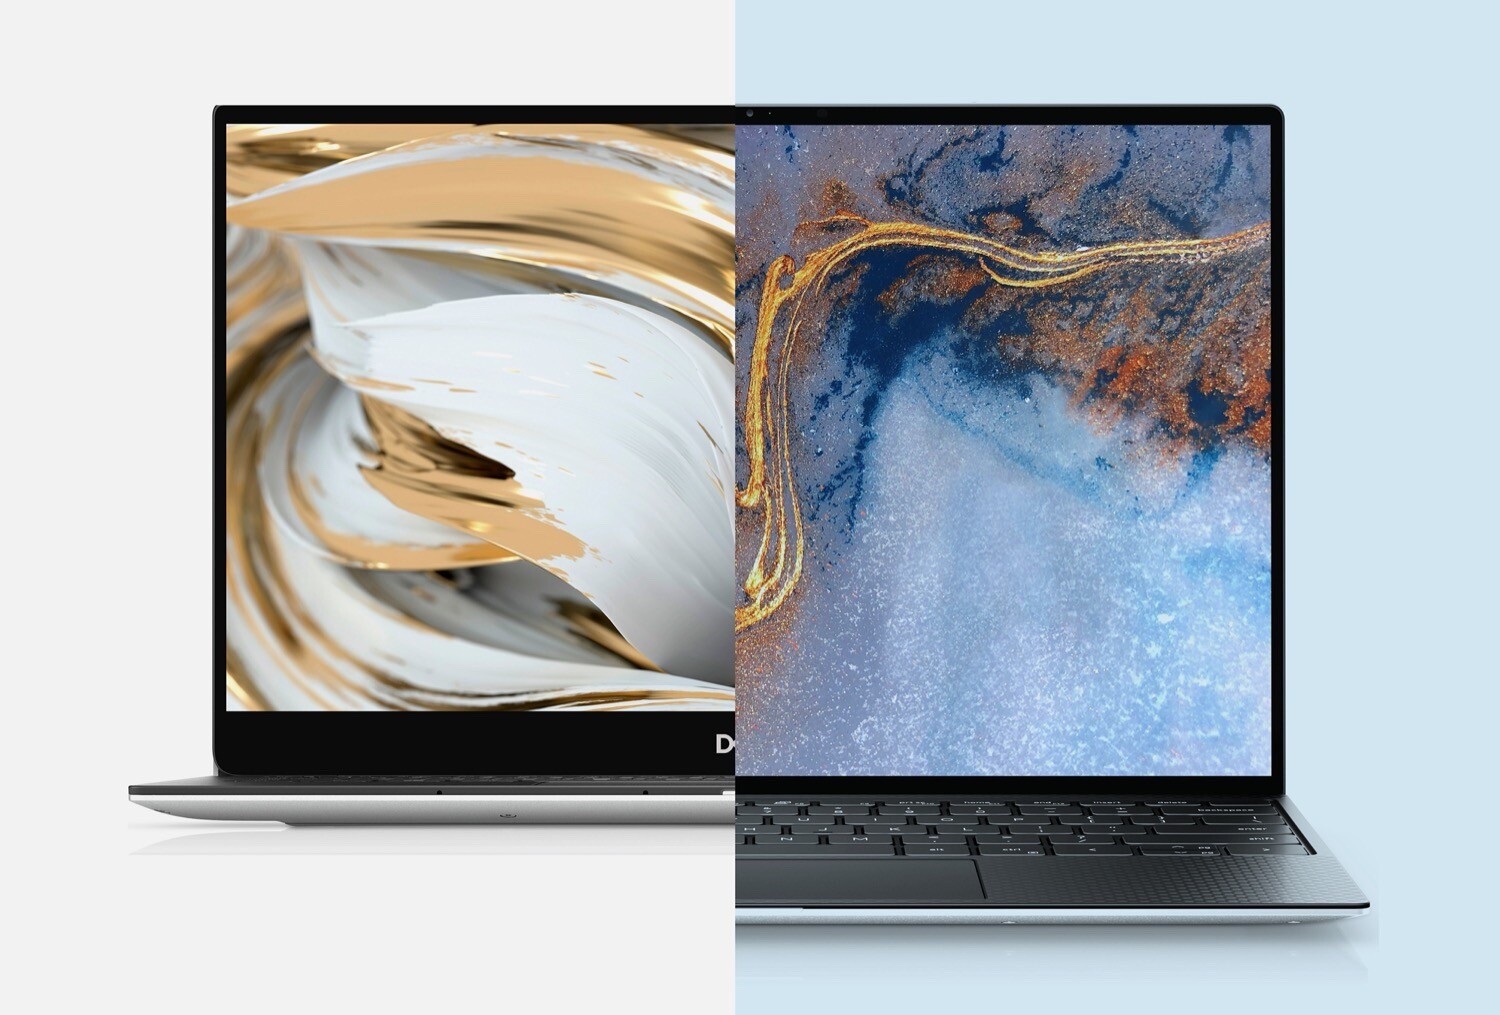
Dell XPS 13 9305 Core i5 Full HD laptop in review: Less display, better colors
 versus XPS 13 9310 (16:10) - Which is the better choice?")
A brand-new Tiger Lake XPS 13 for 1,079 Euros (~$1,303)? Not only does this sound interesting, but it actually is. We took a look at Dell's low-cost XPS 9305. The main difference: The cheaper 9305 is equipped with a 16:9 display, while the XPS 13 9310 features an almost borderless 16:10 display. In return, the 9305 is one millimeter thicker, seven millimeters wider, and minimally lighter. Both variants come with a 52 Wh battery and two Thunderbolt 4 ports. In addition, the 9305 offers another USB-C port.
In this review, we'll take a closer look at the version with a matte 1080p display (non-touch), 8 GB of RAM, a 512 GB SSD, and the Intel Core i5-1135G7. Should the competition with their 1,200-1,600 Euro (~$1,449-~$1,932) models like the MateBook X or the Spectre X360 13 brace for battle?
More Dell laptops on Notebookcheck:
Possible contenders in comparison
Rating | Date | Model | Weight | Height | Size | Resolution | Price |
|---|---|---|---|---|---|---|---|
| 87.7 % v7 (old) | 05 / 2021 | Dell XPS 13 9305 Core i5 FHD i5-1135G7, Iris Xe G7 80EUs | 1.2 kg | 16 mm | 13.30" | 1920x1080 | |
| 88.1 % v7 (old) | 10 / 2020 | Dell XPS 13 9310 Core i7 FHD i7-1165G7, Iris Xe G7 96EUs | 1.3 kg | 14.8 mm | 13.40" | 1920x1200 | |
| 88.9 % v7 (old) | 03 / 2020 | Dell XPS 13 9300 Core i7-1065G7 i7-1065G7, Iris Plus Graphics G7 (Ice Lake 64 EU) | 1.2 kg | 14.8 mm | 13.40" | 1920x1200 | |
| 92.1 % v7 (old) | 06 / 2020 | Apple MacBook Pro 13 2020 2GHz i5 10th-Gen i5-1038NG7, Iris Plus Graphics G7 (Ice Lake 64 EU) | 1.4 kg | 15.6 mm | 13.30" | 2560x1600 | |
| 87.4 % v7 (old) | 06 / 2020 | Huawei MateBook X Pro 2020 i7 i7-10510U, GeForce MX250 | 1.3 kg | 14.6 mm | 13.90" | 3000x2000 | |
| 85.3 % v7 (old) | 08 / 2020 | Lenovo Yoga Slim 7-14ARE R7 4800U, Vega 8 | 1.4 kg | 14.9 mm | 14.00" | 1920x1080 | |
| 88.4 % v7 (old) | 12 / 2019 | HP Spectre x360 13-aw0013dx i7-1065G7, Iris Plus Graphics G7 (Ice Lake 64 EU) | 1.2 kg | 16.9 mm | 13.30" | 1920x1080 |
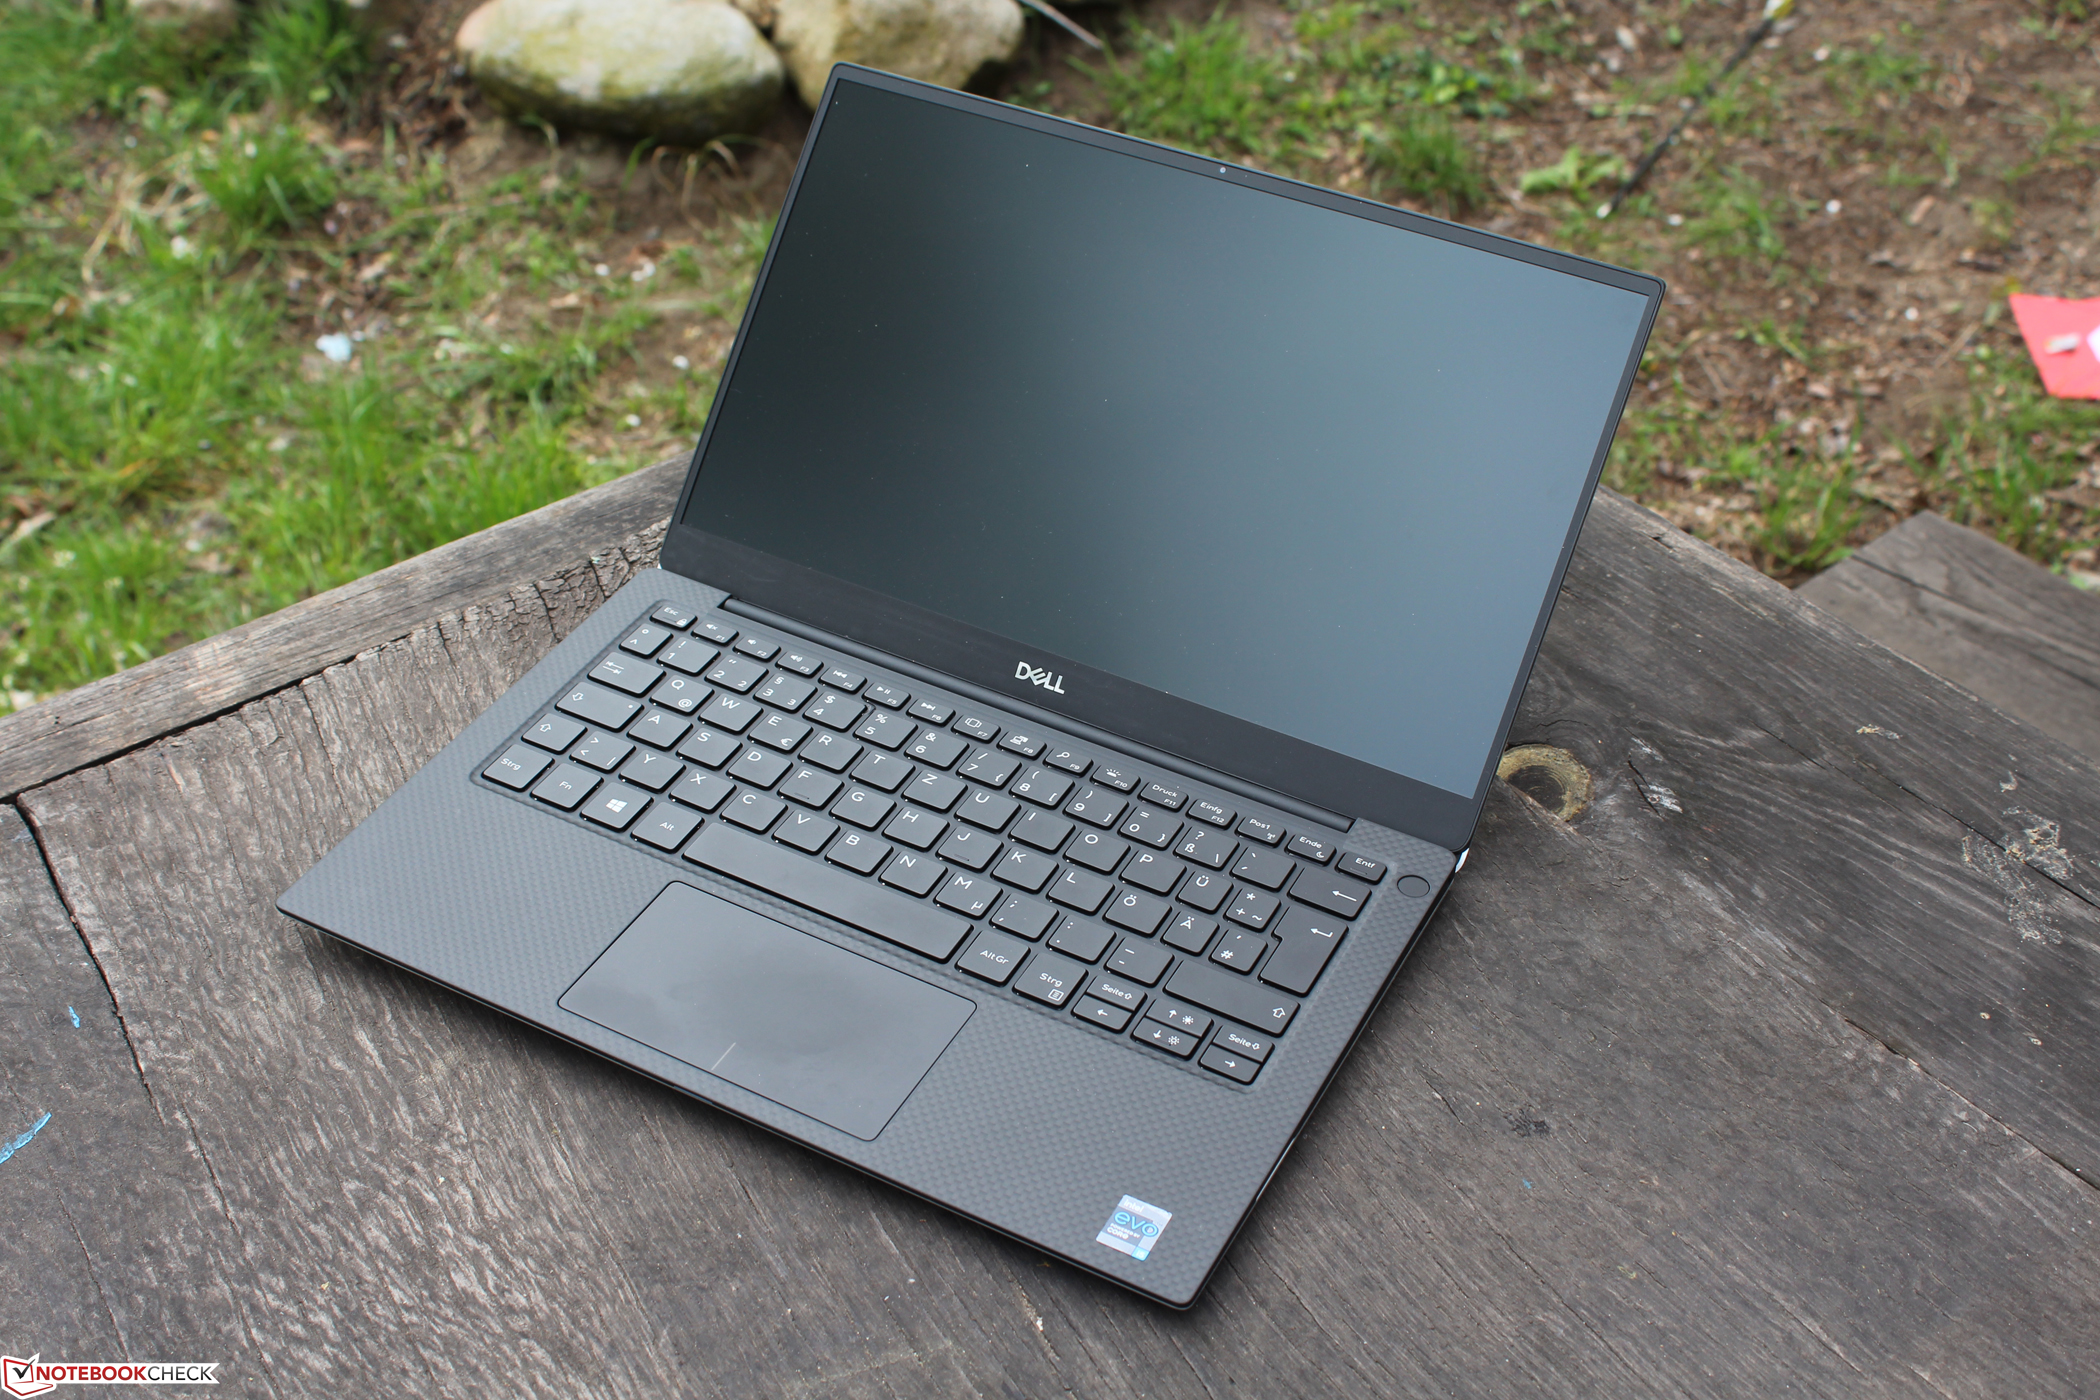
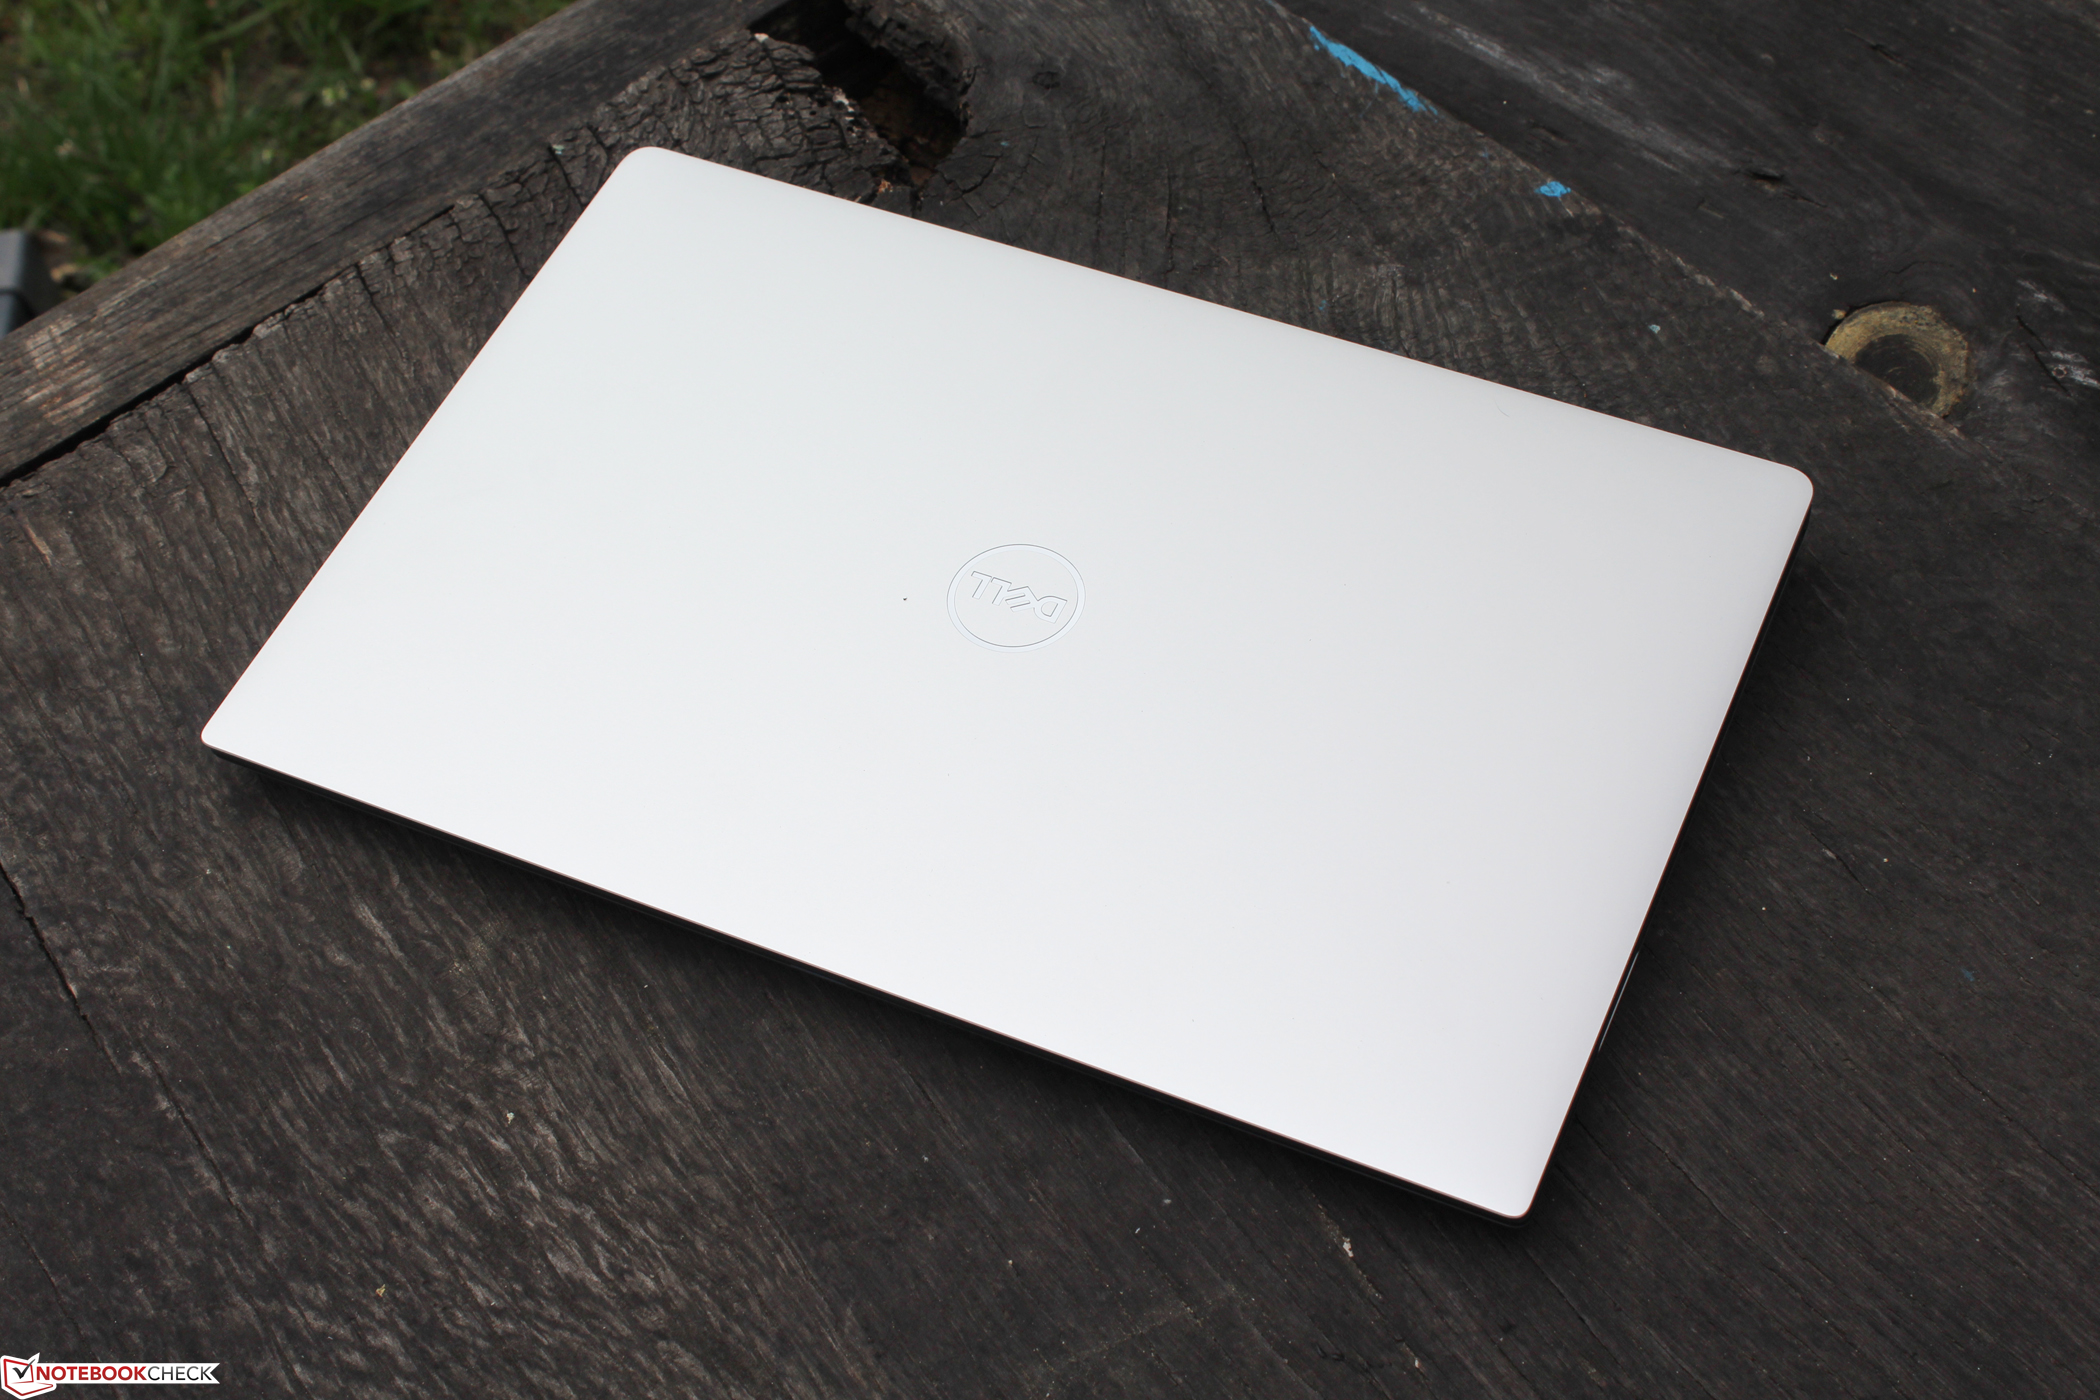
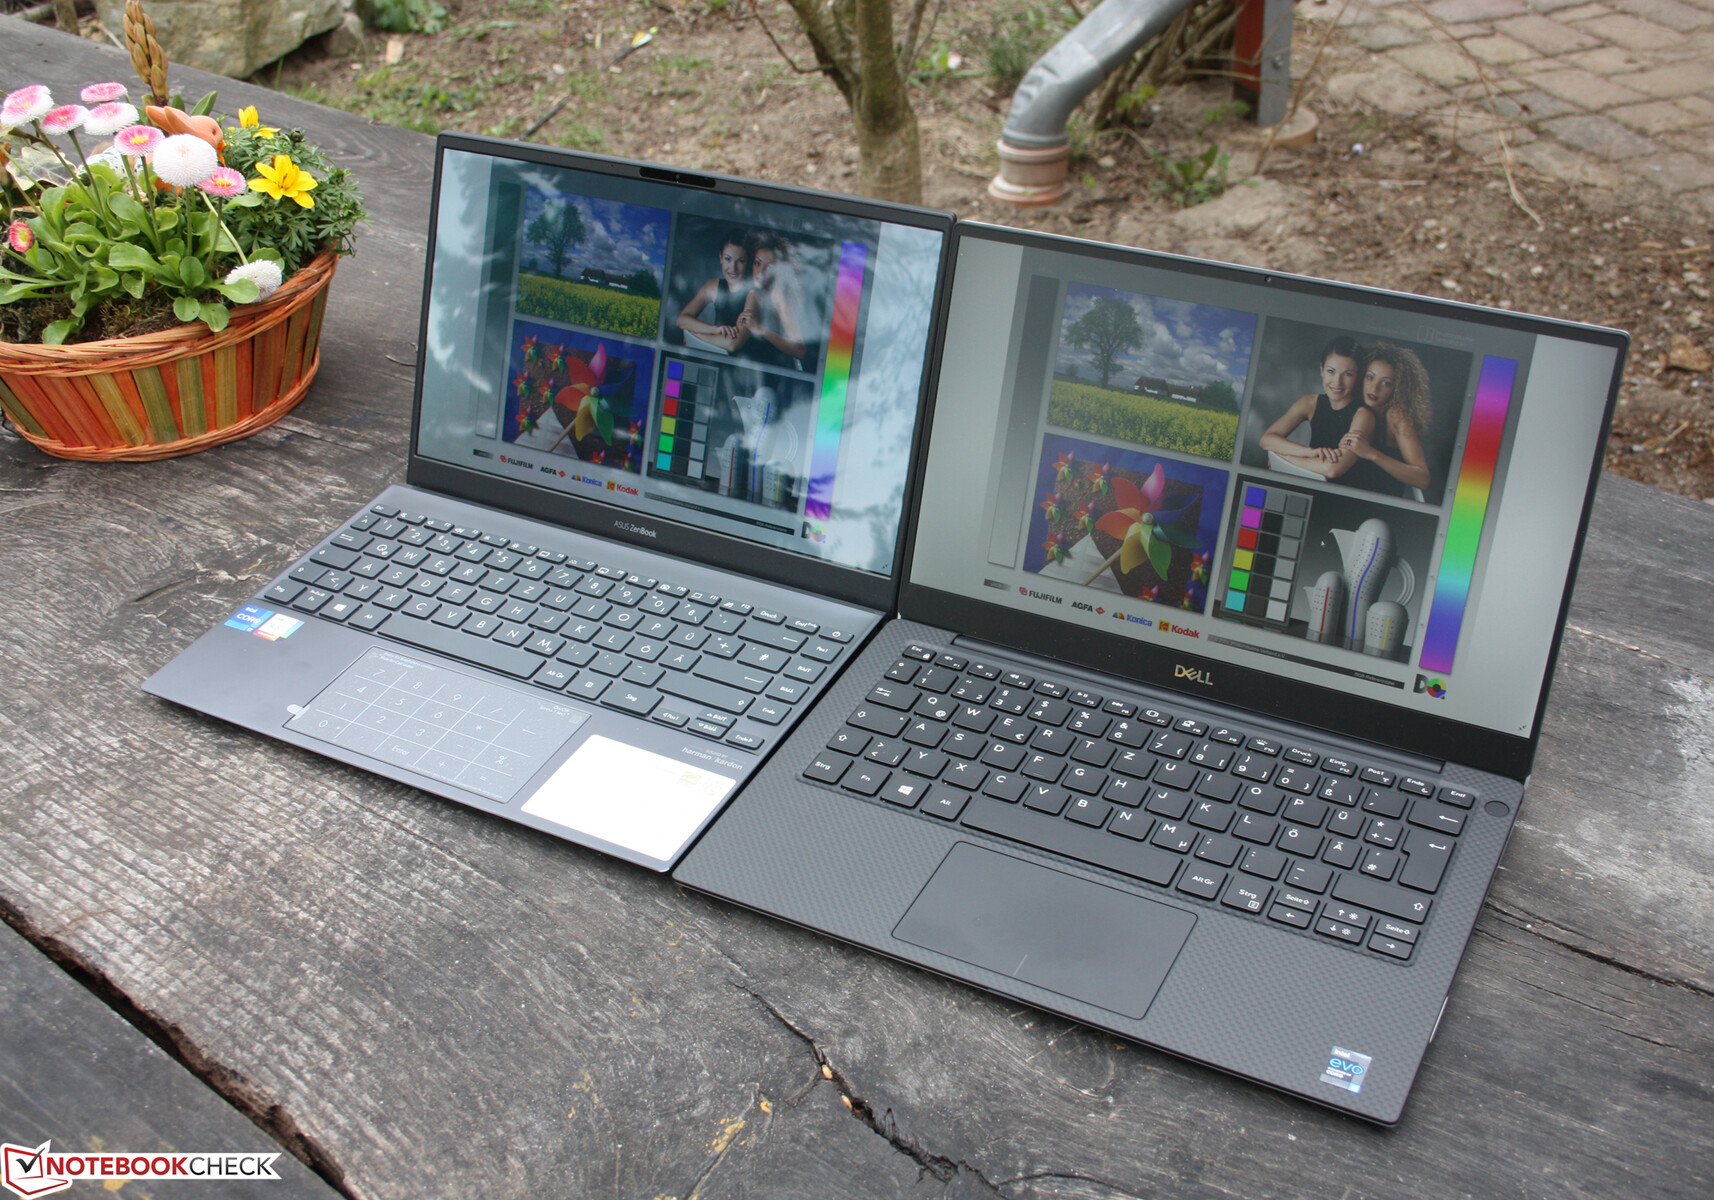
Case - Dell with 1,187 grams
Dell first introduced the 16:10 design of the XPS 13 in early 2020 with the XPS 13 9300. Consequently, we now have a 16:9 version at hand; there are no other updates in terms of looks. Nor are there any color options, so Platinum Silver will have to suffice - but that's also the case with the 9310, at least from what we can currently see in Dell's online store. At the time, we had a white XPS 13 9310 in review.
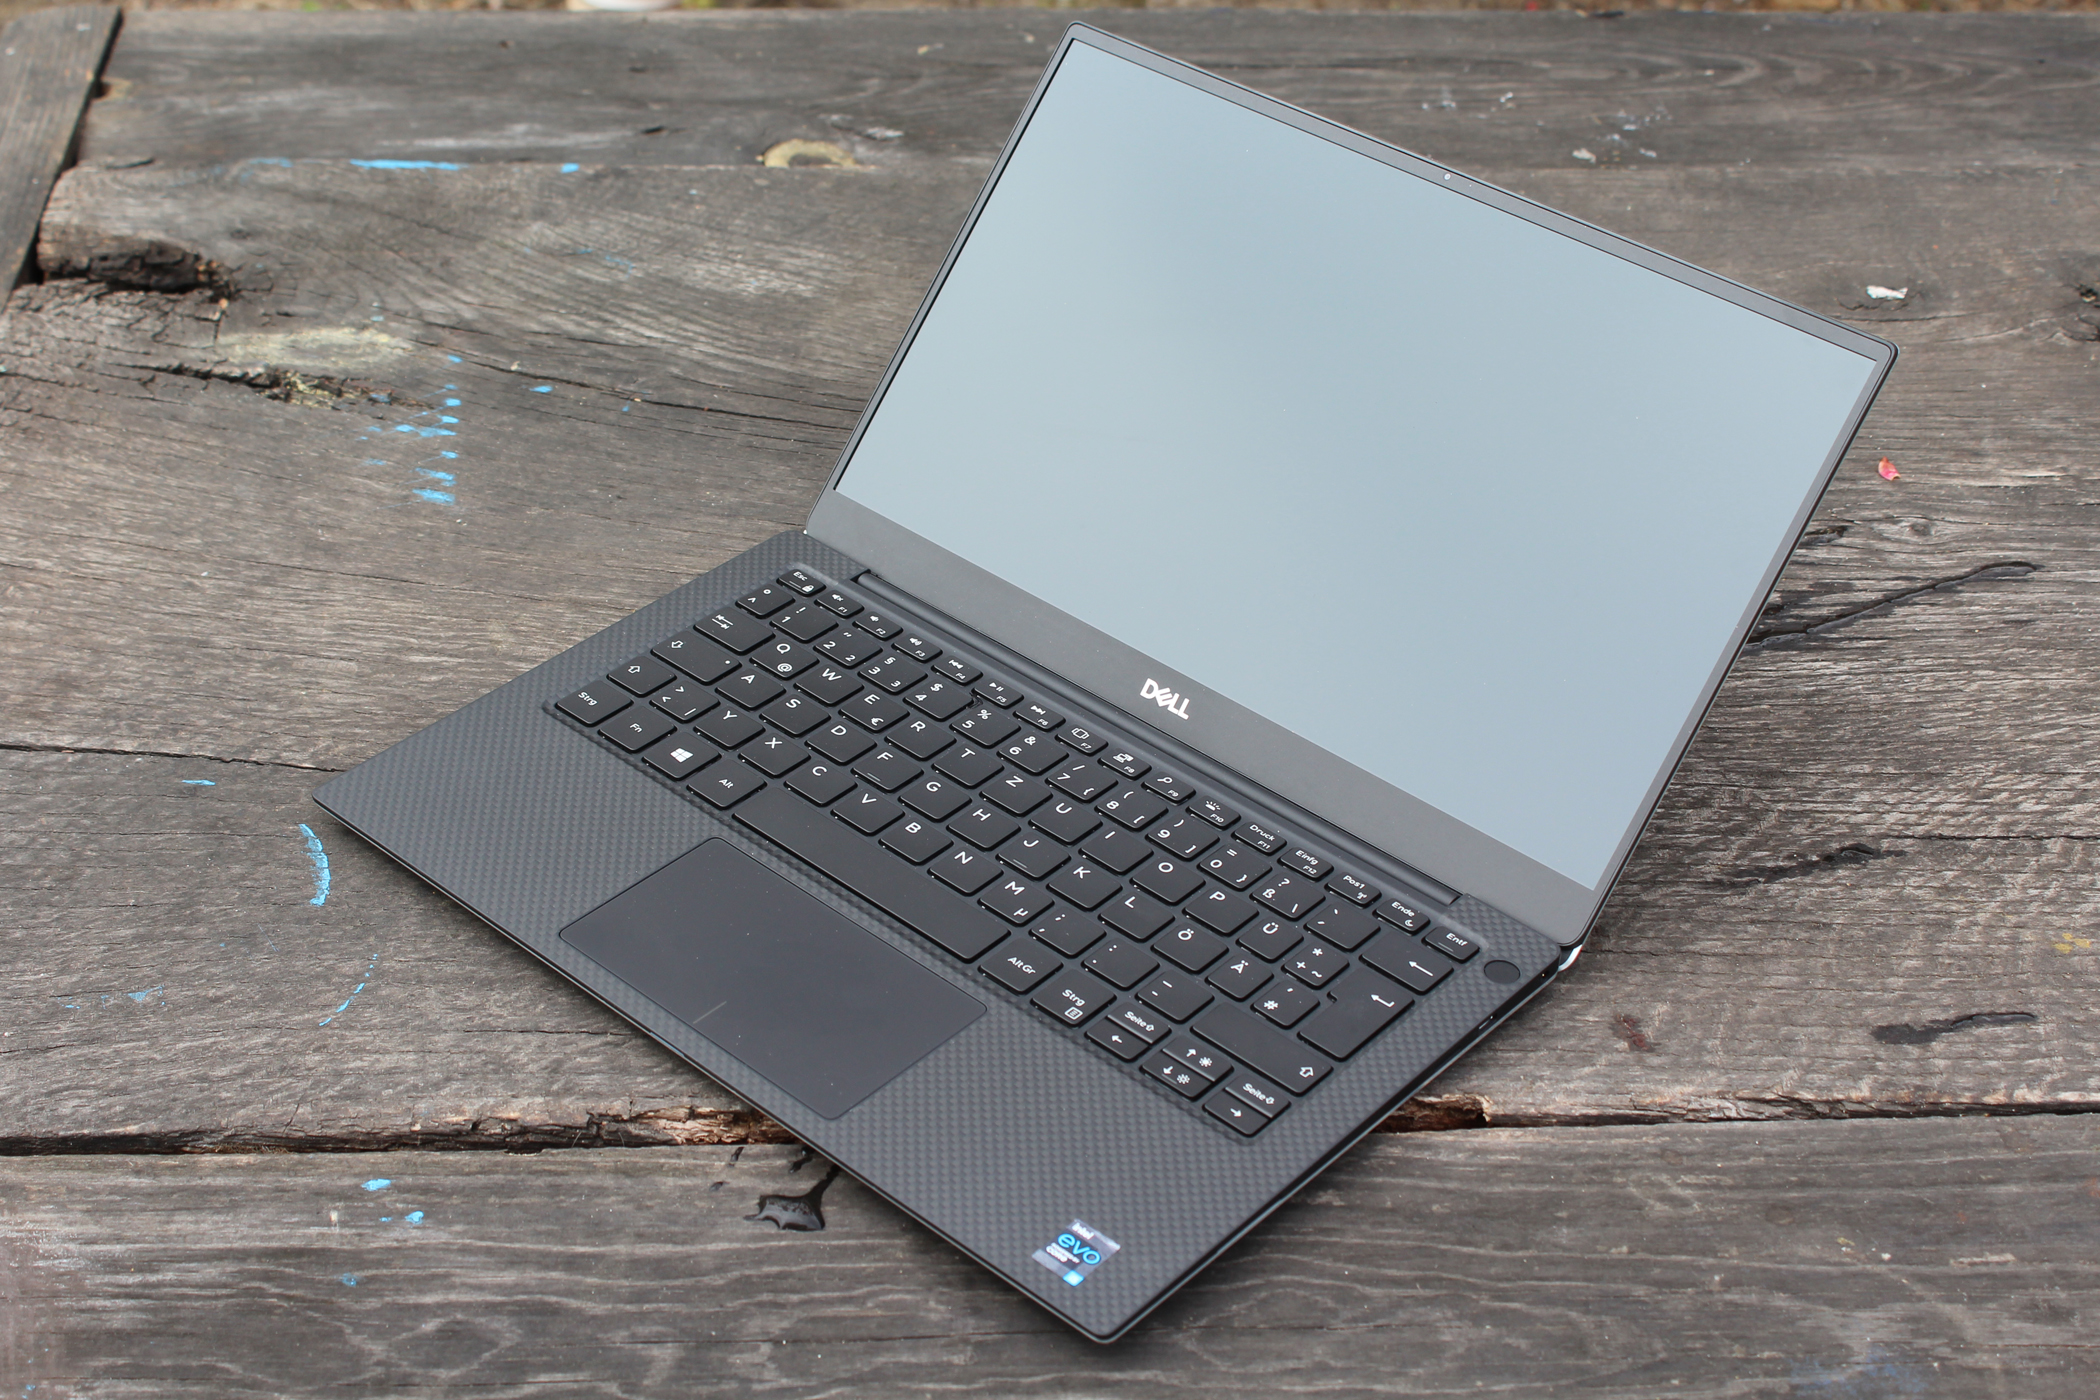

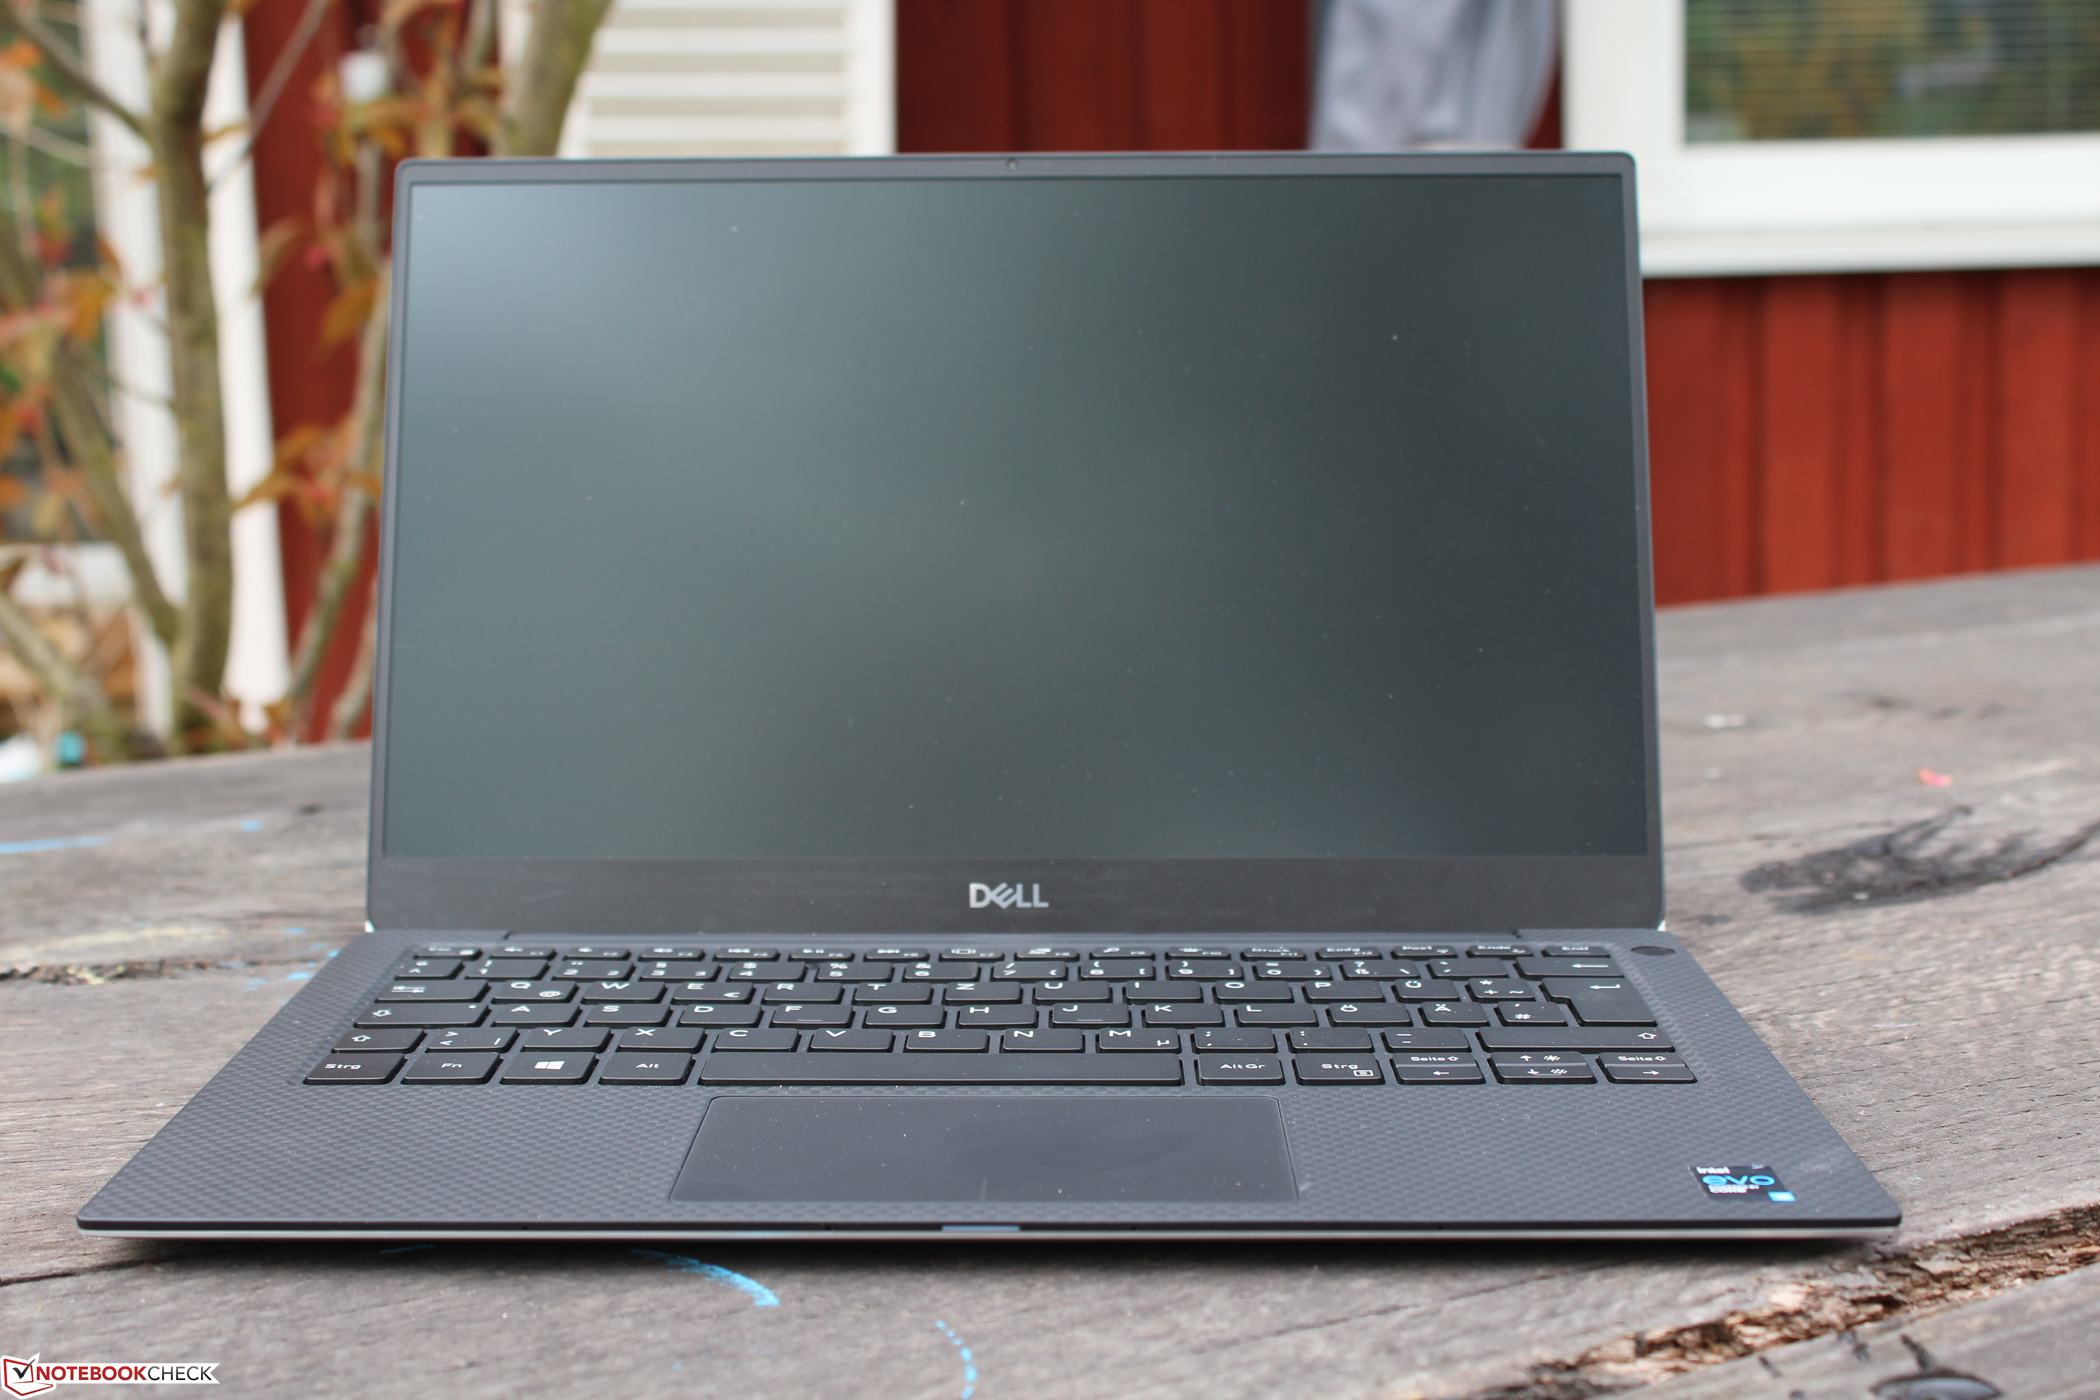
The 9305 is a few millimeters wider than the 9310 as well as one millimeter thicker. This makes its footprint most similar to the HP Spectre x360 13, and its weight is very similar too.
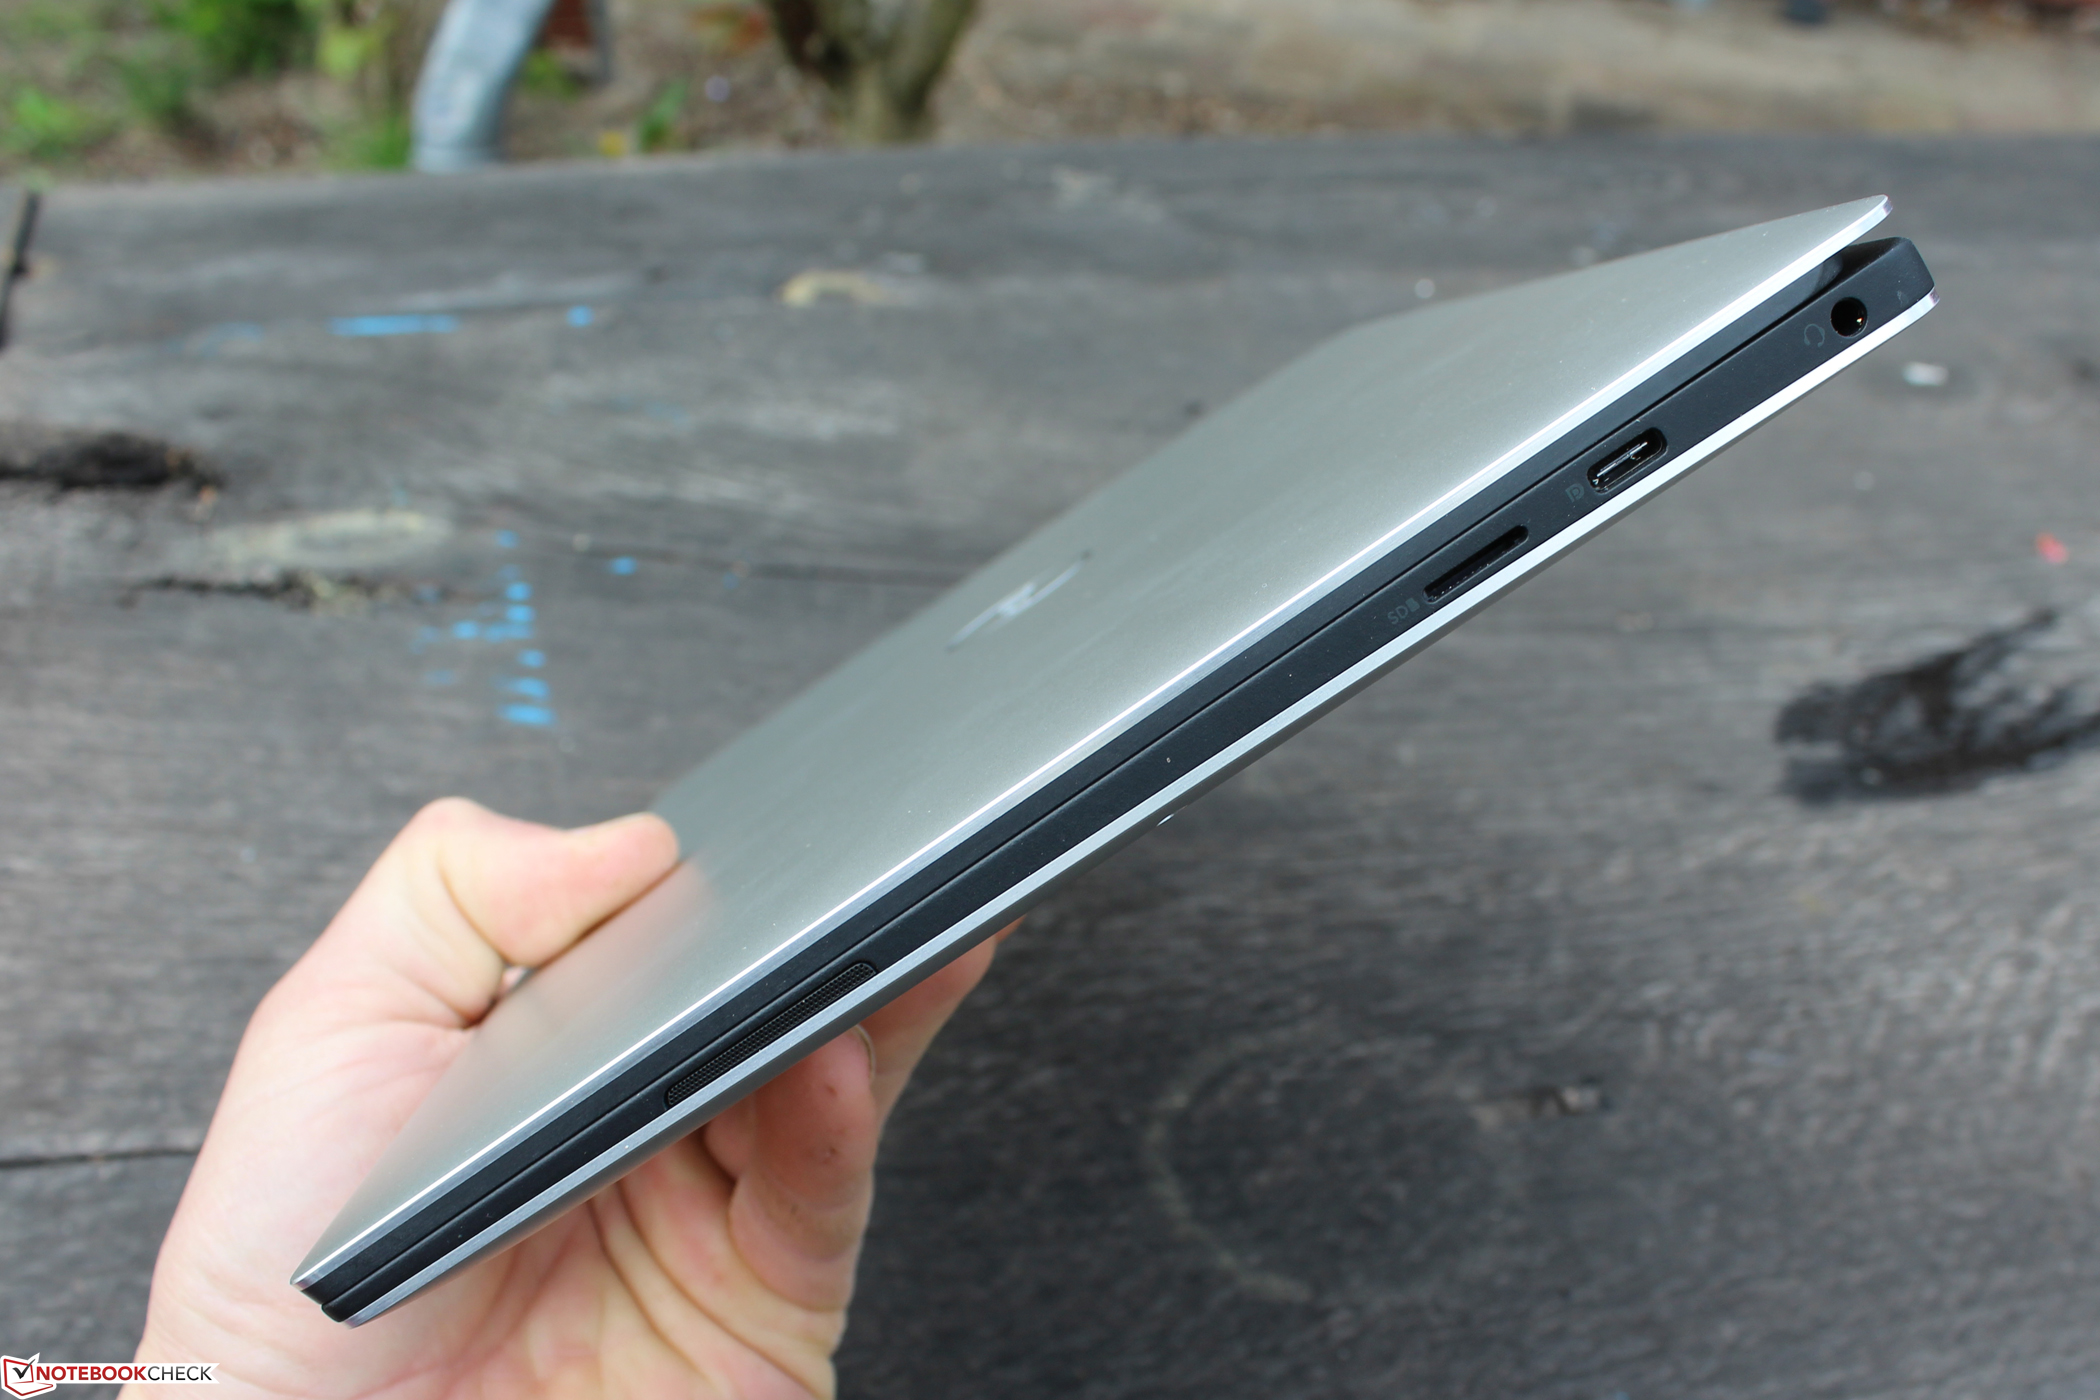
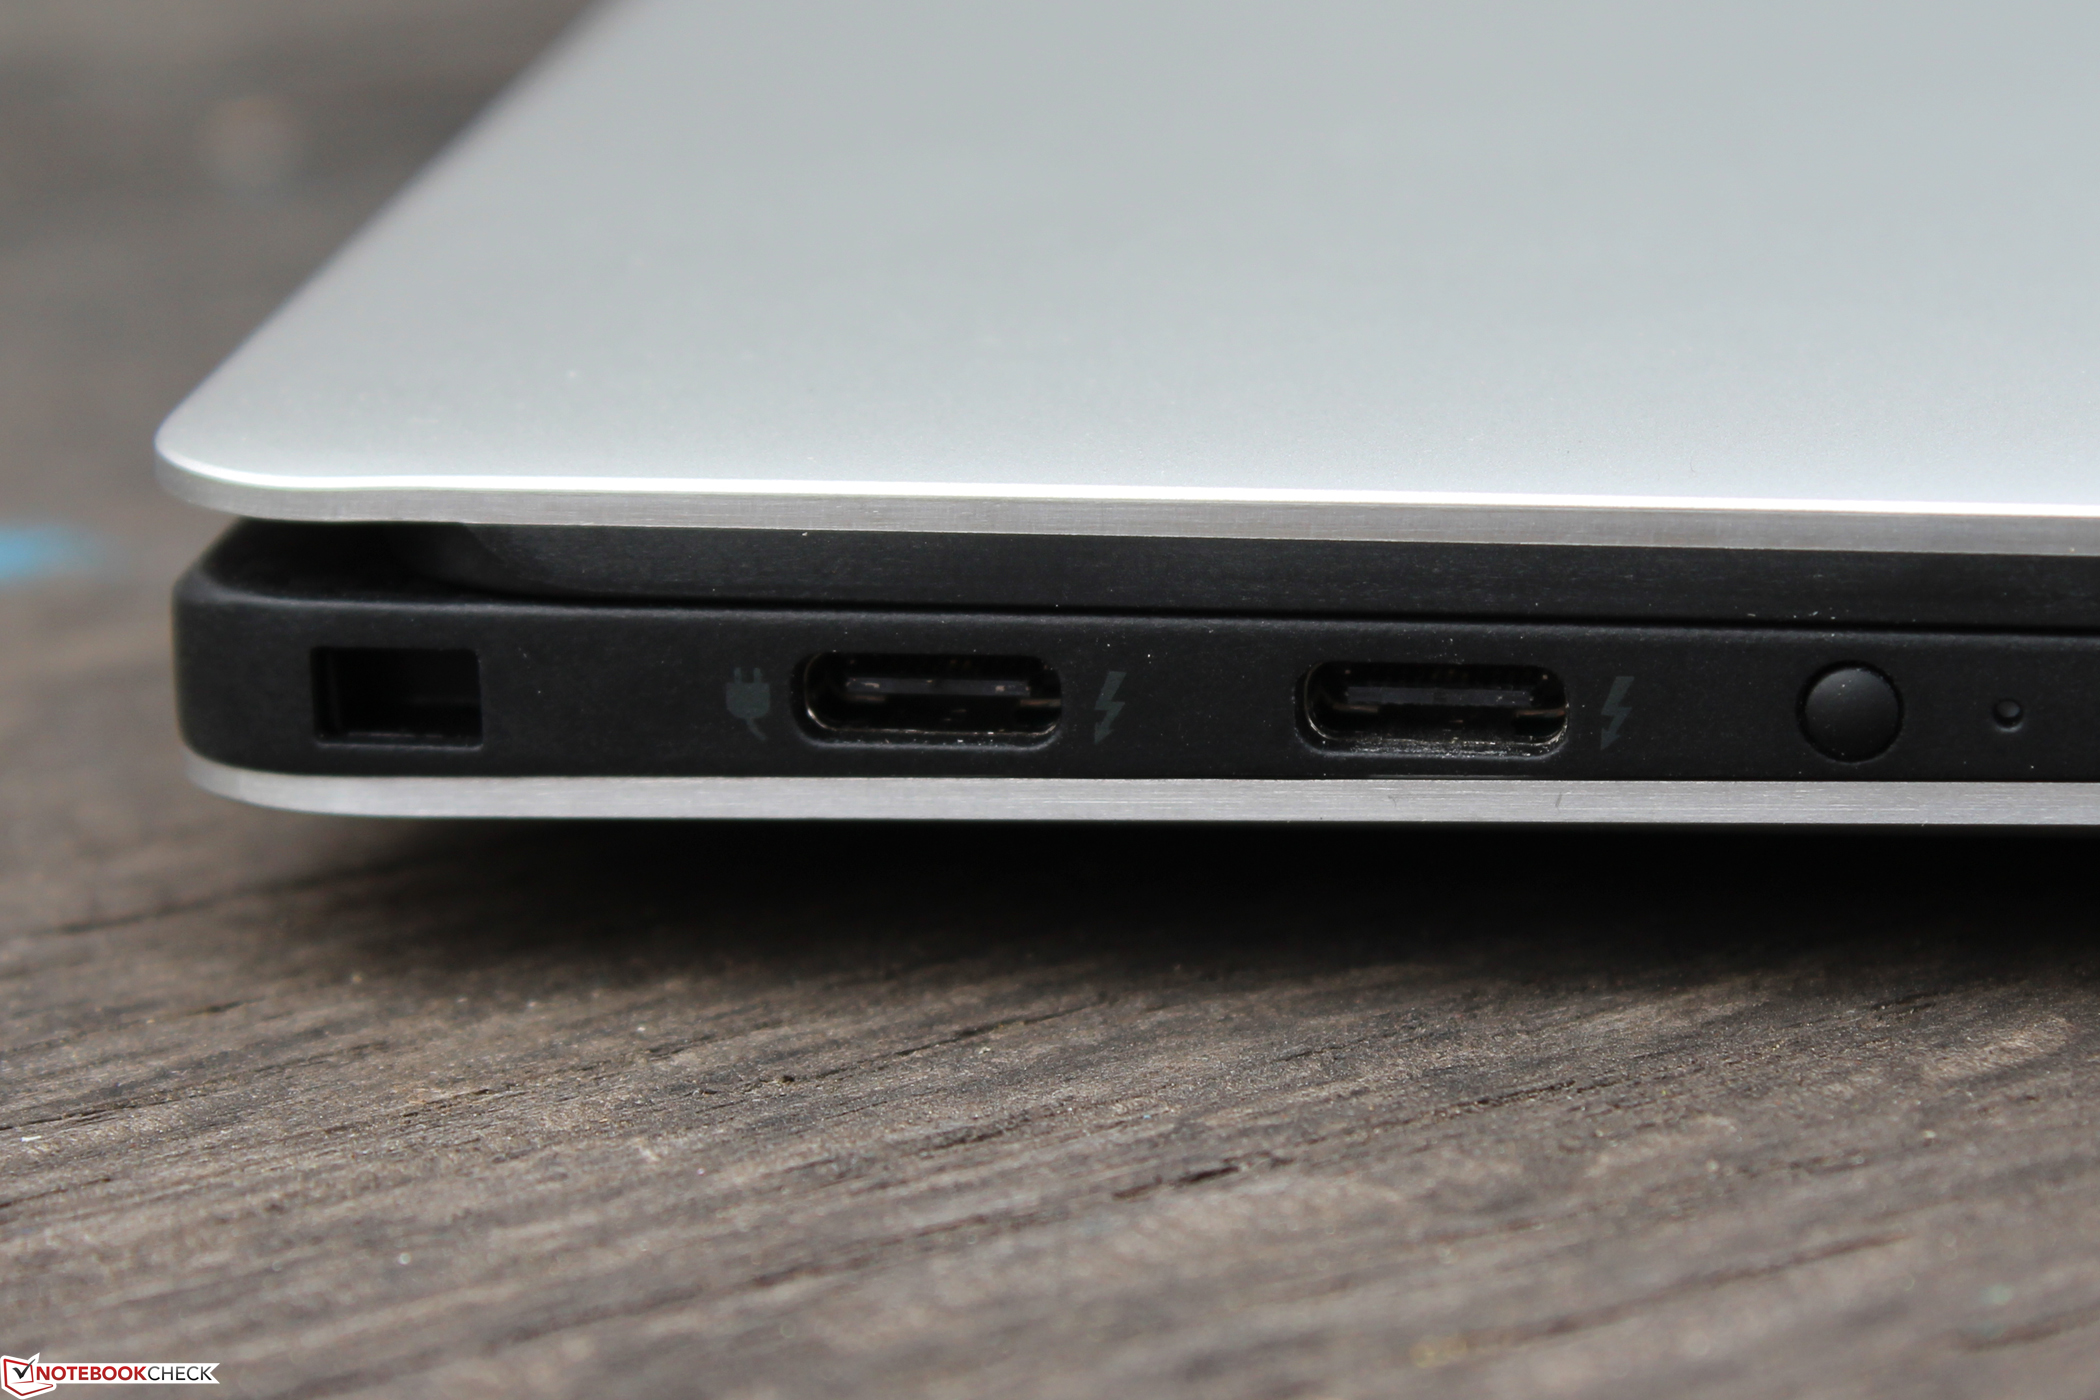
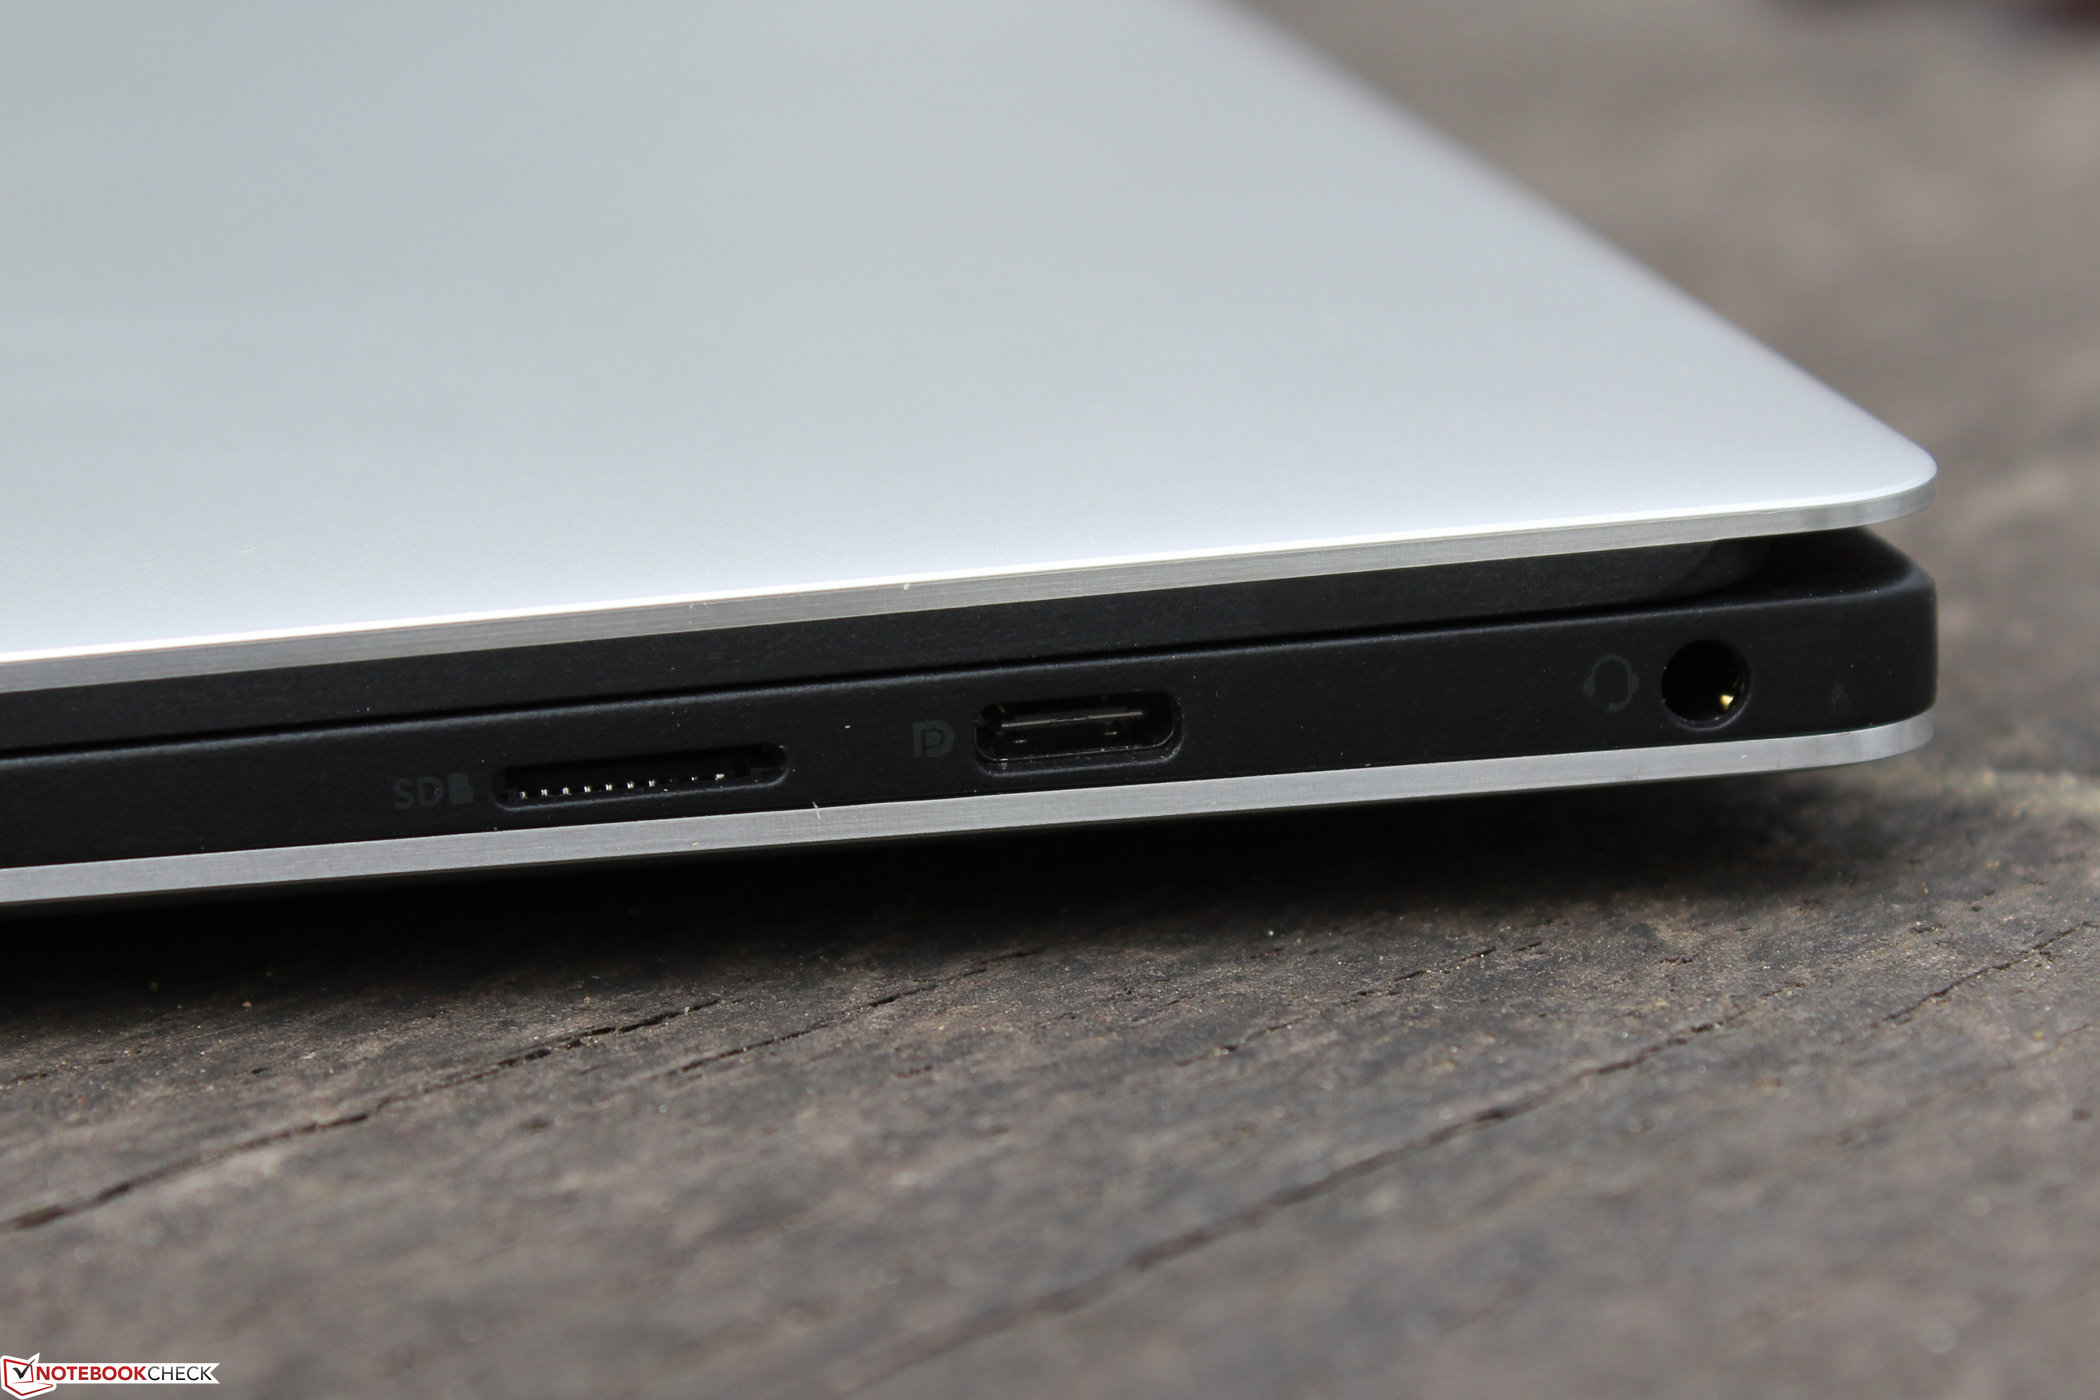
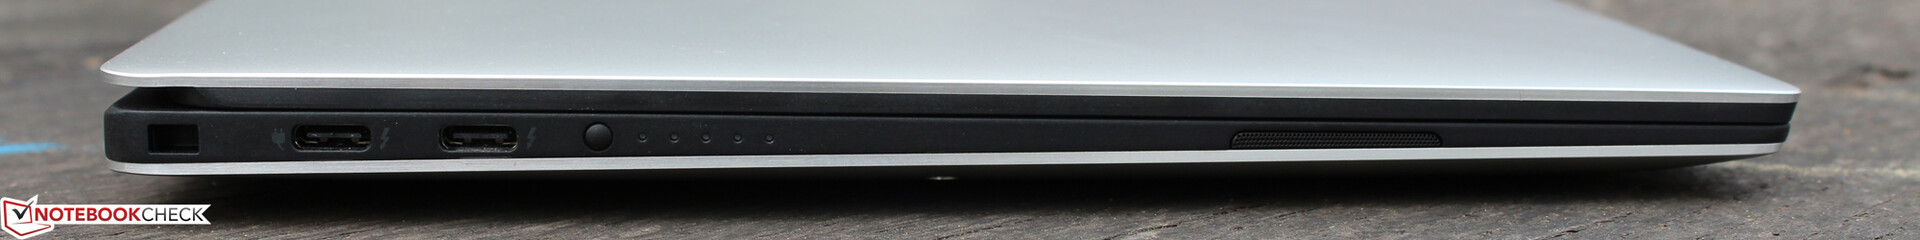
Connectivity - Dell Ultrabook with Thunderbolt 4
The 9305 has one additional port, namely a USB Type-C one with DisplayPort. As a result, there are three Type-C ports, and the TB4 variants are both on the left side (without DisplayPort). The 9310 has one TB4 port on the right side and one on the left, both with DisplayPort.
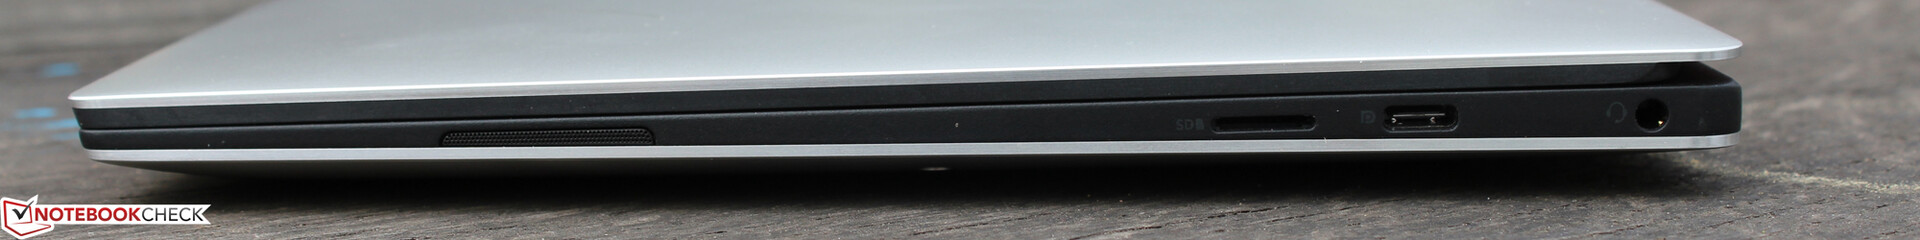
SD card reader
The SD performance is very good; only the fastest card readers in our tests reach 180 MB/s. They probably use USB 3.1 speeds internally. Moreover, inserted microSD cards protrude just under 2 mm beyond the case. We used a 128 GB Angelbird SD card AV PRO UHS-II V60 for our tests.
| SD Card Reader | |
| average JPG Copy Test (av. of 3 runs) | |
| Dell XPS 13 9310 Core i7 FHD (Toshiba Exceria Pro M501 64 GB UHS-II) | |
| Dell XPS 13 9305 Core i5 FHD | |
| HP Spectre x360 13-aw0013dx (Toshiba Exceria Pro M501 microSDXC 64GB) | |
| Average of class Subnotebook (23.7 - 188, n=9, last 2 years) | |
| Lenovo Yoga Slim 7-14ARE (Toshiba Exceria Pro M501 64 GB UHS-II) | |
| maximum AS SSD Seq Read Test (1GB) | |
| Dell XPS 13 9310 Core i7 FHD (Toshiba Exceria Pro M501 64 GB UHS-II) | |
| Dell XPS 13 9305 Core i5 FHD | |
| HP Spectre x360 13-aw0013dx (Toshiba Exceria Pro M501 microSDXC 64GB) | |
| Average of class Subnotebook (24.9 - 195, n=8, last 2 years) | |
| Lenovo Yoga Slim 7-14ARE (Toshiba Exceria Pro M501 64 GB UHS-II) | |
Communication
The XPS can establish wireless connections over Wi-Fi 6 and Bluetooth 5.1. While WLAN speeds reach an average of 1,492 Mb/s for receiving data with our Netgear Nighthawk AX12 reference router, the average of 940 Mb/s for sending data is only sufficient for the middle place in our test field.
Webcam
Like many manufacturers, Dell continues to use a low-resolution webcam with a resolution of 0.9 MP (720p). Image quality is correspondingly mediocre, and details look blurry even in good ambient light. There are many artifacts in the photos, and color reproduction falls short with a poor Delta E value of 16 to 30. However, the competition doesn't tackle the subject in a more professional way, and it also lacks detail sharpness and color accuracy.


Accessories
The package doesn't include a USB-C to USB-A adapter, which was still included with the 9310. A 65-watt power adapter provides energy to a Type-C port (Power Delivery), regardless of which of the three you choose.
Maintenance
Since there haven't been any changes in terms of internal components, we decided against opening the case.
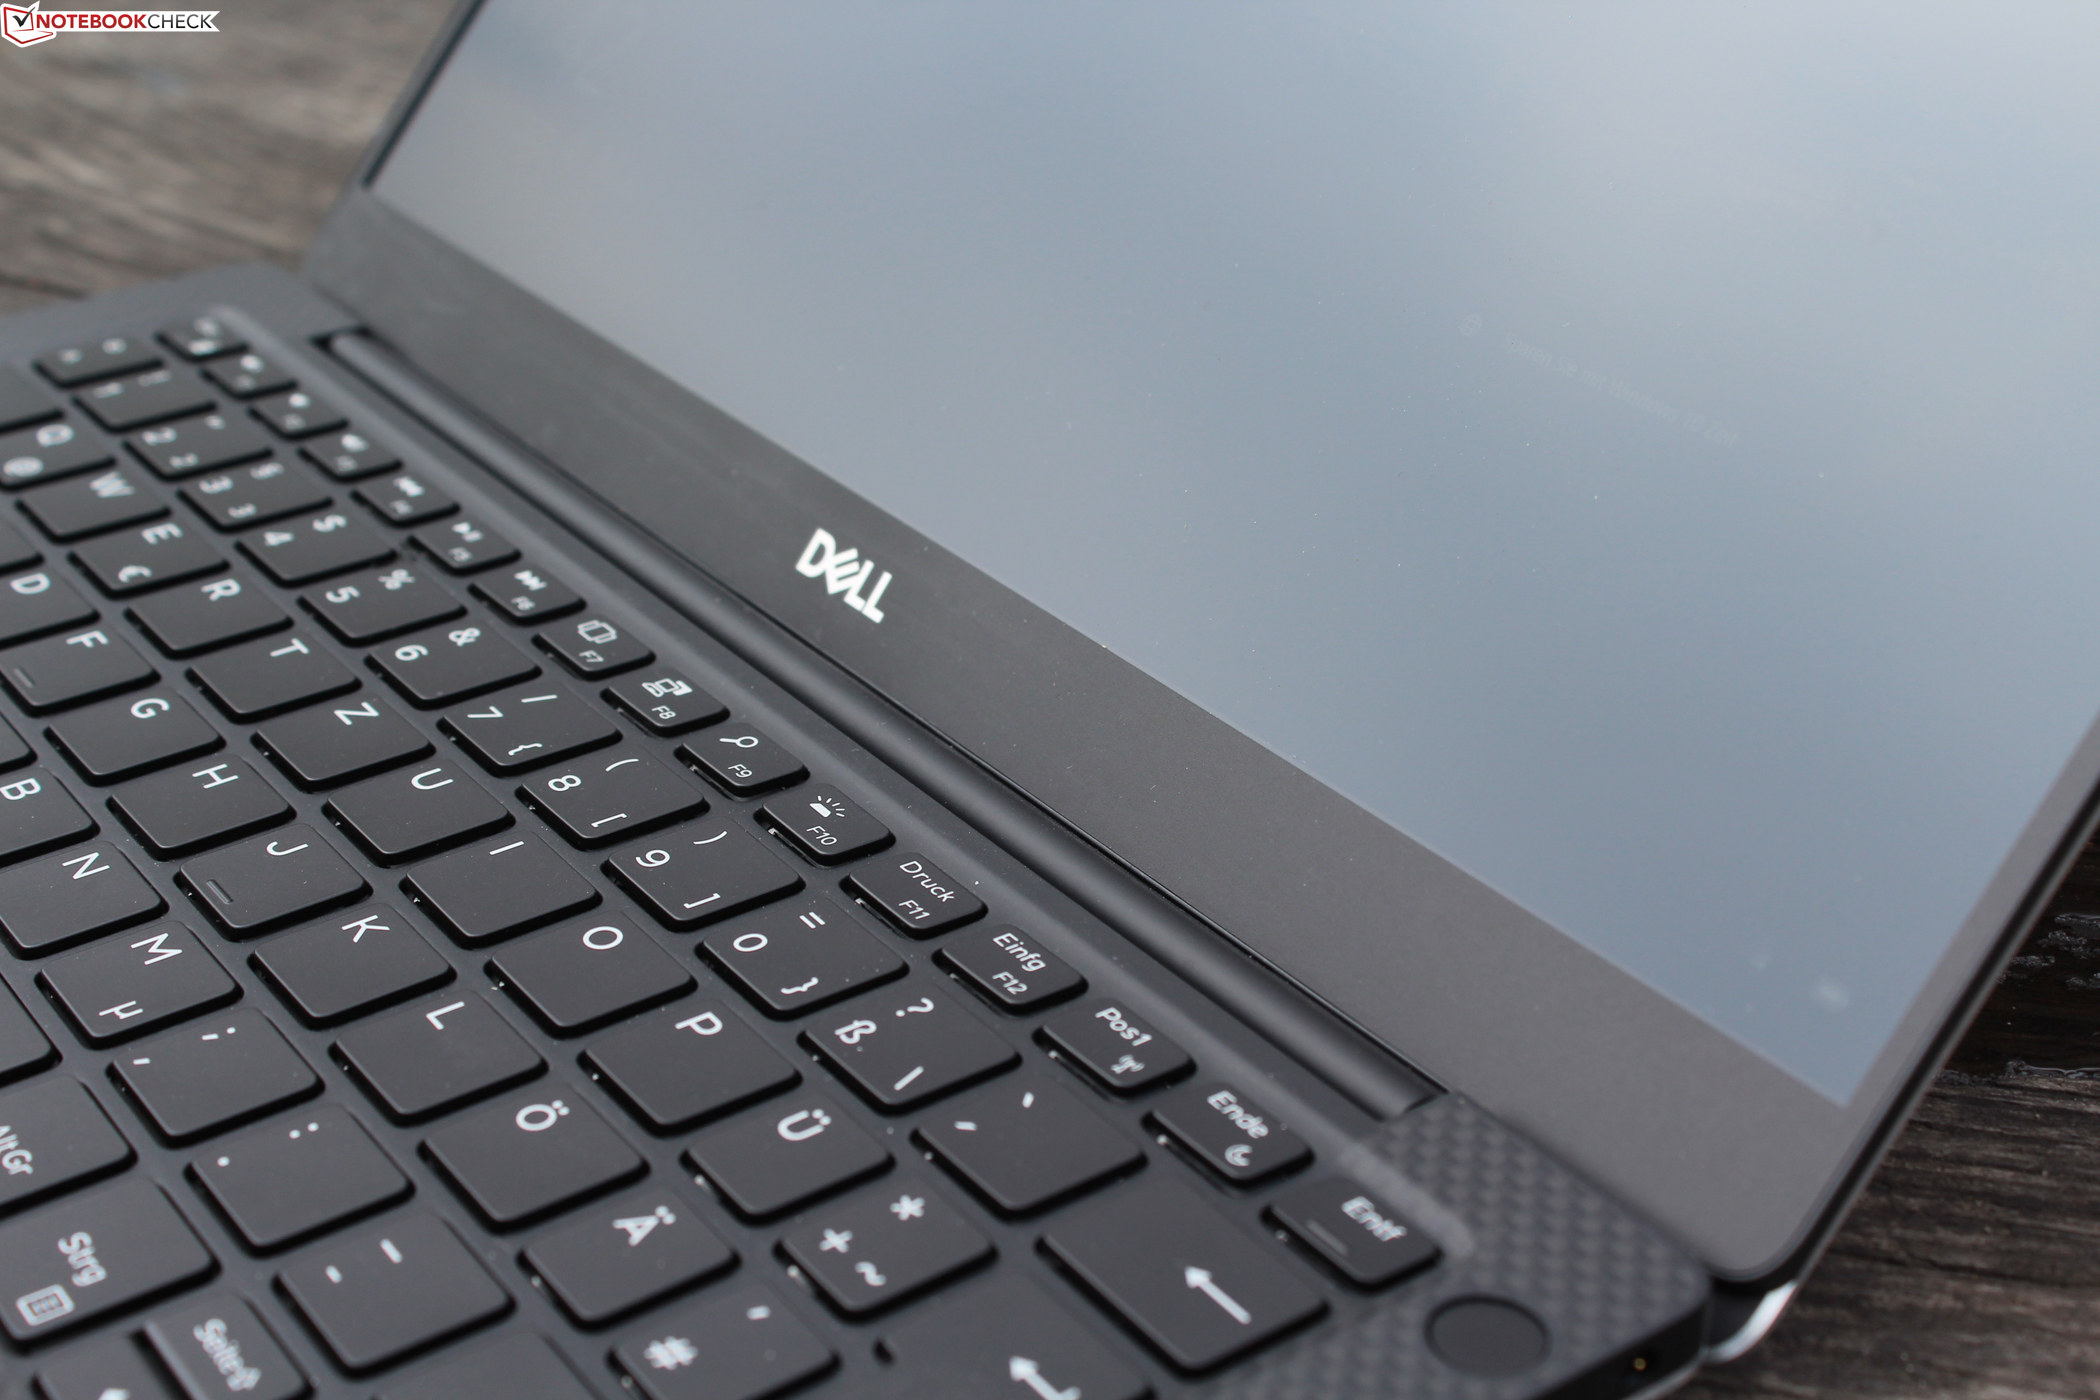
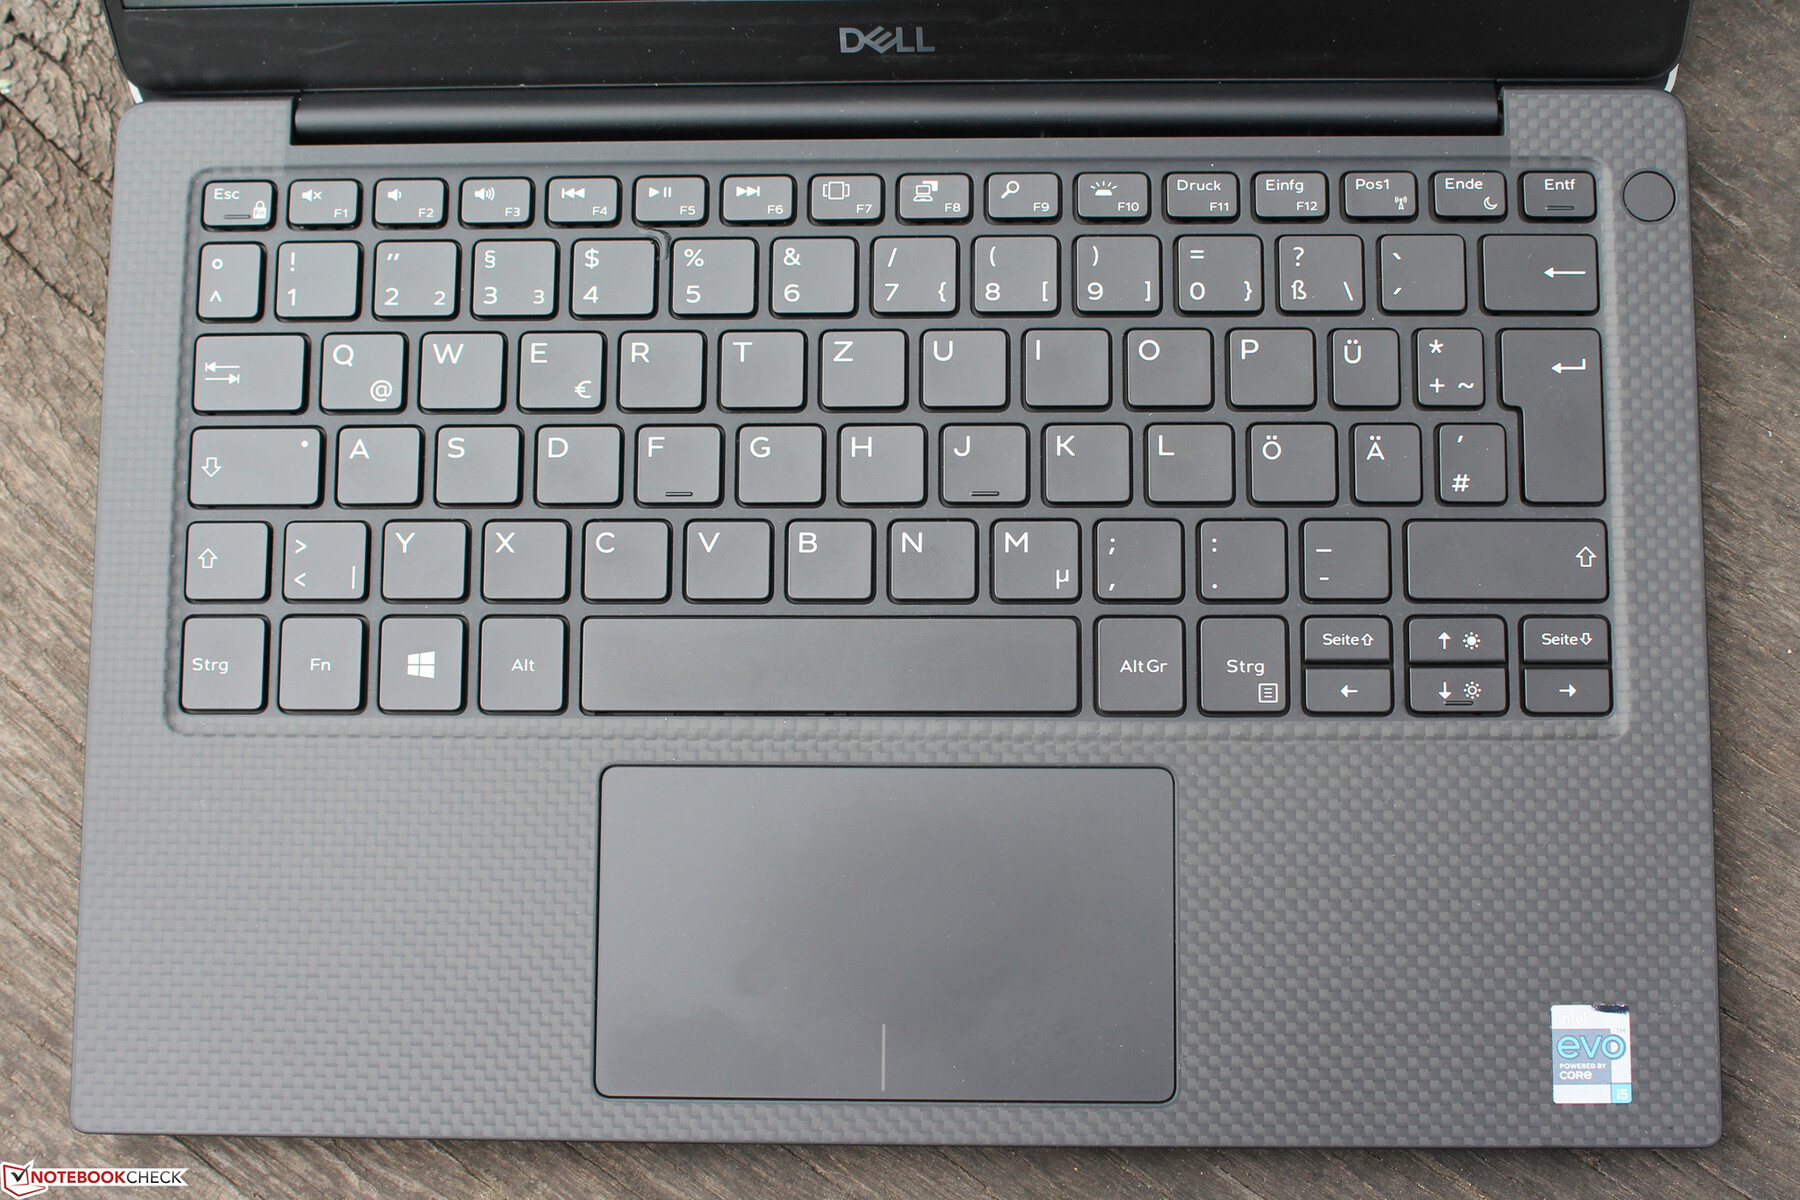
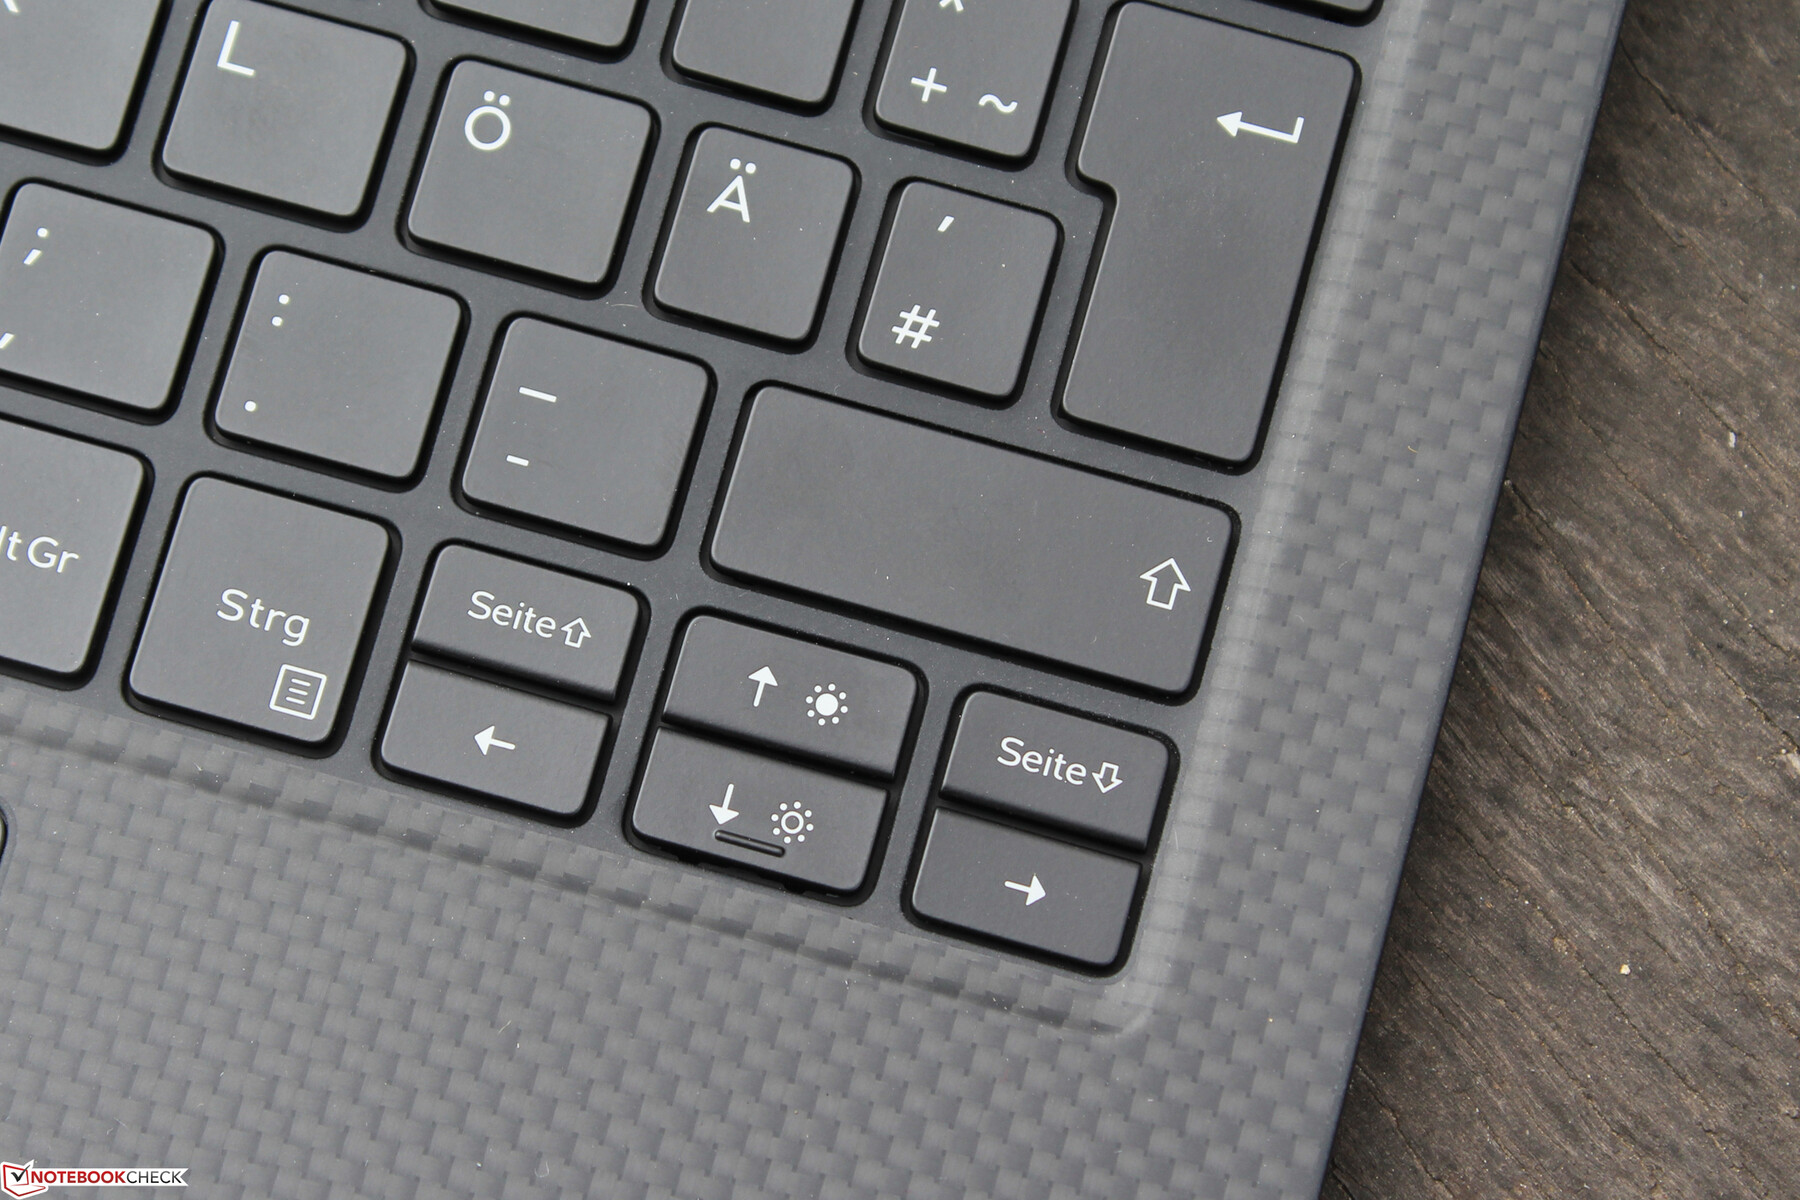
Input devices - XPS 13 with firm key stroke
Keyboard
We find the key stroke to be relatively hard. Furthermore, the keyboard surface yields a bit in the center but only under increased pressure. The firm stroke makes it possible to type quickly, and the clear pressure point provides good feedback. If you are used to desktop keyboards, maybe even mechanical ones, you might still find the stroke too soft. However, the firmness is very good by laptop standards.
The keys have a matte surface with a tendency to feel slippery. Moreover, the keys aren't rubberized either.
You can adjust the duration of the keyboard backlight in steps in the BIOS, including permanently enabling or disabling it. In the automatic mode, the backlight automatically turns on again when the keyboard or trackpad is used.
Touchpad
The trackpad has a short travel between the bottom and almost up to the center. Nevertheless, we experience a good feedback because the pressure point is clear and distinctly audible as well.
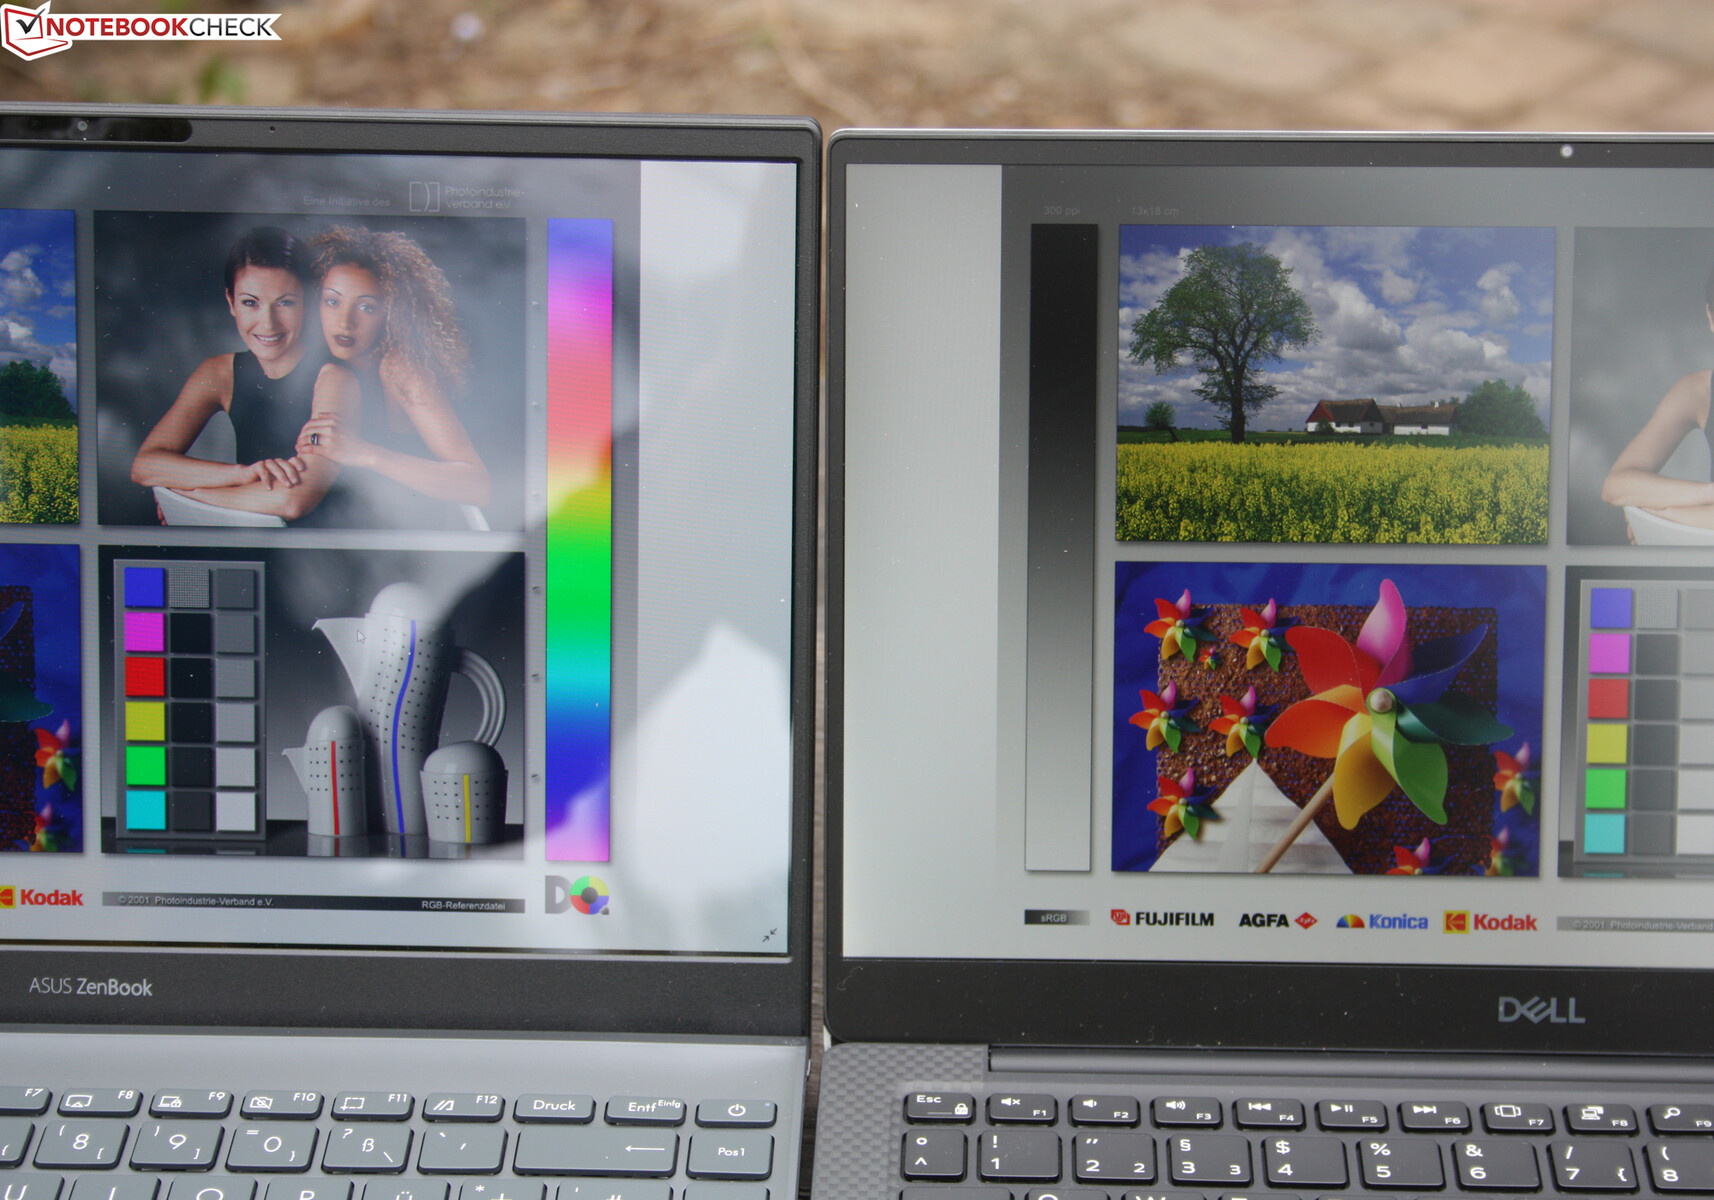
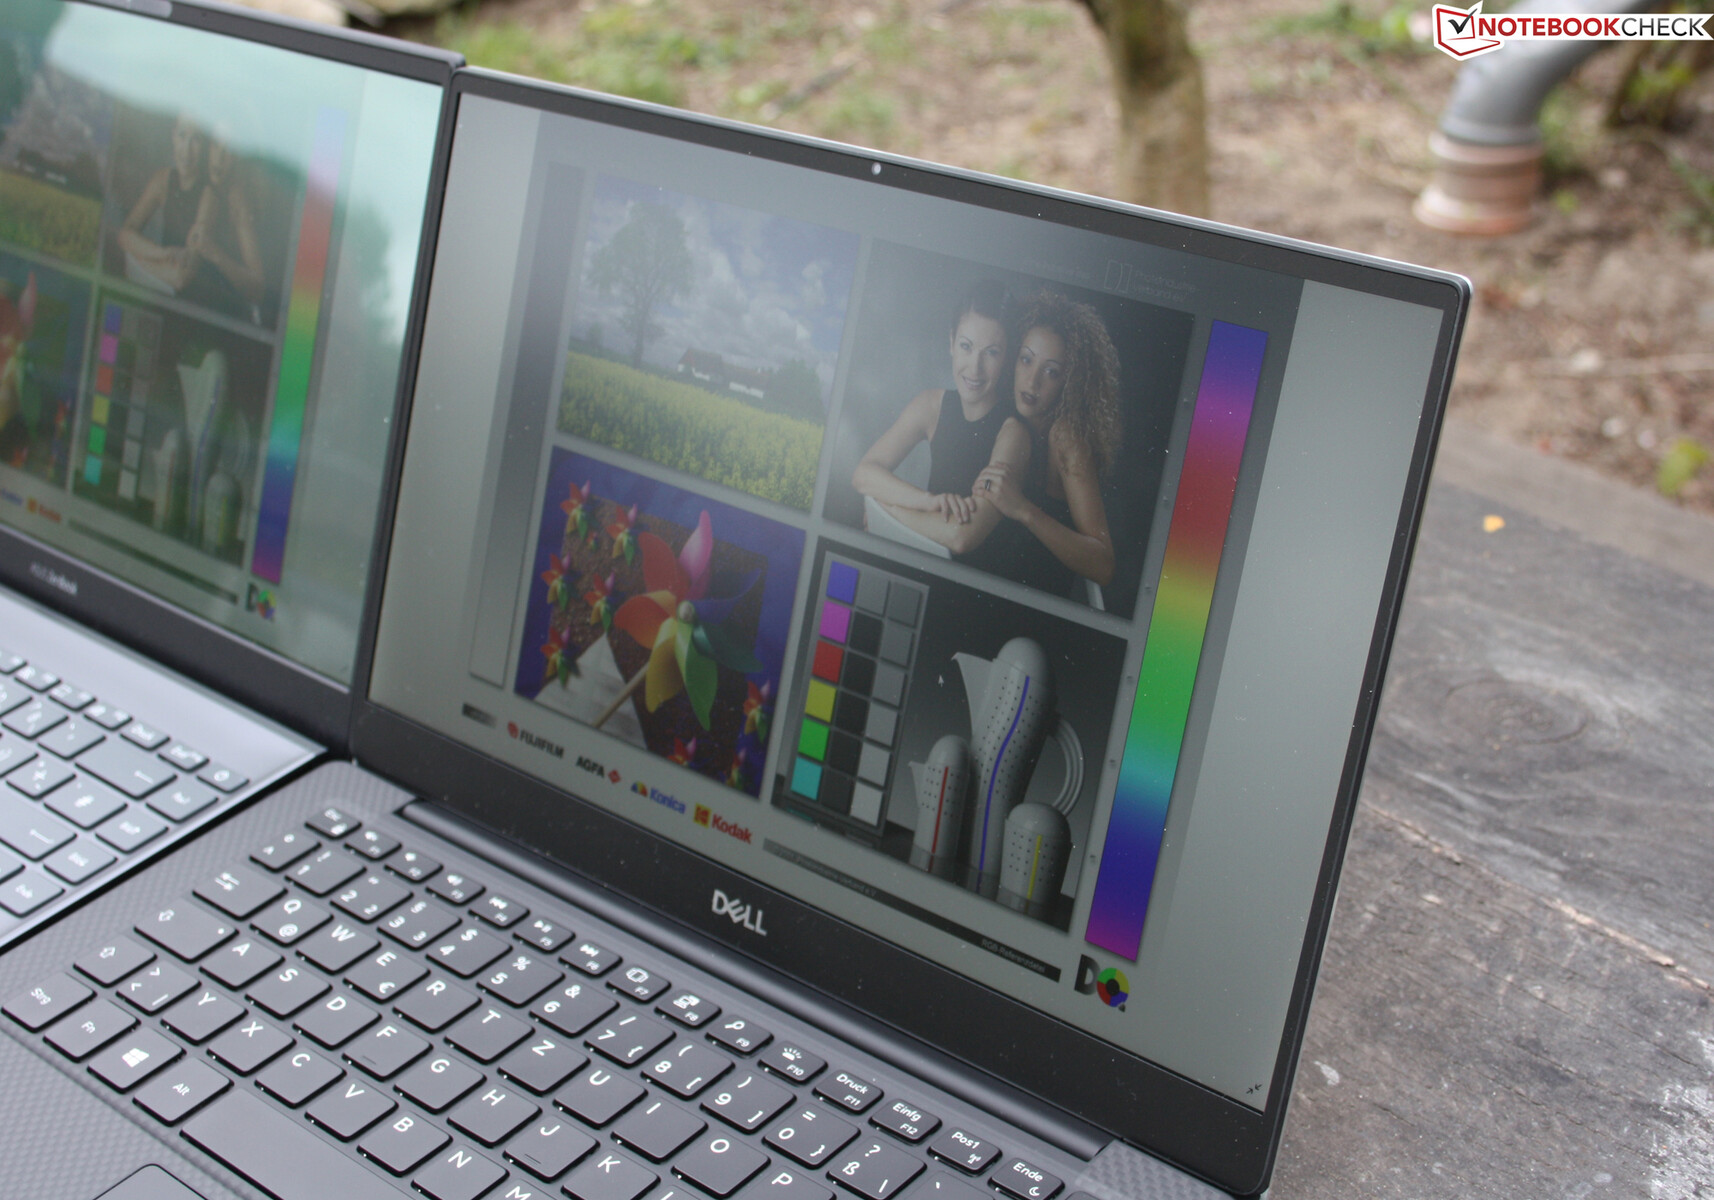
Display - XPS 13 with accurate colors

We managed to get our hands on the most affordable variant that costs 1,000 Euros (~$1,207) and features a semi-matte 1080p display (non-touch). As before, the panel comes from the manufacturer Sharp. Compared with the 16:10 display of the 9310, the average brightness drops from 479 to 446 candelas. This isn't perceptible; just under 500 cd/m² in the center of the screen is still a very good result. However, the maximum achievable brightness drops to 420 cd/m² on battery power, which is not the case with the 9310 (Full HD/4K).
At the same time, the brightness distribution has become worse. We only measure 390 cd/m² at the upper left, which is almost 100 cd/m² less than in the center of the screen. Therefore, the brightness distribution drops from 92% and 84% (9310 Full HD and 9310 4K, respectively) to 77%. The fluctuations might be due to tolerances in the panel manufacturing process. The contrast drops from 1,696:1 (9310 4K) or 1,430:1 (9310 Full HD) to 1,215:1.
| |||||||||||||||||||||||||
Brightness Distribution: 77 %
Center on Battery: 418 cd/m²
Contrast: 1215:1 (Black: 0.4 cd/m²)
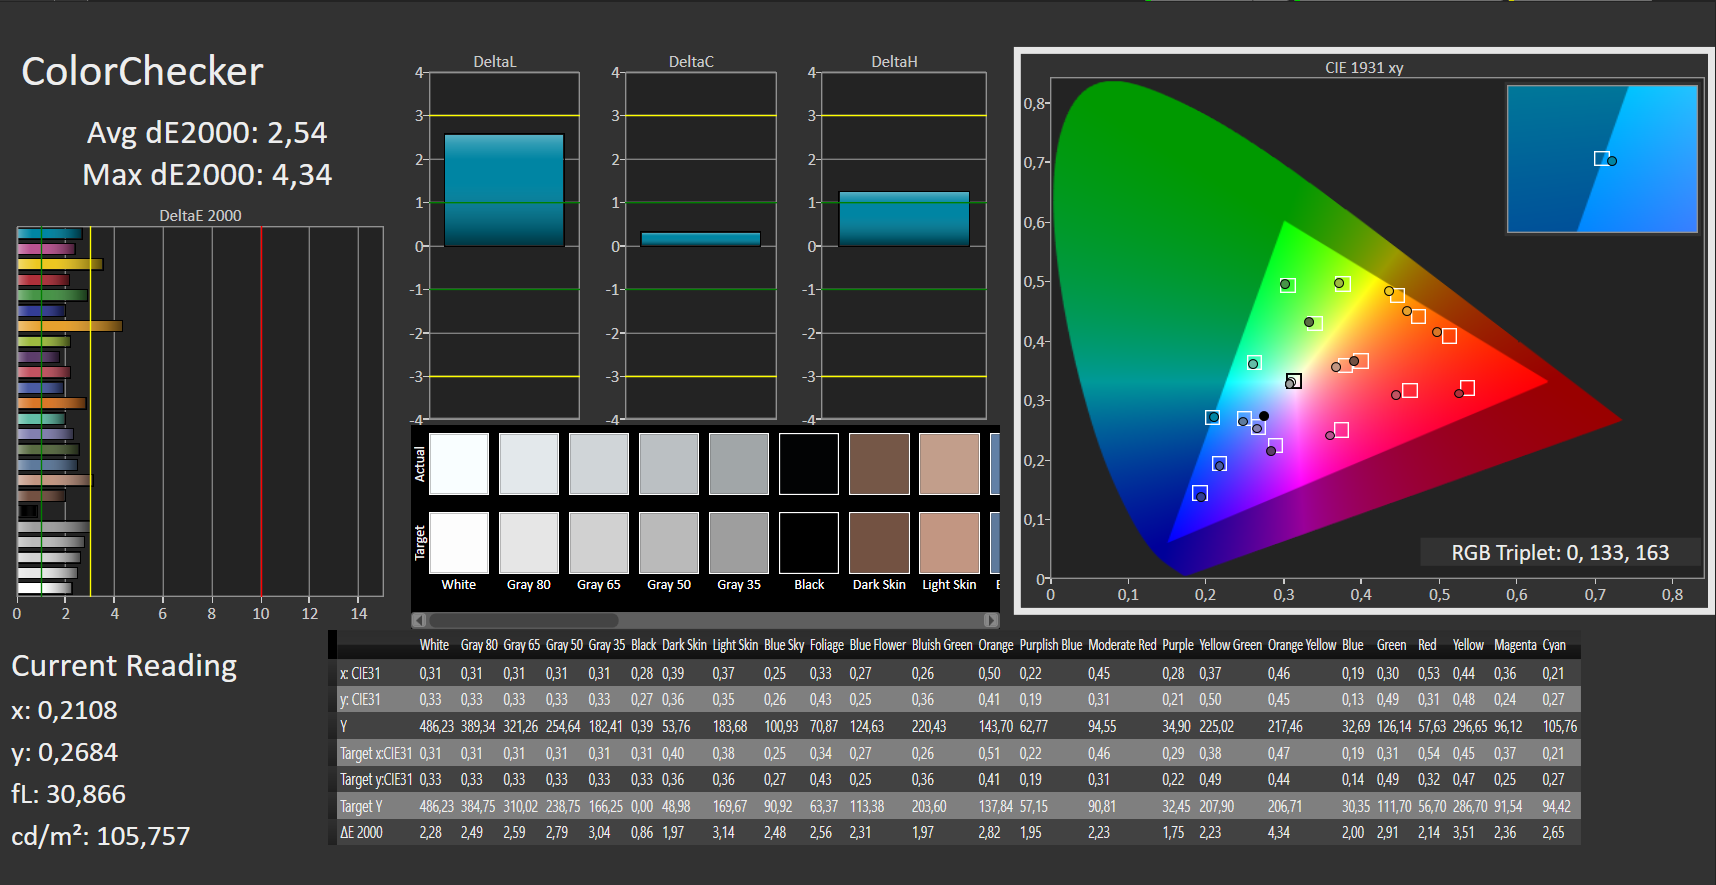
ΔE ColorChecker Calman: 2.54 | ∀{0.5-29.43 Ø4.72}
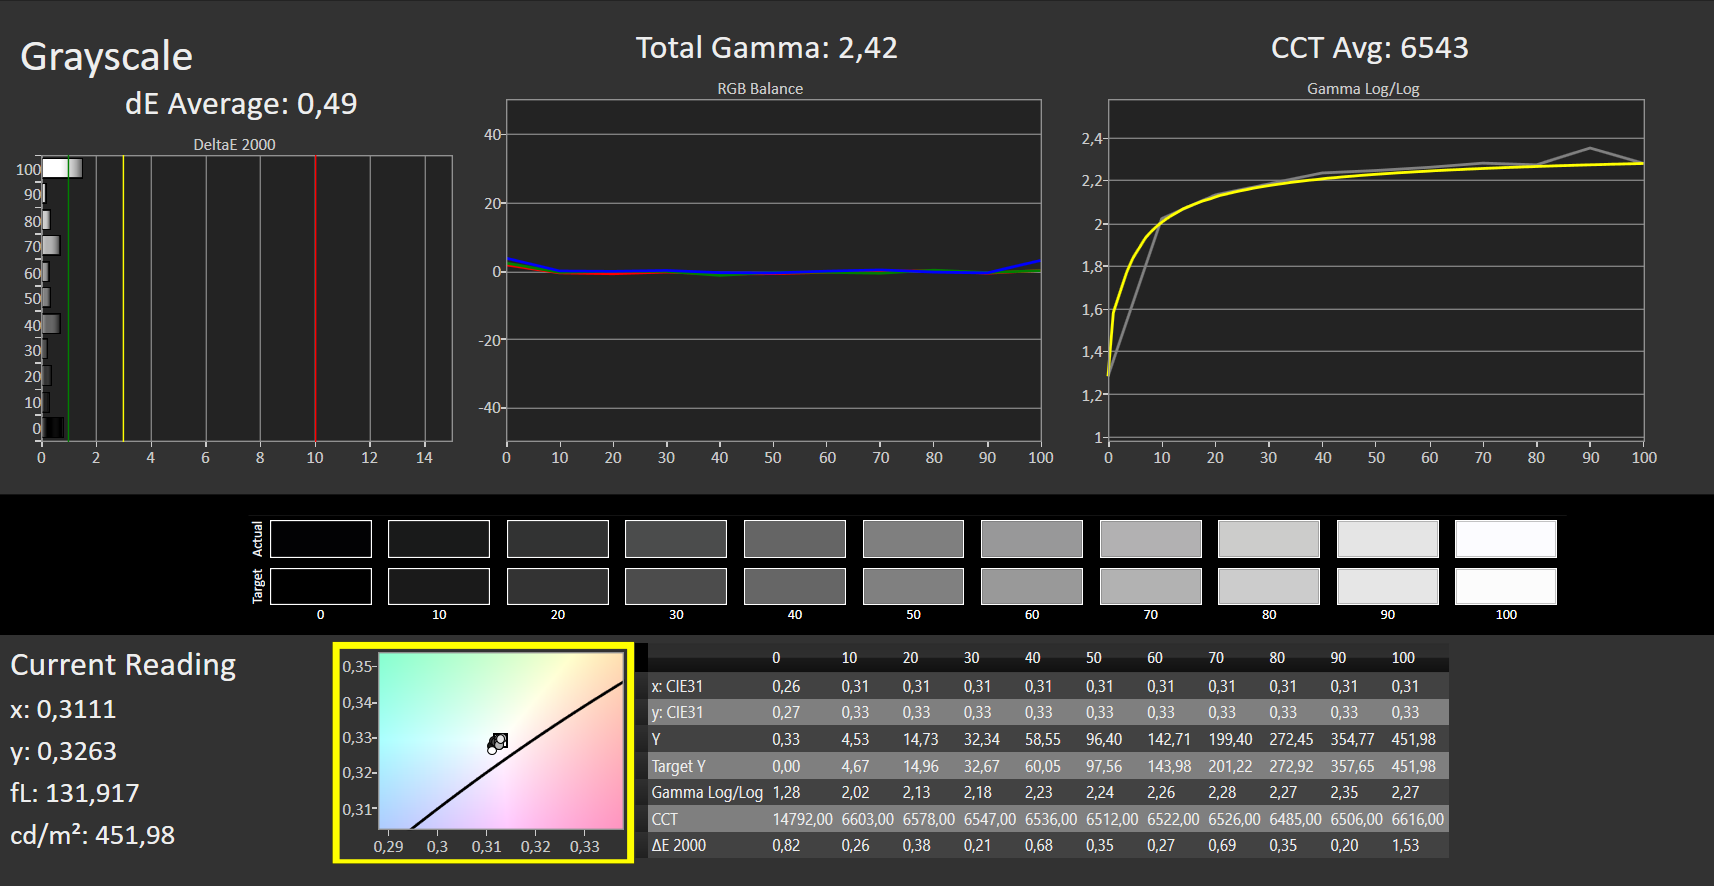
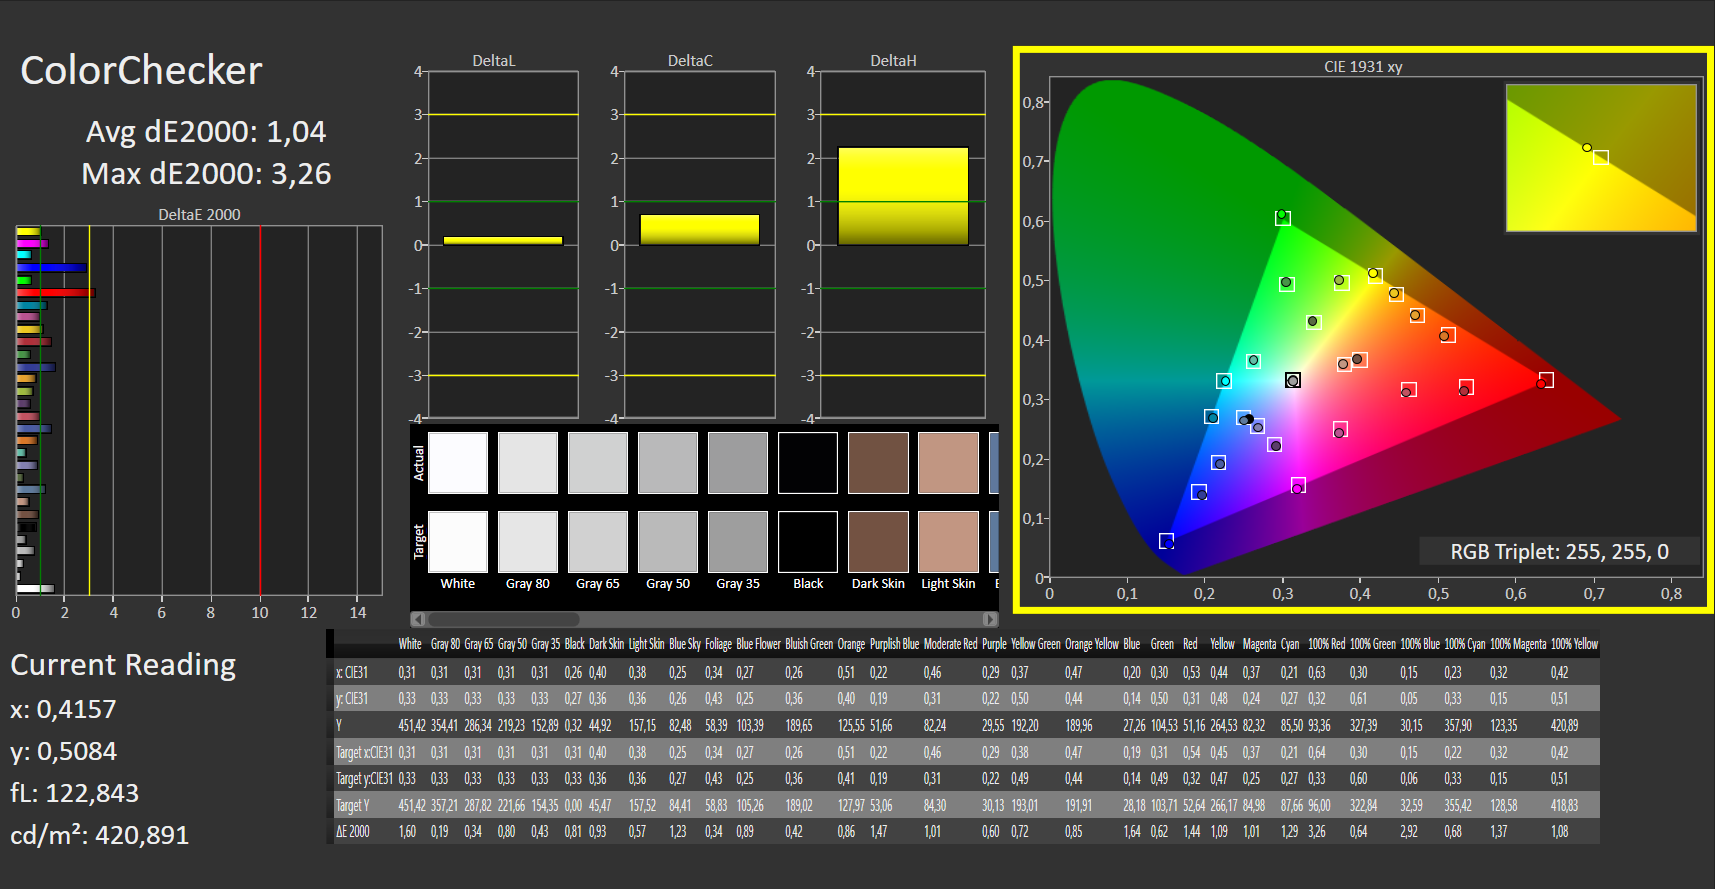
calibrated: 1.04
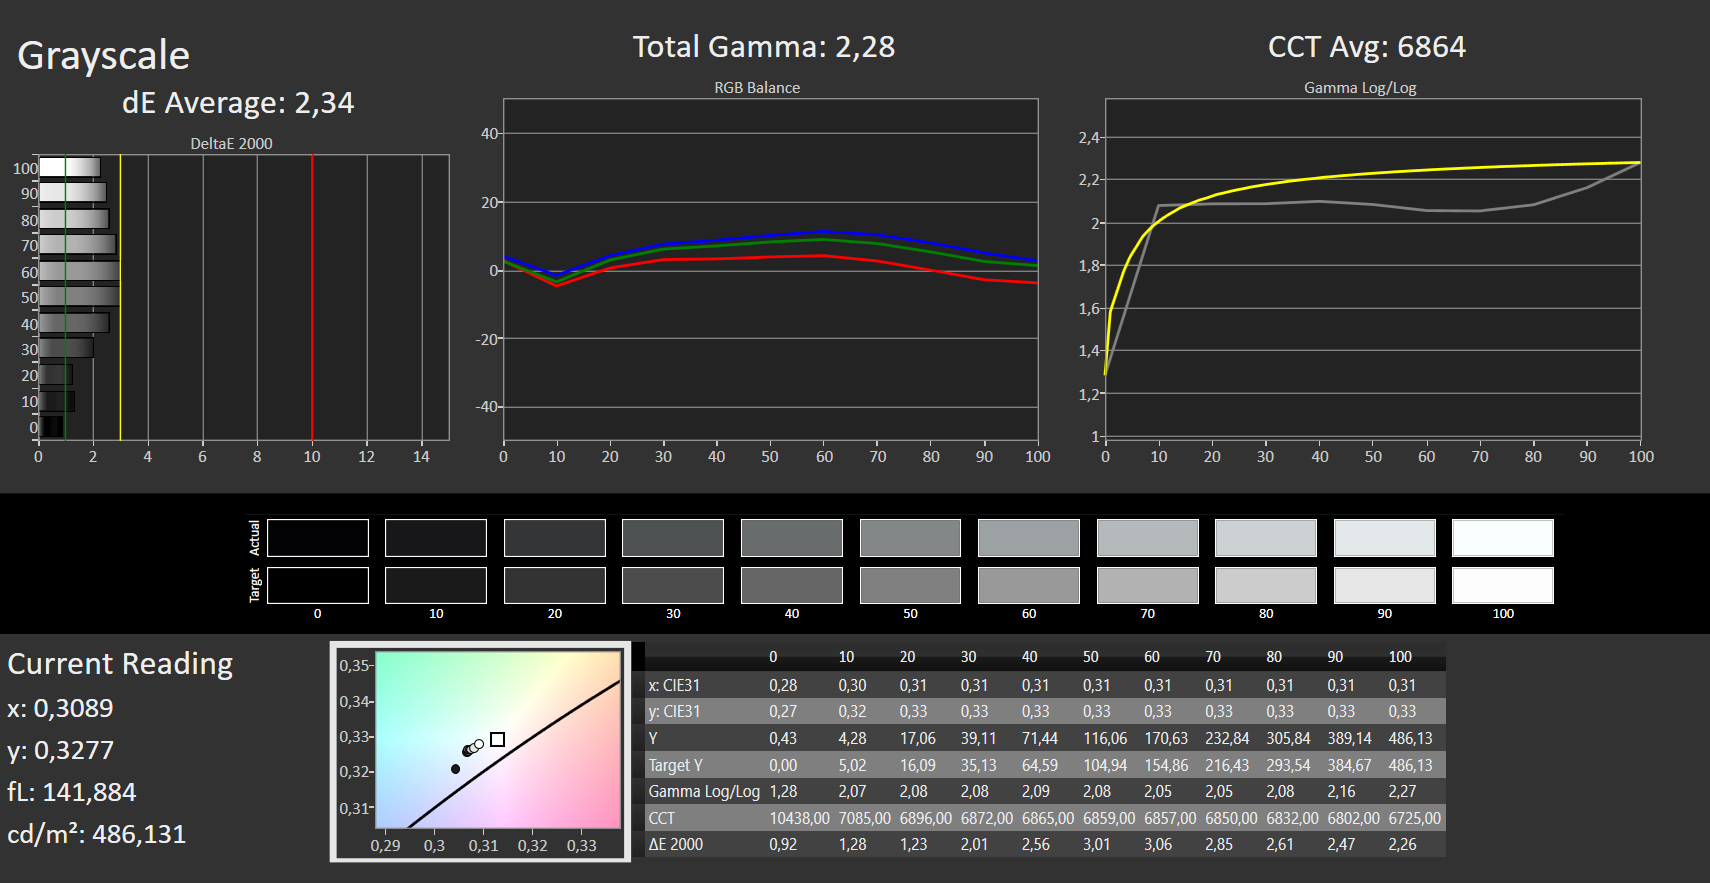
ΔE Greyscale Calman: 2.34 | ∀{0.09-98 Ø4.97}
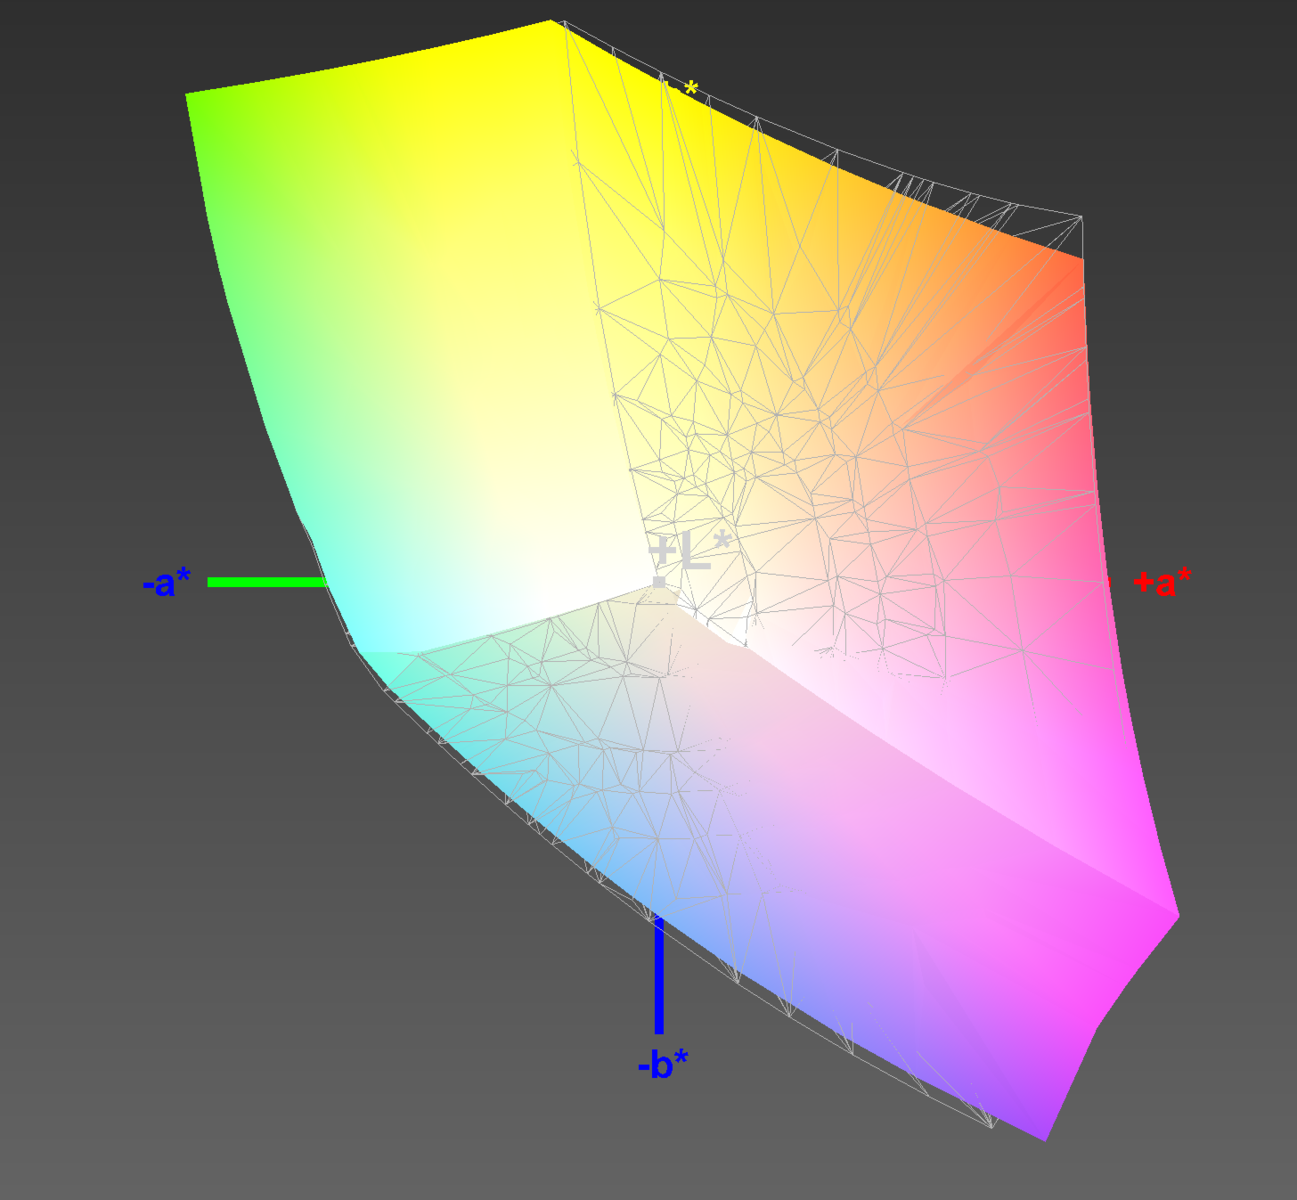
97% sRGB (Calman 2D)
97% sRGB (Argyll 1.6.3 3D)
62% AdobeRGB 1998 (Argyll 1.6.3 3D)
67.1% AdobeRGB 1998 (Argyll 3D)
97.1% sRGB (Argyll 3D)
66.3% Display P3 (Argyll 3D)
Gamma: 2.28
CCT: 6864 K
| Dell XPS 13 9305 Core i5 FHD Sharp SHP14AE, IPS, 1920x1080, 13.3" | Dell XPS 13 9310 Core i7 4K Sharp LQ134R1, IPS, 3840x2400, 13.4" | Dell XPS 13 9310 Core i7 FHD Sharp LQ134N1, IPS, 1920x1200, 13.4" | Dell XPS 13 9300 Core i7-1065G7 Sharp LQ134N1, IPS, 1920x1200, 13.4" | Apple MacBook Pro 13 2020 2GHz i5 10th-Gen APPA03D, IPS, 2560x1600, 13.3" | Huawei MateBook X Pro 2020 i7 JDI LPM139M422A, LTPS, 3000x2000, 13.9" | Lenovo Yoga Slim 7-14ARE AU Optronics B140HAN06.8, IPS, 1920x1080, 14" | |
|---|---|---|---|---|---|---|---|
| Display | 14% | 6% | 1% | 27% | 1% | 6% | |
| Display P3 Coverage (%) | 66.3 | 80.2 21% | 70.9 7% | 66.3 0% | 98.8 49% | 66.6 0% | 71.7 8% |
| sRGB Coverage (%) | 97.1 | 100 3% | 99.1 2% | 97.3 0% | 99.9 3% | 99.4 2% | 99.3 2% |
| AdobeRGB 1998 Coverage (%) | 67.1 | 78.9 18% | 72.9 9% | 68.5 2% | 86.4 29% | 68.6 2% | 72.9 9% |
| Response Times | -29% | -9% | -7% | -2% | -2% | 4% | |
| Response Time Grey 50% / Grey 80% * (ms) | 55 ? | 59.2 ? -8% | 52 ? 5% | 50 ? 9% | 46 ? 16% | 49.6 ? 10% | 45.6 ? 17% |
| Response Time Black / White * (ms) | 27 ? | 40.4 ? -50% | 33.2 ? -23% | 33.2 ? -23% | 32.4 ? -20% | 30.8 ? -14% | 29.6 ? -10% |
| PWM Frequency (Hz) | 996 ? | 2137 ? | 2475 ? | 2500 ? | 113600 ? | 29070 ? | |
| Screen | -4% | -13% | -13% | 17% | 22% | -23% | |
| Brightness middle (cd/m²) | 486 | 508.7 5% | 543.3 12% | 607.6 25% | 512 5% | 557 15% | 399.6 -18% |
| Brightness (cd/m²) | 446 | 479 7% | 524 17% | 595 33% | 491 10% | 532 19% | 385 -14% |
| Brightness Distribution (%) | 77 | 84 9% | 92 19% | 96 25% | 91 18% | 87 13% | 89 16% |
| Black Level * (cd/m²) | 0.4 | 0.3 25% | 0.38 5% | 0.4 -0% | 0.32 20% | 0.33 17% | 0.37 7% |
| Contrast (:1) | 1215 | 1696 40% | 1430 18% | 1519 25% | 1600 32% | 1688 39% | 1080 -11% |
| Colorchecker dE 2000 * | 2.54 | 2.72 -7% | 3.02 -19% | 3.23 -27% | 1.7 33% | 1.4 45% | 3.2 -26% |
| Colorchecker dE 2000 max. * | 4.34 | 4.7 -8% | 7.61 -75% | 8.67 -100% | 3.4 22% | 2.5 42% | 6.44 -48% |
| Colorchecker dE 2000 calibrated * | 1.04 | 1.92 -85% | 1.23 -18% | 1.01 3% | 1 4% | 0.7 33% | 1.73 -66% |
| Greyscale dE 2000 * | 2.34 | 3.4 -45% | 5 -114% | 5.5 -135% | 1.9 19% | 2 15% | 4.7 -101% |
| Gamma | 2.28 96% | 2.11 104% | 2.02 109% | 2.12 104% | 2.19 100% | 2.14 103% | 2.21 100% |
| CCT | 6864 95% | 6245 104% | 6550 99% | 6413 101% | 6817 95% | 6689 97% | 7184 90% |
| Color Space (Percent of AdobeRGB 1998) (%) | 62 | 70.7 14% | 66.8 8% | 63 2% | 77.4 25% | 62.5 1% | 66.3 7% |
| Color Space (Percent of sRGB) (%) | 97 | 100 3% | 99.6 3% | 97.5 1% | 99.9 3% | 99.5 3% | 99.5 3% |
| Total Average (Program / Settings) | -6% /
-4% | -5% /
-9% | -6% /
-10% | 14% /
17% | 7% /
15% | -4% /
-14% |
* ... smaller is better

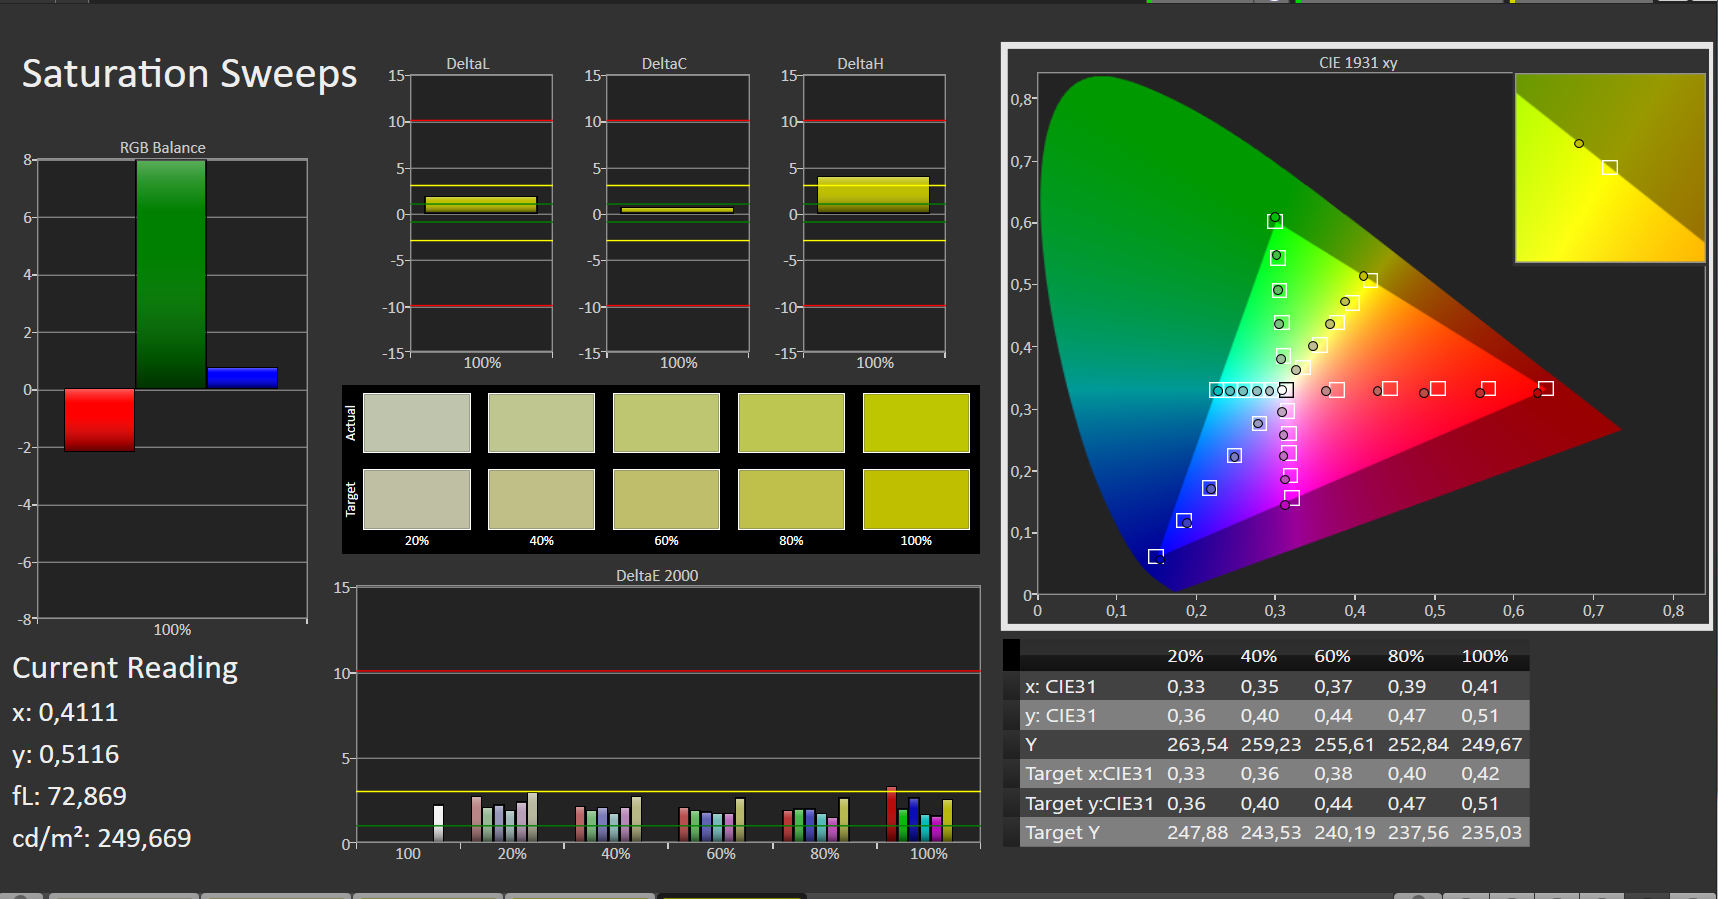
Subjectively speaking, the colors still look vivid enough as we can verify by comparing the display with an OLED panel. Out of the box, the Delta E values are quite respectable: 2.3 and 2.5 (grayscales and colors, respectively) are better than what you'd get with the 9310 panels.
We used a spectrophotometer to perform a calibration, after which the Delta E value for colors drops to a brilliant 1.0, something that isn't achieved by the 9310. It seems that the panel can be calibrated excellently.
The sRGB color space is almost completely covered, and we measure a rate of 97%. The AdobeRGB color space is covered by 62%. These figures are a bit lower than those of the sibling models; however, the last three percentage points don't matter in practice, even when doing image-intensive work.
The panel uses PWM to reduce brightness, but it does so at a moderate frequency of 996 Hz. Only very sensitive users should notice something here. In addition, PWM only kicks in at 20% brightness and below, an avoidable scenario.
In short: Compared to the 9310 with the 1080p IPS panel (Sharp LQ134N1), the Sharp SHP14AE is actually a bit better thanks to a lower Delta E out of the box. Dell's CinemaColor was disabled for all measurements.

The semi-matte surface significantly prevents reflections in outdoor use, but not completely. Compared with reflective panels, the effect is still huge, so you can work outdoors as long as direct light is avoided. The brightness of 418 cd/m² on battery power is the factory setting; it looks like this limitation can be disabled in the BIOS. In our case, however, changing the brightness to 100% had no effect; it remained at 418 cd/m² on battery power.

Display Response Times
| ↔ Response Time Black to White | ||
|---|---|---|
| 27 ms ... rise ↗ and fall ↘ combined | ↗ 10 ms rise |  |
| ↘ 17 ms fall | ||
| The screen shows relatively slow response rates in our tests and may be too slow for gamers. In comparison, all tested devices range from 0.1 (minimum) to 240 (maximum) ms. » 67 % of all devices are better. This means that the measured response time is worse than the average of all tested devices (19.8 ms). | ||
| ↔ Response Time 50% Grey to 80% Grey | ||
| 55 ms ... rise ↗ and fall ↘ combined | ↗ 25 ms rise |  |
| ↘ 30 ms fall | ||
| The screen shows slow response rates in our tests and will be unsatisfactory for gamers. In comparison, all tested devices range from 0.165 (minimum) to 636 (maximum) ms. » 92 % of all devices are better. This means that the measured response time is worse than the average of all tested devices (31 ms). | ||
Screen Flickering / PWM (Pulse-Width Modulation)
| Screen flickering / PWM detected | 996 Hz | ≤ 20 % brightness setting |  |
The display backlight flickers at 996 Hz (worst case, e.g., utilizing PWM) Flickering detected at a brightness setting of 20 % and below. There should be no flickering or PWM above this brightness setting. The frequency of 996 Hz is quite high, so most users sensitive to PWM should not notice any flickering. In comparison: 52 % of all tested devices do not use PWM to dim the display. If PWM was detected, an average of 7747 (minimum: 5 - maximum: 343500) Hz was measured. | |||
As is typical for IPS panels, viewing angles range from good to very good.

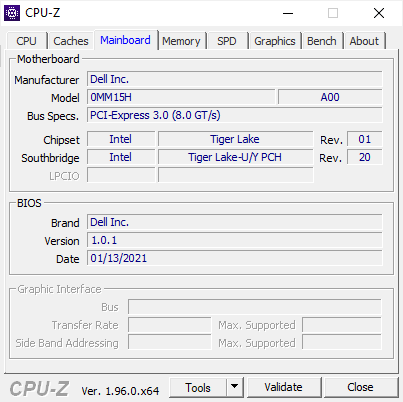
Performance - The XPS goes Turbo
With the Tiger Lake Core i5-1135G7 and Core i7-1165G7, the 9305 has two brand-new chips at its disposal. Both are equipped with Intel Iris Xe iGPUs, the 80EUs version in the i5 and 96EUs in the i7. Both quad-core processors have a TDP of 28 watts. The storage and RAM configuration also varies depending on the chosen hardware.
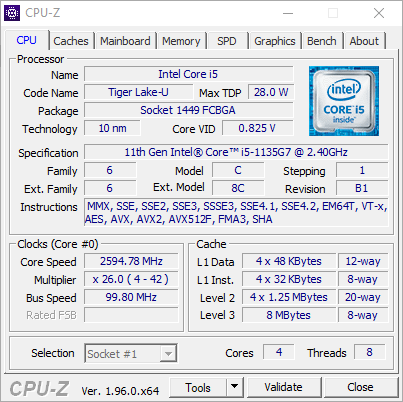

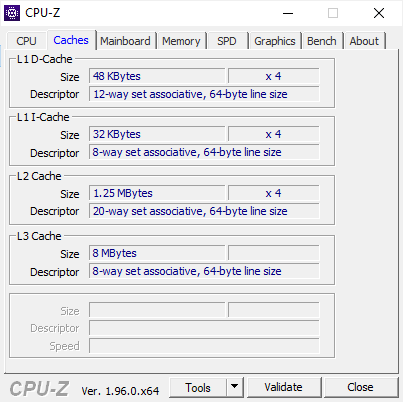
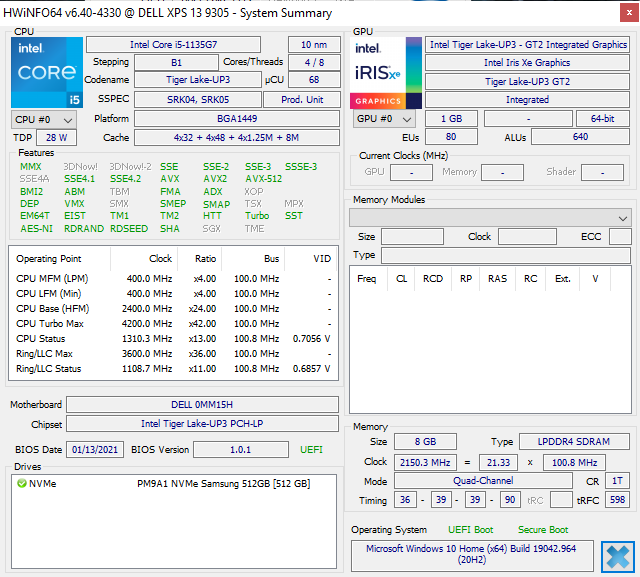
Processor
The Intel Core i5-1135G7 used here is a quad-core processor from Intel's Tiger Lake generation. Its clock rates are between 2.4 and 4.2 GHz, although it's ultimately the configured TDP and the cooling system what will determine the performance provided. Dell configures the 9305 with a PL2 of 60 watts and a PL1 of 15 watts, meaning that the maximum performance of the i5-1135G7 can be reached, at least theoretically.
In our Cinebench R15 endurance test, the CPU displays increasing initial values that always reset and start to ramp up again after reaching a peak. The 9310 i7 behaves similarly, but it starts with a high rate that is never reached again later. The 9305 is evidently more conservative at the beginning of a load phase and consequently allows some performance to remain unused. The ThinkPad L13 Yoga shows that the Intel Core i5-1135G7 can also behave differently. It starts with a higher score, but afterwards, it lags behind on average (605 instead of 650). This is nothing special anymore, since the Ryzen chips eclipse the Tiger Lake ones. Take the Lenovo Yoga Slim 7-14ARE for example.
Cinebench R20: CPU (Single Core) | CPU (Multi Core)
Cinebench R15: CPU Single 64Bit | CPU Multi 64Bit
Blender: v2.79 BMW27 CPU
7-Zip 18.03: 7z b 4 -mmt1 | 7z b 4
Geekbench 5.5: Single-Core | Multi-Core
HWBOT x265 Benchmark v2.2: 4k Preset
LibreOffice : 20 Documents To PDF
R Benchmark 2.5: Overall mean
| Cinebench R23 / Single Core | |
| Average of class Subnotebook (358 - 2213, n=61, last 2 years) | |
| Lenovo ThinkPad L13 Yoga Gen2-20VK000VGE | |
| Average Intel Core i5-1135G7 (1062 - 1373, n=53) | |
| Dell XPS 13 9305 Core i5 FHD | |
| Lenovo Yoga Slim 7-14ARE | |
| Cinebench R23 / Multi Core | |
| Average of class Subnotebook (1555 - 21812, n=60, last 2 years) | |
| Lenovo Yoga Slim 7-14ARE | |
| Dell XPS 13 9305 Core i5 FHD | |
| Average Intel Core i5-1135G7 (2786 - 6136, n=55) | |
| Lenovo ThinkPad L13 Yoga Gen2-20VK000VGE | |
| Cinebench R20 / CPU (Single Core) | |
| Average of class Subnotebook (128 - 832, n=57, last 2 years) | |
| Dell XPS 13 9310 Core i7 FHD | |
| Lenovo ThinkPad L13 Yoga Gen2-20VK000VGE | |
| Average Intel Core i5-1135G7 (375 - 527, n=62) | |
| Dell XPS 13 9305 Core i5 FHD | |
| Lenovo Yoga Slim 7-14ARE | |
| Dell XPS 13 9300 Core i7-1065G7 | |
| Apple MacBook Pro 13 2020 2GHz i5 10th-Gen | |
| Huawei MateBook X Pro 2020 i7 | |
| HP Spectre x360 13-aw0013dx | |
| Cinebench R20 / CPU (Multi Core) | |
| Average of class Subnotebook (579 - 8541, n=57, last 2 years) | |
| Lenovo Yoga Slim 7-14ARE | |
| Apple MacBook Pro 13 2020 2GHz i5 10th-Gen | |
| Dell XPS 13 9310 Core i7 FHD | |
| Dell XPS 13 9300 Core i7-1065G7 | |
| Dell XPS 13 9305 Core i5 FHD | |
| Average Intel Core i5-1135G7 (979 - 2382, n=62) | |
| HP Spectre x360 13-aw0013dx | |
| Lenovo ThinkPad L13 Yoga Gen2-20VK000VGE | |
| Huawei MateBook X Pro 2020 i7 | |
| Cinebench R15 / CPU Single 64Bit | |
| Average of class Subnotebook (72.4 - 322, n=57, last 2 years) | |
| Dell XPS 13 9310 Core i7 FHD | |
| Lenovo ThinkPad L13 Yoga Gen2-20VK000VGE | |
| Average Intel Core i5-1135G7 (141.4 - 205, n=61) | |
| Lenovo Yoga Slim 7-14ARE | |
| Dell XPS 13 9300 Core i7-1065G7 | |
| HP Spectre x360 13-aw0013dx | |
| Huawei MateBook X Pro 2020 i7 | |
| Apple MacBook Pro 13 2020 2GHz i5 10th-Gen | |
| Cinebench R15 / CPU Multi 64Bit | |
| Average of class Subnotebook (327 - 3345, n=57, last 2 years) | |
| Lenovo Yoga Slim 7-14ARE | |
| Dell XPS 13 9310 Core i7 FHD | |
| Average Intel Core i5-1135G7 (431 - 941, n=65) | |
| Apple MacBook Pro 13 2020 2GHz i5 10th-Gen | |
| Dell XPS 13 9300 Core i7-1065G7 | |
| Lenovo ThinkPad L13 Yoga Gen2-20VK000VGE | |
| Dell XPS 13 9305 Core i5 FHD | |
| HP Spectre x360 13-aw0013dx | |
| Huawei MateBook X Pro 2020 i7 | |
| Blender / v2.79 BMW27 CPU | |
| Huawei MateBook X Pro 2020 i7 | |
| Lenovo ThinkPad L13 Yoga Gen2-20VK000VGE | |
| Average Intel Core i5-1135G7 (499 - 1044, n=60) | |
| Dell XPS 13 9310 Core i7 FHD | |
| Dell XPS 13 9305 Core i5 FHD | |
| Average of class Subnotebook (159 - 2271, n=58, last 2 years) | |
| Lenovo Yoga Slim 7-14ARE | |
| Apple MacBook Pro 13 2020 2GHz i5 10th-Gen | |
| 7-Zip 18.03 / 7z b 4 -mmt1 | |
| Average of class Subnotebook (2643 - 6699, n=59, last 2 years) | |
| Dell XPS 13 9310 Core i7 FHD | |
| Lenovo ThinkPad L13 Yoga Gen2-20VK000VGE | |
| Huawei MateBook X Pro 2020 i7 | |
| Average Intel Core i5-1135G7 (3924 - 4921, n=62) | |
| Dell XPS 13 9305 Core i5 FHD | |
| Lenovo Yoga Slim 7-14ARE | |
| Apple MacBook Pro 13 2020 2GHz i5 10th-Gen | |
| 7-Zip 18.03 / 7z b 4 | |
| Lenovo Yoga Slim 7-14ARE | |
| Average of class Subnotebook (11668 - 77867, n=57, last 2 years) | |
| Dell XPS 13 9305 Core i5 FHD | |
| Average Intel Core i5-1135G7 (14745 - 24873, n=62) | |
| Dell XPS 13 9310 Core i7 FHD | |
| Apple MacBook Pro 13 2020 2GHz i5 10th-Gen | |
| Lenovo ThinkPad L13 Yoga Gen2-20VK000VGE | |
| Huawei MateBook X Pro 2020 i7 | |
| Geekbench 5.5 / Single-Core | |
| Average of class Subnotebook (726 - 2224, n=48, last 2 years) | |
| Dell XPS 13 9310 Core i7 FHD | |
| Lenovo ThinkPad L13 Yoga Gen2-20VK000VGE | |
| Average Intel Core i5-1135G7 (1147 - 1428, n=58) | |
| Dell XPS 13 9305 Core i5 FHD | |
| Apple MacBook Pro 13 2020 2GHz i5 10th-Gen | |
| Lenovo Yoga Slim 7-14ARE | |
| Lenovo Yoga Slim 7-14ARE | |
| Huawei MateBook X Pro 2020 i7 | |
| Geekbench 5.5 / Multi-Core | |
| Average of class Subnotebook (2557 - 17218, n=48, last 2 years) | |
| Lenovo Yoga Slim 7-14ARE | |
| Lenovo Yoga Slim 7-14ARE | |
| Dell XPS 13 9310 Core i7 FHD | |
| Dell XPS 13 9305 Core i5 FHD | |
| Average Intel Core i5-1135G7 (3475 - 5472, n=58) | |
| Apple MacBook Pro 13 2020 2GHz i5 10th-Gen | |
| Lenovo ThinkPad L13 Yoga Gen2-20VK000VGE | |
| Huawei MateBook X Pro 2020 i7 | |
| HWBOT x265 Benchmark v2.2 / 4k Preset | |
| Average of class Subnotebook (0.97 - 25.1, n=57, last 2 years) | |
| Lenovo Yoga Slim 7-14ARE | |
| Apple MacBook Pro 13 2020 2GHz i5 10th-Gen | |
| Average Intel Core i5-1135G7 (3.57 - 7.6, n=57) | |
| Dell XPS 13 9310 Core i7 FHD | |
| Lenovo ThinkPad L13 Yoga Gen2-20VK000VGE | |
| Huawei MateBook X Pro 2020 i7 | |
| LibreOffice / 20 Documents To PDF | |
| Apple MacBook Pro 13 2020 2GHz i5 10th-Gen | |
| Dell XPS 13 9305 Core i5 FHD | |
| Lenovo Yoga Slim 7-14ARE | |
| Average of class Subnotebook (39.9 - 220, n=56, last 2 years) | |
| Huawei MateBook X Pro 2020 i7 | |
| Lenovo ThinkPad L13 Yoga Gen2-20VK000VGE | |
| Average Intel Core i5-1135G7 (44.2 - 62.9, n=60) | |
| Dell XPS 13 9310 Core i7 FHD | |
| R Benchmark 2.5 / Overall mean | |
| Apple MacBook Pro 13 2020 2GHz i5 10th-Gen | |
| Dell XPS 13 9305 Core i5 FHD | |
| Huawei MateBook X Pro 2020 i7 | |
| Average Intel Core i5-1135G7 (0.619 - 0.727, n=59) | |
| Lenovo ThinkPad L13 Yoga Gen2-20VK000VGE | |
| Lenovo Yoga Slim 7-14ARE | |
| Dell XPS 13 9310 Core i7 FHD | |
| Average of class Subnotebook (0.4024 - 1.456, n=58, last 2 years) | |
* ... smaller is better
System performance
In the PCMark 10 benchmark for evaluating system performance, the XPS 13 9305 can only claim fourth place in our test field. This isn't relevant because the absolute difference is only 1-2%. The differences are much higher in the subcategories, where the Tiger Lake Core i7 and the Ryzen 7 4800U have the upper hand in Digital Content Creation and Productivity.
The performance achieved by other laptops in our tests can be found in our CPU Benchmarks article.
| PCMark 10 Score | 4692 points | |
Help | ||
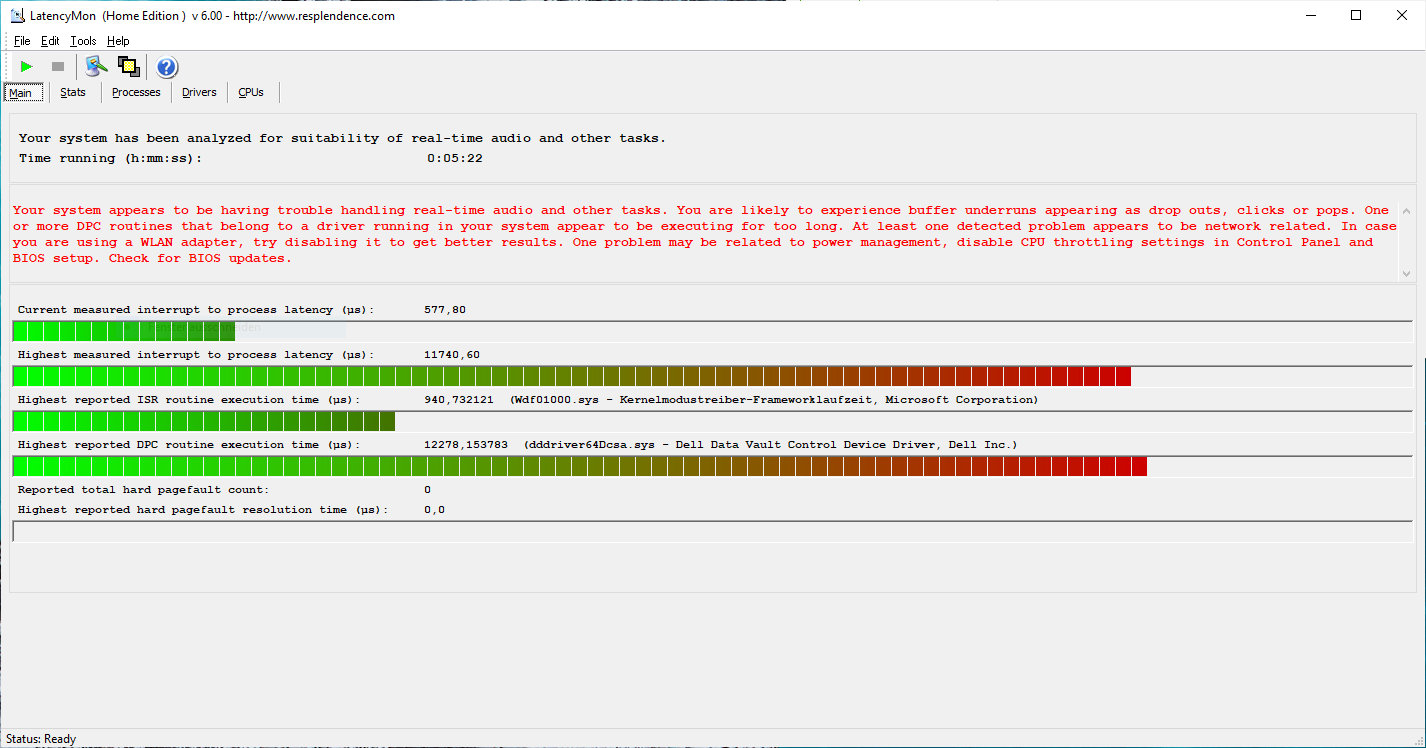
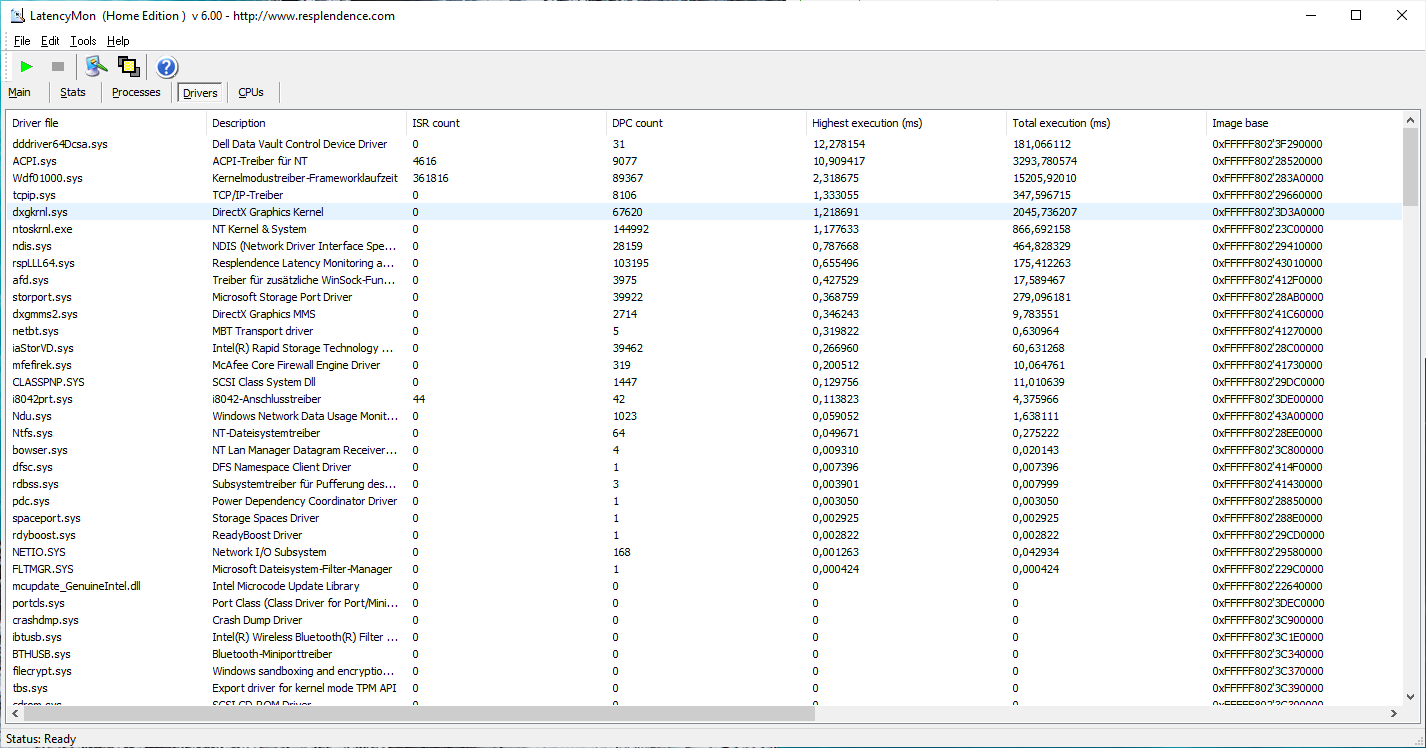
DPC latencies
The XPS 13 9305 shows the lowest interruption times in our test field. This makes it very well suited for real-time applications.
| DPC Latencies / LatencyMon - interrupt to process latency (max), Web, Youtube, Prime95 | |
| Dell XPS 13 9300 Core i7-1065G7 | |
| Lenovo Yoga Slim 7-14ARE | |
| Dell XPS 13 9310 Core i7 FHD | |
| Dell XPS 13 9305 Core i5 FHD | |
* ... smaller is better
Storage
Our test device is equipped with a Samsung PM9A1, and 512 GB is now the minimum configuration option. However, the M.2 NVMe SSD could also come from SK Hynix, Intel, or Toshiba as other XPS samples recently showed.
The Samsung model isn't a high-end NVMe drive. The sequential read and write speeds of 2,000 MB/s and 1,100 MB/s, respectively, are moderate and don't manage to come too close to the popular Samsung PM981 series. However, the Samsung drive catches up to its big sibling when it comes to reading and writing small blocks of data (Write 4K). In the end, the PM981 seems to be 45% faster if we stick to the total score of AS SSD.
More storage benchmarks can be found in our HDD/SSD Benchmarks article.
| Dell XPS 13 9305 Core i5 FHD Samsung PM9A1 MZVL2512HCJQ | Dell XPS 13 9310 Core i7 FHD Micron 2300 512GB MTFDHBA512TDV | Apple MacBook Pro 13 2020 2GHz i5 10th-Gen Apple SSD SM0512F | Huawei MateBook X Pro 2020 i7 Samsung PM981a MZVLB1T0HBLR | Lenovo Yoga Slim 7-14ARE Samsung SSD PM981a MZVLB512HBJQ | Average Samsung PM9A1 MZVL2512HCJQ | |
|---|---|---|---|---|---|---|
| CrystalDiskMark 5.2 / 6 | 26% | -12% | 40% | 54% | 97% | |
| Write 4K (MB/s) | 136.9 | 97.5 -29% | 28.16 -79% | 165.6 21% | 146.1 7% | 179.1 ? 31% |
| Read 4K (MB/s) | 47.34 | 50.9 8% | 17.5 -63% | 50.2 6% | 47.18 0% | 75.6 ? 60% |
| Write Seq (MB/s) | 1150 | 1811 57% | 1195 4% | 1905 66% | 2896 152% | 3016 ? 162% |
| Read Seq (MB/s) | 2052 | 1836 -11% | 1470 -28% | 1669 -19% | 2754 34% | 3350 ? 63% |
| Write 4K Q32T1 (MB/s) | 433 | 521 20% | 205 -53% | 474.6 10% | 425.8 -2% | 459 ? 6% |
| Read 4K Q32T1 (MB/s) | 293 | 357.5 22% | 692 136% | 508 73% | 514 75% | 554 ? 89% |
| Write Seq Q32T1 (MB/s) | 1148 | 2879 151% | 1475 28% | 3007 162% | 2989 160% | 4346 ? 279% |
| Read Seq Q32T1 (MB/s) | 3427 | 3204 -7% | 1920 -44% | 3556 4% | 3568 4% | 6346 ? 85% |
| AS SSD | -110% | -109% | 26% | 0% | 39% | |
| Seq Read (MB/s) | 2629 | 2091 -20% | 1300 -51% | 2737 4% | 1658 -37% | 4656 ? 77% |
| Seq Write (MB/s) | 1270 | 1396 10% | 1518 20% | 2530 99% | 2464 94% | 2742 ? 116% |
| 4K Read (MB/s) | 65.2 | 49.29 -24% | 14.09 -78% | 54 -17% | 59.5 -9% | 67 ? 3% |
| 4K Write (MB/s) | 182.5 | 104.2 -43% | 24.25 -87% | 152.5 -16% | 128.6 -30% | 173.8 ? -5% |
| 4K-64 Read (MB/s) | 1032 | 827 -20% | 725 -30% | 2011 95% | 1576 53% | 1514 ? 47% |
| 4K-64 Write (MB/s) | 1257 | 1636 30% | 169.6 -87% | 1260 0% | 1986 58% | 2355 ? 87% |
| Access Time Read * (ms) | 0.07 | 0.066 6% | 0.172 -146% | 0.066 6% | 0.049 30% | 0.04867 ? 30% |
| Access Time Write * (ms) | 0.023 | 0.365 -1487% | 0.155 -574% | 0.024 -4% | 0.087 -278% | 0.03605 ? -57% |
| Score Read (Points) | 1360 | 1086 -20% | 869 -36% | 2339 72% | 1802 33% | 2047 ? 51% |
| Score Write (Points) | 1567 | 1880 20% | 346 -78% | 1666 6% | 2361 51% | 2778 ? 77% |
| Score Total (Points) | 3573 | 3499 -2% | 1667 -53% | 5191 45% | 5133 44% | 5812 ? 63% |
| Copy ISO MB/s (MB/s) | 1430 | 1544 8% | 1588 11% | 2192 ? 53% | ||
| Copy Program MB/s (MB/s) | 782 | 613 -22% | 550 -30% | 629 ? -20% | ||
| Copy Game MB/s (MB/s) | 1177 | 1451 23% | 1329 13% | 1393 ? 18% | ||
| Total Average (Program / Settings) | -42% /
-60% | -61% /
-68% | 33% /
32% | 27% /
20% | 68% /
60% |
* ... smaller is better

Continuous load read: DiskSpd Read Loop, Queue Depth 8
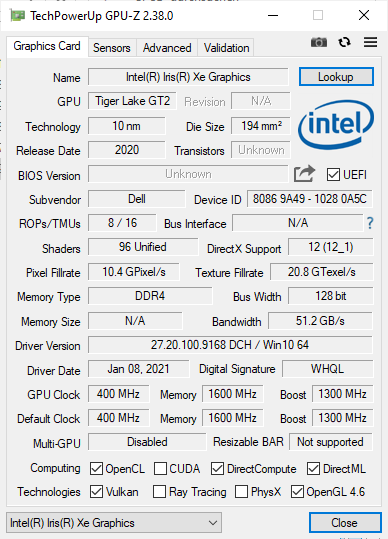
Graphics card
The Intel Iris Xe Graphics G7 internal GPU with its 80 EUs is responsible for displaying image content in the XPS 13 9305. It shares memory with the CPU and benefits from a multi-channel configuration like the one found here. The benchmarks also prove to be correspondingly good, and the Xe Graphics G7 80EUs in the 9305 outperforms the Xe Graphics G7 96EUs (9310 i7) - but not in 3DMark 11. Dell's maximum performance mode was enabled.
You can compare the performance provided by other graphics units in our GPU Benchmarks article.
| 3DMark 11 Performance | 6434 points | |
| 3DMark Fire Strike Score | 4089 points | |
| 3DMark Time Spy Score | 1490 points | |
Help | ||
Gaming performance
The 3DMark results are impressive for an integrated GPU, delivering scores that are 5% to 25% higher than those of the discrete GeForce MX450 or 60% higher than those of the Iris Plus G7 found in the XPS 13 9300. However, as it turns out, these synthetic results don't translate well to real-world gaming performance, so users shouldn't expect frame rates that are 5% to 25% faster than those of a GeForce MX350/MX450 laptop.
Final Fantasy 15 and The Witcher 3, for example, are by no means faster on our XPS 13 9305 than on a laptop powered by the MX450.
| Strange Brigade - 1920x1080 medium AA:medium AF:4 | |
| Average of class Subnotebook (29.8 - 137.5, n=50, last 2 years) | |
| Dell XPS 13 9310 Core i7 FHD | |
| Lenovo Yoga Slim 7-14ARE | |
| Dell XPS 13 9305 Core i5 FHD | |
| Average Intel Iris Xe Graphics G7 80EUs (6 - 48.8, n=86) | |
| F1 2020 - 1920x1080 Medium Preset AF:16x | |
| Average Intel Iris Xe Graphics G7 80EUs (24.8 - 42, n=12) | |
| Dell XPS 13 9305 Core i5 FHD | |
The Witcher 3 Ultra frame rates
| low | med. | high | ultra | QHD | 4K | |
|---|---|---|---|---|---|---|
| GTA V (2015) | 81 | 76 | 23 | 9.7 | ||
| The Witcher 3 (2015) | 47.7 | 18.5 | 12 | |||
| Dota 2 Reborn (2015) | 78.9 | 70.5 | 45.8 | 44 | 20.6 | |
| Final Fantasy XV Benchmark (2018) | 35.3 | 20.3 | 20.3 | 20.3 | 2.98 | |
| X-Plane 11.11 (2018) | 43.4 | 30.5 | 27.7 | 32.5 | ||
| Strange Brigade (2018) | 76.1 | 30.5 | 26.4 | |||
| F1 2020 (2020) | 62 | 28 |
Emissions - The Dell XPS is mostly silent
Noise emissions
The XPS 13 is silent when used for office tasks and browsing the web. When the fans do start up, they operate uniformly and emit an audible noise, which can easily fade out, though.
We didn't detect any other noises, such as coil whine or the like, in our test device.
Noise level
| Idle |
| 26 / 26 / 26 dB(A) |
| Load |
| 33.5 / 33.5 dB(A) |
 | ||
30 dB silent 40 dB(A) audible 50 dB(A) loud |
||
min: | ||
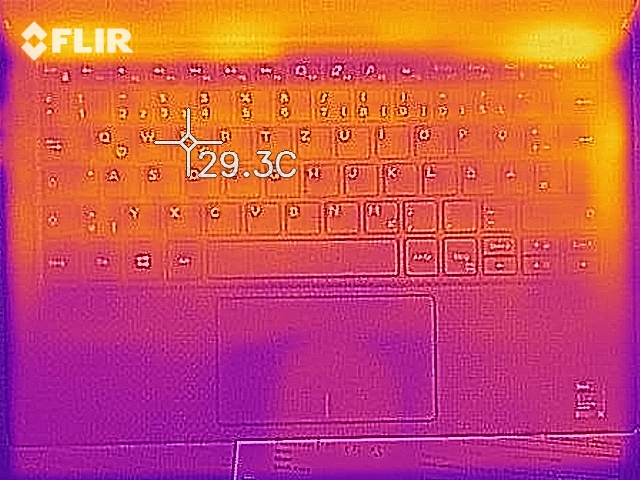
Temperature
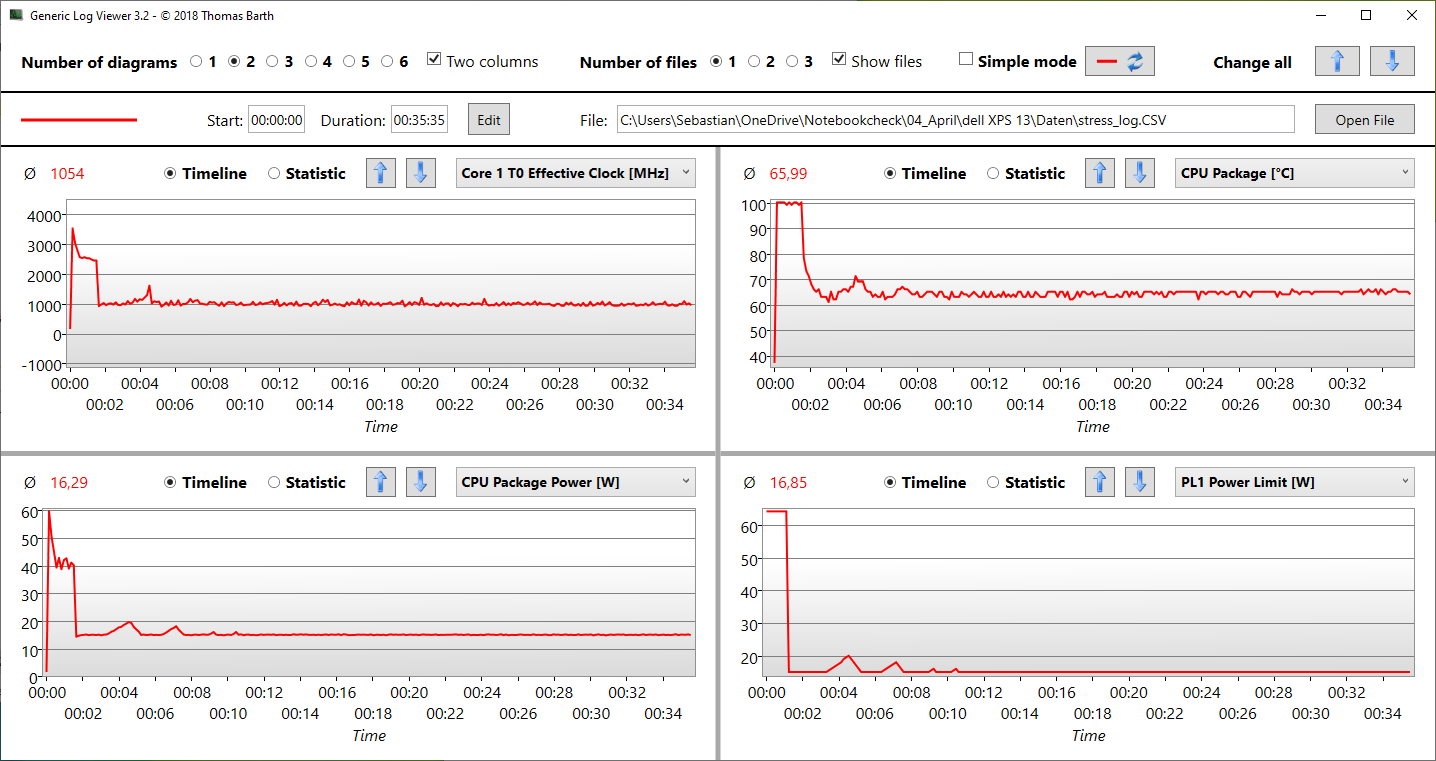
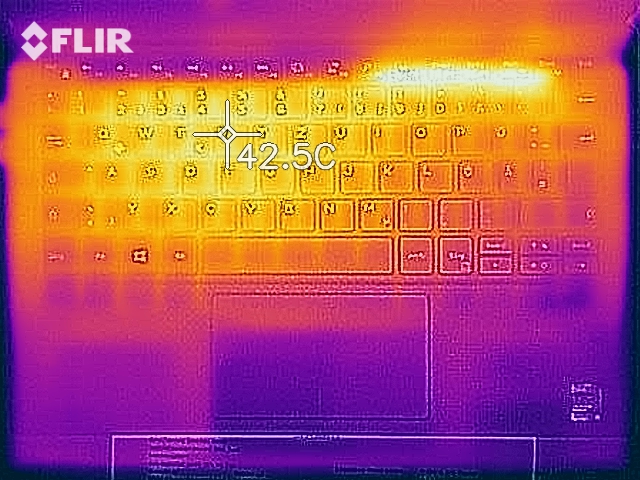
Our measurements show that the Dell XPS reaches surface temperatures of up to 34 °C (~93 °F) under load. The warmest spot is at the rear section of the center, but the palm rests always remain cool. This also allows the laptop to be used under load such as on the lap, for example.
During our one-hour endurance stress test, the temperatures inside the XPS 13 rose up to 100 °C (~212 °F). The cooling system managed to lower these to about 65 °C (~149 °F) by the end of the test, leading to average clock speeds of 1.0 GHz, which is well below the base clock rate. The 60-watt PL1 was maintained for about 1:30 minutes, with heat rapidly reaching the 100 °C (~212 °F) mark and being contained for a while. After this period, power consumption dropped ad hoc to 15 watts.
Since a load level like the one in our stress test is almost impossible in everyday operation, users don't have to expect restrictions due to excessively high temperatures.
(±) The maximum temperature on the upper side is 43.5 °C / 110 F, compared to the average of 35.9 °C / 97 F, ranging from 21.4 to 59 °C for the class Subnotebook.
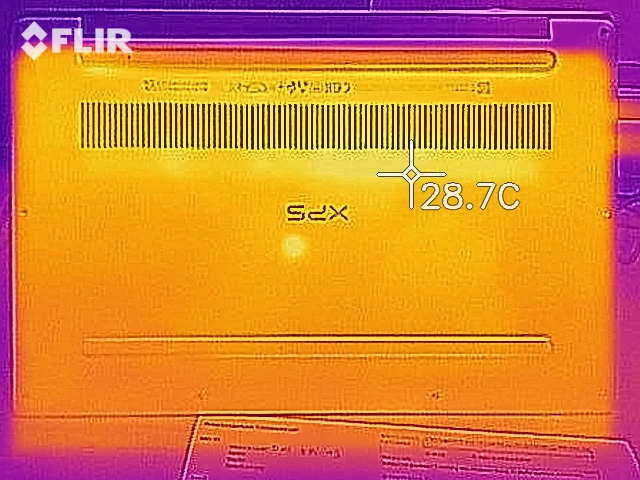
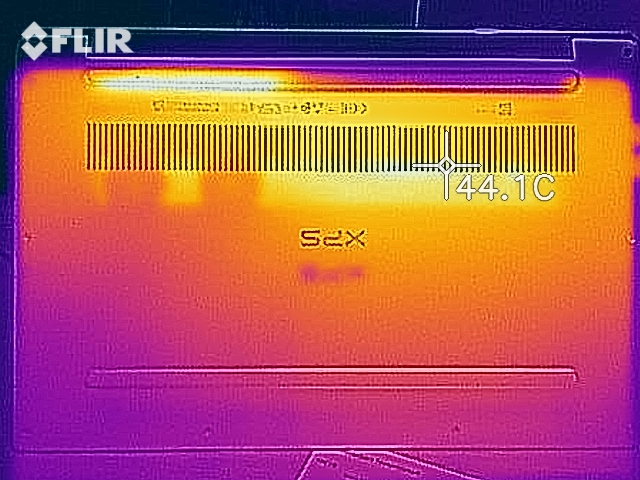
(±) The bottom heats up to a maximum of 44.8 °C / 113 F, compared to the average of 39.2 °C / 103 F
(+) In idle usage, the average temperature for the upper side is 23.8 °C / 75 F, compared to the device average of 30.8 °C / 87 F.
(+) The palmrests and touchpad are cooler than skin temperature with a maximum of 27.6 °C / 81.7 F and are therefore cool to the touch.
(±) The average temperature of the palmrest area of similar devices was 28.2 °C / 82.8 F (+0.6 °C / 1.1 F).
Speakers
The speakers of the Dell XPS 13 9305 are the same as those of the 9310. They are located on the right and left sides under the palm rest, where there is a small opening on each side.
Both mids and highs aren't too lacking, and they are relatively well balanced. The speakers even provide some bass, with an impressive amount of "oomph" coming out of the small case. The manufacturer manages to incorporate the volume of the chassis into the generation of sound. Even covering the speaker openings can hardly put a brake on the sound output.
As usual, the Max Audio Pro tool provides numerous audio enhancements. We can create a surround sound effect using the Waves nX function. For this purpose, the webcam scans the position of the head, and voices or sounds then become louder or softer on the headphones, depending on whether we're standing to the left or right in front of the webcam. This simulates a surround sound experience.
The microphone isn't located next to the webcam but at the front along the edge of the palm rest instead. In our test recording, speech is recorded clearly and without background noise. However, the speaker shouldn't move away from the laptop, because this causes the recording to immediately become quieter, but the background noise remains low.
Dell XPS 13 9305 Core i5 FHD audio analysis
(±) | speaker loudness is average but good (77 dB)
Bass 100 - 315 Hz
(-) | nearly no bass - on average 21.4% lower than median
(±) | linearity of bass is average (7.7% delta to prev. frequency)
Mids 400 - 2000 Hz
(+) | balanced mids - only 4.5% away from median
(+) | mids are linear (6.7% delta to prev. frequency)
Highs 2 - 16 kHz
(+) | balanced highs - only 4.3% away from median
(+) | highs are linear (4.8% delta to prev. frequency)
Overall 100 - 16.000 Hz
(±) | linearity of overall sound is average (17.7% difference to median)
Compared to same class
» 49% of all tested devices in this class were better, 7% similar, 44% worse
» The best had a delta of 5%, average was 18%, worst was 53%
Compared to all devices tested
» 35% of all tested devices were better, 8% similar, 57% worse
» The best had a delta of 4%, average was 23%, worst was 134%
Huawei MateBook X Pro 2020 i7 audio analysis
(±) | speaker loudness is average but good (77.5 dB)
Bass 100 - 315 Hz
(±) | reduced bass - on average 12.8% lower than median
(±) | linearity of bass is average (9.7% delta to prev. frequency)
Mids 400 - 2000 Hz
(±) | higher mids - on average 6.1% higher than median
(+) | mids are linear (4.8% delta to prev. frequency)
Highs 2 - 16 kHz
(±) | higher highs - on average 5.2% higher than median
(+) | highs are linear (5.9% delta to prev. frequency)
Overall 100 - 16.000 Hz
(±) | linearity of overall sound is average (20.2% difference to median)
Compared to same class
» 64% of all tested devices in this class were better, 9% similar, 27% worse
» The best had a delta of 5%, average was 18%, worst was 53%
Compared to all devices tested
» 52% of all tested devices were better, 8% similar, 39% worse
» The best had a delta of 4%, average was 23%, worst was 134%
Lenovo Yoga Slim 7-14ARE audio analysis
(±) | speaker loudness is average but good (81.4 dB)
Bass 100 - 315 Hz
(±) | reduced bass - on average 9.5% lower than median
(±) | linearity of bass is average (8.1% delta to prev. frequency)
Mids 400 - 2000 Hz
(+) | balanced mids - only 4.1% away from median
(+) | mids are linear (6% delta to prev. frequency)
Highs 2 - 16 kHz
(+) | balanced highs - only 4.2% away from median
(±) | linearity of highs is average (7.4% delta to prev. frequency)
Overall 100 - 16.000 Hz
(+) | overall sound is linear (13.9% difference to median)
Compared to same class
» 31% of all tested devices in this class were better, 4% similar, 65% worse
» The best had a delta of 5%, average was 17%, worst was 45%
Compared to all devices tested
» 16% of all tested devices were better, 4% similar, 80% worse
» The best had a delta of 4%, average was 23%, worst was 134%
Energy management - The lights go out sooner than with the 9310
Energy consumption
According to our measurements, the XPS 13 9305 shows an average idle power consumption, but maximum idle consumption shows an increase, especially compared to the other two XPS models in the table.
However, with a power consumption of up to 64 watts under load, it can dominate our test field even under the highest power consumption. We're talking about the PL2 Short Burst of 60 watts. How well the XPS makes use of its processor is also shown by the power consumption when the internal display is inactive, which is presented below. The HP Spectre x360 14 included in our comparison that has the same SoC starts with just under 30 watts and only matches the XPS at a level of 25-28 watts over time. Note: We're not referring to PL1/PL2 here but to the device's energy consumption when the TFT is inactive.
The included charger offers a maximum output of 65 watts and is consequently of sufficient capacity.
| Off / Standby | |
| Idle | |
| Load |
|
Key:
min: | |
| Dell XPS 13 9305 Core i5 FHD i5-1135G7, Iris Xe G7 80EUs, Samsung PM9A1 MZVL2512HCJQ, IPS, 1920x1080, 13.3" | Dell XPS 13 9310 Core i7 FHD i7-1165G7, Iris Xe G7 96EUs, Micron 2300 512GB MTFDHBA512TDV, IPS, 1920x1200, 13.4" | Dell XPS 13 9300 Core i7-1065G7 i7-1065G7, Iris Plus Graphics G7 (Ice Lake 64 EU), Intel SSDPEMKF512G8 NVMe SSD, IPS, 1920x1200, 13.4" | Apple MacBook Pro 13 2020 2GHz i5 10th-Gen i5-1038NG7, Iris Plus Graphics G7 (Ice Lake 64 EU), Apple SSD SM0512F, IPS, 2560x1600, 13.3" | Huawei MateBook X Pro 2020 i7 i7-10510U, GeForce MX250, Samsung PM981a MZVLB1T0HBLR, LTPS, 3000x2000, 13.9" | Average Intel Iris Xe Graphics G7 80EUs | Average of class Subnotebook | |
|---|---|---|---|---|---|---|---|
| Power Consumption | -1% | -5% | -33% | -38% | -12% | -8% | |
| Idle Minimum * (Watt) | 3.2 | 3.9 -22% | 4.2 -31% | 3.8 -19% | 4.3 -34% | 4.49 ? -40% | 3.76 ? -17% |
| Idle Average * (Watt) | 6.7 | 5.9 12% | 6.9 -3% | 8.6 -28% | 8.5 -27% | 7.4 ? -10% | 6.54 ? 2% |
| Idle Maximum * (Watt) | 10.5 | 6.3 40% | 7.5 29% | 10.3 2% | 12 -14% | 9.26 ? 12% | 7.89 ? 25% |
| Load Average * (Watt) | 28.5 | 39.7 -39% | 33.3 -17% | 52.1 -83% | 54.8 -92% | 36.6 ? -28% | 42 ? -47% |
| Witcher 3 ultra * (Watt) | 28.5 | 34.8 -22% | 37.1 -30% | 48.2 -69% | 47.1 -65% | ||
| Load Maximum * (Watt) | 64 | 47.5 26% | 48.4 24% | 65.2 -2% | 61.5 4% | 61.7 ? 4% | 64.8 ? -1% |
* ... smaller is better
External monitor power consumption
Battery life
In our real-world Wi-Fi test, the XPS 13 9305 reaches a runtime of over 9 hours. This means that the 9305 apparently can't utilize its 56 Wh battery as well as the 9310 or 9300 variants. 9 hours is also the worst result in the comparison field, with Apple, Lenovo, Huawei, and HP having more powerful batteries.
We repeated the Wi-Fi test with maximum brightness, which could be an outdoor scenario where you need full brightness. At 5:30 hours, battery life is considerably shorter here.
ExpressCharge is on board, so the battery is fully charged within 1.5 hours. To optimize battery usage (slow charging is better), the Adaptive mode can be selected in Dell's Power Manager: The system will now optimize charging according to the typical battery use - so things will look different if you use the device plugged in frequently as opposed to using it in a mobile mode often.
There are settings for the TFT brightness and keyboard illumination in the BIOS. For example, the maximum brightness can be limited on battery power, which is also the case by default. However, turning off the brightness reduction by selecting 100% had no effect in our test device.
The timeout of the keyboard backlight on battery power can be set between 5 seconds and 15 minutes, or you can even configure it to never happen at all.
| Dell XPS 13 9305 Core i5 FHD i5-1135G7, Iris Xe G7 80EUs, 52 Wh | Dell XPS 13 9310 Core i7 FHD i7-1165G7, Iris Xe G7 96EUs, 52 Wh | Dell XPS 13 9300 Core i7-1065G7 i7-1065G7, Iris Plus Graphics G7 (Ice Lake 64 EU), 52 Wh | Apple MacBook Pro 13 2020 2GHz i5 10th-Gen i5-1038NG7, Iris Plus Graphics G7 (Ice Lake 64 EU), 58 Wh | Huawei MateBook X Pro 2020 i7 i7-10510U, GeForce MX250, 57.4 Wh | Lenovo Yoga Slim 7-14ARE R7 4800U, Vega 8, 61 Wh | HP Spectre x360 13-aw0013dx i7-1065G7, Iris Plus Graphics G7 (Ice Lake 64 EU), 60 Wh | Average of class Subnotebook | |
|---|---|---|---|---|---|---|---|---|
| Battery runtime | 16% | 38% | 32% | -2% | -12% | 16% | 11% | |
| Reader / Idle (h) | 25.4 | 30 18% | 27.1 7% | 37.1 46% | 28.6 ? 13% | |||
| WiFi v1.3 (h) | 9.2 | 11 20% | 12.7 38% | 12.1 32% | 10.4 13% | 10.3 12% | 9.9 8% | 14 ? 52% |
| Load (h) | 2.9 | 3.2 10% | 2.4 -17% | 1.3 -55% | 2.7 -7% | 1.969 ? -32% | ||
| H.264 (h) | 11.5 | 11.9 | 15.4 ? |
Pros
Cons
Verdict
Does the XPS 13 9305 offer a lot of laptop for little money? Yes, and that is why we can recommend it without reservations. The bright, vivid display already shows colors excellently out of the box, so calibration itself is hardly worthwhile. The case has the same quality as the 9310, and this is also true for the input devices.
The Tiger Lake Core i5's performance is utilized in the best possible way, and Turbo is taken advantage of for almost one and a half minutes. Afterwards, performance fluctuates in a wave-like manner, but it always returns to a high level. The Tiger Lake Core i7 variant also exhibited this behavior, although it has a stronger starting phase. With all this said, the system never really gets loud, even in the corresponding Dell performance mode.
The M.2 SSD is upgradeable, but RAM, on the other hand, is not. This should be clear to users at the time of purchase. An upgrade for the pixelated 720p webcam was not to be expected from a budget XPS. But this is actually a pity, since the weak 08/15 webcam simply doesn't measure up anymore in 2021.
We can give the XPS 13 9305 a clear purchase recommendation. No competitor in this performance class offers such a razor-thin and perfect subnotebook for just under 1,100 Euros (~$1,335).
HP's Spectre x360 13 costs at least 1,200 Euros (~$1,456); it doesn't come with Tiger Lake yet, but it does have 16 GB of RAM. Lenovo's Yoga Slim 7 14 is currently a hit for 900 Euros (~$1,092); with its Ryzen 7 4700U APU, it computes faster and is even better equipped with 16 GB RAM and a 512 GB SSD. However, the Yoga is thicker, larger, and it has a glossy panel. The Huawei MateBook X Pro (2020) costs 1,200 Euros (~$1,456), but the Core i5-10210U and the GeForce MX250 are no longer the latest chips. In addition, its gaming performance is lower than that of a Tiger Lake XPS 13.
Price and availability
You can find the Dell XPS 13 9305 in the manufacturer's online store. Prices currently start at $699.99 for the Core i3 version. The base configuration of the Core i5 model comes with 8 GB of RAM and a 256 GB SSD, and it costs $849.99. If you need more storage space, you can go for the Core i7 model with 16 GB of RAM and a 512 GB SSD, which is currently priced at $1,199.99. Alternatively, you can also keep tabs on Amazon and wait for the laptop to pop up there.
Dell XPS 13 9305 Core i5 FHD
- 05/11/2021 v7 (old)
Sebastian Jentsch
Price comparison

