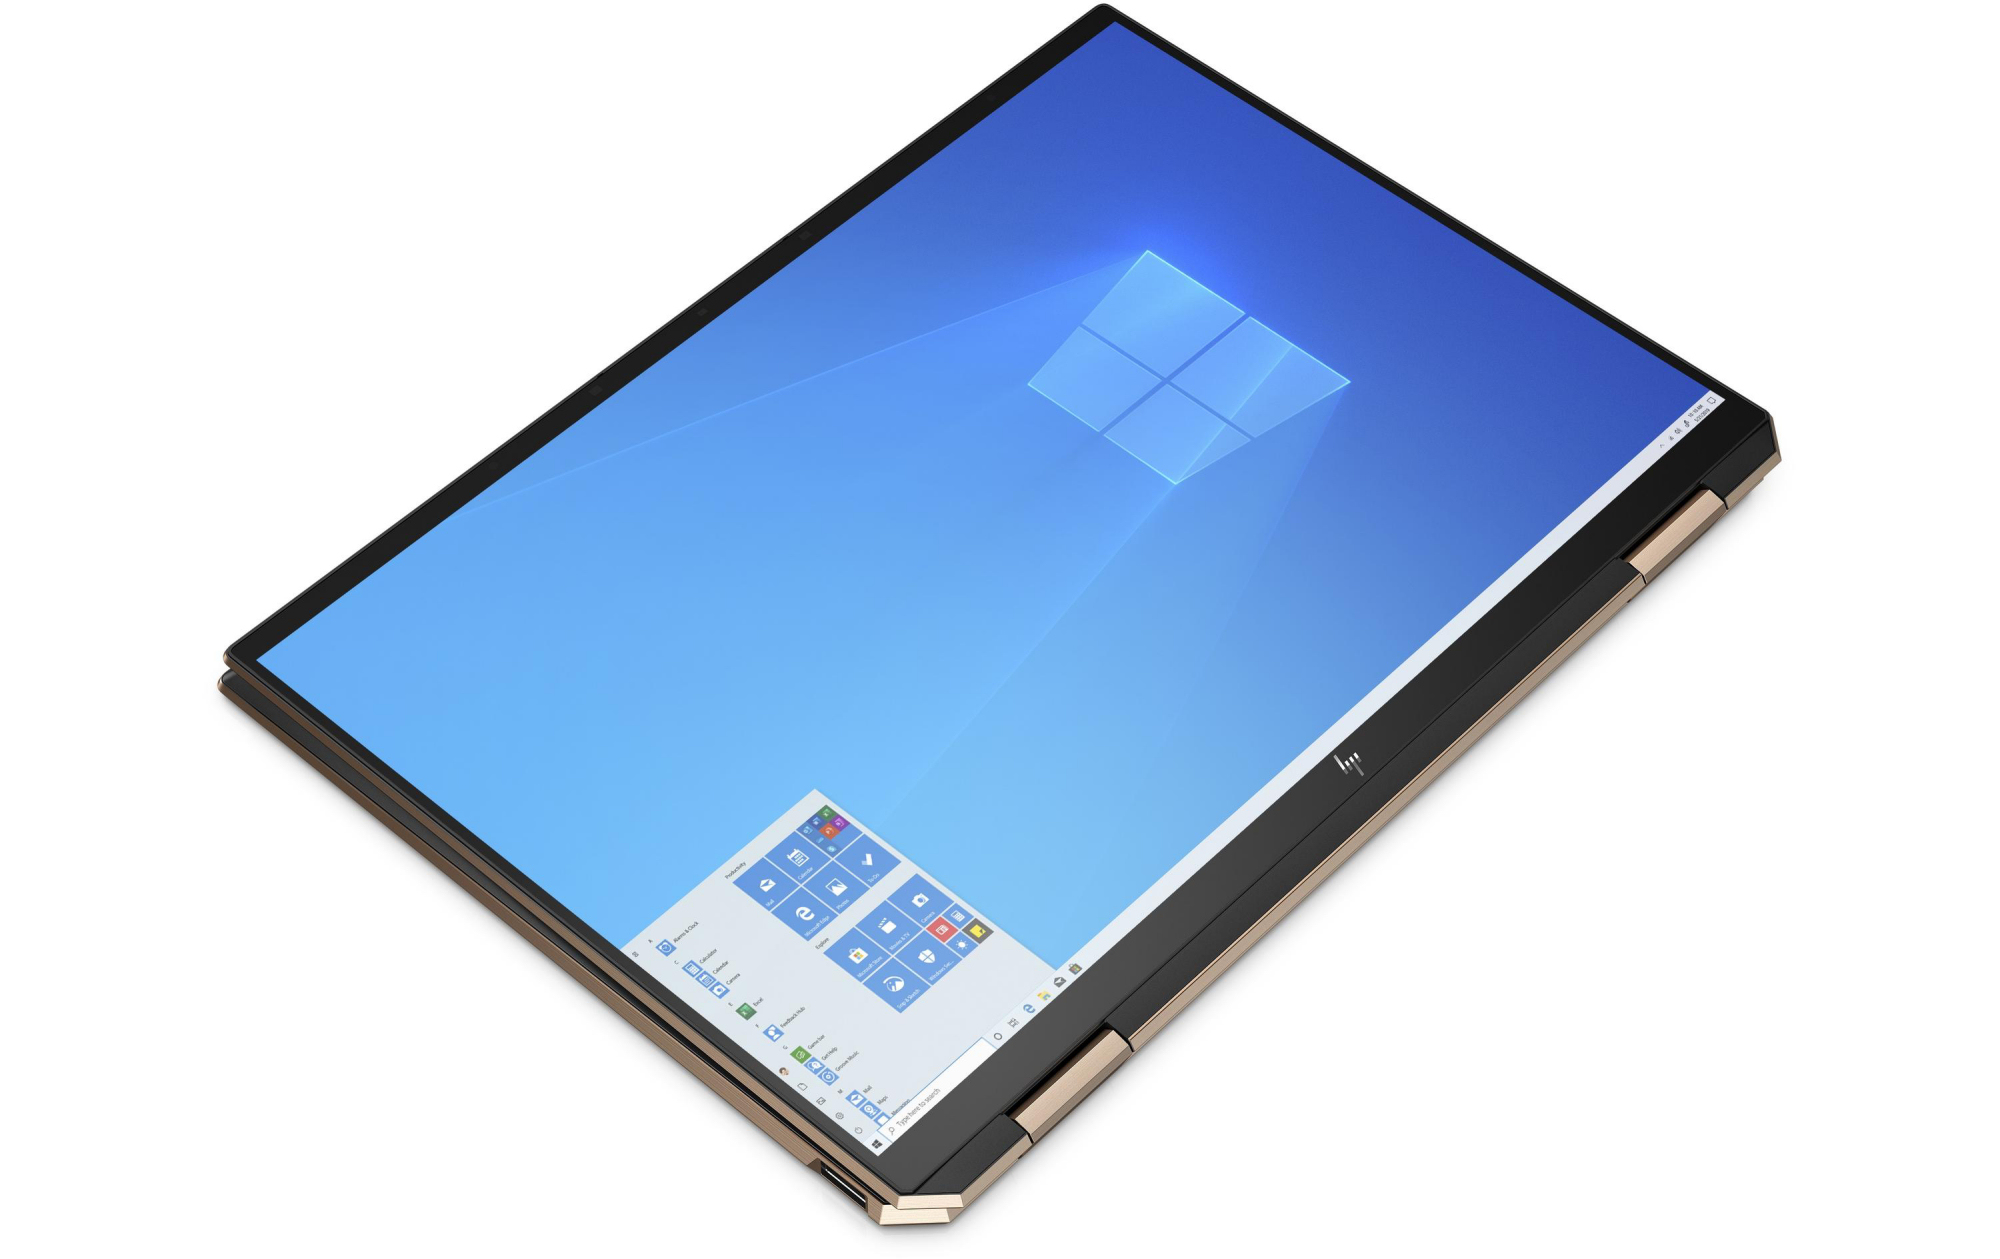
HP Spectre x360 14 Review: High-resolution OLED display, poor battery life

The Spectre x360 is HP’s flagship 2-in-1 device, which is why it costs 1900 Euros (~$2320). There are also cheaper variants. The competing devices include the Dell XPS 13 7390 2-in-1, the MSI Summit E13 Flip Evo, the Samsung Galaxy Book Flex 13.3, the Lenovo Yoga 9i 14ITL5, and the Acer Spin 5 SP513-54N.
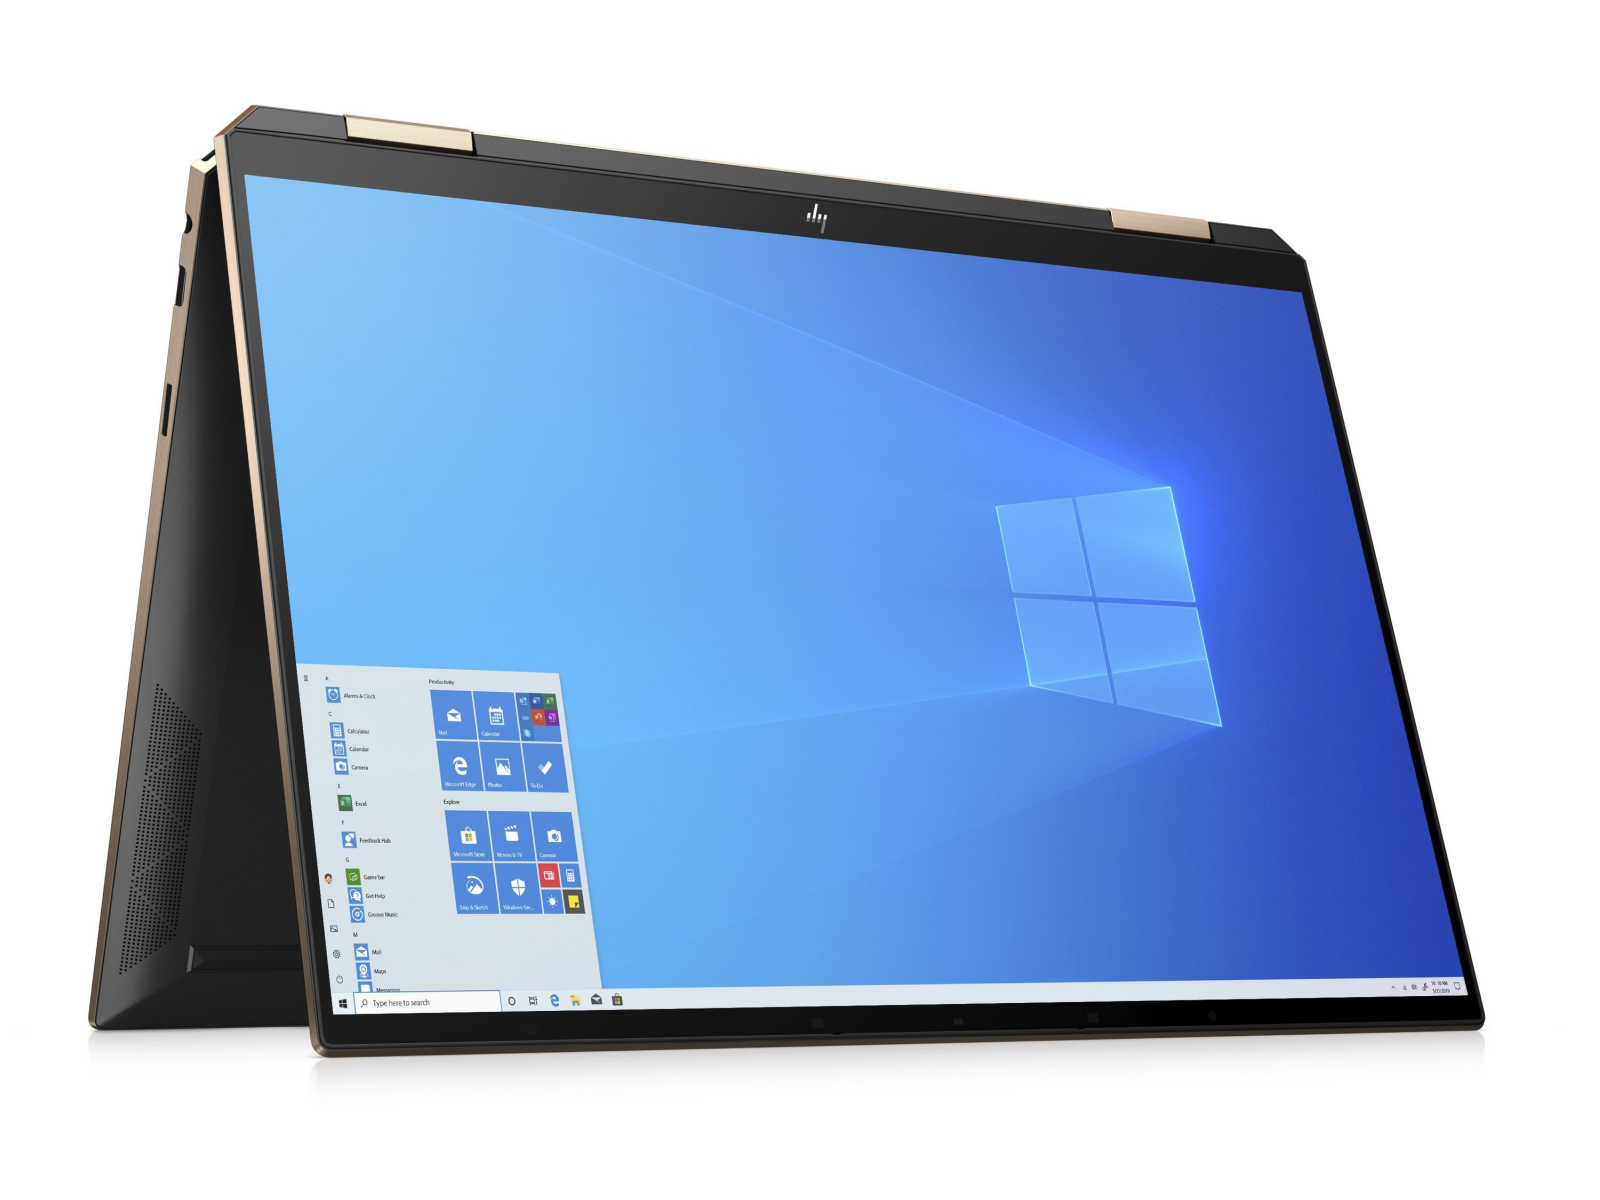
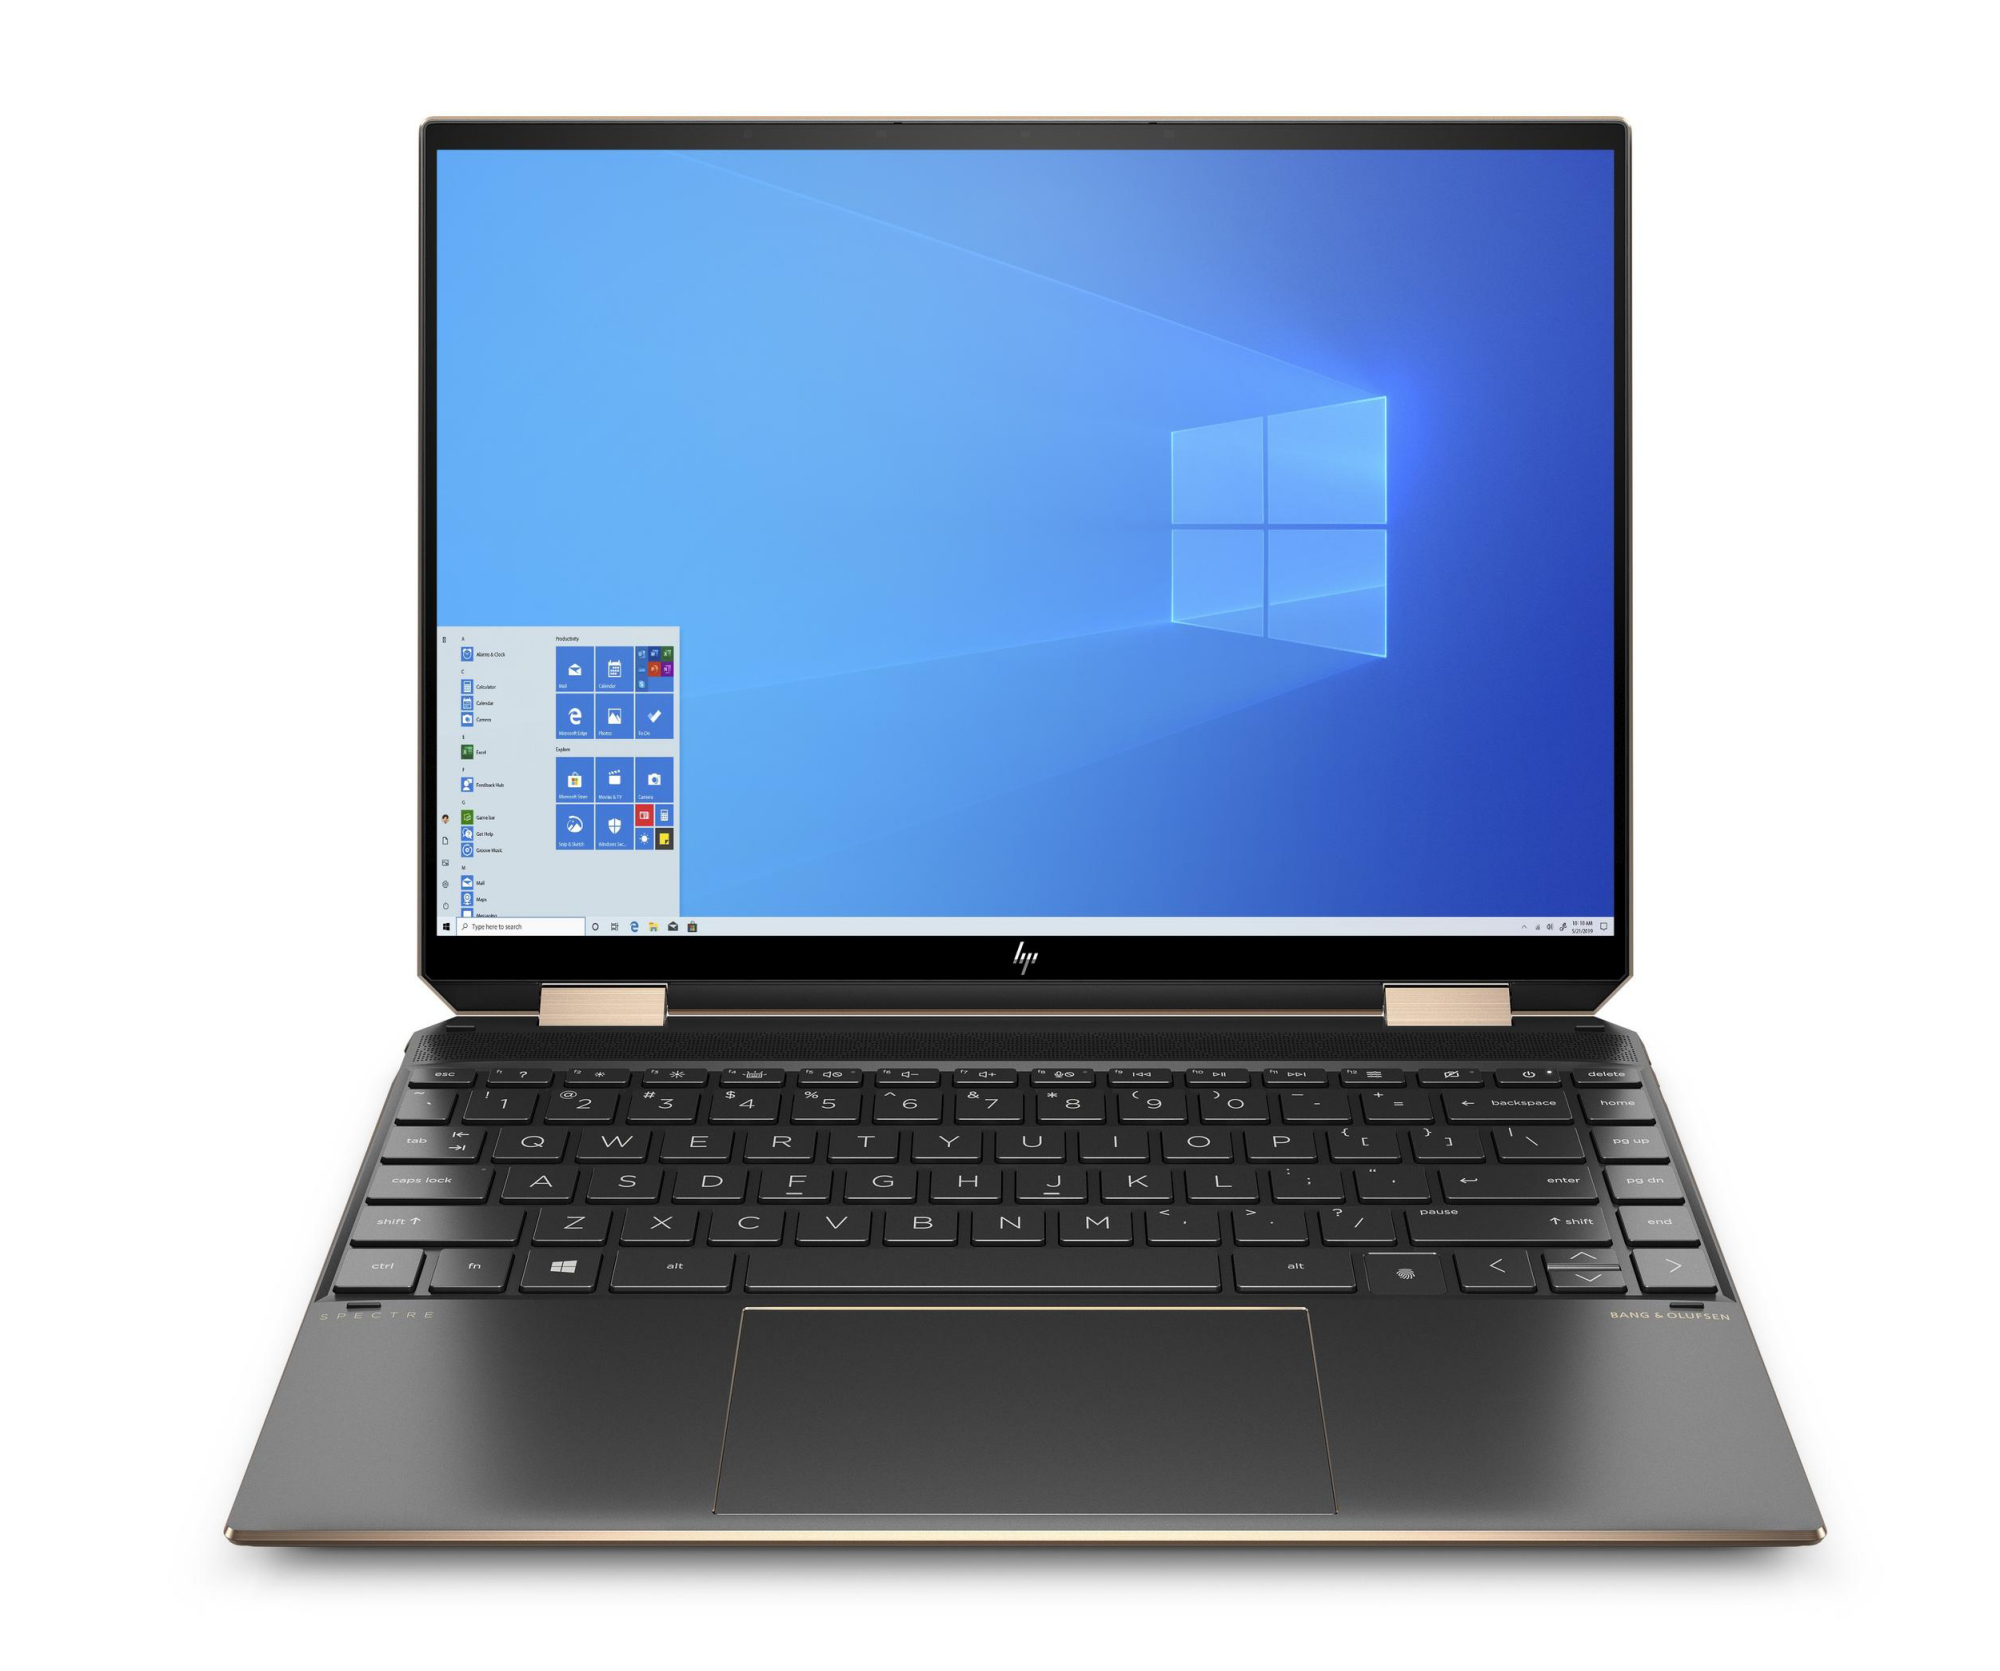
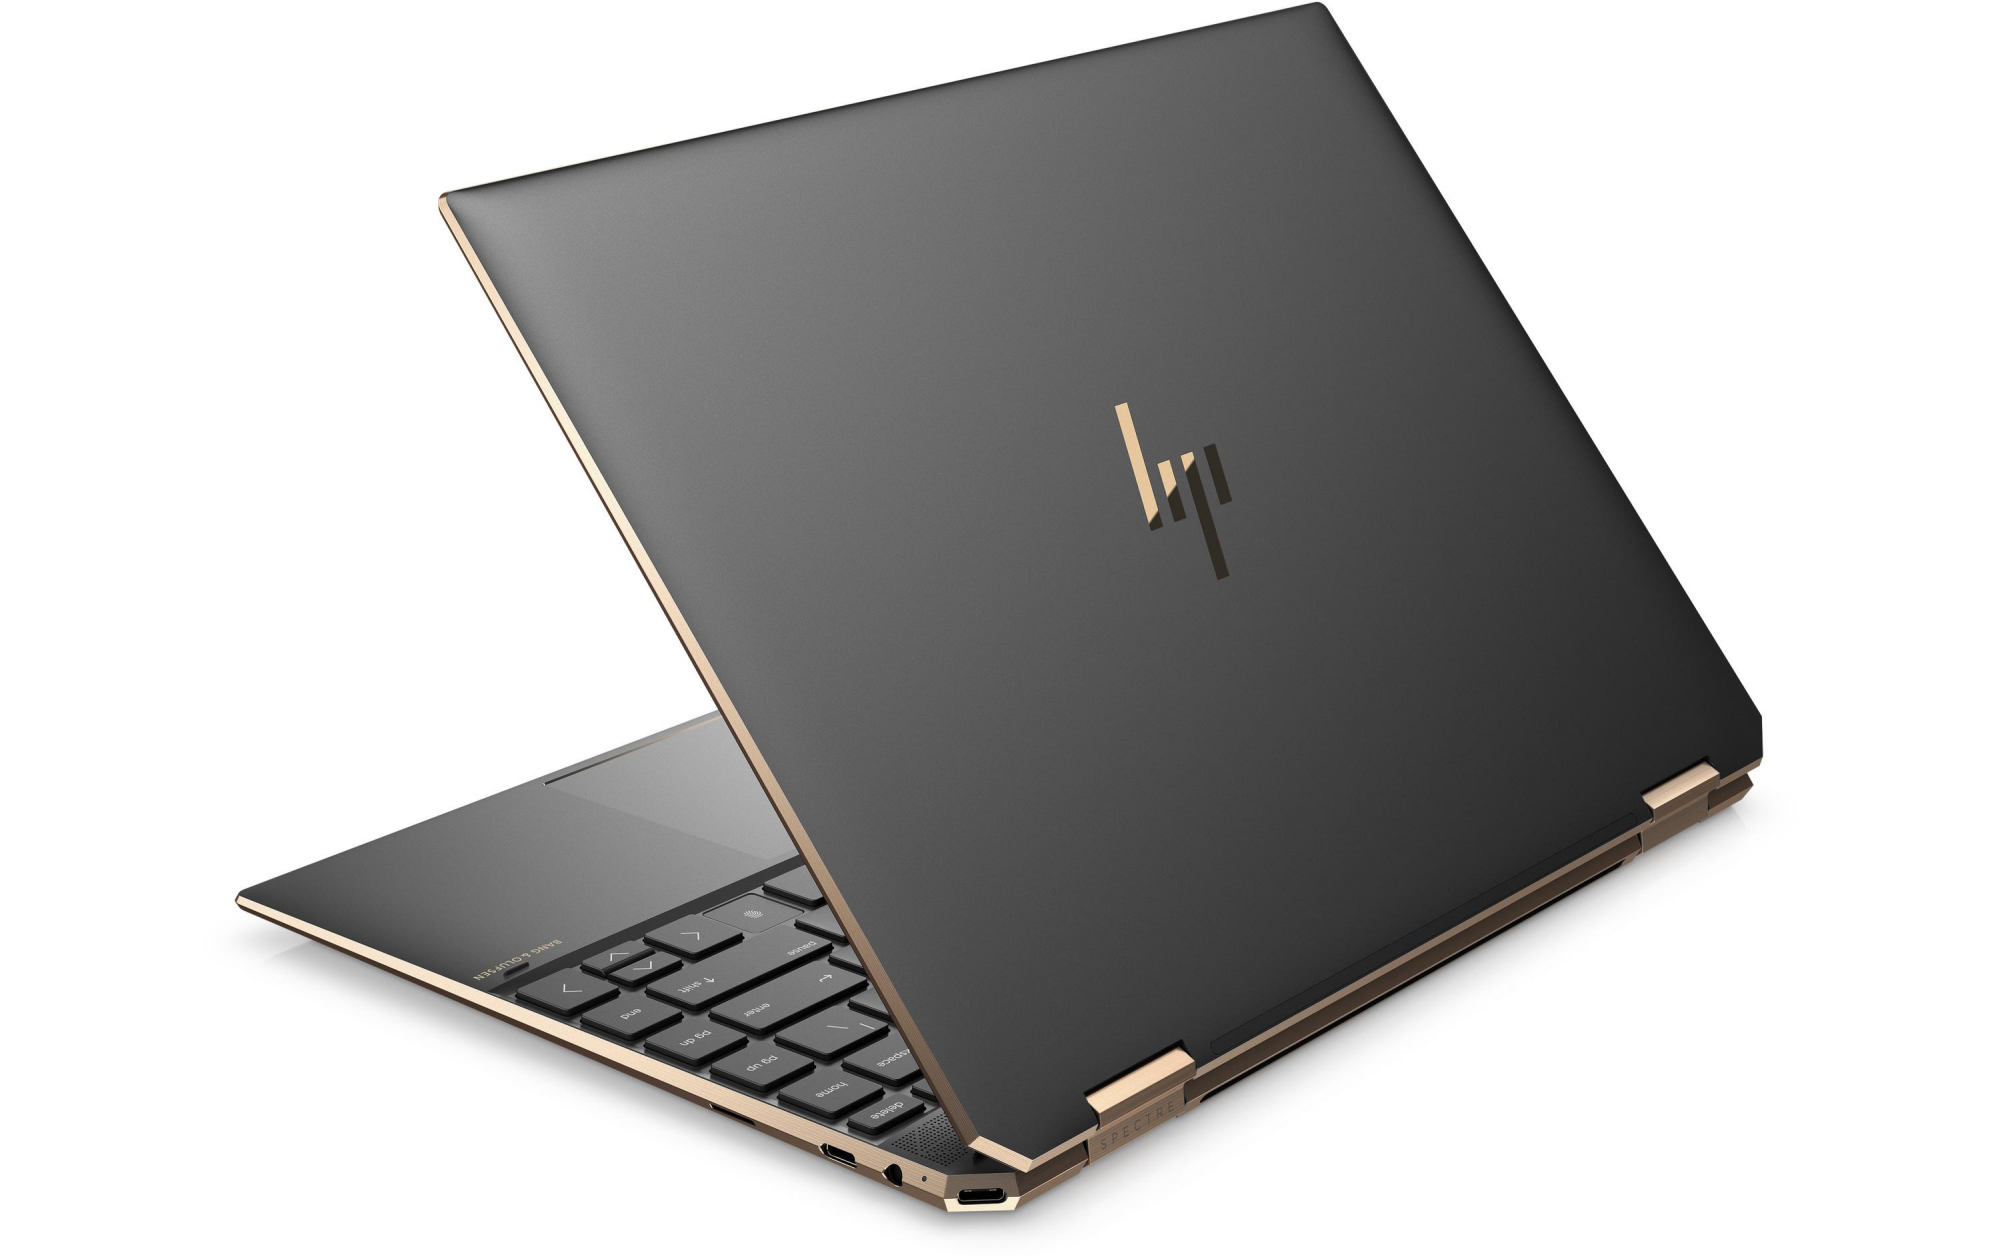
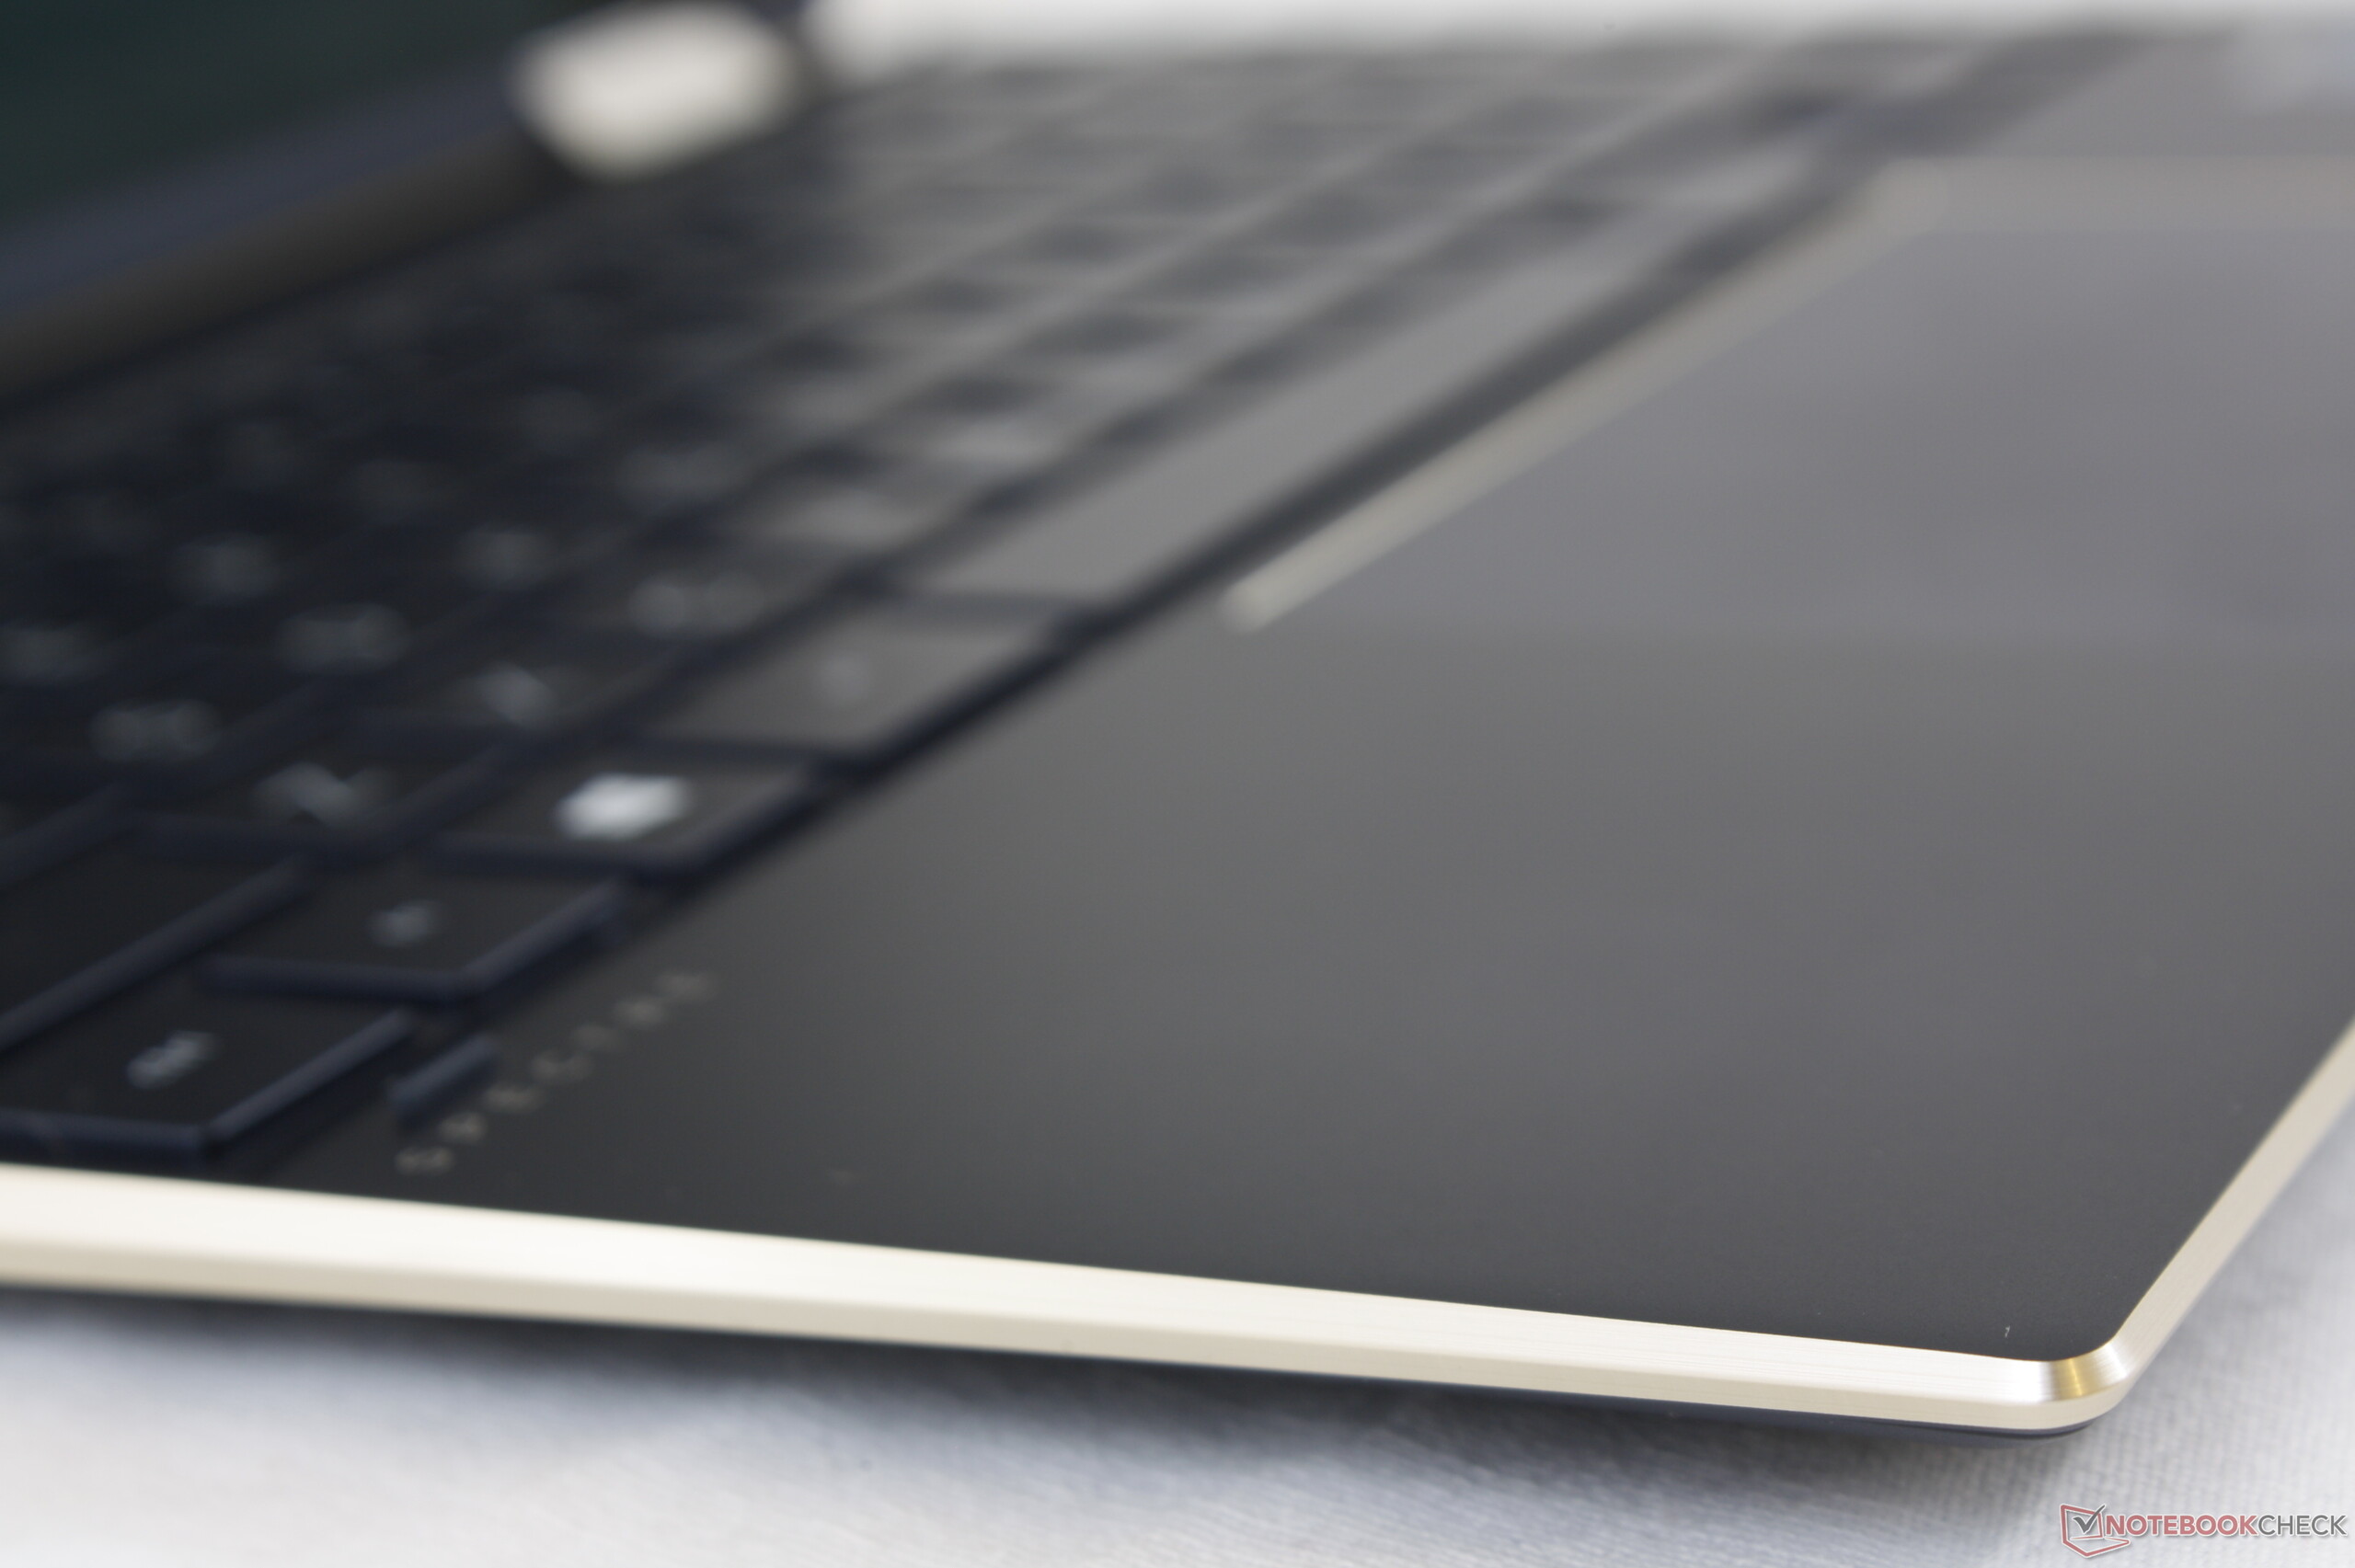
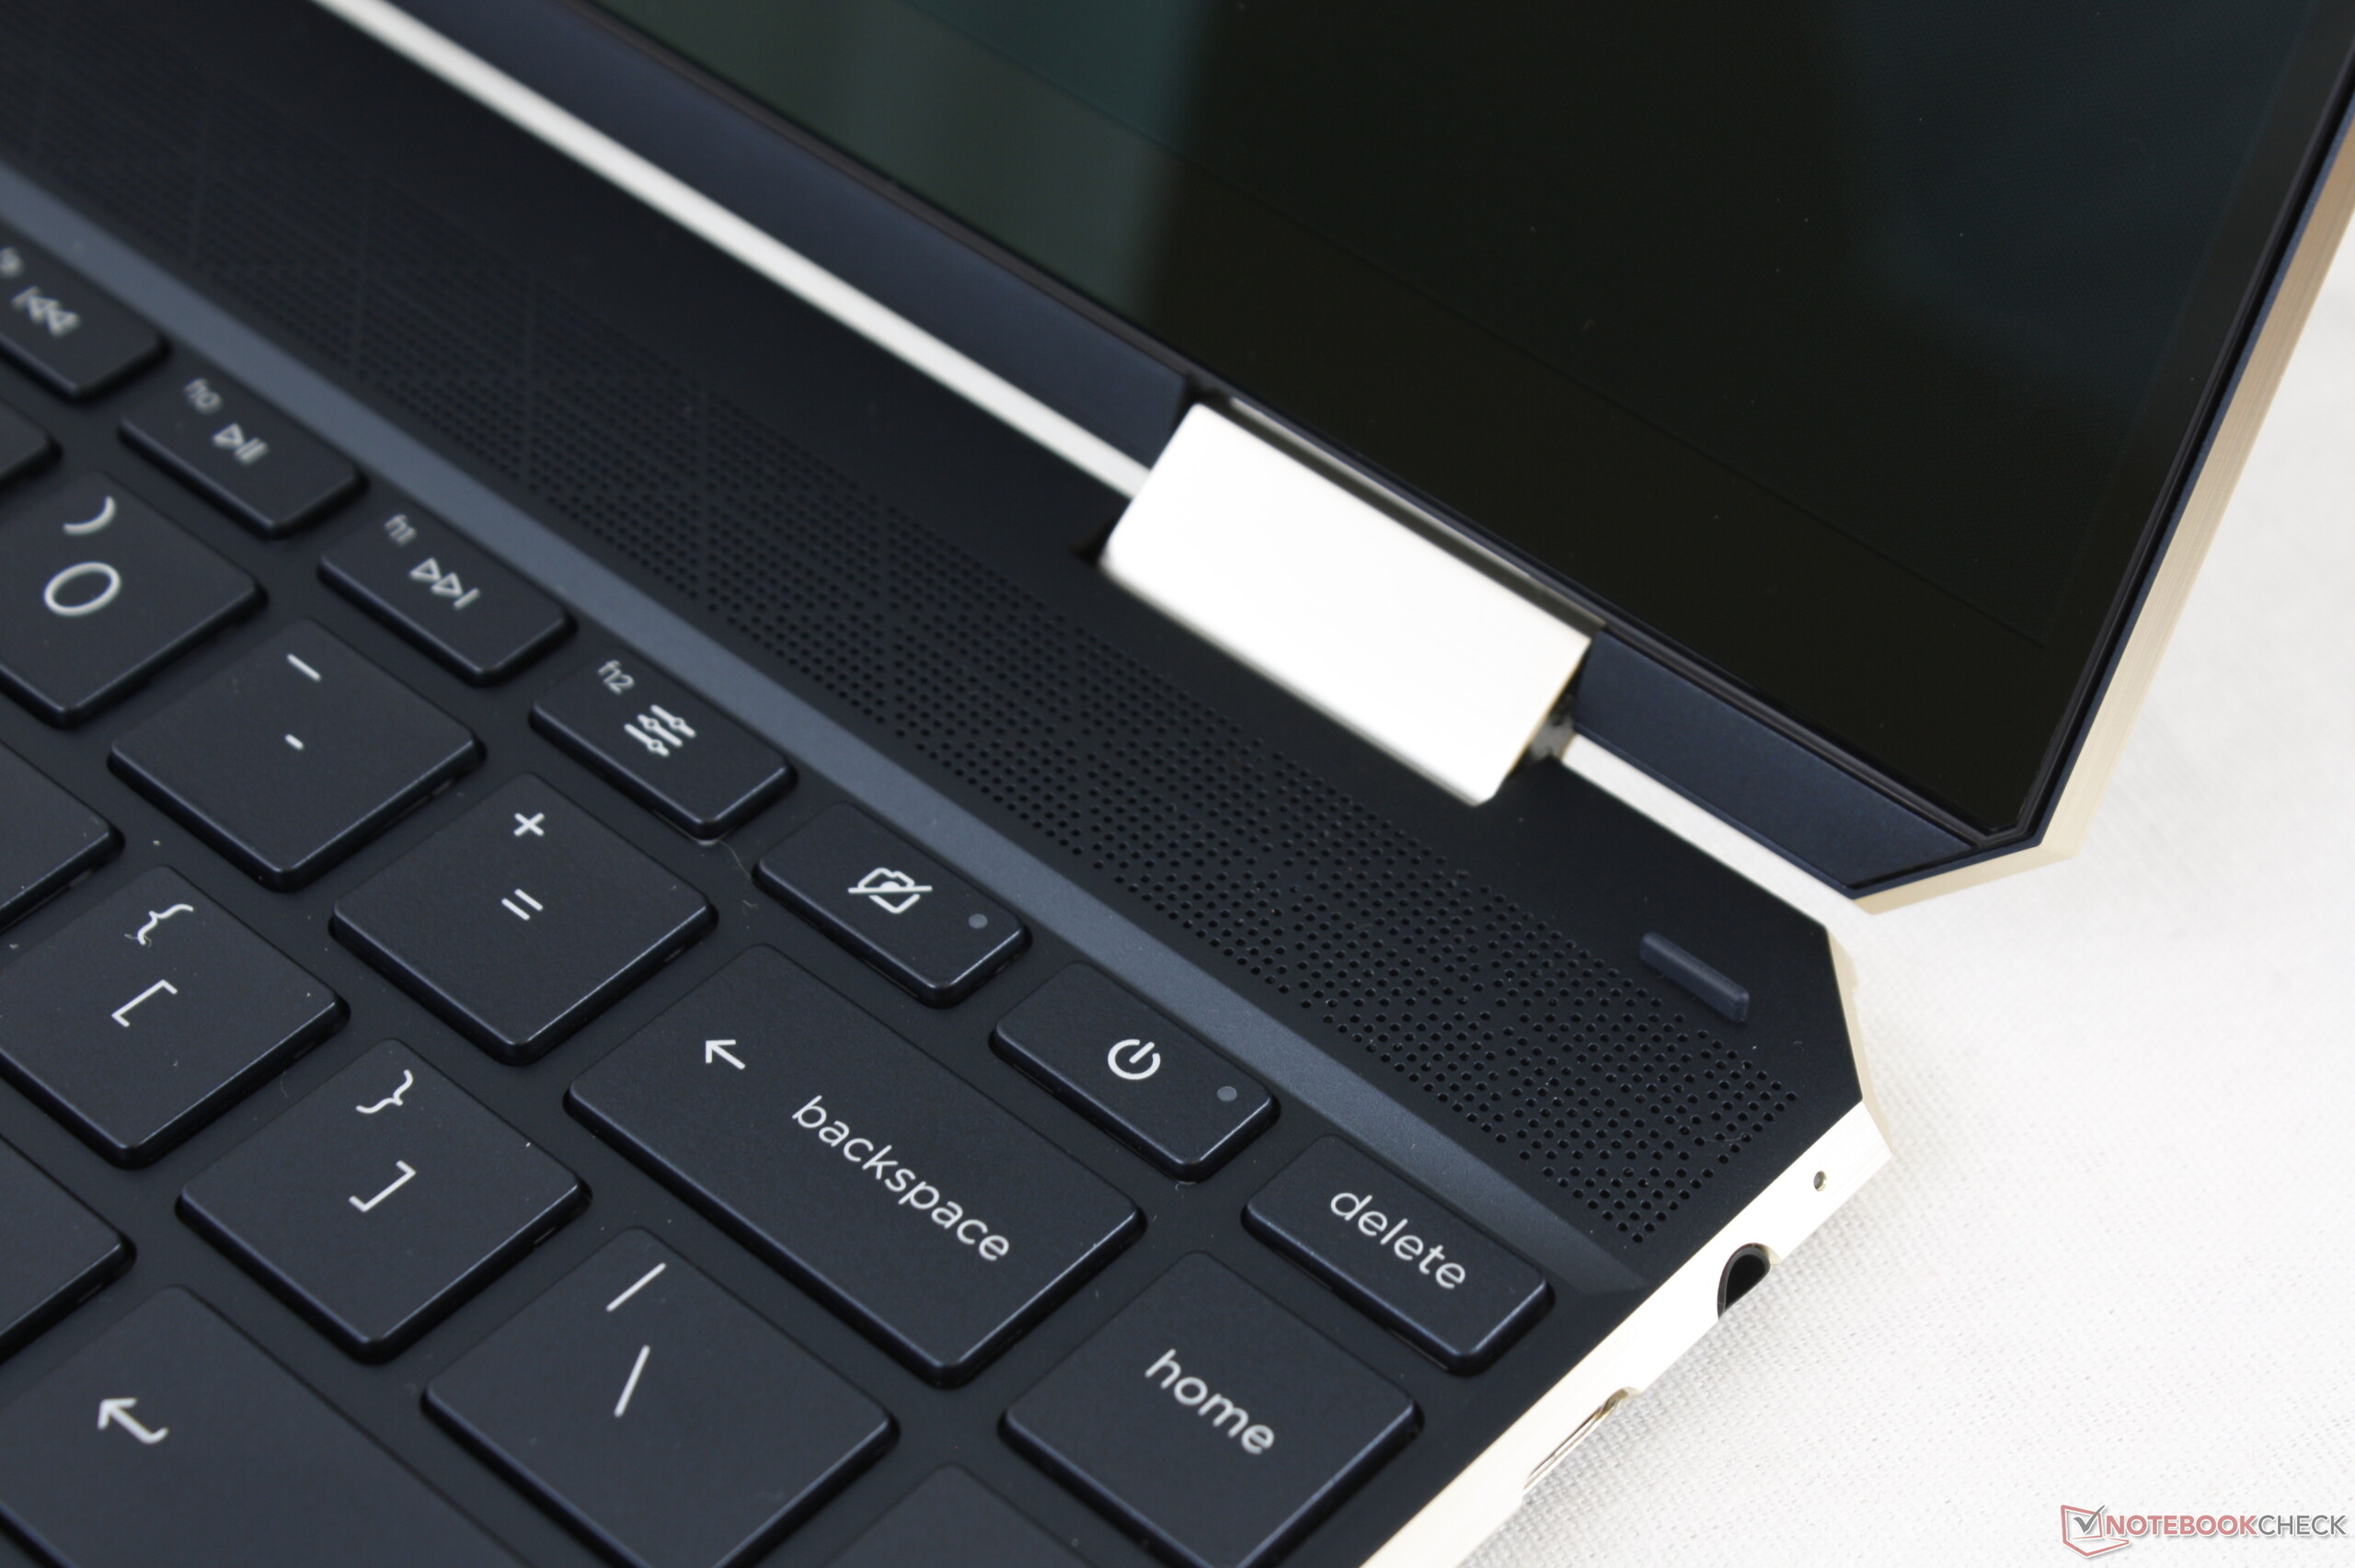
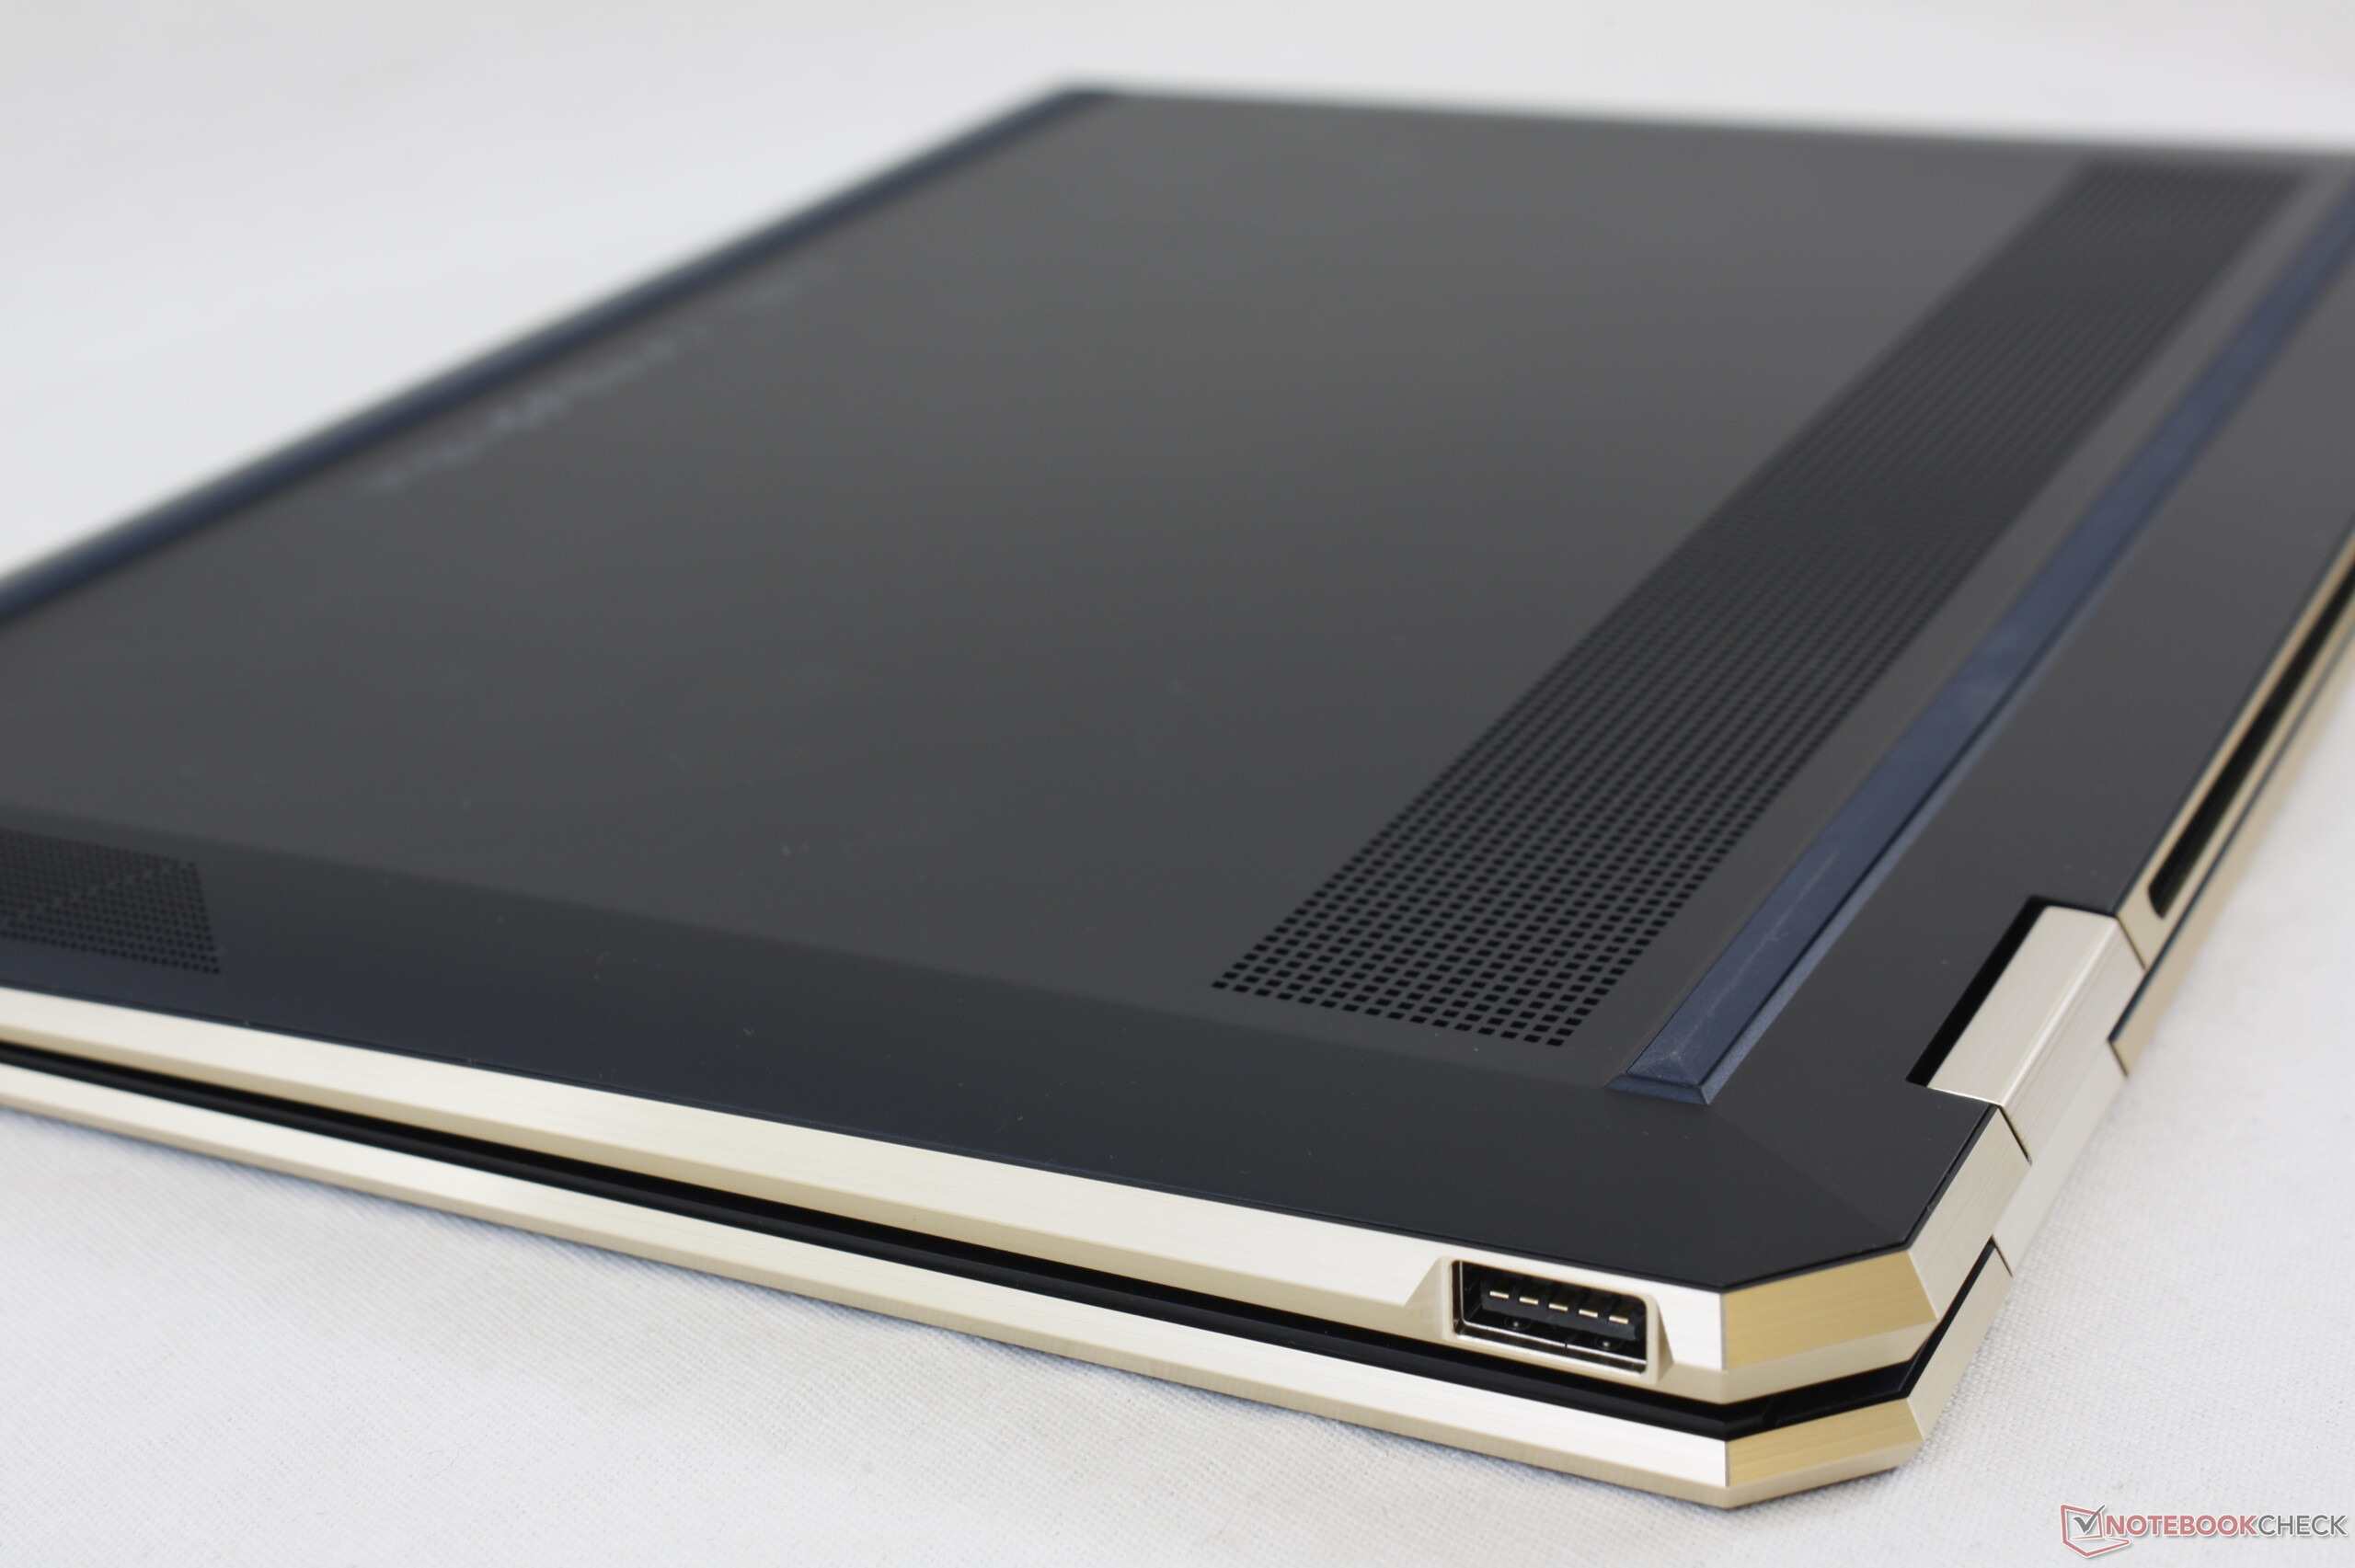
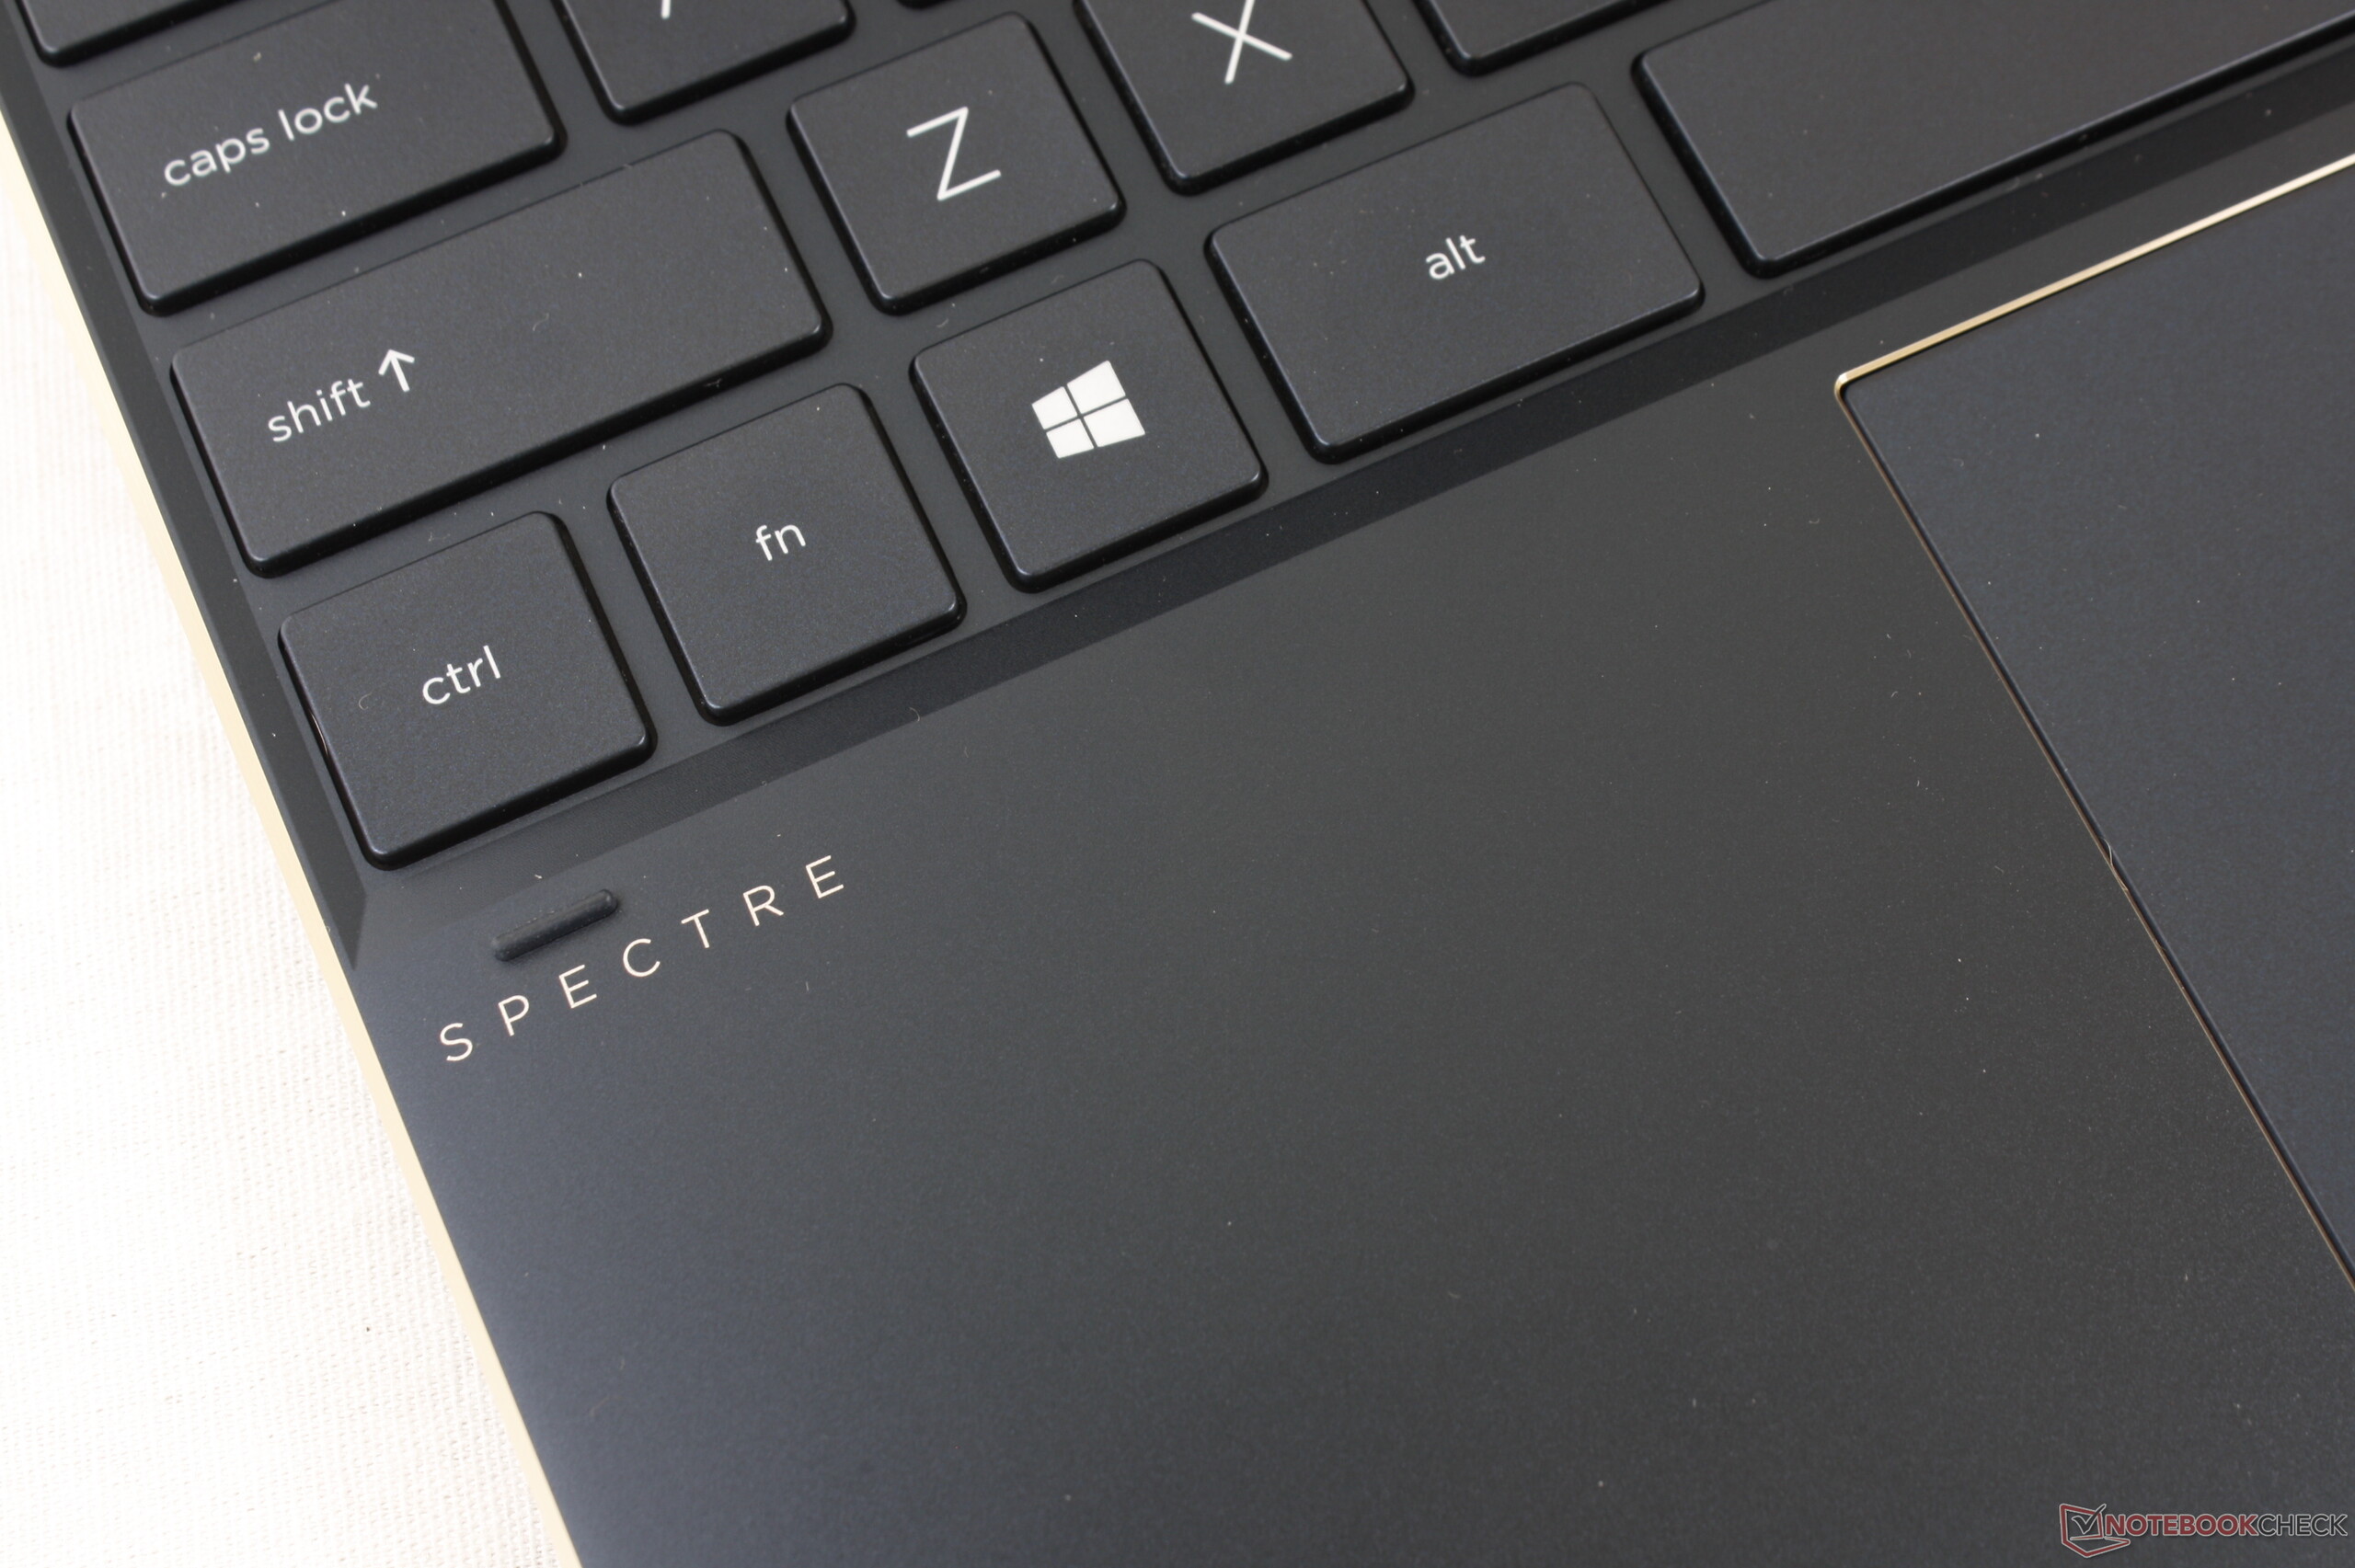
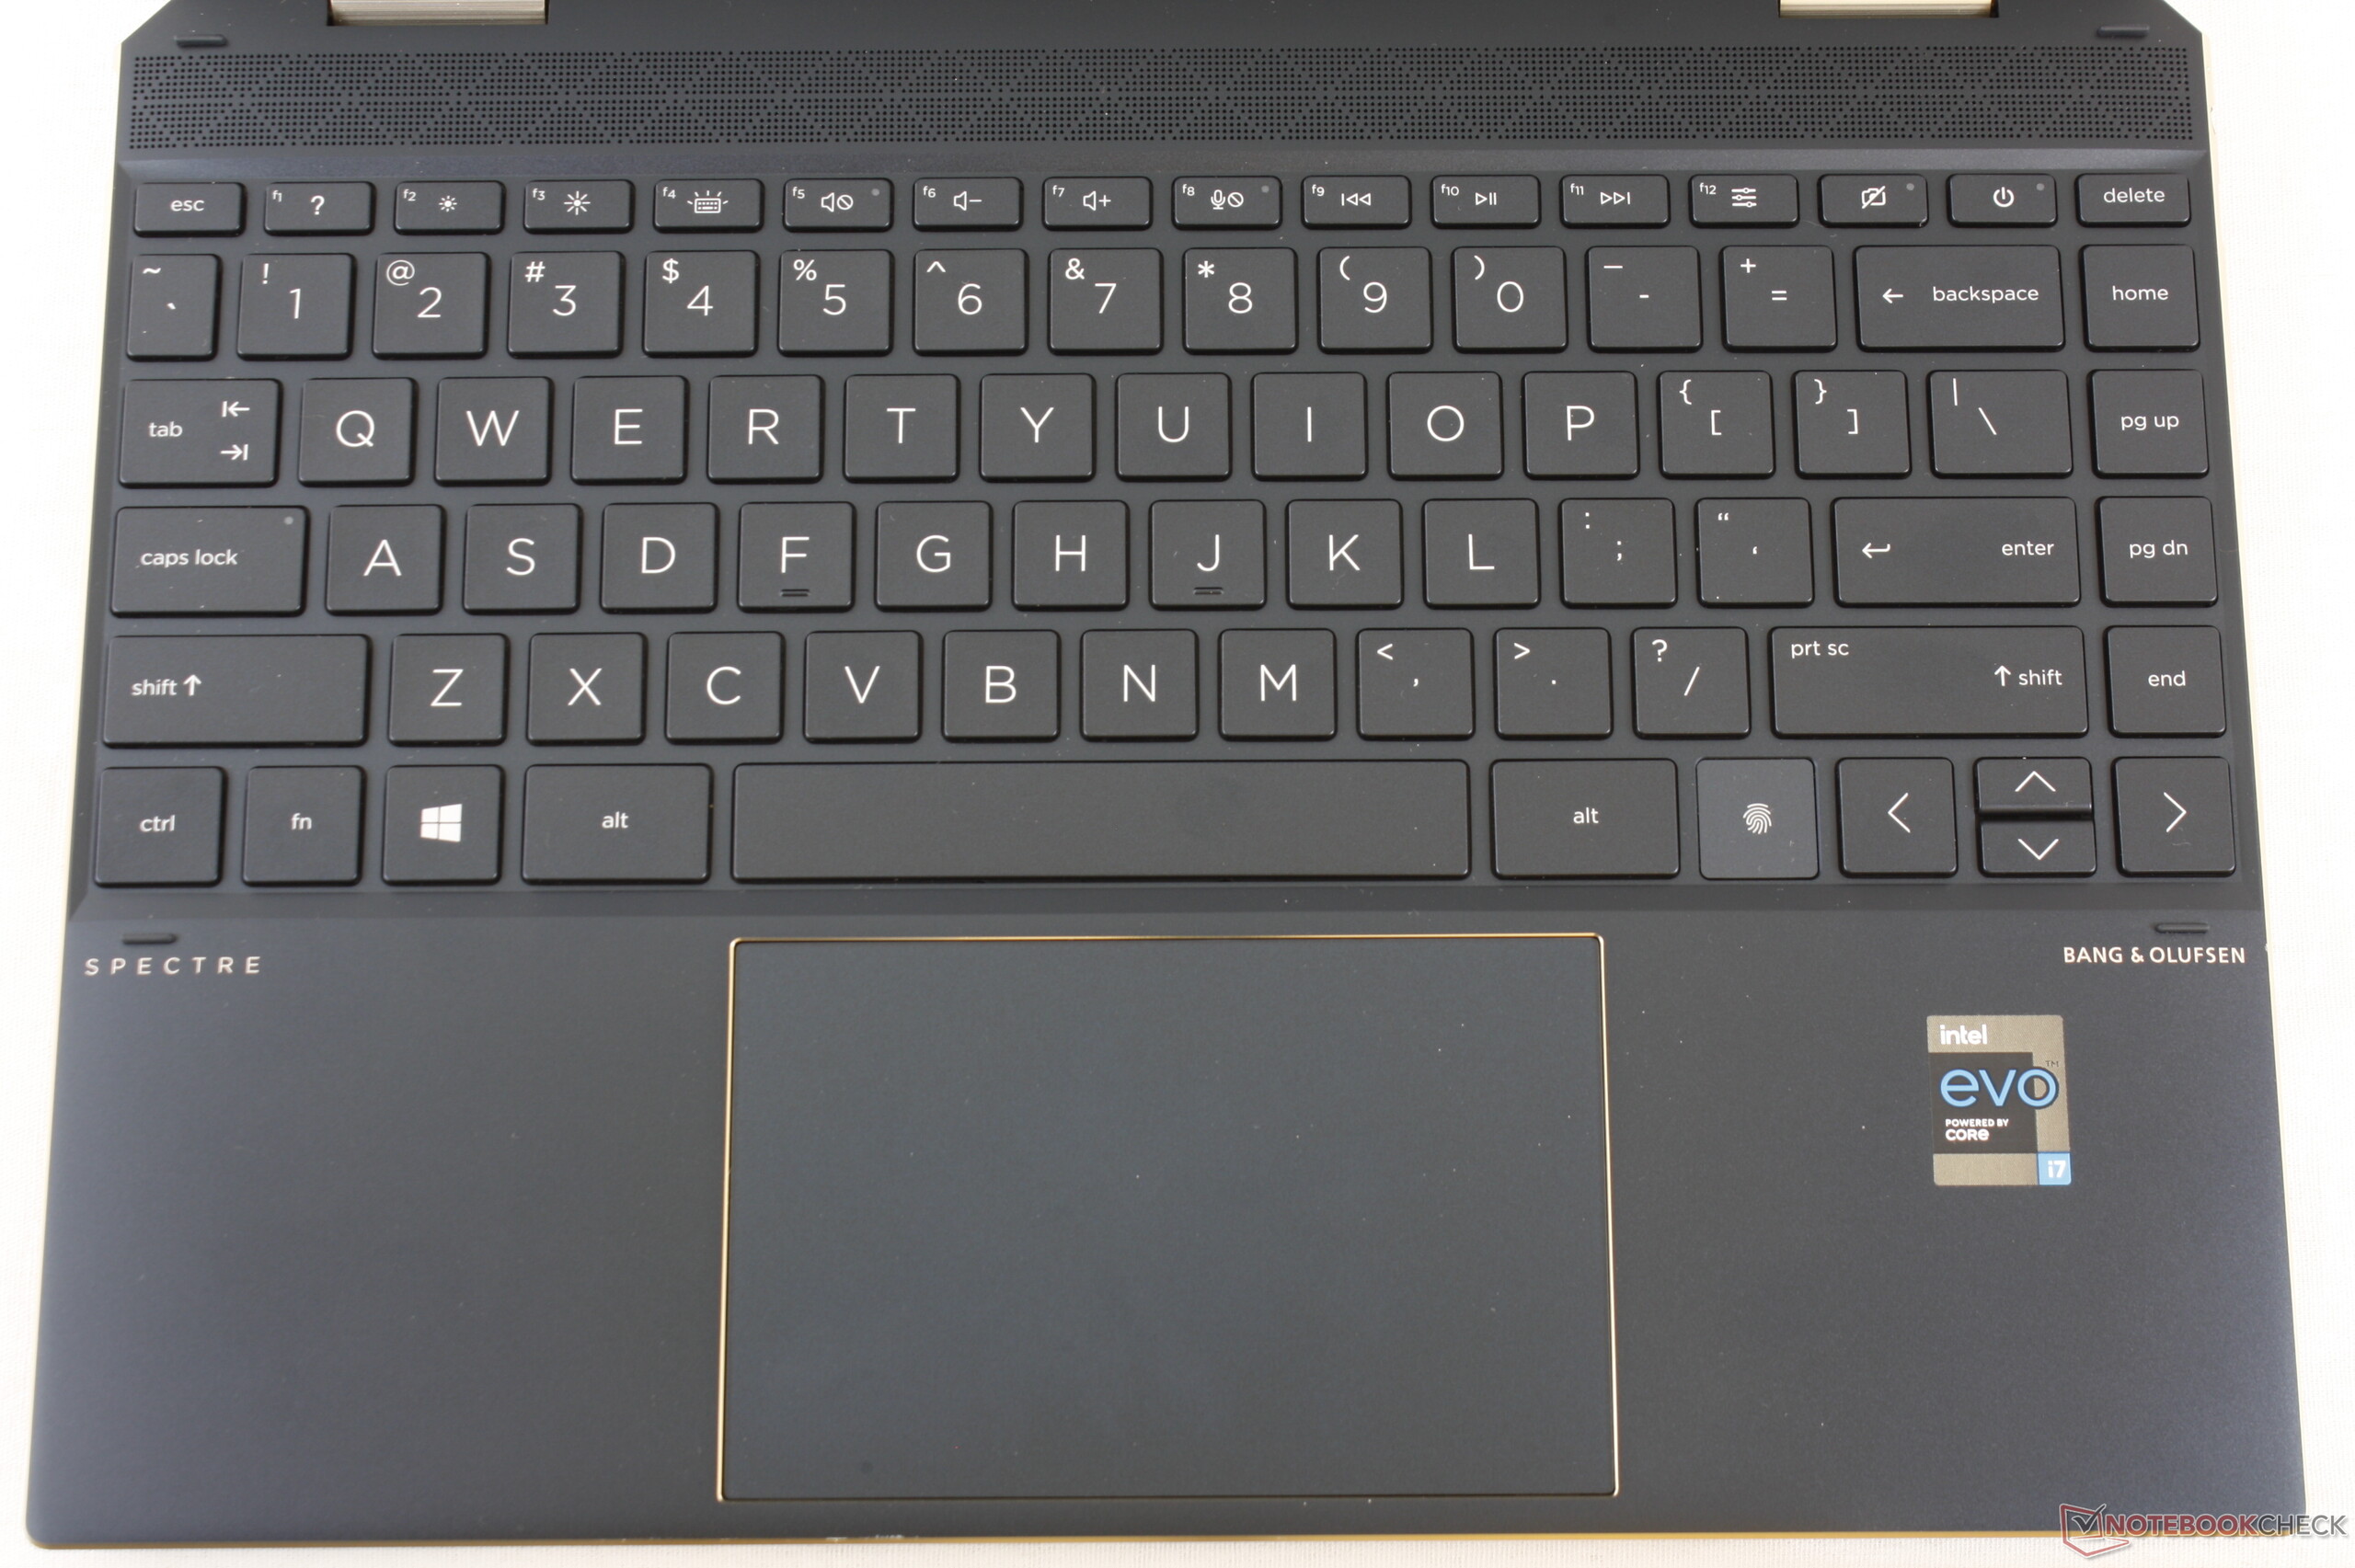
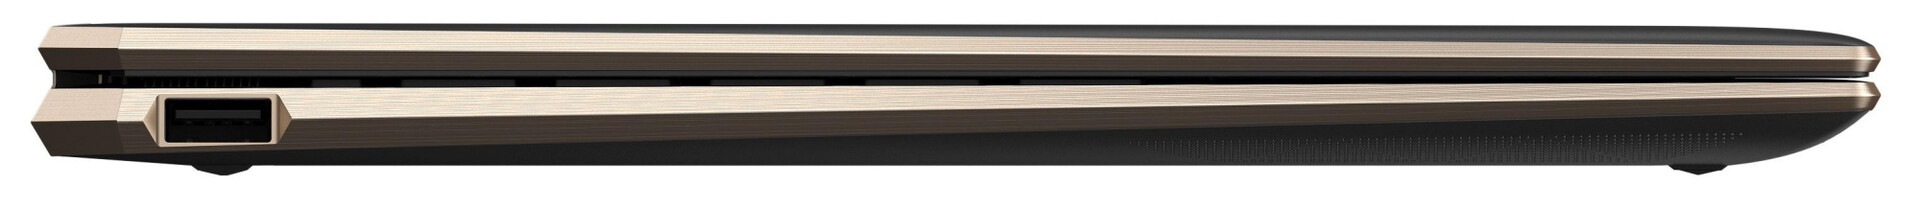
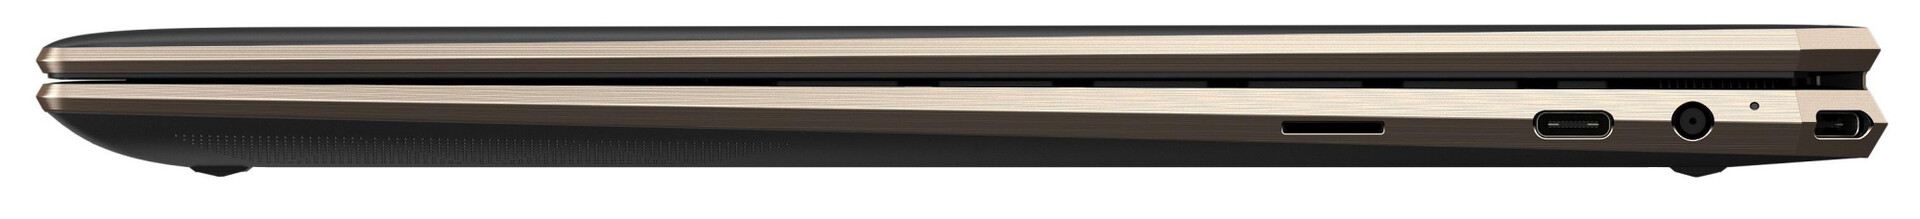
Because both the HP Spectre x360 14-ea0378ng and the HP Spectre x360 14t-ea000 are identically built, we shall skip the sections that deal with the case, connectivity, input devices and the speakers. You can find all the appropriate information in our review of the sibling model.
Likely Competitors
Rating | Date | Model | Weight | Height | Size | Resolution | Price |
|---|---|---|---|---|---|---|---|
| 89.5 % v7 (old) | 05 / 2021 | HP Spectre x360 14-ea0378ng i7-1165G7, Iris Xe G7 96EUs | 1.3 kg | 16.9 mm | 13.50" | 3000x2000 | |
| 84.4 % v7 (old) | 07 / 2020 | Samsung Galaxy Book Flex 13.3 i5-1035G4, Iris Plus Graphics G4 (Ice Lake 48 EU) | 1.2 kg | 13 mm | 13.30" | 1920x1080 | |
| 86.9 % v7 (old) | 04 / 2021 | MSI Summit E13 Flip Evo A11MT i7-1185G7, Iris Xe G7 96EUs | 1.4 kg | 14.9 mm | 13.40" | 1920x1200 | |
| 86.3 % v7 (old) | 10 / 2019 | Dell XPS 13 7390 2-in-1 Core i7 i7-1065G7, Iris Plus Graphics G7 (Ice Lake 64 EU) | 1.3 kg | 13 mm | 13.40" | 1920x1200 | |
| 86.9 % v7 (old) | 02 / 2021 | Lenovo Yoga 9 14 ITL 4K i7-1185G7, Iris Xe G7 96EUs | 1.5 kg | 16.5 mm | 14.00" | 3840x2160 | |
| 88.1 % v7 (old) | 09 / 2020 | Acer Spin 5 SP513-54N-79EY i7-1065G7, Iris Plus Graphics G7 (Ice Lake 64 EU) | 1.2 kg | 14.9 mm | 13.50" | 2256x1504 |
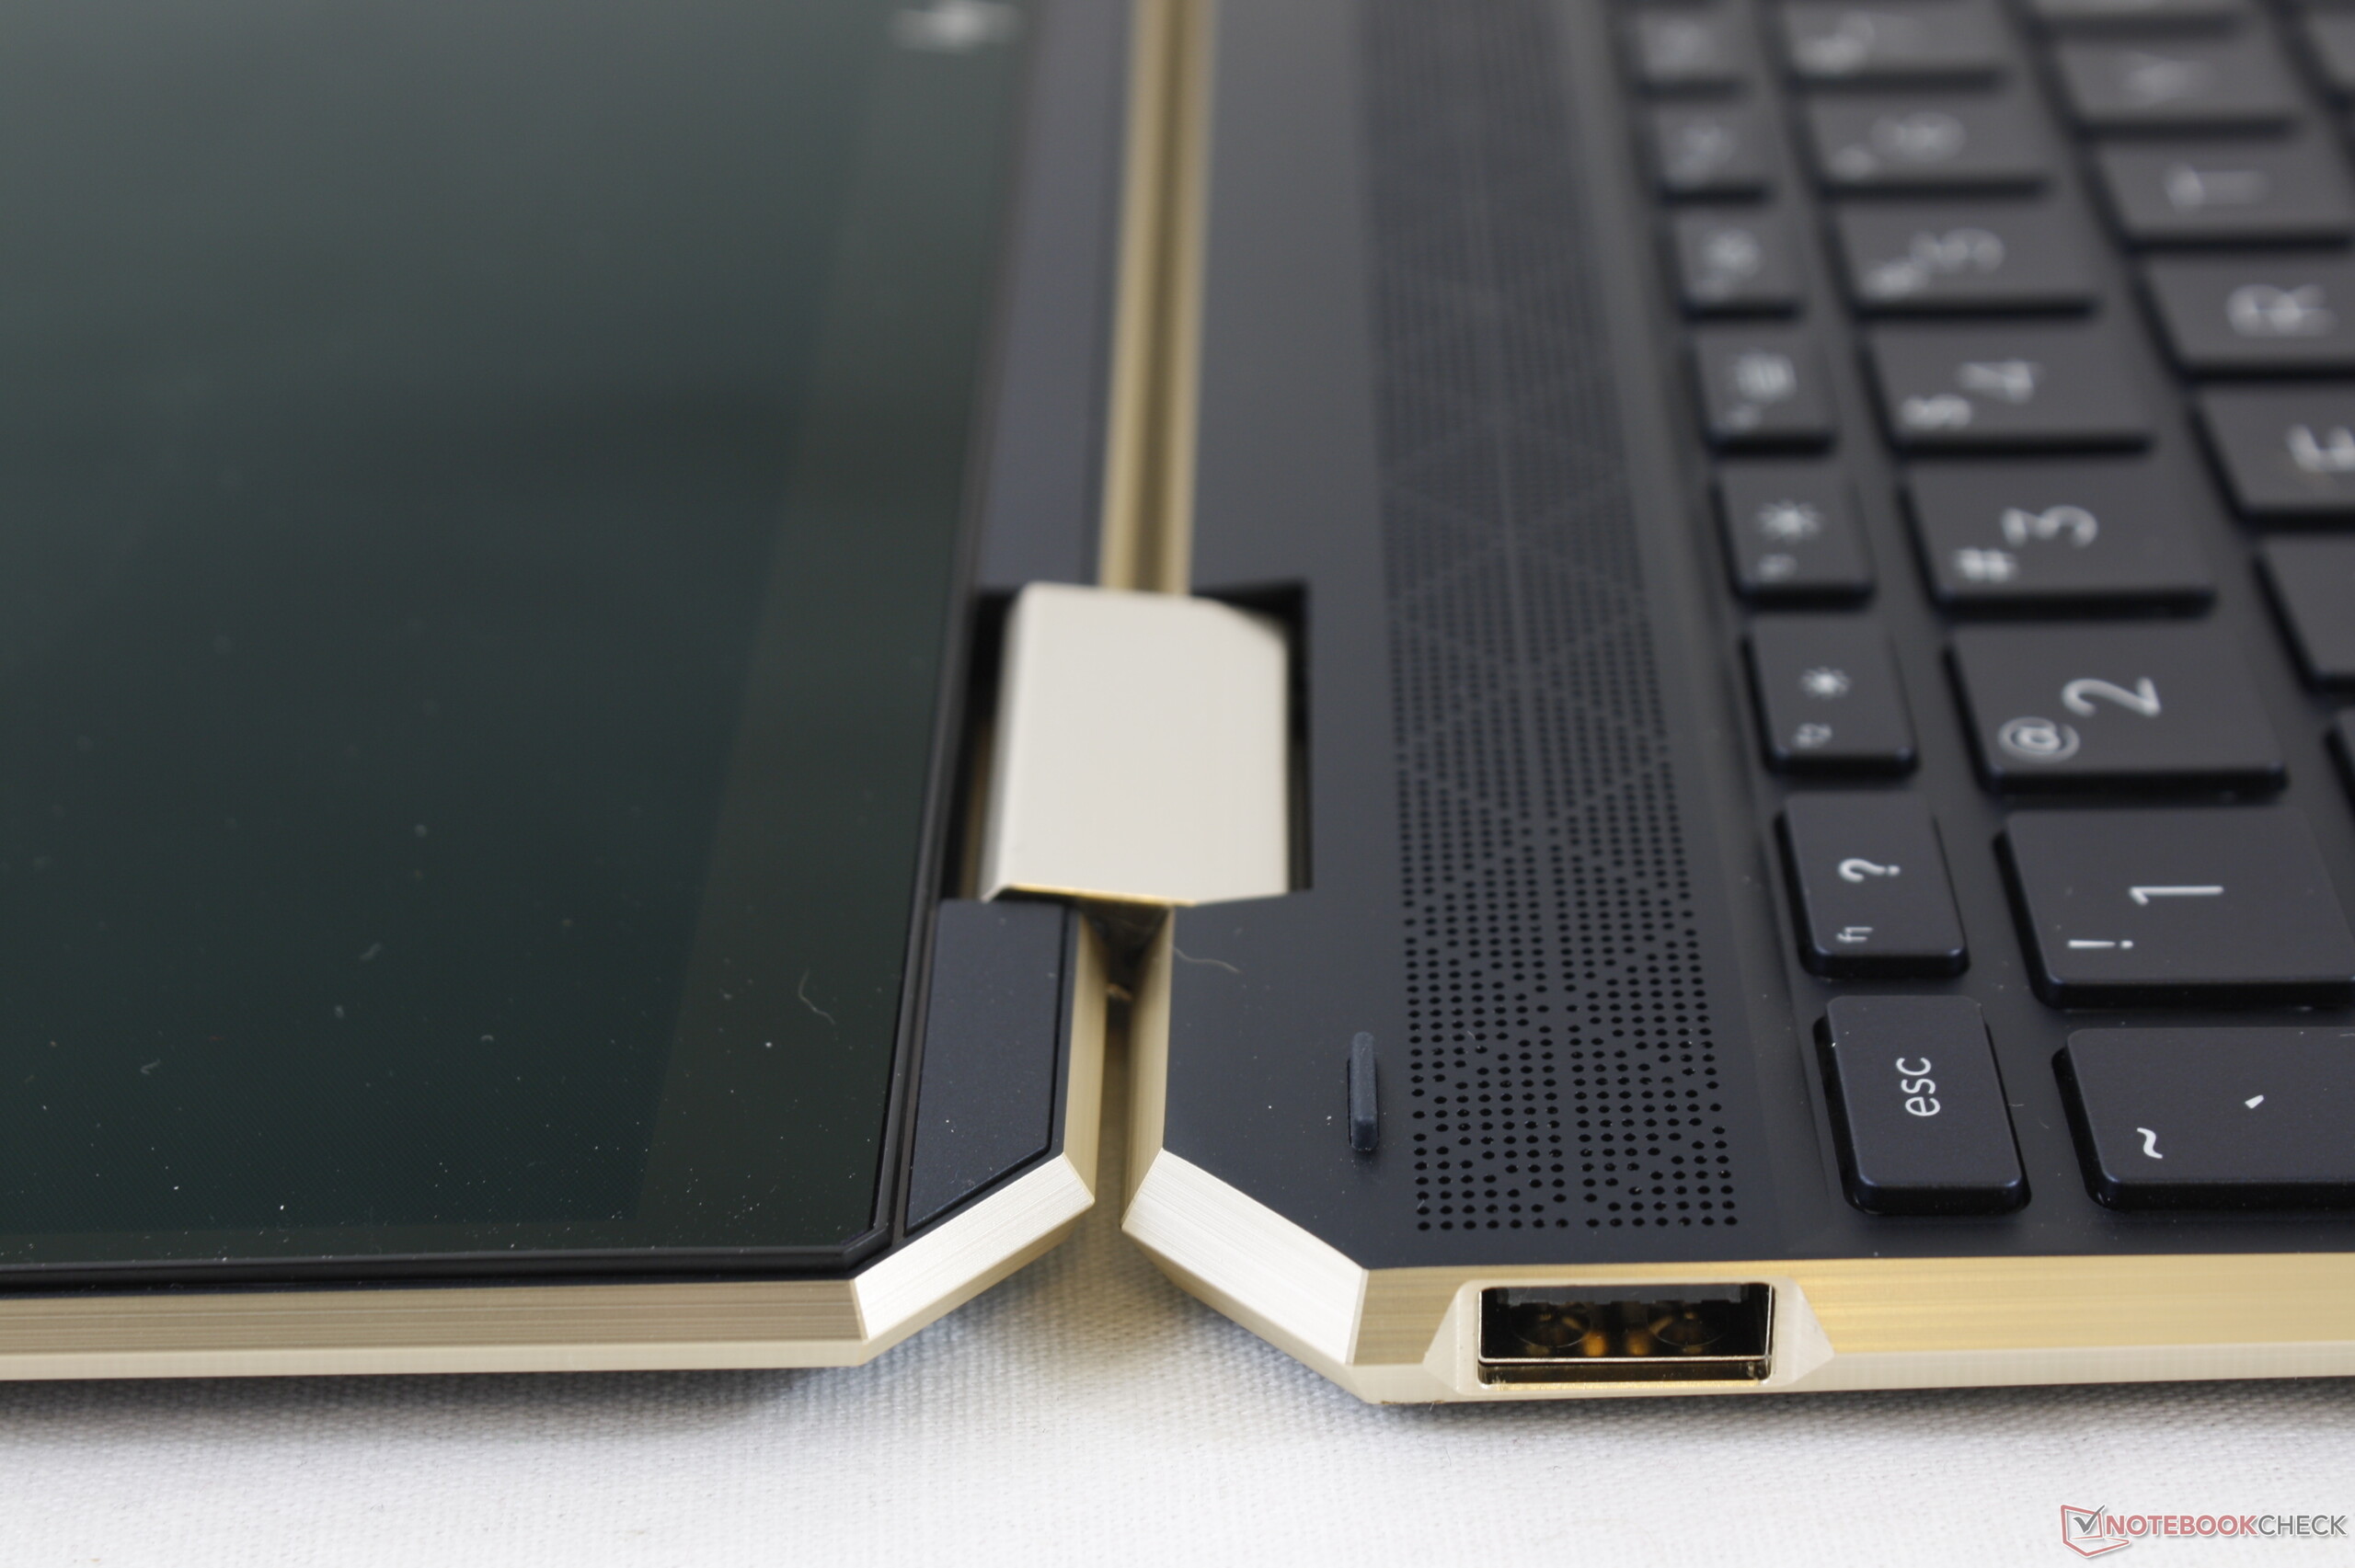
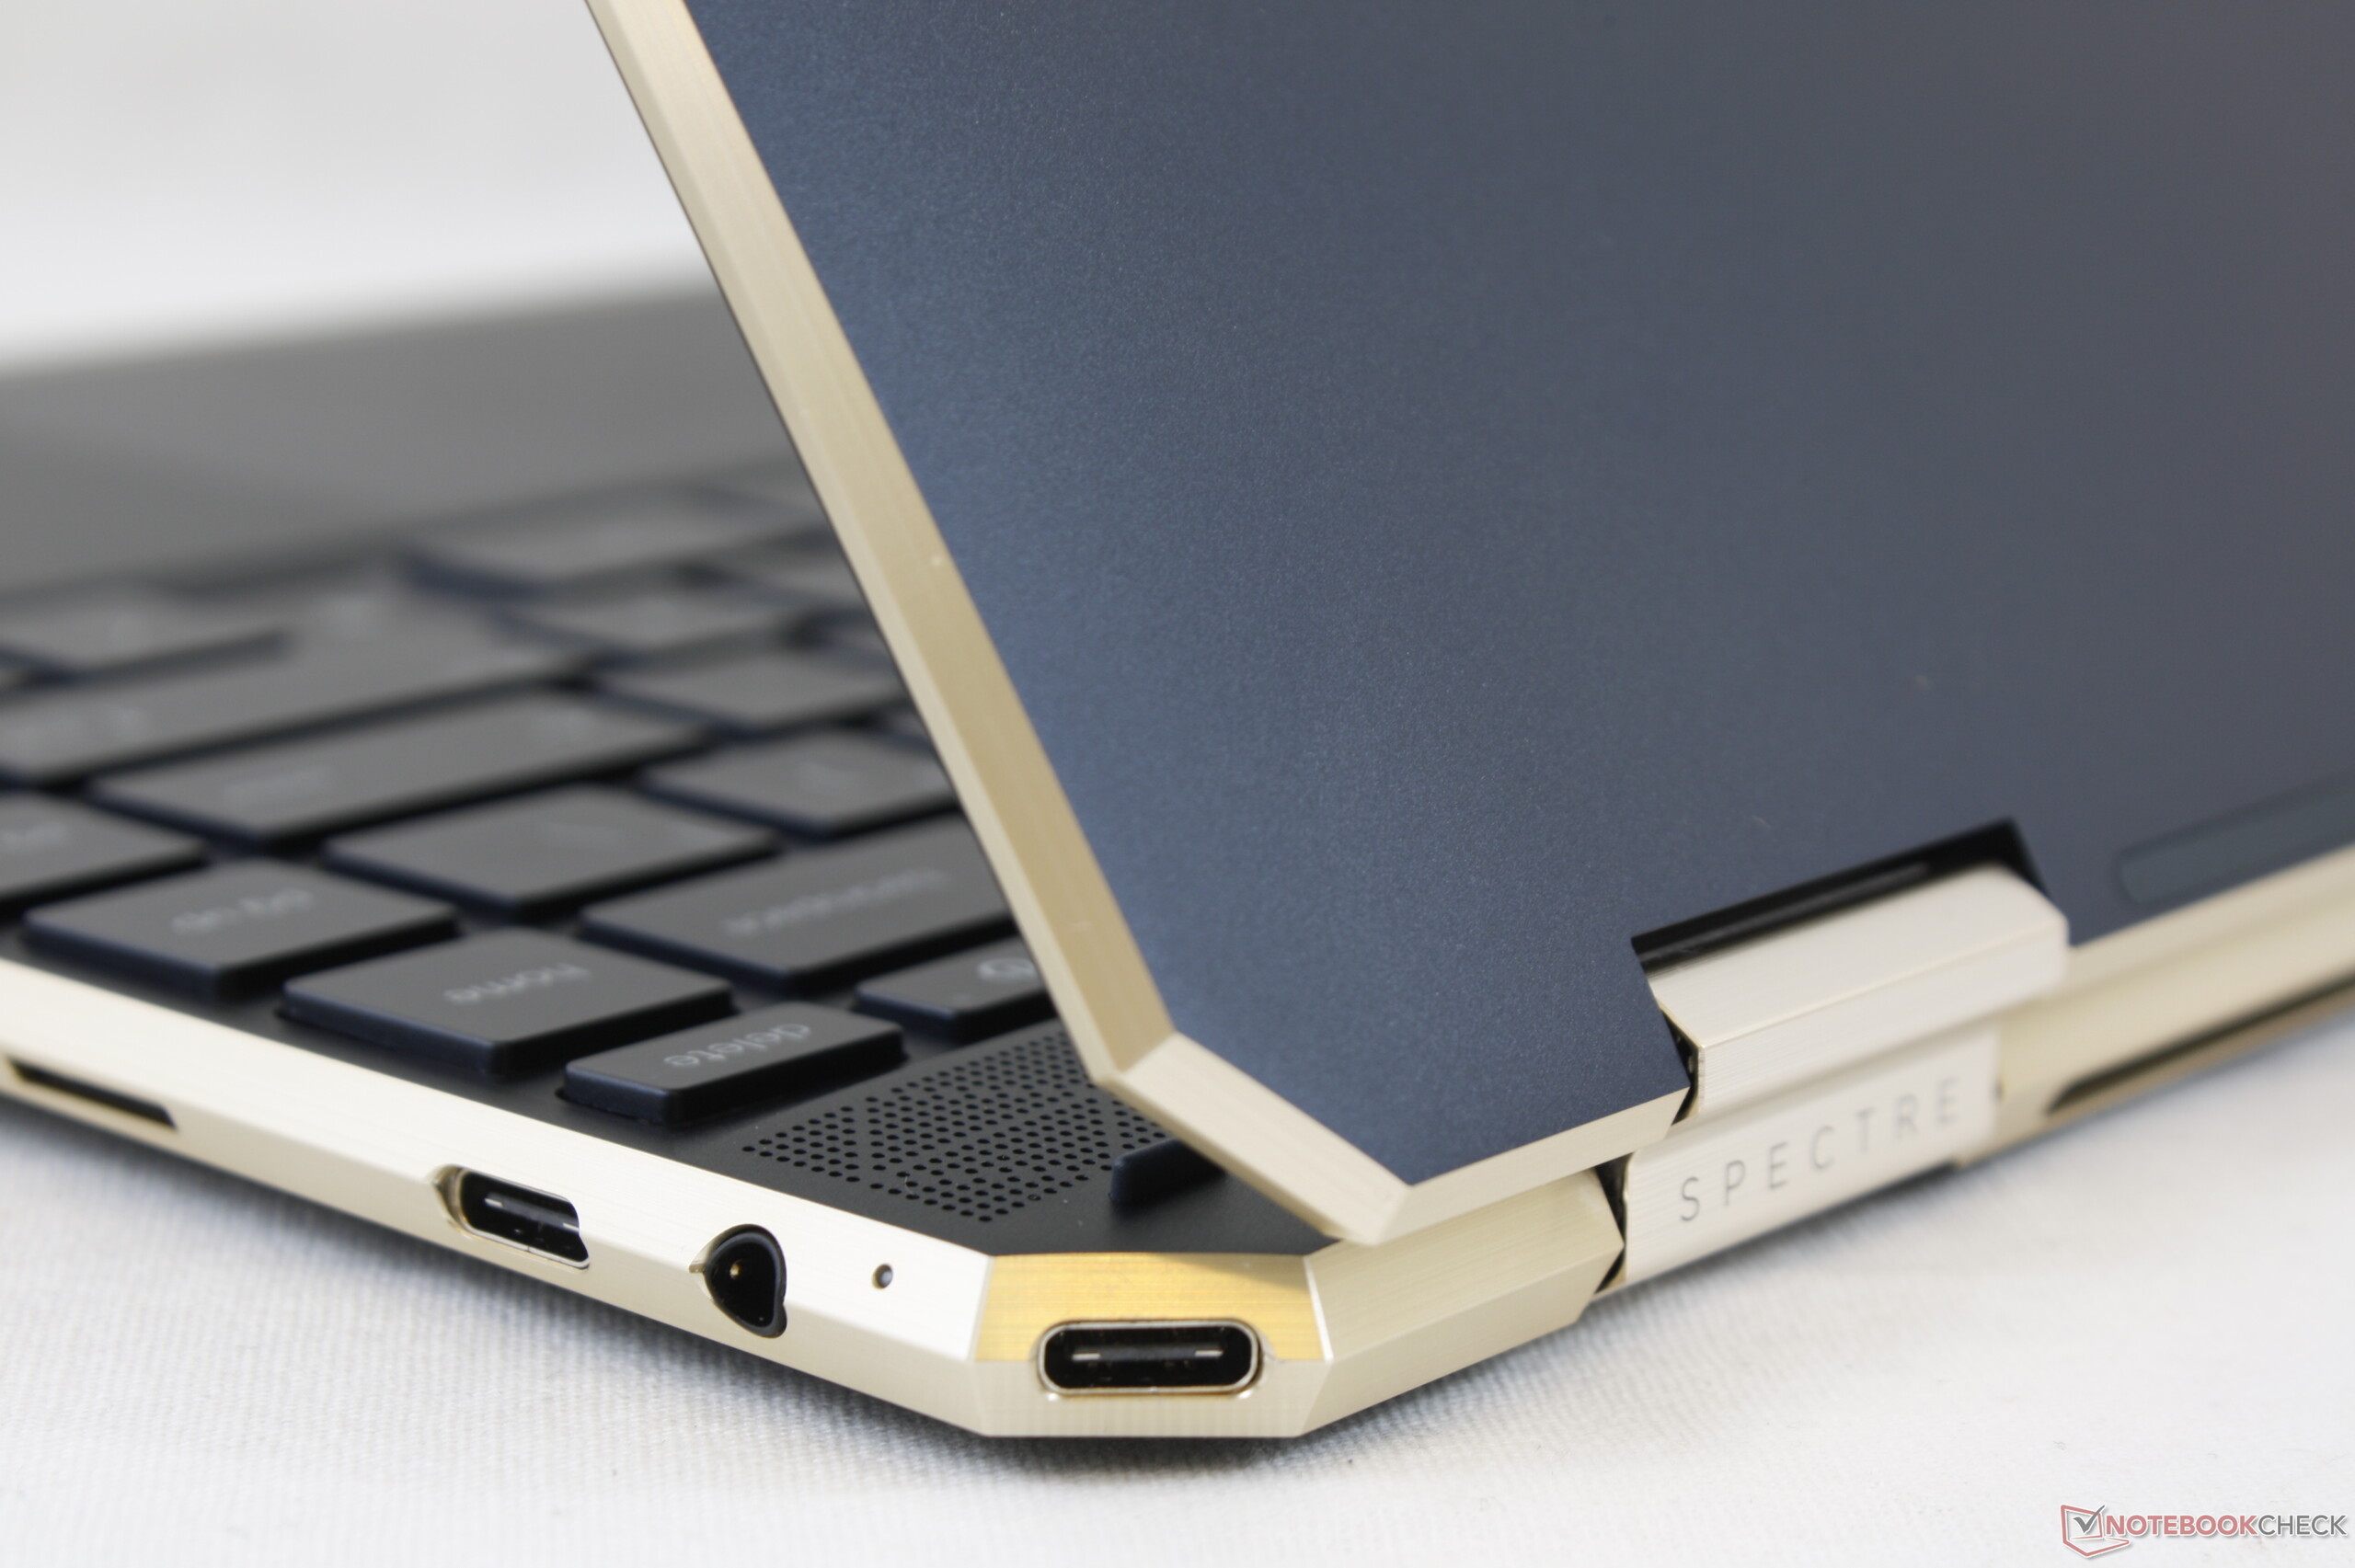
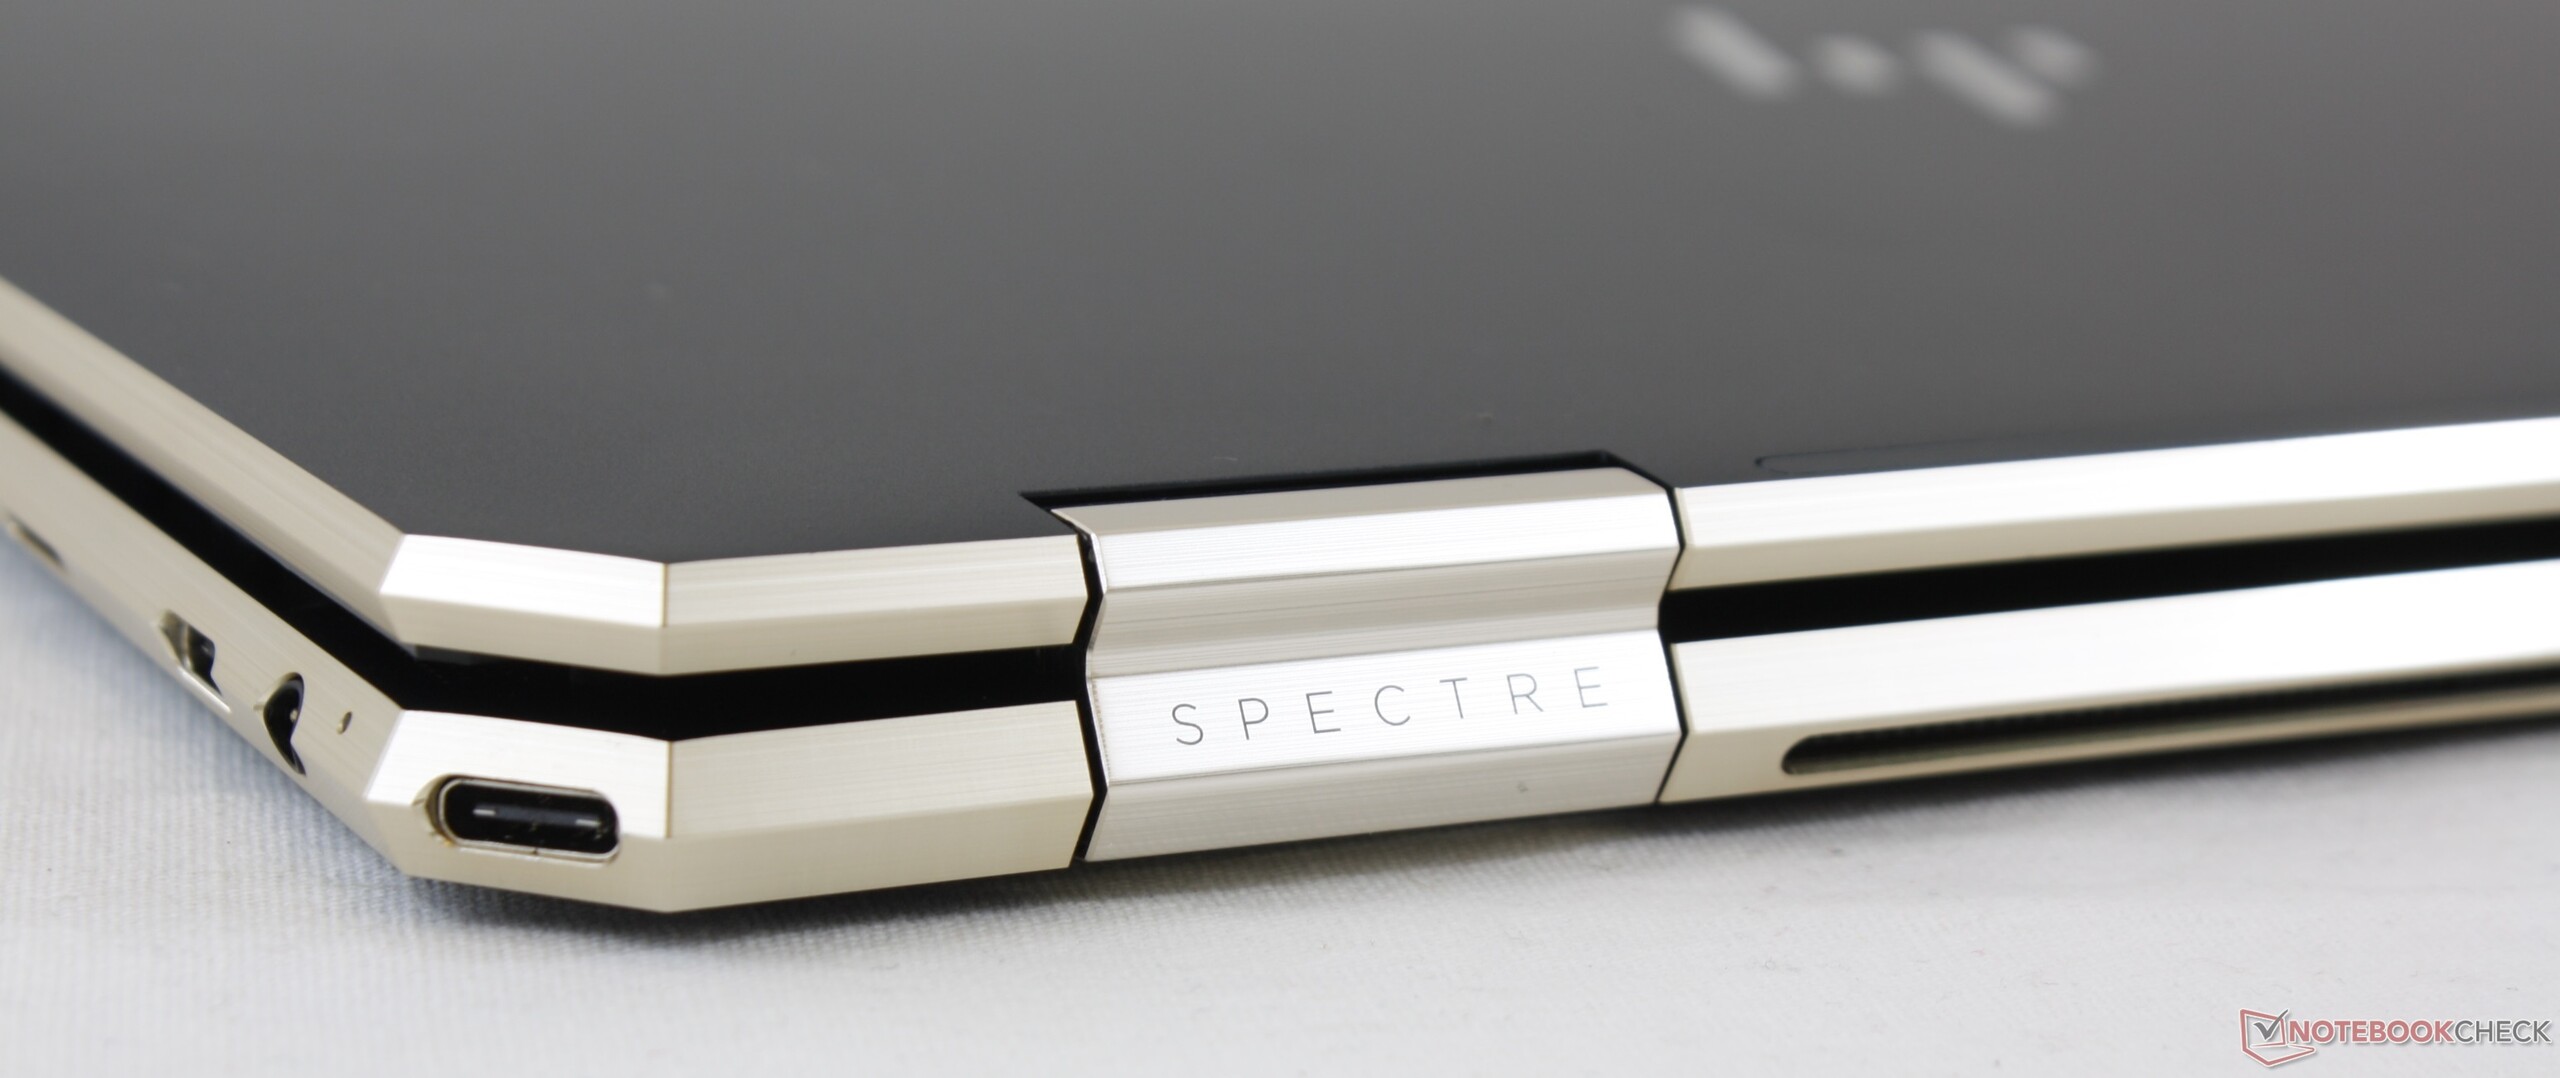
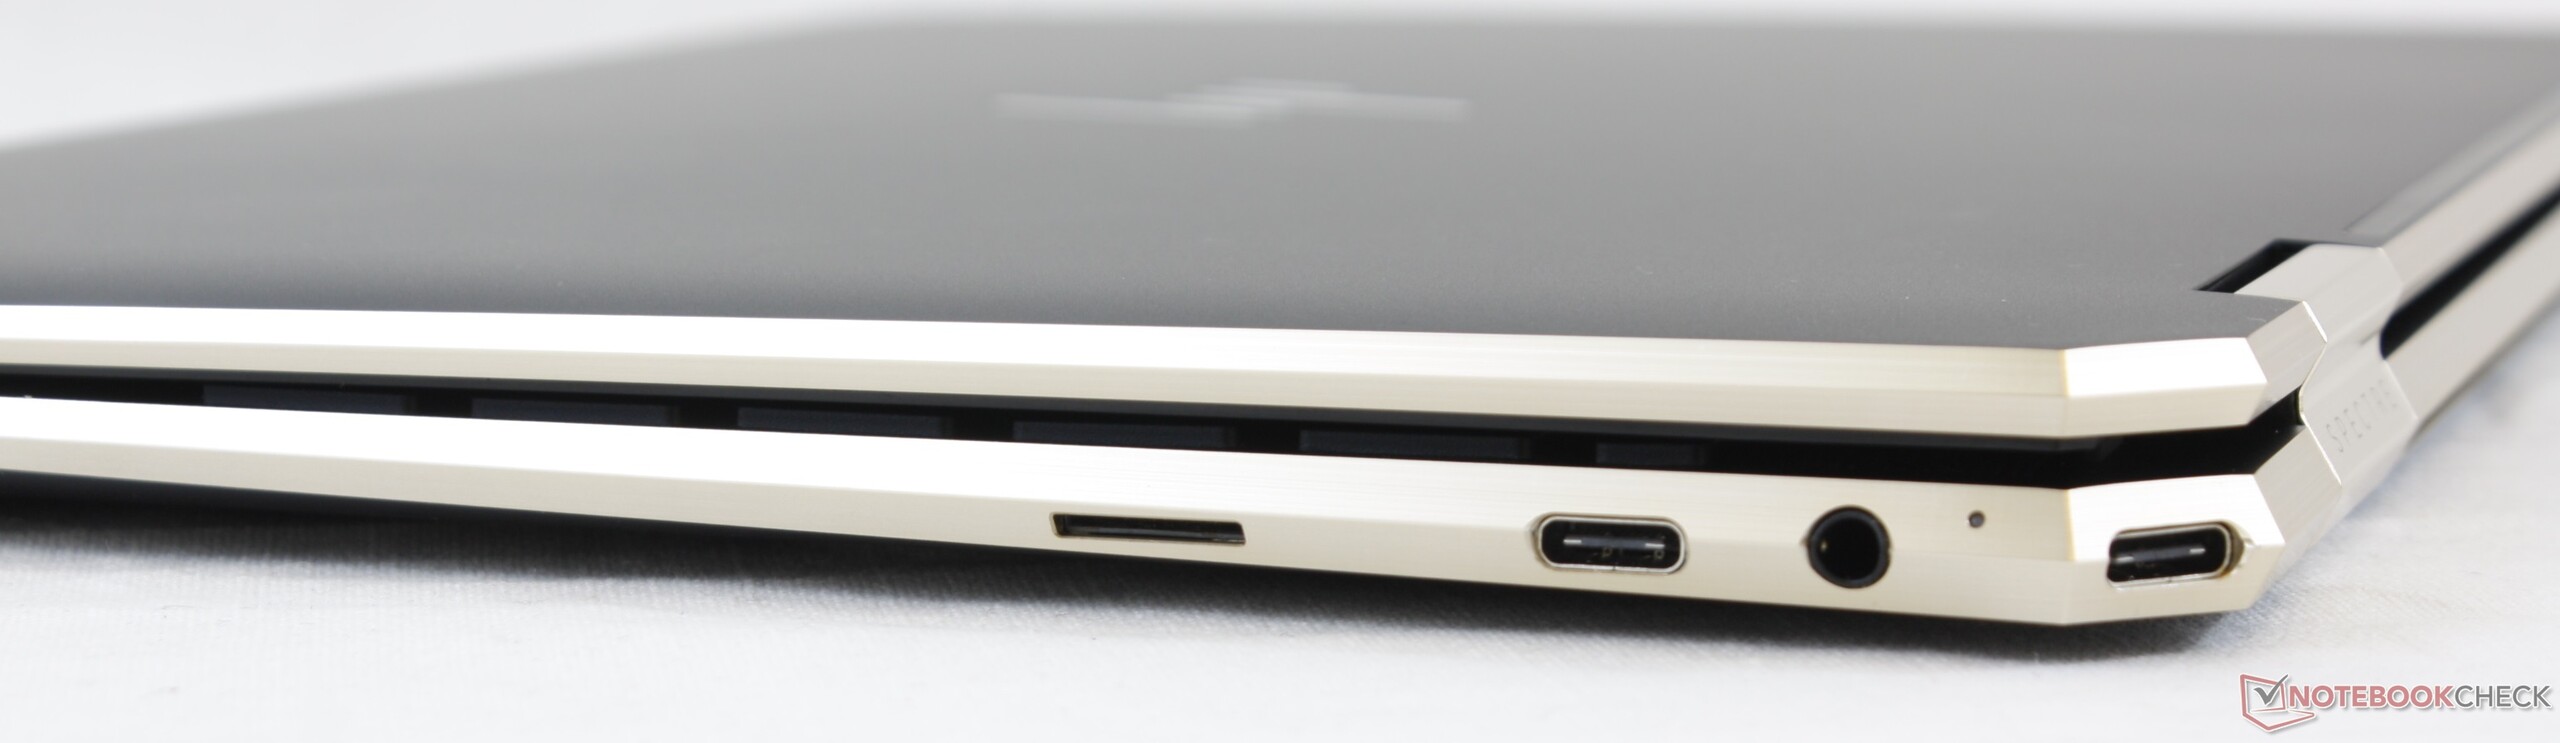
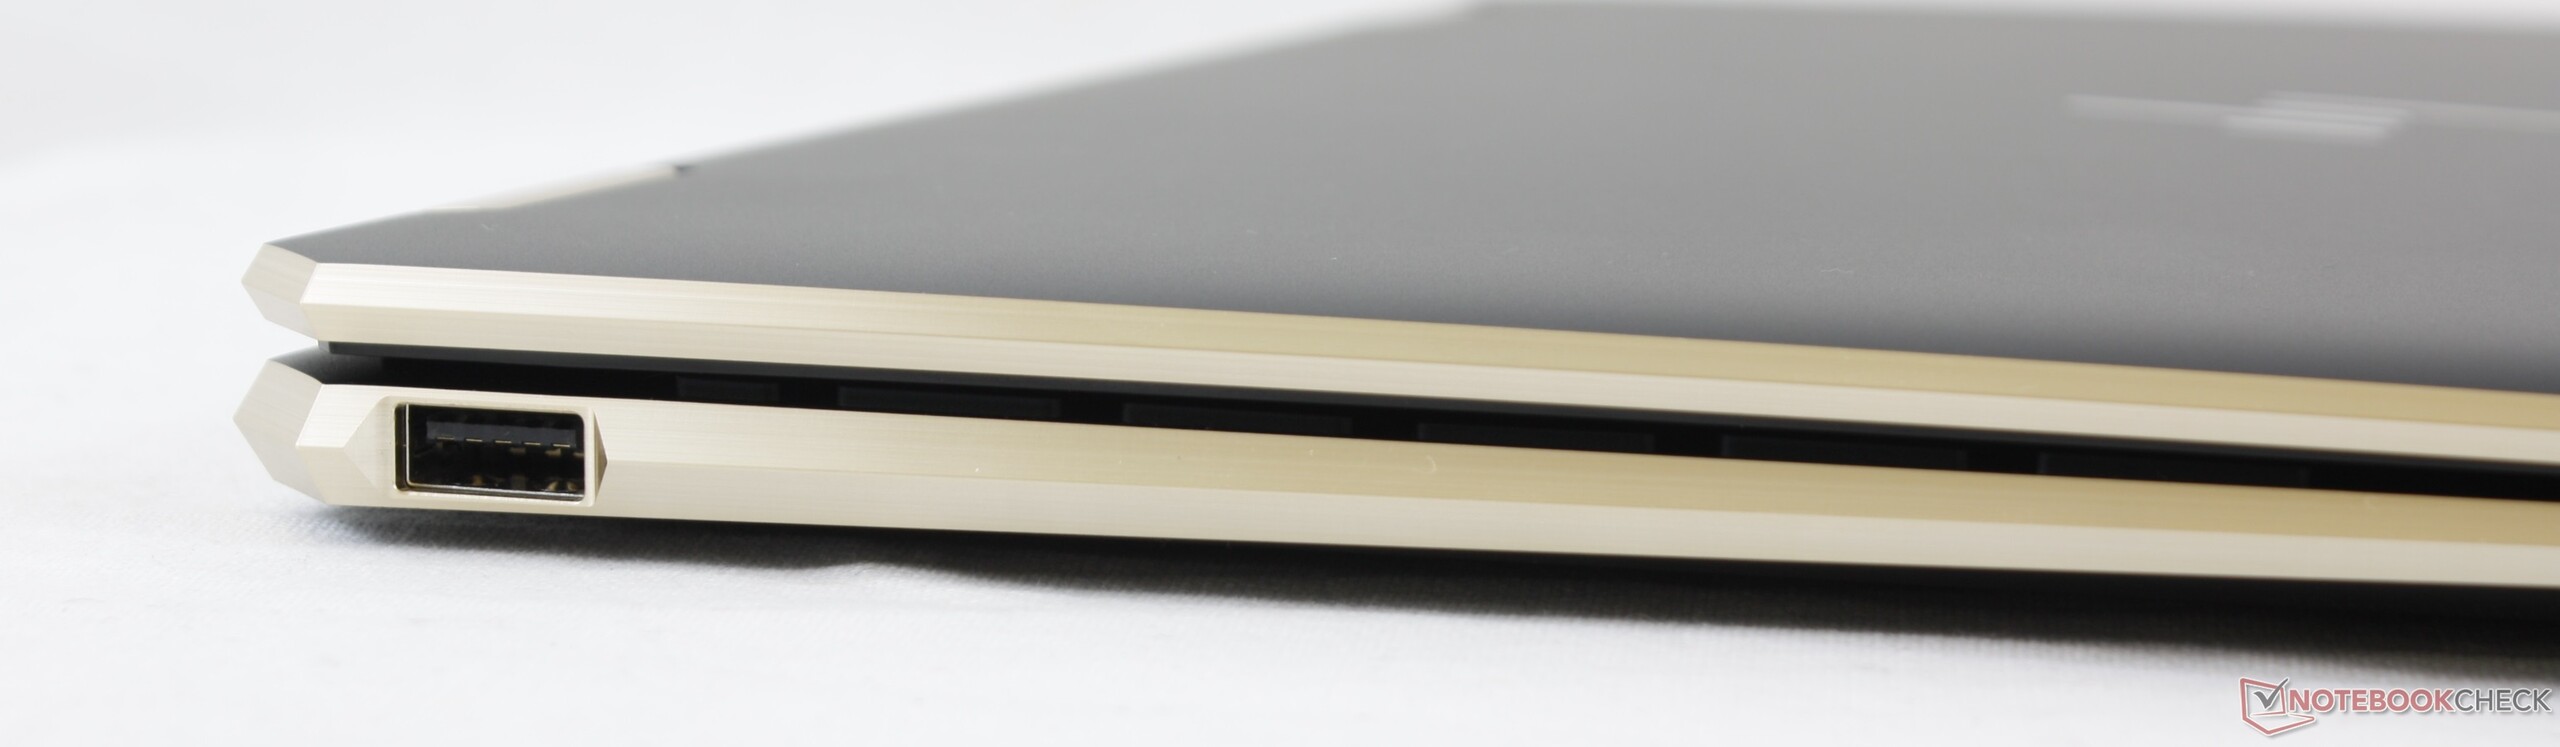
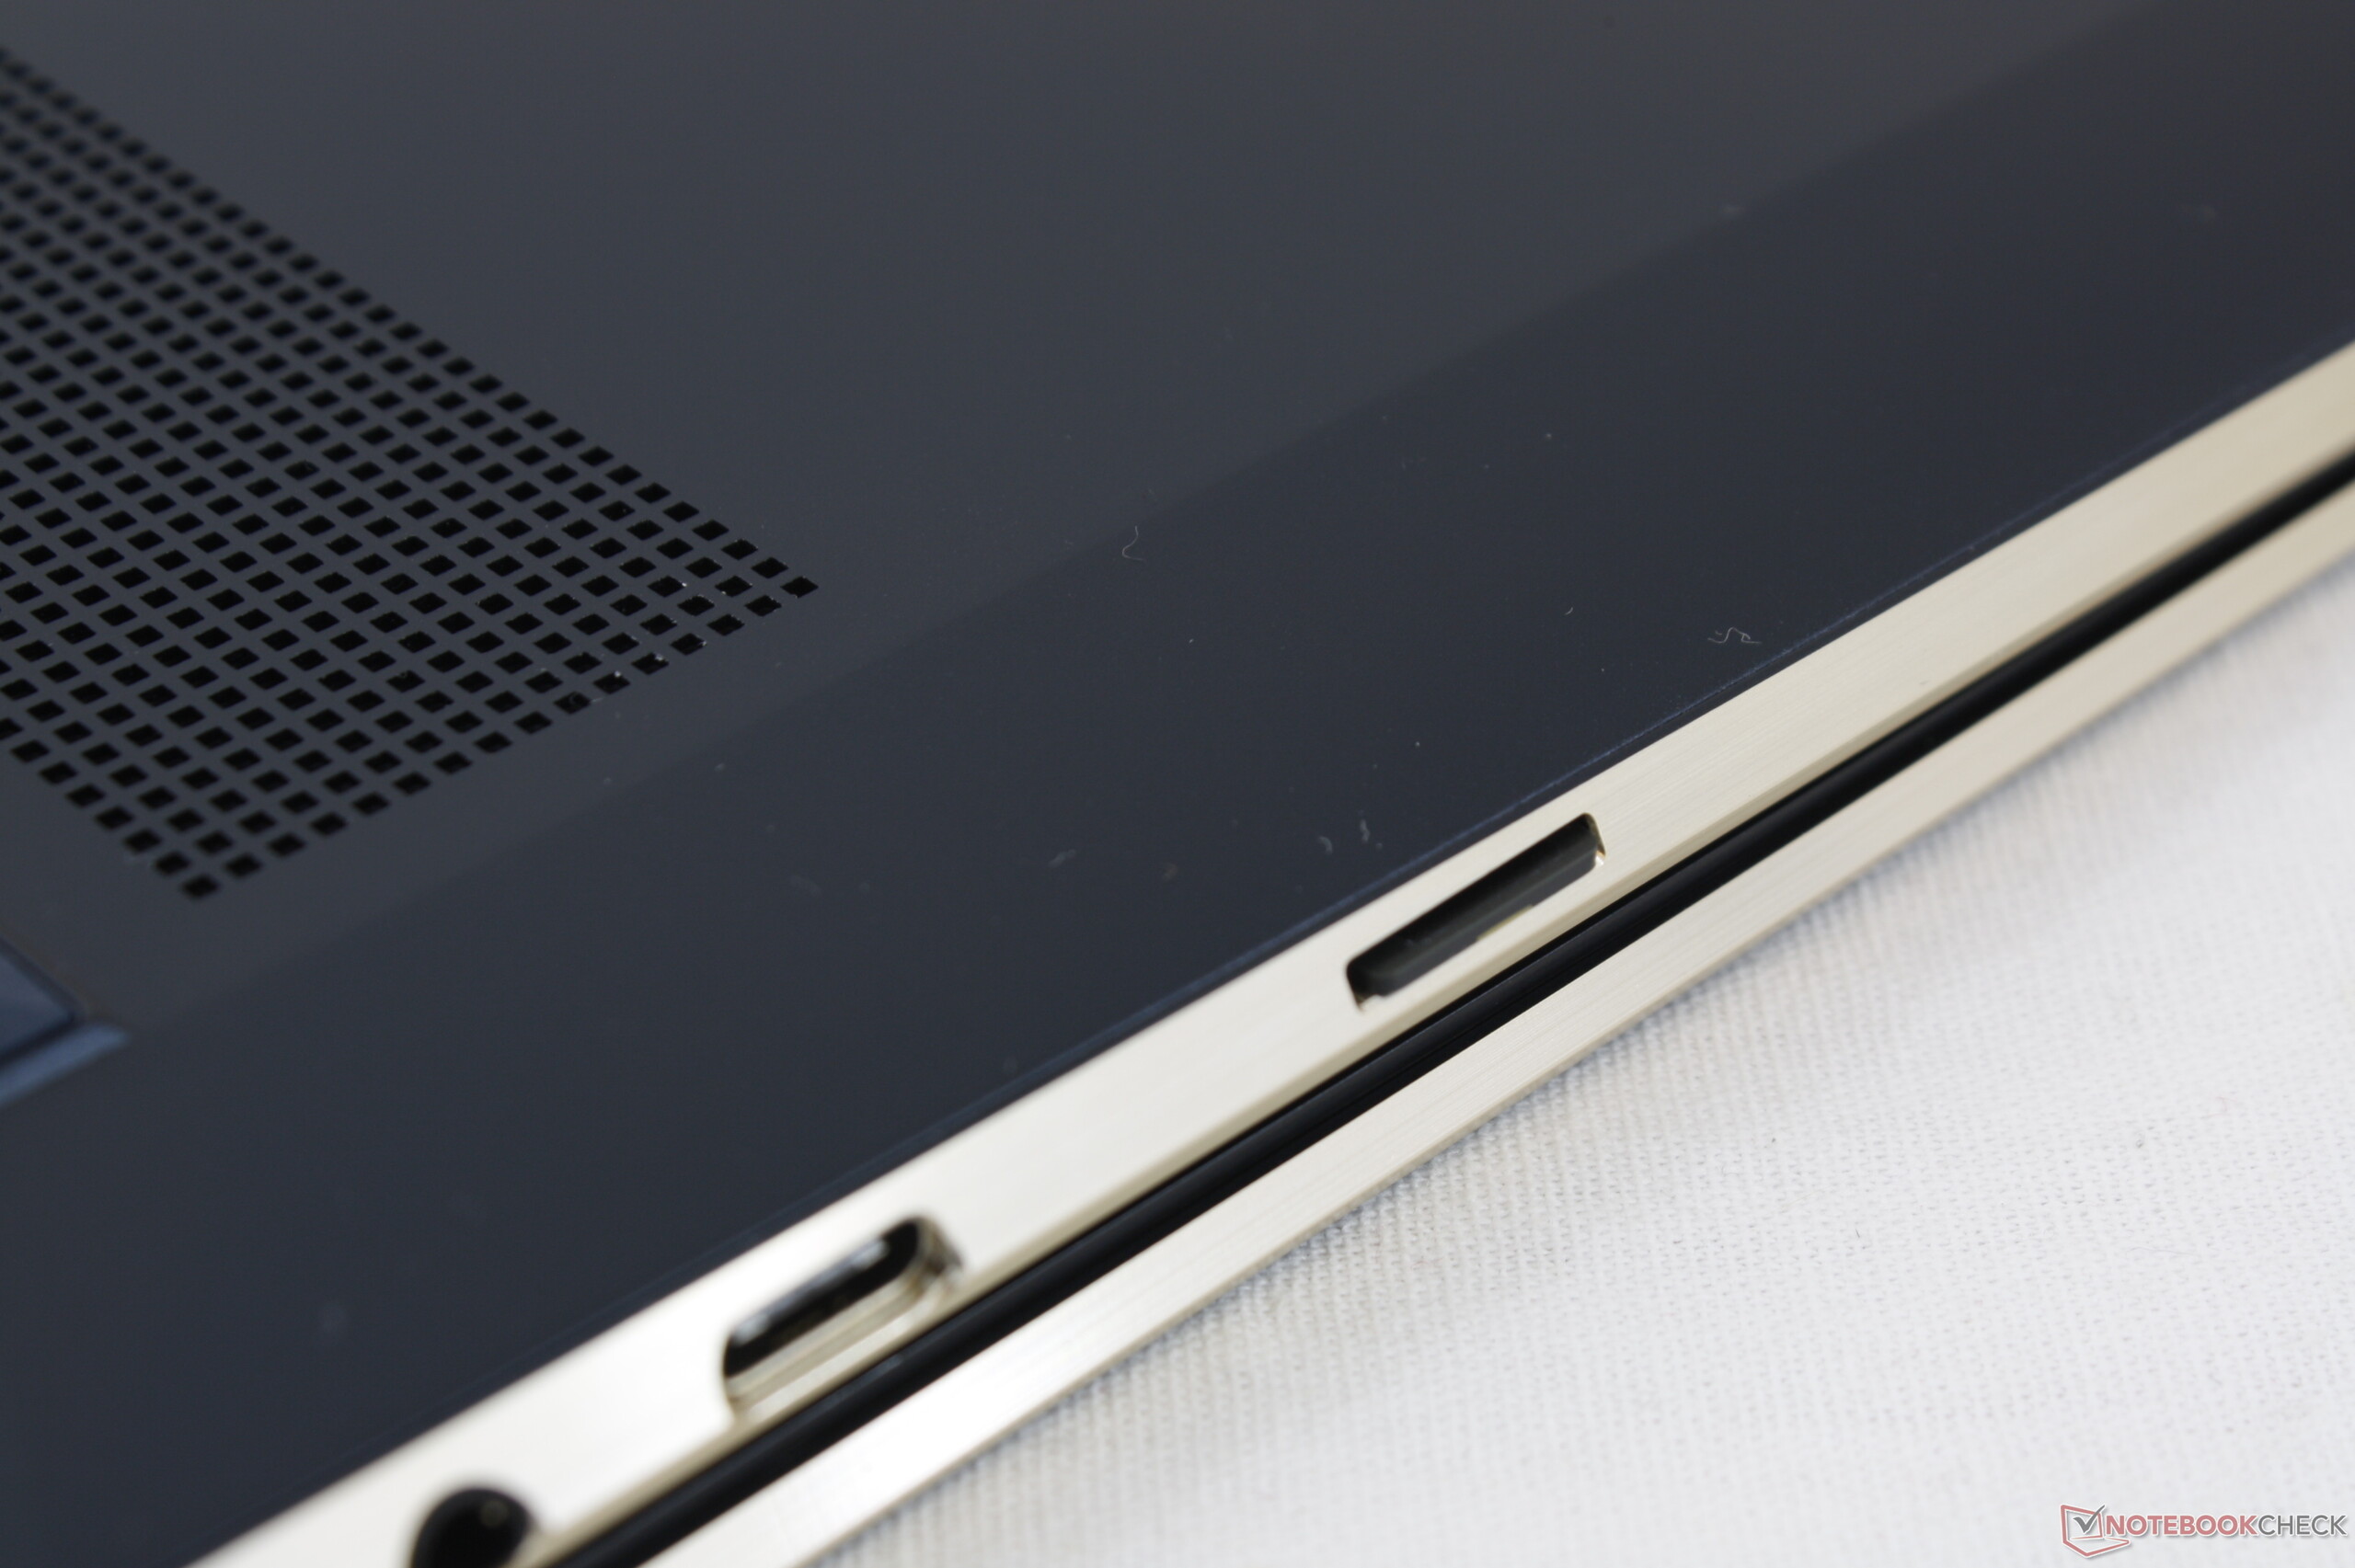
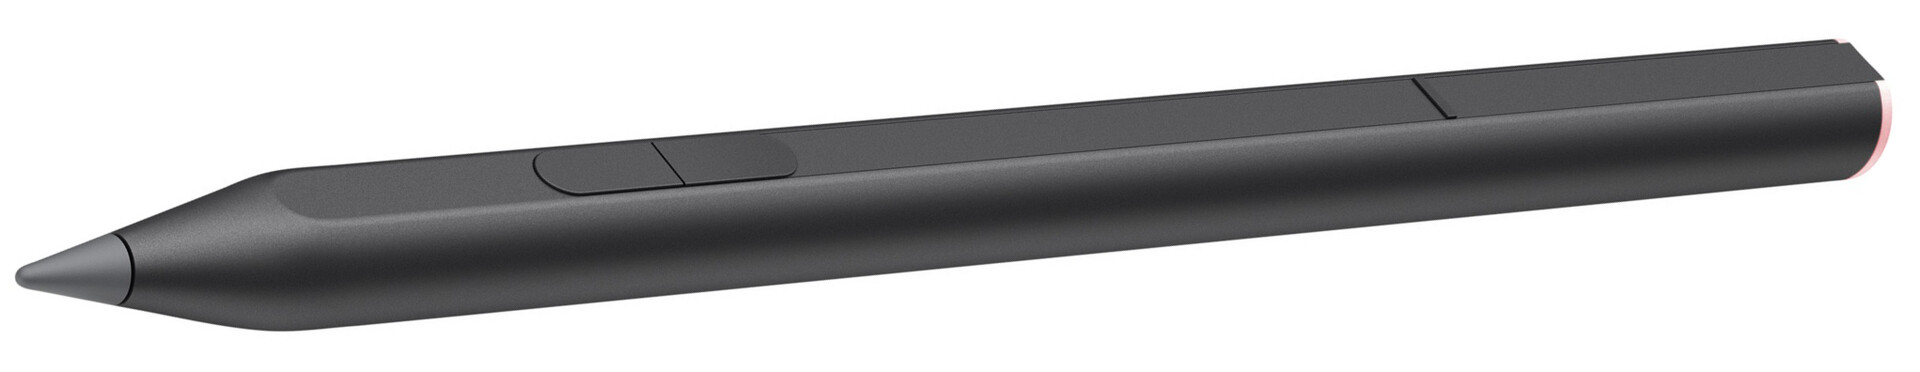
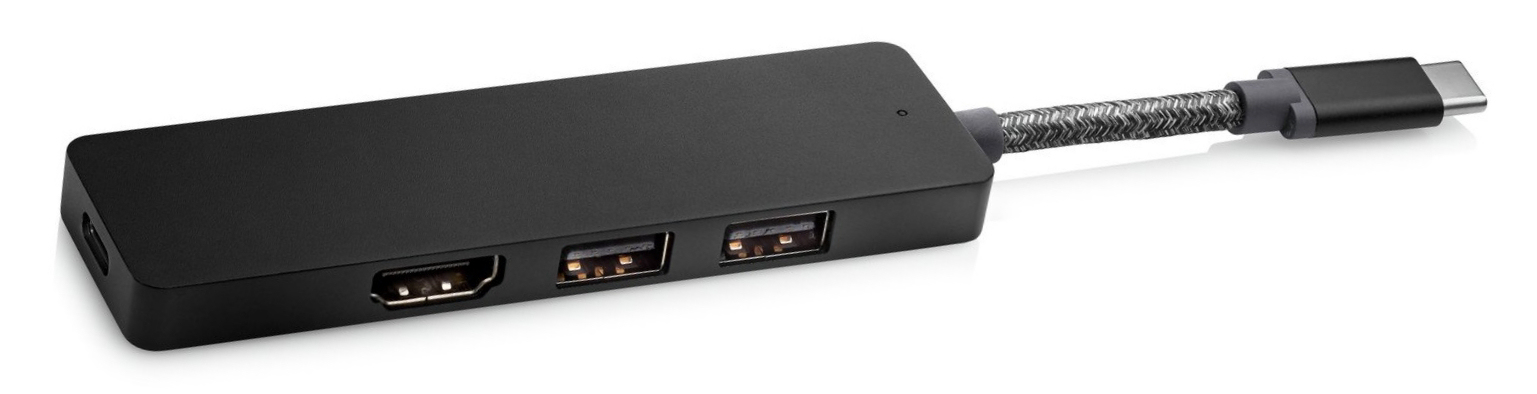
Connectivity - HP Tilt Pen and USB-C hub included
| SD Card Reader | |
| average JPG Copy Test (av. of 3 runs) | |
| HP Spectre x360 14-ea0378ng (Toshiba Exceria Pro M501 microSDXC 64GB) | |
| HP Spectre x360 14t-ea000 (Toshiba Exceria Pro M501 microSDXC 32GB) | |
| Dell XPS 13 7390 2-in-1 Core i7 (Toshiba Exceria Pro M501 64 GB UHS-II) | |
| Samsung Galaxy Book Flex 13.3 (Toshiba Exceria Pro M501 microSDXC 64GB) | |
| MSI Summit E13 Flip Evo A11MT (AV PRO microSD 128 GB V60) | |
| Average of class Convertible (29.4 - 141, n=21, last 2 years) | |
| Acer Spin 5 SP513-54N-79EY (Toshiba Exceria Pro M501 microSDXC 64GB) | |
| maximum AS SSD Seq Read Test (1GB) | |
| HP Spectre x360 14t-ea000 (Toshiba Exceria Pro M501 microSDXC 32GB) | |
| HP Spectre x360 14-ea0378ng (Toshiba Exceria Pro M501 microSDXC 64GB) | |
| Dell XPS 13 7390 2-in-1 Core i7 (Toshiba Exceria Pro M501 64 GB UHS-II) | |
| Average of class Convertible (67.5 - 254, n=20, last 2 years) | |
| Samsung Galaxy Book Flex 13.3 (Toshiba Exceria Pro M501 microSDXC 64GB) | |
| MSI Summit E13 Flip Evo A11MT (AV PRO microSD 128 GB V60) | |
| Acer Spin 5 SP513-54N-79EY (Toshiba Exceria Pro M501 microSDXC 64GB) | |
Communication
The Spectre x360 14 supports Wi-Fi 6 and Bluetooth 5.0, thanks to an Intel communications module (AX201). The Spectre x360 14 does not achieve good speeds in our Wi-Fi test. This is probably due to some sort of driver issue. We did not encounter such issues with the sibling model.


, i5-1035G4, Samsung SSD PM981a MZVLB256HBHQ")
, i5-1035G4, Samsung SSD PM981a MZVLB256HBHQ")
, i7-1065G7, Samsung PM991 MZVLQ1T0HALB")
, i7-1065G7, Samsung PM991 MZVLQ1T0HALB")


")
")
Accessories
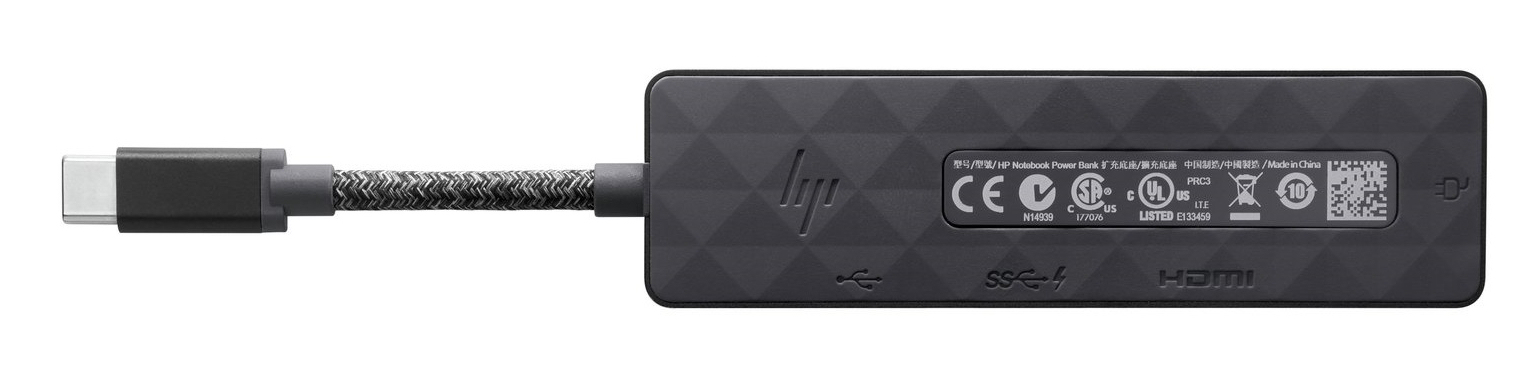
In addition to the device itself, the box contains a carrying sleeve, a USB-C hub (2x USB-A, 1x HDMI, 1x USB-C with Power Pass-Through; PN: 5LX63AA#ABB) and an HP Tilt Pen MPP 2.0 (PN: 3J122AA#ABB). Not all models come with the aforementioned accessories.

Display - 3:2 OLED panel

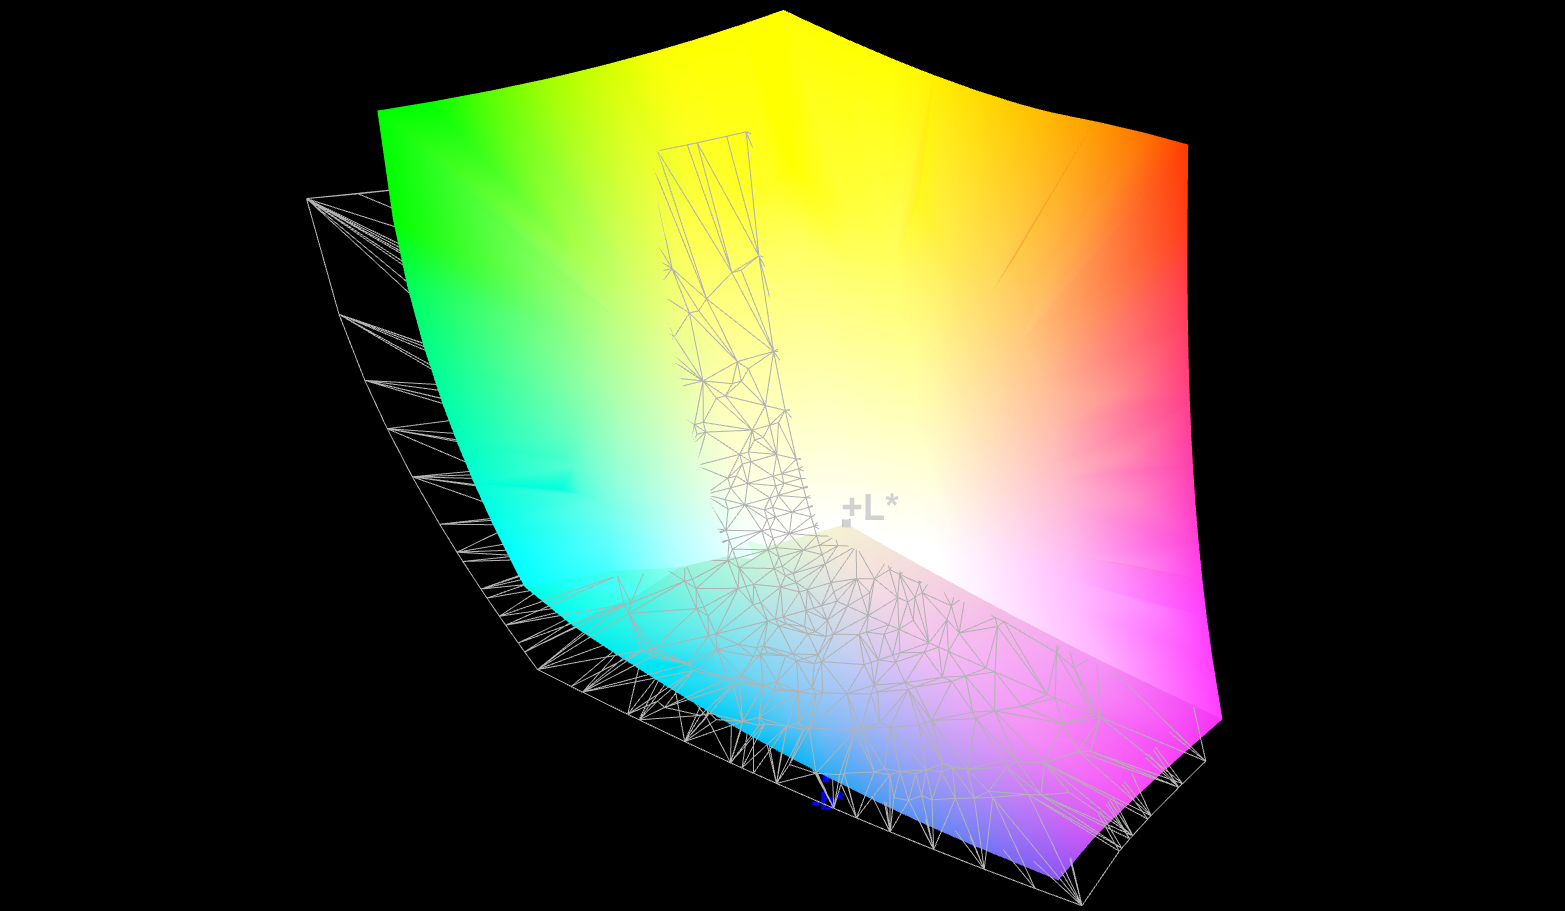
The 13.5-inch OLED panel of the Spectre x360 14 has a superb contrast ratio (37000:1) and an outstanding black value (0.01 cd/m²). The resolution (3000x2000) and the response times are also on a very high level. The maximum screen brightness of 373.8 cd/m² is quite decent. However, the IPS panel (1920x1280) of the sibling model offers a slightly higher maximum screen brightness (393.6 cd/m²). HP also offers a model of the Spectre x360 14 with a 1000-cd/m² panel (IPS, 1920x1280).
At 10% brightness and below, the OLED panel flickers with a frequency of 250 Hz. Because the frequency is so low susceptible individuals may experience headaches and/or eyestrain when using the device for long periods.
| |||||||||||||||||||||||||
Brightness Distribution: 90 %
Center on Battery: 371 cd/m²
Contrast: 37000:1 (Black: 0.01 cd/m²)
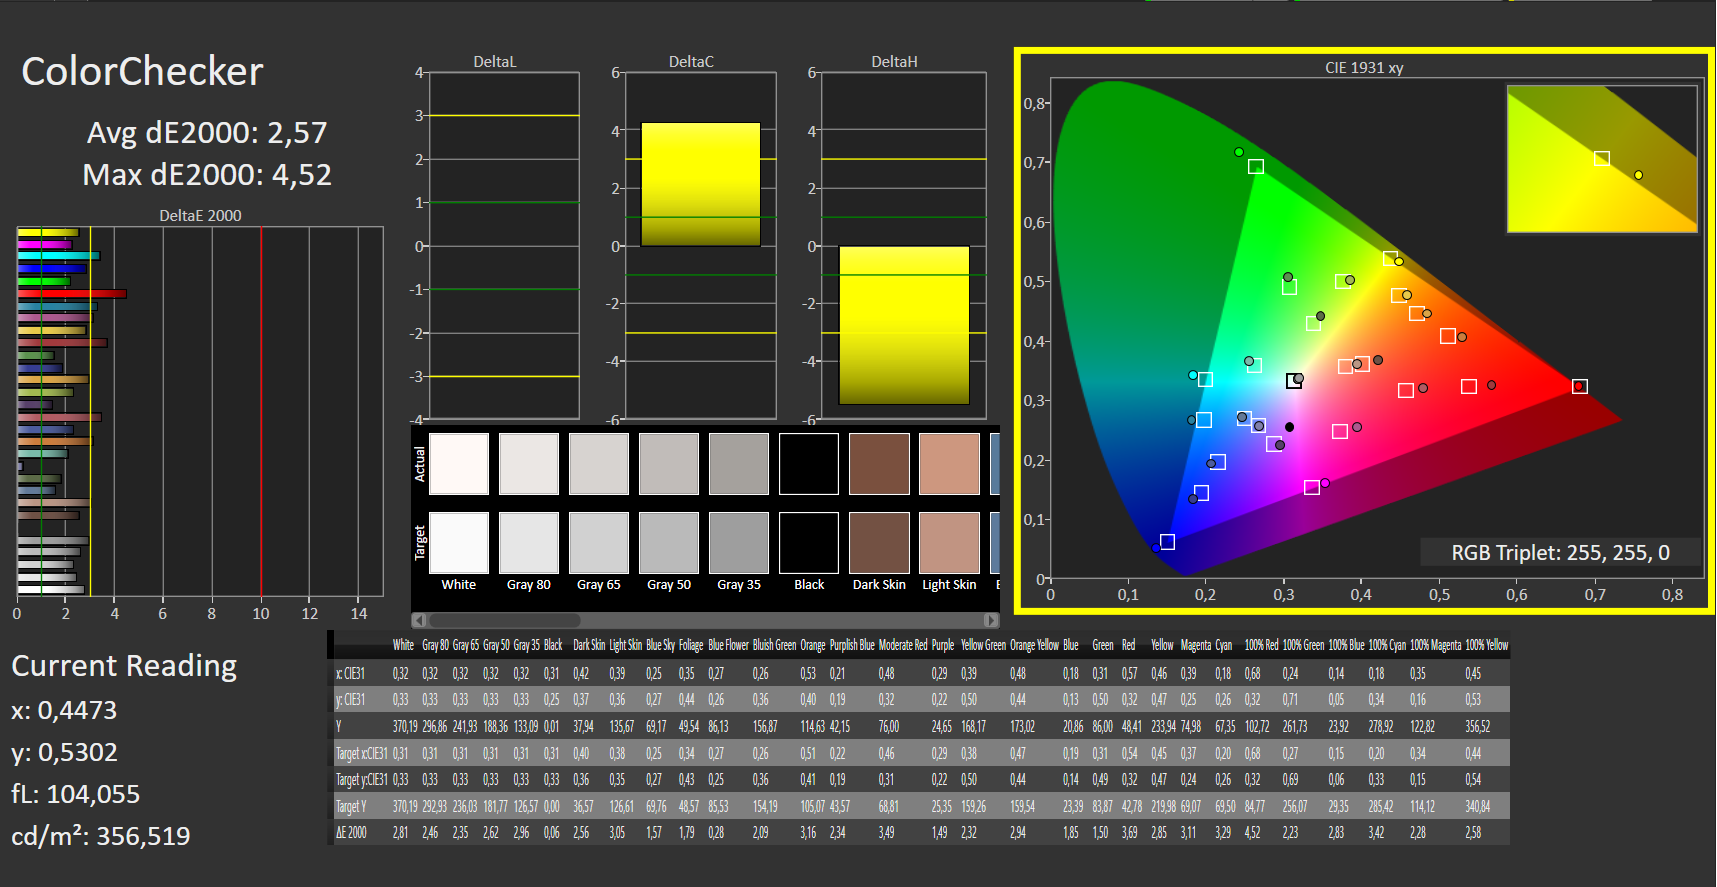
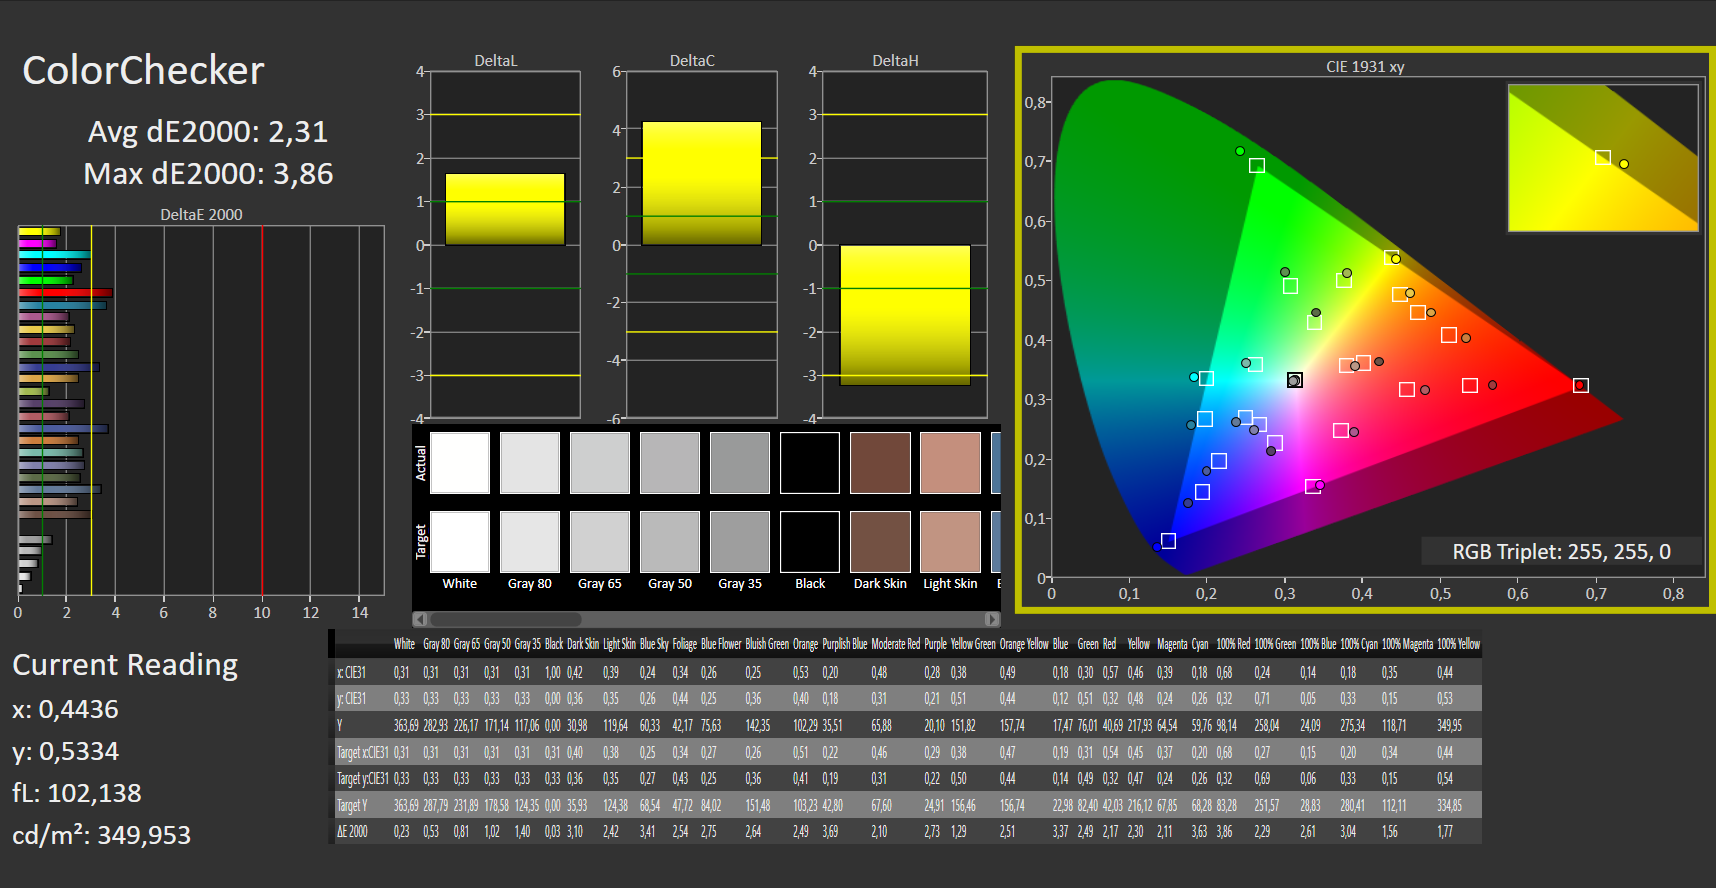
ΔE ColorChecker Calman: 2.57 | ∀{0.5-29.43 Ø4.72}
calibrated: 2.31
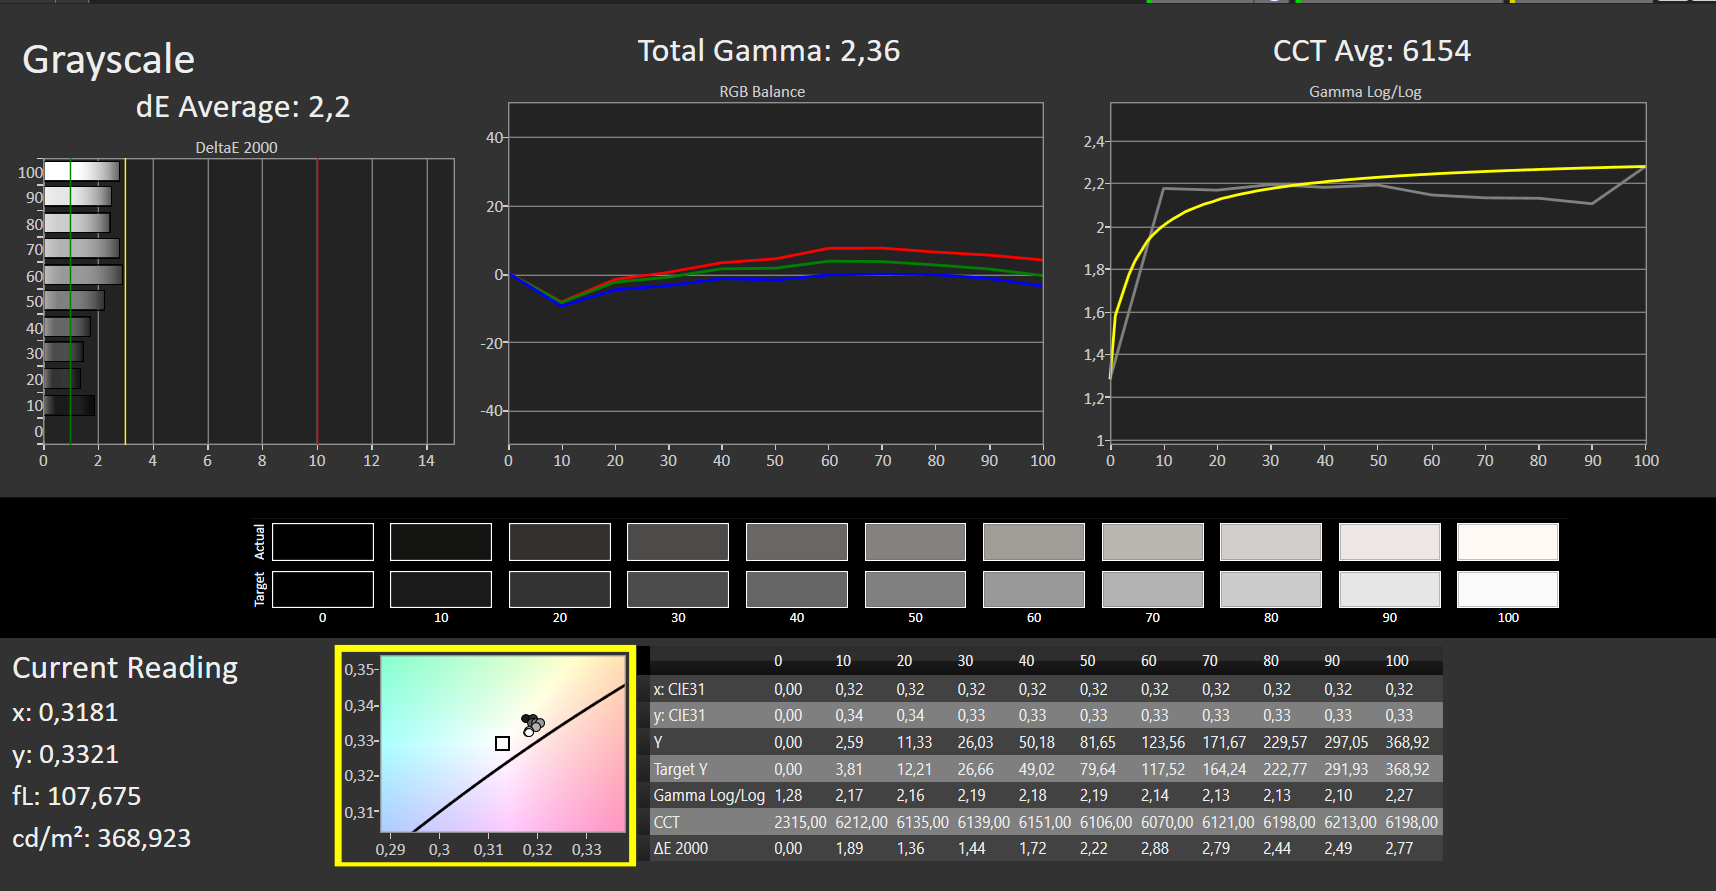
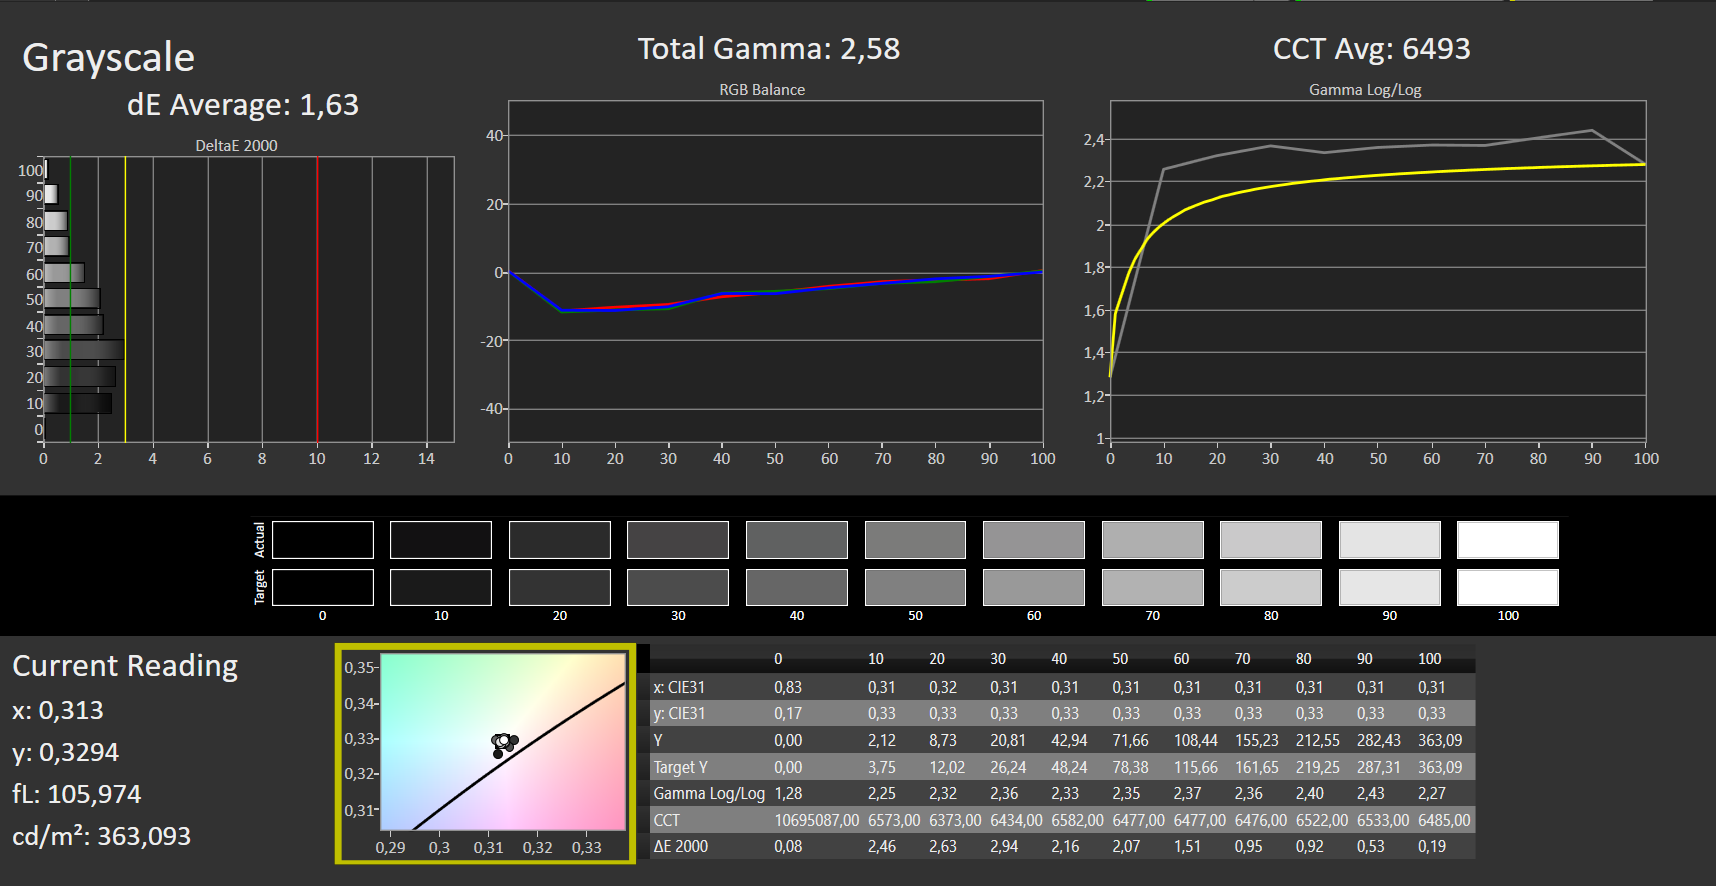
ΔE Greyscale Calman: 2.2 | ∀{0.09-98 Ø4.97}
100% sRGB (Argyll 1.6.3 3D)
85.8% AdobeRGB 1998 (Argyll 1.6.3 3D)
96.1% AdobeRGB 1998 (Argyll 3D)
100% sRGB (Argyll 3D)
99.9% Display P3 (Argyll 3D)
Gamma: 2.36
CCT: 6154 K
| HP Spectre x360 14-ea0378ng Samsung SDC4148, OLED, 3000x2000, 13.5" | Samsung Galaxy Book Flex 13.3 BOE087A, IPS, 1920x1080, 13.3" | MSI Summit E13 Flip Evo A11MT Sharp LQ134N1JW53, IPS, 1920x1200, 13.4" | HP Spectre x360 14t-ea000 LG Philips LGD0663, IPS, 1920x1280, 13.5" | Dell XPS 13 7390 2-in-1 Core i7 Sharp LQ134N1, IPS, 1920x1200, 13.4" | Lenovo Yoga 9 14 ITL 4K Lenovo CSOT3 MNE001EA1-2, IPS, 3840x2160, 14" | Acer Spin 5 SP513-54N-79EY BOE08BC, IPS, 2256x1504, 13.5" | |
|---|---|---|---|---|---|---|---|
| Display | -19% | -22% | -19% | -7% | -19% | ||
| Display P3 Coverage (%) | 99.9 | 69.8 -30% | 65.8 -34% | 69.9 -30% | 94.4 -6% | 69.4 -31% | |
| sRGB Coverage (%) | 100 | 98.8 -1% | 98.2 -2% | 99.2 -1% | 99.3 -1% | 99.6 0% | |
| AdobeRGB 1998 Coverage (%) | 96.1 | 70.6 -27% | 67.9 -29% | 71.5 -26% | 84 -13% | 71 -26% | |
| Response Times | -1675% | -2600% | -2440% | -1820% | -1500% | -1825% | |
| Response Time Grey 50% / Grey 80% * (ms) | 2 ? | 44 ? -2100% | 64 ? -3100% | 62 ? -3000% | 47.6 ? -2280% | 45.6 ? -2180% | 49 ? -2350% |
| Response Time Black / White * (ms) | 2 ? | 27 ? -1250% | 44 ? -2100% | 39.6 ? -1880% | 29.2 ? -1360% | 18.4 ? -820% | 28 ? -1300% |
| PWM Frequency (Hz) | 250 ? | 2500 ? | 208 ? | ||||
| Screen | -538% | -317% | -162% | -343% | -272% | -279% | |
| Brightness middle (cd/m²) | 370 | 473 28% | 551.3 49% | 443.5 20% | 549.8 49% | 493 33% | 454 23% |
| Brightness (cd/m²) | 374 | 434 16% | 517 38% | 394 5% | 520 39% | 453 21% | 426 14% |
| Brightness Distribution (%) | 90 | 86 -4% | 91 1% | 78 -13% | 86 -4% | 85 -6% | 91 1% |
| Black Level * (cd/m²) | 0.01 | 0.39 -3800% | 0.37 -3600% | 0.17 -1600% | 0.39 -3800% | 0.3 -2900% | 0.33 -3200% |
| Contrast (:1) | 37000 | 1213 -97% | 1490 -96% | 2609 -93% | 1410 -96% | 1643 -96% | 1376 -96% |
| Colorchecker dE 2000 * | 2.57 | 5.18 -102% | 1.45 44% | 2.7 -5% | 2.12 18% | 2.2 14% | 1.27 51% |
| Colorchecker dE 2000 max. * | 4.52 | 10.01 -121% | 2.86 37% | 4.36 4% | 3.66 19% | 5.6 -24% | 2.42 46% |
| Colorchecker dE 2000 calibrated * | 2.31 | 1.7 26% | 2.61 -13% | 1.37 41% | 1.2 48% | 0.78 66% | |
| Greyscale dE 2000 * | 2.2 | 7.04 -220% | 1.3 41% | 3.4 -55% | 2.6 -18% | 3.6 -64% | 1.07 51% |
| Gamma | 2.36 93% | 2.35 94% | 2.14 103% | 2.09 105% | 2.3 96% | 2.17 101% | 2.39 92% |
| CCT | 6154 106% | 6753 96% | 6580 99% | 6144 106% | 6884 94% | 6754 96% | 6530 100% |
| Color Space (Percent of AdobeRGB 1998) (%) | 85.8 | 65 -24% | 62.1 -28% | 65.4 -24% | 75.2 -12% | 65 -24% | |
| Color Space (Percent of sRGB) (%) | 100 | 99 -1% | 98.5 -1% | 99.7 0% | 99.3 -1% | 100 0% | |
| Total Average (Program / Settings) | -1107% /
-765% | -979% /
-546% | -875% /
-420% | -727% /
-467% | -593% /
-375% | -708% /
-423% |
* ... smaller is better
Straight out of the box, the colour accuracy is on a good level. We measured a Delta-E 2000 of 2.6—a very decent result. The display does not suffer from a bluish cast. Through calibration, the colour reproduction can be slightly improved: The Delta-E 2000 falls to 2.3 and the grayscale tracking also improves.
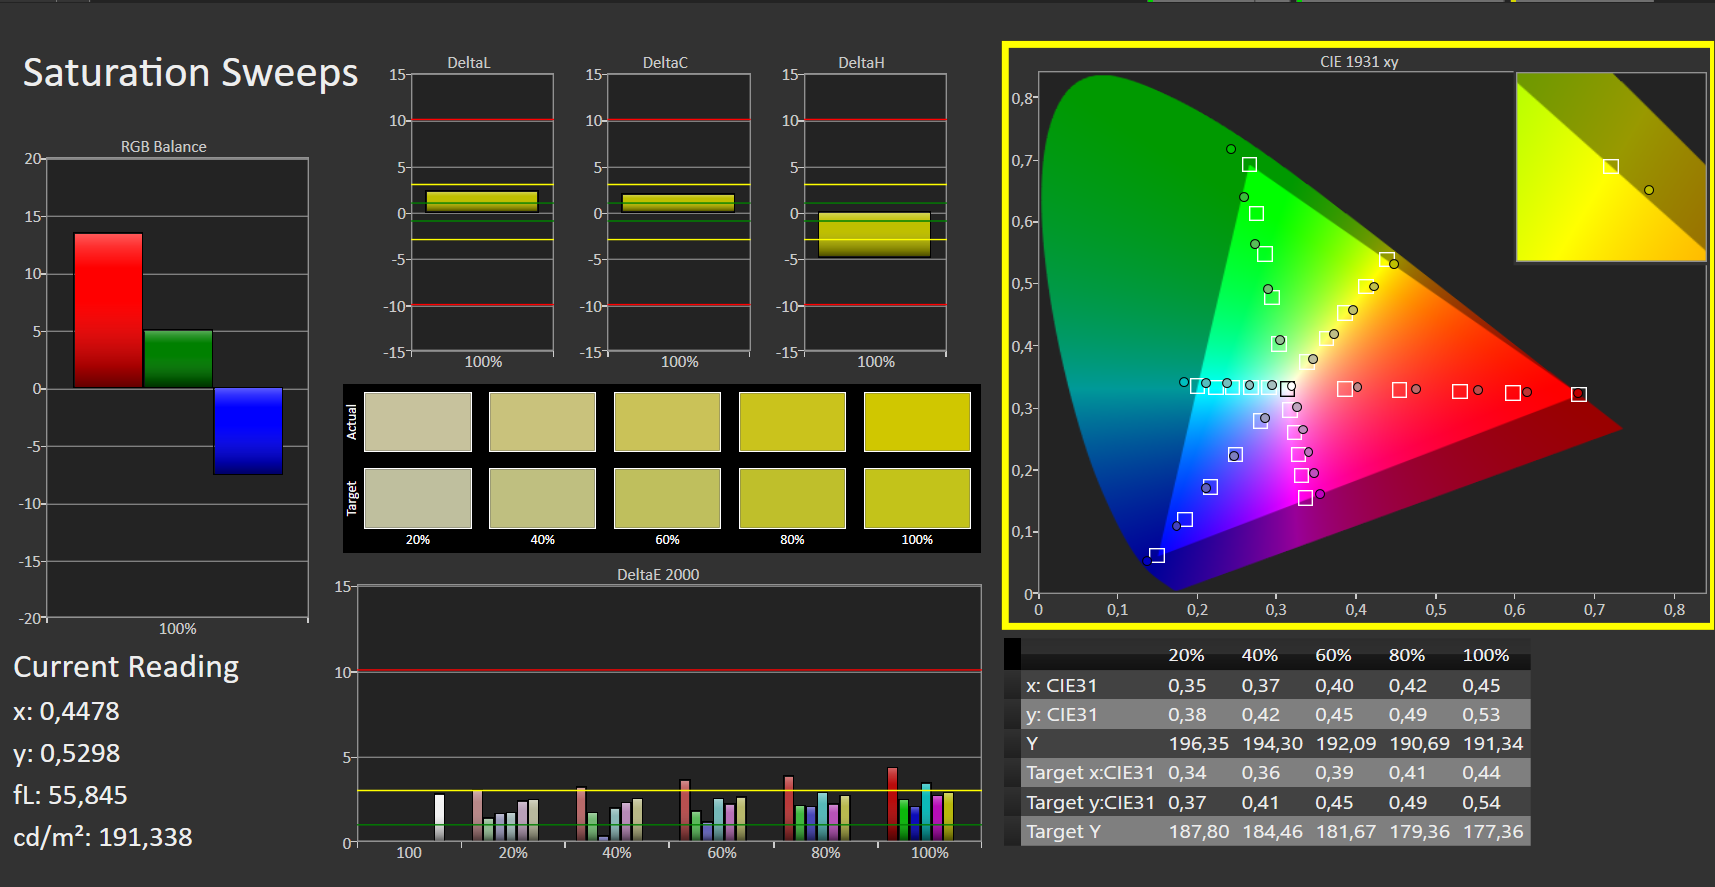
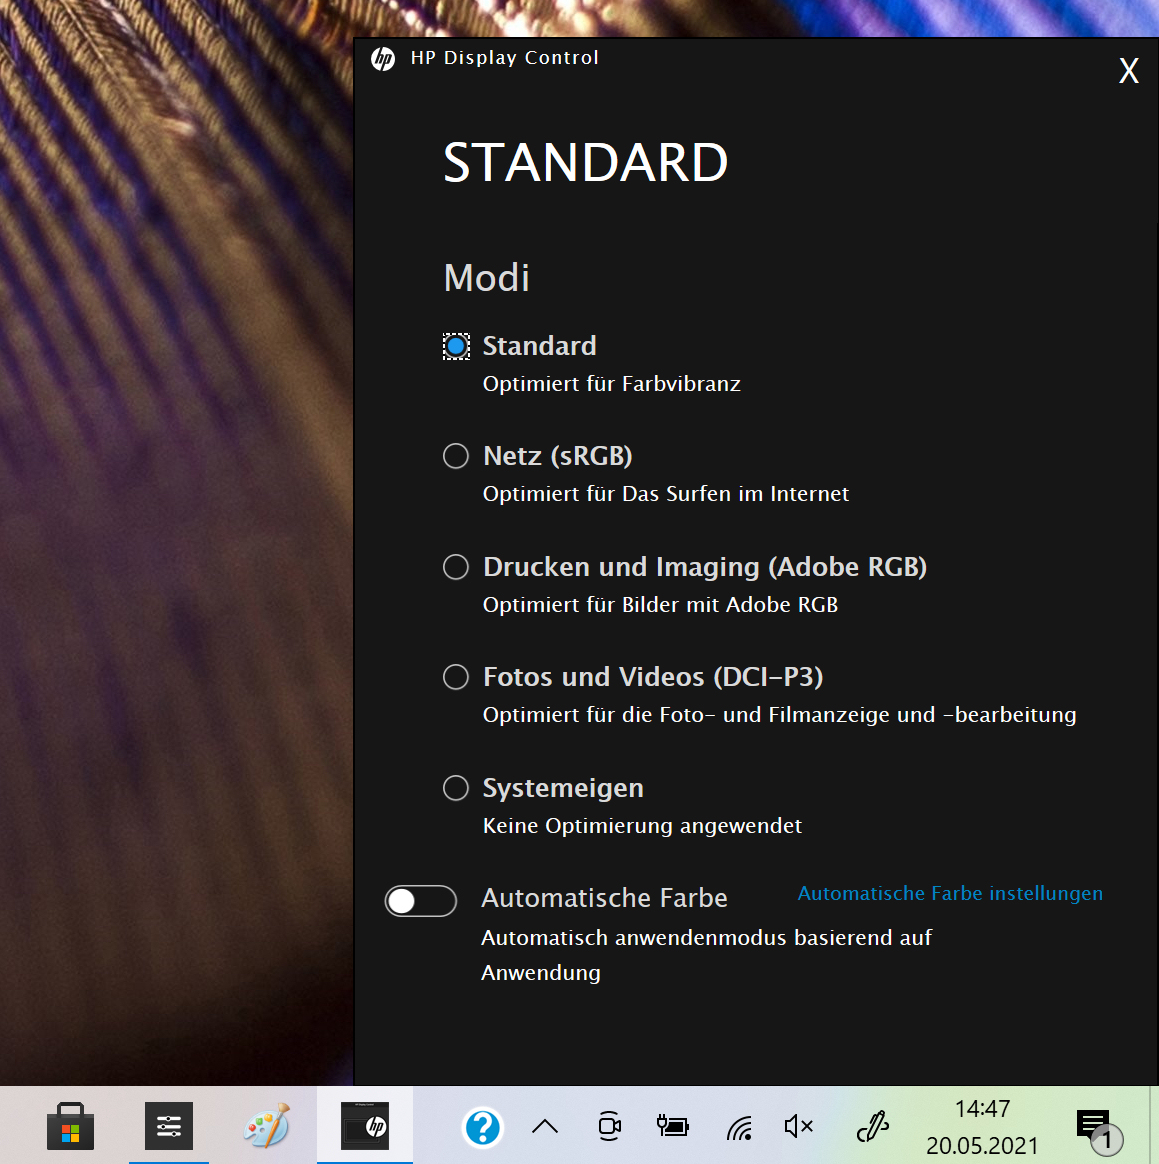
The preinstalled utility known as "HP Display Control" can be used to adjust the colour reproduction. In standard mode, the display covers 100% of the sRGB colour space. The panel also manages to cover 86% of the AdobeRGB colour space.
Display Response Times
| ↔ Response Time Black to White | ||
|---|---|---|
| 2 ms ... rise ↗ and fall ↘ combined | ↗ 1 ms rise |  |
| ↘ 1 ms fall | ||
| The screen shows very fast response rates in our tests and should be very well suited for fast-paced gaming. In comparison, all tested devices range from 0.1 (minimum) to 240 (maximum) ms. » 11 % of all devices are better. This means that the measured response time is better than the average of all tested devices (19.8 ms). | ||
| ↔ Response Time 50% Grey to 80% Grey | ||
| 2 ms ... rise ↗ and fall ↘ combined | ↗ 1 ms rise |  |
| ↘ 1 ms fall | ||
| The screen shows very fast response rates in our tests and should be very well suited for fast-paced gaming. In comparison, all tested devices range from 0.165 (minimum) to 636 (maximum) ms. » 10 % of all devices are better. This means that the measured response time is better than the average of all tested devices (31 ms). | ||
Screen Flickering / PWM (Pulse-Width Modulation)
| Screen flickering / PWM detected | 250 Hz | ≤ 10 % brightness setting |  |
The display backlight flickers at 250 Hz (worst case, e.g., utilizing PWM) Flickering detected at a brightness setting of 10 % and below. There should be no flickering or PWM above this brightness setting. The frequency of 250 Hz is relatively low, so sensitive users will likely notice flickering and experience eyestrain at the stated brightness setting and below. In comparison: 52 % of all tested devices do not use PWM to dim the display. If PWM was detected, an average of 7750 (minimum: 5 - maximum: 343500) Hz was measured. | |||
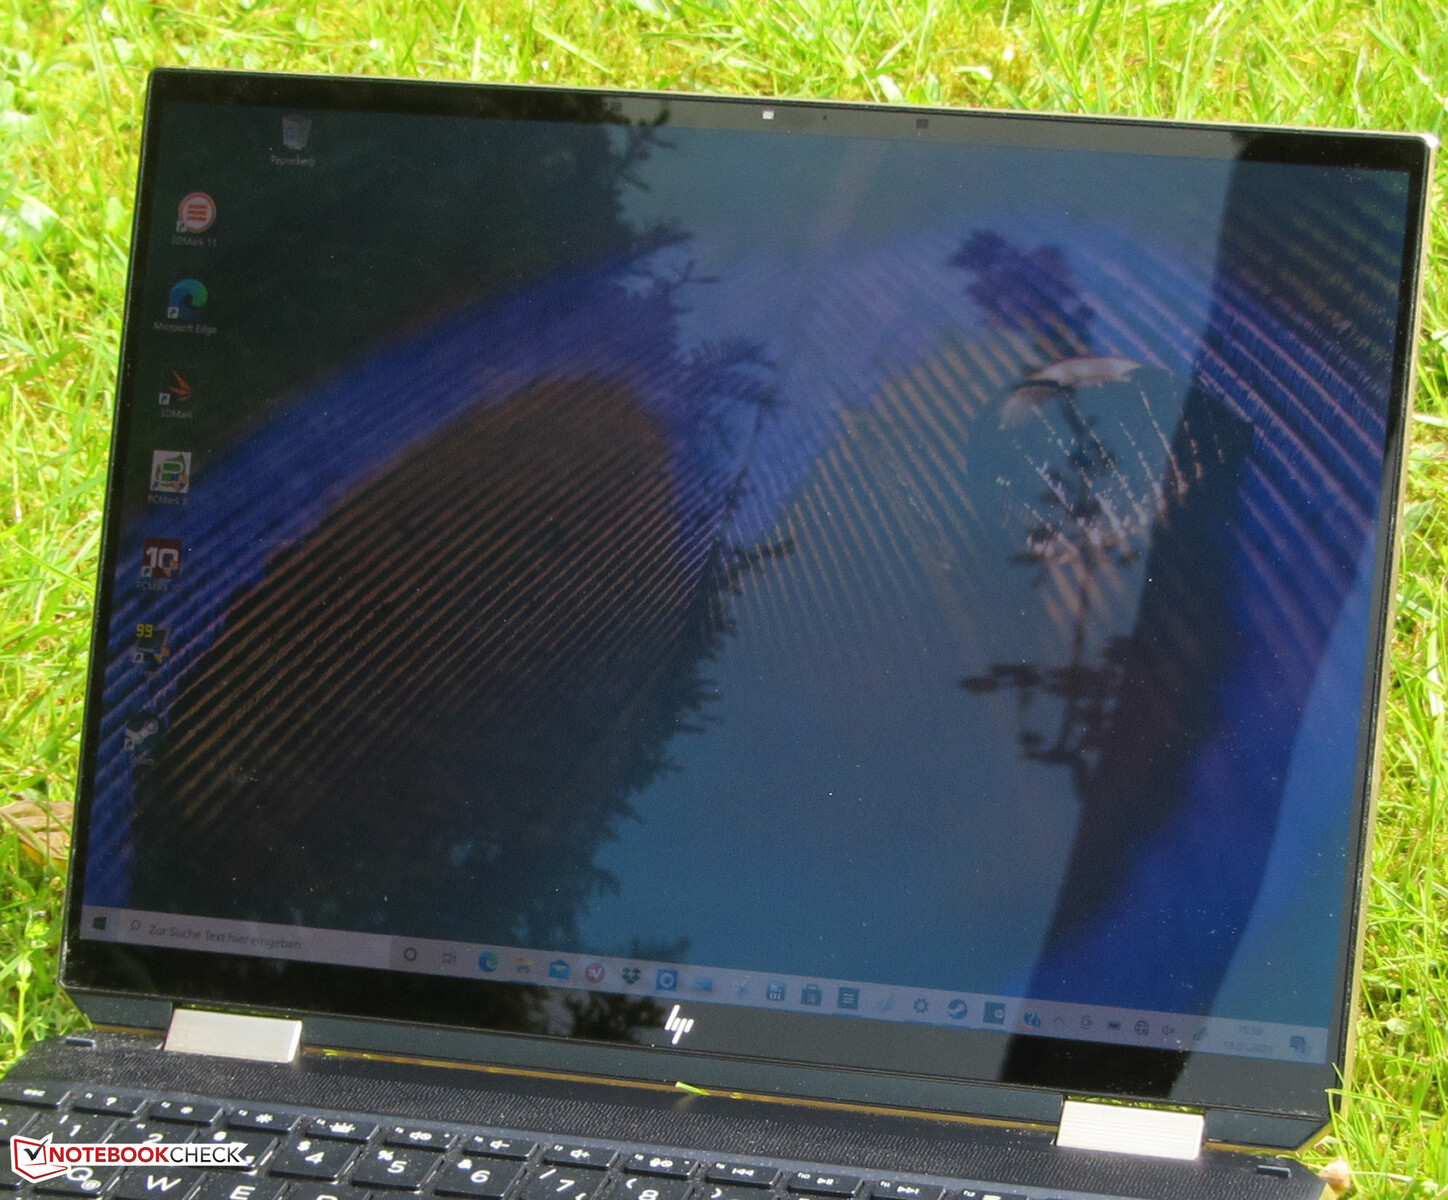
The viewing angles of the OLED panel are very good. Outdoors, the screen content can be hard to read because of the reflective screen surface.

Performance - Spectre x360 with a Tiger Lake chip
The HP Spectre x360 14 is a 2-in-1 device that delivers more than enough performance for office and web-based applications.
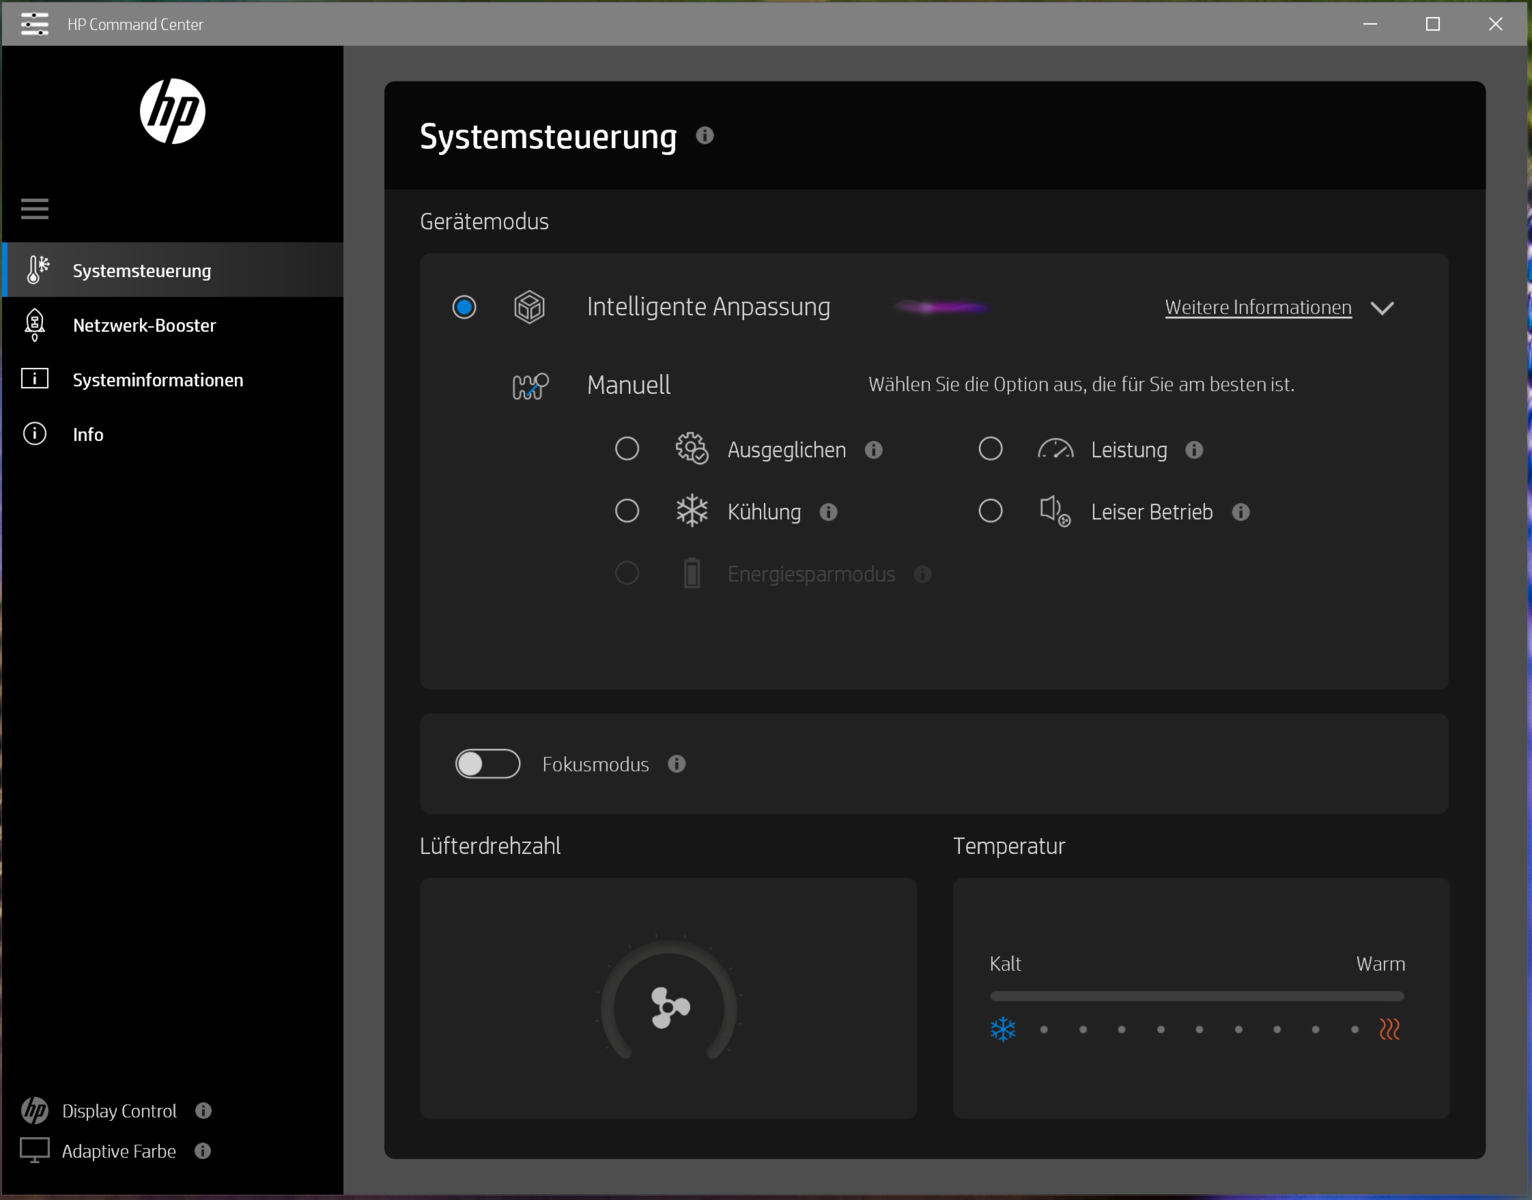
System Settings
The power modes, which can be selected in the "HP Command Center" utility, have an impact on the performance, thermals and the system noise. We used the default power mode in our review. We also conducted some of our benchmarks in performance mode, which we clearly marked.
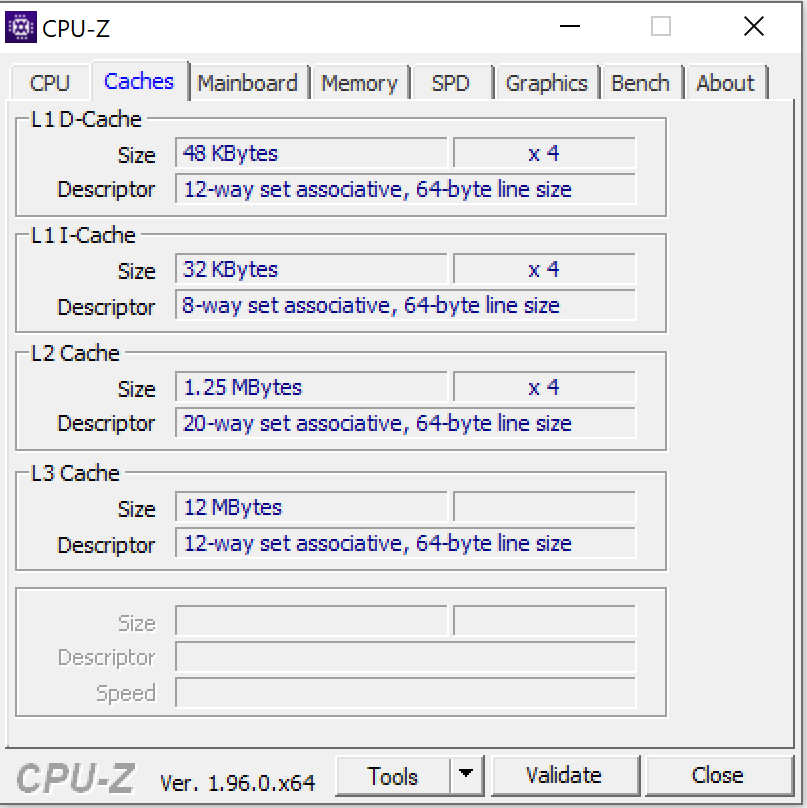
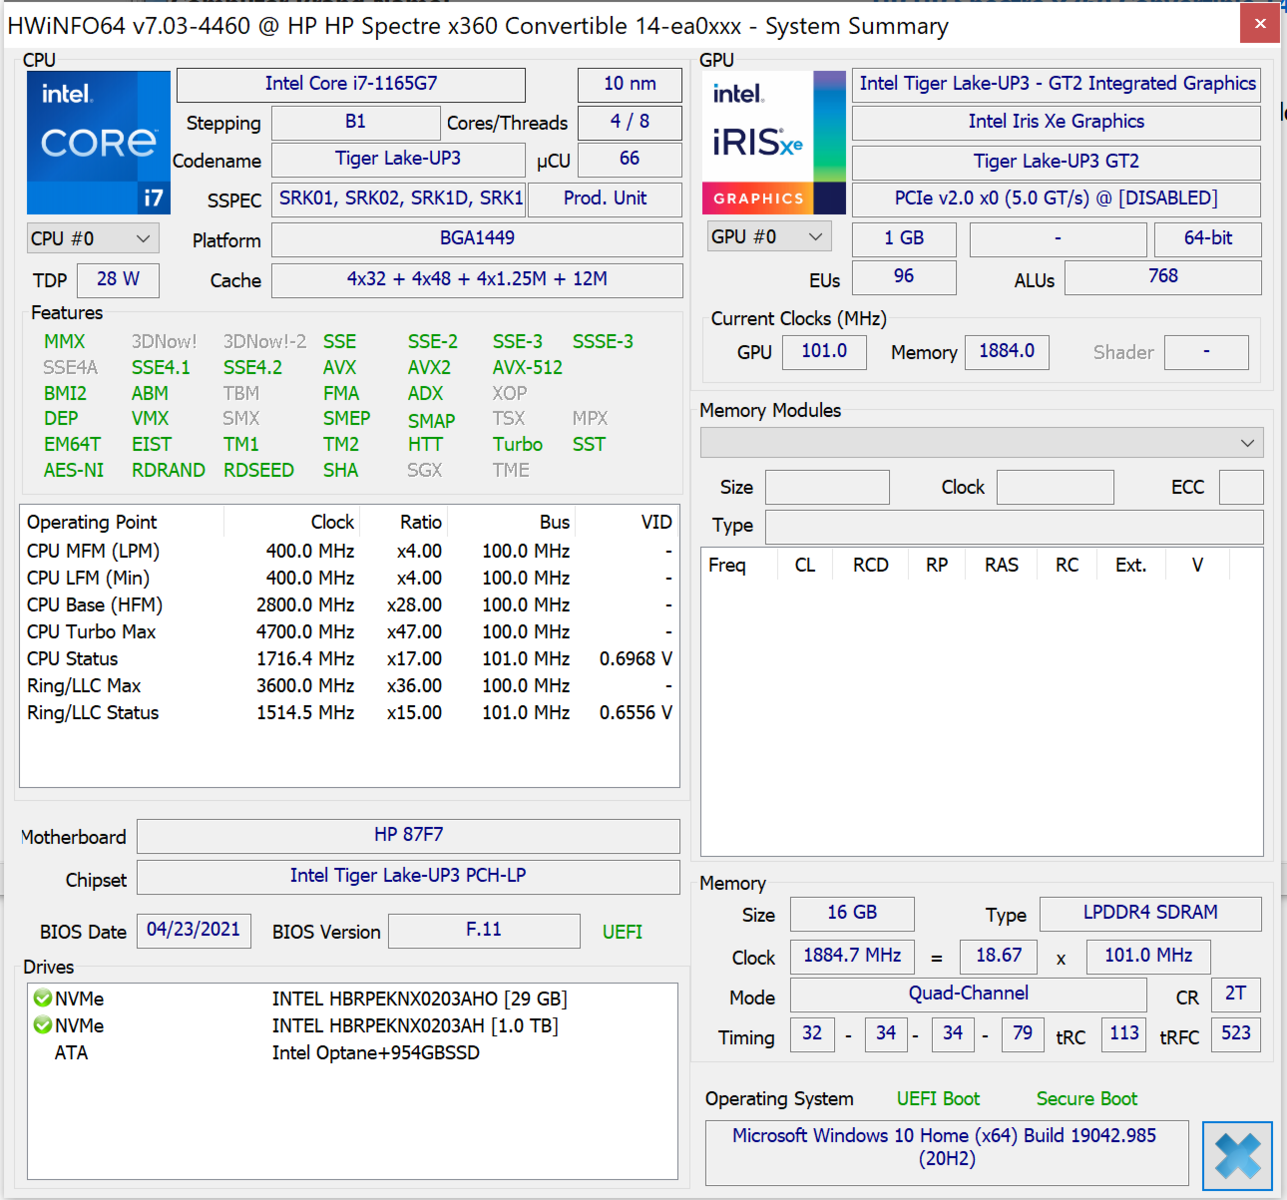
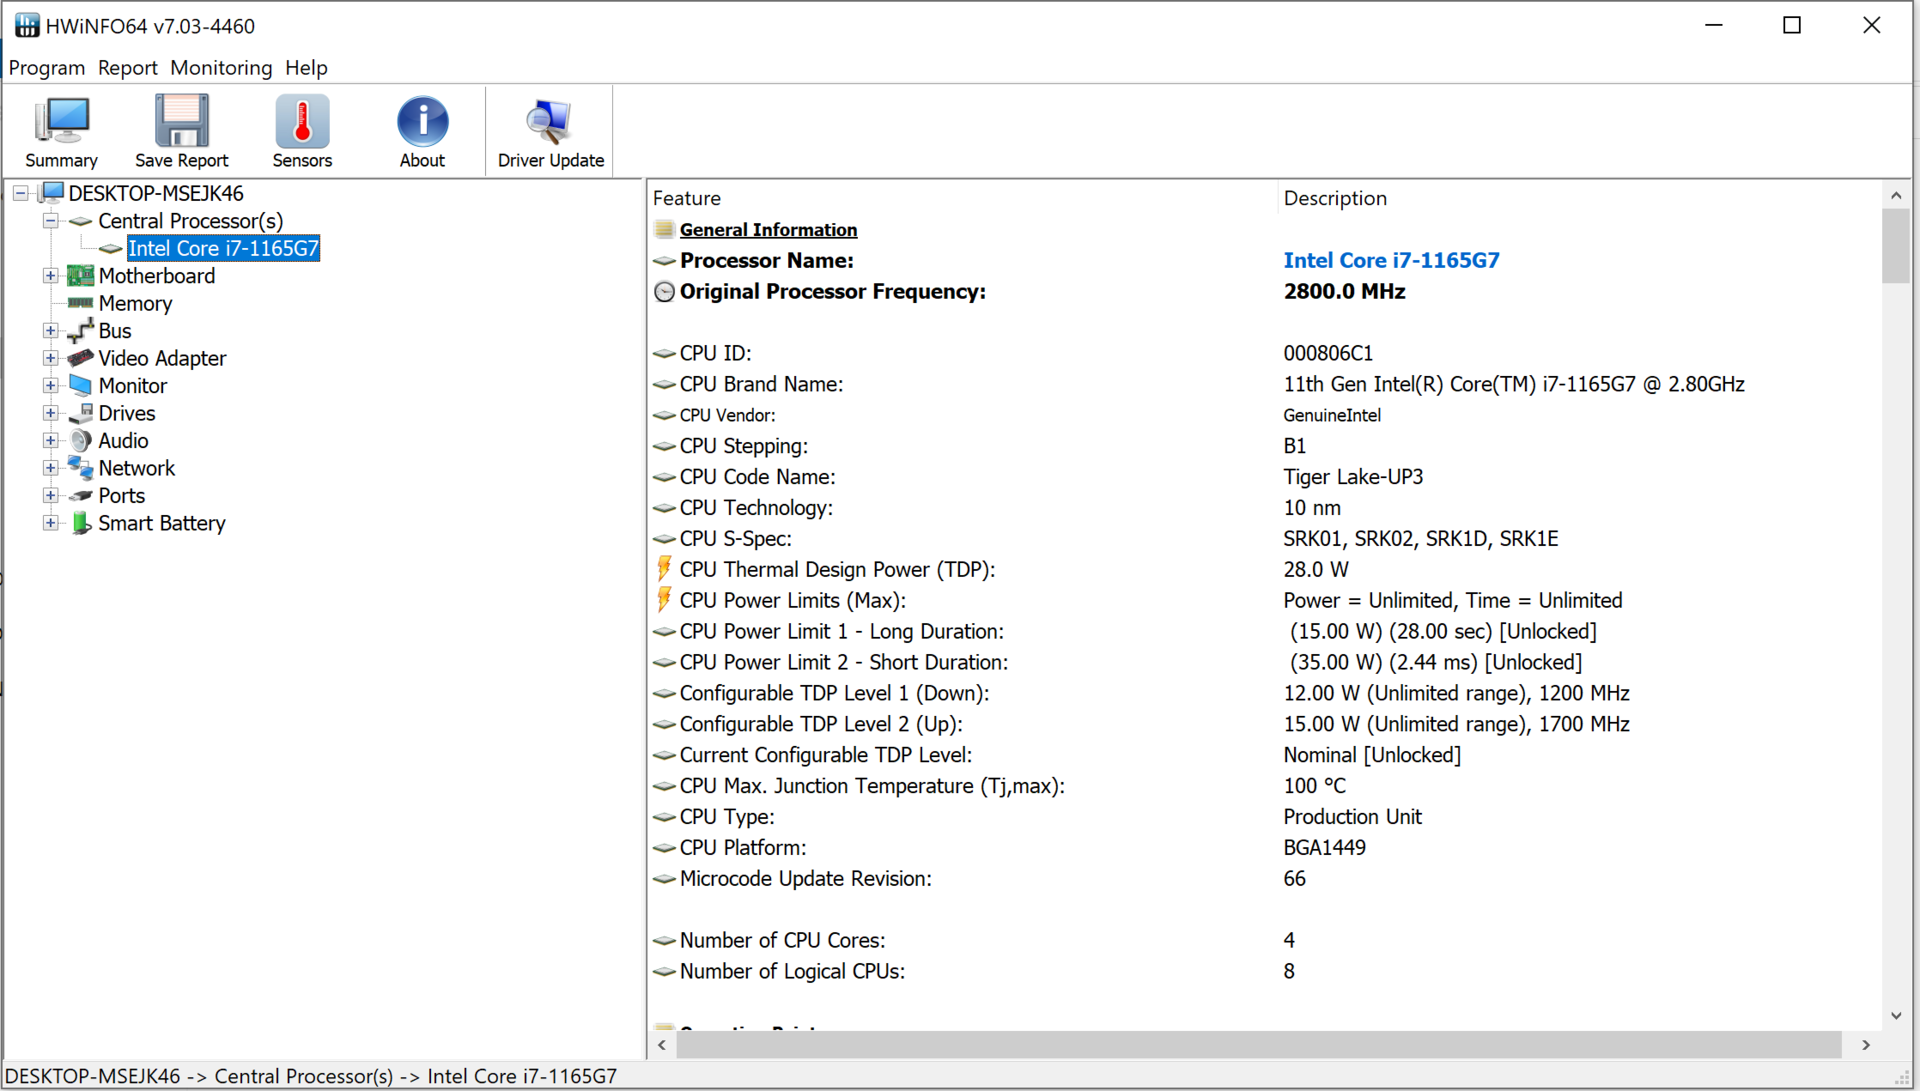
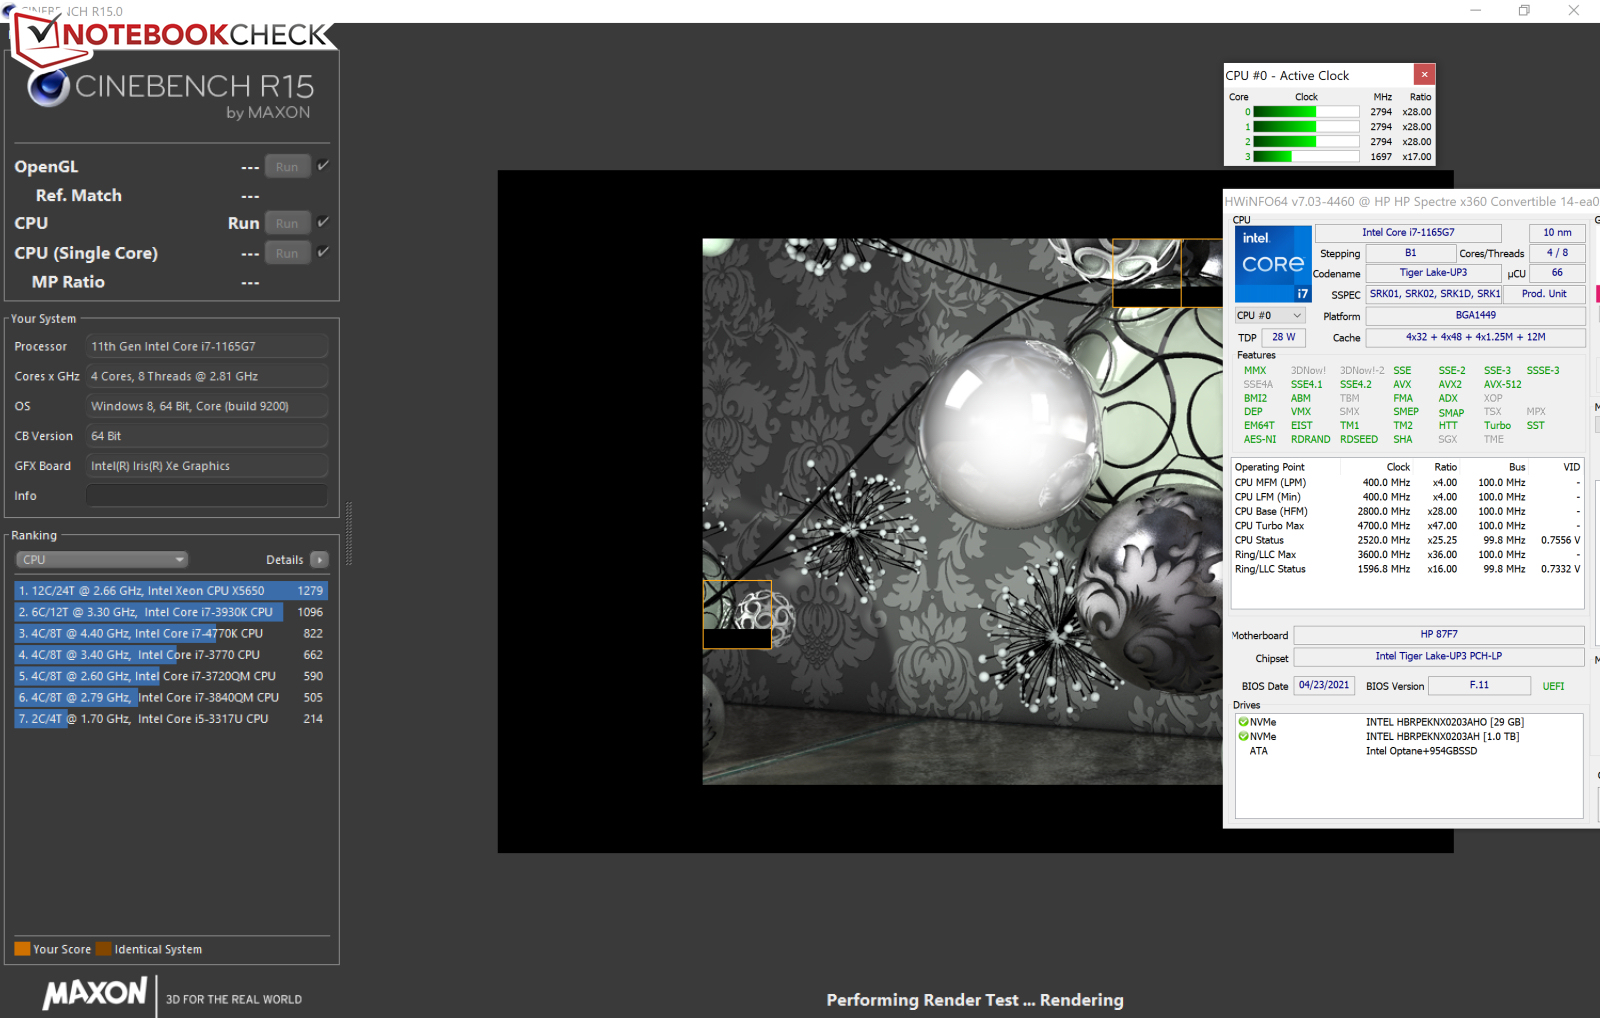
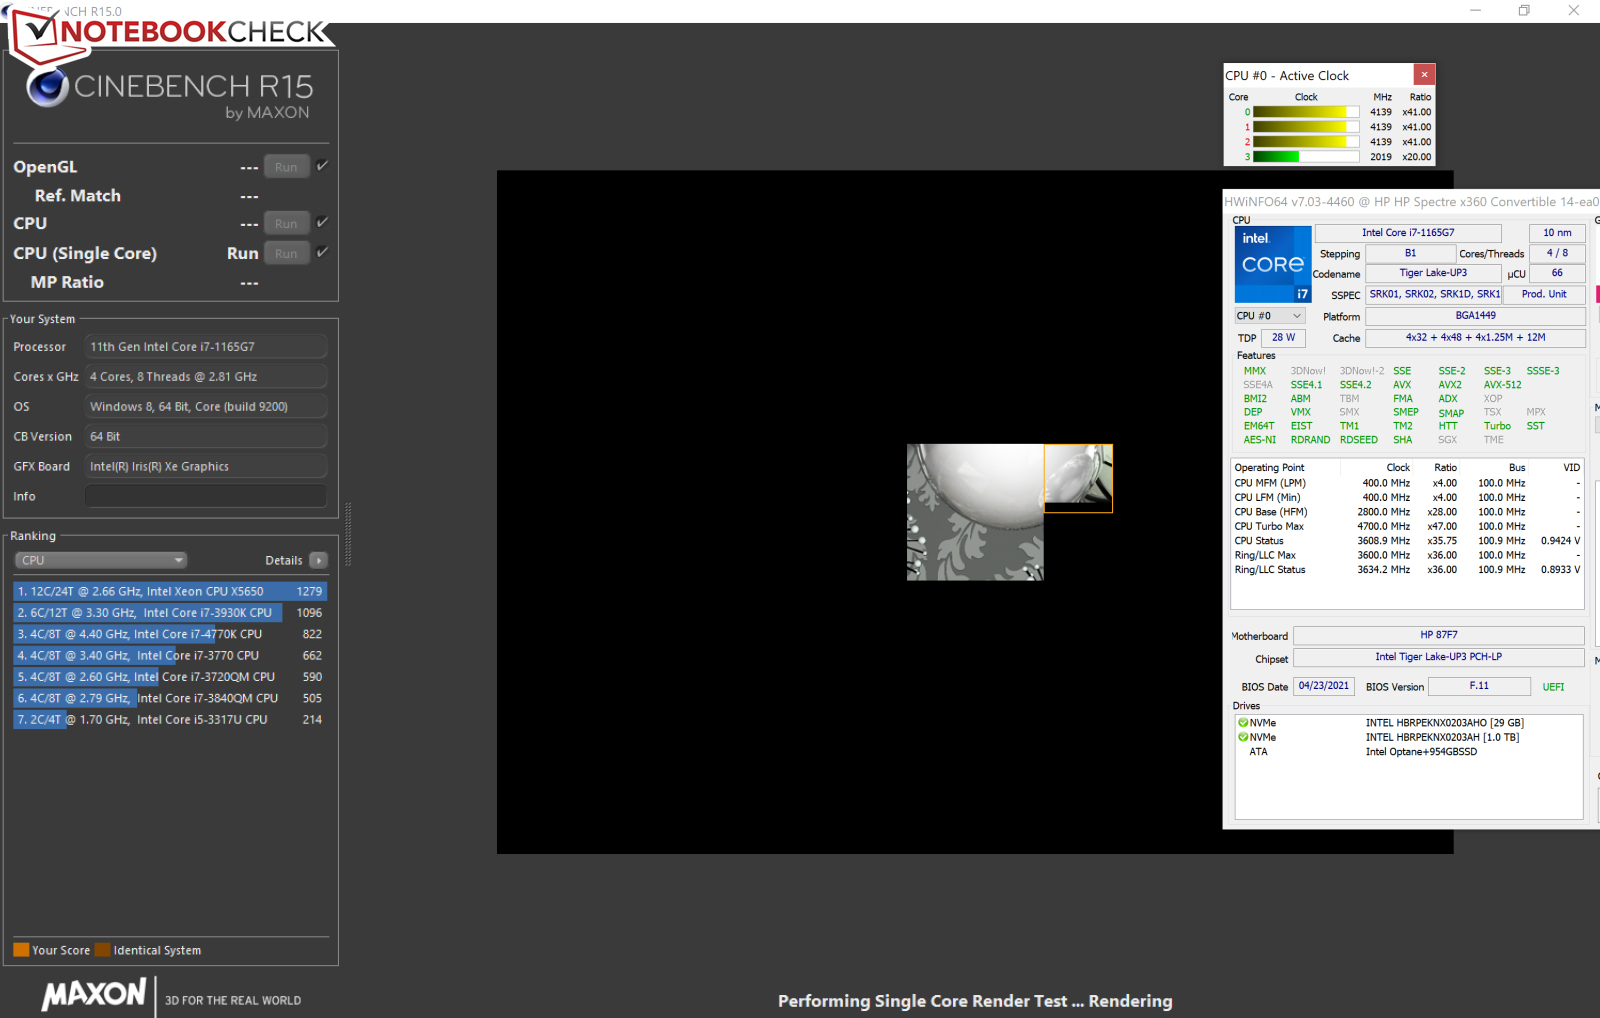
Processor
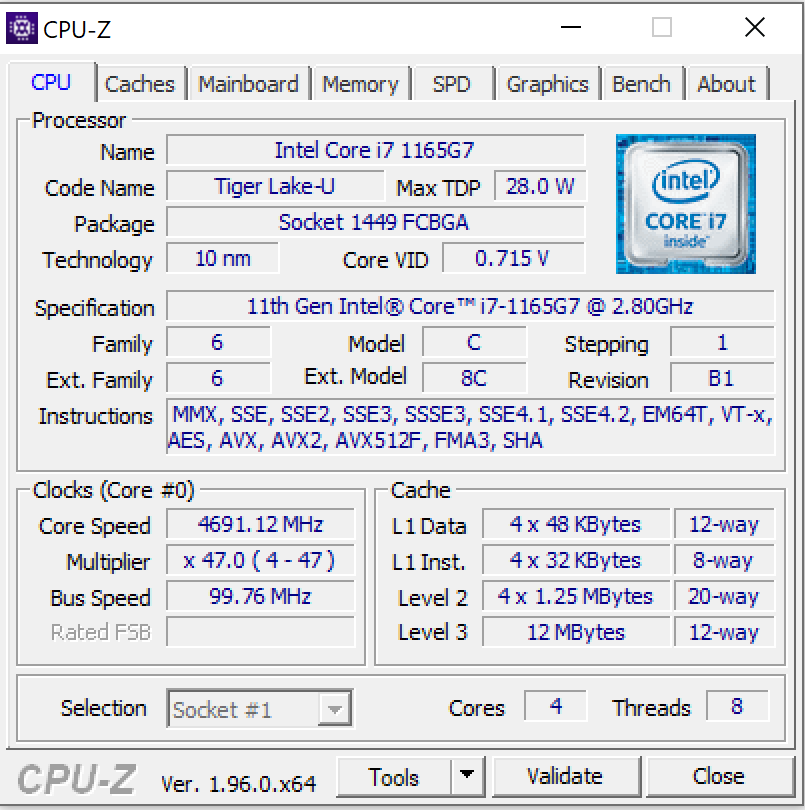
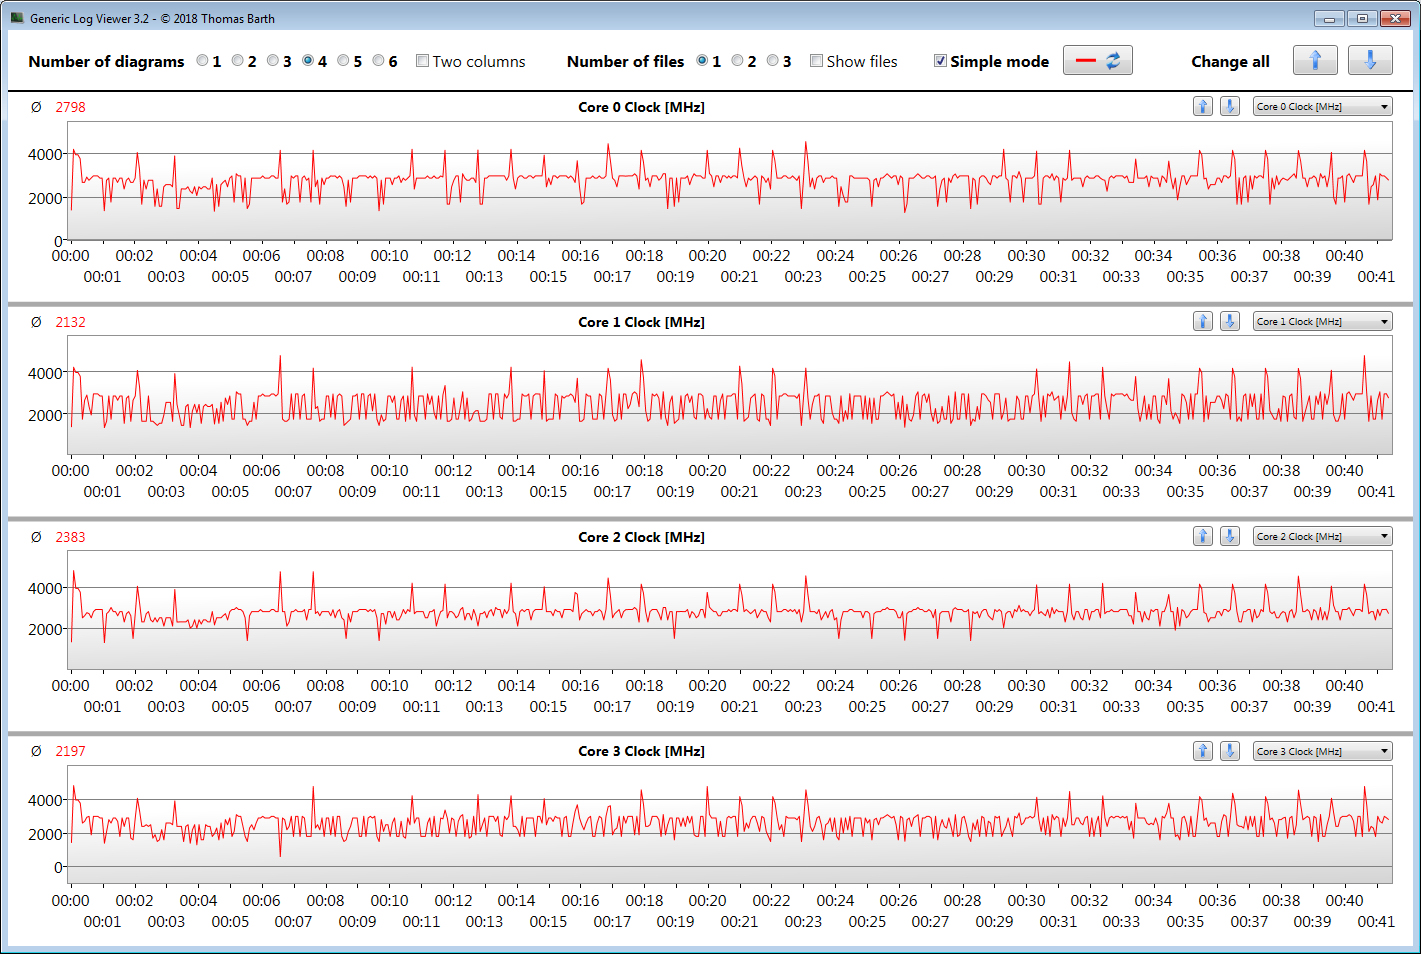
The Core i7-1165G7 a quad-care (Tiger Lake) CPU from Intel. The processor has a base clock of 2.8 GHz and a boost clock of 4.1 GHz for all cores and 4.7 GHz for one core. Hyper-threading (two threads per one core) is supported.
In the multi-core section of the Cinebench R15 benchmarks, the processor operates at 1.6 to 3.8 GHz. In the single-core benchmarks, the CPU runs at 2 to 4.7 GHz. This is the level of performance that we see when the laptop is plugged in. When it is running on battery power, the clock rates drop significantly.
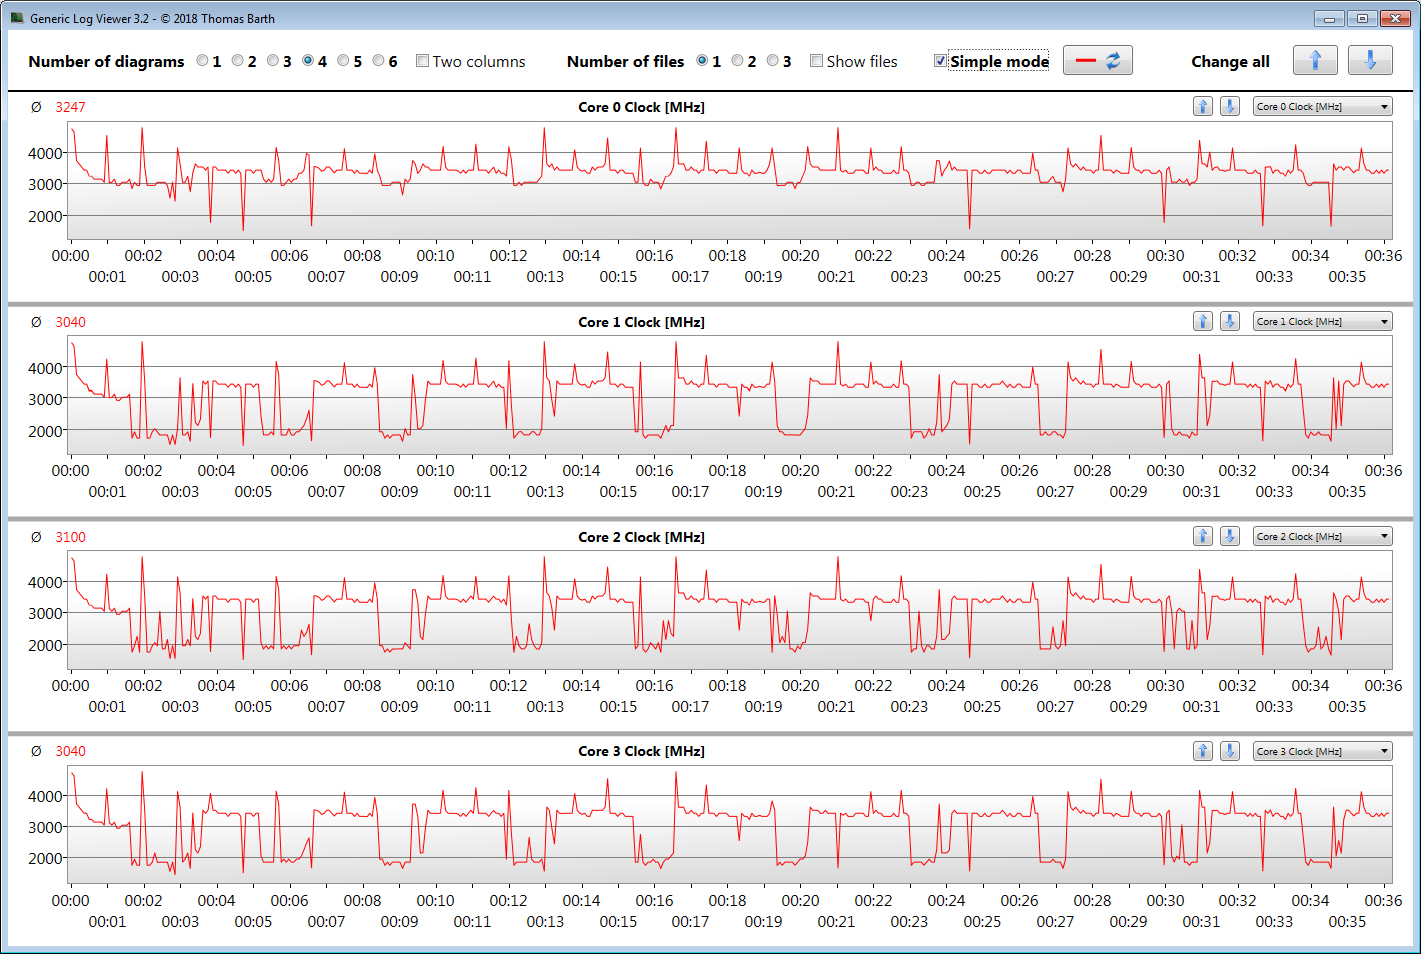
We check if the Turbo boost can be used over an extended period of time by running the Cinebench R15 multi-core benchmark in a continuous loop for 30 minutes. The CPU was able to achieve high clock rates only at the beginning of the CB 15 loop. The clock rates occasionally fell below the base frequency. In performance mode, the clock speeds were higher but less stable.
| Cinebench R23 | |
| Single Core | |
| Average of class Convertible (740 - 2188, n=49, last 2 years) | |
| MSI Summit E13 Flip Evo A11MT | |
| Lenovo Yoga 9 14 ITL 4K | |
| Average Intel Core i7-1165G7 (1110 - 1539, n=59) | |
| HP Spectre x360 14-ea0378ng | |
| HP Spectre x360 14-ea0378ng (Leistung) | |
| Multi Core | |
| Average of class Convertible (1317 - 30959, n=49, last 2 years) | |
| MSI Summit E13 Flip Evo A11MT | |
| Lenovo Yoga 9 14 ITL 4K | |
| Average Intel Core i7-1165G7 (2525 - 6862, n=64) | |
| HP Spectre x360 14-ea0378ng (Leistung) | |
| HP Spectre x360 14-ea0378ng | |
| HWBOT x265 Benchmark v2.2 - 4k Preset | |
| Average of class Convertible (3.43 - 36.2, n=48, last 2 years) | |
| MSI Summit E13 Flip Evo A11MT | |
| HP Spectre x360 14-ea0378ng (Leistung) | |
| Dell XPS 13 7390 2-in-1 Core i7 | |
| Average Intel Core i7-1165G7 (1.39 - 8.47, n=80) | |
| HP Spectre x360 14t-ea000 | |
| Lenovo Yoga 9 14 ITL 4K | |
| HP Spectre x360 14-ea0378ng | |
| Samsung Galaxy Book Flex 13.3 | |
| LibreOffice - 20 Documents To PDF | |
| Samsung Galaxy Book Flex 13.3 | |
| HP Spectre x360 14-ea0378ng | |
| Acer Spin 5 SP513-54N-79EY | |
| Average of class Convertible (42.5 - 84.3, n=48, last 2 years) | |
| Lenovo Yoga 9 14 ITL 4K | |
| HP Spectre x360 14t-ea000 | |
| HP Spectre x360 14-ea0378ng (Leistung) | |
| Average Intel Core i7-1165G7 (21.5 - 88.1, n=78) | |
| MSI Summit E13 Flip Evo A11MT | |
| R Benchmark 2.5 - Overall mean | |
| Samsung Galaxy Book Flex 13.3 | |
| HP Spectre x360 14-ea0378ng (Leistung) | |
| HP Spectre x360 14-ea0378ng | |
| HP Spectre x360 14t-ea000 | |
| Average Intel Core i7-1165G7 (0.552 - 1.002, n=80) | |
| Lenovo Yoga 9 14 ITL 4K | |
| MSI Summit E13 Flip Evo A11MT | |
| Average of class Convertible (0.3915 - 0.84, n=48, last 2 years) | |
* ... smaller is better
System Performance
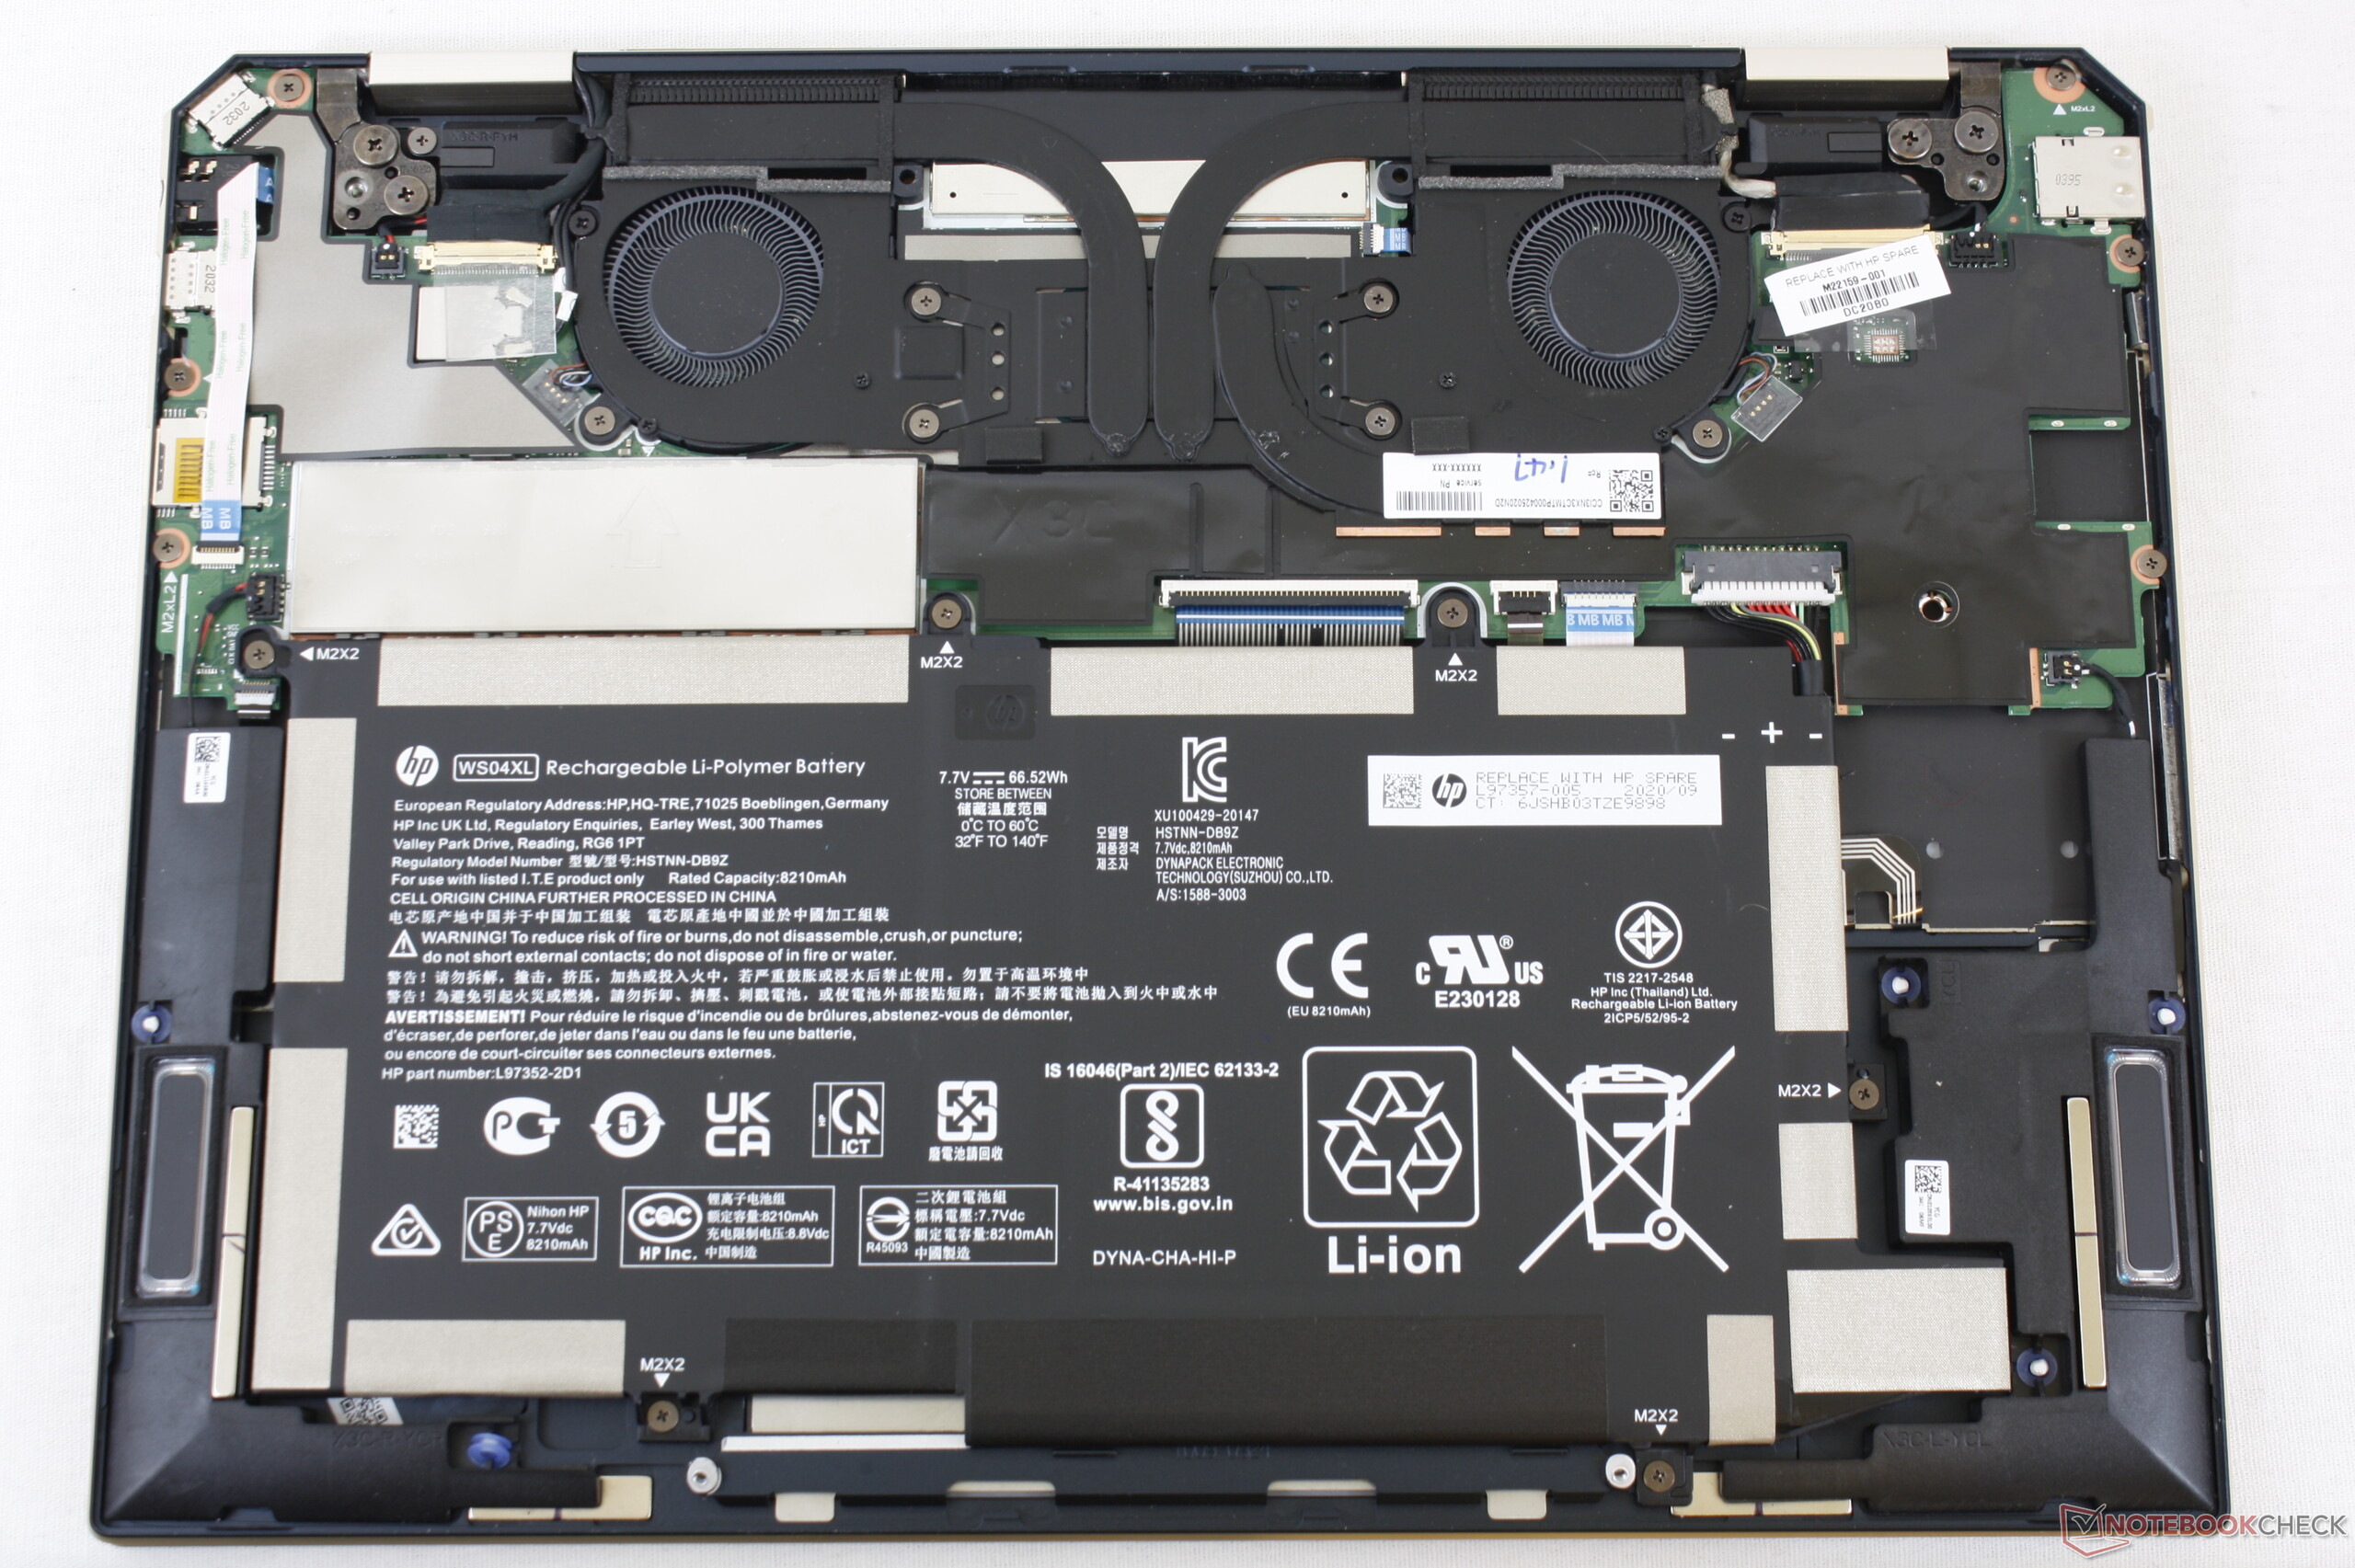
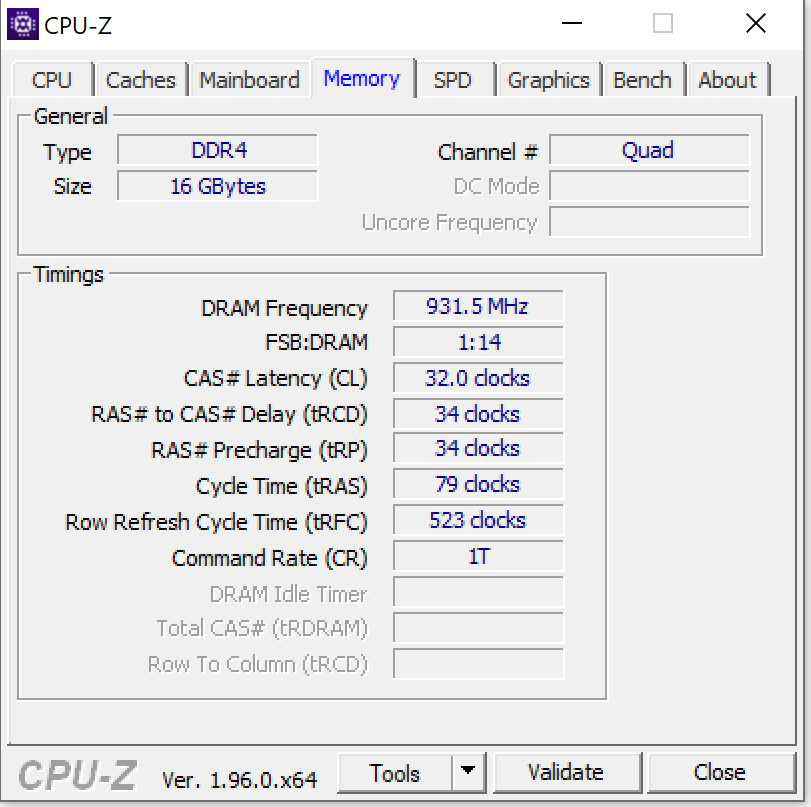
The system feels very responsive. We did not encounter any problems during our review. The Spectre x360 14 offers more than enough performance for office and web-based applications. The PCMark results show the system to be quite well-rounded. The RAM (16 GB, LPDDR4X-3733, soldered-in) runs in dual-channel mode. The amount of RAM cannot be increased.
| PCMark 8 Home Score Accelerated v2 | 3770 points | |
| PCMark 8 Creative Score Accelerated v2 | 4312 points | |
| PCMark 8 Work Score Accelerated v2 | 2721 points | |
| PCMark 10 Score | 4531 points | |
Help | ||
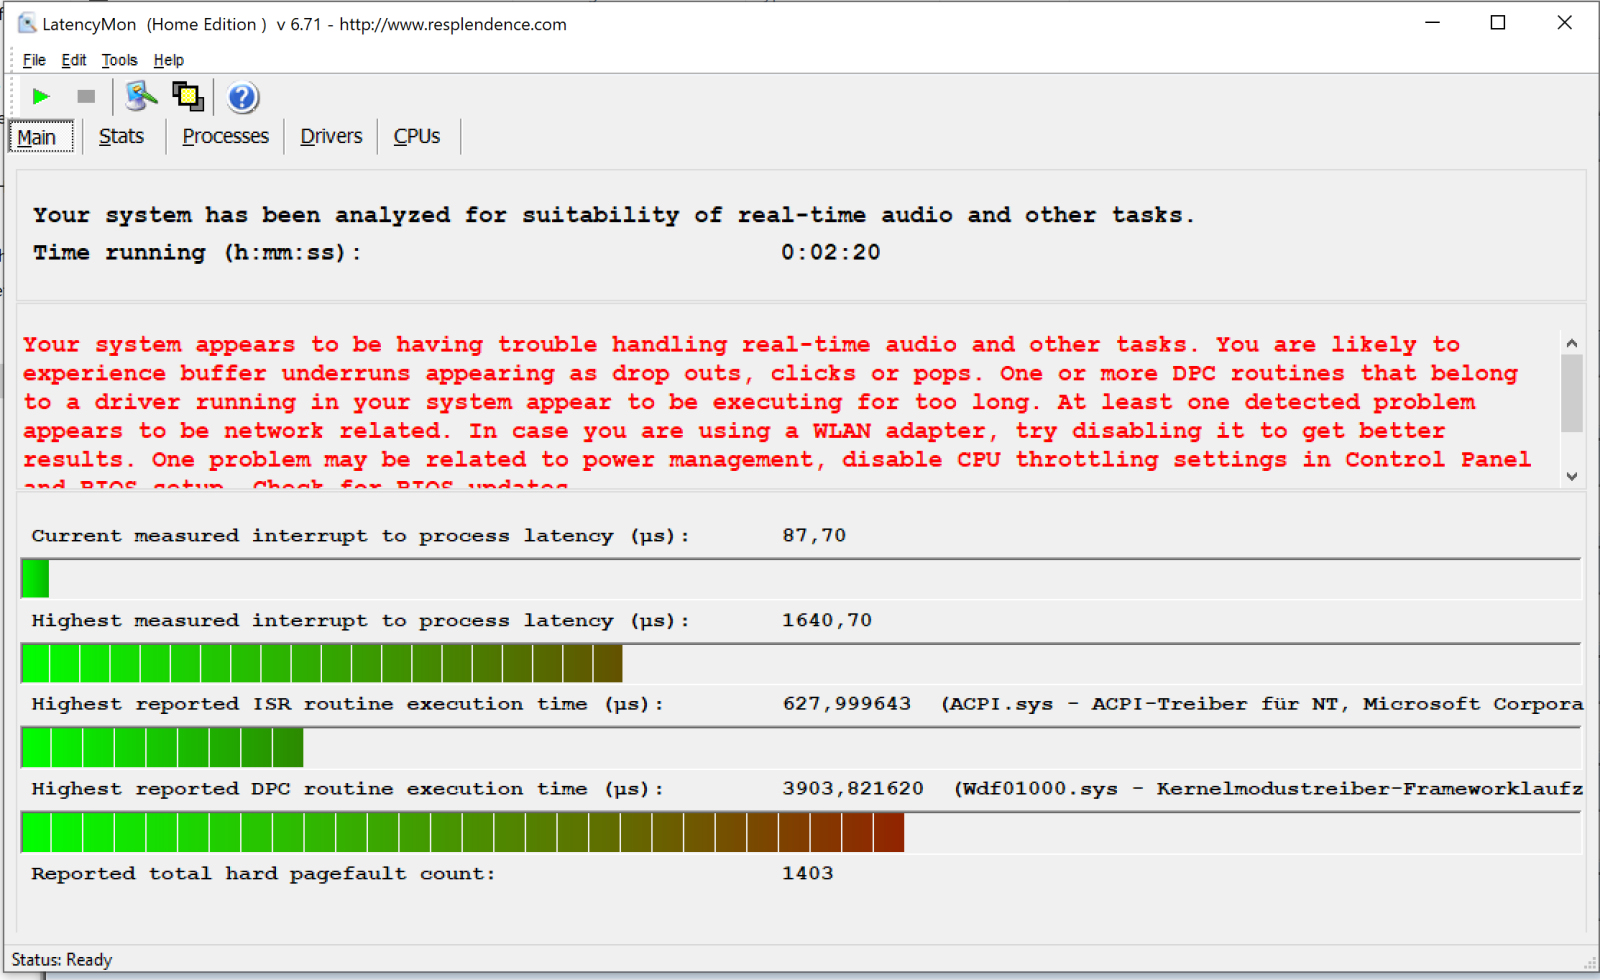
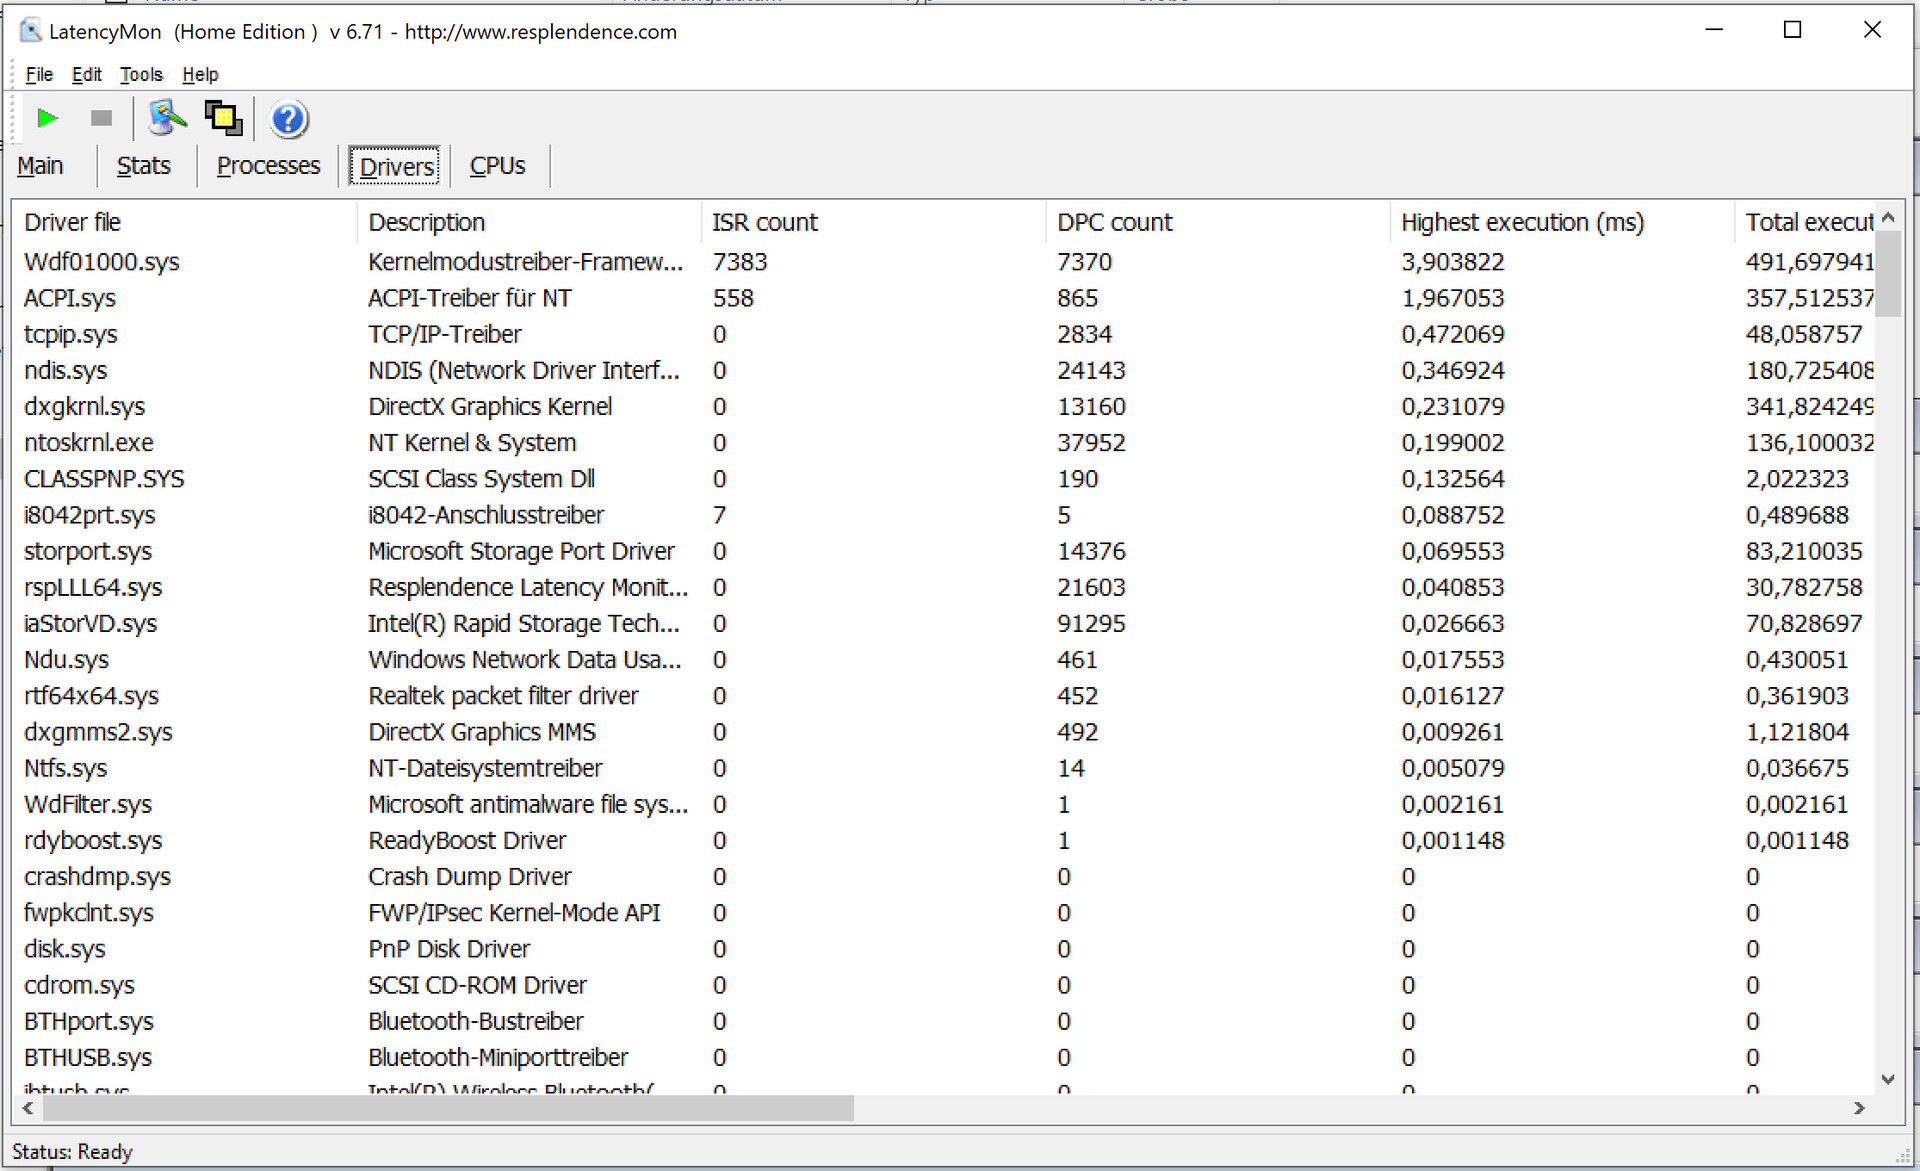
DPC Latencies
Our DPC latency test (web-surfing, 4K video playback, Prime95) reveals that the Spectre x360 is not fit for work with real-time audio and video.
| DPC Latencies / LatencyMon - interrupt to process latency (max), Web, Youtube, Prime95 | |
| MSI Summit E13 Flip Evo A11MT | |
| HP Spectre x360 14t-ea000 | |
| HP Spectre x360 14-ea0378ng | |
| Lenovo Yoga 9i 14ITL5 | |
| Samsung Galaxy Book Flex 13.3 | |
* ... smaller is better
Storage Devices
Our review device features two Intel NVMe SSDs (1 TB, 32 GB), which are housed in one M.2-2280 module. The 32 GB SSD serves as cache for the 1 TB solid state drive. The 32 GB SSD is supposed to increase writing speeds and decrease loading times.
The transfer rates are on a decent level. However, many other SSDs manage to achieve significantly faster data transfer speeds—without any cache SSDs. Howbeit, the cache SSD significantly increases the random read rates.

| HP Spectre x360 14-ea0378ng Intel Optane Memory H10 with Solid State Storage 32GB + 1TB HBRPEKNX0203AH(L/H) | Samsung Galaxy Book Flex 13.3 Samsung SSD PM981a MZVLB256HBHQ | MSI Summit E13 Flip Evo A11MT Phison 1TB SM2801T24GKBB4S-E162 | HP Spectre x360 14t-ea000 Samsung SSD PM981a MZVLB512HBJQ | Dell XPS 13 7390 2-in-1 Core i7 Toshiba BG4 KBG40ZPZ512G | Lenovo Yoga 9 14 ITL 4K WDC PC SN730 SDBPNTY-1T00 | Acer Spin 5 SP513-54N-79EY Samsung PM991 MZVLQ1T0HALB | Average Intel Optane Memory H10 with Solid State Storage 32GB + 1TB HBRPEKNX0203AH(L/H) | |
|---|---|---|---|---|---|---|---|---|
| CrystalDiskMark 5.2 / 6 | 11% | 54% | 4% | -20% | 13% | -11% | 0% | |
| Write 4K (MB/s) | 128.9 | 157.9 22% | 311.1 141% | 82.2 -36% | 106.7 -17% | 161.8 26% | 168.4 31% | 128.9 ? 0% |
| Read 4K (MB/s) | 140 | 48.37 -65% | 56.6 -60% | 45.7 -67% | 49.94 -64% | 40.67 -71% | 55 -61% | 140 ? 0% |
| Write Seq (MB/s) | 1422 | 2196 54% | 2397 69% | 2000 41% | 1223 -14% | 1873 32% | 1422 ? 0% | |
| Read Seq (MB/s) | 1660 | 2064 24% | 2277 37% | 2206 33% | 1801 8% | 2059 24% | 1660 ? 0% | |
| Write 4K Q32T1 (MB/s) | 475.1 | 457 -4% | 803 69% | 451.2 -5% | 325.3 -32% | 530 12% | 476.1 0% | 475 ? 0% |
| Read 4K Q32T1 (MB/s) | 581 | 514 -12% | 849 46% | 351 -40% | 551 -5% | 440.4 -24% | 506 -13% | 581 ? 0% |
| Write Seq Q32T1 (MB/s) | 1793 | 2354 31% | 2410 34% | 2982 66% | 1224 -32% | 3005 68% | 1492 -17% | 1793 ? 0% |
| Read Seq Q32T1 (MB/s) | 2536 | 3557 40% | 4954 95% | 3529 39% | 2350 -7% | 3370 33% | 2357 -7% | 2536 ? 0% |
| Write 4K Q8T8 (MB/s) | 930 | |||||||
| Read 4K Q8T8 (MB/s) | 963 | |||||||
| AS SSD | 51% | 171% | 128% | -41% | 131% | 78% | 28% | |
| Seq Read (MB/s) | 1343 | 2637 96% | 3789 182% | 2188 63% | 1801 34% | 2793 108% | 2071 54% | 1240 ? -8% |
| Seq Write (MB/s) | 1222 | 2000 64% | 2257 85% | 1320 8% | 1125 -8% | 1292 6% | 1462 20% | 916 ? -25% |
| 4K Read (MB/s) | 63.6 | 52.7 -17% | 54.2 -15% | 53.5 -16% | 39.7 -38% | 46.5 -27% | 49.82 -22% | 55.1 ? -13% |
| 4K Write (MB/s) | 107.8 | 148.4 38% | 78.7 -27% | 123.7 15% | 67 -38% | 220.8 105% | 140.7 31% | 112.3 ? 4% |
| 4K-64 Read (MB/s) | 417.5 | 647 55% | 1330 219% | 1010 142% | 1253 200% | 1118 168% | 869 108% | 530 ? 27% |
| 4K-64 Write (MB/s) | 496 | 865 74% | 2038 311% | 1808 265% | 209 -58% | 1573 217% | 729 47% | 601 ? 21% |
| Access Time Read * (ms) | 0.103 | 0.072 30% | 0.042 59% | 0.055 47% | 0.069 33% | 0.041 60% | 0.069 33% | 0.081 ? 21% |
| Access Time Write * (ms) | 0.043 | 0.026 40% | 0.04 7% | 0.076 -77% | 0.625 -1353% | 0.017 60% | 0.028 35% | 0.04233 ? 2% |
| Score Read (Points) | 615 | 963 57% | 1763 187% | 1282 108% | 1472 139% | 1444 135% | 1126 83% | 709 ? 15% |
| Score Write (Points) | 726 | 1214 67% | 2343 223% | 2063 184% | 388 -47% | 1923 165% | 1016 40% | 805 ? 11% |
| Score Total (Points) | 1675 | 2653 58% | 4938 195% | 3970 137% | 2583 54% | 4037 141% | 2700 61% | 1879 ? 12% |
| Copy ISO MB/s (MB/s) | 334.9 | 2270 578% | 1644 391% | 1293 286% | 1812 441% | 1574 370% | 778 ? 132% | |
| Copy Program MB/s (MB/s) | 276.3 | 670 142% | 920 233% | 560 103% | 528 91% | 553 100% | 542 ? 96% | |
| Copy Game MB/s (MB/s) | 433.2 | 1525 252% | 1725 298% | 927 114% | 1134 162% | 993 129% | 845 ? 95% | |
| Total Average (Program / Settings) | 31% /
34% | 113% /
129% | 66% /
83% | -31% /
-34% | 72% /
88% | 34% /
51% | 14% /
18% |
* ... smaller is better
Continuous Read Speed: DiskSpd Read Loop, Queue Depth 8
Graphics Card
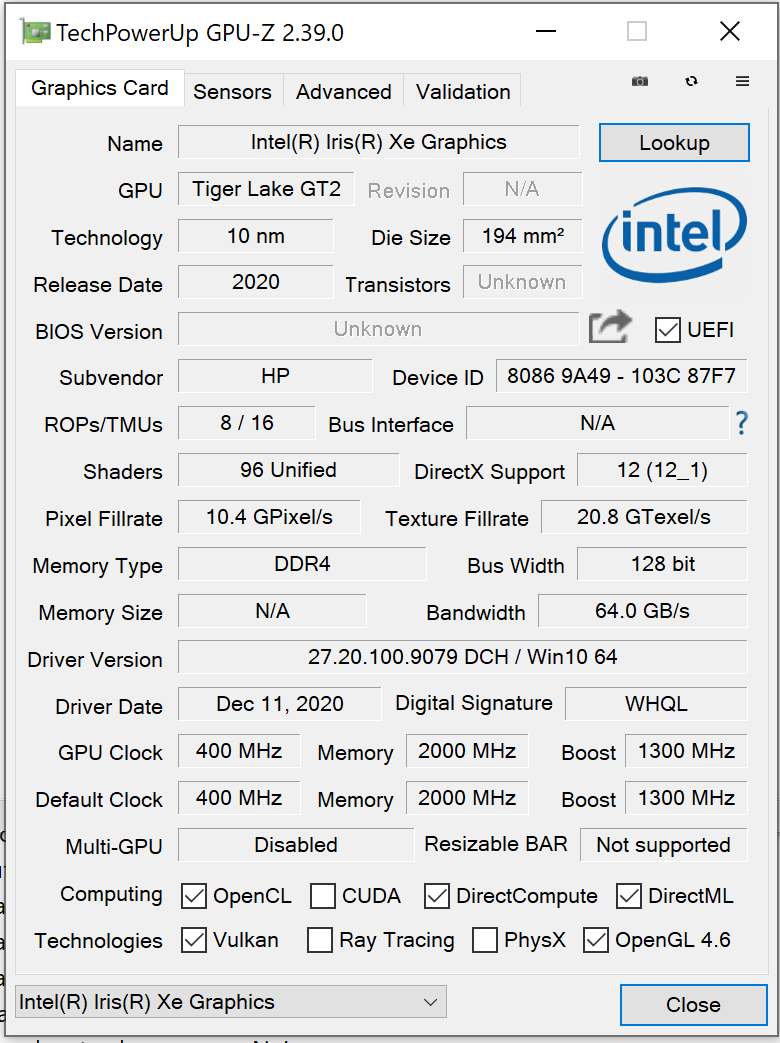
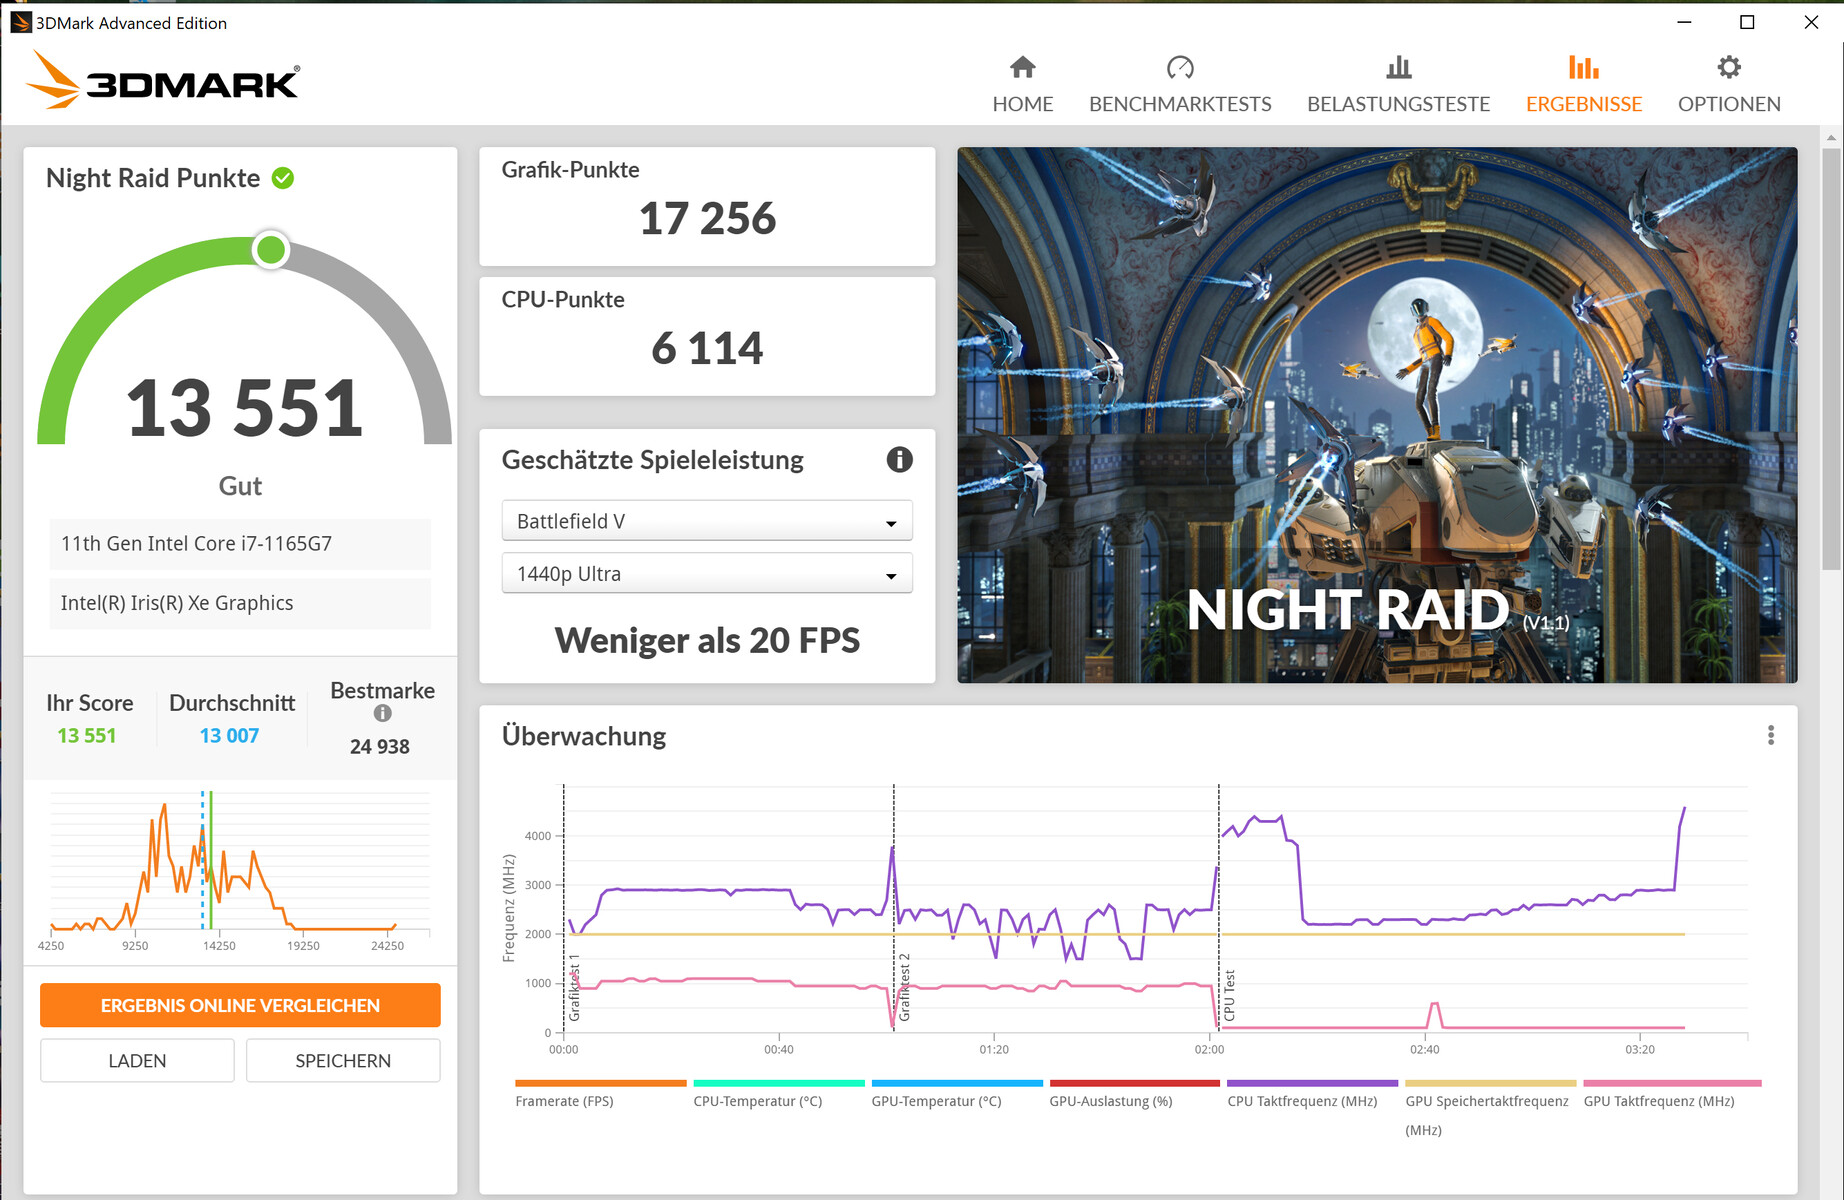
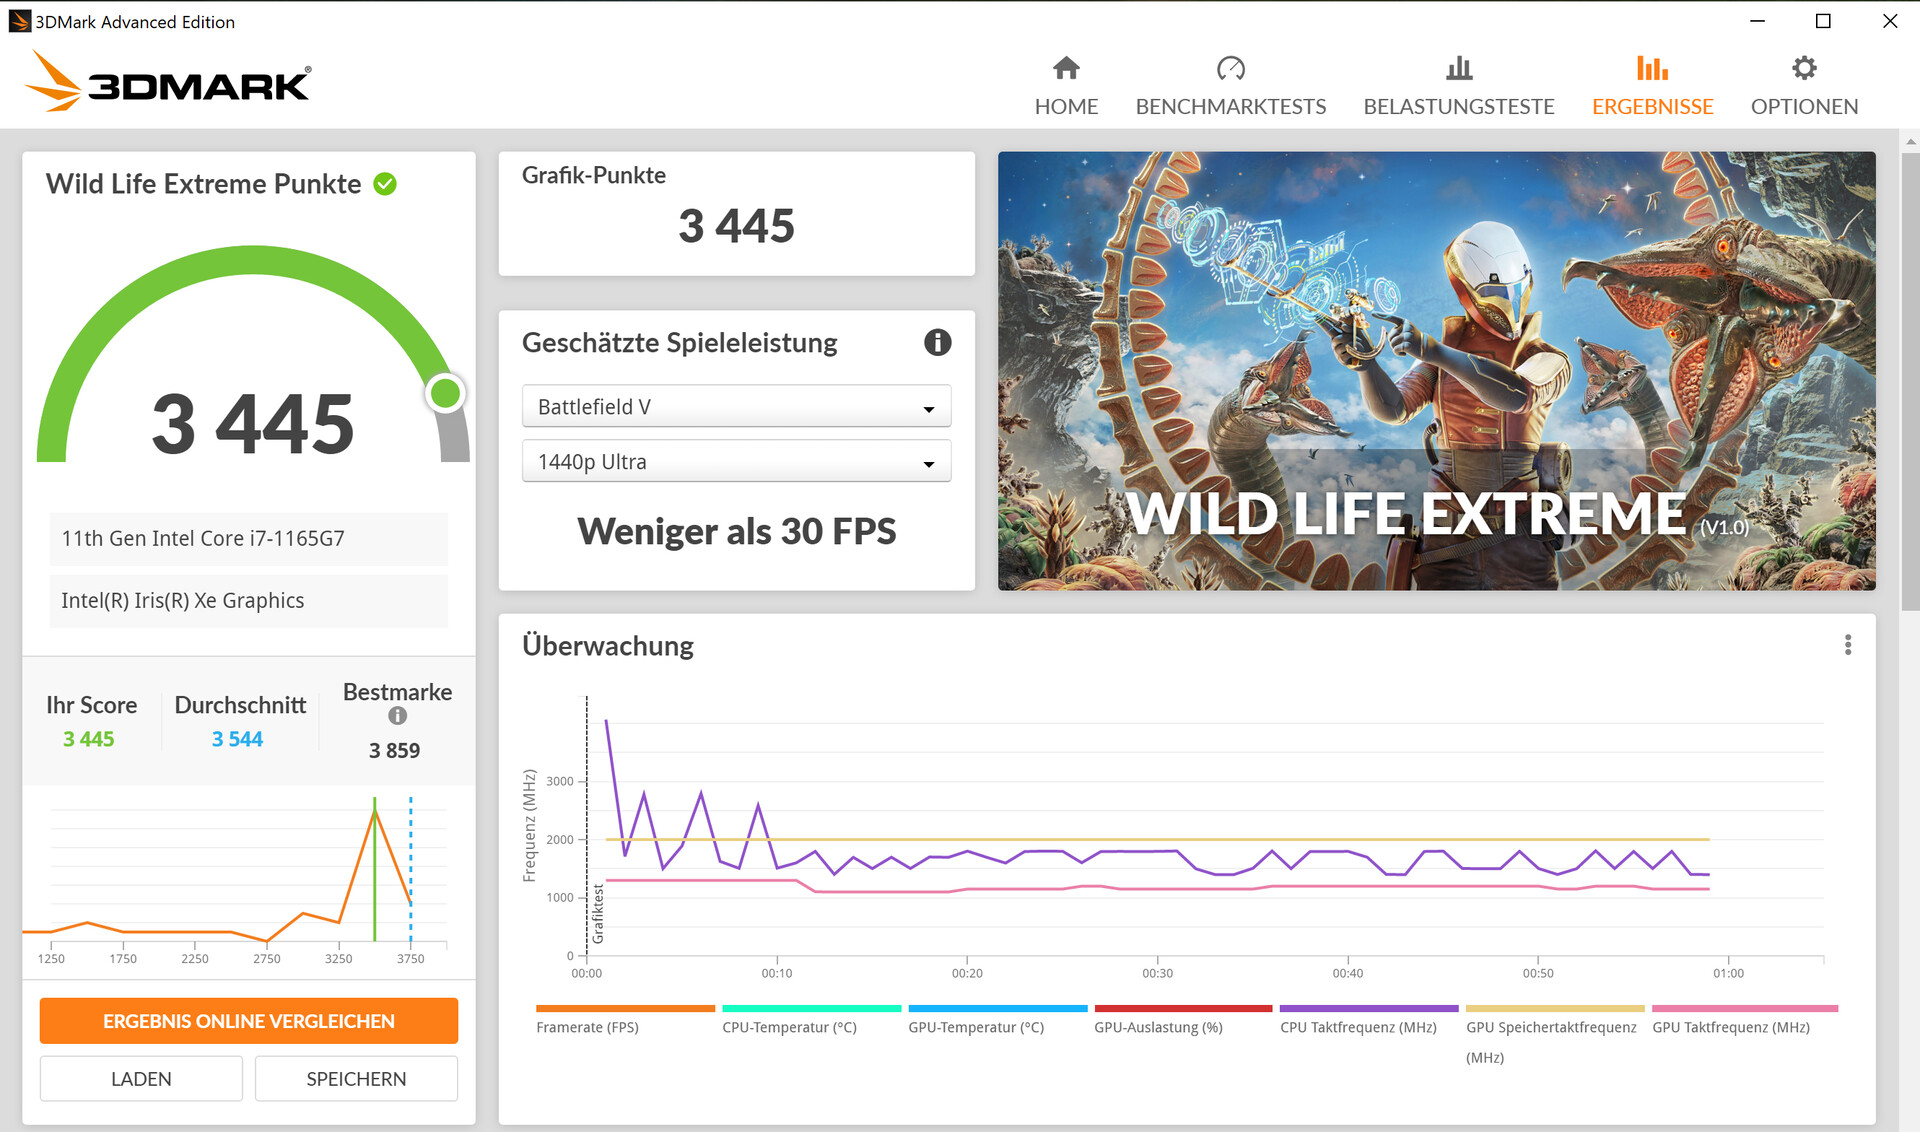
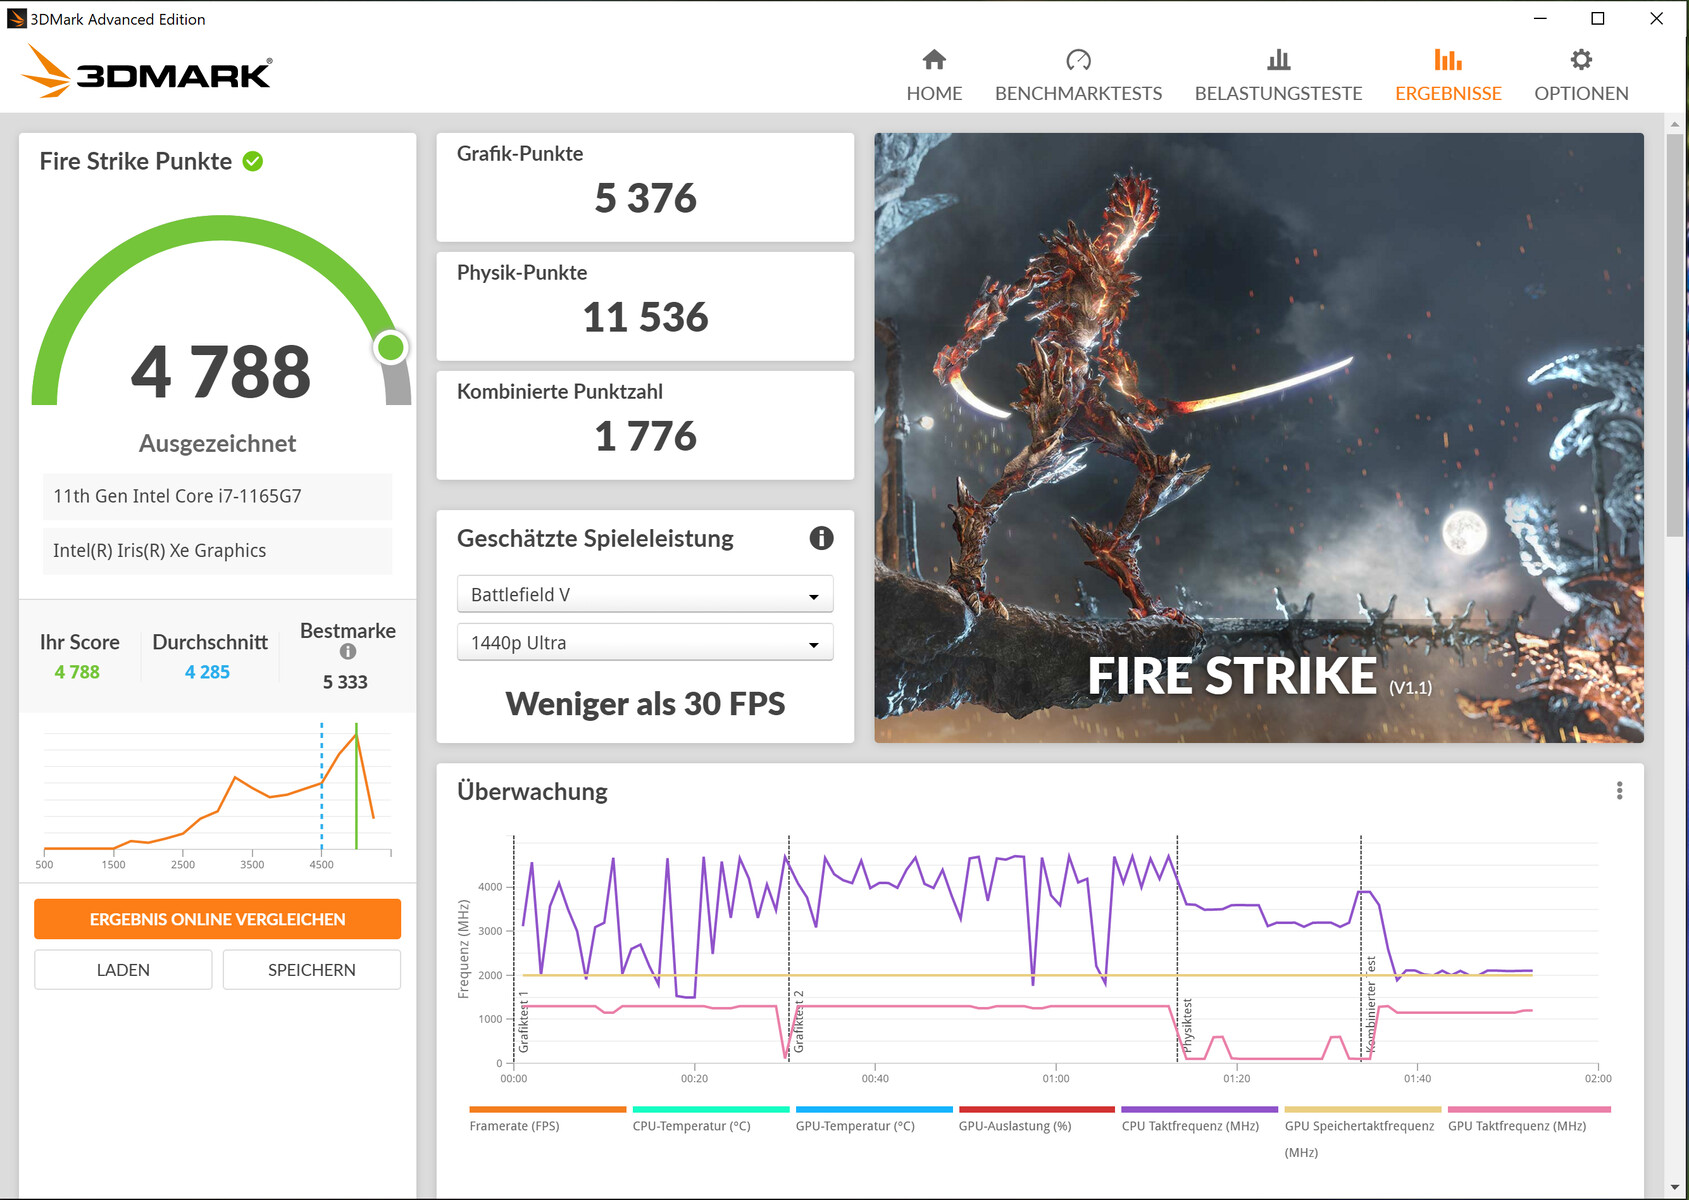
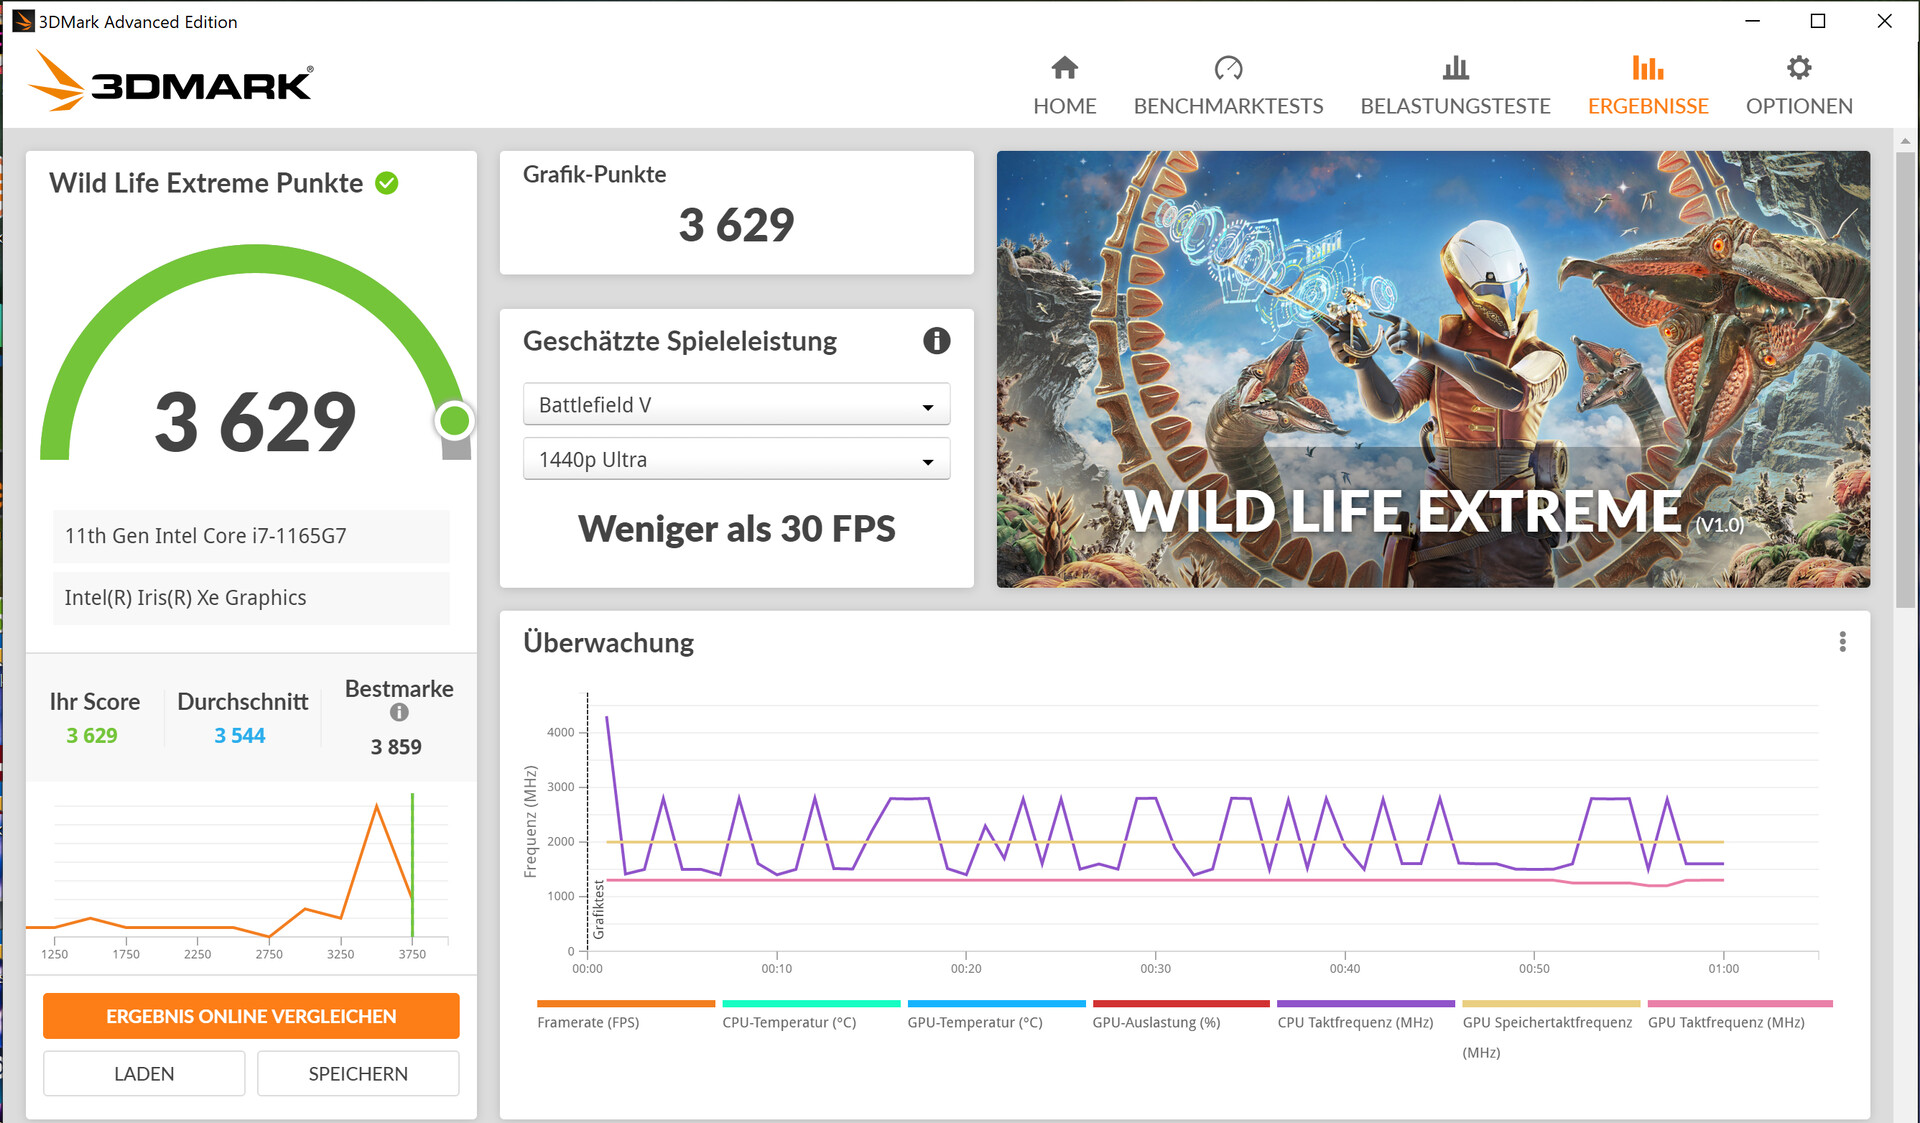
Intel’s Iris Xe Graphics G7 96EU supports DirectX 12 and can achieve core clocks of up to 1300 MHz. The integrated GPU performed as expected in our review. In performance mode, the GPU performs better in the 3DMark benchmarks than in standard mode.
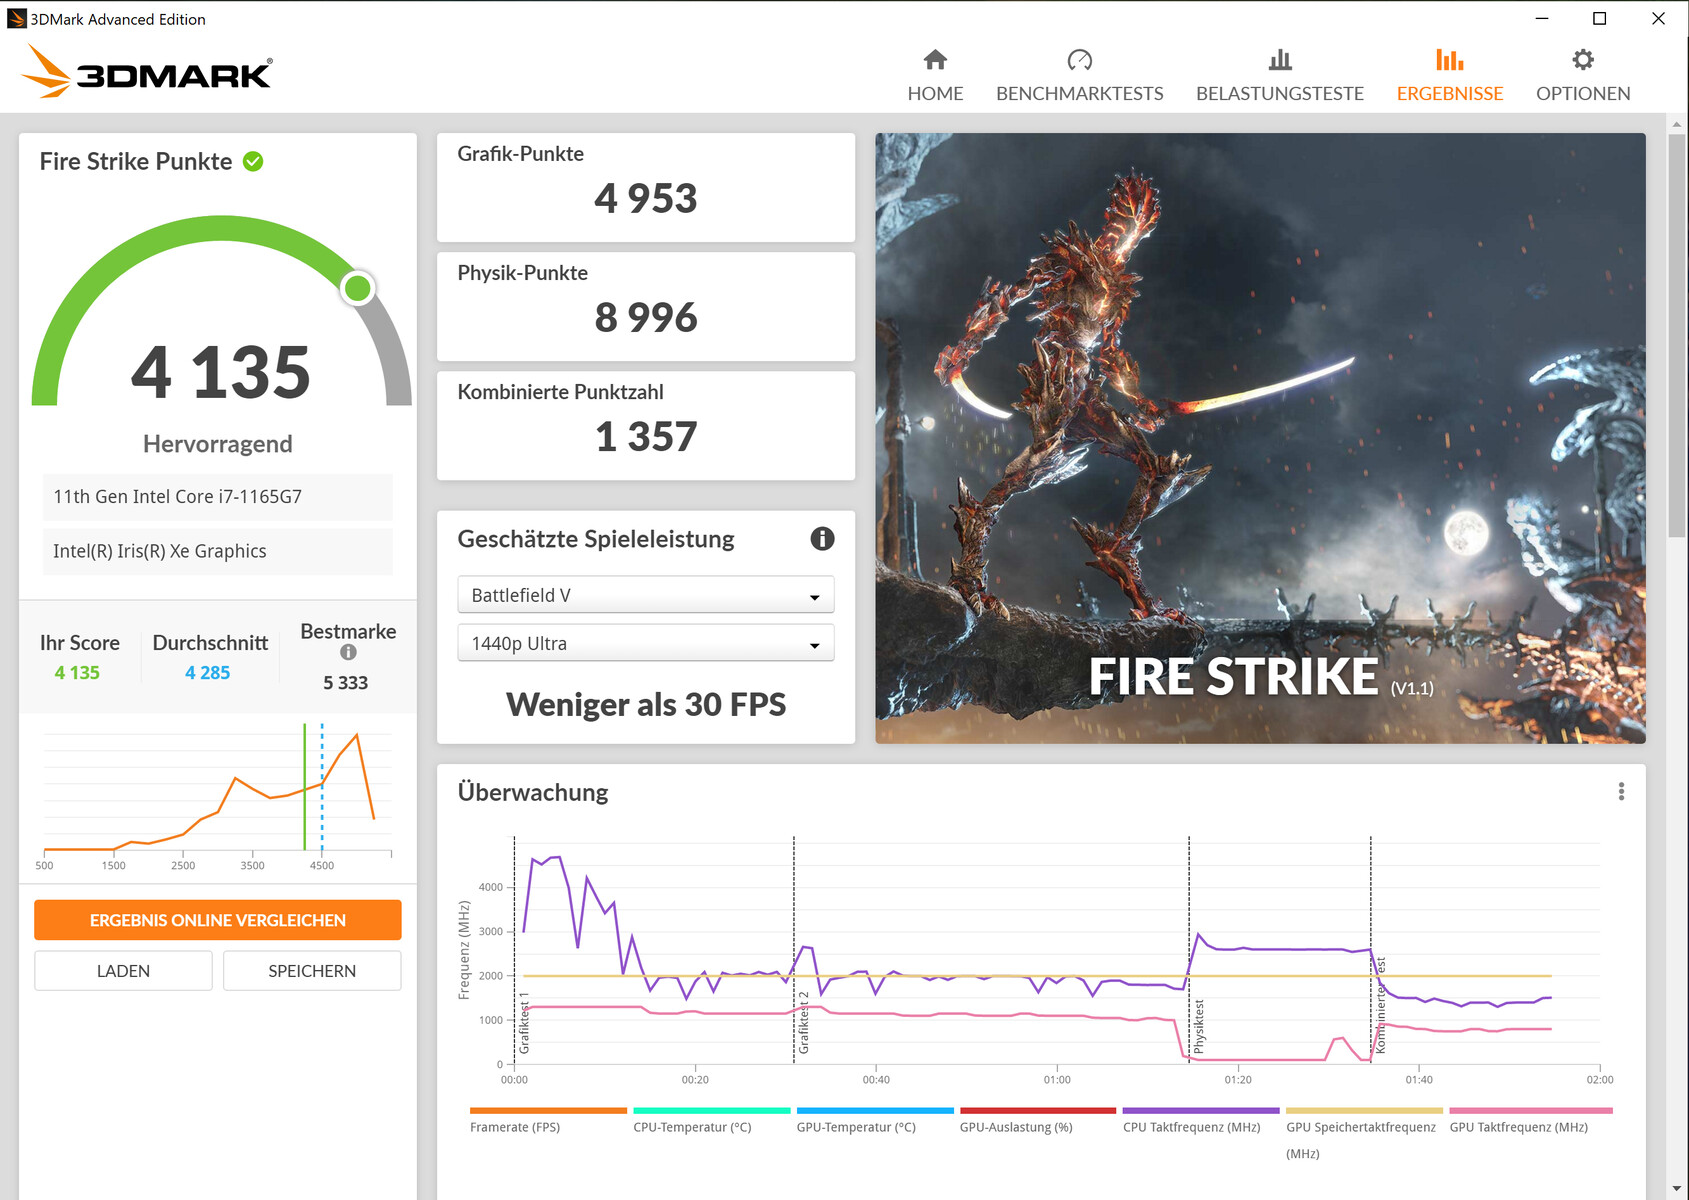

| 3DMark 11 Performance | 5952 points | |
| 3DMark Cloud Gate Standard Score | 14493 points | |
| 3DMark Fire Strike Score | 4135 points | |
| 3DMark Time Spy Score | 1522 points | |
Help | ||
Gaming Performance
Even though the HP laptop is not meant for gaming, it can still achieve playable frame rates in many titles—on low settings and at low resolutions. The iGPU can handle older and non-demanding games without any problems.
In performance mode, the Spectre x360 is able to achieve higher frame rates than in standard mode. The graph depicting the frame rates in The Witcher 3 reveals the difference in performance between the two modes.
| The Witcher 3 - 1366x768 Medium Graphics & Postprocessing | |
| MSI Summit E13 Flip Evo A11MT | |
| Lenovo Yoga 9 14 ITL 4K | |
| Average of class Convertible (44.3 - 77.6, n=3, last 2 years) | |
| HP Spectre x360 14-ea0378ng (Leistung) | |
| Average Intel Iris Xe Graphics G7 96EUs (21.4 - 77.8, n=185) | |
| HP Spectre x360 14t-ea000 | |
| HP Spectre x360 14-ea0378ng | |
| Dell XPS 13 7390 2-in-1 Core i7 | |
| Acer Spin 5 SP513-54N-79EY | |
| Samsung Galaxy Book Flex 13.3 | |
| Dota 2 Reborn - 1366x768 med (1/3) | |
| Average of class Convertible (38.2 - 192.3, n=49, last 2 years) | |
| Average Intel Iris Xe Graphics G7 96EUs (31.6 - 108.5, n=221) | |
| HP Spectre x360 14-ea0378ng (Leistung) | |
| MSI Summit E13 Flip Evo A11MT | |
| HP Spectre x360 14t-ea000 | |
| Acer Spin 5 SP513-54N-79EY | |
| Lenovo Yoga 9 14 ITL 4K | |
| HP Spectre x360 14-ea0378ng | |
| Samsung Galaxy Book Flex 13.3 | |
| X-Plane 11.11 - 1280x720 low (fps_test=1) | |
| Lenovo Yoga 9 14 ITL 4K | |
| Average of class Convertible (22.9 - 138.8, n=50, last 2 years) | |
| HP Spectre x360 14t-ea000 | |
| HP Spectre x360 14-ea0378ng (Leistung) | |
| Average Intel Iris Xe Graphics G7 96EUs (13.4 - 88.4, n=213) | |
| HP Spectre x360 14-ea0378ng | |
| MSI Summit E13 Flip Evo A11MT | |
| Samsung Galaxy Book Flex 13.3 | |
| Strange Brigade - 1280x720 lowest AF:1 | |
| Average of class Convertible (27.6 - 484, n=47, last 2 years) | |
| MSI Summit E13 Flip Evo A11MT (1.47.22.14 D3D12) | |
| HP Spectre x360 14-ea0378ng (1.47.22.14 D3D12, Leistung) | |
| HP Spectre x360 14-ea0378ng (1.47.22.14 D3D12) | |
| Average Intel Iris Xe Graphics G7 96EUs (48.5 - 115.1, n=172) | |
| Far Cry 5 - 1280x720 Low Preset AA:T | |
| Average of class Convertible (15 - 142, n=18, last 2 years) | |
| Average Intel Iris Xe Graphics G7 96EUs (23 - 75, n=93) | |
| HP Spectre x360 14-ea0378ng (Leistung) | |
| HP Spectre x360 14-ea0378ng | |
| Acer Spin 5 SP513-54N-79EY | |
| Samsung Galaxy Book Flex 13.3 | |
We use the video game titled The Witcher 3 to check if the frame rates can be maintained consistently over an extended period of time. For this, we run the game on the highest graphics settings at Full HD resolution (1920x1080) for one hour. Over the entire run of gameplay, the player-controlled character stands still. We did not observe any frame rate drops.
| low | med. | high | ultra | QHD | |
|---|---|---|---|---|---|
| The Witcher 3 (2015) | 64.4 | 43 | 18.8 | 15 | |
| Dota 2 Reborn (2015) | 75.9 | 46.5 | 41.3 | 34.6 | |
| X-Plane 11.11 (2018) | 39 | 34.6 | 27.6 | ||
| Far Cry 5 (2018) | 39 | 18 | 21 | 16 | 13 |
| Strange Brigade (2018) | 87 | 33.2 | 28.5 | 21.6 | |
| Shadow of the Tomb Raider (2018) | 29 | 18 | 15 | 14 | 11 |
Emissions - The HP laptop is neither too hot nor too loud
System Noise
When idle, the fans often stand still, which leads to silent operation. Under load, the fans start spinning. Under medium load, we measured a maximum sound pressure level of 37.5 dB(A)
Noise level
| Idle |
| 26 / 26 / 26 dB(A) |
| Load |
| 37.5 / 36.3 dB(A) |
 | ||
30 dB silent 40 dB(A) audible 50 dB(A) loud |
||
min: | ||
| HP Spectre x360 14-ea0378ng i7-1165G7, Iris Xe G7 96EUs | Samsung Galaxy Book Flex 13.3 i5-1035G4, Iris Plus Graphics G4 (Ice Lake 48 EU) | MSI Summit E13 Flip Evo A11MT i7-1185G7, Iris Xe G7 96EUs | HP Spectre x360 14t-ea000 i7-1165G7, Iris Xe G7 96EUs | Dell XPS 13 7390 2-in-1 Core i7 i7-1065G7, Iris Plus Graphics G7 (Ice Lake 64 EU) | Lenovo Yoga 9 14 ITL 4K i7-1185G7, Iris Xe G7 96EUs | Acer Spin 5 SP513-54N-79EY i7-1065G7, Iris Plus Graphics G7 (Ice Lake 64 EU) | Average Intel Iris Xe Graphics G7 96EUs | Average of class Convertible | |
|---|---|---|---|---|---|---|---|---|---|
| Noise | -10% | -4% | 3% | -6% | -5% | 2% | -0% | 2% | |
| off / environment * (dB) | 26 | 30.7 -18% | 24.5 6% | 25.8 1% | 28.1 -8% | 24.9 4% | 26.9 -3% | 24.9 ? 4% | 24 ? 8% |
| Idle Minimum * (dB) | 26 | 30.7 -18% | 24.7 5% | 25.9 -0% | 28.1 -8% | 24.9 4% | 26.9 -3% | 25.4 ? 2% | 24.3 ? 7% |
| Idle Average * (dB) | 26 | 30.7 -18% | 24.7 5% | 25.9 -0% | 28.1 -8% | 28.3 -9% | 26.9 -3% | 25.6 ? 2% | 24.7 ? 5% |
| Idle Maximum * (dB) | 26 | 30.7 -18% | 26.4 -2% | 25.9 -0% | 28.1 -8% | 29.5 -13% | 27.8 -7% | 26.8 ? -3% | 25.4 ? 2% |
| Load Average * (dB) | 37.5 | 34.8 7% | 37.8 -1% | 26.4 30% | 31.7 15% | 39.7 -6% | 30.5 19% | 35.6 ? 5% | 34.8 ? 7% |
| Load Maximum * (dB) | 36.3 | 34.5 5% | 48.8 -34% | 41.5 -14% | 43.4 -20% | 39.7 -9% | 32.4 11% | 40.8 ? -12% | 42.3 ? -17% |
| Witcher 3 ultra * (dB) | 34.5 | 41.4 | 36.9 | 43.4 | 39.7 |
* ... smaller is better
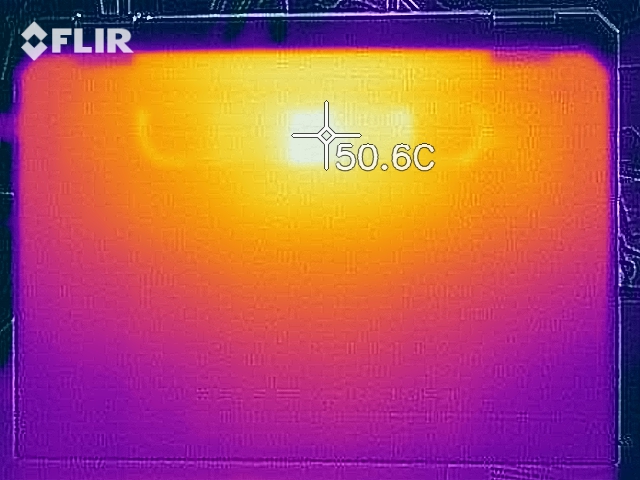
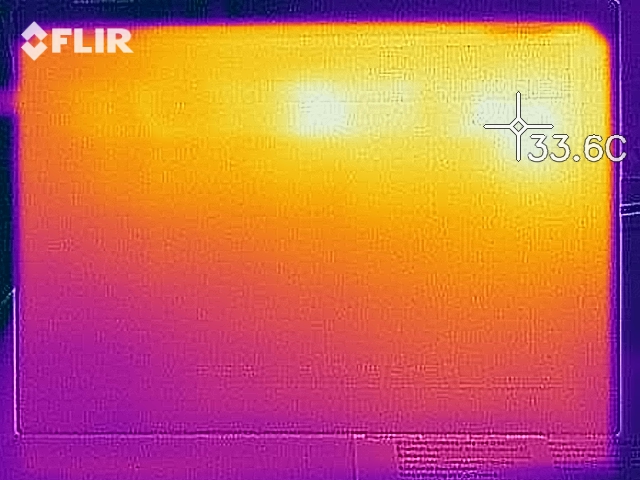
Temperature
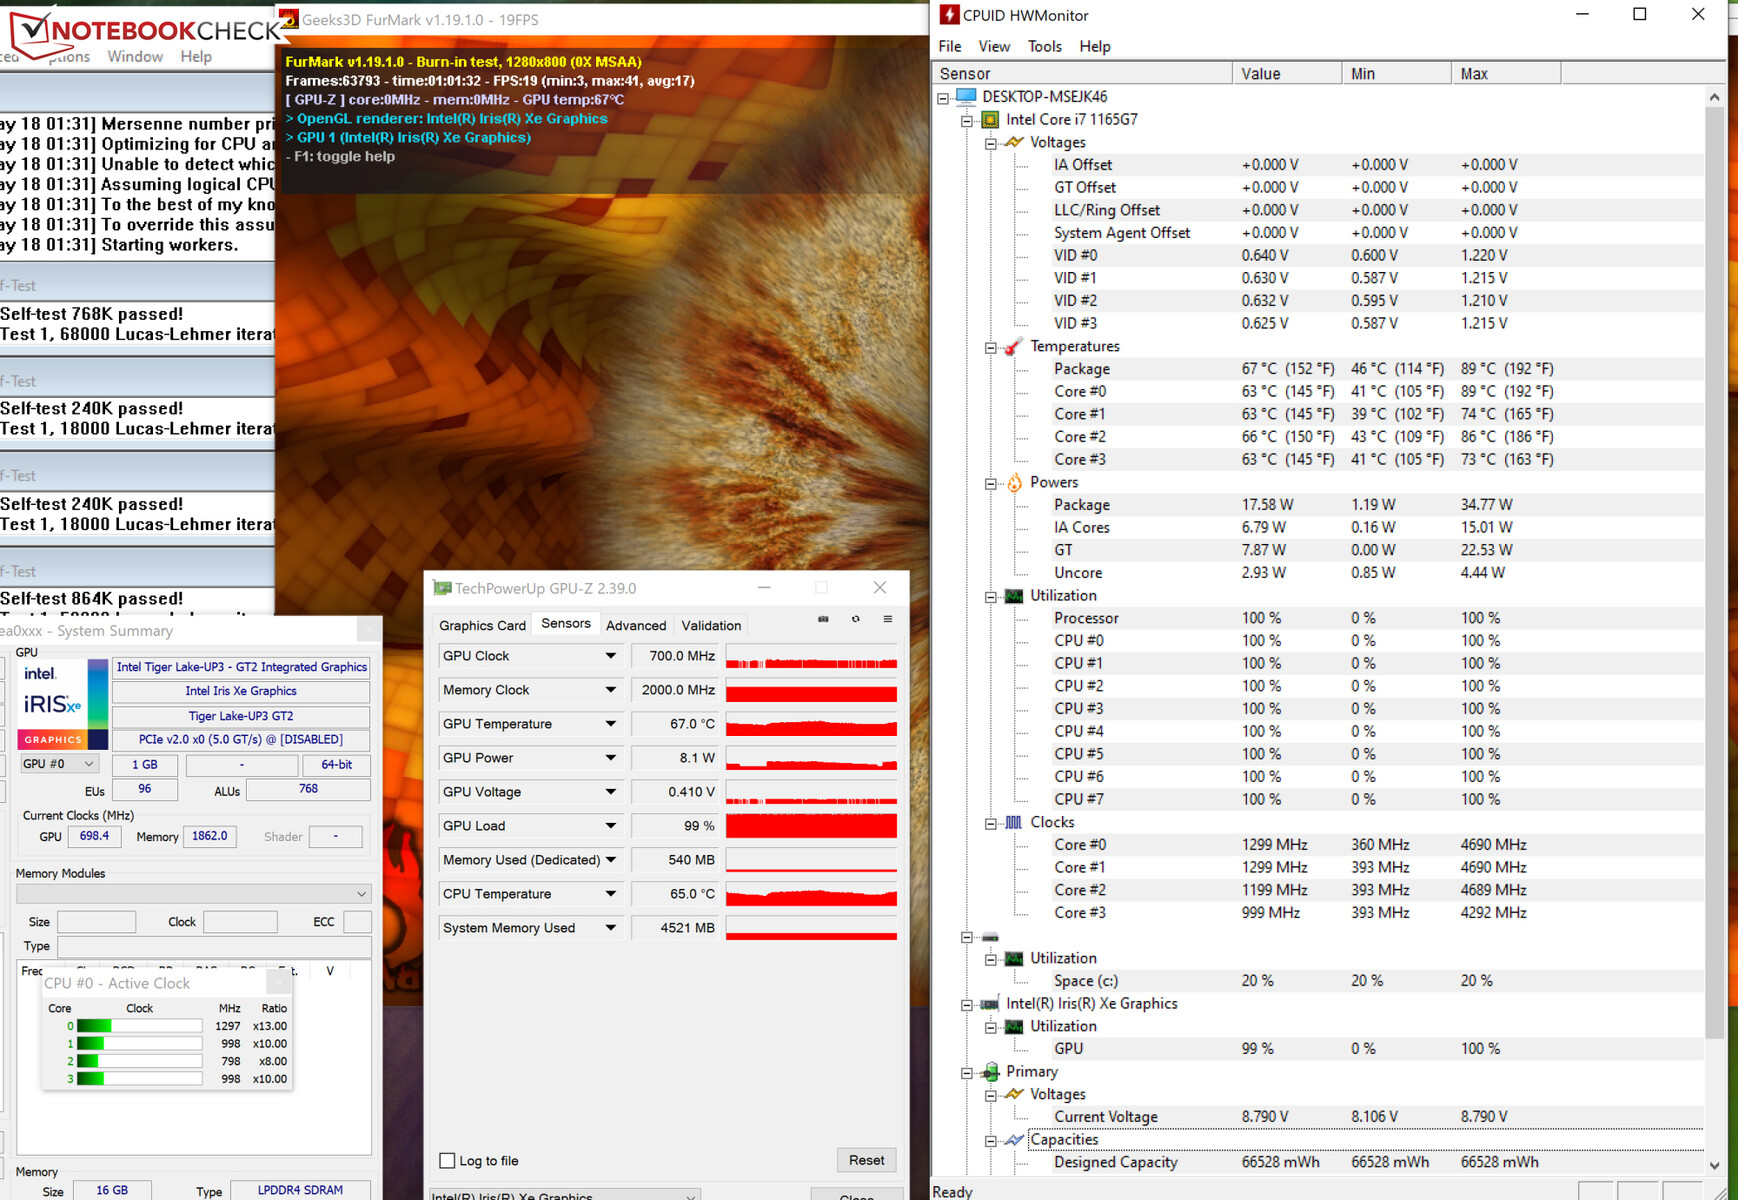
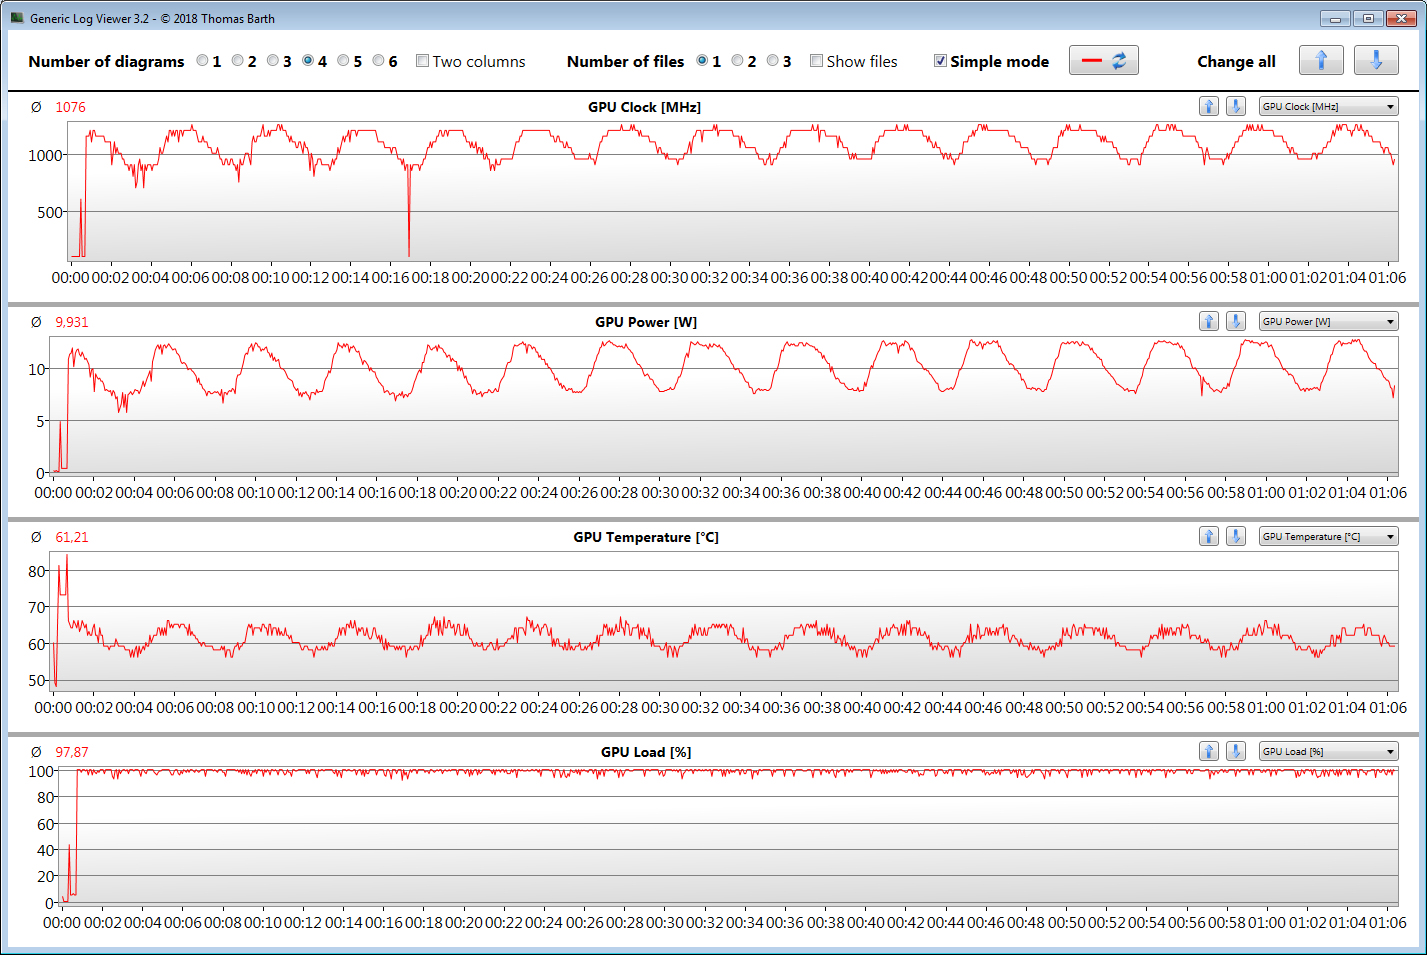
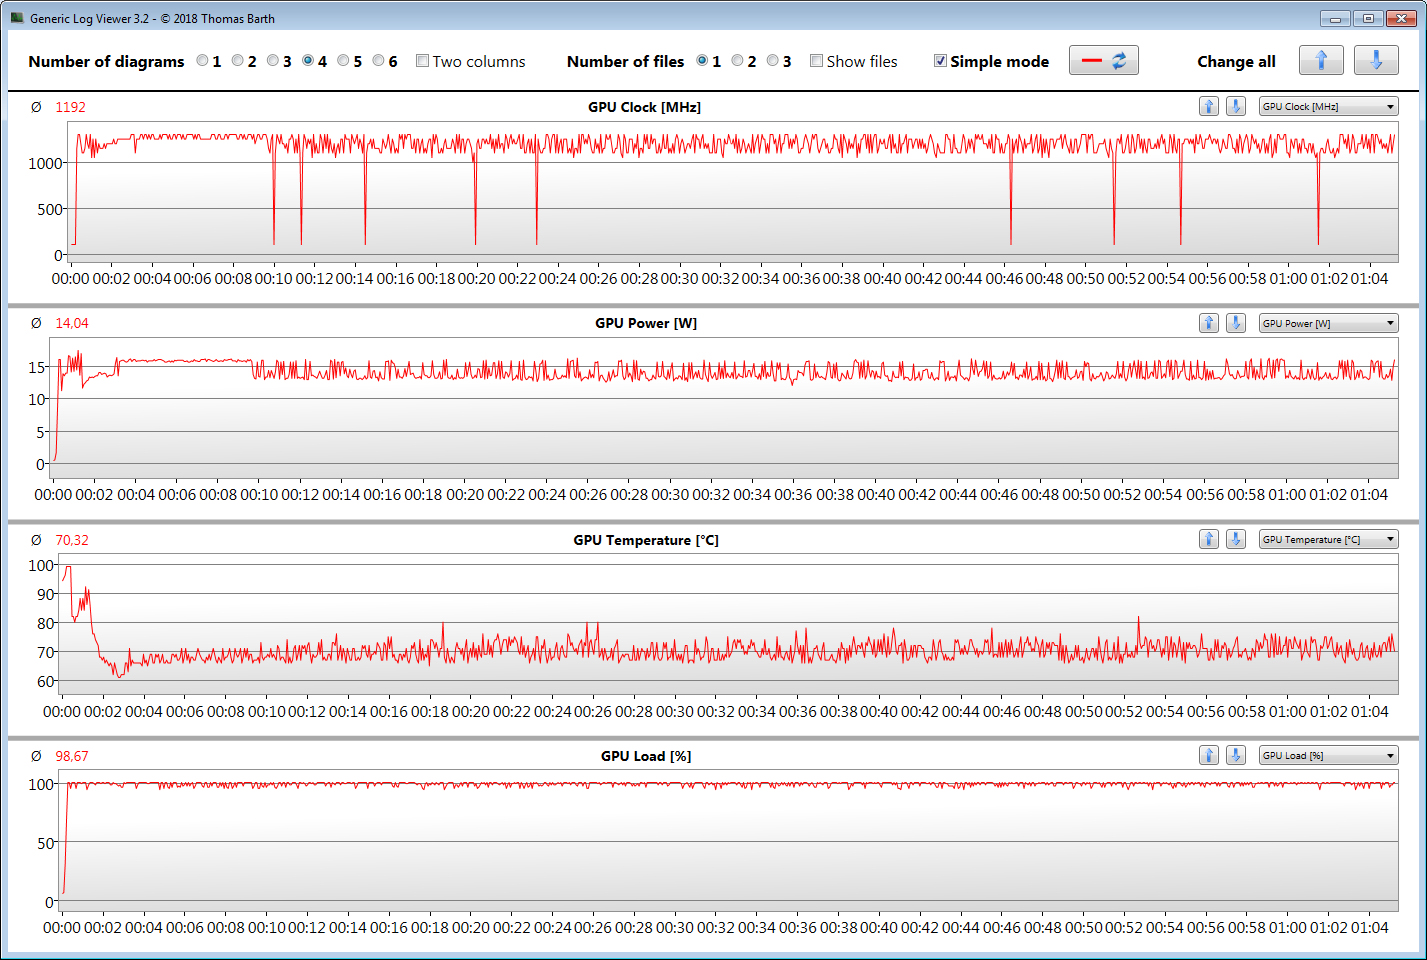
In our stress test (Prime95 and FurMark running continuously for at least one hour), the processor operated at 800 to 1300 MHz and the GPU ran at 700 MHz. The stress test is an extreme case scenario, which is very unlikely to occur in real life. We use it to test system stability.
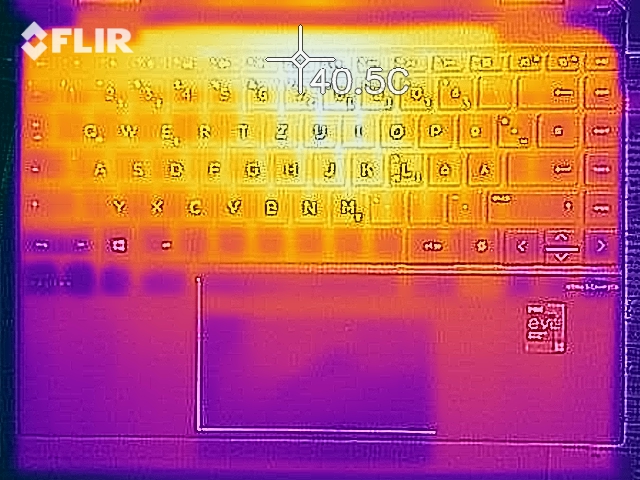
The Spectre x360 14 does not get considerably hot. During our stress test, the 40-°C (104 °F) mark was exceeded at two measurement points. In day-to-day use, the temperatures always remain reasonable.
(+) The maximum temperature on the upper side is 37.1 °C / 99 F, compared to the average of 35.4 °C / 96 F, ranging from 19.6 to 60 °C for the class Convertible.
(±) The bottom heats up to a maximum of 43.1 °C / 110 F, compared to the average of 36.9 °C / 98 F
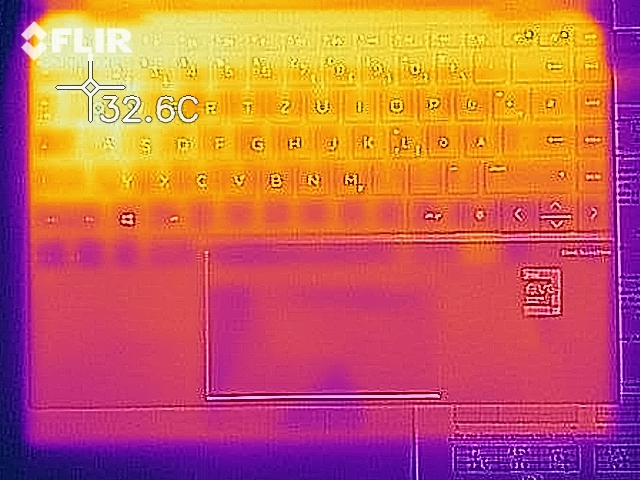
(+) In idle usage, the average temperature for the upper side is 25.4 °C / 78 F, compared to the device average of 30.3 °C / 87 F.
(+) The palmrests and touchpad are cooler than skin temperature with a maximum of 27.8 °C / 82 F and are therefore cool to the touch.
(±) The average temperature of the palmrest area of similar devices was 28 °C / 82.4 F (+0.2 °C / 0.4 F).
| HP Spectre x360 14-ea0378ng i7-1165G7, Iris Xe G7 96EUs | Samsung Galaxy Book Flex 13.3 i5-1035G4, Iris Plus Graphics G4 (Ice Lake 48 EU) | MSI Summit E13 Flip Evo A11MT i7-1185G7, Iris Xe G7 96EUs | HP Spectre x360 14t-ea000 i7-1165G7, Iris Xe G7 96EUs | Dell XPS 13 7390 2-in-1 Core i7 i7-1065G7, Iris Plus Graphics G7 (Ice Lake 64 EU) | Lenovo Yoga 9 14 ITL 4K i7-1185G7, Iris Xe G7 96EUs | Acer Spin 5 SP513-54N-79EY i7-1065G7, Iris Plus Graphics G7 (Ice Lake 64 EU) | Average Intel Iris Xe Graphics G7 96EUs | Average of class Convertible | |
|---|---|---|---|---|---|---|---|---|---|
| Heat | -1% | -25% | -7% | -18% | -1% | 3% | -4% | -2% | |
| Maximum Upper Side * (°C) | 37.1 | 41.6 -12% | 52 -40% | 40.4 -9% | 51.4 -39% | 42 -13% | 38.7 -4% | 41.4 ? -12% | 42 ? -13% |
| Maximum Bottom * (°C) | 43.1 | 40.6 6% | 57.4 -33% | 52.8 -23% | 46.4 -8% | 48.6 -13% | 40.2 7% | 44.5 ? -3% | 43.6 ? -1% |
| Idle Upper Side * (°C) | 29 | 28.1 3% | 30.4 -5% | 27.2 6% | 32 -10% | 25.3 13% | 27.8 4% | 28.3 ? 2% | 27.5 ? 5% |
| Idle Bottom * (°C) | 28.6 | 28.2 1% | 34.2 -20% | 29.2 -2% | 32.8 -15% | 25.5 11% | 27.3 5% | 29.2 ? -2% | 28.5 ? -0% |
* ... smaller is better
Speakers
HP Spectre x360 14-ea0378ng audio analysis
(±) | speaker loudness is average but good (78.5 dB)
Bass 100 - 315 Hz
(-) | nearly no bass - on average 18.2% lower than median
(±) | linearity of bass is average (10% delta to prev. frequency)
Mids 400 - 2000 Hz
(+) | balanced mids - only 2.2% away from median
(+) | mids are linear (5.5% delta to prev. frequency)
Highs 2 - 16 kHz
(+) | balanced highs - only 4.3% away from median
(+) | highs are linear (5.7% delta to prev. frequency)
Overall 100 - 16.000 Hz
(±) | linearity of overall sound is average (15.2% difference to median)
Compared to same class
» 24% of all tested devices in this class were better, 5% similar, 71% worse
» The best had a delta of 6%, average was 20%, worst was 57%
Compared to all devices tested
» 22% of all tested devices were better, 4% similar, 74% worse
» The best had a delta of 4%, average was 23%, worst was 134%
Energy Management - HP’s 2-in-1 device offers great battery runtimes
Energy Consumption
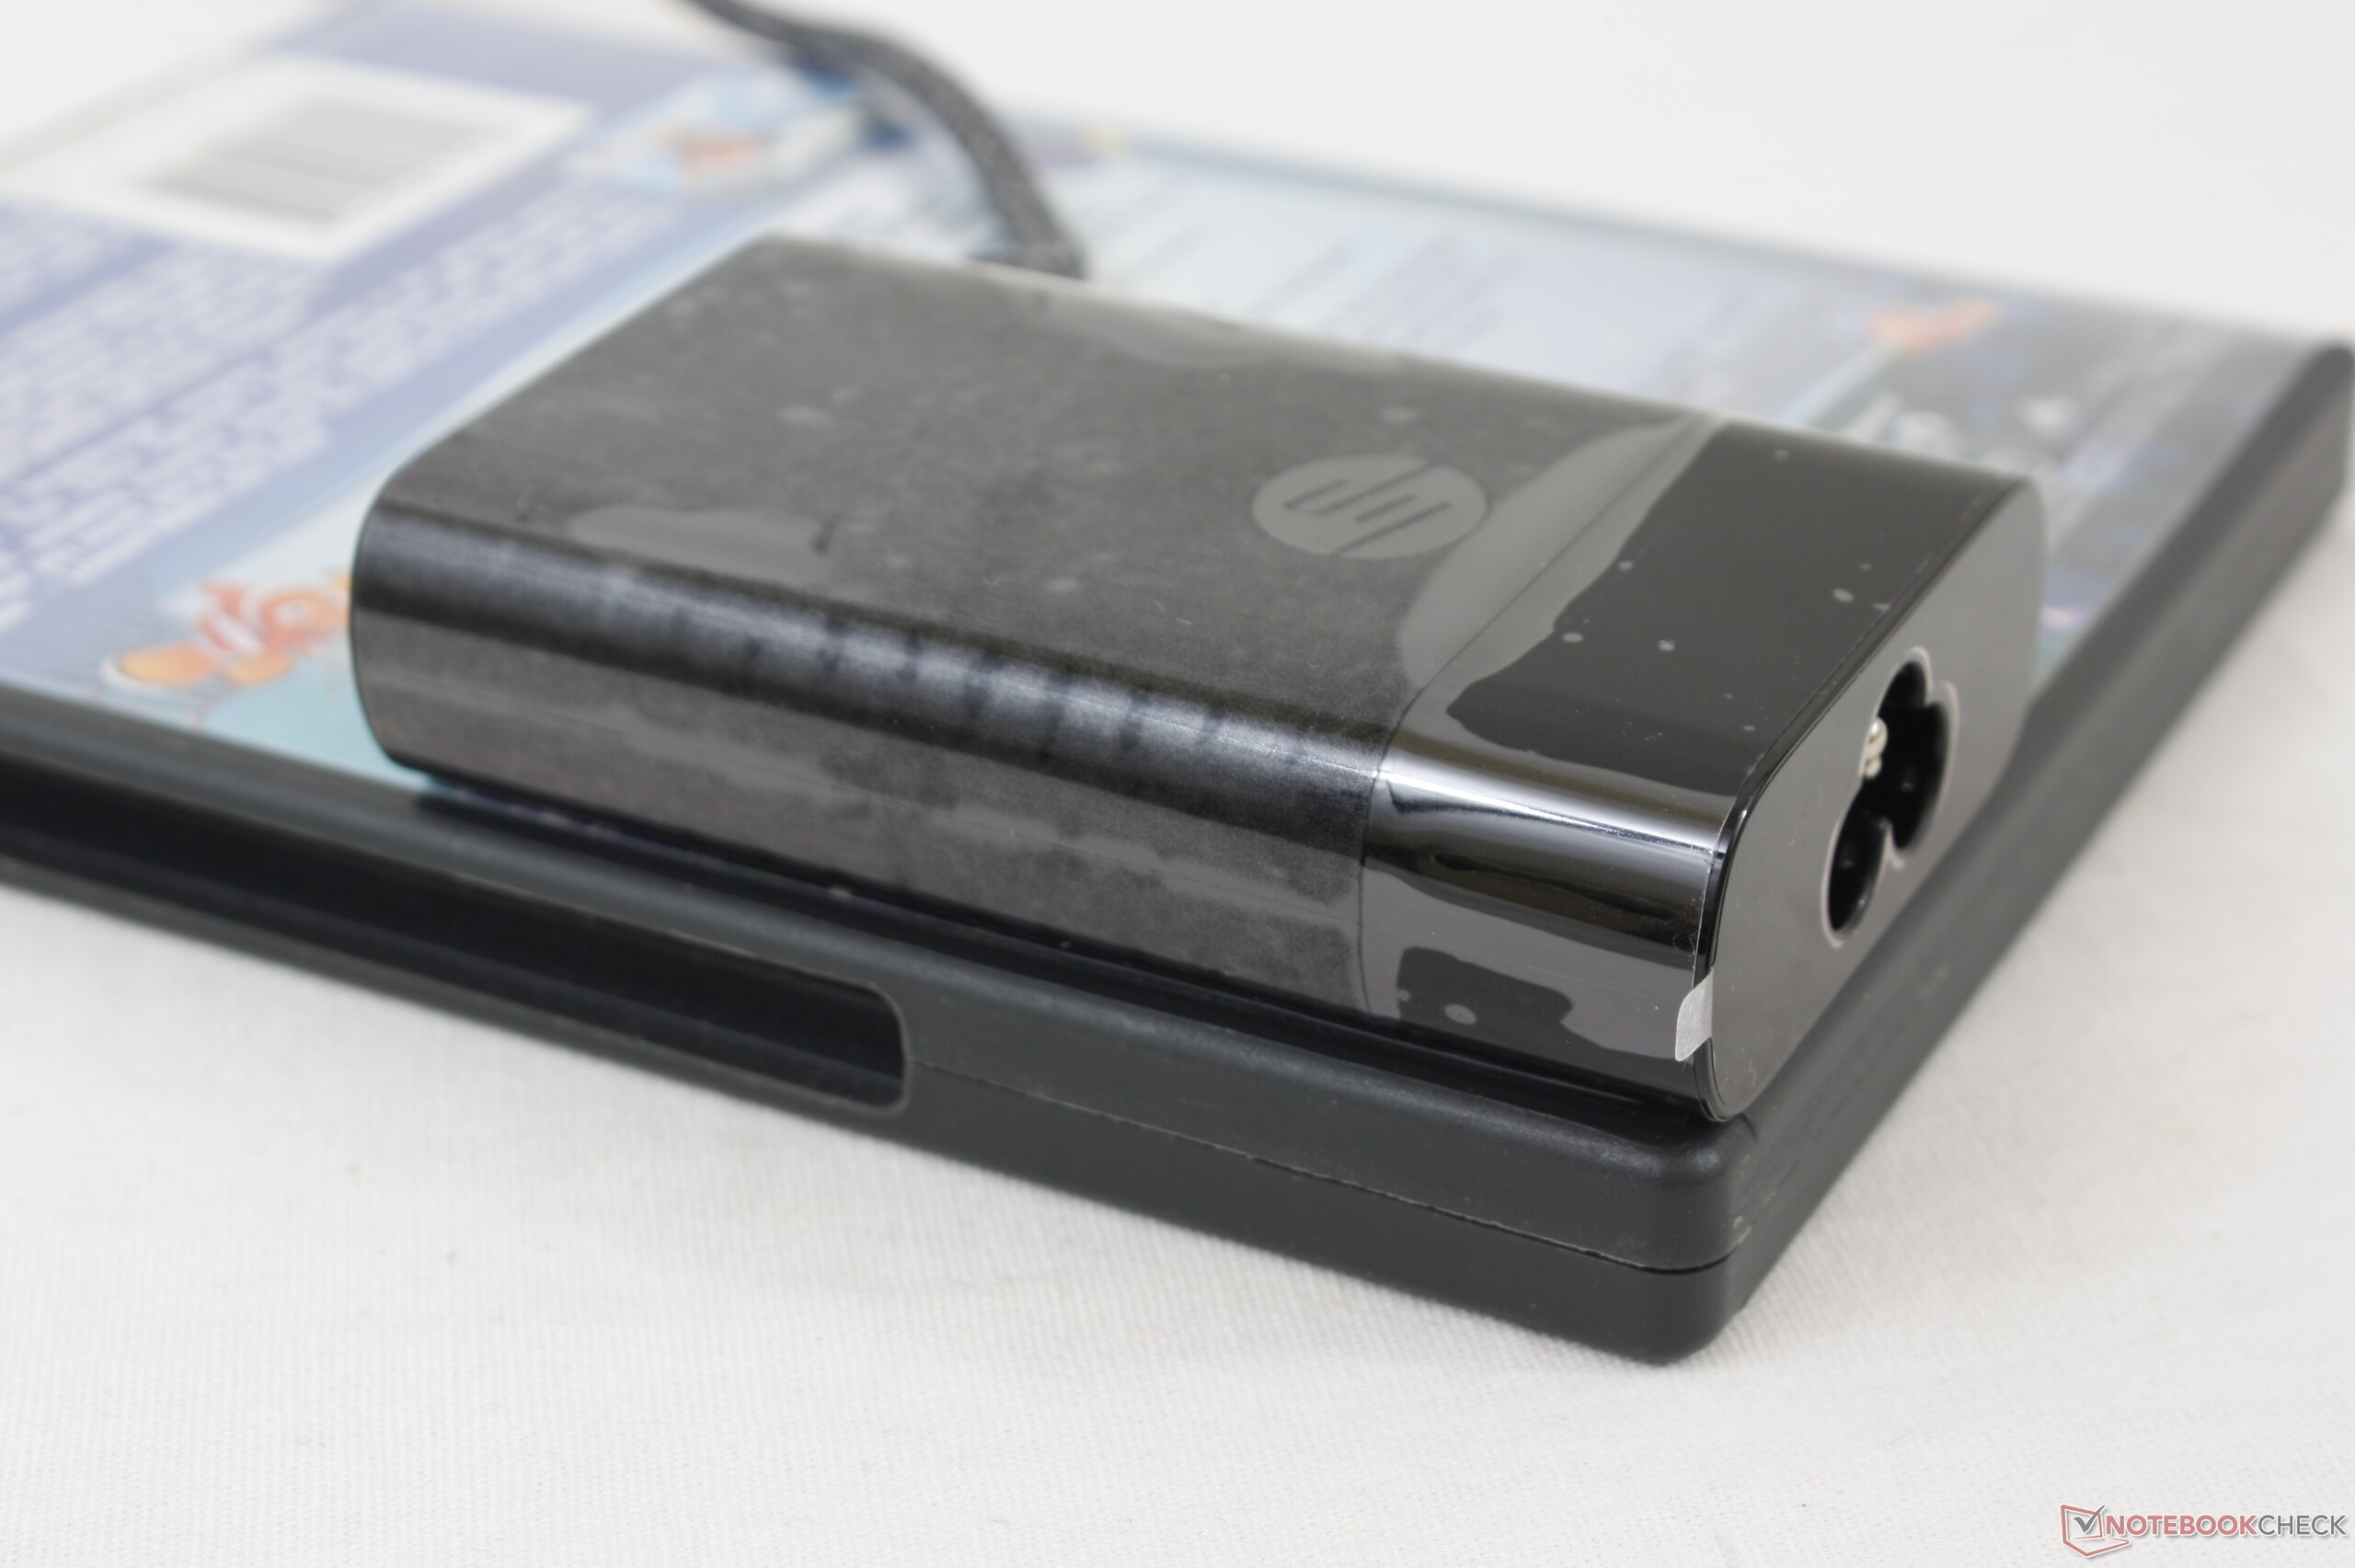
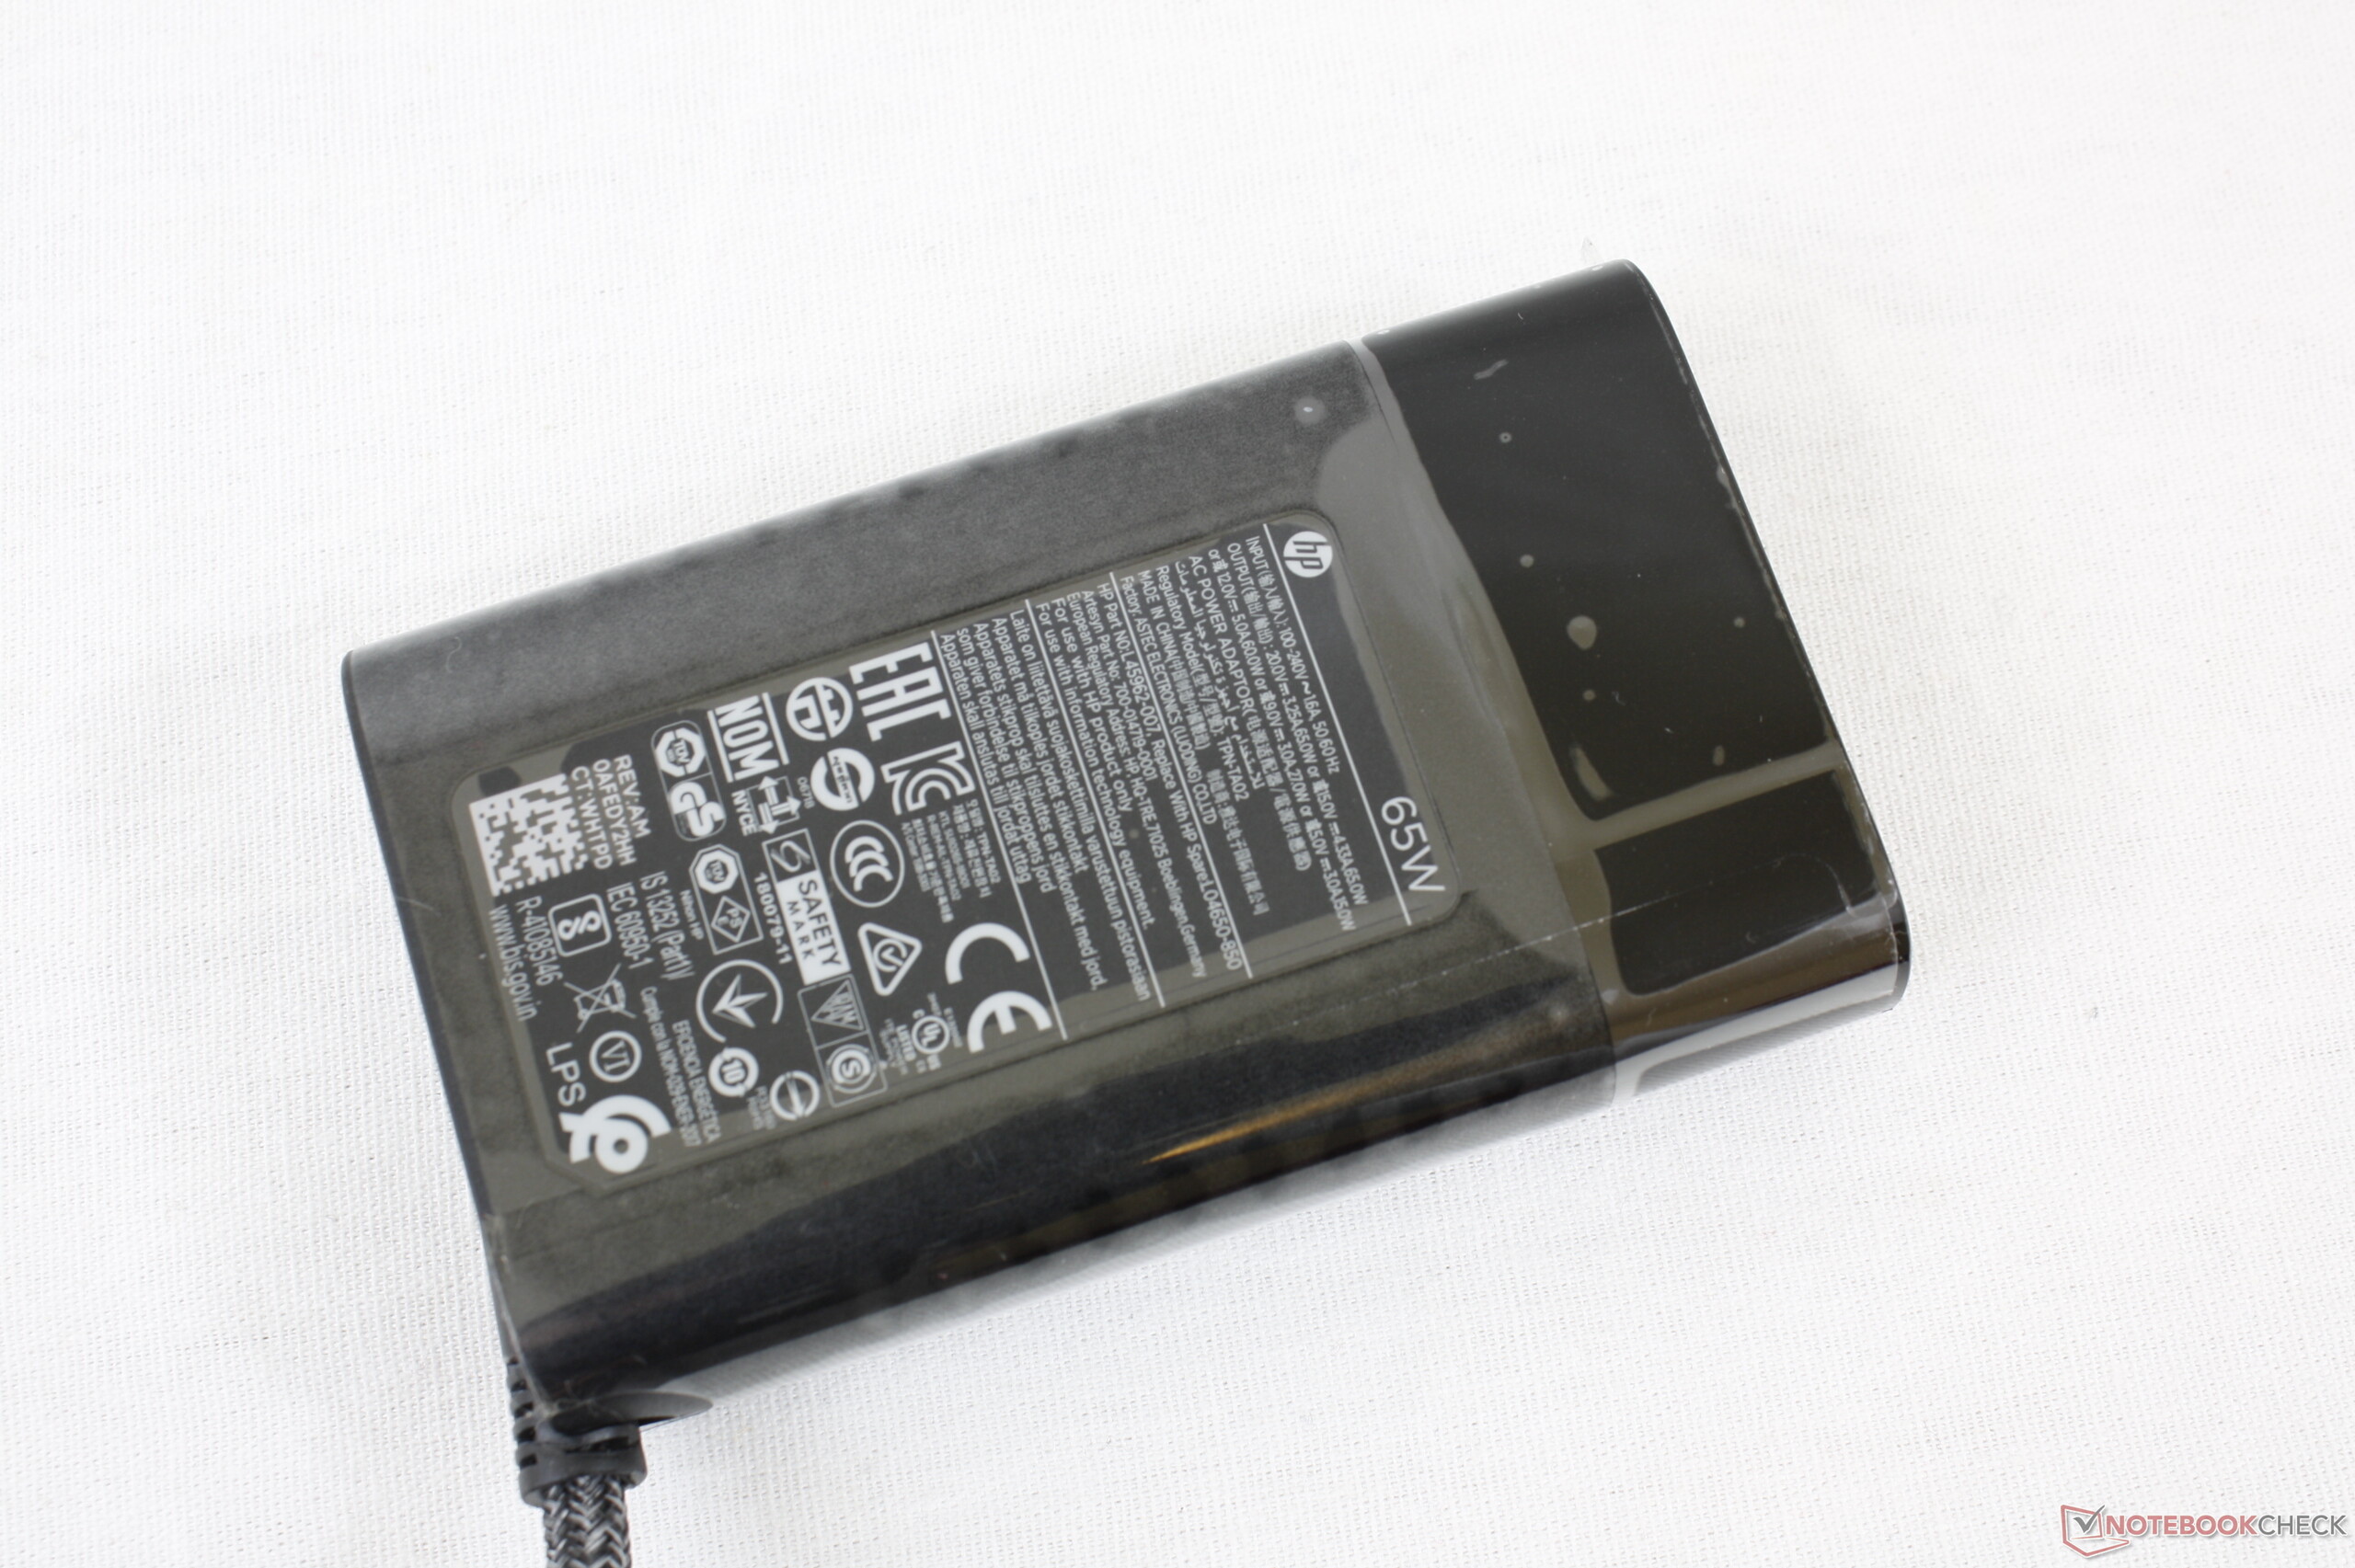
When idle, the maximum power draw amounted to 13.3 W. During our stress test, the energy consumption peaked at 35.6 W. The maximum power draw of our current review device is 20 watts lower than that of the sibling model. The rated output of the proprietary AC adapter is 65 W. The Spectre x360 14 can also be charged via a USB-C port.
| Off / Standby | |
| Idle | |
| Load |
|
Key:
min: | |
| HP Spectre x360 14-ea0378ng i7-1165G7, Iris Xe G7 96EUs | Samsung Galaxy Book Flex 13.3 i5-1035G4, Iris Plus Graphics G4 (Ice Lake 48 EU) | MSI Summit E13 Flip Evo A11MT i7-1185G7, Iris Xe G7 96EUs | HP Spectre x360 14t-ea000 i7-1165G7, Iris Xe G7 96EUs | Dell XPS 13 7390 2-in-1 Core i7 i7-1065G7, Iris Plus Graphics G7 (Ice Lake 64 EU) | Lenovo Yoga 9 14 ITL 4K i7-1185G7, Iris Xe G7 96EUs | Acer Spin 5 SP513-54N-79EY i7-1065G7, Iris Plus Graphics G7 (Ice Lake 64 EU) | Average Intel Iris Xe Graphics G7 96EUs | Average of class Convertible | |
|---|---|---|---|---|---|---|---|---|---|
| Power Consumption | 15% | -10% | 15% | 17% | -12% | 27% | -16% | -3% | |
| Idle Minimum * (Watt) | 6.3 | 3.3 48% | 4.8 24% | 3 52% | 2.6 59% | 4.2 33% | 2.8 56% | 5.51 ? 13% | 4.2 ? 33% |
| Idle Average * (Watt) | 11.2 | 8.9 21% | 8.4 25% | 5.1 54% | 5.3 53% | 10 11% | 5.4 52% | 8.66 ? 23% | 6.87 ? 39% |
| Idle Maximum * (Watt) | 13.3 | 10.4 22% | 8.6 35% | 6.4 52% | 7 47% | 13.2 1% | 7.6 43% | 10.9 ? 18% | 8.57 ? 36% |
| Load Average * (Watt) | 32 | 40 -25% | 47.1 -47% | 39.6 -24% | 43.1 -35% | 42.4 -33% | 36.6 -14% | 45.6 ? -43% | 44.1 ? -38% |
| Load Maximum * (Watt) | 35.6 | 32 10% | 65.9 -85% | 56.2 -58% | 49 -38% | 60.5 -70% | 37 -4% | 67.8 ? -90% | 66.4 ? -87% |
| Witcher 3 ultra * (Watt) | 28 | 51.6 | 39.6 | 43.1 | 43 |
* ... smaller is better
Battery Life
The Spectre x360 lasted 7h and 46m in our Wi-Fi test, which we conduct by running a script that simulates loads that are consistent with browsing the Internet. In our video test (playing back an H.264 video in a loop), the HP laptop lasted 11h and 6m. System settings: The power saving functions are disabled and the brightness is set to 150 cd/m². Moreover, the communications modules are switched off in the video test.
"HP Command Center" features a battery-saving mode which can only be used when the device is running on battery power. In this mode, the Spectre x360 achieved a battery runtime of 8h and 25m in our Wi-Fi test. Here, the brightness was also set to 150 cd/m².
| HP Spectre x360 14-ea0378ng i7-1165G7, Iris Xe G7 96EUs, 66 Wh | Samsung Galaxy Book Flex 13.3 i5-1035G4, Iris Plus Graphics G4 (Ice Lake 48 EU), 69.7 Wh | MSI Summit E13 Flip Evo A11MT i7-1185G7, Iris Xe G7 96EUs, 70 Wh | HP Spectre x360 14t-ea000 i7-1165G7, Iris Xe G7 96EUs, 66 Wh | Dell XPS 13 7390 2-in-1 Core i7 i7-1065G7, Iris Plus Graphics G7 (Ice Lake 64 EU), 51 Wh | Lenovo Yoga 9 14 ITL 4K i7-1185G7, Iris Xe G7 96EUs, 60 Wh | Acer Spin 5 SP513-54N-79EY i7-1065G7, Iris Plus Graphics G7 (Ice Lake 64 EU), 55 Wh | Average of class Convertible | |
|---|---|---|---|---|---|---|---|---|
| Battery runtime | -7% | 23% | 72% | 15% | -11% | 23% | 43% | |
| Reader / Idle (h) | 13.4 | 11.6 -13% | 21.1 57% | 36.4 172% | 21.7 62% | 28.7 ? 114% | ||
| H.264 (h) | 11.1 | 9.9 -11% | 10.5 -5% | 15 ? 35% | ||||
| WiFi v1.3 (h) | 7.8 | 7.2 -8% | 11.2 44% | 11.8 51% | 9 15% | 8.9 14% | 10.8 38% | 12.1 ? 55% |
| Load (h) | 2.6 | 2.6 0% | 1.8 -31% | 2.4 -8% | 1.7 -35% | 2.5 -4% | 1.748 ? -33% |
Pros
Cons
Verdict
Thanks to the Core i7-1165G7, 16 GB of dual-channel RAM (soldered-in, non-expandable) and a 1 TB SSD, the Spectre x360 14 can handle all workloads that are relevant for a device like this. Two Thunderbolt 4/USB 4 ports allow users to connect docking stations or even an external GPU to the convertible.
The OLED screen with a 3:2 aspect ratio is the main feature of the HP Spectre x360 14.
The battery life of the Spectre x360 14 is on a good level, but it is significantly shorter than that of the sibling model. The high-resolution screen is likely to blame for this. The HP Spectre x360 13 (4K, OLED) also had the same problem. The keyboard is very, very good, though.
The OLED touchscreen (3000x2000) offers a superb contrast ratio, good brightness, outstanding colour reproduction, great viewing angles, good colour space coverage (sRGB: 100 %), and fast response times. The main drawback of the OLED display is the low-frequency flickering. The touchscreen can recognise inputs from the included HP Tilt Pen MPP 2.0 and fingers.
Price and Availability
The Spectre x360 14 (Core i7-1165G7, 16 GB RAM, 1 TB SSD, 3K OLED) is currently available on bestbuy.com for $1719.99.
HP Spectre x360 14-ea0378ng
- 05/25/2021 v7 (old)
Sascha Mölck
Price comparison

