HP Pavilion 15 (2021) Laptop Review: 11th Gen Intel and GeForce MX450 Combo
It's been two years since we last reviewed a standard HP Pavilion 15 and a lot has changed since then. HP has updated the chassis design as well as the 8th gen Whiskey Lake-U CPU and GeForce MX250 GPU to 11th gen Tiger Lake-U and the MX450, respectively. The Pavilion name carries some of HP's most affordable laptops in contrast to the higher-end Envy series and flagship Spectre series.
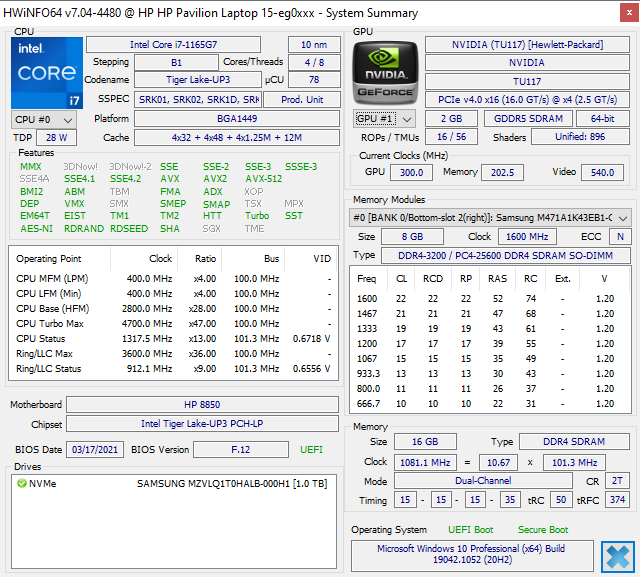
The system we're looking at today has been fully configured with the Core i7-1165G7 CPU, 16 GB of RAM, 1 TB PCIe SSD, and dedicated Nvidia graphics for about $1100 USD. Its specifications are therefore higher than your typical budget Ultrabook especially in terms of graphics as many in this category have no Nvidia options at all.
Competitors to the Pavilion 15 include other entry-level 15.6-inch multimedia laptops like the Dell Inspiron 15 5502, Lenovo IdeaPad 5 15, Honor MagicBook 15, or Asus VivoBook S15 S533EQ.
More HP reviews:
potential competitors in comparison
Rating | Date | Model | Weight | Height | Size | Resolution | Price |
|---|---|---|---|---|---|---|---|
| 81.2 % v7 (old) | 06 / 2021 | HP Pavilion 15-eg i7-1165G7, GeForce MX450 | 1.7 kg | 17.9 mm | 15.60" | 1920x1080 | |
| 75.4 % v7 (old) | 03 / 2020 | HP Pavilion Gaming 15-ec0002ng R5 3550H, GeForce GTX 1050 Mobile | 2.3 kg | 23.5 mm | 15.60" | 1920x1080 | |
| 78.2 % v7 (old) | 12 / 2020 | Dell Inspiron 15 5000 5502 i3-1115G4, UHD Graphics Xe G4 48EUs | 1.6 kg | 17.9 mm | 15.60" | 1920x1080 | |
| 83 % v7 (old) | 07 / 2020 | Lenovo IdeaPad 5 15IIL05 i5-1035G1, GeForce MX350 | 1.7 kg | 17.9 mm | 15.60" | 1920x1080 | |
| 83 % v7 (old) | 08 / 2020 | HP Envy 15-ep0098nr i7-10750H, GeForce RTX 2060 Max-Q | 2 kg | 19 mm | 15.60" | 3840x2160 | |
| 83.4 % v7 (old) | 12 / 2020 | Asus VivoBook S15 S533EQ-BQ002T i7-1165G7, GeForce MX350 | 1.8 kg | 16.1 mm | 15.60" | 1920x1080 |
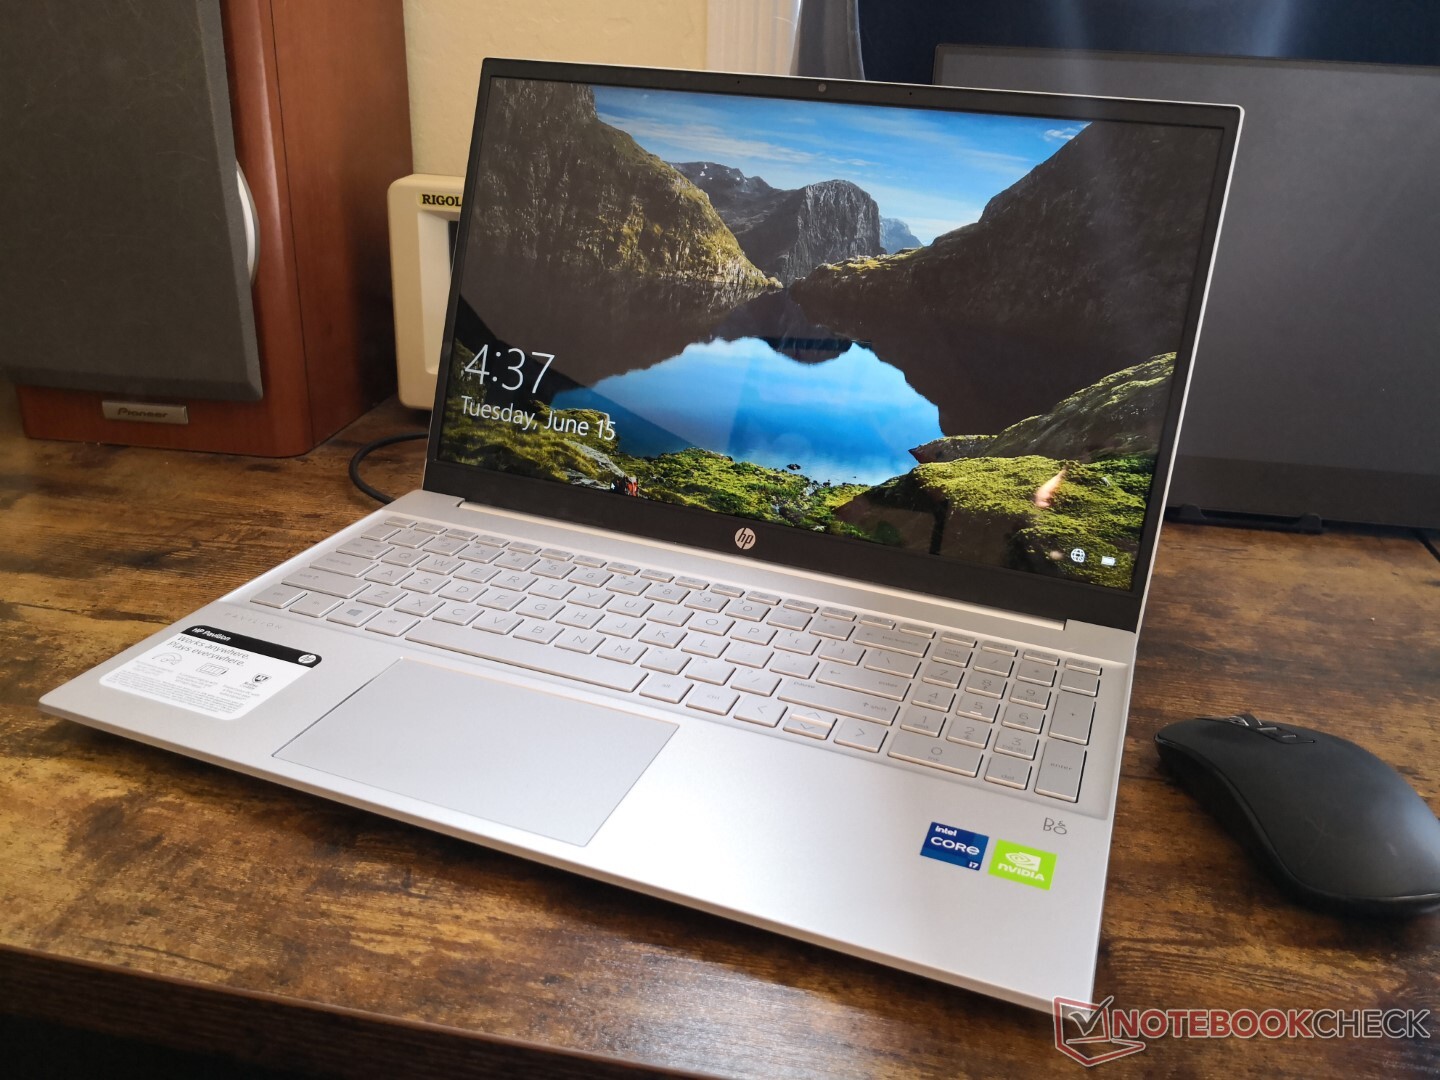
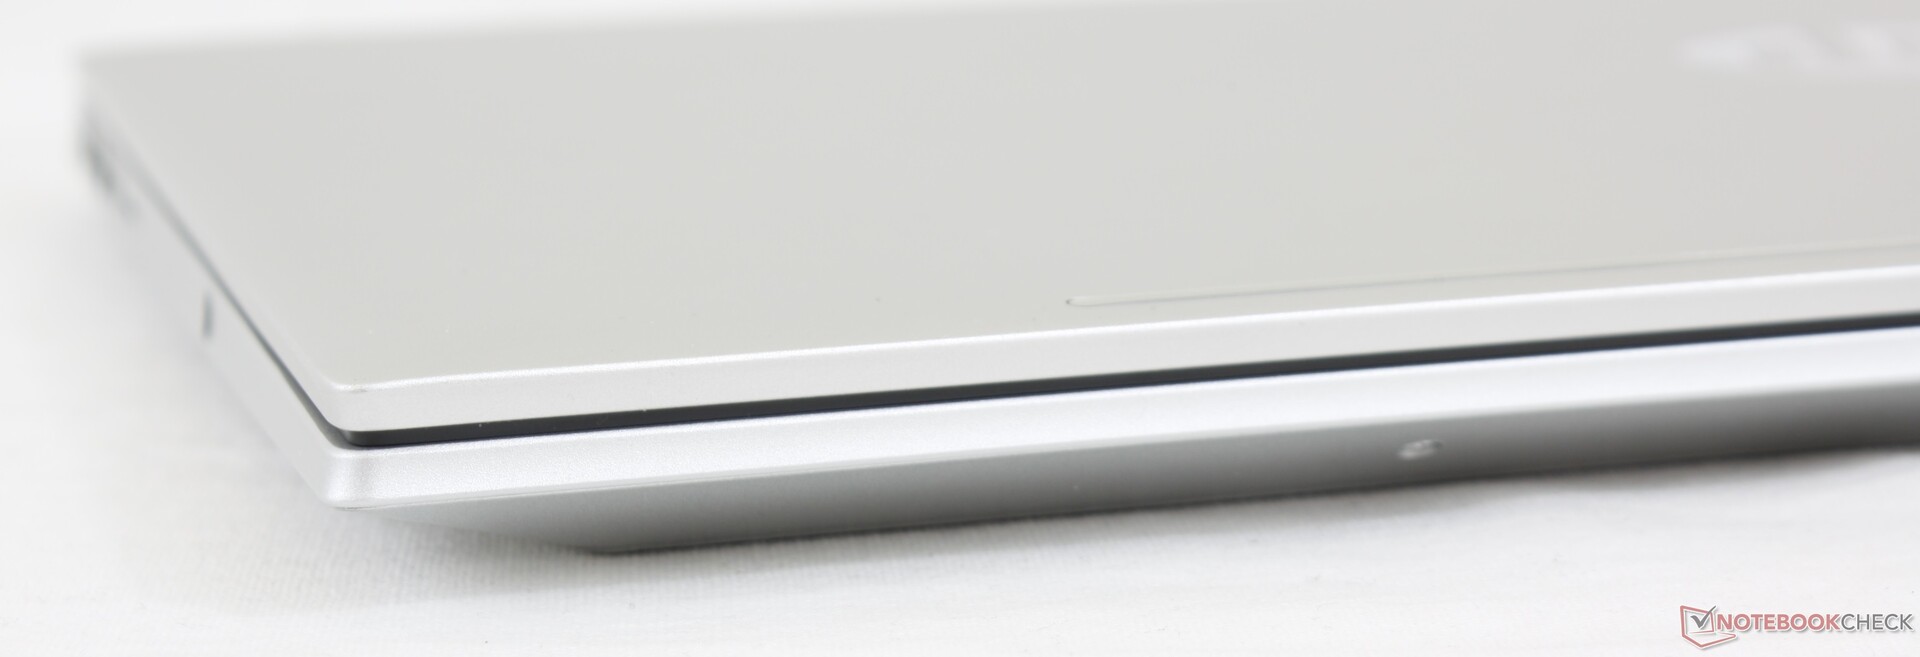
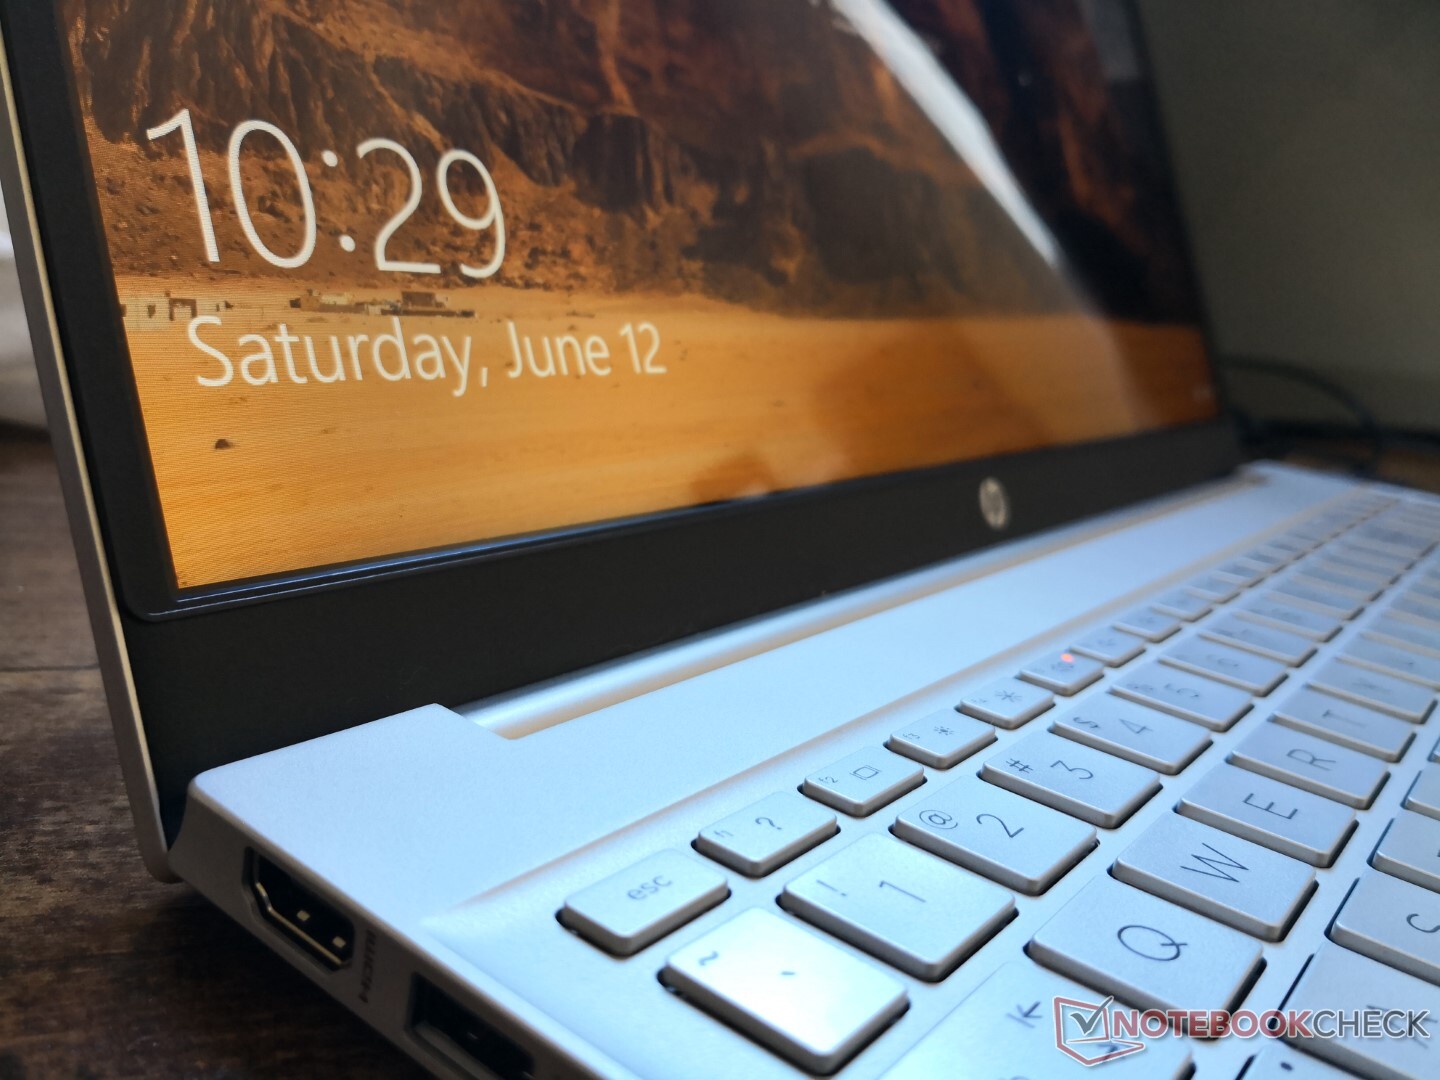
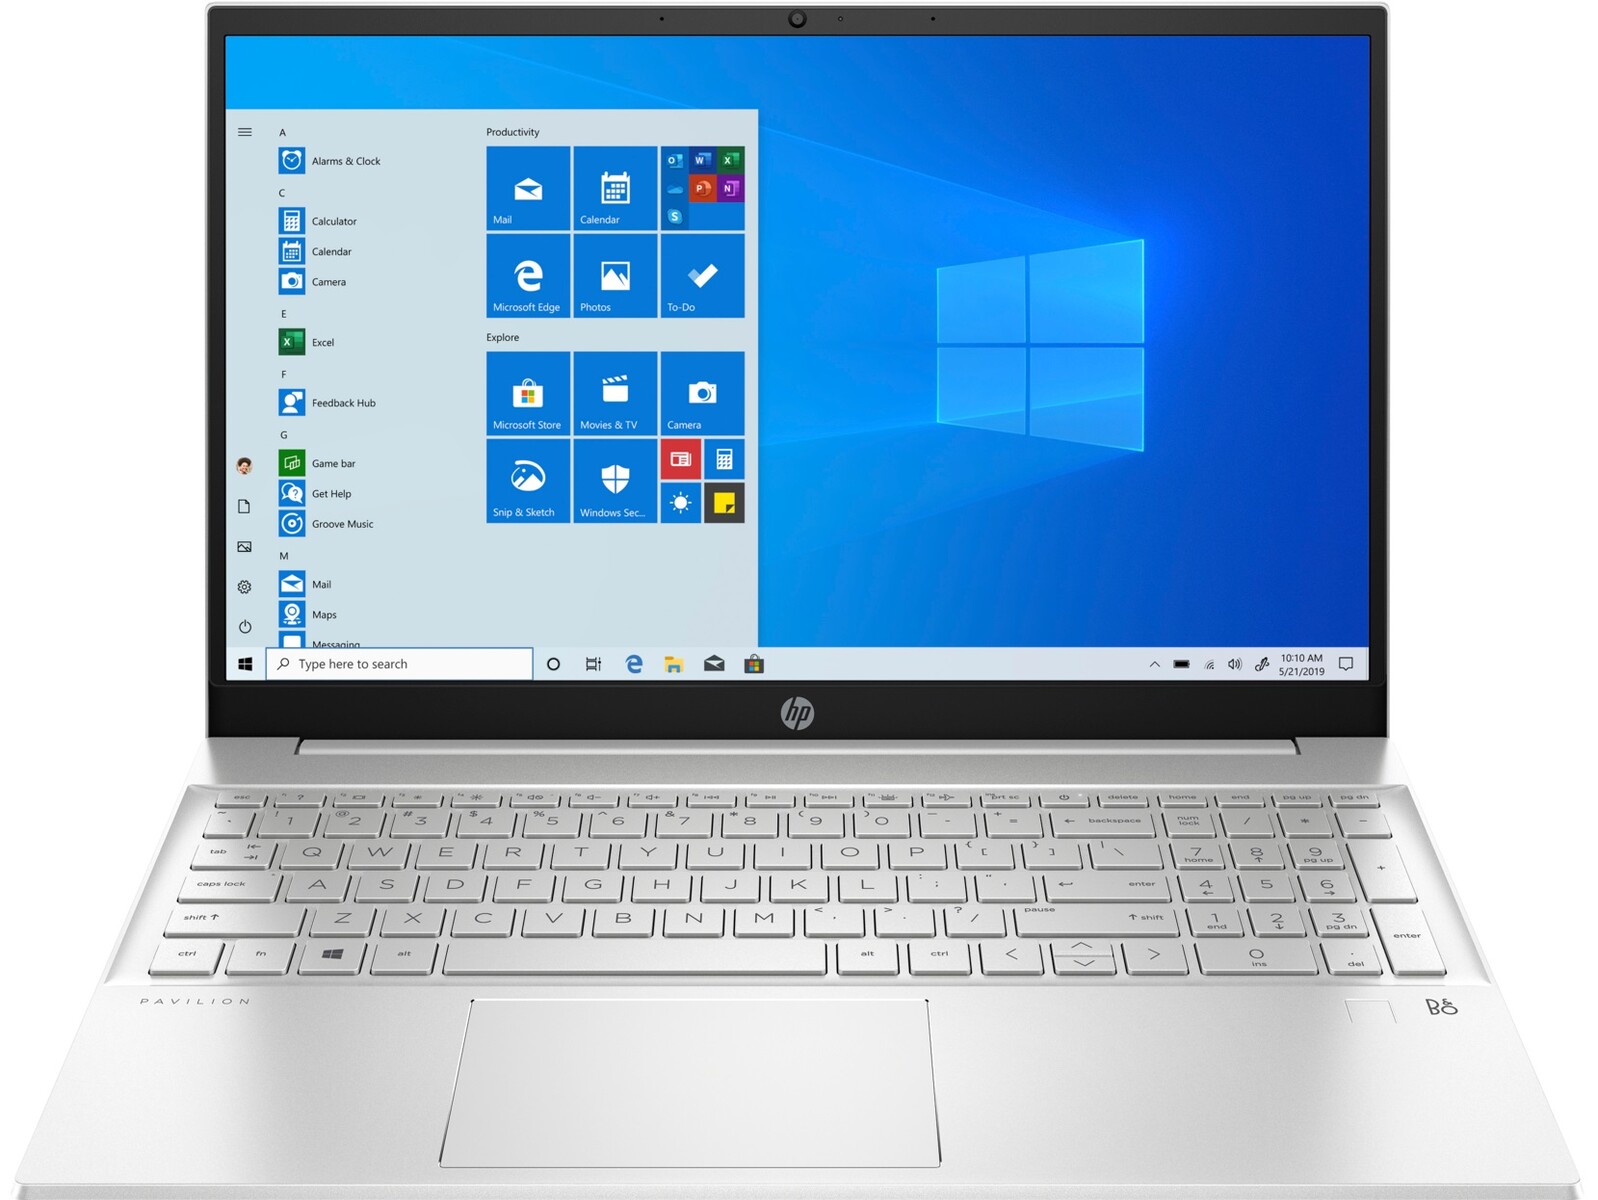
Case — A Sideways Step In Quality
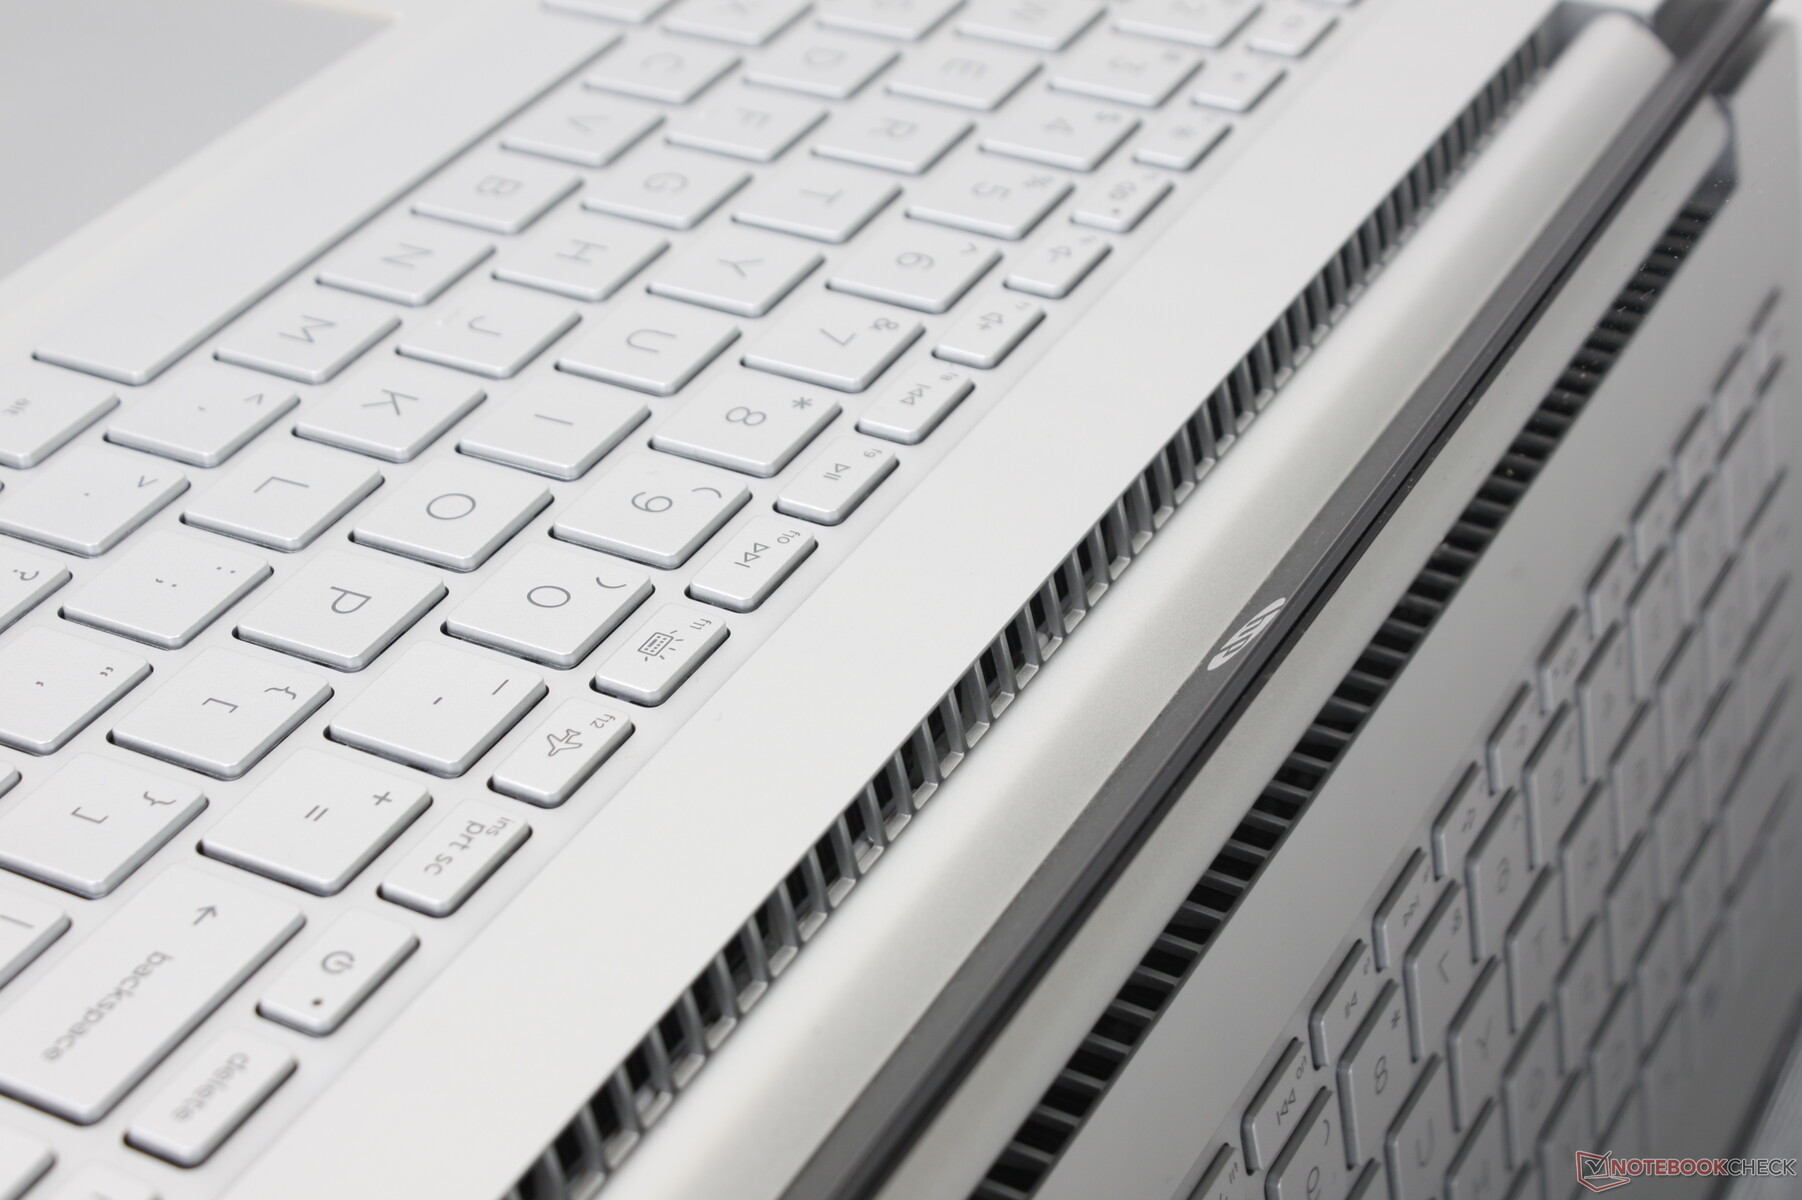
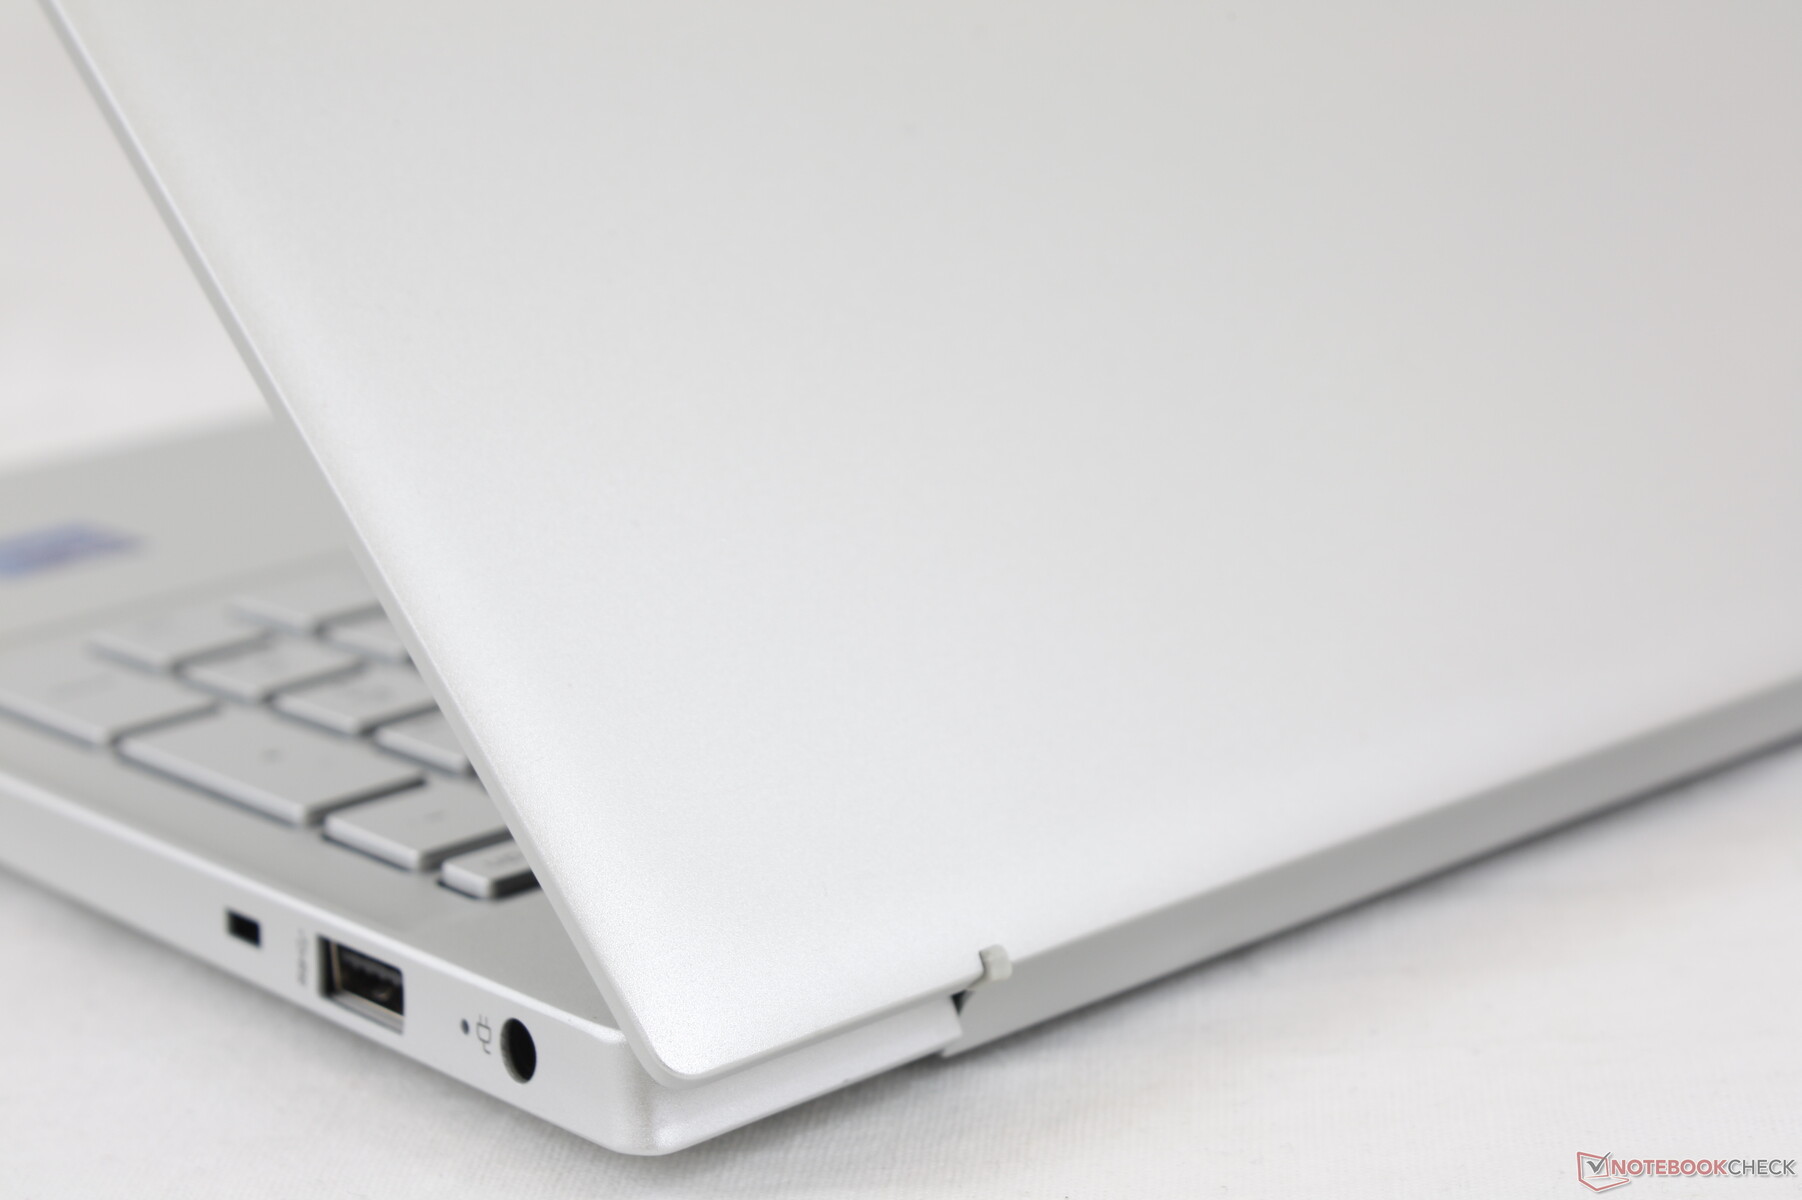
When compared to the older 2019 design, the 2021 model has narrower top and bottom bezels for a smaller footprint while using the same metal and plastic materials. The speaker grilles along the top of the keyboard are now gone for a more simplistic appearance. It's a basic matte impression with none of the flashy chrome-cut trims or sharp MacBook-like edges of the Spectre or Envy, respectively. Whether it looks any better than a competing Asus VivoBook or Lenovo IdeaPad is up to user preference.
Chassis rigidity is weak around the lid and front corners of the base where the system is most susceptible to twisting. It's only a bit better than the aforementioned VivoBook or IdeaPad but not enough to really make a difference in the long term.
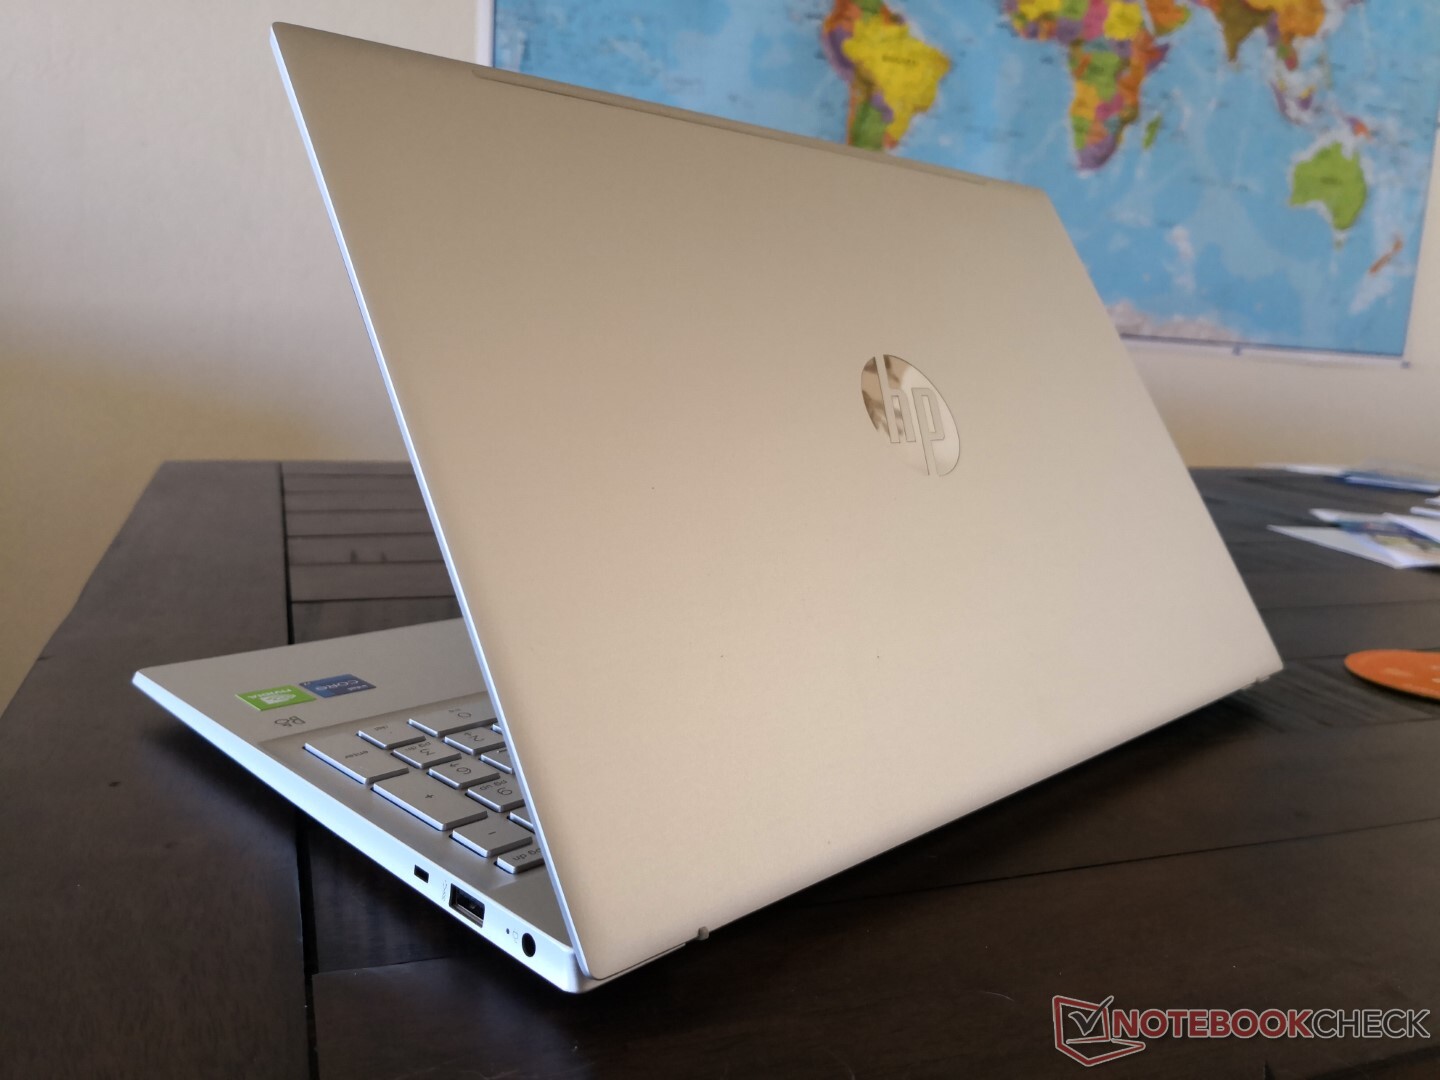
As a budget laptop, the Pavilion 15 isn't trying to be the thinnest or lightest in its category; it just needs to be "good enough" against the competition. Size and weight are therefore very similar to the budget 15.6-inch laptops from other OEMs including the Asus VivoBook S15 or Lenovo IdeaPad 5 15. Moving up to the sleeker HP Envy 15 or Spectre x360 15 will actually be even heavier since those systems have stronger metal frames instead of plastic.
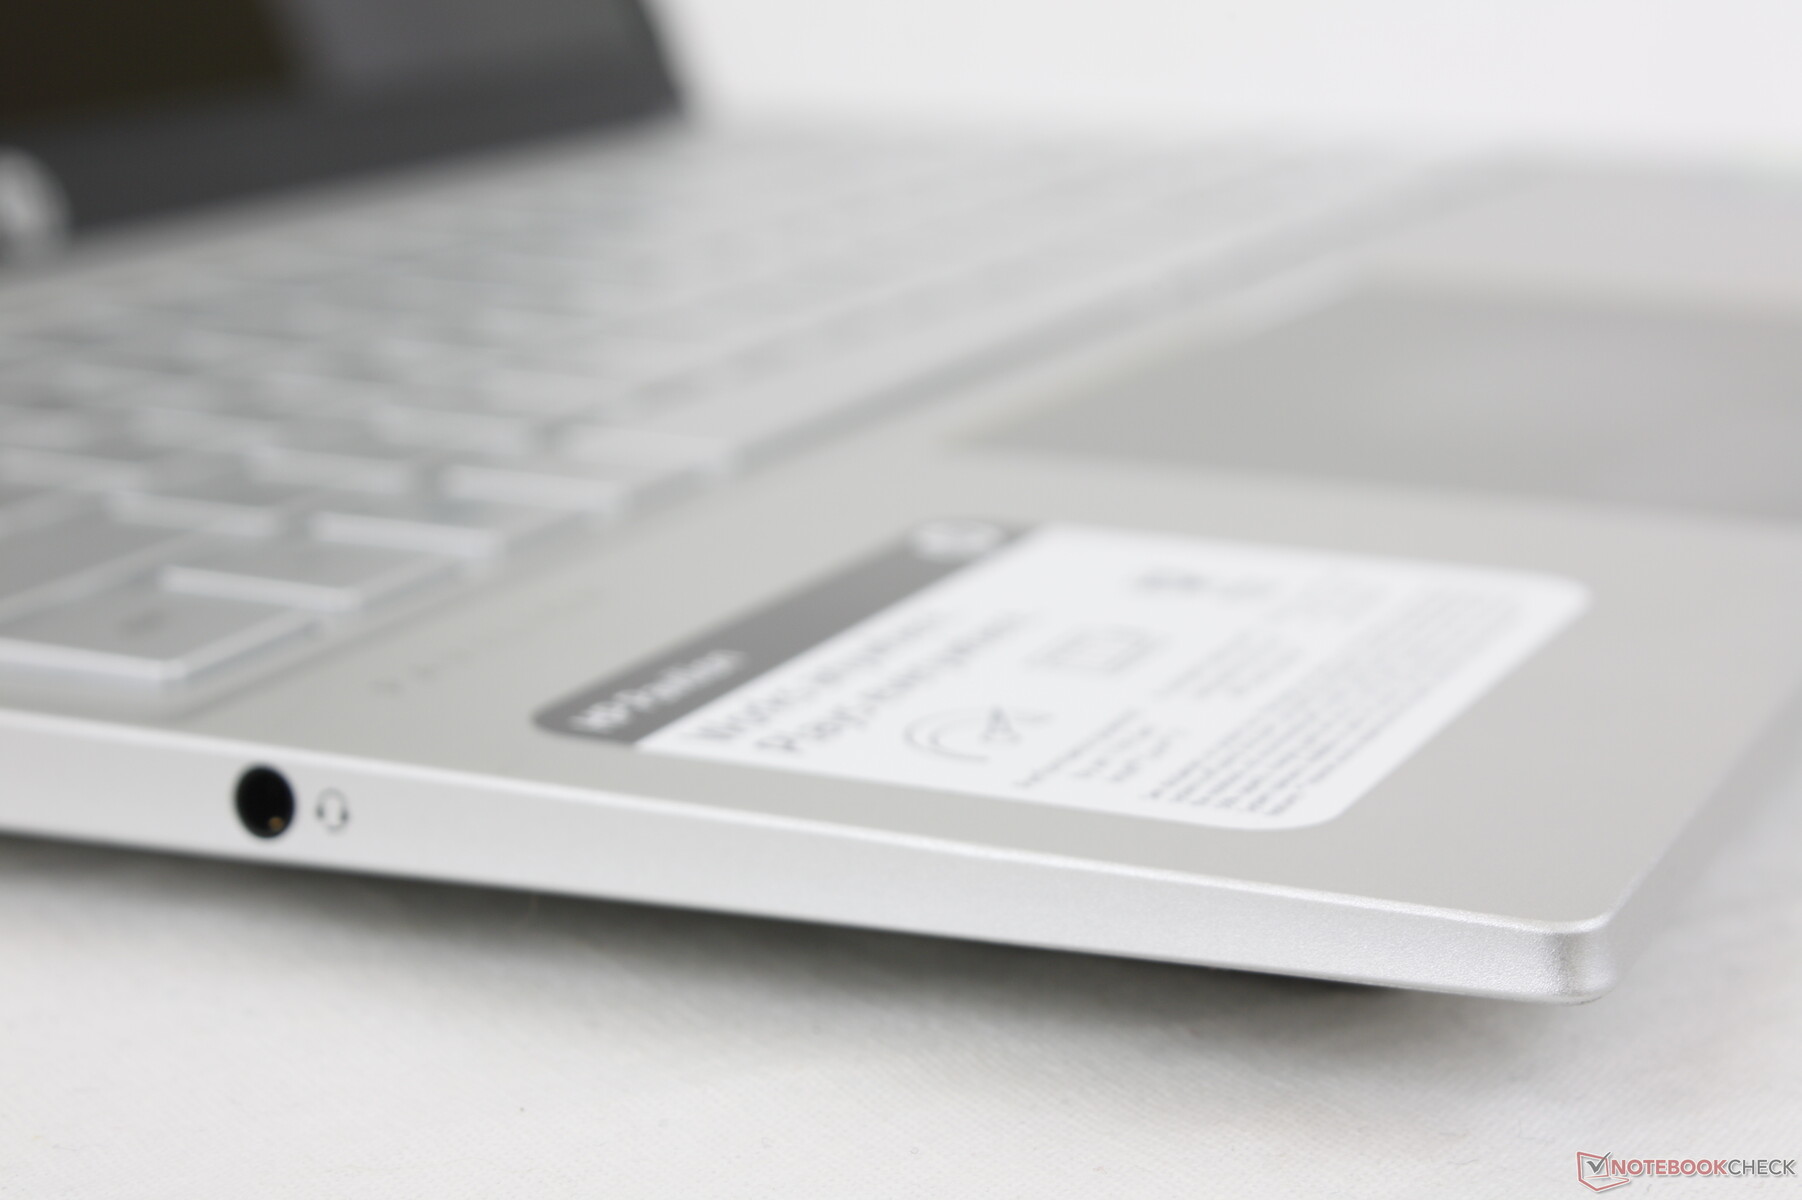
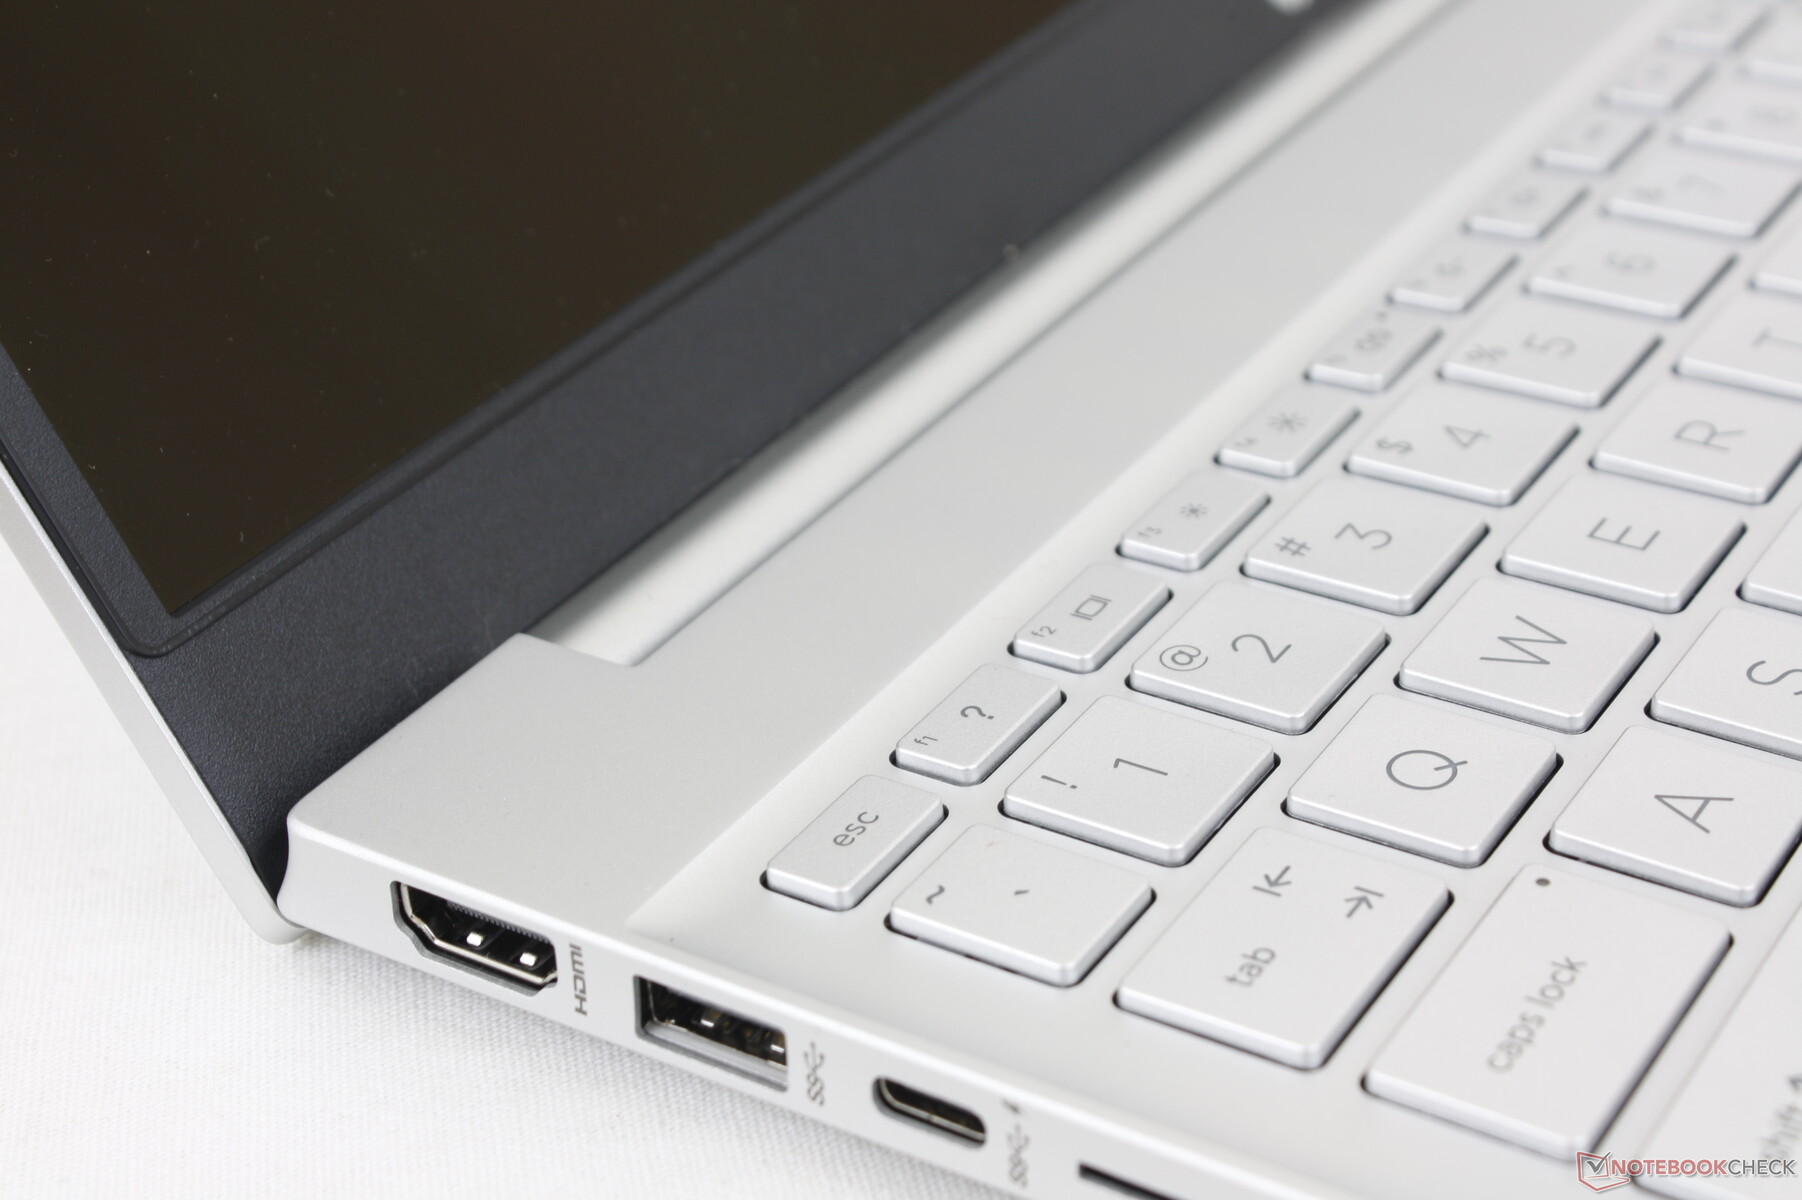
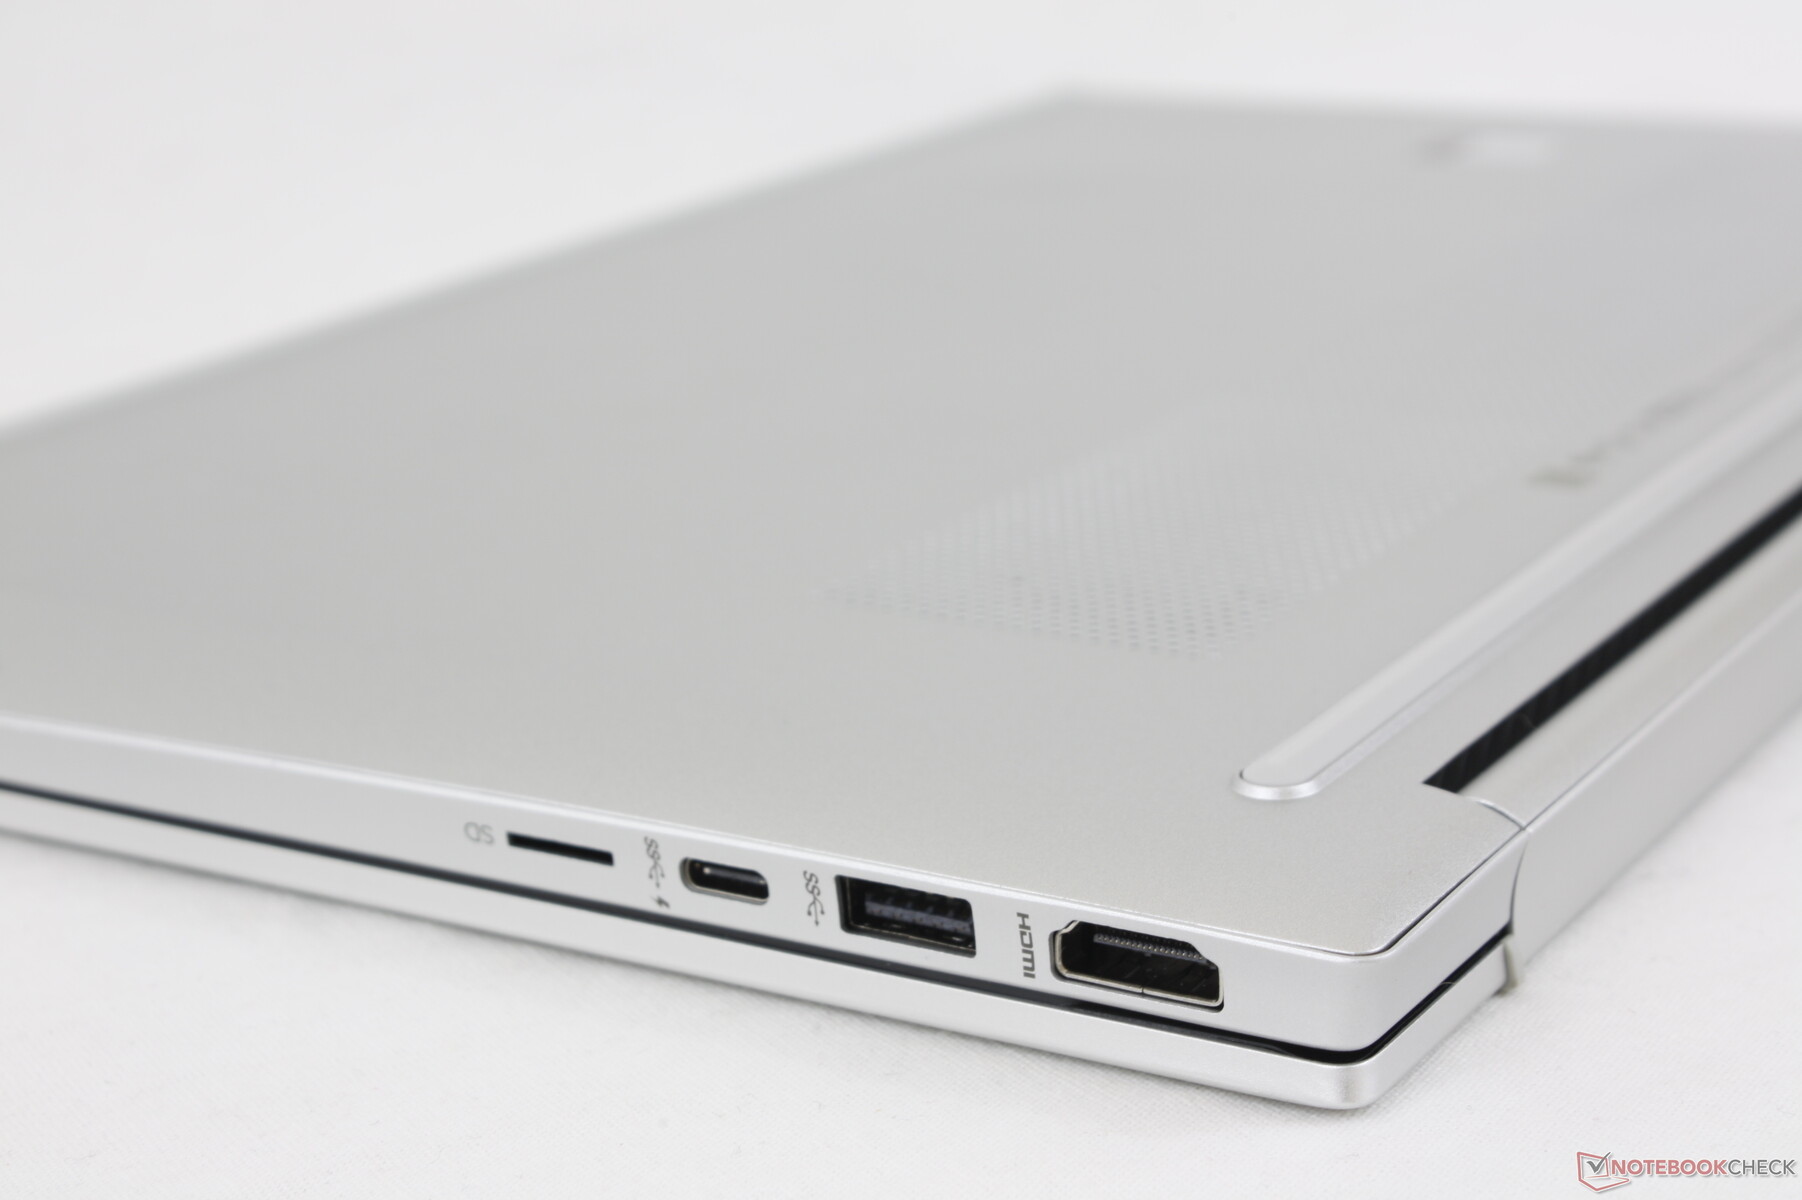
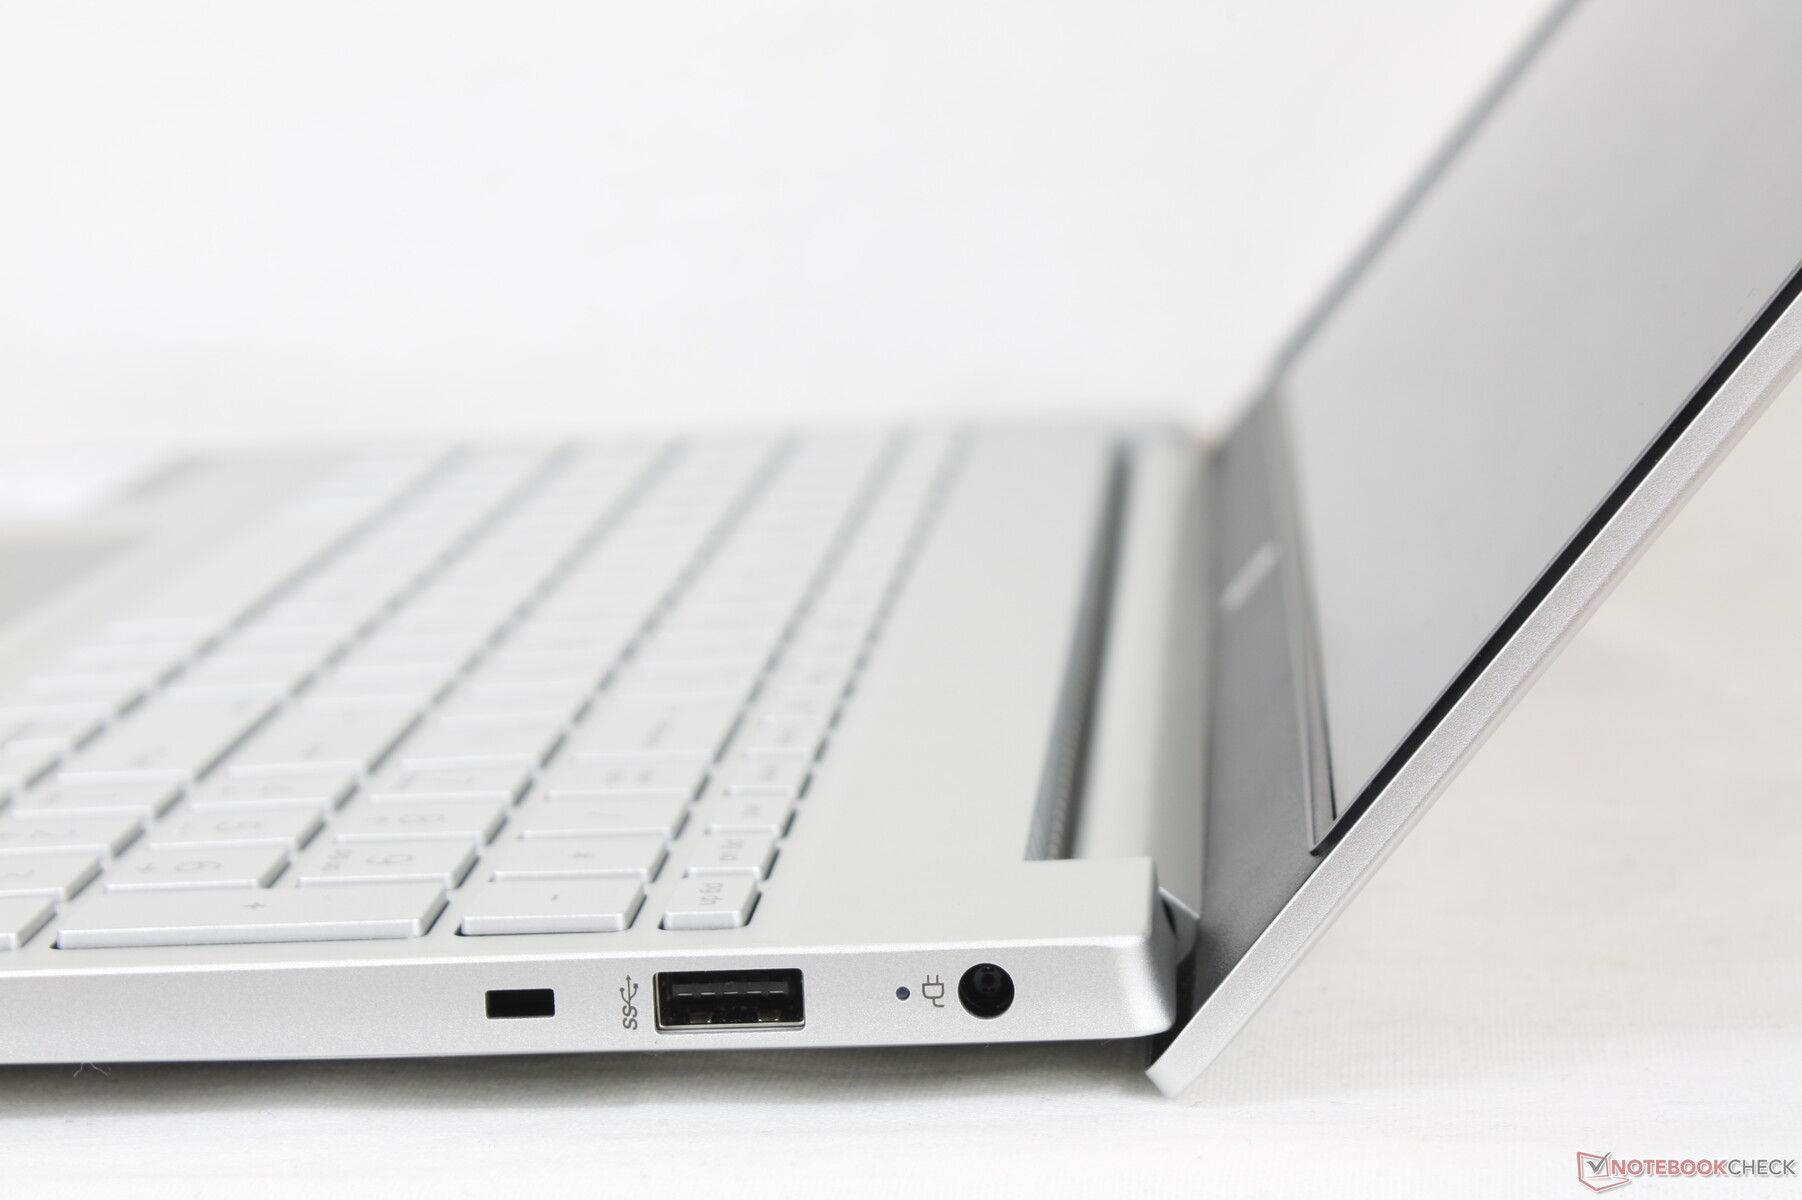
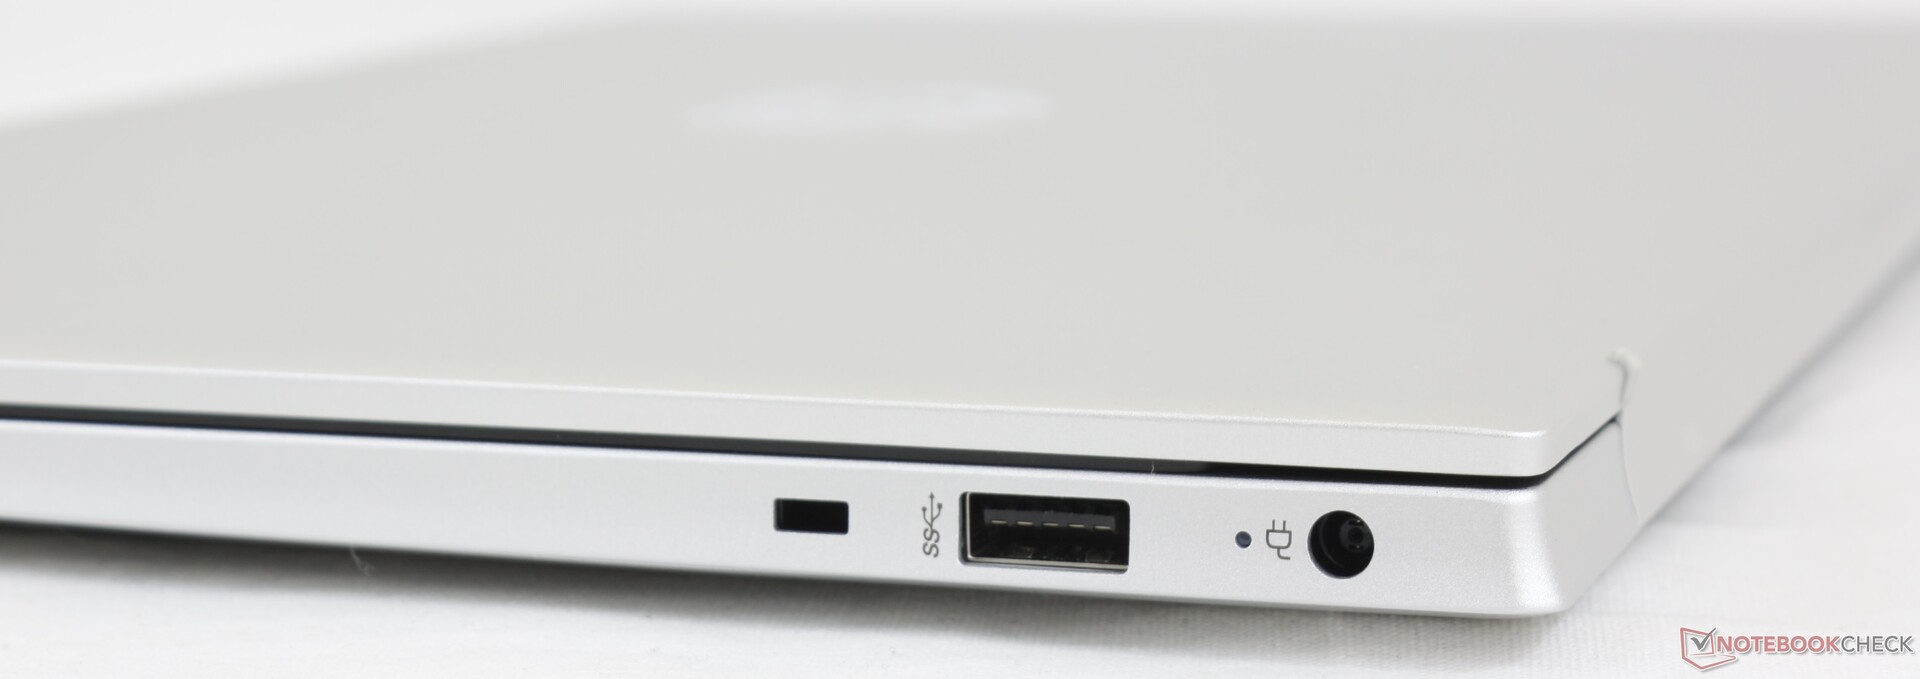
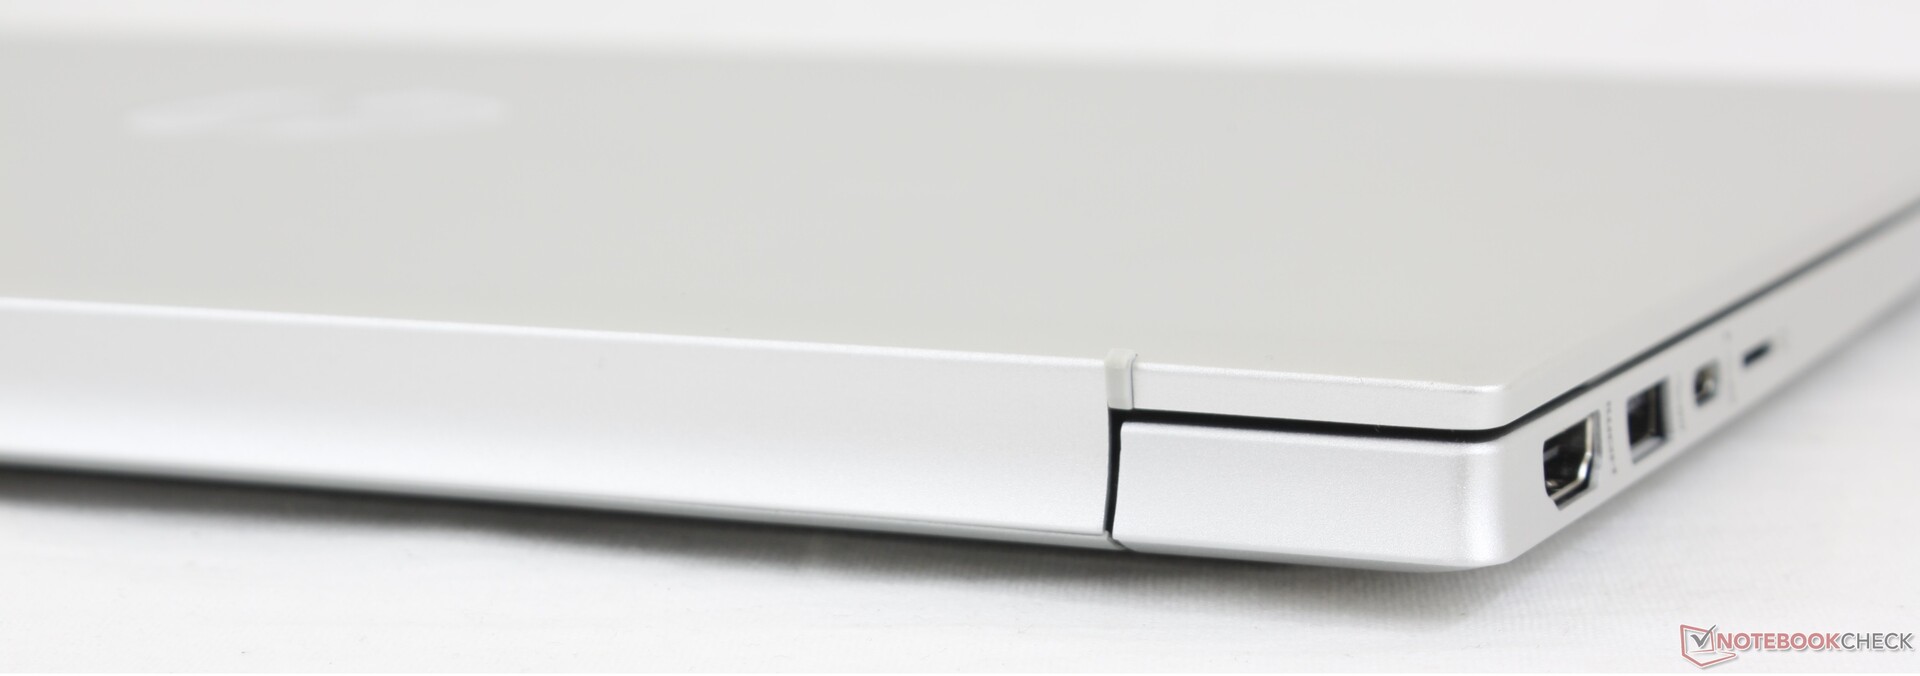
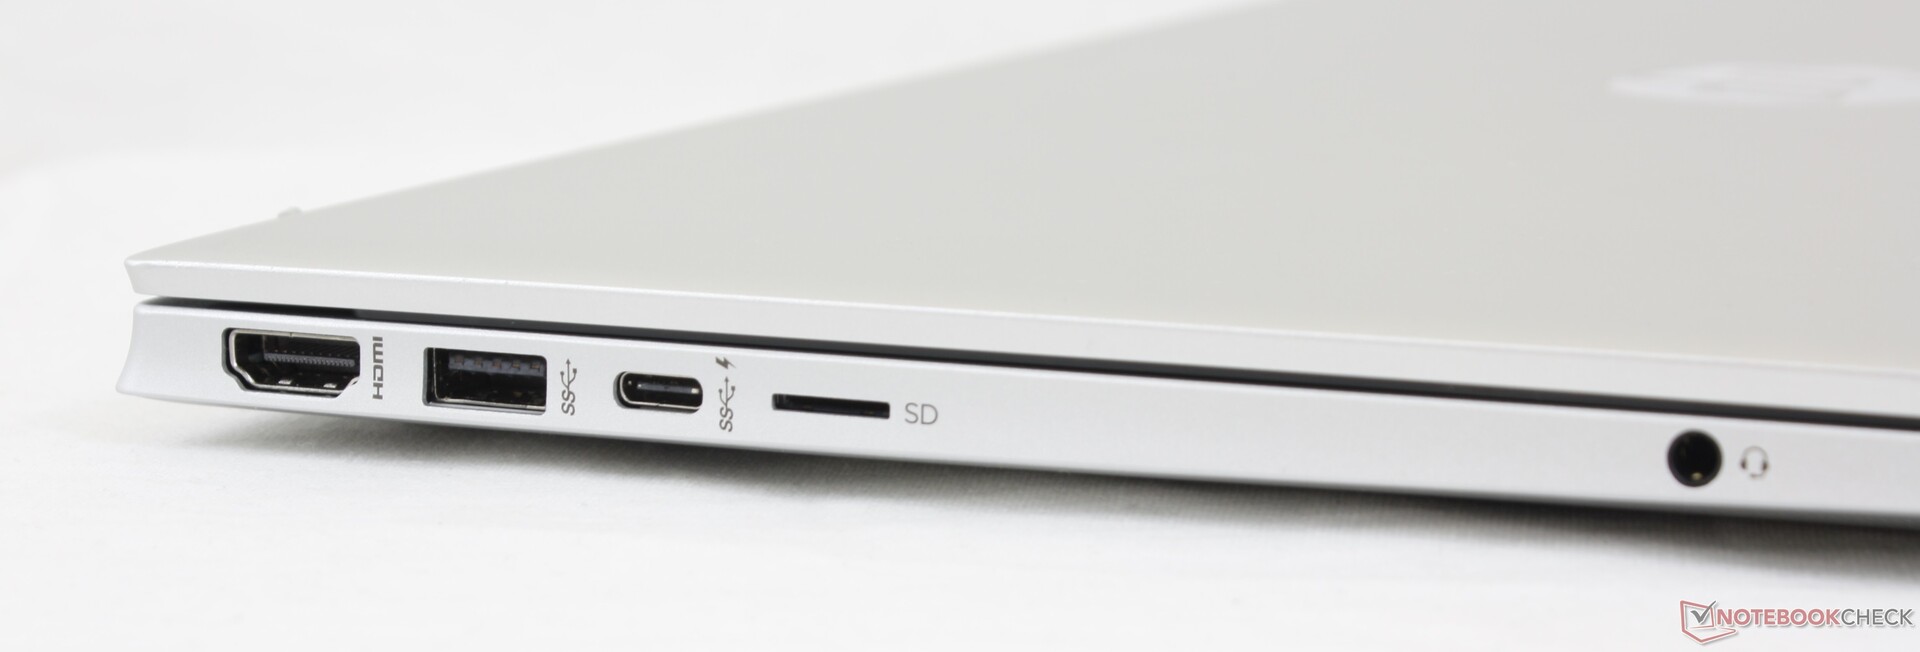
Connectivity — No More RJ-45
Port options are decent for the size. We're surprised to see HDMI 2.0 instead of 1.4 meaning the system properly supports external monitors of up to 4K at 60 FPS. There is no Thunderbolt support, however, as HP wants users to upgrade to the costlier Envy or Spectre series instead.
DisplayPort via USB-C appears to be broken on our unit as shown here. The image on the external monitor would twitch and display incorrectly no matter the settings. We even tried different monitors and laptops, but the results wouldn't change. This seems to be limited to the USB-C port as video-out via HDMI would work without any issues.
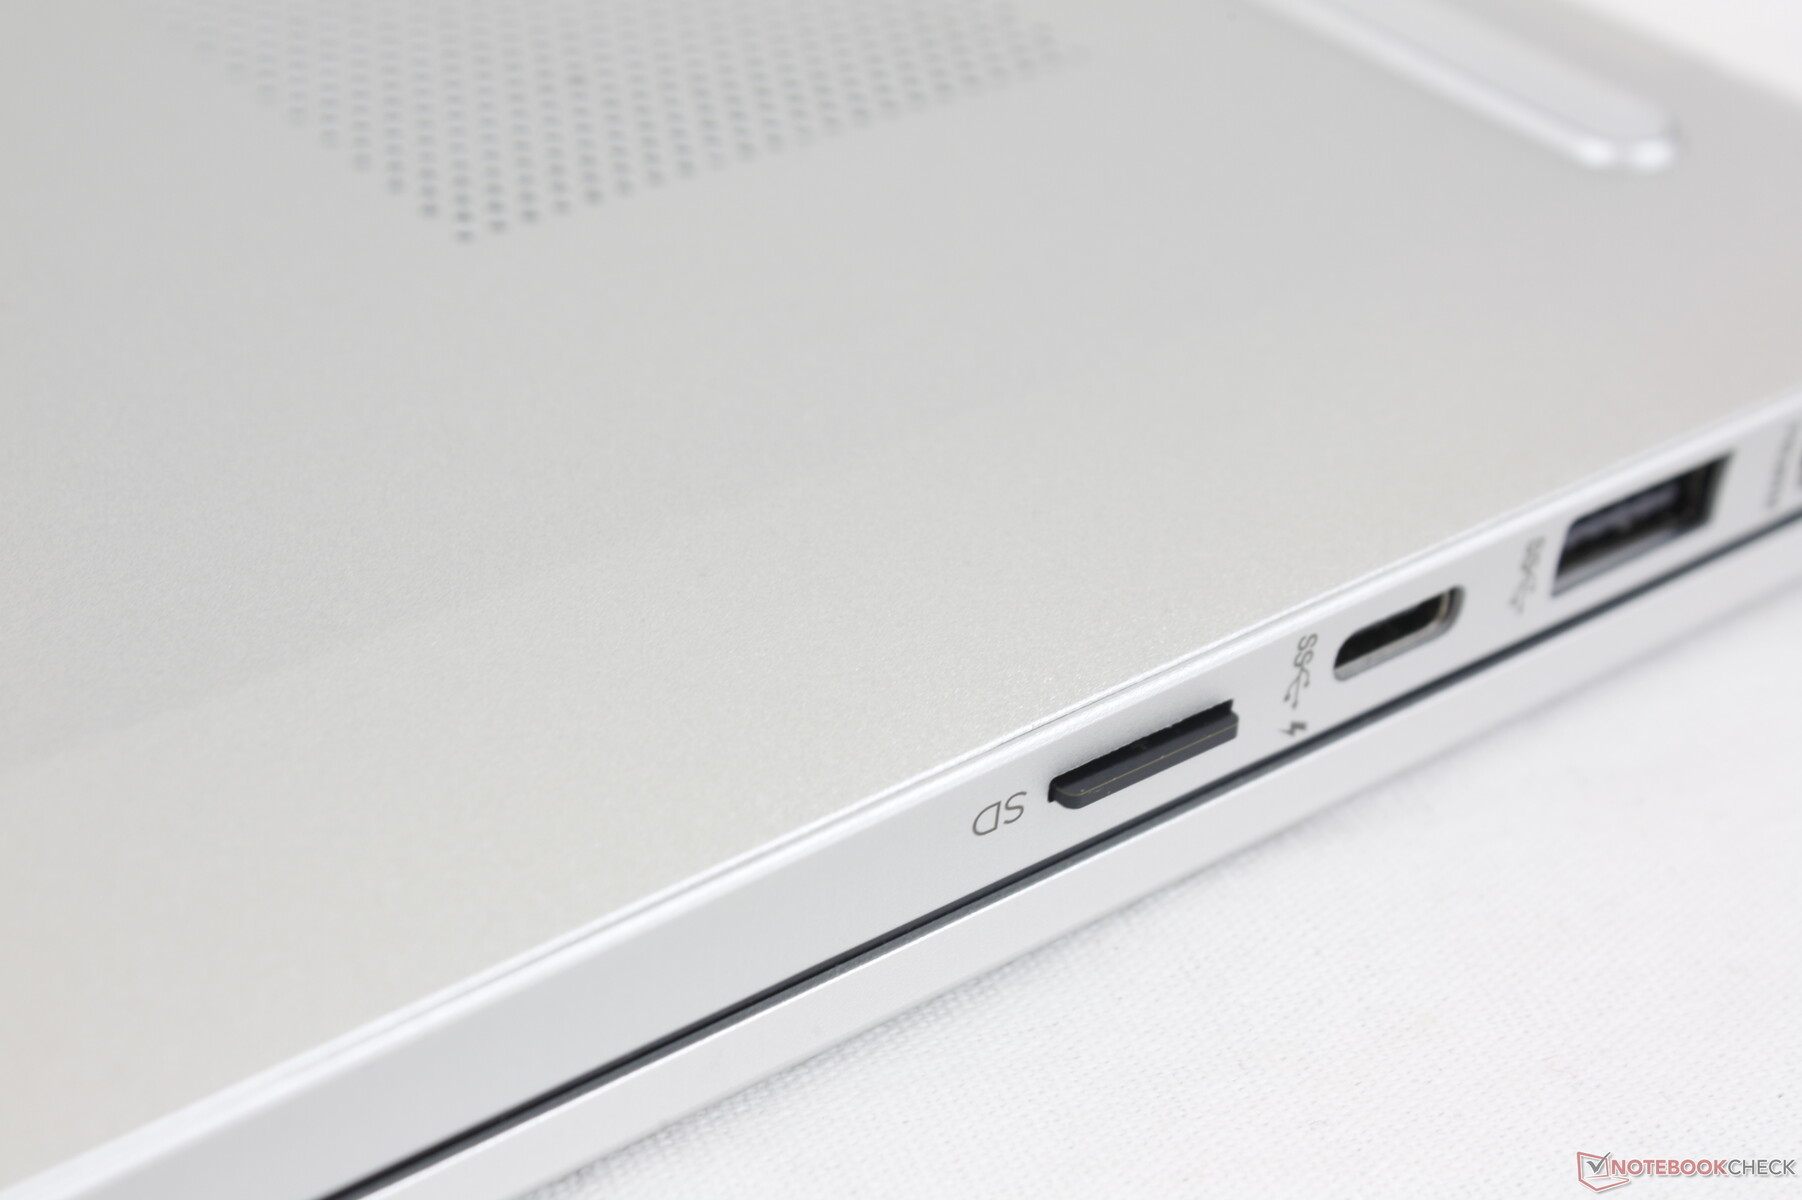
SD Card Reader
Transfer rates from the spring-loaded MicroSD reader is relatively fast at about 70 MB/s. Moving 1 GB of pictures from our UHS-II test card to desktop takes about 15 seconds compared to almost twice that on the older Pavilion 15 Gaming.
| SD Card Reader | |
| average JPG Copy Test (av. of 3 runs) | |
| HP Envy 15-ep0098nr (Toshiba Exceria Pro M501 UHS-II) | |
| HP Pavilion 15-eg (AV PRO microSD 128 GB V60) | |
| HP Pavilion Gaming 15-ec0002ng (Toshiba Exceria Pro SDXC 64 GB UHS-II) | |
| Asus VivoBook S15 S533EQ-BQ002T (Toshiba Exceria Pro M501 microSDXC 64GB) | |
| Lenovo IdeaPad 5 15IIL05 (Toshiba Exceria Pro SDXC 64 GB UHS-II) | |
| Dell Inspiron 15 5000 5502 (Toshiba Exceria Pro M501 microSDXC 32GB) | |
| maximum AS SSD Seq Read Test (1GB) | |
| HP Envy 15-ep0098nr (Toshiba Exceria Pro M501 UHS-II) | |
| HP Pavilion 15-eg (AV PRO microSD 128 GB V60) | |
| HP Pavilion Gaming 15-ec0002ng (Toshiba Exceria Pro SDXC 64 GB UHS-II) | |
| Lenovo IdeaPad 5 15IIL05 (Toshiba Exceria Pro SDXC 64 GB UHS-II) | |
| Dell Inspiron 15 5000 5502 (Toshiba Exceria Pro M501 microSDXC 32GB) | |
| Asus VivoBook S15 S533EQ-BQ002T (Toshiba Exceria Pro M501 microSDXC 64GB) | |
Communication
The Intel AX201 comes standard for Wi-Fi 6 and Bluetooth 5.1 connectivity much like on most other Tiger Lake-U laptops. Connection is stable and without any issues when paired to our Netgear RAX200 test router.
Webcam
Camera quality remains unchanged gen-to-gen. We would at least like to see a camera kill switch or privacy shutter much like on most other laptops these days. There is no IR camera for Windows Hello support.


Maintenance
HP Pavilion laptops are traditionally difficult to crack open and it's no different here. The bottom panel hides four screws underneath the rubber feet to dissuade end-user servicing. Even after removing all the screws, we still found the panel difficult to remove without damaging the chassis. End-user upgrades like RAM and storage and therefore more difficult than it needs to be.
Accessories and Warranty
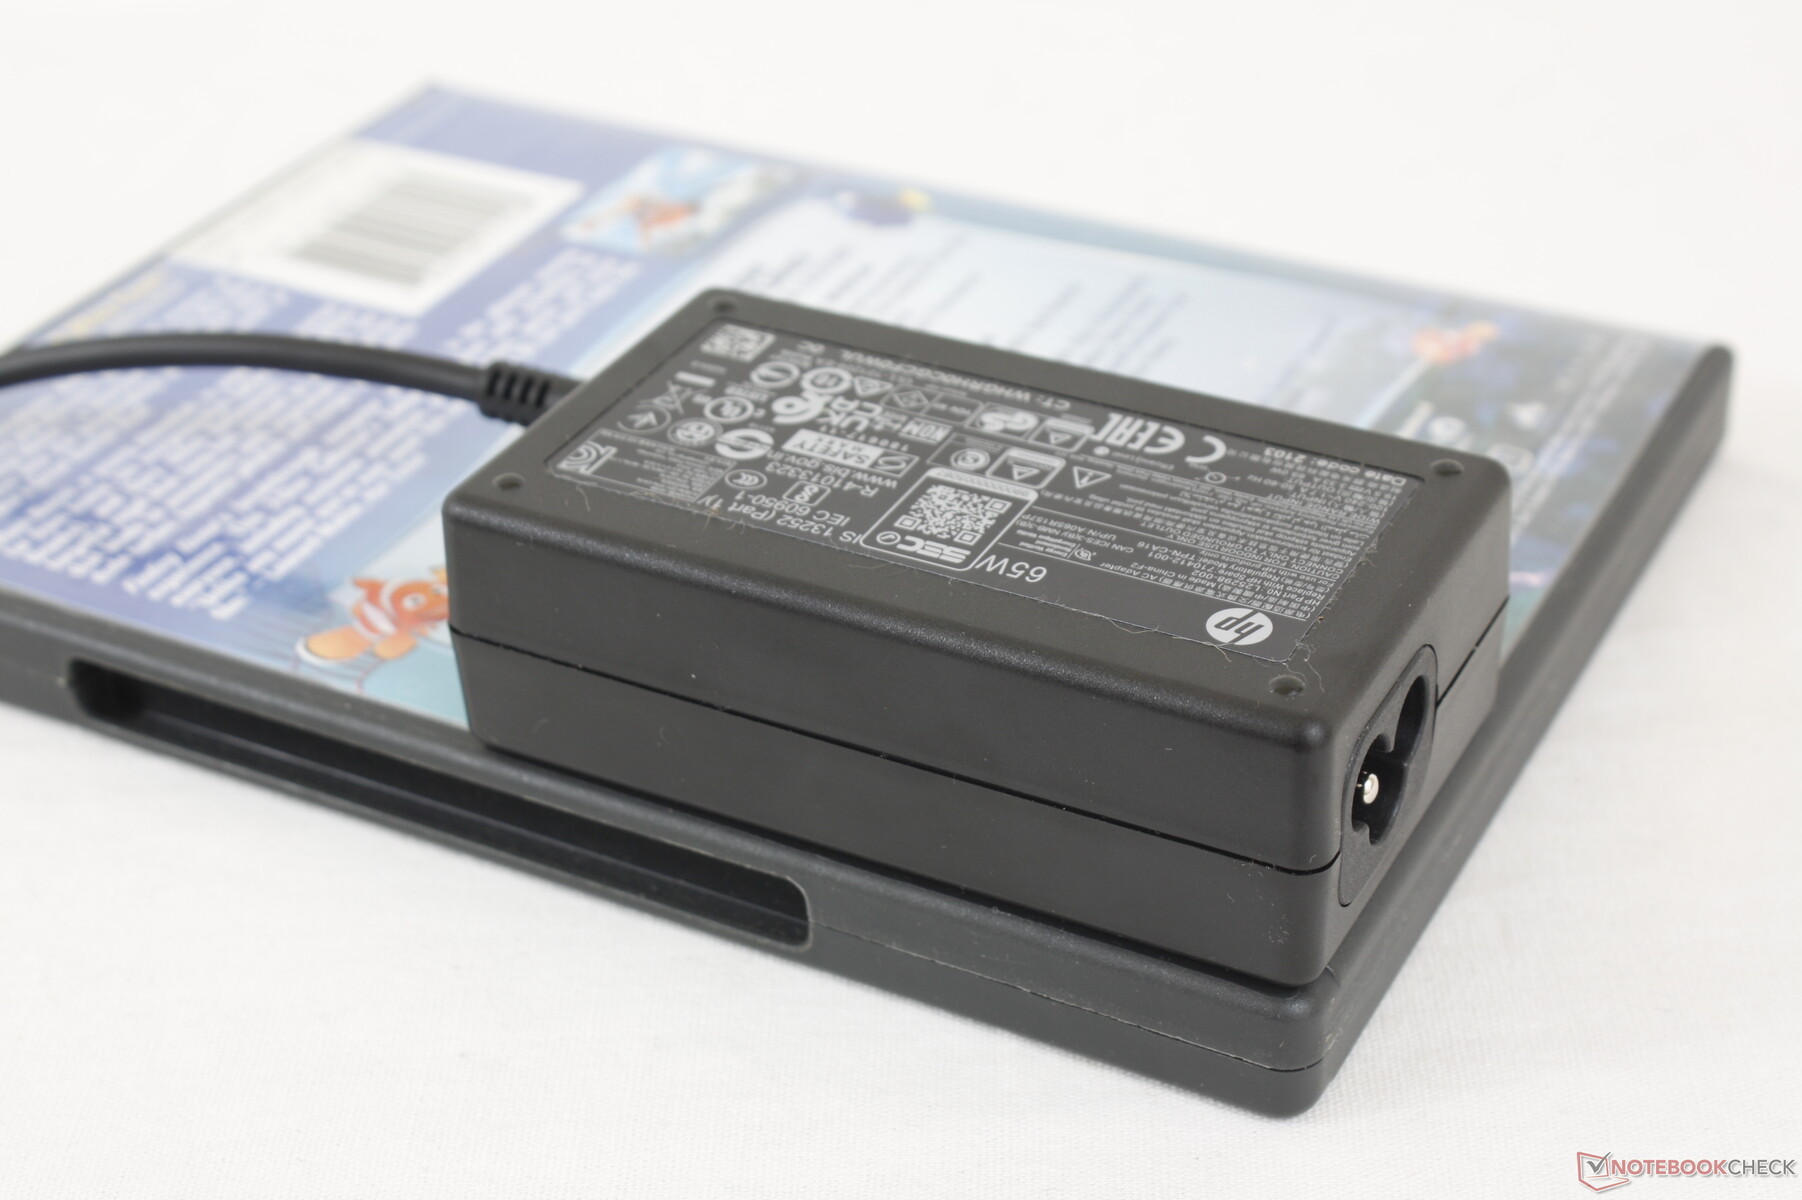
There are no extras in the box other than the barrel-type AC adapter and paperwork. A one-year limited manufacturer warranty applies.
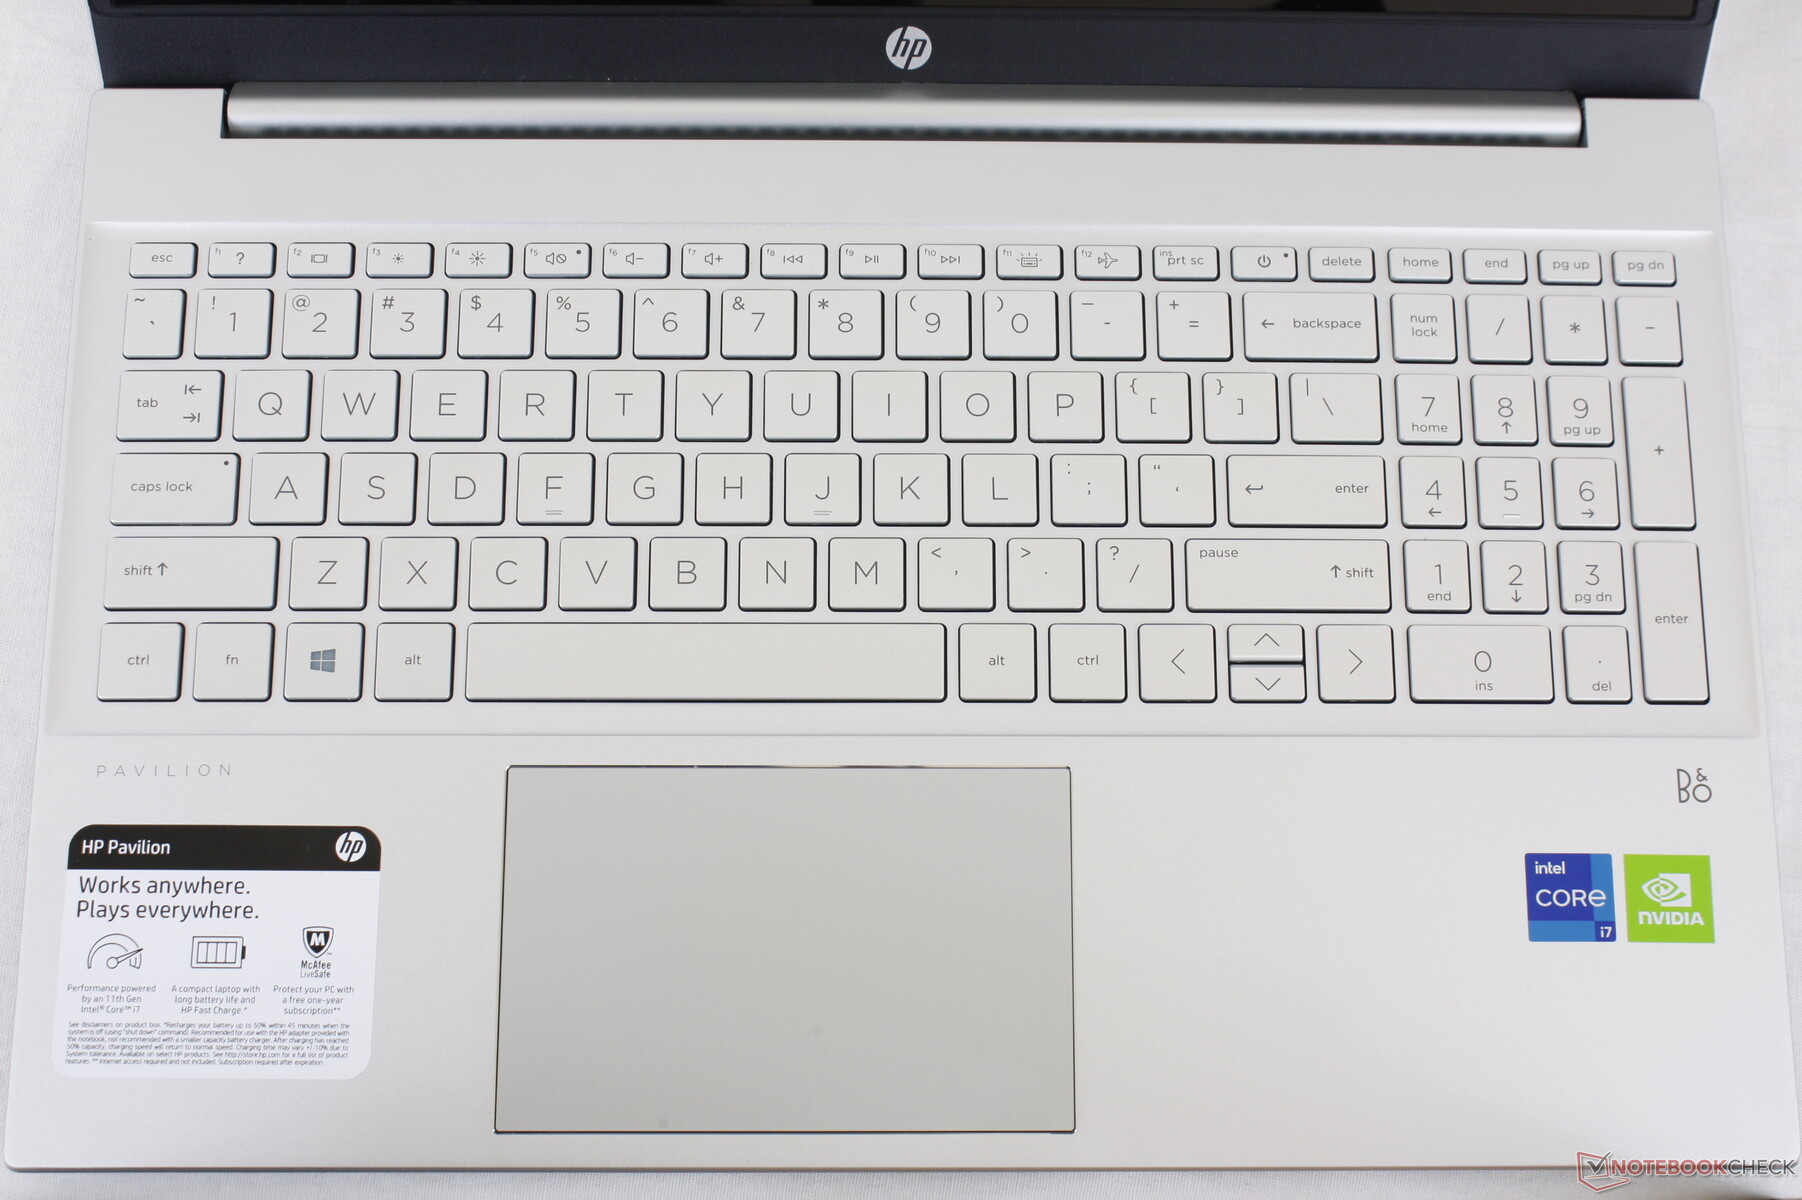
Input Devices — Surprisingly Comfortable Keyboard
Keyboard
Keyboard layout has changed slightly from the 2019 model. The power button, for example, is now a regular keyboard key instead of being off to the left corner. Otherwise, the typing experience remains largely the same. Feedback is surprisingly firm and with good travel to be better than the spongier and lighter keys of the Asus VivoBook or Lenovo IdeaPad.
The NumPad keys offer similar feedback to the QWERTY keys for a good sense of uniformity. It's unfortunate that the NumPad keys are narrower and therefore more cramped for larger fingers.
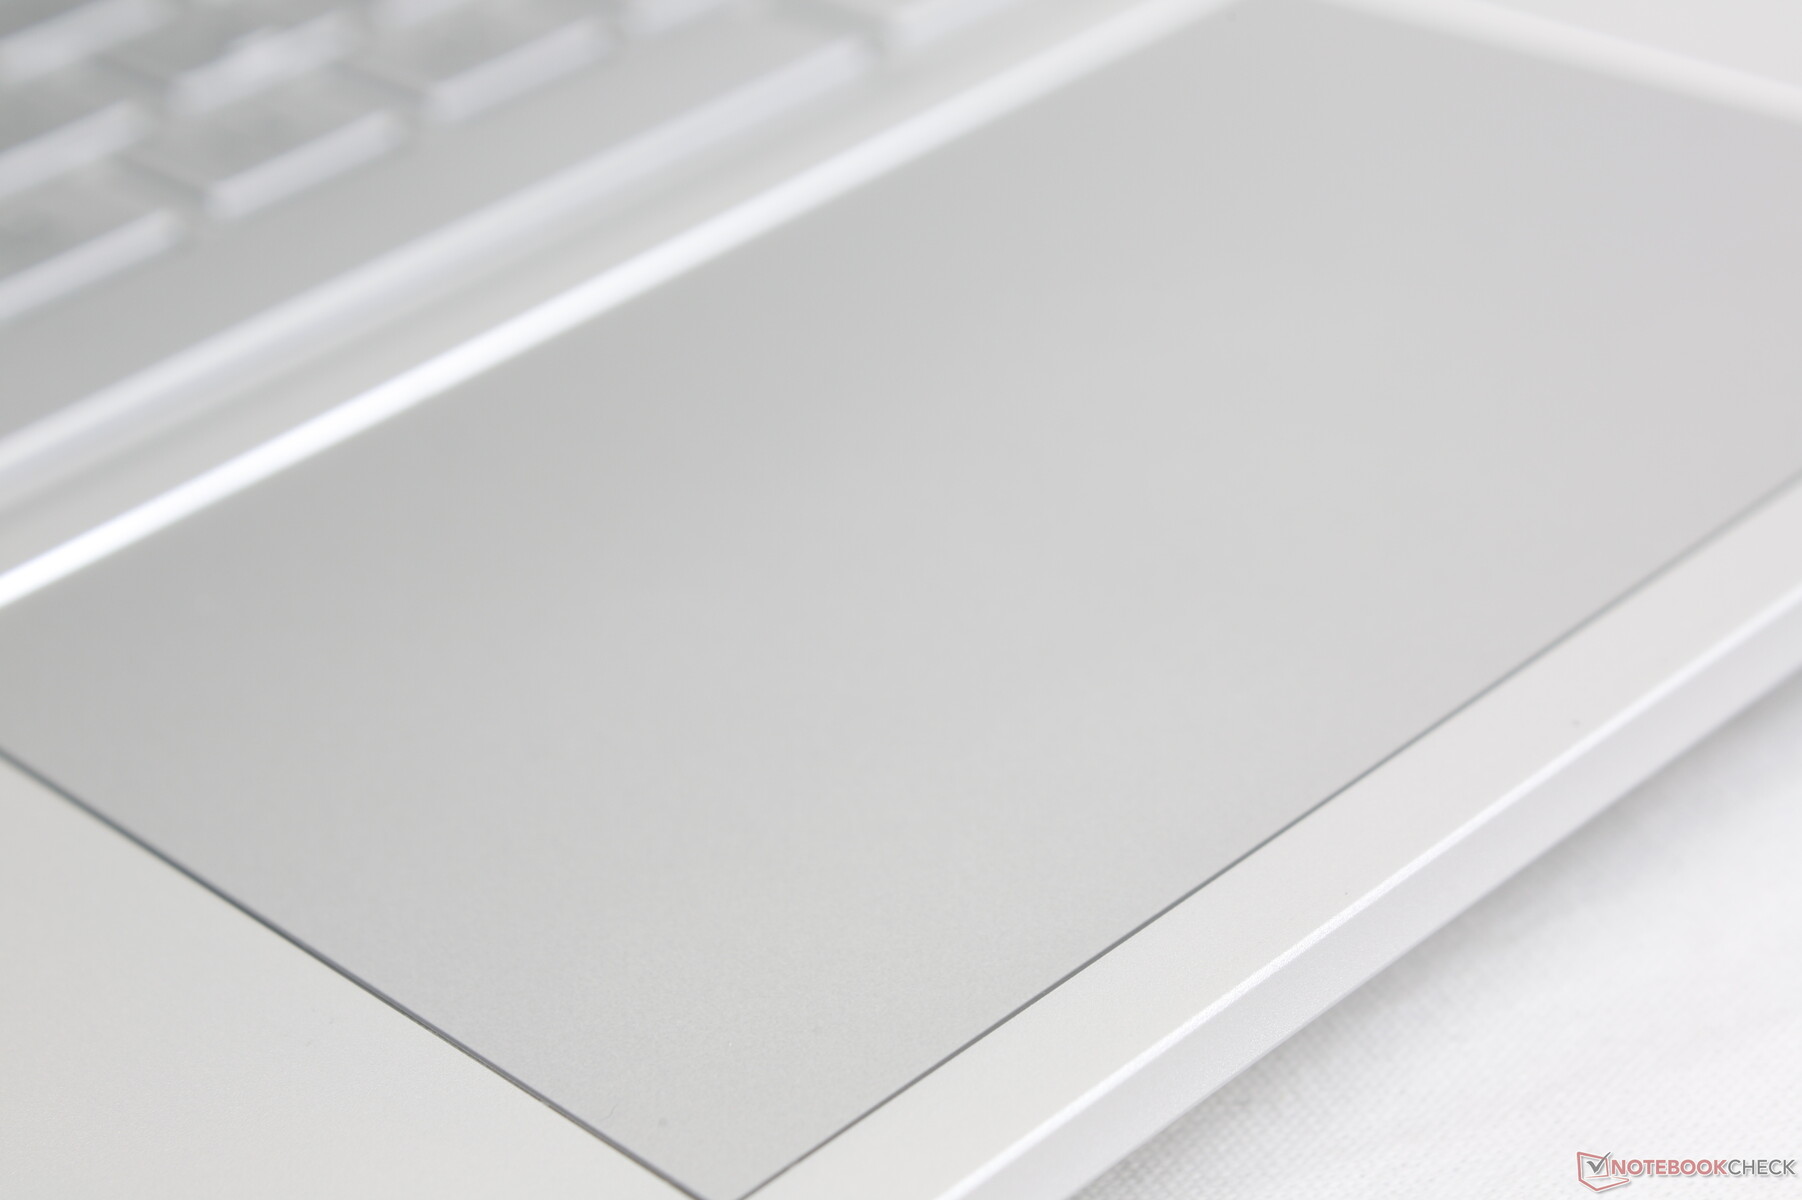
Touchpad
The Precision clickpad is relatively large at 11.5 x 7.4 cm to be essentially the same as the clickpad on the pricier Envy 15 Creator. Traction is smooth when gliding at medium-to-fast speeds while slower speeds will result in moderate sticking to aid in precision. On the other hand, clicking on the clickpad is both shallow and spongy for an uncomfortable experience without an external mouse.


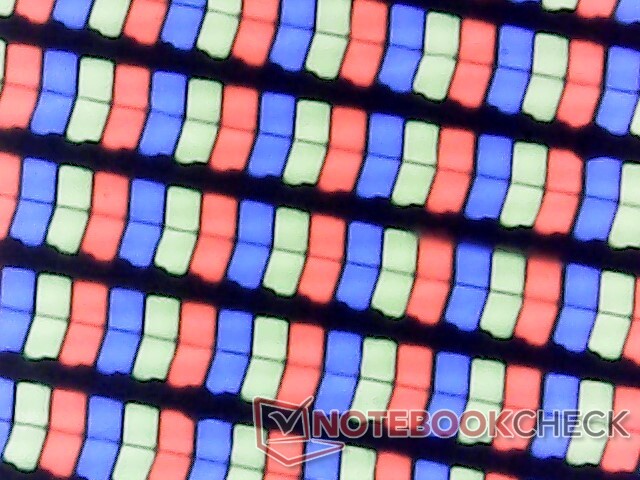
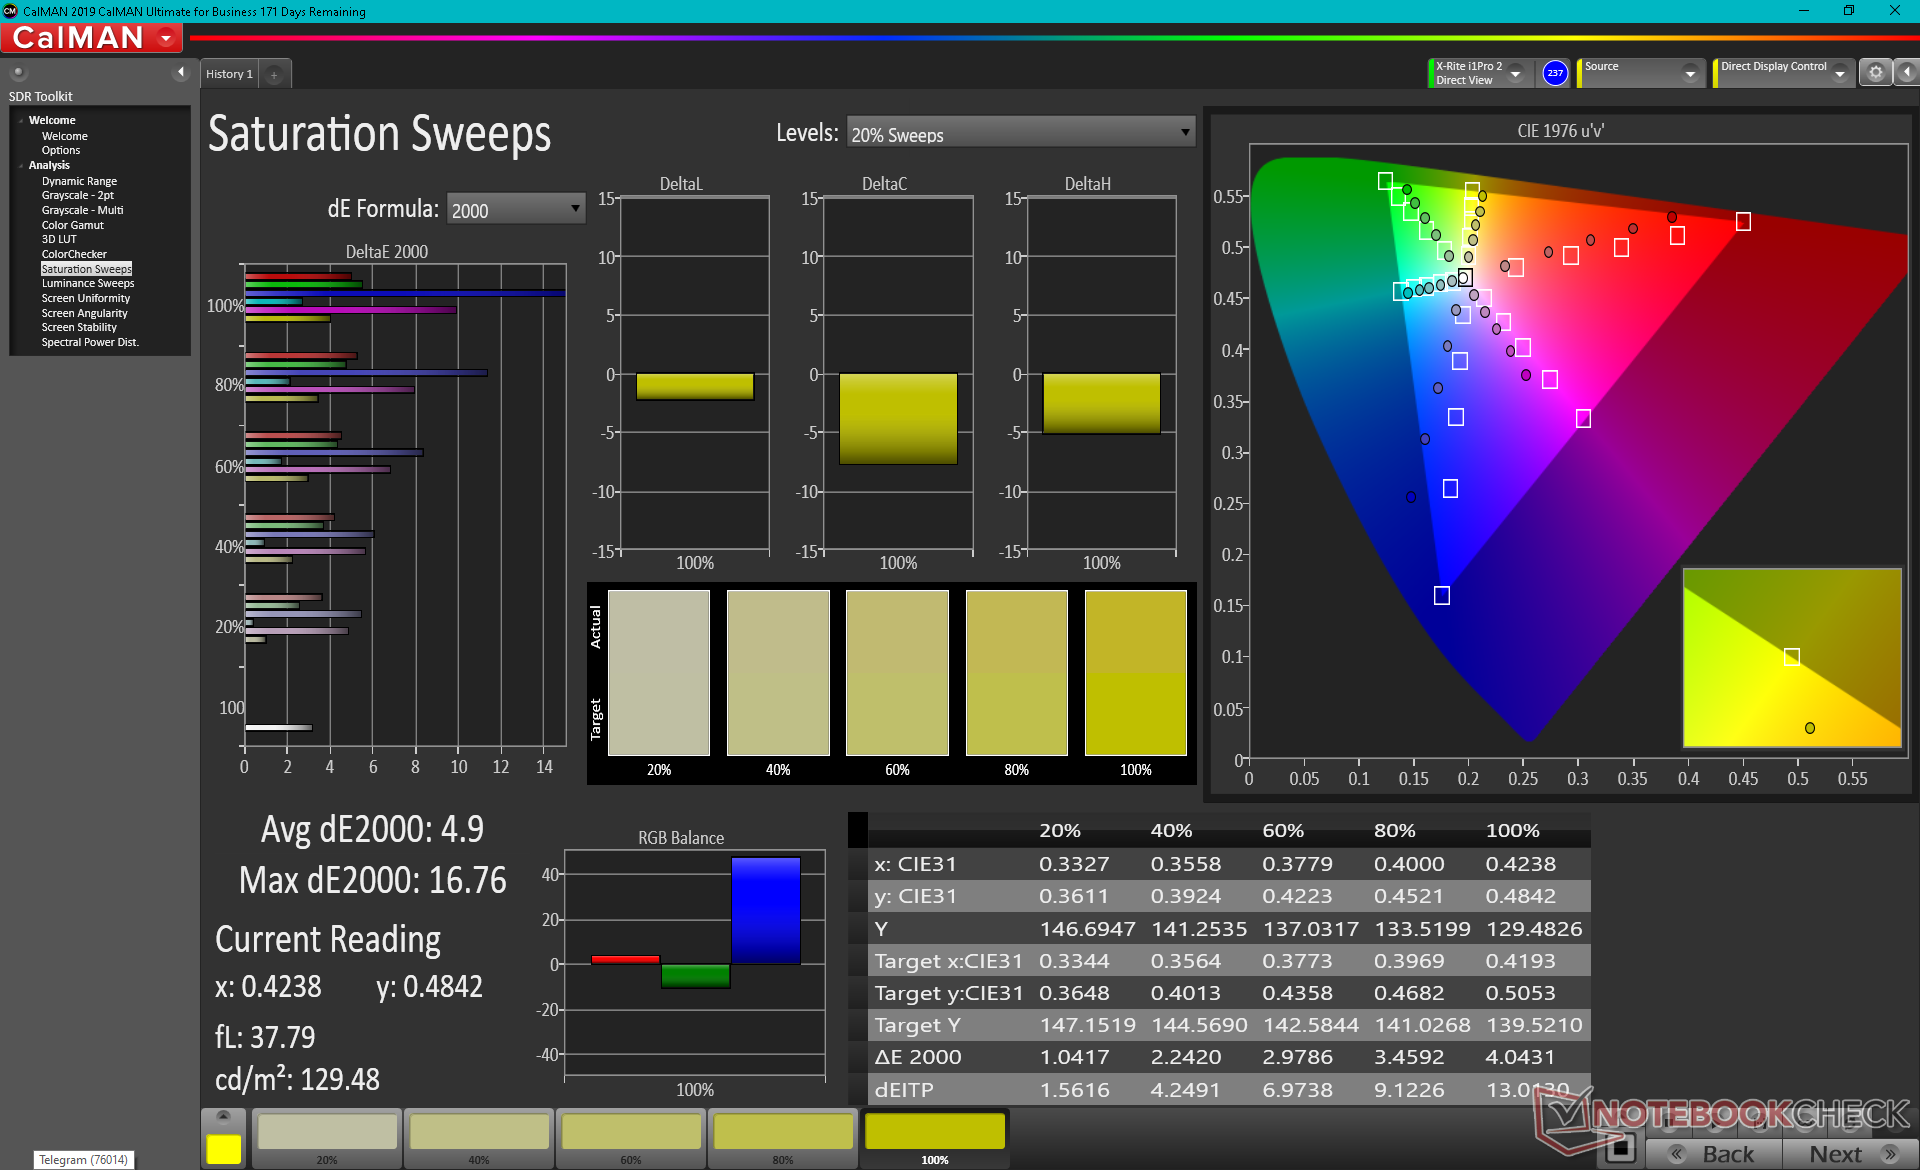
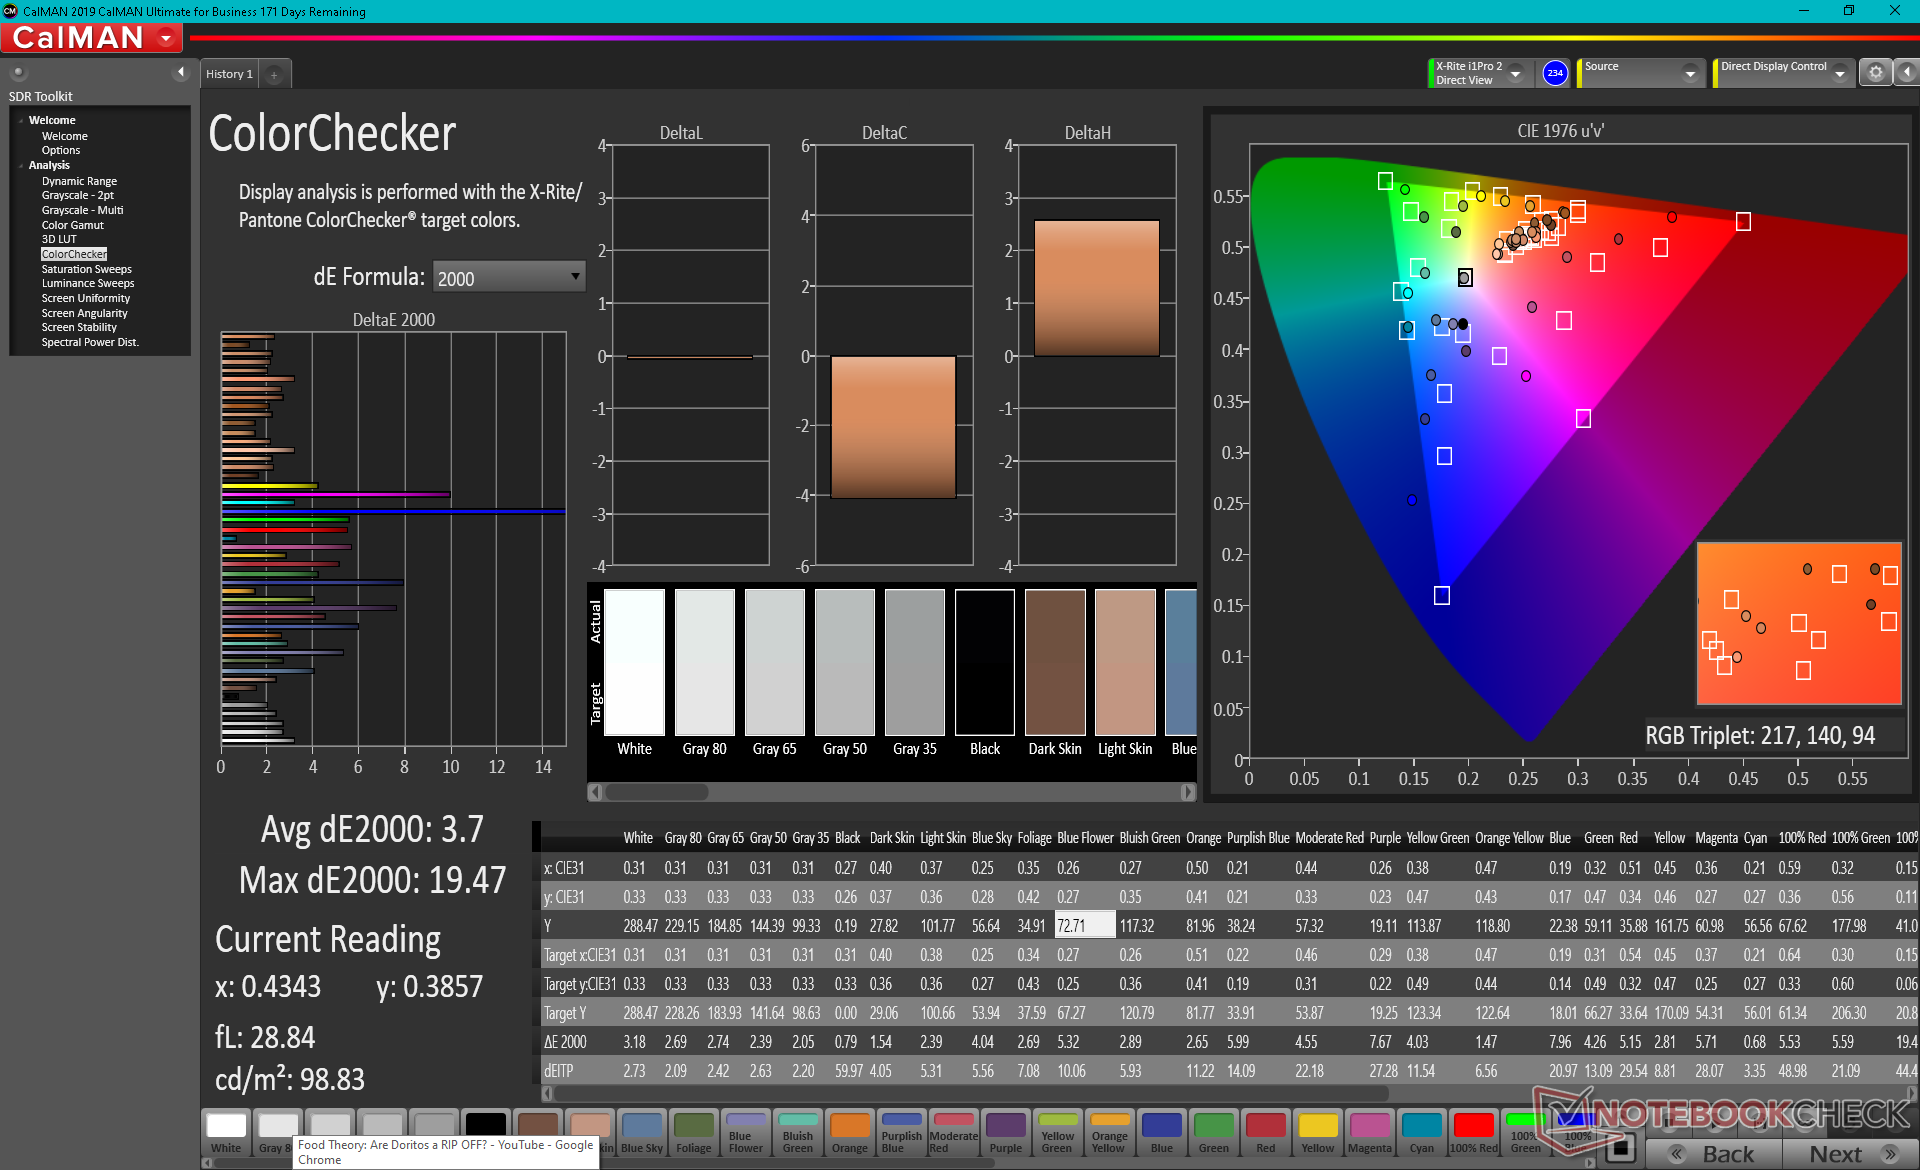
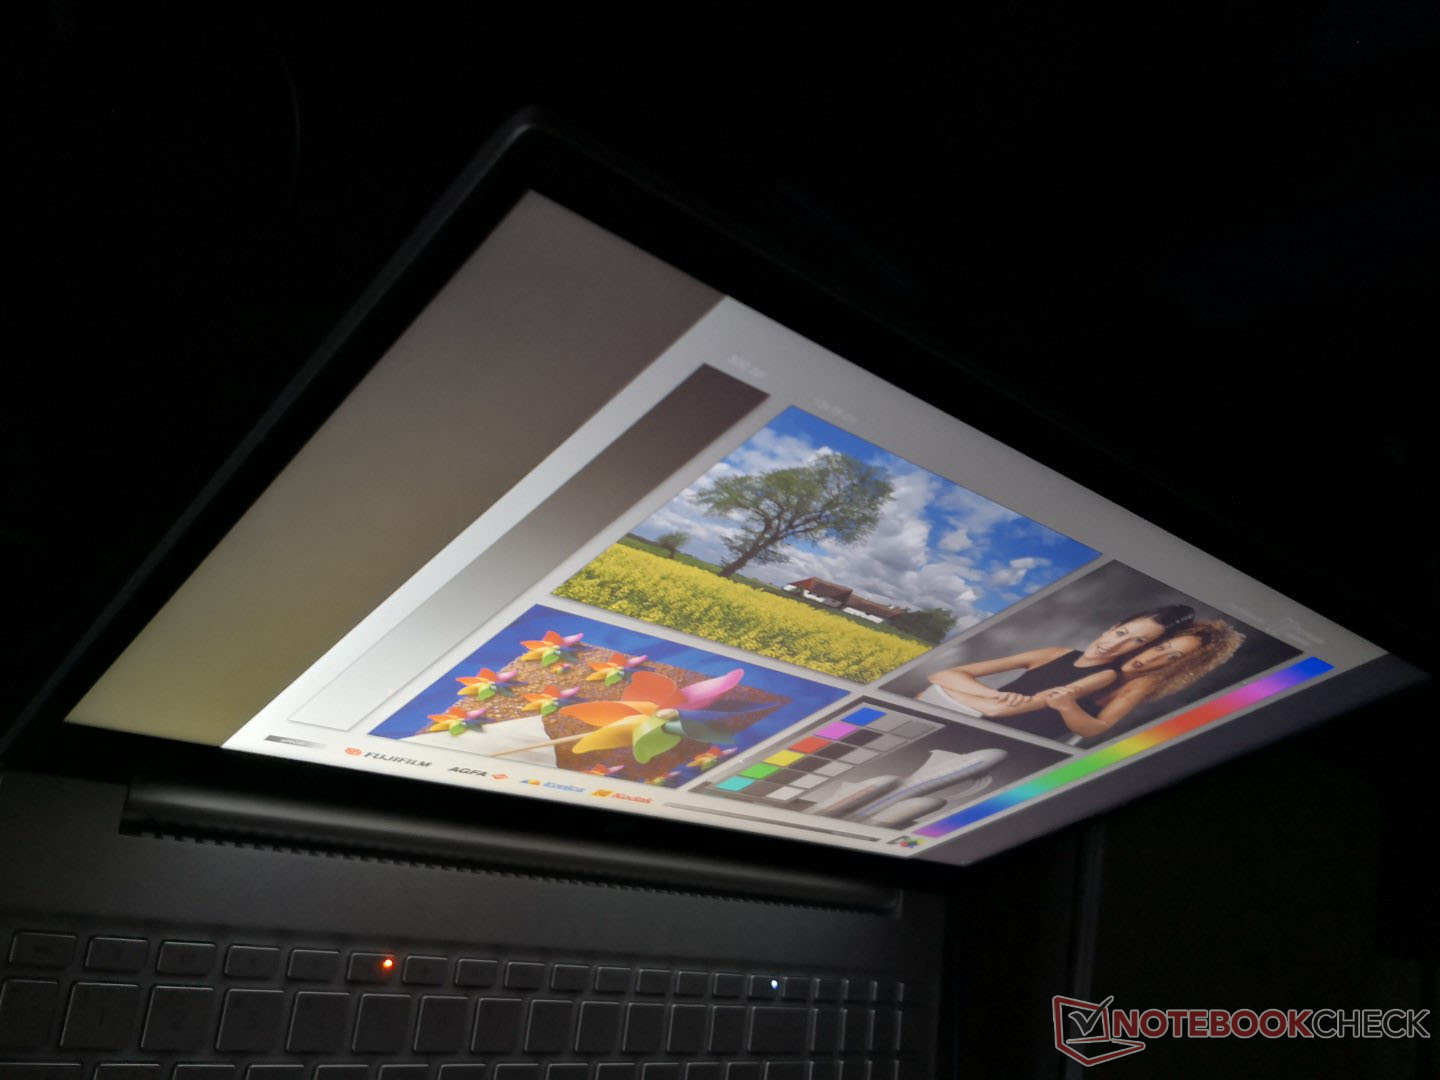
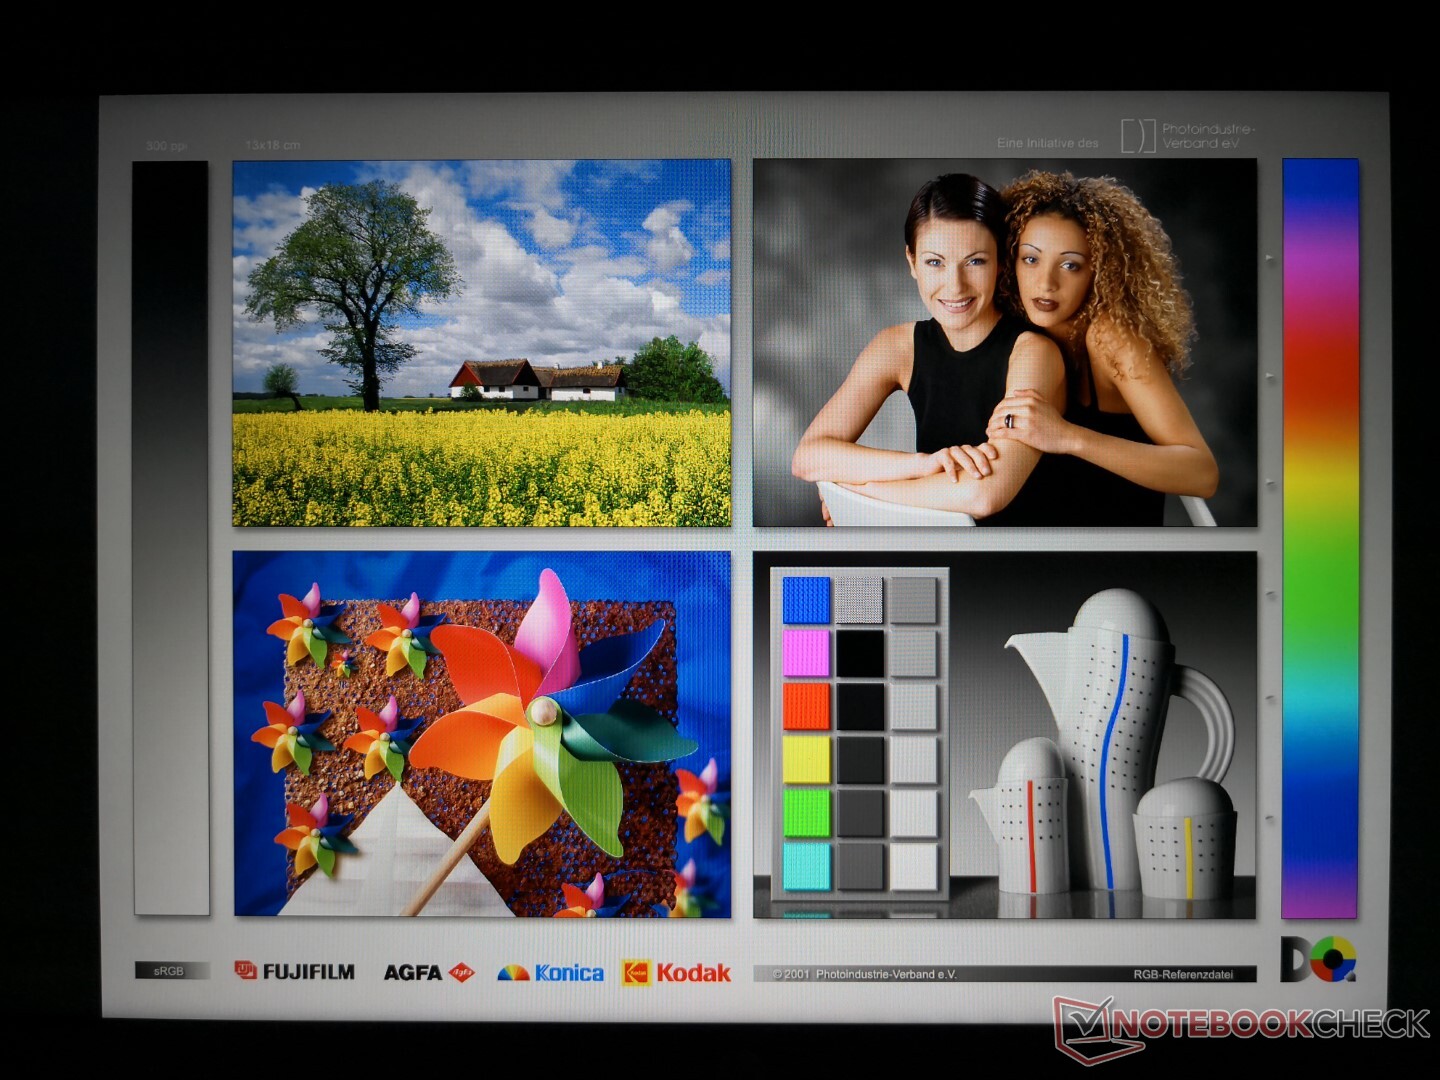
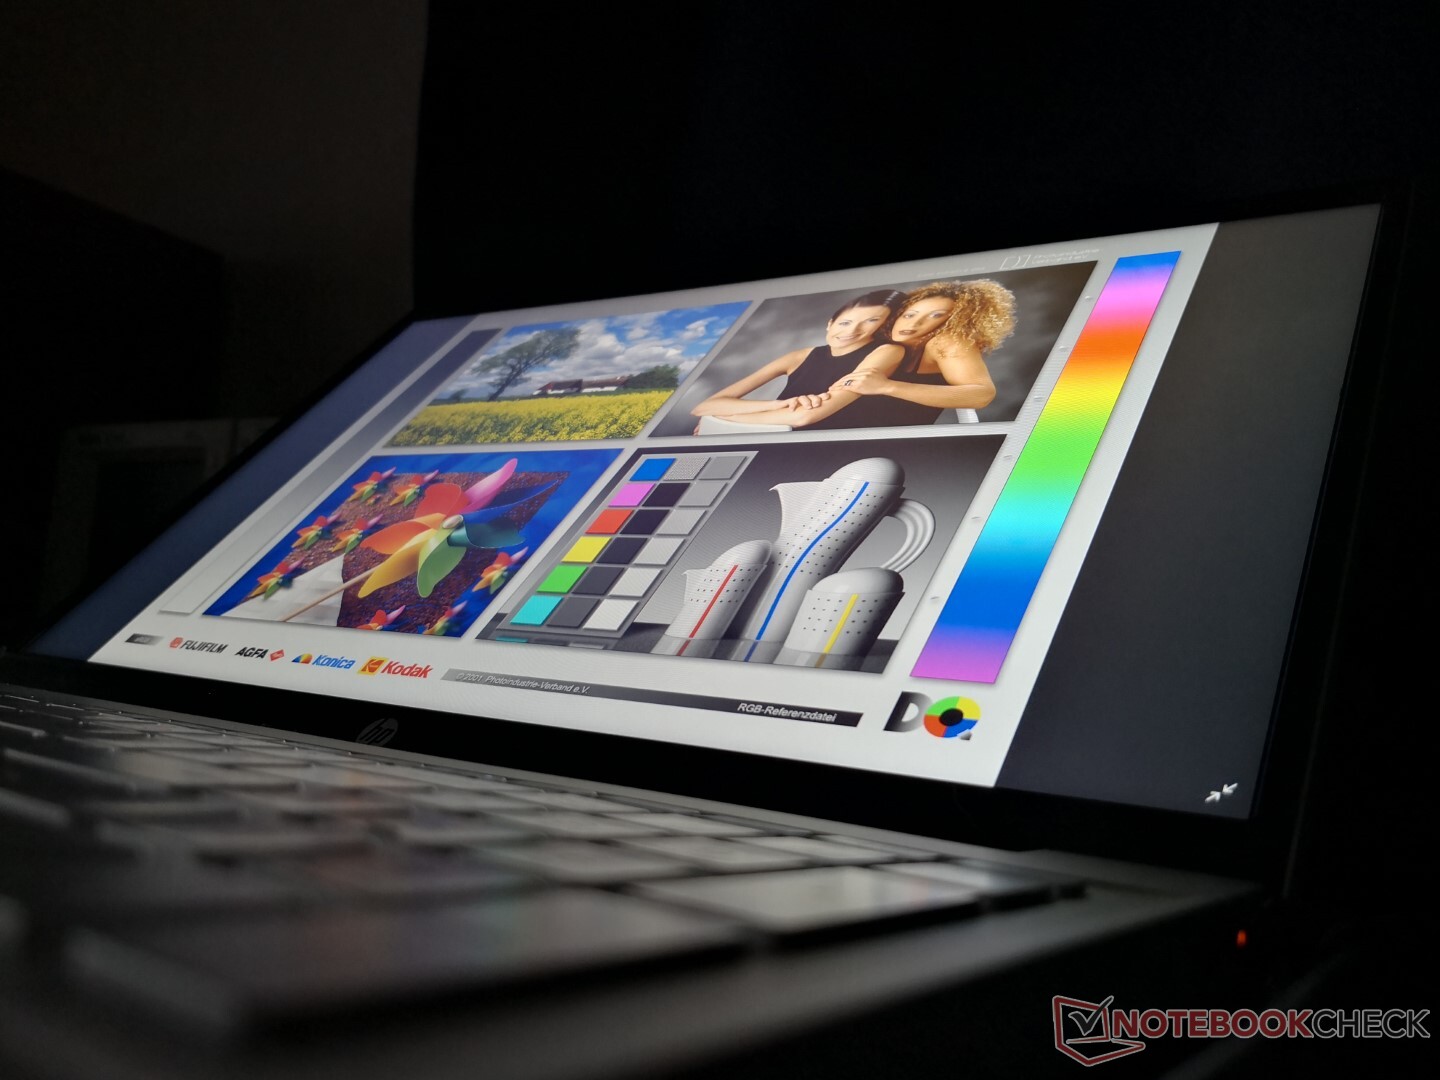
Display — Sharp, But Not Bright
The display is both good and disappointing. It's good in that contrast ratio is relatively high for a budget laptop at over 1000:1 and that images are sharp because to the glossy overlay. Response times are also decent for reduced ghosting when playing games. Unfortunately, the disappointingly dim backlight and limited colors prevent the display from being outstanding in all aspects. Expect some glare even when indoors.

| |||||||||||||||||||||||||
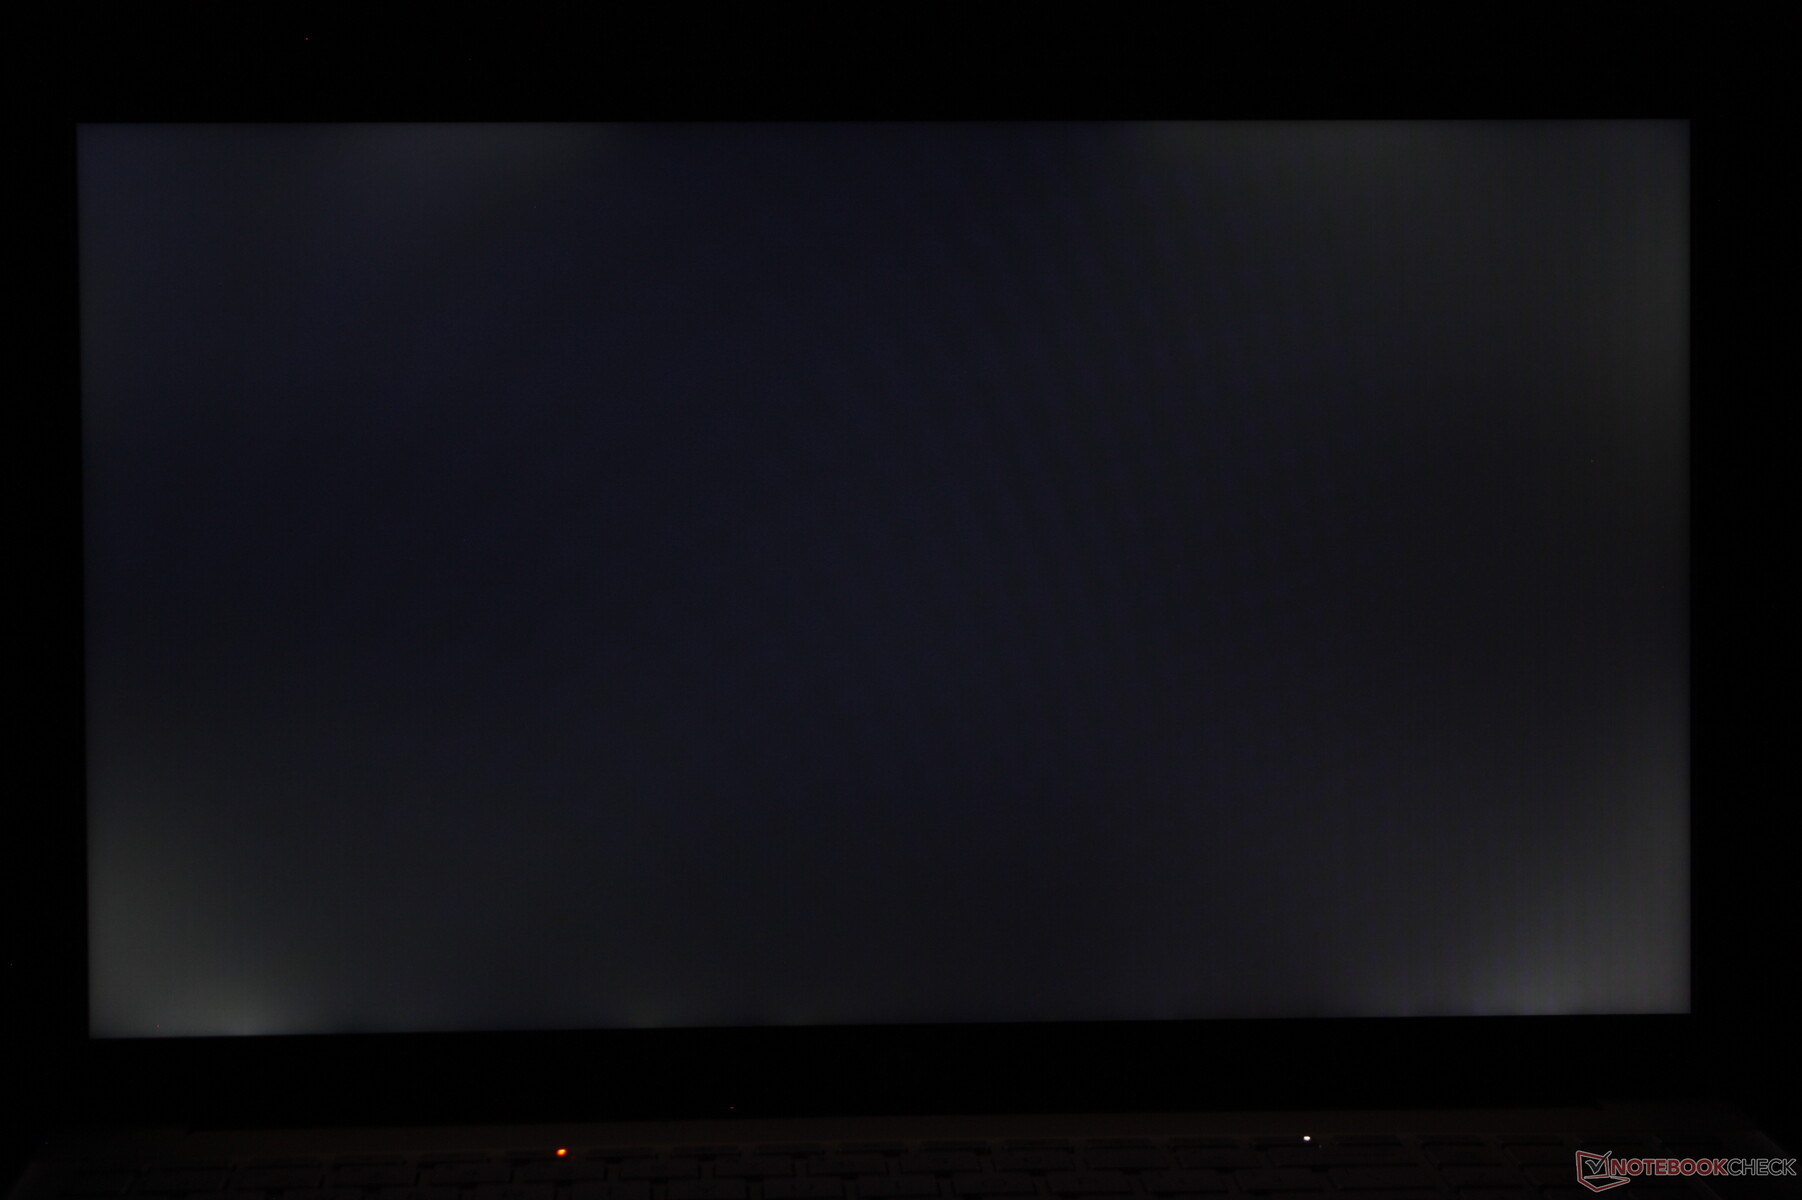
Brightness Distribution: 76 %
Center on Battery: 294.3 cd/m²
Contrast: 1132:1 (Black: 0.26 cd/m²)
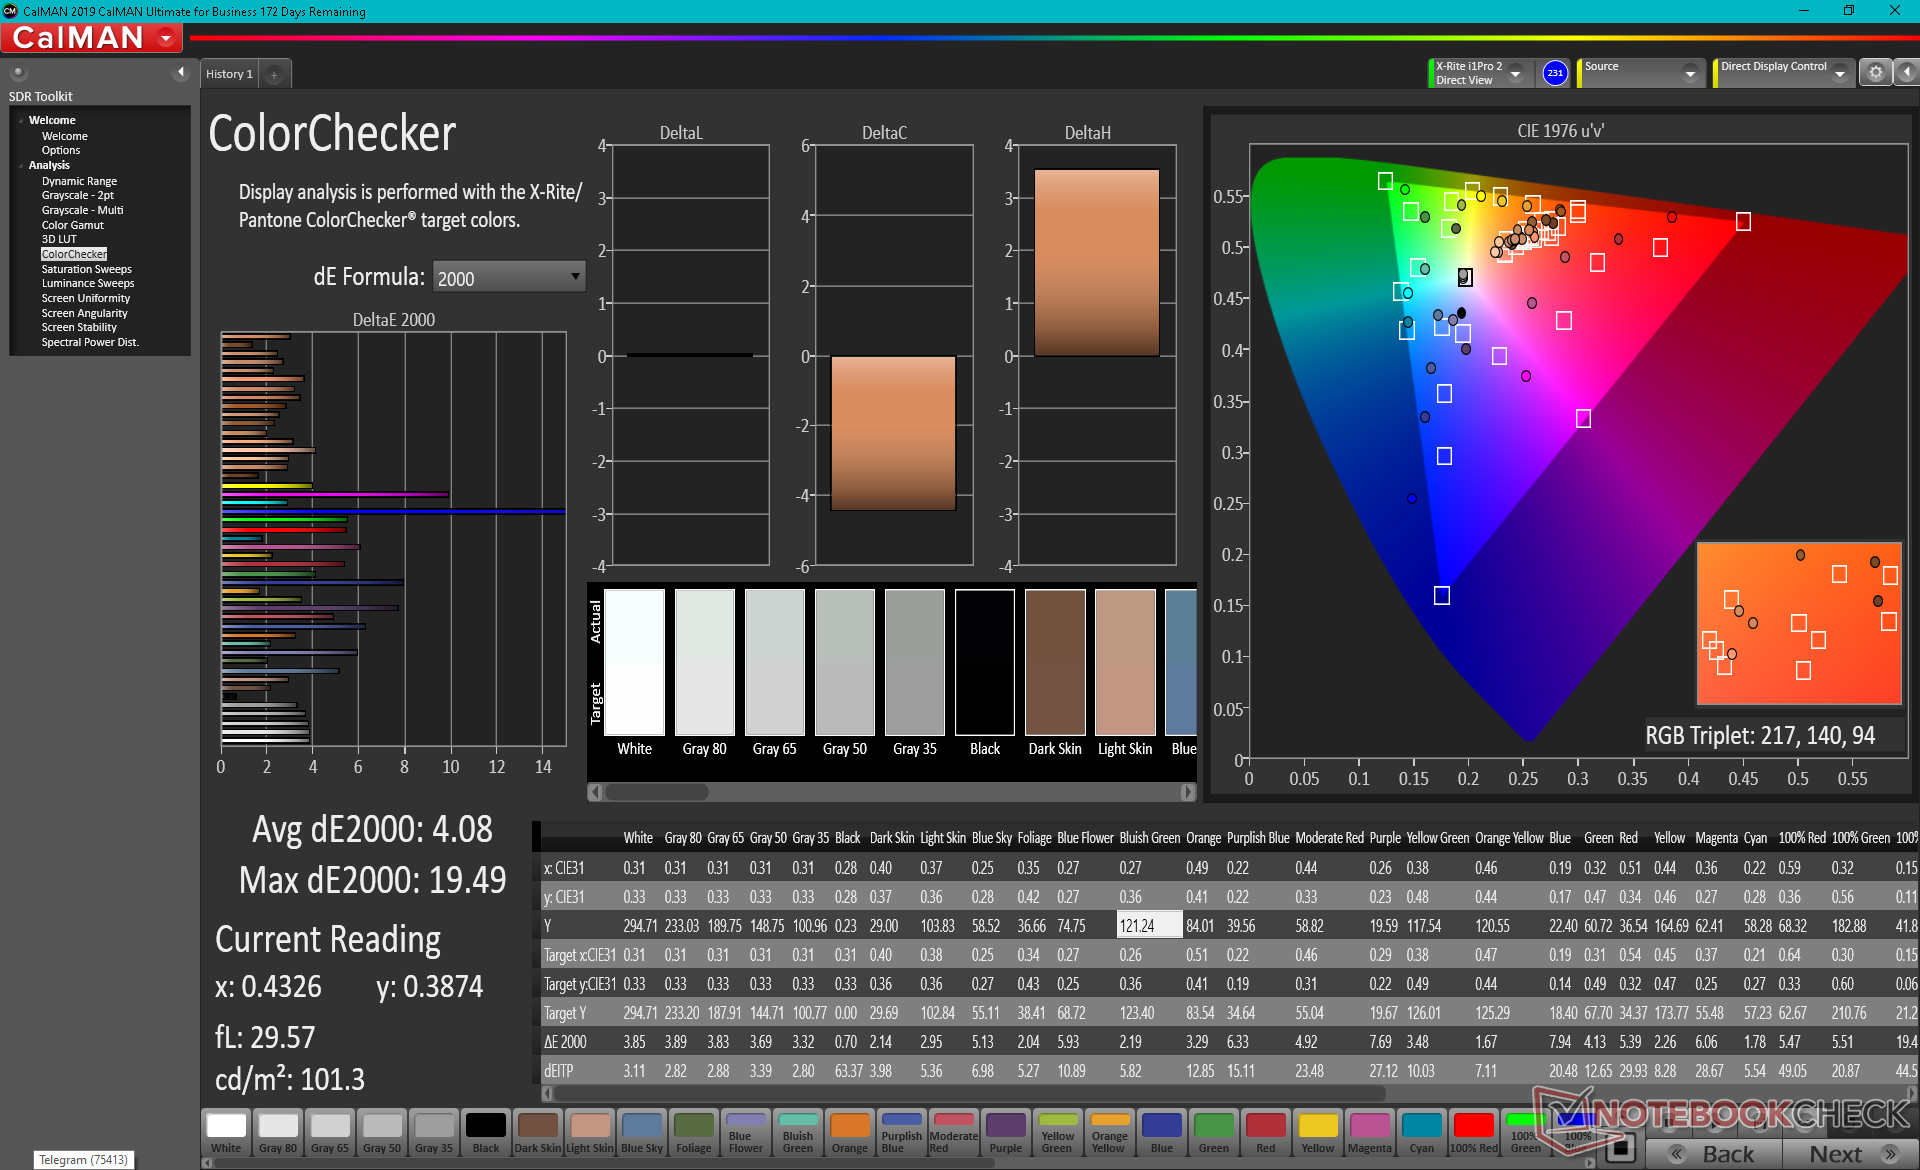
ΔE ColorChecker Calman: 4.08 | ∀{0.5-29.43 Ø4.73}
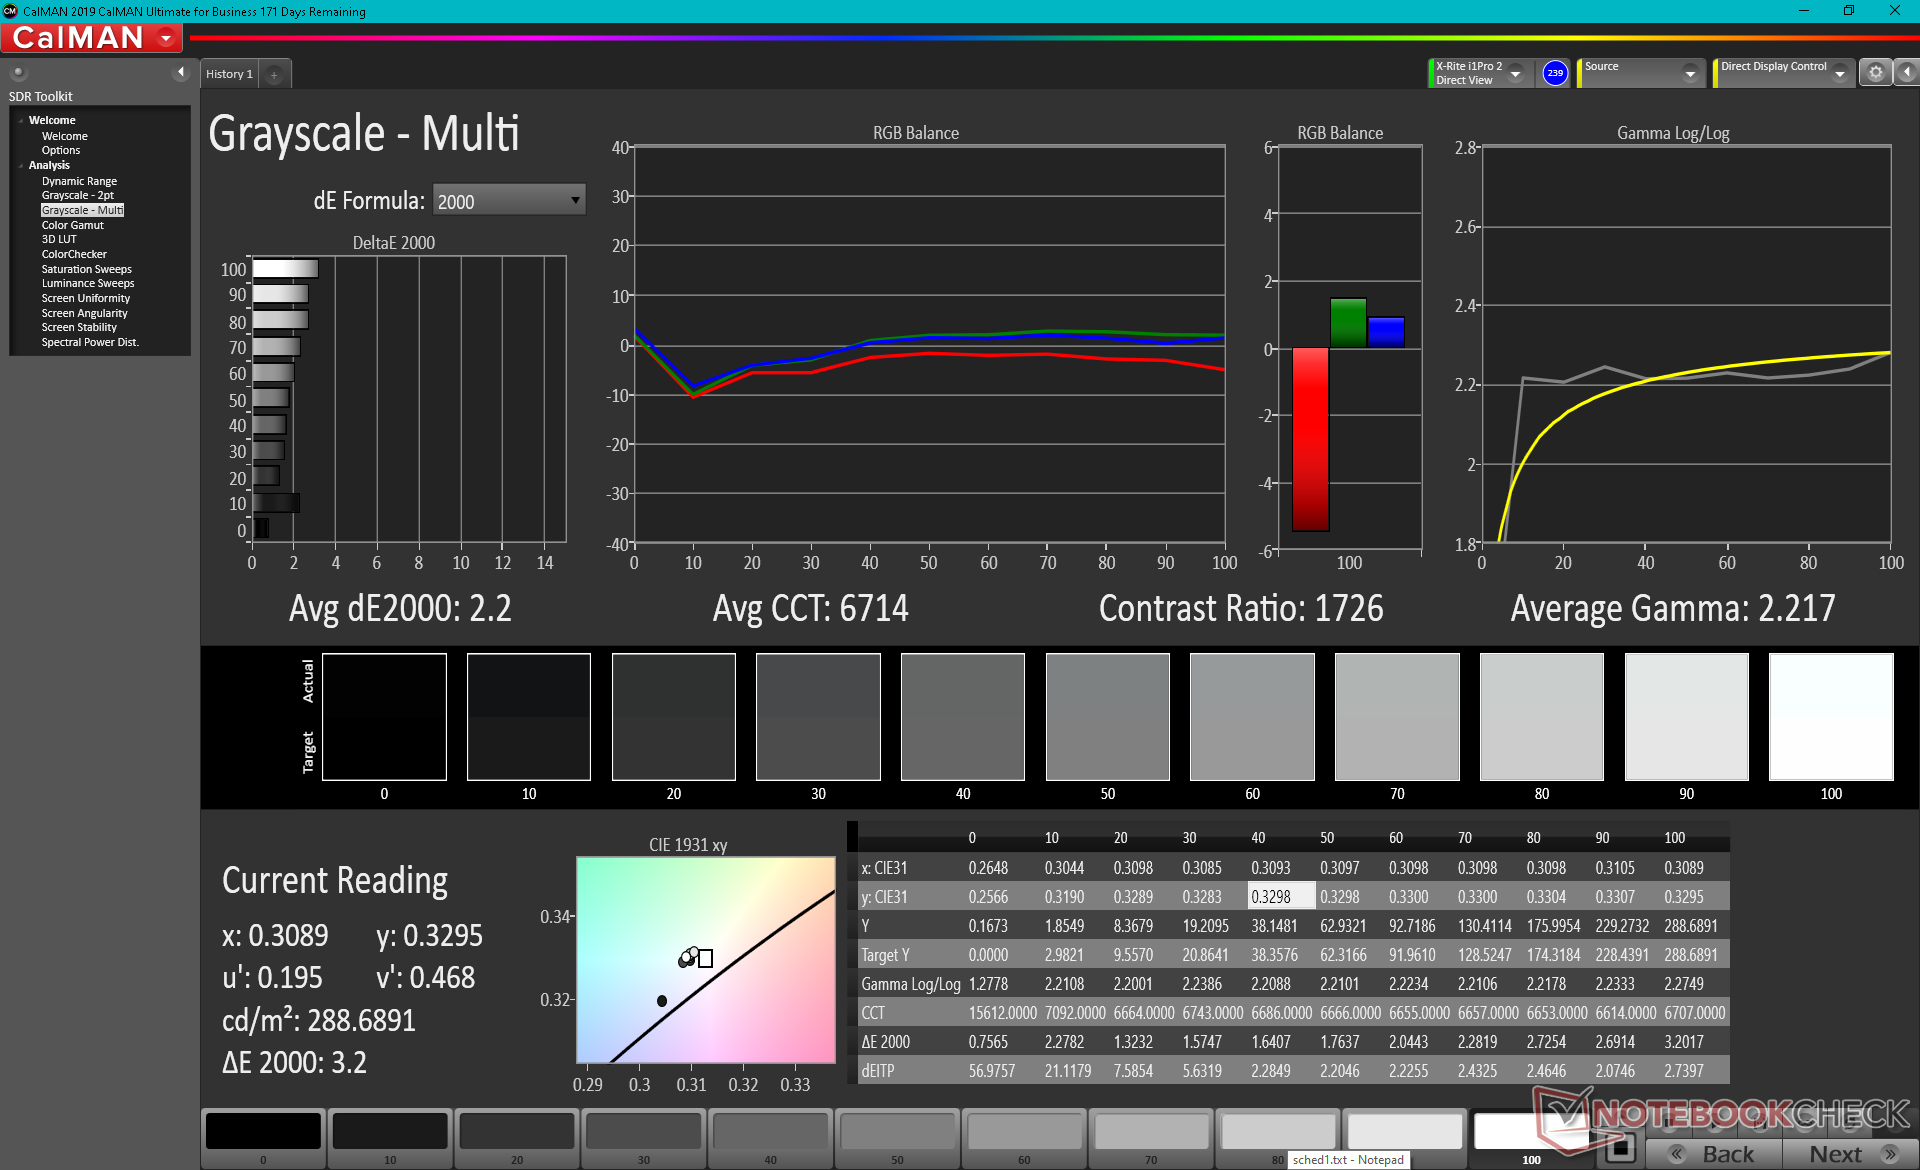
calibrated: 3.7
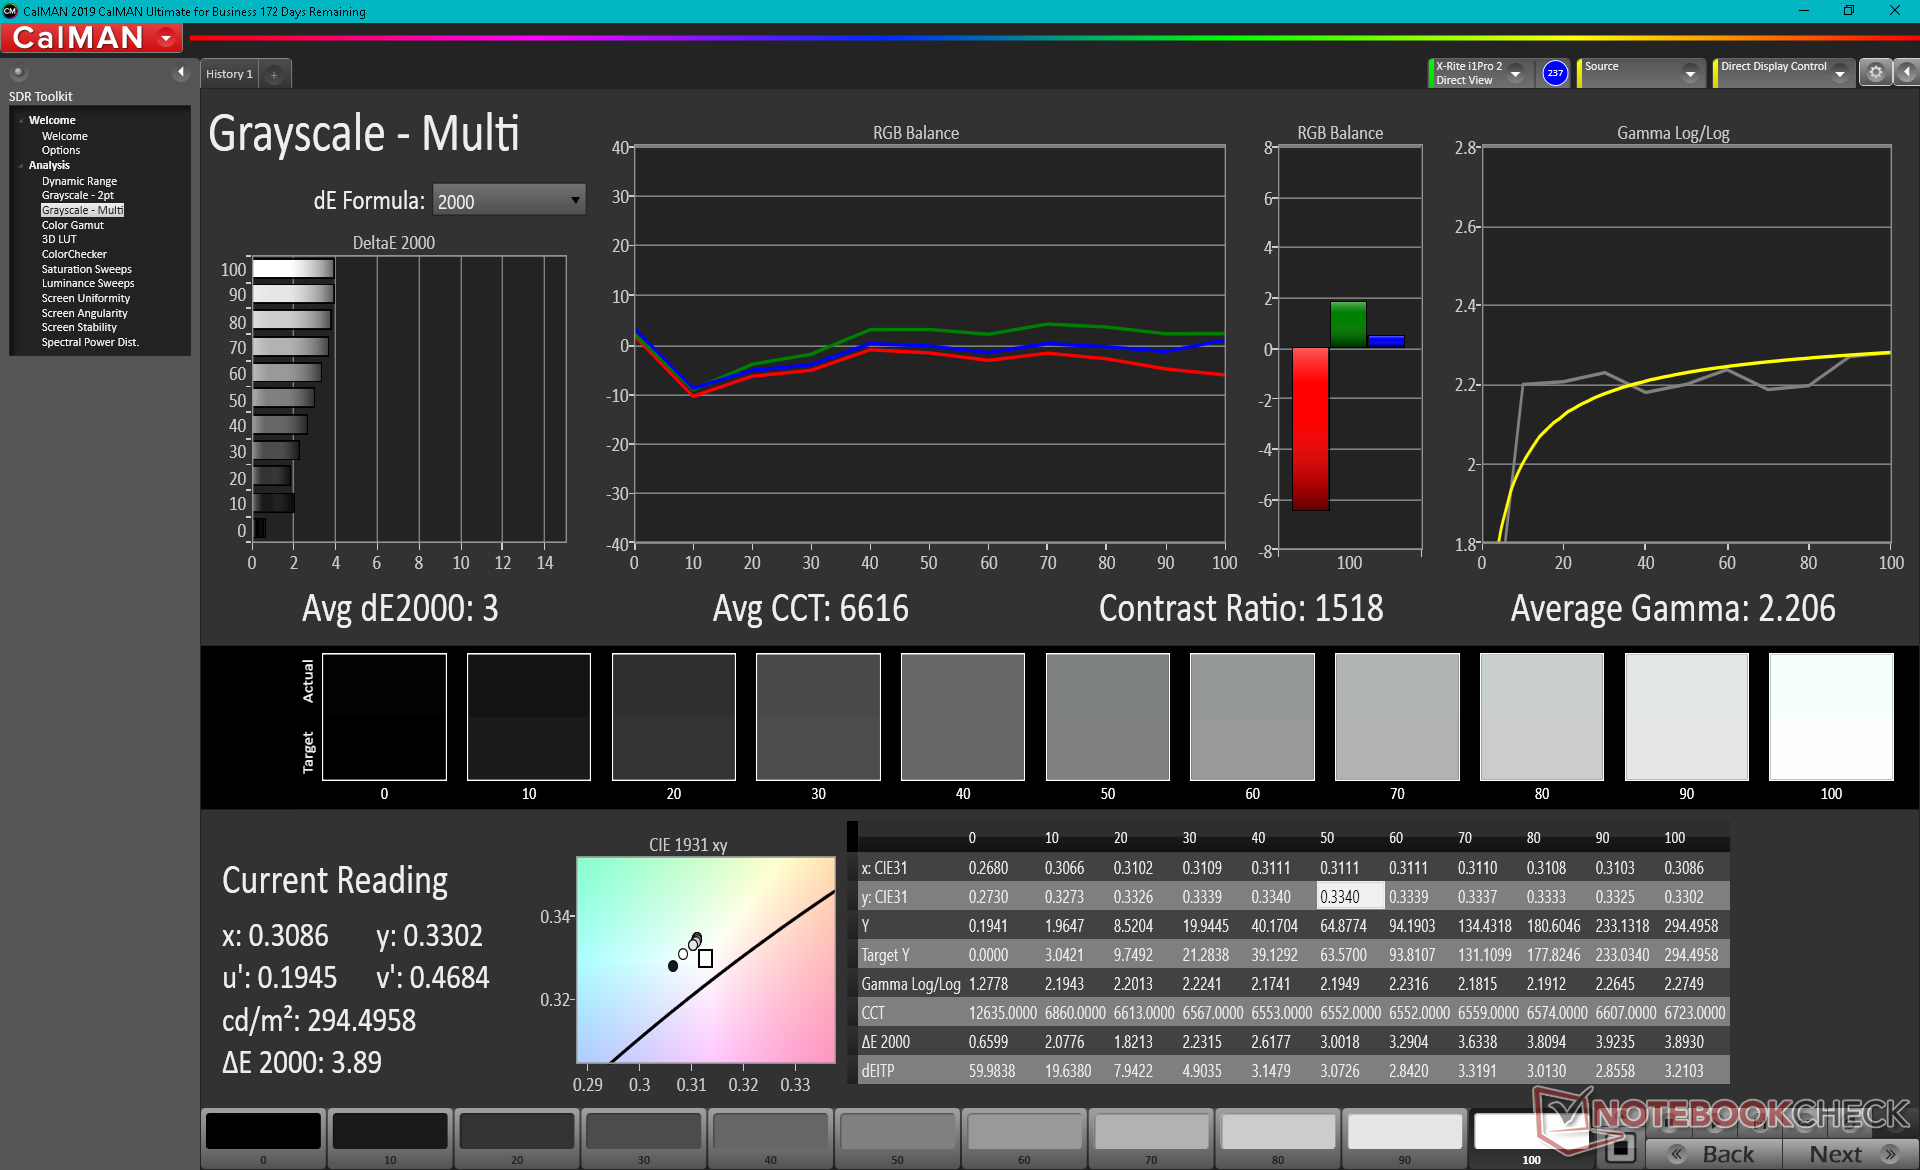
ΔE Greyscale Calman: 3 | ∀{0.09-98 Ø4.97}
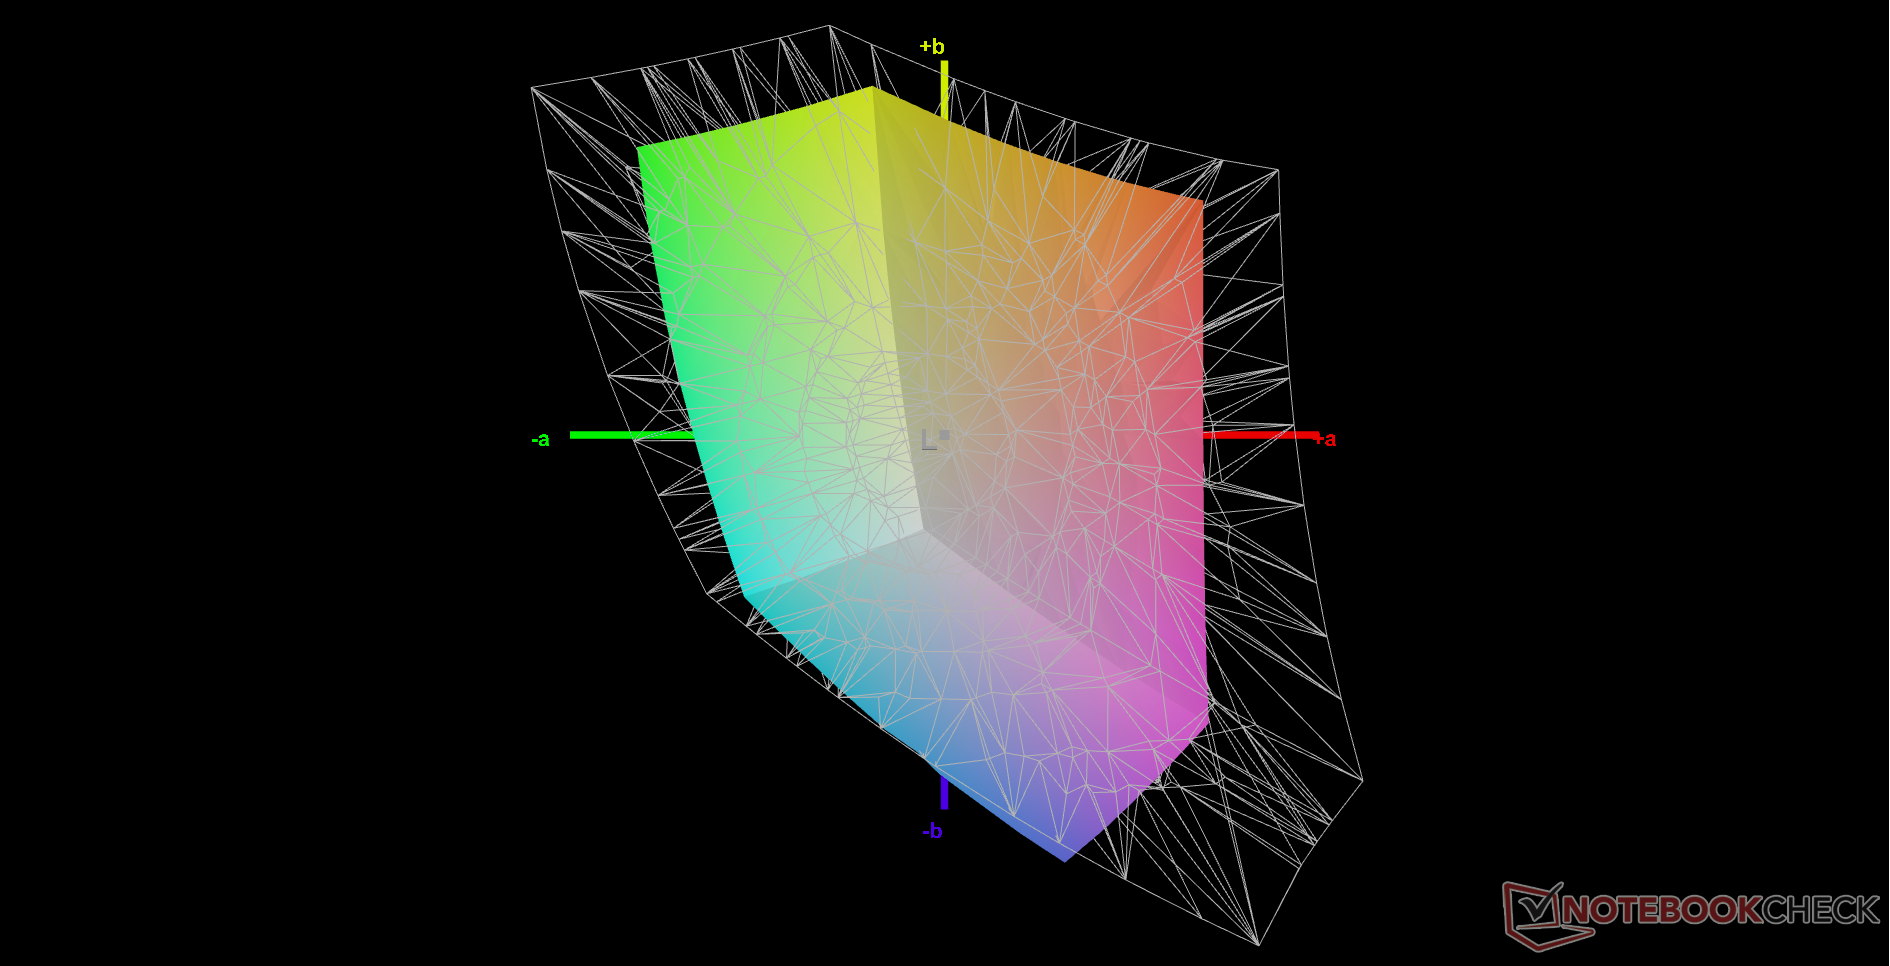
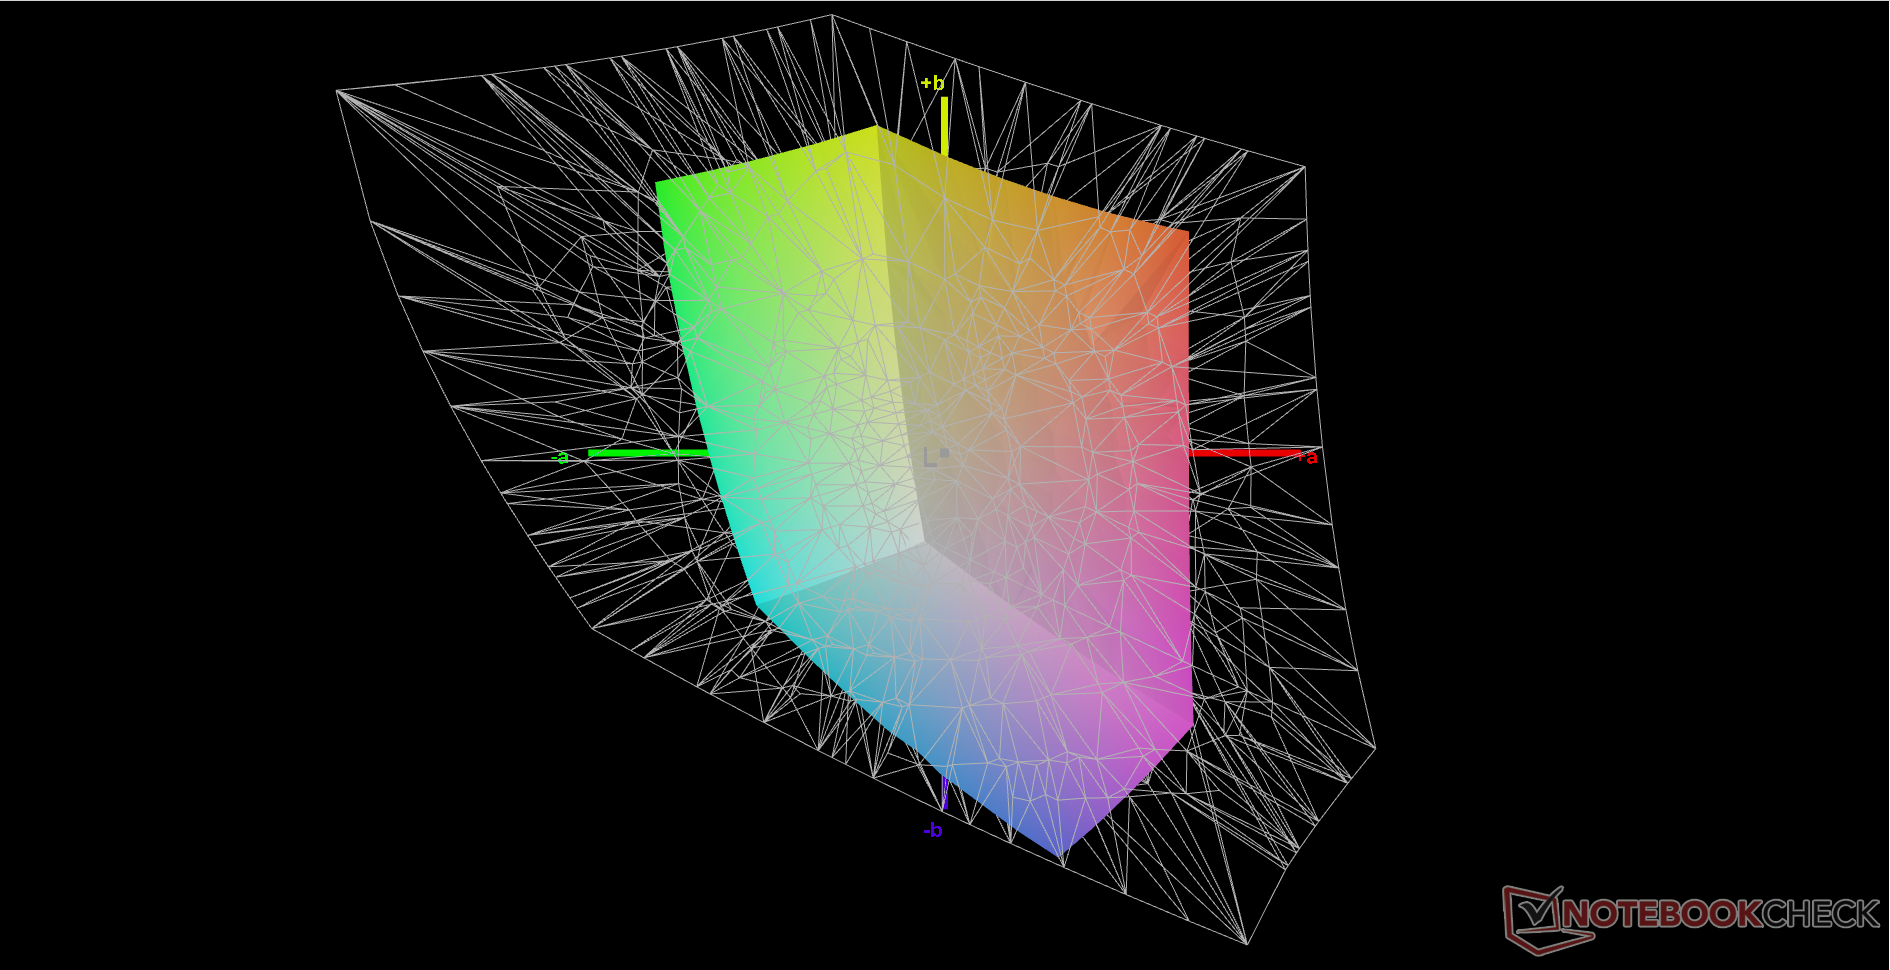
44.4% AdobeRGB 1998 (Argyll 3D)
64% sRGB (Argyll 3D)
42.9% Display P3 (Argyll 3D)
Gamma: 2.21
CCT: 6616 K
| HP Pavilion 15-eg Chi Mei CMN1523, IPS, 15.6", 1920x1080 | HP Pavilion Gaming 15-ec0002ng Chi Mei N156HGA-EA3, TN LED, 15.6", 1920x1080 | Dell Inspiron 15 5000 5502 BOE NV15N3D, IPS, 15.6", 1920x1080 | Lenovo IdeaPad 5 15IIL05 AU Optronics B156HAN02.1, IPS, 15.6", 1920x1080 | HP Envy 15-ep0098nr Samsung SDC4145, AMOLED, 15.6", 3840x2160 | Asus VivoBook S15 S533EQ-BQ002T Panda LM156LF-5L04, IPS, 15.6", 1920x1080 | |
|---|---|---|---|---|---|---|
| Display | -4% | -8% | -12% | 96% | -9% | |
| Display P3 Coverage (%) | 42.9 | 41.22 -4% | 39.42 -8% | 37.63 -12% | 88.5 106% | 39.01 -9% |
| sRGB Coverage (%) | 64 | 61.8 -3% | 58.7 -8% | 56.5 -12% | 100 56% | 58.5 -9% |
| AdobeRGB 1998 Coverage (%) | 44.4 | 42.62 -4% | 40.73 -8% | 38.88 -12% | 99.9 125% | 40.33 -9% |
| Response Times | -29% | -77% | -49% | 93% | -41% | |
| Response Time Grey 50% / Grey 80% * (ms) | 22.8 ? | 44 ? -93% | 45.6 ? -100% | 42 ? -84% | 0.8 ? 96% | 38 ? -67% |
| Response Time Black / White * (ms) | 23.6 ? | 15 ? 36% | 36.4 ? -54% | 27 ? -14% | 2.7 ? 89% | 27 ? -14% |
| PWM Frequency (Hz) | 26320 ? | 250 ? | 1020 ? | 242.7 ? | ||
| Screen | -59% | -10% | -9% | 17% | -13% | |
| Brightness middle (cd/m²) | 294.3 | 233 -21% | 233.1 -21% | 340 16% | 374.3 27% | 287 -2% |
| Brightness (cd/m²) | 251 | 211 -16% | 226 -10% | 325 29% | 379 51% | 261 4% |
| Brightness Distribution (%) | 76 | 82 8% | 90 18% | 88 16% | 91 20% | 84 11% |
| Black Level * (cd/m²) | 0.26 | 0.405 -56% | 0.21 19% | 0.27 -4% | 0.51 -96% | |
| Contrast (:1) | 1132 | 575 -49% | 1110 -2% | 1259 11% | 563 -50% | |
| Colorchecker dE 2000 * | 4.08 | 8.22 -101% | 5.69 -39% | 6.62 -62% | 5.47 -34% | 4.72 -16% |
| Colorchecker dE 2000 max. * | 19.49 | 18.6 5% | 20.62 -6% | 21.05 -8% | 8.22 58% | 17.94 8% |
| Colorchecker dE 2000 calibrated * | 3.7 | 5.12 -38% | 4.71 -27% | 4.61 -25% | 3.74 -1% | |
| Greyscale dE 2000 * | 3 | 10.13 -238% | 3.3 -10% | 4.61 -54% | 2.3 23% | 2.2 27% |
| Gamma | 2.21 100% | 2.27 97% | 2.35 94% | 2.74 80% | 2.09 105% | 2.51 88% |
| CCT | 6616 98% | 11323 57% | 6749 96% | 6262 104% | 6340 103% | 6758 96% |
| Color Space (Percent of AdobeRGB 1998) (%) | 39 | 37.1 | 36 | 87.8 | 37 | |
| Color Space (Percent of sRGB) (%) | 62 | 58 | 56 | 100 | 58 | |
| Total Average (Program / Settings) | -31% /
-41% | -32% /
-19% | -23% /
-16% | 69% /
49% | -21% /
-16% |
* ... smaller is better
Color coverage is limited to just 64 percent of sRGB to represent an entry-level display. Most mid-range to higher-end laptops nowadays promise at least 90 percent sRGB coverage for stronger colors.
X-Rite colorimeter results are a mixed bag. While grayscale and gamma are decent, certain colors like blue and magenta are very off with high deltaE values of 19.5 and 9.9, respectively. These two colors would remain more inaccurate than any other color by large margins even after calibration. Though perfectly fine for web browsing, video, or gaming, graphics editors may want to connect an external monitor or consider a higher-end laptop with more accurate colors. This is supposed to be a budget HP laptop, after all.

Display Response Times
| ↔ Response Time Black to White | ||
|---|---|---|
| 23.6 ms ... rise ↗ and fall ↘ combined | ↗ 13.6 ms rise | 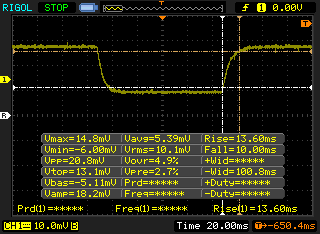 |
| ↘ 10 ms fall | ||
| The screen shows good response rates in our tests, but may be too slow for competitive gamers. In comparison, all tested devices range from 0.1 (minimum) to 240 (maximum) ms. » 54 % of all devices are better. This means that the measured response time is worse than the average of all tested devices (19.9 ms). | ||
| ↔ Response Time 50% Grey to 80% Grey | ||
| 22.8 ms ... rise ↗ and fall ↘ combined | ↗ 10 ms rise | 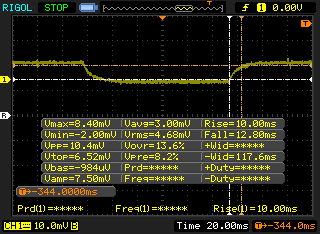 |
| ↘ 12.8 ms fall | ||
| The screen shows good response rates in our tests, but may be too slow for competitive gamers. In comparison, all tested devices range from 0.165 (minimum) to 636 (maximum) ms. » 34 % of all devices are better. This means that the measured response time is better than the average of all tested devices (31.1 ms). | ||
Screen Flickering / PWM (Pulse-Width Modulation)
| Screen flickering / PWM detected | 26320 Hz | ≤ 43 % brightness setting | 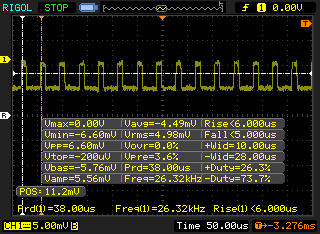 |
The display backlight flickers at 26320 Hz (worst case, e.g., utilizing PWM) Flickering detected at a brightness setting of 43 % and below. There should be no flickering or PWM above this brightness setting. The frequency of 26320 Hz is quite high, so most users sensitive to PWM should not notice any flickering. In comparison: 52 % of all tested devices do not use PWM to dim the display. If PWM was detected, an average of 7810 (minimum: 5 - maximum: 343500) Hz was measured. | |||
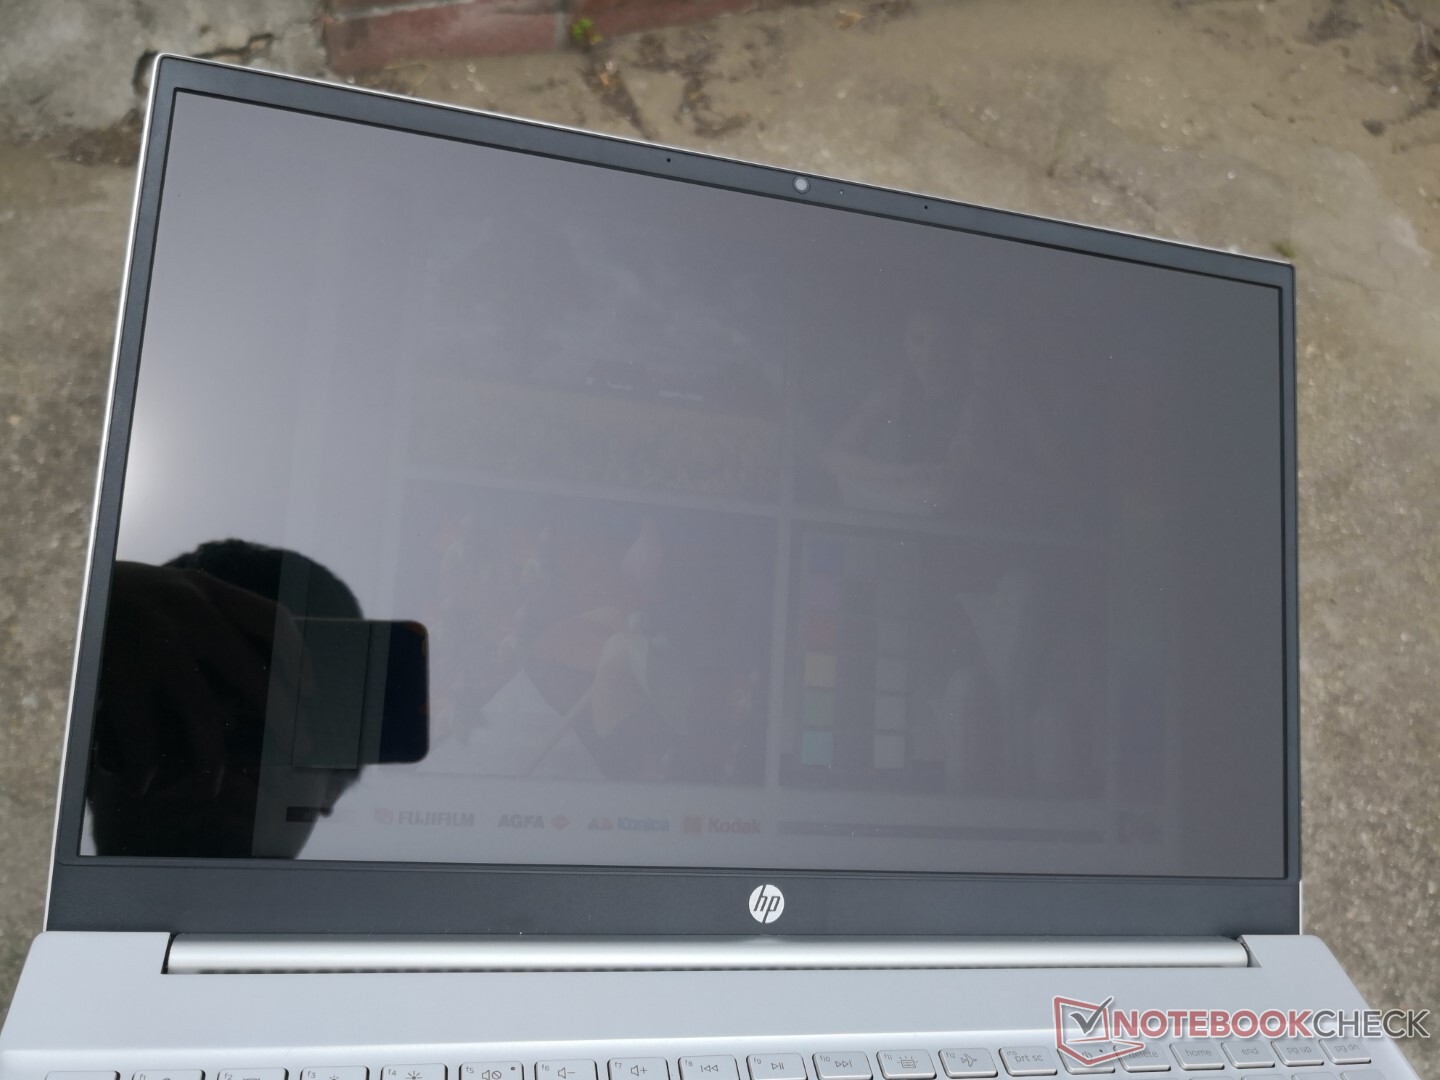
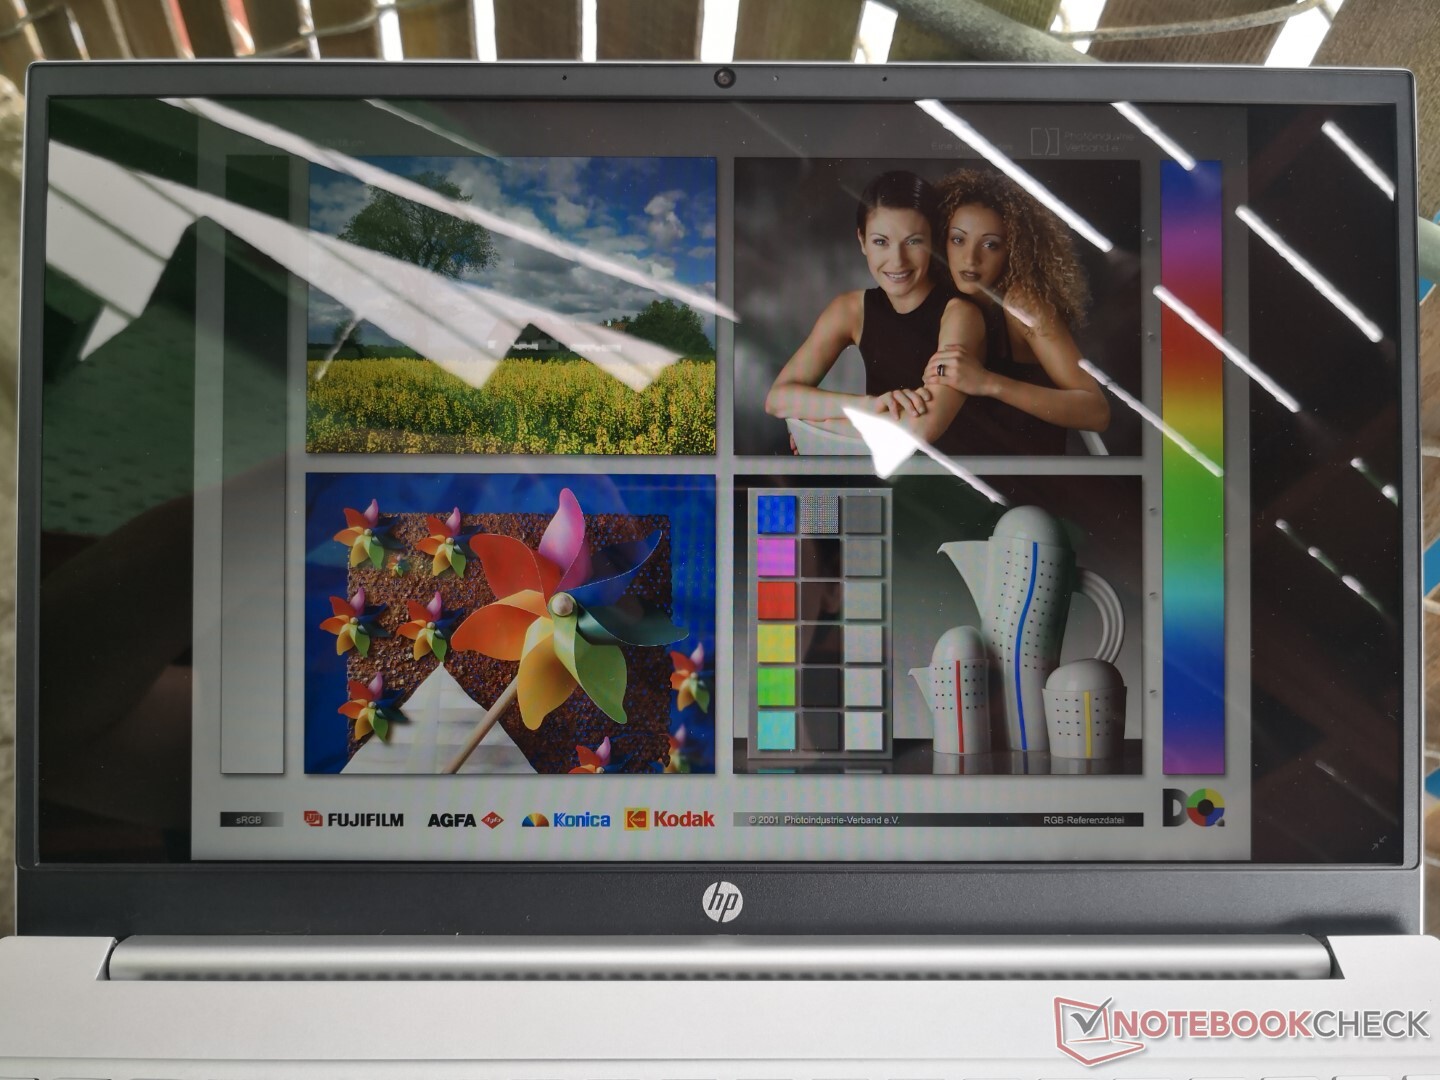
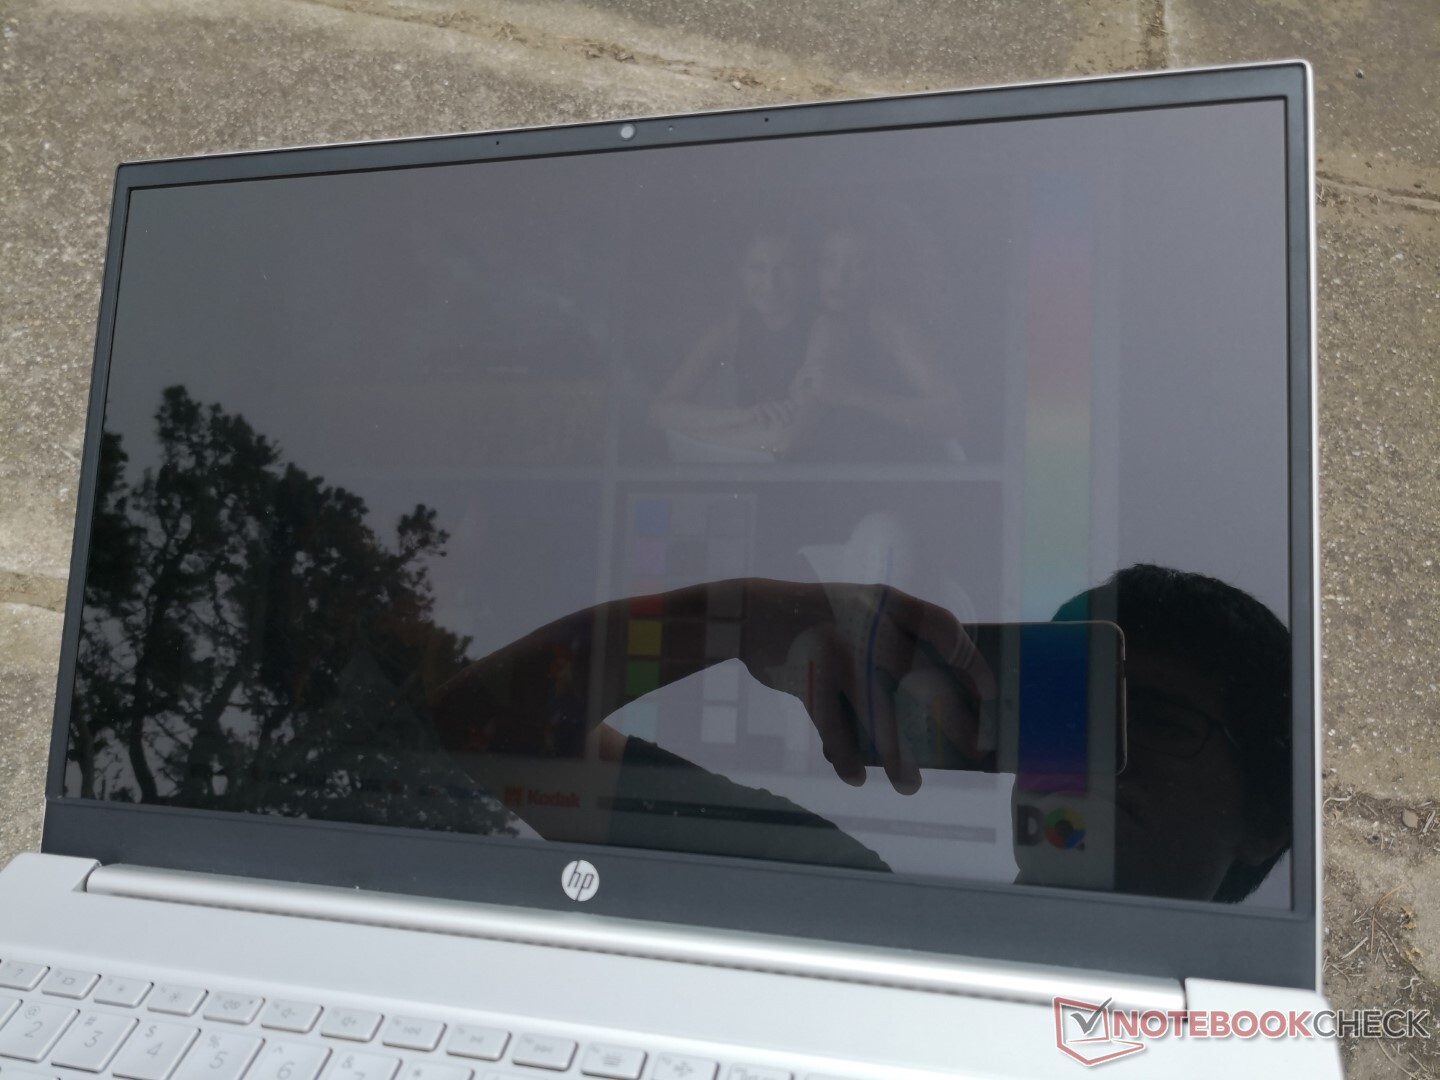
Outdoor visibility is poor because of the overwhelming glare. The dim backlight is unable to overcome both the glossy overlay and natural ambient lighting for a washed out screen. If outdoor visibility is a concern, then you may want to invest in a Spectre convertible instead which offers much brighter display options.
Performance — GeForce MX450 Powerhouse
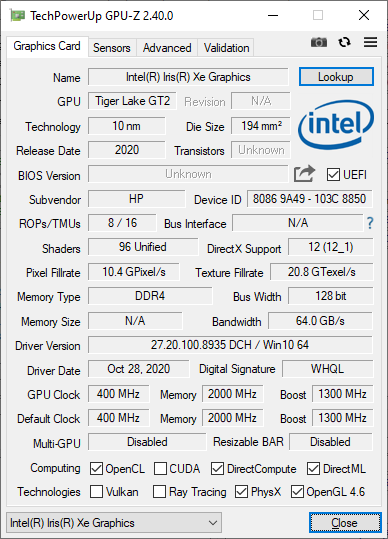
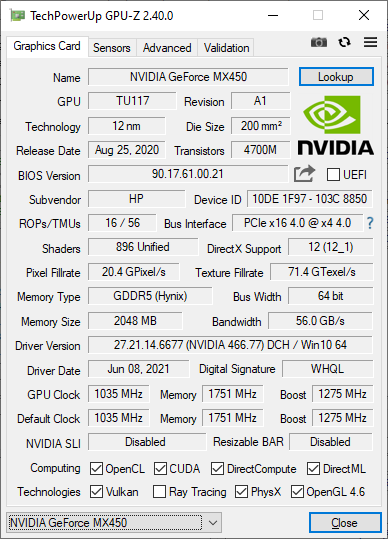
Though the Core i7-1165G7 has become ubiquitous, it's the GeForce MX450 GPU that separates the Pavilion 15 from most other Ultrabooks. Laptops with Tiger Lake CPUs typically lack discrete graphics options since the integrated Intel Iris Xe GPU competes directly with the GeForce MX series.
AMD Ryzen options are available for lower prices with similar display, RAM, and storage options. However, they lack the GeForce MX GPU and AX201 Wi-Fi 6 wireless of the Intel SKUs.
Our unit was set to High Performance mode prior to running any performance benchmarks below for the highest possible scores.
Processor — Limited Turbo Boost Power
Single-thread performance is slightly above the average Core i7-1165G7 laptop in our database by a few percentage points while multi-thread performance is slightly under. Overall performance is somewhat lacking as a result as CineBench scores are comparable to the older and cheaper Core i5-1035G1 even though we know the Core i7-1165G7 is capable of much more. The ADATA Xenia, for example, offers up to 25 to 30 percent faster multi-thread performance than our HP despite the fact that both systems come with the same processor.
Cinebench R23: Multi Core | Single Core
Cinebench R15: CPU Multi 64Bit | CPU Single 64Bit
Blender: v2.79 BMW27 CPU
7-Zip 18.03: 7z b 4 -mmt1 | 7z b 4
Geekbench 5.5: Single-Core | Multi-Core
HWBOT x265 Benchmark v2.2: 4k Preset
LibreOffice : 20 Documents To PDF
R Benchmark 2.5: Overall mean
| Cinebench R20 / CPU (Multi Core) | |
| HP Envy x360 15-eu0097nr | |
| HP Envy 15-ep0098nr | |
| Tuxedo Aura 15 Gen1 | |
| ADATA XPG Xenia Xe | |
| Honor MagicBook 15 4500U | |
| Average Intel Core i7-1165G7 (1060 - 2657, n=81) | |
| HP Pavilion 15-eg | |
| Lenovo IdeaPad 5 15IIL05 | |
| HP Pavilion Gaming 15-ec0002ng | |
| Lenovo Ideapad S340-15IIL | |
| Honor MagicBook 15 i5 1135G7 | |
| HP Pavilion x360 15-dq0065cl | |
| Dell Inspiron 15 5000 5502 | |
| Cinebench R20 / CPU (Single Core) | |
| ADATA XPG Xenia Xe | |
| HP Pavilion 15-eg | |
| Average Intel Core i7-1165G7 (442 - 589, n=81) | |
| Honor MagicBook 15 i5 1135G7 | |
| Dell Inspiron 15 5000 5502 | |
| HP Envy x360 15-eu0097nr | |
| Tuxedo Aura 15 Gen1 | |
| Lenovo Ideapad S340-15IIL | |
| Honor MagicBook 15 4500U | |
| Lenovo IdeaPad 5 15IIL05 | |
| HP Envy 15-ep0098nr | |
| HP Pavilion x360 15-dq0065cl | |
| HP Pavilion Gaming 15-ec0002ng | |
| Cinebench R23 / Multi Core | |
| HP Envy x360 15-eu0097nr | |
| Tuxedo Aura 15 Gen1 | |
| ADATA XPG Xenia Xe | |
| Average Intel Core i7-1165G7 (2525 - 6862, n=64) | |
| HP Pavilion 15-eg | |
| Honor MagicBook 15 i5 1135G7 | |
| Cinebench R23 / Single Core | |
| ADATA XPG Xenia Xe | |
| HP Pavilion 15-eg | |
| Average Intel Core i7-1165G7 (1110 - 1539, n=59) | |
| Honor MagicBook 15 i5 1135G7 | |
| HP Envy x360 15-eu0097nr | |
| Tuxedo Aura 15 Gen1 | |
| Cinebench R15 / CPU Multi 64Bit | |
| HP Envy x360 15-eu0097nr | |
| HP Envy 15-ep0098nr | |
| Tuxedo Aura 15 Gen1 | |
| ADATA XPG Xenia Xe | |
| Honor MagicBook 15 4500U | |
| Honor MagicBook 15 i5 1135G7 | |
| Average Intel Core i7-1165G7 (553 - 1027, n=86) | |
| Lenovo IdeaPad 5 15IIL05 | |
| HP Pavilion Gaming 15-ec0002ng | |
| HP Pavilion 15-eg | |
| Lenovo Ideapad S340-15IIL | |
| HP Pavilion x360 15-dq0065cl | |
| Dell Inspiron 15 5000 5502 | |
| Cinebench R15 / CPU Single 64Bit | |
| ADATA XPG Xenia Xe | |
| HP Pavilion 15-eg | |
| Average Intel Core i7-1165G7 (115 - 230, n=78) | |
| Honor MagicBook 15 i5 1135G7 | |
| HP Envy 15-ep0098nr | |
| Dell Inspiron 15 5000 5502 | |
| Tuxedo Aura 15 Gen1 | |
| HP Envy x360 15-eu0097nr | |
| Lenovo Ideapad S340-15IIL | |
| HP Pavilion x360 15-dq0065cl | |
| Honor MagicBook 15 4500U | |
| Lenovo IdeaPad 5 15IIL05 | |
| HP Pavilion Gaming 15-ec0002ng | |
| Blender / v2.79 BMW27 CPU | |
| Dell Inspiron 15 5000 5502 | |
| Honor MagicBook 15 i5 1135G7 | |
| Average Intel Core i7-1165G7 (468 - 1138, n=80) | |
| Lenovo IdeaPad 5 15IIL05 | |
| HP Pavilion 15-eg | |
| Honor MagicBook 15 4500U | |
| ADATA XPG Xenia Xe | |
| Tuxedo Aura 15 Gen1 | |
| HP Envy 15-ep0098nr | |
| HP Envy x360 15-eu0097nr | |
| 7-Zip 18.03 / 7z b 4 -mmt1 | |
| HP Pavilion 15-eg | |
| ADATA XPG Xenia Xe | |
| Average Intel Core i7-1165G7 (4478 - 5507, n=80) | |
| Dell Inspiron 15 5000 5502 | |
| HP Envy x360 15-eu0097nr | |
| HP Envy 15-ep0098nr | |
| Tuxedo Aura 15 Gen1 | |
| Lenovo IdeaPad 5 15IIL05 | |
| Honor MagicBook 15 4500U | |
| Honor MagicBook 15 i5 1135G7 | |
| 7-Zip 18.03 / 7z b 4 | |
| HP Envy x360 15-eu0097nr | |
| Tuxedo Aura 15 Gen1 | |
| HP Envy 15-ep0098nr | |
| ADATA XPG Xenia Xe | |
| Honor MagicBook 15 4500U | |
| Average Intel Core i7-1165G7 (15347 - 27405, n=80) | |
| HP Pavilion 15-eg | |
| Lenovo IdeaPad 5 15IIL05 | |
| Honor MagicBook 15 i5 1135G7 | |
| Dell Inspiron 15 5000 5502 | |
| Geekbench 5.5 / Single-Core | |
| ADATA XPG Xenia Xe | |
| Average Intel Core i7-1165G7 (1302 - 1595, n=77) | |
| Honor MagicBook 15 i5 1135G7 | |
| Dell Inspiron 15 5000 5502 | |
| HP Envy 15-ep0098nr | |
| Lenovo IdeaPad 5 15IIL05 | |
| Honor MagicBook 15 4500U | |
| HP Envy x360 15-eu0097nr | |
| Tuxedo Aura 15 Gen1 | |
| HP Pavilion Gaming 15-ec0002ng | |
| Geekbench 5.5 / Multi-Core | |
| HP Envy x360 15-eu0097nr | |
| Tuxedo Aura 15 Gen1 | |
| HP Envy 15-ep0098nr | |
| Honor MagicBook 15 4500U | |
| ADATA XPG Xenia Xe | |
| Average Intel Core i7-1165G7 (3078 - 5926, n=77) | |
| Honor MagicBook 15 i5 1135G7 | |
| Lenovo IdeaPad 5 15IIL05 | |
| HP Pavilion Gaming 15-ec0002ng | |
| Dell Inspiron 15 5000 5502 | |
| HWBOT x265 Benchmark v2.2 / 4k Preset | |
| HP Envy x360 15-eu0097nr | |
| HP Envy 15-ep0098nr | |
| Tuxedo Aura 15 Gen1 | |
| ADATA XPG Xenia Xe | |
| Honor MagicBook 15 4500U | |
| HP Pavilion 15-eg | |
| Lenovo IdeaPad 5 15IIL05 | |
| Average Intel Core i7-1165G7 (1.39 - 8.47, n=80) | |
| Honor MagicBook 15 i5 1135G7 | |
| Dell Inspiron 15 5000 5502 | |
| LibreOffice / 20 Documents To PDF | |
| Honor MagicBook 15 4500U | |
| Dell Inspiron 15 5000 5502 | |
| HP Envy x360 15-eu0097nr | |
| Tuxedo Aura 15 Gen1 | |
| Lenovo IdeaPad 5 15IIL05 | |
| Honor MagicBook 15 i5 1135G7 | |
| Average Intel Core i7-1165G7 (21.5 - 88.1, n=78) | |
| HP Envy 15-ep0098nr | |
| ADATA XPG Xenia Xe | |
| HP Pavilion 15-eg | |
| R Benchmark 2.5 / Overall mean | |
| Lenovo IdeaPad 5 15IIL05 | |
| Dell Inspiron 15 5000 5502 | |
| Honor MagicBook 15 4500U | |
| Honor MagicBook 15 i5 1135G7 | |
| HP Envy 15-ep0098nr | |
| Tuxedo Aura 15 Gen1 | |
| Average Intel Core i7-1165G7 (0.552 - 1.002, n=80) | |
| HP Envy x360 15-eu0097nr | |
| ADATA XPG Xenia Xe | |
| HP Pavilion 15-eg | |
Cinebench R23: Multi Core | Single Core
Cinebench R15: CPU Multi 64Bit | CPU Single 64Bit
Blender: v2.79 BMW27 CPU
7-Zip 18.03: 7z b 4 -mmt1 | 7z b 4
Geekbench 5.5: Single-Core | Multi-Core
HWBOT x265 Benchmark v2.2: 4k Preset
LibreOffice : 20 Documents To PDF
R Benchmark 2.5: Overall mean
* ... smaller is better
System Performance
| PCMark 10 / Score | |
| HP Pavilion 15-eg | |
| HP Envy 15-ep0098nr | |
| Average Intel Core i7-1165G7, NVIDIA GeForce MX450 (4823 - 5814, n=9) | |
| Asus VivoBook S15 S533EQ-BQ002T | |
| ADATA XPG Xenia Xe | |
| Lenovo IdeaPad 5 15IIL05 | |
| HP Pavilion Gaming 15-ec0002ng | |
| Dell Inspiron 15 5000 5502 | |
| PCMark 10 / Essentials | |
| ADATA XPG Xenia Xe | |
| HP Pavilion 15-eg | |
| HP Envy 15-ep0098nr | |
| Average Intel Core i7-1165G7, NVIDIA GeForce MX450 (8088 - 9955, n=9) | |
| Asus VivoBook S15 S533EQ-BQ002T | |
| Dell Inspiron 15 5000 5502 | |
| Lenovo IdeaPad 5 15IIL05 | |
| HP Pavilion Gaming 15-ec0002ng | |
| PCMark 10 / Productivity | |
| HP Pavilion 15-eg | |
| Average Intel Core i7-1165G7, NVIDIA GeForce MX450 (7826 - 9292, n=9) | |
| Asus VivoBook S15 S533EQ-BQ002T | |
| HP Envy 15-ep0098nr | |
| ADATA XPG Xenia Xe | |
| Lenovo IdeaPad 5 15IIL05 | |
| Dell Inspiron 15 5000 5502 | |
| HP Pavilion Gaming 15-ec0002ng | |
| PCMark 10 / Digital Content Creation | |
| HP Envy 15-ep0098nr | |
| HP Pavilion 15-eg | |
| Asus VivoBook S15 S533EQ-BQ002T | |
| Average Intel Core i7-1165G7, NVIDIA GeForce MX450 (4812 - 5878, n=9) | |
| ADATA XPG Xenia Xe | |
| HP Pavilion Gaming 15-ec0002ng | |
| Lenovo IdeaPad 5 15IIL05 | |
| Dell Inspiron 15 5000 5502 | |
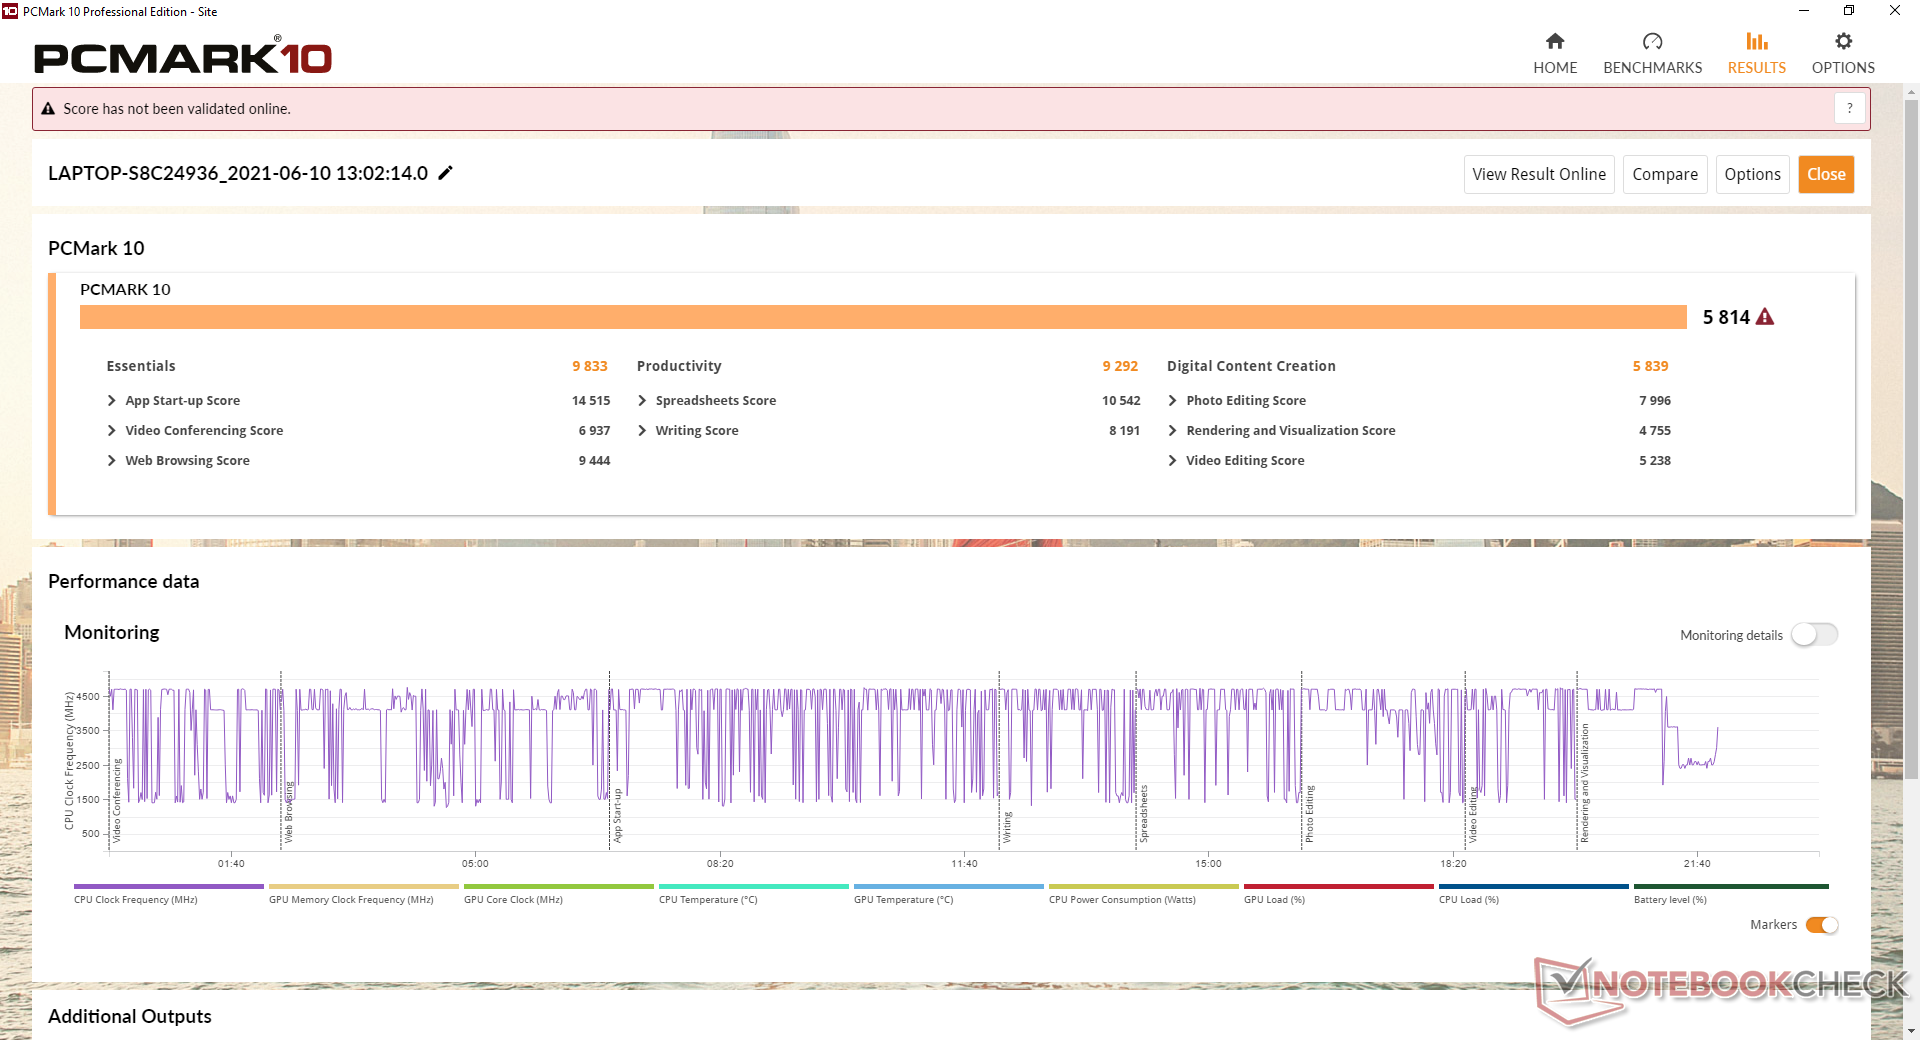
| PCMark 10 Score | 5814 points | |
Help | ||
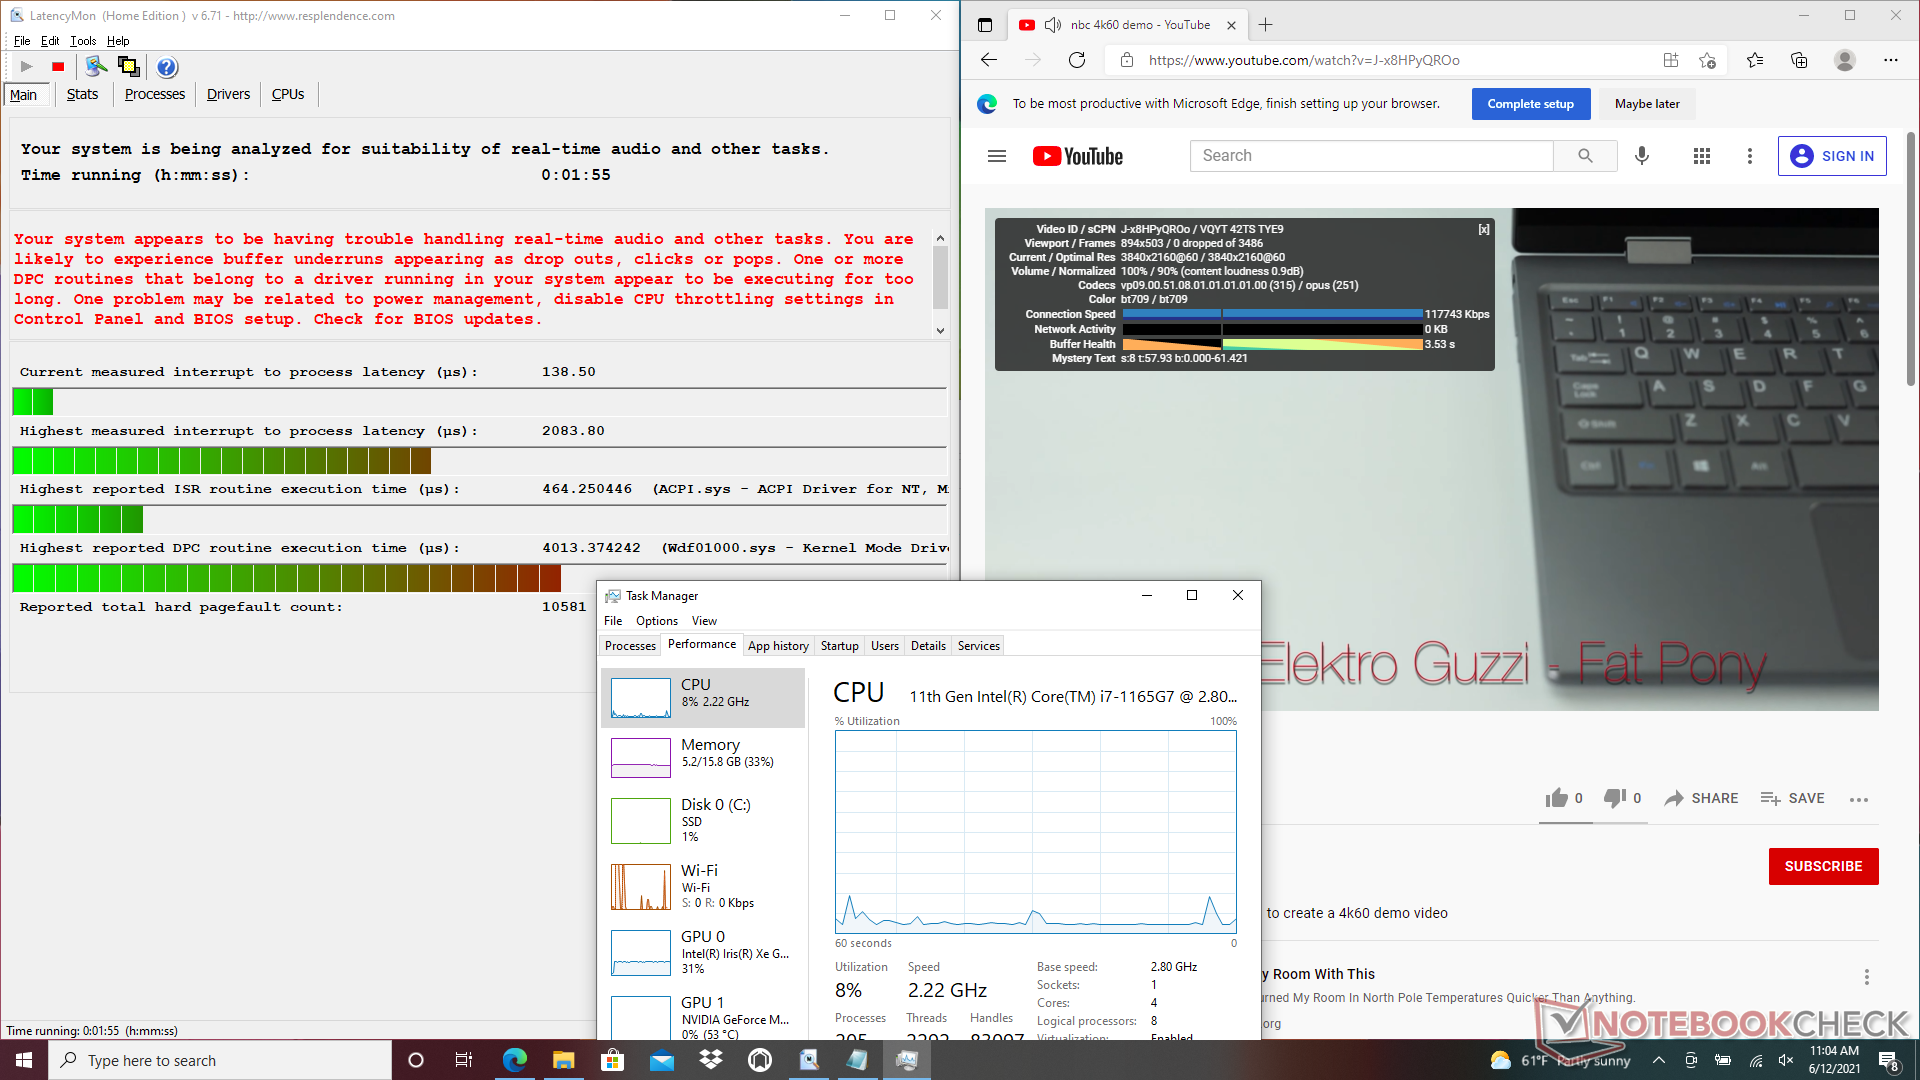
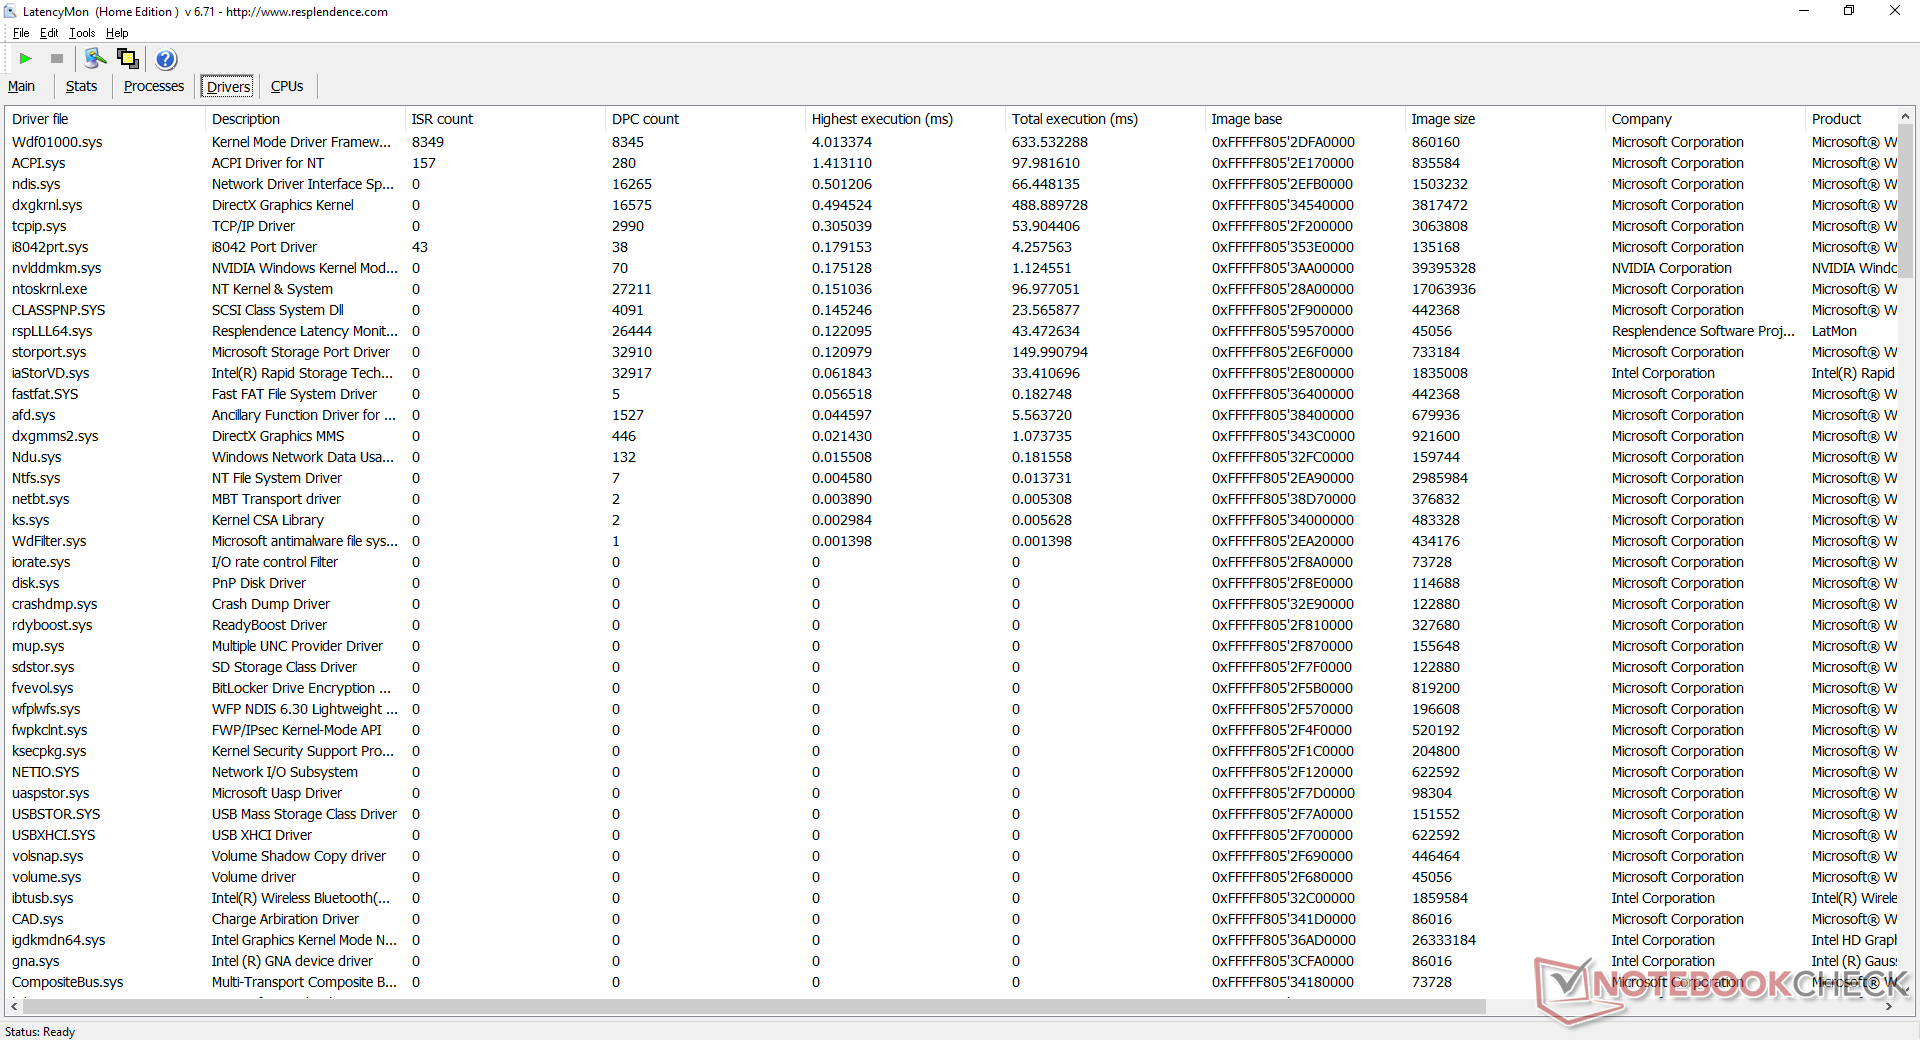
DPC Latency
LatencyMon shows DPC latency issues when opening multiple browser tabs on our homepage. 4K video playback at 60 FPS is otherwise smooth and with no dropped frames.
| DPC Latencies / LatencyMon - interrupt to process latency (max), Web, Youtube, Prime95 | |
| HP Envy 15-ep0098nr | |
| HP Pavilion 15-eg | |
| Dell Inspiron 15 5000 5502 | |
| Lenovo IdeaPad 5 15IIL05 | |
| Asus VivoBook S15 S533EQ-BQ002T | |
* ... smaller is better
Storage Devices
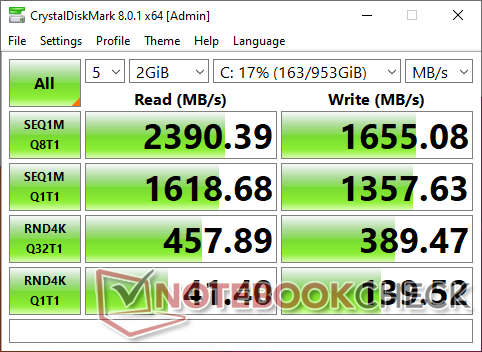
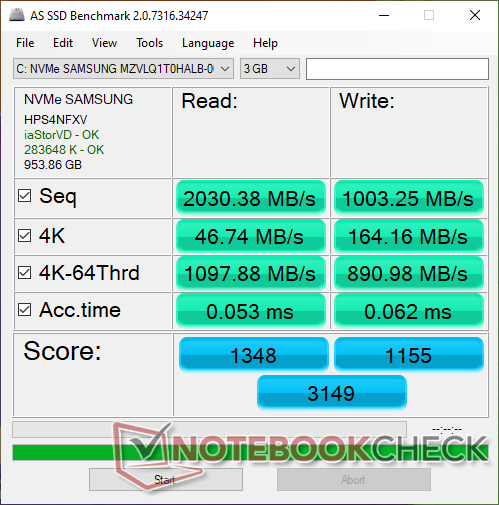
Our unit comes with a mid-range PCIe 3.0 x4 1 TB Samsung PM991 NVMe SSD. The manufacturer advertises sequential read and write rates of 2300 MB/s and 1350 MB/s, respectively, which we can confirm. It's a fast drive relative to the competing Intel 660p or Toshiba BG4 commonly found on other budget laptops.
HP offers no secondary internal storage options.
| HP Pavilion 15-eg Samsung PM991 MZVLQ1T0HALB | HP Pavilion Gaming 15-ec0002ng Intel SSD 660p SSDPEKNW512G8 | Dell Inspiron 15 5000 5502 Toshiba BG4 KBG40ZNS128G | Lenovo IdeaPad 5 15IIL05 SK hynix BC511 HFM512GDHTNI-87A0B | HP Envy 15-ep0098nr Intel Optane Memory H10 with Solid State Storage 32GB + 512GB HBRPEKNX0202A(L/H) | Asus VivoBook S15 S533EQ-BQ002T Intel SSD 660p 1TB SSDPEKNW010T8 | |
|---|---|---|---|---|---|---|
| AS SSD | -61% | -73% | -21% | -40% | -13% | |
| Seq Read (MB/s) | 2030 | 1623 -20% | 1142 -44% | 1625 -20% | 1005 -50% | 1754 -14% |
| Seq Write (MB/s) | 1003 | 891 -11% | 199.8 -80% | 860 -14% | 436.8 -56% | 1567 56% |
| 4K Read (MB/s) | 46.74 | 48.06 3% | 39.5 -15% | 52.1 11% | 51.5 10% | 53 13% |
| 4K Write (MB/s) | 164.2 | 102.1 -38% | 165.7 1% | 131.3 -20% | 88 -46% | 167.9 2% |
| 4K-64 Read (MB/s) | 1098 | 325.6 -70% | 461.2 -58% | 797 -27% | 517 -53% | 586 -47% |
| 4K-64 Write (MB/s) | 891 | 94.1 -89% | 203 -77% | 769 -14% | 839 -6% | 858 -4% |
| Access Time Read * (ms) | 0.053 | 0.171 -223% | 0.124 -134% | 0.063 -19% | 0.088 -66% | 0.097 -83% |
| Access Time Write * (ms) | 0.062 | 0.048 23% | 0.181 -192% | 0.032 48% | 0.151 -144% | 0.038 39% |
| Score Read (Points) | 1348 | 536 -60% | 615 -54% | 1012 -25% | 669 -50% | 815 -40% |
| Score Write (Points) | 1155 | 285 -75% | 389 -66% | 986 -15% | 970 -16% | 1182 2% |
| Score Total (Points) | 3149 | 1077 -66% | 1284 -59% | 2492 -21% | 1972 -37% | 2421 -23% |
| Copy ISO MB/s (MB/s) | 1583 | 566 -64% | 216.8 -86% | 638 -60% | 1173 -26% | 1477 -7% |
| Copy Program MB/s (MB/s) | 682 | 223.8 -67% | 163 -76% | 290.2 -57% | 769 13% | 495.3 -27% |
| Copy Game MB/s (MB/s) | 1428 | 104.3 -93% | 176 -88% | 525 -63% | 1045 -27% | 719 -50% |
| CrystalDiskMark 5.2 / 6 | -15% | -34% | -3% | 5% | 25% | |
| Write 4K (MB/s) | 141.6 | 136.9 -3% | 138.5 -2% | 159.7 13% | 100.2 -29% | 214.4 51% |
| Read 4K (MB/s) | 42.61 | 57 34% | 41.98 -1% | 48.31 13% | 112.8 165% | 58.5 37% |
| Write Seq (MB/s) | 1337 | 968 -28% | 213.5 -84% | 1038 -22% | 537 -60% | 1678 26% |
| Read Seq (MB/s) | 1575 | 1631 4% | 1289 -18% | 1158 -26% | 1270 -19% | 1648 5% |
| Write 4K Q32T1 (MB/s) | 397.8 | 237 -40% | 157.8 -60% | 493.9 24% | 480.6 21% | 644 62% |
| Read 4K Q32T1 (MB/s) | 454.2 | 337.1 -26% | 448.9 -1% | 522 15% | 364.9 -20% | 600 32% |
| Write Seq Q32T1 (MB/s) | 1648 | 963 -42% | 210.5 -87% | 1028 -38% | 1224 -26% | 1760 7% |
| Read Seq Q32T1 (MB/s) | 2388 | 1863 -22% | 1853 -22% | 2280 -5% | 2635 10% | 1853 -22% |
| Total Average (Program / Settings) | -38% /
-44% | -54% /
-59% | -12% /
-15% | -18% /
-23% | 6% /
1% |
* ... smaller is better

Disk Throttling: DiskSpd Read Loop, Queue Depth 8
GPU Performance
Graphics performance is comparable to the Iris Xe 96 EUs in worst case scenarios. More often than not, however, the GeForce MX450 will handily outperform the integrated Intel solution especially when gaming. Running DOTA 2 Reborn on maximum 1080p settings, for example, results in 2x faster frame rates on our Pavilion system when compared to any Iris Xe laptop even though their 3DMark scores are relatively close. Having separate power envelopes for the CPU and GPU means neither processor will be as limited by the performance of the other.
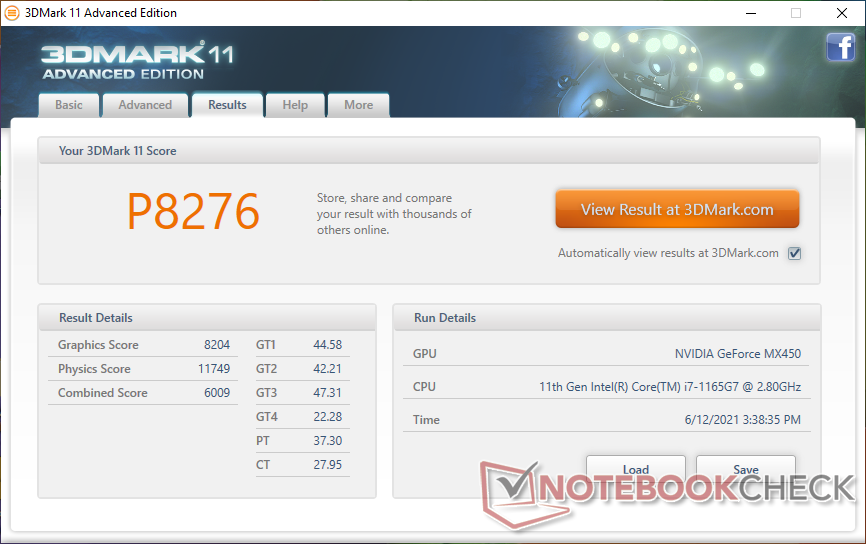
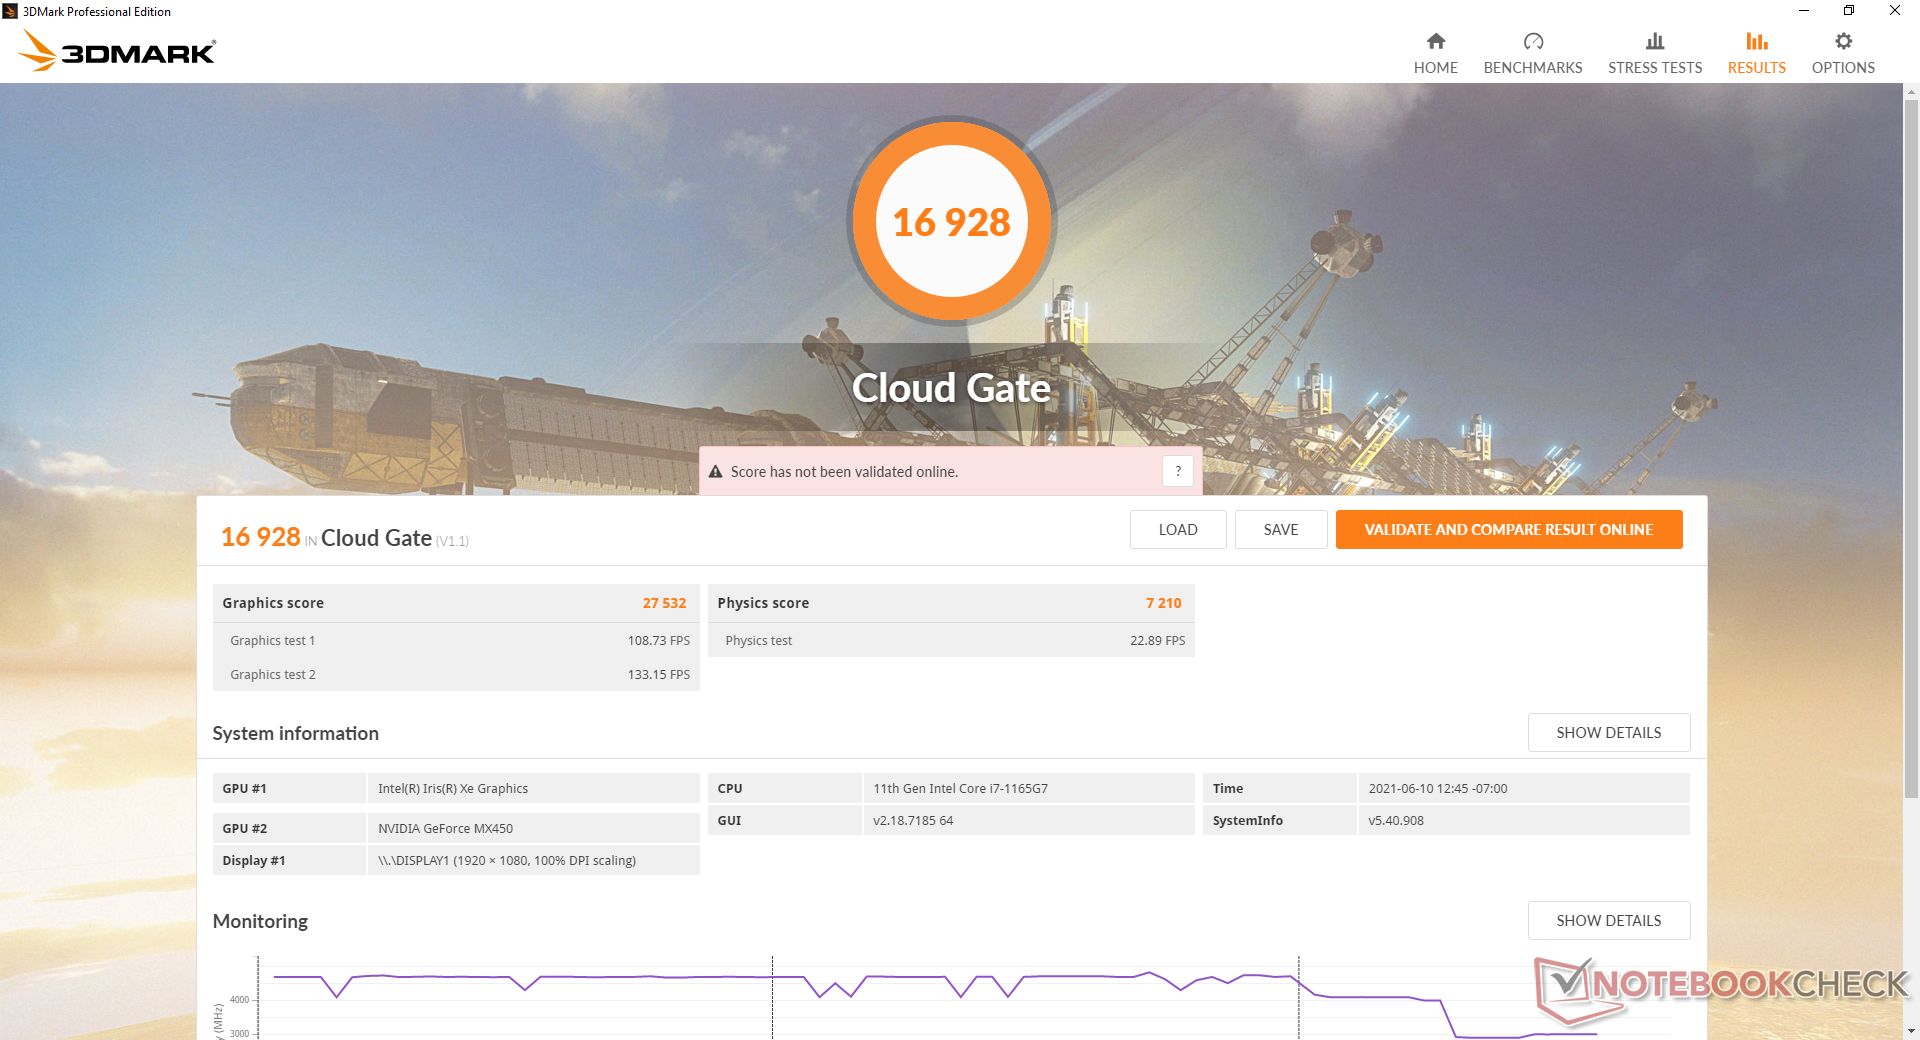
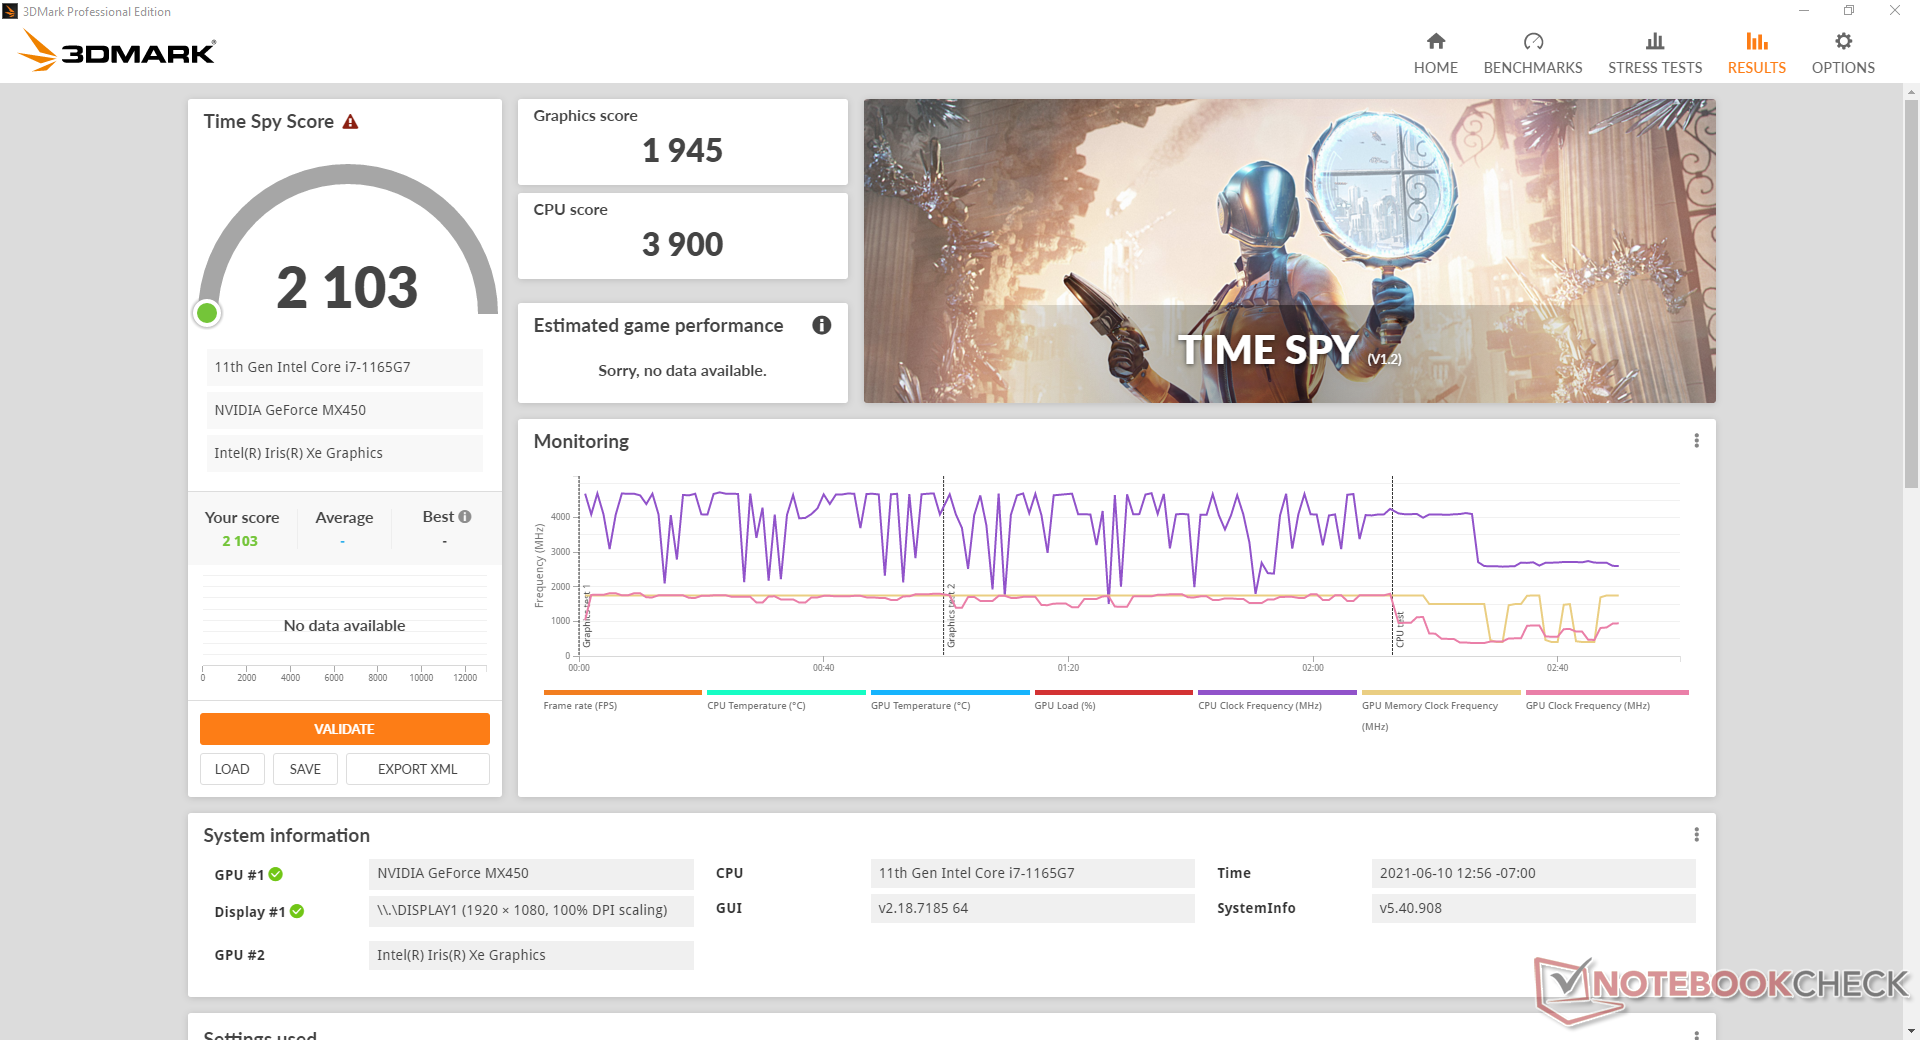
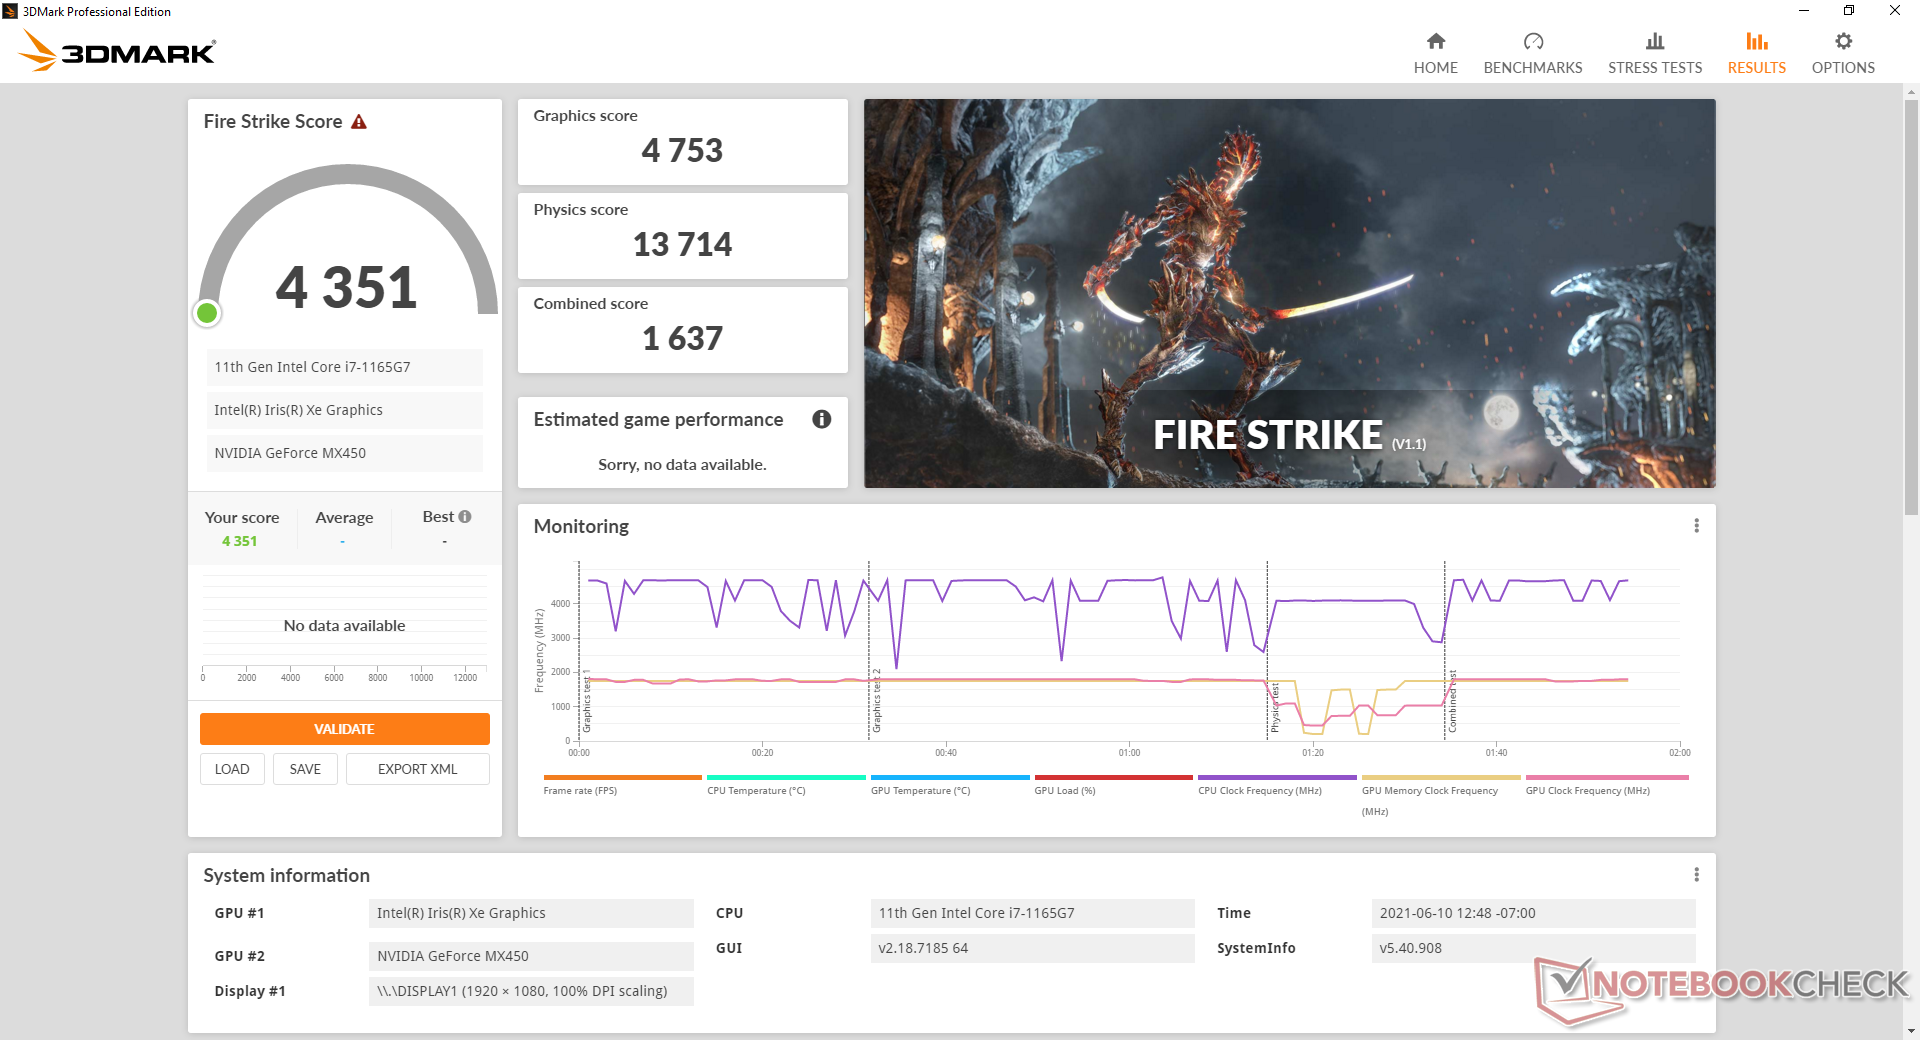
| 3DMark 11 Performance | 8276 points | |
| 3DMark Cloud Gate Standard Score | 16928 points | |
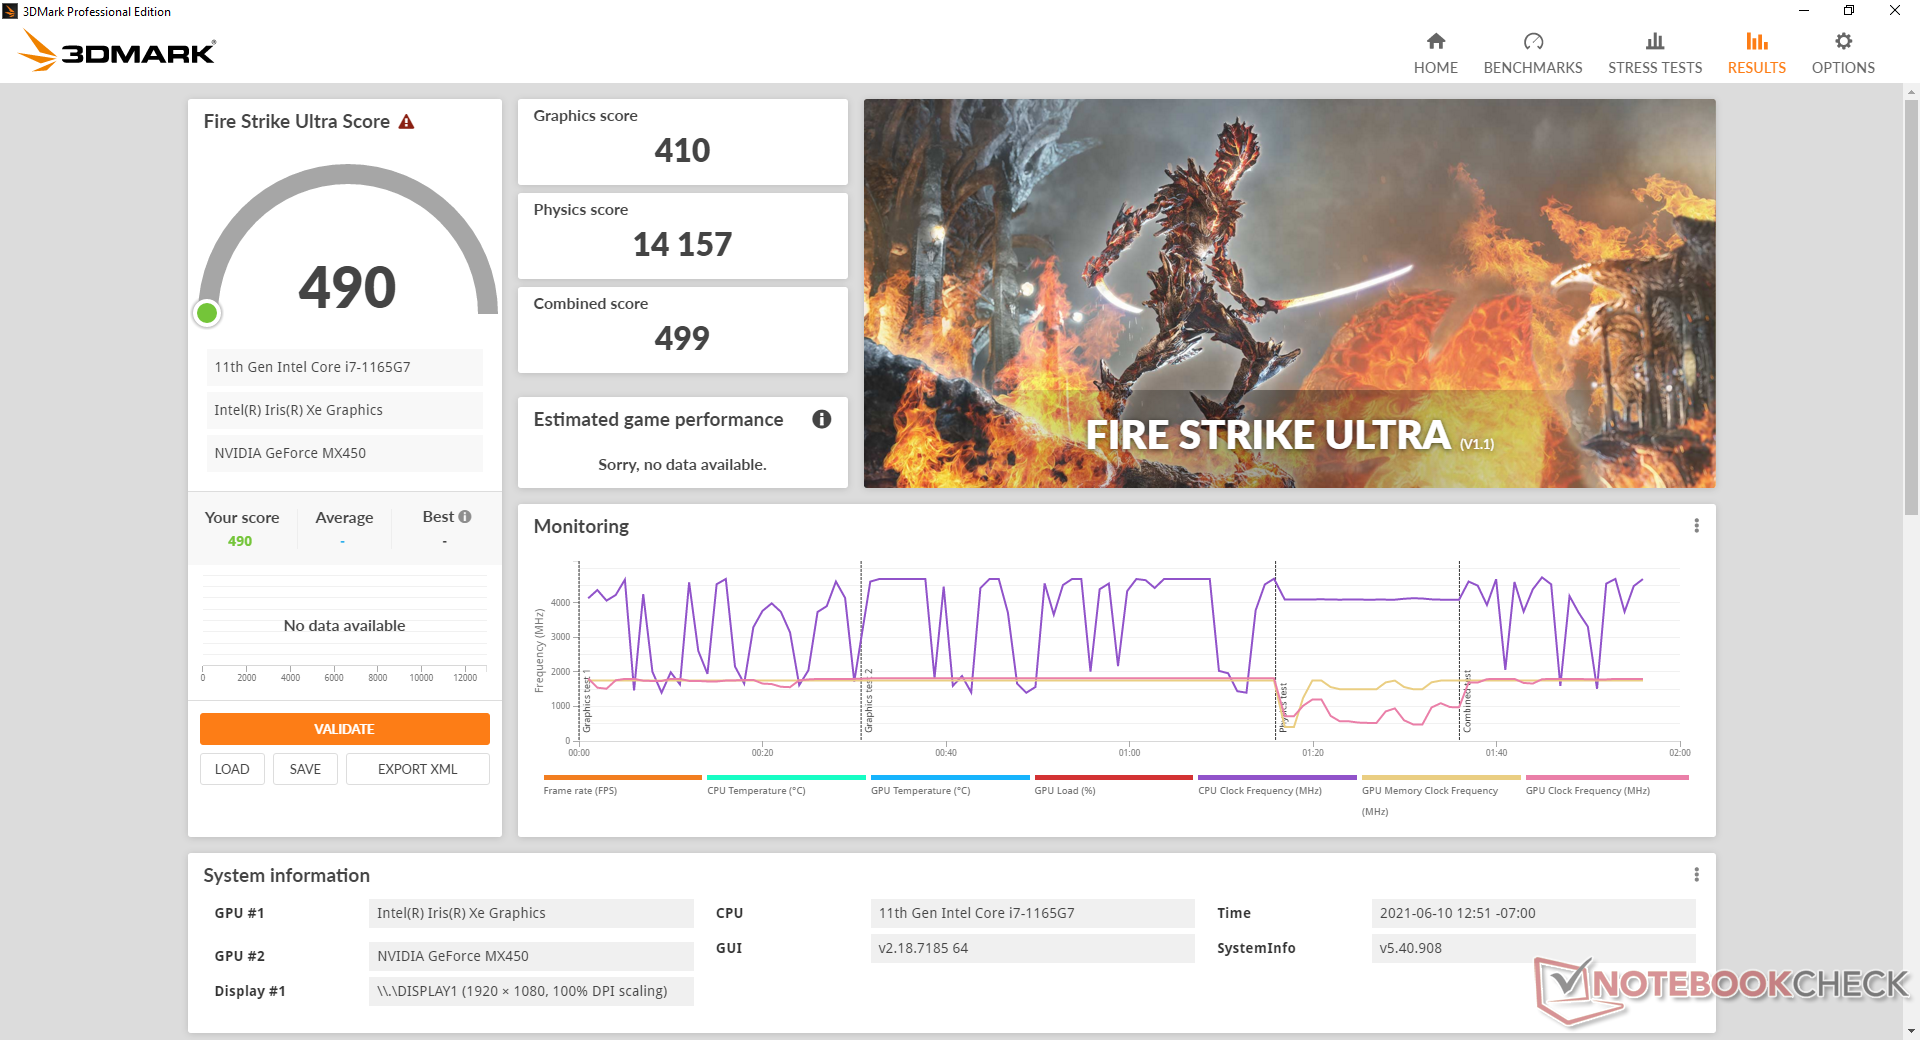
| 3DMark Fire Strike Score | 4351 points | |
| 3DMark Time Spy Score | 2103 points | |
Help | ||
Frame rates are steady when idling on Witcher 3 to suggest no interrupting background activity during gameplay. However, the initial frame rate of 69 FPS drops rather quickly after a few seconds due to the limited Turbo potential of the system.
Witcher 3 FPS Chart
| low | med. | high | ultra | |
|---|---|---|---|---|
| GTA V (2015) | 154 | 141 | 51.5 | 22.8 |
| The Witcher 3 (2015) | 121.4 | 69.7 | 39.7 | 23.6 |
| Dota 2 Reborn (2015) | 139 | 117 | 95.6 | 87.7 |
| Final Fantasy XV Benchmark (2018) | 51.5 | 25.5 | 16.2 | |
| X-Plane 11.11 (2018) | 87.3 | 76.6 | 66 |
Emissions
System Noise — Quiet Overall
Overall fan noise is quite similar to the Asus VivoBook S15. The system is silent when idling or running low loads while gaming loads will induce a fan noise between 39 dB(A) and 42 dB(A). The two fans are somewhat high-pitched and so it's very noticeable when they begin to kick in. Fortunately, the fans don't pulse often and they power down relatively quickly after ending any demanding programs.
We can notice very slight coil whining when placing an ear near the keyboard keys.
| HP Pavilion 15-eg GeForce MX450, i7-1165G7, Samsung PM991 MZVLQ1T0HALB | HP Pavilion Gaming 15-ec0002ng GeForce GTX 1050 Mobile, R5 3550H, Intel SSD 660p SSDPEKNW512G8 | Dell Inspiron 15 5000 5502 UHD Graphics Xe G4 48EUs, i3-1115G4, Toshiba BG4 KBG40ZNS128G | Lenovo IdeaPad 5 15IIL05 GeForce MX350, i5-1035G1, SK hynix BC511 HFM512GDHTNI-87A0B | HP Envy 15-ep0098nr GeForce RTX 2060 Max-Q, i7-10750H, Intel Optane Memory H10 with Solid State Storage 32GB + 512GB HBRPEKNX0202A(L/H) | Asus VivoBook S15 S533EQ-BQ002T GeForce MX350, i7-1165G7, Intel SSD 660p 1TB SSDPEKNW010T8 | |
|---|---|---|---|---|---|---|
| Noise | -13% | 2% | -15% | -26% | 1% | |
| off / environment * (dB) | 25.4 | 30.3 -19% | 27.5 -8% | 30.7 -21% | 26.4 -4% | 25 2% |
| Idle Minimum * (dB) | 25.6 | 30.3 -18% | 27.9 -9% | 30.7 -20% | 32.2 -26% | 25 2% |
| Idle Average * (dB) | 25.6 | 30.3 -18% | 27.9 -9% | 30.7 -20% | 32.2 -26% | 25 2% |
| Idle Maximum * (dB) | 25.6 | 31 -21% | 27.9 -9% | 30.7 -20% | 32.2 -26% | 25 2% |
| Load Average * (dB) | 39.2 | 39.3 -0% | 28.1 28% | 43.4 -11% | 48.3 -23% | 39.5 -1% |
| Witcher 3 ultra * (dB) | 39.1 | 42.9 -10% | 43.2 -10% | 53.7 -37% | 39.3 -1% | |
| Load Maximum * (dB) | 41.5 | 43.3 -4% | 34.8 16% | 43.7 -5% | 58.8 -42% | 41.6 -0% |
* ... smaller is better
Noise level
| Idle |
| 25.6 / 25.6 / 25.6 dB(A) |
| Load |
| 39.2 / 41.5 dB(A) |
 | ||
30 dB silent 40 dB(A) audible 50 dB(A) loud |
||
min: | ||
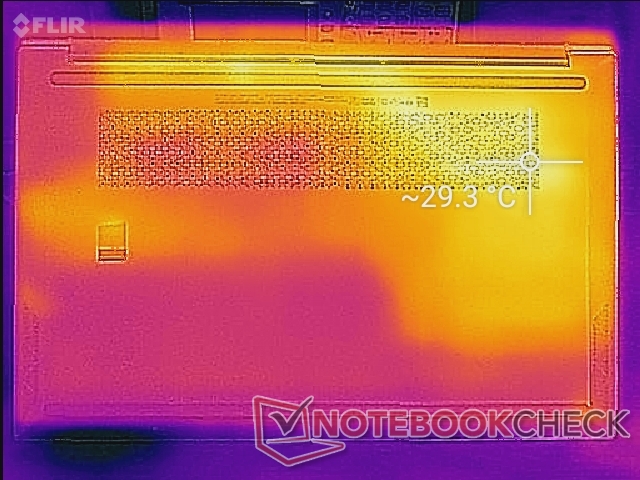
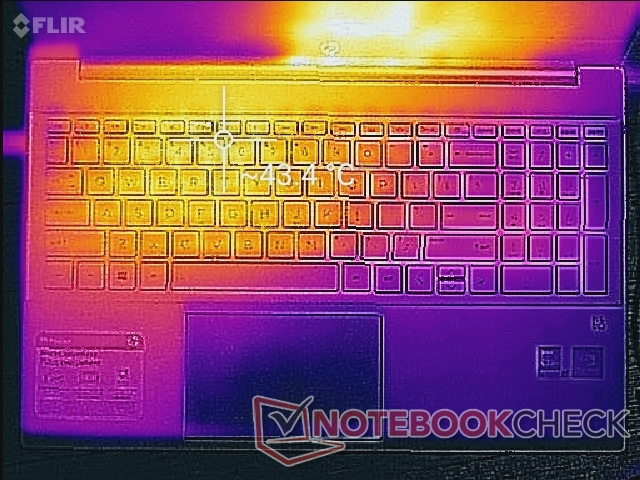
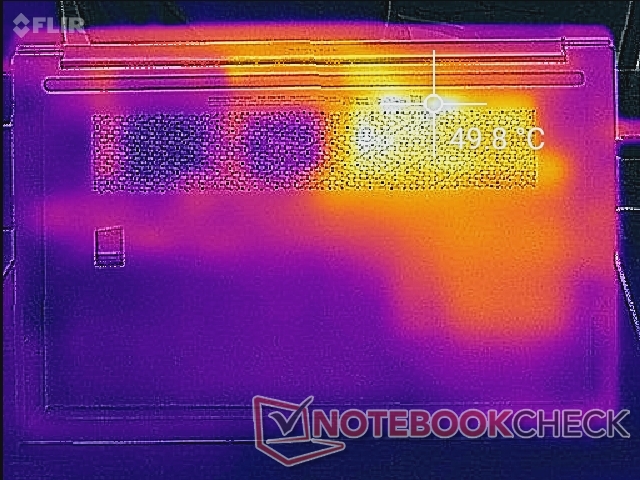
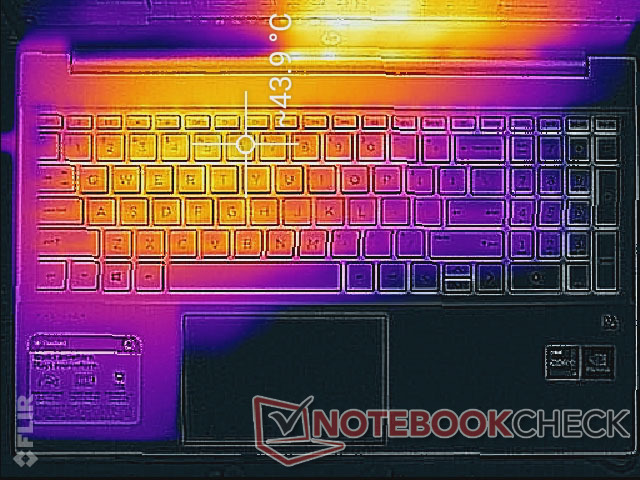
Temperature
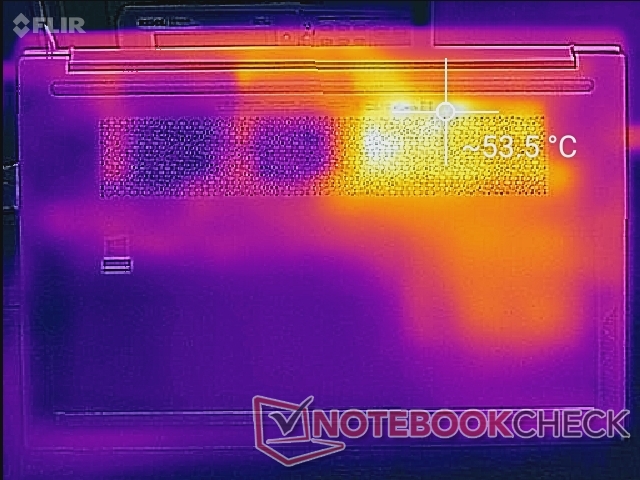
Surface temperatures will always be warmer on the left half of the system than the right half simply because of how the fans and heat pipes are positioned inside. Hot spots can become as warm as 44 C and 54 C on the keyboard deck and bottom surface, respectively, to be a bit warmer than what we recorded on the Pavilion 15 Gaming or ADATA XPG Xenia. Overall heat output is generally higher than most laptops running on only Tiger Lake-U CPUs since our Pavilion includes discrete graphics.
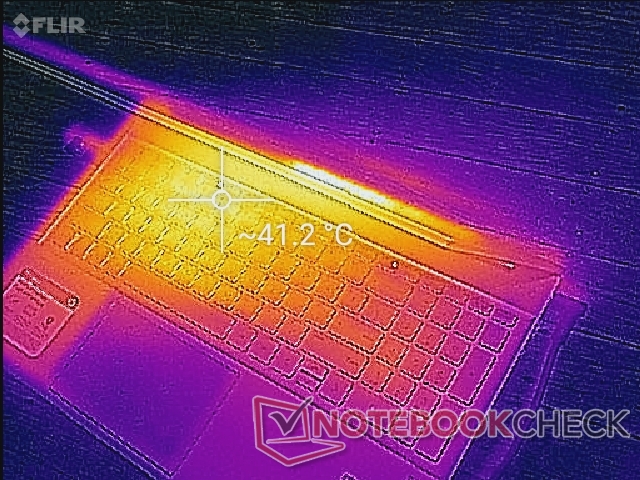
(±) The maximum temperature on the upper side is 44 °C / 111 F, compared to the average of 36.8 °C / 98 F, ranging from 21 to 71 °C for the class Multimedia.
(-) The bottom heats up to a maximum of 53.4 °C / 128 F, compared to the average of 39.1 °C / 102 F
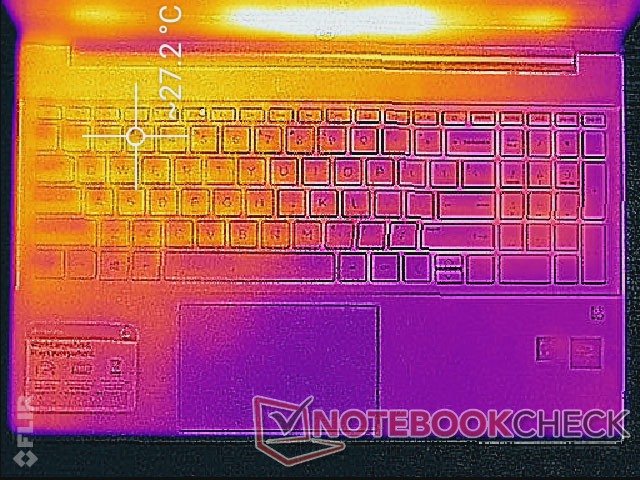
(+) In idle usage, the average temperature for the upper side is 26.1 °C / 79 F, compared to the device average of 31.3 °C / 88 F.
(±) Playing The Witcher 3, the average temperature for the upper side is 34.8 °C / 95 F, compared to the device average of 31.3 °C / 88 F.
(+) The palmrests and touchpad are cooler than skin temperature with a maximum of 31.8 °C / 89.2 F and are therefore cool to the touch.
(-) The average temperature of the palmrest area of similar devices was 28.7 °C / 83.7 F (-3.1 °C / -5.5 F).
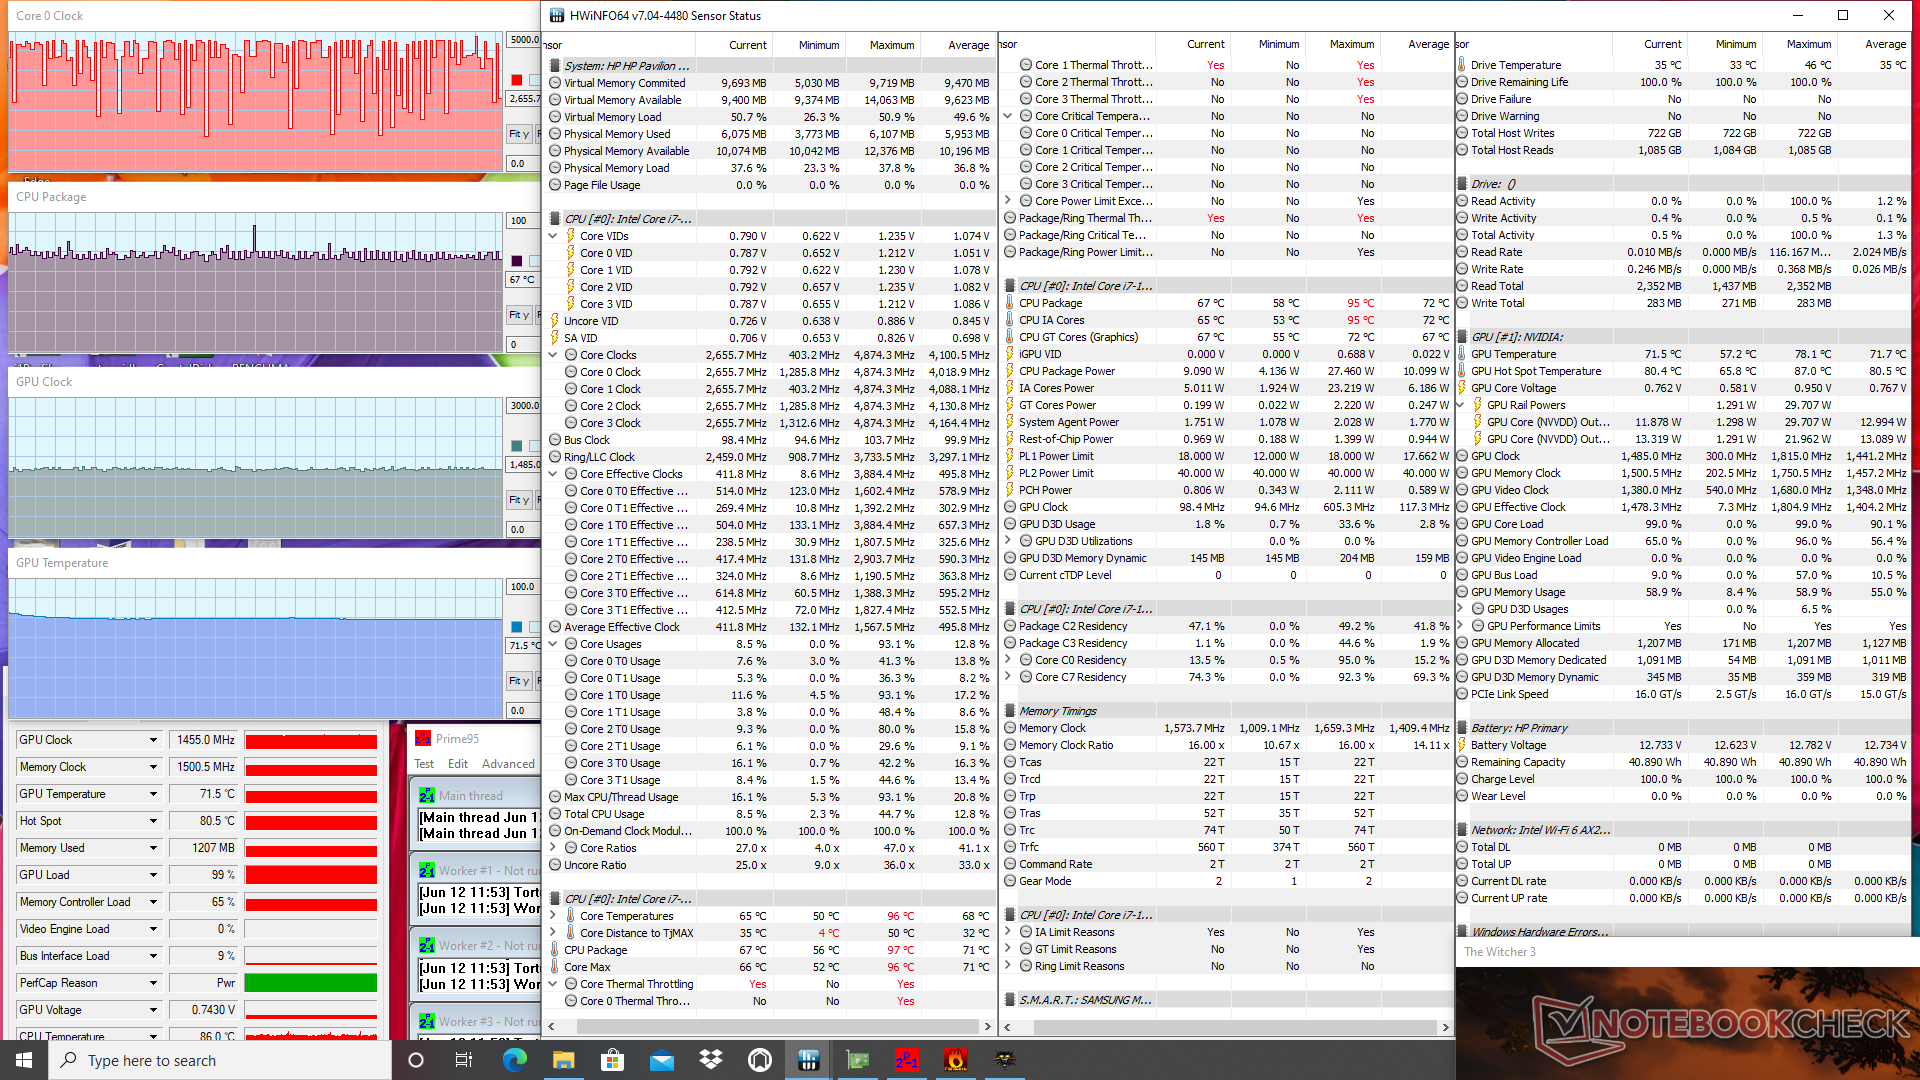
Stress Test
When running Prime95 to stress the CPU, clock rates would boost to the 3.2 to 3.7 GHz range for the first 20 seconds or so at a toasty core temperature of 96 C. Afterwards, clock rate would drop to the 2.0 to 2.5 GHz range in order to maintain a cooler core temperature of 75 C. the ADATA XPG Xenia, which comes with the same Core i7-1165G7 CPU, would stabilize at higher clock rates and temperatures of 3.2 GHz and 81 C, respectively. CPU Turbo Boost potential is therefore more limited than we like on our HP Pavilion.
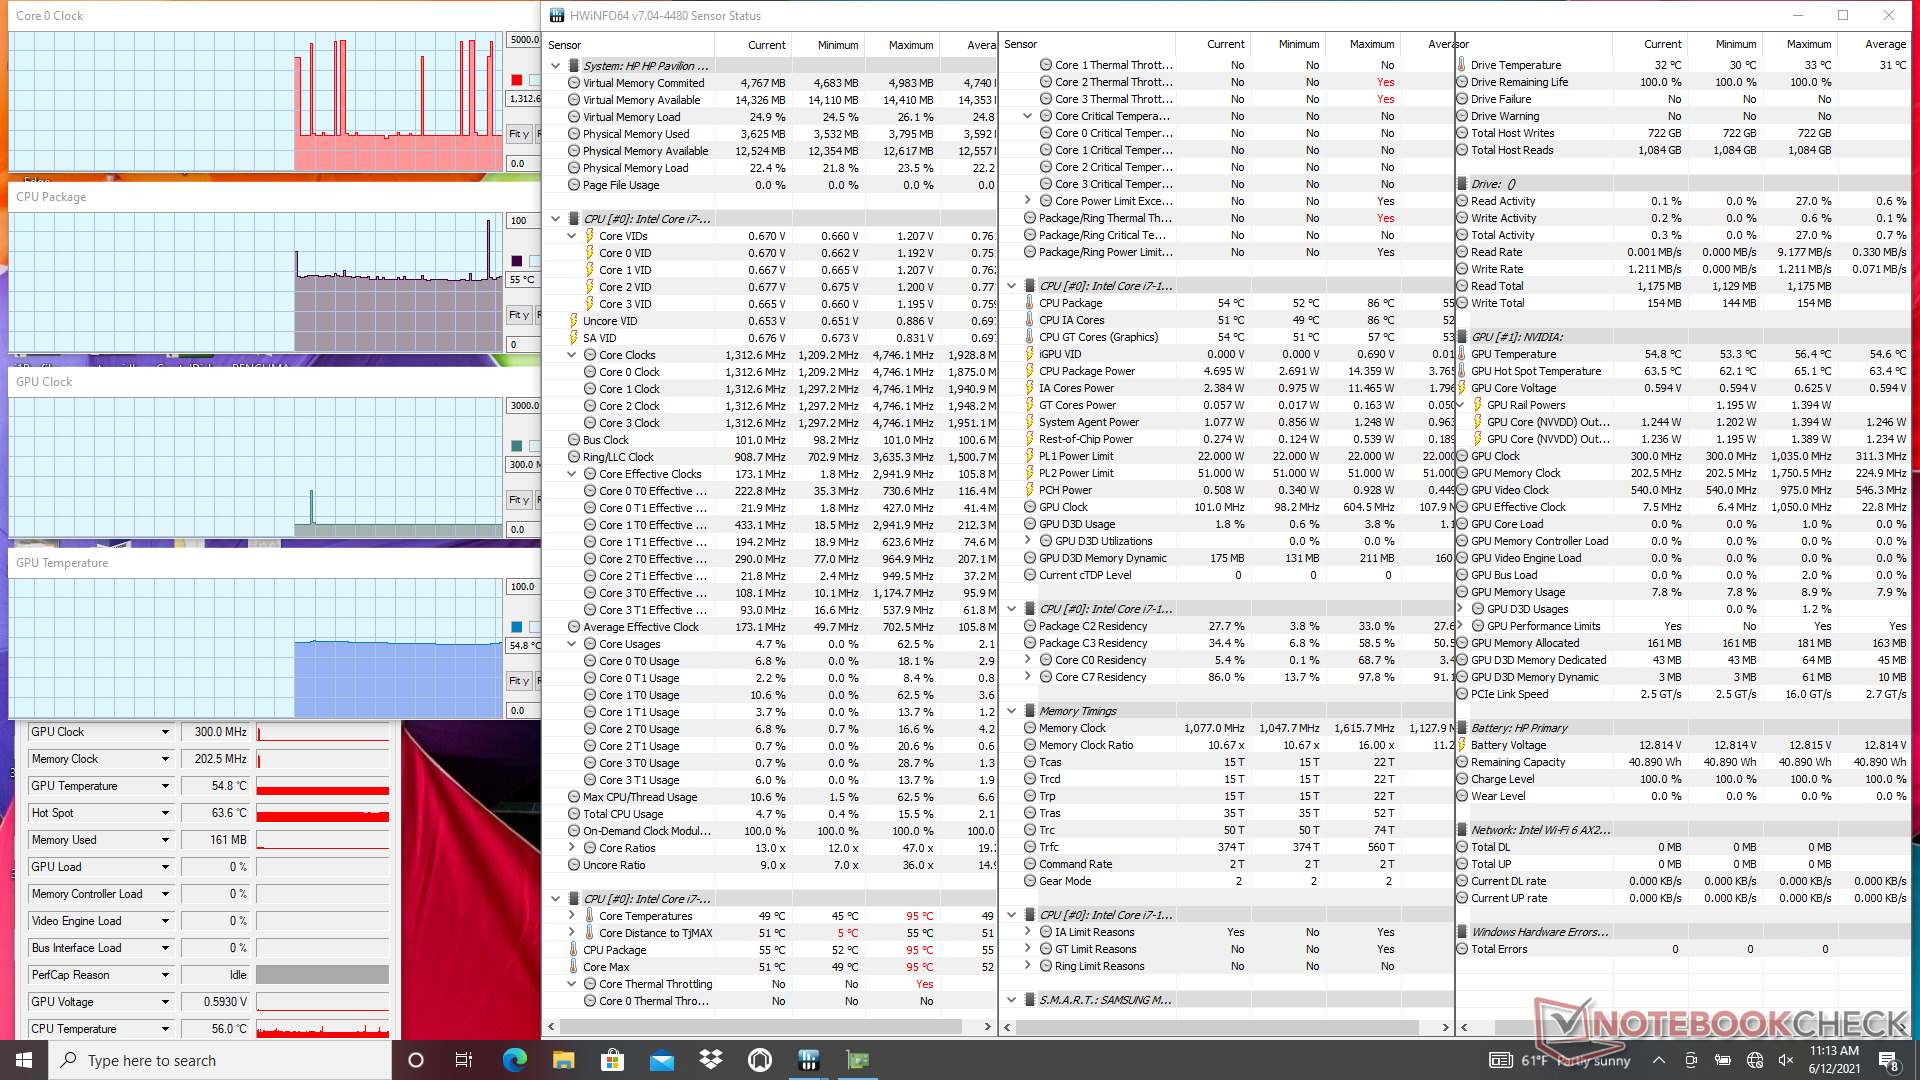
CPU and GPU temperatures would stabilize at 67 C and 72 C, respectively, when running Witcher 3 which are normal ranges for GeForce MX-powered laptops.
Running on battery power will limit performance. A 3DMark 11 test on batteries would return Physics and Graphics scores of 8926 and 7074 points, respectively, compared to 11749 and 8204 points when on mains.
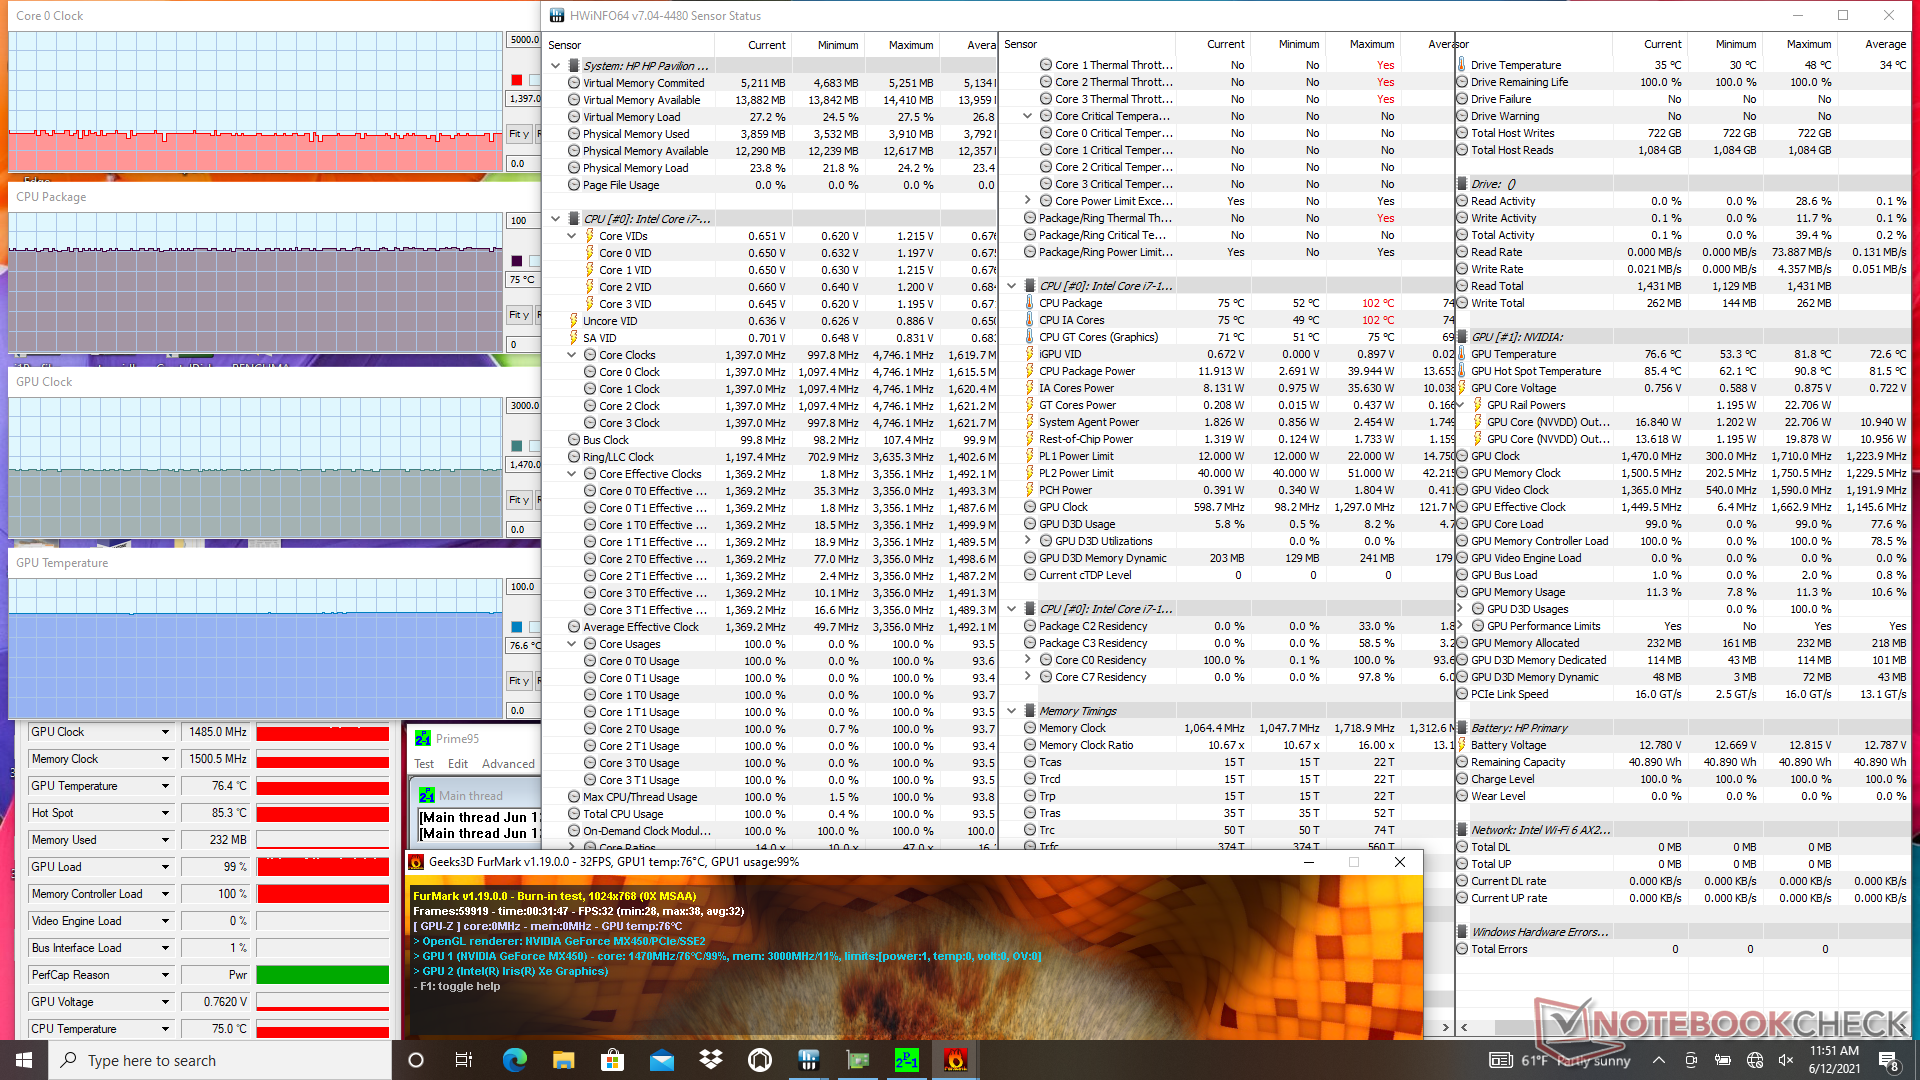
| CPU Clock (GHz) | GPU Clock (MHz) | Average CPU Temperature (°C) | Average GPU Temperature (°C) | |
| System Idle | -- | -- | 55 | 55 |
| Prime95 Stress | 2.0 - 2.5 | -- | 75 | 61 |
| Prime95 + FurMark Stress | 1.1 - 1.4 | 1470 | 75 | 77 |
| Witcher 3 Stress | 1.1 - 4.9 | 1485 | 67 | 72 |
Speakers

The B&O stereo speakers are above average with bass roll-off at around 250 Hz. The broad pink noise curve shows that treble frequencies are not overtuned to avoid the tinny quality of most cheap speakers.
HP Pavilion 15-eg audio analysis
(±) | speaker loudness is average but good (81.3 dB)
Bass 100 - 315 Hz
(-) | nearly no bass - on average 18% lower than median
(±) | linearity of bass is average (12.8% delta to prev. frequency)
Mids 400 - 2000 Hz
(+) | balanced mids - only 2.8% away from median
(+) | mids are linear (4% delta to prev. frequency)
Highs 2 - 16 kHz
(+) | balanced highs - only 1% away from median
(+) | highs are linear (3% delta to prev. frequency)
Overall 100 - 16.000 Hz
(+) | overall sound is linear (13.2% difference to median)
Compared to same class
» 27% of all tested devices in this class were better, 5% similar, 68% worse
» The best had a delta of 5%, average was 17%, worst was 45%
Compared to all devices tested
» 13% of all tested devices were better, 3% similar, 84% worse
» The best had a delta of 4%, average was 24%, worst was 134%
ADATA XPG Xenia Xe audio analysis
(±) | speaker loudness is average but good (79.8 dB)
Bass 100 - 315 Hz
(±) | reduced bass - on average 14.5% lower than median
(±) | linearity of bass is average (10.6% delta to prev. frequency)
Mids 400 - 2000 Hz
(+) | balanced mids - only 2.6% away from median
(+) | mids are linear (3.8% delta to prev. frequency)
Highs 2 - 16 kHz
(+) | balanced highs - only 3.2% away from median
(+) | highs are linear (4% delta to prev. frequency)
Overall 100 - 16.000 Hz
(+) | overall sound is linear (12.9% difference to median)
Compared to same class
» 26% of all tested devices in this class were better, 4% similar, 70% worse
» The best had a delta of 5%, average was 17%, worst was 45%
Compared to all devices tested
» 12% of all tested devices were better, 3% similar, 85% worse
» The best had a delta of 4%, average was 24%, worst was 134%
Energy Management
Power Consumption — More Demanding Than Iris Xe
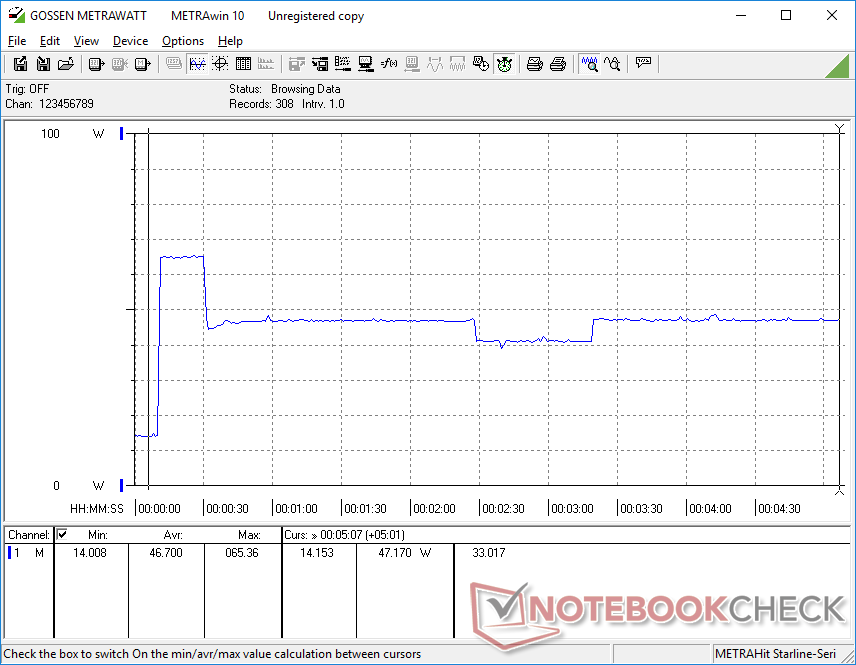
Idling on desktop at the lowest brightness setting consumes just 4.9 W while the maximum brightness setting demands about 3 W more. Enabling the discrete Nvidia GPU via Optimus would increase system draw to 14 W to be several watts more than other Tiger Lake-U laptops without the same GPU option. It's recommended to run the integrated Intel GPU if the extra horsepower from the MX450 isn't needed.
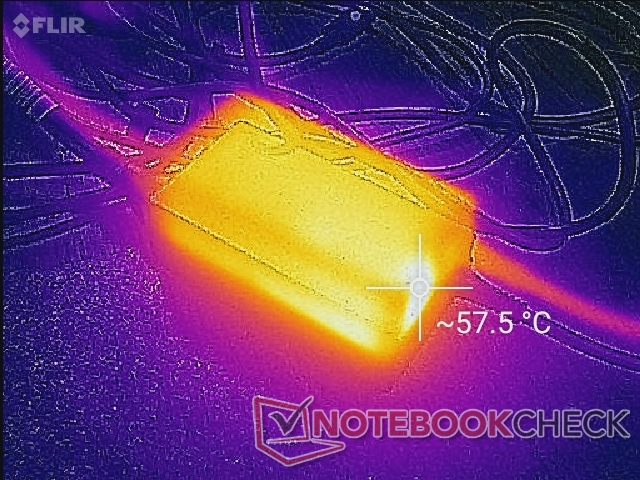
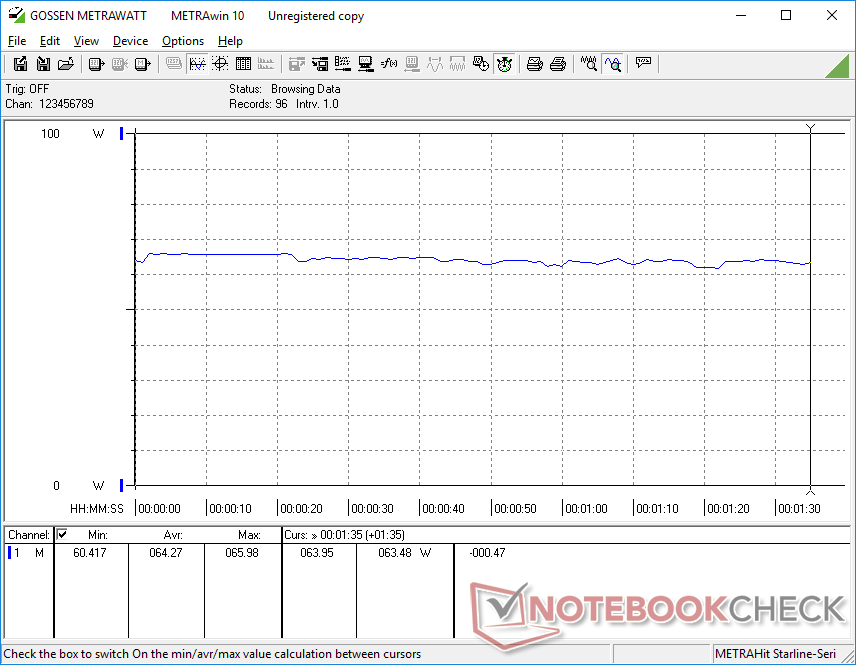
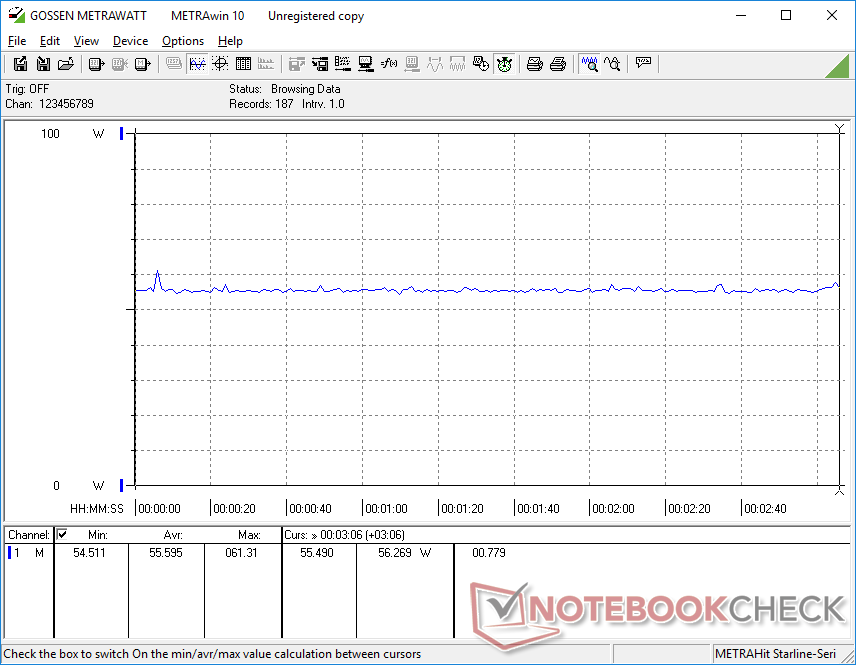
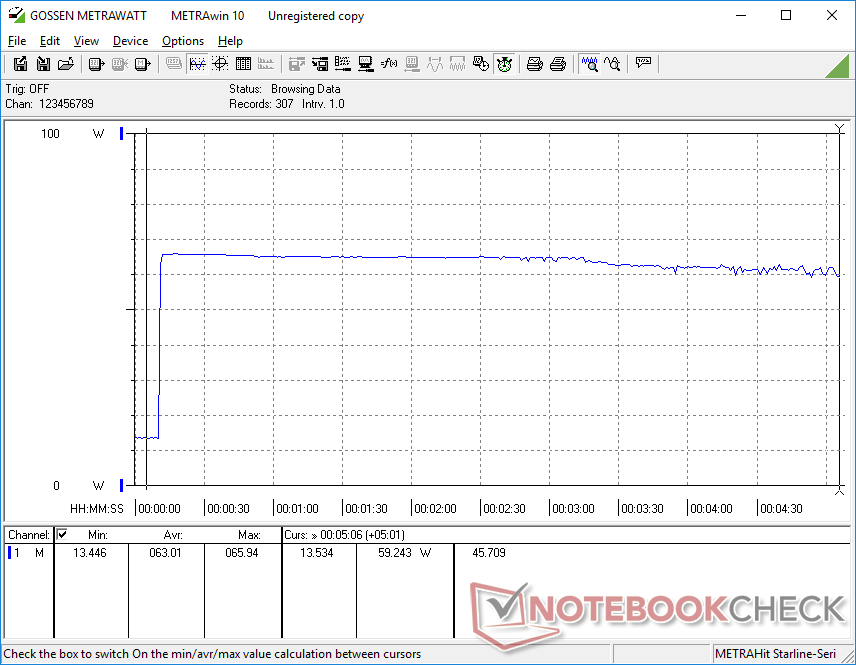
Gaming demands between 55 W and 65 W from the small (~8.9 x 5 x 2.8 cm) 65 W AC adapter. The included adapter is therefore just barely sufficient for running the laptop at its peak and so we would have been more comfortable with a larger 80 W AC adapter instead. Expect the Pavilion 15 to charge more slowly if gaming or running other high loads.
| Off / Standby | |
| Idle | |
| Load |
|
Key:
min: | |
| HP Pavilion 15-eg i7-1165G7, GeForce MX450, Samsung PM991 MZVLQ1T0HALB, IPS, 1920x1080, 15.6" | HP Pavilion Gaming 15-ec0002ng R5 3550H, GeForce GTX 1050 Mobile, Intel SSD 660p SSDPEKNW512G8, TN LED, 1920x1080, 15.6" | Dell Inspiron 15 5000 5502 i3-1115G4, UHD Graphics Xe G4 48EUs, Toshiba BG4 KBG40ZNS128G, IPS, 1920x1080, 15.6" | Lenovo IdeaPad 5 15IIL05 i5-1035G1, GeForce MX350, SK hynix BC511 HFM512GDHTNI-87A0B, IPS, 1920x1080, 15.6" | HP Envy 15-ep0098nr i7-10750H, GeForce RTX 2060 Max-Q, Intel Optane Memory H10 with Solid State Storage 32GB + 512GB HBRPEKNX0202A(L/H), AMOLED, 3840x2160, 15.6" | Asus VivoBook S15 S533EQ-BQ002T i7-1165G7, GeForce MX350, Intel SSD 660p 1TB SSDPEKNW010T8, IPS, 1920x1080, 15.6" | |
|---|---|---|---|---|---|---|
| Power Consumption | -6% | 30% | -1% | -99% | 20% | |
| Idle Minimum * (Watt) | 4.9 | 1.9 61% | 4.3 12% | 4.9 -0% | 9.2 -88% | 3 39% |
| Idle Average * (Watt) | 7.9 | 7.2 9% | 7.1 10% | 9.1 -15% | 14.5 -84% | 6.4 19% |
| Idle Maximum * (Watt) | 14.2 | 9.6 32% | 7.2 49% | 11.6 18% | 18 -27% | 7.9 44% |
| Load Average * (Watt) | 64.3 | 74 -15% | 24.8 61% | 65 -1% | 110.9 -72% | 59 8% |
| Witcher 3 ultra * (Watt) | 55.6 | 75 -35% | 59 -6% | 125.5 -126% | 48 14% | |
| Load Maximum * (Watt) | 65.4 | 124 -90% | 54.3 17% | 65.3 -0% | 194.6 -198% | 68 -4% |
* ... smaller is better
Battery Life
Battery capacity is small as is the case with all basic Pavilion laptops. Consequently, runtimes are average at just 6.5 hours of real-world WLAN use. Higher-end Envy or Spectre models form the same manufacturer can last for several hours longer under similar conditions.
Charging from empty to full capacity takes about 1.5 hours. Users can also recharge the laptop via third-party USB-C AC adapters.
| HP Pavilion 15-eg i7-1165G7, GeForce MX450, 41 Wh | HP Pavilion Gaming 15-ec0002ng R5 3550H, GeForce GTX 1050 Mobile, 52.5 Wh | Dell Inspiron 15 5000 5502 i3-1115G4, UHD Graphics Xe G4 48EUs, 53 Wh | Lenovo IdeaPad 5 15IIL05 i5-1035G1, GeForce MX350, 70 Wh | HP Envy 15-ep0098nr i7-10750H, GeForce RTX 2060 Max-Q, 83 Wh | Asus VivoBook S15 S533EQ-BQ002T i7-1165G7, GeForce MX350, 50 Wh | |
|---|---|---|---|---|---|---|
| Battery runtime | 27% | 96% | 73% | 8% | 27% | |
| Reader / Idle (h) | 15 | 26.7 78% | 23.2 55% | 15 0% | ||
| WiFi v1.3 (h) | 6.6 | 8.4 27% | 9 36% | 11.4 73% | 6 -9% | 8.4 27% |
| Load (h) | 1.2 | 3.3 175% | 2.3 92% | 1.6 33% |
Pros
Cons
Verdict — Good Performance, High Price
The 2021 Pavilion 15 is in a tight spot. If you value the performance consistency of GeForce MX over Iris Xe, then you may find some value in our Pavilion configuration. This system will play games better than any laptop running only on Iris Xe graphics like the Asus VivoBook S15 or ADATA XPG Xenia.
On the other hand, the $1000 to $1100 price point is very similar to the larger Pavilion Gaming 15 with significantly faster Core-H CPUs and GeForce GTX 1650 graphics or even a baseline Core i5 Dell XPS 15 which offers superior design and display. Our Pavilion SKU isn't the best if you're looking to maximize performance or quality for the cost. The difficult serviceability, limited color gamut, and lack of Thunderbolt are hard to forgive once you reach that four-digit price point.
The fully-configured Pavilion 15 isn't particularly bad, but it doesn't excel in any one category, either. Users can do better at the $1000+ USD price point.
Lesser SKUs with the Ryzen 7 4700U retail for $300 to $400 cheaper than our review unit which is much more reasonable for a Pavilion-class system. If you don't need the extra graphics horsepower from the Nvidia GPU, then the less expensive AMD or Iris Xe-only SKUs would suffice.
Additionally, we recommend users check the video output of the USB-C port. We experienced video-out issues on our test unit that could prohibit the laptop from utilizing USB-C external monitors.
Price and availability
HP Pavilion 15-eg
- 06/15/2021 v7 (old)
Allen Ngo
Price comparison
