HP Envy 13 with Intel Tiger Lake and GeForce MX450 in review
Possible competitors in comparison
Rating | Date | Model | Weight | Height | Size | Resolution | Price |
|---|---|---|---|---|---|---|---|
| 85.3 % v7 (old) | 05 / 2021 | HP Envy 13-ba1475ng i7-1165G7, GeForce MX450 | 1.3 kg | 17 mm | 13.30" | 1920x1080 | |
| 87.7 % v7 (old) | 05 / 2021 | Dell XPS 13 9305 Core i5 FHD i5-1135G7, Iris Xe G7 80EUs | 1.2 kg | 16 mm | 13.30" | 1920x1080 | |
| 87.6 % v7 (old) | 03 / 2021 | Lenovo Yoga Slim 7i Carbon 13 ITL i7-1165G7, Iris Xe G7 96EUs | 975 g | 15 mm | 13.30" | 2560x1600 | |
| 91.1 % v7 (old) | 12 / 2020 | Apple MacBook Air 2020 M1 Entry M1, M1 7-Core GPU | 1.3 kg | 16.1 mm | 13.30" | 2560x1600 | |
| 87.1 % v7 (old) | 12 / 2020 | HP Envy 13-ba0001ng i7-10510U, GeForce MX350 | 1.3 kg | 16 mm | 13.30" | 1920x1080 |
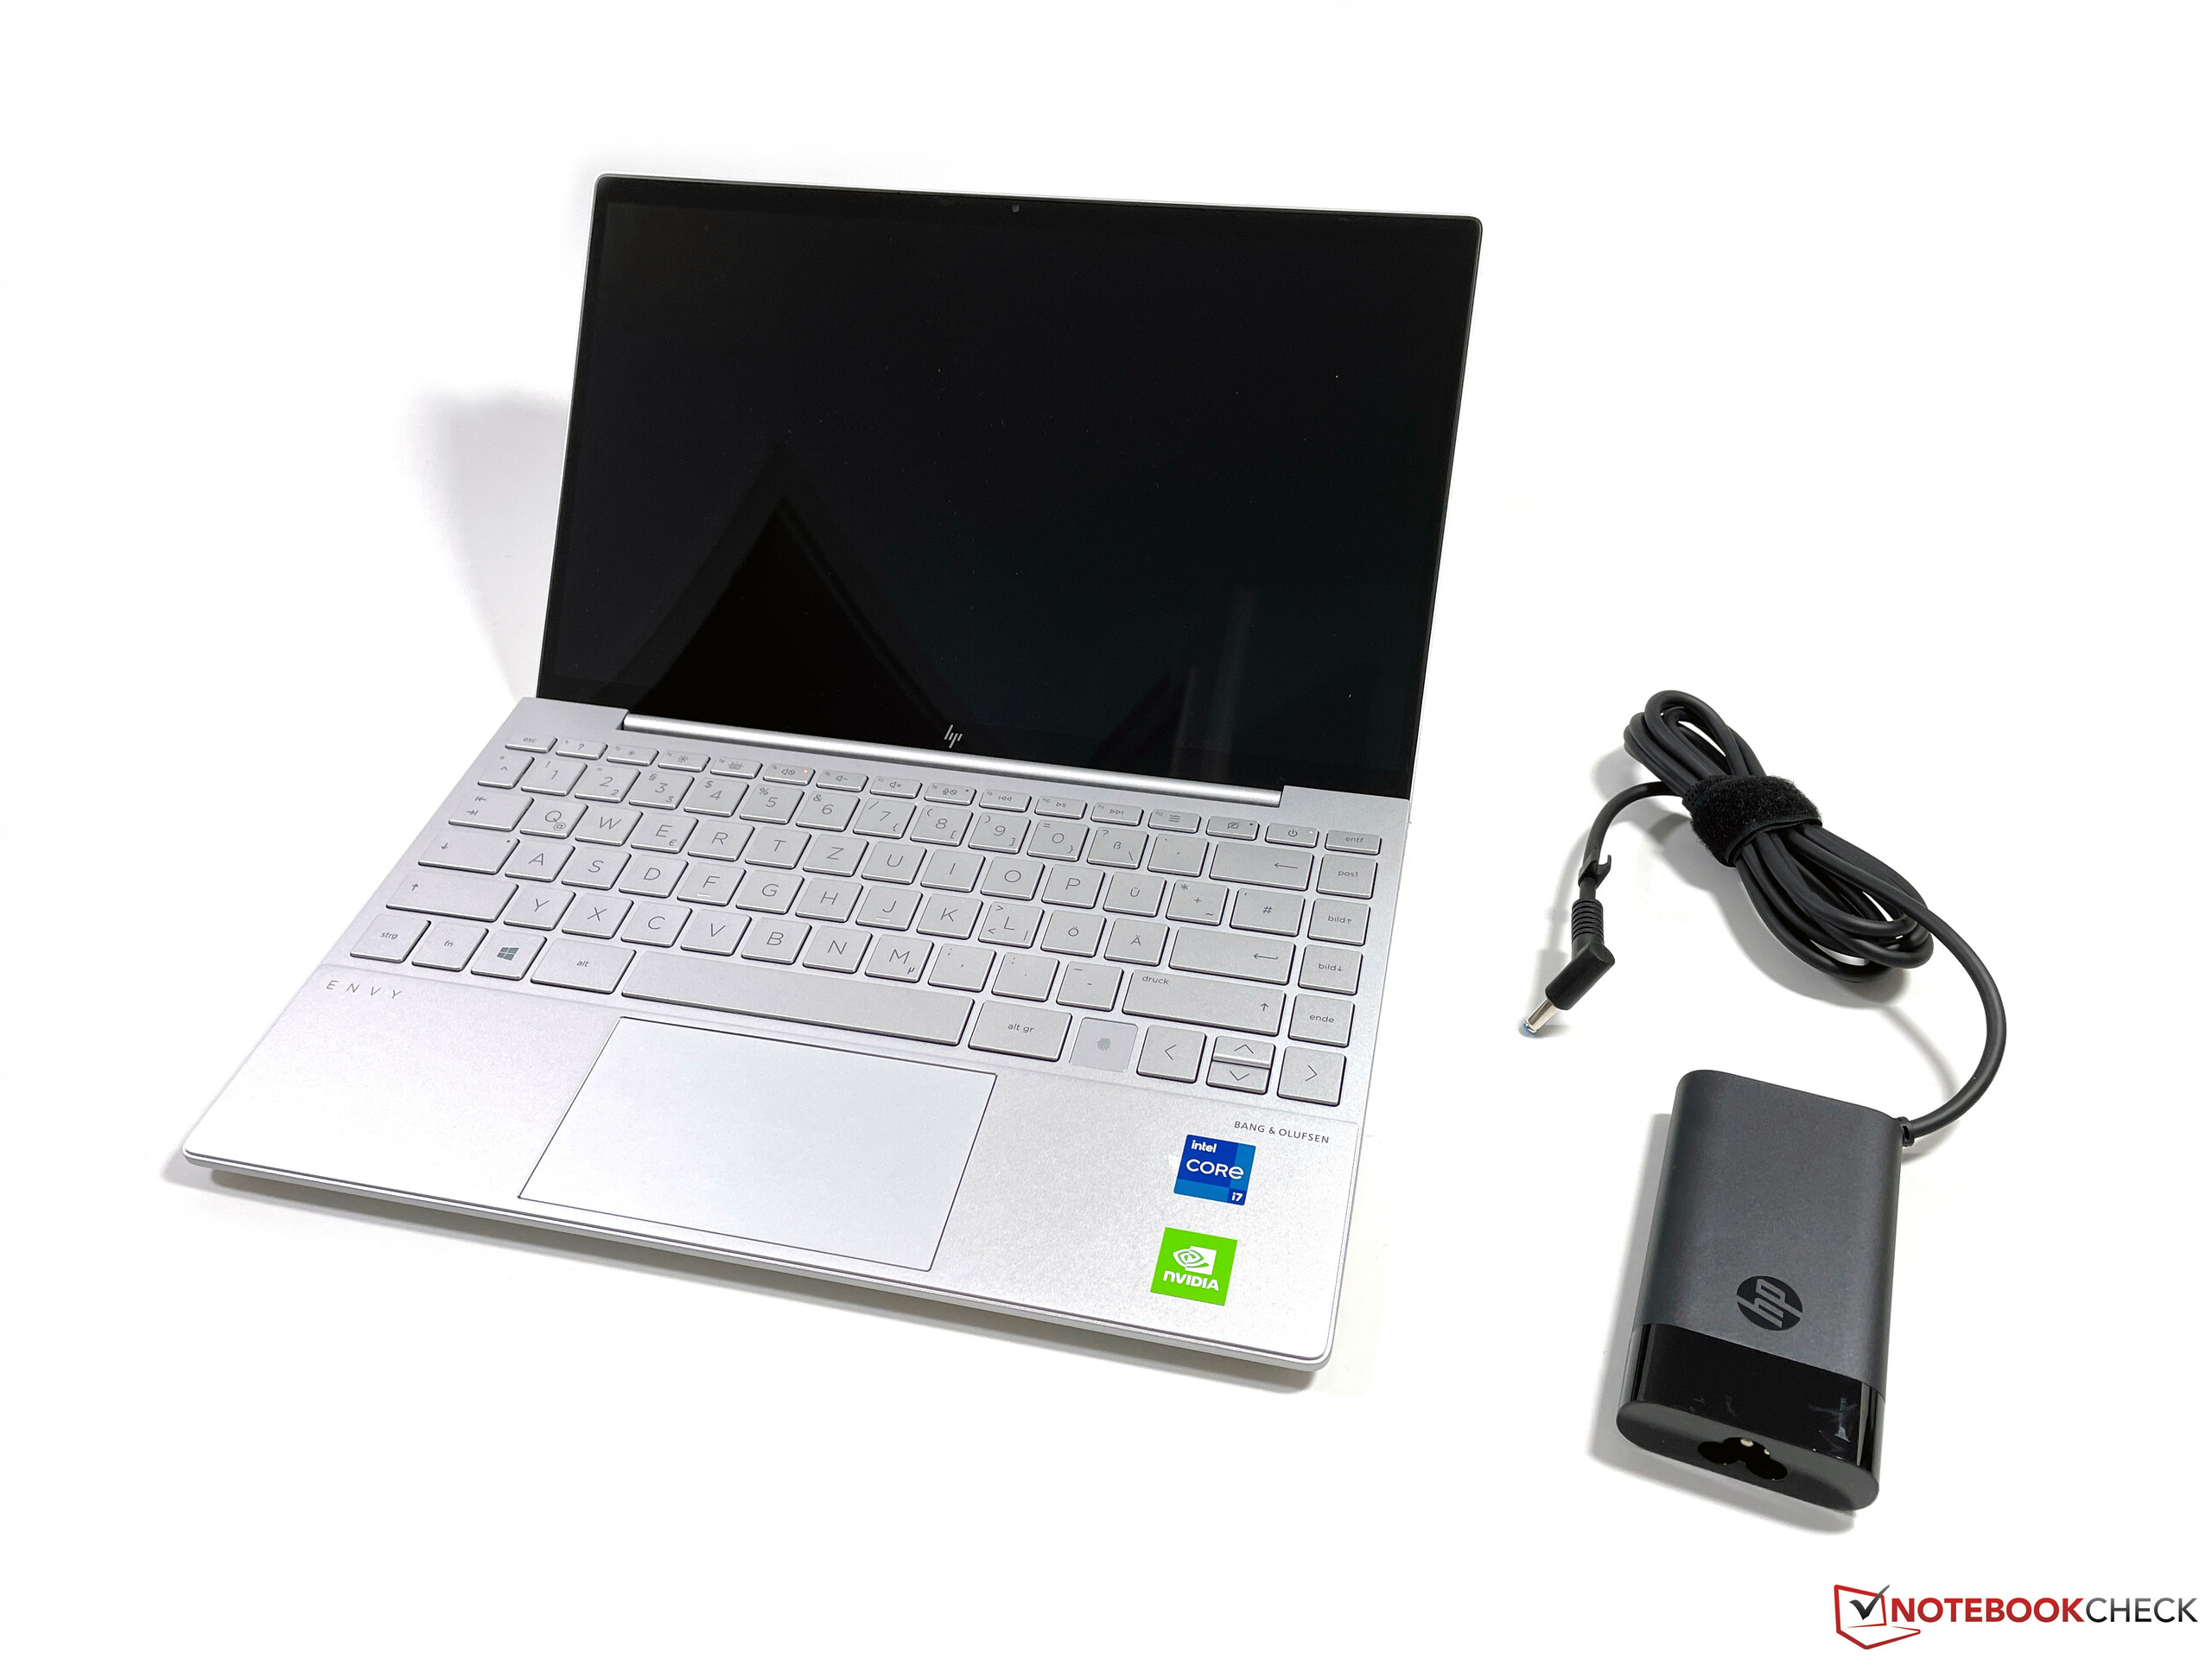
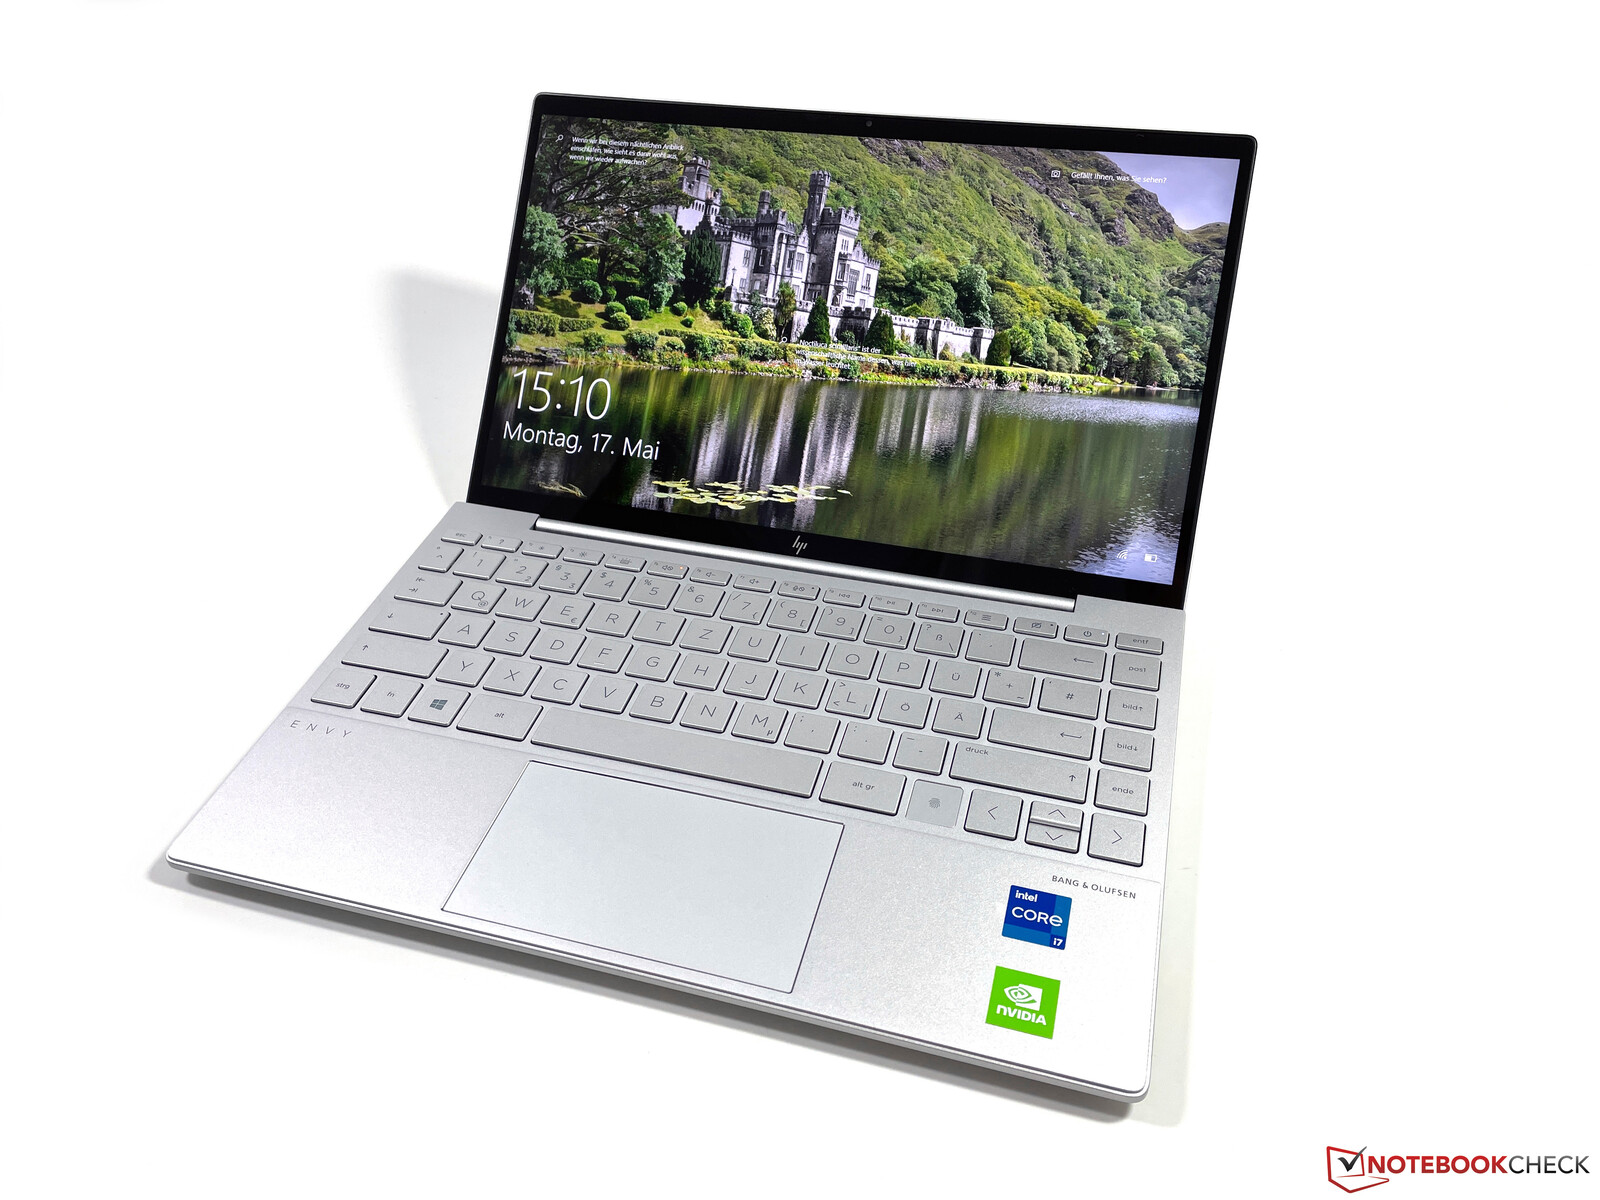
Case, equipment and input devices
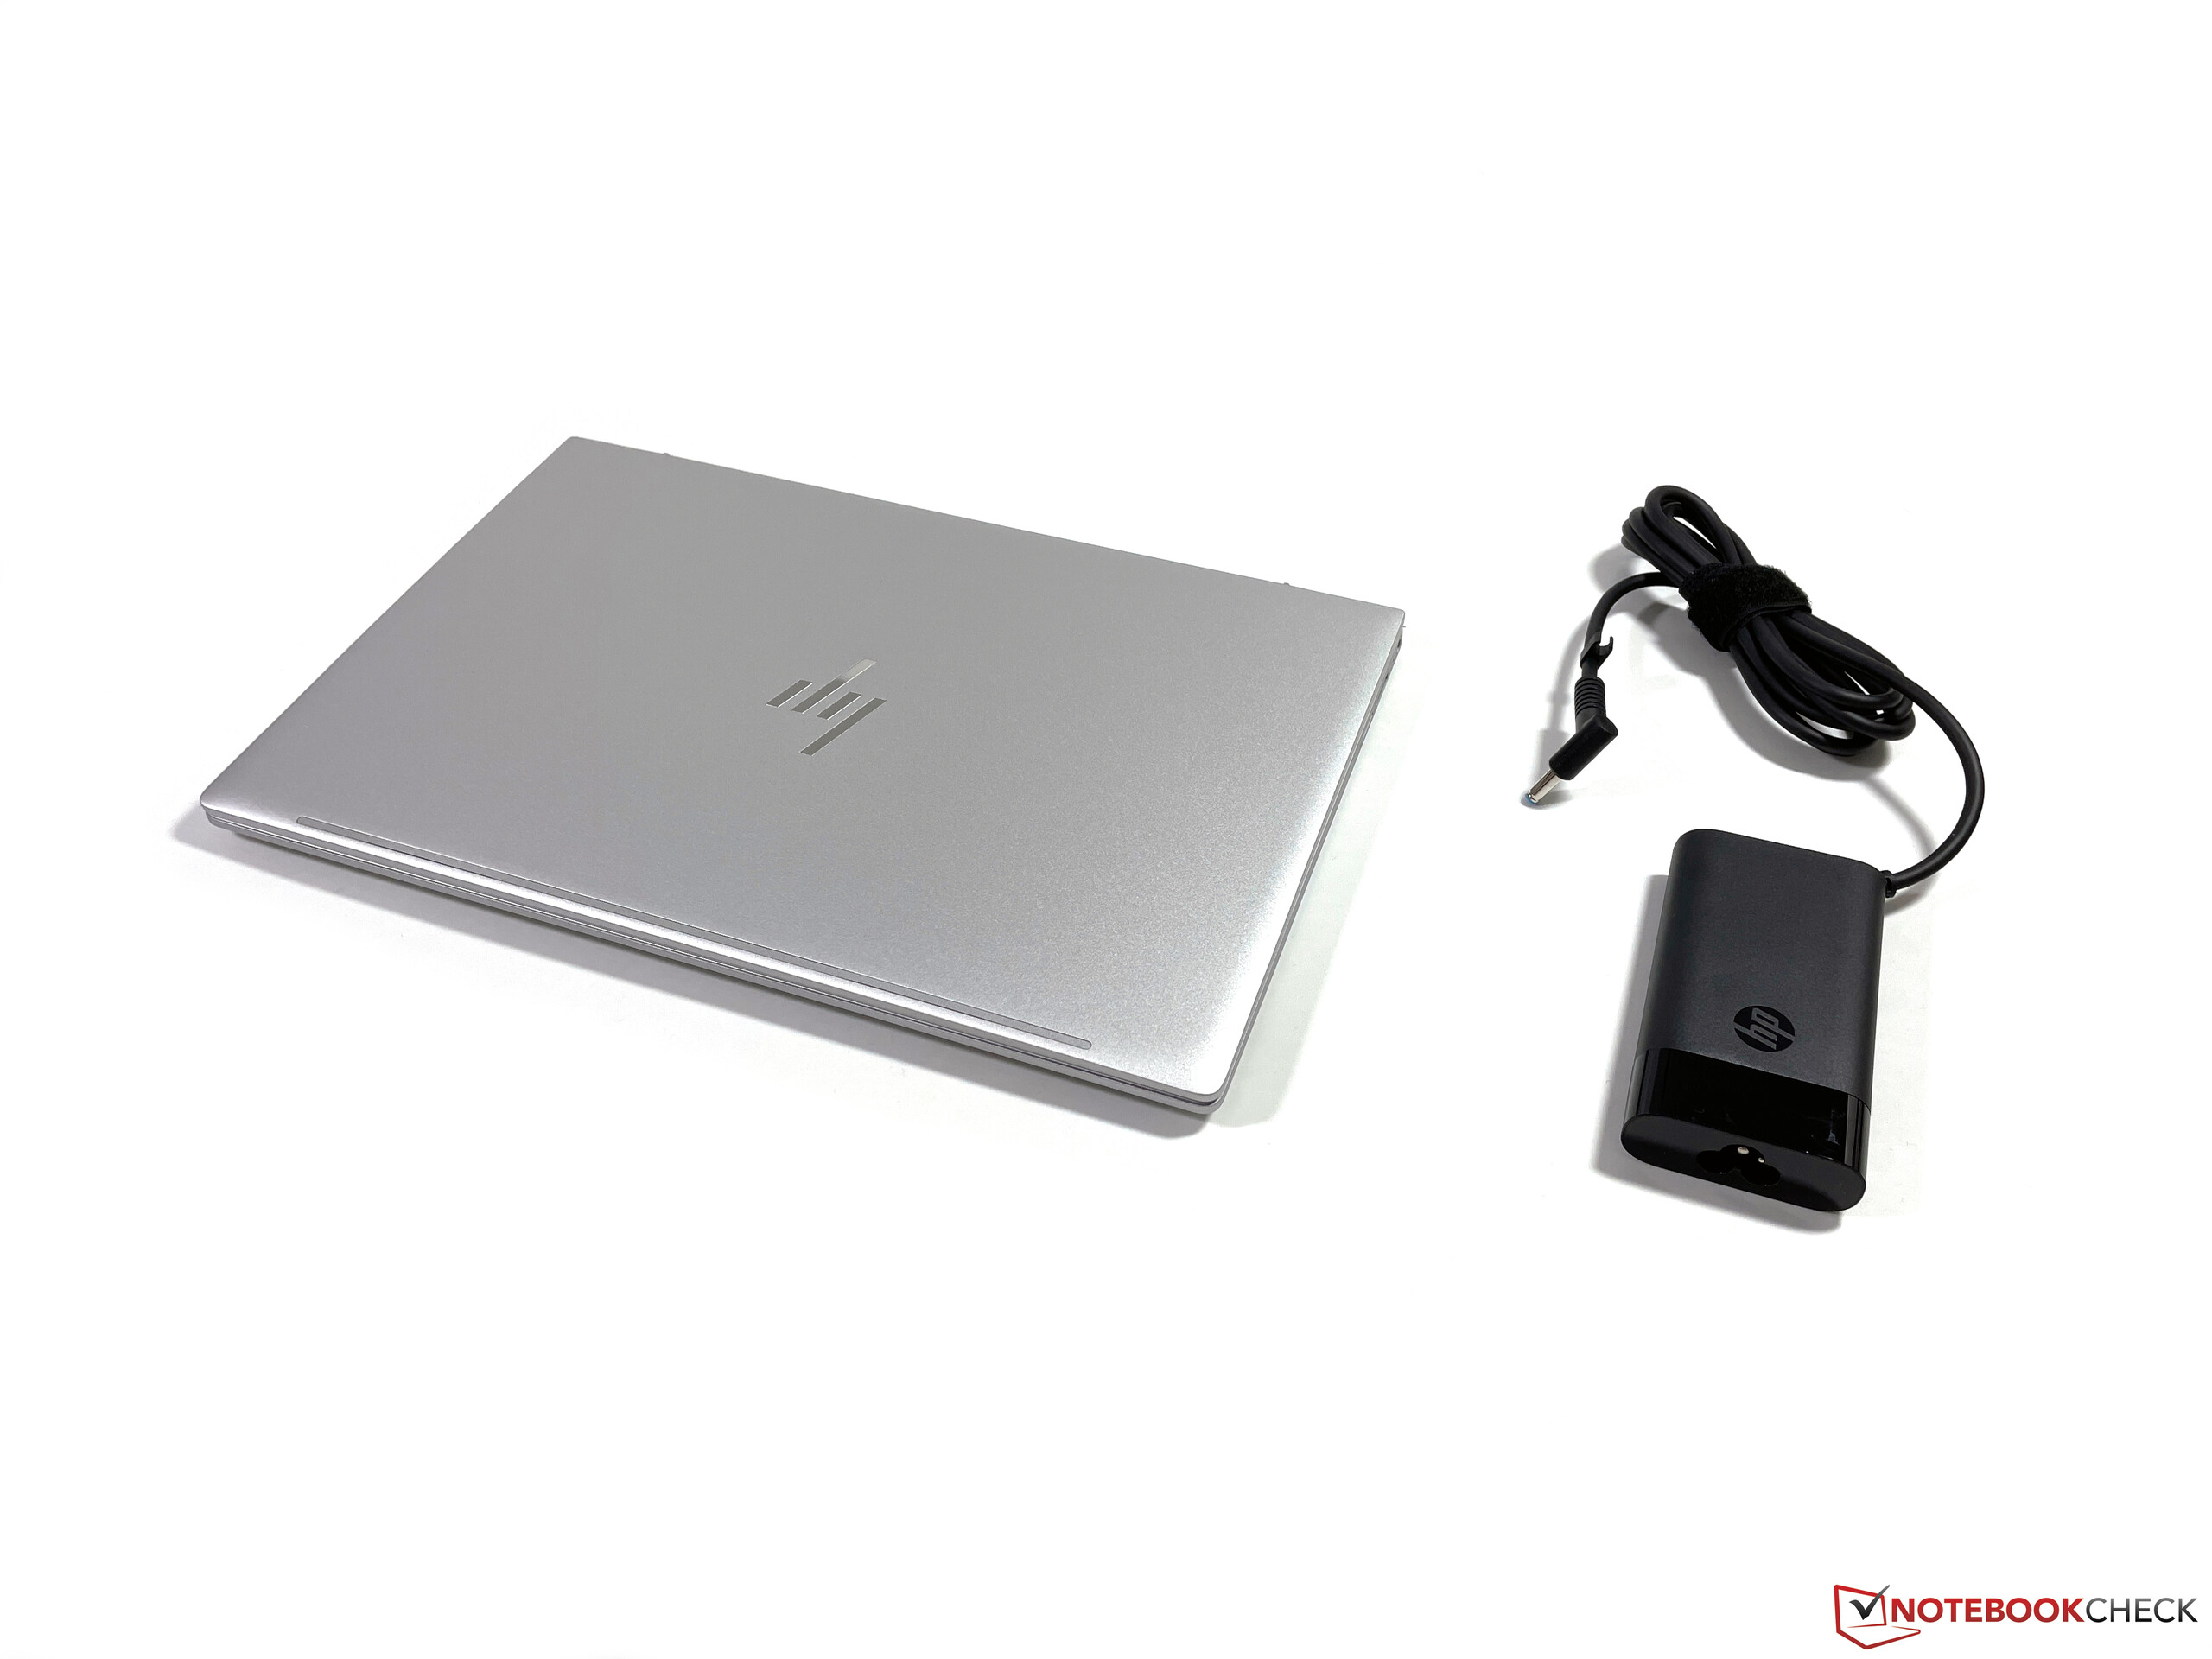
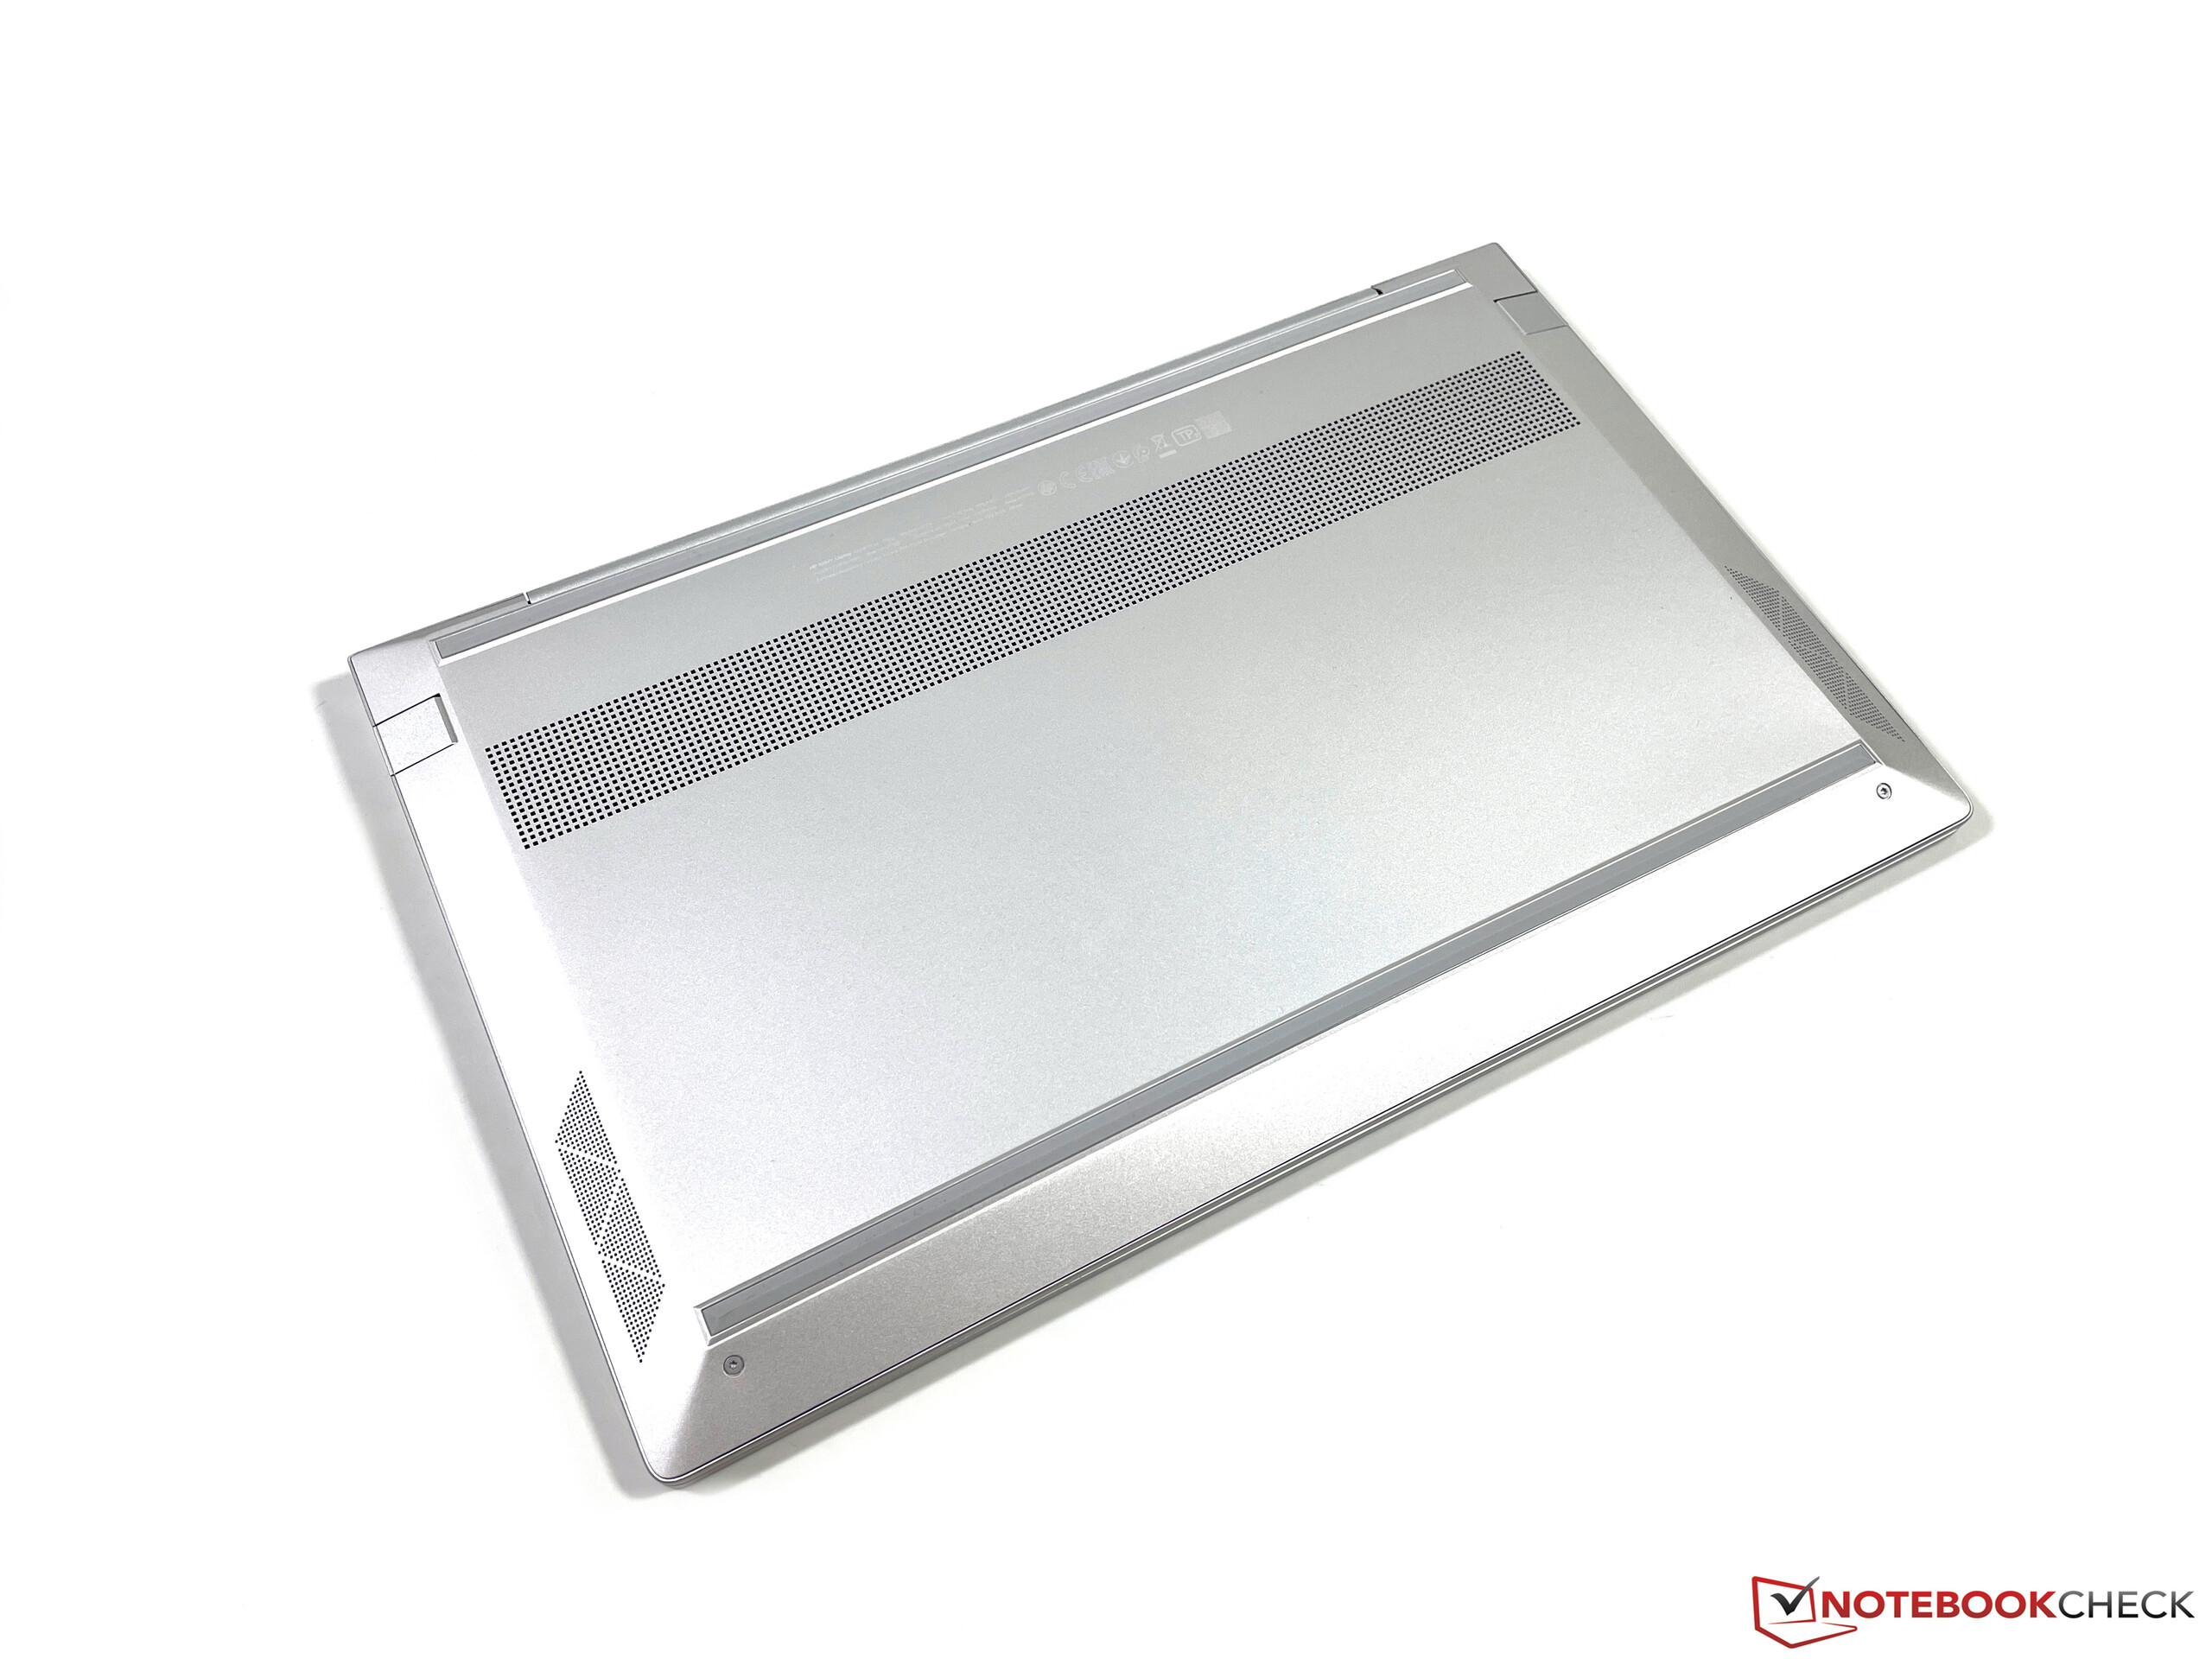
The metal case has improved compared to the Predecessor the metal case has not changed compared to the predecessor and still leaves a stable and high-quality impression. However, the maintenance options are poor because some of the screws are hidden under the glued rubber feet. Removing them without damaging them is hardly possible.
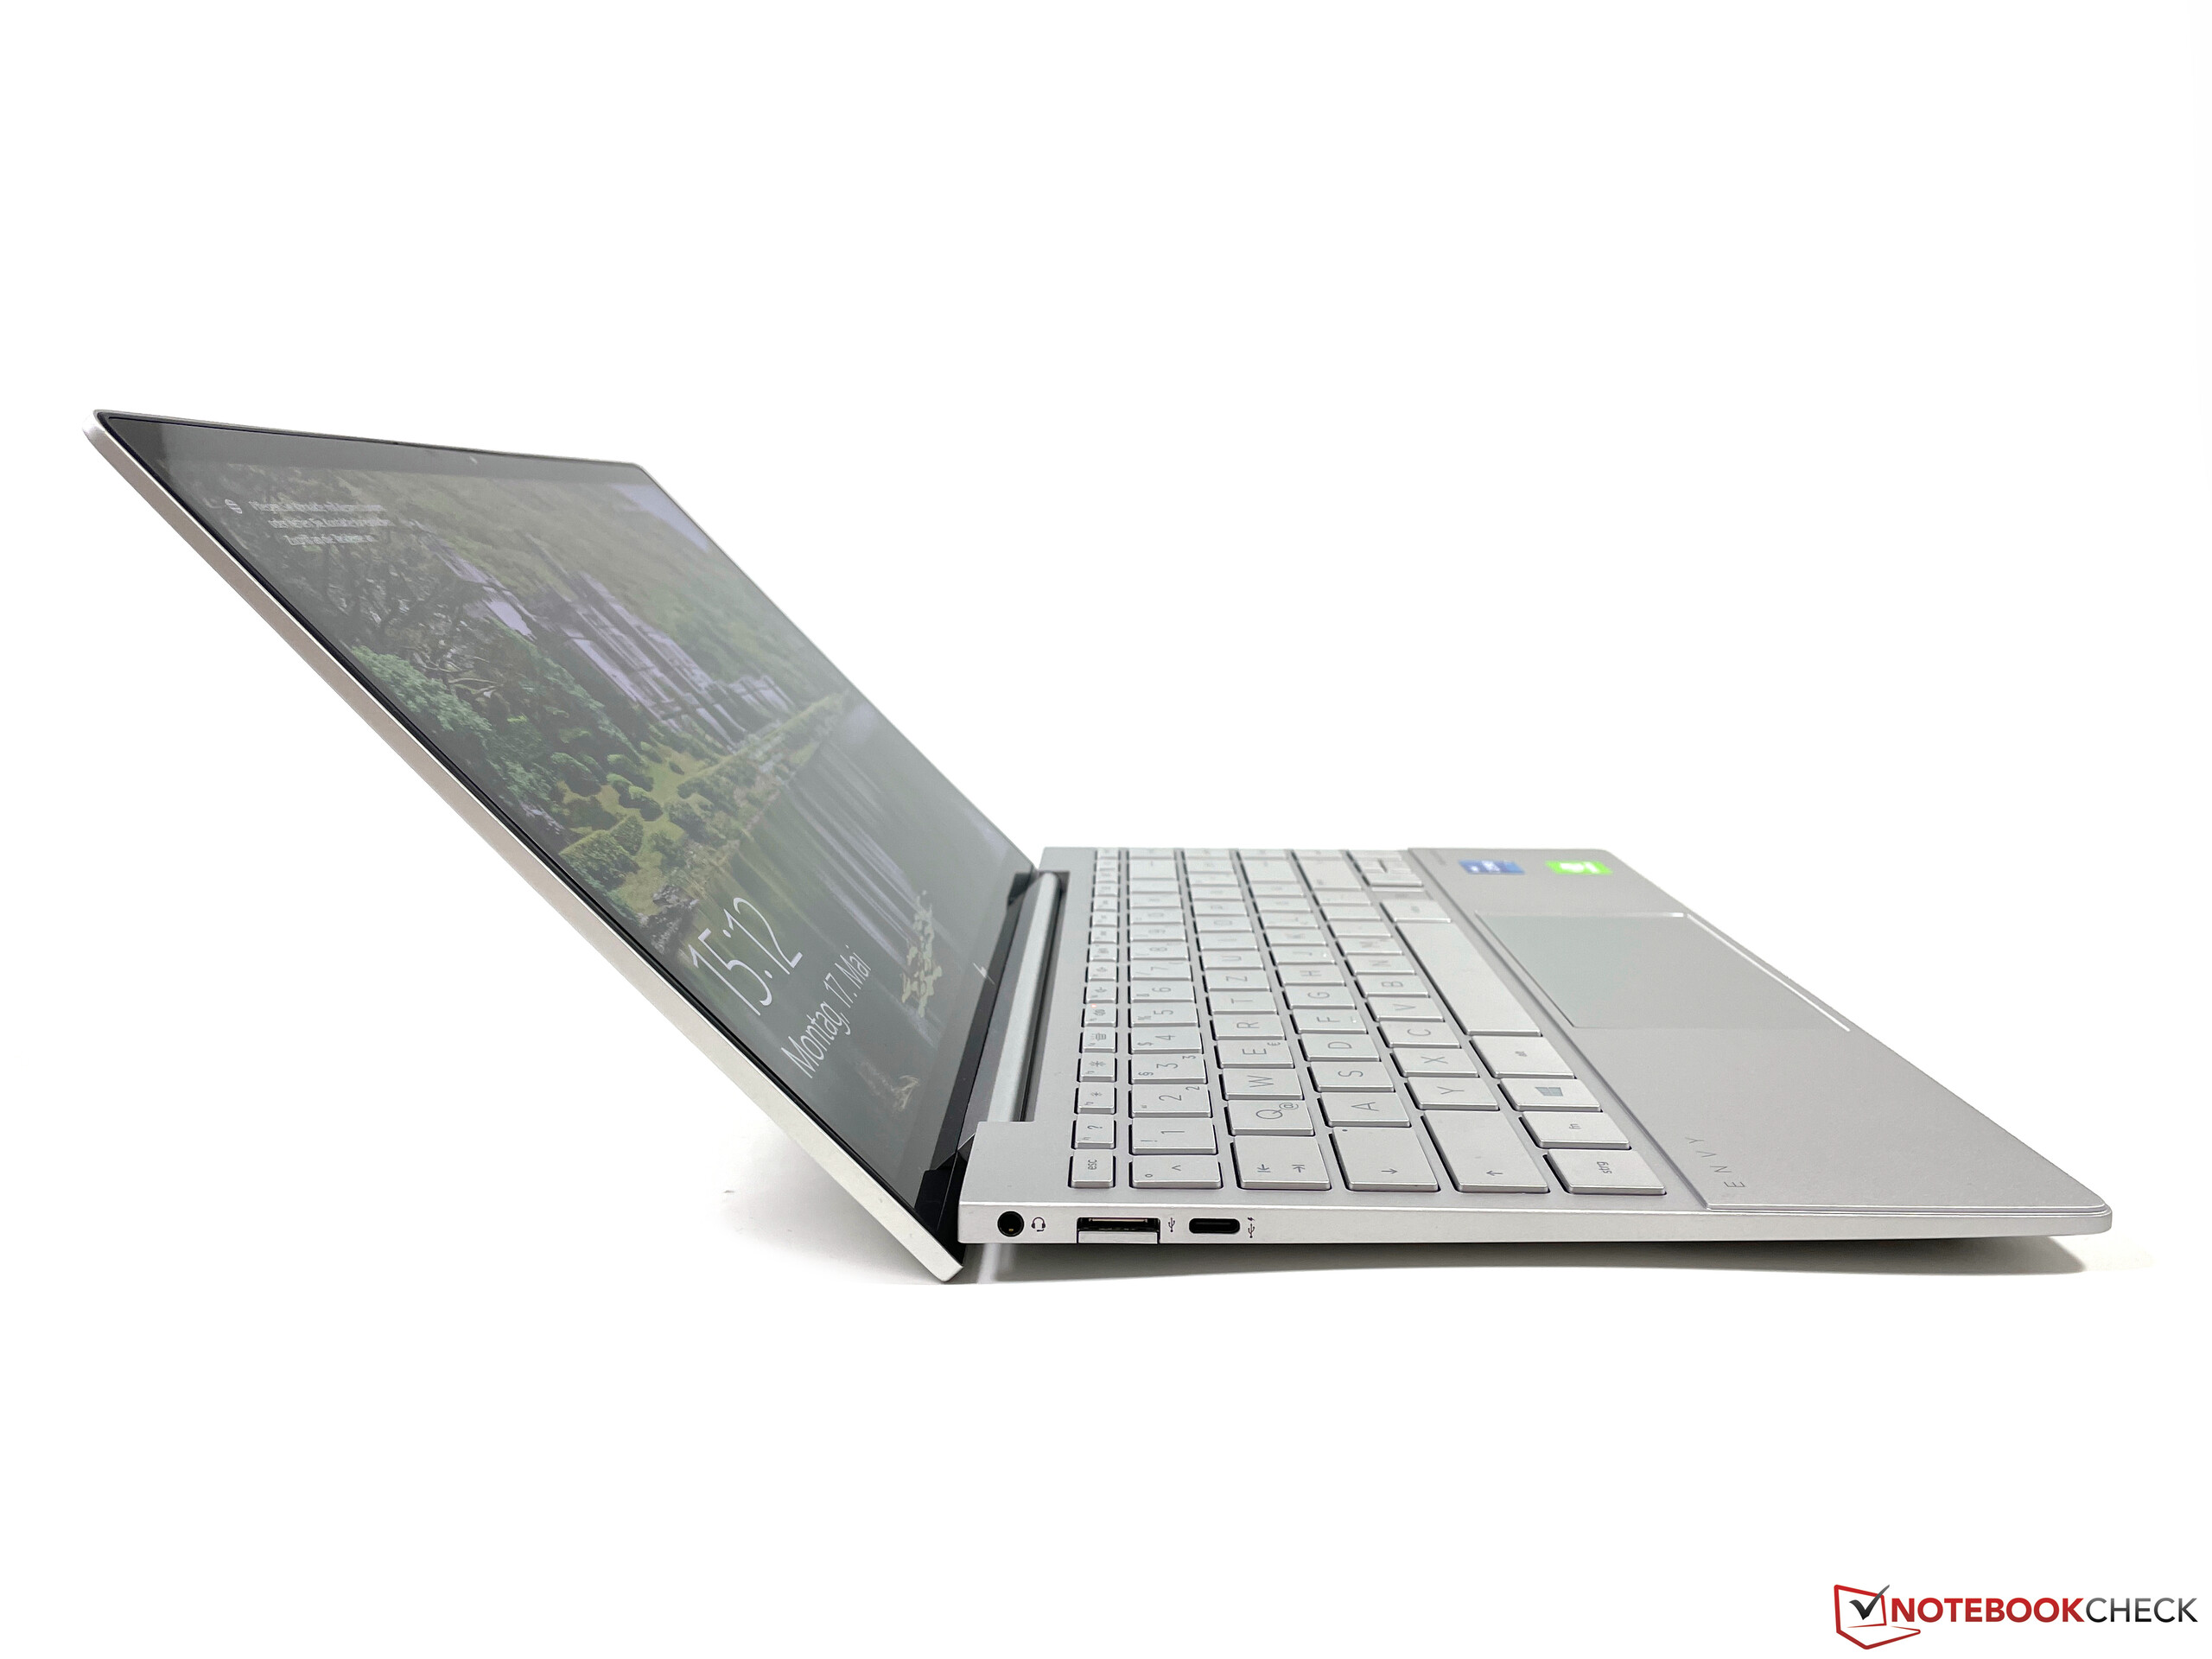
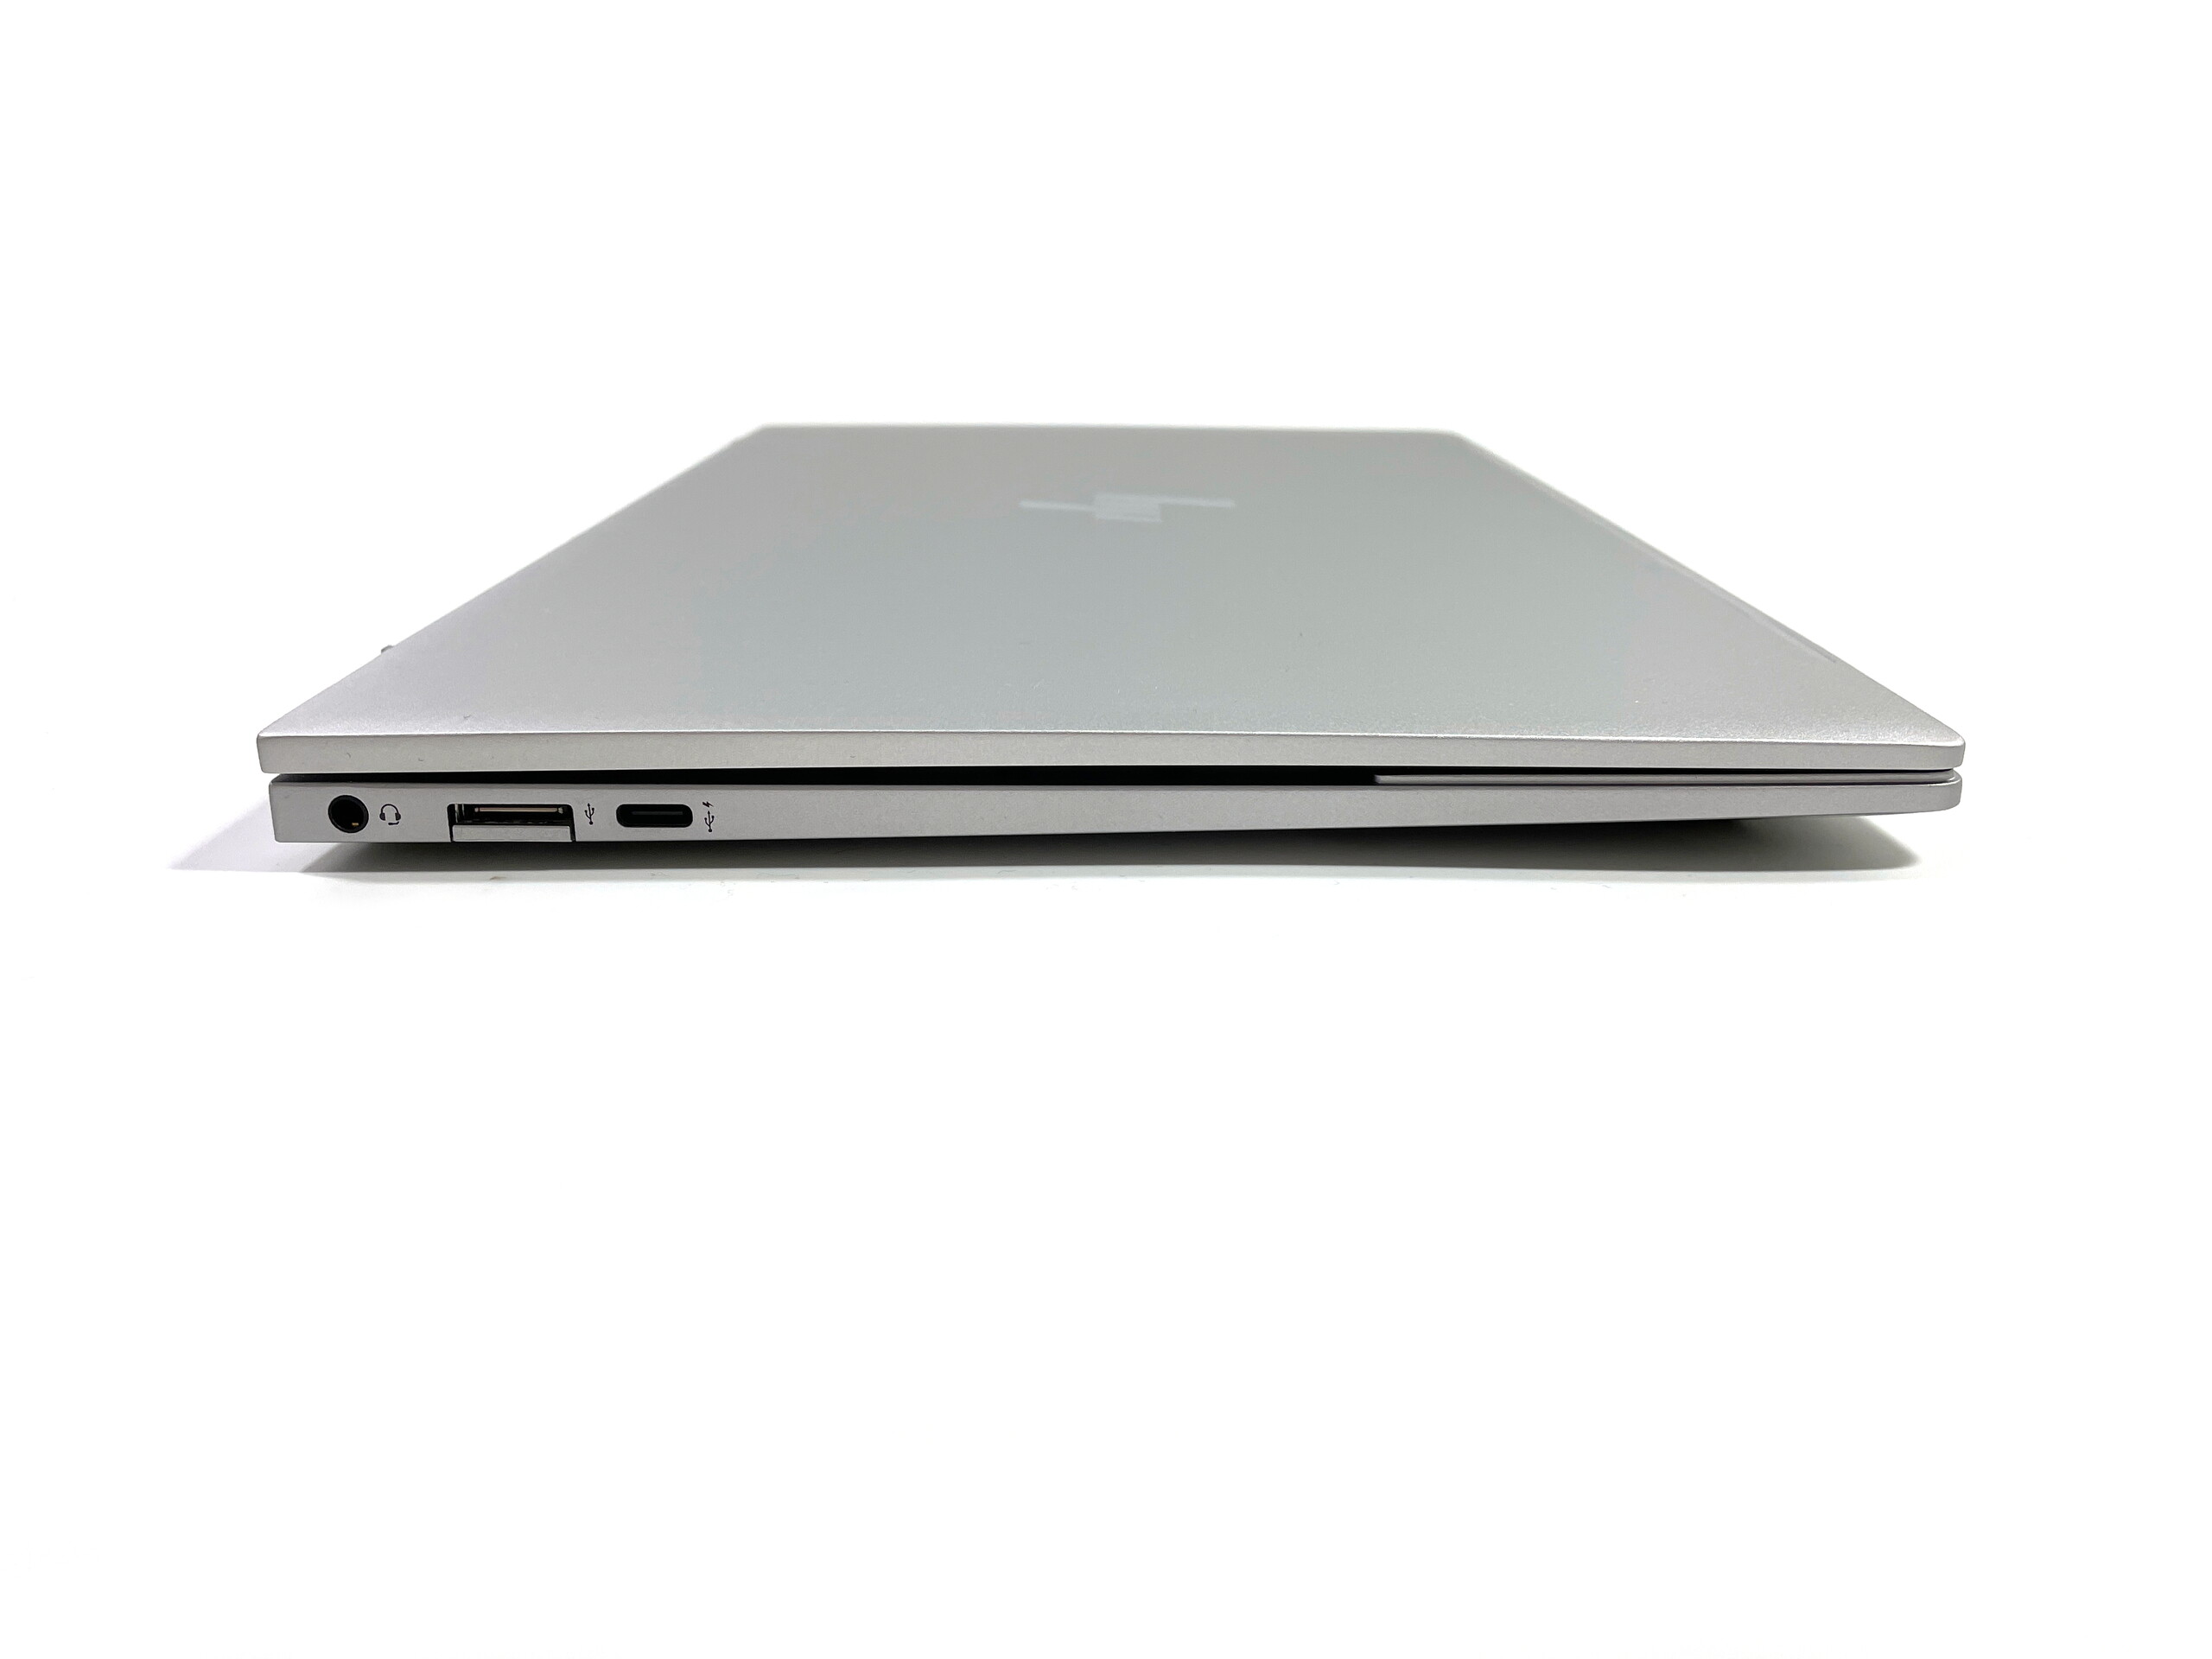
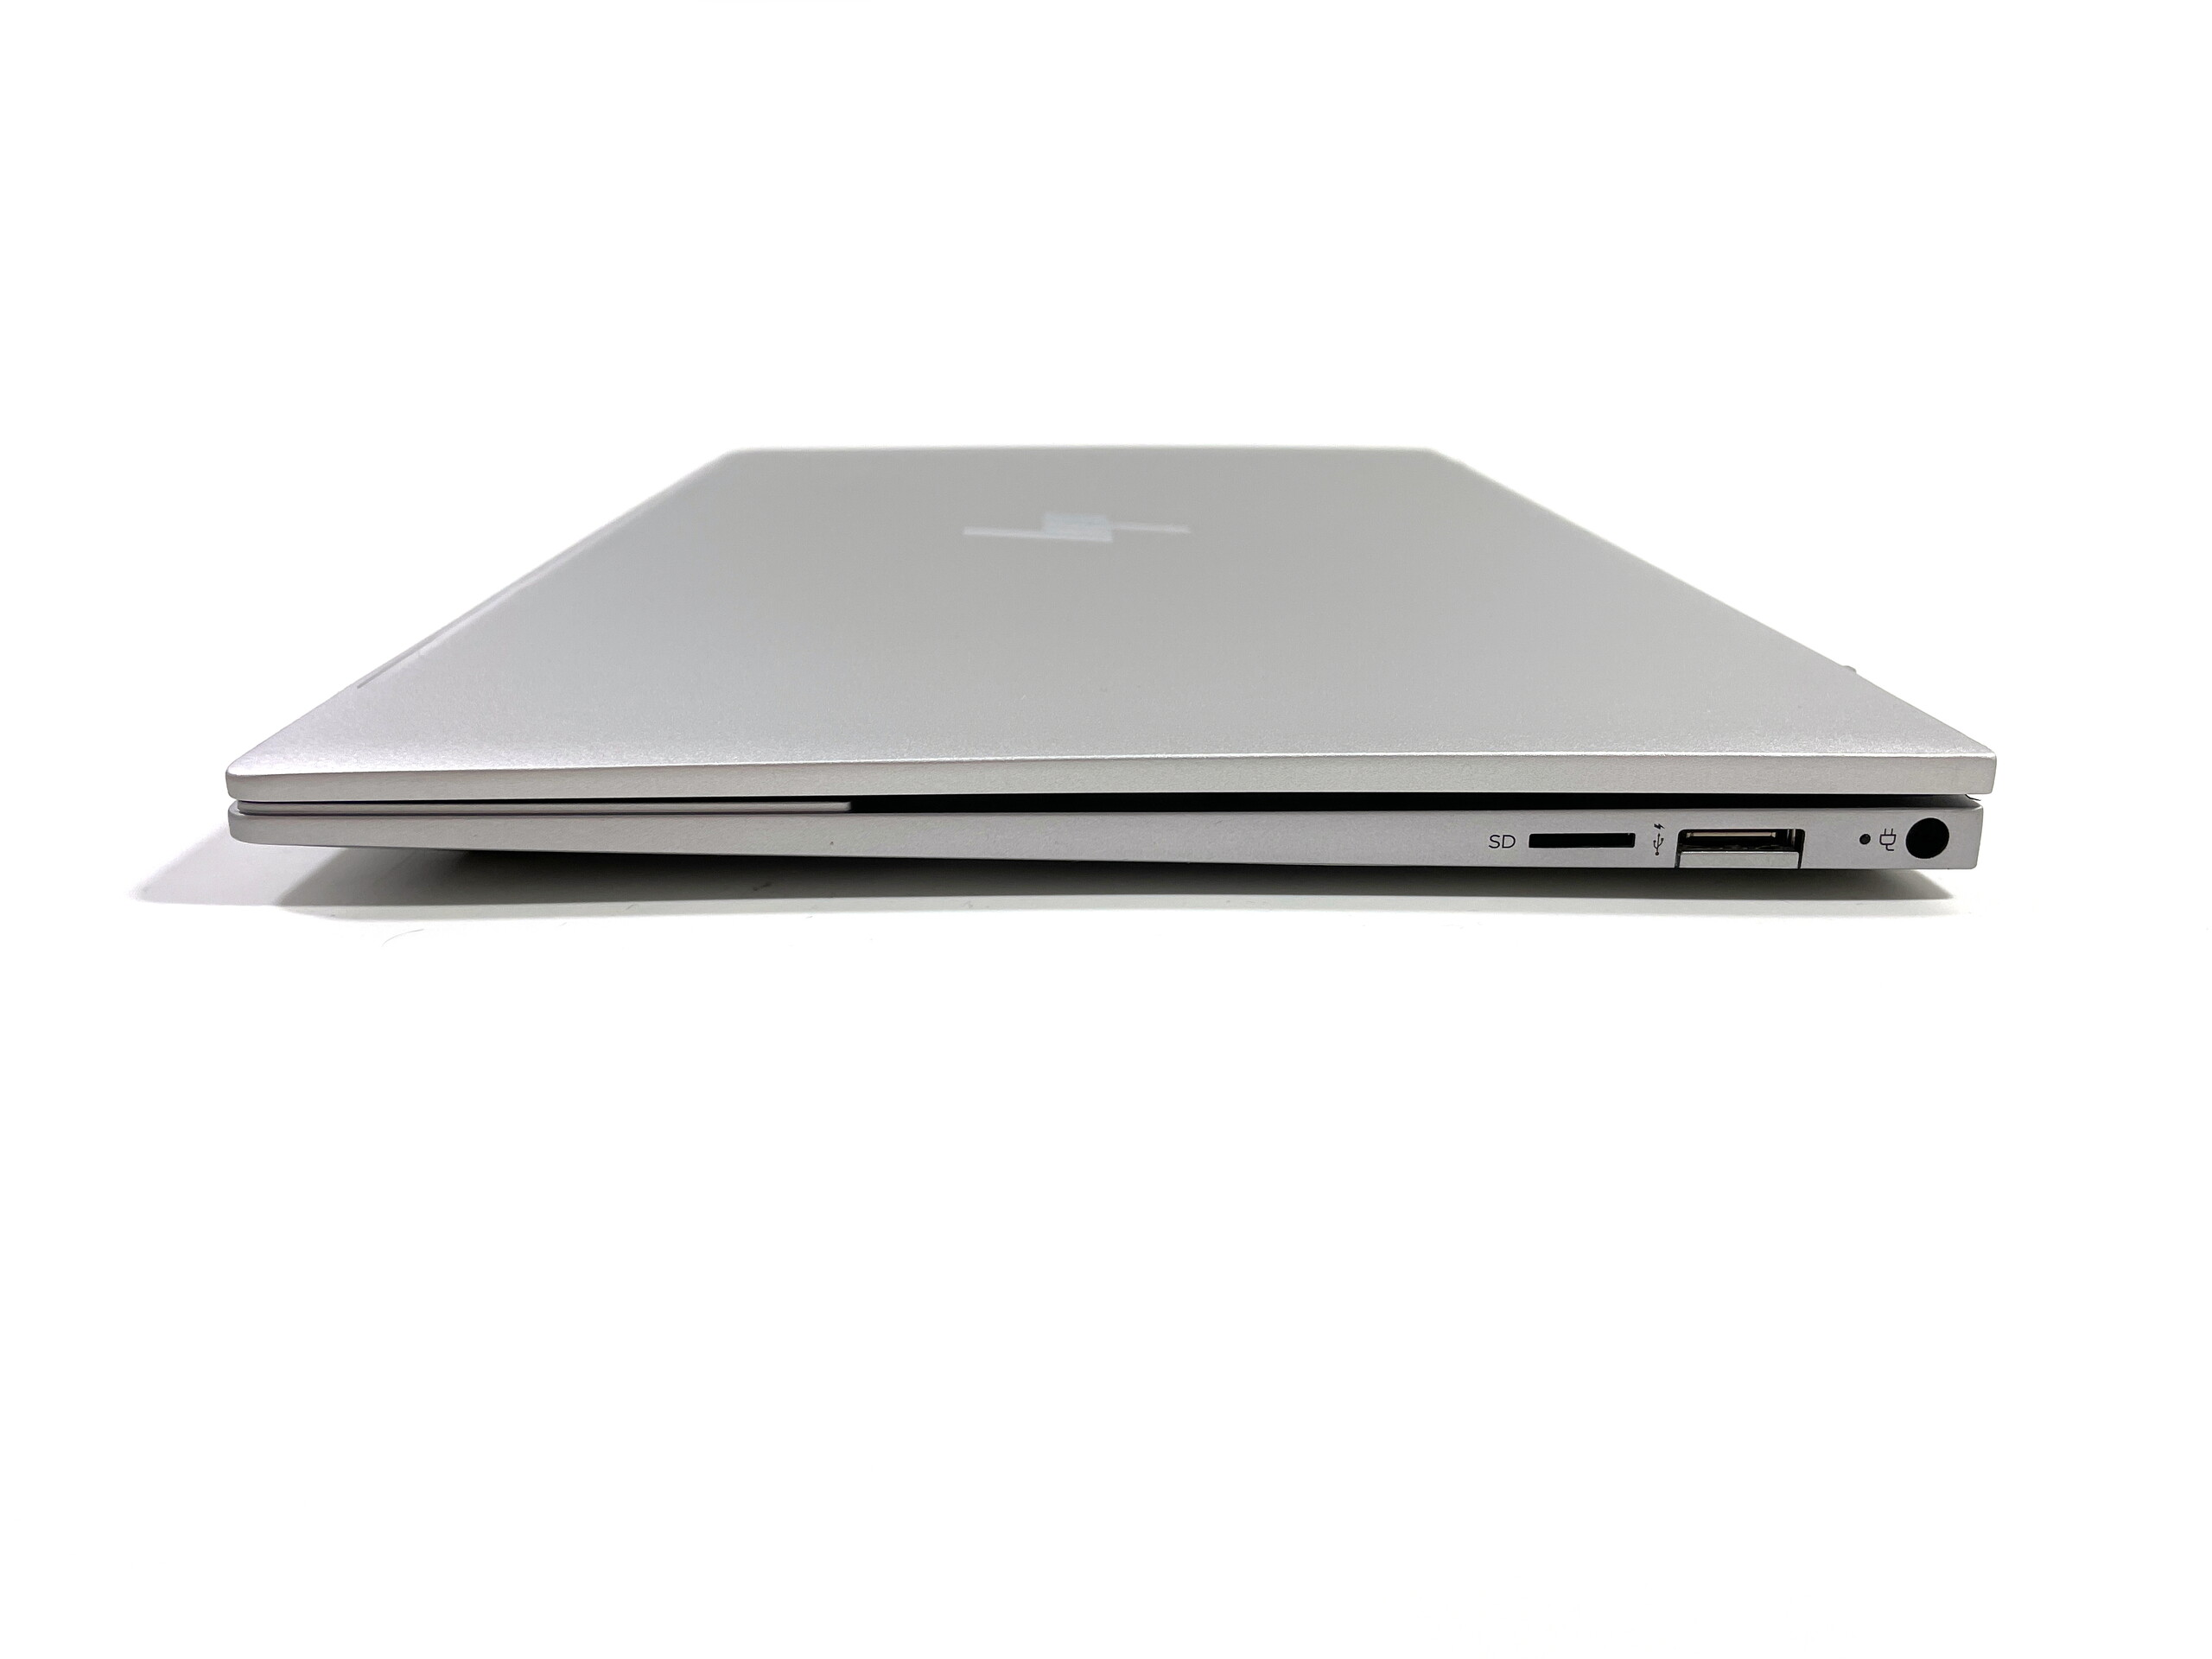
The new Envy 13 scores both in terms of features (Wi-Fi 6 now with better performance) and ports, even though it does not offer Thunderbolt 4. Besides the USB-C port (Gen.2 with DisplayPort 1.4), which can also be used for charging, there is also a conventional USB-A port on both sides. You do not have to do without a microSD reader either. The proprietary charging plug would not have been absolutely necessary, but at least existing power adapters can still be used this way.
The input devices are still very decent and the keyboard is also backlit. Qualitatively, there is a disadvantage compared to the more expensive HP EliteBooks, but the precise stroke allows writing long texts comfortably. The wide ClickPad also works very well in practice.

| SD Card Reader | |
| average JPG Copy Test (av. of 3 runs) | |
| Dell XPS 13 9305 Core i5 FHD | |
| HP Envy 13-ba1475ng (AV Pro V60) | |
| Average of class Subnotebook (23.7 - 188, n=9, last 2 years) | |
| HP Envy 13-ba0001ng (Toshiba Exceria Pro M501 microSDXC 64GB) | |
| maximum AS SSD Seq Read Test (1GB) | |
| Dell XPS 13 9305 Core i5 FHD | |
| Average of class Subnotebook (24.9 - 195, n=8, last 2 years) | |
| HP Envy 13-ba1475ng (AV Pro V60) | |
| HP Envy 13-ba0001ng (Toshiba Exceria Pro M501 microSDXC 64GB) | |


Display - Envy with 13.3-inch IPS panel
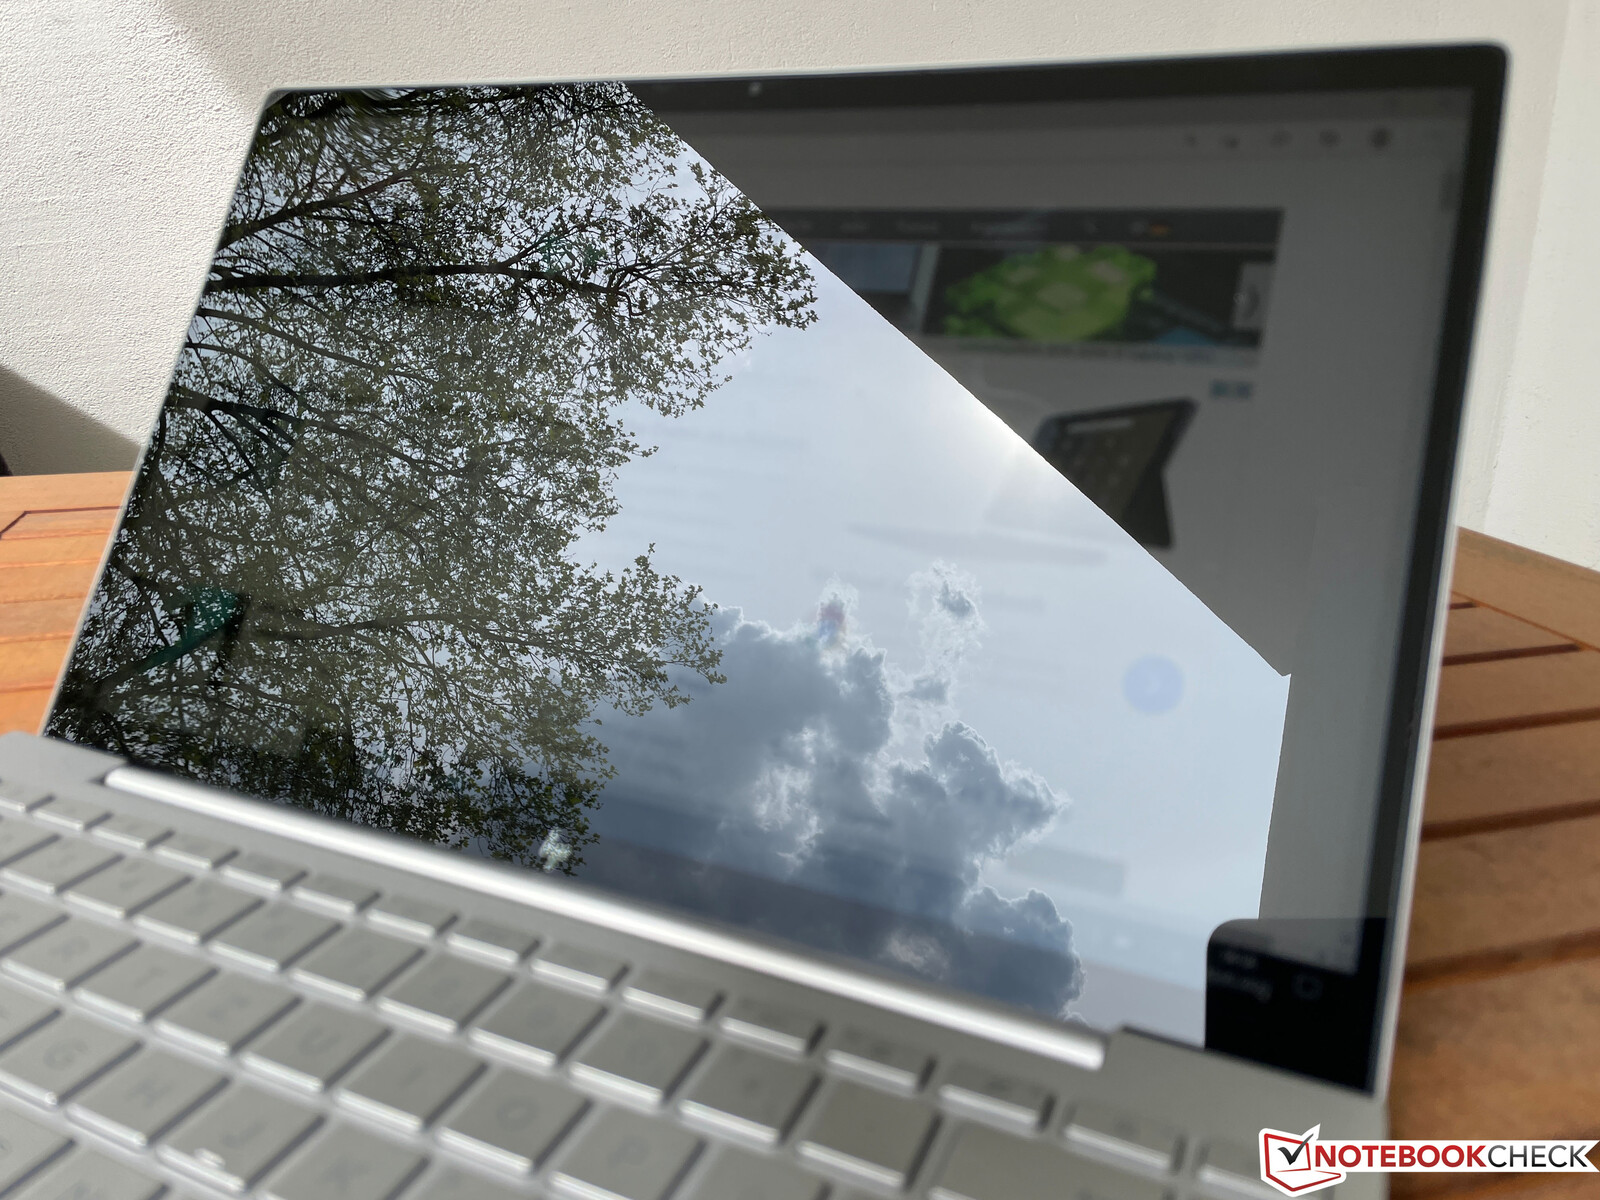
The basic specifications of the screen remain the same: 13.3-inch screen diagonal, Full HD resolution, IPS panel, 400 cd/m² brightness and glossy surface. The subjective picture quality is still very good, but the panel is still extremely reflective and even in bright rooms there can be restrictions. Outdoors, you have to look for a suitable spot in the shade, otherwise you won't recognize anything.
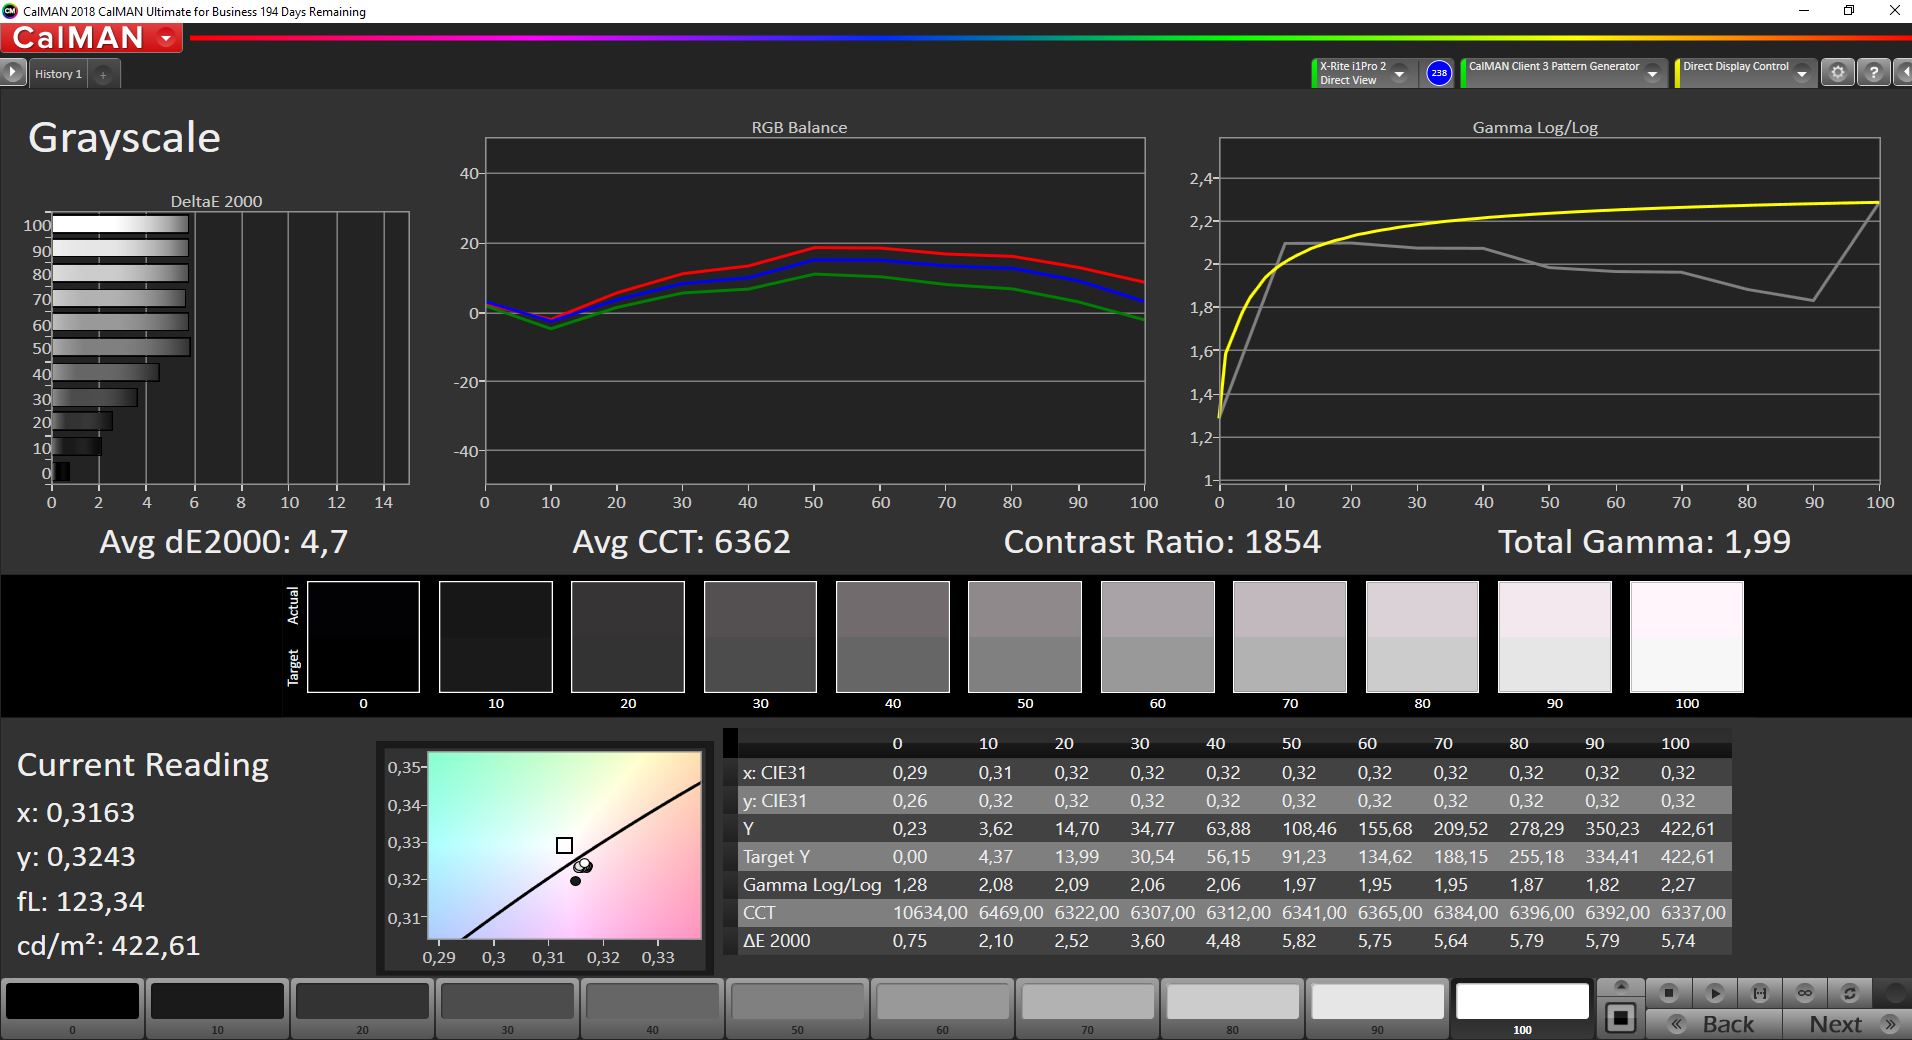
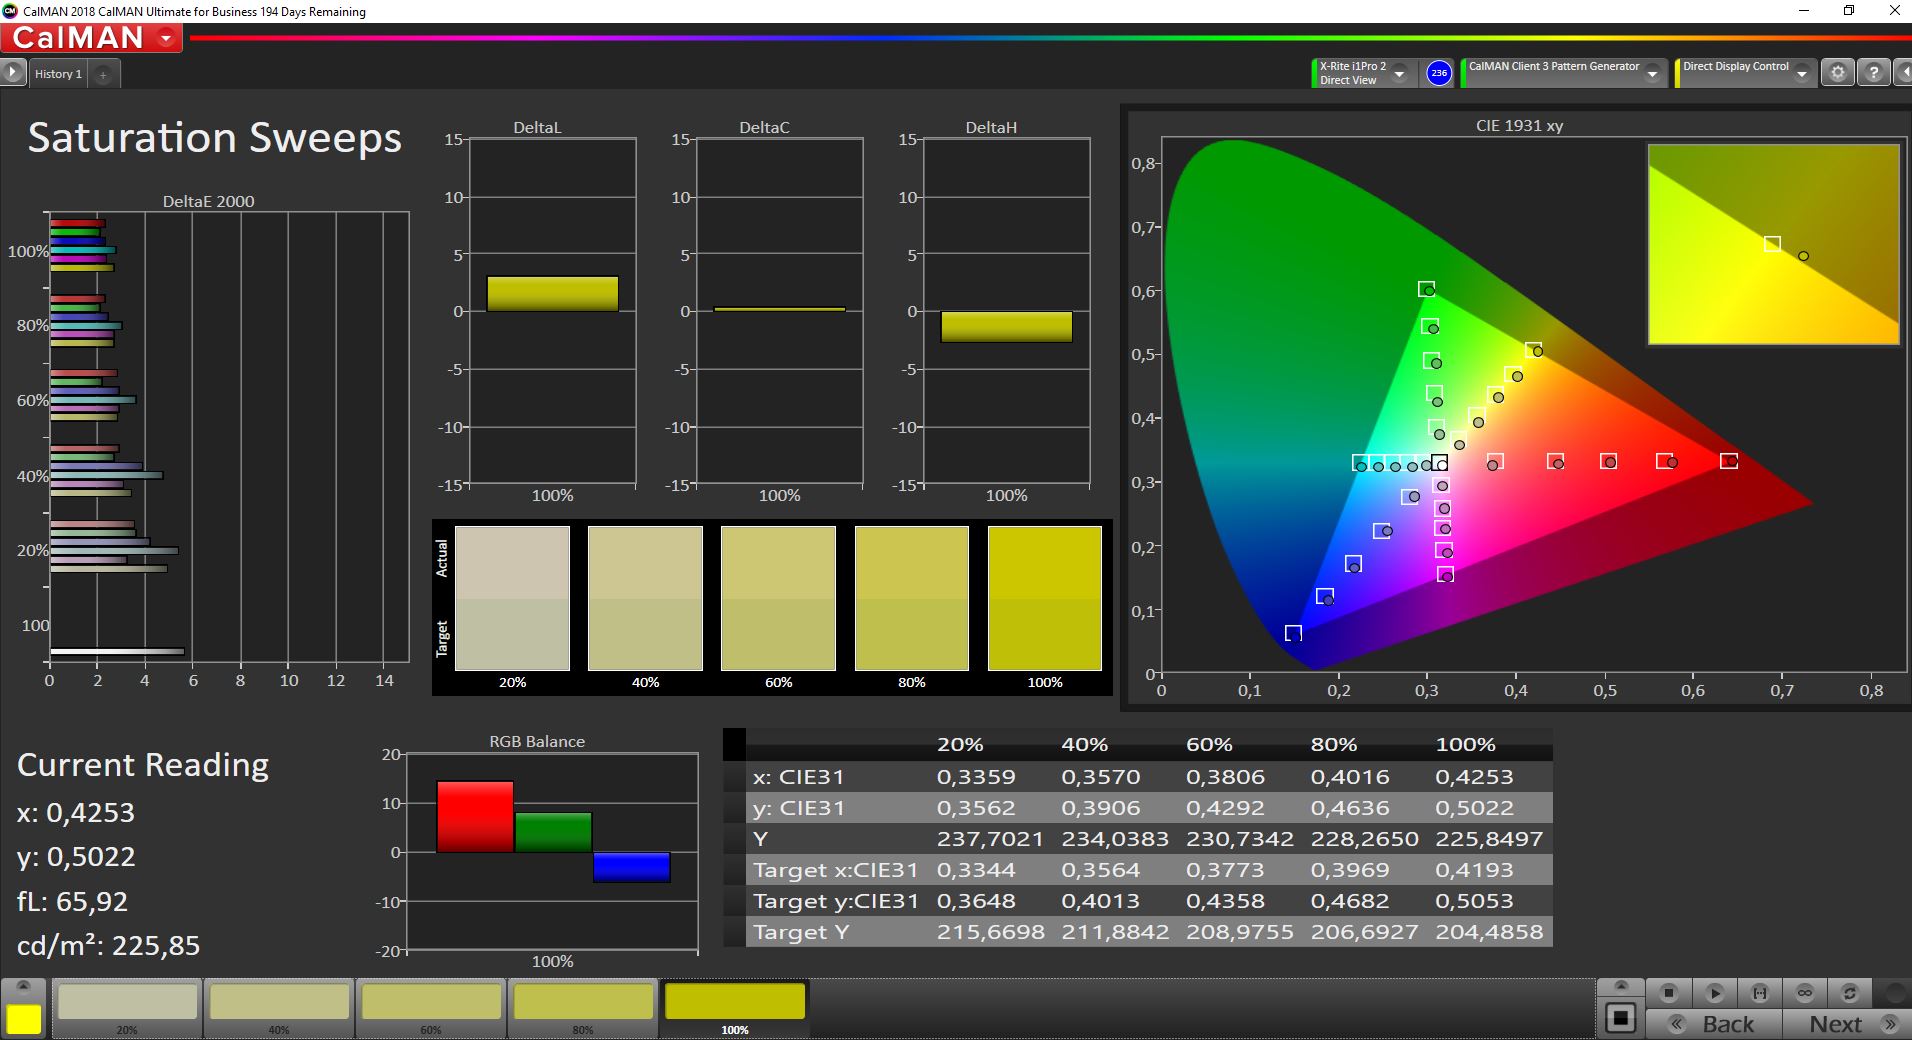
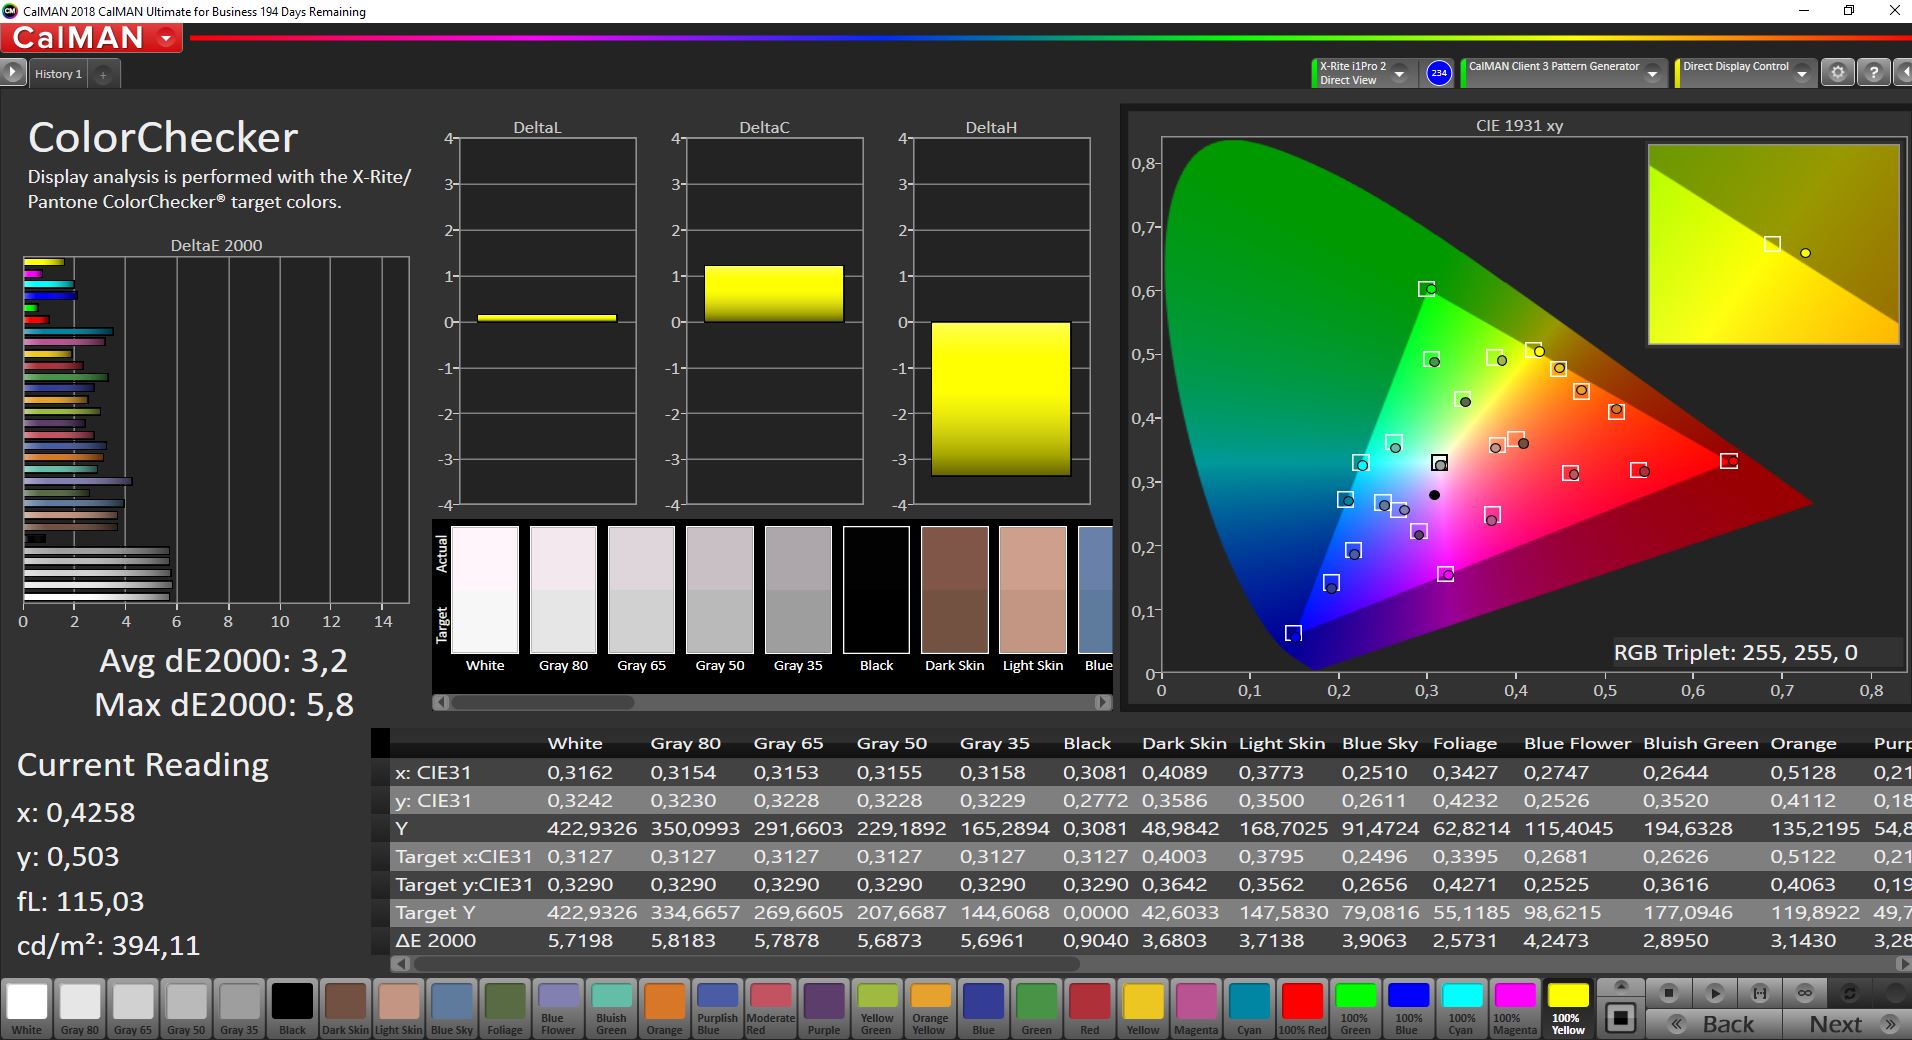
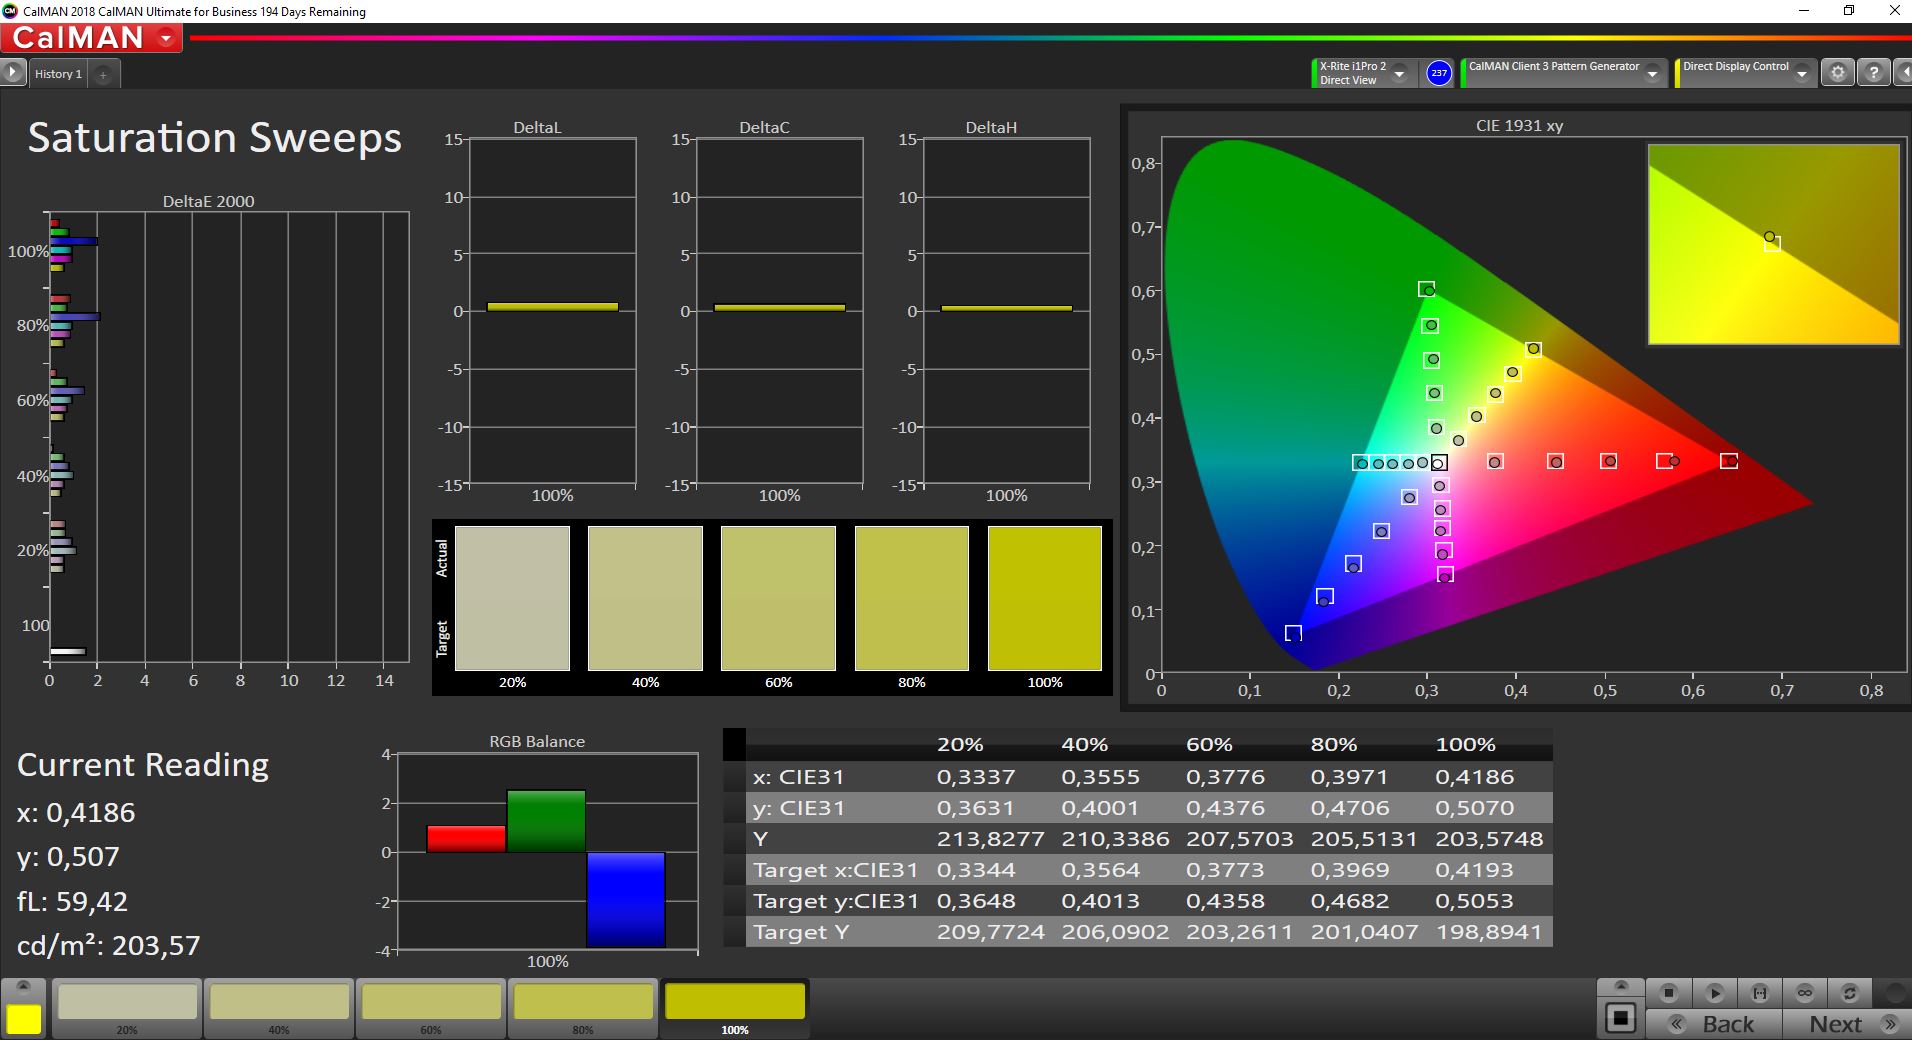
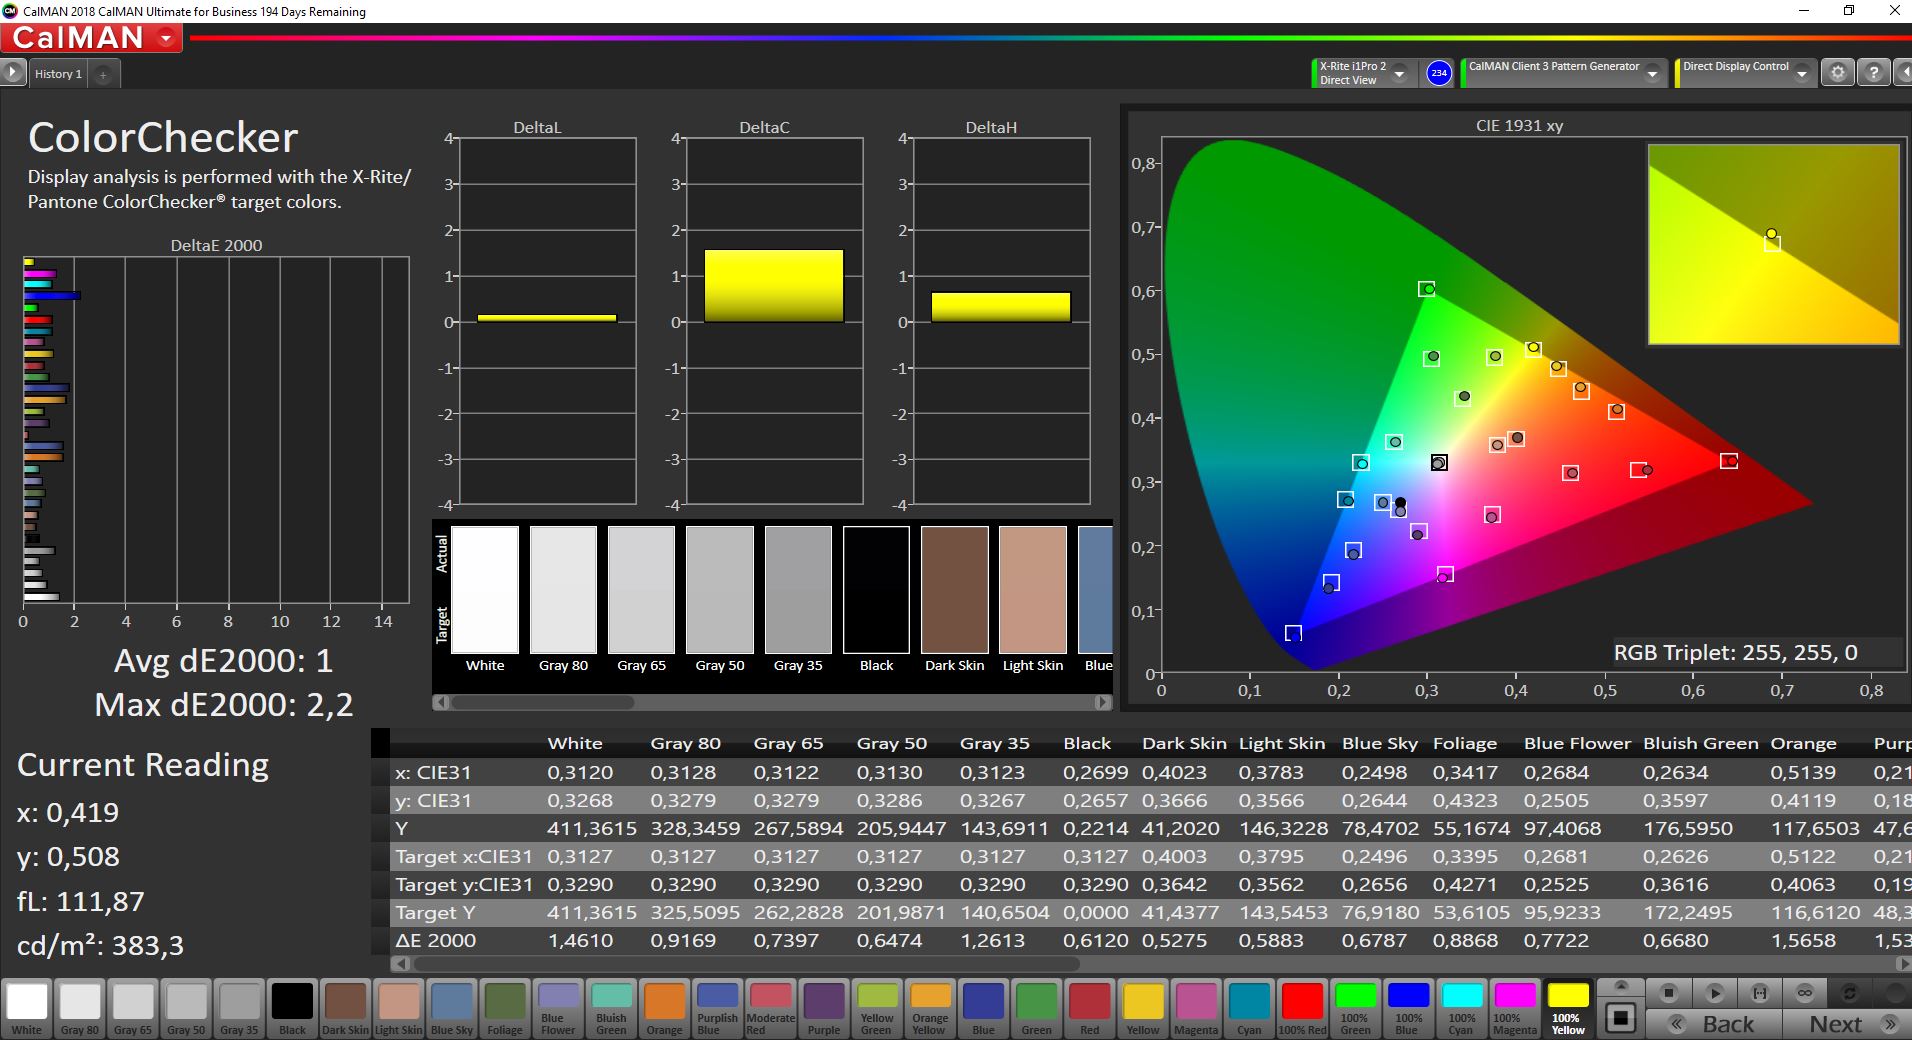
Somewhat surprisingly, another panel from Chi Mei (instead of AU Optronics) is used. It also fulfills the basic properties, but it is a bit worse in all measured values. PWM is also used, but the frequency of 26 kHz is very high and should not cause any problems. The small sRGB color space is almost completely covered, but those who want to edit pictures should calibrate the panel (or use our calibrated profile). Highlights are not a big problem in our test device.
| |||||||||||||||||||||||||
Brightness Distribution: 83 %
Center on Battery: 413 cd/m²
Contrast: 1839:1 (Black: 0.23 cd/m²)
ΔE ColorChecker Calman: 3.2 | ∀{0.5-29.43 Ø4.73}
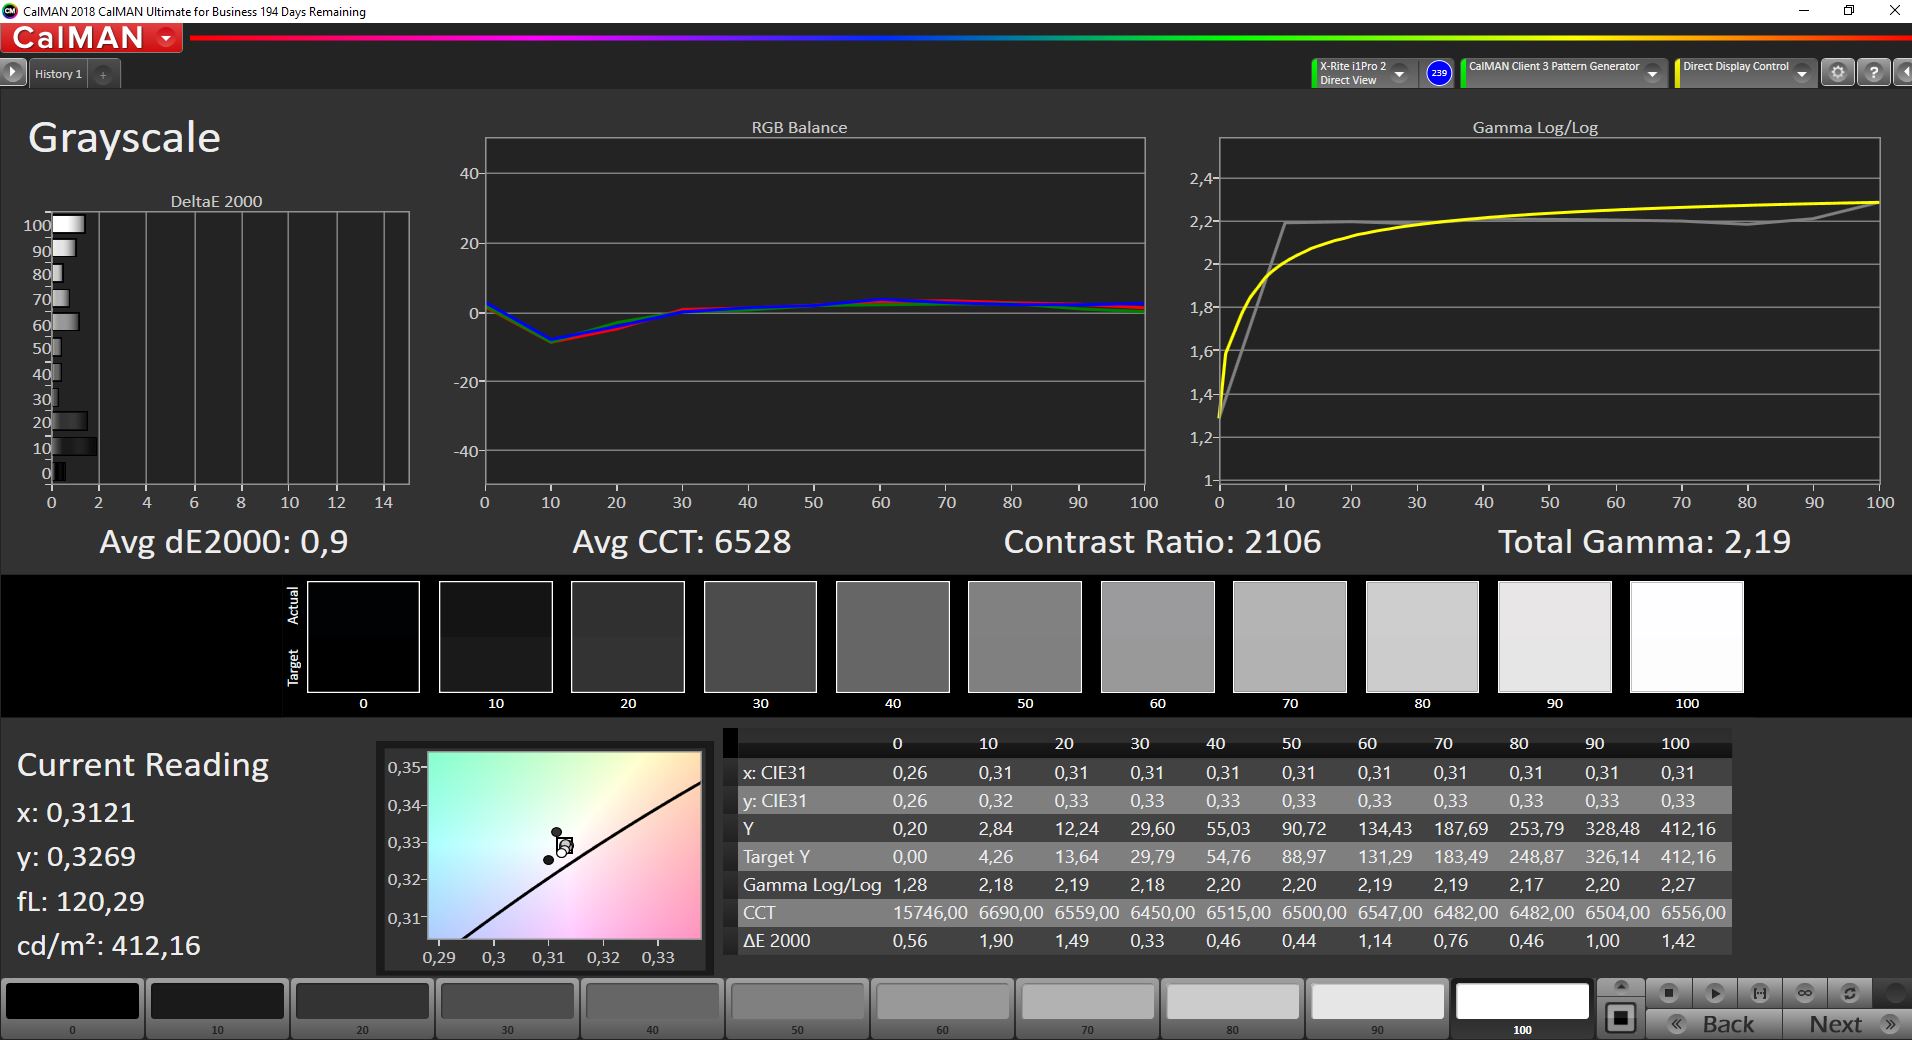
calibrated: 1
ΔE Greyscale Calman: 4.7 | ∀{0.09-98 Ø4.97}
97.5% sRGB (Argyll 1.6.3 3D)
61.9% AdobeRGB 1998 (Argyll 1.6.3 3D)
67.5% AdobeRGB 1998 (Argyll 3D)
97.6% sRGB (Argyll 3D)
66.4% Display P3 (Argyll 3D)
Gamma: 1.99
CCT: 6362 K
| HP Envy 13-ba1475ng CMN139D, IPS, 1920x1080, 13.3" | Dell XPS 13 9305 Core i5 FHD Sharp SHP14AE, IPS, 1920x1080, 13.3" | Lenovo Yoga Slim 7i Carbon 13 ITL N133GCA-GQ1, a-SI IPS LED, 2560x1600, 13.3" | Apple MacBook Air 2020 M1 Entry IPS, 2560x1600, 13.3" | HP Envy 13-ba0001ng AU Optronics AUO3A8C, IPS, 1920x1080, 13.3" | |
|---|---|---|---|---|---|
| Display | -1% | -1% | 26% | 2% | |
| Display P3 Coverage (%) | 66.4 | 66.3 0% | 65.1 -2% | 98.6 48% | 67.1 1% |
| sRGB Coverage (%) | 97.6 | 97.1 -1% | 97.1 -1% | 100 2% | 99.1 2% |
| AdobeRGB 1998 Coverage (%) | 67.5 | 67.1 -1% | 66.6 -1% | 85.9 27% | 69.2 3% |
| Response Times | 12% | 35% | 31% | 6% | |
| Response Time Grey 50% / Grey 80% * (ms) | 66 ? | 55 ? 17% | 38.4 ? 42% | 31 ? 53% | 56 ? 15% |
| Response Time Black / White * (ms) | 28.8 ? | 27 ? 6% | 20.8 ? 28% | 26.1 ? 9% | 30 ? -4% |
| PWM Frequency (Hz) | 26040 ? | 996 ? | 118000 ? | ||
| Screen | 0% | 5% | 11% | 22% | |
| Brightness middle (cd/m²) | 423 | 486 15% | 325 -23% | 417 -1% | 466 10% |
| Brightness (cd/m²) | 405 | 446 10% | 297 -27% | 395 -2% | 418 3% |
| Brightness Distribution (%) | 83 | 77 -7% | 83 0% | 91 10% | 85 2% |
| Black Level * (cd/m²) | 0.23 | 0.4 -74% | 0.26 -13% | 0.39 -70% | 0.215 7% |
| Contrast (:1) | 1839 | 1215 -34% | 1250 -32% | 1069 -42% | 2167 18% |
| Colorchecker dE 2000 * | 3.2 | 2.54 21% | 2.2 31% | 1.12 65% | 1.06 67% |
| Colorchecker dE 2000 max. * | 5.8 | 4.34 25% | 3.5 40% | 2.71 53% | 1.59 73% |
| Colorchecker dE 2000 calibrated * | 1 | 1.04 -4% | 0.6 40% | 0.77 23% | 1.09 -9% |
| Greyscale dE 2000 * | 4.7 | 2.34 50% | 2.8 40% | 1.7 64% | 1.3 72% |
| Gamma | 1.99 111% | 2.28 96% | 2.05 107% | 2207 0% | 2.39 92% |
| CCT | 6362 102% | 6864 95% | 6452 101% | 6870 95% | 6699 97% |
| Color Space (Percent of AdobeRGB 1998) (%) | 61.9 | 62 0% | 61.3 -1% | 63 2% | |
| Color Space (Percent of sRGB) (%) | 97.5 | 97 -1% | 97 -1% | 99 2% | |
| Total Average (Program / Settings) | 4% /
1% | 13% /
8% | 23% /
17% | 10% /
17% |
* ... smaller is better
Display Response Times
| ↔ Response Time Black to White | ||
|---|---|---|
| 28.8 ms ... rise ↗ and fall ↘ combined | ↗ 11.6 ms rise | 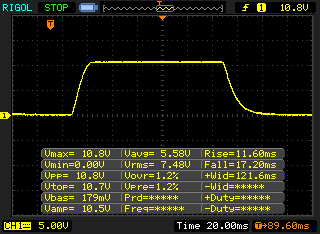 |
| ↘ 17.2 ms fall | ||
| The screen shows relatively slow response rates in our tests and may be too slow for gamers. In comparison, all tested devices range from 0.1 (minimum) to 240 (maximum) ms. » 76 % of all devices are better. This means that the measured response time is worse than the average of all tested devices (19.9 ms). | ||
| ↔ Response Time 50% Grey to 80% Grey | ||
| 66 ms ... rise ↗ and fall ↘ combined | ↗ 30.4 ms rise | 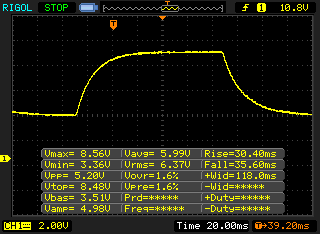 |
| ↘ 35.6 ms fall | ||
| The screen shows slow response rates in our tests and will be unsatisfactory for gamers. In comparison, all tested devices range from 0.165 (minimum) to 636 (maximum) ms. » 98 % of all devices are better. This means that the measured response time is worse than the average of all tested devices (31.1 ms). | ||
Screen Flickering / PWM (Pulse-Width Modulation)
| Screen flickering / PWM detected | 26040 Hz | ≤ 40 % brightness setting | 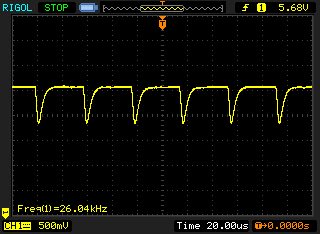 |
The display backlight flickers at 26040 Hz (worst case, e.g., utilizing PWM) Flickering detected at a brightness setting of 40 % and below. There should be no flickering or PWM above this brightness setting. The frequency of 26040 Hz is quite high, so most users sensitive to PWM should not notice any flickering. In comparison: 52 % of all tested devices do not use PWM to dim the display. If PWM was detected, an average of 7791 (minimum: 5 - maximum: 343500) Hz was measured. | |||
Performance, emissions and battery life
Thanks to the combination of moderni7-1165G7 CPU (Tiger Lake), 16 GB RAM and PCIe-SSD from Intel (512 GB), the subjective performance impression is very good. The device offers enough performance for everyday tasks and there should not be any problems in the coming years.
The processor itself is limited to 20 watts after a short time and then remains stable there, but the competition offers more performance here and AMD is massively superior especially in the multi-core tests.
Besides the fast integrated Xe Graphics G7 hP also installs the dedicated GeForce-MX450-GPUHowever, it is the slowest version (N18S-LP) with a TGP of only 12 watts. In the synthetic benchmarks, the MX450 even falls behind the modern iGPUs, but in the real gaming benchmarks we see an advantage of about 20-30%. Furthermore, the performance remains stable even during longer gaming sessions and on battery power.
There are no problems with the temperatures, but you can hear the fan clearly (~40-43 dB(A)) under maximum load as well as during gaming. However, the noise is not unpleasant. More disturbing is the fact that the fan sometimes starts up in idle or standby without an obvious reason. HP should work on this again. There is not much criticism for the two stereo speakers. Bass is hardly present due to the design, but the sound is otherwise pleasing.
The battery life has remained constant. We determined a very good 10.5 hours in the WLAN test with 150 cd/m²; it is still around 8 hours in full brightness.
Cinebench R15 Loop
Cinebench R20: CPU (Single Core) | CPU (Multi Core)
Cinebench R15: CPU Single 64Bit | CPU Multi 64Bit
Blender: v2.79 BMW27 CPU
7-Zip 18.03: 7z b 4 -mmt1 | 7z b 4
Geekbench 5.5: Single-Core | Multi-Core
HWBOT x265 Benchmark v2.2: 4k Preset
LibreOffice : 20 Documents To PDF
R Benchmark 2.5: Overall mean
| Cinebench R23 / Single Core | |
| Average of class Subnotebook (358 - 2213, n=61, last 2 years) | |
| Apple MacBook Air 2020 M1 Entry | |
| Asus ZenBook 13 UM325S | |
| Average Intel Core i7-1165G7 (1110 - 1539, n=59) | |
| HP Envy 13-ba1475ng | |
| Lenovo Yoga Slim 7i Carbon 13 ITL | |
| Dell XPS 13 9305 Core i5 FHD | |
| Cinebench R23 / Multi Core | |
| Average of class Subnotebook (1555 - 21812, n=60, last 2 years) | |
| Asus ZenBook 13 UM325S | |
| Apple MacBook Air 2020 M1 Entry | |
| Dell XPS 13 9305 Core i5 FHD | |
| Average Intel Core i7-1165G7 (2525 - 6862, n=64) | |
| HP Envy 13-ba1475ng | |
| Lenovo Yoga Slim 7i Carbon 13 ITL | |
| Cinebench R20 / CPU (Single Core) | |
| Average of class Subnotebook (128 - 832, n=57, last 2 years) | |
| Lenovo Yoga Slim 7i Carbon 13 ITL | |
| Asus ZenBook 13 UM325S | |
| Average Intel Core i7-1165G7 (442 - 589, n=81) | |
| HP Envy 13-ba1475ng | |
| Dell XPS 13 9305 Core i5 FHD | |
| HP Envy 13-ba0001ng | |
| Apple MacBook Air 2020 M1 Entry | |
| Cinebench R20 / CPU (Multi Core) | |
| Average of class Subnotebook (579 - 8541, n=57, last 2 years) | |
| Asus ZenBook 13 UM325S | |
| Average Intel Core i7-1165G7 (1060 - 2657, n=81) | |
| Apple MacBook Air 2020 M1 Entry | |
| Dell XPS 13 9305 Core i5 FHD | |
| Lenovo Yoga Slim 7i Carbon 13 ITL | |
| HP Envy 13-ba1475ng | |
| HP Envy 13-ba0001ng | |
| Cinebench R15 / CPU Single 64Bit | |
| Average of class Subnotebook (72.4 - 322, n=57, last 2 years) | |
| Asus ZenBook 13 UM325S | |
| Lenovo Yoga Slim 7i Carbon 13 ITL | |
| Average Intel Core i7-1165G7 (115 - 230, n=78) | |
| Apple MacBook Air 2020 M1 Entry | |
| HP Envy 13-ba1475ng | |
| HP Envy 13-ba0001ng | |
| Cinebench R15 / CPU Multi 64Bit | |
| Average of class Subnotebook (327 - 3345, n=57, last 2 years) | |
| Asus ZenBook 13 UM325S | |
| Apple MacBook Air 2020 M1 Entry | |
| Average Intel Core i7-1165G7 (553 - 1027, n=86) | |
| Lenovo Yoga Slim 7i Carbon 13 ITL | |
| Dell XPS 13 9305 Core i5 FHD | |
| HP Envy 13-ba1475ng | |
| HP Envy 13-ba0001ng | |
| Blender / v2.79 BMW27 CPU | |
| HP Envy 13-ba0001ng | |
| Lenovo Yoga Slim 7i Carbon 13 ITL | |
| Apple MacBook Air 2020 M1 Entry | |
| HP Envy 13-ba1475ng | |
| Dell XPS 13 9305 Core i5 FHD | |
| Average Intel Core i7-1165G7 (468 - 1138, n=80) | |
| Average of class Subnotebook (159 - 2271, n=58, last 2 years) | |
| Asus ZenBook 13 UM325S | |
| 7-Zip 18.03 / 7z b 4 -mmt1 | |
| Average of class Subnotebook (2643 - 6699, n=59, last 2 years) | |
| Apple MacBook Air 2020 M1 Entry | |
| Asus ZenBook 13 UM325S | |
| Lenovo Yoga Slim 7i Carbon 13 ITL | |
| Average Intel Core i7-1165G7 (4478 - 5507, n=80) | |
| HP Envy 13-ba1475ng | |
| HP Envy 13-ba0001ng | |
| Dell XPS 13 9305 Core i5 FHD | |
| 7-Zip 18.03 / 7z b 4 | |
| Average of class Subnotebook (11668 - 77867, n=57, last 2 years) | |
| Asus ZenBook 13 UM325S | |
| Apple MacBook Air 2020 M1 Entry | |
| Dell XPS 13 9305 Core i5 FHD | |
| Average Intel Core i7-1165G7 (15347 - 27405, n=80) | |
| Lenovo Yoga Slim 7i Carbon 13 ITL | |
| HP Envy 13-ba1475ng | |
| HP Envy 13-ba0001ng | |
| Geekbench 5.5 / Single-Core | |
| Average of class Subnotebook (726 - 2224, n=48, last 2 years) | |
| Apple MacBook Air 2020 M1 Entry | |
| Lenovo Yoga Slim 7i Carbon 13 ITL | |
| Average Intel Core i7-1165G7 (1302 - 1595, n=77) | |
| HP Envy 13-ba1475ng | |
| Asus ZenBook 13 UM325S | |
| Dell XPS 13 9305 Core i5 FHD | |
| HP Envy 13-ba0001ng | |
| Geekbench 5.5 / Multi-Core | |
| Average of class Subnotebook (2557 - 17218, n=48, last 2 years) | |
| Apple MacBook Air 2020 M1 Entry | |
| Asus ZenBook 13 UM325S | |
| Lenovo Yoga Slim 7i Carbon 13 ITL | |
| Dell XPS 13 9305 Core i5 FHD | |
| Average Intel Core i7-1165G7 (3078 - 5926, n=77) | |
| HP Envy 13-ba1475ng | |
| HP Envy 13-ba0001ng | |
| HWBOT x265 Benchmark v2.2 / 4k Preset | |
| Average of class Subnotebook (0.97 - 25.1, n=57, last 2 years) | |
| Asus ZenBook 13 UM325S | |
| Average Intel Core i7-1165G7 (1.39 - 8.47, n=80) | |
| HP Envy 13-ba1475ng | |
| Lenovo Yoga Slim 7i Carbon 13 ITL | |
| HP Envy 13-ba0001ng | |
| LibreOffice / 20 Documents To PDF | |
| Dell XPS 13 9305 Core i5 FHD | |
| Average of class Subnotebook (39.9 - 220, n=56, last 2 years) | |
| HP Envy 13-ba0001ng | |
| HP Envy 13-ba1475ng | |
| Asus ZenBook 13 UM325S | |
| Lenovo Yoga Slim 7i Carbon 13 ITL | |
| Average Intel Core i7-1165G7 (21.5 - 88.1, n=78) | |
| Apple MacBook Air 2020 M1 Entry | |
| R Benchmark 2.5 / Overall mean | |
| Apple MacBook Air 2020 M1 Entry | |
| HP Envy 13-ba0001ng | |
| Dell XPS 13 9305 Core i5 FHD | |
| HP Envy 13-ba1475ng | |
| Average Intel Core i7-1165G7 (0.552 - 1.002, n=80) | |
| Lenovo Yoga Slim 7i Carbon 13 ITL | |
| Asus ZenBook 13 UM325S | |
| Average of class Subnotebook (0.4024 - 1.456, n=58, last 2 years) | |
* ... smaller is better
| DPC Latencies / LatencyMon - interrupt to process latency (max), Web, Youtube, Prime95 | |
| HP Envy 13-ba0001ng | |
| Lenovo Yoga Slim 7i Carbon 13 ITL | |
| HP Envy 13-ba1475ng | |
| Dell XPS 13 9305 Core i5 FHD | |
* ... smaller is better
| HP Envy 13-ba1475ng Intel SSD 660p SSDPEKNW512G8 | Dell XPS 13 9305 Core i5 FHD Samsung PM9A1 MZVL2512HCJQ | Lenovo Yoga Slim 7i Carbon 13 ITL Samsung SSD PM981a MZVLB512HBJQ | HP Envy 13-ba0001ng Intel SSD 660p SSDPEKNW512G8 | Average Intel SSD 660p SSDPEKNW512G8 | Average of class Subnotebook | |
|---|---|---|---|---|---|---|
| CrystalDiskMark 5.2 / 6 | 22% | 61% | 4% | 3% | 131% | |
| Write 4K (MB/s) | 133.5 | 136.9 3% | 139.5 4% | 146.3 10% | 136 ? 2% | 154.6 ? 16% |
| Read 4K (MB/s) | 39.66 | 47.34 19% | 36.38 -8% | 55.7 40% | 55.2 ? 39% | 64.2 ? 62% |
| Write Seq (MB/s) | 907 | 1150 27% | 1977 118% | 949 5% | 926 ? 2% | 2846 ? 214% |
| Read Seq (MB/s) | 1481 | 2052 39% | 2207 49% | 1494 1% | 1523 ? 3% | 3299 ? 123% |
| Write 4K Q32T1 (MB/s) | 446.2 | 433 -3% | 510 14% | 408.5 -8% | 380 ? -15% | 431 ? -3% |
| Read 4K Q32T1 (MB/s) | 335.1 | 293 -13% | 387.8 16% | 304 -9% | 334 ? 0% | 500 ? 49% |
| Write Seq Q32T1 (MB/s) | 975 | 1148 18% | 2986 206% | 984 1% | 987 ? 1% | 4622 ? 374% |
| Read Seq Q32T1 (MB/s) | 1874 | 3427 83% | 3540 89% | 1779 -5% | 1744 ? -7% | 5783 ? 209% |
| The Witcher 3 | |
| 1366x768 Medium Graphics & Postprocessing | |
| Average of class Subnotebook (71 - 115, n=8, last 2 years) | |
| HP Envy 13-ba1475ng | |
| Average NVIDIA GeForce MX450 (34 - 81.4, n=14) | |
| Lenovo Yoga Slim 7i Carbon 13 ITL | |
| Dell XPS 13 9305 Core i5 FHD | |
| HP Envy 13-ba0001ng | |
| 1920x1080 High Graphics & Postprocessing (Nvidia HairWorks Off) | |
| Average of class Subnotebook (25.6 - 64, n=13, last 2 years) | |
| HP Envy 13-ba1475ng | |
| Average NVIDIA GeForce MX450 (21 - 46, n=16) | |
| Lenovo Yoga Slim 7i Carbon 13 ITL | |
| HP Envy 13-ba0001ng | |
| Dell XPS 13 9305 Core i5 FHD | |
| 1920x1080 Ultra Graphics & Postprocessing (HBAO+) | |
| Average of class Subnotebook (13.9 - 34.6, n=13, last 2 years) | |
| Average NVIDIA GeForce MX450 (17.2 - 24.8, n=16) | |
| HP Envy 13-ba1475ng | |
| Dell XPS 13 9305 Core i5 FHD | |
| HP Envy 13-ba0001ng | |
| low | med. | high | ultra | |
|---|---|---|---|---|
| The Witcher 3 (2015) | 112 | 65 | 35 | 18 |
| Dota 2 Reborn (2015) | 133 | 115 | 91.5 | 81.9 |
| X-Plane 11.11 (2018) | 71.5 | 63.5 | 51.2 |
Noise emissions
Noise level
| Idle |
| 24.6 / 24.6 / 30.2 dB(A) |
| Load |
| 39.9 / 43.4 dB(A) |
 | ||
30 dB silent 40 dB(A) audible 50 dB(A) loud |
||
min: | ||
Temperature
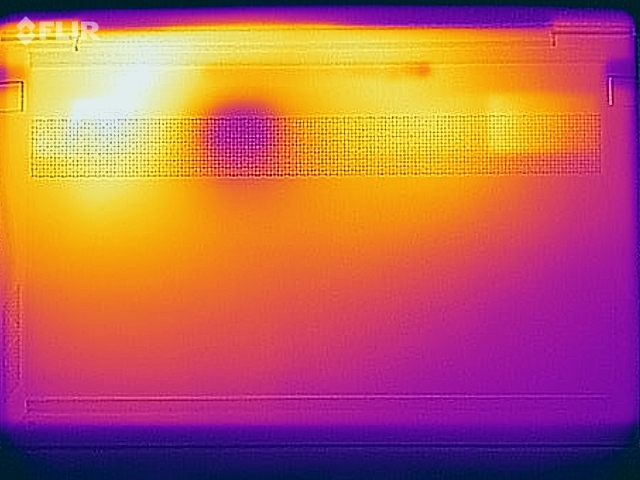
(-) The maximum temperature on the upper side is 45.1 °C / 113 F, compared to the average of 35.9 °C / 97 F, ranging from 21.4 to 59 °C for the class Subnotebook.
(-) The bottom heats up to a maximum of 46.1 °C / 115 F, compared to the average of 39.2 °C / 103 F
(+) In idle usage, the average temperature for the upper side is 25.5 °C / 78 F, compared to the device average of 30.8 °C / 87 F.
(-) Playing The Witcher 3, the average temperature for the upper side is 39.8 °C / 104 F, compared to the device average of 30.8 °C / 87 F.
(±) The palmrests and touchpad can get very hot to the touch with a maximum of 37.7 °C / 99.9 F.
(-) The average temperature of the palmrest area of similar devices was 28.2 °C / 82.8 F (-9.5 °C / -17.1 F).

Loudspeaker
HP Envy 13-ba1475ng audio analysis
(±) | speaker loudness is average but good (80.7 dB)
Bass 100 - 315 Hz
(±) | reduced bass - on average 11.2% lower than median
(±) | linearity of bass is average (10.2% delta to prev. frequency)
Mids 400 - 2000 Hz
(+) | balanced mids - only 4.2% away from median
(+) | mids are linear (6.2% delta to prev. frequency)
Highs 2 - 16 kHz
(+) | balanced highs - only 3.2% away from median
(+) | highs are linear (4.8% delta to prev. frequency)
Overall 100 - 16.000 Hz
(+) | overall sound is linear (13.8% difference to median)
Compared to same class
» 24% of all tested devices in this class were better, 6% similar, 70% worse
» The best had a delta of 5%, average was 18%, worst was 53%
Compared to all devices tested
» 15% of all tested devices were better, 4% similar, 81% worse
» The best had a delta of 4%, average was 24%, worst was 134%
Dell XPS 13 9305 Core i5 FHD audio analysis
(±) | speaker loudness is average but good (77 dB)
Bass 100 - 315 Hz
(-) | nearly no bass - on average 21.4% lower than median
(±) | linearity of bass is average (7.7% delta to prev. frequency)
Mids 400 - 2000 Hz
(+) | balanced mids - only 4.5% away from median
(+) | mids are linear (6.7% delta to prev. frequency)
Highs 2 - 16 kHz
(+) | balanced highs - only 4.3% away from median
(+) | highs are linear (4.8% delta to prev. frequency)
Overall 100 - 16.000 Hz
(±) | linearity of overall sound is average (17.7% difference to median)
Compared to same class
» 49% of all tested devices in this class were better, 7% similar, 44% worse
» The best had a delta of 5%, average was 18%, worst was 53%
Compared to all devices tested
» 35% of all tested devices were better, 8% similar, 57% worse
» The best had a delta of 4%, average was 24%, worst was 134%
Energy absorption
| Off / Standby | |
| Idle | |
| Load |
|
Key:
min: | |
Battery life
Pros
Cons
Verdict - HP Envy remains a good subnotebook with a bit more GPU power
HP refreshes its compact Envy 13 with a Tiger Lake processor and the dedicated GeForce MX450. This is a rarity in compact subnotebooks, because the integrated graphics chips have caught up significantly in the meantime and offer sufficient performance for most use cases. However, the MX450 still has an advantage in gaming and could make the difference between playable/unplayable. However, you should know that the Envy 13 is still not a gaming laptop; the overall performance is too low for that. We will have to decide for ourselves whether the dGPU is really worth it, but we like the fact that HP at least offers this combination. However, the performance could be increased considerably with a current AMD Ryzen chip, especially in the CPU area
Nothing has changed in the good and stable metal casing, but that includes the poor maintainability. Access to the components is much easier in other HP models, which should definitely be improved. This also applies to the fan, which starts every now and then for no apparent reason when idling. We like the fact that HP still includes a microSD reader and two normal USB-A ports in combination with USB-C, even though we would have liked Thunderbolt 4 support.
With the Tiger Lake processor and the MX450 GPU, the new Envy 13 now offers a bit more performance, but not much else has changed. It remains a good subnotebook with a bit more graphics performance and without serious weak points.
The screen scores a bit worse overall than in the previously tested model, since a different panel is now used. However, we assume that HP uses several suppliers due to the high number of laptops, which we also know from Lenovo, for example. However, the subjective picture quality is still very good, only the very reflective surface can be annoying.
Price and availability
Our test device of the Envy 13 is available for 1,099 Euros at Cyberport, for example.
HP Envy 13-ba1475ng
- 05/24/2021 v7 (old)
Andreas Osthoff
Price comparison

