HP EliteBook Dragonfly Max Convertible Review: Sure View Has Its Ups And Downs ↺
After launching the first generation Elite Dragonfly G1 in early 2020, HP is now readying its second generation models with 11th gen Intel Tiger Lake-U for 2021. The two new models are the Dragonfly G2 and even higher-end Dragonfly Max packed with more features and performance than on the original G1 model. The main differences between them are summarized in the table below, but they all otherwise share similar chassis designs and dimensions.
| Elite Dragonfly G1 | Elite Dragonfly G2 | Elite Dragonfly Max |
|---|---|---|
| Intel 8th gen Whiskey Lake-U 720p (1.2 MP) webcam Up to 16 GB LPDDR3 RAM 4G connectivity | Intel 11th gen Tiger Lake-U Up to 32 GB LPDDR4 VRAM HP Context Aware AI noise reduction 5G connectivity option HP Tamper Lock | Includes all Dragonfly G2 features plus: Higher resolution 5 MP webcam 4th world-facing mic New Sparkling Black color HP Eye Ease (low blue light) 4-cell battery HP Sure View HP Sure Recover with Embedded Reimaging |
| Q1 2020 | Q2 2021 | Q2 2021 |
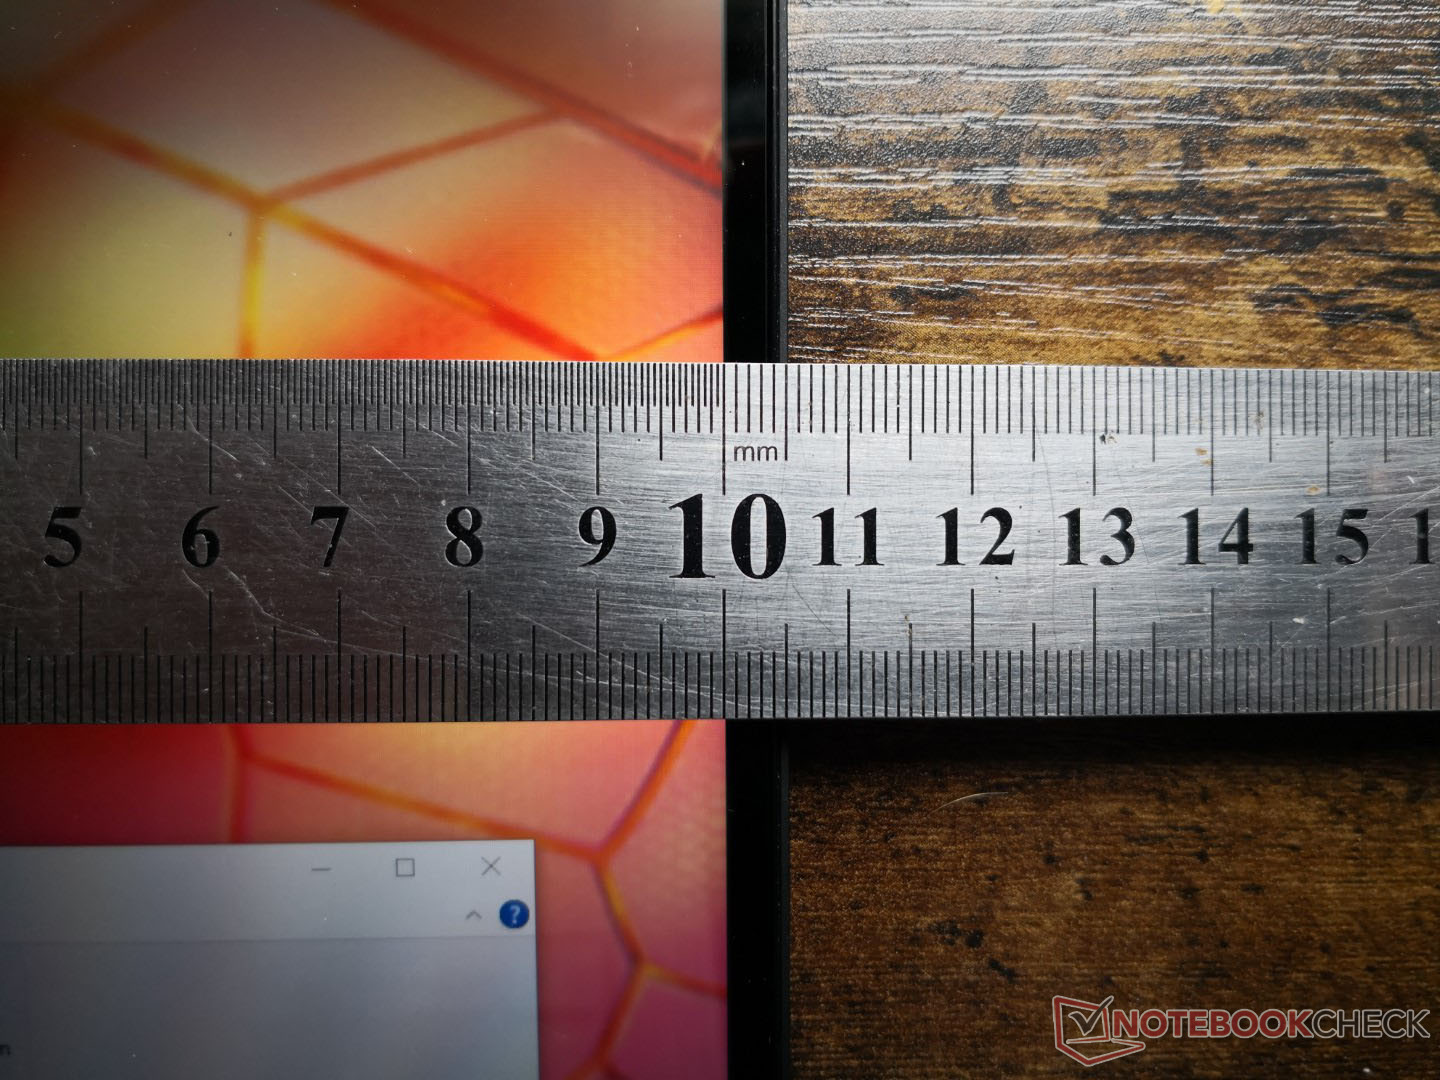
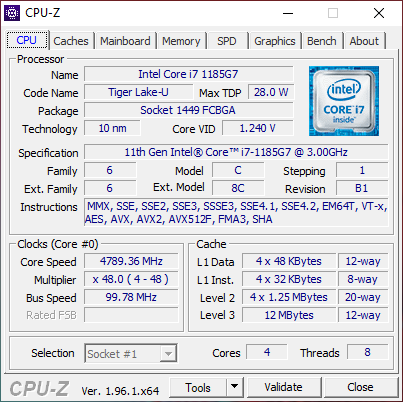
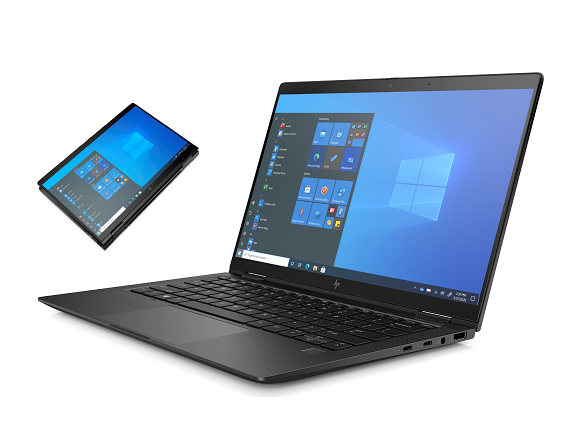
Our test unit has been fully configured with the Core i7-1185G7 CPU, 16 GB RAM, 1000-nit Gorilla Glass 5 Sure View touchscreen, Snapdragon X55 5G LTE, and 512 GB PCIe SSD for about $2500 USD. Other options include the Core i7-1165G7, 32 GB RAM, or no WWAN broadband.
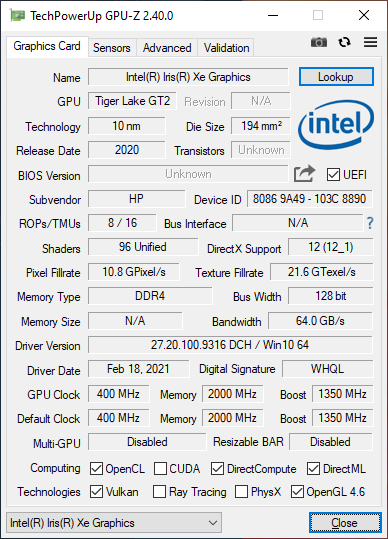
It's worth noting that there are no Iris Xe Max discrete GPU options despite what the model name may suggest. All SKUs at the moment come with integrated Iris Xe graphics across the board. The "Max" in this case is to differentiate the configuration from the lesser Dragonfly G2.
Alternatives to the HP EliteBook Dragonfly Max include other 13.3-inch business laptops like the Lenovo ThinkPad X13 Yoga G2, MSI Summit E13 Flip Evo, Asus ZenBook Flip S UX371, or the 14-inch Dell Latitude 14 9410.
More HP reviews:
potential competitors in comparison
Rating | Date | Model | Weight | Height | Size | Resolution | Price |
|---|---|---|---|---|---|---|---|
| 90.8 % v7 (old) | 06 / 2021 | HP Elite Dragonfly Max i7-1185G7, Iris Xe G7 96EUs | 1.2 kg | 16 mm | 13.30" | 1920x1080 | |
| 87.8 % v7 (old) | 05 / 2021 | HP Spectre x360 13-aw2003dx i5-1135G7, Iris Xe G7 80EUs | 1.2 kg | 16.9 mm | 13.30" | 3840x2160 | |
| 91.1 % v7 (old) | 06 / 2021 | Lenovo ThinkPad X13 Yoga G2 i7-1165G7, Iris Xe G7 96EUs | 1.2 kg | 15.39 mm | 13.30" | 2560x1600 | |
| 86.9 % v7 (old) | 04 / 2021 | MSI Summit E13 Flip Evo A11MT i7-1185G7, Iris Xe G7 96EUs | 1.4 kg | 14.9 mm | 13.40" | 1920x1200 | |
| 86.3 % v7 (old) | 09 / 2020 | Asus ZenBook Flip S UX371 i7-1165G7, Iris Xe G7 96EUs | 1.2 kg | 13.9 mm | 13.30" | 3840x2160 | |
| 90.3 % v7 (old) | 04 / 2020 | HP Elite Dragonfly-8MK79EA i5-8265U, UHD Graphics 620 | 1.1 kg | 16.1 mm | 13.30" | 1920x1080 |
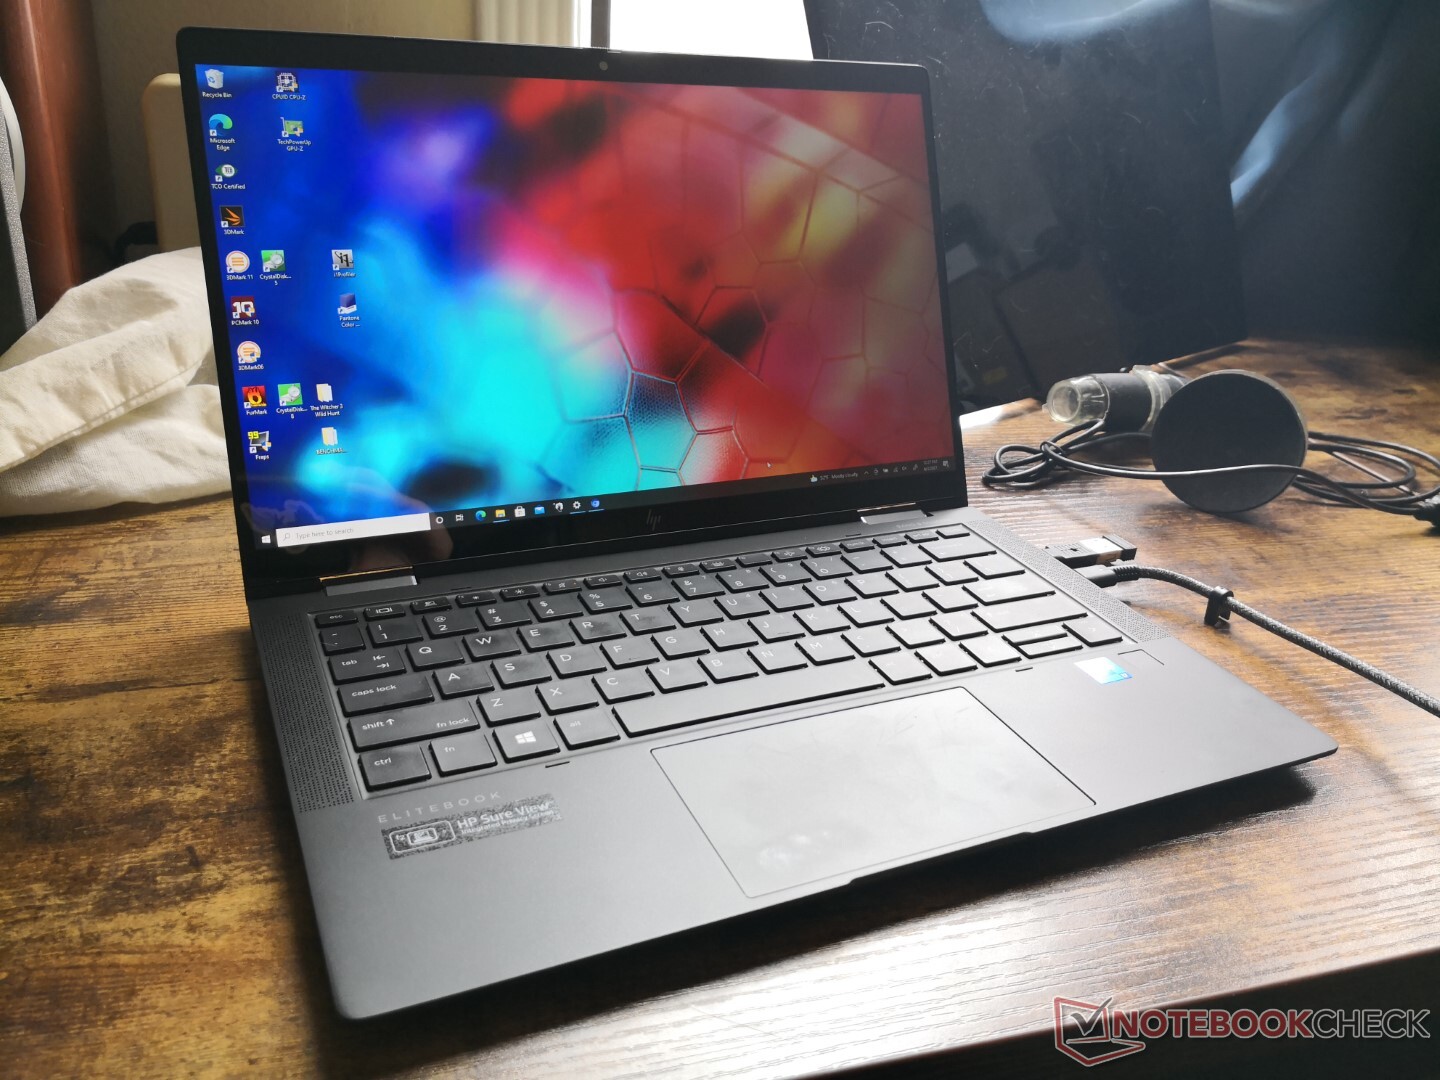
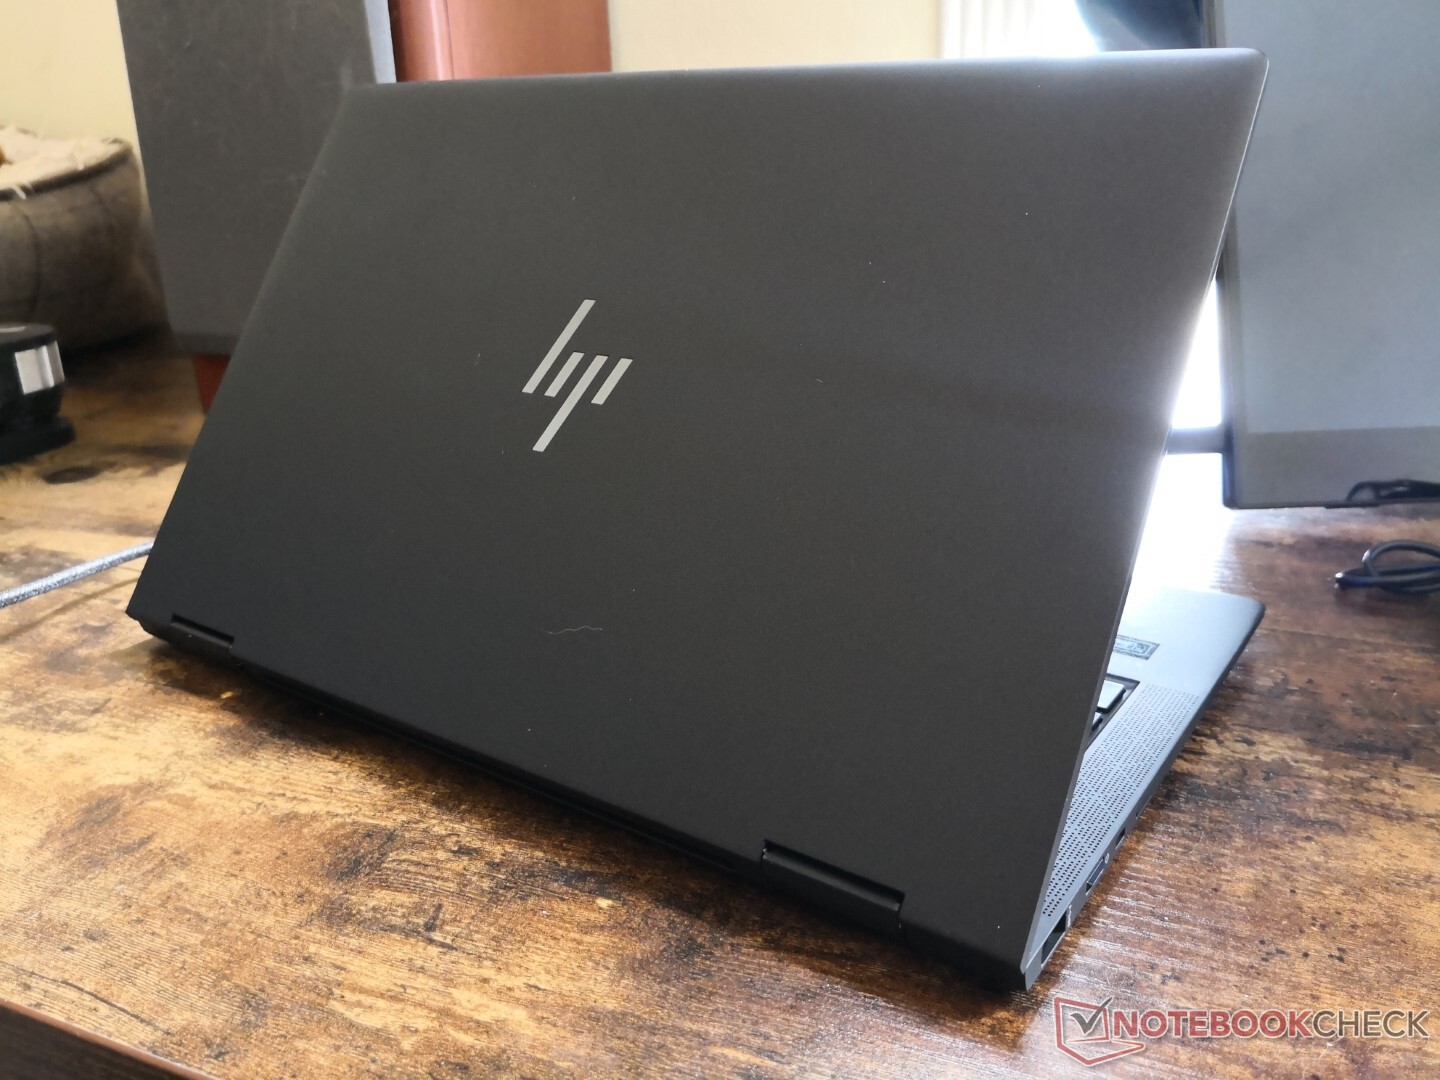
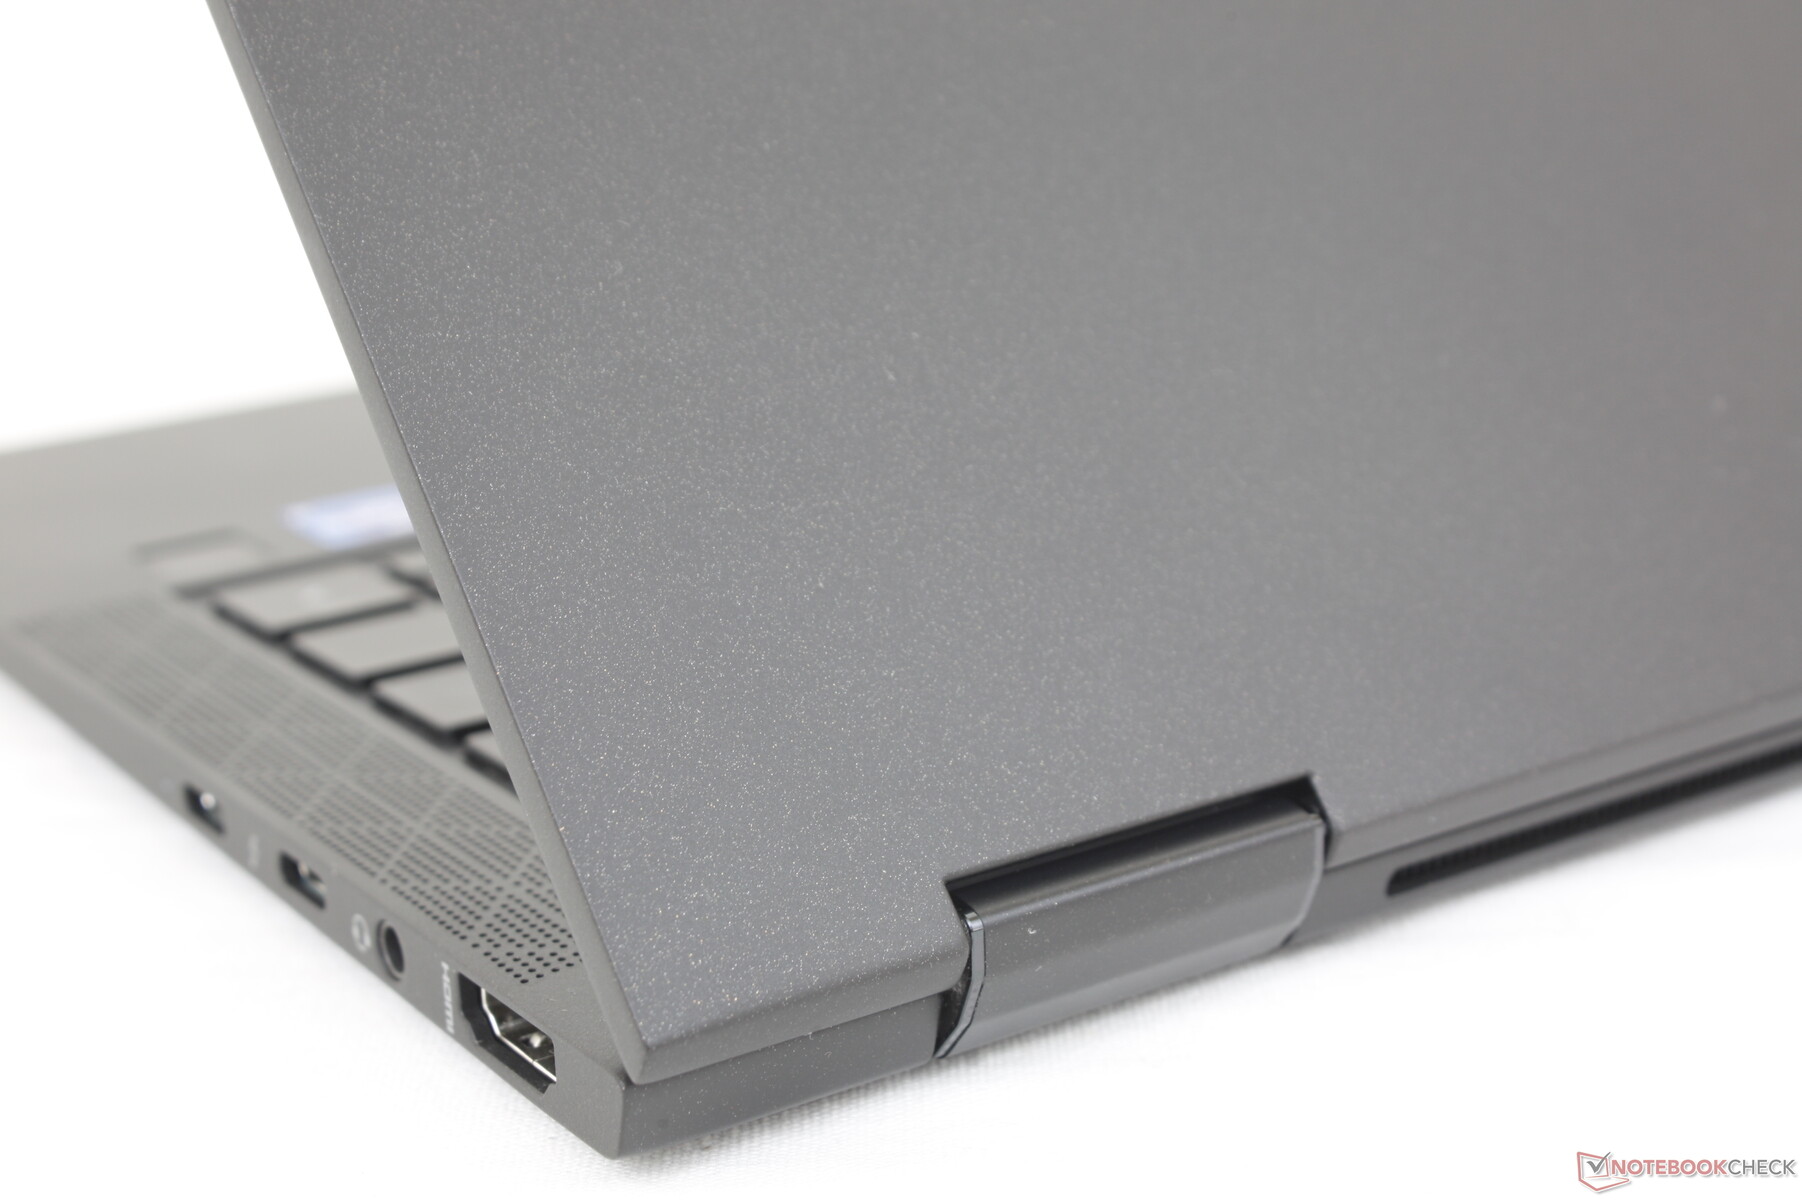
Case: A Professional Spectre
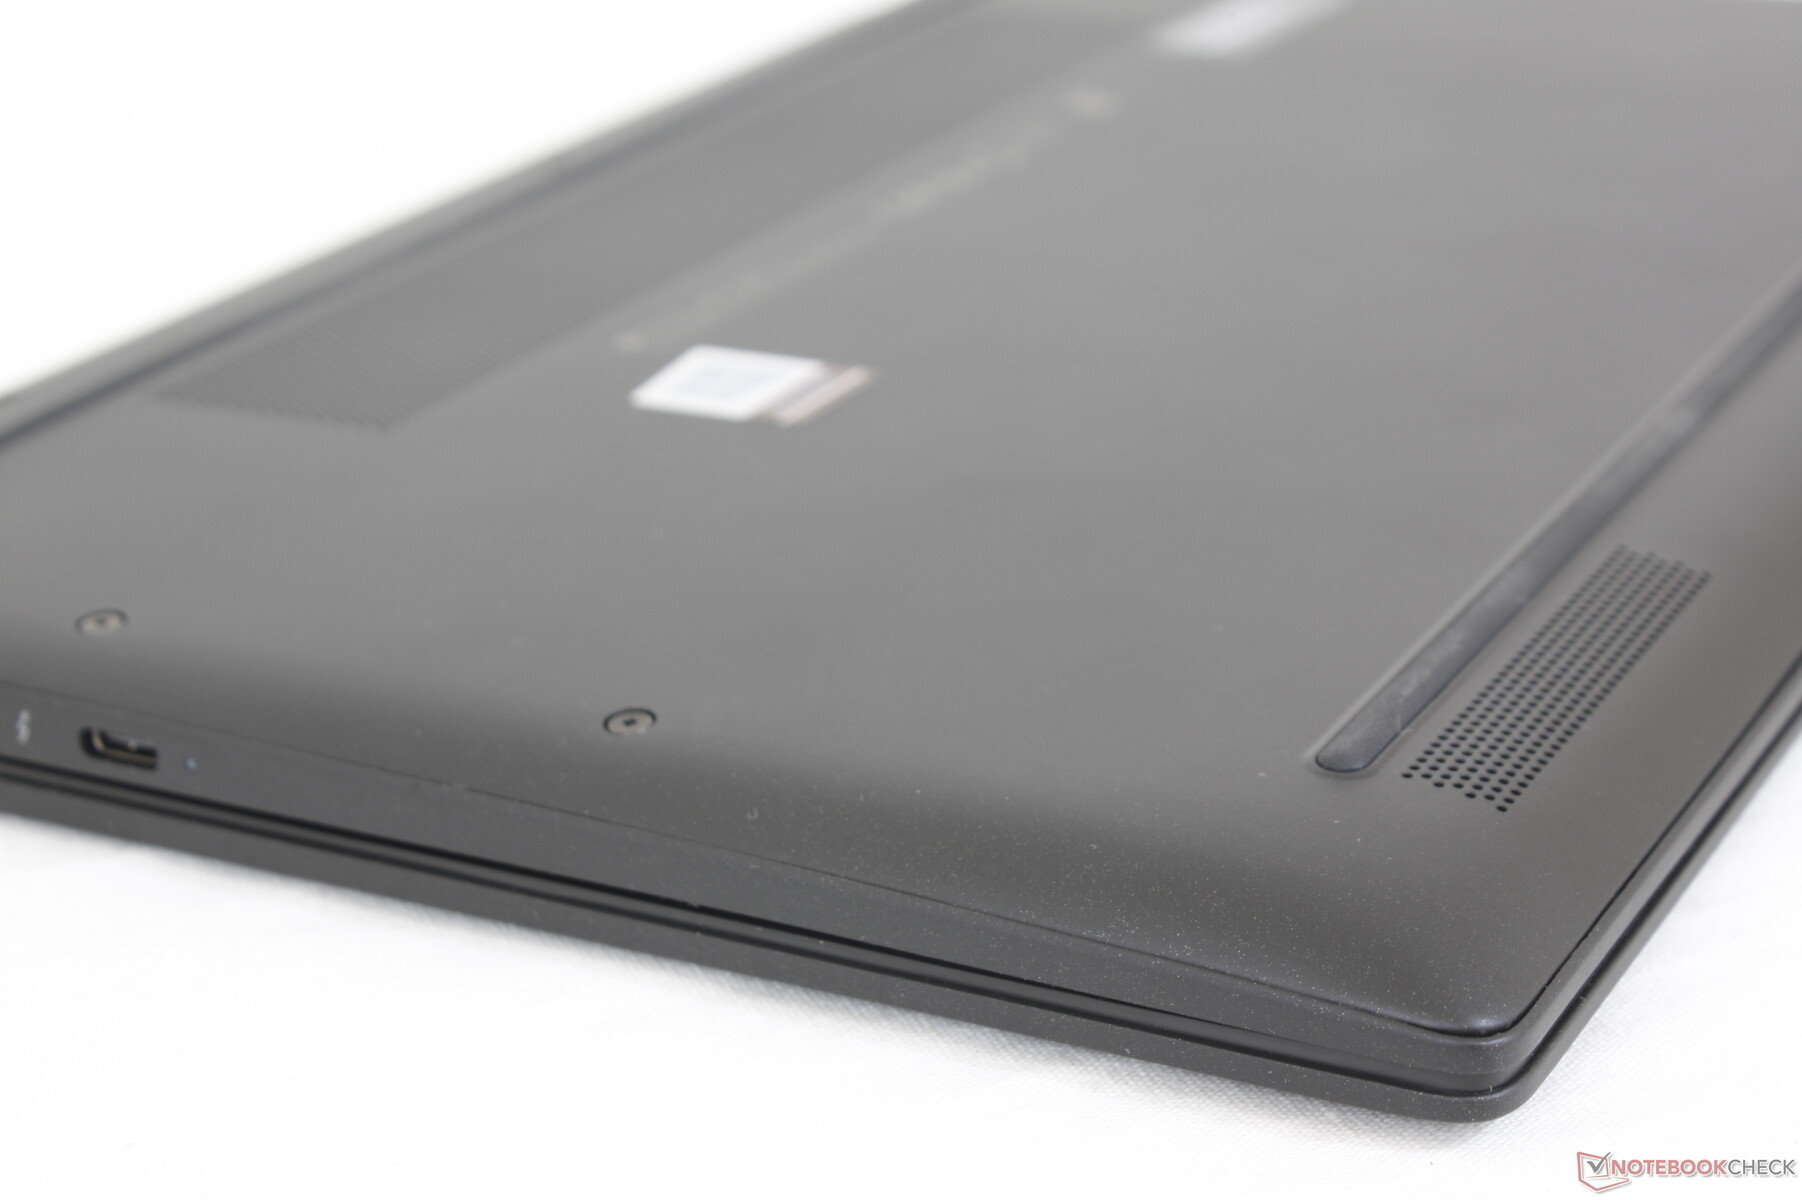
The MIL-STD 810H certified magnesium skeleton is similar to the original Dragonfly but with a few superficial differences. Firstly, HP has added a sparkling black finish which slightly roughens the texture compared to the super-smooth metal of the original. Secondly, more of the mechanical and metal parts have been sourced from recycled materials for sustainability purposes. Chassis rigidity remains excellent with no creaking and very little warping. The center of the outer lid flexes most to applied pressure, but we don't find it to be of any concern.
When compared to HP's other high-end 13.3-inch convertible, the Dragonfly Max doesn't necessarily feel any stronger or weaker in terms of quality. Instead, it's the visual style that separates the two laptops. The all-matte Dragonfly design is arguably a better fit for professional environments than the flashy gold-trimmed Spectre.
Much like the original Dragonfly, the Dragonfly Max continues to be one of the smallest and most portable 13.3-inch business Ultrabooks in the market. The competing Dynabook Portégé X30W-J is even lighter by over 200 grams, but it lacks the optional WAN and 5G features of our Dragonfly Max.
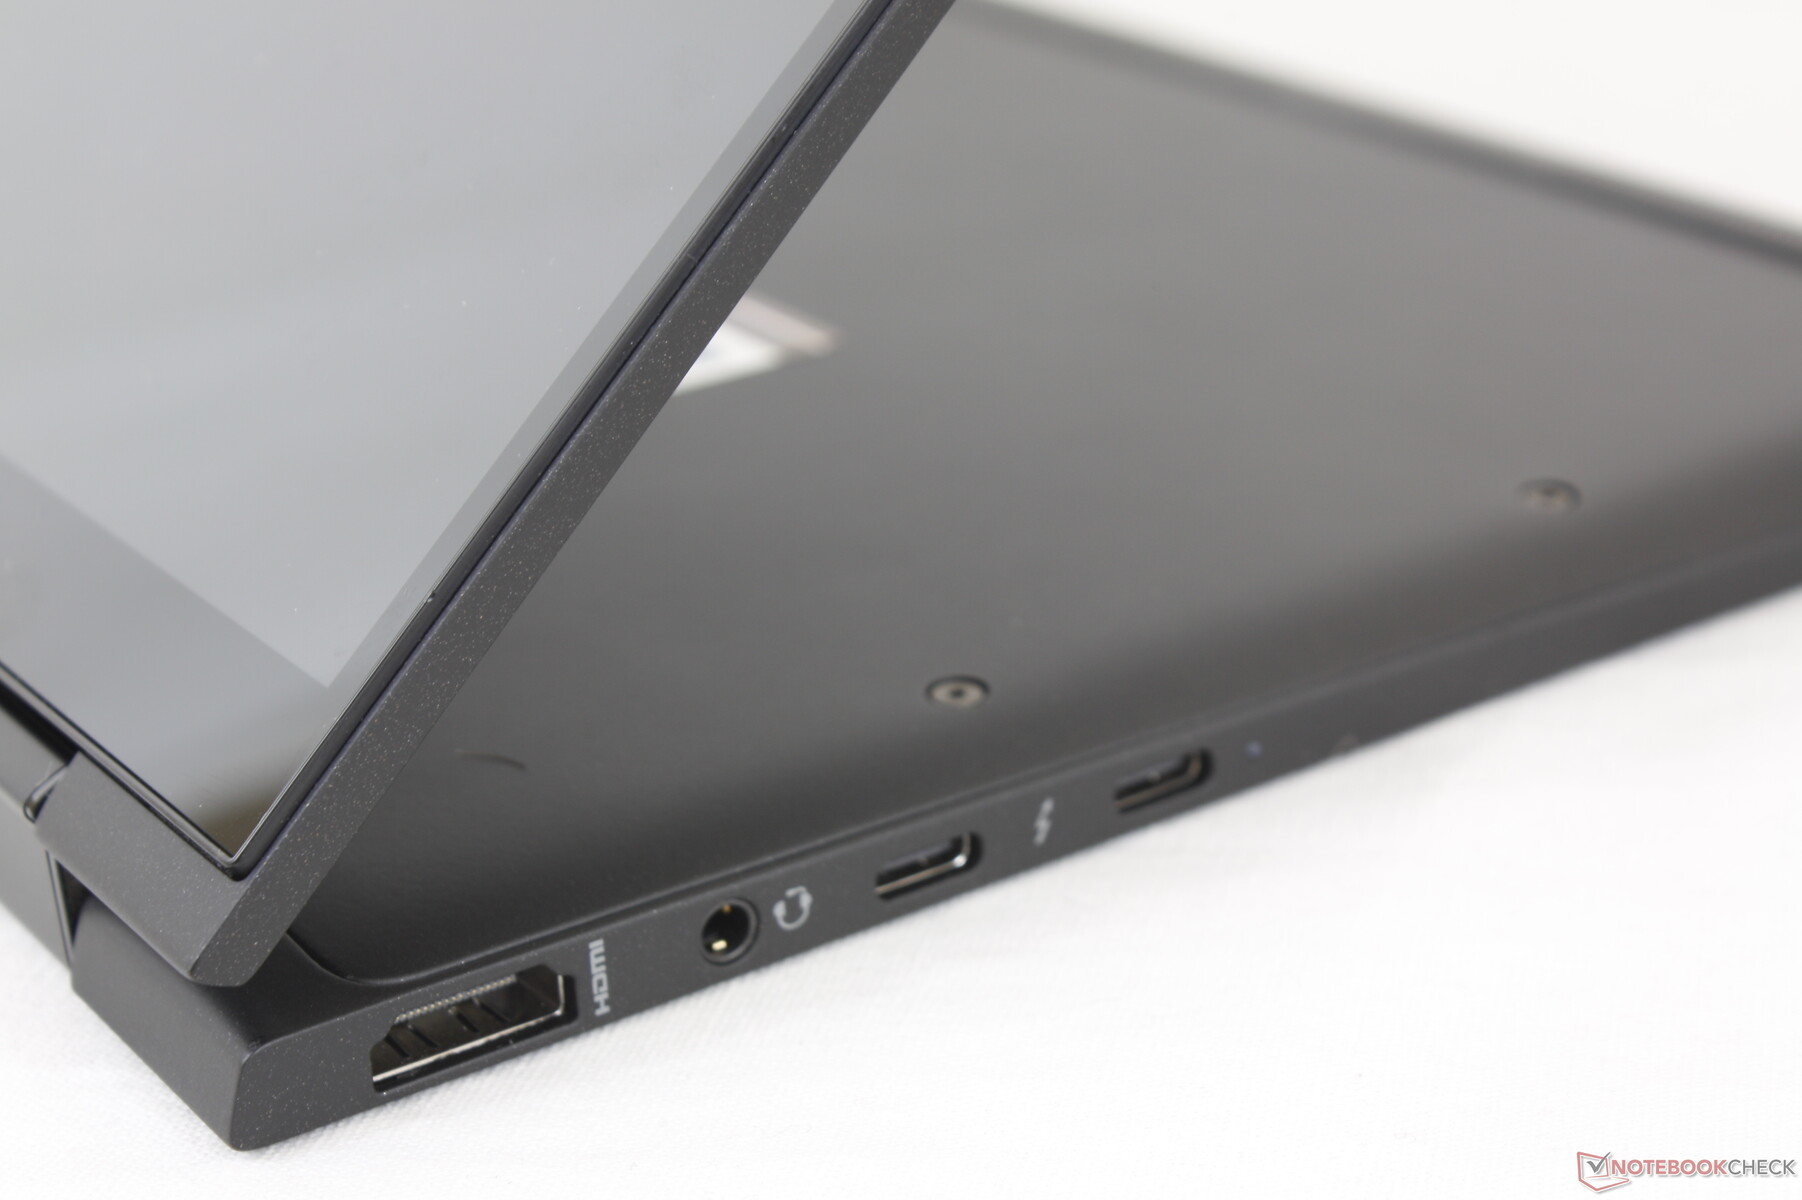
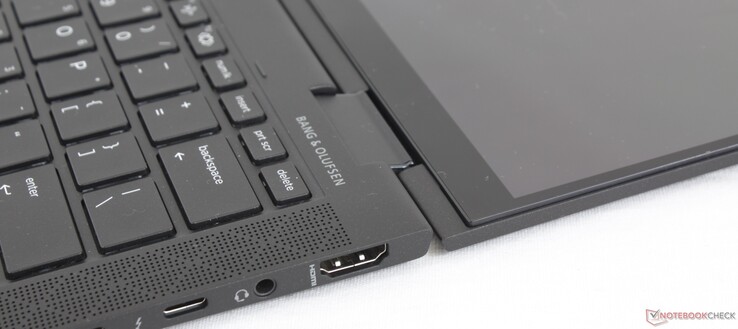
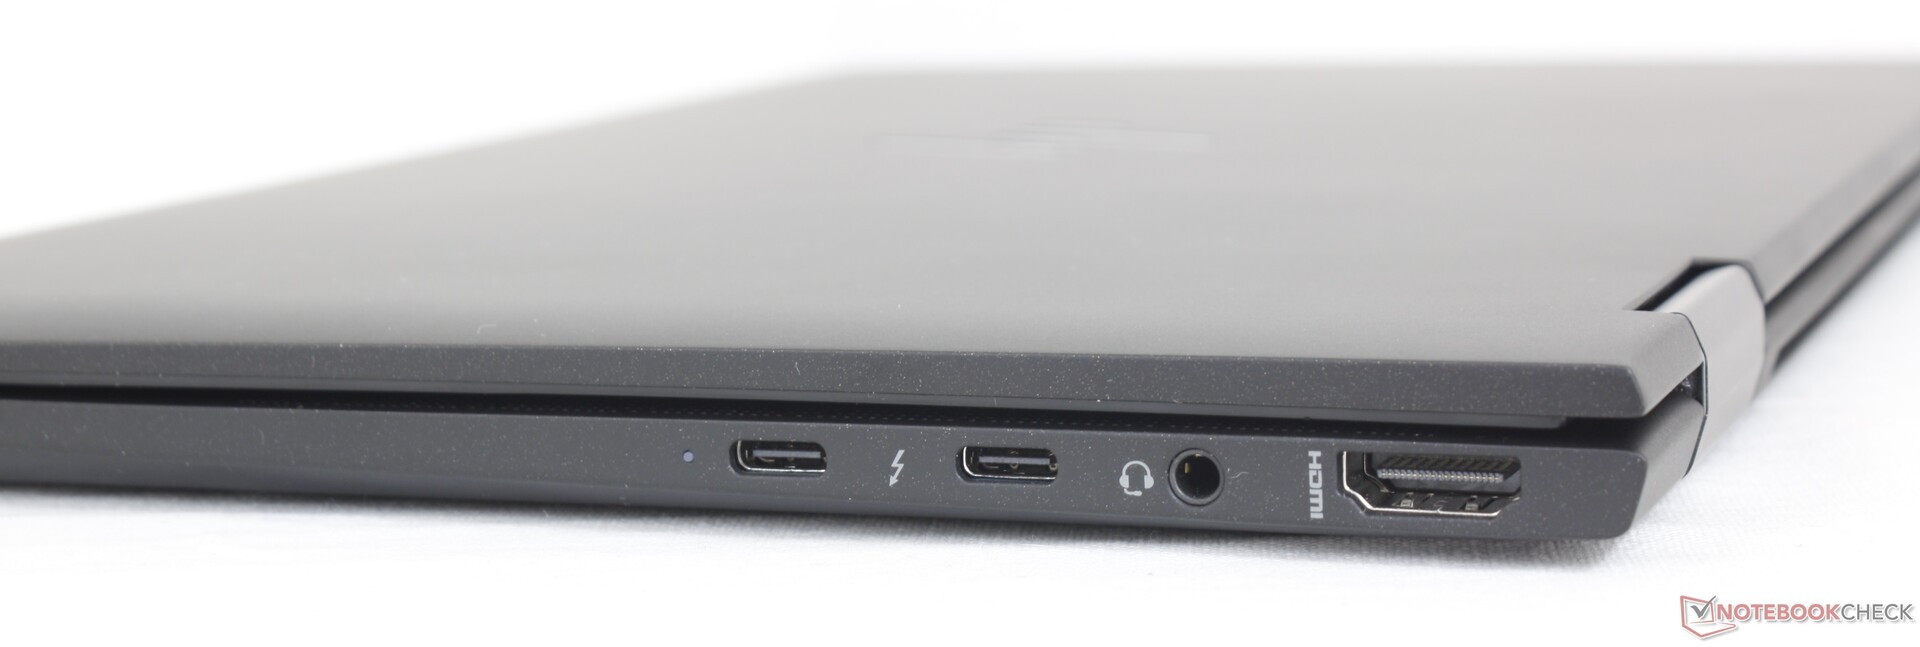
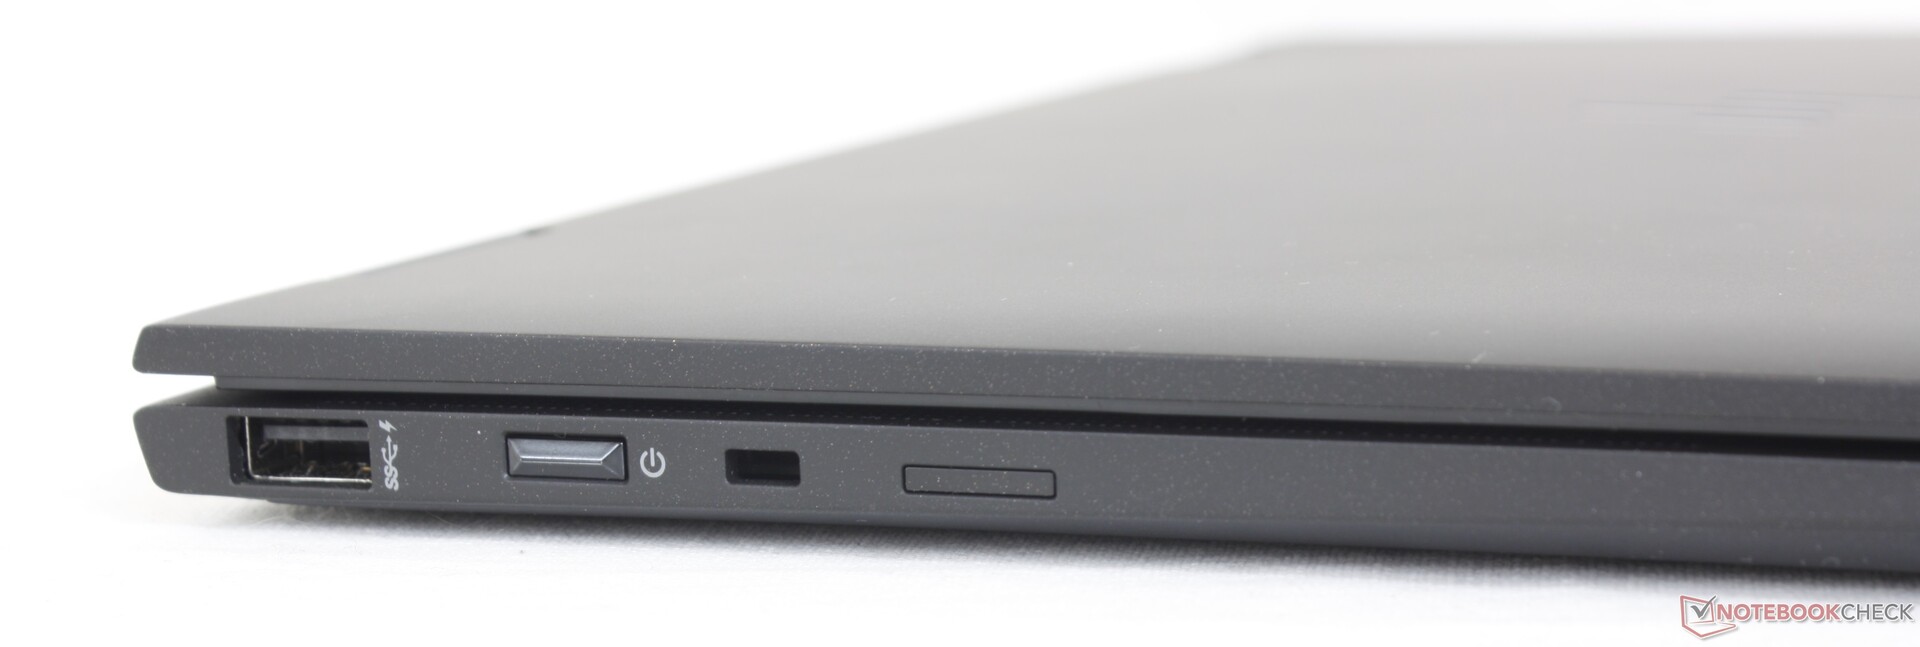
Connectivity: Now With Thunderbolt 4
Port options are identical to the 2020 Dragonfly but with two important upgrades: the Thunderbolt 3 and HDMI 1.4 ports are now Thunderbolt 4 and HDMI 2.0, respectively. The latter update is particularly important as it allows users to connect 4K60 external monitors. For future models, we hope to see USB-C ports along both the left and right edges of the laptop much like on the Razer Blade Stealth for easier charging.
There is no SD card reader as HP wants to push QuickDrop instead.
Communication
An Intel AX201 comes standard for Wi-Fi 6 and Bluetooth 5.1 connectivity. If configured with 5G, the unit will come with a Qualcomm Snapdragon X55 with support for SIM and even eSIM. All supported 5G bands can be found on Qualcomm's product page for the modem. HP offers the option between AT&T or Verizon, but T-Mobile will also work.
Webcam
The Dragonfly Max is unique in that it's one of the first 13.3-inch laptops to ship with a 5 MP webcam instead of the usual 1 MP or 2 MP sensor. Users can take pictures at resolutions of up to 2560 x 1920 or record video at up to 1440p and 30 FPS. Though picture quality is noticeably sharper, the camera still suffers from the same issues as most other laptop webcams including poor performance at low-light conditions, poor colors, and no 60 FPS recording option.


Security
The additional security features help differentiate the EliteBook series from the Spectre series. The Dragonfly Max Comes with Automatic DriveLock, fingerprint reader, IR, webcam shutter, Secure Erase, TPM 2.0 and vPro, Sure Click, Sure Start, BIOSphere, Sure View, Sure Sense, and more with many that are exclusive to the Elitebook family.
Maintenance
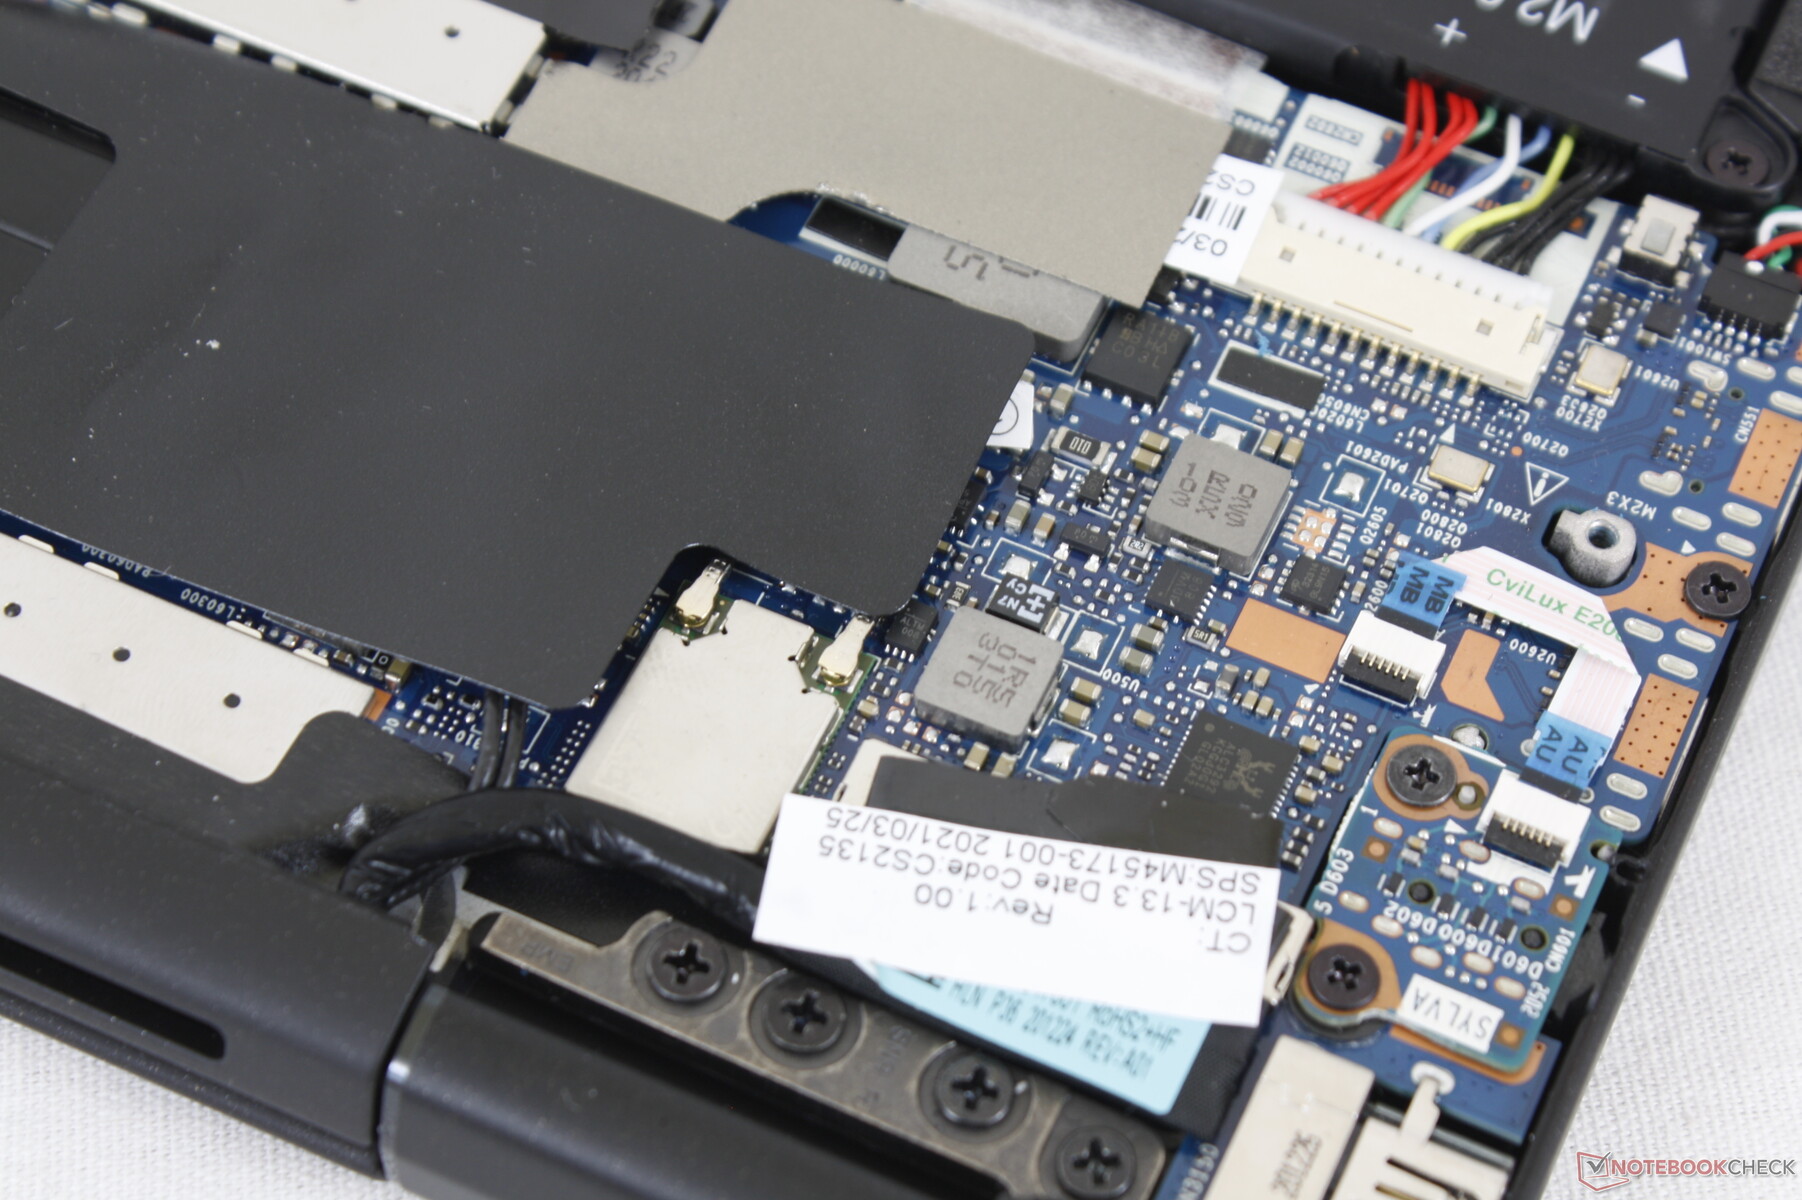
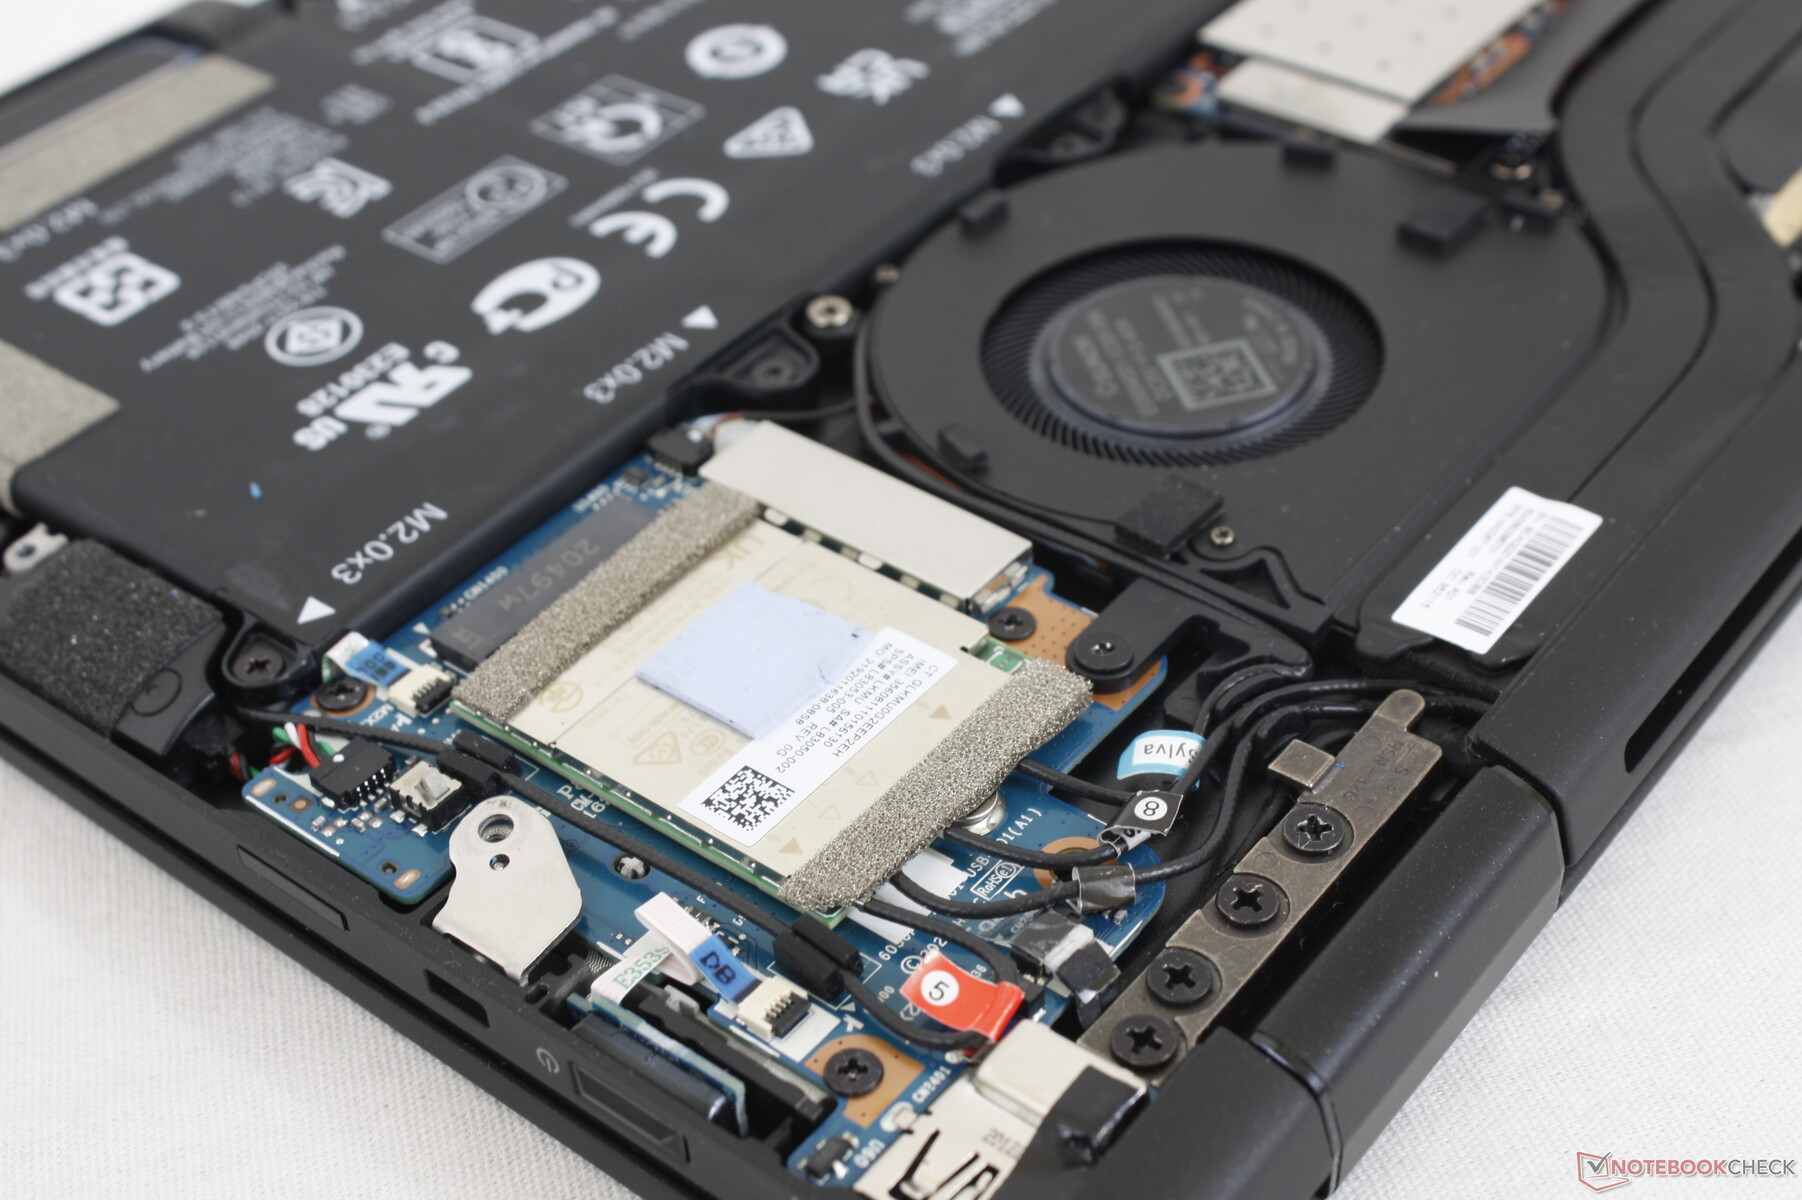
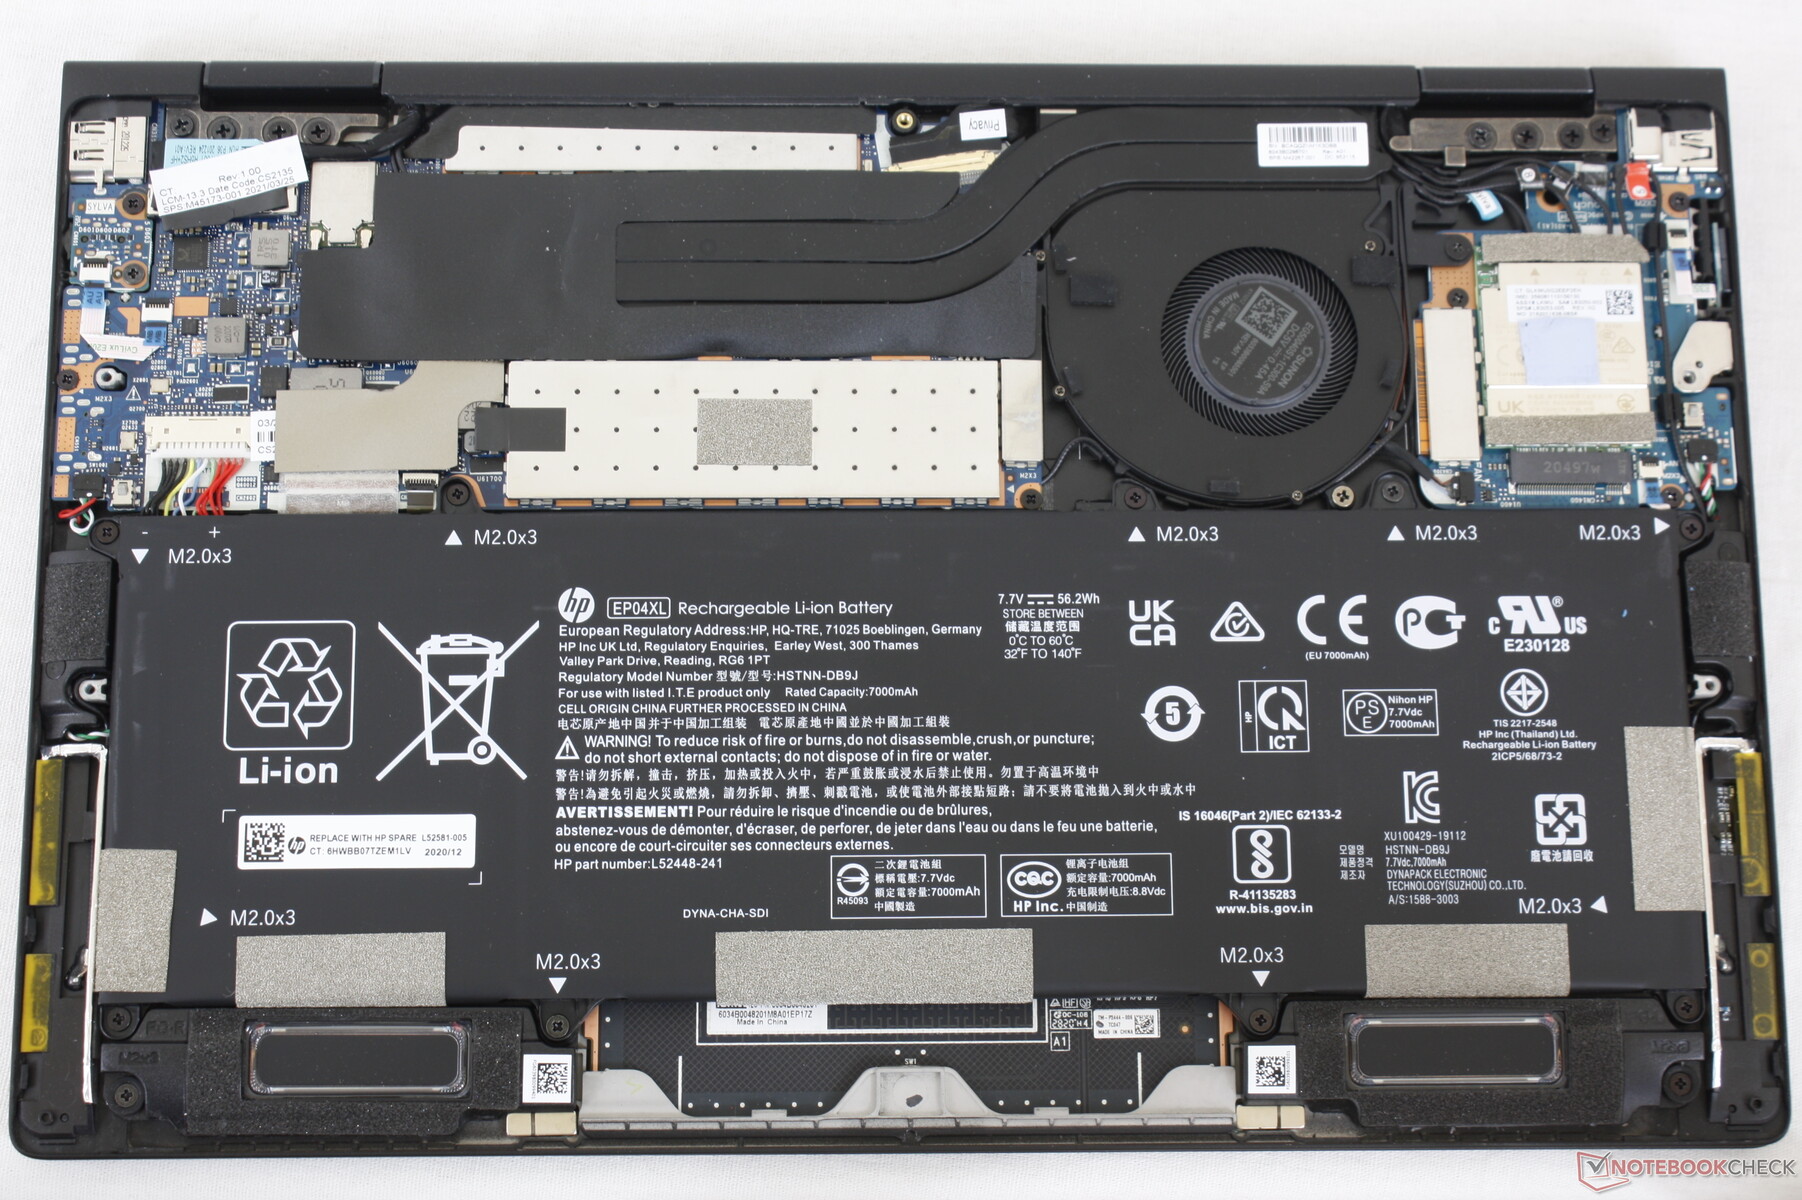
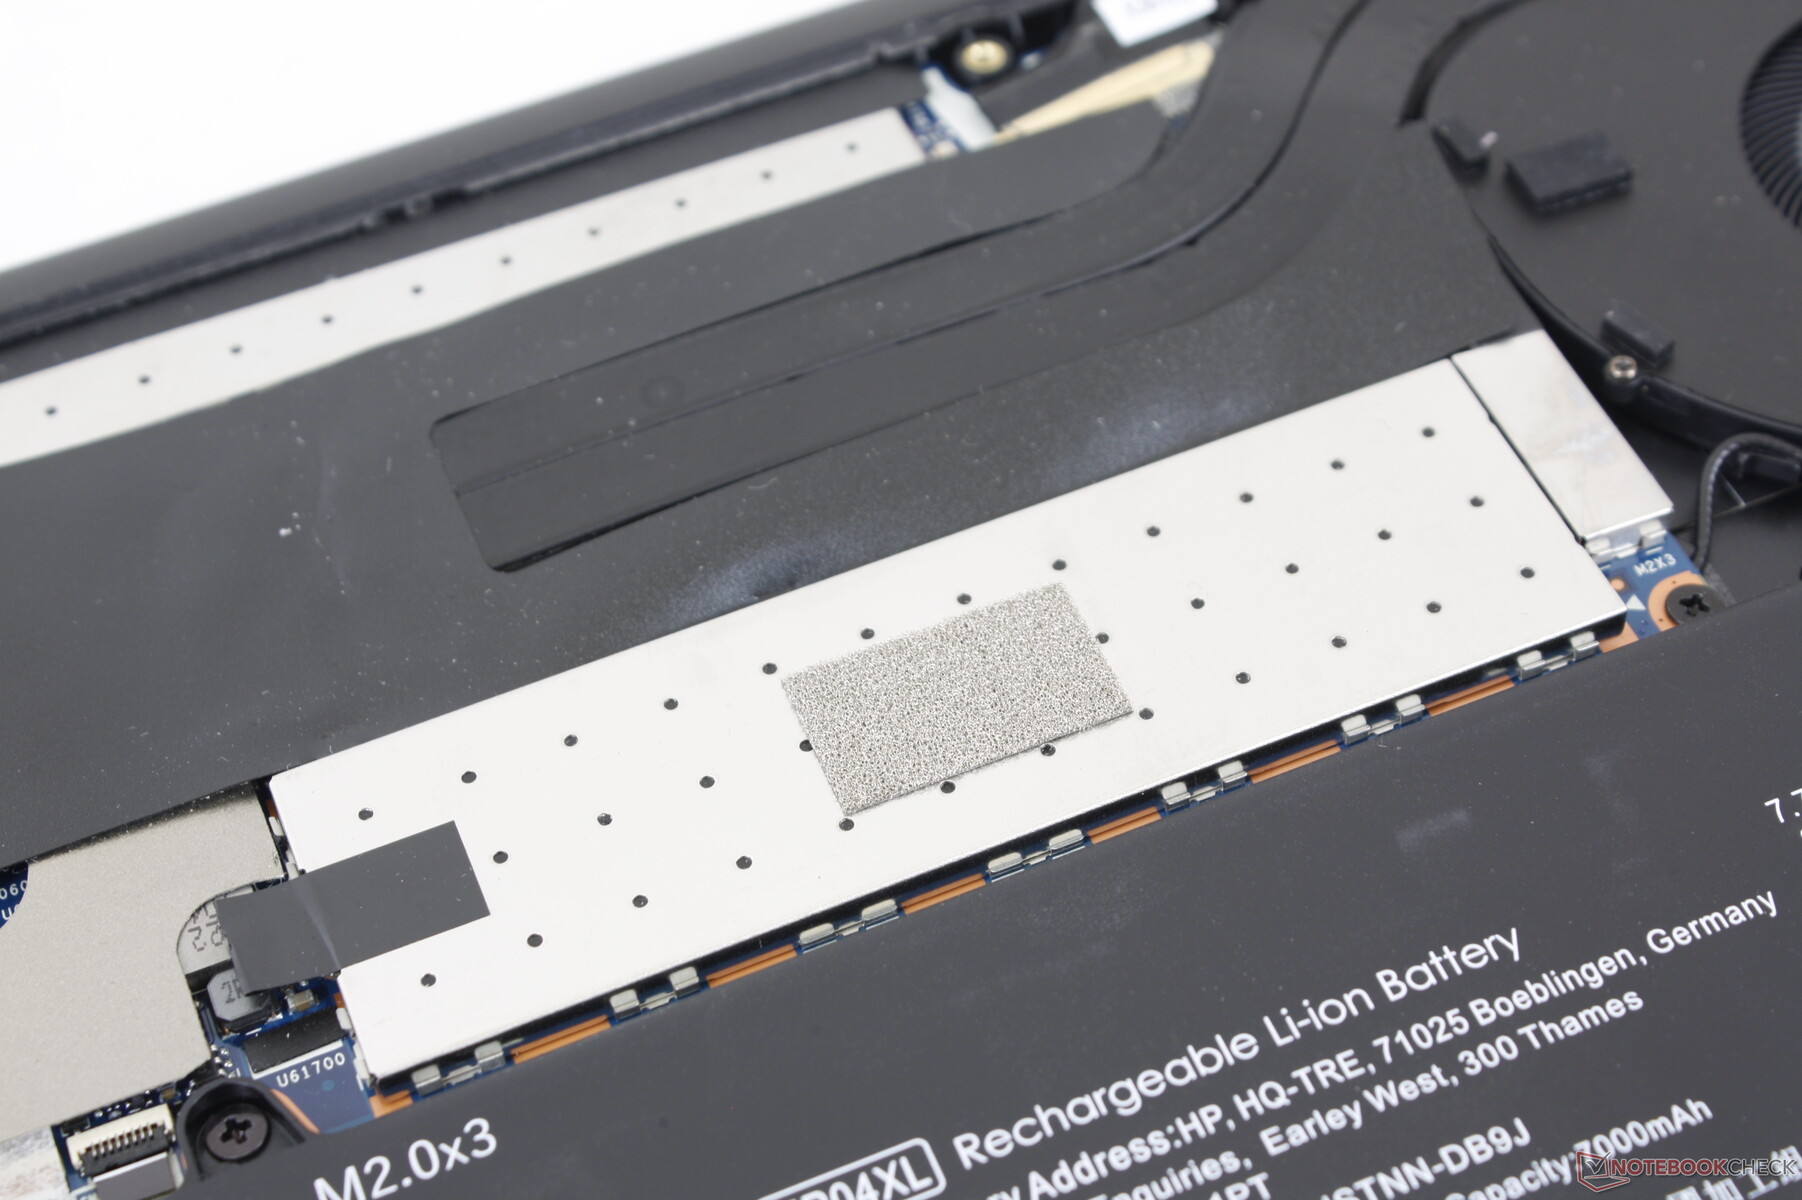
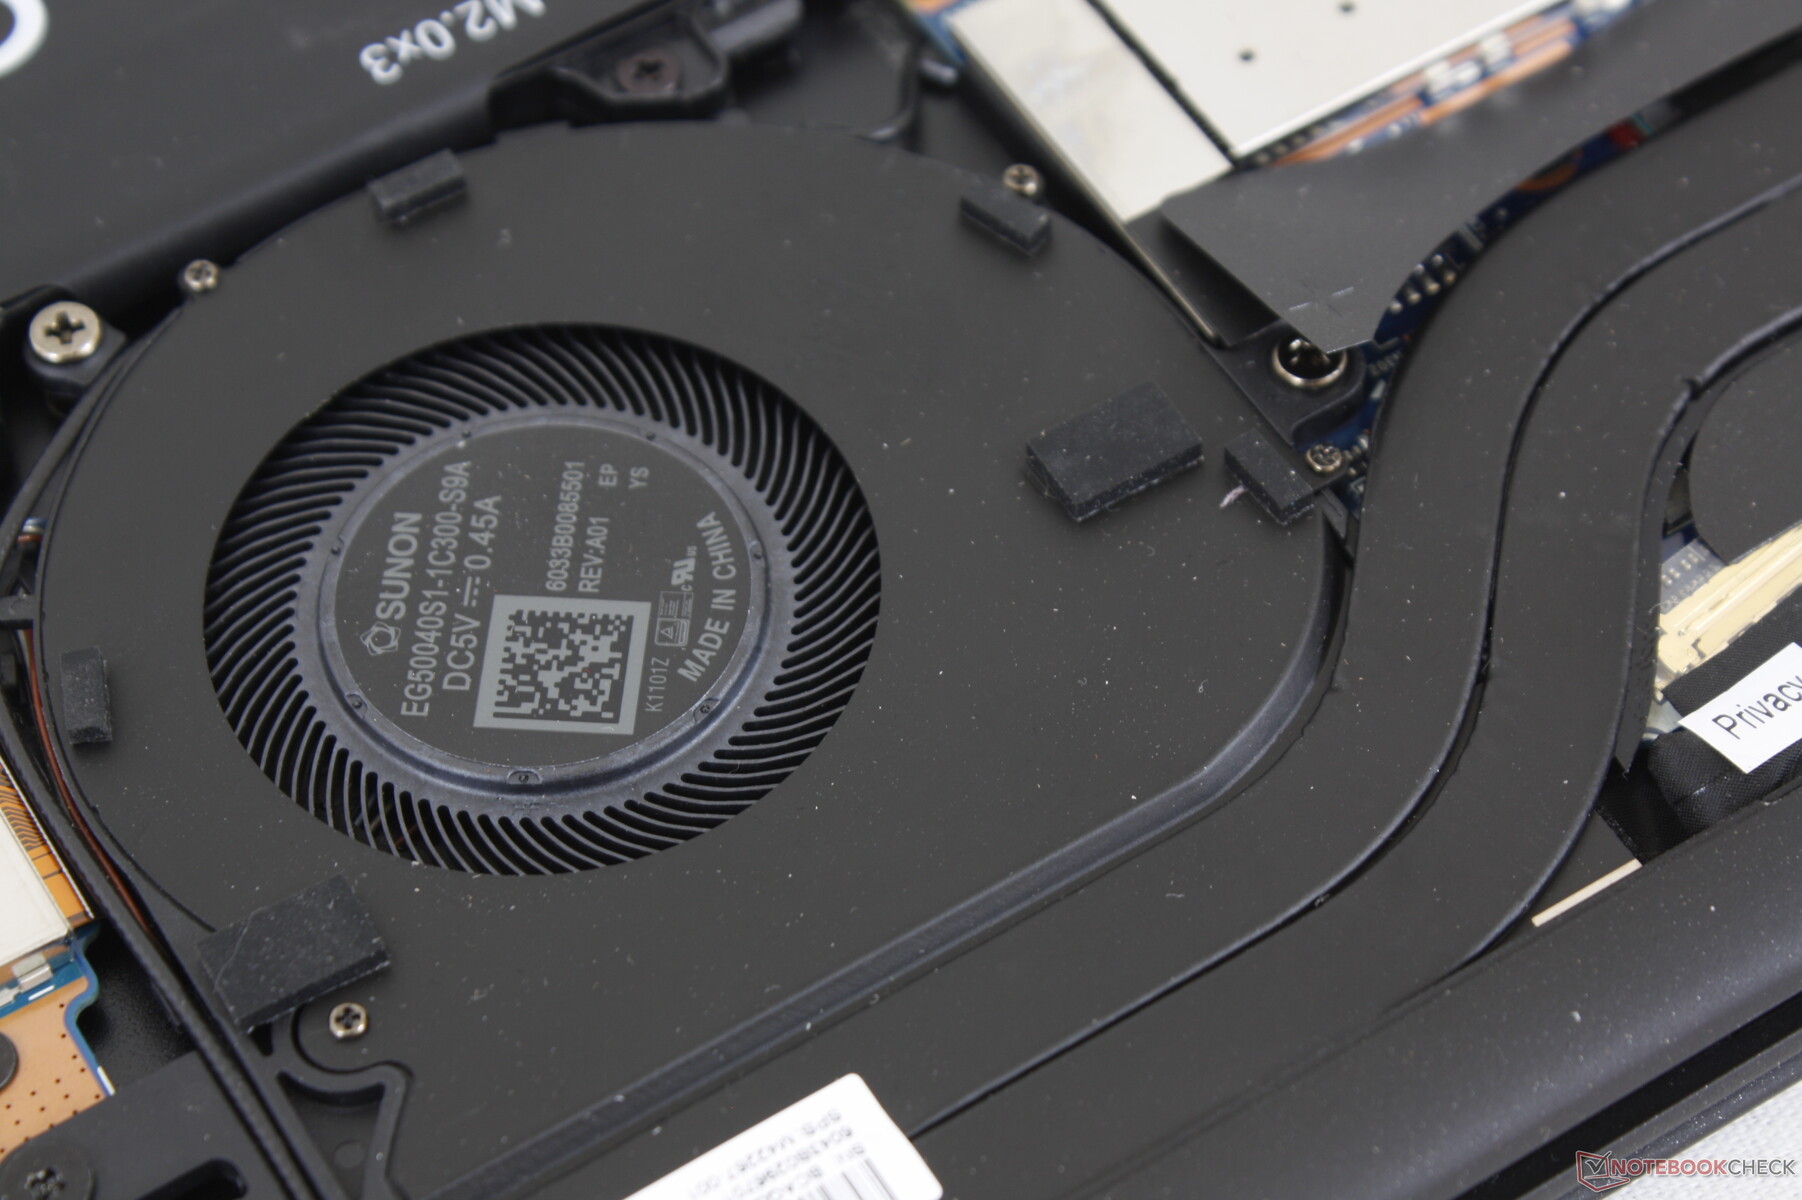
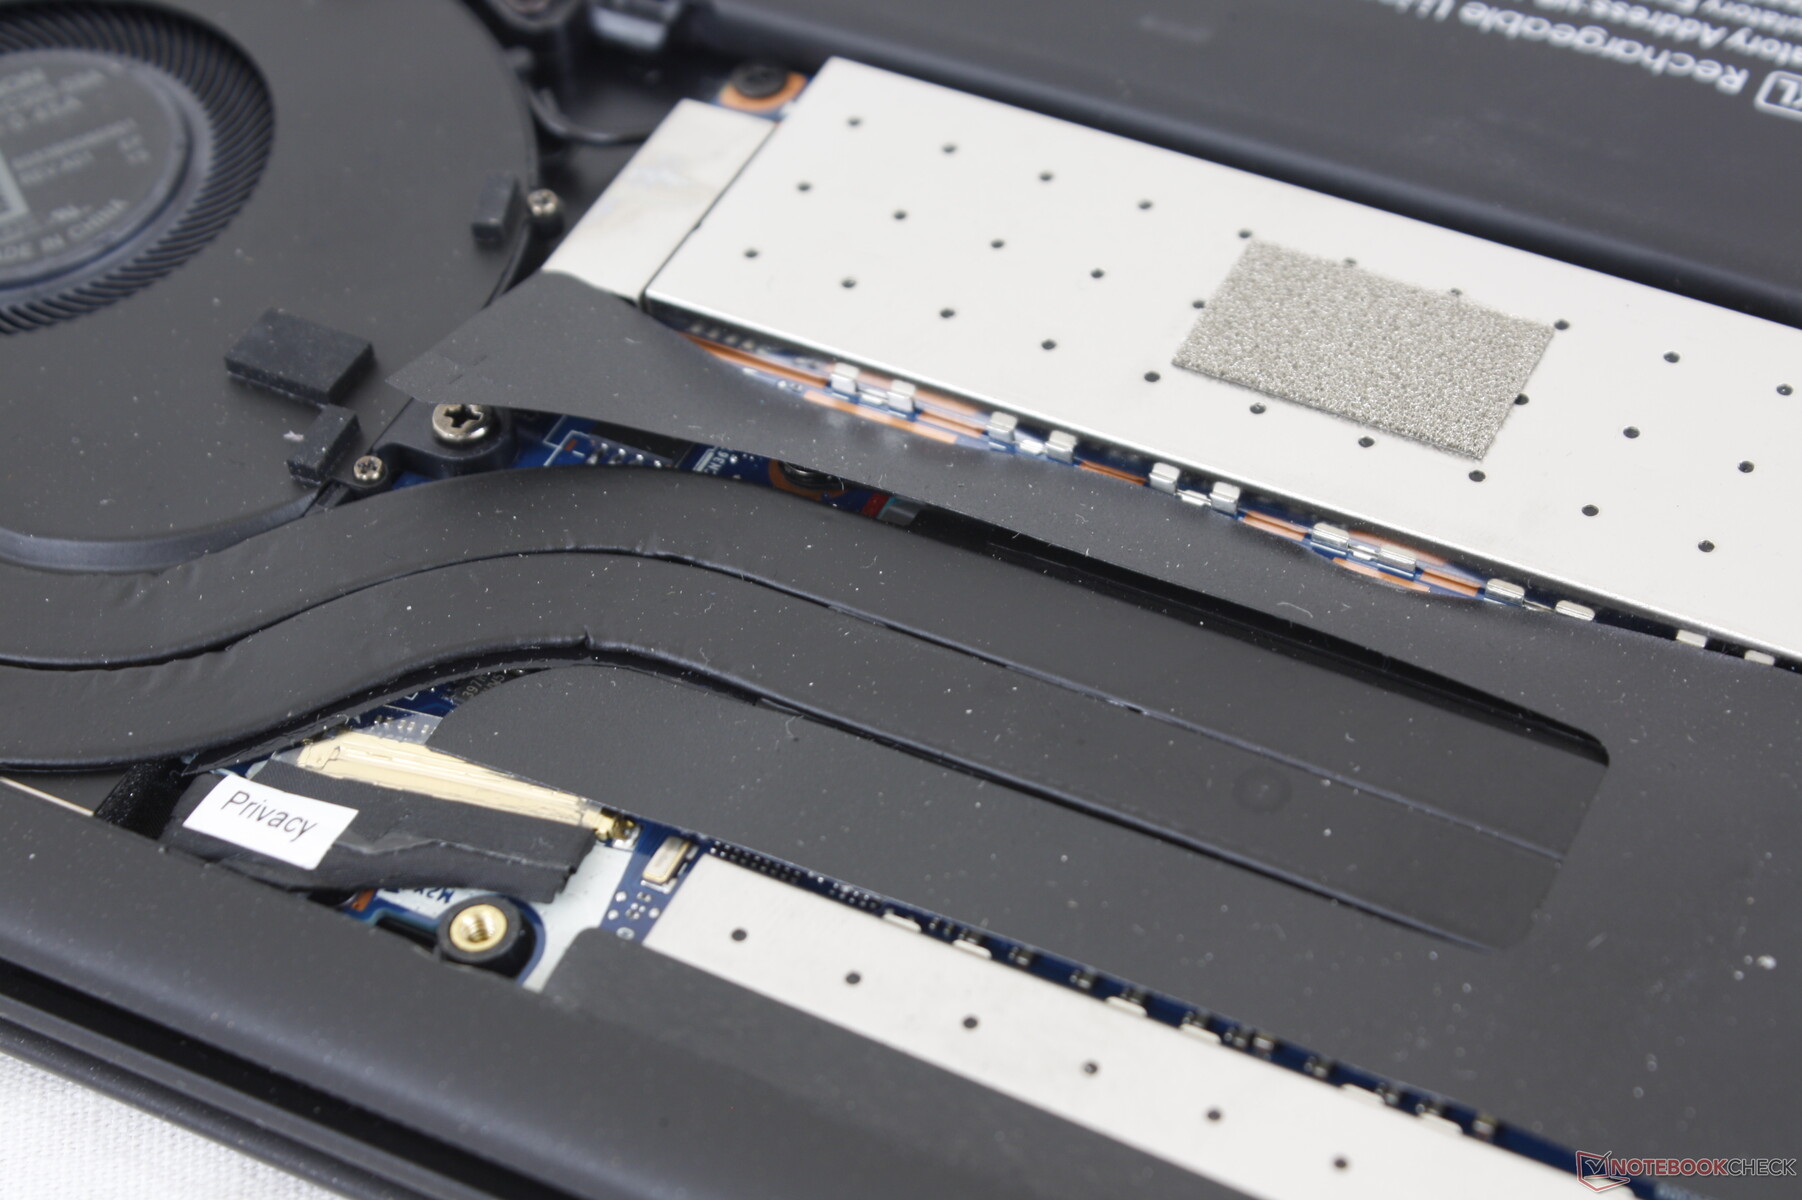
The bottom panel is secured by five easily accessible T5 Torx screws with none hidden underneath the rubber feet. Users can service the battery, WLAN, WWAN, and M.2 2280 SSD while the RAM modules are soldered.
Accessories and Warranty
The retail box includes no extras beyond the AC adapter and paperwork. A carrying case or stylus would have been nice add-ons.
A 3-year limited manufacturer warranty comes standard compared to just one year on consumer-level laptops like the Spectre or Envy series.
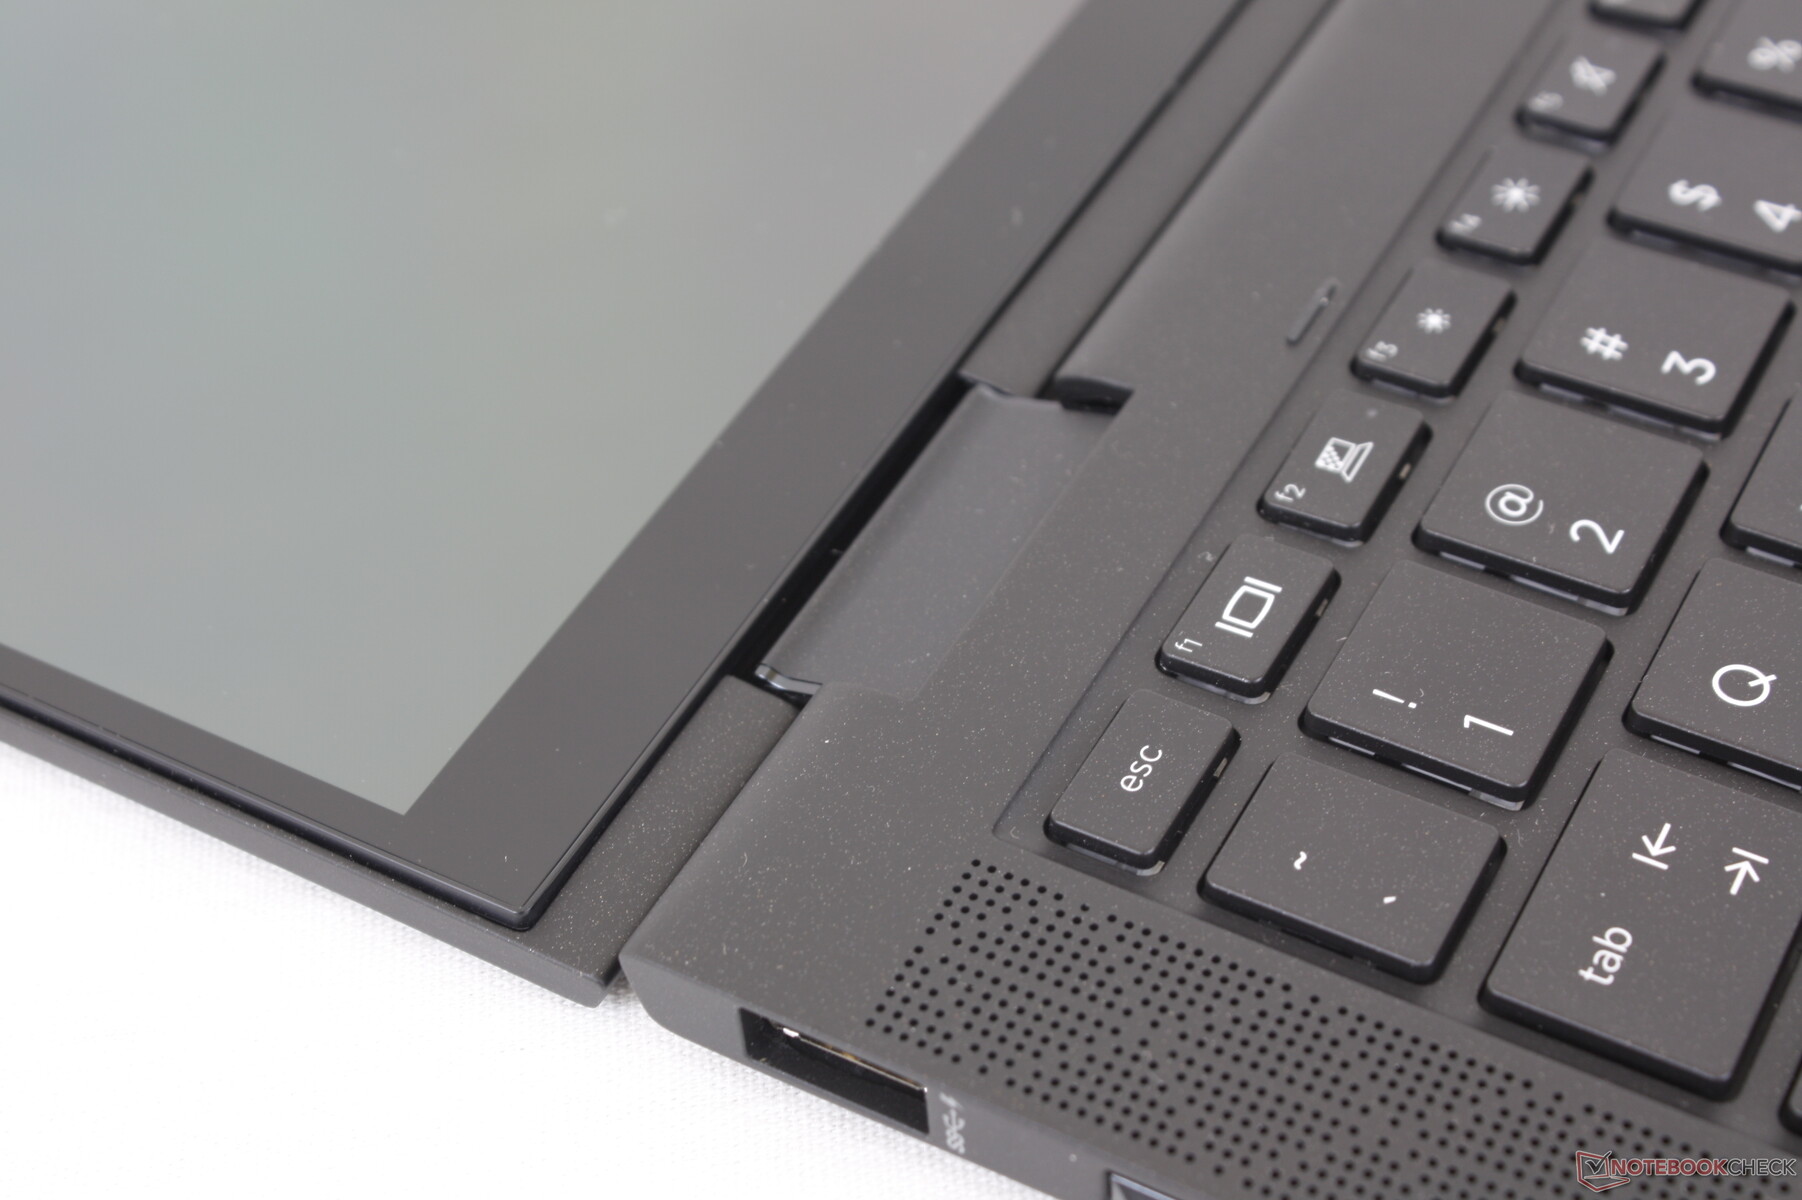
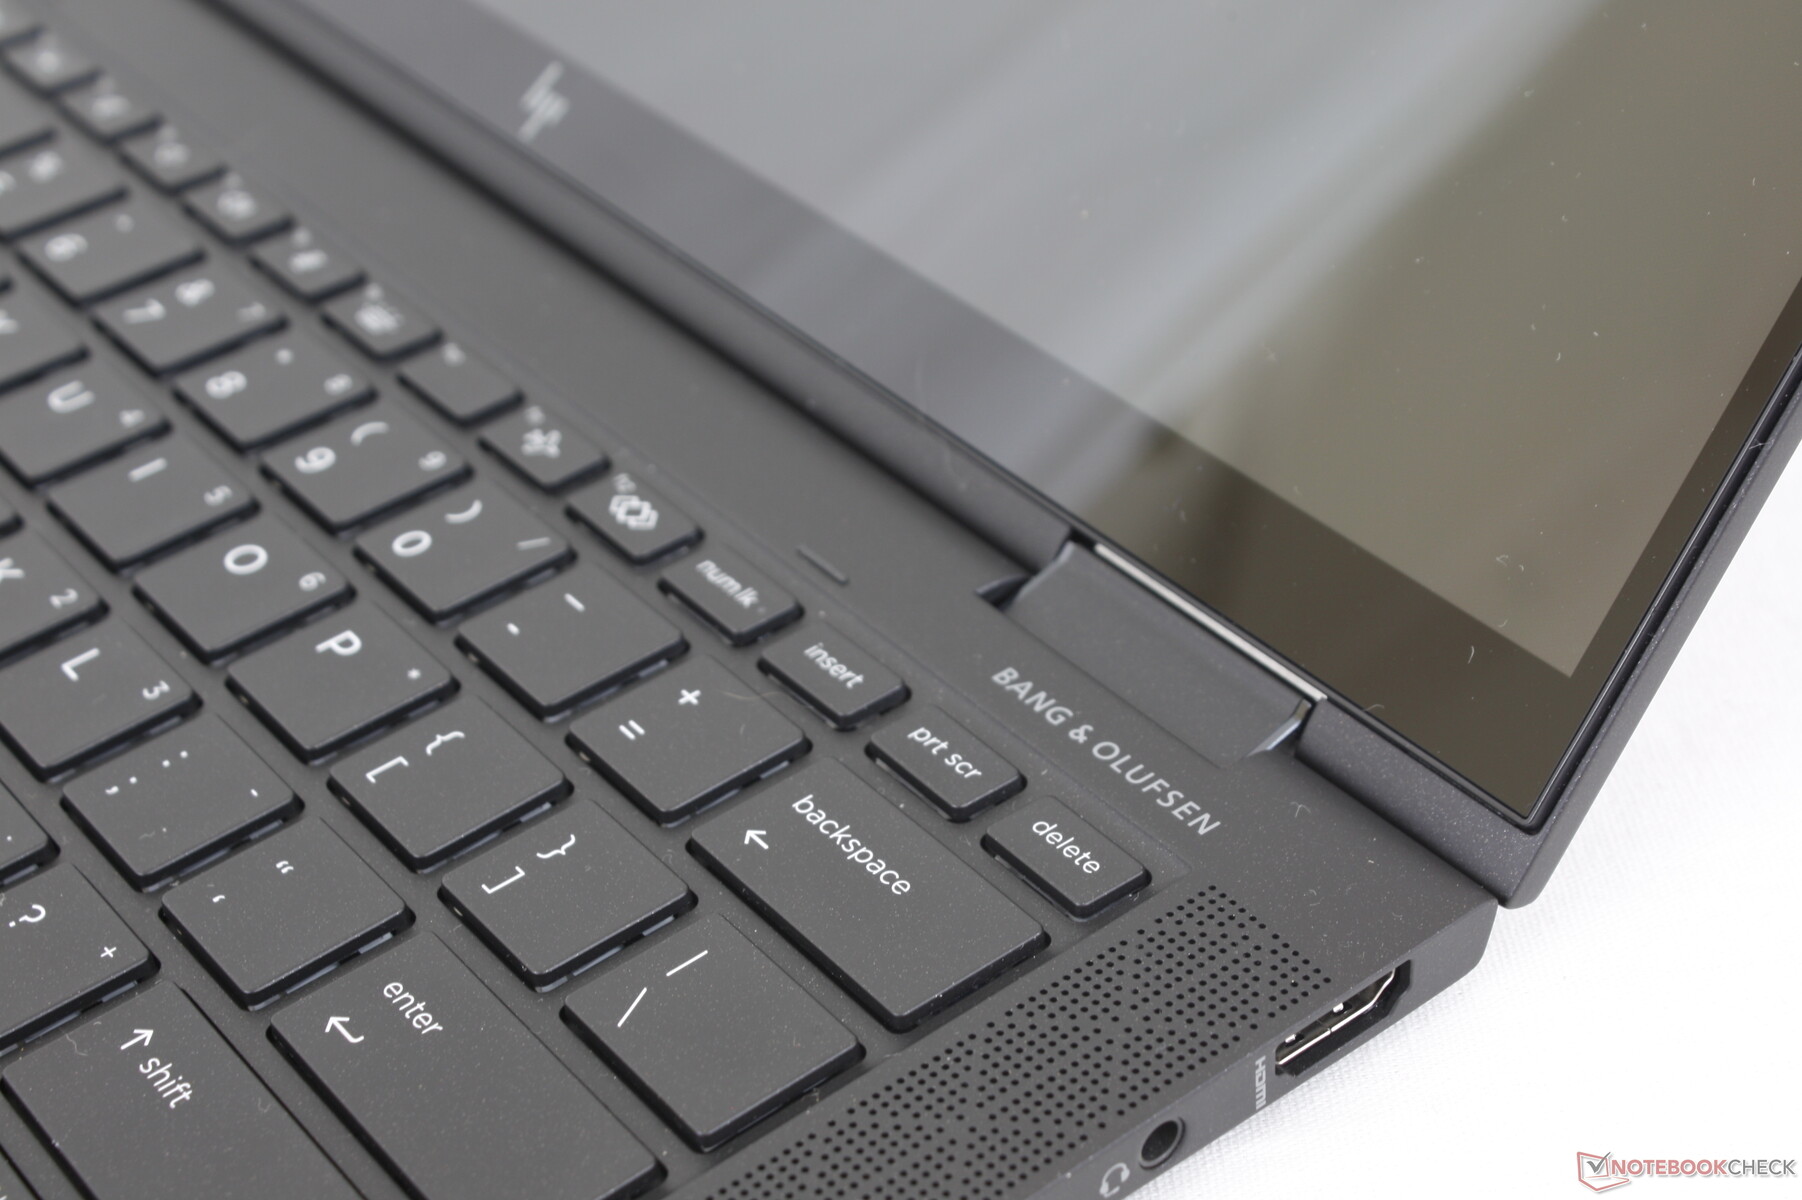
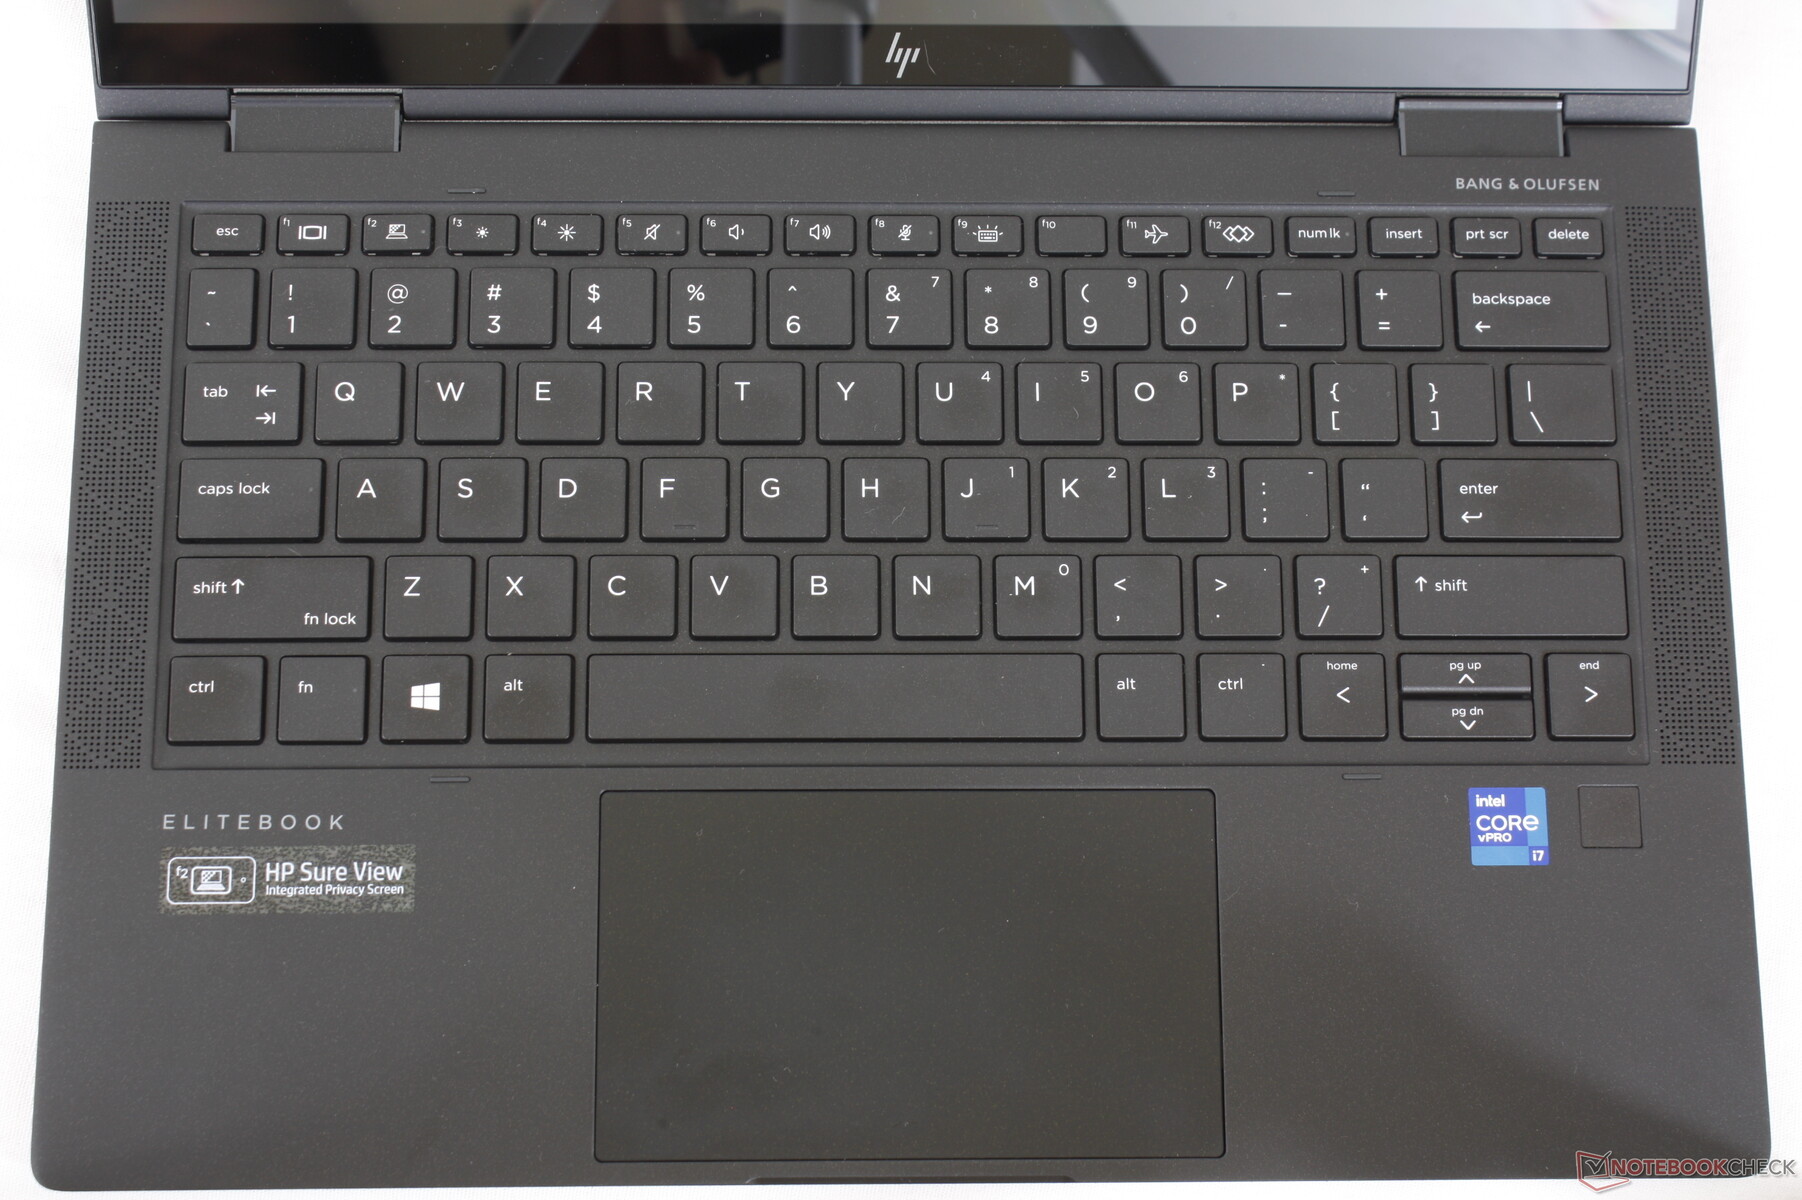
Input Devices: One of the Best Keyboards on a Convertible
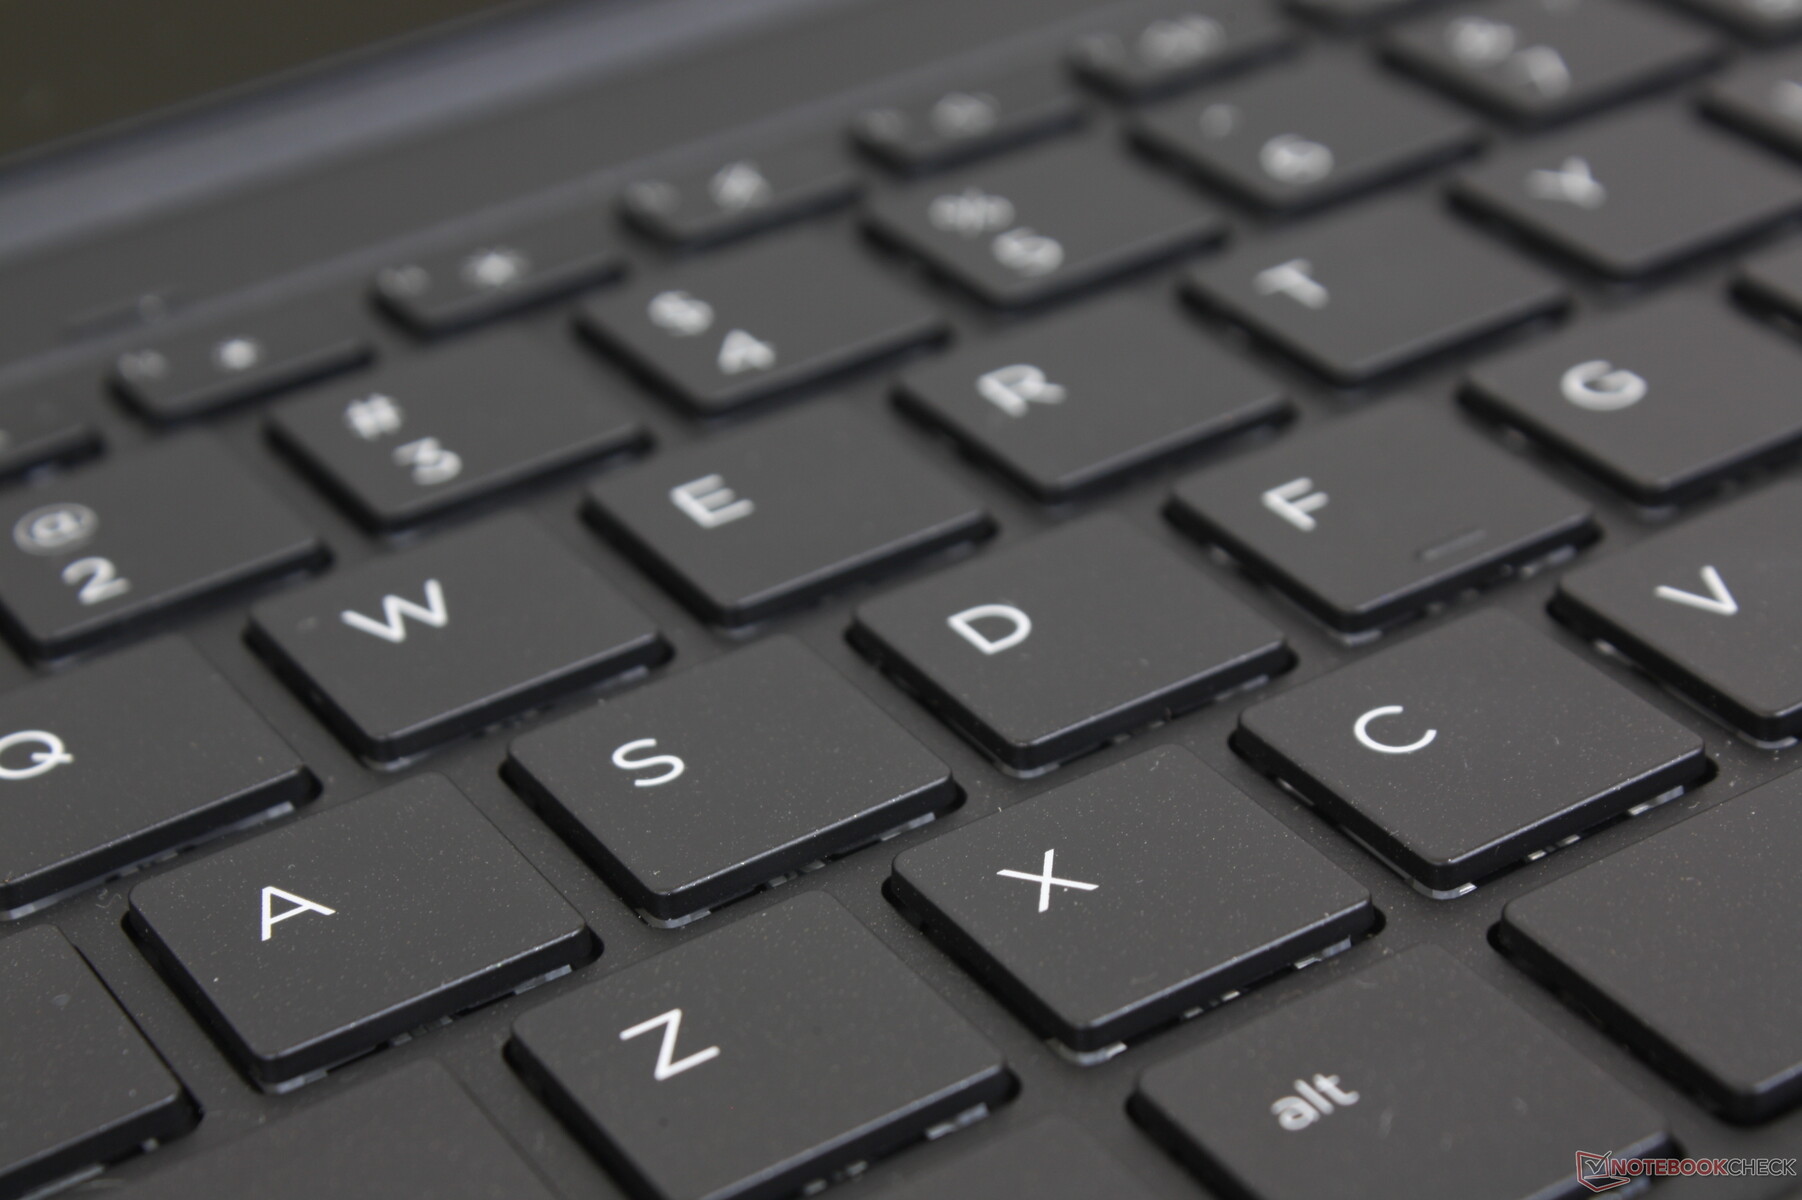
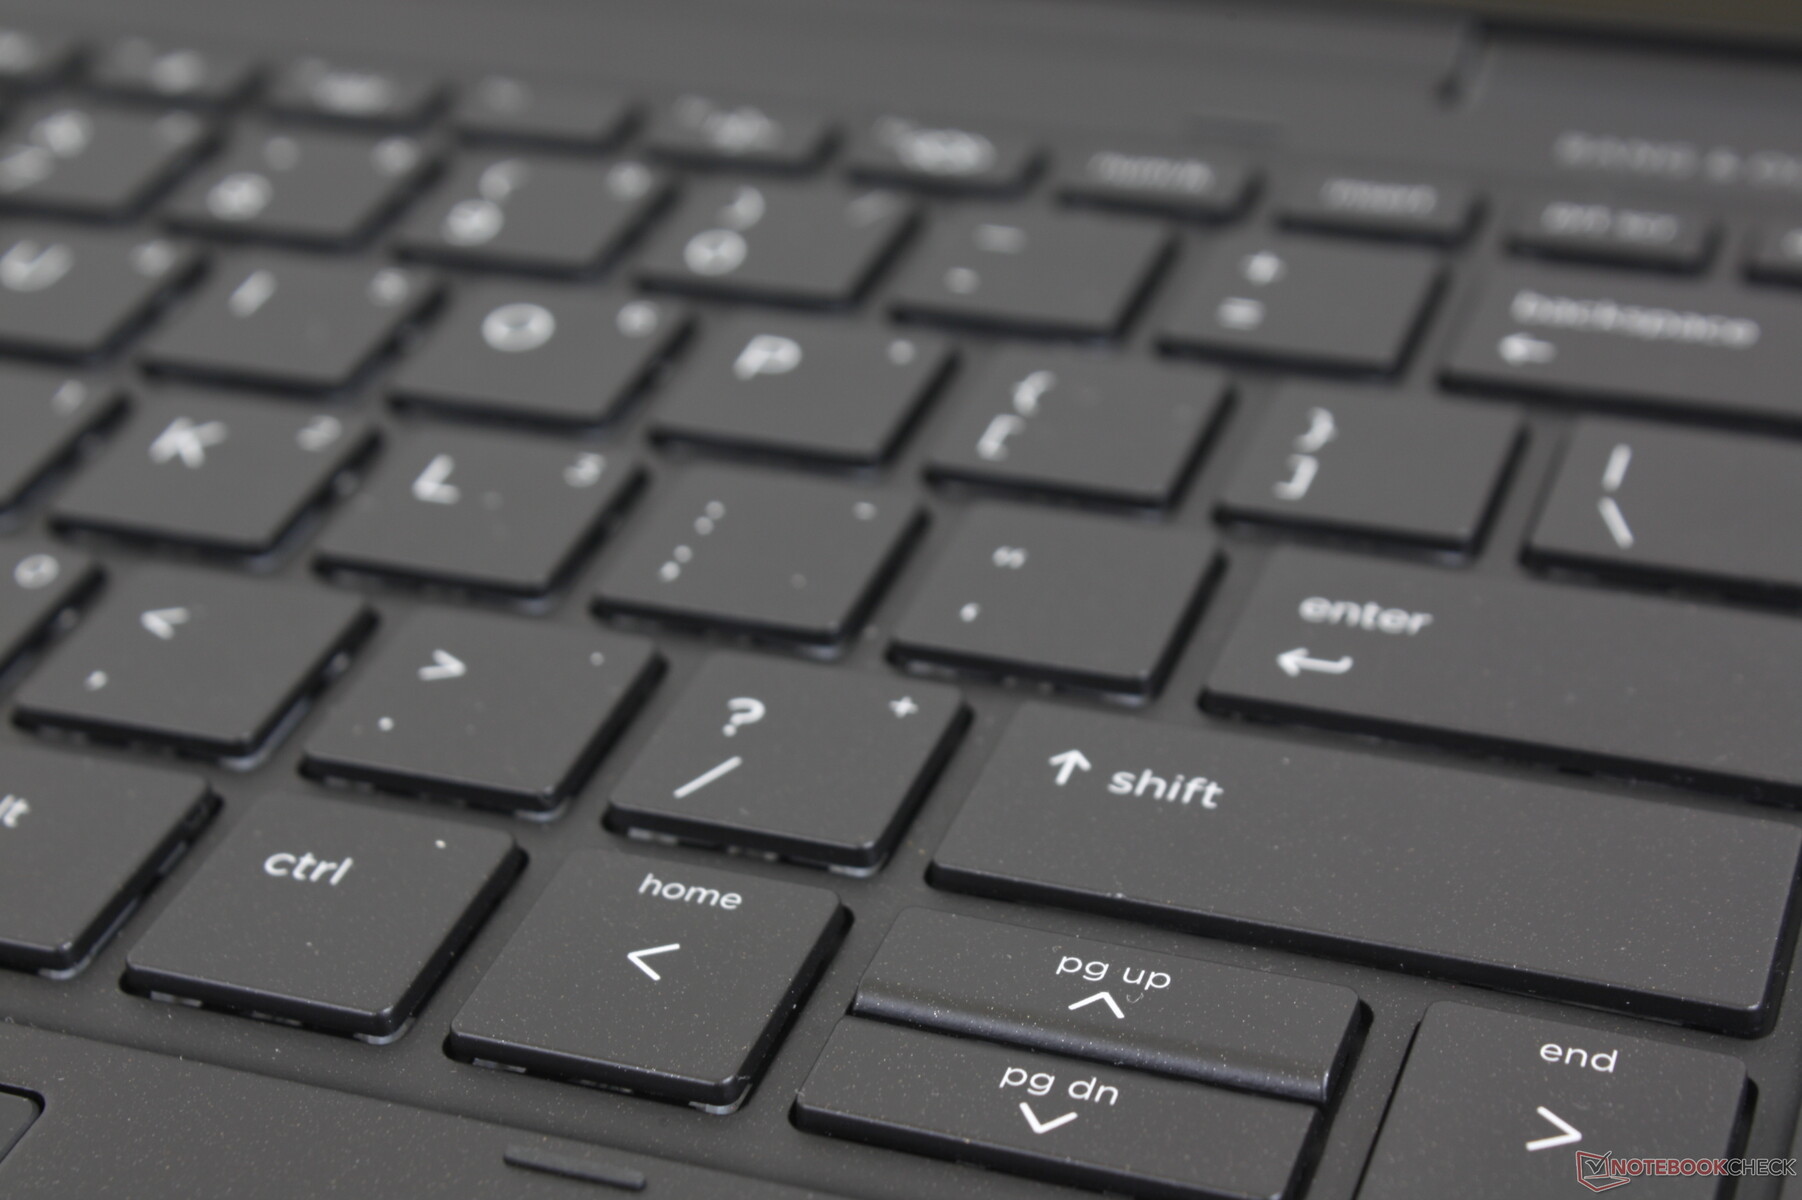
Keyboard
key feedback is sharper, deeper, and firmer than on most other Ultrabooks where the keys are typically shallower and spongier. Clatter is moderately loud, however, but the slight increase in noise is well worth the more comfortable typing experience.
Key layout has changed from the 2020 version to be more in line with the latest Envy laptops. Most notably, HP has removed the Calendar key for a much more useful Programmable or user-customizable key.
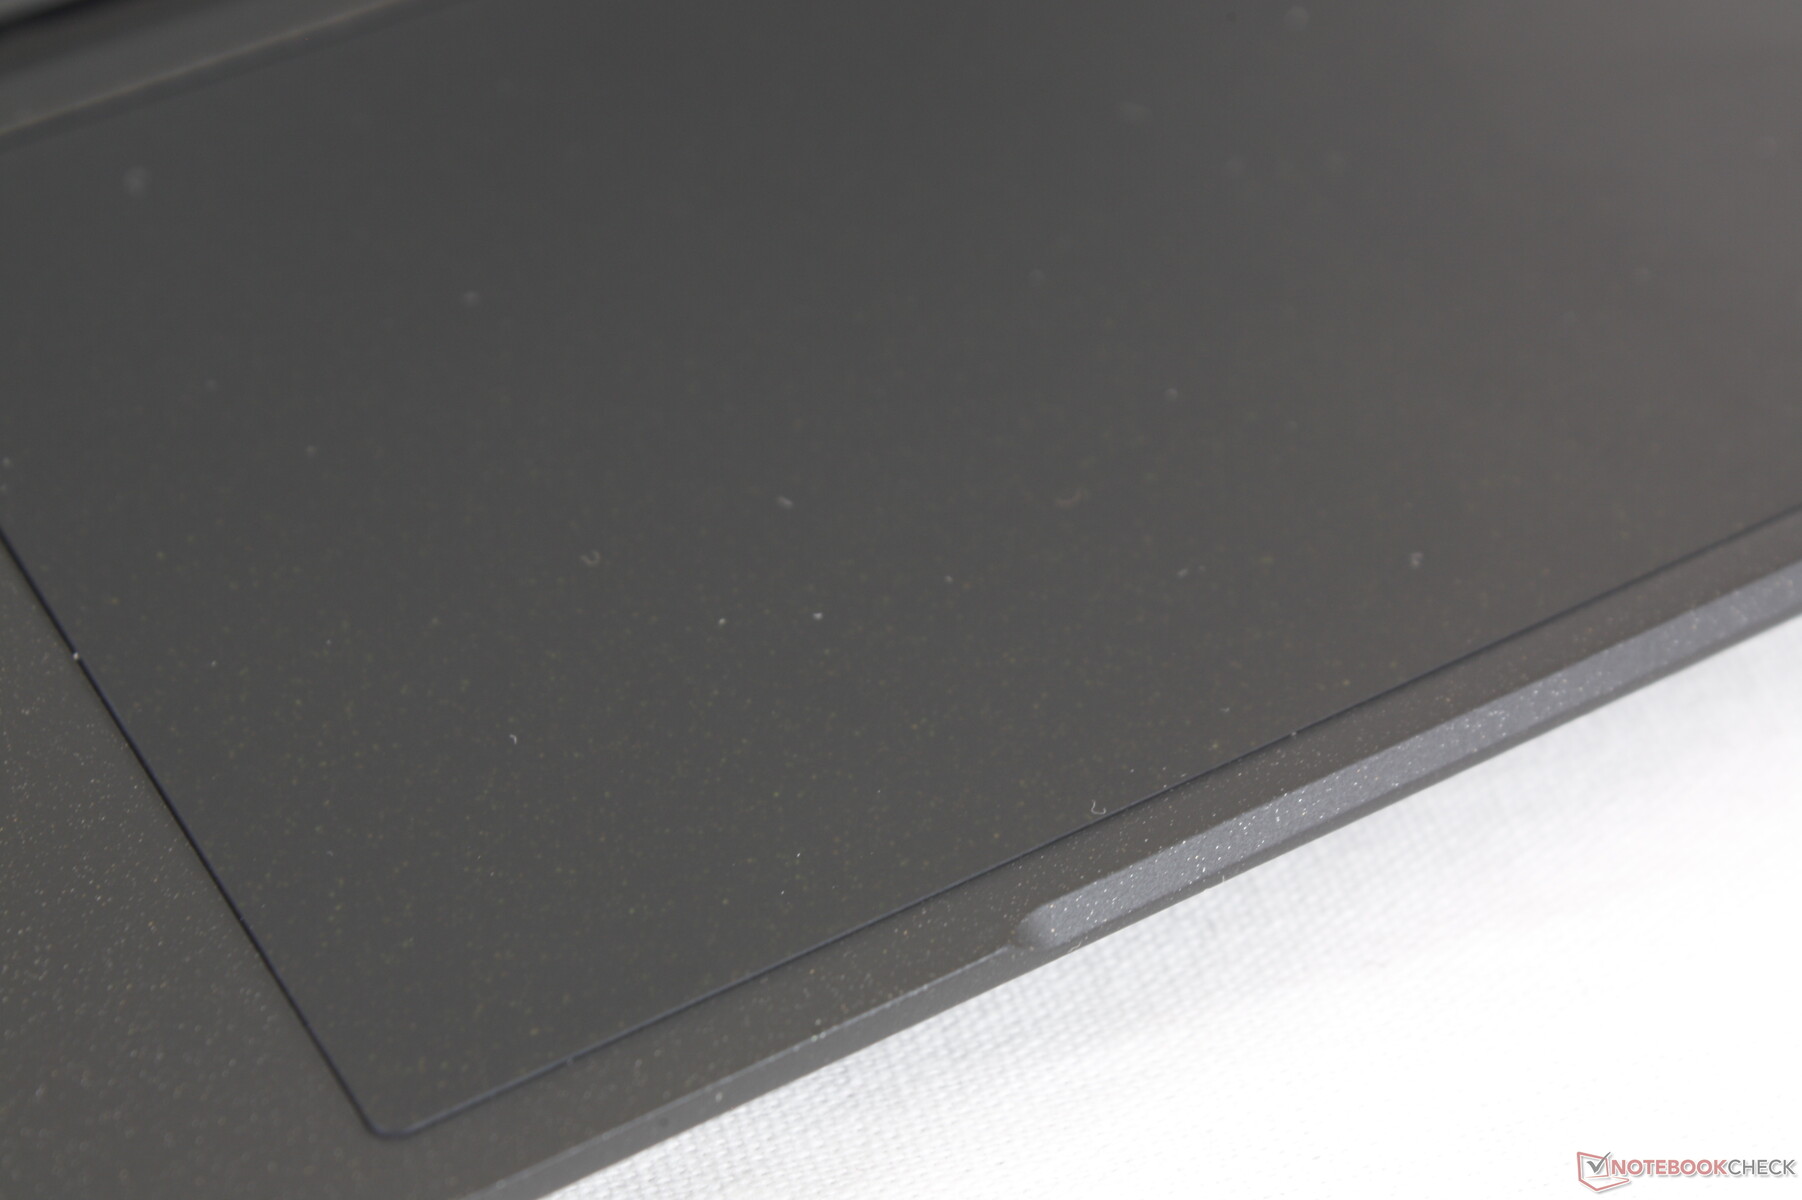
Touchpad
The Precision clickpad is larger than the one on the latest Spectre x360 13 (11 x 6.5 cm vs. 11.1 x 5.6 cm). Traction is smooth and with just very little sticking when gliding at slow speeds. We find feedback to be softer and quieter than on the Spectre x360 13 when clicking, but it's not overly soft to be considered too spongy.
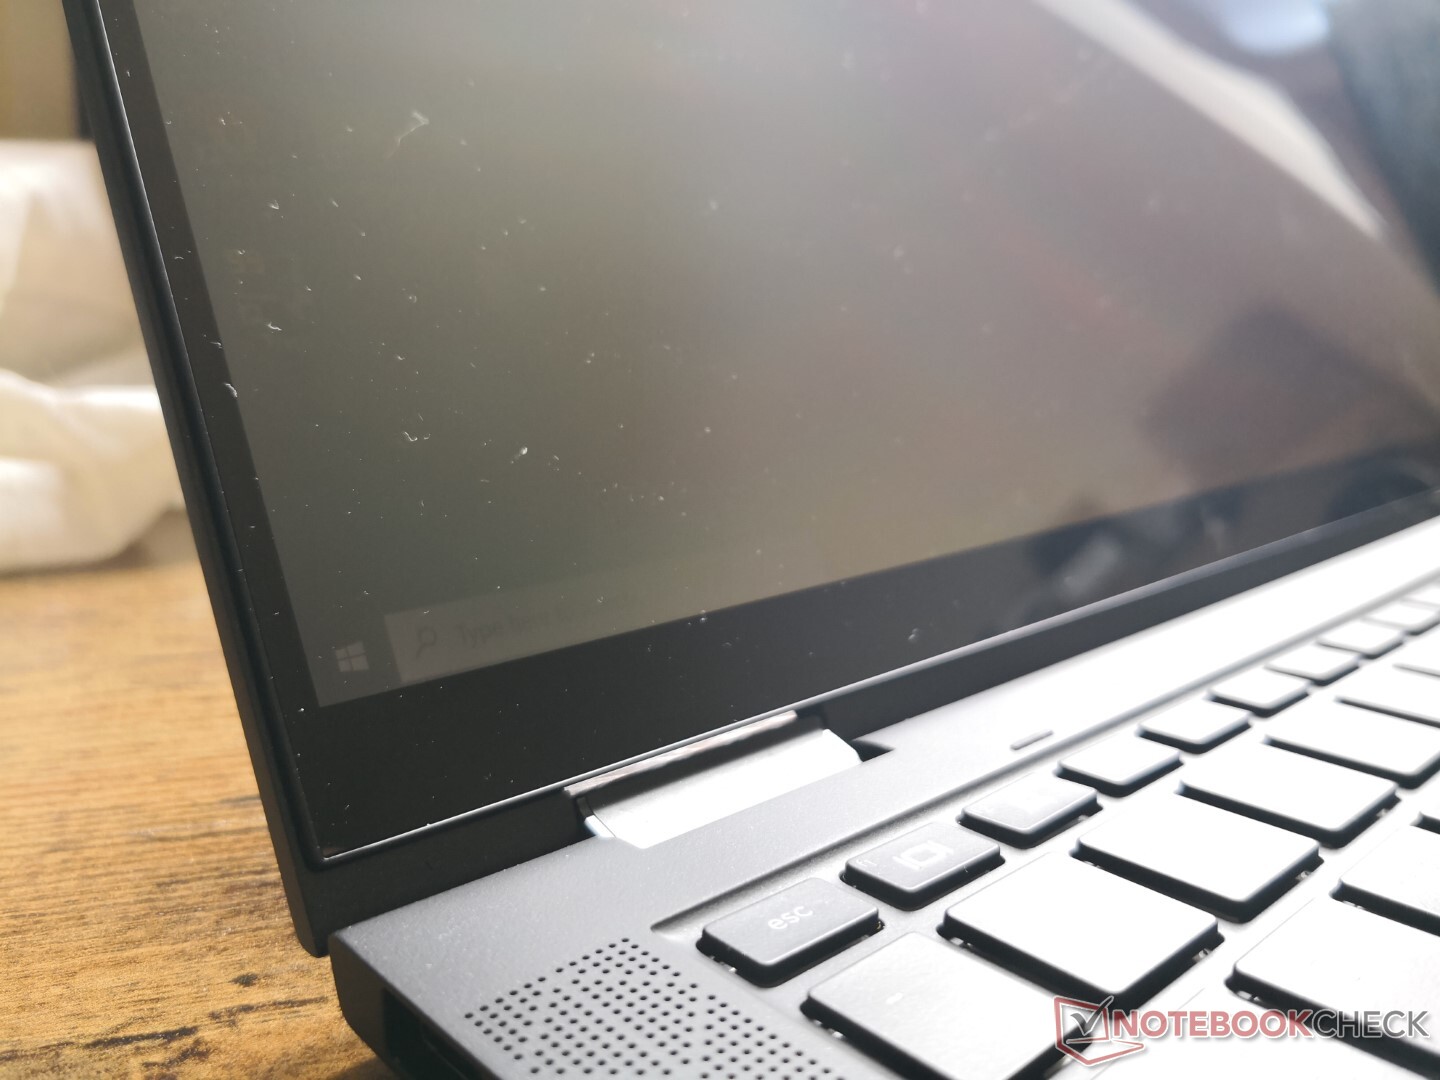
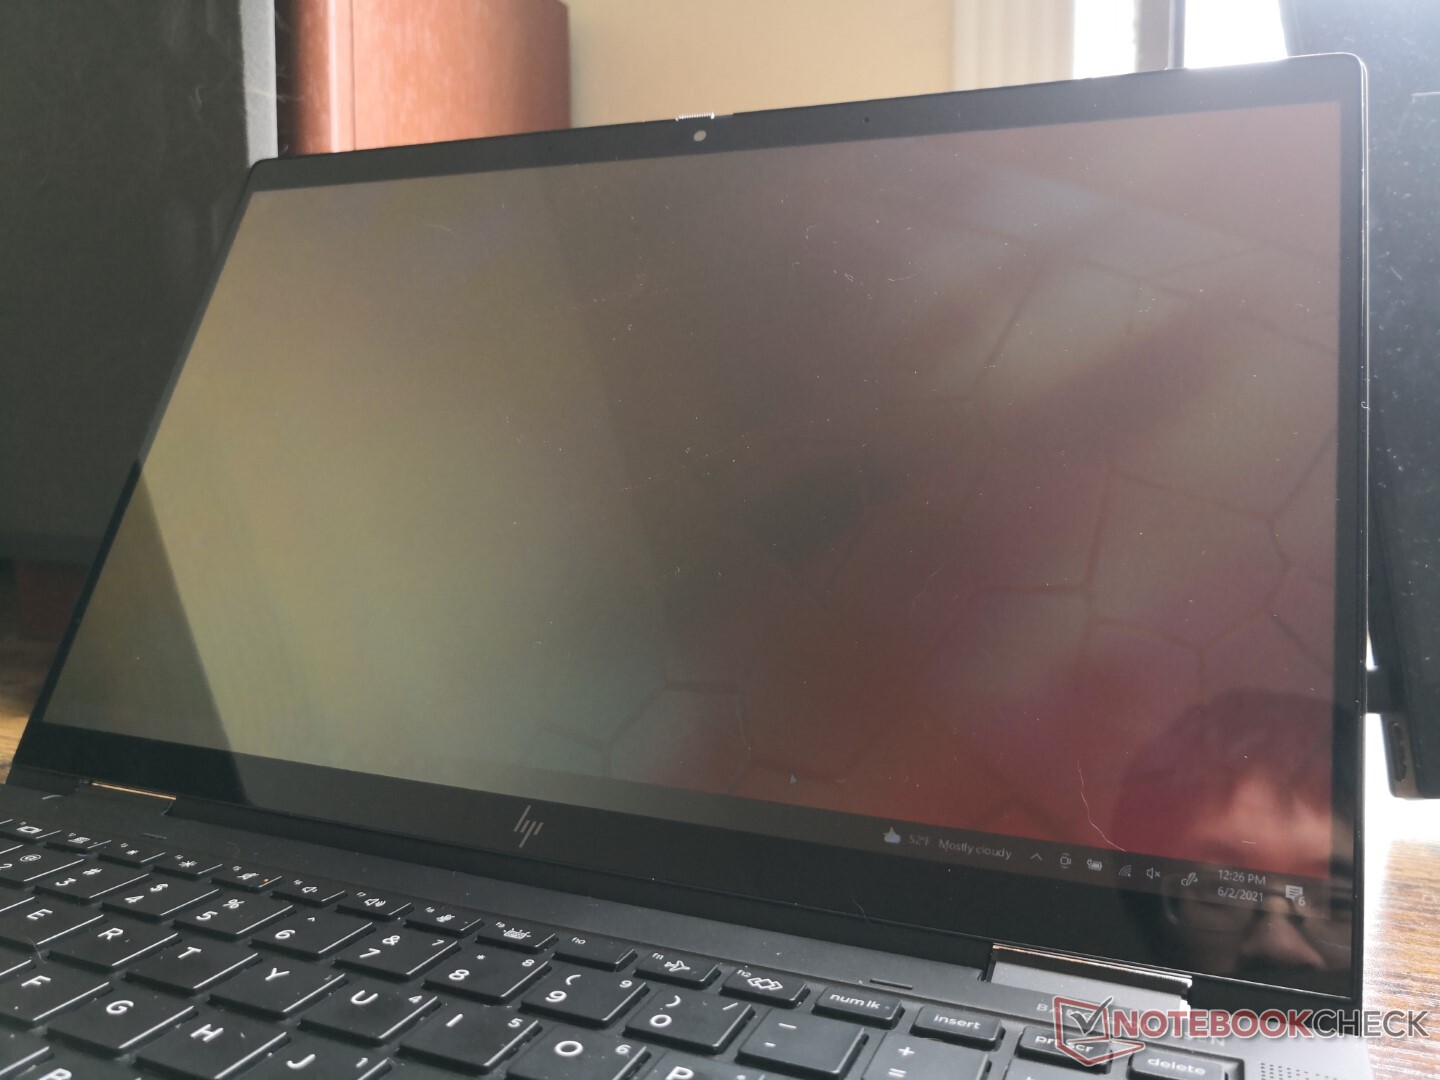
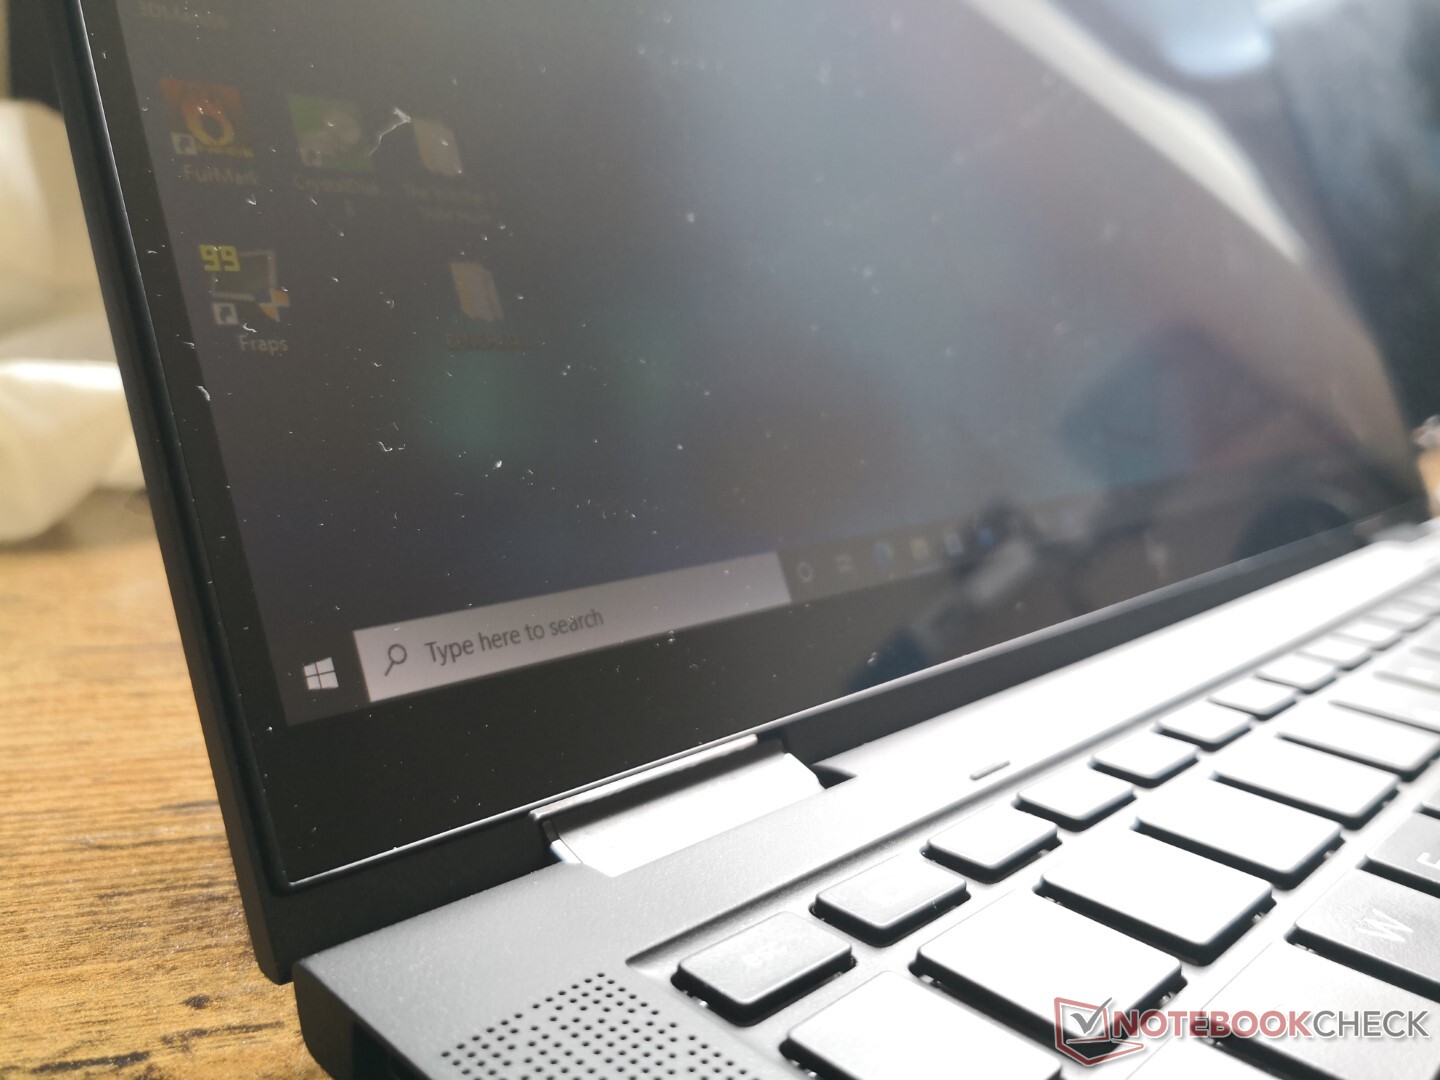
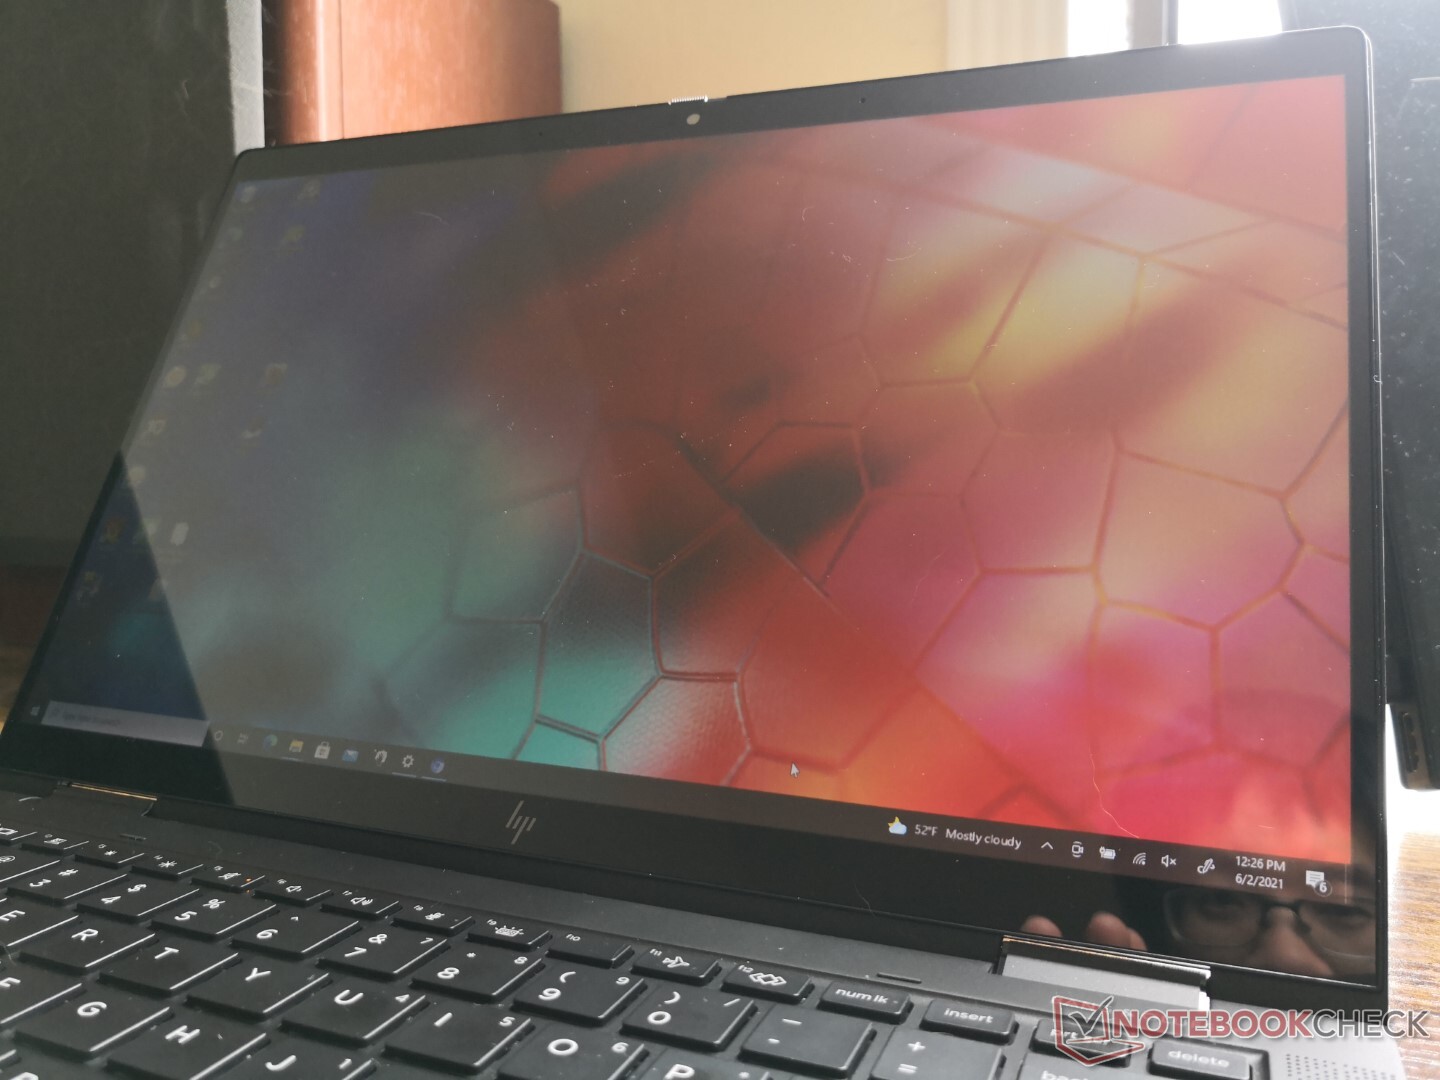
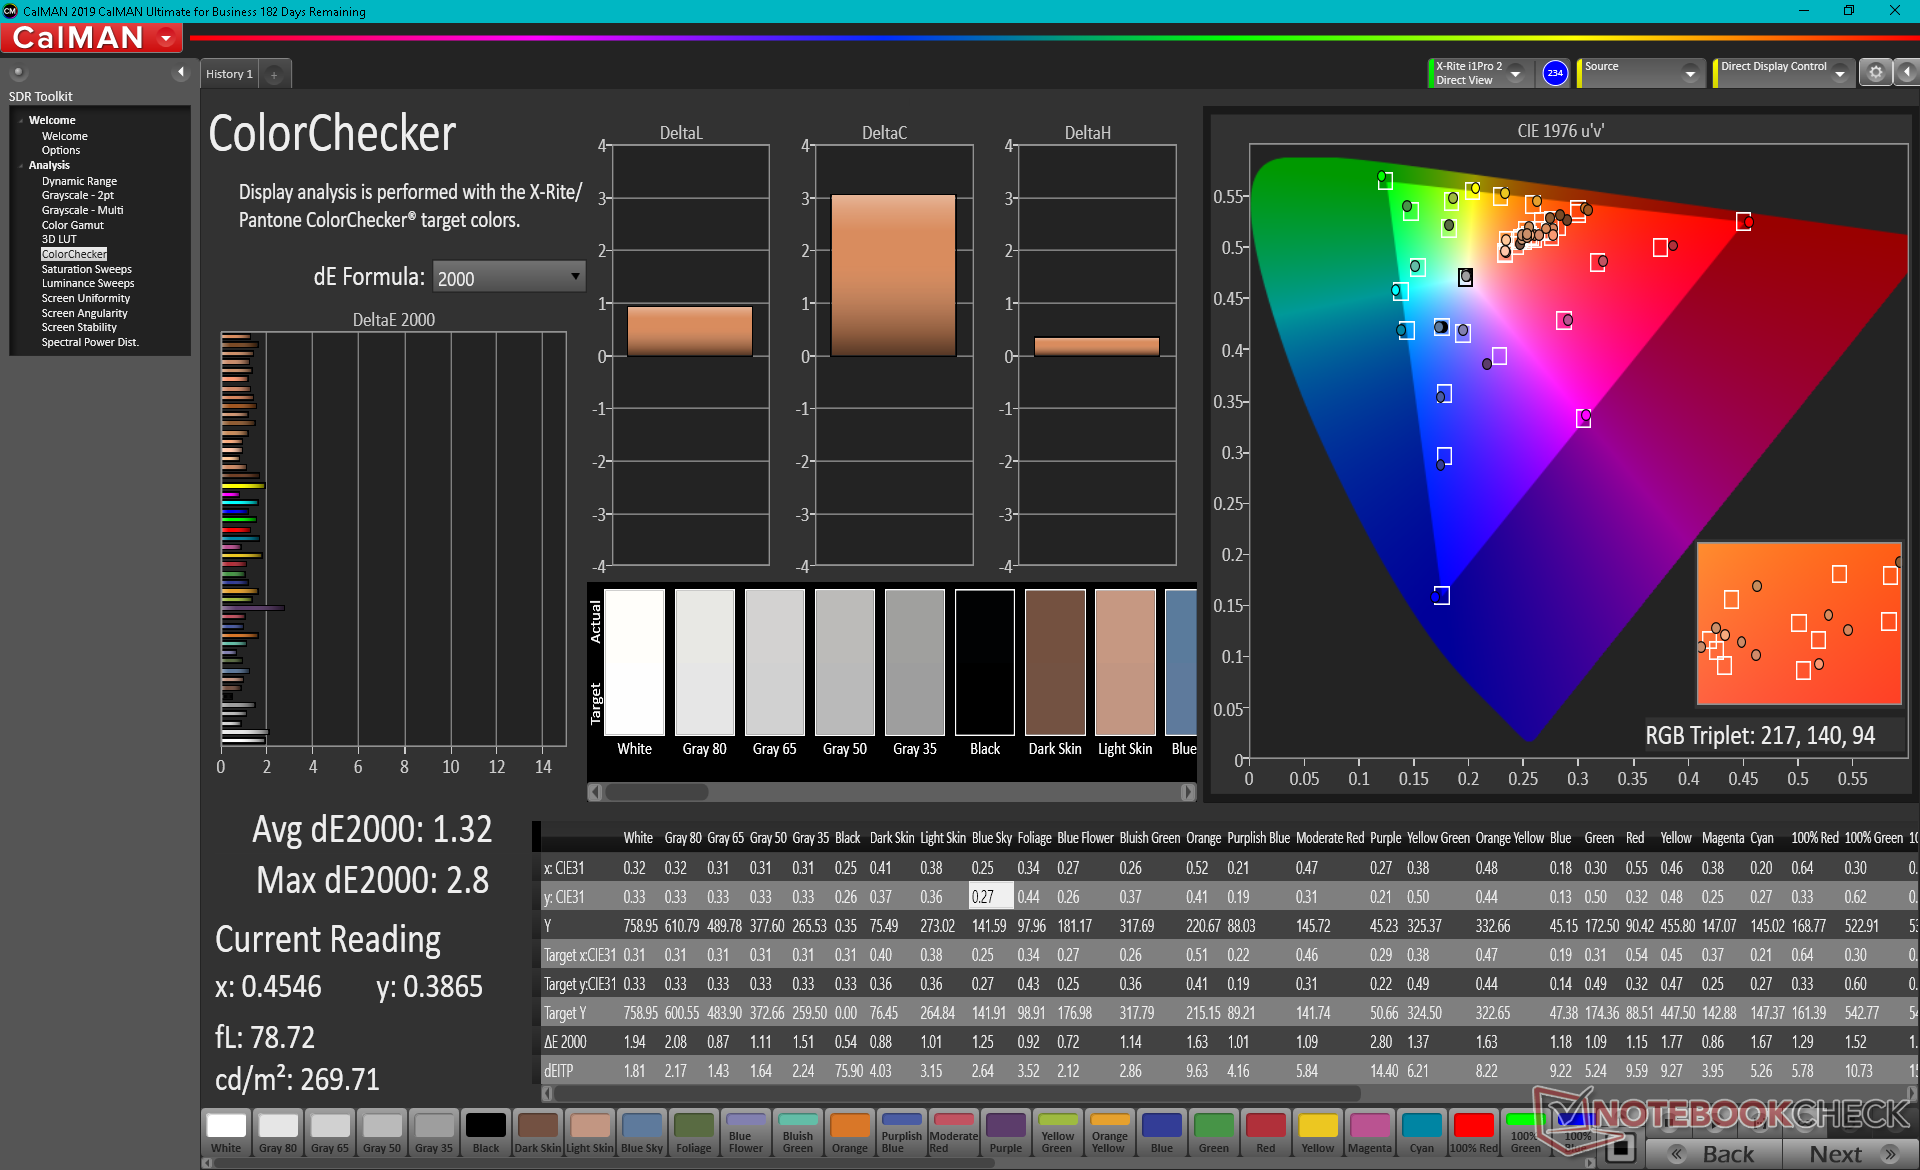
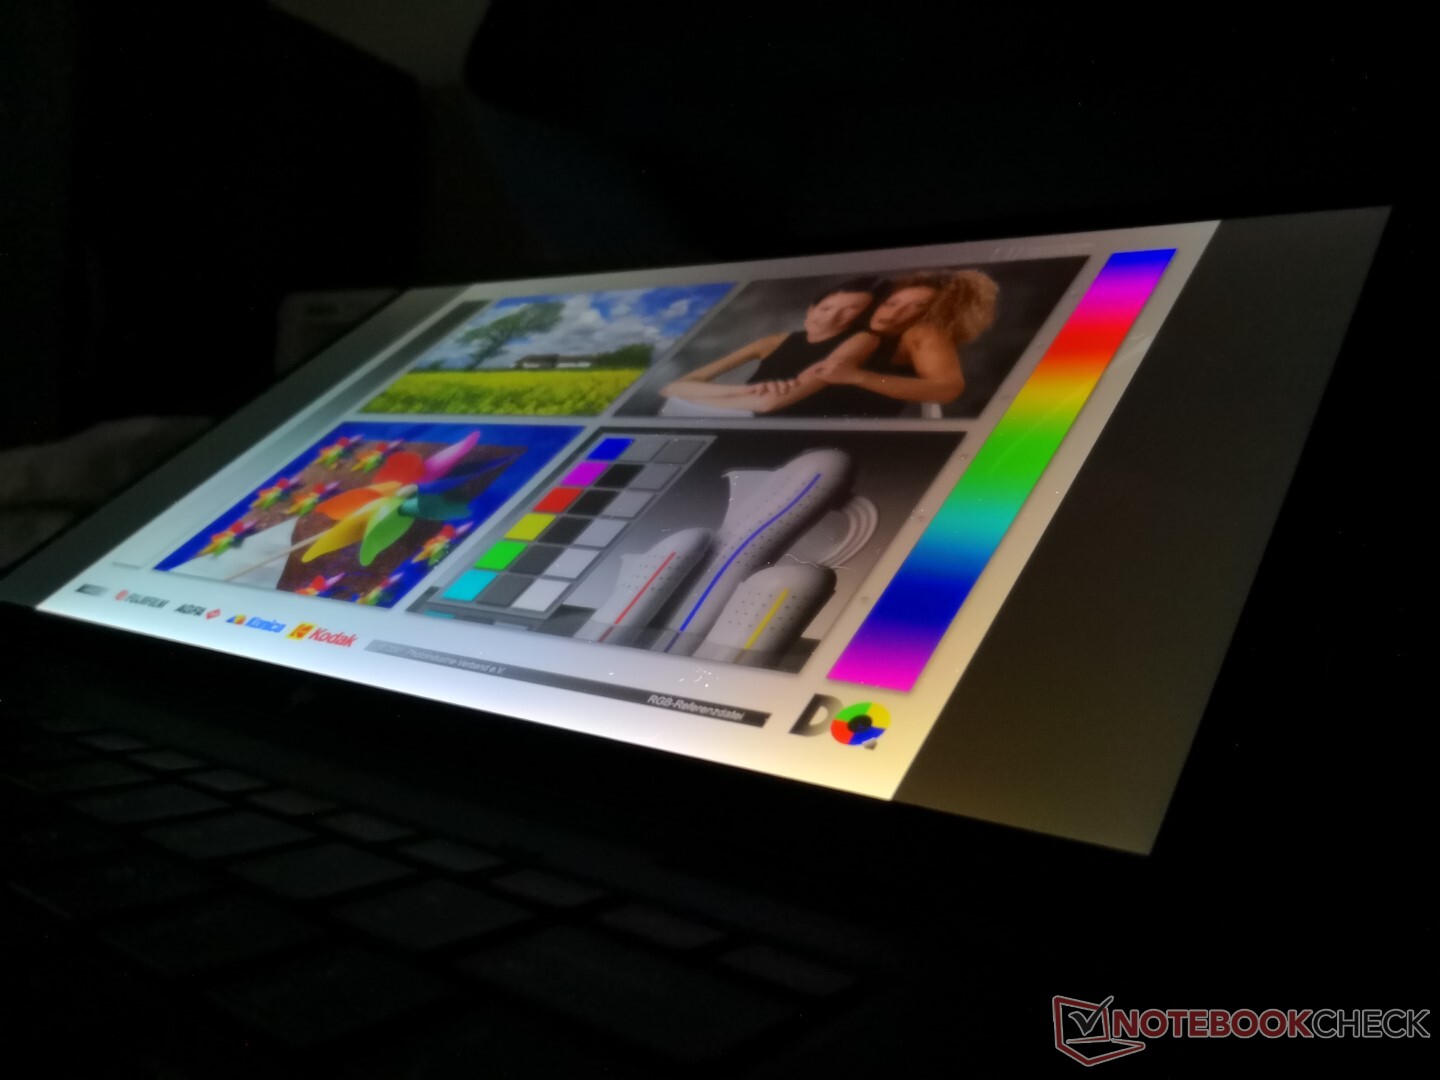
Display: Sure View has its Downsides
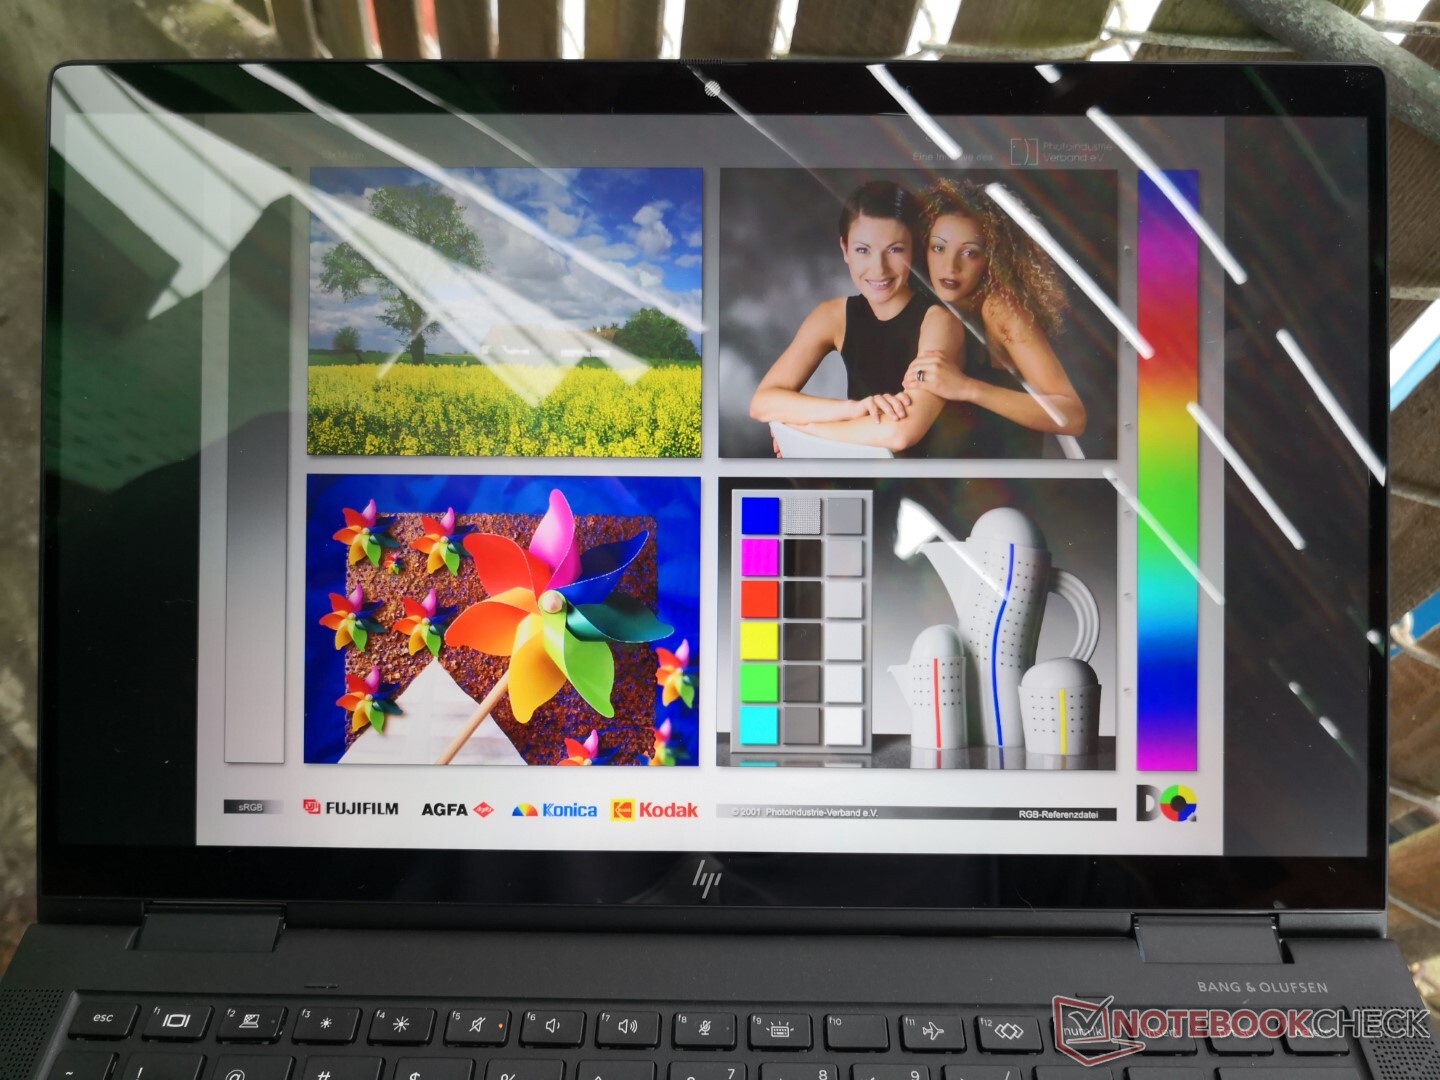
Interestingly, the Dragonfly Max uses an InfoVision IPS panel instead of the AU Optronics one as found on the original Dragonfly. HP says the low blue light filter for reducing eyestrain is exclusive to the Dragonfly Max similar to what Dell offers for some of its XPS laptops. Innate characteristics like response times, contrast ratio, and color coverage are otherwise nearly identical between the Dragonfly Max and original Dragonfly.
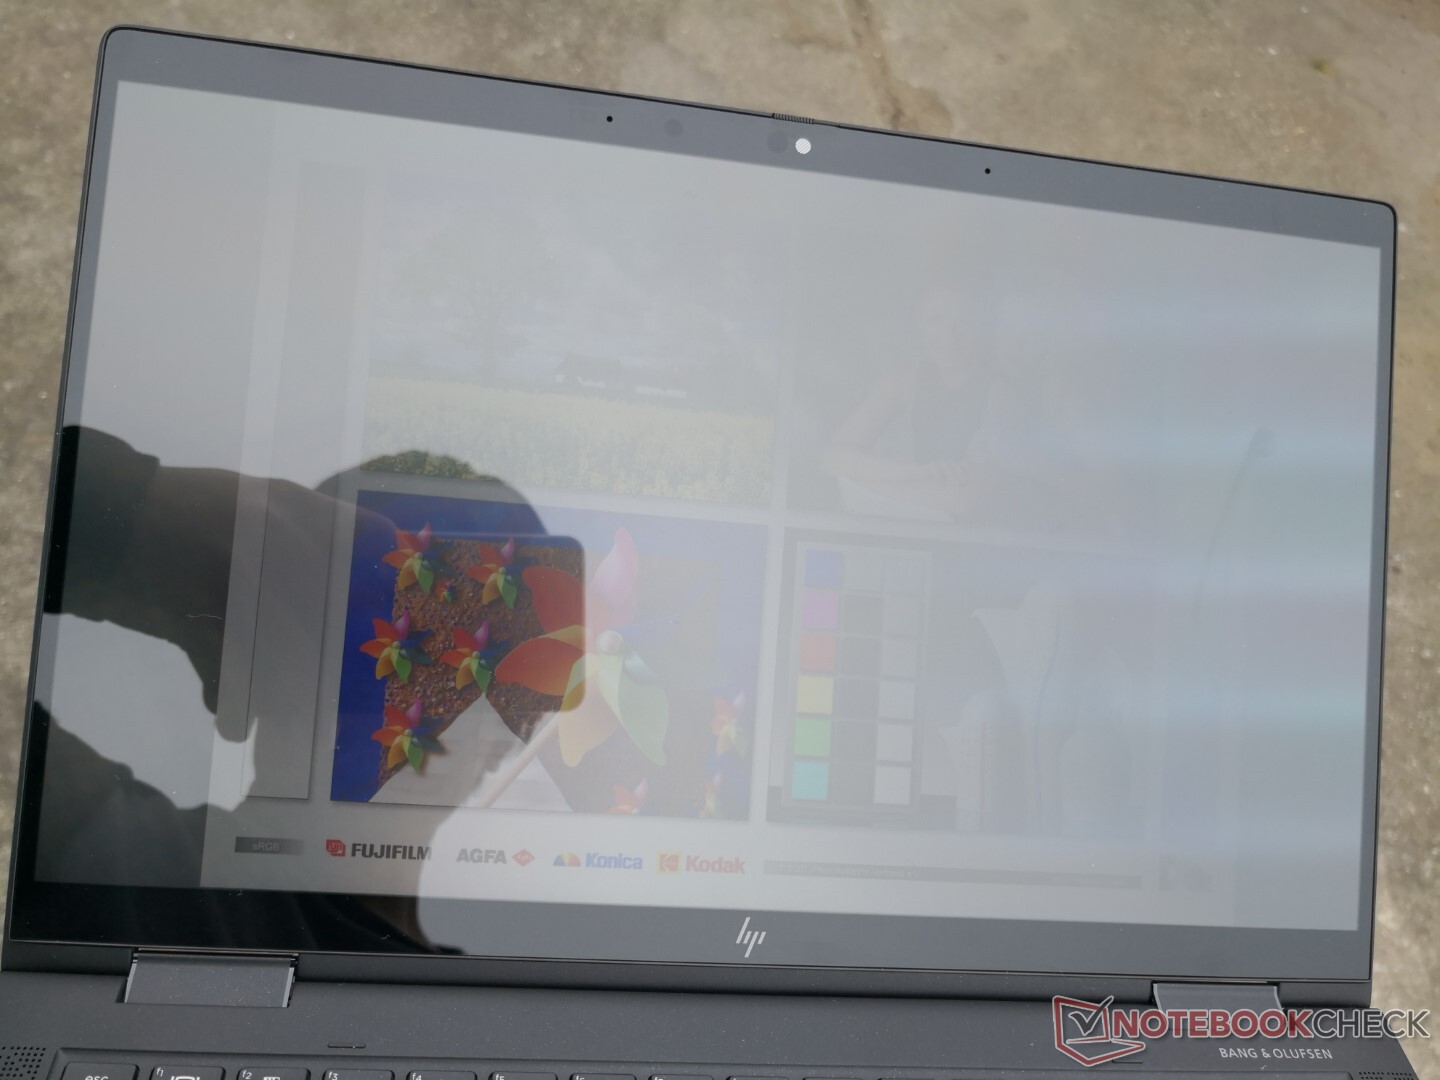
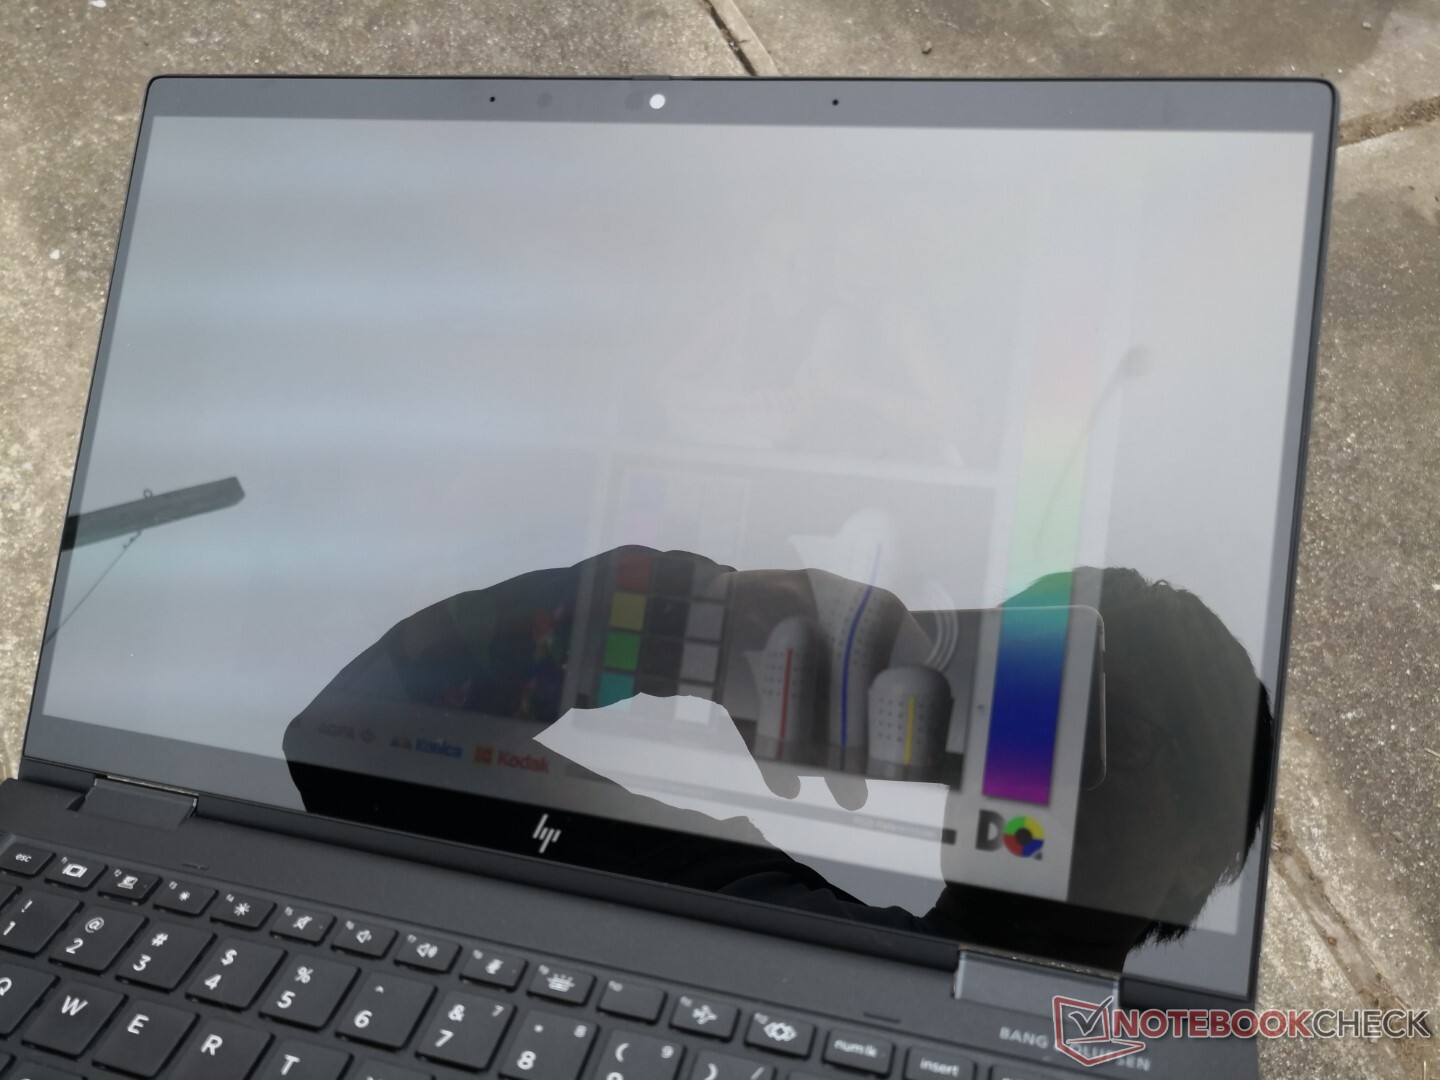
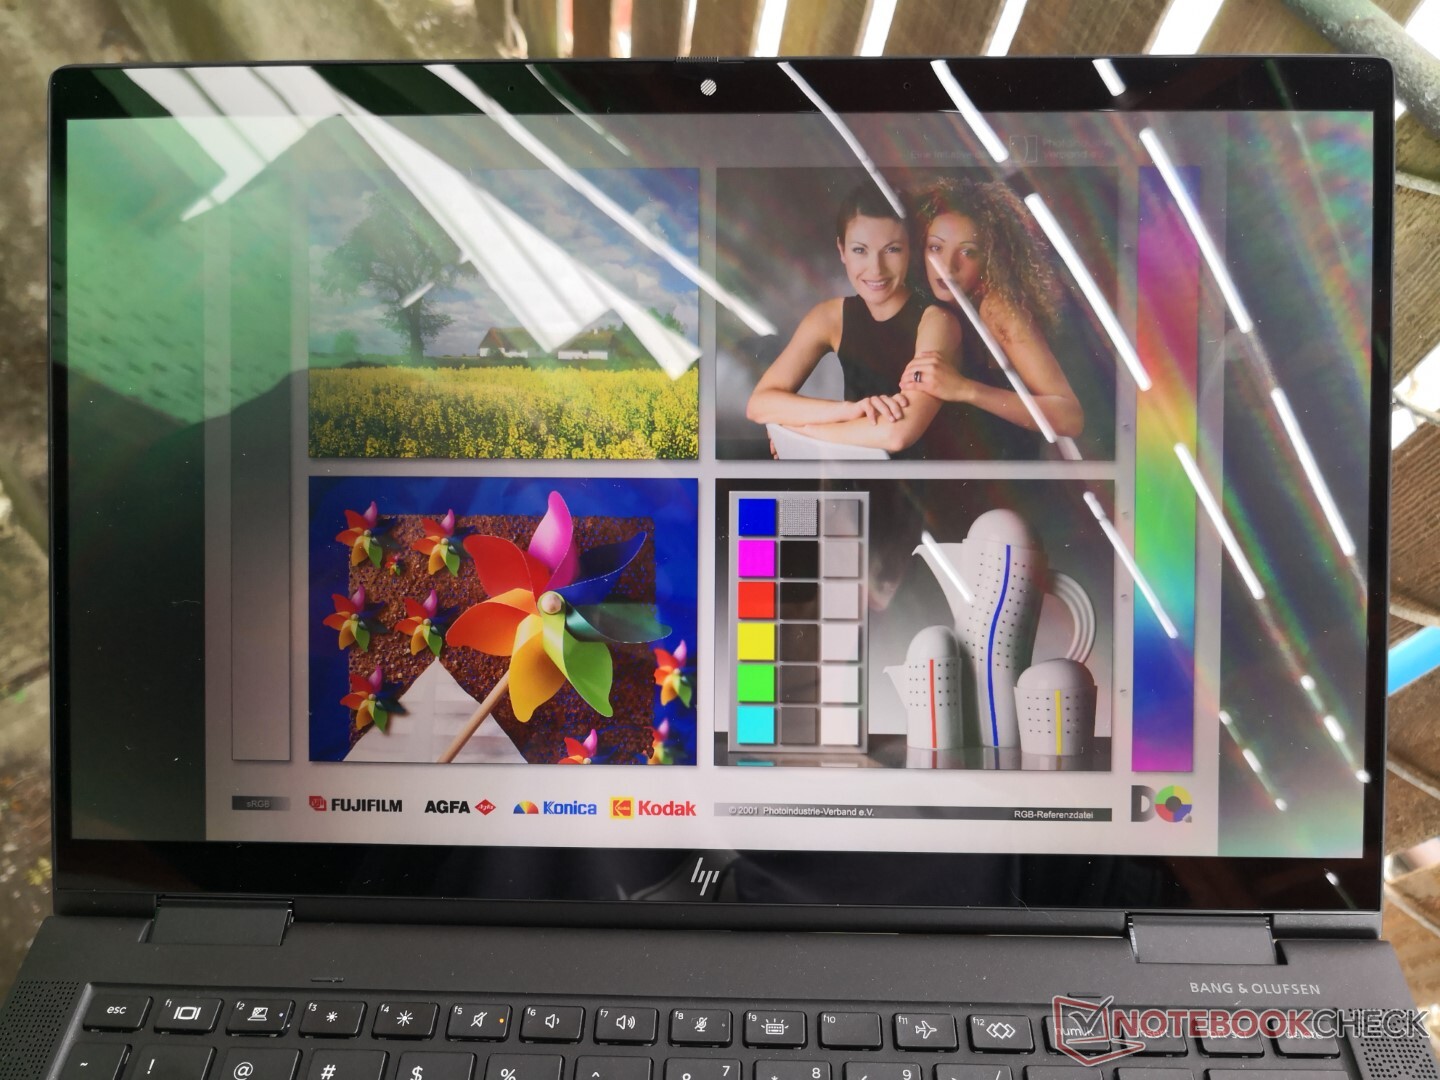
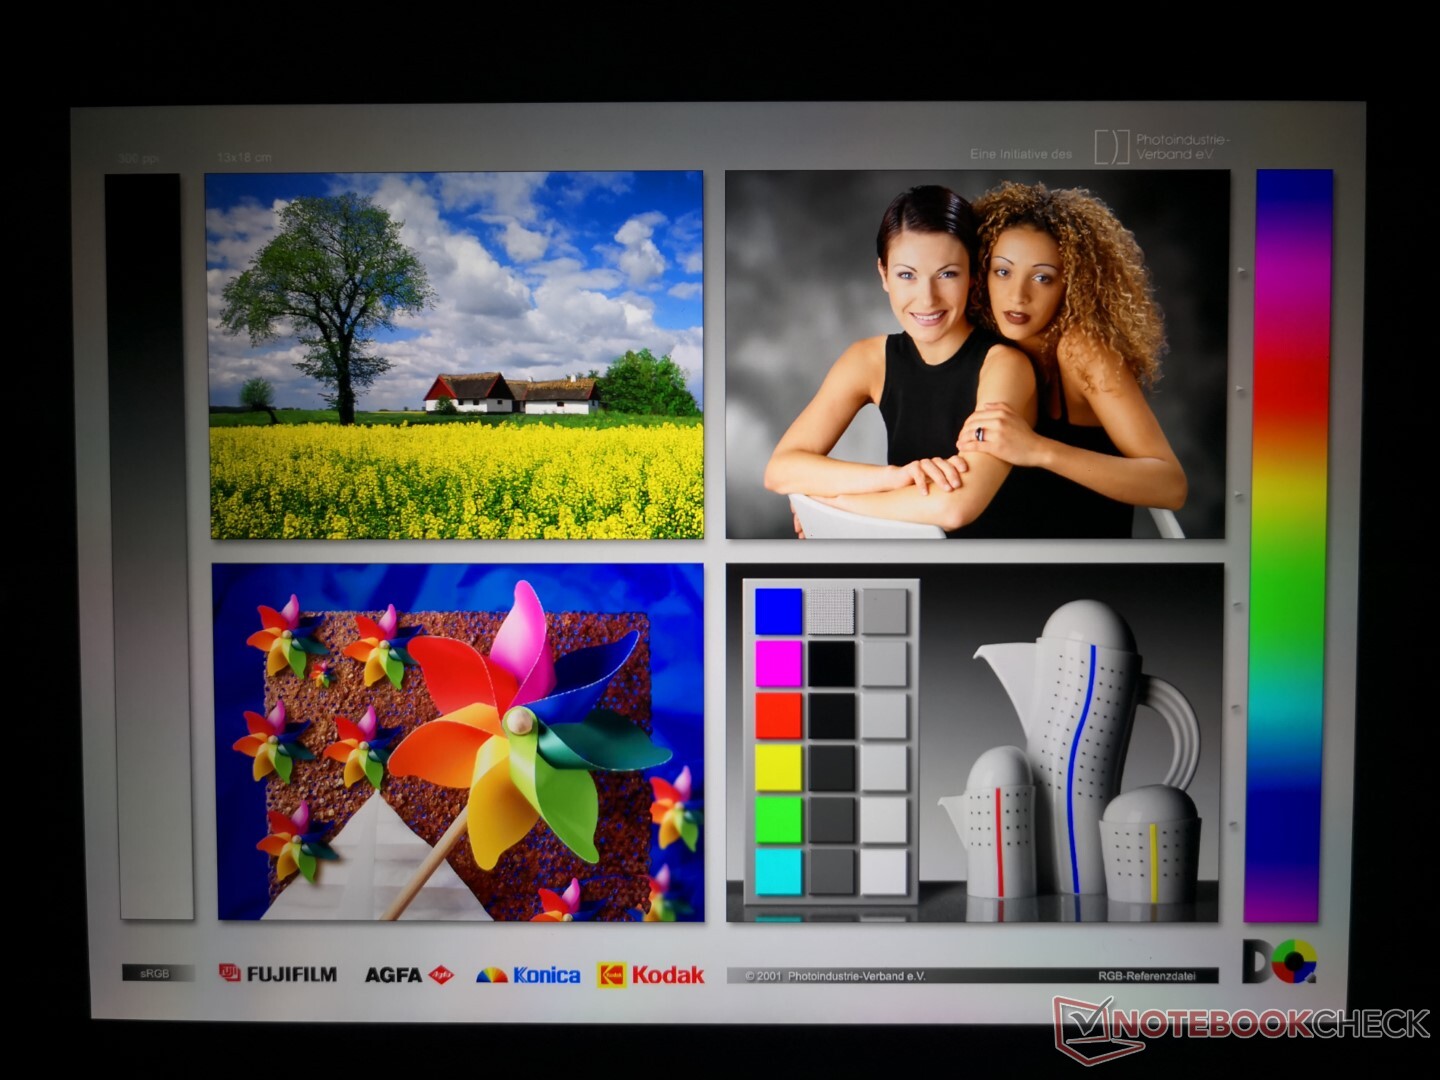
Image quality leaves a lot to be desired. While glossy displays are normally known for offering sharp texts and images, the Dragonfly Max incorporates an additional Sure View layer to limit viewing angles for privacy concerns. This layer has an unfortunate side effect of blurring the underlying pixels for blurrier texts and images. Its impact on display quality isn't minor either as we can immediately see how much cleaner and crisper competing laptops like the Dell XPS 13 can be. Even the glossy Sure View-free Spectre x360 13 can provide a much cleaner image than what our Dragonfly Max is capable of.
Keep in mind that the advertised 1000-nit brightness of our test unit is the official rating for the backlight before factoring in the Sure View layer, RGB layer, and Gorilla Glass overlay. Actual brightness is closer to the 700-nit to 800-nit range as a result when Sure View is off. Enabling Sure View will drop display brightness even further.


| |||||||||||||||||||||||||
Brightness Distribution: 75 %
Center on Battery: 777.5 cd/m²
Contrast: 1767:1 (Black: 0.44 cd/m²)
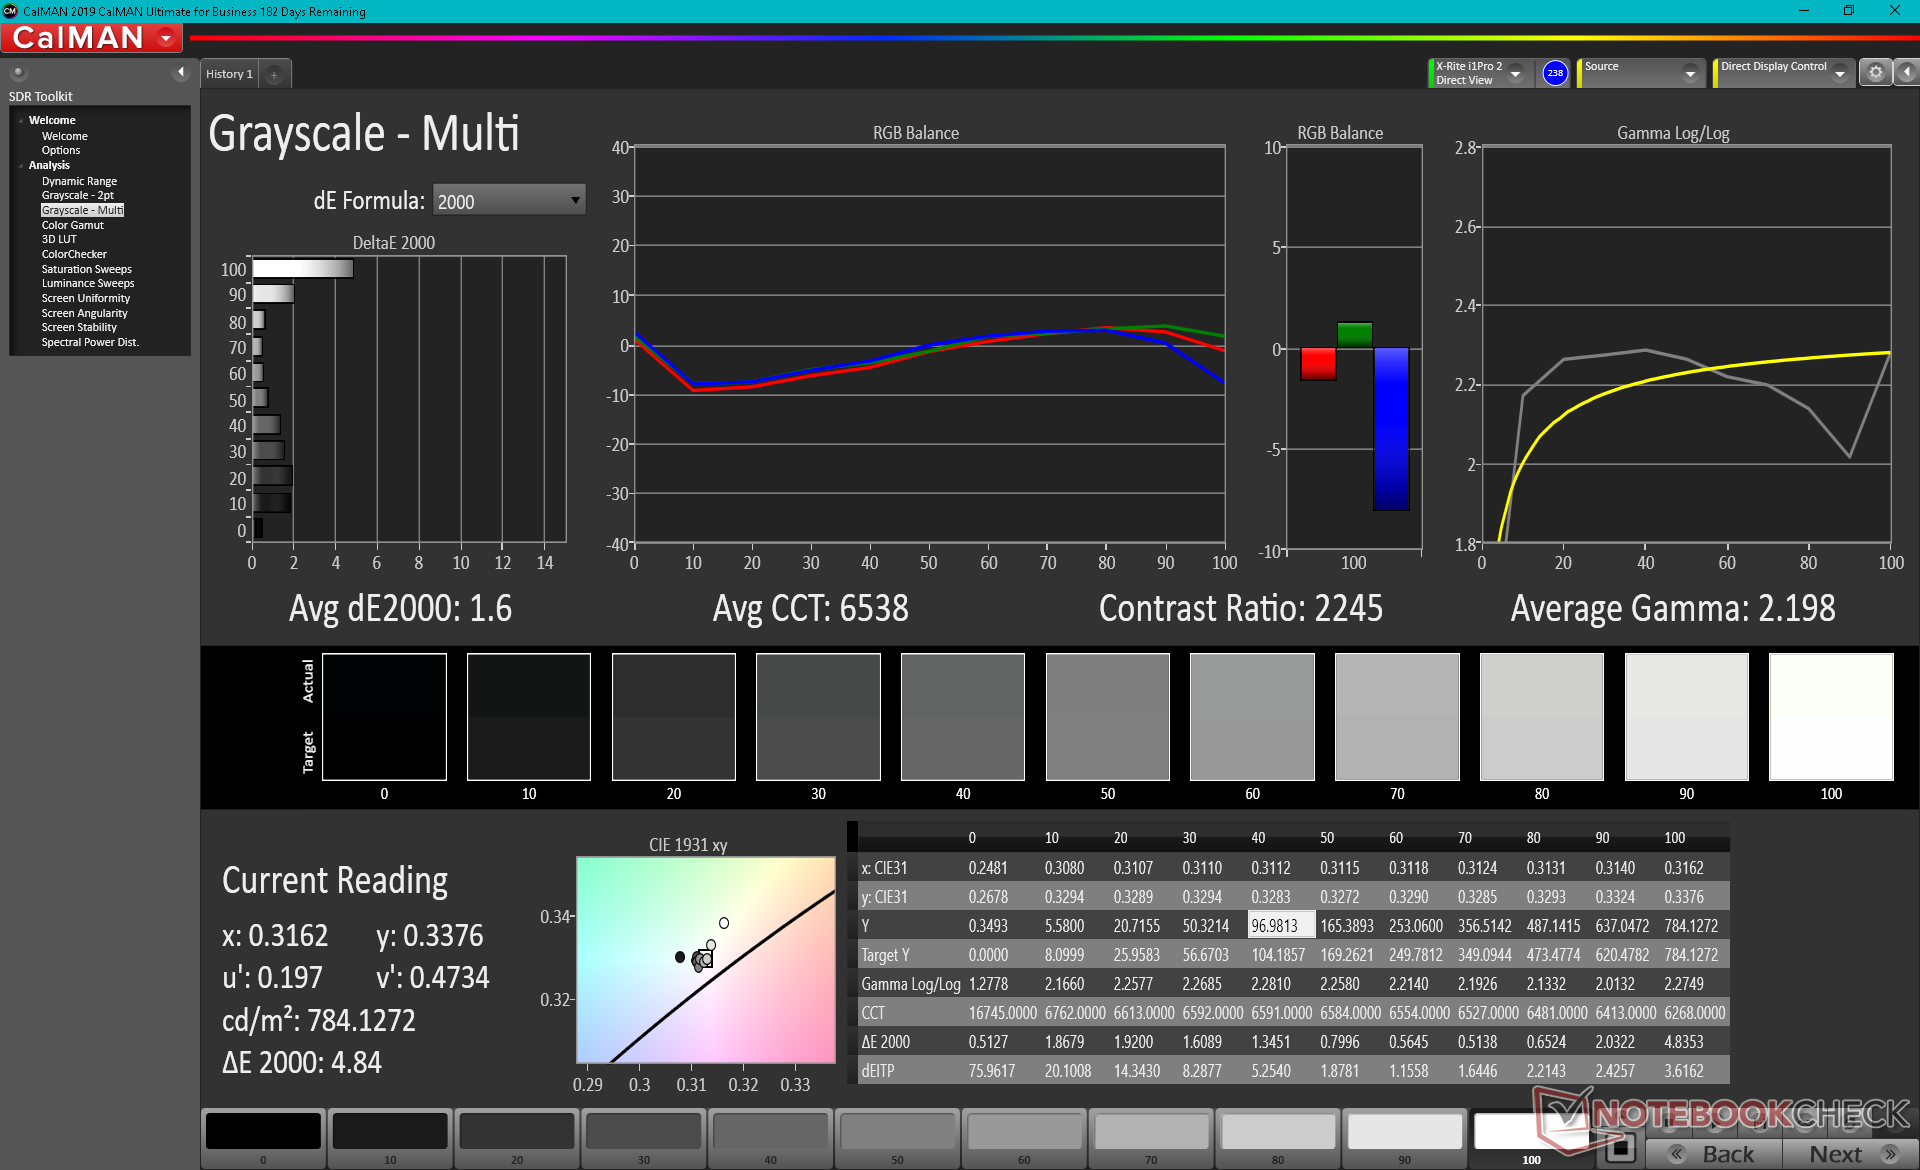
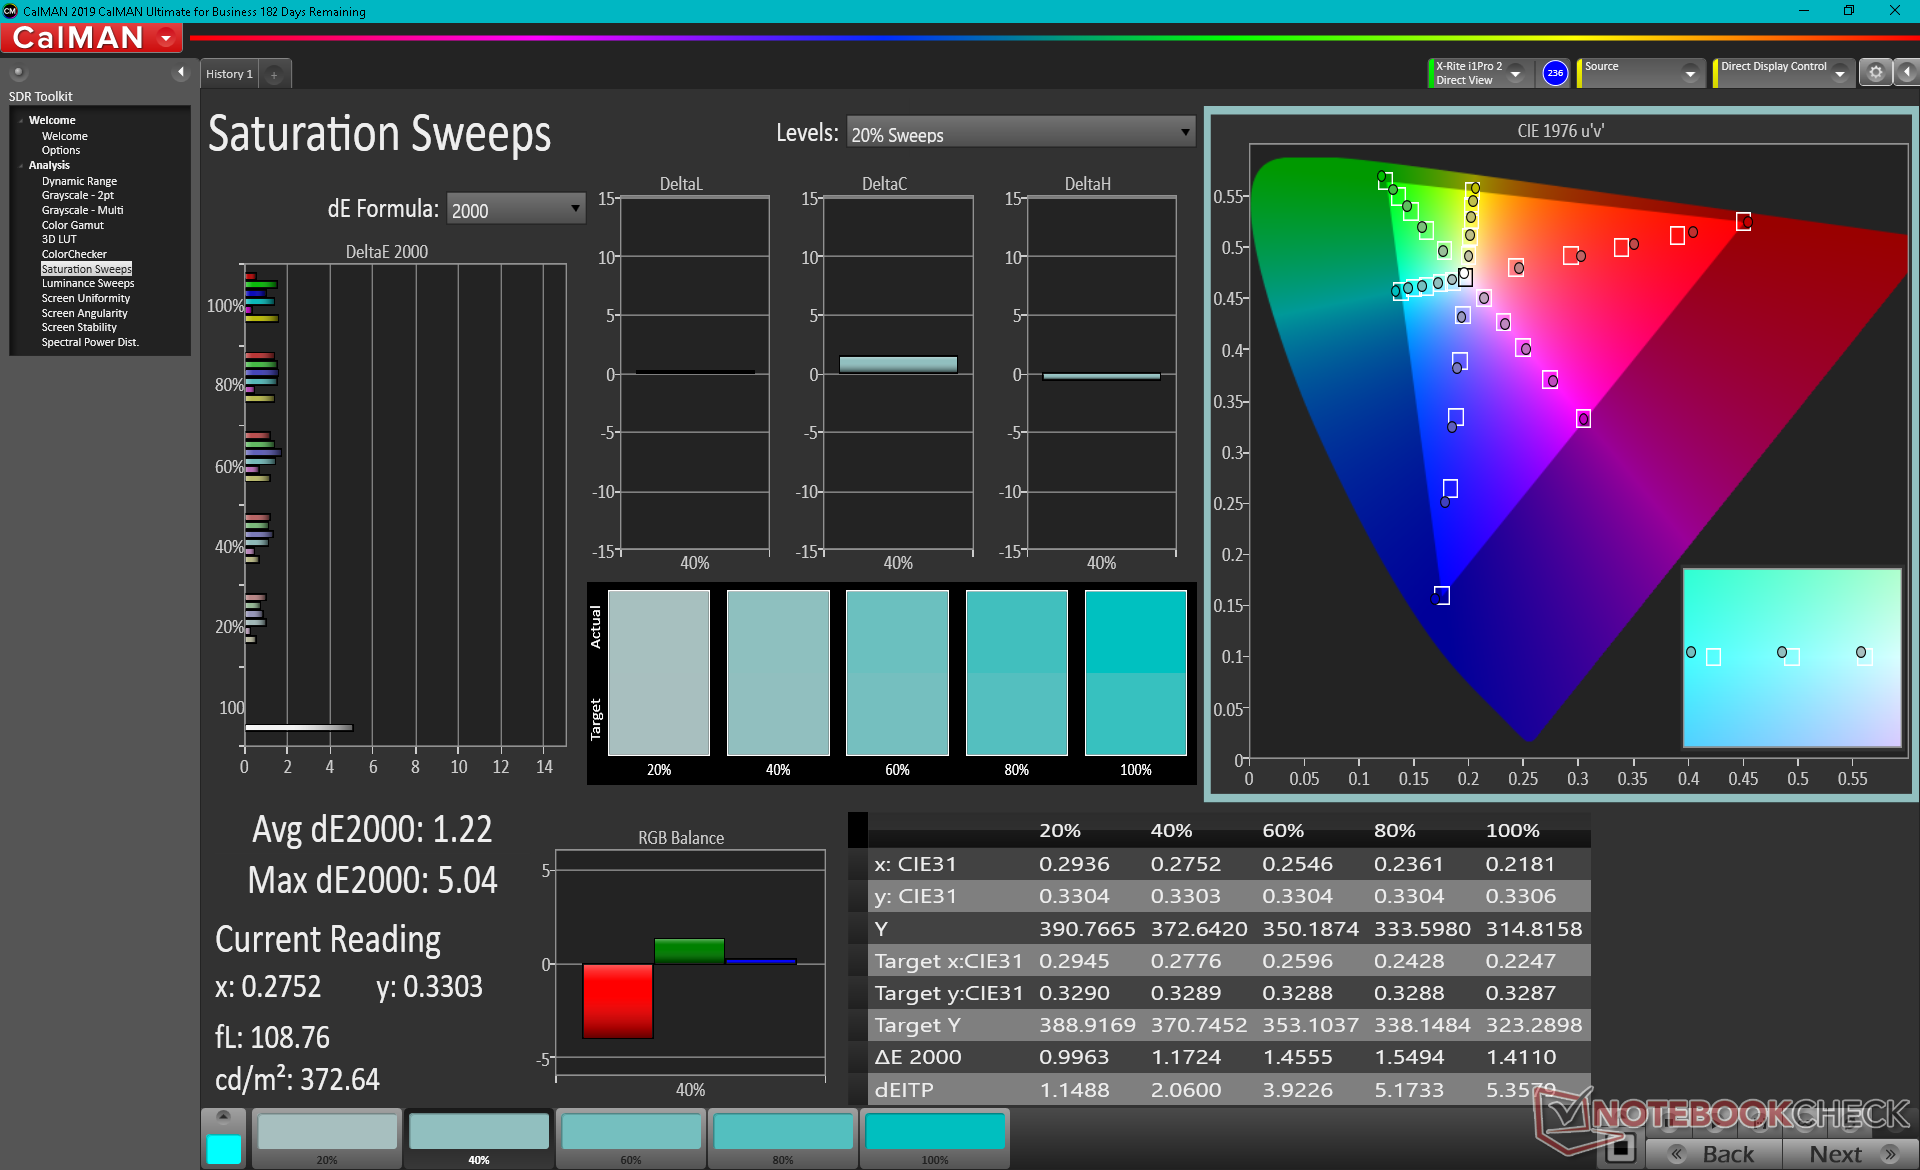
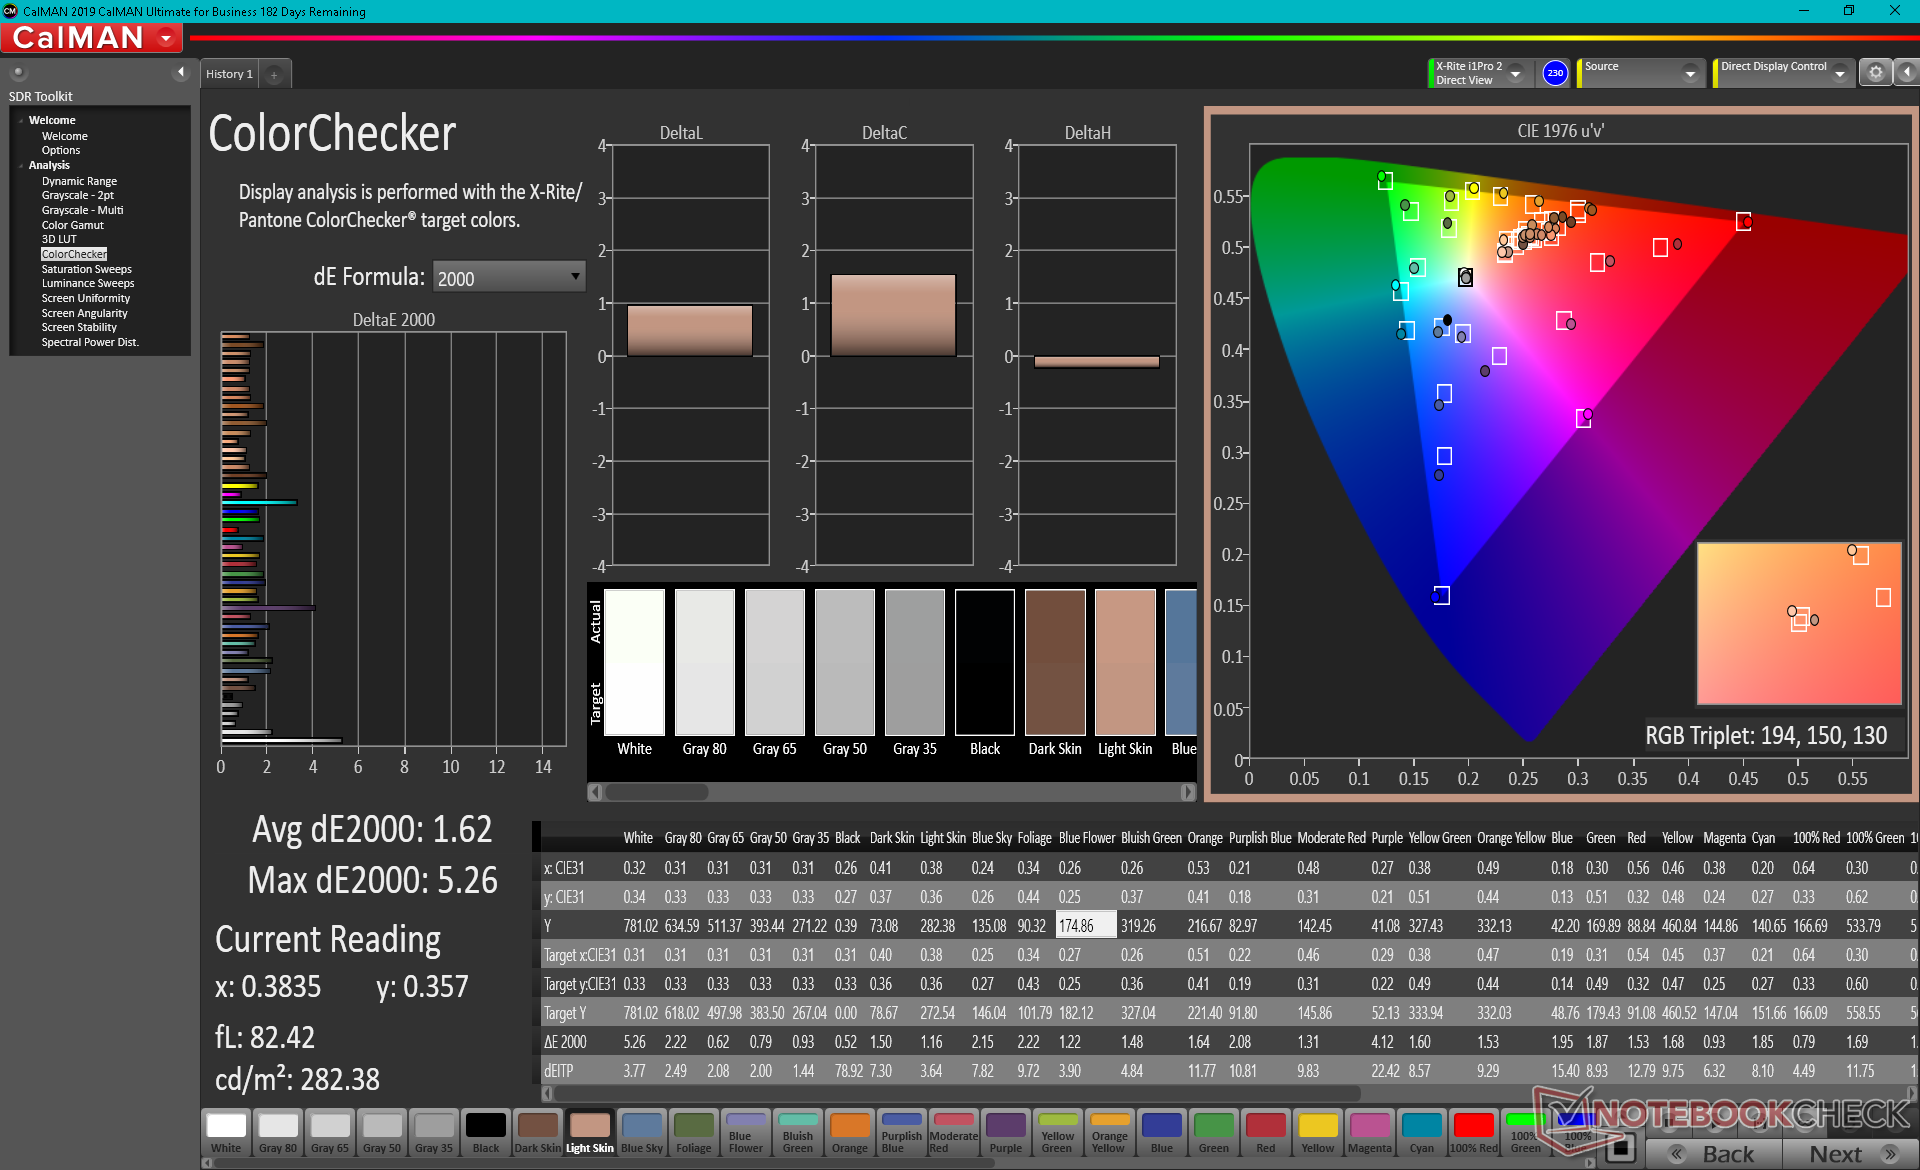
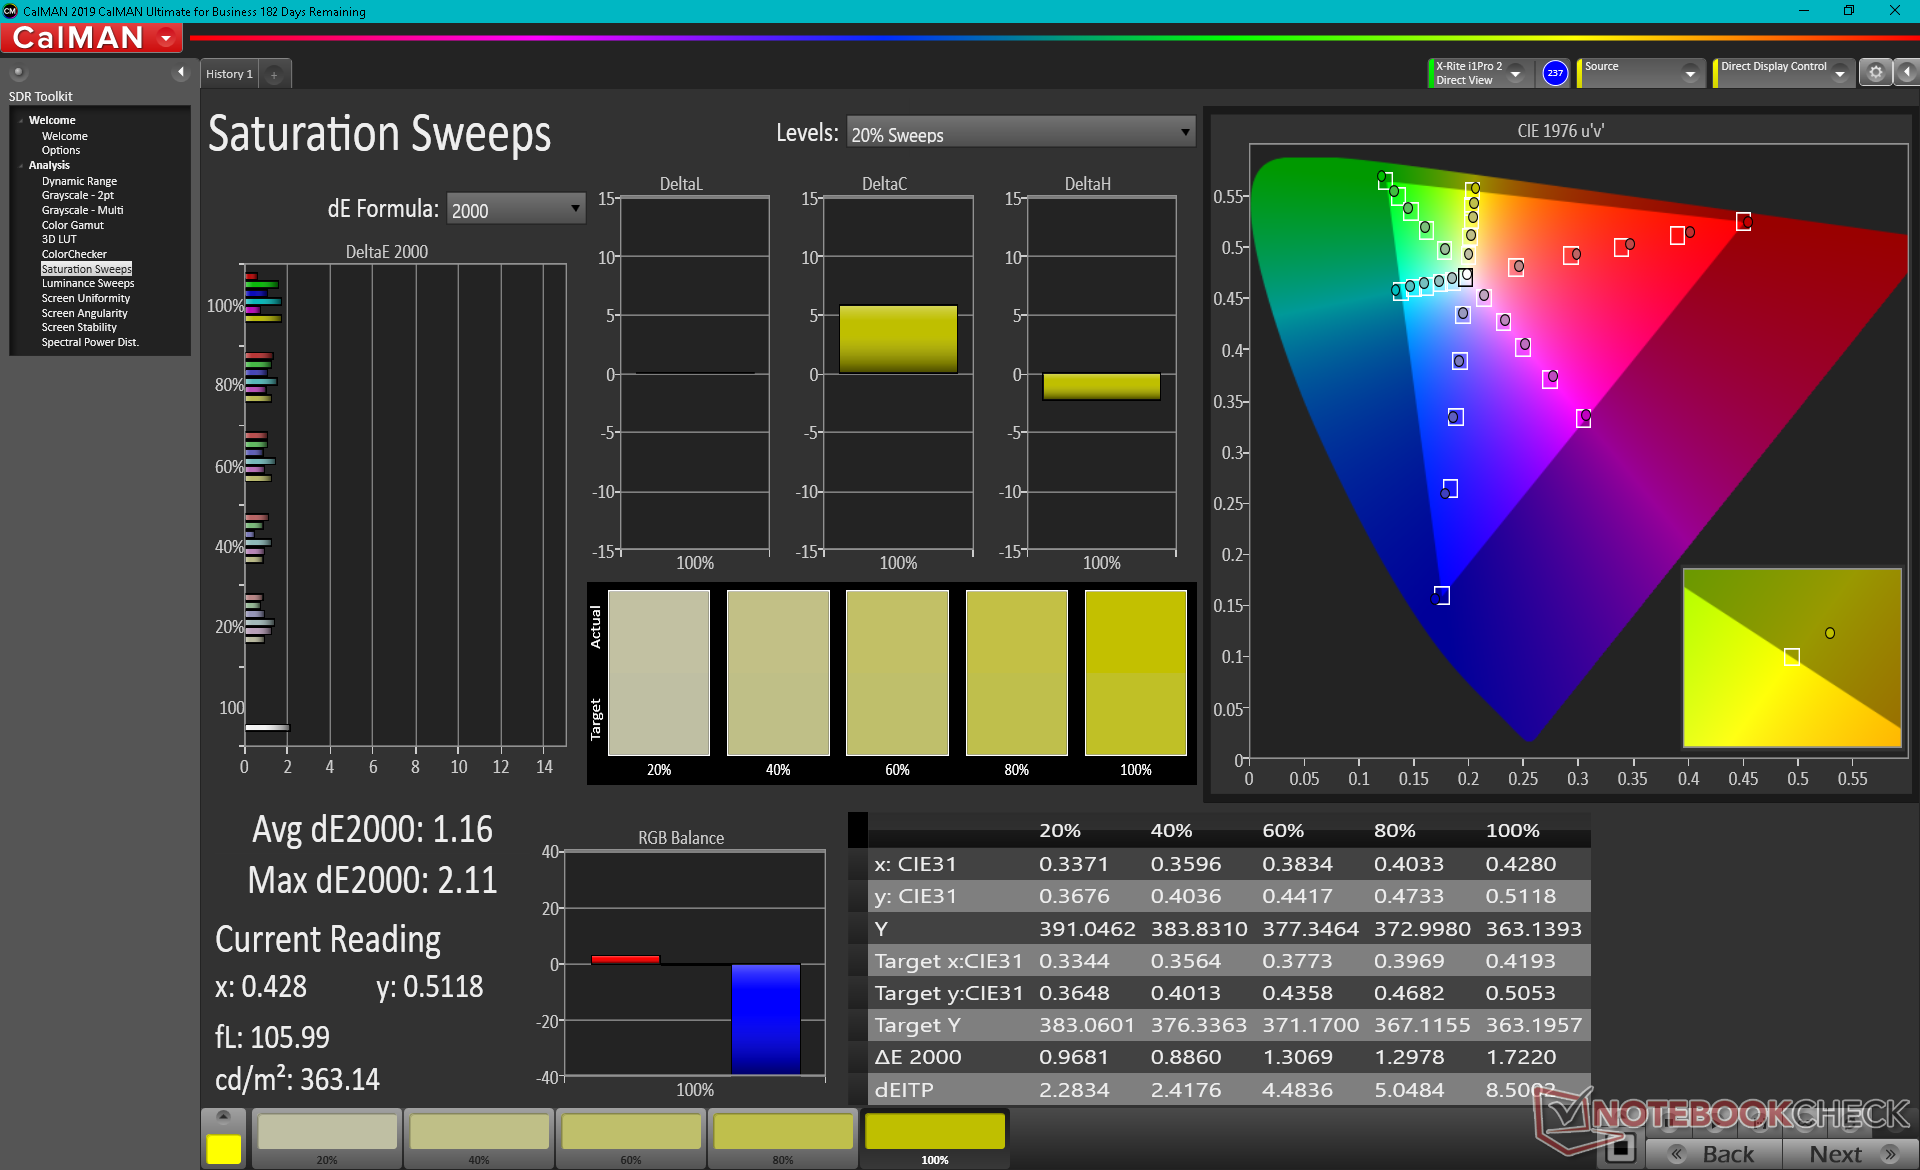
ΔE ColorChecker Calman: 1.62 | ∀{0.5-29.43 Ø4.73}
calibrated: 1.32
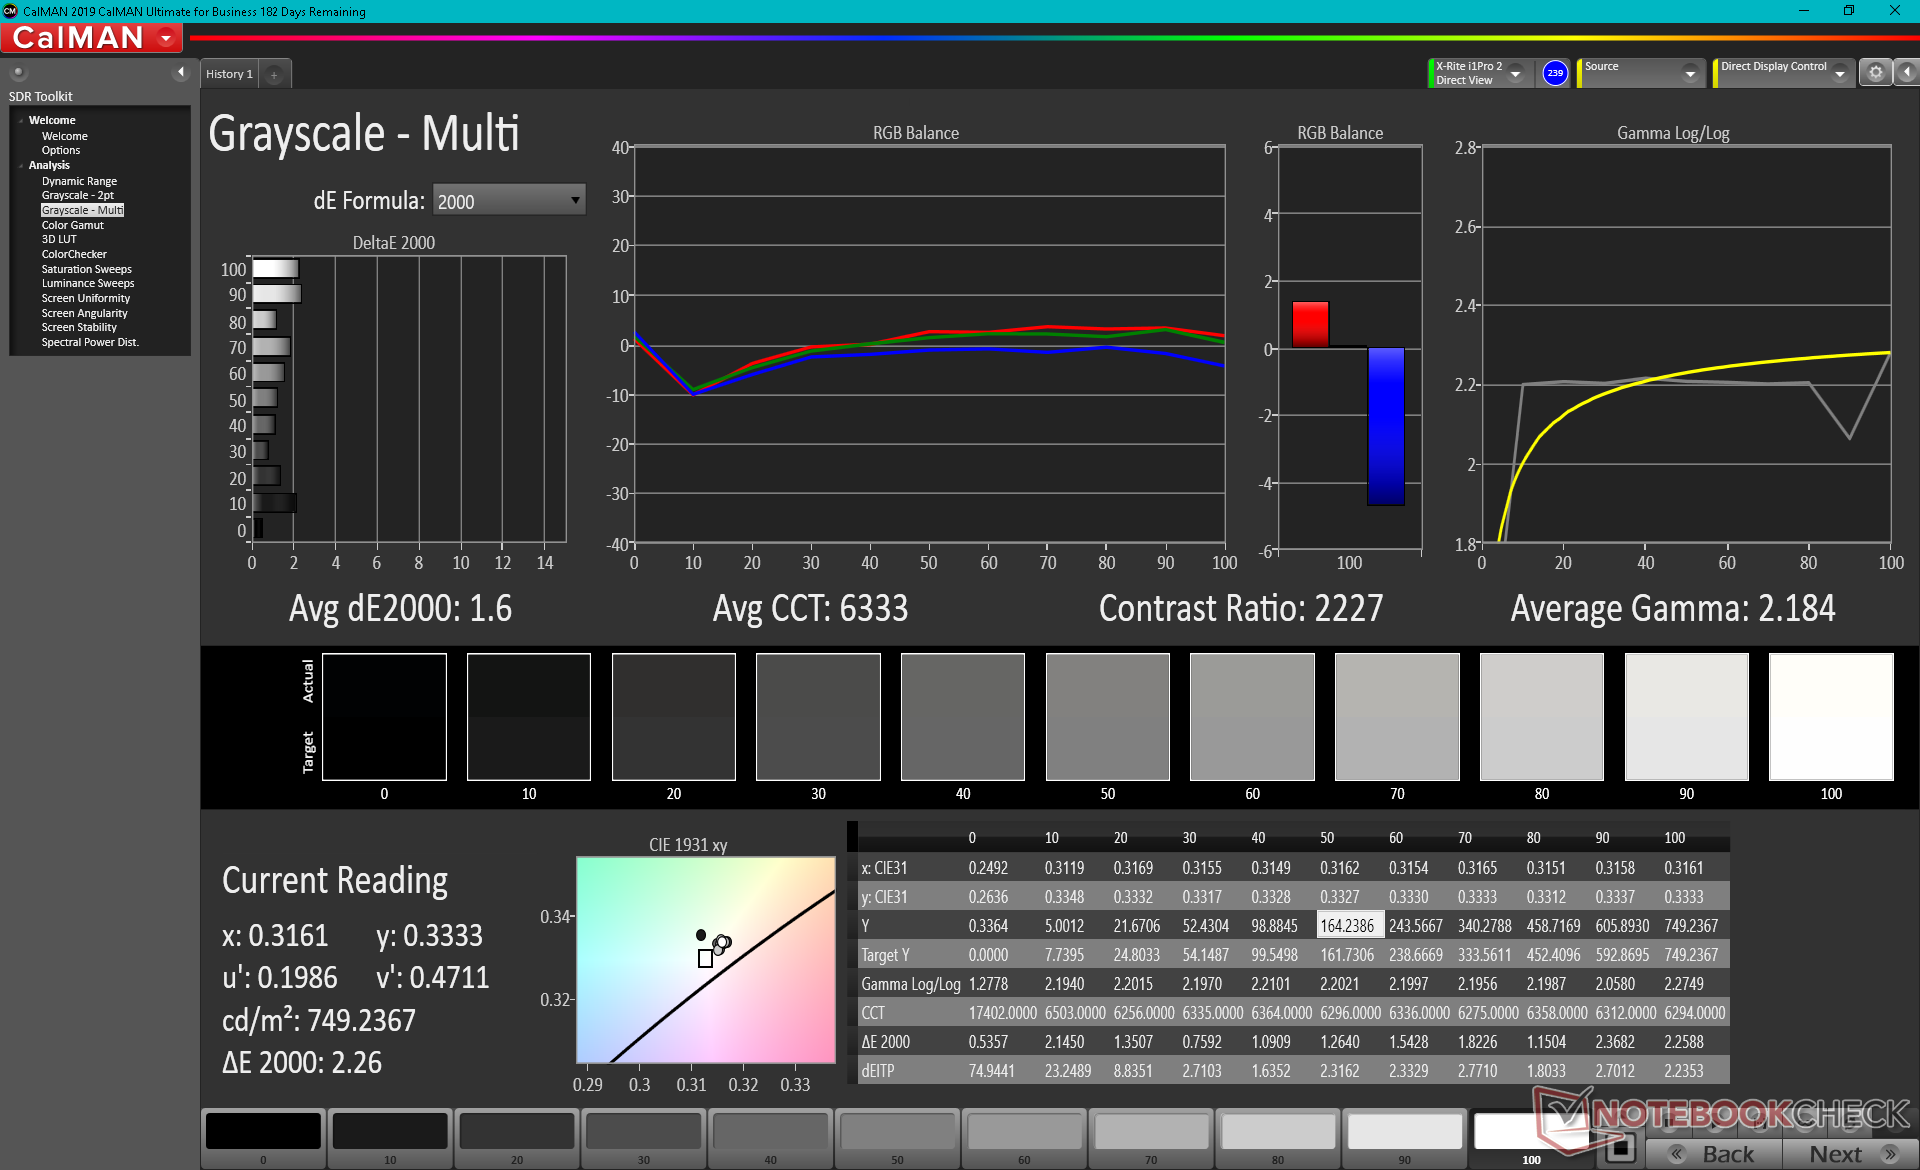
ΔE Greyscale Calman: 1.6 | ∀{0.09-98 Ø4.97}
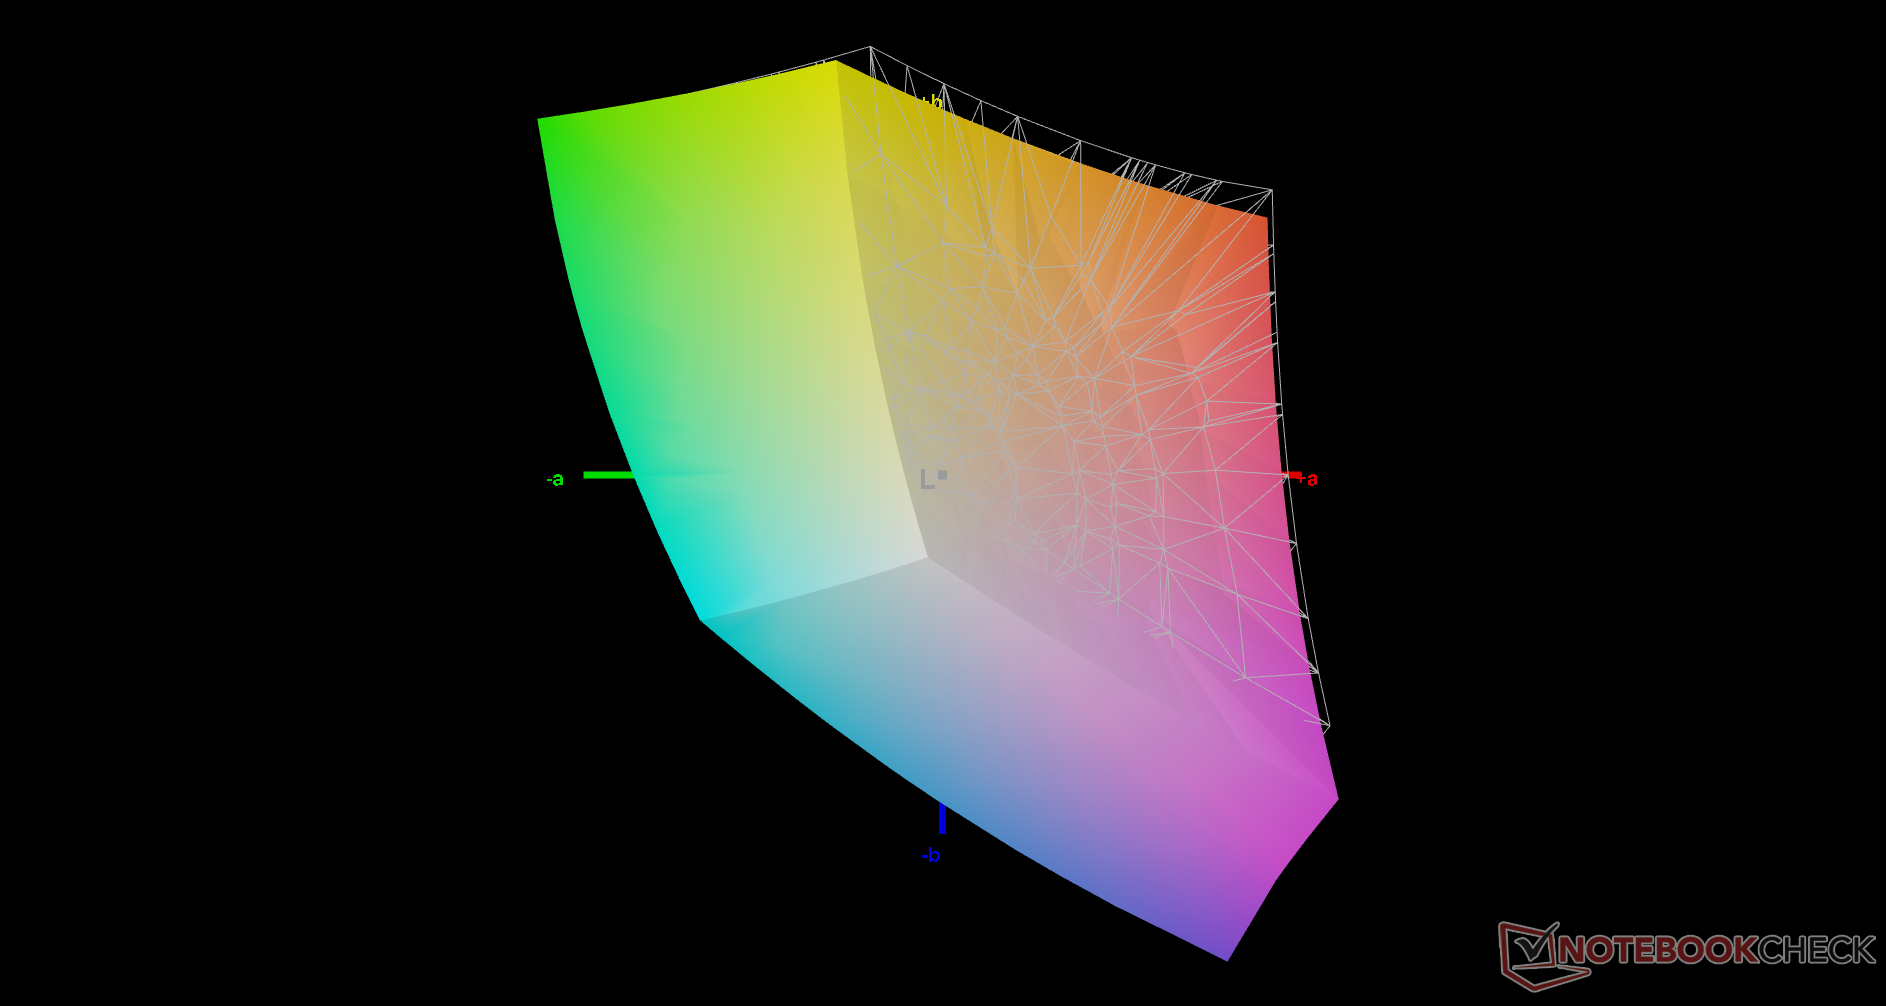
94.8% sRGB (Argyll 1.6.3 3D)
72.3% AdobeRGB 1998 (Argyll 1.6.3 3D)
Gamma: 2.2
CCT: 6538 K
| HP Elite Dragonfly Max InfoVision X133NVFL R0, IPS, 13.3", 1920x1080 | HP Spectre x360 13-aw2003dx Samsung SDC4149, OLED, 13.3", 3840x2160 | Lenovo ThinkPad X13 Yoga G2 LP133WQ1-SPF2, IPS LED, 13.3", 2560x1600 | MSI Summit E13 Flip Evo A11MT Sharp LQ134N1JW53, IPS, 13.4", 1920x1200 | Asus ZenBook Flip S UX371 SDC4147, OLED, 13.3", 3840x2160 | HP Elite Dragonfly-8MK79EA AUO5E2D, IPS, 13.3", 1920x1080 | |
|---|---|---|---|---|---|---|
| Display | ||||||
| Display P3 Coverage (%) | 70 | 68.3 | 69.8 | 99.9 | 69 | |
| sRGB Coverage (%) | 88.5 | 99.1 | 98.8 | 100 | 99.4 | |
| AdobeRGB 1998 Coverage (%) | 81.2 | 70.3 | 70.6 | 100 | 70.9 | |
| Response Times | 93% | -8% | -41% | 94% | -21% | |
| Response Time Grey 50% / Grey 80% * (ms) | 44.8 ? | 2.8 ? 94% | 52 ? -16% | 64 ? -43% | 2 ? 96% | 60.8 ? -36% |
| Response Time Black / White * (ms) | 32 ? | 2.8 ? 91% | 32 ? -0% | 44 ? -38% | 2.8 ? 91% | 33.8 ? -6% |
| PWM Frequency (Hz) | 242.7 ? | 59.5 ? | ||||
| Screen | -96% | 9% | 0% | -30% | -4% | |
| Brightness middle (cd/m²) | 777.5 | 355 -54% | 460 -41% | 551.3 -29% | 365 -53% | 411 -47% |
| Brightness (cd/m²) | 727 | 368 -49% | 423 -42% | 517 -29% | 372 -49% | 388 -47% |
| Brightness Distribution (%) | 75 | 93 24% | 85 13% | 91 21% | 91 21% | 87 16% |
| Black Level * (cd/m²) | 0.44 | 0.33 25% | 0.37 16% | 0.03 93% | 0.22 50% | |
| Contrast (:1) | 1767 | 1394 -21% | 1490 -16% | 12167 589% | 1868 6% | |
| Colorchecker dE 2000 * | 1.62 | 5.74 -254% | 1 38% | 1.45 10% | 7.6 -369% | 1.8 -11% |
| Colorchecker dE 2000 max. * | 5.26 | 9.52 -81% | 1.5 71% | 2.86 46% | 12.9 -145% | 4.1 22% |
| Colorchecker dE 2000 calibrated * | 1.32 | 6.69 -407% | 0.8 39% | 1.7 -29% | 4.1 -211% | 1 24% |
| Greyscale dE 2000 * | 1.6 | 2.2 -38% | 1.2 25% | 1.3 19% | 5.4 -238% | 2.5 -56% |
| Gamma | 2.2 100% | 2.03 108% | 2.26 97% | 2.14 103% | 1.6 138% | 2.26 97% |
| CCT | 6538 99% | 6505 100% | 6652 98% | 6580 99% | 6327 103% | 6448 101% |
| Color Space (Percent of AdobeRGB 1998) (%) | 72.3 | 73.6 2% | 64.4 -11% | 65 -10% | 92 27% | 64.7 -11% |
| Color Space (Percent of sRGB) (%) | 94.8 | 88.6 -7% | 99.12 5% | 99 4% | 100 5% | 99.3 5% |
| Total Average (Program / Settings) | -2% /
-62% | 1% /
7% | -21% /
-6% | 32% /
-11% | -13% /
-7% |
* ... smaller is better
Color space covers essentially all of sRGB to be in line with most mid-range to high-end Ultrabooks. For AdobeRGB or DCI-P3, users will have to consider the Spectre or Envy series instead as the Dragonfly is lacking these options.
The display is well-calibrated out of the box with very low average deltaE values and a nearly perfect gamma of 2.198 in spite of our Sure View comments above. End-user calibration is not necessary as any changes would be minimal as shown by our CalMan results below.
Display Response Times
| ↔ Response Time Black to White | ||
|---|---|---|
| 32 ms ... rise ↗ and fall ↘ combined | ↗ 18.8 ms rise | 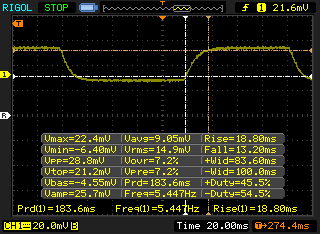 |
| ↘ 13.2 ms fall | ||
| The screen shows slow response rates in our tests and will be unsatisfactory for gamers. In comparison, all tested devices range from 0.1 (minimum) to 240 (maximum) ms. » 86 % of all devices are better. This means that the measured response time is worse than the average of all tested devices (19.9 ms). | ||
| ↔ Response Time 50% Grey to 80% Grey | ||
| 44.8 ms ... rise ↗ and fall ↘ combined | ↗ 20.4 ms rise | 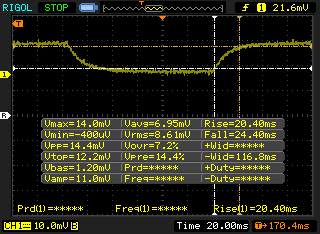 |
| ↘ 24.4 ms fall | ||
| The screen shows slow response rates in our tests and will be unsatisfactory for gamers. In comparison, all tested devices range from 0.165 (minimum) to 636 (maximum) ms. » 76 % of all devices are better. This means that the measured response time is worse than the average of all tested devices (31.1 ms). | ||
Screen Flickering / PWM (Pulse-Width Modulation)
| Screen flickering / PWM not detected | 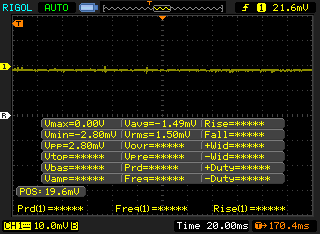 | ||
In comparison: 52 % of all tested devices do not use PWM to dim the display. If PWM was detected, an average of 7784 (minimum: 5 - maximum: 343500) Hz was measured. | |||
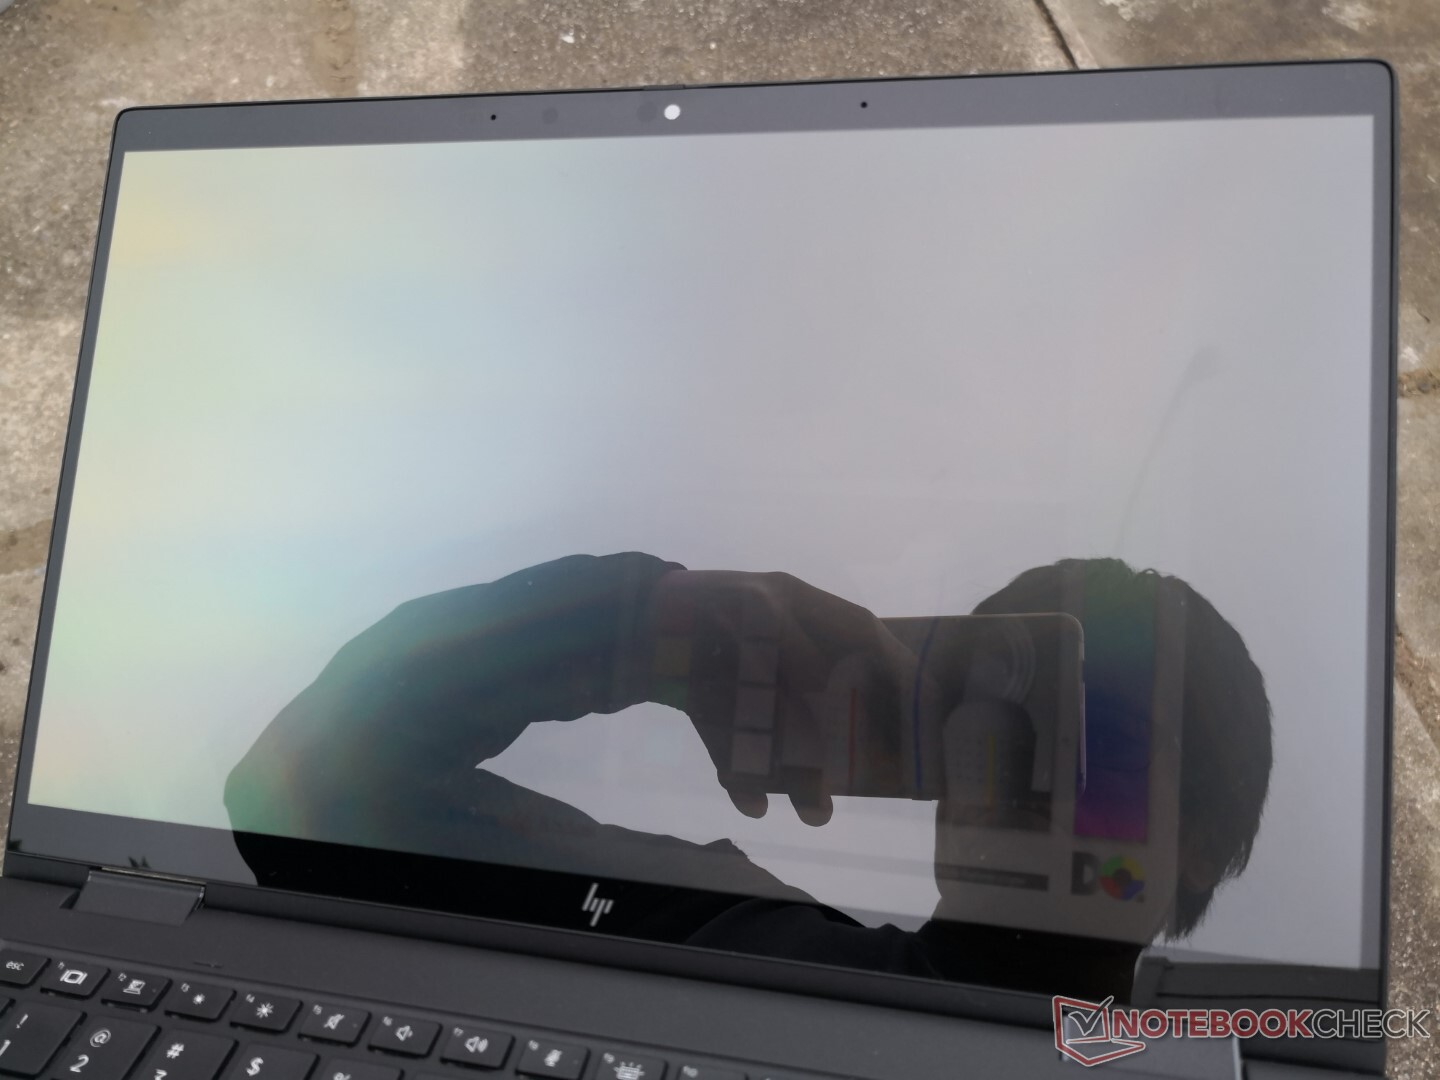
Viewing angles and outdoor visibility are not as good as we had hoped despite the bright backlight. The Sure View filter impacts viewing angles so strongly that even the main user might have a hard time seeing everything on the display clearly. Not only is glare very noticeable, but everything becomes white and illegible if the screen is turned by just a slight angle. You'd be better off with a 400-nit or 500-nit display without Sure View than a 1000-nit display with Sure View if outdoor visibility is a concern.
Performance: 11th Gen Tiger Lake with iris Xe
All SKUs come with either the Core i7-1165G7 or Core i7-1185G7 vPro and nothing less. High-end HP laptops like the Dragonfly continue to support Intel CPUs only; for AMD Ryzen options, users will have to look at lesser Envy or clamshell EliteBook models instead.
Our unit was set to Best Performance mode prior to running any performance benchmarks below for the highest possible scores. The system comes with HP Context Aware which will automatically reduce performance if the laptop is not on a flat table. HP says this feature will be disabled if the Windows performance slider is set to Best Performance.
Processor
Raw multi-thread performance is below average with CineBench xT scores that are 30 percent slower than the average laptop with the same Core i7-1185G7 CPU. It's still a significant leap over the older Whiskey Lake-U options on last year's Dragonfly, but it's not as big of a difference as it could have been.
Single-thread performance remains excellent and faster than most other U-series laptops as per usual for Intel CPUs.
Cinebench R23: Multi Core | Single Core
Cinebench R15: CPU Multi 64Bit | CPU Single 64Bit
Blender: v2.79 BMW27 CPU
7-Zip 18.03: 7z b 4 -mmt1 | 7z b 4
Geekbench 5.5: Single-Core | Multi-Core
HWBOT x265 Benchmark v2.2: 4k Preset
LibreOffice : 20 Documents To PDF
R Benchmark 2.5: Overall mean
| Cinebench R23 / Multi Core | |
| Lenovo IdeaPad 5 14ALC05 82LM005YGE | |
| Average Intel Core i7-1185G7 (3610 - 6383, n=24) | |
| HP Spectre x360 13-aw2003dx | |
| Lenovo ThinkPad X13 Yoga G2 | |
| HP Elite Dragonfly Max | |
| Cinebench R23 / Single Core | |
| Average Intel Core i7-1185G7 (1251 - 1532, n=24) | |
| HP Elite Dragonfly Max | |
| HP Spectre x360 13-aw2003dx | |
| Lenovo ThinkPad X13 Yoga G2 | |
| Lenovo IdeaPad 5 14ALC05 82LM005YGE | |
| Geekbench 5.5 / Single-Core | |
| HP Elite Dragonfly Max | |
| Average Intel Core i7-1185G7 (1398 - 1626, n=21) | |
| Lenovo ThinkPad X13 Yoga G2 | |
| HP Spectre x360 13-aw2003dx | |
| Samsung Galaxy Book Flex 13.3 | |
| Acer Spin 5 SP513-54N-79EY | |
| Lenovo IdeaPad 5 14ALC05 82LM005YGE | |
| Acer Swift 3 SF314-42-R4XJ | |
| HP Envy x360 13-ay0010nr | |
| HWBOT x265 Benchmark v2.2 / 4k Preset | |
| Lenovo IdeaPad 5 14ALC05 82LM005YGE | |
| Acer Swift 3 SF314-42-R4XJ | |
| HP Envy x360 13-ay0010nr | |
| Average Intel Core i7-1185G7 (5.02 - 8.13, n=27) | |
| HP Spectre x360 13-aw2003dx | |
| HP Elite Dragonfly Max | |
| Lenovo ThinkPad X13 Yoga G2 | |
| HP Elite Dragonfly-8MK79EA | |
| Samsung Galaxy Book Flex 13.3 | |
| LibreOffice / 20 Documents To PDF | |
| Lenovo IdeaPad 5 14ALC05 82LM005YGE | |
| HP Envy x360 13-ay0010nr | |
| Acer Swift 3 SF314-42-R4XJ | |
| Samsung Galaxy Book Flex 13.3 | |
| HP Spectre x360 13-aw2003dx | |
| Acer Spin 5 SP513-54N-79EY | |
| Average Intel Core i7-1185G7 (41.3 - 61.7, n=26) | |
| HP Elite Dragonfly Max | |
| Lenovo ThinkPad X13 Yoga G2 | |
| R Benchmark 2.5 / Overall mean | |
| Samsung Galaxy Book Flex 13.3 | |
| HP Spectre x360 13-aw2003dx | |
| Acer Swift 3 SF314-42-R4XJ | |
| HP Envy x360 13-ay0010nr | |
| Lenovo ThinkPad X13 Yoga G2 | |
| Lenovo IdeaPad 5 14ALC05 82LM005YGE | |
| HP Elite Dragonfly Max | |
| Average Intel Core i7-1185G7 (0.55 - 0.615, n=27) | |
* ... smaller is better
System Performance
PCMark scores are consistently ahead of last year's Dragonfly model especially in Digital Content Creation where the more powerful Iris Xe GPU can make the most difference.
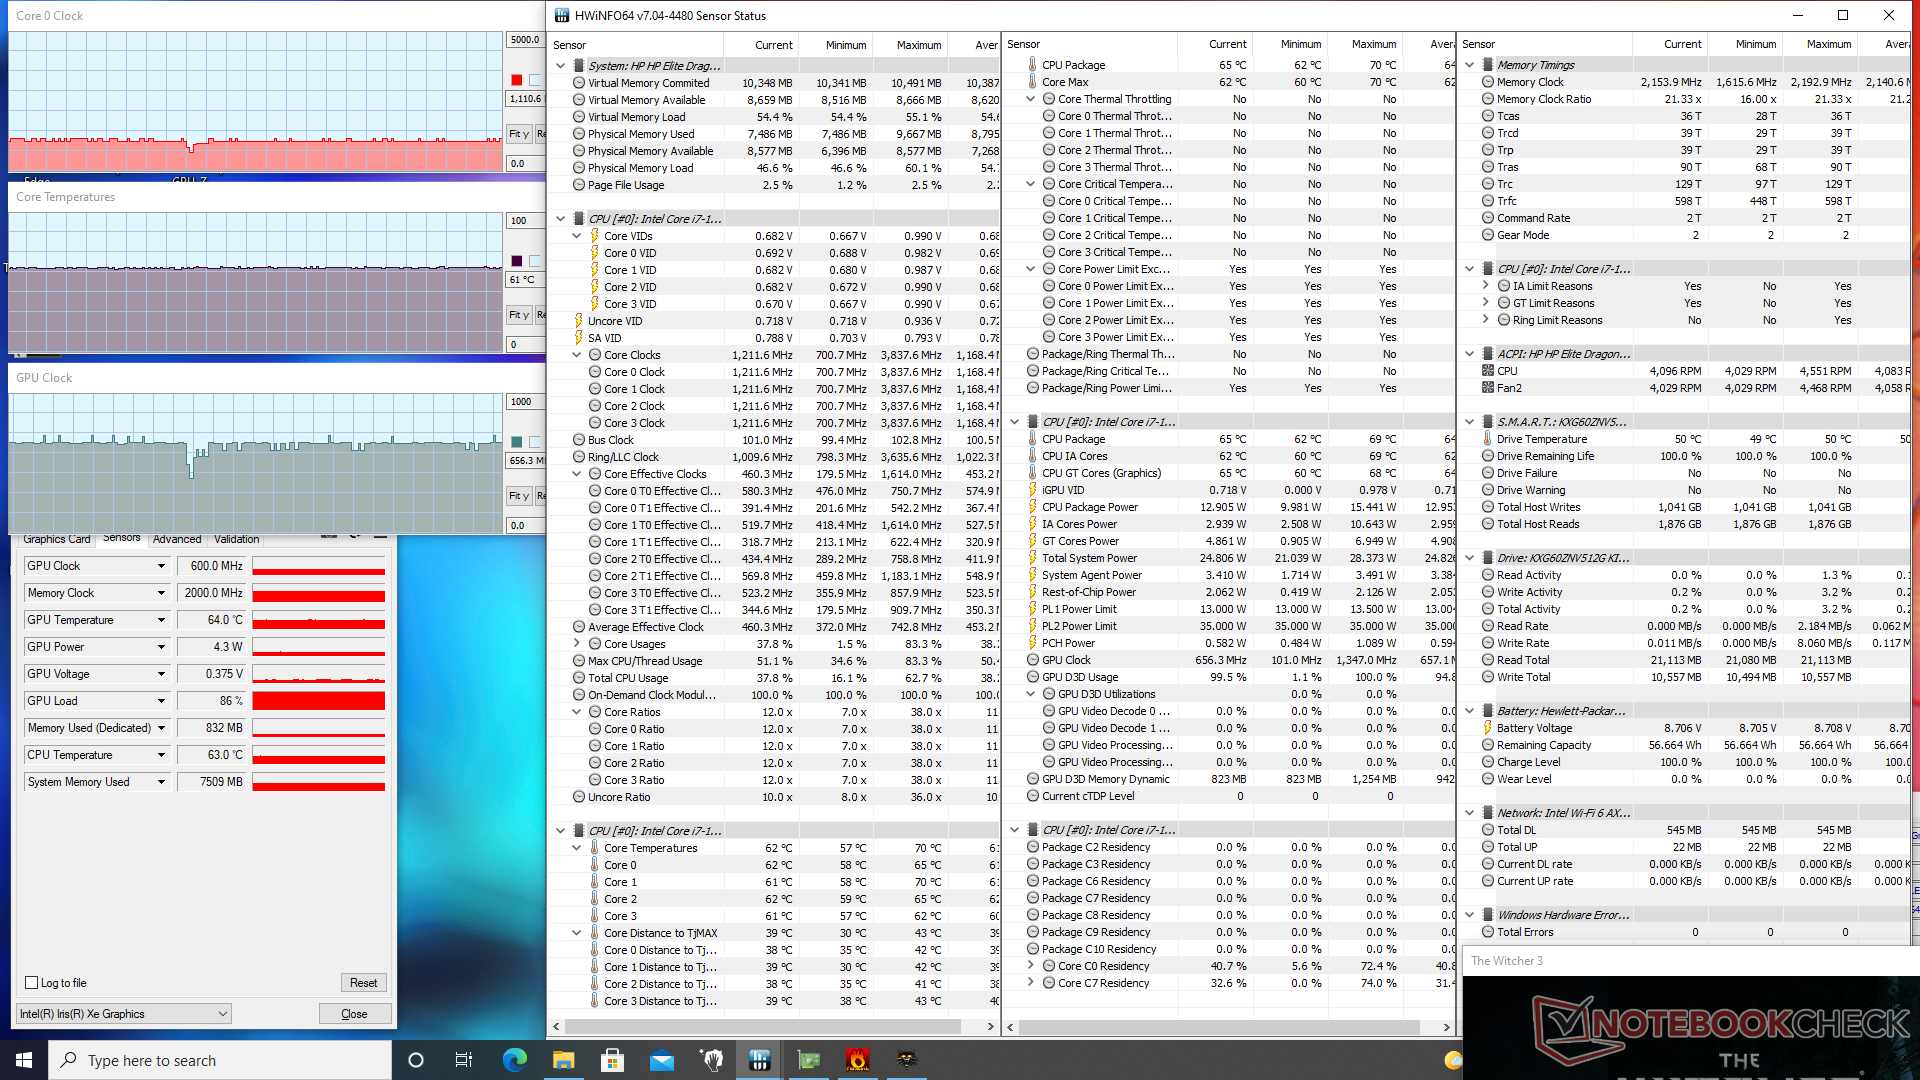
We experienced no software or hardware issues during our time with the test unit. However, expect a lot of popups during the first few days of use from the various pre-installed HP applications.
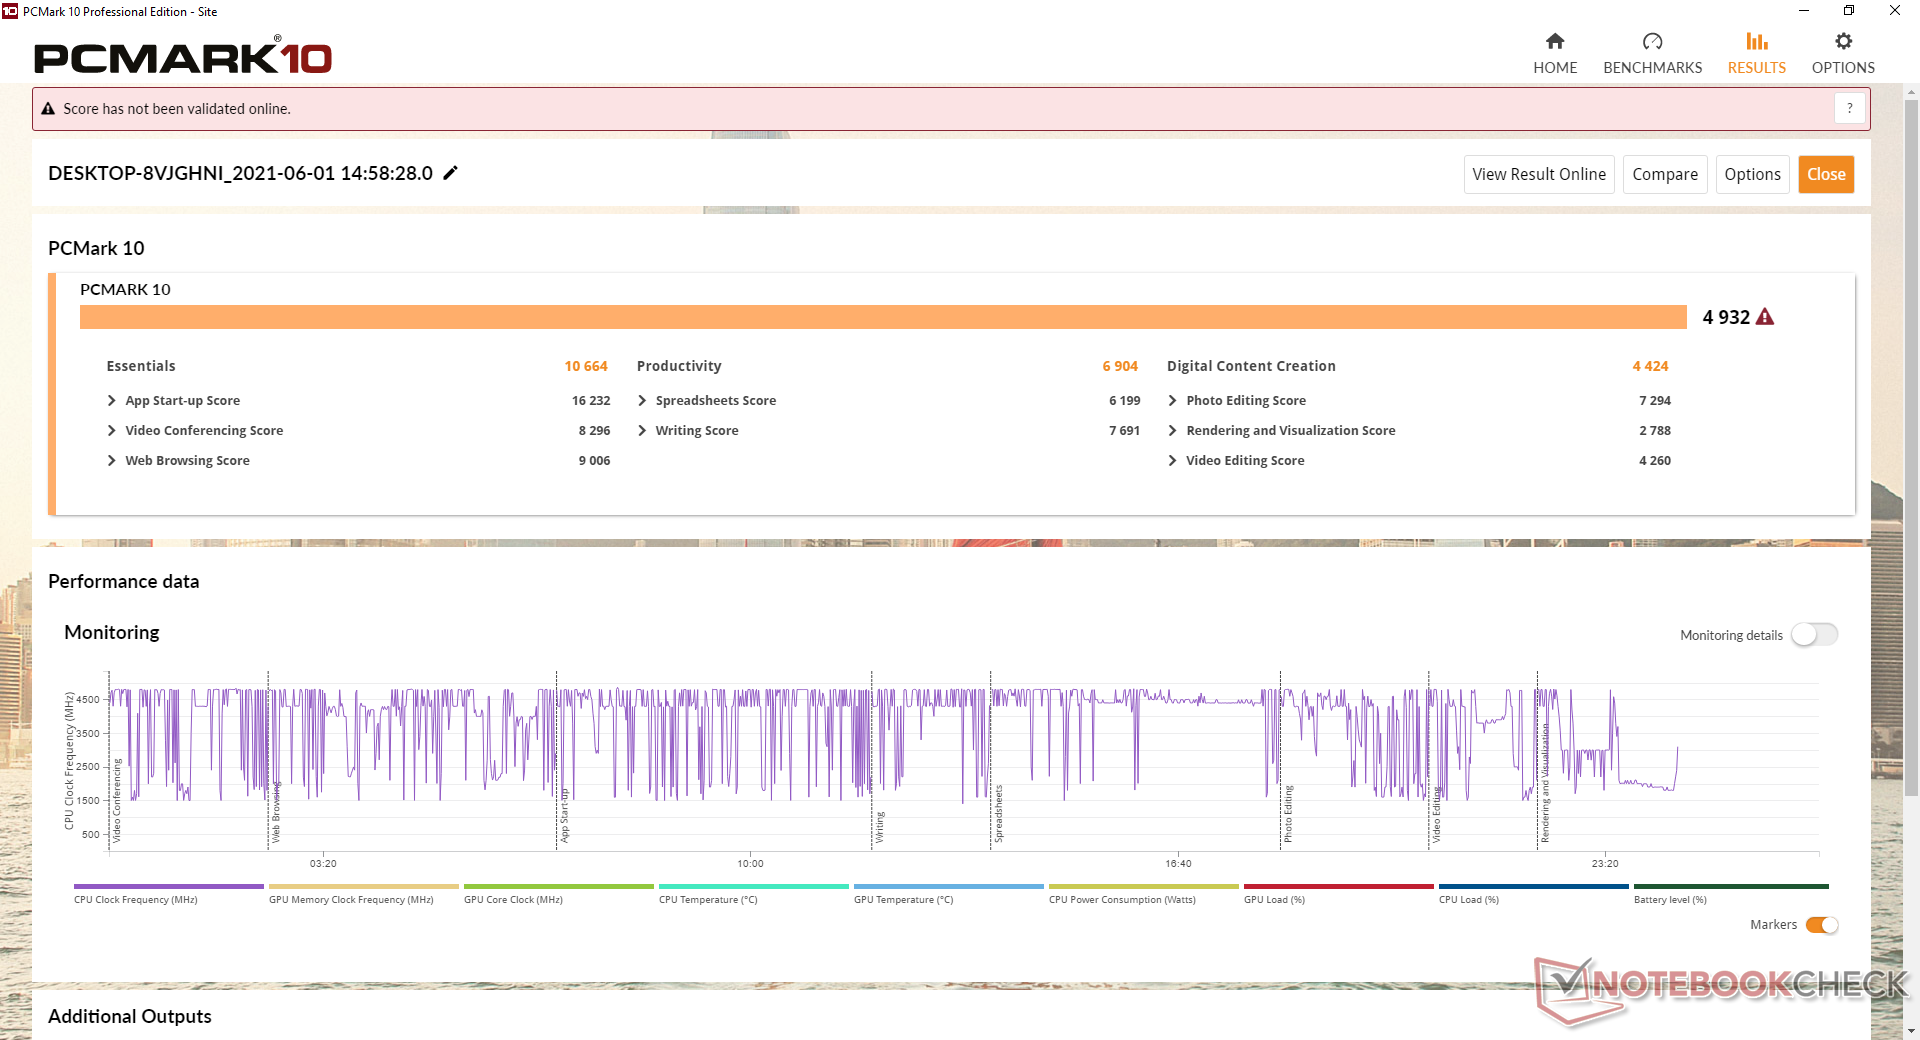
| PCMark 10 Score | 4932 points | |
Help | ||
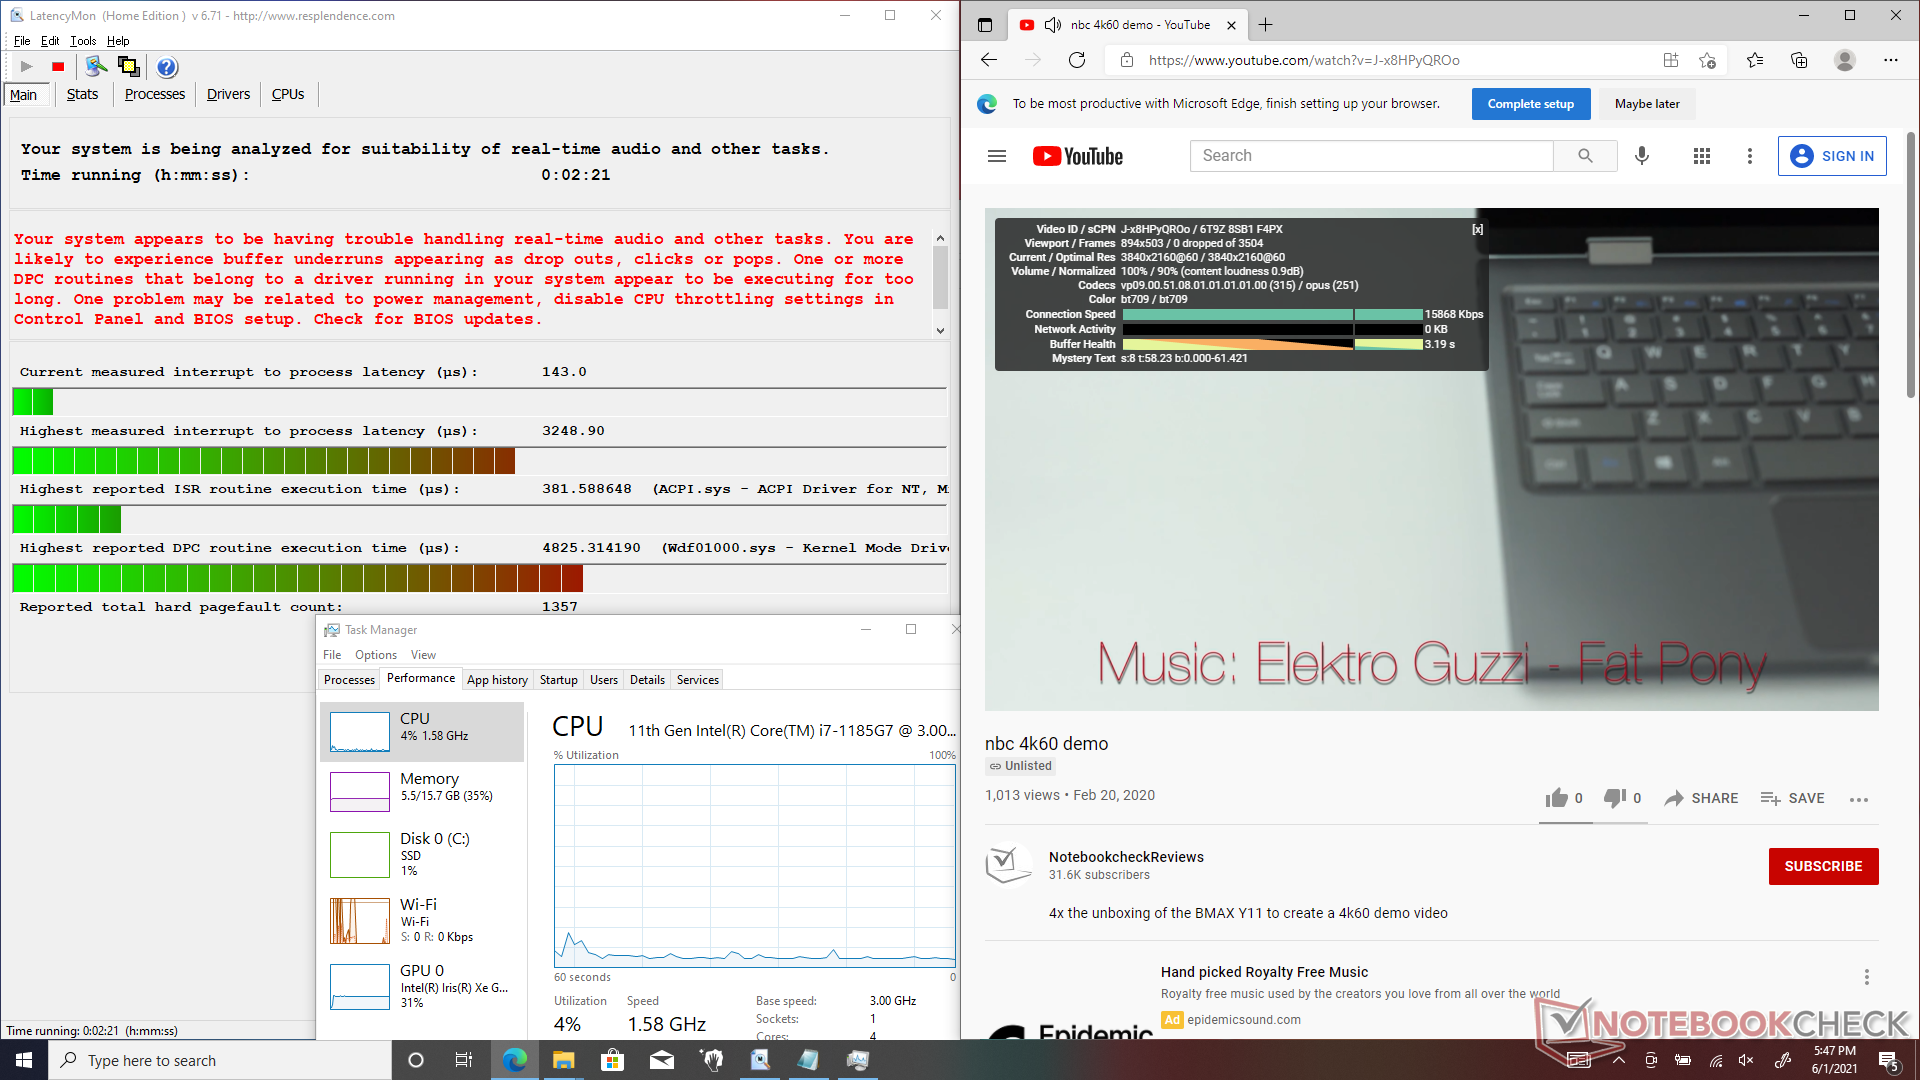
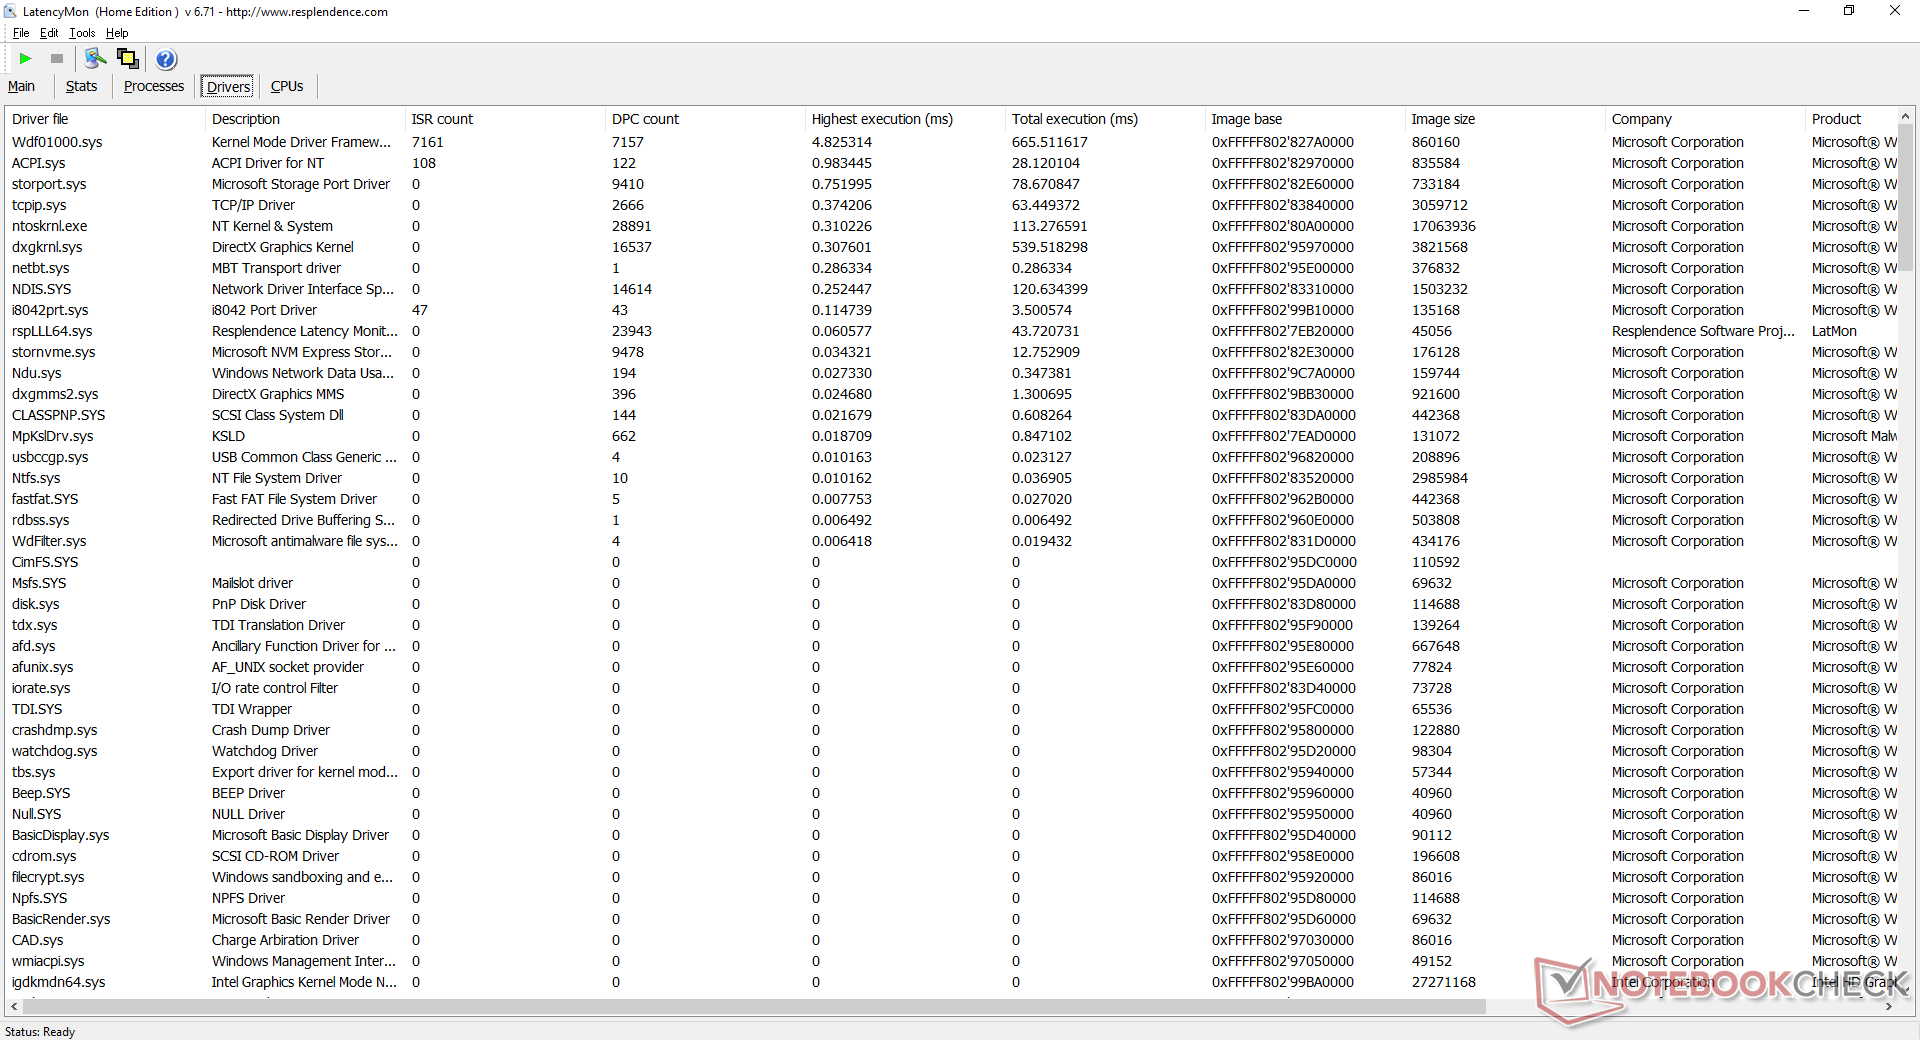
DPC Latency
LatencyMon shows DPC latency issues when opening multiple browser tabs on our homepage. 4K video playback at 60 FPS is otherwise smooth and with no dropped frames.
| DPC Latencies / LatencyMon - interrupt to process latency (max), Web, Youtube, Prime95 | |
| HP Elite Dragonfly Max | |
| MSI Summit E13 Flip Evo A11MT | |
| HP Spectre x360 13-aw2003dx | |
| Lenovo ThinkPad X13 Yoga G2 | |
| Asus ZenBook Flip S UX371 | |
* ... smaller is better
Storage Devices
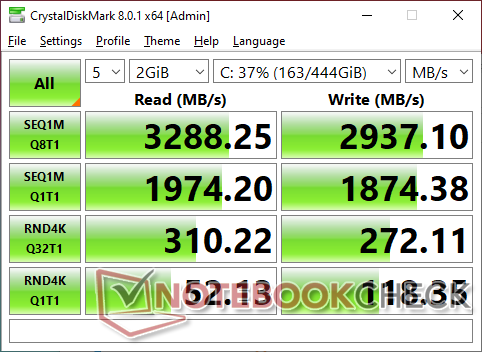
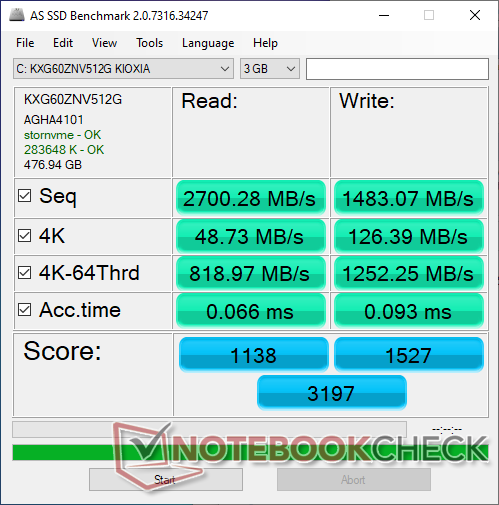
Our unit comes with a 512 GB Toshiba XG6 NVMe SSD which is the lowest option available. Users may configure up to 2 TB or simply upgrade themselves. HP isn't offering any Optane options unlike on most Spectre laptops.
Transfer rates are excellent at almost 2500 MB/s sequential write and 3300 MB/s sequential read compared to just half that or slower on the 512 GB Intel SSD 660p, Samsung PM991, or SK Hynix BC511. However, there's no guarantee that all Dragonfly SKUs will come with Toshiba XG6 NVMe SSDs.
| HP Elite Dragonfly Max Toshiba XG6 KXG60ZNV512G | HP Envy 13-ba1475ng Intel SSD 660p SSDPEKNW512G8 | Dell XPS 13 9305 Core i5 FHD Samsung PM9A1 MZVL2512HCJQ | Microsoft Surface Laptop 4 13 i7 Samsung PM991 MZ9LQ512HALU | Dell Latitude 5310-GXX0D SK Hynix BC511 HFM512GDJTNI | |
|---|---|---|---|---|---|
| AS SSD | -22% | 15% | -24% | -14% | |
| Seq Read (MB/s) | 2700 | 1608 -40% | 2629 -3% | 1821 -33% | 1975 -27% |
| Seq Write (MB/s) | 1483 | 659 -56% | 1270 -14% | 794 -46% | 1002 -32% |
| 4K Read (MB/s) | 48.73 | 51.3 5% | 65.2 34% | 47.54 -2% | 51.8 6% |
| 4K Write (MB/s) | 126.4 | 151.8 20% | 182.5 44% | 141.6 12% | 121.7 -4% |
| 4K-64 Read (MB/s) | 819 | 322.1 -61% | 1032 26% | 782 -5% | 806 -2% |
| 4K-64 Write (MB/s) | 1252 | 800 -36% | 1257 0% | 766 -39% | 780 -38% |
| Access Time Read * (ms) | 0.066 | 0.077 -17% | 0.07 -6% | 0.191 -189% | 0.04 39% |
| Access Time Write * (ms) | 0.093 | 0.046 51% | 0.023 75% | 0.027 71% | 0.031 67% |
| Score Read (Points) | 1138 | 534 -53% | 1360 20% | 1012 -11% | 1055 -7% |
| Score Write (Points) | 1527 | 1018 -33% | 1567 3% | 987 -35% | 1002 -34% |
| Score Total (Points) | 3197 | 1797 -44% | 3573 12% | 2477 -23% | 2562 -20% |
| Copy ISO MB/s (MB/s) | 1927 | 961 -50% | 1430 -26% | 1243 -35% | 742 -61% |
| Copy Program MB/s (MB/s) | 573 | 753 31% | 782 36% | 628 10% | 389.9 -32% |
| Copy Game MB/s (MB/s) | 1145 | 896 -22% | 1177 3% | 976 -15% | 556 -51% |
| CrystalDiskMark 5.2 / 6 | -14% | -2% | -20% | -5% | |
| Write 4K (MB/s) | 99 | 133.5 35% | 136.9 38% | 118.2 19% | 145.5 47% |
| Read 4K (MB/s) | 52.3 | 39.66 -24% | 47.34 -9% | 37.54 -28% | 48.83 -7% |
| Write Seq (MB/s) | 1765 | 907 -49% | 1150 -35% | 1017 -42% | 1067 -40% |
| Read Seq (MB/s) | 2065 | 1481 -28% | 2052 -1% | 926 -55% | 1133 -45% |
| Write 4K Q32T1 (MB/s) | 291.7 | 446.2 53% | 433 48% | 354.2 21% | 420.3 44% |
| Read 4K Q32T1 (MB/s) | 314 | 335.1 7% | 293 -7% | 352.6 12% | 462.6 47% |
| Write Seq Q32T1 (MB/s) | 2549 | 975 -62% | 1148 -55% | 1174 -54% | 1077 -58% |
| Read Seq Q32T1 (MB/s) | 3282 | 1874 -43% | 3427 4% | 2261 -31% | 2302 -30% |
| Total Average (Program / Settings) | -18% /
-19% | 7% /
9% | -22% /
-23% | -10% /
-11% |
* ... smaller is better

Disk Throttling: DiskSpd Read Loop, Queue Depth 8
GPU Performance
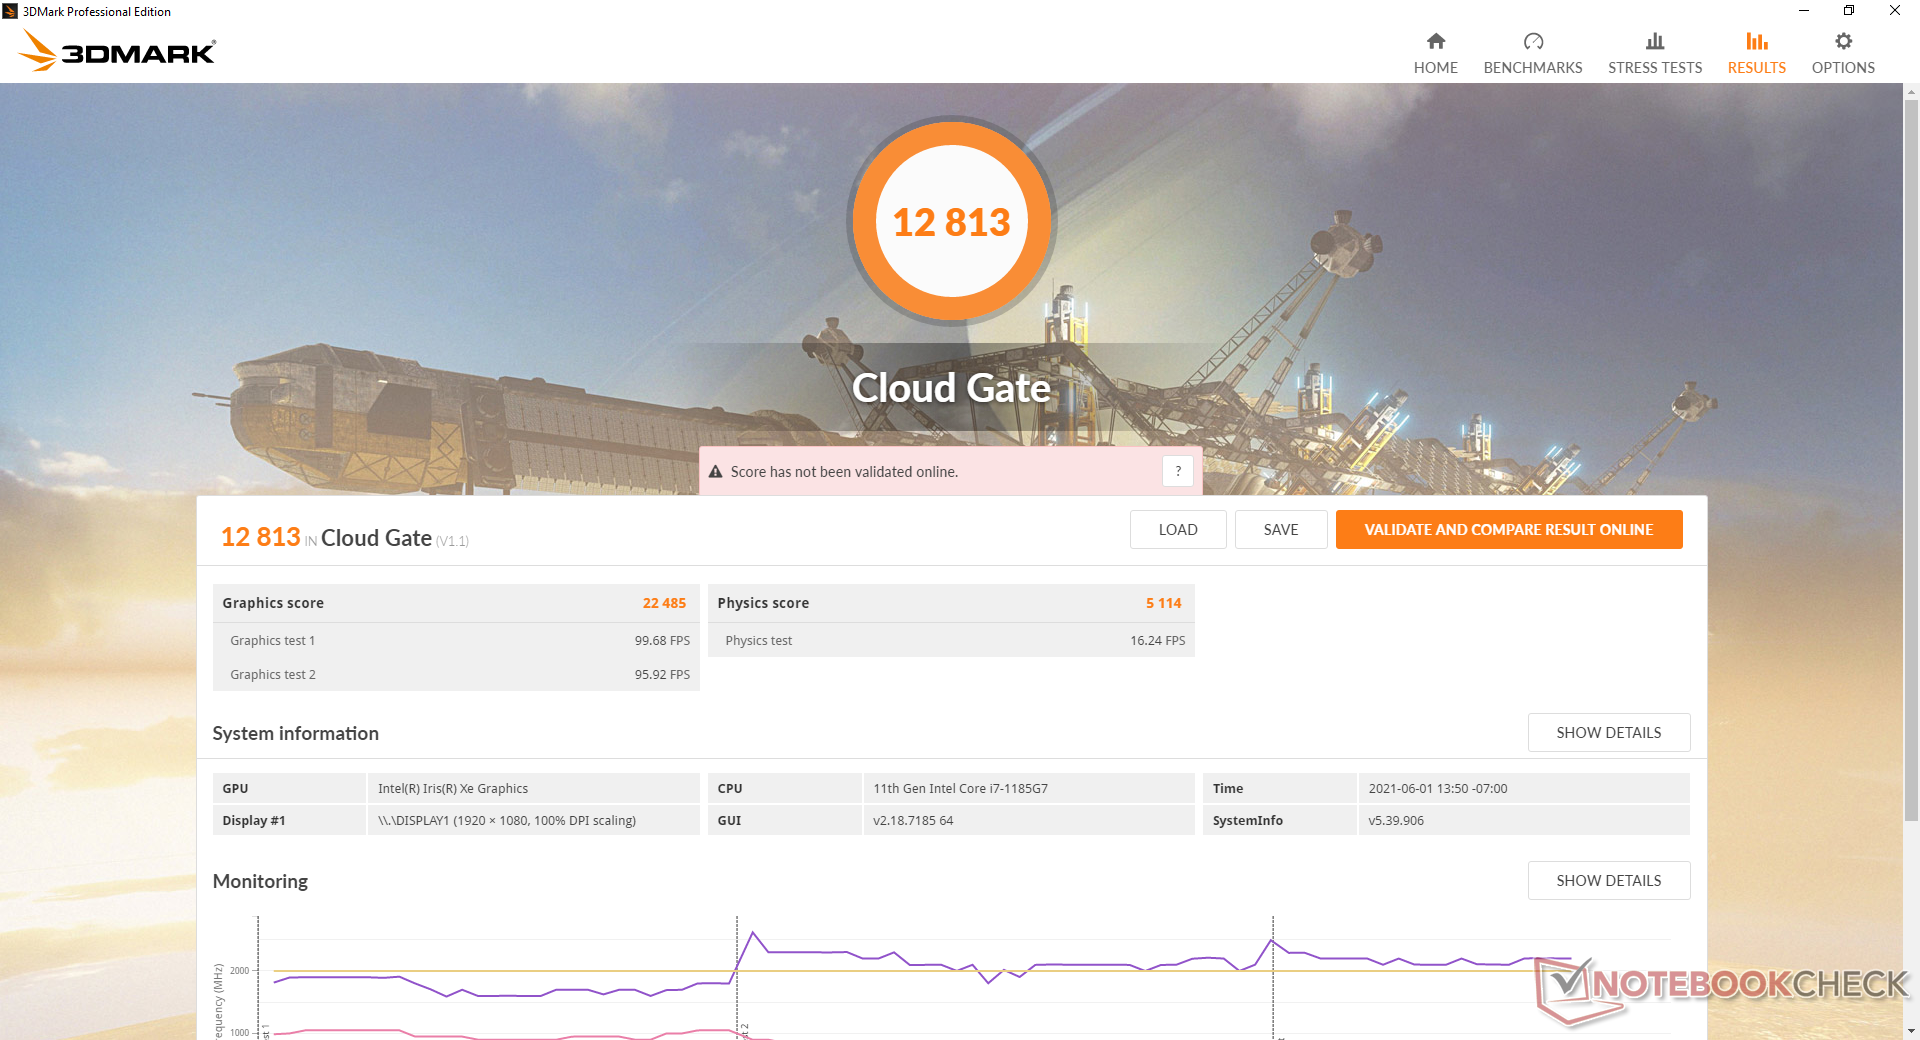
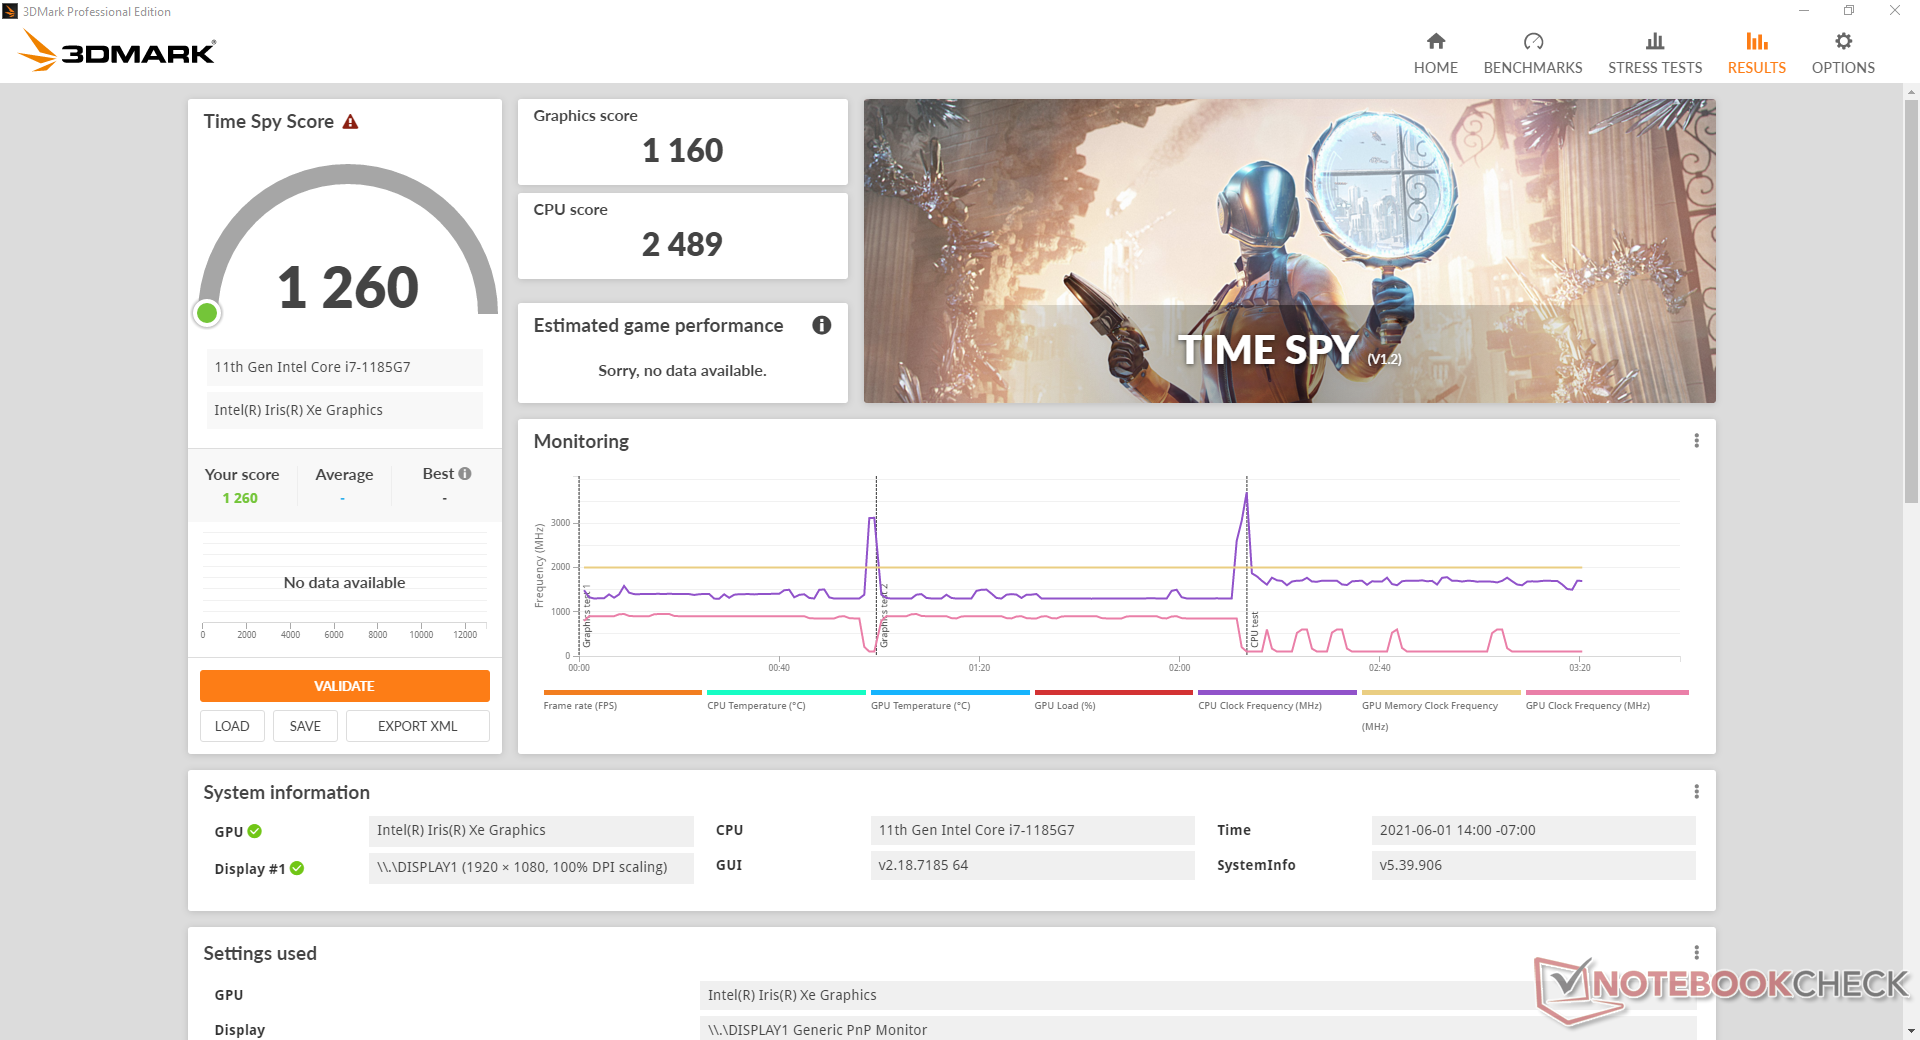
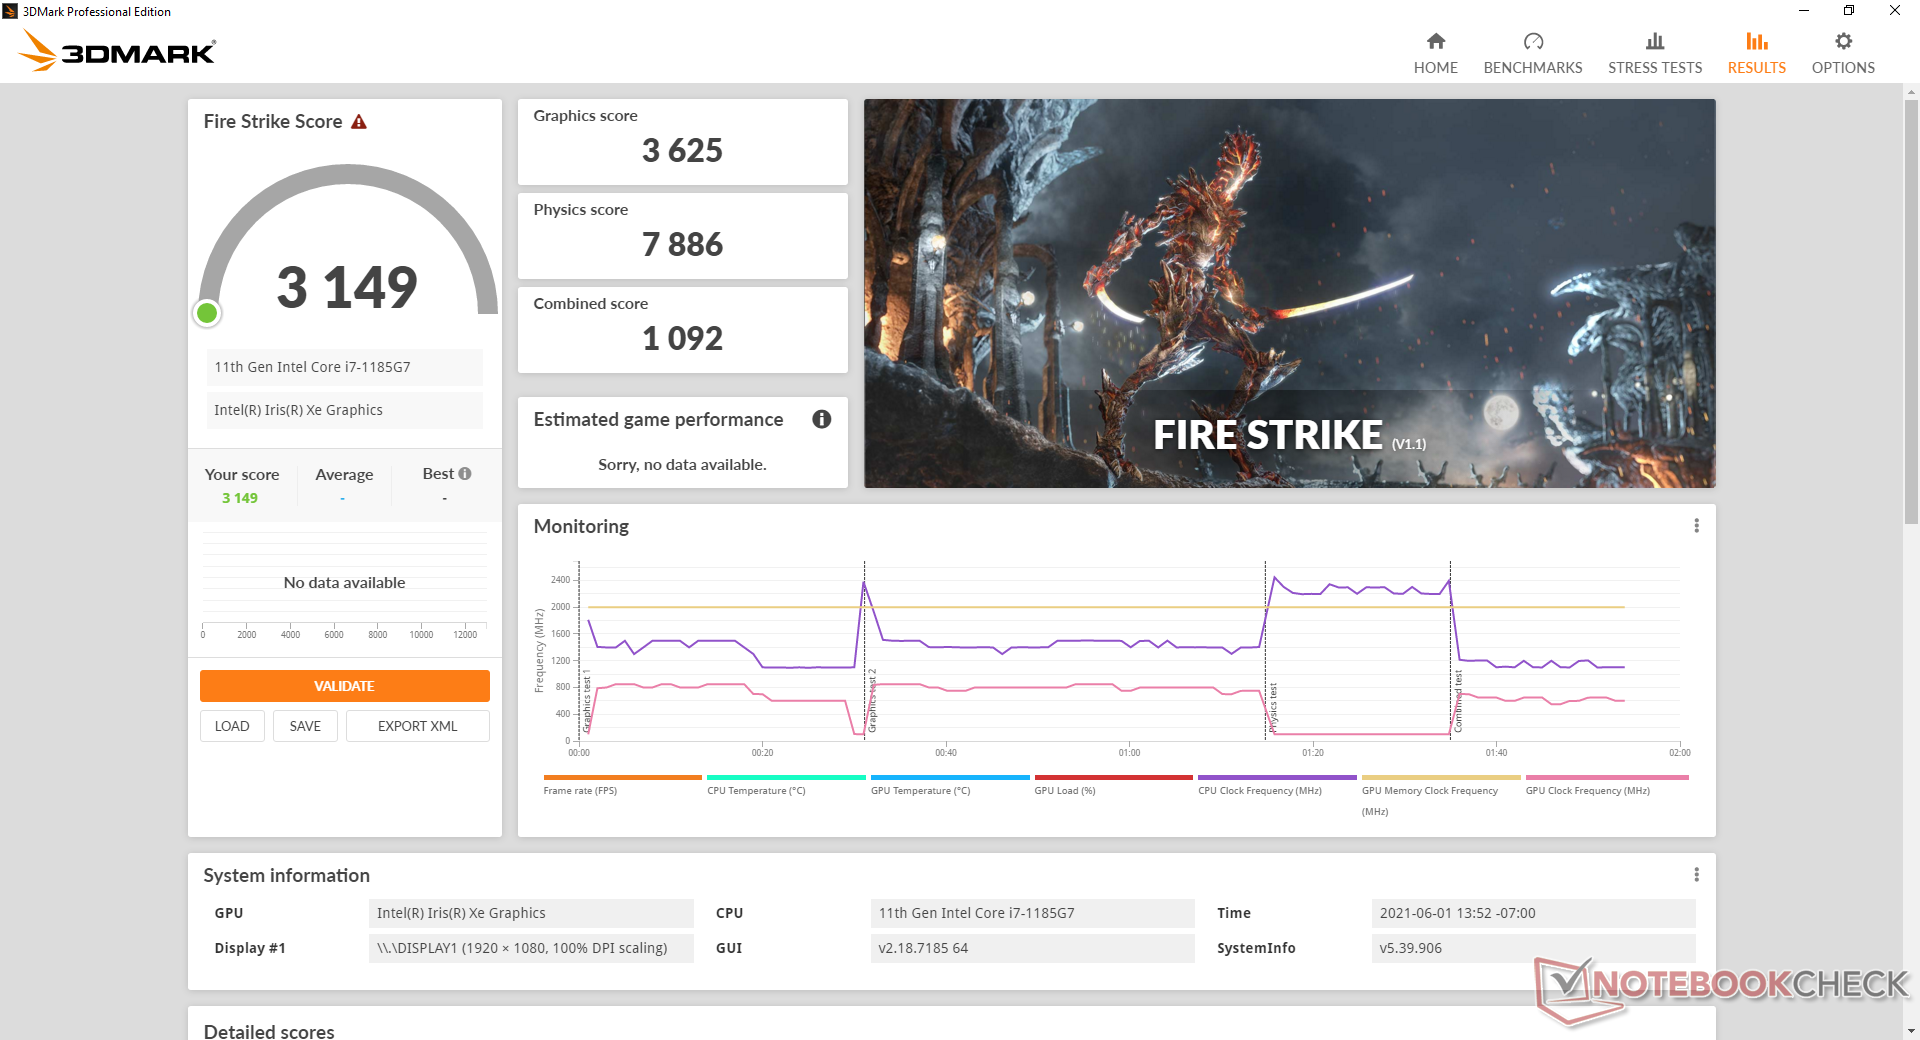
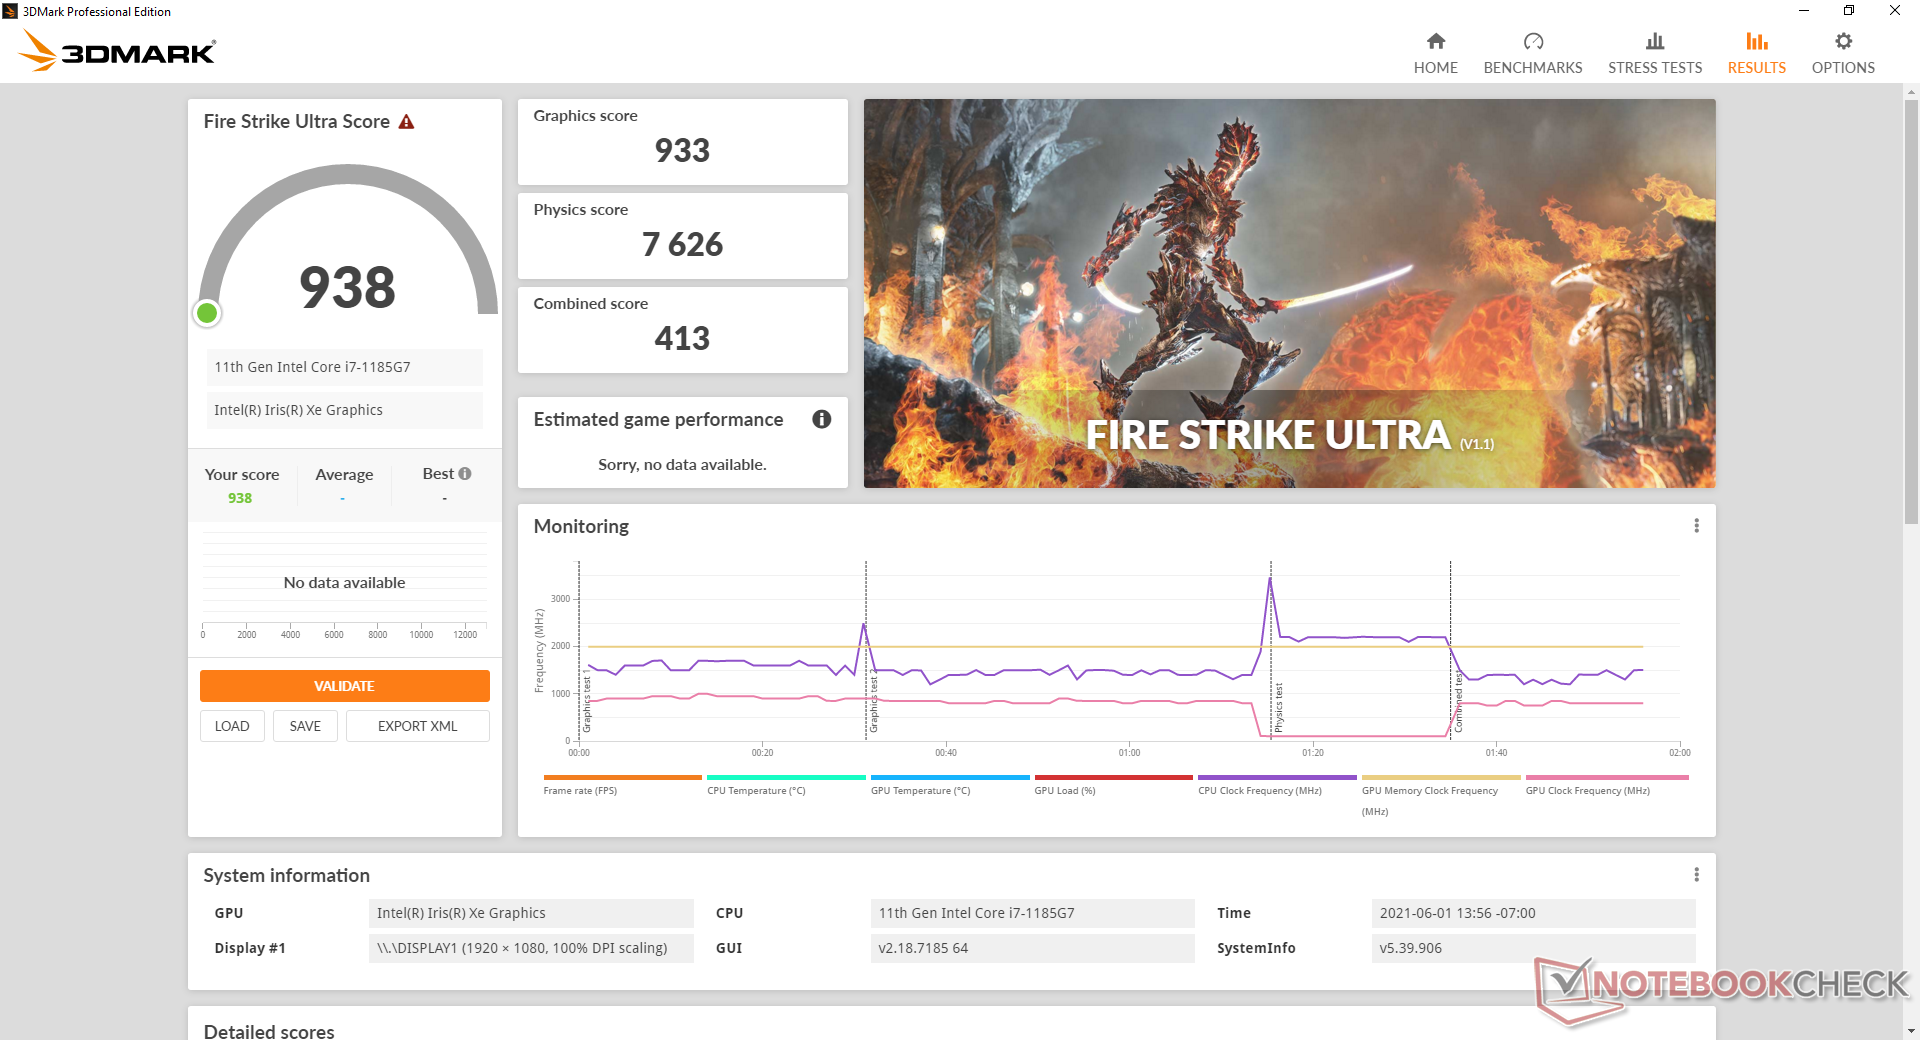
Graphics performance is disappointing with 3DMark results that are 20 to 27 percent slower than the average laptop in our database equipped with the same Iris Xe 96 EUs GPU. Furthermore, frame rates may fluctuate when gaming due to the fluctuating clock rates when under high processing stress. The Dragonfly Max isn't a gaming machine, however, so the below-average Iris Xe performance isn't a huge issue. Users upgrading from older UHD Graphics 620 or even Iris Plus will still see noticeable improvements.
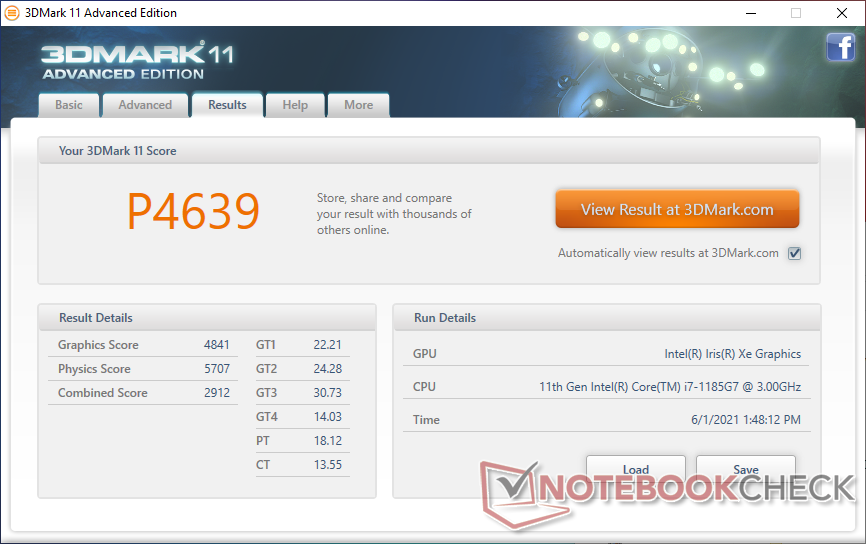
| 3DMark 11 Performance | 4639 points | |
| 3DMark Cloud Gate Standard Score | 12813 points | |
| 3DMark Fire Strike Score | 3149 points | |
| 3DMark Time Spy Score | 1260 points | |
Help | ||
| low | med. | high | ultra | |
|---|---|---|---|---|
| The Witcher 3 (2015) | 72.4 | 48.2 | 28.9 | 13.6 |
| Dota 2 Reborn (2015) | 71.8 | 47.4 | 35.1 | 35.2 |
| Final Fantasy XV Benchmark (2018) | 26.5 | 15.3 | 11.2 | |
| X-Plane 11.11 (2018) | 23.3 | 29.5 | 26.4 | |
| Strange Brigade (2018) | 76.4 | 27.7 | 23.1 | 18.5 |
Emissions: Quiet Even if it Means Lower Performance
System Noise
Fan noise is very quiet much like what we observed on the original Dragonfly. In fact, it's one of the quietest convertibles currently available even when running higher processing loads like games. In comparison, the Spectre x360 13 would run significantly louder at well over 40 dB(A) when stressed. We suspect that HP's insistence on keeping the Dragonfly as quiet as possible is a contributing factor to the disappointing CPU and GPU performance results recorded above.
| HP Elite Dragonfly Max Iris Xe G7 96EUs, i7-1185G7, Toshiba XG6 KXG60ZNV512G | HP Spectre x360 13-aw2003dx Iris Xe G7 80EUs, i5-1135G7, Intel Optane Memory H10 with Solid State Storage 32GB + 512GB HBRPEKNX0202A(L/H) | Lenovo ThinkPad X13 Yoga G2 Iris Xe G7 96EUs, i7-1165G7, WDC PC SN730 SDBQNTY-1T00 | MSI Summit E13 Flip Evo A11MT Iris Xe G7 96EUs, i7-1185G7, Phison 1TB SM2801T24GKBB4S-E162 | Asus ZenBook Flip S UX371 Iris Xe G7 96EUs, i7-1165G7, WDC PC SN730 SDBPNTY-1T00 | HP Elite Dragonfly-8MK79EA UHD Graphics 620, i5-8265U, Intel Optane Memory H10 with Solid State Storage 32GB + 512GB HBRPEKNX0202A(L/H) | |
|---|---|---|---|---|---|---|
| Noise | -11% | -0% | -17% | -9% | -14% | |
| off / environment * (dB) | 24.9 | 25.3 -2% | 24 4% | 24.5 2% | 29 -16% | 29.5 -18% |
| Idle Minimum * (dB) | 24.9 | 25.4 -2% | 24 4% | 24.7 1% | 29 -16% | 29.5 -18% |
| Idle Average * (dB) | 24.9 | 25.4 -2% | 24 4% | 24.7 1% | 29 -16% | 30 -20% |
| Idle Maximum * (dB) | 24.9 | 25.4 -2% | 24 4% | 26.4 -6% | 29 -16% | 30.3 -22% |
| Load Average * (dB) | 29.7 | 25.4 14% | 32.72 -10% | 37.8 -27% | 30.9 -4% | 31.6 -6% |
| Witcher 3 ultra * (dB) | 31.3 | 44.6 -42% | 41.4 -32% | 30.9 1% | ||
| Load Maximum * (dB) | 31.3 | 44.8 -43% | 33.88 -8% | 48.8 -56% | 30.9 1% | 31.6 -1% |
* ... smaller is better
Noise level
| Idle |
| 24.9 / 24.9 / 24.9 dB(A) |
| Load |
| 29.7 / 31.3 dB(A) |
 | ||
30 dB silent 40 dB(A) audible 50 dB(A) loud |
||
min: | ||
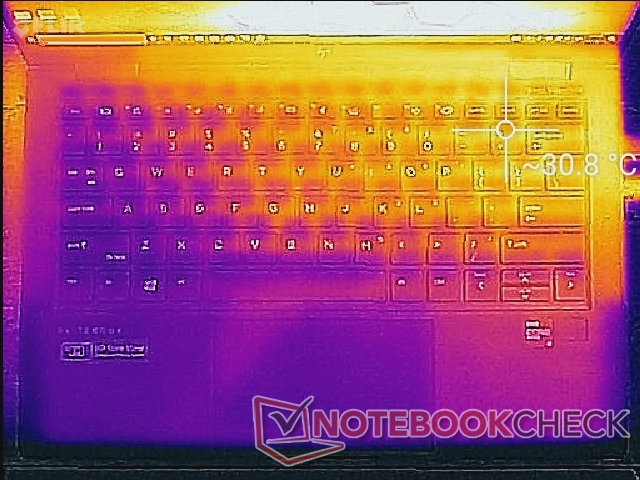
Temperature
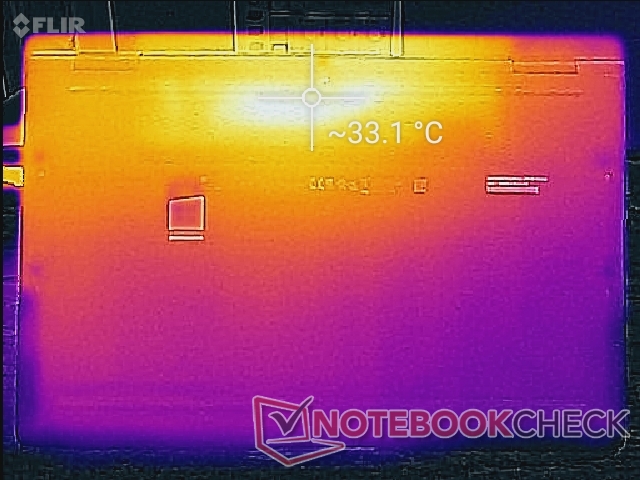
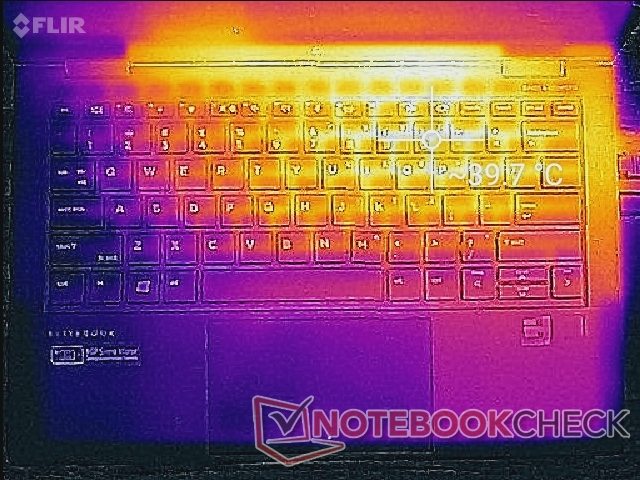
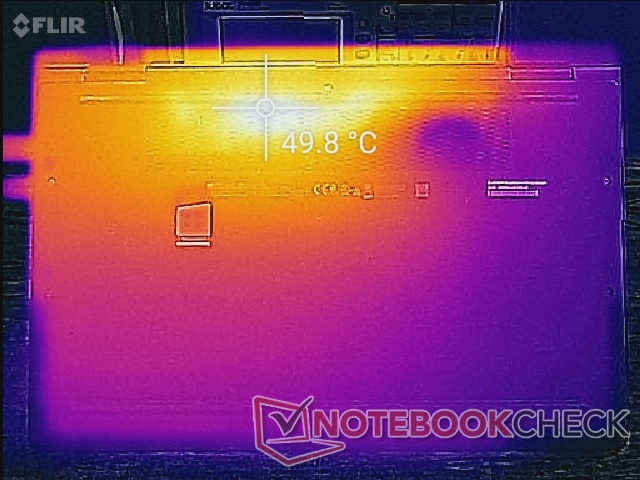
Surface temperature is asymmetrical unlike on the Spectre x360 13 due to the asymmetrical cooling cooling solution in the Dragonfly. One half of the laptop will always be warmer than the other half as a result. When under high processing loads, the right side of the keyboard can be as warm as 40 C compared to just 26 C on the left side of the keyboard. The difference is noticeable but not enough to be bothersome. The hot spot along the rear of the bottom can be as warm as 50 C which is similar to what we observed on the 2020 Dragonfly and Asus ZenBook Flip S UX371.
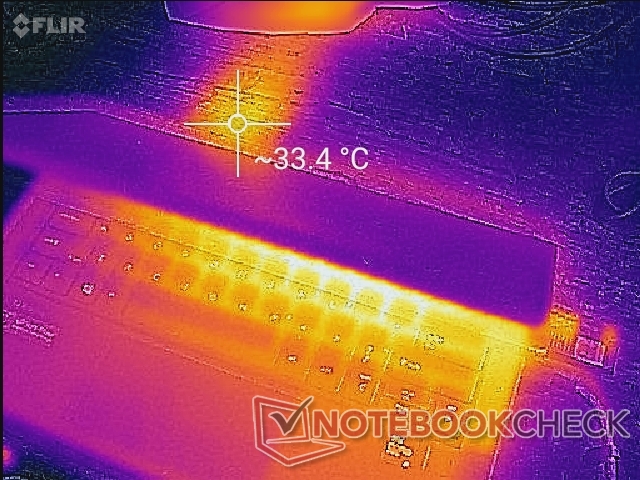
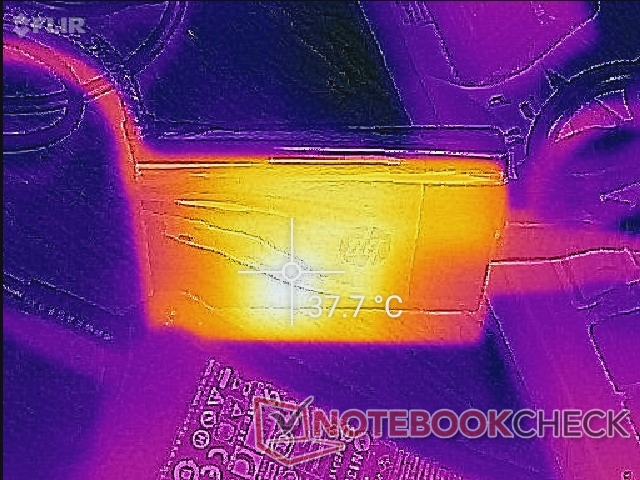
(+) The maximum temperature on the upper side is 39.4 °C / 103 F, compared to the average of 35.4 °C / 96 F, ranging from 19.6 to 60 °C for the class Convertible.
(-) The bottom heats up to a maximum of 50 °C / 122 F, compared to the average of 36.9 °C / 98 F
(+) In idle usage, the average temperature for the upper side is 28.5 °C / 83 F, compared to the device average of 30.3 °C / 87 F.
(+) The palmrests and touchpad are cooler than skin temperature with a maximum of 28 °C / 82.4 F and are therefore cool to the touch.
(±) The average temperature of the palmrest area of similar devices was 28 °C / 82.4 F (0 °C / 0 F).
Stress Test
Clock rates are relatively slow for a Core i7-1185G7 laptop. When running Prime95 to stress the CPU, clock rates would boost to the 2.4 to 3.1 GHz range for about 20 seconds until reaching a core temperature of 97 C. Thereafter, clock rates would tank to the 1.2 to 1.5 GHz range in order to maintain a cooler core temperature of 63 C to 71 C. The MSI Summit E13 Flip with the same Core i7 CPU would stabilize in the 2.8 to 3.0 GHz range instead albeit at higher core temperatures.
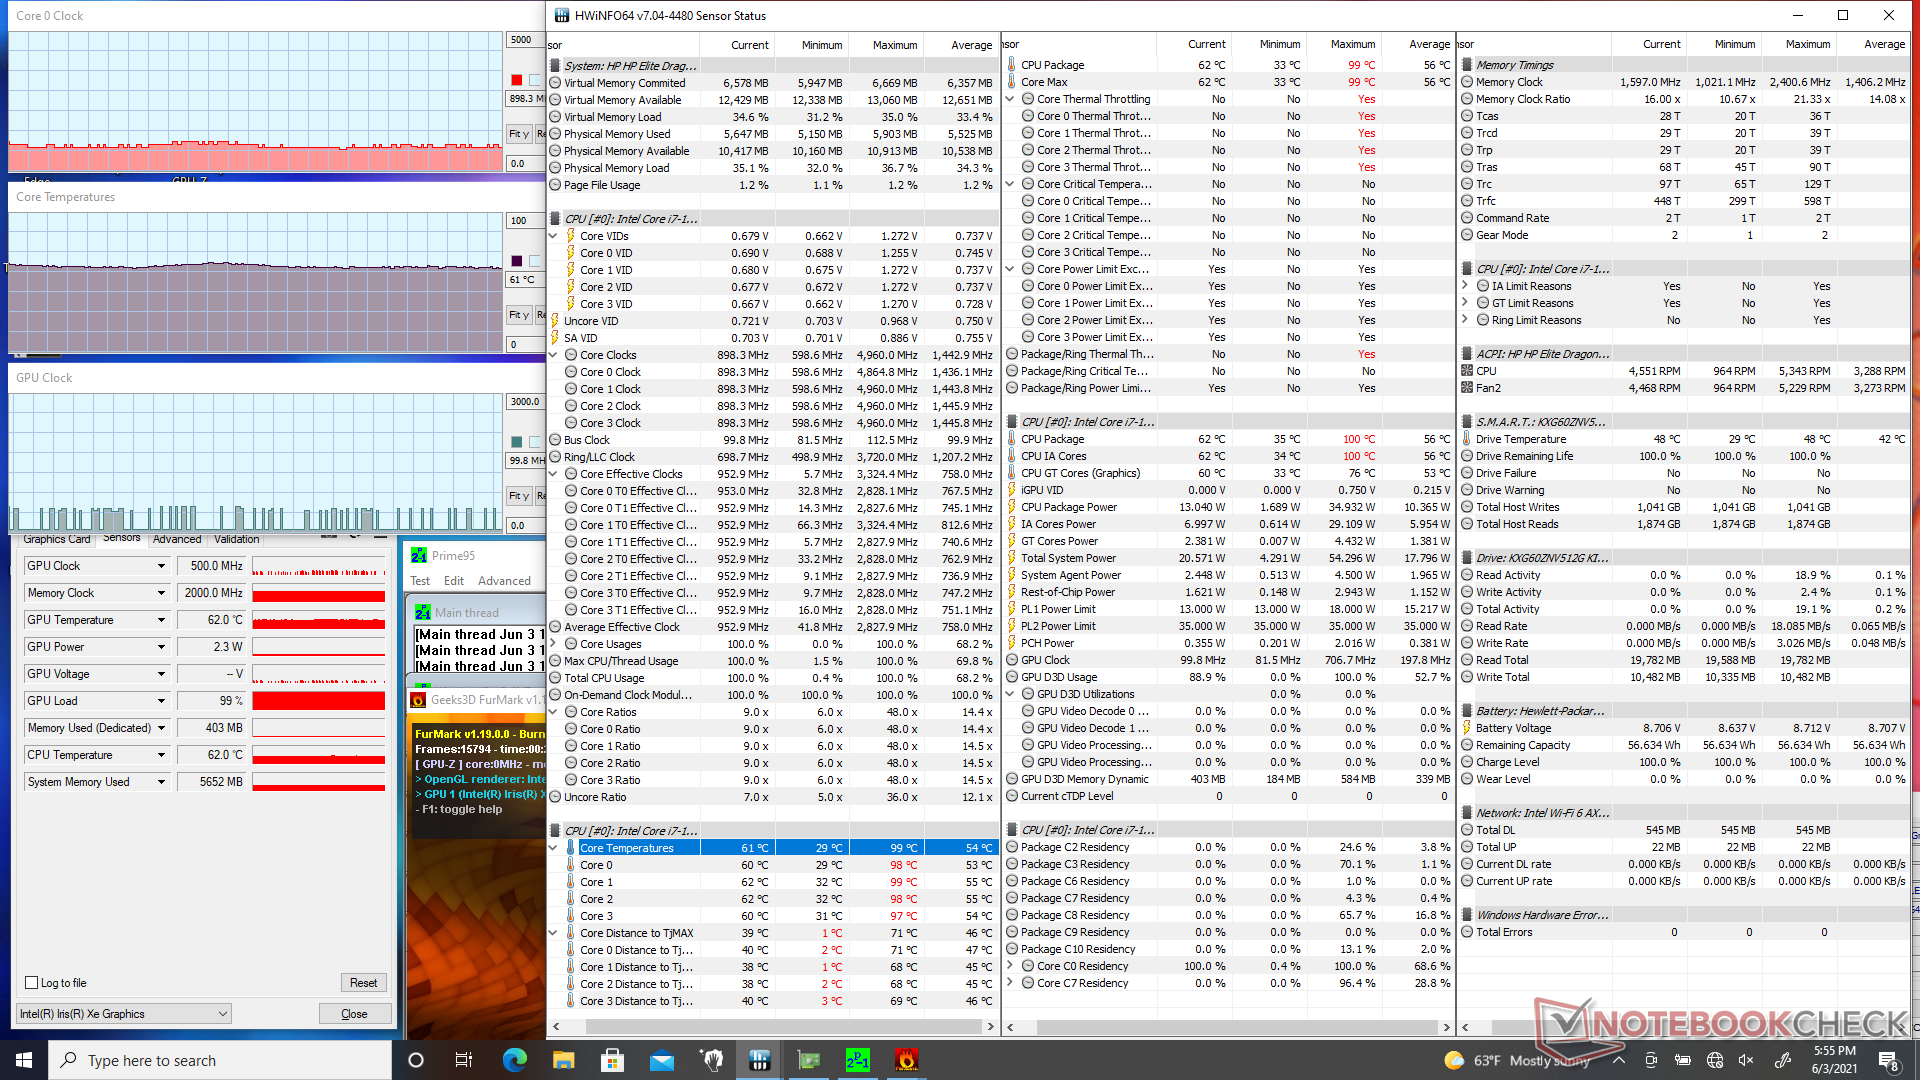
GPU clock rates are similarly slow when running demanding loads like games. For example, clock rates wound range from 400 to 700 MHz when running Witcher 3 compared to 1350 MHz on the aforementioned MSI. Temperatures are definitely lower on the HP system, but the performance cost is somewhat steep.
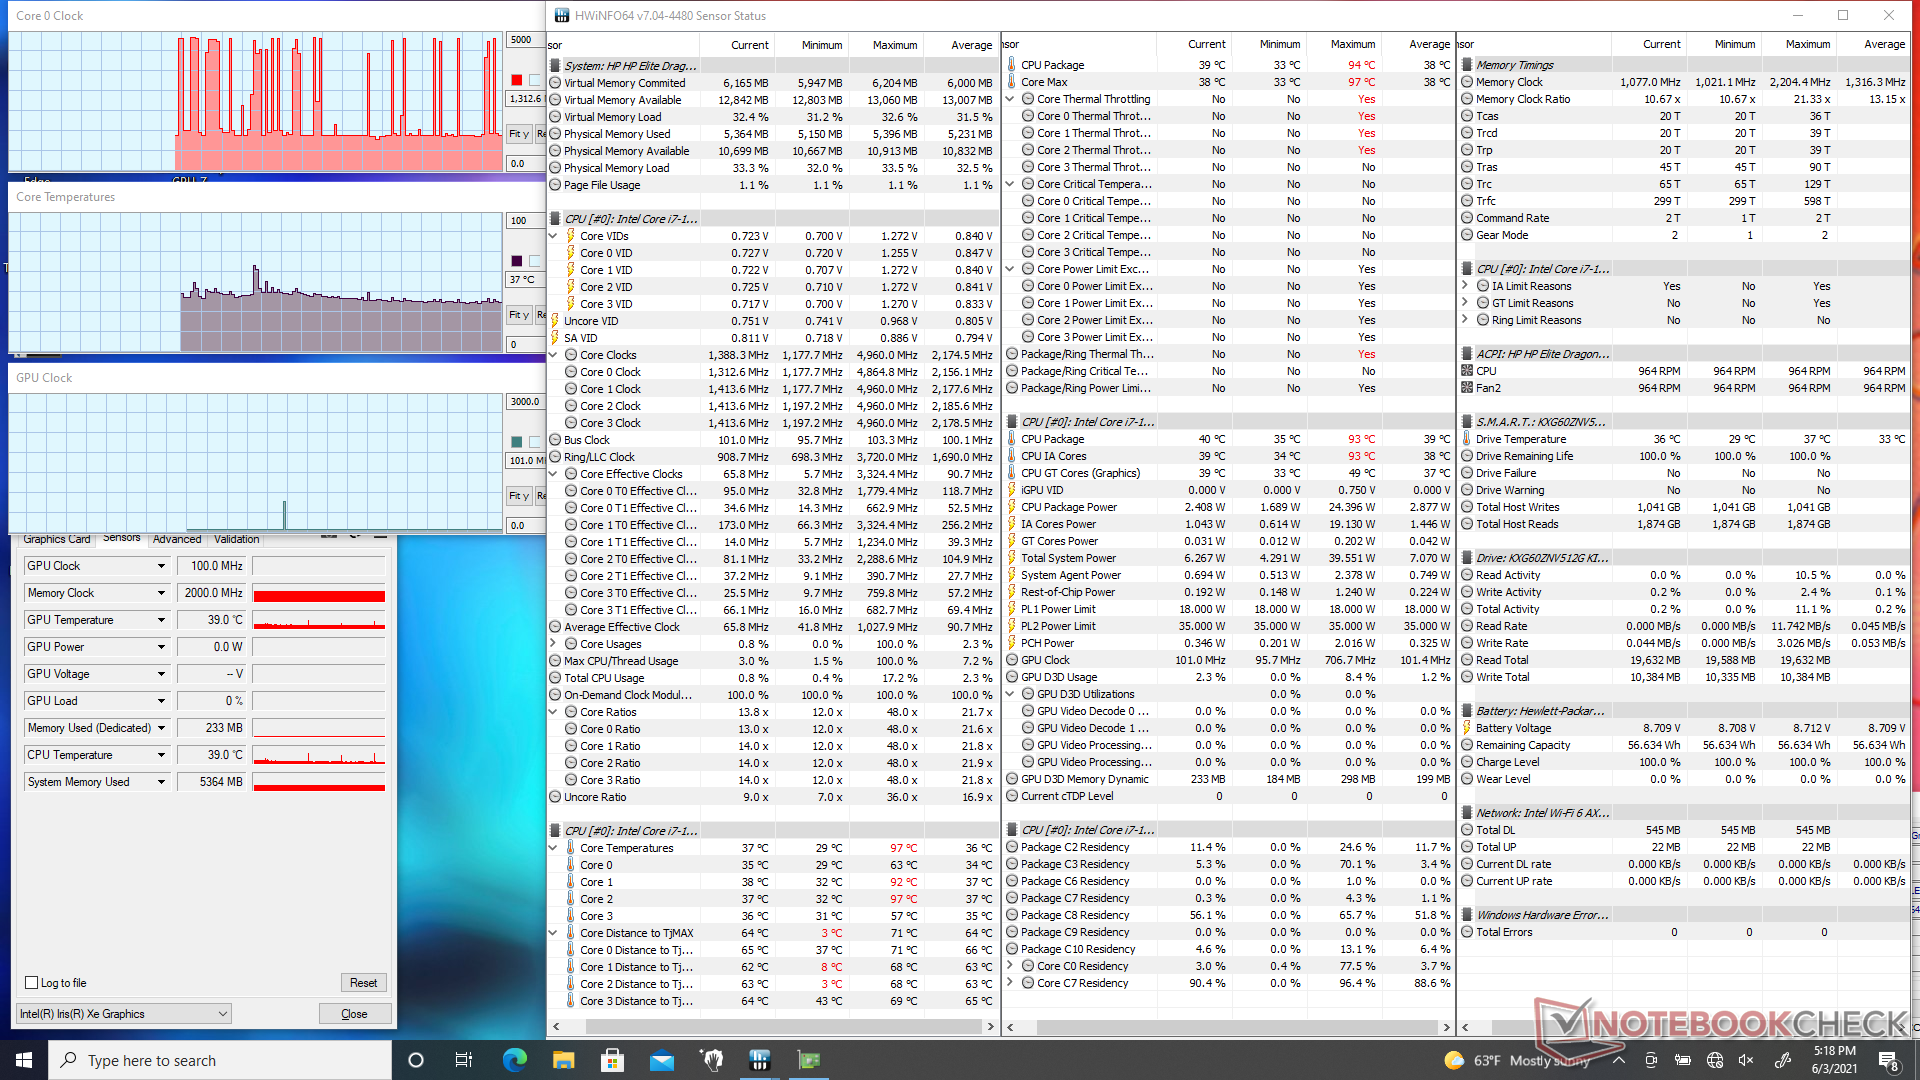
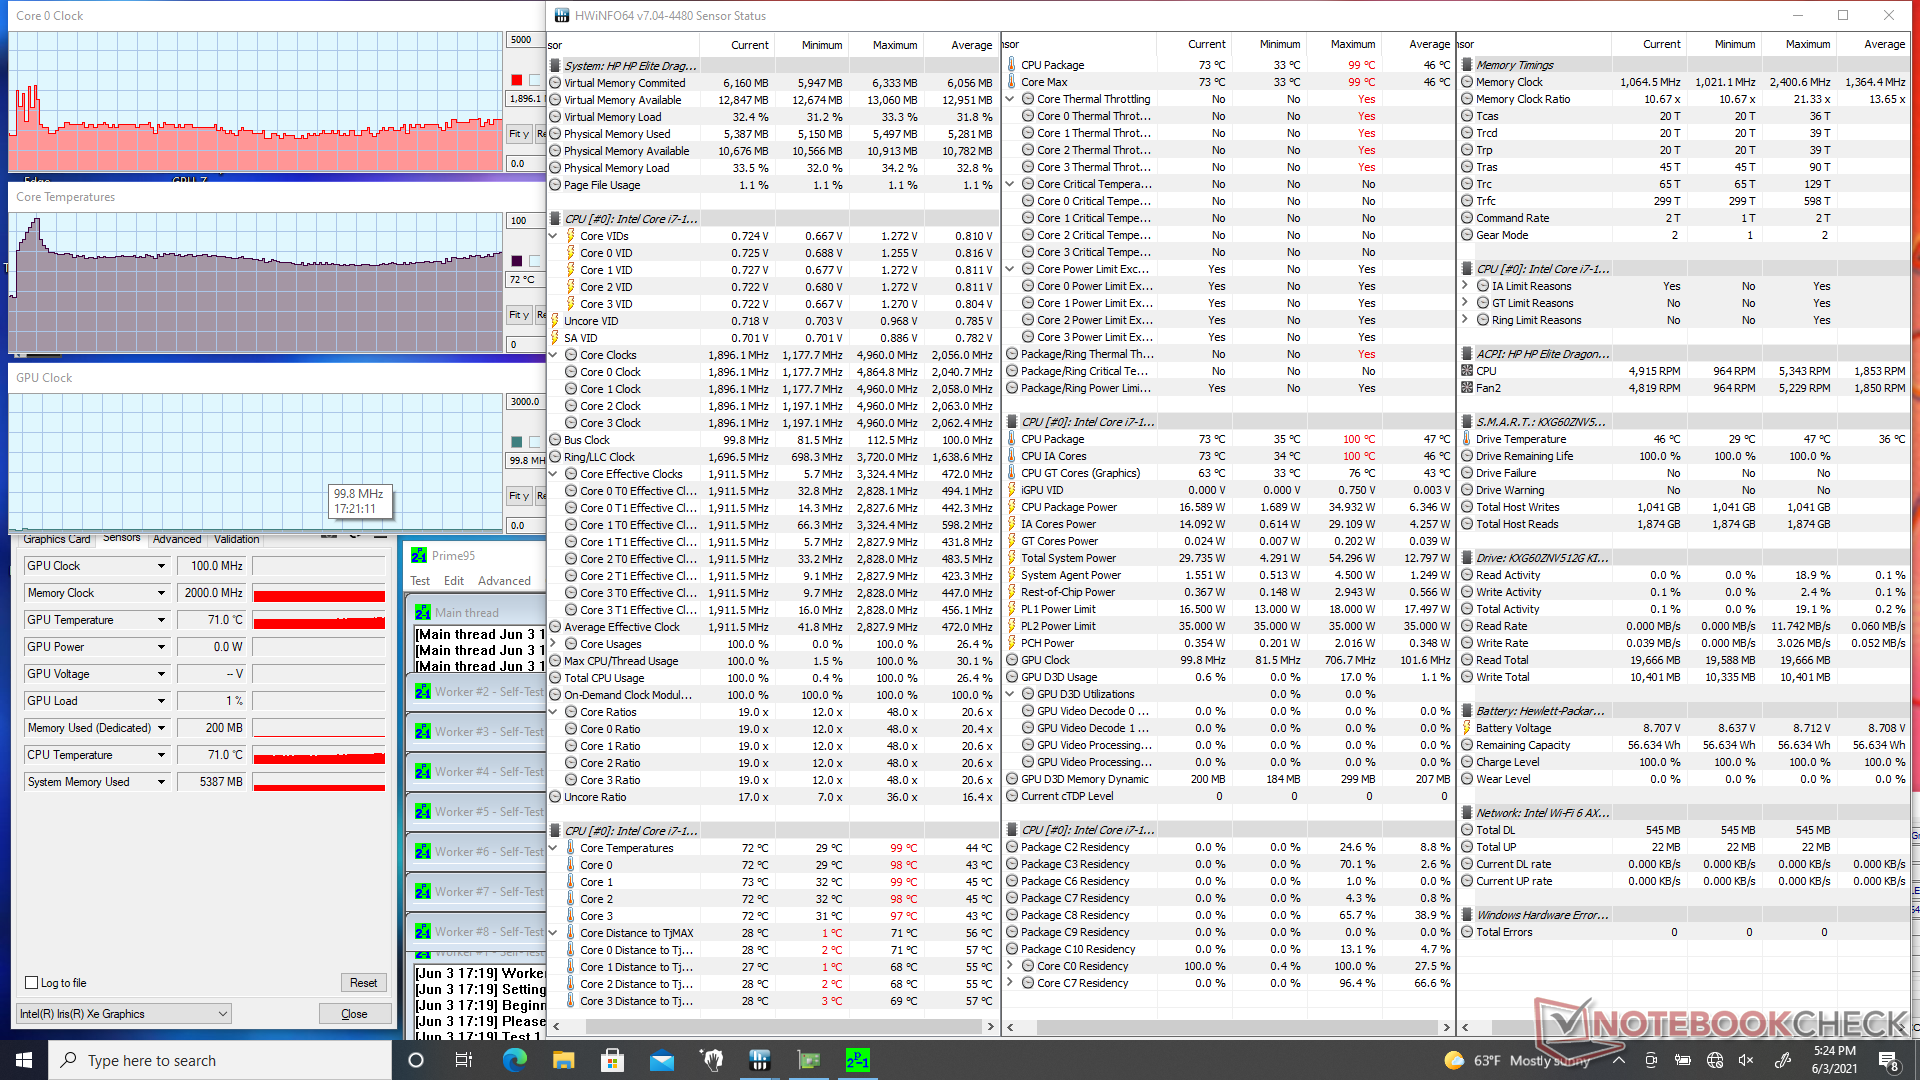
| CPU Clock (GHz) | GPU Clock (MHz) | Average CPU Temperature (°C) | |
| System Idle | -- | -- | 37 |
| Prime95 Stress | 1.2 - 1.5 | -- | 63 - 71 |
| Prime95 + FurMark Stress | 0.9 - 1.1 | 100 - 500 | 61 |
| Witcher 3 Stress | 1.0 - 1.1 | 400 - 700 | 61 |
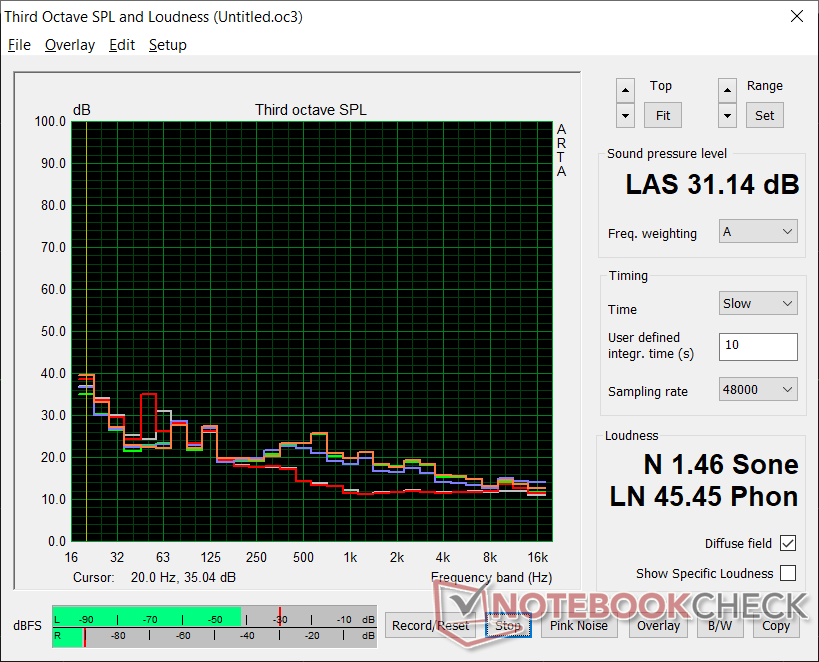
Speakers


HP Elite Dragonfly Max audio analysis
(+) | speakers can play relatively loud (87.1 dB)
Bass 100 - 315 Hz
(±) | reduced bass - on average 11.4% lower than median
(±) | linearity of bass is average (11.8% delta to prev. frequency)
Mids 400 - 2000 Hz
(+) | balanced mids - only 2.7% away from median
(+) | mids are linear (3.1% delta to prev. frequency)
Highs 2 - 16 kHz
(+) | balanced highs - only 4.4% away from median
(+) | highs are linear (5.4% delta to prev. frequency)
Overall 100 - 16.000 Hz
(+) | overall sound is linear (10.2% difference to median)
Compared to same class
» 6% of all tested devices in this class were better, 2% similar, 92% worse
» The best had a delta of 6%, average was 20%, worst was 57%
Compared to all devices tested
» 5% of all tested devices were better, 1% similar, 94% worse
» The best had a delta of 4%, average was 24%, worst was 134%
Apple MacBook 12 (Early 2016) 1.1 GHz audio analysis
(+) | speakers can play relatively loud (83.6 dB)
Bass 100 - 315 Hz
(±) | reduced bass - on average 11.3% lower than median
(±) | linearity of bass is average (14.2% delta to prev. frequency)
Mids 400 - 2000 Hz
(+) | balanced mids - only 2.4% away from median
(+) | mids are linear (5.5% delta to prev. frequency)
Highs 2 - 16 kHz
(+) | balanced highs - only 2% away from median
(+) | highs are linear (4.5% delta to prev. frequency)
Overall 100 - 16.000 Hz
(+) | overall sound is linear (10.2% difference to median)
Compared to same class
» 7% of all tested devices in this class were better, 2% similar, 91% worse
» The best had a delta of 5%, average was 18%, worst was 53%
Compared to all devices tested
» 5% of all tested devices were better, 1% similar, 94% worse
» The best had a delta of 4%, average was 24%, worst was 134%
Energy Management: High Performance-Per-Watt
Power Consumption
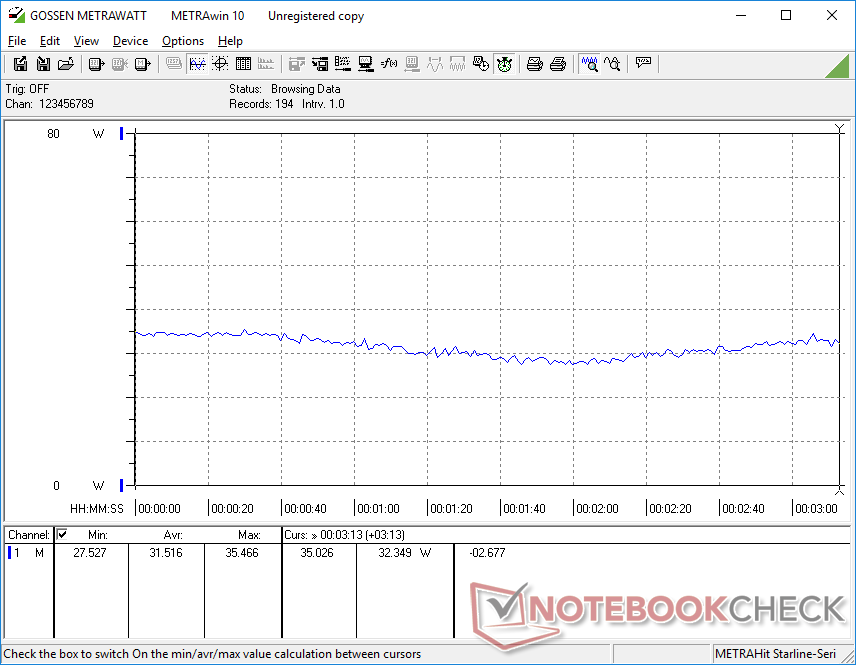
Power consumption during low loads is a bit higher than most other 13.3-inch laptops because of the extra-bright 1000-nit backlight. Idling on desktop with Sure View active at the lowest brightness setting would consume just 2.9 W compared to 9.9 W with Sure View off and at the maximum brightness setting. The difference between minimum and maximum brightness for most 13.3-inch laptops is typically just 3 W to 4 W in comparison.
Running higher loads like games would consume between 31 W and 38 W to be lower than many other Tiger Lake-U laptops. The MSI Summit E13 Flip, for example, would consume between 47 W and 52 W when under the same conditions. The lower power consumption on the Dragonfly Max correlates with its lower raw performance scores recorded above.
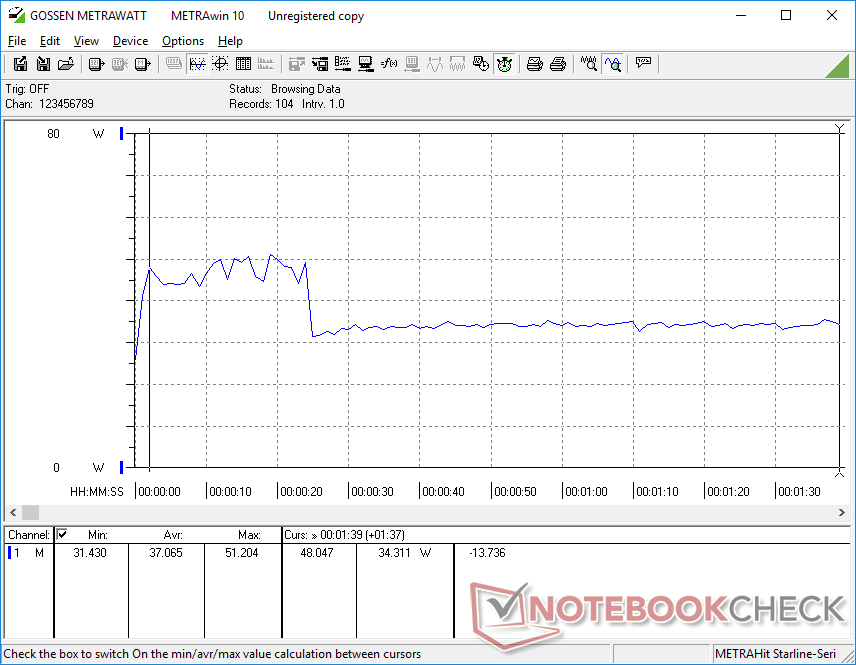
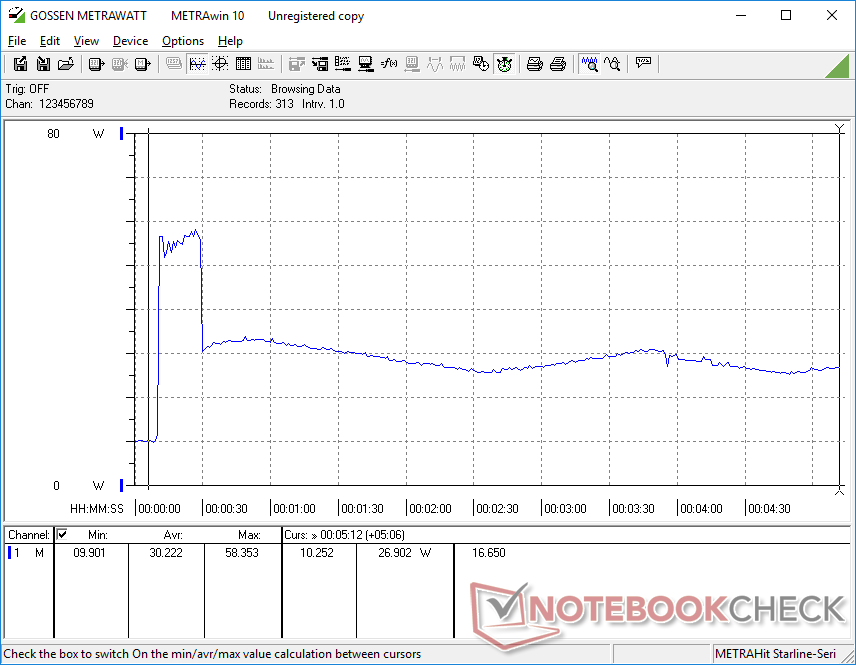
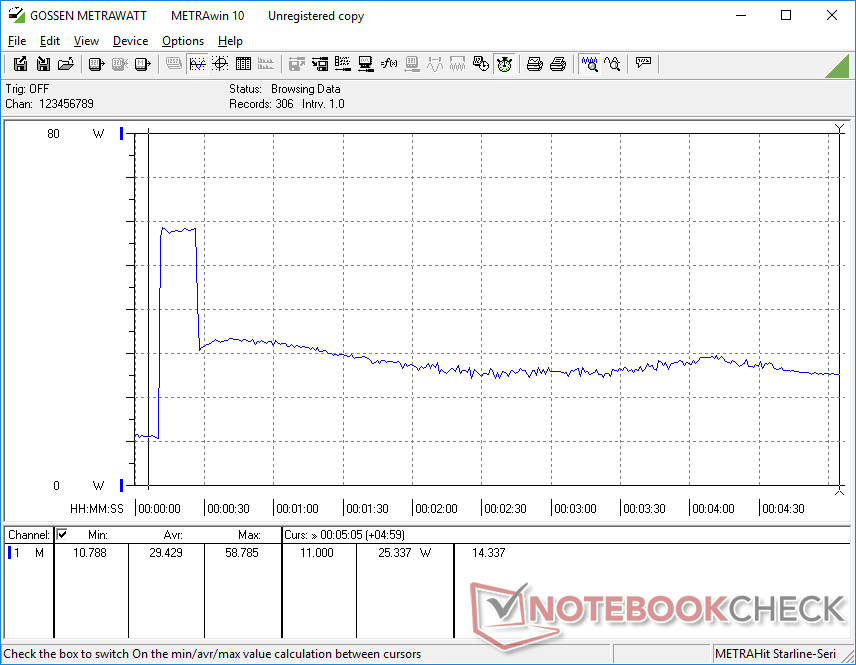
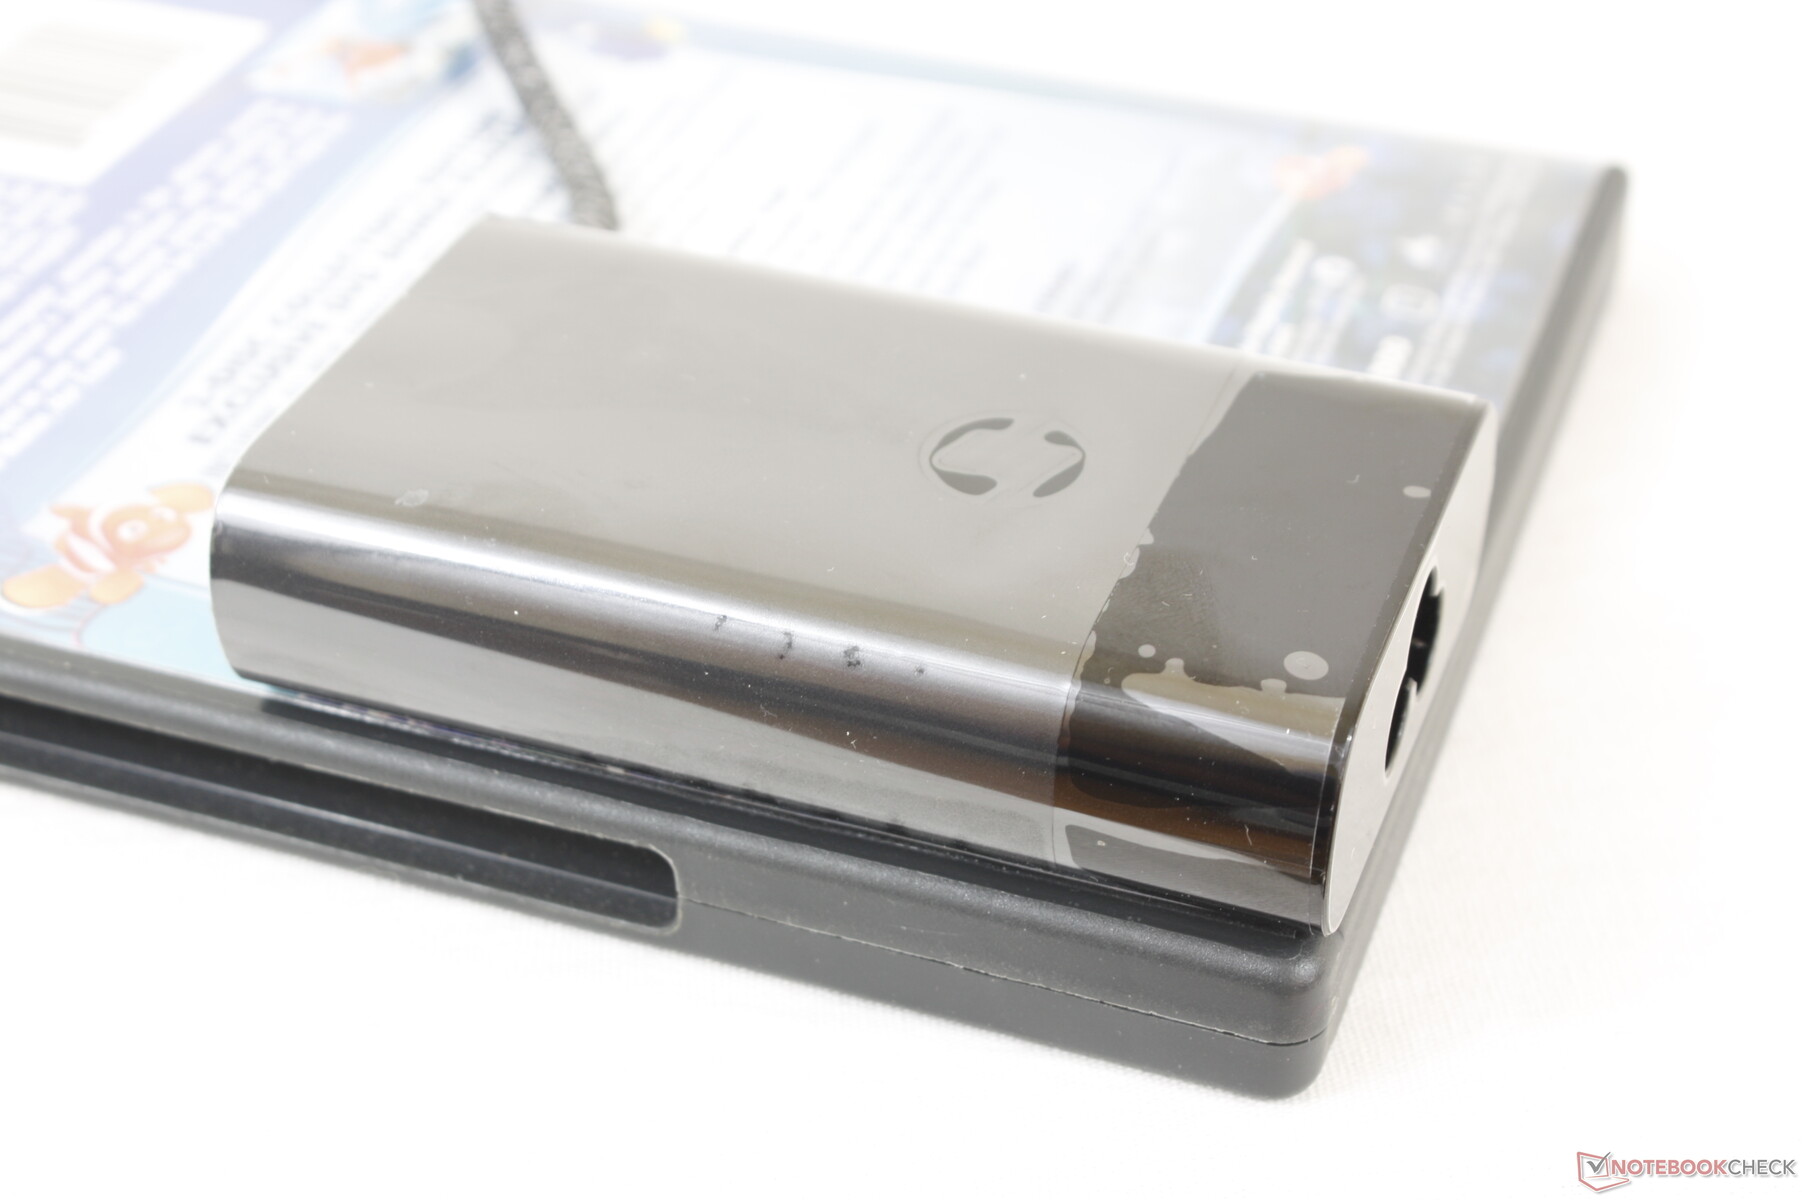
We're able to measure a temporary maximum draw of 58.8 W from the small (~8.8 x 5.3 x 2.1 cm) 65 W AC adapter lasting for about the first 20 seconds when running Prime95. This eventually falls to around 27 W since Turbo Boost potential is limited on the Dragonfly.
| Off / Standby | |
| Idle | |
| Load |
|
Key:
min: | |
| HP Elite Dragonfly Max i7-1185G7, Iris Xe G7 96EUs, Toshiba XG6 KXG60ZNV512G, IPS, 1920x1080, 13.3" | HP Spectre x360 13-aw2003dx i5-1135G7, Iris Xe G7 80EUs, Intel Optane Memory H10 with Solid State Storage 32GB + 512GB HBRPEKNX0202A(L/H), OLED, 3840x2160, 13.3" | MSI Summit E13 Flip Evo A11MT i7-1185G7, Iris Xe G7 96EUs, Phison 1TB SM2801T24GKBB4S-E162, IPS, 1920x1200, 13.4" | Asus ZenBook Flip S UX371 i7-1165G7, Iris Xe G7 96EUs, WDC PC SN730 SDBPNTY-1T00, OLED, 3840x2160, 13.3" | HP Elite Dragonfly-8MK79EA i5-8265U, UHD Graphics 620, Intel Optane Memory H10 with Solid State Storage 32GB + 512GB HBRPEKNX0202A(L/H), IPS, 1920x1080, 13.3" | |
|---|---|---|---|---|---|
| Power Consumption | -19% | -23% | -23% | 15% | |
| Idle Minimum * (Watt) | 2.9 | 5.7 -97% | 4.8 -66% | 6.1 -110% | 3.5 -21% |
| Idle Average * (Watt) | 9.9 | 8.4 15% | 8.4 15% | 10.6 -7% | 5.1 48% |
| Idle Maximum * (Watt) | 10.4 | 8.8 15% | 8.6 17% | 13.8 -33% | 8.1 22% |
| Load Average * (Watt) | 37.1 | 38.9 -5% | 47.1 -27% | 32.2 13% | 35.6 4% |
| Witcher 3 ultra * (Watt) | 31.5 | 40.5 -29% | 51.6 -64% | 28.3 10% | |
| Load Maximum * (Watt) | 58.8 | 66.9 -14% | 65.9 -12% | 64.7 -10% | 44.7 24% |
* ... smaller is better
Battery Life
Runtimes are slightly longer than on the 2020 model by almost an hour despite the identical 56 Wh battery capacity between them. Users can expect 11 hours of real-world WLAN use when at the 150-nits brightness setting. Results are quite close to the MSI Summit E13 Flip even though the latter comes equipped with a larger 70 Wh battery.
Charging from empty to full capacity takes just under 1.5 hours.
| HP Elite Dragonfly Max i7-1185G7, Iris Xe G7 96EUs, 56 Wh | HP Spectre x360 13-aw2003dx i5-1135G7, Iris Xe G7 80EUs, 60 Wh | Lenovo ThinkPad X13 Yoga G2 i7-1165G7, Iris Xe G7 96EUs, 52.8 Wh | MSI Summit E13 Flip Evo A11MT i7-1185G7, Iris Xe G7 96EUs, 70 Wh | Asus ZenBook Flip S UX371 i7-1165G7, Iris Xe G7 96EUs, 67 Wh | HP Elite Dragonfly-8MK79EA i5-8265U, UHD Graphics 620, 56.2 Wh | |
|---|---|---|---|---|---|---|
| Battery runtime | -47% | -23% | -21% | -21% | -6% | |
| Reader / Idle (h) | 28.7 | 11.9 -59% | 21.1 -26% | |||
| WiFi v1.3 (h) | 11 | 6.1 -45% | 9.3 -15% | 11.2 2% | 6.7 -39% | 10.1 -8% |
| Load (h) | 2.9 | 1.8 -38% | 2 -31% | 1.8 -38% | 2.8 -3% | 2.8 -3% |
Pros
Cons
Verdict: Test Out Sure View in Person Before Deciding
From a quality and visual standpoint, the Dragonfly Max is reflective of its high price and flagship business convertible category. It's both light and small without needing to sacrifice rigidity, security, or features. There just aren't any other 13.3-inch convertibles out there with 5G connectivity, 5 MP webcam, 1000-nit display options, and Intel vPro all in one.
CPU and GPU performance is slower than most other Tiger Lake-U laptops but still faster than any Whiskey Lake-U or older model. You'll definitely see a performance boost if upgrading from pre 10th gen Intel systems, but you may want to consider higher TDP models like the Spectre x360 13 or MSI Summit E13 Flip if raw ULV performance is priority.
Dress the Spectre x360 13 in a professional suit and tie and you'll have the EliteBook Dragonfly Max. The unit prioritizes Sure View and low fan noise to a fault as picture quality is blurrier and performance is slower, respectively, than many other 13.3-inch laptops with 11th gen Intel.
The one aspect dragging down the whole laptop is the Sure View filter because it severely degrades the visual experience for the primary user. The feature makes it more difficult for peripheral viewers to see the screen, but this comes at the heavy cost of brightness and clarity for the person it is supposed to be helping. The worst part is that these consequences remain even if Sure View is disabled.
For the best Dragonfly Max experience, it's highly recommended to demo two Dragonfly SKUs — one with Sure View and one without — to see the massive display quality differences between them and then consider if the feature is worth the investment. The laptop itself otherwise excels in almost every other category to be worth a serious look.
Price and availability
The Dragonfly Max is not yet widely through retail channels as of this writing. HP is currently accepting pre-orders for the Dragonfly Max starting at $2265 USD with an expected ship date of October.
HP Elite Dragonfly Max
- 06/06/2021 v7 (old)
Allen Ngo
Price comparison
