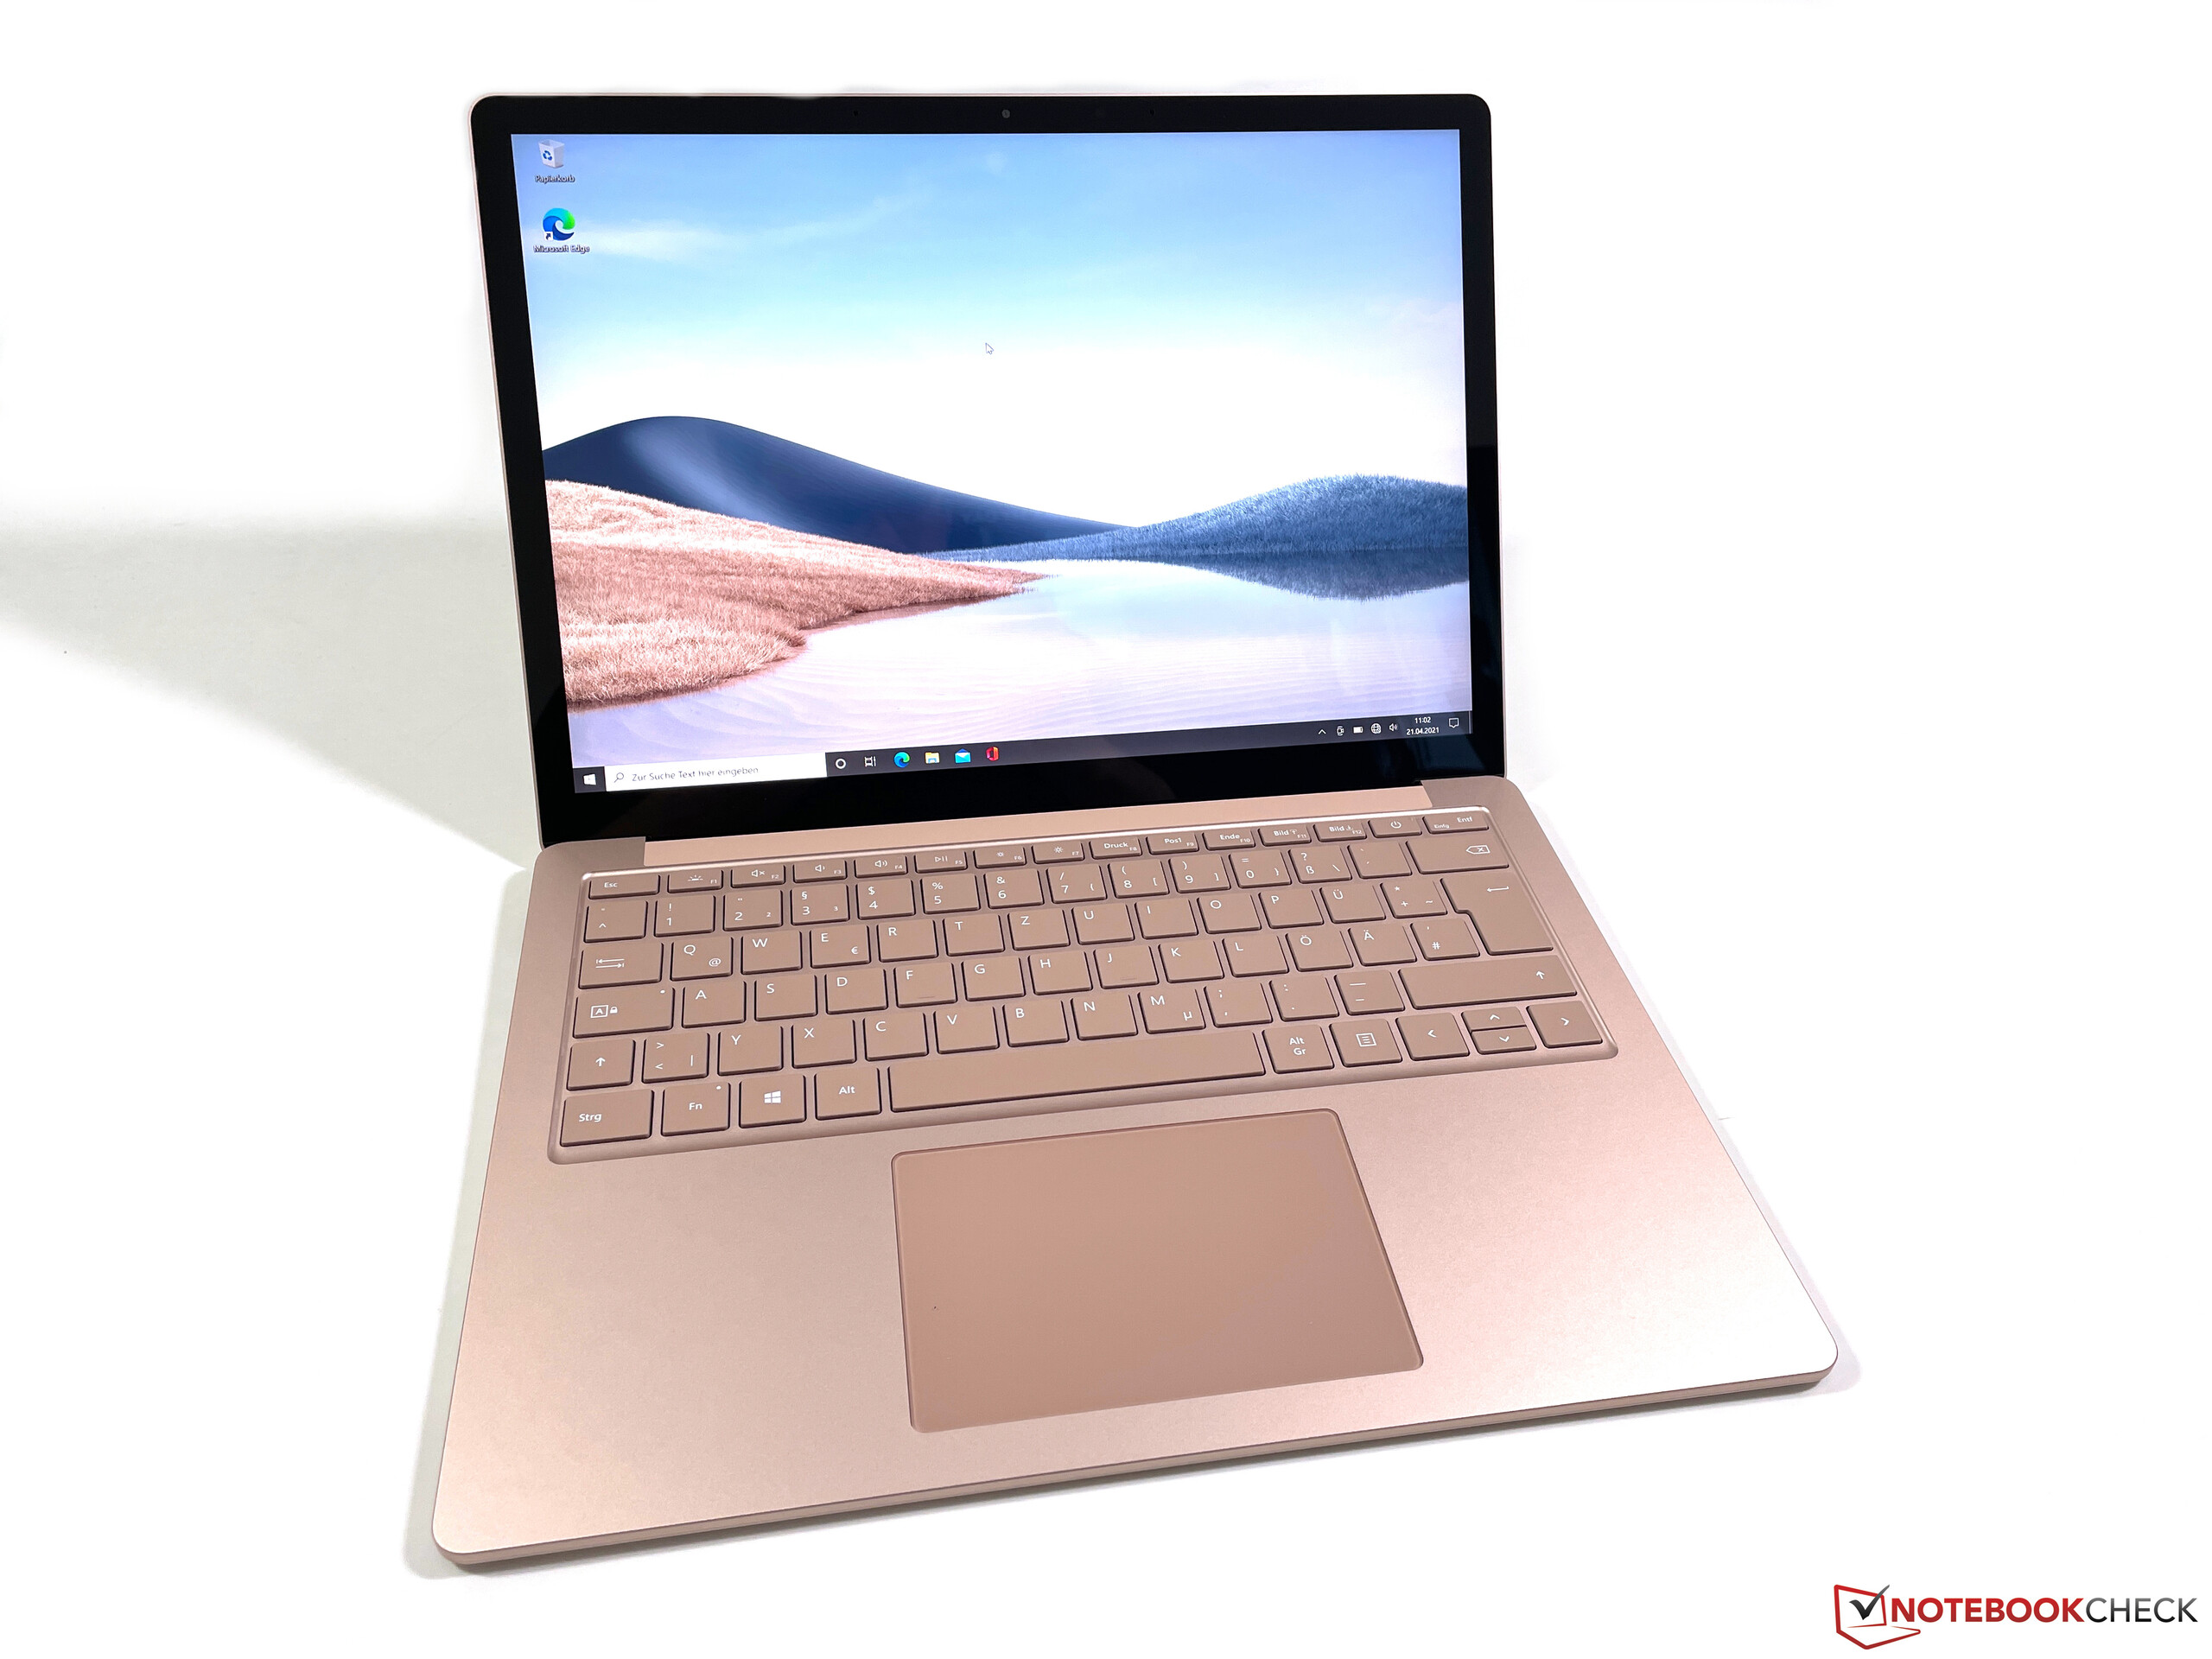
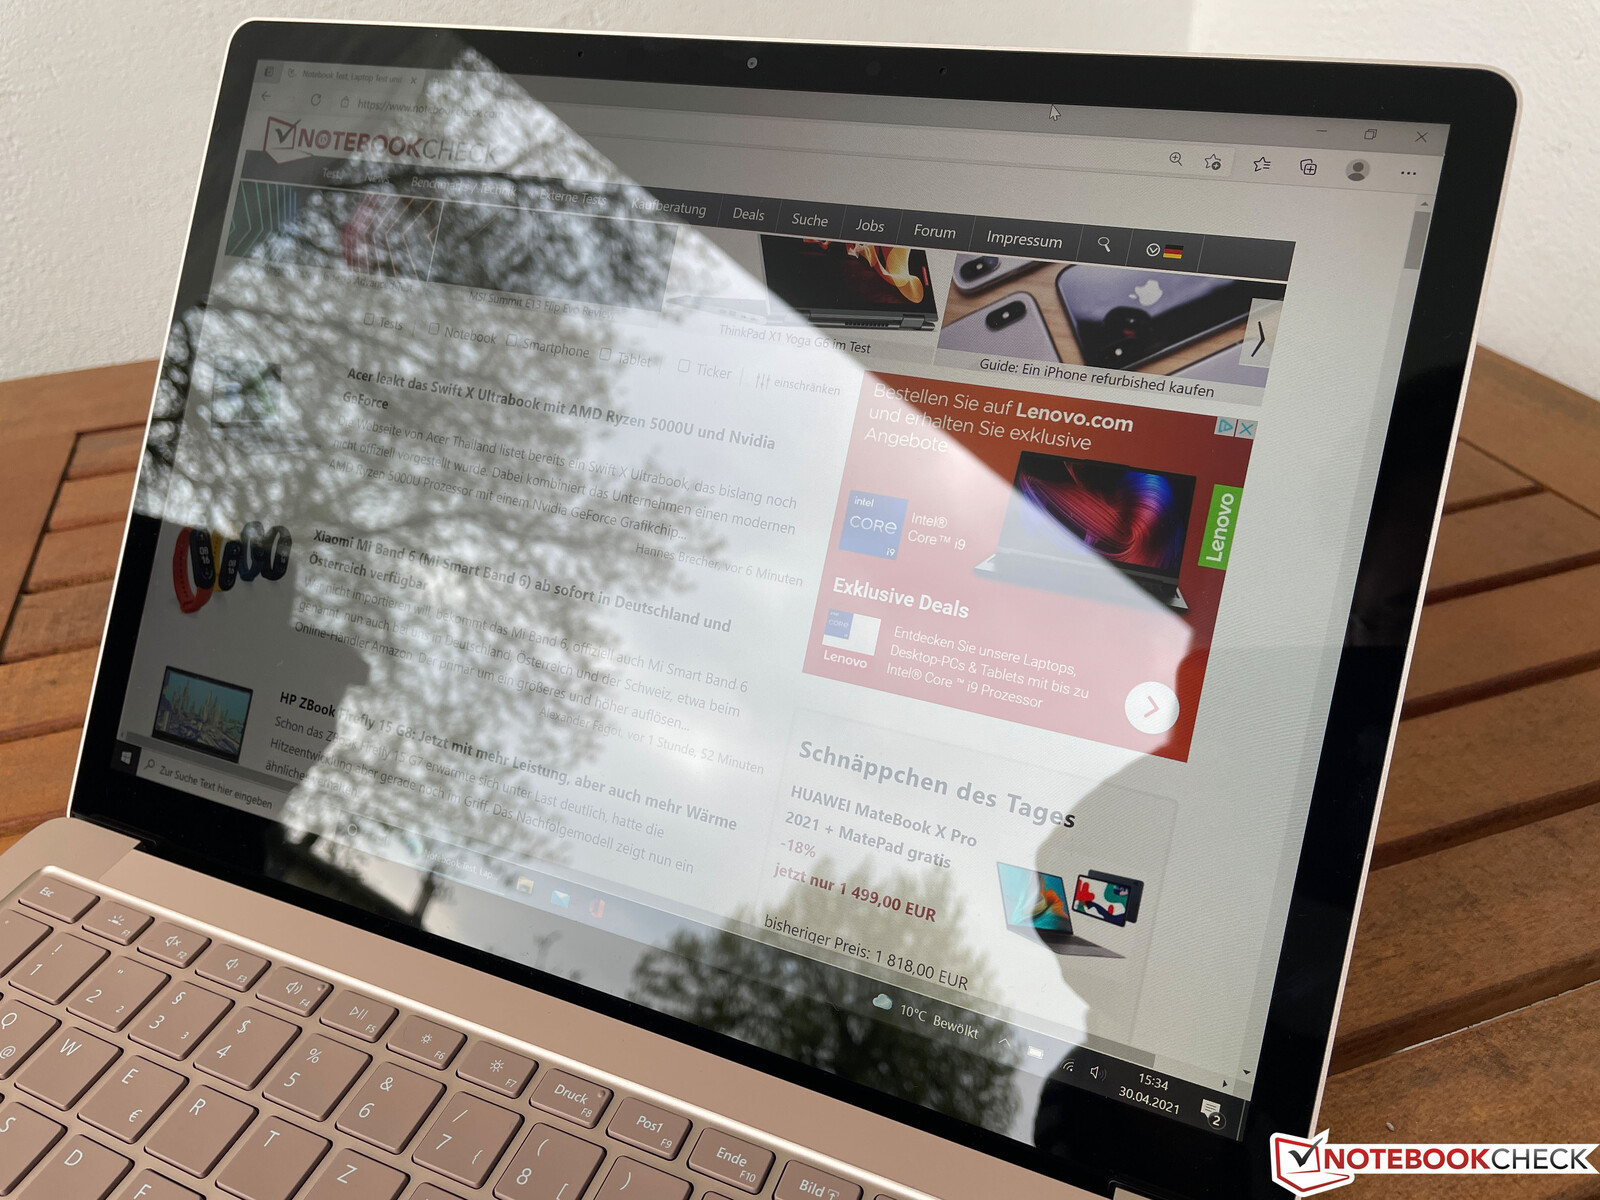
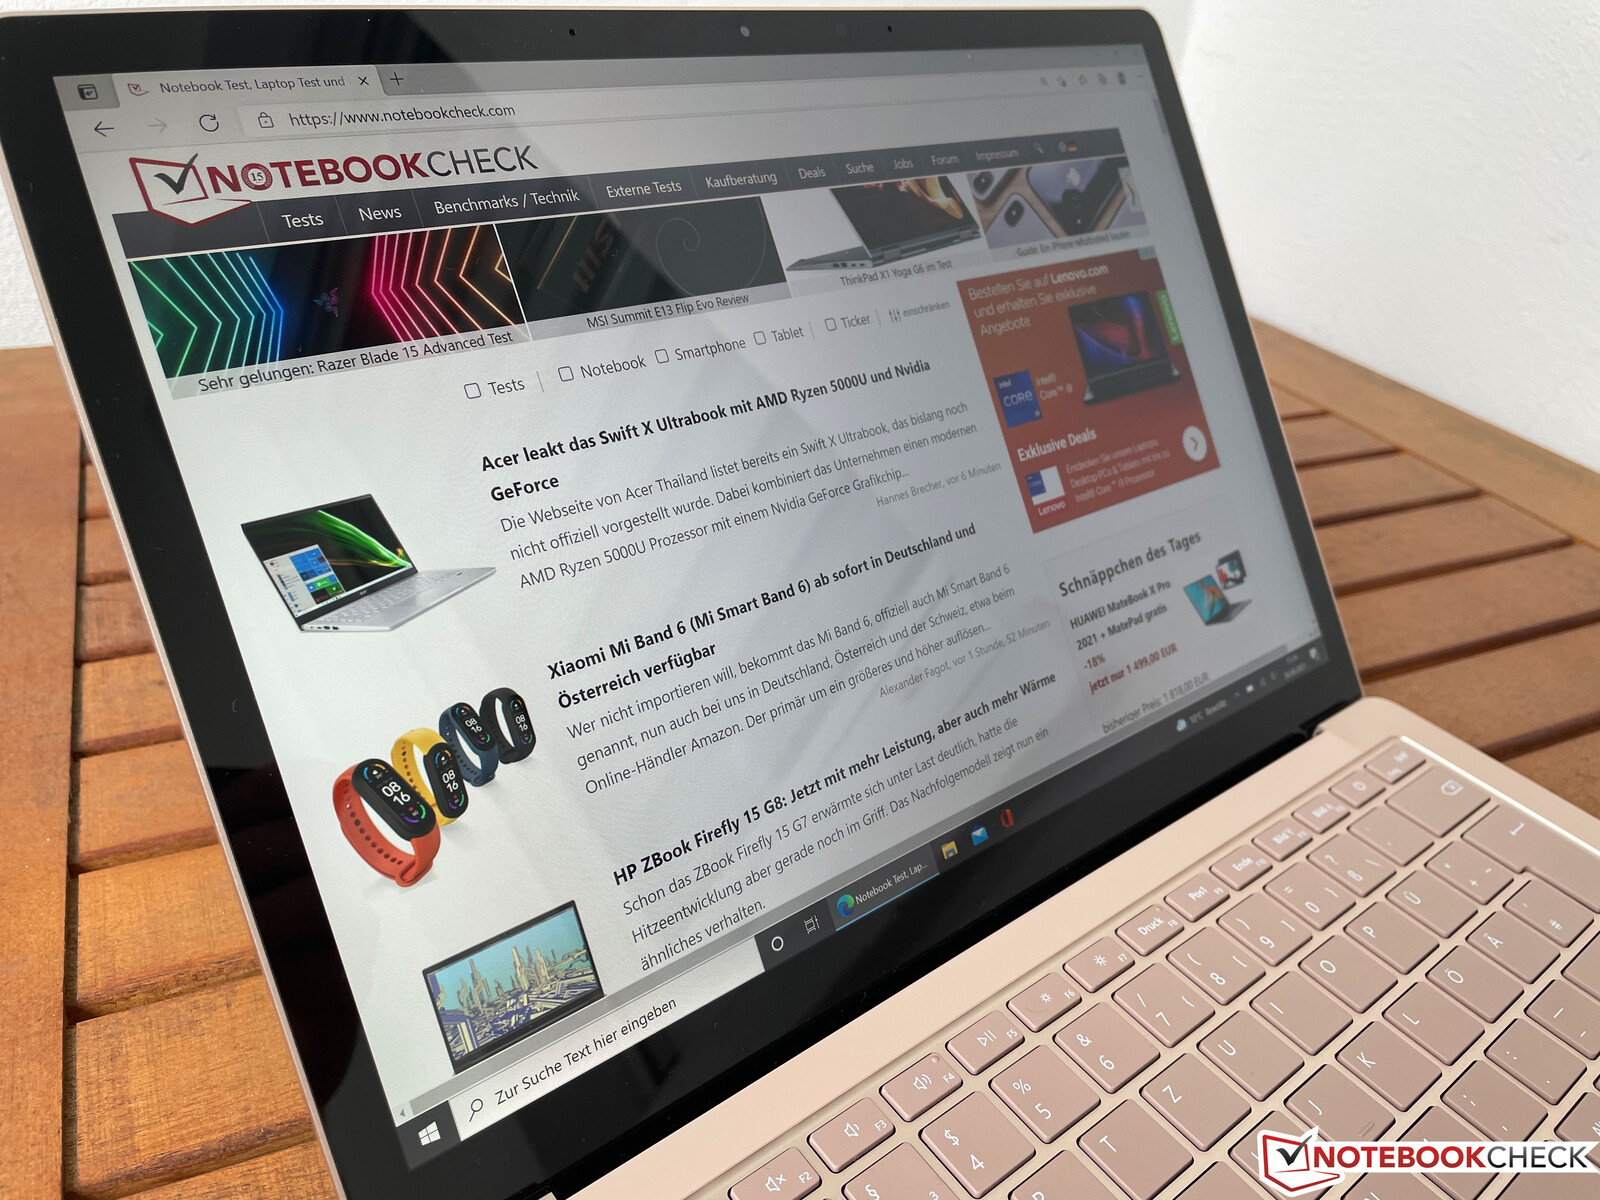
Microsoft Surface Laptop 4 13 Laptop Review - Too expensive with Intel CPU?

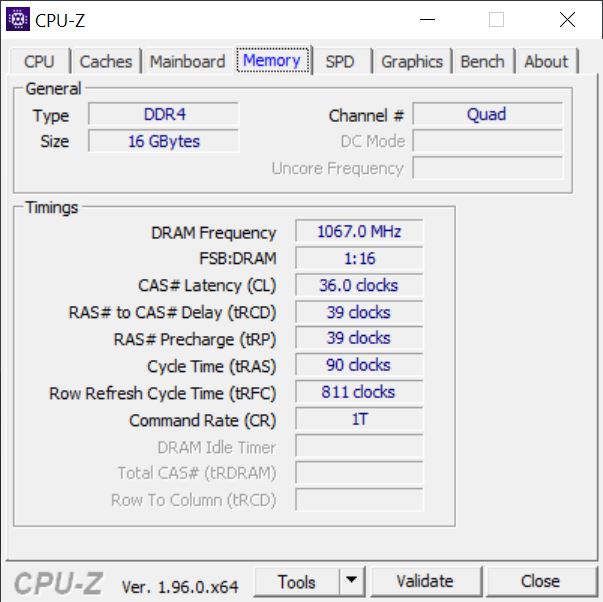
The larger 15-inch model of the Surface Laptop 4 was already available with Intel or AMD CPUs last year, and Microsoft now adds an AMD option for the smaller 13.5-inch Surface Laptop 4 as well. Except for the processor, however, nothing really changed. Our test model is equipped with a Core i7-1185G7 CPU, 16 GB RAM, and 512 GB PCIe-SSD storage for 1849 Euros. The AMD CPU is only available with 8 GB RAM and 256 GB storage, and you have to get an Intel CPU if you need more memory/storage. The base price with a Core i5 is 1449 Euros (8 GB RAM, 512 GB SSD). We will focus on the performance in this article, please see our previous review of the Surface Laptop 3 for comprehensive information on the chassis and the input devices.
mögliche Konkurrenten im Vergleich
Rating | Date | Model | Weight | Height | Size | Resolution | Price |
|---|---|---|---|---|---|---|---|
| 84.7 % v7 (old) | 05 / 2021 | Microsoft Surface Laptop 4 13 i7 i7-1185G7, Iris Xe G7 96EUs | 1.3 kg | 14.5 mm | 13.50" | 2256x1504 | |
| 87.6 % v7 (old) | 03 / 2021 | Lenovo Yoga Slim 7i Carbon 13 ITL i7-1165G7, Iris Xe G7 96EUs | 975 g | 15 mm | 13.30" | 2560x1600 | |
| 87.4 % v7 (old) | 12 / 2020 | Dell XPS 13 9310 Core i7 4K i7-1185G7, Iris Xe G7 96EUs | 1.3 kg | 14.8 mm | 13.40" | 3840x2400 | |
| 91.1 % v7 (old) | 12 / 2020 | Apple MacBook Pro 13 Late 2020 M1 Entry (8 / 256 GB) M1, M1 8-Core GPU | 1.4 kg | 15.6 mm | 13.30" | 2560x1600 |
Case & Connectivity
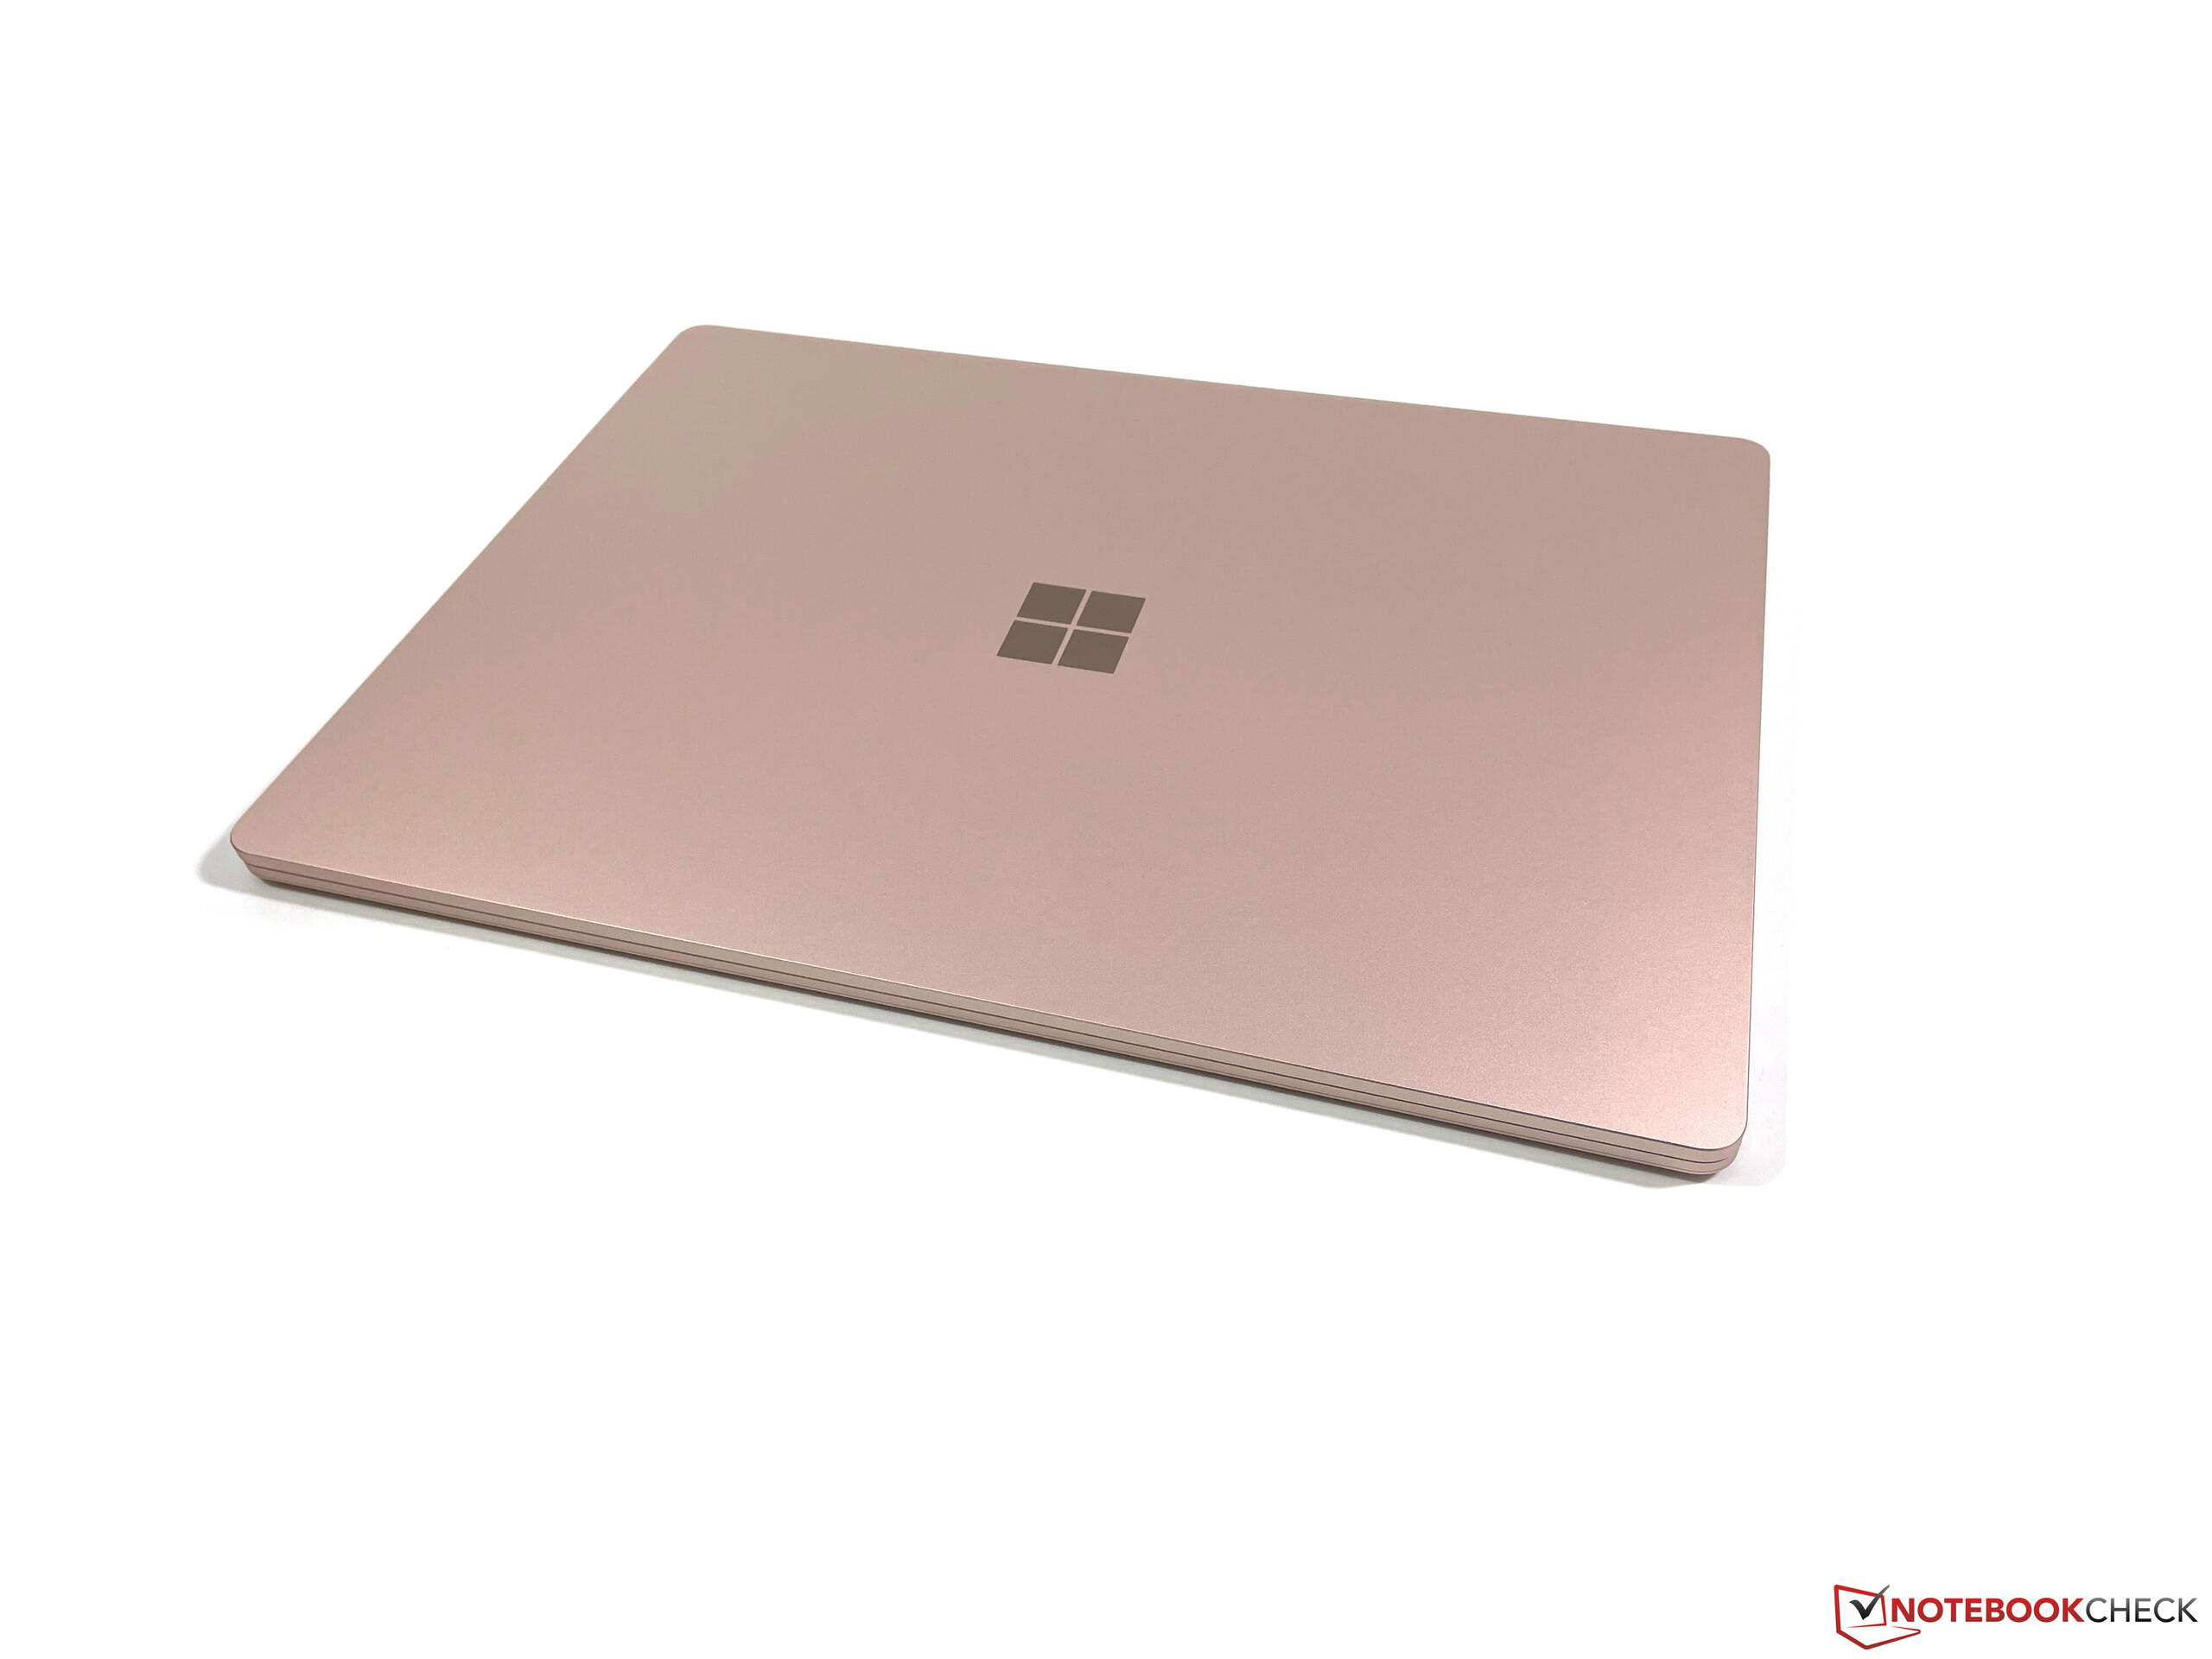
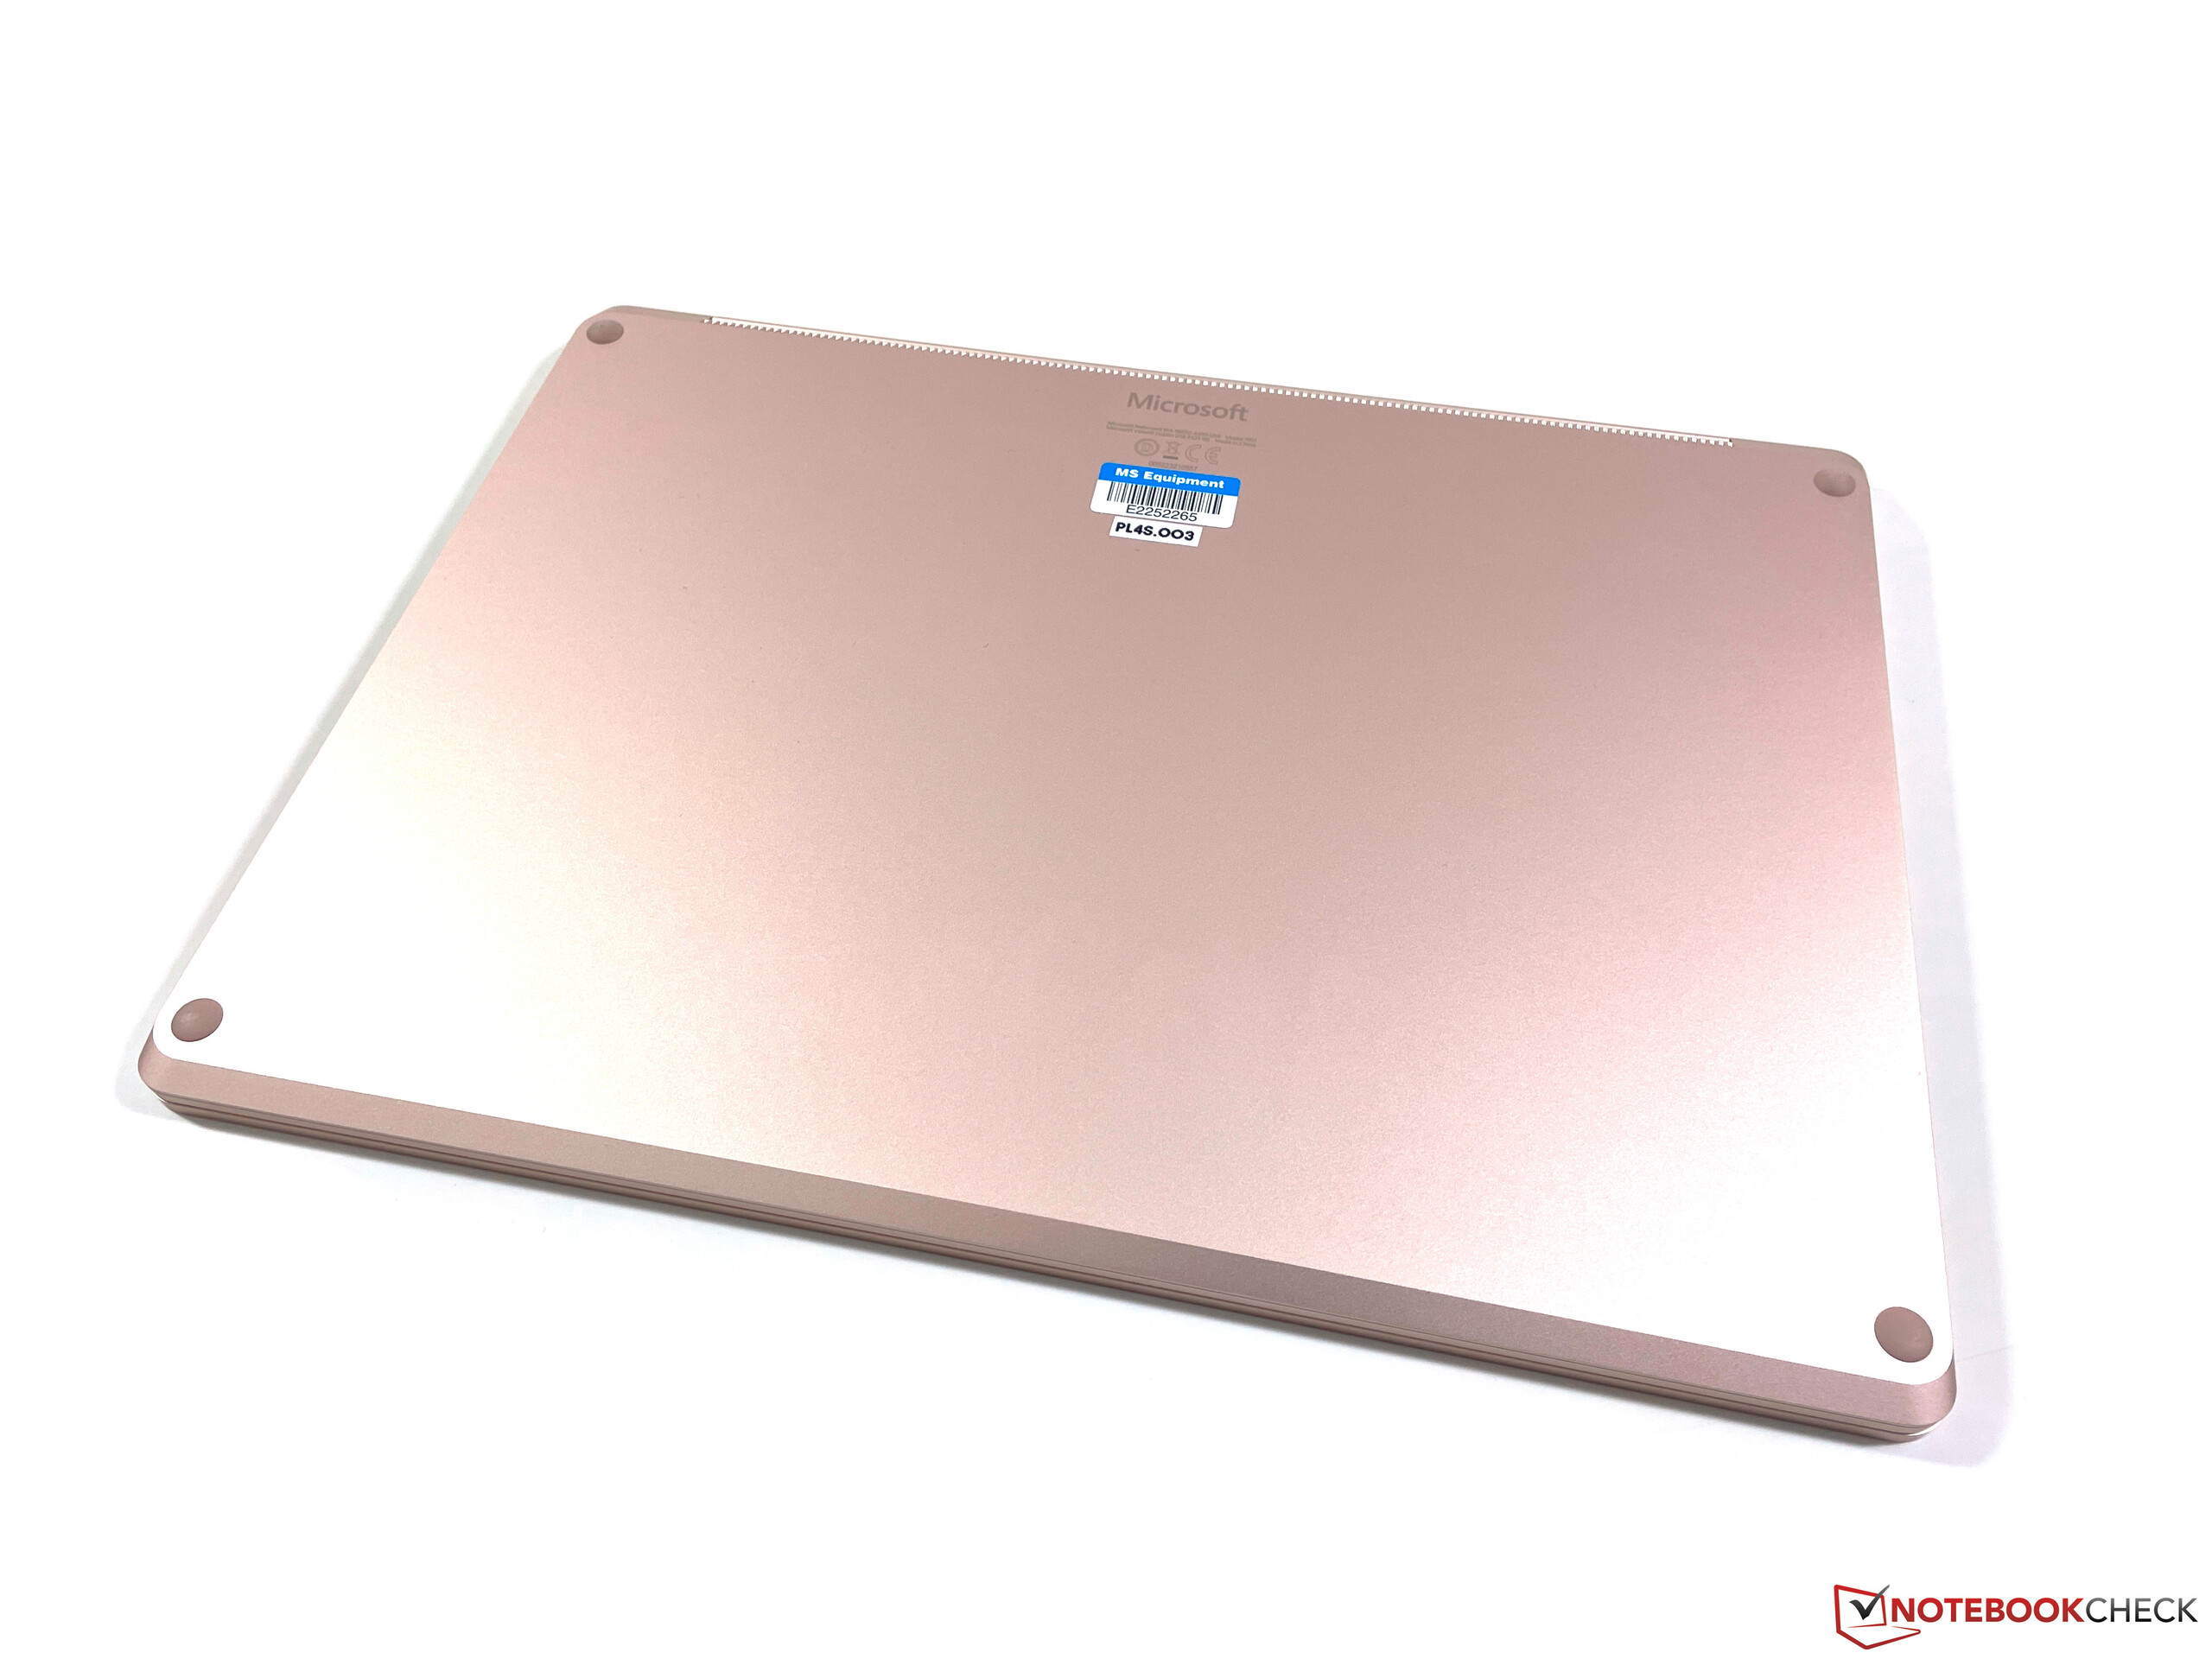
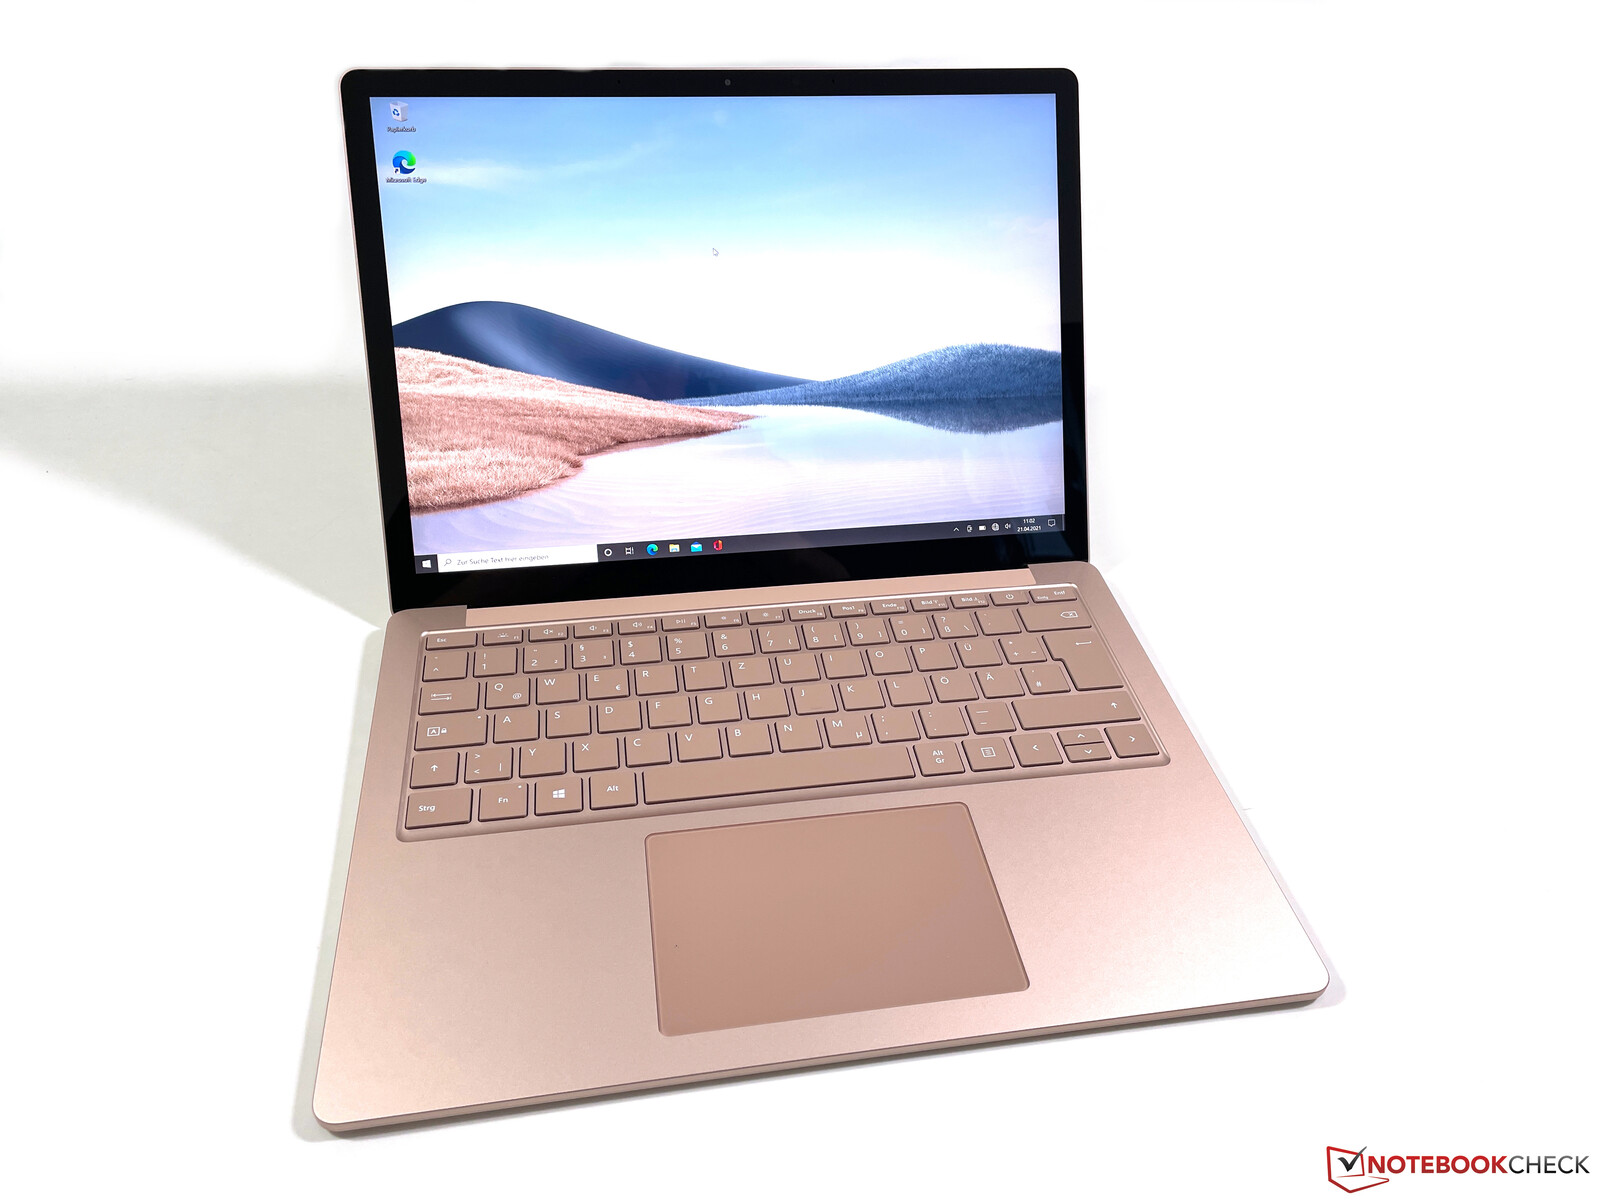
The case is once again available in multiple colors and you can either get metal or Alcantara for the top of the base unit. A direct comparison reveals that the Alcantara version is not quite as sturdy in the center keyboard area, but there should not be any limitations in practice. All in all, the chassis quality is still very good, but you can hardly maintain the device. The screws are hidden underneath glued support feet and all you could change is the compact M.2-2230 SSD, even though there are not many suitable drives on the market anyway.
Connectivity
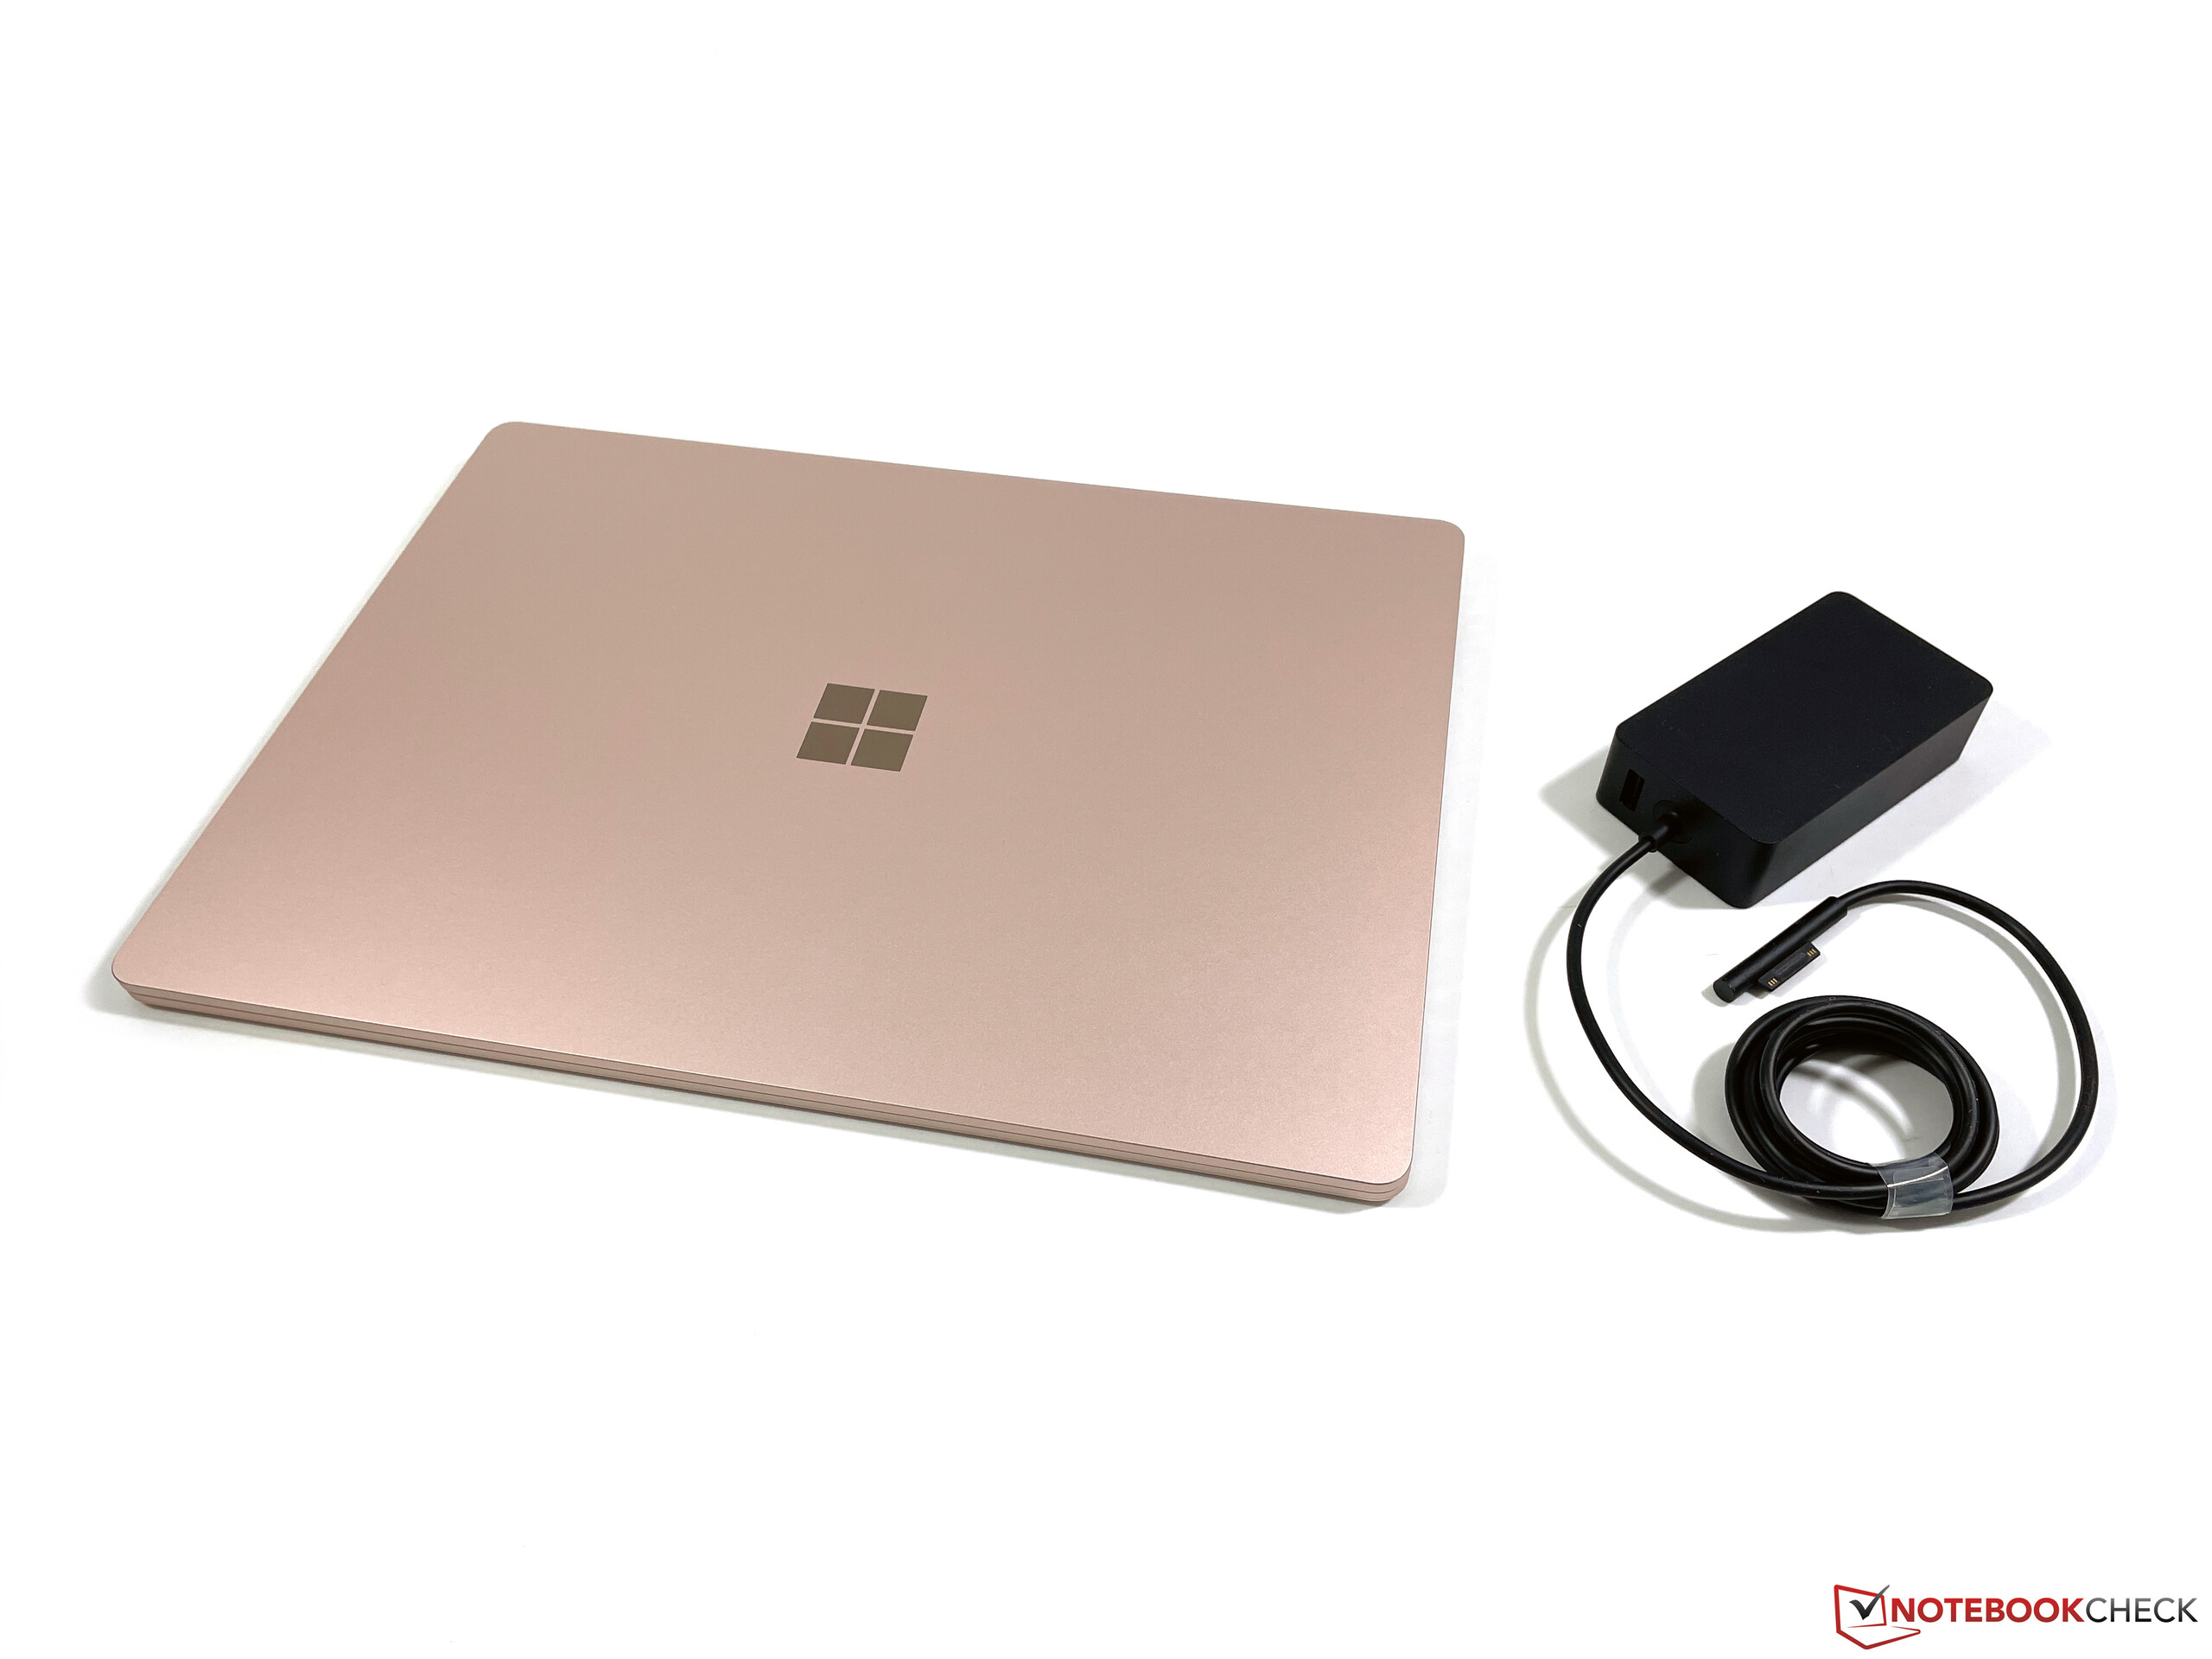
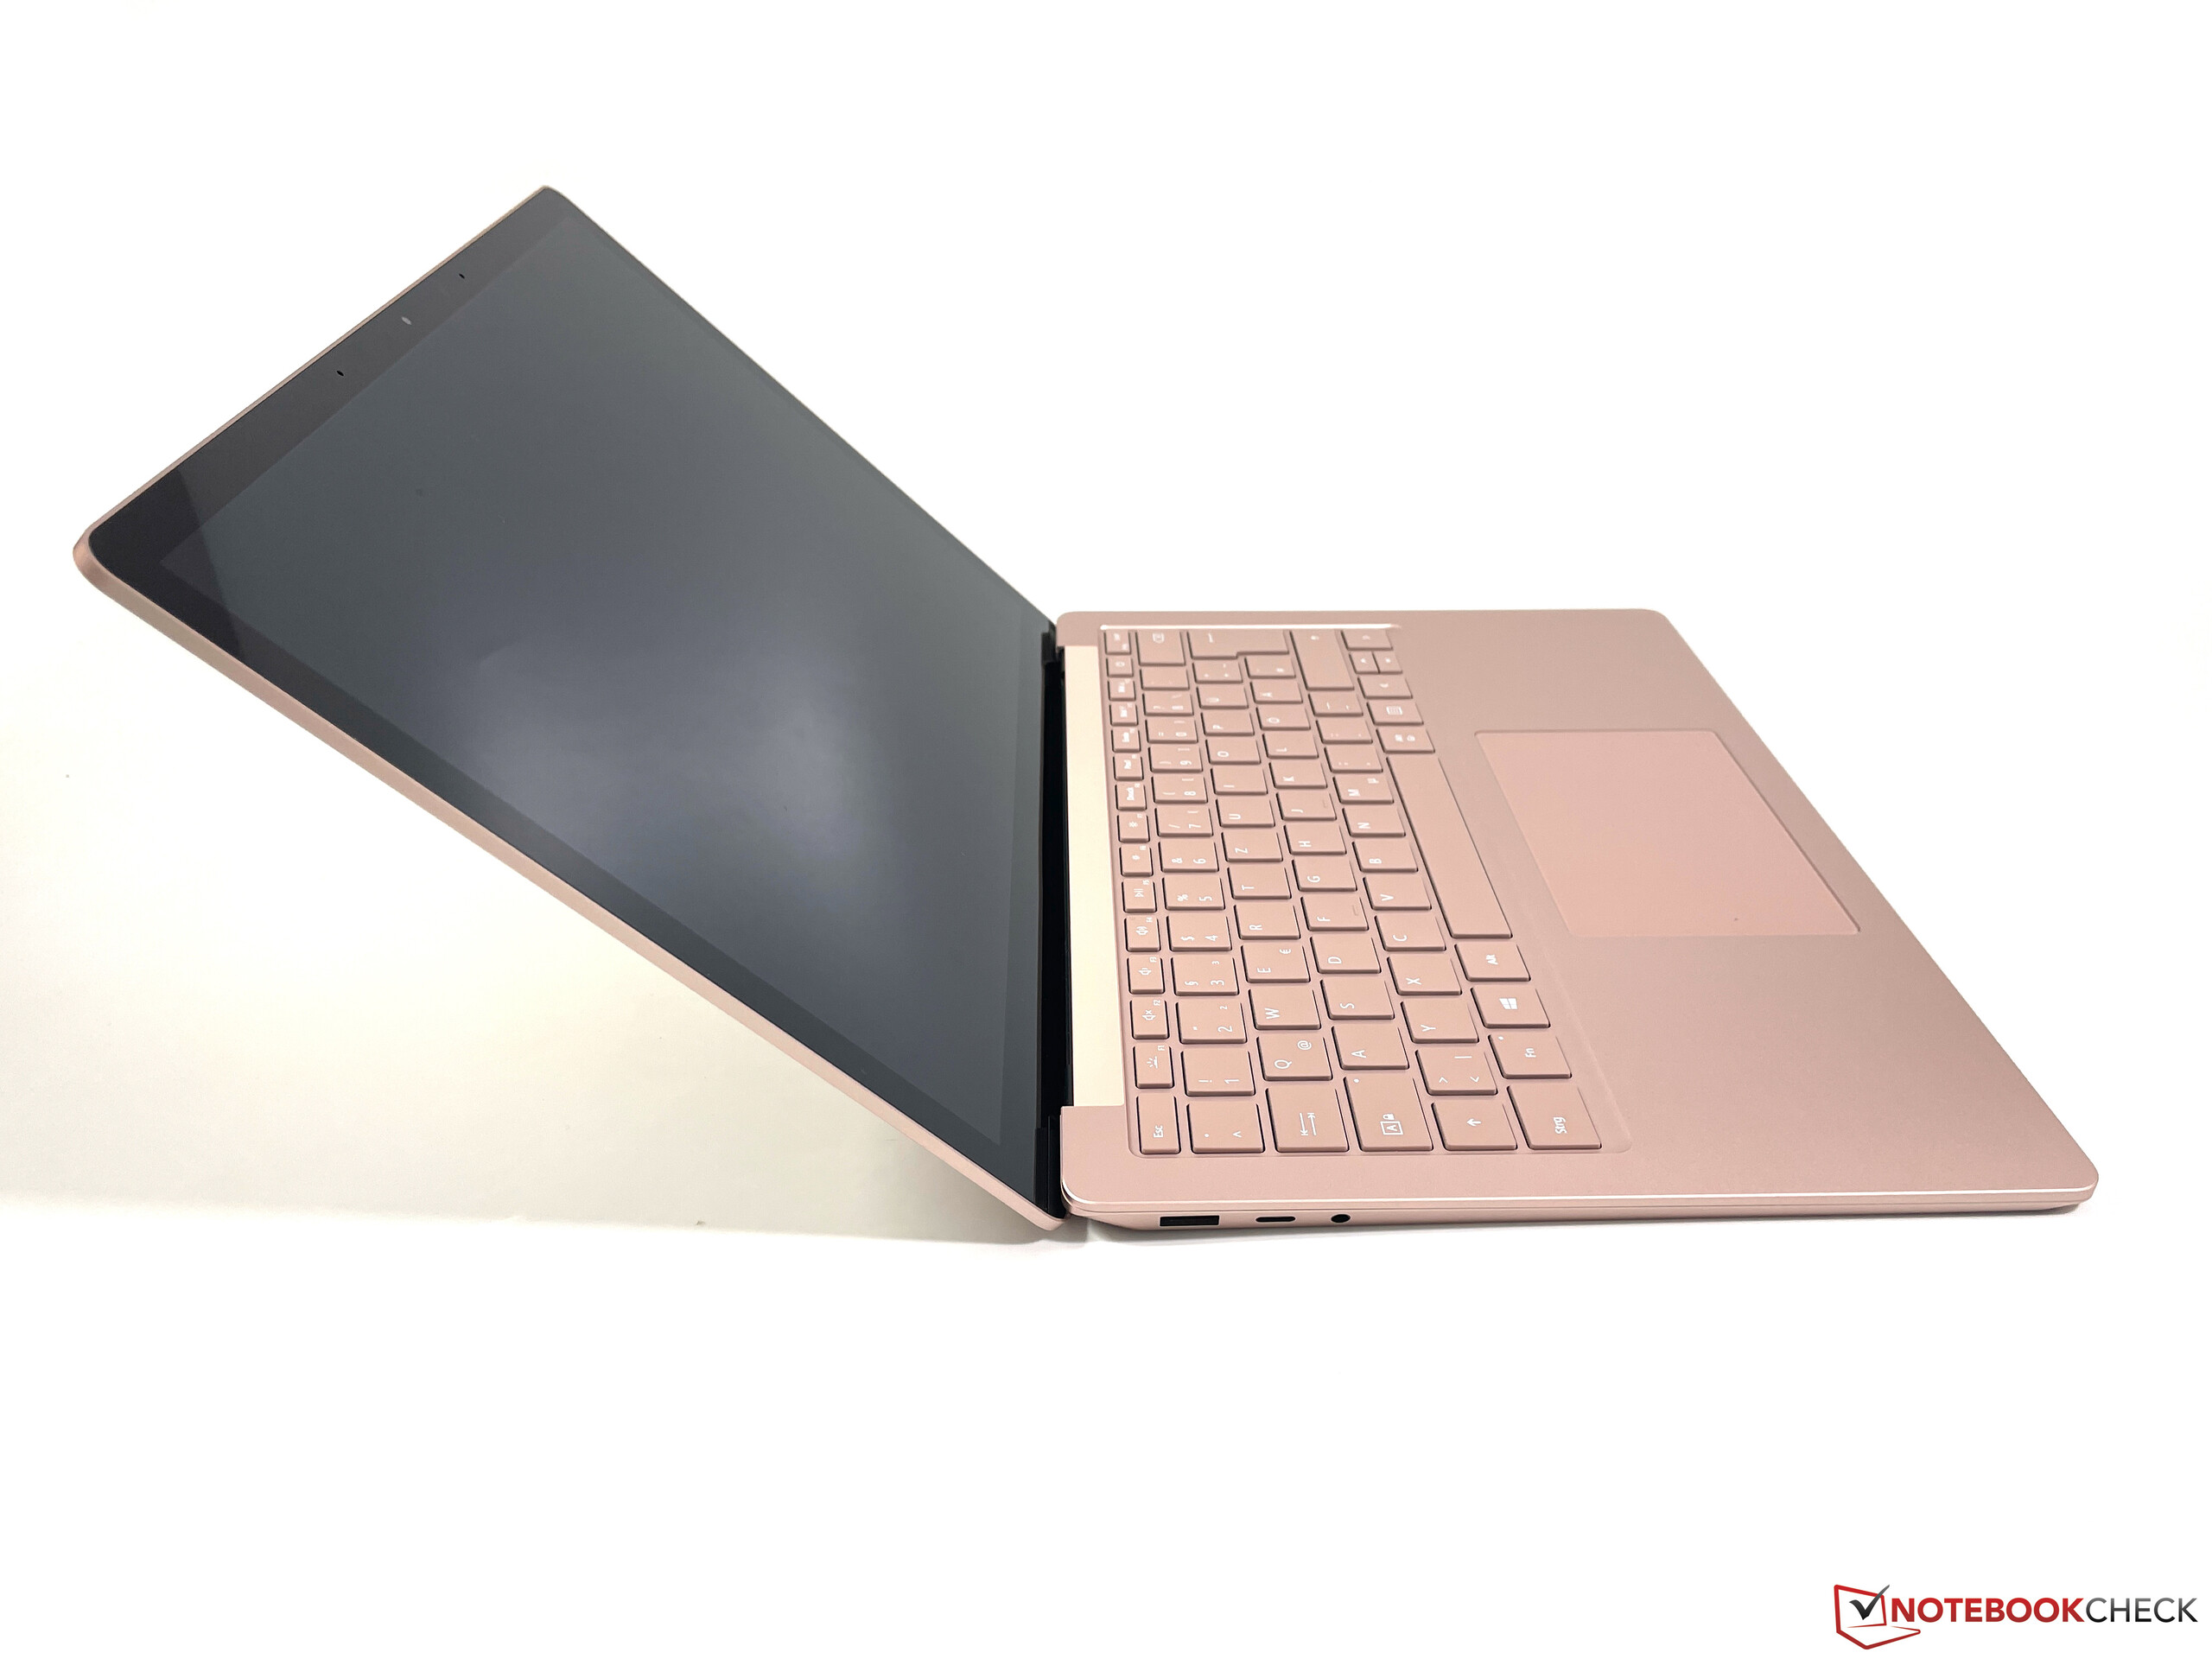
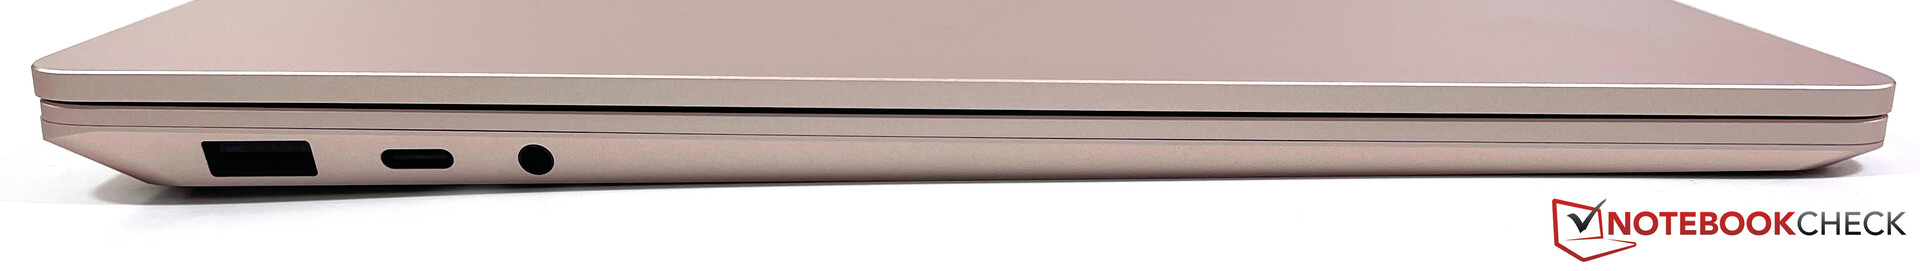
Microsoft still avoids modern Thunderbolt 4 or USB 4 connectors, and you once again get the proprietary Surface Connect port for the power adapter and some accessories from Microsoft on the right side, but the handling is not great. Due to the angled base unit, you can only attach the power adapter when you lift the device on the right side. It is also possible to charge via USB-C.
The Wi-Fi module (Intel AX201) is identical to the previous model and it supports the fast Wi-Fi 6 standard. Our standardized Wi-Fi test with the router Netgear Nighthawk RAX120 reveals good transfer rates and we did not experience any signal problems with the router from Netgear or the AVM Fritz!Box 7590. Contrary to the Surface Pro 7 Plus, there is no option for an LTE module on the Surface Laptop 4.


Input Devices
The input devices did not change. The keyboard is decent for a subnotebook and the touchpad is very reliable. Our chassis color is called Sandstone and the contrast on the keys with the white lettering is not great, and the white illumination does not really help, either.
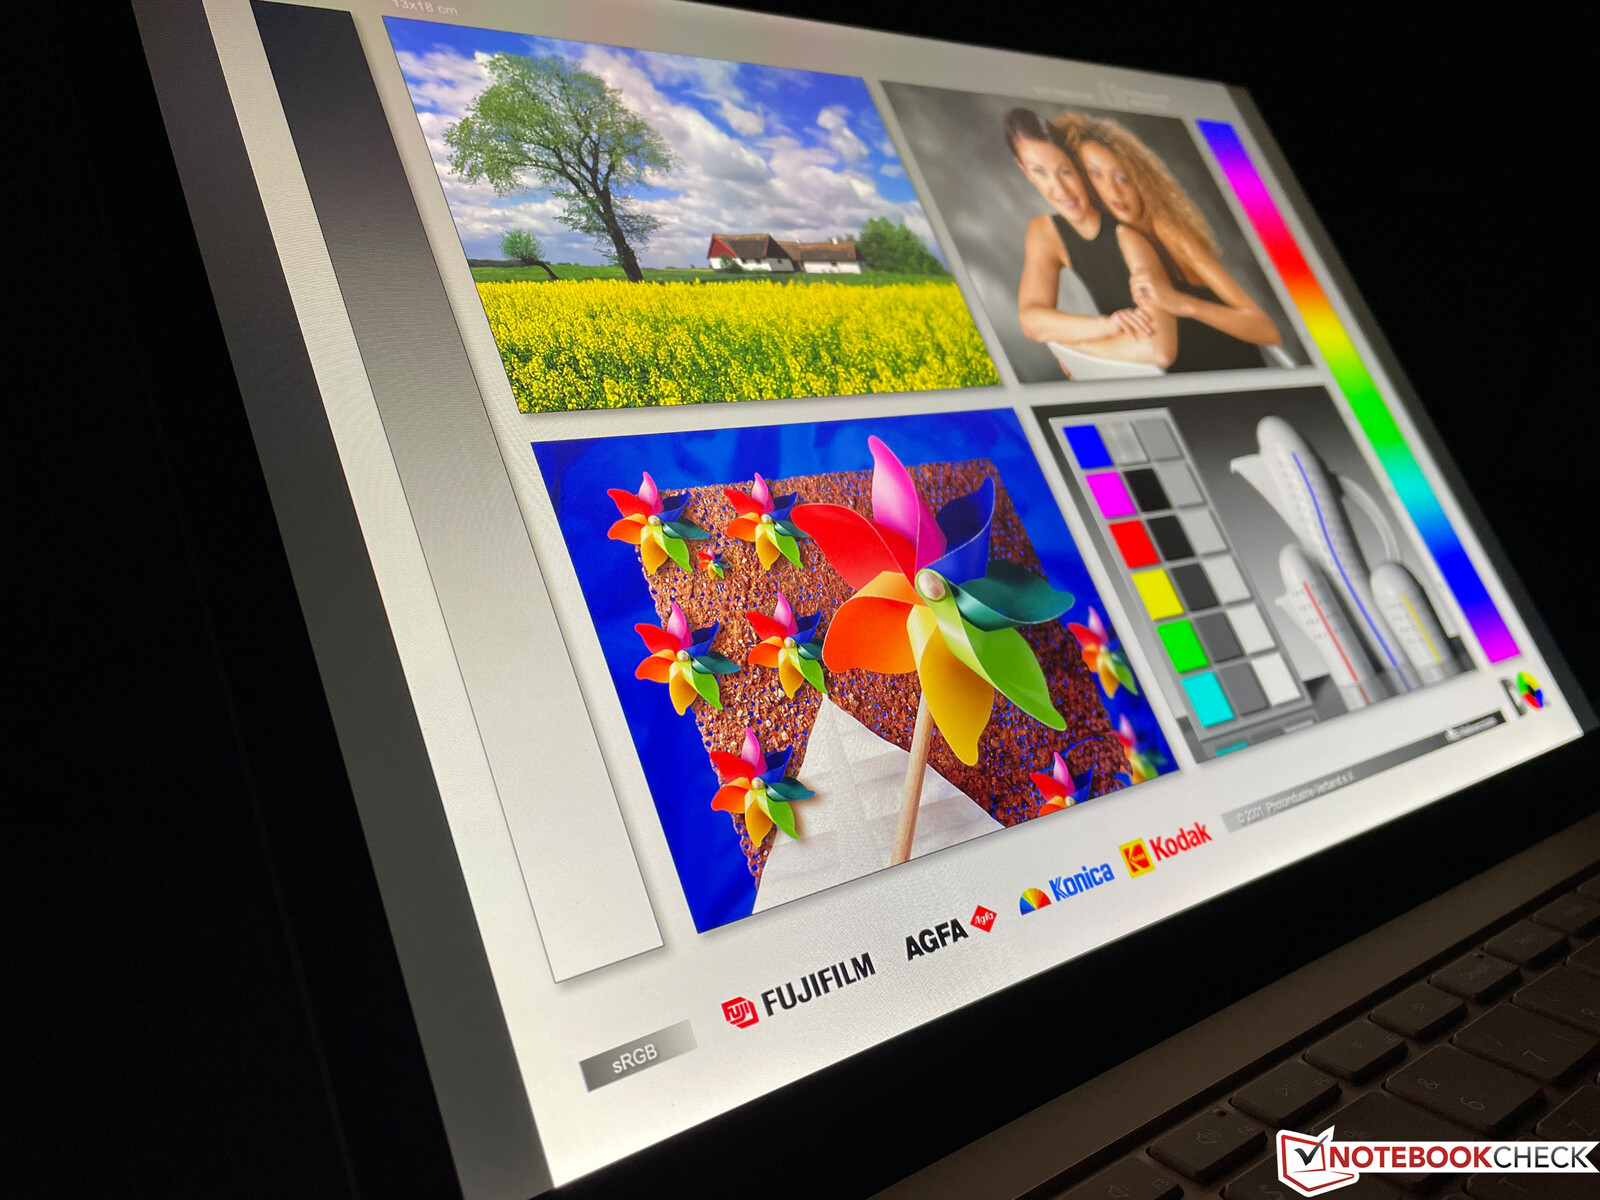
Display - Surface with 3:2 Touchscreen
We can keep it short in the display section, because Microsoft still uses the same panel. The subjective picture impression is excellent and you can only notice minor backlight bleeding on the bottom edge. The display is also identical at around 400 nits, but this also means there is no much headroom in very bright environments and the competition from Dell or Apple is superior in this respect.
| |||||||||||||||||||||||||
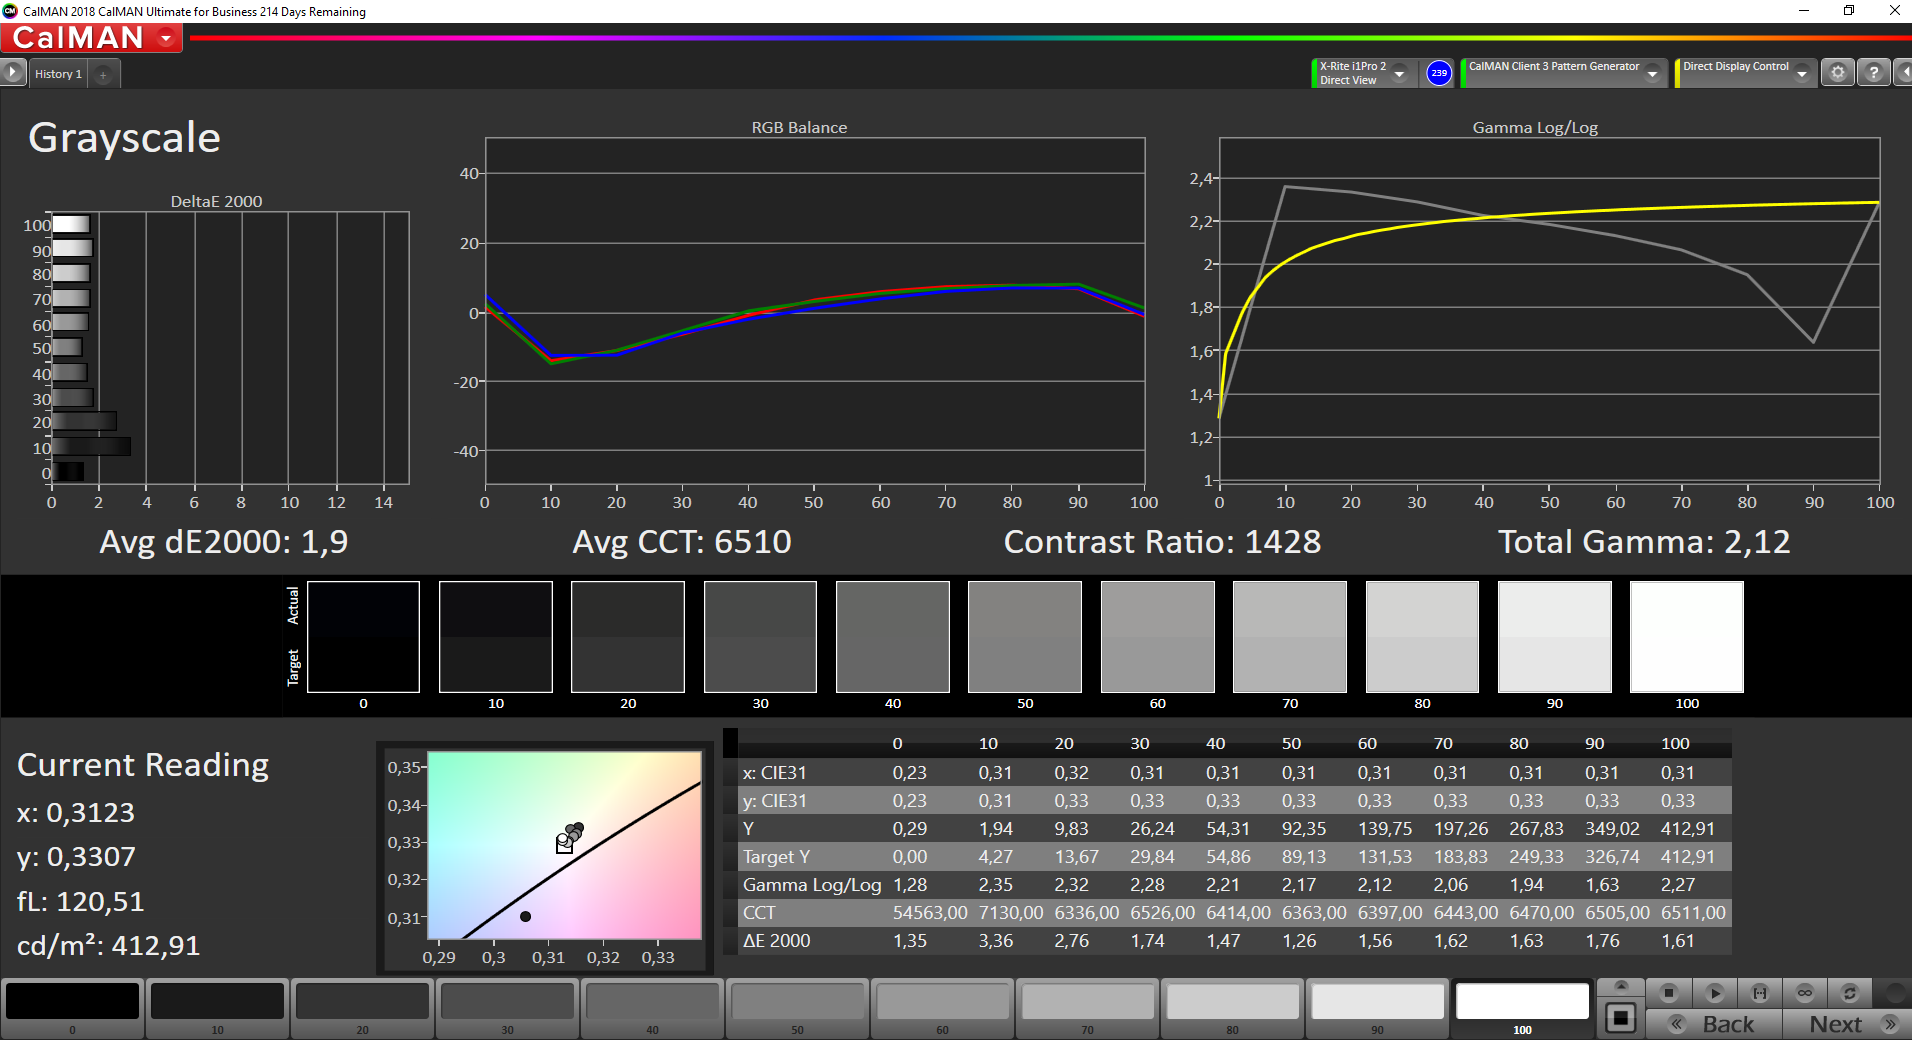
Brightness Distribution: 94 %
Center on Battery: 406 cd/m²
Contrast: 1424:1 (Black: 0.29 cd/m²)
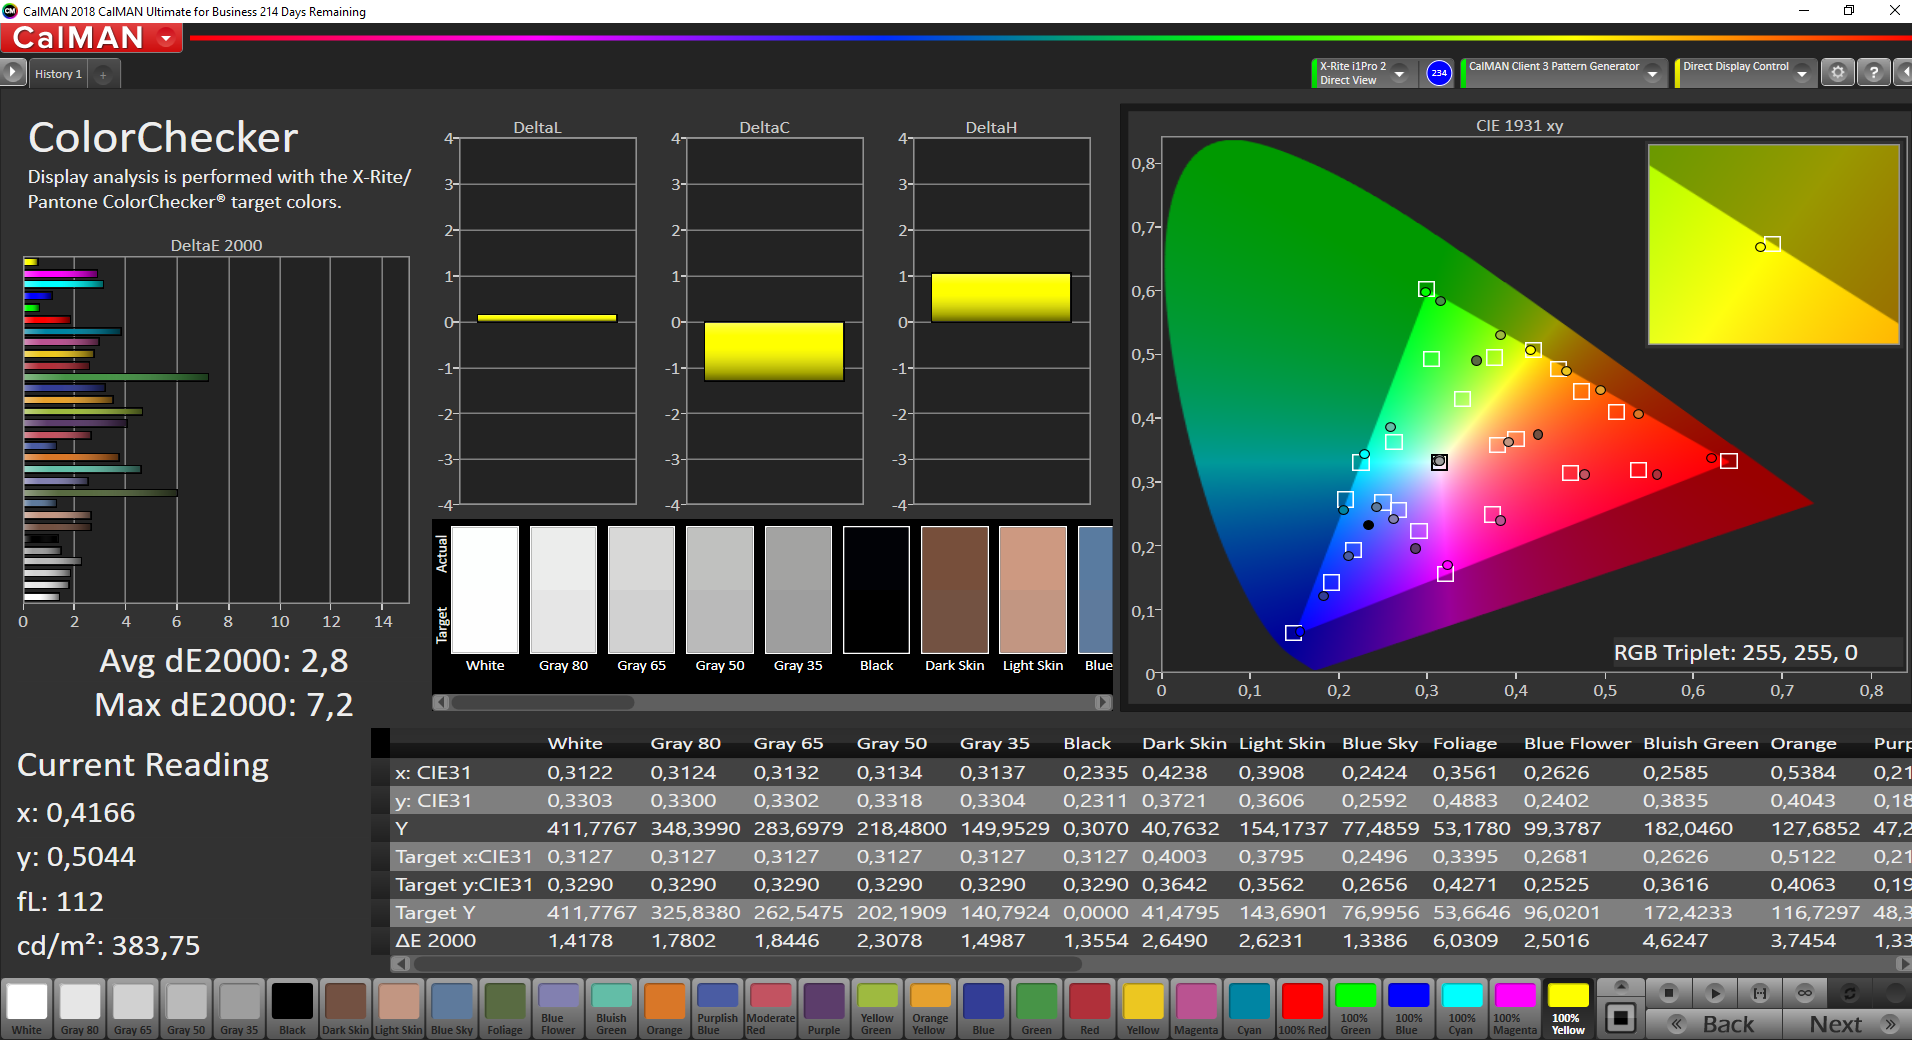
ΔE ColorChecker Calman: 2.8 | ∀{0.5-29.43 Ø4.73}
calibrated: 0.8
ΔE Greyscale Calman: 1.9 | ∀{0.09-98 Ø4.97}
97.2% sRGB (Argyll 1.6.3 3D)
61.6% AdobeRGB 1998 (Argyll 1.6.3 3D)
66.9% AdobeRGB 1998 (Argyll 3D)
97.2% sRGB (Argyll 3D)
64.7% Display P3 (Argyll 3D)
Gamma: 2.12
CCT: 6510 K
| Microsoft Surface Laptop 4 13 i7 LQ135P1JX51, IPS, 2256x1504, 13.5" | Lenovo Yoga Slim 7i Carbon 13 ITL N133GCA-GQ1, a-SI IPS LED, 2560x1600, 13.3" | Dell XPS 13 9310 Core i7 4K Sharp LQ134R1, IPS, 3840x2400, 13.4" | Apple MacBook Pro 13 Late 2020 M1 Entry (8 / 256 GB) IPS, 2560x1600, 13.3" | Microsoft Surface Laptop 3 13 Core i5-1035G7 Sharp LQ135P1JX51, IPS, 2256x1504, 13.5" | |
|---|---|---|---|---|---|
| Display | 0% | 15% | 1% | ||
| Display P3 Coverage (%) | 64.7 | 65.1 1% | 80.2 24% | 65.7 2% | |
| sRGB Coverage (%) | 97.2 | 97.1 0% | 100 3% | 98.6 1% | |
| AdobeRGB 1998 Coverage (%) | 66.9 | 66.6 0% | 78.9 18% | 67.8 1% | |
| Response Times | 44% | 2% | 31% | 1% | |
| Response Time Grey 50% / Grey 80% * (ms) | 62.8 ? | 38.4 ? 39% | 59.2 ? 6% | 48 ? 24% | 59.2 ? 6% |
| Response Time Black / White * (ms) | 39.8 ? | 20.8 ? 48% | 40.4 ? -2% | 25.2 ? 37% | 41.6 ? -5% |
| PWM Frequency (Hz) | 21930 ? | 2137 ? | 122000 ? | 21740 ? | |
| Screen | -1% | -10% | 22% | 10% | |
| Brightness middle (cd/m²) | 413 | 325 -21% | 508.7 23% | 510 23% | 403.4 -2% |
| Brightness (cd/m²) | 400 | 297 -26% | 479 20% | 491 23% | 397 -1% |
| Brightness Distribution (%) | 94 | 83 -12% | 84 -11% | 94 0% | 89 -5% |
| Black Level * (cd/m²) | 0.29 | 0.26 10% | 0.3 -3% | 0.29 -0% | 0.34 -17% |
| Contrast (:1) | 1424 | 1250 -12% | 1696 19% | 1759 24% | 1186 -17% |
| Colorchecker dE 2000 * | 2.8 | 2.2 21% | 2.72 3% | 1.3 54% | 0.94 66% |
| Colorchecker dE 2000 max. * | 7.2 | 3.5 51% | 4.7 35% | 3 58% | 2.92 59% |
| Colorchecker dE 2000 calibrated * | 0.8 | 0.6 25% | 1.92 -140% | 0.99 -24% | |
| Greyscale dE 2000 * | 1.9 | 2.8 -47% | 3.4 -79% | 2 -5% | 0.9 53% |
| Gamma | 2.12 104% | 2.05 107% | 2.11 104% | 2.23 99% | 2.13 103% |
| CCT | 6510 100% | 6452 101% | 6245 104% | 6933 94% | 6620 98% |
| Color Space (Percent of AdobeRGB 1998) (%) | 61.6 | 61.3 0% | 70.7 15% | 88.3 43% | 62.3 1% |
| Color Space (Percent of sRGB) (%) | 97.2 | 97 0% | 100 3% | 100 3% | 98.7 2% |
| Total Average (Program / Settings) | 14% /
5% | 2% /
-4% | 27% /
24% | 4% /
8% |
* ... smaller is better
Display Response Times
| ↔ Response Time Black to White | ||
|---|---|---|
| 39.8 ms ... rise ↗ and fall ↘ combined | ↗ 21.2 ms rise | 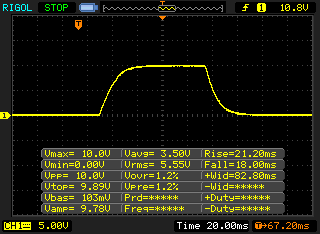 |
| ↘ 18 ms fall | ||
| The screen shows slow response rates in our tests and will be unsatisfactory for gamers. In comparison, all tested devices range from 0.1 (minimum) to 240 (maximum) ms. » 97 % of all devices are better. This means that the measured response time is worse than the average of all tested devices (19.9 ms). | ||
| ↔ Response Time 50% Grey to 80% Grey | ||
| 62.8 ms ... rise ↗ and fall ↘ combined | ↗ 30.4 ms rise | 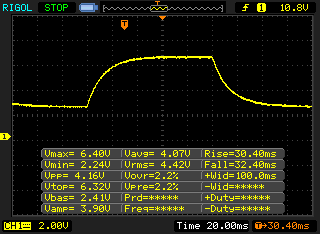 |
| ↘ 32.4 ms fall | ||
| The screen shows slow response rates in our tests and will be unsatisfactory for gamers. In comparison, all tested devices range from 0.165 (minimum) to 636 (maximum) ms. » 97 % of all devices are better. This means that the measured response time is worse than the average of all tested devices (31.1 ms). | ||
Screen Flickering / PWM (Pulse-Width Modulation)
| Screen flickering / PWM detected | 21930 Hz | ≤ 50 % brightness setting | 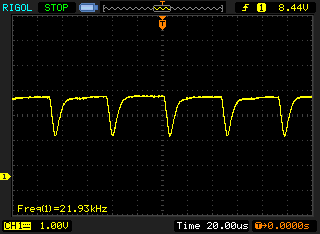 |
The display backlight flickers at 21930 Hz (worst case, e.g., utilizing PWM) Flickering detected at a brightness setting of 50 % and below. There should be no flickering or PWM above this brightness setting. The frequency of 21930 Hz is quite high, so most users sensitive to PWM should not notice any flickering. In comparison: 52 % of all tested devices do not use PWM to dim the display. If PWM was detected, an average of 7798 (minimum: 5 - maximum: 343500) Hz was measured. | |||
The factory calibration is a bit worse compared to the previous test model, but there is no color cast. All the color deviations are within the desired range after our calibration, so the display is suited for picture/video editing in the small sRGB color space.


Performance - Tiger Lake i7 at 25W
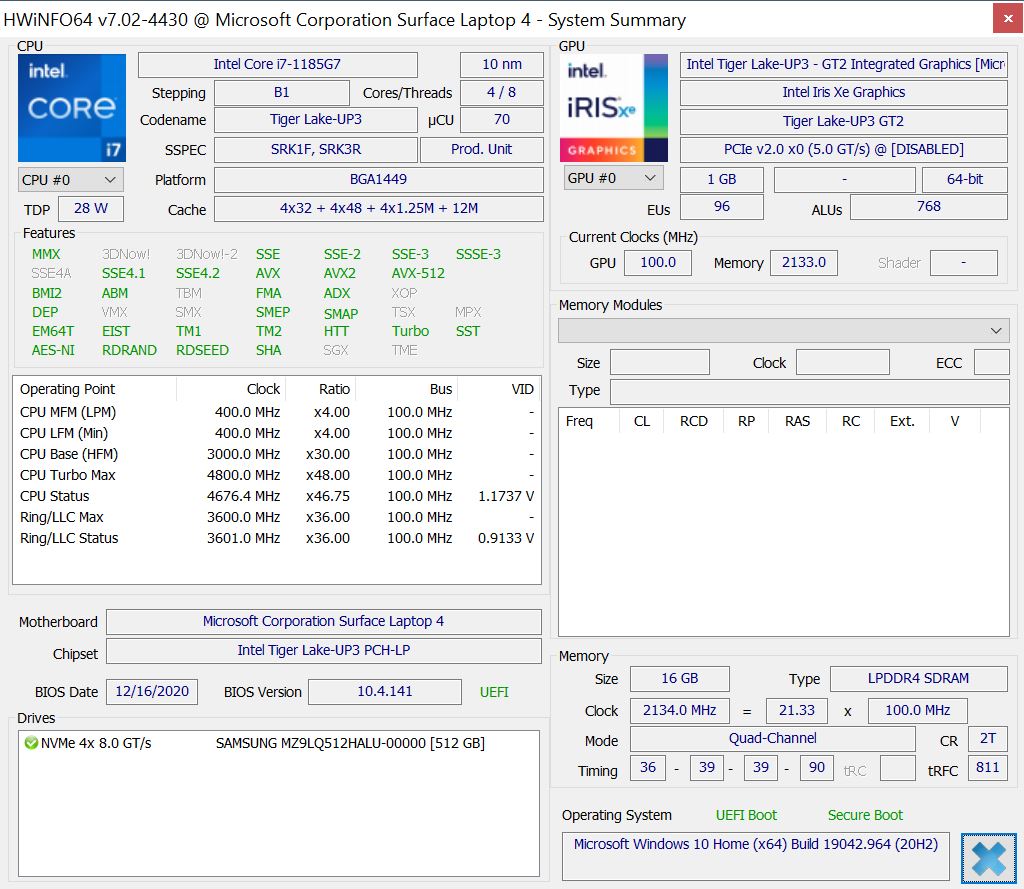
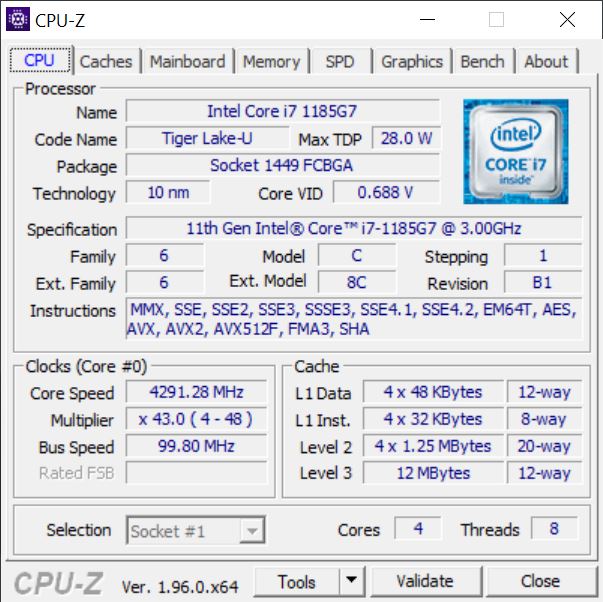
Processor - i7-1185G7
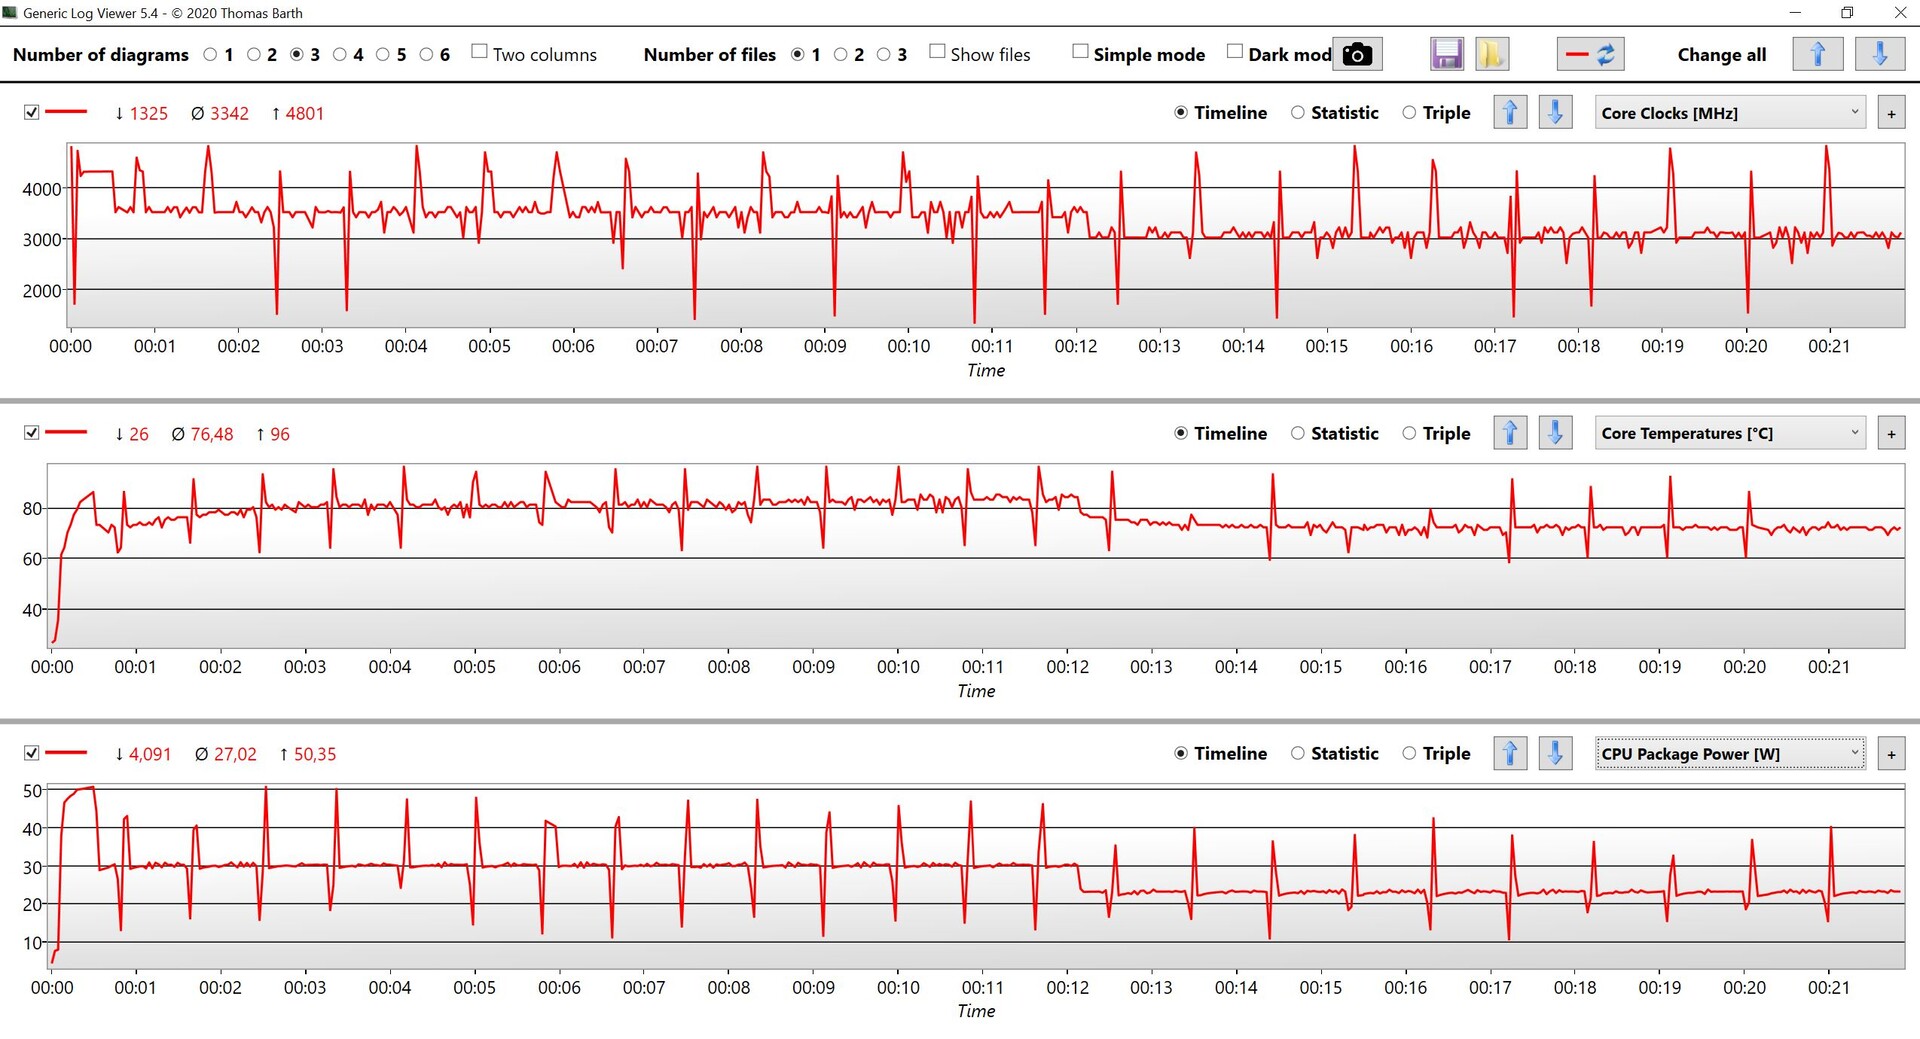
Our test unit is equipped with the fastest ULV processor from Intel you can get right now, the Core i7-1185G7 (Tiger Lake) with four cores and a maximum clock of up to 4.8 GHz (or 4.3 GHz for all active cores, respectively. The power limits are very generous for a 13-inch laptop at 50W for short bursts and then 30W (4x ~3.5 GHz) for a couple of minutes. We can see that the TDP level will eventually level off at 23W (4x 3.0-3.1 GHz) after around 12 minutes.
This means the Surface Laptop is faster than the rivals from Lenovo and Dell, and the i7 is also a very powerful CPU for everyday tasks, but the big problem is the comparison with Apple's M1 chip in the MacBook Pro 13. It is on par in native applications when we look at the single-core performance (see Cinebench R23), but it is much faster than the i7 in multi-core scenarios (at a much lower power consumption).
The performance is not reduced on battery power.
Cinebench R20: CPU (Single Core) | CPU (Multi Core)
Cinebench R15: CPU Single 64Bit | CPU Multi 64Bit
Blender: v2.79 BMW27 CPU
7-Zip 18.03: 7z b 4 -mmt1 | 7z b 4
Geekbench 5.5: Single-Core | Multi-Core
HWBOT x265 Benchmark v2.2: 4k Preset
LibreOffice : 20 Documents To PDF
R Benchmark 2.5: Overall mean
| Cinebench R23 / Single Core | |
| Average of class Subnotebook (358 - 2213, n=63, last 2 years) | |
| Microsoft Surface Laptop 4 13 i7 | |
| Apple MacBook Pro 13 Late 2020 M1 Entry (8 / 256 GB) | |
| Average Intel Core i7-1185G7 (1251 - 1532, n=24) | |
| Dell XPS 13 9310 Core i7 4K | |
| Lenovo Yoga Slim 7i Carbon 13 ITL | |
| Cinebench R23 / Multi Core | |
| Average of class Subnotebook (1555 - 21812, n=62, last 2 years) | |
| Apple MacBook Pro 13 Late 2020 M1 Entry (8 / 256 GB) | |
| Average Intel Core i7-1185G7 (3610 - 6383, n=24) | |
| Microsoft Surface Laptop 4 13 i7 | |
| Dell XPS 13 9310 Core i7 4K | |
| Lenovo Yoga Slim 7i Carbon 13 ITL | |
| Cinebench R20 / CPU (Single Core) | |
| Average of class Subnotebook (128 - 832, n=59, last 2 years) | |
| Microsoft Surface Laptop 4 13 i7 | |
| Dell XPS 13 9310 Core i7 4K | |
| Average Intel Core i7-1185G7 (489 - 593, n=28) | |
| Lenovo Yoga Slim 7i Carbon 13 ITL | |
| Microsoft Surface Laptop 3 13 Core i5-1035G7 | |
| Apple MacBook Pro 13 Late 2020 M1 Entry (8 / 256 GB) | |
| Cinebench R20 / CPU (Multi Core) | |
| Average of class Subnotebook (579 - 8541, n=59, last 2 years) | |
| Apple MacBook Pro 13 Late 2020 M1 Entry (8 / 256 GB) | |
| Average Intel Core i7-1185G7 (1425 - 2493, n=28) | |
| Dell XPS 13 9310 Core i7 4K | |
| Microsoft Surface Laptop 4 13 i7 | |
| Lenovo Yoga Slim 7i Carbon 13 ITL | |
| Microsoft Surface Laptop 3 13 Core i5-1035G7 | |
| Cinebench R15 / CPU Single 64Bit | |
| Average of class Subnotebook (72.4 - 322, n=59, last 2 years) | |
| Microsoft Surface Laptop 4 13 i7 | |
| Lenovo Yoga Slim 7i Carbon 13 ITL | |
| Dell XPS 13 9310 Core i7 4K | |
| Average Intel Core i7-1185G7 (168 - 230, n=27) | |
| Apple MacBook Pro 13 Late 2020 M1 Entry (8 / 256 GB) | |
| Microsoft Surface Laptop 3 13 Core i5-1035G7 | |
| Cinebench R15 / CPU Multi 64Bit | |
| Average of class Subnotebook (327 - 3345, n=59, last 2 years) | |
| Apple MacBook Pro 13 Late 2020 M1 Entry (8 / 256 GB) | |
| Microsoft Surface Laptop 4 13 i7 | |
| Dell XPS 13 9310 Core i7 4K | |
| Average Intel Core i7-1185G7 (617 - 1066, n=32) | |
| Lenovo Yoga Slim 7i Carbon 13 ITL | |
| Microsoft Surface Laptop 3 13 Core i5-1035G7 | |
| Blender / v2.79 BMW27 CPU | |
| Microsoft Surface Laptop 3 13 Core i5-1035G7 | |
| Lenovo Yoga Slim 7i Carbon 13 ITL | |
| Dell XPS 13 9310 Core i7 4K | |
| Microsoft Surface Laptop 4 13 i7 | |
| Average Intel Core i7-1185G7 (478 - 745, n=28) | |
| Average of class Subnotebook (159 - 2271, n=60, last 2 years) | |
| 7-Zip 18.03 / 7z b 4 -mmt1 | |
| Average of class Subnotebook (2643 - 6699, n=61, last 2 years) | |
| Microsoft Surface Laptop 4 13 i7 | |
| Lenovo Yoga Slim 7i Carbon 13 ITL | |
| Average Intel Core i7-1185G7 (3678 - 5507, n=27) | |
| Dell XPS 13 9310 Core i7 4K | |
| Microsoft Surface Laptop 3 13 Core i5-1035G7 | |
| 7-Zip 18.03 / 7z b 4 | |
| Average of class Subnotebook (11668 - 77867, n=59, last 2 years) | |
| Microsoft Surface Laptop 4 13 i7 | |
| Average Intel Core i7-1185G7 (18812 - 27693, n=27) | |
| Dell XPS 13 9310 Core i7 4K | |
| Lenovo Yoga Slim 7i Carbon 13 ITL | |
| Microsoft Surface Laptop 3 13 Core i5-1035G7 | |
| Geekbench 5.5 / Single-Core | |
| Average of class Subnotebook (726 - 2224, n=50, last 2 years) | |
| Apple MacBook Pro 13 Late 2020 M1 Entry (8 / 256 GB) | |
| Lenovo Yoga Slim 7i Carbon 13 ITL | |
| Dell XPS 13 9310 Core i7 4K | |
| Microsoft Surface Laptop 4 13 i7 | |
| Average Intel Core i7-1185G7 (1398 - 1626, n=21) | |
| Geekbench 5.5 / Multi-Core | |
| Average of class Subnotebook (2557 - 17218, n=50, last 2 years) | |
| Apple MacBook Pro 13 Late 2020 M1 Entry (8 / 256 GB) | |
| Dell XPS 13 9310 Core i7 4K | |
| Microsoft Surface Laptop 4 13 i7 | |
| Lenovo Yoga Slim 7i Carbon 13 ITL | |
| Average Intel Core i7-1185G7 (4620 - 5944, n=21) | |
| HWBOT x265 Benchmark v2.2 / 4k Preset | |
| Average of class Subnotebook (0.97 - 25.1, n=59, last 2 years) | |
| Average Intel Core i7-1185G7 (5.02 - 8.13, n=27) | |
| Microsoft Surface Laptop 4 13 i7 | |
| Dell XPS 13 9310 Core i7 4K | |
| Lenovo Yoga Slim 7i Carbon 13 ITL | |
| Microsoft Surface Laptop 3 13 Core i5-1035G7 | |
| LibreOffice / 20 Documents To PDF | |
| Average of class Subnotebook (39.9 - 220, n=58, last 2 years) | |
| Microsoft Surface Laptop 4 13 i7 | |
| Average Intel Core i7-1185G7 (41.3 - 61.7, n=26) | |
| Lenovo Yoga Slim 7i Carbon 13 ITL | |
| Dell XPS 13 9310 Core i7 4K | |
| R Benchmark 2.5 / Overall mean | |
| Dell XPS 13 9310 Core i7 4K | |
| Average Intel Core i7-1185G7 (0.55 - 0.615, n=27) | |
| Microsoft Surface Laptop 4 13 i7 | |
| Lenovo Yoga Slim 7i Carbon 13 ITL | |
| Average of class Subnotebook (0.4024 - 1.456, n=60, last 2 years) | |
* ... smaller is better
System Performance
The subjective performance impression with the fast processor and the PCIe-SSD is very good, which is also supported by the good benchmark results. However, all the comparison devices are pretty much on the same level, and you will not notice a difference in everyday situations even when you come from the old Surface Laptop 3.
| PCMark 10 Score | 4809 points | |
Help | ||
DPC Latency
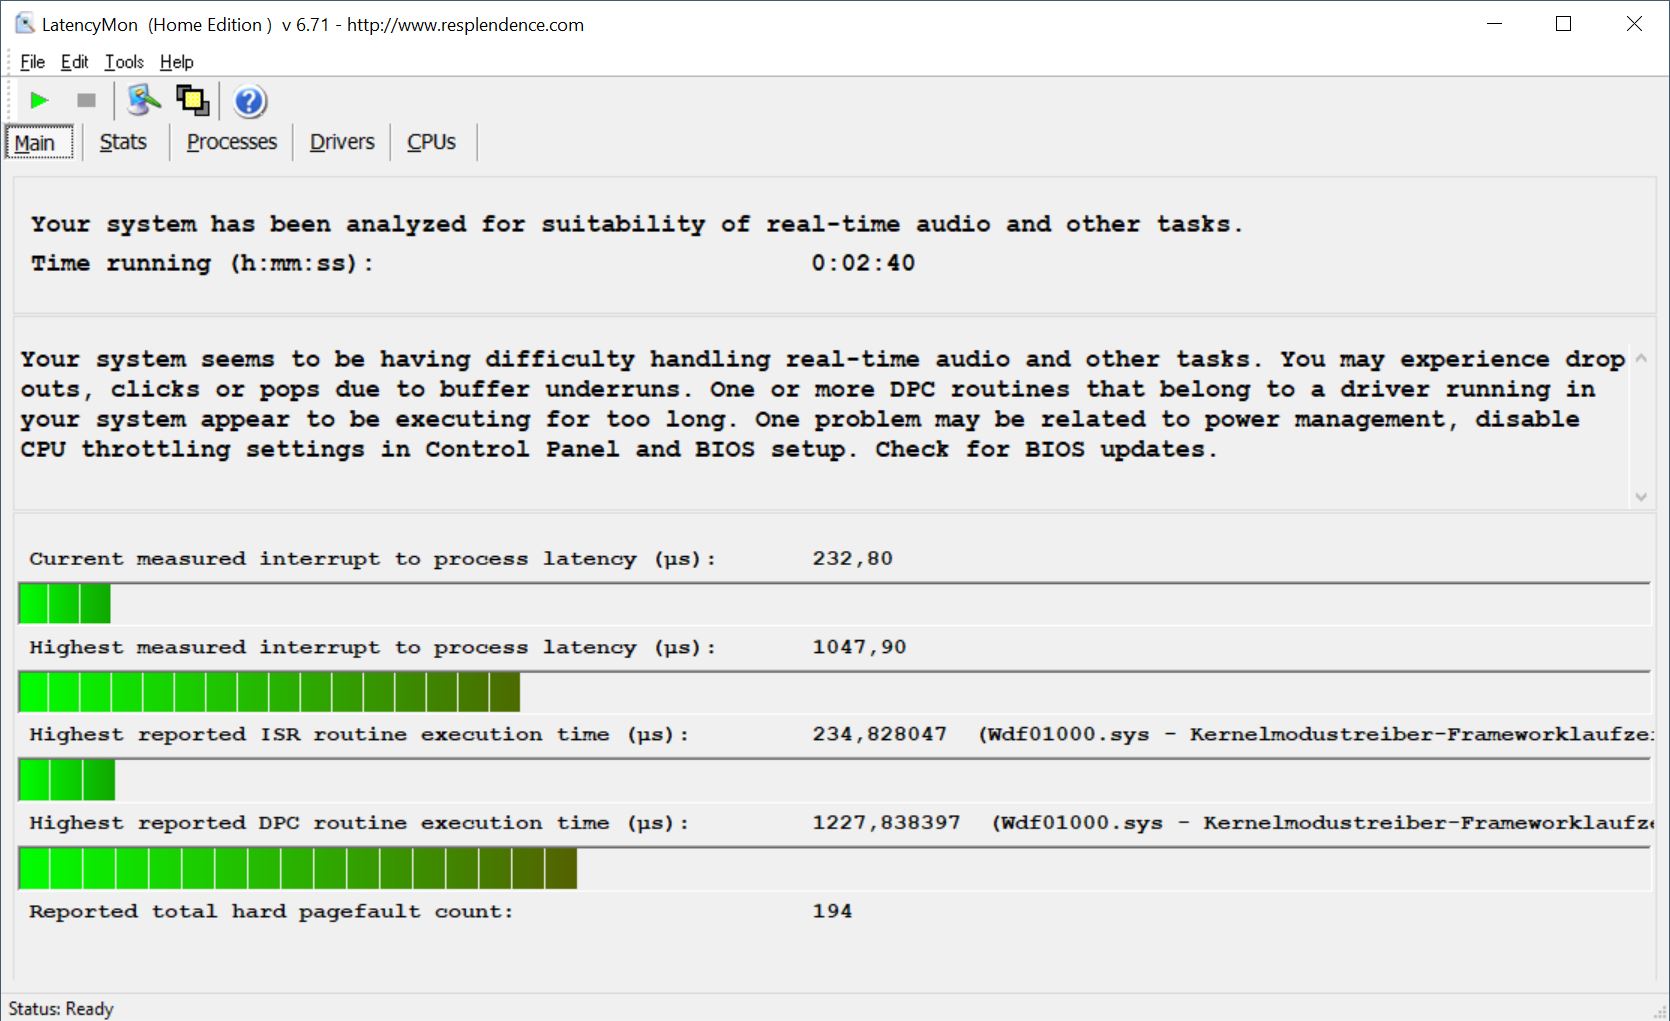
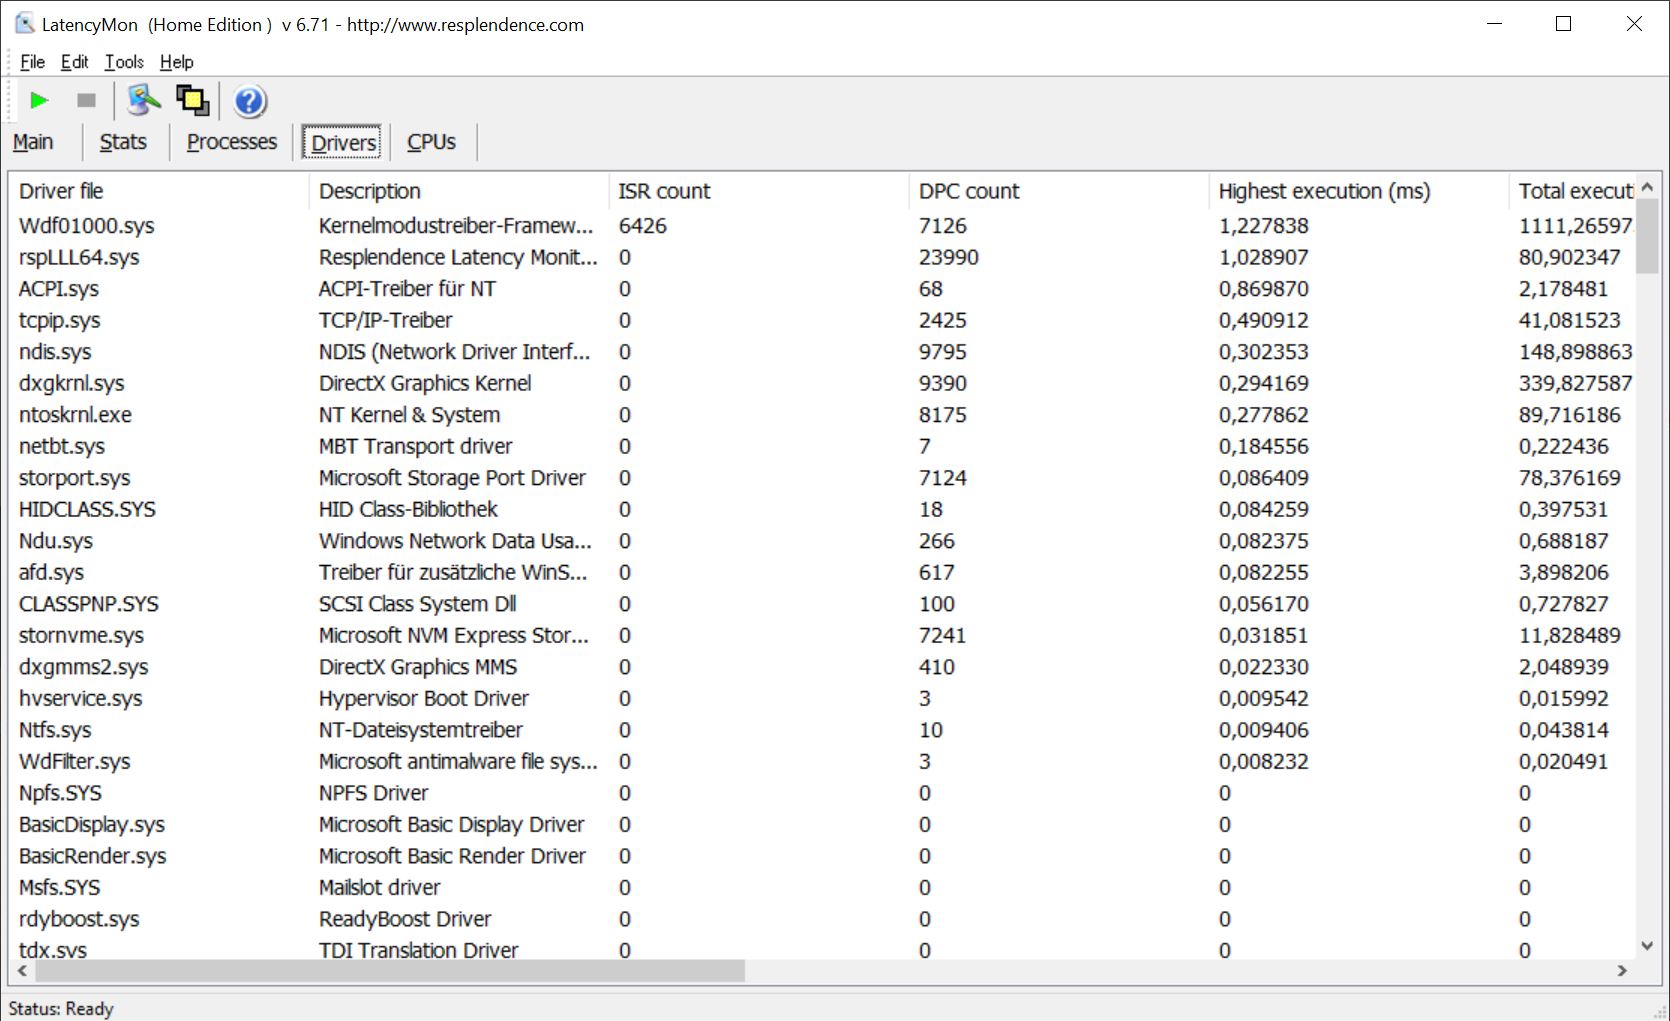
| DPC Latencies / LatencyMon - interrupt to process latency (max), Web, Youtube, Prime95 | |
| Dell XPS 13 9310 Core i7 4K | |
| Microsoft Surface Laptop 4 13 i7 | |
| Lenovo Yoga Slim 7i Carbon 13 ITL | |
* ... smaller is better
Storage Devices
Microsoft uses compact M.2-2230 SSDs like on the Surface Pro 7 Plus, which is attached via PCIe interface. Our test model was equipped with a PM991 from Samsung and a storage capacity of 512 GB; 426 GB are free for the user after the initial set-up. The transfer rates are just average and the competitors use faster drives, but you will hardly notice the difference in everyday scenarios.
| Microsoft Surface Laptop 4 13 i7 Samsung PM991 MZ9LQ512HALU | Lenovo Yoga Slim 7i Carbon 13 ITL Samsung SSD PM981a MZVLB512HBJQ | Dell XPS 13 9310 Core i7 4K Micron 2300 512GB MTFDHBA512TDV | Microsoft Surface Laptop 3 13 Core i5-1035G7 SK hynix BC501 HFM256GDGTNG | Average Samsung PM991 MZ9LQ512HALU | Average of class Subnotebook | |
|---|---|---|---|---|---|---|
| CrystalDiskMark 5.2 / 6 | 64% | 42% | -7% | 14% | 131% | |
| Write 4K (MB/s) | 118.2 | 139.5 18% | 86 -27% | 112.3 -5% | 130.2 ? 10% | 153.3 ? 30% |
| Read 4K (MB/s) | 37.54 | 36.38 -3% | 40.11 7% | 42.13 12% | 42 ? 12% | 64 ? 70% |
| Write Seq (MB/s) | 1017 | 1977 94% | 1738 71% | 630 -38% | 1063 ? 5% | 2860 ? 181% |
| Read Seq (MB/s) | 926 | 2207 138% | 1553 68% | 1023 10% | 1274 ? 38% | 3311 ? 258% |
| Write 4K Q32T1 (MB/s) | 354.2 | 510 44% | 454.9 28% | 336.6 -5% | 411 ? 16% | 429 ? 21% |
| Read 4K Q32T1 (MB/s) | 352.6 | 387.8 10% | 385.4 9% | 399.6 13% | 439 ? 25% | 493 ? 40% |
| Write Seq Q32T1 (MB/s) | 1174 | 2986 154% | 2784 137% | 821 -30% | 1189 ? 1% | 4606 ? 292% |
| Read Seq Q32T1 (MB/s) | 2261 | 3540 57% | 3217 42% | 2030 -10% | 2275 ? 1% | 5795 ? 156% |
| AS SSD | 63% | -21% | -45% | -8% | 71% | |
| Seq Read (MB/s) | 1821 | 2861 57% | 2144 18% | 1387 -24% | 1604 ? -12% | 4466 ? 145% |
| Seq Write (MB/s) | 794 | 1321 66% | 1389 75% | 504 -37% | 1014 ? 28% | 2929 ? 269% |
| 4K Read (MB/s) | 47.54 | 52.5 10% | 49.77 5% | 42.35 -11% | 44.4 ? -7% | 59.2 ? 25% |
| 4K Write (MB/s) | 141.6 | 196.7 39% | 105 -26% | 120 -15% | 134.8 ? -5% | 169.4 ? 20% |
| 4K-64 Read (MB/s) | 782 | 1153 47% | 855 9% | 497.4 -36% | 818 ? 5% | 844 ? 8% |
| 4K-64 Write (MB/s) | 766 | 1807 136% | 1660 117% | 354.9 -54% | 744 ? -3% | 1697 ? 122% |
| Access Time Read * (ms) | 0.191 | 0.064 66% | 0.058 70% | 0.055 71% | 0.1445 ? 24% | 0.06516 ? 66% |
| Access Time Write * (ms) | 0.027 | 0.018 33% | 0.272 -907% | 0.093 -244% | 0.061 ? -126% | 0.05493 ? -103% |
| Score Read (Points) | 1012 | 1491 47% | 1119 11% | 678 -33% | 1023 ? 1% | 1348 ? 33% |
| Score Write (Points) | 987 | 2136 116% | 1904 93% | 525 -47% | 980 ? -1% | 2159 ? 119% |
| Score Total (Points) | 2477 | 4322 74% | 3570 44% | 1520 -39% | 2507 ? 1% | 4135 ? 67% |
| Copy ISO MB/s (MB/s) | 1243 | 1929 55% | 764 -39% | 1264 ? 2% | 2574 ? 107% | |
| Copy Program MB/s (MB/s) | 628 | 1012 61% | 256.1 -59% | 515 ? -18% | 827 ? 32% | |
| Copy Game MB/s (MB/s) | 976 | 1737 78% | 368.4 -62% | 995 ? 2% | 1744 ? 79% | |
| Total Average (Program / Settings) | 64% /
63% | 11% /
2% | -26% /
-31% | 3% /
-0% | 101% /
93% |
* ... smaller is better

Disk Throttling: DiskSpd Read Loop, Queue Depth 8
GPU Performance
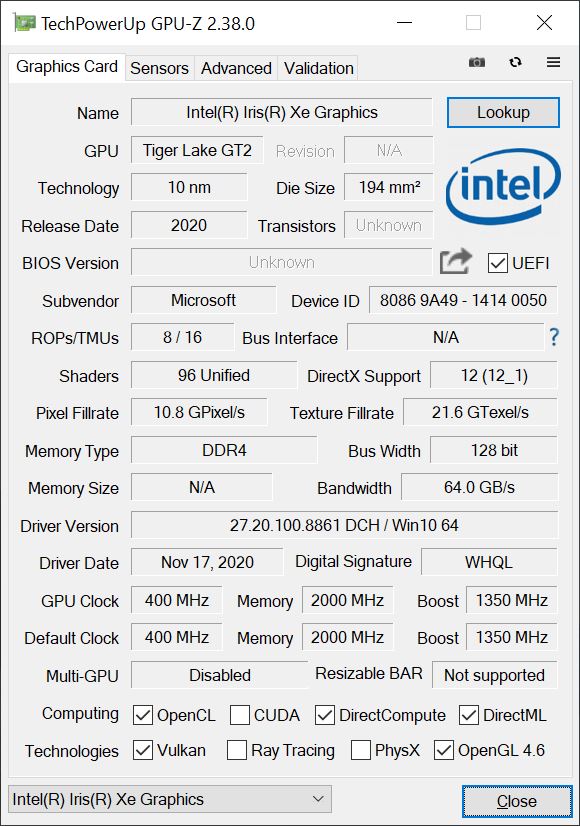
The Core i7-1185G7 is equipped with the most powerful version of Intel's Xe Graphics G7 (96 EUs). It has a slightly higher clock of 1350 MHz and is much faster than the old UHD Graphics. Depending on the benchmark, the new Surface Laptop 4 is between 60-100% faster than the previous model. The integrated GPU is a good solution for common workloads including high-resolution video playback and the efficiency during video playback was further improved with this generation.
The graphics performance is not completely stable; the 3DMark Fire Strike stress test is not passed at 94.4%, but this deficit can be ignored even in longer gaming sessions. The GPU performs similar on battery power.
| 3DMark 11 Performance | 7364 points | |
| 3DMark Cloud Gate Standard Score | 20740 points | |
| 3DMark Fire Strike Score | 5010 points | |
| 3DMark Time Spy Score | 1776 points | |
Help | ||
Gaming Performance
Despite the increased performance of the iGPU, the Surface Laptop 4 is only suited for older or less demanding tiles. Modern games will often require substantial reductions in terms of resolution and/or settings. More gaming benchmarks with the Xe Graphics G7 are available here.
| low | med. | high | ultra | |
|---|---|---|---|---|
| The Witcher 3 (2015) | 95 | 61 | 33 | 16 |
| Dota 2 Reborn (2015) | 83 | 56.9 | 37.7 | 37.4 |
| X-Plane 11.11 (2018) | 24.8 | 34.1 | 31.3 |
Emissions & Energy
System Noise
The increased performance also affects the fan noise. The maximum noise level of around 40 dB(A) is comparable to the previous model, but the fan reaches this level quicker at moderate workloads compared to the previous model. The fan is still idling a lot of the time when you do daily stuff and you can reduce the fan noise with the Windows performance slider when you don’t need the full performance. Still, the fan speed is not high-pitched or annoying even at the full speed and we did not notice any electronic sounds like coil whine.
Noise level
| Idle |
| 24.2 / 24.2 / 24.2 dB(A) |
| Load |
| 39.5 / 39.5 dB(A) |
 | ||
30 dB silent 40 dB(A) audible 50 dB(A) loud |
||
min: | ||
| Microsoft Surface Laptop 4 13 i7 Iris Xe G7 96EUs, i7-1185G7, Samsung PM991 MZ9LQ512HALU | Lenovo Yoga Slim 7i Carbon 13 ITL Iris Xe G7 96EUs, i7-1165G7, Samsung SSD PM981a MZVLB512HBJQ | Dell XPS 13 9310 Core i7 4K Iris Xe G7 96EUs, i7-1185G7, Micron 2300 512GB MTFDHBA512TDV | Apple MacBook Pro 13 Late 2020 M1 Entry (8 / 256 GB) M1 8-Core GPU, M1, Apple SSD AP0256 | Microsoft Surface Laptop 3 13 Core i5-1035G7 Iris Plus Graphics G7 (Ice Lake 64 EU), i5-1035G7, SK hynix BC501 HFM256GDGTNG | |
|---|---|---|---|---|---|
| Noise | -12% | -4% | -12% | -8% | |
| off / environment * (dB) | 24.2 | 28.7 -19% | 27.7 -14% | 29.2 -21% | 28.5 -18% |
| Idle Minimum * (dB) | 24.2 | 28.7 -19% | 27.8 -15% | 29.2 -21% | 28.5 -18% |
| Idle Average * (dB) | 24.2 | 28.7 -19% | 27.8 -15% | 29.2 -21% | 28.5 -18% |
| Idle Maximum * (dB) | 24.2 | 30.6 -26% | 27.8 -15% | 29.2 -21% | 28.5 -18% |
| Load Average * (dB) | 39.5 | 37.3 6% | 27.9 29% | 32.1 19% | 28.5 28% |
| Load Maximum * (dB) | 39.5 | 37.3 6% | 37 6% | 41.9 -6% | 40.4 -2% |
| Witcher 3 ultra * (dB) | 37.3 | 32.8 | 40.4 |
* ... smaller is better
Temperature
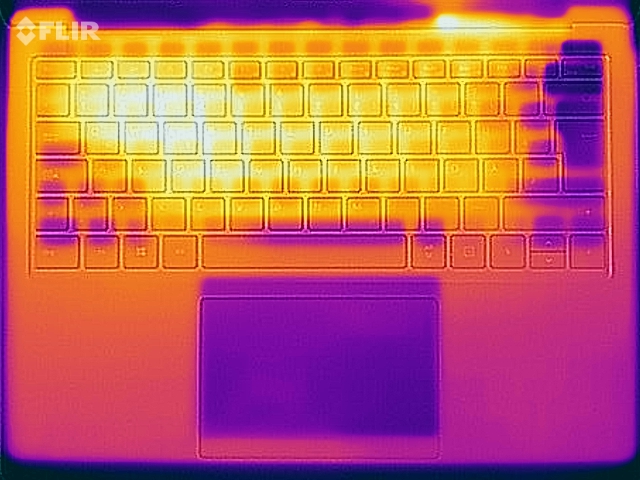
The metal surfaces of the Surface Laptop 4 get pretty warm under load and almost 47 °C is subjectively more uncomfortable at direct skin contact compared to plastic cases. You should not put it on your lap when you really stress it, but low workloads (like web browsing, video playback) are no problem at all.
Our stress test with combined CPU/GPU load shows that the processor consumes almost 60W at first (just as a reminder, it is a CPU with a nominal TDP value of 15W), but then levels of at 30W and later at 23W (similar to pure CPU performance). CPU and GPU have to share the TDP, so the CPU only runs at 1.6-1.7 GHz and the iGPU with 900 MHz.
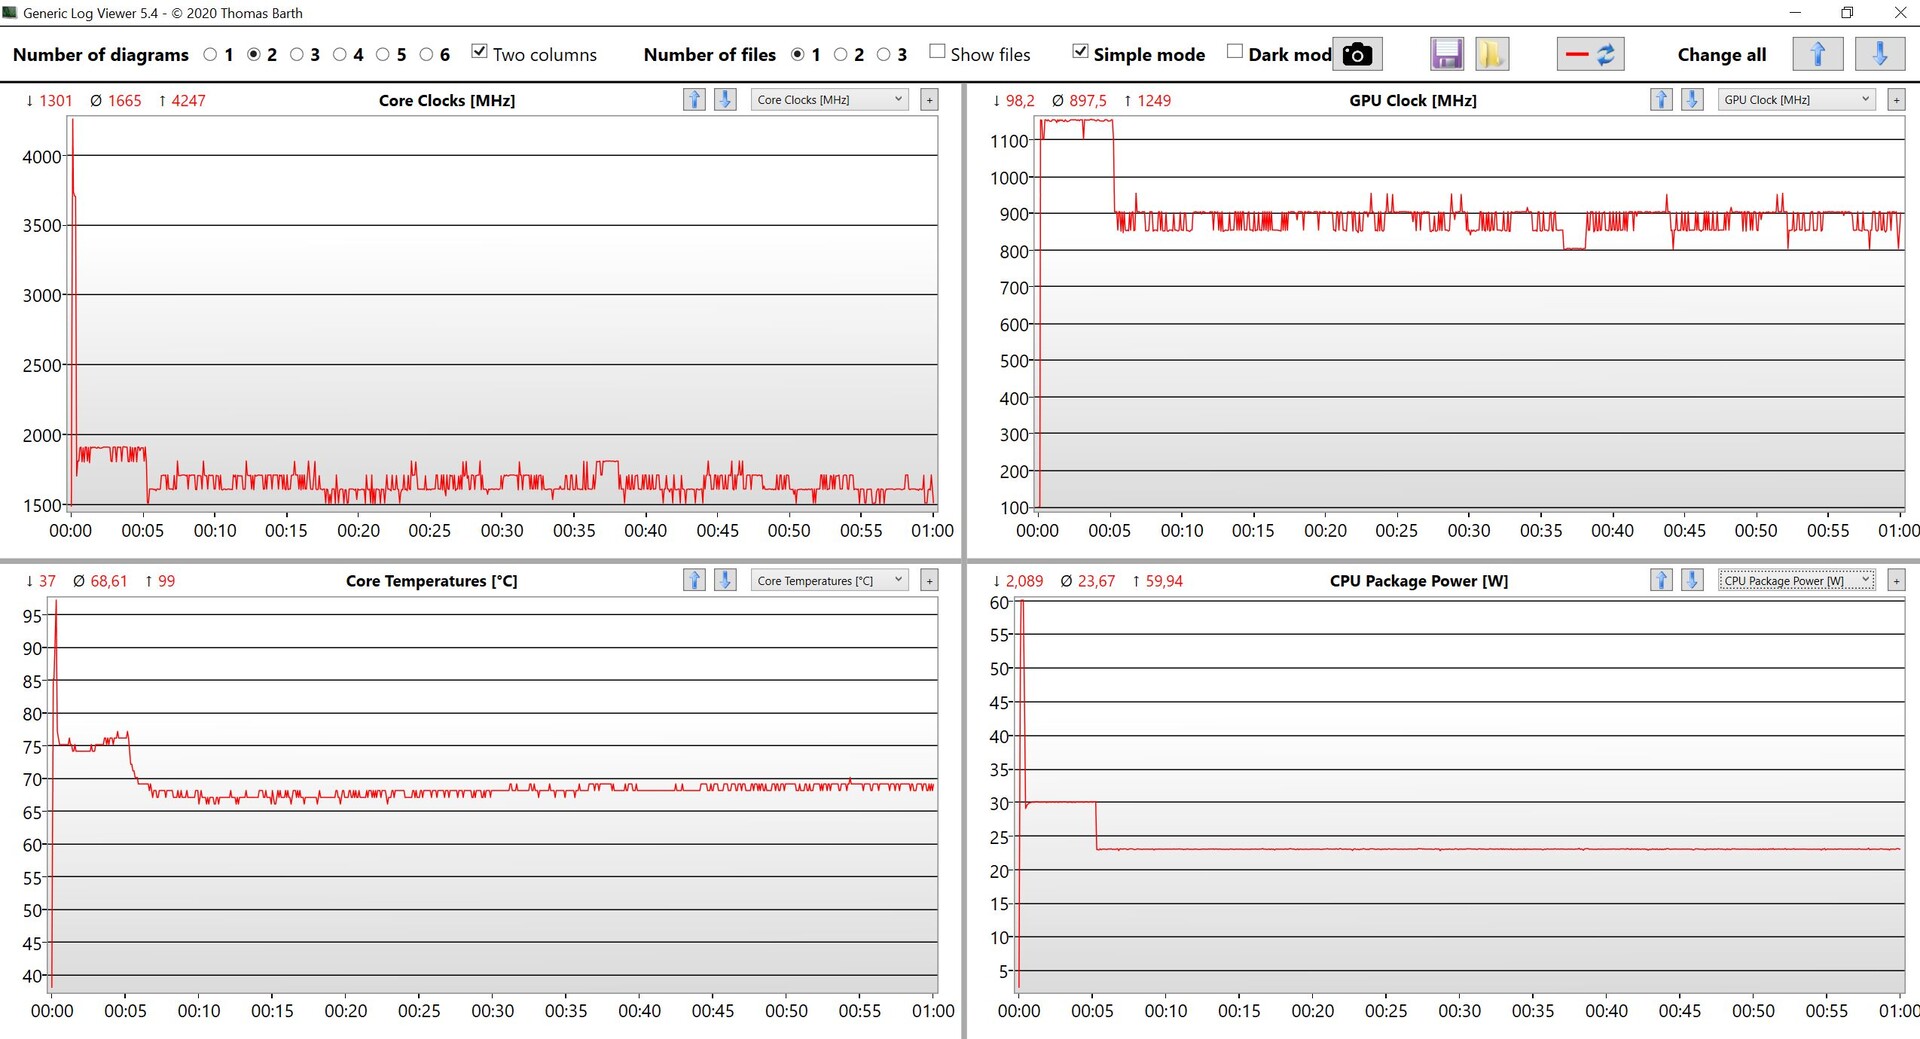
(±) The maximum temperature on the upper side is 44.6 °C / 112 F, compared to the average of 35.9 °C / 97 F, ranging from 21.4 to 59 °C for the class Subnotebook.
(-) The bottom heats up to a maximum of 46.9 °C / 116 F, compared to the average of 39.2 °C / 103 F
(+) In idle usage, the average temperature for the upper side is 23.5 °C / 74 F, compared to the device average of 30.8 °C / 87 F.
(-) Playing The Witcher 3, the average temperature for the upper side is 39.9 °C / 104 F, compared to the device average of 30.8 °C / 87 F.
(±) The palmrests and touchpad can get very hot to the touch with a maximum of 37.7 °C / 99.9 F.
(-) The average temperature of the palmrest area of similar devices was 28.2 °C / 82.8 F (-9.5 °C / -17.1 F).

Speakers
The two stereo speakers of the Surface Laptop are still very good. As expected, you do not get much bass, but the sound is still rich and the modules are also loud enough for meetings or conferences. They also work well for media playback; external speakers or headphones sound better, but are not really necessary.
Microsoft Surface Laptop 4 13 i7 audio analysis
(±) | speaker loudness is average but good (78.4 dB)
Bass 100 - 315 Hz
(±) | reduced bass - on average 10.5% lower than median
(±) | linearity of bass is average (7.9% delta to prev. frequency)
Mids 400 - 2000 Hz
(+) | balanced mids - only 2.7% away from median
(+) | mids are linear (3.5% delta to prev. frequency)
Highs 2 - 16 kHz
(+) | balanced highs - only 3.2% away from median
(+) | highs are linear (5.8% delta to prev. frequency)
Overall 100 - 16.000 Hz
(+) | overall sound is linear (12.2% difference to median)
Compared to same class
» 15% of all tested devices in this class were better, 4% similar, 81% worse
» The best had a delta of 5%, average was 18%, worst was 53%
Compared to all devices tested
» 10% of all tested devices were better, 2% similar, 88% worse
» The best had a delta of 4%, average was 24%, worst was 134%
Apple MacBook Pro 13 Late 2020 M1 Entry (8 / 256 GB) audio analysis
(±) | speaker loudness is average but good (77.5 dB)
Bass 100 - 315 Hz
(±) | reduced bass - on average 8.7% lower than median
(±) | linearity of bass is average (8.6% delta to prev. frequency)
Mids 400 - 2000 Hz
(+) | balanced mids - only 4.2% away from median
(+) | mids are linear (4.2% delta to prev. frequency)
Highs 2 - 16 kHz
(+) | balanced highs - only 1.2% away from median
(+) | highs are linear (4% delta to prev. frequency)
Overall 100 - 16.000 Hz
(+) | overall sound is linear (12.9% difference to median)
Compared to same class
» 19% of all tested devices in this class were better, 5% similar, 76% worse
» The best had a delta of 5%, average was 18%, worst was 53%
Compared to all devices tested
» 12% of all tested devices were better, 3% similar, 85% worse
» The best had a delta of 4%, average was 24%, worst was 134%
Power Consumption
Our consumption measurements are pretty inconspicuous. As always, you should avoid the highest level of the keyboard illumination on battery power, because it will drain the battery unnecessarily. The consumption in the stress test is 65W for a short while, but quickly levels off at 47W (30W TDP) or 38W (23W TDP), respectively. The 65W power adapter is therefore completely sufficient. The power adapter also offers an additional USB-A port (up to 5W), where you can charge other devices like a smartphone.
| Off / Standby | |
| Idle | |
| Load |
|
Key:
min: | |
Battery Runtime
Microsoft slightly increased the battery capacity from 45 to 47.7 Wh, but the runtime in the Wi-Fi test is still a bit lower due to the more powerful components. We determine a runtime of around 7.5 hours at 150 nits and just ~6 hours at the maximum brightness. Only the 4K model of the Dell XPS 13 9310 is beaten, all the other rivals have more stamina, and the advantage of the MacBook Pro 13 is massive, because it manages about 20 hours (and still ~10 hours at the maximum brightness).
Pros
Cons
Verdict - Microsoft falls behind
The Surface Laptop 4 13.5 with the Intel processor is basically just a minor update with a new and faster processor, but the biggest advantage is the more efficient and faster integrated GPU. Everything else is pretty much the same.
We still like the sturdy chassis and the 3:2 touchscreen also creates a good picture, but it would benefit from a more powerful backlight in brighter environments. The speakers are also good, but connectivity and battery runtime are two aspects where the device has fallen behind the competition.
Despite the new processor, the Surface Laptop 4 13.5 feels pretty outdated and Microsoft should consider a major update. The price-performance ratio is pretty bad and it is not easy to recommend the laptop. We do not understand the limitations of the configurations, either.
The Surface Laptop 4 13.5 is hardly a bargain and 1849 Euros for our test unit is a steep price. Sure, a similarly equipped MacBook Pro 13 with 16 GB RAM and 512 GB SSD storage is even a little bit more expensive, but it is definitely the better product with more performance, modern ports, a better display, and especially much more stamina.
Price and Availability
Our test model of the Surface Laptop 4 13.5 is available at Amazon for $1699.
Microsoft Surface Laptop 4 13 i7
- 05/11/2021 v7 (old)
Andreas Osthoff
