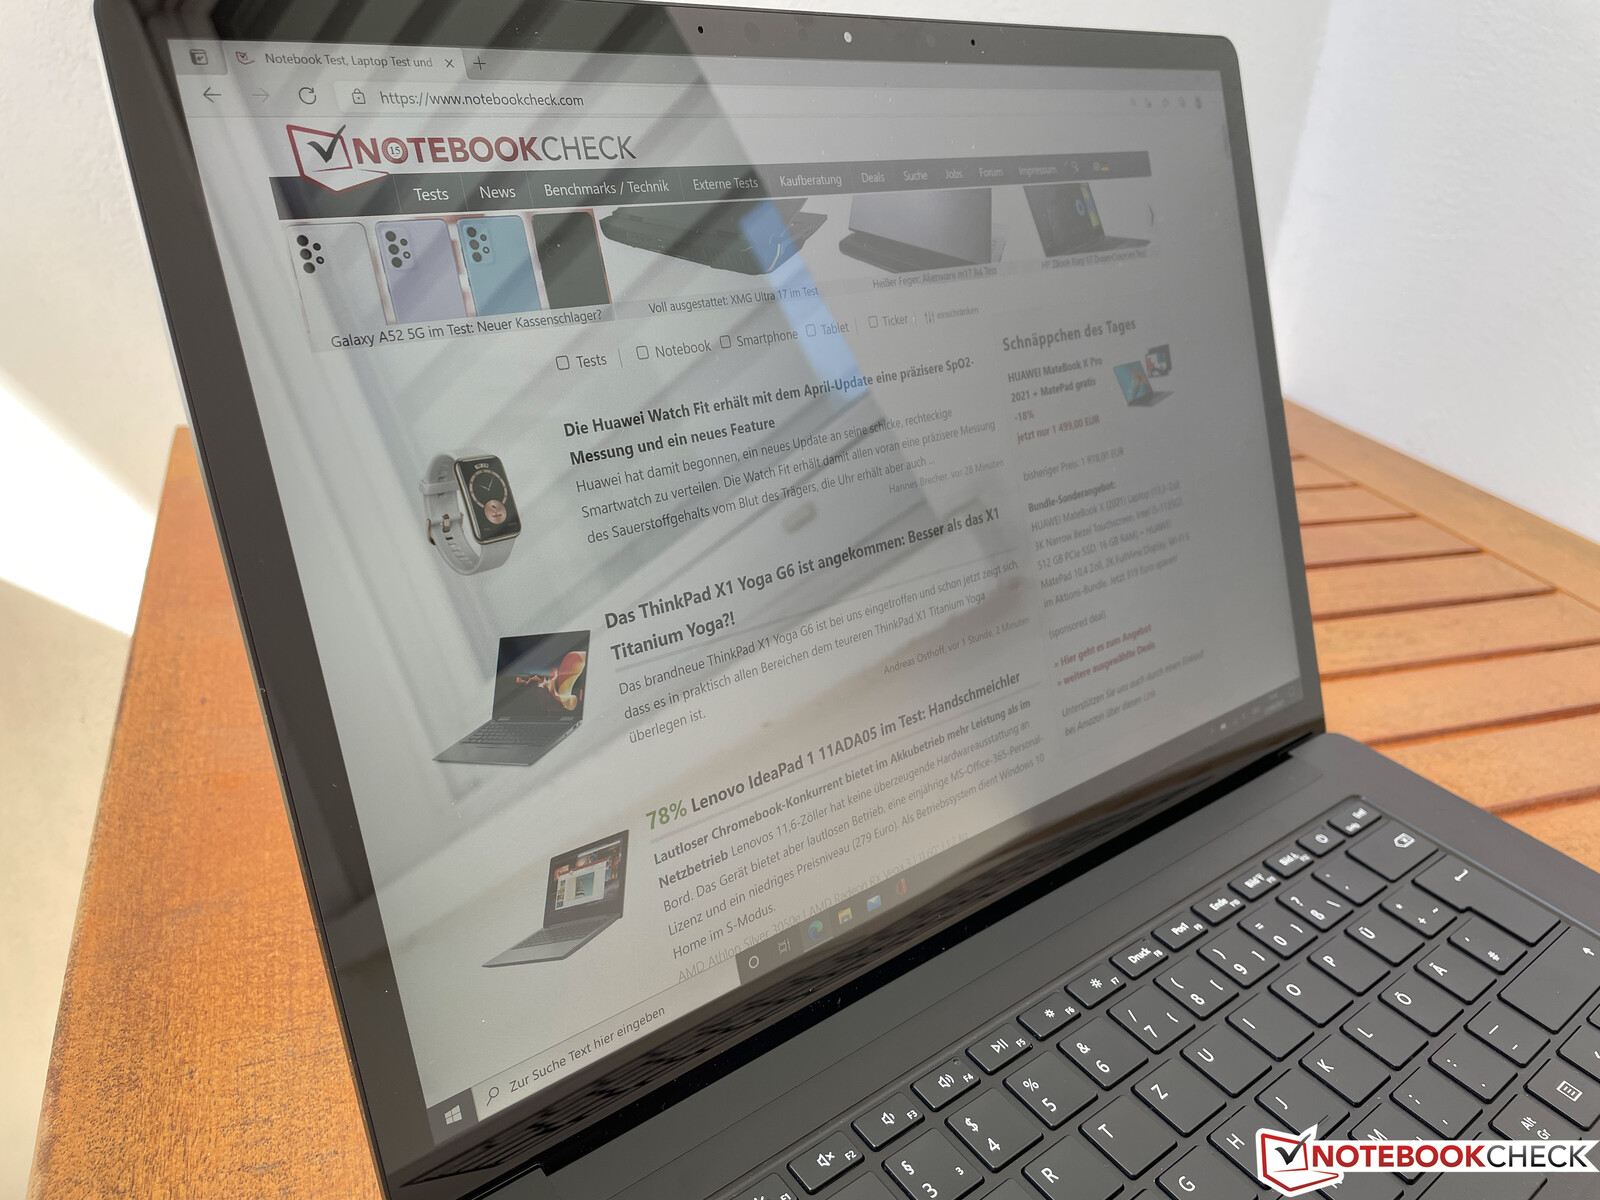
Microsoft Surface Laptop 4 15 laptop review: New AMD processor and more endurance
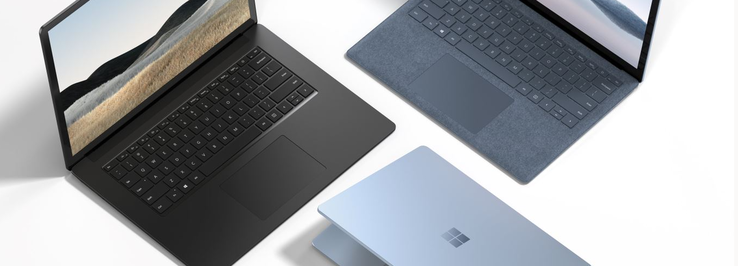
The new Microsoft Surface Laptop 4 is again offered in two sizes: 13.5 inch and 15 inch, and both are now offered with either AMD or Intel processors. Today we test the larger 15-inch model with the AMD processor. Like in the Surface Laptop 3, it also uses a custom AMD chip, but now it is based on the Ryzen 4000 platform. Alternatively, there are also Intel Tiger Lake CPUs.
There are various configurations, some of which have unnecessary limitations. For example, those who need 32 GB of RAM must also choose a model with an Intel CPU. The available configurations of the Surface Laptop 4 15 are listed below:
| CPU | AMD Ryzen 7 4980U | AMD Ryzen 7 4980U | AMD Ryzen 7 4980U | Intel Tiger Lake Core i7-1185G7 | Intel Tiger Lake Core i7-1185G7 |
|---|---|---|---|---|---|
| RAM | 8 GB | 8 GB | 16 GB | 16 GB | 32 GB |
| SSD | 256 GB | 512 GB | 512 GB | 512 GB | 1 TB |
| Price | 1,449€ (~$1,751) | 1,649€ (~$1,993) | 1,849€ (~$2,234) | 1,949€ (~$2,355) | 2,699€ (~$3,261) |
There is only one model that can be compared, and its AMD version costs 100 Euros (~$121) less. The entry-level models are exclusively available with an AMD CPU, but Microsoft is very stingy in terms of the RAM and SSD. It is also a bit surprising that Microsoft again uses the known case including the identical display, input devices, and speakers. So we will be brief in those categories and rather take a more detailed look at the new AMD processor, comparing it also with its Intel counterpart. For more information on the identical sections, we also recommend our reviews on the Surface Laptop 3:
Possible Competitors in Comparison
Rating | Date | Model | Weight | Height | Size | Resolution | Price |
|---|---|---|---|---|---|---|---|
| 84.9 % v7 (old) | 04 / 2021 | Microsoft Surface Laptop 4 15 AMD TFF_00028 R7 4980U, Vega 8 | 1.6 kg | 14.7 mm | 15.00" | 2496x1664 | |
| 87.7 % v7 (old) | 12 / 2020 | Schenker Vision 15 i7-1165G7, Iris Xe G7 96EUs | 1.7 kg | 15 mm | 15.60" | 1920x1080 | |
| 86.8 % v7 (old) | 05 / 2020 | Dell XPS 15 9500 Core i5 i5-10300H, UHD Graphics 630 | 1.8 kg | 18 mm | 15.60" | 1920x1200 | |
| 84.9 % v7 (old) | 03 / 2021 | Tuxedo Pulse 15 R5 4600H, Vega 6 | 1.5 kg | 17 mm | 15.60" | 1920x1080 | |
| 90.1 % v7 (old) | 01 / 2021 | Lenovo ThinkPad X1 Extreme Gen3-20TLS0UV00 i7-10750H, GeForce GTX 1650 Ti Max-Q | 1.7 kg | 18.7 mm | 15.60" | 1920x1080 |
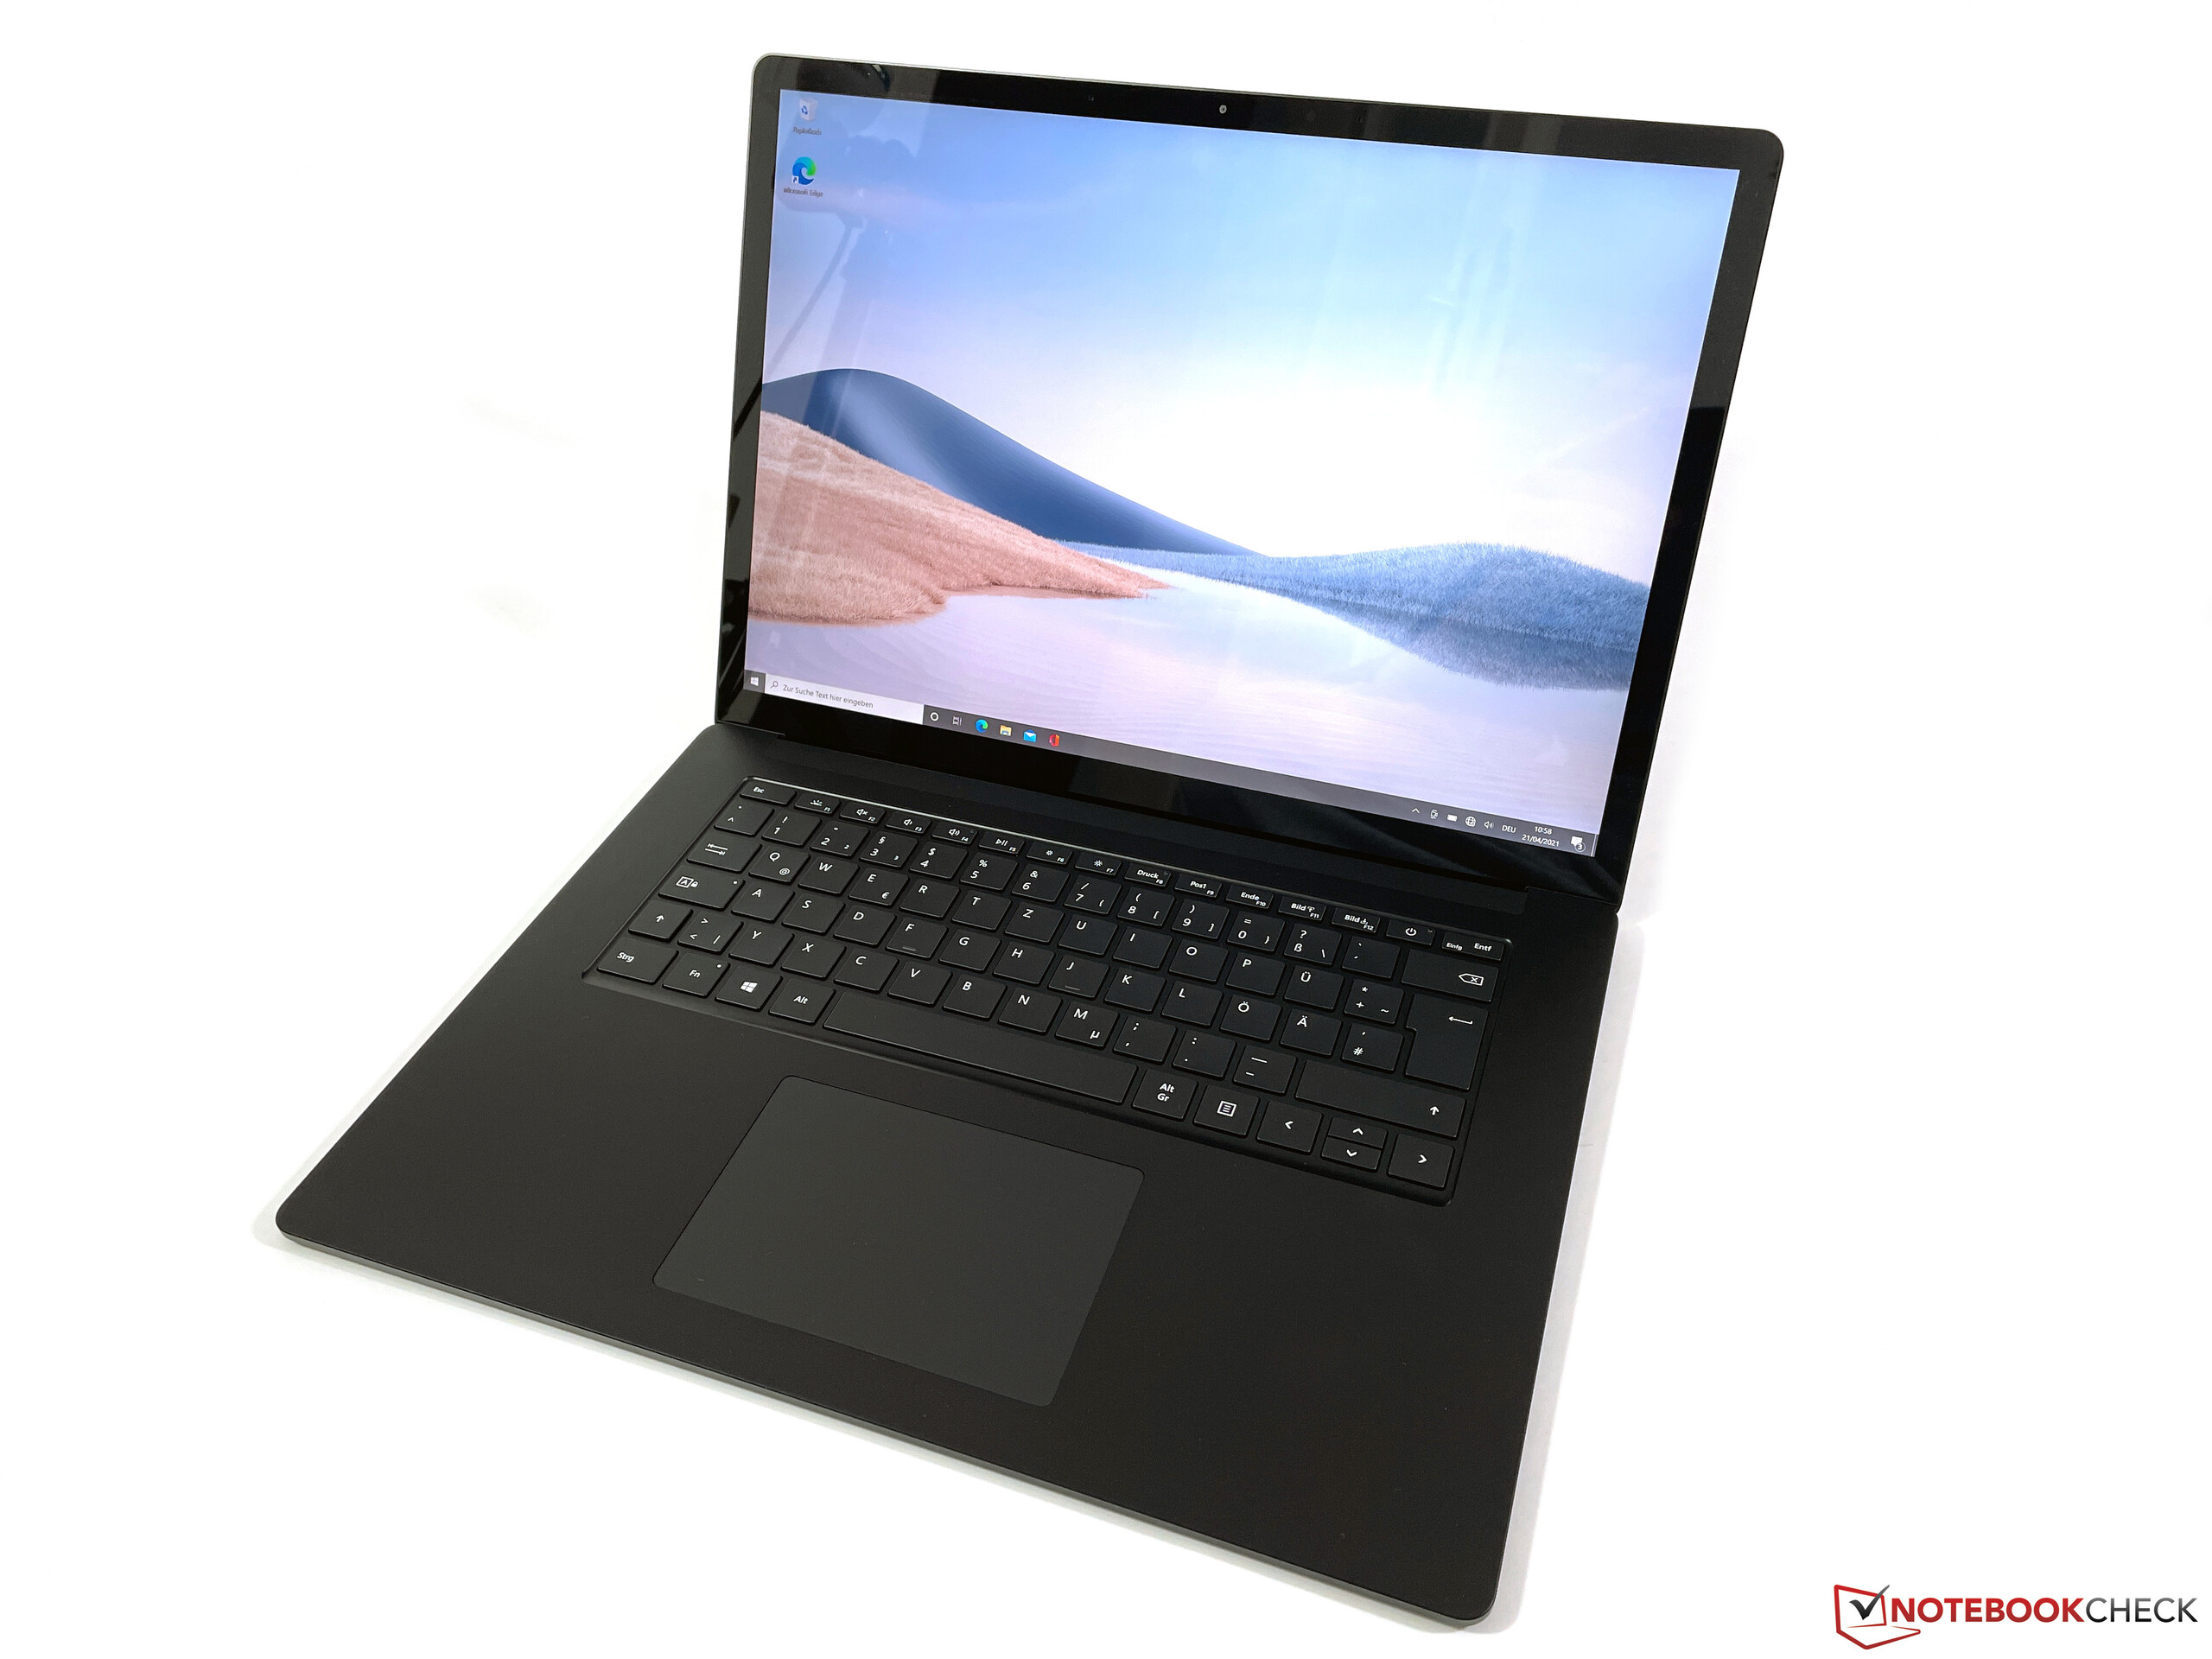
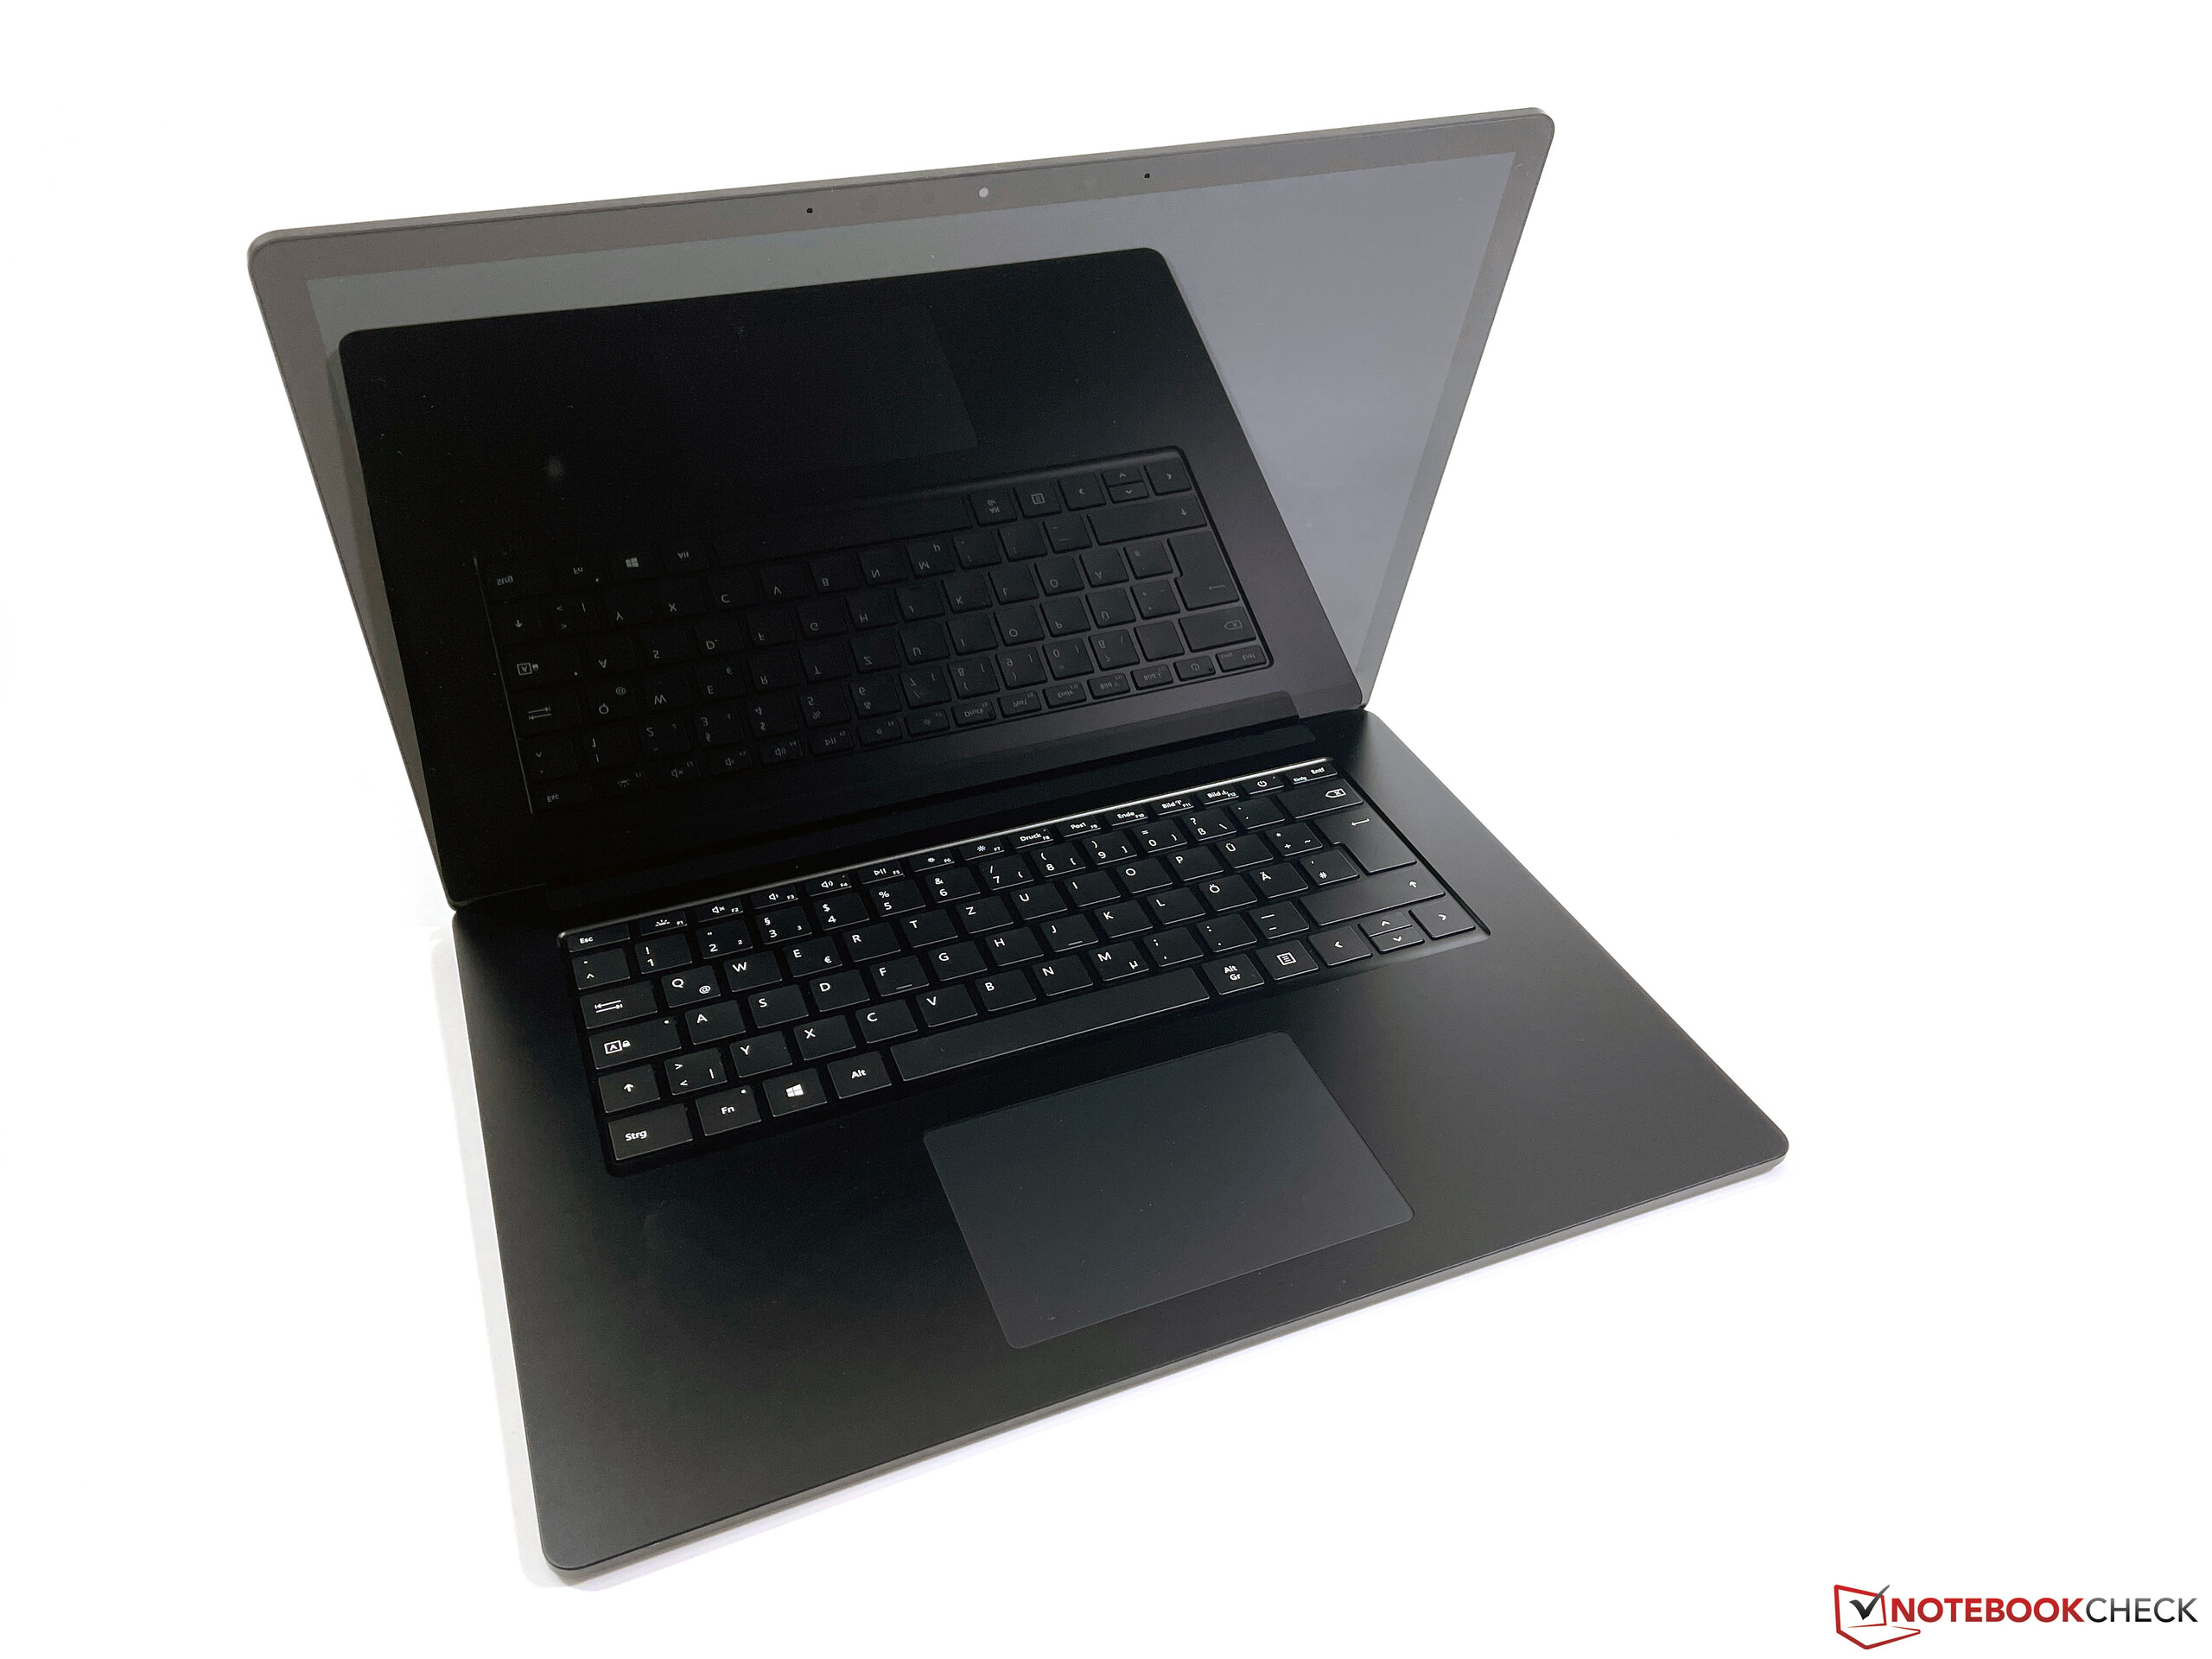
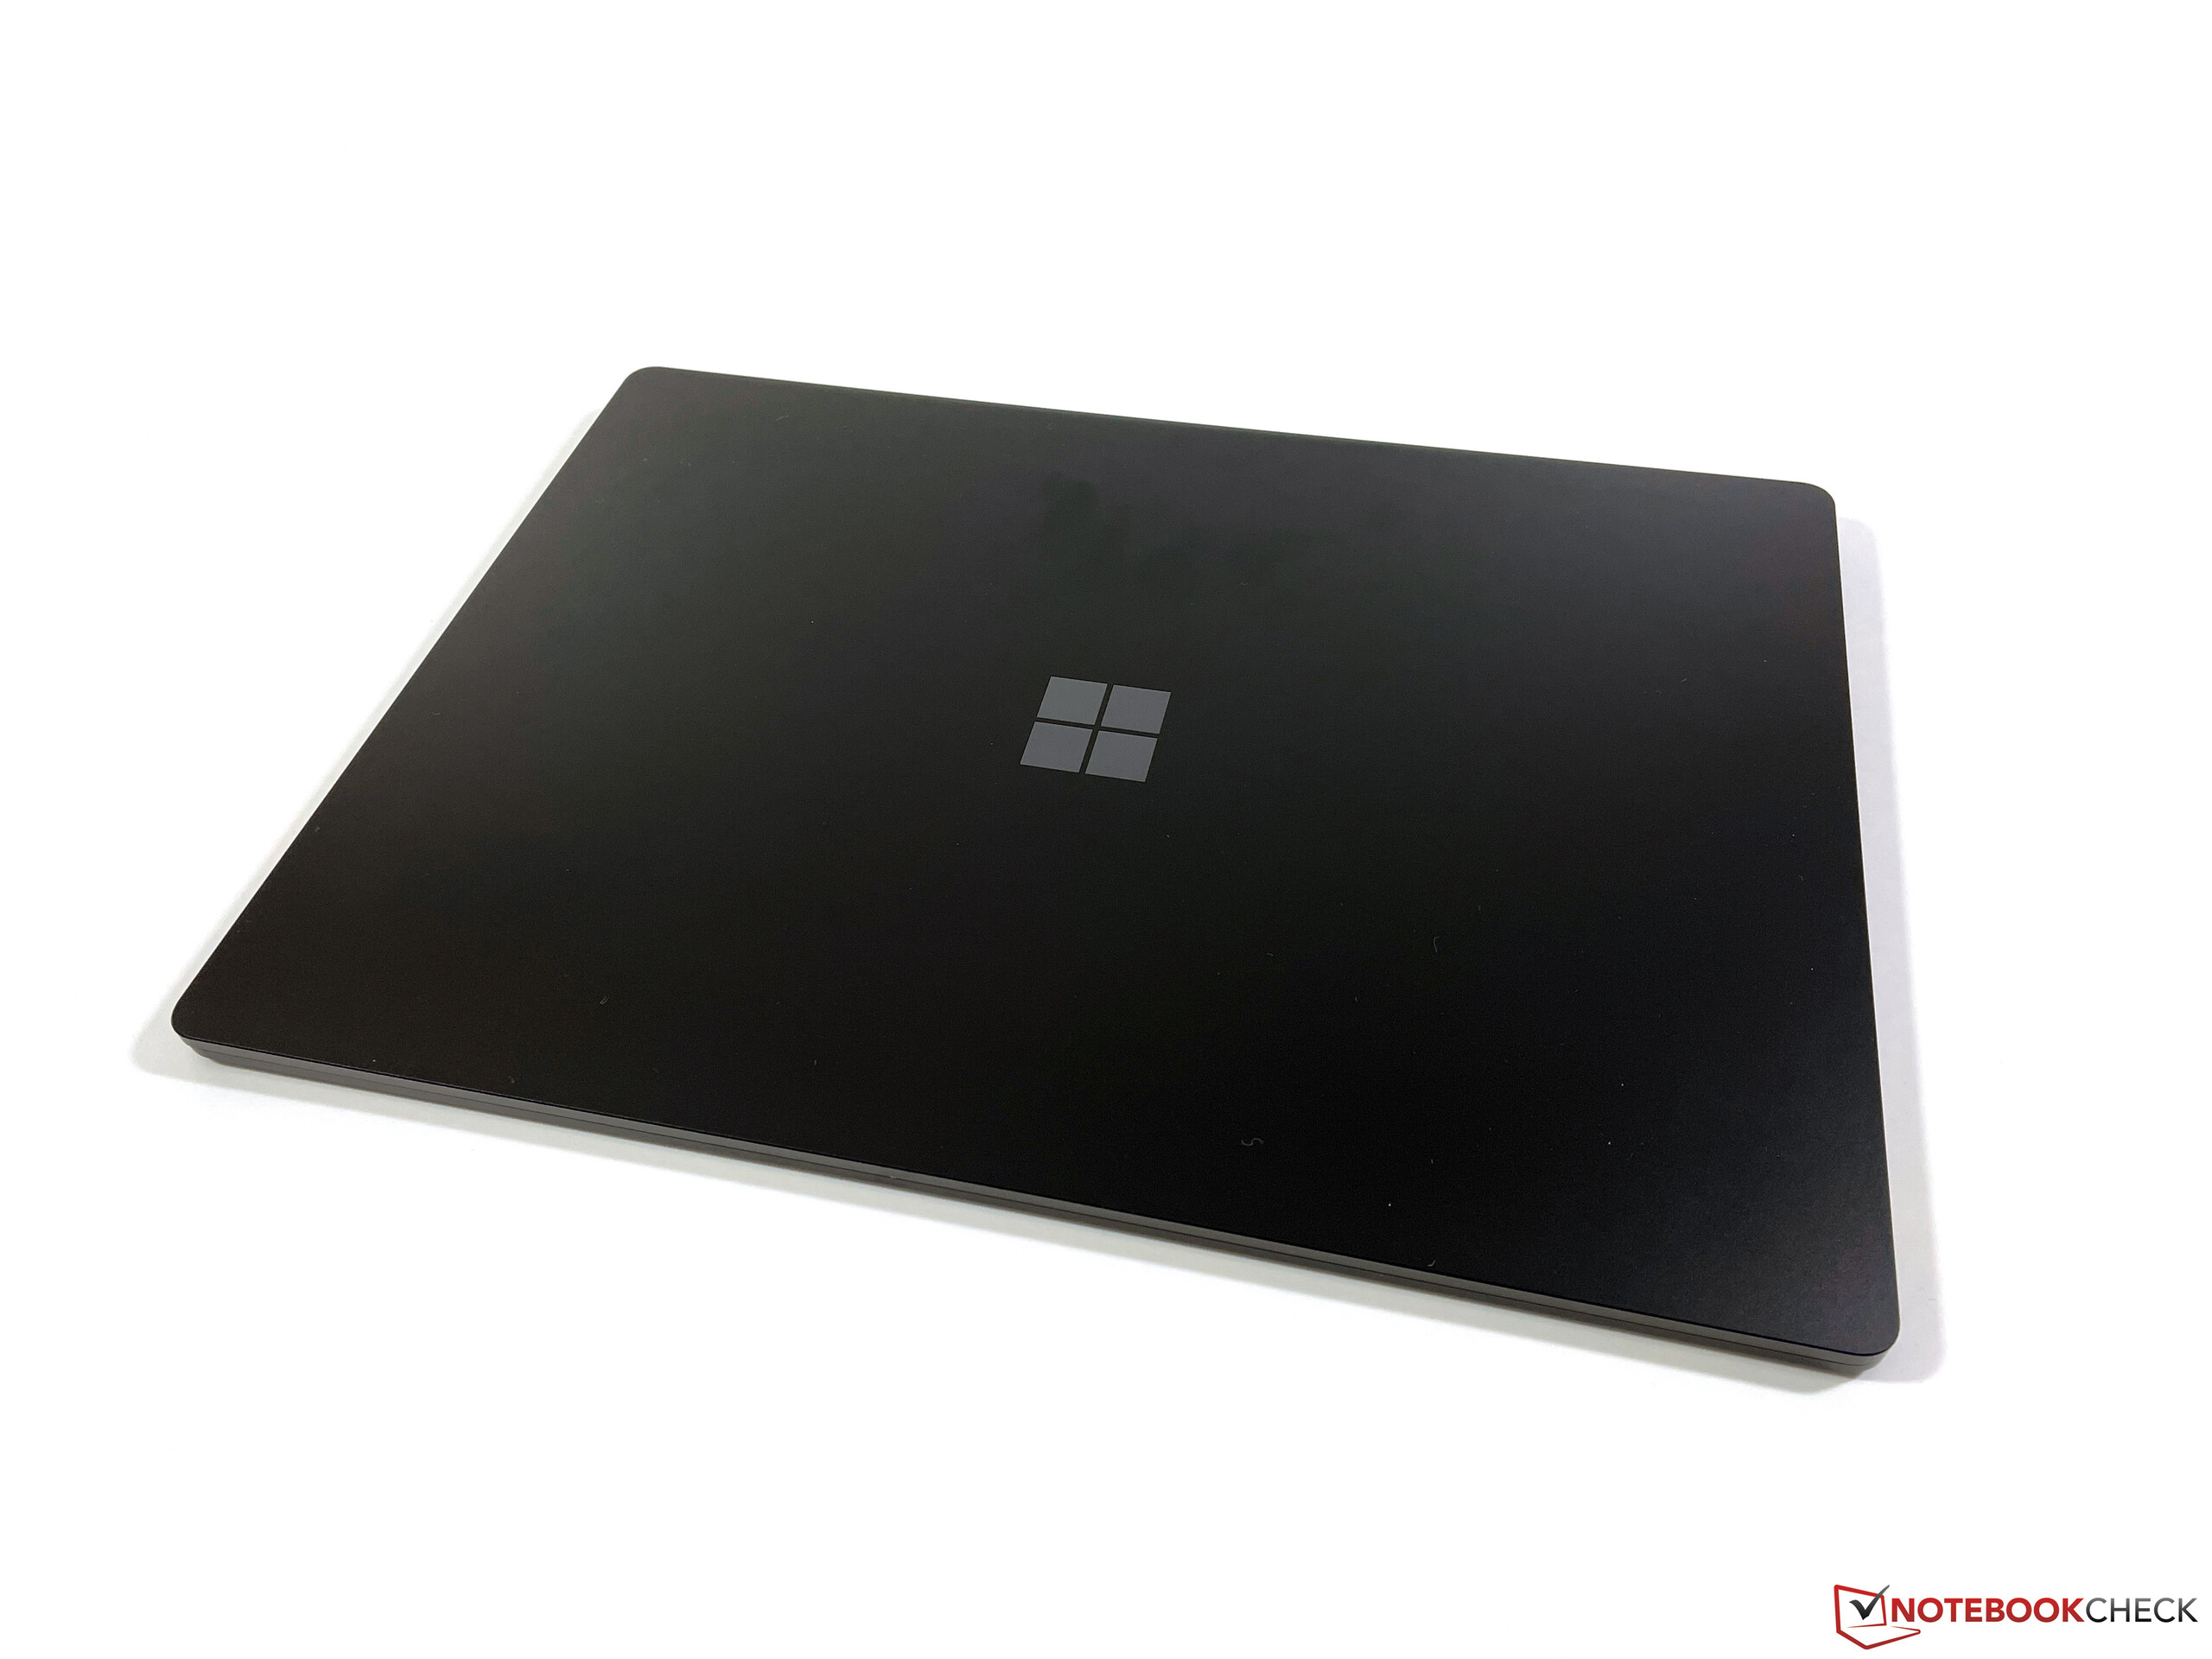
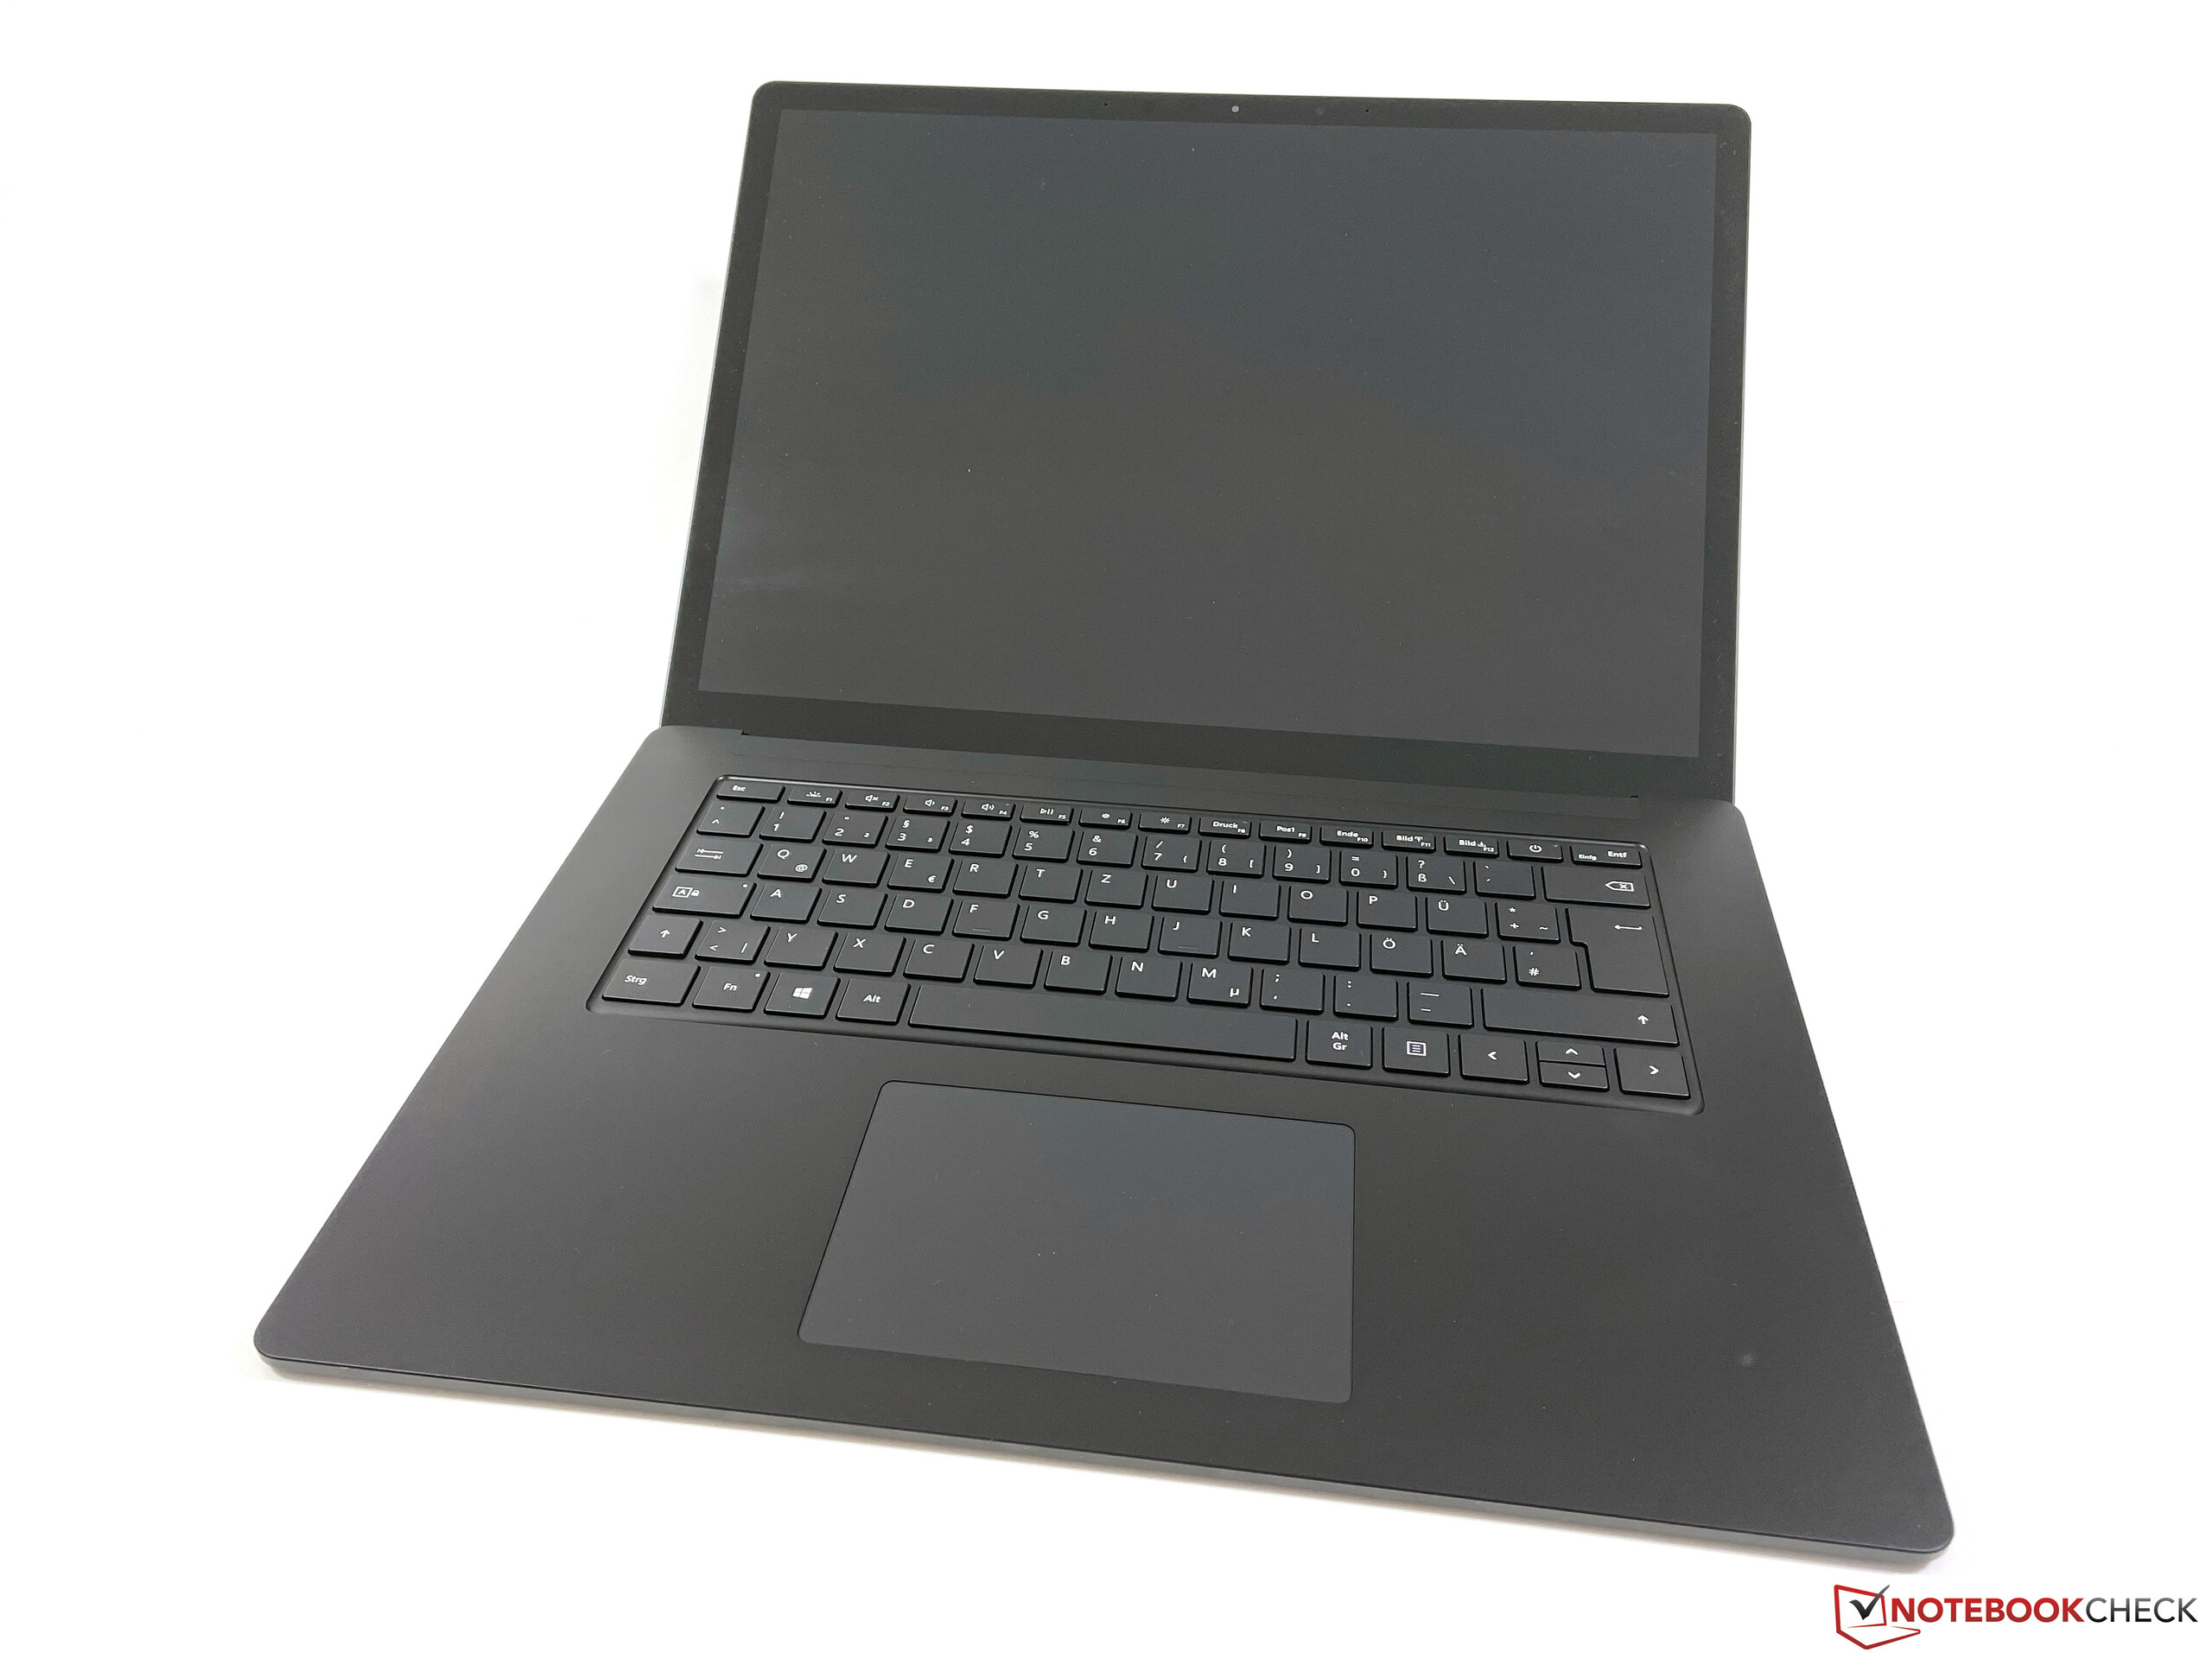
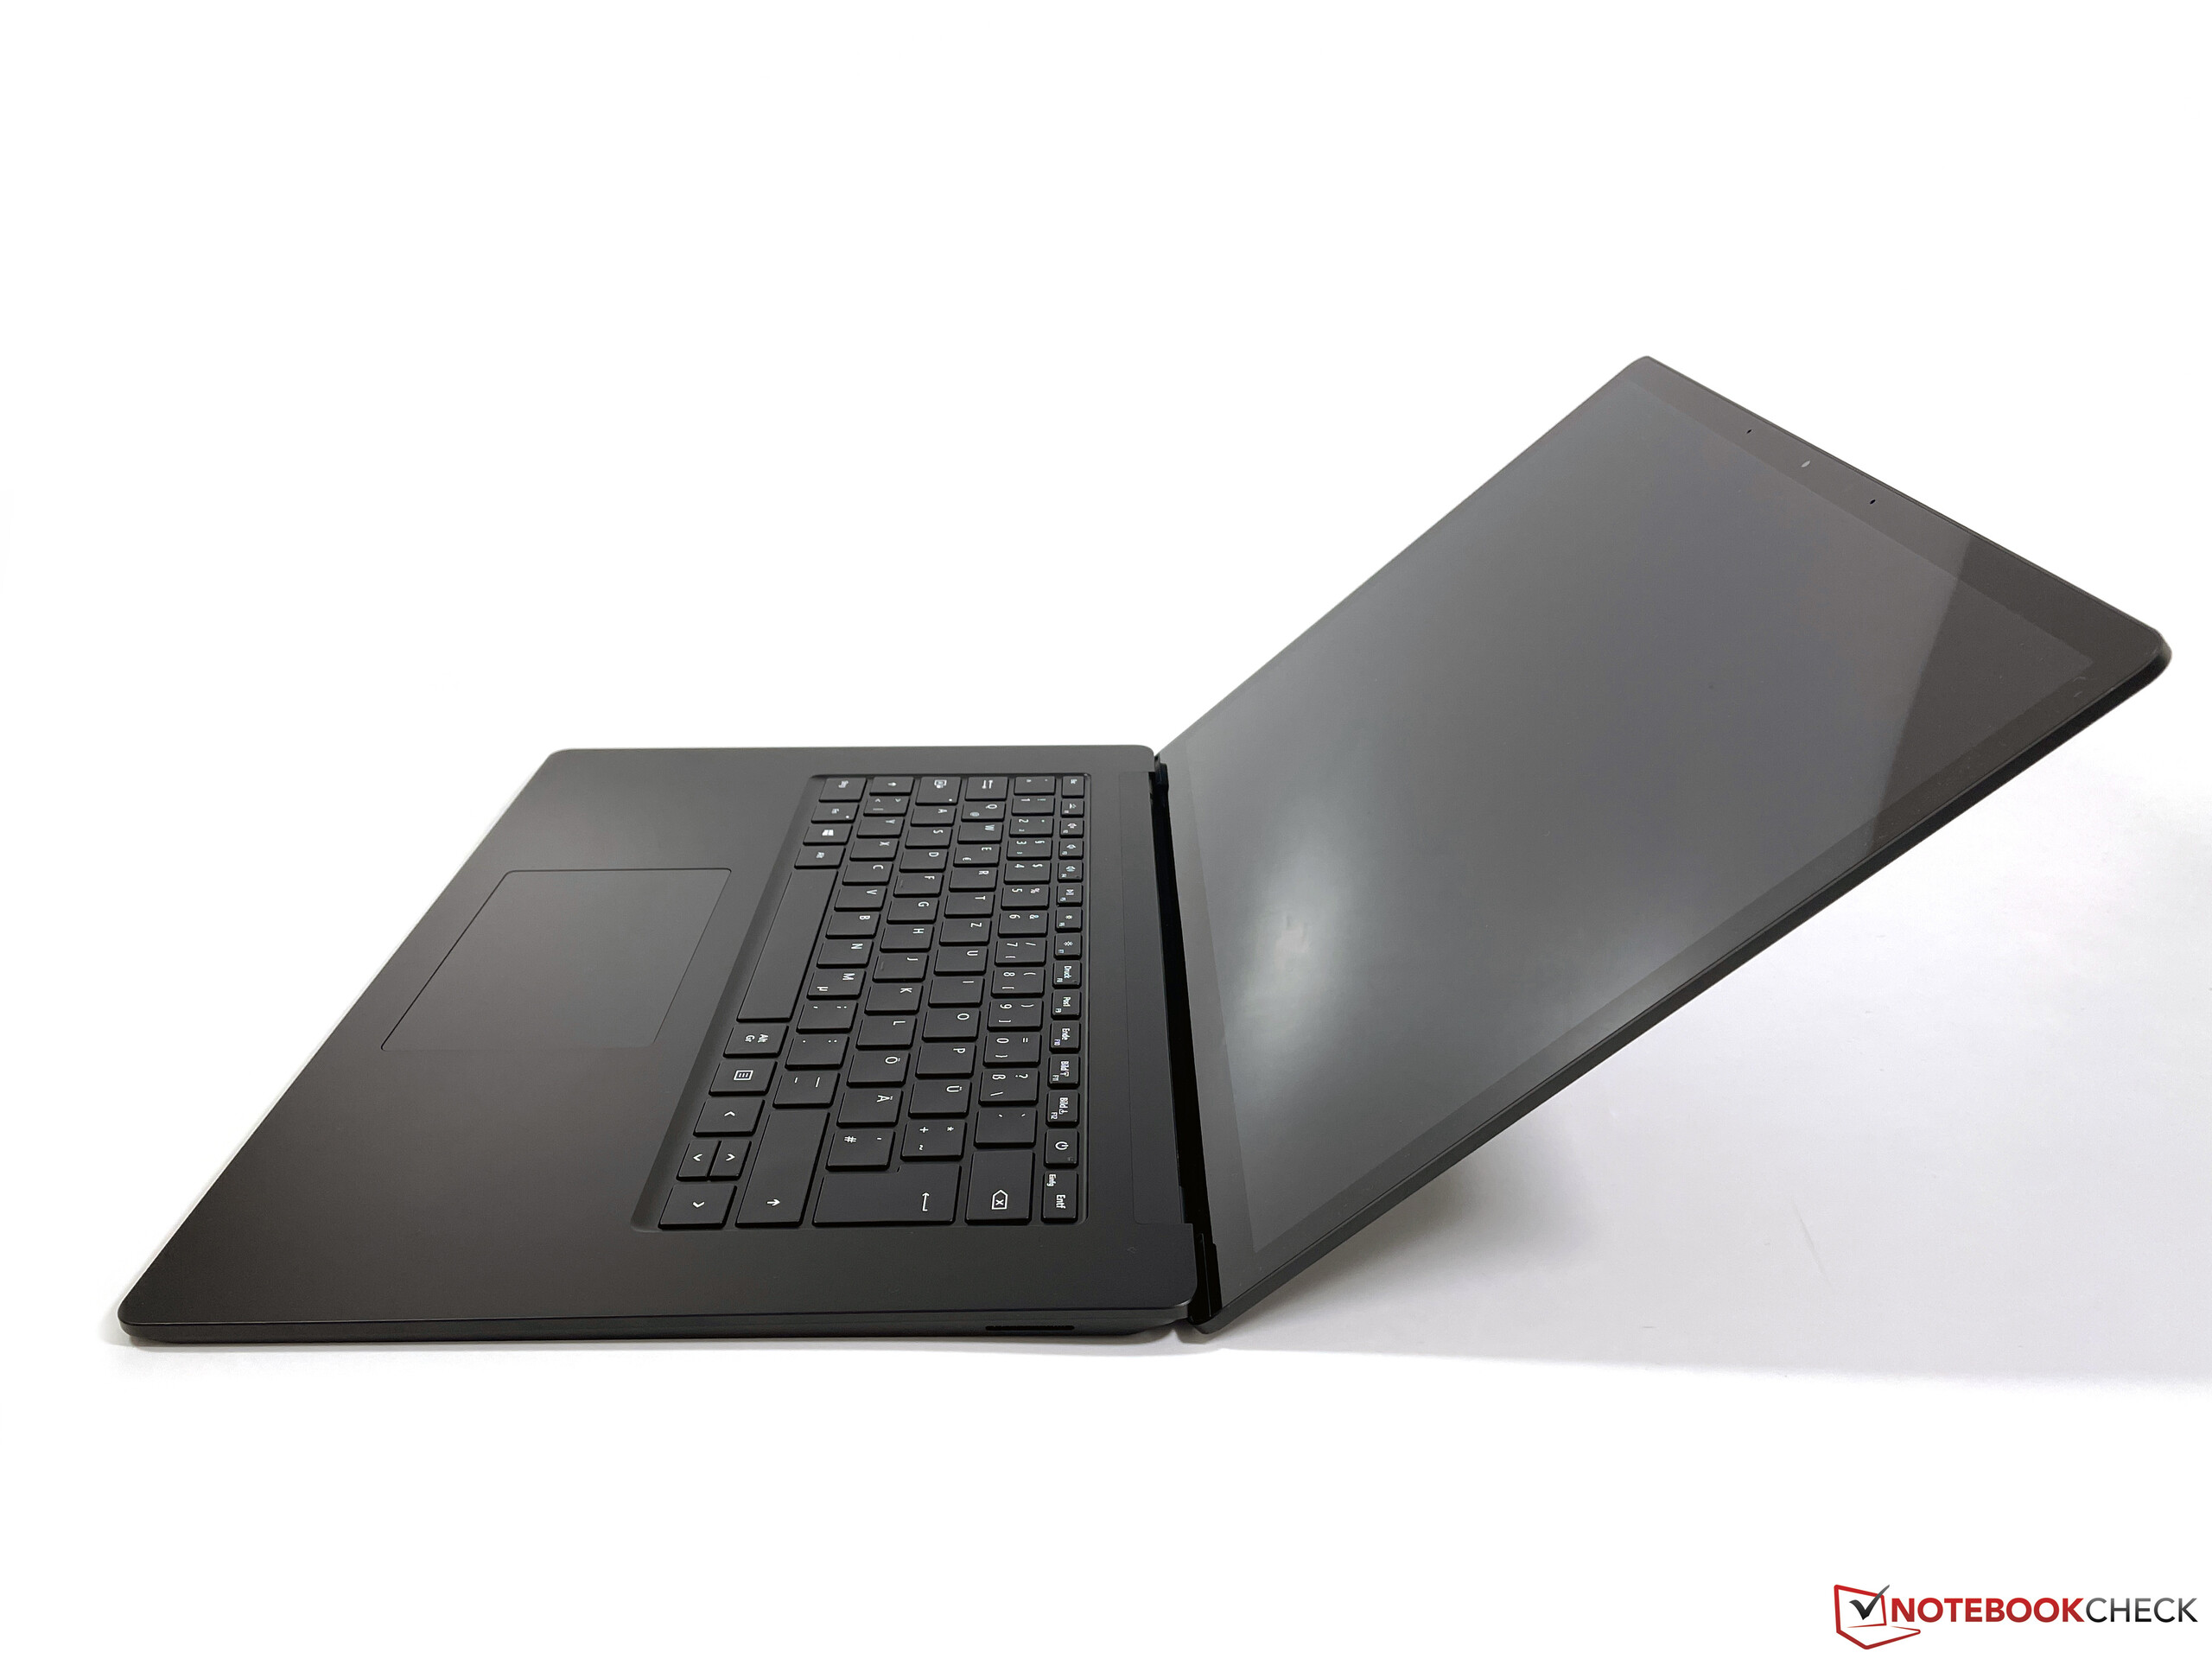
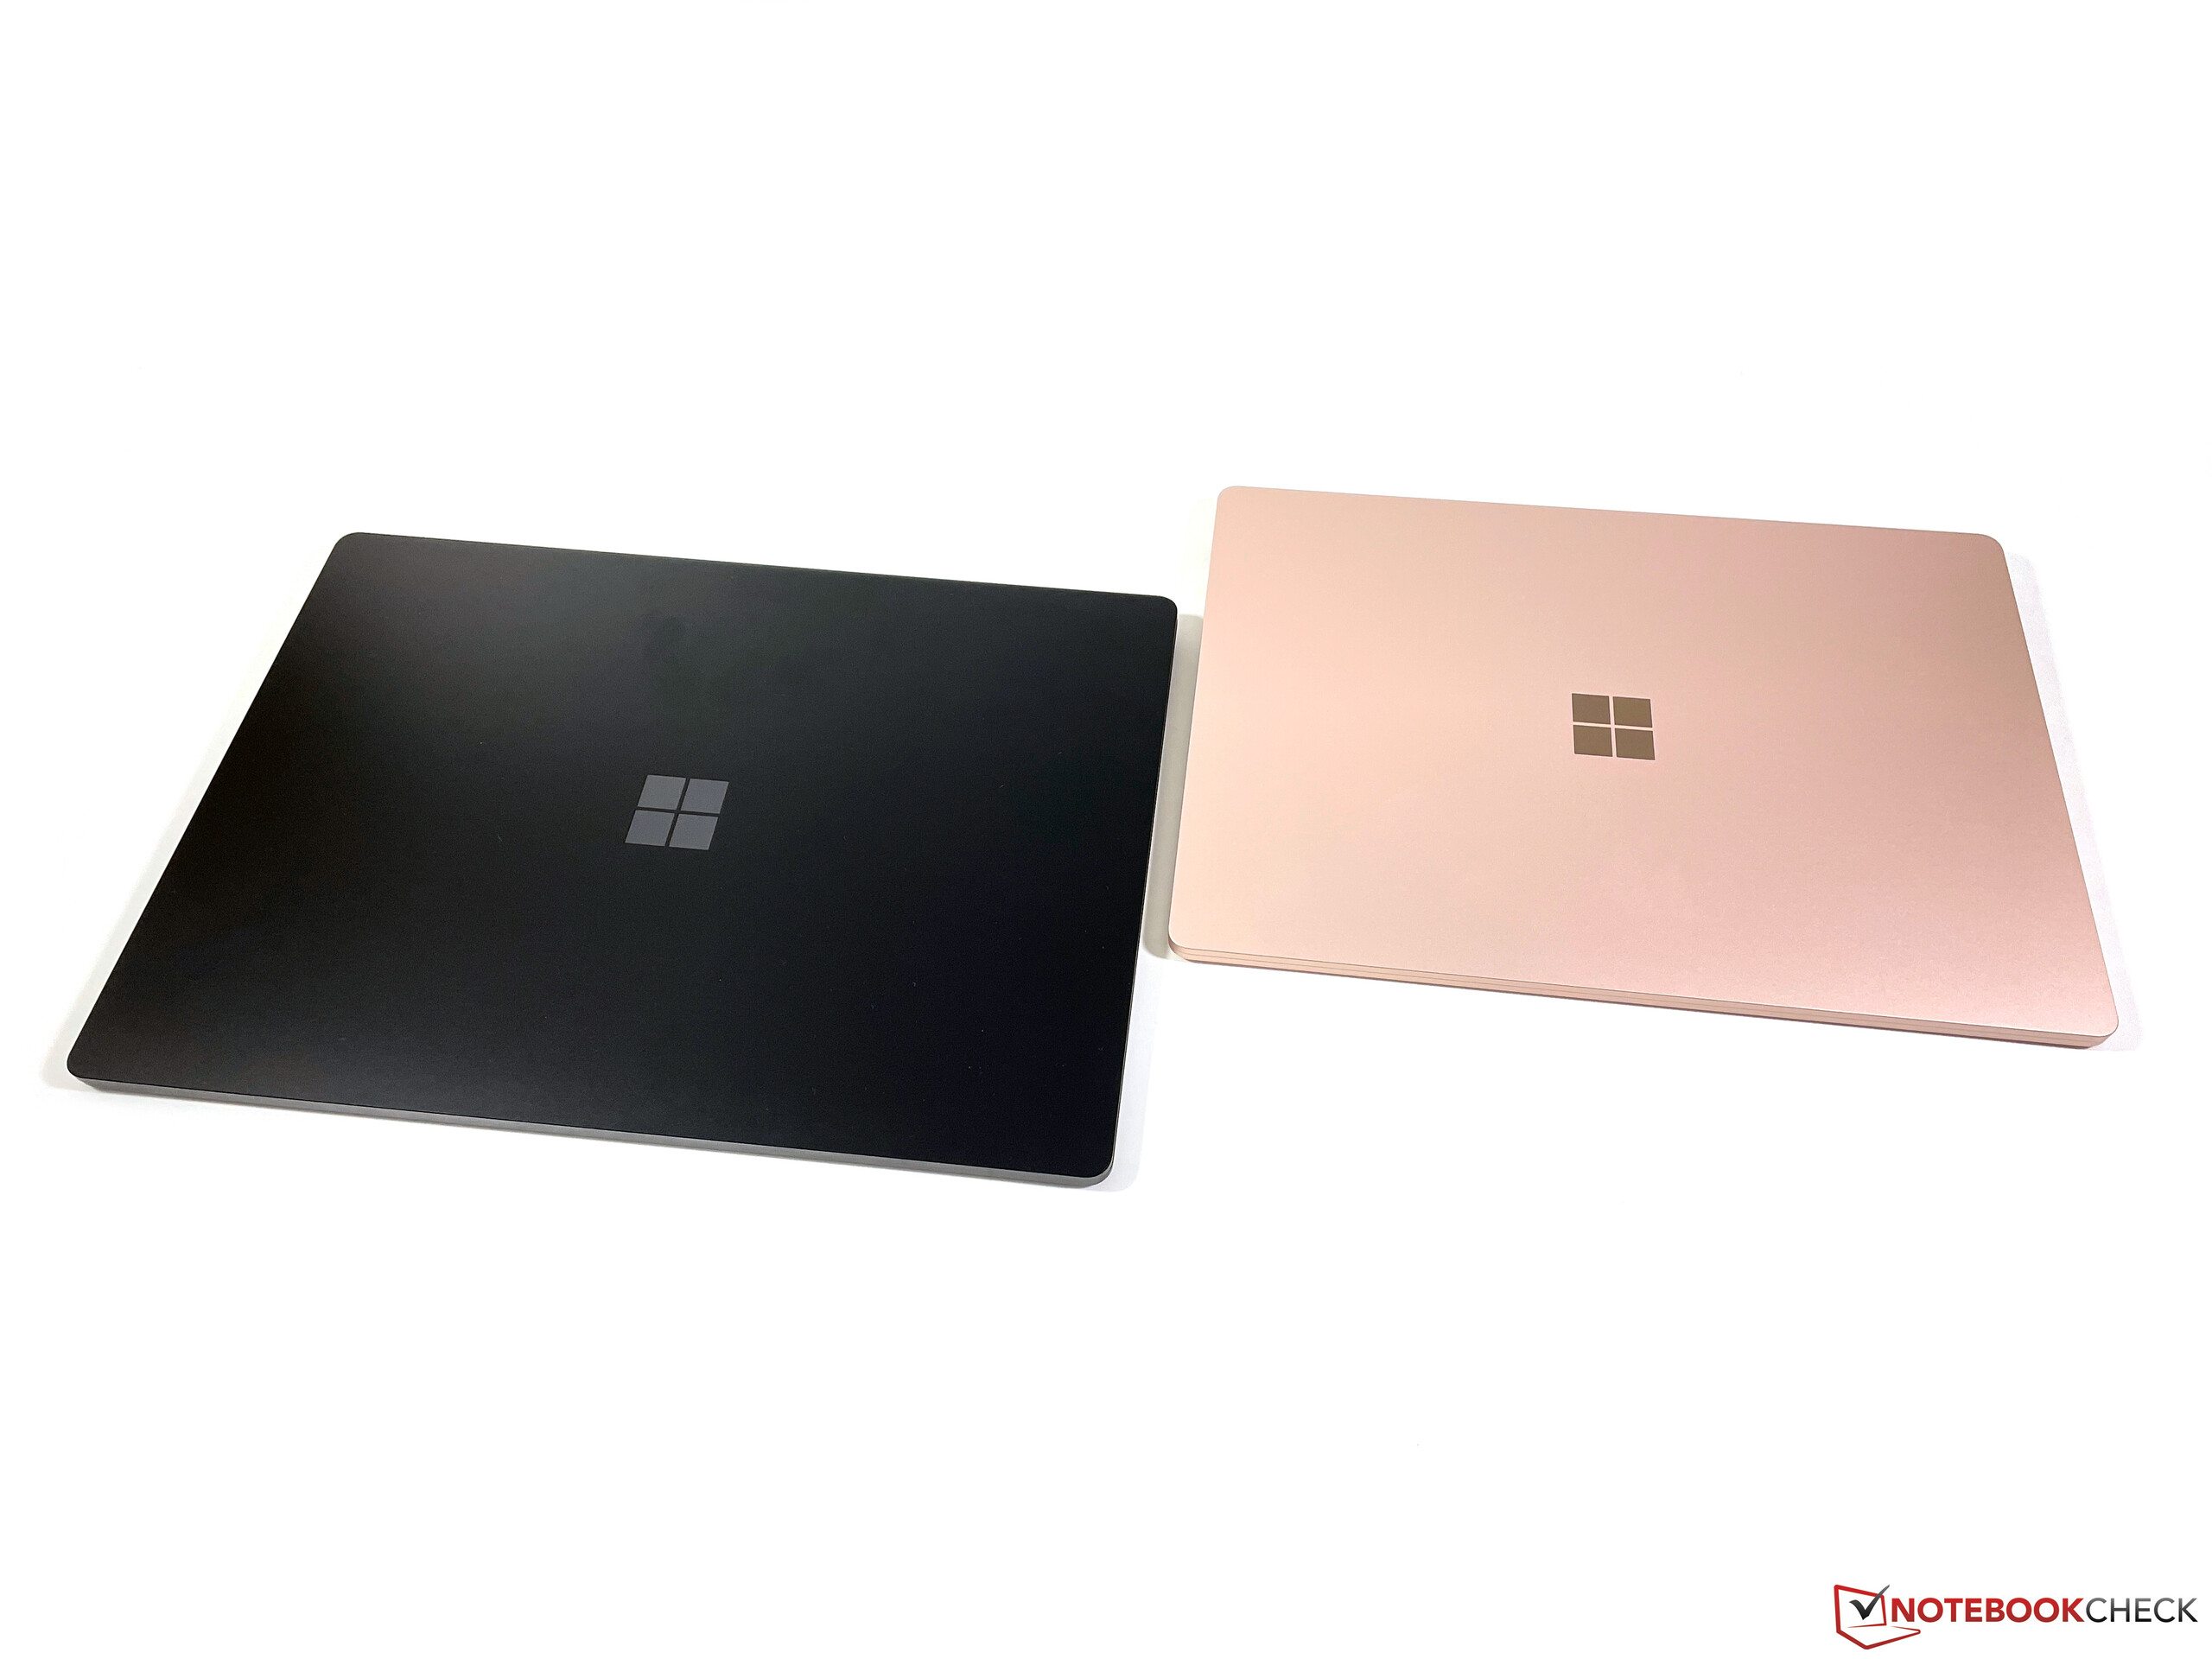
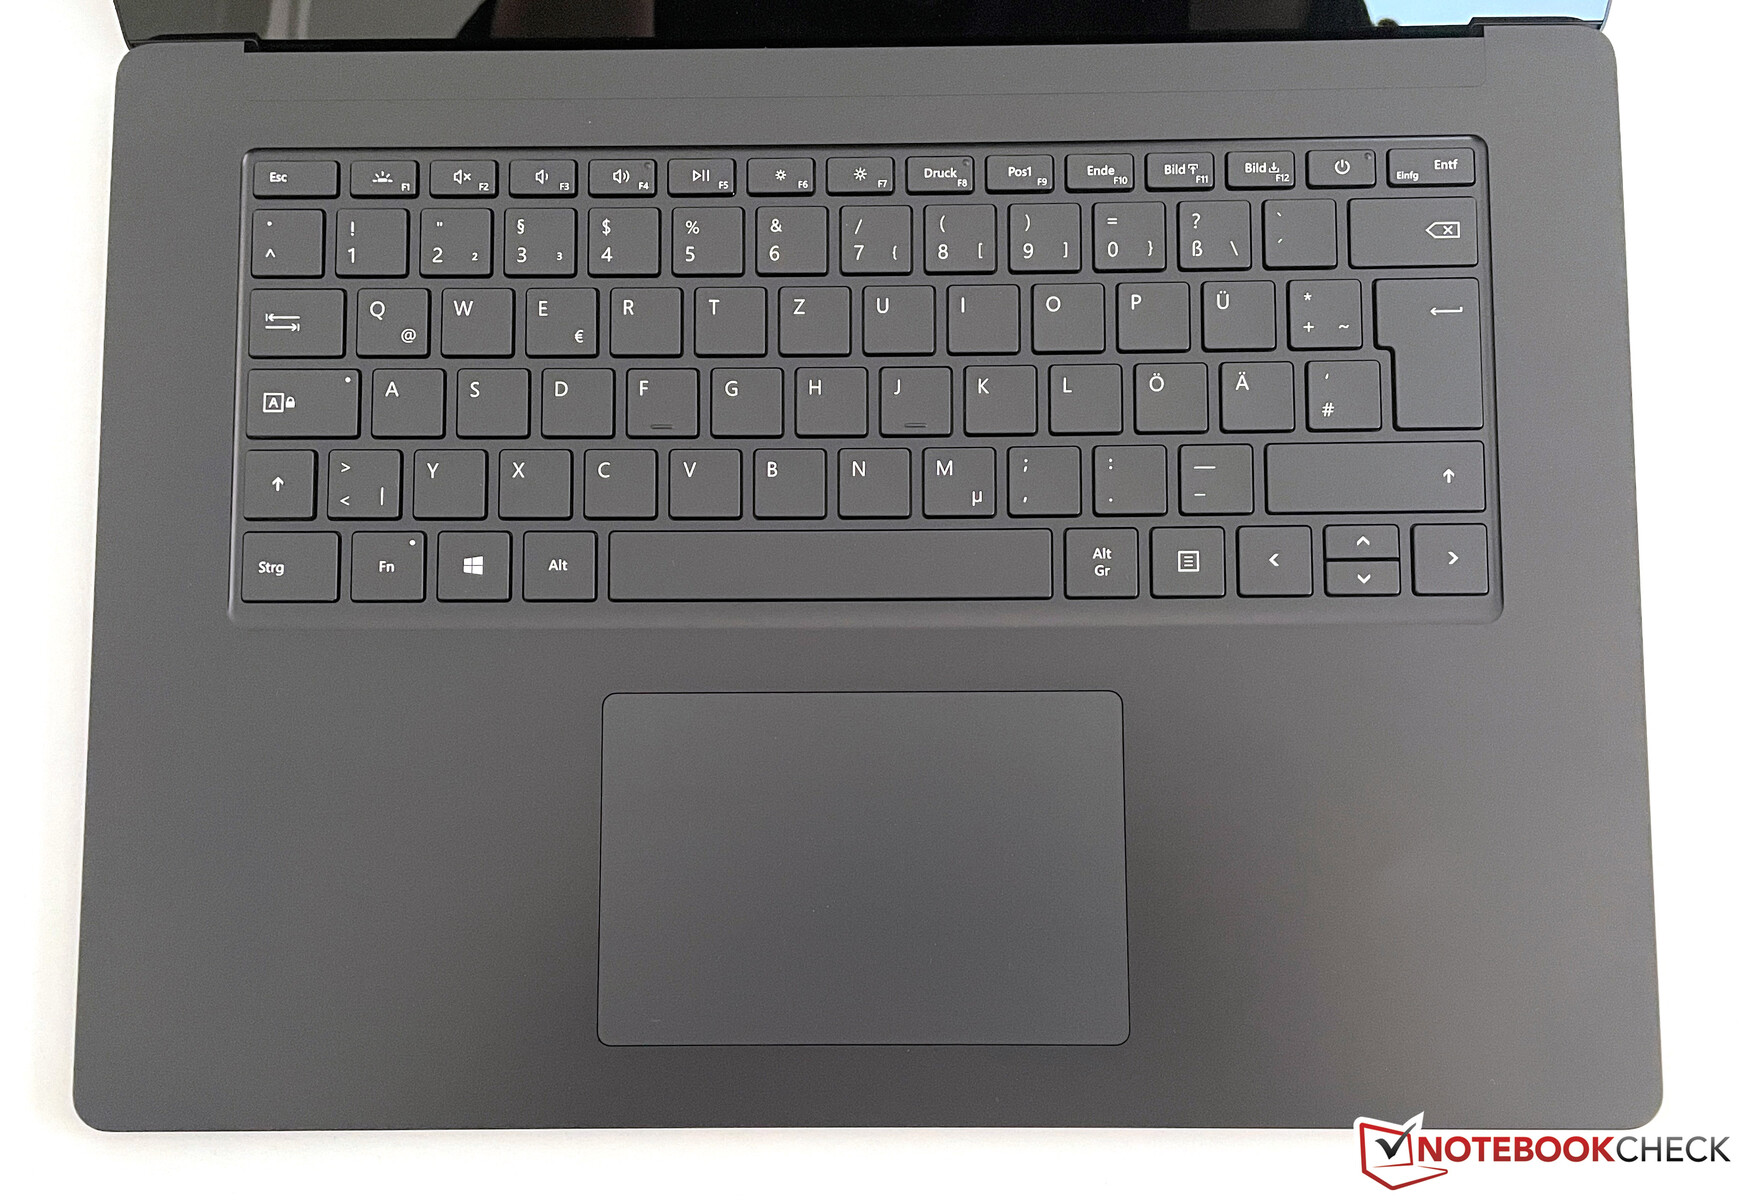
Case - Surface with a metal case
As mentioned above, Microsoft uses the same case as in the Surface Laptop 3 before. For a modern device, the bezels are comparatively large (11 mm, ~0.43 in on top and on the sides and 14 mm, ~0.55 in below), but the workmanship continues to be very good. There are no flawed transitions between the materials, and the base unit and the display lid are very robust.
While the smaller Surface Laptop 4 continues to be available with an Alcantara cover layer for the base unit, the larger 15-inch model is exclusively available in metal. In terms of the colors, you can choose between matte black and platinum. Our black model hides fingerprints fairly well, but dust becomes quickly noticeable.
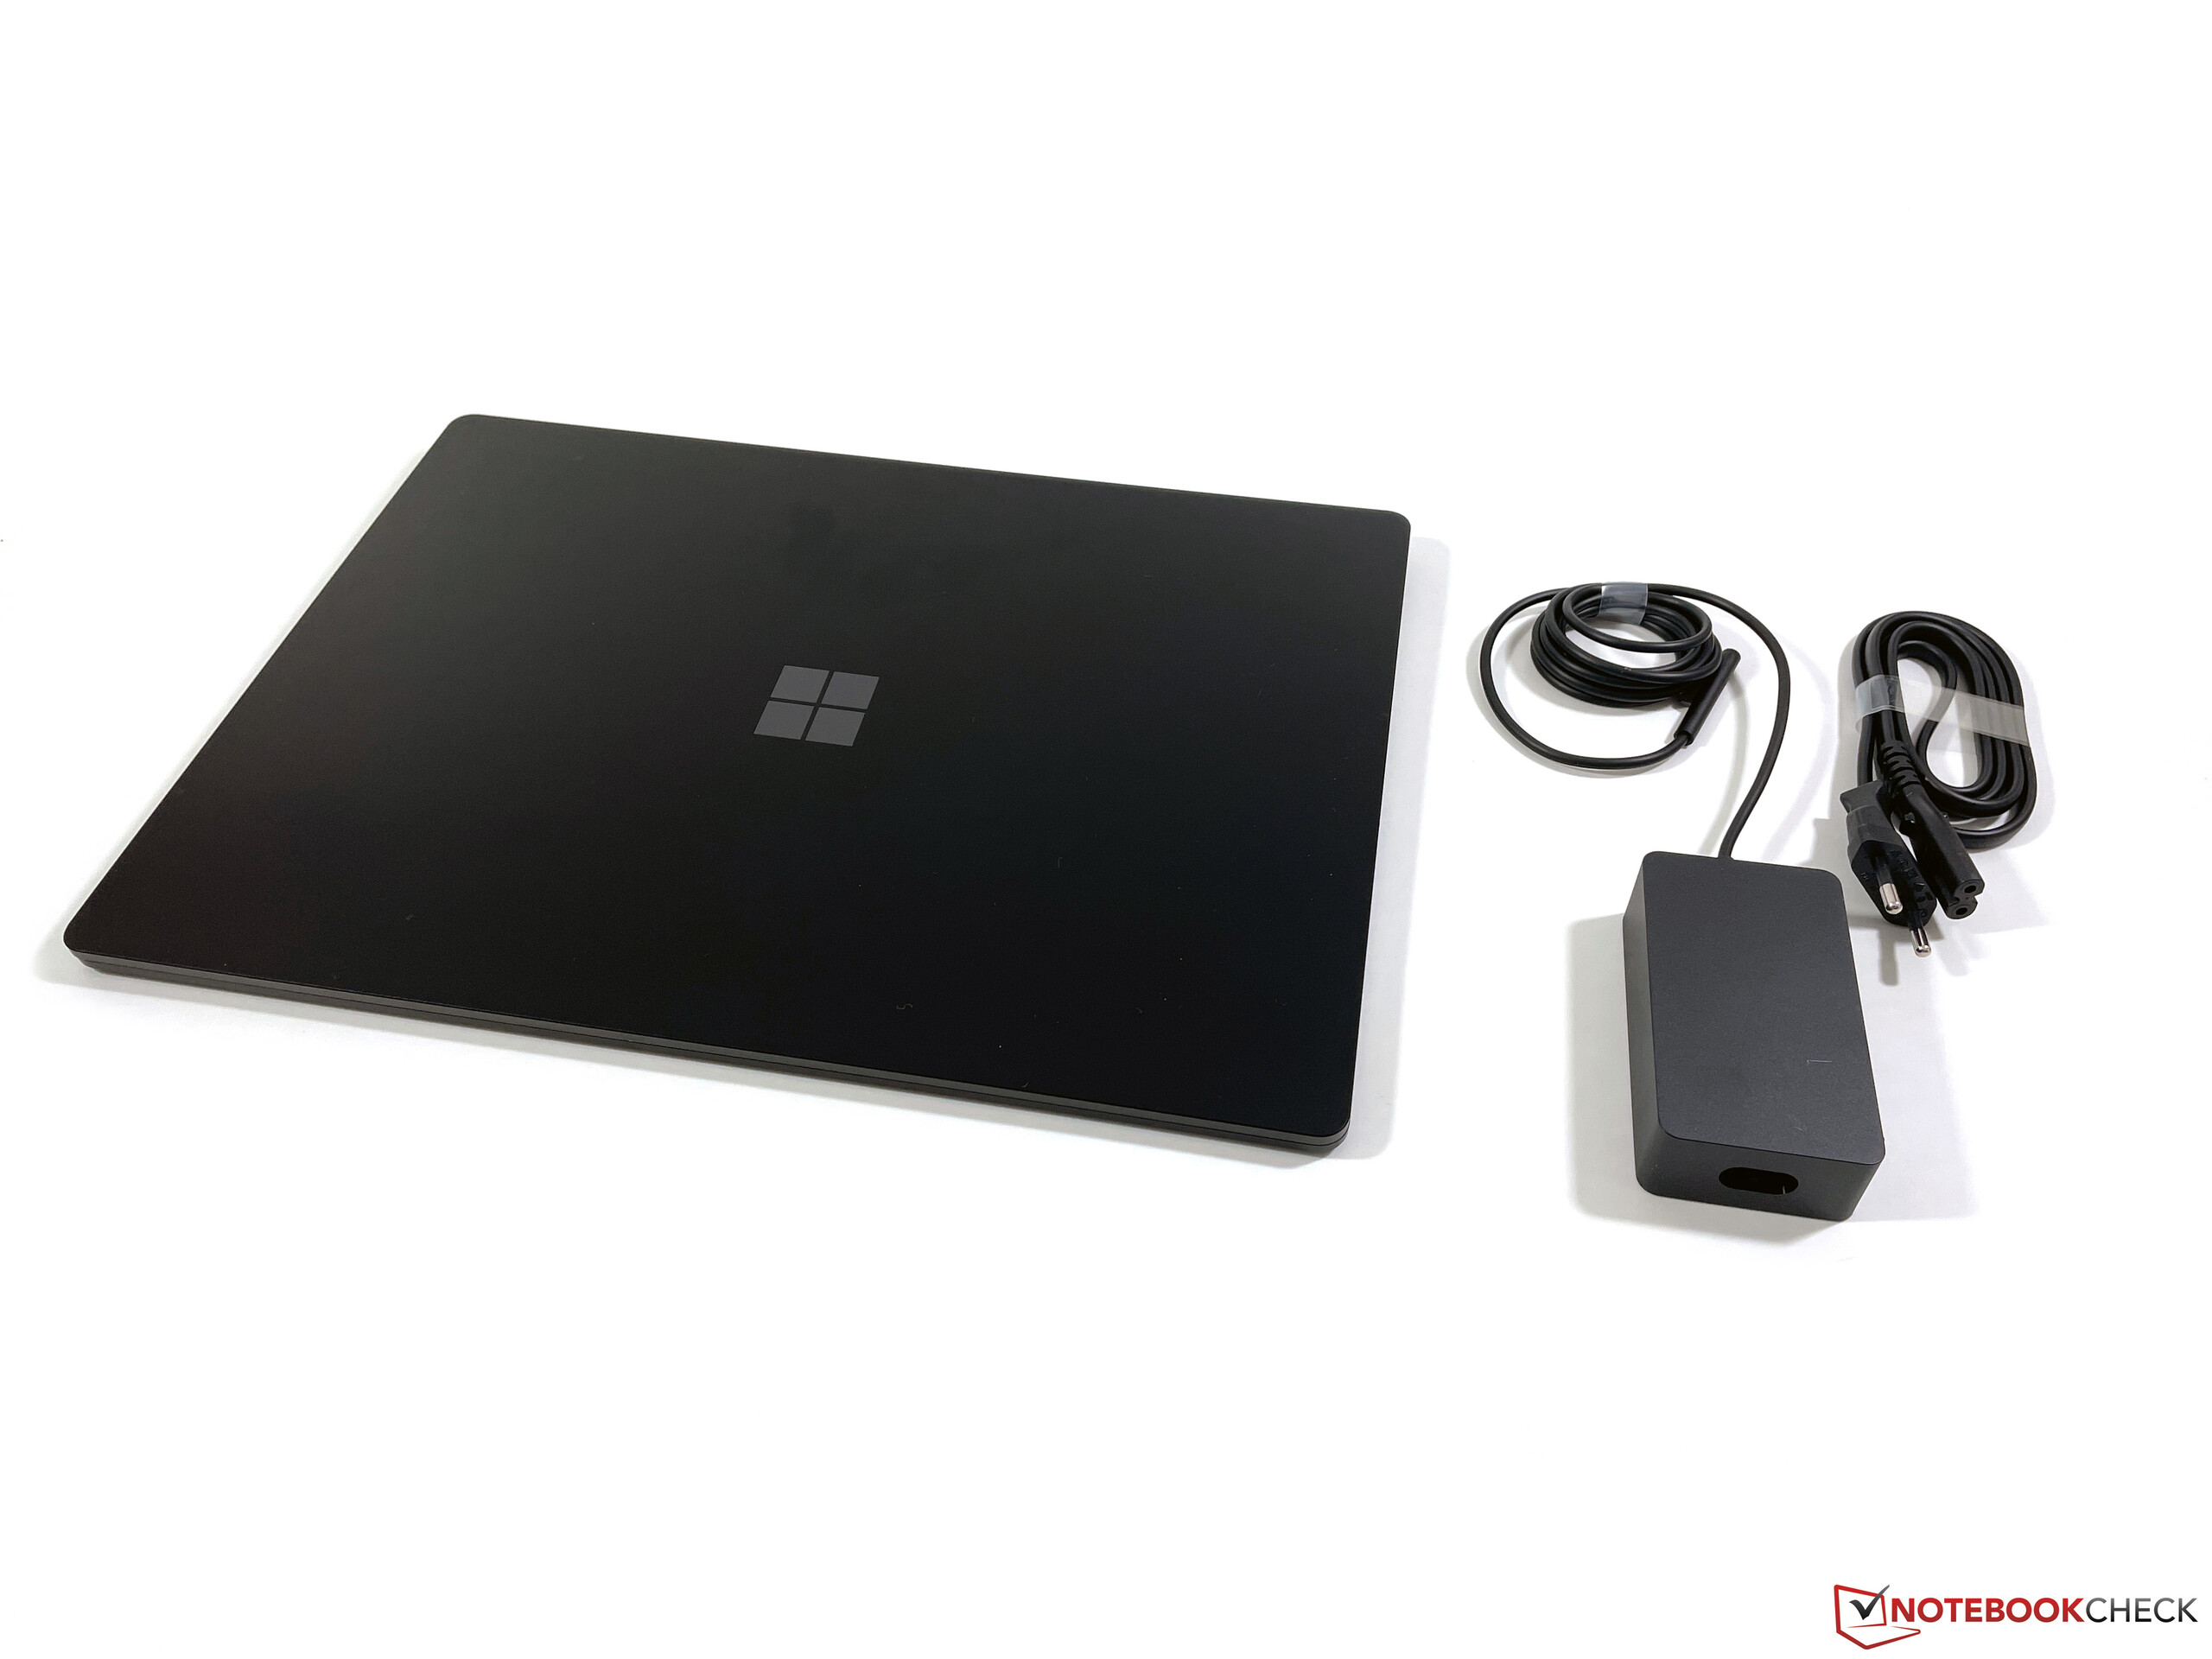
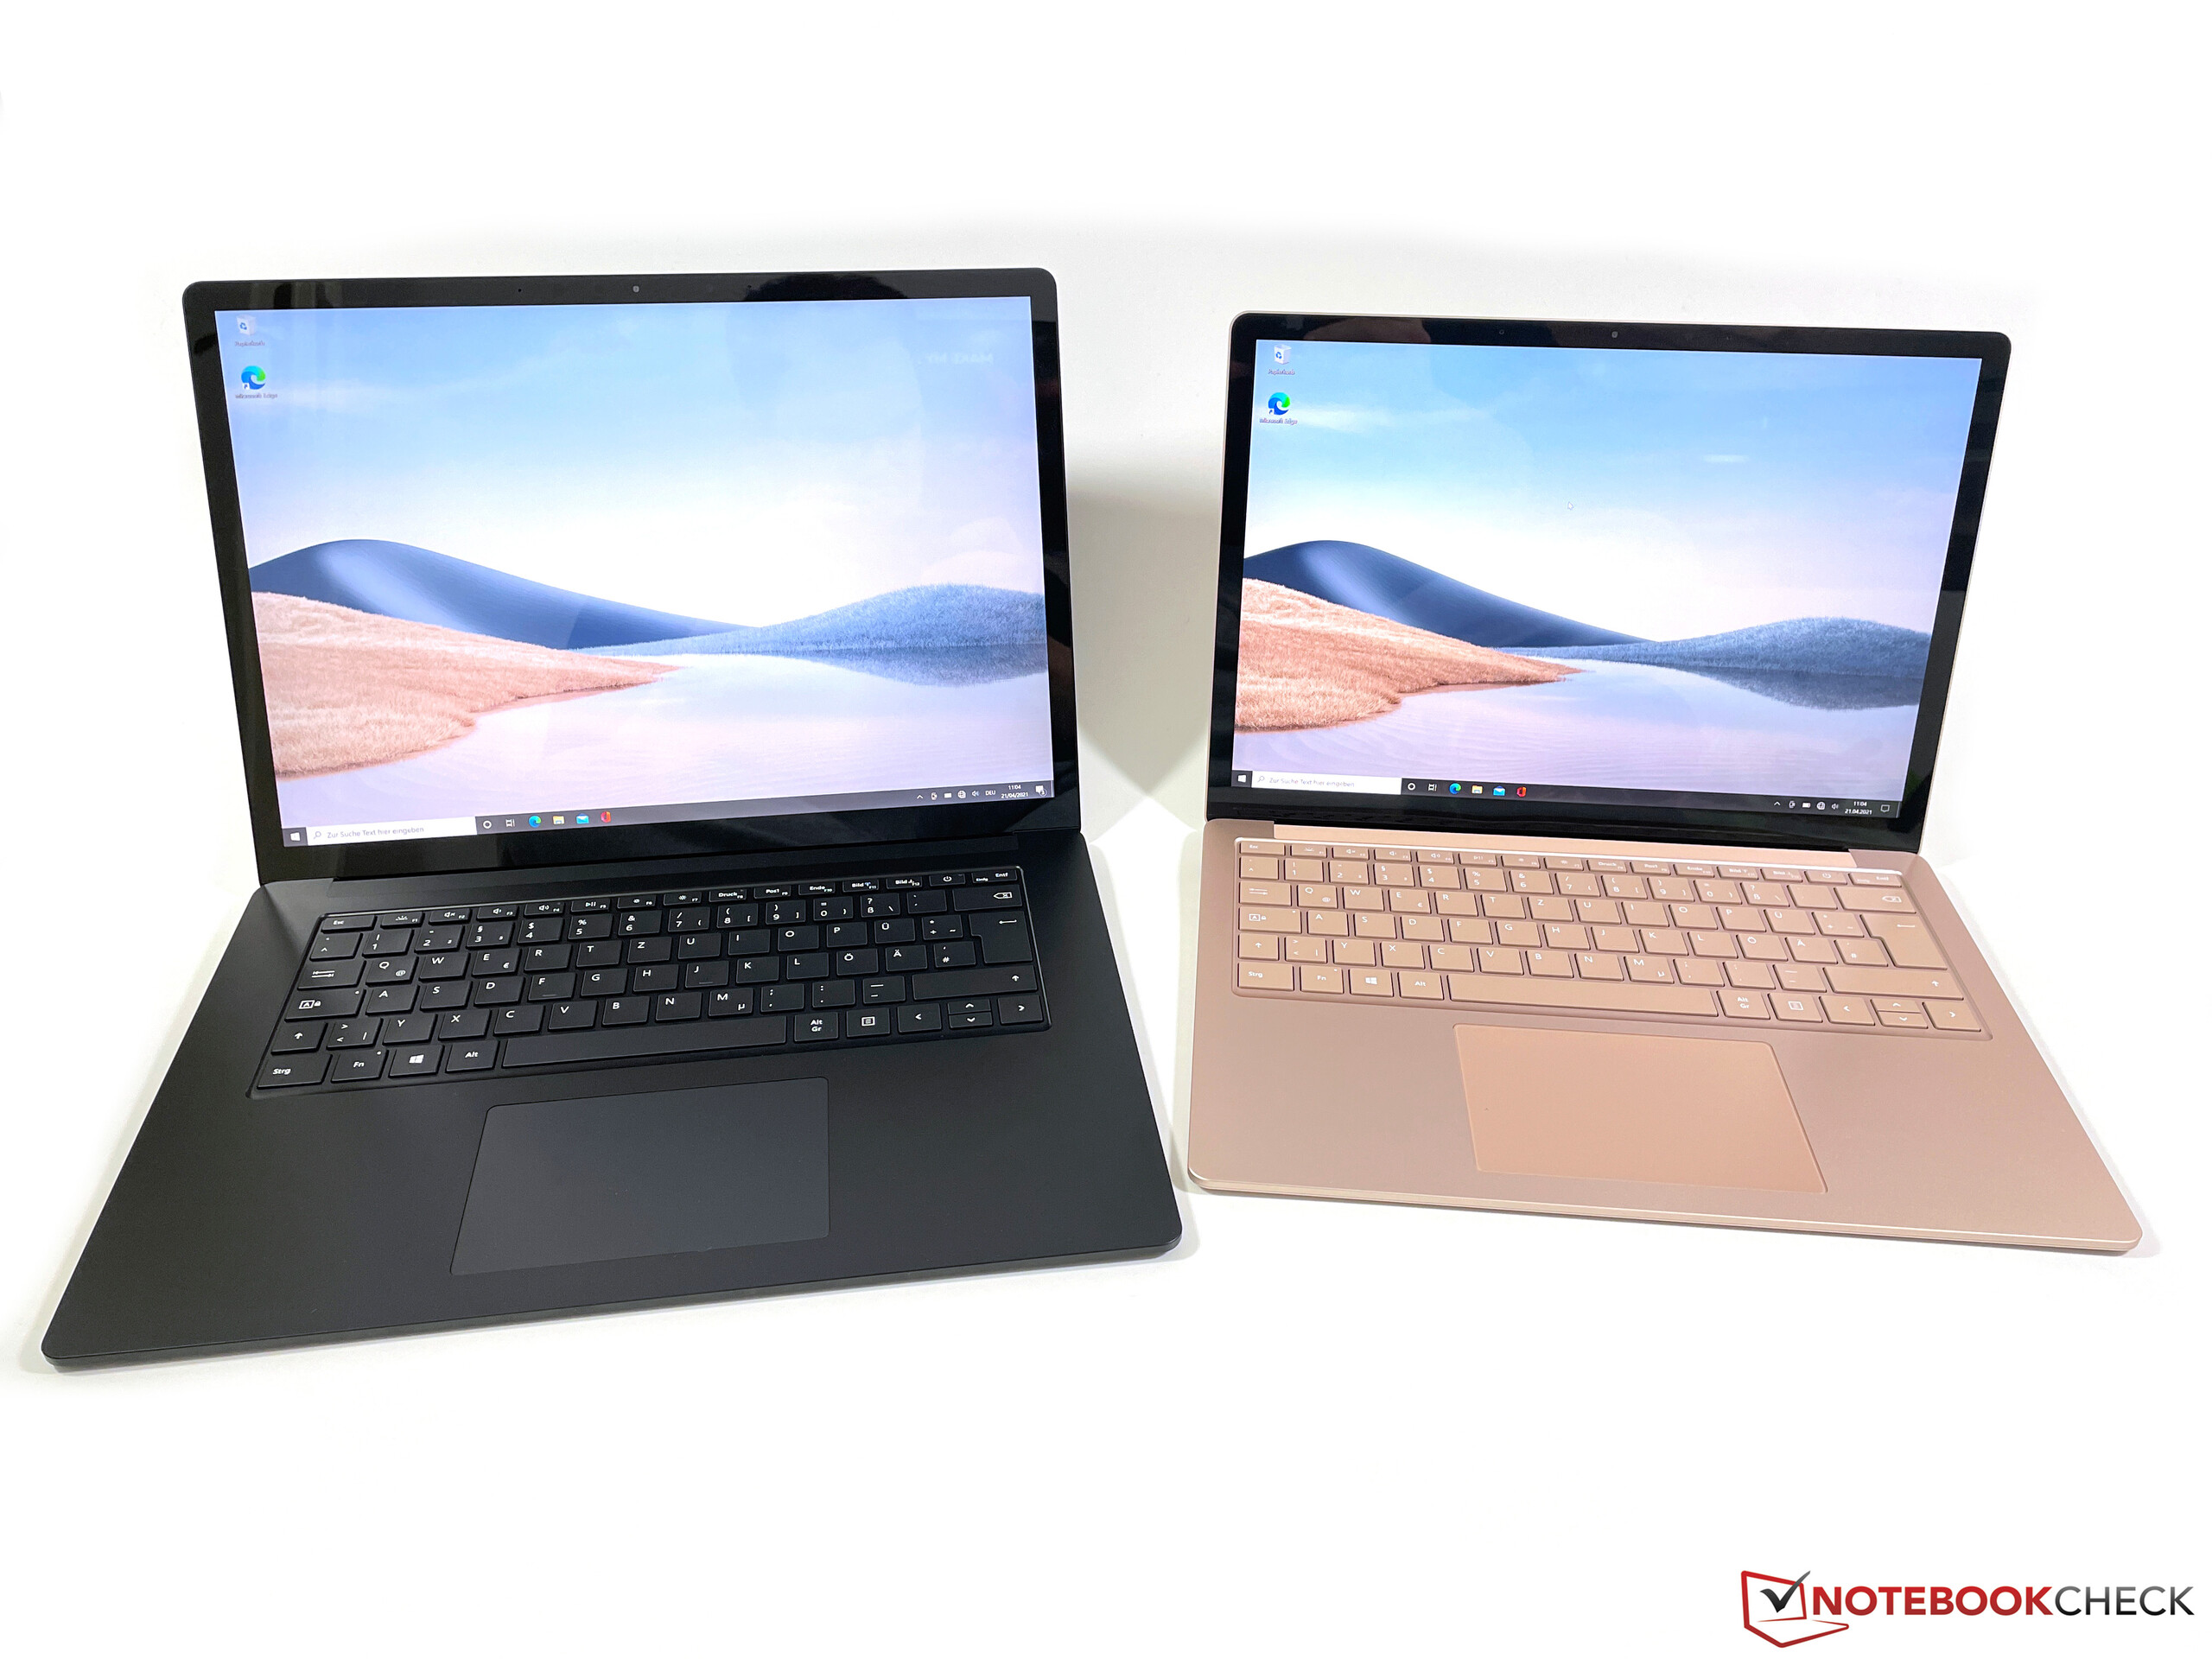
Due to the 3:2 format of the panel, the Surface Laptop is slightly less wide but also deeper than the competitors. With its 1,562 grams (~3.44 lb), the Surface Laptop 4 is one of the lightest devices in our comparison. When you take it on the road, there is also an additional 300 grams (~0.66 lb) for the charger.
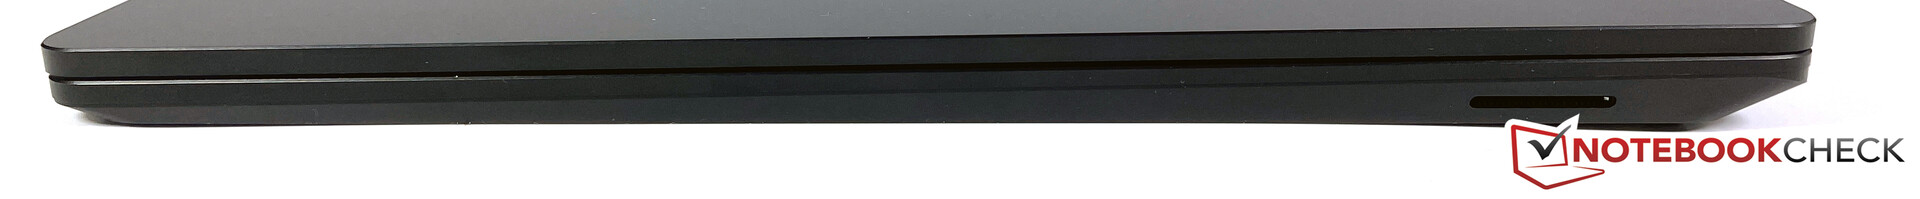
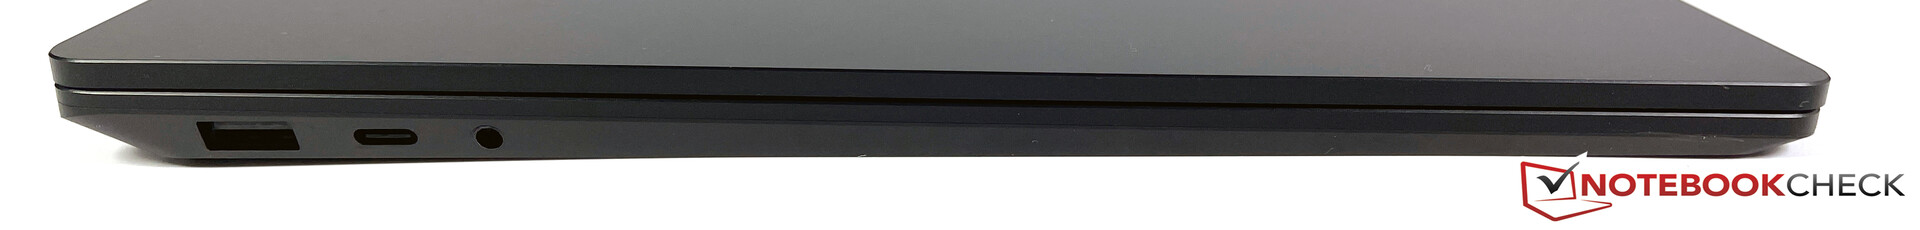
Connections - Microsoft continues to forgo Thunderbolt
The connection equipment continues to be a large weakness of the Surface Laptop. Although Microsoft includes a regular USB-A as well as a USB-C port (that can also be used for charging), those only support the old USB 3.2 Gen. 1 standard. Both the AMD and Intel versions continue to force you to make do without Thunderbolt or USB 4. Instead, the manufacturer insists on the Surface Connector, which sits on the right side and is simply impractical in real life. Although the plug is held in place by a magnet, the slanted base unit makes it almost impossible to connect the charger without having to lift up the laptop.
Communication
The Surface Laptop 4 now supports the fast 802.11ax standard (Wi-Fi 6), and the transfer rates in our standardized test using the Netgear RAX120 router also turn out to be decent. After the new Surface Pro 7 Plus is now finally also available with an LTE modem, we also had some hopes for the Surface Laptop, but there is no support for WWAN modules.
Webcam
There is also some standstill in terms of the webcam, since there is only the same bad 720p camera as before. To be fair, we also need to mention that most other manufacturers also don't do a better job here, but Microsoft shows with the good front cameras of the Surface Pro that it is possible to do better. Of course the amount of space is more limited in a laptop lid, but more should have been possible considering the fairly large display bezels.


Security
Microsoft has equipped the laptop with a TPM 2.0 module, and login via Windows Hello is also supported. But otherwise, there are no additional security features such as a Kensington lock, smart card reader, or fingerprint sensor. Some real business laptops offer more here.
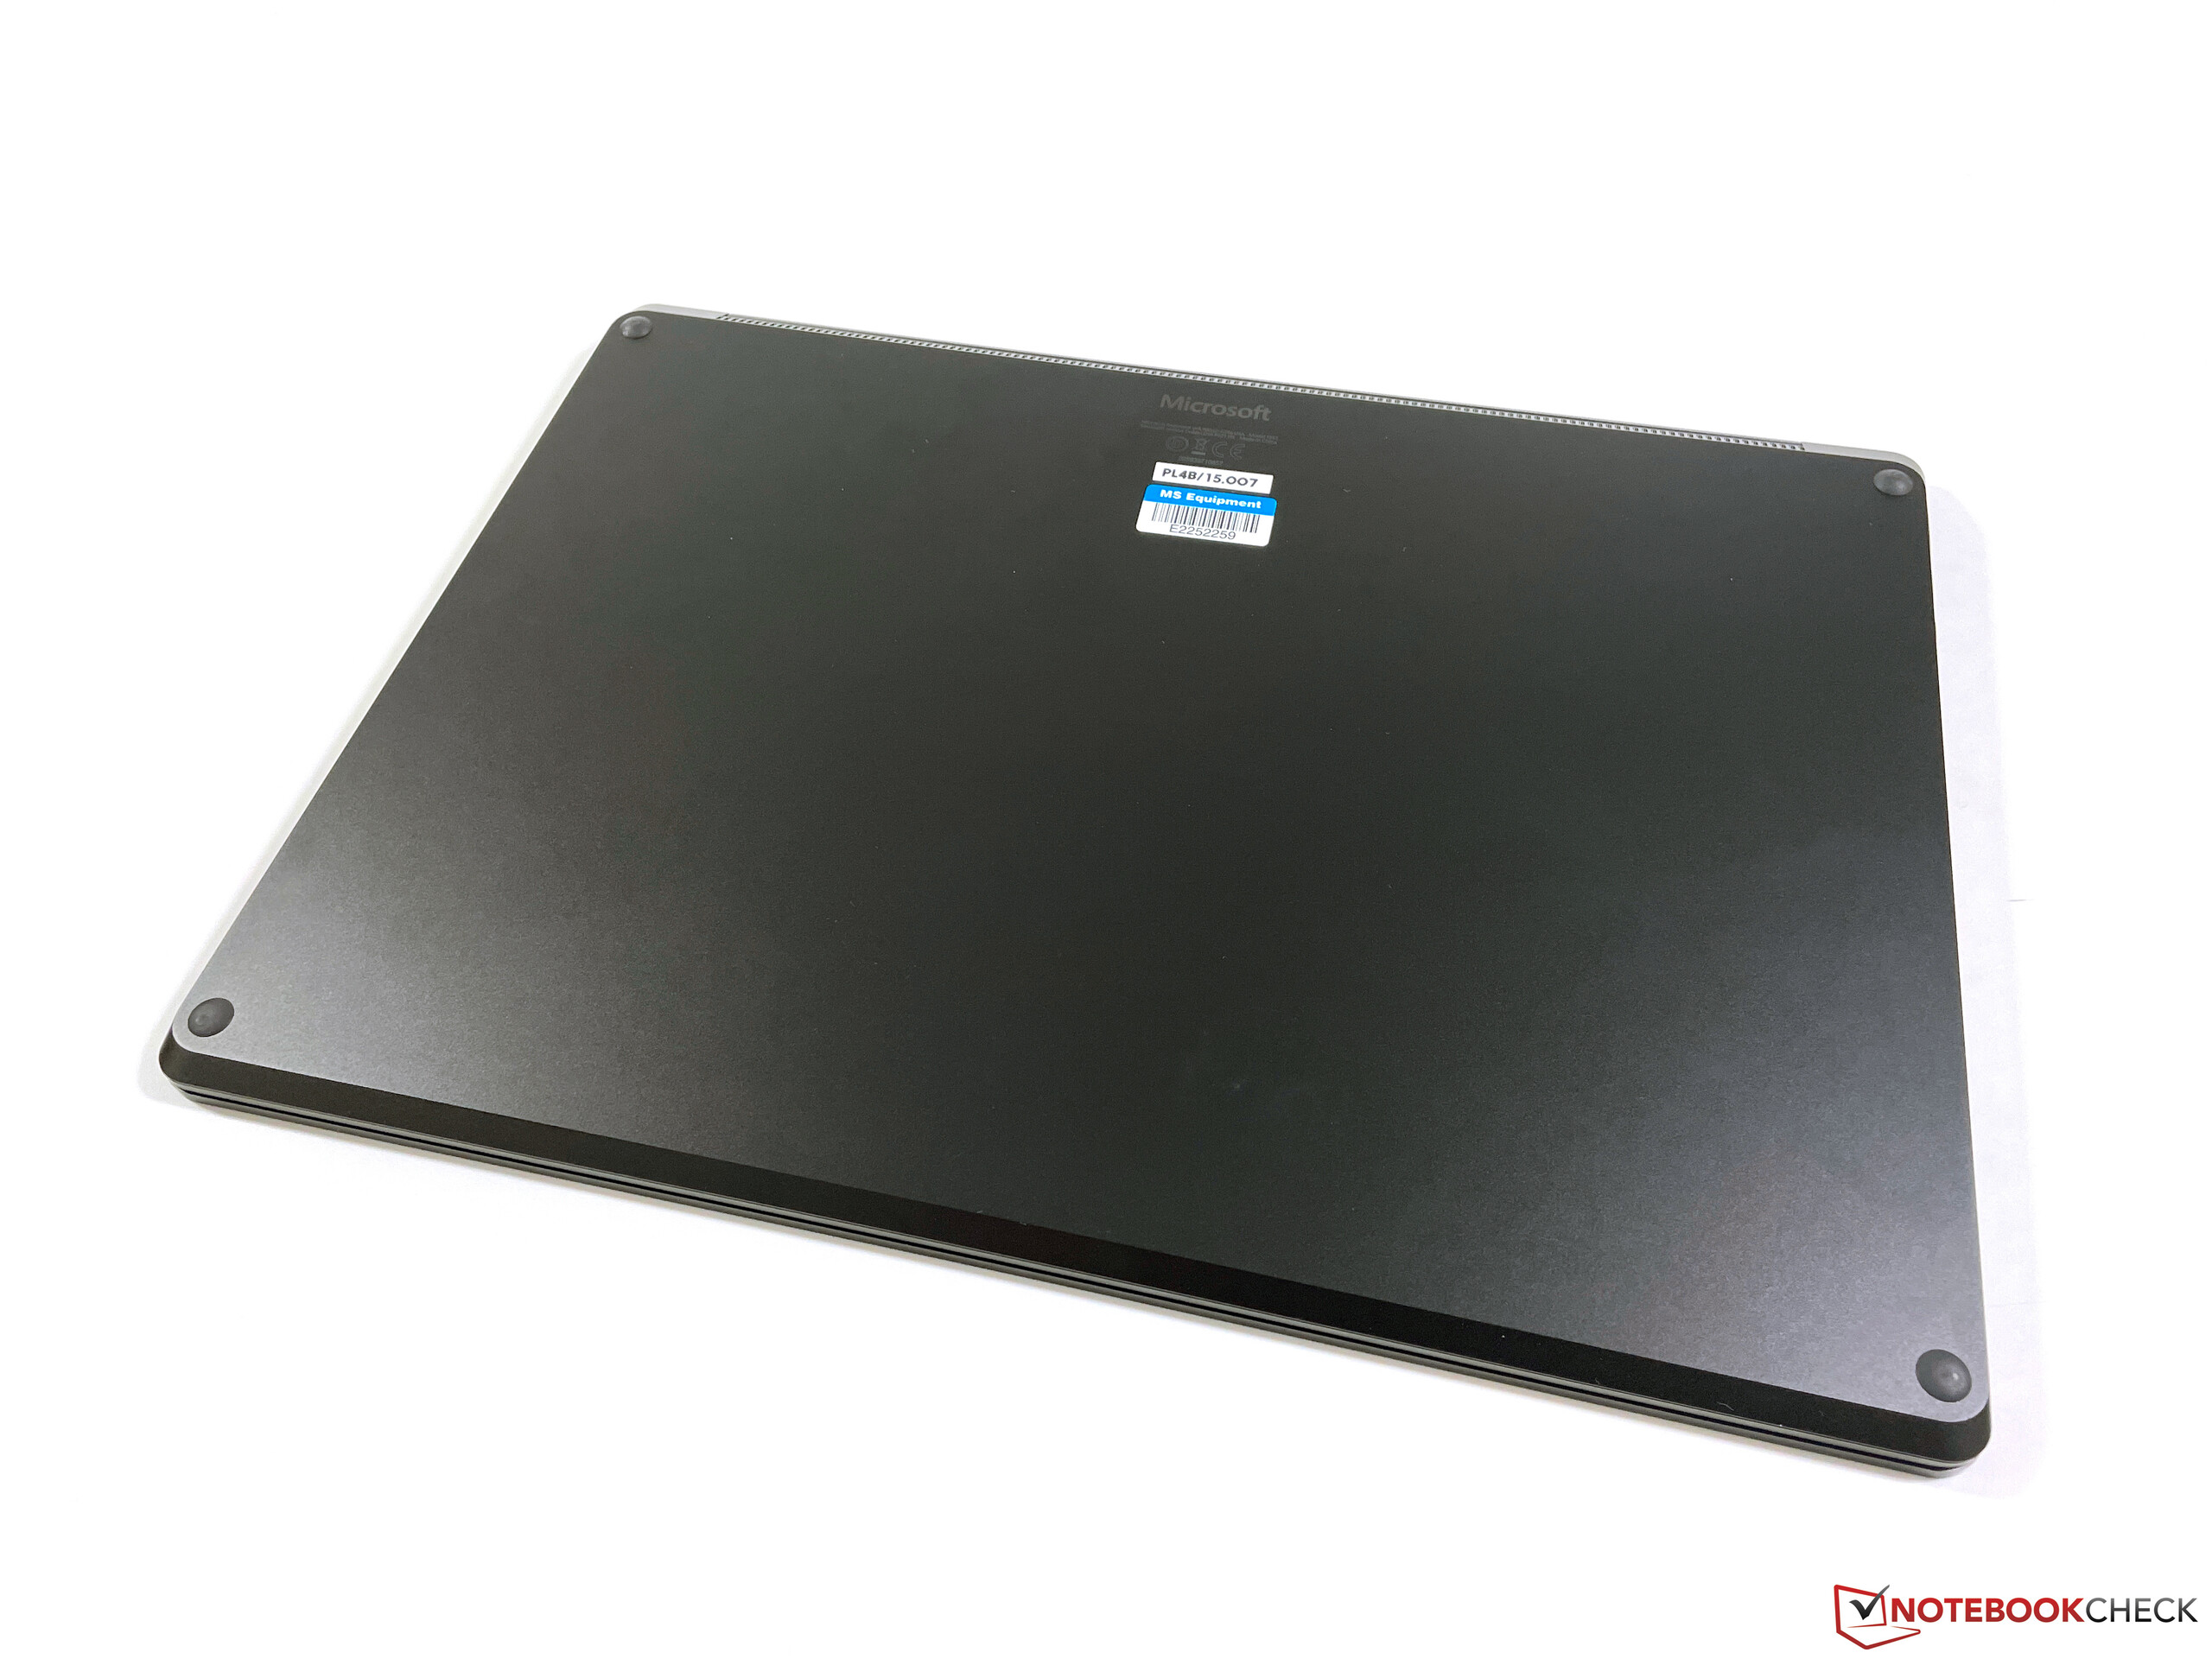
Maintenance
There continue to be hardly any maintenance options for the Surface Laptop 4. There are four screws that are located underneath the glued-on rubber feet, but removing those without causing any damage is not so easy. Regardless of this, inside the laptop you would only be able to replace the small M.2-2230 SSD that is also used in the Surface Pro 7 Plus, for example. However, Microsoft does not intend a replacement to be made by the user.
Warranty
Microsoft only offers a one-year warranty on the Surface Laptop 4. Of course there is still the two-year warranty required by law in Germany.
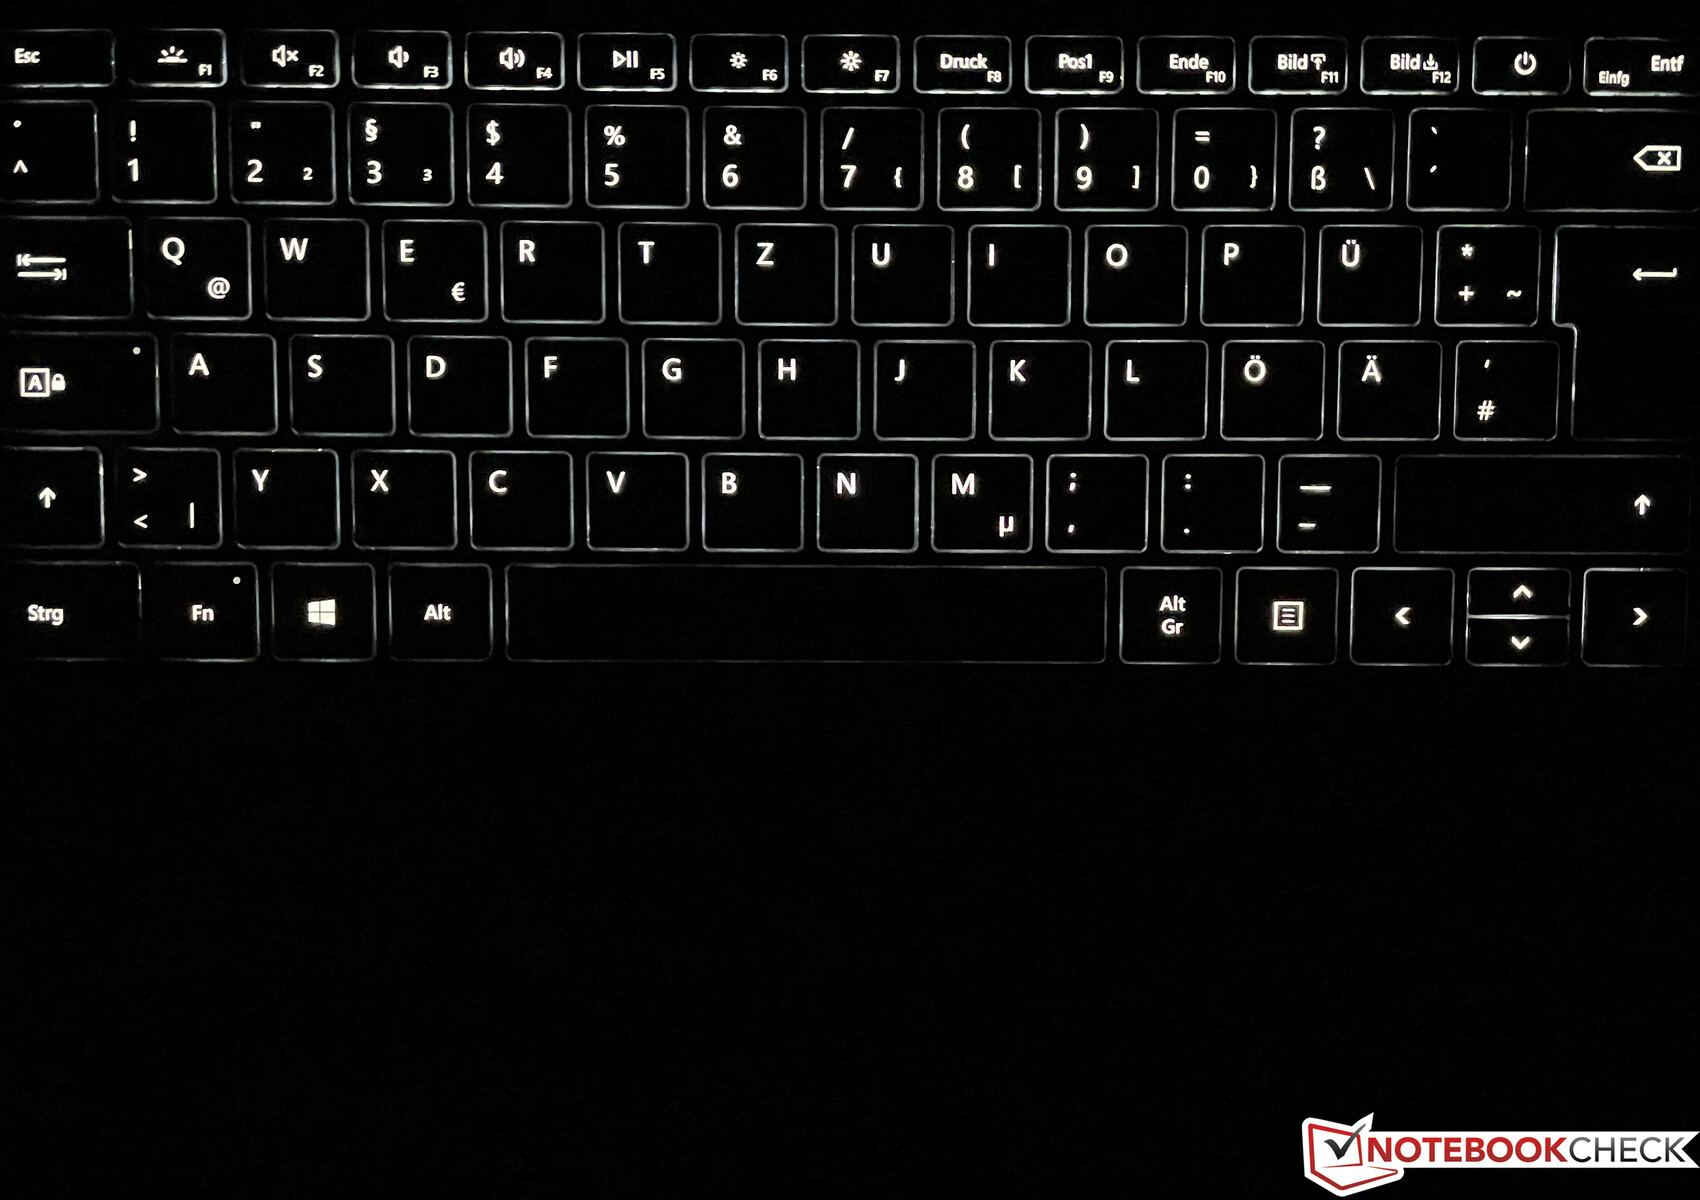
Input Devices - Surface with pen input
In terms of the input devices, nothing changed compared to the predecessor either. The illuminated chiclet keyboard offers a decent typing experience overall, but particularly the large keys (space, Enter) tend to produce some clattering. We really like the large ClickPad. Inputs are transferred cleanly, the pad is integrated perfectly, and the clicking sounds also reflect a high quality.
Optionally, the Surface Laptop also supports input via the Surface Pen (4,096 pressure levels) that is available separately (~110 Euros, ~$133).
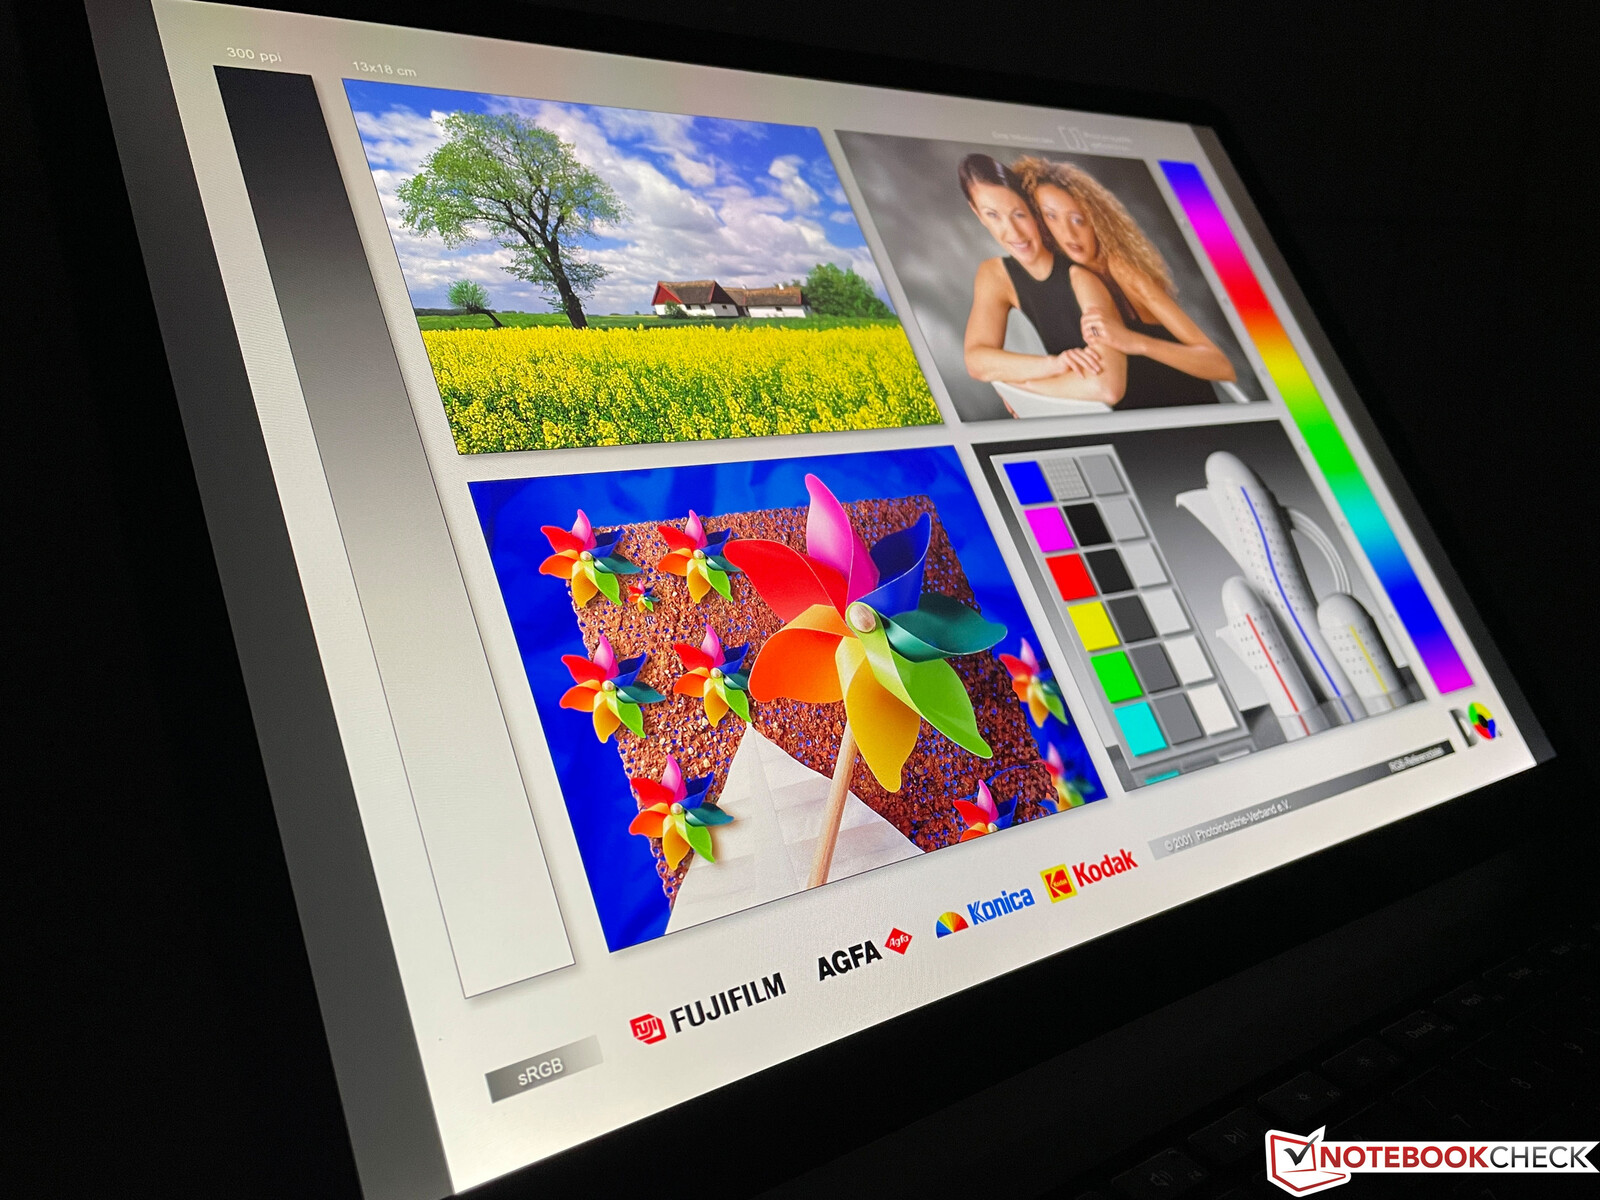
Display - Surface with 3:2 Pixel Sense
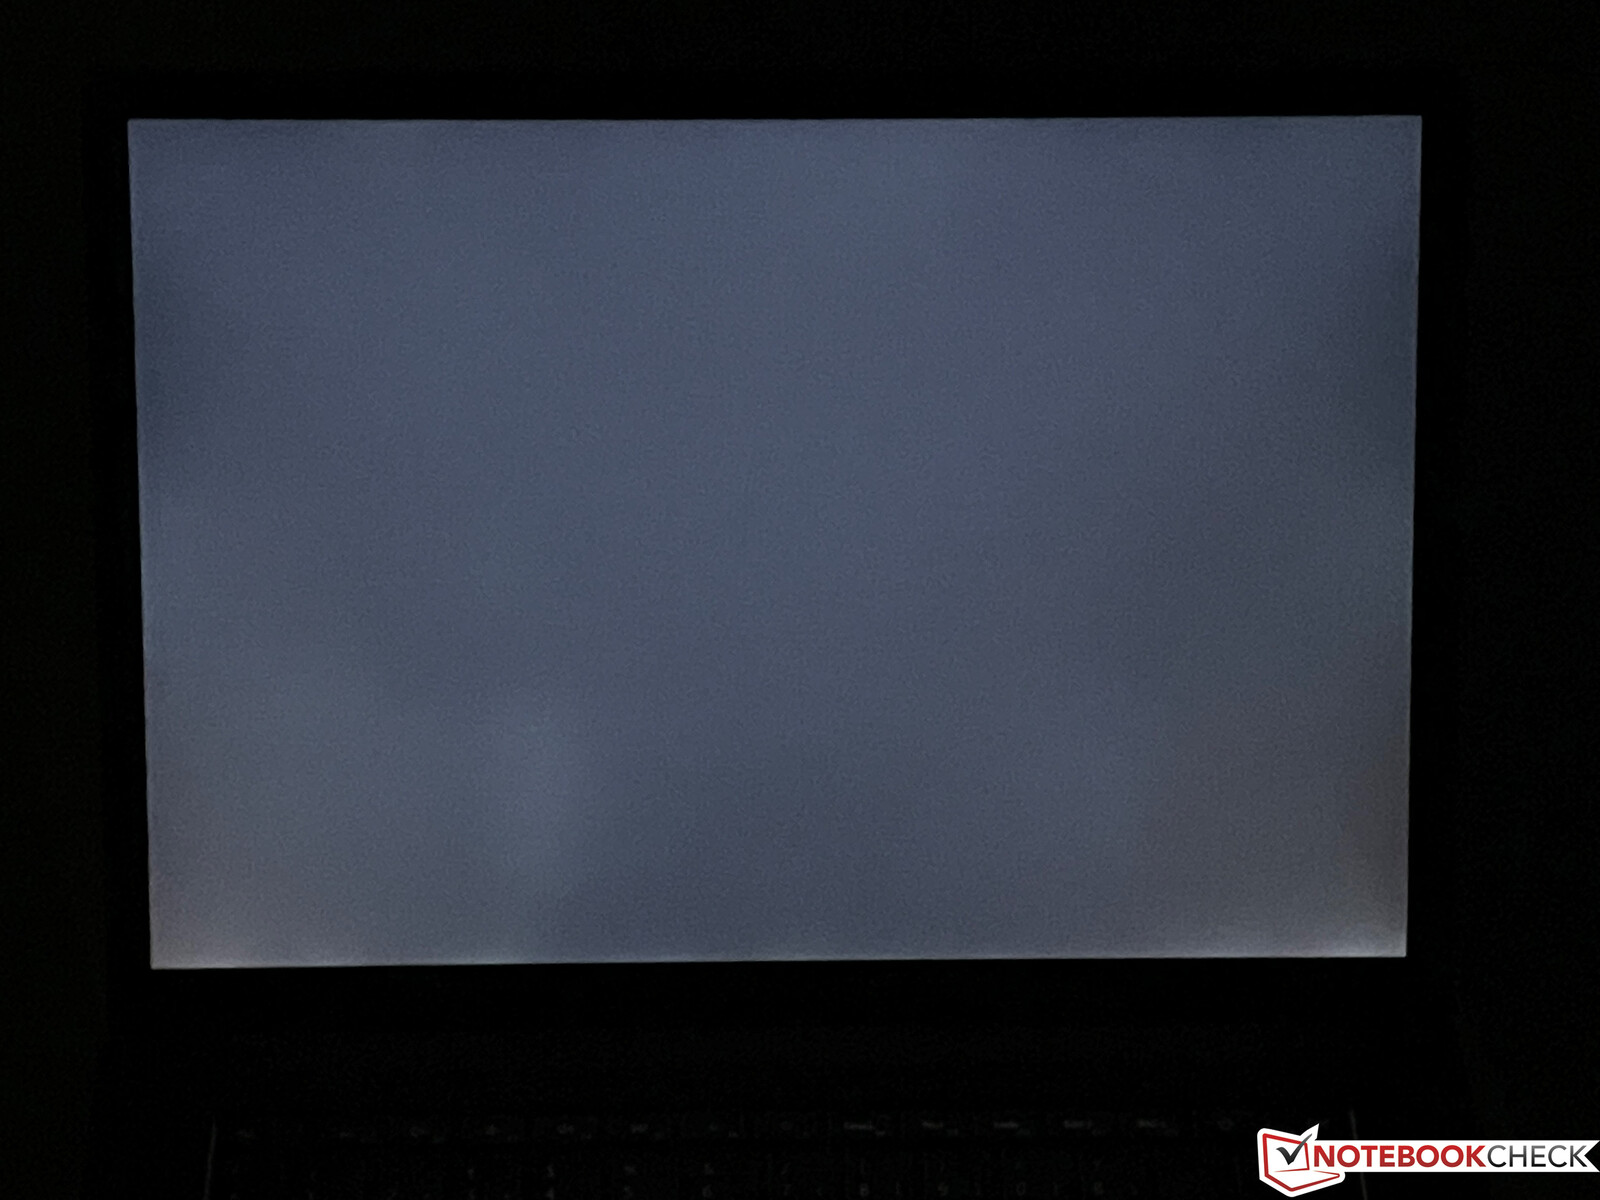
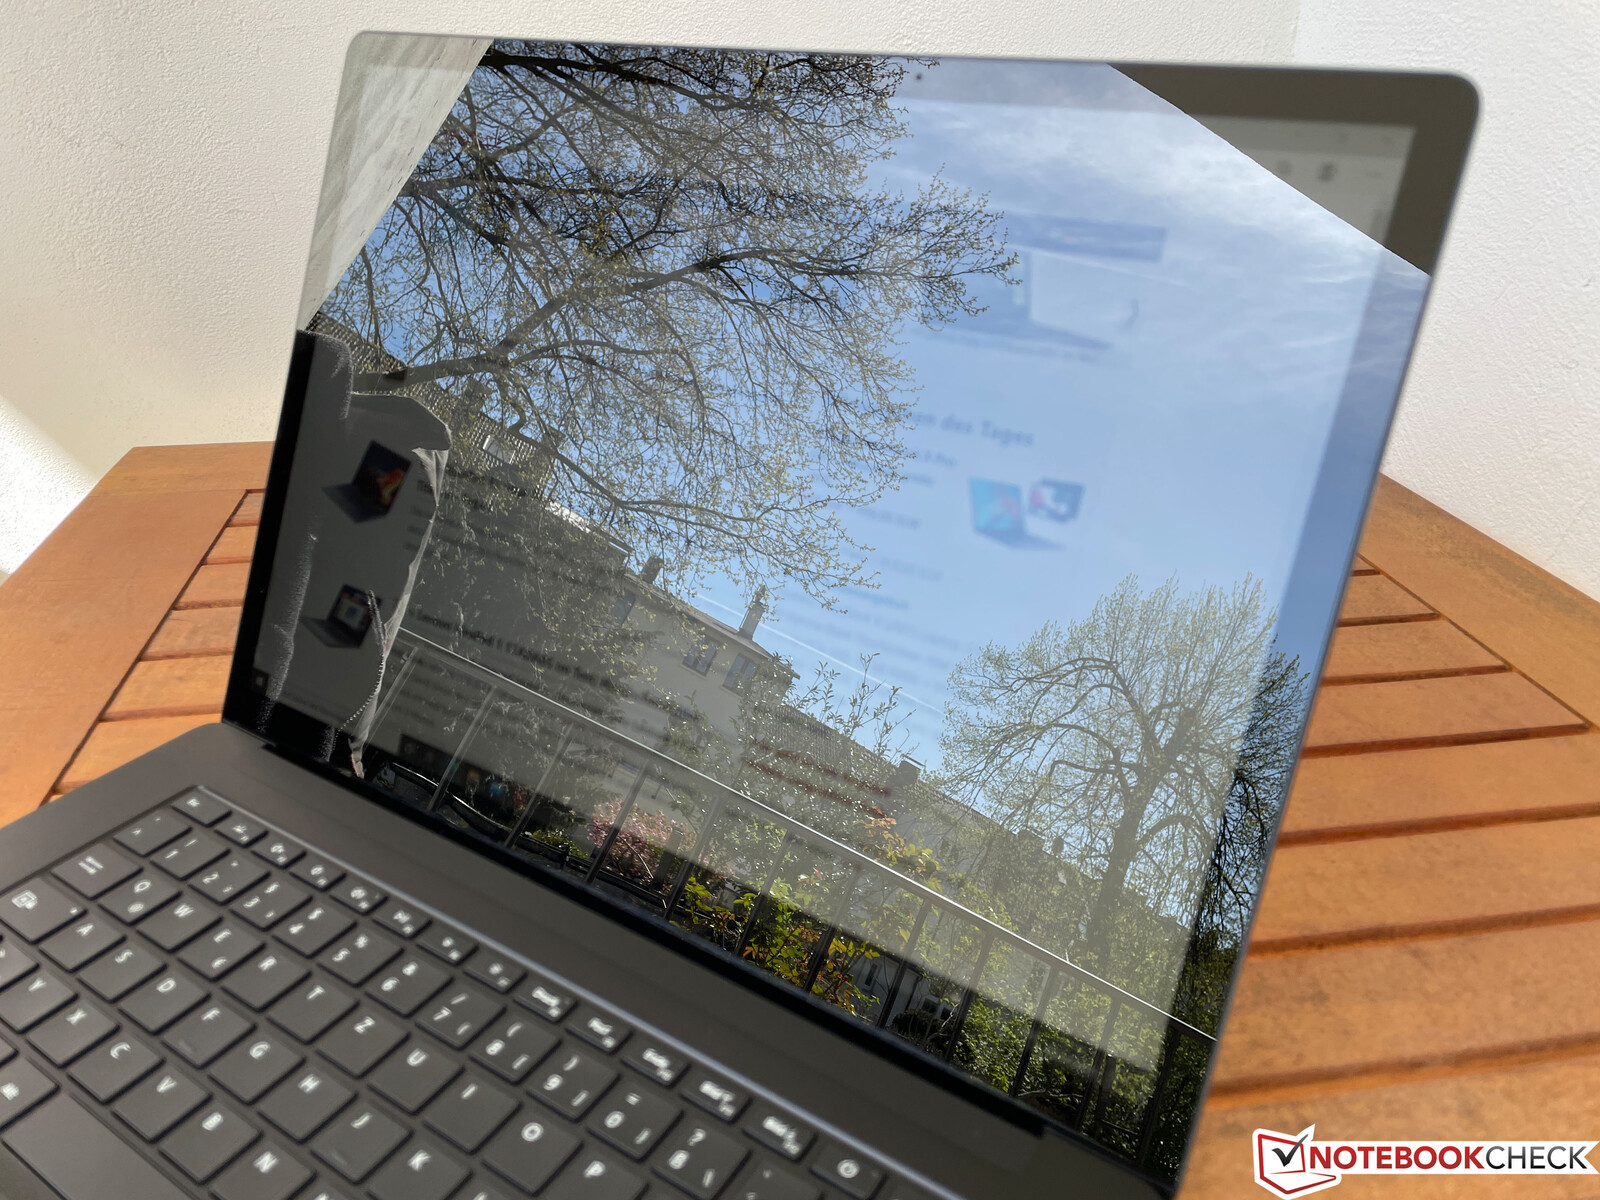
The display from Sharp remains unchanged. The 15-inch screen (2496x1664 pixels, 201 PPI) in the 3:2 format is a reflective capacitive touchscreen that subjectively produces a very good image quality. All the contents are displayed sharply and colors appear vibrant. It is also possible to adjust the brightness according to the environment light conditions via sensor.
There is also some standstill in terms of the brightness, and at barely 380 cd/m² on average here, we measure even slightly less than in the old model. On the other hand, the black value and contrast (>1500:1) are completely okay. While the panel doesn't have any glaring problems with light halos, we measure PWM flickering at a brightness of 50% and below. However, since the frequency is extremely high at more than 20 kHz, it shouldn't really cause any problems. Due to slow response times, there can be some visible ghosting effects particularly with a dark background.
| |||||||||||||||||||||||||
Brightness Distribution: 79 %
Center on Battery: 401 cd/m²
Contrast: 1558:1 (Black: 0.26 cd/m²)
ΔE ColorChecker Calman: 2.6 | ∀{0.5-29.43 Ø4.72}
calibrated: 0.9
ΔE Greyscale Calman: 1.9 | ∀{0.09-98 Ø4.97}
97.7% sRGB (Argyll 1.6.3 3D)
62% AdobeRGB 1998 (Argyll 1.6.3 3D)
67.3% AdobeRGB 1998 (Argyll 3D)
97.7% sRGB (Argyll 3D)
65.2% Display P3 (Argyll 3D)
Gamma: 2.11
CCT: 6825 K
| Microsoft Surface Laptop 4 15 AMD TFF_00028 SHP14B4, IPS, 2496x1664, 15" | Schenker Vision 15 BOE08F5, IPS, 1920x1080, 15.6" | Dell XPS 15 9500 Core i5 Sharp LQ156N1, IPS, 1920x1200, 15.6" | Tuxedo Pulse 15 LQ156M1JW01, IPS, 1920x1080, 15.6" | Lenovo ThinkPad X1 Extreme Gen3-20TLS0UV00 N156HCE-GN1, IPS, 1920x1080, 15.6" | Microsoft Surface Laptop 3 15 Ryzen 5 3580U Sharp LQ150P1JX51, IPS, 2496x1664, 15" | |
|---|---|---|---|---|---|---|
| Display | 2% | 15% | 4% | -7% | 0% | |
| Display P3 Coverage (%) | 65.2 | 69.3 6% | 81.5 25% | 69.2 6% | 61 -6% | 66.9 3% |
| sRGB Coverage (%) | 97.7 | 94 -4% | 100 2% | 99.4 2% | 89.9 -8% | 99.3 2% |
| AdobeRGB 1998 Coverage (%) | 67.3 | 70.8 5% | 79.6 18% | 70.5 5% | 62.2 -8% | 63.7 -5% |
| Response Times | -14% | 18% | -14% | 35% | 1% | |
| Response Time Grey 50% / Grey 80% * (ms) | 58.4 ? | 60 ? -3% | 42 ? 28% | 59.2 ? -1% | 33.6 ? 42% | 47.2 ? 19% |
| Response Time Black / White * (ms) | 31.2 ? | 39 ? -25% | 28.8 ? 8% | 39.2 ? -26% | 22.4 ? 28% | 36.8 ? -18% |
| PWM Frequency (Hz) | 21550 ? | 25000 ? | 26040 ? | 21370 ? | ||
| Screen | -22% | -19% | -4% | -3% | -4% | |
| Brightness middle (cd/m²) | 405 | 478 18% | 592 46% | 314 -22% | 518 28% | 416.9 3% |
| Brightness (cd/m²) | 379 | 462 22% | 565 49% | 292 -23% | 513 35% | 389 3% |
| Brightness Distribution (%) | 79 | 94 19% | 85 8% | 85 8% | 88 11% | 86 9% |
| Black Level * (cd/m²) | 0.26 | 0.27 -4% | 0.46 -77% | 0.19 27% | 0.38 -46% | 0.4 -54% |
| Contrast (:1) | 1558 | 1770 14% | 1287 -17% | 1653 6% | 1363 -13% | 1042 -33% |
| Colorchecker dE 2000 * | 2.6 | 3.2 -23% | 3.19 -23% | 2.1 19% | 2.1 19% | 2.75 -6% |
| Colorchecker dE 2000 max. * | 6.6 | 8.4 -27% | 5.45 17% | 5.5 17% | 4.5 32% | 6.64 -1% |
| Colorchecker dE 2000 calibrated * | 0.9 | 2 -122% | 2.03 -126% | 0.9 -0% | 1.3 -44% | 0.71 21% |
| Greyscale dE 2000 * | 1.9 | 4.5 -137% | 3.9 -105% | 3.4 -79% | 2.7 -42% | 1.8 5% |
| Gamma | 2.11 104% | 2.16 102% | 2.25 98% | 2.28 96% | 2.35 94% | 2.09 105% |
| CCT | 6825 95% | 6788 96% | 6522 100% | 6355 102% | 7042 92% | 6646 98% |
| Color Space (Percent of AdobeRGB 1998) (%) | 62 | 63.1 2% | 71.6 15% | 64.5 4% | 57.7 -7% | 63.4 2% |
| Color Space (Percent of sRGB) (%) | 97.7 | 93.6 -4% | 100 2% | 99.3 2% | 90.4 -7% | 99.4 2% |
| Total Average (Program / Settings) | -11% /
-16% | 5% /
-8% | -5% /
-3% | 8% /
1% | -1% /
-3% |
* ... smaller is better
To analyze the panel, we use the professional CalMAN software in combination with the X-Rite i1 Pro 2 spectral photometer. The calibration in the state of delivery shows no color tint, but several color deviations turn out higher than the important DeltaE 2000 target limit of 3 compared to the sRGB reference, so the colors are not reproduced accurately.
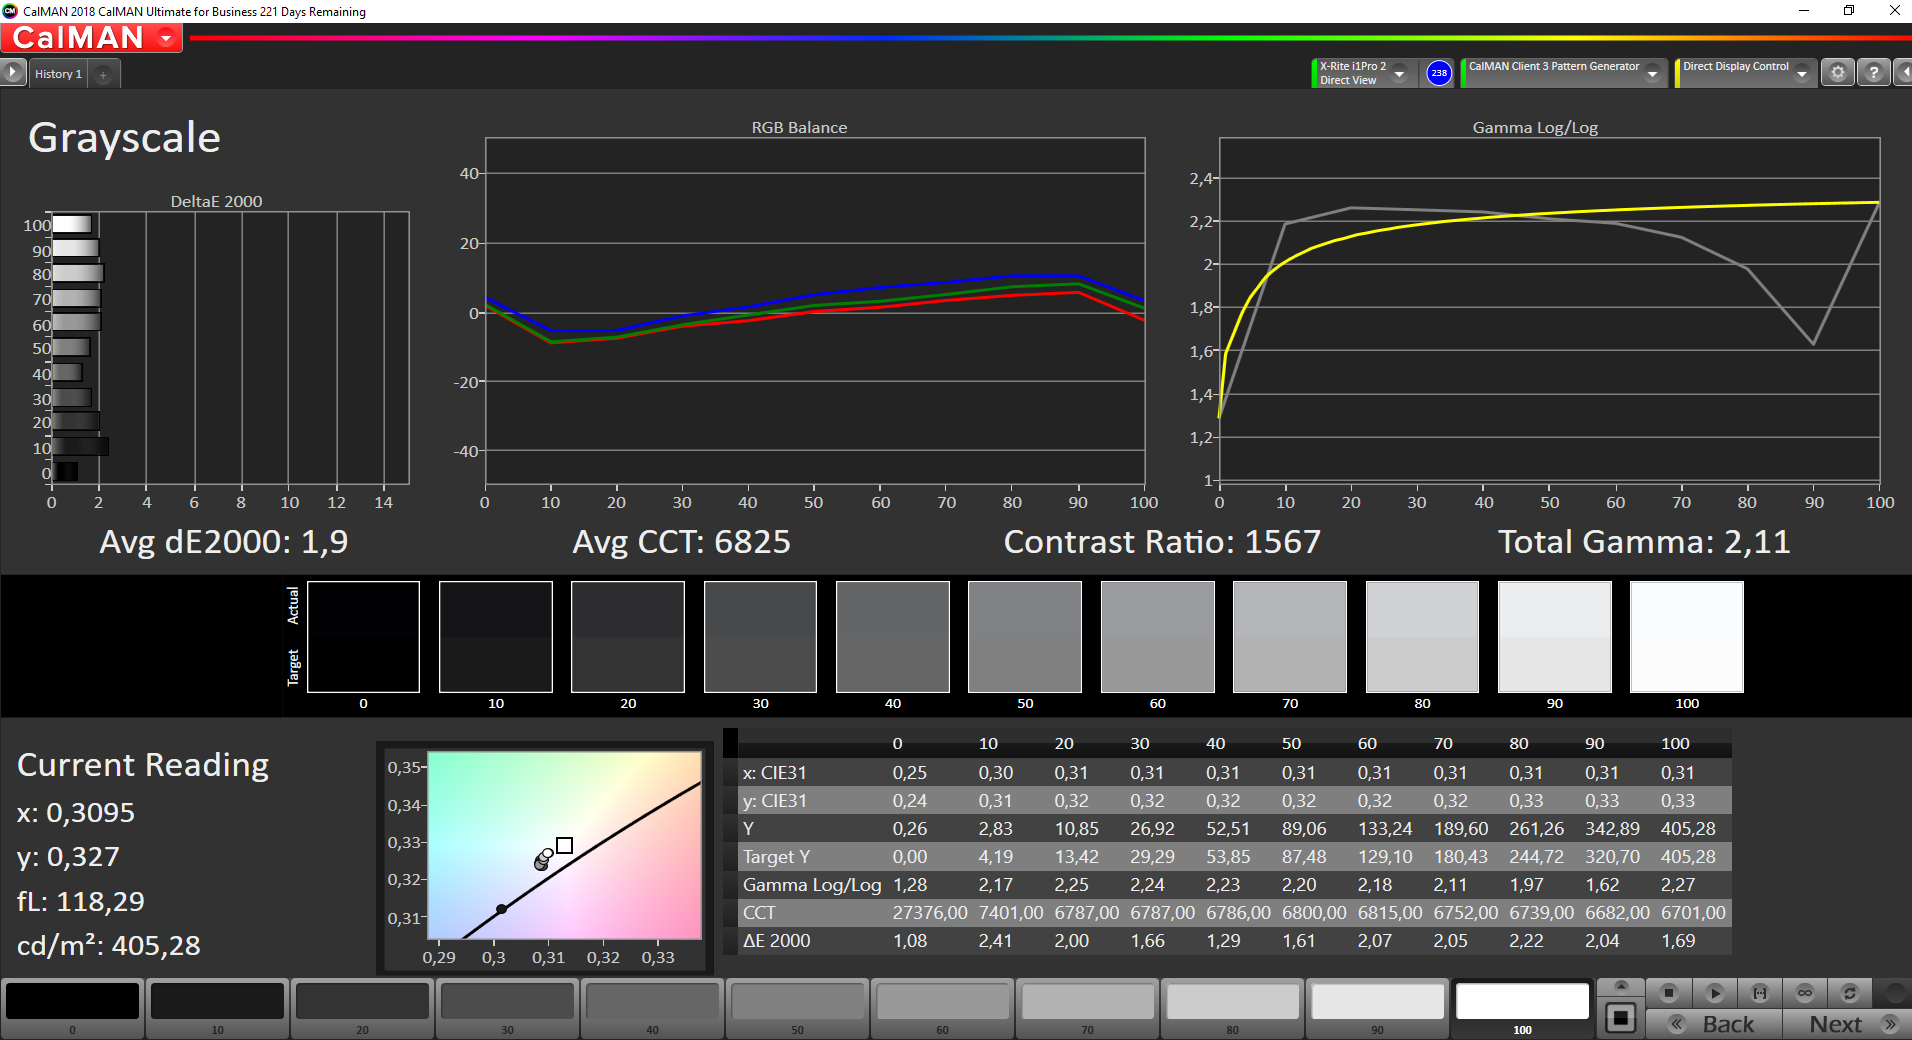
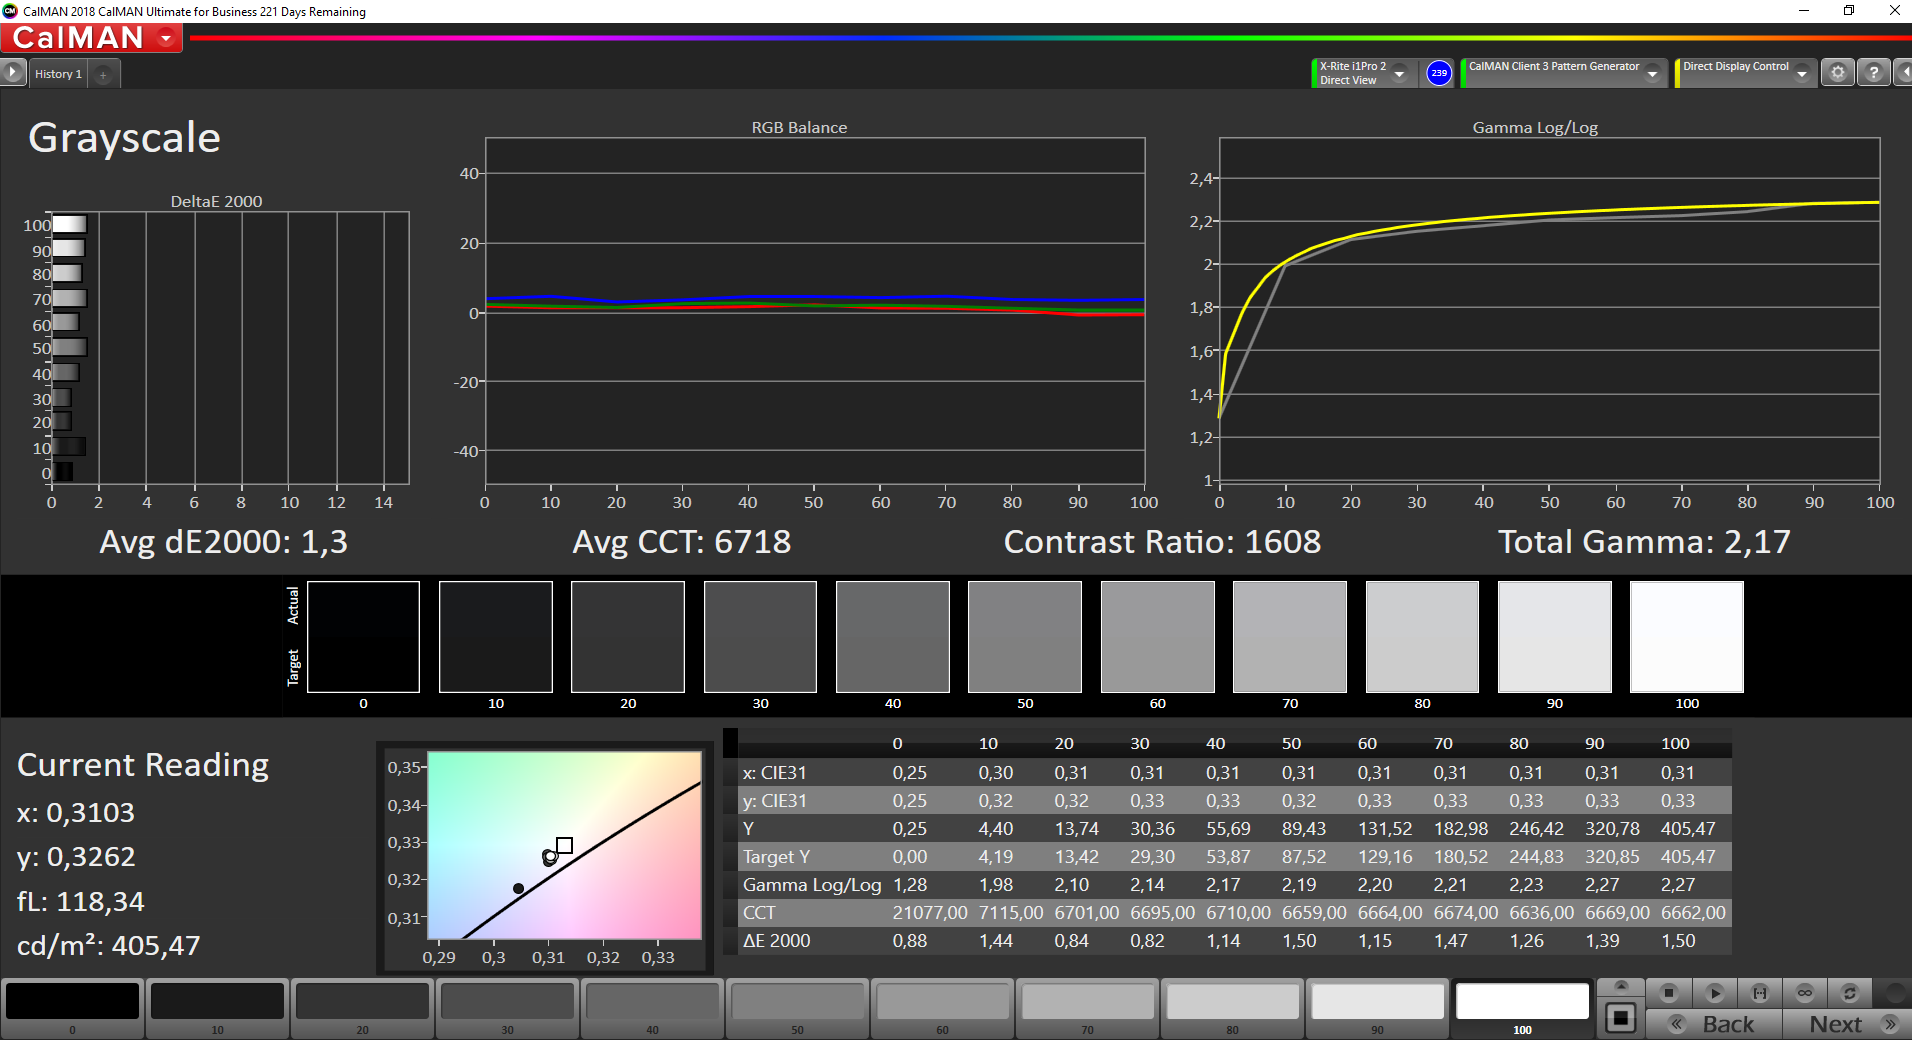
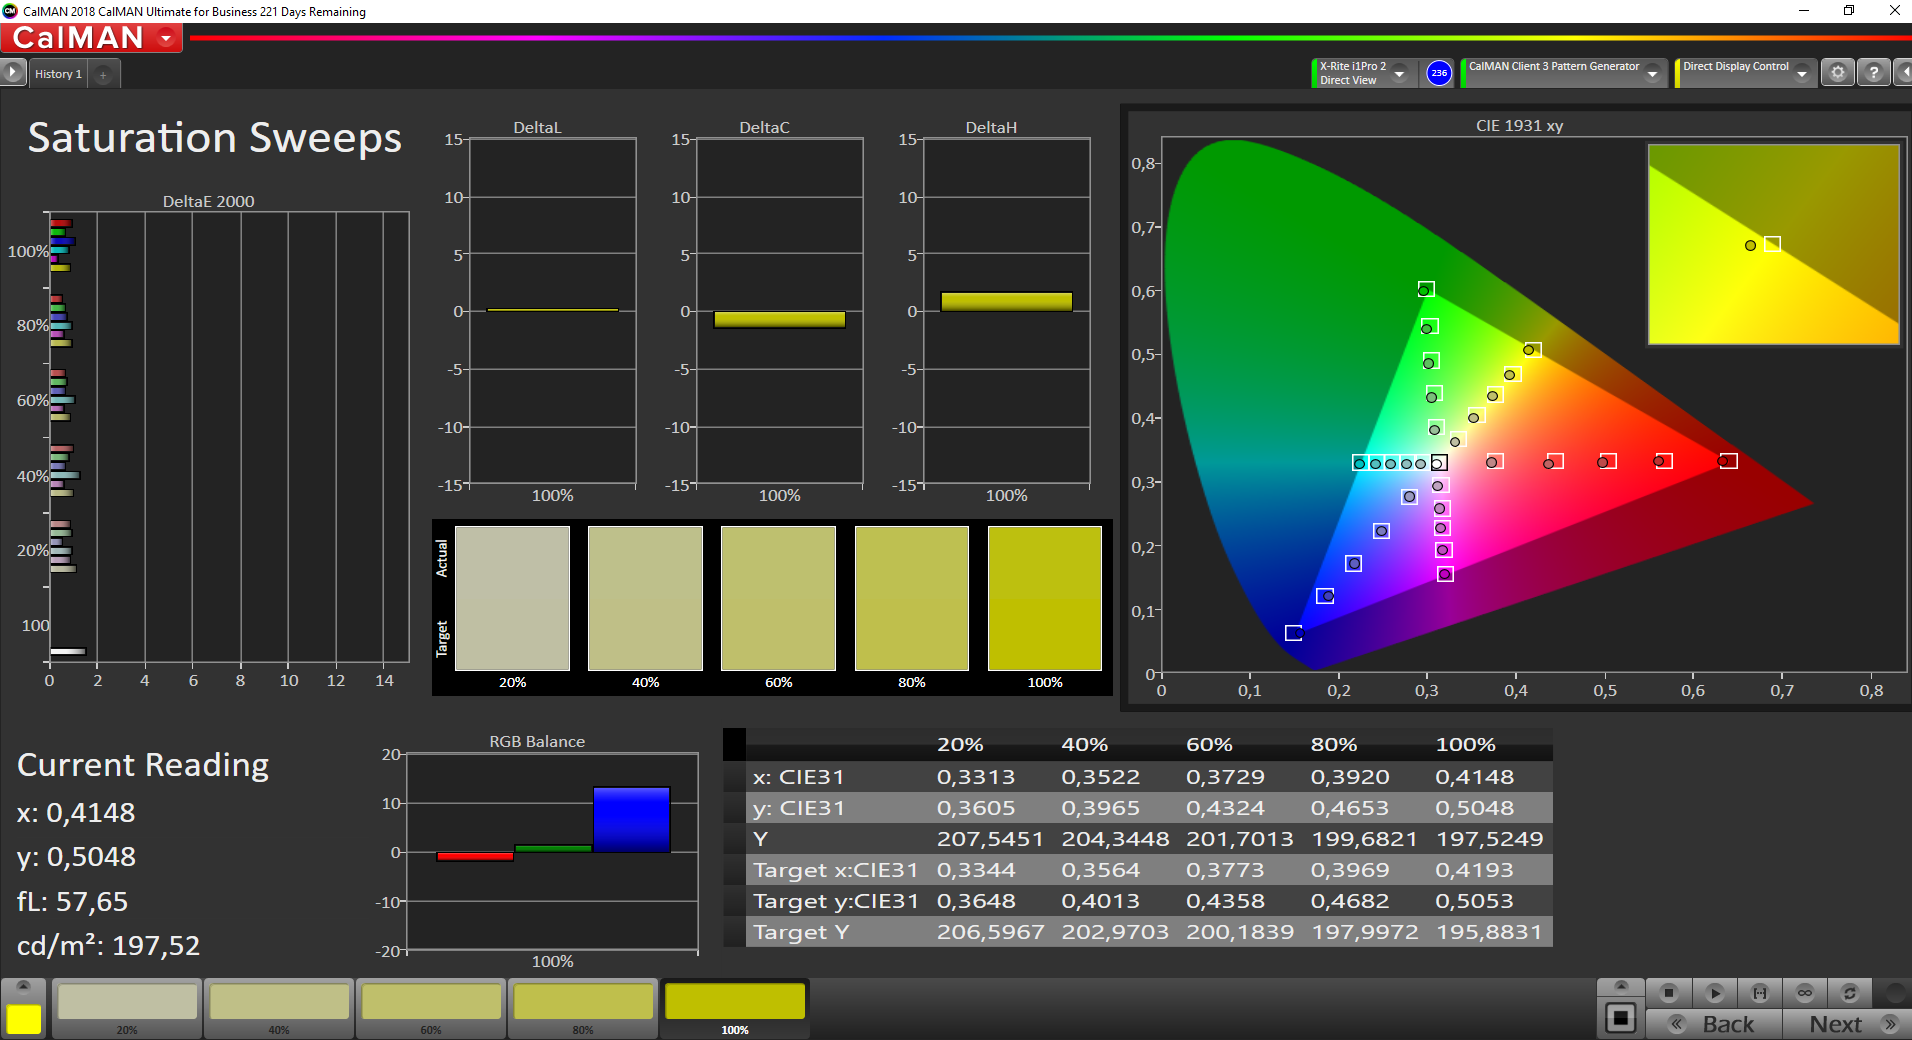
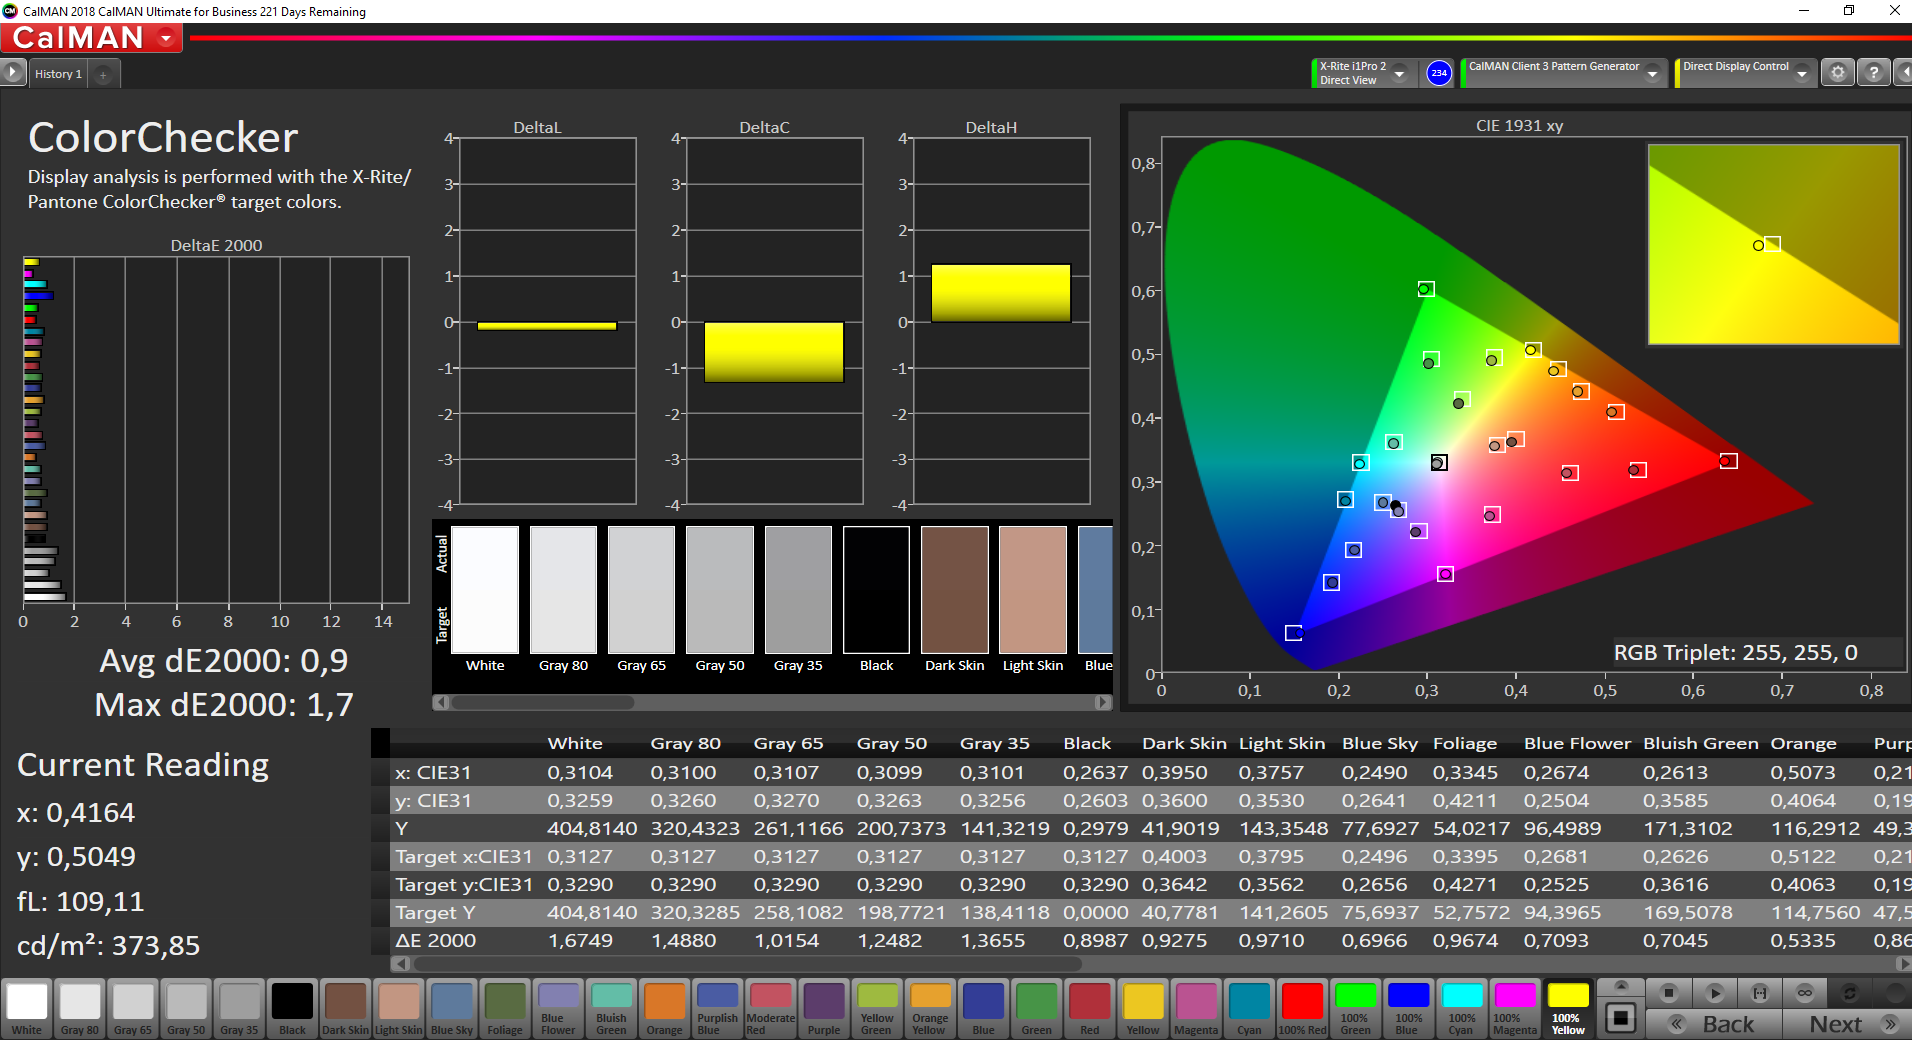
We are able to remedy this situation with our calibration (the profile file is available above for free download). While the grayscale display improves minimally, the color deviations are now significantly smaller, and thanks to the almost complete coverage of the sRGB color space, image processing is now also possible.
Display Response Times
| ↔ Response Time Black to White | ||
|---|---|---|
| 31.2 ms ... rise ↗ and fall ↘ combined | ↗ 14 ms rise | 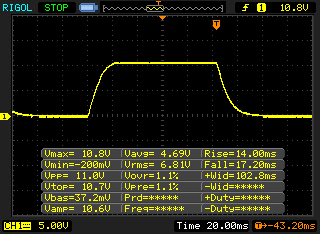 |
| ↘ 17.2 ms fall | ||
| The screen shows slow response rates in our tests and will be unsatisfactory for gamers. In comparison, all tested devices range from 0.1 (minimum) to 240 (maximum) ms. » 84 % of all devices are better. This means that the measured response time is worse than the average of all tested devices (19.8 ms). | ||
| ↔ Response Time 50% Grey to 80% Grey | ||
| 58.4 ms ... rise ↗ and fall ↘ combined | ↗ 28.4 ms rise | 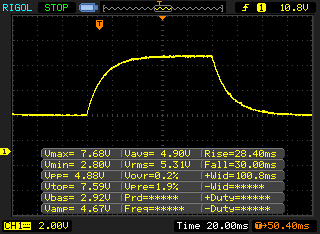 |
| ↘ 30 ms fall | ||
| The screen shows slow response rates in our tests and will be unsatisfactory for gamers. In comparison, all tested devices range from 0.165 (minimum) to 636 (maximum) ms. » 95 % of all devices are better. This means that the measured response time is worse than the average of all tested devices (31 ms). | ||
Screen Flickering / PWM (Pulse-Width Modulation)
| Screen flickering / PWM detected | 21550 Hz | ≤ 50 % brightness setting | 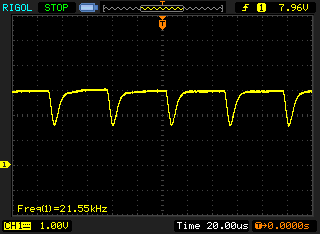 |
The display backlight flickers at 21550 Hz (worst case, e.g., utilizing PWM) Flickering detected at a brightness setting of 50 % and below. There should be no flickering or PWM above this brightness setting. The frequency of 21550 Hz is quite high, so most users sensitive to PWM should not notice any flickering. In comparison: 52 % of all tested devices do not use PWM to dim the display. If PWM was detected, an average of 7747 (minimum: 5 - maximum: 343500) Hz was measured. | |||
The combination of a reflective display and average brightness creates some problems outdoors. Particularly in bright surroundings, there will soon be some strong reflections, even if there are no direct light sources such as direct sunlight. There can even be some problems indoors, for example if there is a window behind you. To remedy this, the maximum brightness would need to be higher. We have no complaint about the viewing-angle stability of the IPS panel.
Performance - AMD Ryzen Surface Edition
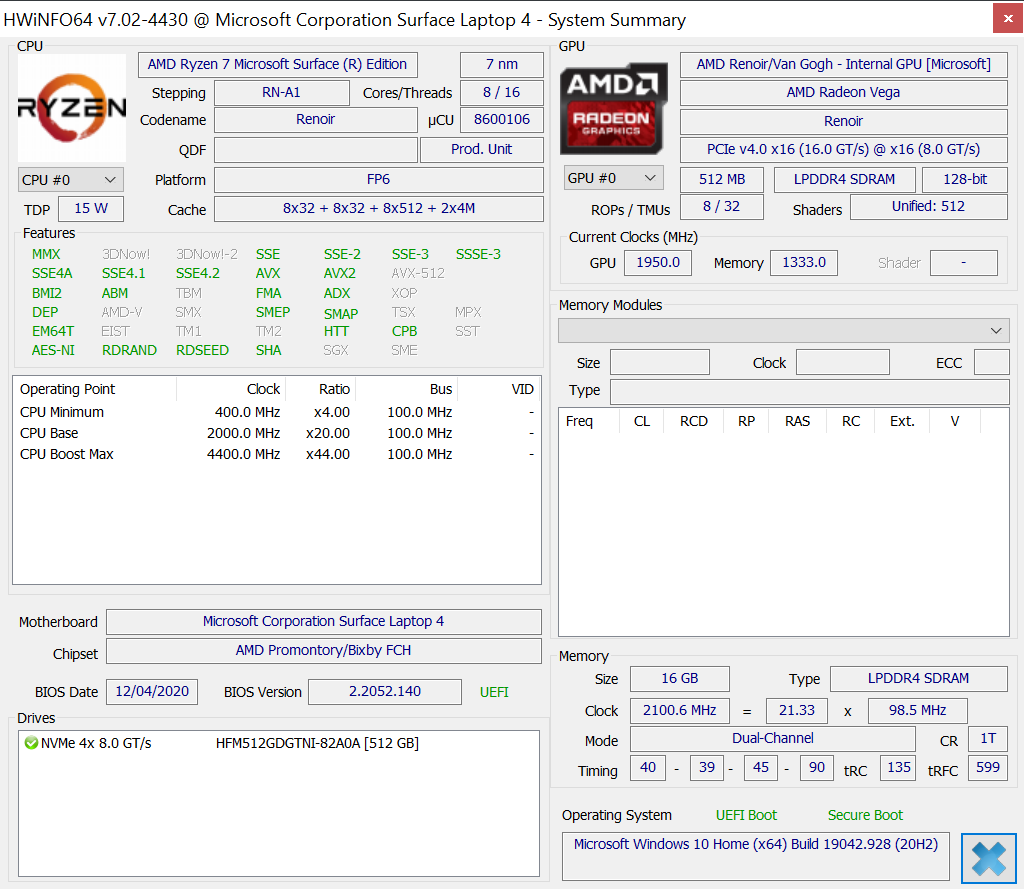
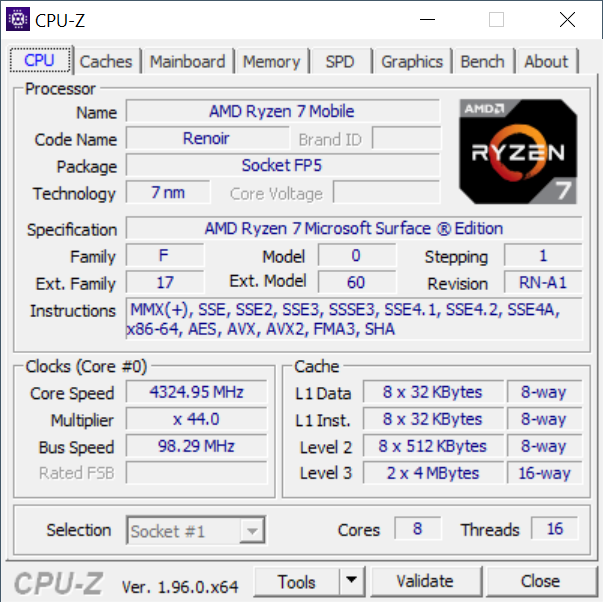
Microsoft offers the Surface Laptop 4 with either an Intel Tiger Lake CPU (i7-1185G7) or an AMD Ryzen processor (Ryzen 7 4980U), which is a model that was specifically designed for Microsoft. However, the largest differences to the regular Ryzen 7 4800U appear to be with the integrated graphics card.
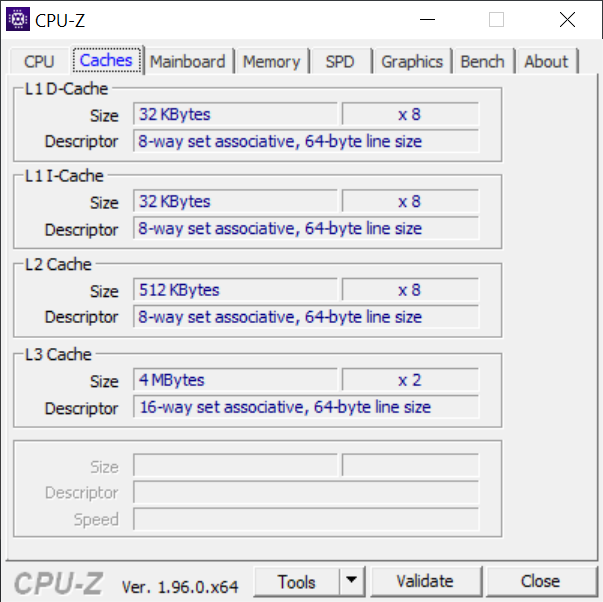
Processor
The AMD Ryzen 7 4980U is basically a regular 4800U, which we were already able to test. However, the availability of this processor was extremely limited. The choice of the CPU appears to be a little surprising, since there are already laptops with the new Ryzen 5000 chips (but there might also be some availability issues there). So the Surface Laptop 4 already appears slightly aged at its introduction.
On the other hand, the performance of the octa-core processor is still very good, and particularly in the multi-core tests, the Surface Laptop 4 is able to place at the top of the comparison field. However, we are a bit disappointed about the TDP limits that quickly level out at 23 watts (briefly at 44 watts). First, we would have expected a bit more margin in a 15-inch laptop without a dGPU, and then the configuration is identical to that of the smaller Surface Laptop 4 13.5-inch. This also means that at least we can compare the performances easily and also get a good idea how the alternative i7-1185G7 will perform in the Surface Laptop 4 15.
When you are able to use all cores, the AMD model is almost twice as fast as the i7-1185G7. While the i7 has an advantage of 20-25% in the single-core tests, the Ryzen 7 is not slow there either, and you will hardly notice the difference in everyday operation. Since the configurations with the AMD processor are also 100 Euros cheaper (~$127), this is the logical choice for buyers.
In battery operation, the CPU power is significantly reduced (~15 watts), which leads to a performance reduction of about 45%.
Cinebench R15: CPU Single 64Bit | CPU Multi 64Bit
Blender: v2.79 BMW27 CPU
7-Zip 18.03: 7z b 4 -mmt1 | 7z b 4
Geekbench 5.5: Single-Core | Multi-Core
HWBOT x265 Benchmark v2.2: 4k Preset
LibreOffice : 20 Documents To PDF
R Benchmark 2.5: Overall mean
| Cinebench R20 / CPU (Single Core) | |
| Average of class Subnotebook (128 - 832, n=57, last 2 years) | |
| Microsoft Surface Laptop 4 13 i7 | |
| Schenker Vision 15 | |
| Microsoft Surface Laptop 4 15 AMD TFF_00028 | |
| Average AMD Ryzen 7 4980U (n=1) | |
| Lenovo ThinkPad X1 Extreme Gen3-20TLS0UV00 | |
| Lenovo Yoga Slim 7-14ARE | |
| Tuxedo Pulse 15 | |
| Dell XPS 15 9500 Core i5 | |
| Microsoft Surface Laptop 3 15 Ryzen 5 3580U | |
| Cinebench R20 / CPU (Multi Core) | |
| Average of class Subnotebook (579 - 8541, n=57, last 2 years) | |
| Microsoft Surface Laptop 4 15 AMD TFF_00028 | |
| Average AMD Ryzen 7 4980U (n=1) | |
| Lenovo Yoga Slim 7-14ARE | |
| Tuxedo Pulse 15 | |
| Lenovo ThinkPad X1 Extreme Gen3-20TLS0UV00 | |
| Dell XPS 15 9500 Core i5 | |
| Schenker Vision 15 | |
| Microsoft Surface Laptop 4 13 i7 | |
| Microsoft Surface Laptop 3 15 Ryzen 5 3580U | |
| Cinebench R15 / CPU Single 64Bit | |
| Average of class Subnotebook (72.4 - 322, n=57, last 2 years) | |
| Schenker Vision 15 | |
| Microsoft Surface Laptop 4 13 i7 | |
| Lenovo ThinkPad X1 Extreme Gen3-20TLS0UV00 | |
| Dell XPS 15 9500 Core i5 | |
| Lenovo Yoga Slim 7-14ARE | |
| Microsoft Surface Laptop 4 15 AMD TFF_00028 | |
| Average AMD Ryzen 7 4980U (n=1) | |
| Tuxedo Pulse 15 | |
| Microsoft Surface Laptop 3 15 Ryzen 5 3580U | |
| Cinebench R15 / CPU Multi 64Bit | |
| Average of class Subnotebook (327 - 3345, n=57, last 2 years) | |
| Microsoft Surface Laptop 4 15 AMD TFF_00028 | |
| Average AMD Ryzen 7 4980U (n=1) | |
| Lenovo Yoga Slim 7-14ARE | |
| Tuxedo Pulse 15 | |
| Lenovo ThinkPad X1 Extreme Gen3-20TLS0UV00 | |
| Schenker Vision 15 | |
| Microsoft Surface Laptop 4 13 i7 | |
| Dell XPS 15 9500 Core i5 | |
| Microsoft Surface Laptop 3 15 Ryzen 5 3580U | |
| Blender / v2.79 BMW27 CPU | |
| Microsoft Surface Laptop 3 15 Ryzen 5 3580U | |
| Microsoft Surface Laptop 4 13 i7 | |
| Schenker Vision 15 | |
| Dell XPS 15 9500 Core i5 | |
| Lenovo ThinkPad X1 Extreme Gen3-20TLS0UV00 | |
| Average of class Subnotebook (159 - 2271, n=58, last 2 years) | |
| Tuxedo Pulse 15 | |
| Microsoft Surface Laptop 4 15 AMD TFF_00028 | |
| Average AMD Ryzen 7 4980U (n=1) | |
| Lenovo Yoga Slim 7-14ARE | |
| 7-Zip 18.03 / 7z b 4 -mmt1 | |
| Average of class Subnotebook (2643 - 6699, n=59, last 2 years) | |
| Lenovo ThinkPad X1 Extreme Gen3-20TLS0UV00 | |
| Microsoft Surface Laptop 4 13 i7 | |
| Schenker Vision 15 | |
| Dell XPS 15 9500 Core i5 | |
| Lenovo Yoga Slim 7-14ARE | |
| Tuxedo Pulse 15 | |
| Microsoft Surface Laptop 4 15 AMD TFF_00028 | |
| Average AMD Ryzen 7 4980U (n=1) | |
| Microsoft Surface Laptop 3 15 Ryzen 5 3580U | |
| 7-Zip 18.03 / 7z b 4 | |
| Lenovo Yoga Slim 7-14ARE | |
| Average of class Subnotebook (11668 - 77867, n=57, last 2 years) | |
| Microsoft Surface Laptop 4 15 AMD TFF_00028 | |
| Average AMD Ryzen 7 4980U (n=1) | |
| Tuxedo Pulse 15 | |
| Lenovo ThinkPad X1 Extreme Gen3-20TLS0UV00 | |
| Schenker Vision 15 | |
| Dell XPS 15 9500 Core i5 | |
| Microsoft Surface Laptop 4 13 i7 | |
| Microsoft Surface Laptop 3 15 Ryzen 5 3580U | |
| Geekbench 5.5 / Single-Core | |
| Average of class Subnotebook (726 - 2224, n=48, last 2 years) | |
| Schenker Vision 15 | |
| Microsoft Surface Laptop 4 13 i7 | |
| Lenovo ThinkPad X1 Extreme Gen3-20TLS0UV00 | |
| Dell XPS 15 9500 Core i5 | |
| Lenovo Yoga Slim 7-14ARE | |
| Lenovo Yoga Slim 7-14ARE | |
| Microsoft Surface Laptop 4 15 AMD TFF_00028 | |
| Average AMD Ryzen 7 4980U (n=1) | |
| Tuxedo Pulse 15 | |
| Microsoft Surface Laptop 3 15 Ryzen 5 3580U | |
| Geekbench 5.5 / Multi-Core | |
| Average of class Subnotebook (2557 - 17218, n=48, last 2 years) | |
| Microsoft Surface Laptop 4 15 AMD TFF_00028 | |
| Average AMD Ryzen 7 4980U (n=1) | |
| Lenovo Yoga Slim 7-14ARE | |
| Lenovo Yoga Slim 7-14ARE | |
| Tuxedo Pulse 15 | |
| Schenker Vision 15 | |
| Microsoft Surface Laptop 4 13 i7 | |
| Lenovo ThinkPad X1 Extreme Gen3-20TLS0UV00 | |
| Dell XPS 15 9500 Core i5 | |
| Microsoft Surface Laptop 3 15 Ryzen 5 3580U | |
| HWBOT x265 Benchmark v2.2 / 4k Preset | |
| Average of class Subnotebook (0.97 - 25.1, n=57, last 2 years) | |
| Lenovo Yoga Slim 7-14ARE | |
| Tuxedo Pulse 15 | |
| Microsoft Surface Laptop 4 15 AMD TFF_00028 | |
| Average AMD Ryzen 7 4980U (n=1) | |
| Lenovo ThinkPad X1 Extreme Gen3-20TLS0UV00 | |
| Schenker Vision 15 | |
| Dell XPS 15 9500 Core i5 | |
| Microsoft Surface Laptop 4 13 i7 | |
| Microsoft Surface Laptop 3 15 Ryzen 5 3580U | |
| LibreOffice / 20 Documents To PDF | |
| Microsoft Surface Laptop 4 15 AMD TFF_00028 | |
| Average AMD Ryzen 7 4980U (n=1) | |
| Dell XPS 15 9500 Core i5 | |
| Tuxedo Pulse 15 | |
| Lenovo Yoga Slim 7-14ARE | |
| Average of class Subnotebook (39.9 - 220, n=56, last 2 years) | |
| Microsoft Surface Laptop 4 13 i7 | |
| Lenovo ThinkPad X1 Extreme Gen3-20TLS0UV00 | |
| Schenker Vision 15 | |
| R Benchmark 2.5 / Overall mean | |
| Dell XPS 15 9500 Core i5 | |
| Microsoft Surface Laptop 4 15 AMD TFF_00028 | |
| Average AMD Ryzen 7 4980U (n=1) | |
| Tuxedo Pulse 15 | |
| Lenovo Yoga Slim 7-14ARE | |
| Lenovo ThinkPad X1 Extreme Gen3-20TLS0UV00 | |
| Microsoft Surface Laptop 4 13 i7 | |
| Schenker Vision 15 | |
| Average of class Subnotebook (0.4024 - 1.456, n=58, last 2 years) | |
* ... smaller is better
System Performance
Like in most modern laptops with fast PCIe SSD storage, the subjective impression of the performance is also very good for the Surface Laptop 4. In the synthetic PCMark benchmarks, our test unit also does an excellent job.
| PCMark 10 Score | 5154 points | |
Help | ||
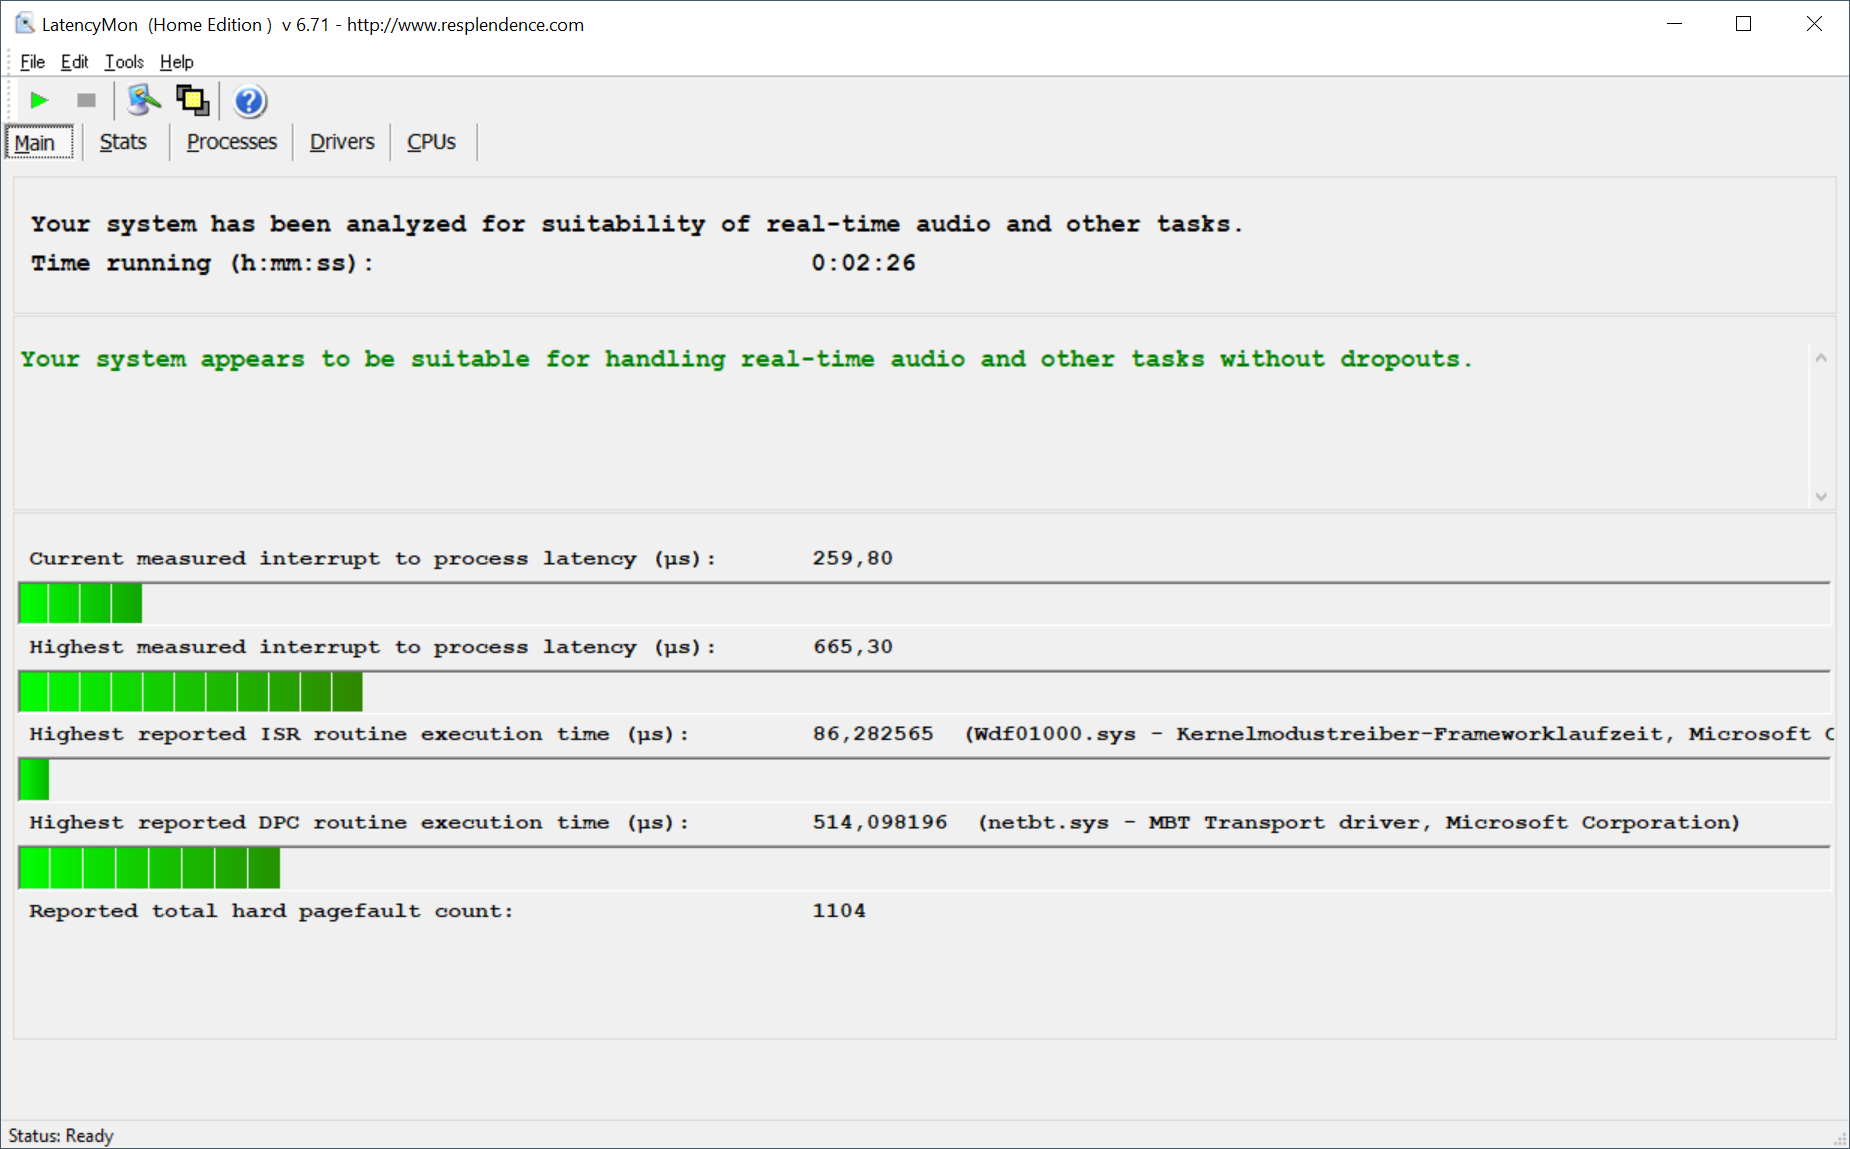
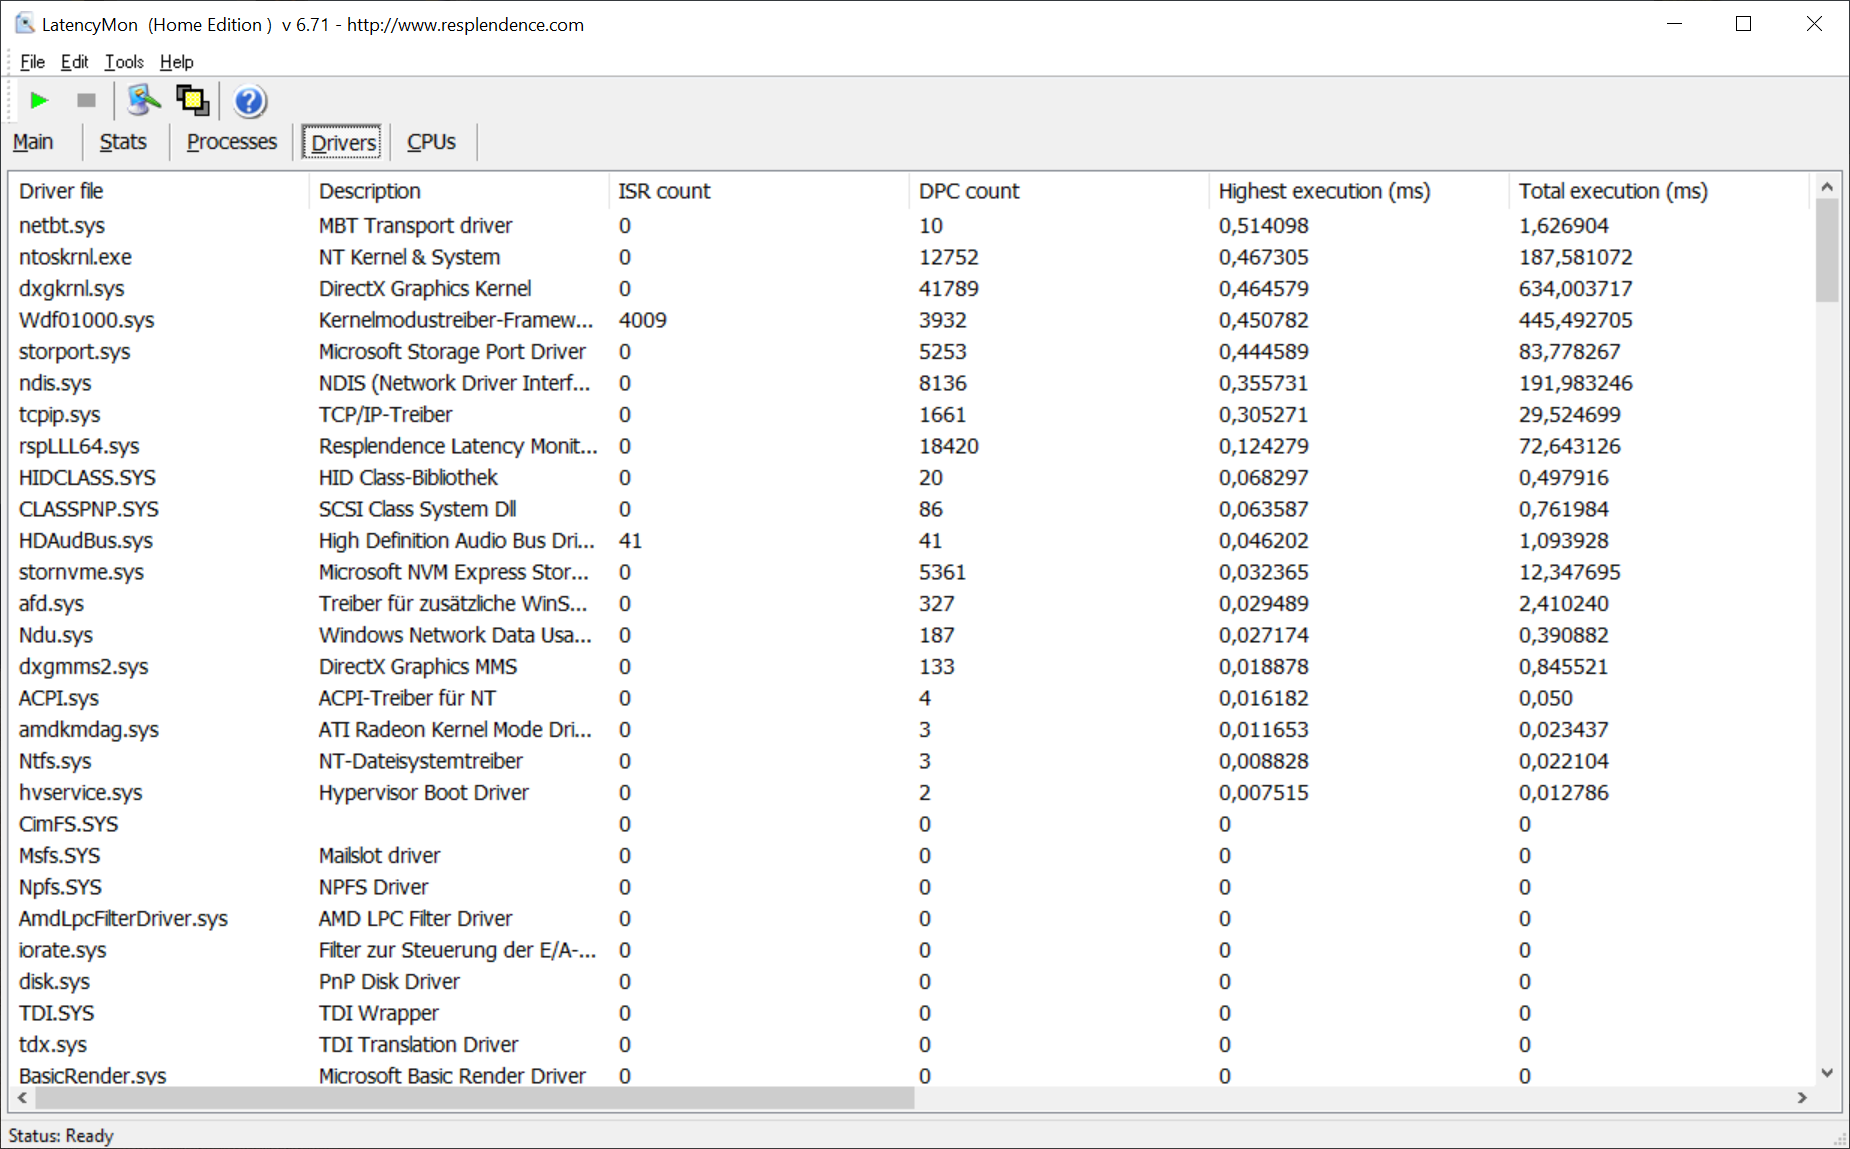
DPC Latencies
Our standardized DPC test shows no problems, so the Surface Laptop 4 is also suited for real-time audio processing.
| DPC Latencies / LatencyMon - interrupt to process latency (max), Web, Youtube, Prime95 | |
| Schenker Vision 15 | |
| Dell XPS 15 9500 Core i5 | |
| Tuxedo Pulse 15 | |
| Microsoft Surface Laptop 4 15 AMD TFF_00028 | |
| Lenovo ThinkPad X1 Extreme Gen3-20TLS0UV00 | |
* ... smaller is better
Storage Solution
Microsoft uses a compact M.2-2230 SSD that is connected via PCIe. This SK Hynix model offers a storage capacity of 512 GB (423 GB available after the first startup) but only achieves average transfer rates. While the SSD will definitely not become a bottleneck in everyday operation, at this point there are already SSDs that are significantly faster, and PCIe 4.0 is also not supported yet.
| Microsoft Surface Laptop 4 15 AMD TFF_00028 SK Hynix BC511 HFM512GDJTNI | Schenker Vision 15 Samsung SSD 980 Pro 1TB MZ-V8P1T0BW | Dell XPS 15 9500 Core i5 Toshiba KBG40ZNS256G NVMe | Tuxedo Pulse 15 Samsung SSD 970 EVO Plus 1TB | Lenovo ThinkPad X1 Extreme Gen3-20TLS0UV00 Toshiba XG6 KXG6AZNV1T02 | Microsoft Surface Laptop 3 15 Ryzen 5 3580U SK hynix BC501 HFM256GDGTNG | Average SK Hynix BC511 HFM512GDJTNI | |
|---|---|---|---|---|---|---|---|
| CrystalDiskMark 5.2 / 6 | 236% | 21% | 101% | 90% | -4% | 20% | |
| Write 4K (MB/s) | 80.8 | 238.1 195% | 93.3 15% | 110.5 37% | 159.5 97% | 99 23% | 111 ? 37% |
| Read 4K (MB/s) | 32.8 | 79.2 141% | 45.9 40% | 43.38 32% | 53.1 62% | 35.63 9% | 42.6 ? 30% |
| Write Seq (MB/s) | 851 | 4139 386% | 1211 42% | 3041 257% | 1723 102% | 706 -17% | 1037 ? 22% |
| Read Seq (MB/s) | 1008 | 4133 310% | 1633 62% | 2414 139% | 2164 115% | 1044 4% | 1100 ? 9% |
| Write 4K Q32T1 (MB/s) | 308.1 | 697 126% | 273.1 -11% | 392 27% | 469.2 52% | 326.6 6% | 410 ? 33% |
| Read 4K Q32T1 (MB/s) | 340.8 | 758 122% | 356 4% | 490.9 44% | 543 59% | 270 -21% | 444 ? 30% |
| Write Seq Q32T1 (MB/s) | 1043 | 5187 397% | 1198 15% | 3329 219% | 3055 193% | 820 -21% | 1072 ? 3% |
| Read Seq Q32T1 (MB/s) | 2311 | 7117 208% | 2269 -2% | 3568 54% | 3296 43% | 2028 -12% | 2269 ? -2% |
| AS SSD | 183% | -170% | 124% | 55% | -48% | 4% | |
| Seq Read (MB/s) | 1211 | 5427 348% | 1423 18% | 2425 100% | 2553 111% | 1122 -7% | 1458 ? 20% |
| Seq Write (MB/s) | 734 | 3886 429% | 766 4% | 2539 246% | 974 33% | 514 -30% | 900 ? 23% |
| 4K Read (MB/s) | 44.5 | 72.9 64% | 42.21 -5% | 55.6 25% | 49.69 12% | 34.98 -21% | 49 ? 10% |
| 4K Write (MB/s) | 115.7 | 219.3 90% | 74.8 -35% | 157.2 36% | 139.5 21% | 96.8 -16% | 114.9 ? -1% |
| 4K-64 Read (MB/s) | 739 | 2209 199% | 973 32% | 1878 154% | 1462 98% | 492 -33% | 776 ? 5% |
| 4K-64 Write (MB/s) | 771 | 2265 194% | 218.8 -72% | 2512 226% | 1474 91% | 339.9 -56% | 744 ? -4% |
| Access Time Read * (ms) | 0.051 | 0.033 35% | 0.125 -145% | 0.034 33% | 0.063 -24% | 0.056 -10% | 0.061 ? -20% |
| Access Time Write * (ms) | 0.032 | 0.02 37% | 0.552 -1625% | 0.024 25% | 0.031 3% | 0.11 -244% | 0.03329 ? -4% |
| Score Read (Points) | 904 | 2825 213% | 1157 28% | 2176 141% | 1767 95% | 639 -29% | 970 ? 7% |
| Score Write (Points) | 960 | 2873 199% | 370 -61% | 2923 204% | 1711 78% | 488 -49% | 949 ? -1% |
| Score Total (Points) | 2315 | 7069 205% | 2094 -10% | 6221 169% | 4308 86% | 1434 -38% | 2401 ? 4% |
| Copy ISO MB/s (MB/s) | 2775 | 1151 | 2101 | 2094 | 828 | 864 ? | |
| Copy Program MB/s (MB/s) | 662 | 499.4 | 437 | 657 | 200.5 | 309 ? | |
| Copy Game MB/s (MB/s) | 1655 | 733 | 1027 | 1447 | 387.4 | 499 ? | |
| Total Average (Program / Settings) | 210% /
205% | -75% /
-90% | 113% /
114% | 73% /
70% | -26% /
-30% | 12% /
11% |
* ... smaller is better

Constant Performance Reads: DiskSpd Read Loop, Queue Depth 8
Graphics Card
In terms of its pure performance, the Radeon RX Vega 8 of our test unit is comparable with the regular RX Vega 8, but there seem to be some optimizations in the built-in video decoder. When reproducing 4K videos, the GPU load of the Vega 8 is usually not higher than 60% (Intel Xe Graphics G7 ~32%), but in our test unit with the custom AMD chip it is lower than 10%, which should also benefit the battery life during video reproduction.
The Xe Graphics G7 of the alternative i7 processor is significantly faster in the benchmarks, but the Surface Laptop 4 is not a gaming laptop, whether it uses the AMD or the Intel GPU. When gaming, you are either limited to older games or to low or medium detail settings. On the other hand, the GPU performance remains relatively constant. Although it barely fails the Fire Strike stress test, a difference of about 5% is hardly noticeable during gaming. The performance of the iGPU is not reduced in battery operation.
| 3DMark 11 Performance | 6440 points | |
| 3DMark Cloud Gate Standard Score | 19575 points | |
| 3DMark Fire Strike Score | 3442 points | |
| 3DMark Time Spy Score | 1291 points | |
Help | ||
| low | med. | high | ultra | |
|---|---|---|---|---|
| The Witcher 3 (2015) | 70.6 | 44.4 | 18.4 | 13.6 |
| Dota 2 Reborn (2015) | 91 | 75.3 | 50.5 | 47.6 |
| X-Plane 11.11 (2018) | 40.4 | 32.3 | 27.3 | |
| Far Cry 5 (2018) | 42 | 19 | ||
| F1 2020 (2020) | 83 | 40 | 31 | 21 |
Emissions - The Surface Laptop often remains silent
Noise Emissions
The fan control adjustment is extremely defensive, causing the device to remain completely quiet in many usage scenarios. Even under full load, it takes more than 60 seconds before the fan turns on. After that, the fan speed increases gradually until it reaches a maximum noise level of 40 dB(A) a little later during the stress test as well as while gaming. The whirring is then clearly noticeable, but its frequency is neither too high nor is it annoying in any way. We were also unable to notice any other electronic noises.
Noise level
| Idle |
| 24.2 / 24.2 / 24.2 dB(A) |
| Load |
| 39.9 / 39.9 dB(A) |
 | ||
30 dB silent 40 dB(A) audible 50 dB(A) loud |
||
min: | ||
| Microsoft Surface Laptop 4 15 AMD TFF_00028 Vega 8, R7 4980U, SK Hynix BC511 HFM512GDJTNI | Schenker Vision 15 Iris Xe G7 96EUs, i7-1165G7, Samsung SSD 980 Pro 1TB MZ-V8P1T0BW | Dell XPS 15 9500 Core i5 UHD Graphics 630, i5-10300H, Toshiba KBG40ZNS256G NVMe | Tuxedo Pulse 15 Vega 6, R5 4600H, Samsung SSD 970 EVO Plus 1TB | Lenovo ThinkPad X1 Extreme Gen3-20TLS0UV00 GeForce GTX 1650 Ti Max-Q, i7-10750H, Toshiba XG6 KXG6AZNV1T02 | Microsoft Surface Laptop 3 15 Ryzen 5 3580U Vega 9, R5 3580U, SK hynix BC501 HFM256GDGTNG | |
|---|---|---|---|---|---|---|
| Noise | -15% | -7% | -1% | -15% | -6% | |
| off / environment * (dB) | 24.2 | 29.8 -23% | 28 -16% | 24.4 -1% | 29.5 -22% | 28 -16% |
| Idle Minimum * (dB) | 24.2 | 29.8 -23% | 28 -16% | 24.4 -1% | 29.5 -22% | 28 -16% |
| Idle Average * (dB) | 24.2 | 29.8 -23% | 28 -16% | 24.4 -1% | 29.5 -22% | 28 -16% |
| Idle Maximum * (dB) | 24.2 | 31.1 -29% | 28 -16% | 28.6 -18% | 29.9 -24% | 28 -16% |
| Load Average * (dB) | 39.9 | 40.5 -2% | 28 30% | 32.3 19% | 44.2 -11% | 29.2 27% |
| Witcher 3 ultra * (dB) | 39.9 | 40.5 -2% | 40.1 -1% | 36.1 10% | 39 2% | |
| Load Maximum * (dB) | 39.9 | 40.5 -2% | 41.9 -5% | 42.3 -6% | 44.2 -11% | 41.4 -4% |
* ... smaller is better
Temperature
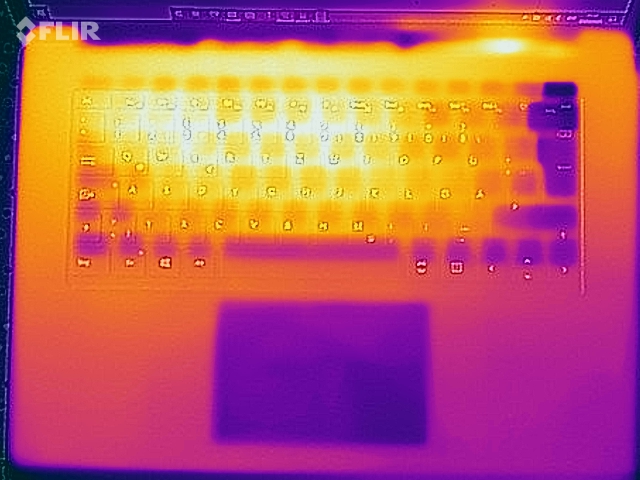
Under low load, the case remains comfortably cool, but with high load levels, the surfaces become quite warm. While a maximum of ~45 °C (113 °F) on the bottom and ~42 °C (108 °F) on top is not critical by any means, in contrast to plastic cases, the metal surfaces can then subjectively feel quite uncomfortable to the touch. You should therefore avoid placing the device on your lap under high loads.
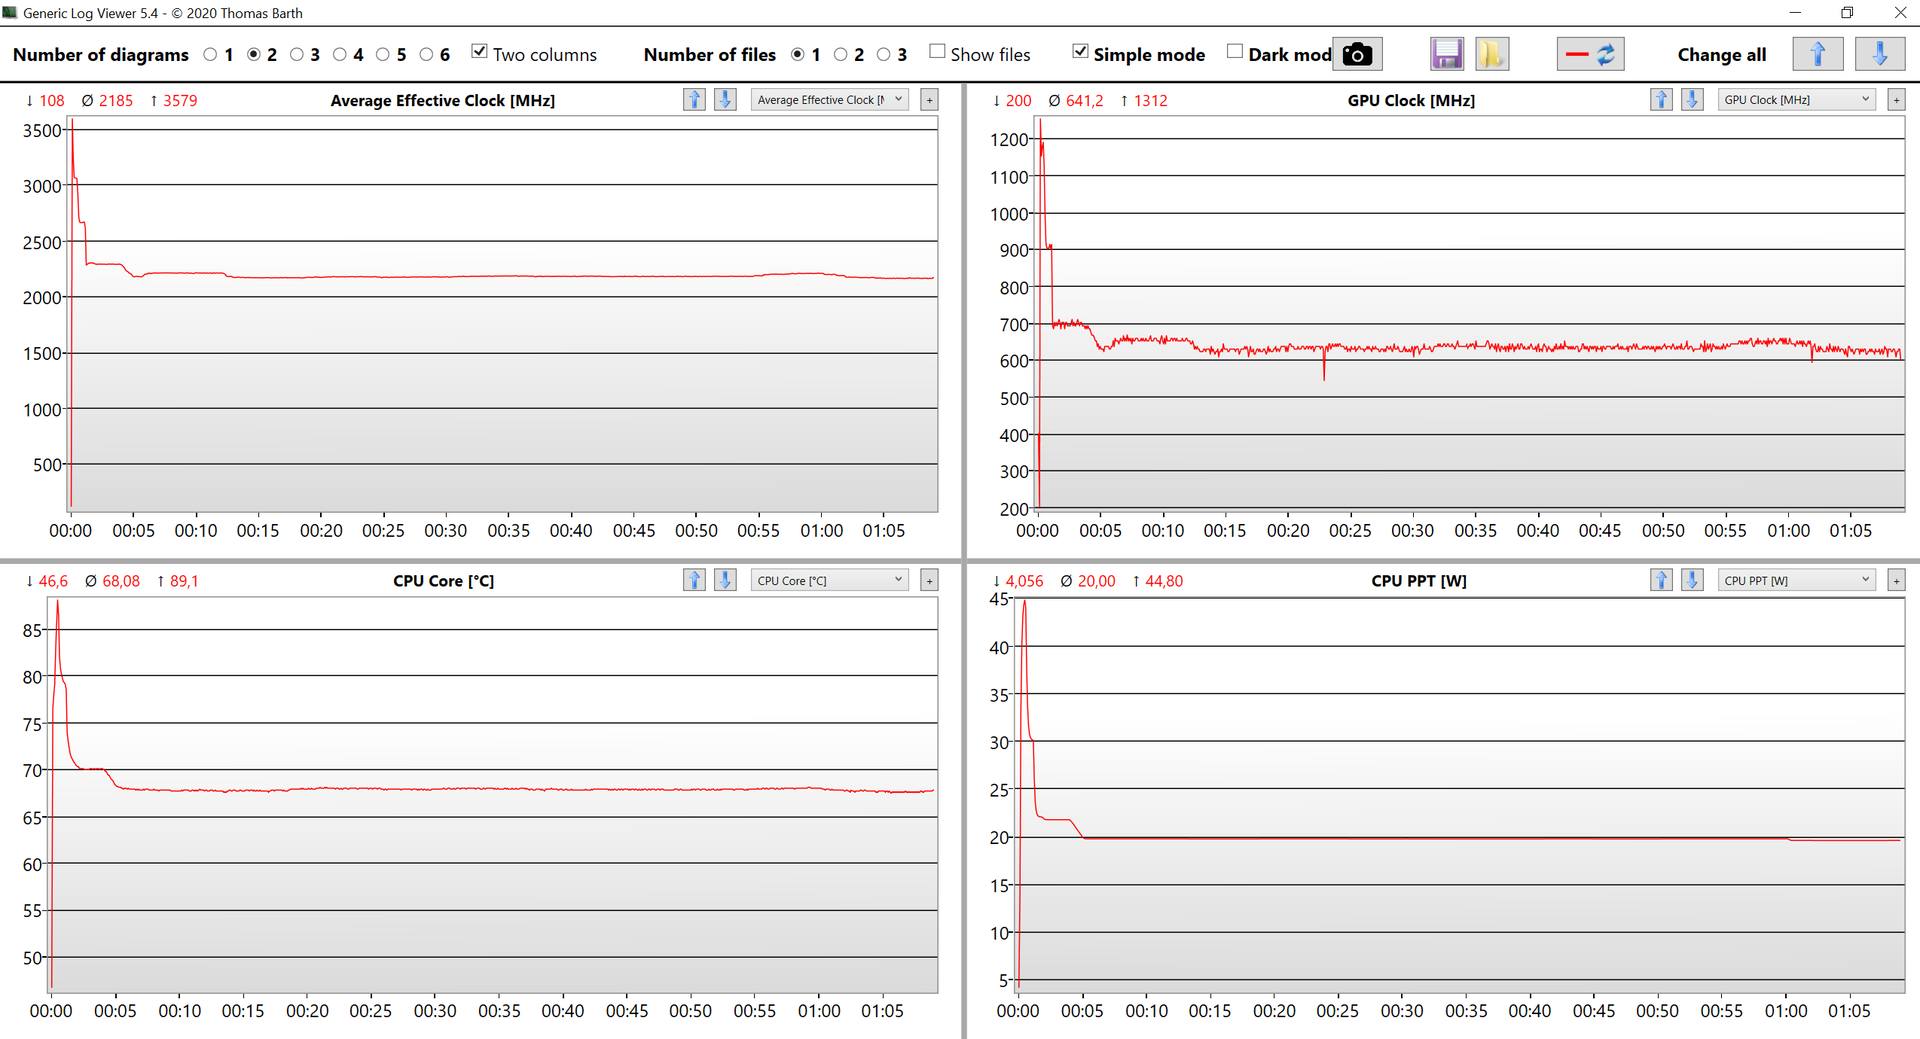
In the stress test, the power consumption quickly levels out at 20 watts, which the CPU and iGPU have to share. The eight processor cores then still run at a clock speed of ~2.2 GHz and the iGPU at ~640 MHz. Right after the stress test, the performance is not impacted.
(±) The maximum temperature on the upper side is 41.8 °C / 107 F, compared to the average of 35.9 °C / 97 F, ranging from 21.4 to 59 °C for the class Subnotebook.
(±) The bottom heats up to a maximum of 44.8 °C / 113 F, compared to the average of 39.2 °C / 103 F
(+) In idle usage, the average temperature for the upper side is 22.6 °C / 73 F, compared to the device average of 30.8 °C / 87 F.
(±) Playing The Witcher 3, the average temperature for the upper side is 37.7 °C / 100 F, compared to the device average of 30.8 °C / 87 F.
(+) The palmrests and touchpad are reaching skin temperature as a maximum (34.4 °C / 93.9 F) and are therefore not hot.
(-) The average temperature of the palmrest area of similar devices was 28.2 °C / 82.8 F (-6.2 °C / -11.1 F).
Speaker
Since there are no specific speaker grills, the sound from the speakers continues to be output via the keyboard. While there are devices with louder modules, the quality is very good overall. So external speakers are not necessarily needed. However, at higher sound volumes, the palm rest resonates noticeably.
Microsoft Surface Laptop 4 15 AMD TFF_00028 audio analysis
(±) | speaker loudness is average but good (78.7 dB)
Bass 100 - 315 Hz
(±) | reduced bass - on average 13.6% lower than median
(±) | linearity of bass is average (8.5% delta to prev. frequency)
Mids 400 - 2000 Hz
(+) | balanced mids - only 2.2% away from median
(+) | mids are linear (4.3% delta to prev. frequency)
Highs 2 - 16 kHz
(+) | balanced highs - only 2.4% away from median
(+) | highs are linear (3.9% delta to prev. frequency)
Overall 100 - 16.000 Hz
(+) | overall sound is linear (12.1% difference to median)
Compared to same class
» 15% of all tested devices in this class were better, 5% similar, 81% worse
» The best had a delta of 5%, average was 18%, worst was 53%
Compared to all devices tested
» 10% of all tested devices were better, 2% similar, 88% worse
» The best had a delta of 4%, average was 23%, worst was 134%
Dell XPS 15 9500 Core i5 audio analysis
(+) | speakers can play relatively loud (84.2 dB)
Bass 100 - 315 Hz
(+) | good bass - only 4.6% away from median
(±) | linearity of bass is average (10% delta to prev. frequency)
Mids 400 - 2000 Hz
(+) | balanced mids - only 3.3% away from median
(+) | mids are linear (4.5% delta to prev. frequency)
Highs 2 - 16 kHz
(+) | balanced highs - only 2.4% away from median
(+) | highs are linear (4.3% delta to prev. frequency)
Overall 100 - 16.000 Hz
(+) | overall sound is linear (7.7% difference to median)
Compared to same class
» 6% of all tested devices in this class were better, 2% similar, 91% worse
» The best had a delta of 5%, average was 17%, worst was 45%
Compared to all devices tested
» 1% of all tested devices were better, 0% similar, 98% worse
» The best had a delta of 4%, average was 23%, worst was 134%
Schenker Vision 15 audio analysis
(±) | speaker loudness is average but good (79.5 dB)
Bass 100 - 315 Hz
(-) | nearly no bass - on average 17% lower than median
(±) | linearity of bass is average (11.5% delta to prev. frequency)
Mids 400 - 2000 Hz
(+) | balanced mids - only 3.2% away from median
(+) | mids are linear (4.5% delta to prev. frequency)
Highs 2 - 16 kHz
(+) | balanced highs - only 3.3% away from median
(+) | highs are linear (5.4% delta to prev. frequency)
Overall 100 - 16.000 Hz
(±) | linearity of overall sound is average (19.5% difference to median)
Compared to same class
» 63% of all tested devices in this class were better, 7% similar, 29% worse
» The best had a delta of 5%, average was 17%, worst was 45%
Compared to all devices tested
» 49% of all tested devices were better, 7% similar, 44% worse
» The best had a delta of 4%, average was 23%, worst was 134%
Power Management - A more efficient Radeon iGPU
Power Consumption
The power consumption has remained at about the same level overall. In the stress test, the consumption reaches a maximum of 64.9 watts, but this quickly levels out at ~36 watts. The included 65-Watt charger is therefore completely sufficient. The charger also offers an additional USB-A connection, allowing you to charge another device (max. 5 watts).
| Off / Standby | |
| Idle | |
| Load |
|
Key:
min: | |
| Microsoft Surface Laptop 4 15 AMD TFF_00028 R7 4980U, Vega 8, SK Hynix BC511 HFM512GDJTNI, IPS, 2496x1664, 15" | Schenker Vision 15 i7-1165G7, Iris Xe G7 96EUs, Samsung SSD 980 Pro 1TB MZ-V8P1T0BW, IPS, 1920x1080, 15.6" | Dell XPS 15 9500 Core i5 i5-10300H, UHD Graphics 630, Toshiba KBG40ZNS256G NVMe, IPS, 1920x1200, 15.6" | Tuxedo Pulse 15 R5 4600H, Vega 6, Samsung SSD 970 EVO Plus 1TB, IPS, 1920x1080, 15.6" | Lenovo ThinkPad X1 Extreme Gen3-20TLS0UV00 i7-10750H, GeForce GTX 1650 Ti Max-Q, Toshiba XG6 KXG6AZNV1T02, IPS, 1920x1080, 15.6" | Microsoft Surface Laptop 3 15 Ryzen 5 3580U R5 3580U, Vega 9, SK hynix BC501 HFM256GDGTNG, IPS, 2496x1664, 15" | Average AMD Radeon RX Vega 8 (Ryzen 4000/5000) | Average of class Subnotebook | |
|---|---|---|---|---|---|---|---|---|
| Power Consumption | 2% | -5% | -16% | -71% | 6% | -12% | 3% | |
| Idle Minimum * (Watt) | 3.6 | 3.5 3% | 2.9 19% | 5 -39% | 5 -39% | 3.3 8% | 5.3 ? -47% | 3.76 ? -4% |
| Idle Average * (Watt) | 6.5 | 6.3 3% | 7.6 -17% | 7.7 -18% | 9 -38% | 7.1 -9% | 7.85 ? -21% | 6.54 ? -1% |
| Idle Maximum * (Watt) | 8.9 | 6.8 24% | 8 10% | 8.7 2% | 12.2 -37% | 7.2 19% | 9.31 ? -5% | 7.89 ? 11% |
| Load Average * (Watt) | 46.5 | 43.2 7% | 41.7 10% | 42.4 9% | 94.4 -103% | 44.8 4% | 44.2 ? 5% | 42 ? 10% |
| Witcher 3 ultra * (Watt) | 43.4 | 52 -20% | 44 -1% | 89 -105% | 45.1 -4% | |||
| Load Maximum * (Watt) | 64.9 | 67.7 -4% | 94.8 -46% | 97.2 -50% | 133.9 -106% | 53 18% | 58.9 ? 9% | 64.8 ? -0% |
* ... smaller is better
Battery Life
The Surface Laptop 4 has the smallest battery by far, since as in the smaller 13-inch model, Microsoft also uses a 47-Wh model here. However, despite the large display, the battery life is not bad, and we also definitely see an improvement compared to the older model. It lasts for almost 10.5 hours in our WLAN test at 150 cd/m² and still more than 7 hours at the maximum brightness. The result in the video test, which turns out excellent at almost 15 hours, is interesting. The improved efficiency of the iGPU should play a larger role here.
Interestingly, Microsoft also specifies a longer battery life for the AMD versions of the Surface Laptop 4. We can confirm this by comparing it with the smaller Surface Laptop 4 with the Intel Tiger Lake processor: Despite having the same battery capacity and smaller display, its battery life turns out slightly lower in the WLAN test.
| Microsoft Surface Laptop 4 15 AMD TFF_00028 R7 4980U, Vega 8, 47.4 Wh | Schenker Vision 15 i7-1165G7, Iris Xe G7 96EUs, 73 Wh | Dell XPS 15 9500 Core i5 i5-10300H, UHD Graphics 630, 56 Wh | Tuxedo Pulse 15 R5 4600H, Vega 6, 91 Wh | Lenovo ThinkPad X1 Extreme Gen3-20TLS0UV00 i7-10750H, GeForce GTX 1650 Ti Max-Q, 80 Wh | Microsoft Surface Laptop 3 15 Ryzen 5 3580U R5 3580U, Vega 9, 45 Wh | Average of class Subnotebook | |
|---|---|---|---|---|---|---|---|
| Battery runtime | 8% | -24% | 6% | -17% | -23% | 6% | |
| H.264 (h) | 14.8 | 18.7 26% | 12.2 -18% | 15.4 ? 4% | |||
| WiFi v1.3 (h) | 10.4 | 15.2 46% | 9.3 -11% | 13.7 32% | 11.6 12% | 9.1 -13% | 14 ? 35% |
| Load (h) | 2.5 | 1.3 -48% | 1.6 -36% | 2 -20% | 1.4 -44% | 1.7 -32% | 1.969 ? -21% |
| Reader / Idle (h) | 26.4 | 18.7 | 28.6 ? |
Pros
Cons
Verdict - The Surface Laptop 4 looks a little outdated

The fourth generation of the Surface Laptop is really only a CPU upgrade with Intel Tiger Lake chips and the special AMD Ryzen processor. The latter is still based on the older 4000 series and already appears slightly outdated at the laptop's introduction. While the performance largely corresponds to the regular Ryzen 7 4800U mobile processor, there are apparently some optimizations in the integrated video decoder, which also has a positive effect on the battery life. We are a bit disappointed about the fact that the larger 15-inch model offers no performance advantage over the smaller 13.5-inch Surface Laptop, since the TDP configuration is the same. The battery life is also identical, so the additional space in the case is completely wasted.
In terms of the choice between AMD and Intel, we recommend the more affordable AMD configuration. The multi-core performance is significantly higher and it also offers the better battery life. Even though the Intel i7 offers a higher single-core performance and also more graphics performance, this is still an iGPU, causing the gaming performance to be limited. Due to the lack of a Thunderbolt port, you cannot connect an external GPU.
The only additional upgrade is the faster Wi-Fi 6 module, but otherwise the Surface Laptop 4 limps significantly behind the competitors. Microsoft remains faithful to the impractical Surface Connect port and continues to shun faster connections such as Thunderbolt or USB 4. There is not even an option for a WWAN module. The 3:2 display is good overall, but its reflective surface limits its use in bright surroundings. A brighter panel would definitely help here. The old 720p webcam is also hardly able to convince.
A new processor, but otherwise mostly stagnation: In many areas, the Surface Laptop 4 remains behind the competitors. For the high purchase price, we expect state-of-the-art technology in 2021.
By itself, the Surface Laptop 4 15 is basically not a bad device, but for the high purchase price we also expect current technology. Microsoft takes the easy way out with the fourth generation and continues to use the old case with the known limitations (few connections, a bad webcam, large display bezels). In addition, the space of the larger case is not used optimally, and there is no additional performance compared to the smaller 13.5-inch model. The competitors in this price and size range usually offer dedicated graphics cards with significantly more GPU performance.
Price and Availability
The test configuration of the Surface Laptop 4 with 16 GB of RAM, a 512-GB SSD, and AMD CPU is available for 1,849 Euros at Cyberport in Germany. The Microsoft Store in the US lists it for ~$1,350, but it is currently not available, while the corresponding model with the Intel Tiger Lake processor costs ~$1,620.
Microsoft Surface Laptop 4 15 AMD TFF_00028
- 04/27/2021 v7 (old)
Andreas Osthoff
Price comparison

