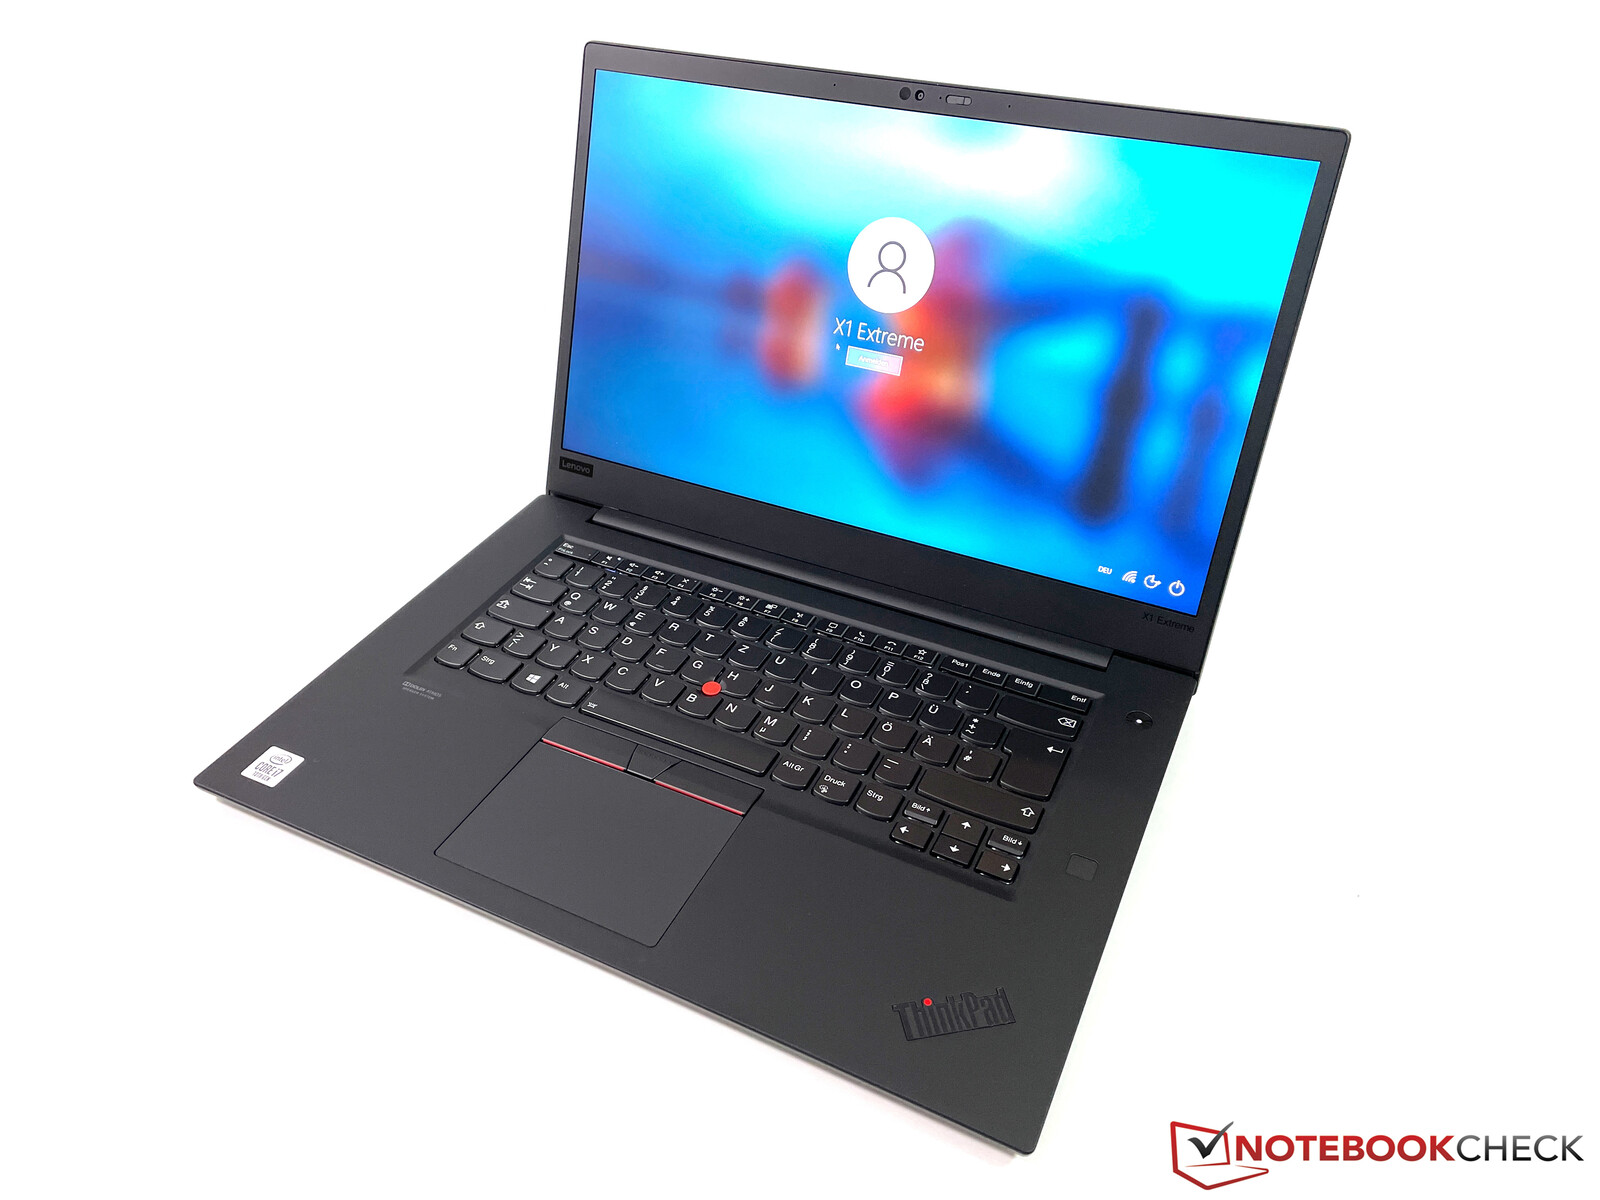
ThinkPad X1 Extreme Gen3 2020: Lenovo's Premium Multimedia Laptop with GTX 1650 Ti Max-Q in Review
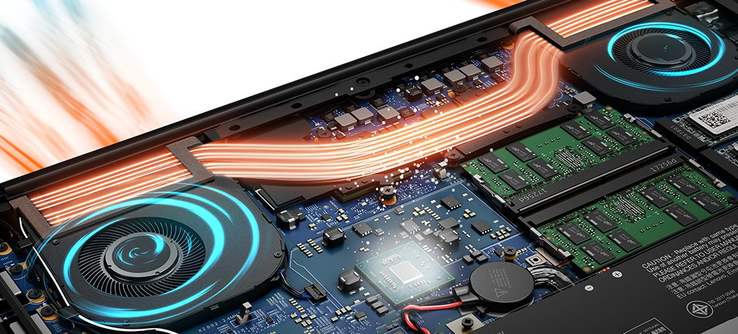
We were a little surprised that Lenovo once again uses the familiar chassis for the third version of its multimedia laptop. The updates are limited to a refreshed Intel processor (10th generation) as well as the slightly more powerful GeForce GTX 1650 Ti Max-Q. We are obviously eager to see how the familiar cooling solution will handle the faster GPU, or if you can just get the predecessor.
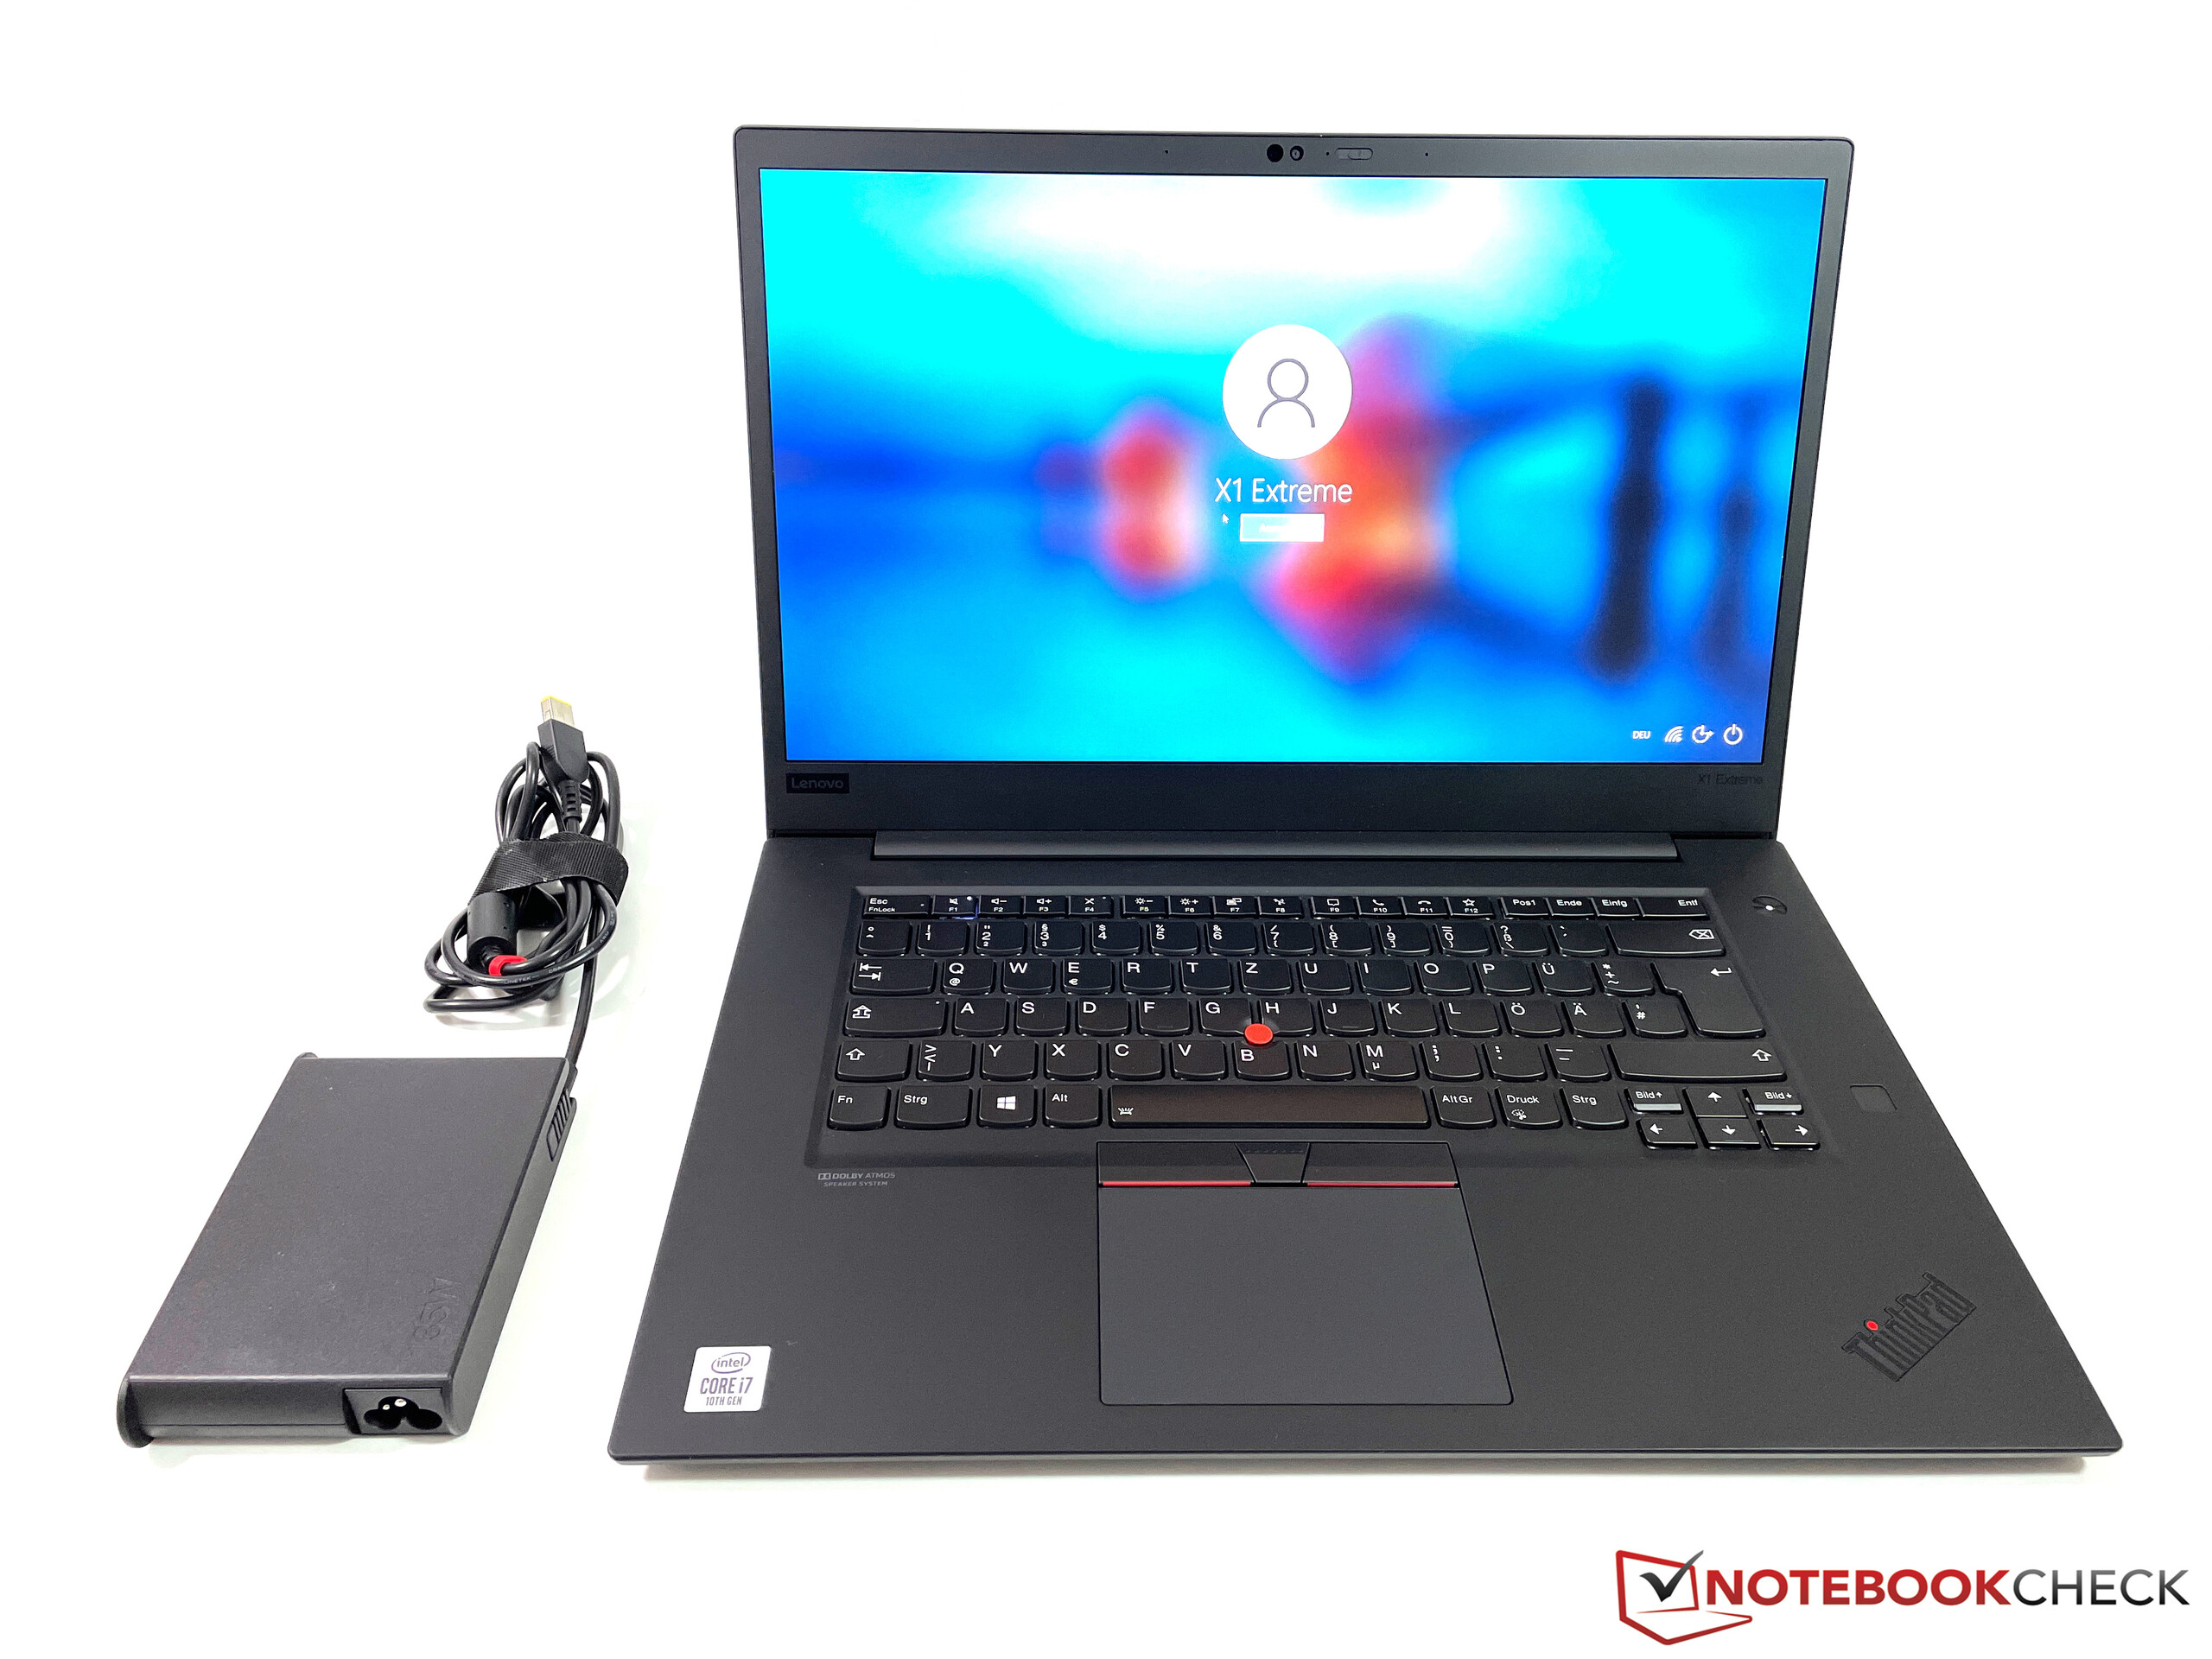
Our test unit with the designation 20TLS0UV00 is an education model without Windows. For about 1950 Euros, you get a Core i7 processor, 16 GB RAM, a 1 TB PCIe-SSD, the GeForce GTX 1650 Ti Max-Q GPU, as well as a matte 1080p panel with HDR400 support, but it is still a 16:9 panel. There is currently no corresponding topseller unit for regular customers and you cannot customize the X1 Extreme Gen3 at Lenovo right now, but we expect a price bump of 400-500 Euros (including Windows).
Some areas are identical to the previous model of the X1 Extreme, so please have a look at our previous review for more information on the case, the maintenance, the input devices, and the speakers:
Possible competitors in comparison
Rating | Date | Model | Weight | Height | Size | Resolution | Price |
|---|---|---|---|---|---|---|---|
| 90.1 % v7 (old) | 01 / 2021 | Lenovo ThinkPad X1 Extreme Gen3-20TLS0UV00 i7-10750H, GeForce GTX 1650 Ti Max-Q | 1.7 kg | 18.7 mm | 15.60" | 1920x1080 | |
| 90.1 % v7 (old) | 06 / 2020 | Dell XPS 15 9500 Core i7 4K UHD i7-10875H, GeForce GTX 1650 Ti Mobile | 2 kg | 18 mm | 15.60" | 3840x2400 | |
| 89.7 % v7 (old) | 12 / 2019 | Apple MacBook Pro 16 2019 i9 5500M i9-9880H, Radeon Pro 5500M | 2 kg | 16.2 mm | 16.00" | 3072x1920 | |
| 87 % v7 (old) | 12 / 2020 | Asus ZenBook UX535-M01440 i7-10750H, GeForce GTX 1650 Ti Max-Q | 2 kg | 20 mm | 15.60" | 3840x2160 | |
| 87.7 % v7 (old) | 12 / 2020 | Schenker Vision 15 i7-1165G7, Iris Xe G7 96EUs | 1.7 kg | 15 mm | 15.60" | 1920x1080 | |
| 87.1 % v7 (old) | 02 / 2020 | Lenovo ThinkPad X1 Extreme 2019 20QV000WGE i7-9750H, GeForce GTX 1650 Mobile | 1.7 kg | 18.7 mm | 15.60" | 3840x2160 |
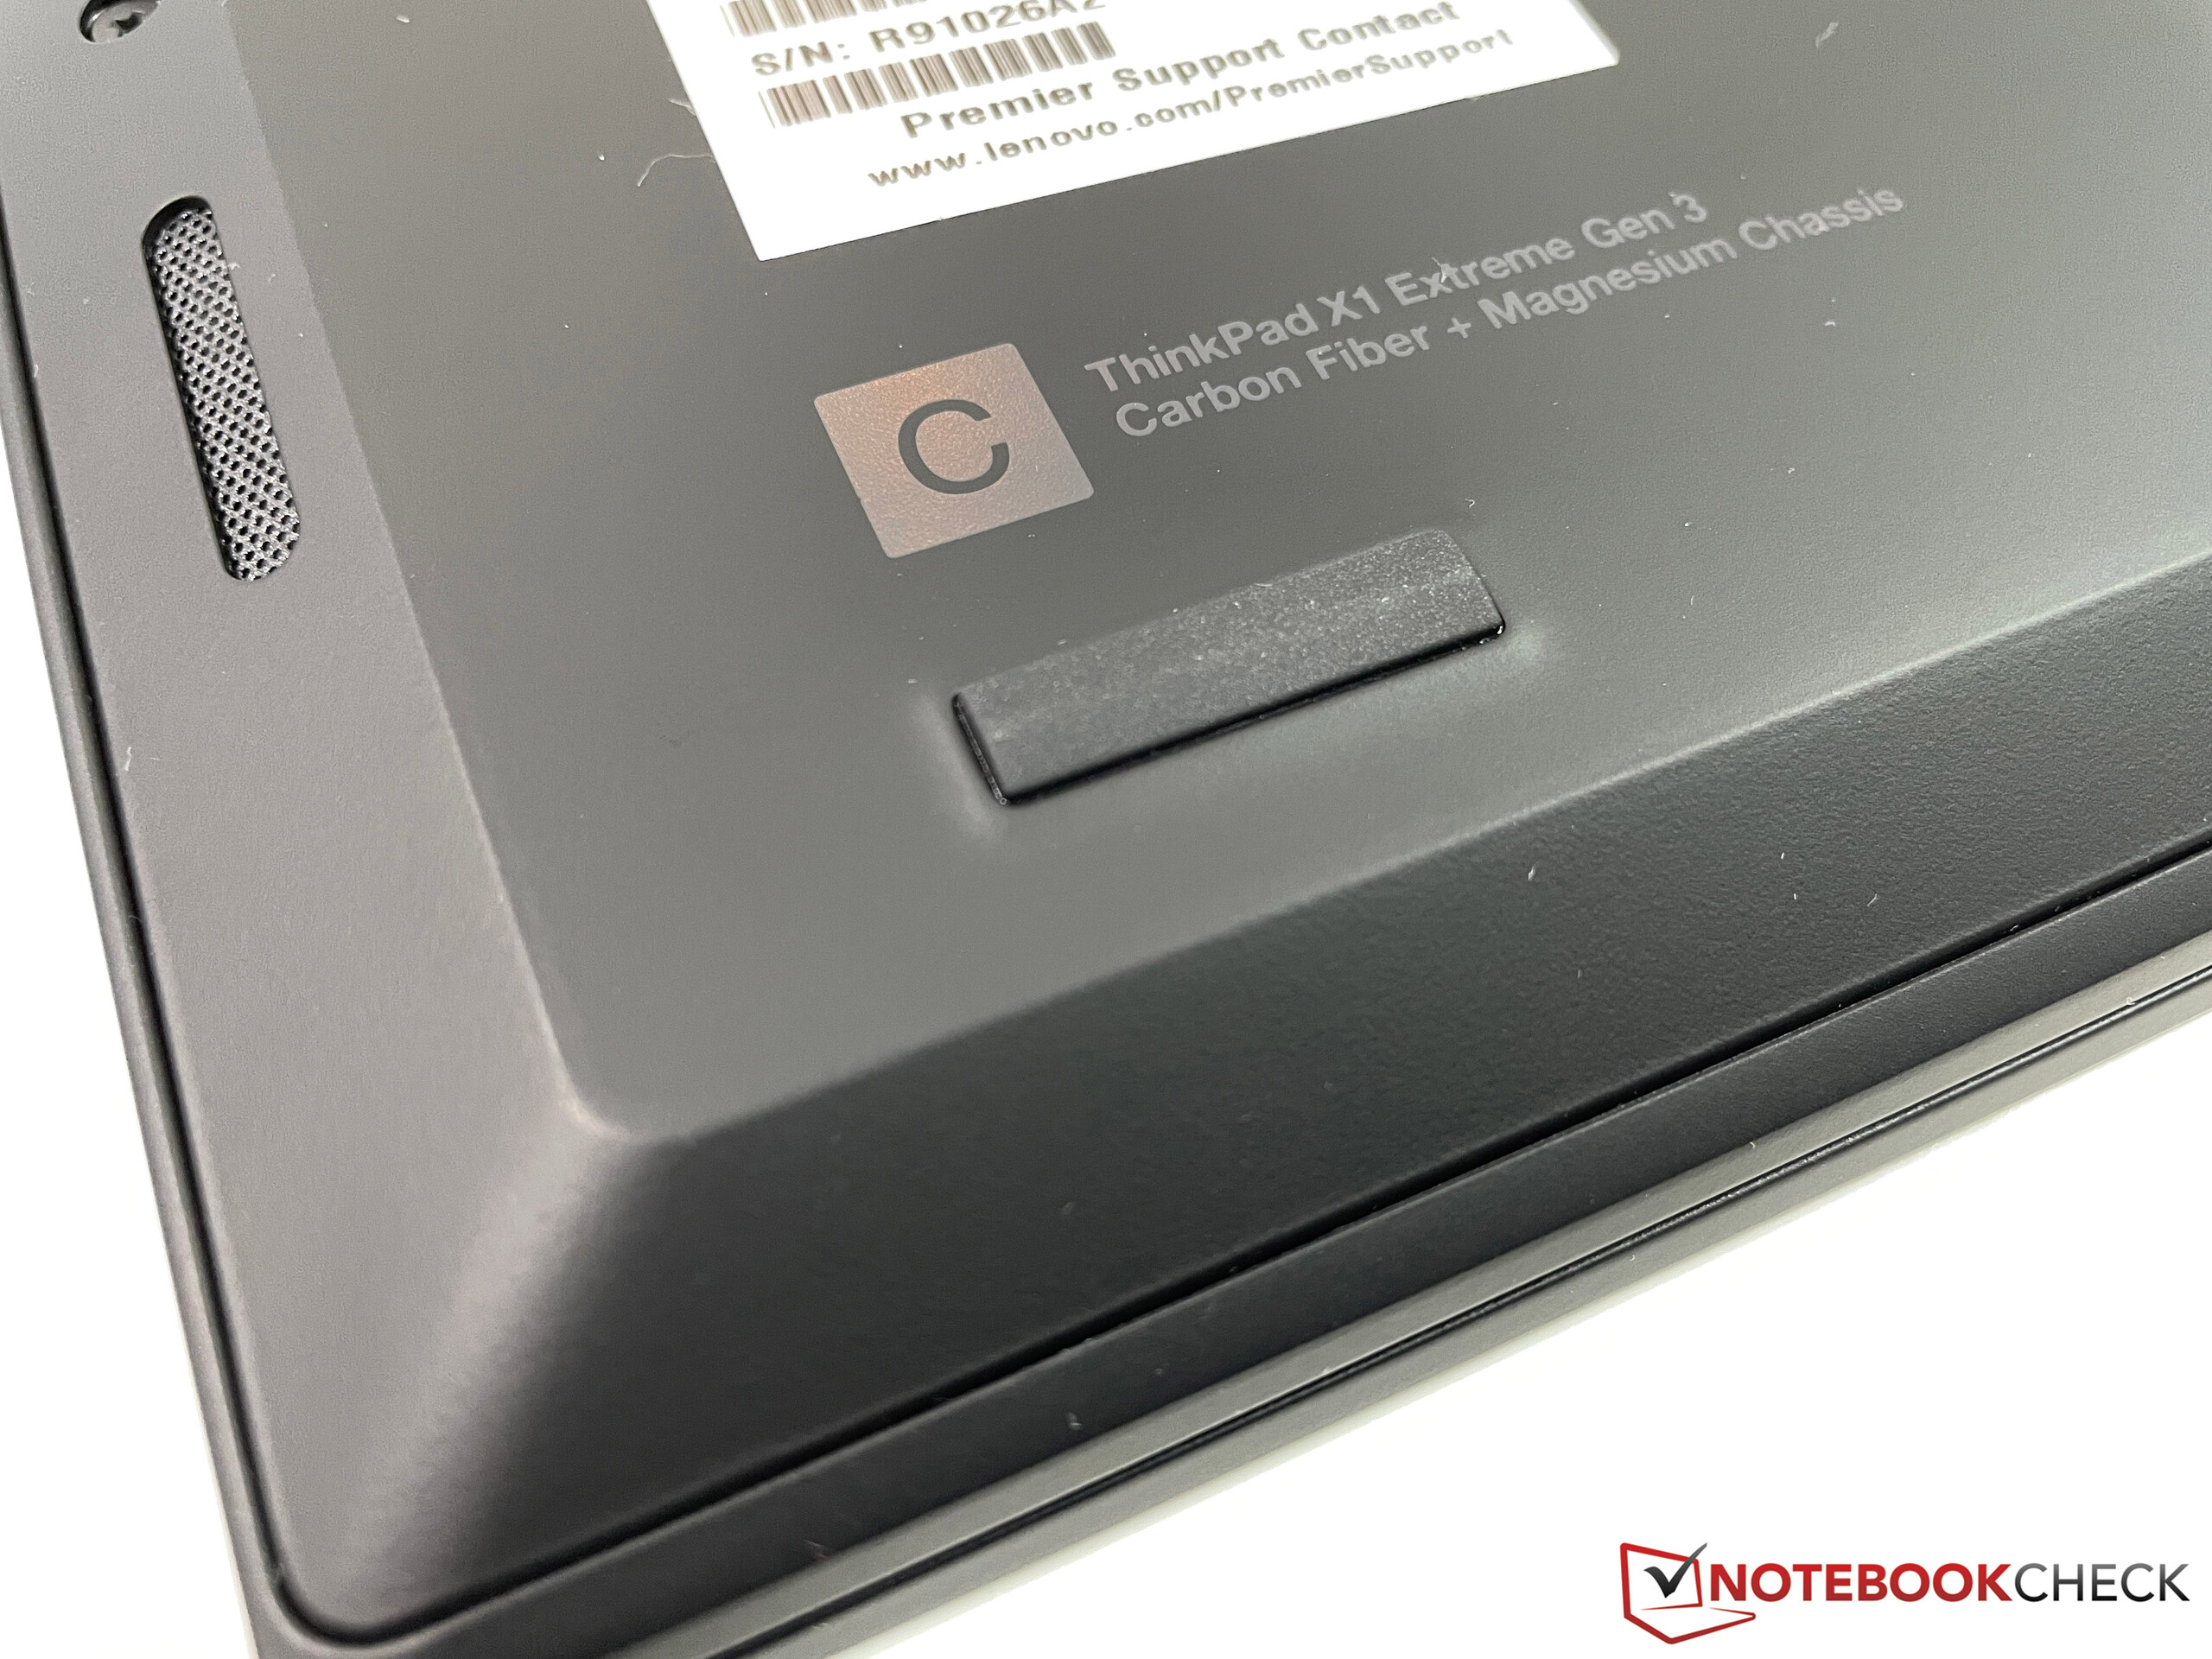
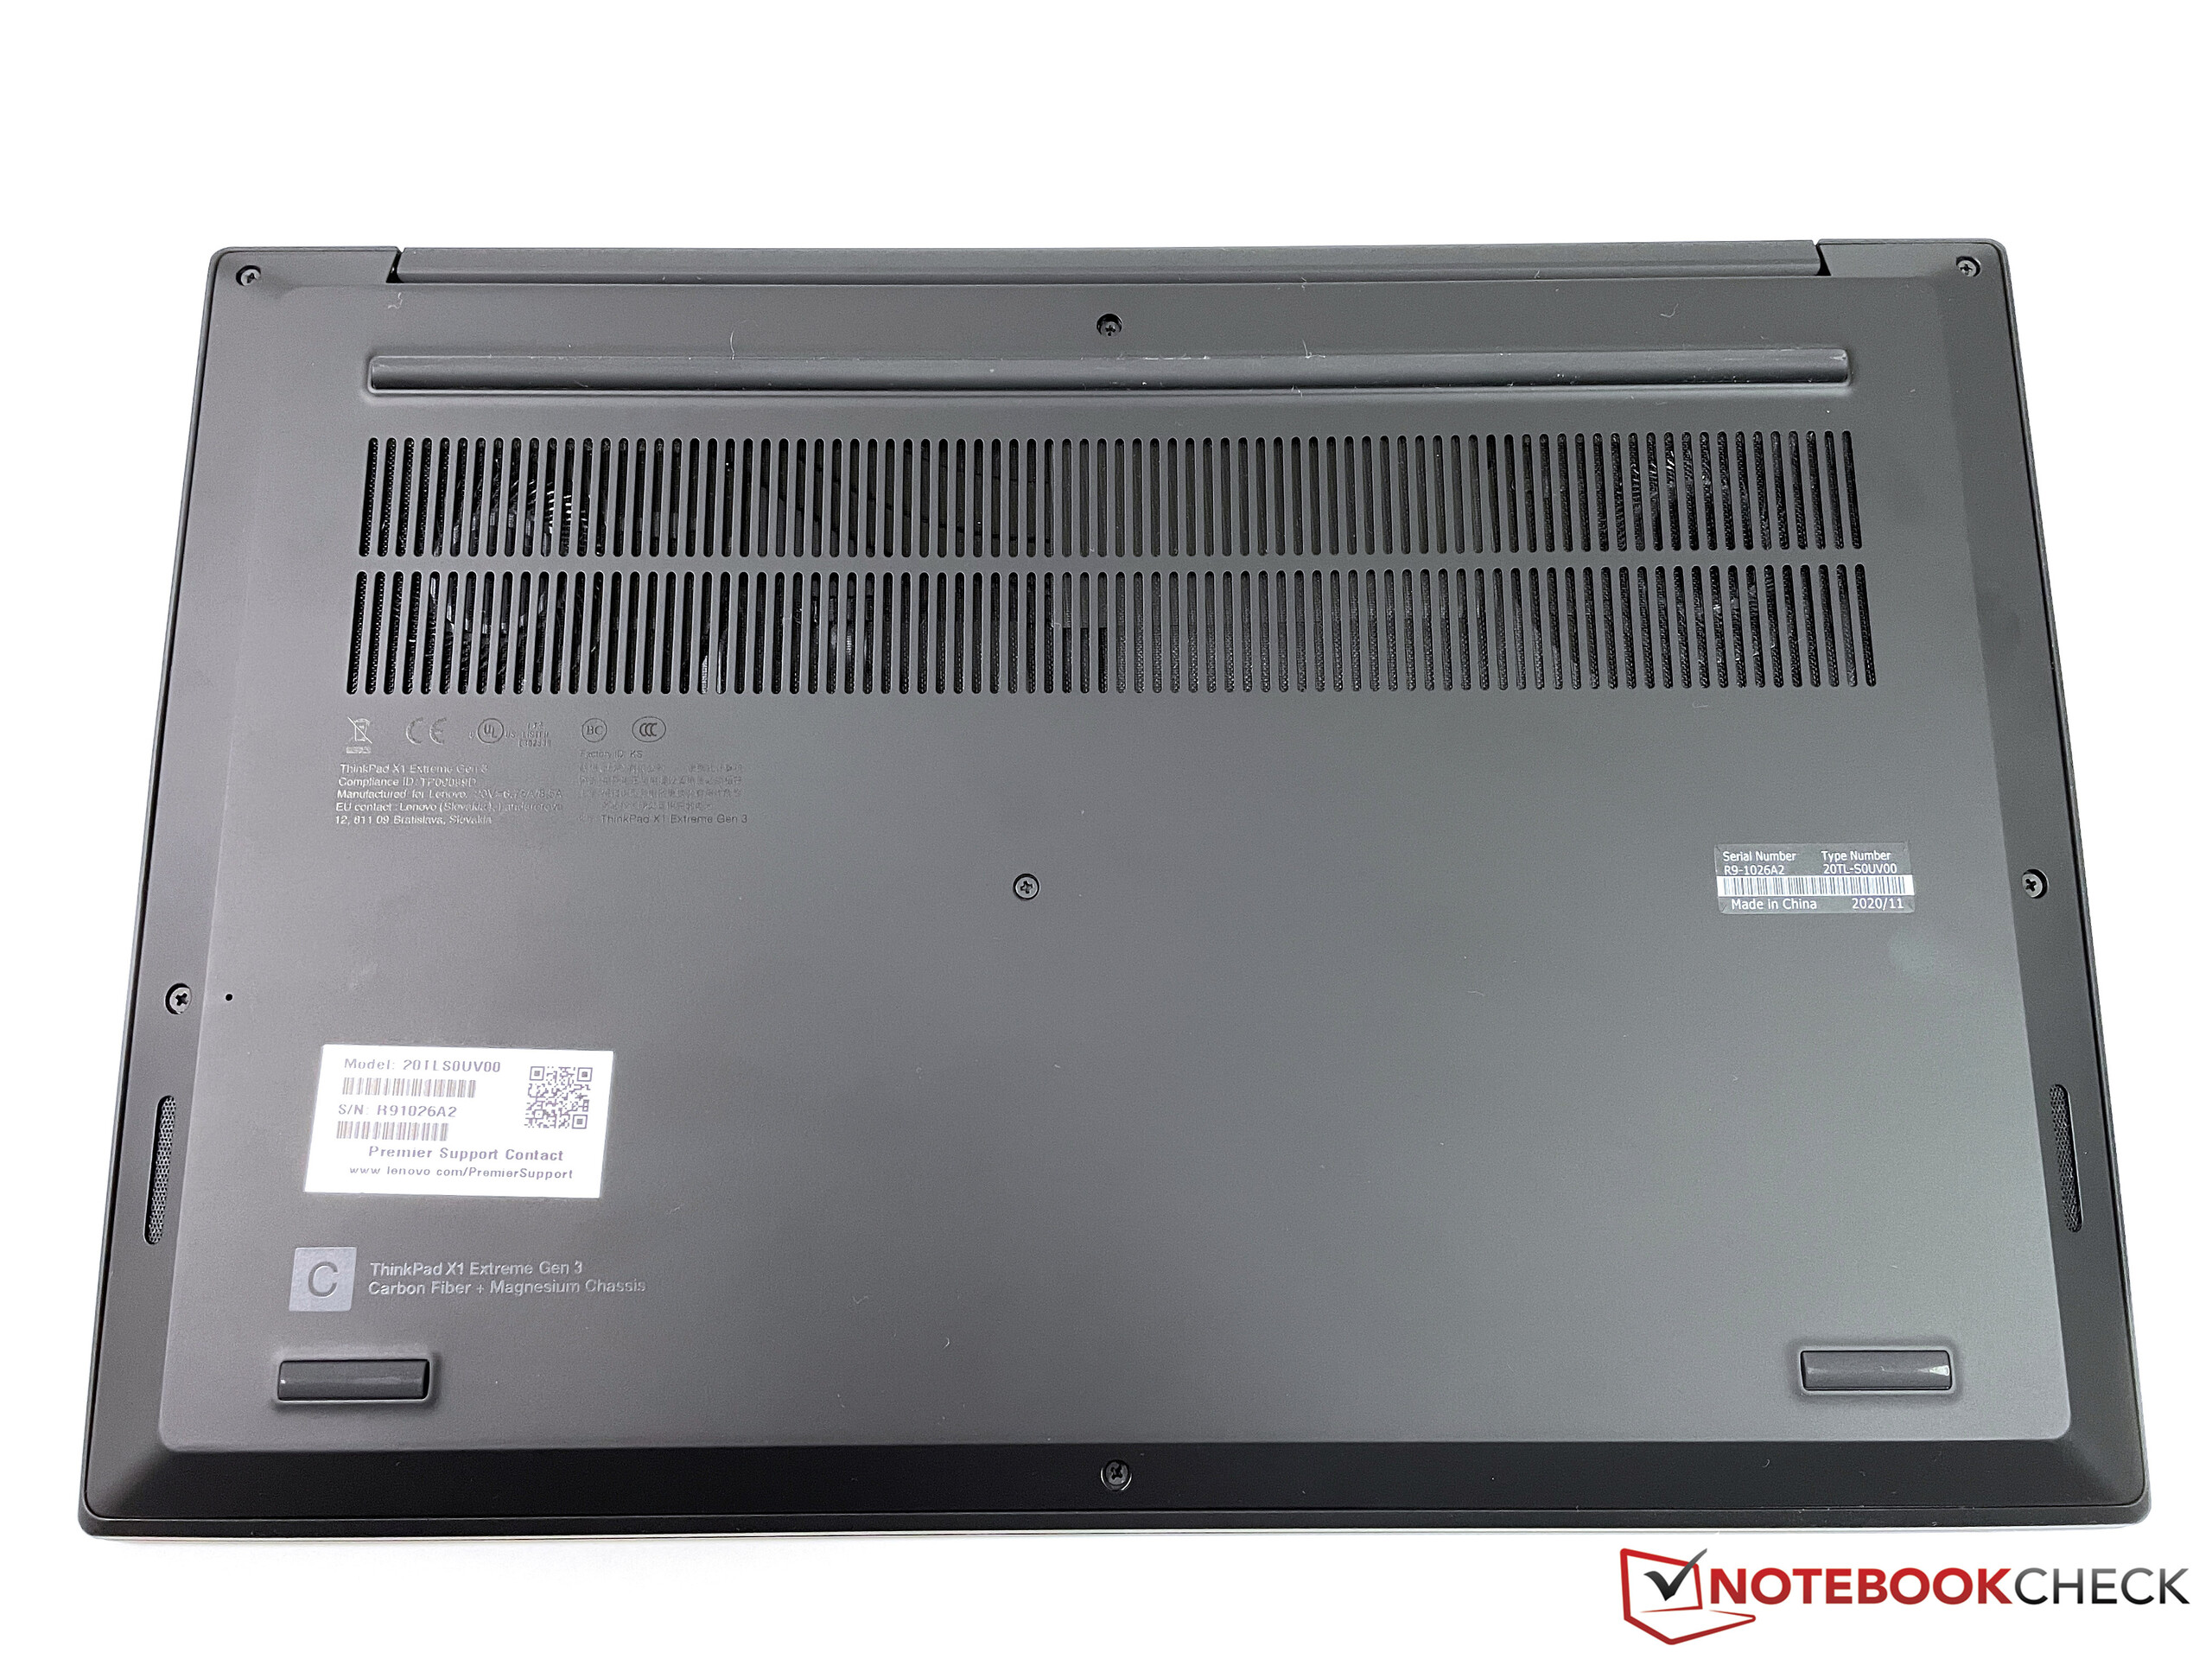
Case & Connectivity - ThinkPad is almost unchanged
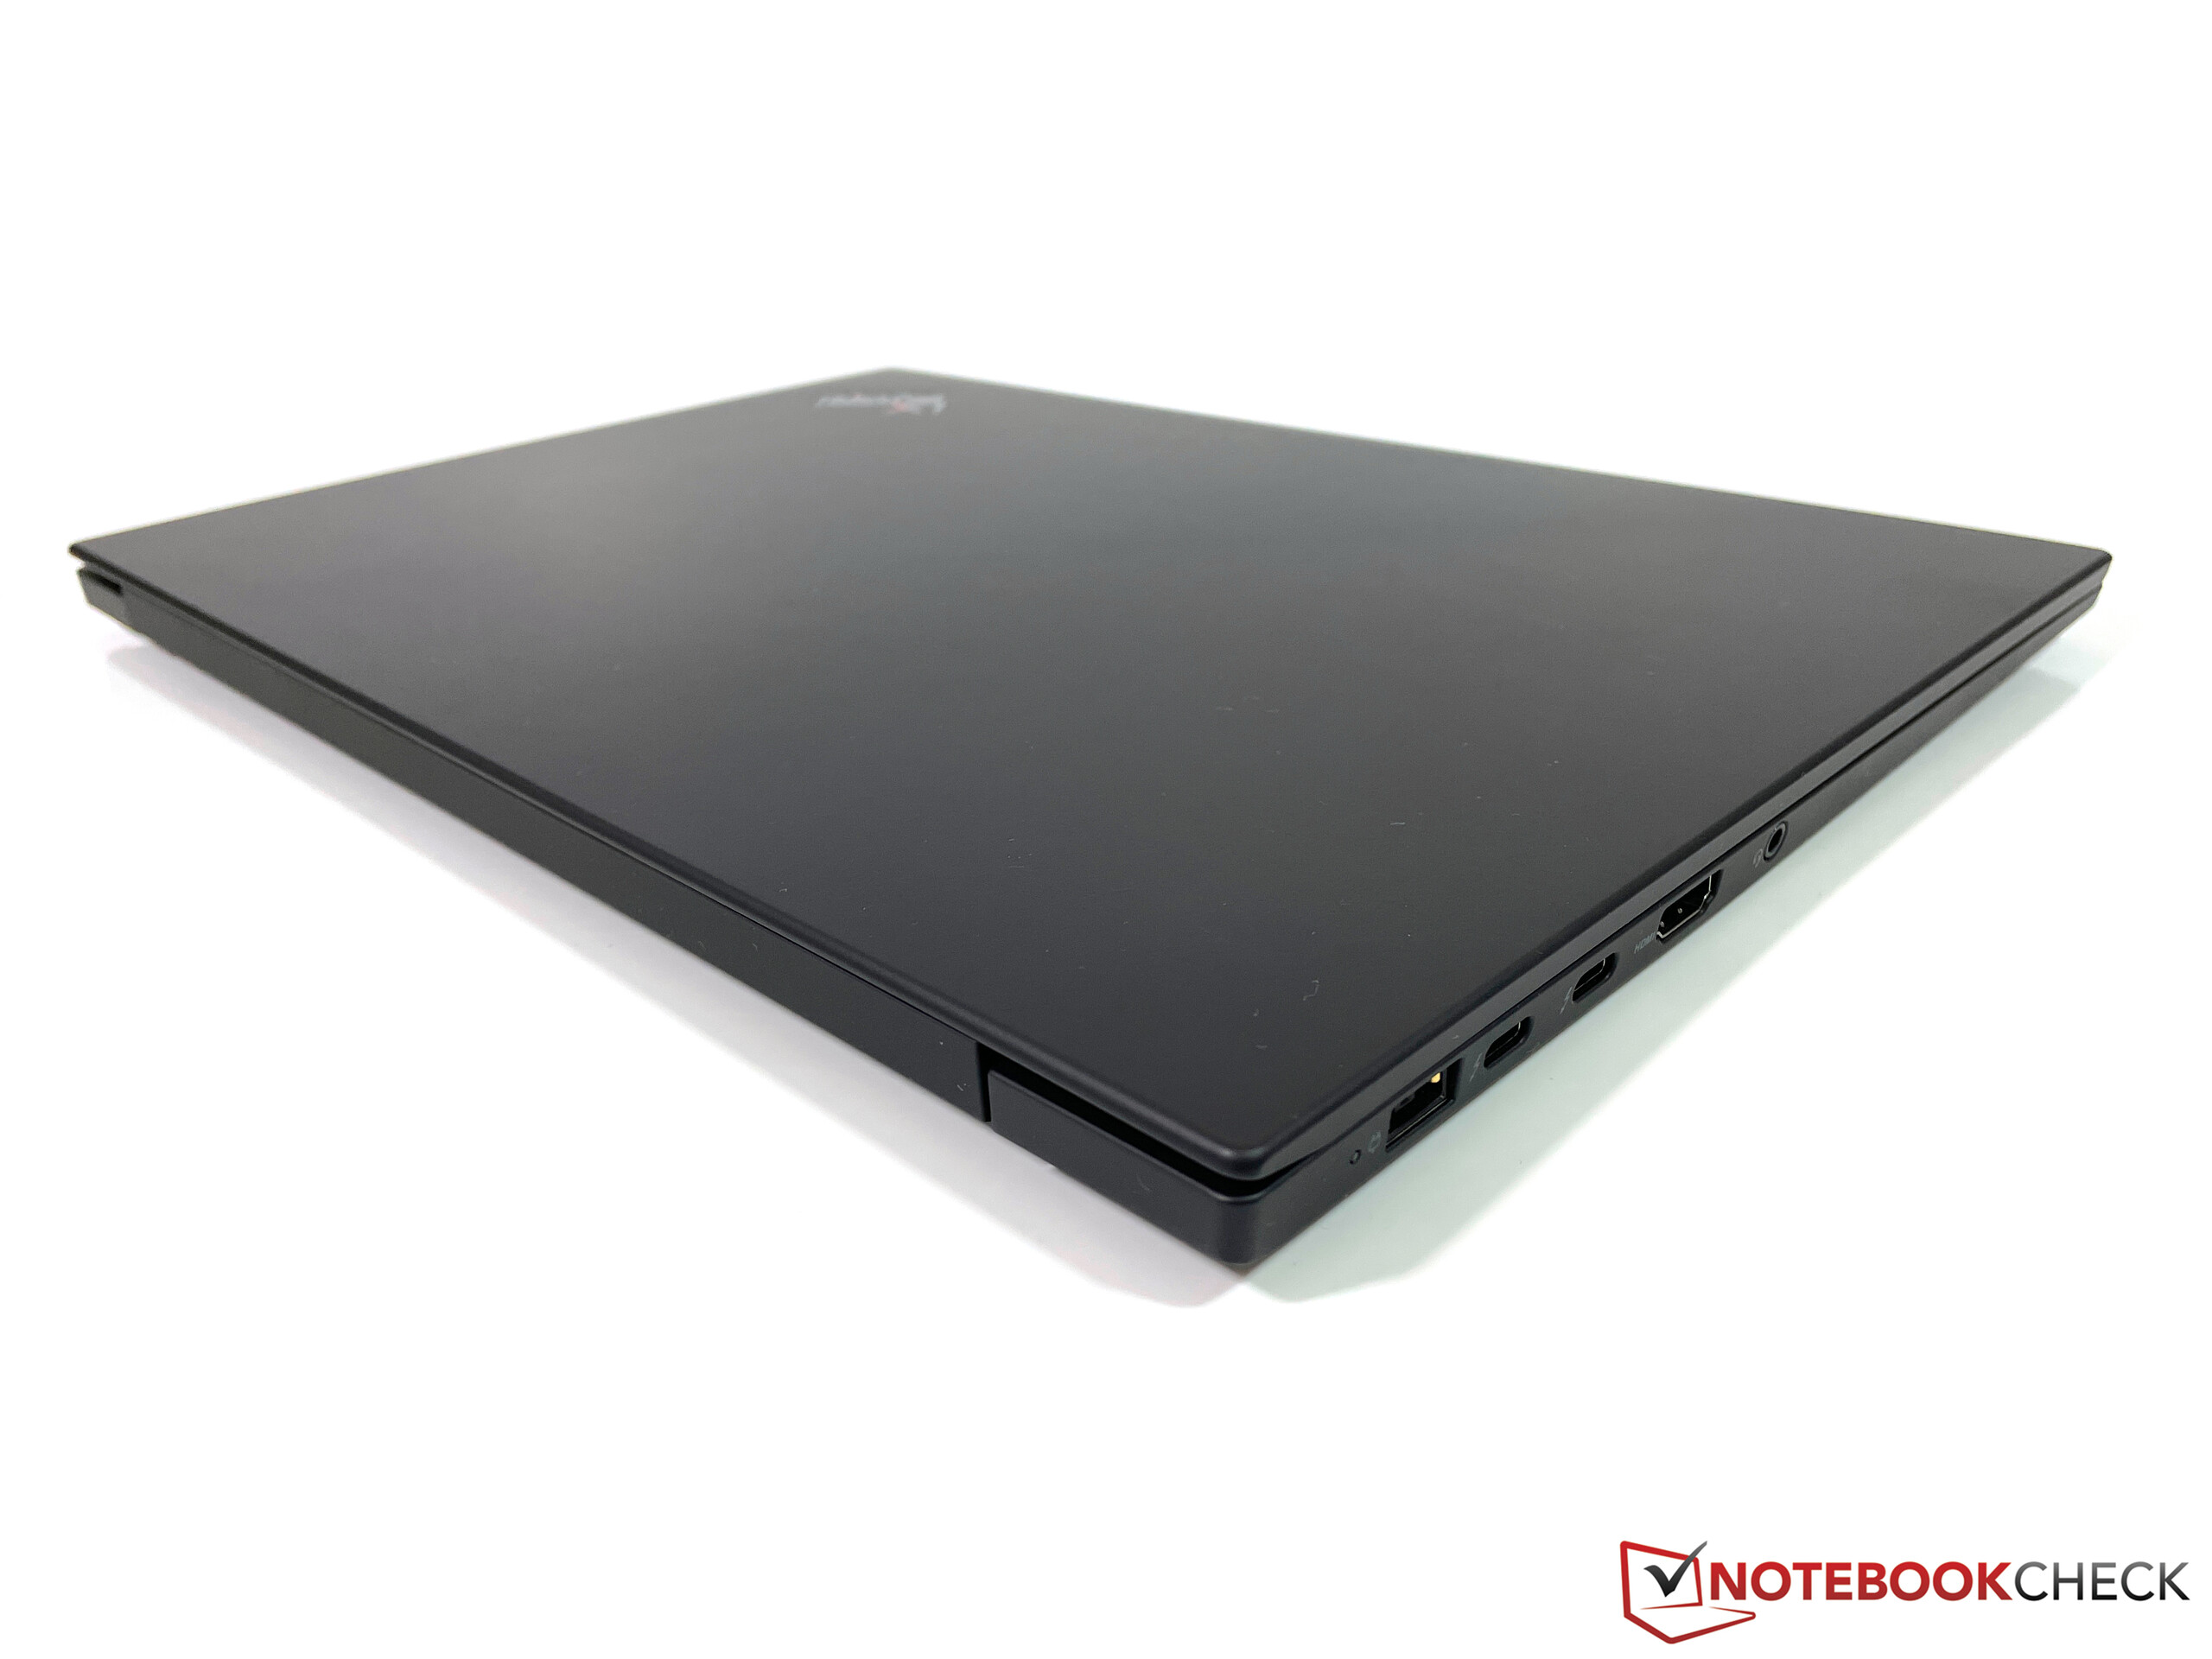
Compared to the second generation of the ThinkPad X1 Extreme there are only differences in terms of connectivity. The notebook is now available with LTE, but you must select it when you buy the device, because the X1 Extreme Gen3 is not WWAN-ready (no antennas installed). The Mini-Ethernet port is gone and there is no dedicated LAN card anymore (Intel I219-V in the predecessor), but you get a USB-C to Ethernet adapter instead. The SmartCard reader was removed as well. The basic chassis construction did not change, however. If you go for a configuration with a 4K screen, you will get a lid with a carbon fiber pattern.


| SD Card Reader | |
| average JPG Copy Test (av. of 3 runs) | |
| Dell XPS 15 9500 Core i7 4K UHD (Toshiba Exceria Pro SDXC 64 GB UHS-II) | |
| Lenovo ThinkPad X1 Extreme 2019 20QV000WGE (Toshiba Exceria Pro SDXC 64 GB UHS-II) | |
| Average of class Multimedia (23 - 531, n=43, last 2 years) | |
| Lenovo ThinkPad X1 Extreme Gen3-20TLS0UV00 (Toshiba Exceria Pro SDXC 64 GB UHS-II) | |
| Asus ZenBook UX535-M01440 (Toshiba Exceria Pro M501 microSDXC 64GB) | |
| maximum AS SSD Seq Read Test (1GB) | |
| Lenovo ThinkPad X1 Extreme Gen3-20TLS0UV00 (Toshiba Exceria Pro SDXC 64 GB UHS-II) | |
| Lenovo ThinkPad X1 Extreme 2019 20QV000WGE (Toshiba Exceria Pro SDXC 64 GB UHS-II) | |
| Dell XPS 15 9500 Core i7 4K UHD (Toshiba Exceria Pro SDXC 64 GB UHS-II) | |
| Average of class Multimedia (27.9 - 1455, n=42, last 2 years) | |
| Asus ZenBook UX535-M01440 (Toshiba Exceria Pro M501 microSDXC 64GB) | |


Display - X1 Extreme with matte 1080p screen


The ThinkPad X1 Extreme is still available with different panel options. In addition to the matte 1080p screen of our review unit, you can also get a 4K model or even a 4K OLED panel. We expect the switch to 16:10 panels for the next model, so we still have to live with the 16:9 options.
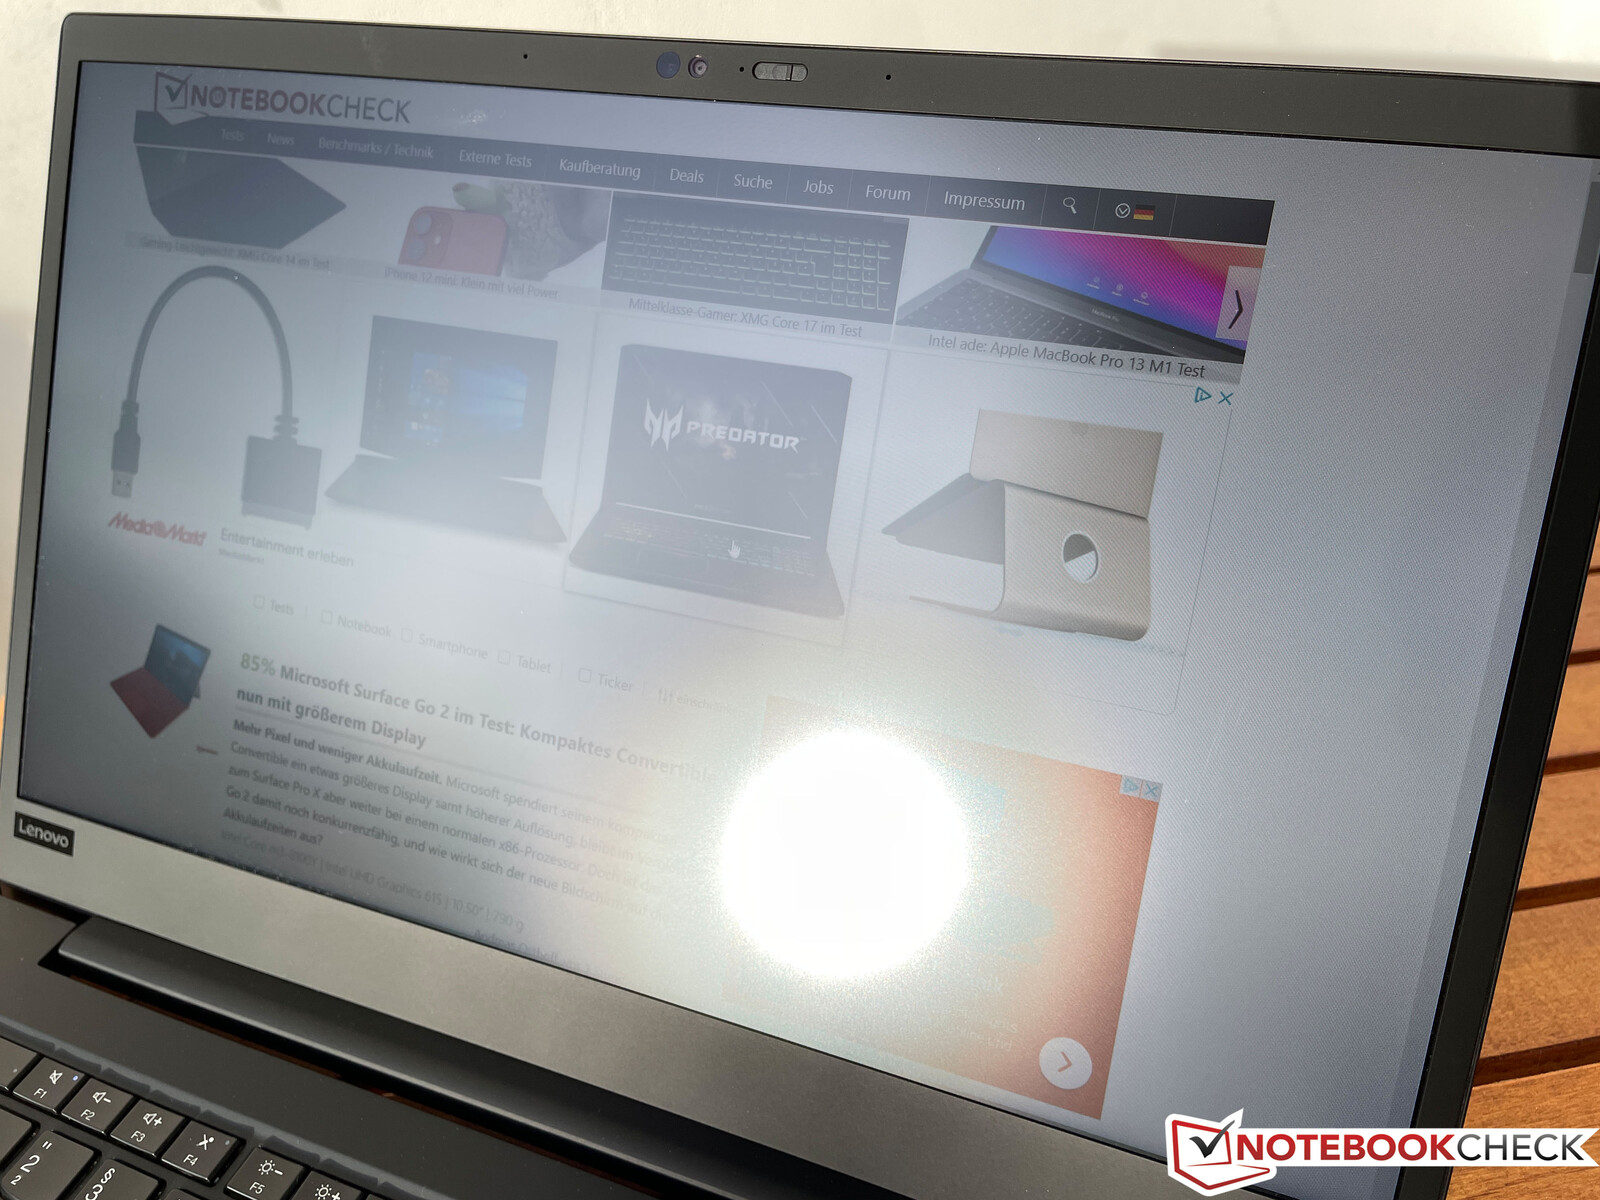
The subjective picture quality of the 1080p screen is good, and even bright areas do not appear grainy. Yes, 4K panels create even sharper images, but contents are still sufficiently crisp here and you will not have any scaling issues with Windows.
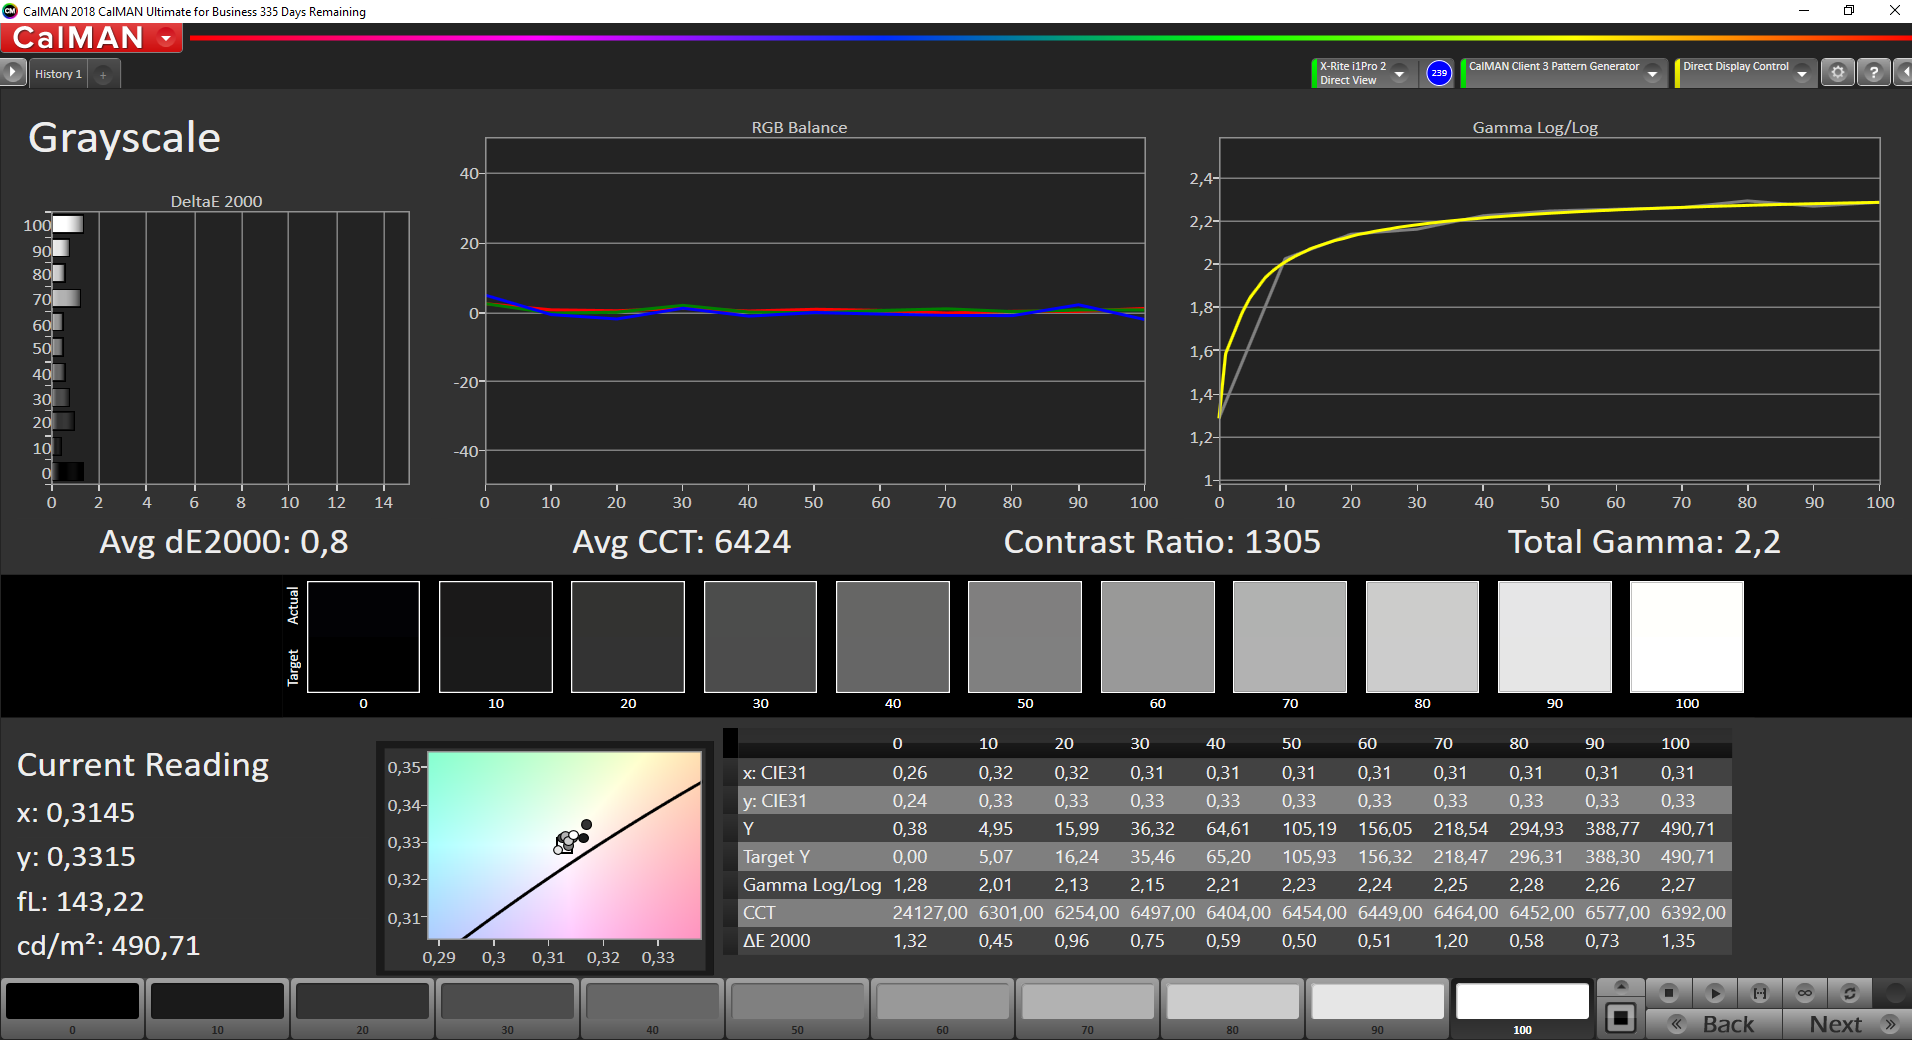
The average brightness is above 500 cd/m² and even surpasses the 4K screen we reviewed on the 2019 model. The black value is a bit high at 0.38, but the contrast ratio is still good at more than 1300:1. You can see backlight bleeding at the edges on a completely black picture, but this is not a big issue in practice. We also determined PWM at a brightness of 50 % or lower, but the frequency is very high at 26 kHz and should not cause any problems.
| |||||||||||||||||||||||||
Brightness Distribution: 88 %
Center on Battery: 517 cd/m²
Contrast: 1363:1 (Black: 0.38 cd/m²)
ΔE ColorChecker Calman: 2.1 | ∀{0.5-29.43 Ø4.73}
calibrated: 1.3
ΔE Greyscale Calman: 2.7 | ∀{0.09-98 Ø4.97}
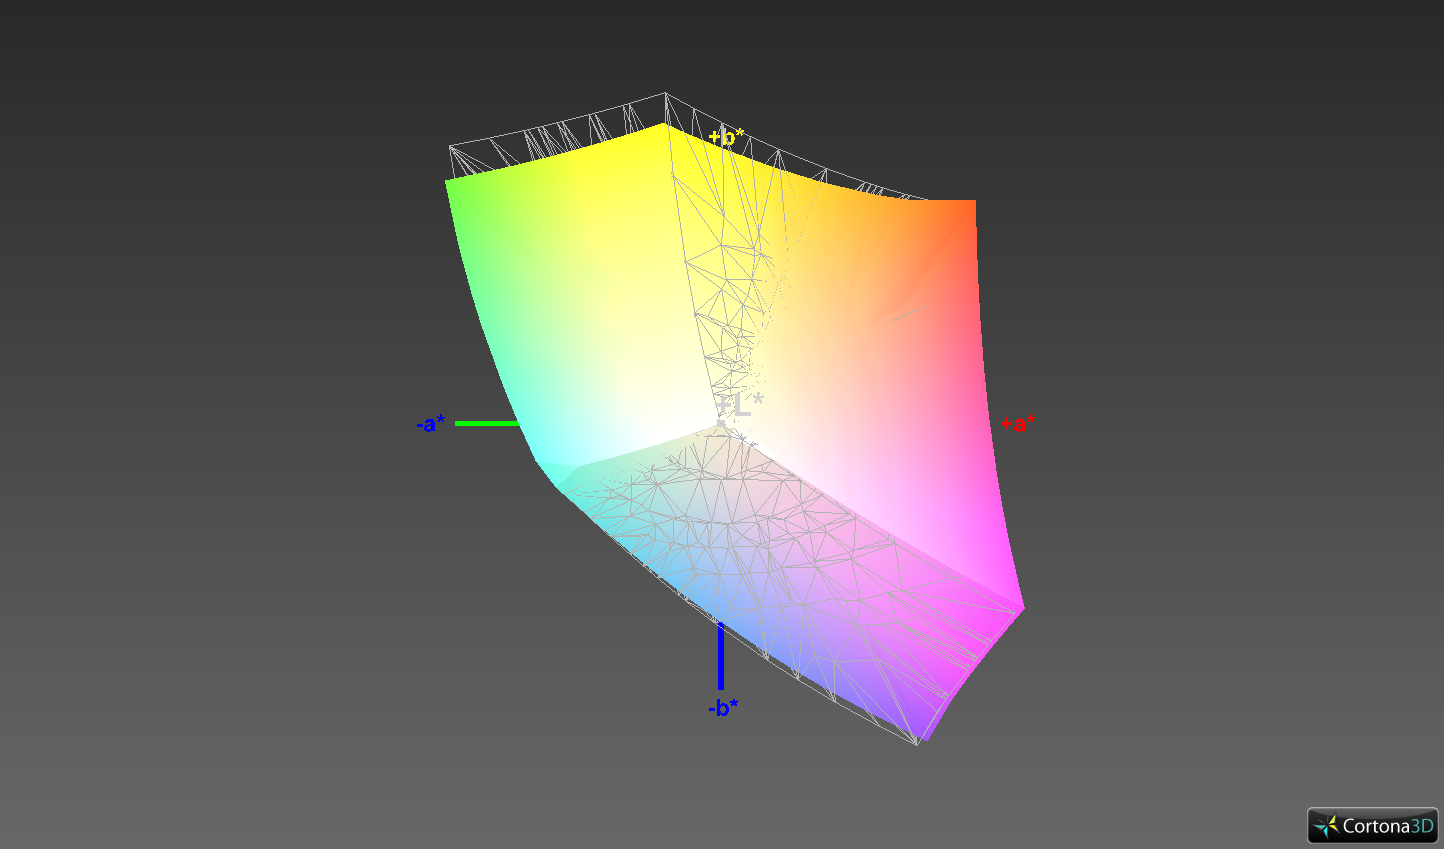
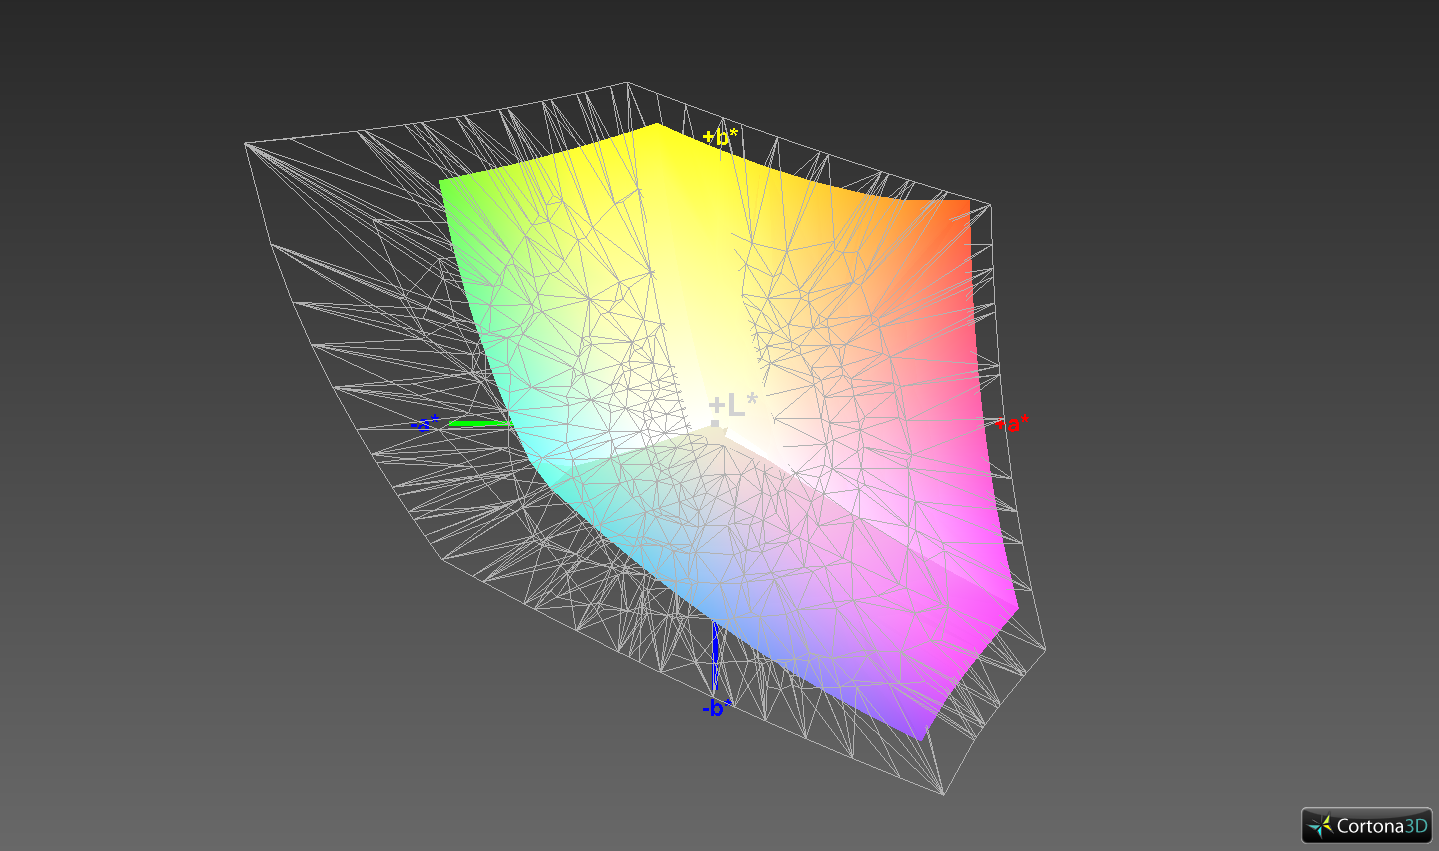
90.4% sRGB (Argyll 1.6.3 3D)
57.7% AdobeRGB 1998 (Argyll 1.6.3 3D)
62.2% AdobeRGB 1998 (Argyll 3D)
89.9% sRGB (Argyll 3D)
61% Display P3 (Argyll 3D)
Gamma: 2.35
CCT: 7042 K
| Lenovo ThinkPad X1 Extreme Gen3-20TLS0UV00 N156HCE-GN1, IPS, 1920x1080, 15.6" | Dell XPS 15 9500 Core i7 4K UHD Sharp LQ156R1, IPS, 3840x2400, 15.6" | Apple MacBook Pro 16 2019 i9 5500M APPA044, IPS, 3072x1920, 16" | Asus ZenBook UX535-M01440 BOE0866, IPS, 3840x2160, 15.6" | Schenker Vision 15 BOE08F5, IPS, 1920x1080, 15.6" | Lenovo ThinkPad X1 Extreme 2019 20QV000WGE NE156QUM-N66, IPS, 3840x2160, 15.6" | |
|---|---|---|---|---|---|---|
| Display | 39% | 12% | 11% | 33% | ||
| Display P3 Coverage (%) | 61 | 89.7 47% | 68.8 13% | 69.3 14% | 82 34% | |
| sRGB Coverage (%) | 89.9 | 100 11% | 99.5 11% | 94 5% | 99.1 10% | |
| AdobeRGB 1998 Coverage (%) | 62.2 | 99.8 60% | 70.1 13% | 70.8 14% | 96.9 56% | |
| Response Times | -55% | -56% | -4% | -77% | -37% | |
| Response Time Grey 50% / Grey 80% * (ms) | 33.6 ? | 54 ? -61% | 52.4 ? -56% | 34 ? -1% | 60 ? -79% | 46.4 ? -38% |
| Response Time Black / White * (ms) | 22.4 ? | 33.2 ? -48% | 34.9 ? -56% | 24 ? -7% | 39 ? -74% | 30.4 ? -36% |
| PWM Frequency (Hz) | 26040 ? | 131700 | ||||
| Screen | -29% | 7% | -7% | -18% | -31% | |
| Brightness middle (cd/m²) | 518 | 557.9 8% | 519 0% | 402 -22% | 478 -8% | 464 -10% |
| Brightness (cd/m²) | 513 | 541 5% | 477 -7% | 375 -27% | 462 -10% | 448 -13% |
| Brightness Distribution (%) | 88 | 91 3% | 86 -2% | 84 -5% | 94 7% | 90 2% |
| Black Level * (cd/m²) | 0.38 | 0.39 -3% | 0.39 -3% | 0.35 8% | 0.27 29% | 0.36 5% |
| Contrast (:1) | 1363 | 1431 5% | 1331 -2% | 1149 -16% | 1770 30% | 1289 -5% |
| Colorchecker dE 2000 * | 2.1 | 4.54 -116% | 2.28 -9% | 2.47 -18% | 3.2 -52% | 4.2 -100% |
| Colorchecker dE 2000 max. * | 4.5 | 7.92 -76% | 6.54 -45% | 4.32 4% | 8.4 -87% | 11.4 -153% |
| Colorchecker dE 2000 calibrated * | 1.3 | 3.82 -194% | 0.86 34% | 2.36 -82% | 2 -54% | 0.8 38% |
| Greyscale dE 2000 * | 2.7 | 3.2 -19% | 0.9 67% | 2.26 16% | 4.5 -67% | 7.2 -167% |
| Gamma | 2.35 94% | 1.99 111% | 2145 0% | 2.49 88% | 2.16 102% | 2.17 101% |
| CCT | 7042 92% | 6451 101% | 6572 99% | 6285 103% | 6788 96% | 6345 102% |
| Color Space (Percent of AdobeRGB 1998) (%) | 57.7 | 89.5 55% | 78 35% | 99 72% | 63.1 9% | 85.2 48% |
| Color Space (Percent of sRGB) (%) | 90.4 | 100 11% | 93.6 4% | 99 10% | ||
| Total Average (Program / Settings) | -15% /
-20% | -25% /
-4% | 0% /
-3% | -28% /
-20% | -12% /
-20% |
* ... smaller is better
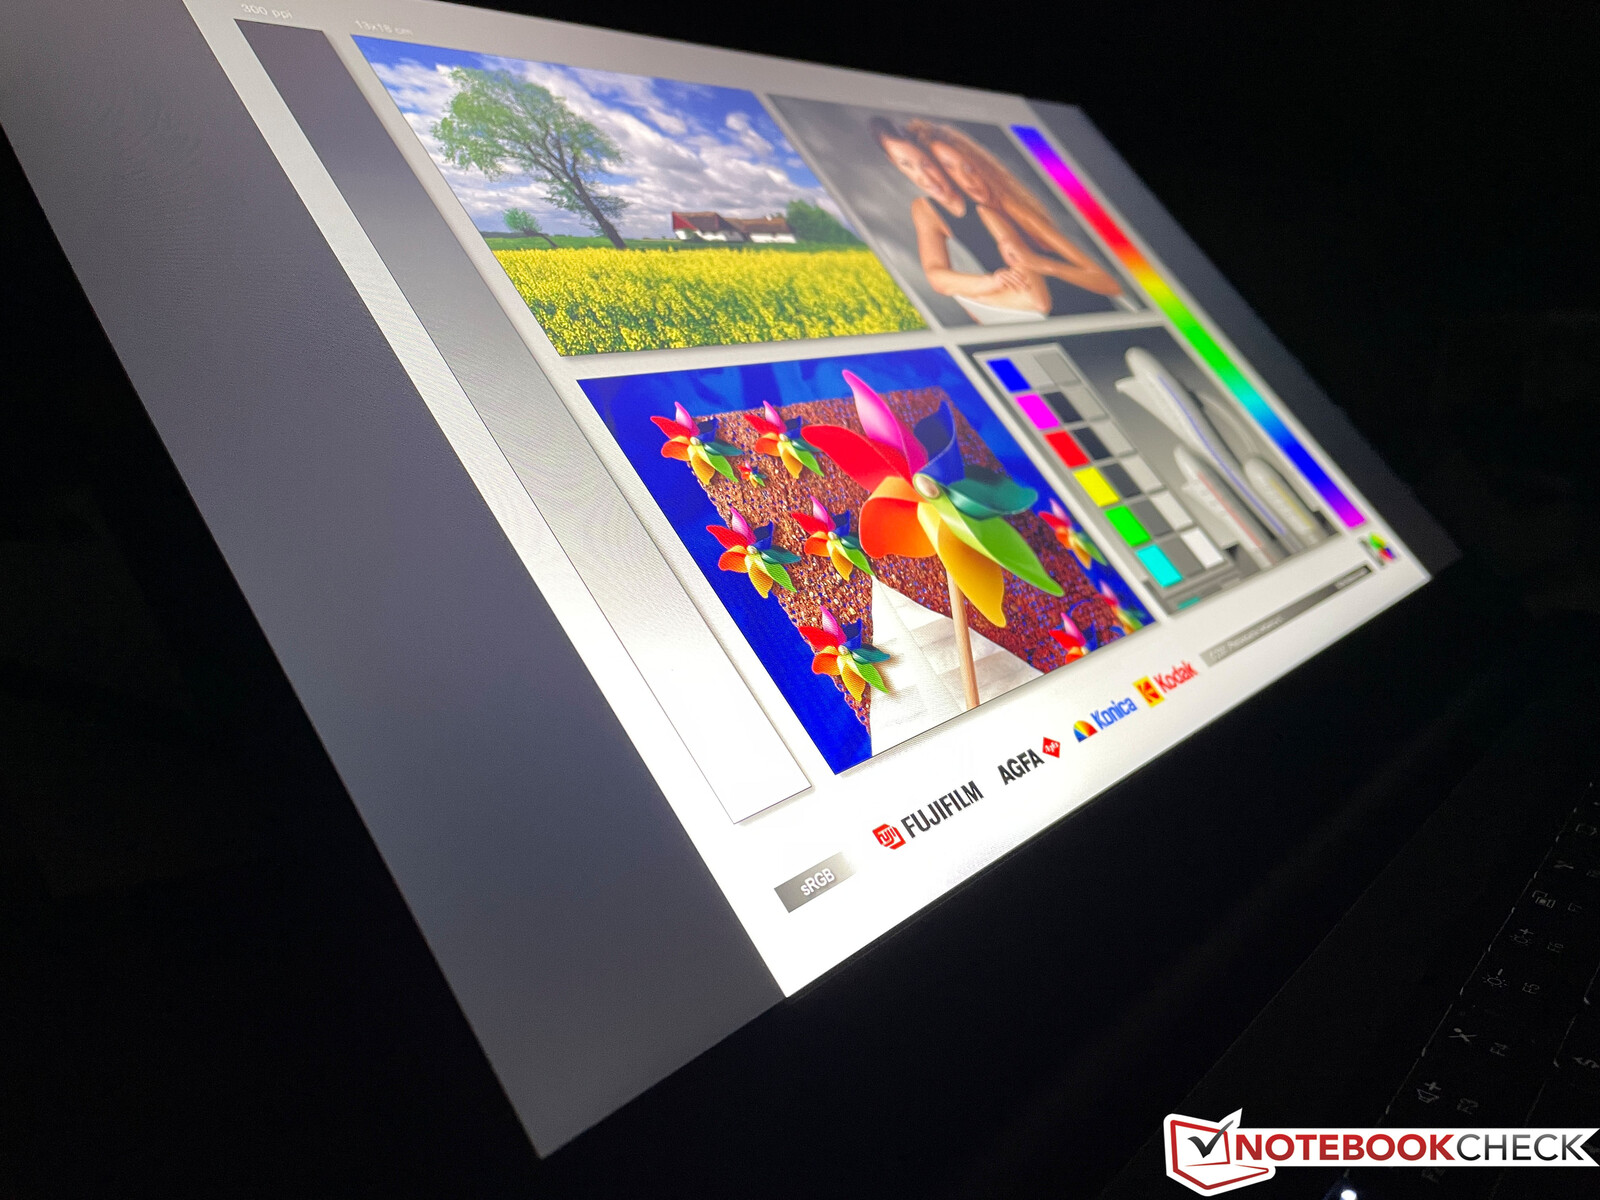
The calibration out of the box is already pretty decent, because the grayscale only shows a small color cast towards blue in combination with a slightly cool color temperature. You will not notice it unless you compare it with a calibrated screen though. The color deviations are also okay, only red surpasses the important mark of 3.
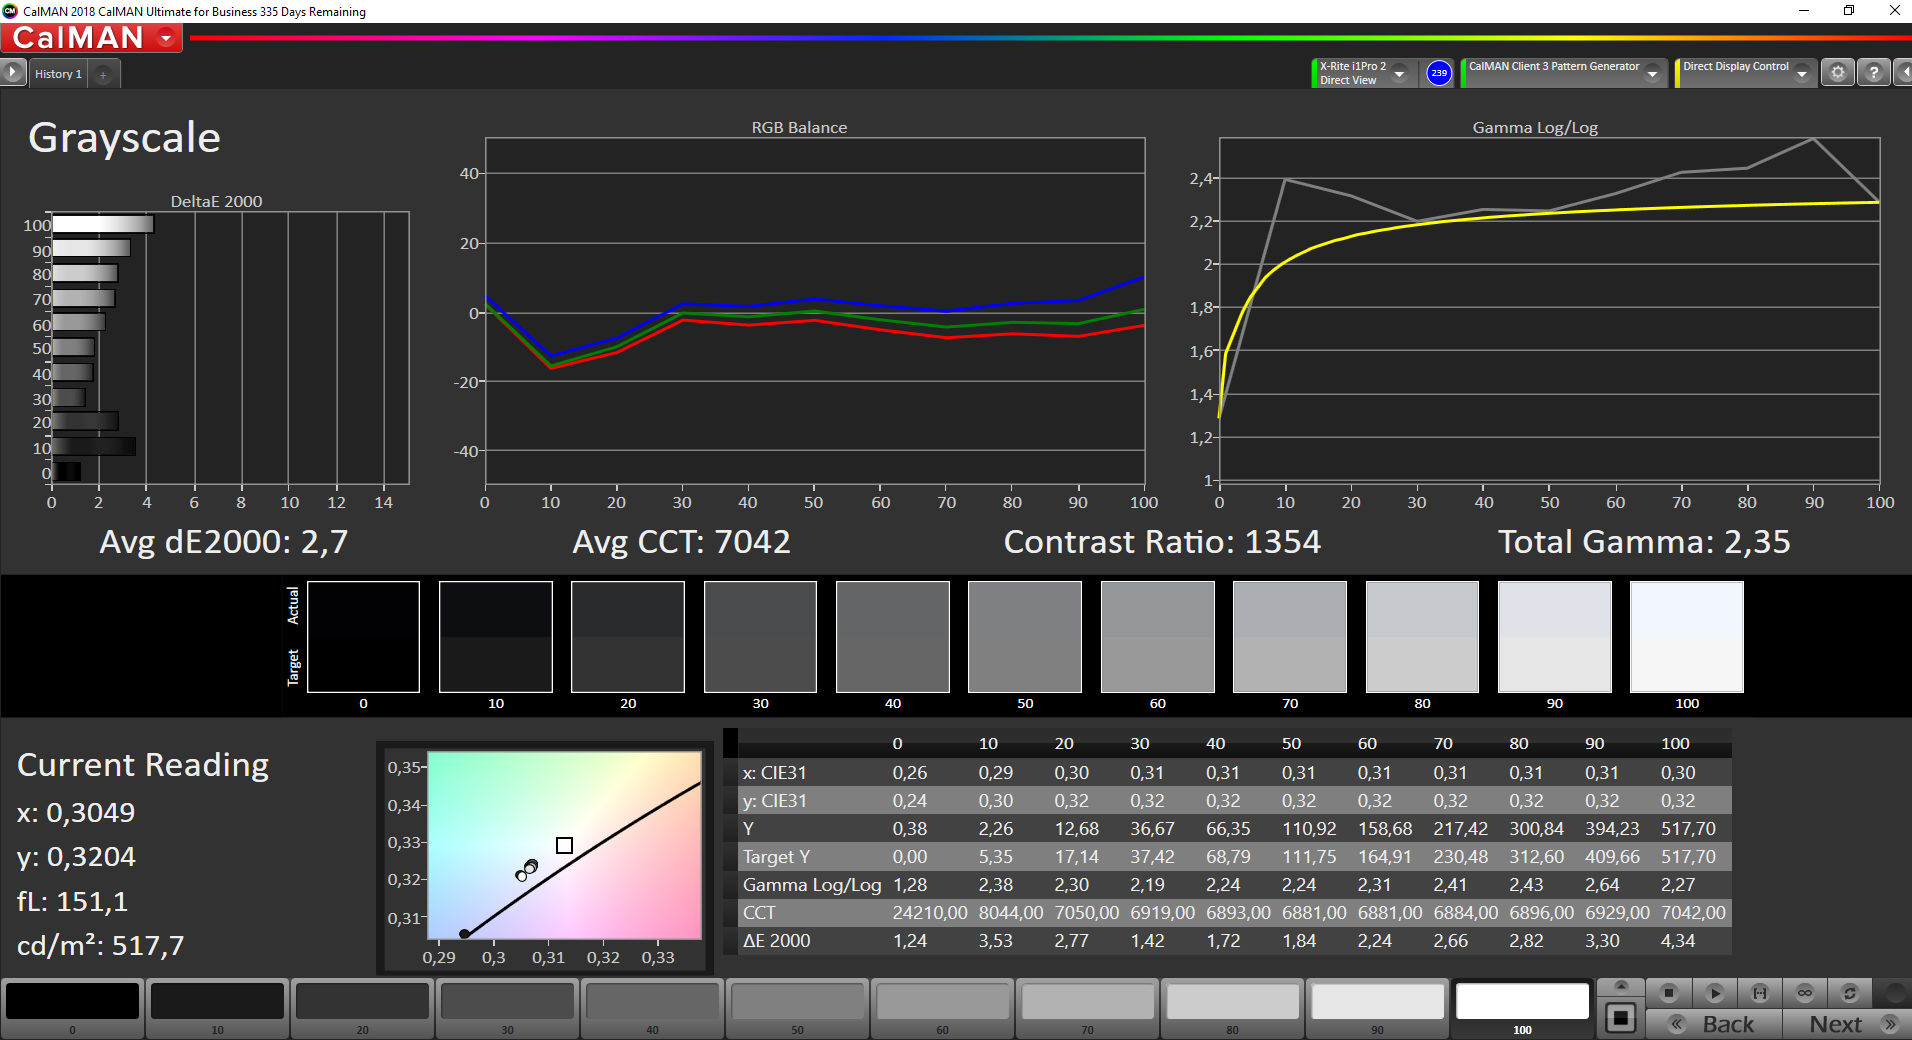
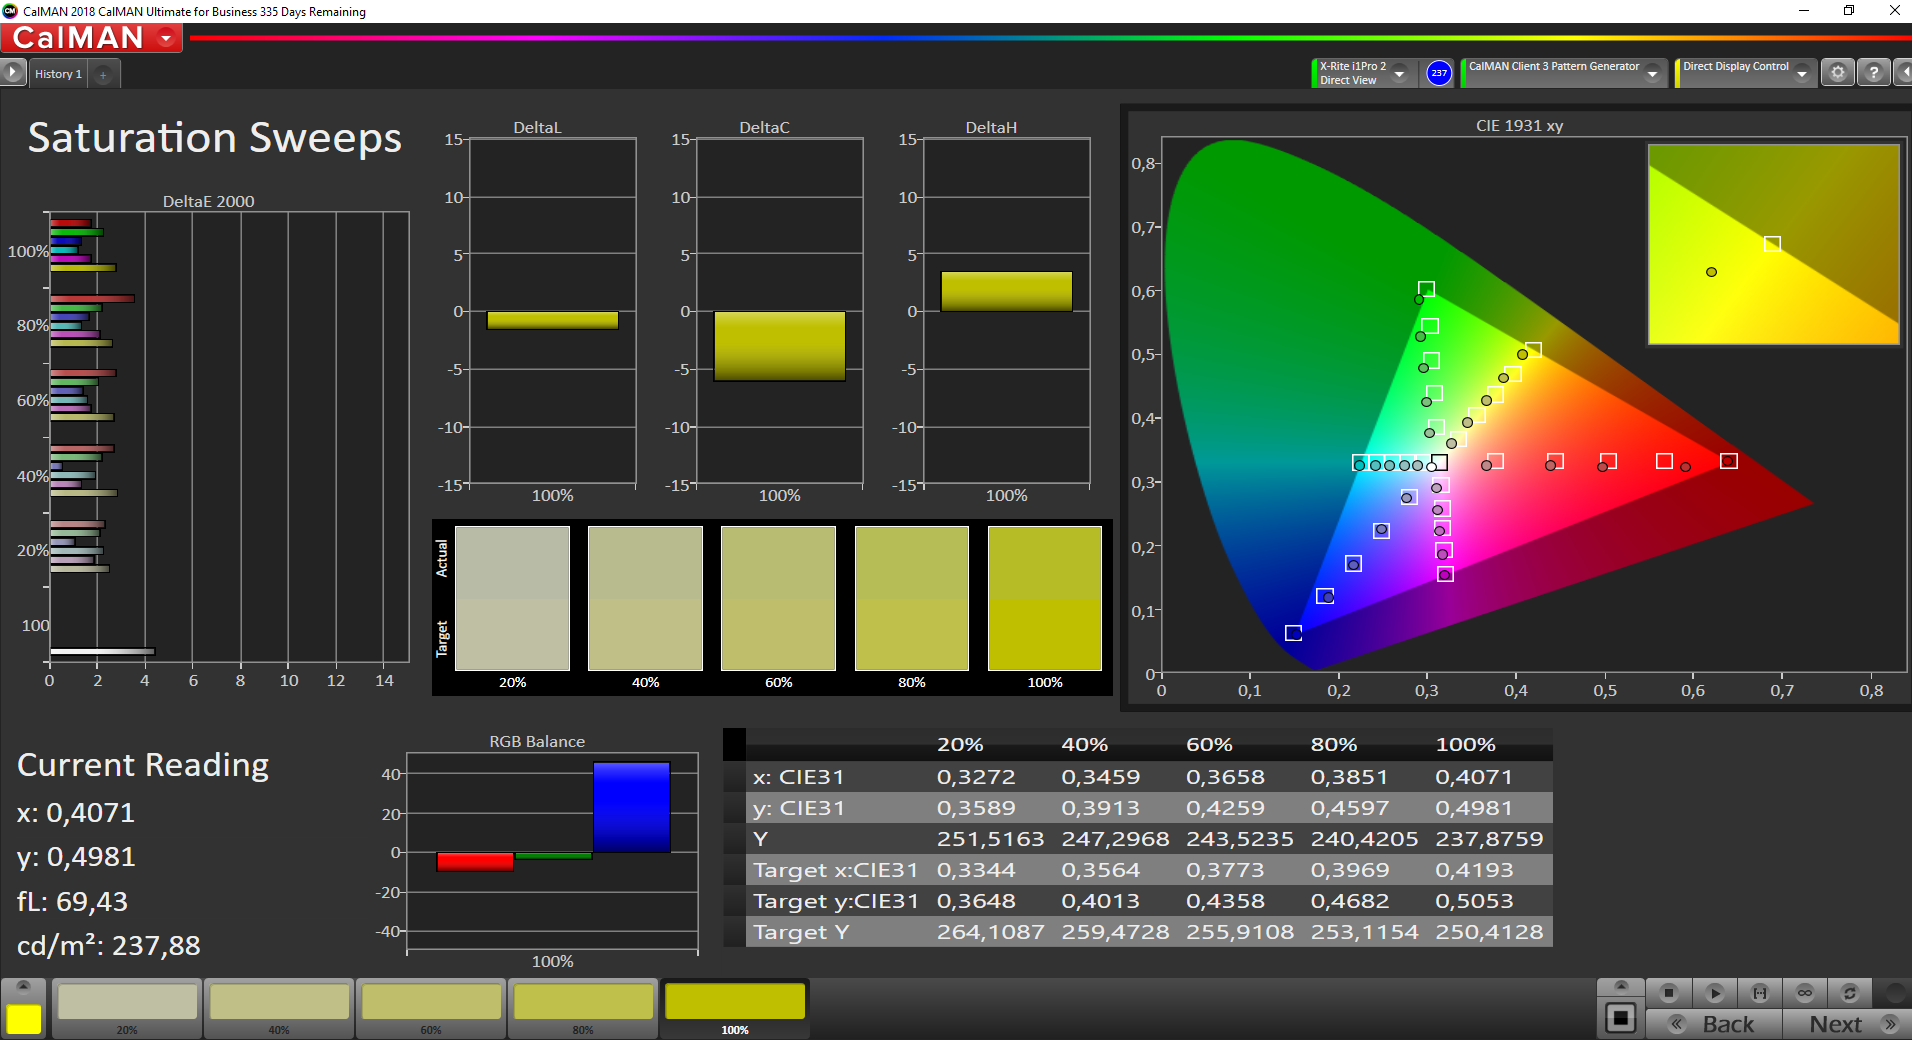
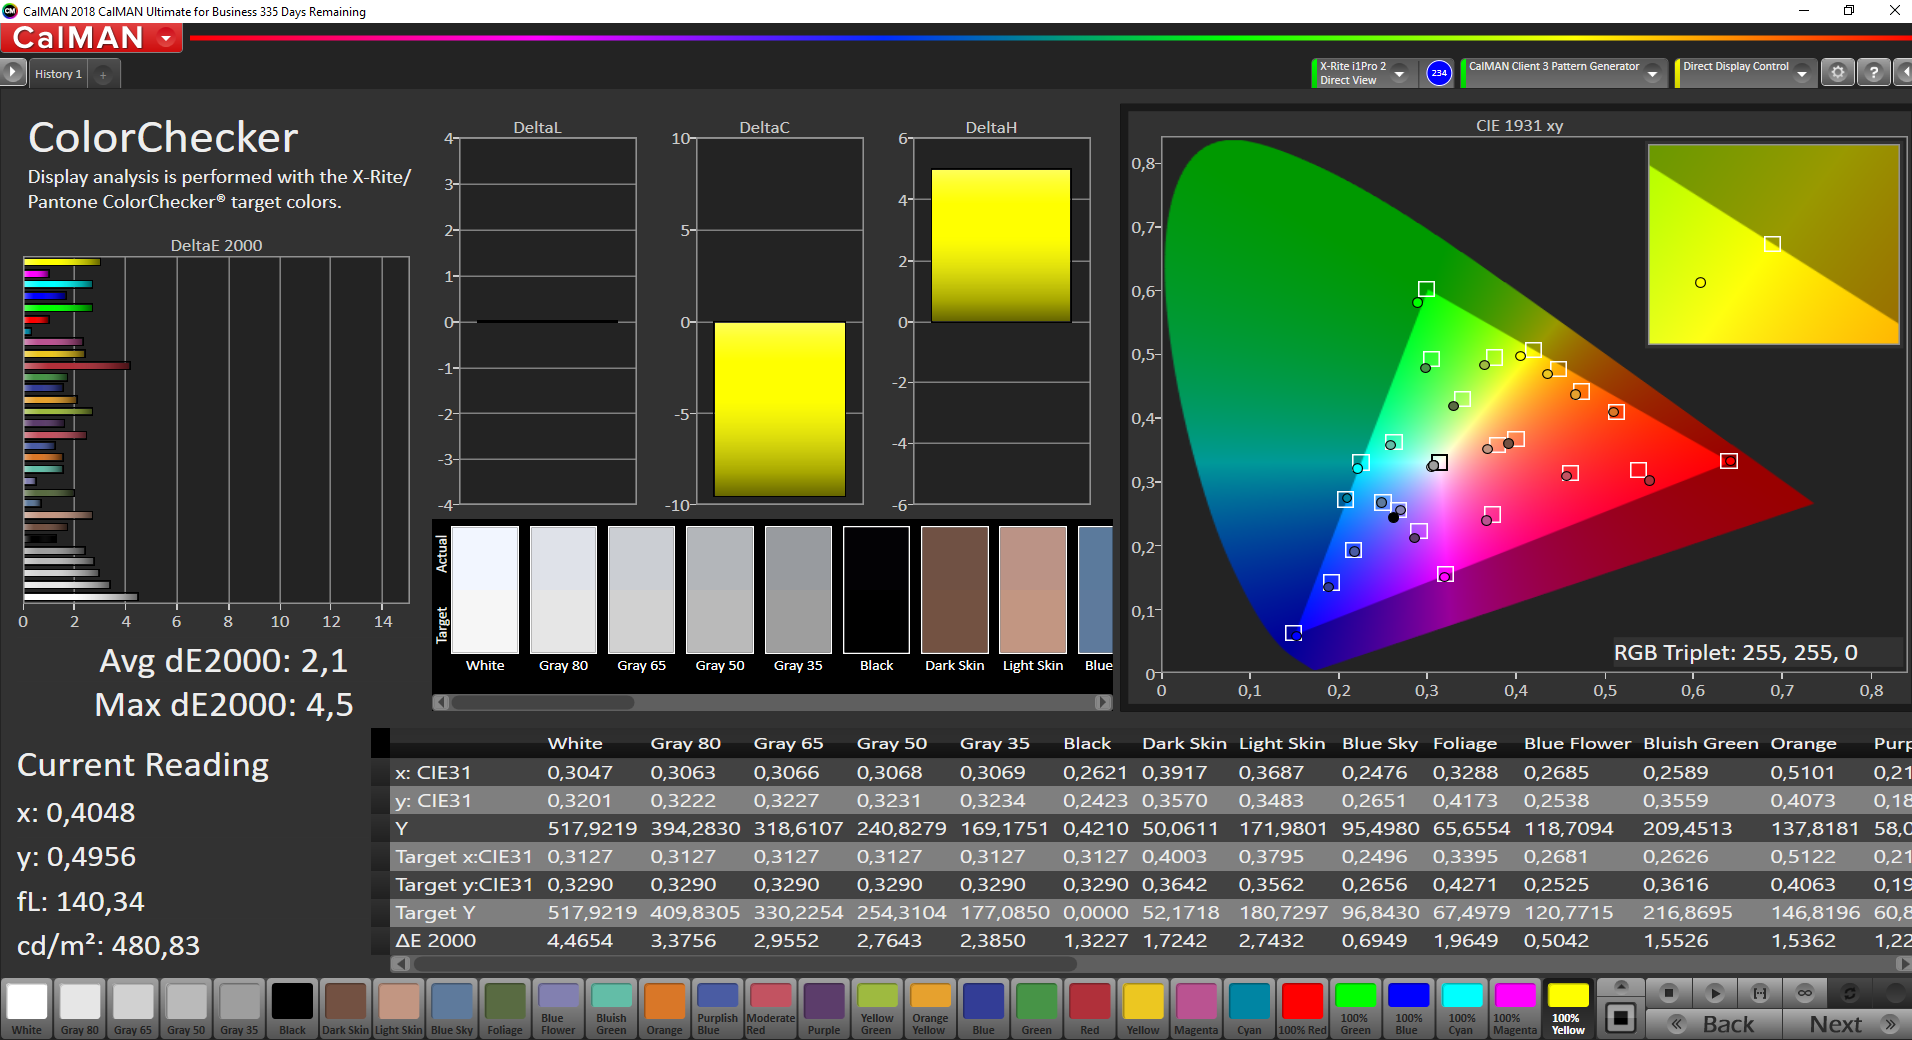
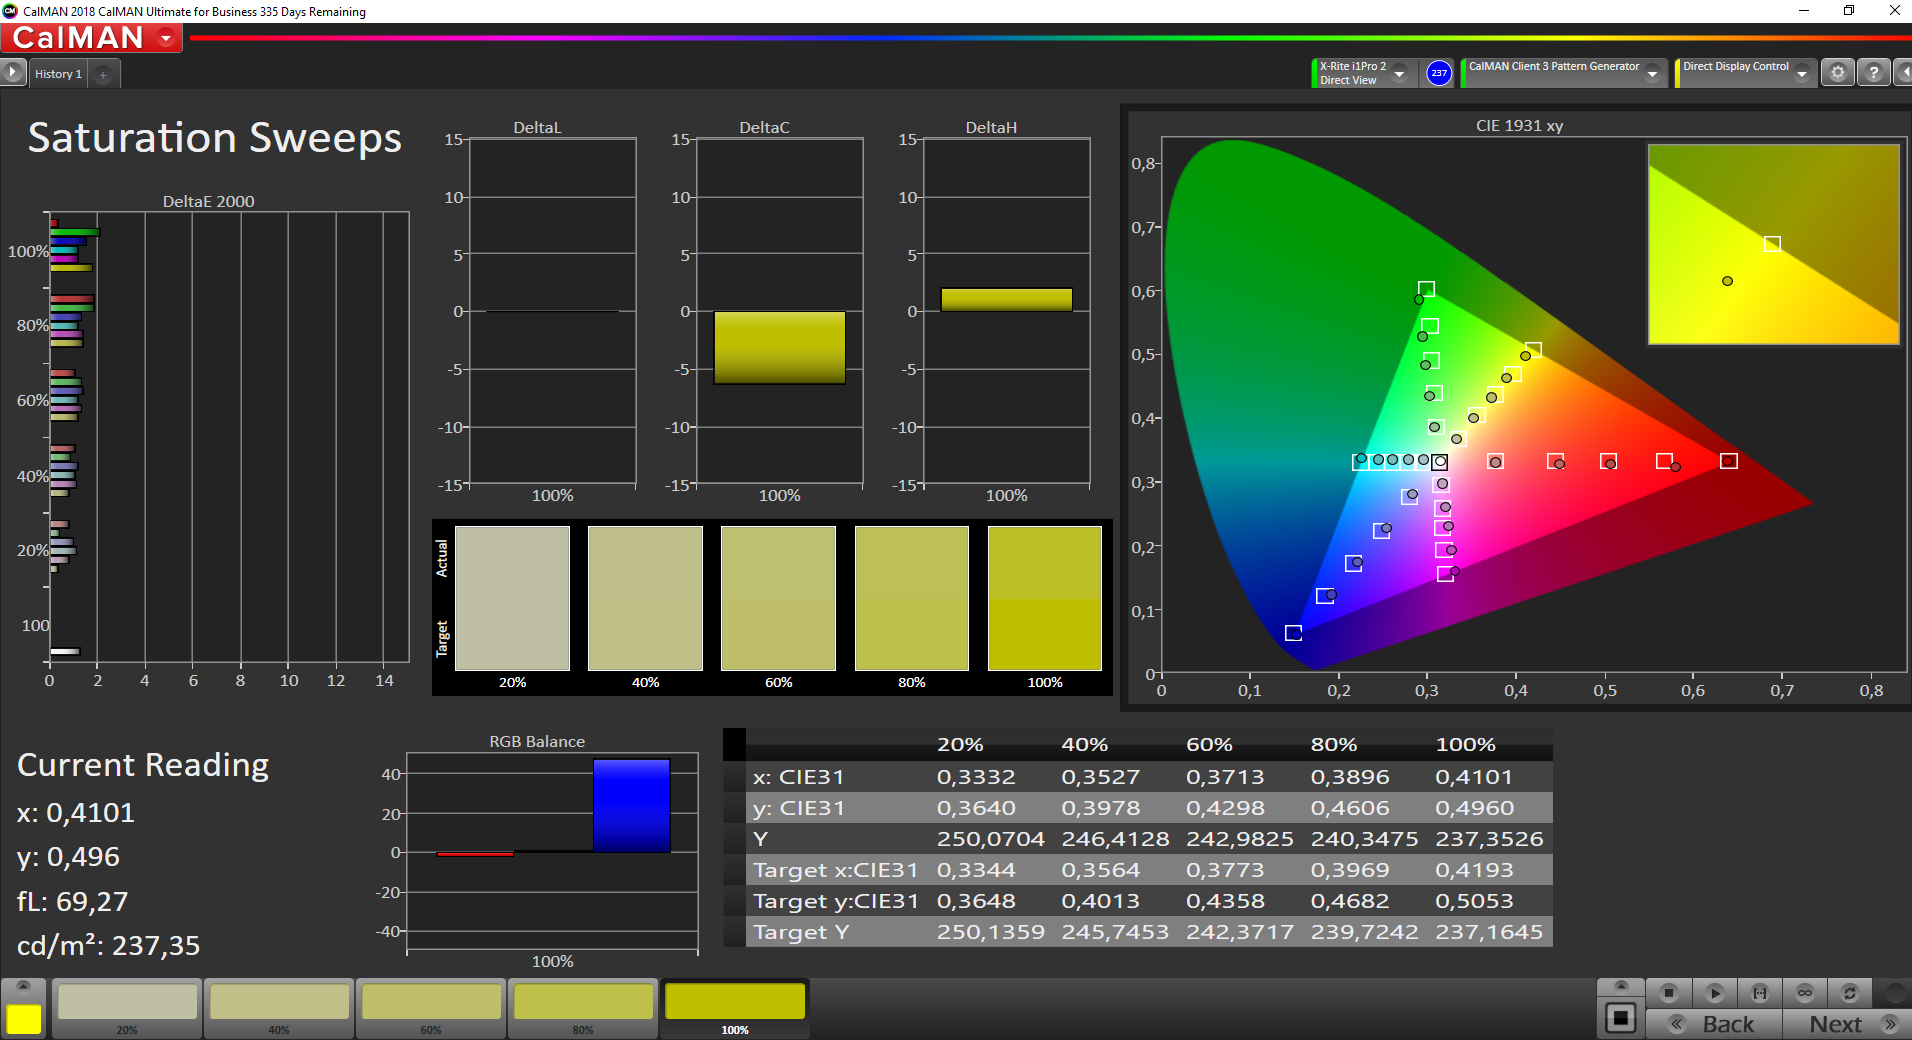
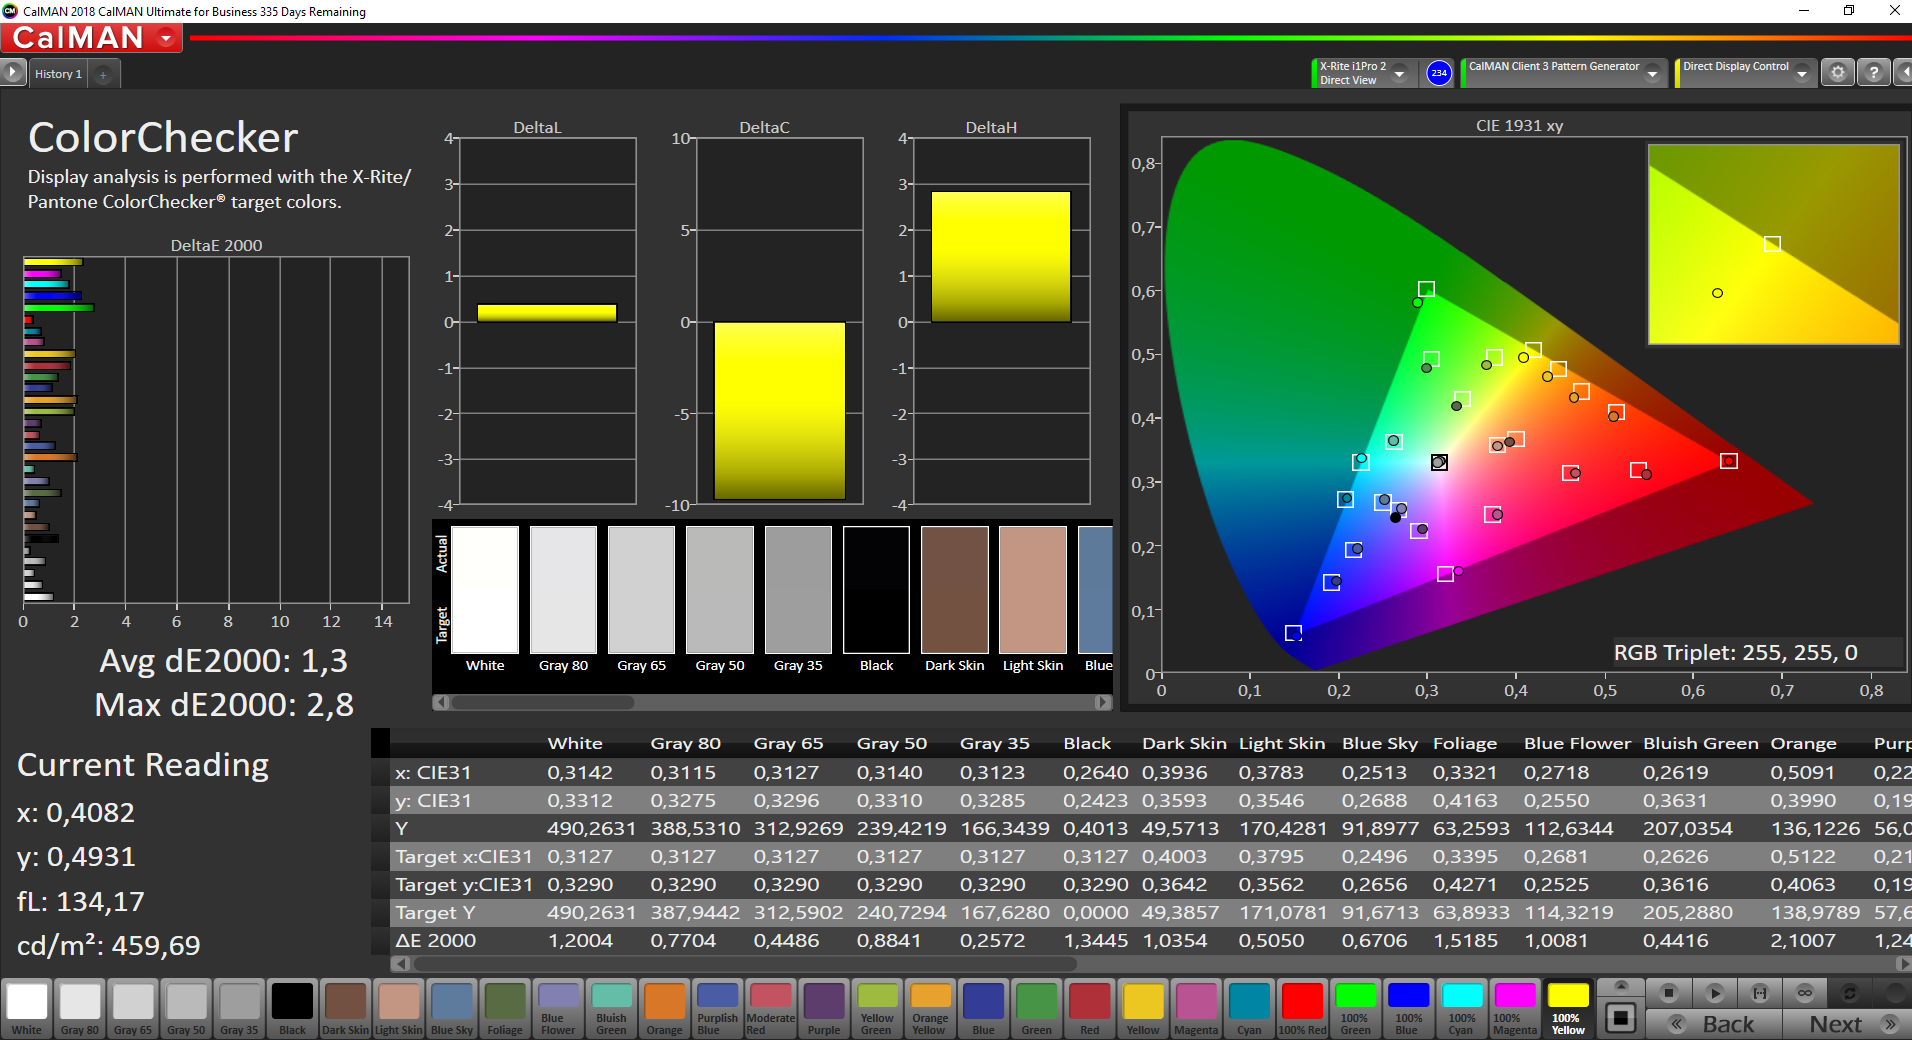
We calibrated and retested the panel with the professional CalMAN software and the X-Rite i1 Pro 2 spectrophotometer. In addition to the improved grayscale performance, the color deviations are better as well. This means the panel is generally suited for picture/video editing, but the sRGB color gamut is only covered by 90.4 %. We would have expected at least full sRGB coverage at this price point.
Display Response Times
| ↔ Response Time Black to White | ||
|---|---|---|
| 22.4 ms ... rise ↗ and fall ↘ combined | ↗ 12.8 ms rise | 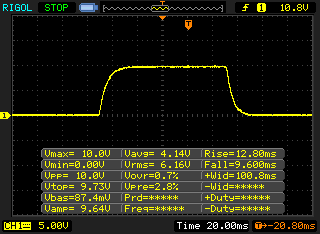 |
| ↘ 9.6 ms fall | ||
| The screen shows good response rates in our tests, but may be too slow for competitive gamers. In comparison, all tested devices range from 0.1 (minimum) to 240 (maximum) ms. » 50 % of all devices are better. This means that the measured response time is worse than the average of all tested devices (19.9 ms). | ||
| ↔ Response Time 50% Grey to 80% Grey | ||
| 33.6 ms ... rise ↗ and fall ↘ combined | ↗ 17.2 ms rise | 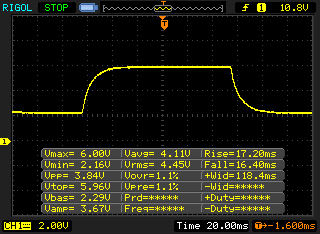 |
| ↘ 16.4 ms fall | ||
| The screen shows slow response rates in our tests and will be unsatisfactory for gamers. In comparison, all tested devices range from 0.165 (minimum) to 636 (maximum) ms. » 46 % of all devices are better. This means that the measured response time is similar to the average of all tested devices (31.1 ms). | ||
Screen Flickering / PWM (Pulse-Width Modulation)
| Screen flickering / PWM detected | 26040 Hz | ≤ 50 % brightness setting | 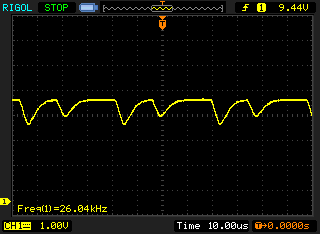 |
The display backlight flickers at 26040 Hz (worst case, e.g., utilizing PWM) Flickering detected at a brightness setting of 50 % and below. There should be no flickering or PWM above this brightness setting. The frequency of 26040 Hz is quite high, so most users sensitive to PWM should not notice any flickering. In comparison: 52 % of all tested devices do not use PWM to dim the display. If PWM was detected, an average of 7794 (minimum: 5 - maximum: 343500) Hz was measured. | |||
You can use the matte panel even in very bright environments as long as you can avoid reflections from direct light sources. The maximum display brightness is not reduced on battery power. There is no problem with the viewing angle stability of the IPS screen.


Performance - Better performance utilization thanks to louder fans
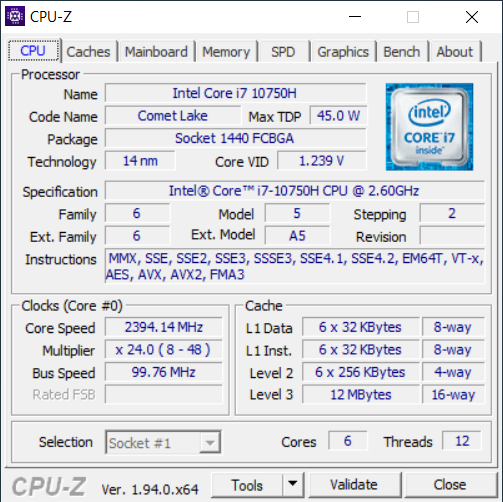
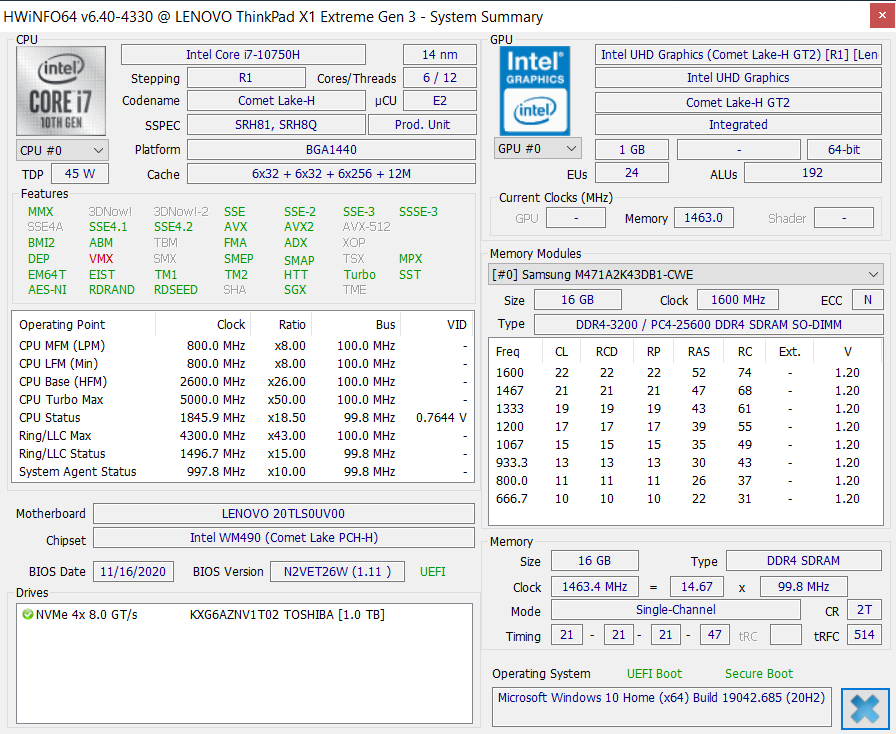
Processor - X1 Extreme only with Intel Comet Lake
Our test unit is equipped with the Intel Core i7-10750H from the familiar Comet Lake generation (14 nm). It has 6 cores (12 threads) and can run at up to 5.0 GHz on one core or up to 4.3 GHz for all active cores, respectively.
The performance utilization was a big issue on the 2019 X1 Extreme, because the power consumption was limited to just 30W after a little while. It seems Lenovo has heard the criticism, because the TDP limits are now much higher at 90/62 Watts. The fan speed was increased to compensate for the additional heat, but more on that later.
We can see a consumption of ~89W at the beginning of the multi-core tests, which results in 6x 4.2-4.3 GHz. This value drops to 62W after a while (6x 3.6 GHz) and can be maintained. So far, so good, but the problem is the comparison with AMD's Ryzen CPUs. If we look at the comparable Ryzen 5 4600H in the Honor MagicBook Pro, which has 6 cores (12 threads) as well, it is evident how much worse Intel's position is right now in the 45W segment. The Ryzen 5 4600H is not only ~15 % faster in CB R15 Multi, but it also consumes 20W less power.
The TDP limits are a bit lower on battery power at 58/80W, which results in a performance drop of ~15 %.
Cinebench R15: CPU Single 64Bit | CPU Multi 64Bit
Blender: v2.79 BMW27 CPU
7-Zip 18.03: 7z b 4 -mmt1 | 7z b 4
Geekbench 5.5: Single-Core | Multi-Core
HWBOT x265 Benchmark v2.2: 4k Preset
LibreOffice : 20 Documents To PDF
R Benchmark 2.5: Overall mean
| Cinebench R20 / CPU (Single Core) | |
| Average of class Multimedia (425 - 853, n=64, last 2 years) | |
| Schenker Vision 15 | |
| Dell XPS 15 9500 Core i7 4K UHD | |
| Lenovo ThinkPad X1 Extreme Gen3-20TLS0UV00 | |
| Average Intel Core i7-10750H (431 - 504, n=43) | |
| Asus ZenBook UX535-M01440 | |
| Apple MacBook Pro 16 2019 i9 5500M | |
| Apple MacBook Pro 16 2019 i9 5500M | |
| Cinebench R20 / CPU (Multi Core) | |
| Average of class Multimedia (1887 - 12912, n=64, last 2 years) | |
| Apple MacBook Pro 16 2019 i9 5500M | |
| Apple MacBook Pro 16 2019 i9 5500M | |
| Dell XPS 15 9500 Core i7 4K UHD | |
| Asus ZenBook UX535-M01440 | |
| Average Intel Core i7-10750H (1749 - 3325, n=43) | |
| Lenovo ThinkPad X1 Extreme Gen3-20TLS0UV00 | |
| Schenker Vision 15 | |
| Cinebench R15 / CPU Single 64Bit | |
| Average of class Multimedia (184.8 - 326, n=66, last 2 years) | |
| Schenker Vision 15 | |
| Lenovo ThinkPad X1 Extreme Gen3-20TLS0UV00 | |
| Dell XPS 15 9500 Core i7 4K UHD | |
| Asus ZenBook UX535-M01440 | |
| Average Intel Core i7-10750H (184 - 213, n=45) | |
| Lenovo ThinkPad X1 Extreme 2019 20QV000WGE | |
| Apple MacBook Pro 16 2019 i9 5500M | |
| Apple MacBook Pro 16 2019 i9 5500M | |
| Cinebench R15 / CPU Multi 64Bit | |
| Average of class Multimedia (856 - 5224, n=68, last 2 years) | |
| Apple MacBook Pro 16 2019 i9 5500M | |
| Apple MacBook Pro 16 2019 i9 5500M | |
| Dell XPS 15 9500 Core i7 4K UHD | |
| Asus ZenBook UX535-M01440 | |
| Average Intel Core i7-10750H (804 - 1418, n=50) | |
| Lenovo ThinkPad X1 Extreme Gen3-20TLS0UV00 | |
| Lenovo ThinkPad X1 Extreme 2019 20QV000WGE | |
| Schenker Vision 15 | |
| Blender / v2.79 BMW27 CPU | |
| Schenker Vision 15 | |
| Lenovo ThinkPad X1 Extreme 2019 20QV000WGE | |
| Asus ZenBook UX535-M01440 | |
| Average Intel Core i7-10750H (322 - 587, n=43) | |
| Lenovo ThinkPad X1 Extreme Gen3-20TLS0UV00 | |
| Dell XPS 15 9500 Core i7 4K UHD | |
| Apple MacBook Pro 16 2019 i9 5500M | |
| Average of class Multimedia (100 - 557, n=65, last 2 years) | |
| 7-Zip 18.03 / 7z b 4 -mmt1 | |
| Average of class Multimedia (3666 - 7545, n=63, last 2 years) | |
| Lenovo ThinkPad X1 Extreme Gen3-20TLS0UV00 | |
| Dell XPS 15 9500 Core i7 4K UHD | |
| Asus ZenBook UX535-M01440 | |
| Average Intel Core i7-10750H (4504 - 5470, n=43) | |
| Schenker Vision 15 | |
| Apple MacBook Pro 16 2019 i9 5500M | |
| Lenovo ThinkPad X1 Extreme 2019 20QV000WGE | |
| 7-Zip 18.03 / 7z b 4 | |
| Average of class Multimedia (29095 - 130368, n=62, last 2 years) | |
| Apple MacBook Pro 16 2019 i9 5500M | |
| Dell XPS 15 9500 Core i7 4K UHD | |
| Lenovo ThinkPad X1 Extreme Gen3-20TLS0UV00 | |
| Average Intel Core i7-10750H (26040 - 37345, n=43) | |
| Asus ZenBook UX535-M01440 | |
| Lenovo ThinkPad X1 Extreme 2019 20QV000WGE | |
| Schenker Vision 15 | |
| Geekbench 5.5 / Single-Core | |
| Average of class Multimedia (805 - 2974, n=62, last 2 years) | |
| Schenker Vision 15 | |
| Dell XPS 15 9500 Core i7 4K UHD | |
| Lenovo ThinkPad X1 Extreme Gen3-20TLS0UV00 | |
| Asus ZenBook UX535-M01440 | |
| Average Intel Core i7-10750H (1114 - 1333, n=43) | |
| Apple MacBook Pro 16 2019 i9 5500M | |
| Geekbench 5.5 / Multi-Core | |
| Average of class Multimedia (4652 - 20422, n=62, last 2 years) | |
| Dell XPS 15 9500 Core i7 4K UHD | |
| Apple MacBook Pro 16 2019 i9 5500M | |
| Average Intel Core i7-10750H (4443 - 6674, n=43) | |
| Schenker Vision 15 | |
| Asus ZenBook UX535-M01440 | |
| Lenovo ThinkPad X1 Extreme Gen3-20TLS0UV00 | |
| HWBOT x265 Benchmark v2.2 / 4k Preset | |
| Average of class Multimedia (5.26 - 36.1, n=63, last 2 years) | |
| Apple MacBook Pro 16 2019 i9 5500M | |
| Dell XPS 15 9500 Core i7 4K UHD | |
| Asus ZenBook UX535-M01440 | |
| Average Intel Core i7-10750H (5.54 - 11.6, n=43) | |
| Lenovo ThinkPad X1 Extreme Gen3-20TLS0UV00 | |
| Schenker Vision 15 | |
| Lenovo ThinkPad X1 Extreme 2019 20QV000WGE | |
| LibreOffice / 20 Documents To PDF | |
| Asus ZenBook UX535-M01440 | |
| Apple MacBook Pro 16 2019 i9 5500M | |
| Apple MacBook Pro 16 2019 i9 5500M | |
| Average Intel Core i7-10750H (43.1 - 99.2, n=43) | |
| Dell XPS 15 9500 Core i7 4K UHD | |
| Average of class Multimedia (23.9 - 146.7, n=64, last 2 years) | |
| Lenovo ThinkPad X1 Extreme Gen3-20TLS0UV00 | |
| Schenker Vision 15 | |
| R Benchmark 2.5 / Overall mean | |
| Apple MacBook Pro 16 2019 i9 5500M | |
| Apple MacBook Pro 16 2019 i9 5500M | |
| Average Intel Core i7-10750H (0.578 - 0.708, n=42) | |
| Asus ZenBook UX535-M01440 | |
| Lenovo ThinkPad X1 Extreme Gen3-20TLS0UV00 | |
| Dell XPS 15 9500 Core i7 4K UHD | |
| Schenker Vision 15 | |
| Average of class Multimedia (0.3604 - 0.947, n=63, last 2 years) | |
* ... smaller is better
System Performance
There are no surprises in this section. Thanks to the fast processor and the PCIe-SSD, the X1 Extreme is a very fast device as we expected. This is also confirmed by the synthetic benchmarks. We did not experience any issues during our review period, either.
| PCMark 10 Score | 5225 points | |
Help | ||
DPC Latency
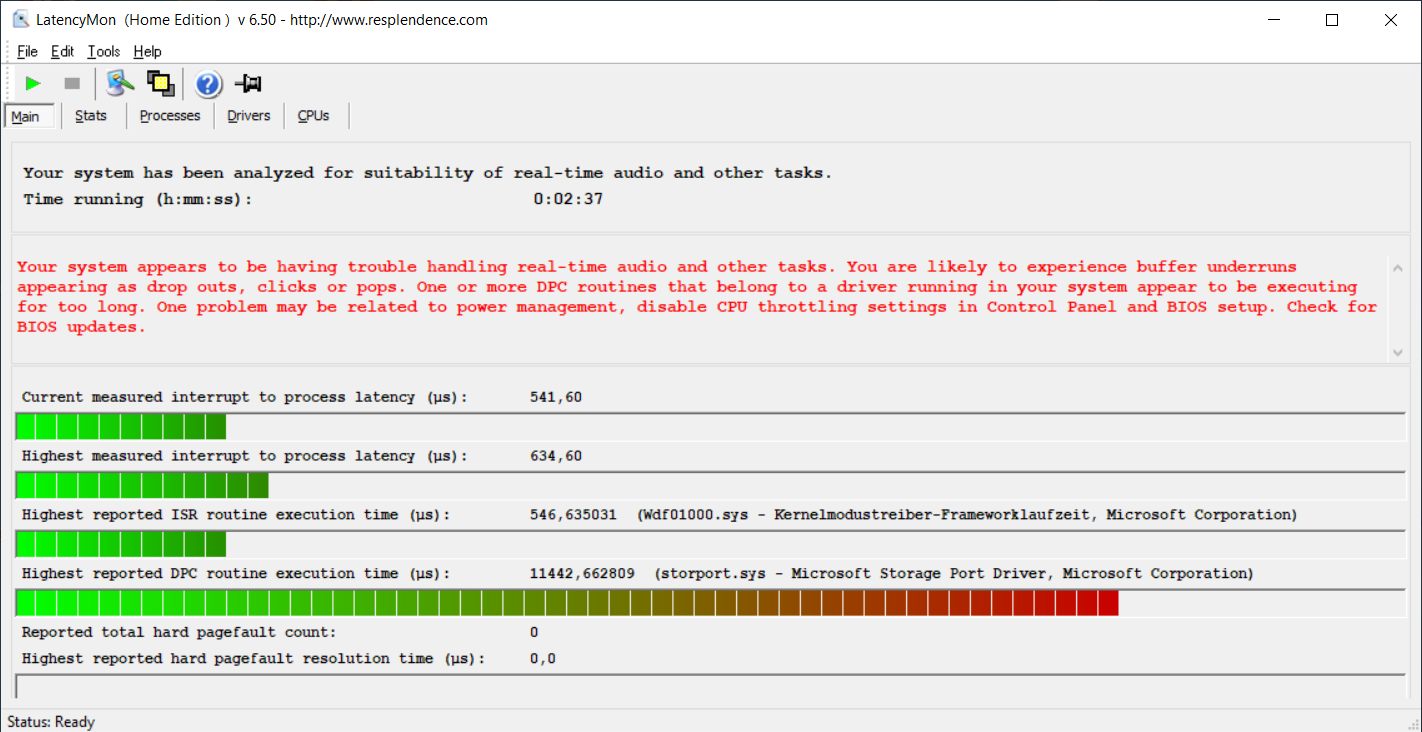
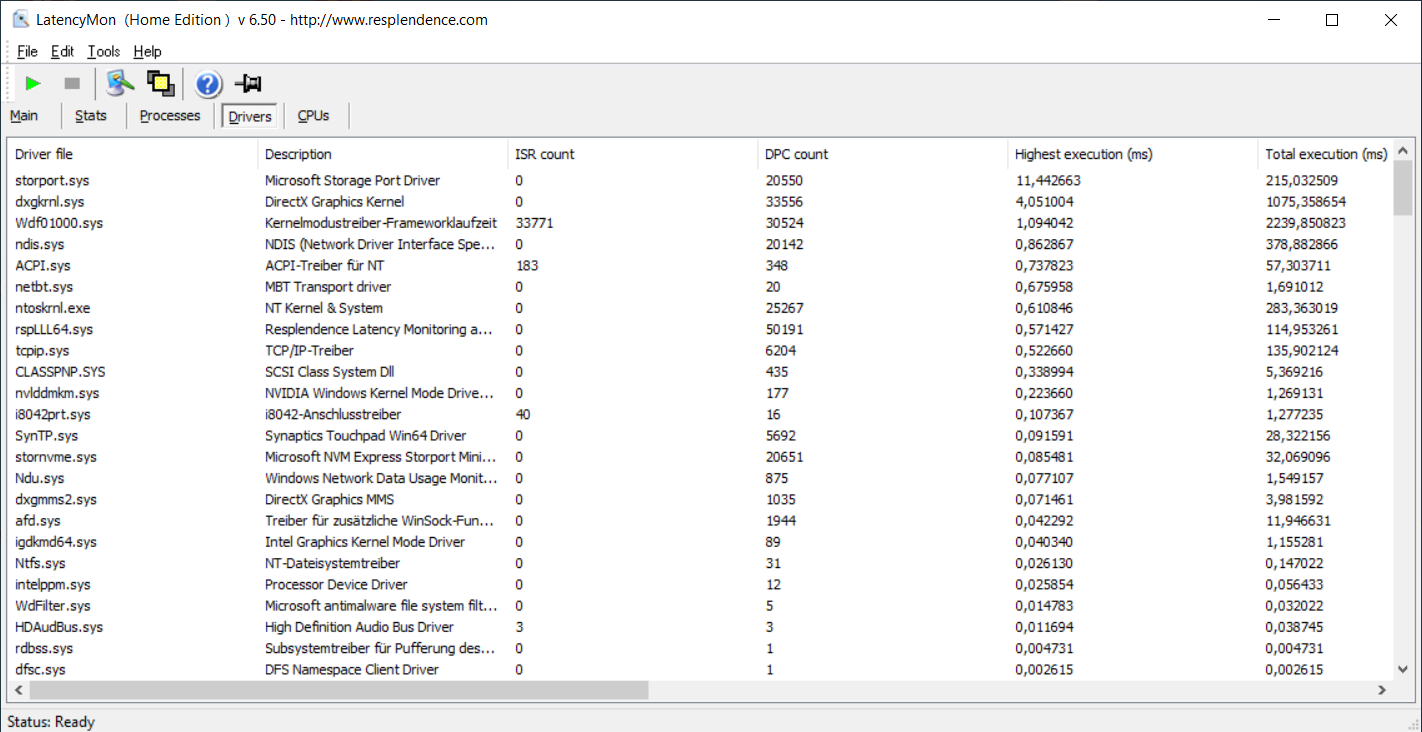
| DPC Latencies / LatencyMon - interrupt to process latency (max), Web, Youtube, Prime95 | |
| Dell XPS 15 9500 Core i7 4K UHD | |
| Schenker Vision 15 | |
| Asus ZenBook UX535-M01440 | |
| Lenovo ThinkPad X1 Extreme Gen3-20TLS0UV00 | |
* ... smaller is better
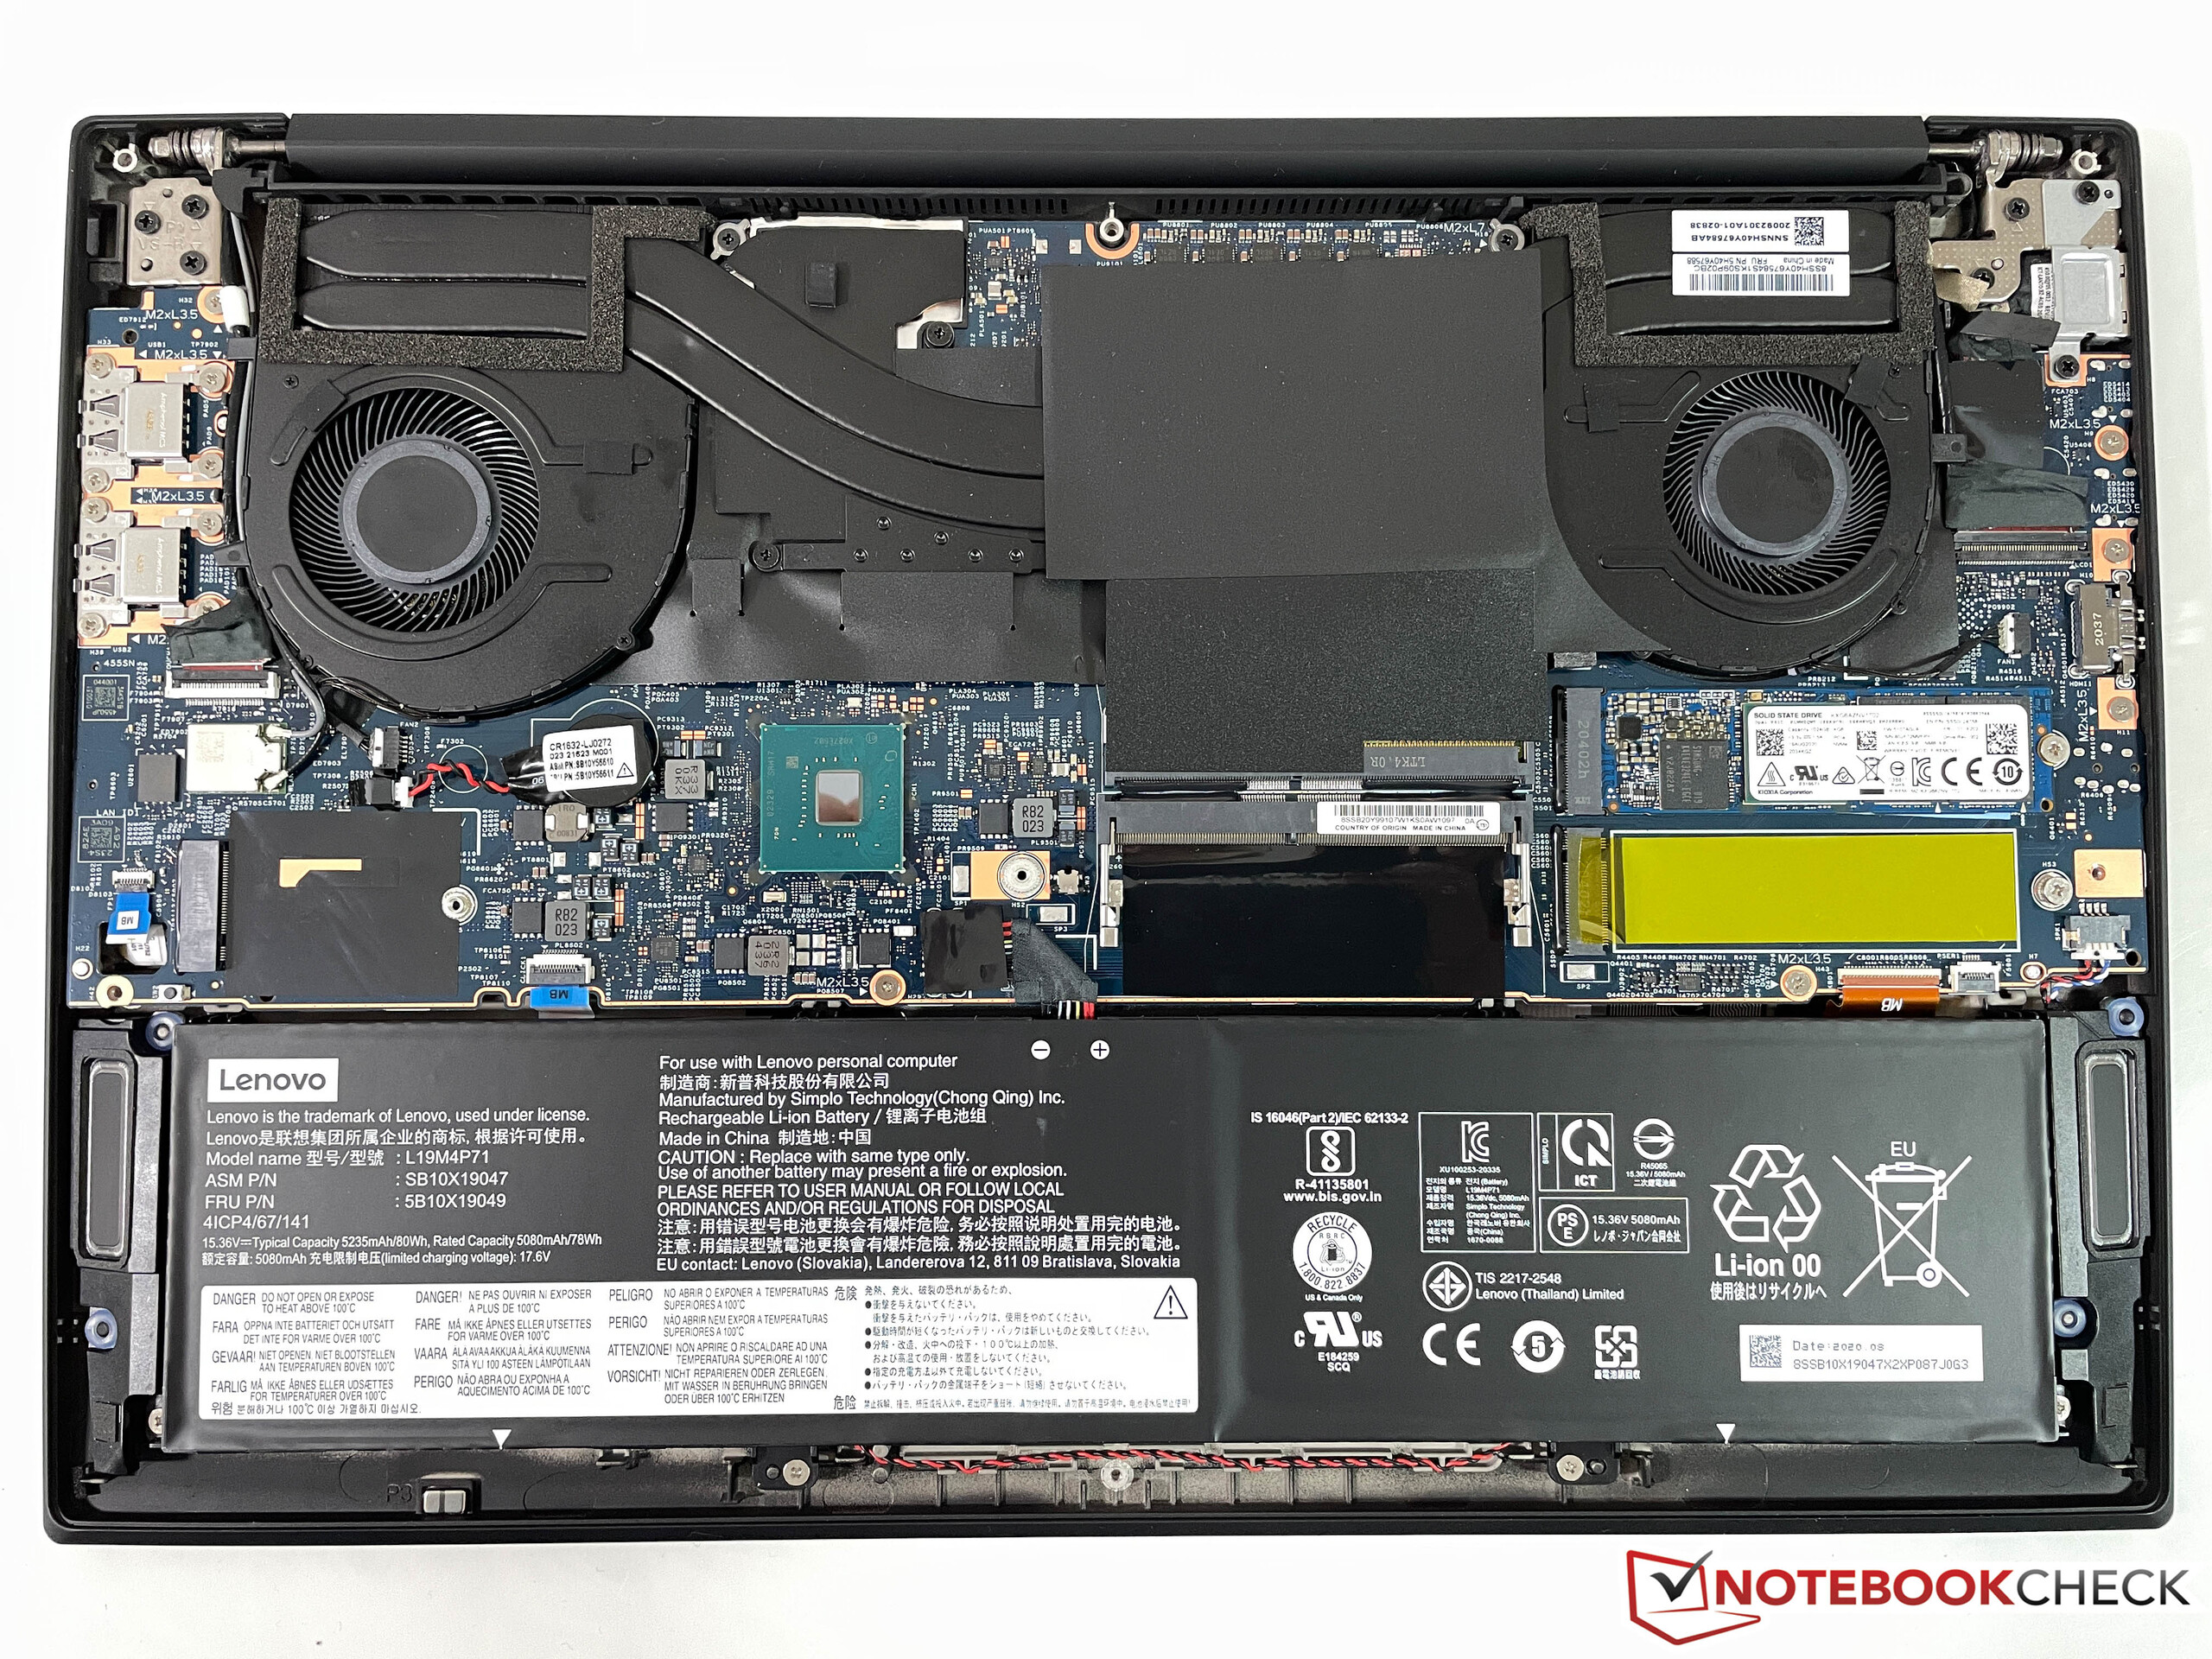
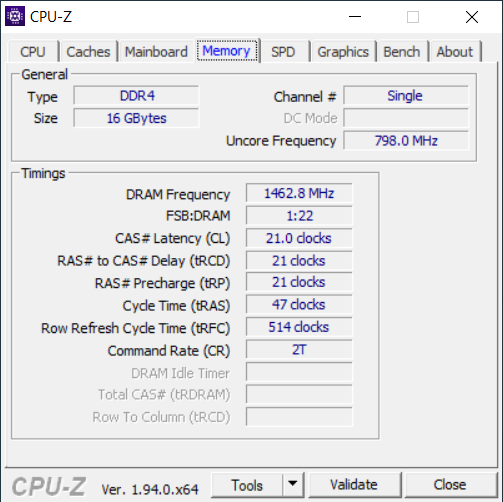
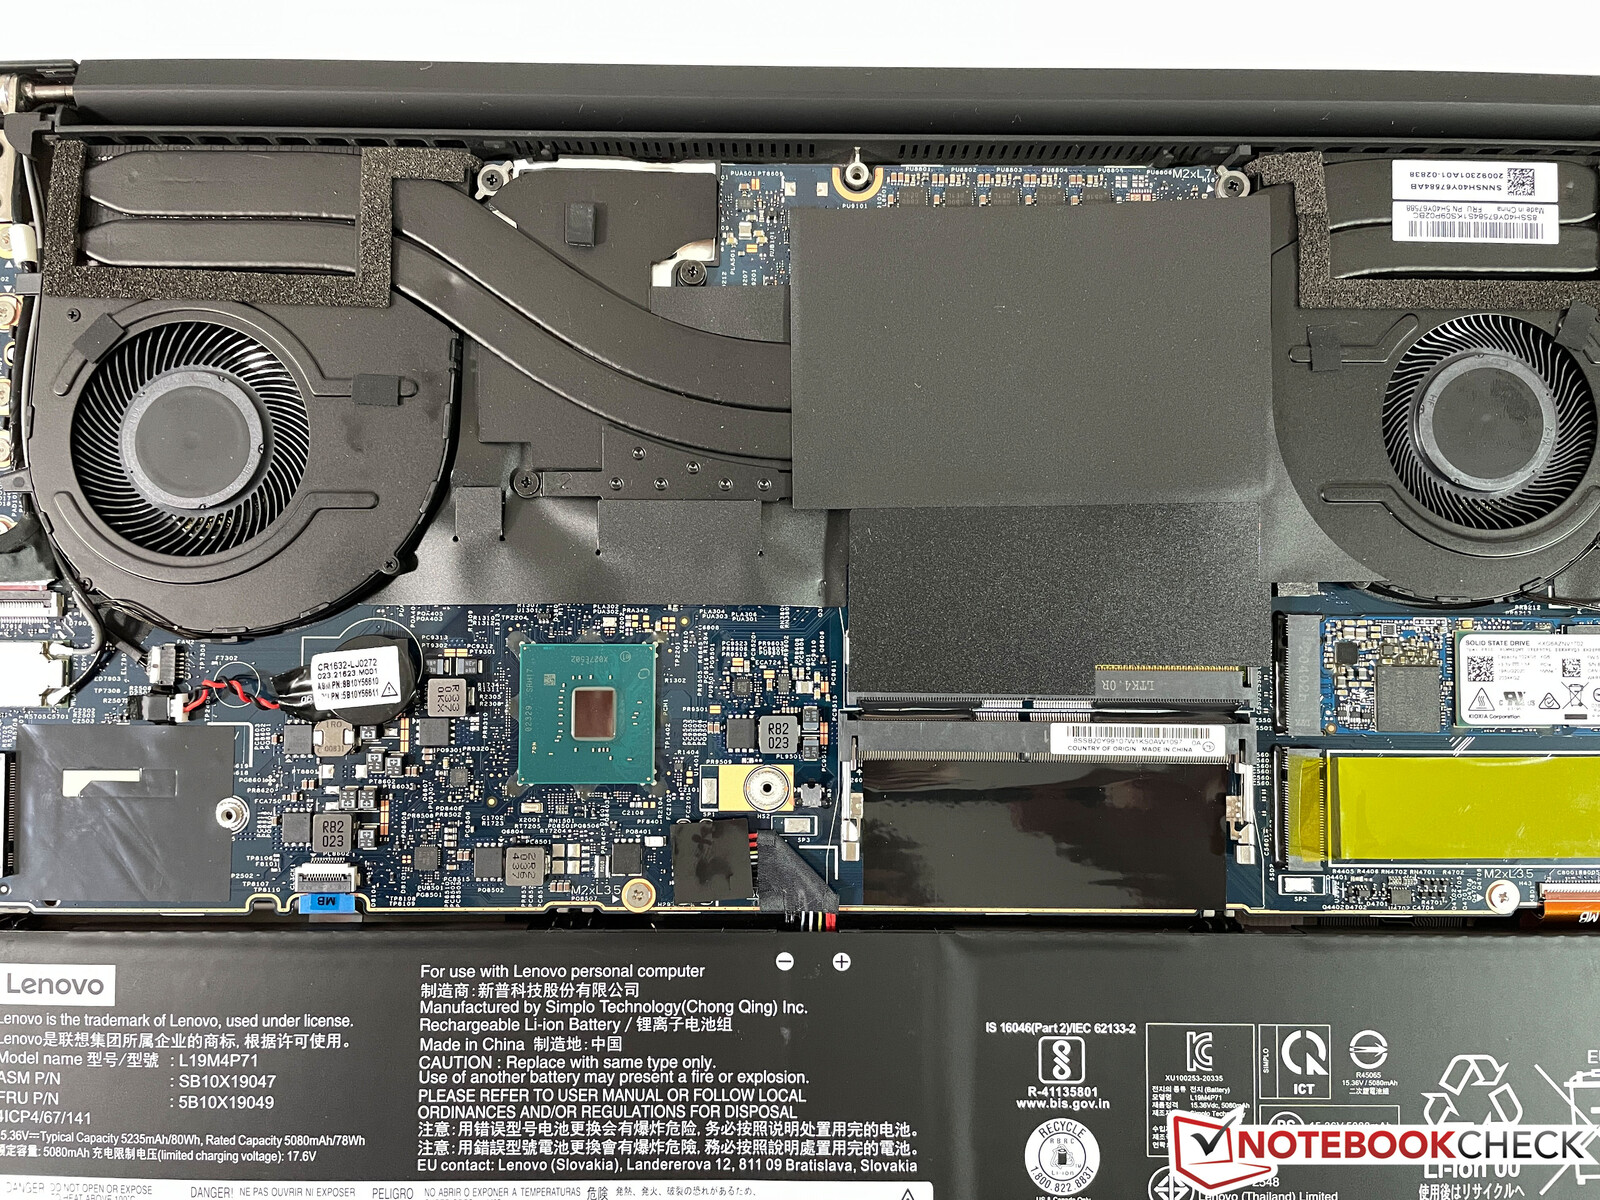
Storage Devices - 2x NVMe-SSD
The ThinkPad X1 Extreme still offers two PCIe-3.0-x4 slots for M.2-2280 SSDs. Our test unit is equipped with a single NVMe drive from Toshiba. It has a storage capacity of 1 TB (917 GB available for the user) and manages very good transfer rates. It is very easy to install a second PCIe-SSD, but the new PCIe 4.0 standard (compare Schenker Vision 15 with Samsung SSD 980 Pro) is not supported,
| Lenovo ThinkPad X1 Extreme Gen3-20TLS0UV00 Toshiba XG6 KXG6AZNV1T02 | Dell XPS 15 9500 Core i7 4K UHD SK Hynix PC611 512GB | Apple MacBook Pro 16 2019 i9 5500M Apple SSD AP1024 7171 | Asus ZenBook UX535-M01440 WDC PC SN730 SDBPNTY-1T00 | Schenker Vision 15 Samsung SSD 980 Pro 1TB MZ-V8P1T0BW | Lenovo ThinkPad X1 Extreme 2019 20QV000WGE Samsung SSD PM981 MZVLB512HAJQ | Average Toshiba XG6 KXG6AZNV1T02 | |
|---|---|---|---|---|---|---|---|
| CrystalDiskMark 5.2 / 6 | -12% | -19% | -15% | 76% | -7% | -1% | |
| Write 4K (MB/s) | 159.5 | 123.3 -23% | 55.5 -65% | 110 -31% | 238.1 49% | 148.1 -7% | 162.2 ? 2% |
| Read 4K (MB/s) | 53.1 | 41.85 -21% | 16.21 -69% | 43.44 -18% | 79.2 49% | 47.31 -11% | 54.8 ? 3% |
| Write Seq (MB/s) | 1723 | 2054 19% | 1959 14% | 1957 14% | 4139 140% | 1414 -18% | 1745 ? 1% |
| Read Seq (MB/s) | 2164 | 1617 -25% | 1763 -19% | 1615 -25% | 4133 91% | 1320 -39% | 1941 ? -10% |
| Write 4K Q32T1 (MB/s) | 469.2 | 413 -12% | 398.5 -15% | 341.6 -27% | 697 49% | 493.6 5% | 493 ? 5% |
| Read 4K Q32T1 (MB/s) | 543 | 377.5 -30% | 648 19% | 364.3 -33% | 758 40% | 594 9% | 542 ? 0% |
| Write Seq Q32T1 (MB/s) | 3055 | 2705 -11% | 2727 -11% | 3081 1% | 5187 70% | 2970 -3% | 2961 ? -3% |
| Read Seq Q32T1 (MB/s) | 3296 | 3442 4% | 3242 -2% | 3251 -1% | 7117 116% | 3472 5% | 3190 ? -3% |
| AS SSD | -30% | -24% | -15% | 67% | 18% | 4% | |
| Seq Read (MB/s) | 2553 | 2072 -19% | 2531 -1% | 1886 -26% | 5427 113% | 2352 -8% | 2545 ? 0% |
| Seq Write (MB/s) | 974 | 1486 53% | 2289 135% | 1221 25% | 3886 299% | 2106 116% | 1730 ? 78% |
| 4K Read (MB/s) | 49.69 | 47.41 -5% | 15.85 -68% | 41.16 -17% | 72.9 47% | 55 11% | 51.3 ? 3% |
| 4K Write (MB/s) | 139.5 | 117.6 -16% | 39.88 -71% | 101.2 -27% | 219.3 57% | 138.1 -1% | 149.7 ? 7% |
| 4K-64 Read (MB/s) | 1462 | 967 -34% | 1267 -13% | 1022 -30% | 2209 51% | 1265 -13% | 1283 ? -12% |
| 4K-64 Write (MB/s) | 1474 | 715 -51% | 1749 19% | 1618 10% | 2265 54% | 1952 32% | 1411 ? -4% |
| Access Time Read * (ms) | 0.063 | 0.057 10% | 0.122 -94% | 0.058 8% | 0.033 48% | 0.053 16% | 0.06 ? 5% |
| Access Time Write * (ms) | 0.031 | 0.096 -210% | 0.095 -206% | 0.037 -19% | 0.02 35% | 0.027 13% | 0.02875 ? 7% |
| Score Read (Points) | 1767 | 1222 -31% | 1536 -13% | 1252 -29% | 2825 60% | 1556 -12% | 1589 ? -10% |
| Score Write (Points) | 1711 | 981 -43% | 2018 18% | 1841 8% | 2873 68% | 2301 34% | 1734 ? 1% |
| Score Total (Points) | 4308 | 2809 -35% | 4317 0% | 3706 -14% | 7069 64% | 4650 8% | 4103 ? -5% |
| Copy ISO MB/s (MB/s) | 2094 | 1999 -5% | 1995 -5% | 1611 -23% | 2775 33% | 1754 ? -16% | |
| Copy Program MB/s (MB/s) | 657 | 627 -5% | 584 -11% | 509 -23% | 662 1% | 698 ? 6% | |
| Copy Game MB/s (MB/s) | 1447 | 1001 -31% | 1135 -22% | 677 -53% | 1655 14% | 1347 ? -7% | |
| Total Average (Program / Settings) | -21% /
-24% | -22% /
-22% | -15% /
-15% | 72% /
70% | 6% /
7% | 2% /
2% |
* ... smaller is better

DiskSpd Read Loop, Queue Depth 8
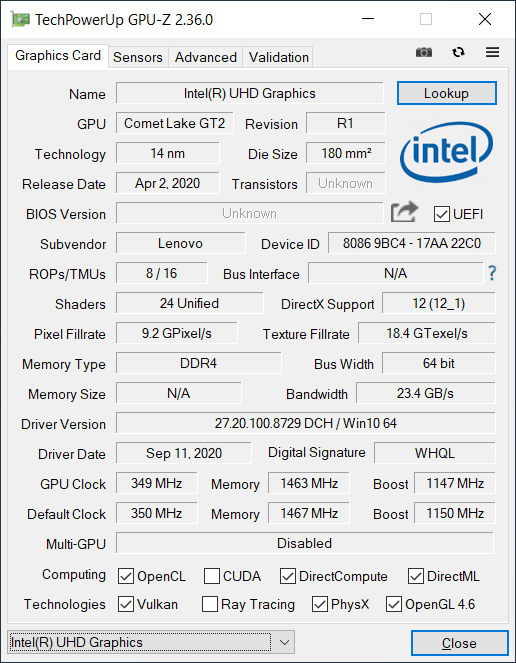
GPU Performance - GTX 1650 Ti Max-Q with 35 Watts
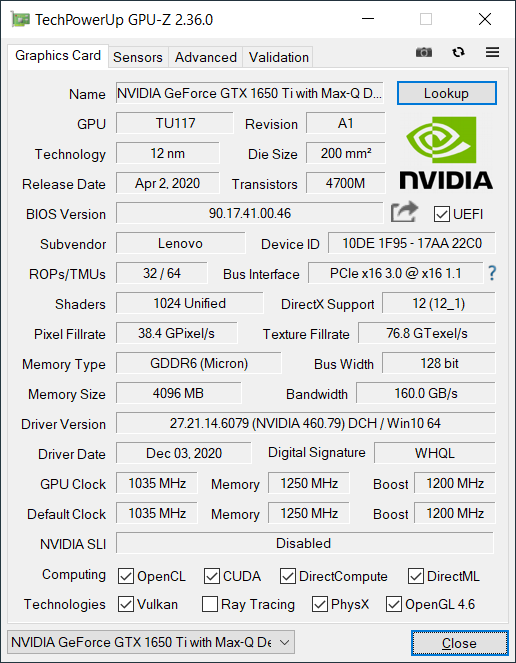
Lenovo equips the third generation of the X1 Extreme with a small upgrade from the Nvidia GeForce GTX 1650 Max-Q to the GeForce GTX 1650 Ti Max-Q. It is the version with 35W, which manages a maximum core clock of ~1600 MHz. The advantage over the previous model is 15-20 % in the synthetic benchmarks and the results are slightly better than the results we have in our database for our GTX 1650 Ti Max-Q laptops. The advantage of the Dell XPS 15 with the regular GeForce GTX 1650 Ti is not much faster, either.
The performance is also steady under longer workloads; the demanding 3DMark Time Spy stress test is easily passed at 98.6 %. The performance is slightly reduced on battery power, the Fire Strike Graphics score drops by ~5 % (9105 vs. 8617 points).
| 3DMark 11 Performance | 12021 points | |
| 3DMark Fire Strike Score | 8343 points | |
| 3DMark Time Spy Score | 3585 points | |
Help | ||
Gaming Performance
The ThinkPad X1 Extreme is once again very close to the Dell XPS 15 with the regular GTX 1650 Ti (non Max-Q). All in all, the ThinkPad can handle games and you can often combine the native 1080p resolution with high settings. Only very demanding titles require lower details to ensure smooth gameplay. Our Witcher 3 long-term test confirms the performance can be maintained and there is no FPS drop in longer gaming sessions.
| low | med. | high | ultra | QHD | 4K | |
|---|---|---|---|---|---|---|
| The Witcher 3 (2015) | 199 | 117 | 66 | 36.1 | 24 | |
| Dota 2 Reborn (2015) | 130 | 117 | 107 | 101 | ||
| X-Plane 11.11 (2018) | 92.6 | 72.8 | 63.1 | |||
| Far Cry 5 (2018) | 115 | 64 | 60 | 56 | 38 | 17 |
| F1 2020 (2020) | 211 | 107 | 82 | 57 | 41 | 22 |
| Death Stranding (2020) | 99.6 | 60.9 | 56.4 | 54.4 | 35.9 | 16.8 |
| Horizon Zero Dawn (2020) | 99 | 58 | 48 | 40 | 30 | 8 |
| Crysis Remastered (2020) | 154.1 | 59.8 | 31.9 | 23.6 | ||
| Serious Sam 4 (2020) | 115.7 | 51.9 | 40.8 | 30.5 | 22.3 | |
| Mafia Definitive Edition (2020) | 93.9 | 46.2 | 43 | 27.9 | 14.1 | |
| Star Wars Squadrons (2020) | 222 | 124 | 112.9 | 103.4 | 70 | 30.7 |
| FIFA 21 (2020) | 210 | 202 | 192.9 | 165.2 | 129.6 | 79.6 |
| Watch Dogs Legion (2020) | 89 | 54 | 47 | 21 | 14 | |
| Assassin´s Creed Valhalla (2020) | 74 | 45 | 32 | 14 | ||
| Call of Duty Black Ops Cold War (2020) | 100 | 55.6 | 44.1 | 40.2 | 25.8 | 10.6 |
| Yakuza Like a Dragon (2020) | 105.1 | 46.9 | 44.8 | 39.6 | 25.4 | 12.4 |
| Immortals Fenyx Rising (2020) | 77 | 48 | 32 | 29 | 24 | 14 |
| Cyberpunk 2077 1.0 (2020) | 63.7 | 33 | 26.8 | 22.2 |
Emissions - ThinkPad now with louder fans
System Noise
The fan setup did not change, but they now spin much faster under load. While the predecessor reached up to 36 dB(A), we can measure up to 44 dB(A) for the new model. The fans also spin up very quickly under load and reach their maximum speed. The CPU load seems to be the decisive factor here, because some games with little CPU load (like Witcher 3, Assassins Creed: Valhalla) level off at ~36 dB(A).
We we like that you get more performance from the components (especially CPU), but it also shows that the cooling solution does not have much headroom left. A successor (probably with even more powerful components) will probably need an updated cooling solution as well. We did not notice any other electronic noises.
Noise level
| Idle |
| 29.5 / 29.5 / 29.9 dB(A) |
| Load |
| 44.2 / 44.2 dB(A) |
 | ||
30 dB silent 40 dB(A) audible 50 dB(A) loud |
||
min: | ||
| Lenovo ThinkPad X1 Extreme Gen3-20TLS0UV00 GeForce GTX 1650 Ti Max-Q, i7-10750H, Toshiba XG6 KXG6AZNV1T02 | Dell XPS 15 9500 Core i7 4K UHD GeForce GTX 1650 Ti Mobile, i7-10875H, SK Hynix PC611 512GB | Apple MacBook Pro 16 2019 i9 5500M Radeon Pro 5500M, i9-9880H, Apple SSD AP1024 7171 | Asus ZenBook UX535-M01440 GeForce GTX 1650 Ti Max-Q, i7-10750H, WDC PC SN730 SDBPNTY-1T00 | Schenker Vision 15 Iris Xe G7 96EUs, i7-1165G7, Samsung SSD 980 Pro 1TB MZ-V8P1T0BW | Lenovo ThinkPad X1 Extreme 2019 20QV000WGE GeForce GTX 1650 Mobile, i7-9750H, Samsung SSD PM981 MZVLB512HAJQ | |
|---|---|---|---|---|---|---|
| Noise | -1% | -4% | 9% | -0% | 7% | |
| off / environment * (dB) | 29.5 | 28.4 4% | 29.8 -1% | 24.6 17% | 29.8 -1% | 28.5 3% |
| Idle Minimum * (dB) | 29.5 | 28.4 4% | 29.9 -1% | 24.6 17% | 29.8 -1% | 28.5 3% |
| Idle Average * (dB) | 29.5 | 28.4 4% | 29.9 -1% | 24.6 17% | 29.8 -1% | 28.5 3% |
| Idle Maximum * (dB) | 29.9 | 28.4 5% | 29.9 -0% | 24.6 18% | 31.1 -4% | 28.5 5% |
| Load Average * (dB) | 44.2 | 46 -4% | 43 3% | 41.3 7% | 40.5 8% | 36.3 18% |
| Witcher 3 ultra * (dB) | 36.1 | 42 -16% | 45.4 -26% | 42 -16% | 40.5 -12% | 36.3 -1% |
| Load Maximum * (dB) | 44.2 | 47.1 -7% | 46.1 -4% | 41.4 6% | 40.5 8% | 36.3 18% |
* ... smaller is better
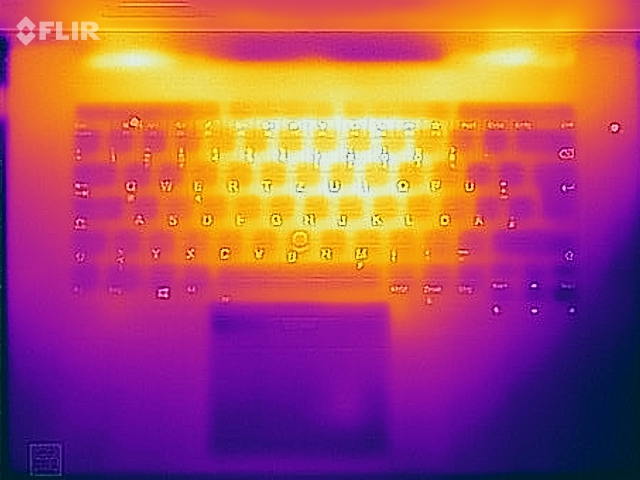
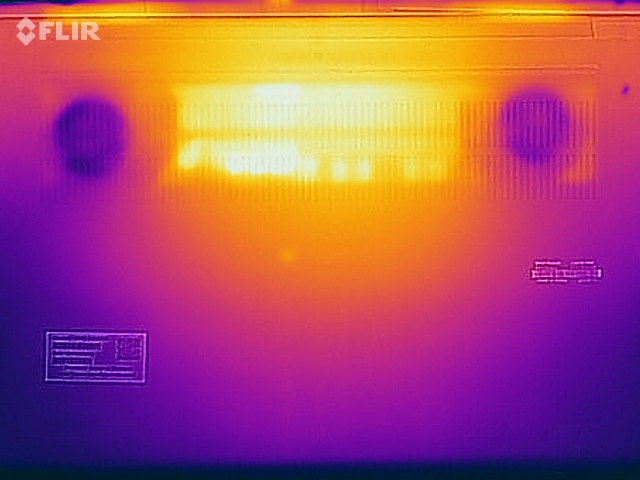
Temperature
The additional performance over the 2019 X1 Extreme is well compensated by the higher fan speeds, because the temperature development under load is almost identical. The middle keyboard section gets noticeably warm at more than 45 °C and you notice it during typing, but there are no limitations. We measure more than 50 °C at the bottom, so you should not put the device on your lap in these extreme scenarios.
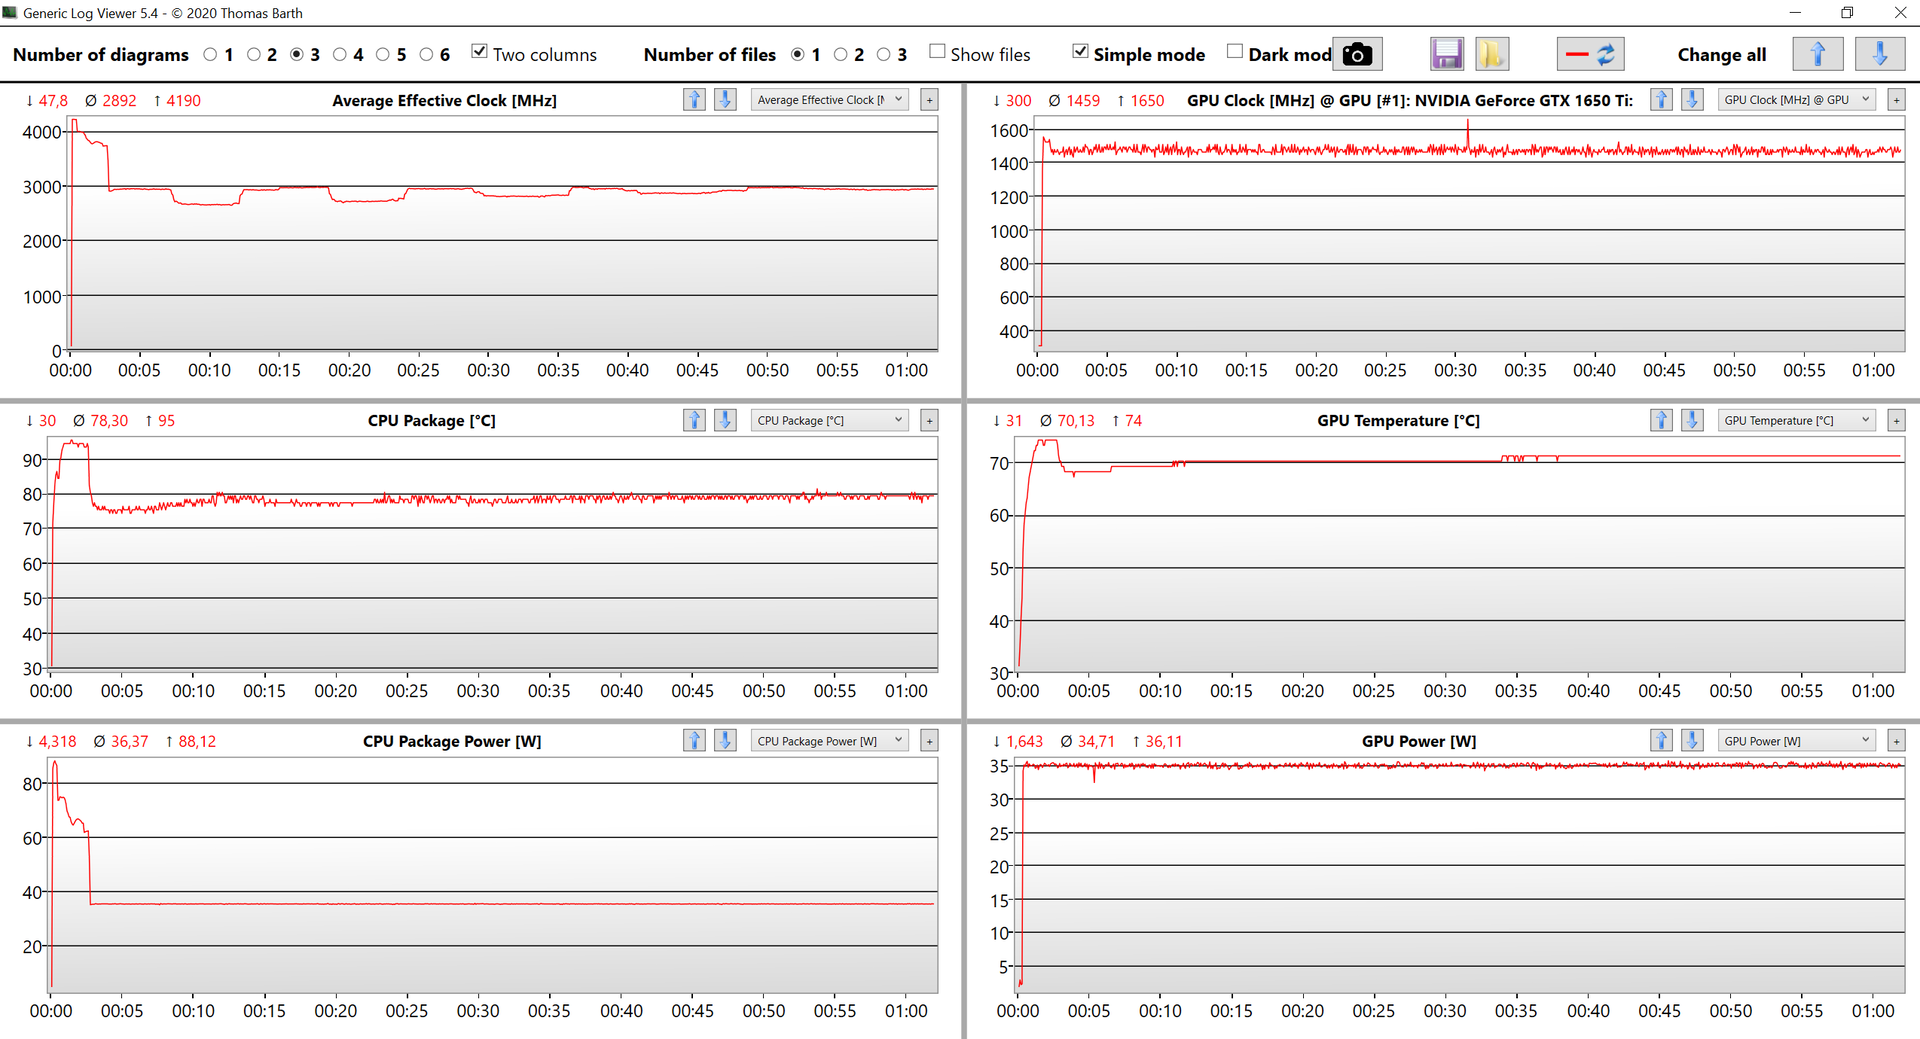
Our stress test with Prime95 and FurMark shows that the system favors the graphics card, which is running close to its maximum core clock (~1500 MHz & 35W). The processor on the other hand levels off at around 6x 2.9 GHz, which corresponds to a power consumption of 35W. The performance under combined workloads was therefore improved compared to the predecessor as well. There is no performance deficit immediately after the stress test.
(-) The maximum temperature on the upper side is 48.8 °C / 120 F, compared to the average of 36.8 °C / 98 F, ranging from 21 to 71 °C for the class Multimedia.
(-) The bottom heats up to a maximum of 51.1 °C / 124 F, compared to the average of 39.1 °C / 102 F
(+) In idle usage, the average temperature for the upper side is 22.9 °C / 73 F, compared to the device average of 31.3 °C / 88 F.
(+) The palmrests and touchpad are cooler than skin temperature with a maximum of 31.7 °C / 89.1 F and are therefore cool to the touch.
(-) The average temperature of the palmrest area of similar devices was 28.7 °C / 83.7 F (-3 °C / -5.4 F).
Speakers
Lenovo ThinkPad X1 Extreme Gen3-20TLS0UV00 audio analysis
(±) | speaker loudness is average but good (77.2 dB)
Bass 100 - 315 Hz
(±) | reduced bass - on average 9.1% lower than median
(±) | linearity of bass is average (11.6% delta to prev. frequency)
Mids 400 - 2000 Hz
(±) | higher mids - on average 7.2% higher than median
(+) | mids are linear (5.4% delta to prev. frequency)
Highs 2 - 16 kHz
(+) | balanced highs - only 3.9% away from median
(+) | highs are linear (5.7% delta to prev. frequency)
Overall 100 - 16.000 Hz
(±) | linearity of overall sound is average (19.7% difference to median)
Compared to same class
» 65% of all tested devices in this class were better, 6% similar, 29% worse
» The best had a delta of 5%, average was 17%, worst was 45%
Compared to all devices tested
» 50% of all tested devices were better, 7% similar, 43% worse
» The best had a delta of 4%, average was 24%, worst was 134%
Apple MacBook Pro 16 2019 i9 5500M audio analysis
(+) | speakers can play relatively loud (82.3 dB)
Bass 100 - 315 Hz
(+) | good bass - only 2.3% away from median
(+) | bass is linear (5% delta to prev. frequency)
Mids 400 - 2000 Hz
(+) | balanced mids - only 2.7% away from median
(+) | mids are linear (3.4% delta to prev. frequency)
Highs 2 - 16 kHz
(+) | balanced highs - only 2.1% away from median
(+) | highs are linear (2.6% delta to prev. frequency)
Overall 100 - 16.000 Hz
(+) | overall sound is linear (6.9% difference to median)
Compared to same class
» 5% of all tested devices in this class were better, 1% similar, 94% worse
» The best had a delta of 5%, average was 17%, worst was 45%
Compared to all devices tested
» 1% of all tested devices were better, 0% similar, 99% worse
» The best had a delta of 4%, average was 24%, worst was 134%
Energy Management - X1 Extreme FHD with long runtimes
Power Consumption

The idle measurements clearly show the more efficient 1080p screen. You should also consider the keyboard illumination on battery power. The first level only increases the consumption by 0.3W, but the second level by 1.6W. We measure up to 133.9W during our stress test, but the value quickly levels off (in correspondence to the CPU performance) at ~101W. The provided 135W power adapter is therefore completely sufficient. If you order the X1 Extreme Gen3 with the optional Core i9 processor, you will also get a more powerful 170W PSU.
| Off / Standby | |
| Idle | |
| Load |
|
Key:
min: | |
| Lenovo ThinkPad X1 Extreme Gen3-20TLS0UV00 i7-10750H, GeForce GTX 1650 Ti Max-Q, Toshiba XG6 KXG6AZNV1T02, IPS, 1920x1080, 15.6" | Dell XPS 15 9500 Core i7 4K UHD i7-10875H, GeForce GTX 1650 Ti Mobile, SK Hynix PC611 512GB, IPS, 3840x2400, 15.6" | Apple MacBook Pro 16 2019 i9 5500M i9-9880H, Radeon Pro 5500M, Apple SSD AP1024 7171, IPS, 3072x1920, 16" | Asus ZenBook UX535-M01440 i7-10750H, GeForce GTX 1650 Ti Max-Q, WDC PC SN730 SDBPNTY-1T00, IPS, 3840x2160, 15.6" | Schenker Vision 15 i7-1165G7, Iris Xe G7 96EUs, Samsung SSD 980 Pro 1TB MZ-V8P1T0BW, IPS, 1920x1080, 15.6" | Lenovo ThinkPad X1 Extreme 2019 20QV000WGE i7-9750H, GeForce GTX 1650 Mobile, Samsung SSD PM981 MZVLB512HAJQ, IPS, 3840x2160, 15.6" | Average NVIDIA GeForce GTX 1650 Ti Max-Q | Average of class Multimedia | |
|---|---|---|---|---|---|---|---|---|
| Power Consumption | -25% | -6% | 5% | 42% | -32% | -17% | 4% | |
| Idle Minimum * (Watt) | 5 | 5.7 -14% | 3.7 26% | 4.4 12% | 3.5 30% | 8.5 -70% | 7.23 ? -45% | 5.71 ? -14% |
| Idle Average * (Watt) | 9 | 13.5 -50% | 12.1 -34% | 9.8 -9% | 6.3 30% | 14.7 -63% | 12.6 ? -40% | 10.1 ? -12% |
| Idle Maximum * (Watt) | 12.2 | 19.6 -61% | 17 -39% | 14.5 -19% | 6.8 44% | 19.4 -59% | 16.3 ? -34% | 12.4 ? -2% |
| Load Average * (Watt) | 94.4 | 114.1 -21% | 91.5 3% | 83 12% | 43.2 54% | 89.6 5% | 80.6 ? 15% | 65 ? 31% |
| Witcher 3 ultra * (Watt) | 89 | 93 -4% | 103 -16% | 67 25% | 52 42% | 96.1 -8% | ||
| Load Maximum * (Watt) | 133.9 | 135.2 -1% | 102.3 24% | 123 8% | 67.7 49% | 129.8 3% | 107.7 ? 20% | 112.2 ? 16% |
* ... smaller is better
Battery Runtime
The battery capacity is still 80 Wh. The previous model suffered from the high consumption of the high-resolution 4K panel. With the 1080p screen, we determine a video runtime of 12 hours and around 11.5 hours in our Wi-Fi web browsing test (both at 150 cd/m², corresponds to 55 % of the maximum brightness on our unit). The Wi-Fi test still runs for more than 8 hours when we use the maximum brightness.
A full charge takes ~135 minutes when the device is turned on. 80 % of the capacity is available after ~74 minutes.
| Lenovo ThinkPad X1 Extreme Gen3-20TLS0UV00 i7-10750H, GeForce GTX 1650 Ti Max-Q, 80 Wh | Dell XPS 15 9500 Core i7 4K UHD i7-10875H, GeForce GTX 1650 Ti Mobile, 86 Wh | Apple MacBook Pro 16 2019 i9 5500M i9-9880H, Radeon Pro 5500M, 99.8 Wh | Asus ZenBook UX535-M01440 i7-10750H, GeForce GTX 1650 Ti Max-Q, 96 Wh | Schenker Vision 15 i7-1165G7, Iris Xe G7 96EUs, 73 Wh | Lenovo ThinkPad X1 Extreme 2019 20QV000WGE i7-9750H, GeForce GTX 1650 Mobile, 80 Wh | Average of class Multimedia | |
|---|---|---|---|---|---|---|---|
| Battery runtime | 11% | -15% | 9% | 26% | -45% | 19% | |
| H.264 (h) | 12.2 | 9.7 -20% | 11.9 -2% | 18.7 53% | 4.7 -61% | 16.4 ? 34% | |
| WiFi v1.3 (h) | 11.6 | 9.1 -22% | 12 3% | 10.1 -13% | 15.2 31% | 4.8 -59% | 12 ? 3% |
| Load (h) | 1.4 | 2 43% | 1 -29% | 2 43% | 1.3 -7% | 1.2 -14% | 1.675 ? 20% |
| Reader / Idle (h) | 23 | 18.3 | 25.2 ? | ||||
| Witcher 3 ultra (h) | 0.9 |
Pros
Cons
Verdict - Lenovo has improved the performance
The ThinkPad X1 Extreme Gen3 only looks like a small update at first, but there are some changes when you have a closer look. Let's start with the negative changes, which include the removal of the Mini-Ethernet port as well as the SmartCard reader. The X1 Extreme is now available with LTE in return, but you have to buy an LTE model, because it cannot be upgraded due to the lack of the corresponding antennas.
We still criticized the low CPU performance of the previous model due to low TDP limits. Lenovo has improved this with the new model and gets more performance out of the Intel processor. The X1 family still does not get AMD CPUs, but we already know this problem from other premium devices like Dell's XPS lineup. The graphics performance was also increased with the Nvidia GeForce GTX 1650 Ti Max-Q. The price for more performance is the louder fan noise, but we believe this is a good compromise. After all, you should be able to utilize the performance of the components you paid for. However, the cooling solution seems to have reached its limitations, and more powerful components will probably require an overhauled cooling solution for the next model.
The third generation of the Lenovo ThinkPad X1 Extreme offers more performance, but you have to live with louder fans in return. The matte 1080p screen is very bright and allows very long battery runtimes, but it is not ideal if you want to edit pictures on the go.
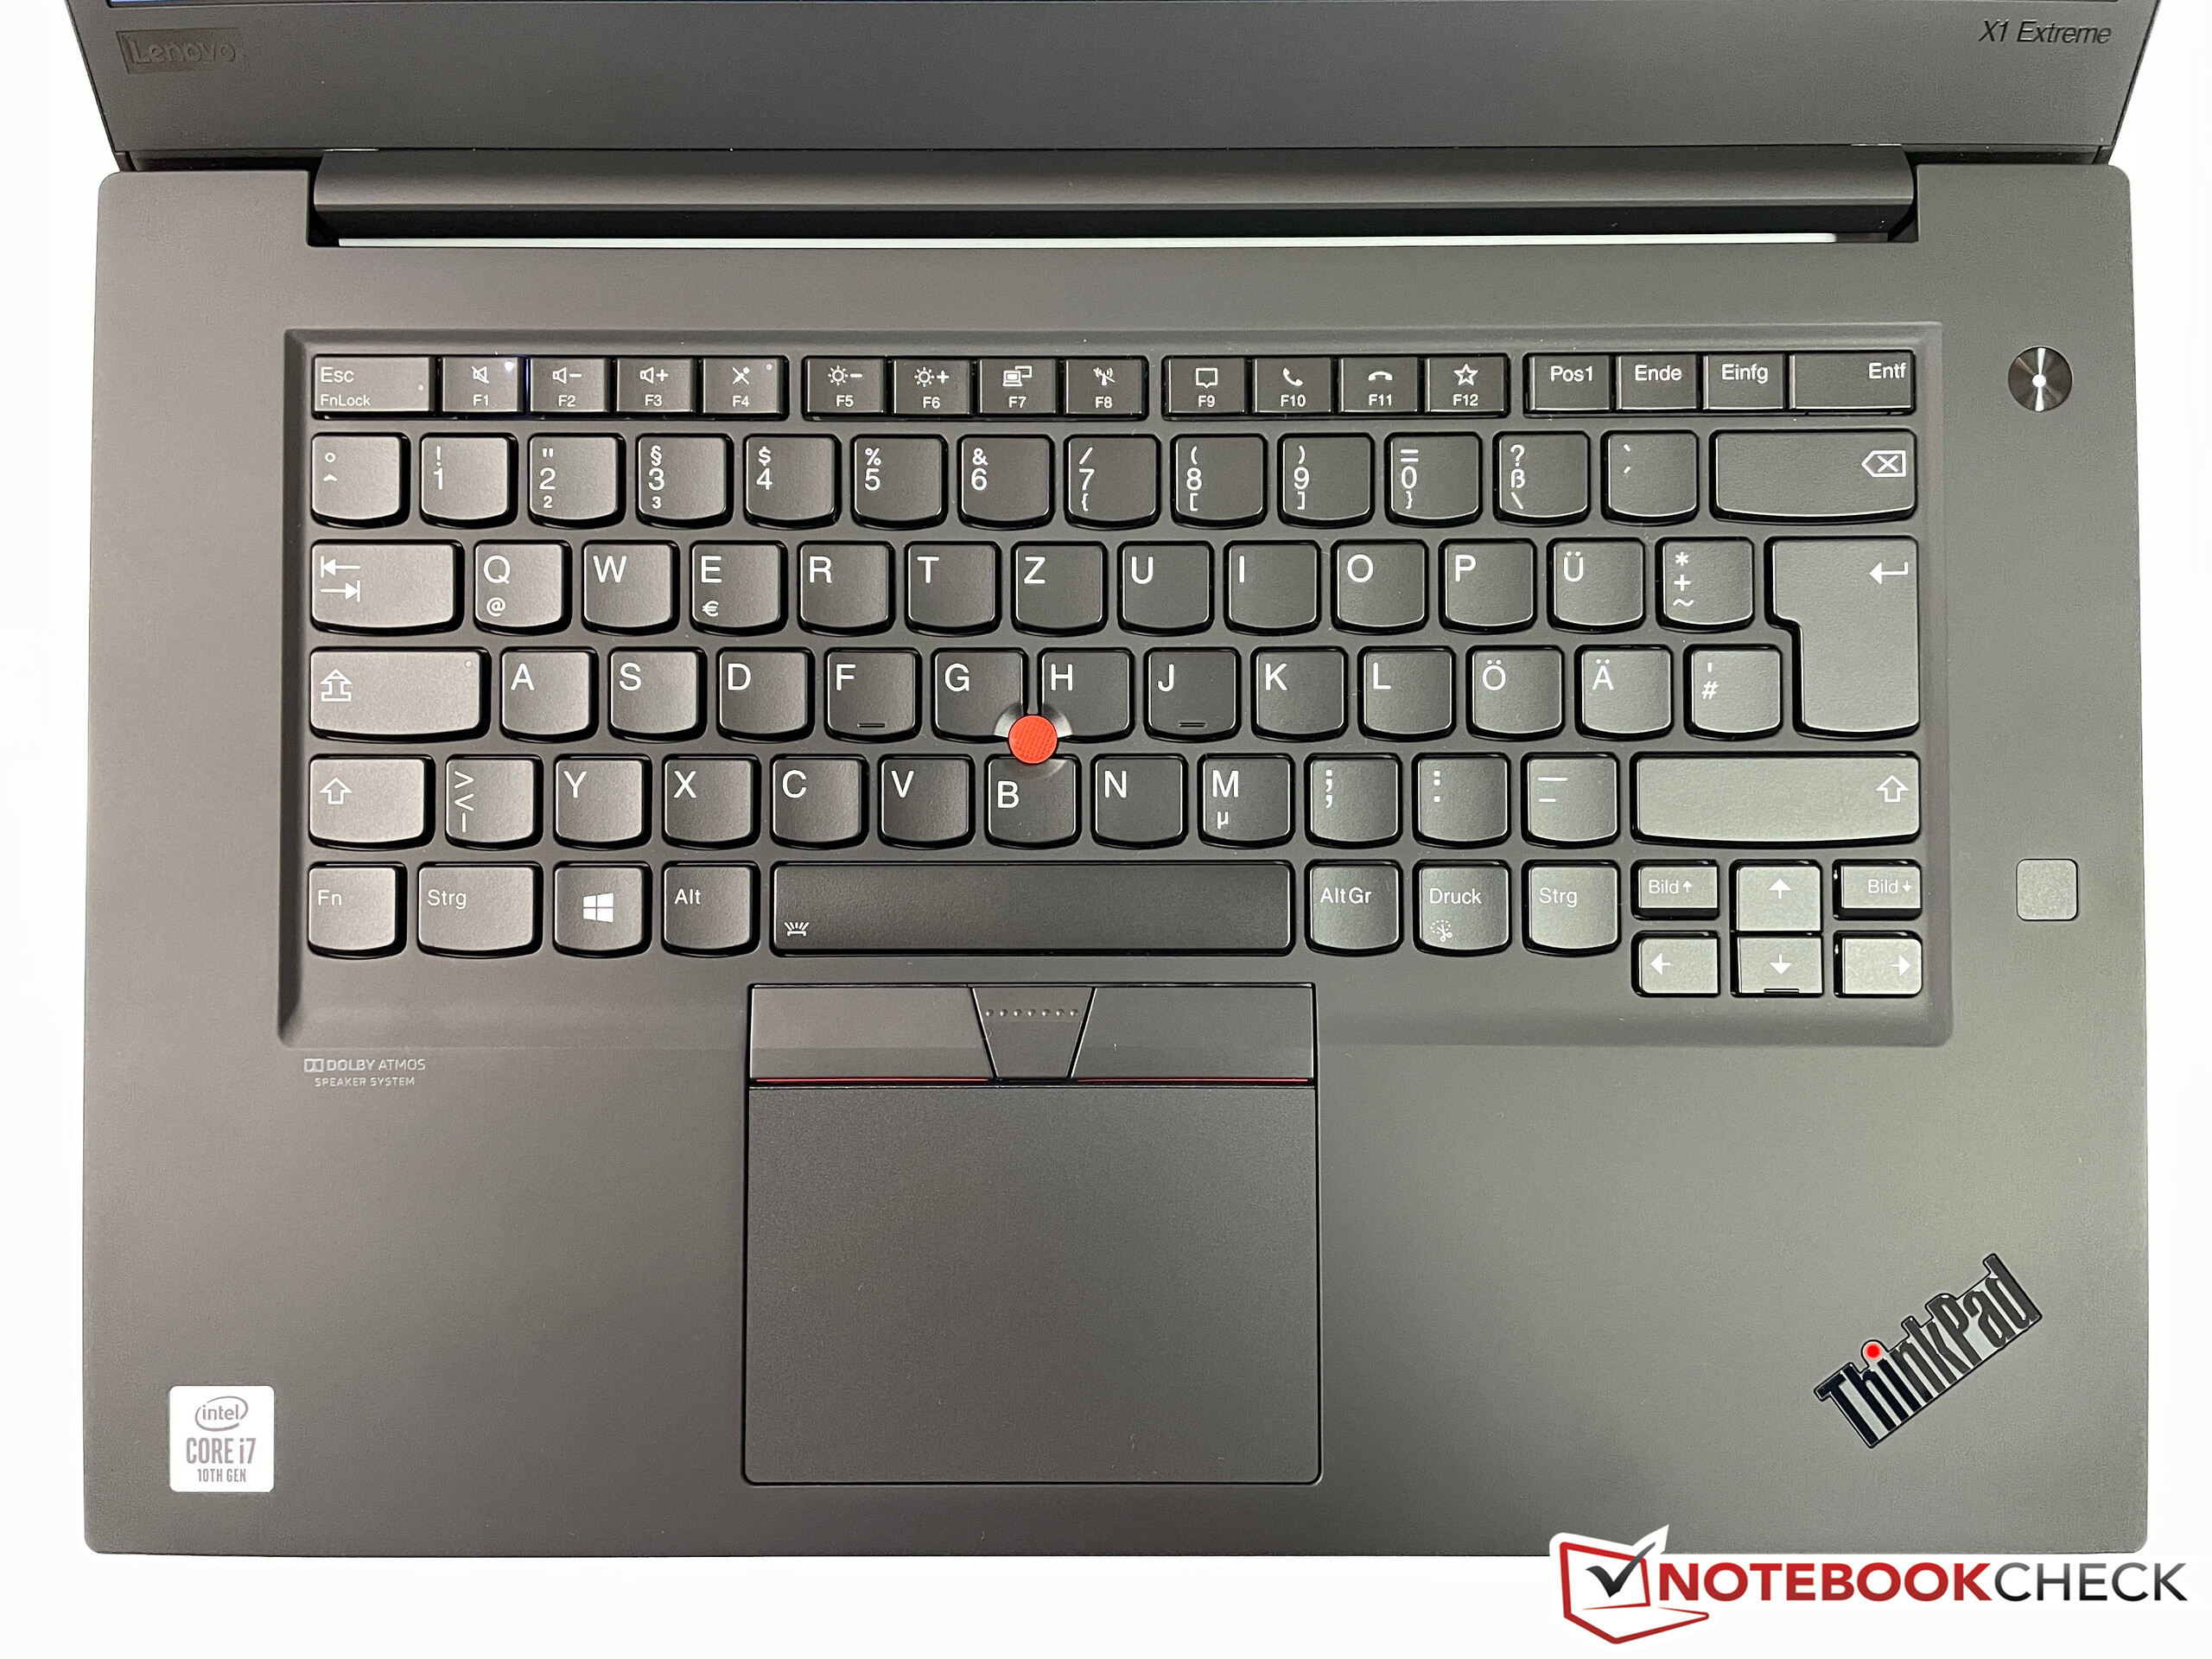
The matte 1080p screen leaves a good impression and the battery runtime is much longer compared to the 4K SKU. However, at this price point, we would have expected full sRGB color gamut, but it is still a good screen for productive tasks. We expect the next iteration of the ThinkPad X1 Extreme will get a 16:10 panel. The input devices (the keyboard in particular) are still excellent and overall, the the third generation of the ThinkPad x1 Extreme is once again a very good multimedia laptop.
Price and Availability
As tested, the Lenovo ThinkPad X1 Extreme Gen3 is available for around 1950 Euros at Campuspoint.
A similar spec with the higher-resolution 4K panel is available at Amazon for around 2900 Euros.
Lenovo ThinkPad X1 Extreme Gen3-20TLS0UV00
- 01/03/2021 v7 (old)
Andreas Osthoff
Price comparison
