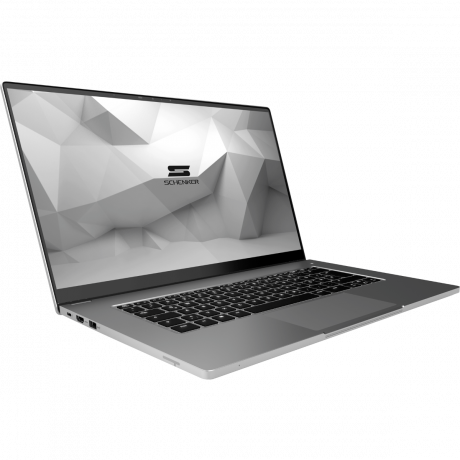
Schenker Vision 15 (Intel NUC M15) Laptop Review: Intel's answer to XPS 15 and MacBook Pro?
Intel just announced the new NUC M15 reference notebook a couple of days ago, and we already have a device from Schenker Technologies in review. The Schenker Vision 15 is a 15.6-inch premium multimedia laptop with Intel's latest Tiger Lake processor including integrated graphics card. According to press information, Intel put a lot of effort into an efficient motherboard design and powerful cooling, and we will obviously check these claims. The display is a glossy 1080p touchscreen with a brightness of 450 nits, which is surrounded by a unibody aluminum case.
Our test unit is a pre-production unit with Beta BIOS drivers, so there can be changes when the notebooks will be shipped to customers. The entry-level price is 1499 Euros. You can order the Schenker Vision 15 starting December 4th with shipping expected in January 2021. If you prefer a device with Linux, you should take a closer look at the counterpart from Tuxedo, the InfinityBook Pro 15 Gen6.
Note: Intel's reference notebook is designed to meet all the requirements for an Intel Evo certification, but the individual models from different resellers still must be certified. The Schenker Vision 15 meets all the requirements for the Intel Evo platform.
Competitors
Rating | Date | Model | Weight | Height | Size | Resolution | Price |
|---|---|---|---|---|---|---|---|
| 87.7 % v7 (old) | 12 / 2020 | Schenker Vision 15 i7-1165G7, Iris Xe G7 96EUs | 1.7 kg | 15 mm | 15.60" | 1920x1080 | |
| 89.7 % v7 (old) | 12 / 2019 | Apple MacBook Pro 16 2019 i9 5500M i9-9880H, Radeon Pro 5500M | 2 kg | 16.2 mm | 16.00" | 3072x1920 | |
| 86.8 % v7 (old) | 05 / 2020 | Dell XPS 15 9500 Core i5 i5-10300H, UHD Graphics 630 | 1.8 kg | 18 mm | 15.60" | 1920x1200 | |
| 84.5 % v7 (old) | 11 / 2020 | Honor MagicBook Pro (AMD) R5 4600H, Vega 6 | 1.7 kg | 16.9 mm | 16.10" | 1920x1080 | |
| 84.8 % v7 (old) | 07 / 2020 | LG Gram 15Z90N i5-1035G7, Iris Plus Graphics G7 (Ice Lake 64 EU) | 1.1 kg | 16.8 mm | 15.60" | 1920x1080 |
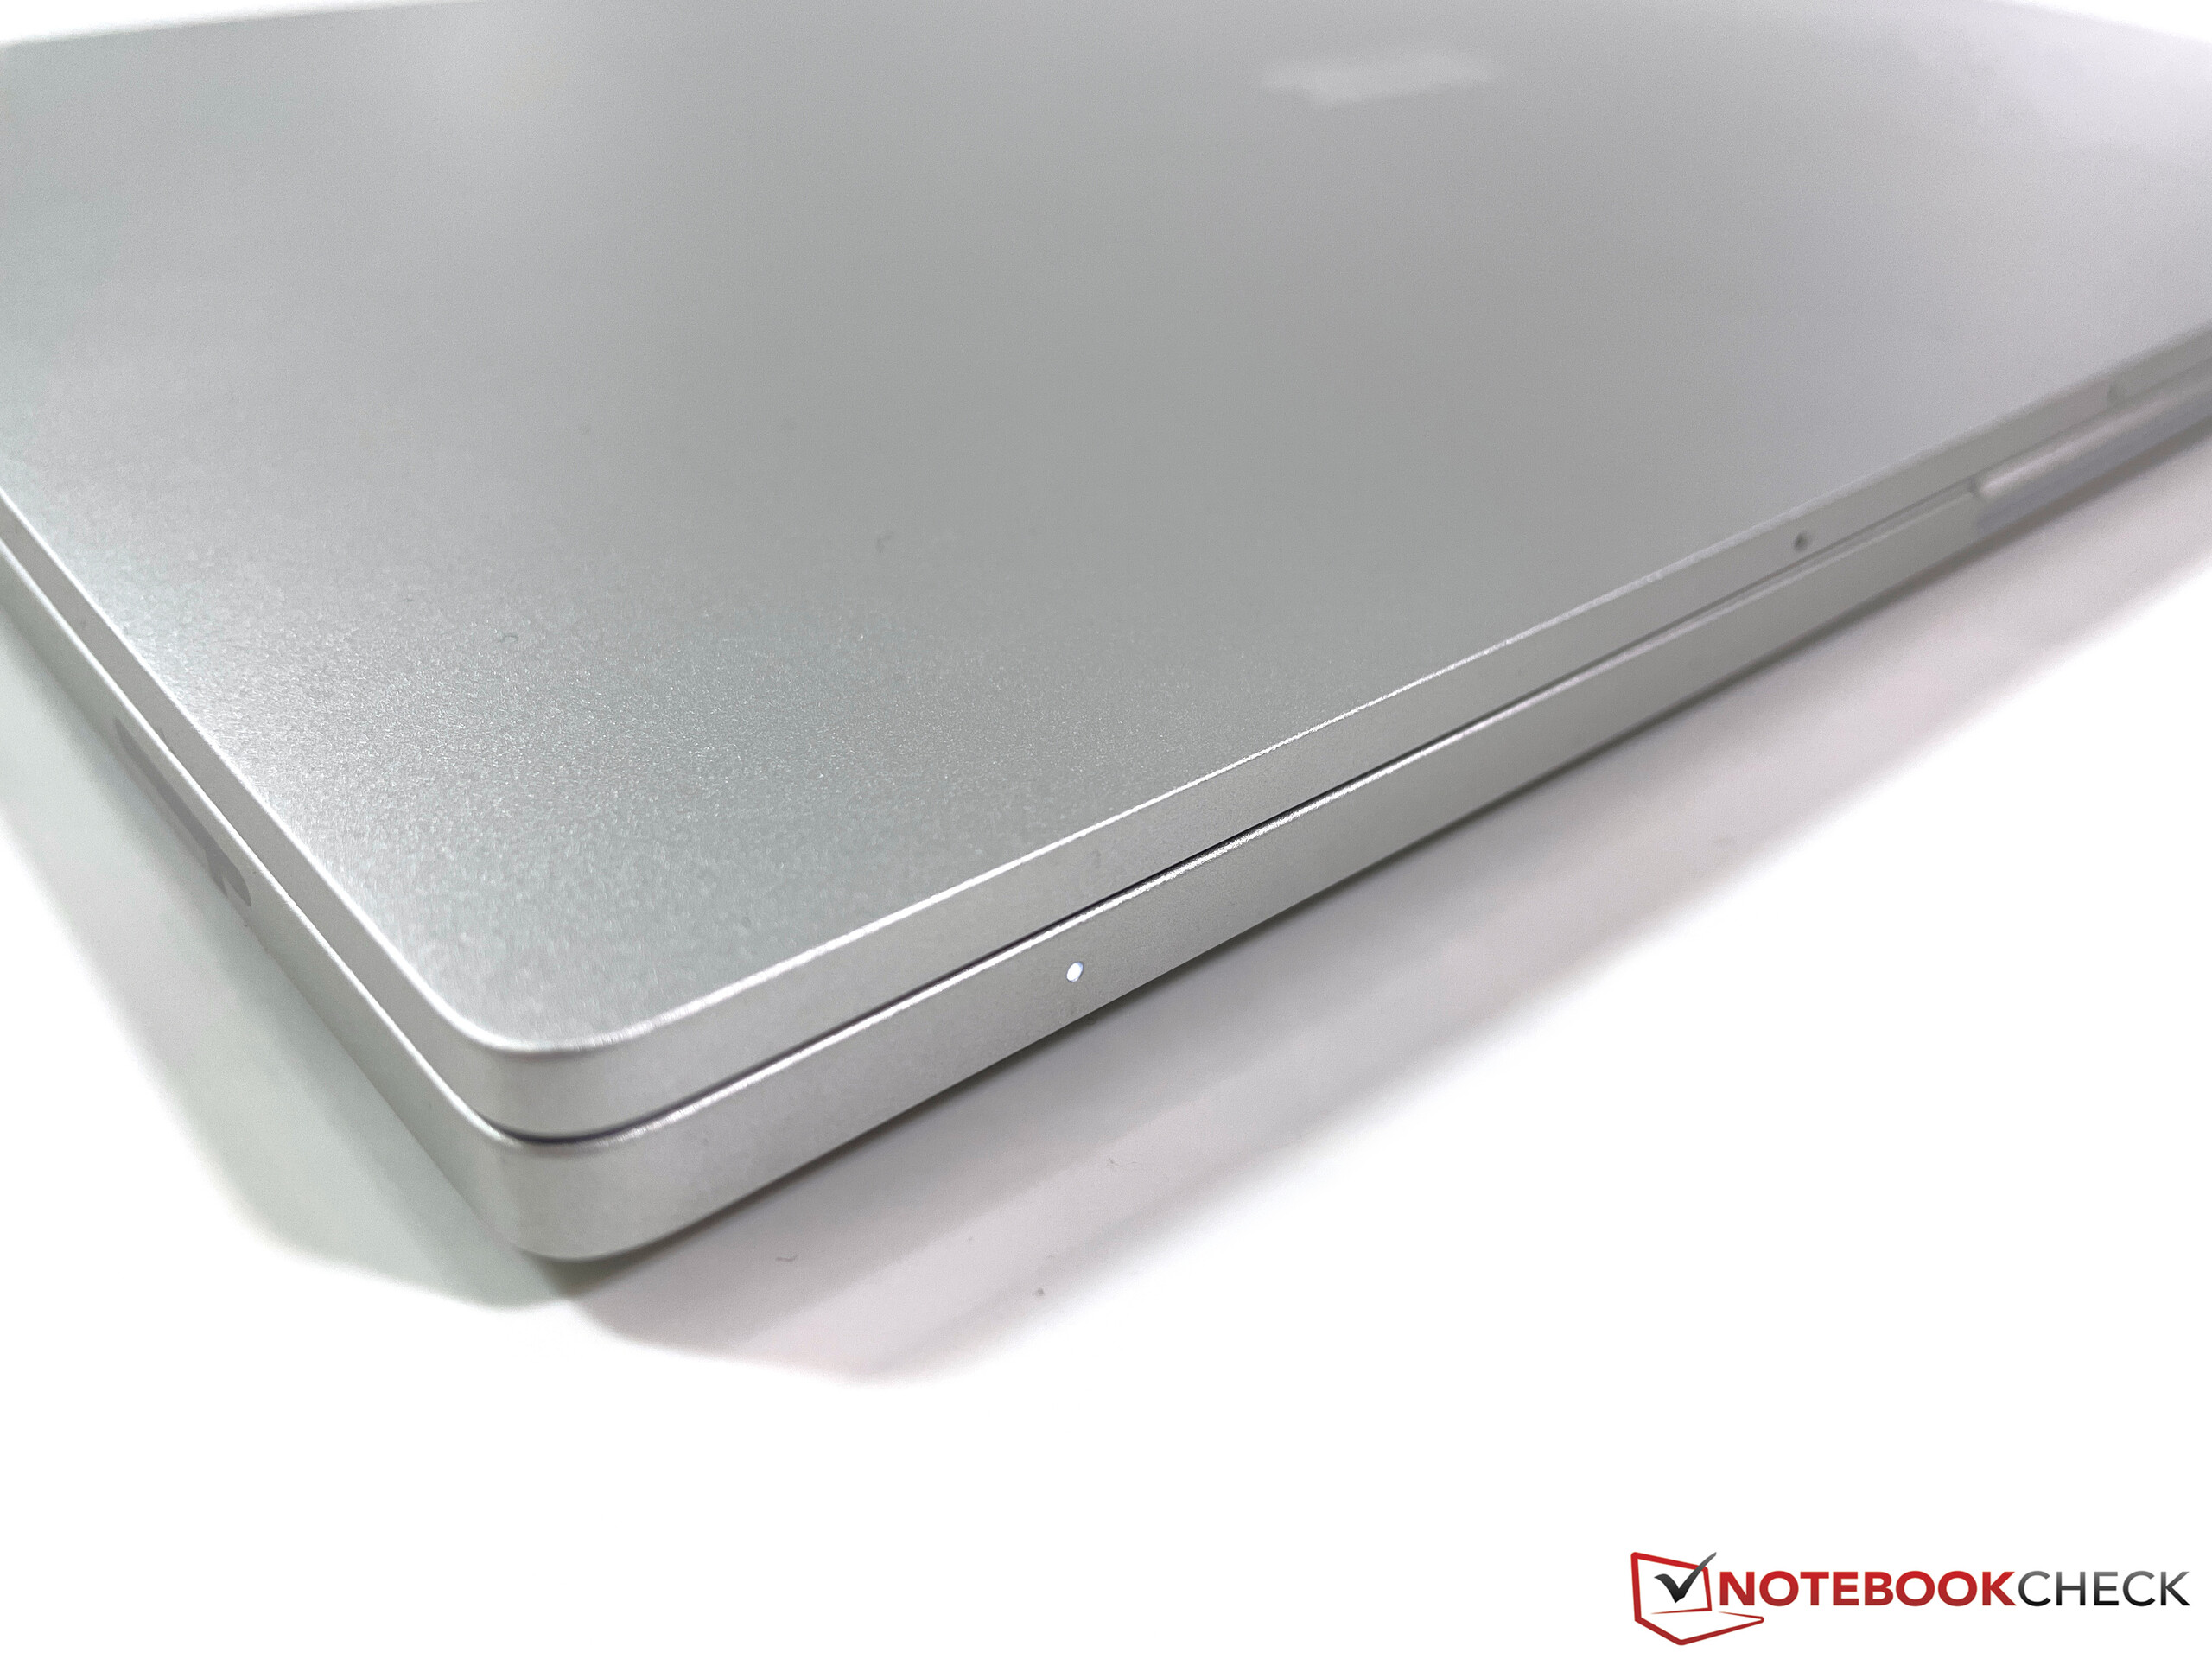
Case - Unibody aluminum shell
The case is made of a unibody aluminum construction, which definitely meets the premium claim. The case design itself is pretty simple. The base unit reminds us of the Apple MacBook Pro, but the edges are a bit more rounded, so it is more comfortable to touch. The lid on the other hand is a bit thicker compared to many rivals and does not get slimmer towards the front, either. At launch, the case will only be available in silver, but a black version is supposed to follow later. The black keyboard and the black bezels create a nice contrast to the silver design.
Our pre-production unit is already very well-built, and we cannot notice any build quality issues. The same applies for the stability; especially the base unit is very sturdy and there are no creaking noises. The area around the keyboard is slightly deeper, which allows more key travel. The center area can be pushed down a bit with a lot of pressure, but this should not be an issue in practice, even when you type with a lot of energy.
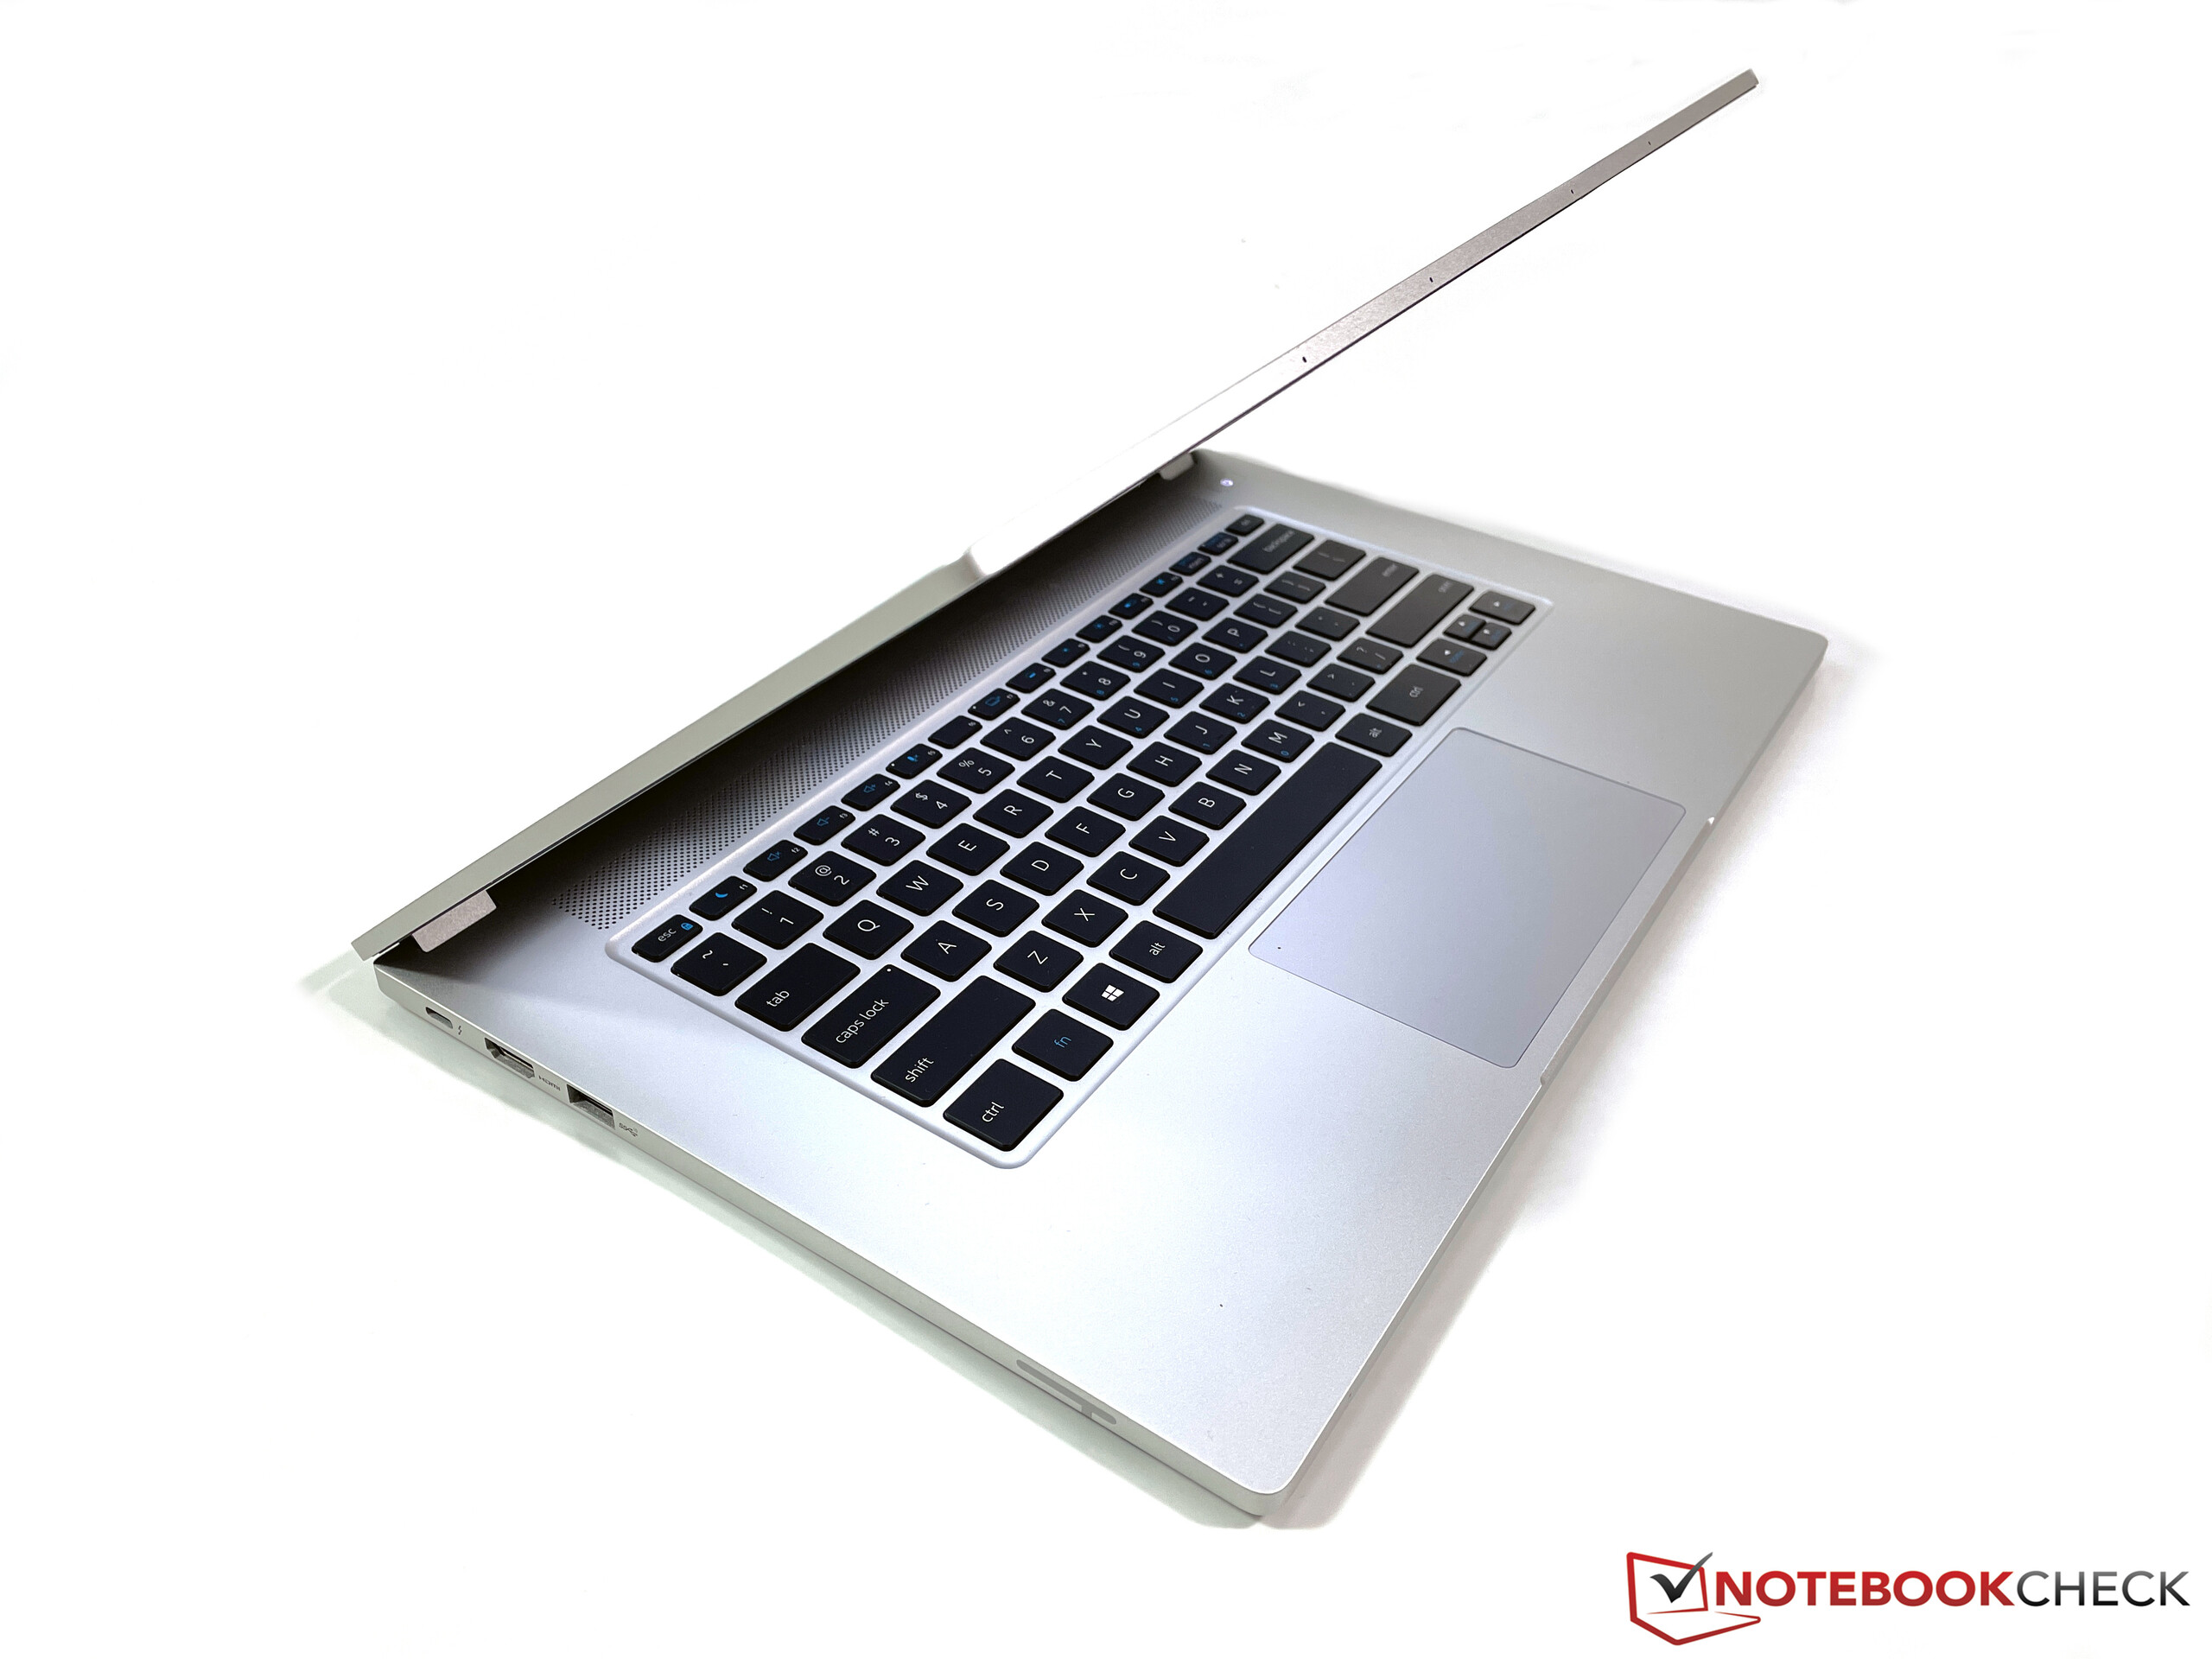
There are two hinges at the sides of the case, which keep the lid securely in place at all angles. The maximum opening angle is 180 degrees. All in all, the two hinges are very well adjusted. They are firm enough, but it is still easy to open the lid with just one hand (there is also a small indentation at the front). The stability of the lid on the other hand is not perfect. Twisting attempts result in some creaking sounds and we can provoke ripples on the screen with concentrated pressure.
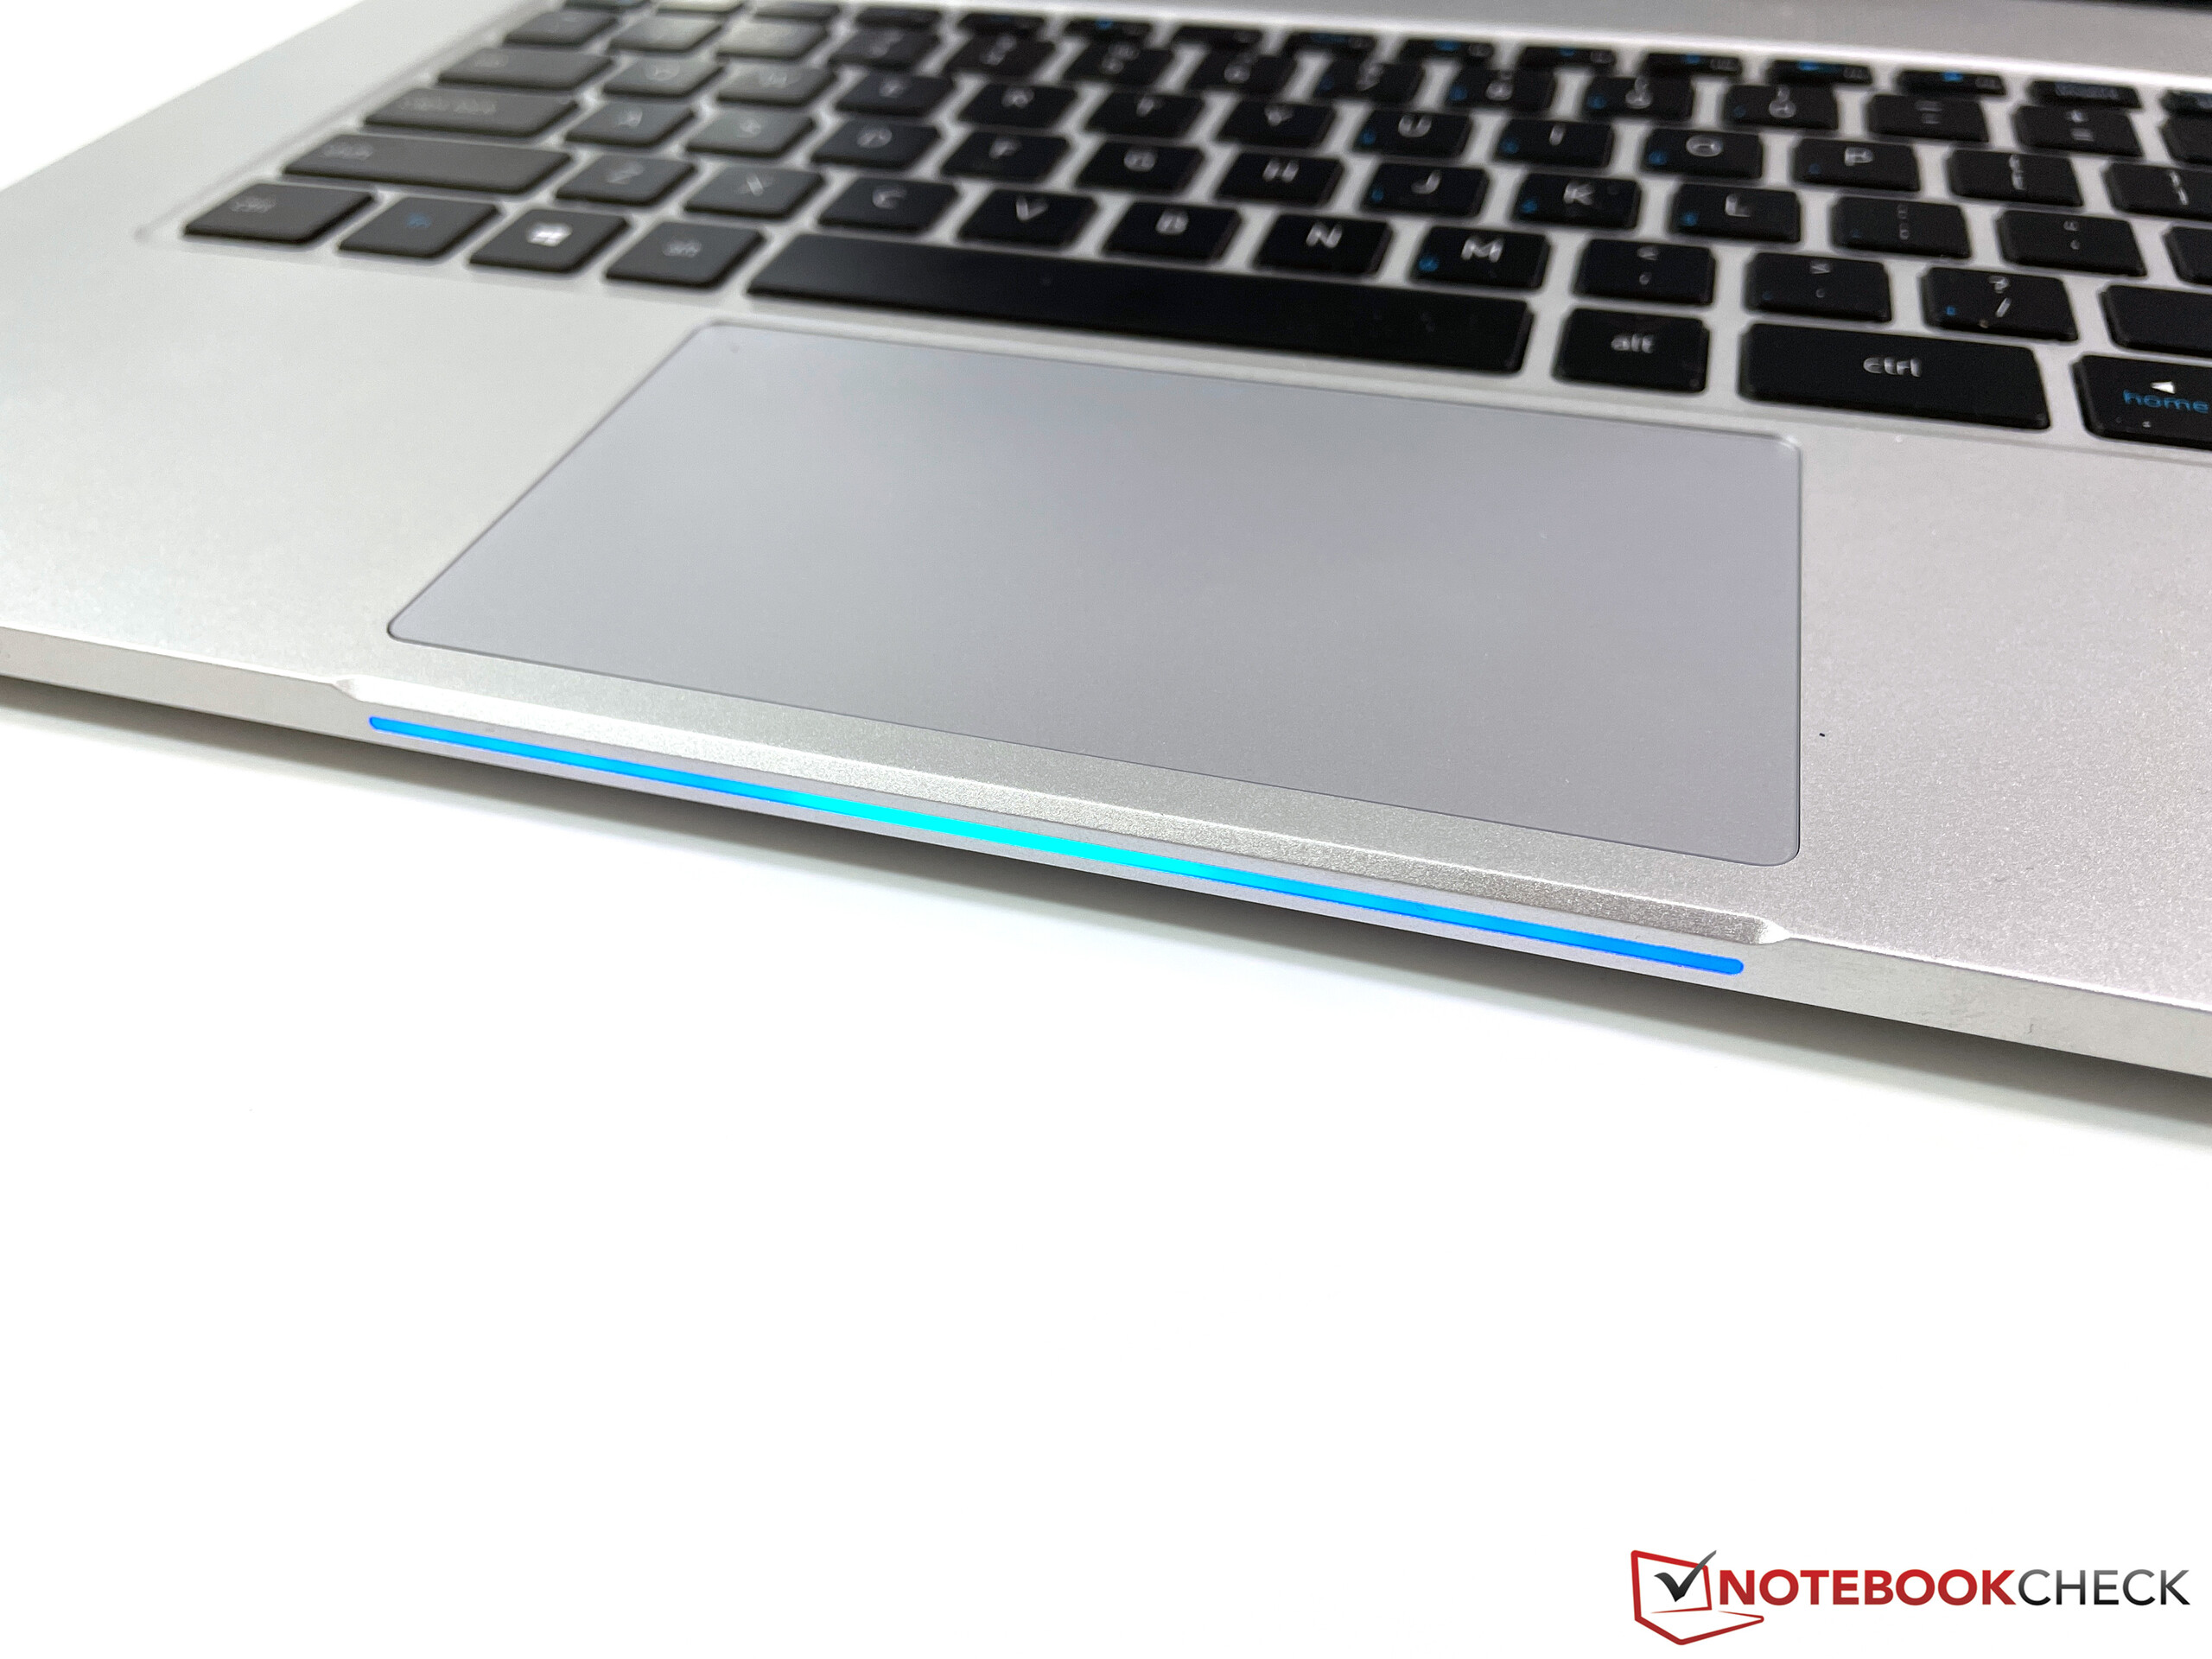
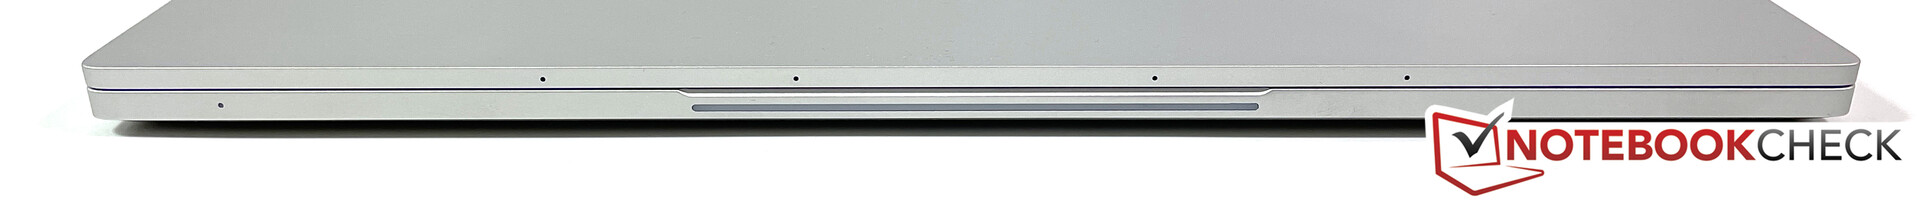
The power button is also a status LED (white or orange when the battery charge is low) and there is a second LED at the front of the case, which is also white or orange when the lid is closed. Finally, there is a large LED strip at the front, which is used for voice assistants. Amazon's Alexa was pre-loaded on our unit and the strip is glowing in blue when you give voice commands. However, we think this is just a gimmick without a major benefit.
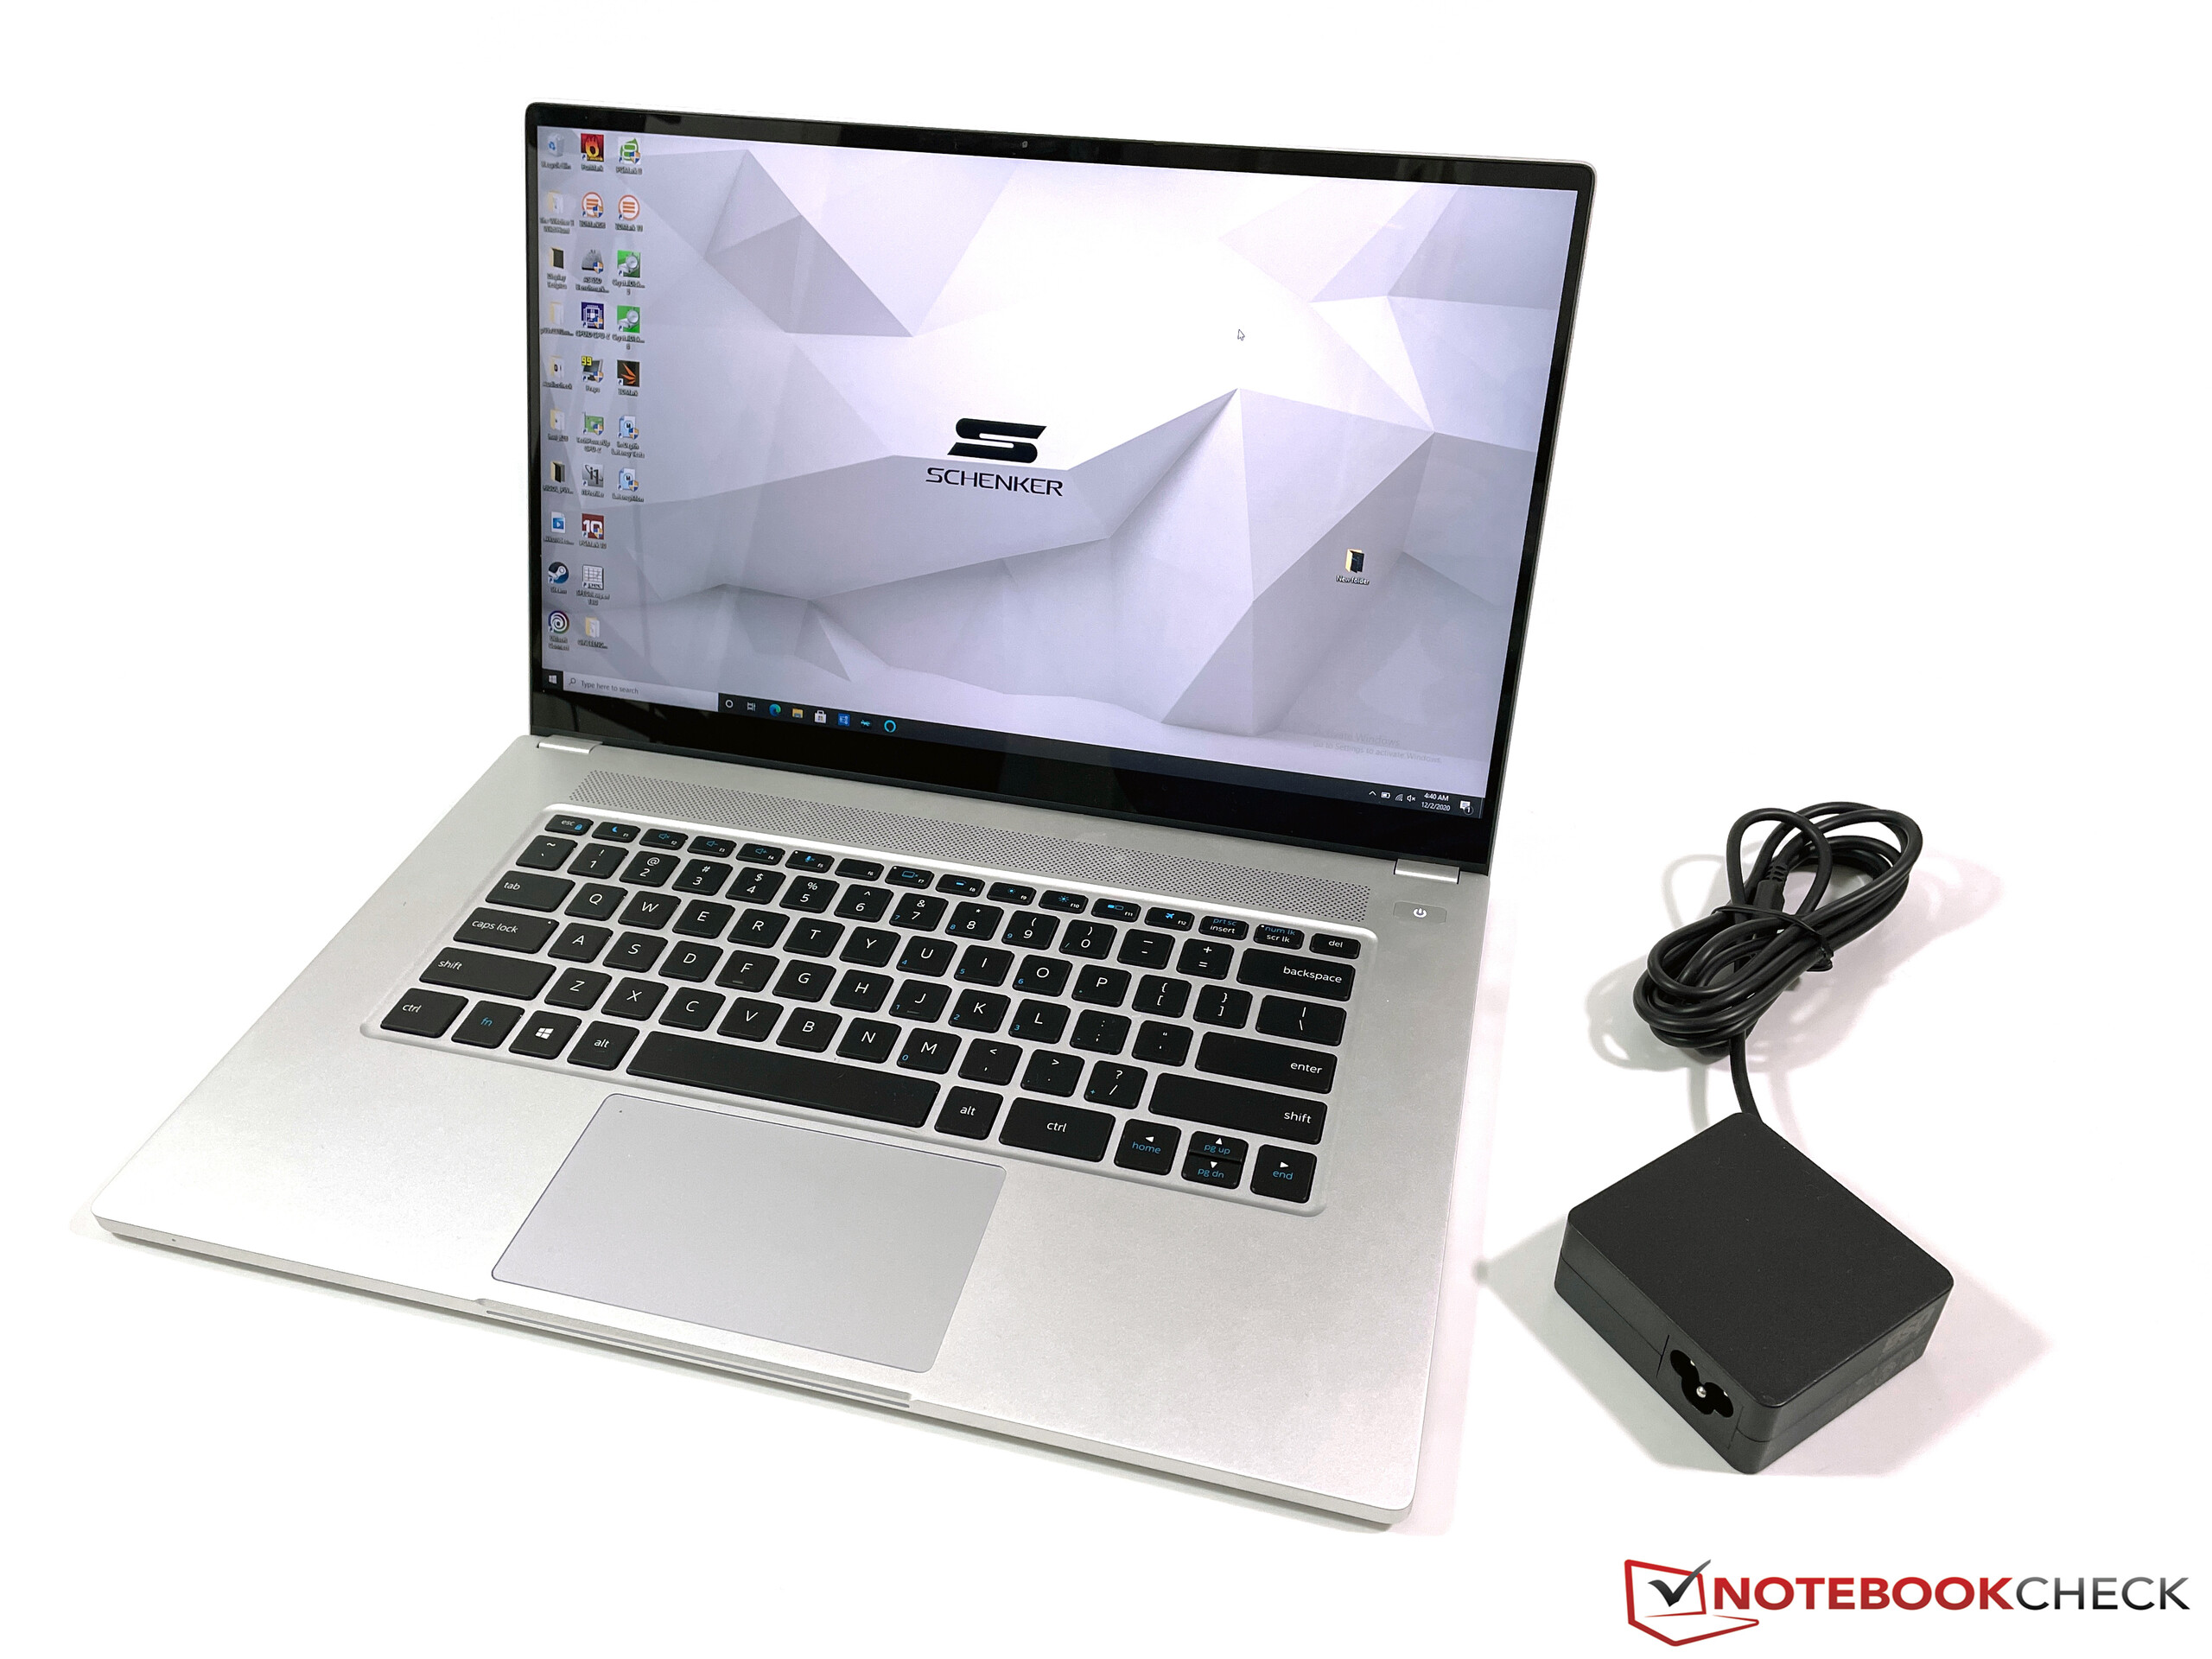
Dell's XPS 15 is a bit narrower in terms of footprint, but the Vision 15 is slightly slimmer and lighter at 1.7 kg in return. The LG Gram 15 is even more compact and lighter, but the other two competitors are larger and heavier. All in all, a decent performance. The 65W power adapter has a comparatively long cable and adds about 350 grams to the overall weight.
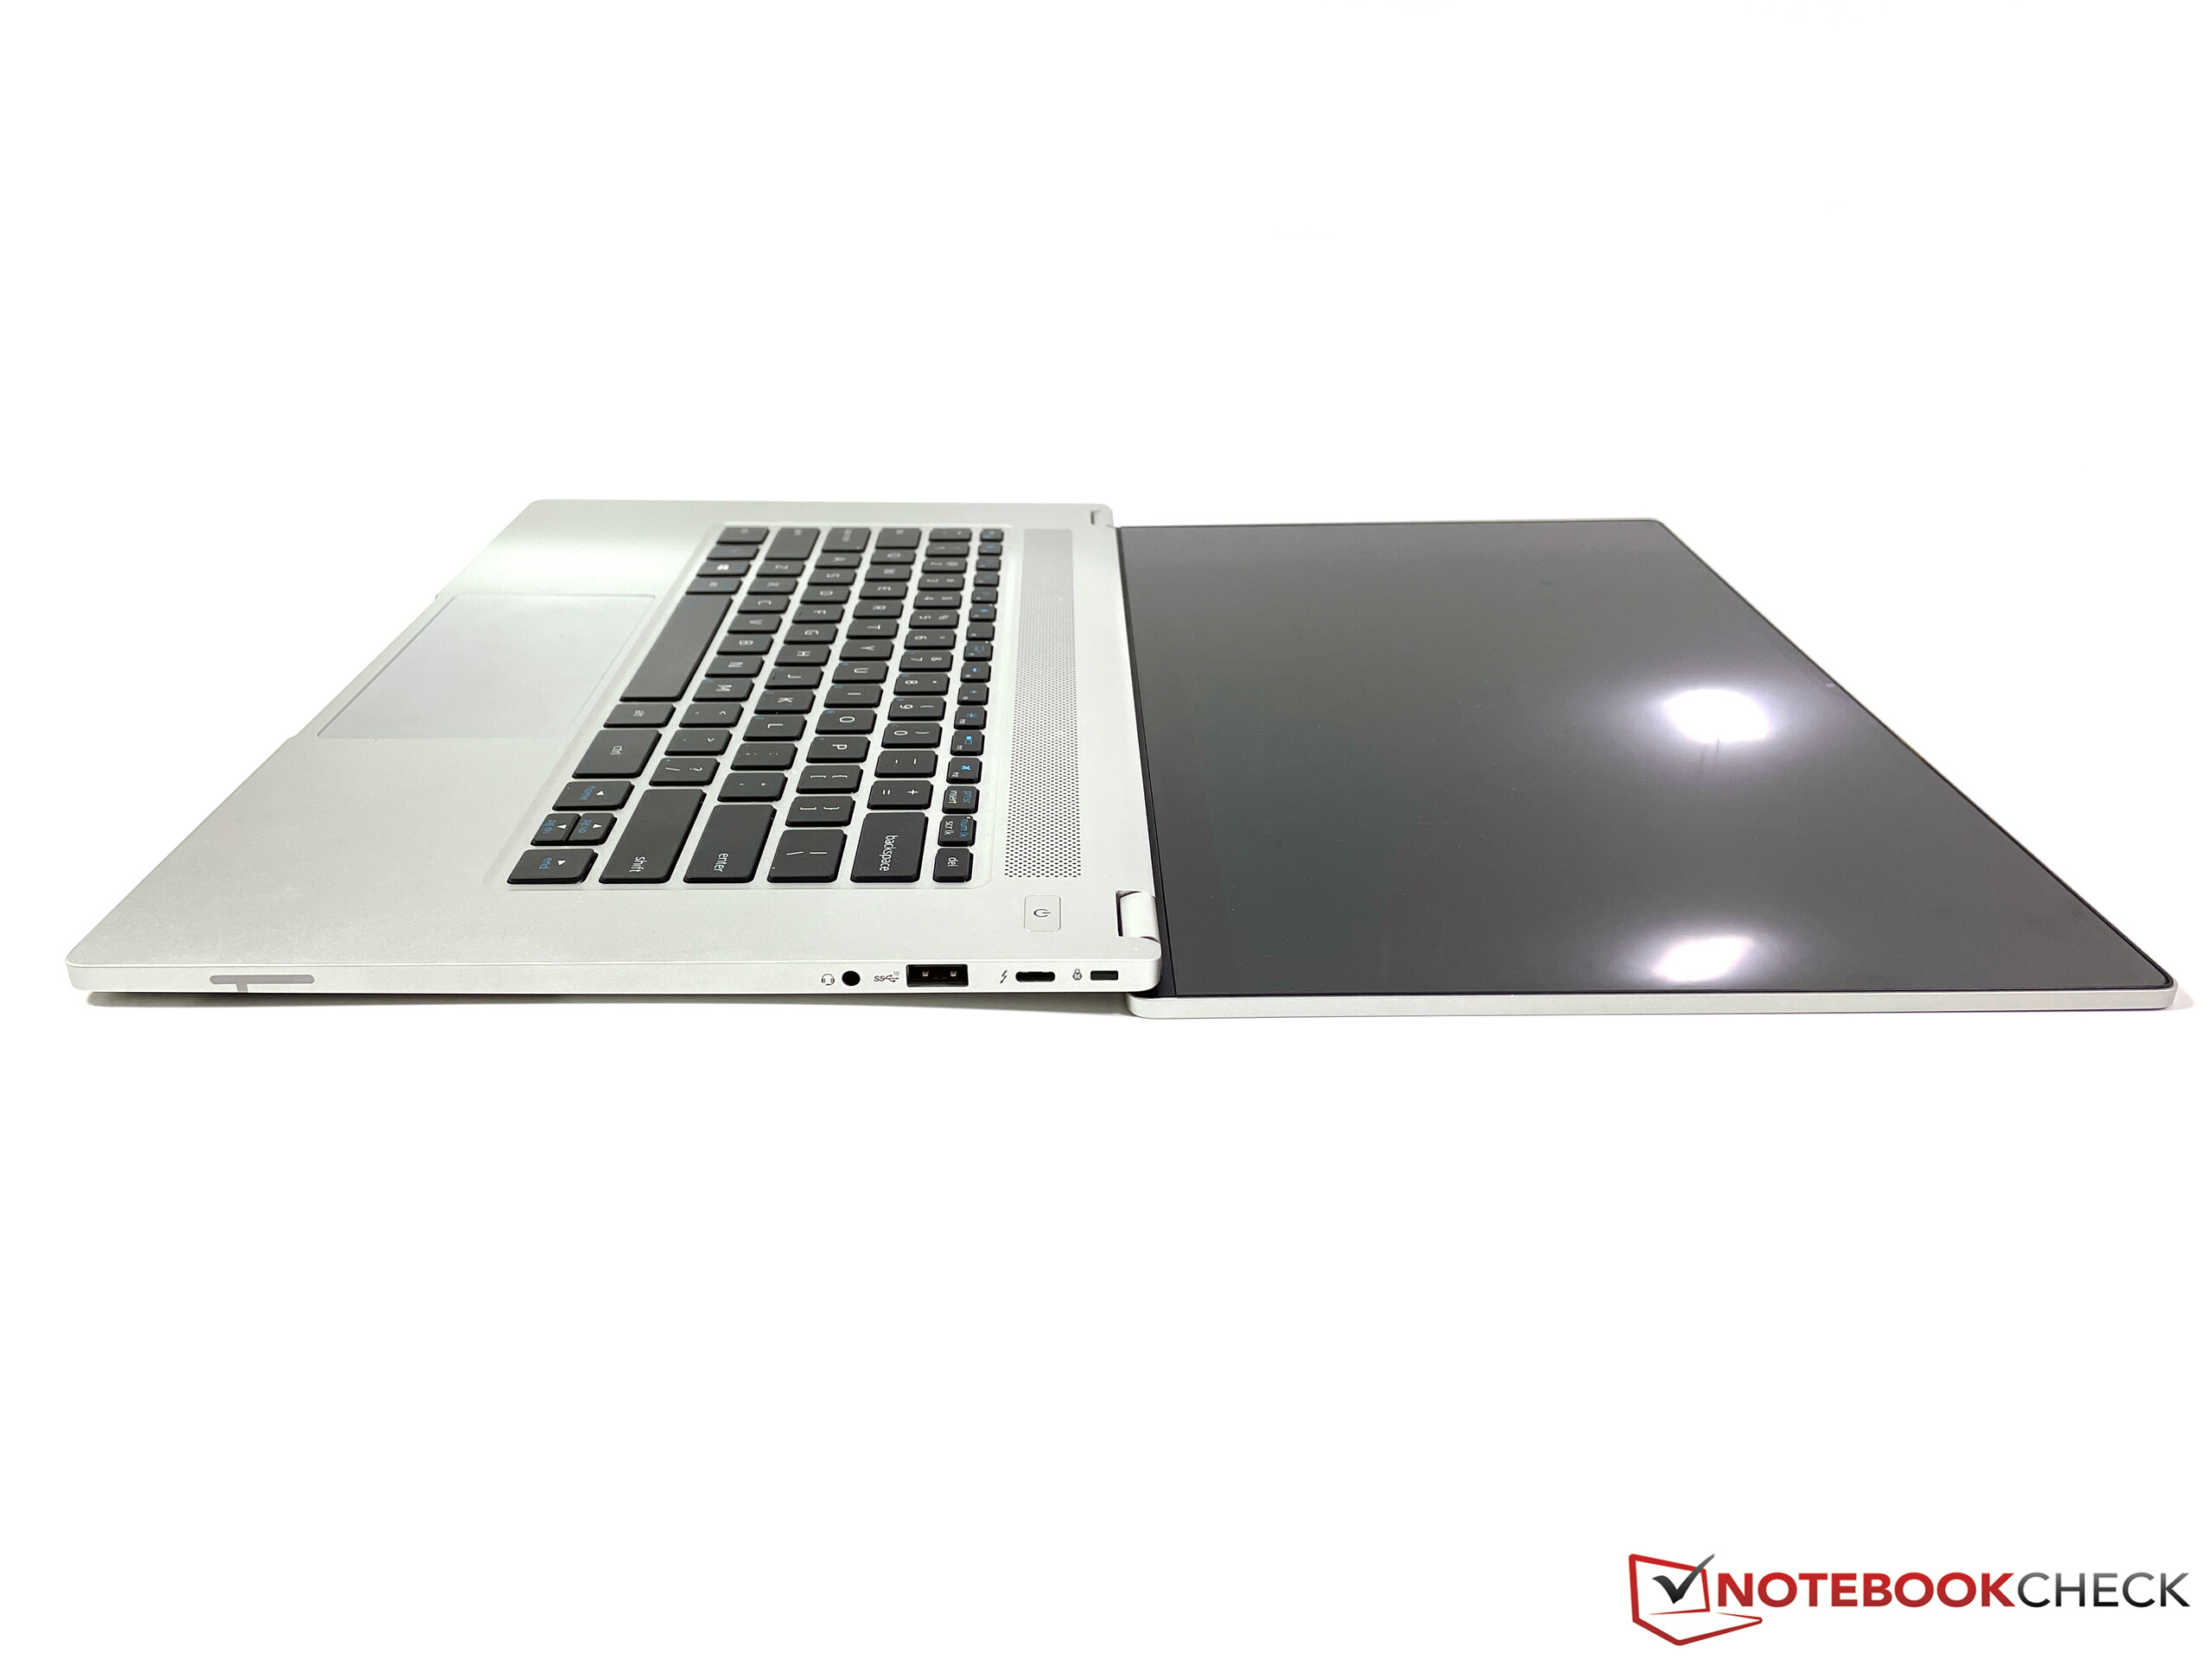
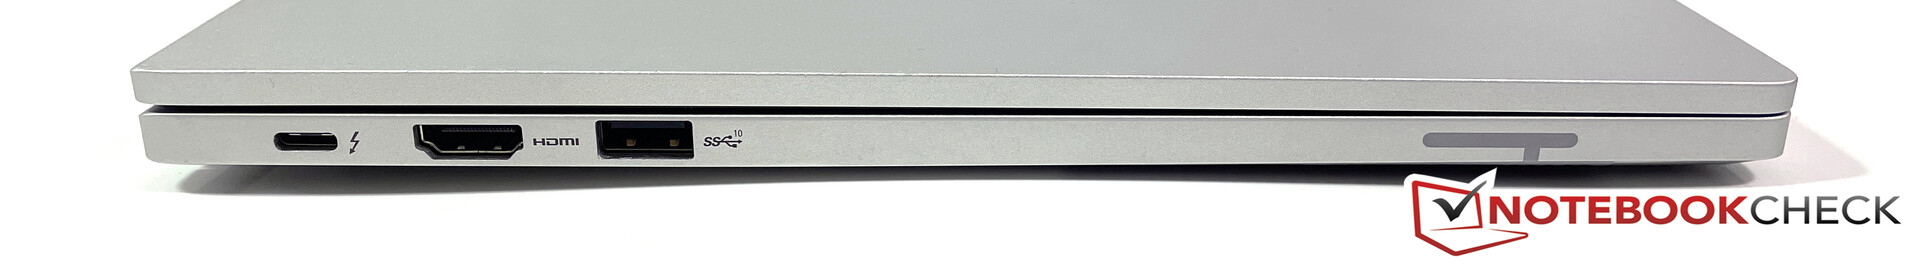
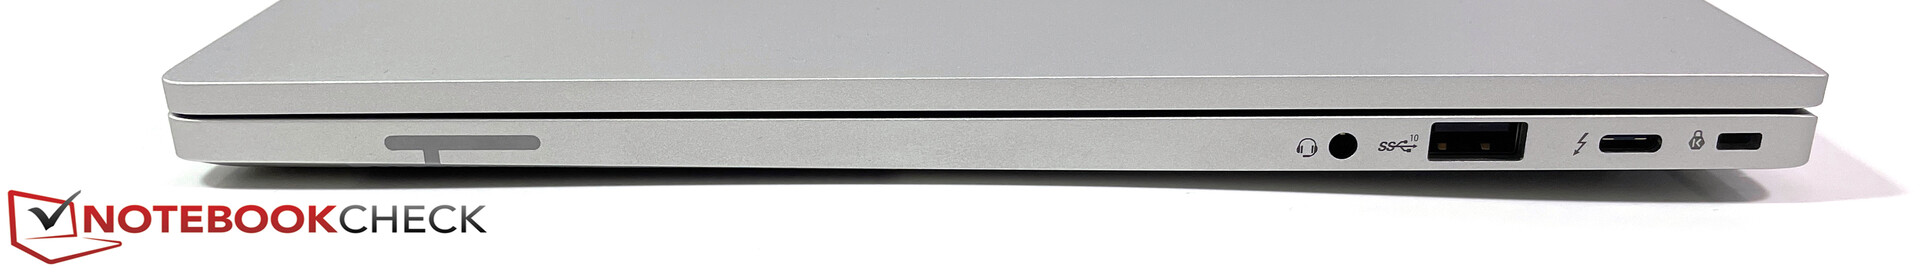
Connectivity - Thunderbolt 4 on both sides
You get Thunderbolt 4 ports with USB-C connectors (w/ charging & DisplayPort 1.4) as well as a regular USB-A port (USB 3.2 Gen.2) on both sides of the case. We really like the layout because you can charge the device on either side and usually use peripherals without adapters. You also get a full-size HDMI output, but Intel did not include a card reader.
Communication - Wi-Fi 6
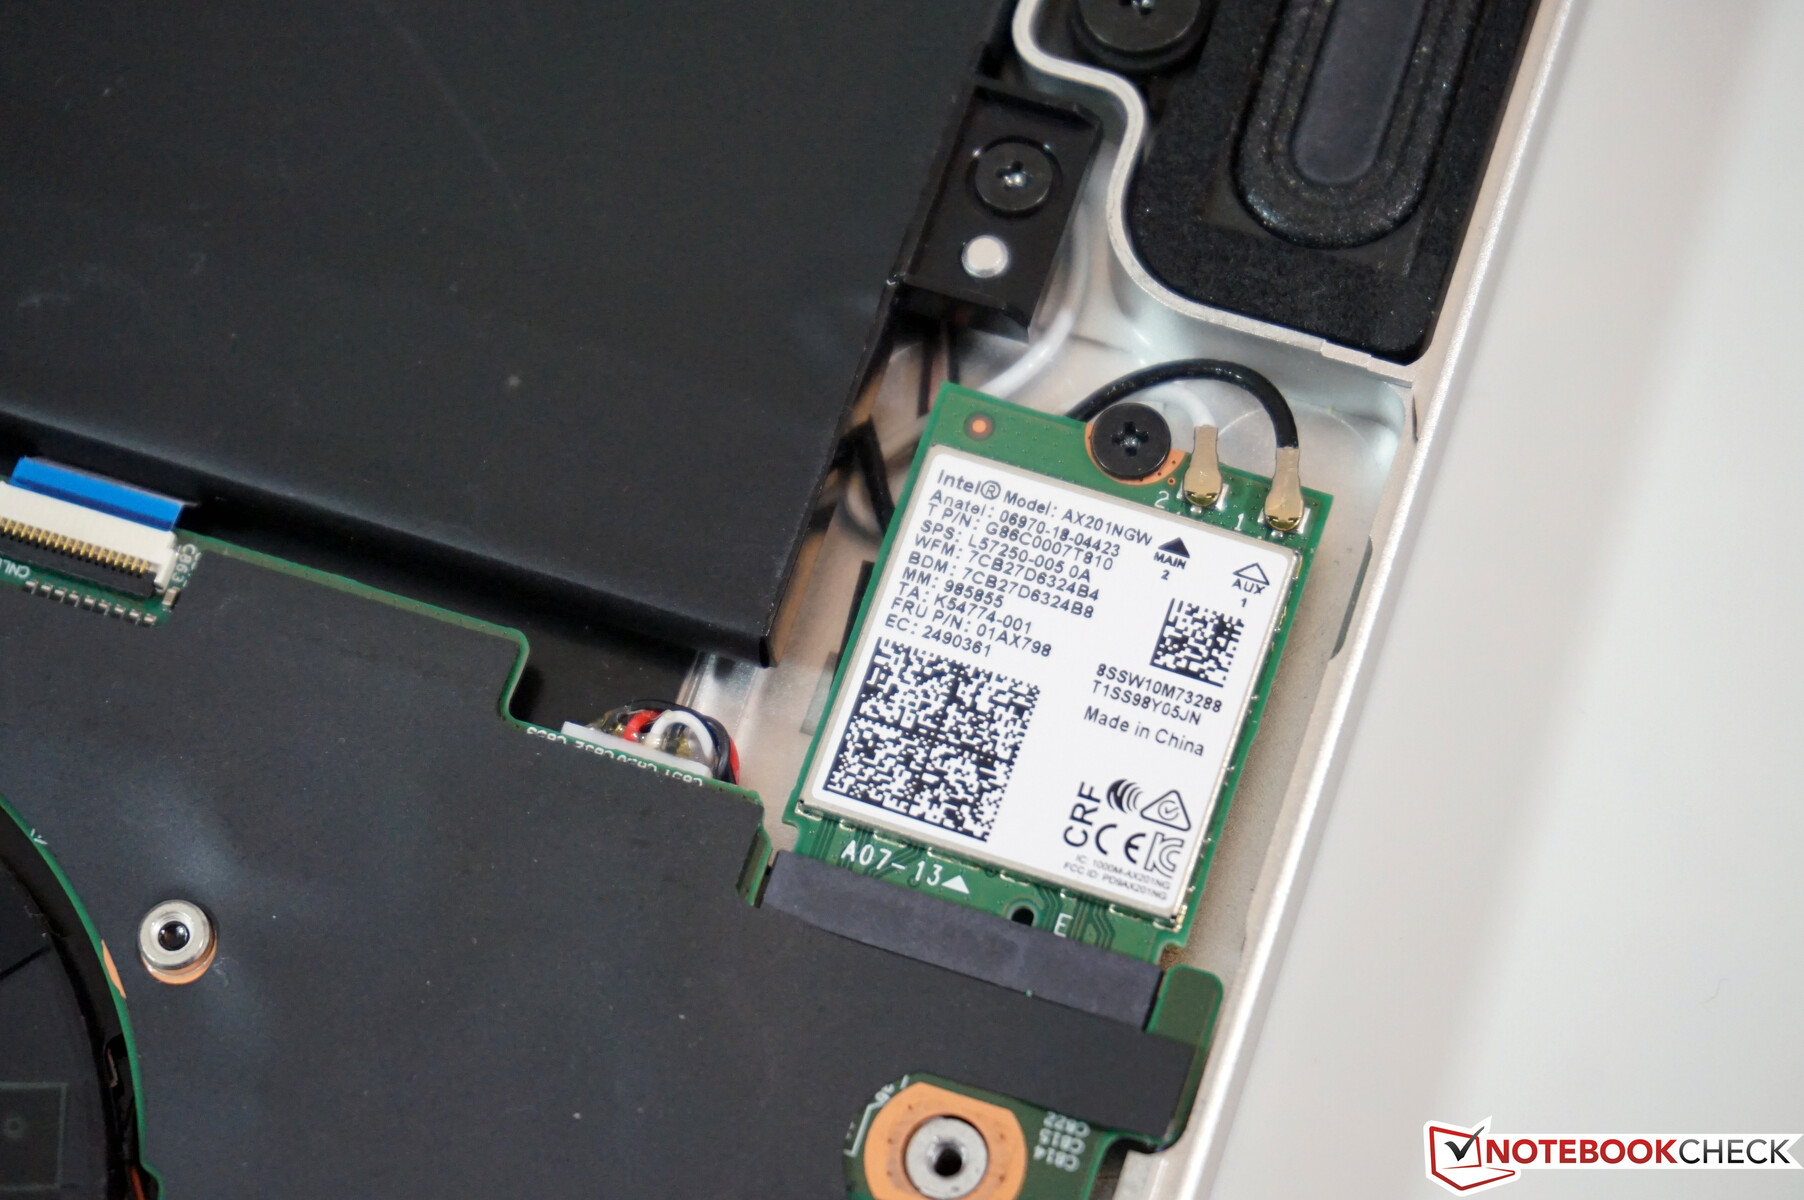
It is no surprise that Intel is using one of its own Wi-Fi modules. However, the module is replaceable and not soldered onto the motherboard like on many modern machines.
The Vision 15 is equipped with the AX201 module, which supports the fast Wi-Fi 6 standard (802.11ax) including Bluetooth 5.1. We managed to get very high transfer rates of more than 1.3 Gbps in our standardized test with the router Netgear RAX120, so the Vision 15 is at the top of our comparison group. We did not notice any signal problems with wireless networks during the review period, either.
Webcam


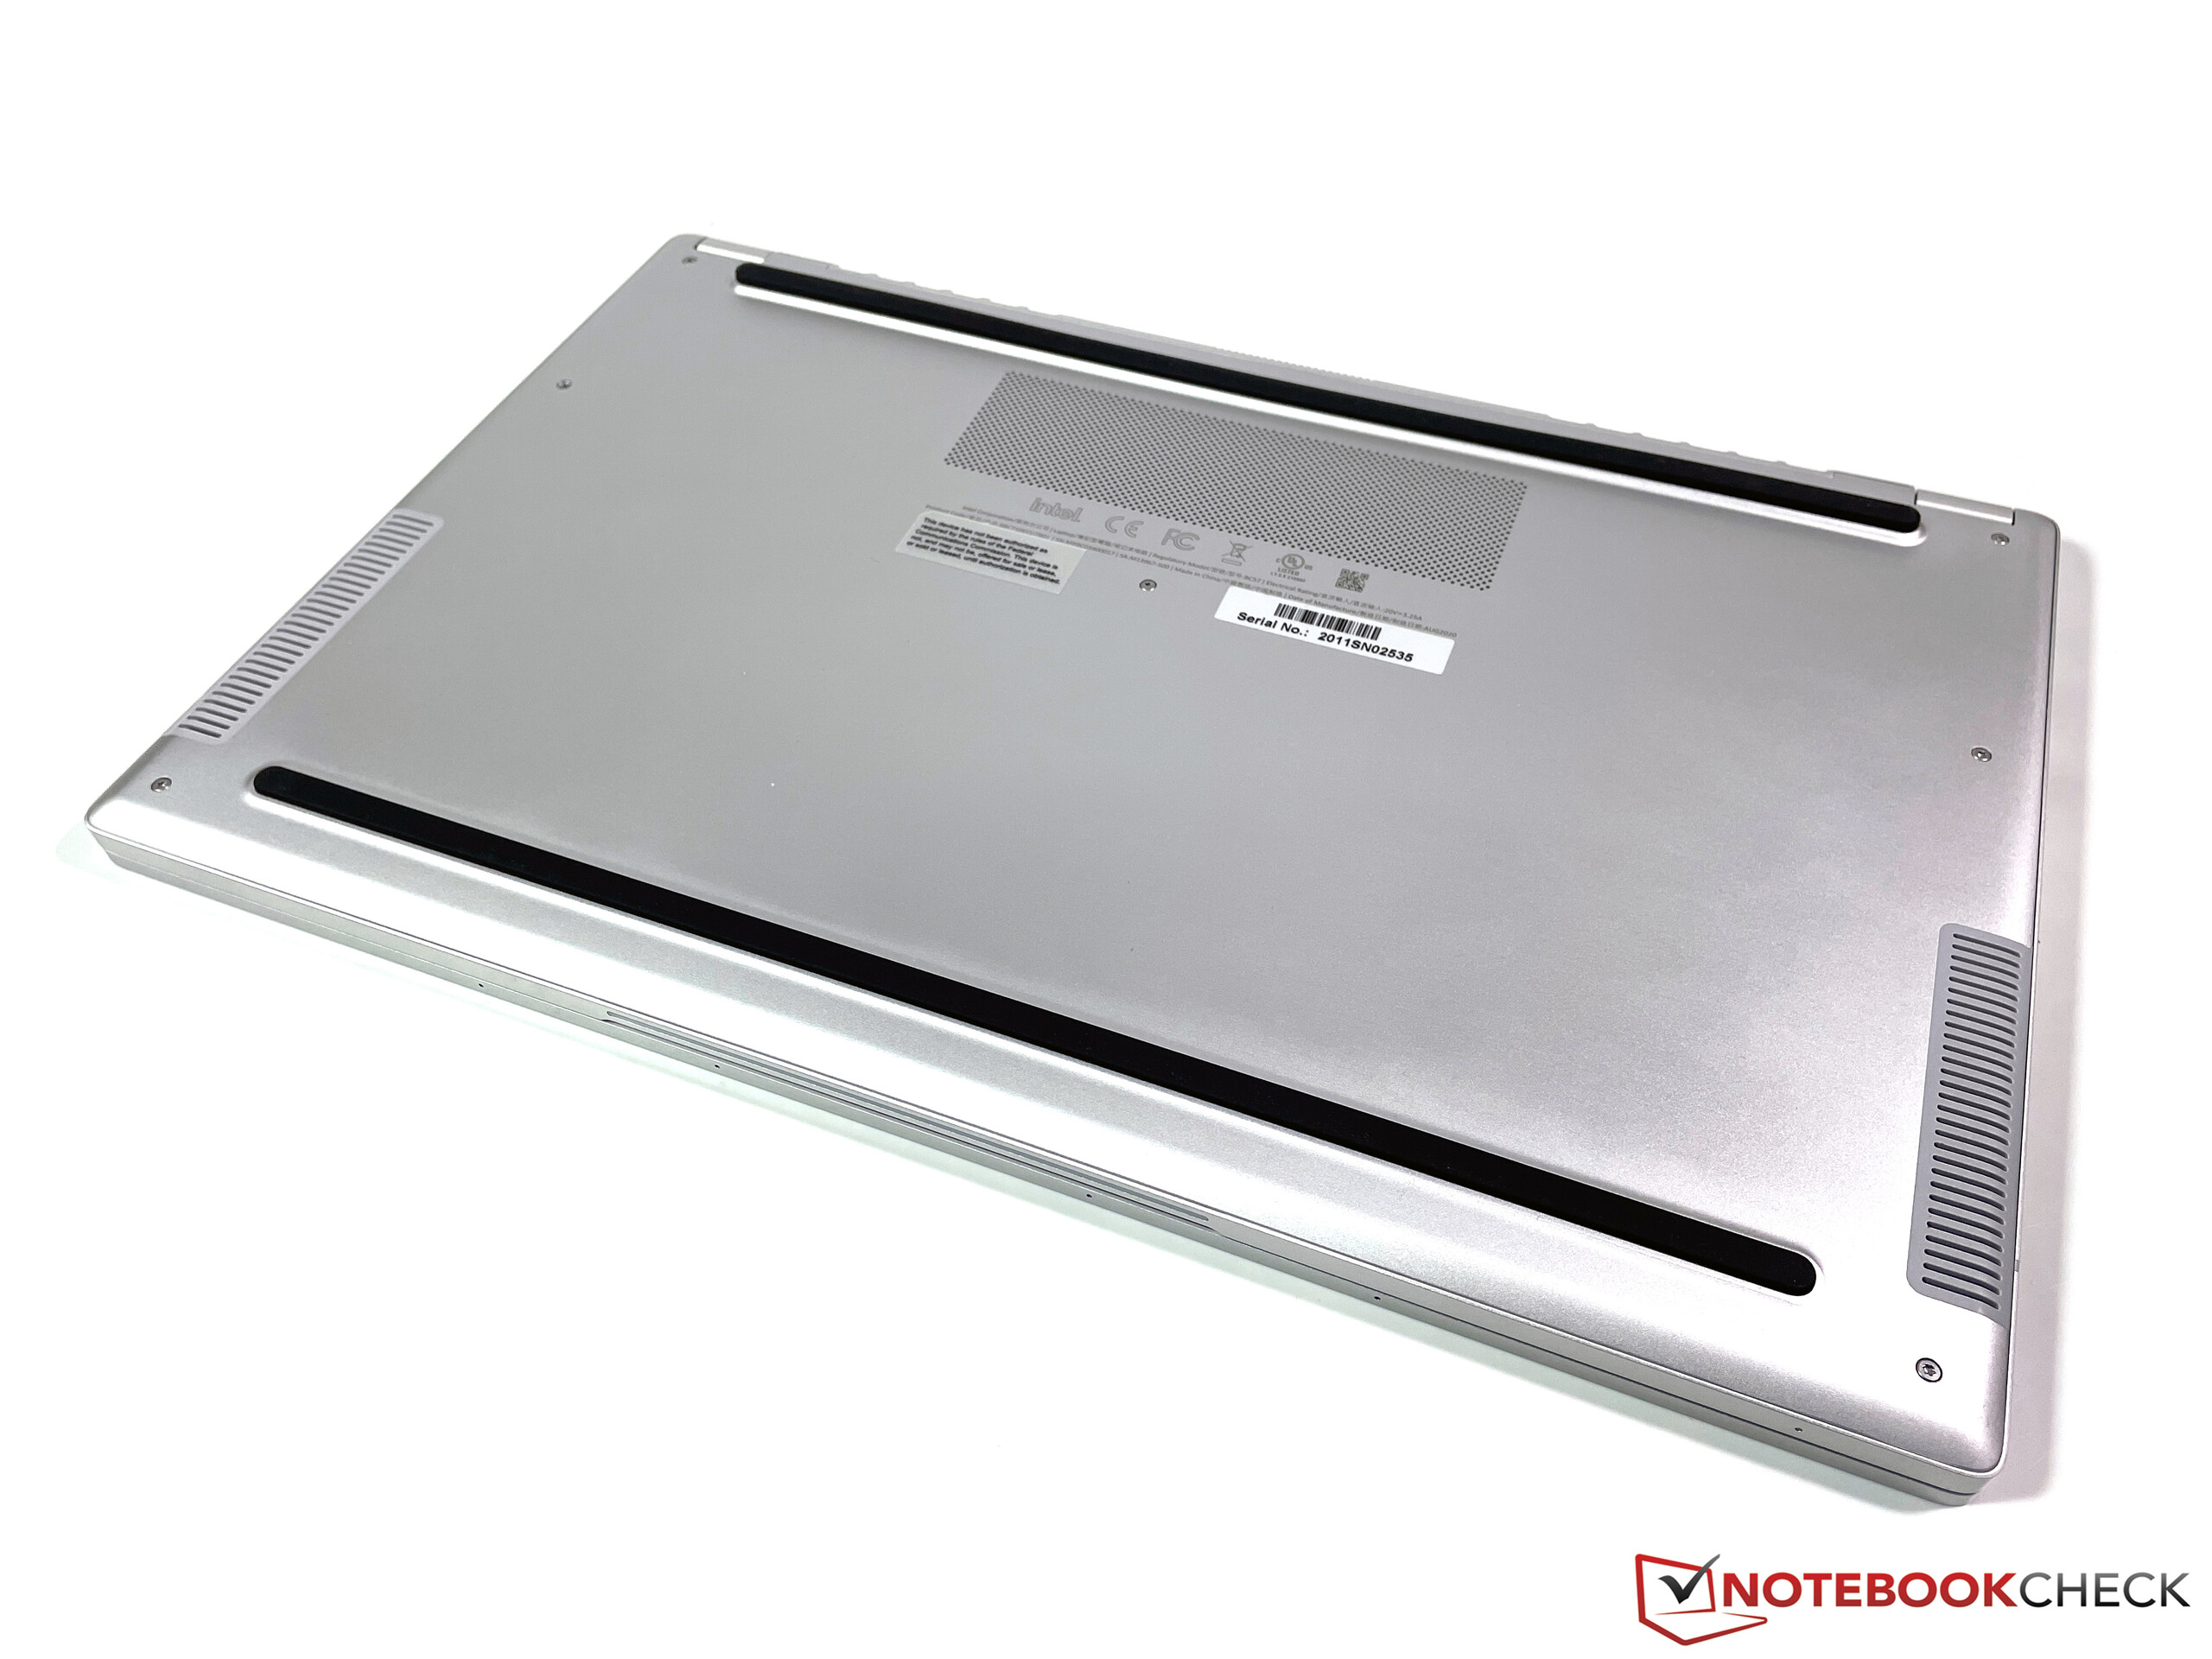
Maintenance
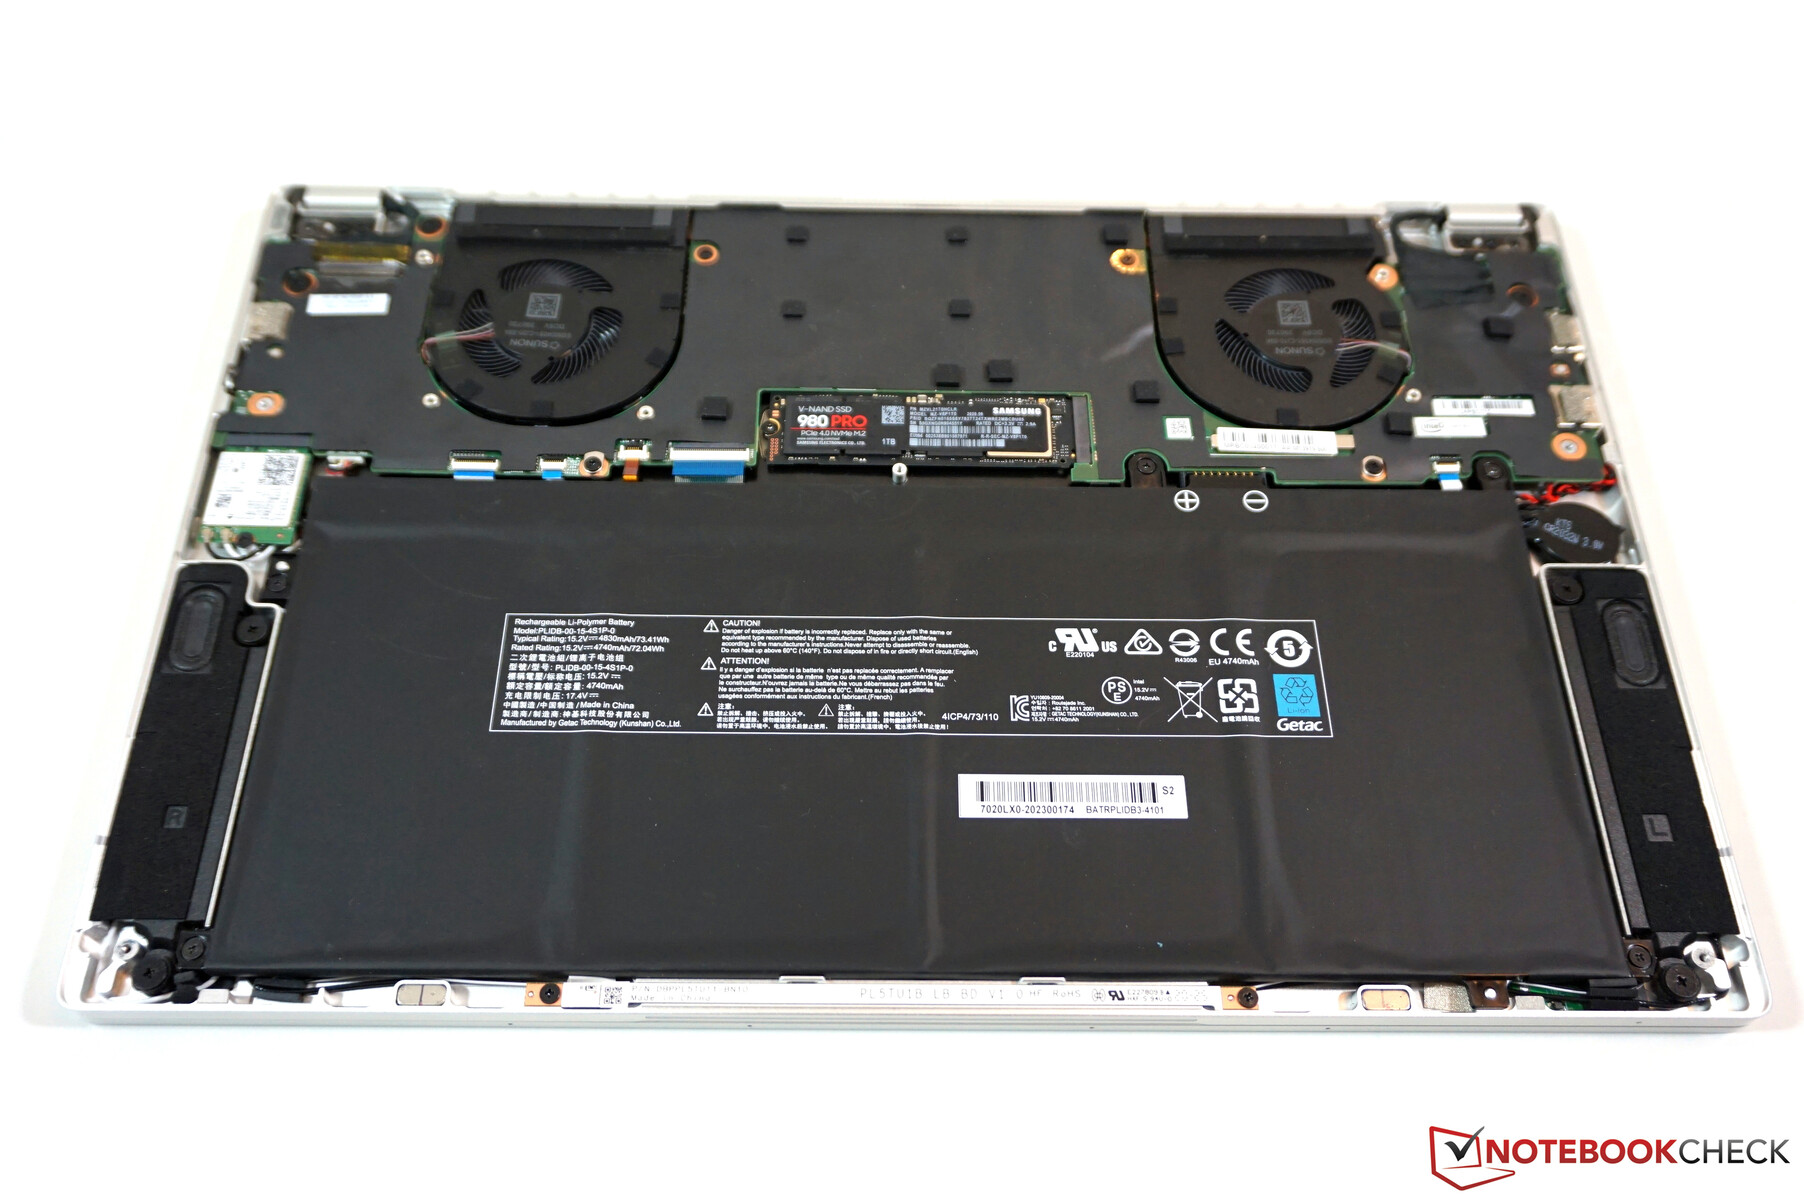
The bottom panel is secured by 7 Torx screws (T6) and is easy to remove. What we find is a very clean layout with access to the M.2-2280 SSD, the Wi-Fi module, as well as the CMOS battery. You can also clean the fans and replace the battery.
Input Devices
Keyboard
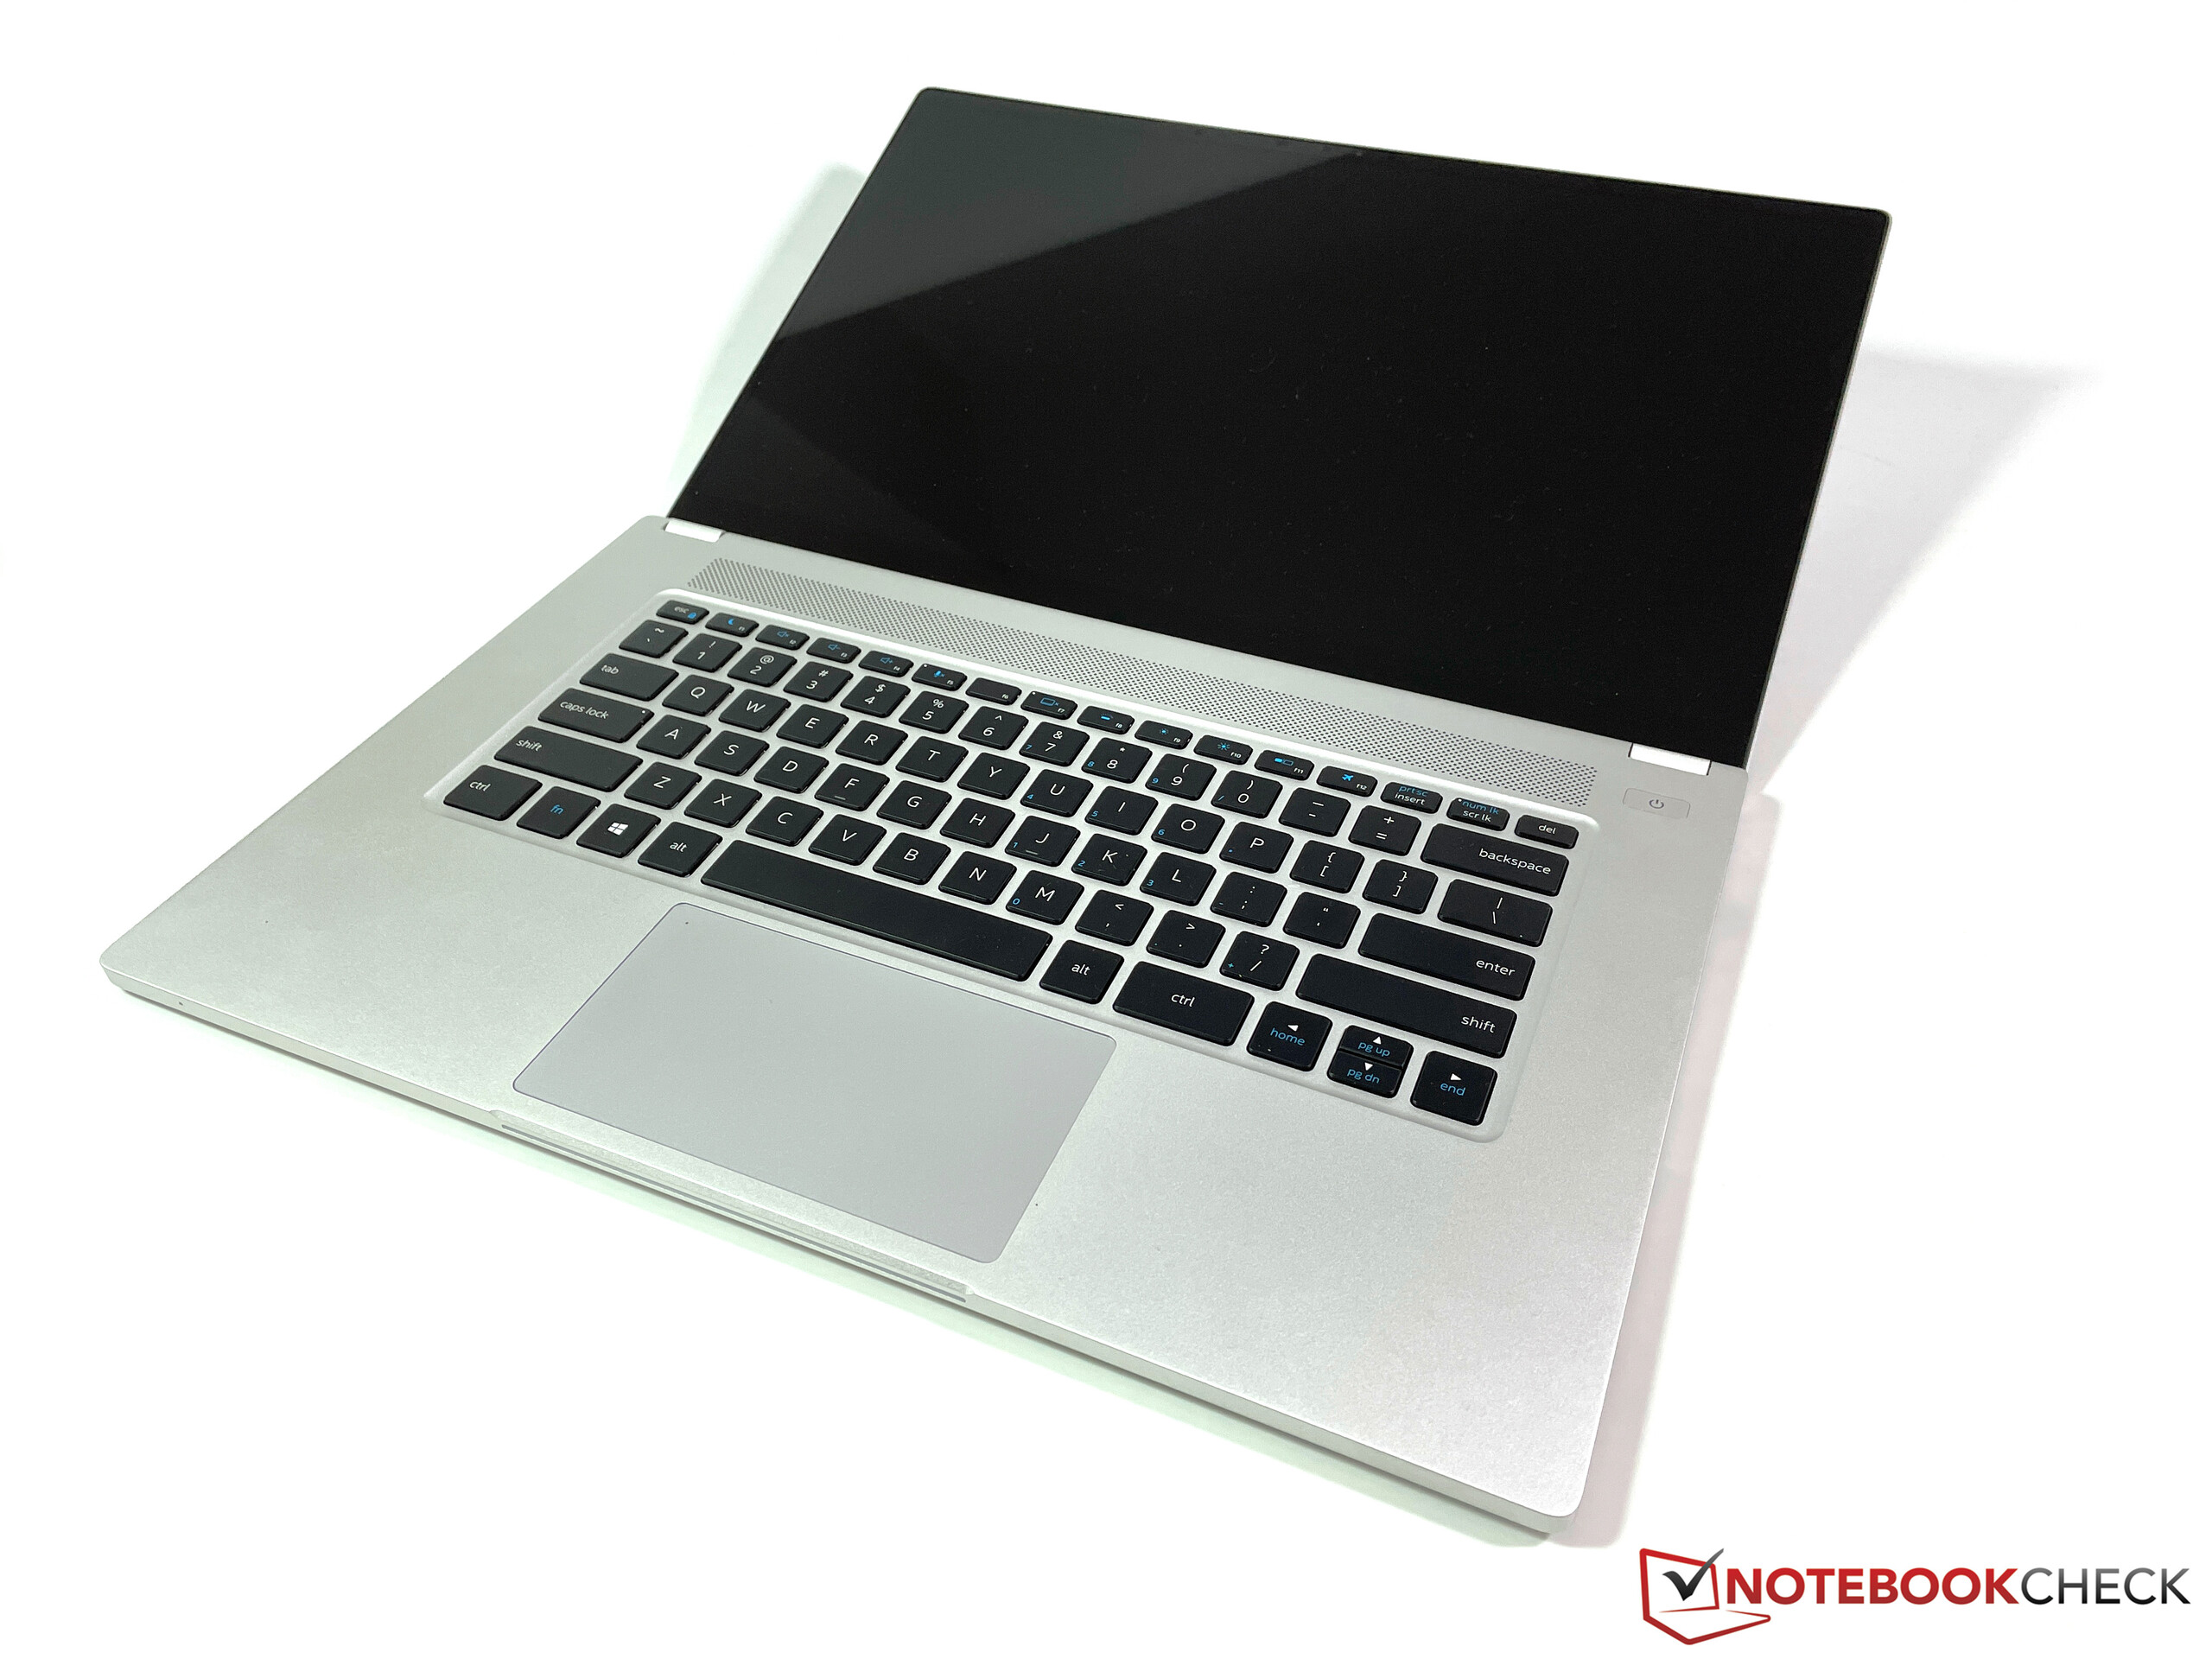
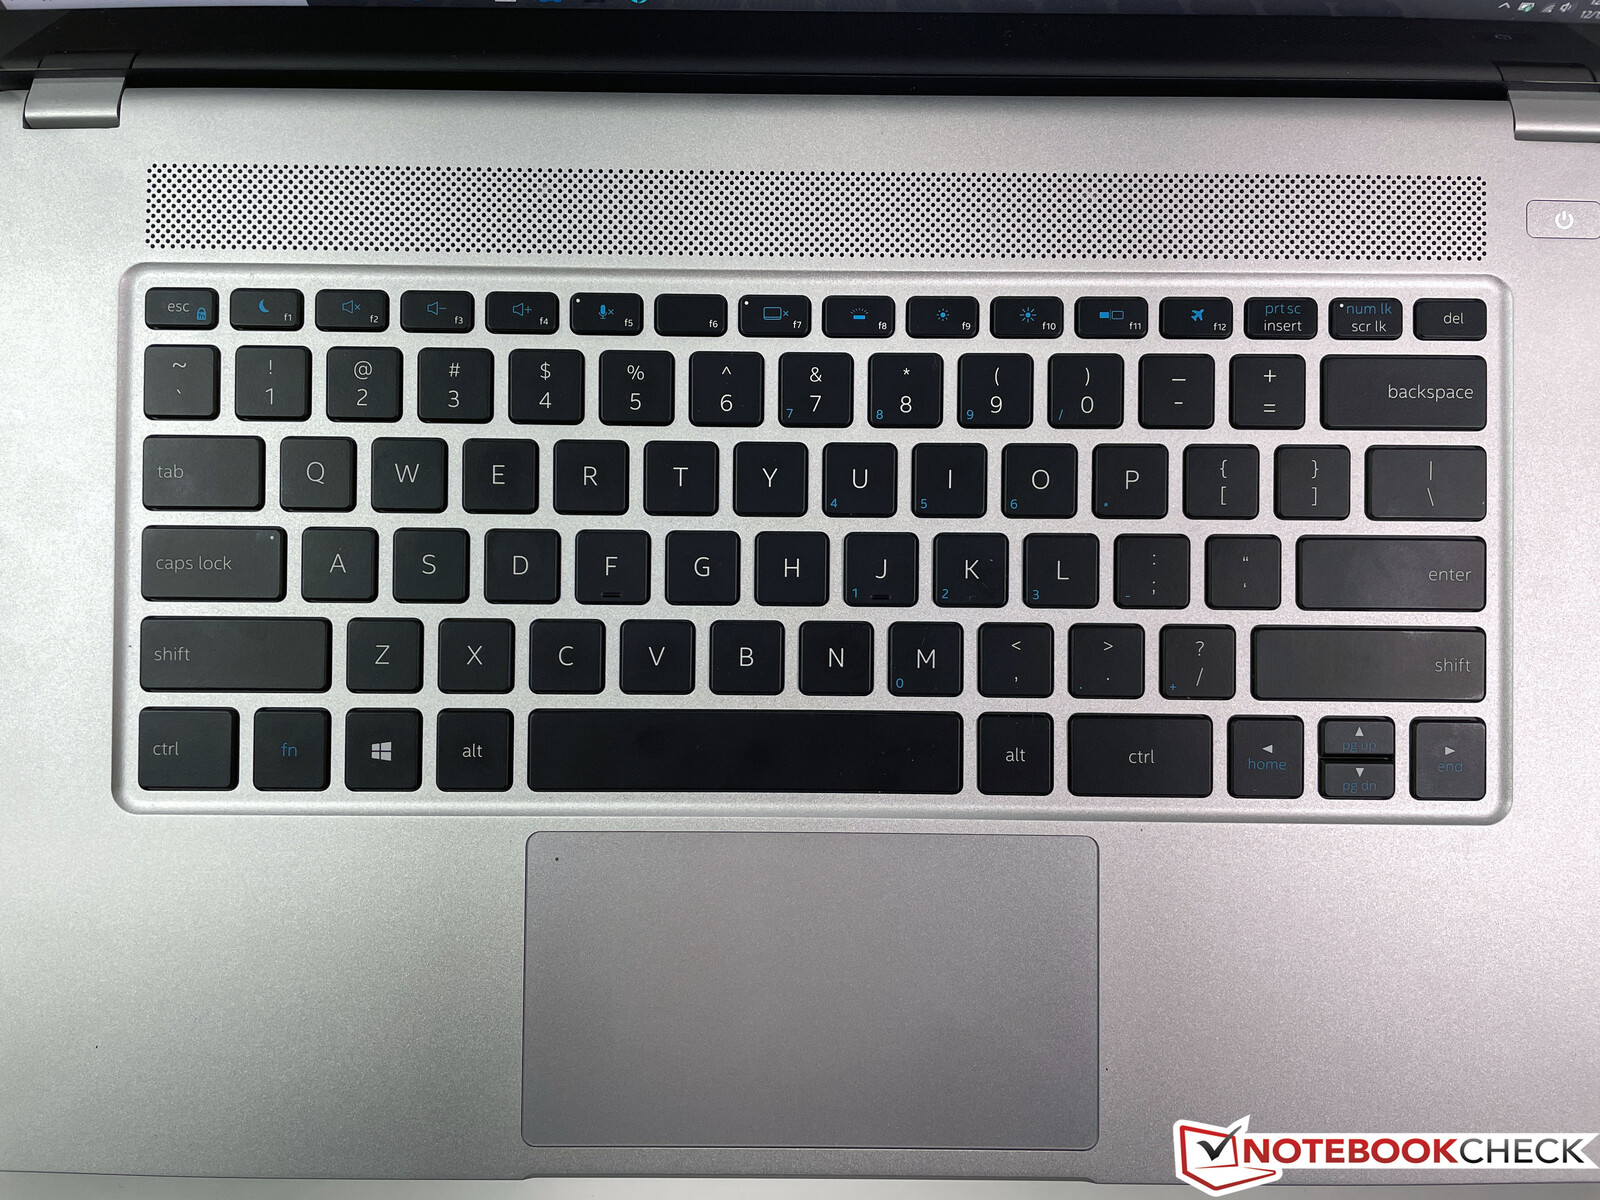
The Vision 15 is equipped with a black chiclet keyboard without dedicated numeric keypad. Our pre-production unit was equipped with an English keyboard, but there are 25 different layouts you can choose from when you order the device. Thanks to the indentation in the keyboard area, the key travel is very generous. The key stroke itself is very precise and also pretty quiet at the same time, which results in a very good typing experience. However, the individual keys are a little bit smaller than usual at 16 x 16 mm and the spacing is also bigger than usual. We think Intel could have used larger keys.
There are even better keyboards when you look at premium business notebooks (like HP EliteBook or Lenovo ThinkPad T-series), but we prefer the typing experience of the Vision 15 over the current MacBook Pro 16 or the Dell XPS 15, for example.
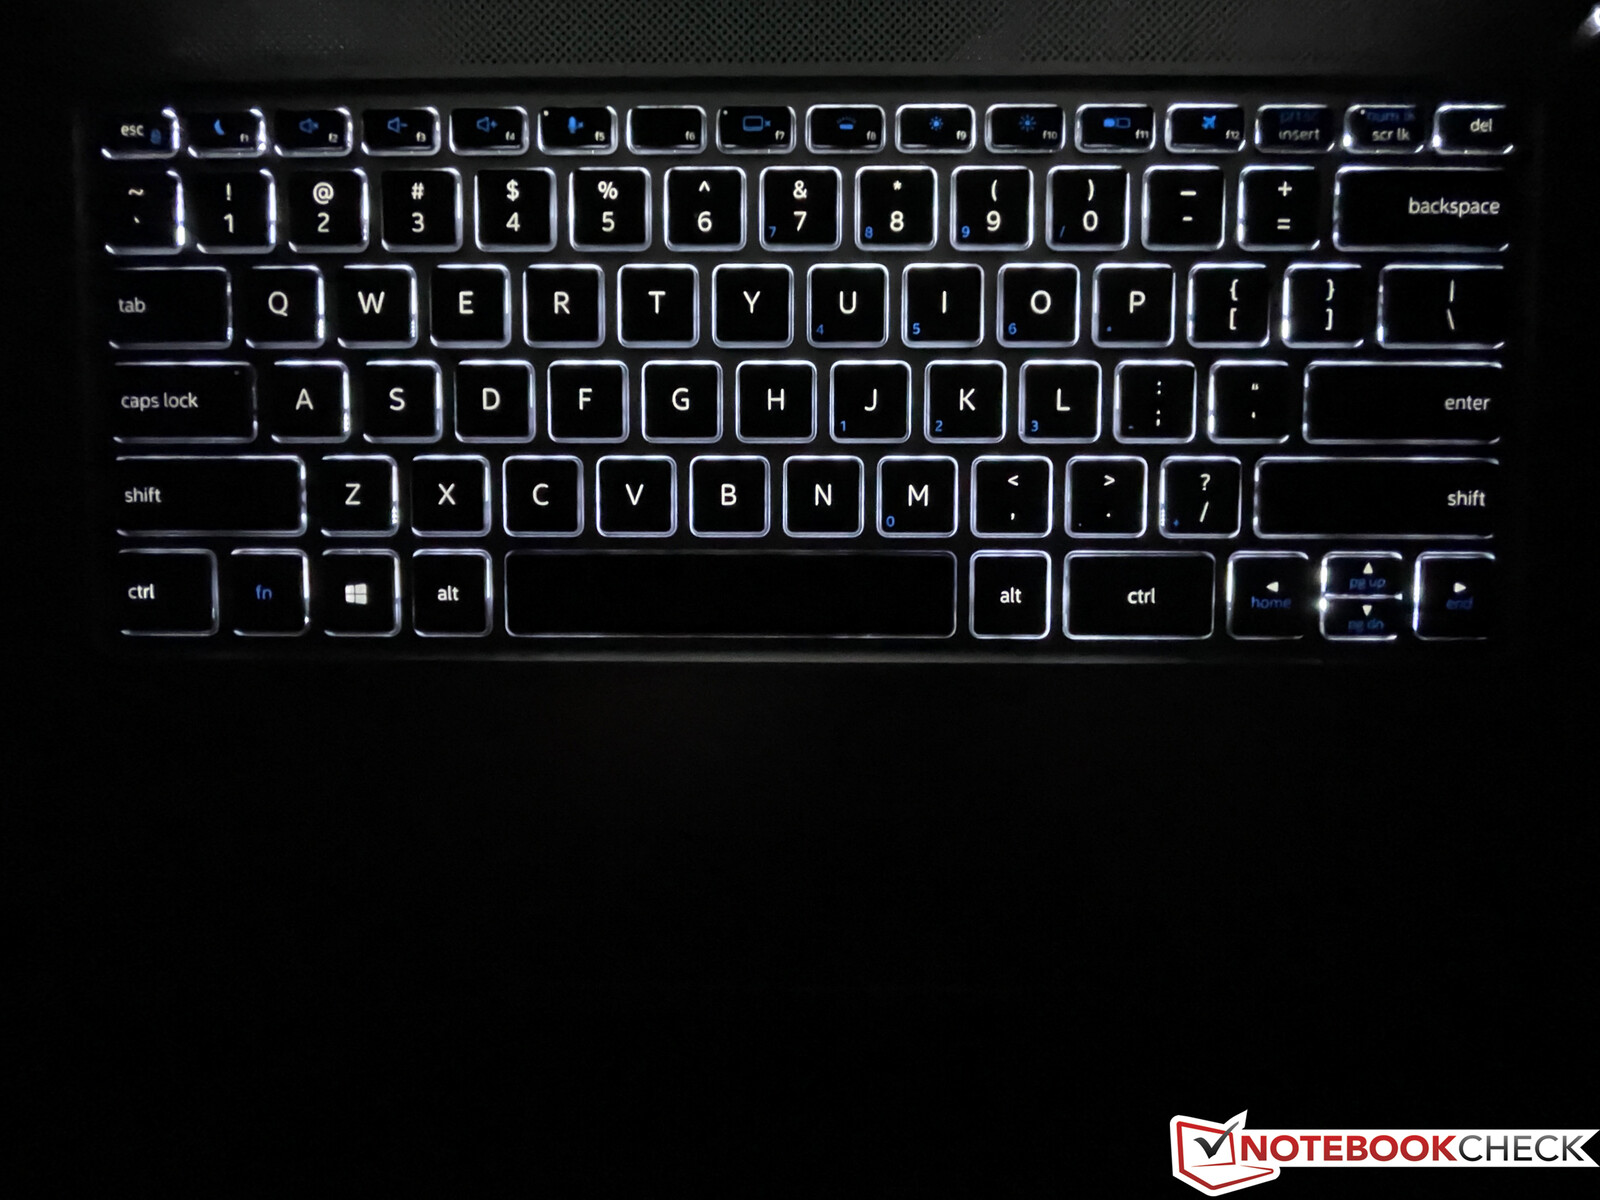
There is room for improvements in terms of keyboard illumination. It is white and has two intensity levels, but it quickly turns off when you stop typing. Schenker has already told us that you will have more settings on the final product. Similar to the majority of Windows laptops, the keyboard illumination is not automatically activated via ambient light sensor. Apple's MacBooks with their multi-level illumination still have a big advantage in this respect.
Touchpad
The touchpad with the glass surface meets the Microsoft Precision standard. It is sufficiently sized at 12 x 6.5 cm and offers great gliding capabilities, so the cursor control is no problem at all. Standard Windows gestures with up to four fingers are supported as well. You can click the pad down in the lower half, which results in a very even and very quiet clicking sound. There is a small LED in the upper left corner of the touchpad, which is active when the pad is turned off (Fn + F7).
Display - Full-HD Touchscreen

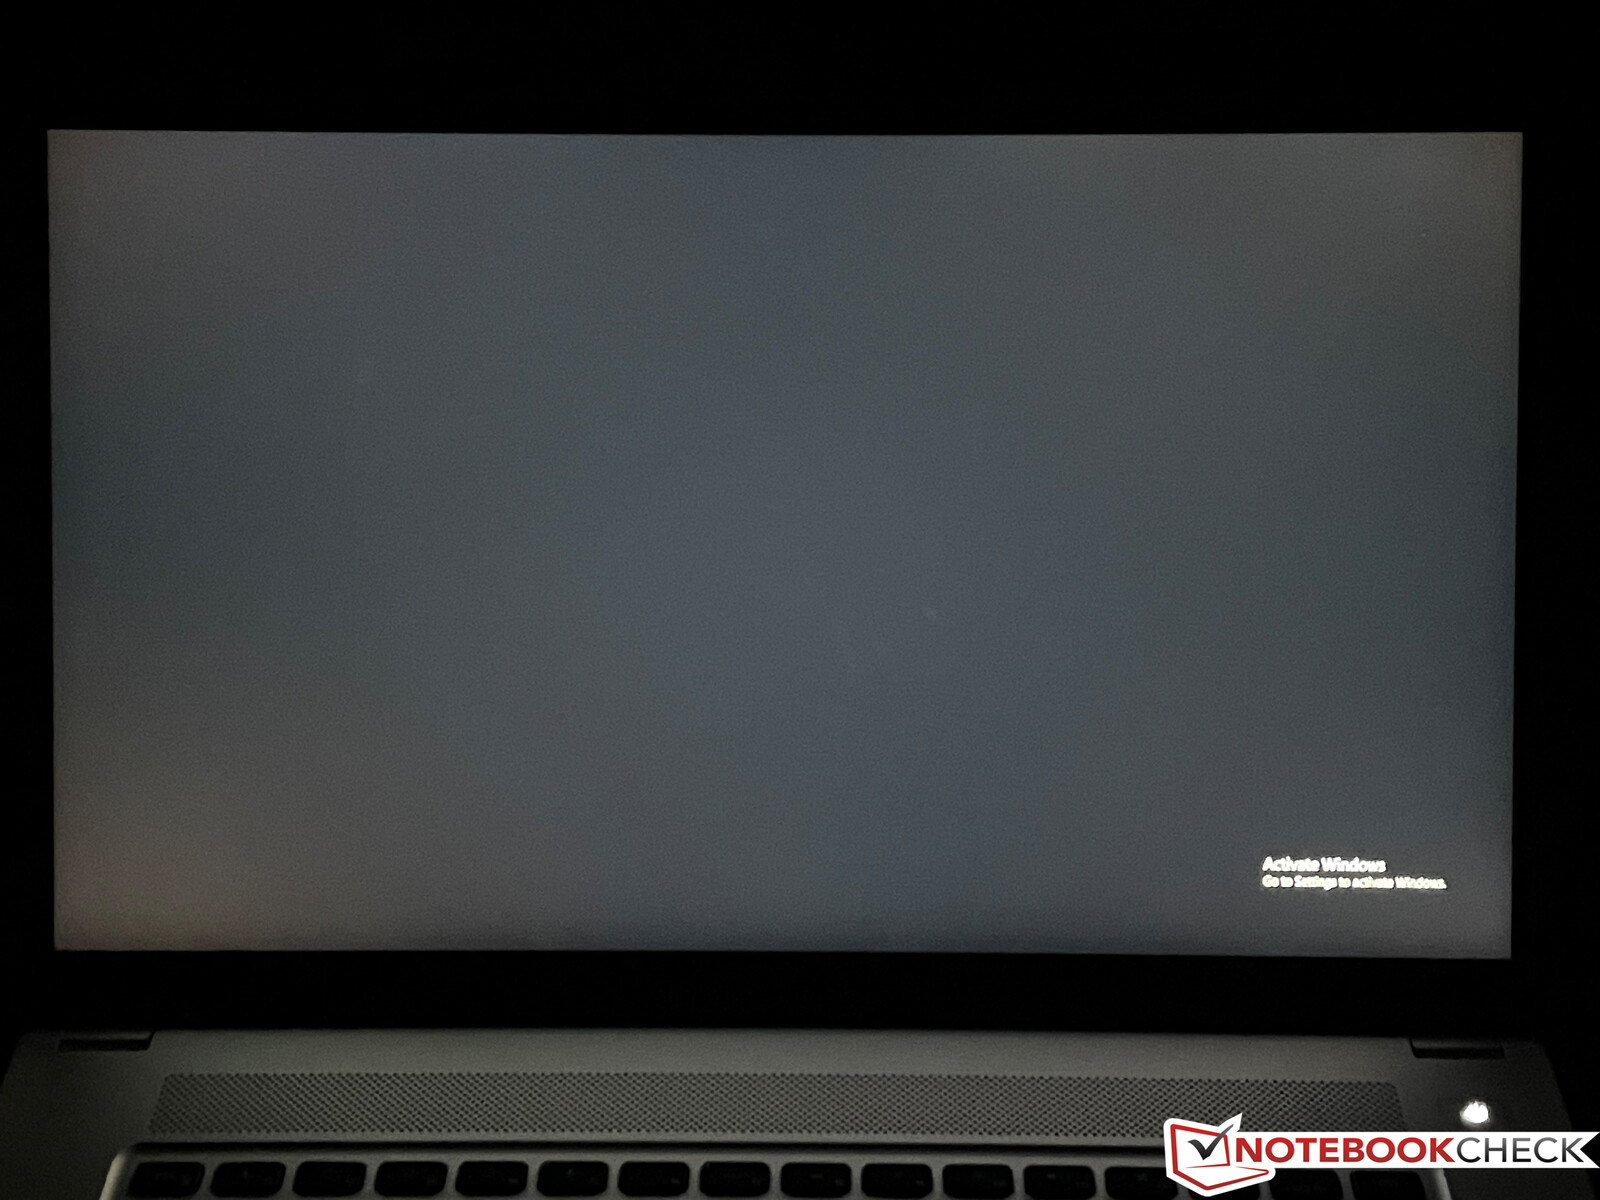
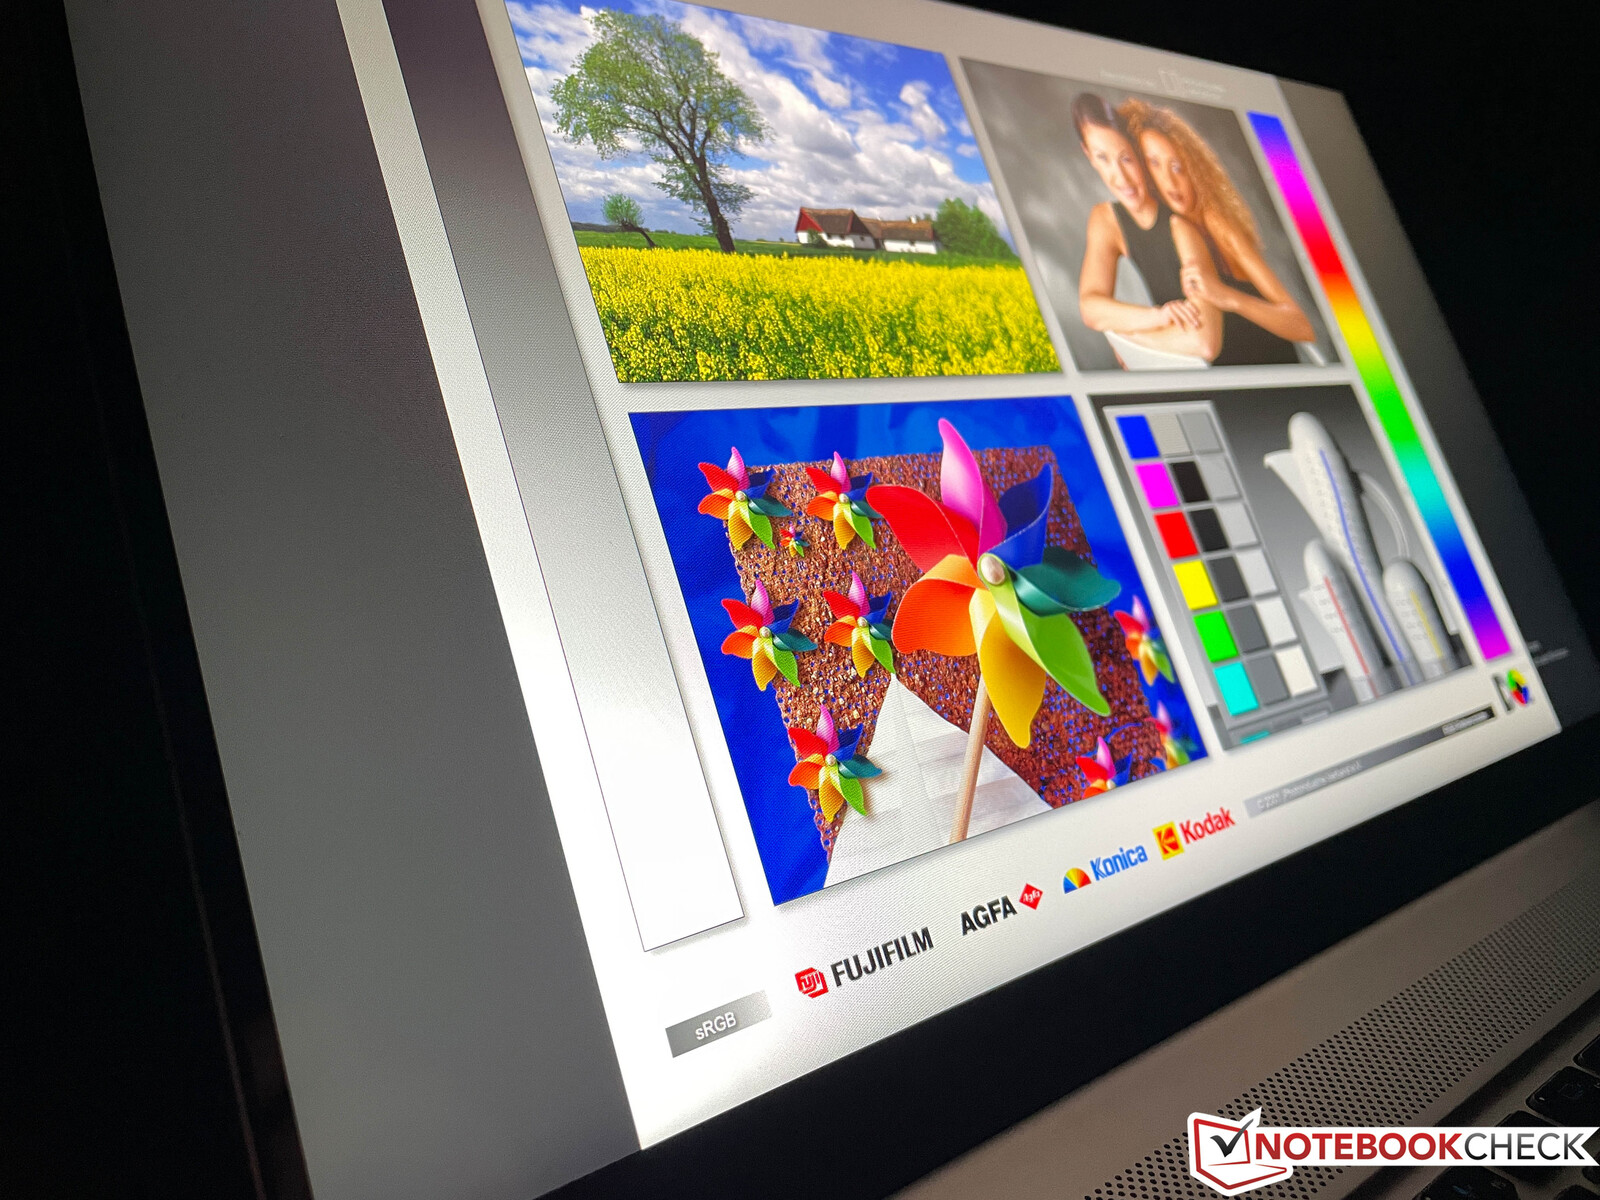
Intel decided to go for a 16:9 touchscreen with the 1080p resolution (1920 x 1080 pixels). It is unfortunate that Intel did not follow the current trend towards 16:10 panels since there would have been sufficient space. Our test unit is equipped with a panel from BOE (BOE08F5), which offers a very good subjective picture impression. The screen is bright, displays vivid colors and sharp images even with the 1080p resolution. There is also no visible backlight bleeding even at the maximum brightness.
The manufacturer advertises a brightness of 450 nits, and we can confirm that claim. The brightness distribution is also very even at 94 % (max. 478 cd/m², 462 cd/m² on average). The brightness is significantly lower on battery by default, but you can adjust this setting in Intel's Graphics Control Center. The black value is decent at 0.27 cd/m², which results in a very good contrast ratio of 1770:1.
We cannot detect PWM flickering, but the response times of the panel are very slow. This results in visible ghosting when you use the device when you move the cursor, for example.
| |||||||||||||||||||||||||
Brightness Distribution: 94 %
Center on Battery: 478 cd/m²
Contrast: 1770:1 (Black: 0.27 cd/m²)
ΔE ColorChecker Calman: 3.2 | ∀{0.5-29.43 Ø4.71}
calibrated: 2
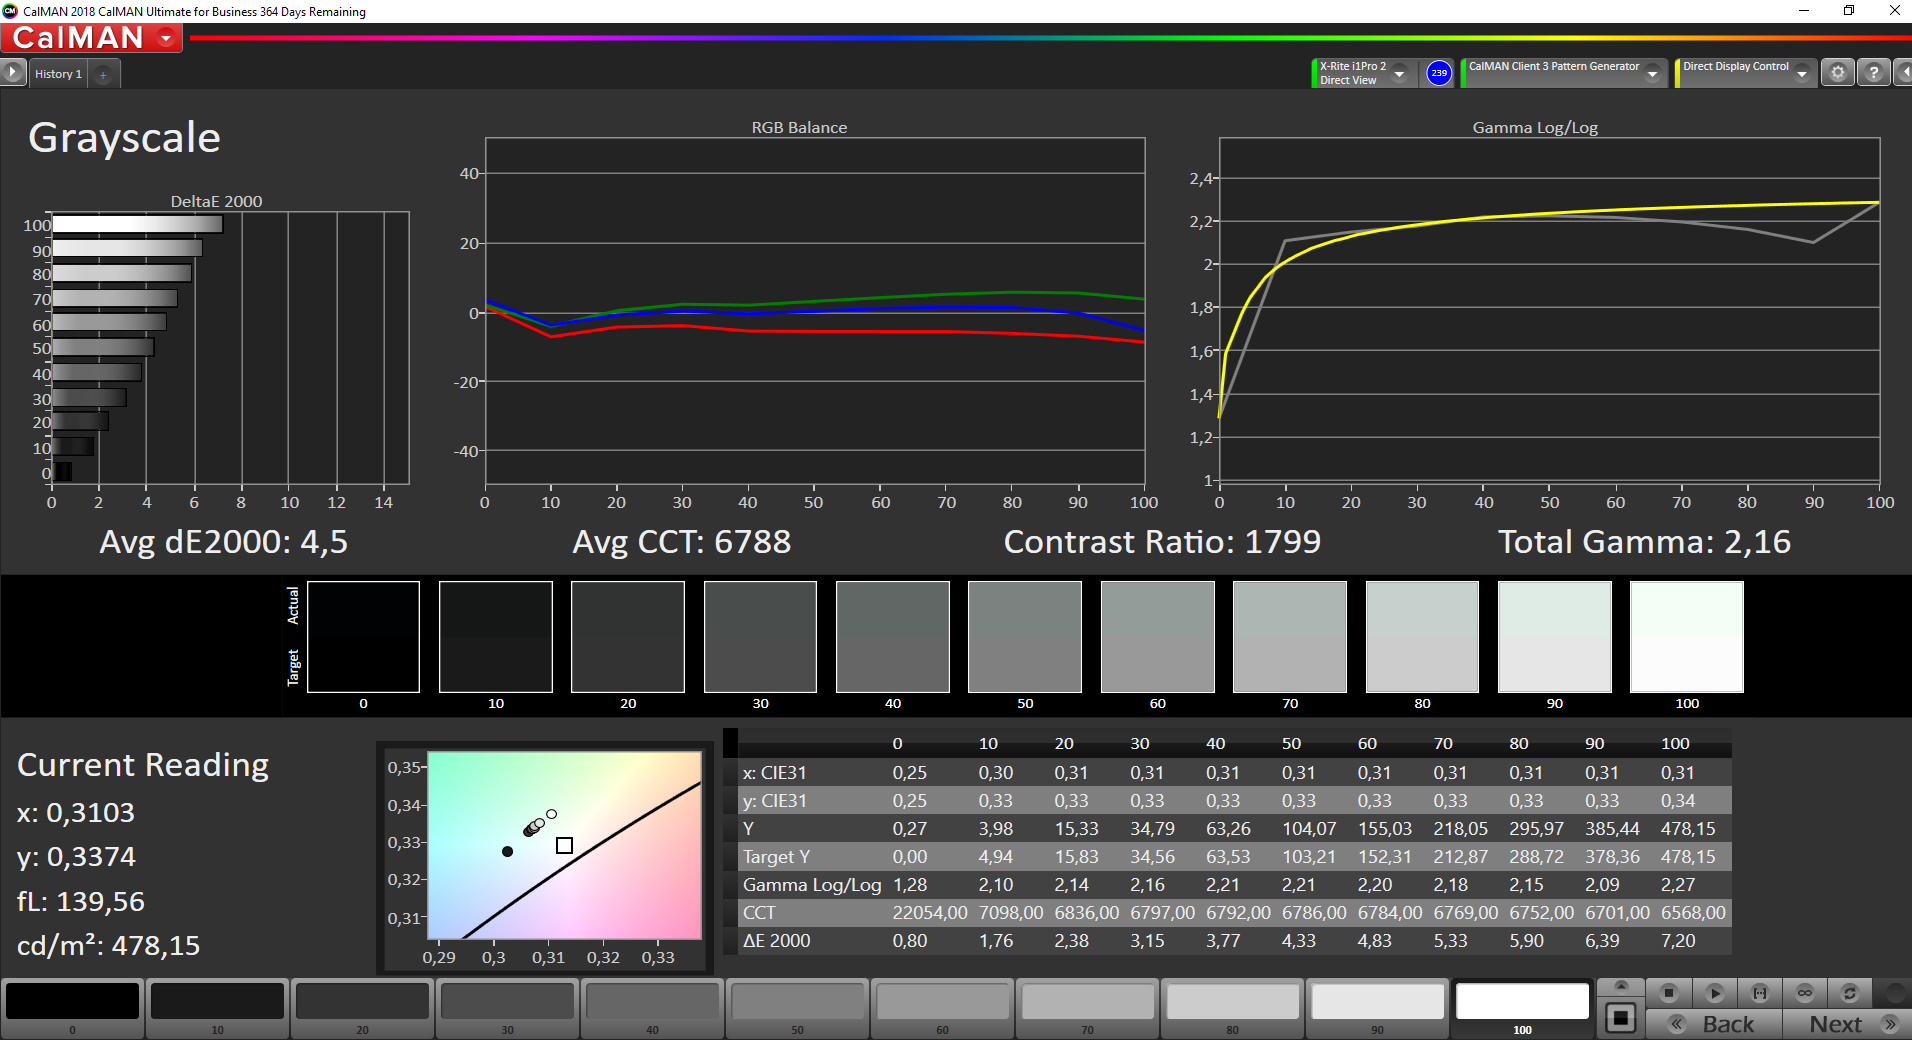
ΔE Greyscale Calman: 4.5 | ∀{0.09-98 Ø4.96}
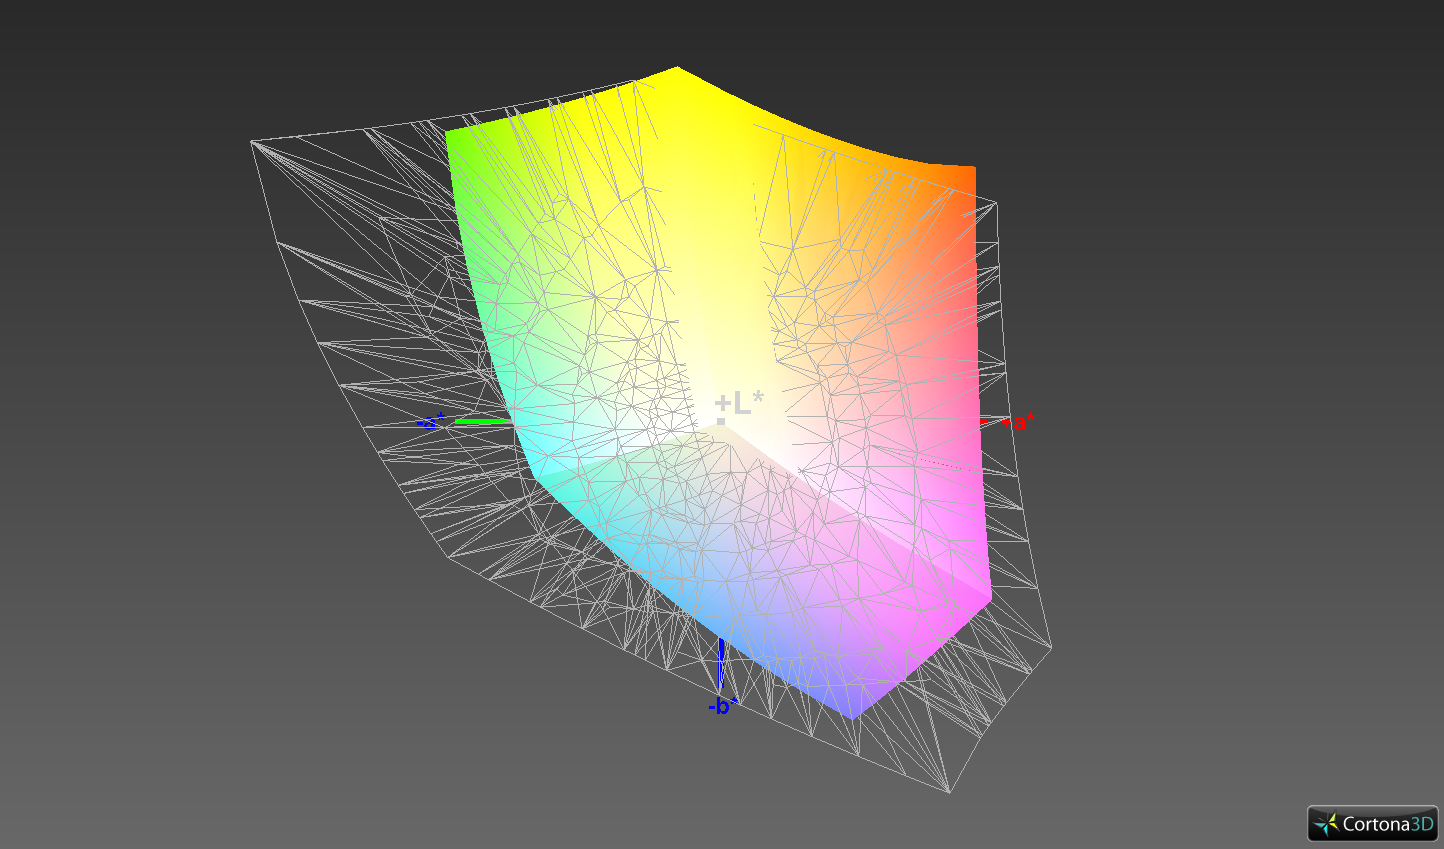
93.6% sRGB (Argyll 1.6.3 3D)
63.1% AdobeRGB 1998 (Argyll 1.6.3 3D)
70.8% AdobeRGB 1998 (Argyll 3D)
94% sRGB (Argyll 3D)
69.3% Display P3 (Argyll 3D)
Gamma: 2.16
CCT: 6788 K
| Schenker Vision 15 BOE08F5, IPS, 1920x1080, 15.6" | Apple MacBook Pro 16 2019 i9 5500M APPA044, IPS, 3072x1920, 16" | Dell XPS 15 9500 Core i5 Sharp LQ156N1, IPS, 1920x1200, 15.6" | Honor MagicBook Pro (AMD) N161HCA-EA3, IPS, 1920x1080, 16.1" | LG Gram 15Z90N LP156WF9-SPN1, .2 IPS LED, 1920x1080, 15.6" | |
|---|---|---|---|---|---|
| Display | 12% | -10% | -3% | ||
| Display P3 Coverage (%) | 69.3 | 81.5 18% | 67.5 -3% | 66 -5% | |
| sRGB Coverage (%) | 94 | 100 6% | 69.7 -26% | 96.4 3% | |
| AdobeRGB 1998 Coverage (%) | 70.8 | 79.6 12% | 69.7 -2% | 66.8 -6% | |
| Response Times | 12% | 28% | 36% | 42% | |
| Response Time Grey 50% / Grey 80% * (ms) | 60 ? | 52.4 ? 13% | 42 ? 30% | 37.6 ? 37% | 36 ? 40% |
| Response Time Black / White * (ms) | 39 ? | 34.9 ? 11% | 28.8 ? 26% | 25.6 ? 34% | 22 ? 44% |
| PWM Frequency (Hz) | 131700 | 25250 ? | |||
| Screen | 15% | 1% | 24% | 6% | |
| Brightness middle (cd/m²) | 478 | 519 9% | 592 24% | 337 -29% | 366 -23% |
| Brightness (cd/m²) | 462 | 477 3% | 565 22% | 312 -32% | 342 -26% |
| Brightness Distribution (%) | 94 | 86 -9% | 85 -10% | 89 -5% | 88 -6% |
| Black Level * (cd/m²) | 0.27 | 0.39 -44% | 0.46 -70% | 0.2 26% | 0.28 -4% |
| Contrast (:1) | 1770 | 1331 -25% | 1287 -27% | 1685 -5% | 1307 -26% |
| Colorchecker dE 2000 * | 3.2 | 2.28 29% | 3.19 -0% | 0.8 75% | 2.68 16% |
| Colorchecker dE 2000 max. * | 8.4 | 6.54 22% | 5.45 35% | 1.1 87% | 5.25 37% |
| Colorchecker dE 2000 calibrated * | 2 | 0.86 57% | 2.03 -1% | 0.7 65% | 1.08 46% |
| Greyscale dE 2000 * | 4.5 | 0.9 80% | 3.9 13% | 1 78% | 2.4 47% |
| Gamma | 2.16 102% | 2145 0% | 2.25 98% | 2.2 100% | 2.25 98% |
| CCT | 6788 96% | 6572 99% | 6522 100% | 6538 99% | 6474 100% |
| Color Space (Percent of AdobeRGB 1998) (%) | 63.1 | 78 24% | 71.6 13% | 63.8 1% | 61 -3% |
| Color Space (Percent of sRGB) (%) | 93.6 | 100 7% | 99.5 6% | 96 3% | |
| Total Average (Program / Settings) | 14% /
14% | 14% /
6% | 17% /
19% | 15% /
9% |
* ... smaller is better
Our further measurements with the professional CalMAN software and the X-Rite i1 Pro 2 spectrophotometer reveal some drawbacks of the panel. The first thing you notice is the bad calibration ex-works with high average deviations (compared to the sRGB reference) for the grayscale with a slight color cast towards green/blue (even though it is hardly visible with the naked eye) as well as the slightly cool color temperature, which helps the maximum brightness. However, the high color deviations are even more noticeable.
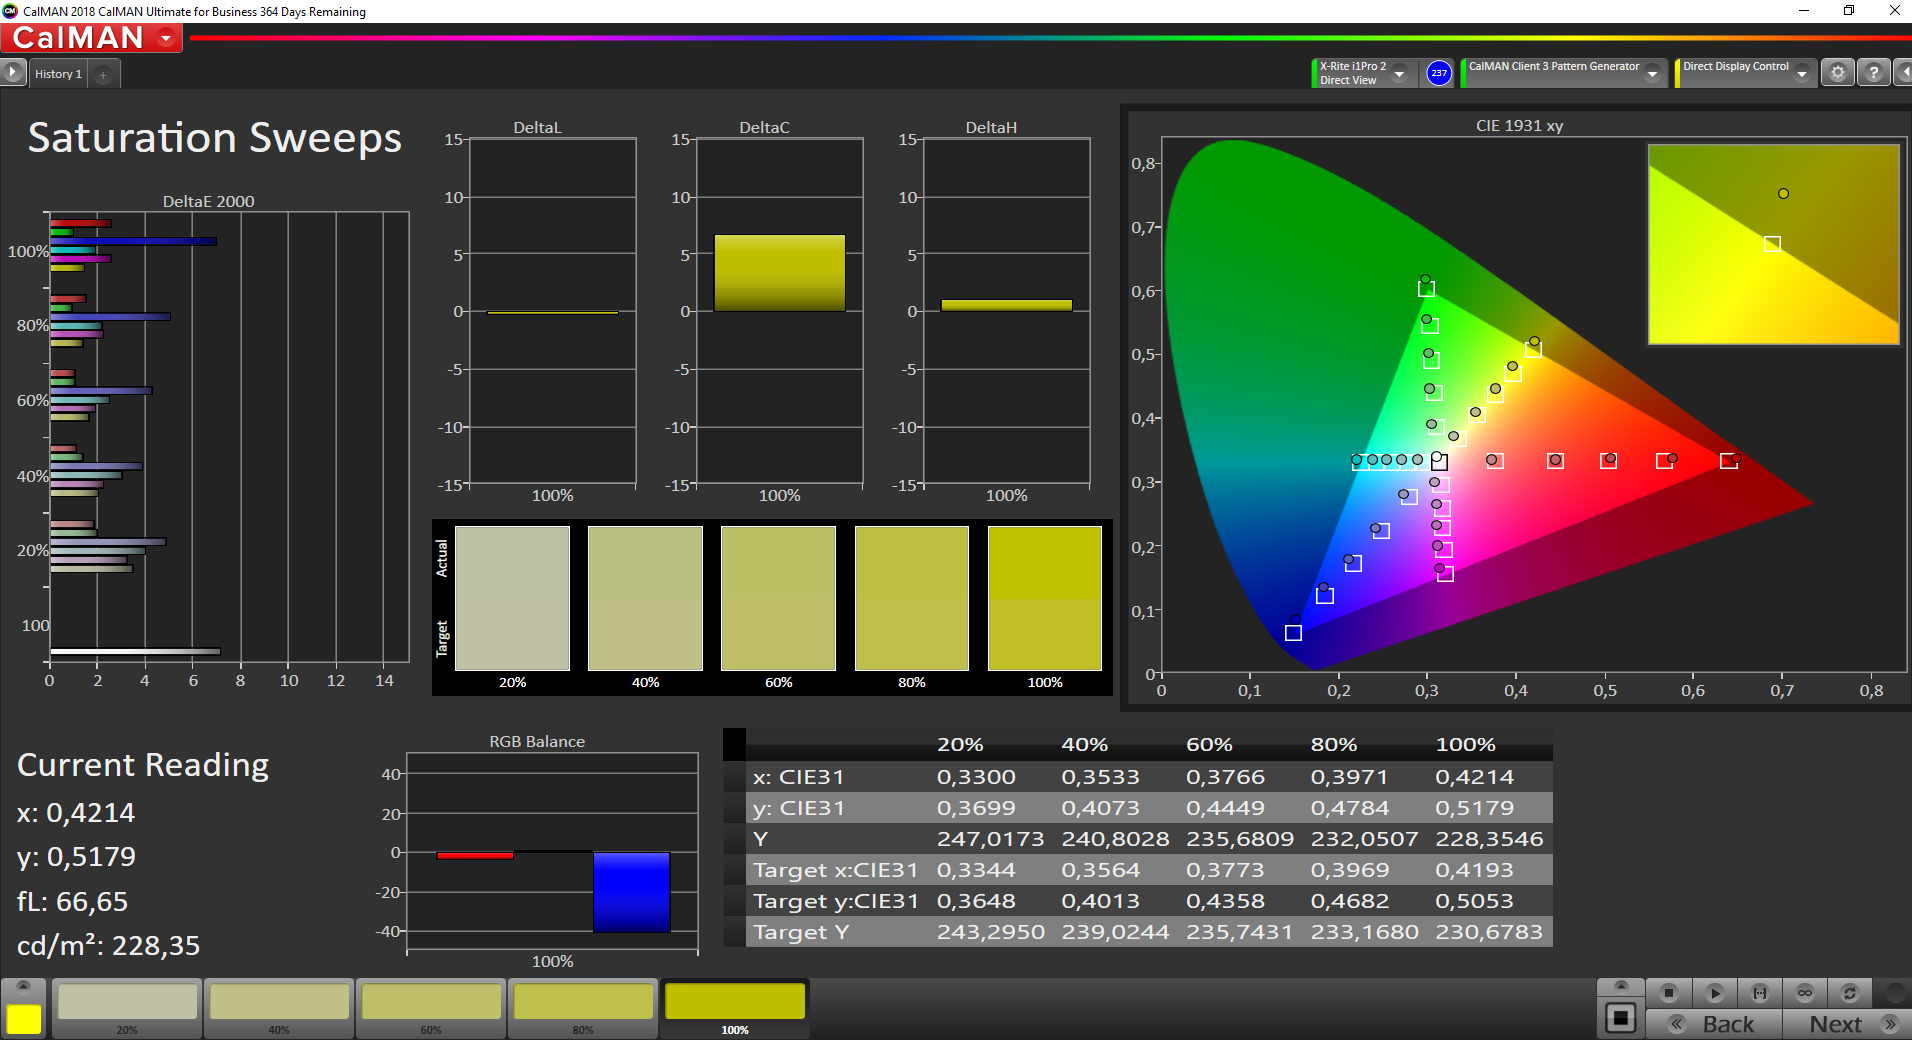
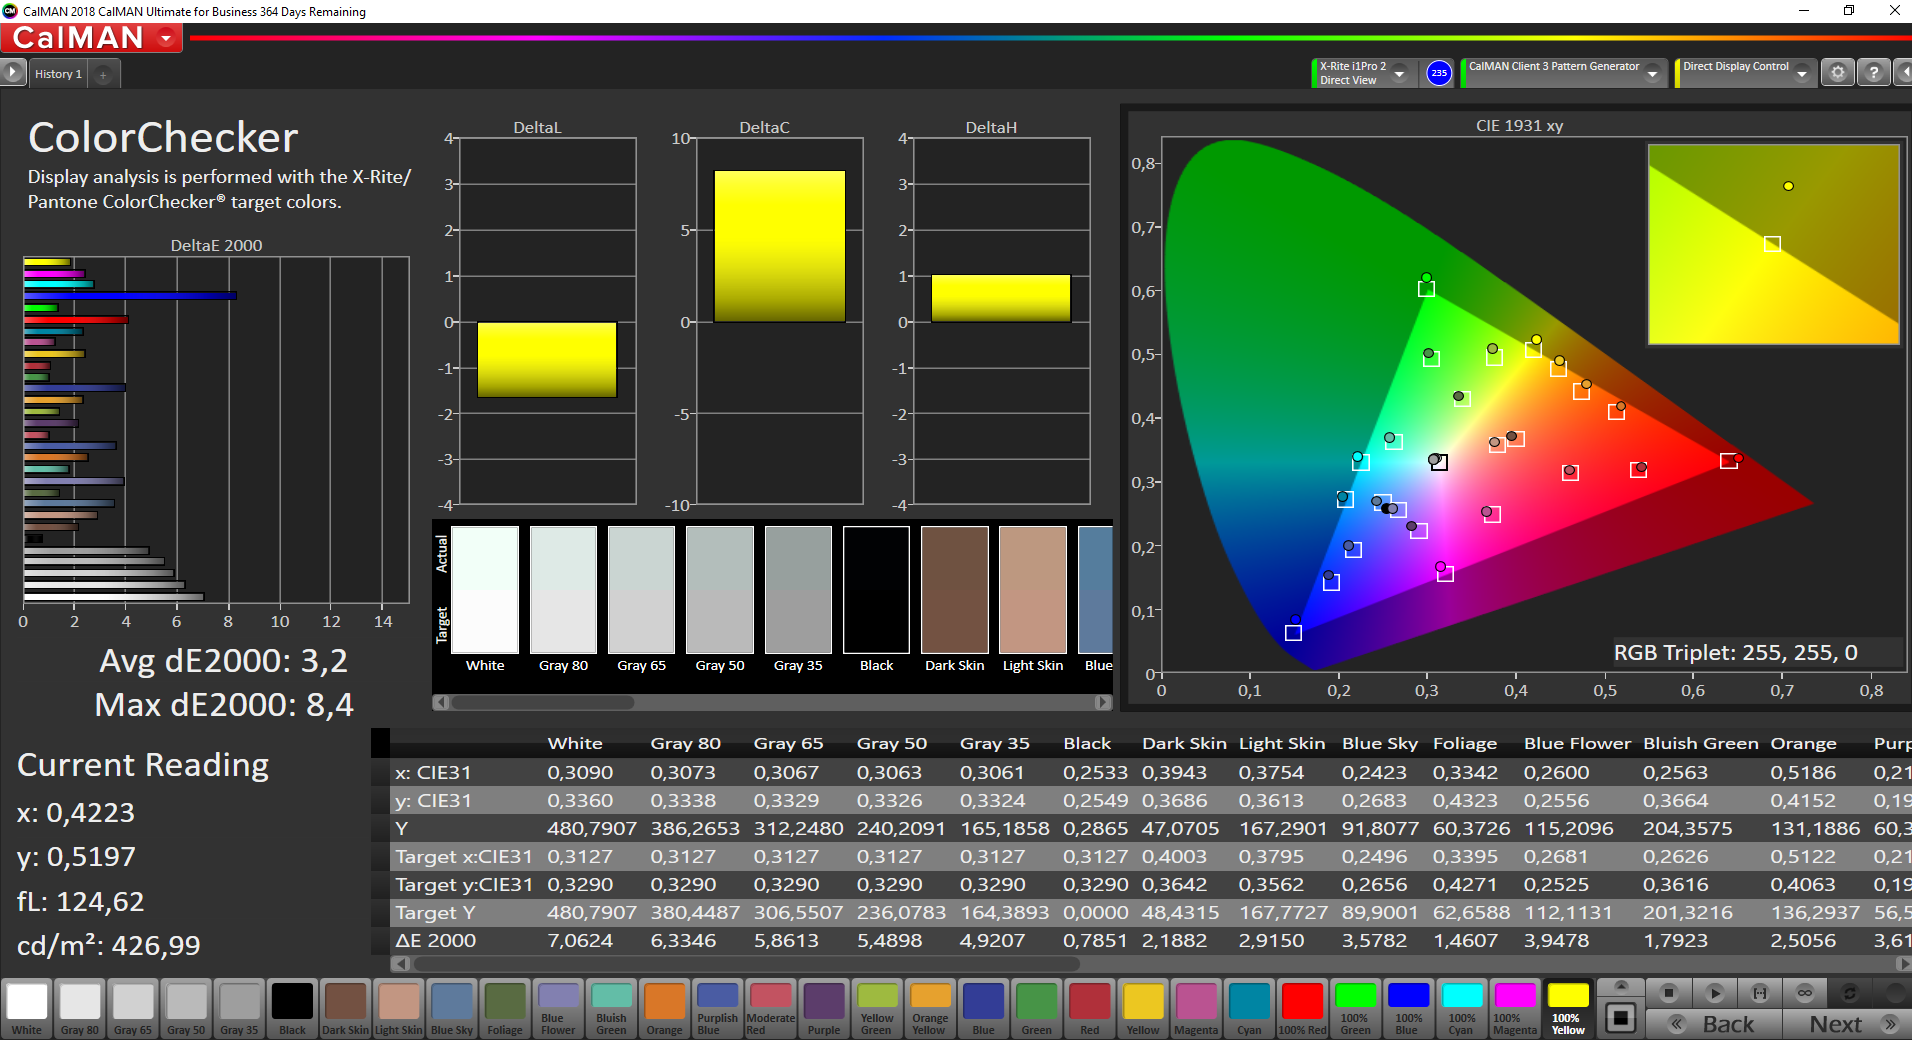
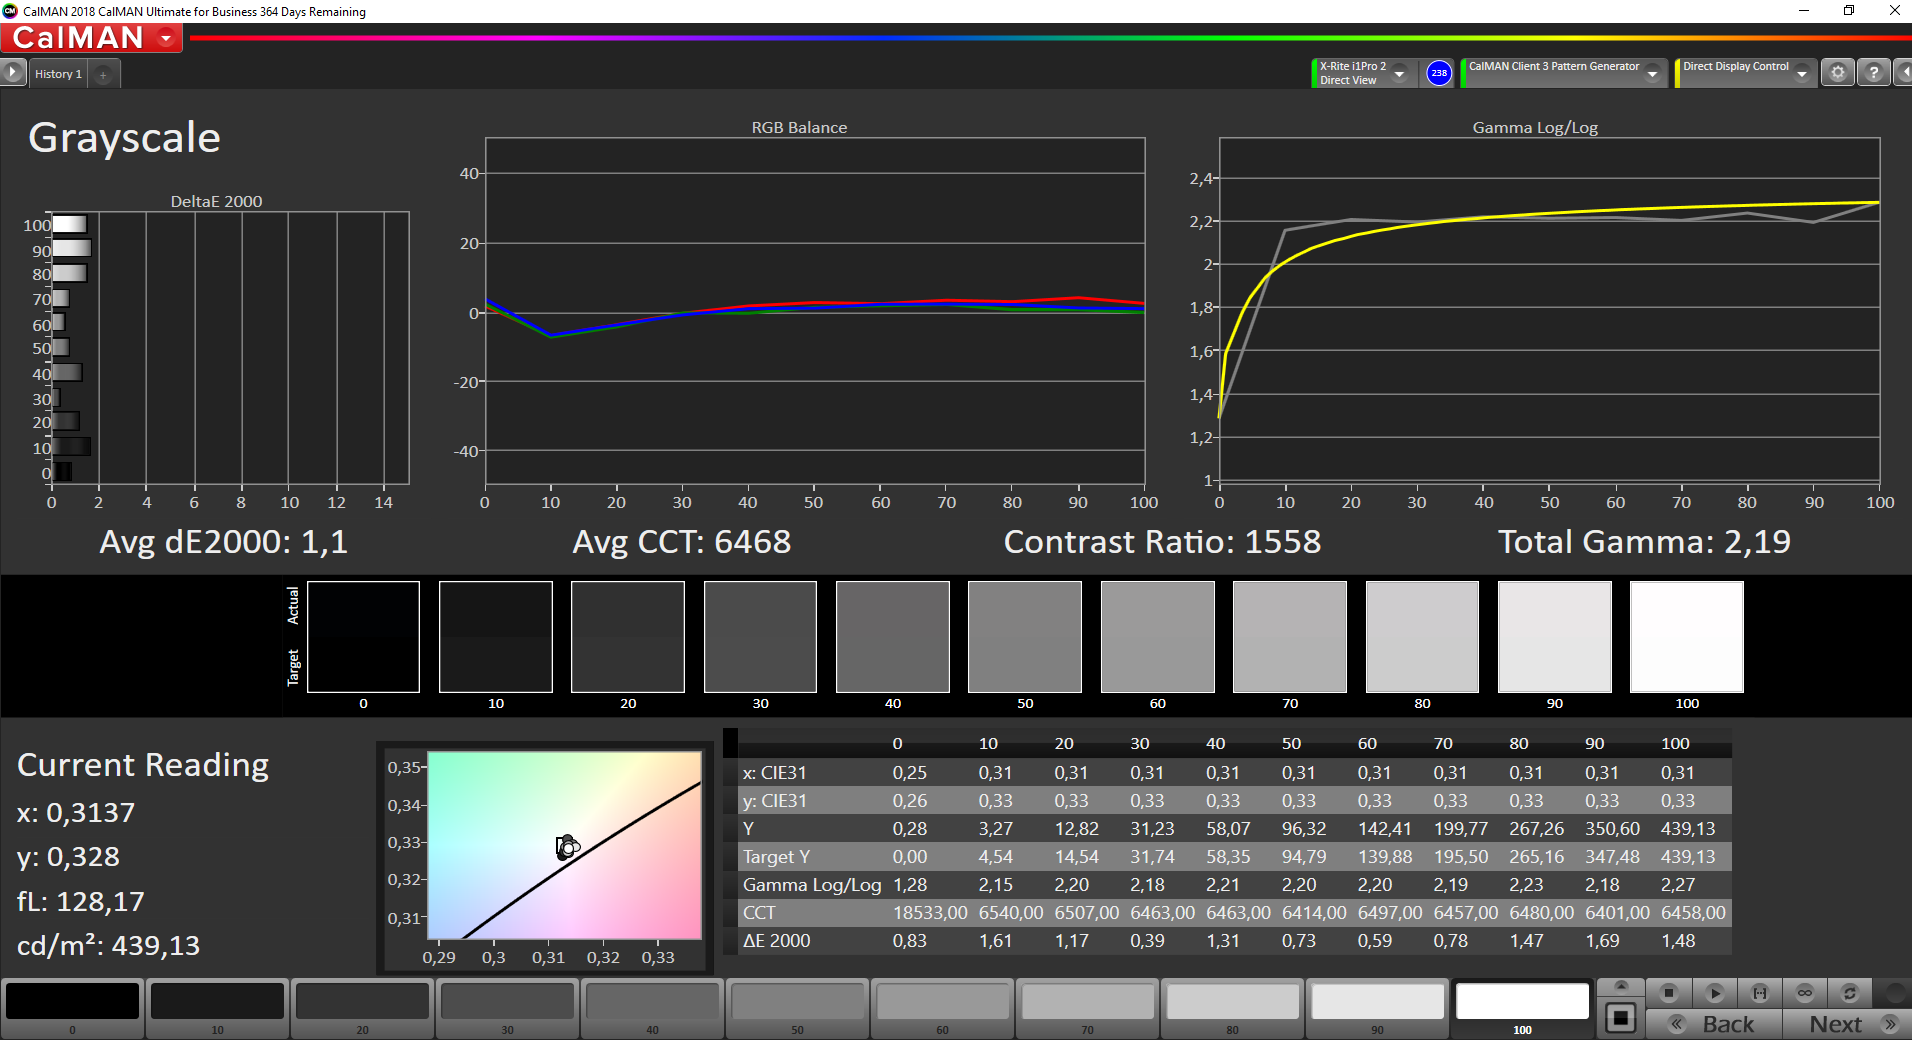
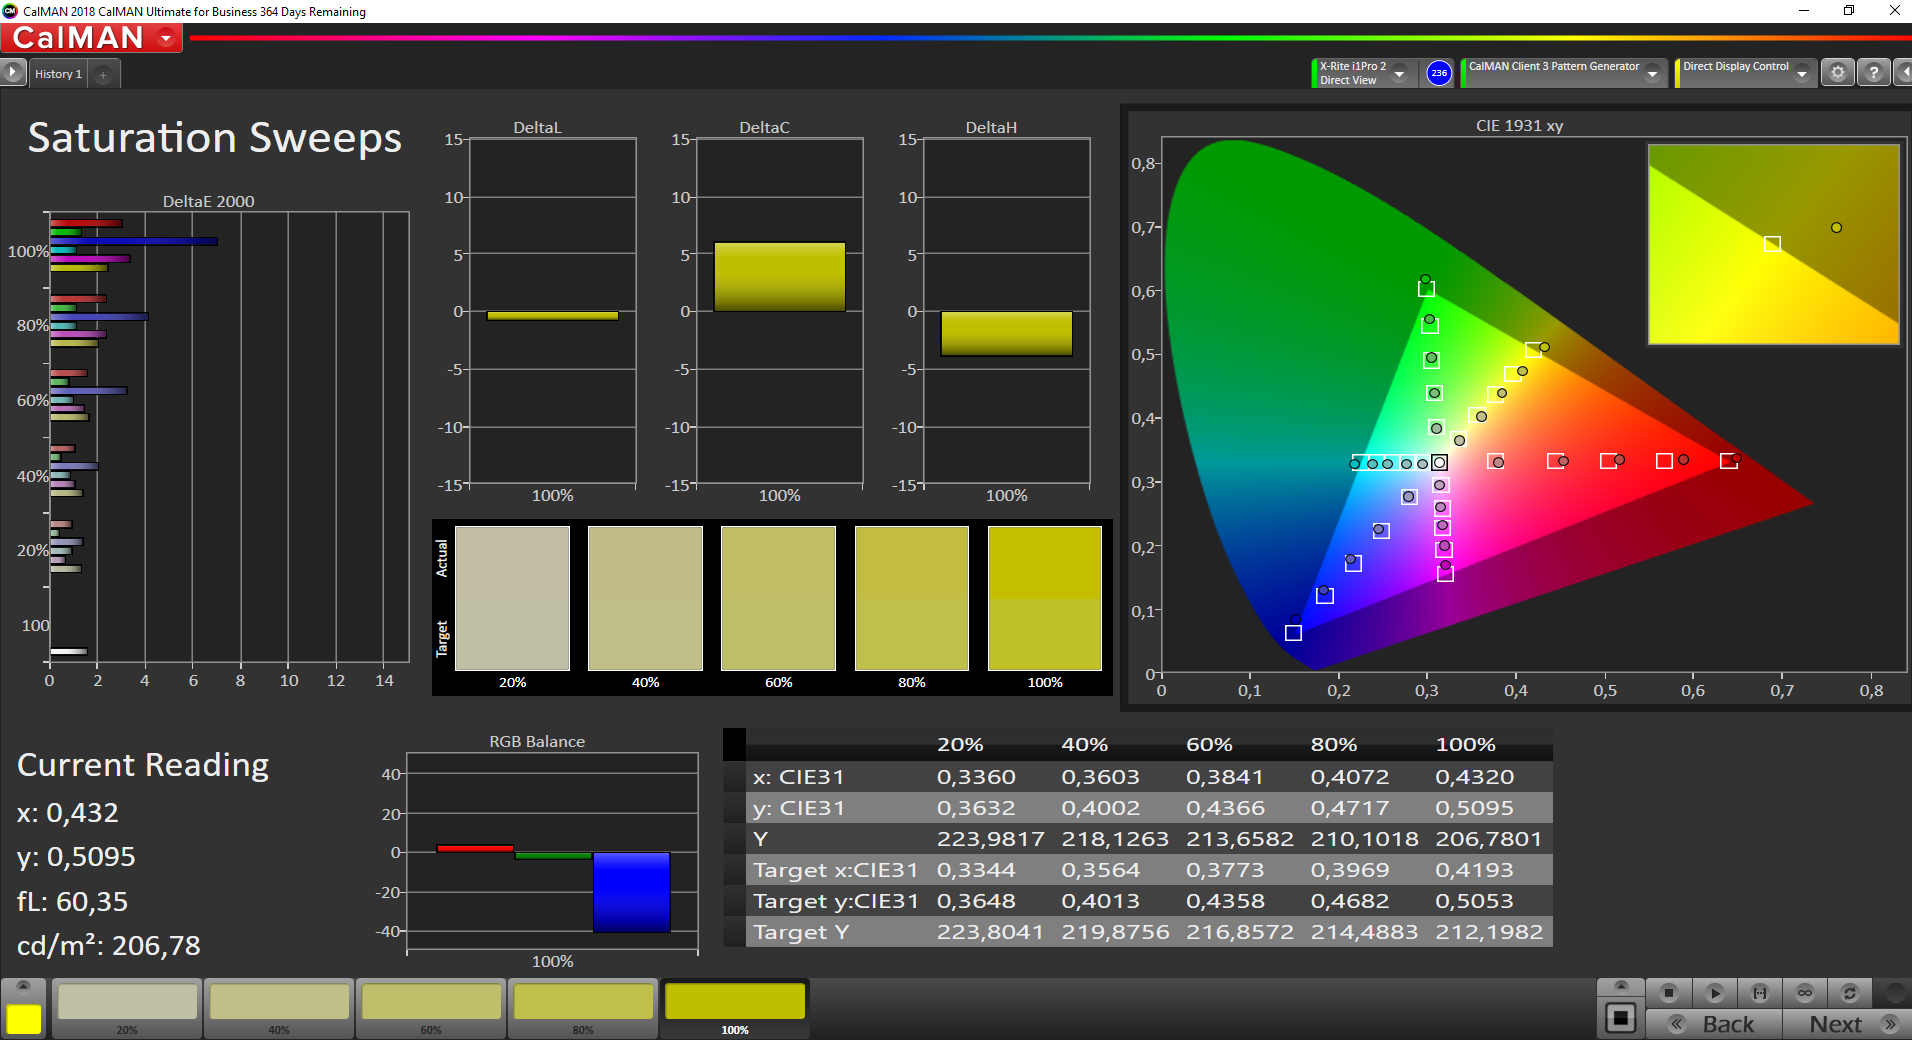
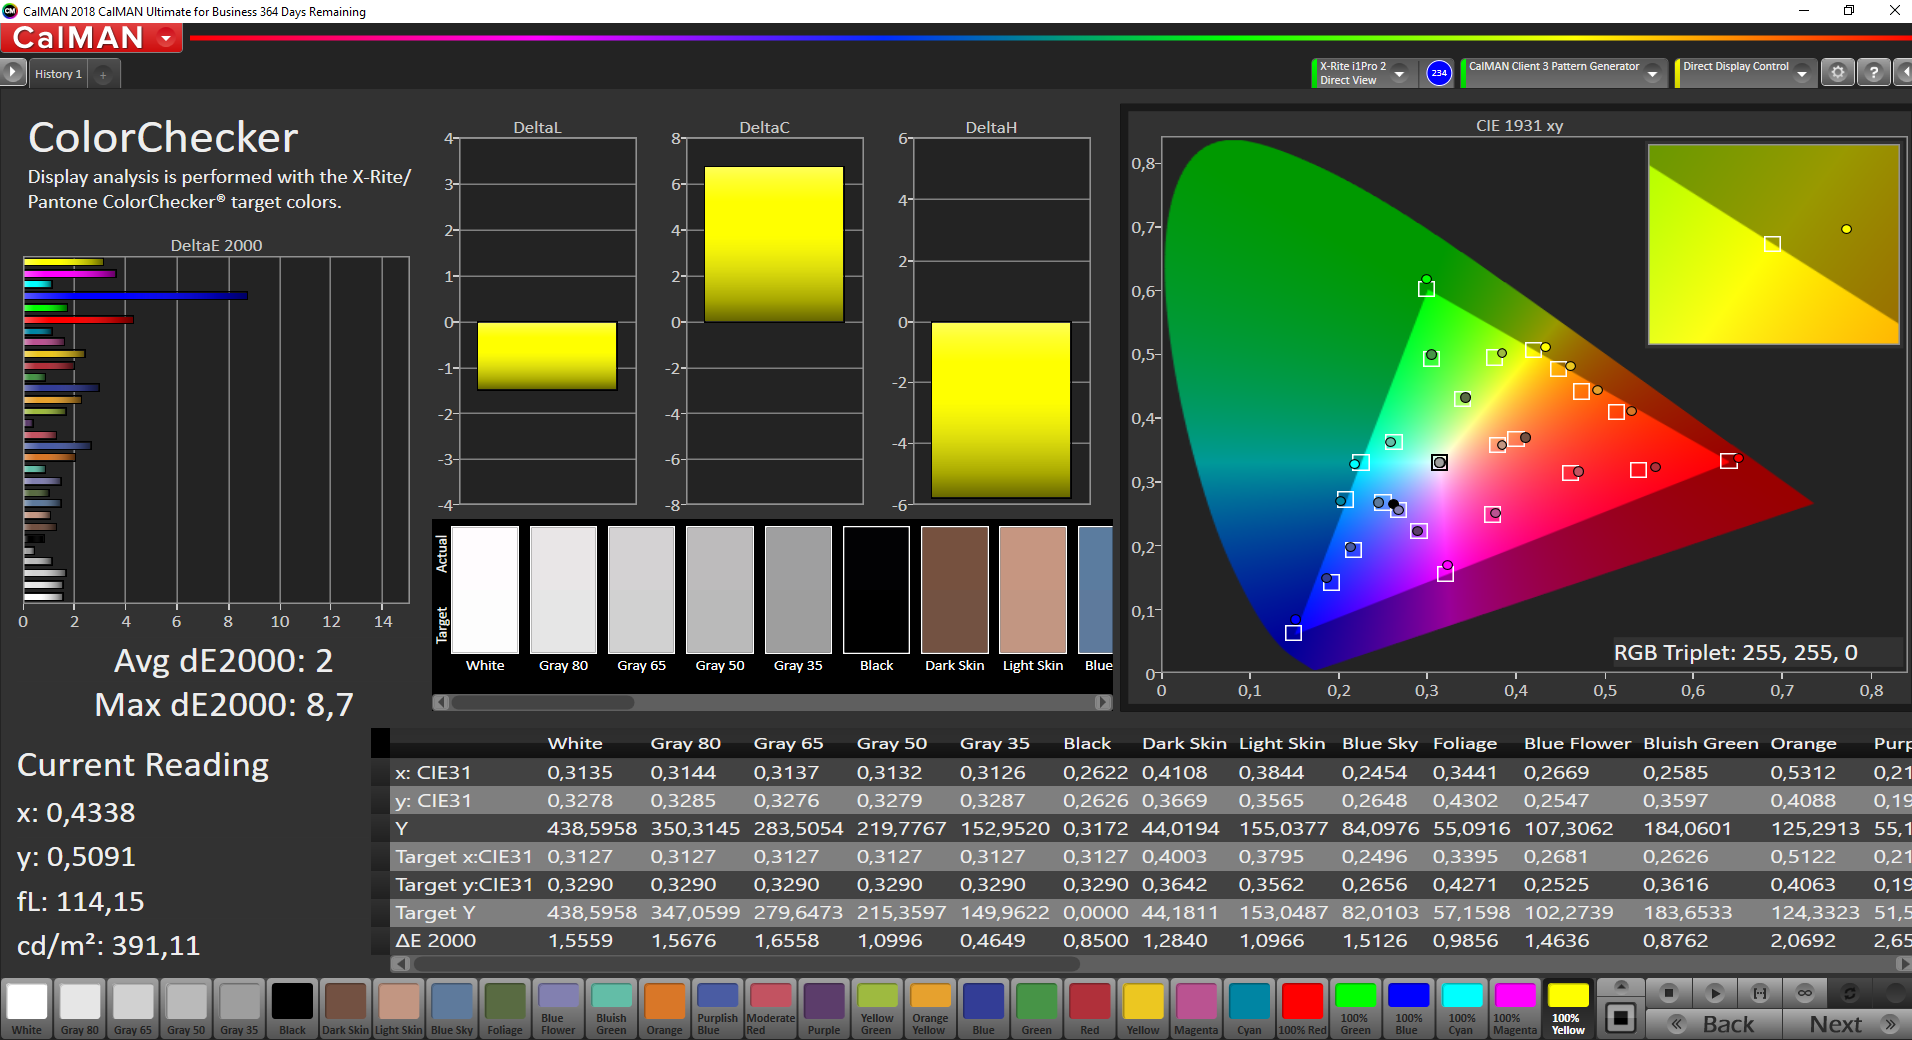
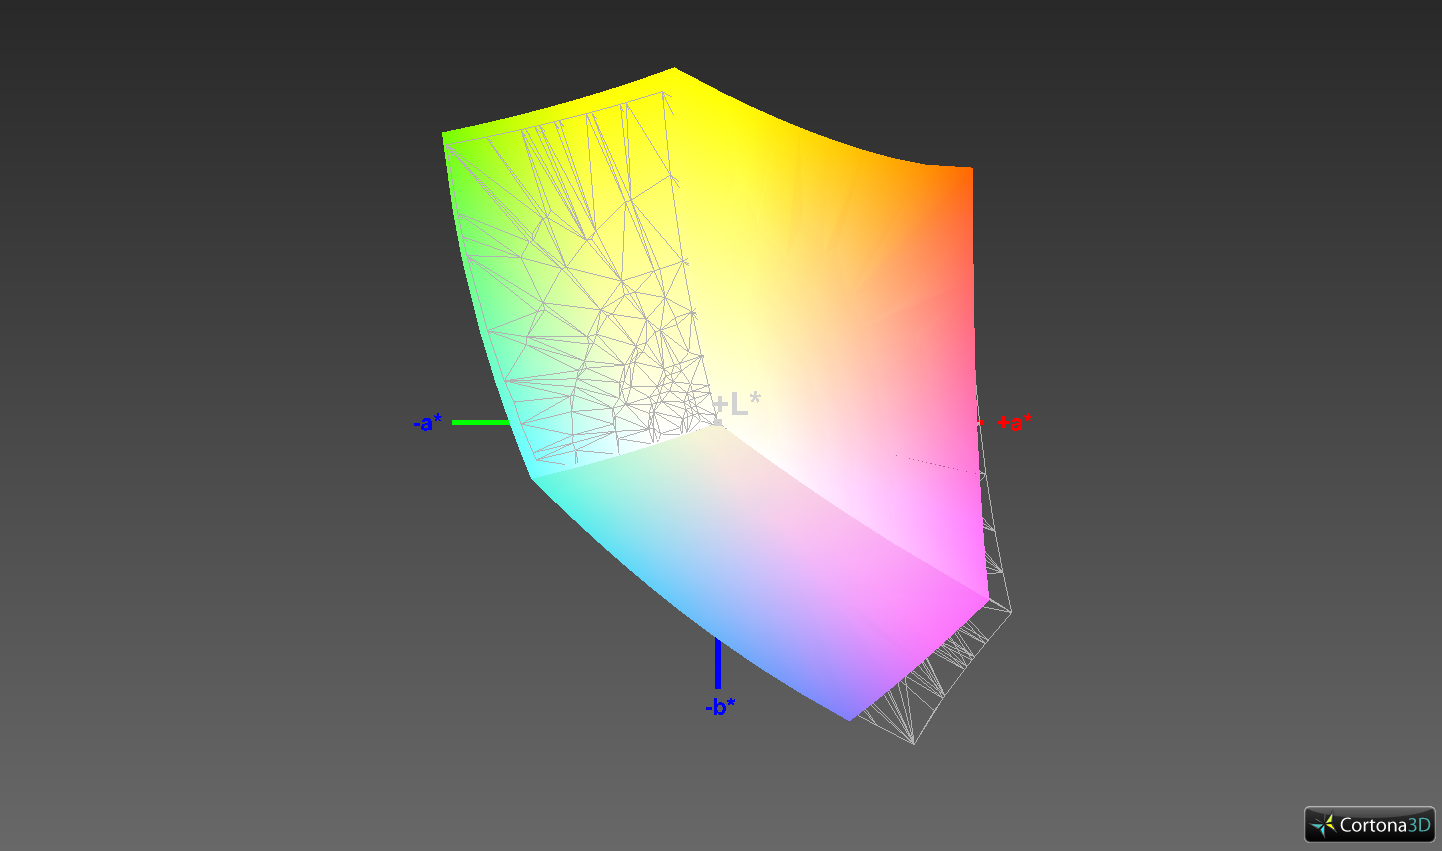
We can correct the grayscale performance with our calibration (the profile is available for download in the box above), even though the maximum brightness drops by around 40 nits. The overall color accuracy is improved as well, however, there are still two noticeable outliers. The sRGB color gamut is not covered completely, either, at 93.6 % (AdobeRGB: 63.1 %), so the panel is not ideal for accurate picture/video editing. We would have expected more considering the starting price of the device. For comparison: All the rivals including the much more affordable Honor MagicBook Pro are superior in this respect.
Display Response Times
| ↔ Response Time Black to White | ||
|---|---|---|
| 39 ms ... rise ↗ and fall ↘ combined | ↗ 19.2 ms rise | 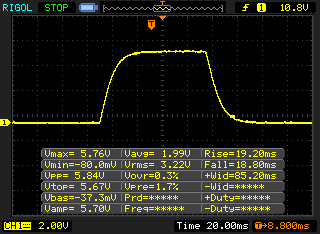 |
| ↘ 18.8 ms fall | ||
| The screen shows slow response rates in our tests and will be unsatisfactory for gamers. In comparison, all tested devices range from 0.1 (minimum) to 240 (maximum) ms. » 97 % of all devices are better. This means that the measured response time is worse than the average of all tested devices (19.8 ms). | ||
| ↔ Response Time 50% Grey to 80% Grey | ||
| 60 ms ... rise ↗ and fall ↘ combined | ↗ 29.2 ms rise | 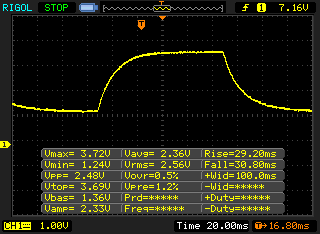 |
| ↘ 30.8 ms fall | ||
| The screen shows slow response rates in our tests and will be unsatisfactory for gamers. In comparison, all tested devices range from 0.165 (minimum) to 636 (maximum) ms. » 96 % of all devices are better. This means that the measured response time is worse than the average of all tested devices (30.9 ms). | ||
Screen Flickering / PWM (Pulse-Width Modulation)
| Screen flickering / PWM not detected | 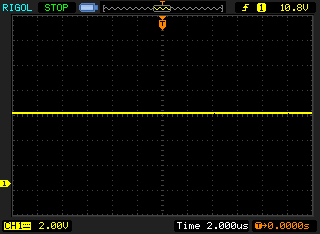 | ||
In comparison: 52 % of all tested devices do not use PWM to dim the display. If PWM was detected, an average of 7744 (minimum: 5 - maximum: 343500) Hz was measured. | |||
The IPS panel has no problems with the viewing angles. The glossy screen obviously affects the usability outdoors. Due to the bad weather right now, we can unfortunately not provide any outdoor pictures in sunlight, but you can still see the reflections on a cloudy day. If you can avoid reflections, however, the brightness is sufficient to ensure a comfortable viewing experience.
Performance - Tiger Lake and PCIe 4.0
Intel designed the NUC M15 reference laptop to get the most performance from the Tiger Lake processor. All the performance related settings can be controlled via Windows power slider, so there is no additional software to adjust performance settings. Schenker also confirmed that the final version of the Vision 15 will not be shipped with the usual ControlCenter.
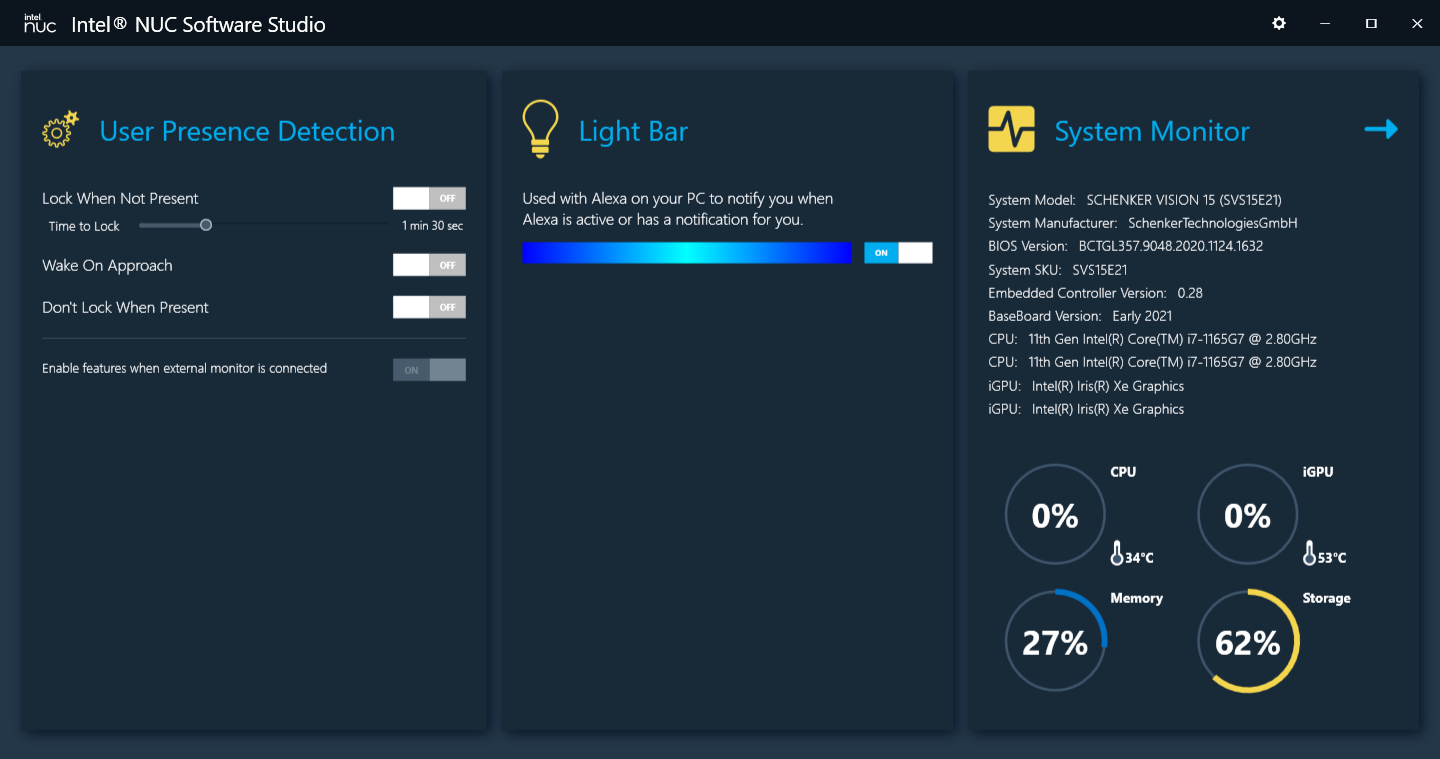
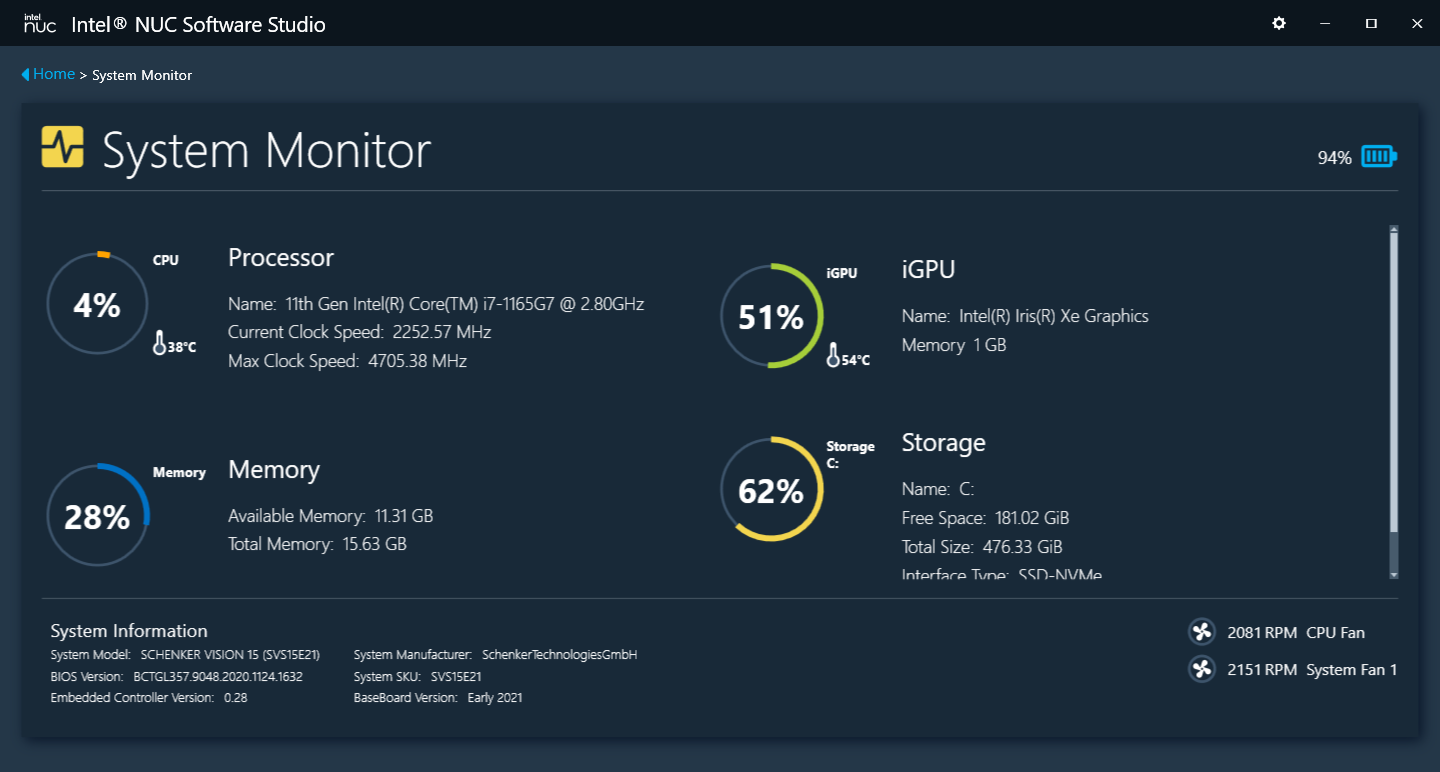
Intel ships its own software called NUC Software Studio instead. It offers some rudimentary settings including the control of the LED strip, settings for user recognition as well as hardware monitoring with the temperatures and the load of the components as well as the speed of the two fans.
The performance settings of the Windows power slider have a big effect on the behavior of the laptop, both in terms of performance as well as the fan control (more on that later). We always use the setting Best Performance for our benchmarks and measurements. We have listed the TDP values of the different modes in the table below. One thing to mention (and a big difference to other laptops) is the fact that the laptop uses sensors to decide when to leave PL2 and switch to PL1. Usually, there is a fixed time setting. This means the device can stay in the higher performance when it is cold.
| Windows Performance Setting | PL1 | PL2 |
|---|---|---|
| Best Performance | 40 Watts | 50 Watts |
| Better Performance | 28 Watts | 50 Watts |
| Better Battery | 18 Watts | 25 Watts |
| Battery Saver (only on battery) | 15 Watts | 20 Watts |
These values already show that Intel wants to get the maximum amount of performance from the Tiger Lake CPUs, and we can already say that these values can be maintained by the system. However, at the same time you have to question whether the 15W classification of the current Intel CPUs makes any sense when we are almost in the range of the more powerful H-series processors (45W).
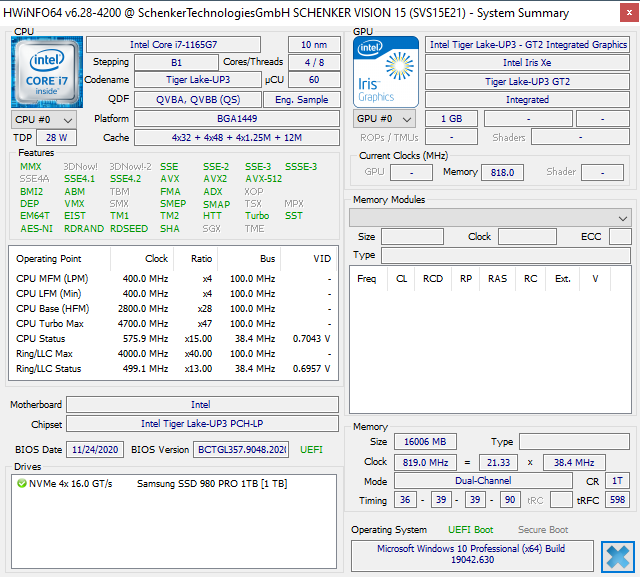
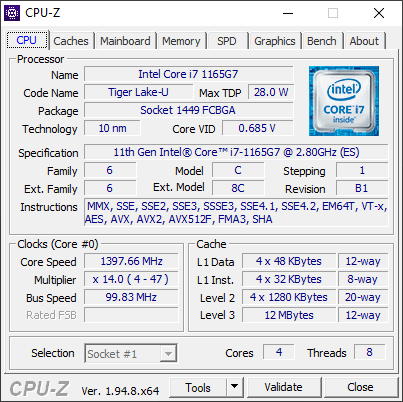
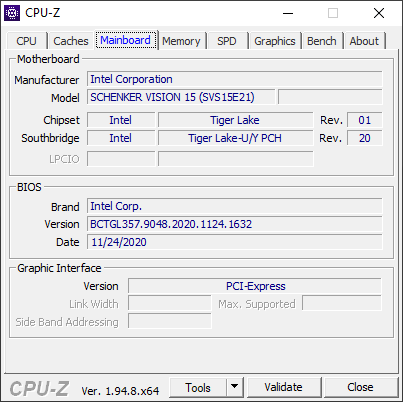
Processor - Tiger Lake UP3
The processor of the Vision 15 has the designation Core i7-1165G7 (UP3) and is from the current Tiger Lake generation. It is a quad-core CPU manufactured in a 10nm process. The base clock is 2.8 GHz, but a single core can reach up to 4.7 GHz via Turbo; all four cores simultaneously up to 4.1 GHz. More technical specs are available here. Schenker will also offer models of the Vision 15 with the slower Core i5-1135G7 as well as models with vPro support later.
The device can fully utilize the power limits. We can see 48W with the full 8x 4.1 GHz at the beginning of the Cinebench R15 Multi loop. The consumption will eventually level off at 40W, which results in 8x 3.8 GHz. Single-core benchmarks are performed with 4.5-4.7 GHz (~23-24W).
Thanks to the high Turbo clock, the results are very good in the single-core benchmarks. The performance is also stable in the multi-core tests and superior to other U-series Intel CPUs and even some H-series models like the Dell XPS 15, but even Tiger Lake cannot change the fact that AMDs U-series processors have a massive advantage at lower consumption levels.
The device has the same power limits on battery power and there is no performance reduction.
Cinebench R15: CPU Single 64Bit | CPU Multi 64Bit
Blender: v2.79 BMW27 CPU
7-Zip 18.03: 7z b 4 -mmt1 | 7z b 4
Geekbench 5.5: Single-Core | Multi-Core
HWBOT x265 Benchmark v2.2: 4k Preset
LibreOffice : 20 Documents To PDF
R Benchmark 2.5: Overall mean
| Cinebench R20 / CPU (Single Core) | |
| Average of class Multimedia (425 - 853, n=56, last 2 years) | |
| Average Intel Core i7-1165G7 (442 - 589, n=81) | |
| Schenker Vision 15 | |
| HP EliteBook 845 G7 Ryzen 7 Pro 4750U | |
| Apple MacBook Pro 16 2019 i9 5500M | |
| Apple MacBook Pro 16 2019 i9 5500M | |
| Honor MagicBook Pro (AMD) | |
| Dell XPS 15 9500 Core i5 | |
| LG Gram 15Z90N | |
| Cinebench R20 / CPU (Multi Core) | |
| Average of class Multimedia (1887 - 12912, n=56, last 2 years) | |
| Apple MacBook Pro 16 2019 i9 5500M | |
| Apple MacBook Pro 16 2019 i9 5500M | |
| HP EliteBook 845 G7 Ryzen 7 Pro 4750U | |
| Honor MagicBook Pro (AMD) | |
| Dell XPS 15 9500 Core i5 | |
| Schenker Vision 15 | |
| Average Intel Core i7-1165G7 (1060 - 2657, n=81) | |
| LG Gram 15Z90N | |
| Cinebench R15 / CPU Single 64Bit | |
| Average of class Multimedia (184.8 - 326, n=58, last 2 years) | |
| Schenker Vision 15 | |
| Average Intel Core i7-1165G7 (115 - 230, n=78) | |
| Dell XPS 15 9500 Core i5 | |
| Apple MacBook Pro 16 2019 i9 5500M | |
| Apple MacBook Pro 16 2019 i9 5500M | |
| HP EliteBook 845 G7 Ryzen 7 Pro 4750U | |
| Honor MagicBook Pro (AMD) | |
| LG Gram 15Z90N | |
| Cinebench R15 / CPU Multi 64Bit | |
| Average of class Multimedia (856 - 5224, n=60, last 2 years) | |
| Apple MacBook Pro 16 2019 i9 5500M | |
| Apple MacBook Pro 16 2019 i9 5500M | |
| Honor MagicBook Pro (AMD) | |
| HP EliteBook 845 G7 Ryzen 7 Pro 4750U | |
| Schenker Vision 15 | |
| Dell XPS 15 9500 Core i5 | |
| Average Intel Core i7-1165G7 (553 - 1027, n=86) | |
| LG Gram 15Z90N | |
| Blender / v2.79 BMW27 CPU | |
| LG Gram 15Z90N | |
| Average Intel Core i7-1165G7 (468 - 1138, n=80) | |
| Schenker Vision 15 | |
| Dell XPS 15 9500 Core i5 | |
| Honor MagicBook Pro (AMD) | |
| Apple MacBook Pro 16 2019 i9 5500M | |
| HP EliteBook 845 G7 Ryzen 7 Pro 4750U | |
| Average of class Multimedia (100 - 557, n=57, last 2 years) | |
| 7-Zip 18.03 / 7z b 4 -mmt1 | |
| Average of class Multimedia (3666 - 7545, n=55, last 2 years) | |
| Average Intel Core i7-1165G7 (4478 - 5507, n=80) | |
| Schenker Vision 15 | |
| Dell XPS 15 9500 Core i5 | |
| Apple MacBook Pro 16 2019 i9 5500M | |
| HP EliteBook 845 G7 Ryzen 7 Pro 4750U | |
| Honor MagicBook Pro (AMD) | |
| LG Gram 15Z90N | |
| 7-Zip 18.03 / 7z b 4 | |
| Average of class Multimedia (26062 - 130368, n=54, last 2 years) | |
| HP EliteBook 845 G7 Ryzen 7 Pro 4750U | |
| Apple MacBook Pro 16 2019 i9 5500M | |
| Honor MagicBook Pro (AMD) | |
| Schenker Vision 15 | |
| Dell XPS 15 9500 Core i5 | |
| Average Intel Core i7-1165G7 (15347 - 27405, n=80) | |
| LG Gram 15Z90N | |
| Geekbench 5.5 / Single-Core | |
| Average of class Multimedia (805 - 2974, n=55, last 2 years) | |
| Schenker Vision 15 | |
| Average Intel Core i7-1165G7 (1302 - 1595, n=77) | |
| Dell XPS 15 9500 Core i5 | |
| LG Gram 15Z90N | |
| HP EliteBook 845 G7 Ryzen 7 Pro 4750U | |
| Honor MagicBook Pro (AMD) | |
| Apple MacBook Pro 16 2019 i9 5500M | |
| Geekbench 5.5 / Multi-Core | |
| Average of class Multimedia (4652 - 20422, n=55, last 2 years) | |
| Apple MacBook Pro 16 2019 i9 5500M | |
| HP EliteBook 845 G7 Ryzen 7 Pro 4750U | |
| Honor MagicBook Pro (AMD) | |
| Schenker Vision 15 | |
| Average Intel Core i7-1165G7 (3078 - 5926, n=77) | |
| Dell XPS 15 9500 Core i5 | |
| LG Gram 15Z90N | |
| HWBOT x265 Benchmark v2.2 / 4k Preset | |
| Average of class Multimedia (5.26 - 36.1, n=55, last 2 years) | |
| Apple MacBook Pro 16 2019 i9 5500M | |
| HP EliteBook 845 G7 Ryzen 7 Pro 4750U | |
| Honor MagicBook Pro (AMD) | |
| Schenker Vision 15 | |
| Dell XPS 15 9500 Core i5 | |
| Average Intel Core i7-1165G7 (1.39 - 8.47, n=80) | |
| LibreOffice / 20 Documents To PDF | |
| HP EliteBook 845 G7 Ryzen 7 Pro 4750U | |
| Dell XPS 15 9500 Core i5 | |
| Honor MagicBook Pro (AMD) | |
| Apple MacBook Pro 16 2019 i9 5500M | |
| Apple MacBook Pro 16 2019 i9 5500M | |
| Average of class Multimedia (23.9 - 146.7, n=56, last 2 years) | |
| Average Intel Core i7-1165G7 (21.5 - 88.1, n=78) | |
| Schenker Vision 15 | |
| LG Gram 15Z90N | |
| R Benchmark 2.5 / Overall mean | |
| LG Gram 15Z90N | |
| Apple MacBook Pro 16 2019 i9 5500M | |
| Apple MacBook Pro 16 2019 i9 5500M | |
| Dell XPS 15 9500 Core i5 | |
| Honor MagicBook Pro (AMD) | |
| HP EliteBook 845 G7 Ryzen 7 Pro 4750U | |
| Average Intel Core i7-1165G7 (0.552 - 1.002, n=80) | |
| Schenker Vision 15 | |
| Average of class Multimedia (0.3604 - 0.947, n=55, last 2 years) | |
* ... smaller is better
System Performance
The subjective performance impression of the Vision 15 is excellent. All inputs are executed without perceptible delays and applications launch very quickly. The device also wakes up almost instantaneously from standby. Our synthetic benchmark results confirm the good subjective impression.
| PCMark 8 Home Score Accelerated v2 | 5364 points | |
| PCMark 8 Creative Score Accelerated v2 | 7573 points | |
| PCMark 8 Work Score Accelerated v2 | 3169 points | |
| PCMark 10 Score | 5158 points | |
Help | ||
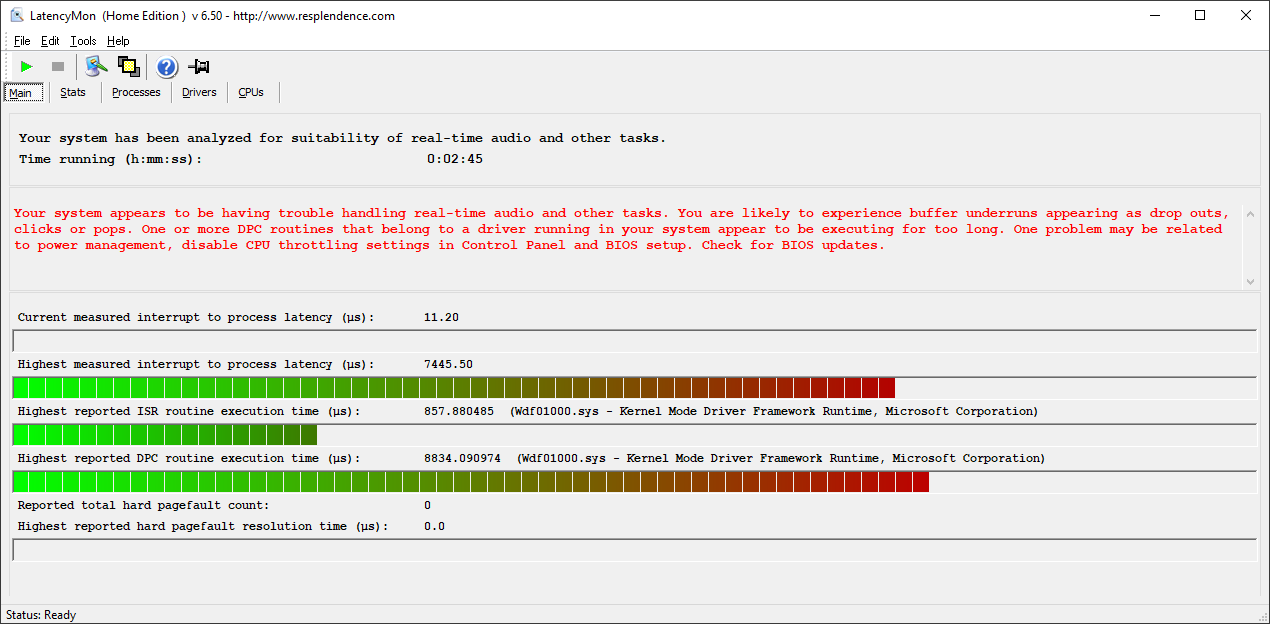
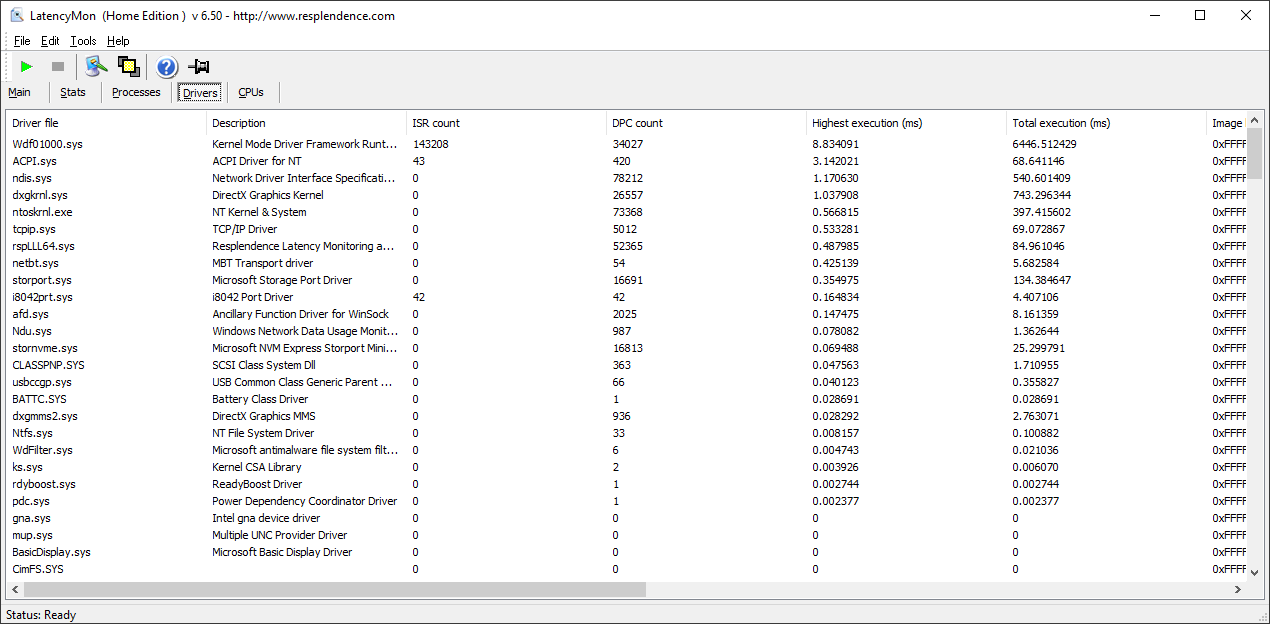
DPC-Latency
Our DPC Latency test still shows high latency figures for the Vision 15. According to the manufacturer, the device was developed with stable latency figures in mind, so we have to wait for the final BIOS version to evaluate the performance in this regard.
| DPC Latencies / LatencyMon - interrupt to process latency (max), Web, Youtube, Prime95 | |
| Schenker Vision 15 | |
| LG Gram 15Z90N | |
| Dell XPS 15 9500 Core i5 | |
| Honor MagicBook Pro (AMD) | |
* ... smaller is better
Storage Devices - Vision 15 with PCIe 4.0
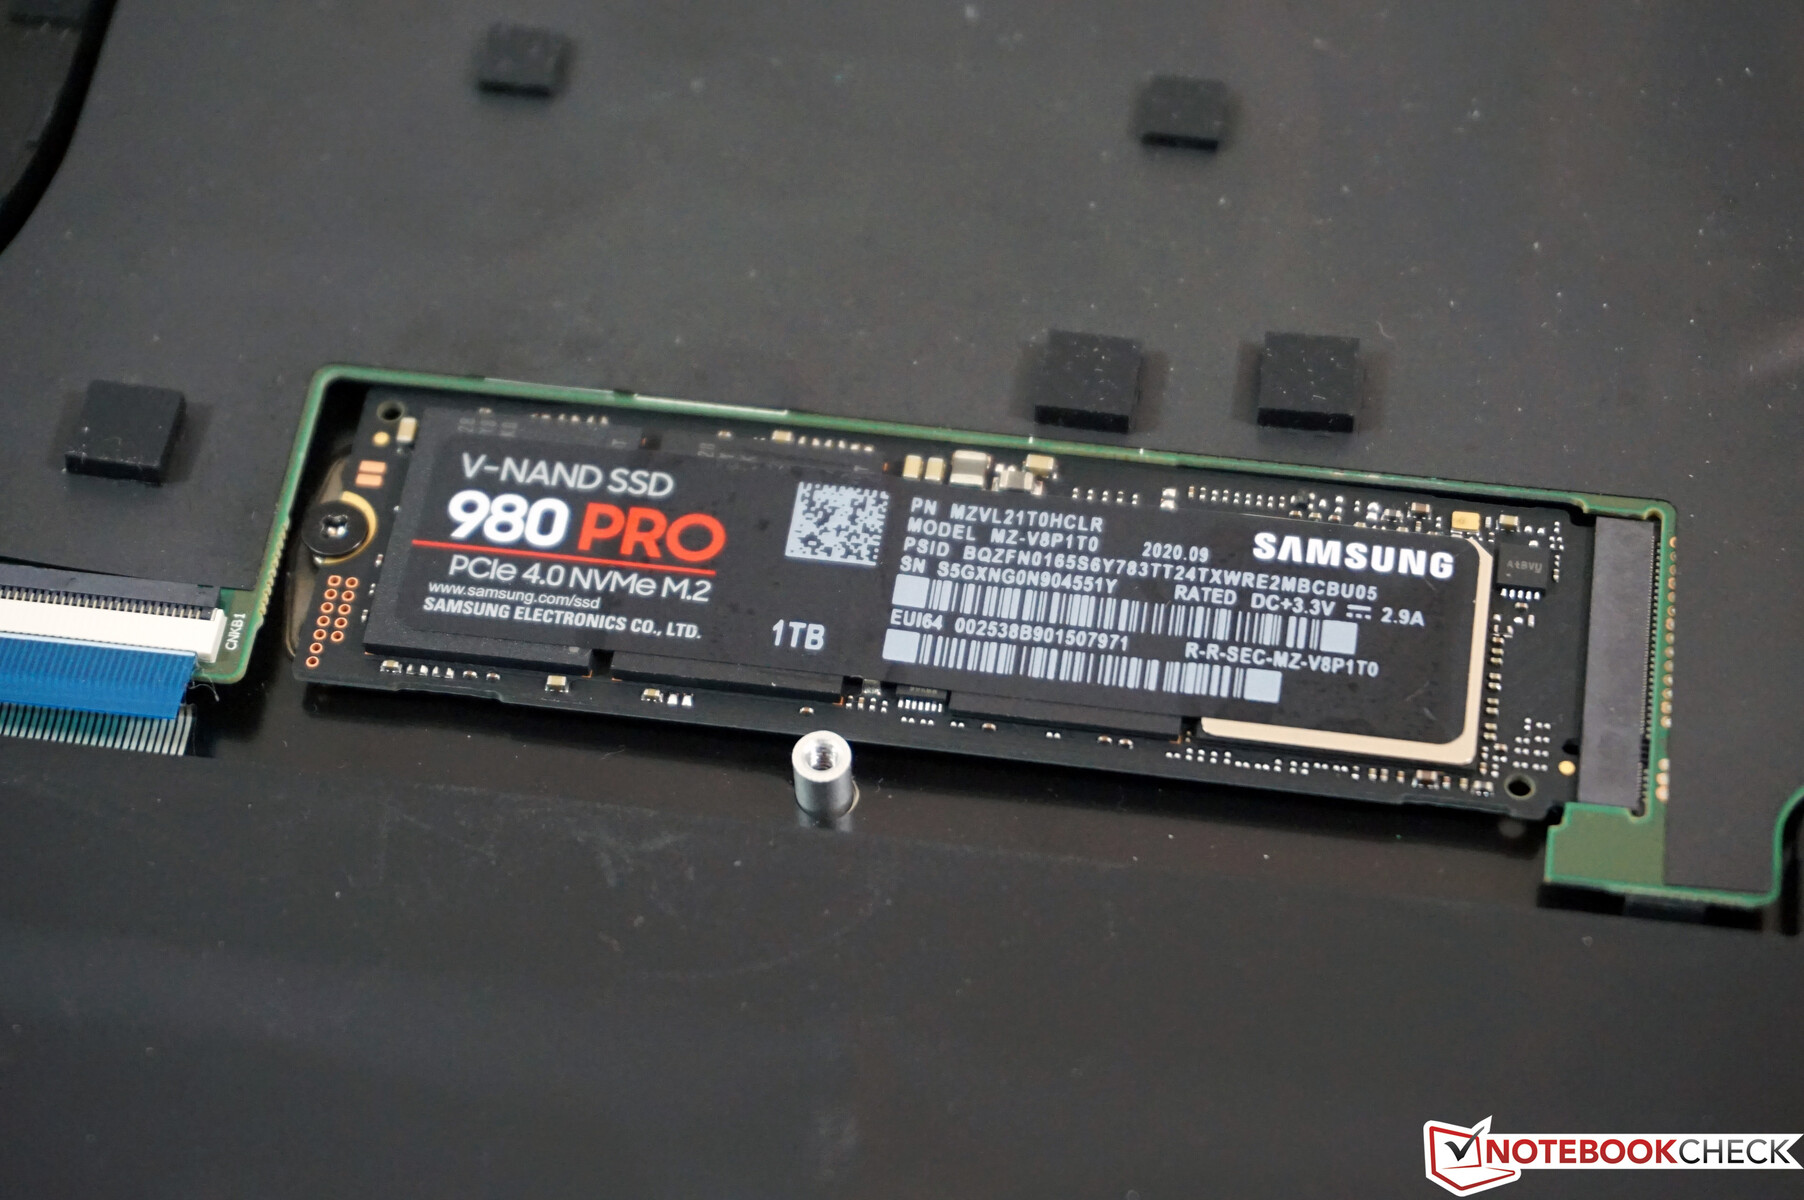
The Vision 15 has a single M.2-2280 slot, which is already attached via PCIe 4.0 interface. Our test unit is equipped with a corresponding SSD from Samsung (980 Pro) with a storage capacity of 1 TB, which can benefit from the fast interface. We can see sequential transfer rates of more than 7 GB/s (read) and 5 GB/s (write), respectively. All in all, a very good performance of the new SSD.
| Schenker Vision 15 Samsung SSD 980 Pro 1TB MZ-V8P1T0BW | Apple MacBook Pro 16 2019 i9 5500M Apple SSD AP1024 7171 | Dell XPS 15 9500 Core i5 Toshiba KBG40ZNS256G NVMe | Honor MagicBook Pro (AMD) WDC PC SN730 SDBPNTY-512G | LG Gram 15Z90N SK Hynix PC401 512GB M.2 (HFS512GD9TNG) | Average Samsung SSD 980 Pro 1TB MZ-V8P1T0BW | |
|---|---|---|---|---|---|---|
| CrystalDiskMark 5.2 / 6 | -53% | -62% | -49% | -44% | -1% | |
| Write 4K (MB/s) | 238.1 | 55.5 -77% | 93.3 -61% | 156.9 -34% | 177.1 -26% | 220 ? -8% |
| Read 4K (MB/s) | 79.2 | 16.21 -80% | 45.9 -42% | 48.81 -38% | 47.88 -40% | 85.1 ? 7% |
| Write Seq (MB/s) | 4139 | 1959 -53% | 1211 -71% | 1050 -75% | 2182 -47% | 3911 ? -6% |
| Read Seq (MB/s) | 4133 | 1763 -57% | 1633 -60% | 2517 -39% | 1900 -54% | 3999 ? -3% |
| Write 4K Q32T1 (MB/s) | 697 | 398.5 -43% | 273.1 -61% | 408.7 -41% | 448.4 -36% | 551 ? -21% |
| Read 4K Q32T1 (MB/s) | 758 | 648 -15% | 356 -53% | 504 -34% | 470.3 -38% | 977 ? 29% |
| Write Seq Q32T1 (MB/s) | 5187 | 2727 -47% | 1198 -77% | 1087 -79% | 2228 -57% | 4932 ? -5% |
| Read Seq Q32T1 (MB/s) | 7117 | 3242 -54% | 2269 -68% | 3407 -52% | 3454 -51% | 6842 ? -4% |
| Write 4K Q8T8 (MB/s) | 1283 | 1390 ? | ||||
| Read 4K Q8T8 (MB/s) | 1052 | 2134 ? | ||||
| AS SSD | -82% | -265% | -39% | -46% | -9% | |
| Seq Read (MB/s) | 5427 | 2531 -53% | 1423 -74% | 2749 -49% | 2842 -48% | 4838 ? -11% |
| Seq Write (MB/s) | 3886 | 2289 -41% | 766 -80% | 2348 -40% | 974 -75% | 3490 ? -10% |
| 4K Read (MB/s) | 72.9 | 15.85 -78% | 42.21 -42% | 44.22 -39% | 50.5 -31% | 72 ? -1% |
| 4K Write (MB/s) | 219.3 | 39.88 -82% | 74.8 -66% | 140.5 -36% | 147.5 -33% | 188.8 ? -14% |
| 4K-64 Read (MB/s) | 2209 | 1267 -43% | 973 -56% | 1450 -34% | 1191 -46% | 2234 ? 1% |
| 4K-64 Write (MB/s) | 2265 | 1749 -23% | 218.8 -90% | 2346 4% | 1275 -44% | 2622 ? 16% |
| Access Time Read * (ms) | 0.033 | 0.122 -270% | 0.125 -279% | 0.079 -139% | 0.043 -30% | 0.04075 ? -23% |
| Access Time Write * (ms) | 0.02 | 0.095 -375% | 0.552 -2660% | 0.027 -35% | 0.027 -35% | 0.03363 ? -68% |
| Score Read (Points) | 2825 | 1536 -46% | 1157 -59% | 1769 -37% | 1526 -46% | 2811 ? 0% |
| Score Write (Points) | 2873 | 2018 -30% | 370 -87% | 2721 -5% | 1520 -47% | 3159 ? 10% |
| Score Total (Points) | 7069 | 4317 -39% | 2094 -70% | 5376 -24% | 3741 -47% | 7334 ? 4% |
| Copy ISO MB/s (MB/s) | 2775 | 1995 -28% | 1151 -59% | 1135 -59% | 2688 ? -3% | |
| Copy Program MB/s (MB/s) | 662 | 584 -12% | 499.4 -25% | 346 -48% | 568 ? -14% | |
| Copy Game MB/s (MB/s) | 1655 | 1135 -31% | 733 -56% | 665 -60% | 1346 ? -19% | |
| Total Average (Program / Settings) | -68% /
-72% | -164% /
-191% | -44% /
-43% | -45% /
-45% | -5% /
-7% |
* ... smaller is better

Dauerleistung Lesen: DiskSpd Read Loop, Queue Depth 8
GPU Performance - Intel Xe Graphics
The integrated GPU of the Tiger Lake processor is called Iris Xe Graphics. It is the most powerful version with 96 shader units and a maximum core clock of 1300 MHz. More technical information about the iGPU is available here.
Similar to previous versions of Intel's iGPUs, you once again get a powerful video decoder, which handles high-resolution video playback with ease and even some video editing is no problem thanks to QuickSync support. The big difference compared to previous models is the performance, which is much better now. Even AMD's iGPUs are beaten in the synthetic tests, just like the entry-level dedicated GPUs from Nvidia (MX250/MX350).
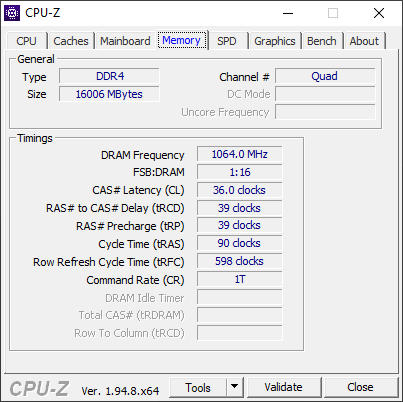
The benchmark results of the Vision 15 are always better than the average values in our database for this iGPU. There are two reasons for that: The performance is not limited by the TDP, and the iGPU obviously benefits from the fast LPDDR4X memory in a dual-channel configuration.
The performance of the iGPU is stable under sustained workloads (Time Spy Stress test is passed at 99.3 %) and there are no limitations on battery power, either.
| 3DMark 11 Performance | 7478 points | |
| 3DMark Ice Storm Standard Score | 72171 points | |
| 3DMark Fire Strike Score | 5238 points | |
| 3DMark Time Spy Score | 1804 points | |
Help | ||
Gaming Performance
Thanks to the fast iGPU, the Vision 15 is also suited for some games. It is obviously not a full-fledged gaming laptop with a powerful dGPU, but even modern titles often run smoothly at low/medium settings. Our Witcher 3 stress test (preset high) confirms the steady performance of the laptop.
| low | med. | high | ultra | |
|---|---|---|---|---|
| The Witcher 3 (2015) | 97.8 | 63.1 | 35.4 | 15.5 |
| Dota 2 Reborn (2015) | 76.5 | 76.2 | 53.6 | 49.7 |
| X-Plane 11.11 (2018) | 46.4 | 39.3 | 34.4 | |
| Far Cry 5 (2018) | 63 | 30 | 28 | 26 |
| F1 2020 (2020) | 93 | 50 | 38 | 24 |
Emissions - Sensitive fans, low surface temperatures
System Noise
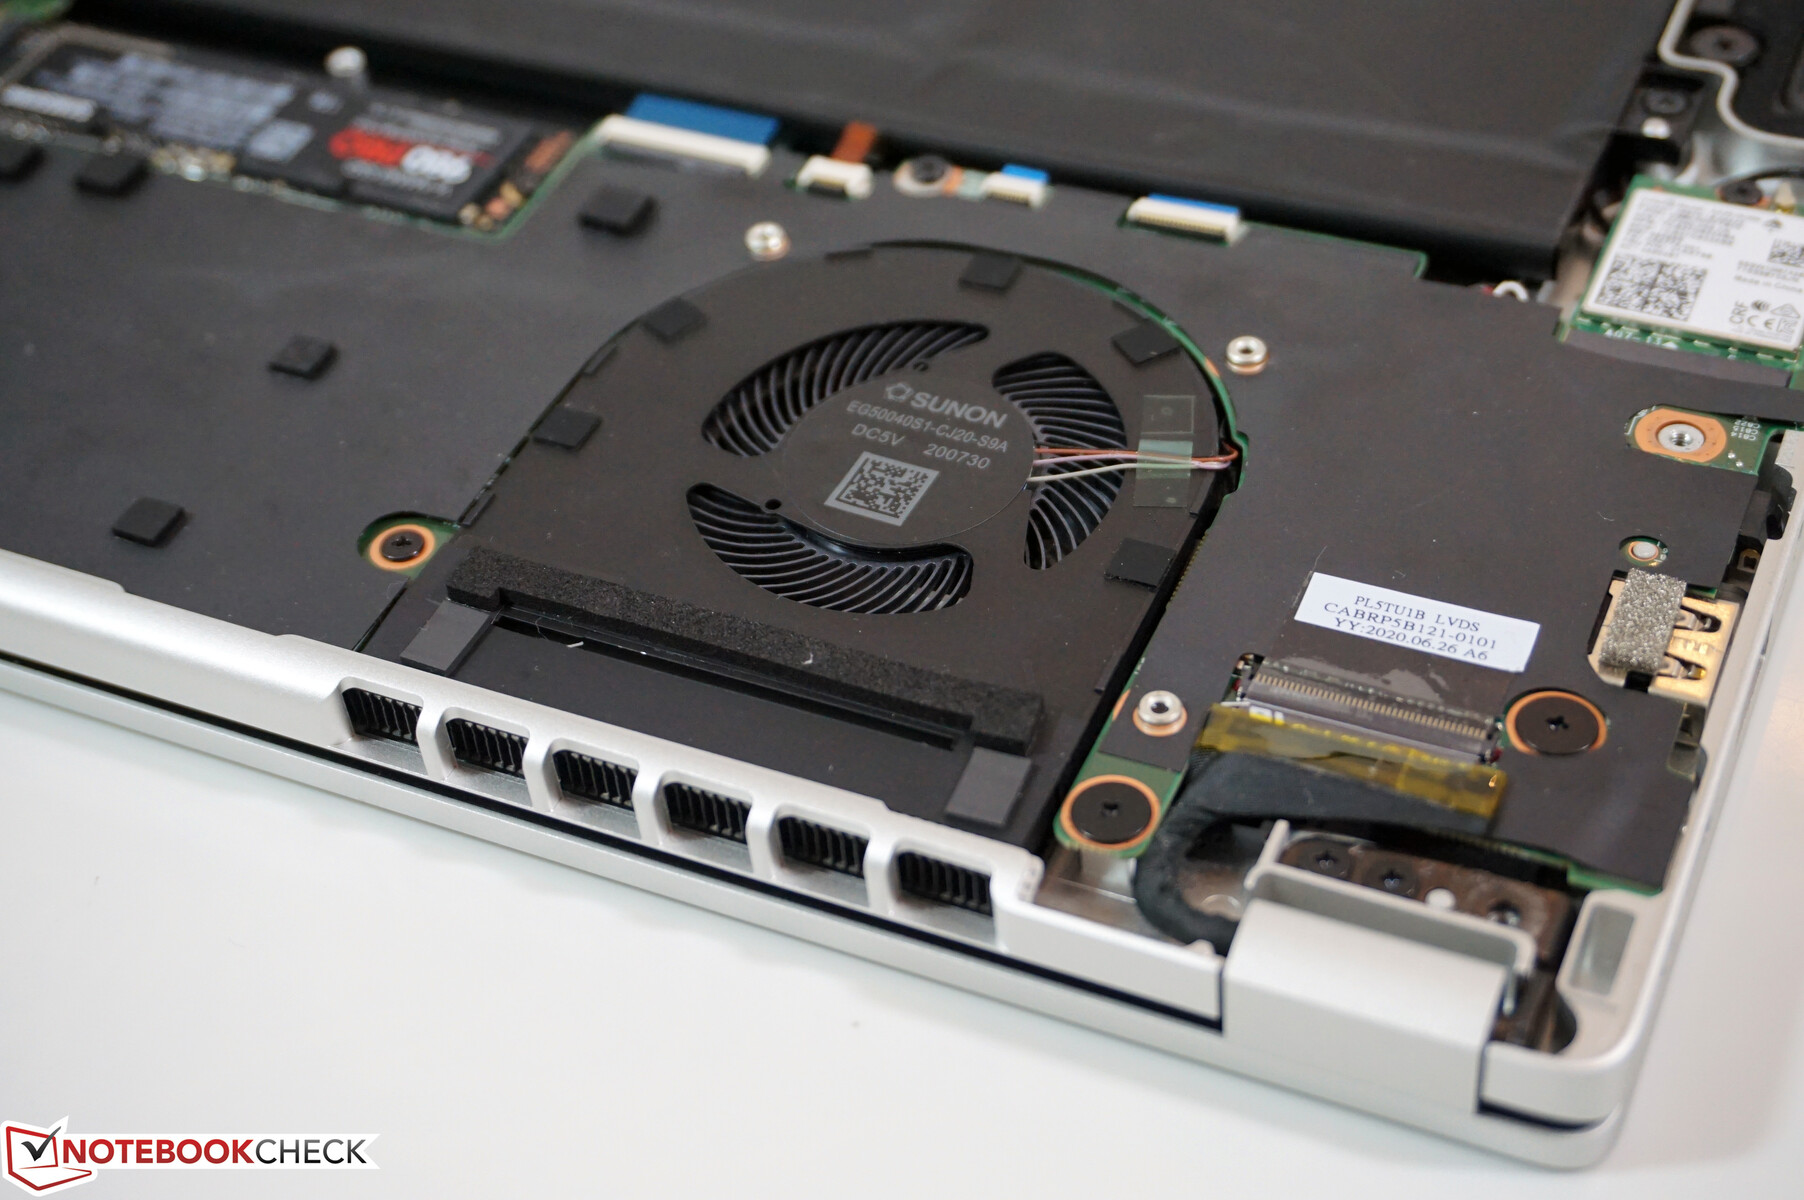
The cooling solution consists of two fans and two heat pipes. As we have previously noted, the fan noise is heavily influenced by the performance mode you select. The first fan levels (2000-3200 rpm) are only audible as a quiet murmur and we can measure up to 32.2 dB(A) in the mode Better Performance (medium setting); the fans are barely audible at all in the mode Better Battery. Once you select Best Performance, however, this changes quickly and even short peak load will result in more than 35 dB(A) all the way up to the maximum noise level of 40.5 dB(A) after a few seconds. The murmur of the fans is still very pleasant and there is no high-pitched frequency at these fan speeds (4670 rpm).
One aspect we do not like and is hopefully adjusted for the final version is the sensitivity of the fans to load. With the current Beta BIOS version, they just ramp um too quickly, which can be a bit annoying in practice. We would definitely recommend the profile Better Performance for everyday use. The CPU can still benefit from the high PL2 limit (50W), but the fans stay much quieter. We did not notice any other electronic noises.
Noise level
| Idle |
| 29.8 / 29.8 / 31.1 dB(A) |
| Load |
| 40.5 / 40.5 dB(A) |
 | ||
30 dB silent 40 dB(A) audible 50 dB(A) loud |
||
min: | ||
| Schenker Vision 15 Iris Xe G7 96EUs, i7-1165G7, Samsung SSD 980 Pro 1TB MZ-V8P1T0BW | Apple MacBook Pro 16 2019 i9 5500M Radeon Pro 5500M, i9-9880H, Apple SSD AP1024 7171 | Dell XPS 15 9500 Core i5 UHD Graphics 630, i5-10300H, Toshiba KBG40ZNS256G NVMe | Honor MagicBook Pro (AMD) Vega 6, R5 4600H, WDC PC SN730 SDBPNTY-512G | LG Gram 15Z90N Iris Plus Graphics G7 (Ice Lake 64 EU), i5-1035G7, SK Hynix PC401 512GB M.2 (HFS512GD9TNG) | |
|---|---|---|---|---|---|
| Noise | -4% | 9% | 8% | 3% | |
| off / environment * (dB) | 29.8 | 29.8 -0% | 28 6% | 29.7 -0% | 30.7 -3% |
| Idle Minimum * (dB) | 29.8 | 29.9 -0% | 28 6% | 29.7 -0% | 30.7 -3% |
| Idle Average * (dB) | 29.8 | 29.9 -0% | 28 6% | 29.7 -0% | 30.7 -3% |
| Idle Maximum * (dB) | 31.1 | 29.9 4% | 28 10% | 30.5 2% | 31.9 -3% |
| Load Average * (dB) | 40.5 | 43 -6% | 28 31% | 31 23% | 34 16% |
| Witcher 3 ultra * (dB) | 40.5 | 45.4 -12% | 31.3 23% | ||
| Load Maximum * (dB) | 40.5 | 46.1 -14% | 41.9 -3% | 36.7 9% | 34.2 16% |
* ... smaller is better
Temperature
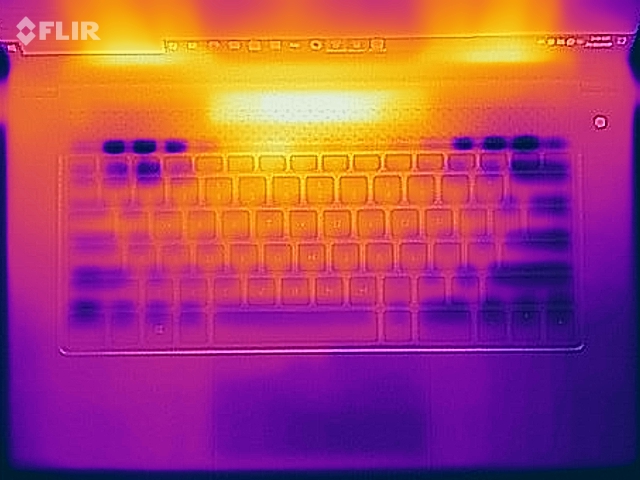
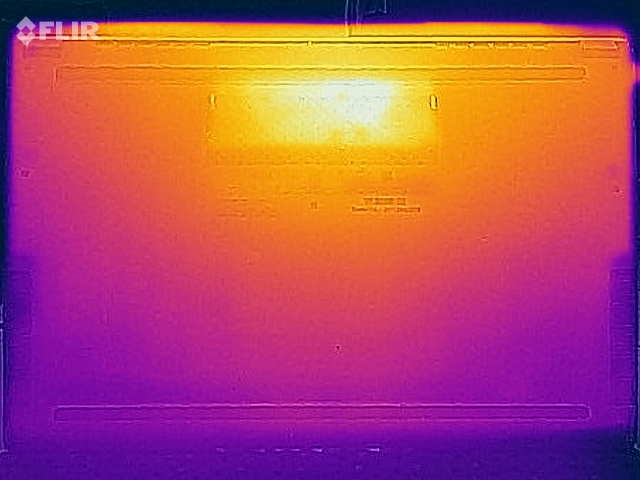
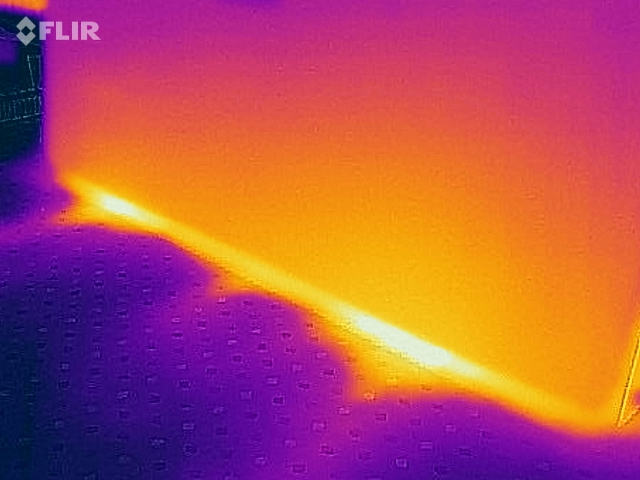
The surface temperatures of the Vision 15 are definitely a highlight of the device. As you can see on the following thermal images, a large portion of the base unit including the whole keyboard stays very cool during the stress test; the maximum temperature at the keyboard is 36 °C. The area above the keyboard is noticeably warmer at 42 °C, but you will hardly touch this surface when you use the laptop. The hot spot at the bottom is located between the mesh and the rubber support foot, but is not too hot at 44 °C. Considering the high performance, these are good results and you can still put the notebook on your lap under load.
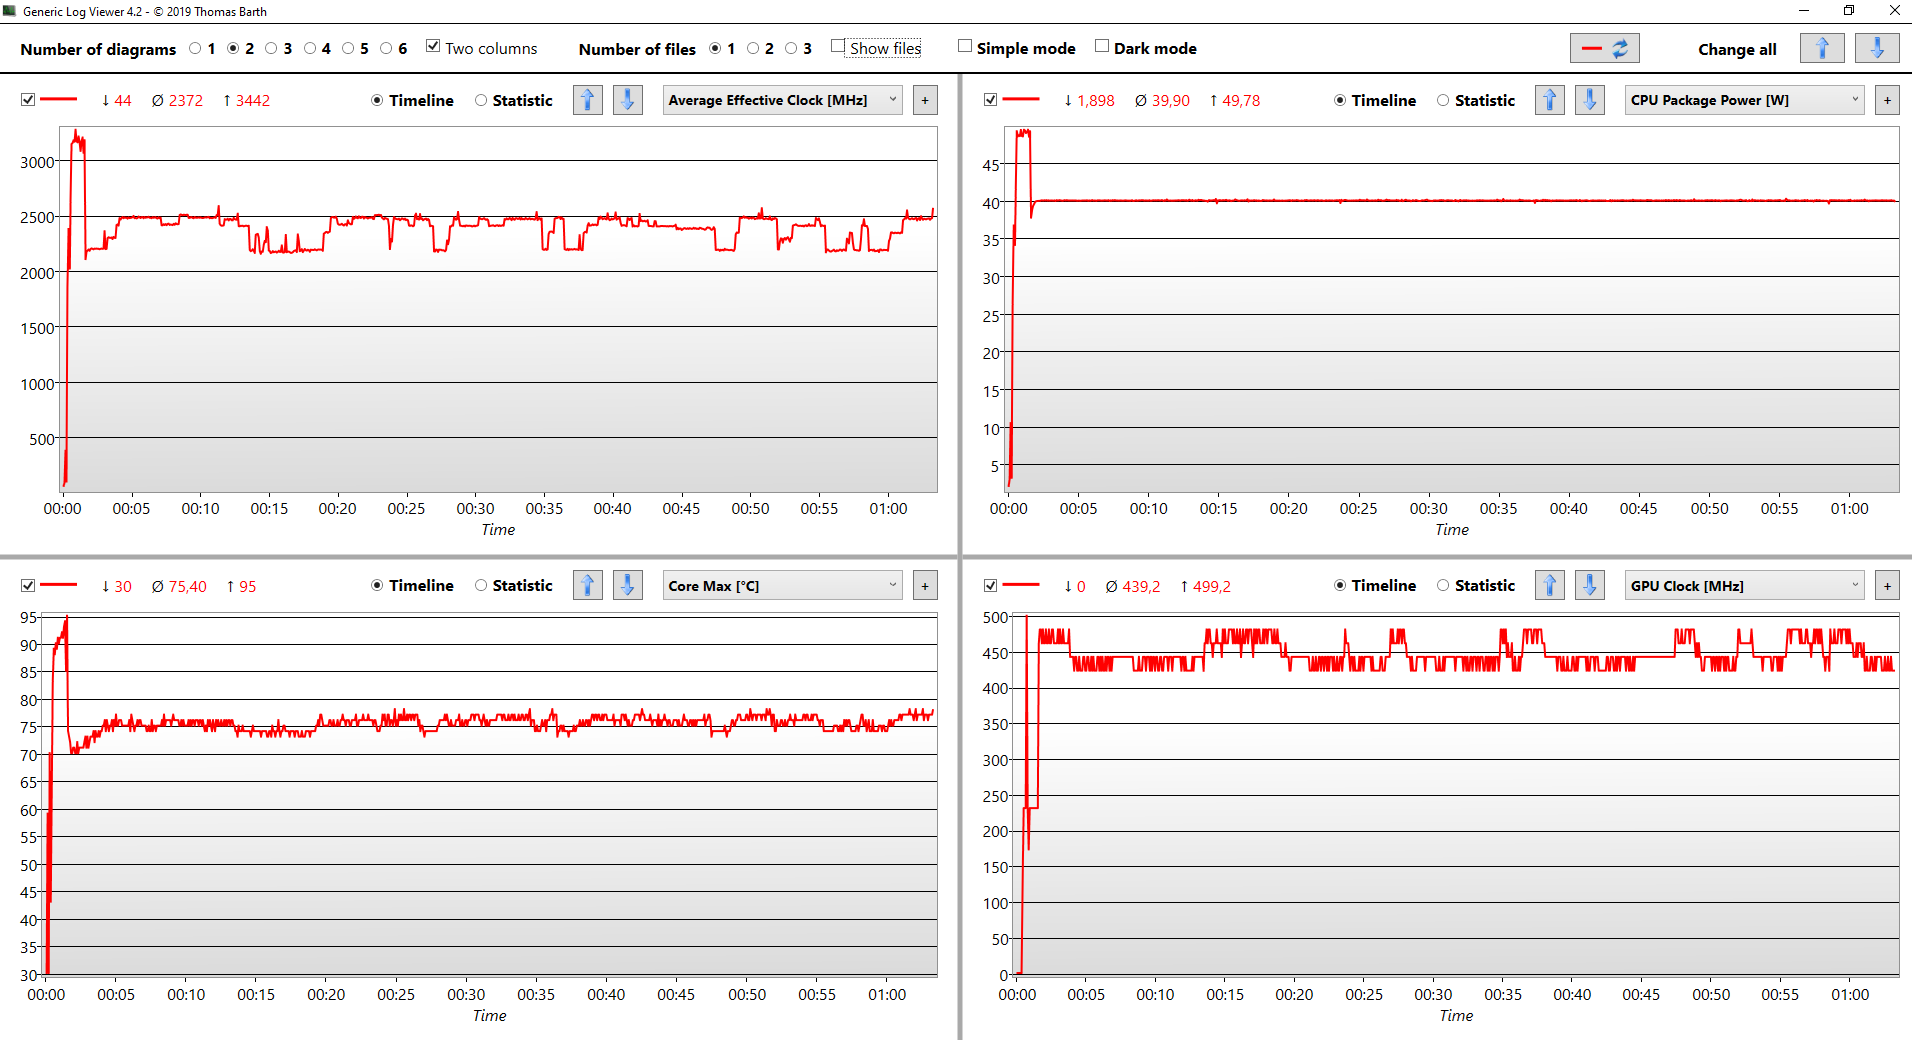
The stress test with maximum CPU and GPU load reveals a very similar behavior like we saw under pure CPU load. The consumption is at 50W for about a minute and levels off at 40W as soon as the CPU temperature reaches more than 96 °C. This level can be maintained during the stress test. We see 8x 2.3-2.4 GHz for the CPU as well as ~450 MHz for the iGPU. The CPU temperature is completely uncritical at 75 °C. There is no performance reduction immediately after the stress test.
(±) The maximum temperature on the upper side is 42.4 °C / 108 F, compared to the average of 36.8 °C / 98 F, ranging from 21 to 71 °C for the class Multimedia.
(-) The bottom heats up to a maximum of 46.8 °C / 116 F, compared to the average of 39.1 °C / 102 F
(+) In idle usage, the average temperature for the upper side is 23.6 °C / 74 F, compared to the device average of 31.3 °C / 88 F.
(+) Playing The Witcher 3, the average temperature for the upper side is 29.7 °C / 85 F, compared to the device average of 31.3 °C / 88 F.
(+) The palmrests and touchpad are cooler than skin temperature with a maximum of 25.9 °C / 78.6 F and are therefore cool to the touch.
(+) The average temperature of the palmrest area of similar devices was 28.7 °C / 83.7 F (+2.8 °C / 5.1 F).
Speakers
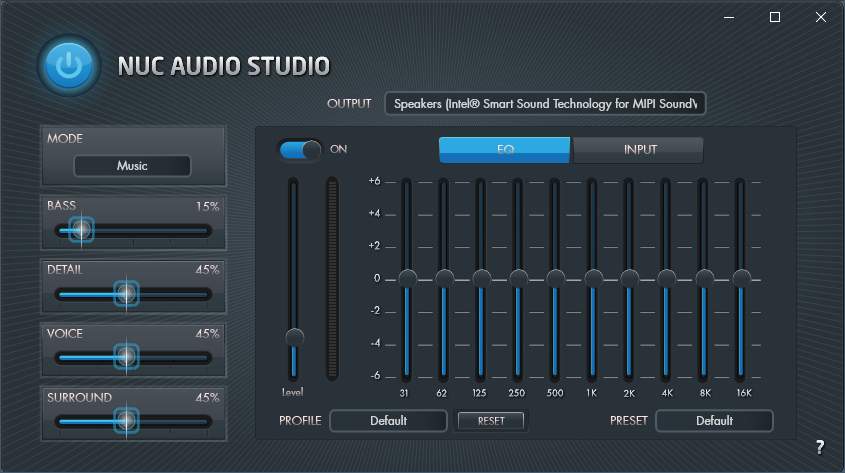
The two speakers are located at the front edges and direct the sound towards the bottom, so it can be muffled depending on the underground. Intel provides its own software (NUC Audio Studio), which includes some settings and presets for different sources (music, movie, voice, gaming). This means there is no reason to include addition third-party software.
The result is decent, and you can use the speaker for some music and video playback. However, there are definitely notebooks with better sound systems available, including direct rivals like the Dell XPS 15 or the MacBook Pro 16.
There are four microphones integrated into the lid. We tested them and the performance was very good during test calls.
Schenker Vision 15 audio analysis
(±) | speaker loudness is average but good (79.5 dB)
Bass 100 - 315 Hz
(-) | nearly no bass - on average 17% lower than median
(±) | linearity of bass is average (11.5% delta to prev. frequency)
Mids 400 - 2000 Hz
(+) | balanced mids - only 3.2% away from median
(+) | mids are linear (4.5% delta to prev. frequency)
Highs 2 - 16 kHz
(+) | balanced highs - only 3.3% away from median
(+) | highs are linear (5.4% delta to prev. frequency)
Overall 100 - 16.000 Hz
(±) | linearity of overall sound is average (19.5% difference to median)
Compared to same class
» 63% of all tested devices in this class were better, 7% similar, 29% worse
» The best had a delta of 5%, average was 17%, worst was 45%
Compared to all devices tested
» 49% of all tested devices were better, 7% similar, 44% worse
» The best had a delta of 4%, average was 23%, worst was 134%
Dell XPS 15 9500 Core i5 audio analysis
(+) | speakers can play relatively loud (84.2 dB)
Bass 100 - 315 Hz
(+) | good bass - only 4.6% away from median
(±) | linearity of bass is average (10% delta to prev. frequency)
Mids 400 - 2000 Hz
(+) | balanced mids - only 3.3% away from median
(+) | mids are linear (4.5% delta to prev. frequency)
Highs 2 - 16 kHz
(+) | balanced highs - only 2.4% away from median
(+) | highs are linear (4.3% delta to prev. frequency)
Overall 100 - 16.000 Hz
(+) | overall sound is linear (7.7% difference to median)
Compared to same class
» 6% of all tested devices in this class were better, 2% similar, 91% worse
» The best had a delta of 5%, average was 17%, worst was 45%
Compared to all devices tested
» 1% of all tested devices were better, 0% similar, 98% worse
» The best had a delta of 4%, average was 23%, worst was 134%
Energy Management - Vision 15 with long runtimes
Power Consumption
According to the manufacturer, the power consumption was a big focus during the development of the device, but not all our results confirm that. Some rivals, for example, have a lower idle min consumption, even though the overall performance here is very good. However, both the consumption for standby and when the device is turned off still leave room for optimizations.
The load results are impacted by the high TDP levels of the system. We measure up to 67.7W under maximum load, which will level off at around 57W. This means the provided 65W power adapter is sufficient, but there is not much headroom when you want to charge the battery under load, for example.
| Off / Standby | |
| Idle | |
| Load |
|
Key:
min: | |
| Schenker Vision 15 i7-1165G7, Iris Xe G7 96EUs, Samsung SSD 980 Pro 1TB MZ-V8P1T0BW, IPS, 1920x1080, 15.6" | Apple MacBook Pro 16 2019 i9 5500M i9-9880H, Radeon Pro 5500M, Apple SSD AP1024 7171, IPS, 3072x1920, 16" | Dell XPS 15 9500 Core i5 i5-10300H, UHD Graphics 630, Toshiba KBG40ZNS256G NVMe, IPS, 1920x1200, 15.6" | Honor MagicBook Pro (AMD) R5 4600H, Vega 6, WDC PC SN730 SDBPNTY-512G, IPS, 1920x1080, 16.1" | LG Gram 15Z90N i5-1035G7, Iris Plus Graphics G7 (Ice Lake 64 EU), SK Hynix PC401 512GB M.2 (HFS512GD9TNG), .2 IPS LED, 1920x1080, 15.6" | Average Intel Iris Xe Graphics G7 96EUs | Average of class Multimedia | |
|---|---|---|---|---|---|---|---|
| Power Consumption | -85% | -12% | -10% | 1% | -32% | -64% | |
| Idle Minimum * (Watt) | 3.5 | 3.7 -6% | 2.9 17% | 4.2 -20% | 2.9 17% | 5.51 ? -57% | 5.62 ? -61% |
| Idle Average * (Watt) | 6.3 | 12.1 -92% | 7.6 -21% | 8.4 -33% | 7.7 -22% | 8.66 ? -37% | 10.2 ? -62% |
| Idle Maximum * (Watt) | 6.8 | 17 -150% | 8 -18% | 9.7 -43% | 11.4 -68% | 10.9 ? -60% | 12.5 ? -84% |
| Load Average * (Watt) | 43.2 | 91.5 -112% | 41.7 3% | 39.5 9% | 31.5 27% | 45.6 ? -6% | 65 ? -50% |
| Witcher 3 ultra * (Watt) | 52 | 103 -98% | 39.1 25% | ||||
| Load Maximum * (Watt) | 67.7 | 102.3 -51% | 94.8 -40% | 67.1 1% | 32 53% | 67.8 ? -0% | 111.9 ? -65% |
* ... smaller is better
Battery Runtime
The combination of 73Wh battery in combination with low consumption values results in very long battery runtimes. Our Wi-Fi test at an adjusted luminance of 150 nits (in the case of the test unit 32% of the maximum brightness) results in a runtime of more than 15 hours and more than 18 hours during video playback. We still record 11 hours when we run the Wi-Fi test at maximum brightness, which is still an excellent result. This means the Vision 15 is superior to the rivals.
The load runtime is obviously impacted by the unrestricted performance on battery power, so the battery will be drained after about 80 minutes in a worst-case scenario.
There is no quick-charge functionality and the charging performance is very linear. You can expect about 25% every 30 minutes when the device is in standby. The full charge takes 2 hours and 20 minutes with the 65W power adapter.
| Schenker Vision 15 i7-1165G7, Iris Xe G7 96EUs, 73 Wh | Apple MacBook Pro 16 2019 i9 5500M i9-9880H, Radeon Pro 5500M, 99.8 Wh | Dell XPS 15 9500 Core i5 i5-10300H, UHD Graphics 630, 56 Wh | Honor MagicBook Pro (AMD) R5 4600H, Vega 6, 56 Wh | LG Gram 15Z90N i5-1035G7, Iris Plus Graphics G7 (Ice Lake 64 EU), 80 Wh | Average of class Multimedia | |
|---|---|---|---|---|---|---|
| Battery runtime | -31% | -8% | -28% | 54% | -1% | |
| H.264 (h) | 18.7 | 9.7 -48% | 10.6 -43% | 11.2 -40% | 16.8 ? -10% | |
| WiFi v1.3 (h) | 15.2 | 12 -21% | 9.3 -39% | 10.3 -32% | 12.1 -20% | 12.3 ? -19% |
| Load (h) | 1.3 | 1 -23% | 1.6 23% | 1.2 -8% | 4.2 223% | 1.645 ? 27% |
| Witcher 3 ultra (h) | 0.9 | |||||
| Reader / Idle (h) | 26.4 | 25.6 | 24.9 ? |
Pros
Cons
Verdict - Convincing first try
Intel's new reference notebook, which was co-developed by the NUC team, was definitely a surprise for many users. It has a premium claim and with an entry-level price of 1500 Euros, Intel positions the device against other premium multimedia laptops from Dell or Apple, for example. The lack of a dedicated GPU is not necessarily an issue considering the performance of the new iGPUs and not every user wants to play games on the laptop.
The Schenker Vision 15 in review is the first retail model based on the NUC M15 design. The processor is a current Tiger Lake i7, and its performance is very well utilized here. We particularly liked that all the performance and fan controls are directly operated via Windows power slider, which is comfortable and easy. We also like the cooling solution, and the surface temperatures stay very low even under load. However, the fans are very sensitive to load and quickly start spinning even though it not always necessary with the current BIOS version. We think this should be improved for the final product.
High performance, modern ports, great chassis, and long battery runtime: Intel's reference design is a good basis, only the display cannot fully meet the expectations of the high price tag. Intel should also tweak the fan control.
The unibody aluminum chassis leaves a very high-quality impression and is very sturdy. You also get very modern ports with Thunderbolt 4 in a convenient layout (charging is possible on both sides), but it is unfortunate that there is no SD-card reader. We also like the input devices, and you get very long battery runtimes from the 73Wh battery.
The display selection does not really meet the high price tag. The 1080p touchscreen is not bad by any means, but there are some drawbacks. We are a bit surprised that Intel completely ignores the trend back towards 16:10 displays. The panel also suffers from slow response times and the color accuracy is not perfect.
All in all, the Schenker Vision 15 still leaves a very good overall impression, and it is definitely an interesting alternative if you are looking for a high-quality multimedia laptop and do not need a dedicated GPU for gaming.
Schenker Vision 15
- 12/02/2020 v7 (old)
Andreas Osthoff
Price comparison
