A Ryzen 7 4800U for Businesses: HP EliteBook 845 G7 Ryzen 7 Pro 4750U Laptop Review
We had recently checked out the HP EliteBook 845 G7 equipped with the hexa-core Ryzen 5 Pro 4650U CPU, 8 GB of single-channel RAM, and 250-nit display panel option. This time, we want to see how well the pricier configuration with the octa-core Ryzen 7 Pro 4750U CPU, 16 GB of dual-channel RAM, and 400-nit panel option can compare. What performance and display differences can users expect between these two SKUs?
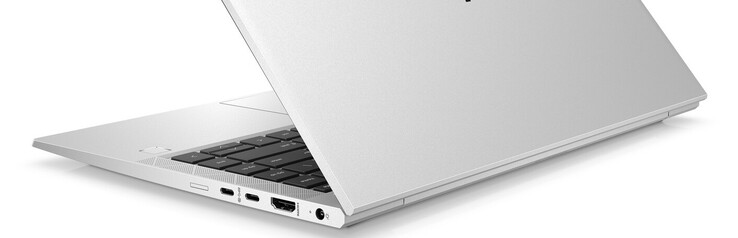
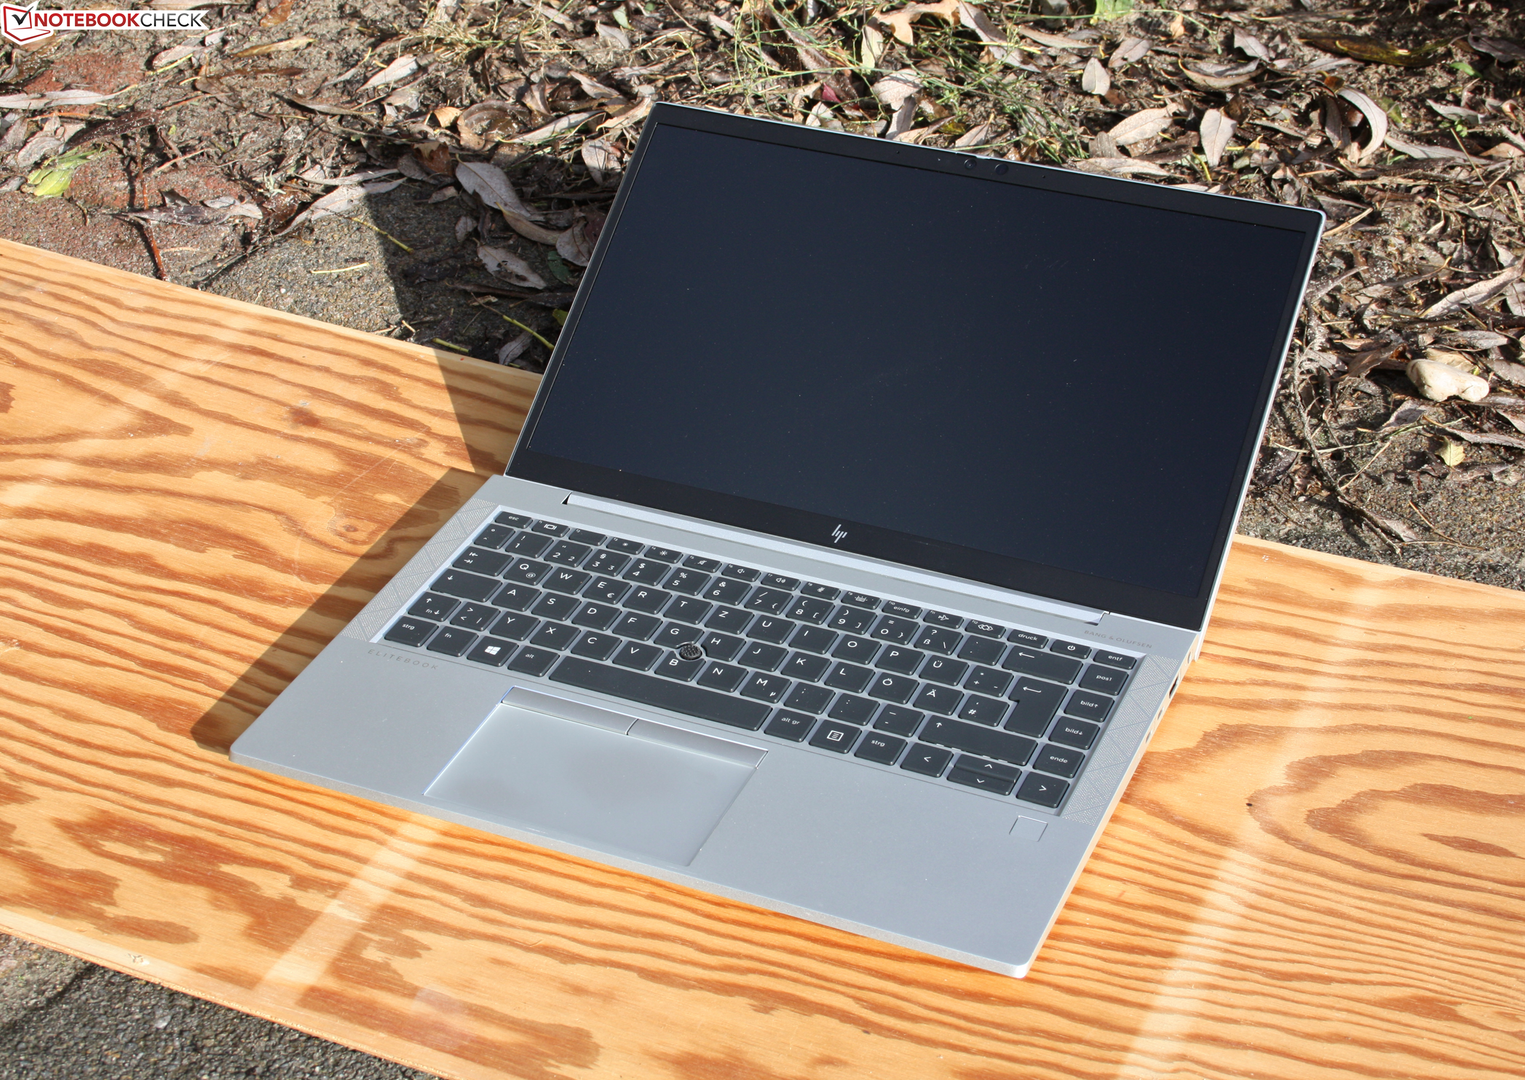
Our test unit as configured retails for about $1300 or more. We recommend reading up on our review on the Ryzen 5 configuration to learn more about the physical features of the laptop including its keyboard, port options, and serviceability.
Alternatives to the HP EliteBook 845 G7 include other high-end 14-inch business laptops like the Lenovo X1 Carbon and Dell Latitude 7410 or prosumer laptops like the Huawei MateBook X Pro or Asus ZenBook S UX393.
More HP reviews:
potential competitors in comparison
Rating | Date | Model | Weight | Height | Size | Resolution | Price |
|---|---|---|---|---|---|---|---|
| 88.2 % v7 (old) | 11 / 2020 | HP EliteBook 845 G7 Ryzen 7 Pro 4750U R7 PRO 4750U, Vega 7 | 1.4 kg | 17.9 mm | 14.00" | 1920x1080 | |
| 88.9 % v7 (old) | 11 / 2020 | Lenovo ThinkPad T14-20UES00H00 R5 PRO 4650U, Vega 6 | 1.5 kg | 17.9 mm | 14.00" | 1920x1080 | |
| 88.9 % v7 (old) | 07 / 2020 | Dell Latitude 7410 i7-10610U, UHD Graphics 620 | 1.4 kg | 19.3 mm | 14.00" | 3840x2160 | |
| 83.2 % v7 (old) | 07 / 2020 | HP ProBook 445 G7 175W4EA R5 4500U, Vega 6 | 1.6 kg | 18 mm | 14.00" | 1920x1080 | |
| 85.3 % v7 (old) | 08 / 2020 | Lenovo Yoga Slim 7-14ARE R7 4800U, Vega 8 | 1.4 kg | 14.9 mm | 14.00" | 1920x1080 | |
| 85.4 % v7 (old) | 11 / 2020 | Dynabook Portégé X40-G-10K i5-10210U, UHD Graphics 620 | 1.3 kg | 16.9 mm | 14.00" | 1920x1080 |
Case
Communication
Webcam


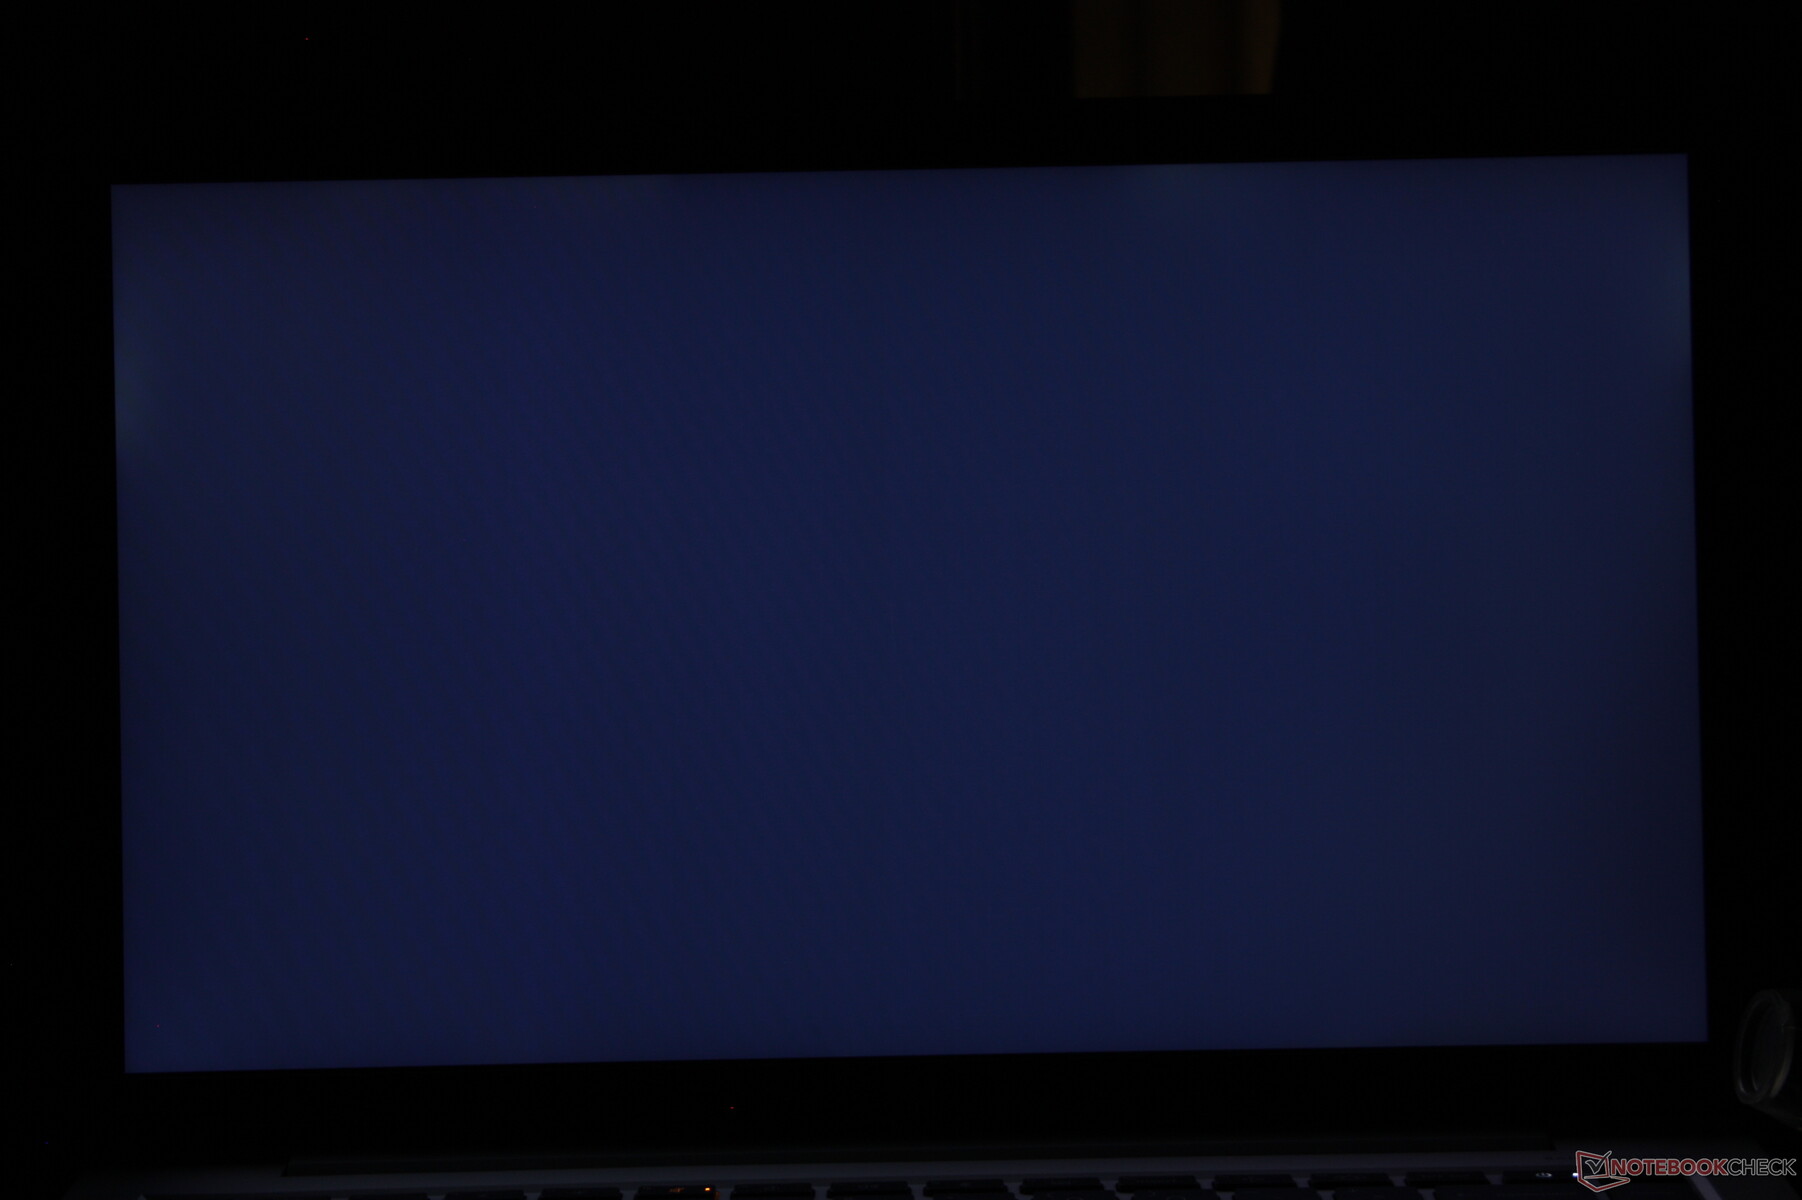
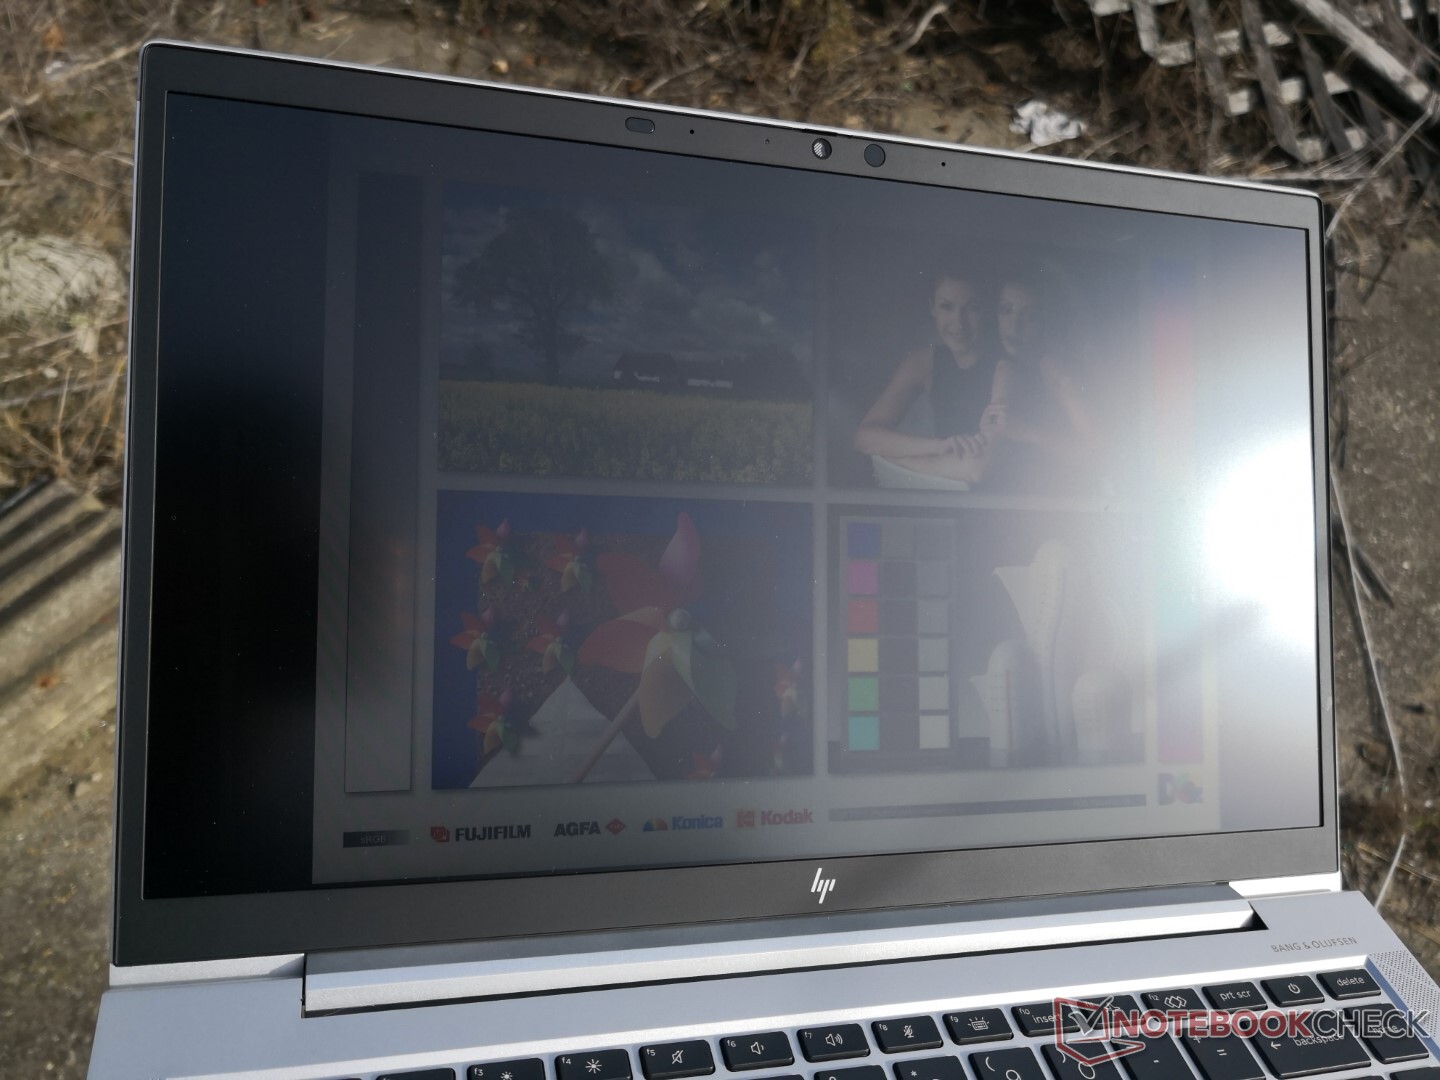
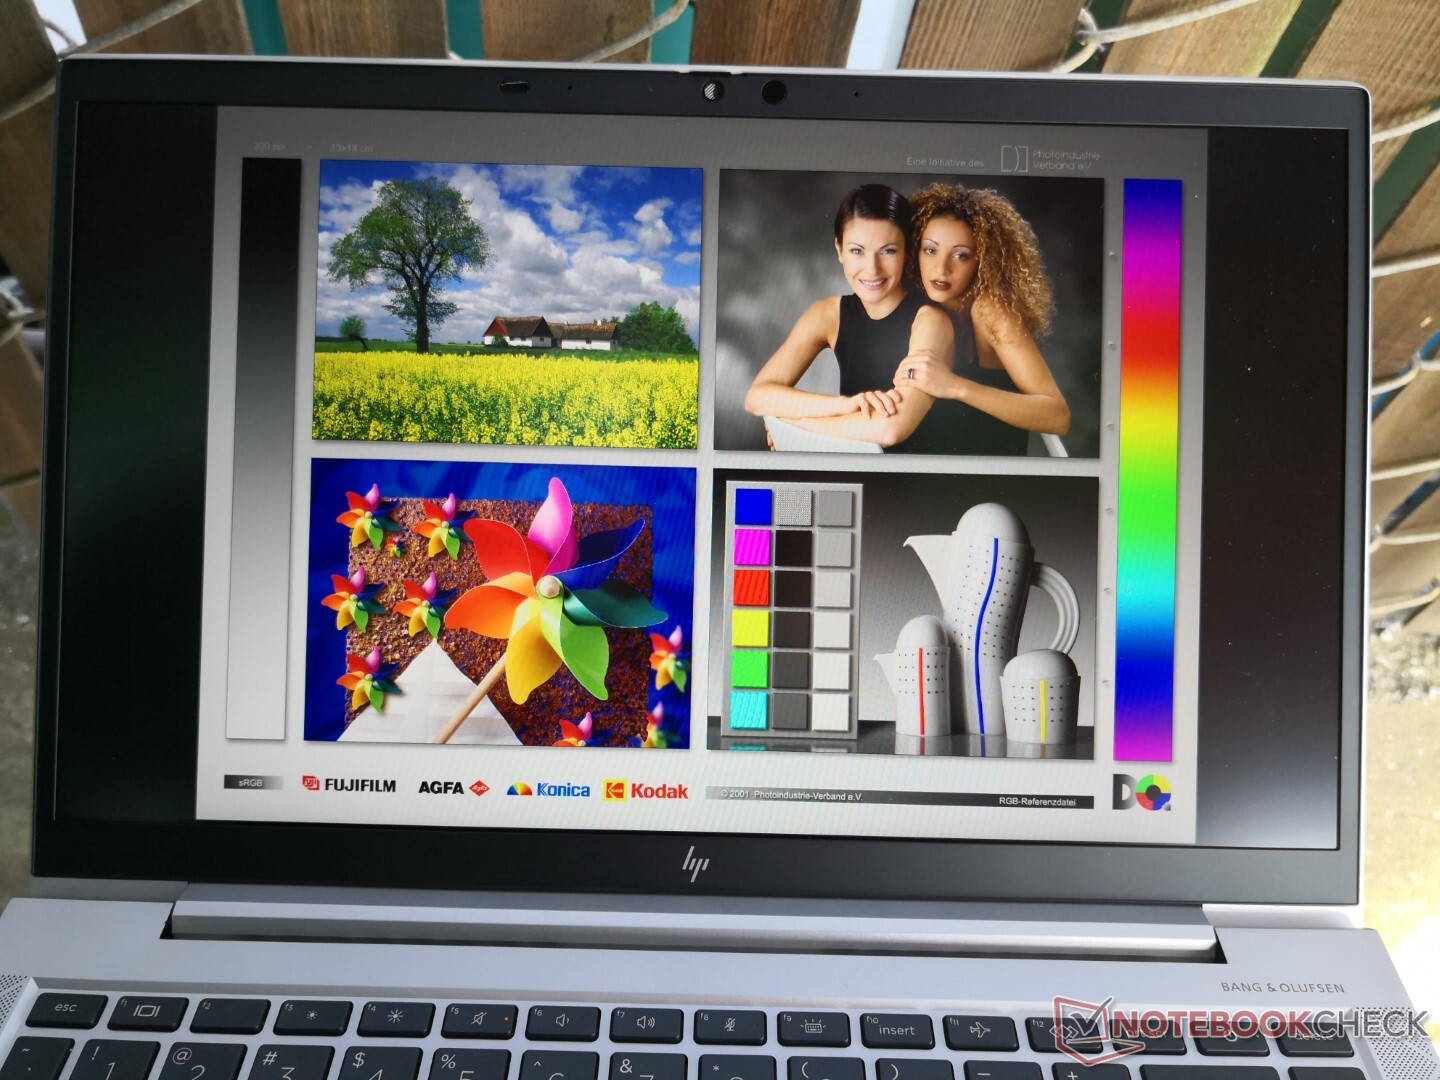
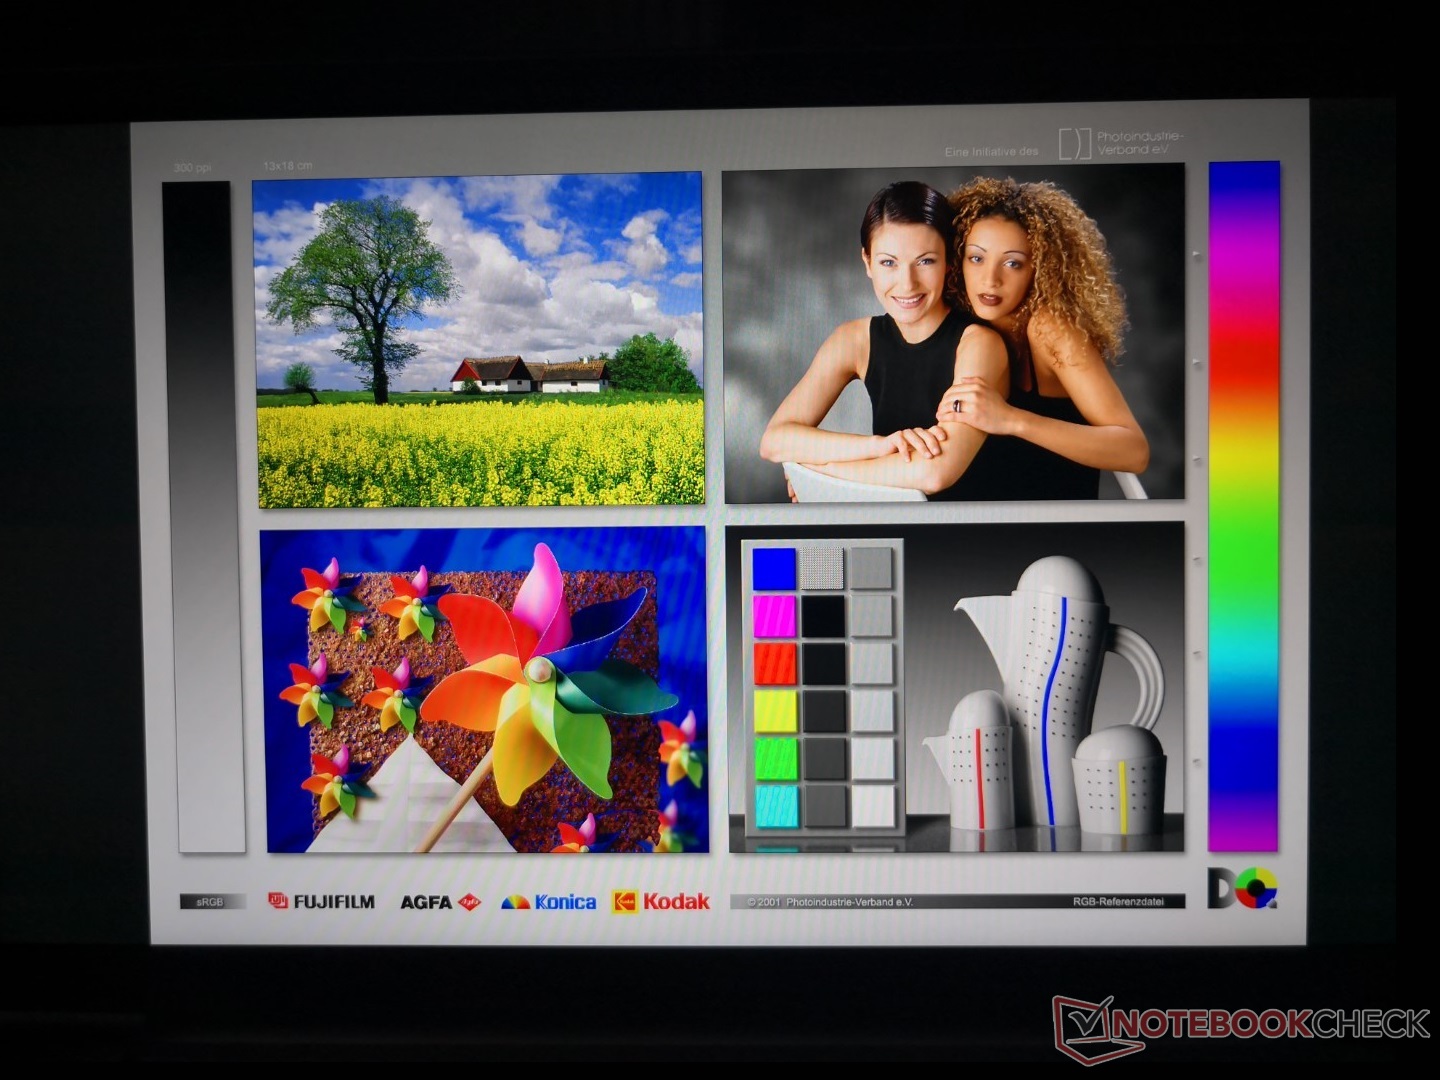
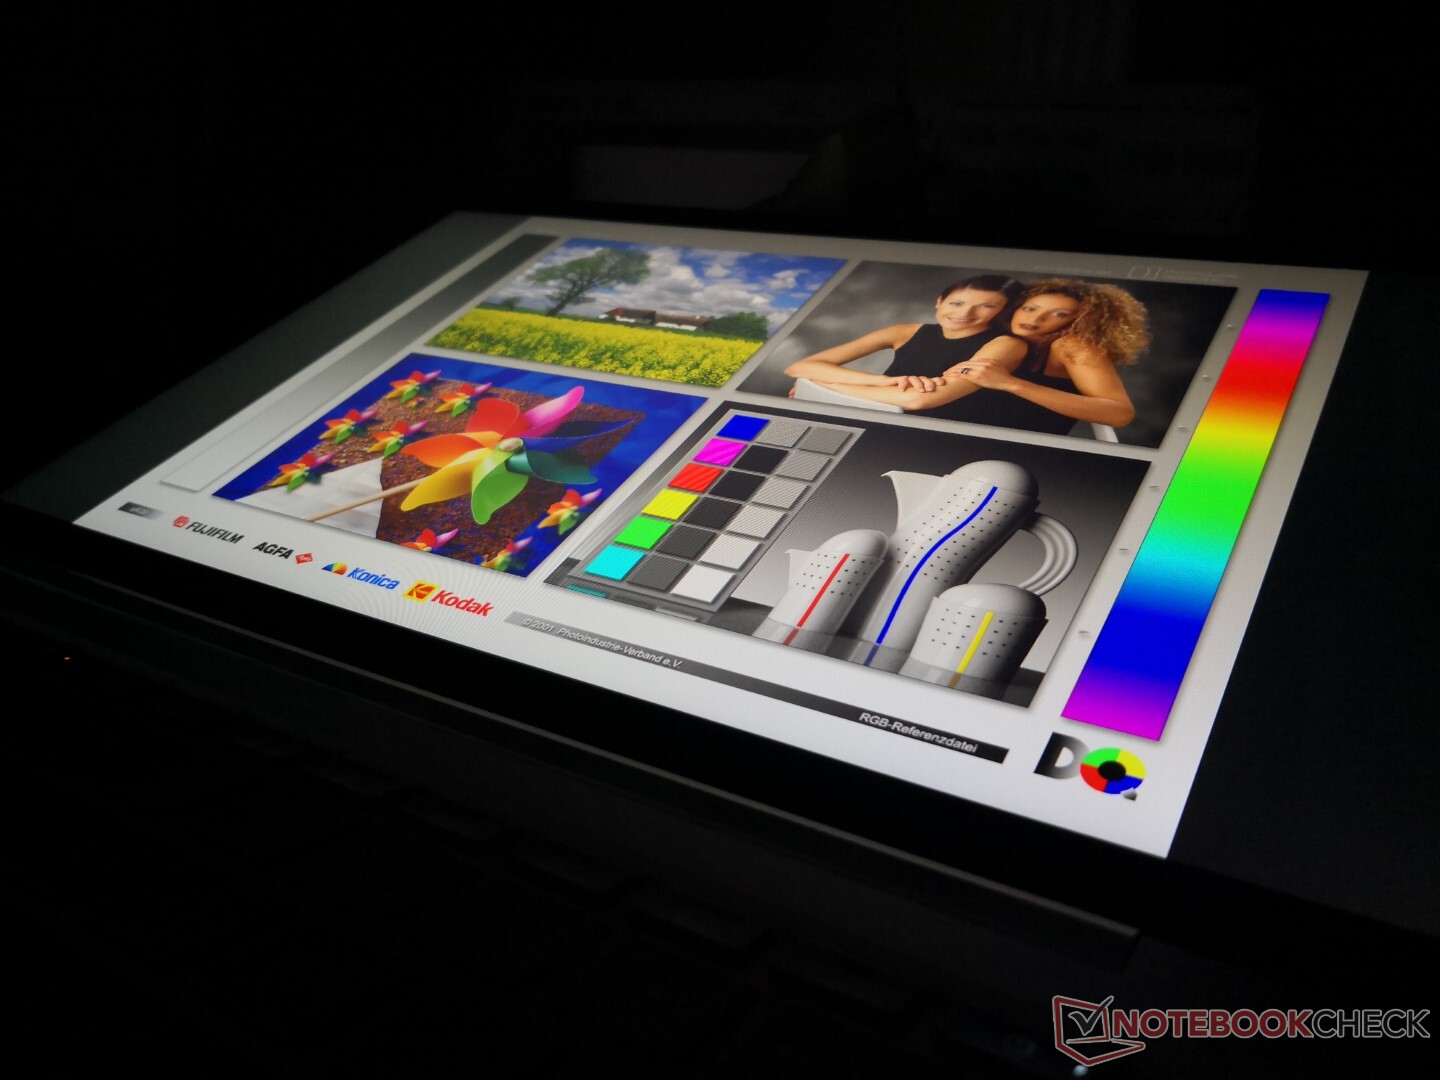
Display
Our configuration comes equipped with a 400-nit AU Optronics panel in contrast to the 250-nit LG Philips panel on our Ryzen 5 SKU. Other than being brighter, this particular panel also offers deeper colors and a similar contrast ratio of over 1000:1. Black-white and gray-gray response times, however, are slower for more noticeable ghosting here. Still, we find this trade-off to be well worth it especially for an office laptop where colors and brightness are often more important than super-fast response times.
Note that maximum brightness will automatically drop to just 184 nits when on battery power due to AMD Vari-Bright. Disabling this feature via the included Radeon software lifts this low ceiling up to 432.5 nits.

| |||||||||||||||||||||||||
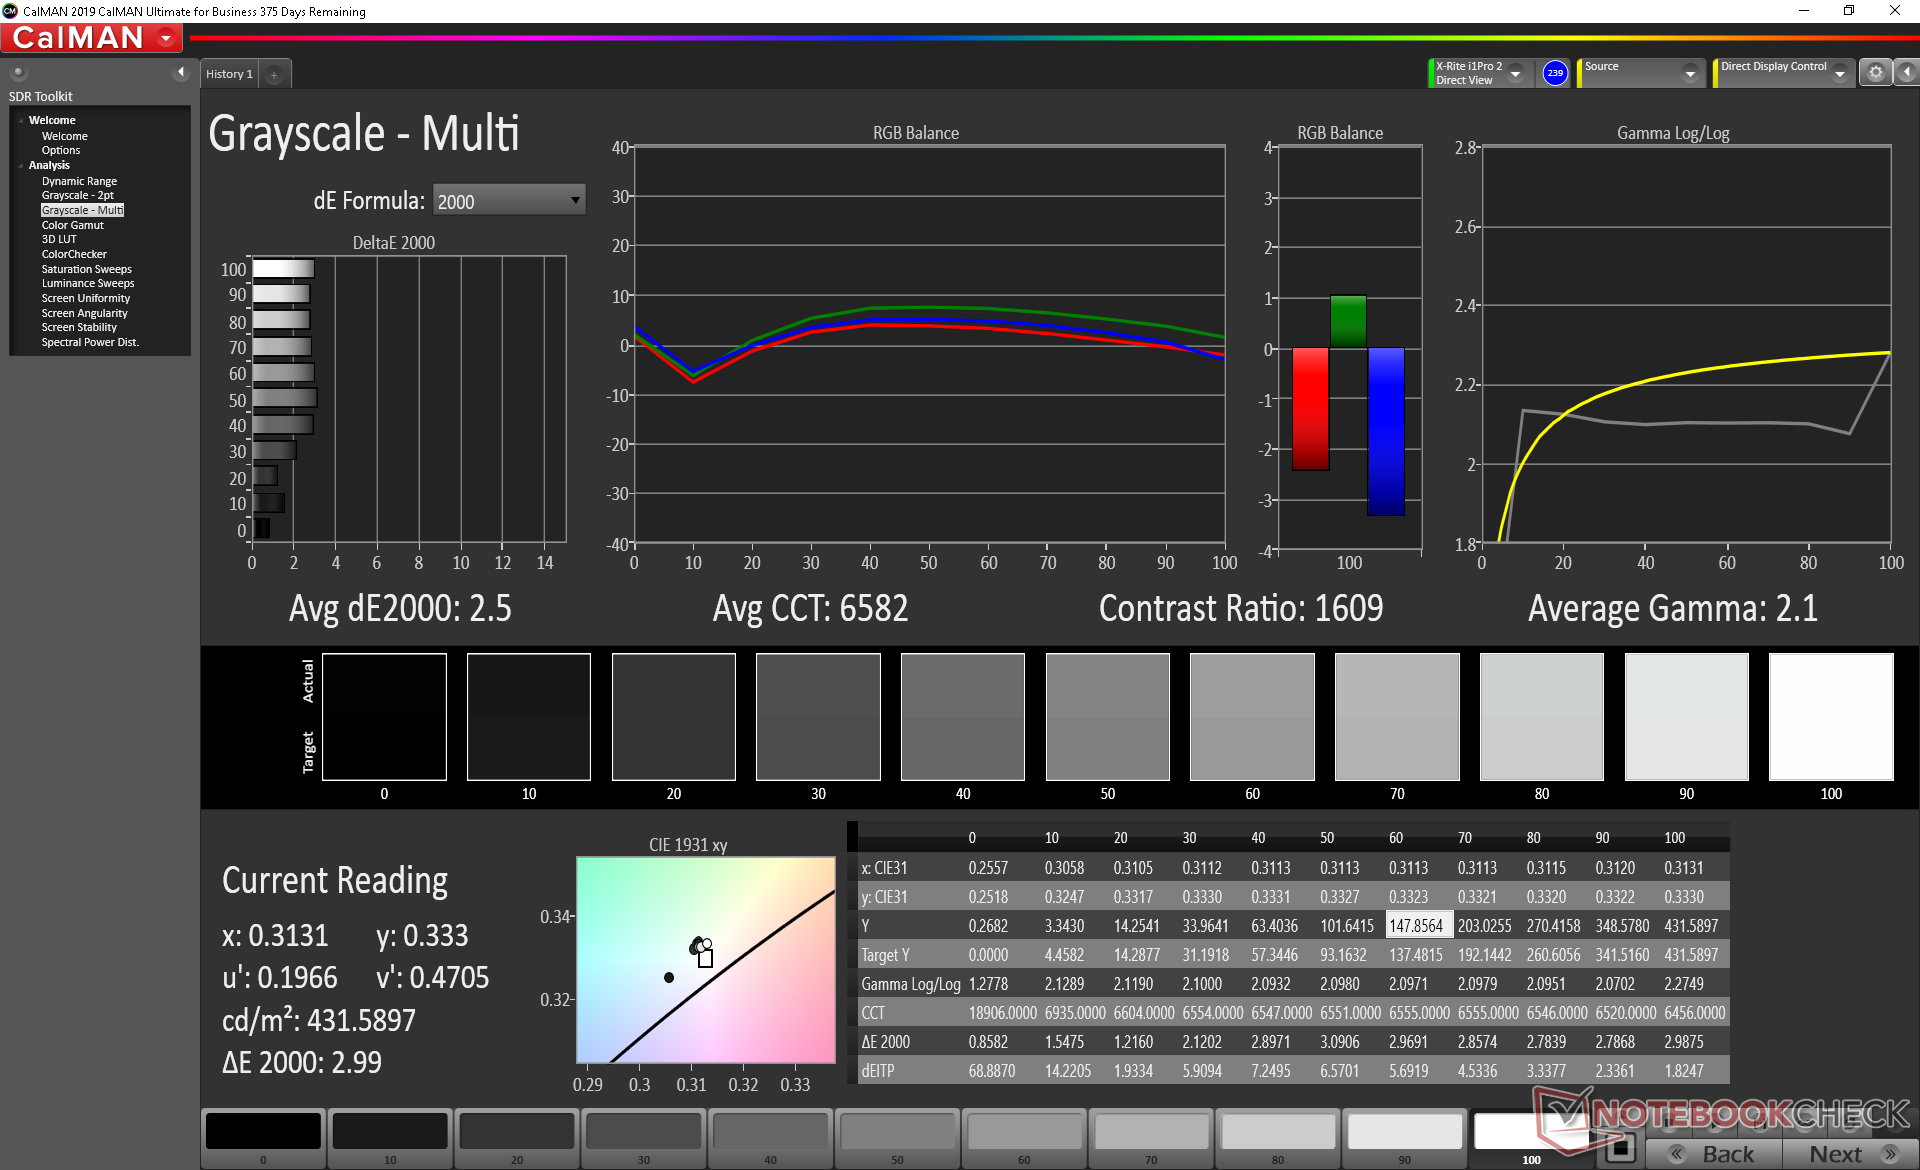
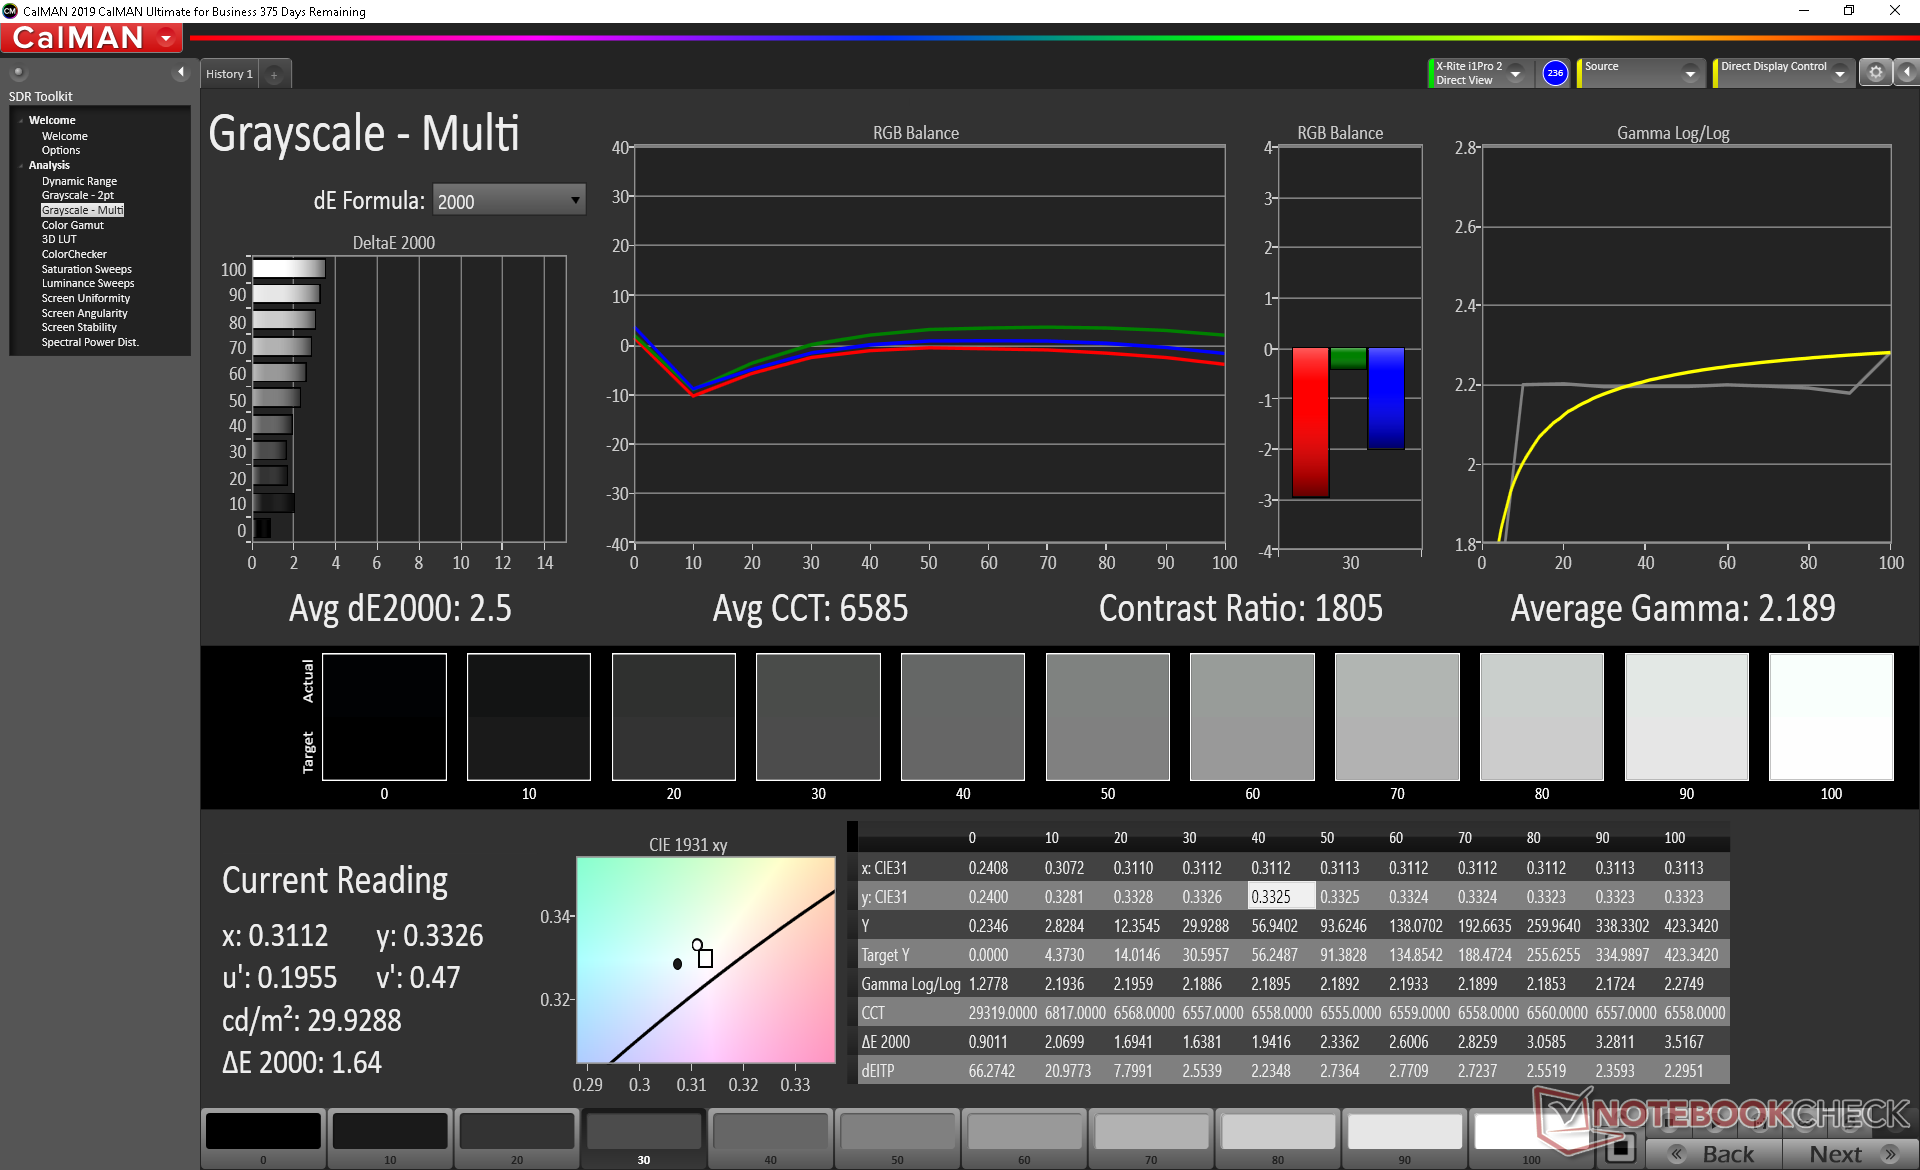
Brightness Distribution: 86 %
Center on Battery: 432.5 cd/m²
Contrast: 1442:1 (Black: 0.3 cd/m²)
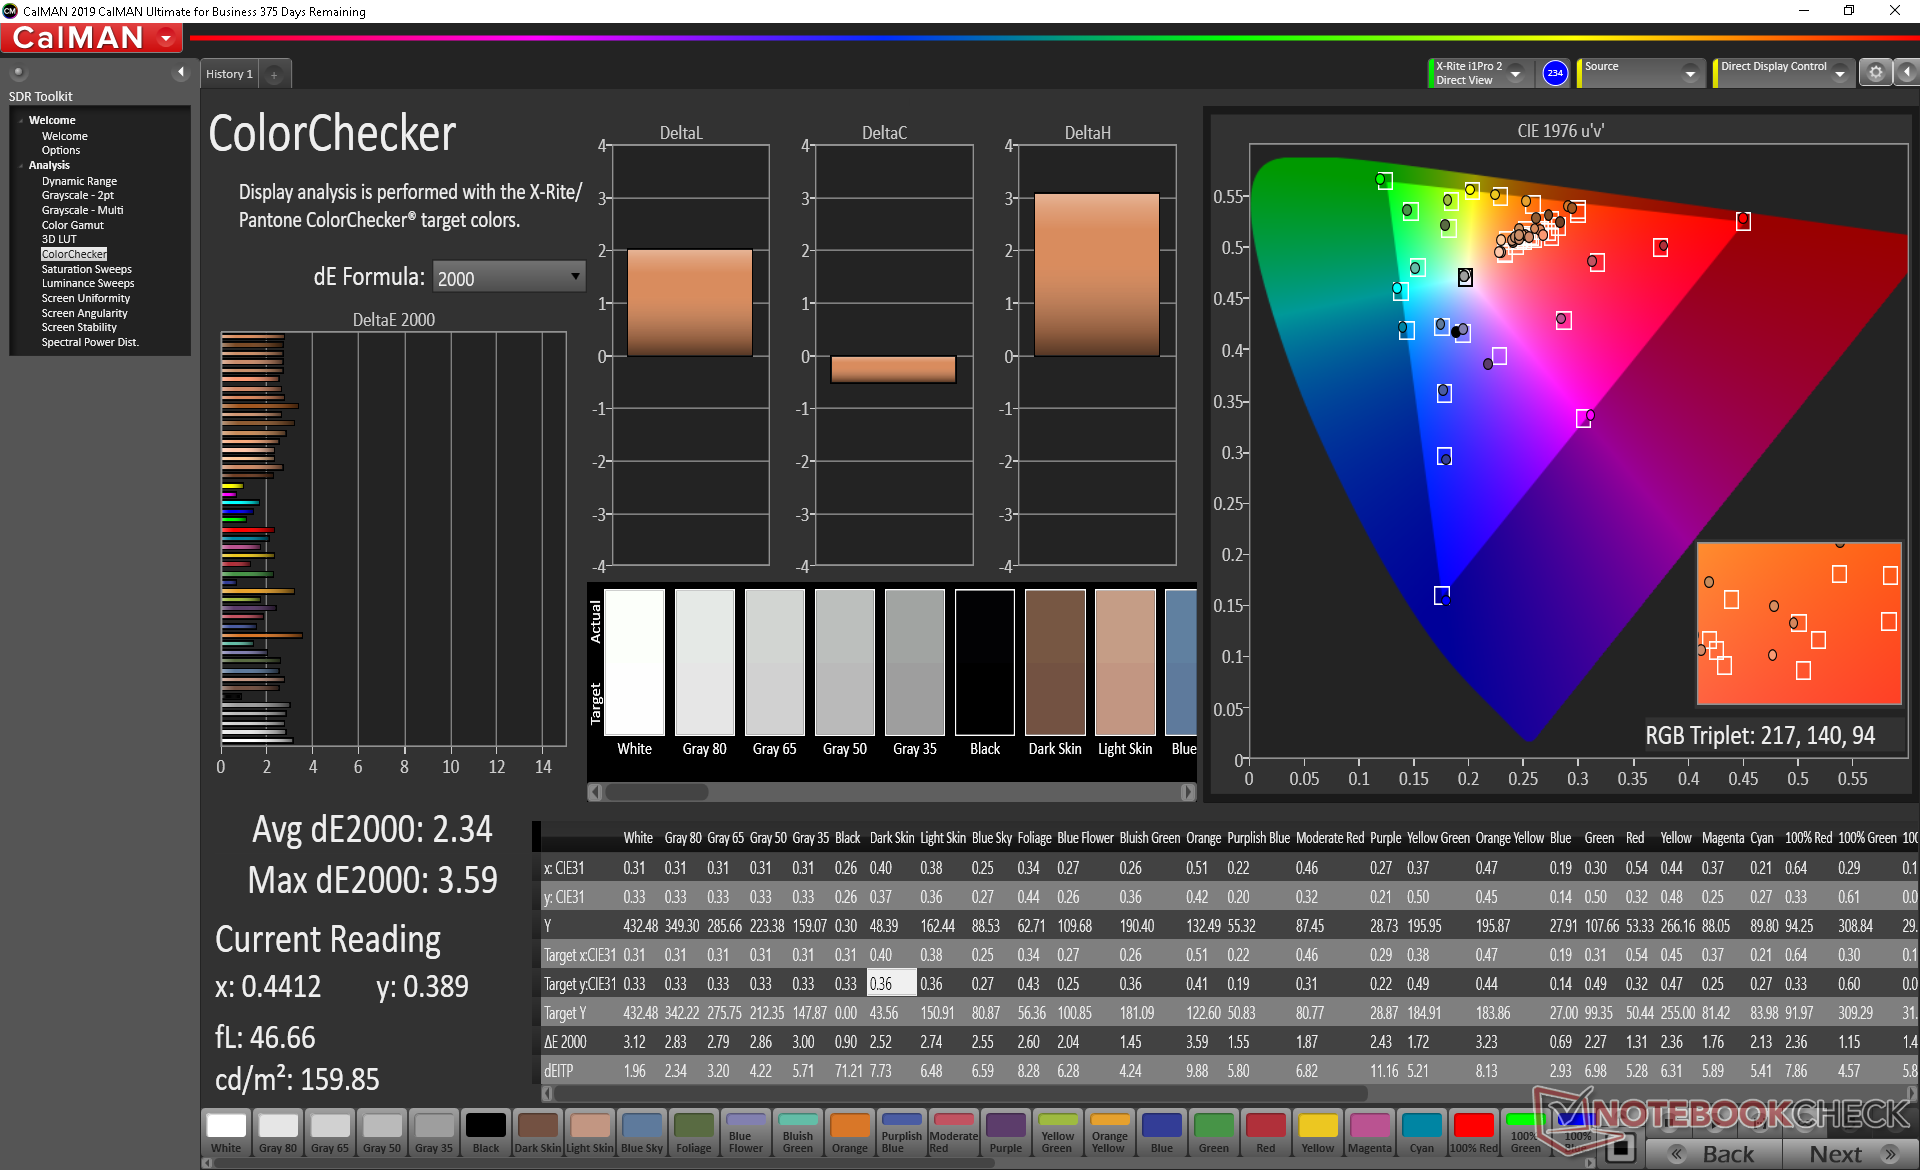
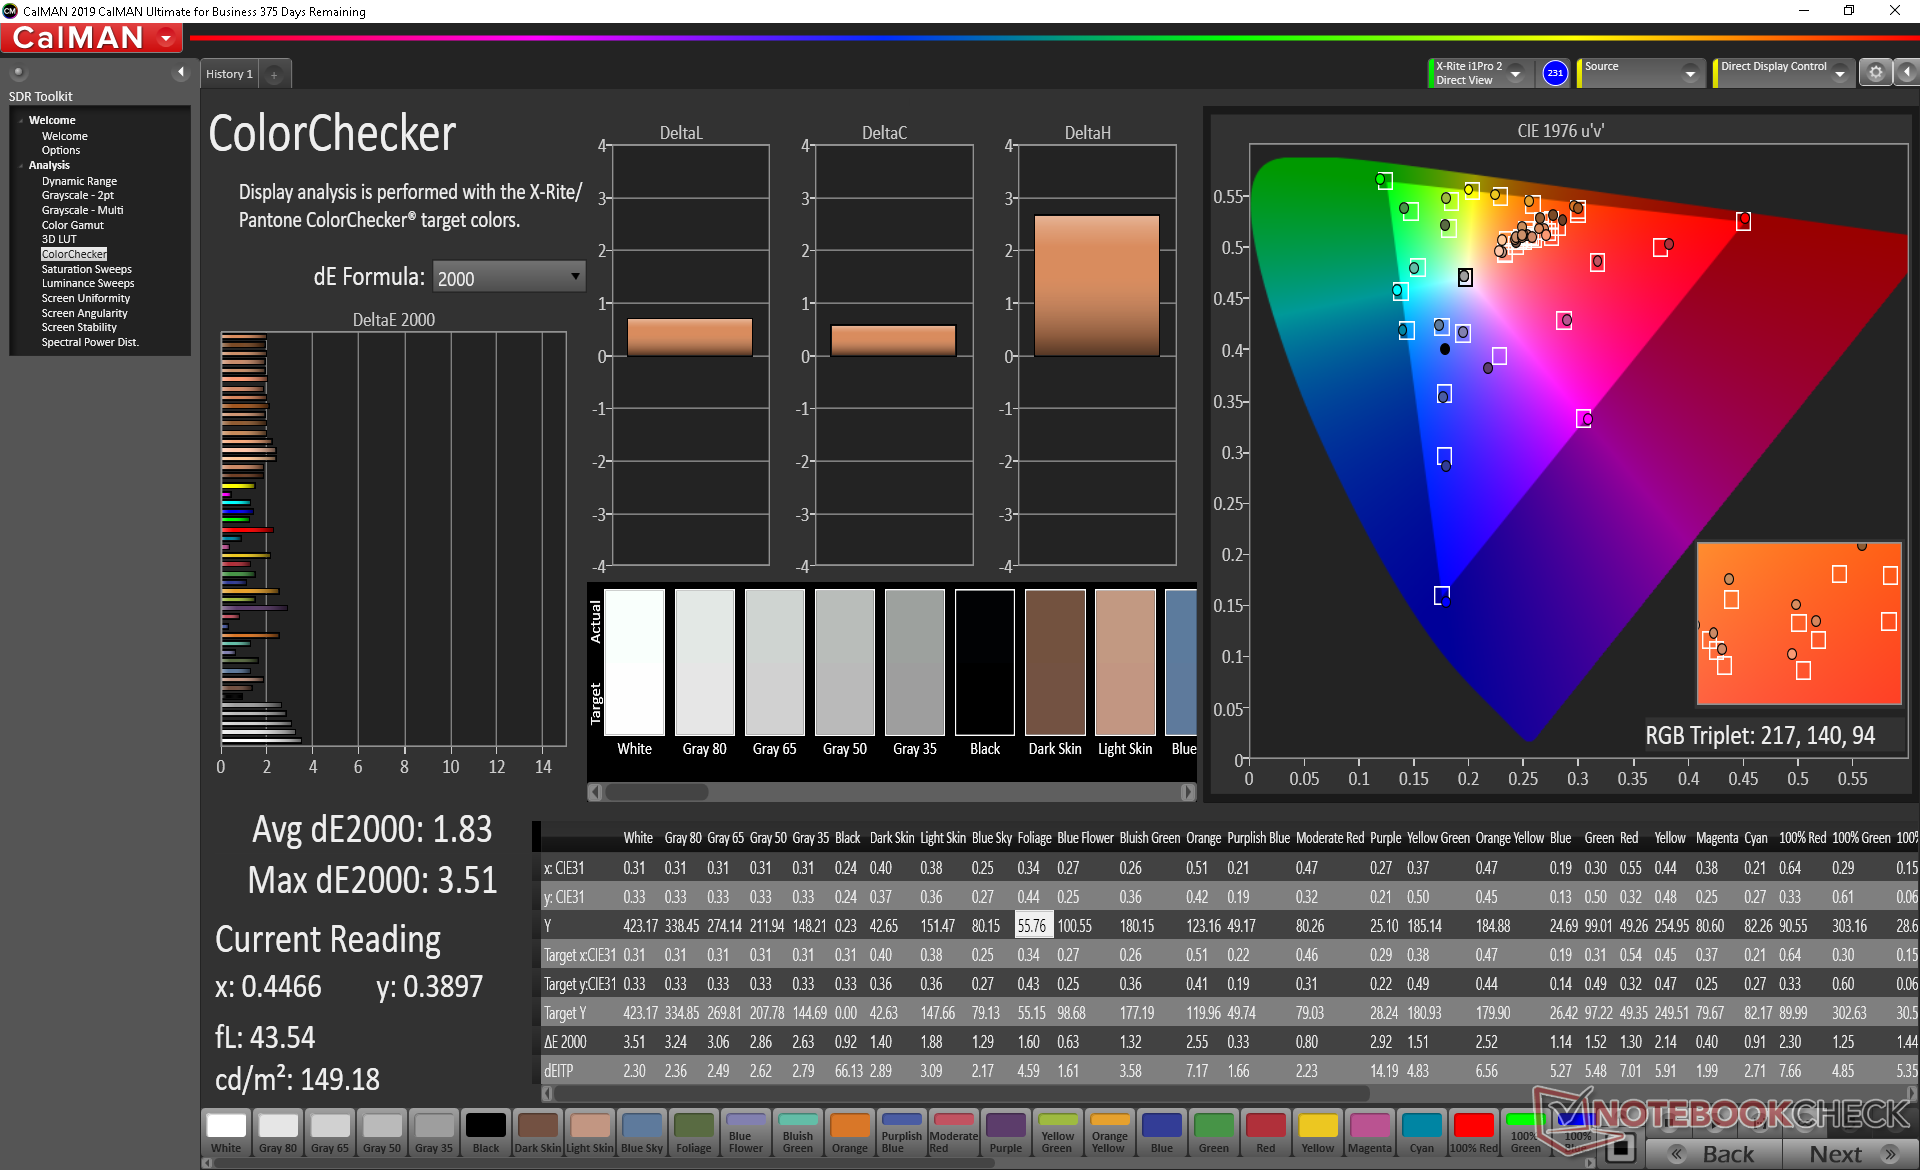
ΔE ColorChecker Calman: 2.34 | ∀{0.5-29.43 Ø4.71}
calibrated: 1.83
ΔE Greyscale Calman: 2.5 | ∀{0.09-98 Ø4.96}
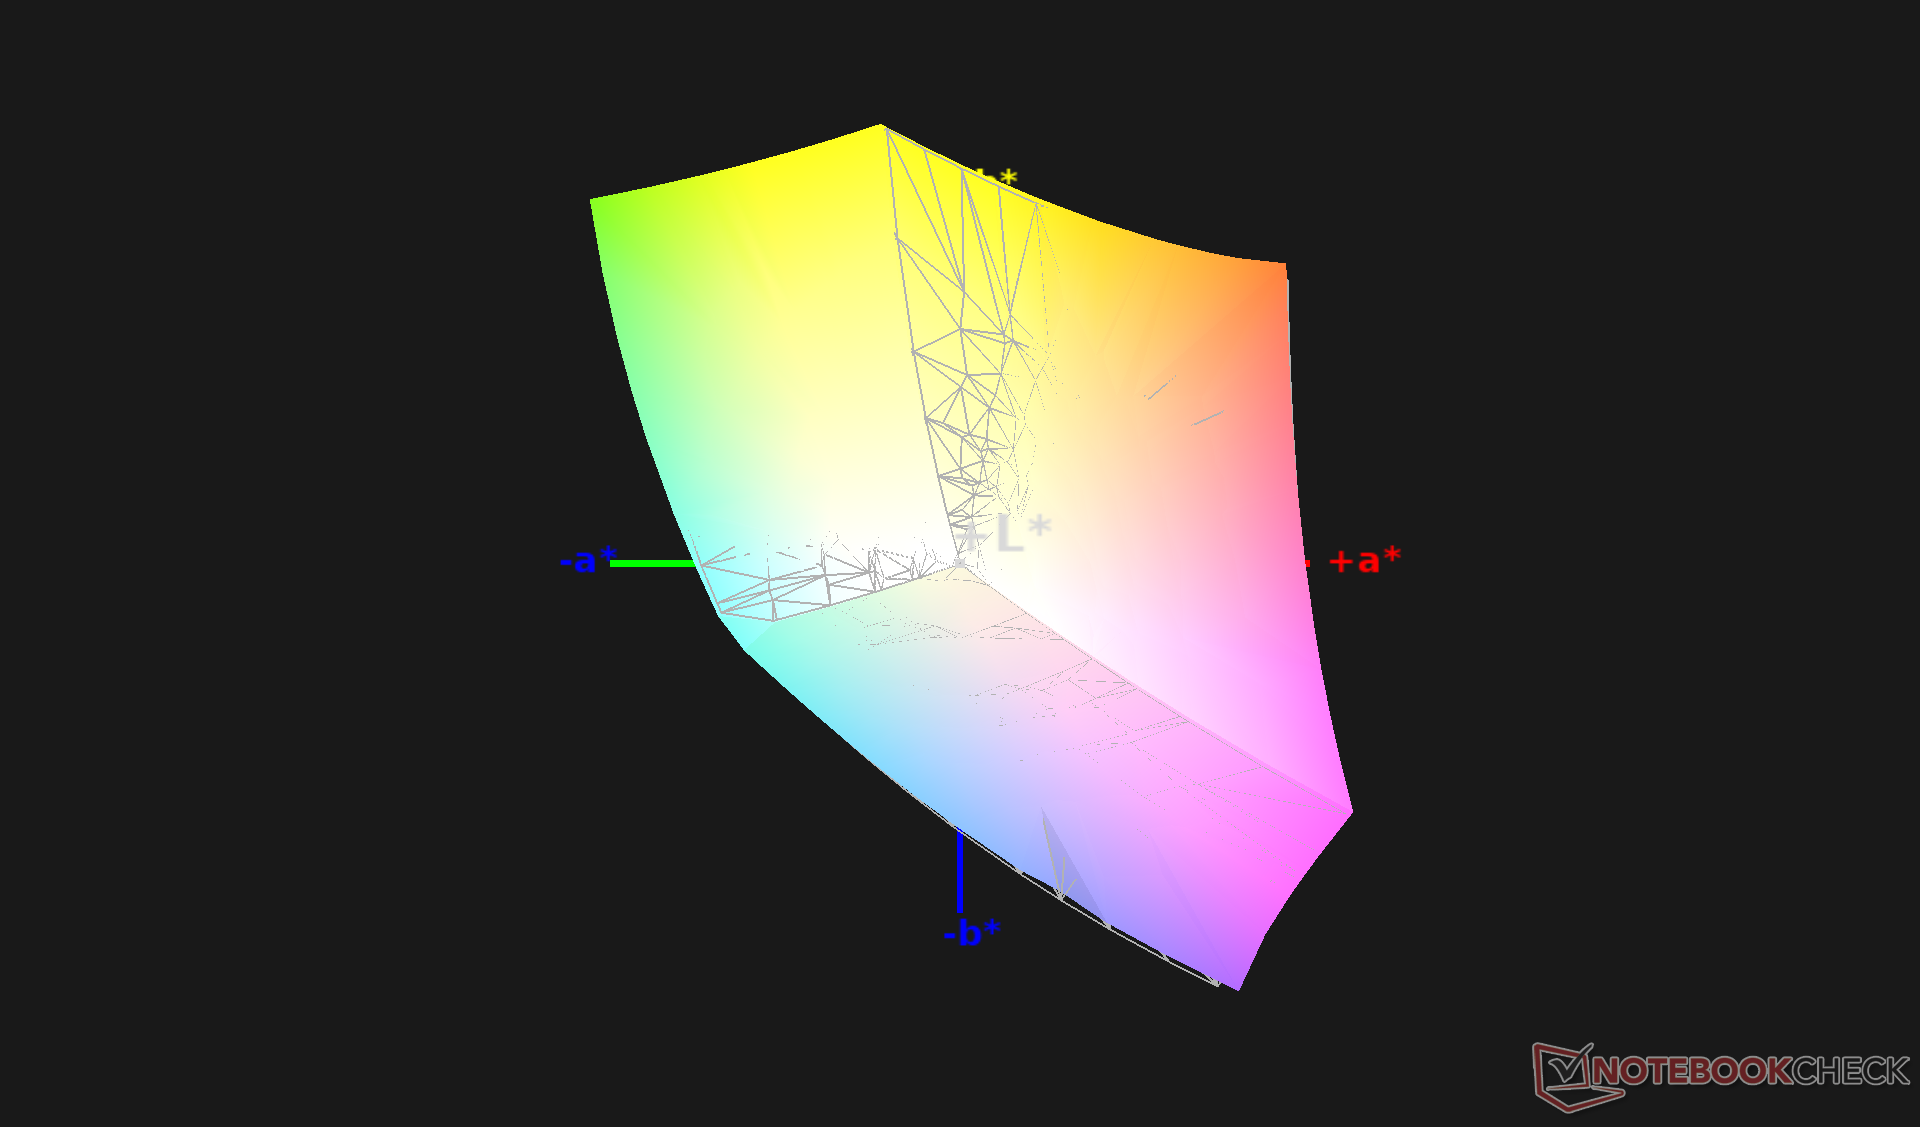
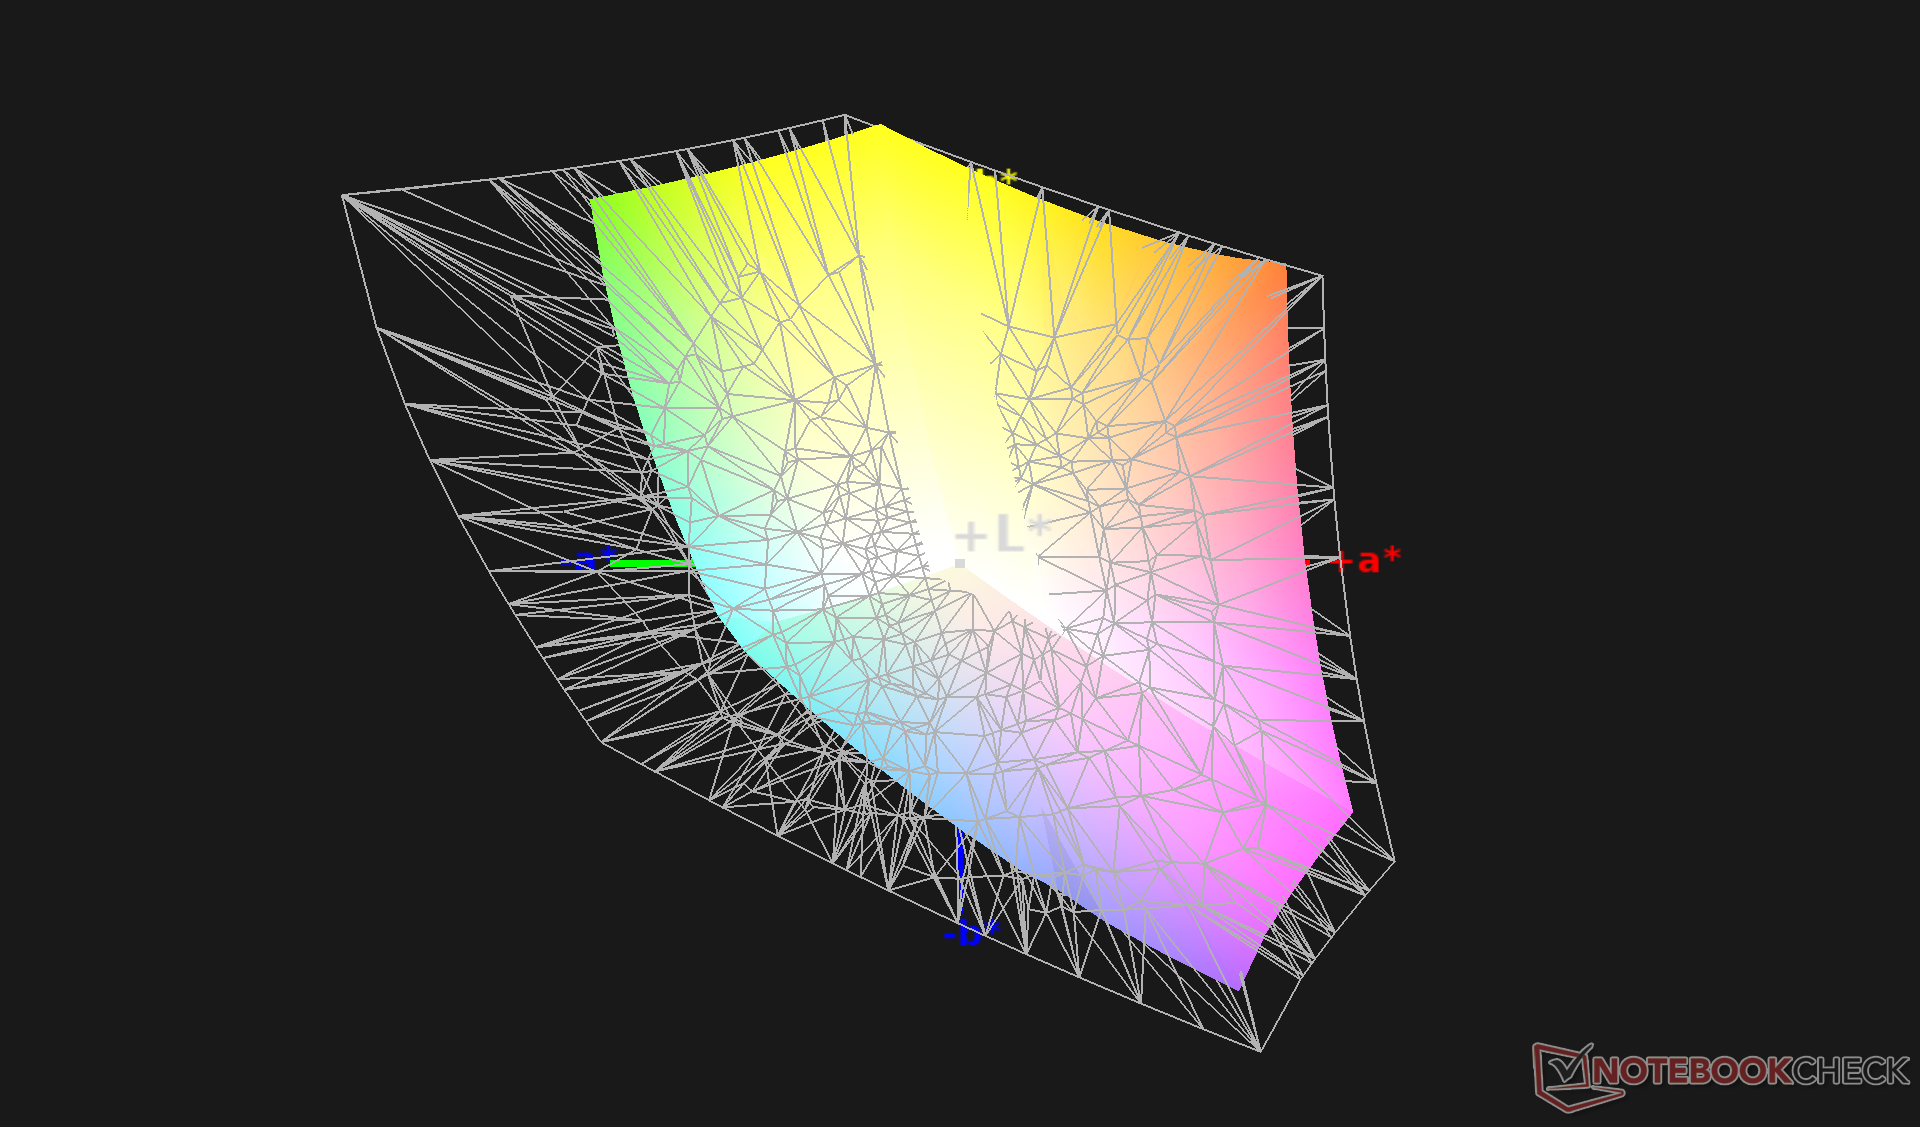
99.4% sRGB (Argyll 1.6.3 3D)
63.8% AdobeRGB 1998 (Argyll 1.6.3 3D)
69.8% AdobeRGB 1998 (Argyll 3D)
98.5% sRGB (Argyll 3D)
68.2% Display P3 (Argyll 3D)
Gamma: 2.1
CCT: 6582 K
| HP EliteBook 845 G7 Ryzen 7 Pro 4750U AU Optronics AUO068B, IPS, 14", 1920x1080 | HP EliteBook 845 G7-23Y60EA LG Philips LGD064E, IPS, 14", 1920x1080 | Lenovo ThinkPad T14-20UES00H00 B140HAN05.7, IPS, 14", 1920x1080 | Dell Latitude 7410 AU Optronics B140ZAN, IPS, 14", 3840x2160 | HP ProBook 445 G7 175W4EA BOE0868, IPS, 14", 1920x1080 | Huawei Matebook X Pro i5 Tianma XM, IPS, 13.9", 3000x2000 | |
|---|---|---|---|---|---|---|
| Display | -45% | -3% | 3% | -40% | -3% | |
| Display P3 Coverage (%) | 68.2 | 36.76 -46% | 66.1 -3% | 71.8 5% | 39.92 -41% | 65.9 -3% |
| sRGB Coverage (%) | 98.5 | 55.3 -44% | 95.8 -3% | 99.3 1% | 59.6 -39% | 95.2 -3% |
| AdobeRGB 1998 Coverage (%) | 69.8 | 37.98 -46% | 67.2 -4% | 72.4 4% | 41.25 -41% | 67.6 -3% |
| Response Times | 43% | 14% | 42% | 32% | 37% | |
| Response Time Grey 50% / Grey 80% * (ms) | 65.2 ? | 37 ? 43% | 64 ? 2% | 39.2 ? 40% | 40 ? 39% | 40.4 ? 38% |
| Response Time Black / White * (ms) | 39.6 ? | 23 ? 42% | 29.6 ? 25% | 22.4 ? 43% | 30 ? 24% | 25.6 ? 35% |
| PWM Frequency (Hz) | 192 ? | |||||
| Screen | -40% | -4% | -38% | -73% | -32% | |
| Brightness middle (cd/m²) | 432.5 | 227 -48% | 406 -6% | 388.6 -10% | 277 -36% | 442.7 2% |
| Brightness (cd/m²) | 405 | 220 -46% | 403 0% | 365 -10% | 270 -33% | 428 6% |
| Brightness Distribution (%) | 86 | 82 -5% | 88 2% | 82 -5% | 88 2% | 84 -2% |
| Black Level * (cd/m²) | 0.3 | 0.18 40% | 0.2 33% | 0.35 -17% | 0.285 5% | 0.31 -3% |
| Contrast (:1) | 1442 | 1261 -13% | 2030 41% | 1110 -23% | 972 -33% | 1428 -1% |
| Colorchecker dE 2000 * | 2.34 | 4.1 -75% | 3.3 -41% | 4.04 -73% | 5.53 -136% | 2.24 4% |
| Colorchecker dE 2000 max. * | 3.59 | 7.06 -97% | 4.8 -34% | 9.2 -156% | 10.68 -197% | 7.19 -100% |
| Colorchecker dE 2000 calibrated * | 1.83 | 4.04 -121% | 1.5 18% | 1.25 32% | 4.43 -142% | 1.11 39% |
| Greyscale dE 2000 * | 2.5 | 1.99 20% | 3.6 -44% | 6.4 -156% | 6.2 -148% | 9.7 -288% |
| Gamma | 2.1 105% | 2.48 89% | 2.43 91% | 2.3 96% | 2.34 94% | 1.42 155% |
| CCT | 6582 99% | 6607 98% | 6893 94% | 6957 93% | 7342 89% | 6227 104% |
| Color Space (Percent of AdobeRGB 1998) (%) | 63.8 | 35 -45% | 61.5 -4% | 66.4 4% | 38 -40% | 61.6 -3% |
| Color Space (Percent of sRGB) (%) | 99.4 | 55 -45% | 95.5 -4% | 99.4 0% | 59 -41% | 95 -4% |
| Total Average (Program / Settings) | -14% /
-30% | 2% /
-1% | 2% /
-20% | -27% /
-54% | 1% /
-18% |
* ... smaller is better
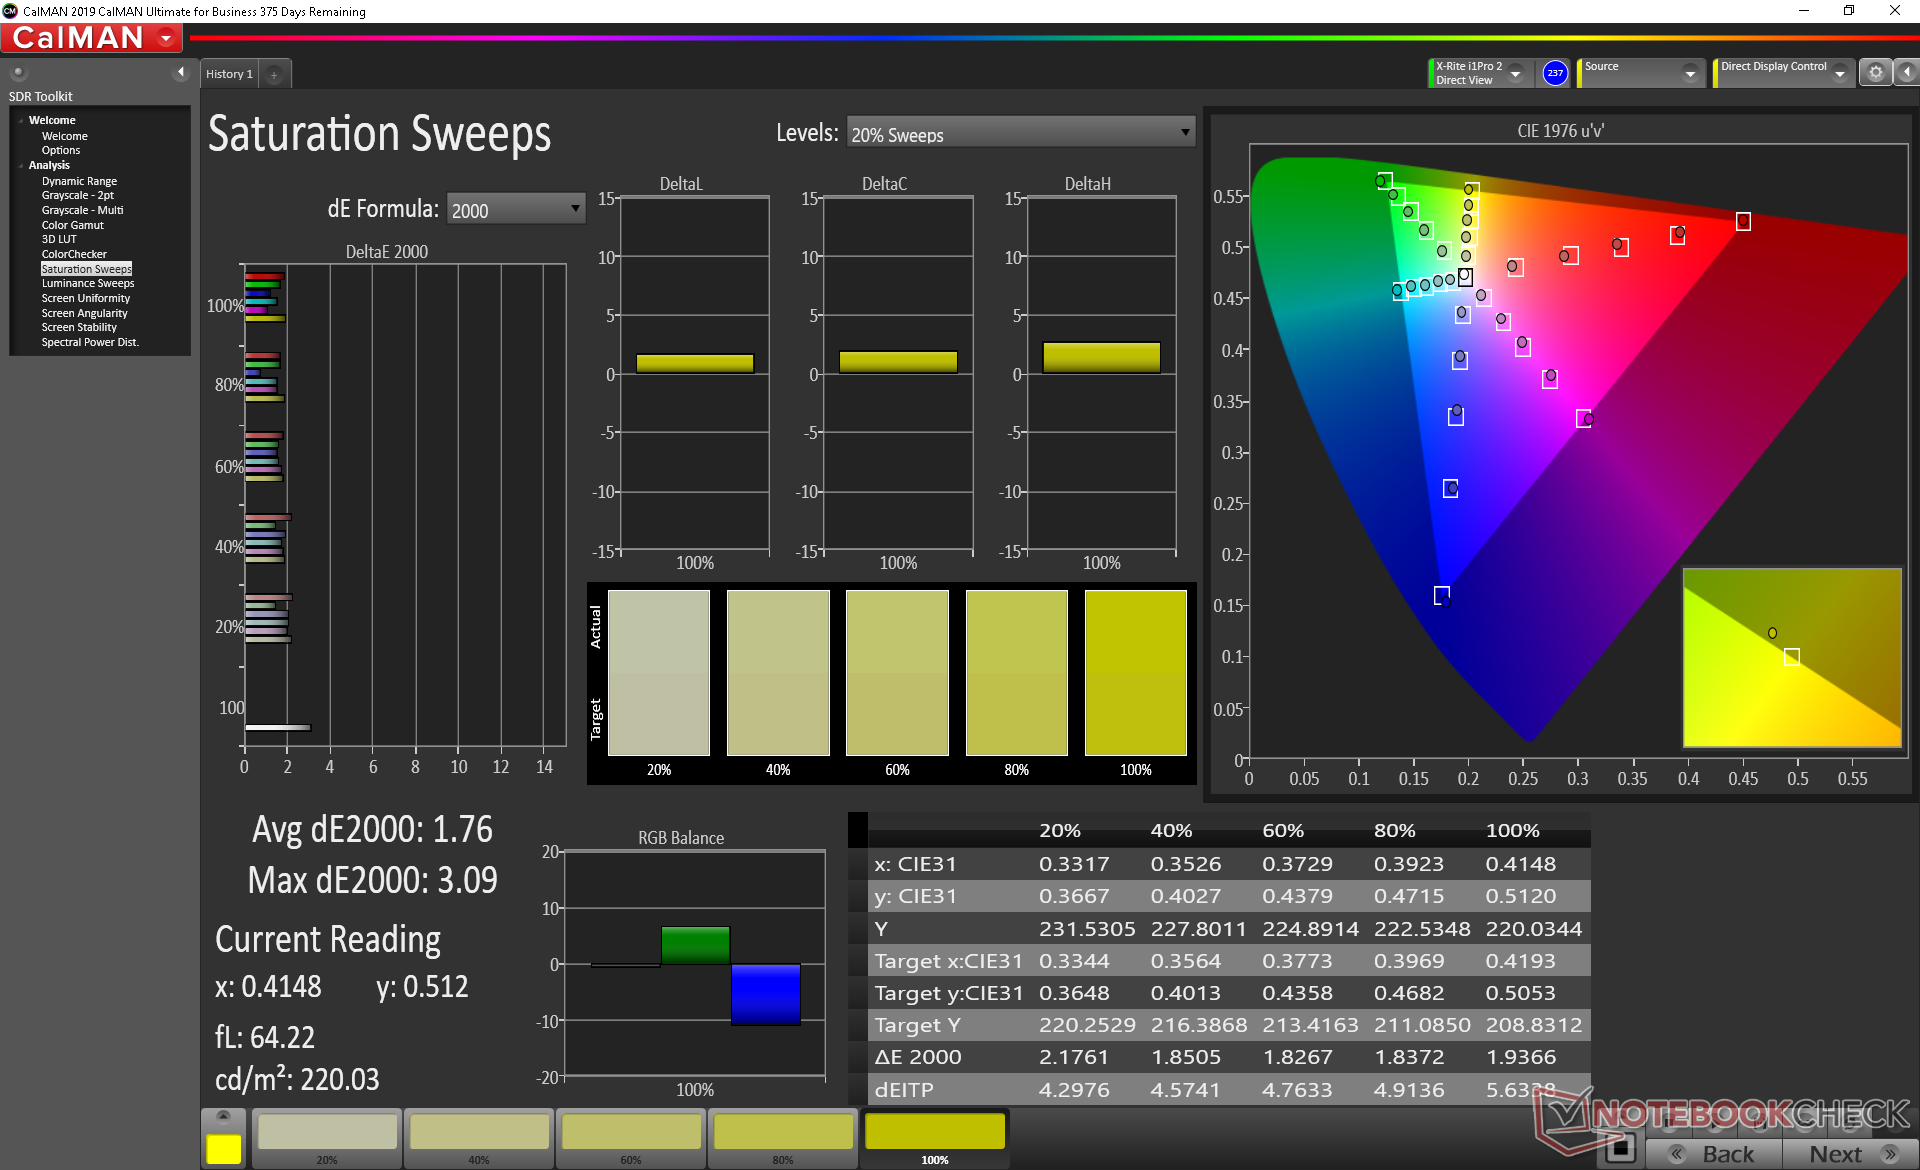
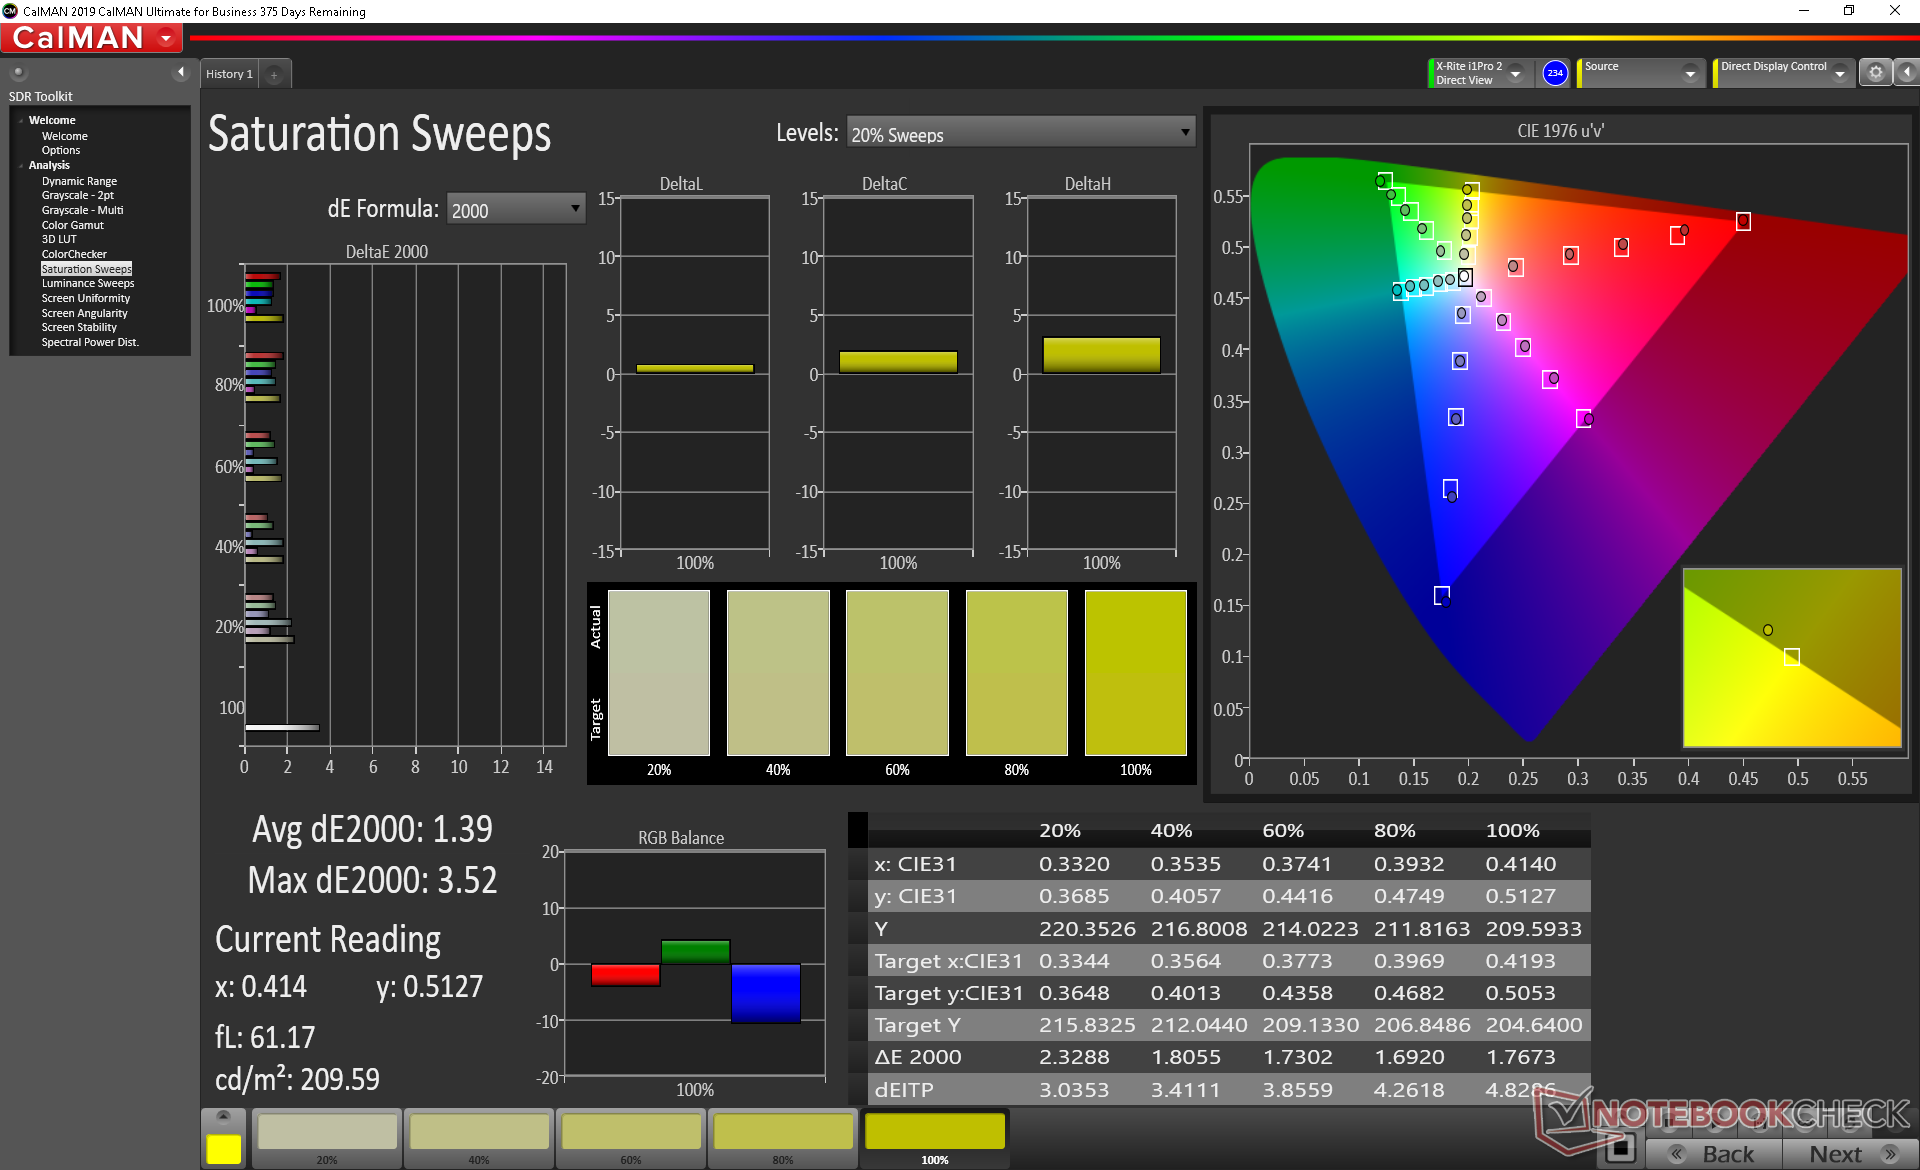
Color space is two times greater than on our less expensive 6-core EliteBook 845 G7 configuration. Our 400-nit panel option covers all of sRGB and approximately 64 percent of AdobeRGB to be suitable for most editors or content creators.
The panel is well-calibrated out of the box with average grayscale and color DeltaE values of just 2.5 and 2.34, respectively. Calibrating the display ourselves even further would improve both gamma and RGB balance just marginally.
Display Response Times
| ↔ Response Time Black to White | ||
|---|---|---|
| 39.6 ms ... rise ↗ and fall ↘ combined | ↗ 20 ms rise | 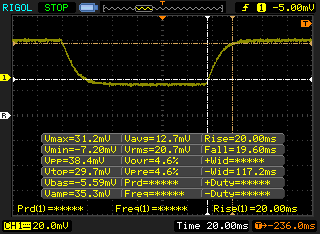 |
| ↘ 19.6 ms fall | ||
| The screen shows slow response rates in our tests and will be unsatisfactory for gamers. In comparison, all tested devices range from 0.1 (minimum) to 240 (maximum) ms. » 97 % of all devices are better. This means that the measured response time is worse than the average of all tested devices (19.8 ms). | ||
| ↔ Response Time 50% Grey to 80% Grey | ||
| 65.2 ms ... rise ↗ and fall ↘ combined | ↗ 30.8 ms rise | 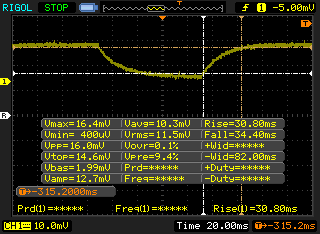 |
| ↘ 34.4 ms fall | ||
| The screen shows slow response rates in our tests and will be unsatisfactory for gamers. In comparison, all tested devices range from 0.165 (minimum) to 636 (maximum) ms. » 98 % of all devices are better. This means that the measured response time is worse than the average of all tested devices (30.9 ms). | ||
Screen Flickering / PWM (Pulse-Width Modulation)
| Screen flickering / PWM not detected | 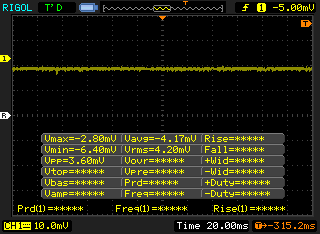 | ||
In comparison: 52 % of all tested devices do not use PWM to dim the display. If PWM was detected, an average of 7741 (minimum: 5 - maximum: 343500) Hz was measured. | |||
Though the 400-nit display is brighter than the 250-nit display on our Ryzen 5 model, it's still not bright enough to be viewable outdoors. Luckily, HP offers an even brighter 1000-nit panel option for its EliteBook 845 series much like on the EliteBook 1030/1040 series.
Performance
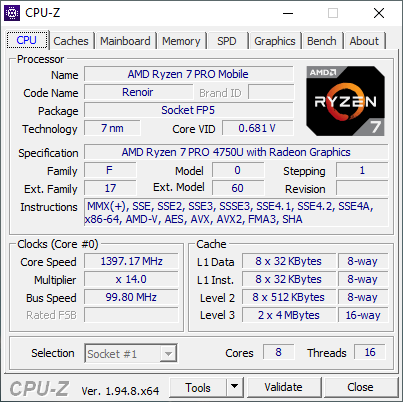
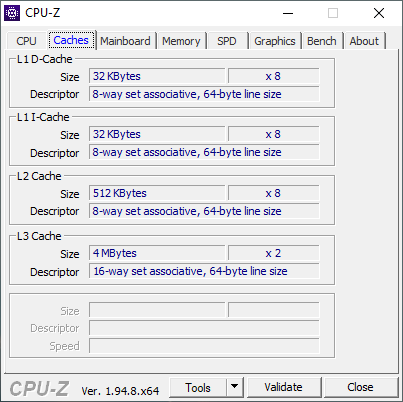
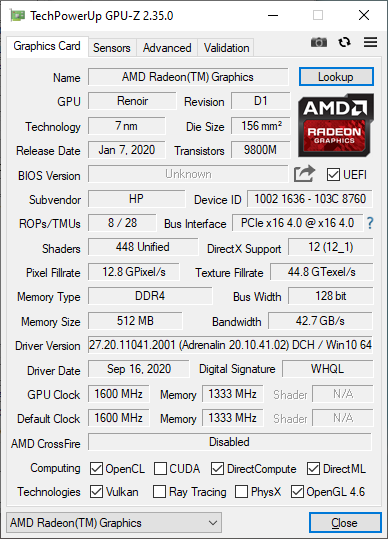
Unlike the Intel-powered EliteBook 840 G7 series, the EliteBook 845 G7 series is home to all the 7 nm AMD options. Users can choose between the Ryzen 3 Pro 4450U, Ryzen 5 Pro 4650U, or Ryzen 7 Pro 4750U. The Ryzen 7 Pro 4750U is essentially the business version of the consumer Ryzen 7 4800U meaning it supports memory encryption, Secure Boot, Trusted Applications, and other hardware-based security measures. Clock rates are slightly slower than the Ryzen 7 4800U as a result of the security overhead (1.7 GHz vs. 1.8 GHz base). The number of GPU cores has been reduced from 8 (Vega 8) to 7 (Vega 7).
Processor
Much like the Ryzen 7 4800U, multi-thread performance on the octa-core Ryzen 7 Pro 4750U is insanely fast when considering the small chassis form factor and small 15 W to 25 W TDP range. CineBench results rank our processor to be on par with the hexa-core Core i7-10750H which is a more much power-hungry processor commonly found on larger laptops like the HP Envy 15, HP Spectre x360 15, or the Dell XPS 15. Intel has no proper U-series octa-core equivalent at the moment as its closest alternative is the 14 nm hexa-core Core i7-10810U which also boasts much slower integrated graphics performance as well.
Upgrading from the 6-core Ryzen 5 Pro 4650U to the 8-core Ryzen Pro 4750U will bring a 20 to 25 percent performance boost in multi-threaded workloads while single-core performance is essentially the same.
Cinebench R15: CPU Multi 64Bit | CPU Single 64Bit
Blender: v2.79 BMW27 CPU
7-Zip 18.03: 7z b 4 -mmt1 | 7z b 4
Geekbench 5.5: Single-Core | Multi-Core
HWBOT x265 Benchmark v2.2: 4k Preset
LibreOffice : 20 Documents To PDF
R Benchmark 2.5: Overall mean
Cinebench R15: CPU Multi 64Bit | CPU Single 64Bit
Blender: v2.79 BMW27 CPU
7-Zip 18.03: 7z b 4 -mmt1 | 7z b 4
Geekbench 5.5: Single-Core | Multi-Core
HWBOT x265 Benchmark v2.2: 4k Preset
LibreOffice : 20 Documents To PDF
R Benchmark 2.5: Overall mean
* ... smaller is better
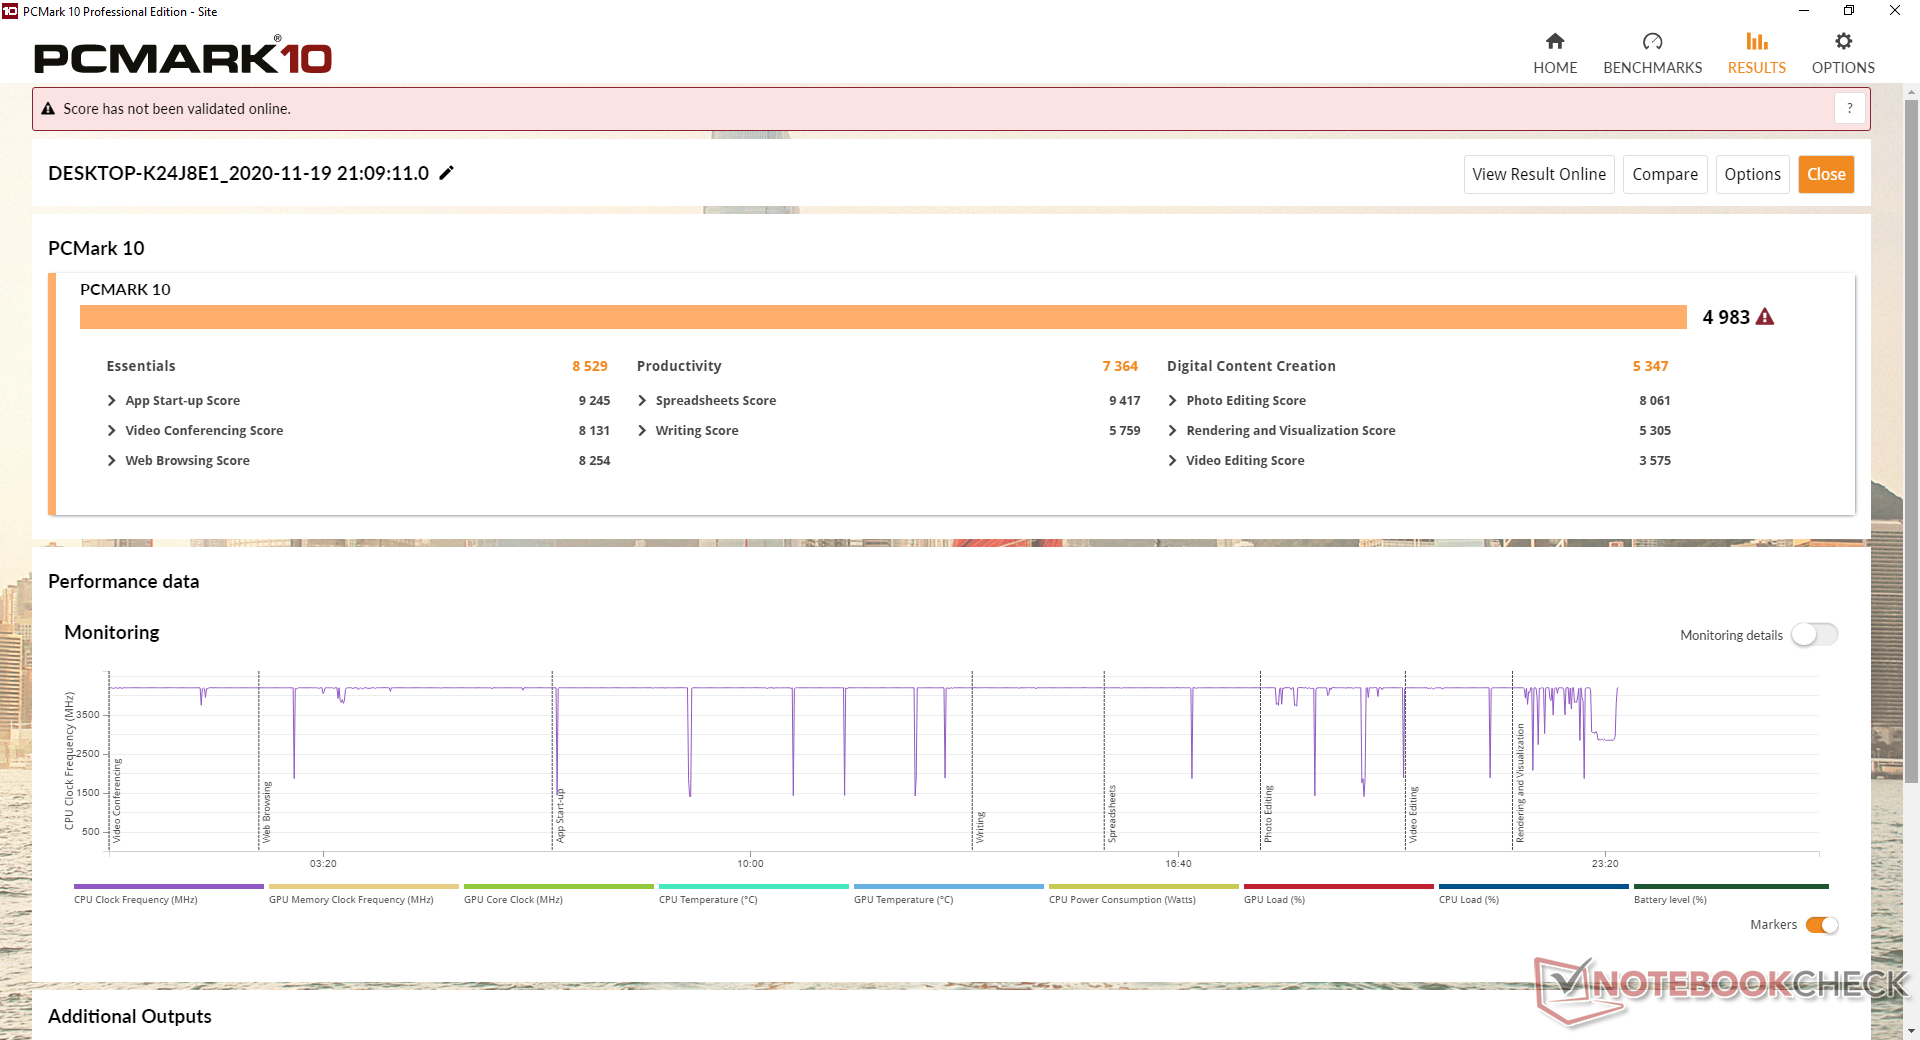
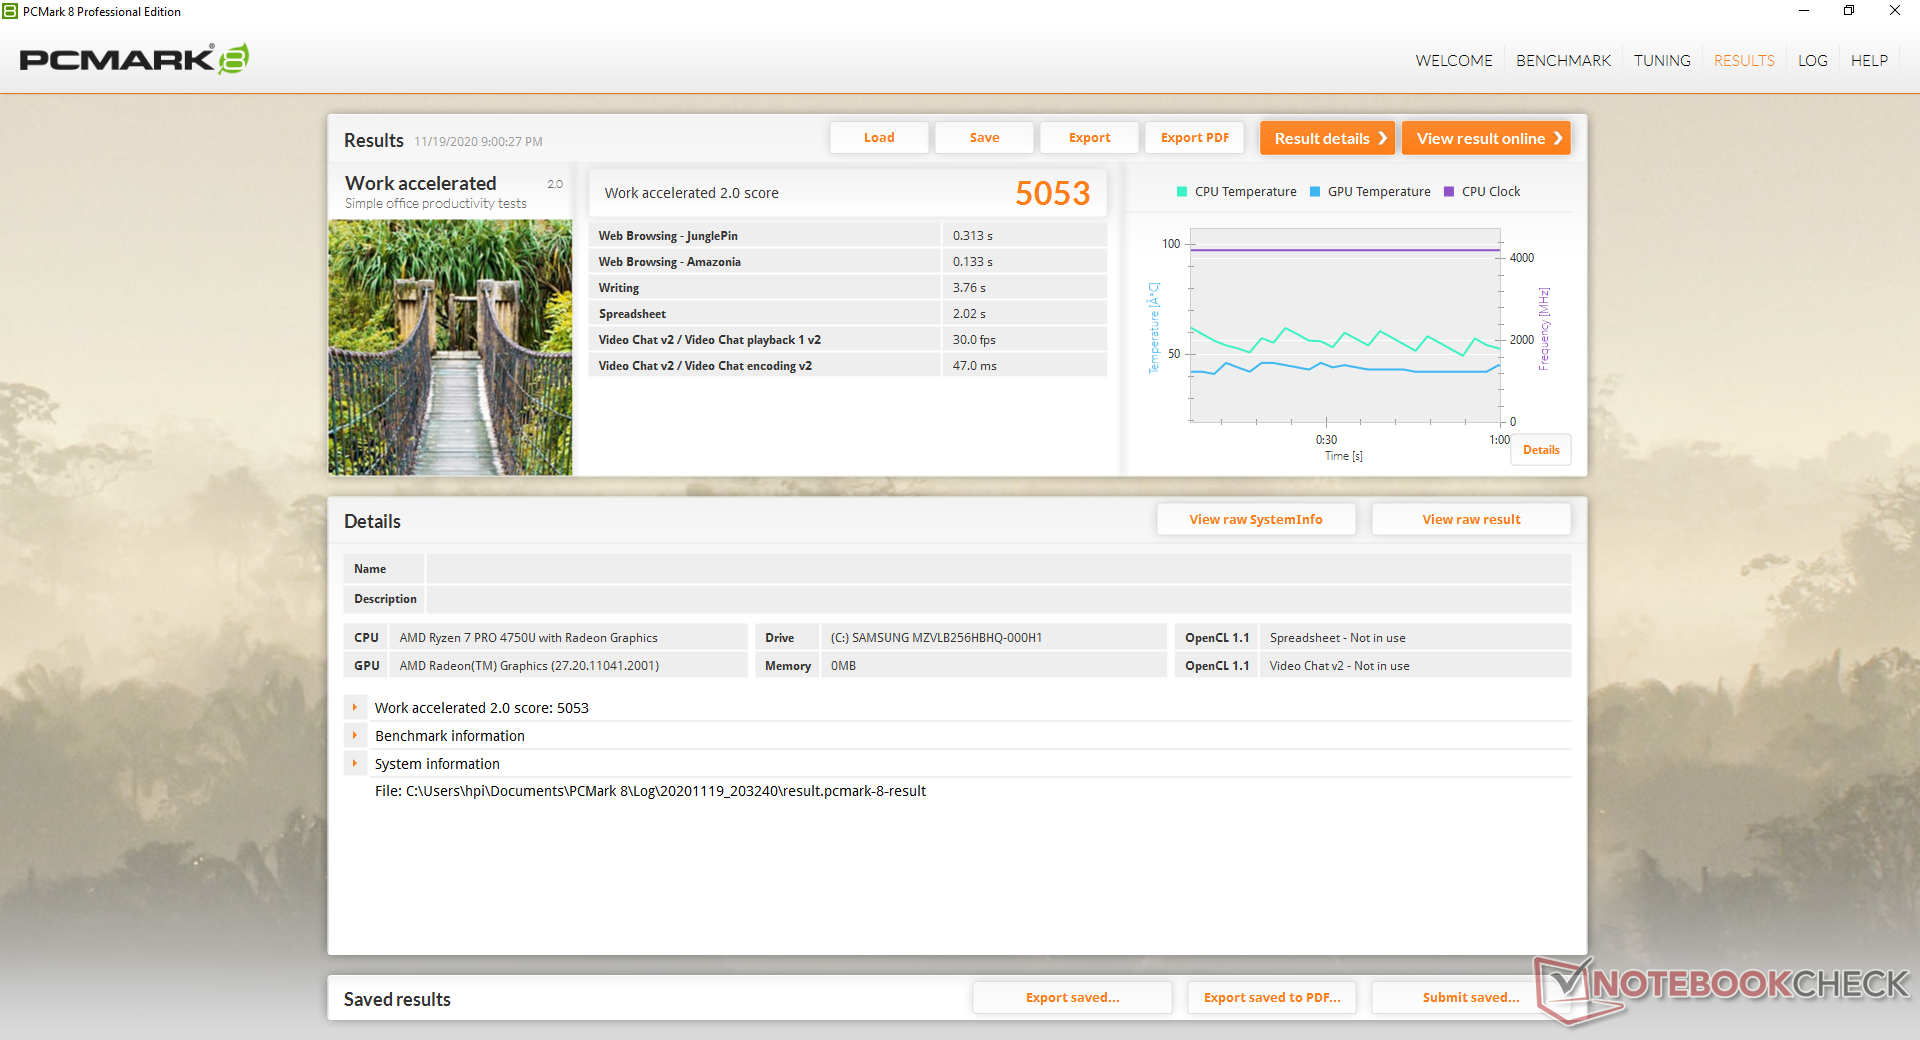
System Performance
PCMark results are excellent for a business laptop especially in Digital Content Creation where the extra CPU cores and fast integrated Vega 7 graphics come in handy.
We experienced no software issues with our test unit. On the hardware side, however, our HP P700 external SSD would constantly disconnect and reconnect when attached to any of USB-A ports of the laptop. Connecting the external SSD via USB-C solves the issue. Nonetheless, we recommend testing various USB-A devices to check if the USB ports are exhibiting any issues.
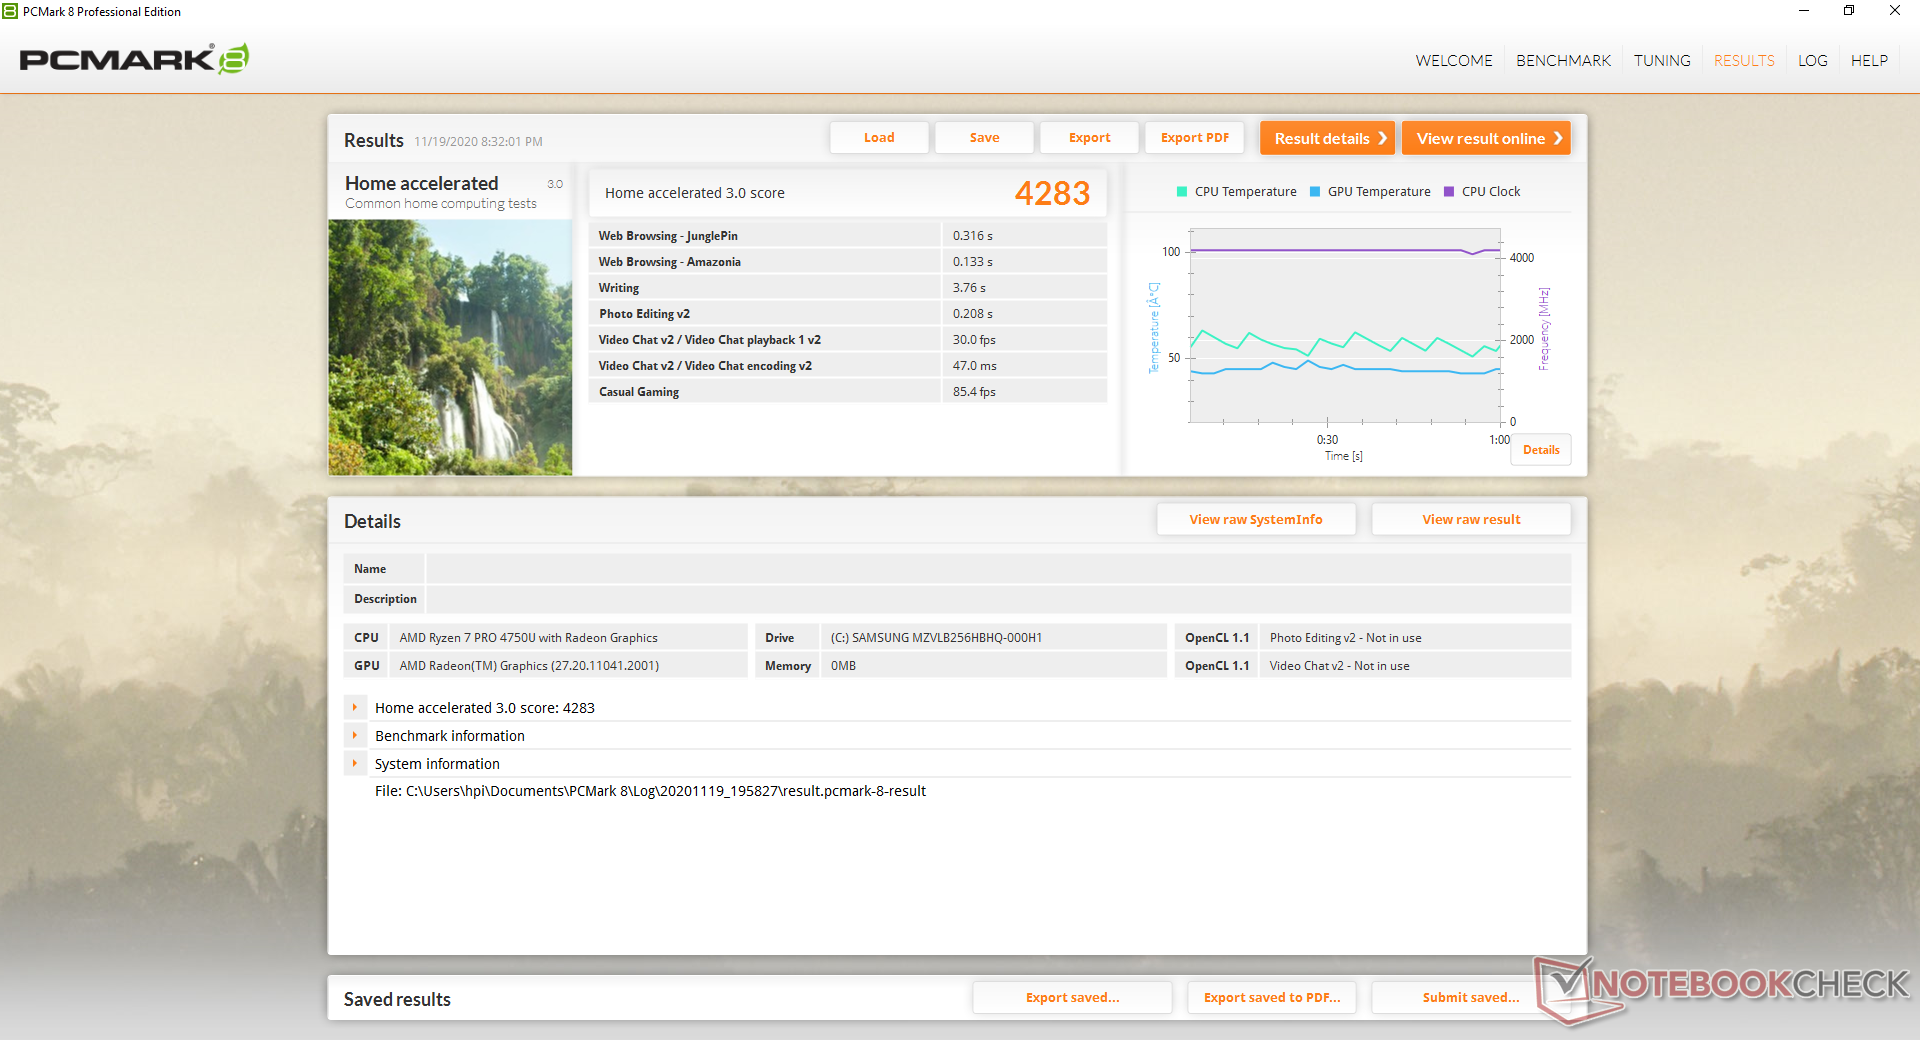
| PCMark 8 Home Score Accelerated v2 | 4283 points | |
| PCMark 8 Work Score Accelerated v2 | 5053 points | |
| PCMark 10 Score | 4983 points | |
Help | ||
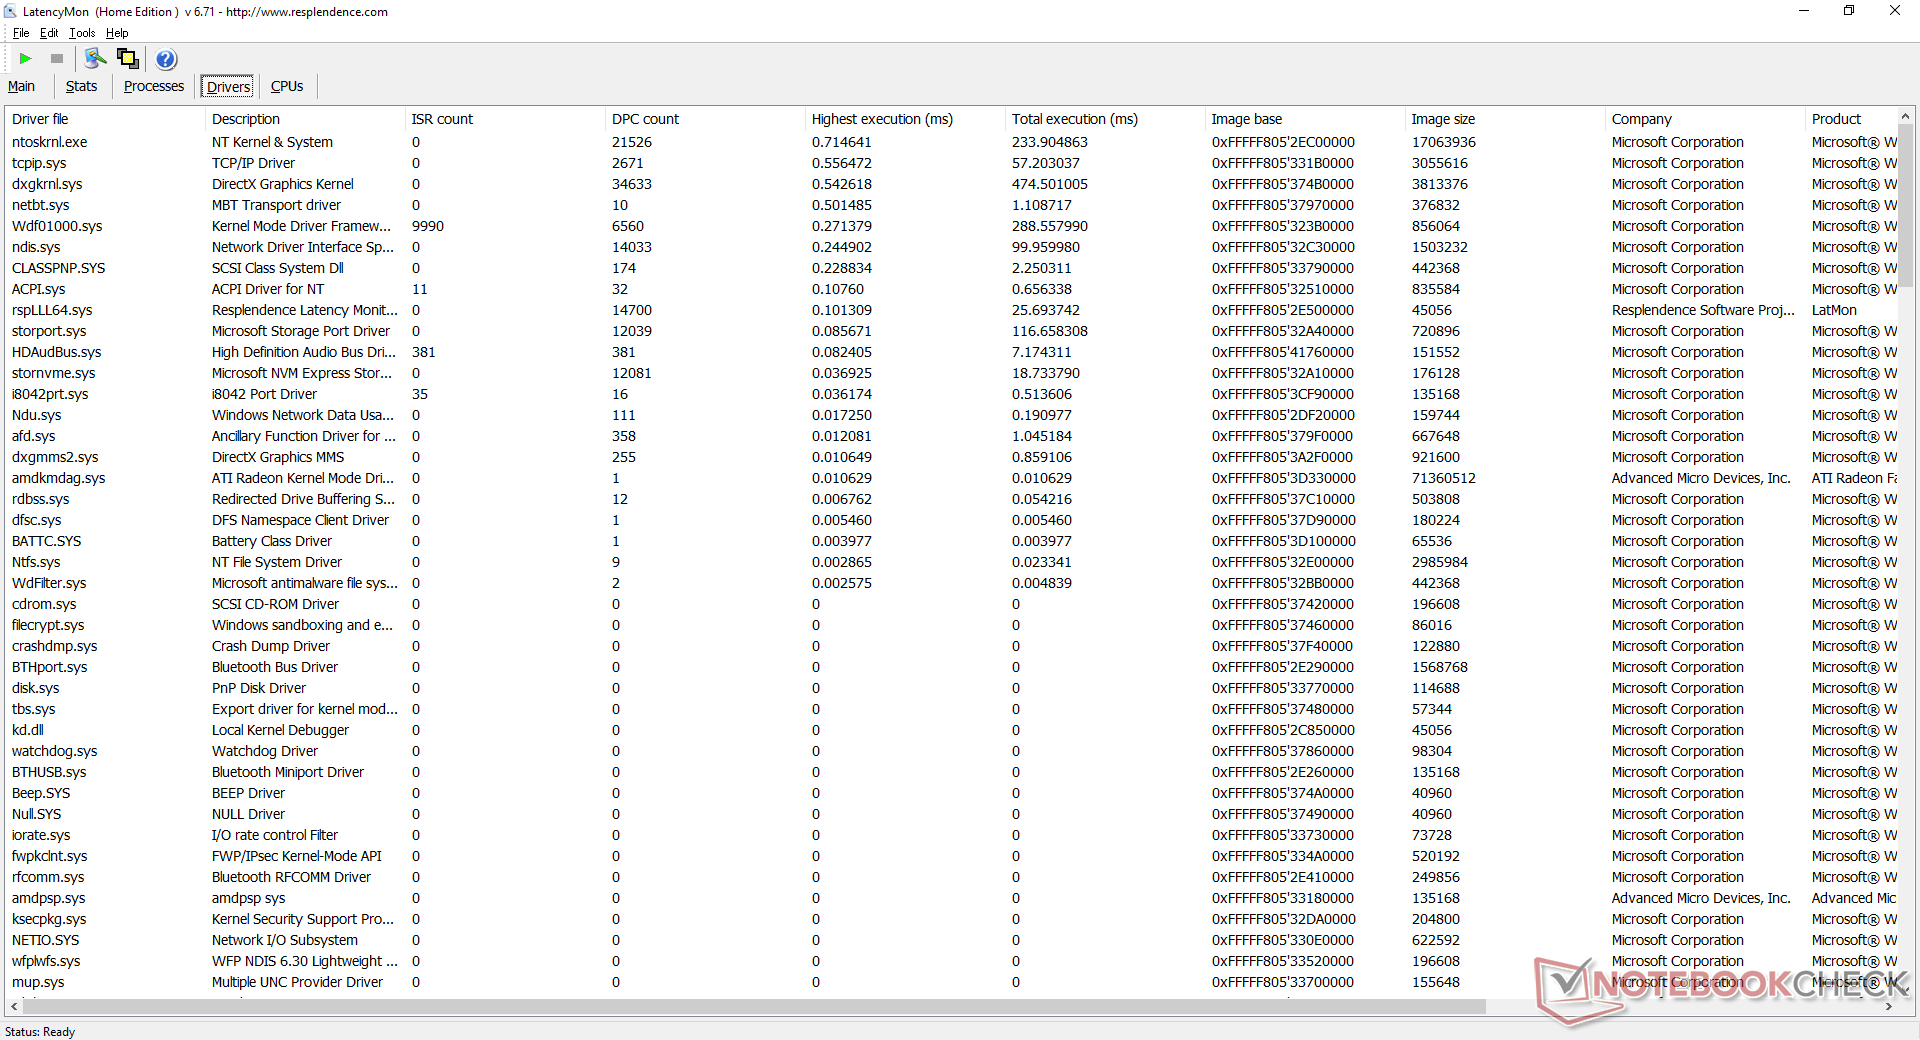
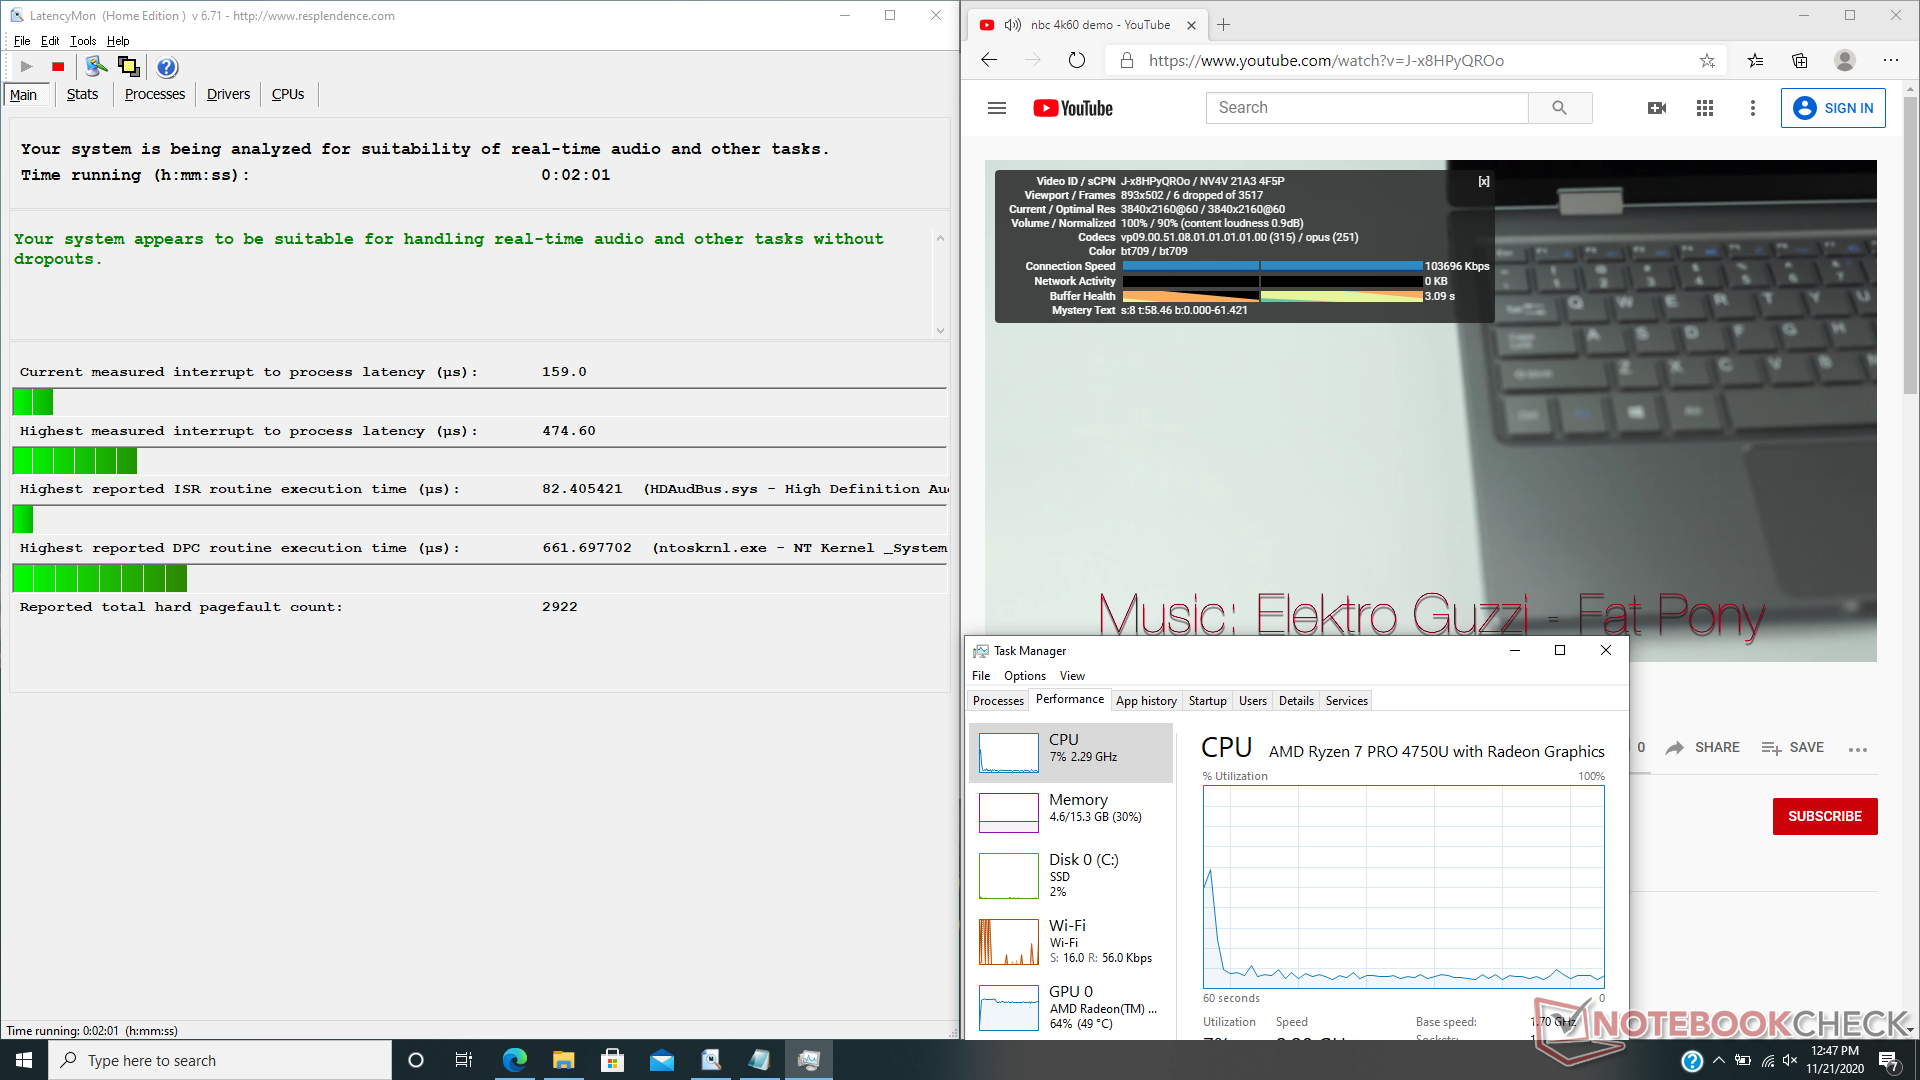
DPC Latency
LattencyMon shows no DPC latency issues when opening multiple browser tabs on our homepage. 4K UHD video playback is also smooth with just 6 dropped frames during our minute-long YouTube test.
| DPC Latencies / LatencyMon - interrupt to process latency (max), Web, Youtube, Prime95 | |
| Lenovo ThinkPad T14-20UES00H00 | |
| HP ProBook 445 G7 175W4EA | |
| HP EliteBook 845 G7-23Y60EA | |
| Dell Latitude 7410 | |
| HP EliteBook 845 G7 Ryzen 7 Pro 4750U | |
* ... smaller is better
Storage Devices
Storage drives often differ between regions or resellers. Our Ryzen 7 EliteBook 845 G7, for example, comes with a 256 GB Samsung PM981a compared to the 256 GB PM991 on the Ryzen 5 option. The PM981a is significantly faster than the PM991 especially in sequential write rates. users can configure up to 1 TB, but we can't guarantee what specific drives will actually be included.
| HP EliteBook 845 G7 Ryzen 7 Pro 4750U Samsung SSD PM981a MZVLB256HBHQ | HP EliteBook 845 G7-23Y60EA Samsung PM991 MZVLQ256HAJD | Lenovo ThinkPad T14-20UES00H00 Samsung SSD PM981a MZVLB512HBJQ | Dell Latitude 7410 Toshiba XG6 KXG60ZNV512G | HP ProBook 445 G7 175W4EA Samsung PM991 MZVLQ512HALU | Huawei Matebook X Pro i5 Samsung PM961 MZVLW256HEHP | |
|---|---|---|---|---|---|---|
| AS SSD | -42% | 59% | 67% | -18% | 21% | |
| Seq Read (MB/s) | 1976 | 1649 -17% | 2138 8% | 1837 -7% | 1936 -2% | 2416 22% |
| Seq Write (MB/s) | 1389 | 615 -56% | 1226 -12% | 1438 4% | 1213 -13% | 1170 -16% |
| 4K Read (MB/s) | 50.7 | 42.8 -16% | 55 8% | 48.1 -5% | 44.09 -13% | 48.33 -5% |
| 4K Write (MB/s) | 105.5 | 110.5 5% | 123.5 17% | 132.1 25% | 118.5 12% | 103.1 -2% |
| 4K-64 Read (MB/s) | 853 | 450 -47% | 850 0% | 660 -23% | 867 2% | 1039 22% |
| 4K-64 Write (MB/s) | 1970 | 780 -60% | 1852 -6% | 1163 -41% | 838 -57% | 399.6 -80% |
| Access Time Read * (ms) | 0.058 | 0.154 -166% | 0.04 31% | 0.059 -2% | 0.122 -110% | 0.058 -0% |
| Access Time Write * (ms) | 0.104 | 0.035 66% | 0.029 72% | 0.096 8% | 0.034 67% | 0.036 65% |
| Score Read (Points) | 1101 | 658 -40% | 1119 2% | 891 -19% | 1105 0% | 1329 21% |
| Score Write (Points) | 2214 | 953 -57% | 2098 -5% | 1439 -35% | 1078 -51% | 620 -72% |
| Score Total (Points) | 3862 | 1910 -51% | 3758 -3% | 2780 -28% | 2721 -30% | 2575 -33% |
| Copy ISO MB/s (MB/s) | 1422 | 236 -83% | 1386 -3% | 2089 47% | 739 -48% | |
| Copy Program MB/s (MB/s) | 71 | 60.6 -15% | 417.7 488% | 548 672% | 312.3 340% | |
| Copy Game MB/s (MB/s) | 277.8 | 126.6 -54% | 916 230% | 1226 341% | 486.3 75% | |
| CrystalDiskMark 5.2 / 6 | -41% | -8% | -5% | -23% | -33% | |
| Write 4K (MB/s) | 111.4 | 80.6 -28% | 88.1 -21% | 133.4 20% | 144.6 30% | 116.5 5% |
| Read 4K (MB/s) | 58.2 | 31.2 -46% | 38.28 -34% | 51.3 -12% | 38.08 -35% | 42.18 -28% |
| Write Seq (MB/s) | 2195 | 883 -60% | 2002 -9% | 1897 -14% | 1320 -40% | 1079 -51% |
| Read Seq (MB/s) | 2516 | 1352 -46% | 2153 -14% | 2202 -12% | 1397 -44% | 1030 -59% |
| Write 4K Q32T1 (MB/s) | 472.1 | 361 -24% | 423.7 -10% | 384.9 -18% | 324.2 -31% | 225.7 -52% |
| Read 4K Q32T1 (MB/s) | 380.5 | 272 -29% | 393.2 3% | 318.7 -16% | 434.8 14% | 302.9 -20% |
| Write Seq Q32T1 (MB/s) | 2339 | 979 -58% | 2889 24% | 2866 23% | 1382 -41% | 1174 -50% |
| Read Seq Q32T1 (MB/s) | 3565 | 2286 -36% | 3566 0% | 3122 -12% | 2354 -34% | 3394 -5% |
| Total Average (Program / Settings) | -42% /
-42% | 26% /
35% | 31% /
41% | -21% /
-20% | -6% /
1% |
* ... smaller is better

Disk Throttling: DiskSpd Read Loop, Queue Depth 8
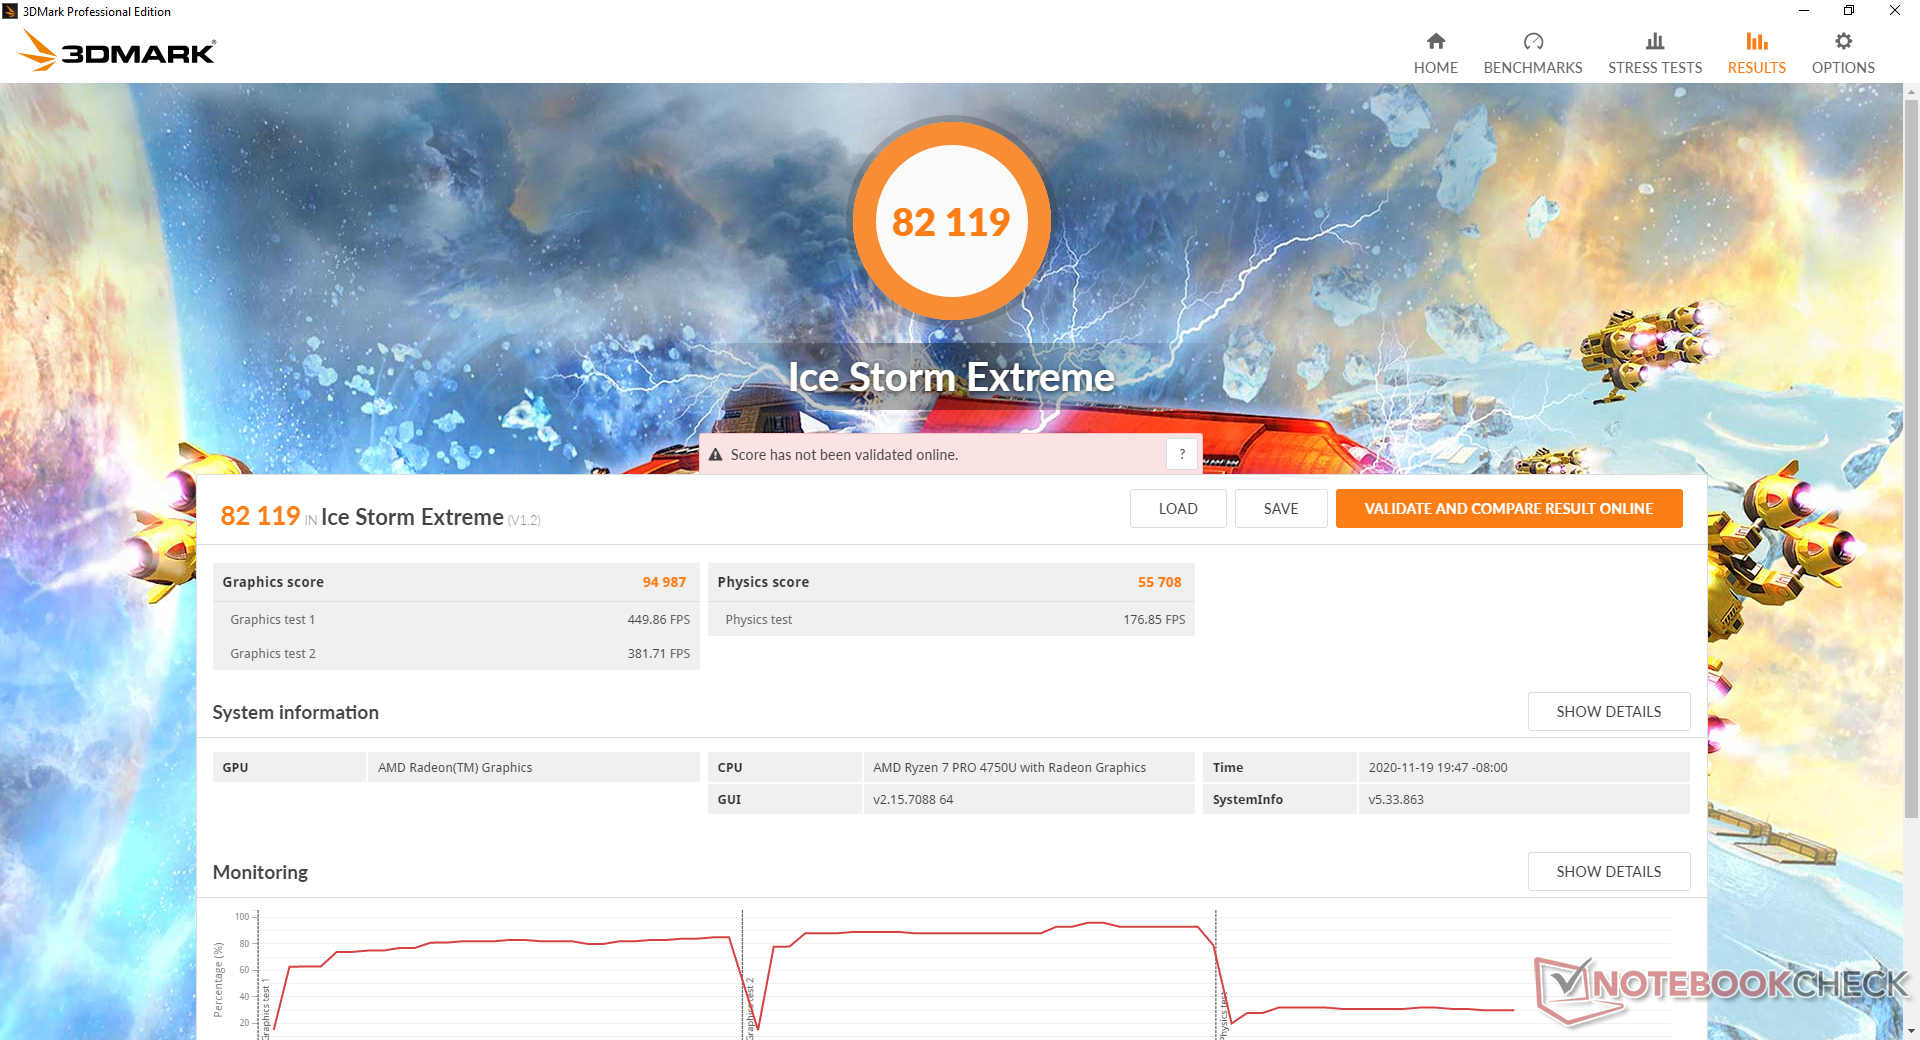
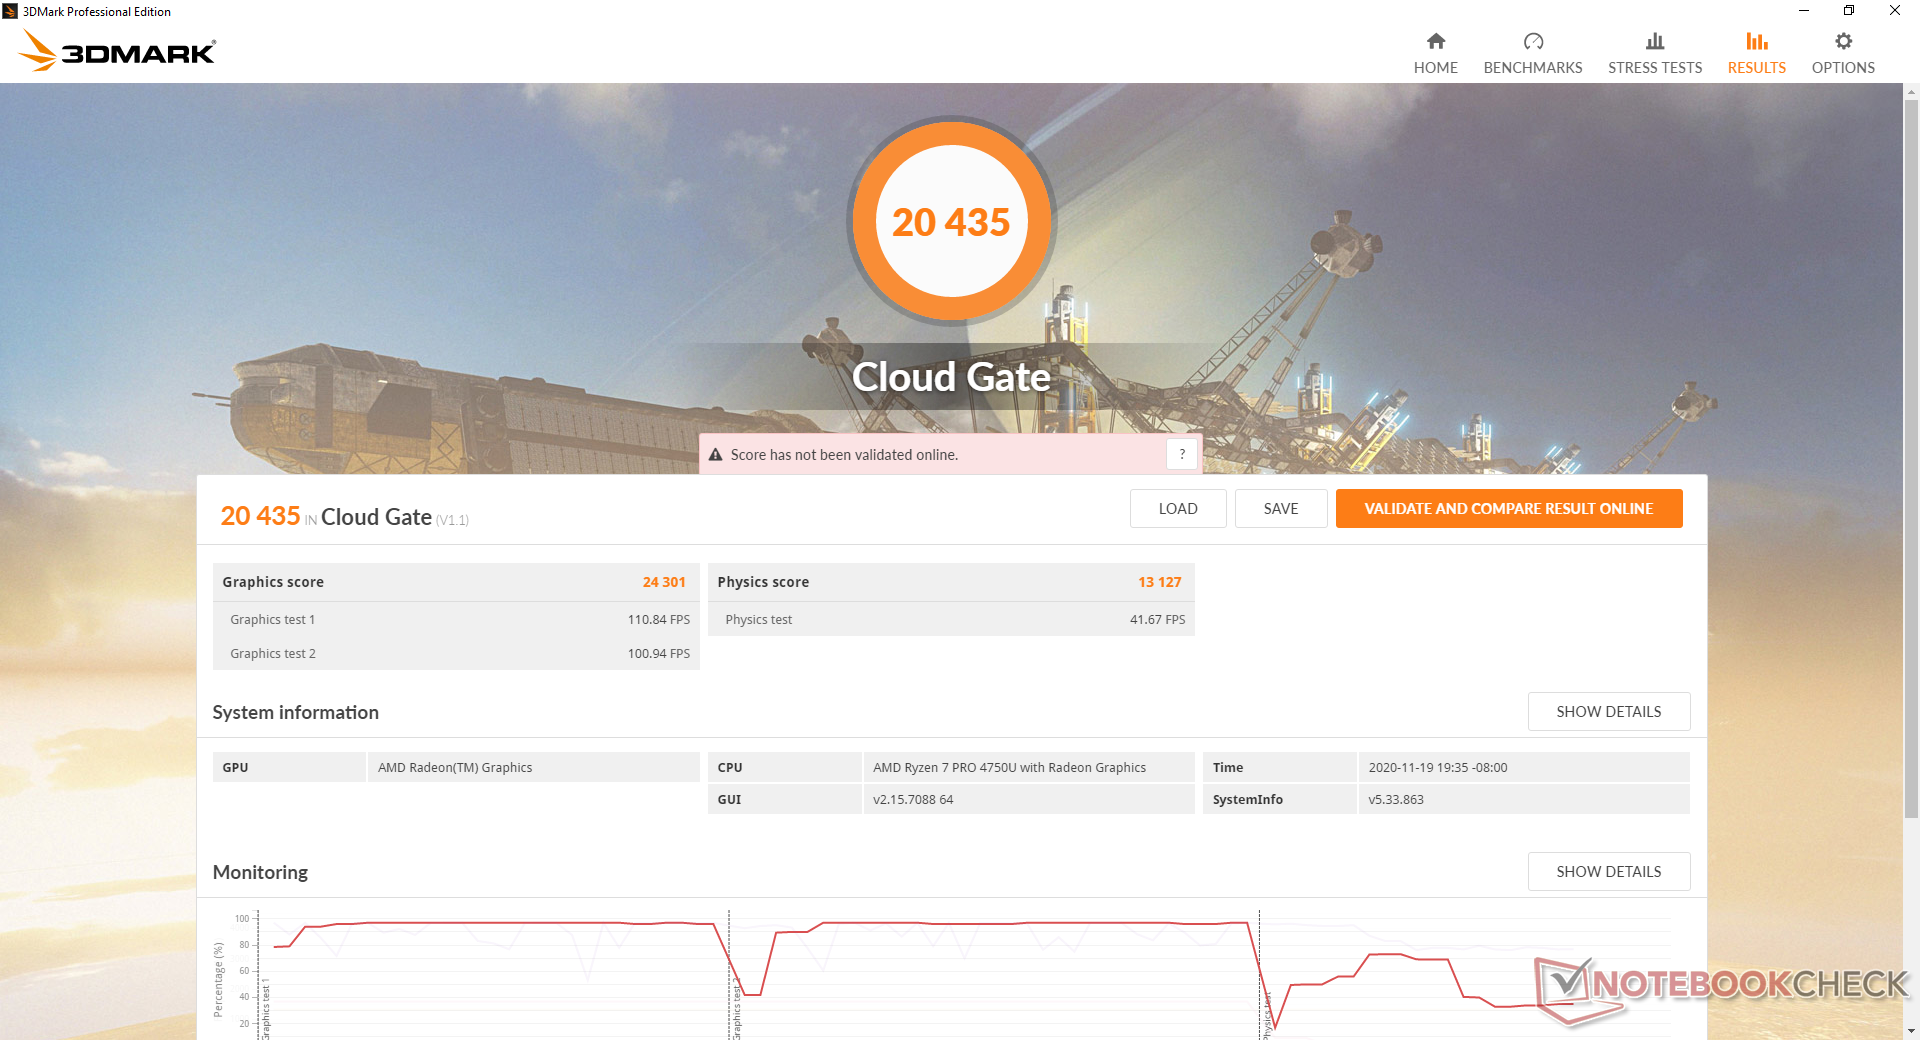
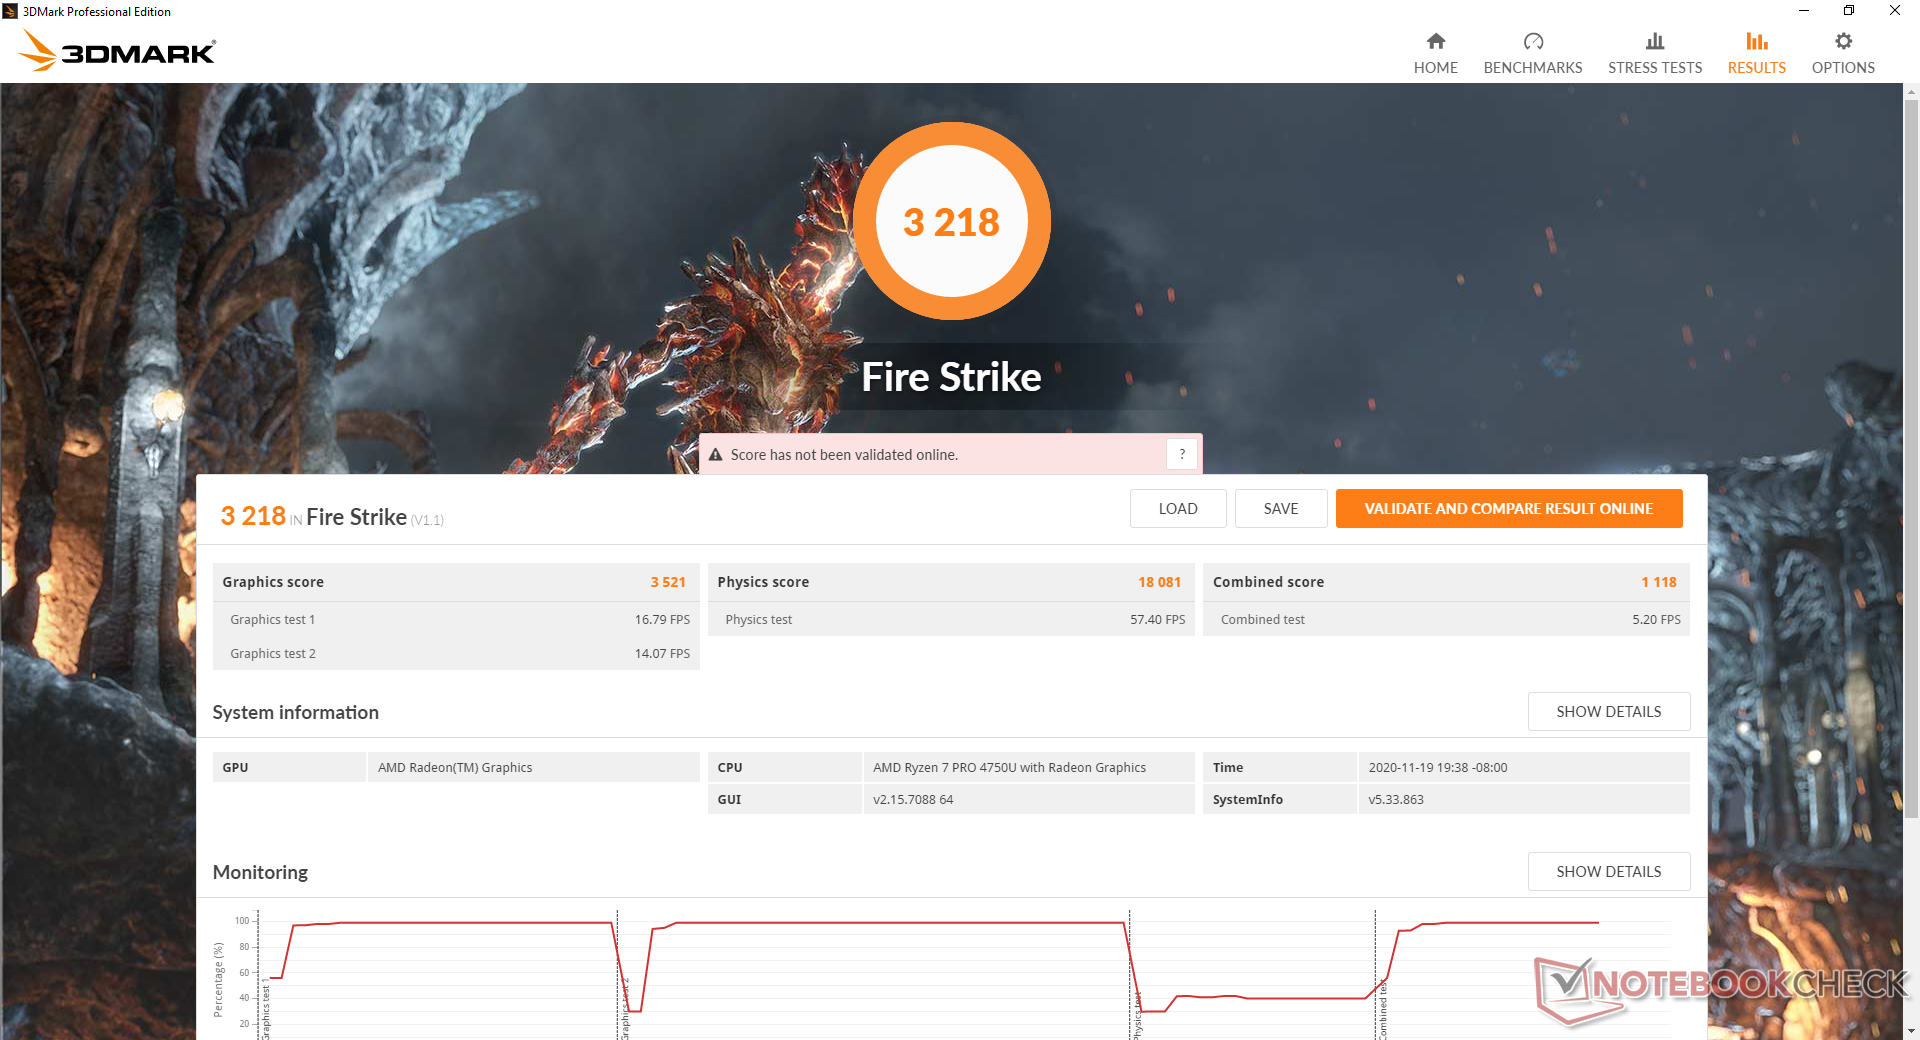
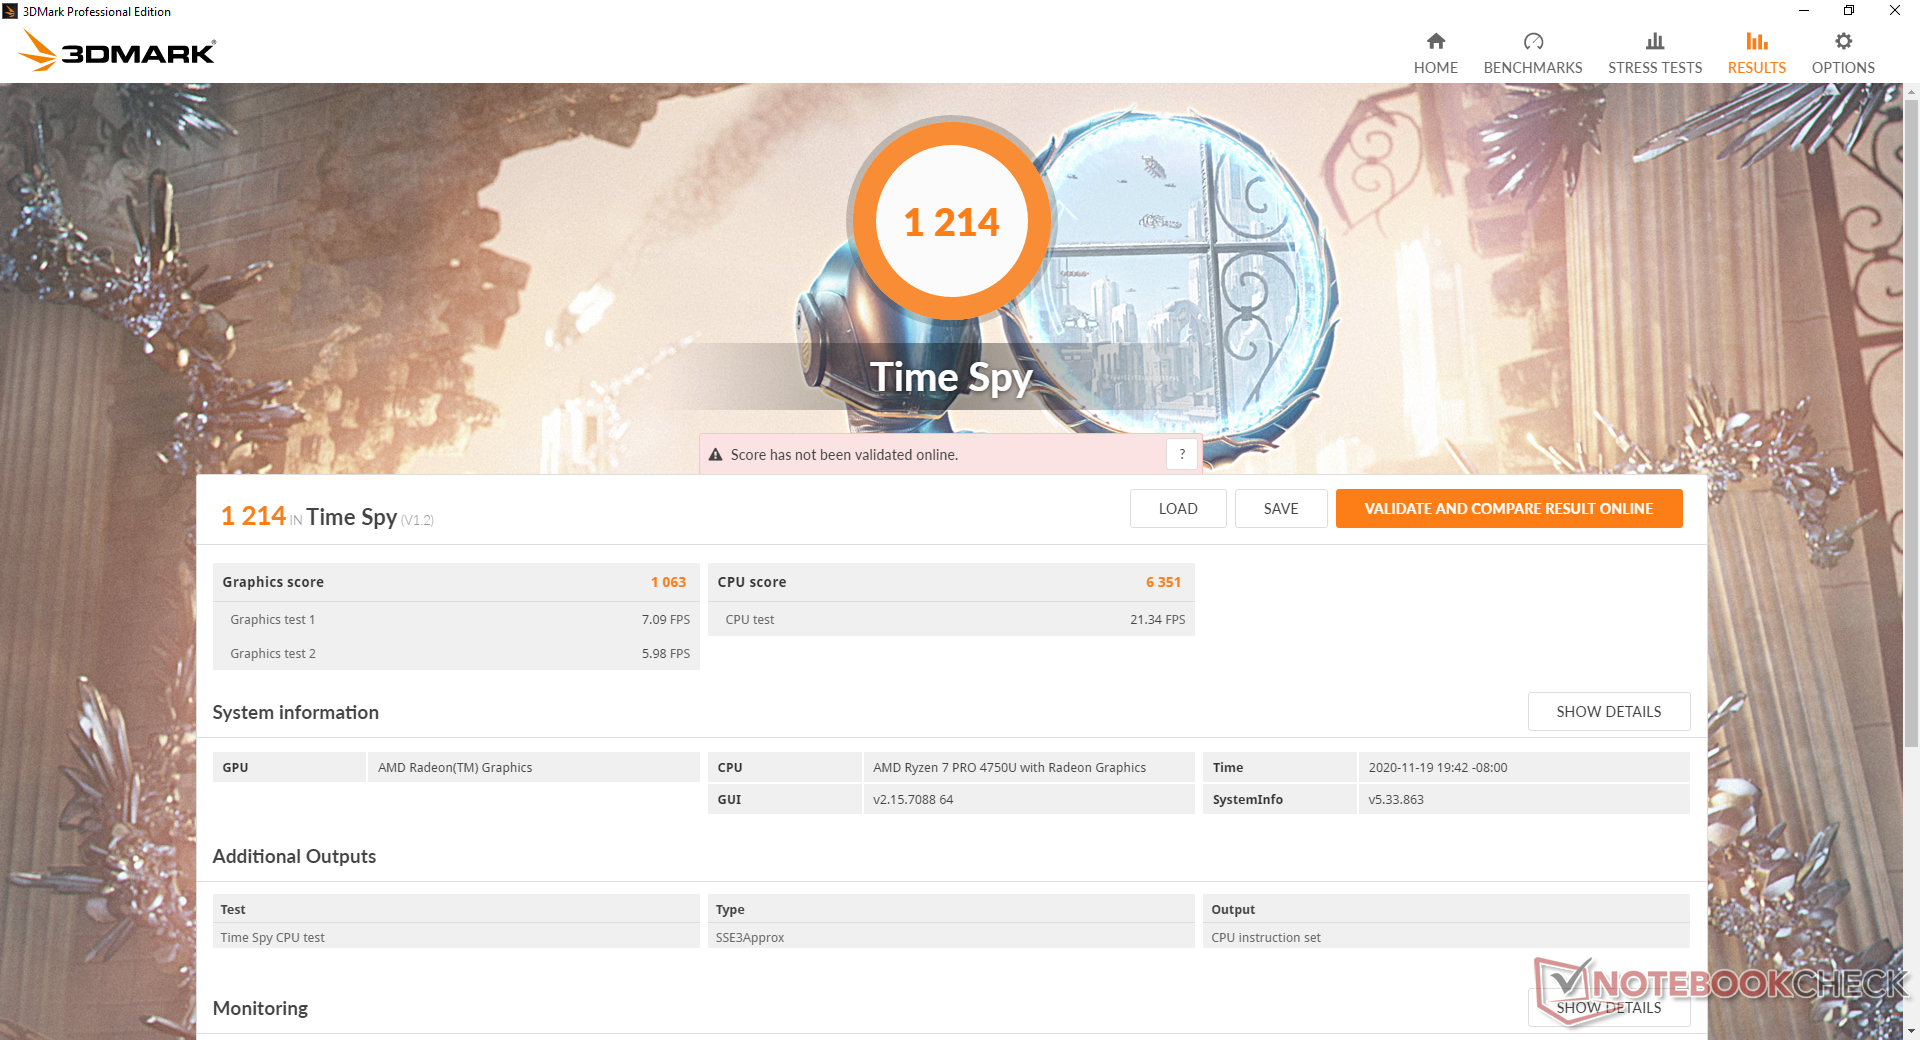
GPU Performance
Graphics performance is excellent especially for a business laptop running on just integrated graphics. The Radeon RX Vega 7 here is consistently faster than even the Core i7 Iris Xe in the recently released Asus ZenBook 14 UX425EA according to 3DMark benchmarks. Results are also on par with the discrete GeForce MX250. This doesn't necessarily mean that our HP system will run games faster than other systems the Iris Xe or GeForce MX250 due to differences in drivers and optimizations, but the raw performance is impressive nonetheless.
Note that our Vega 7 GPU is performing over 60 percent faster than the Vega 6 GPU in our Ryzen 5 EliteBook 845 G7. The wide delta can be partly attributed to the single-channel 8 GB RAM on our Ryzen 5 SKU compared to the dual-channel 16 GB RAM on our Ryzen 7 SKU. The graphics performance difference between Vega 6 and Vega 7 should therefore be much closer than what is presented below between these two HP laptops.
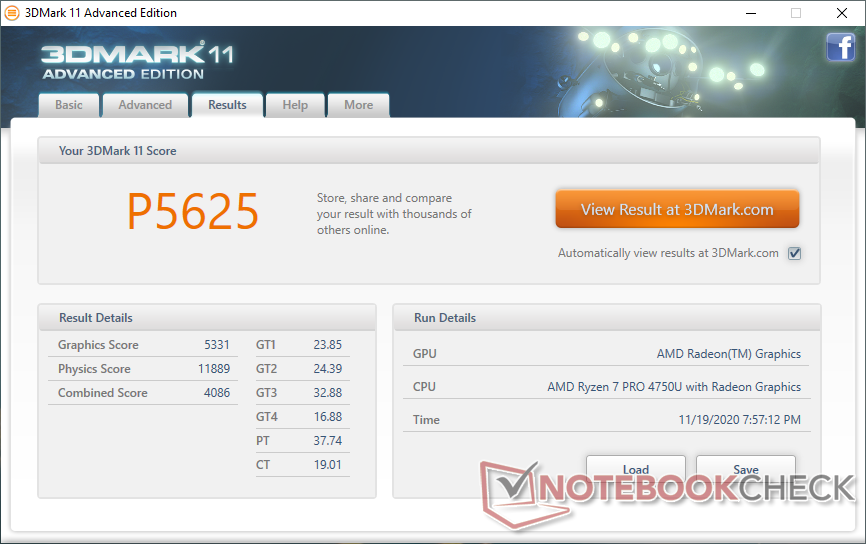
| 3DMark 06 Standard Score | 22324 points | |
| 3DMark 11 Performance | 5625 points | |
| 3DMark Cloud Gate Standard Score | 20435 points | |
| 3DMark Fire Strike Score | 3218 points | |
| 3DMark Time Spy Score | 1214 points | |
Help | ||
| low | med. | high | ultra | |
|---|---|---|---|---|
| The Witcher 3 (2015) | 70.5 | 43.4 | 22.3 | 14.4 |
| Dota 2 Reborn (2015) | 91.6 | 78.9 | 53.9 | 50.7 |
| Final Fantasy XV Benchmark (2018) | 34 | 17.1 | 10.7 | |
| X-Plane 11.11 (2018) | 39.5 | 31.5 | 28.1 |
Emissions
System Noise
Fan noise is about the same as on the Ryzen 5 SKU after accounting for the differences in environmental noise. An exception, however, occurs when running Prime95 or when the processor is subjected to similar extreme loads. In such scenarios, fan noise will plateau louder at almost 40 dB(A). The noise is higher-pitched than we would like as well meaning the fan is more noticeable when it starts ramping up.
| HP EliteBook 845 G7 Ryzen 7 Pro 4750U Vega 7, R7 PRO 4750U, Samsung SSD PM981a MZVLB256HBHQ | HP EliteBook 845 G7-23Y60EA Vega 6, R5 PRO 4650U, Samsung PM991 MZVLQ256HAJD | Lenovo ThinkPad T14-20UES00H00 Vega 6, R5 PRO 4650U, Samsung SSD PM981a MZVLB512HBJQ | Dell Latitude 7410 UHD Graphics 620, i7-10610U, Toshiba XG6 KXG60ZNV512G | HP ProBook 445 G7 175W4EA Vega 6, R5 4500U, Samsung PM991 MZVLQ512HALU | Huawei Matebook X Pro i5 GeForce MX150, i5-8250U, Samsung PM961 MZVLW256HEHP | |
|---|---|---|---|---|---|---|
| Noise | 17% | 6% | 7% | 2% | 2% | |
| off / environment * (dB) | 30 | 25.4 15% | 29.3 2% | 28.1 6% | 30.7 -2% | 27.9 7% |
| Idle Minimum * (dB) | 30.6 | 25.4 17% | 29.3 4% | 28.1 8% | 30.7 -0% | 27.9 9% |
| Idle Average * (dB) | 30.6 | 25.4 17% | 29.3 4% | 28.1 8% | 30.7 -0% | 27.9 9% |
| Idle Maximum * (dB) | 30.6 | 25.4 17% | 30.3 1% | 28.1 8% | 30.7 -0% | 27.9 9% |
| Load Average * (dB) | 33.6 | 29.6 12% | 31.3 7% | 30 11% | 32.3 4% | 36.2 -8% |
| Load Maximum * (dB) | 39.2 | 29.5 25% | 33 16% | 39.3 -0% | 34.8 11% | 45.2 -15% |
| Witcher 3 ultra * (dB) | 33 | 45 |
* ... smaller is better
Noise level
| Idle |
| 30.6 / 30.6 / 30.6 dB(A) |
| Load |
| 33.6 / 39.2 dB(A) |
 | ||
30 dB silent 40 dB(A) audible 50 dB(A) loud |
||
min: | ||
Temperature
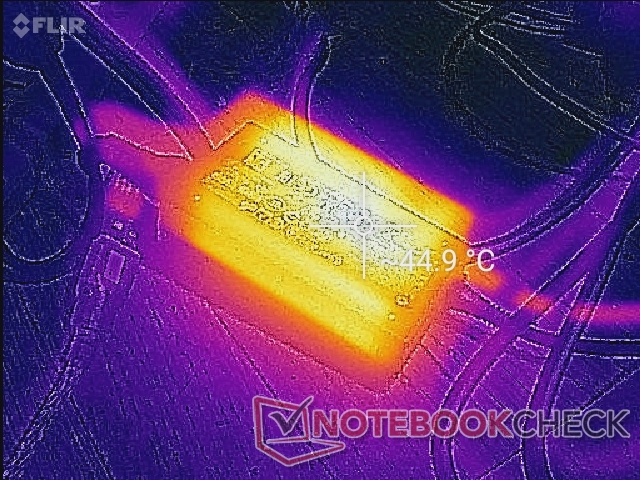
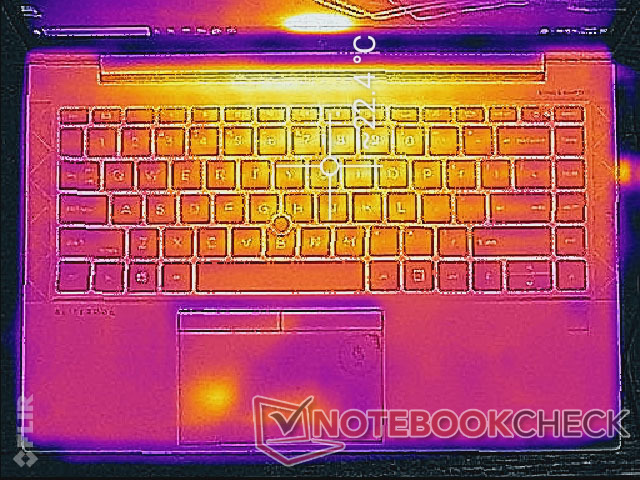
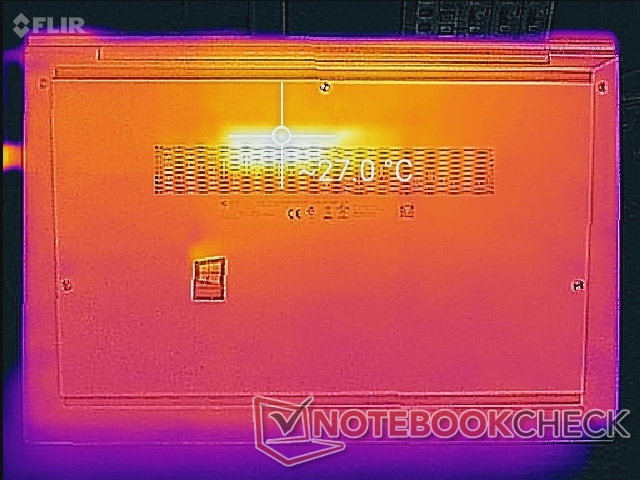
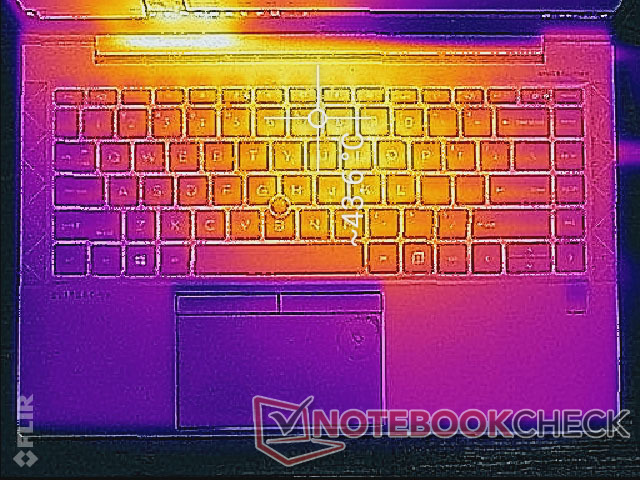
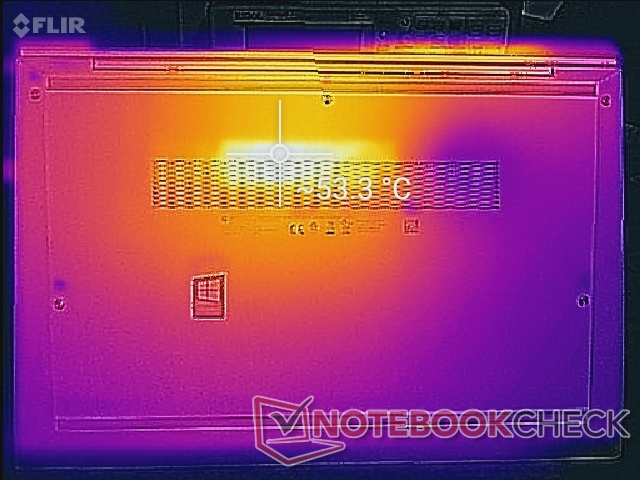
Surface temperatures are generally warmer than on the 6-core EliteBook 845 G7. Hot spots when running extreme loads reach up to 44 C and 53 C on the top and bottom surfaces of the chassis, respectively, compared to just 39 C on the 6-core configuration. The palm rests and most of the keyboard keys remain cooler and so the higher temperatures are not bothersome.
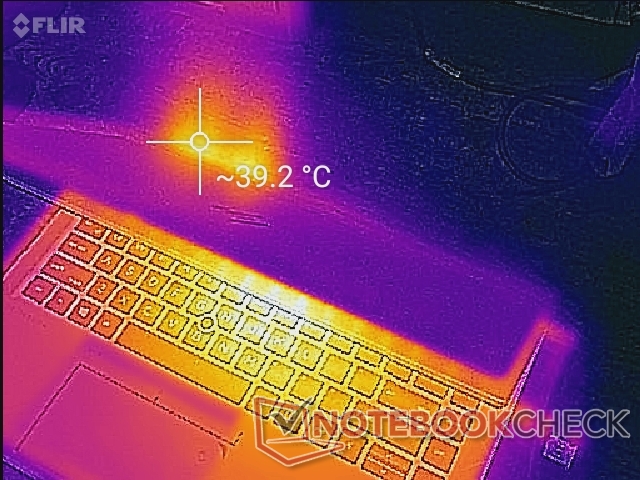
(±) The maximum temperature on the upper side is 43.6 °C / 110 F, compared to the average of 35.9 °C / 97 F, ranging from 21.4 to 59 °C for the class Subnotebook.
(-) The bottom heats up to a maximum of 52.6 °C / 127 F, compared to the average of 39.2 °C / 103 F
(+) In idle usage, the average temperature for the upper side is 21.5 °C / 71 F, compared to the device average of 30.8 °C / 87 F.
(+) The palmrests and touchpad are cooler than skin temperature with a maximum of 29.4 °C / 84.9 F and are therefore cool to the touch.
(±) The average temperature of the palmrest area of similar devices was 28.2 °C / 82.8 F (-1.2 °C / -2.1 F).
Stress Test
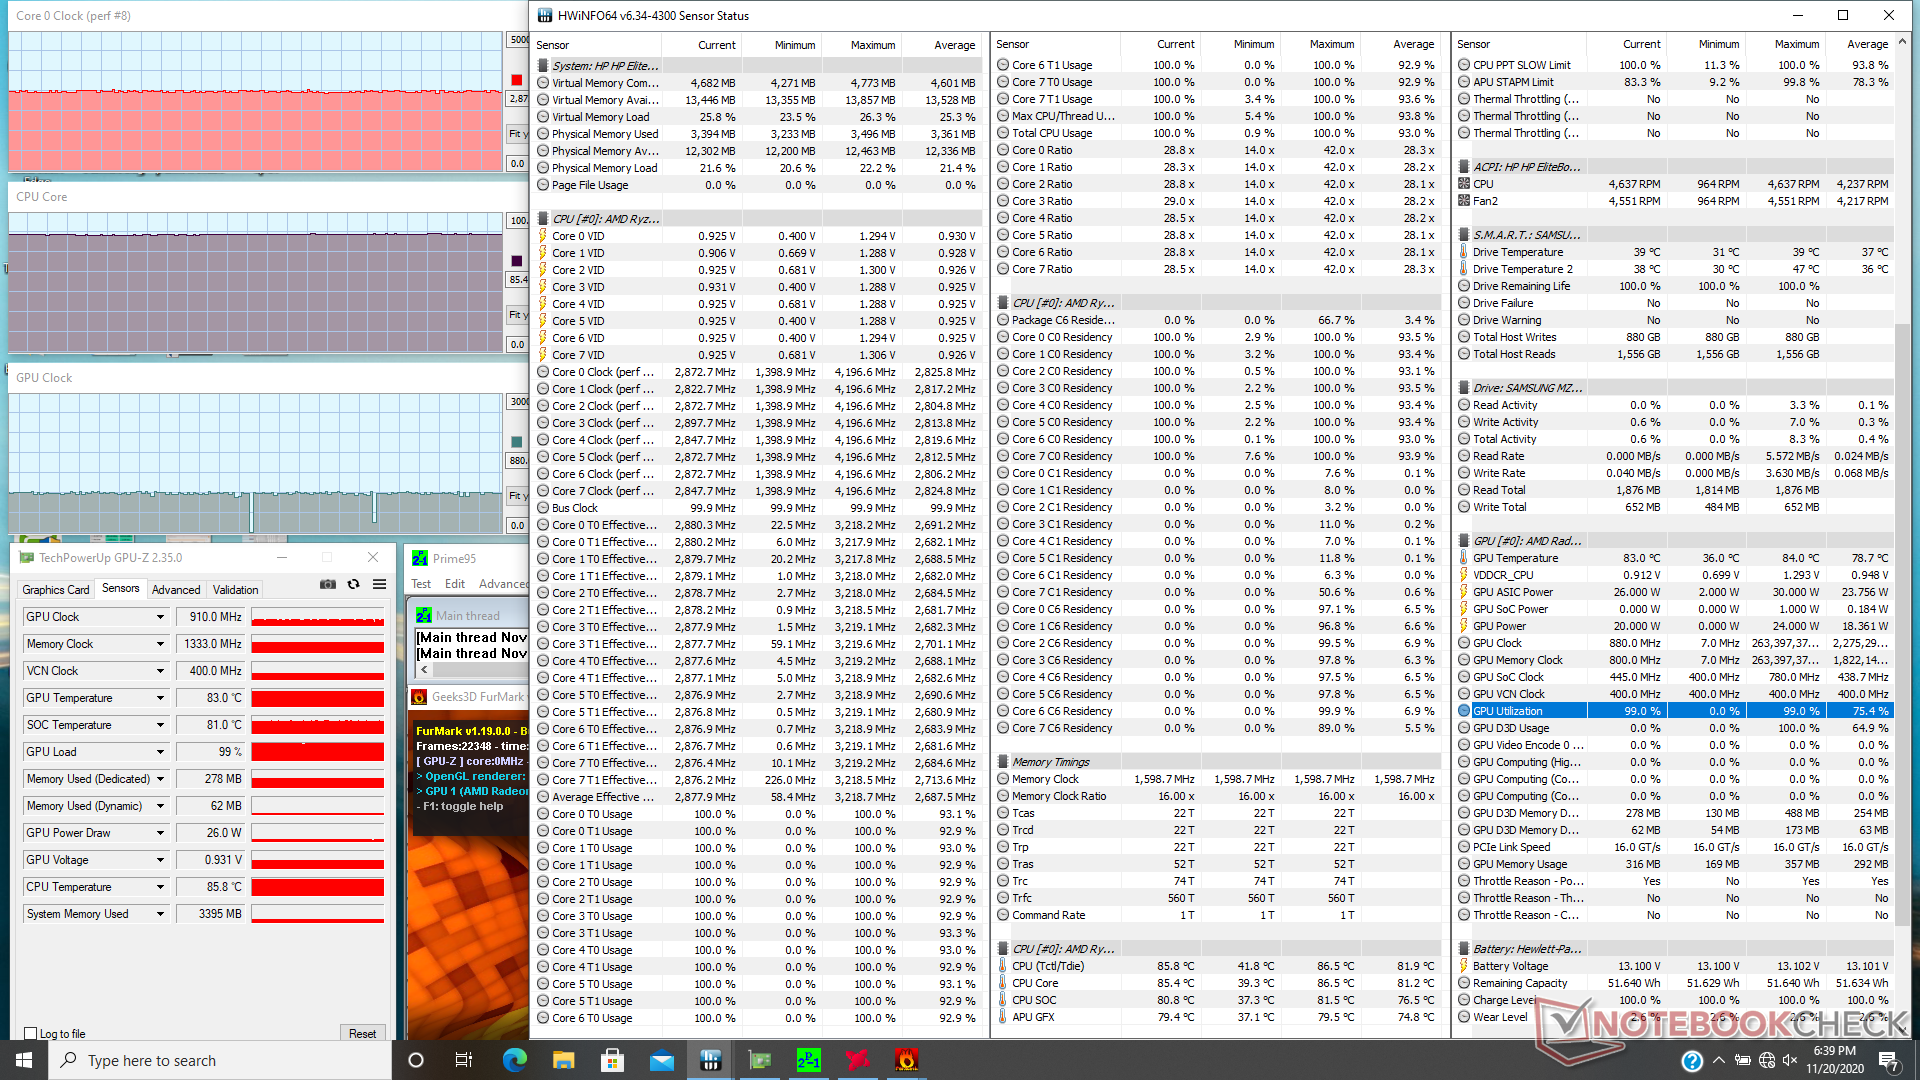
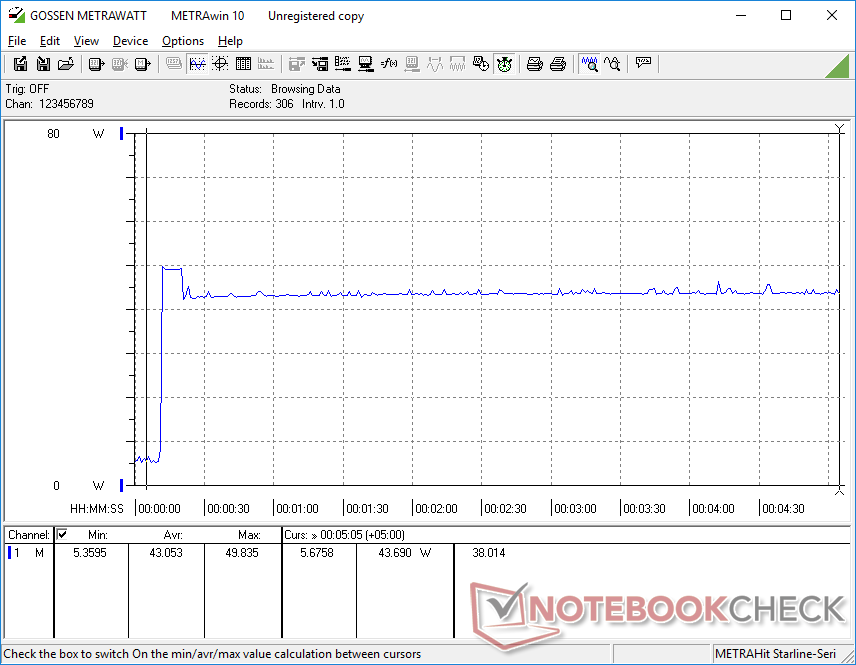
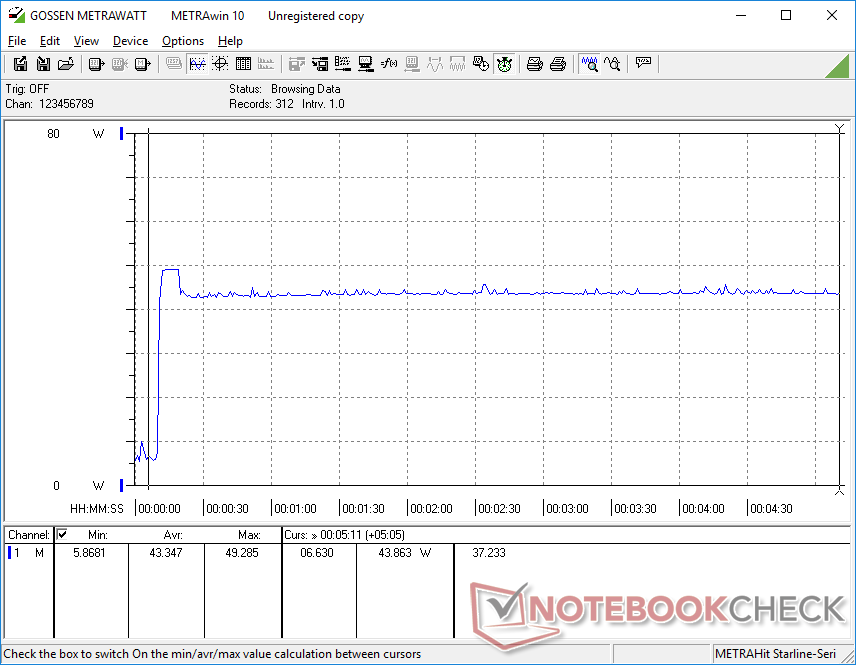
When running Prime95, the CPU would boost to 3.2 GHz for just a few seconds before falling and stabilizing at 2.9 GHz and 84 C which is warmer than on most Ultrabooks. Interestingly, core temperature is generally cooler than what we observed on the Ryzen 5 version of the EliteBook 845 G7 where that CPU would reach 100 C when running CineBench R15.
Running on battery power will not limit performance. A 3DMark 11 test on batteries would return Physics and Graphics scores of 12102 and 5134 points, respectively, compared to 11889 and 5331 points on mains.
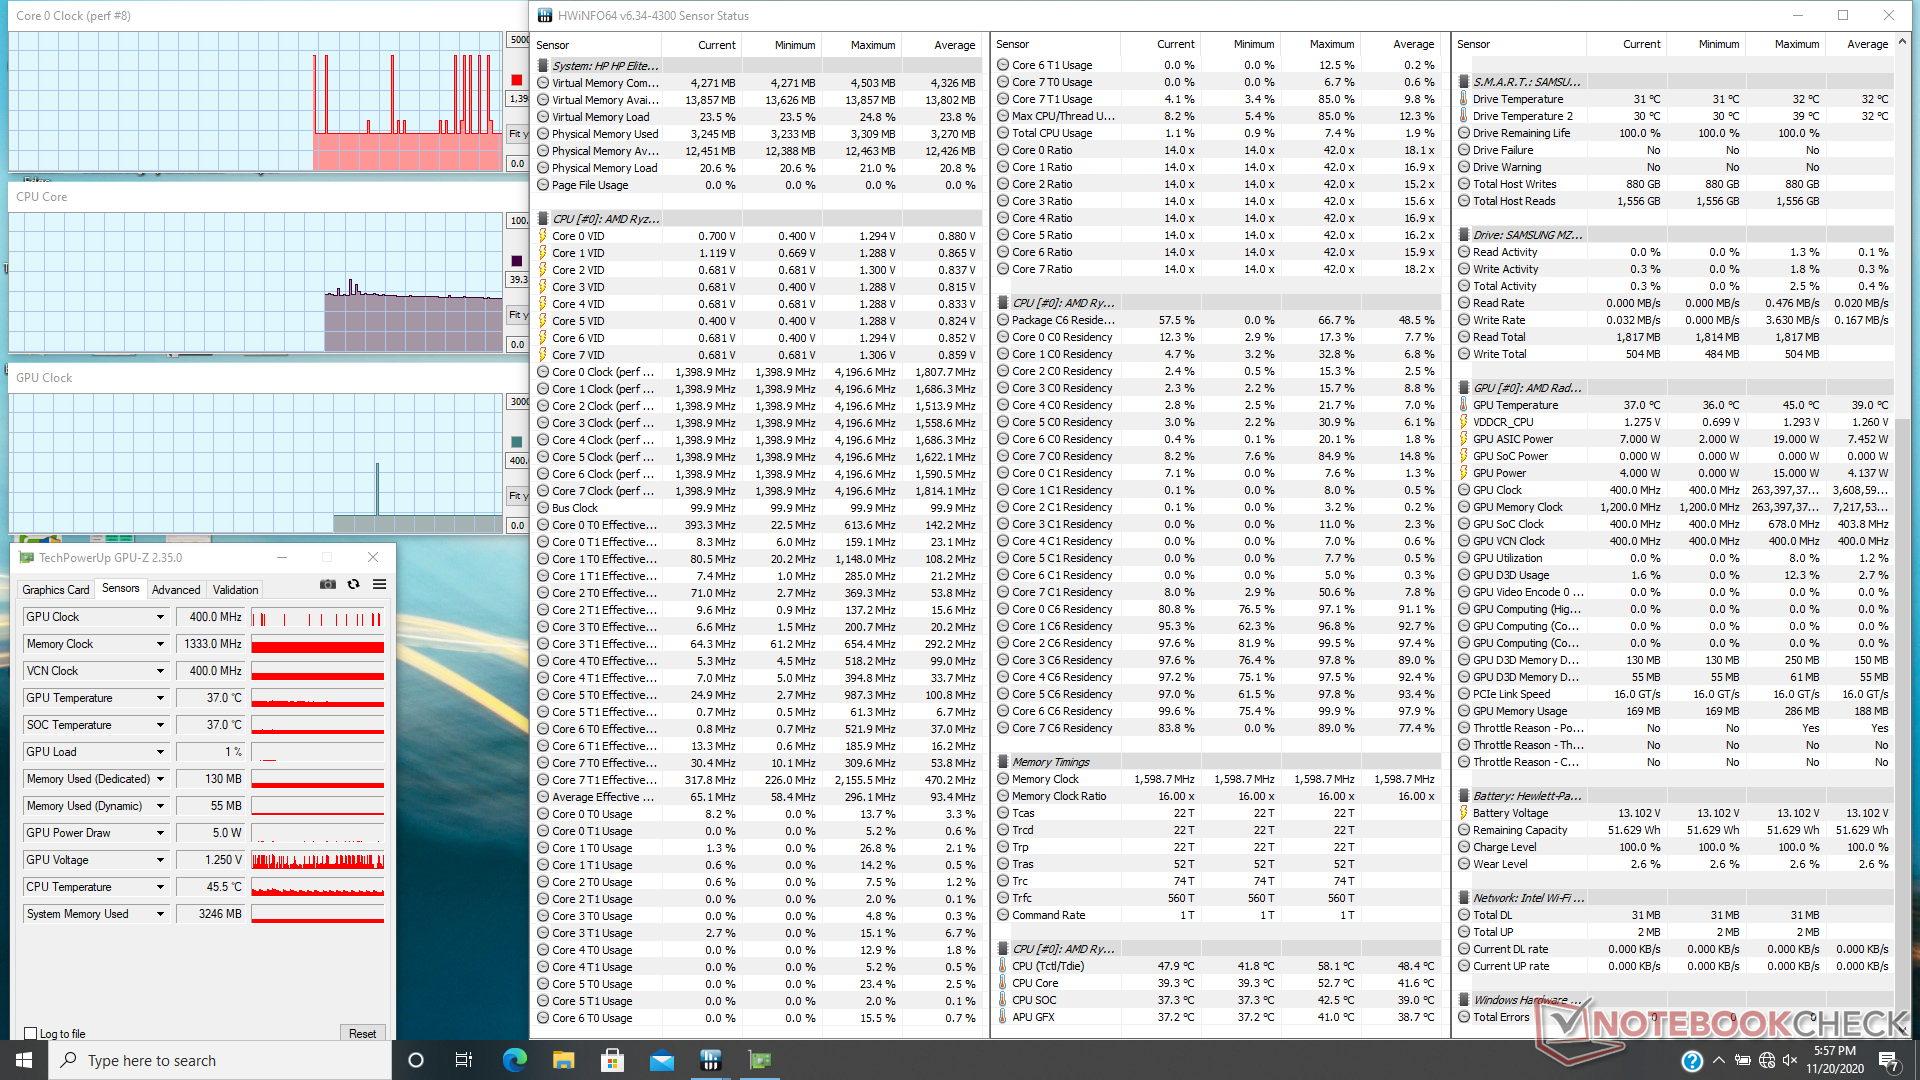
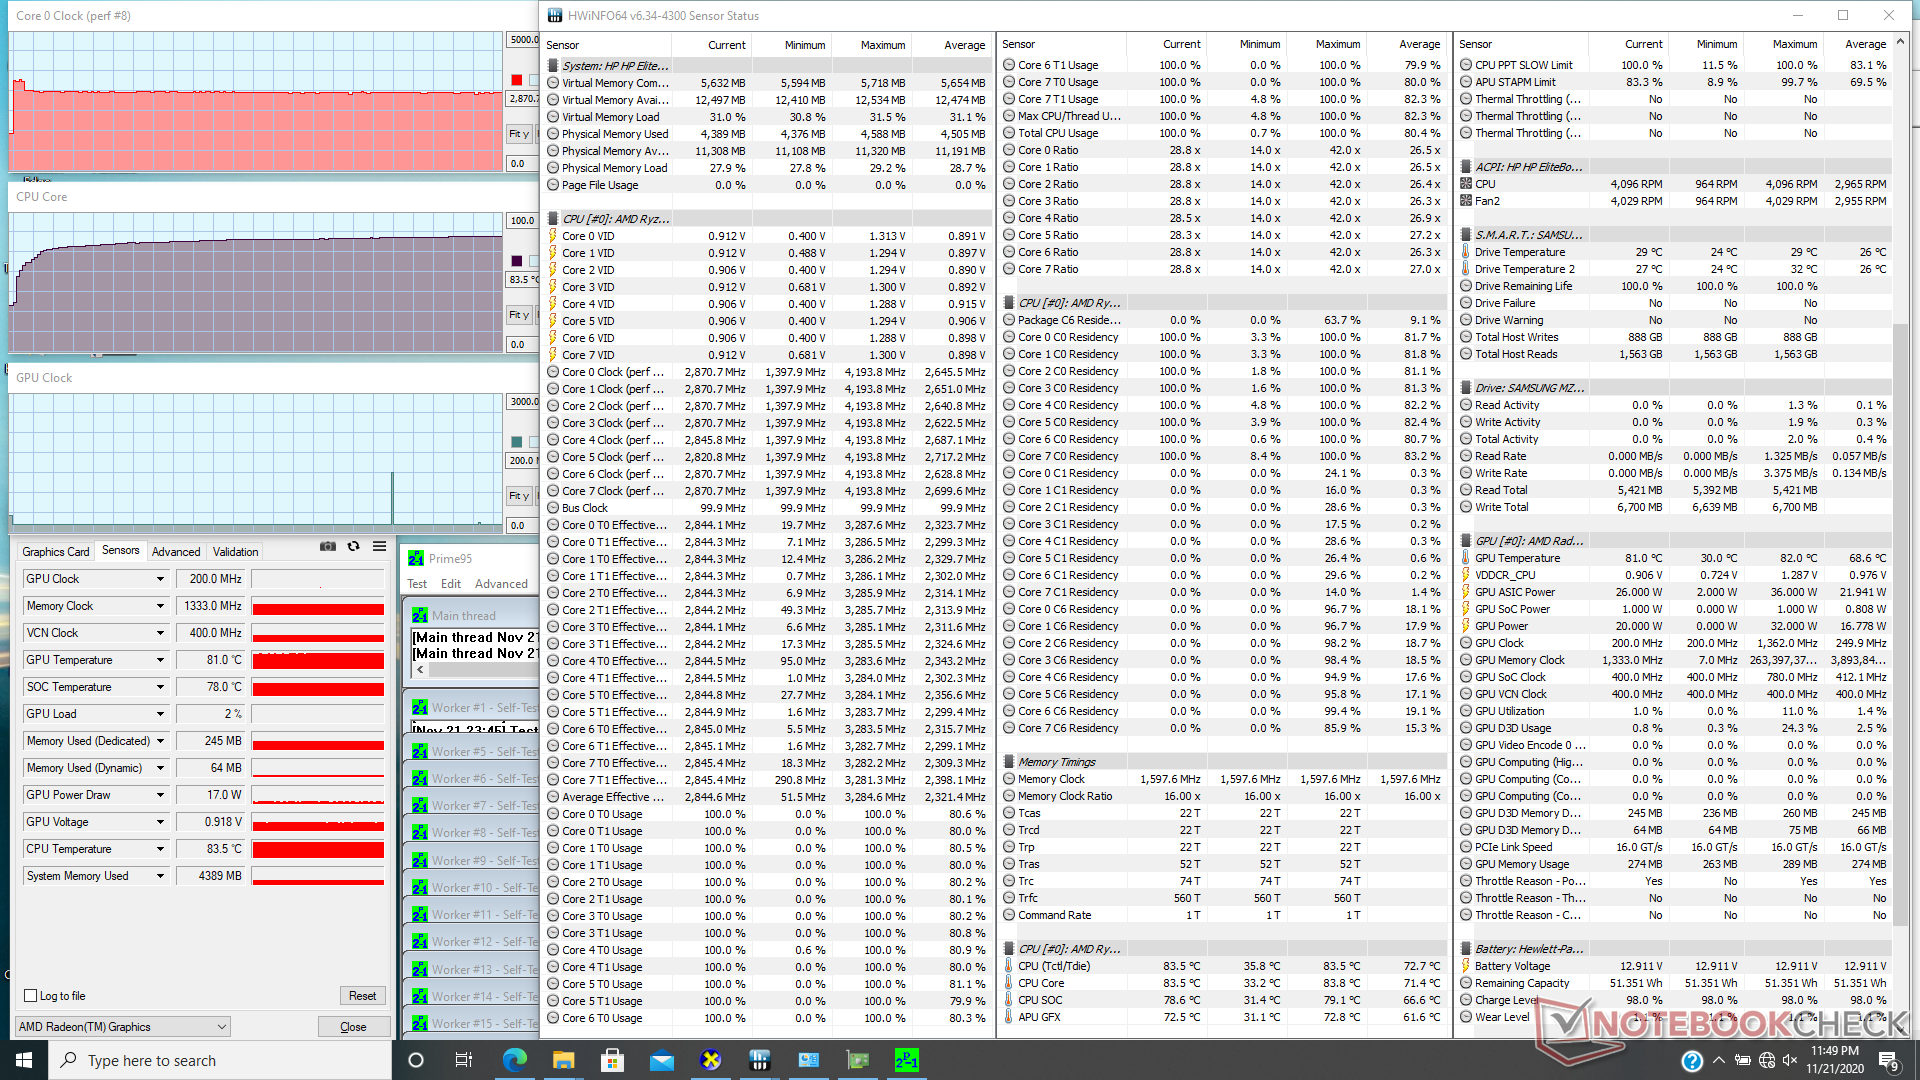
| CPU Clock (GHz) | GPU Clock (MHz) | Average CPU Temperature (°C) | |
| System Idle | -- | -- | 39 |
| Prime95 Stress | 2.9 | -- | 84 |
| Prime95 + FurMark Stress | 2.9 | 910 | 85 |
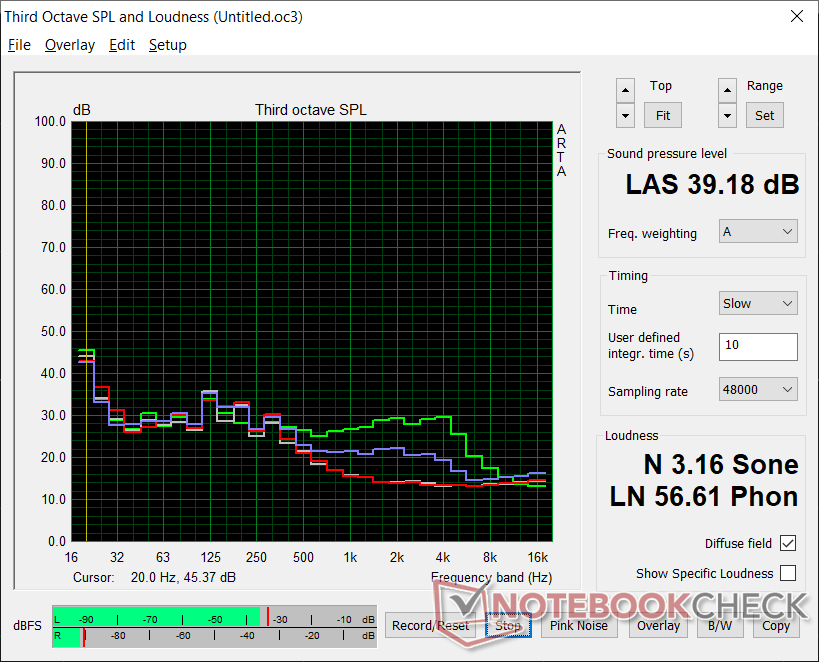
Speakers
HP EliteBook 845 G7 Ryzen 7 Pro 4750U audio analysis
(±) | speaker loudness is average but good (78.7 dB)
Bass 100 - 315 Hz
(±) | reduced bass - on average 13.1% lower than median
(±) | linearity of bass is average (10.8% delta to prev. frequency)
Mids 400 - 2000 Hz
(+) | balanced mids - only 2.2% away from median
(+) | mids are linear (3.5% delta to prev. frequency)
Highs 2 - 16 kHz
(+) | balanced highs - only 3.4% away from median
(+) | highs are linear (6.6% delta to prev. frequency)
Overall 100 - 16.000 Hz
(+) | overall sound is linear (13.4% difference to median)
Compared to same class
» 23% of all tested devices in this class were better, 5% similar, 72% worse
» The best had a delta of 5%, average was 18%, worst was 53%
Compared to all devices tested
» 14% of all tested devices were better, 4% similar, 82% worse
» The best had a delta of 4%, average was 23%, worst was 134%
Apple MacBook 12 (Early 2016) 1.1 GHz audio analysis
(+) | speakers can play relatively loud (83.6 dB)
Bass 100 - 315 Hz
(±) | reduced bass - on average 11.3% lower than median
(±) | linearity of bass is average (14.2% delta to prev. frequency)
Mids 400 - 2000 Hz
(+) | balanced mids - only 2.4% away from median
(+) | mids are linear (5.5% delta to prev. frequency)
Highs 2 - 16 kHz
(+) | balanced highs - only 2% away from median
(+) | highs are linear (4.5% delta to prev. frequency)
Overall 100 - 16.000 Hz
(+) | overall sound is linear (10.2% difference to median)
Compared to same class
» 7% of all tested devices in this class were better, 2% similar, 90% worse
» The best had a delta of 5%, average was 18%, worst was 53%
Compared to all devices tested
» 5% of all tested devices were better, 1% similar, 94% worse
» The best had a delta of 4%, average was 23%, worst was 134%
Energy Management
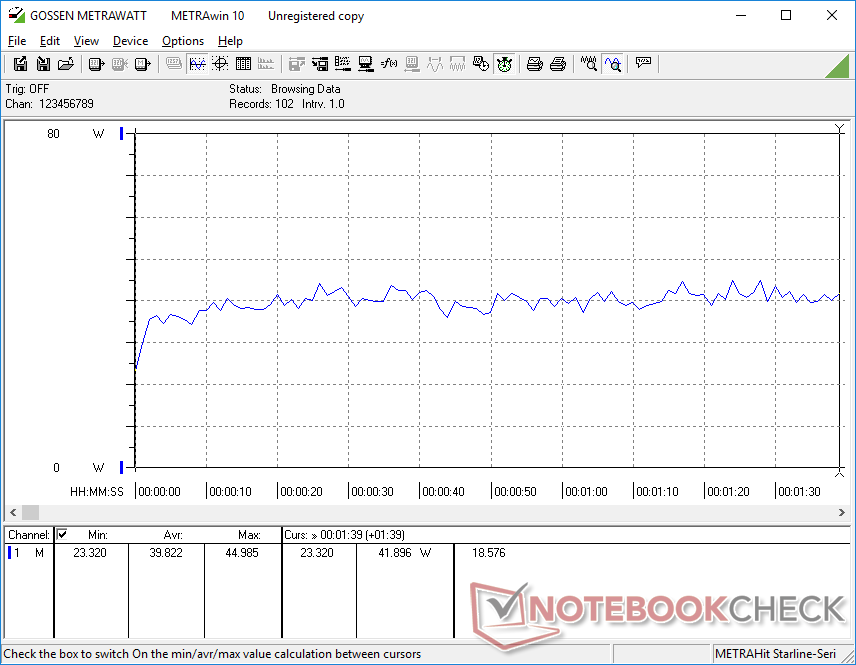
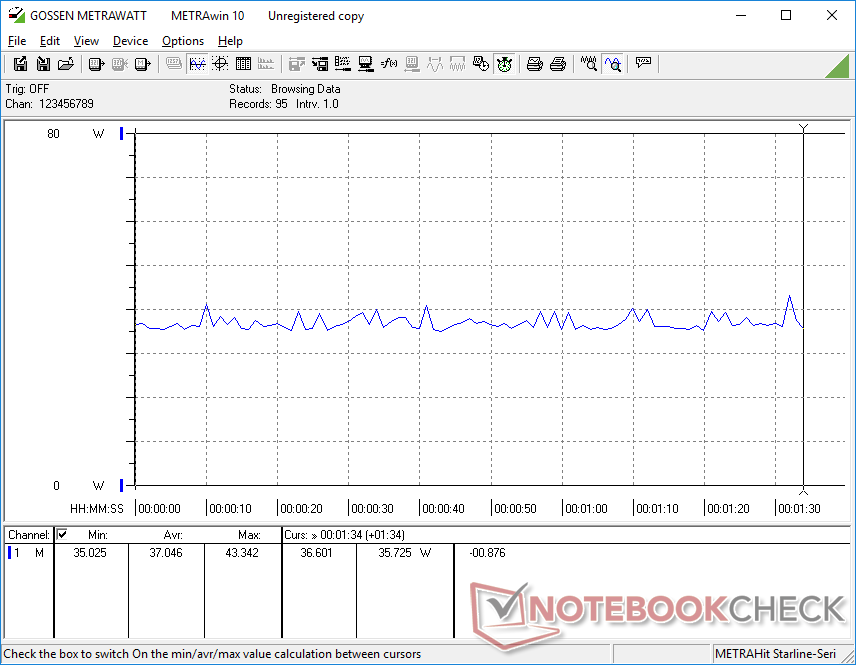
Power Consumption
When compared to the 6-core EliteBook 845 G7, our 8-core version consumes more power when under load. Running 3DMark 06 draws 40 percent more from the outlet for a 25 to 25 percent increase in multi-thread CPU performance and a 60 percent increase in graphics performance. Performance-per-watt here is higher than anticipated especially when compared to Intel's last generation Ice Lake or Comet Lake-U series.
The 65 W AC adapter is small (~8.8 x 5 x 2.8 cm) and capable of recharging the laptop at a decent rate when running extreme loads.
| Off / Standby | |
| Idle | |
| Load |
|
Key:
min: | |
| HP EliteBook 845 G7 Ryzen 7 Pro 4750U R7 PRO 4750U, Vega 7, Samsung SSD PM981a MZVLB256HBHQ, IPS, 1920x1080, 14" | HP EliteBook 845 G7-23Y60EA R5 PRO 4650U, Vega 6, Samsung PM991 MZVLQ256HAJD, IPS, 1920x1080, 14" | Lenovo ThinkPad T14-20UES00H00 R5 PRO 4650U, Vega 6, Samsung SSD PM981a MZVLB512HBJQ, IPS, 1920x1080, 14" | Dell Latitude 7410 i7-10610U, UHD Graphics 620, Toshiba XG6 KXG60ZNV512G, IPS, 3840x2160, 14" | HP ProBook 445 G7 175W4EA R5 4500U, Vega 6, Samsung PM991 MZVLQ512HALU, IPS, 1920x1080, 14" | Huawei Matebook X Pro i5 i5-8250U, GeForce MX150, Samsung PM961 MZVLW256HEHP, IPS, 3000x2000, 13.9" | |
|---|---|---|---|---|---|---|
| Power Consumption | -5% | -53% | -27% | -16% | -48% | |
| Idle Minimum * (Watt) | 2.6 | 3.1 -19% | 5.8 -123% | 3.7 -42% | 3.5 -35% | 3.5 -35% |
| Idle Average * (Watt) | 5 | 5.6 -12% | 8.3 -66% | 6.2 -24% | 6.2 -24% | 8.9 -78% |
| Idle Maximum * (Watt) | 5.6 | 8.6 -54% | 11 -96% | 7 -25% | 8.8 -57% | 12.3 -120% |
| Load Average * (Watt) | 39.8 | 28.4 29% | 39.5 1% | 43.2 -9% | 30 25% | 54.2 -36% |
| Witcher 3 ultra * (Watt) | 37.1 | 42.4 -14% | ||||
| Load Maximum * (Watt) | 49.9 | 35.4 29% | 40.8 18% | 68.6 -37% | 45 10% | 52.1 -4% |
* ... smaller is better
Battery Life
Expect around 13 hours of real-world WLAN use when running on battery power. The system can be recharged via USB-C or the proprietary AC barrel port.
| HP EliteBook 845 G7 Ryzen 7 Pro 4750U R7 PRO 4750U, Vega 7, 53 Wh | HP EliteBook 845 G7-23Y60EA R5 PRO 4650U, Vega 6, 56 Wh | Lenovo ThinkPad T14-20UES00H00 R5 PRO 4650U, Vega 6, 50 Wh | Dell Latitude 7410 i7-10610U, UHD Graphics 620, 68 Wh | HP ProBook 445 G7 175W4EA R5 4500U, Vega 6, 45 Wh | Huawei Matebook X Pro i5 i5-8250U, GeForce MX150, 57.4 Wh | |
|---|---|---|---|---|---|---|
| Battery runtime | -8% | -37% | -17% | -35% | -30% | |
| WiFi v1.3 (h) | 13.3 | 12.2 -8% | 8.4 -37% | 11 -17% | 8.7 -35% | 9.3 -30% |
| Reader / Idle (h) | 16.2 | 31.3 | 12.4 | 20.7 | ||
| Load (h) | 2.3 | 1.2 | 2.9 | 1.6 | 2.2 |
Pros
Cons
Verdict
Laptops powered by the latest AMD Renoir CPUs deserve more attention than they're getting simply because they're outperforming the usual Intel options at the same price or less especially in graphics performance. If the types of applications you run can benefit from additional physical cores or faster GPU performance, then a Ryzen 5 or Ryzen 7 configuration will be a no-brainer. It's a shame that HP doesn't include these same AMD options for more of its EliteBook models like on the Dragonfly or EliteBook 1030/1040 series.
As for the display, we believe the upgrade from 250-nit to 400-nit is worth considering mostly because it brings deeper and more accurate colors alongside the bump in brightness level. Battery life isn't significantly impacted and outdoor visibility will be a bit better as well. When configured correctly, the EliteBook 845 G7 gets almost everything right.
The EliteBook 845 G7 is the fastest 14-inch business laptop we've seen with an AMD processor. More manufacturers should follow on HP's footsteps and begin incorporating 6-core and 8-core Ryzen U-series options on a wider range of business Ultrabooks. If you absolutely must have Thunderbolt connectivity and an SD reader, however, then you'll have to look elsewhere.
HP EliteBook 845 G7 Ryzen 7 Pro 4750U
- 11/24/2020 v7 (old)
Allen Ngo
Price comparison
