Asus Zenbook S UX393JA Laptop Review: The Microsoft Surface Alternative
Last year's ZenBook S13 UX392 combined a Whiskey Lake-U CPU with a GeForce MX150 GPU in an attractive 16:9 form factor. This year's ZenBook S UX393 could have been a simple update, but Asus has gone the extra mile by completely redesigning the chassis and internals for a brand new look yet again. The UX393 makes the jump from 16:9 to 3:2 and foregoes the discrete Nvidia GPU for Intel Ice Lake and Iris Plus instead. Though aesthetically pleasing, there are a few key drawbacks to keep in mind before putting down $1600 to $1700 USD for such a machine.
Direct competitors to the ZenBook S13 UX393 include other flagship 3:2 like the Microsoft Surface Laptop 3 or Huawei MateBook X Pro. The 16:10 Dell XPS 13 or ThinkPad X1 Nano may also be seen as alternatives to the Asus.
More Asus reviews:
Rating | Date | Model | Weight | Height | Size | Resolution | Price |
|---|---|---|---|---|---|---|---|
| 85.1 % v7 (old) | 10 / 2020 | Asus Zenbook S UX393JA i7-1065G7, Iris Plus Graphics G7 (Ice Lake 64 EU) | 1.4 kg | 15.7 mm | 13.90" | 3300x2200 | |
| 86.9 % v7 (old) | 06 / 2020 | Microsoft Surface Book 3 13.5 i7-1065G7, GeForce GTX 1650 Max-Q | 1.6 kg | 23 mm | 13.50" | 3000x2000 | |
| 87.4 % v7 (old) | 06 / 2020 | Huawei MateBook X Pro 2020 i7 i7-10510U, GeForce MX250 | 1.3 kg | 14.6 mm | 13.90" | 3000x2000 | |
| 86.6 % v6 (old) | 05 / 2019 | Asus ZenBook S13 UX392FN i7-8565U, GeForce MX150 | 1.1 kg | 12.9 mm | 13.90" | 1920x1080 | |
| 84.4 % v7 (old) | 10 / 2020 | Lenovo Yoga Slim 7-14IIL05 i7-1065G7, GeForce MX350 | 1.4 kg | 14.9 mm | 14.00" | 1920x1080 | |
| 88.9 % v7 (old) | 03 / 2020 | Dell XPS 13 9300 Core i7-1065G7 i7-1065G7, Iris Plus Graphics G7 (Ice Lake 64 EU) | 1.2 kg | 14.8 mm | 13.40" | 1920x1200 |
Case
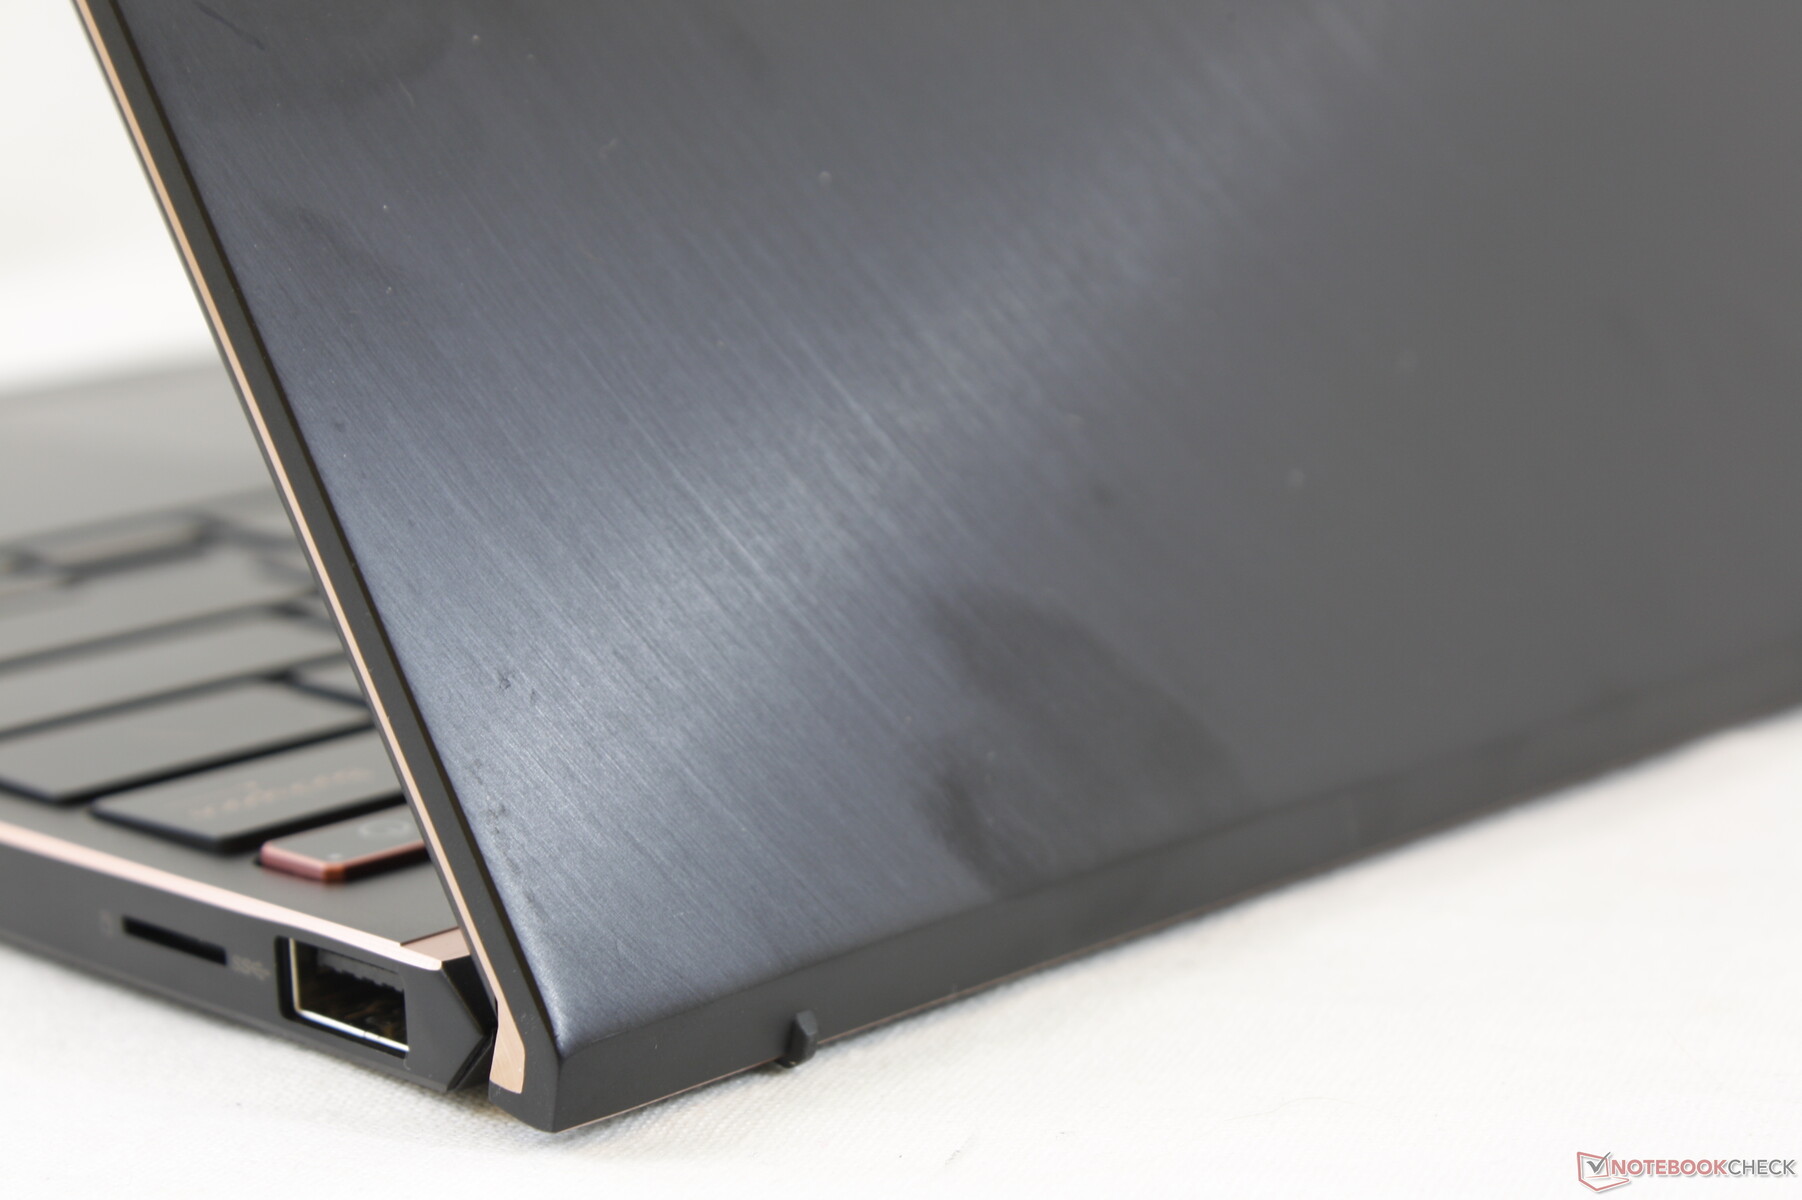
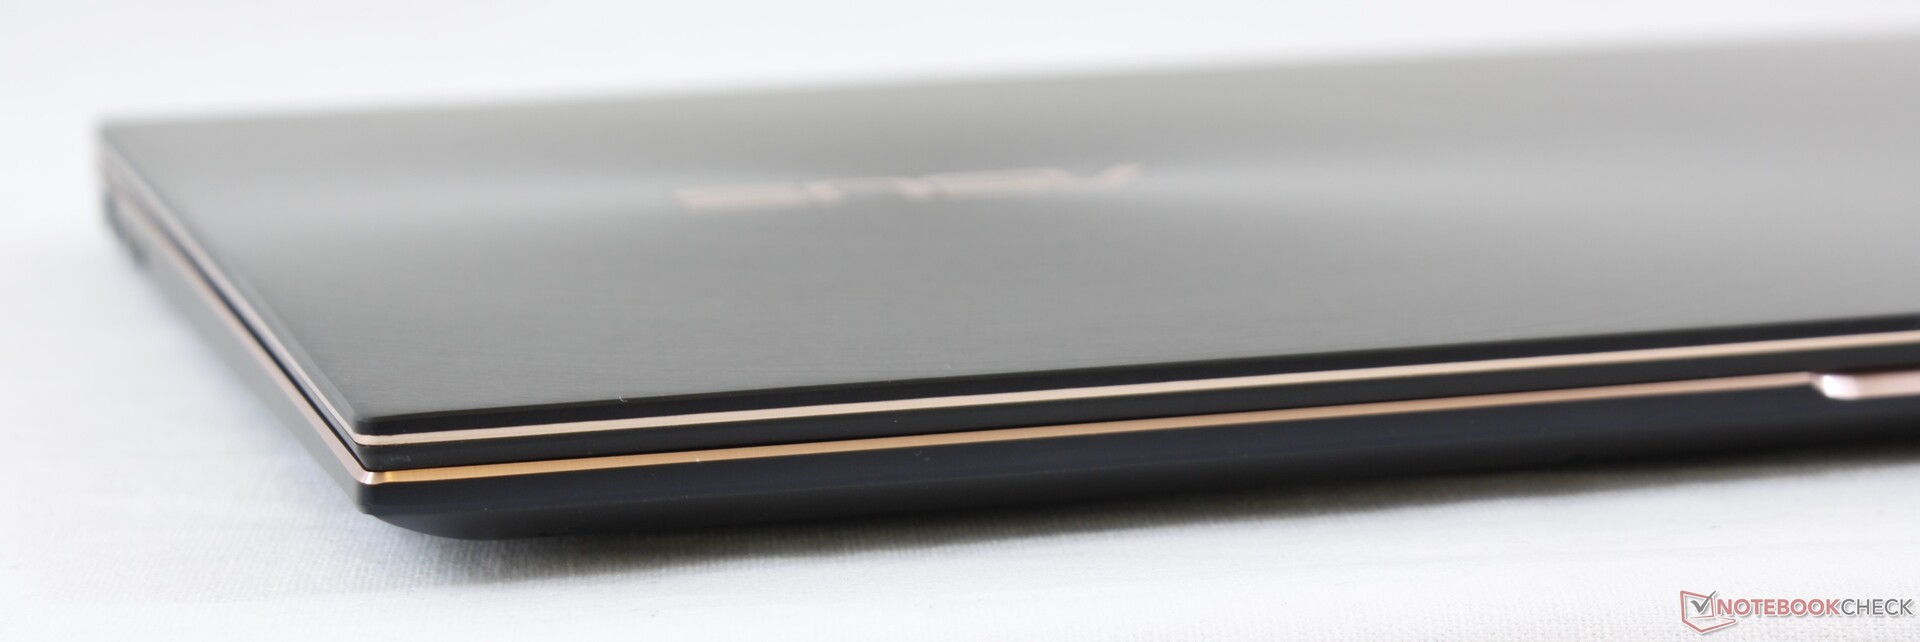
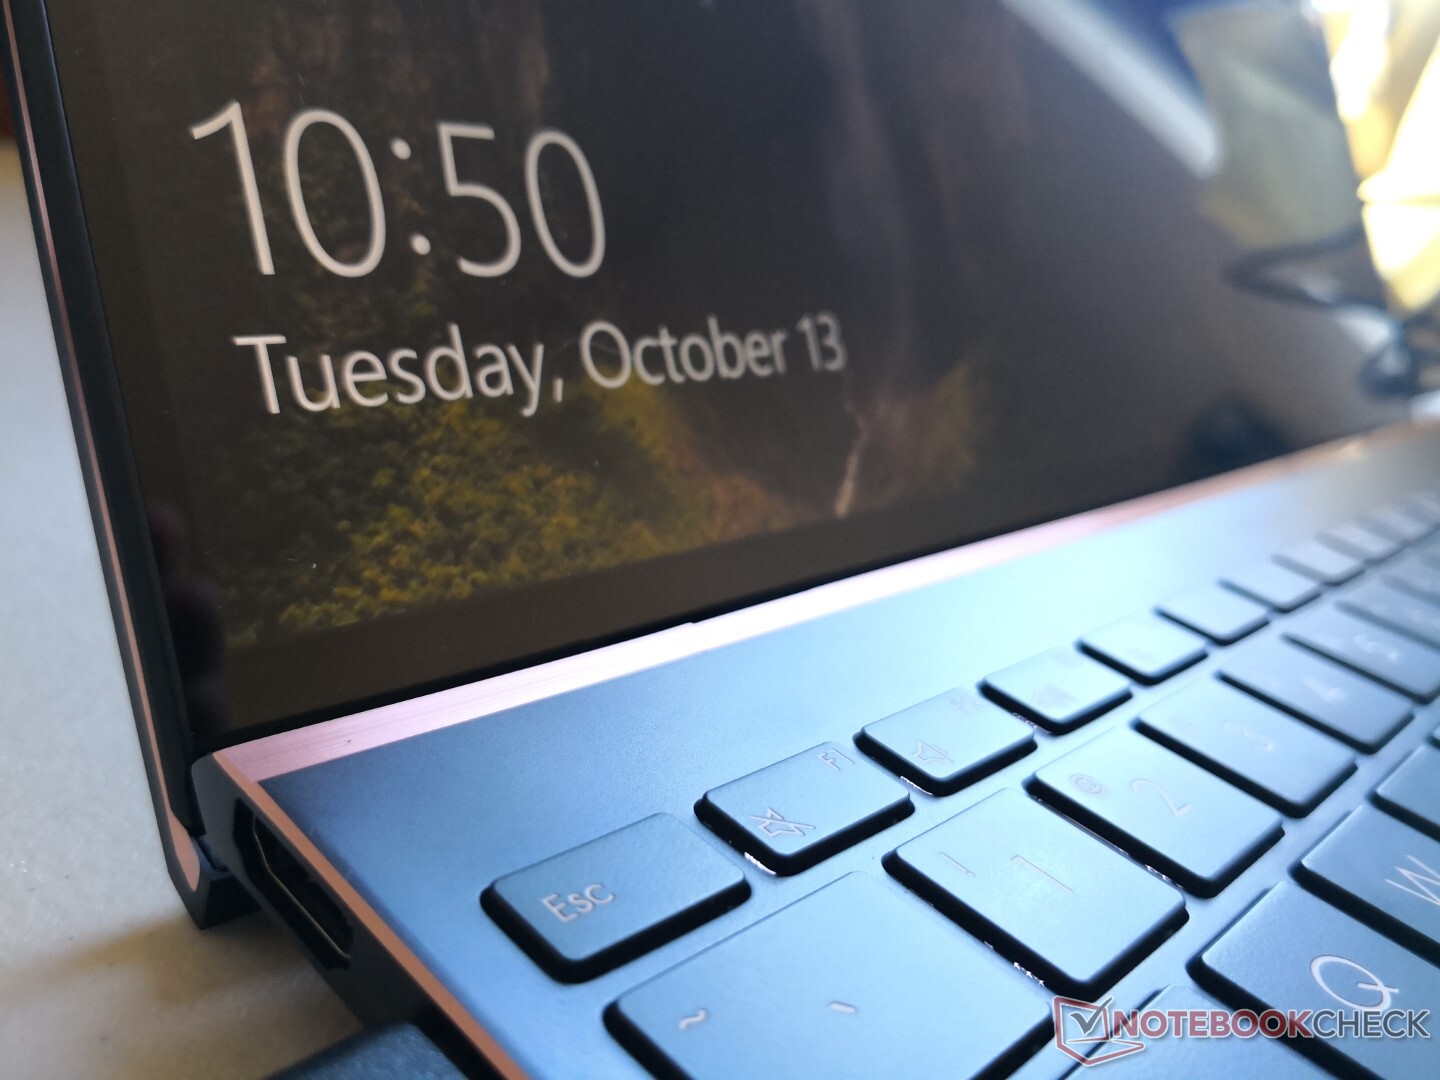
The metal chassis is firm and rigid with no creaking and only minimal warping when attempting to twist its corners. Our main complaint involves the hinges which feel weaker at wider angles. Ideally, hinge rigidity should be taut and uniform at all angles, but the hinges here don't give a strong sense of longevity in this regard.
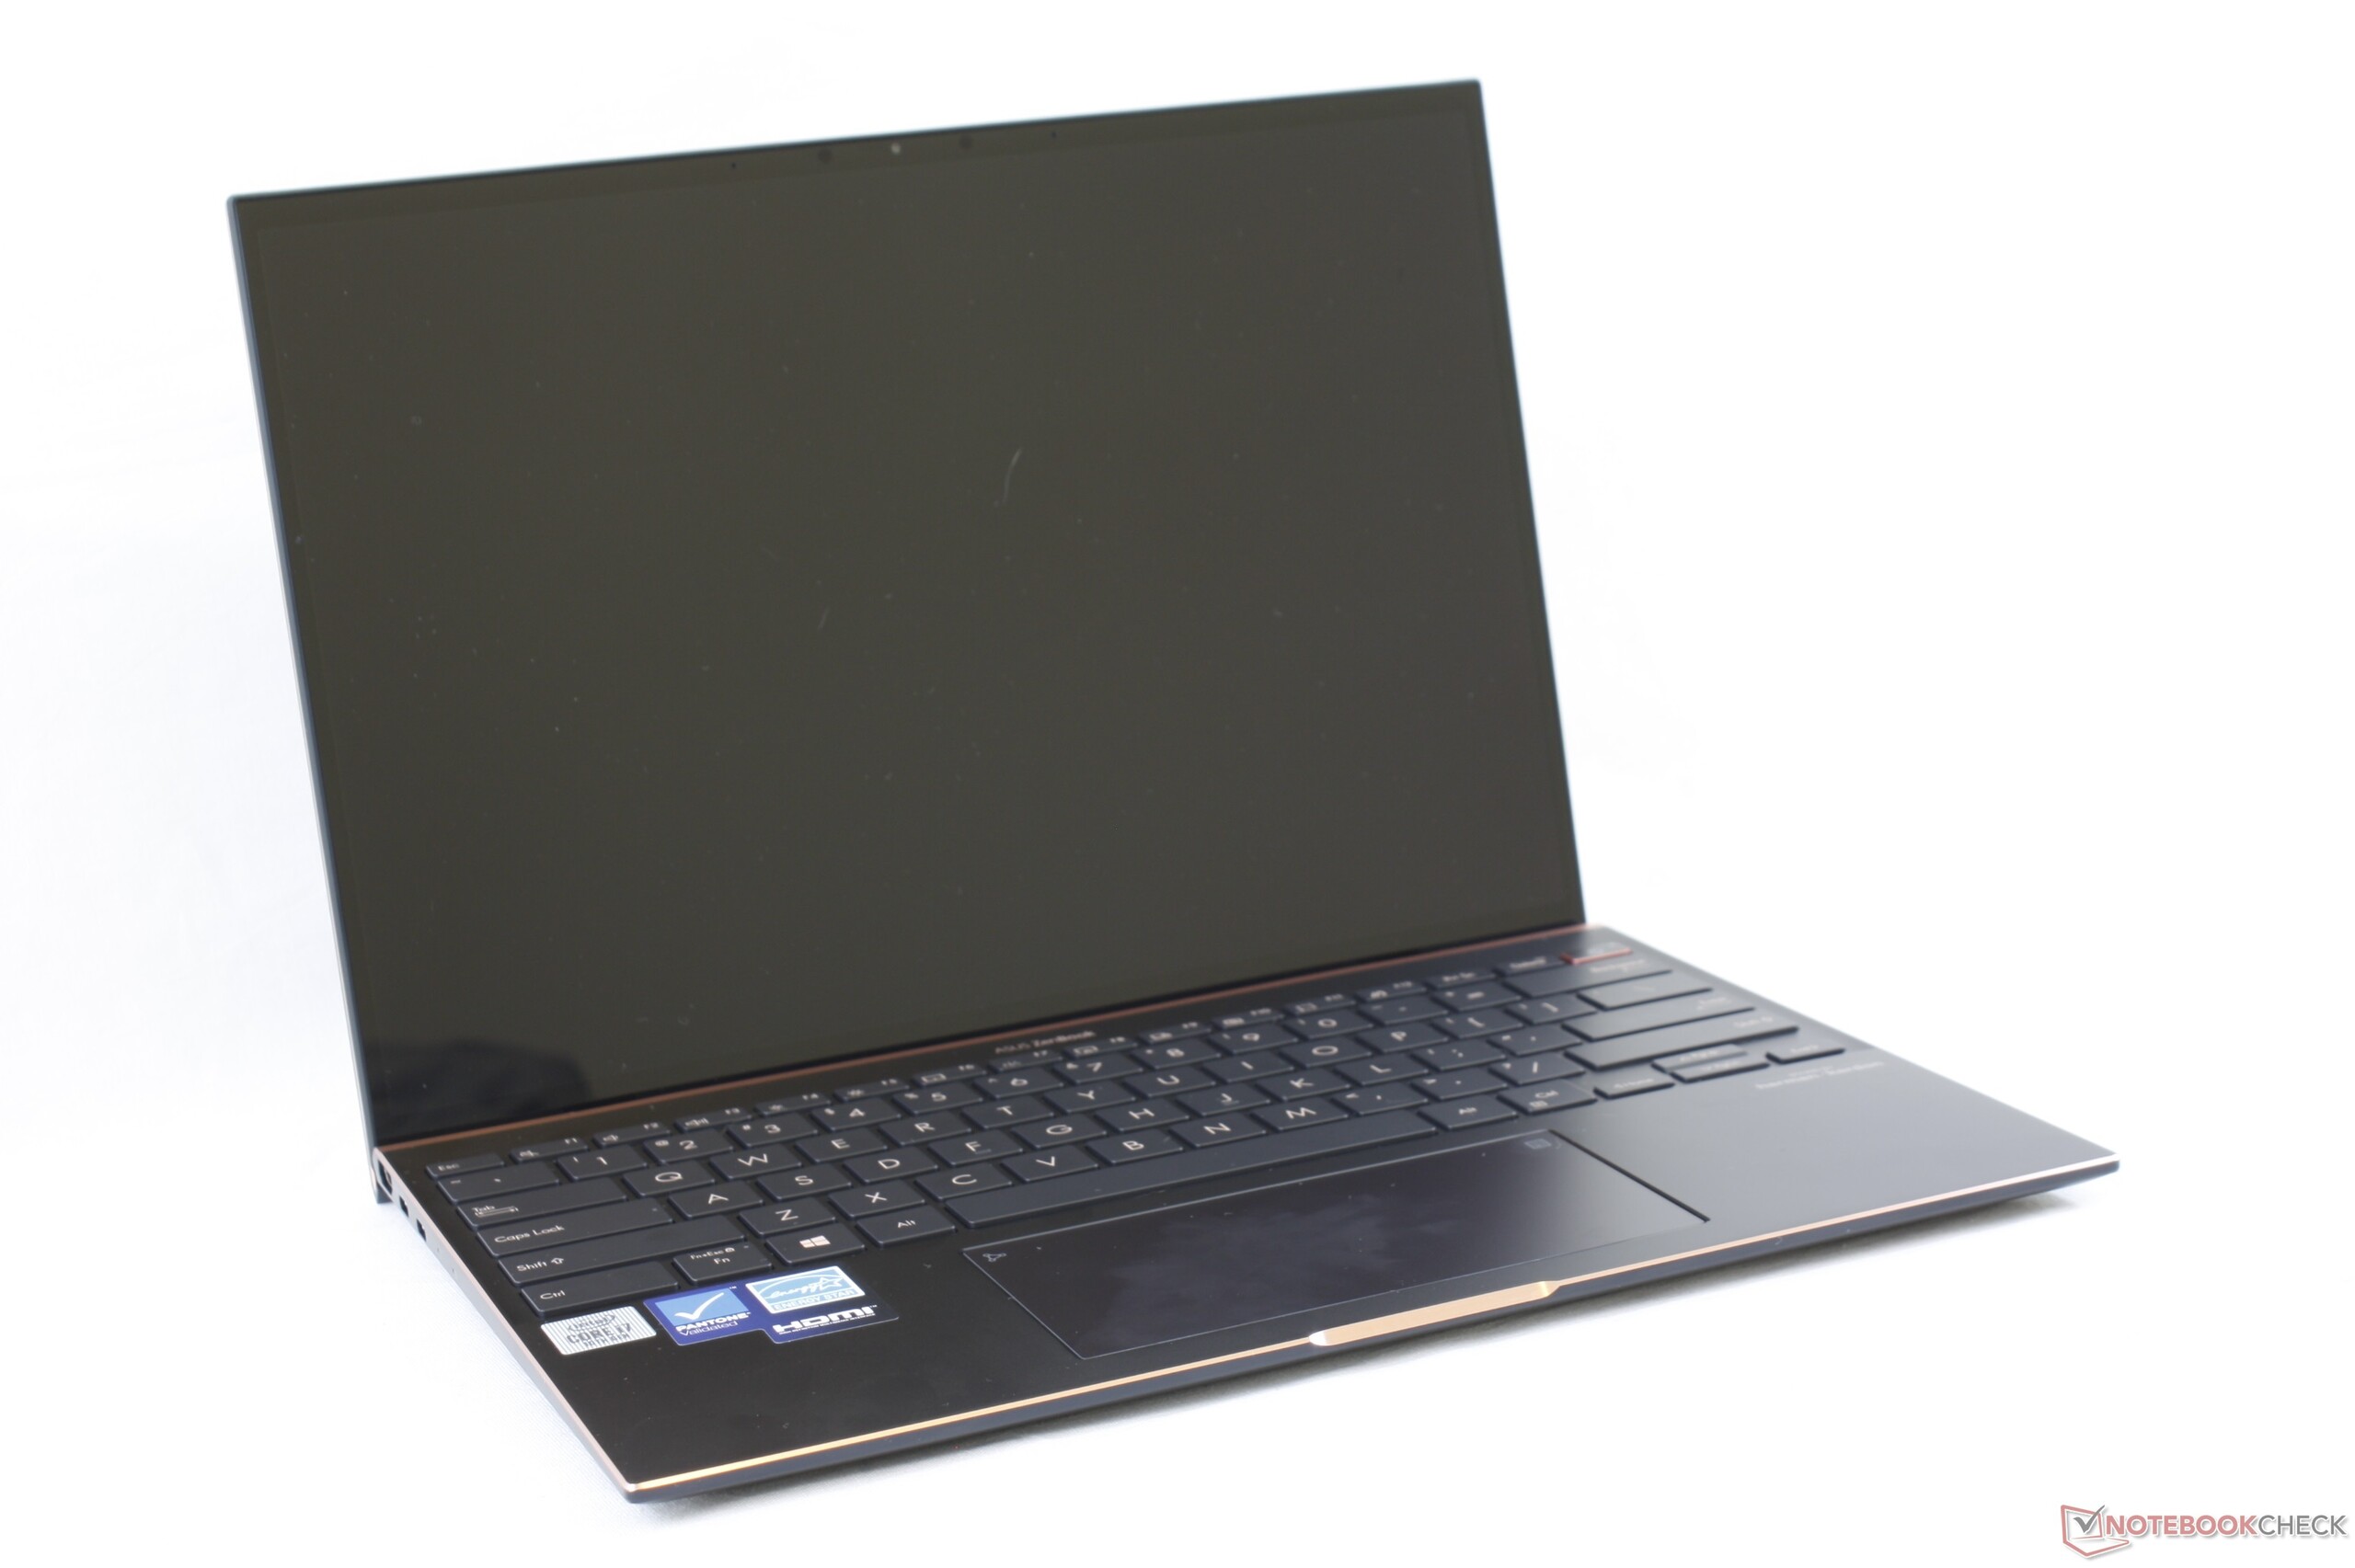
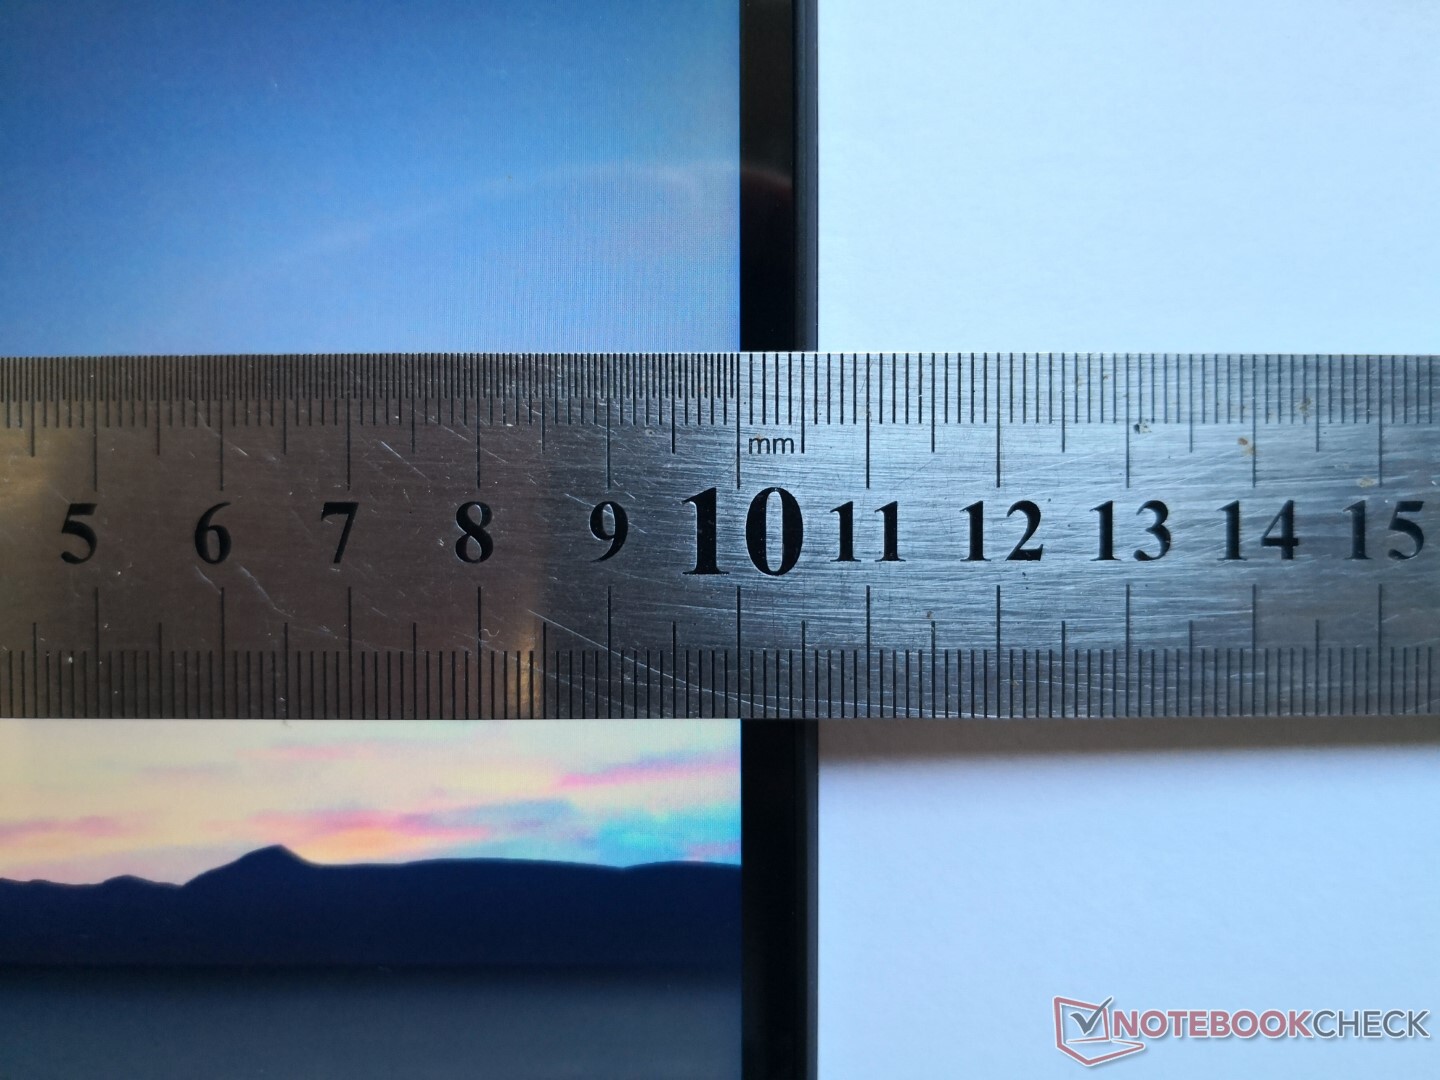
The move from 16:9 to 3:2 has resulted in a larger, heavier, and thicker build than the UX392. Overall dimensions and weight are actually much closer to the 13.5-inch Surface Laptop 3 or MateBook X Pro and so this is still a compact subnotebook relative to its closest competitors.
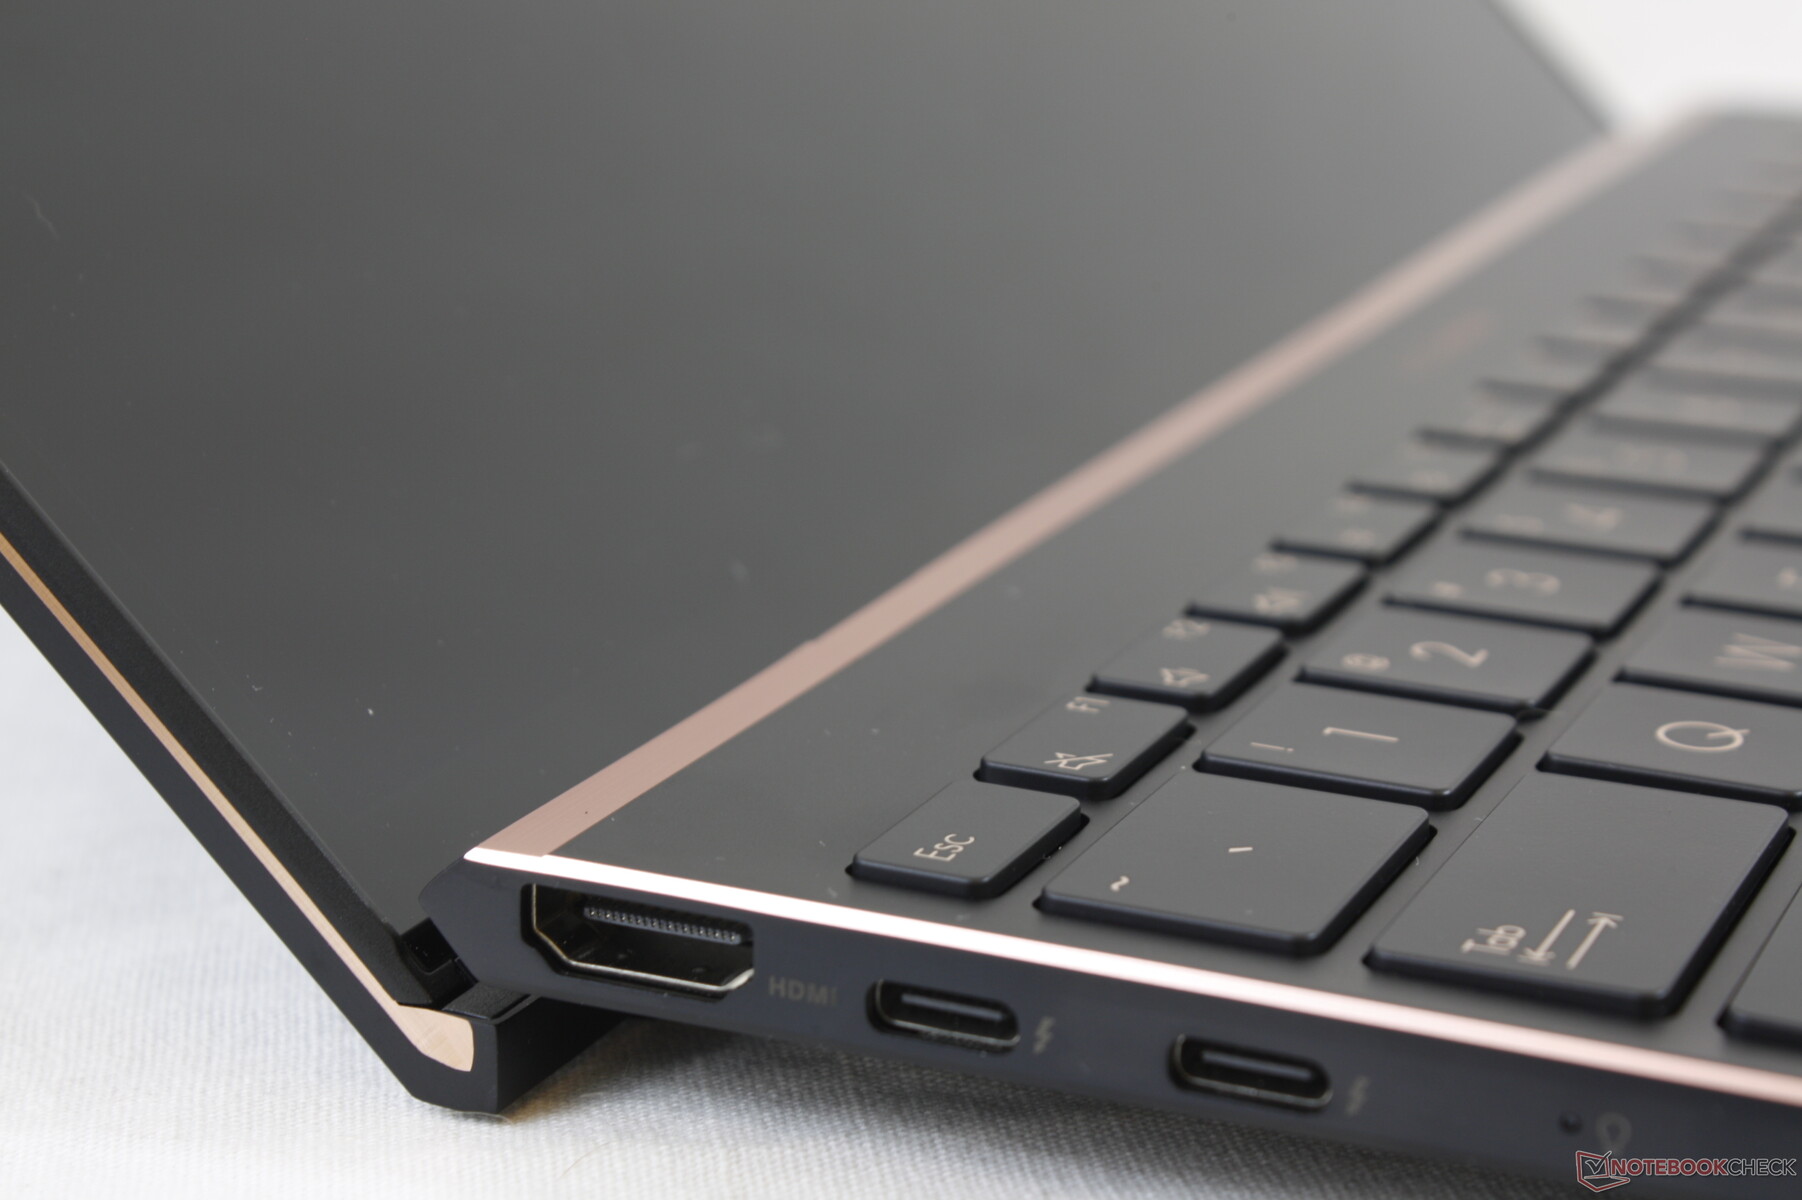
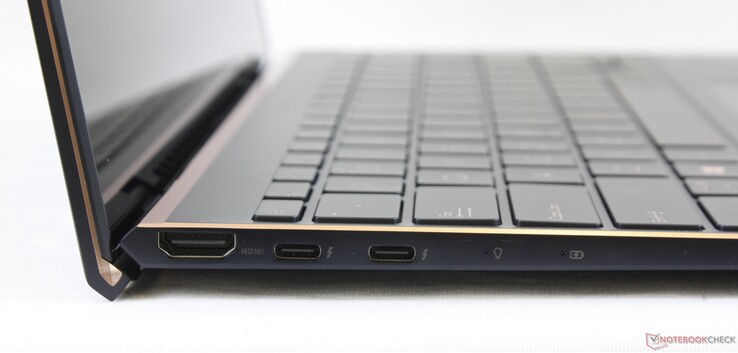
Connectivity
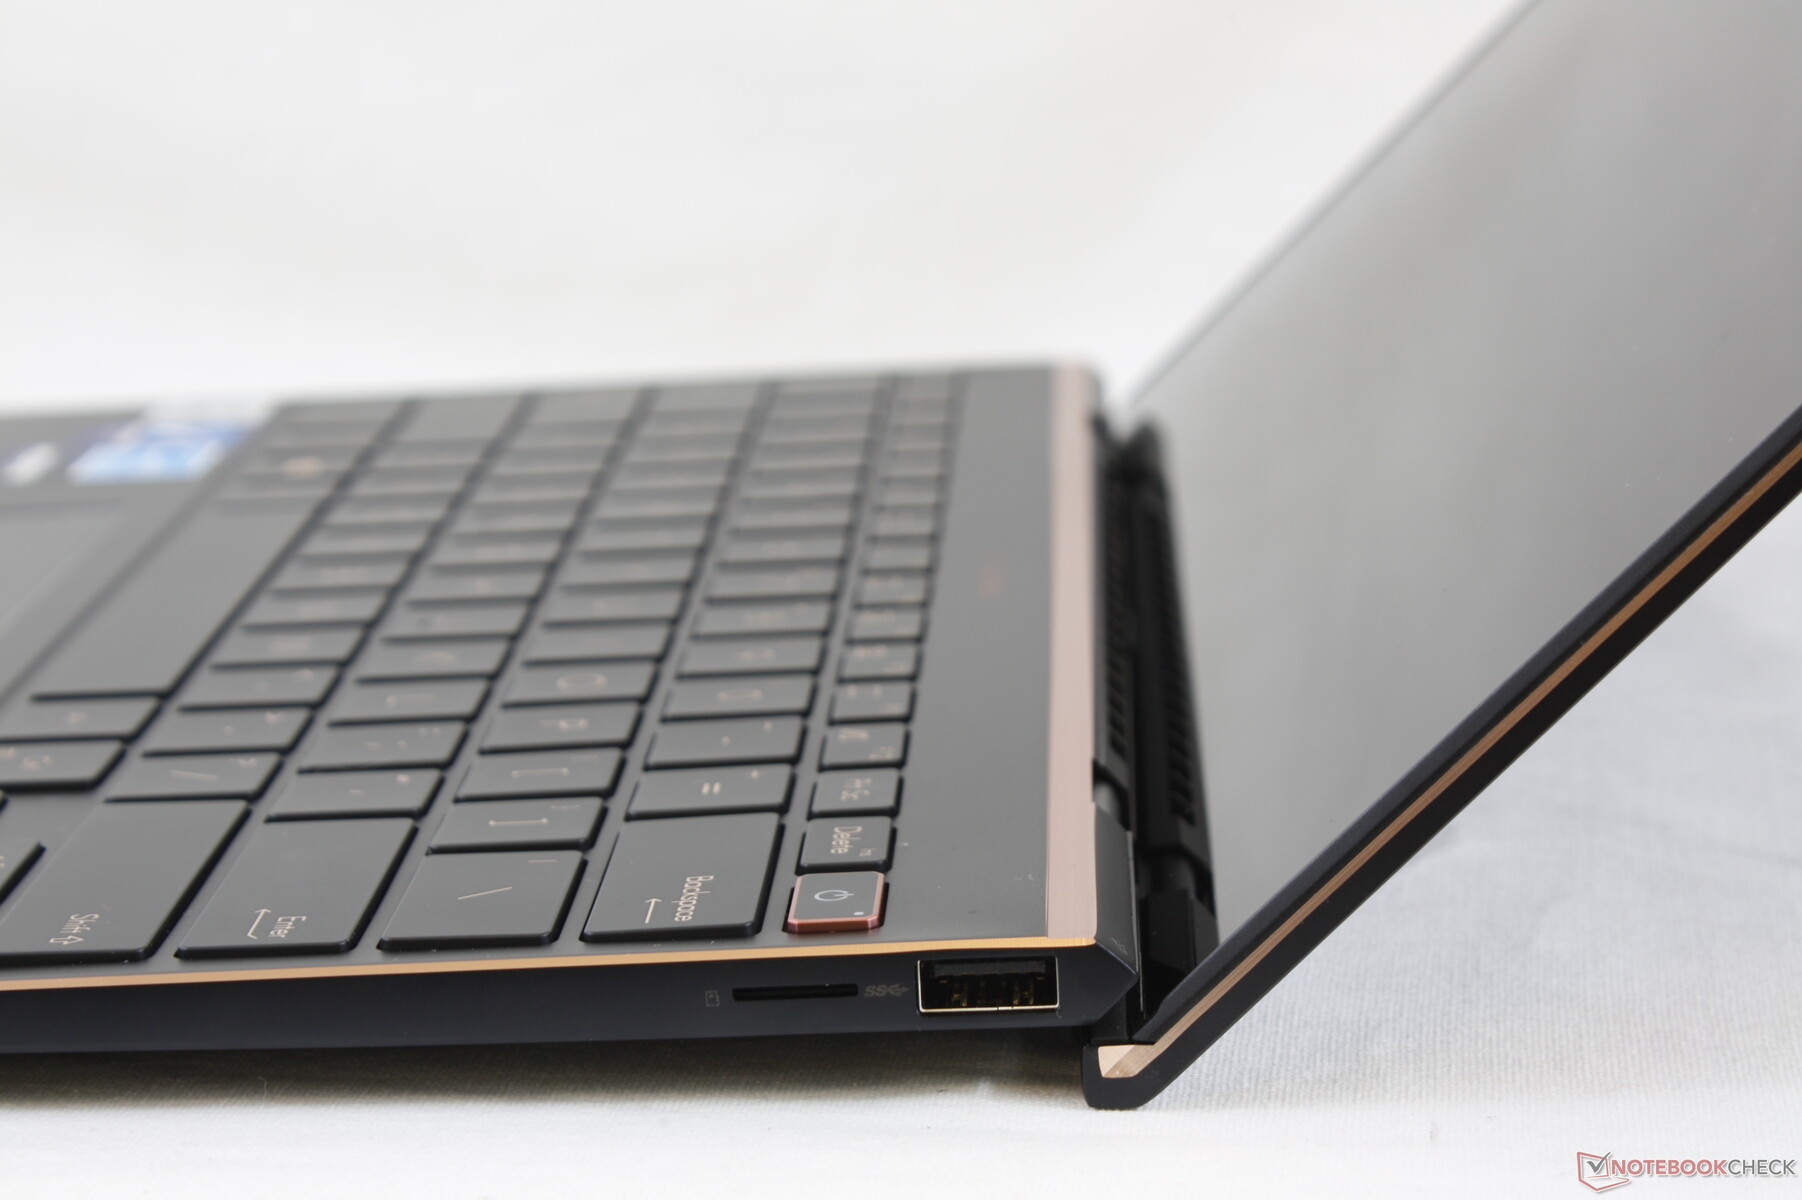
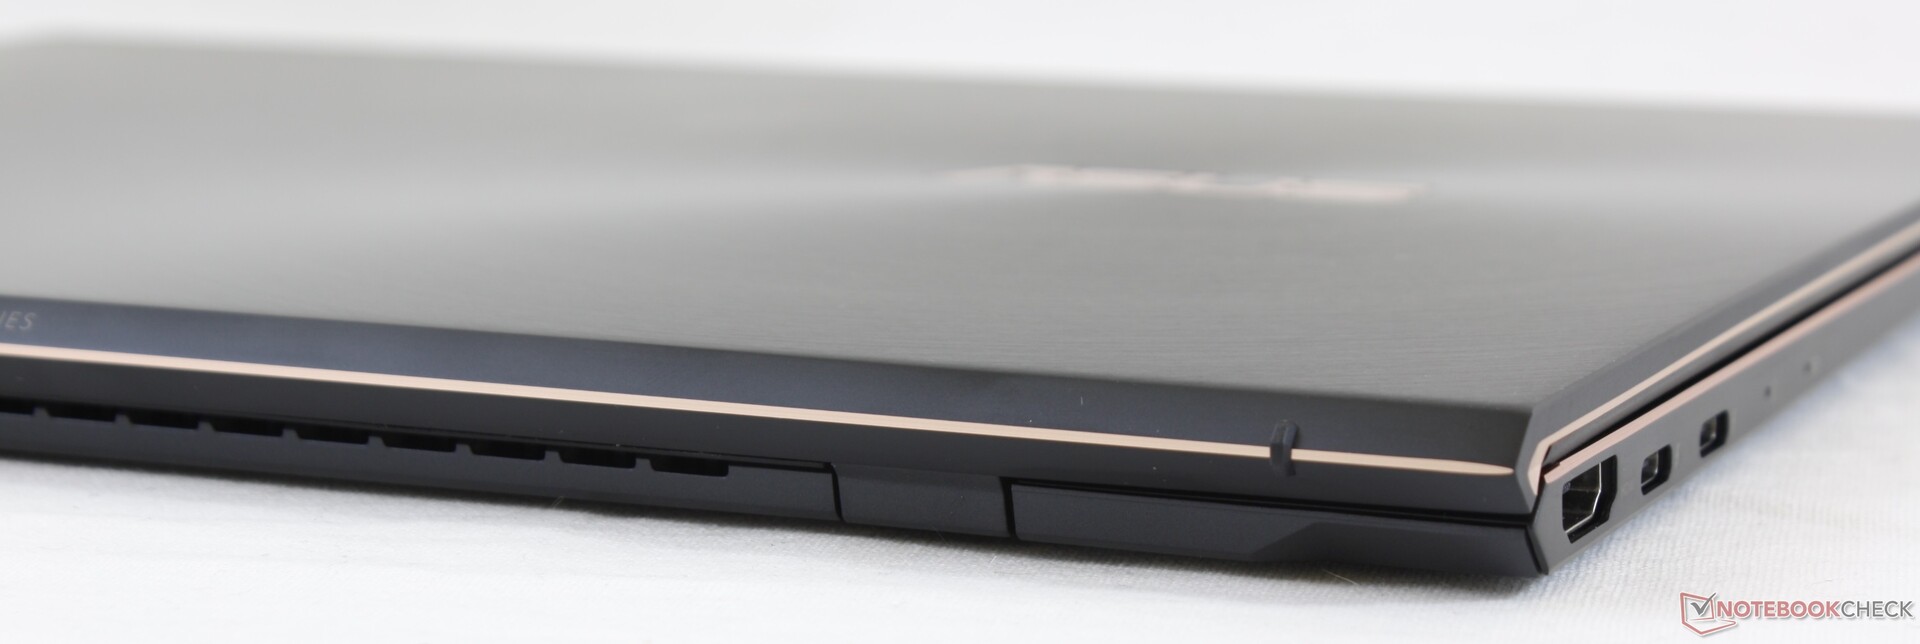
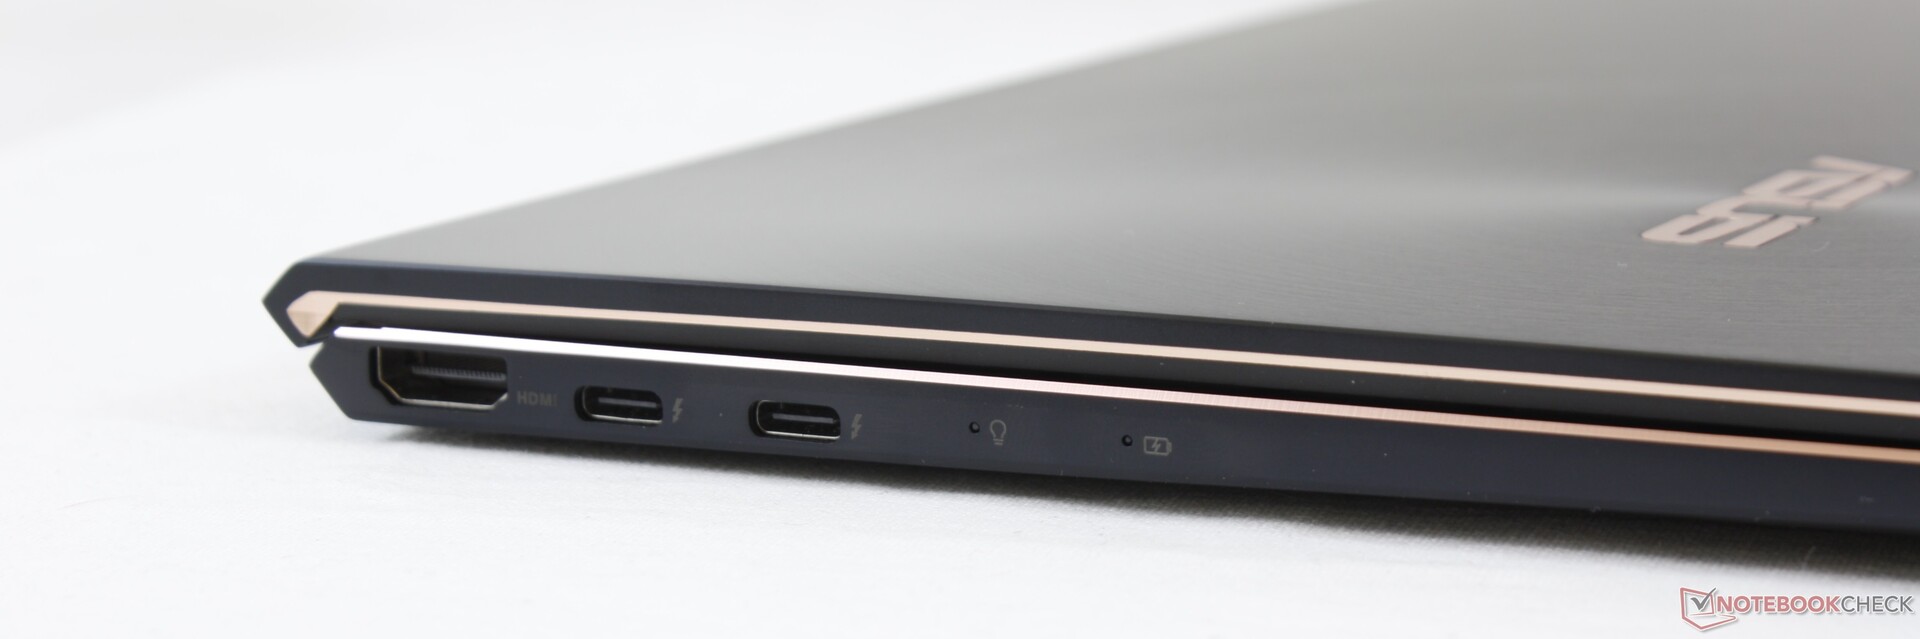
Port options are similar to the older UX392 but with two important differences. Firstly, Asus has dropped the 3.5 mm audio jack meaning owners will have to rely on Bluetooth headphones or the included USB-C to 3.5 mm audio adapter. Secondly, the two USB-C ports are now Thunderbolt 3 compatible for a wider range of external docking options and monitors.
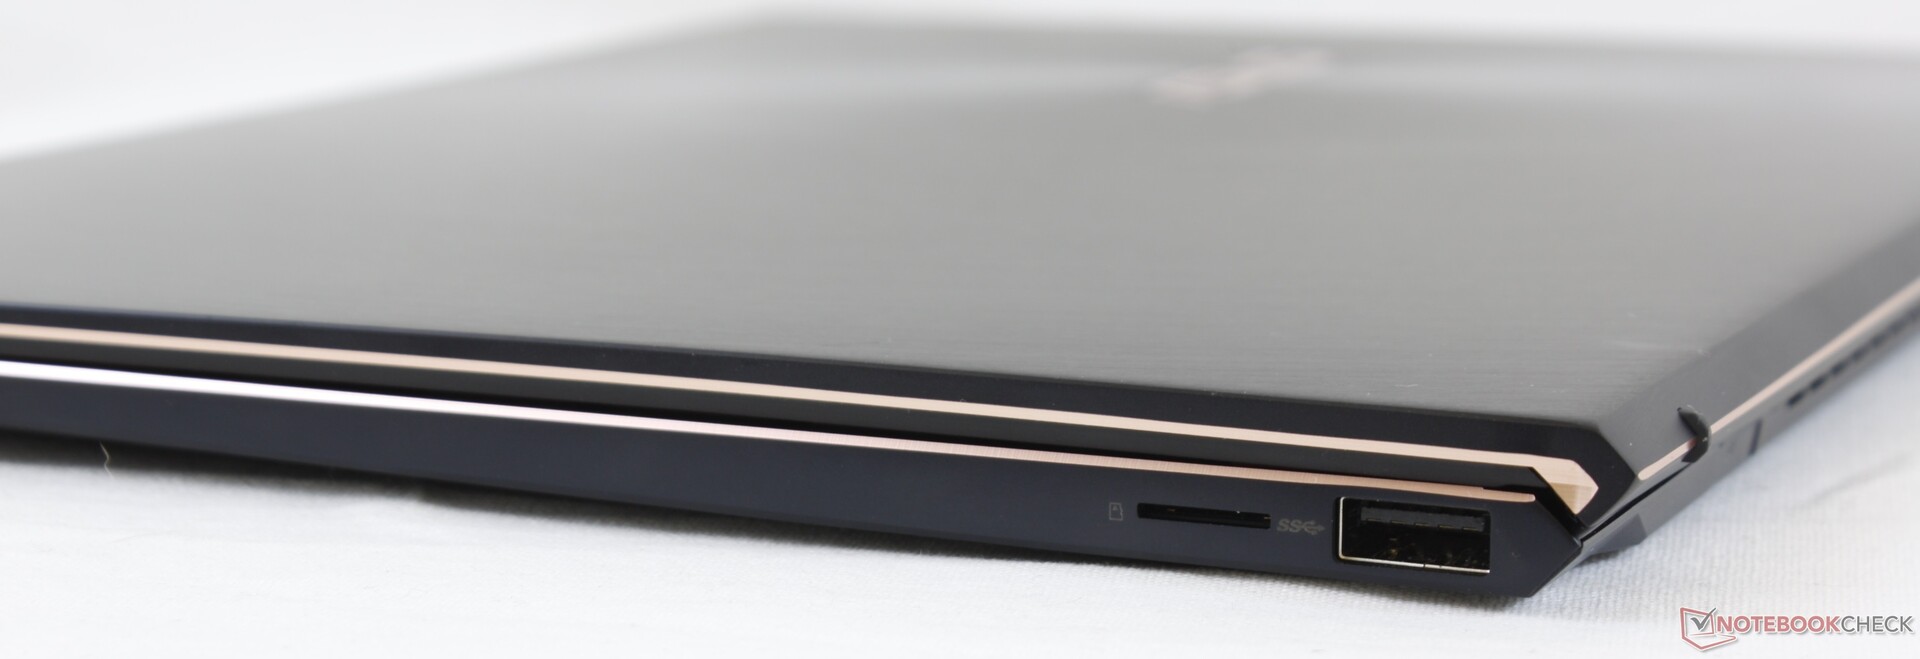
SD Card Reader
Transfer rates from the MicroSD reader are slower than the card reader on the older UX392 by half. Moving 1 GB of pictures from our UHS-II test card to desktop takes almost 30 seconds.
| SD Card Reader | |
| average JPG Copy Test (av. of 3 runs) | |
| Dell XPS 13 9300 Core i7-1065G7 (Toshiba Exceria Pro M501 64 GB UHS-II) | |
| Microsoft Surface Book 3 13.5 (Toshiba Exceria Pro M501 microSDXC 64GB) | |
| Asus ZenBook S13 UX392FN (Toshiba Exceria Pro M501 64 GB UHS-II) | |
| Asus Zenbook S UX393JA (Toshiba Exceria Pro M501 64 GB UHS-II) | |
| Lenovo Yoga Slim 7-14IIL05 (Toshiba Exceria Pro M501 64 GB UHS-II) | |
| maximum AS SSD Seq Read Test (1GB) | |
| Microsoft Surface Book 3 13.5 (Toshiba Exceria Pro M501 microSDXC 64GB) | |
| Dell XPS 13 9300 Core i7-1065G7 (Toshiba Exceria Pro M501 64 GB UHS-II) | |
| Asus ZenBook S13 UX392FN (Toshiba Exceria Pro M501 64 GB UHS-II) | |
| Asus Zenbook S UX393JA (Toshiba Exceria Pro M501 64 GB UHS-II) | |
| Lenovo Yoga Slim 7-14IIL05 (Toshiba Exceria Pro M501 64 GB UHS-II) | |
Communication
The AX201 comes standard for Wi-Fi 6 connectivity. Though we didn't experience any issues when connected to our Netgear RAX200 test router, average transmit speeds are slower than expected at only about 822 Mbps.
Webcam

, i7-1065G7, Intel SSD 660p 1TB SSDPEKNW010T8")
, i7-1065G7, Intel SSD 660p 1TB SSDPEKNW010T8")
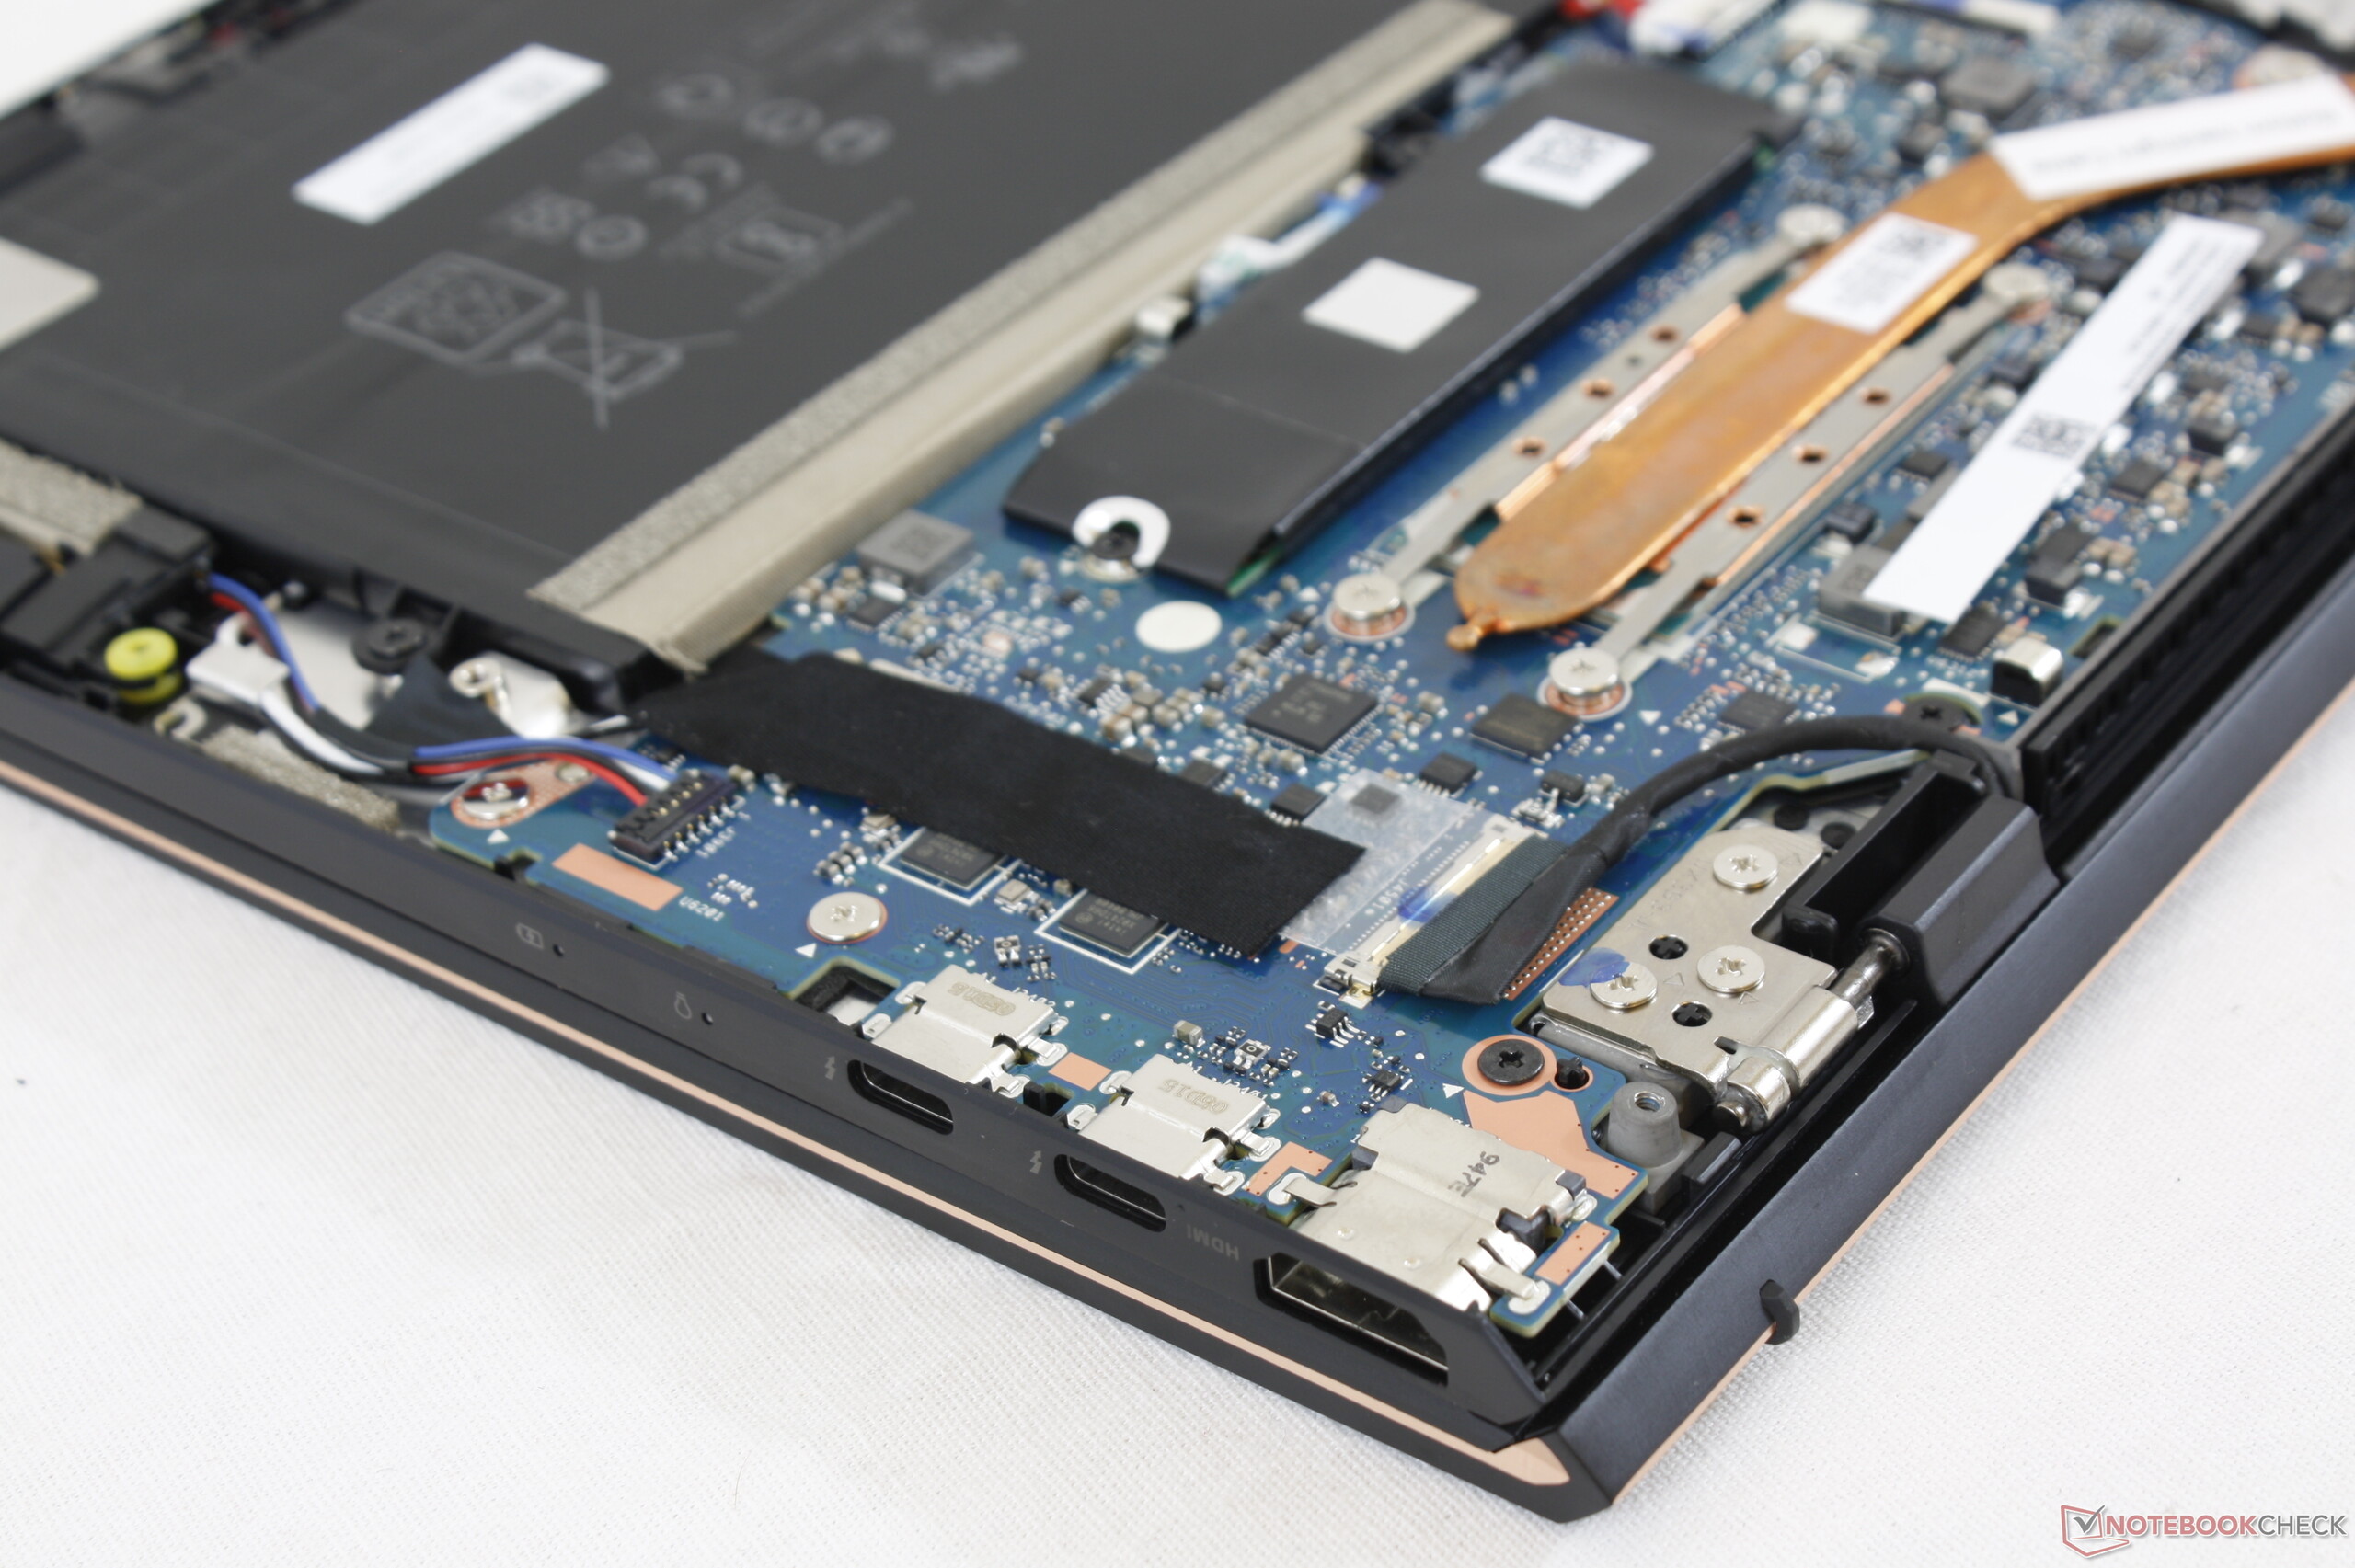
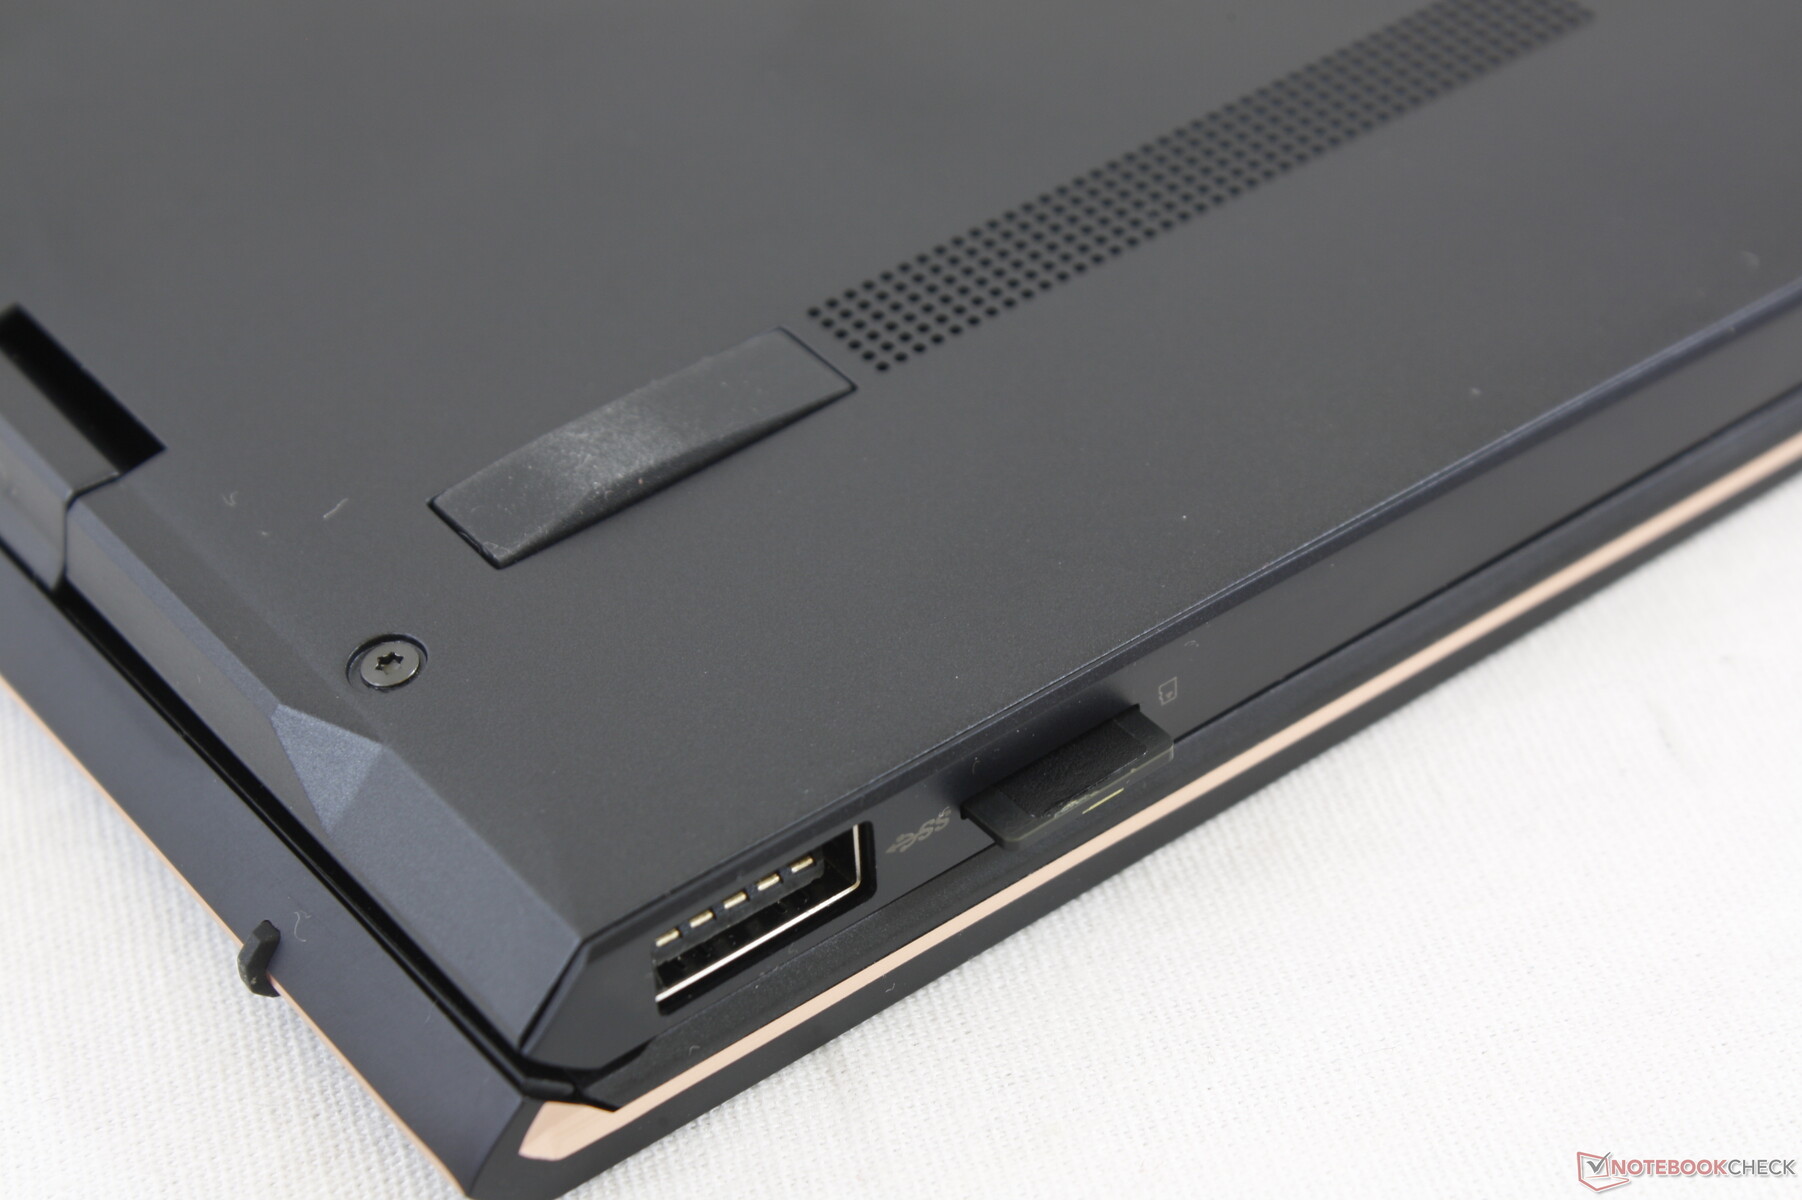
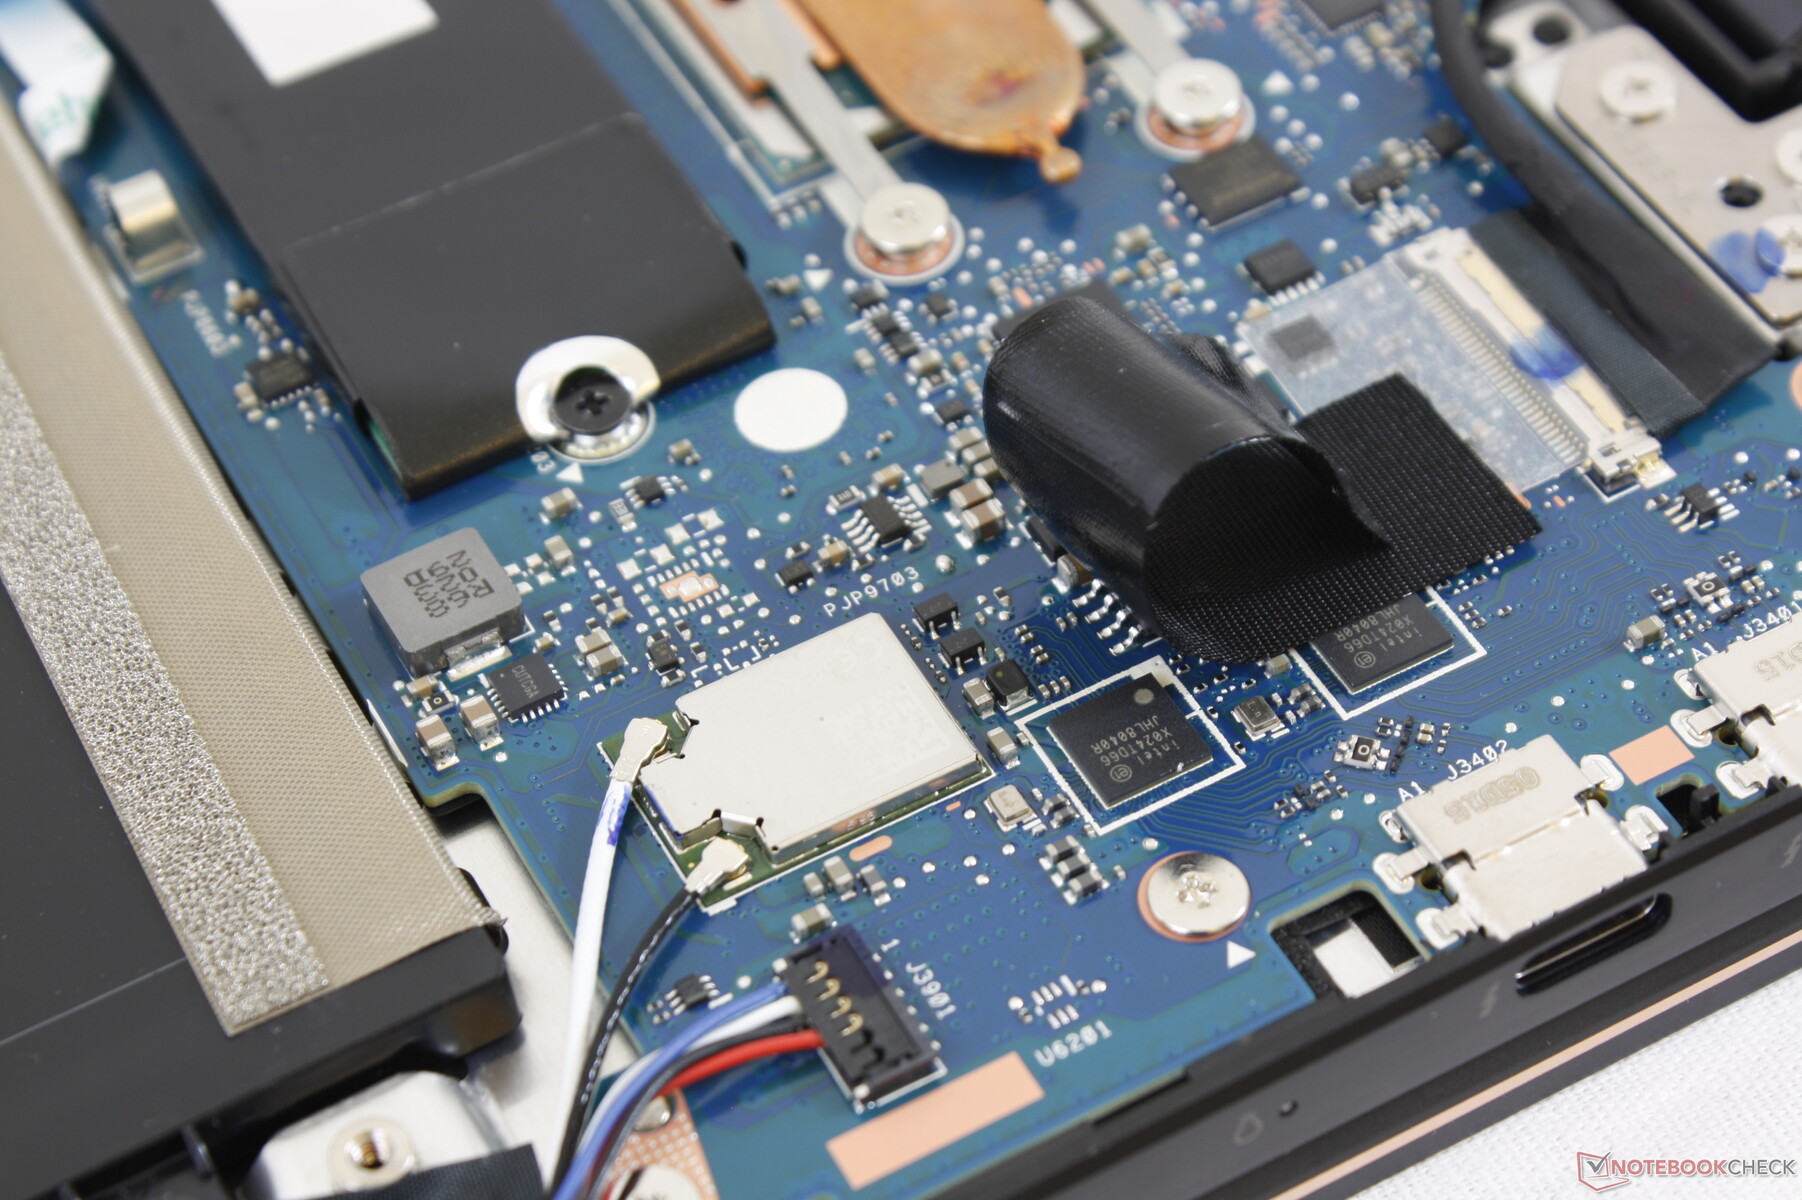
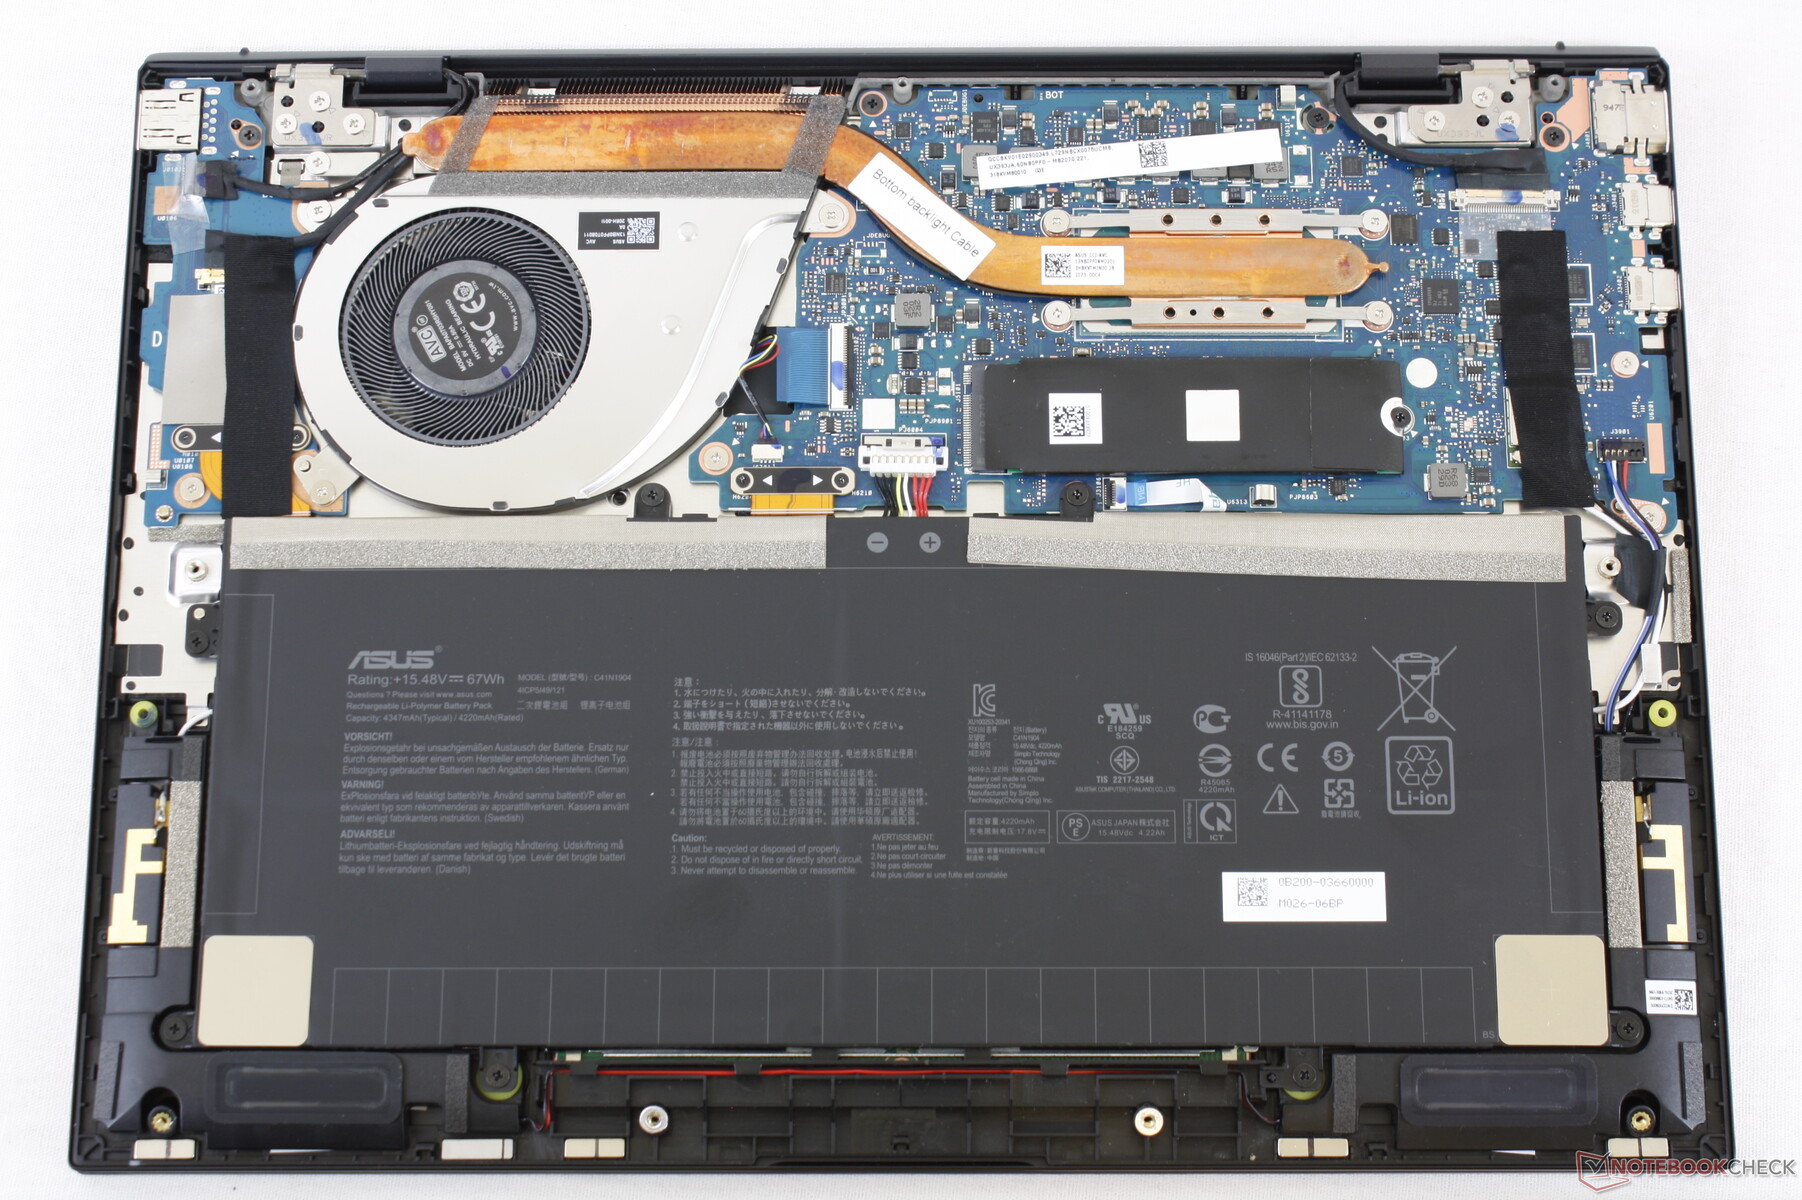
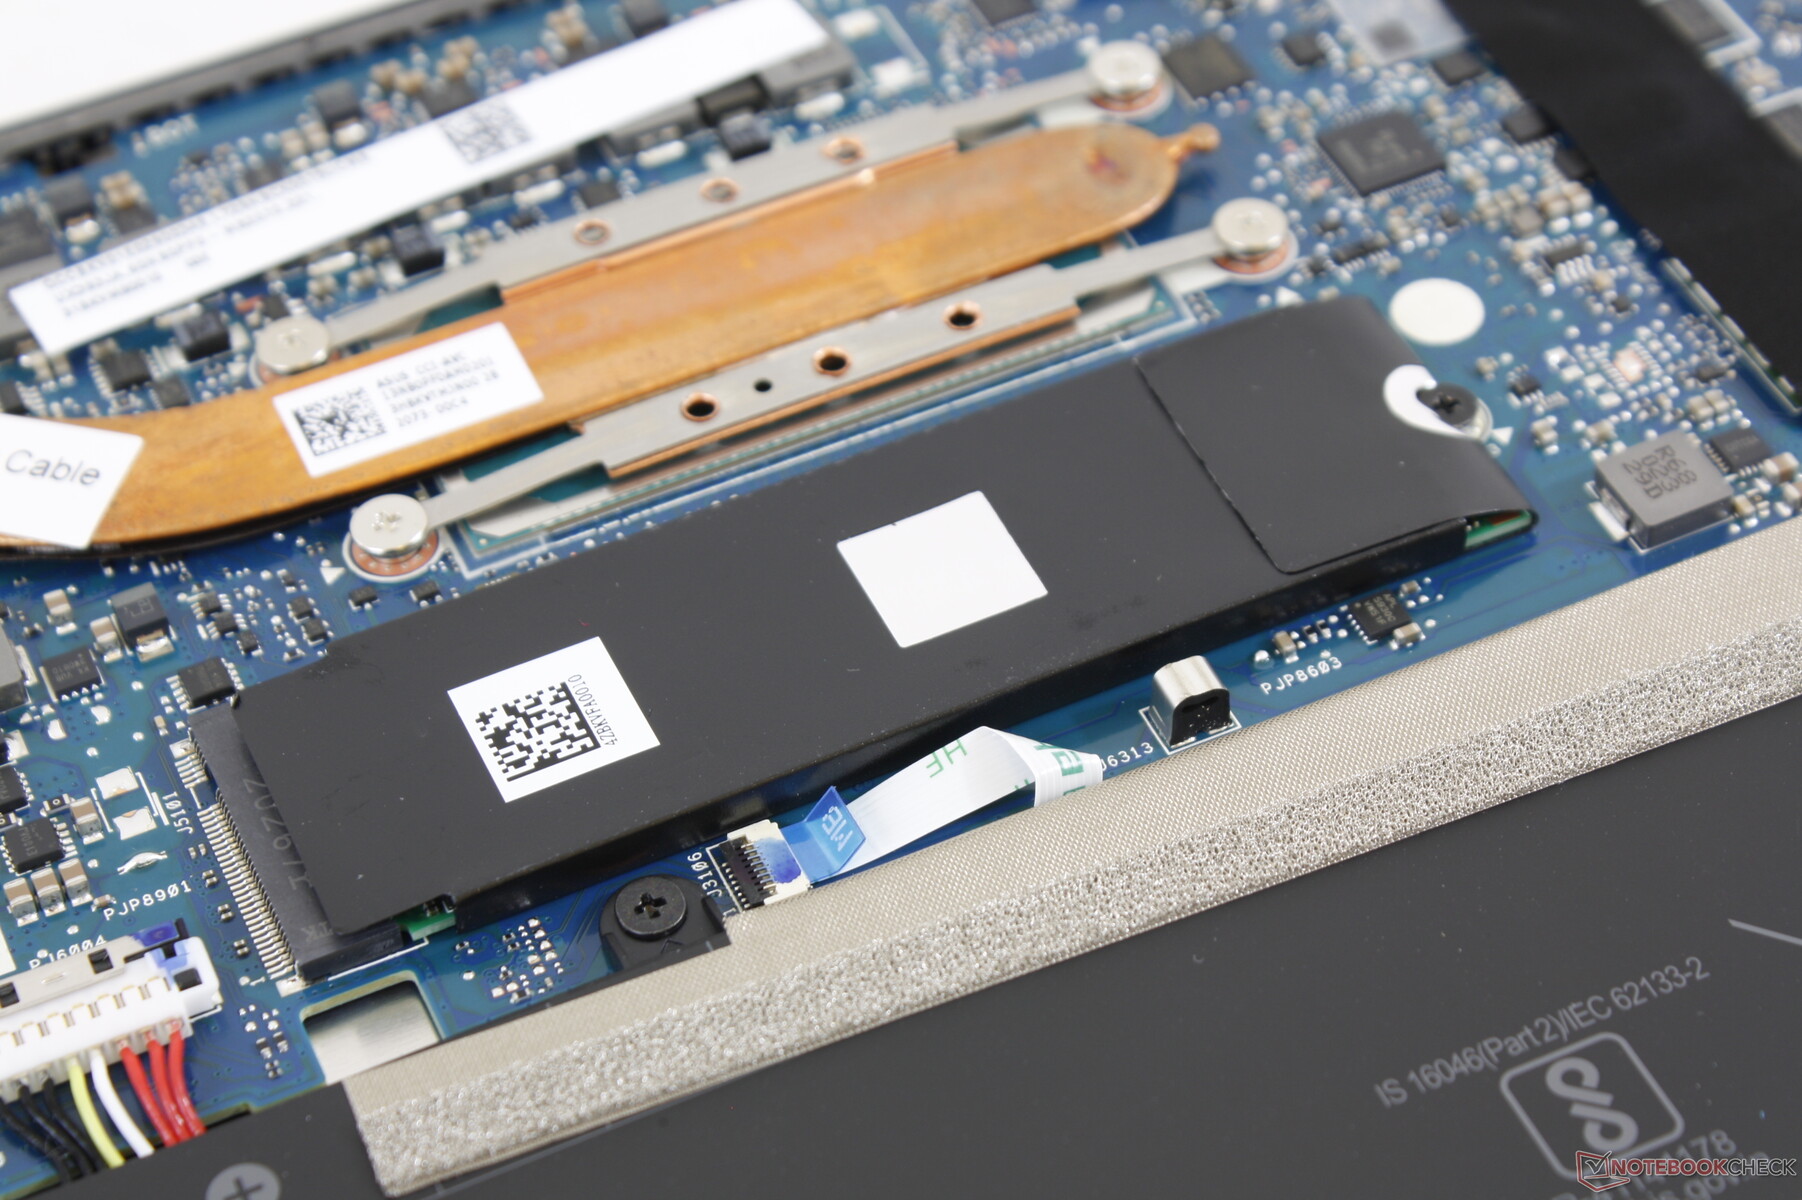
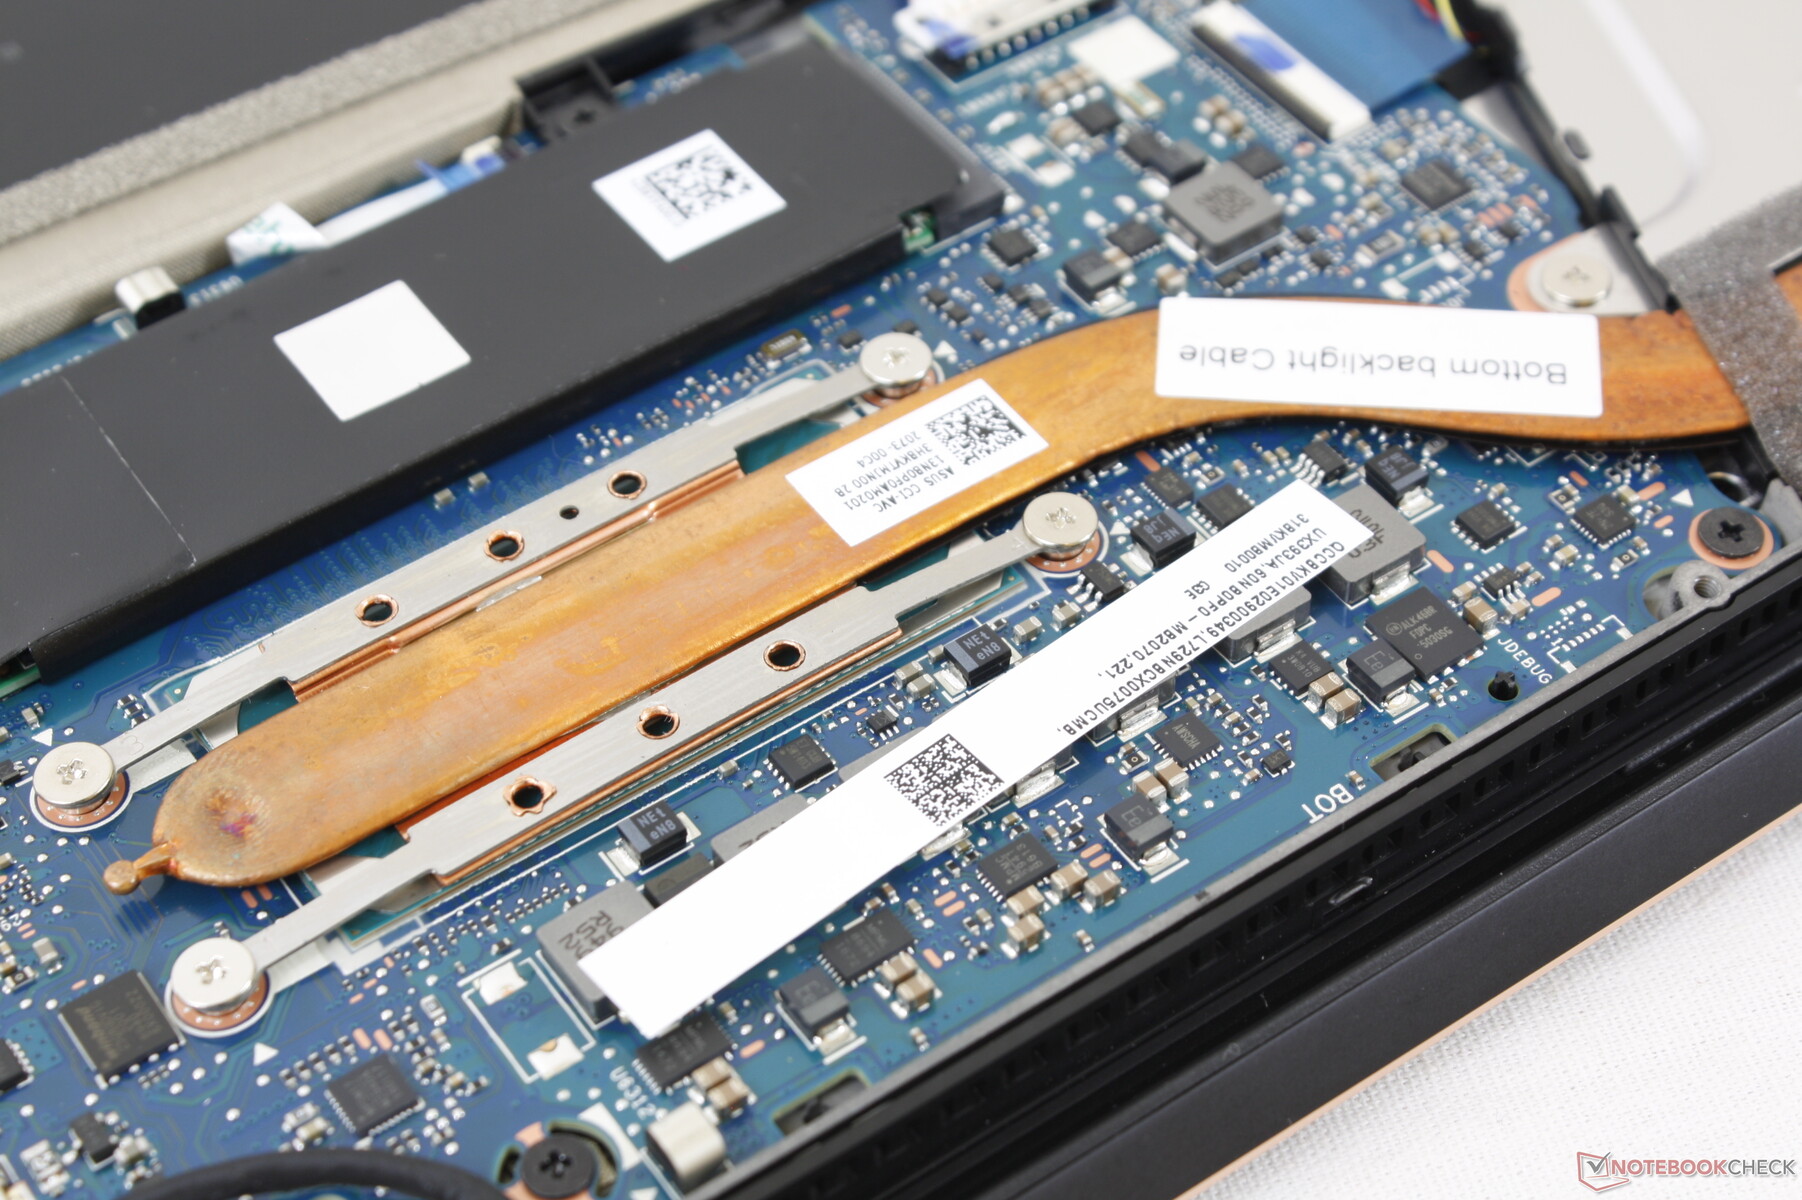
Maintenance
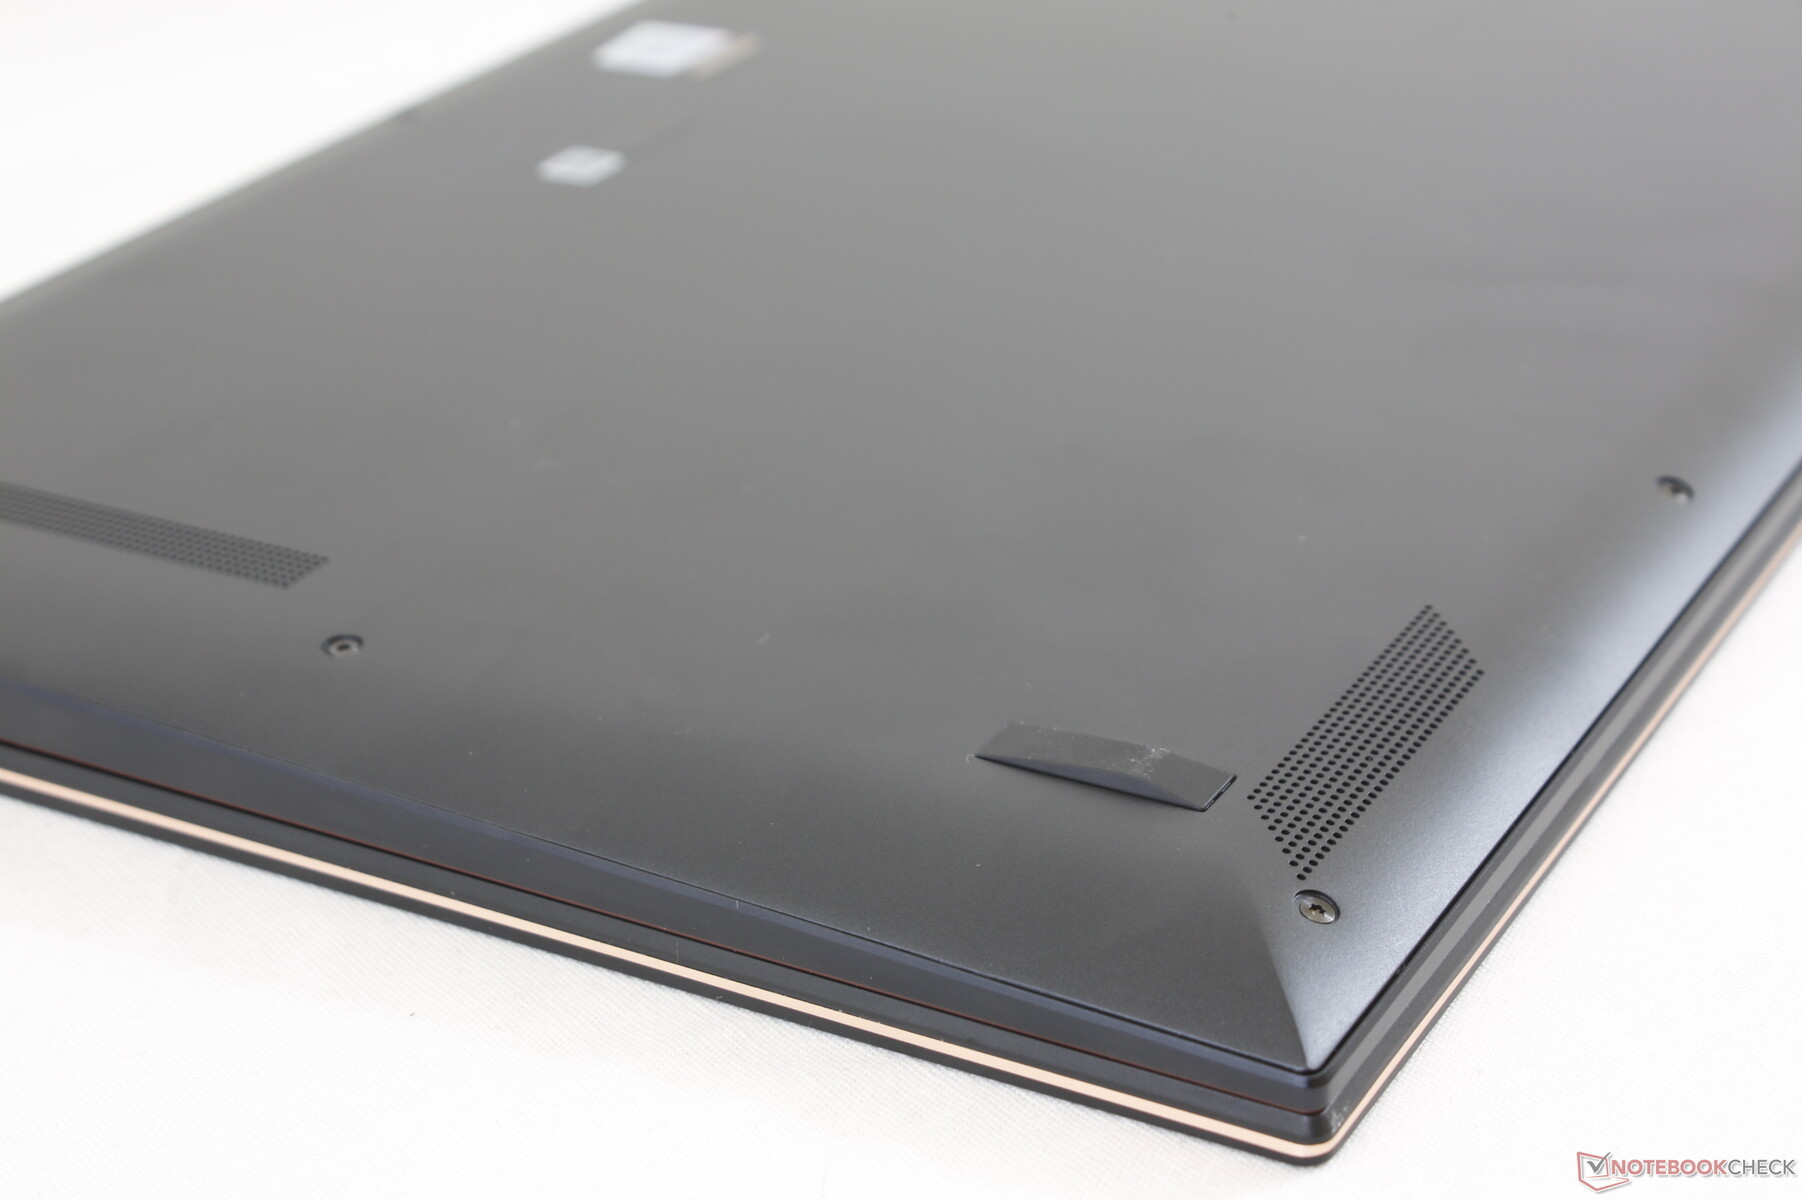
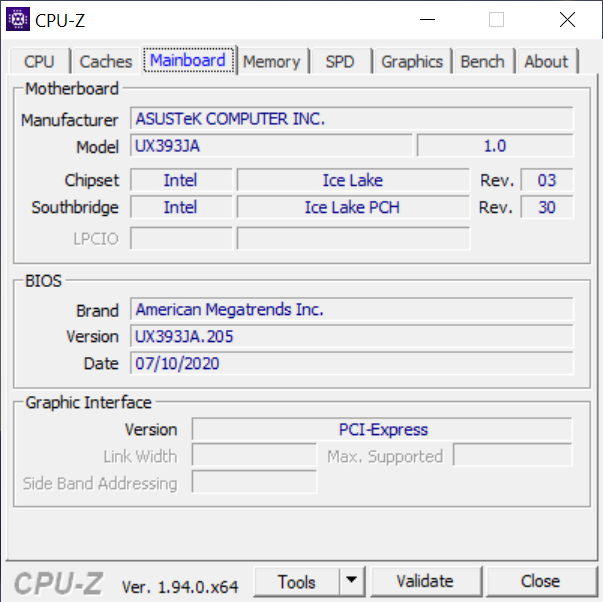
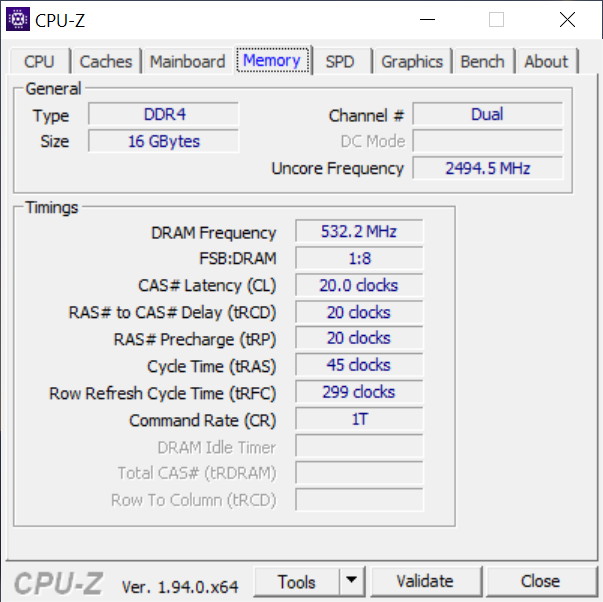
The bottom panel comes off easily with just a T5 Torx wrench. However, there's not much to upgrade beyond the M.2 SSD as both WLAN and RAM are soldered.
Accessories and Warranty
The retail box includes a USB-C to 3.5 mm audio adapter and a protective carrying sleeve in addition to the usual paperwork and AC adapter. The standard one-year limited warranty applies.
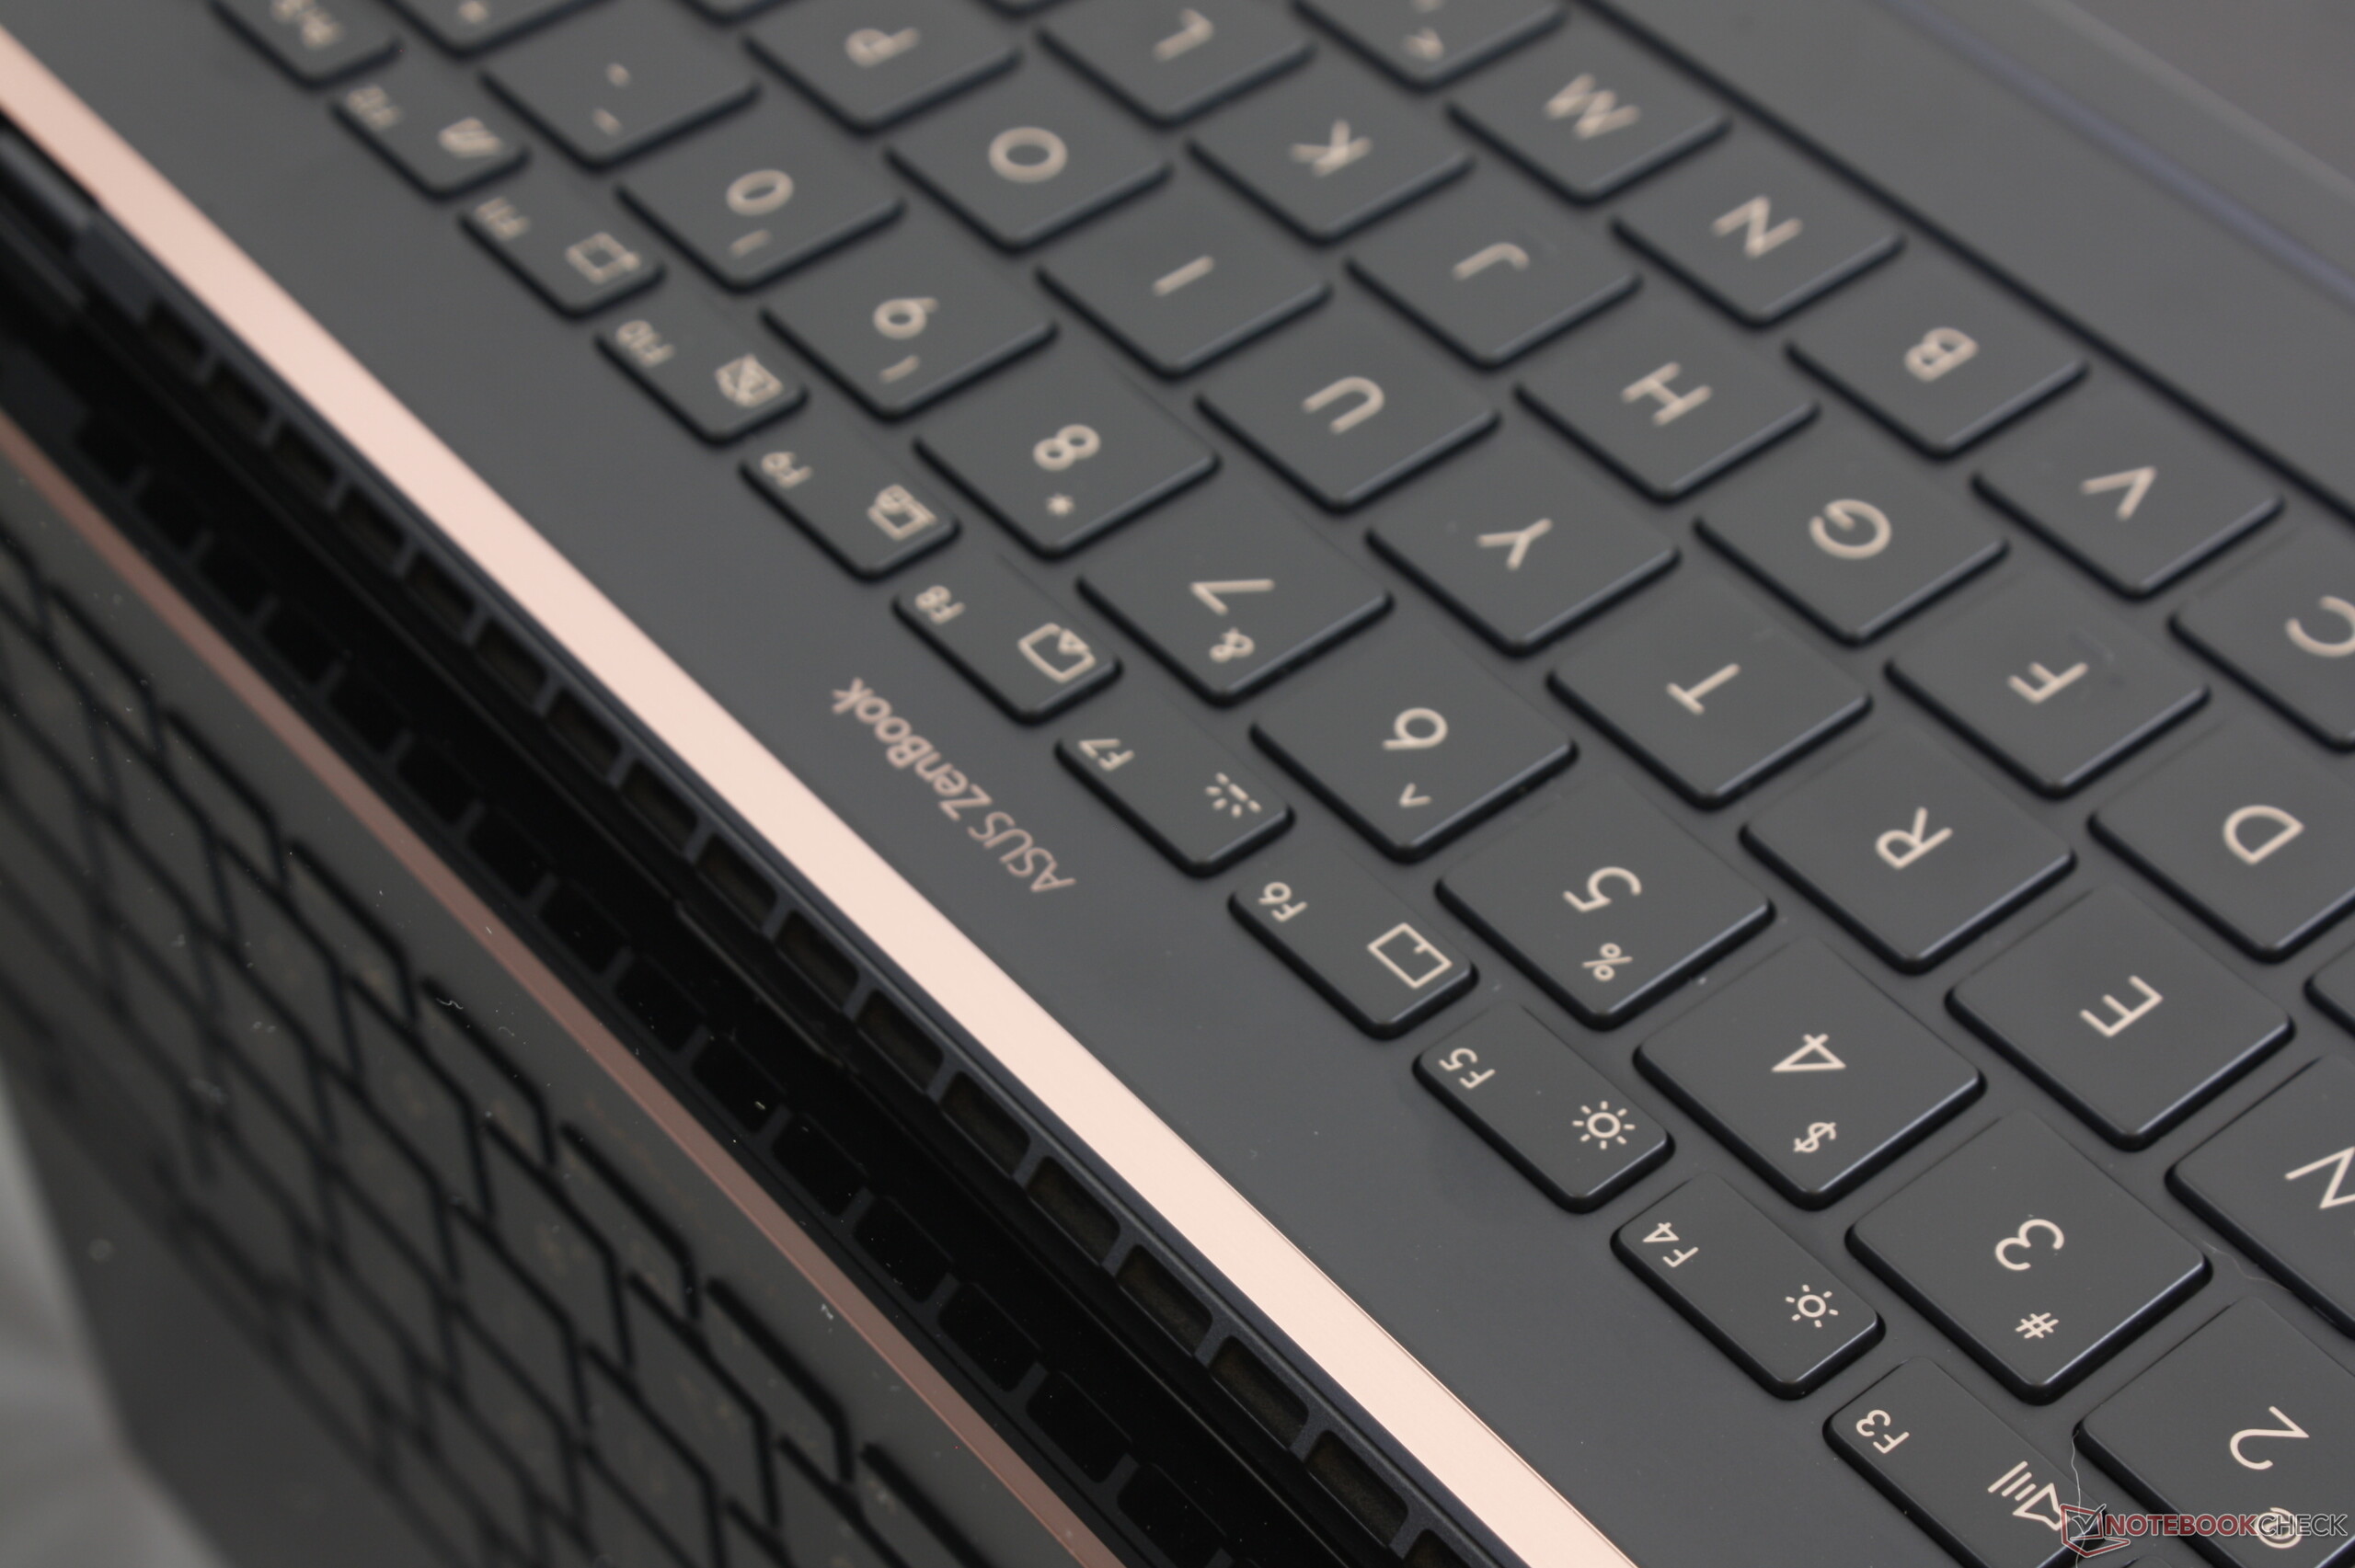
Input Devices
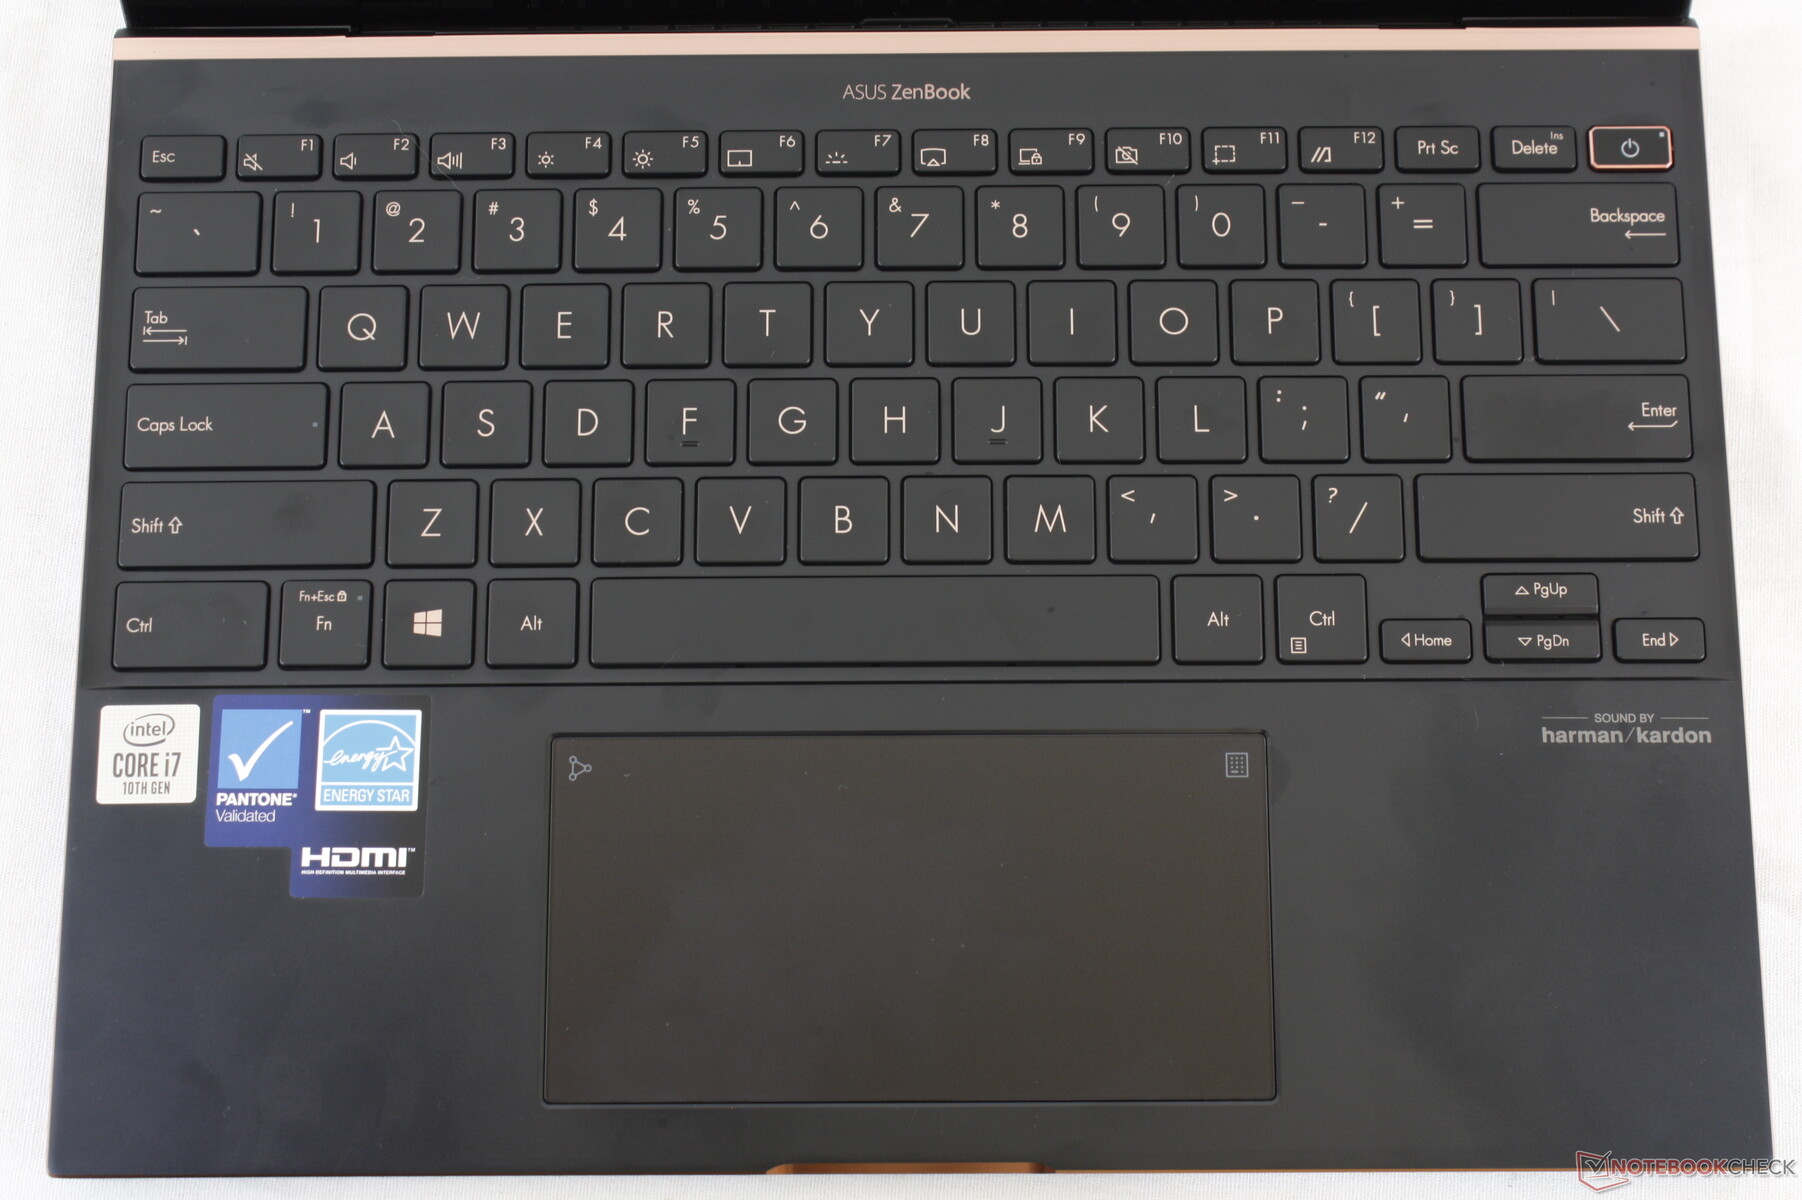
Keyboard
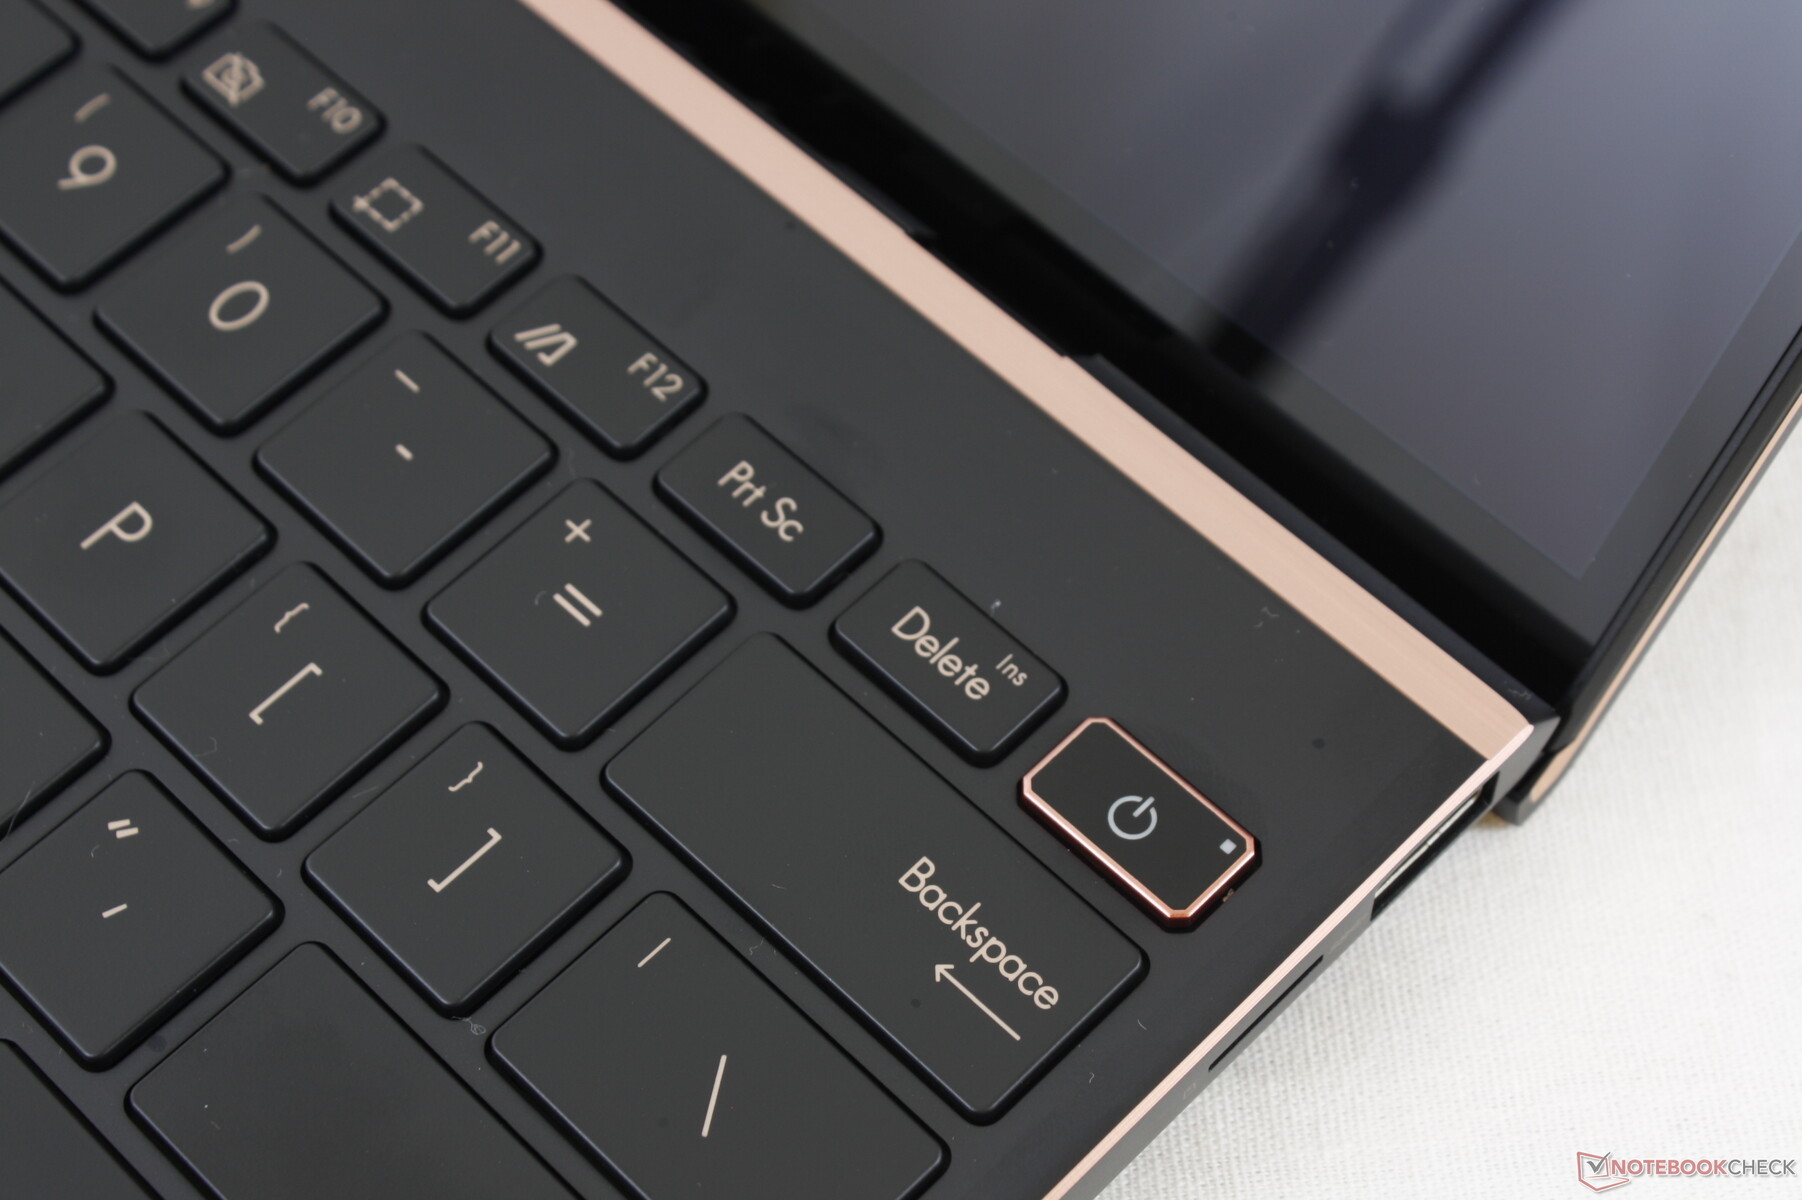
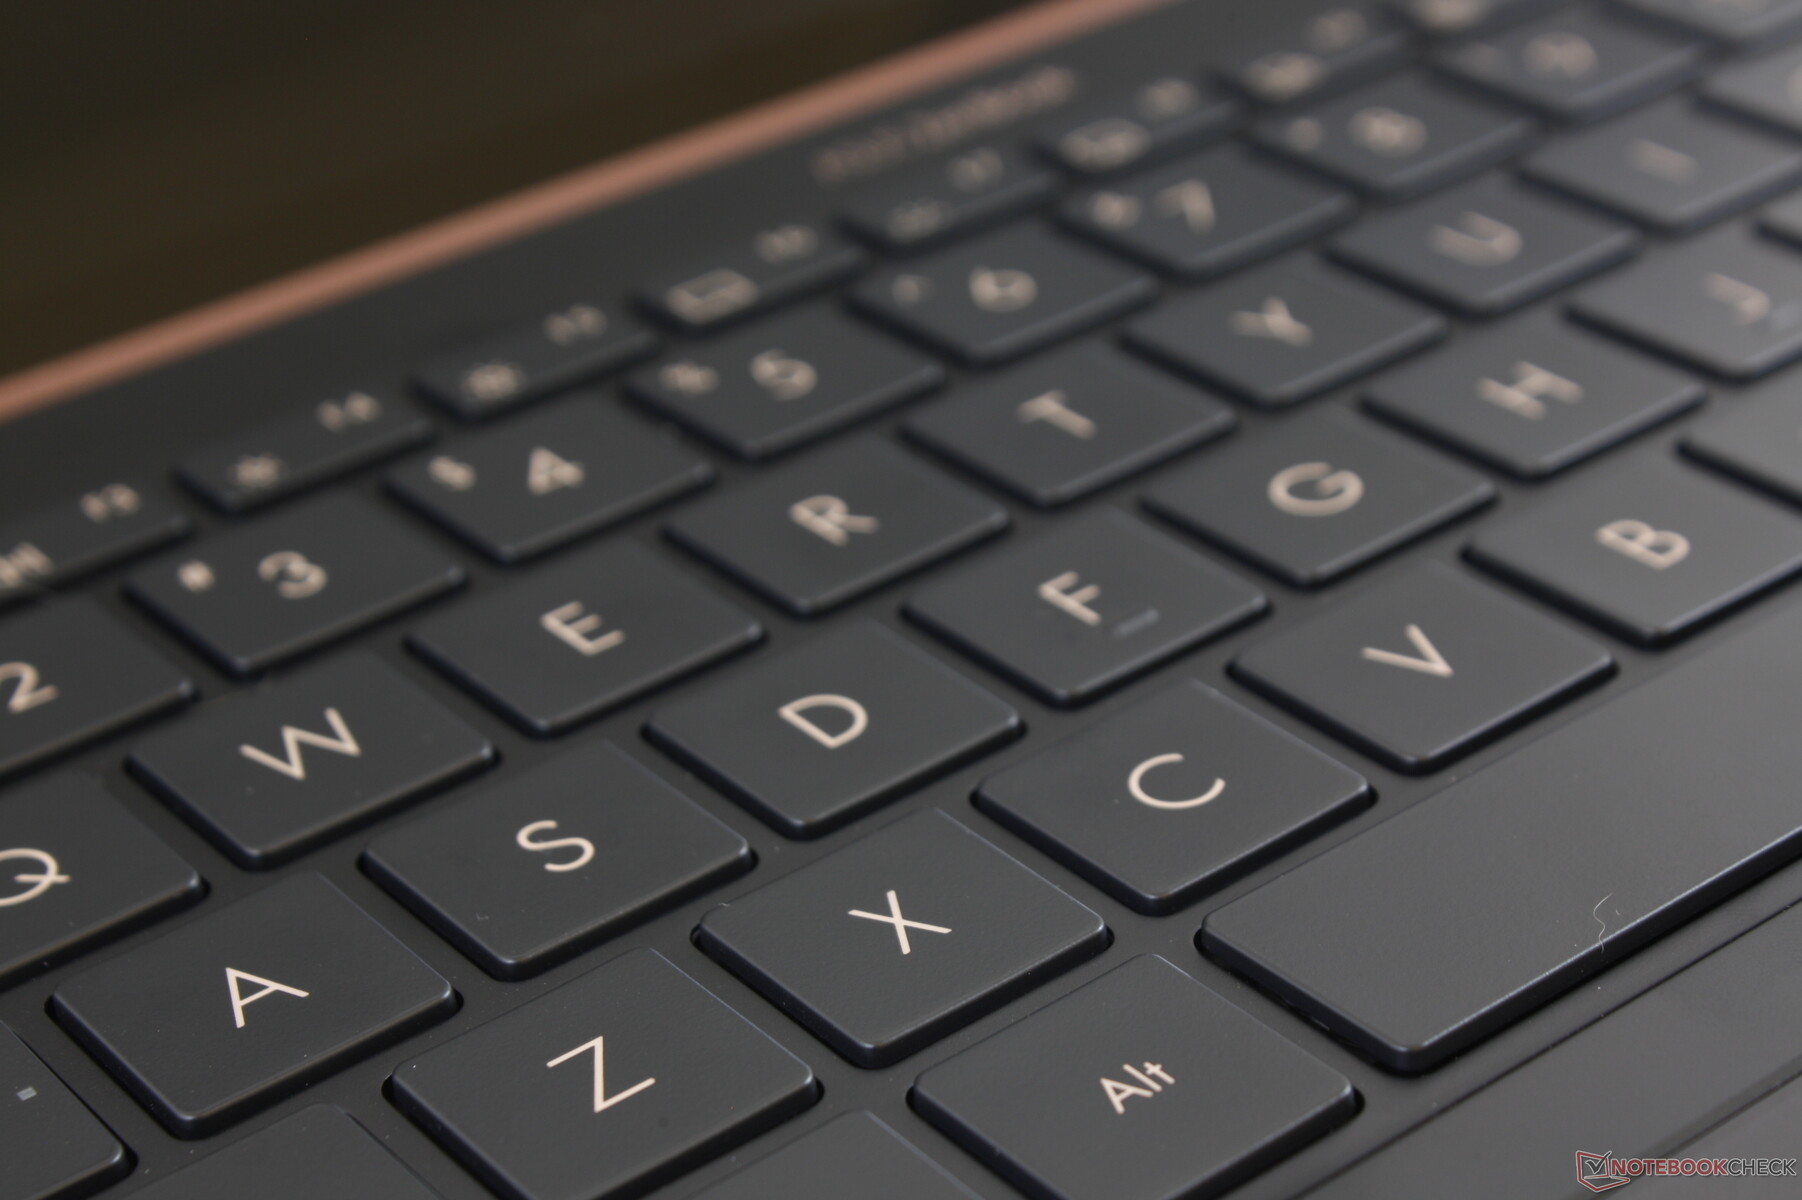
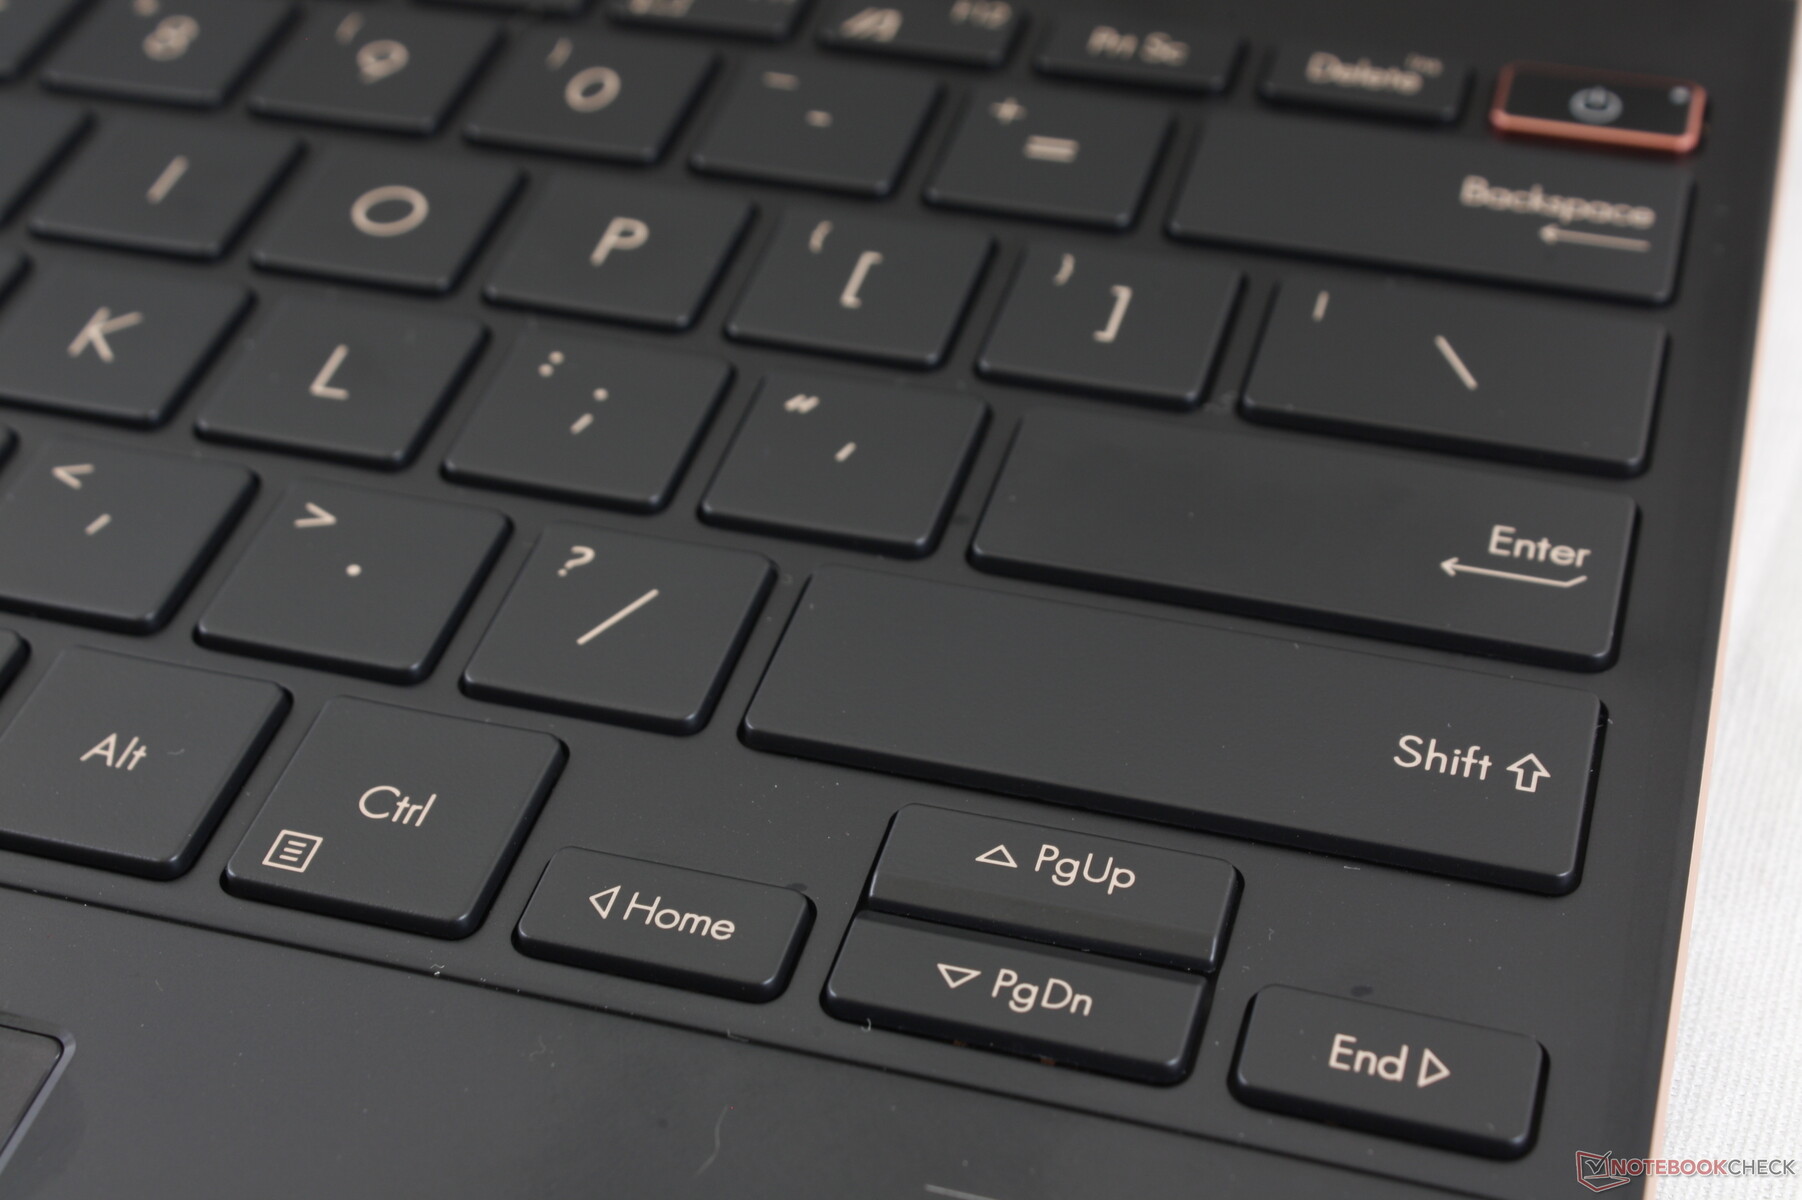
Keyboard layout remains identical to the UX392 save for some secondary function changes on the first row of keys. Travel is shallow while the Space and Enter keys clatter more loudly than the main QWERTY keys when pressed. Feedback is otherwise decent if not slightly softer than on the HP Spectre 13 series.
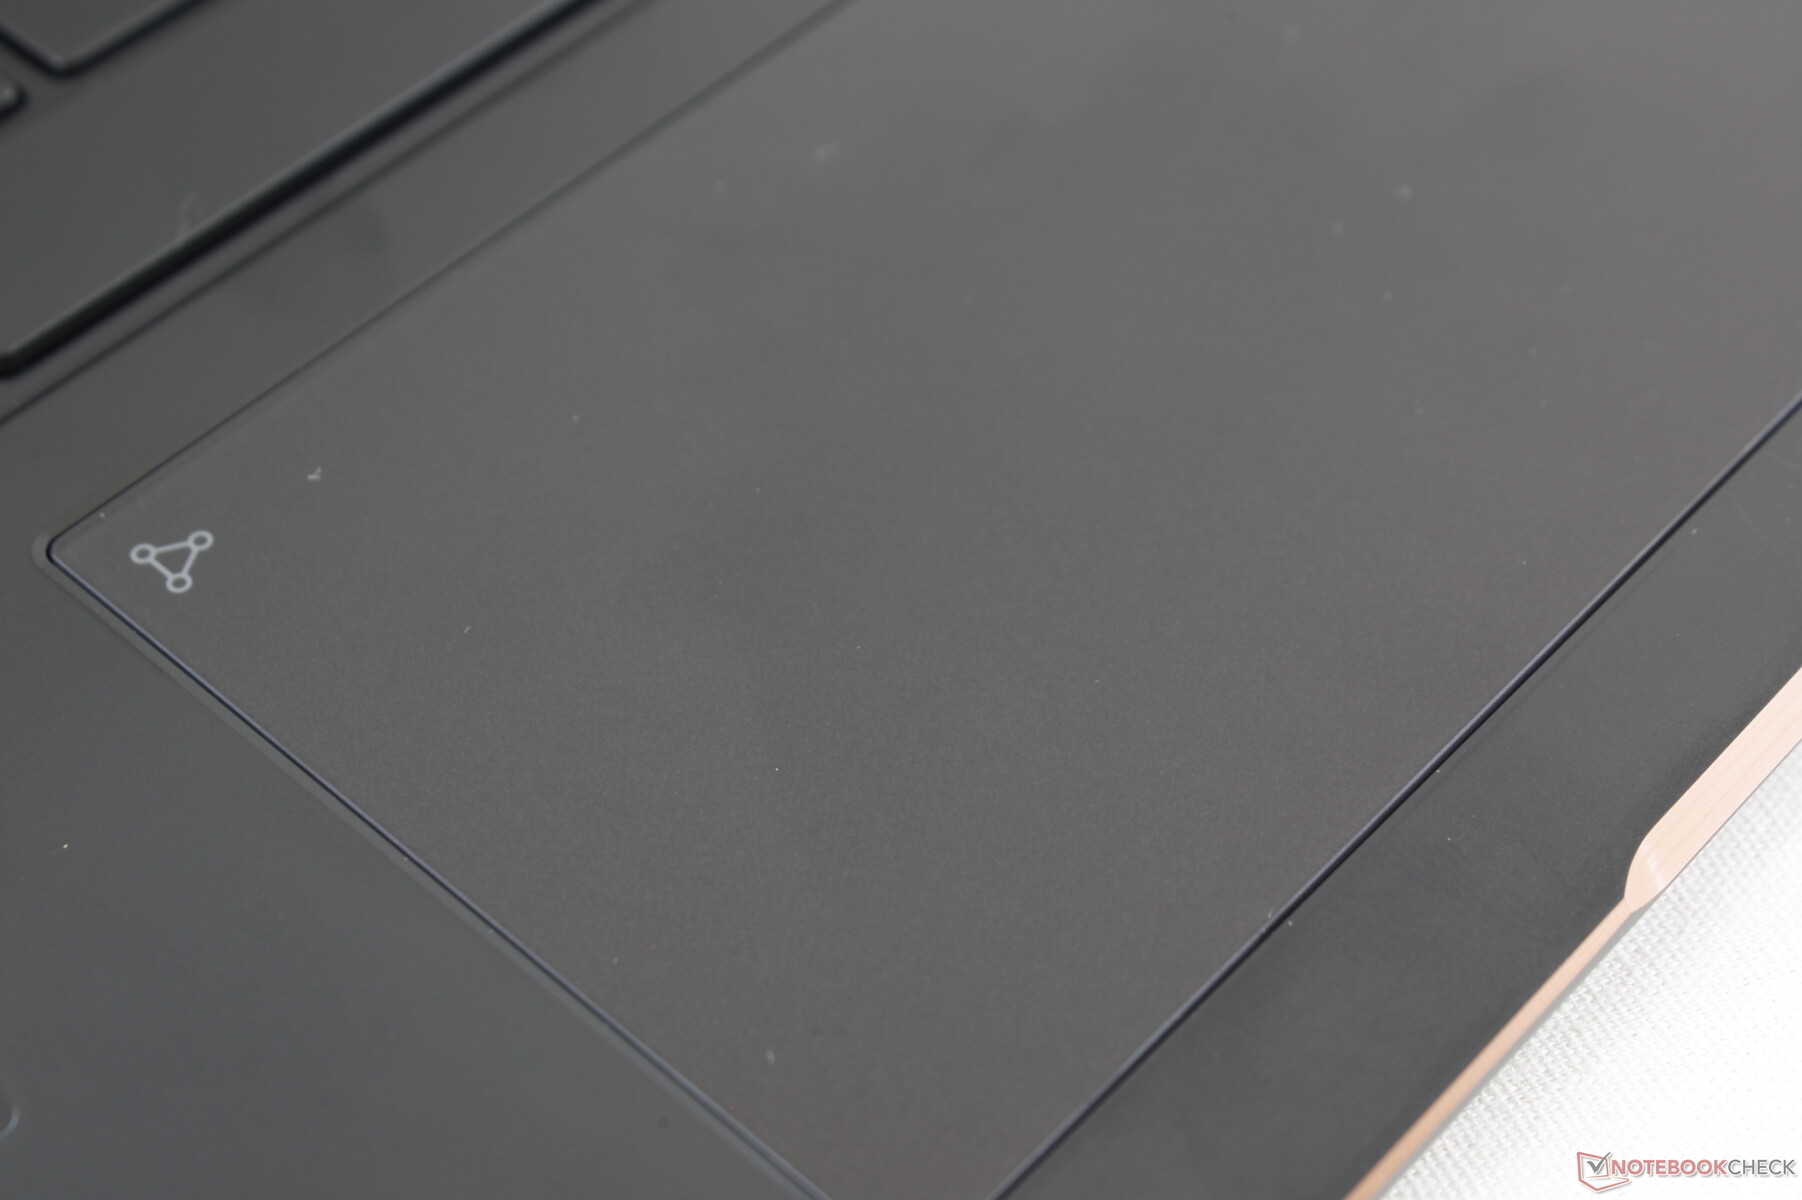
Touchpad
The sizeable clickpad (13 x 6.5 cm) is only slightly smaller than the one on the Surface Laptop 3 (11.5 x 7.6 cm) while being much larger than the clickpad on the older UX392 (10.5 x 6.2 cm). Its surface is completely smooth with only minimal sticking when gliding at slower speeds. Its integrated mouse clicks, however, are far too shallow and with weak feedback.
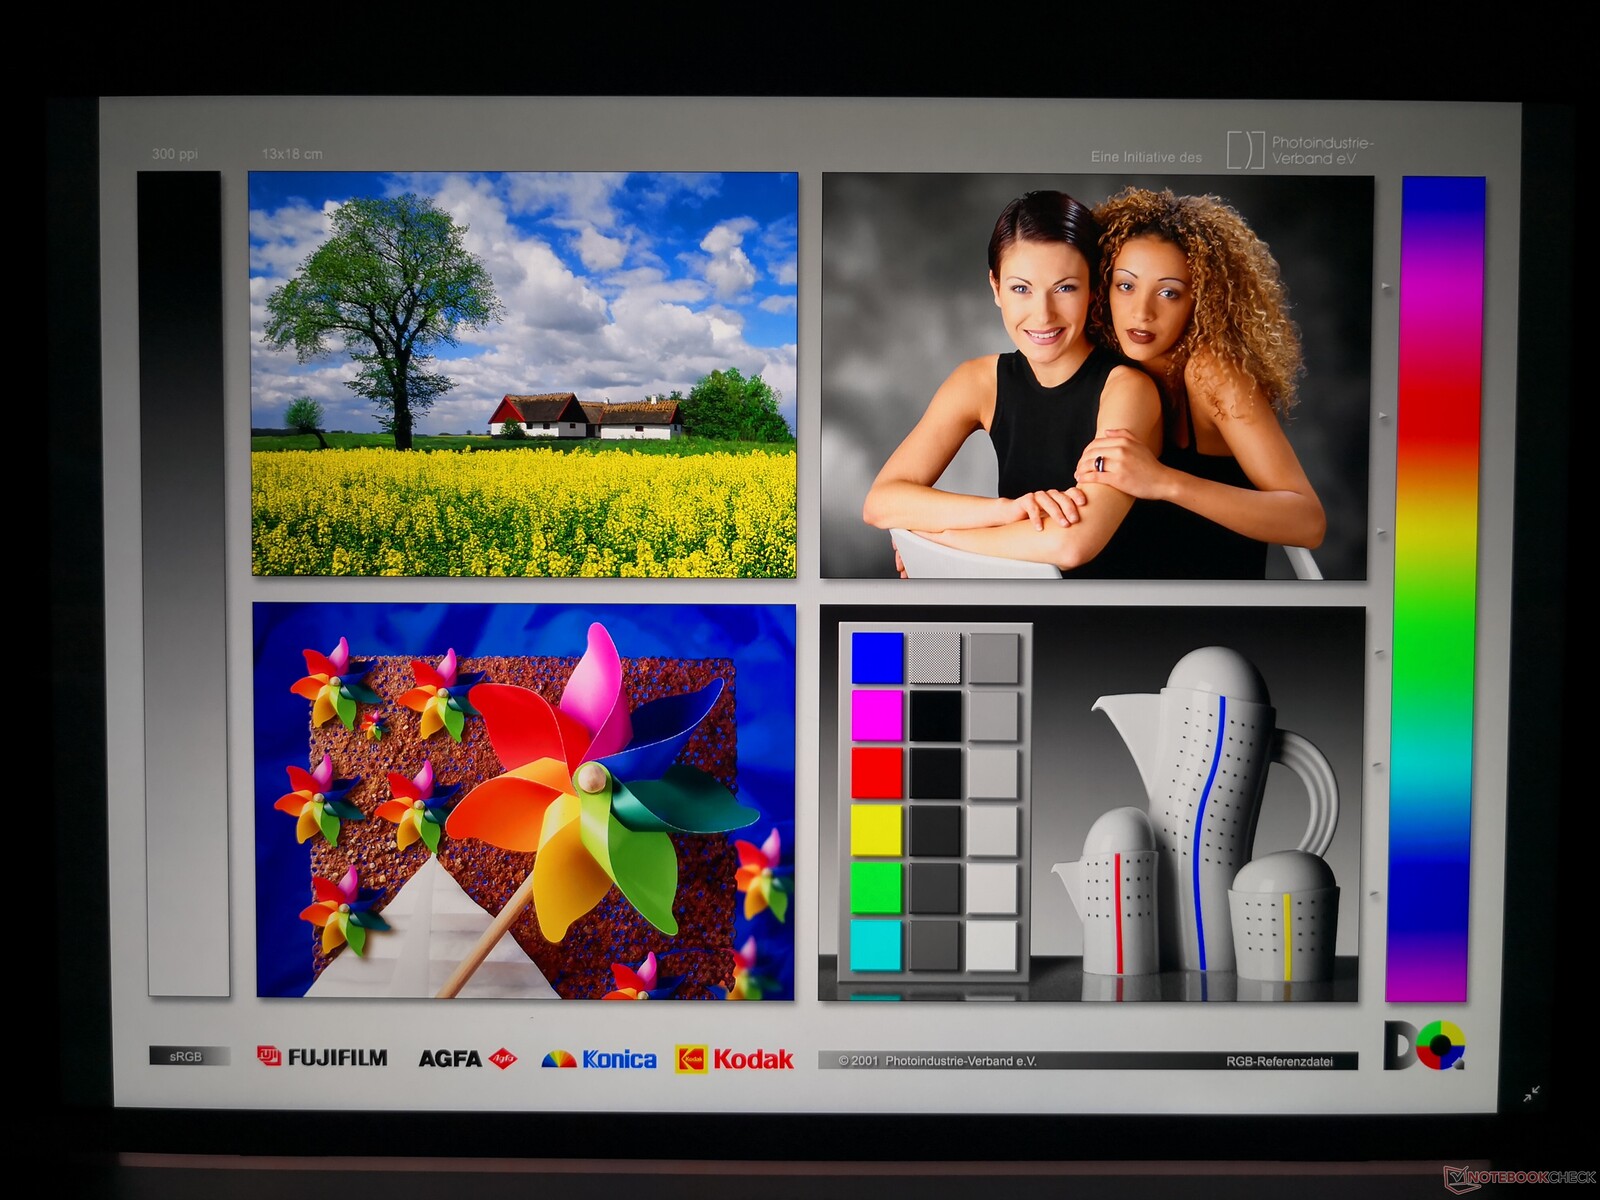
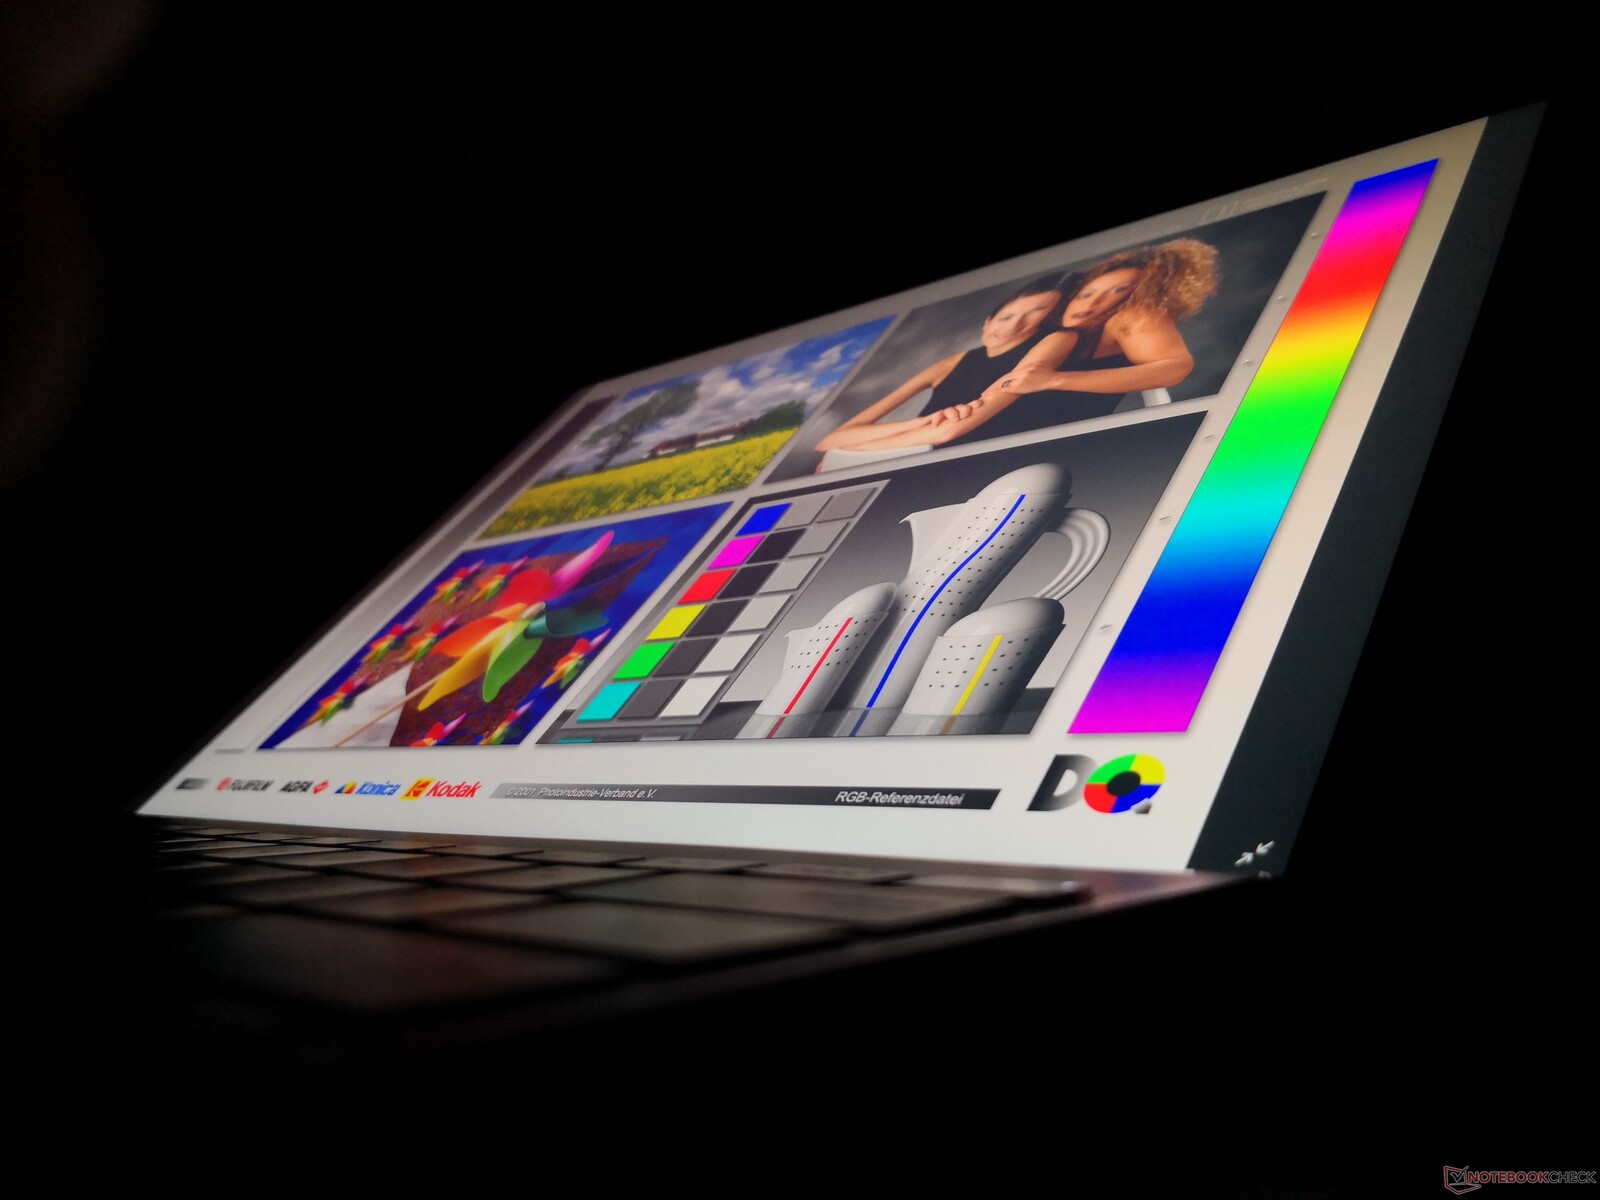
Display
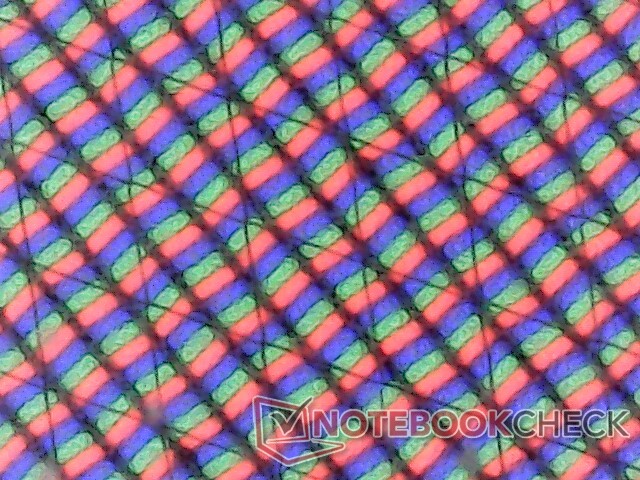
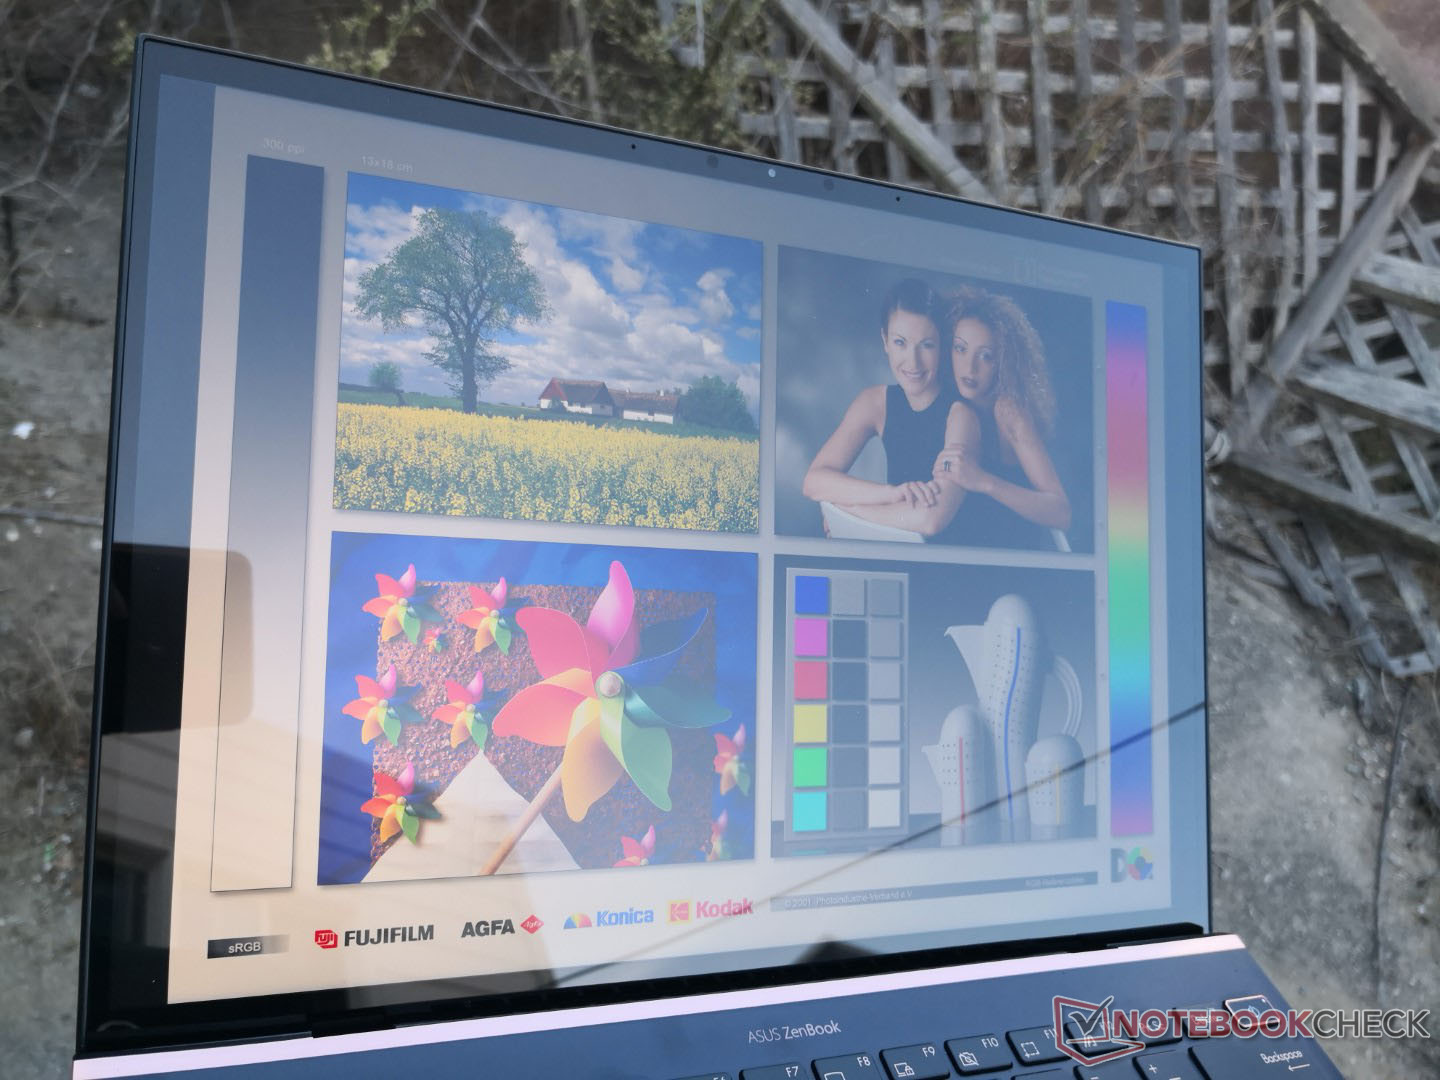
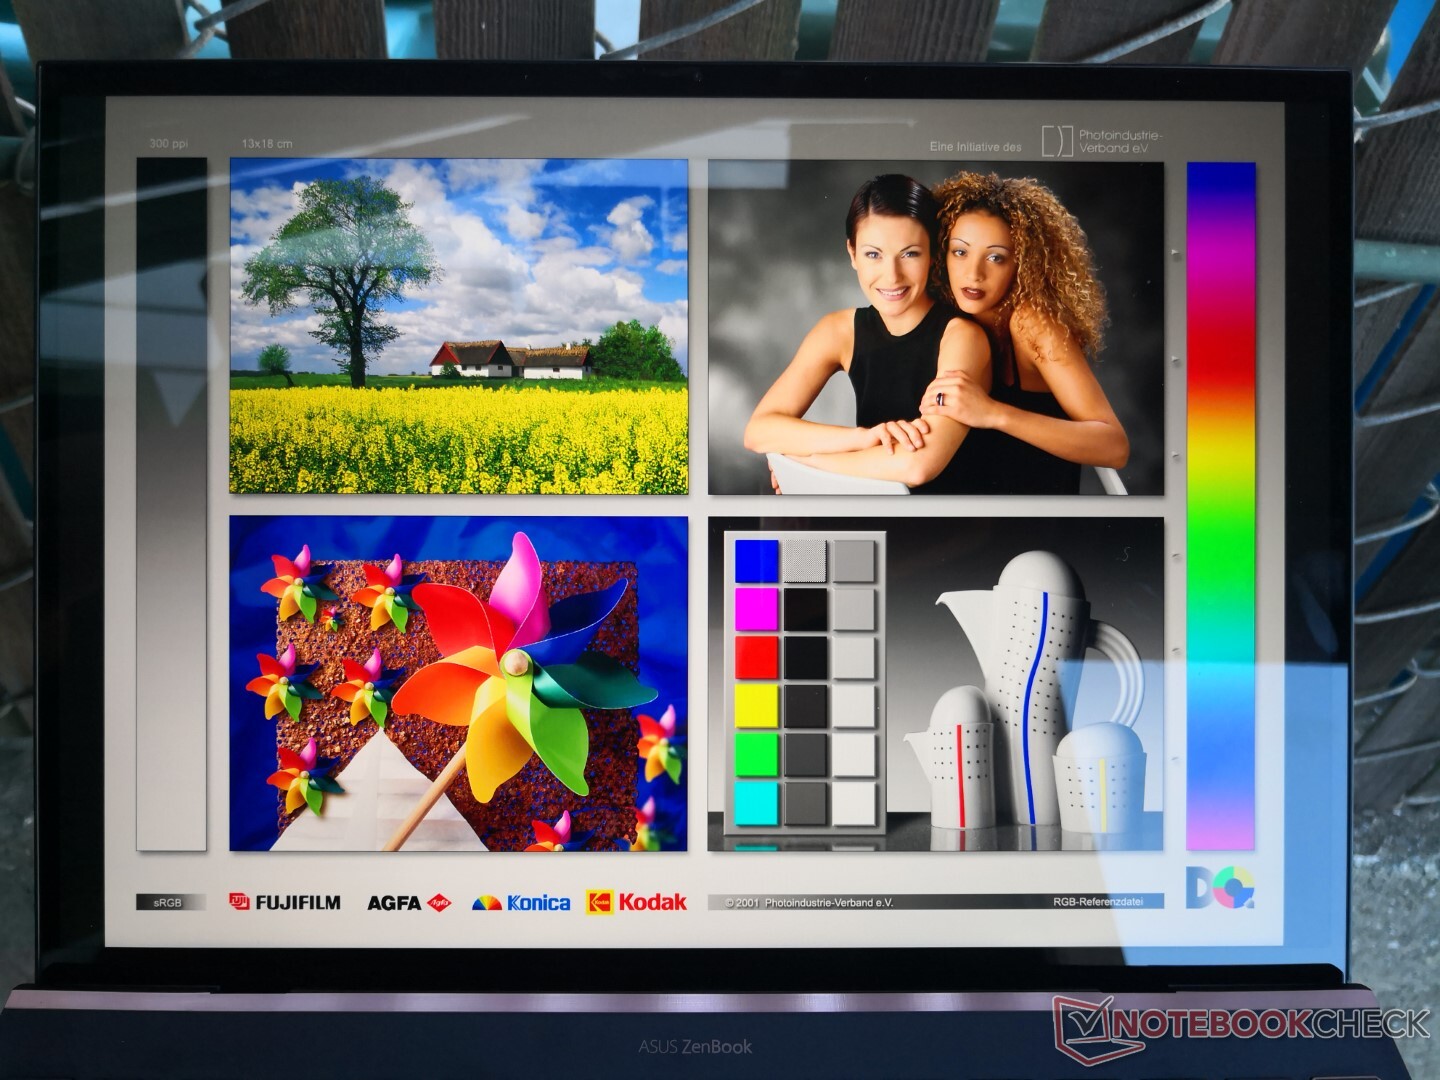
The 3:2 AU Optronics B139KAN01.0 can be found on no other laptop in our database. When compared to the Sharp and JDI panels on the Surface Laptop 3 13.5 and MateBook X Pro, respectively, native resolution is higher and color space is slightly wider as it covers all of DCI-P3. Asus calibrates each panel at factory in accordance to the standard.
Although the touchscreen is gorgeous at first glance, there are some downsides. Brightness and contrast are not on the same level as the MateBook X Pro display and response times are still slow for noticeable ghosting. This latter characteristic is common on many Ultrabooks since most users will not be gaming on these machines.
| |||||||||||||||||||||||||
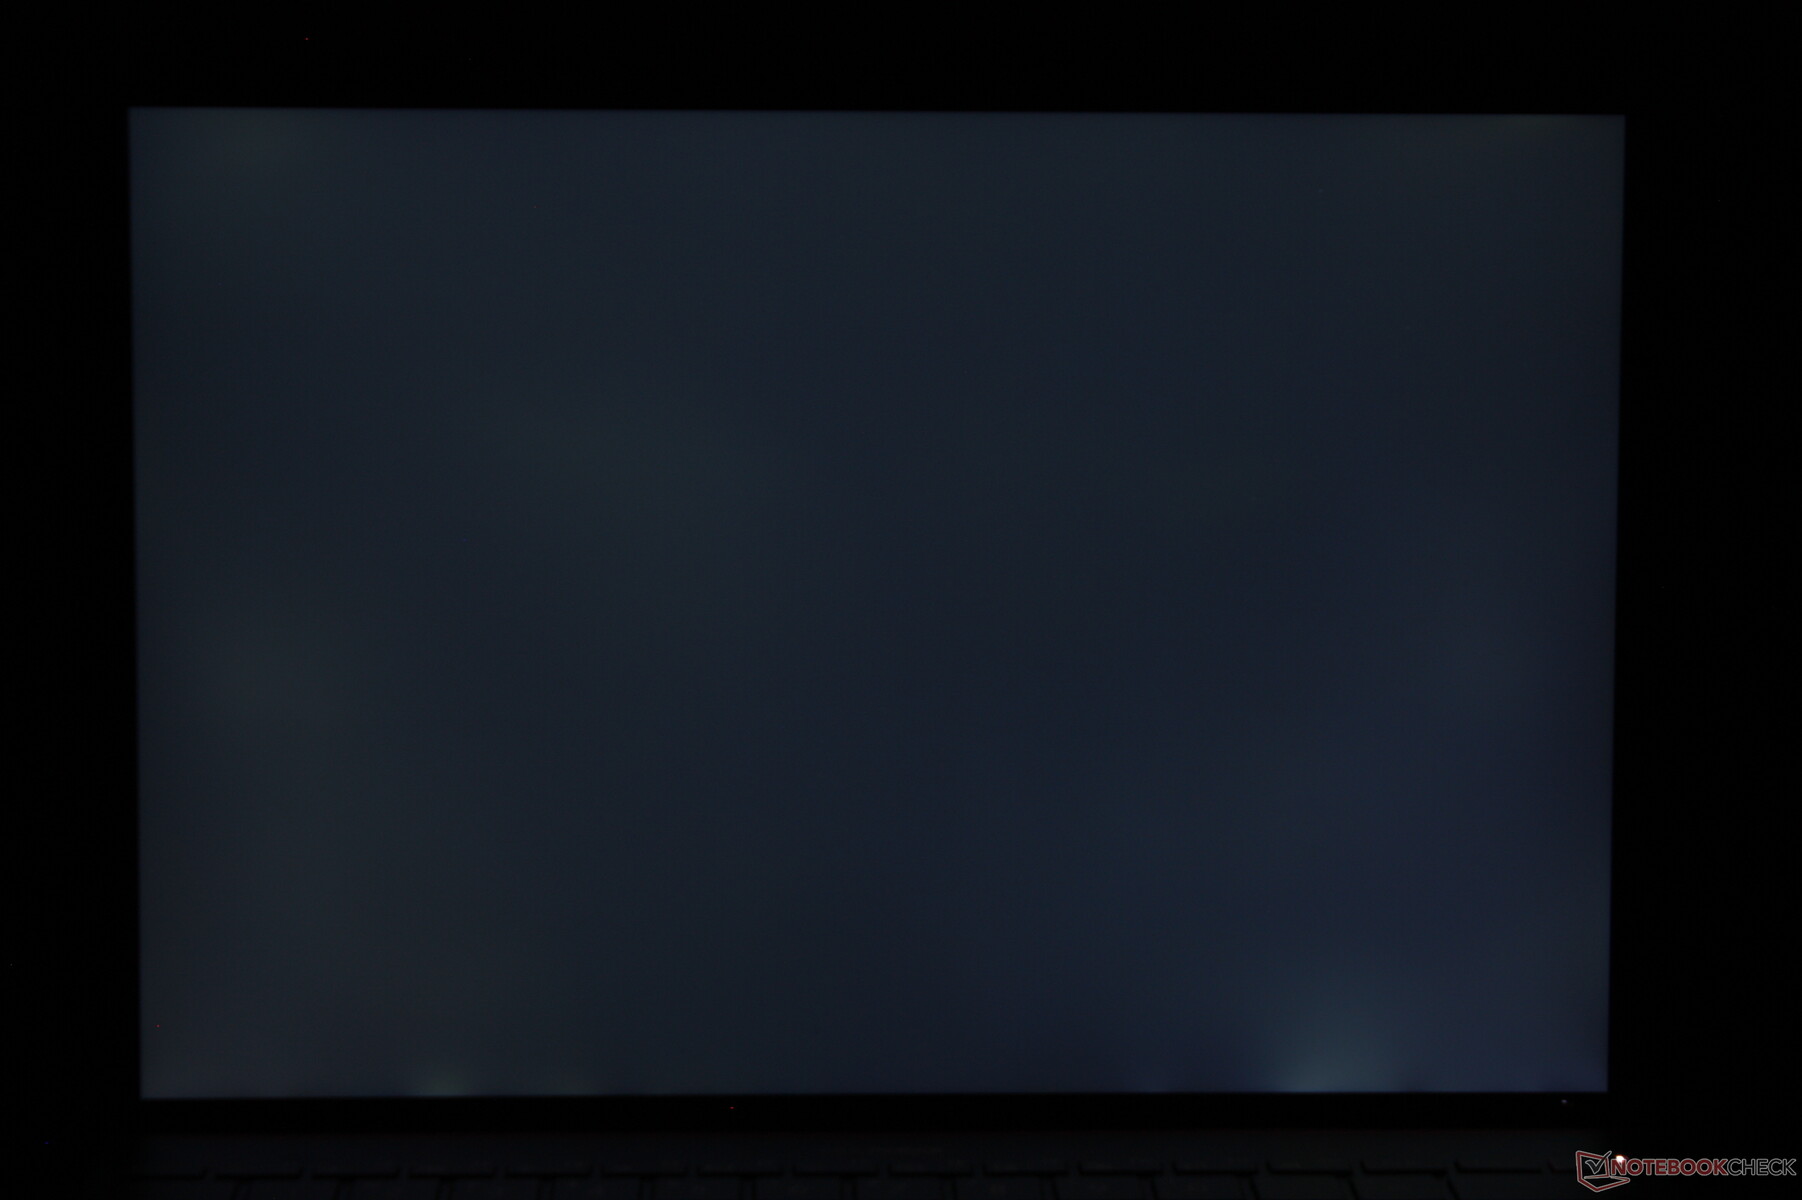
Brightness Distribution: 89 %
Center on Battery: 444.1 cd/m²
Contrast: 1200:1 (Black: 0.37 cd/m²)
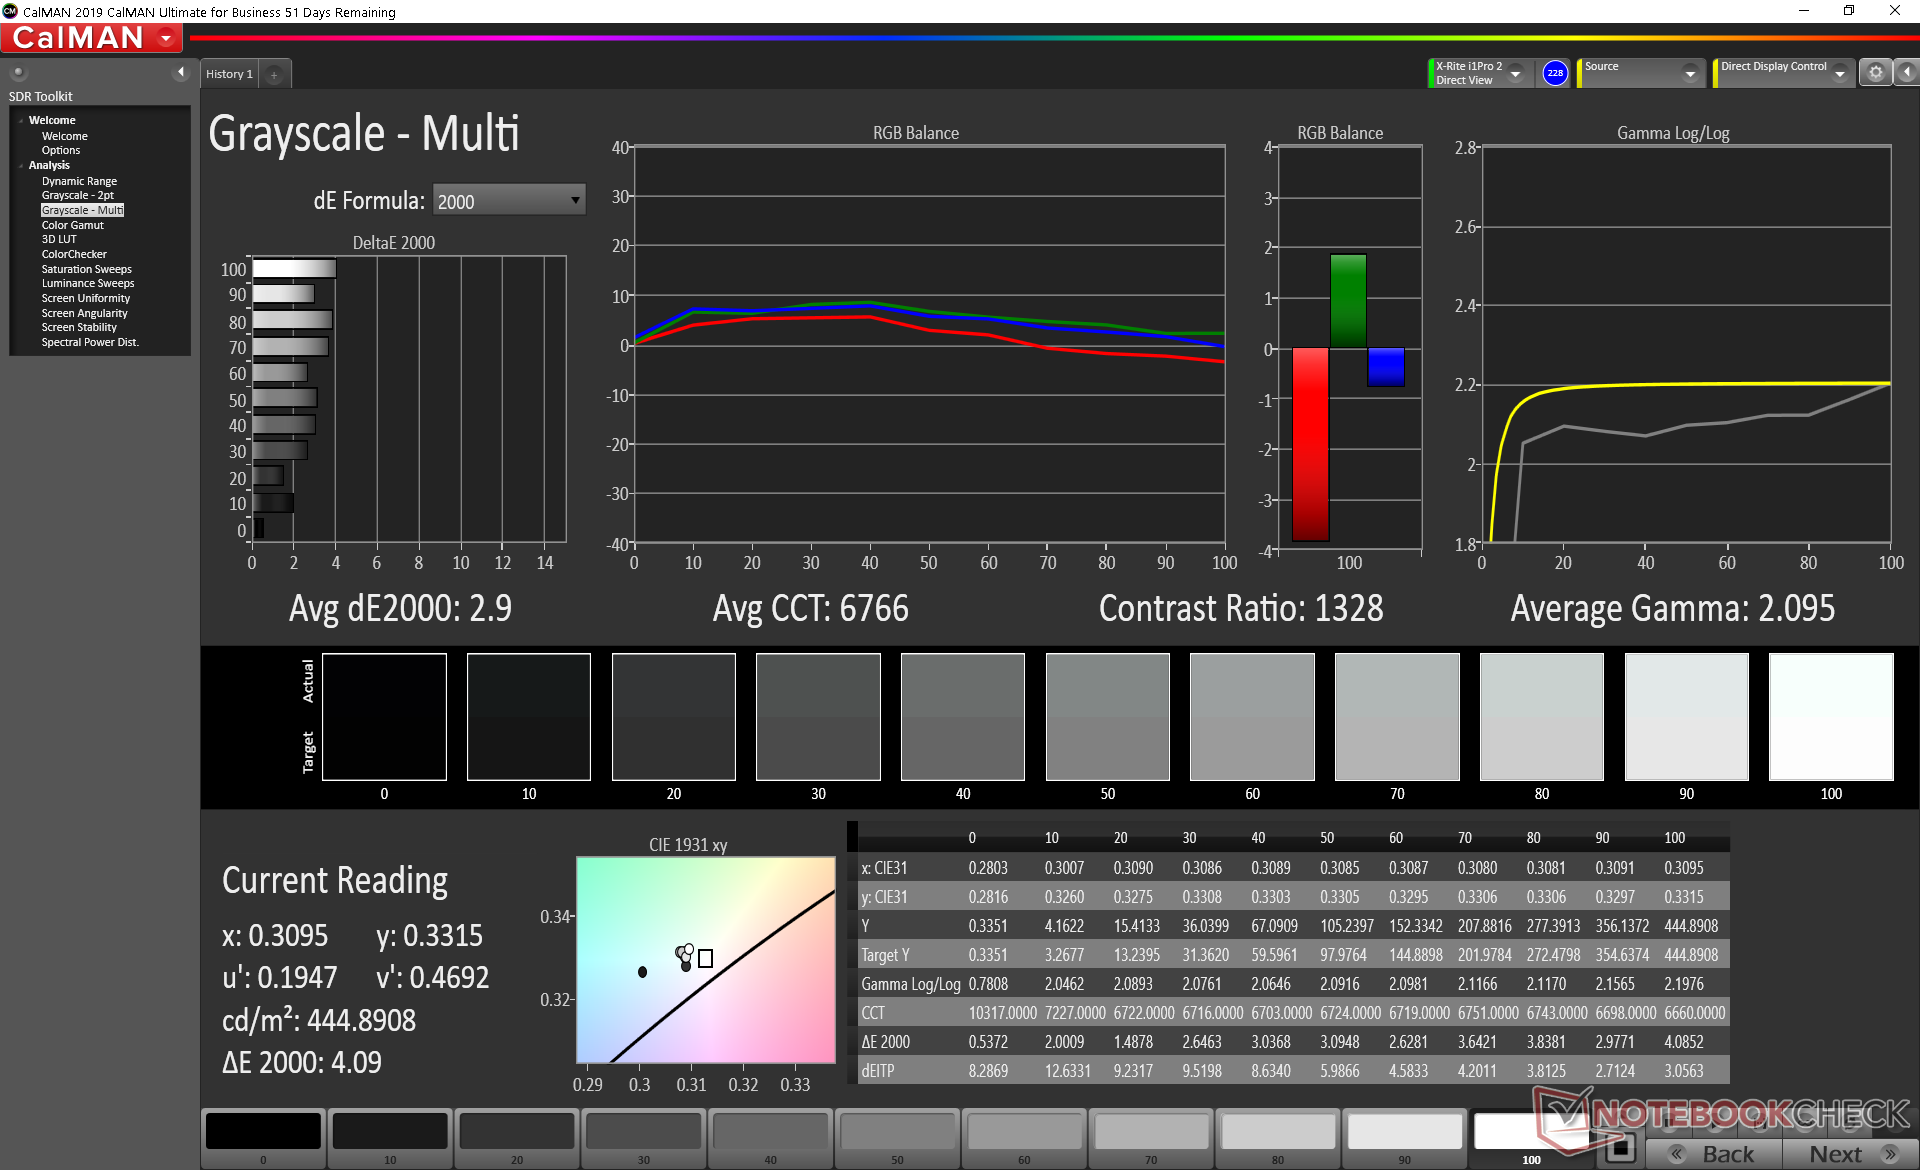
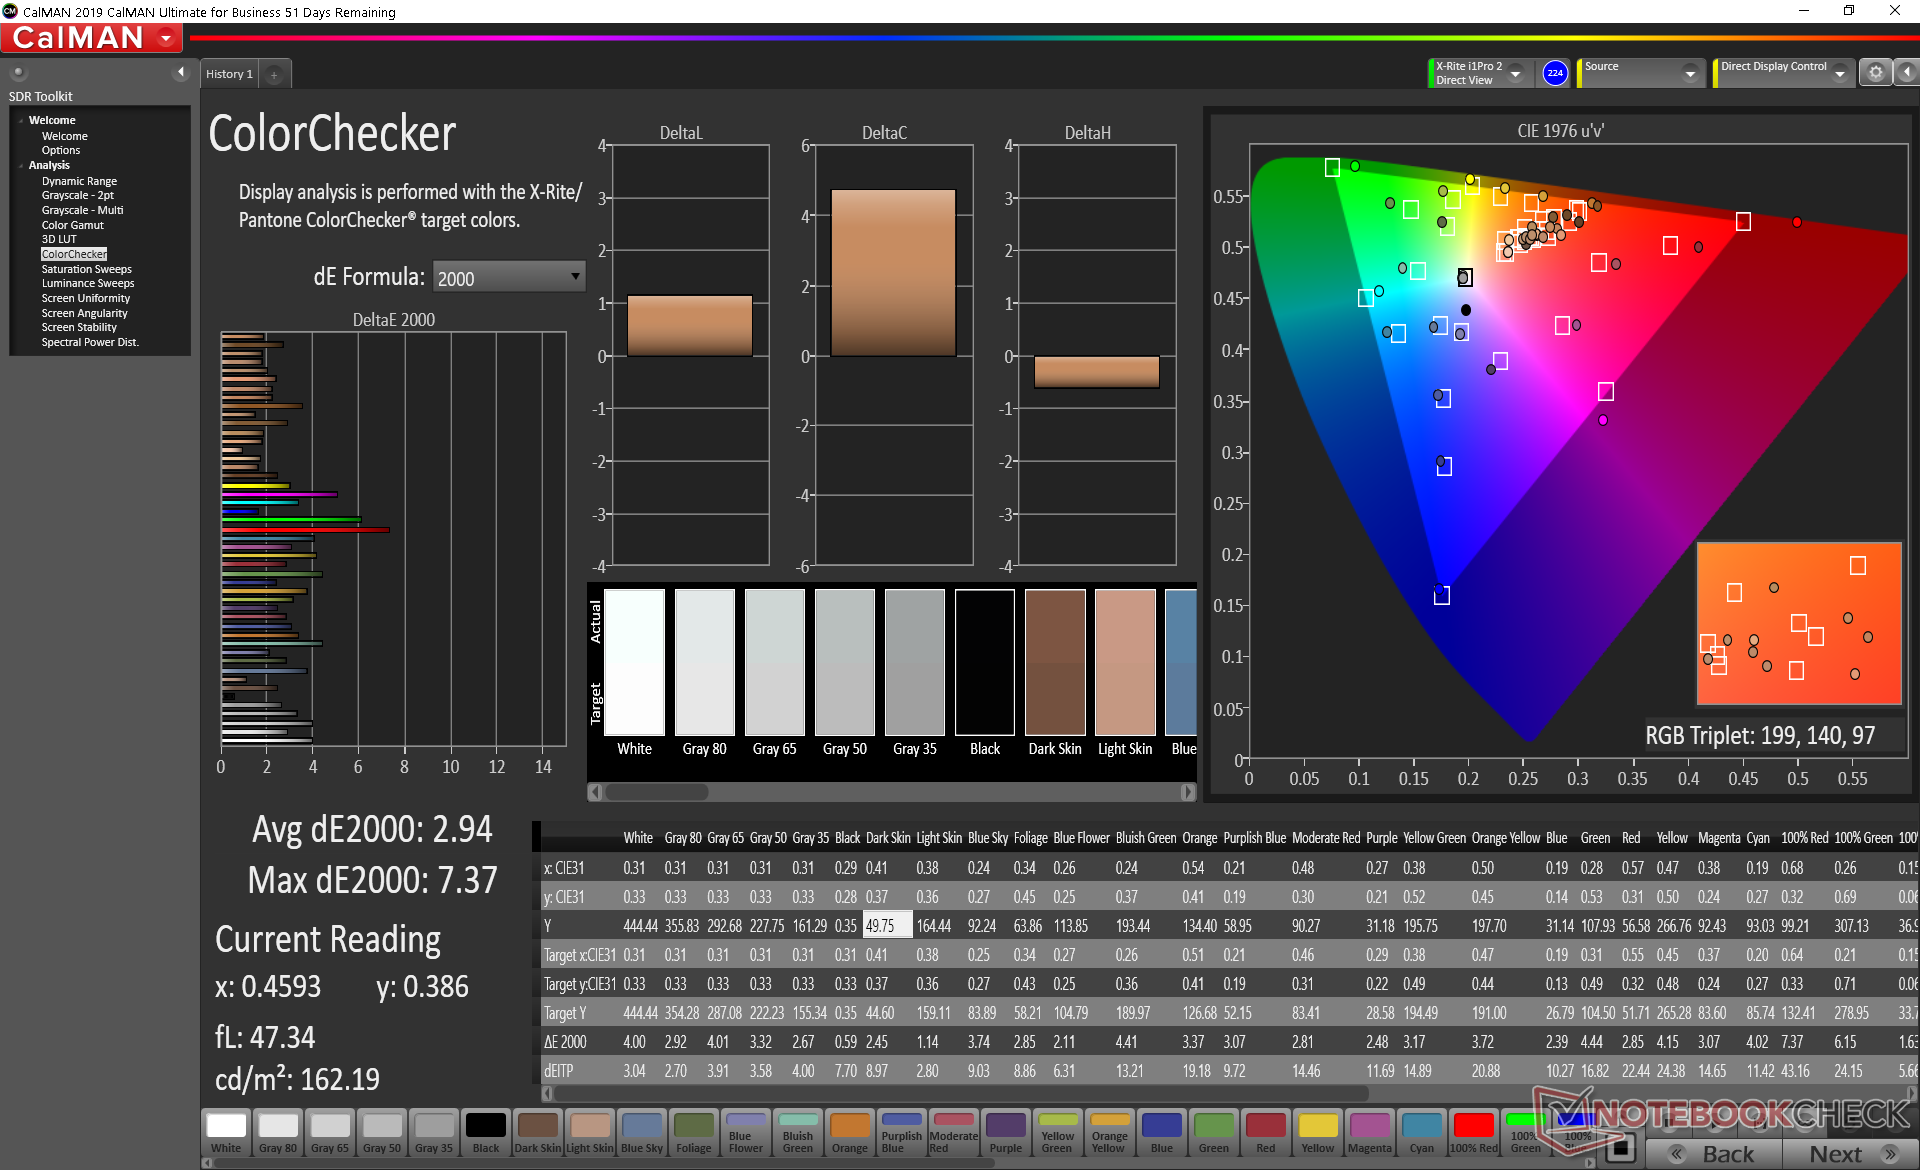
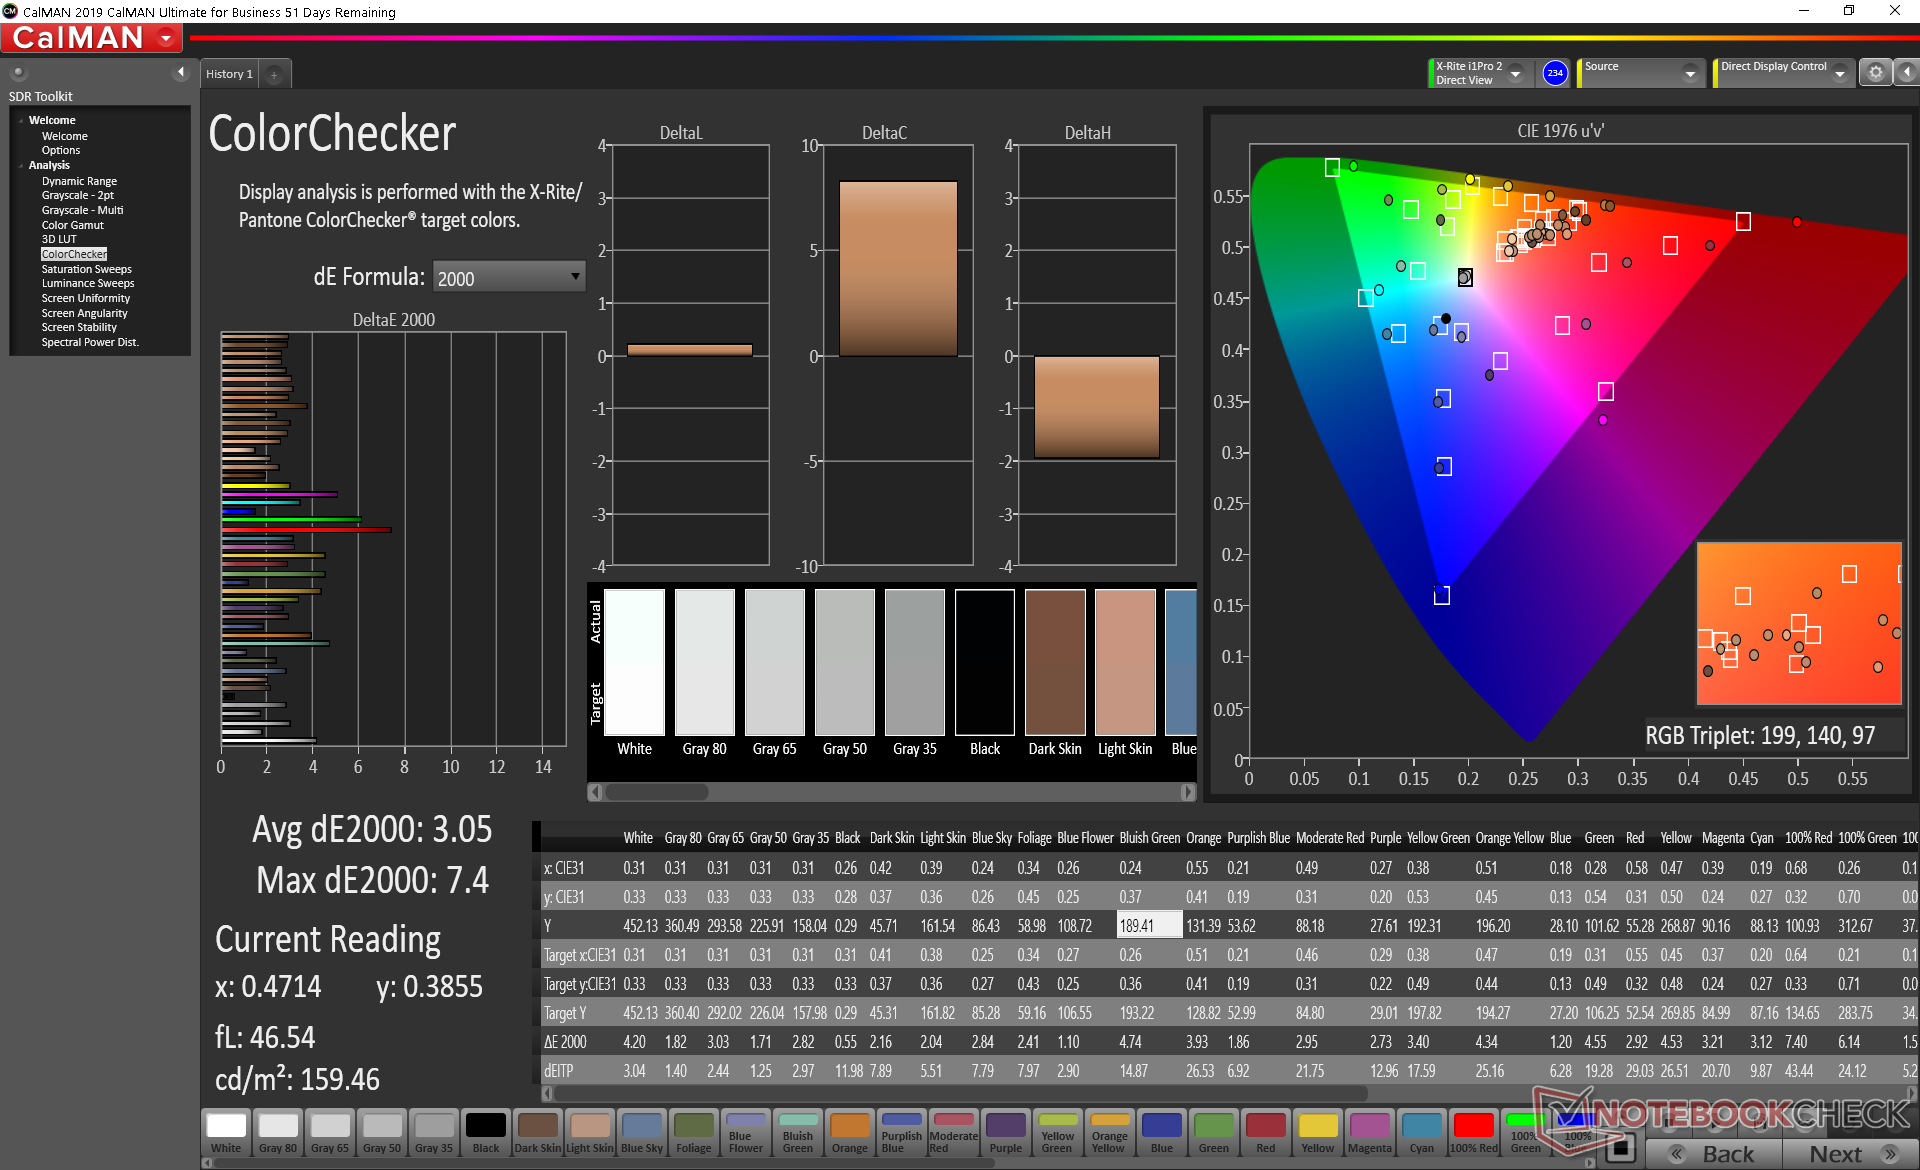
ΔE ColorChecker Calman: 2.94 | ∀{0.5-29.43 Ø4.71}
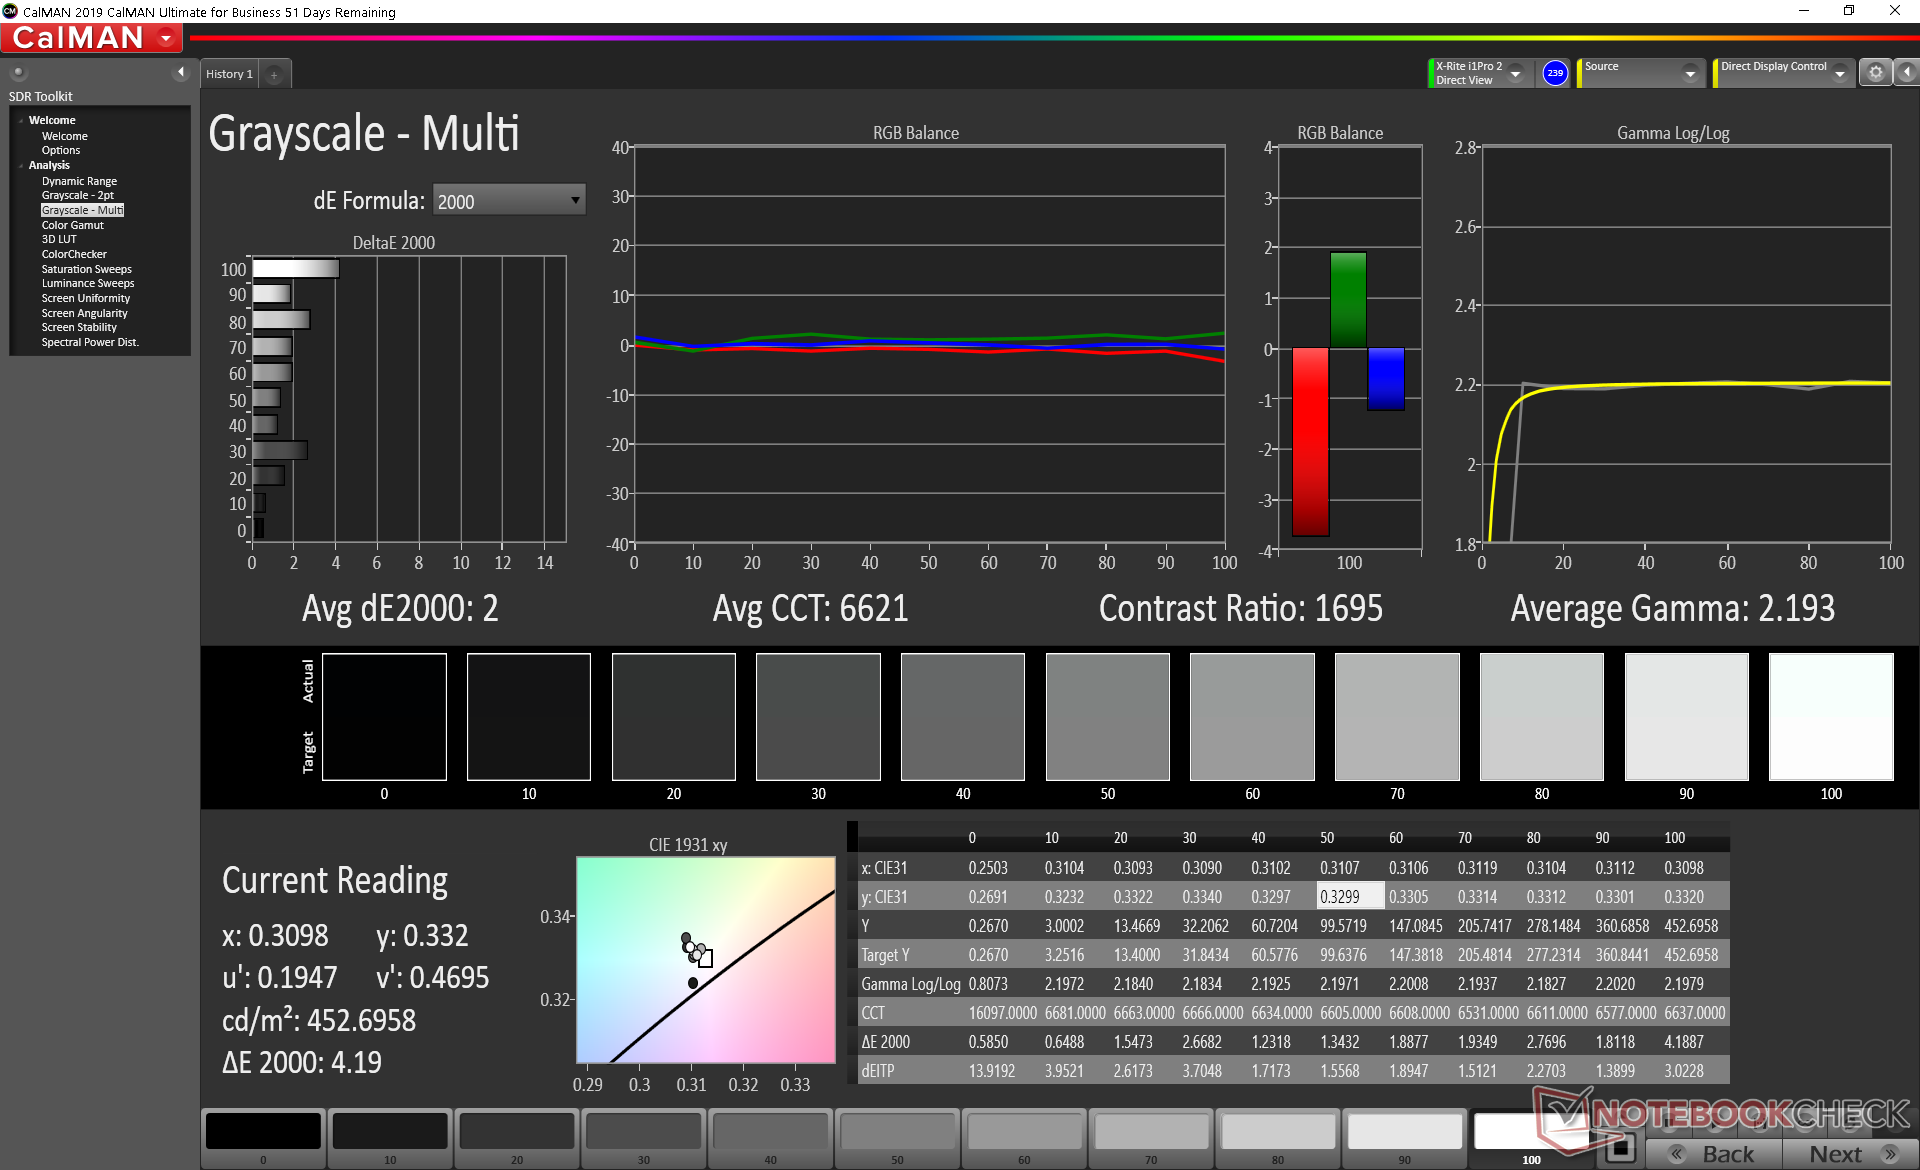
calibrated: 3.05
ΔE Greyscale Calman: 2.9 | ∀{0.09-98 Ø4.96}
99.8% sRGB (Argyll 1.6.3 3D)
78.2% AdobeRGB 1998 (Argyll 1.6.3 3D)
87.9% AdobeRGB 1998 (Argyll 3D)
99.8% sRGB (Argyll 3D)
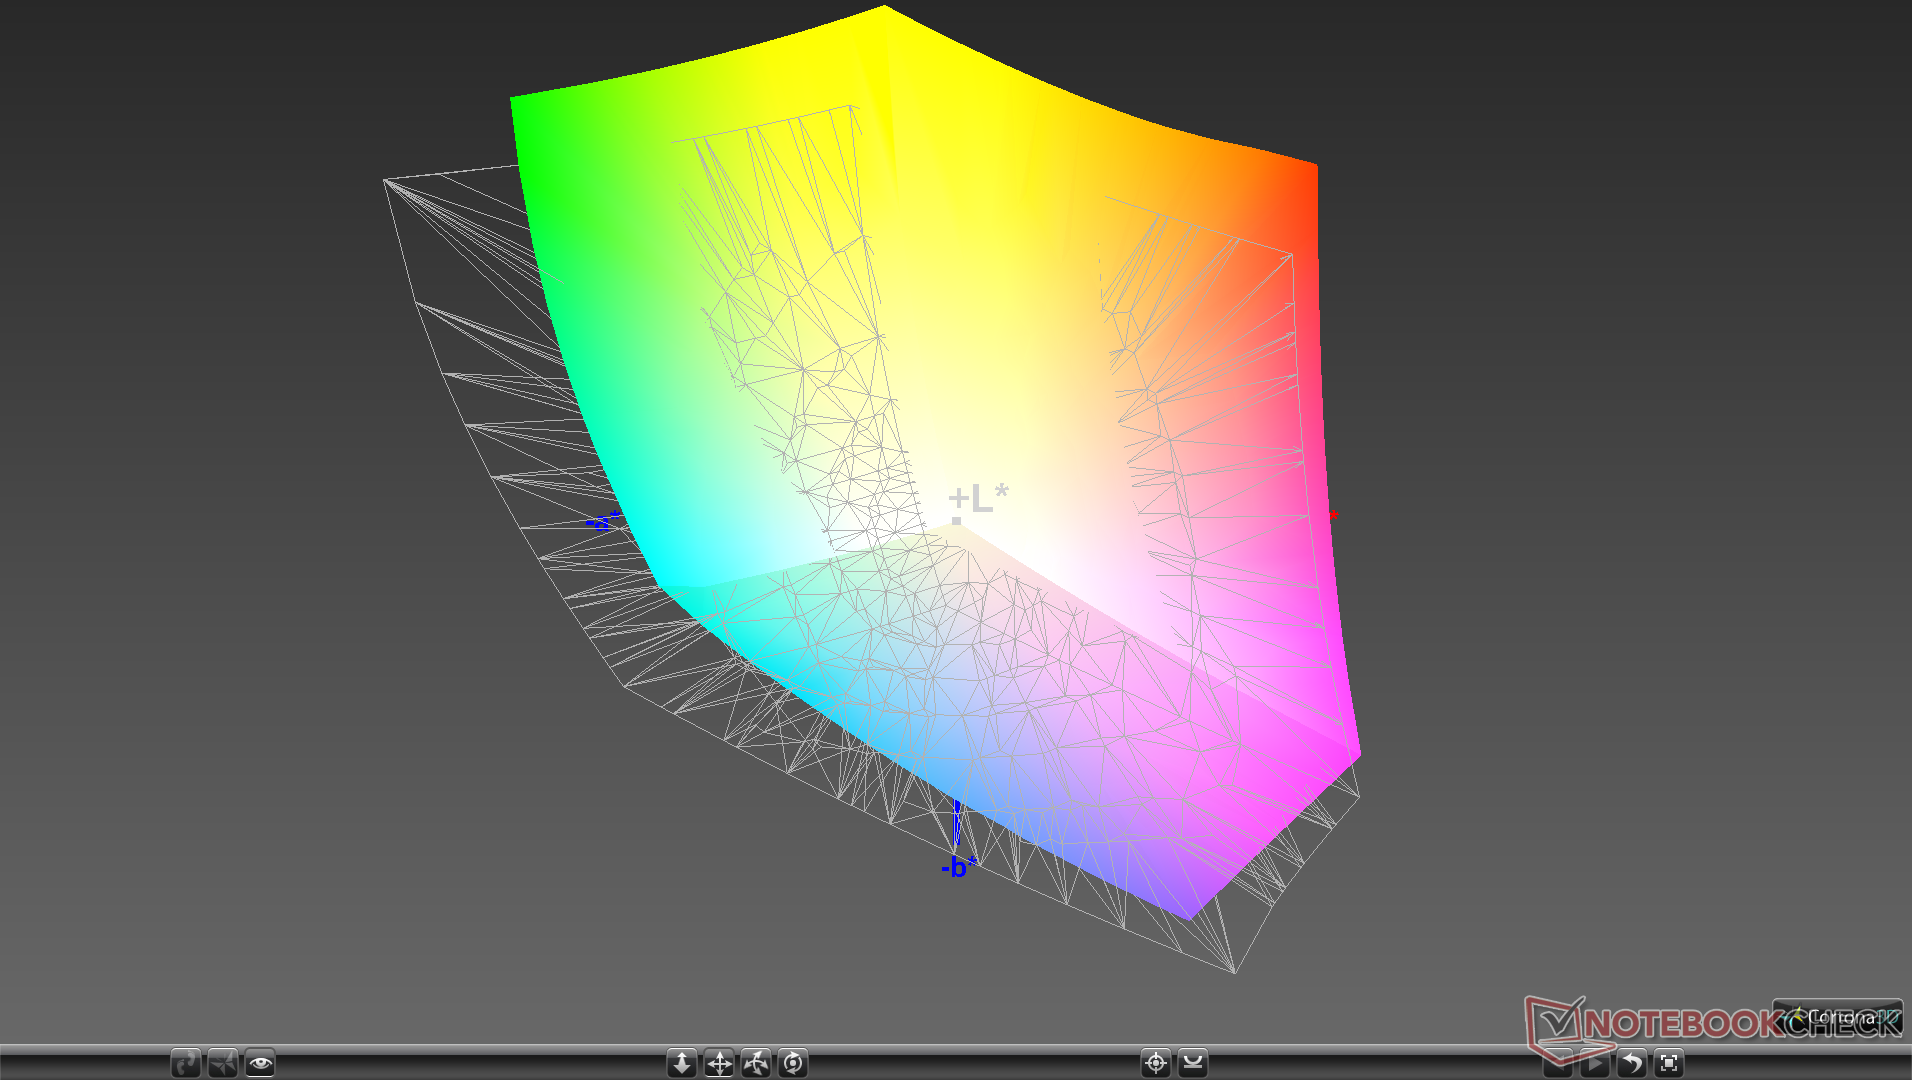
97.7% Display P3 (Argyll 3D)
Gamma: 2.1
CCT: 6766 K
| Asus Zenbook S UX393JA AU Optronics B139KAN01.0, IPS, 13.9", 3300x2200 | Microsoft Surface Laptop 3 13 Core i5-1035G7 Sharp LQ135P1JX51, IPS, 13.5", 2256x1504 | Huawei MateBook X Pro 2020 i7 JDI LPM139M422A, LTPS, 13.9", 3000x2000 | Asus ZenBook S13 UX392FN Tianma XM, IPS, 13.9", 1920x1080 | Lenovo Yoga Slim 7-14IIL05 N140HCG-EQ1, , 14", 1920x1080 | Dell XPS 13 9300 Core i7-1065G7 Sharp LQ134N1, IPS, 13.4", 1920x1200 | |
|---|---|---|---|---|---|---|
| Display | -19% | -18% | -19% | -18% | -19% | |
| Display P3 Coverage (%) | 97.7 | 65.7 -33% | 66.6 -32% | 67.5 -31% | 66.4 -32% | 66.3 -32% |
| sRGB Coverage (%) | 99.8 | 98.6 -1% | 99.4 0% | 95.8 -4% | 98.8 -1% | 97.3 -3% |
| AdobeRGB 1998 Coverage (%) | 87.9 | 67.8 -23% | 68.6 -22% | 69 -22% | 68.4 -22% | 68.5 -22% |
| Response Times | -6% | 17% | 26% | 9% | 13% | |
| Response Time Grey 50% / Grey 80% * (ms) | 56.4 ? | 59.2 ? -5% | 49.6 ? 12% | 47.2 ? 16% | 51.2 ? 9% | 50 ? 11% |
| Response Time Black / White * (ms) | 38.8 ? | 41.6 ? -7% | 30.8 ? 21% | 24.8 ? 36% | 35.2 ? 9% | 33.2 ? 14% |
| PWM Frequency (Hz) | 21740 ? | 29070 ? | 2500 ? | |||
| Screen | 21% | 28% | 16% | 11% | 3% | |
| Brightness middle (cd/m²) | 444.1 | 403.4 -9% | 557 25% | 466 5% | 289 -35% | 607.6 37% |
| Brightness (cd/m²) | 423 | 397 -6% | 532 26% | 462 9% | 286 -32% | 595 41% |
| Brightness Distribution (%) | 89 | 89 0% | 87 -2% | 90 1% | 92 3% | 96 8% |
| Black Level * (cd/m²) | 0.37 | 0.34 8% | 0.33 11% | 0.33 11% | 0.17 54% | 0.4 -8% |
| Contrast (:1) | 1200 | 1186 -1% | 1688 41% | 1412 18% | 1700 42% | 1519 27% |
| Colorchecker dE 2000 * | 2.94 | 0.94 68% | 1.4 52% | 1.93 34% | 2.5 15% | 3.23 -10% |
| Colorchecker dE 2000 max. * | 7.37 | 2.92 60% | 2.5 66% | 4.26 42% | 4.7 36% | 8.67 -18% |
| Colorchecker dE 2000 calibrated * | 3.05 | 0.99 68% | 0.7 77% | 1.99 35% | 0.6 80% | 1.01 67% |
| Greyscale dE 2000 * | 2.9 | 0.9 69% | 2 31% | 1.7 41% | 3.4 -17% | 5.5 -90% |
| Gamma | 2.1 105% | 2.13 103% | 2.14 103% | 2.15 102% | 1.98 111% | 2.12 104% |
| CCT | 6766 96% | 6620 98% | 6689 97% | 6382 102% | 7005 93% | 6413 101% |
| Color Space (Percent of AdobeRGB 1998) (%) | 78.2 | 62.3 -20% | 62.5 -20% | 62.2 -20% | 62.6 -20% | 63 -19% |
| Color Space (Percent of sRGB) (%) | 99.8 | 98.7 -1% | 99.5 0% | 95.7 -4% | 98.9 -1% | 97.5 -2% |
| Total Average (Program / Settings) | -1% /
10% | 9% /
18% | 8% /
10% | 1% /
6% | -1% /
0% |
* ... smaller is better
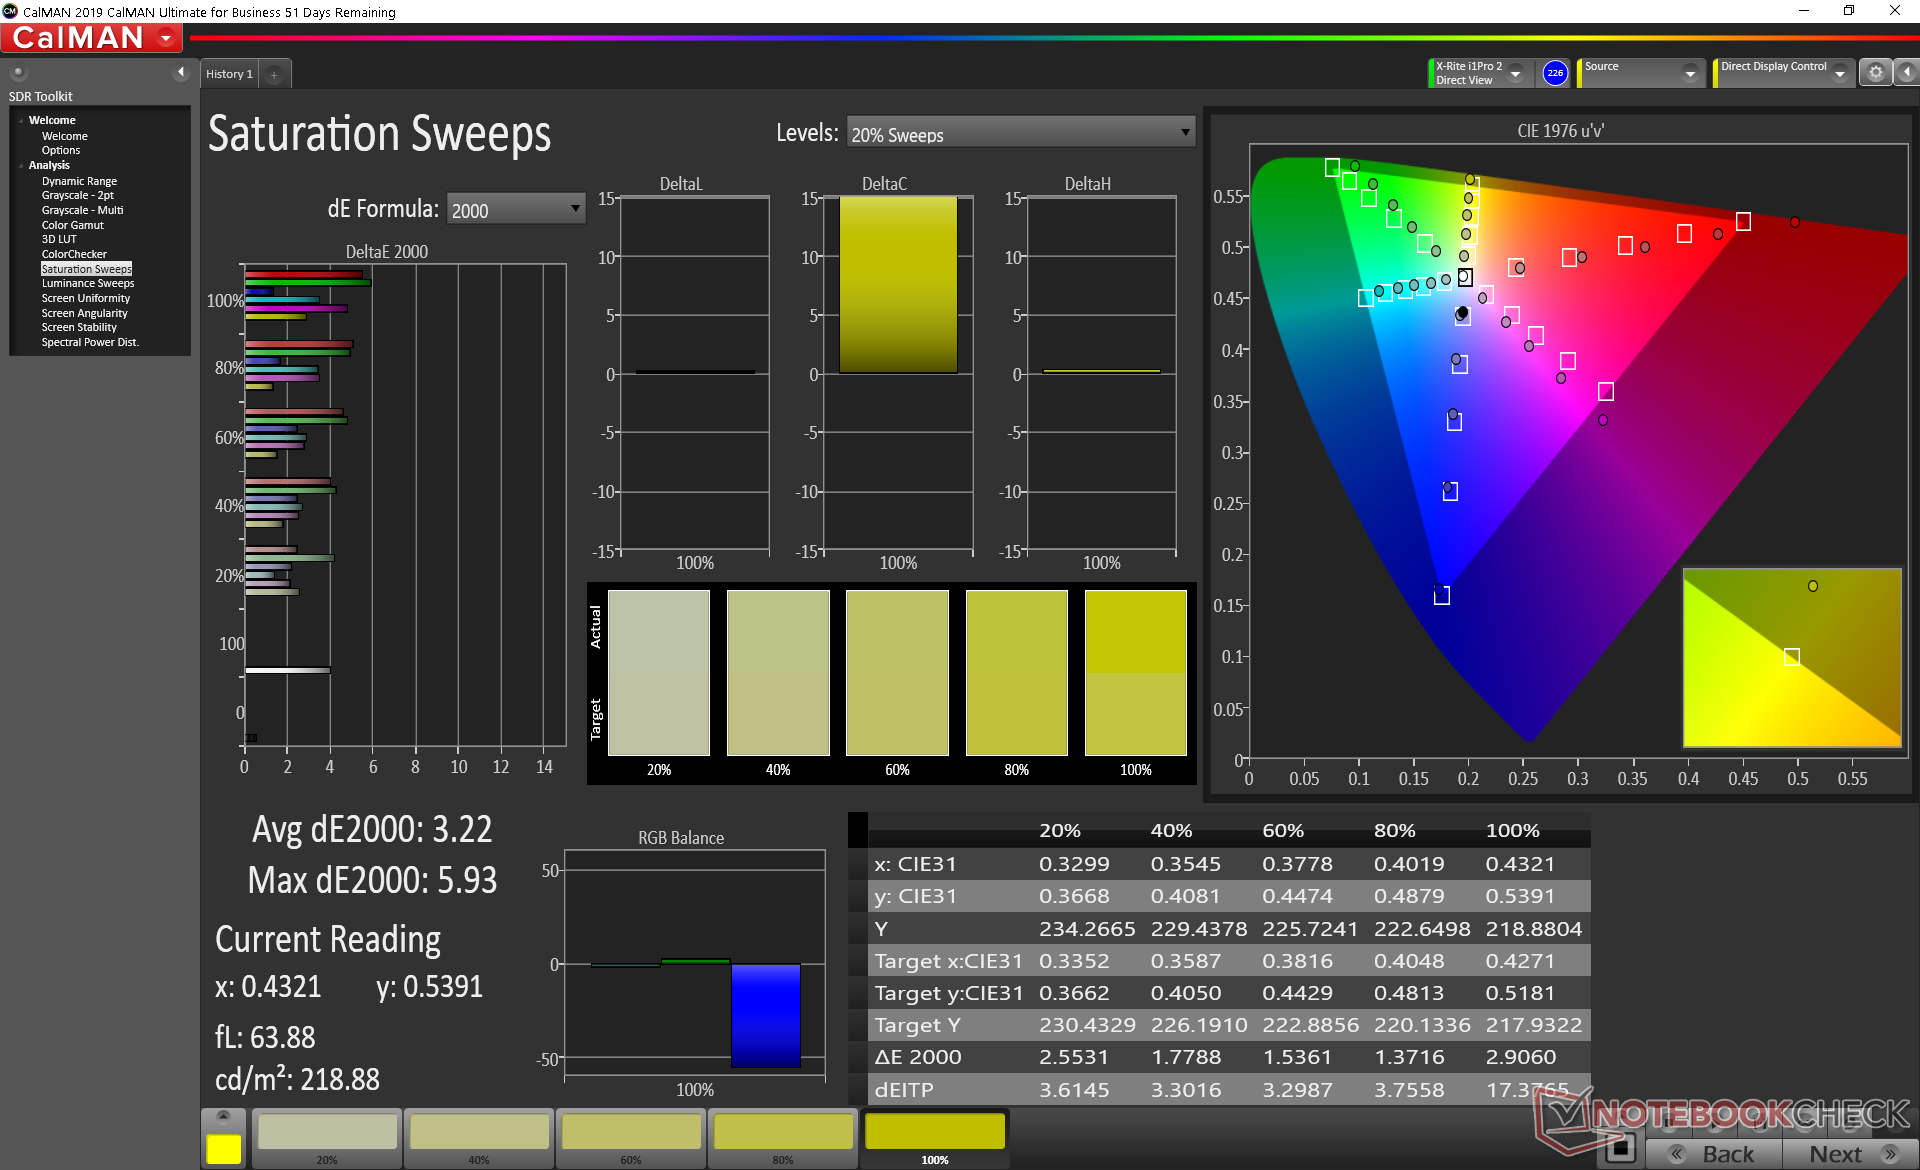
Color space covers all of sRGB and 78 percent of AdobeRGB. Note that Asus advertises full DCI-P3 coverage meaning a small portion of the color space will not overlap with the AdobeRGB standard. Indeed, this is what we can observe as approximately 16 percent of the color space lies outside of AdobeRGB.
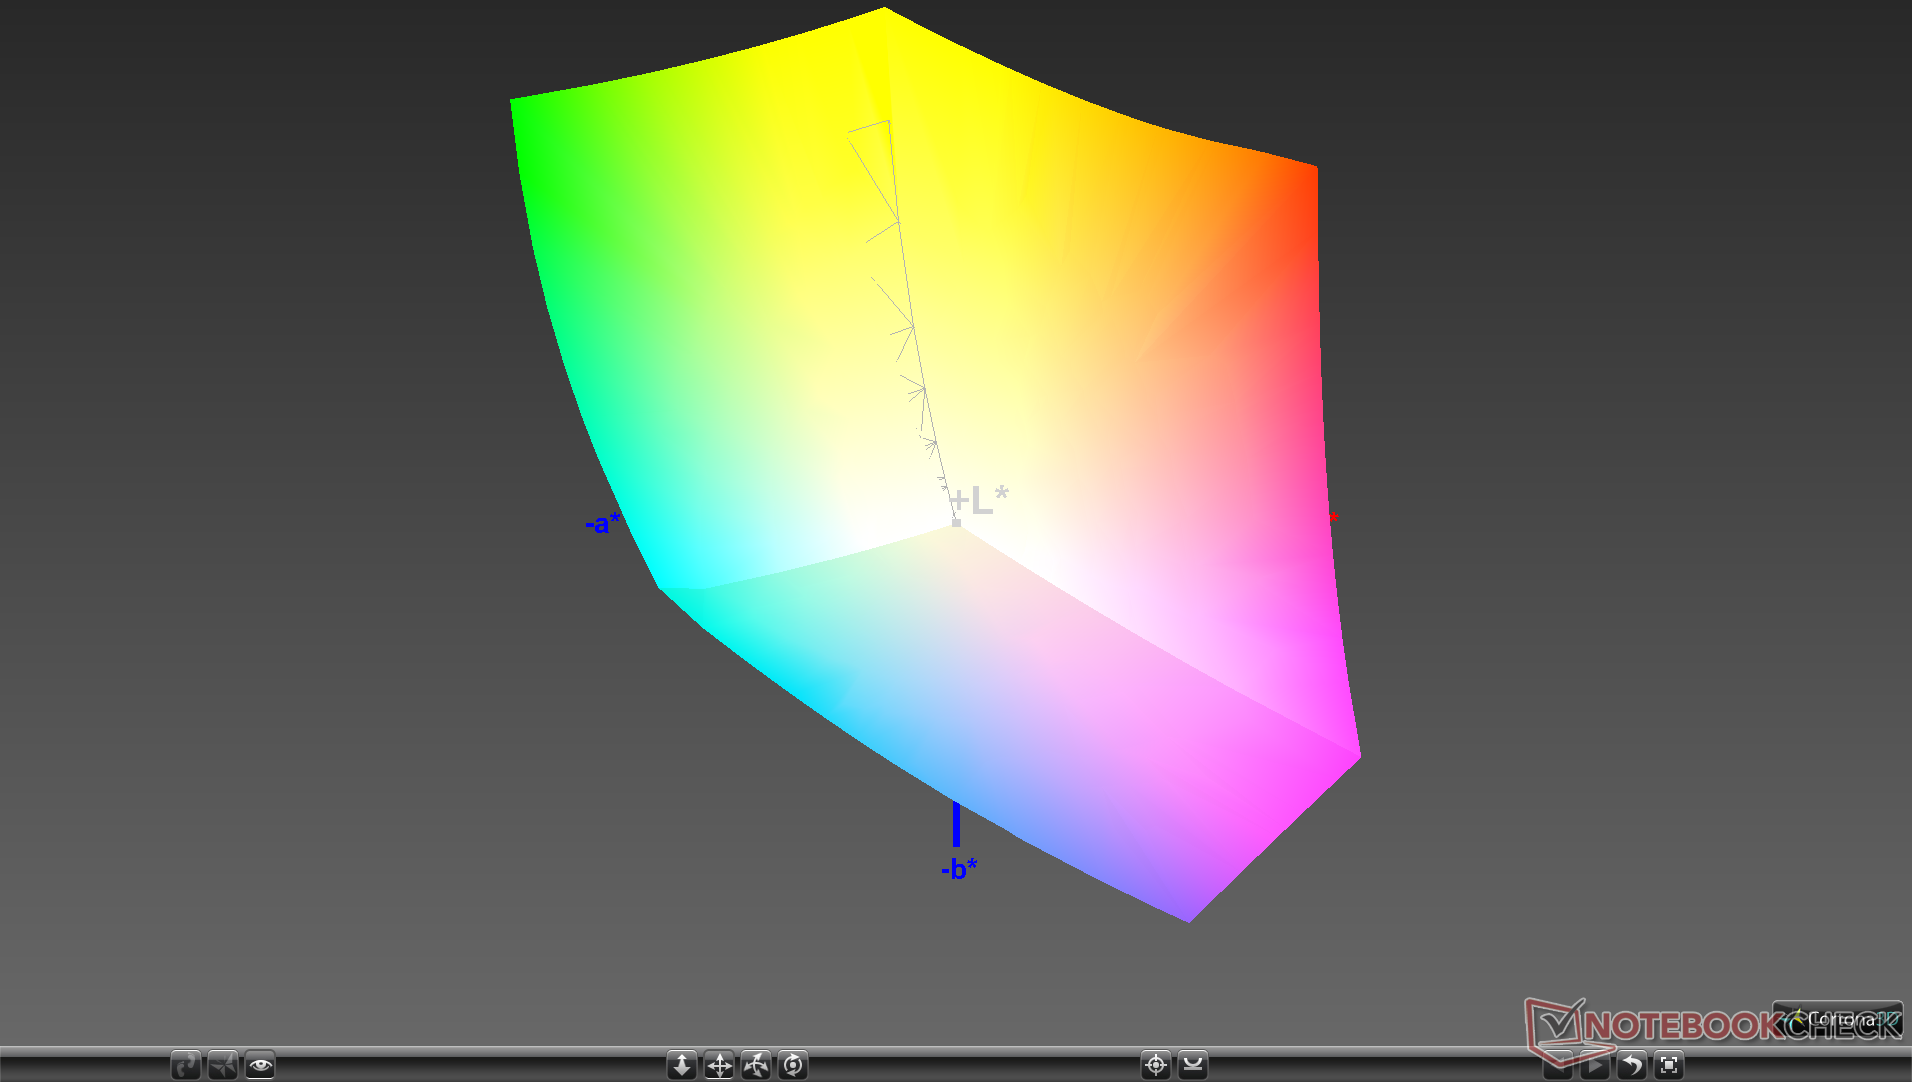
X-Rite colorimeter measurements reveal a well-calibrated display out of the box. Color temperature is slightly too cool which can be easily addressed.

Display Response Times
| ↔ Response Time Black to White | ||
|---|---|---|
| 38.8 ms ... rise ↗ and fall ↘ combined | ↗ 23.2 ms rise | 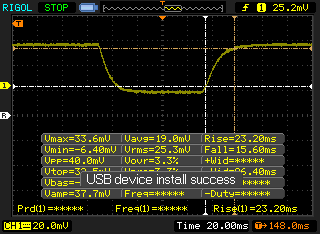 |
| ↘ 15.6 ms fall | ||
| The screen shows slow response rates in our tests and will be unsatisfactory for gamers. In comparison, all tested devices range from 0.1 (minimum) to 240 (maximum) ms. » 96 % of all devices are better. This means that the measured response time is worse than the average of all tested devices (19.8 ms). | ||
| ↔ Response Time 50% Grey to 80% Grey | ||
| 56.4 ms ... rise ↗ and fall ↘ combined | ↗ 26.4 ms rise | 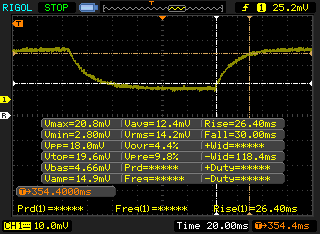 |
| ↘ 30 ms fall | ||
| The screen shows slow response rates in our tests and will be unsatisfactory for gamers. In comparison, all tested devices range from 0.165 (minimum) to 636 (maximum) ms. » 93 % of all devices are better. This means that the measured response time is worse than the average of all tested devices (31 ms). | ||
Screen Flickering / PWM (Pulse-Width Modulation)
| Screen flickering / PWM not detected | 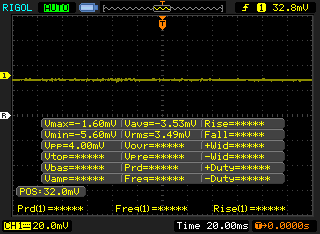 | ||
In comparison: 52 % of all tested devices do not use PWM to dim the display. If PWM was detected, an average of 7751 (minimum: 5 - maximum: 343500) Hz was measured. | |||
Performance
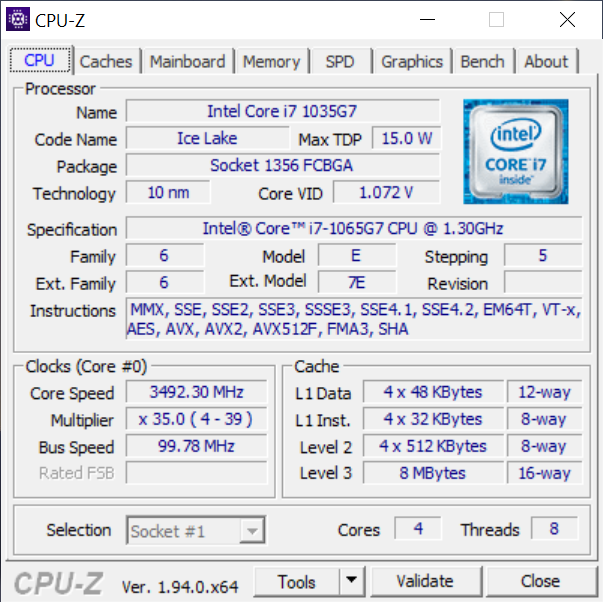
Processor
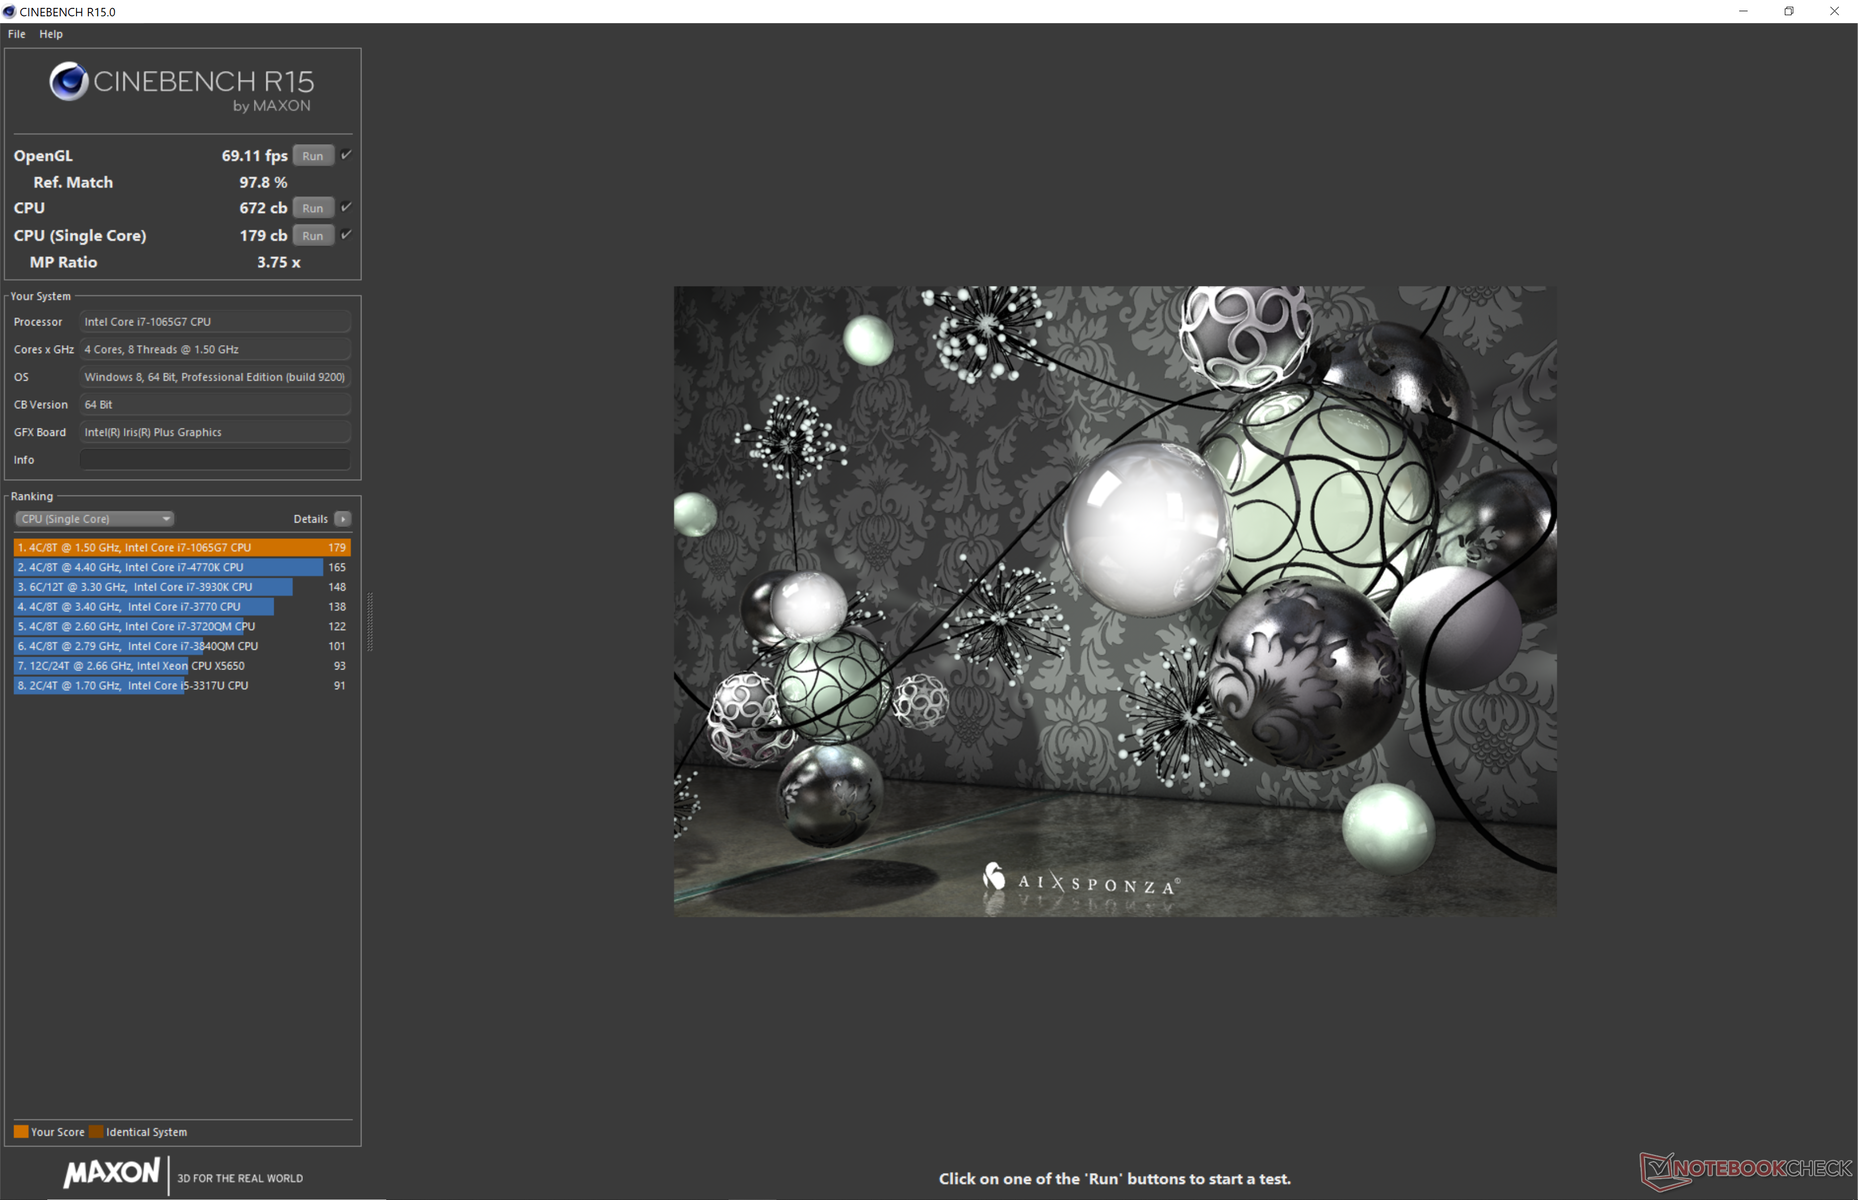
CPU performance is within just a few percentage points of the average Core i7-1065G7 in our database taken from about 30 other laptops. When compared to the Core i7-8565U in last year's UX392, multi-thread performance is only about 15 percent faster after accounting for any performance throttling on both systems. Turbo Boost performance is not as long lasting as other laptops including the older UX392 as illustrated by our CineBench R15 xT loop comparison graph below.
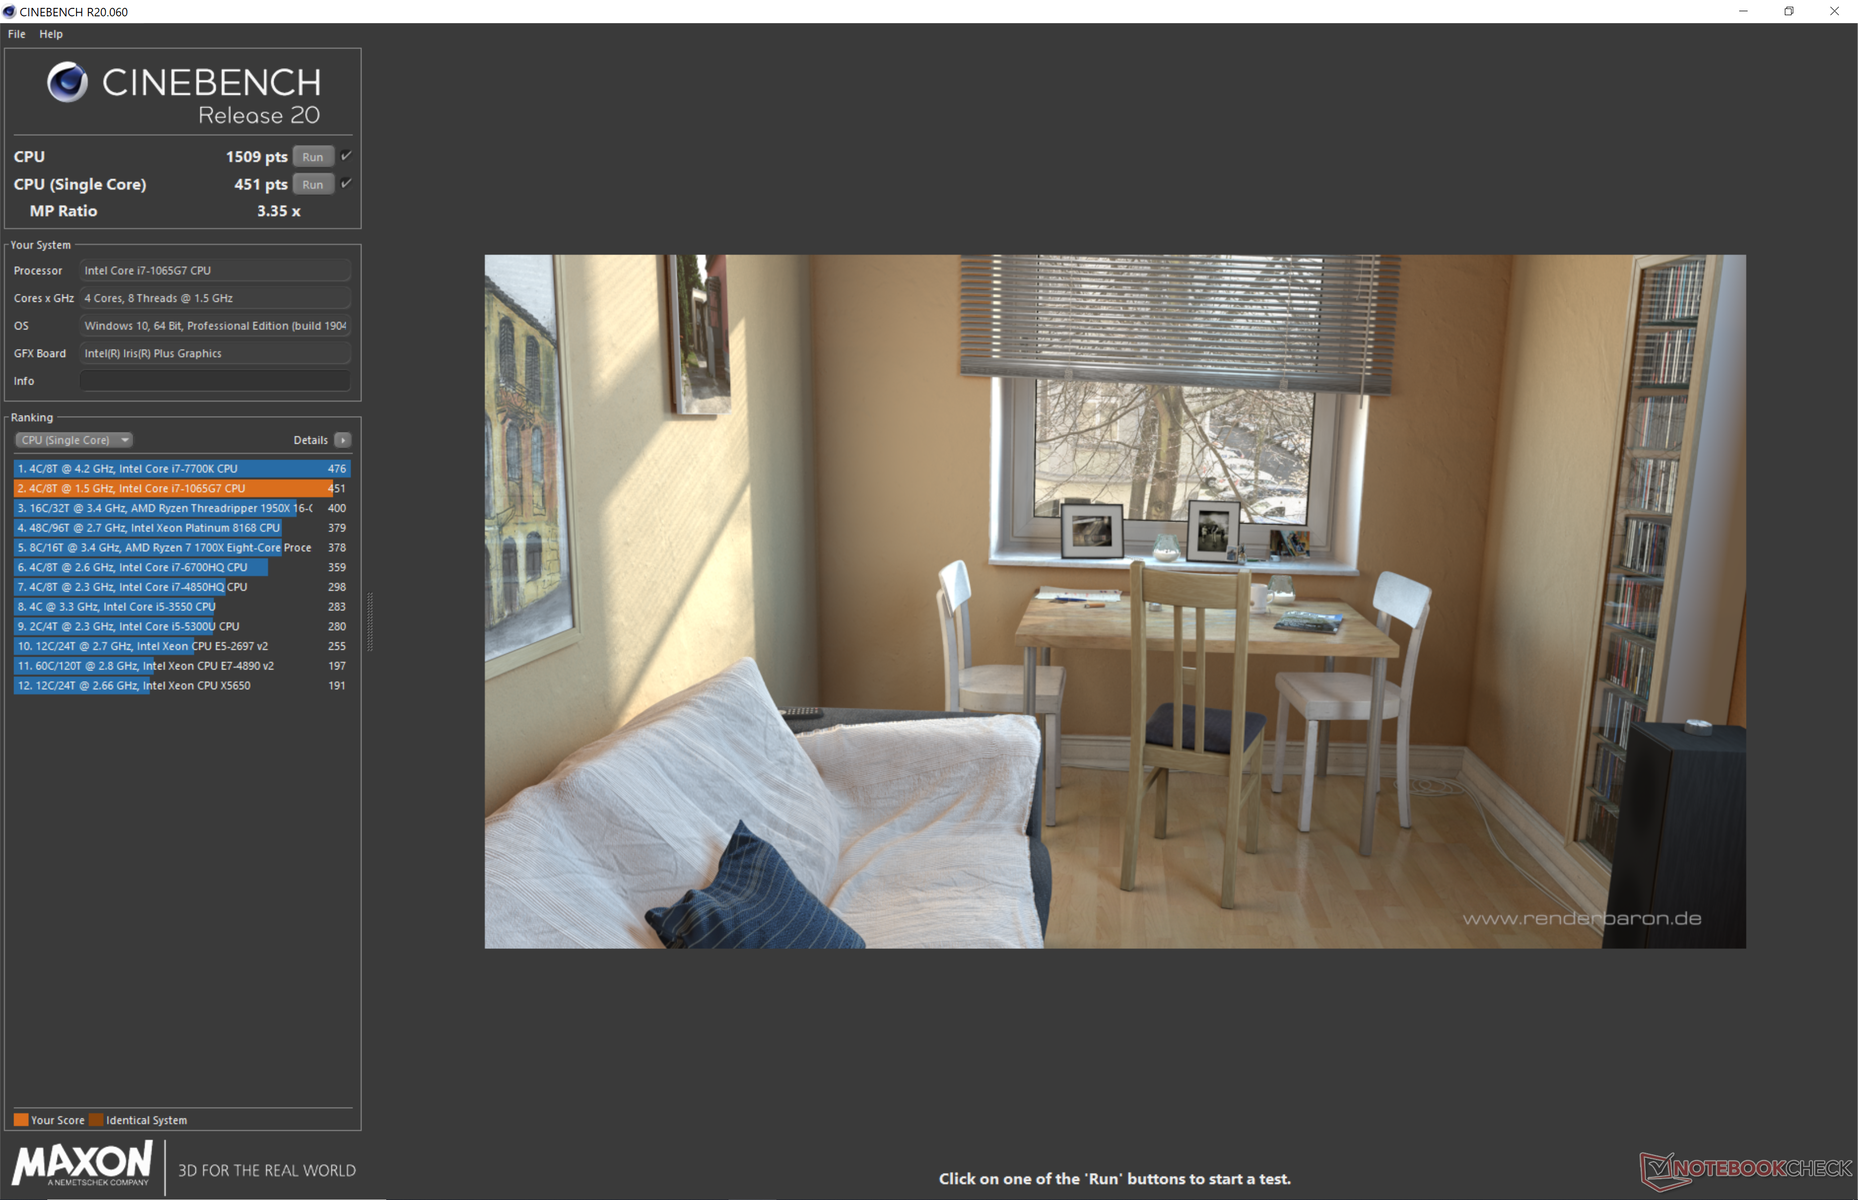
Cinebench R15: CPU Multi 64Bit | CPU Single 64Bit
Blender: v2.79 BMW27 CPU
7-Zip 18.03: 7z b 4 -mmt1 | 7z b 4
Geekbench 5.5: Single-Core | Multi-Core
HWBOT x265 Benchmark v2.2: 4k Preset
LibreOffice : 20 Documents To PDF
R Benchmark 2.5: Overall mean
| Geekbench 5.5 / Single-Core | |
| Asus ZenBook 14 UX425EA | |
| Asus Zenbook S UX393JA | |
| Average Intel Core i7-1065G7 (948 - 1348, n=18) | |
| Asus ZenBook 14 UX434FL-DB77 | |
| Lenovo Yoga Slim 7-14ARE | |
| Lenovo Yoga Slim 7-14ARE | |
| Acer Swift 3 SF314-42-R4XJ | |
| Lenovo IdeaPad 5 14ARE05 | |
| Acer Swift 3 SF314-42-R27B | |
| Geekbench 5.5 / Multi-Core | |
| Lenovo Yoga Slim 7-14ARE | |
| Lenovo Yoga Slim 7-14ARE | |
| Asus ZenBook 14 UX425EA | |
| Acer Swift 3 SF314-42-R4XJ | |
| Lenovo IdeaPad 5 14ARE05 | |
| Asus Zenbook S UX393JA | |
| Average Intel Core i7-1065G7 (2464 - 4855, n=18) | |
| Acer Swift 3 SF314-42-R27B | |
| Asus ZenBook 14 UX434FL-DB77 | |
| HWBOT x265 Benchmark v2.2 / 4k Preset | |
| Lenovo Yoga Slim 7-14ARE | |
| Acer Swift 3 SF314-42-R4XJ | |
| Lenovo IdeaPad 5 14ARE05 | |
| Asus ZenBook 14 UX425EA | |
| Asus ZenBook 14 UX434FL-DB77 | |
| Microsoft Surface Laptop 3 13 Core i5-1035G7 | |
| Asus Zenbook S UX393JA | |
| Average Intel Core i7-1065G7 (2.2 - 6.38, n=22) | |
| Acer Swift 3 SF314-42-R27B | |
| HP Envy x360 13-ar0601ng | |
| LibreOffice / 20 Documents To PDF | |
| Asus ZenBook 14 UX434FL-DB77 | |
| Acer Swift 3 SF314-42-R27B | |
| Average Intel Core i7-1065G7 (46.9 - 85.3, n=19) | |
| Acer Swift 3 SF314-42-R4XJ | |
| Lenovo IdeaPad 5 14ARE05 | |
| Lenovo Yoga Slim 7-14ARE | |
| Asus Zenbook S UX393JA | |
| Asus ZenBook 14 UX425EA | |
| R Benchmark 2.5 / Overall mean | |
| Asus ZenBook 14 UX434FL-DB77 | |
| Average Intel Core i7-1065G7 (0.661 - 0.798, n=18) | |
| Acer Swift 3 SF314-42-R27B | |
| Asus Zenbook S UX393JA | |
| Lenovo IdeaPad 5 14ARE05 | |
| Acer Swift 3 SF314-42-R4XJ | |
| Lenovo Yoga Slim 7-14ARE | |
| Asus ZenBook 14 UX425EA | |
* ... smaller is better
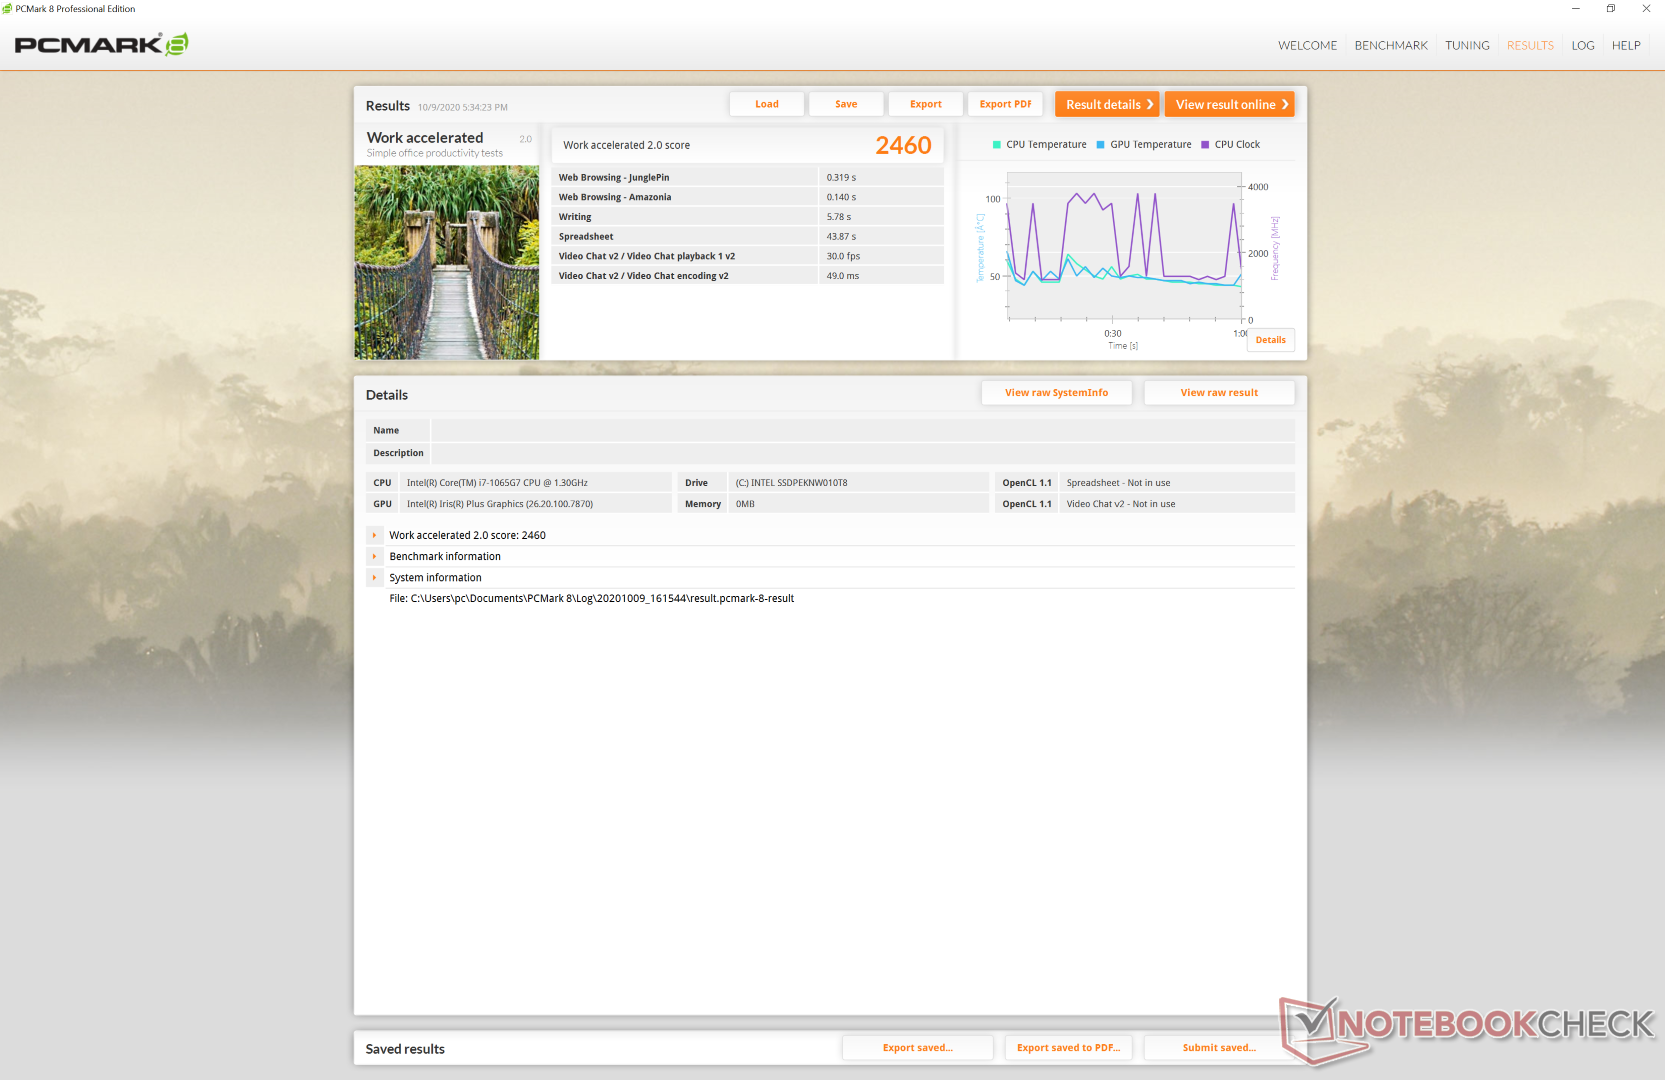
System Performance
We experienced a bug on our unit where the laptop would not recognize the plugged in USB-C AC adapter even after double-checking any settings on MyAsus. We had to discharge the battery further before the laptop would mysteriously recognize the plugged in adapter again.
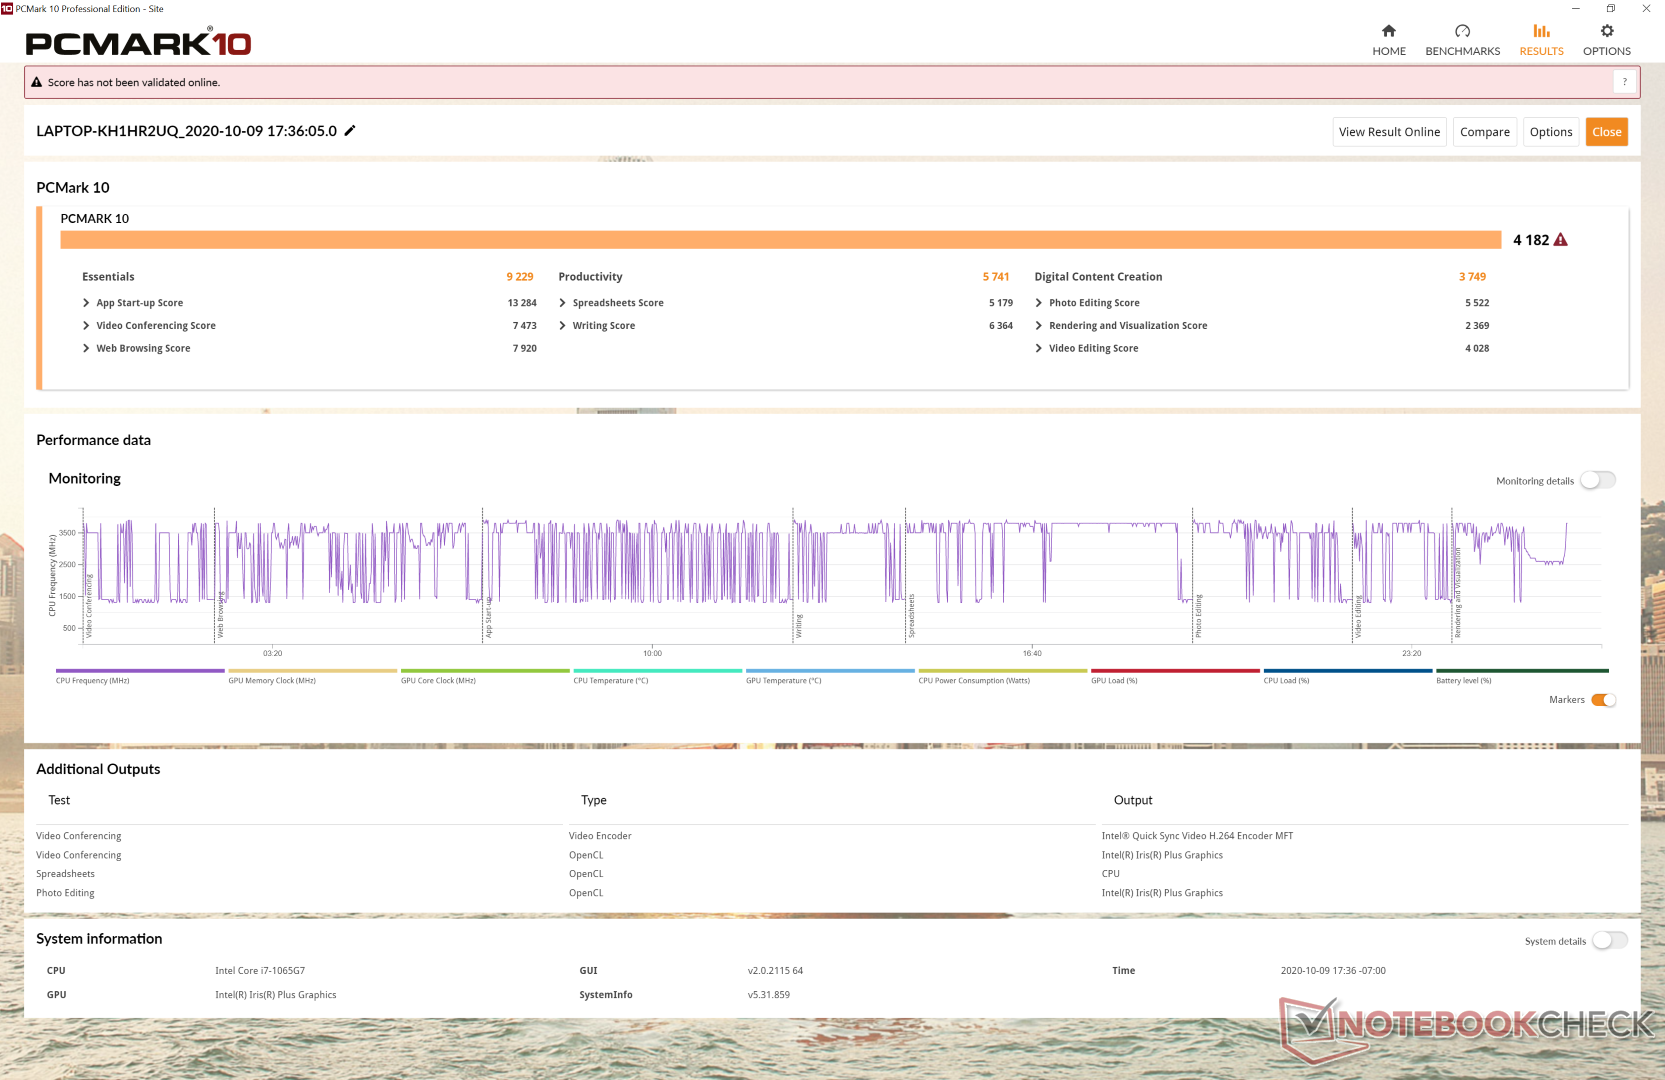
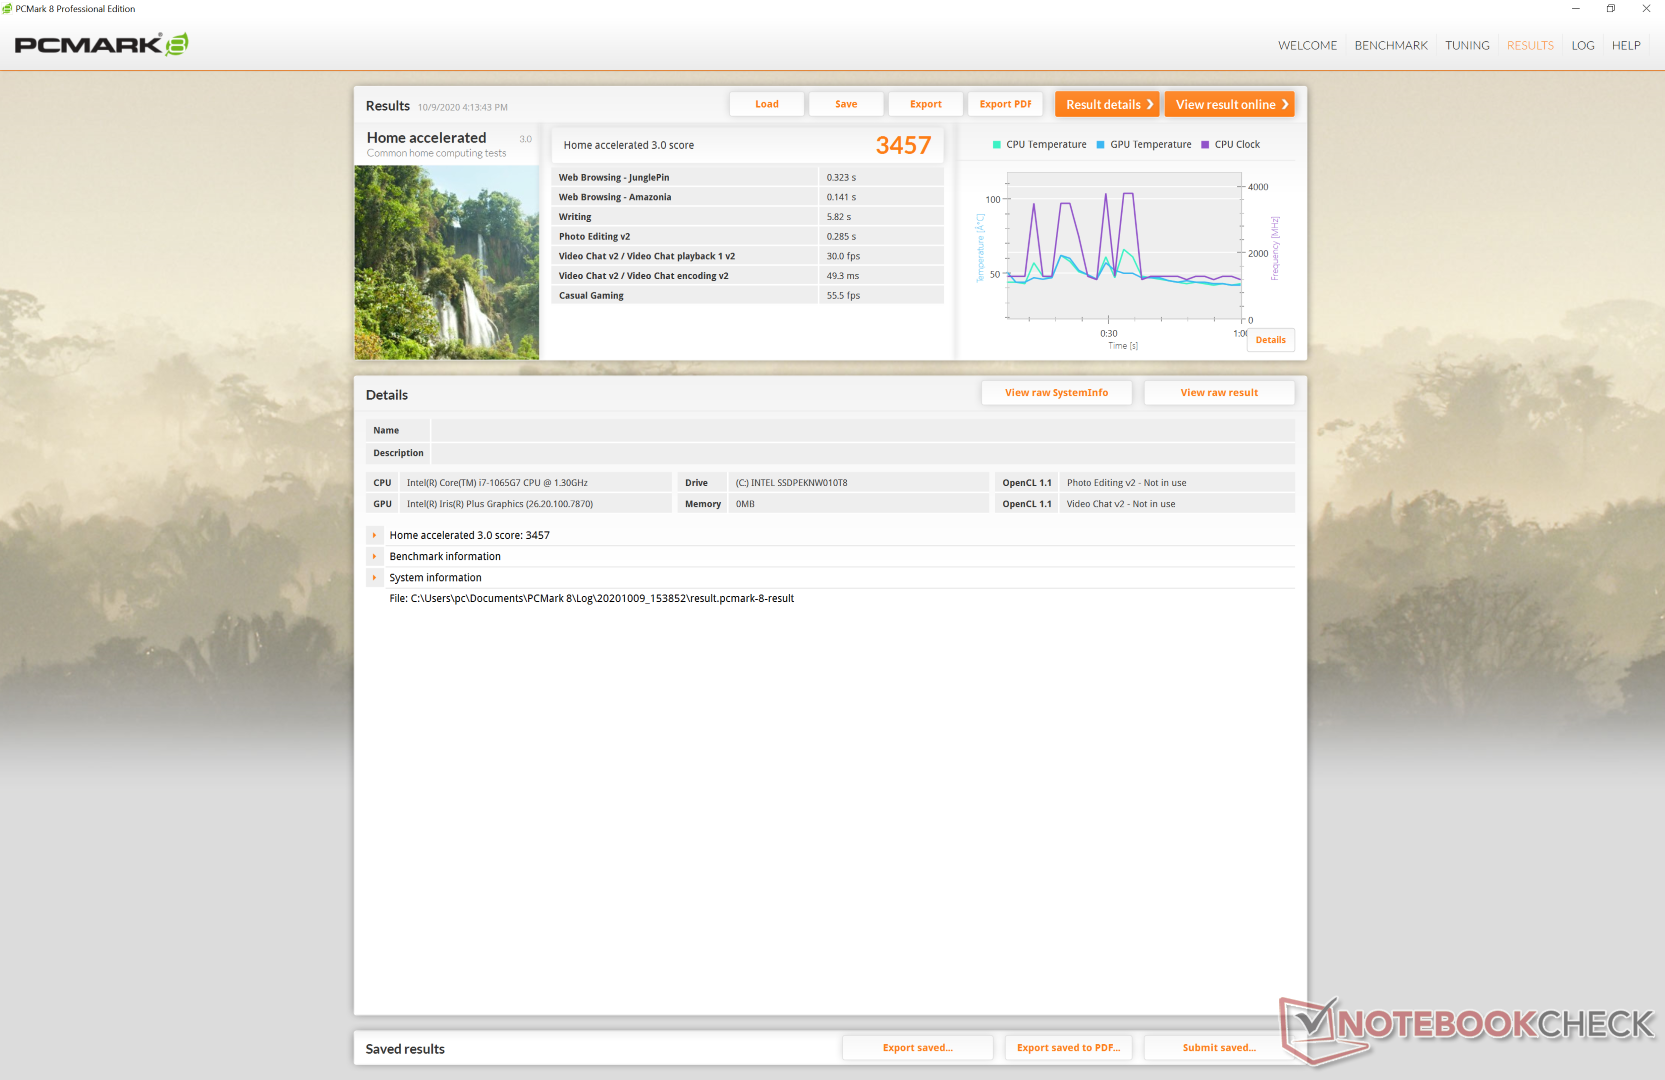
| PCMark 8 Home Score Accelerated v2 | 3457 points | |
| PCMark 8 Work Score Accelerated v2 | 2460 points | |
| PCMark 10 Score | 4182 points | |
Help | ||
DPC Latency
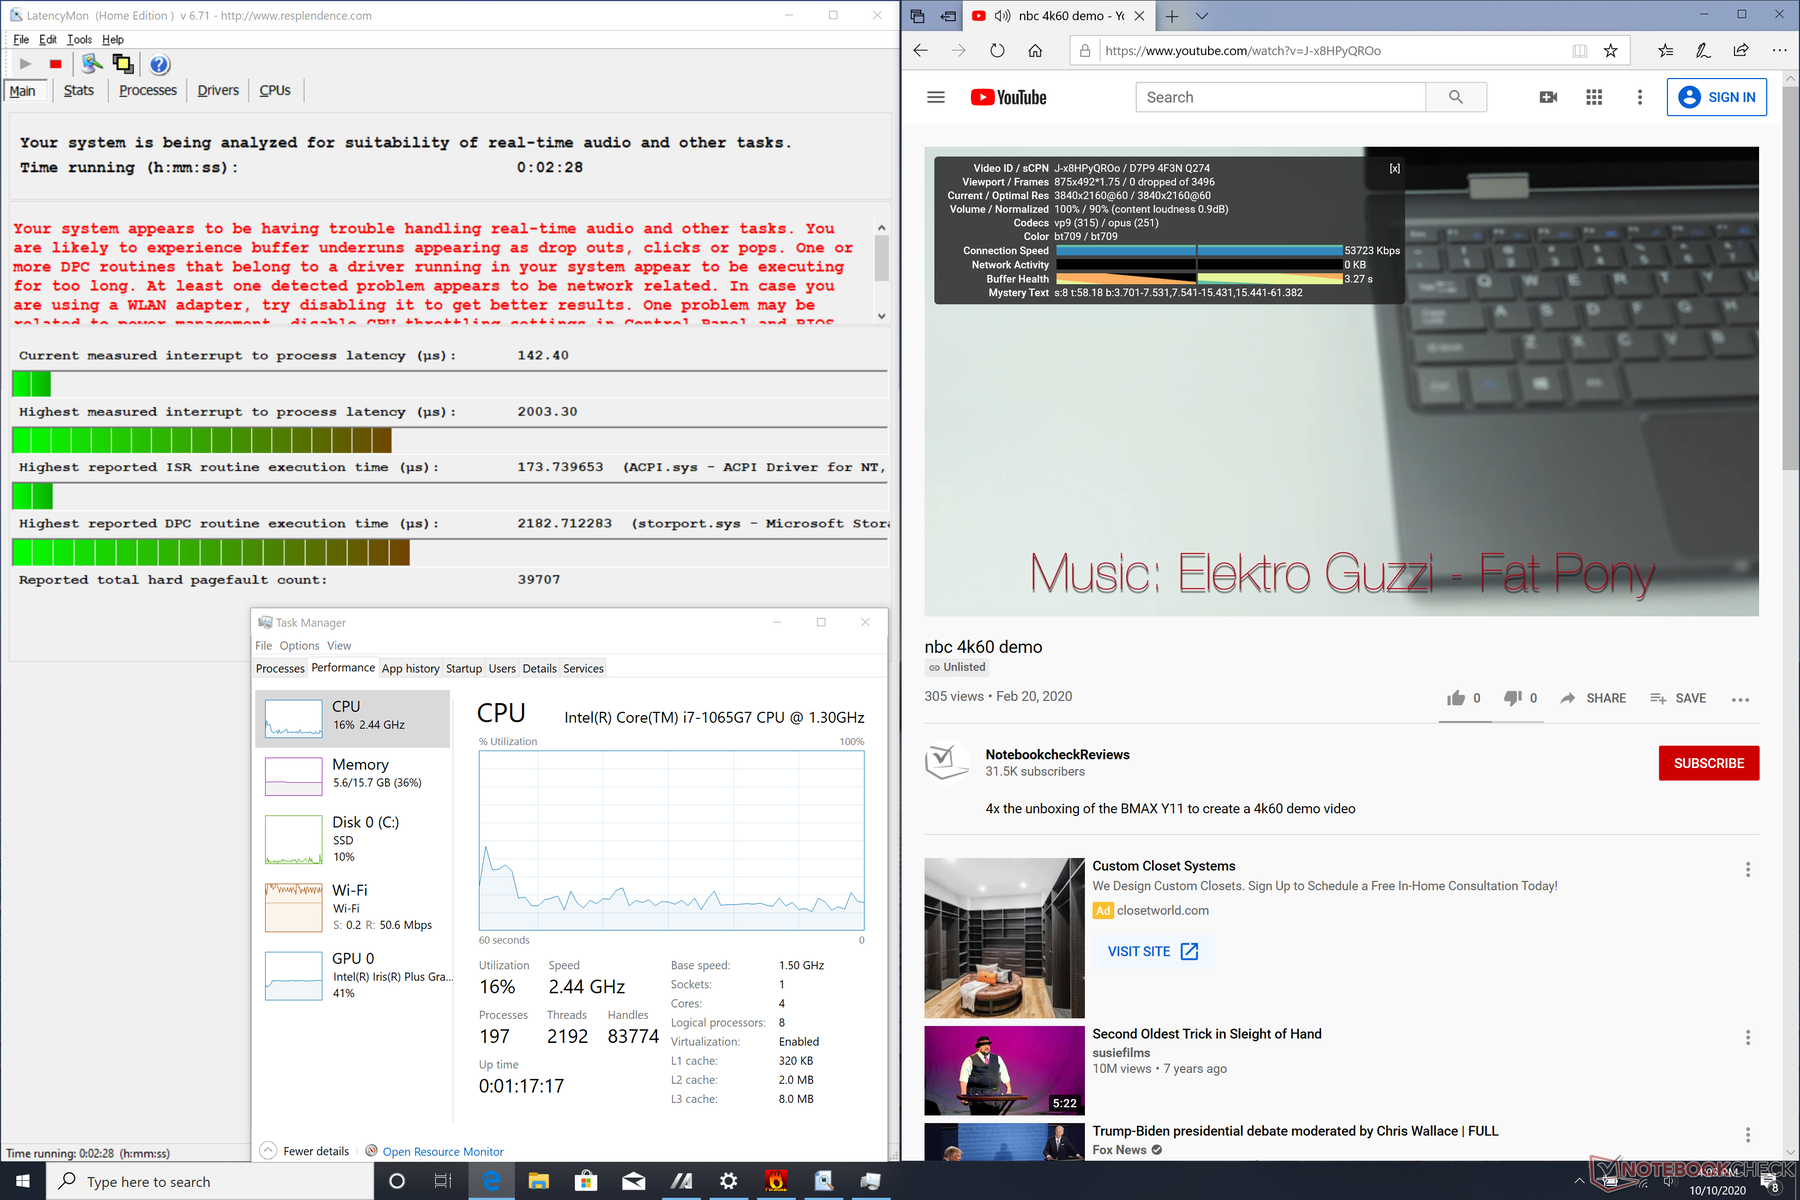
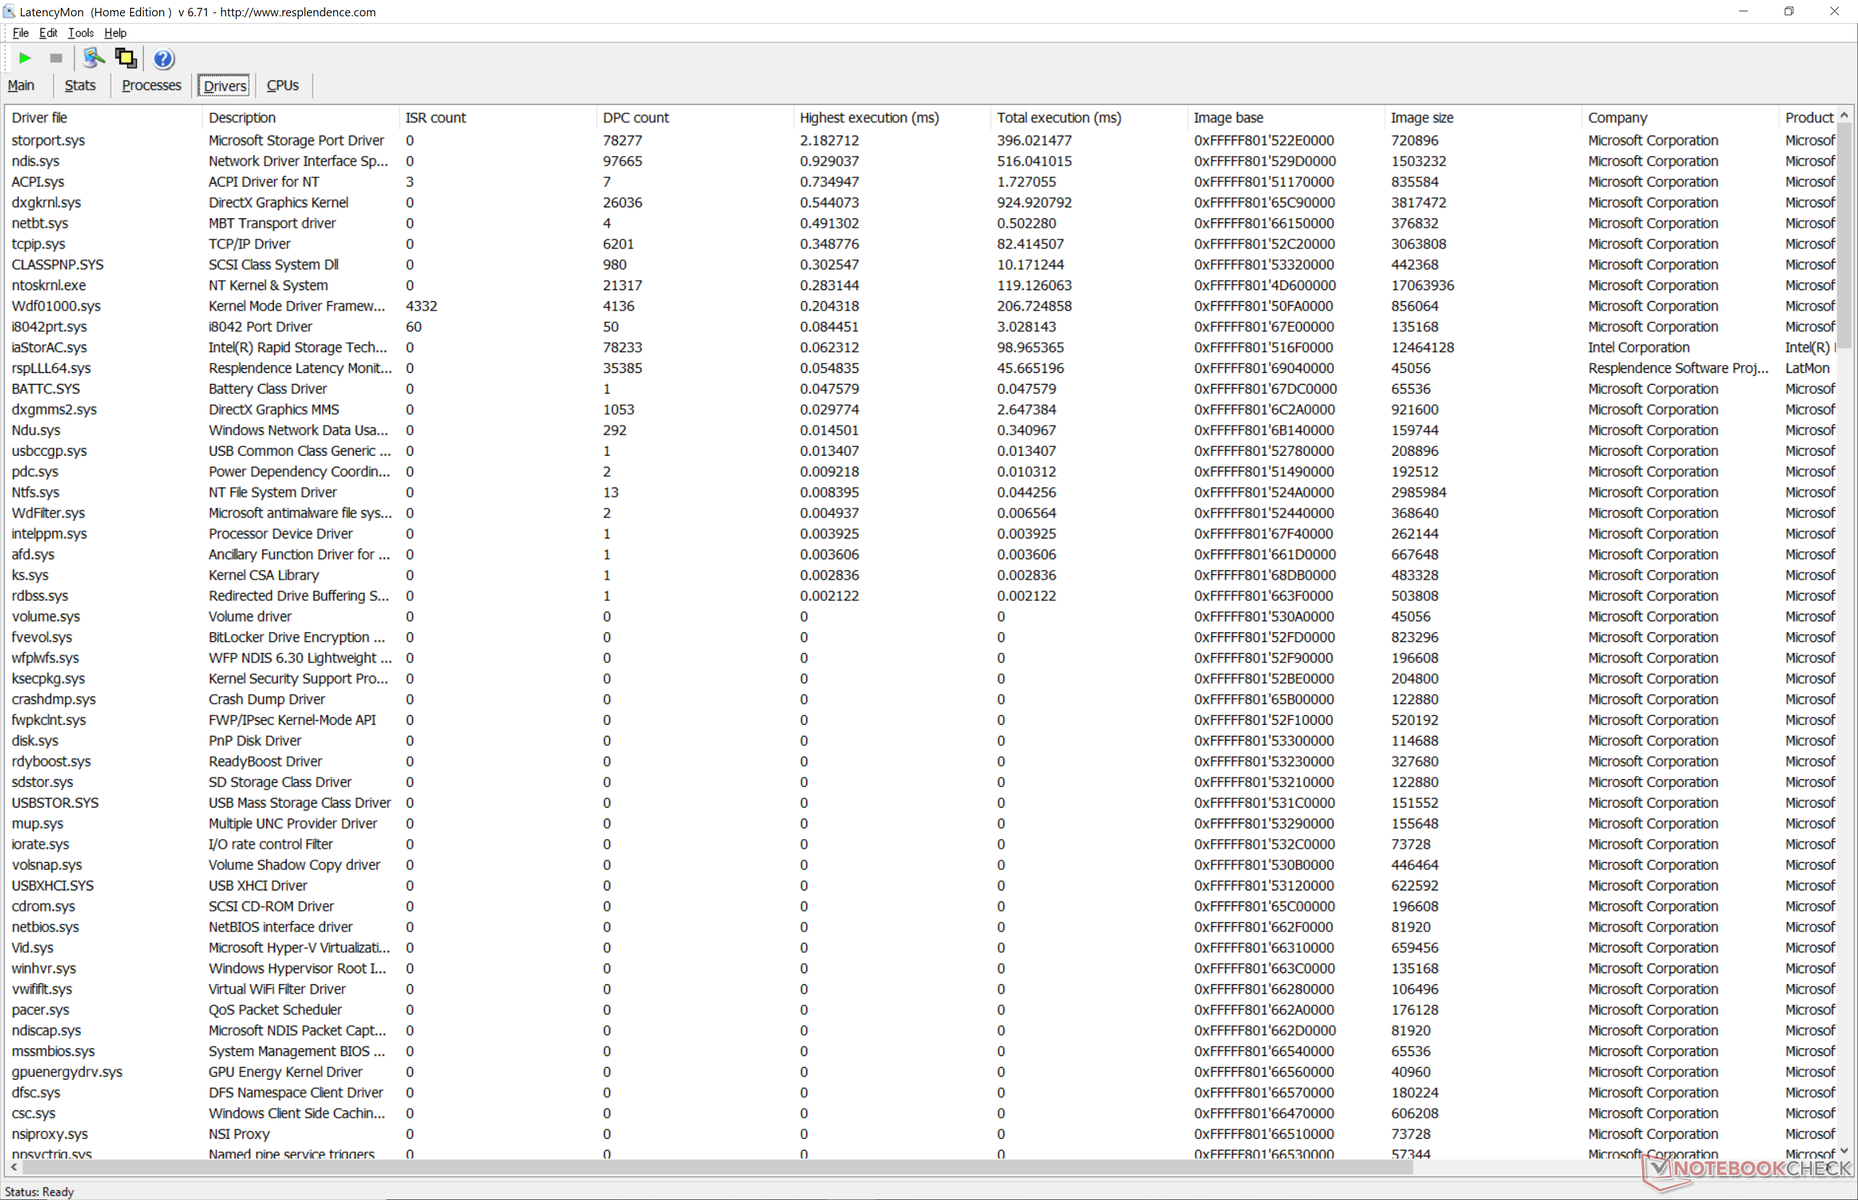
LatencyMon reveals DPC latency issues related to storport.sys when opening multiple tabs on our homepage. 4K UHD video playback at 60 FPS is otherwise smooth and with no dropped frames during our minute-long YouTube test.
| DPC Latencies / LatencyMon - interrupt to process latency (max), Web, Youtube, Prime95 | |
| Dell XPS 13 9300 Core i7-1065G7 | |
| Asus Zenbook S UX393JA | |
| Microsoft Surface Book 3 13.5 | |
| Lenovo Yoga Slim 7-14IIL05 | |
* ... smaller is better
Storage Devices
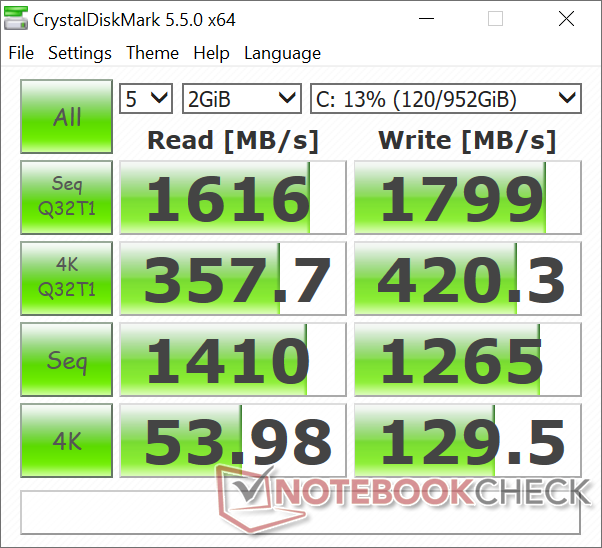
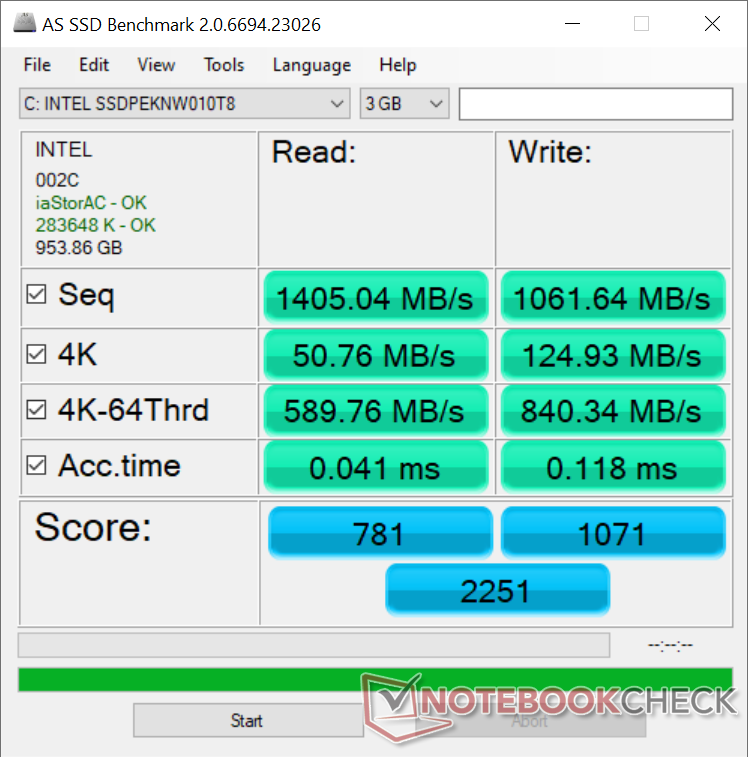
Asus laptops commonly come with Intel 660p SSDs and our UX393 is no exception. Unlike higher-end NVMe SSDs that can approach 3000 MB/s, however, transfer rates on this mid-range 1 TB Intel 660p cap out at "only" 1800 MB/s. This will not significantly impact real-world scenarios especially on an Ultrabook powered by a U-series CPU.
| Asus Zenbook S UX393JA Intel SSD 660p 1TB SSDPEKNW010T8 | Microsoft Surface Book 3 13.5 SK Hynix BC501 HFM512GDJTNG | Huawei MateBook X Pro 2020 i7 Samsung PM981a MZVLB1T0HBLR | Asus ZenBook S13 UX392FN WDC PC SN520 SDAPNUW-512G | Dell XPS 13 9300 Core i7-1065G7 Intel SSDPEMKF512G8 NVMe SSD | |
|---|---|---|---|---|---|
| AS SSD | -13% | 87% | 13% | -9% | |
| Seq Read (MB/s) | 1405 | 1707 21% | 2737 95% | 1224 -13% | 1956 39% |
| Seq Write (MB/s) | 1062 | 510 -52% | 2530 138% | 907 -15% | 1227 16% |
| 4K Read (MB/s) | 50.8 | 38.77 -24% | 54 6% | 41.46 -18% | 63 24% |
| 4K Write (MB/s) | 124.9 | 100.9 -19% | 152.5 22% | 126.2 1% | 156.6 25% |
| 4K-64 Read (MB/s) | 590 | 630 7% | 2011 241% | 1021 73% | 475.6 -19% |
| 4K-64 Write (MB/s) | 840 | 707 -16% | 1260 50% | 1251 49% | 539 -36% |
| Access Time Read * (ms) | 0.041 | 0.085 -107% | 0.066 -61% | 0.053 -29% | 0.042 -2% |
| Access Time Write * (ms) | 0.118 | 0.035 70% | 0.024 80% | 0.027 77% | 0.105 11% |
| Score Read (Points) | 781 | 839 7% | 2339 199% | 1185 52% | 734 -6% |
| Score Write (Points) | 1071 | 859 -20% | 1666 56% | 1468 37% | 818 -24% |
| Score Total (Points) | 2251 | 2077 -8% | 5191 131% | 3250 44% | 1915 -15% |
| Copy ISO MB/s (MB/s) | 1459 | 1404 -4% | 1022 -30% | ||
| Copy Program MB/s (MB/s) | 600 | 402.4 -33% | 302.8 -50% | ||
| Copy Game MB/s (MB/s) | 1411 | 902 -36% | 491.4 -65% | ||
| CrystalDiskMark 5.2 / 6 | -27% | 42% | 5% | 33% | |
| Write 4K (MB/s) | 129.5 | 88.4 -32% | 165.6 28% | 149.2 15% | 186.8 44% |
| Read 4K (MB/s) | 54 | 39.53 -27% | 50.2 -7% | 47.18 -13% | 71.4 32% |
| Write Seq (MB/s) | 1265 | 691 -45% | 1905 51% | 750 -41% | 1203 -5% |
| Read Seq (MB/s) | 1410 | 1032 -27% | 1669 18% | 1137 -19% | 2600 84% |
| Write 4K Q32T1 (MB/s) | 420.3 | 279.6 -33% | 474.6 13% | 749 78% | 514 22% |
| Read 4K Q32T1 (MB/s) | 357.7 | 261.6 -27% | 508 42% | 478.7 34% | 570 59% |
| Write Seq Q32T1 (MB/s) | 1799 | 868 -52% | 3007 67% | 1453 -19% | 786 -56% |
| Read Seq Q32T1 (MB/s) | 1616 | 2075 28% | 3556 120% | 1713 6% | 2947 82% |
| Total Average (Program / Settings) | -20% /
-19% | 65% /
68% | 9% /
10% | 12% /
6% |
* ... smaller is better

Disk Throttling: DiskSpd Read Loop, Queue Depth 8
GPU Performance
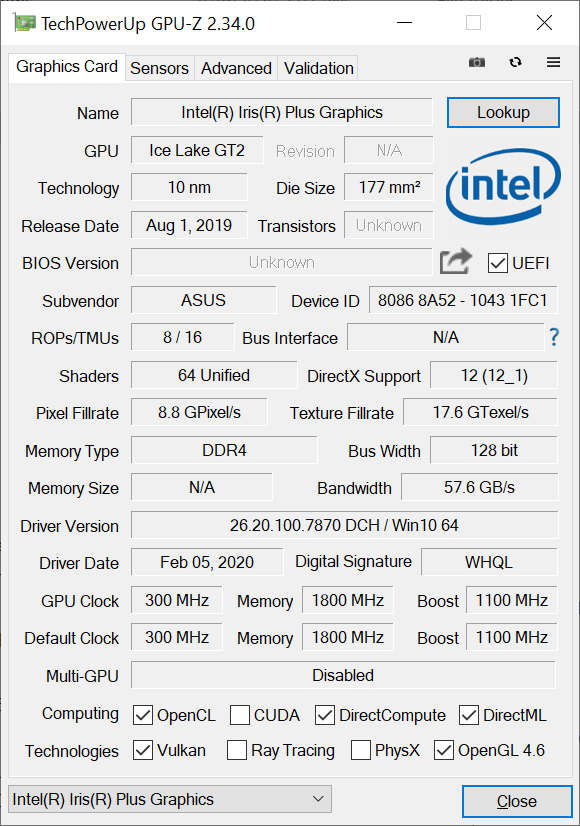
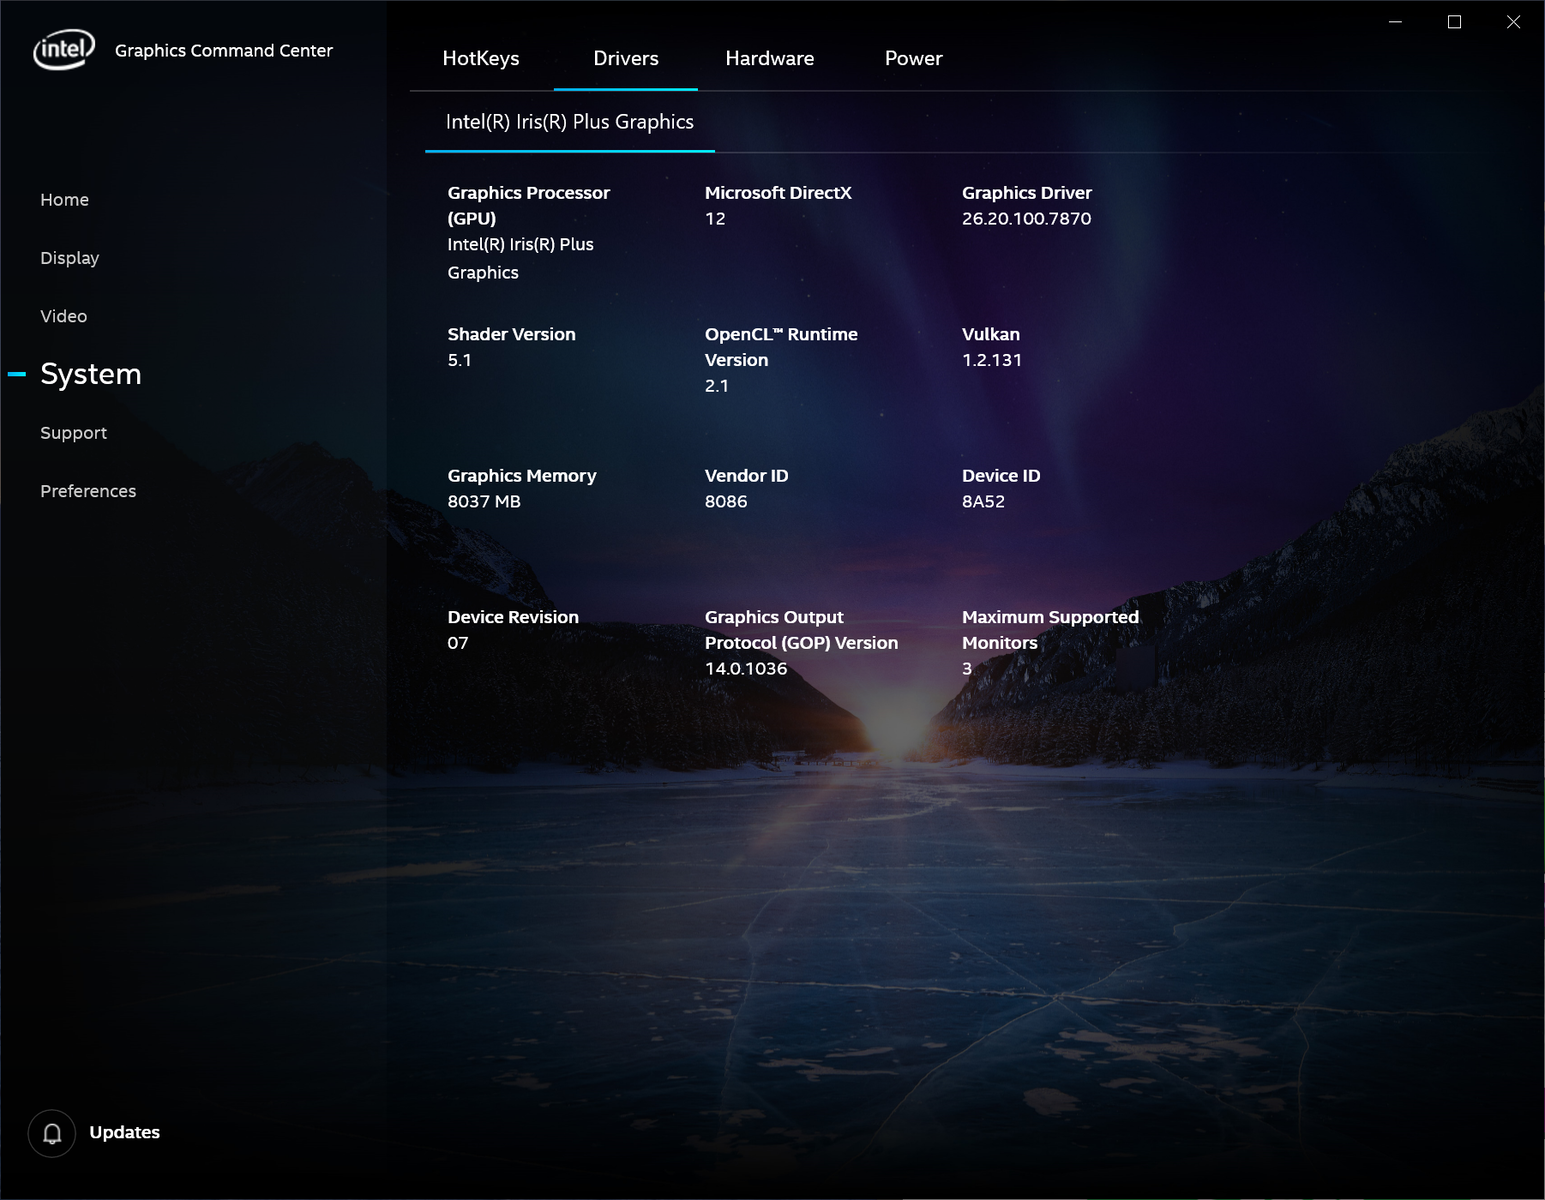
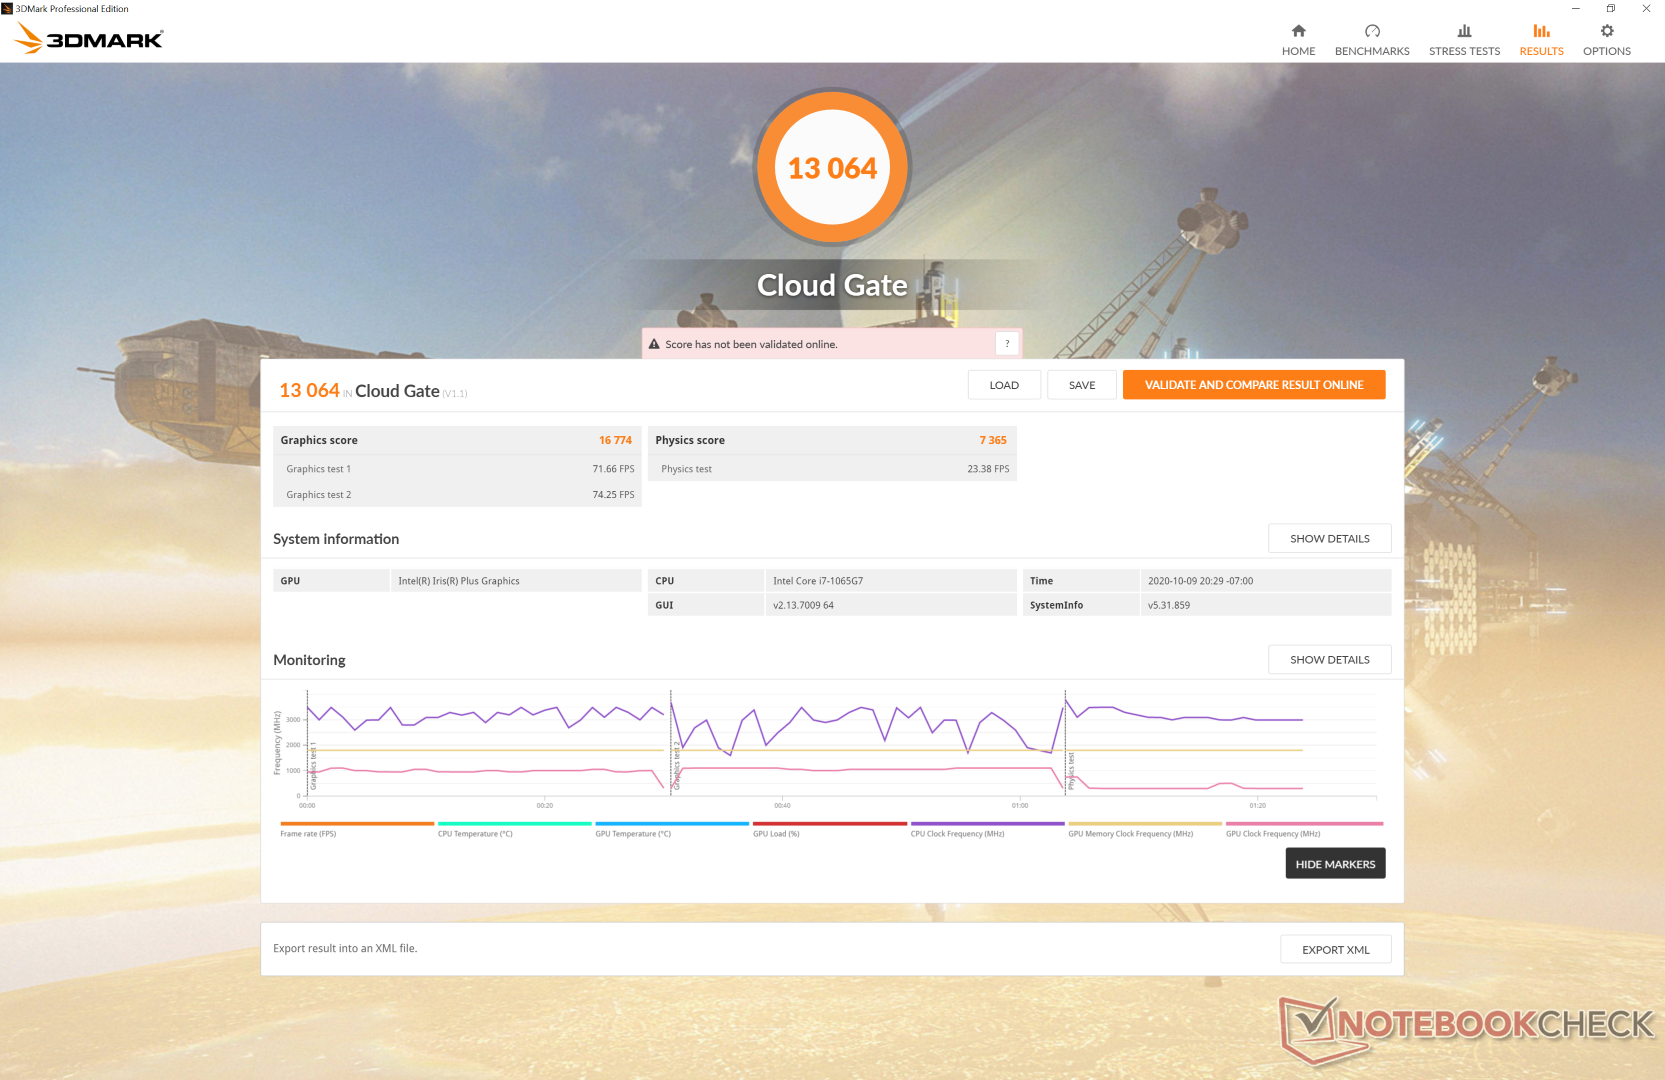
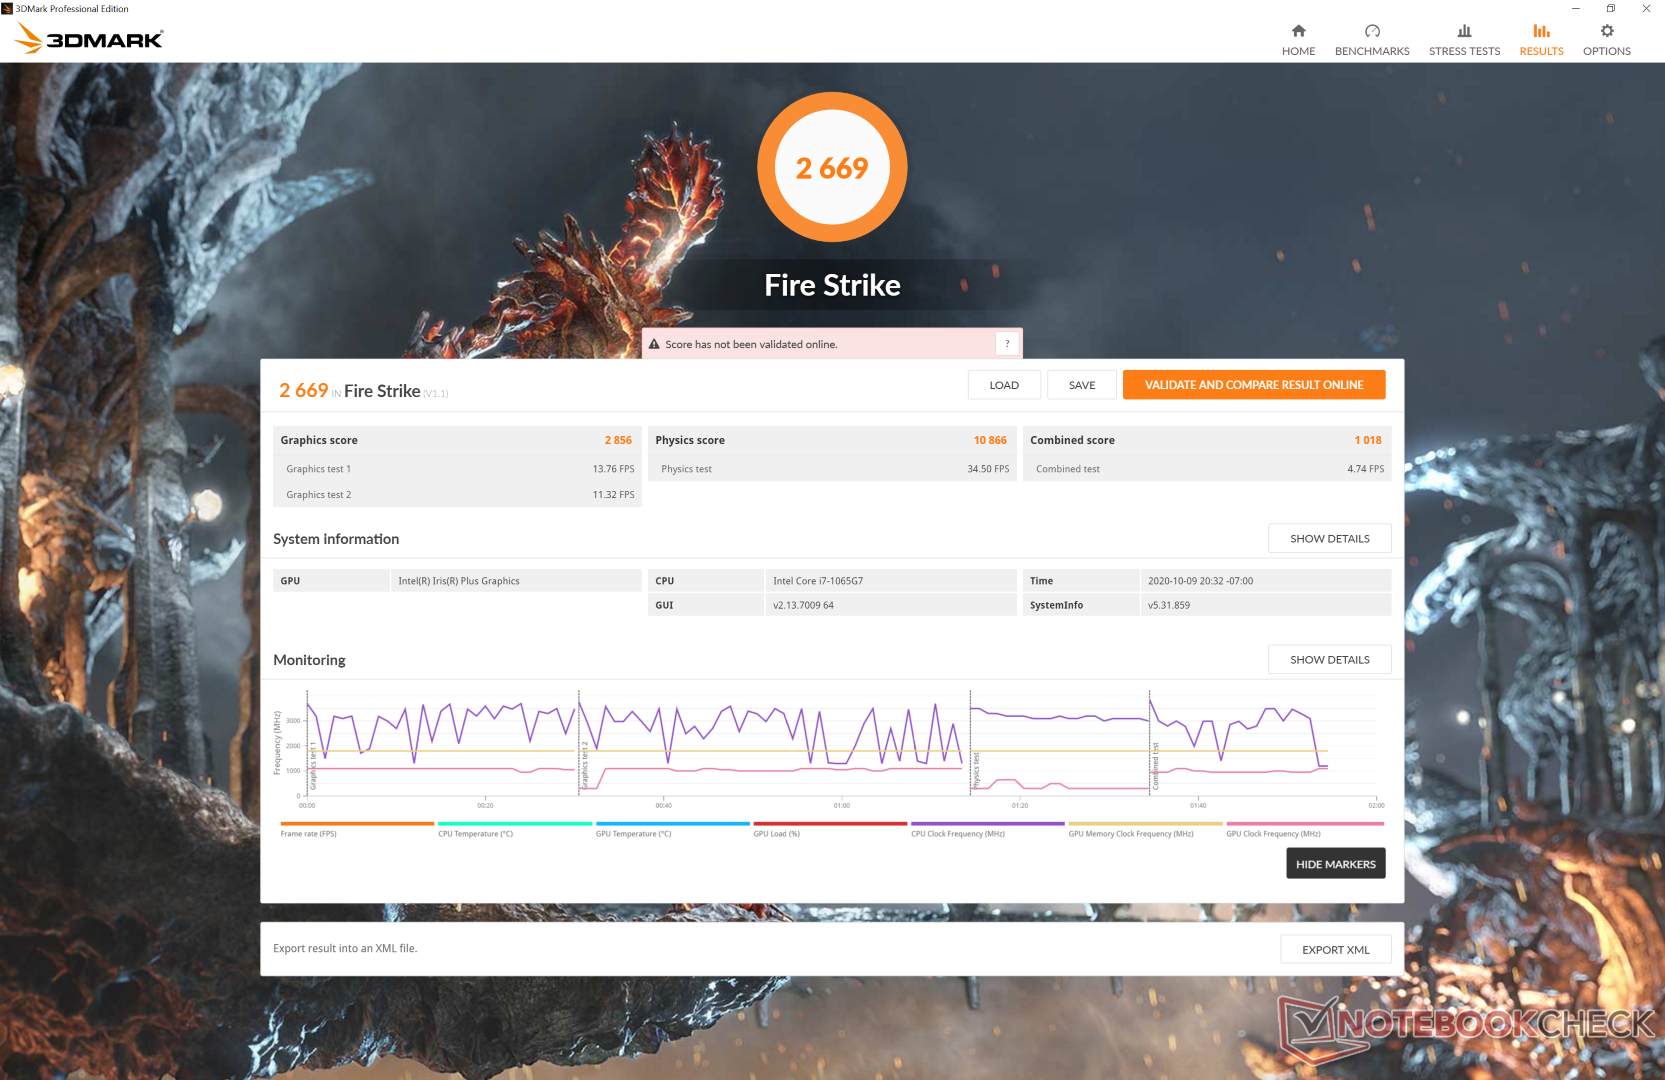
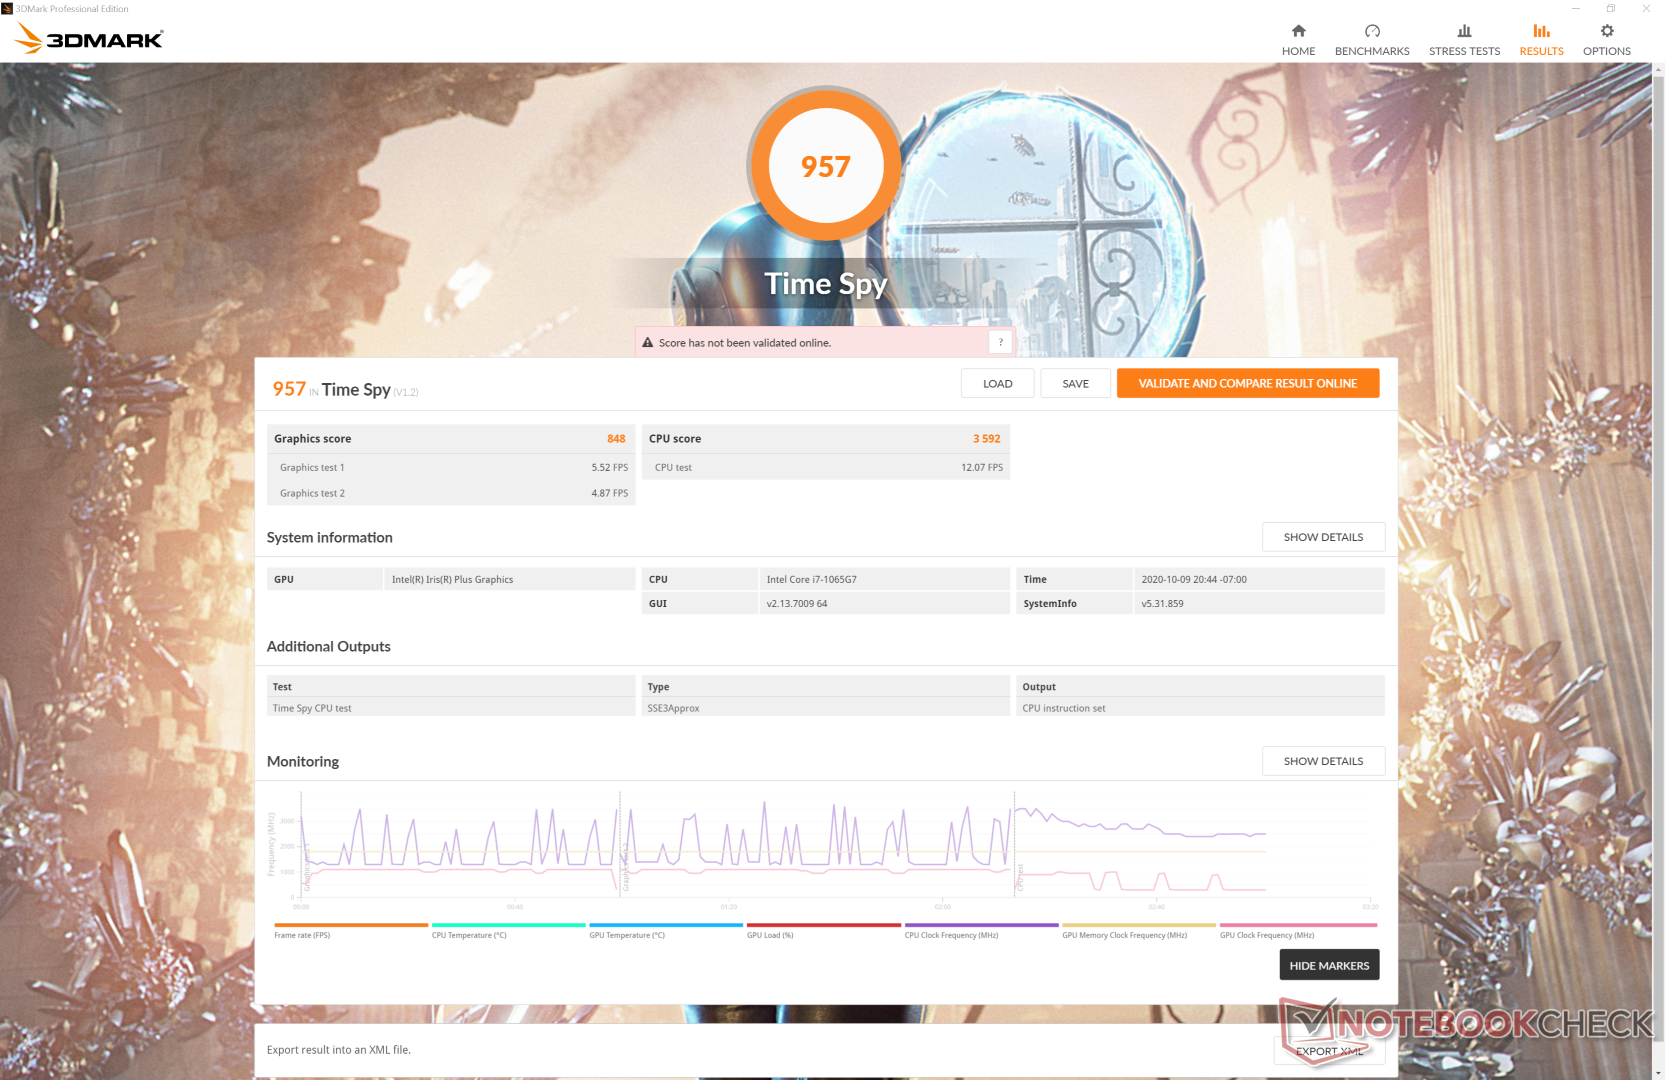
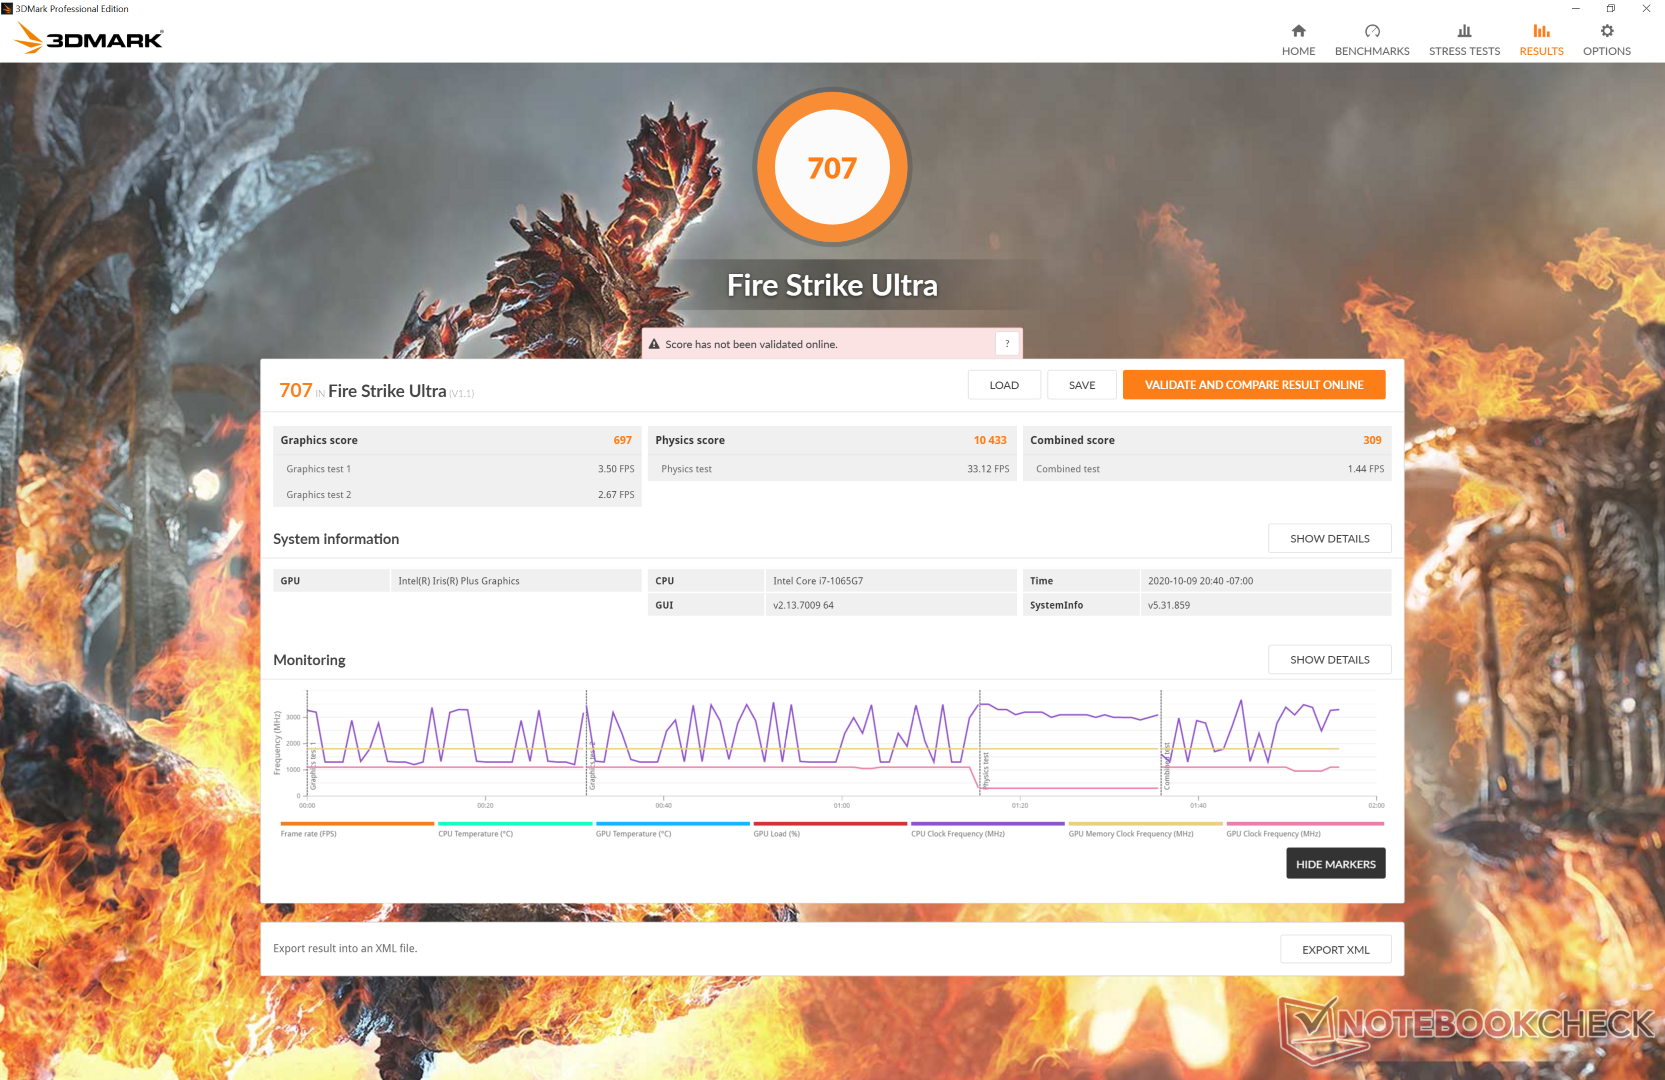
Graphics performance is where we expect it to be relative to other laptops with the same Iris Plus G7 GPU if not slightly higher. 3DMark results also show it to be neck-to-neck with the GeForce MX150 in the older UX392. Nonetheless, real-world gaming performance will often be slower than the MX150 due to various factors in favor of the Nvidia GPU including more optimized drivers, dedicated VRAM, and a higher TDP ceiling of up to 25 W.
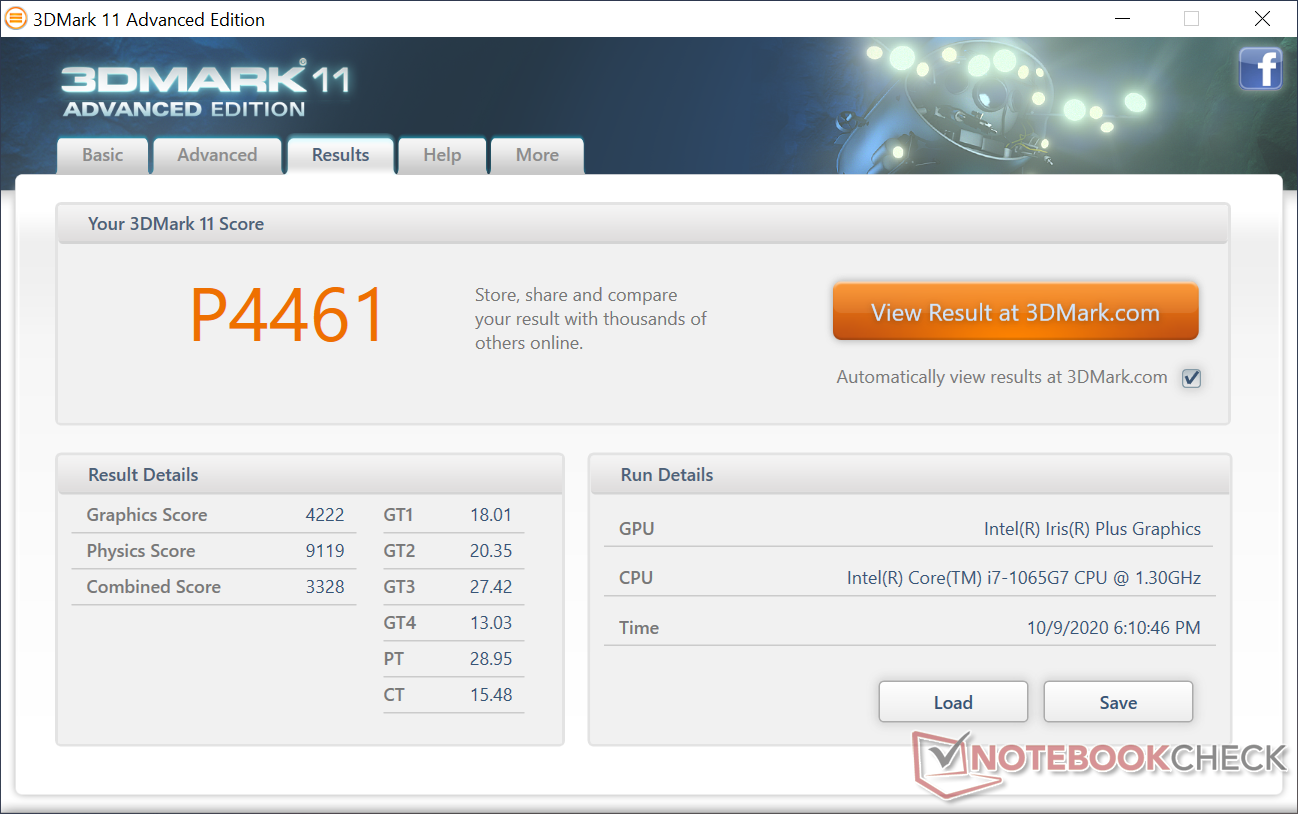
| 3DMark 11 Performance | 4461 points | |
| 3DMark Cloud Gate Standard Score | 13064 points | |
| 3DMark Fire Strike Score | 2669 points | |
| 3DMark Time Spy Score | 957 points | |
Help | ||
| low | med. | high | ultra | |
|---|---|---|---|---|
| The Witcher 3 (2015) | 50.5 | 31.4 | 18.1 | 9 |
| Dota 2 Reborn (2015) | 96 | 59.2 | 36.4 | 33 |
| Final Fantasy XV Benchmark (2018) | 20.7 | 11.3 | 8.09 | |
| X-Plane 11.11 (2018) | 38.9 | 20.9 | 19.2 | |
| Strange Brigade (2018) | 50.7 | 21.4 | 17.3 | 15.2 |
Emissions
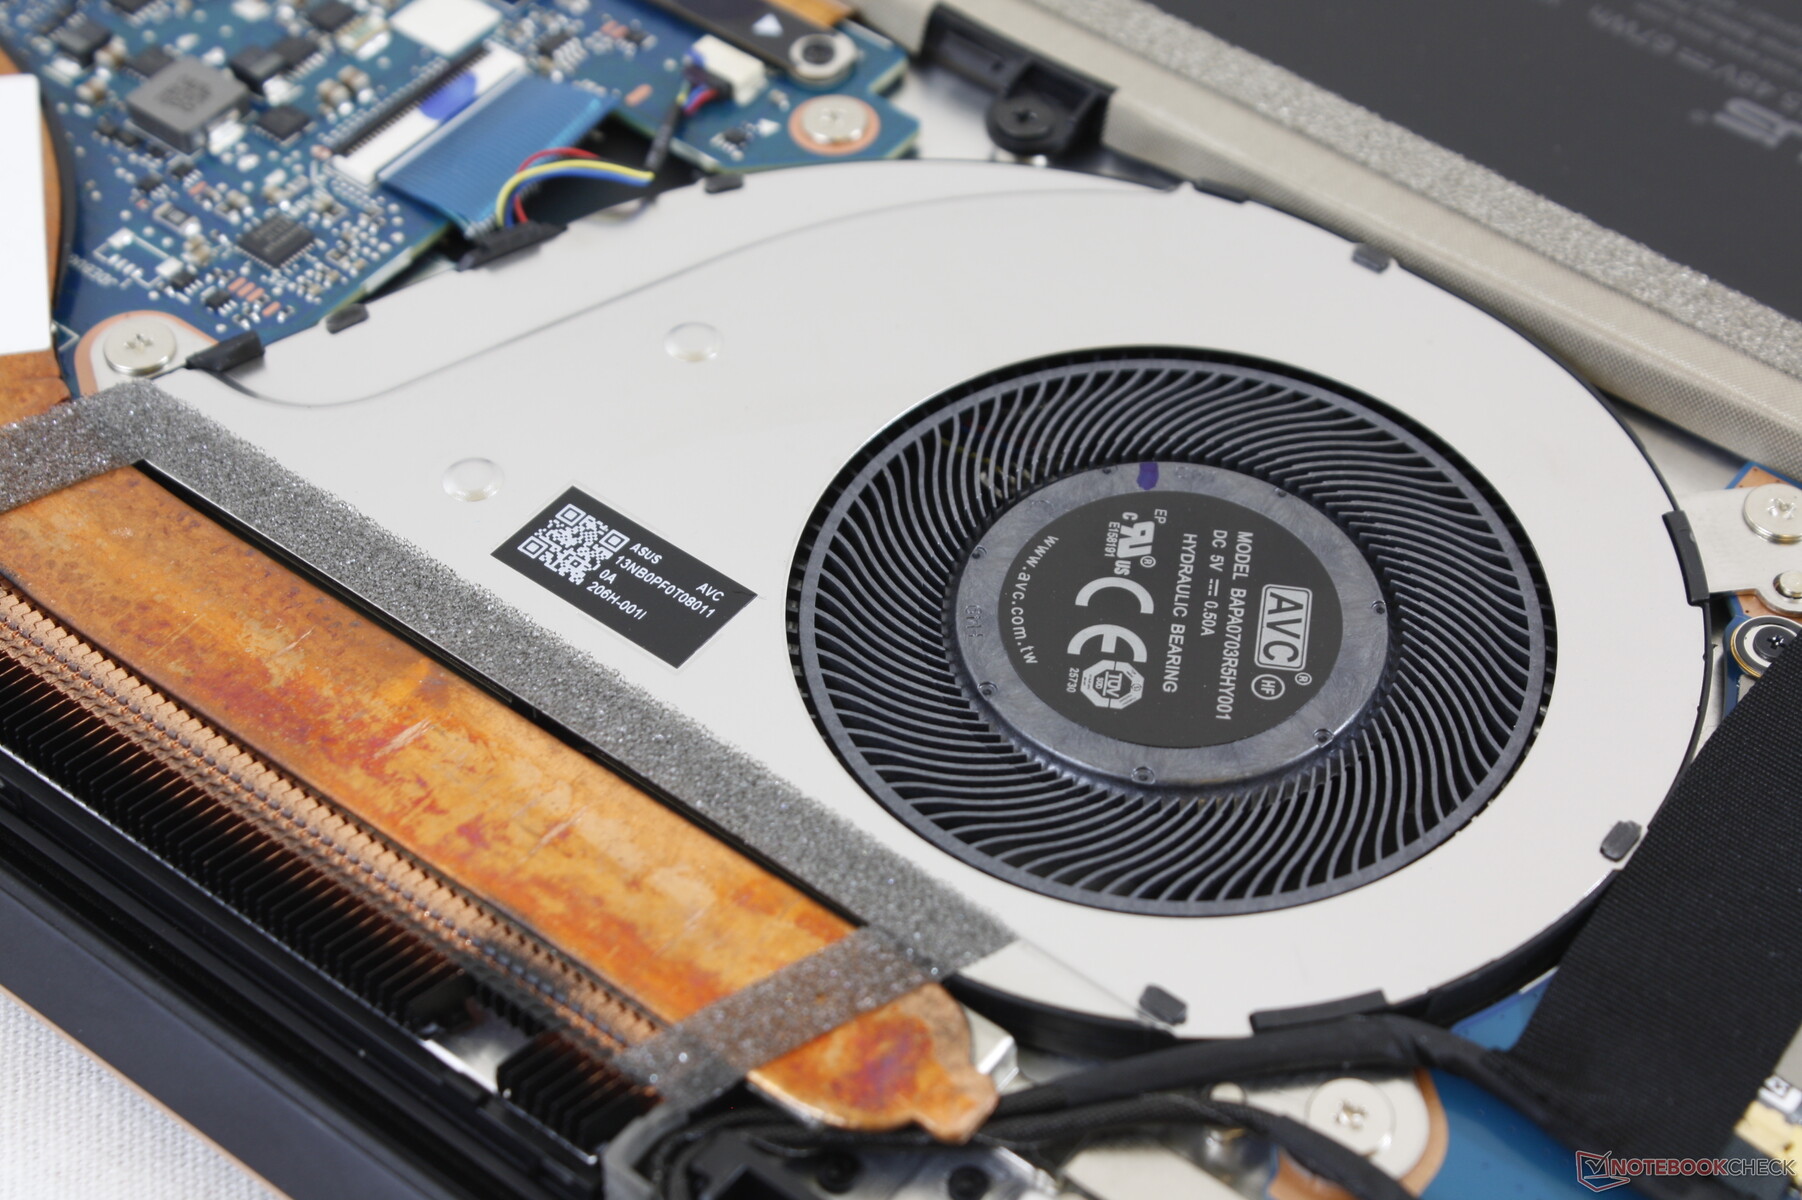
System Noise
The laptop fan is usually active but barely audible when in a typical office environment. Web browsing or video streaming, for example, will result in a slight fan noise of 31 dB(A) but it will otherwise not induce any annoying fan pulsing behavior. Running higher loads like games will nonetheless cause the Asus to run at about 40 dB(A) or as loudly as the Surface Laptop or MateBook X Pro.
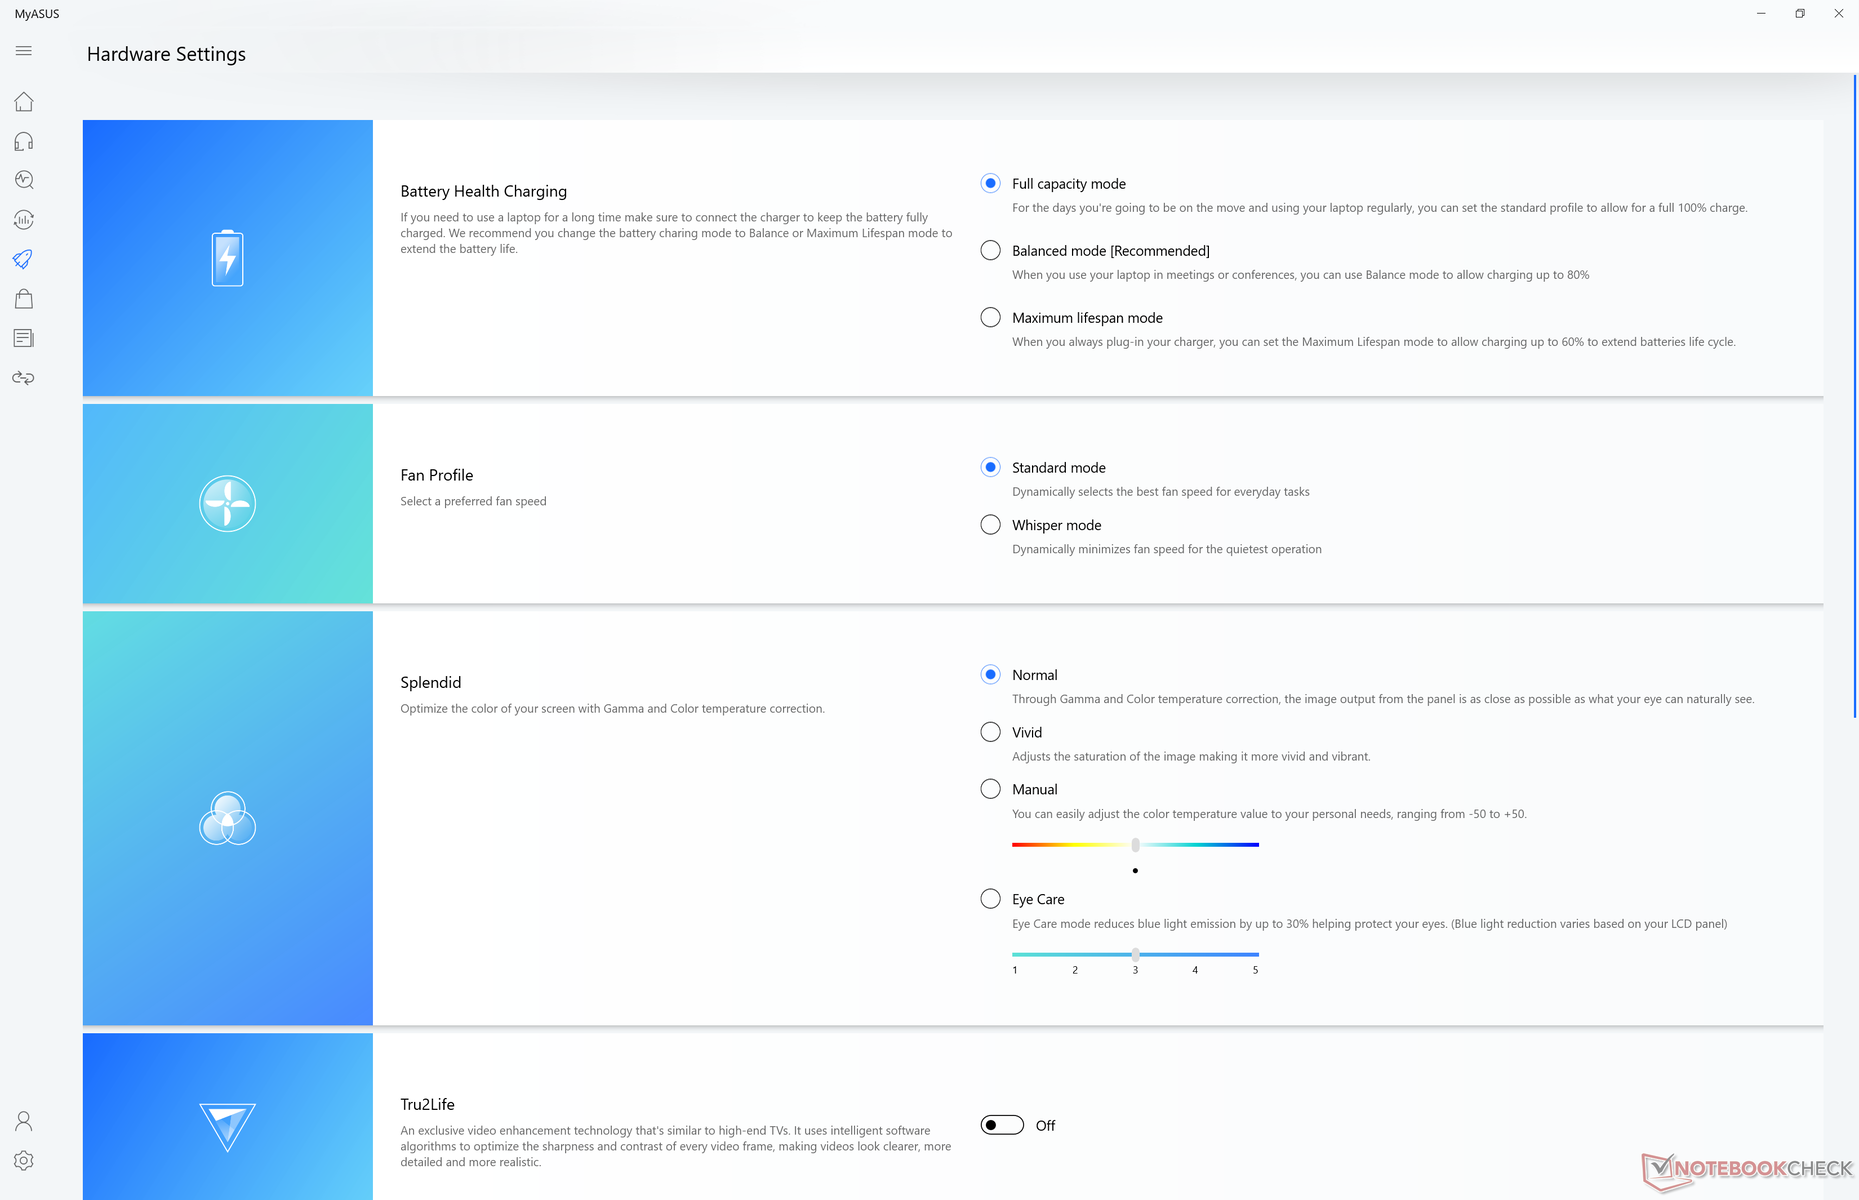
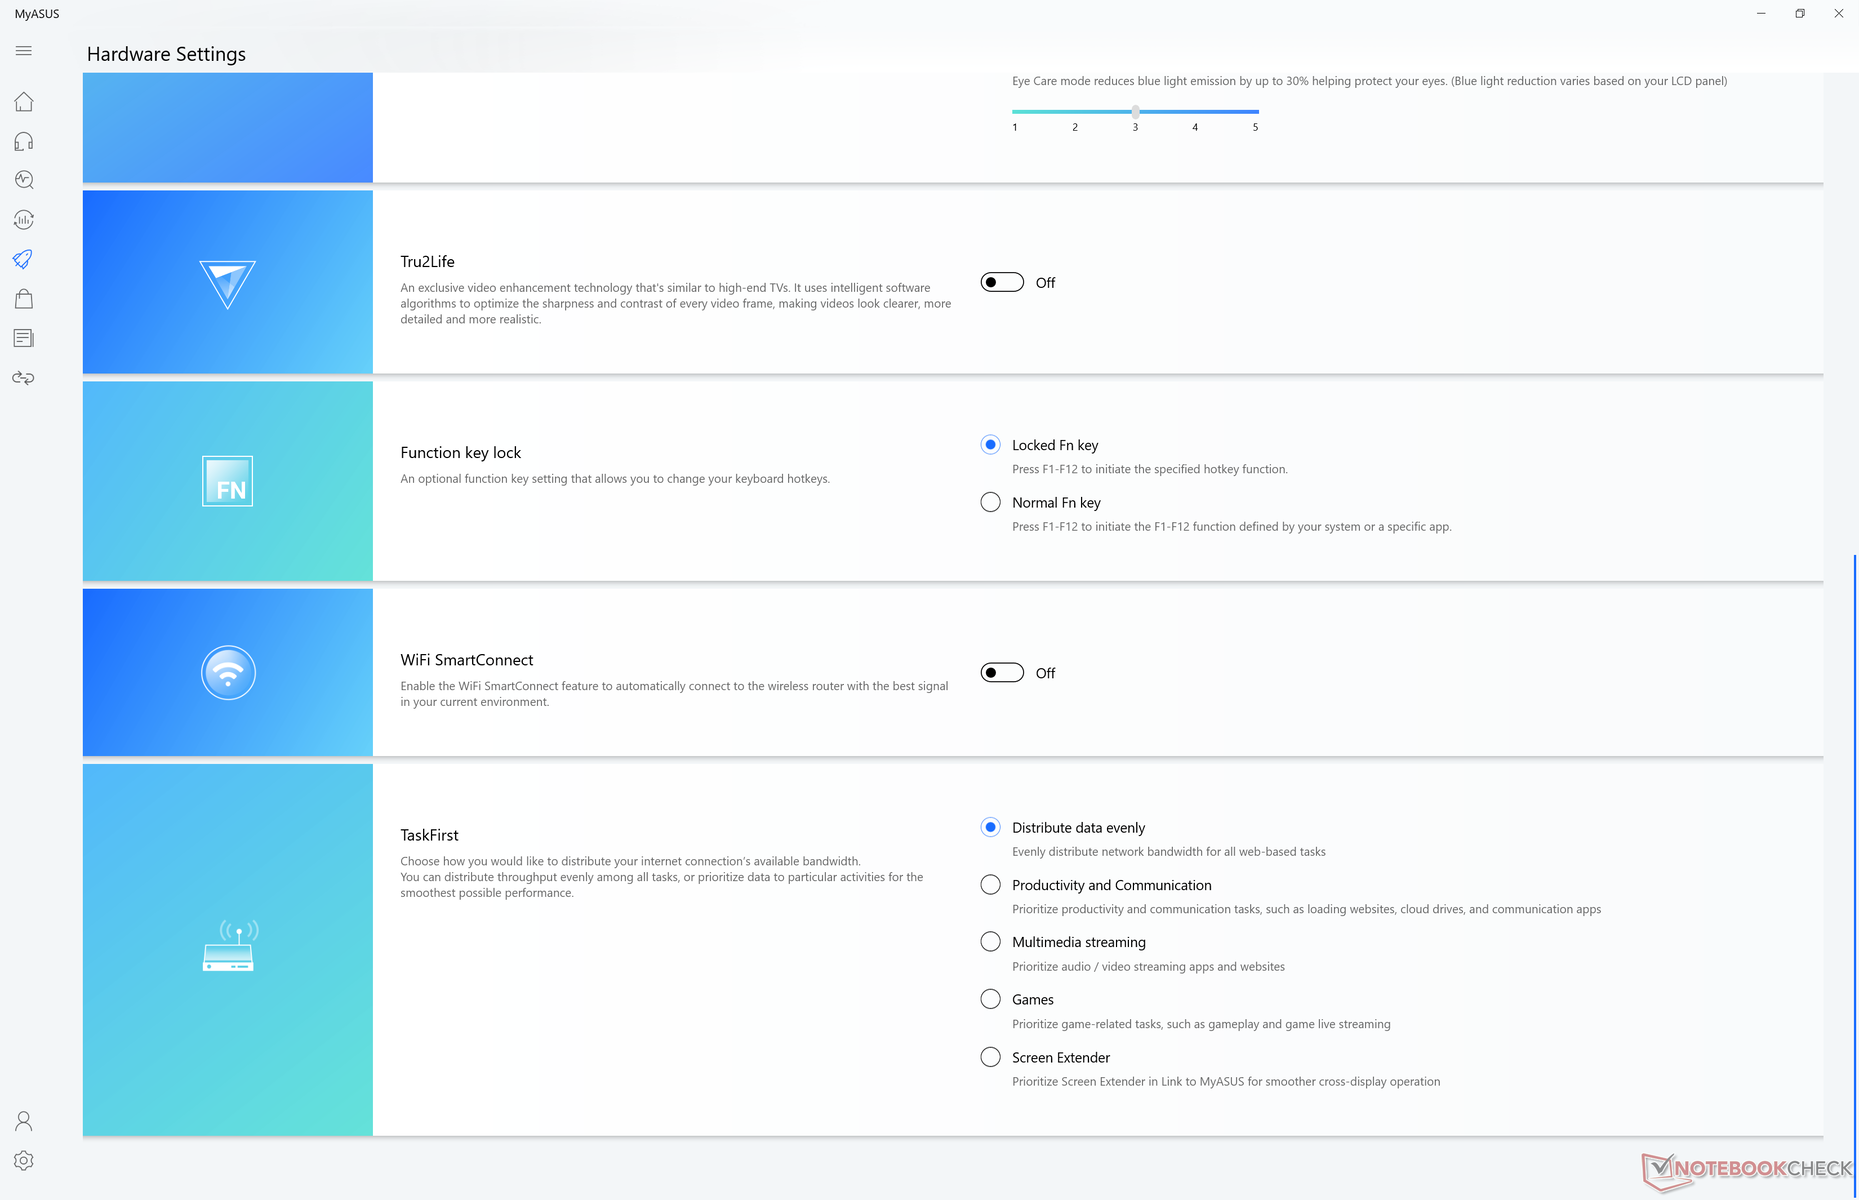
We recommend owners become familiar with the MyAsus software as fan profiles and other systems settings can be found here.
| Asus Zenbook S UX393JA Iris Plus Graphics G7 (Ice Lake 64 EU), i7-1065G7, Intel SSD 660p 1TB SSDPEKNW010T8 | Microsoft Surface Laptop 3 13 Core i5-1035G7 Iris Plus Graphics G7 (Ice Lake 64 EU), i5-1035G7, SK hynix BC501 HFM256GDGTNG | Huawei MateBook X Pro 2020 i7 GeForce MX250, i7-10510U, Samsung PM981a MZVLB1T0HBLR | Asus ZenBook S13 UX392FN GeForce MX150, i7-8565U, WDC PC SN520 SDAPNUW-512G | Lenovo Yoga Slim 7-14IIL05 GeForce MX350, i7-1065G7, WDC PC SN730 SDBPNTY-512G | Dell XPS 13 9300 Core i7-1065G7 Iris Plus Graphics G7 (Ice Lake 64 EU), i7-1065G7, Intel SSDPEMKF512G8 NVMe SSD | |
|---|---|---|---|---|---|---|
| Noise | 2% | -2% | -2% | -6% | 2% | |
| off / environment * (dB) | 26.9 | 28.5 -6% | 29.6 -10% | 28.1 -4% | 29.3 -9% | 28.3 -5% |
| Idle Minimum * (dB) | 26.9 | 28.5 -6% | 29.6 -10% | 28.1 -4% | 29.3 -9% | 28.3 -5% |
| Idle Average * (dB) | 29 | 28.5 2% | 29.6 -2% | 28.1 3% | 29.3 -1% | 28.3 2% |
| Idle Maximum * (dB) | 31.1 | 28.5 8% | 30.3 3% | 29 7% | 30.5 2% | 28.3 9% |
| Load Average * (dB) | 37.7 | 28.5 24% | 38 -1% | 41.1 -9% | 41.5 -10% | 32.5 14% |
| Witcher 3 ultra * (dB) | 40.2 | 40.4 -0% | 38 5% | 41.1 -2% | 41.5 -3% | 39.3 2% |
| Load Maximum * (dB) | 38.1 | 40.4 -6% | 38 -0% | 41.1 -8% | 41.5 -9% | 39.3 -3% |
* ... smaller is better
Noise level
| Idle |
| 26.9 / 29 / 31.1 dB(A) |
| Load |
| 37.7 / 38.1 dB(A) |
 | ||
30 dB silent 40 dB(A) audible 50 dB(A) loud |
||
min: | ||
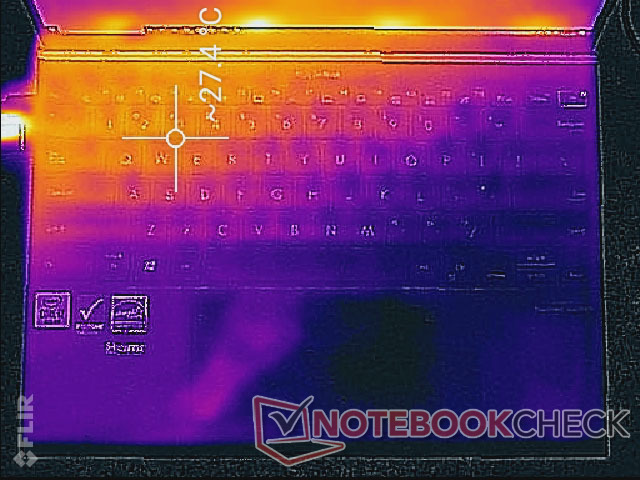
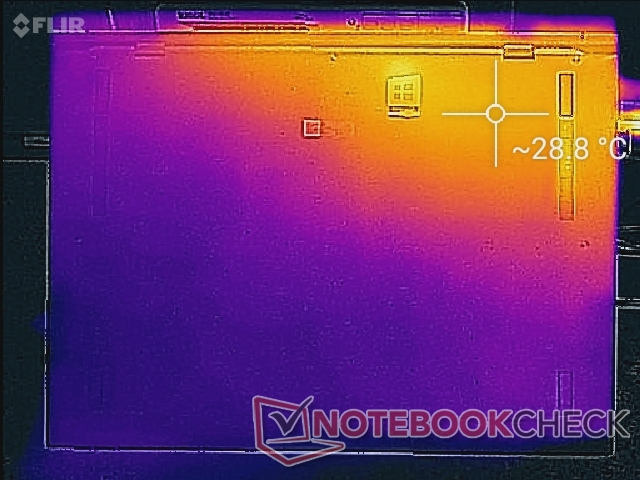
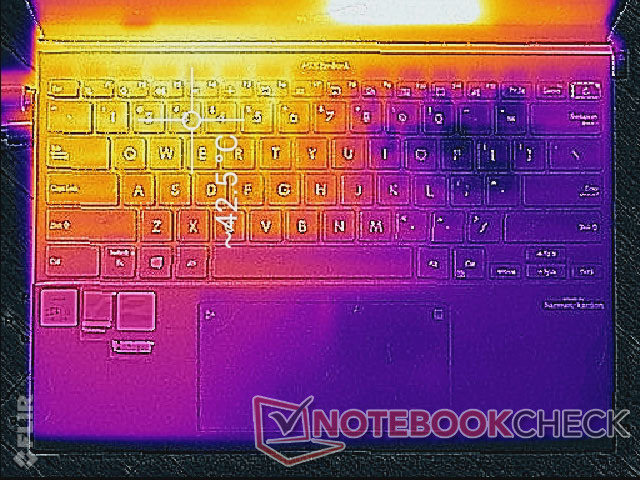
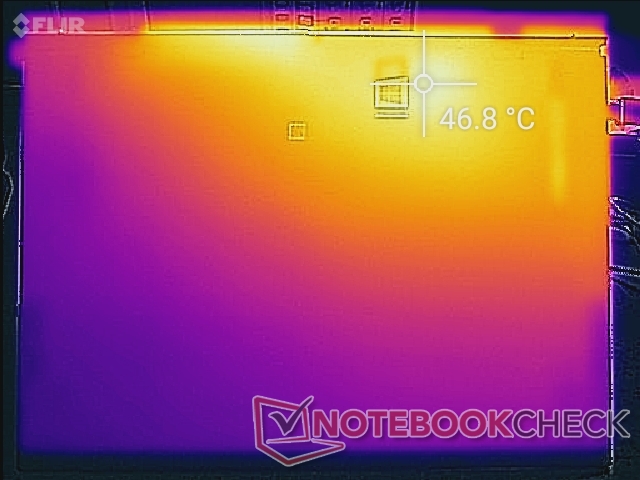
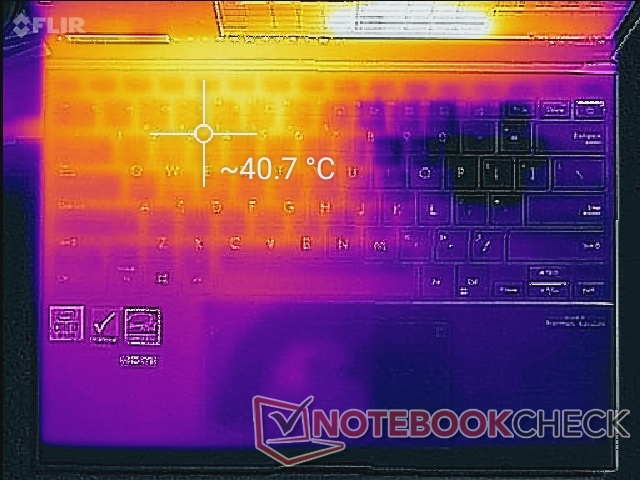
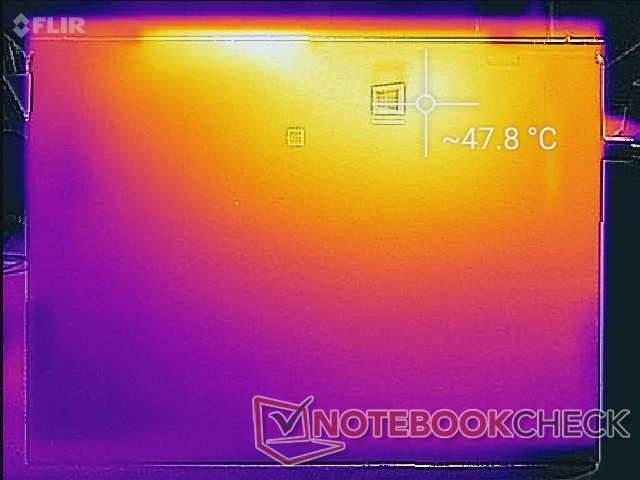
Temperature
Surface temperatures will always be warmer on the left half of the laptop than the right half due to the how the cooling solution and CPU are positioned inside. When under high processing stress like gaming, hot spots can become as warm as 43 C or 48 C on the keyboard or bottom surfaces, respectively, to be similar to the XPS 13 9300. Expect warm keys after longer sessions of browsing or heavy use.
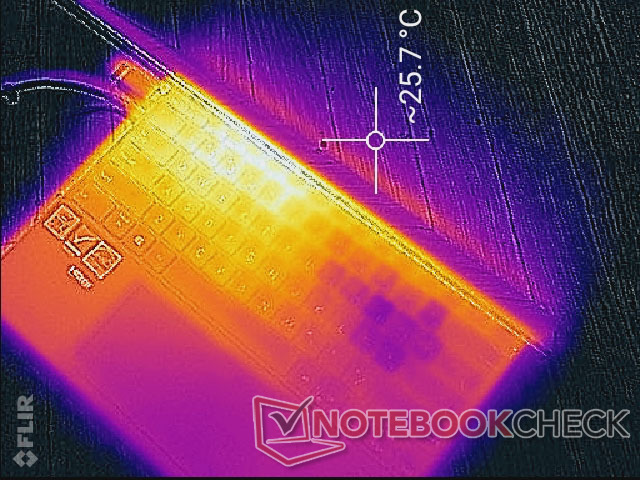
(±) The maximum temperature on the upper side is 42 °C / 108 F, compared to the average of 35.9 °C / 97 F, ranging from 21.4 to 59 °C for the class Subnotebook.
(-) The bottom heats up to a maximum of 48.6 °C / 119 F, compared to the average of 39.2 °C / 103 F
(+) In idle usage, the average temperature for the upper side is 25.5 °C / 78 F, compared to the device average of 30.8 °C / 87 F.
(±) Playing The Witcher 3, the average temperature for the upper side is 32.8 °C / 91 F, compared to the device average of 30.8 °C / 87 F.
(+) The palmrests and touchpad are cooler than skin temperature with a maximum of 31 °C / 87.8 F and are therefore cool to the touch.
(-) The average temperature of the palmrest area of similar devices was 28.2 °C / 82.8 F (-2.8 °C / -5 F).
Stress Test
When under Prime95 stress, the CPU would stabilize at 1.9 GHz and at a core temperature of 73 C to be both warmer and slower than what we observed on the Whiskey Lake-U-powered UX392. CPU clock rates would boost up to 3.5 GHz for only the first second or so before falling to be in line with what we observed during our CineBench xT loop test and power consumption readings.
When running Witcher 3, the CPU would again stabilize at a warmer temperature of 76 C compared to only 60 C to 68 C on the older UX392. Running on battery power will limit performance; a 3DMark 11 run on batteries would return Physics and Graphics and scores of 7076 and 3541 points, respectively, compared to 9119 and 4222 points when on mains.
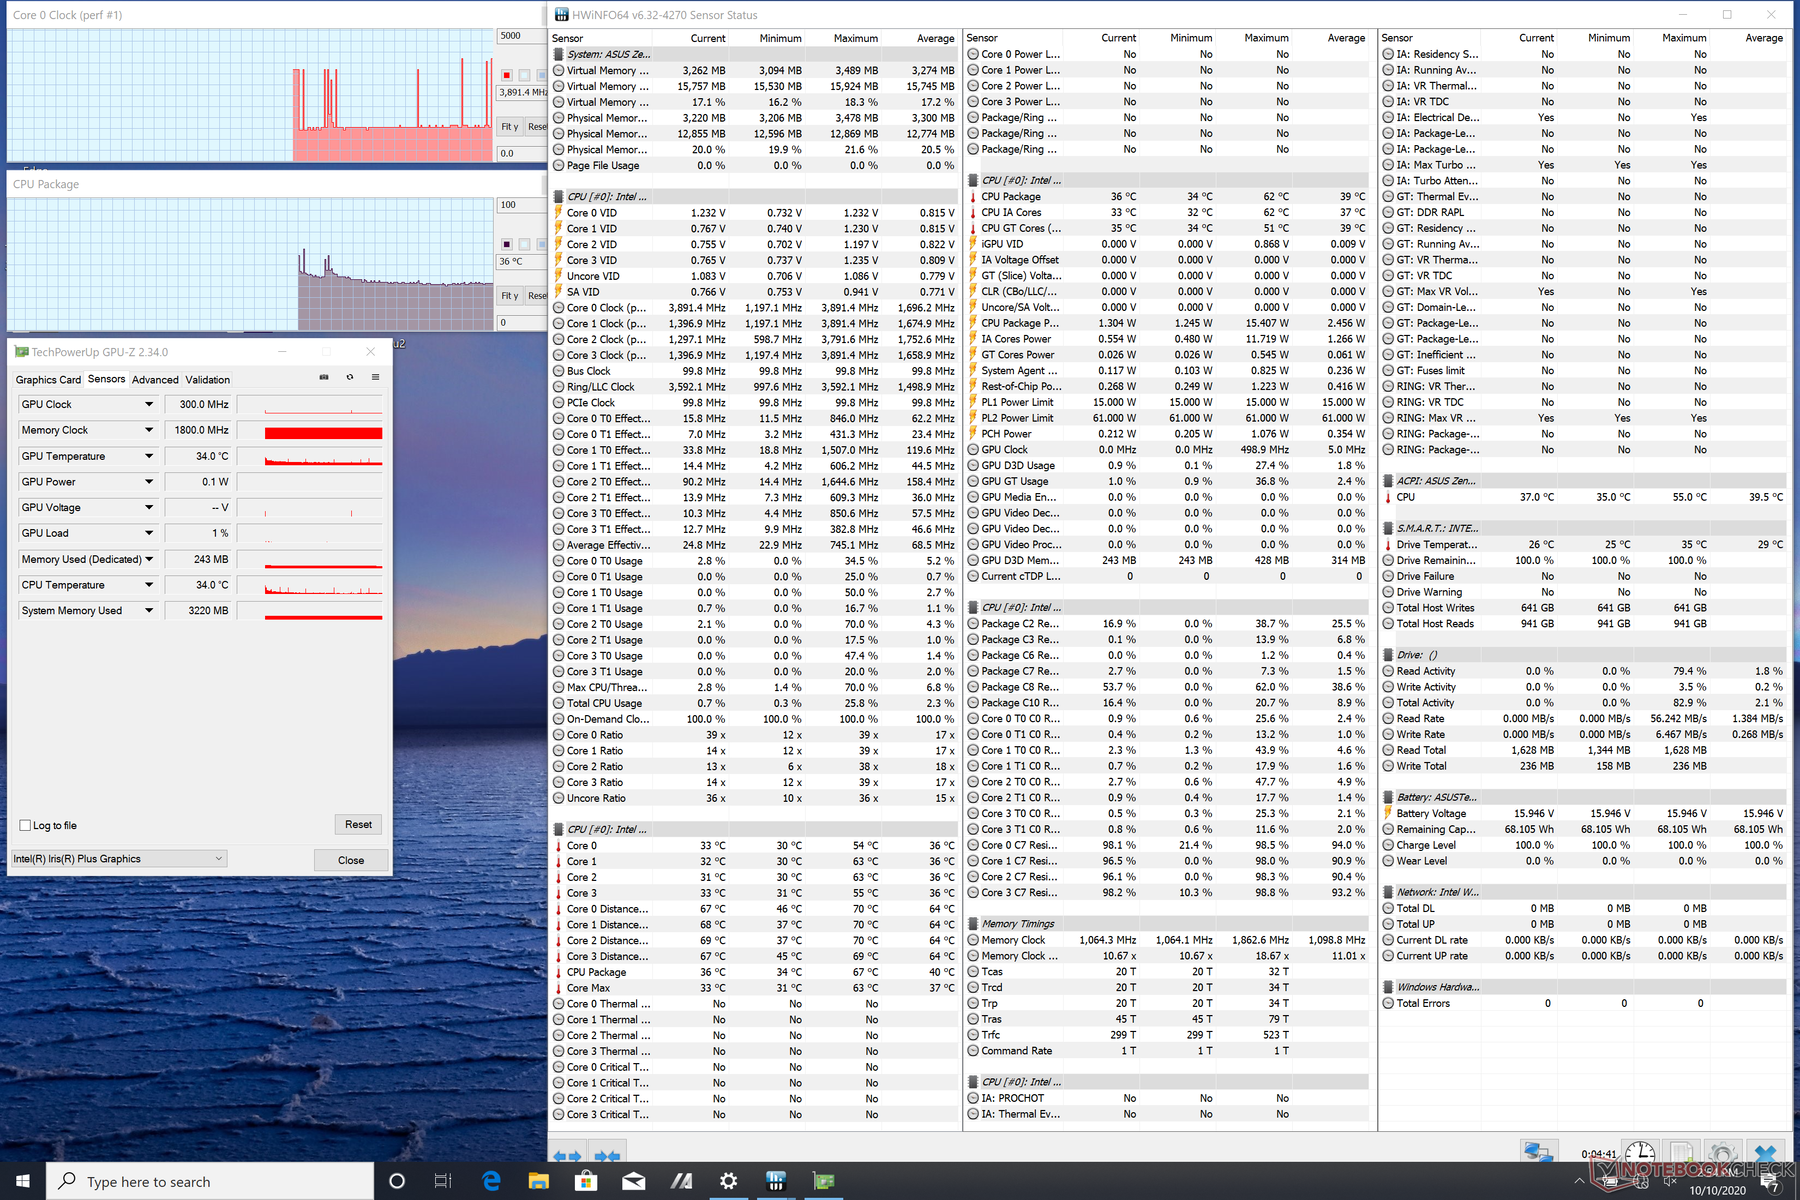
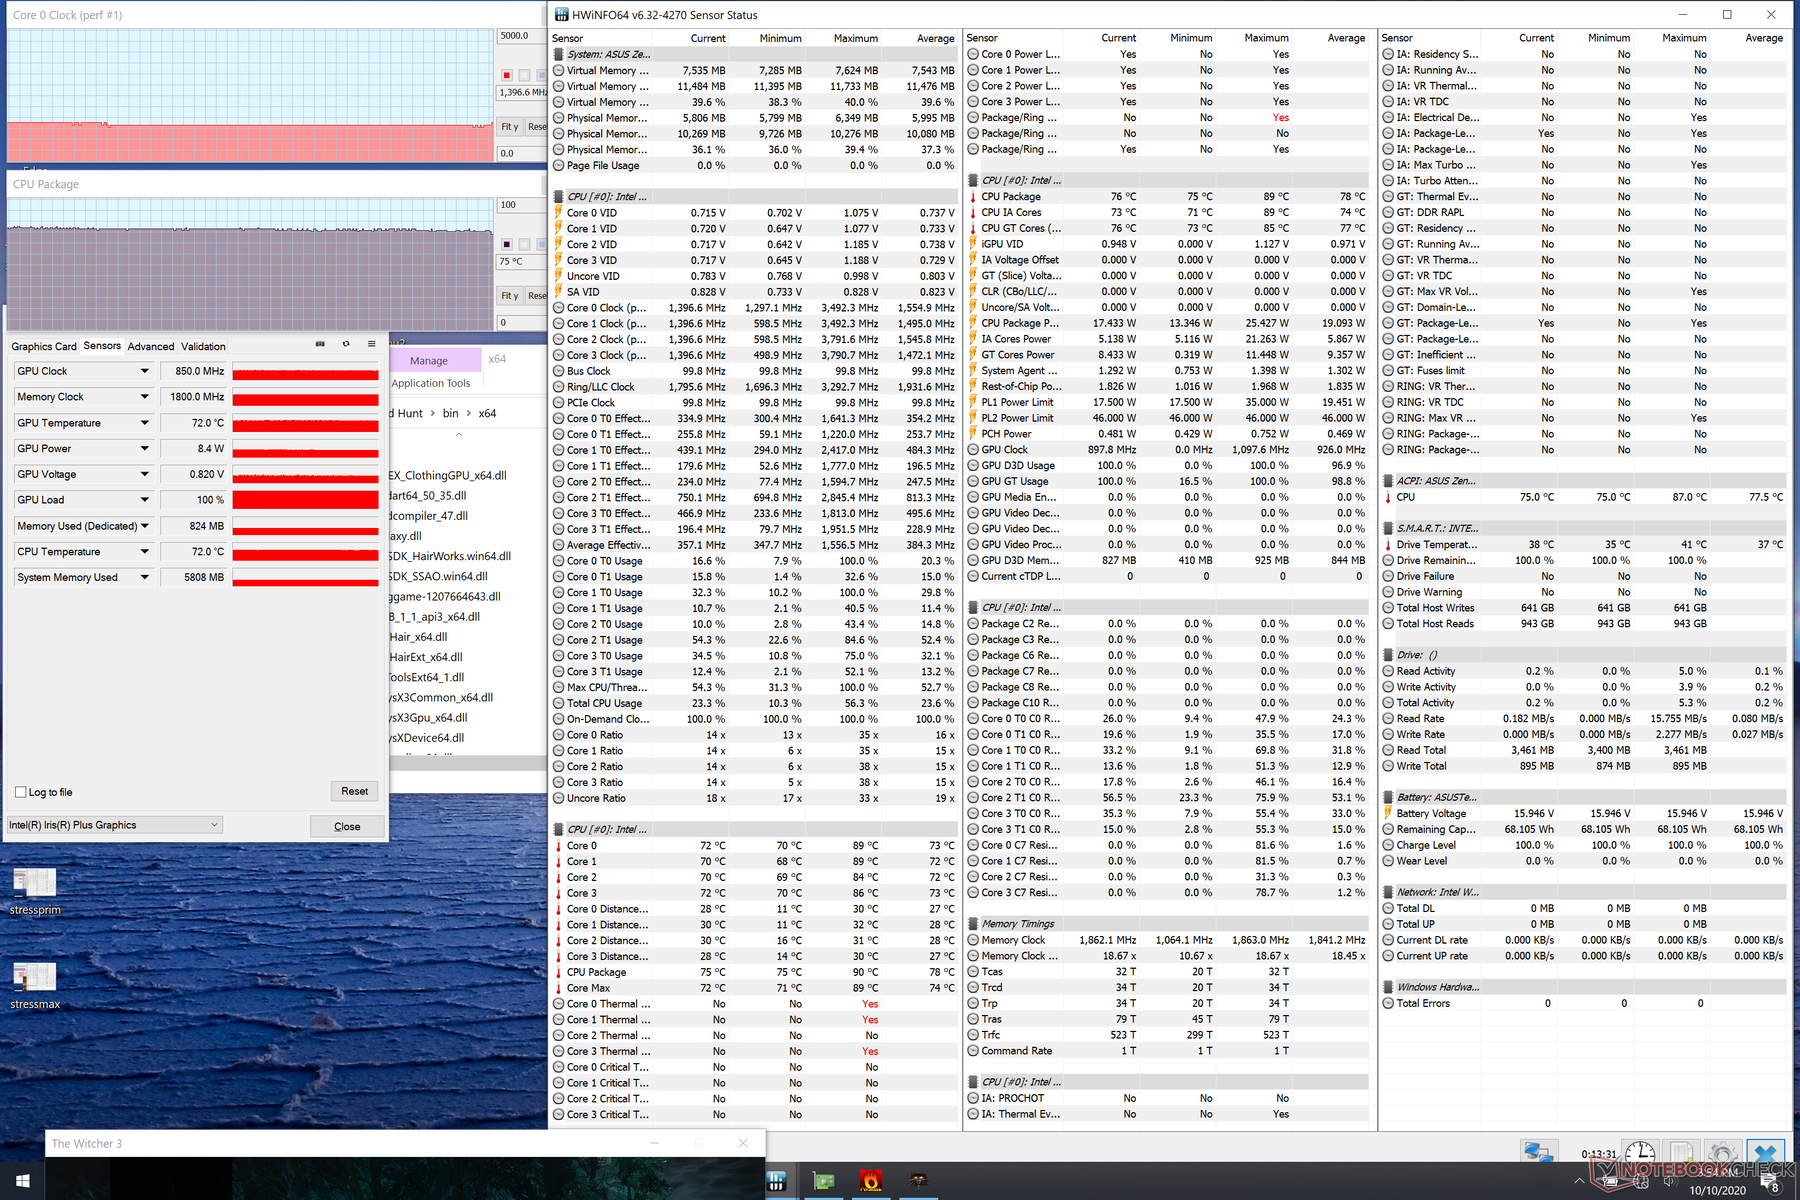
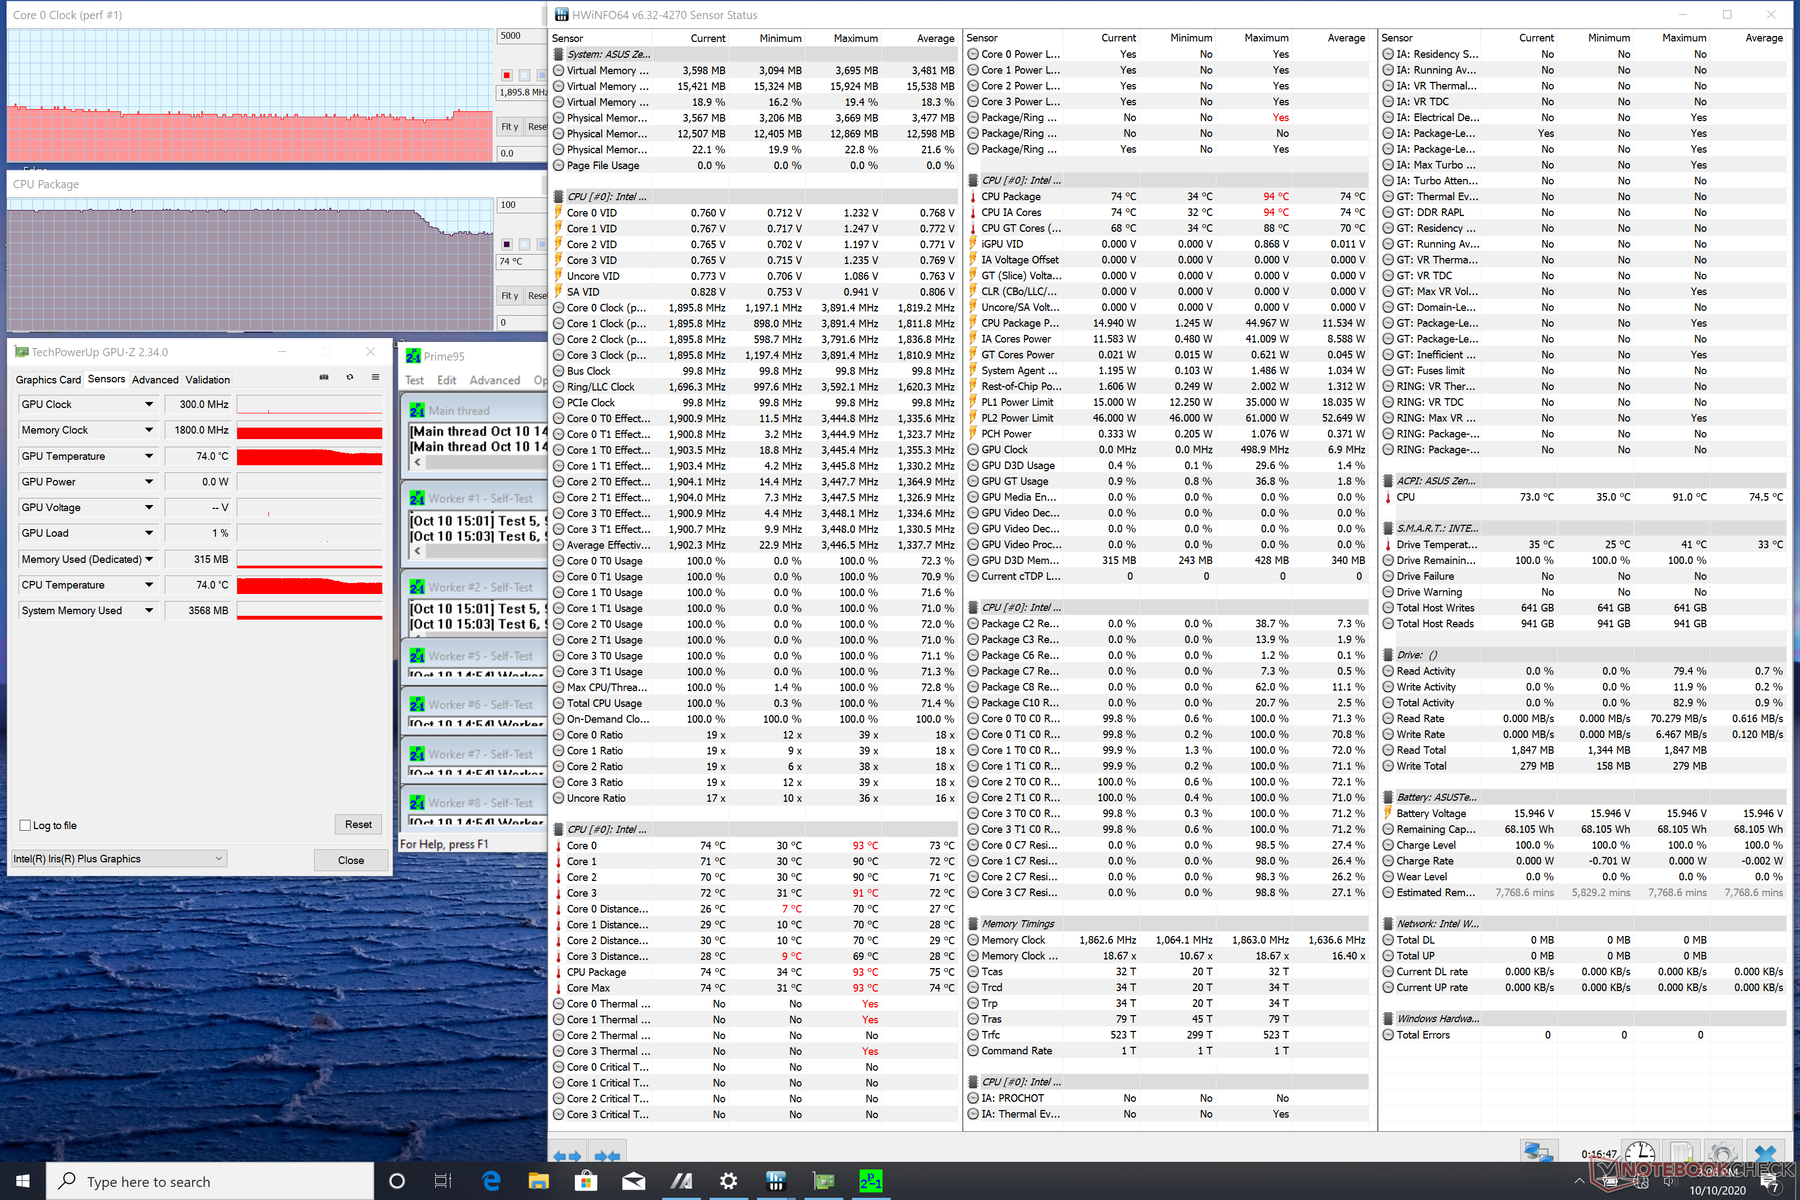
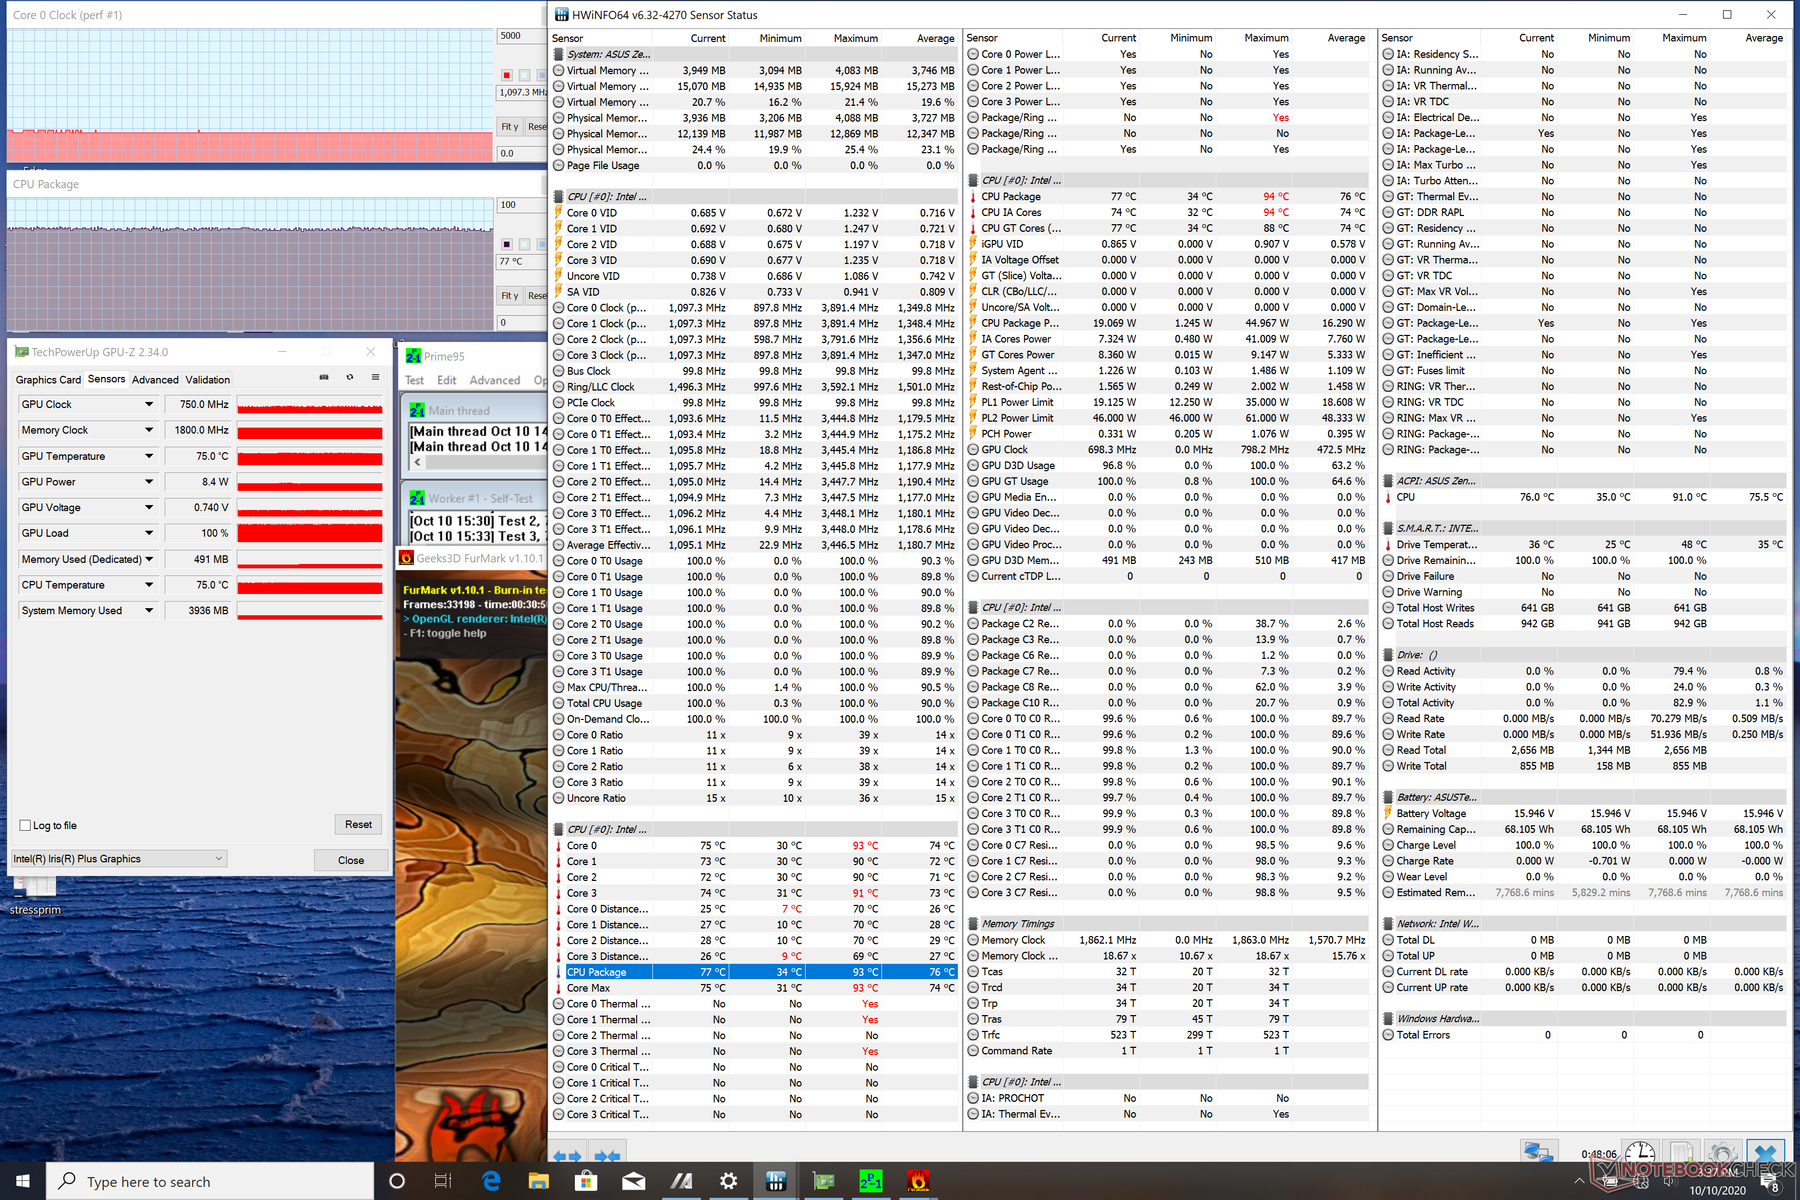
| CPU Clock (GHz) | GPU Clock (MHz) | Average CPU Temperature (°C) | |
| System Idle | -- | -- | 36 |
| Prime95 Stress | 1.9 | -- | 74 |
| Prime95 + FurMark Stress | 1.1 | 750 | 77 |
| Witcher 3 Stress | 1.4 | 850 | 76 |
Speakers


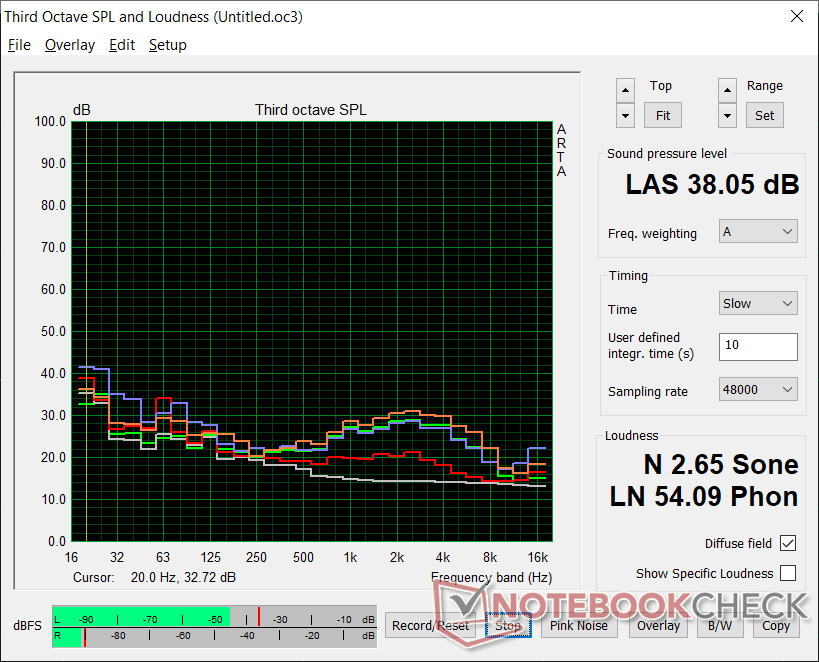
Asus Zenbook S UX393JA audio analysis
(+) | speakers can play relatively loud (89.2 dB)
Bass 100 - 315 Hz
(±) | reduced bass - on average 14.9% lower than median
(±) | linearity of bass is average (9.6% delta to prev. frequency)
Mids 400 - 2000 Hz
(+) | balanced mids - only 3% away from median
(+) | mids are linear (3% delta to prev. frequency)
Highs 2 - 16 kHz
(+) | balanced highs - only 4.8% away from median
(+) | highs are linear (3.5% delta to prev. frequency)
Overall 100 - 16.000 Hz
(+) | overall sound is linear (13.1% difference to median)
Compared to same class
» 21% of all tested devices in this class were better, 5% similar, 74% worse
» The best had a delta of 5%, average was 18%, worst was 53%
Compared to all devices tested
» 13% of all tested devices were better, 3% similar, 84% worse
» The best had a delta of 4%, average was 23%, worst was 134%
Apple MacBook 12 (Early 2016) 1.1 GHz audio analysis
(+) | speakers can play relatively loud (83.6 dB)
Bass 100 - 315 Hz
(±) | reduced bass - on average 11.3% lower than median
(±) | linearity of bass is average (14.2% delta to prev. frequency)
Mids 400 - 2000 Hz
(+) | balanced mids - only 2.4% away from median
(+) | mids are linear (5.5% delta to prev. frequency)
Highs 2 - 16 kHz
(+) | balanced highs - only 2% away from median
(+) | highs are linear (4.5% delta to prev. frequency)
Overall 100 - 16.000 Hz
(+) | overall sound is linear (10.2% difference to median)
Compared to same class
» 7% of all tested devices in this class were better, 2% similar, 90% worse
» The best had a delta of 5%, average was 18%, worst was 53%
Compared to all devices tested
» 5% of all tested devices were better, 1% similar, 94% worse
» The best had a delta of 4%, average was 23%, worst was 134%
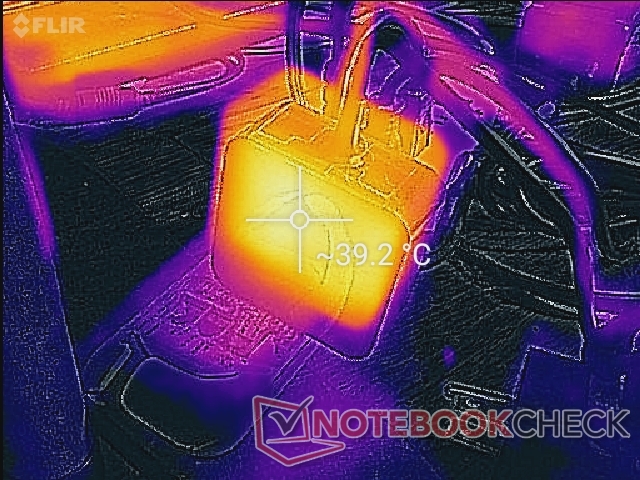
Energy Management
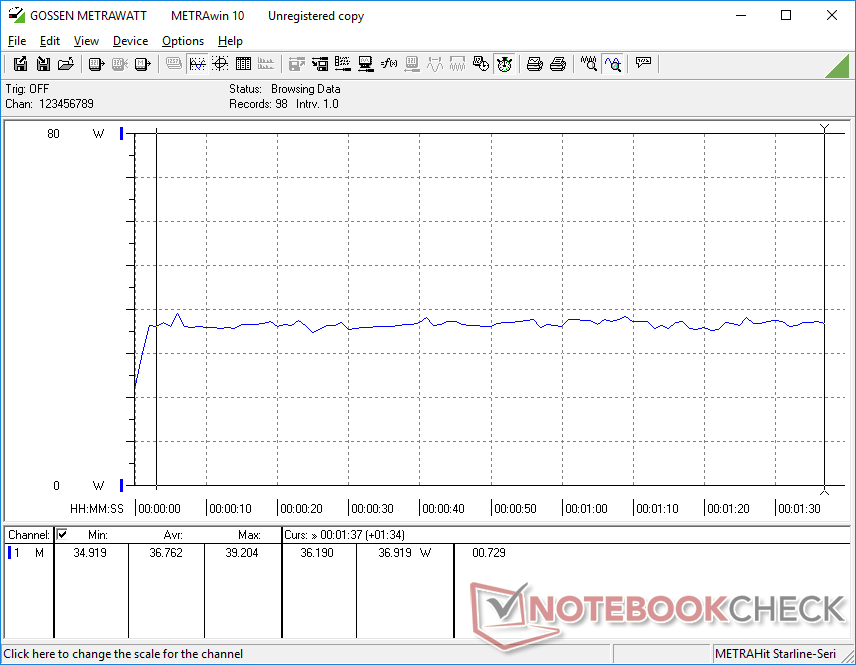
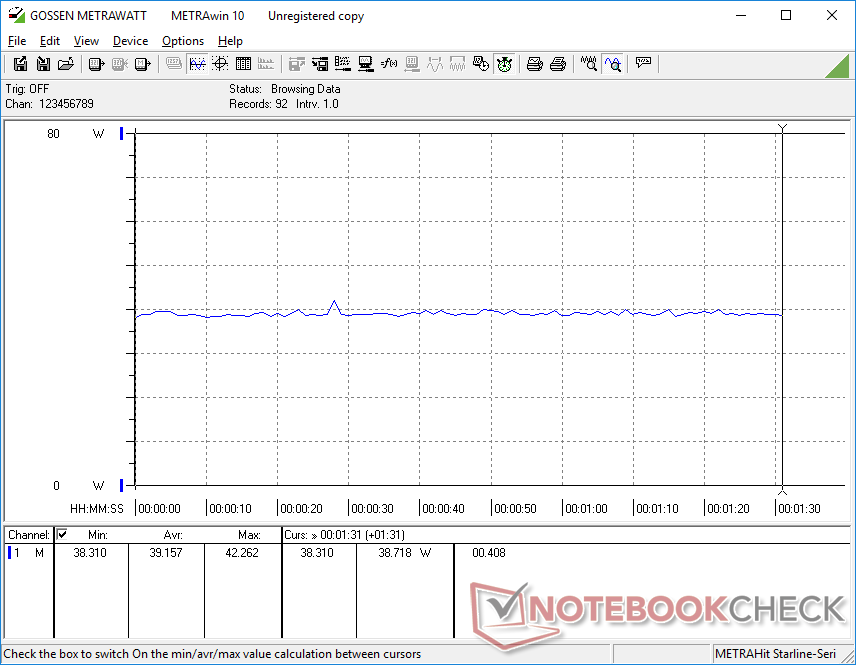
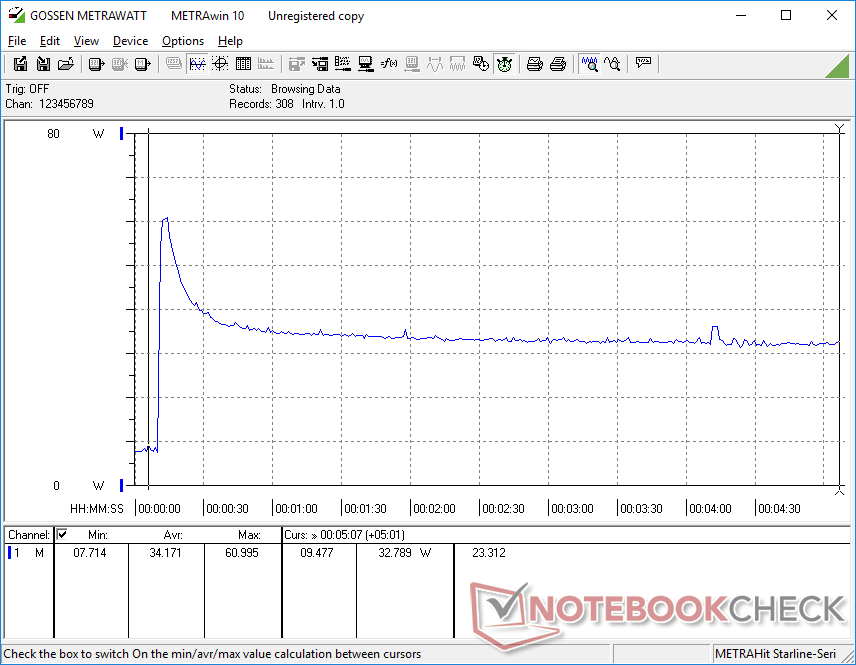
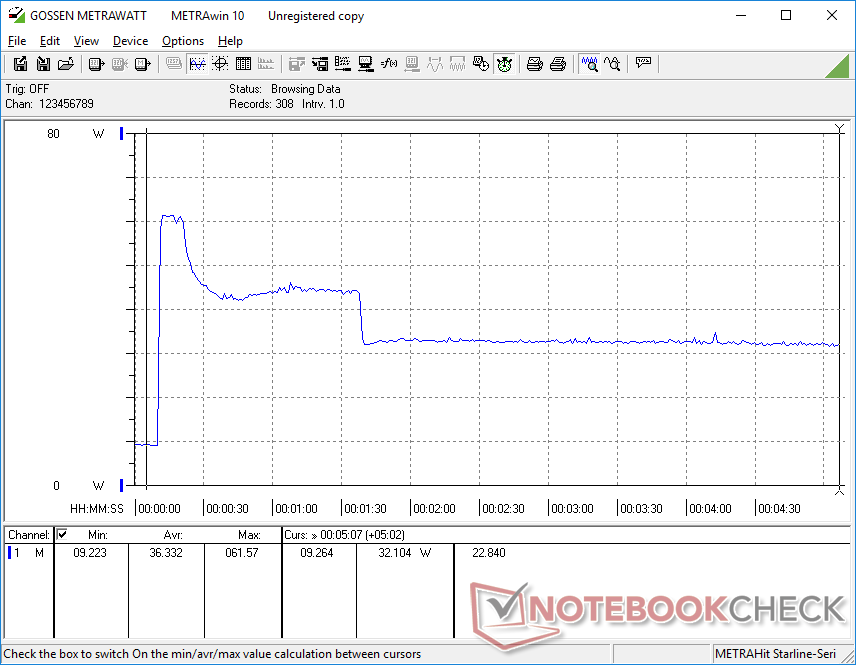
Power Consumption
Overall power consumption is similar to the 15-inch Microsoft Surface Laptop 3 albeit by just a few watts less on average. It's also not all that different from the older GeForce MX150-powered UX392FN either despite the swap to an Ice Lake CPU and GPU.
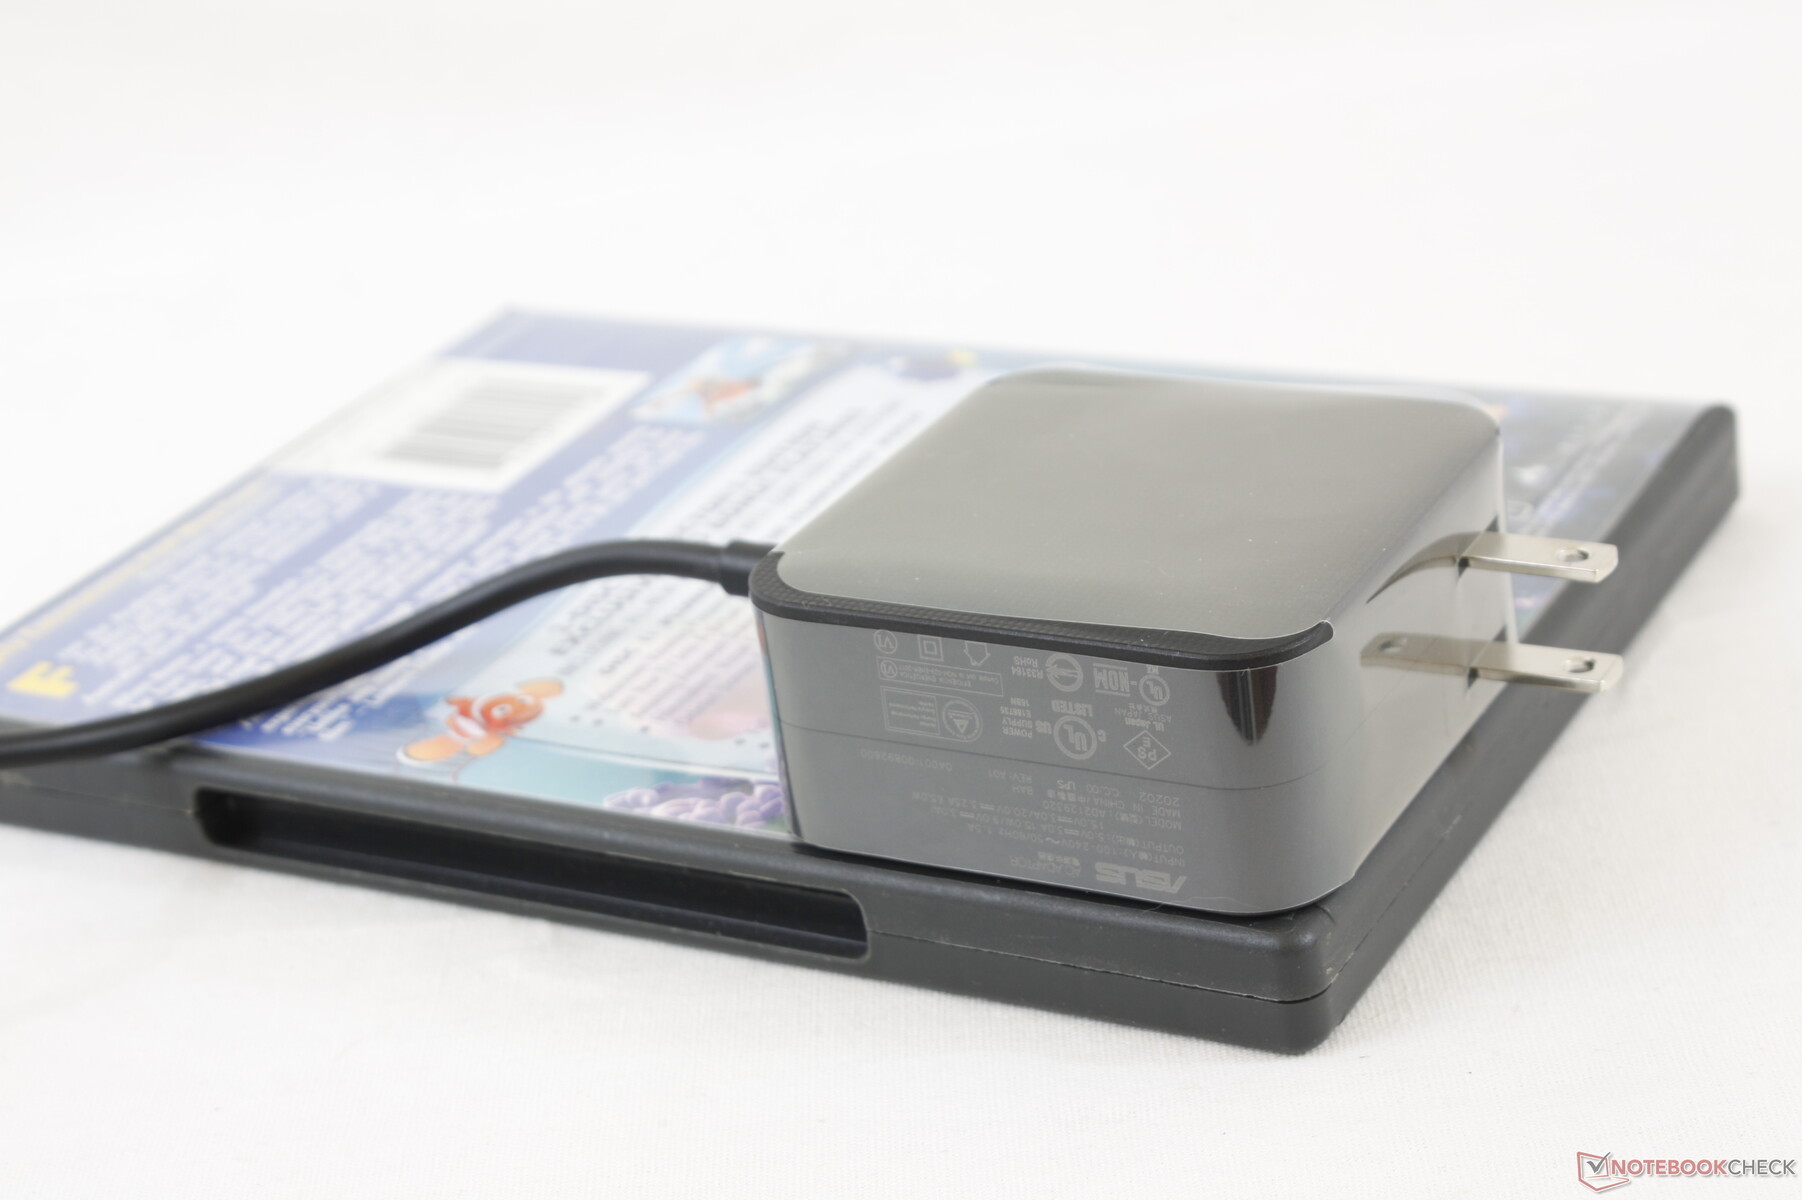
We're able to measure a maximum draw of 61.6 W from the small (6.4 x 6.4 x 2.8 cm) AC adapter when running Prime95 and FurMark. This rate would quickly fall over time since Turbo Boost clock rates are not sustainable over long periods.
| Off / Standby | |
| Idle | |
| Load |
|
Key:
min: | |
| Asus Zenbook S UX393JA i7-1065G7, Iris Plus Graphics G7 (Ice Lake 64 EU), Intel SSD 660p 1TB SSDPEKNW010T8, IPS, 3300x2200, 13.9" | Microsoft Surface Laptop 3 15 i7-1065G7 i7-1065G7, Iris Plus Graphics G7 (Ice Lake 64 EU), Toshiba KBG40ZNS256G NVMe, IPS, 2496x1664, 15" | Huawei MateBook X Pro 2020 i7 i7-10510U, GeForce MX250, Samsung PM981a MZVLB1T0HBLR, LTPS, 3000x2000, 13.9" | Asus ZenBook S13 UX392FN i7-8565U, GeForce MX150, WDC PC SN520 SDAPNUW-512G, IPS, 1920x1080, 13.9" | Lenovo Yoga Slim 7-14IIL05 i7-1065G7, GeForce MX350, WDC PC SN730 SDBPNTY-512G, , 1920x1080, 14" | Dell XPS 13 9300 Core i7-1065G7 i7-1065G7, Iris Plus Graphics G7 (Ice Lake 64 EU), Intel SSDPEMKF512G8 NVMe SSD, IPS, 1920x1200, 13.4" | |
|---|---|---|---|---|---|---|
| Power Consumption | -8% | -21% | -5% | -15% | 9% | |
| Idle Minimum * (Watt) | 4.1 | 4.4 -7% | 4.3 -5% | 3.4 17% | 3.7 10% | 4.2 -2% |
| Idle Average * (Watt) | 7.5 | 8.3 -11% | 8.5 -13% | 6.3 16% | 5.7 24% | 6.9 8% |
| Idle Maximum * (Watt) | 8.5 | 8.6 -1% | 12 -41% | 10.4 -22% | 8.2 4% | 7.5 12% |
| Load Average * (Watt) | 36.8 | 43.6 -18% | 54.8 -49% | 51 -39% | 57.1 -55% | 33.3 10% |
| Witcher 3 ultra * (Watt) | 39.2 | 41.5 -6% | 47.1 -20% | 39 1% | 54 -38% | 37.1 5% |
| Load Maximum * (Watt) | 61.6 | 64.4 -5% | 61.5 -0% | 62.7 -2% | 82.8 -34% | 48.4 21% |
* ... smaller is better
Battery Life
Battery capacity is larger than on the last generation UX392 (67 Wh vs. 50 Wh), but WLAN runtimes remain about the same. We're able to record just over 8 hours of real-world browsing use which is average for an Ultrabook or subnotebook.
Recharging from empty to full capacity takes just over 2 hours.
| Asus Zenbook S UX393JA i7-1065G7, Iris Plus Graphics G7 (Ice Lake 64 EU), 67 Wh | Microsoft Surface Book 3 13.5 i7-1065G7, GeForce GTX 1650 Max-Q, 69 Wh | Huawei MateBook X Pro 2020 i7 i7-10510U, GeForce MX250, 57.4 Wh | Asus ZenBook S13 UX392FN i7-8565U, GeForce MX150, 50 Wh | Lenovo Yoga Slim 7-14IIL05 i7-1065G7, GeForce MX350, 61 Wh | Dell XPS 13 9300 Core i7-1065G7 i7-1065G7, Iris Plus Graphics G7 (Ice Lake 64 EU), 52 Wh | |
|---|---|---|---|---|---|---|
| Battery runtime | -21% | 7% | -21% | -15% | 53% | |
| Reader / Idle (h) | 38.4 | 16.5 -57% | 28.5 -26% | |||
| WiFi v1.3 (h) | 8.3 | 6.6 -20% | 10.4 25% | 8.4 1% | 9.9 19% | 12.7 53% |
| Load (h) | 2.7 | 3.1 15% | 2.4 -11% | 1.7 -37% | 1.4 -48% |
Pros
Cons
Verdict
There is both a lot to like about the ZenBook S UX393 and also a lot that can be improved. When compared to the Surface Laptop 3 13, the Asus blows it out of the water as it is able to offer a larger, brighter, more colorful and higher resolution display within the same chassis size. It also sports more ports than the Microsoft laptop which doesn't even have Thunderbolt 3, HDMI, or an easily accessible M.2 SSD. The Surface Laptop 3 feels barebones and outdated once you become accustomed to the Asus.
The advantages aren't as clear-cut when compared to the Huawei MateBook X Pro. The Huawei system is indubitably faster in terms of GPU power since it uses discrete Nvidia MX graphics and its keyboard keys are firmer and more comfortable to type on. The lack of both a webcam shutter and 3.5 mm audio port on the Asus is puzzling while the slow MicroSD reader may annoy content creators. The UX393 is still a notable upgrade over the UX392 in spite of the size increase, warmer temperatures, and bumpy Ice Lake performance.
The high-end Asus ZenBook S UX393 feels great to hold and travel with and its 3:2 touchscreen is impressive. However, we would love to see GeForce MX and Ryzen options instead of relying solely on Ice Lake CPUs.
Asus Zenbook S UX393JA
- 10/14/2020 v7 (old)
Allen Ngo
Price comparison
