A Mini Multitasking Monster: Asus ZenBook Duo 14 UX482 Laptop Review
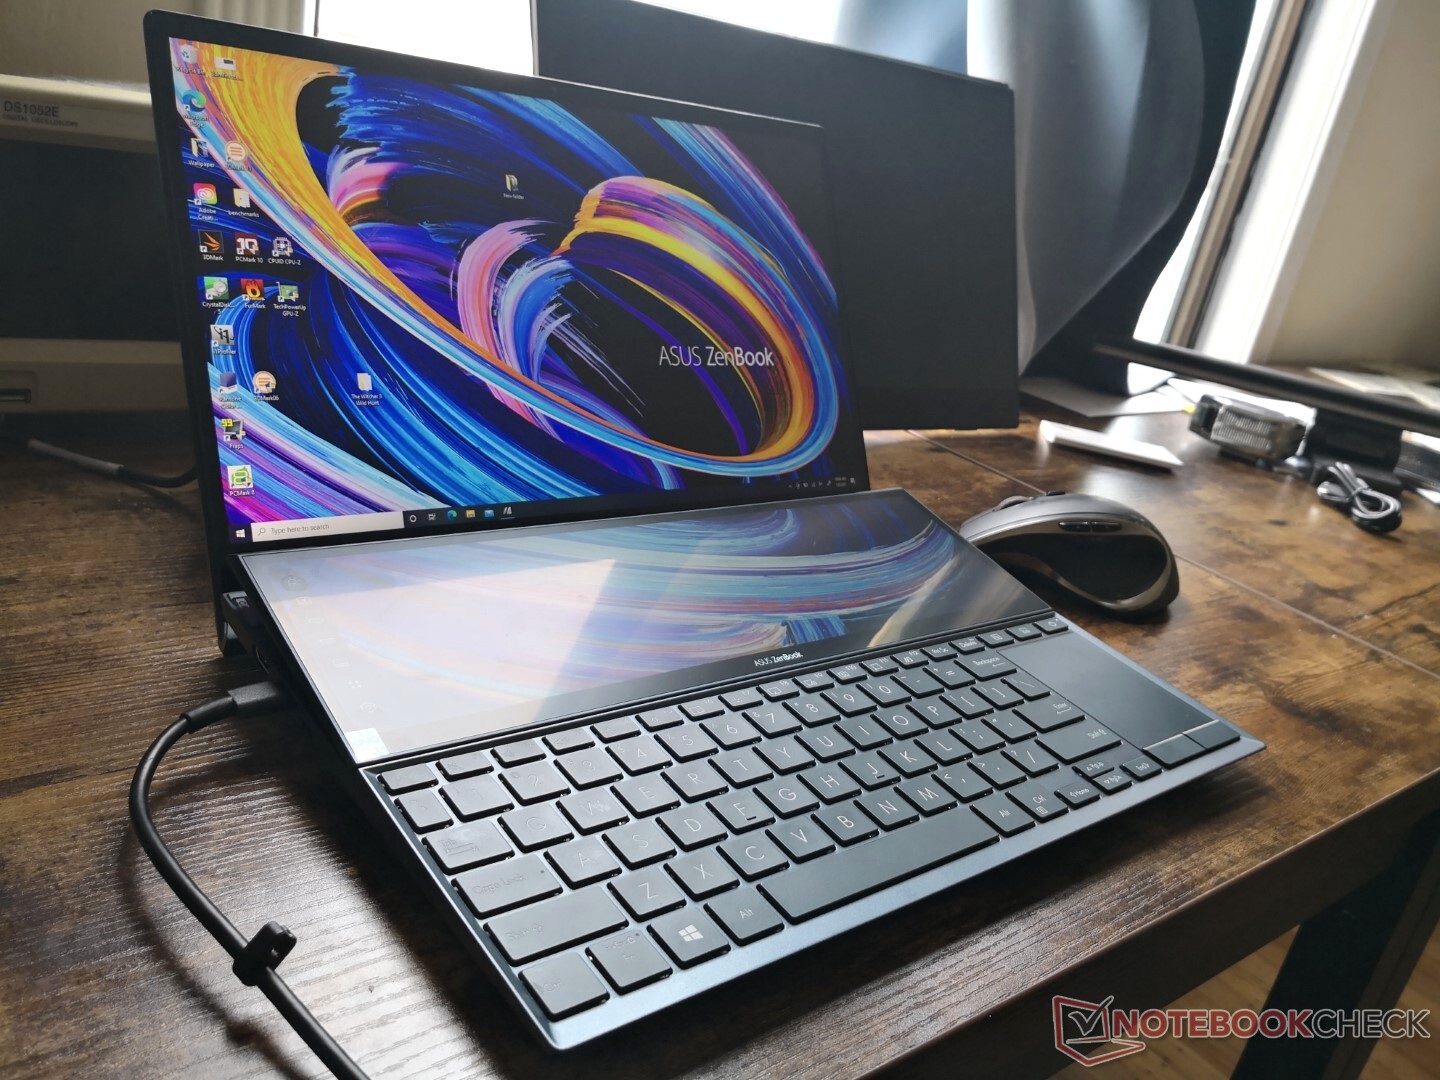
It has barely been a full year since we last checked out the dual-screen ZenBook Duo UX481 and Asus is already launching a full-in ZenBook Duo UX482 to succeed it. The latest model may look similar at first glance, but it actually introduces several significant improvements both inside and out. This review will focus on the differences between the UX482 and UX481 and what users can expect from Asus' 2021 dual-screen Ultrabook.
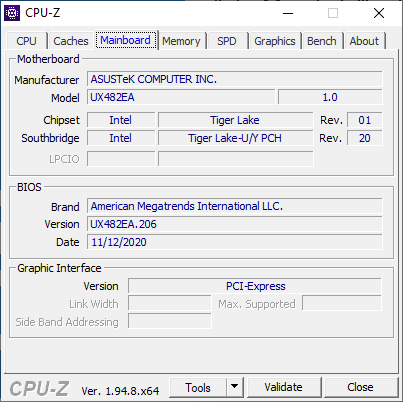
Configurations range from the Core i5-1135G7 CPU with 8 GB of fast LPDDR4X-4266 RAM up to the Core i7-1165G7 with 32 GB of RAM and discrete GeForce MX450 graphics. Our specific SKU retails for about $1300 USD. All configurations are otherwise fixed with a primary 14-inch FHD IPS display and secondary 12.6-inch 1920 x 515 ScreenPad. A larger 15.6-inch ZenBook Duo UX582 model is also available.
Competitors to the ZenBook Duo UX482 include other high-end 14-inch Ultrabooks like the MSI Prestige 14, Lenovo Yoga Slim 7, or Huawei MateBook 14. Of course, none come with the same secondary display feature that makes the UX492 so special.
More Asus reviews:
potential competitors in comparison
Rating | Date | Model | Weight | Height | Size | Resolution | Price |
|---|---|---|---|---|---|---|---|
| 85.1 % v7 (old) | 01 / 2021 | Asus ZenBook Duo 14 UX482EA i7-1165G7, Iris Xe G7 96EUs | 1.6 kg | 16.9 mm | 14.00" | 1920x1080 | |
| 82.5 % v7 (old) | 12 / 2020 | MSI Prestige 14 Evo A11M-005 i7-1185G7, Iris Xe G7 96EUs | 1.2 kg | 16 mm | 14.00" | 1920x1080 | |
| 87.1 % v7 (old) | 12 / 2020 | Lenovo Yoga 9i 14ITL5 i5-1135G7, Iris Xe G7 80EUs | 1.4 kg | 15.7 mm | 14.00" | 1920x1080 | |
| 84.1 % v7 (old) | 01 / 2021 | Asus Zenbook 14 UX435EG i7-1165G7, GeForce MX450 | 1.3 kg | 16.9 mm | 14.00" | 1920x1080 | |
| 80.7 % v7 (old) | 07 / 2020 | Asus VivoBook S14 S433FL i7-10510U, GeForce MX250 | 1.4 kg | 16 mm | 14.00" | 1920x1080 | |
| 82.7 % v7 (old) | 05 / 2020 | Asus ZenBook Duo UX481FL i7-10510U, GeForce MX250 | 1.8 kg | 19 mm | 14.00" | 1920x1080 |
Case
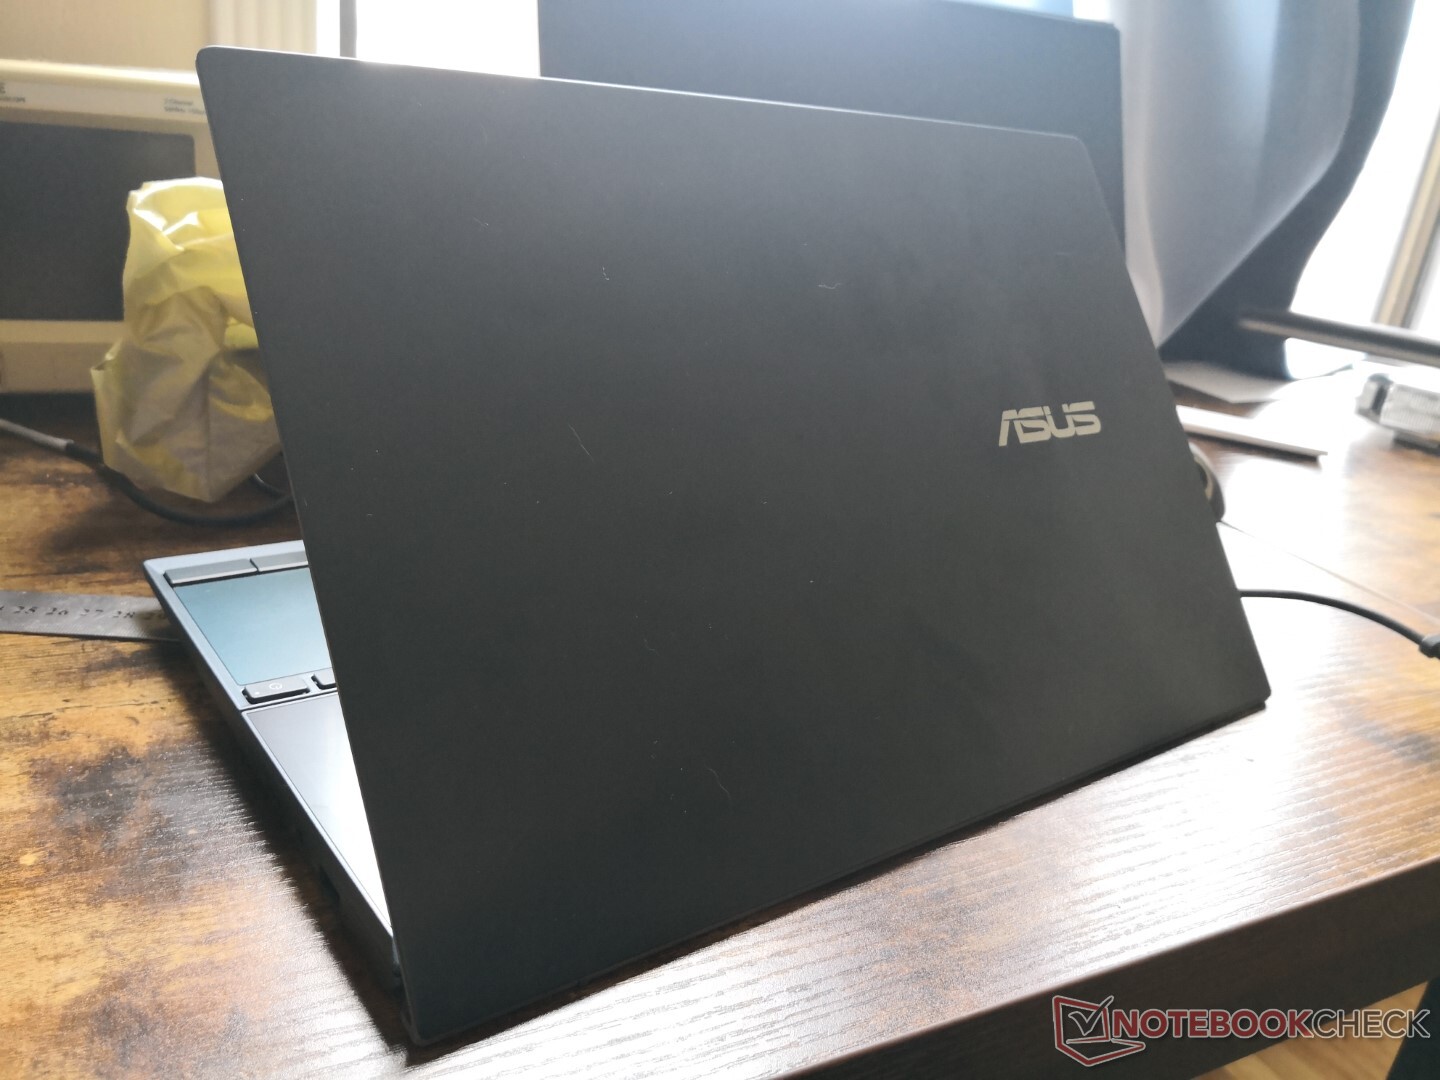
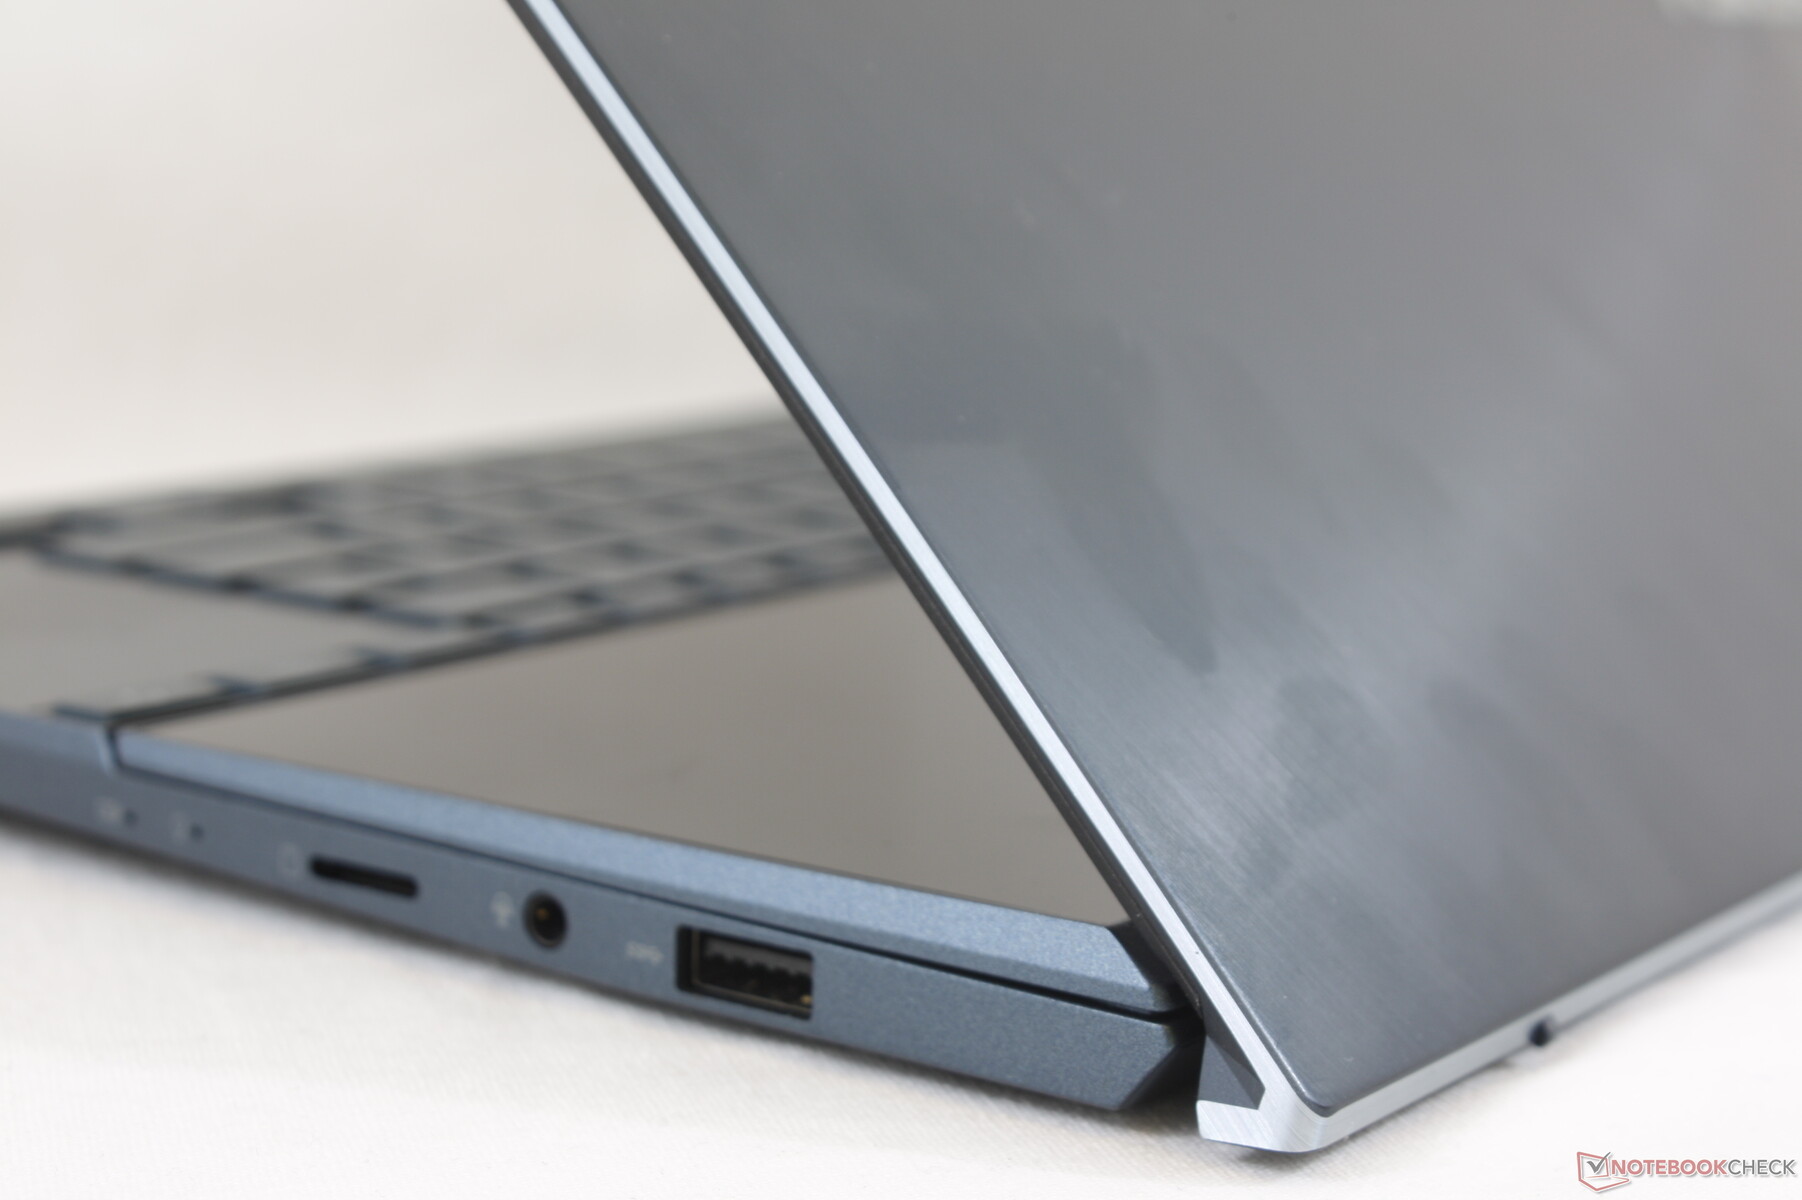
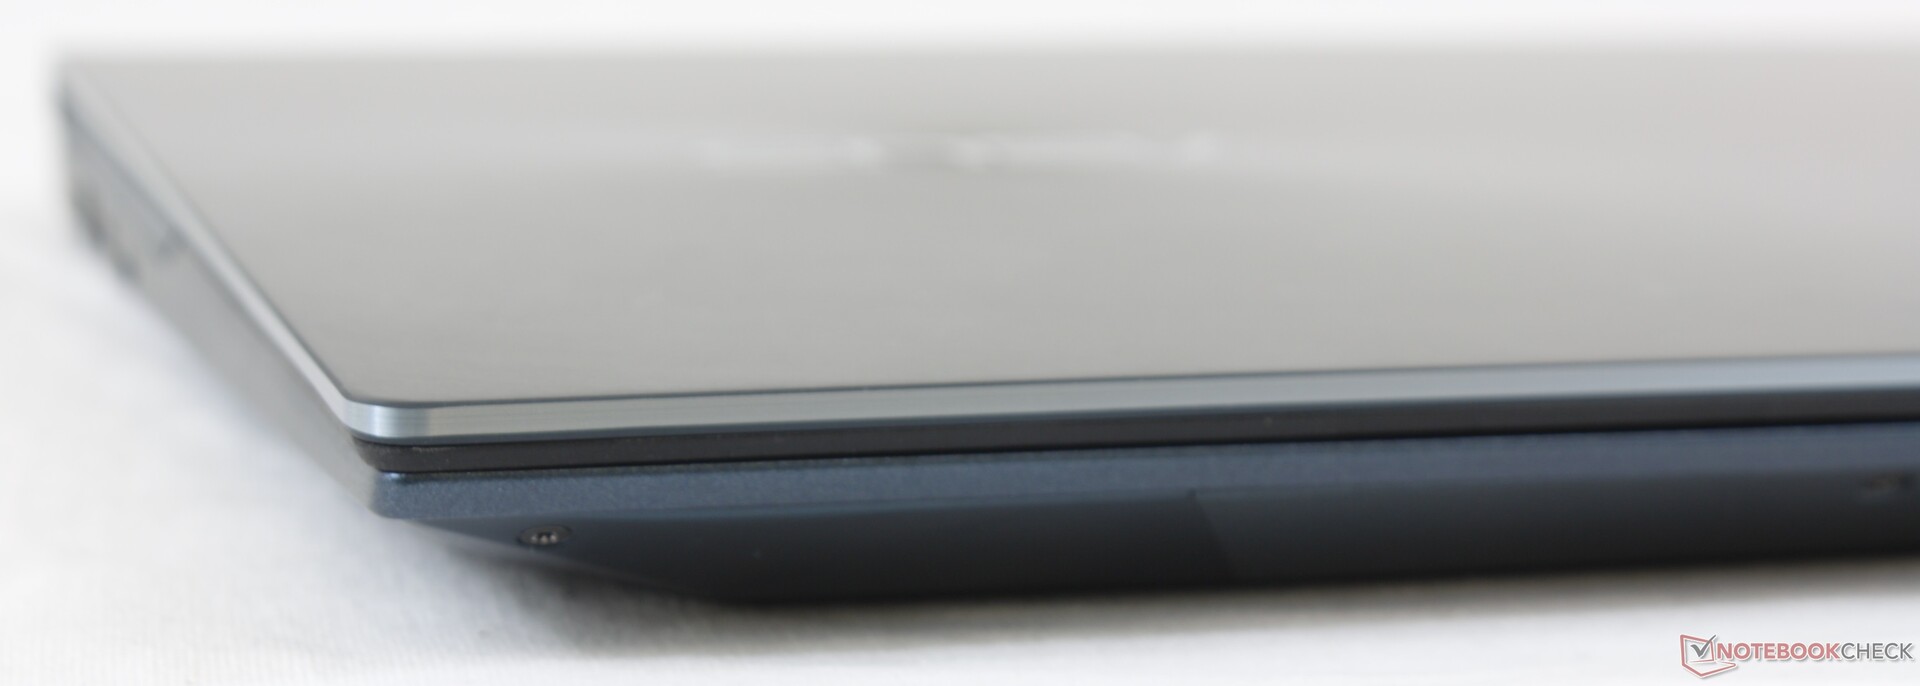
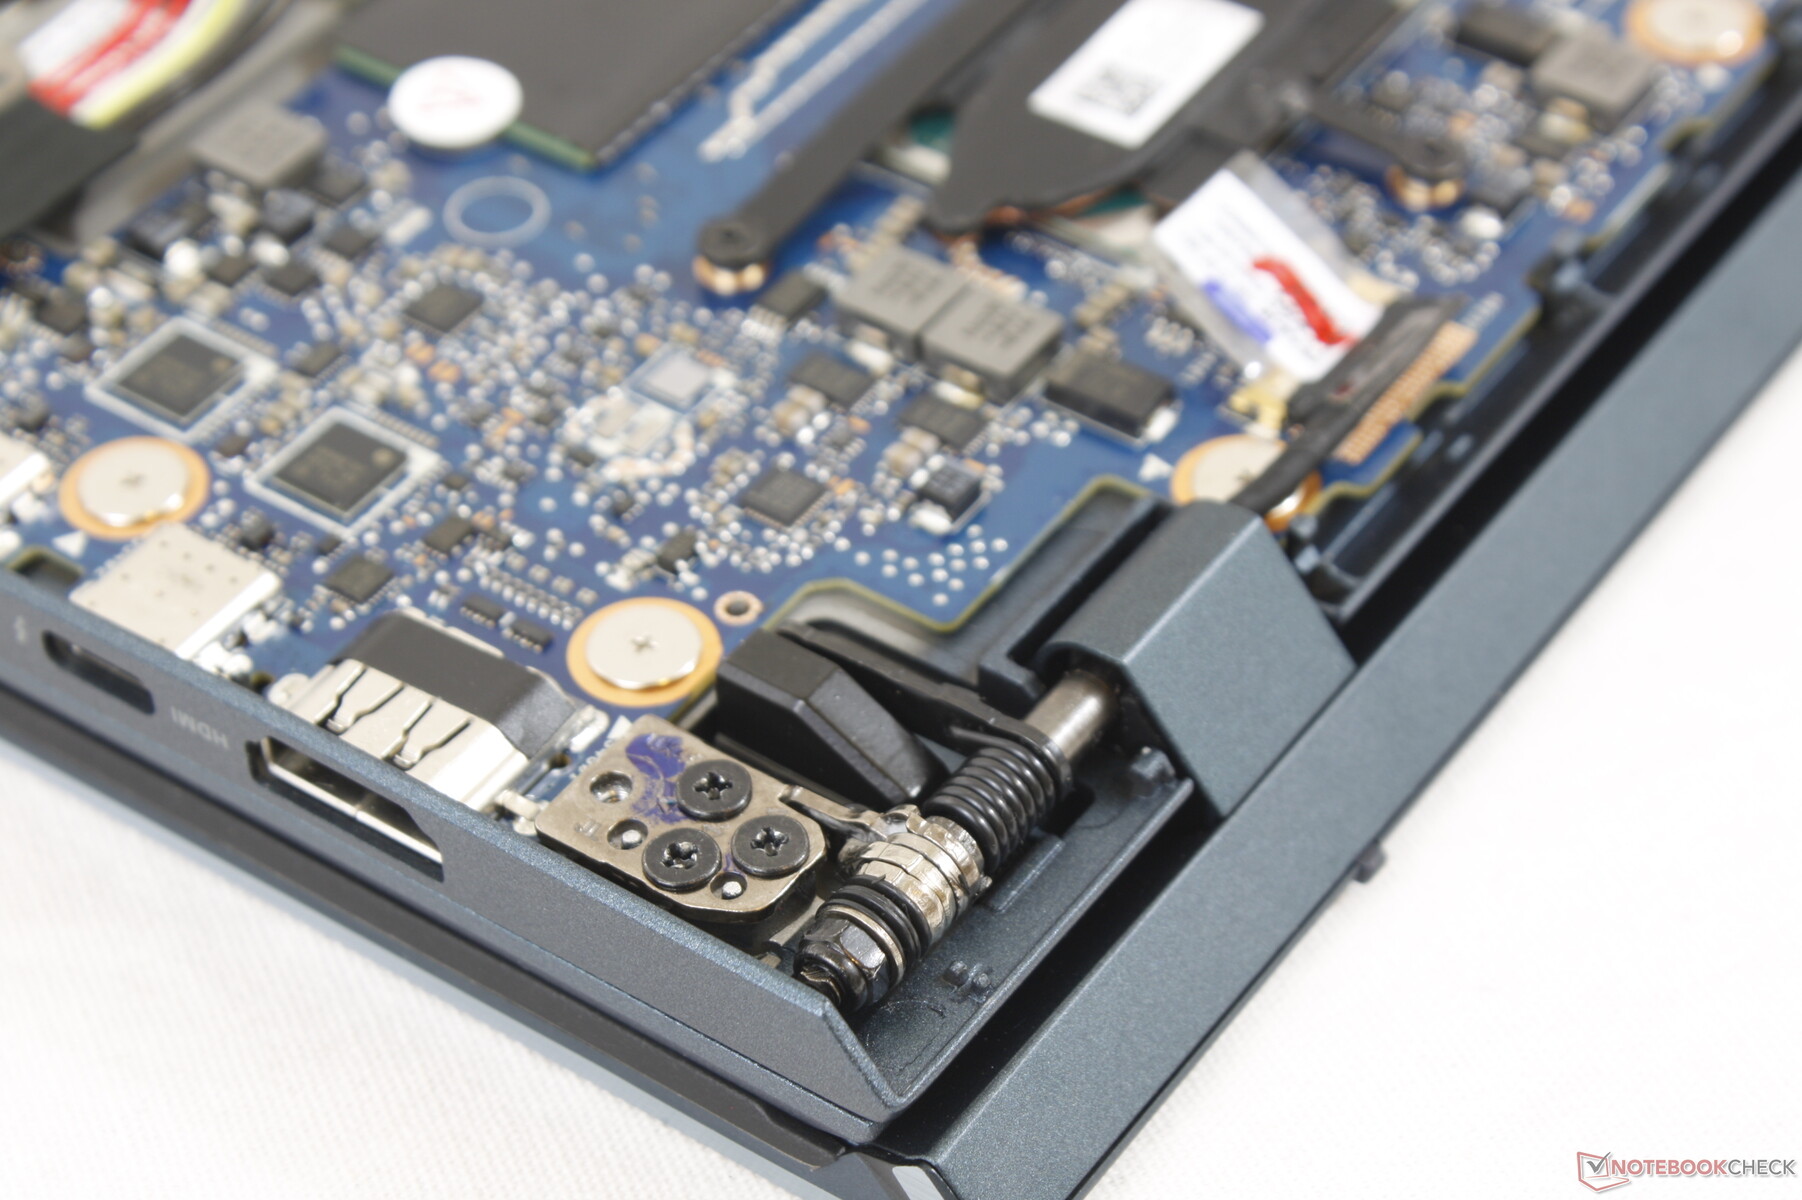
The metal chassis is mostly the same as on the UX481 but with a couple of major changes. Firstly, Asus has completely redesigned the zinc alloy hinges to be 30 percent smaller than the hinges on the UX481. The size reduction has allowed the chassis to be 3 mm thinner and consequently ~200 g lighter than the outgoing UX481. Hinge rigidity feels uniform at all angles and with minimal teetering, but we can still hear a bit of creaking when opening the lid.
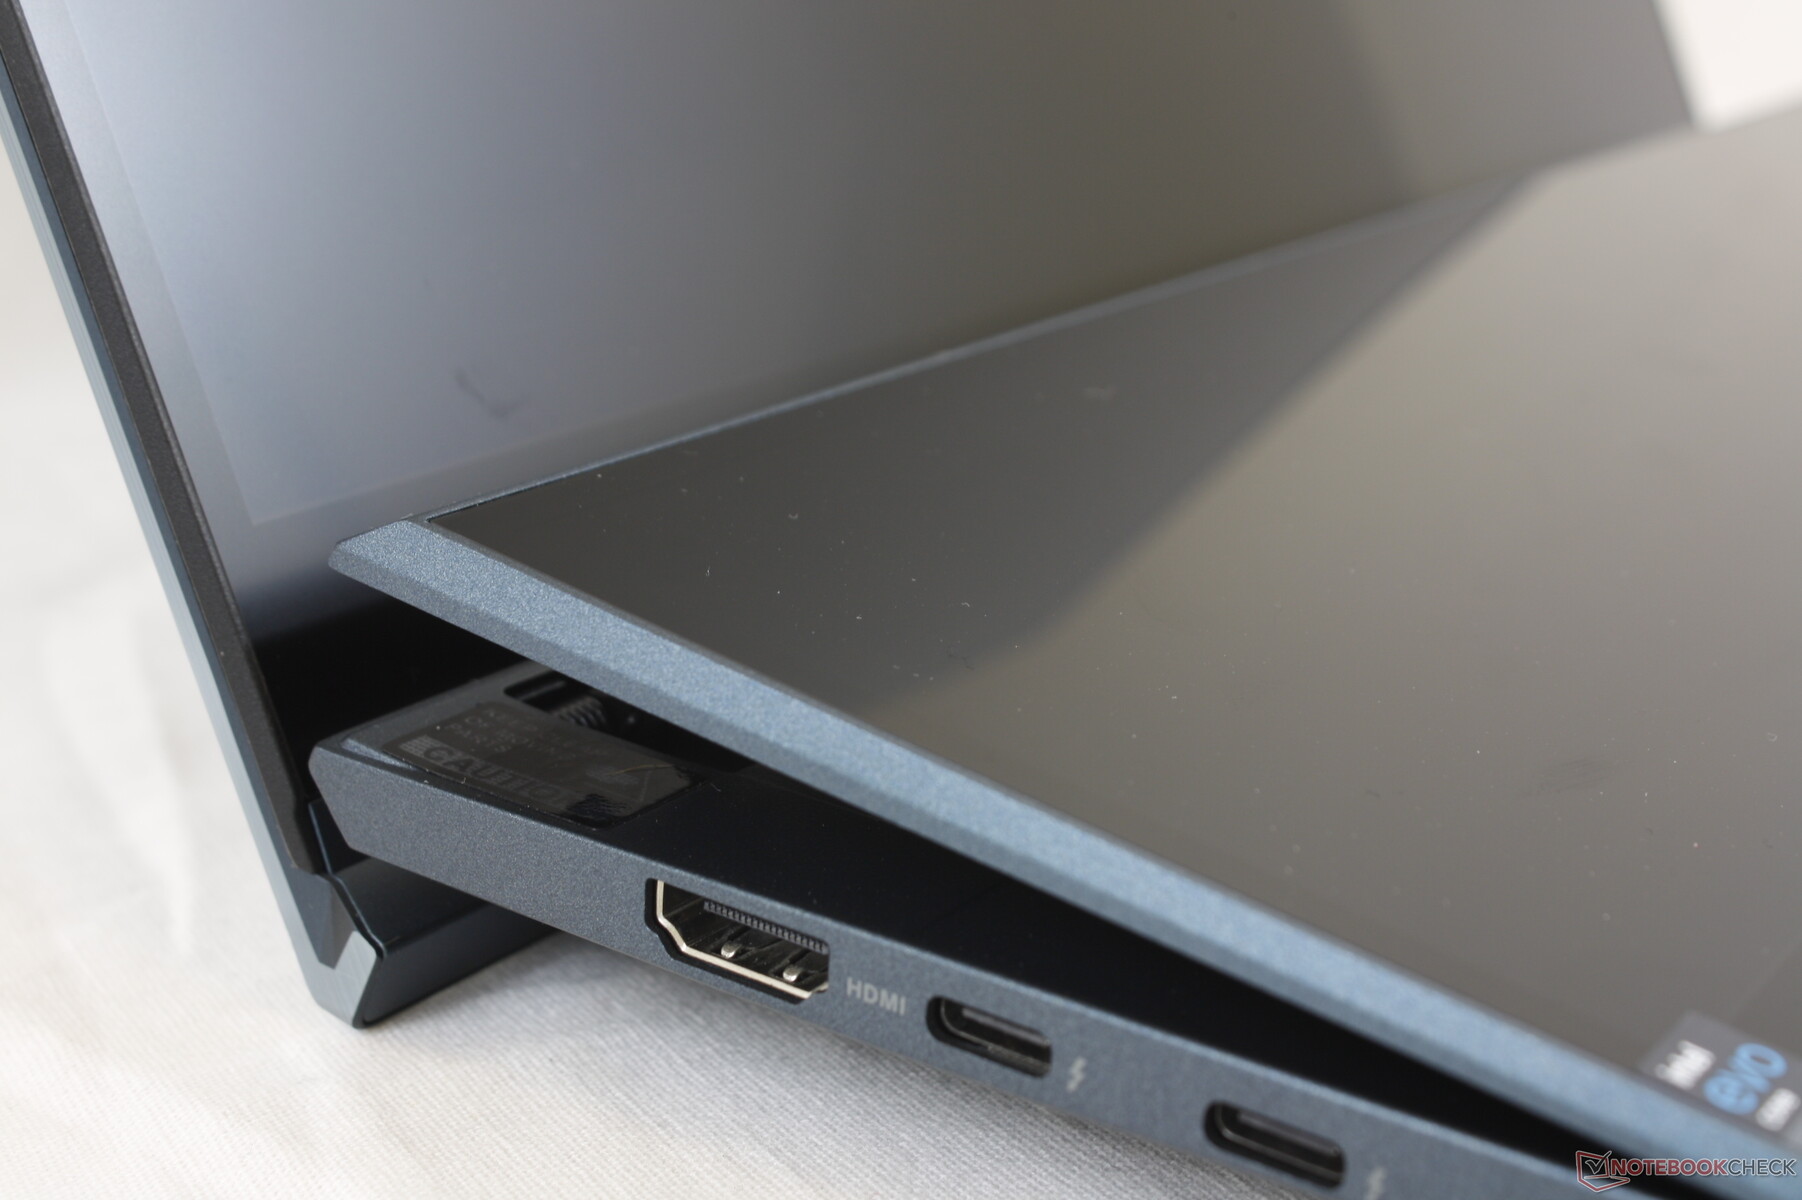
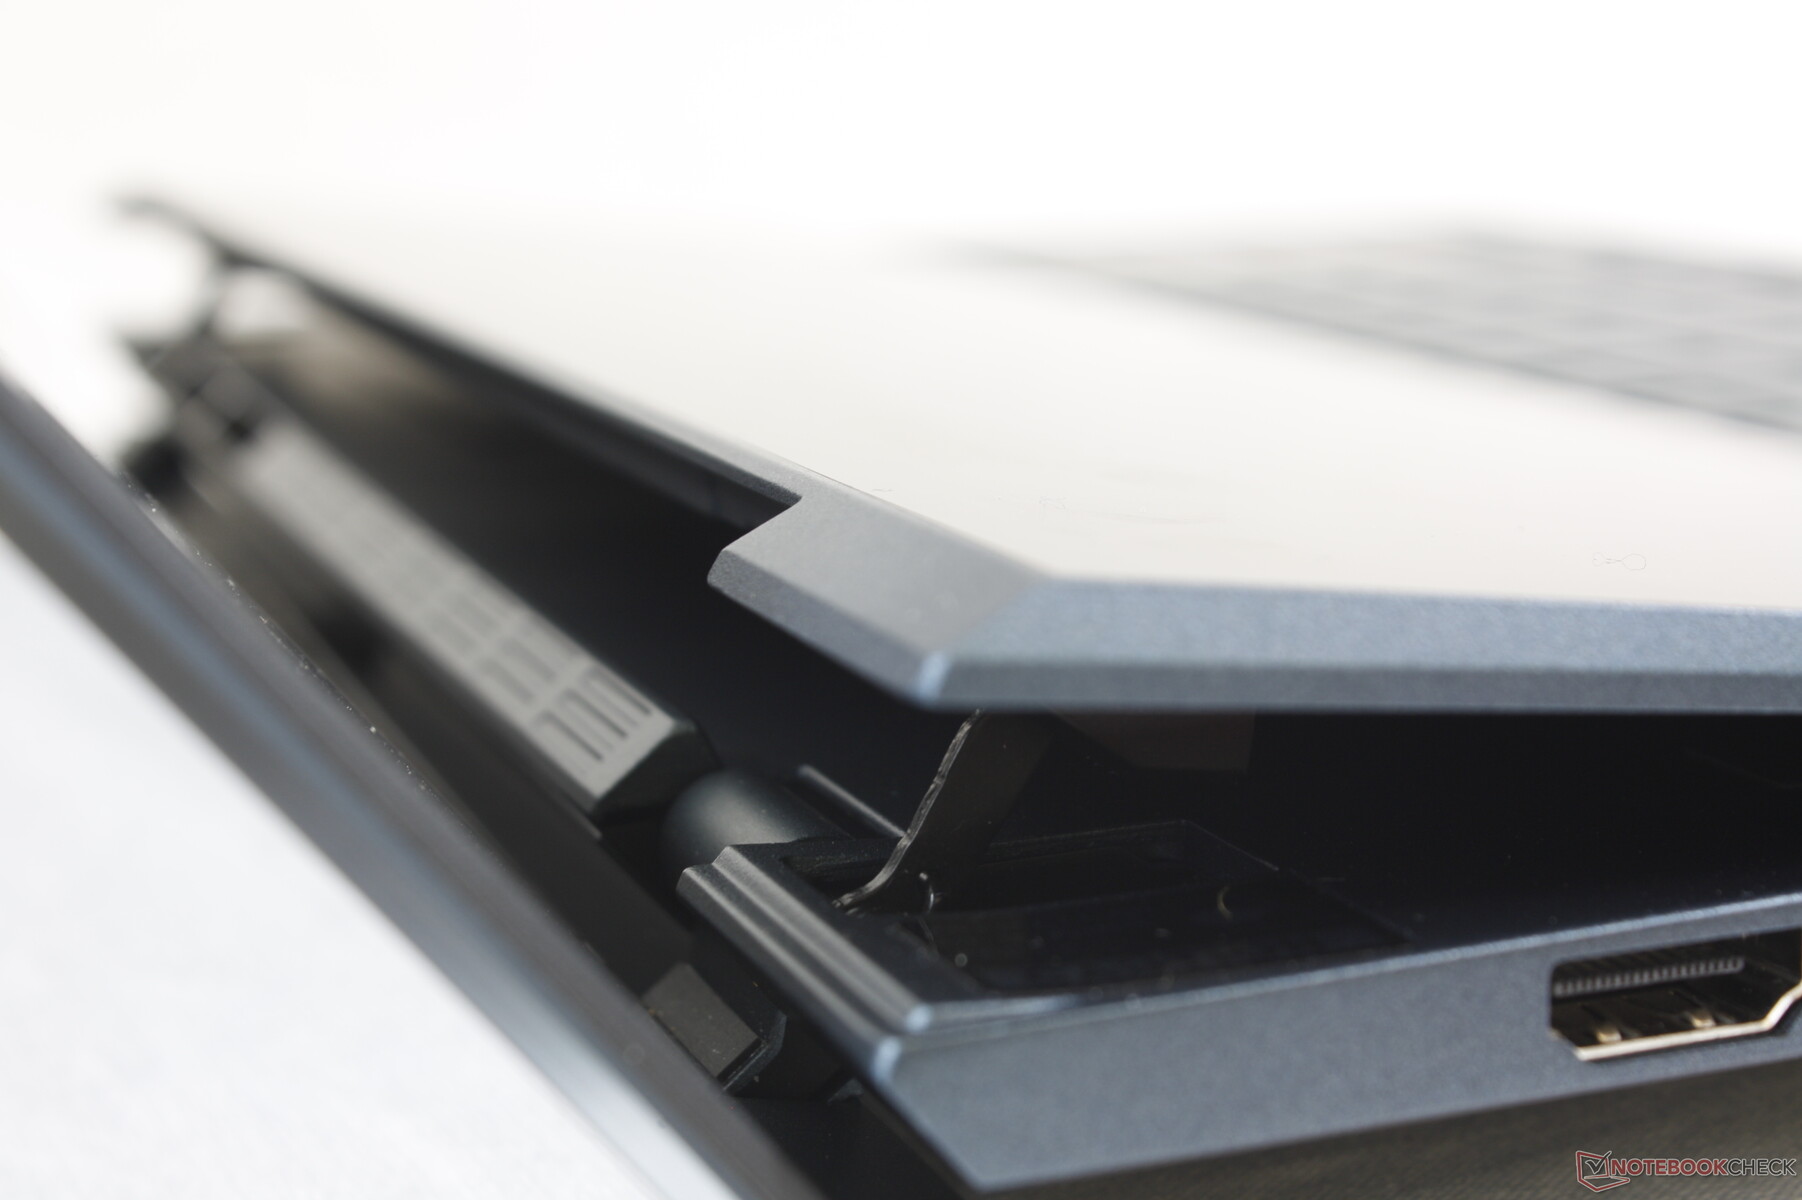
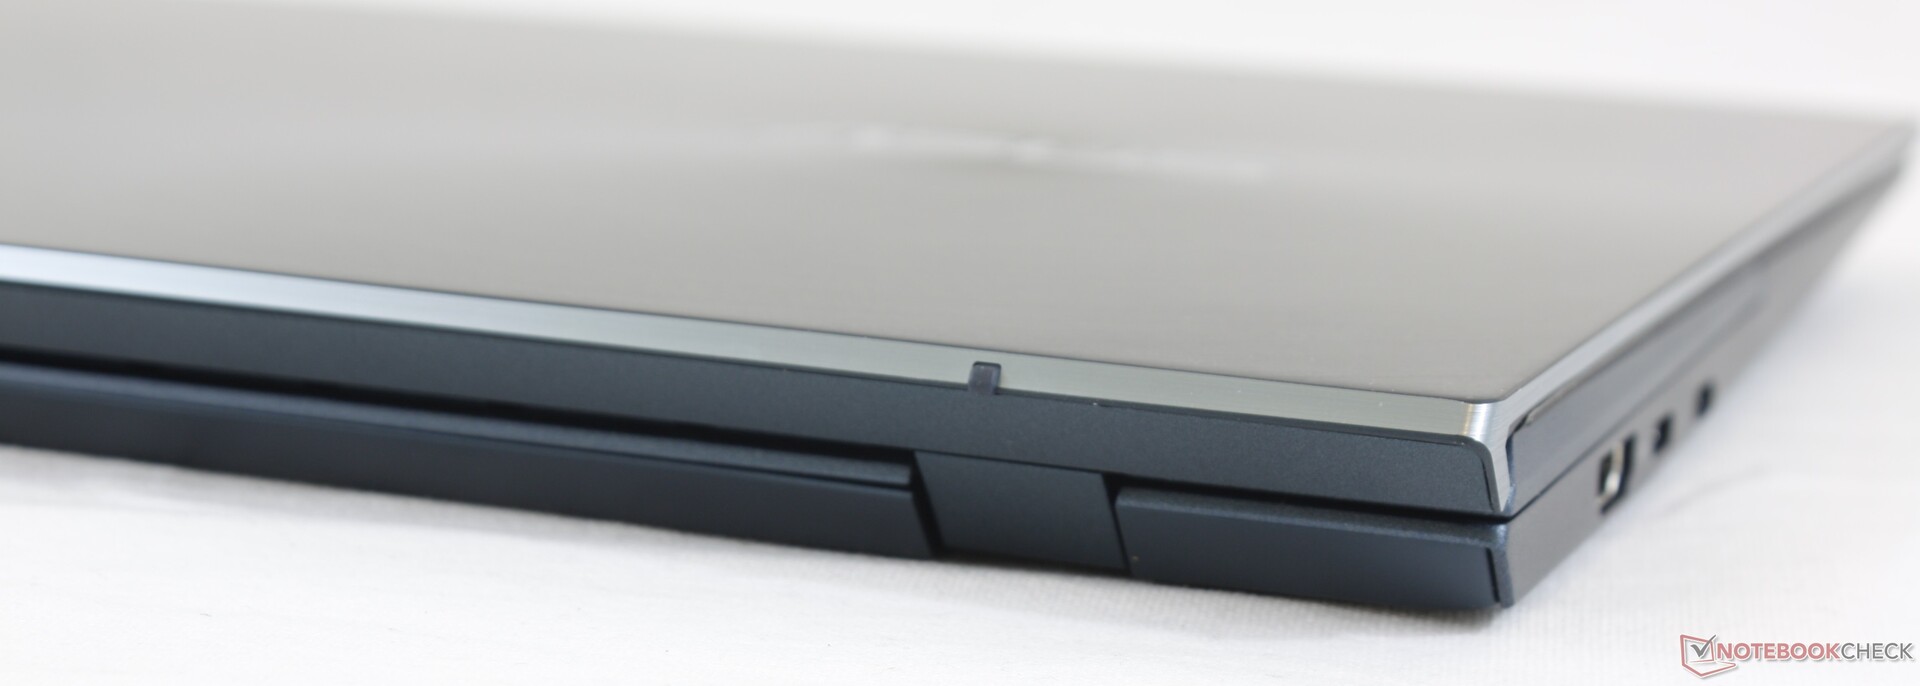
The second major change relates to the ScreenPad as the entire display will now lift at an angle to improve both viewing angles and cooling. Asus calls it the Active Aerodynamic System (AAS+) which, when combined with the existing ErgoLift hinges, promises up tp 49 percent better airflow than on the previous model. This directly impacts performance as the manufacturer can now claim a sustainable 28 W CPU TDP which we will go into detail in our Performance sections below.
The new ZenBook is still noticeably heavier than traditional 14-inch laptops including Asus' own ZenBook 14 UX425/435 by about 300 g. The second screen adds to the overall weight albeit not by as much as last year's model.
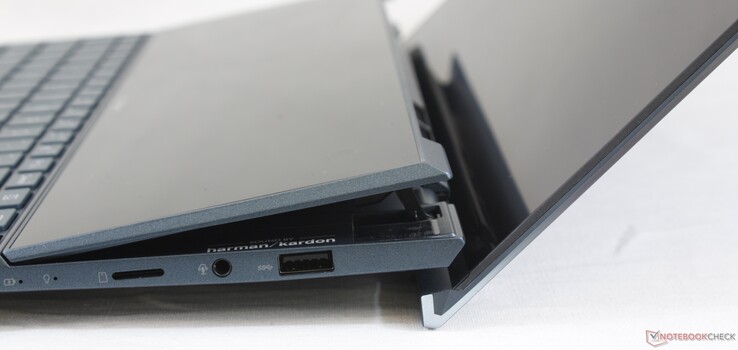
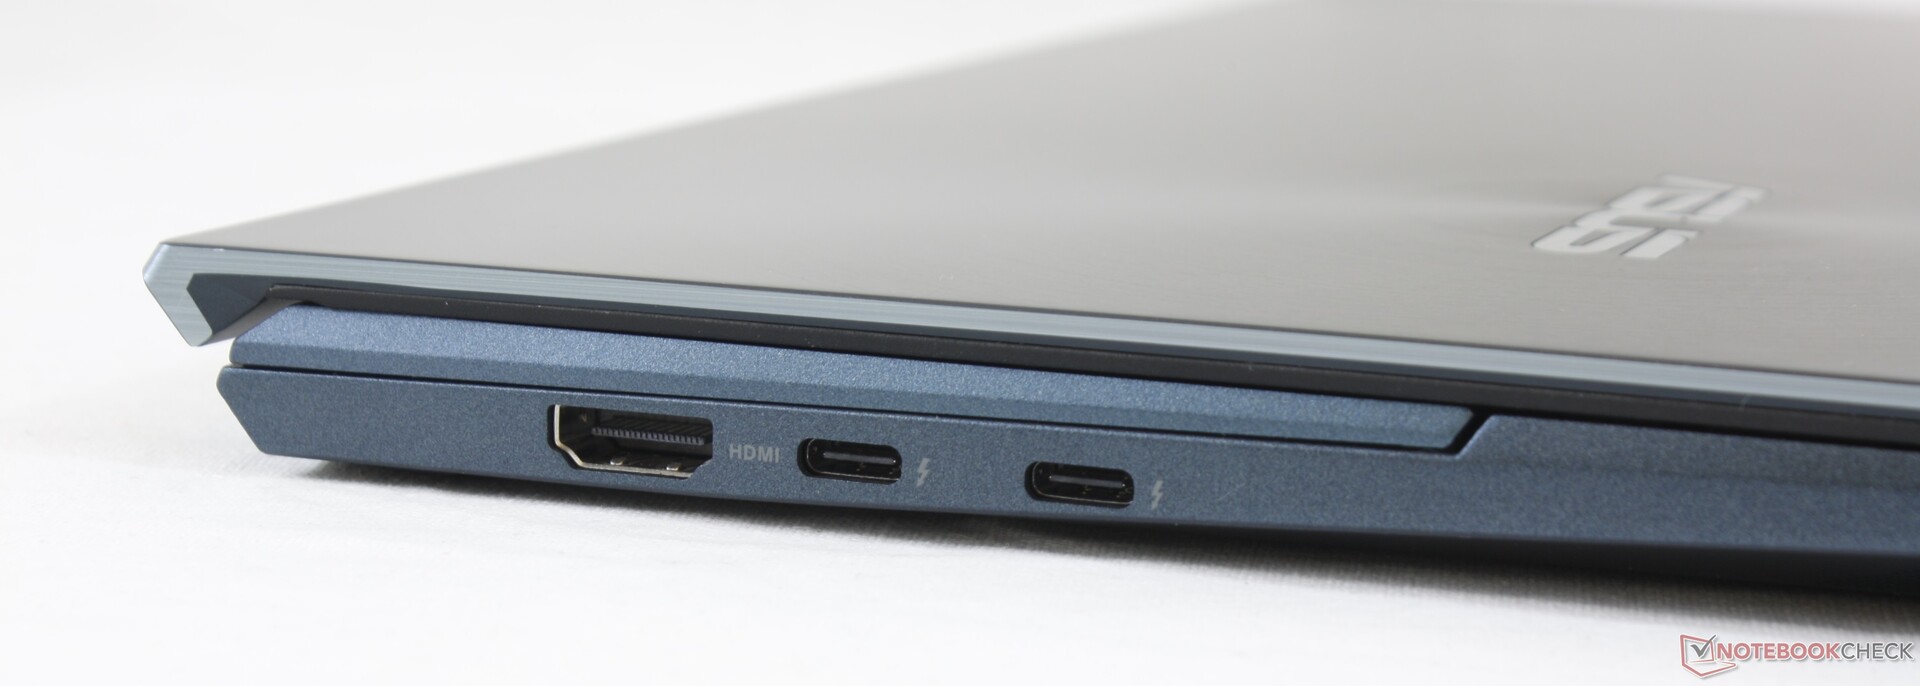
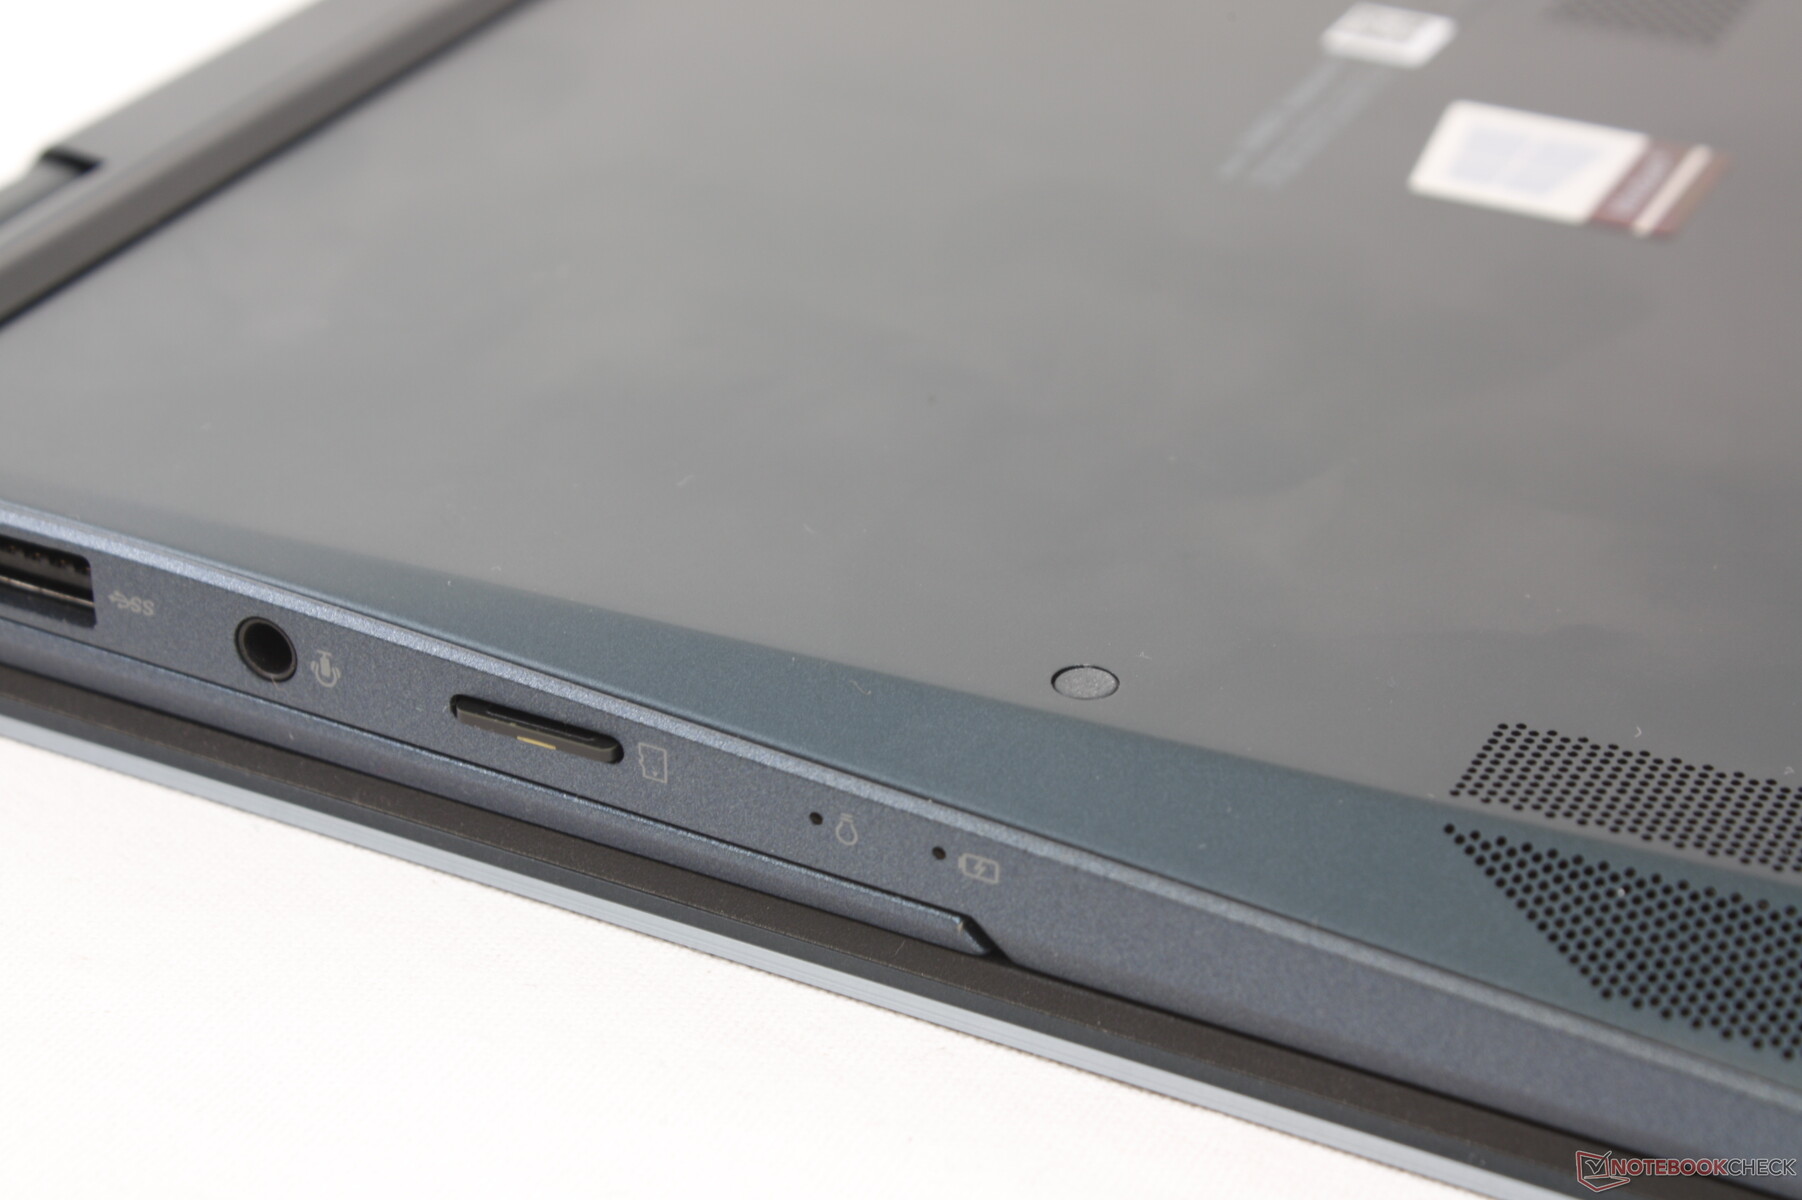
Connectivity
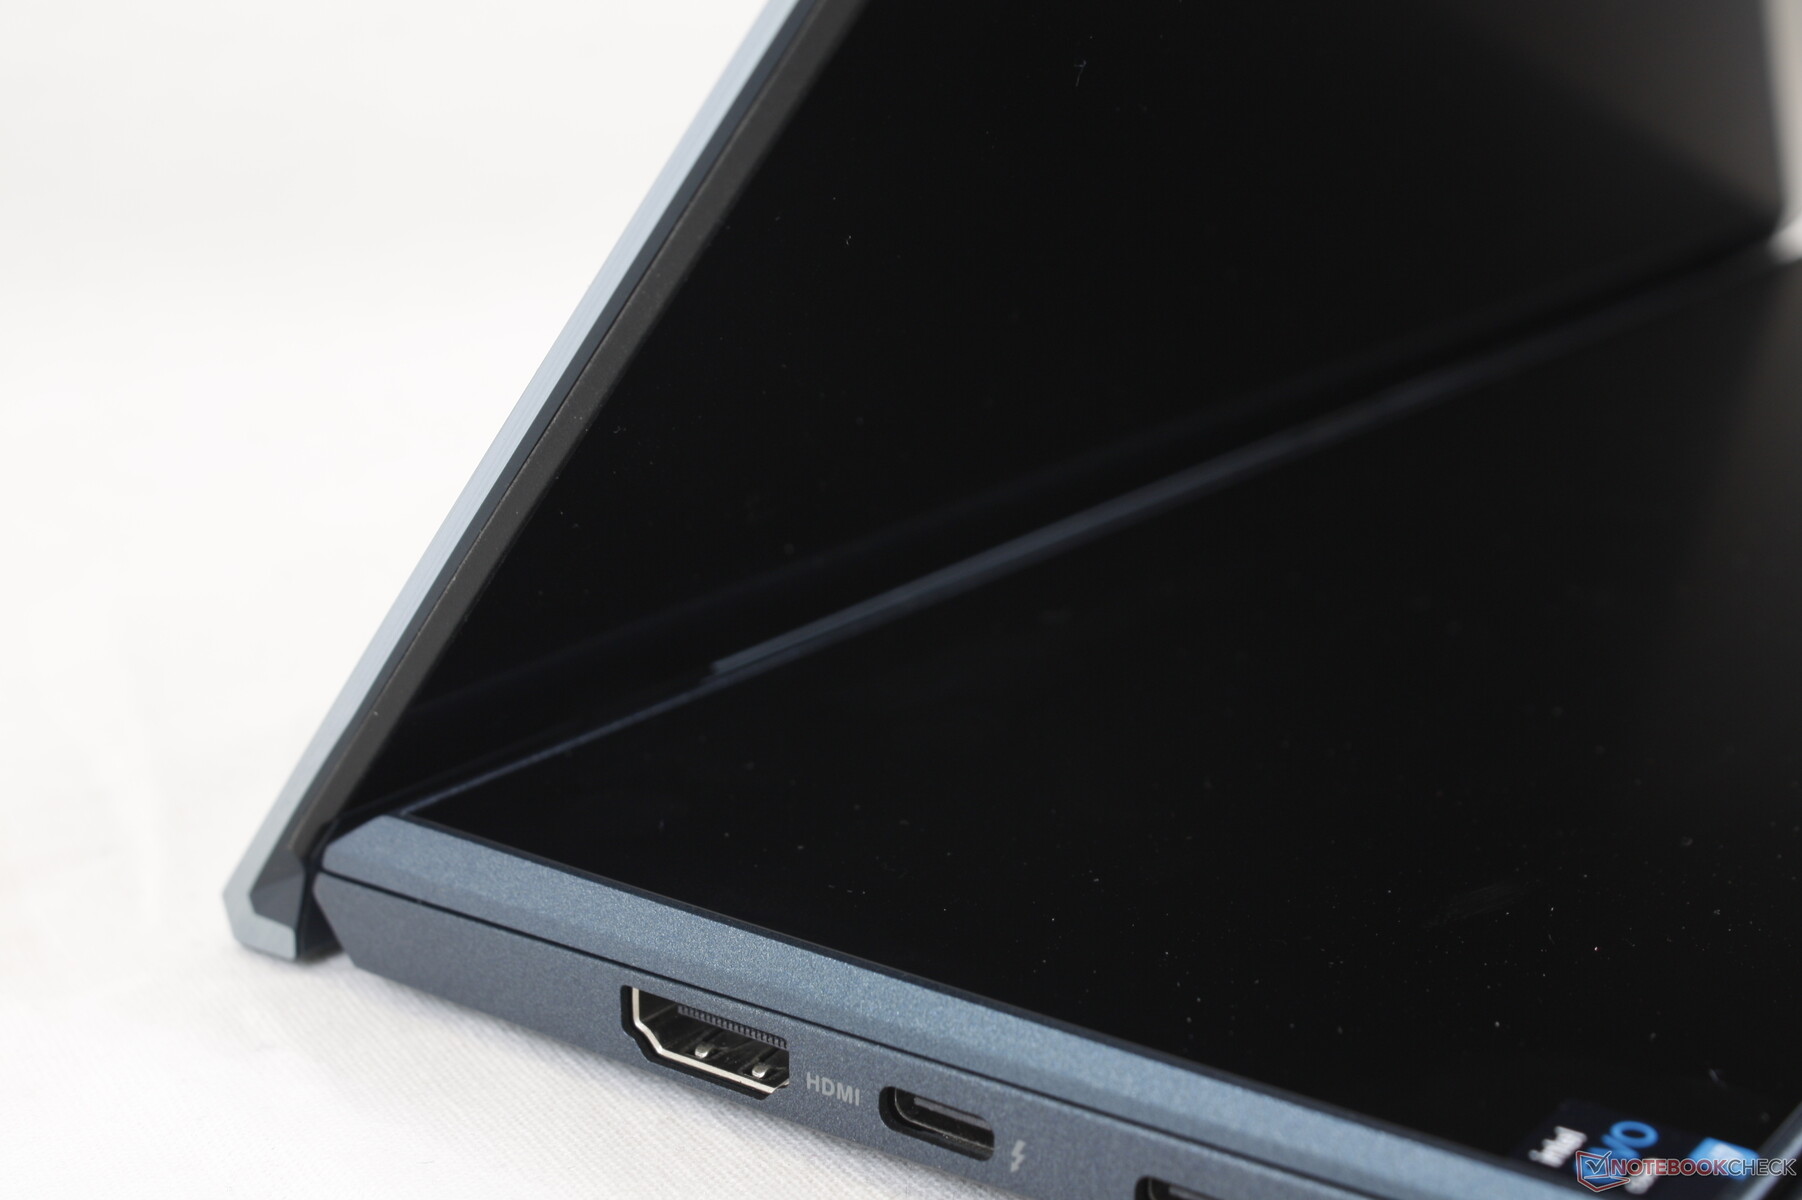
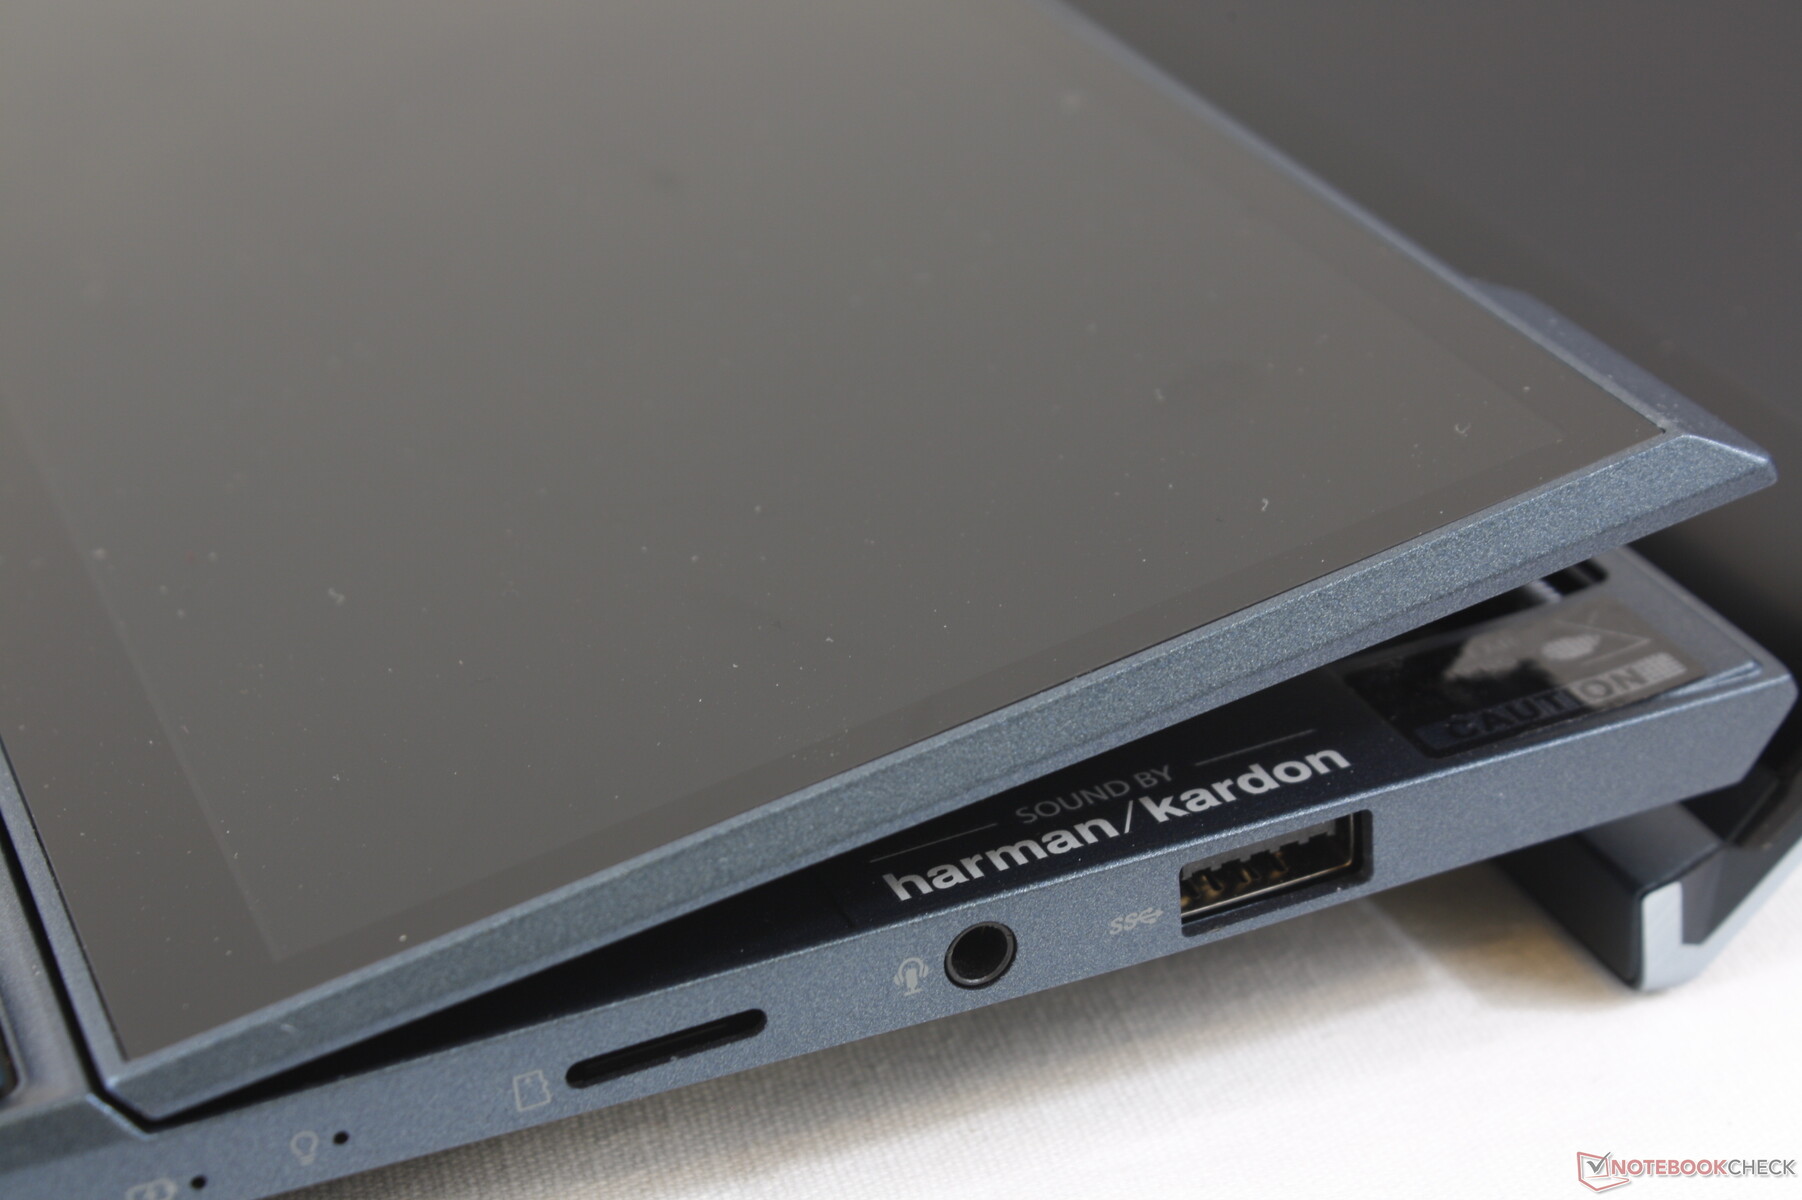
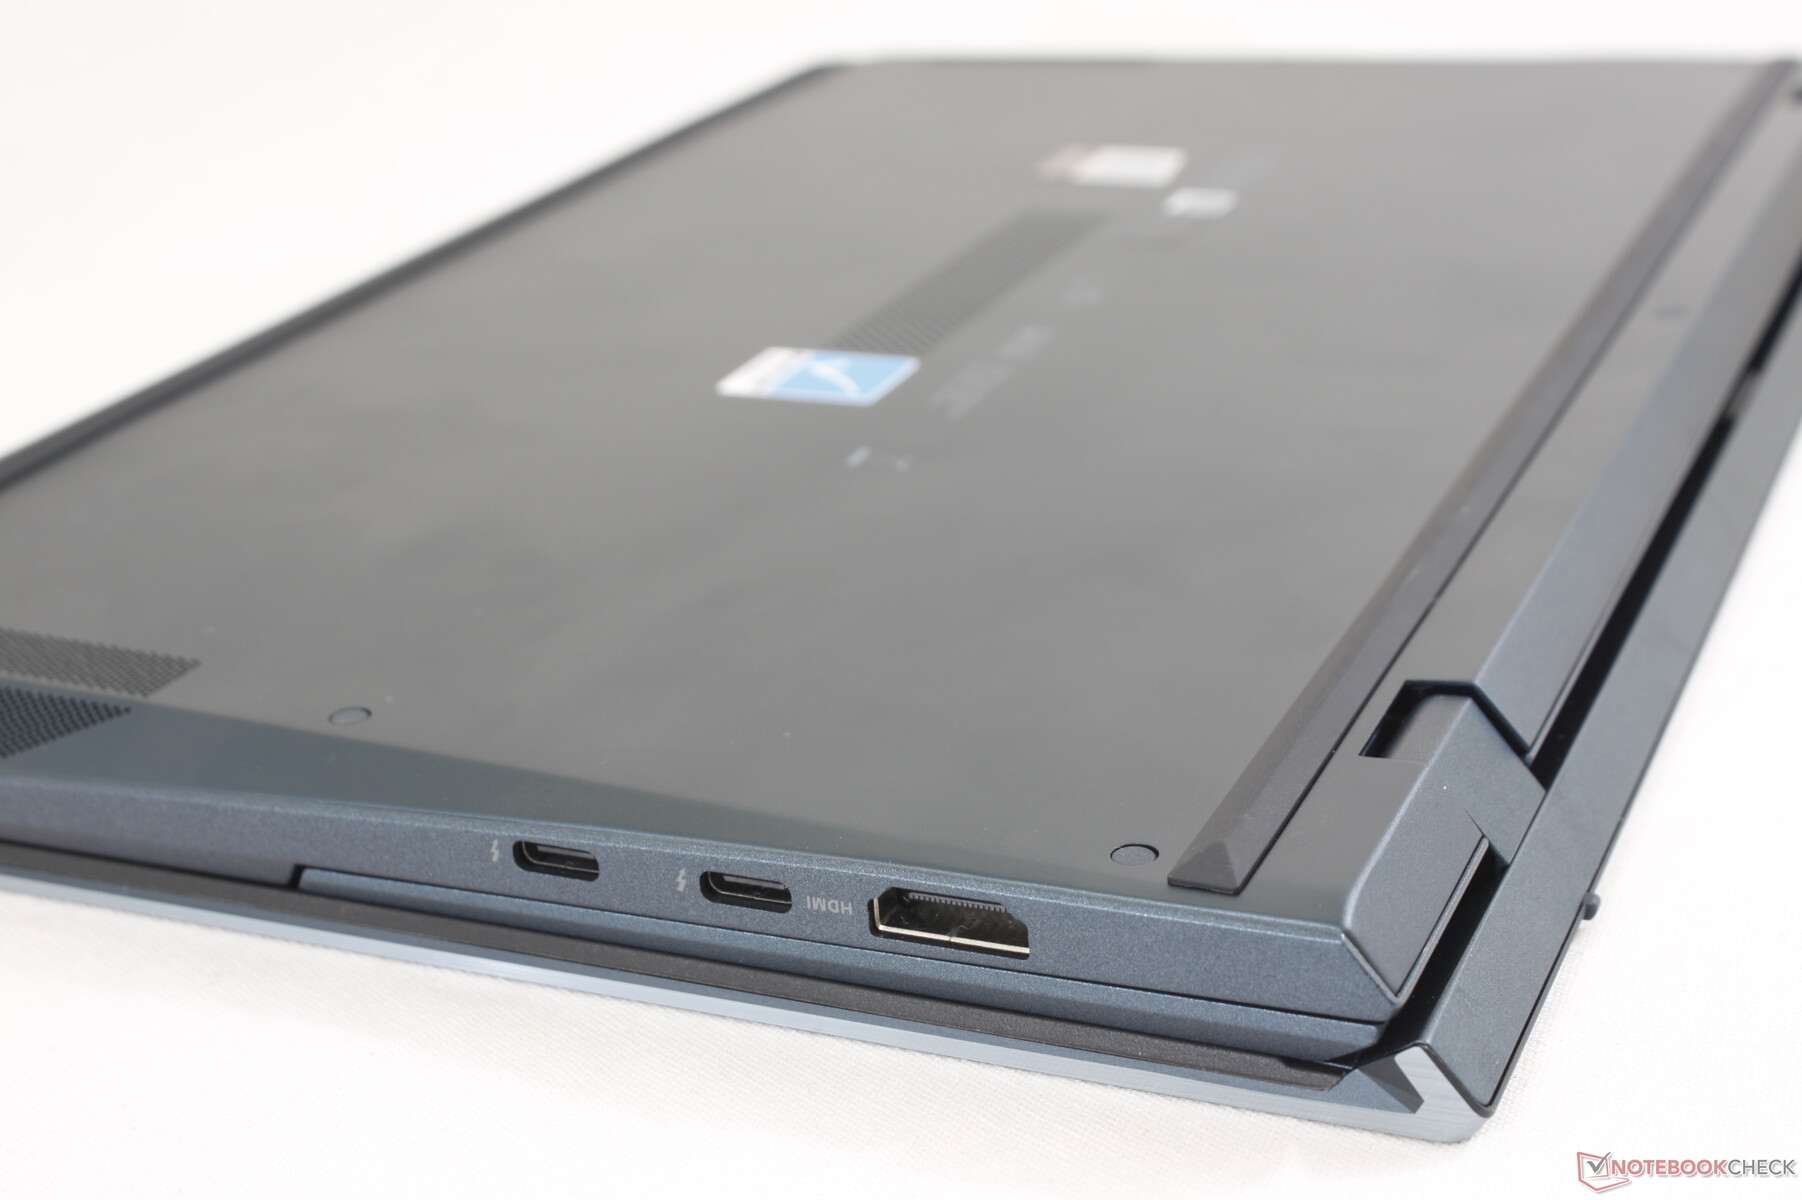
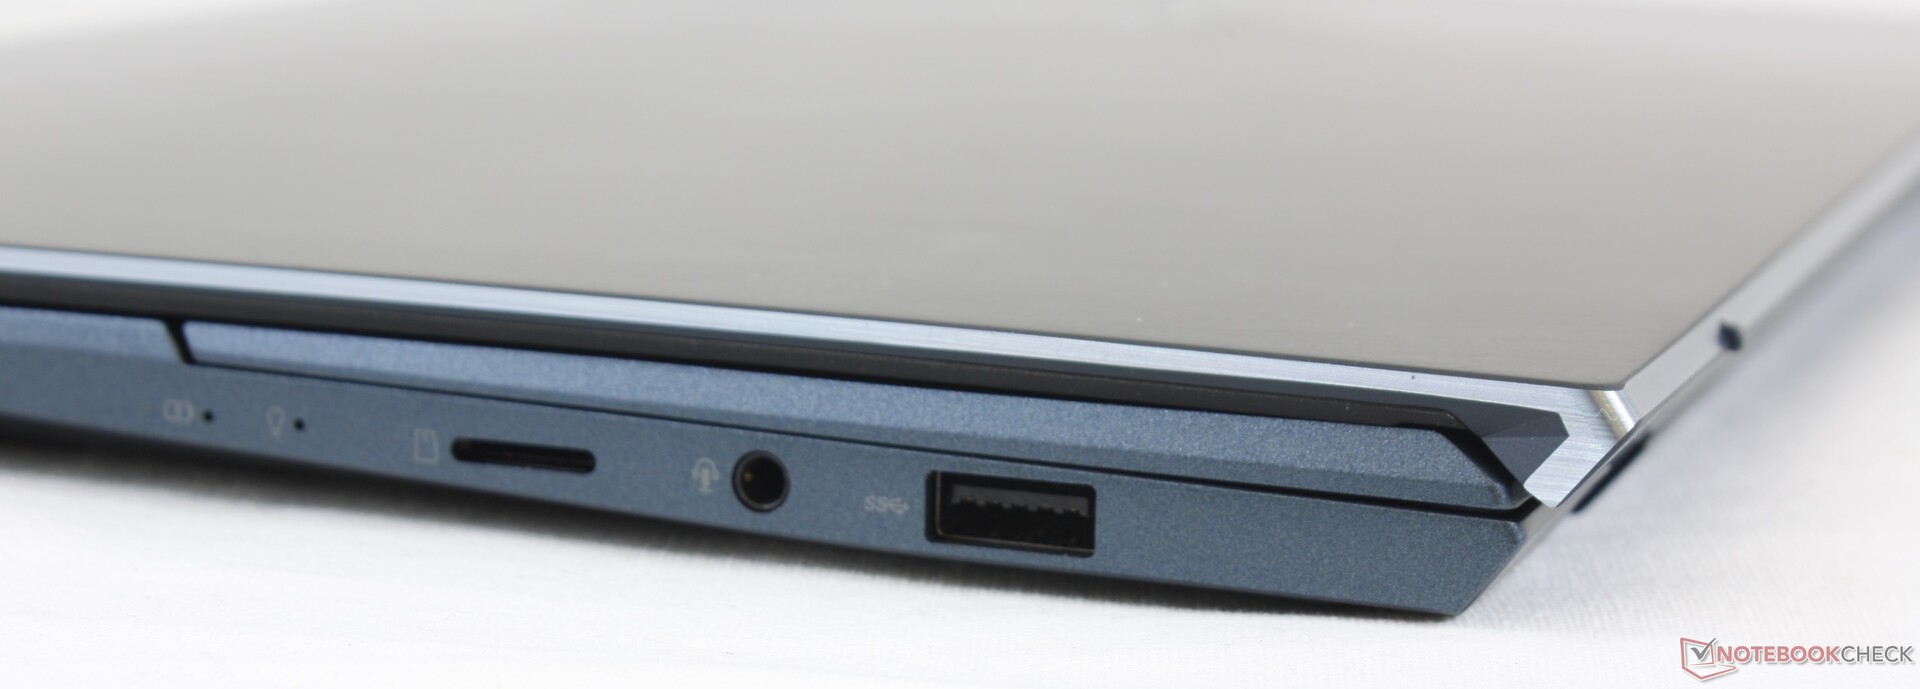
Port options have changed from the preceding UX481 mostly for the better. The proprietary AC barrel port, for example, has been removed in favor of a second USB-C port which also improves the docking capabilities of the system. On the other hand, there is now just one USB-A port compared to two on last year's model. Both USB-C ports are compatible with Thunderbolt 4 devices.
SD Card Reader
For reasons unknown to us, Asus has downgraded its MicroSD card reader to be 3x slower than the same card reader on the older UX481. Moving 1 GB of pictures from our UHS-II test card to desktop takes about 41 seconds on our UX482 compared to 13 seconds on the UX481. Video or photo editors might find this change maddening.
| SD Card Reader | |
| average JPG Copy Test (av. of 3 runs) | |
| Asus Zenbook 14 UX435EG (Toshiba Exceria Pro M501 microSDXC 64GB) | |
| Asus ZenBook Duo UX481FL (Toshiba Exceria Pro M501 microSDXC 64GB) | |
| Asus ZenBook Duo 14 UX482EA (Toshiba Exceria Pro M501 microSDXC 32GB) | |
| Asus VivoBook S14 S433FL (Toshiba Exceria Pro M501 microSDXC 64GB) | |
| maximum AS SSD Seq Read Test (1GB) | |
| Asus Zenbook 14 UX435EG (Toshiba Exceria Pro M501 microSDXC 64GB) | |
| Asus ZenBook Duo UX481FL (Toshiba Exceria Pro M501 microSDXC 64GB) | |
| Asus ZenBook Duo 14 UX482EA (Toshiba Exceria Pro M501 microSDXC 32GB) | |
| Asus VivoBook S14 S433FL (Toshiba Exceria Pro M501 microSDXC 64GB) | |
Communication
Webcam


Maintenance
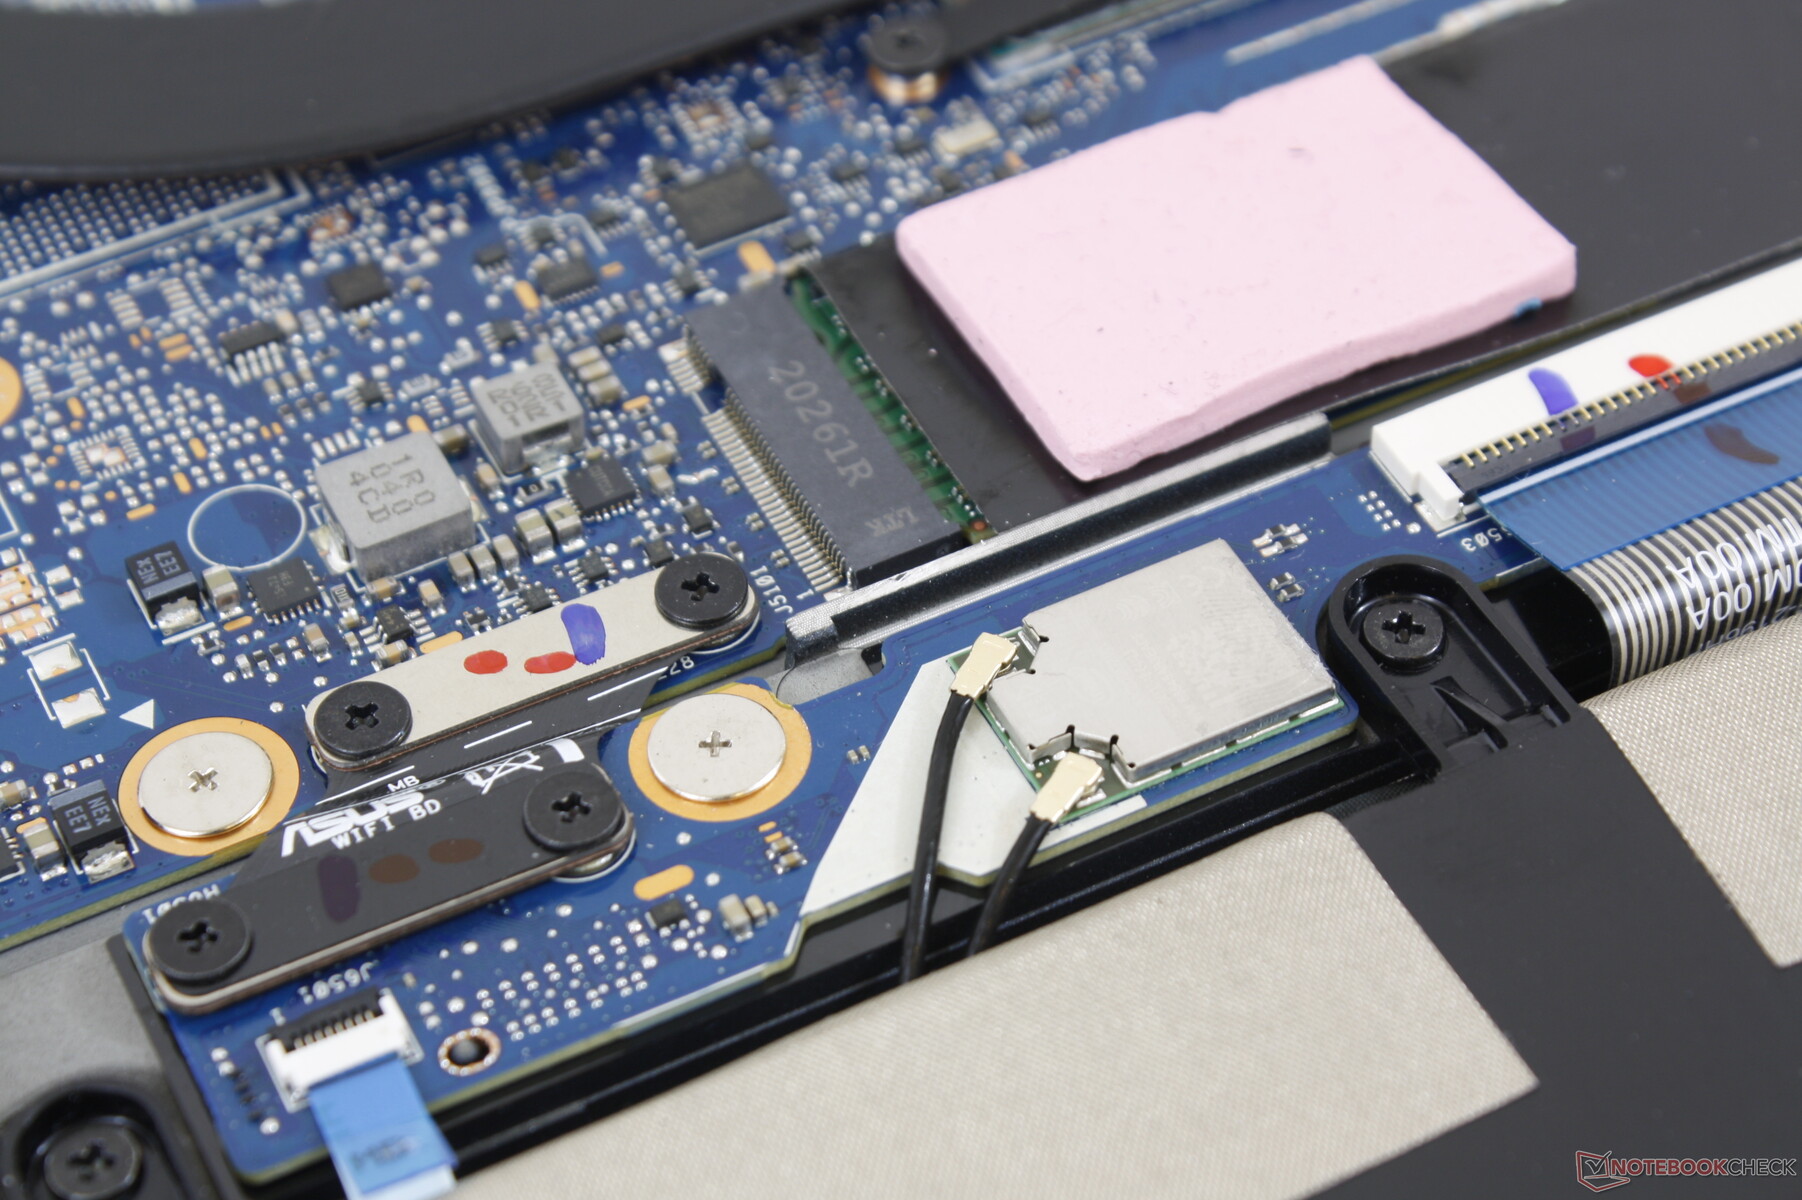
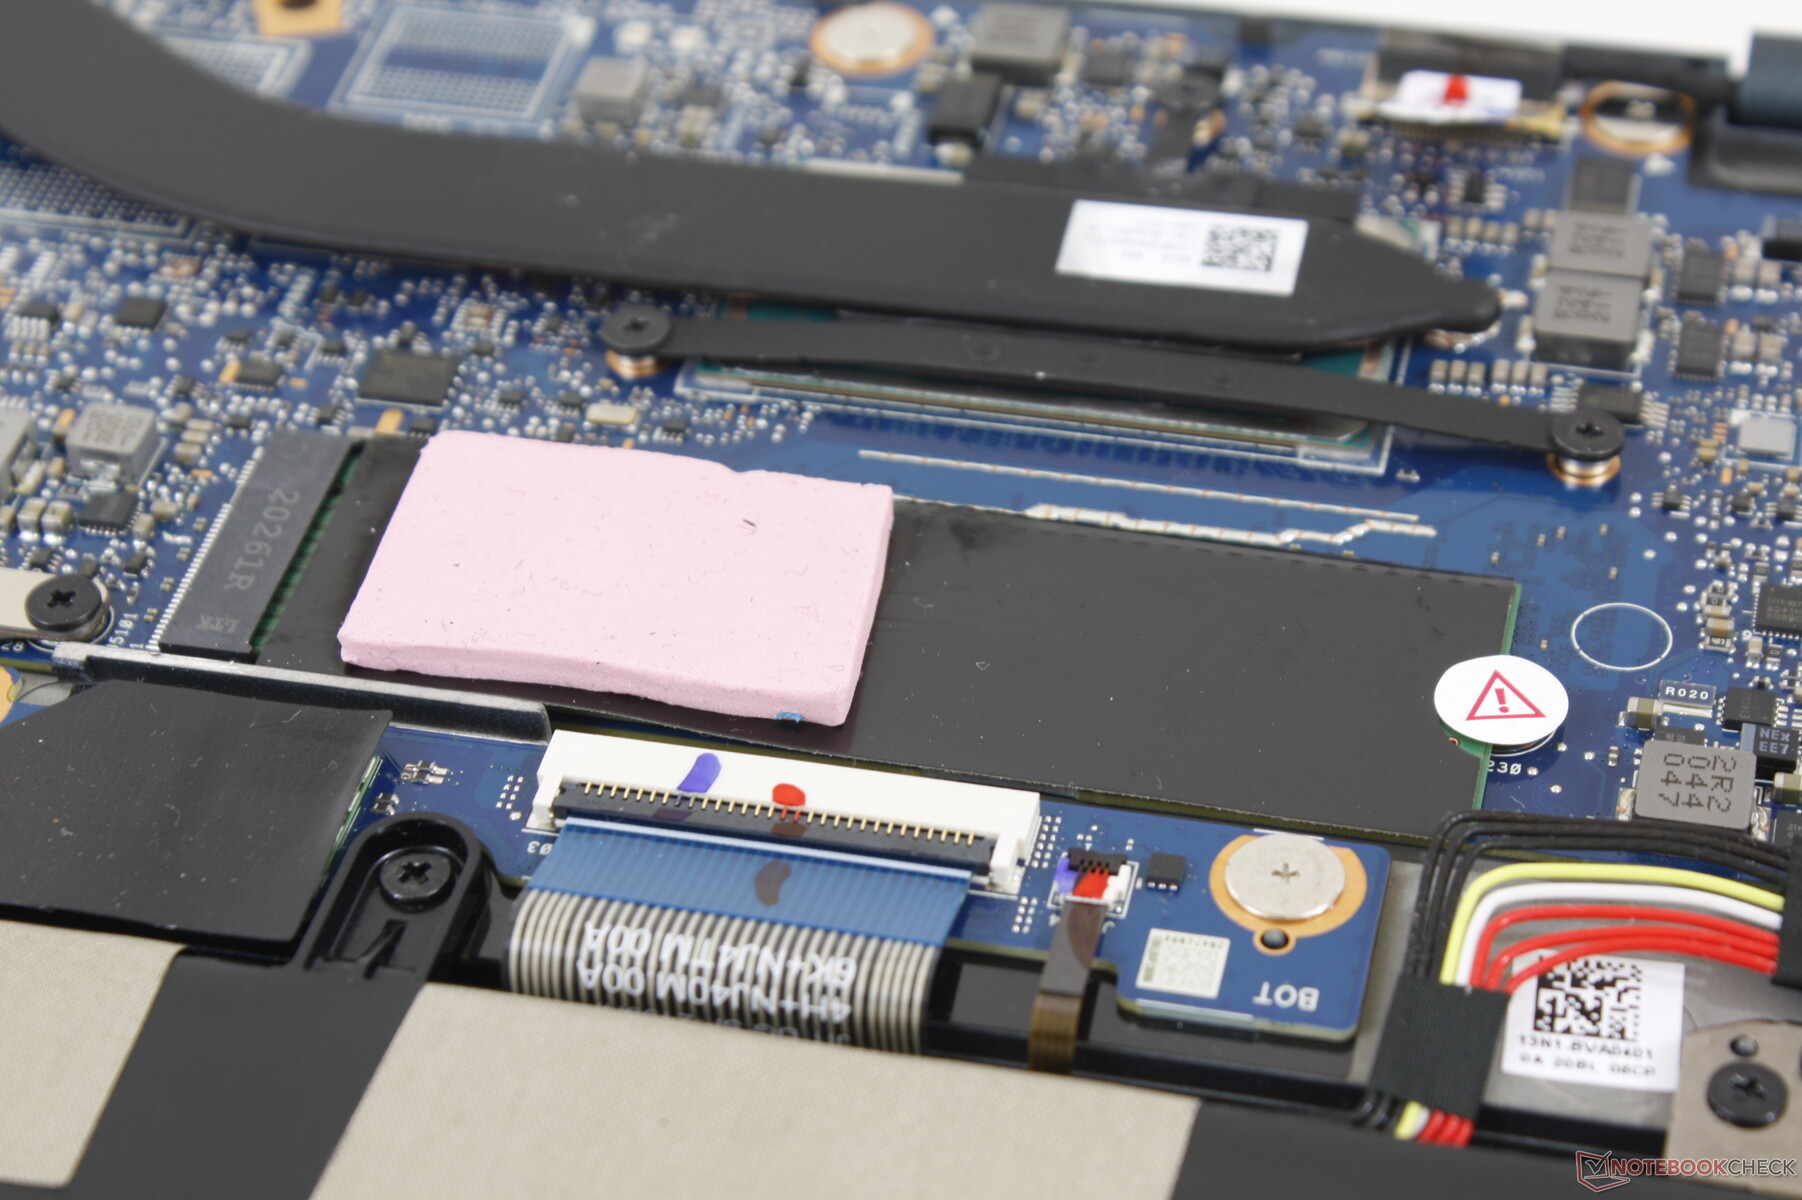
The bottom panel pops off easily assuming you have a T5 Torx wrench on hand. There are thankfully no screws hidden underneath the rubber feet unlike on some HP laptops. Unfortunately, only the M.2 SSD is upgradeable as both the WLAN and RAM modules are soldered.
Accessories and Warranty
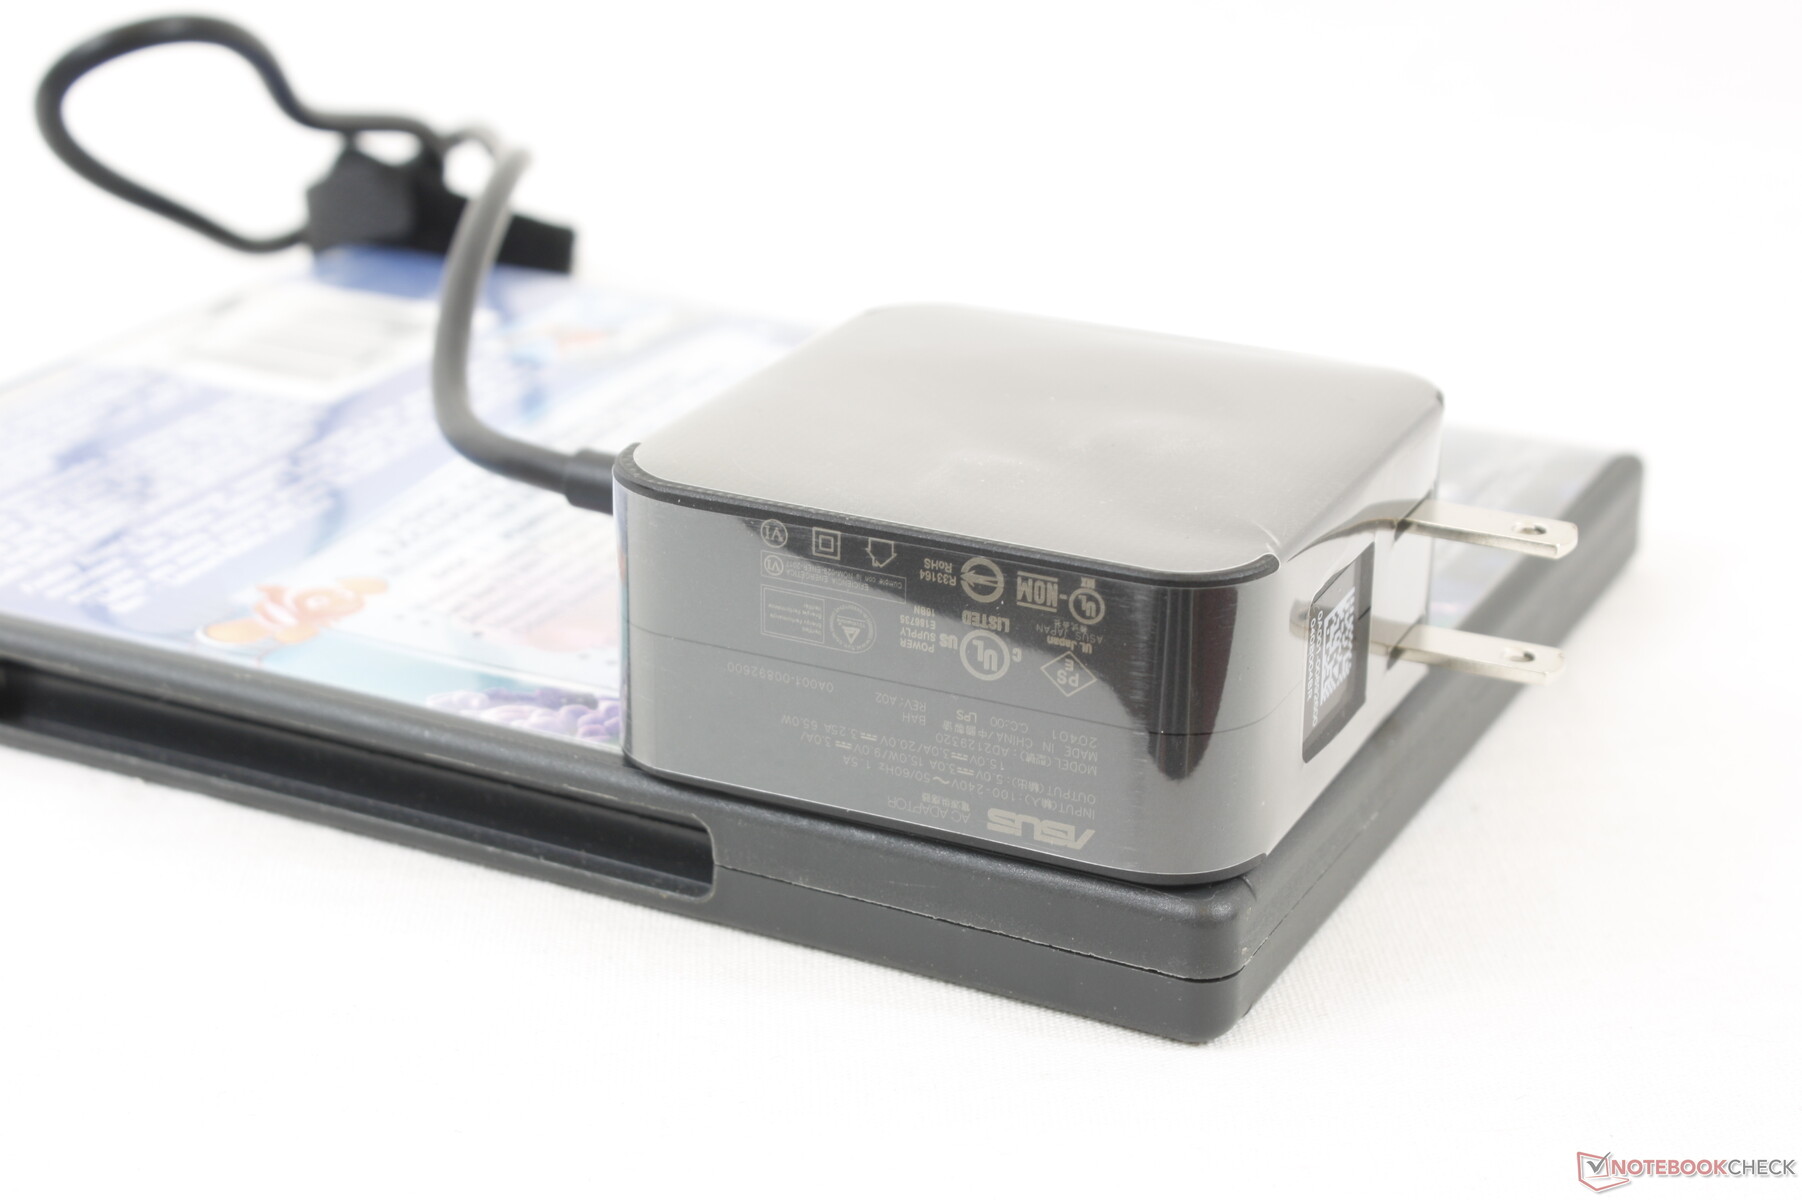
The retail packaging includes a carrying sleeve, foldable stand, and an active stylus pen alongside the usual paperwork. A palm rest is not included unlike on the larger UX581.
The standard one-year limited warranty applies.
Input Devices
Keyboard
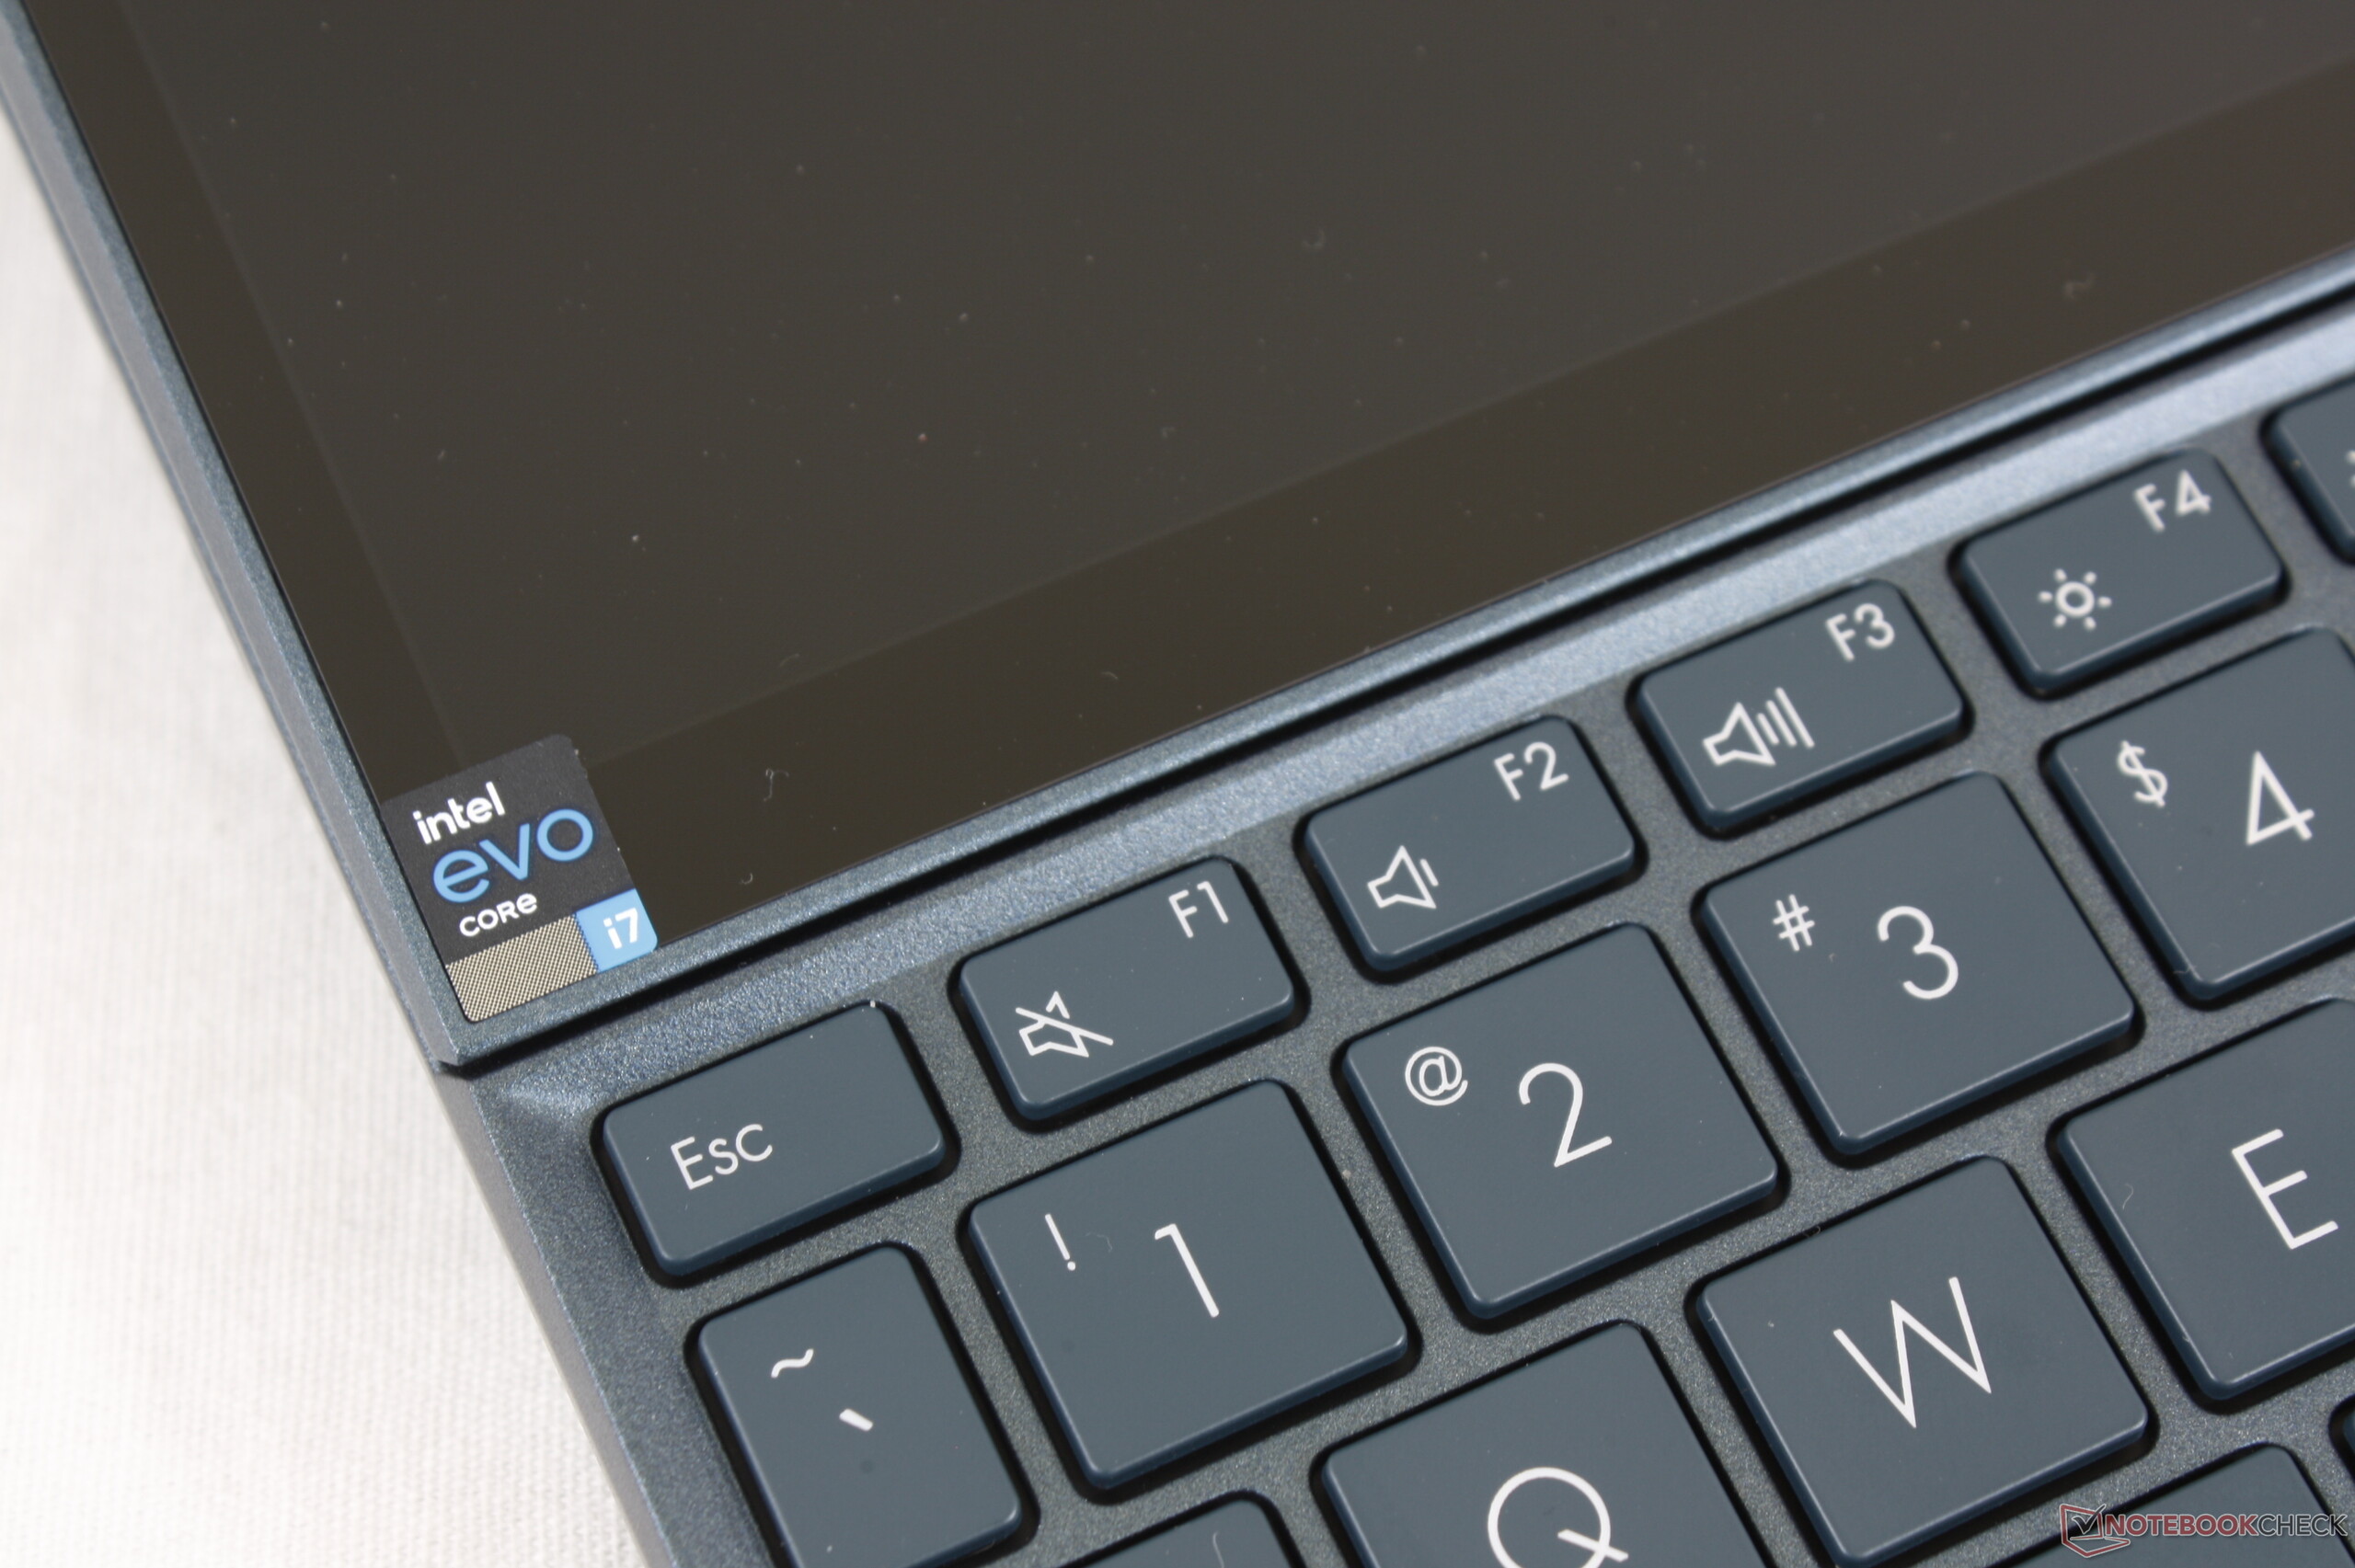
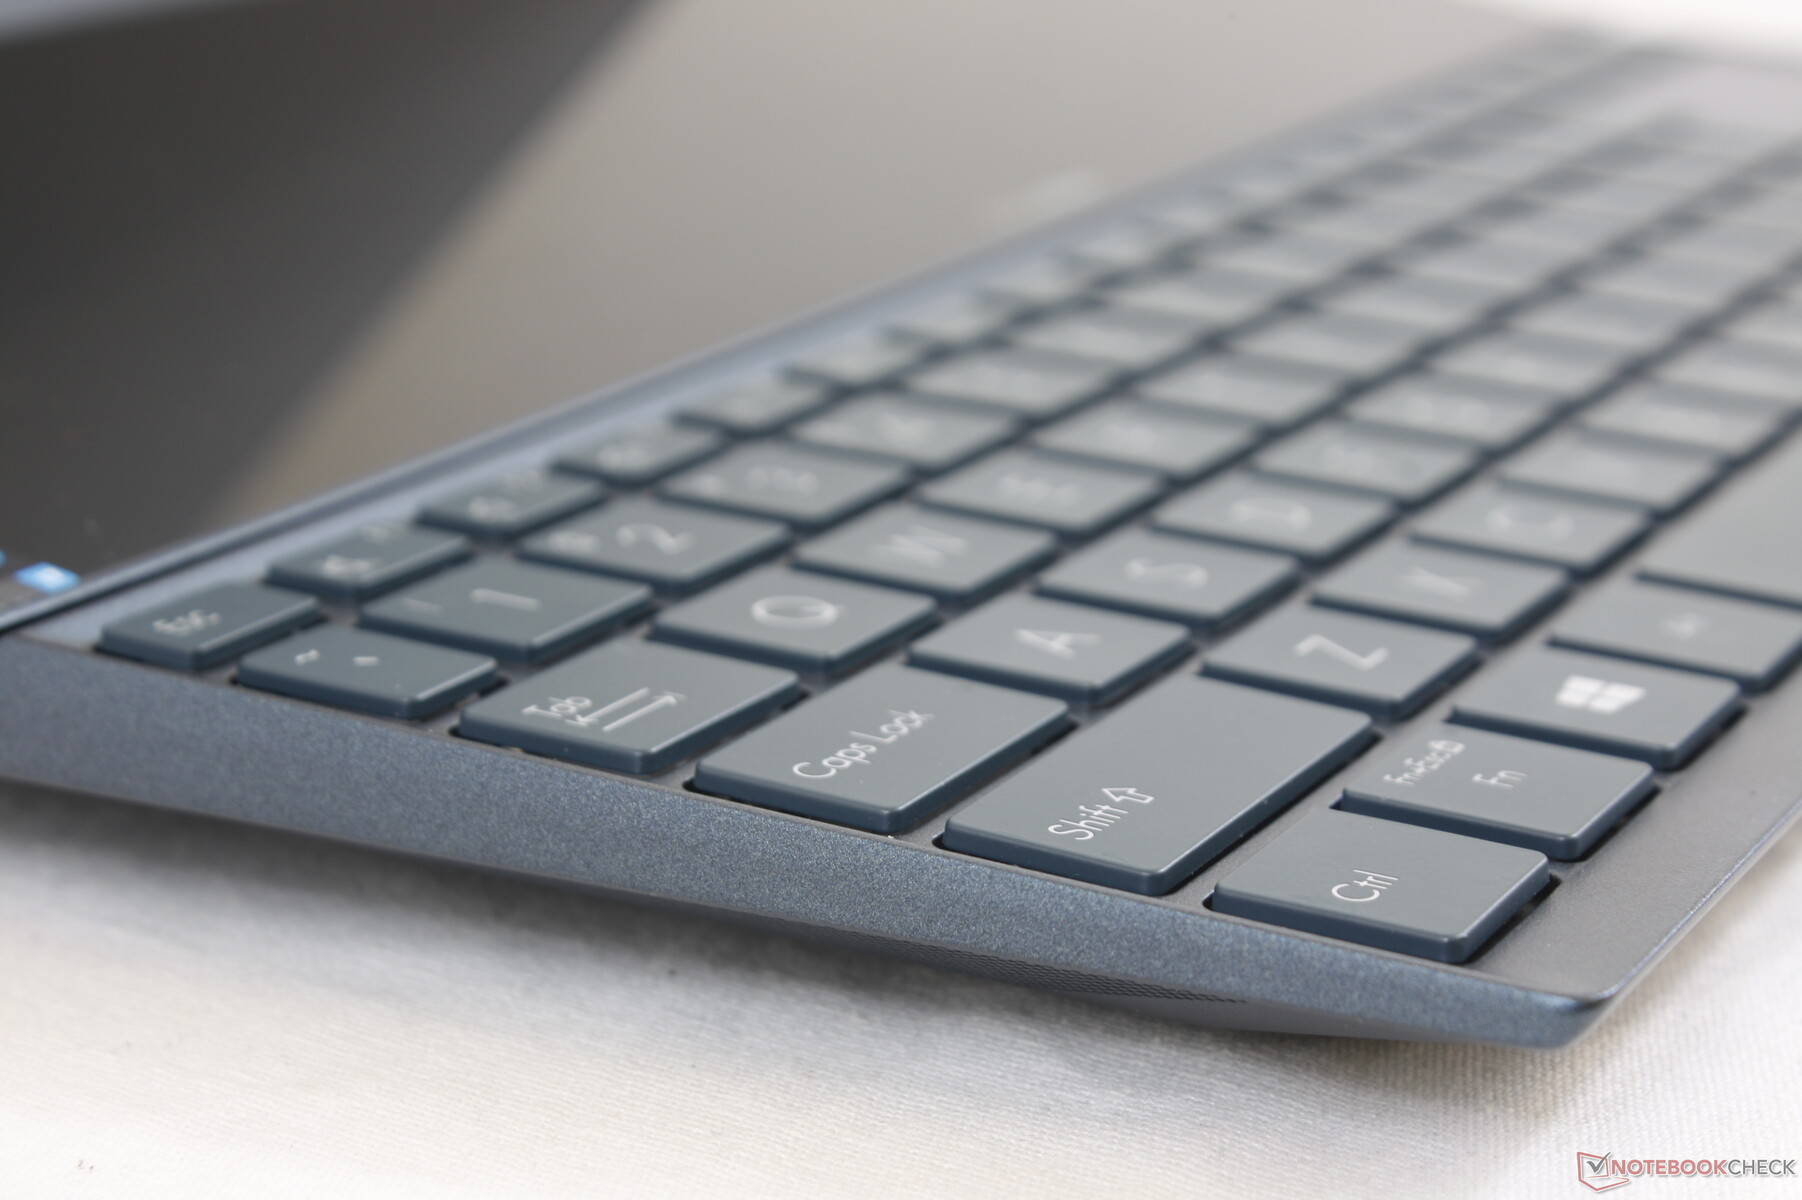
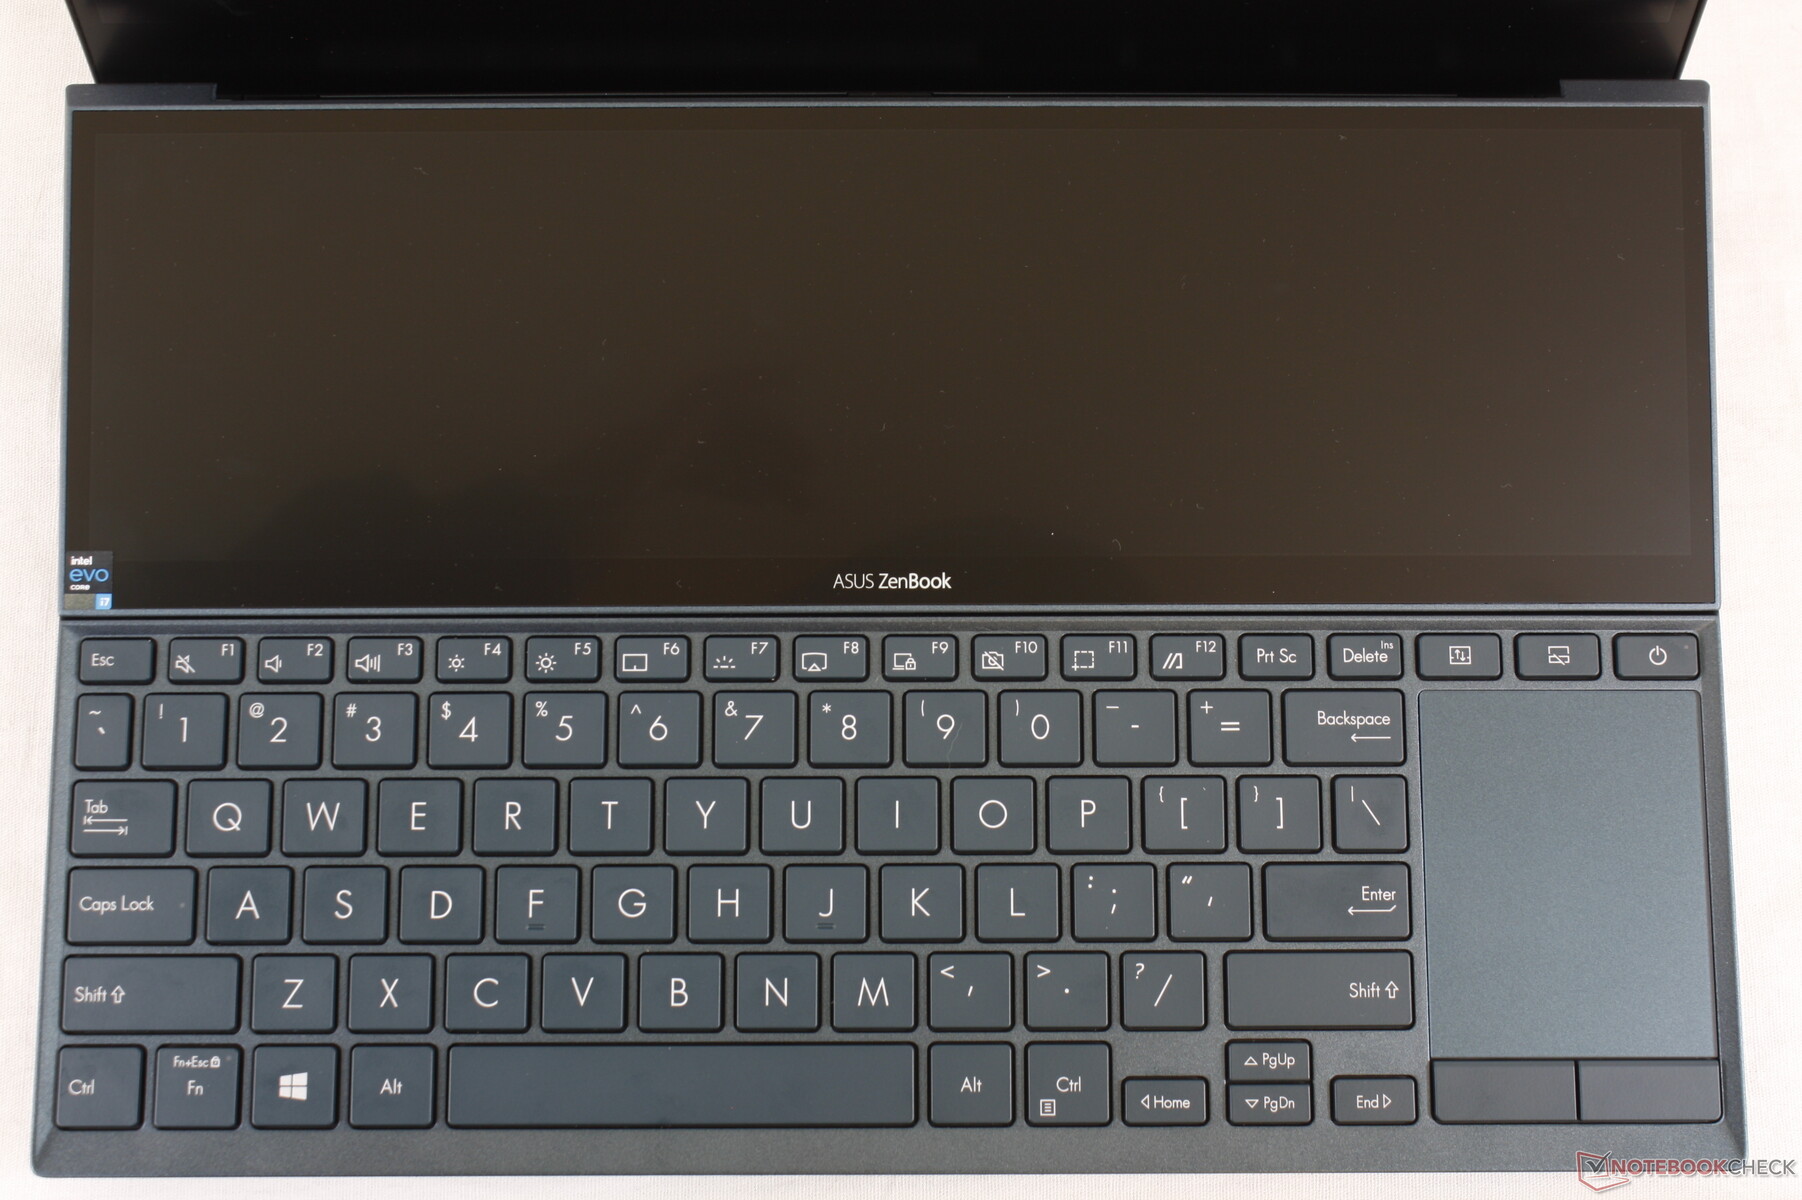
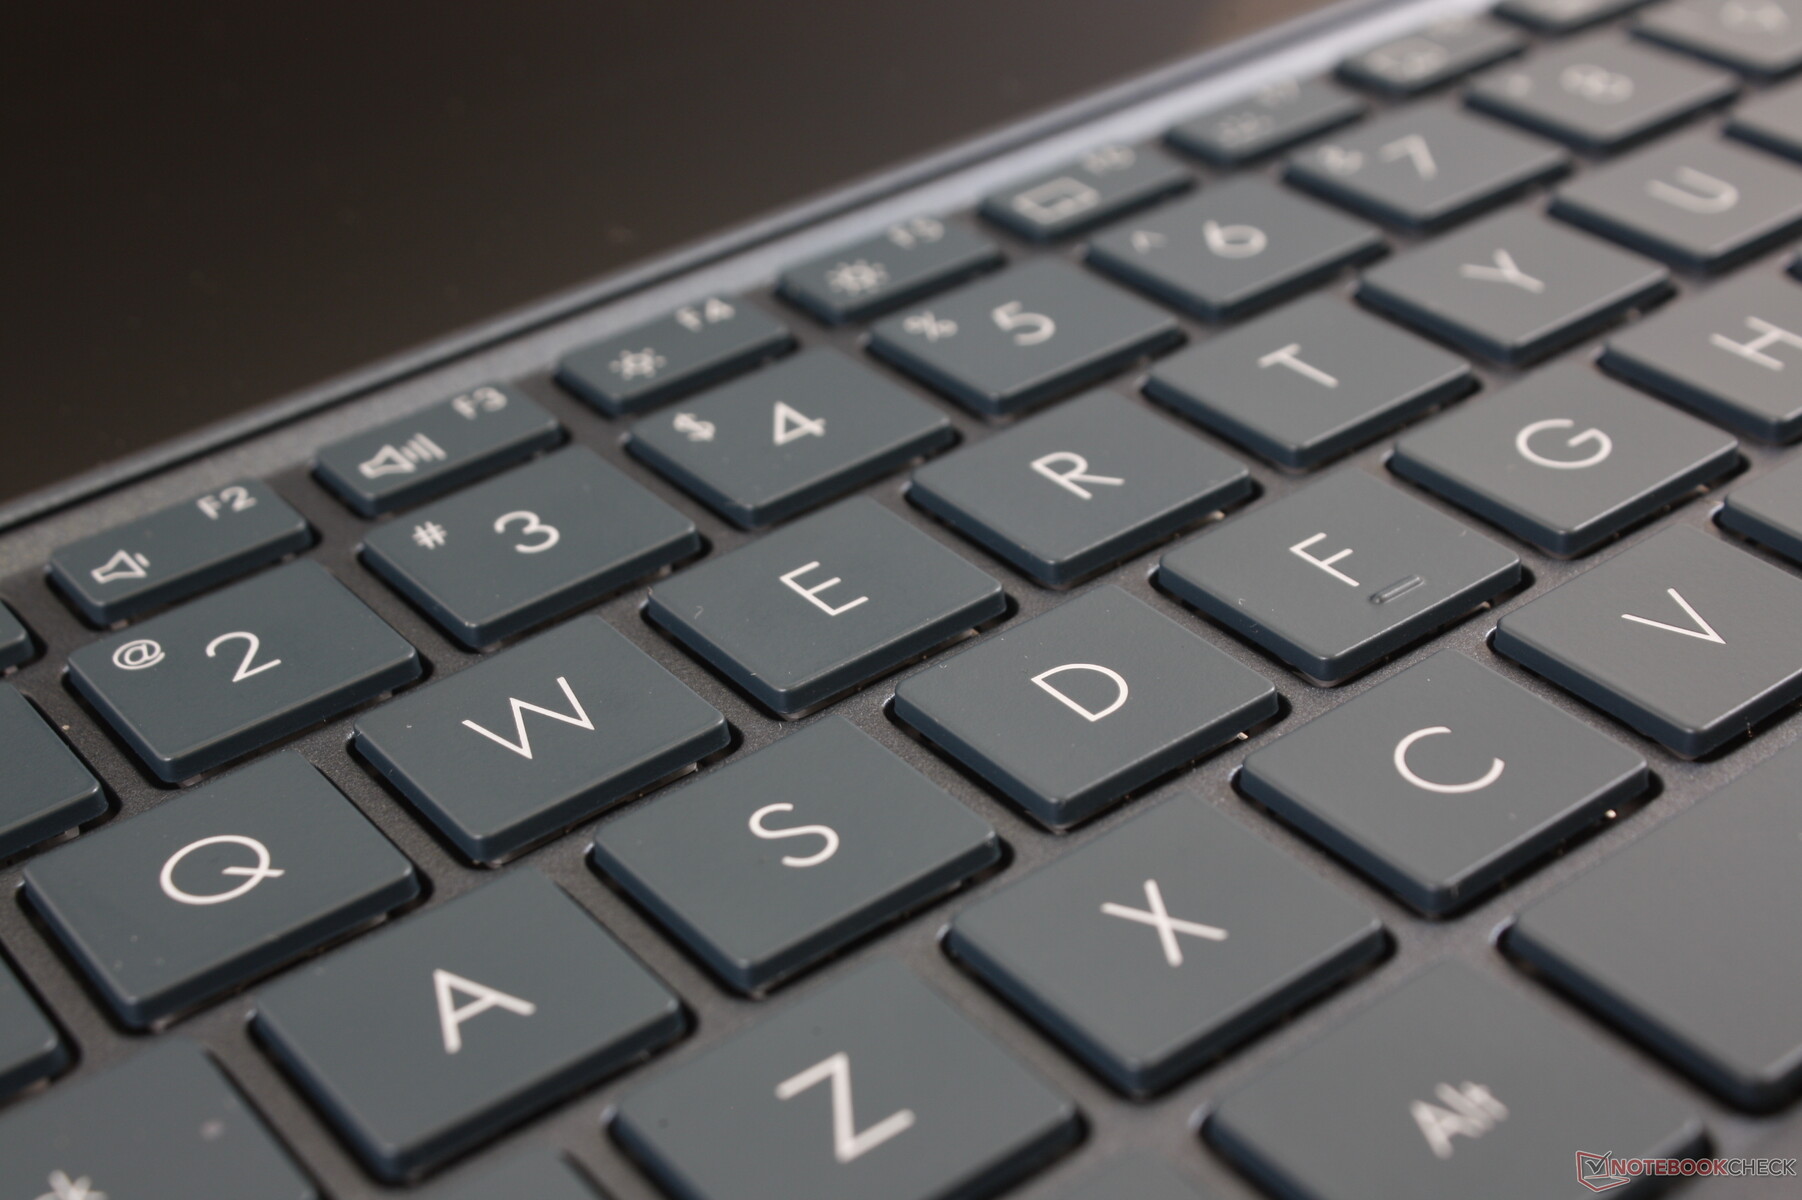
The typing experience remains identical to the UX481 including the shallow travel and relatively firm feedback. The upfront positioning works well on a spacious office desk, but it is definitely not as comfortable as a traditional laptop when workspace is tight such as on trains or airplanes.
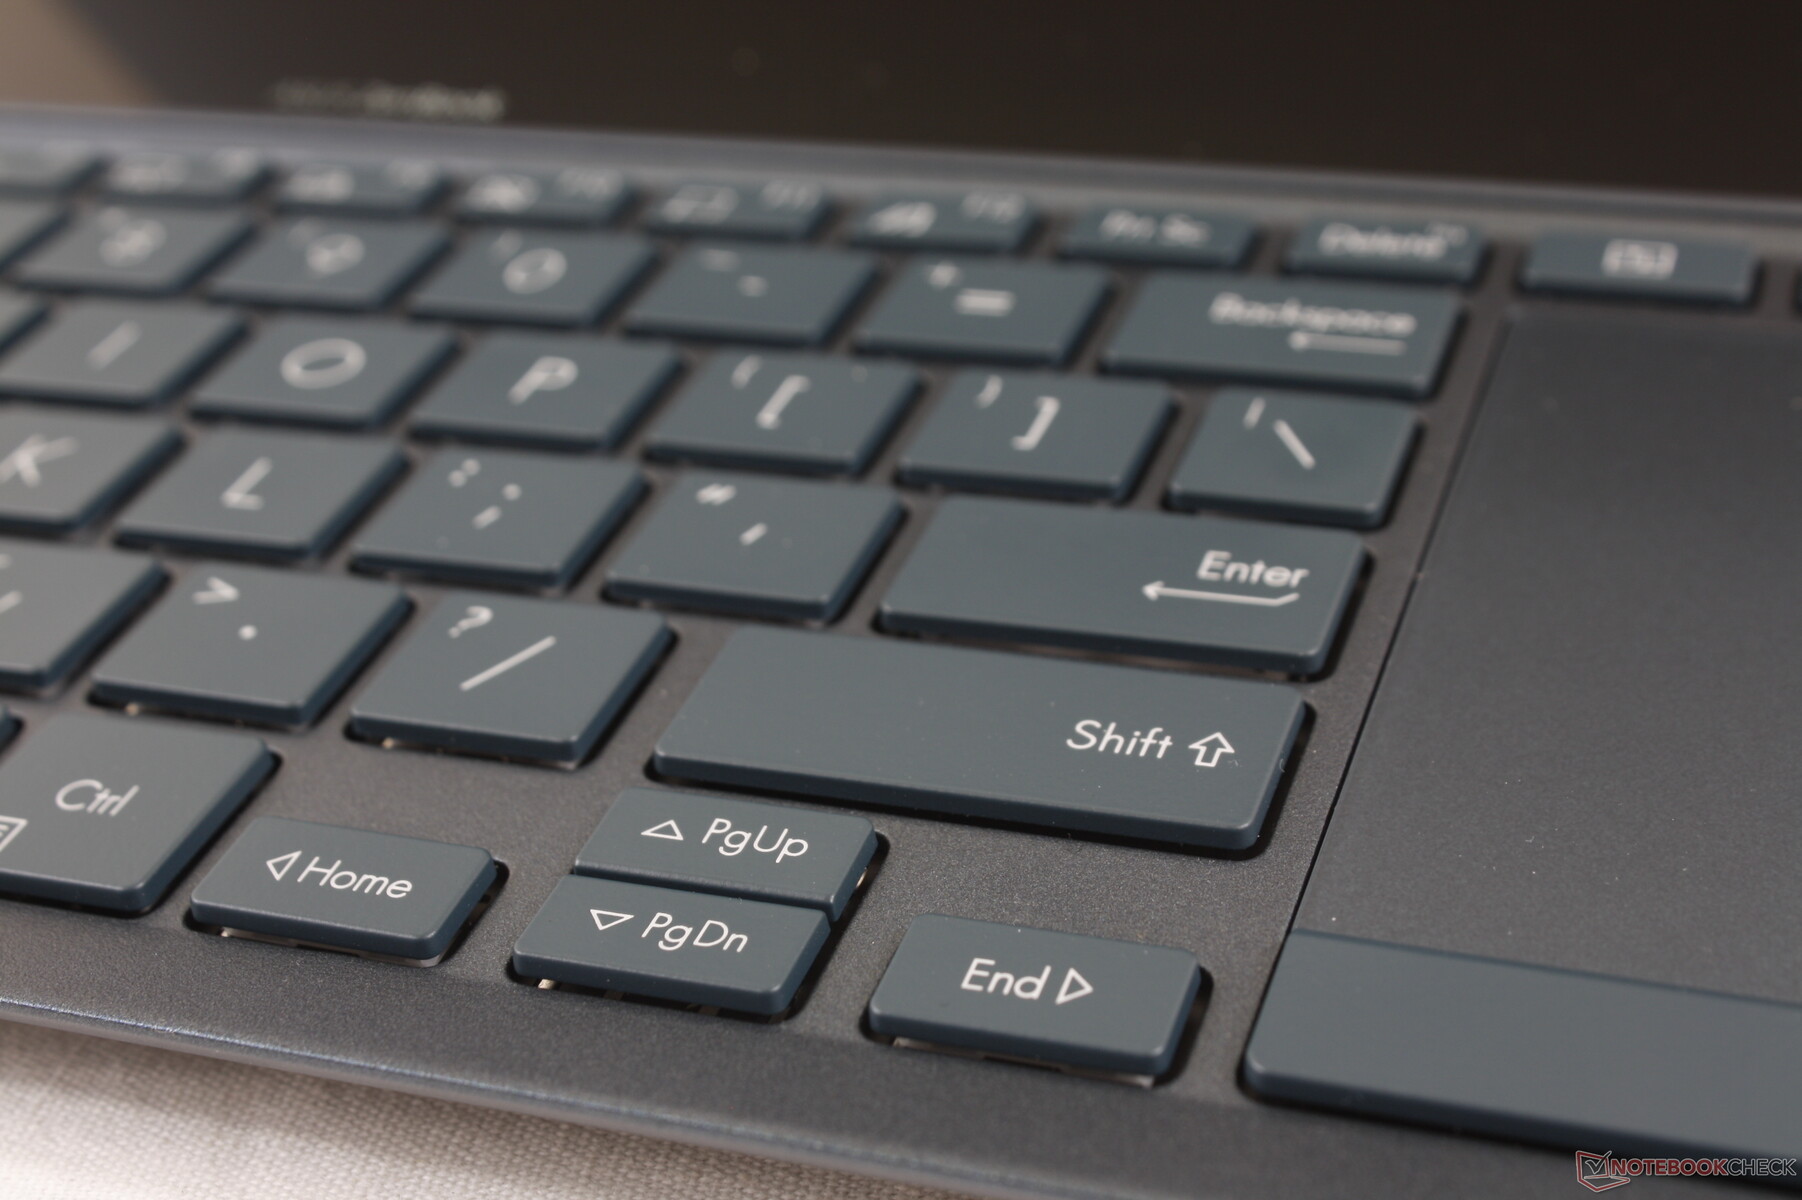
A notable change to the layout of the keyboard is the elongated right Shift key at the expense of smaller arrow keys. This is a similar move that Razer implemented on its latest Blade laptops.
Touchpad
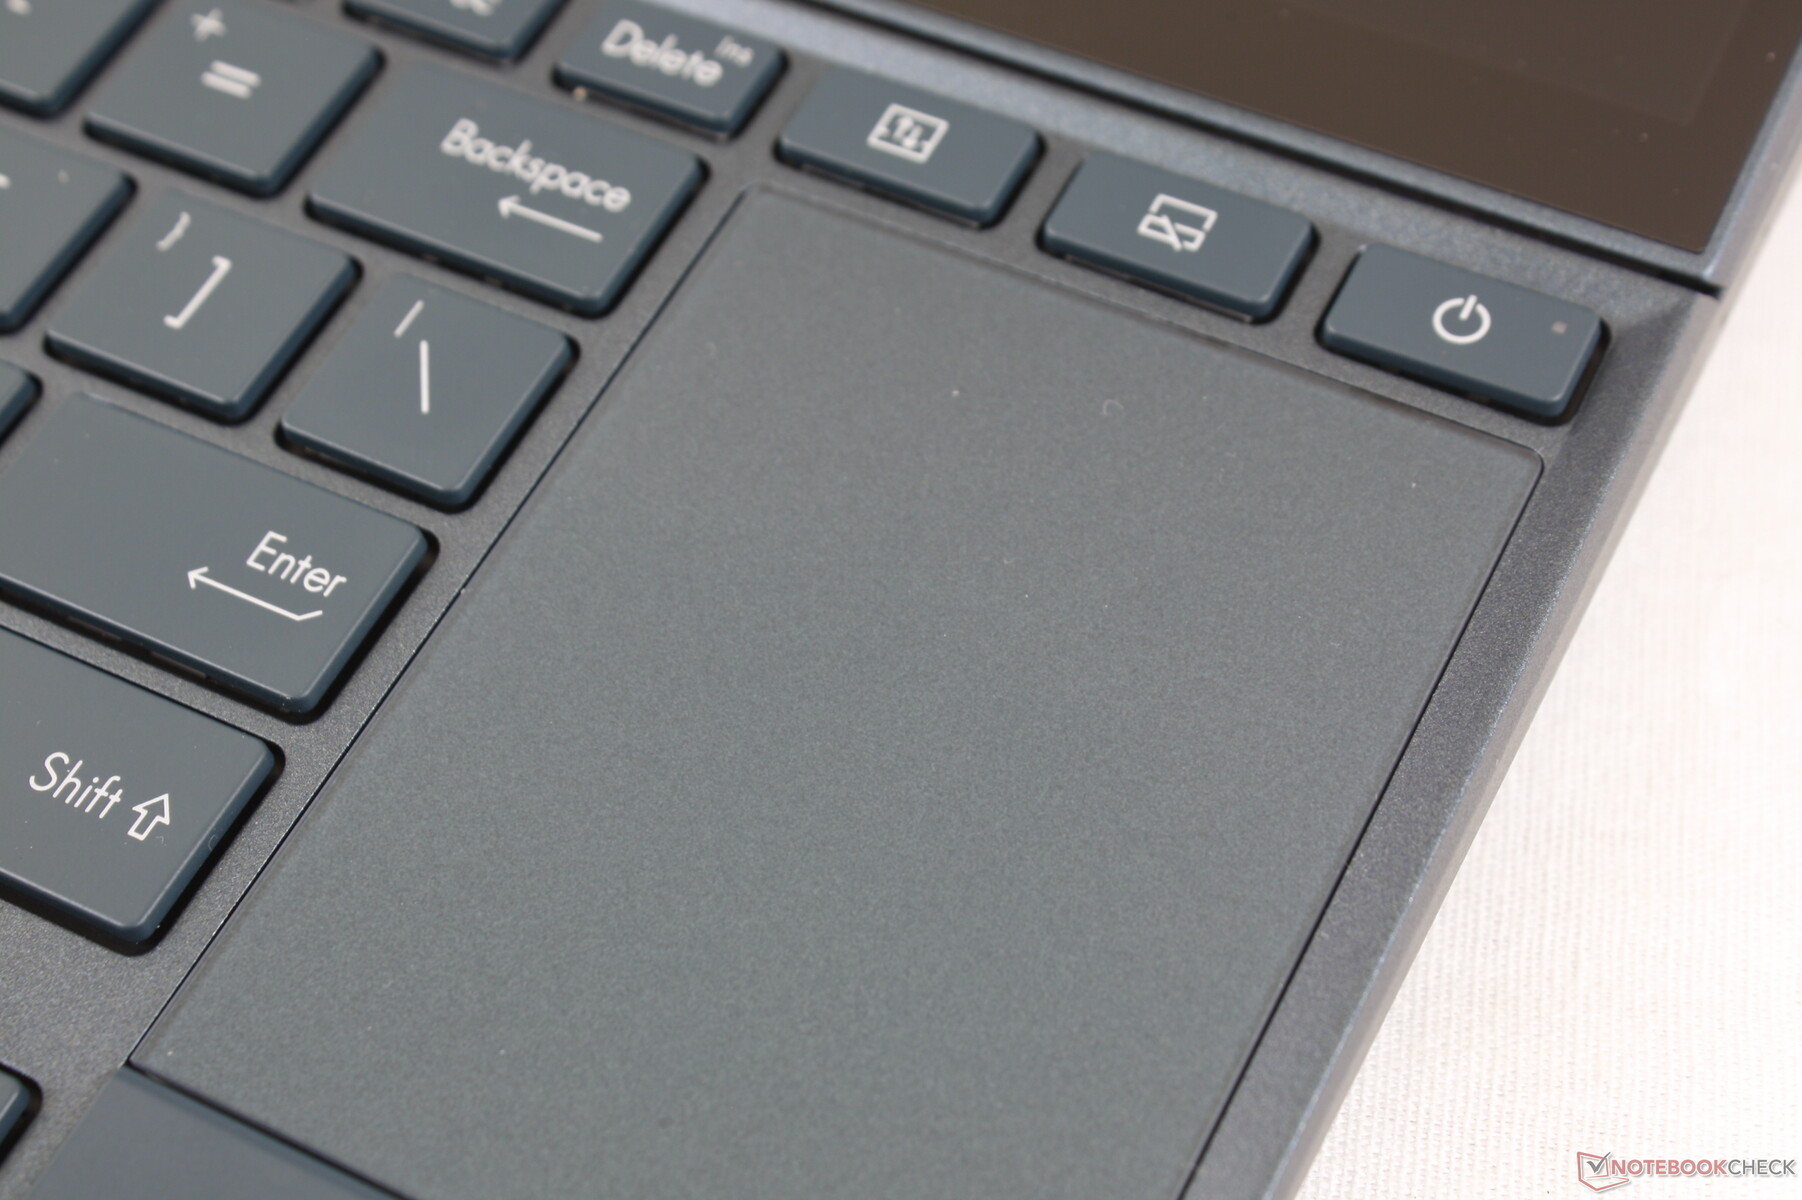
The touchpad and dedicated mouse buttons remain identical to the UX481. It's still small at only 5.5 x 7 cm while the buttons are just as quiet as before. It's worth noting that the secondary touchscreen can be turned into a giant touchpad for the primary display.
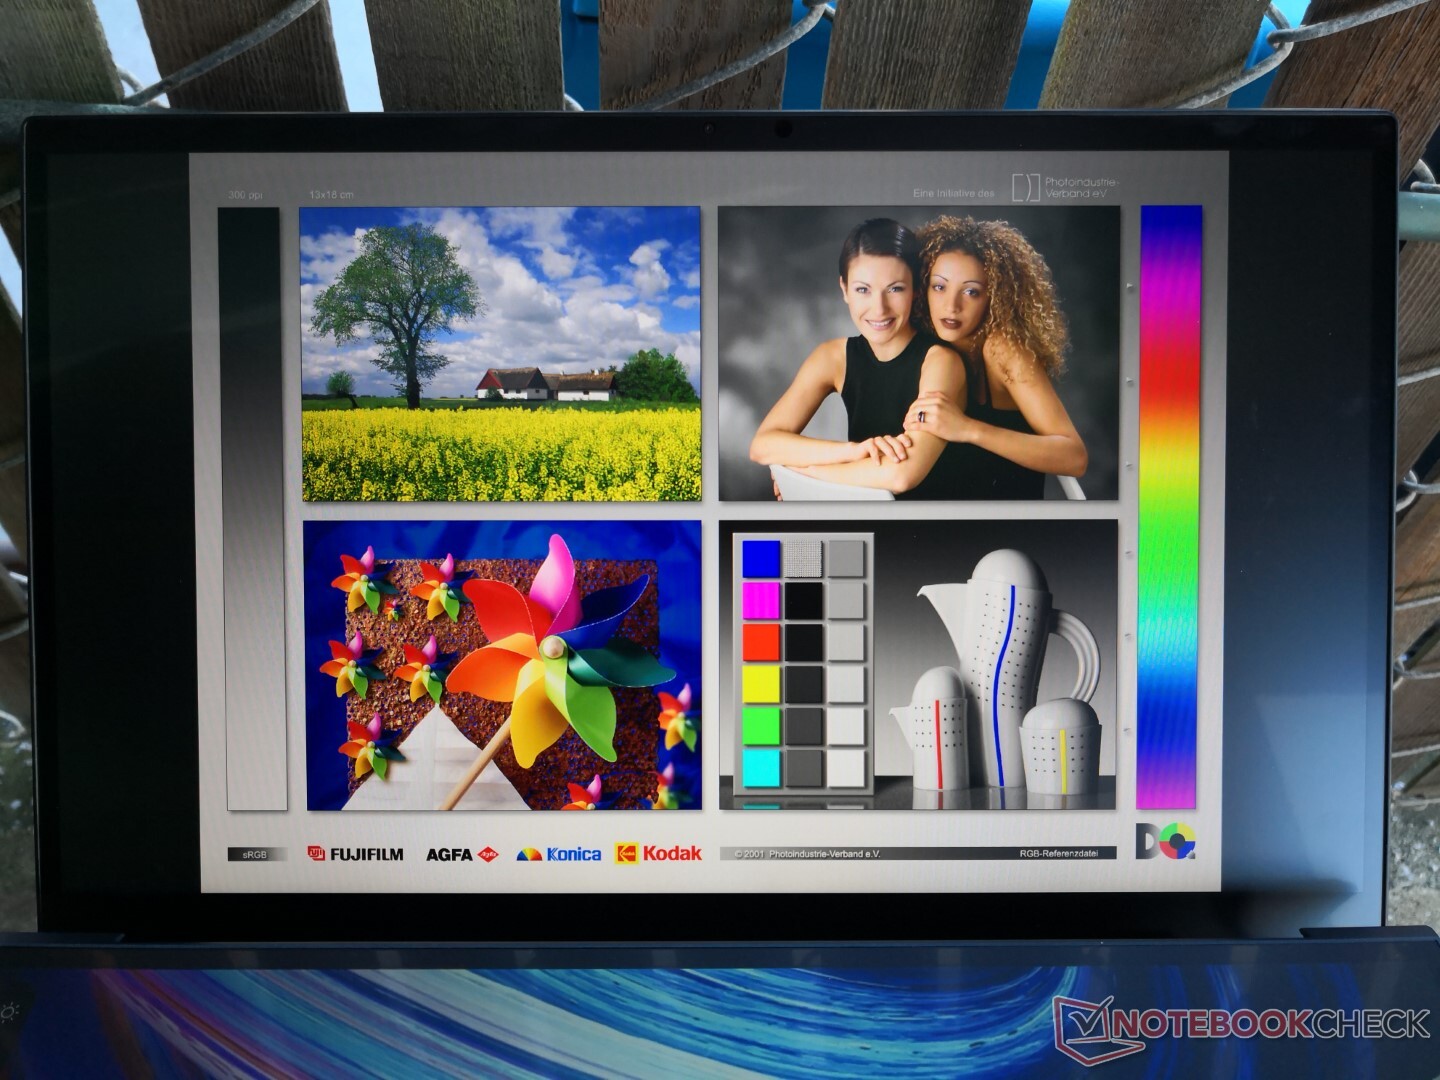
Display
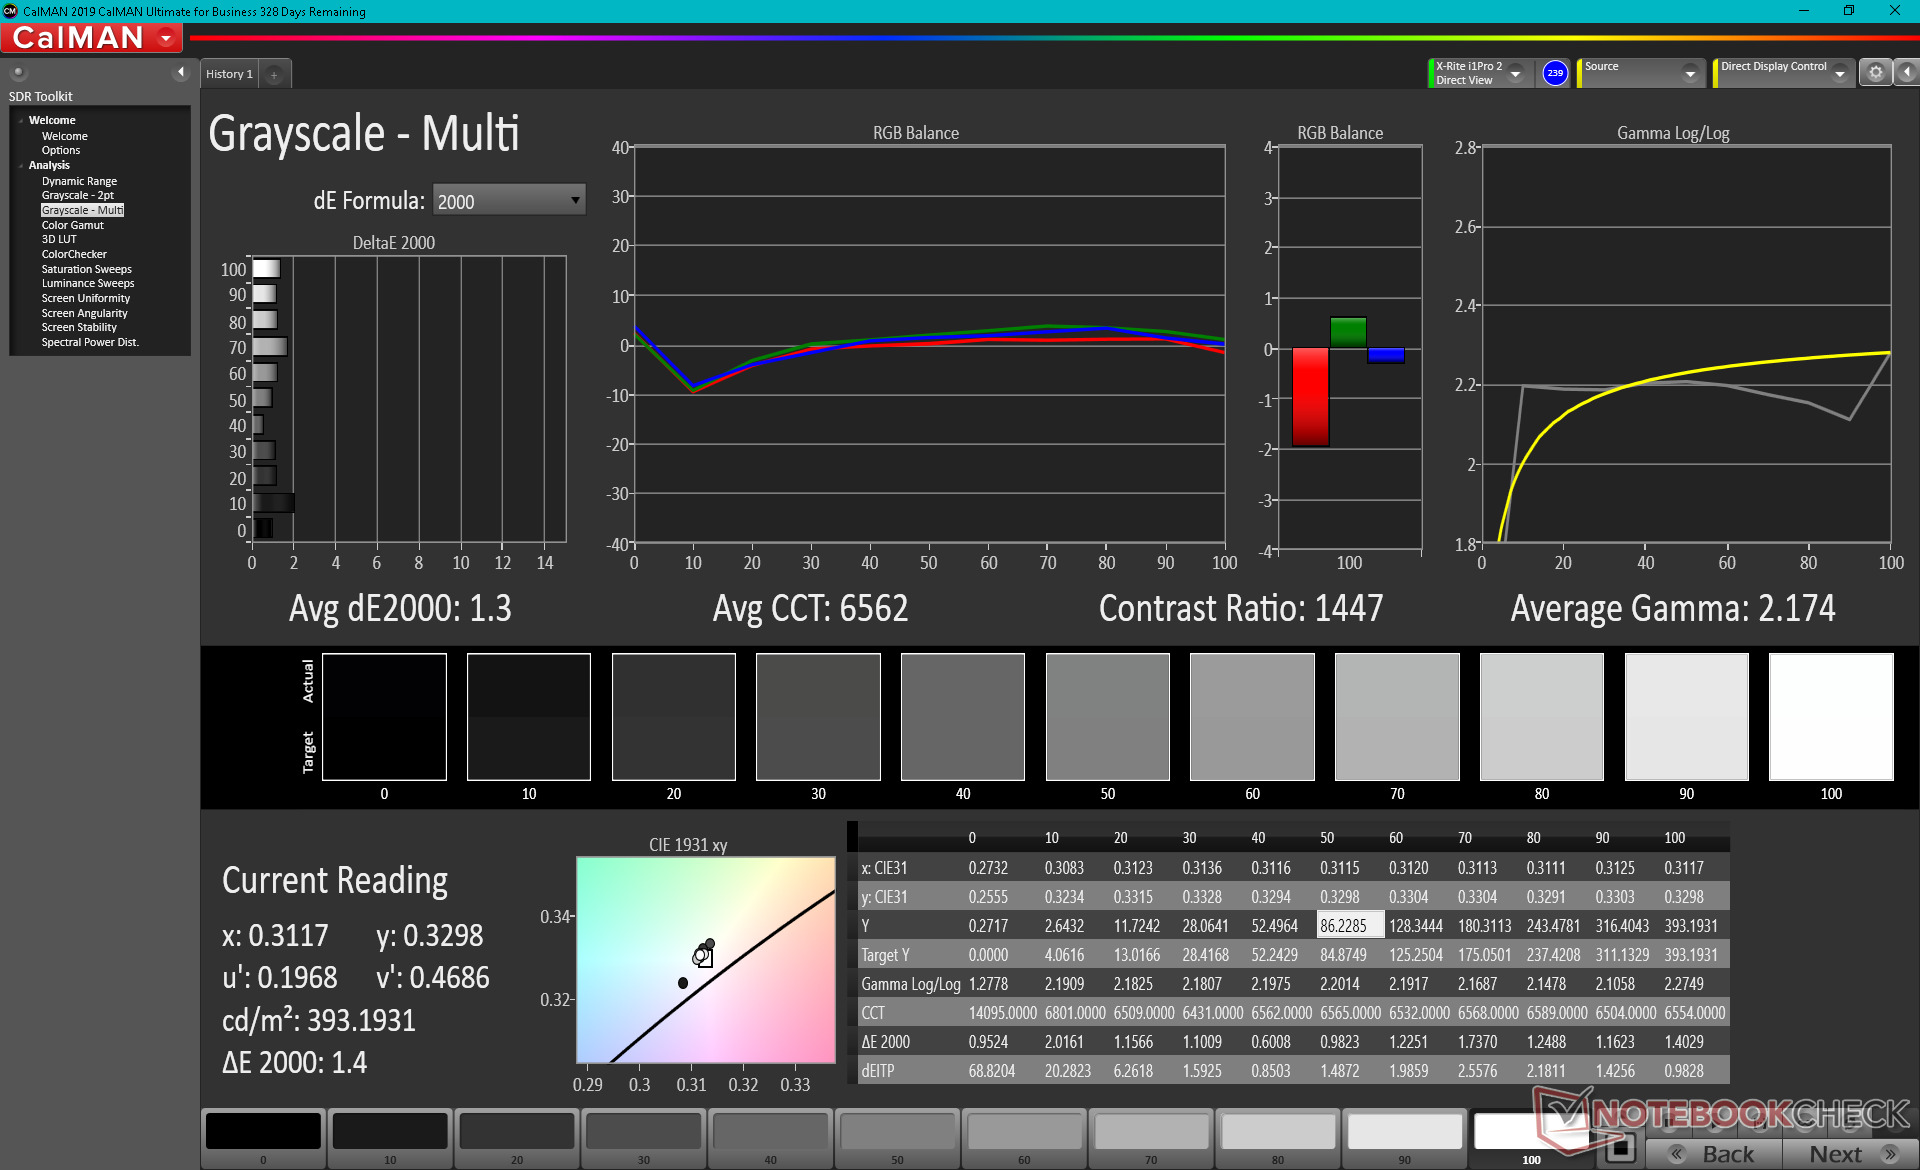
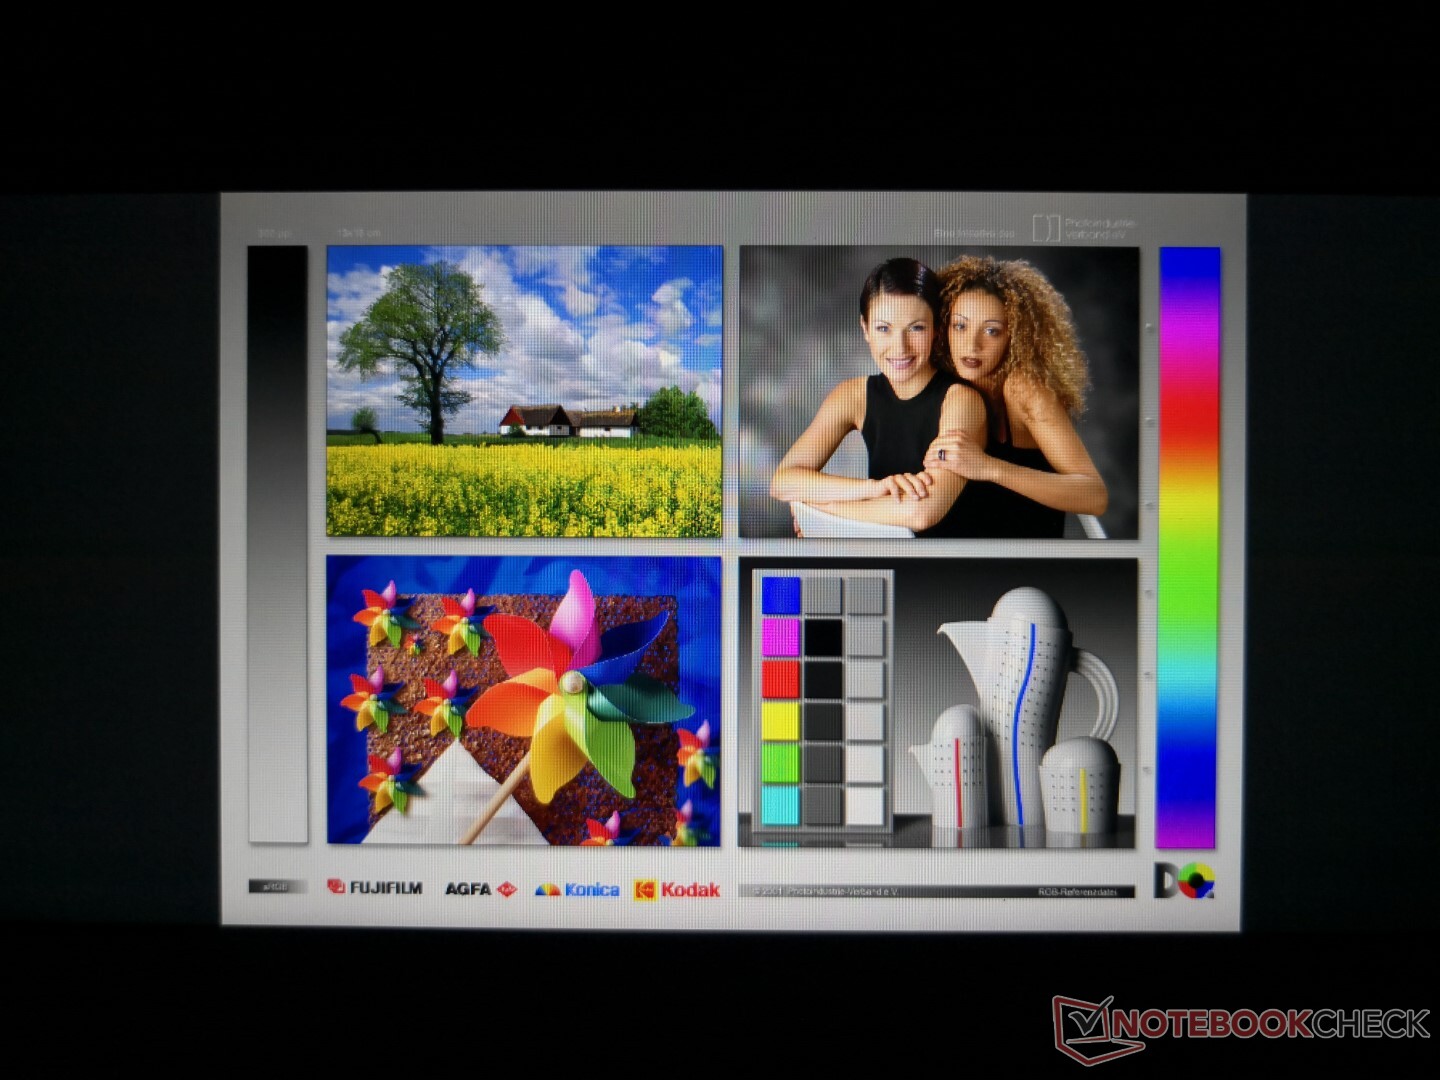
The AU Optronics B140HAN06.8 IPS panel as found on our ZenBook Duo UX482 can also be found on the ZenBook 14 UX425 and Lenovo Yoga Slim 7 14. These three laptops share similar display characteristics as a result including the high contrast ratio and deep colors. Last year's ZenBook Duo UX481 came with a Chi Mei panel instead and so the switch to AU Optronics this year was unexpected. When compared to the Chi Mei, the newer AUO panel is brighter and with deeper black levels but at the cost of slower black-white/gray-gray response times for more noticeable ghosting.


| |||||||||||||||||||||||||
Brightness Distribution: 90 %
Center on Battery: 361.8 cd/m²
Contrast: 1292:1 (Black: 0.28 cd/m²)
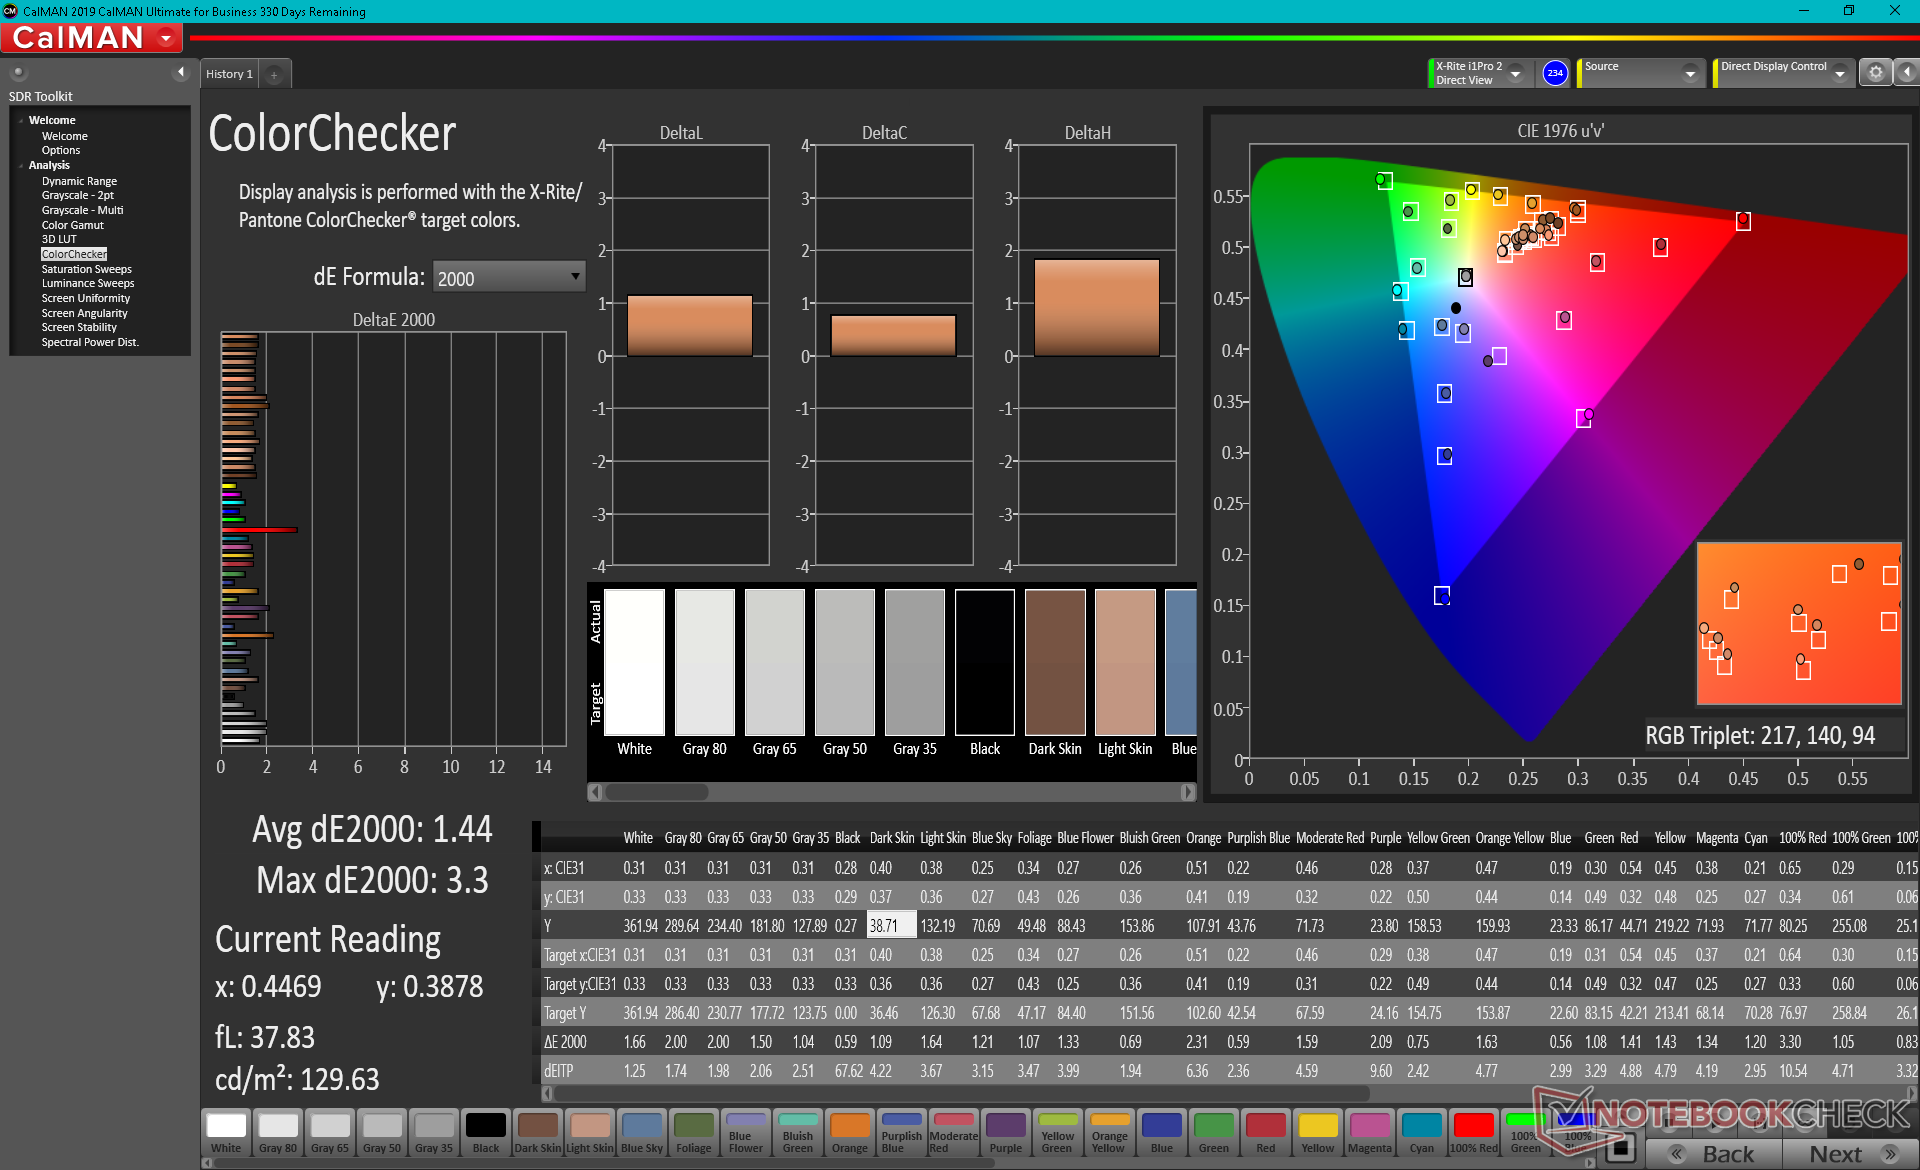
ΔE ColorChecker Calman: 1.44 | ∀{0.5-29.43 Ø4.72}
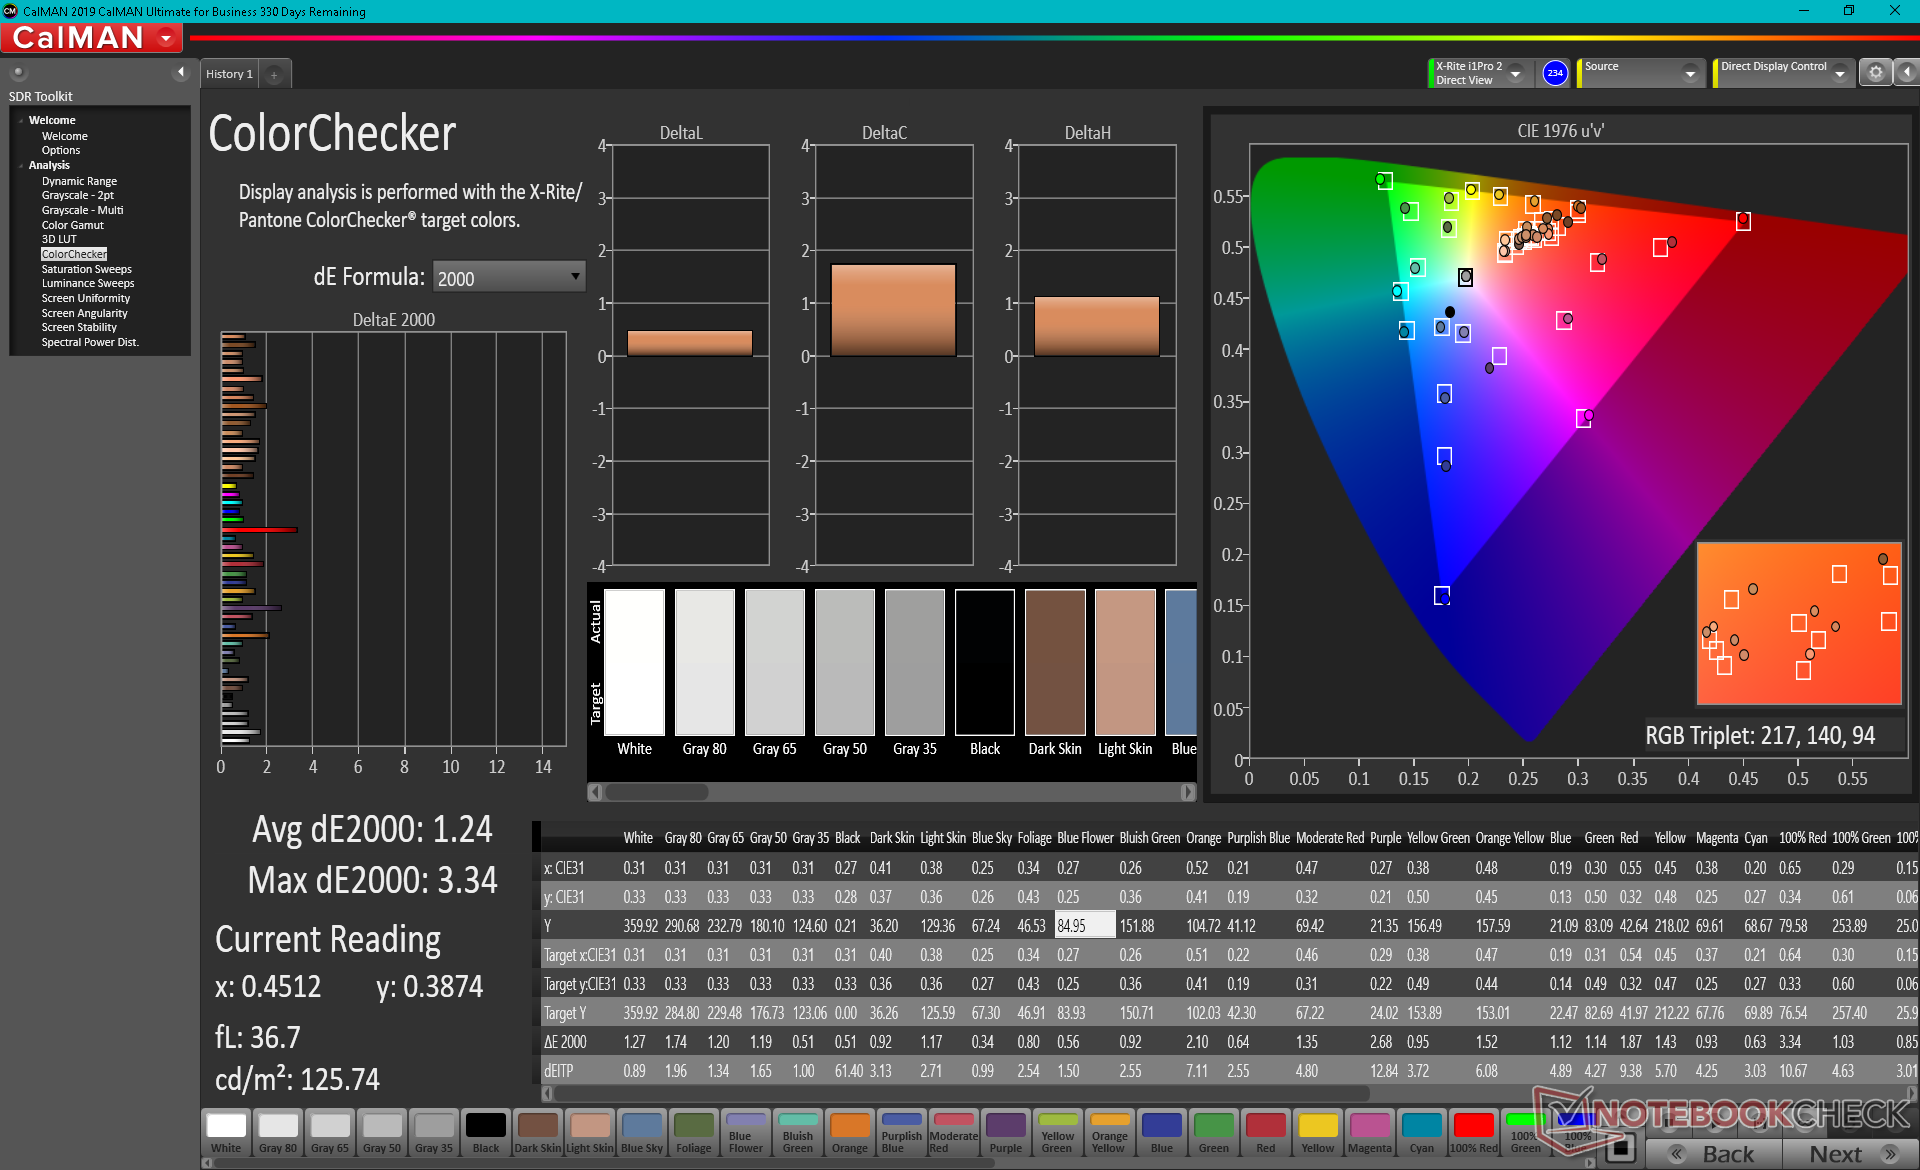
calibrated: 1.24
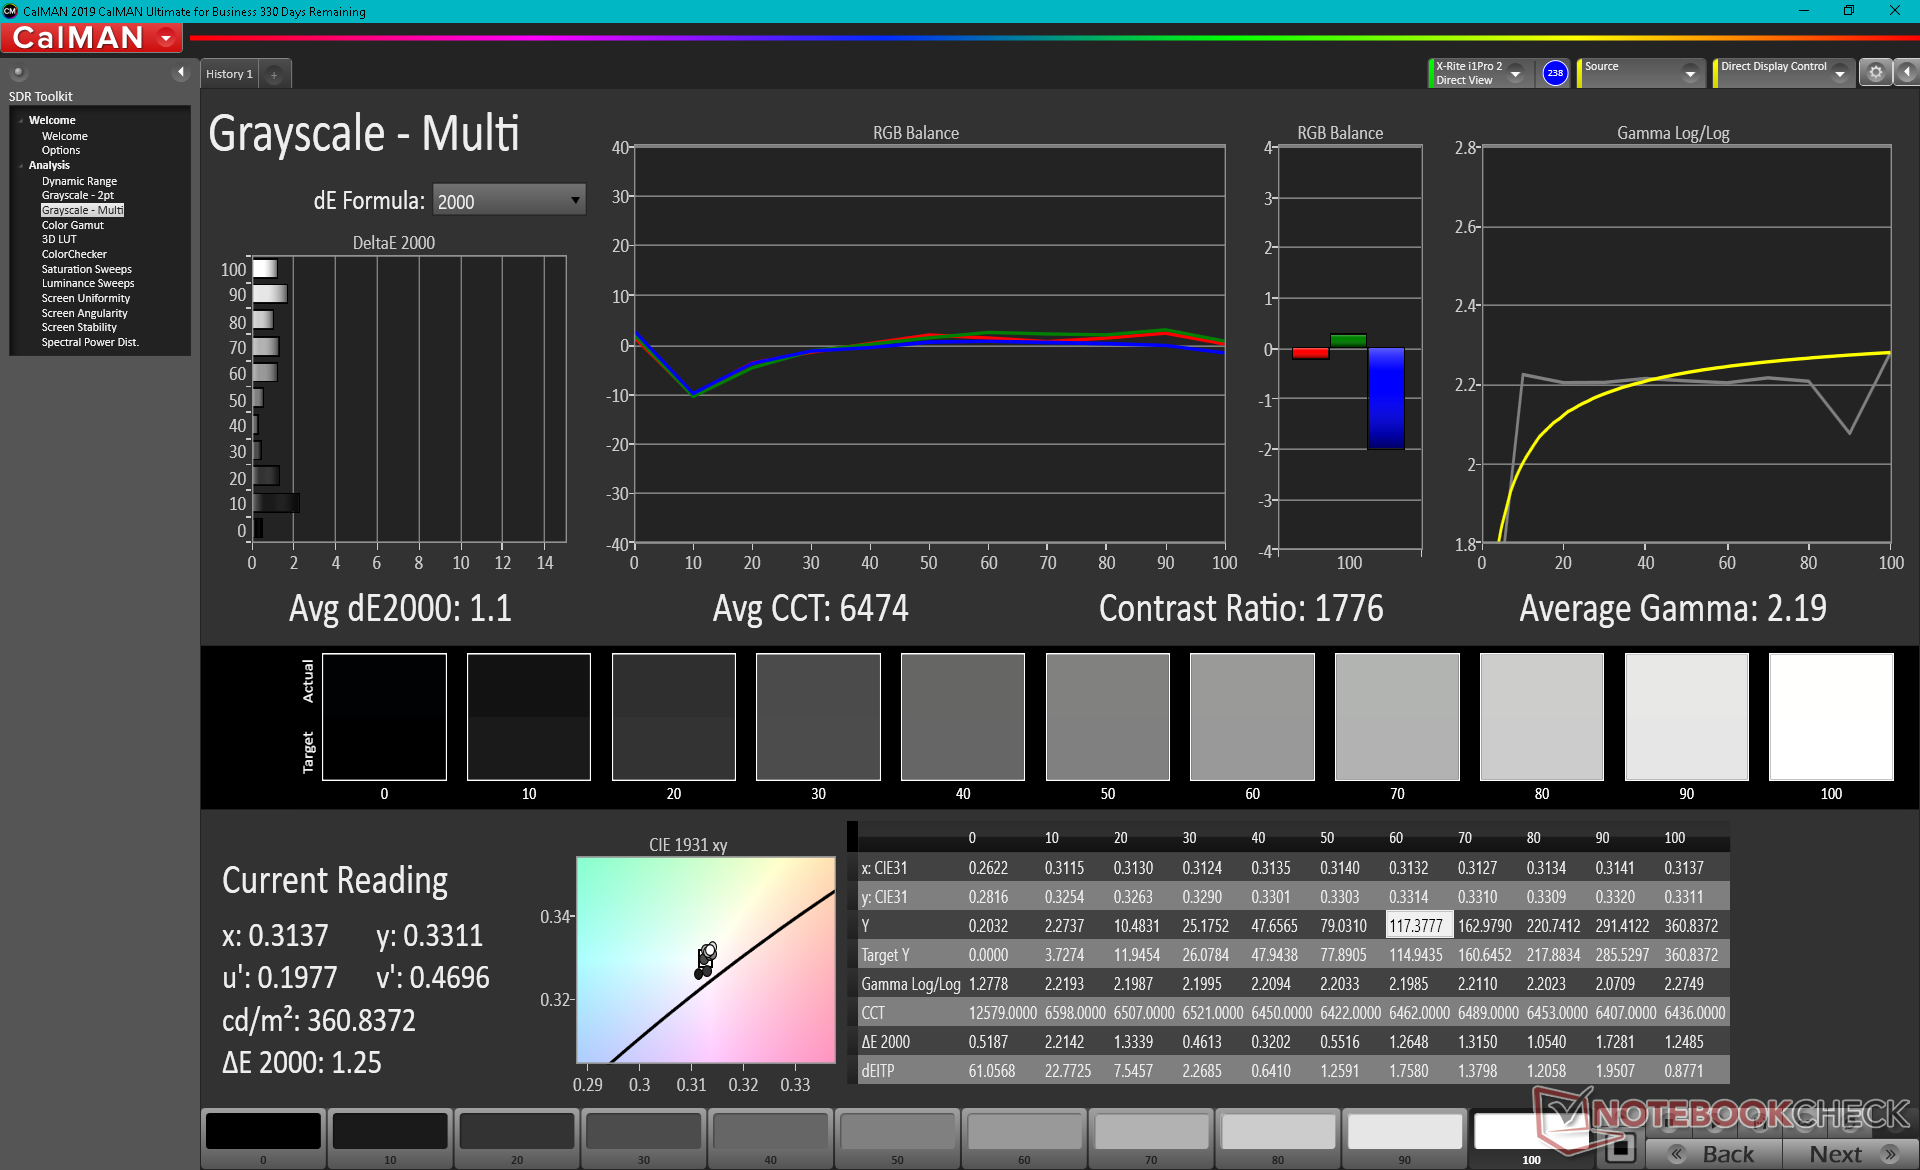
ΔE Greyscale Calman: 1.3 | ∀{0.09-98 Ø4.97}
99.3% sRGB (Argyll 1.6.3 3D)
64.9% AdobeRGB 1998 (Argyll 1.6.3 3D)
71% AdobeRGB 1998 (Argyll 3D)
99.1% sRGB (Argyll 3D)
69% Display P3 (Argyll 3D)
Gamma: 2.15
CCT: 6411 K
| Asus ZenBook Duo 14 UX482EA AU Optronics B140HAN06.8, IPS, 14", 1920x1080 | MSI Prestige 14 Evo A11M-005 AUO B140HAN06.2 (AUO623D), IPS-Level, 14", 1920x1080 | Lenovo Yoga 9i 14ITL5 LG Display LP140WF9-SPE2, IPS, 14", 1920x1080 | Asus Zenbook 14 UX435EG Au Optronics B140HAN03.2, IPS, 14", 1920x1080 | Asus VivoBook S14 S433FL Chi Mei CMN14D4, IPS, 14", 1920x1080 | Asus ZenBook Duo UX481FL Chi Mei N140HCE-EN2, IPS, 14", 1920x1080 | |
|---|---|---|---|---|---|---|
| Display | 0% | -7% | -11% | -39% | -2% | |
| Display P3 Coverage (%) | 69 | 68.8 0% | 64.2 -7% | 60.9 -12% | 41.55 -40% | 67.1 -3% |
| sRGB Coverage (%) | 99.1 | 99.4 0% | 94.2 -5% | 90.4 -9% | 62 -37% | 99.5 0% |
| AdobeRGB 1998 Coverage (%) | 71 | 70.9 0% | 65 -8% | 62.3 -12% | 42.99 -39% | 68.9 -3% |
| Response Times | 12% | 14% | 35% | 44% | 45% | |
| Response Time Grey 50% / Grey 80% * (ms) | 56.4 ? | 59.6 ? -6% | 55.2 ? 2% | 39 ? 31% | 34 ? 40% | 31.2 ? 45% |
| Response Time Black / White * (ms) | 46 ? | 32.8 ? 29% | 34.4 ? 25% | 28 ? 39% | 24 ? 48% | 25.6 ? 44% |
| PWM Frequency (Hz) | 250 ? | 24750 ? | ||||
| Screen | -33% | -43% | -86% | -126% | -14% | |
| Brightness middle (cd/m²) | 361.8 | 293 -19% | 365 1% | 323 -11% | 220 -39% | 301 -17% |
| Brightness (cd/m²) | 351 | 277 -21% | 346 -1% | 313 -11% | 204 -42% | 285 -19% |
| Brightness Distribution (%) | 90 | 89 -1% | 82 -9% | 80 -11% | 68 -24% | 89 -1% |
| Black Level * (cd/m²) | 0.28 | 0.18 36% | 0.23 18% | 0.36 -29% | 0.155 45% | 0.42 -50% |
| Contrast (:1) | 1292 | 1628 26% | 1587 23% | 897 -31% | 1419 10% | 717 -45% |
| Colorchecker dE 2000 * | 1.44 | 2.95 -105% | 3.65 -153% | 4.86 -238% | 5.23 -263% | 1.01 30% |
| Colorchecker dE 2000 max. * | 3.3 | 6.03 -83% | 6.69 -103% | 7.52 -128% | 21.51 -552% | 3.42 -4% |
| Colorchecker dE 2000 calibrated * | 1.24 | 0.9 27% | 1.61 -30% | 3.64 -194% | 4.4 -255% | 0.97 22% |
| Greyscale dE 2000 * | 1.3 | 4.2 -223% | 4 -208% | 4.83 -272% | 3.77 -190% | 2.2 -69% |
| Gamma | 2.15 102% | 2.099 105% | 2.33 94% | 2.64 83% | 2.35 94% | 2.19 100% |
| CCT | 6411 101% | 6622 98% | 6873 95% | 7405 88% | 6666 98% | 6605 98% |
| Color Space (Percent of AdobeRGB 1998) (%) | 64.9 | 71 9% | 60.1 -7% | 57.5 -11% | 40 -38% | 63.2 -3% |
| Color Space (Percent of sRGB) (%) | 99.3 | 93 -6% | 93.9 -5% | 90.3 -9% | 62 -38% | 99.5 0% |
| Total Average (Program / Settings) | -7% /
-21% | -12% /
-29% | -21% /
-57% | -40% /
-88% | 10% /
-5% |
* ... smaller is better
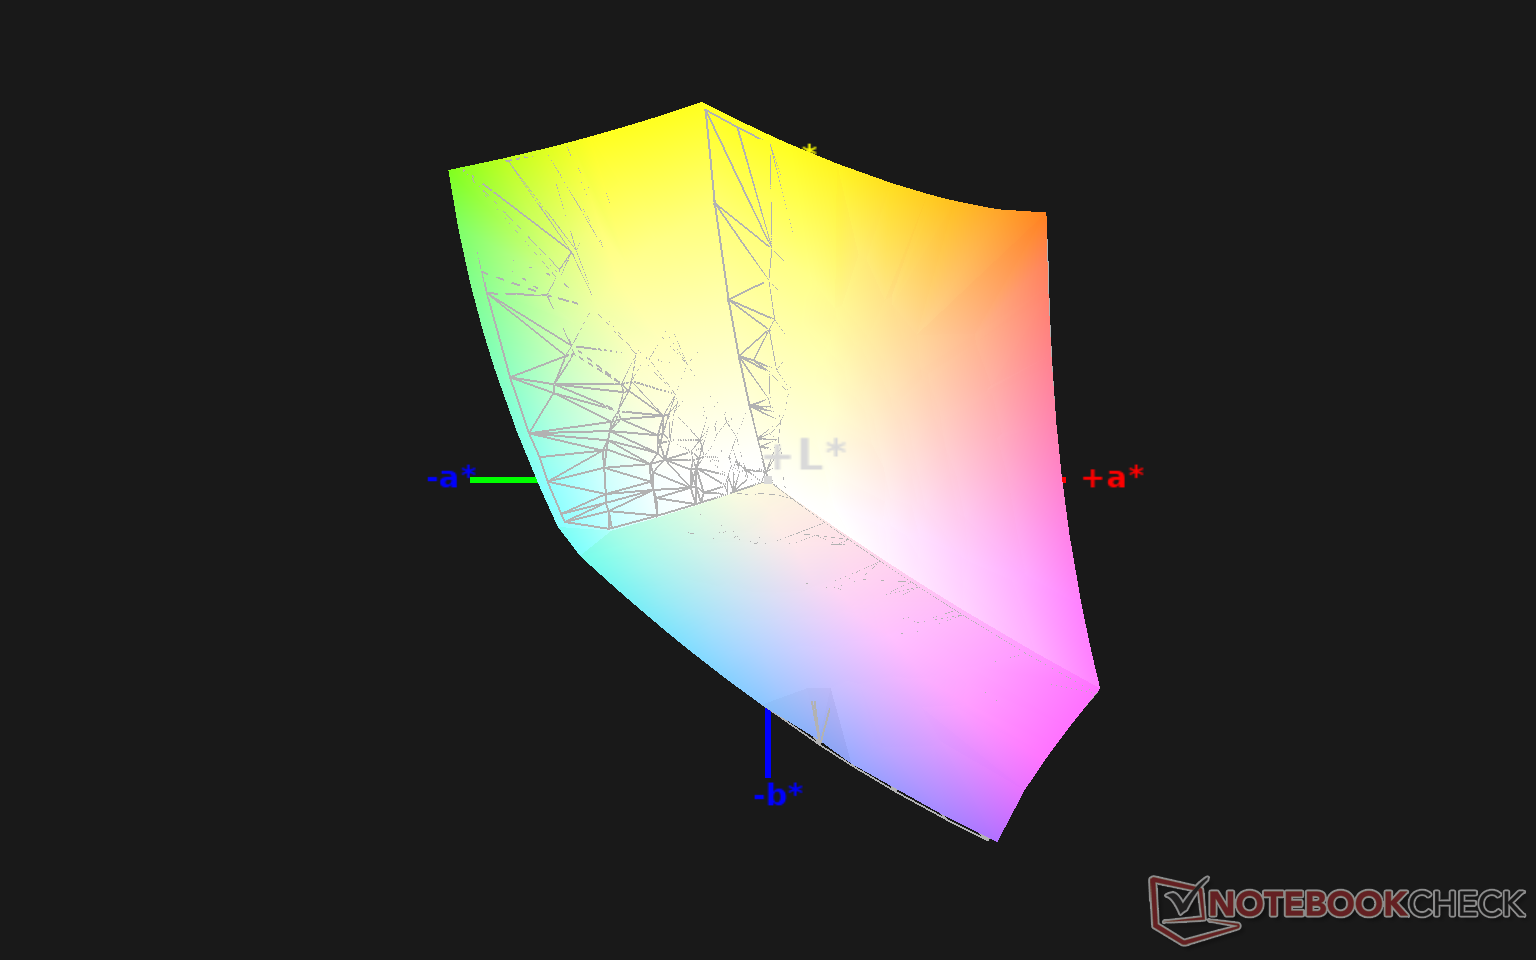
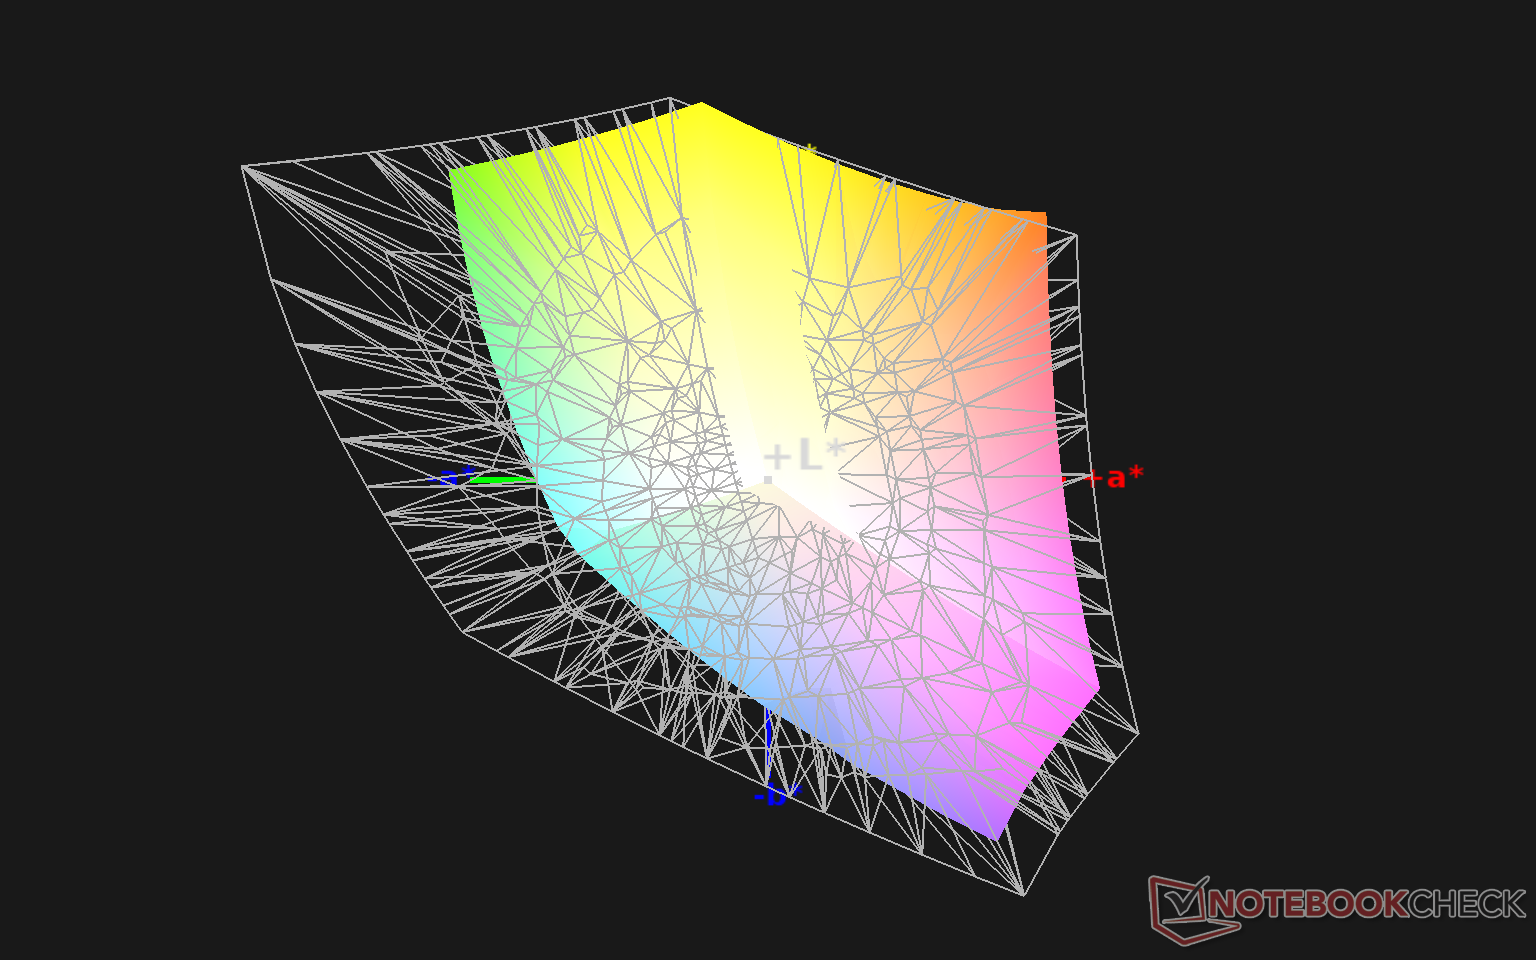
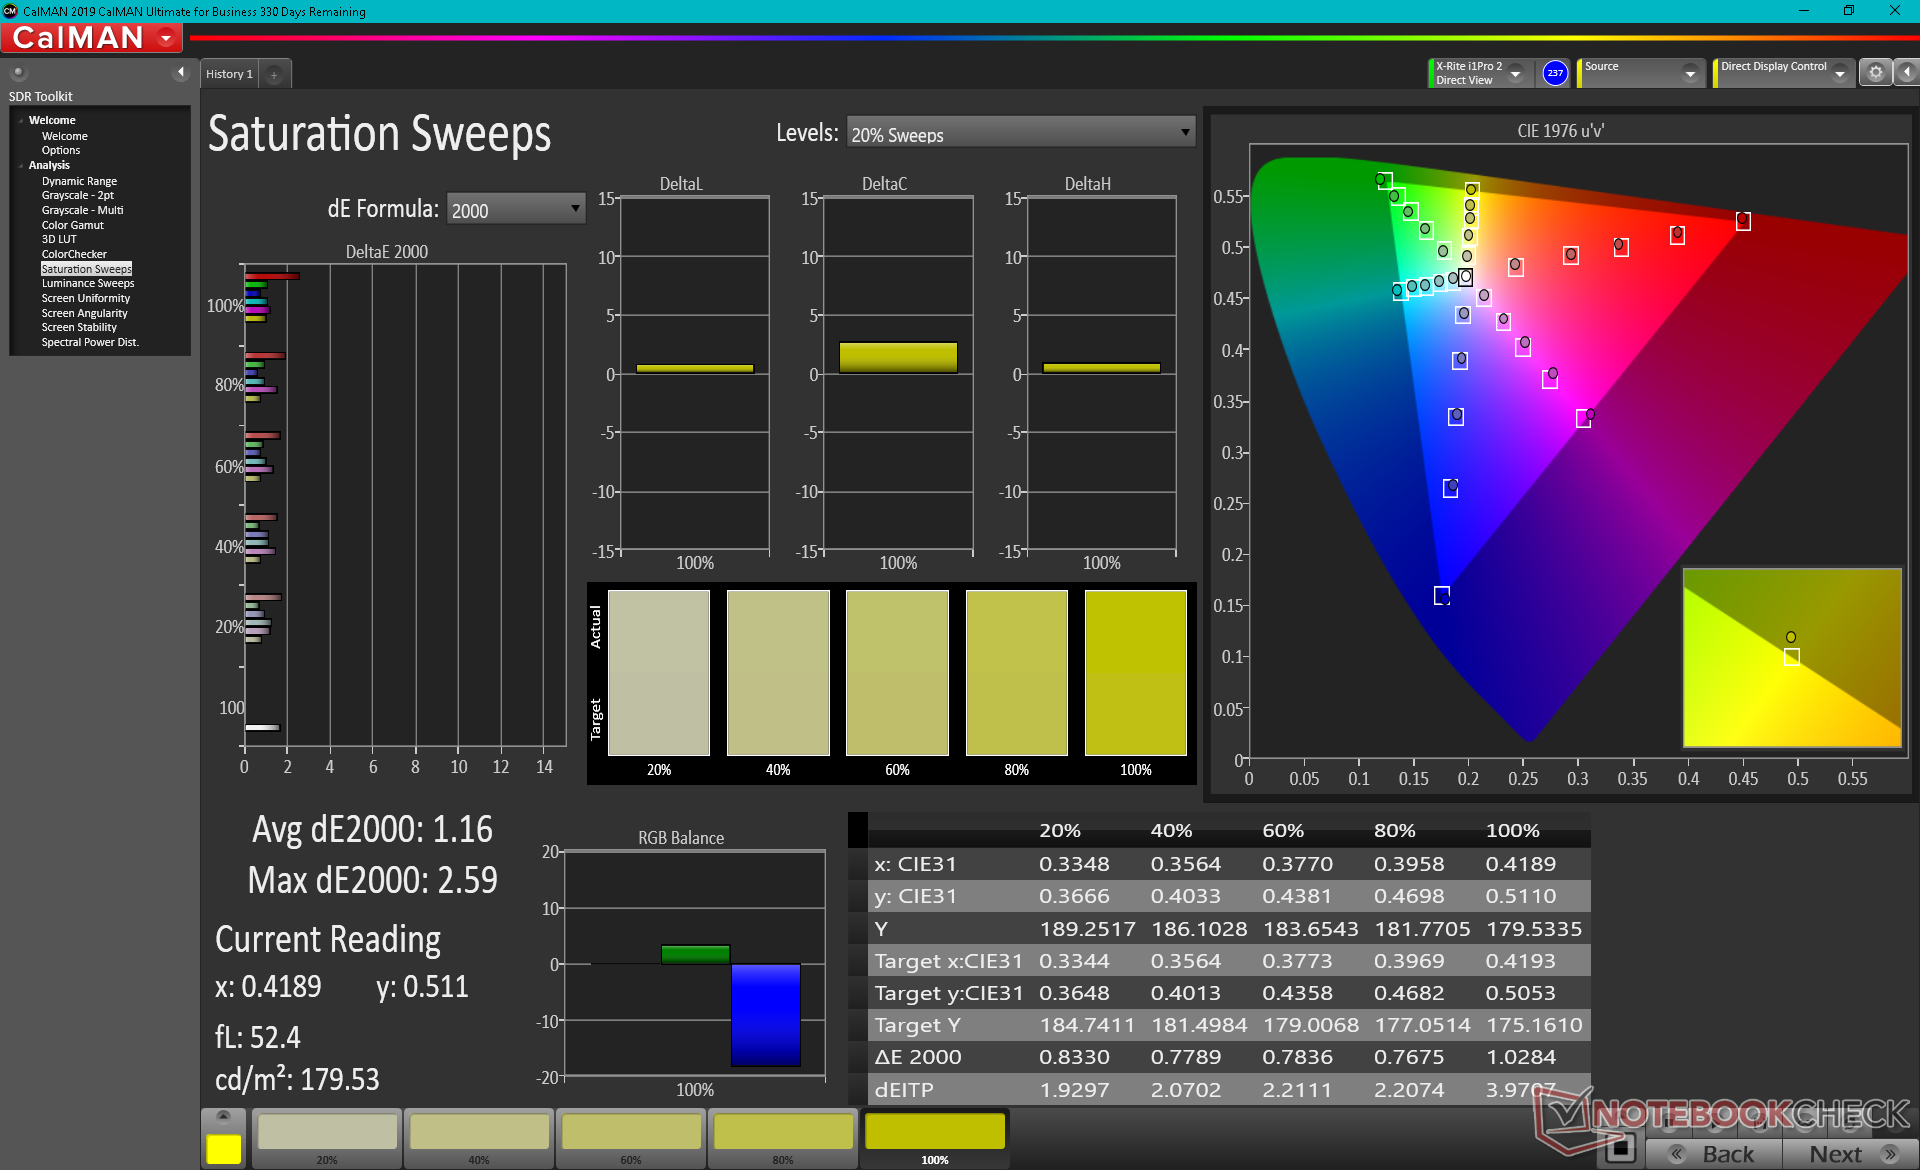
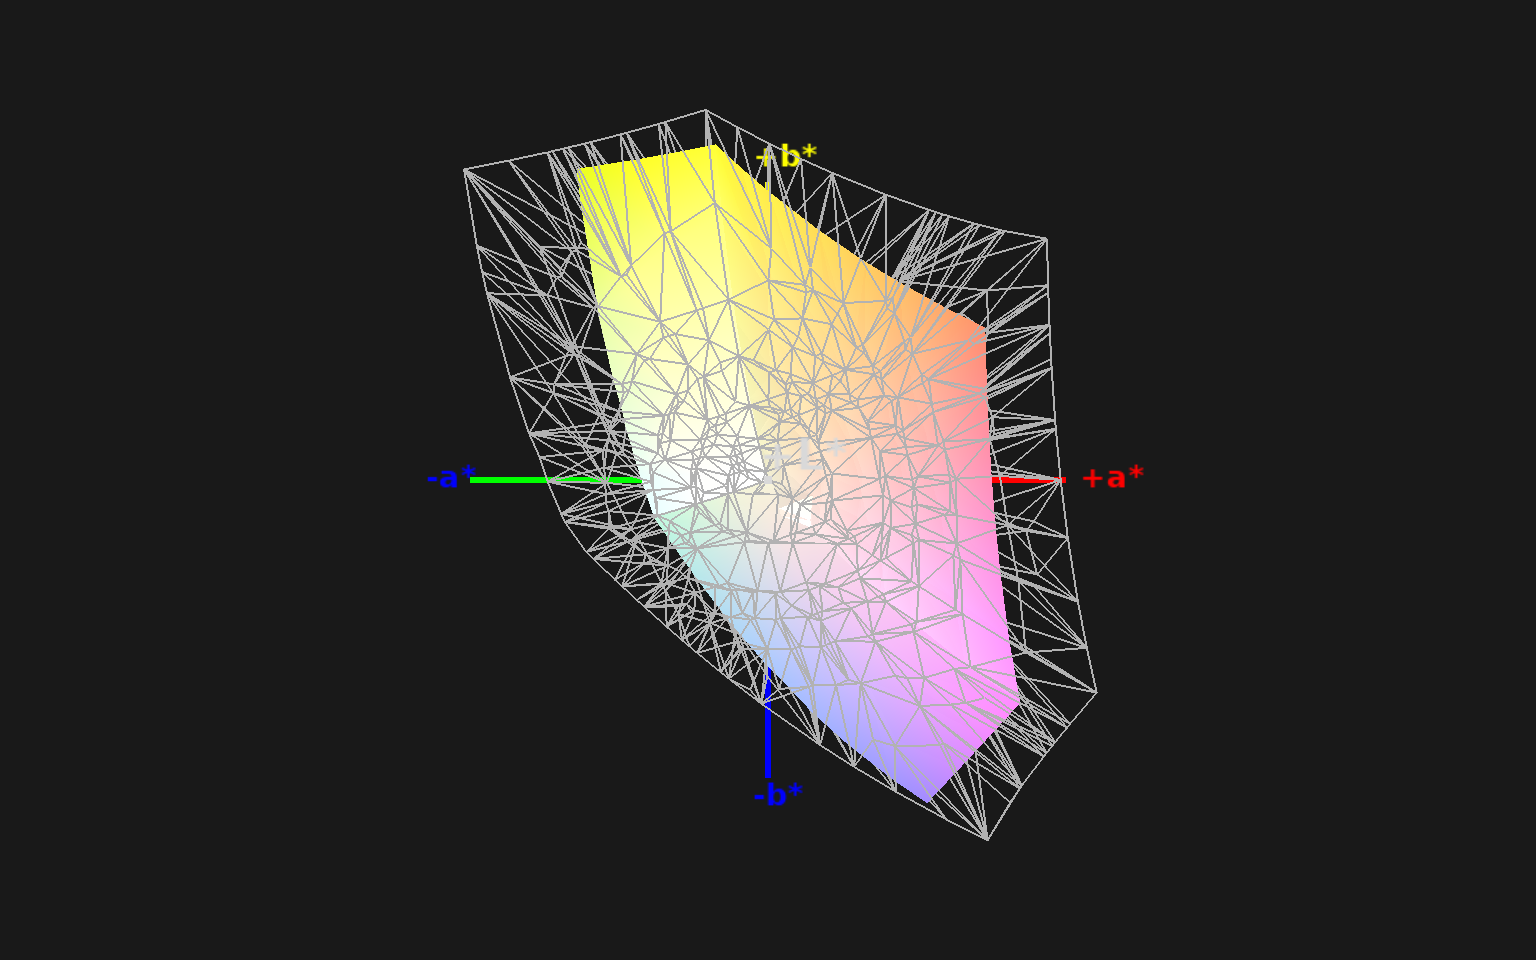
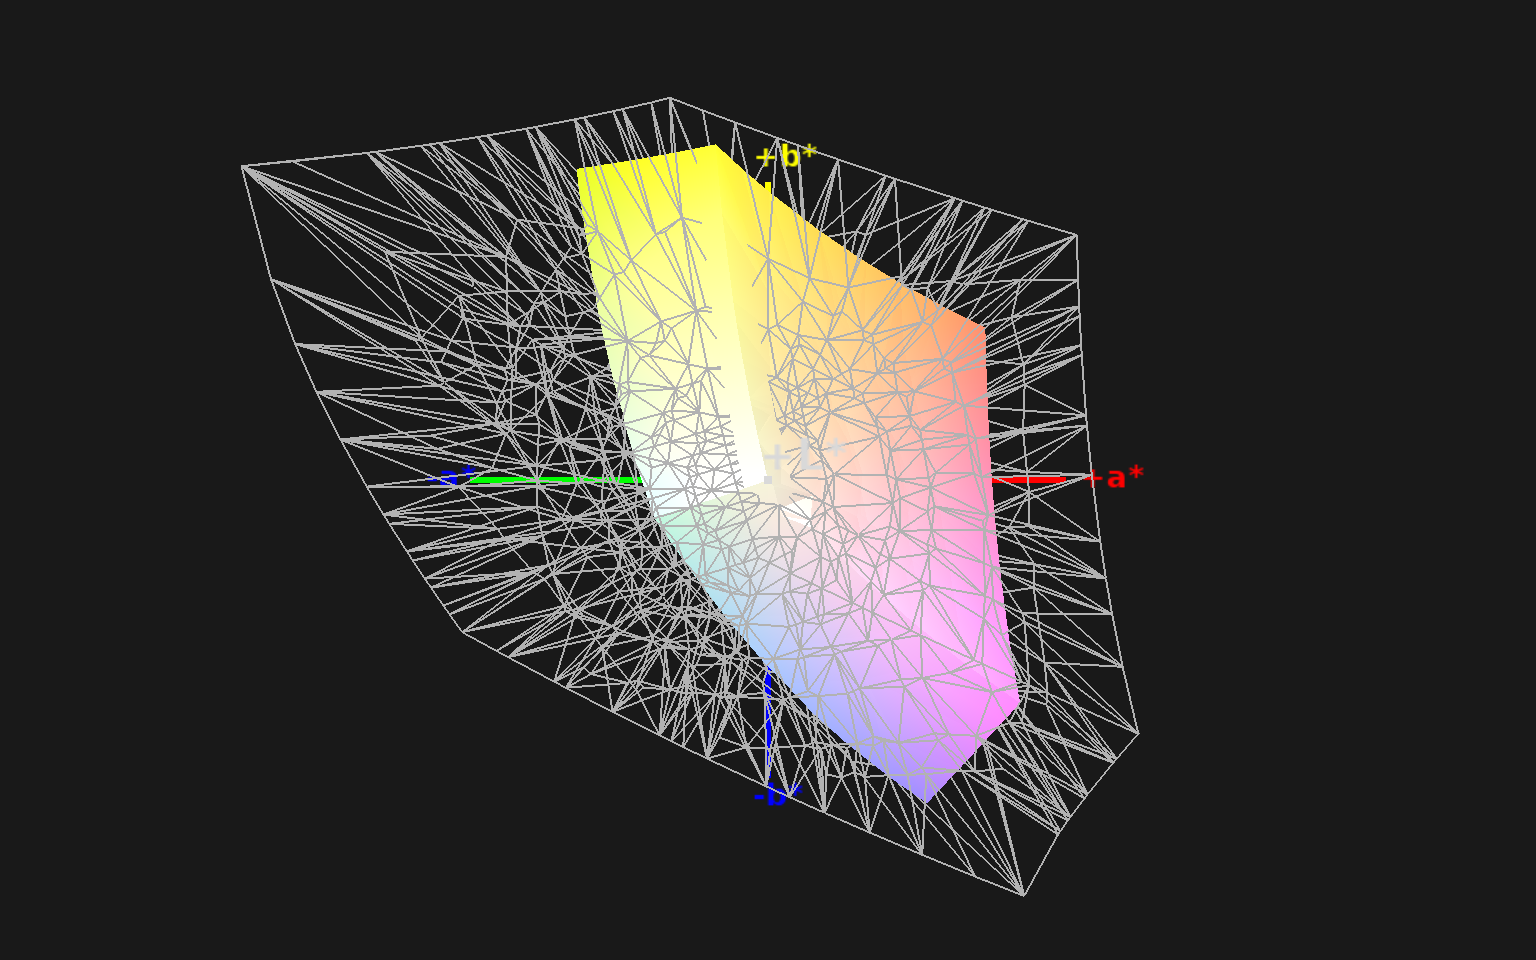
Color space on the primary display covers all of sRGB and 65 percent of AdobeRGB to represent a high-end panel. The displays on most flagship Ultrabooks have similar ranges. For full AdobeRGB coverage or more, users should look at the larger ZenBook Pro 15 or Dell XPS 15 9570 series instead.
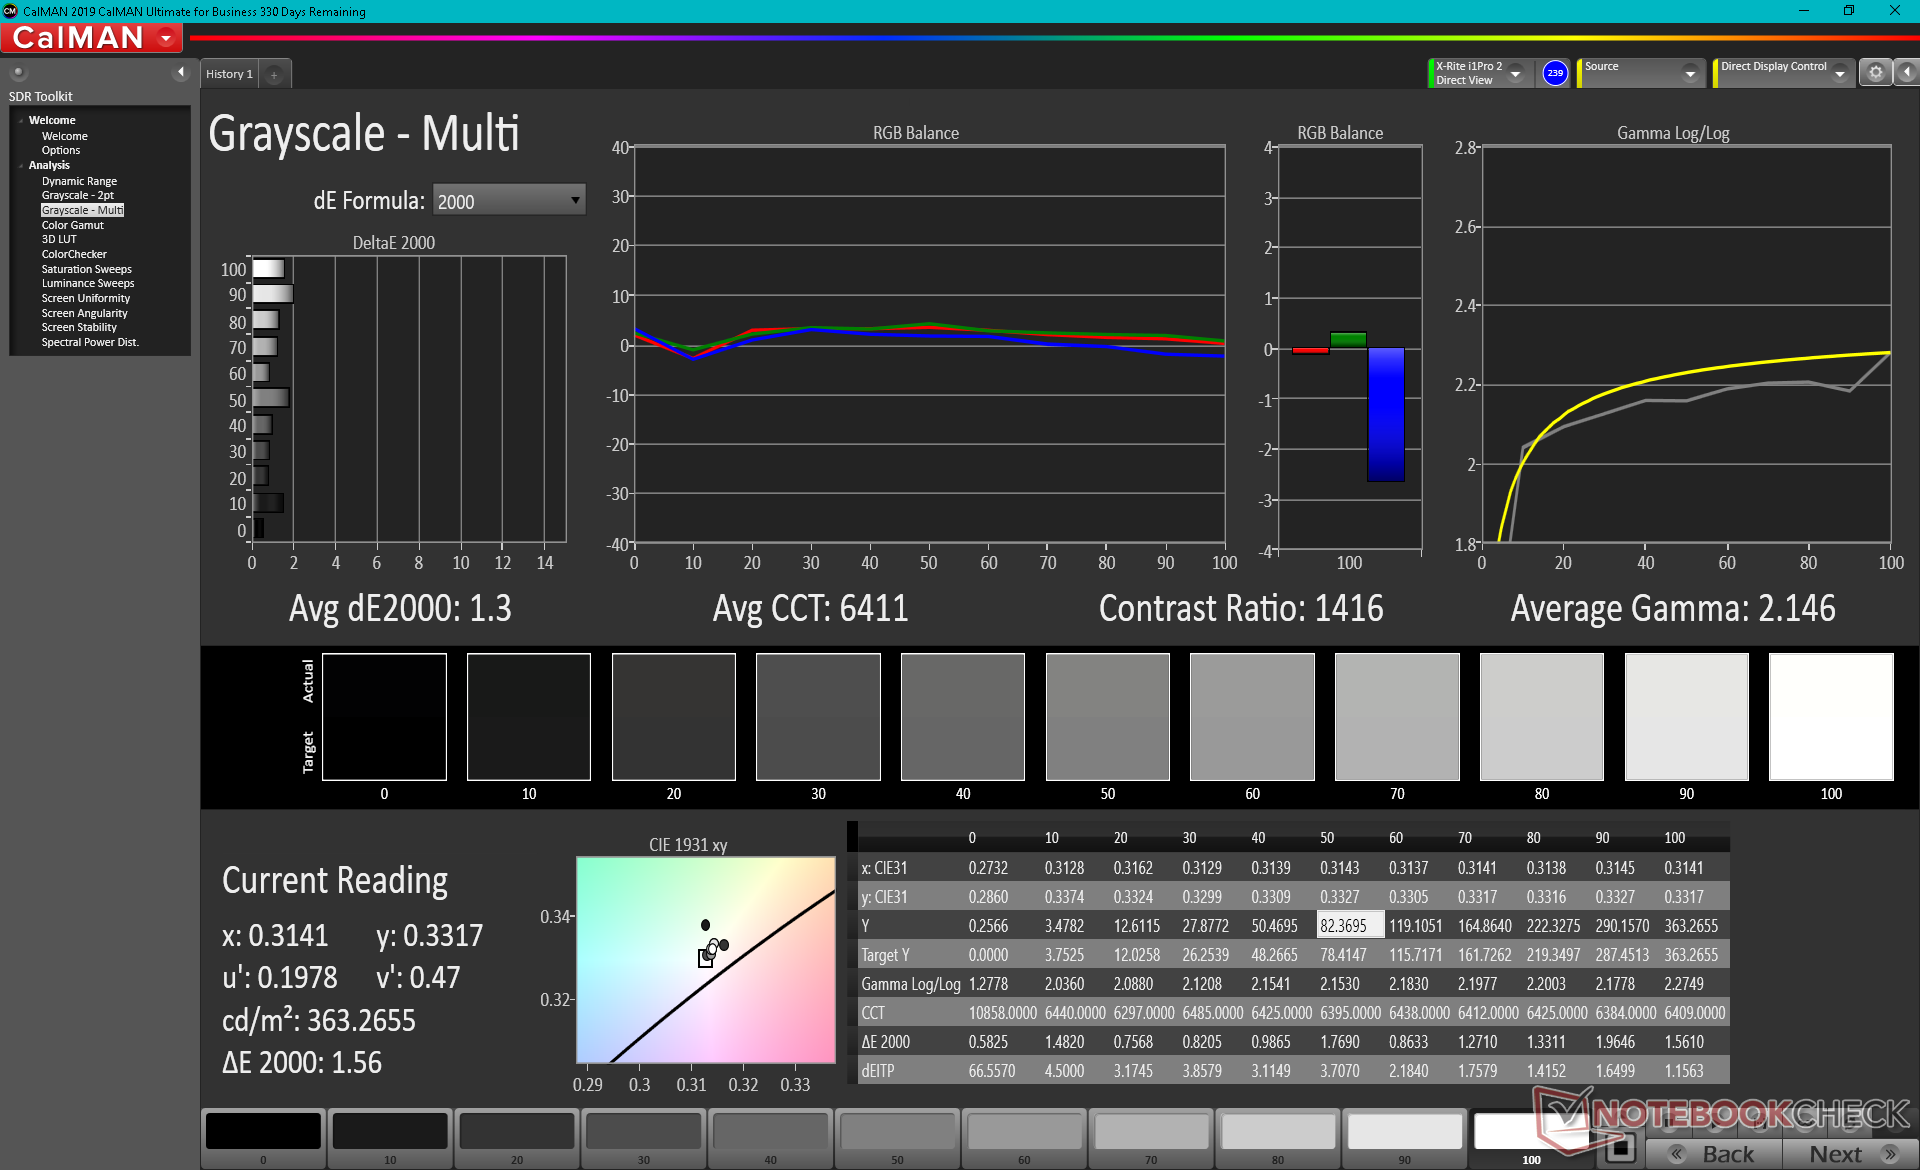
X-Rite colorimeter measurements reveal a well-calibrated display out of the box with average grayscale and color DeltaE values of just 1.3 and 1.44, respectively. An end-user calibration is not necessary.

Display Response Times
| ↔ Response Time Black to White | ||
|---|---|---|
| 46 ms ... rise ↗ and fall ↘ combined | ↗ 24.4 ms rise | 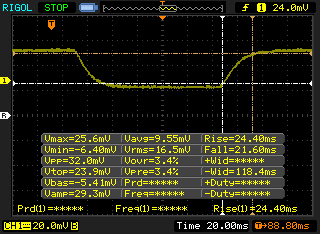 |
| ↘ 21.6 ms fall | ||
| The screen shows slow response rates in our tests and will be unsatisfactory for gamers. In comparison, all tested devices range from 0.1 (minimum) to 240 (maximum) ms. » 99 % of all devices are better. This means that the measured response time is worse than the average of all tested devices (19.8 ms). | ||
| ↔ Response Time 50% Grey to 80% Grey | ||
| 56.4 ms ... rise ↗ and fall ↘ combined | ↗ 30 ms rise | 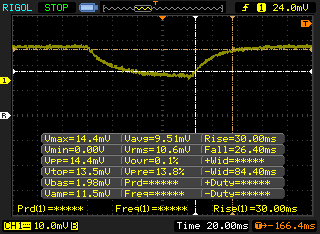 |
| ↘ 26.4 ms fall | ||
| The screen shows slow response rates in our tests and will be unsatisfactory for gamers. In comparison, all tested devices range from 0.165 (minimum) to 636 (maximum) ms. » 93 % of all devices are better. This means that the measured response time is worse than the average of all tested devices (31 ms). | ||
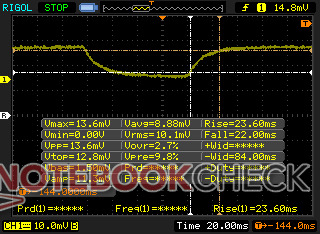
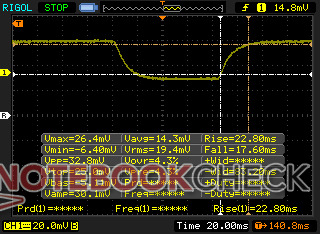
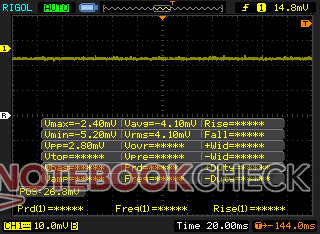
Screen Flickering / PWM (Pulse-Width Modulation)
| Screen flickering / PWM not detected | 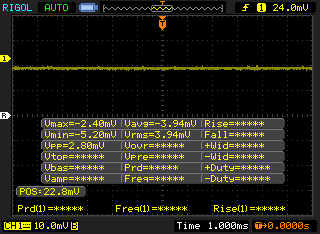 | ||
In comparison: 52 % of all tested devices do not use PWM to dim the display. If PWM was detected, an average of 7747 (minimum: 5 - maximum: 343500) Hz was measured. | |||
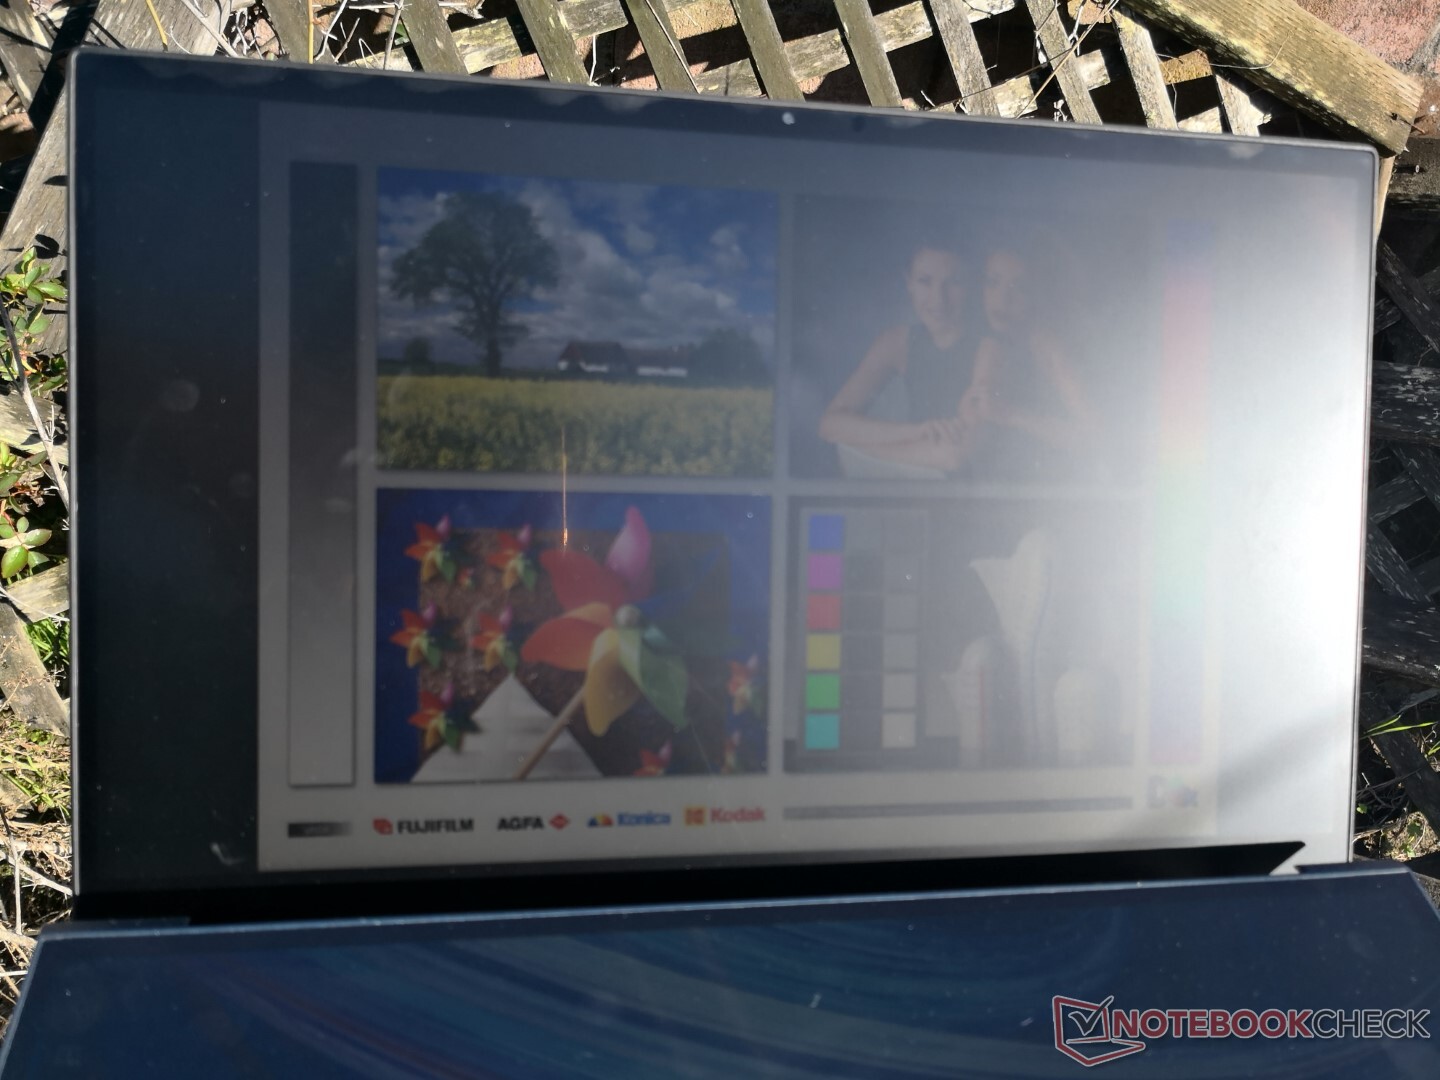
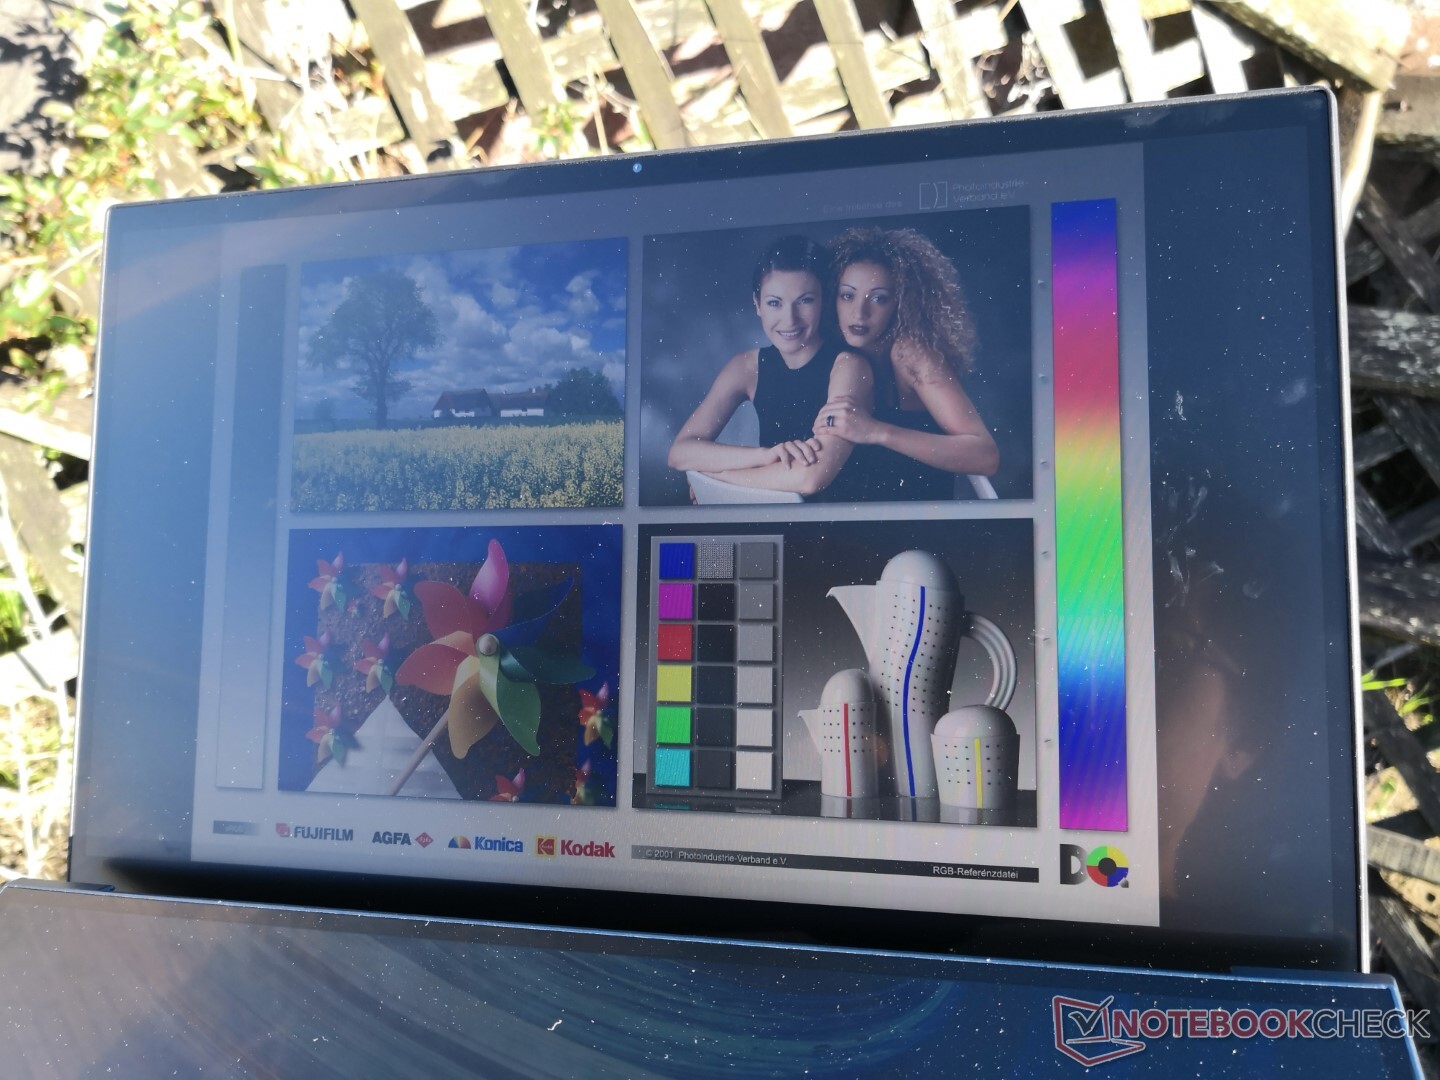
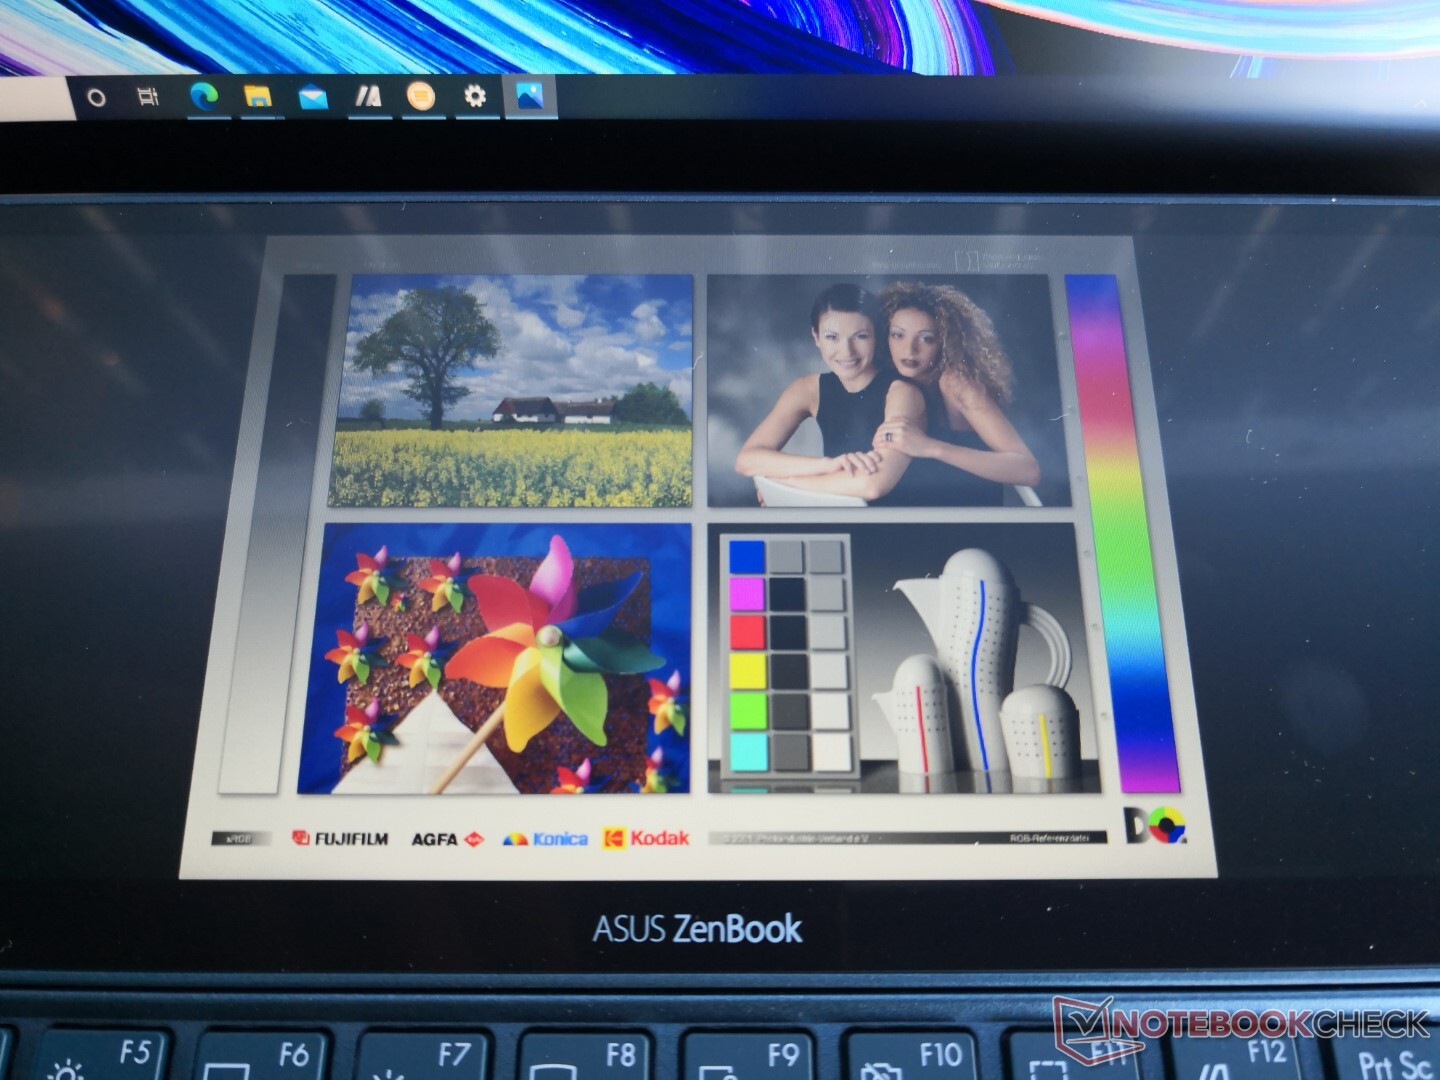
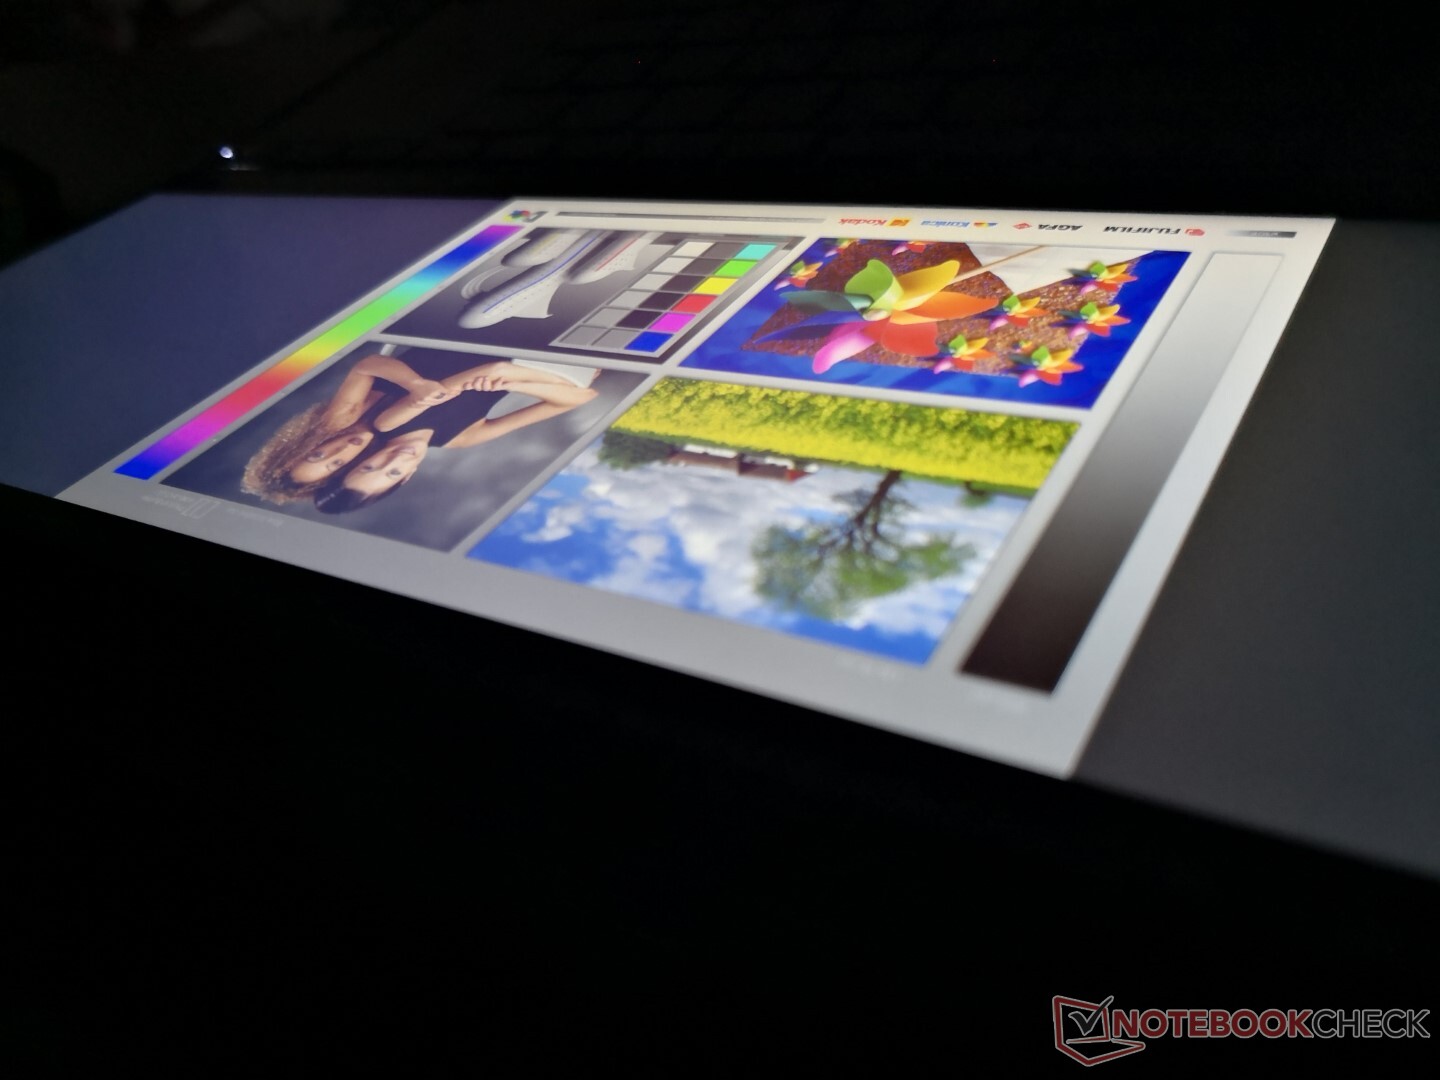
Outdoor visibility is better than last year's model as Asus has upped the maximum brightness by about 20 percent. It's not enough to overcome sunlight or eliminate glare, but it helps for cloudy days or if working under shade.

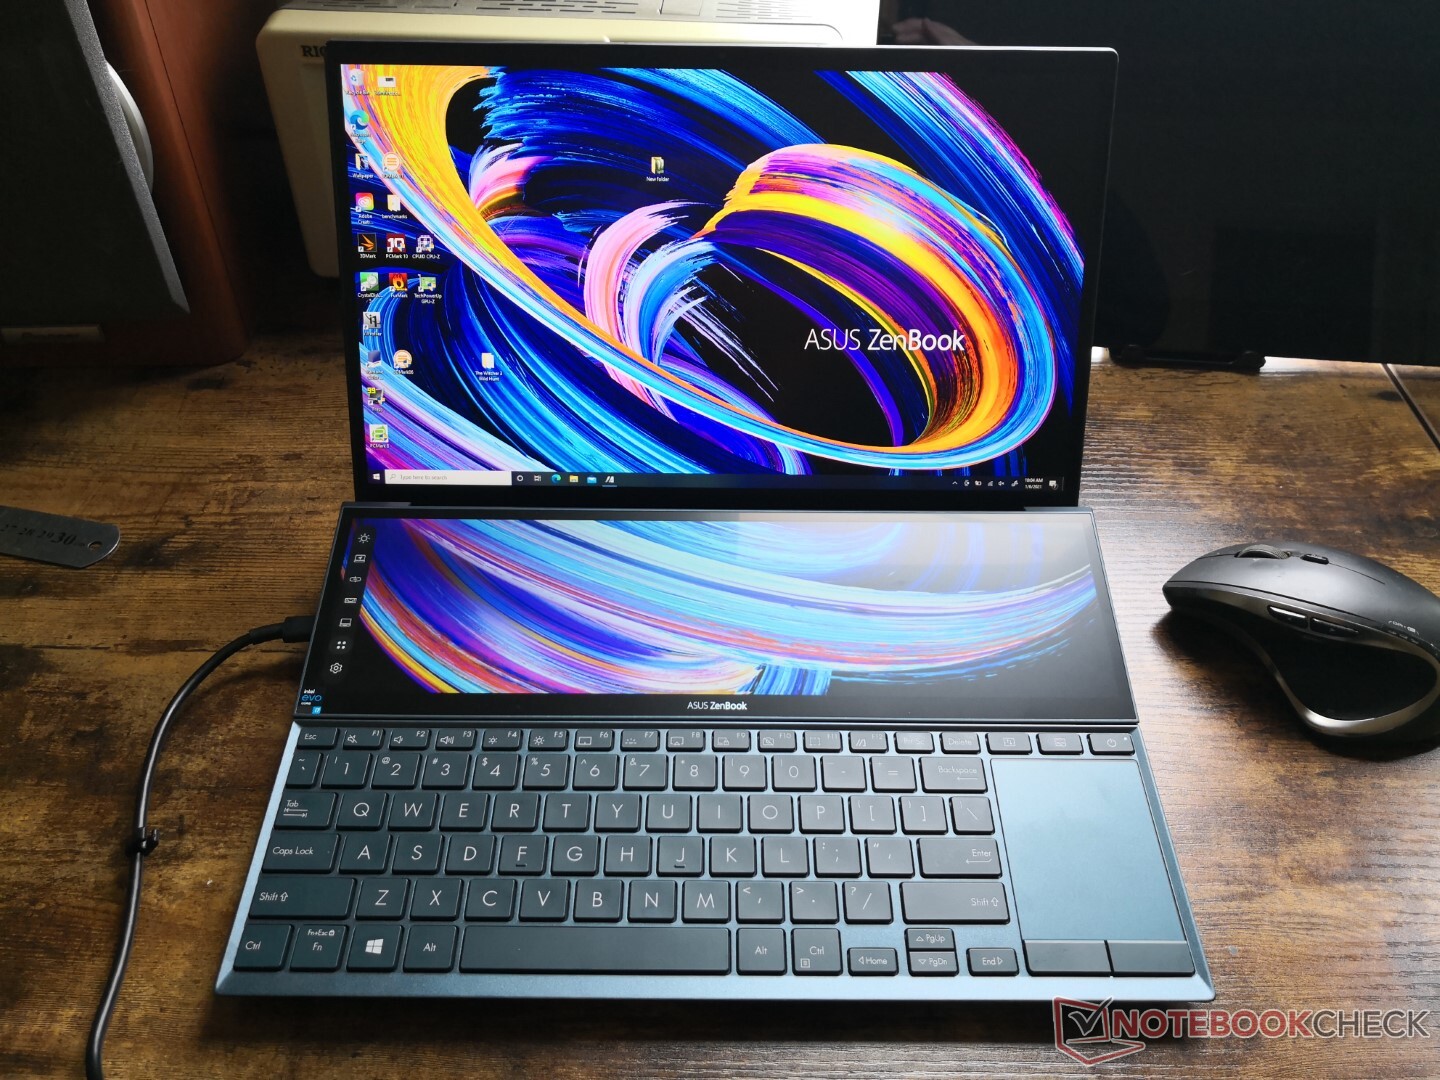
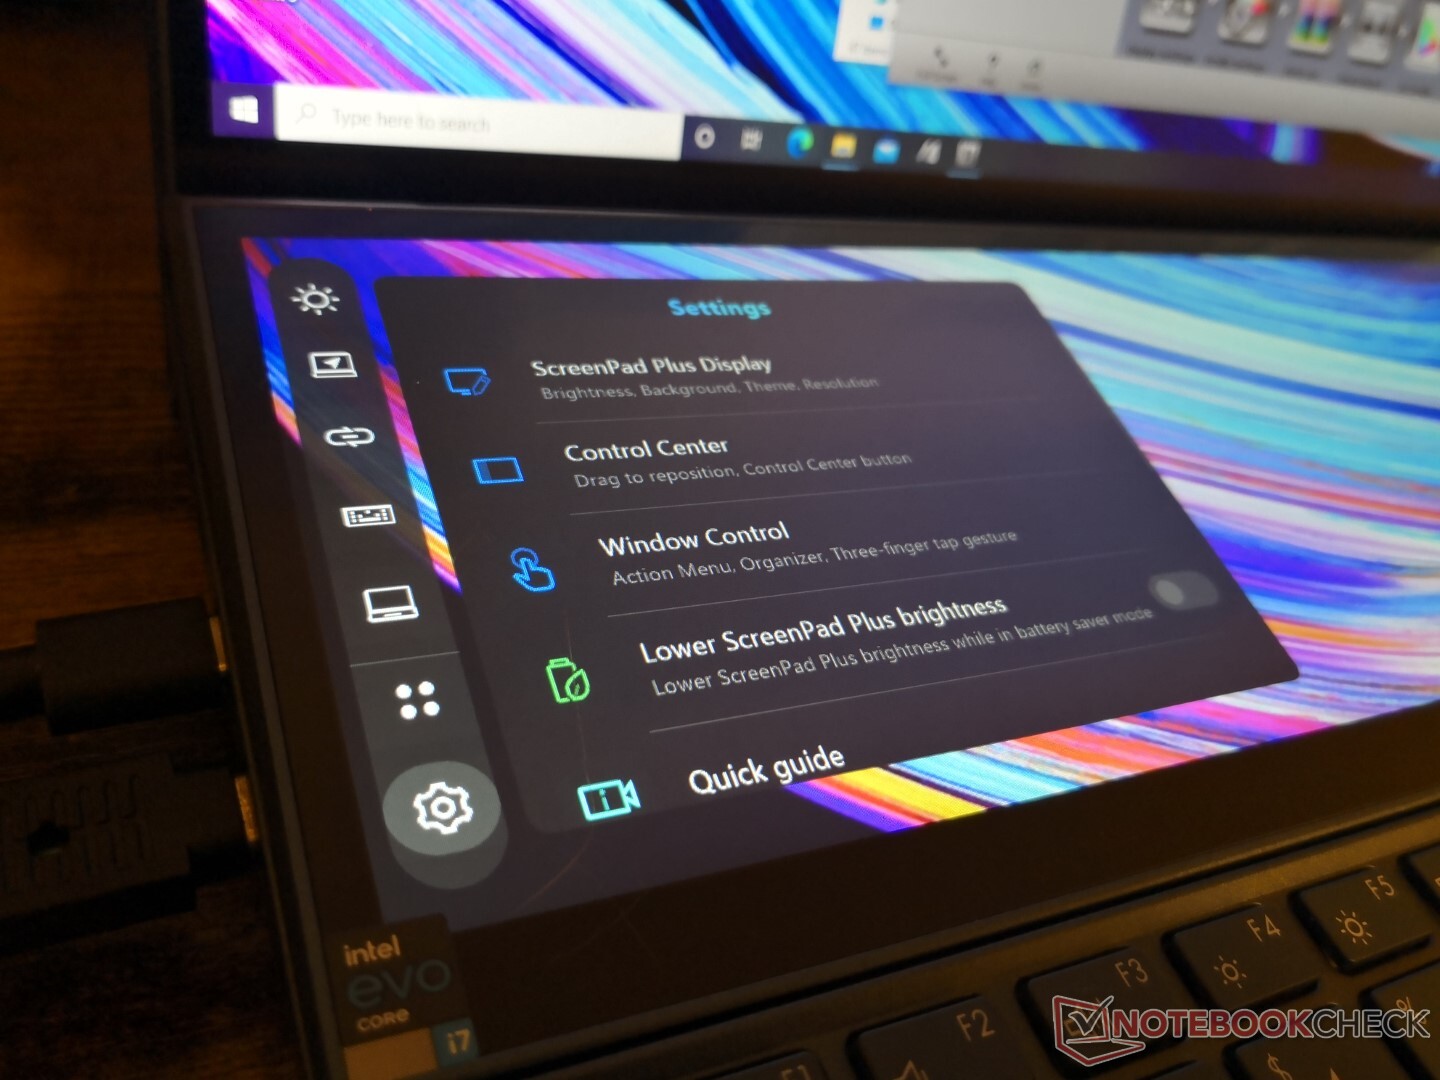
ScreenPad
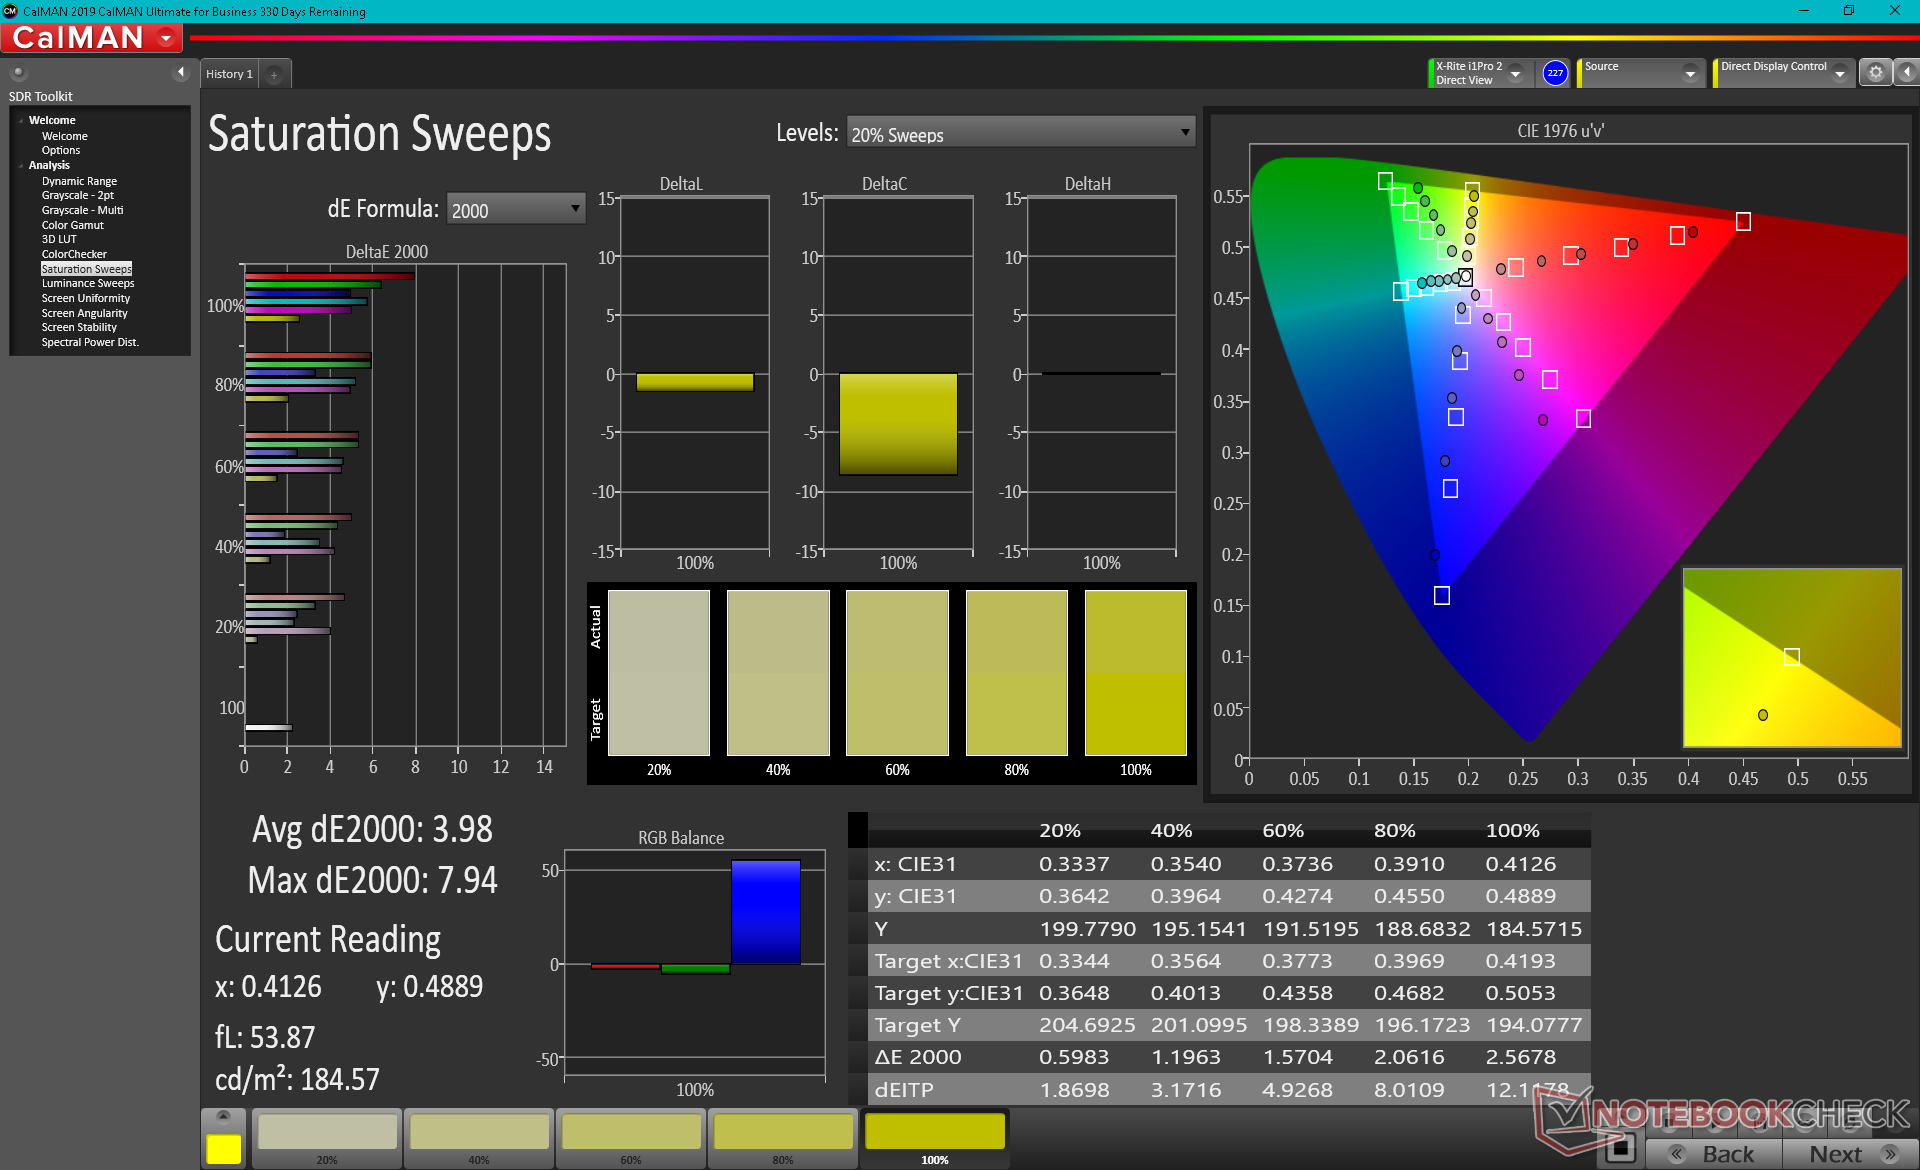
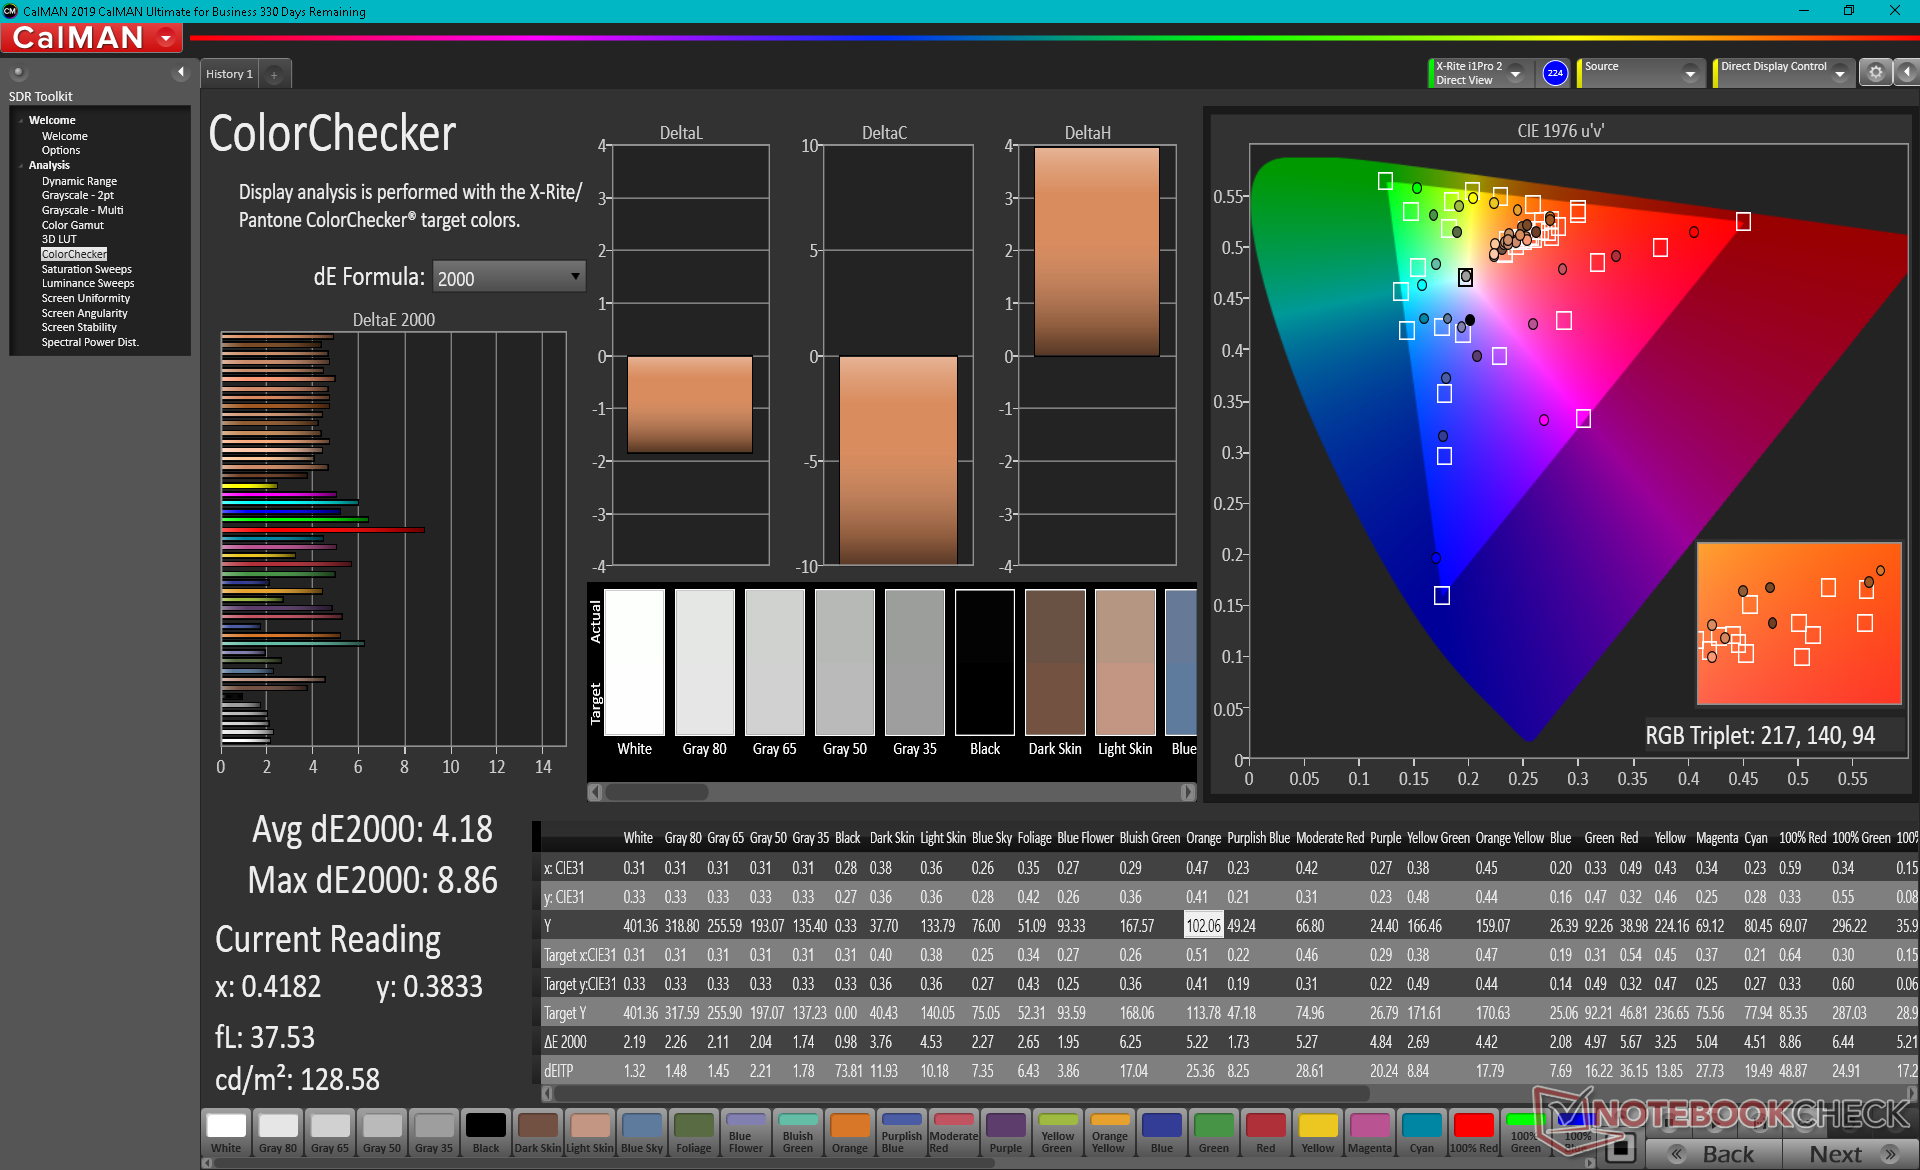
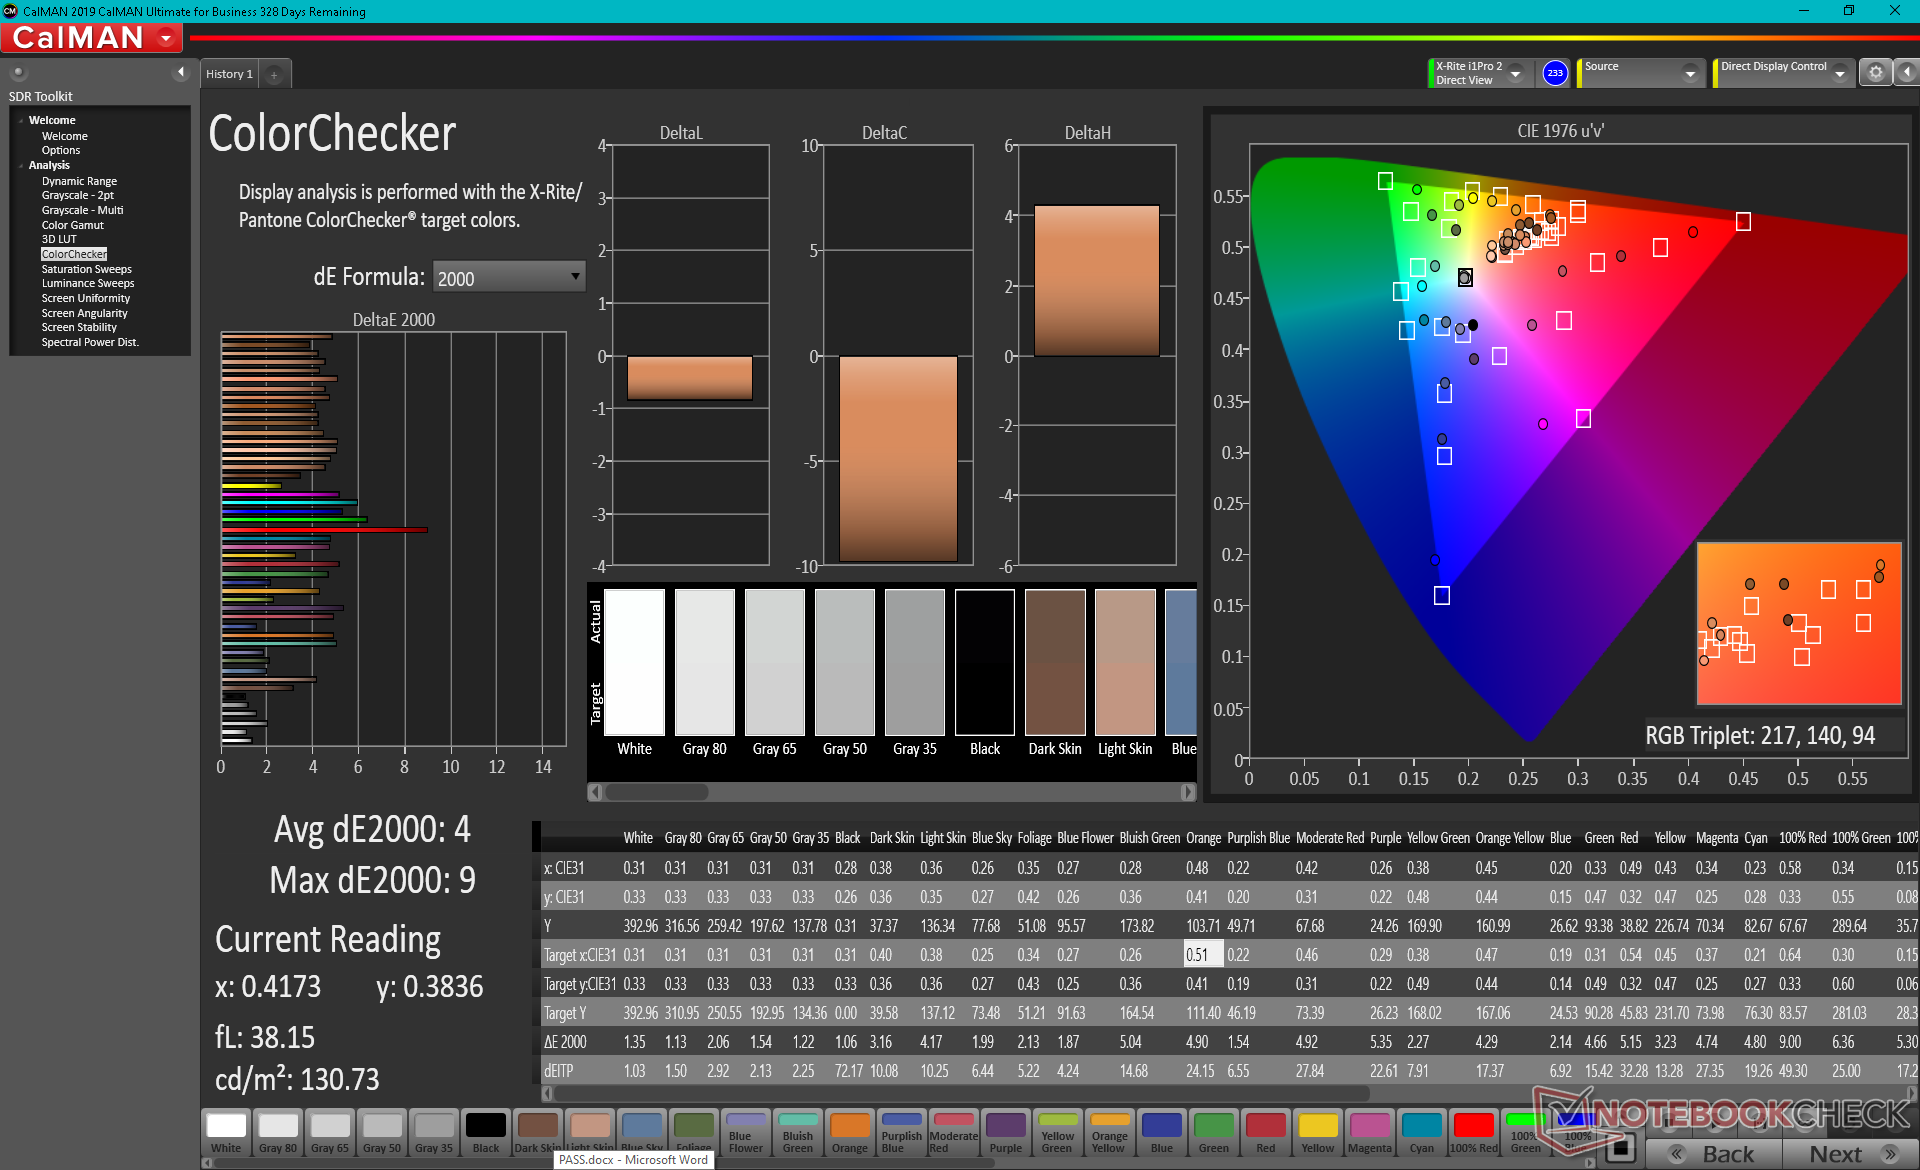
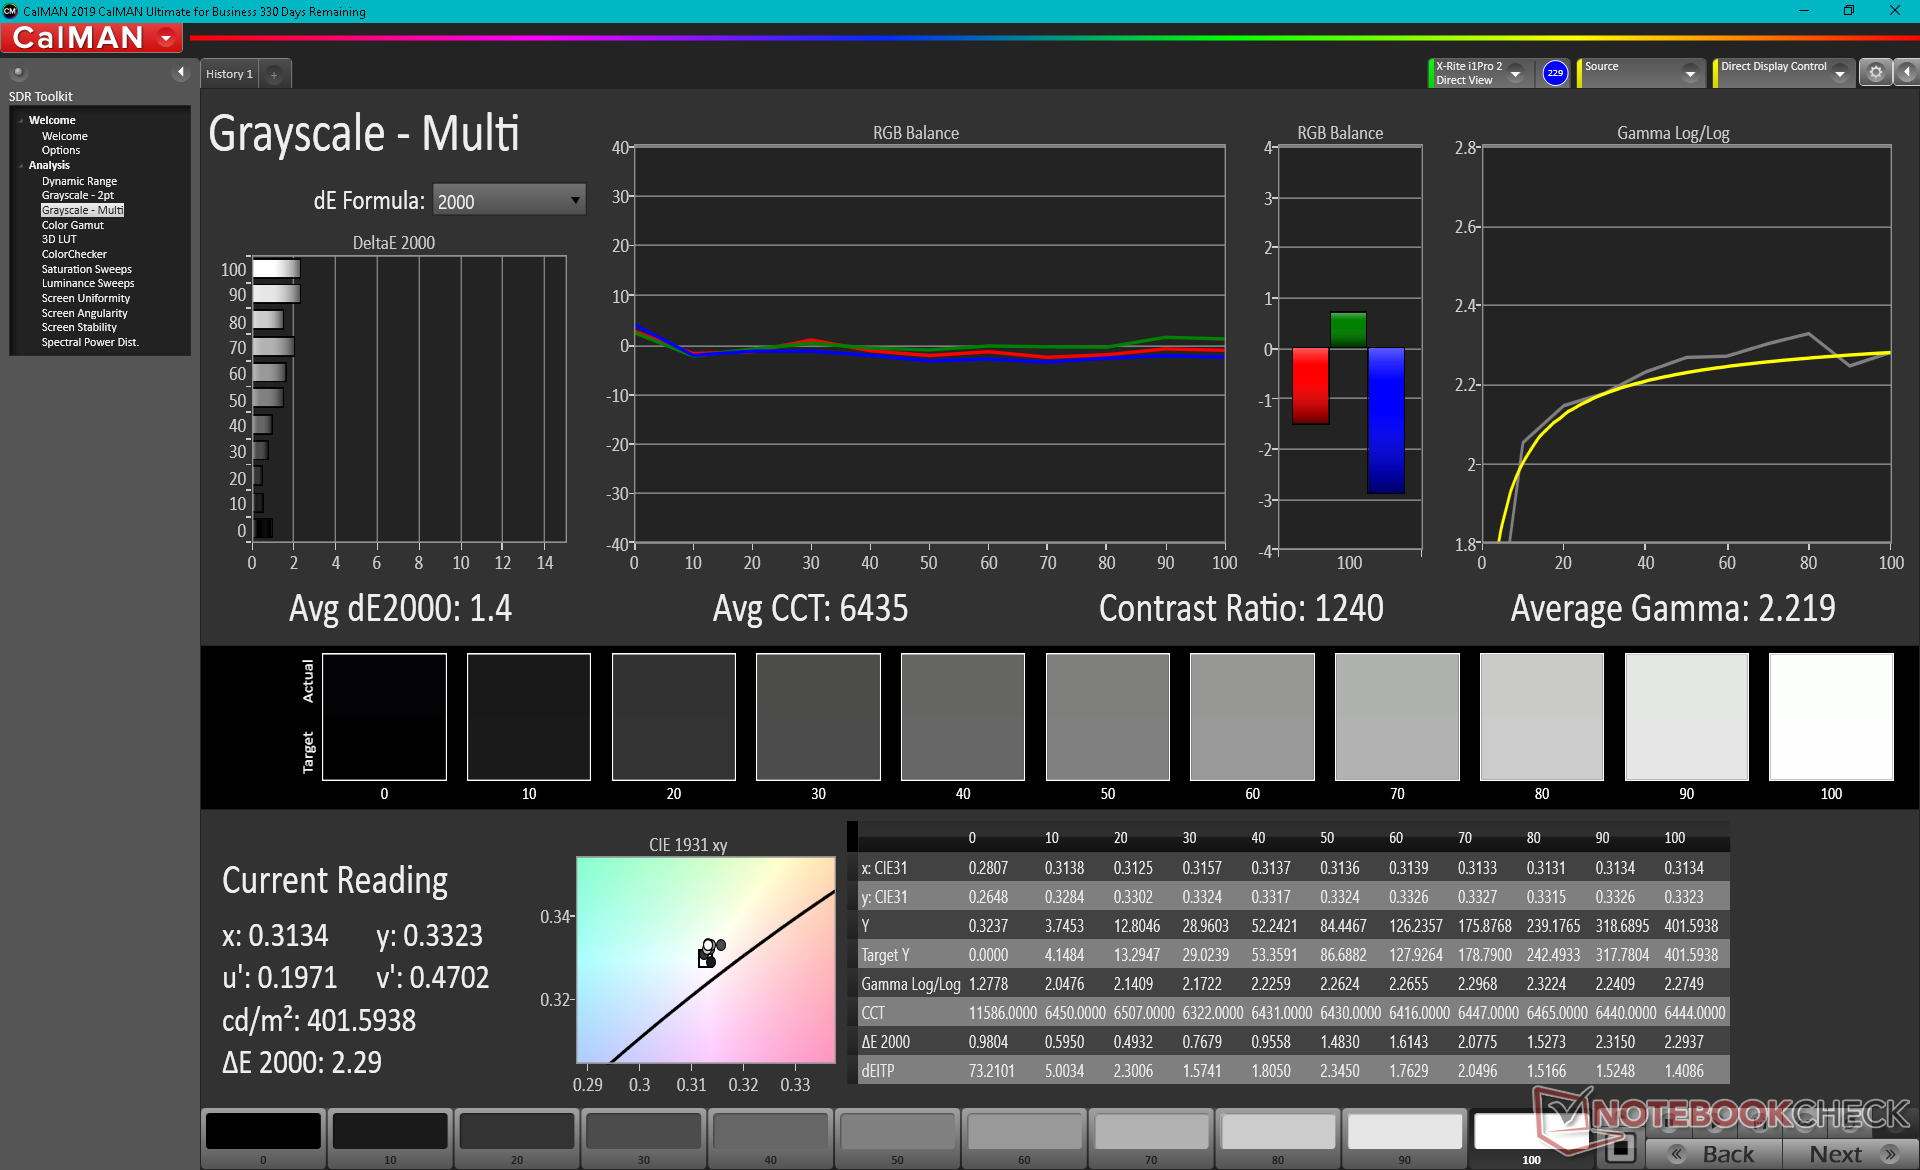
The UX482 ScreenPad uses a newer version of the IPS BOE panel from the UX481 (HF NV126B5M_N42 instead of the HF NV126B5M_N41). When compared to the older panel, the newer one is brighter (400 nits vs. 300 nits) and with a deeper contrast ratio (~1200:1 vs. ~800:1) but at the cost of slower black-white and gray-gray response times. Color space hasn't changed gen-to-gen at just 60 percent of sRGB compared to the 100 percent coverage of the main display which makes the ScreenPad unfit for editing where deeper colors are desired.
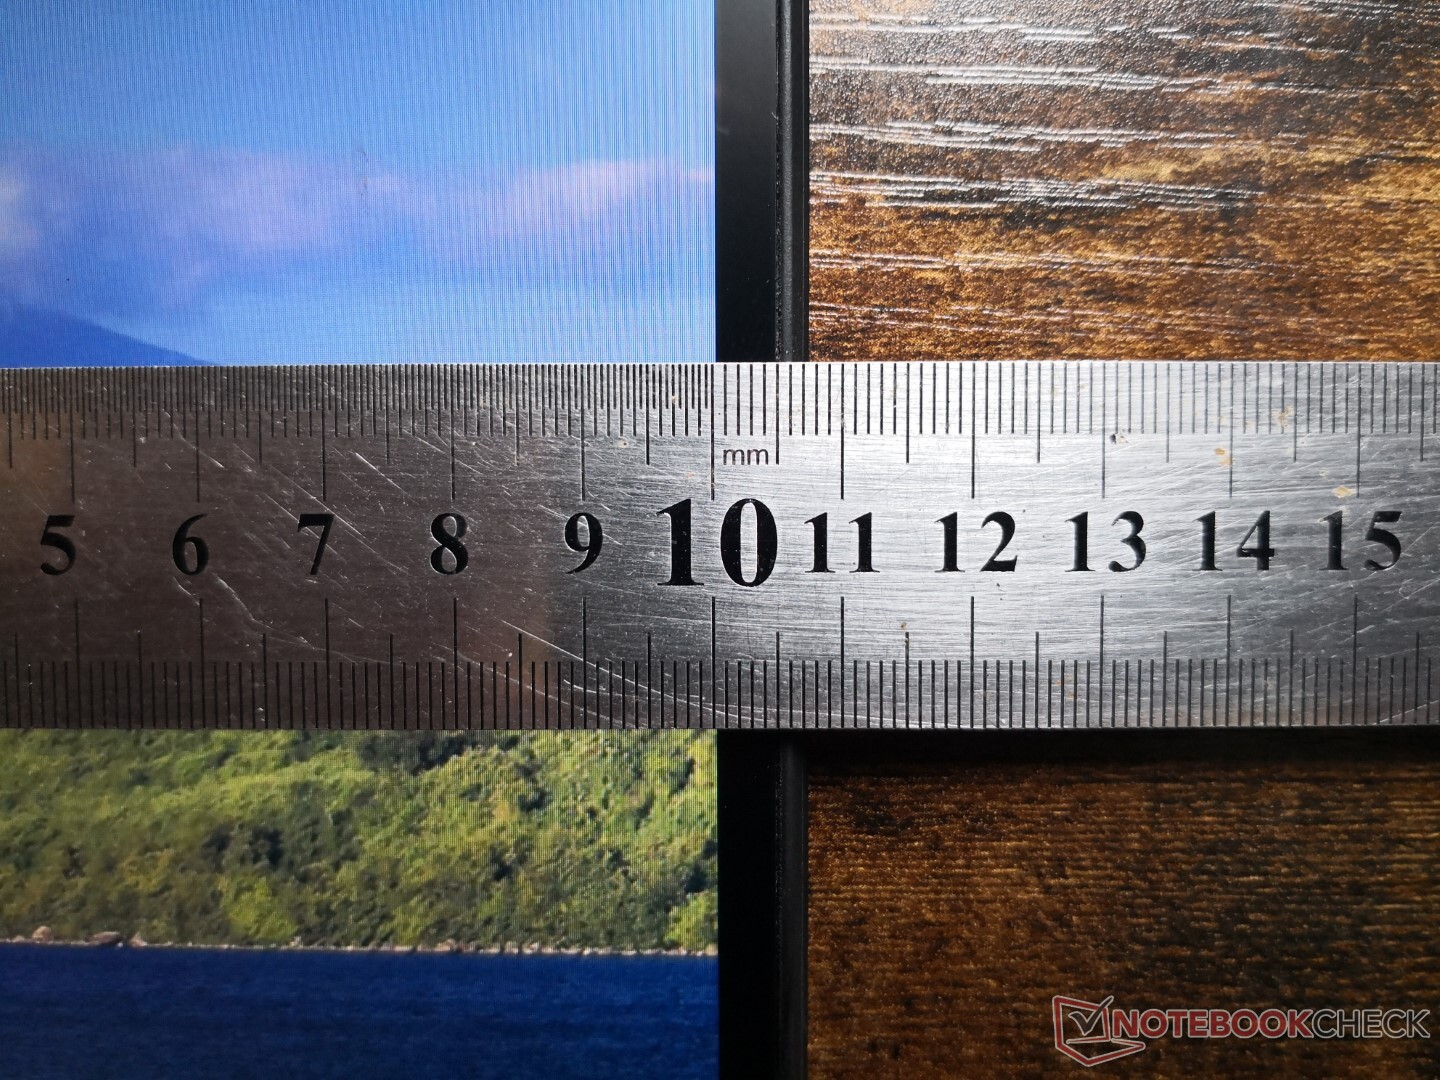
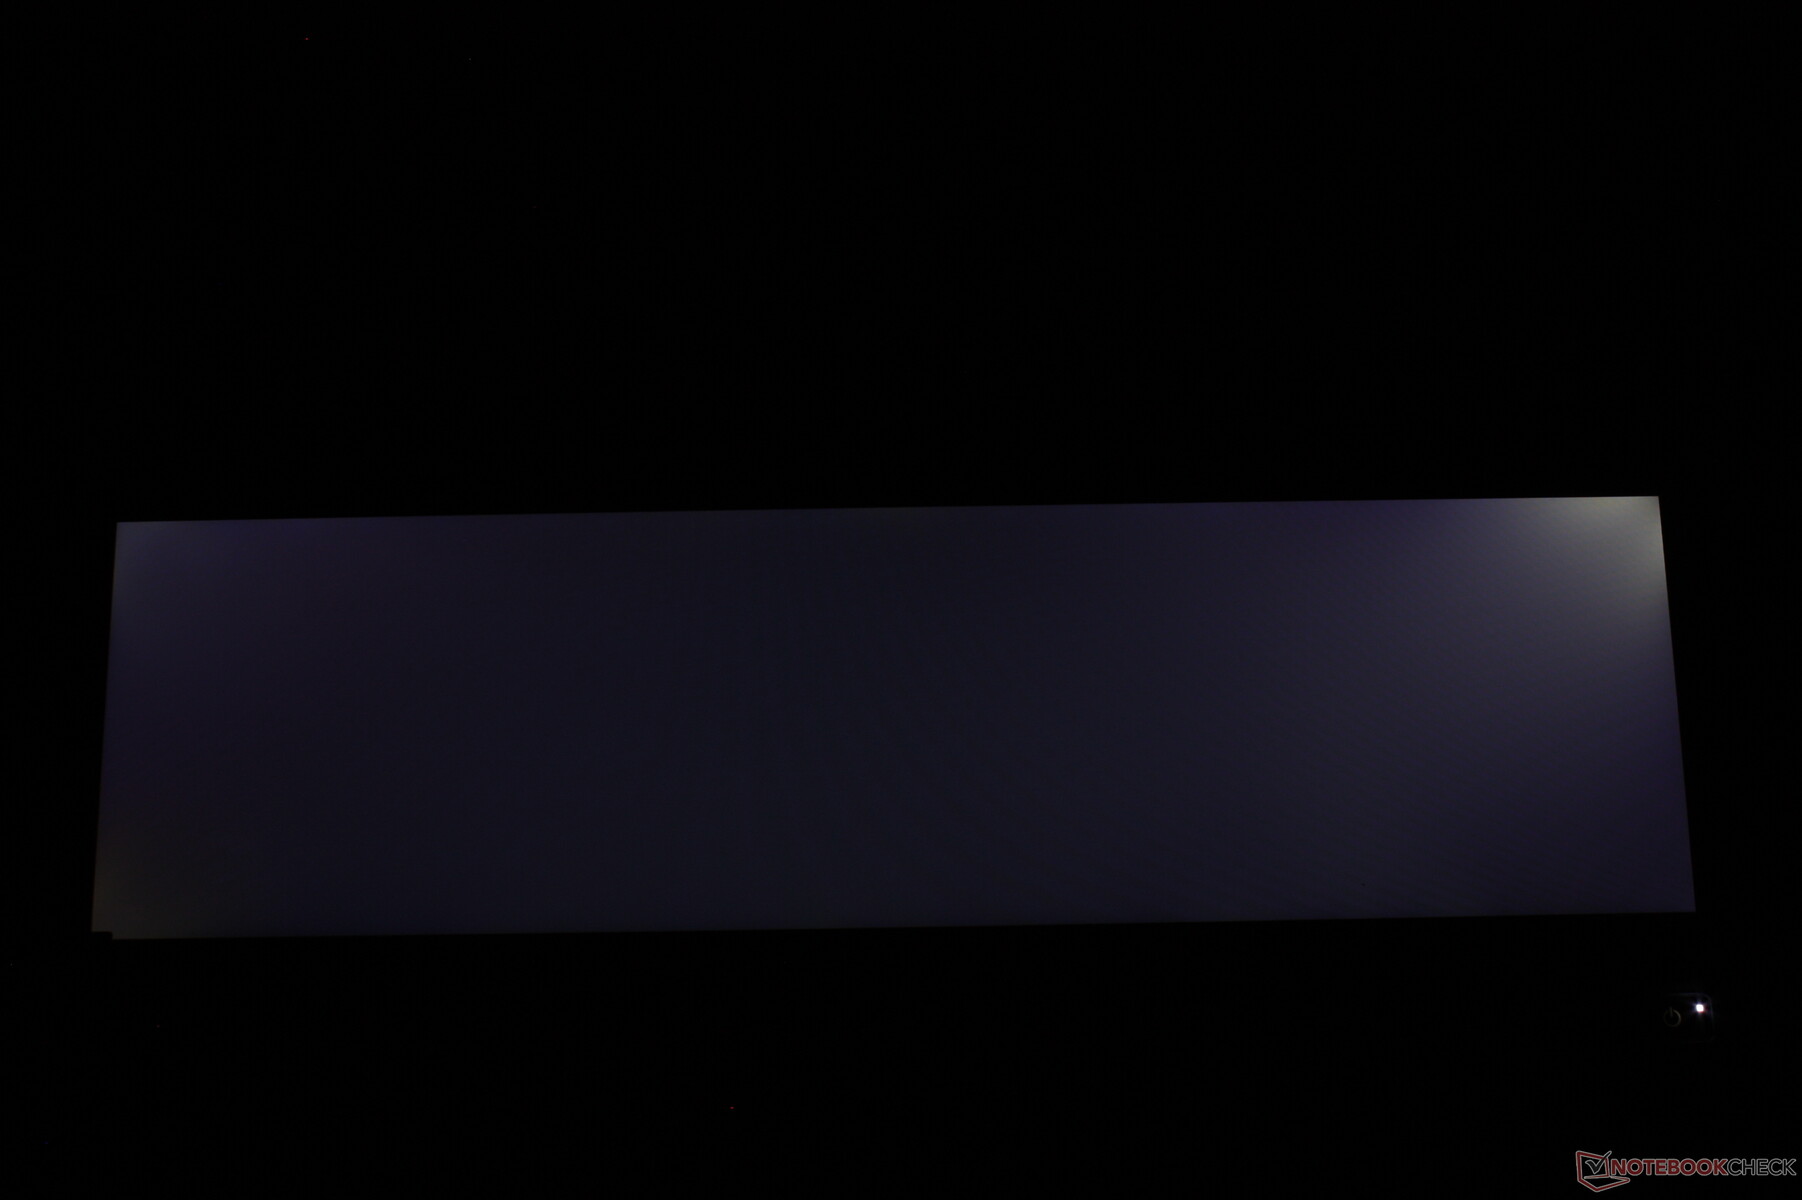
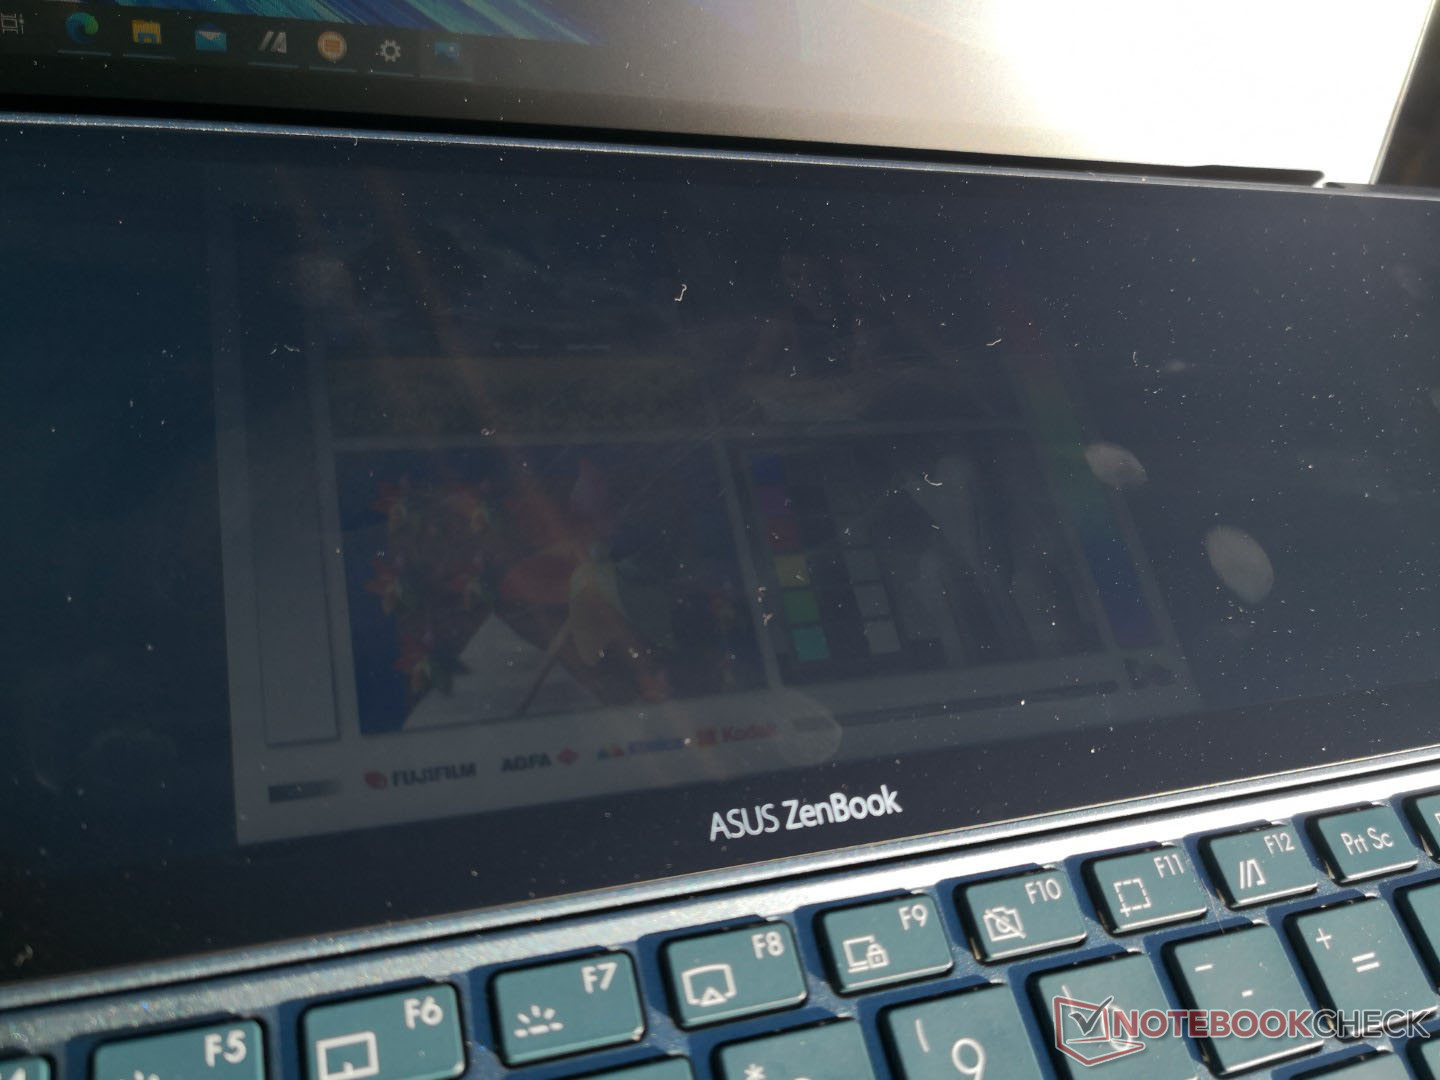
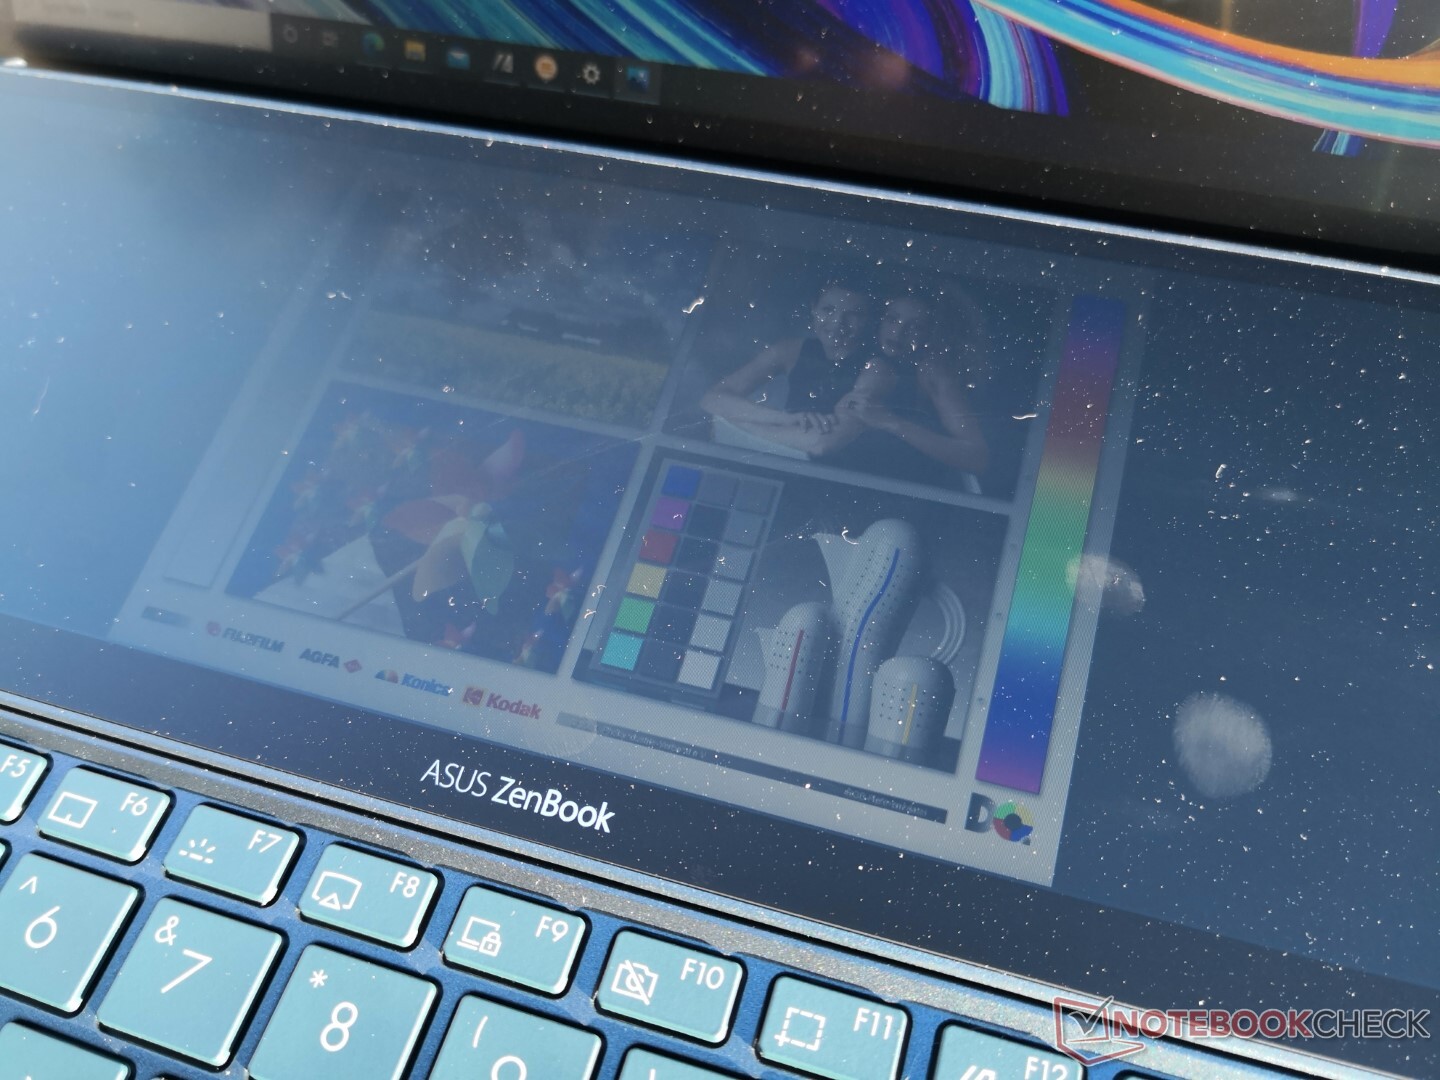
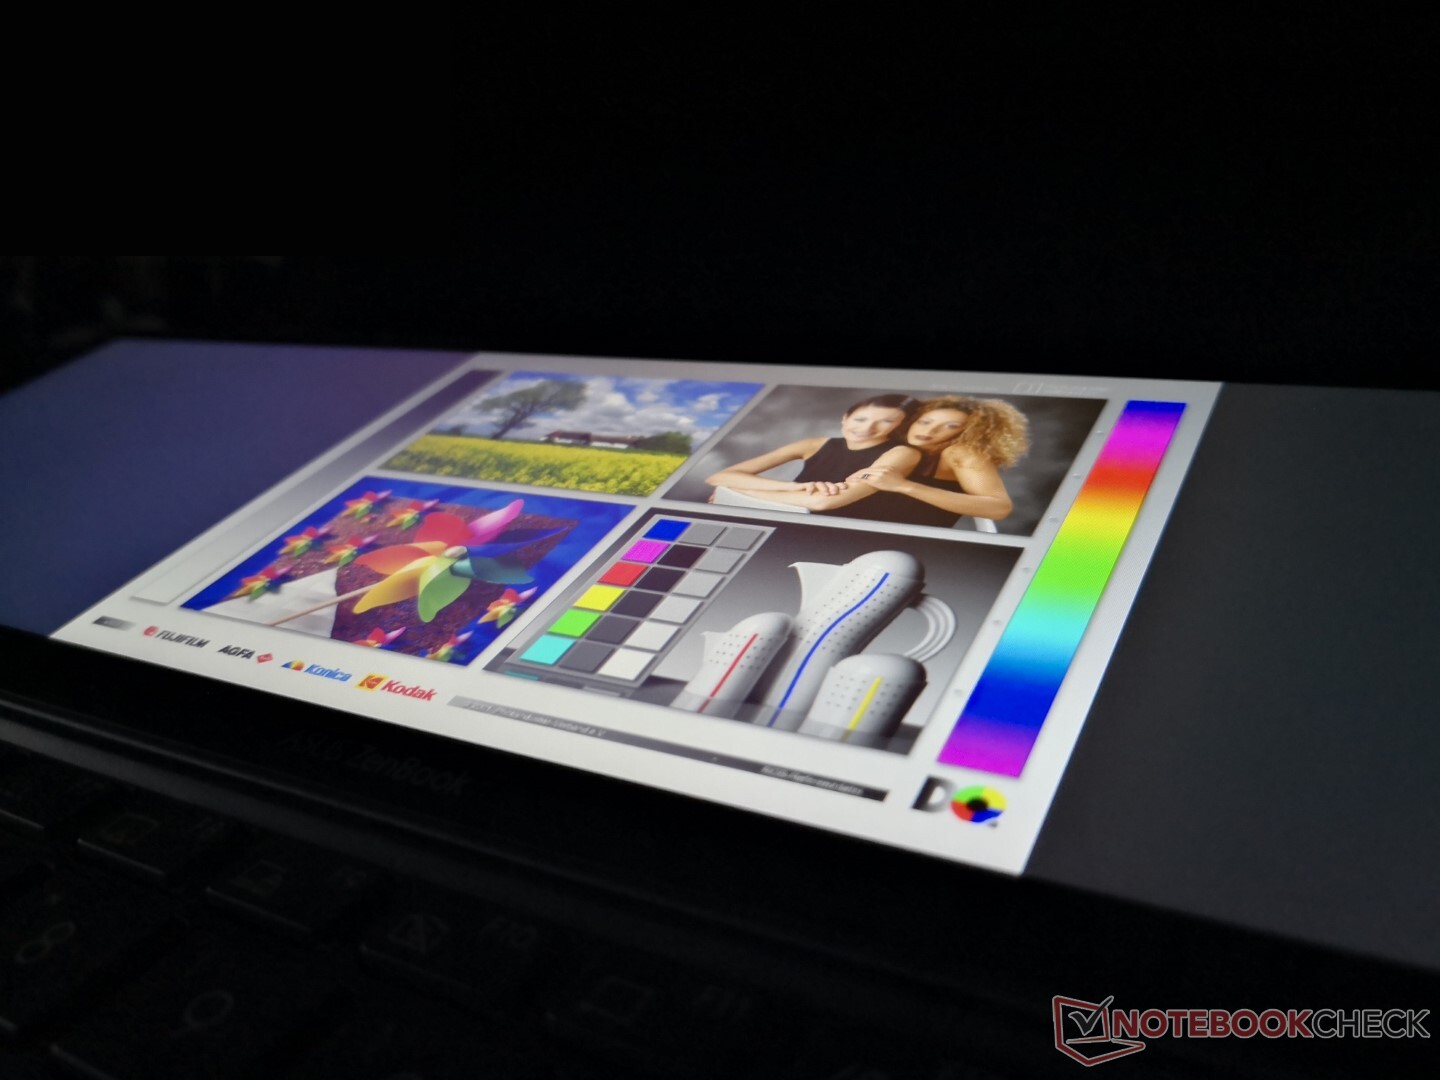
Visibility suffers greatly if outdoors despite the bump in brightness. Additionally, our test unit suffers from heavy uneven backlight bleeding along the top right corner as shown by the picture below.
Asus says any ScreenPad suggestions or potential app developers should contact asc_support@asus.com.
| ScreenPad Plus | |
| Response Time Grey 50% / Grey 80% | 45.6 ms combined |
| Response Time Black / White * | 40.4 ms combined |
| Brightness Middle | 399.8 nits (354.4 if on battery power) |
| Contrast | 1176:1 |
| Colorchecker DeltaE2000 | 4.18 |
| Colorchecker DeltaE2000 max. | 8.86 |
| Colorchecker DeltaE2000 calibrated | 4.00 |
| Greyscale DeltaE2000 | 1.4 |
| Gamma | 2.22 |
| CCT | 6435 |
| Color Space (Percent of AdobeRGB 1998) | 37.9 percent |
| Color Space (Percent of sRGB) | 59.8 percent |

Performance
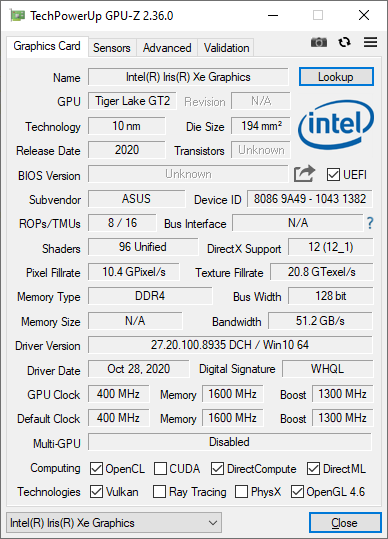
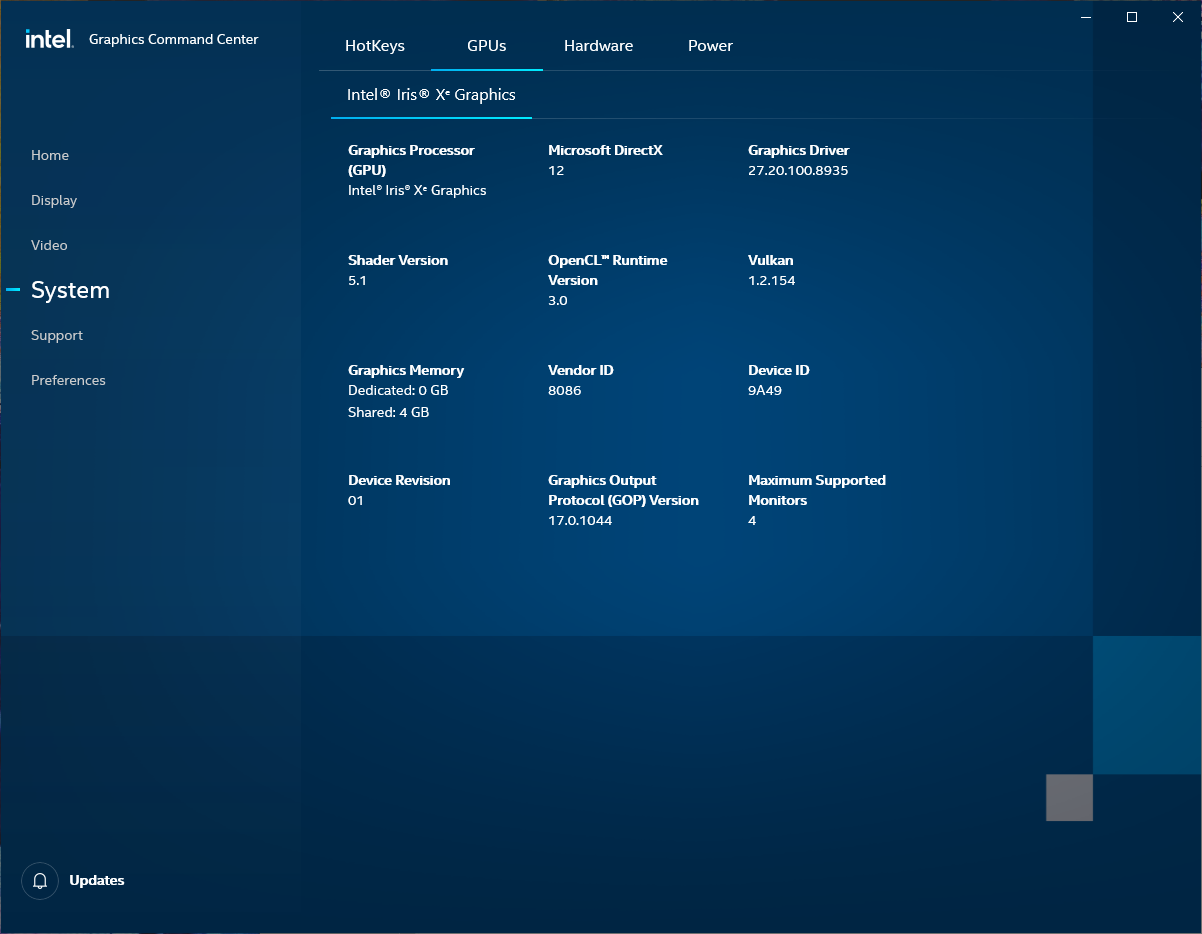
Configurations max out at the Core i7-1165G7 with no AMD Ryzen SKUs since this is an Intel Evo product. Nonetheless, the GeForce MX450 is optional should users want more graphics horsepower. It's interesting to see an Nvidia option but no Intel Xe Max option unlike on the recent Dell Inspiron 7506 2-in-1.
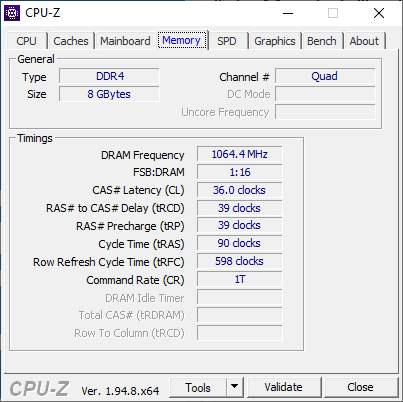
RAM is soldered and so buyers should select their configurations carefully.
Our system was set to Performance mode via the MyAsus application prior to running all performance benchmarks below for the highest possible scores. We recommend owners become familiar with the Asus software since almost all features and vendor updates can be toggled here.

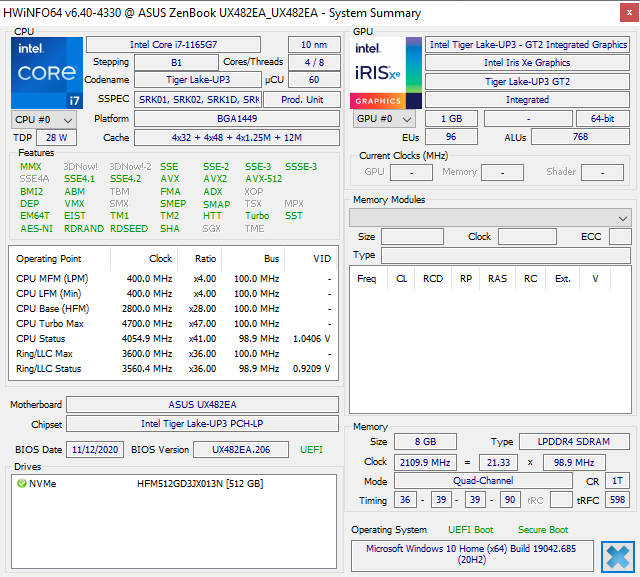
Processor
CPU performance is better than expected at 15 percent higher than the average Core i7-1165G7 in our database. This delta is wide enough to outperform even the more expensive Core i7-1185G7 as found on the new MSI Prestige 14 Evo or Dell XPS 13 9310. Performance sustainability is also good with no major dips in clock rates over time as shown by our CineBench R15 xT loop graph below.
Note that the Core i5-1135G7 is only about 10 percent slower than the Core i7-1165G7 meaning users won't see that big of a CPU performance difference by going with the less expensive Core i5 option.
Cinebench R15: CPU Multi 64Bit | CPU Single 64Bit
Blender: v2.79 BMW27 CPU
7-Zip 18.03: 7z b 4 -mmt1 | 7z b 4
Geekbench 5.5: Single-Core | Multi-Core
HWBOT x265 Benchmark v2.2: 4k Preset
LibreOffice : 20 Documents To PDF
R Benchmark 2.5: Overall mean
Cinebench R15: CPU Multi 64Bit | CPU Single 64Bit
Blender: v2.79 BMW27 CPU
7-Zip 18.03: 7z b 4 -mmt1 | 7z b 4
Geekbench 5.5: Single-Core | Multi-Core
HWBOT x265 Benchmark v2.2: 4k Preset
LibreOffice : 20 Documents To PDF
R Benchmark 2.5: Overall mean
* ... smaller is better
System Performance
PCMark benchmarks are where we expect them to be relative to other laptops with the same Core i7-1165G7 CPU and integrated Iris Xe graphics. Though we didn't experience any software or hardware issues with our test unit, Asus has integrated a lot of software overlays and settings that users may not like. Wireless, for example, will automatically connect to any available network even if the "connect automatically" Windows box is unchecked.
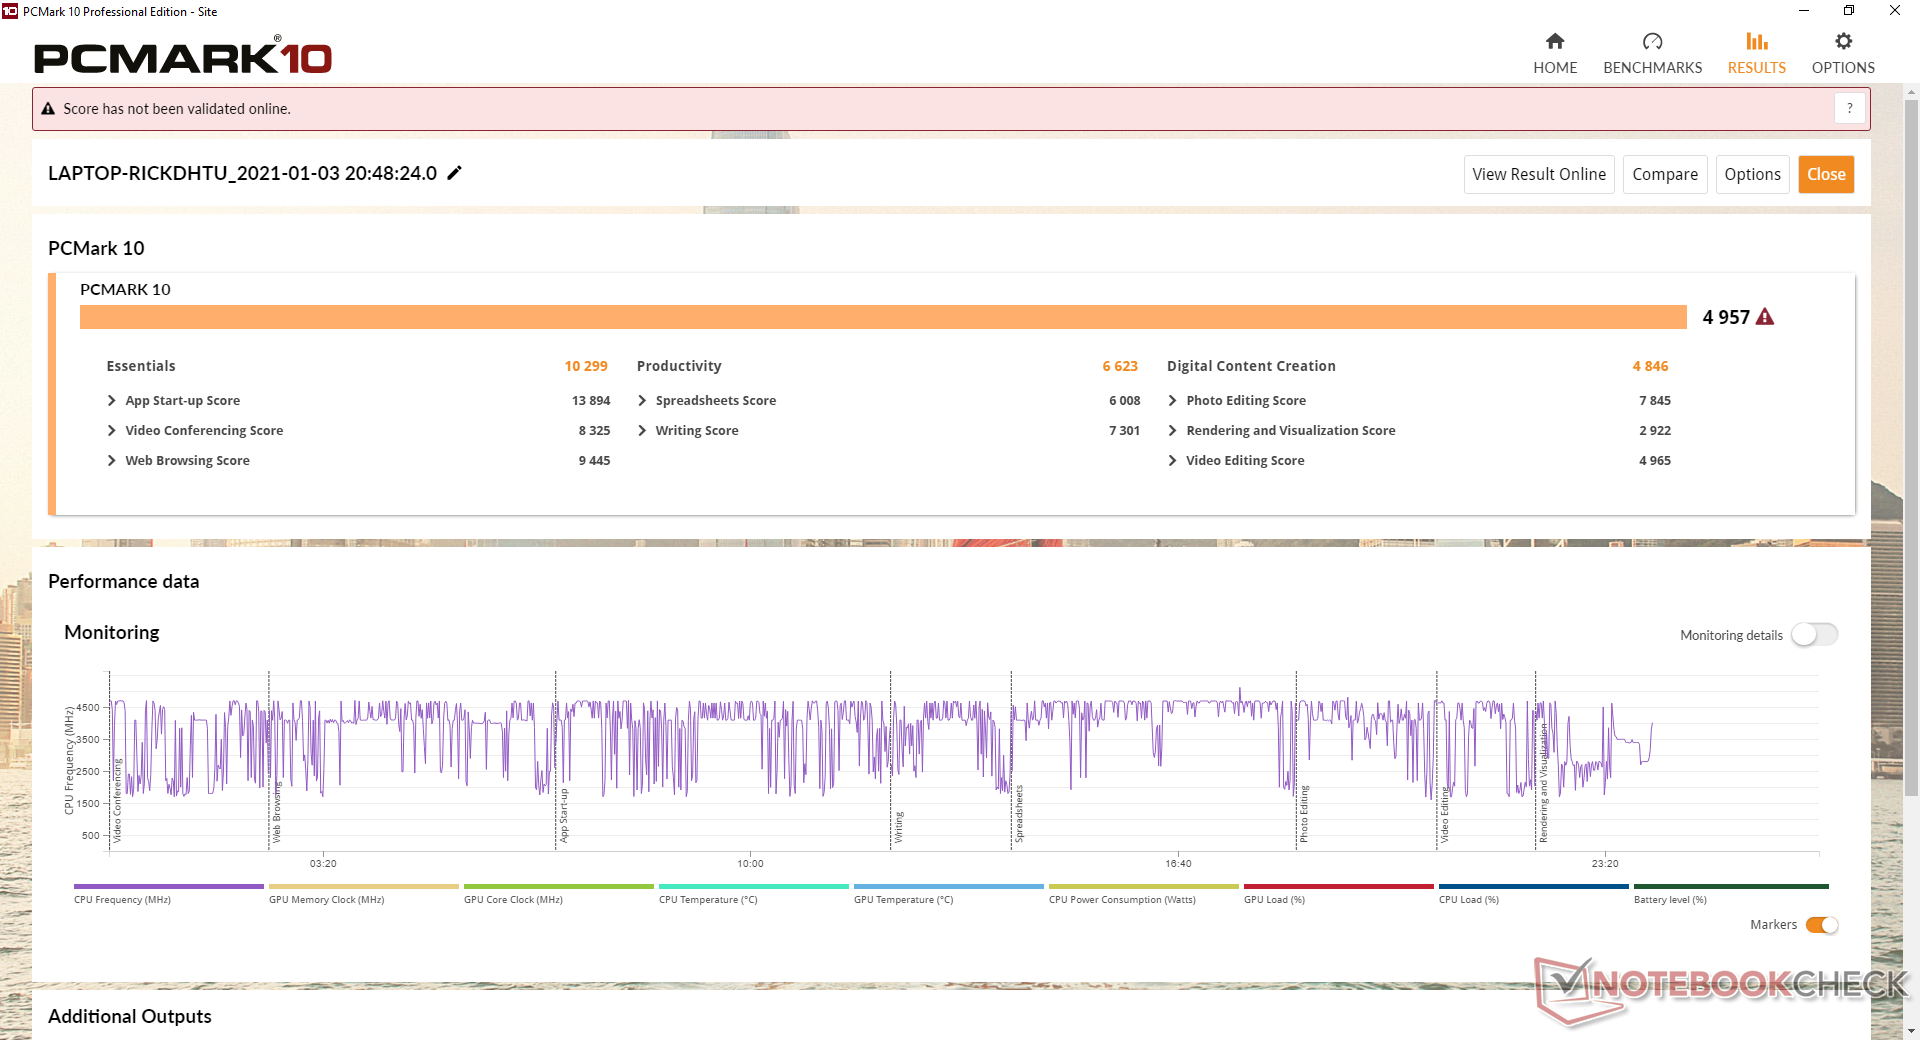
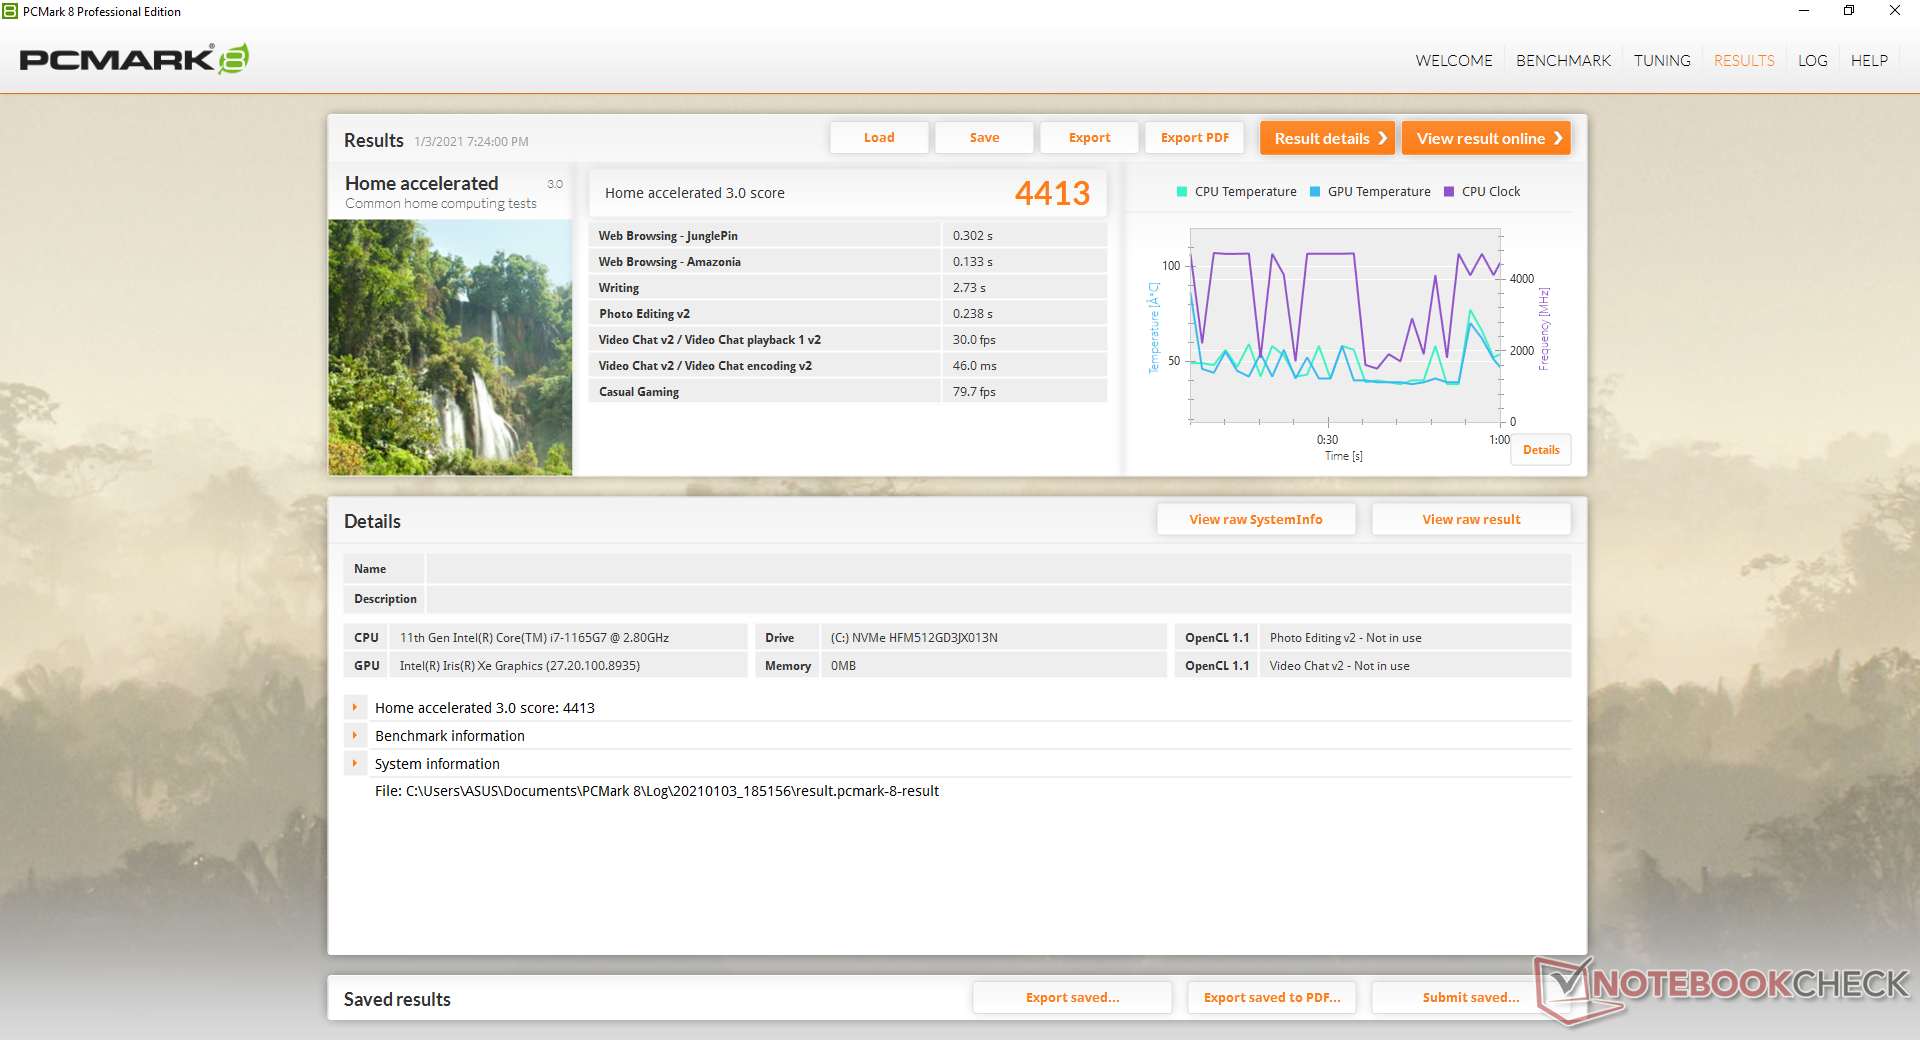
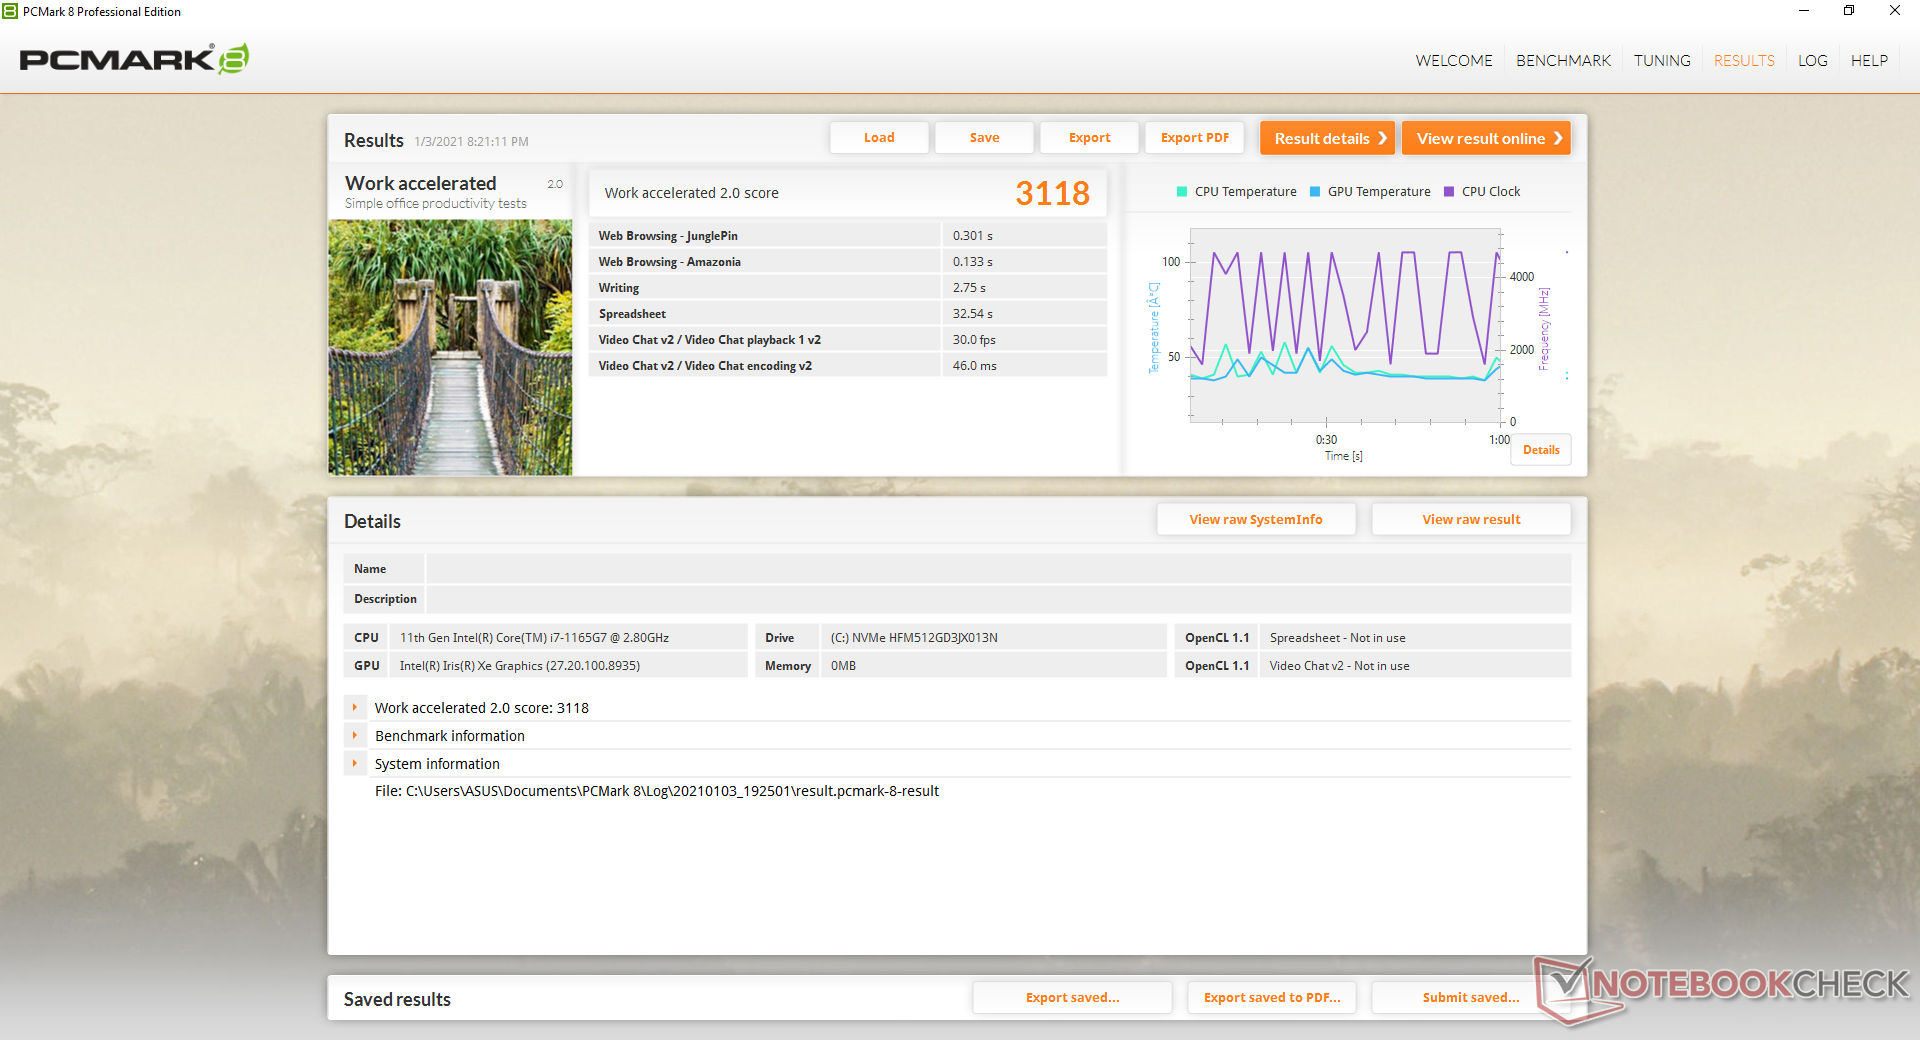
| PCMark 8 Home Score Accelerated v2 | 4413 points | |
| PCMark 8 Work Score Accelerated v2 | 3118 points | |
| PCMark 10 Score | 4957 points | |
Help | ||
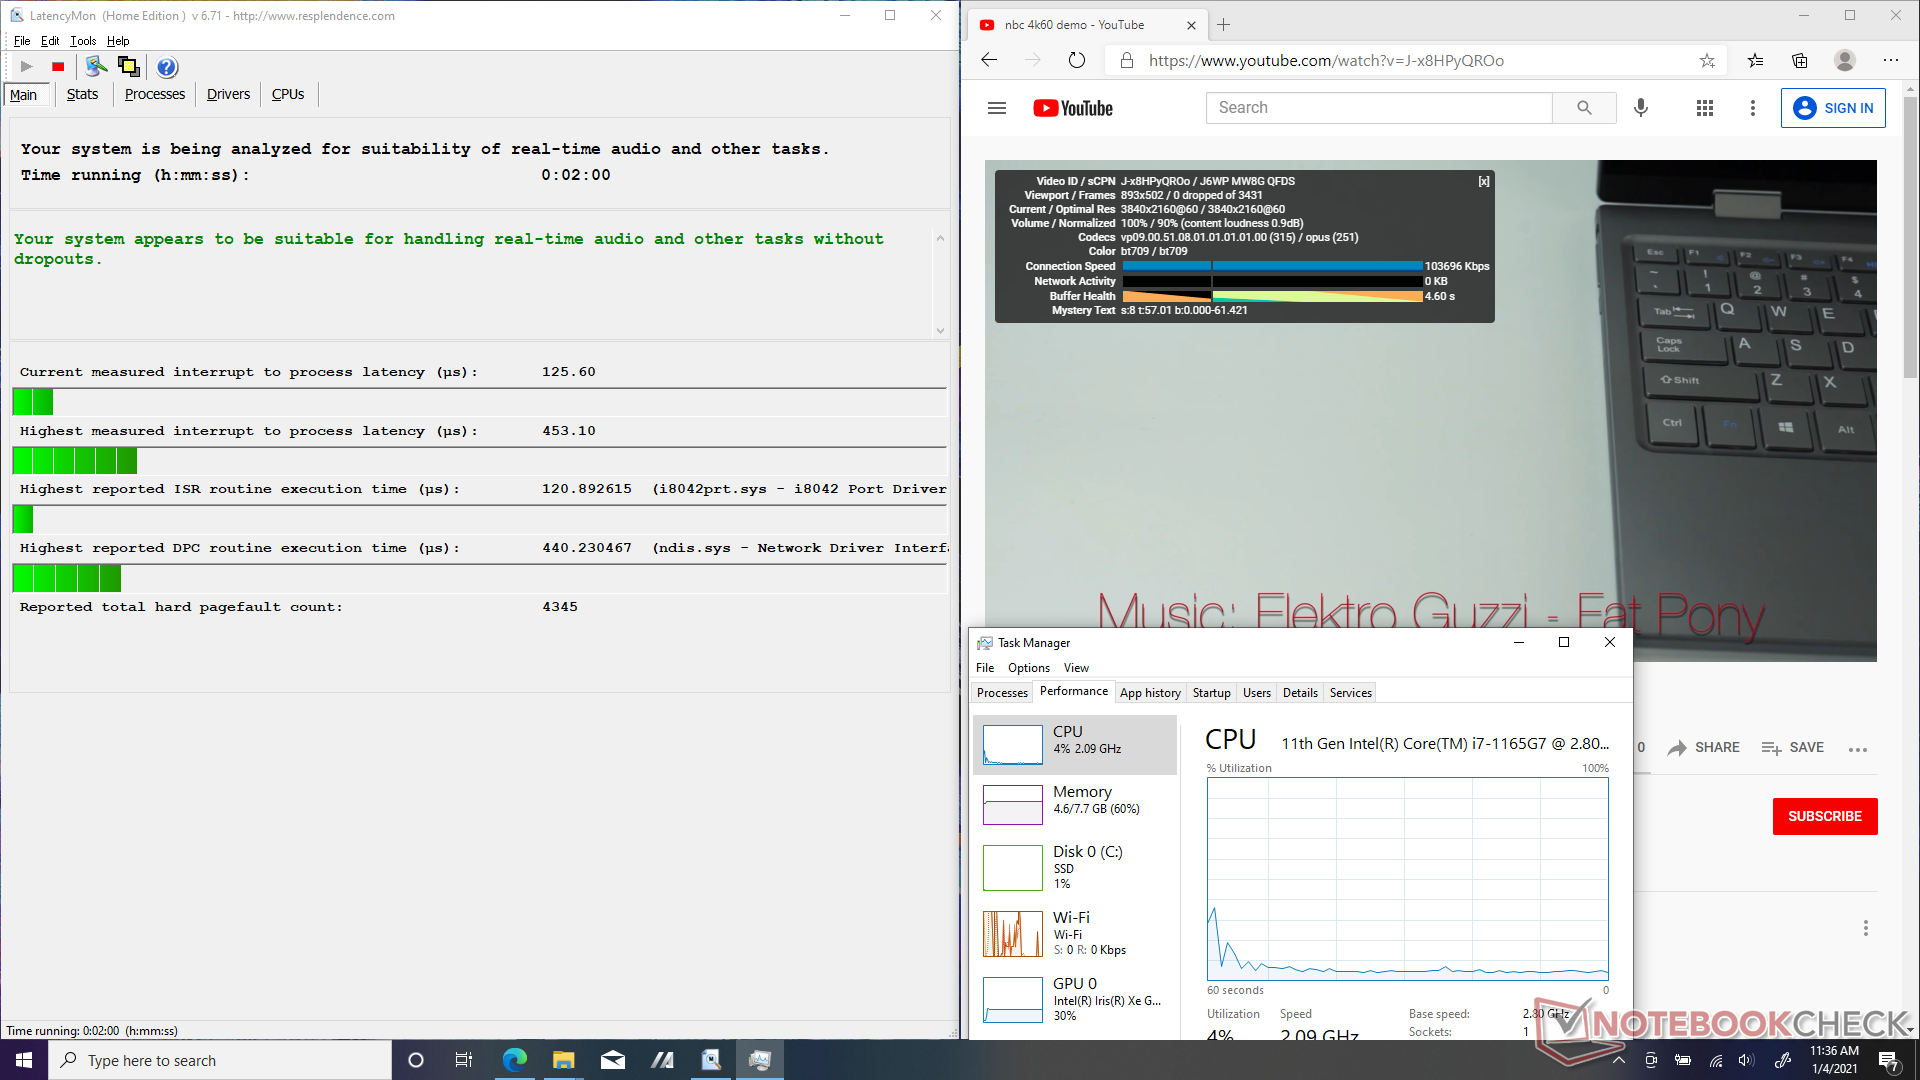
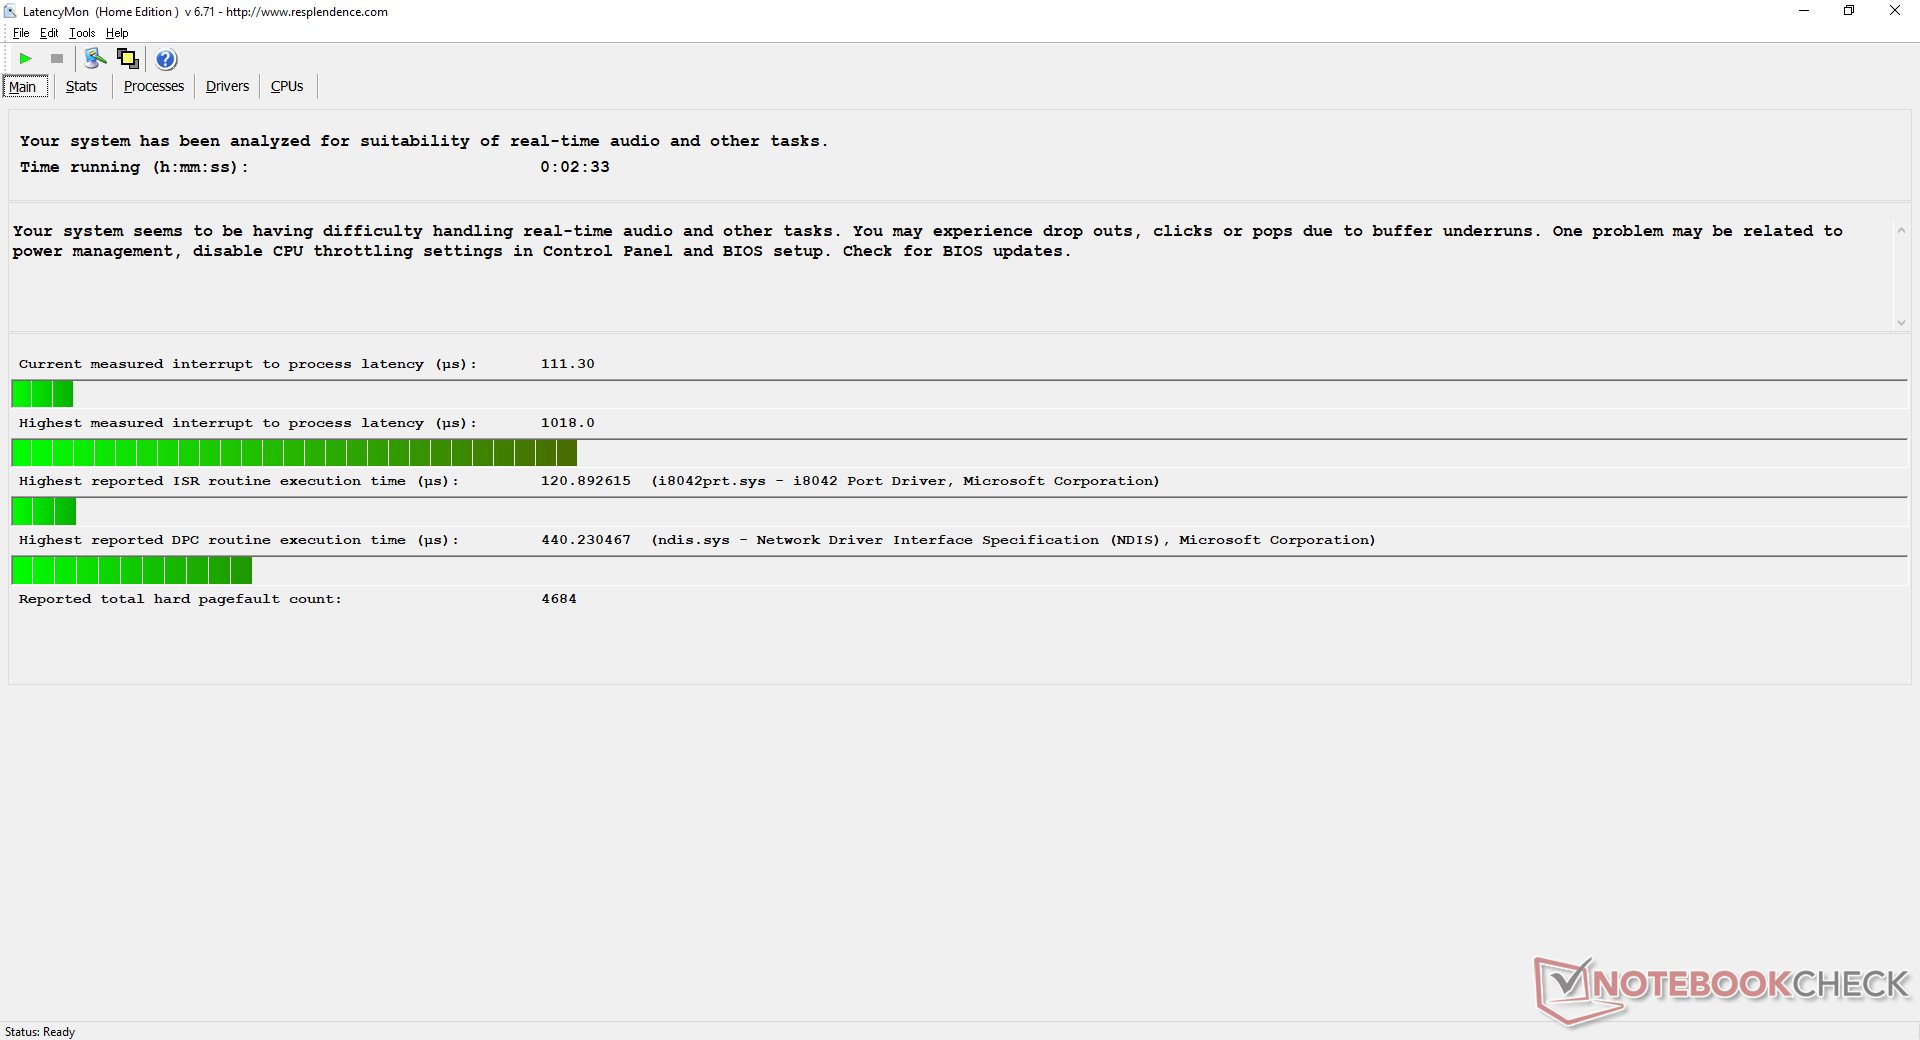
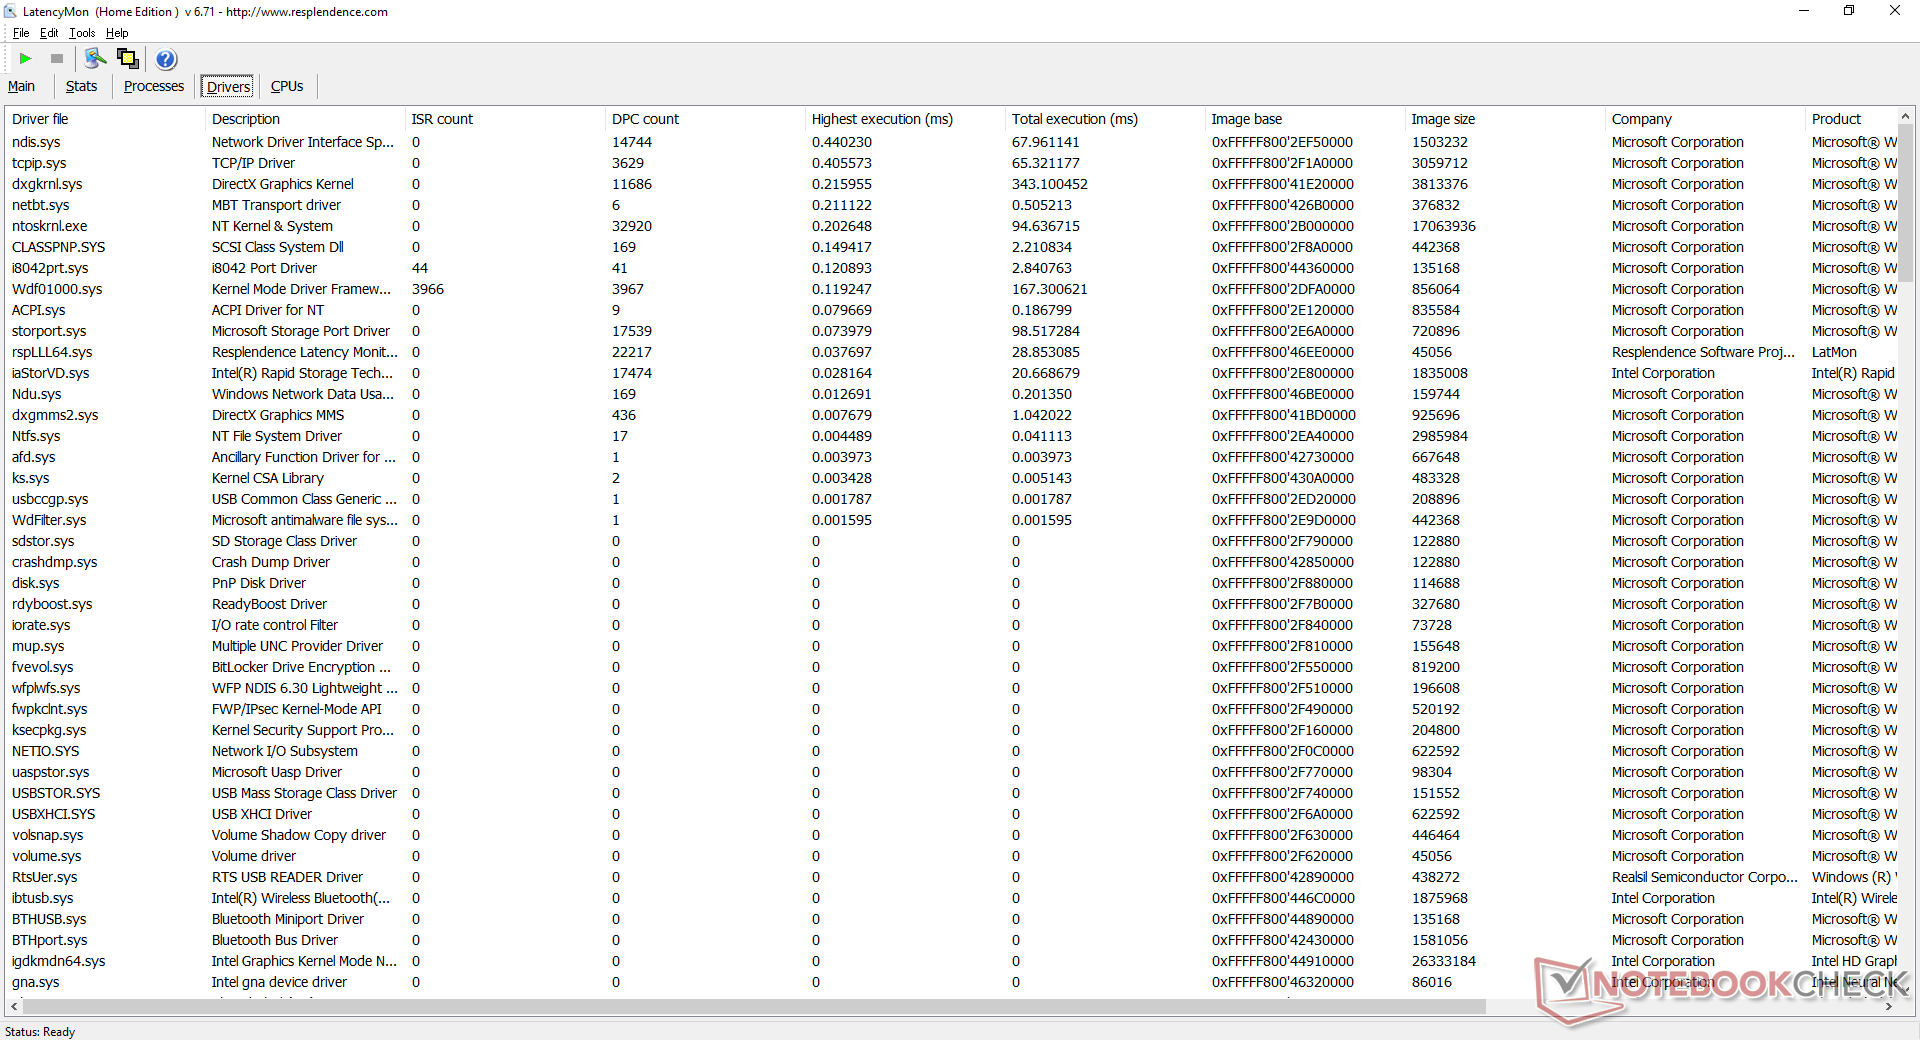
DPC Latency
LatencyMon shows no DPC latency issues when browsing our homepage with multiple tabs open. When Prime95 is initiated, however, the interrupt to process latency would spike. 4K UHD video playback at 60 FPS is otherwise smooth and with no dropped frames during our minute-long YouTube test.
| DPC Latencies / LatencyMon - interrupt to process latency (max), Web, Youtube, Prime95 | |
| Asus ZenBook Duo UX481FL | |
| Lenovo Yoga 9i 14ITL5 | |
| MSI Prestige 14 Evo A11M-005 | |
| Asus VivoBook S14 S433FL | |
| Asus ZenBook Duo 14 UX482EA | |
| Asus Zenbook 14 UX435EG | |
* ... smaller is better
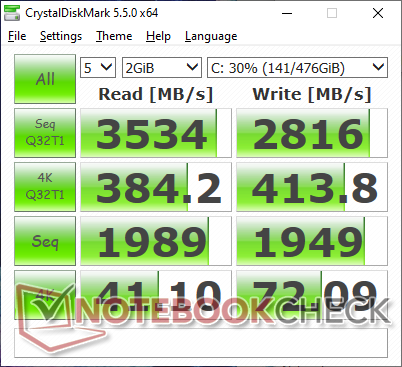
Storage Devices
Though our test unit comes with a 512 GB SK Hynix PCIe 3 x4 NVMe SSD, users may receive Intel 660p or Samsung SSDs instead depending on the retailer or region. Benchmarks show this to be a high-end SSD with transfer rates reaching north of 3000 MB/s similar to the Samsung PM981a.
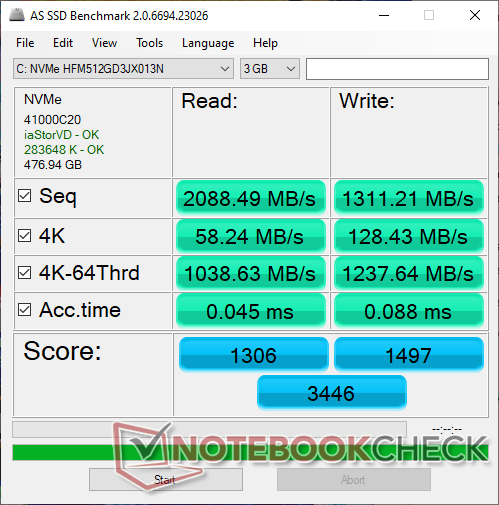
| Asus ZenBook Duo 14 UX482EA SK Hynix HFM512GD3JX013N | MSI Prestige 14 Evo A11M-005 Phison 512GB SM280512GKBB4S-E162 | Lenovo Yoga 9i 14ITL5 Samsung SSD PM981a MZVLB256HBHQ | Asus Zenbook 14 UX435EG Samsung PM981a MZVLB1T0HBLR | Asus VivoBook S14 S433FL Intel Optane Memory H10 with Solid State Storage 32GB + 512GB HBRPEKNX0202A(L/H) | Asus ZenBook Duo UX481FL Intel SSD 660p 1TB SSDPEKNW010T8 | |
|---|---|---|---|---|---|---|
| AS SSD | 35% | -18% | 36% | -44% | -22% | |
| Seq Read (MB/s) | 2088 | 3760 80% | 2177 4% | 2861 37% | 957 -54% | 1237 -41% |
| Seq Write (MB/s) | 1311 | 2335 78% | 813 -38% | 2837 116% | 353.1 -73% | 1069 -18% |
| 4K Read (MB/s) | 58.2 | 66.8 15% | 53.2 -9% | 60.3 4% | 62.4 7% | 52.1 -10% |
| 4K Write (MB/s) | 128.4 | 184.3 44% | 180 40% | 164.2 28% | 122.8 -4% | 134.7 5% |
| 4K-64 Read (MB/s) | 1039 | 1801 73% | 531 -49% | 1598 54% | 386.2 -63% | 585 -44% |
| 4K-64 Write (MB/s) | 1238 | 1754 42% | 398.5 -68% | 1572 27% | 605 -51% | 854 -31% |
| Access Time Read * (ms) | 0.045 | 0.135 -200% | 0.052 -16% | 0.046 -2% | 0.107 -138% | 0.05 -11% |
| Access Time Write * (ms) | 0.088 | 0.018 80% | 0.058 34% | 0.021 76% | 0.046 48% | 0.117 -33% |
| Score Read (Points) | 1306 | 2244 72% | 802 -39% | 1945 49% | 544 -58% | 761 -42% |
| Score Write (Points) | 1497 | 2172 45% | 660 -56% | 2020 35% | 763 -49% | 1095 -27% |
| Score Total (Points) | 3446 | 5500 60% | 1822 -47% | 4966 44% | 1581 -54% | 2255 -35% |
| Copy ISO MB/s (MB/s) | 2248 | 1962 -13% | 2414 7% | 1714 -24% | ||
| Copy Program MB/s (MB/s) | 559 | 522 -7% | 575 3% | 511 -9% | ||
| Copy Game MB/s (MB/s) | 1087 | 1258 16% | 1408 30% | 1187 9% | ||
| CrystalDiskMark 5.2 / 6 | 59% | 10% | 57% | 16% | 2% | |
| Write 4K (MB/s) | 72.1 | 248.4 245% | 139.6 94% | 211.8 194% | 124.9 73% | 140.7 95% |
| Read 4K (MB/s) | 41.1 | 56.4 37% | 37.3 -9% | 50.1 22% | 147.9 260% | 55.6 35% |
| Write Seq (MB/s) | 1949 | 2513 29% | 1827 -6% | 2938 51% | 753 -61% | 1415 -27% |
| Read Seq (MB/s) | 1989 | 2250 13% | 2253 13% | 2639 33% | 1223 -39% | 1516 -24% |
| Write 4K Q32T1 (MB/s) | 413.8 | 589 42% | 467.9 13% | 656 59% | 369.2 -11% | 474.5 15% |
| Read 4K Q32T1 (MB/s) | 384.2 | 696 81% | 366.7 -5% | 723 88% | 358.1 -7% | 403.4 5% |
| Write Seq Q32T1 (MB/s) | 2816 | 2515 -11% | 2349 -17% | 3022 7% | 1057 -62% | 1796 -36% |
| Read Seq Q32T1 (MB/s) | 3534 | 4915 39% | 3540 0% | 3561 1% | 2738 -23% | 1913 -46% |
| Total Average (Program / Settings) | 47% /
45% | -4% /
-8% | 47% /
44% | -14% /
-19% | -10% /
-13% |
* ... smaller is better

Disk Throttling: DiskSpd Read Loop, Queue Depth 8
GPU Performance
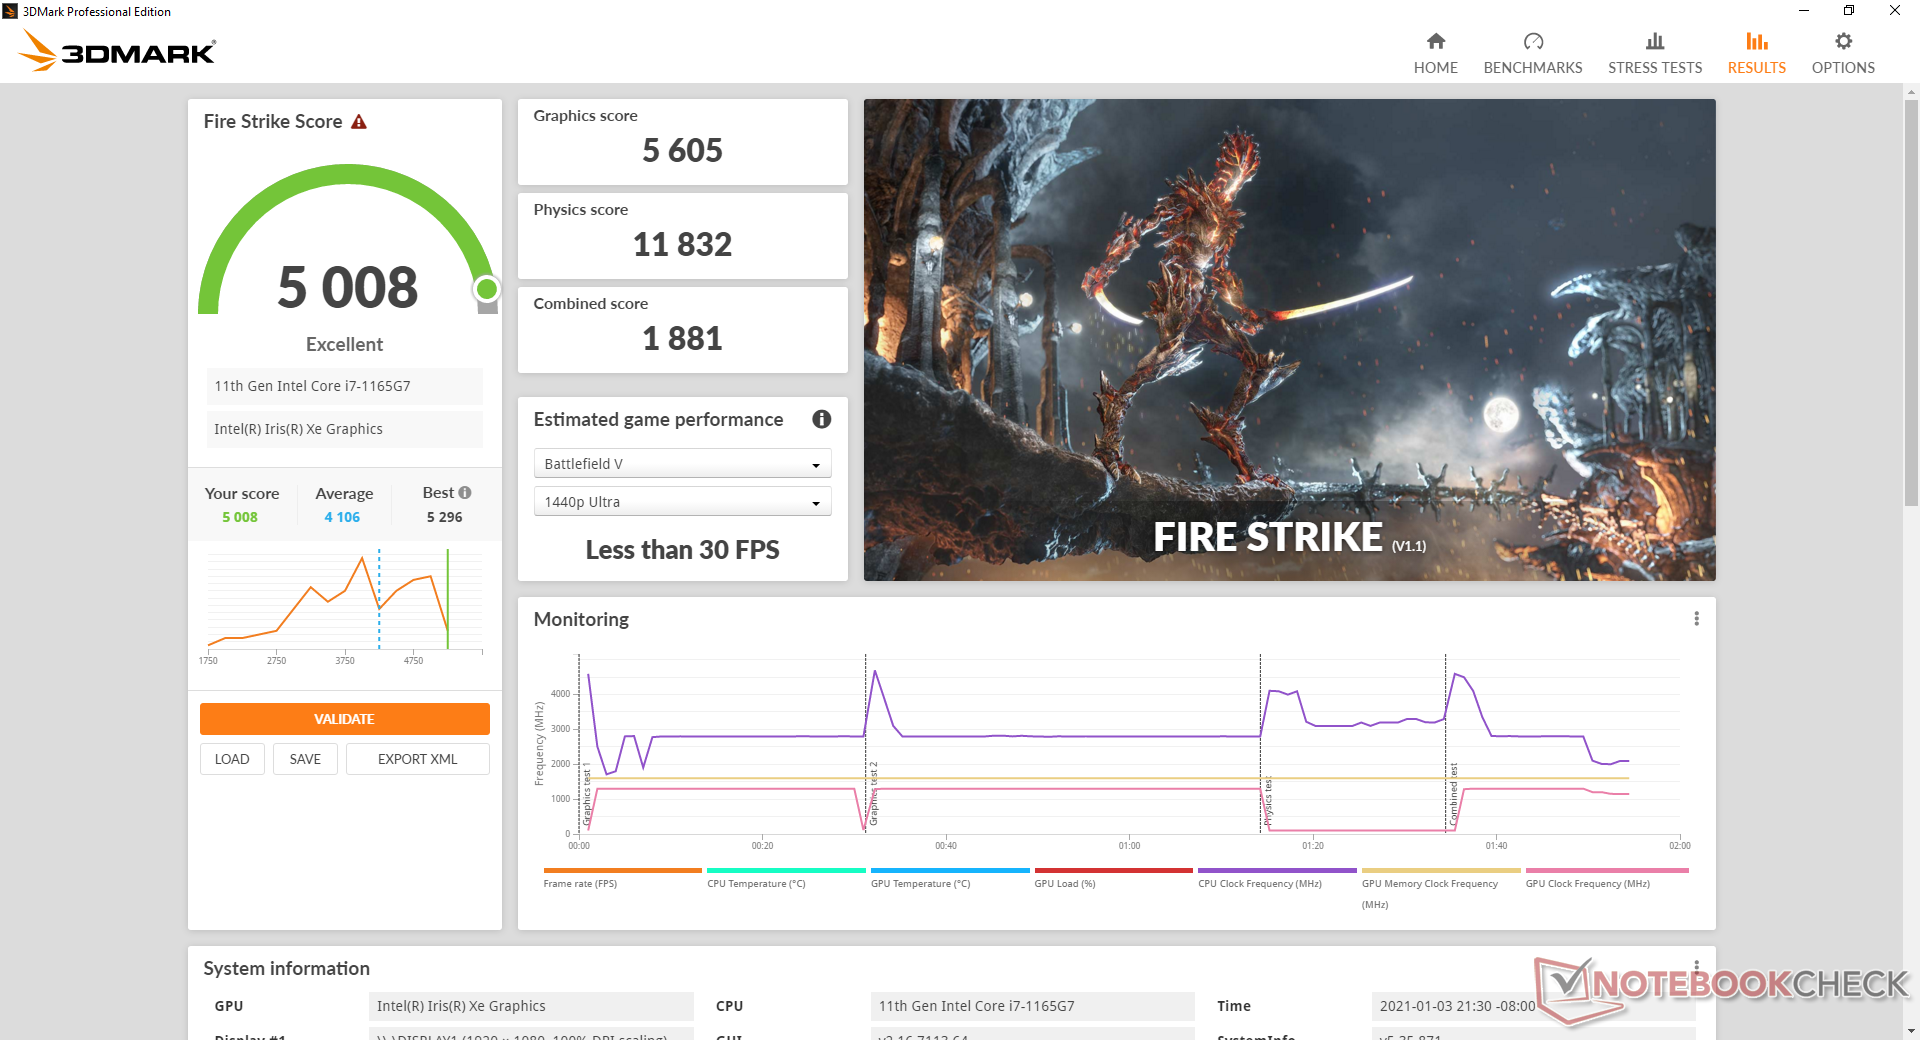
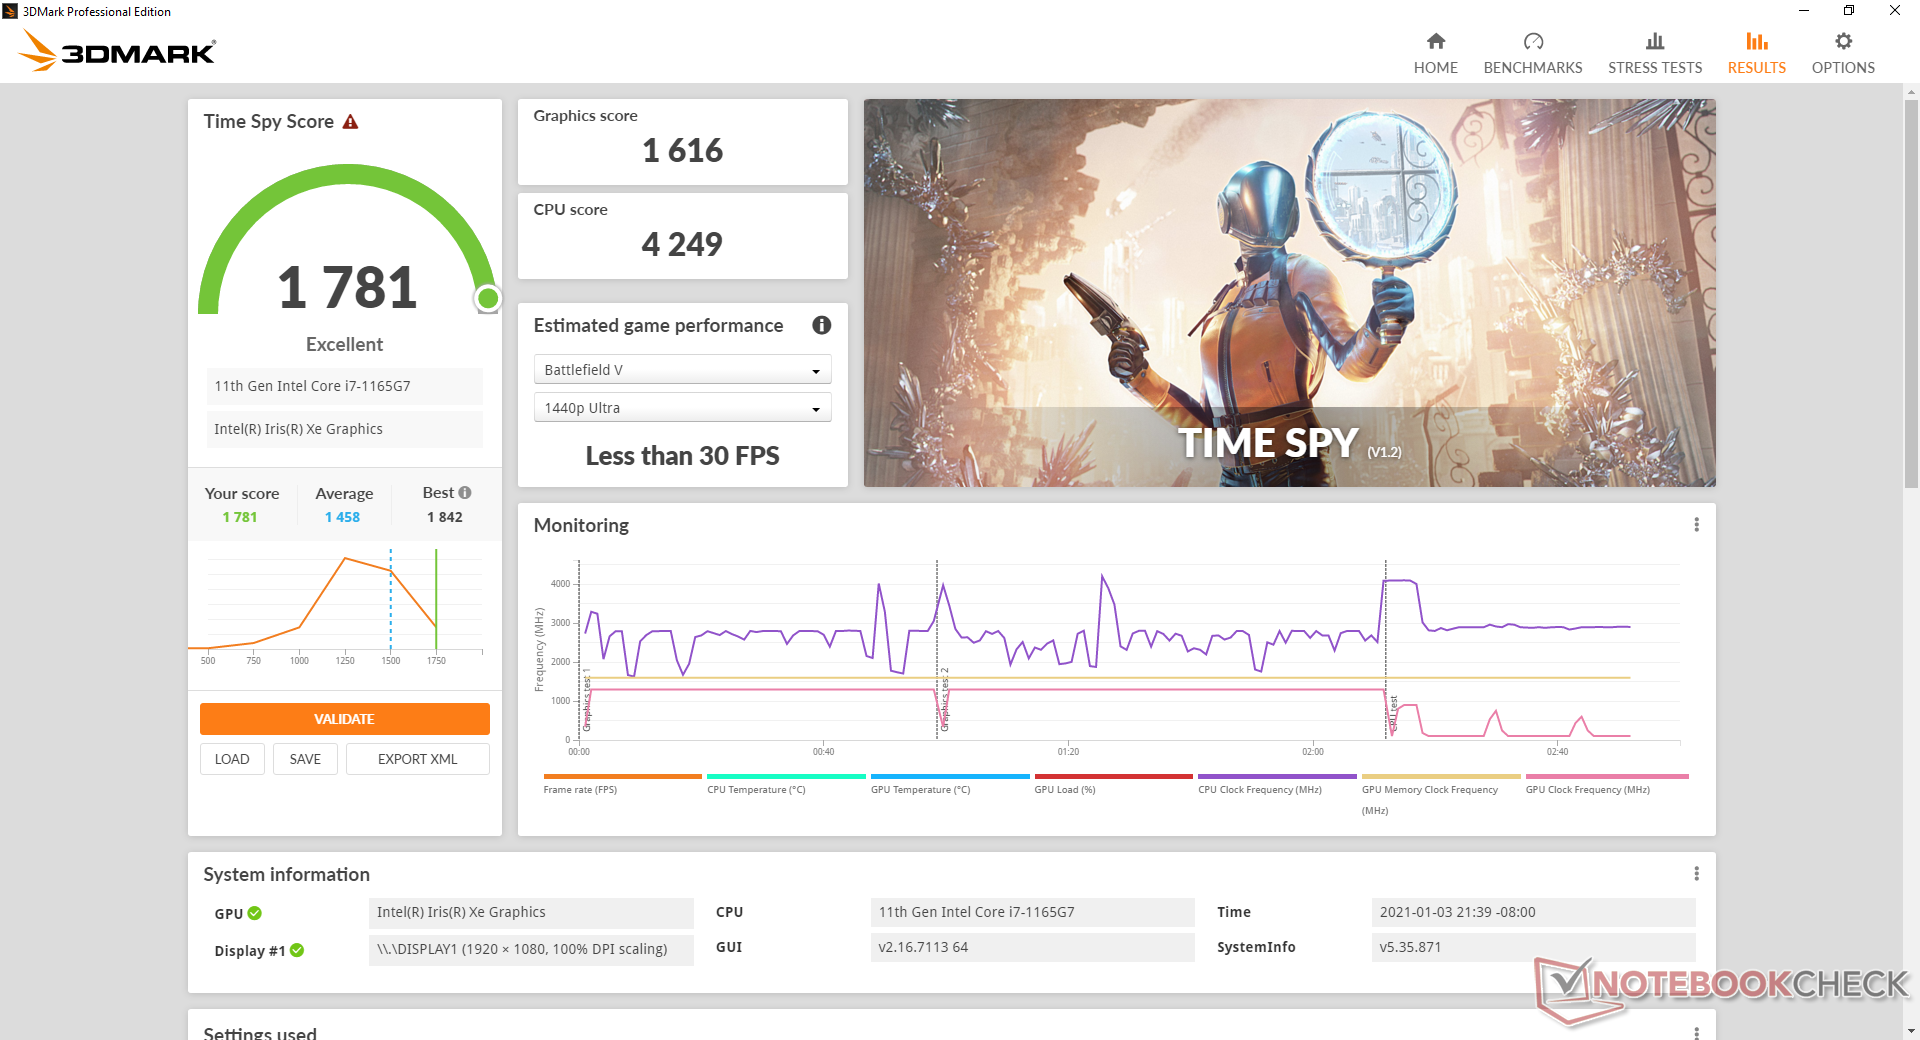
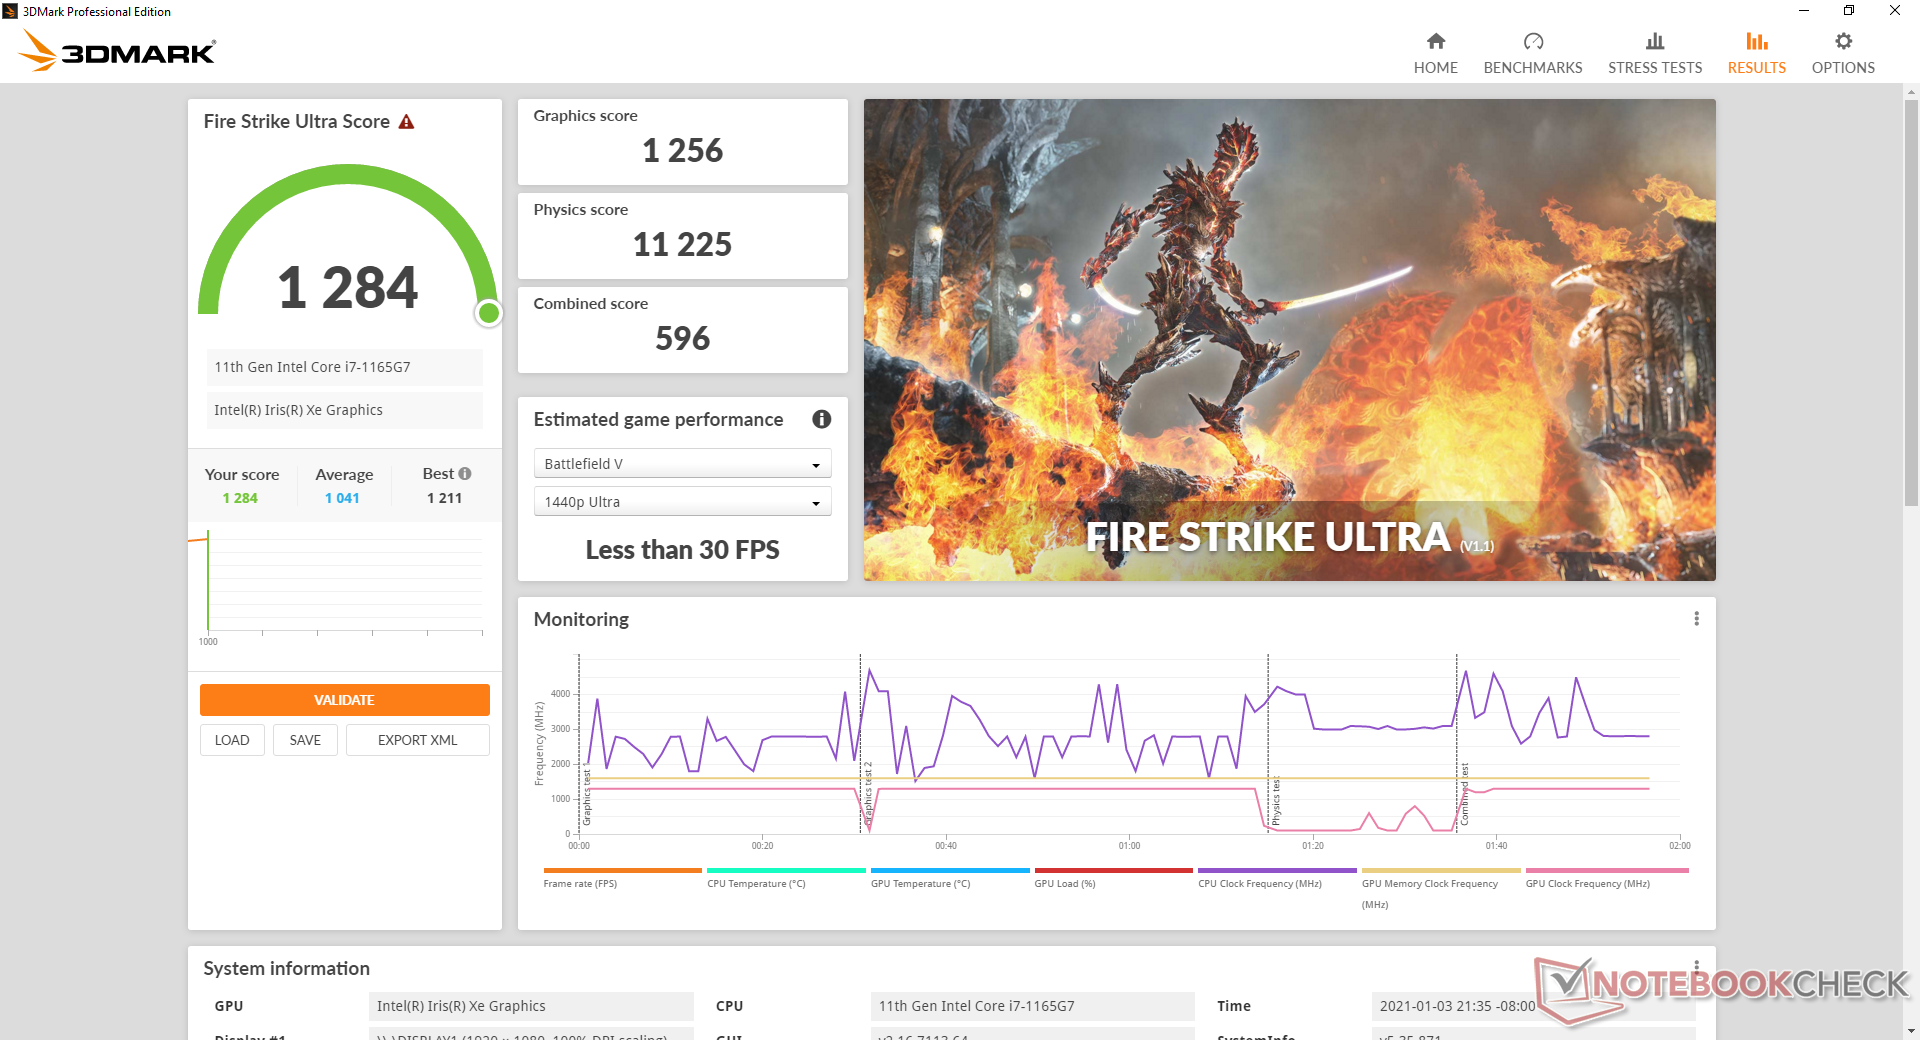
Raw graphics performance is excellent according to 3DMark benchmarks with scores that are higher than the GeForce MX350. Nonetheless, actual gaming performance will vary wildly as we've already proven. This means that users upgrading to the optional GeForce MX450 will see better overall gaming performance than the Iris Xe even if their 3DMark numbers can be neck-to-neck.
Opting for the lesser Core i5-1135G7 SKU with the Iris Xe 80 EUs will entail a 15 to 20 percent GPU performance penalty from the Core i7-1165G7 Xe 96 EUs.
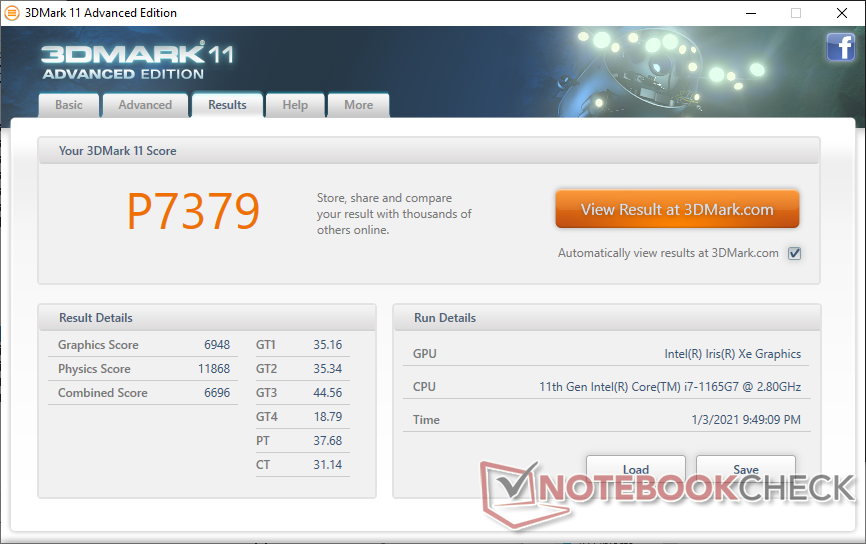
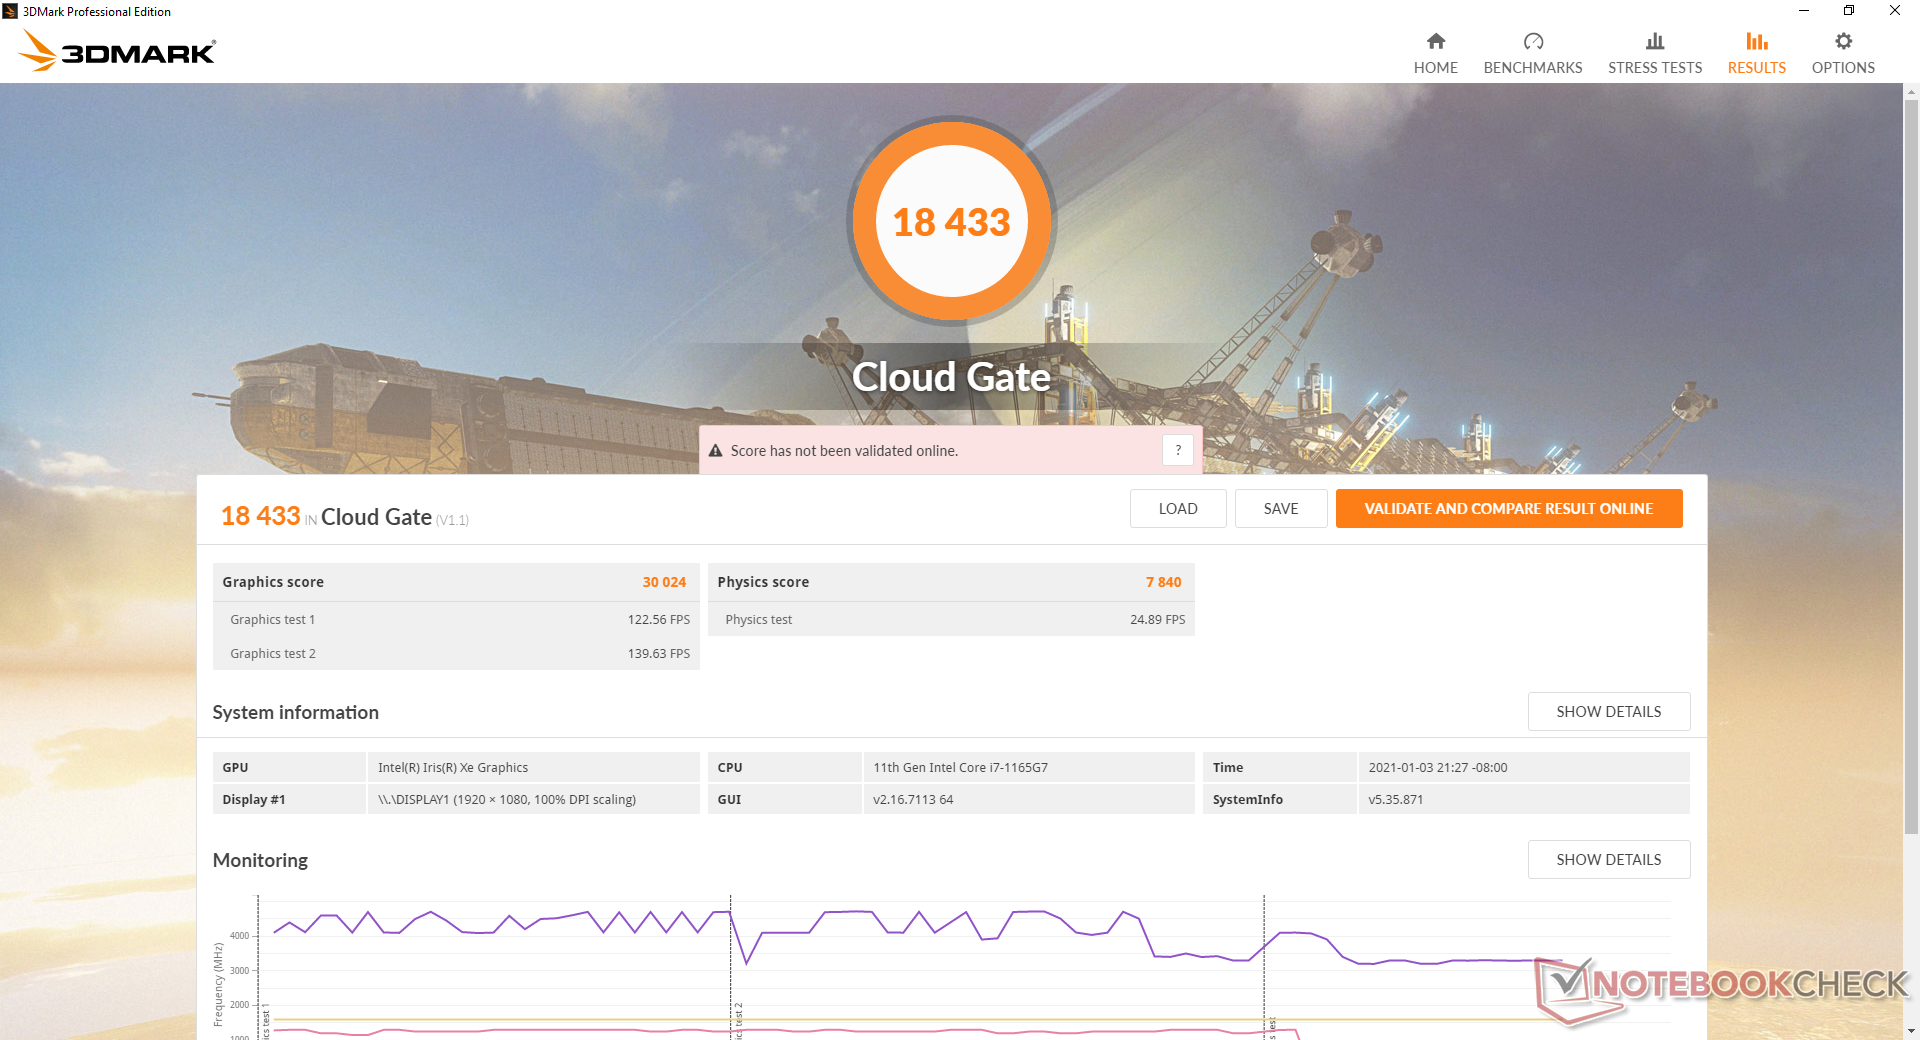
| 3DMark 11 Performance | 7379 points | |
| 3DMark Cloud Gate Standard Score | 18433 points | |
| 3DMark Fire Strike Score | 5008 points | |
| 3DMark Time Spy Score | 1781 points | |
Help | ||
| low | med. | high | ultra | |
|---|---|---|---|---|
| The Witcher 3 (2015) | 95.1 | 57.5 | 32 | 14.4 |
| Dota 2 Reborn (2015) | 83.2 | 74.7 | 58.6 | 49.8 |
| Final Fantasy XV Benchmark (2018) | 45.3 | 24.6 | 14.6 | |
| X-Plane 11.11 (2018) | 46.1 | 43.8 | 33.7 |
Emissions
System Noise
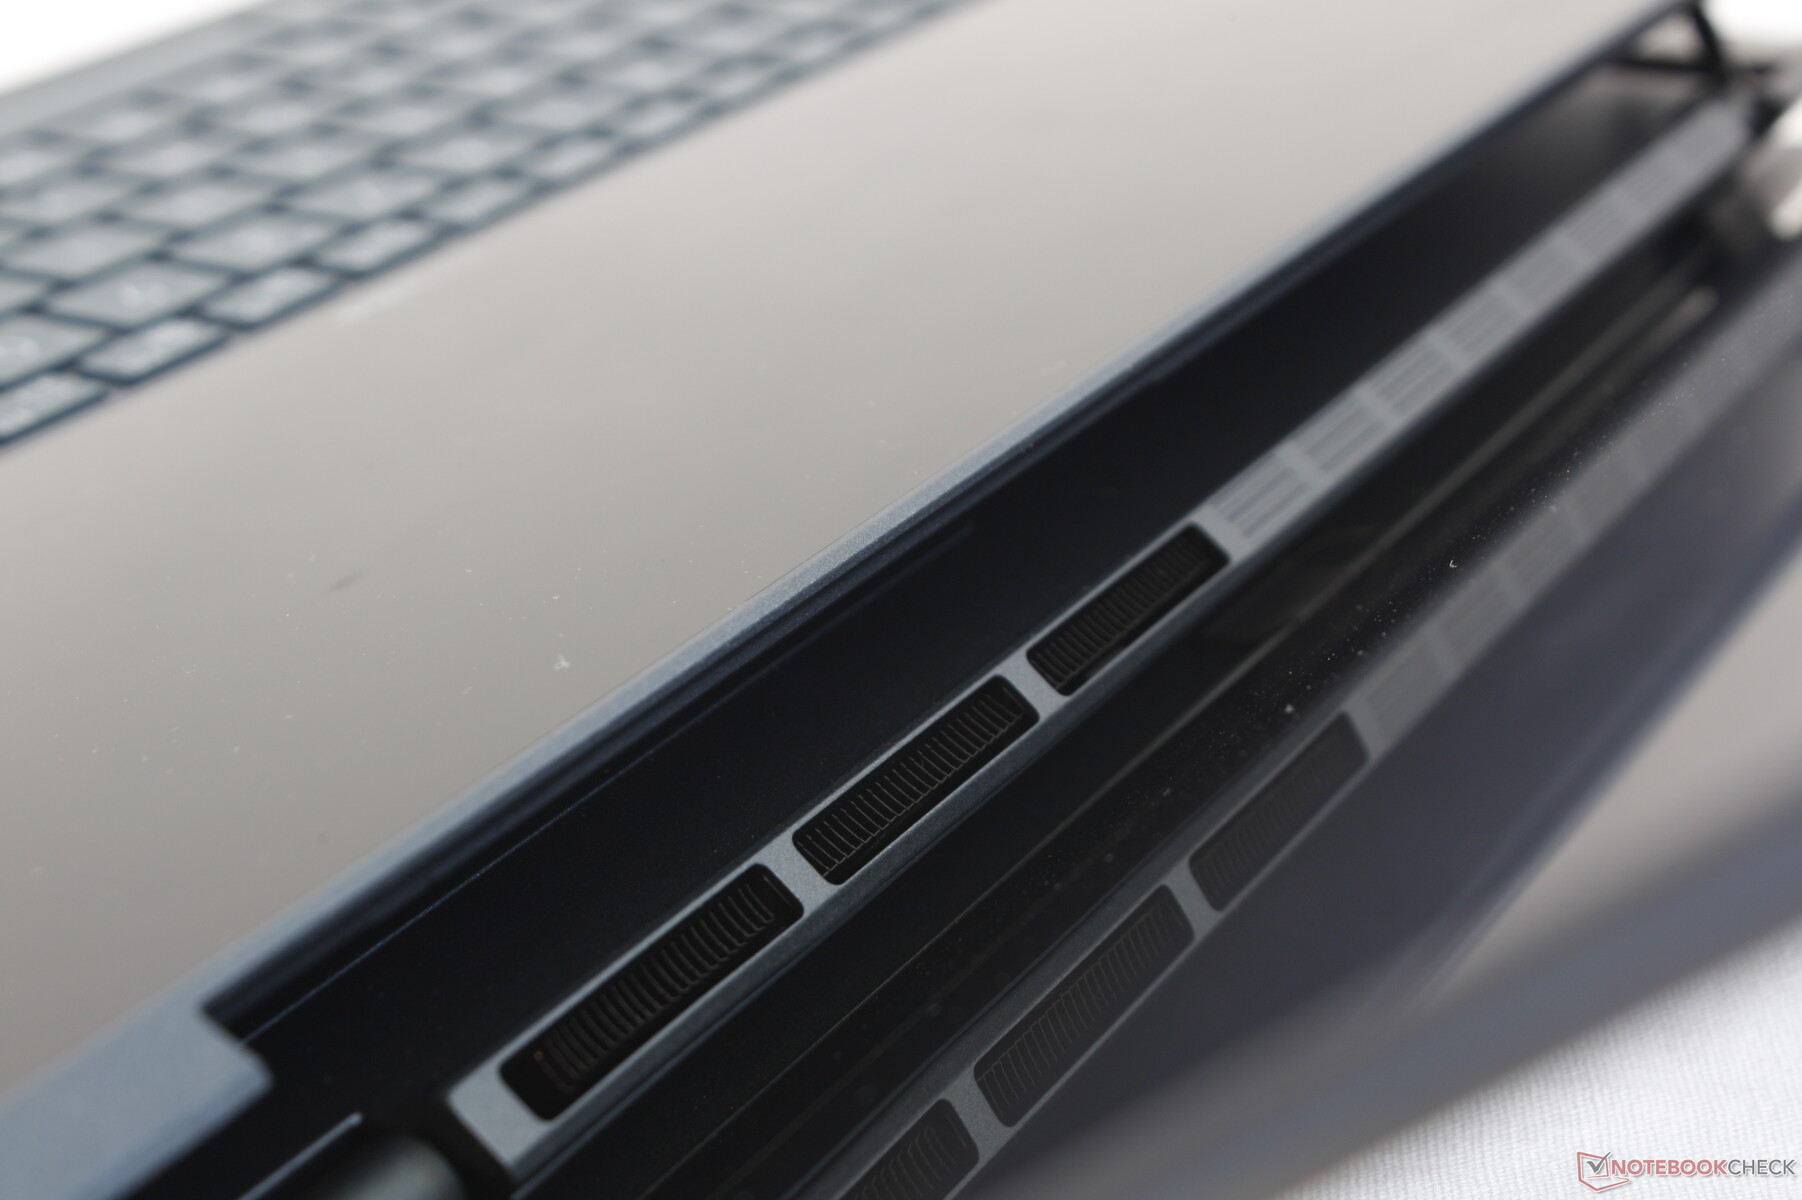
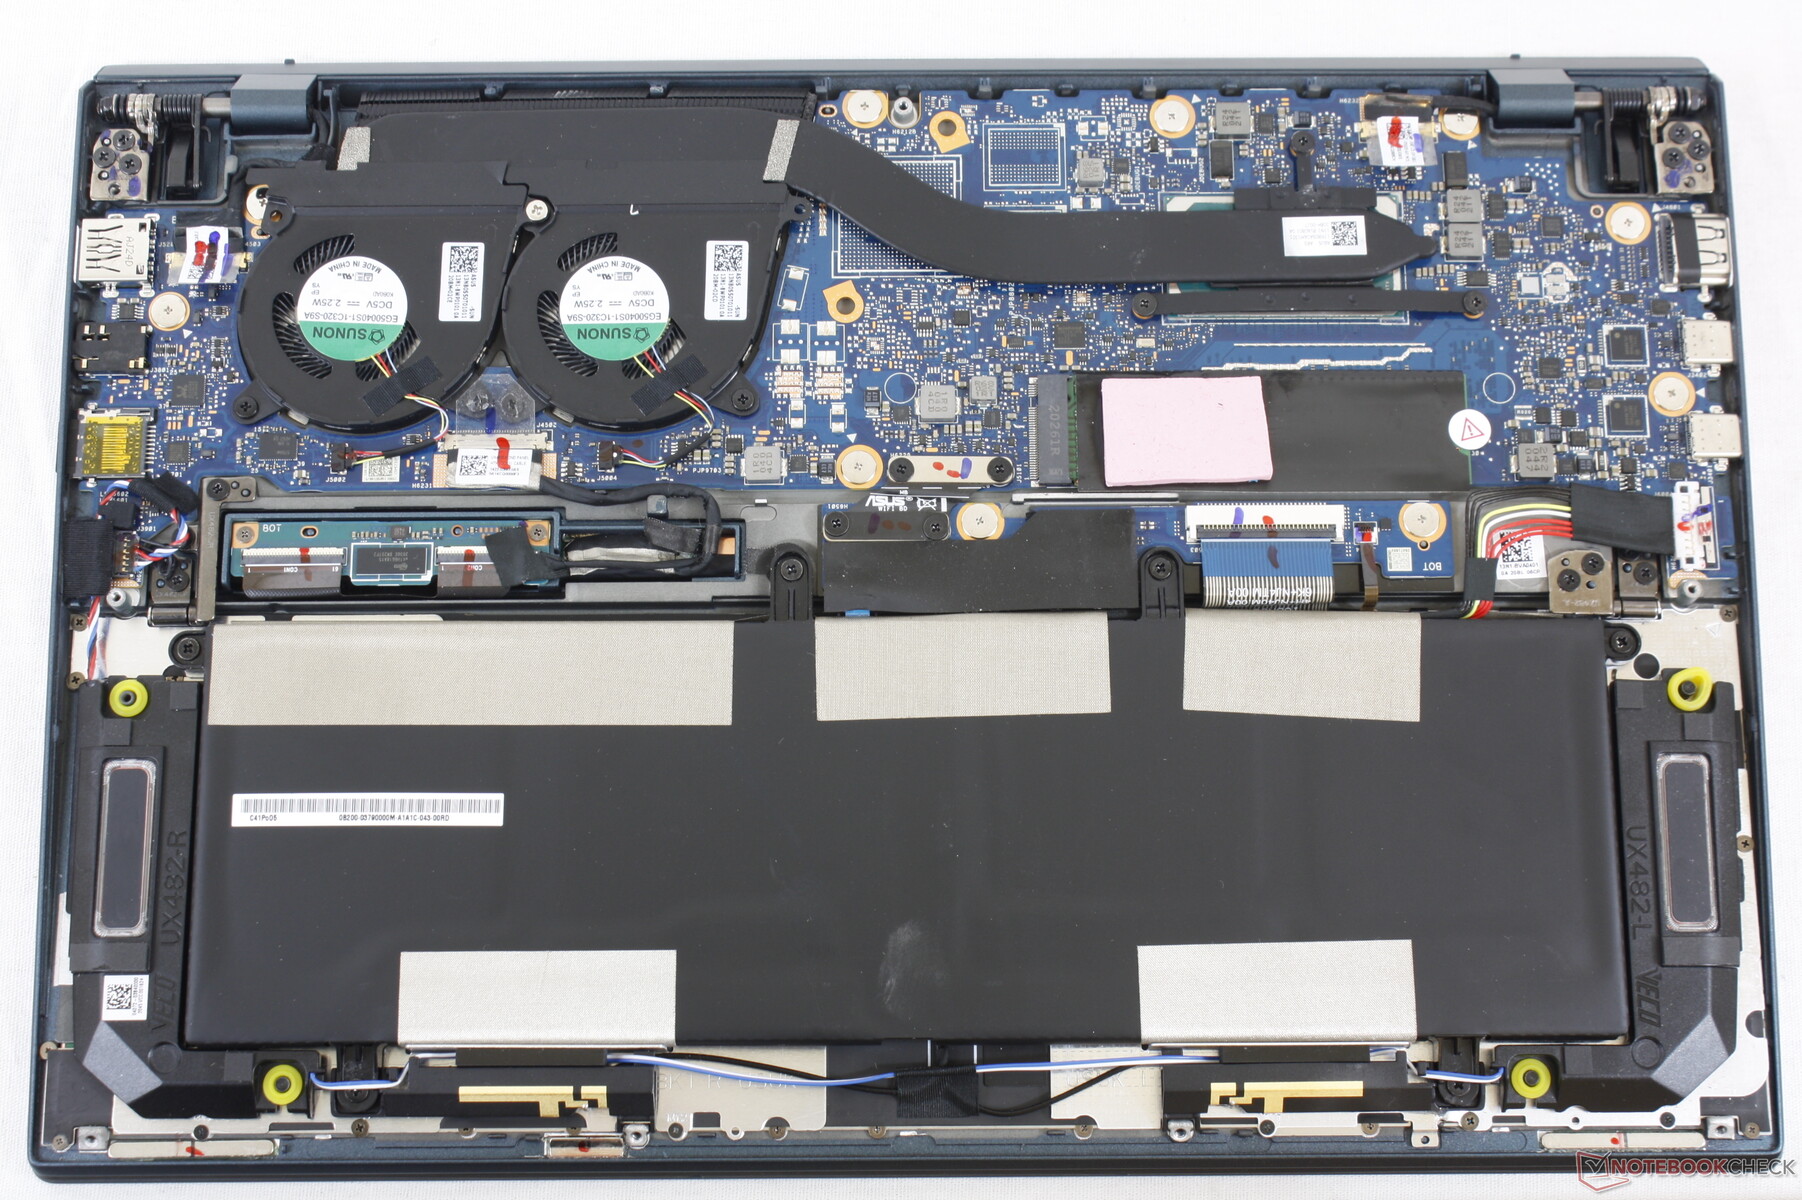
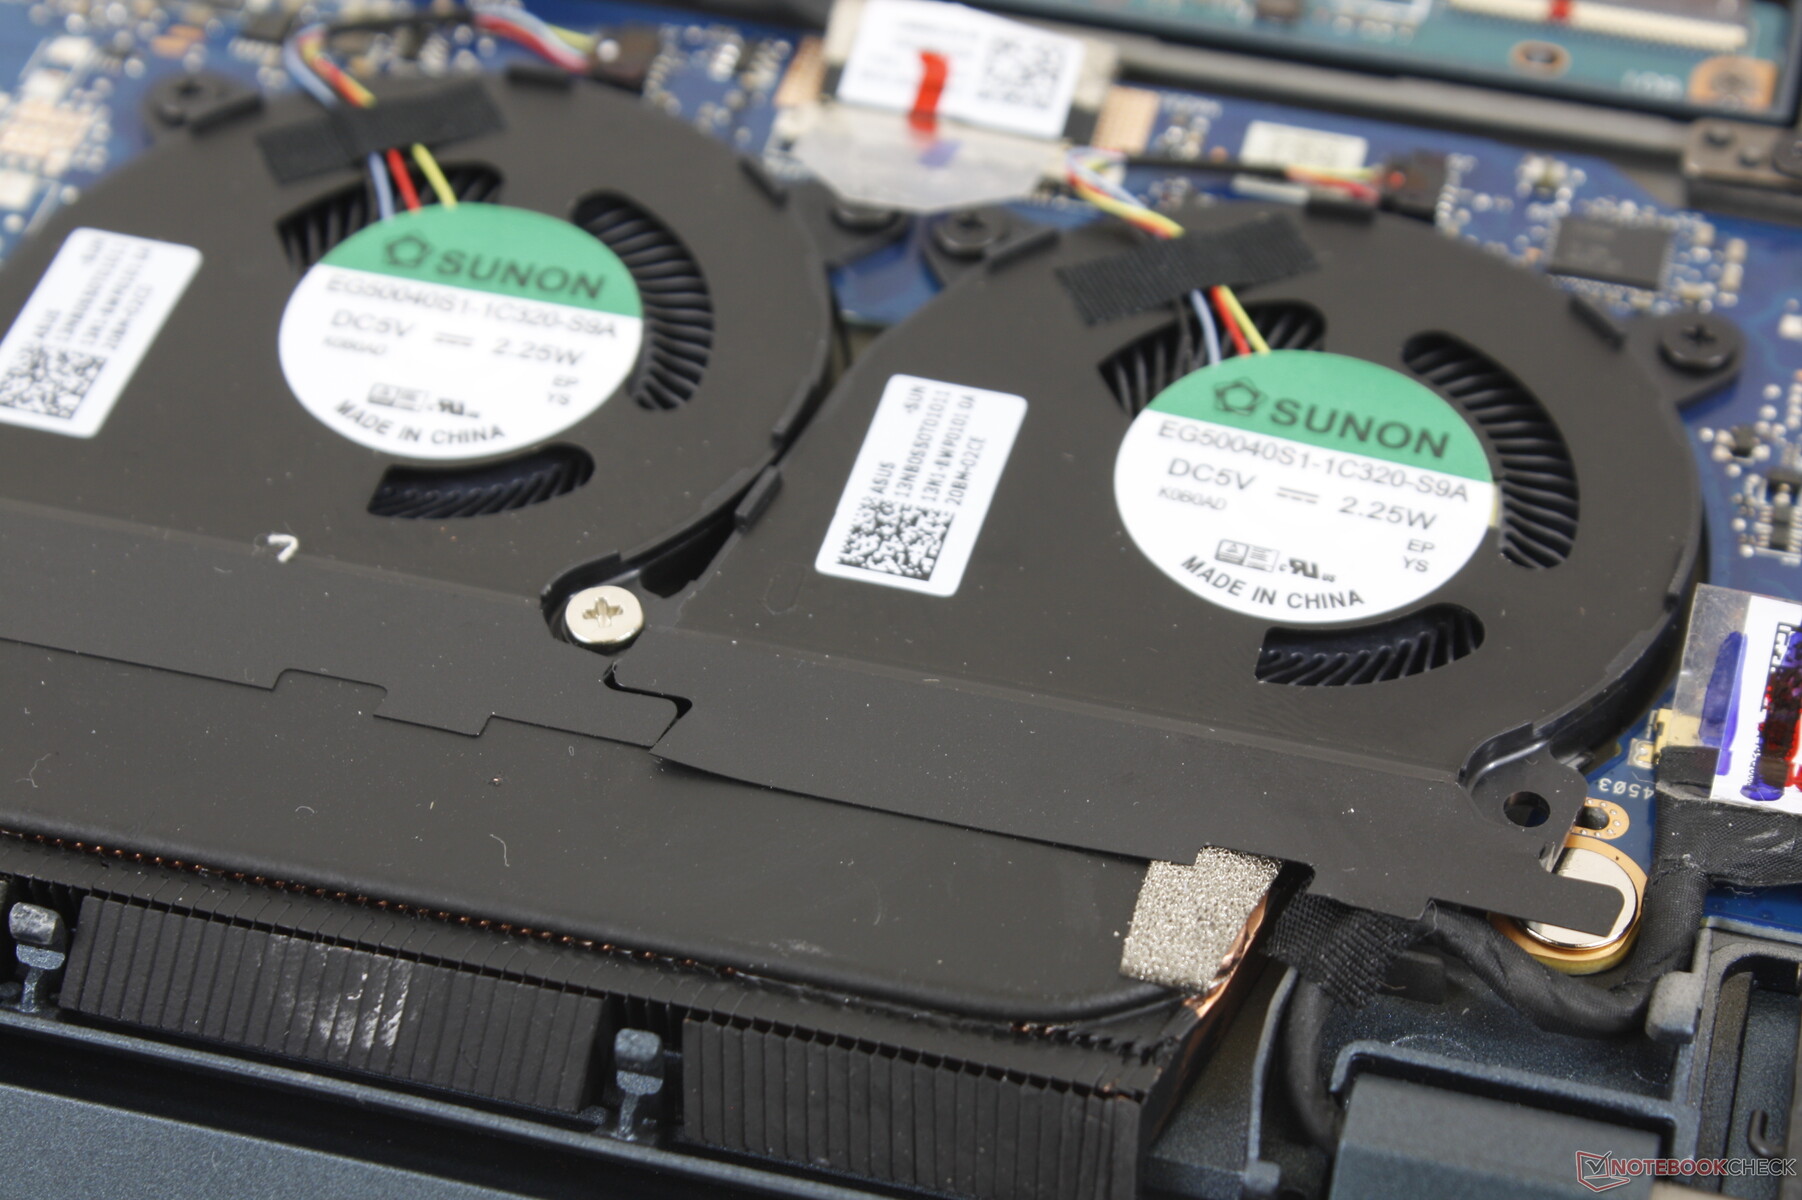
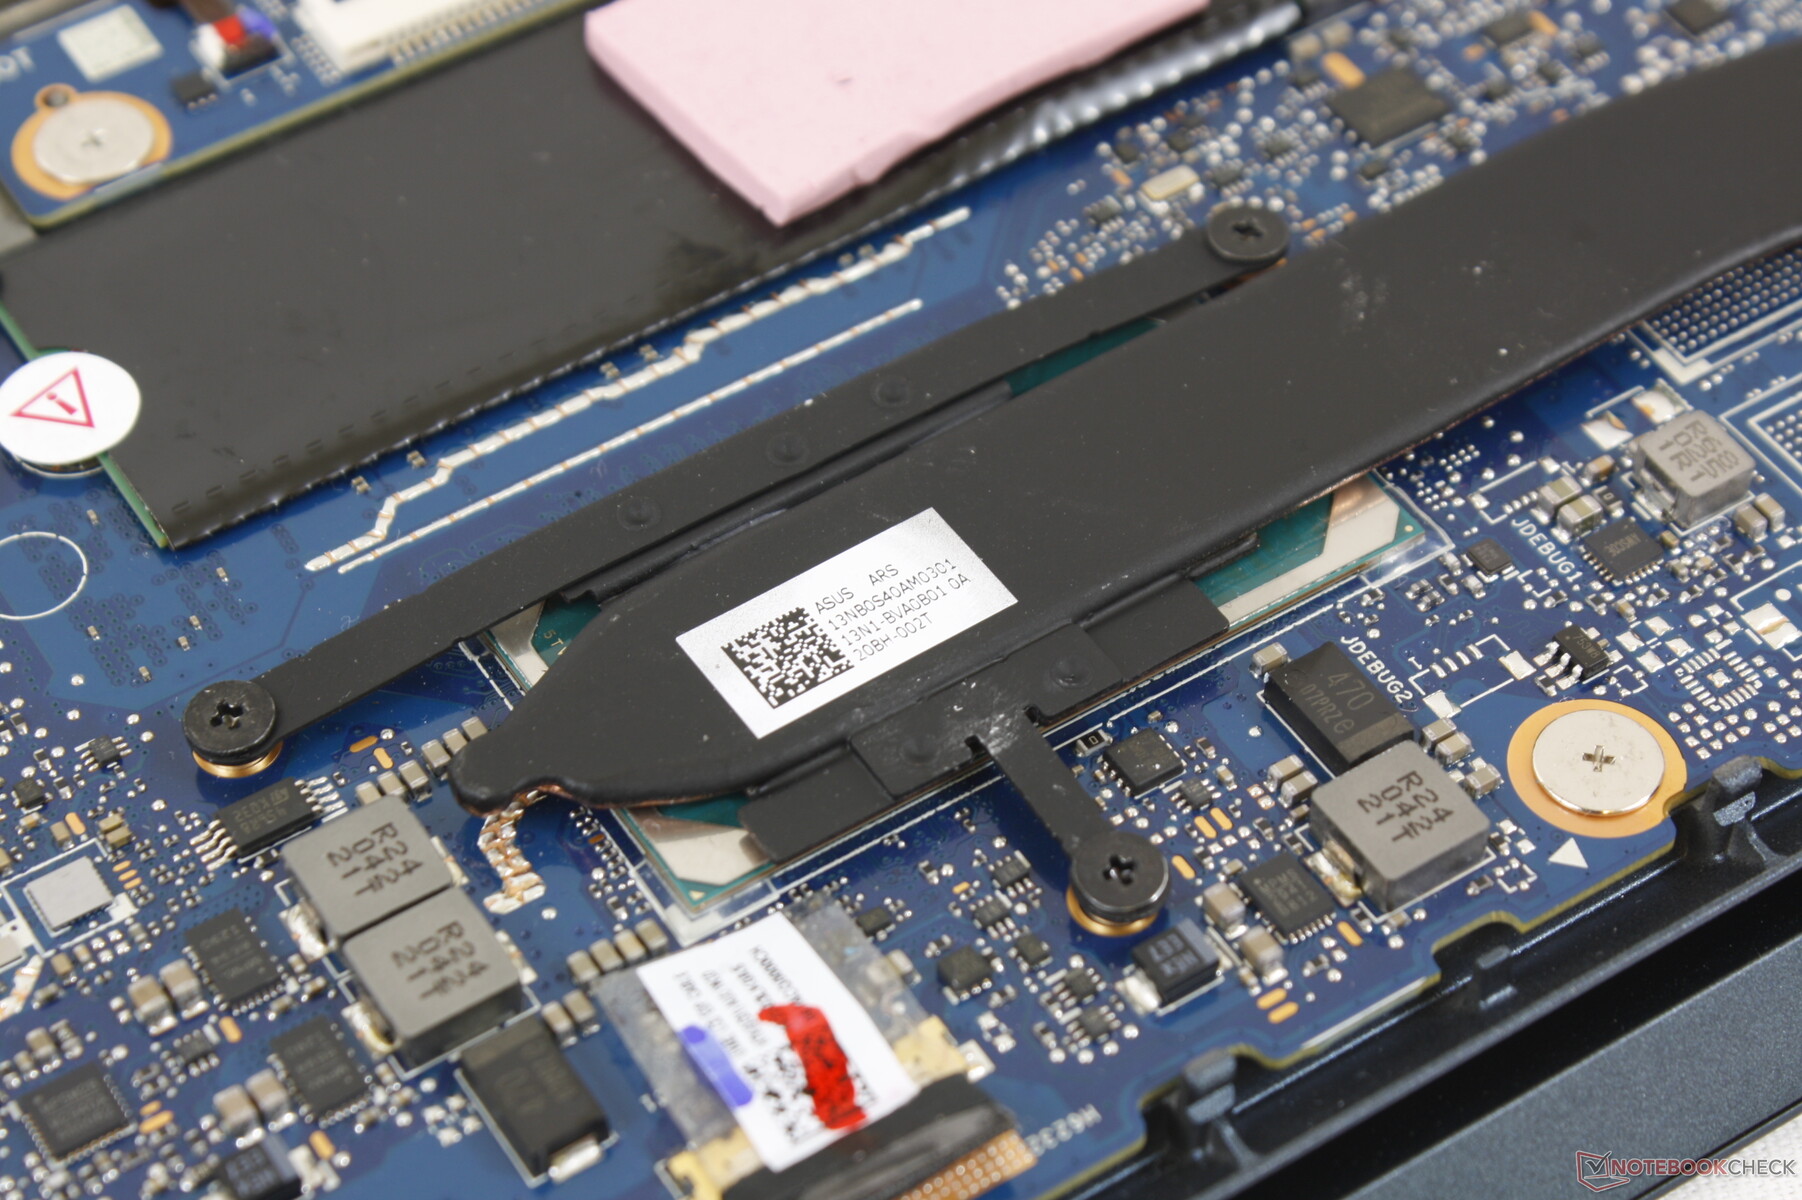
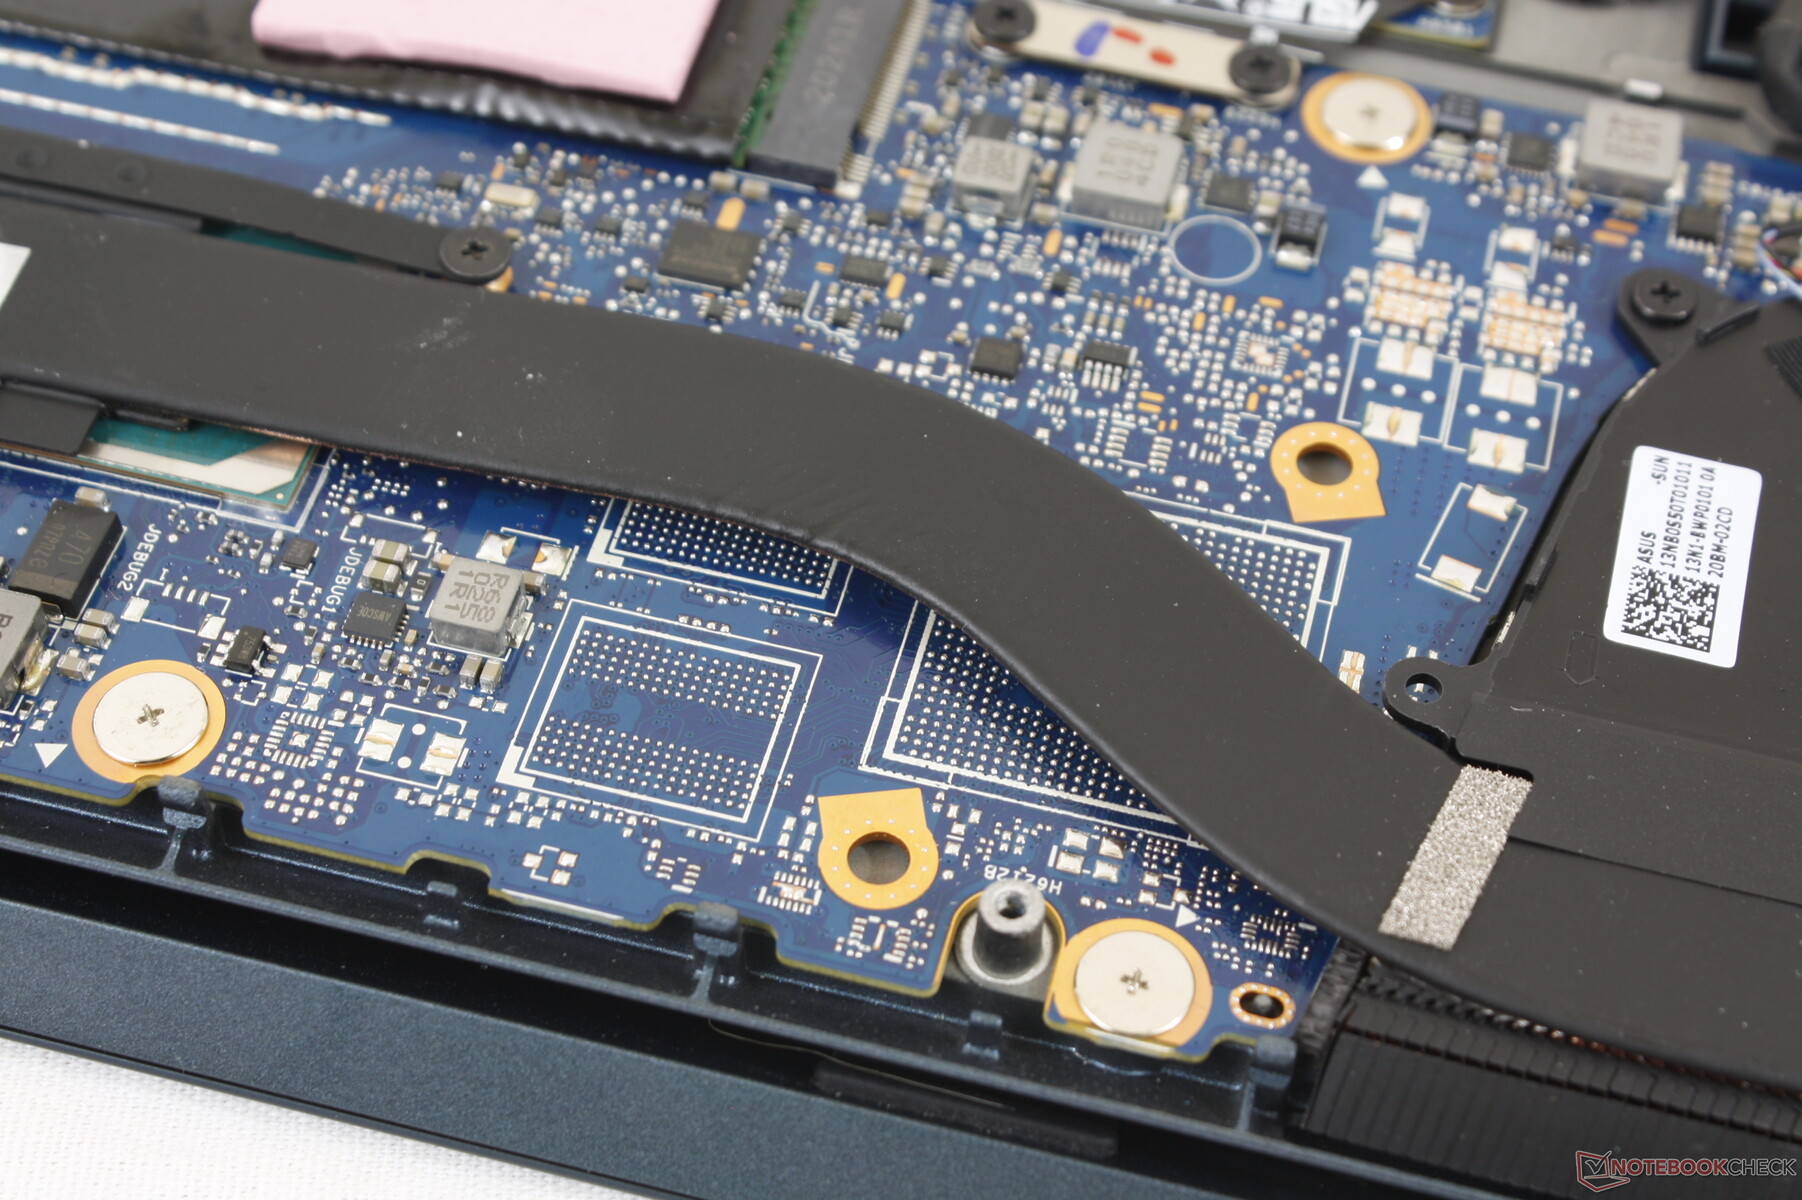
Asus has made minor adjustments to the cooling solution. When compared to the UX481, the UX482 uses just one larger heat pipe instead of two smaller ones while the two fans now have even more fan blades for improved airflow.
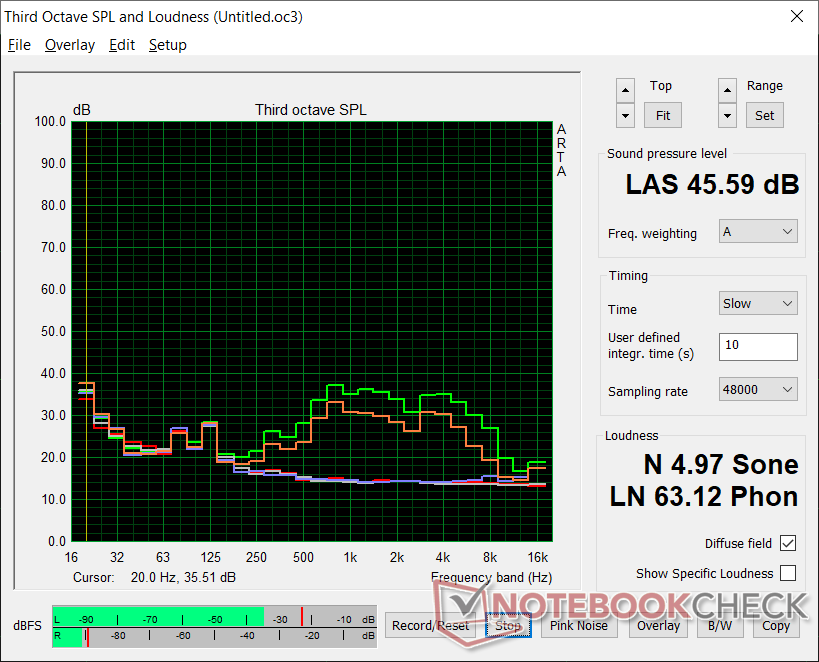
The UX482 is able to remain quieter for longer than its predecessor. When running 3DMark 06, for example, the laptop is able to remain silent throughout the first 90 seconds even when on Performance mode. Nonetheless, the fans can become quite loud at the 40 to 46 dB(A) range when running demanding loads like games to be louder than what we recorded on the UX481. In other words, the system is quieter when running low to low-medium loads but louder when running constant higher loads.
| Asus ZenBook Duo 14 UX482EA Iris Xe G7 96EUs, i7-1165G7, SK Hynix HFM512GD3JX013N | MSI Prestige 14 Evo A11M-005 Iris Xe G7 96EUs, i7-1185G7, Phison 512GB SM280512GKBB4S-E162 | Lenovo Yoga 9i 14ITL5 Iris Xe G7 80EUs, i5-1135G7, Samsung SSD PM981a MZVLB256HBHQ | Asus Zenbook 14 UX435EG GeForce MX450, i7-1165G7, Samsung PM981a MZVLB1T0HBLR | Asus VivoBook S14 S433FL GeForce MX250, i7-10510U, Intel Optane Memory H10 with Solid State Storage 32GB + 512GB HBRPEKNX0202A(L/H) | Asus ZenBook Duo UX481FL GeForce MX250, i7-10510U, Intel SSD 660p 1TB SSDPEKNW010T8 | |
|---|---|---|---|---|---|---|
| Noise | -12% | -4% | -6% | -18% | -8% | |
| off / environment * (dB) | 26.3 | 24 9% | 26.3 -0% | 25.6 3% | 30.7 -17% | 28.3 -8% |
| Idle Minimum * (dB) | 26.5 | 25 6% | 26.3 1% | 25.6 3% | 31 -17% | 28.3 -7% |
| Idle Average * (dB) | 26.5 | 27 -2% | 26.3 1% | 25.6 3% | 31 -17% | 28.3 -7% |
| Idle Maximum * (dB) | 26.5 | 39 -47% | 26.3 1% | 26.3 1% | 31.3 -18% | 28.3 -7% |
| Load Average * (dB) | 26.7 | 43 -61% | 34.1 -28% | 41.6 -56% | 43.4 -63% | 39.1 -46% |
| Witcher 3 ultra * (dB) | 40.7 | 39 4% | 43.4 -7% | 41.6 -2% | 42.8 -5% | 39.1 4% |
| Load Maximum * (dB) | 45.6 | 43 6% | 43.3 5% | 41.6 9% | 41.5 9% | 39.1 14% |
* ... smaller is better
Noise level
| Idle |
| 26.5 / 26.5 / 26.5 dB(A) |
| Load |
| 26.7 / 45.6 dB(A) |
 | ||
30 dB silent 40 dB(A) audible 50 dB(A) loud |
||
min: | ||
Temperature
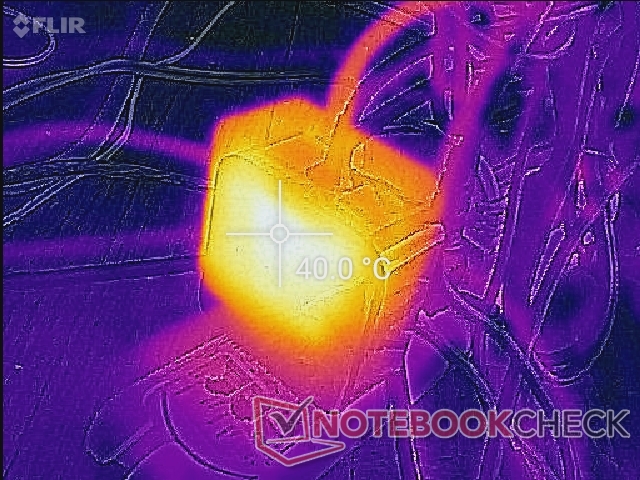
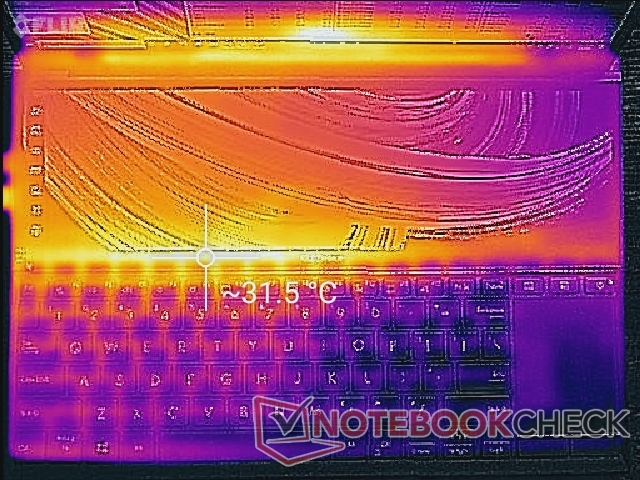
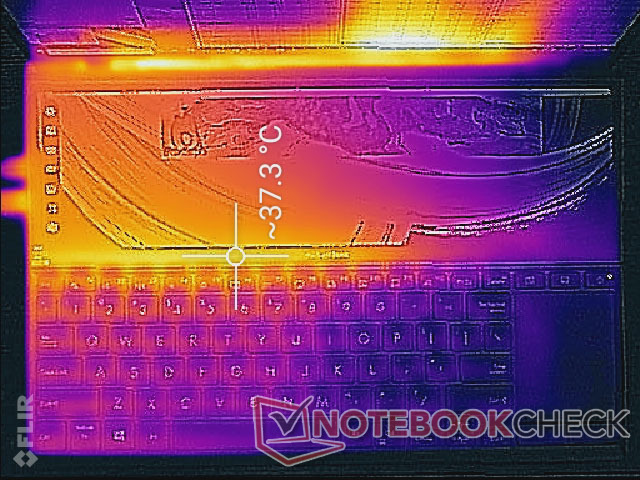
Surface temperature development is different than most other Ultrabooks due to the ZenBook's unique secondary display and positioning of the keyboard. When running high loads, for example, the hot spot will be along the edge in between keyboard and ScreenPad whereas it would have been directly on the keyboard keys for most other laptops. This works in favor of Asus as users can type on the ZenBook Duo without ever needing to worry about overly warm keys or palm rests.
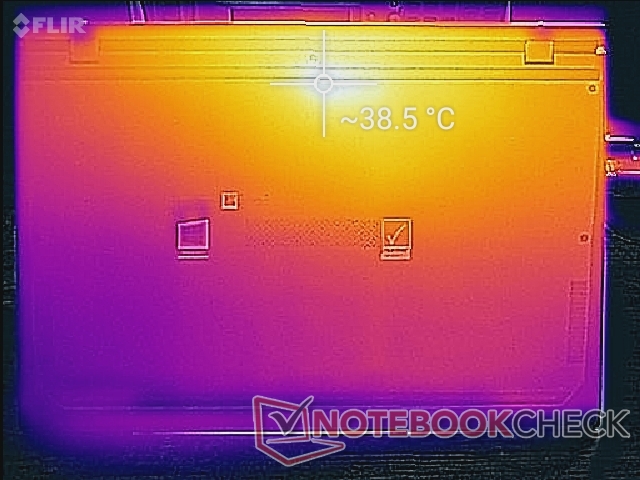
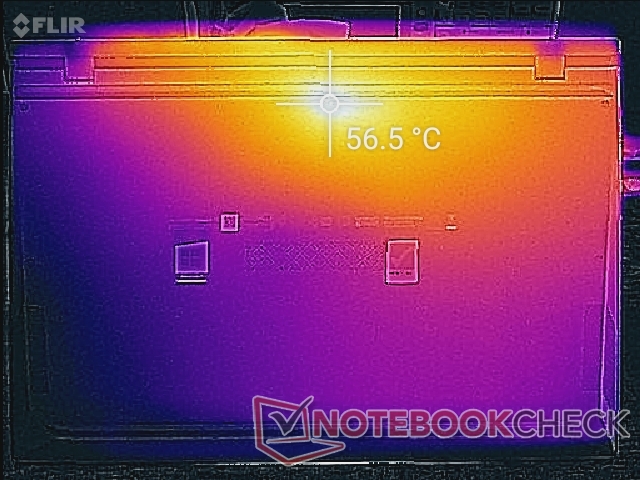
The bottom hot spot can become much warmer than the top at over 56 C. In comparison, the ZenBook 14 UX425EA with the same Core i7-1165G7 CPU would peak at only about 44 C when under similar conditions. The higher-than-average CPU performance noted above appears to come at a higher-than-average surface temperature.
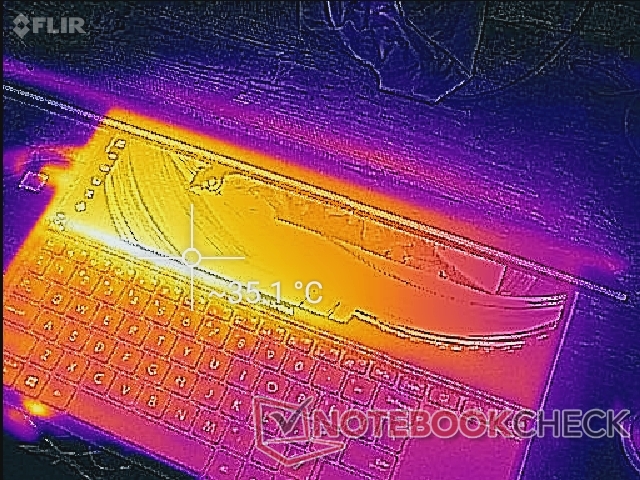
(+) The maximum temperature on the upper side is 37.2 °C / 99 F, compared to the average of 36.8 °C / 98 F, ranging from 21 to 71 °C for the class Multimedia.
(-) The bottom heats up to a maximum of 56.6 °C / 134 F, compared to the average of 39.1 °C / 102 F
(+) In idle usage, the average temperature for the upper side is 28.1 °C / 83 F, compared to the device average of 31.3 °C / 88 F.
(+) The palmrests and touchpad are cooler than skin temperature with a maximum of 30 °C / 86 F and are therefore cool to the touch.
(±) The average temperature of the palmrest area of similar devices was 28.7 °C / 83.7 F (-1.3 °C / -2.3 F).
Stress Test
Running Prime95 causes the CPU to spike to 4.1 GHz for just a few seconds and at a core temperature of 95 C. Clock rates and temperature would then fall and stabilize at more sustainable levels of 3.3 GHz and 87 C, respectively. The ZenBook 14 UX425EA, which uses the exact same Core i7-1165G7 CPU as our UX482EA, would stabilize at much lower clock rates and temperatures of 2.4 GHz and 68 C, respectively, when under similar conditions. Significant temperature differences can also be observed between the two laptops when running Witcher 3 to represent gaming loads. The UX482 definitely runs warm, but users will be getting more performance out of the same internal hardware.
Running on battery power will not limit performance. A 3DMark 11 run on batteries returns almost the same Physics and Graphics scores as a run on mains.
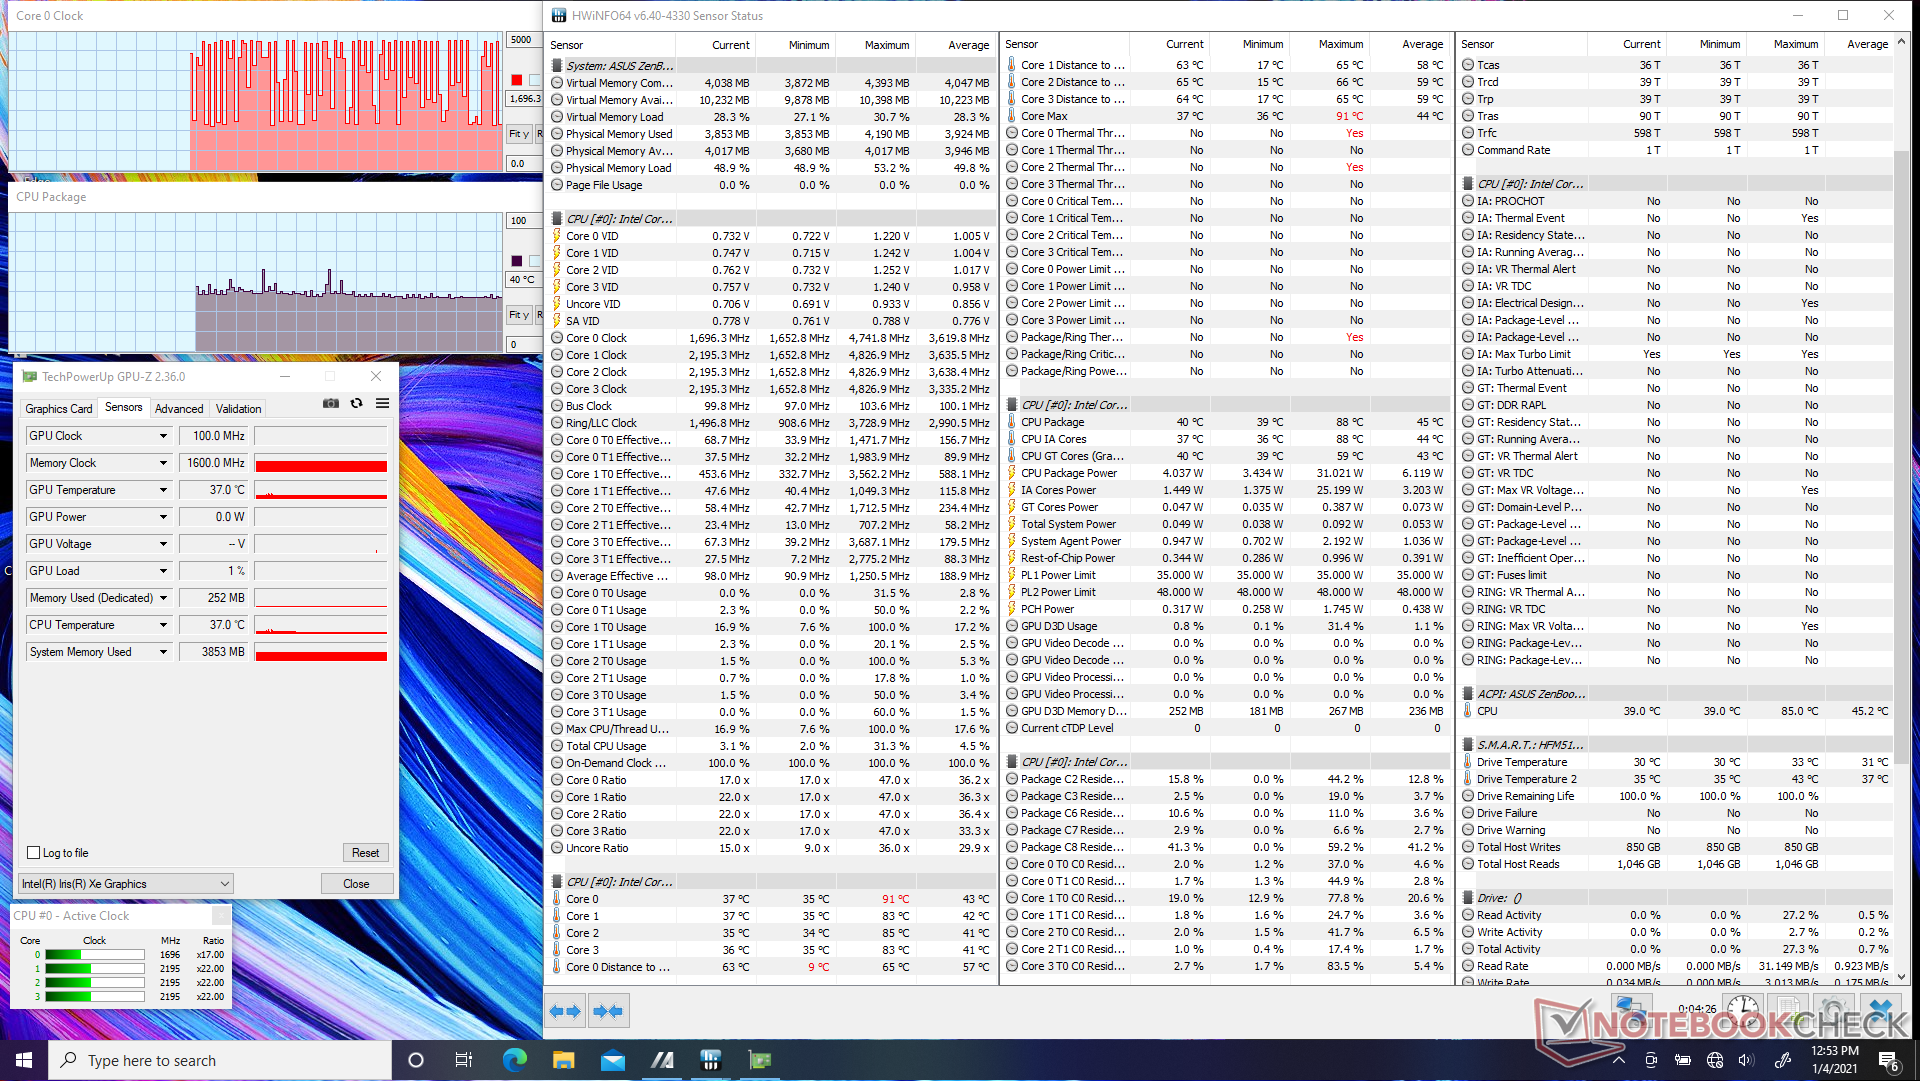

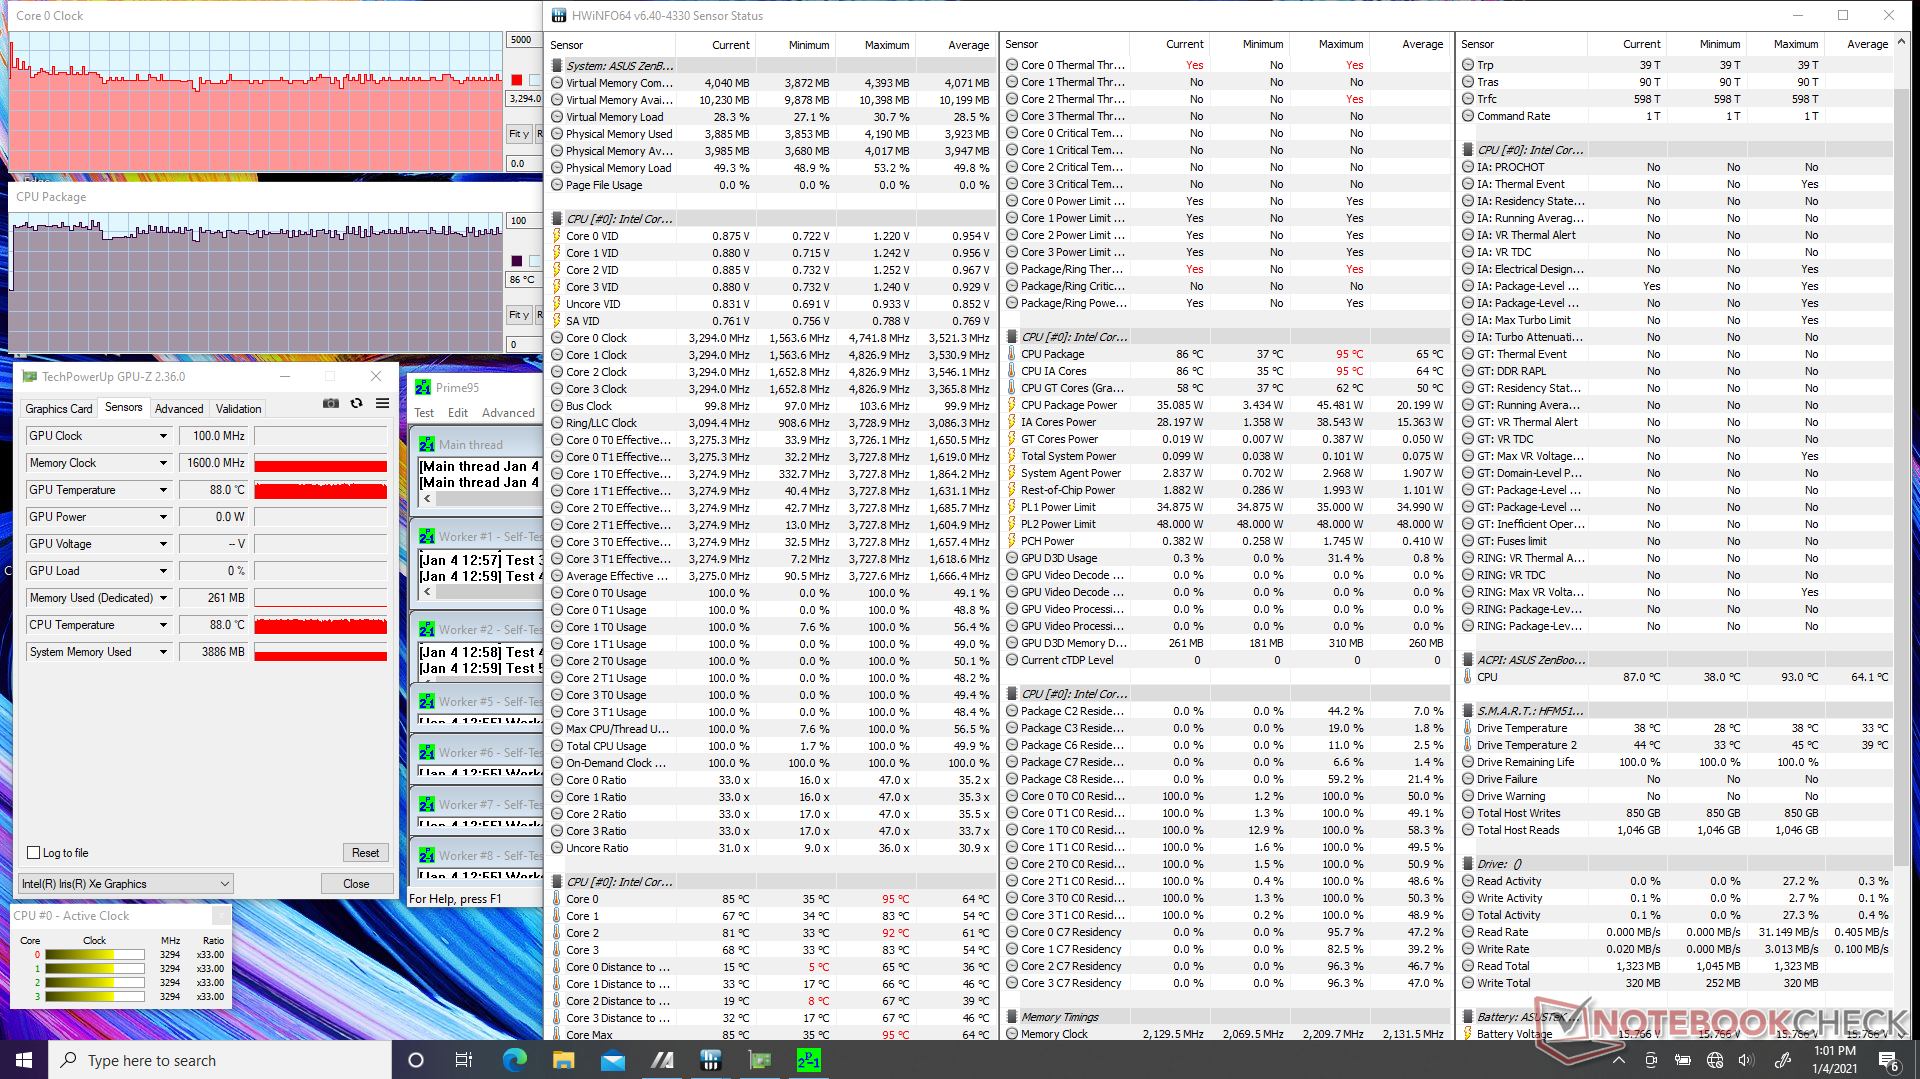
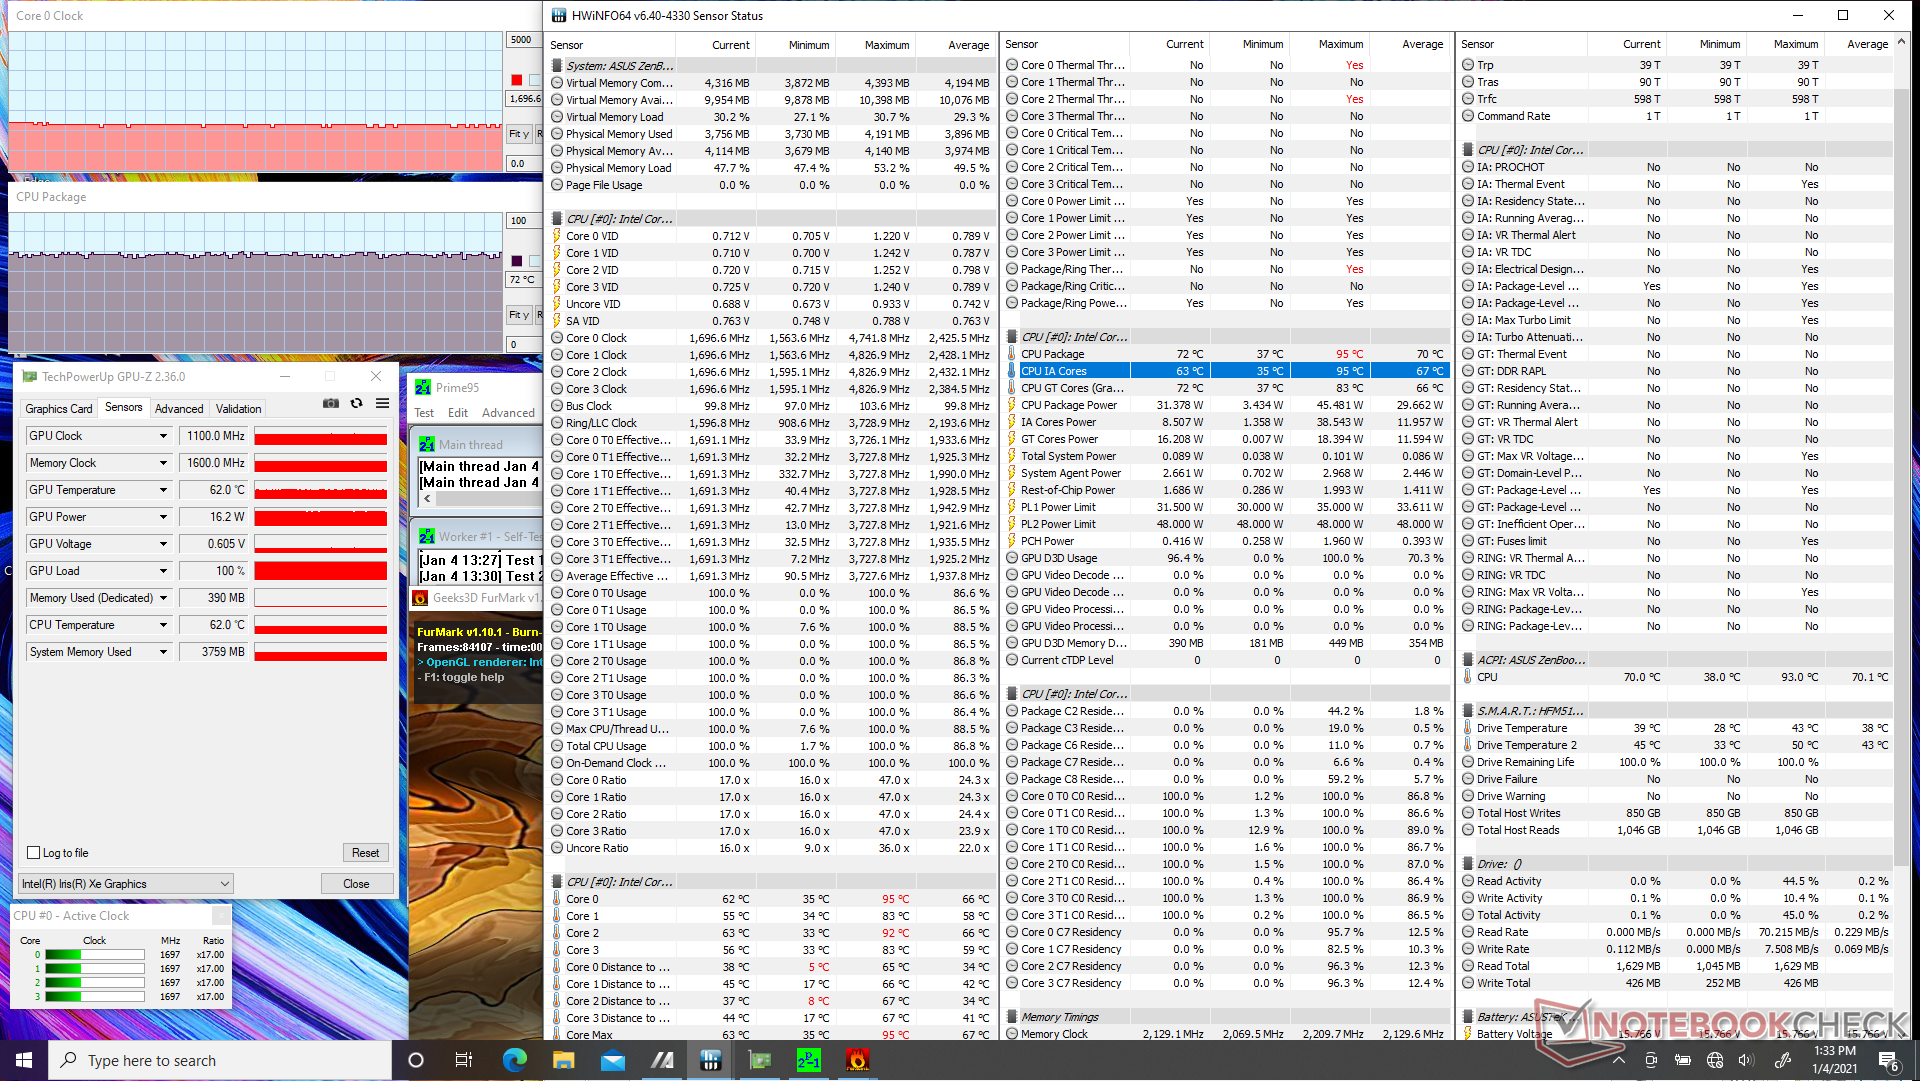
| CPU Clock (GHz) | GPU Clock (MHz) | Average CPU Temperature (°C) | |
| System Idle | -- | -- | 40 |
| Prime95 Stress | 3.3 - 3.4 | -- | 87 |
| Prime95 + FurMark Stress | 1.6 - 1.7 | 1100 | 72 |
| Witcher 3 Stress | 3.5 | 1300 | 71 |
Speakers


Asus ZenBook Duo 14 UX482EA audio analysis
(±) | speaker loudness is average but good (75.1 dB)
Bass 100 - 315 Hz
(-) | nearly no bass - on average 17.6% lower than median
(-) | bass is not linear (16.2% delta to prev. frequency)
Mids 400 - 2000 Hz
(+) | balanced mids - only 4.8% away from median
(+) | mids are linear (4% delta to prev. frequency)
Highs 2 - 16 kHz
(+) | balanced highs - only 2.1% away from median
(+) | highs are linear (5.8% delta to prev. frequency)
Overall 100 - 16.000 Hz
(±) | linearity of overall sound is average (17.9% difference to median)
Compared to same class
» 53% of all tested devices in this class were better, 7% similar, 40% worse
» The best had a delta of 5%, average was 17%, worst was 45%
Compared to all devices tested
» 37% of all tested devices were better, 8% similar, 55% worse
» The best had a delta of 4%, average was 23%, worst was 134%
Apple MacBook 12 (Early 2016) 1.1 GHz audio analysis
(+) | speakers can play relatively loud (83.6 dB)
Bass 100 - 315 Hz
(±) | reduced bass - on average 11.3% lower than median
(±) | linearity of bass is average (14.2% delta to prev. frequency)
Mids 400 - 2000 Hz
(+) | balanced mids - only 2.4% away from median
(+) | mids are linear (5.5% delta to prev. frequency)
Highs 2 - 16 kHz
(+) | balanced highs - only 2% away from median
(+) | highs are linear (4.5% delta to prev. frequency)
Overall 100 - 16.000 Hz
(+) | overall sound is linear (10.2% difference to median)
Compared to same class
» 7% of all tested devices in this class were better, 2% similar, 90% worse
» The best had a delta of 5%, average was 18%, worst was 53%
Compared to all devices tested
» 5% of all tested devices were better, 1% similar, 94% worse
» The best had a delta of 4%, average was 23%, worst was 134%
Energy Management
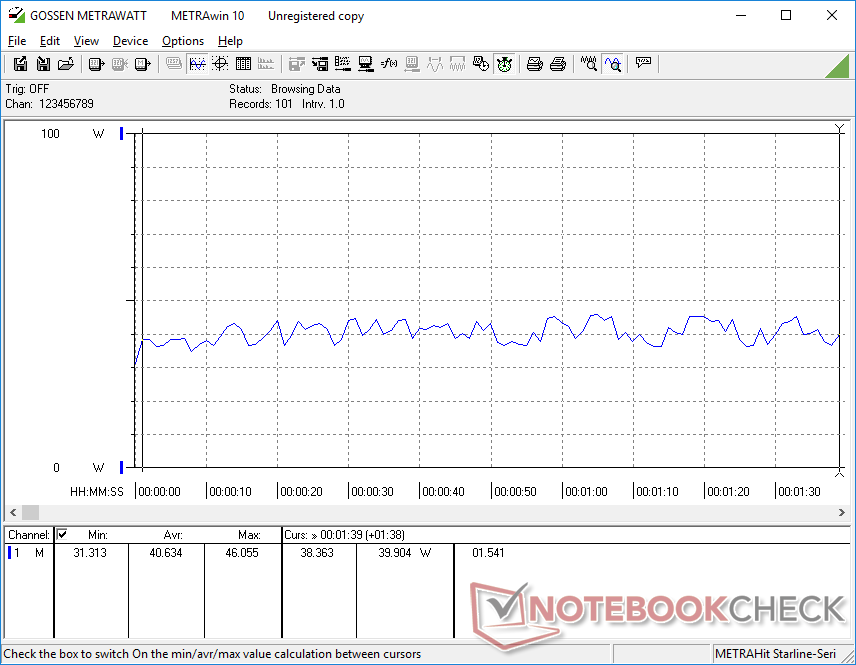
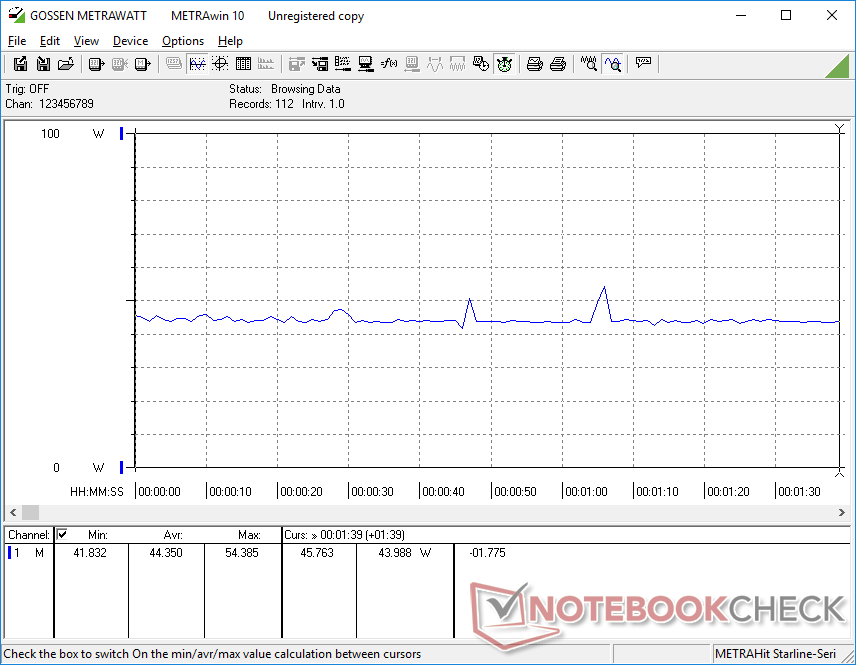
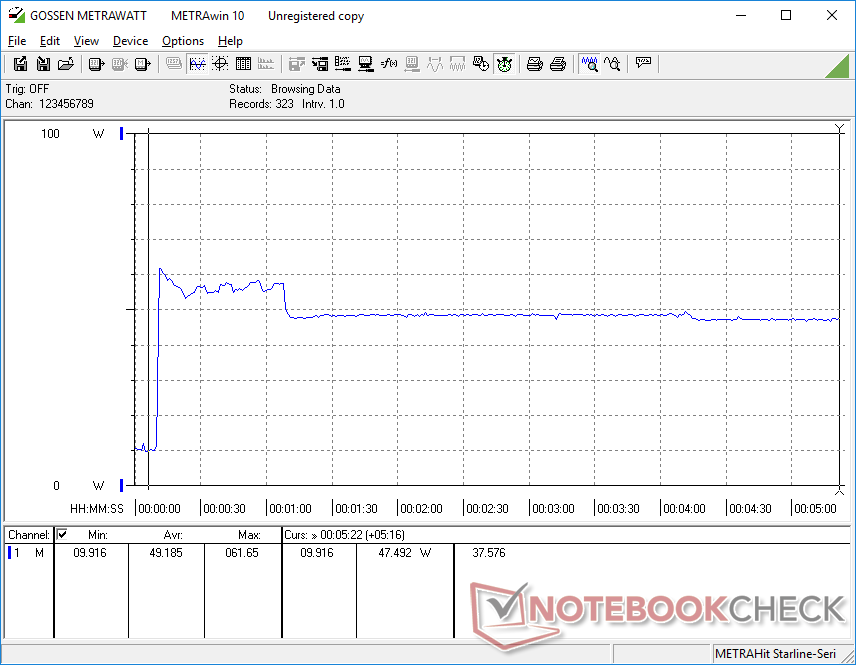
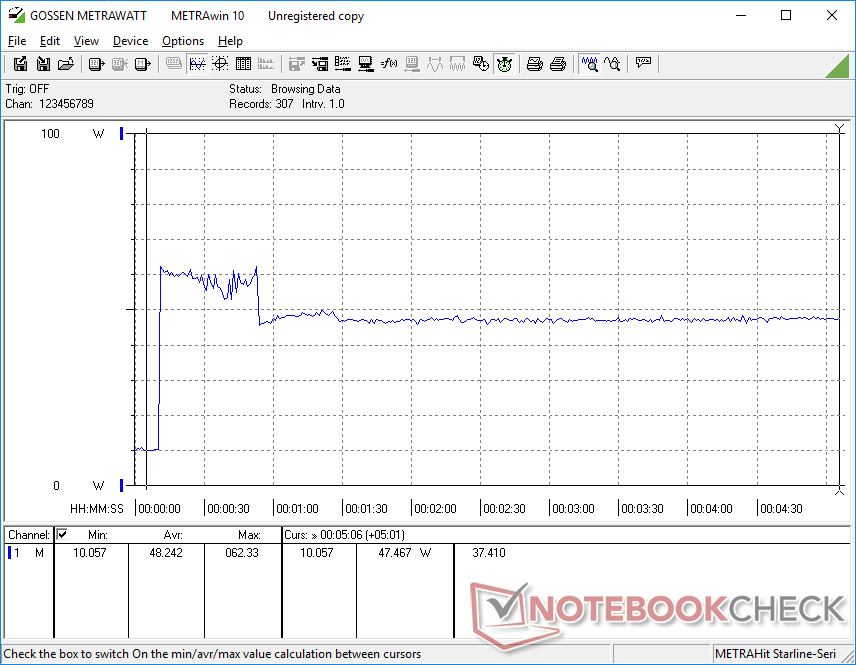
Power Consumption
Idling on desktop demands just 3.6 W when the ScreenPad is disabled and the main display is set to minimum brightness. If both displays are on and set to their maximum brightness levels, consumption jumps to 10 W. Running the ScreenPad on maximum brightness appears to draw about 4 W to 5 W which is exactly what we observed on last year's UX481.
Average consumption when running heavier loads like games ranges from 40 W to 45 W compared to ~55 W on the Asus VivoBook 14 or ZenBook UX435 each equipped with GeForce MX graphics. We're able to record a maximum of 62.4 W when running Prime95, but this draw is only temporary due to thermal limits.
| Off / Standby | |
| Idle | |
| Load |
|
Key:
min: | |
| Asus ZenBook Duo 14 UX482EA i7-1165G7, Iris Xe G7 96EUs, SK Hynix HFM512GD3JX013N, IPS, 1920x1080, 14" | MSI Prestige 14 Evo A11M-005 i7-1185G7, Iris Xe G7 96EUs, Phison 512GB SM280512GKBB4S-E162, IPS-Level, 1920x1080, 14" | Lenovo Yoga 9i 14ITL5 i5-1135G7, Iris Xe G7 80EUs, Samsung SSD PM981a MZVLB256HBHQ, IPS, 1920x1080, 14" | Asus Zenbook 14 UX435EG i7-1165G7, GeForce MX450, Samsung PM981a MZVLB1T0HBLR, IPS, 1920x1080, 14" | Asus VivoBook S14 S433FL i7-10510U, GeForce MX250, Intel Optane Memory H10 with Solid State Storage 32GB + 512GB HBRPEKNX0202A(L/H), IPS, 1920x1080, 14" | Asus ZenBook Duo UX481FL i7-10510U, GeForce MX250, Intel SSD 660p 1TB SSDPEKNW010T8, IPS, 1920x1080, 14" | |
|---|---|---|---|---|---|---|
| Power Consumption | -8% | 12% | -5% | 8% | -5% | |
| Idle Minimum * (Watt) | 3.6 | 5 -39% | 3.3 8% | 3.4 6% | 2.4 33% | 3.5 3% |
| Idle Average * (Watt) | 9.3 | 7 25% | 6.7 28% | 7.6 18% | 4.2 55% | 10 -8% |
| Idle Maximum * (Watt) | 10 | 11 -10% | 6.9 31% | 14.2 -42% | 7.8 22% | 11 -10% |
| Load Average * (Watt) | 40.6 | 54 -33% | 41.4 -2% | 56 -38% | 57 -40% | 53 -31% |
| Witcher 3 ultra * (Watt) | 44.3 | 39 12% | 39.3 11% | 41 7% | 52 -17% | 35.6 20% |
| Load Maximum * (Watt) | 62.4 | 65 -4% | 64.7 -4% | 50.4 19% | 64 -3% | 63.6 -2% |
* ... smaller is better
Battery Life
Much like on last year's UX481, the UX482 comes with an equally large 70 Wh internal battery to make up for the fact that there are two power-hungry displays. Users can expect about 8.5 hours of real-world WLAN use when both displays are active and set to 150 nits. If the secondary display is disabled, WLAN battery life would jump by several more hours.
Charging from empty to full capacity is fast at only 1.5 hours despite the large battery size.
| Asus ZenBook Duo 14 UX482EA i7-1165G7, Iris Xe G7 96EUs, 70 Wh | MSI Prestige 14 Evo A11M-005 i7-1185G7, Iris Xe G7 96EUs, 52.4 Wh | Lenovo Yoga 9i 14ITL5 i5-1135G7, Iris Xe G7 80EUs, 60 Wh | Asus Zenbook 14 UX435EG i7-1165G7, GeForce MX450, 63 Wh | Asus VivoBook S14 S433FL i7-10510U, GeForce MX250, 50 Wh | Asus ZenBook Duo UX481FL i7-10510U, GeForce MX250, 70 Wh | |
|---|---|---|---|---|---|---|
| Battery runtime | -49% | -14% | -41% | 2% | -14% | |
| Reader / Idle (h) | 36.8 | 13.8 -62% | 37.7 2% | 18.5 -50% | 22.1 -40% | |
| WiFi v1.3 (h) | 8.4 | 7.5 -11% | 9.9 18% | 8.5 1% | 8.6 2% | 9.5 13% |
| Load (h) | 4.4 | 1.1 -75% | 1.7 -61% | 1.2 -73% | 3.7 -16% |
Pros
Cons
Verdict
In our review of the ZenBook Duo UX481, we criticized the ScreenPad for its poor viewing angles relative to the user. Glare was almost unavoidable which significantly impacted the user experience and general utility of the secondary display. For the ZenBook Duo UX482, Asus has alleviated this problem by tilting the ScreenPad forward for a more direct viewing angle to the user. The end result reduces some of the glare to improve apparent colors and brightness but not outright eliminate it. In short, the UX482 is easier to use for multi-tasking while being noticeably thinner, lighter, and faster than the model preceding it.
Core drawbacks of the UX481 remain. For one, the weight gain from the ScreenPad is obvious when compared to traditional 14-inch laptops while the upfront keyboard can be uncomfortable to type on without a large desk. Secondly, there is still some glare from the tilted ScreenPad meaning colors and brightness will almost always be inferior to the main display. And lastly, don't expect a 1:1 color profile between the two displays since the ScreenPad panel has a narrower gamut. Any actual editing should still be done on the main display while controls and secondary windows should be relegated to the ScreenPad.
The ZenBook Duo UX482 is unmatched in its size category for serious multi-taskers. However, this comes at the cost of weight and thickness and a potentially less ergonomic keyboard.
We do believe that an OLED ScreenPad can improve colors and reduce glare even further over the current IPS solution. However, the supply of such OLED panels in this very specific aspect ratio and size is likely cost prohibitive at the moment.
Performance-wise, we're impressed by the implementation of the Core i7 CPU here especially after the somewhat disappointing ZenBook 14 UX425 performance. The UX482 is able to maintain higher boost clock rates for much longer periods than what we observed on the UX425 or UX481. Temperatures are warmer, but we think performance hunters and graphics editors won't mind the inconvenience.
Price and availability
Pre-orders for the Asus ZenBook Duo 14 UX482 will begin on January 14.
Asus ZenBook Duo 14 UX482EA
- 01/07/2021 v7 (old)
Allen Ngo
Price comparison
