Dell Inspiron 15 7000 7506 2-in-1 Black Edition vs. Silver Edition: What's The Difference?
Usually when a laptop comes in multiple color options, everything else about the hardware would remain identical. In the case of the Inspiron 15 7506 2-in-1 Silver Edition and Inspiron 15 7506 2-in-1 Black Edition, however, Dell has made two laptops with several key differences between them both internally and externally. In fact, the differences can be so considerable that the Black Edition currently retails for at least $500 more than the Silver Edition. This review will dive into what makes the Black Edition so special to justify its higher price tag.
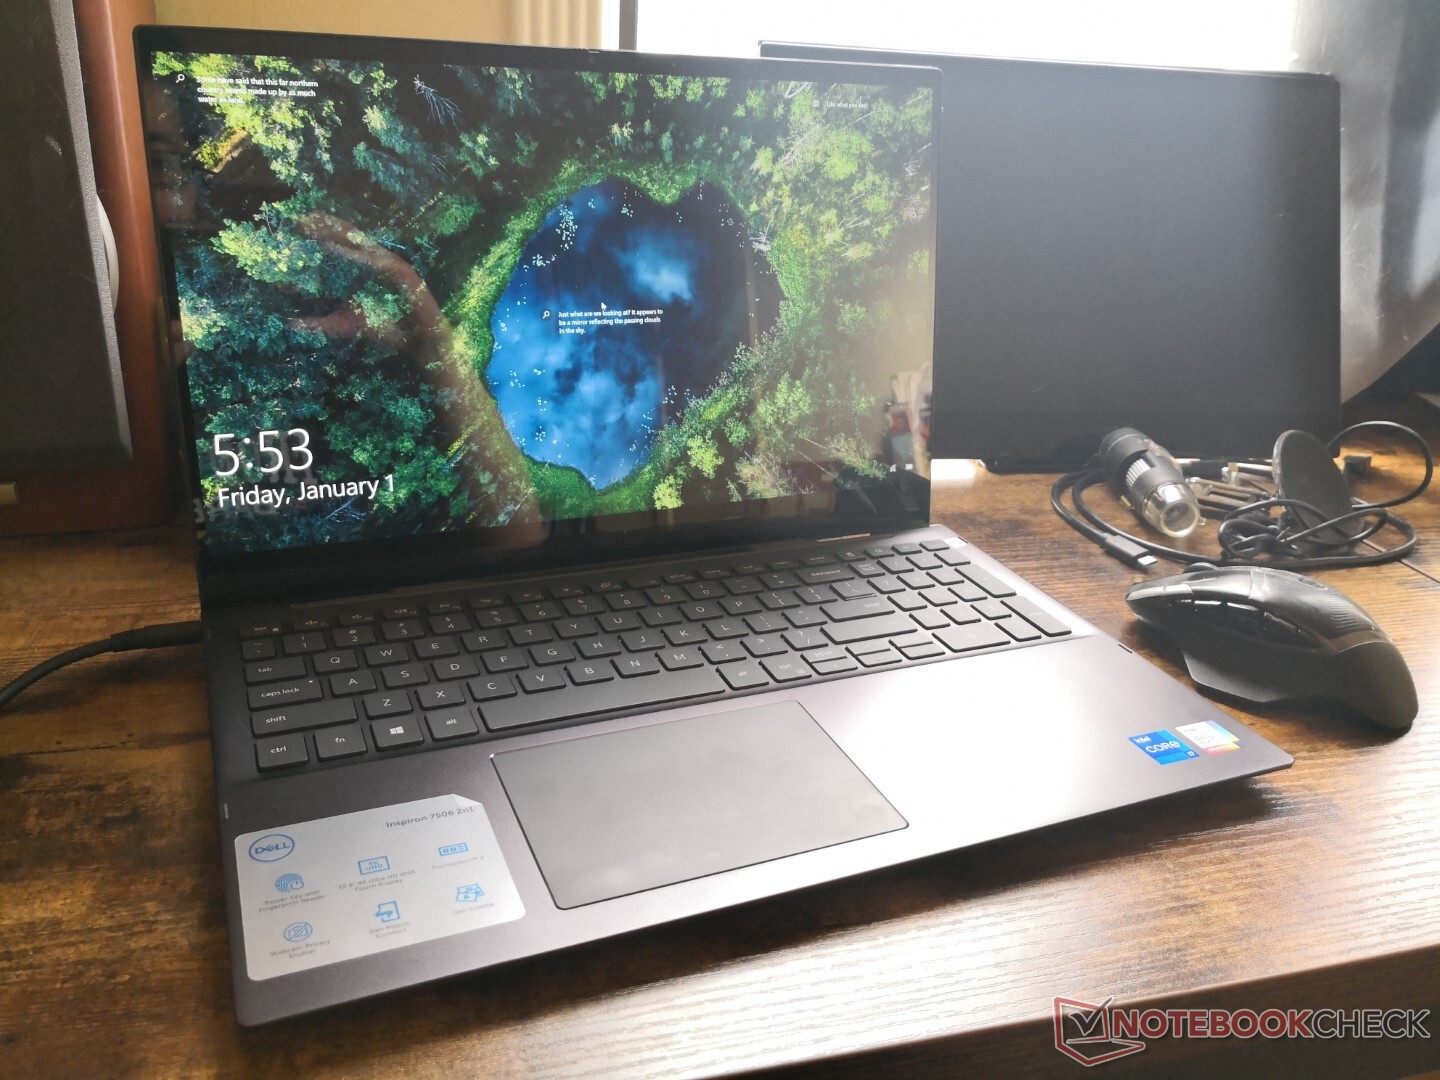
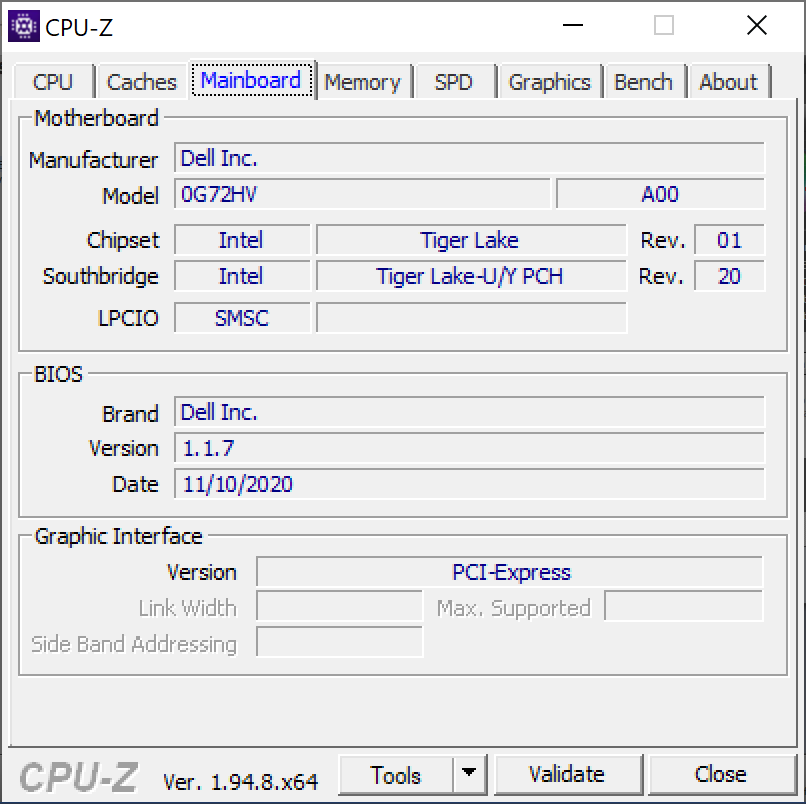
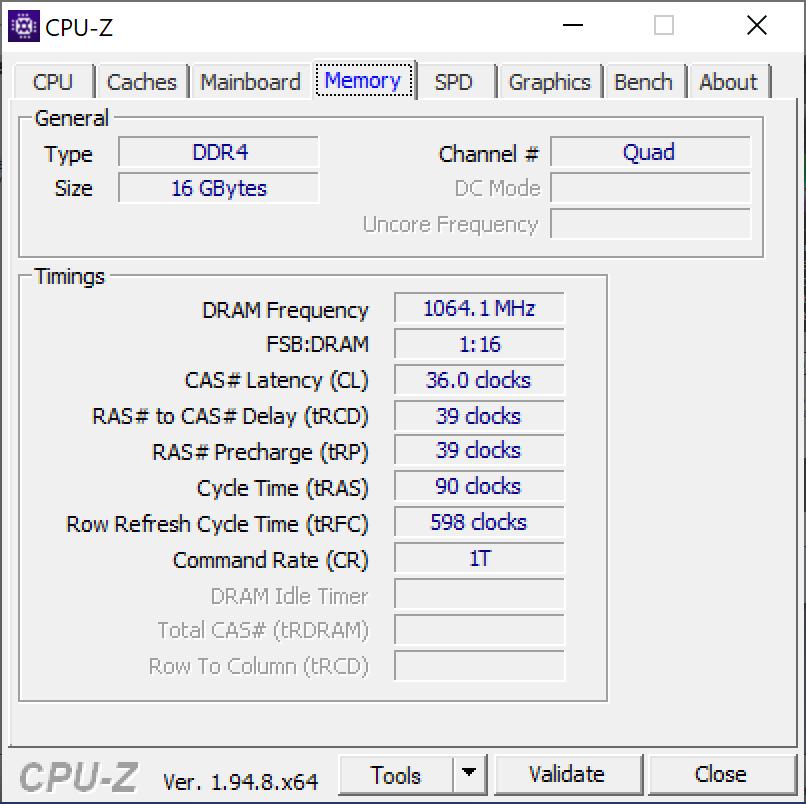
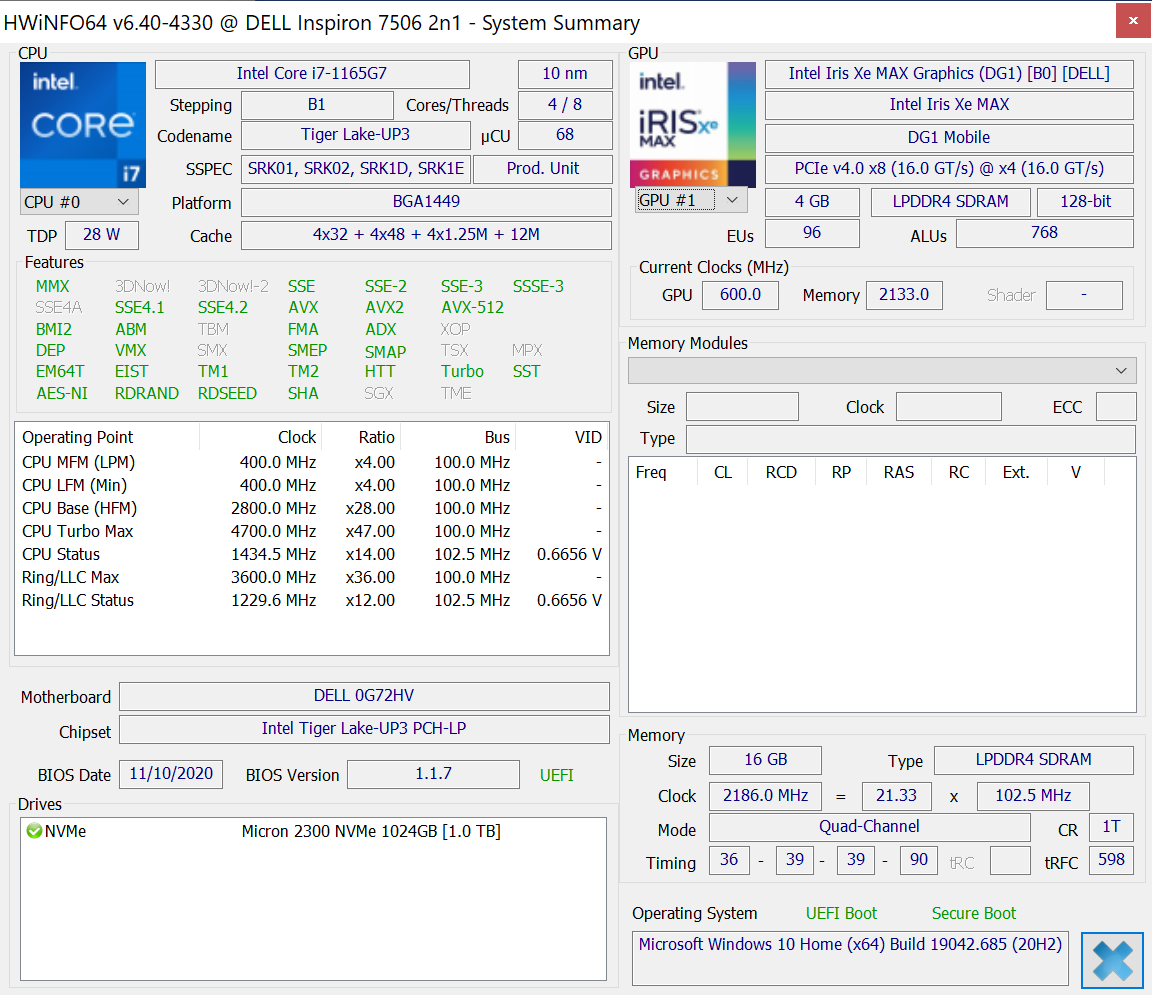
Our test unit comes configured with the Core i7-1165G7 CPU, 16 GB of soldered RAM, 1 TB NVMe SSD, 4K UHD touchscreen, and Intel Iris Xe Max discrete graphics. We recommend checking out our review on the Inspiron 15 7506 2-in-1 Silver Edition first since the Black Edition shares many of the same physical features.
More Dell reviews:
potential competitors in comparison
Rating | Date | Model | Weight | Height | Size | Resolution | Price |
|---|---|---|---|---|---|---|---|
| 82.4 % v7 (old) | 01 / 2021 | Dell Inspiron 15 7000 7506 2-in-1 Black Edition i7-1165G7, Xe MAX | 1.9 kg | 17.94 mm | 15.60" | 3840x2160 | |
| 87.3 % v7 (old) | 10 / 2020 | Samsung Galaxy Book Flex 15-NP950 i7-1065G7, GeForce MX250 | 1.6 kg | 14.9 mm | 15.60" | 1920x1080 | |
| 82.8 % v7 (old) | 09 / 2020 | HP Envy x360 15-ee0257ng R5 4500U, Vega 6 | 2 kg | 18.9 mm | 15.60" | 1920x1080 | |
| 88.3 % v7 (old) | 06 / 2020 | Microsoft Surface Book 3 15 i7-1065G7, GeForce GTX 1660 Ti Max-Q | 1.9 kg | 23 mm | 15.00" | 3240x2160 | |
| 86.5 % v7 (old) | 03 / 2020 | Asus ZenBook Flip 15 UX563FD-A1027T i7-10510U, GeForce GTX 1050 Max-Q | 1.9 kg | 19.9 mm | 15.60" | 3840x2160 | |
| 84.8 % v7 (old) | 01 / 2020 | Lenovo Yoga C740-15IML i7-10510U, UHD Graphics 620 | 1.9 kg | 17.25 mm | 15.60" | 1920x1080 | |
| 81.2 % v7 (old) | 12 / 2020 | Dell Inspiron 15 7506 2-in-1 P97F i5-1135G7, Iris Xe G7 80EUs | 1.8 kg | 17.94 mm | 15.60" | 1920x1080 |
Case
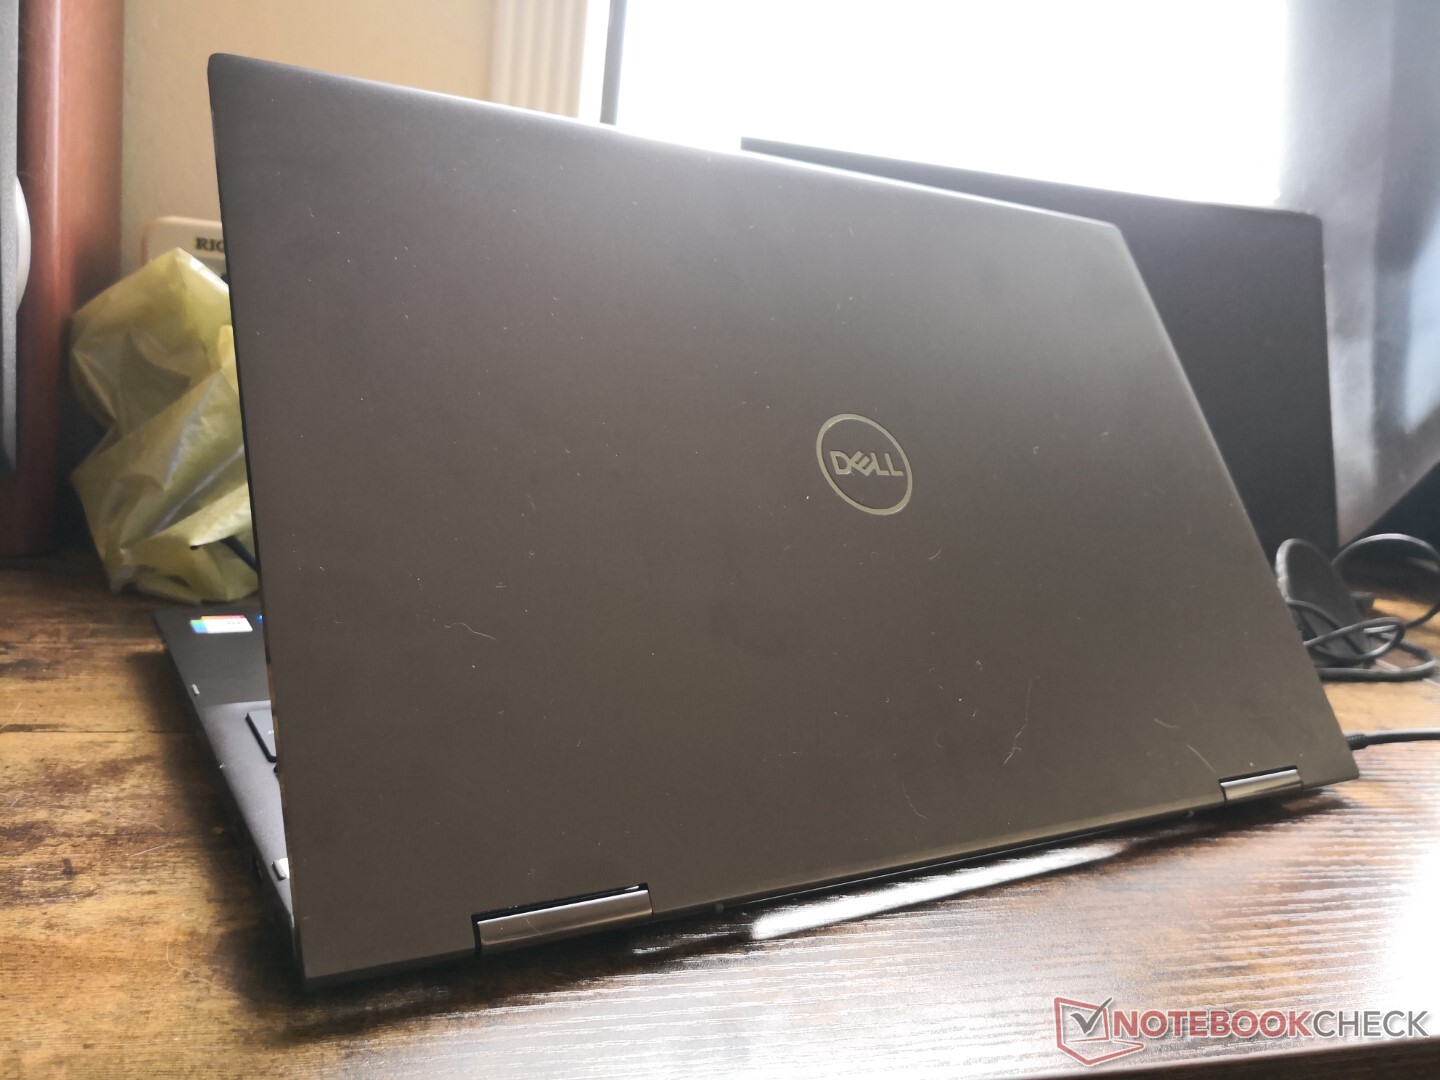
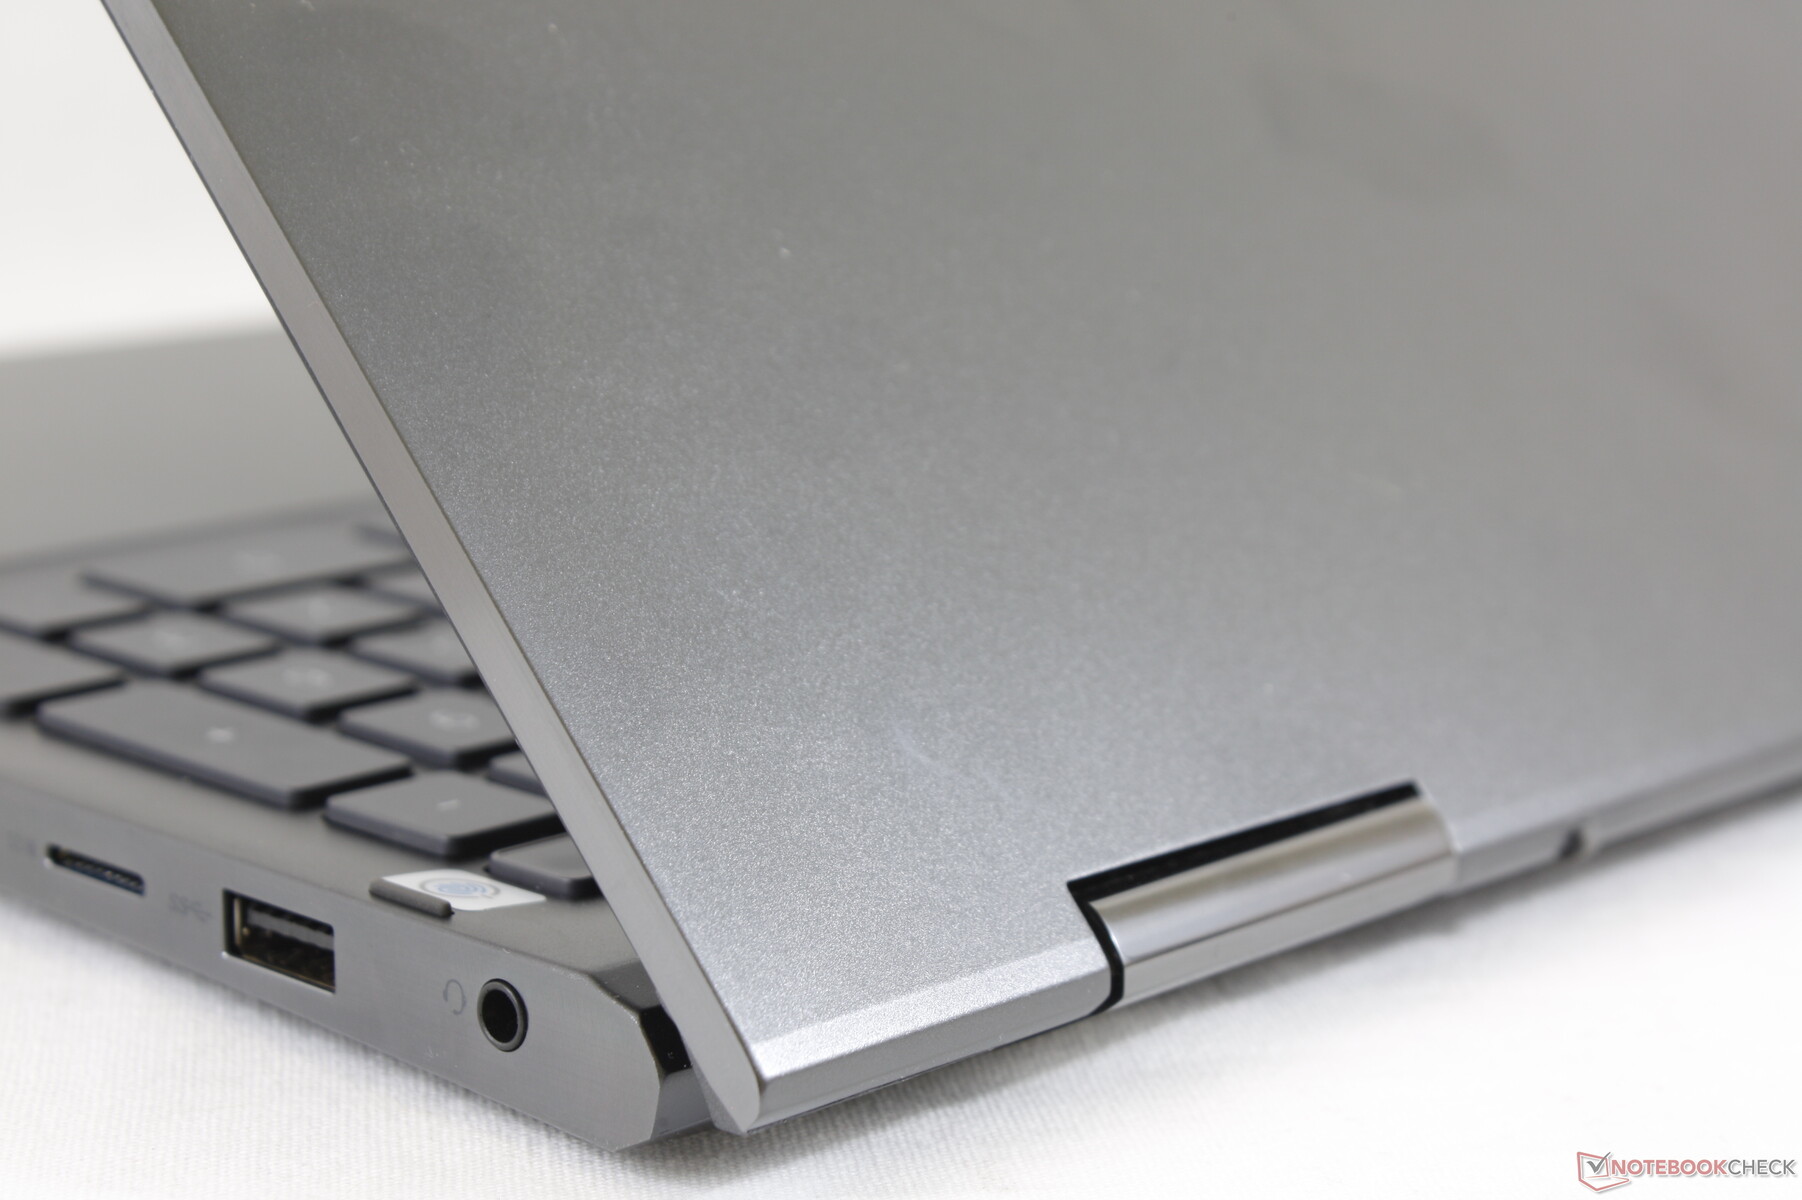
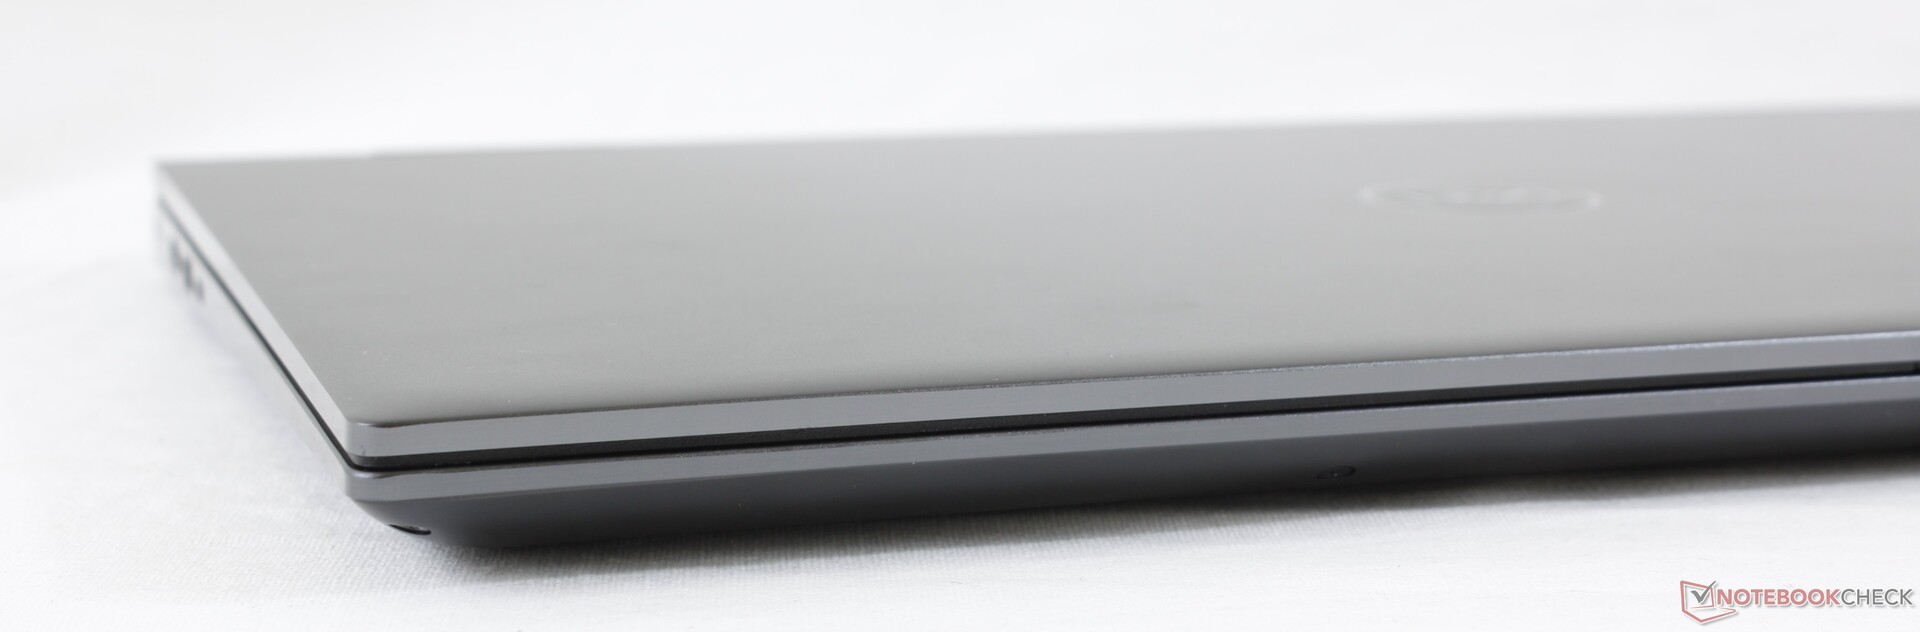
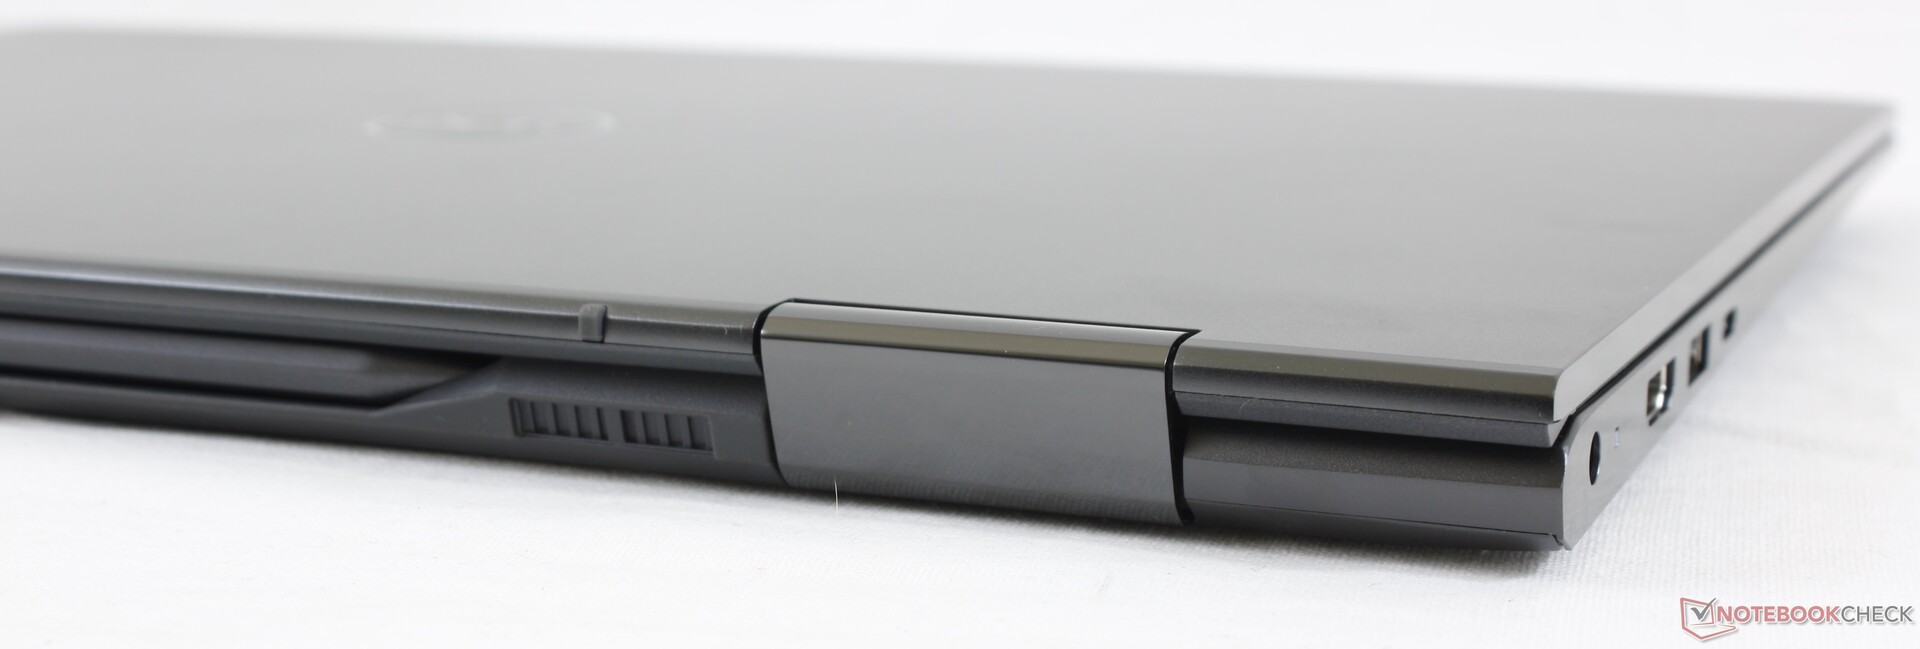
The aluminum chassis is identical to the Inspiron 15 7506 2-in-1 Silver Edition but with a handful of minor visual differences. Certain features are only found on certain models meaning users should choose carefully as these are more than just simple color choices. Beyond that, both laptops utilize the same materials, keyboard, clickpad, and other physical features for similar first impressions between them.
The major differences between the Inspiron 15 7506 2-in-1 Silver and Black Editions are as follows:
| Silver Edition | Black Edition | |
|---|---|---|
| CPU | Up to Core i5-1135G7 | Up to Core i7-1165G7 |
| GPU | Up to GeForce GeForce MX330 w/ 2 GB GDDR5 VRAM | Up to Iris Xe Max w/ 4 GB LPDDR4X VRAM |
| RAM | Up to 16 GB 3200 MHz (2x SODIMM) | Up to 16 GB 4267 MHz (Soldered) |
| Display | 1080p touchscreen | 4K UHD touchscreen |
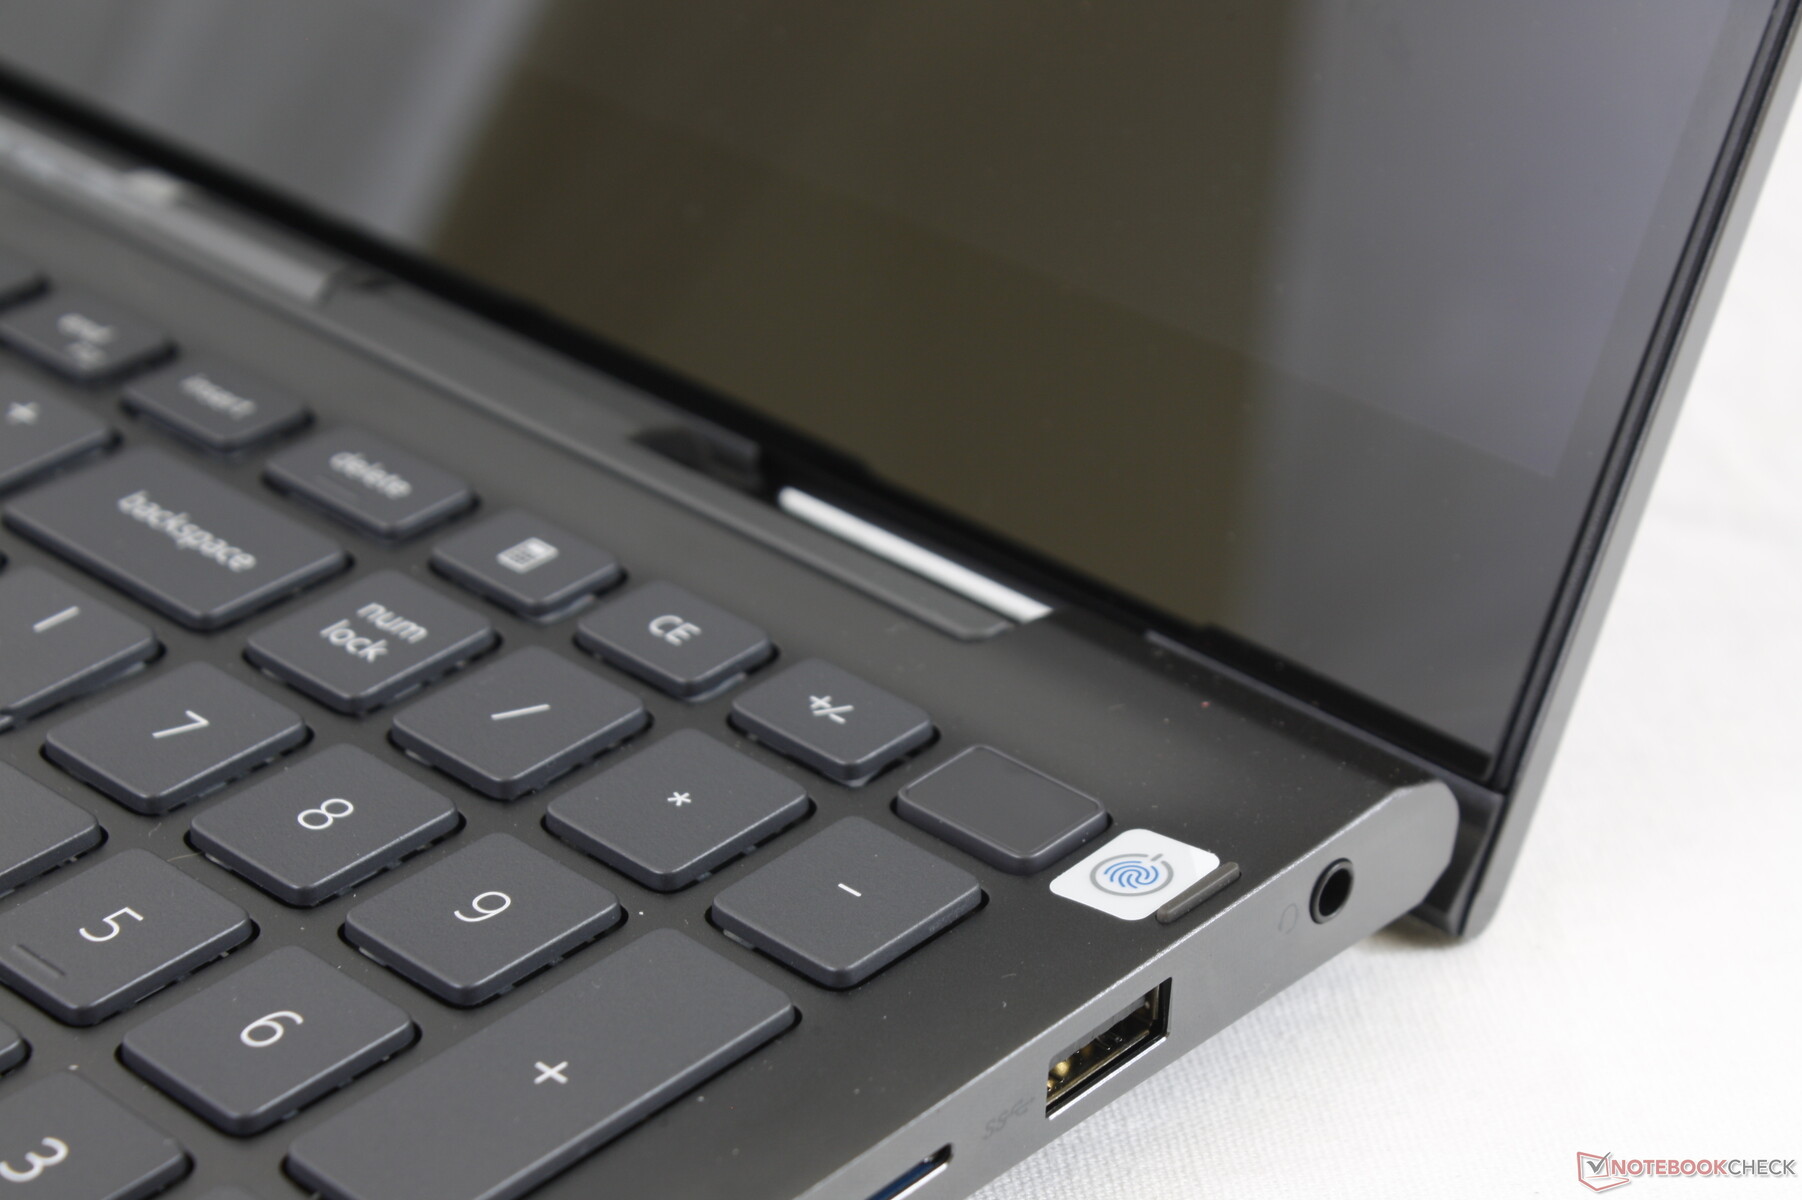
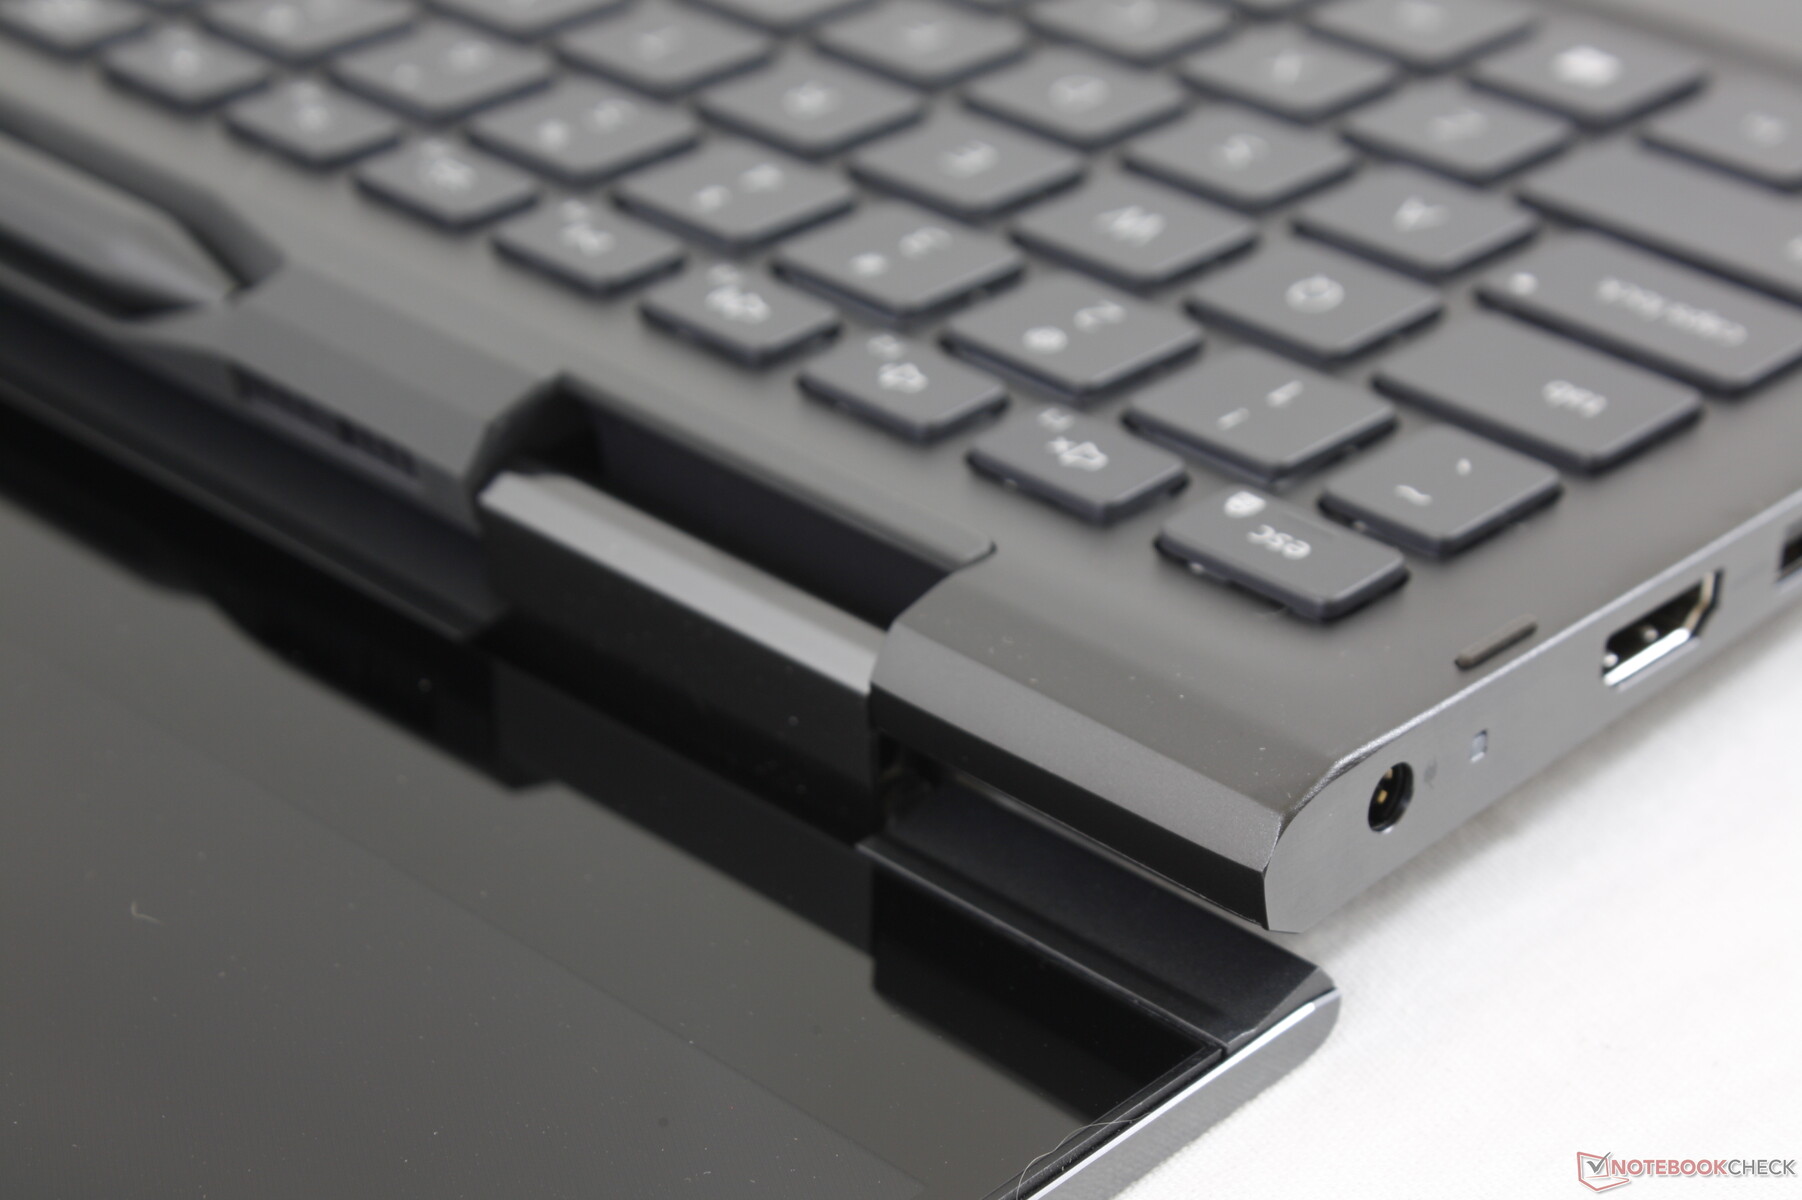
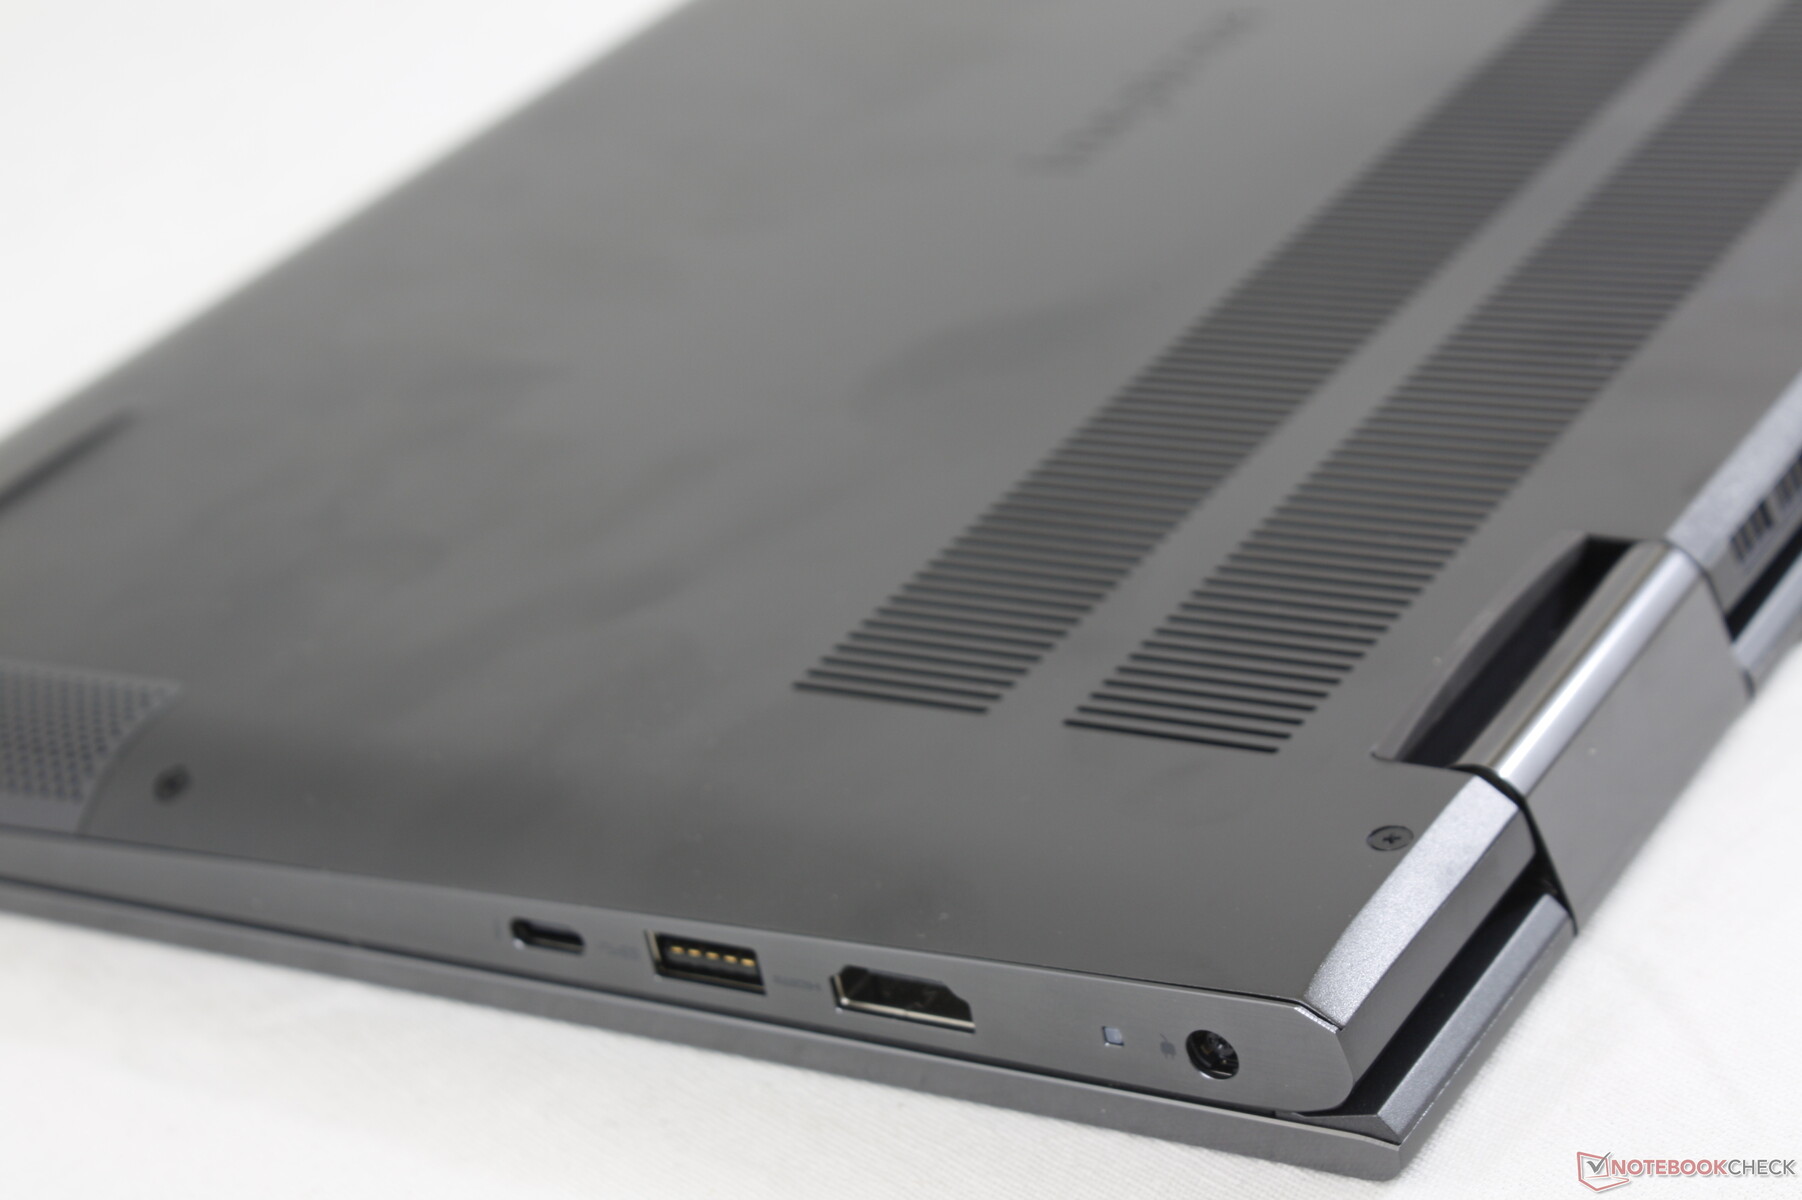
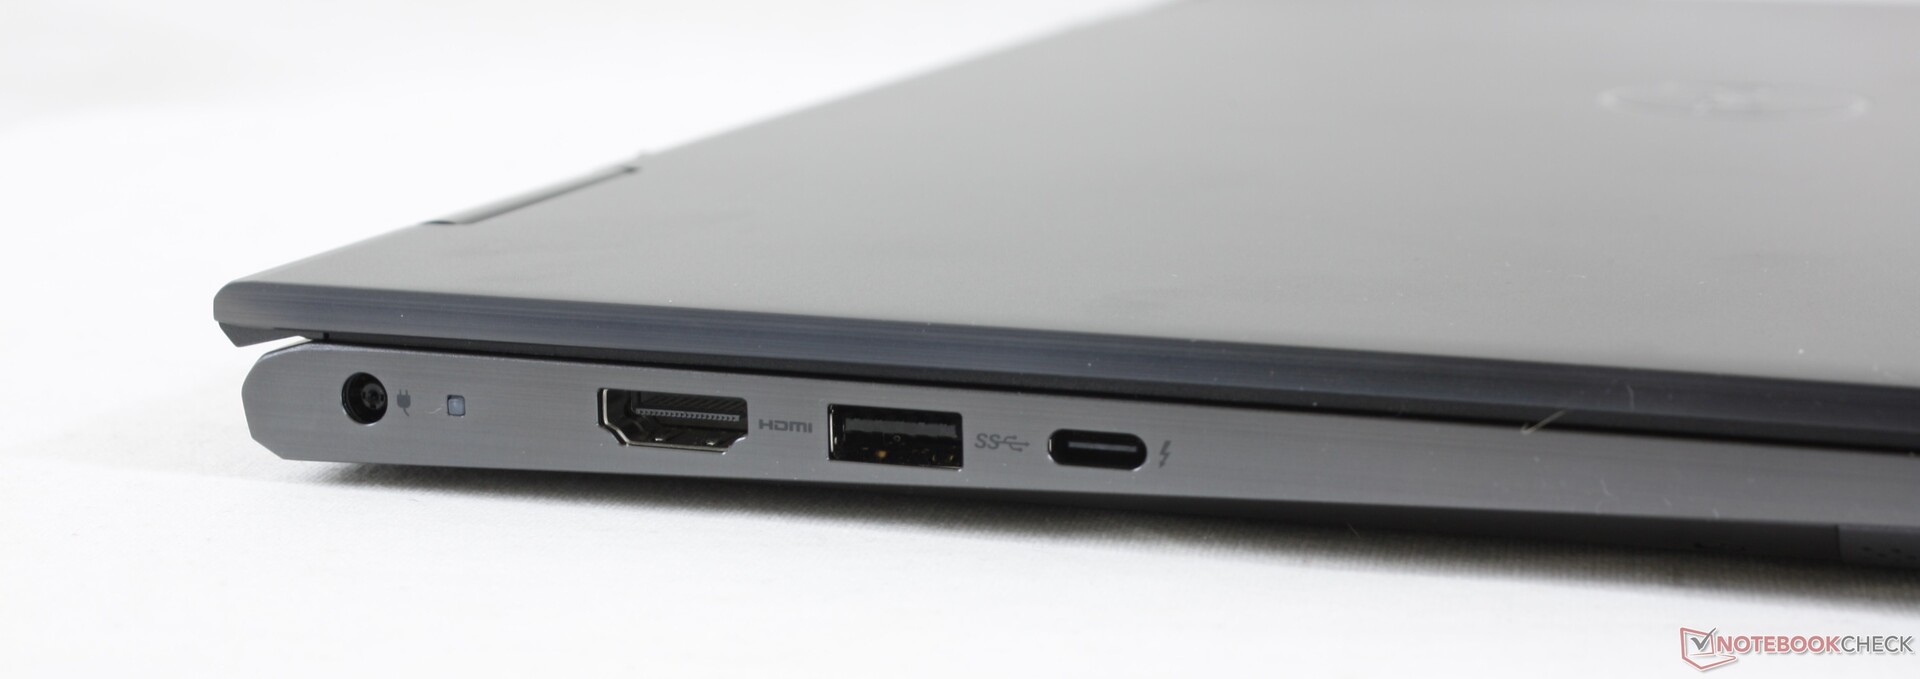
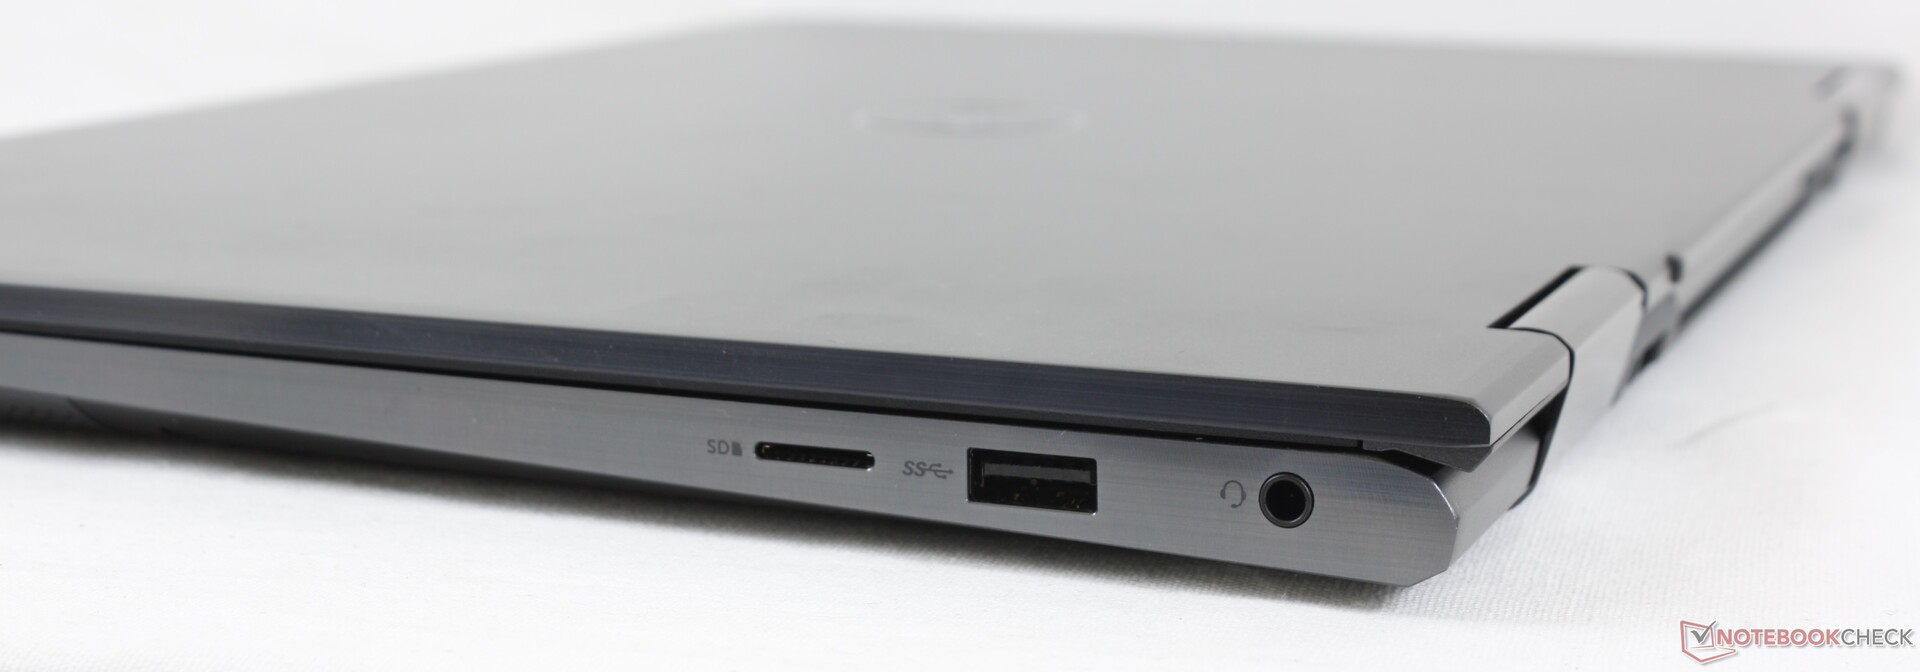
| Ports | HDMI 1.4 Full-size SD card reader | HDMI 2.0 MicroSD card reader |
| WLAN | Intel AX201 (removable) | Intel AX201 (soldered) |
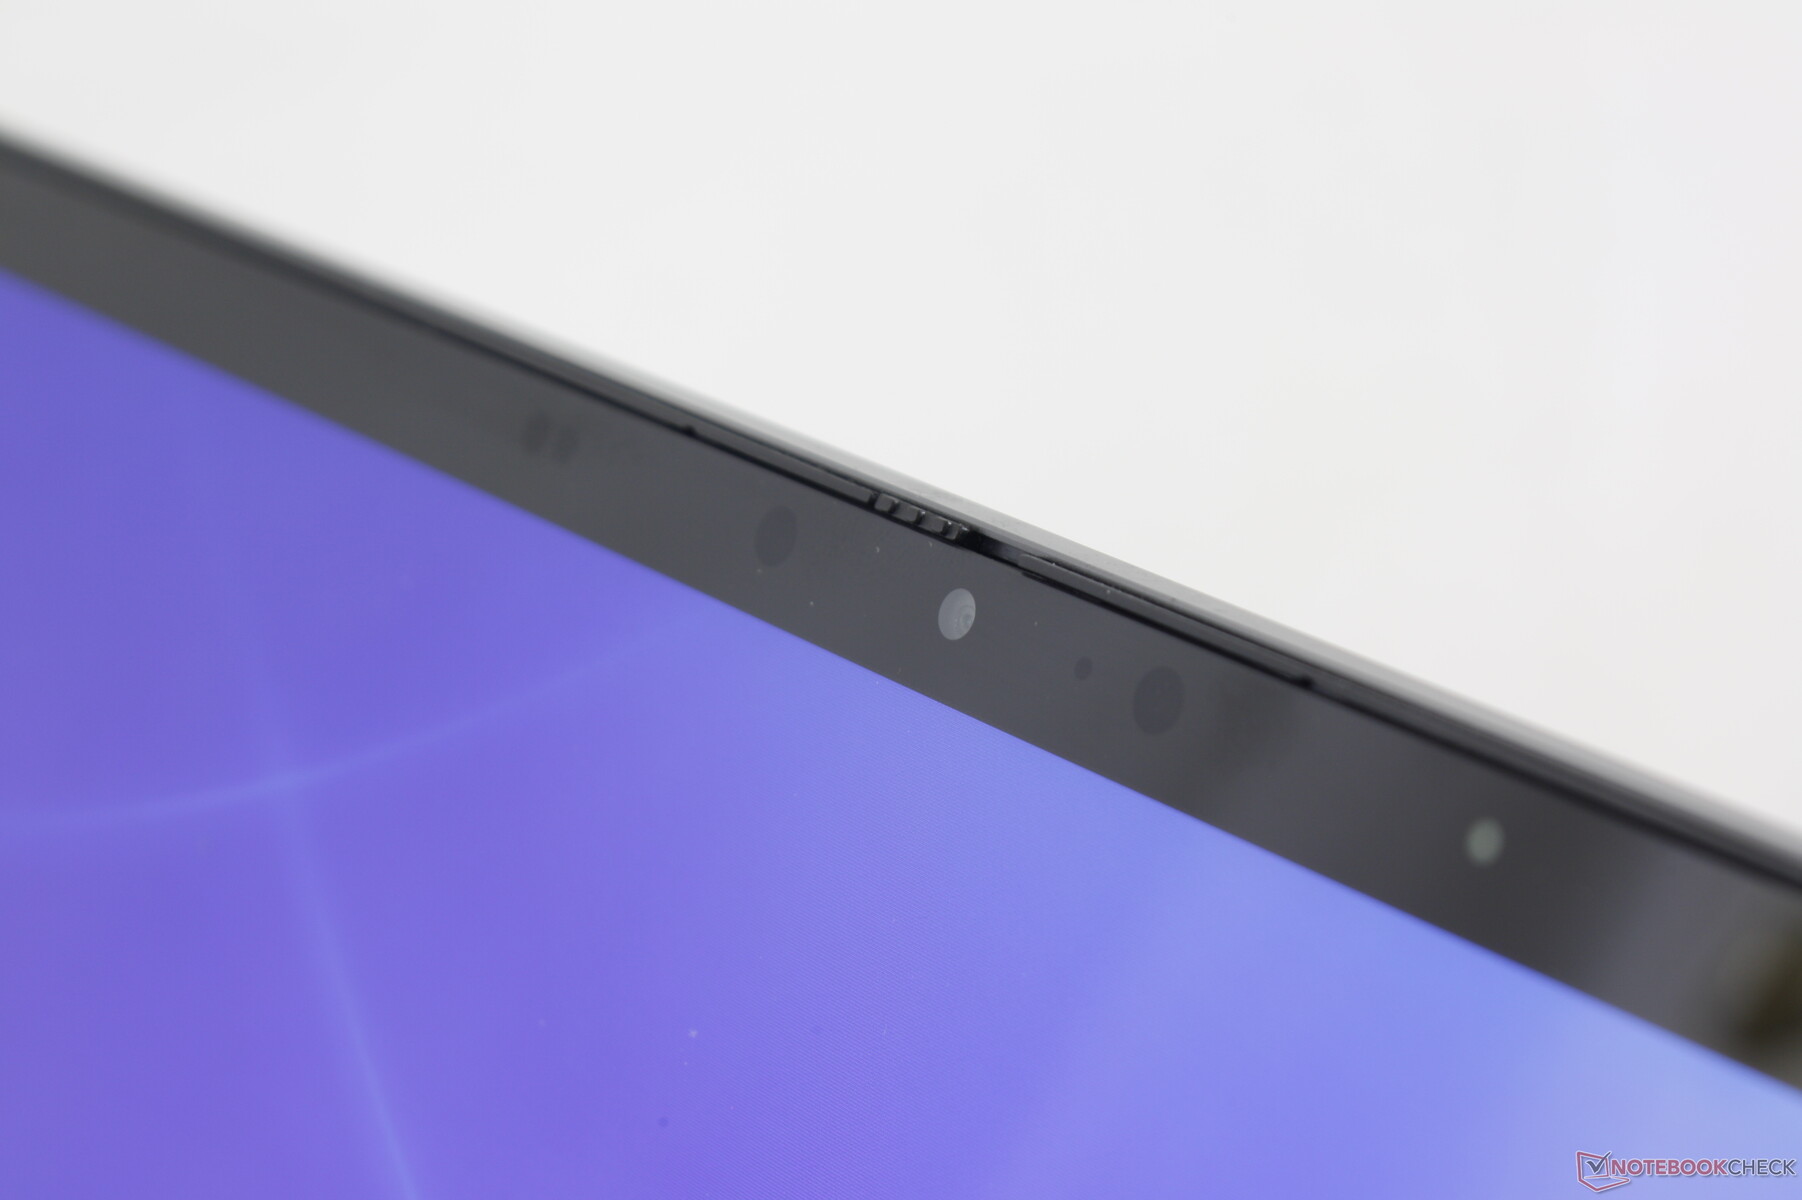
| IR Camera | No | Yes |
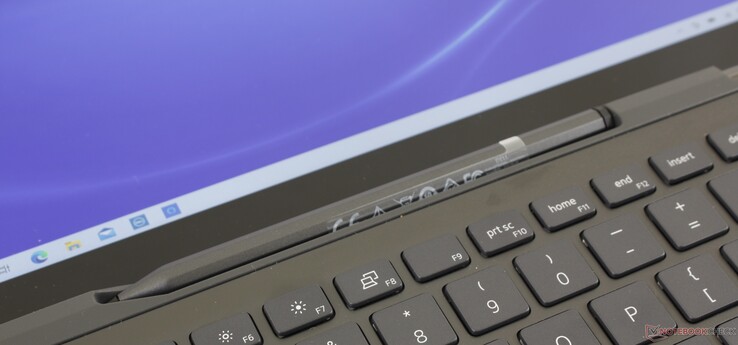
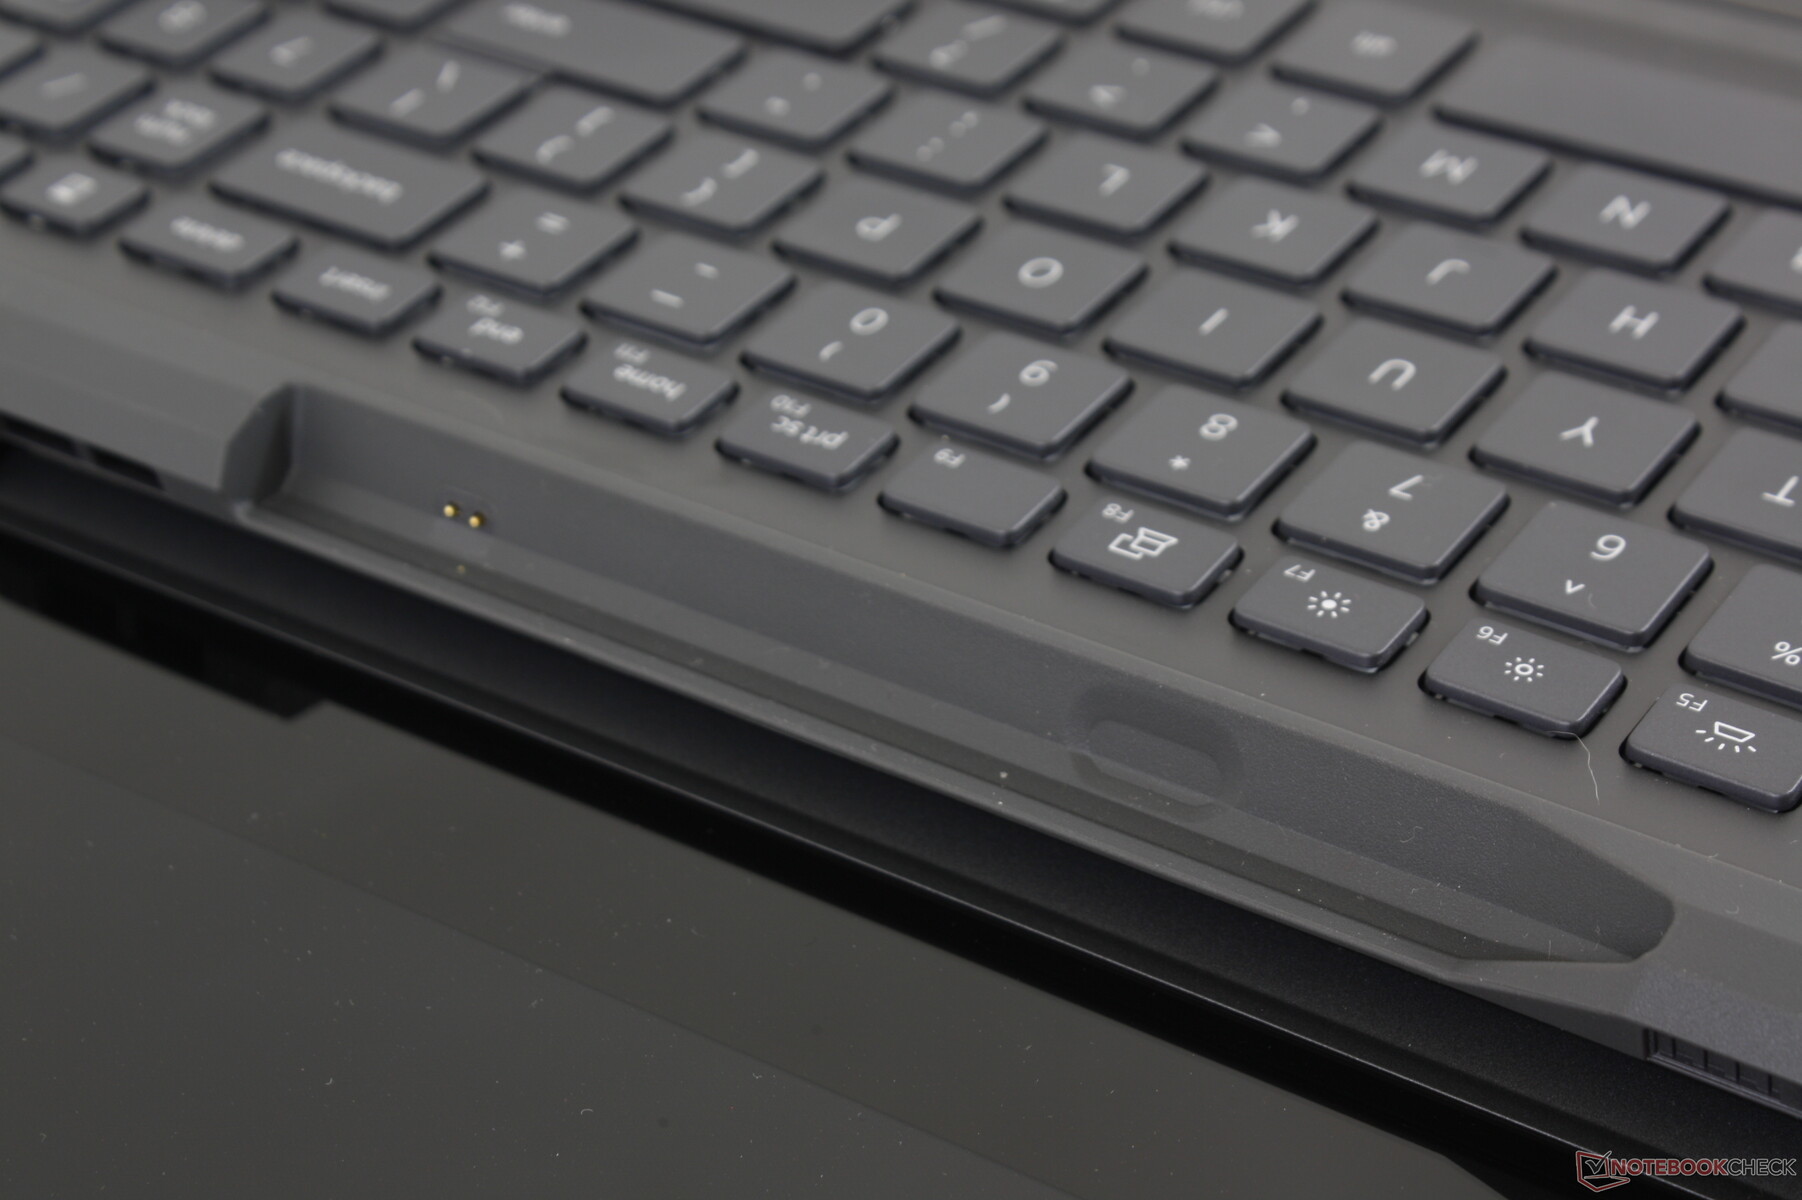
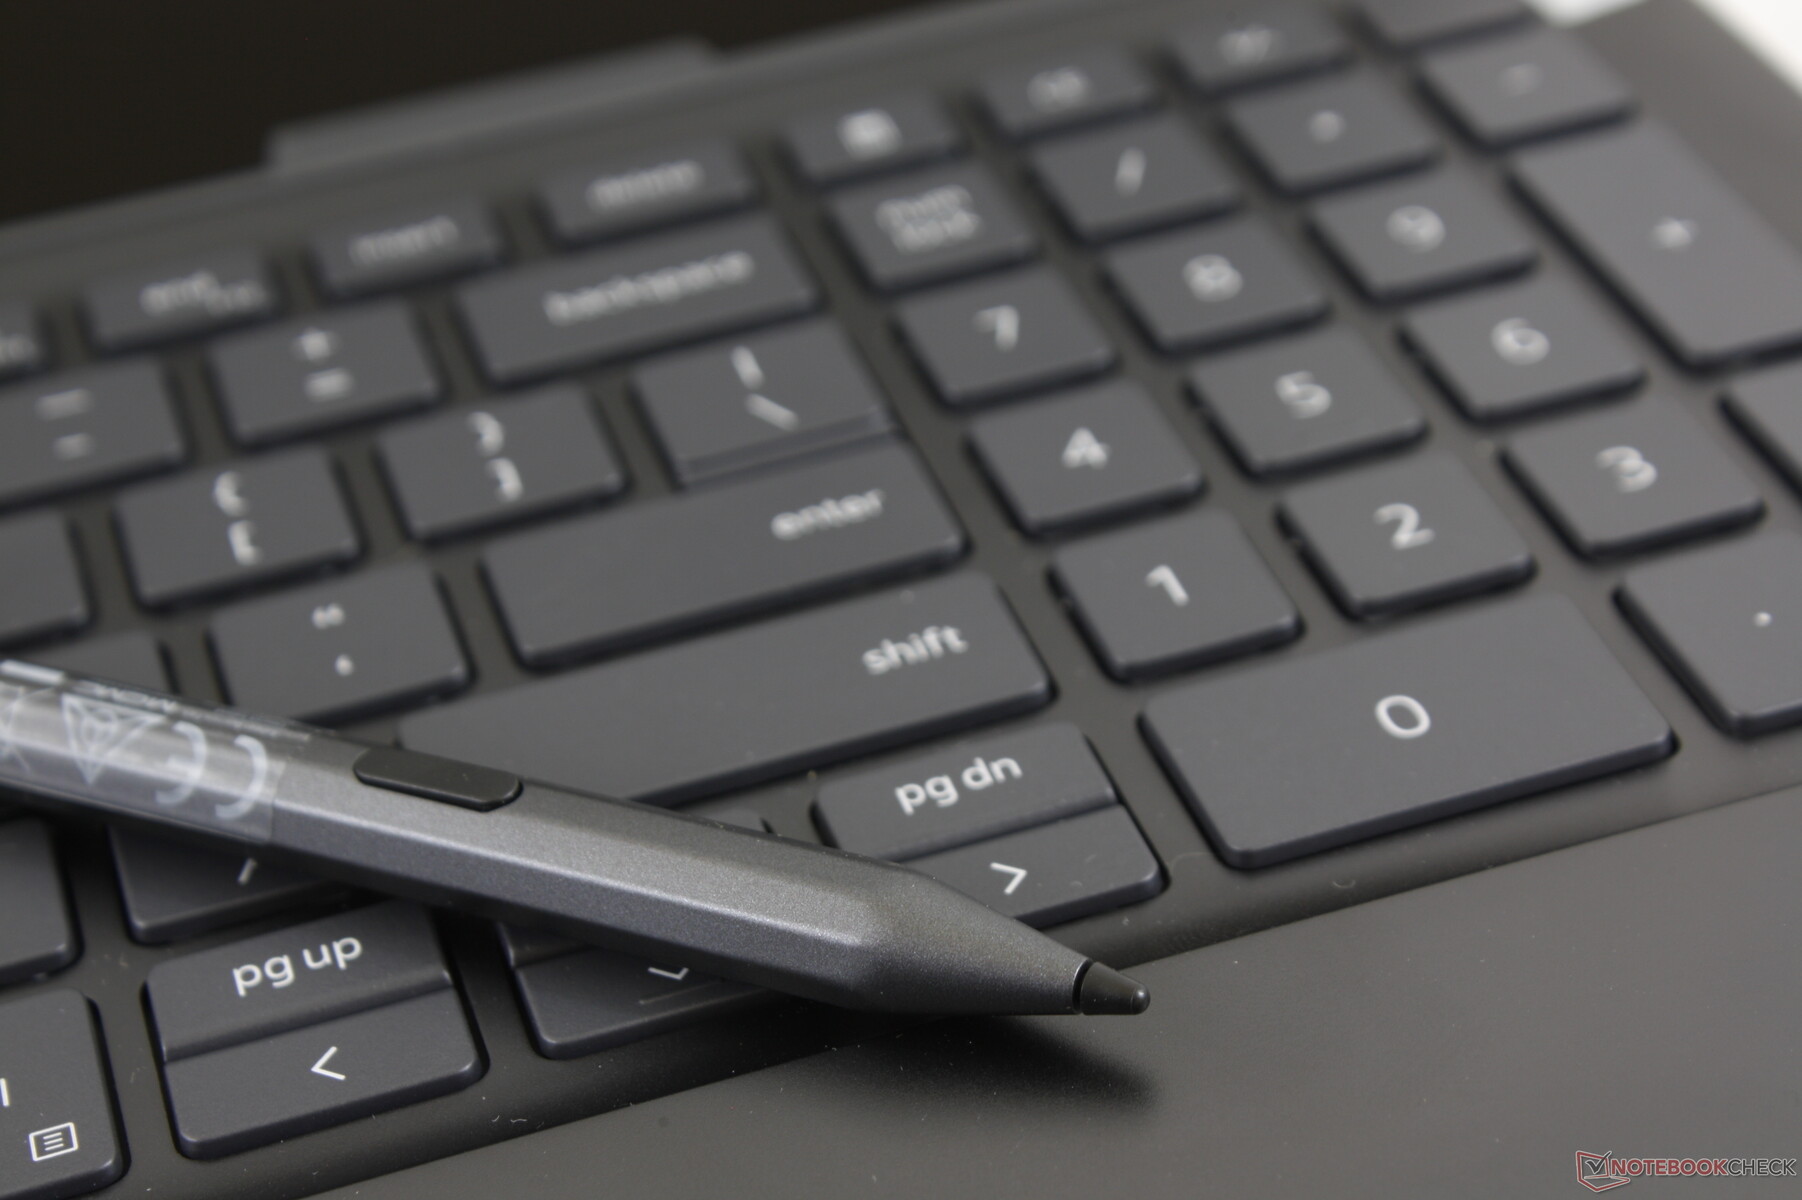
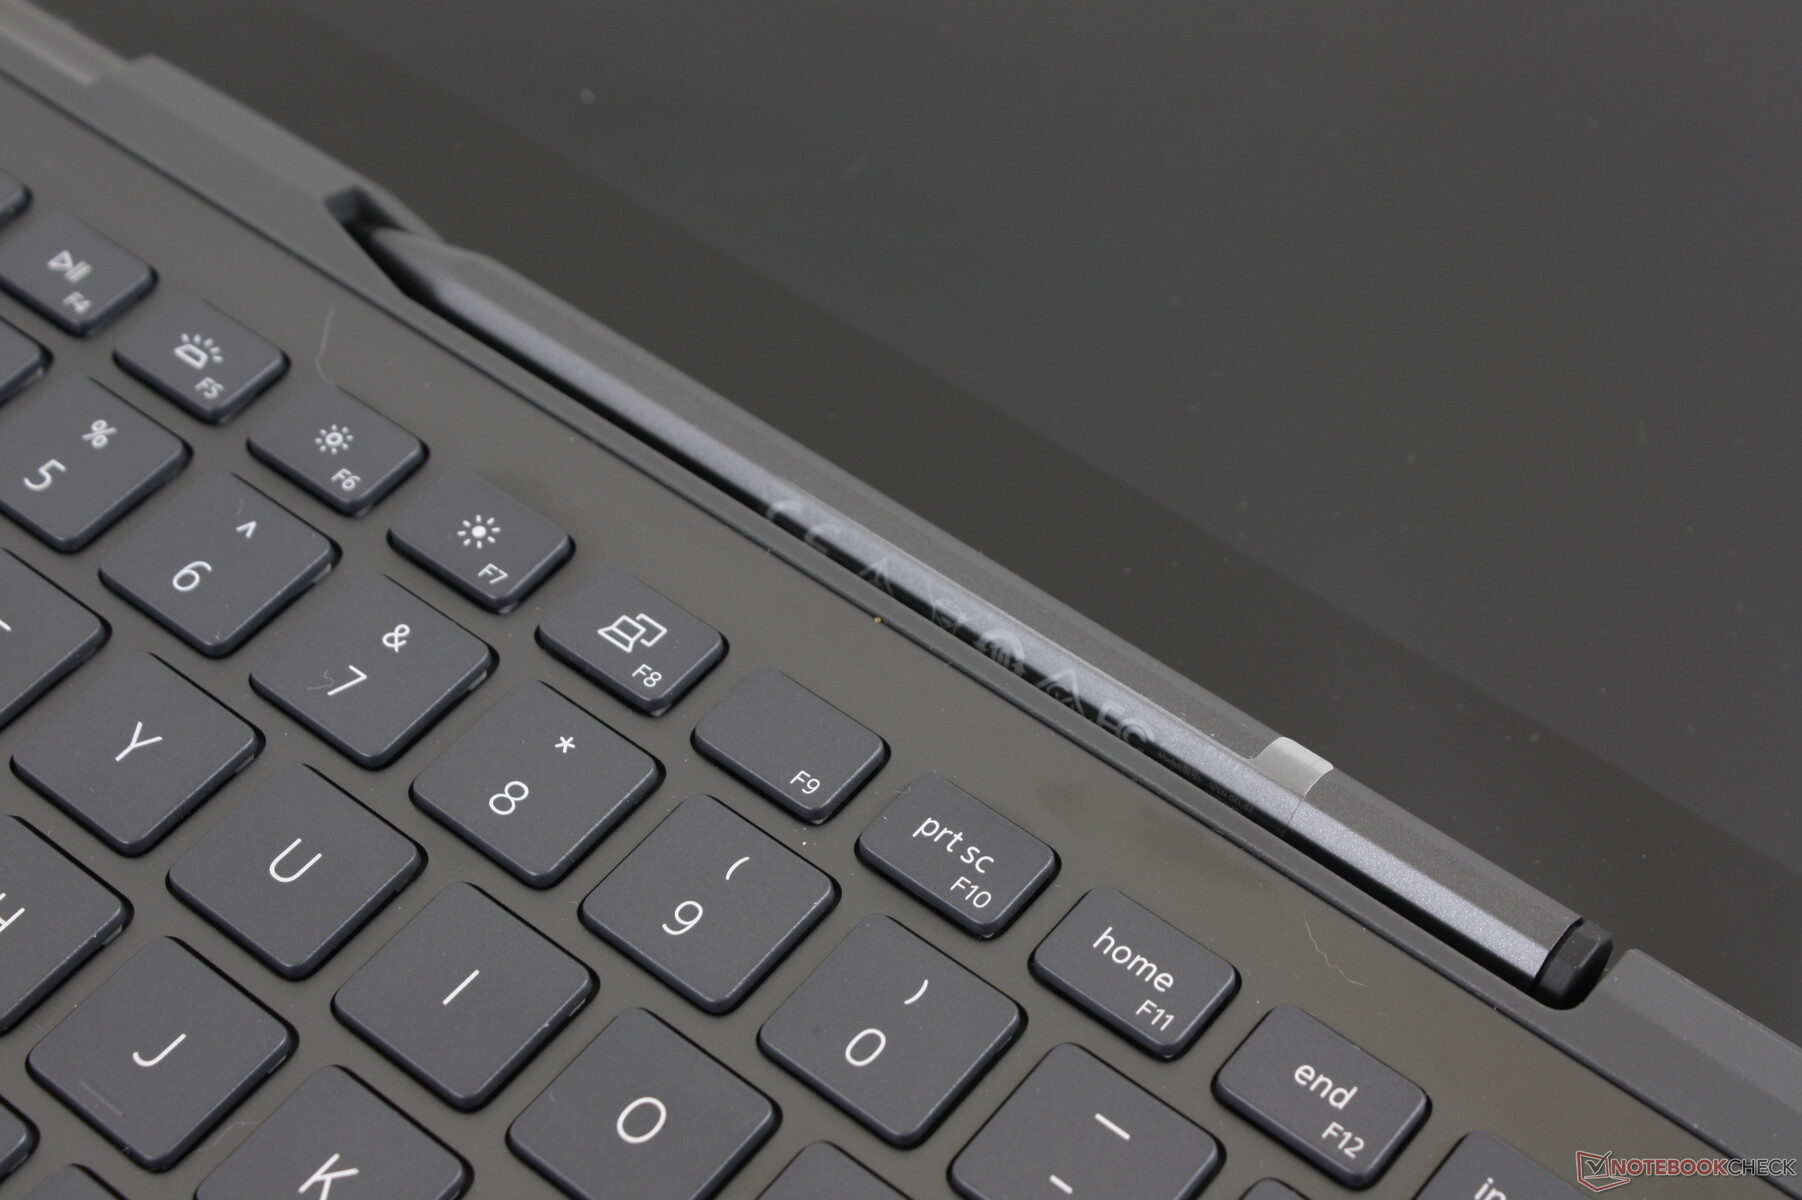
| Pen Garage | No | Yes |
| Dell Active Pen | PN350M, sold separately | PN771M, included in box |
| Battery, Power | 53 Wh Smaller 65 W AC adapter | 68 Wh Larger 90 W AC adapter |
| Weight | >1.78 kg | >1.91 kg |
| Price | >$700 USD | >$1500 USD |
Connectivity
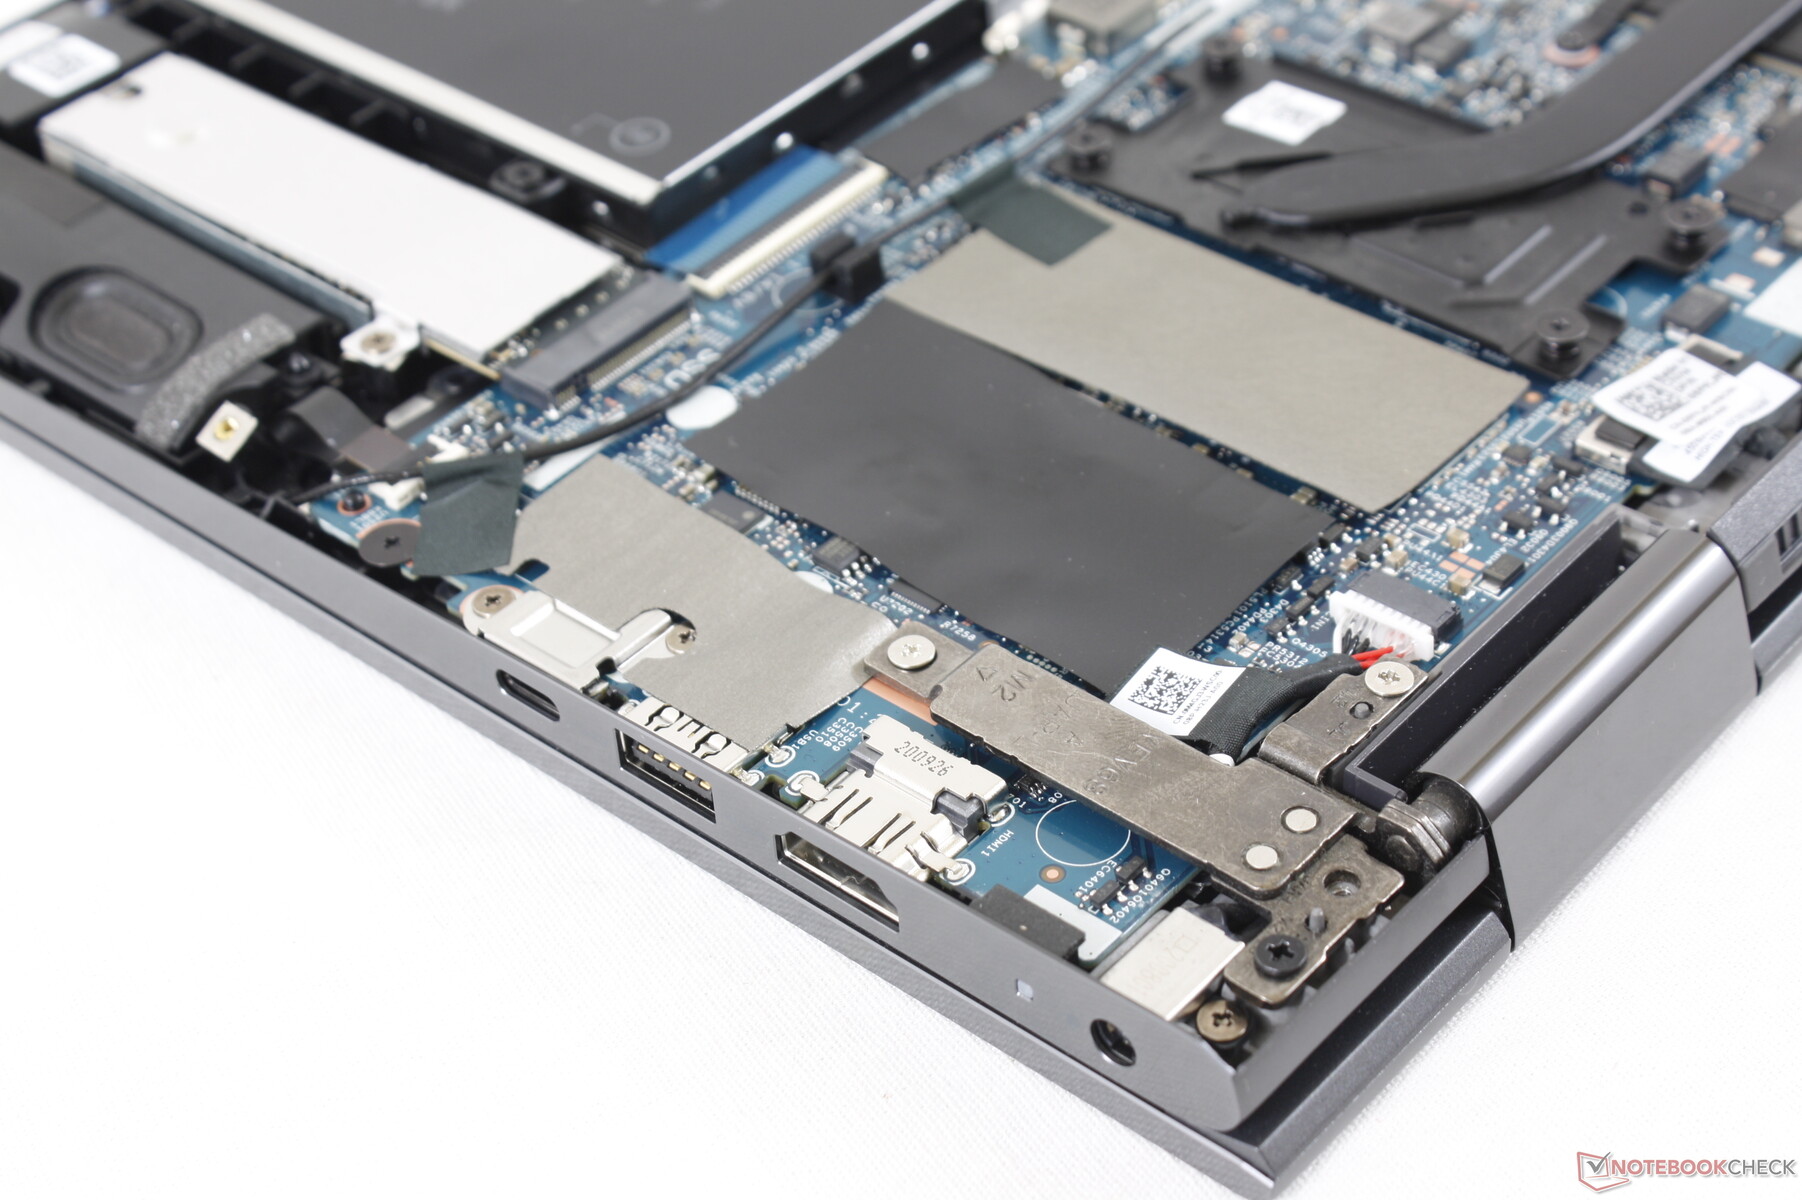
The Black Edition swaps out the full-size SD reader on the Silver Edition for a smaller MicroSD one. It's an inconvenient change since microSD to full-size SD adapters are quite common.
SD Card Reader
Transfer rates from the SD card reader are as slow as on the Silver Edition. Moving 1 GB of pictures from our UHS-II card to desktop takes about 50 seconds.
| SD Card Reader | |
| average JPG Copy Test (av. of 3 runs) | |
| Microsoft Surface Book 3 15 (Toshiba Exceria Pro M501 microSDXC 64GB) | |
| Samsung Galaxy Book Flex 15-NP950 (Toshiba Exceria Pro M501 microSDXC 64GB) | |
| HP Envy x360 15-ee0257ng (Toshiba Exceria Pro SDXC 64 GB UHS-II) | |
| Asus ZenBook Flip 15 UX563FD-A1027T (Toshiba Exceria Pro SDXC 64 GB UHS-II) | |
| Dell Inspiron 15 7506 2-in-1 P97F (Toshiba Exceria Pro SDXC 64 GB UHS-II) | |
| Dell Inspiron 15 7000 7506 2-in-1 Black Edition (Toshiba Exceria Pro M501 microSDXC 32GB) | |
| maximum AS SSD Seq Read Test (1GB) | |
| Microsoft Surface Book 3 15 (Toshiba Exceria Pro M501 microSDXC 64GB) | |
| Samsung Galaxy Book Flex 15-NP950 (Toshiba Exceria Pro M501 microSDXC 64GB) | |
| HP Envy x360 15-ee0257ng (Toshiba Exceria Pro SDXC 64 GB UHS-II) | |
| Dell Inspiron 15 7506 2-in-1 P97F (Toshiba Exceria Pro SDXC 64 GB UHS-II) | |
| Dell Inspiron 15 7000 7506 2-in-1 Black Edition (Toshiba Exceria Pro M501 microSDXC 32GB) | |
Communication
We experienced no connectivity issues when paired to our Netgear RAX200 router. However, transfer rates are slower than what we recorded on the Silver Edition model.
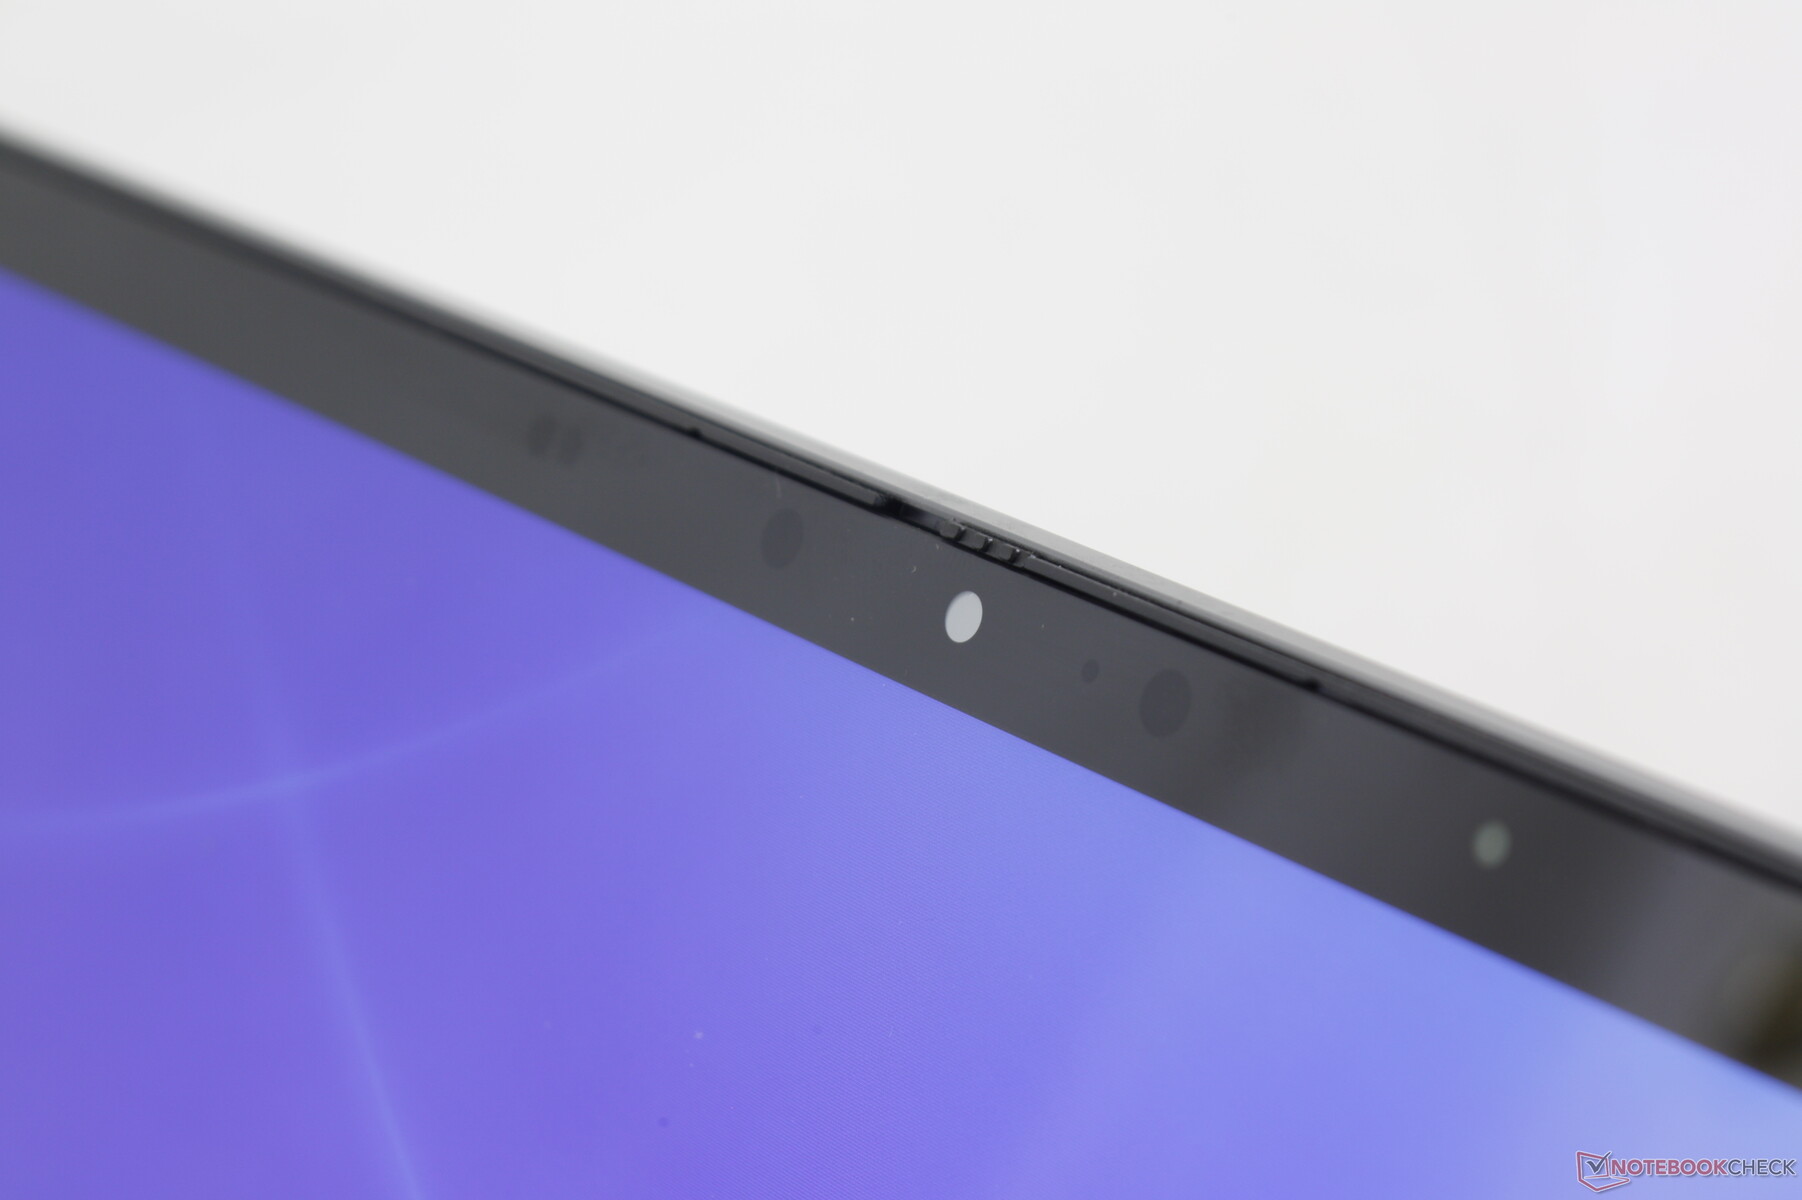
Webcam


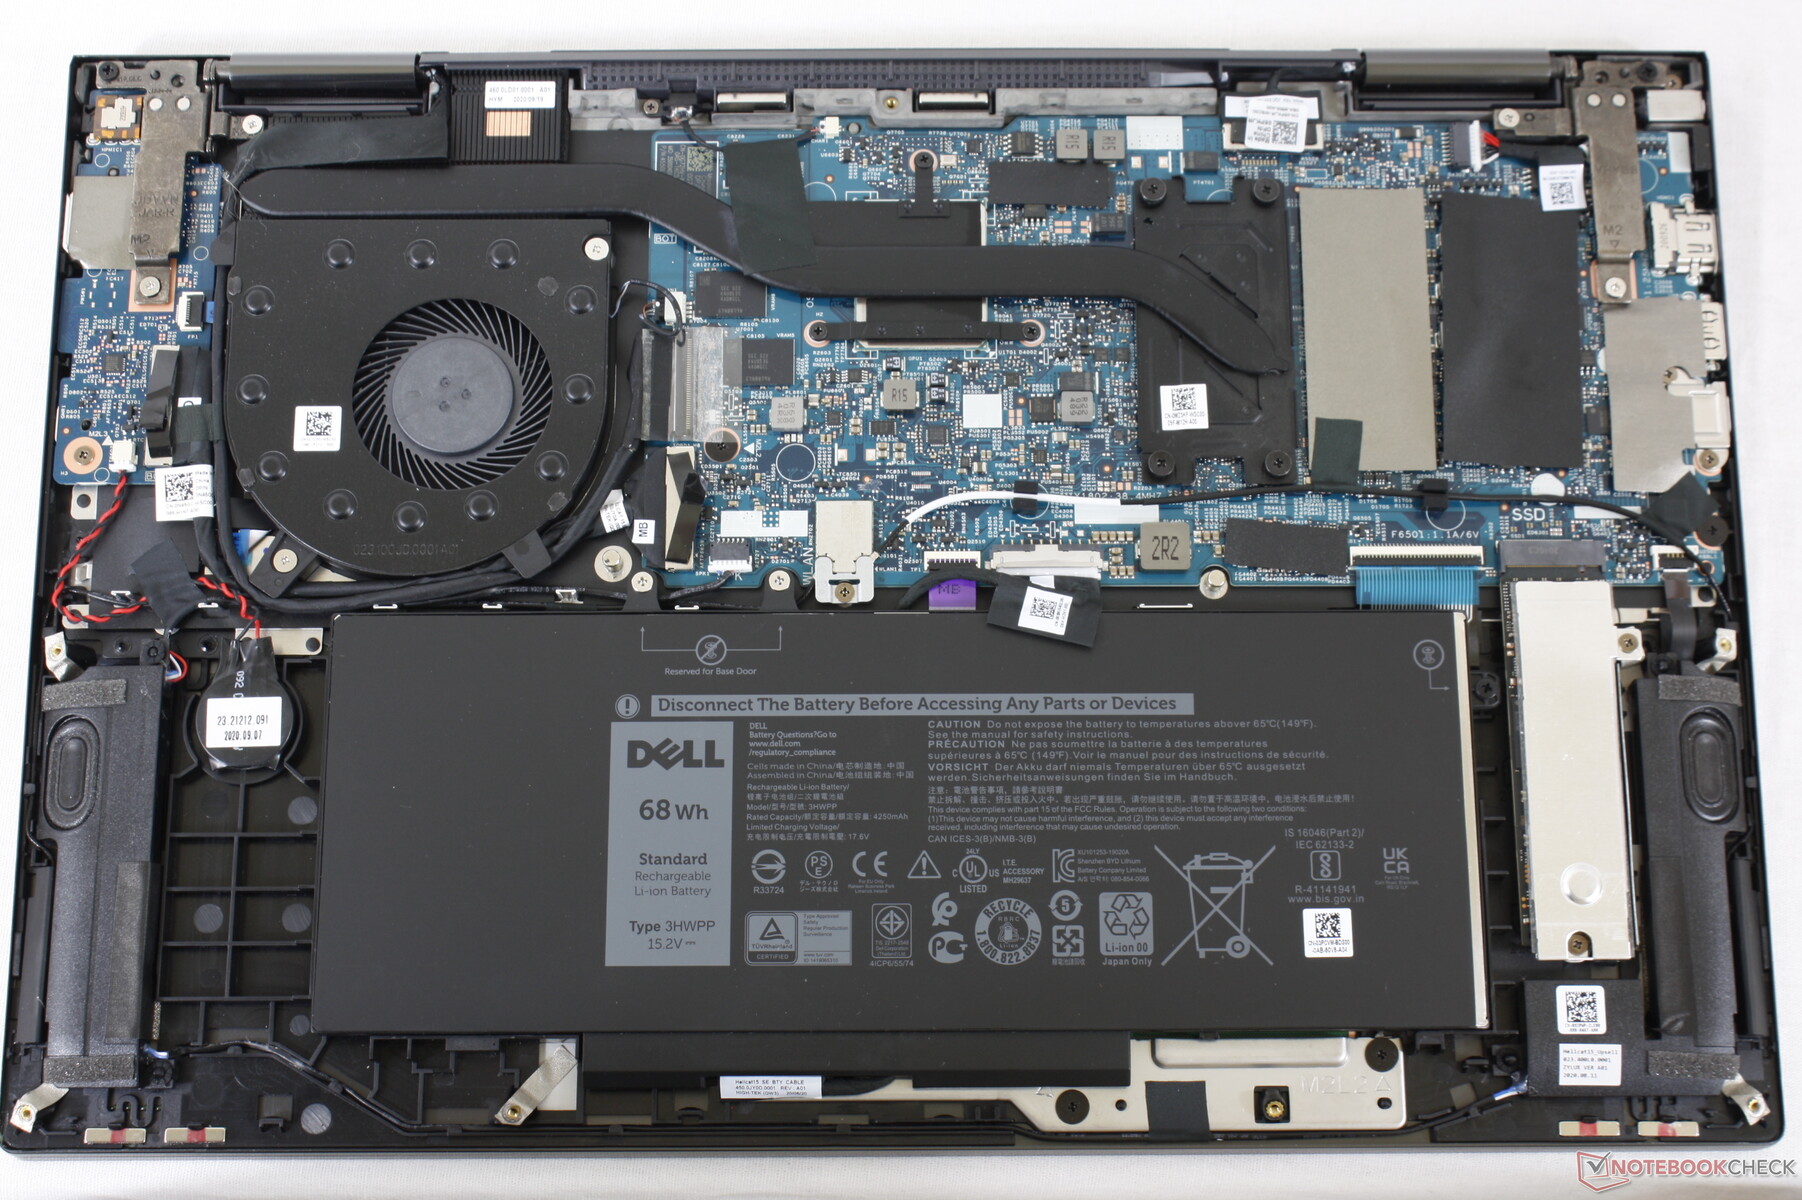
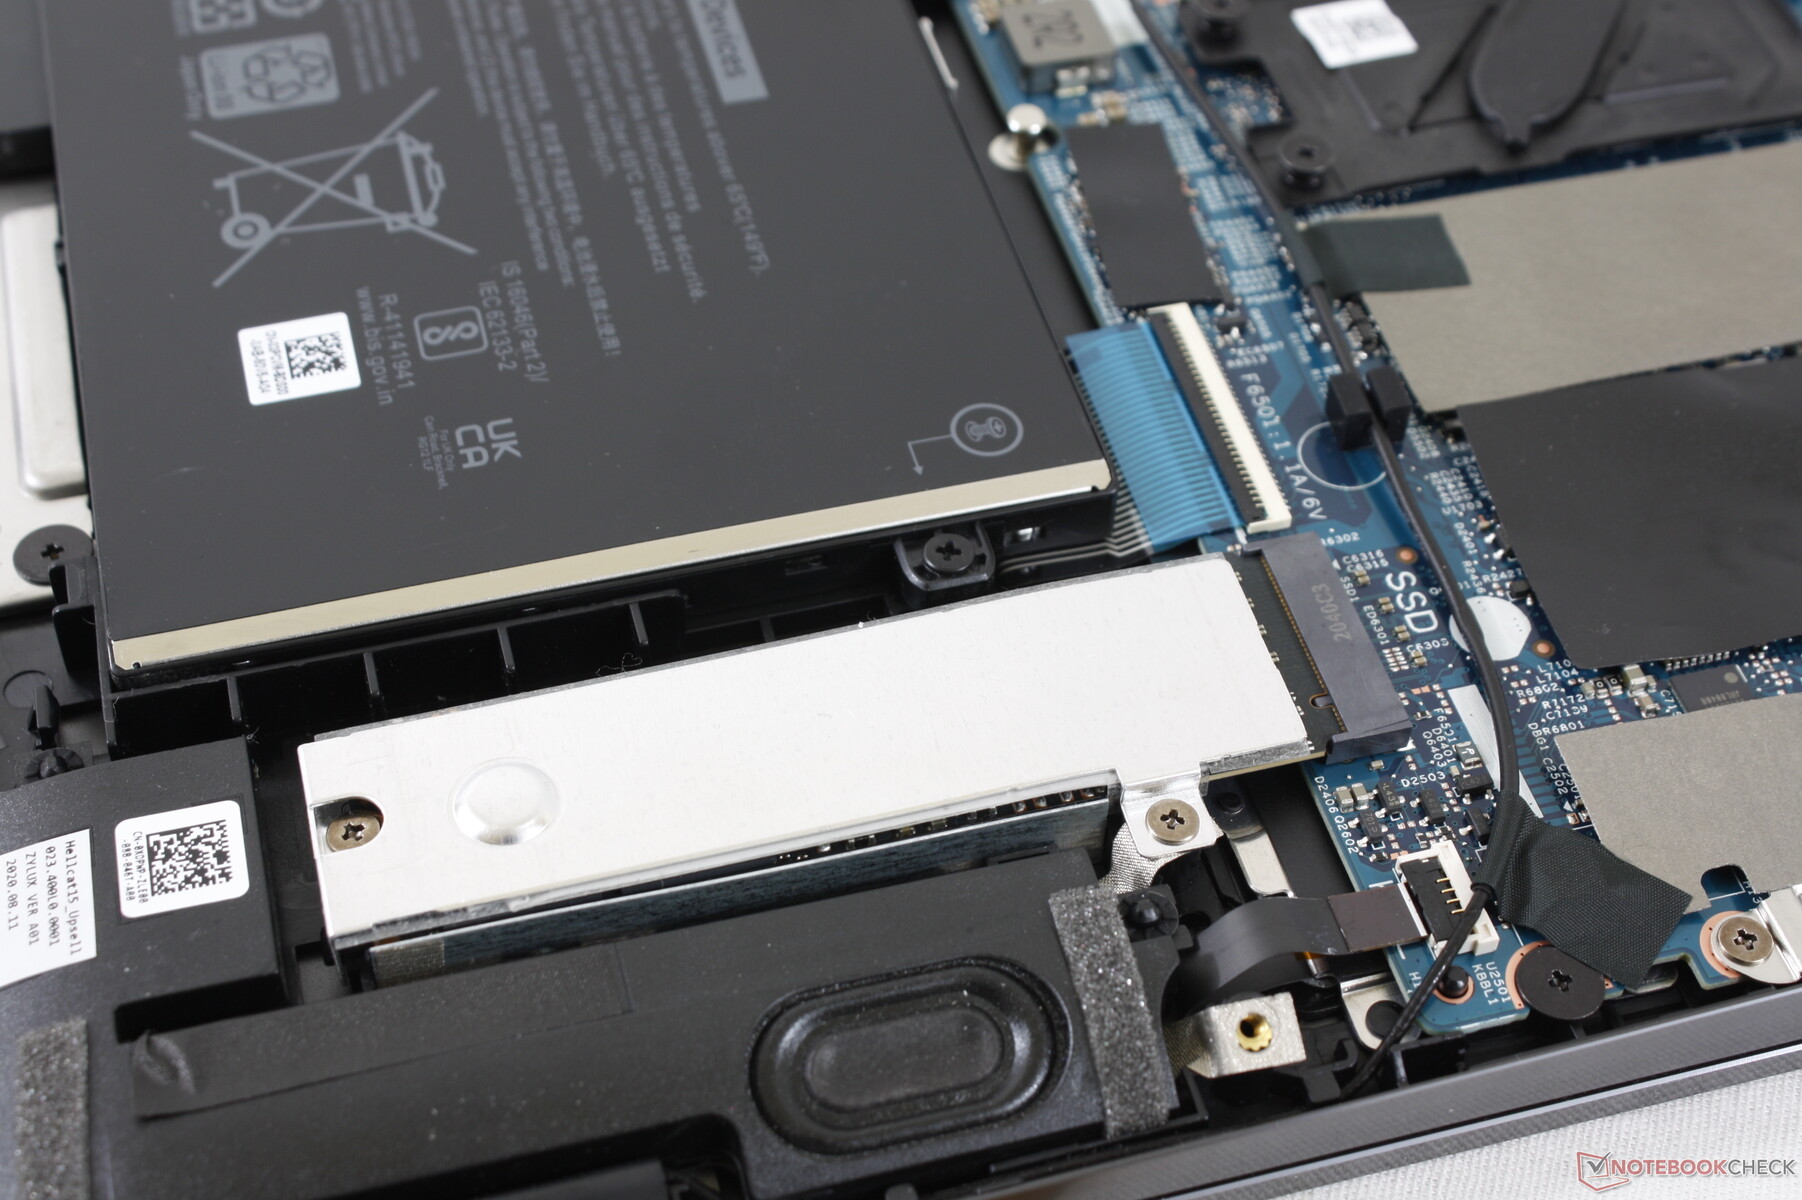
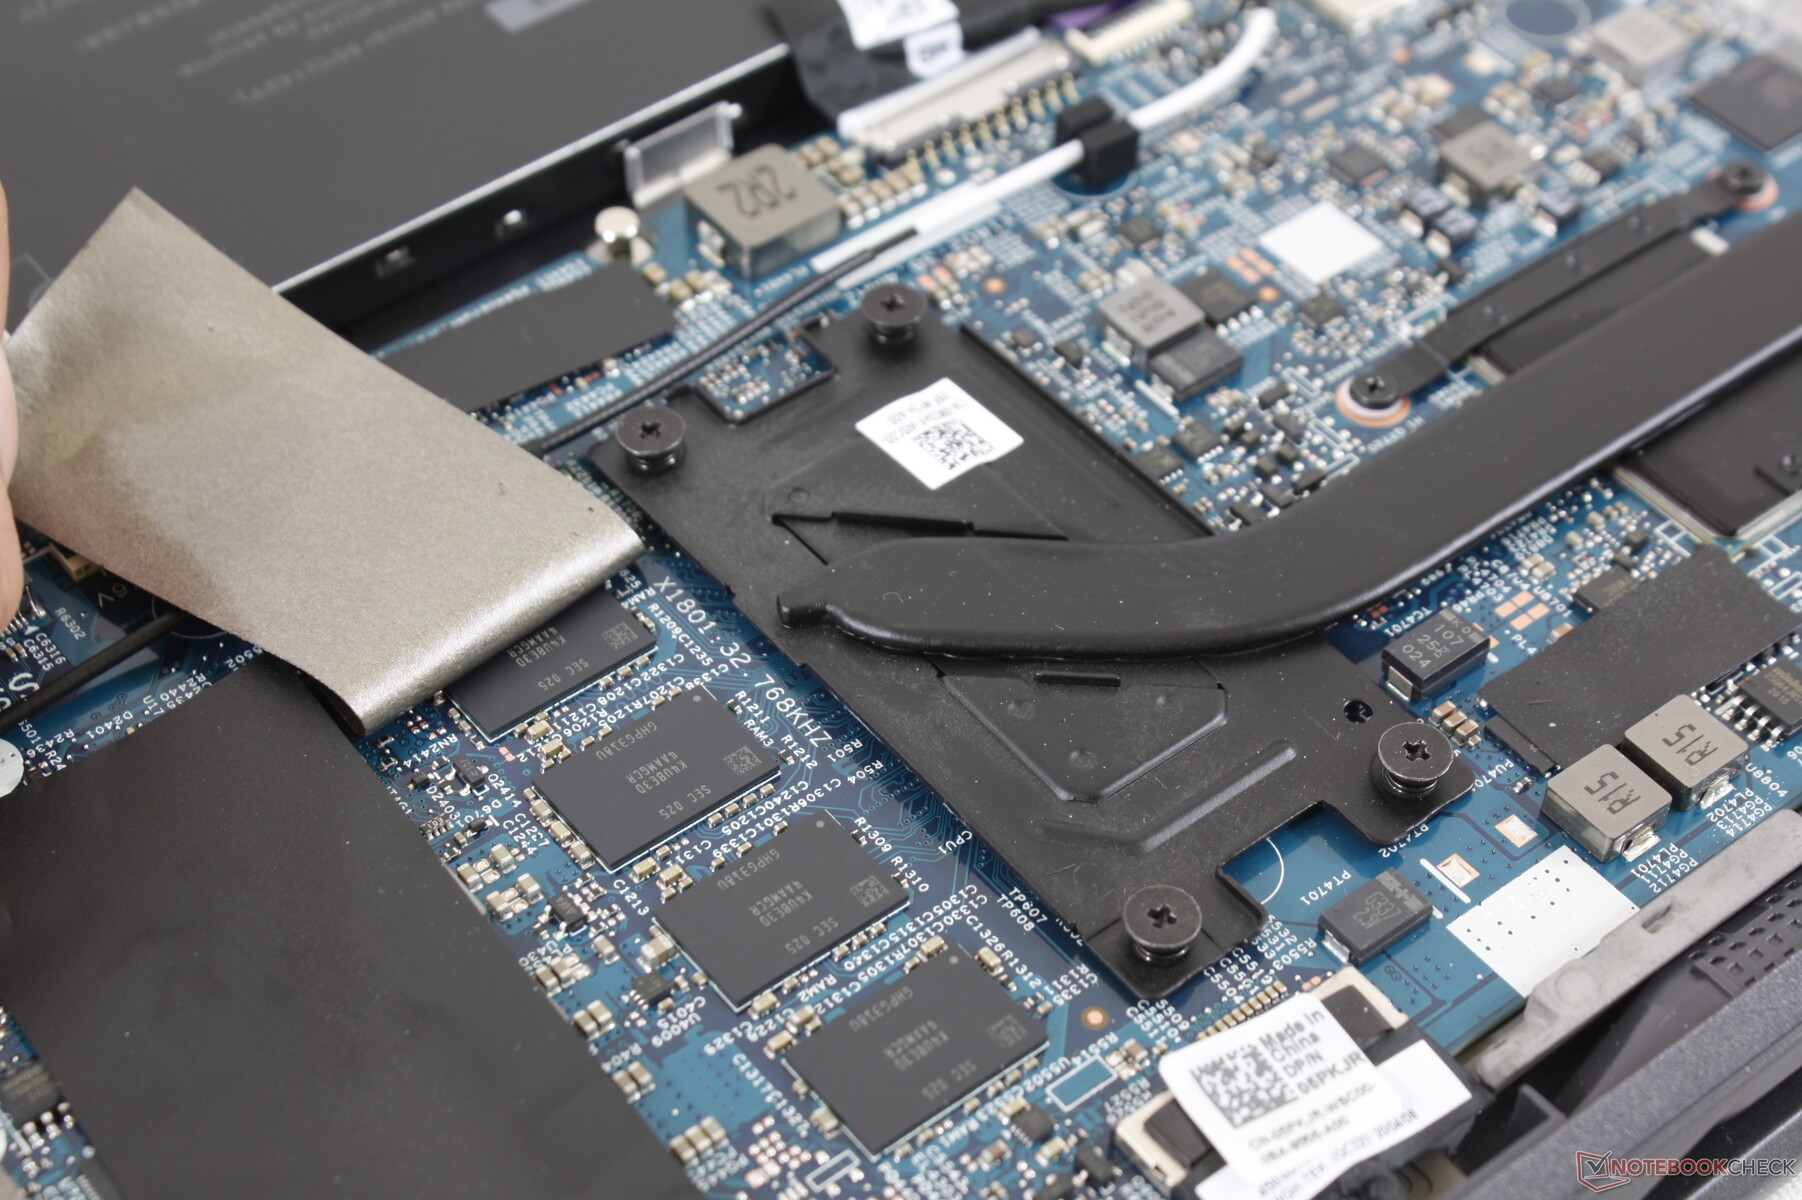
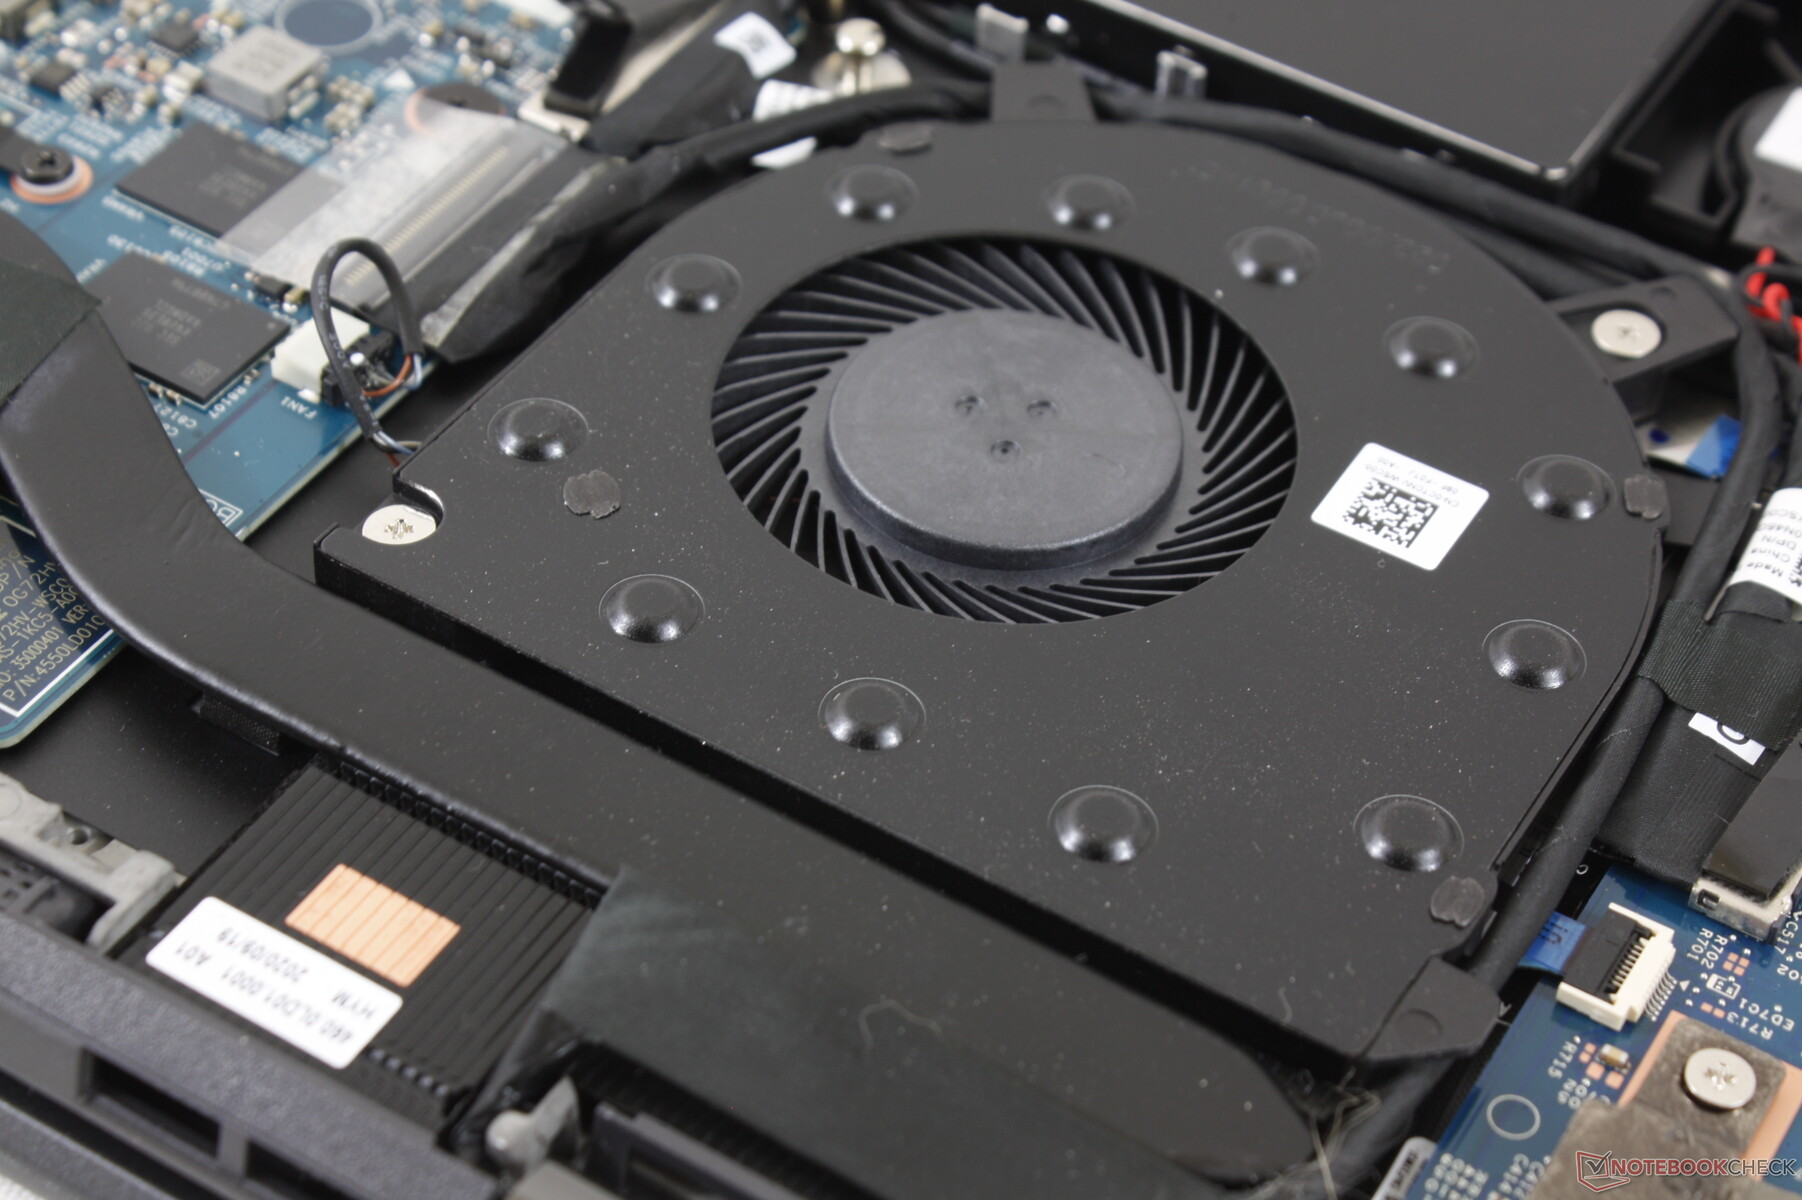
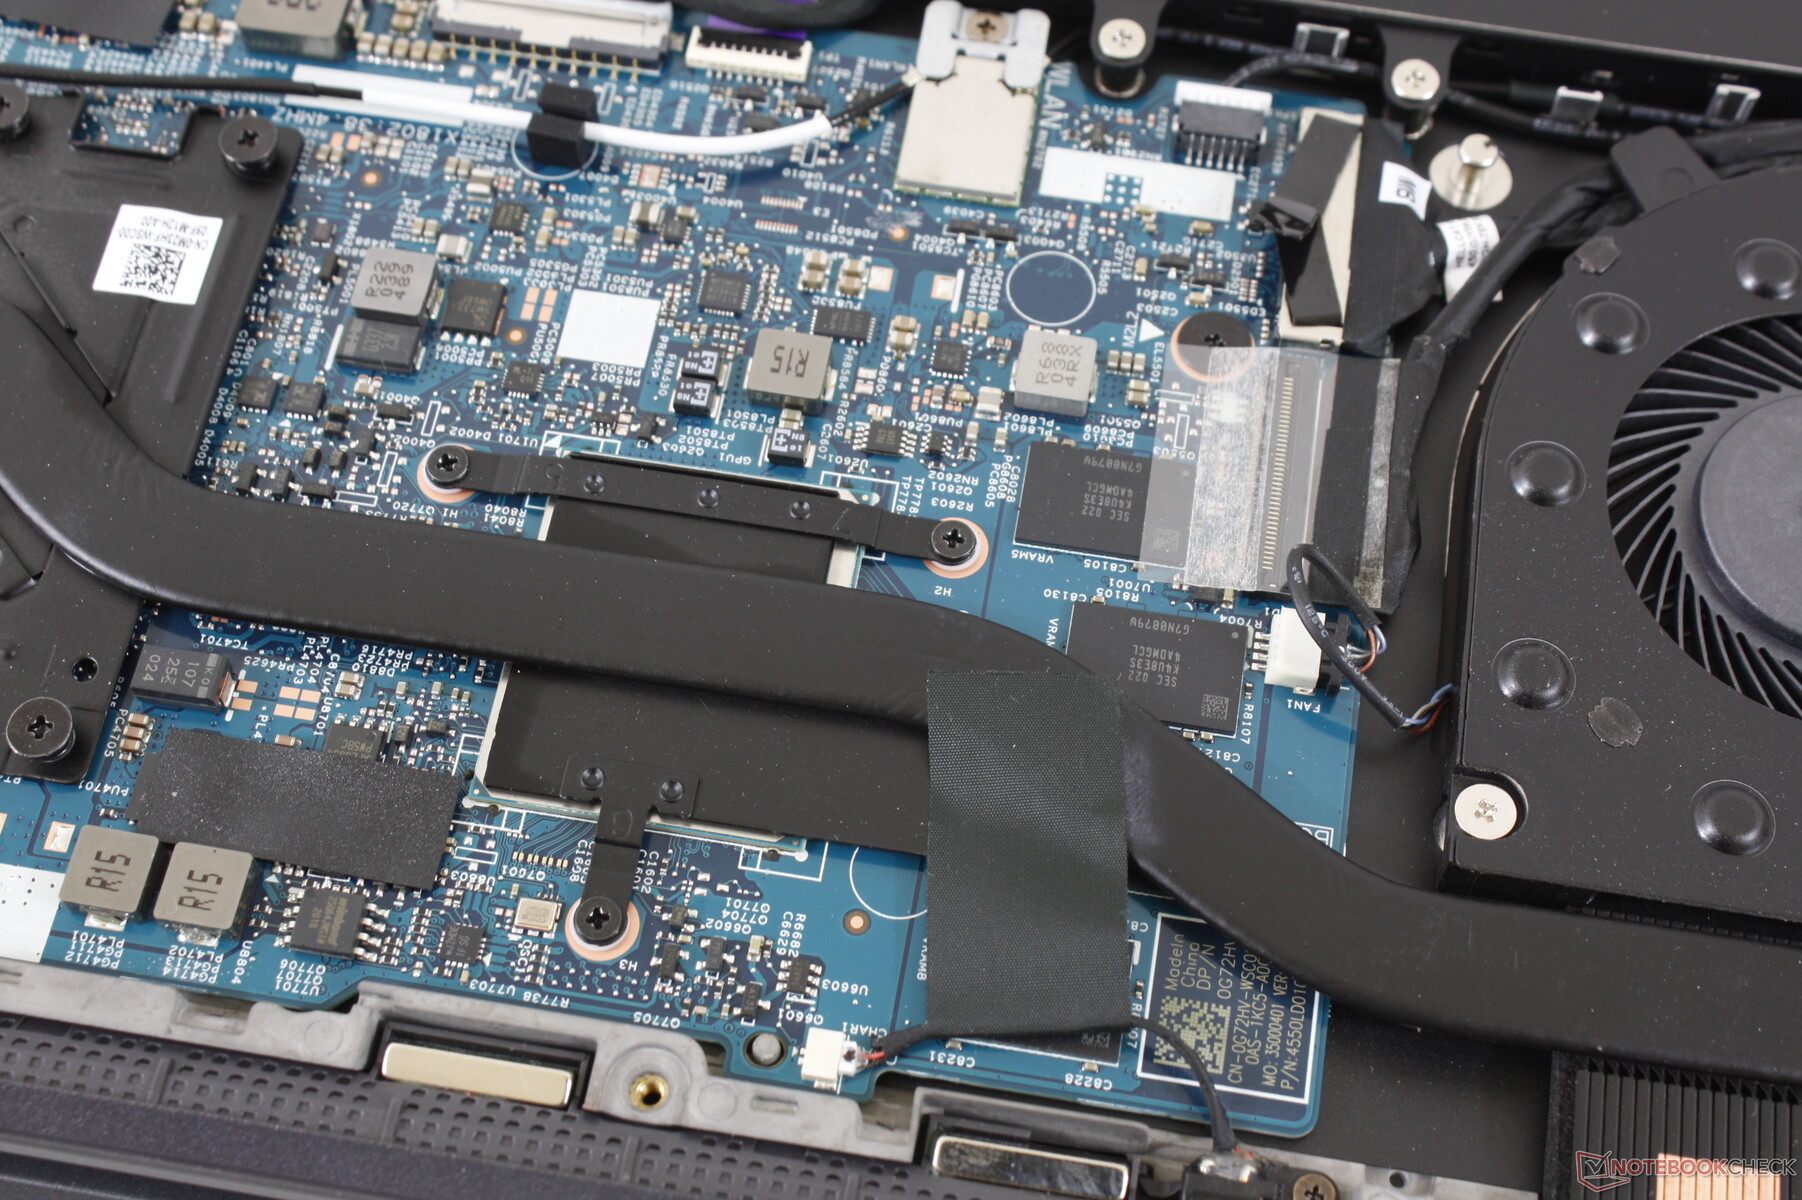
Maintenance
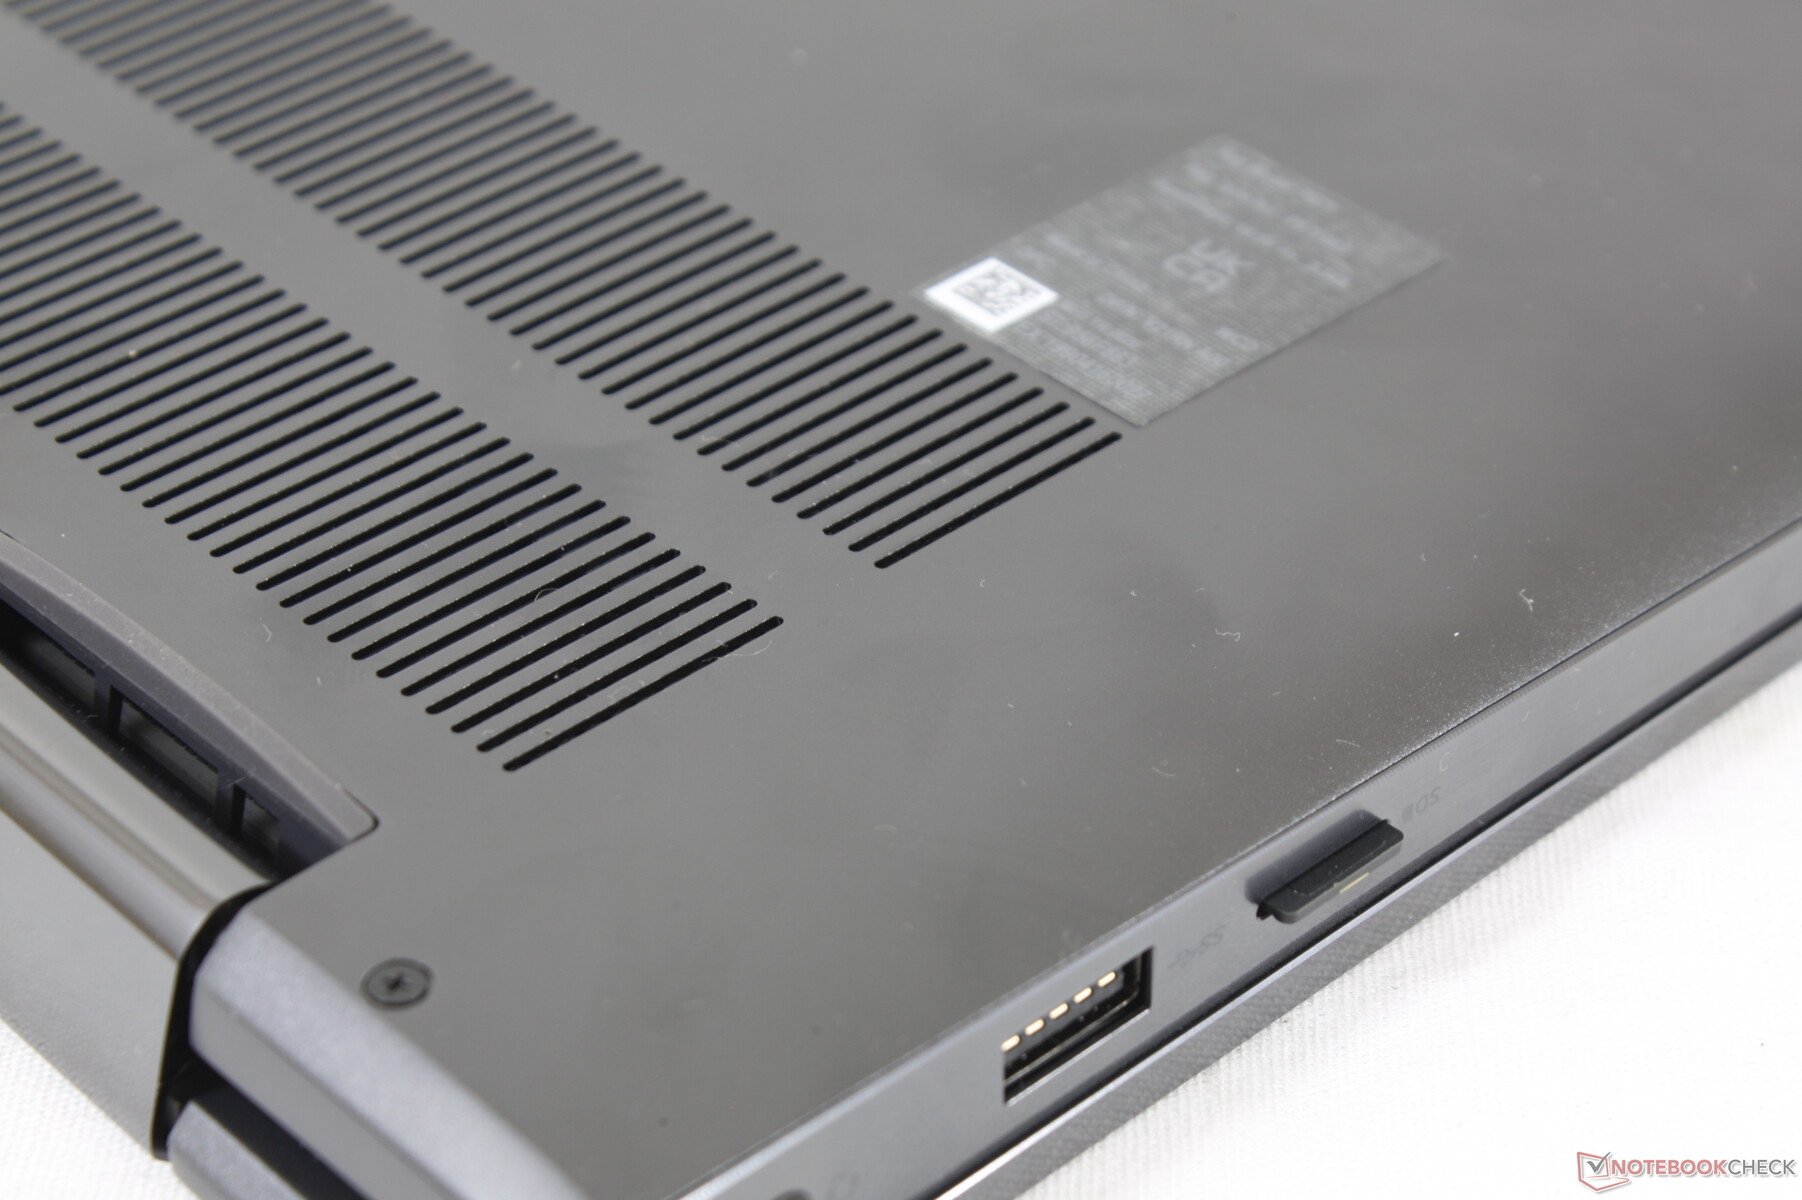
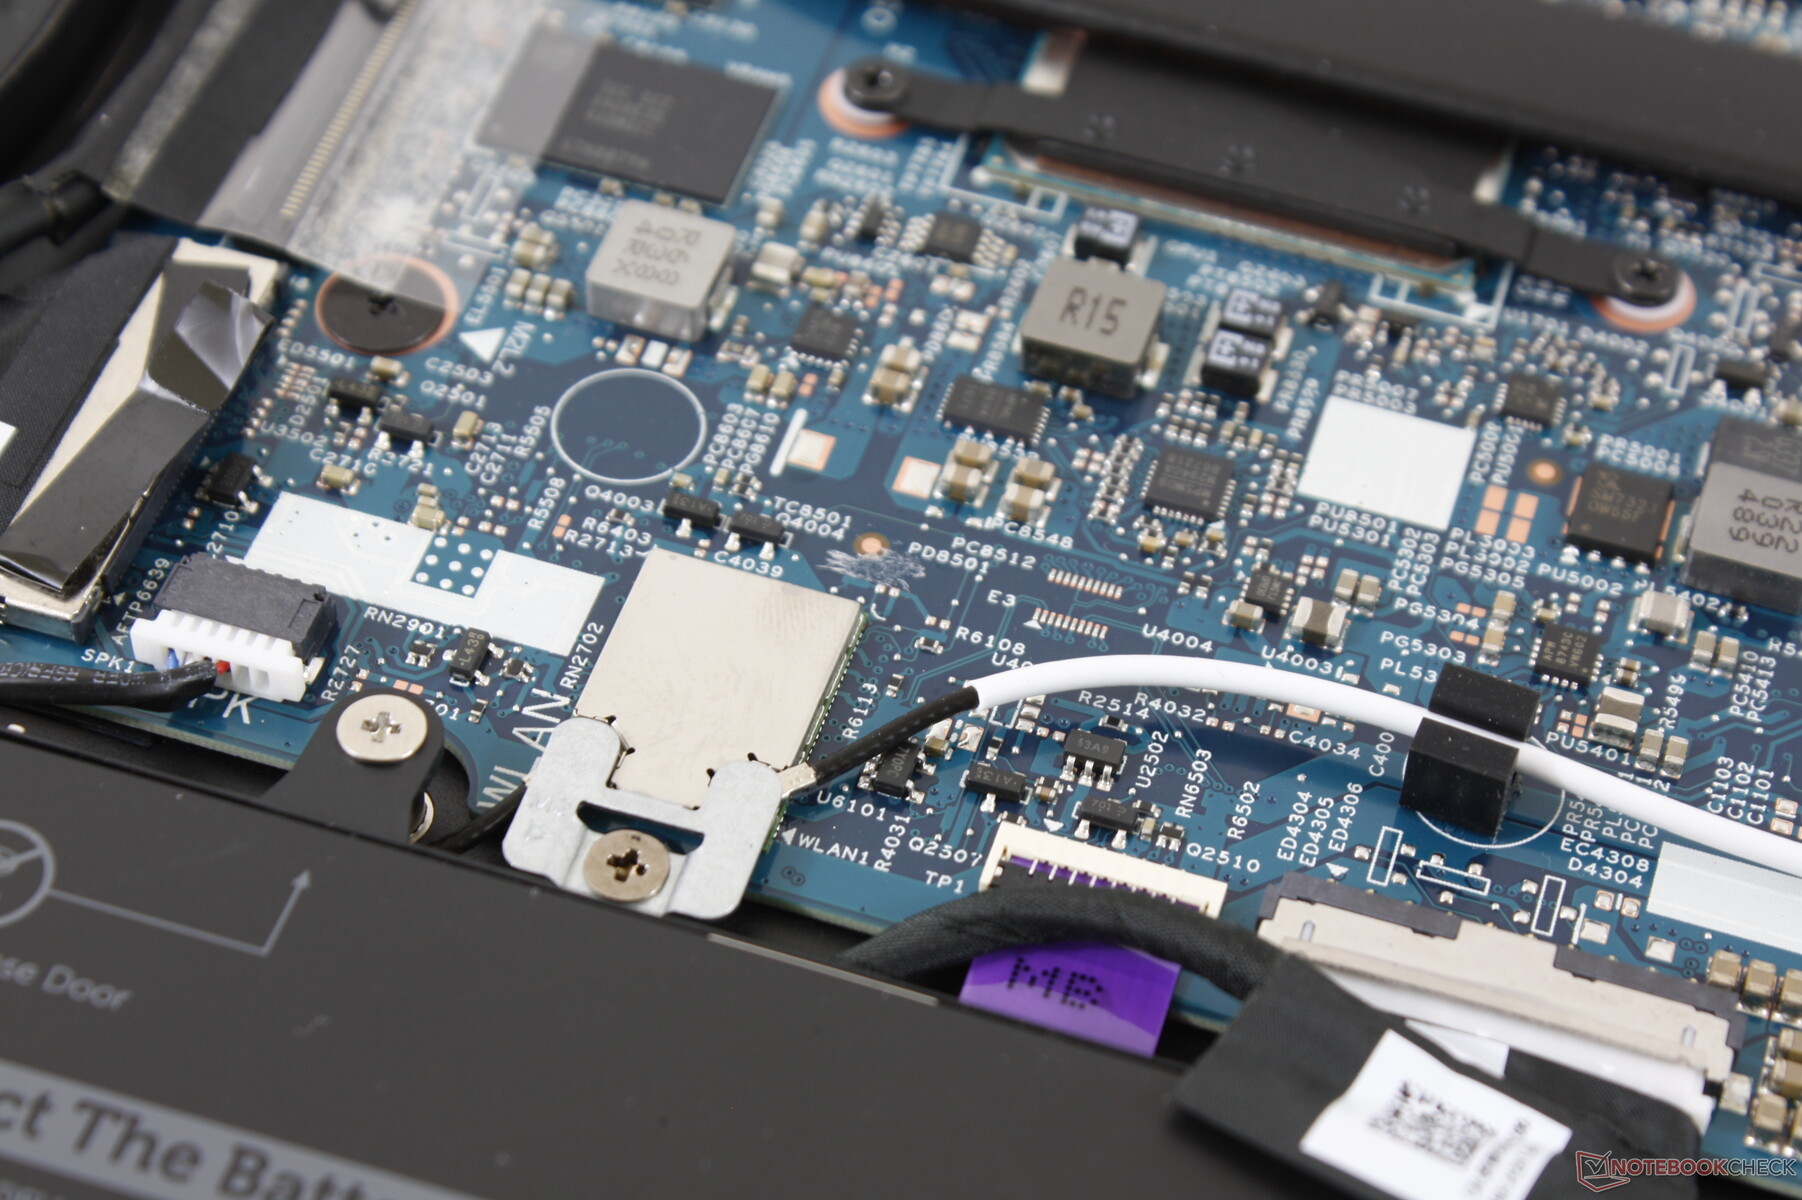
The bottom panel is very easy to remove and service. Nonetheless, keep in mind that both RAM and WLAN are soldered here unlike on the Silver Edition.
Accessories and Warranty
The box includes the Dell PN771M active pen. We find the pen to be more ergonomic than the Lenovo pen on the Yoga C940 because the Dell is thicker and easier to grip.
The standard one-year limited warranty applies with plenty of extensions options if purchased from Dell.
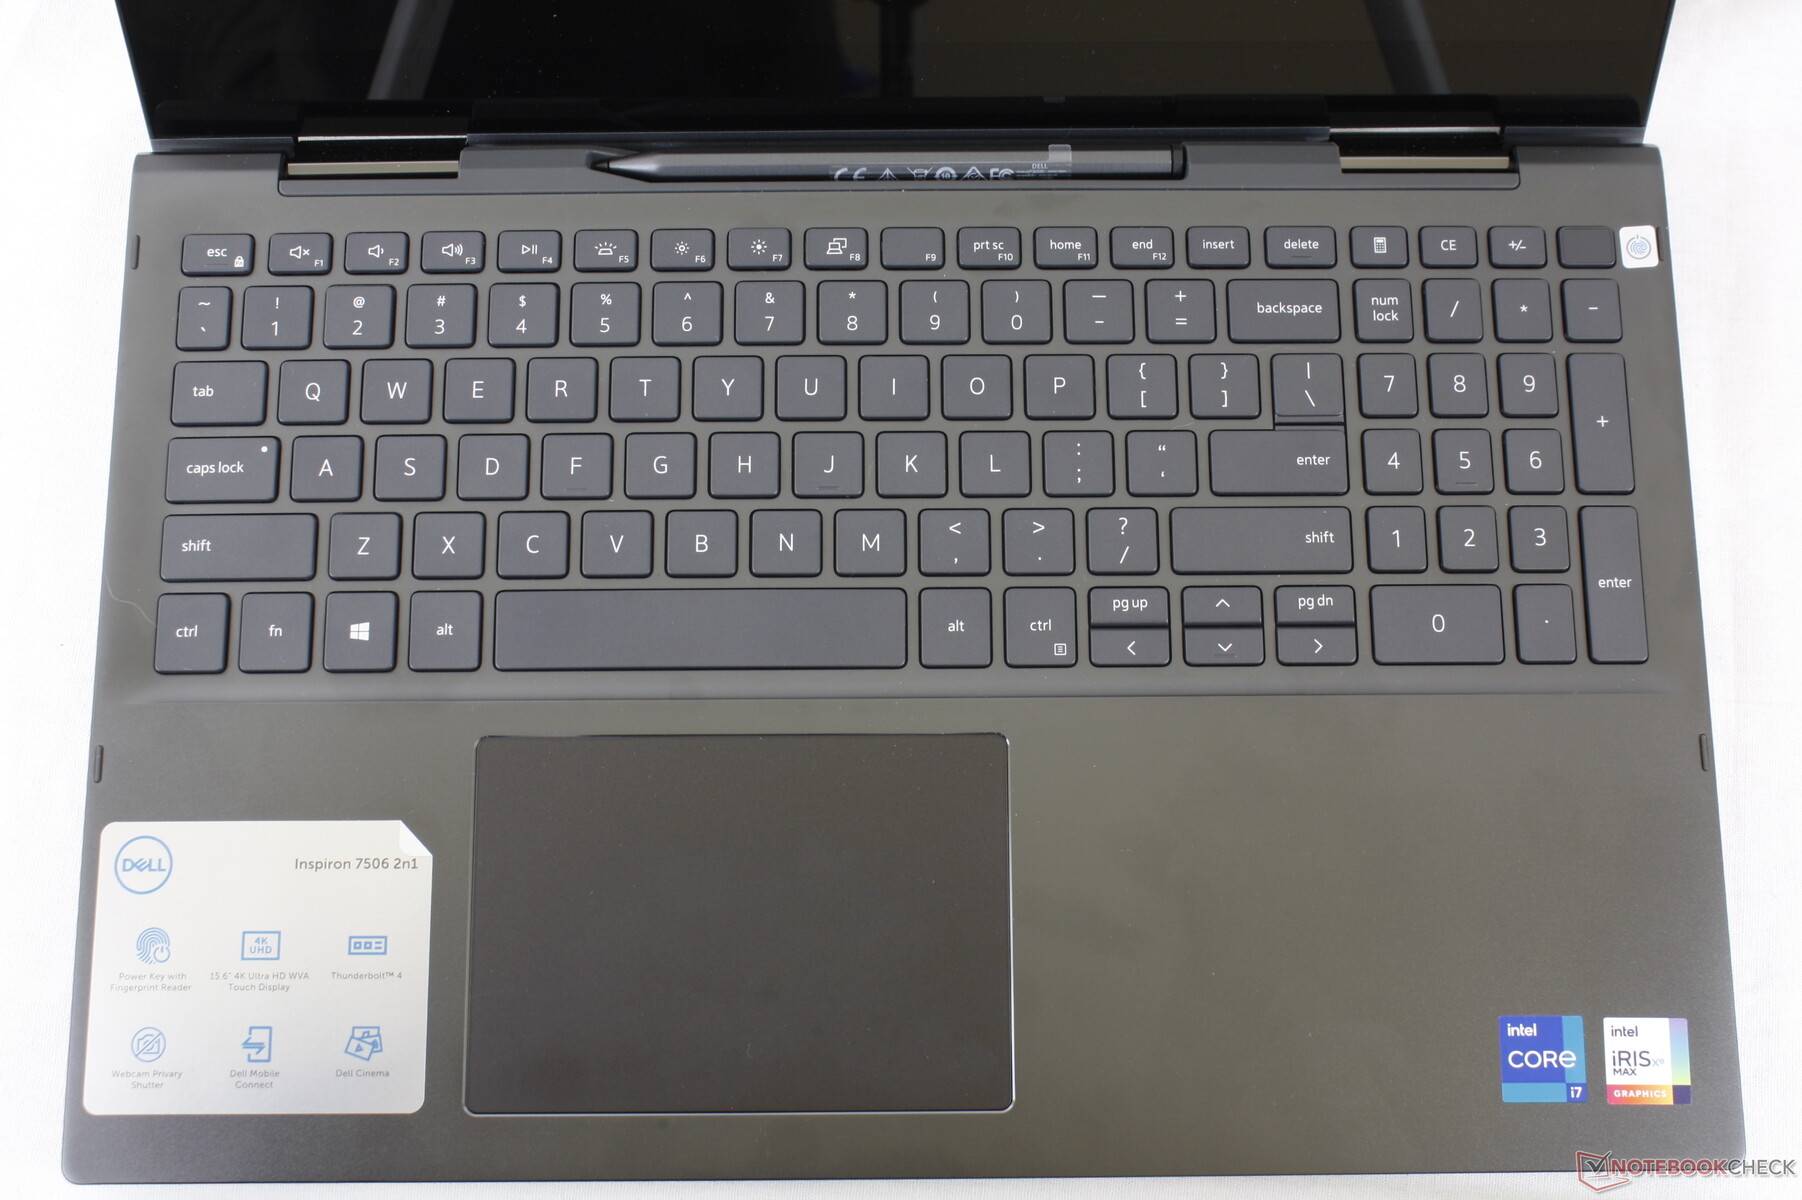
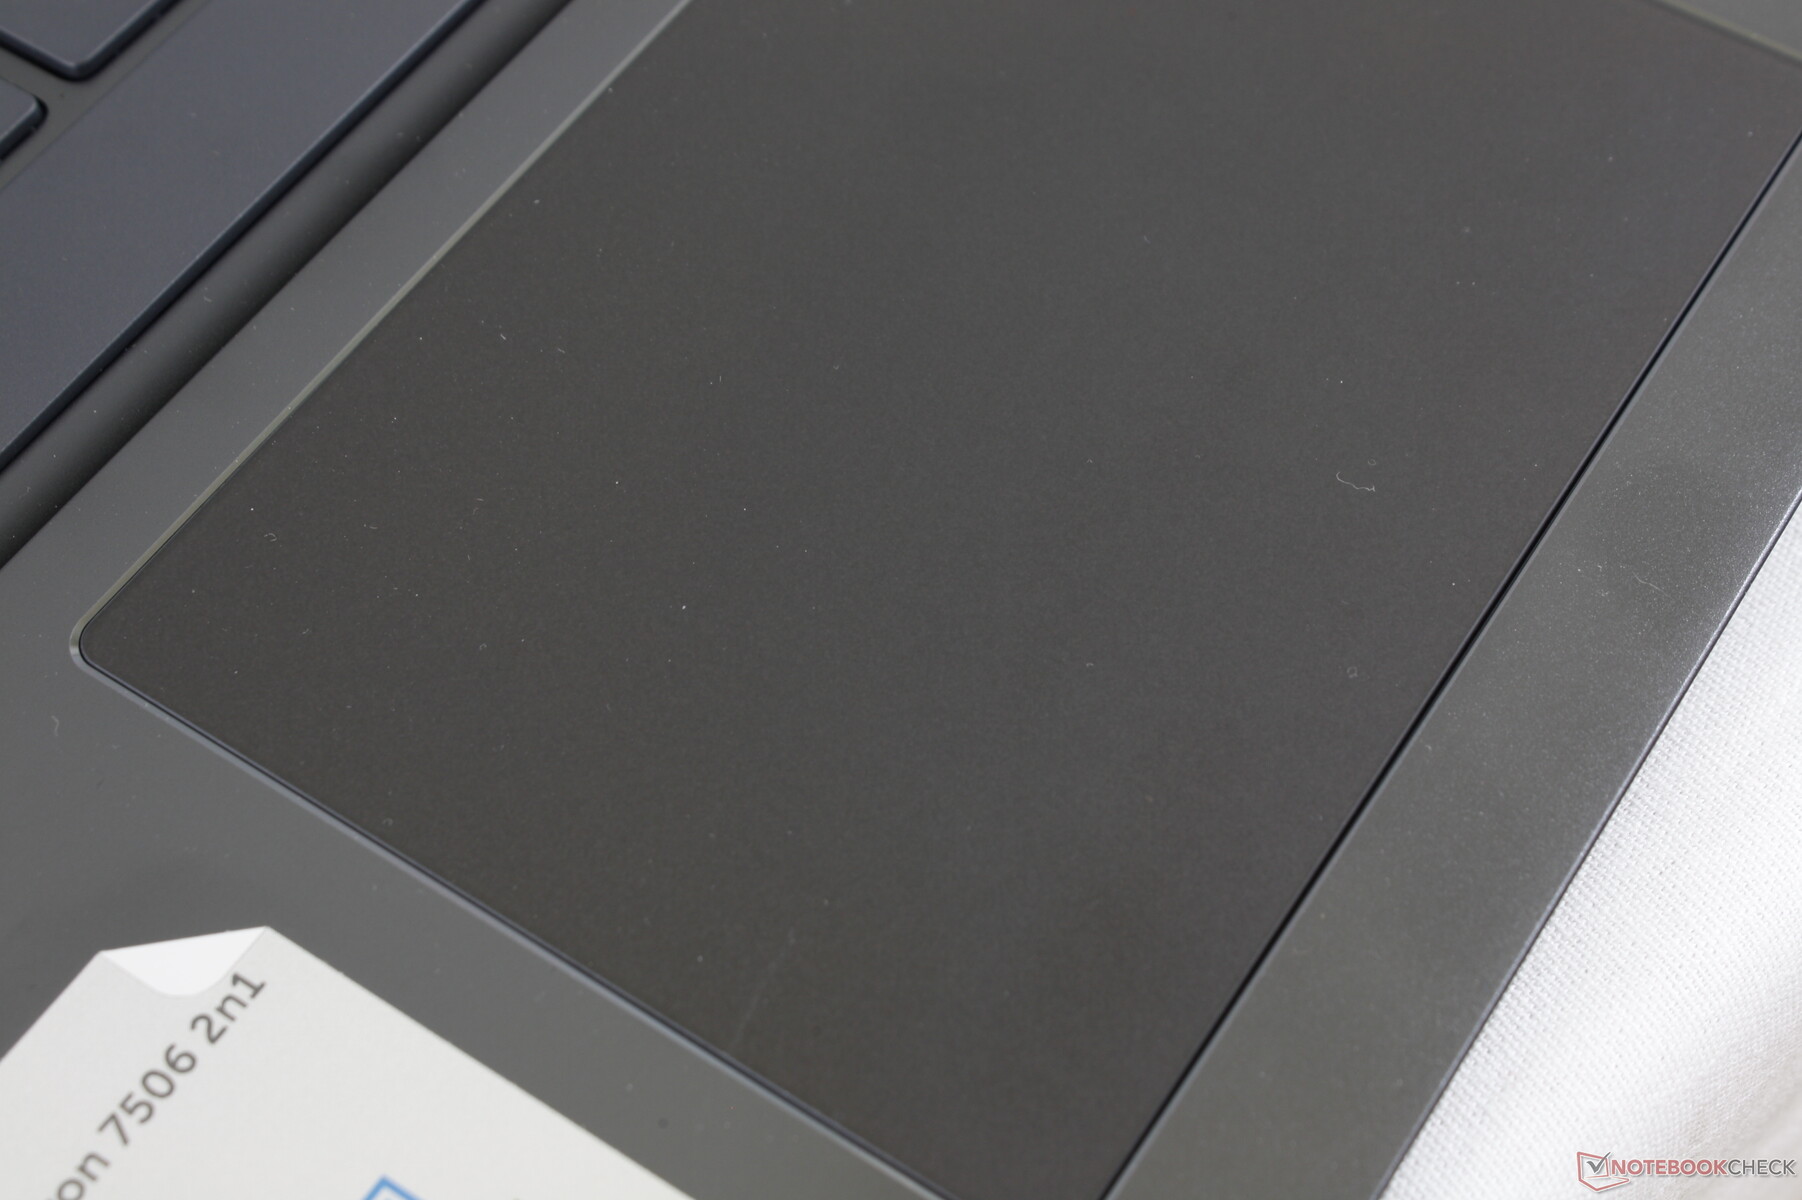
Input Devices
Though the Black Edition shares the same keyboard and clickpad as on the Silver Edition, the symbols on each key are actually much easier to see since the white font contrasts better with the black key caps when compared to the gray font and silver keycaps of the Silver Edition.
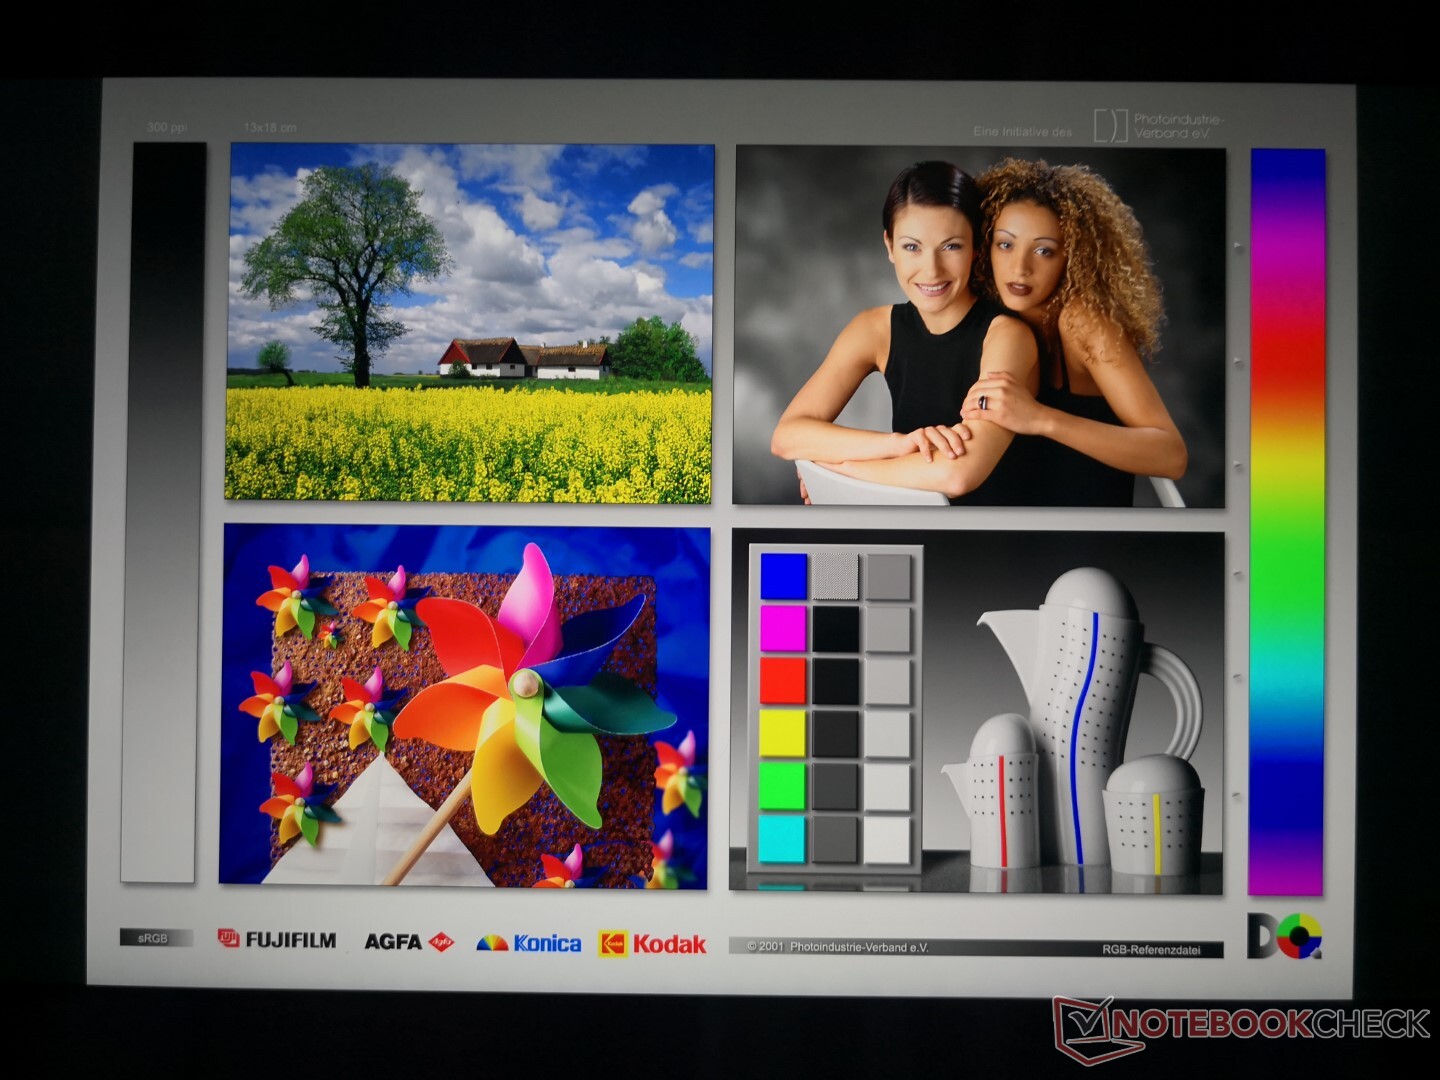
Display
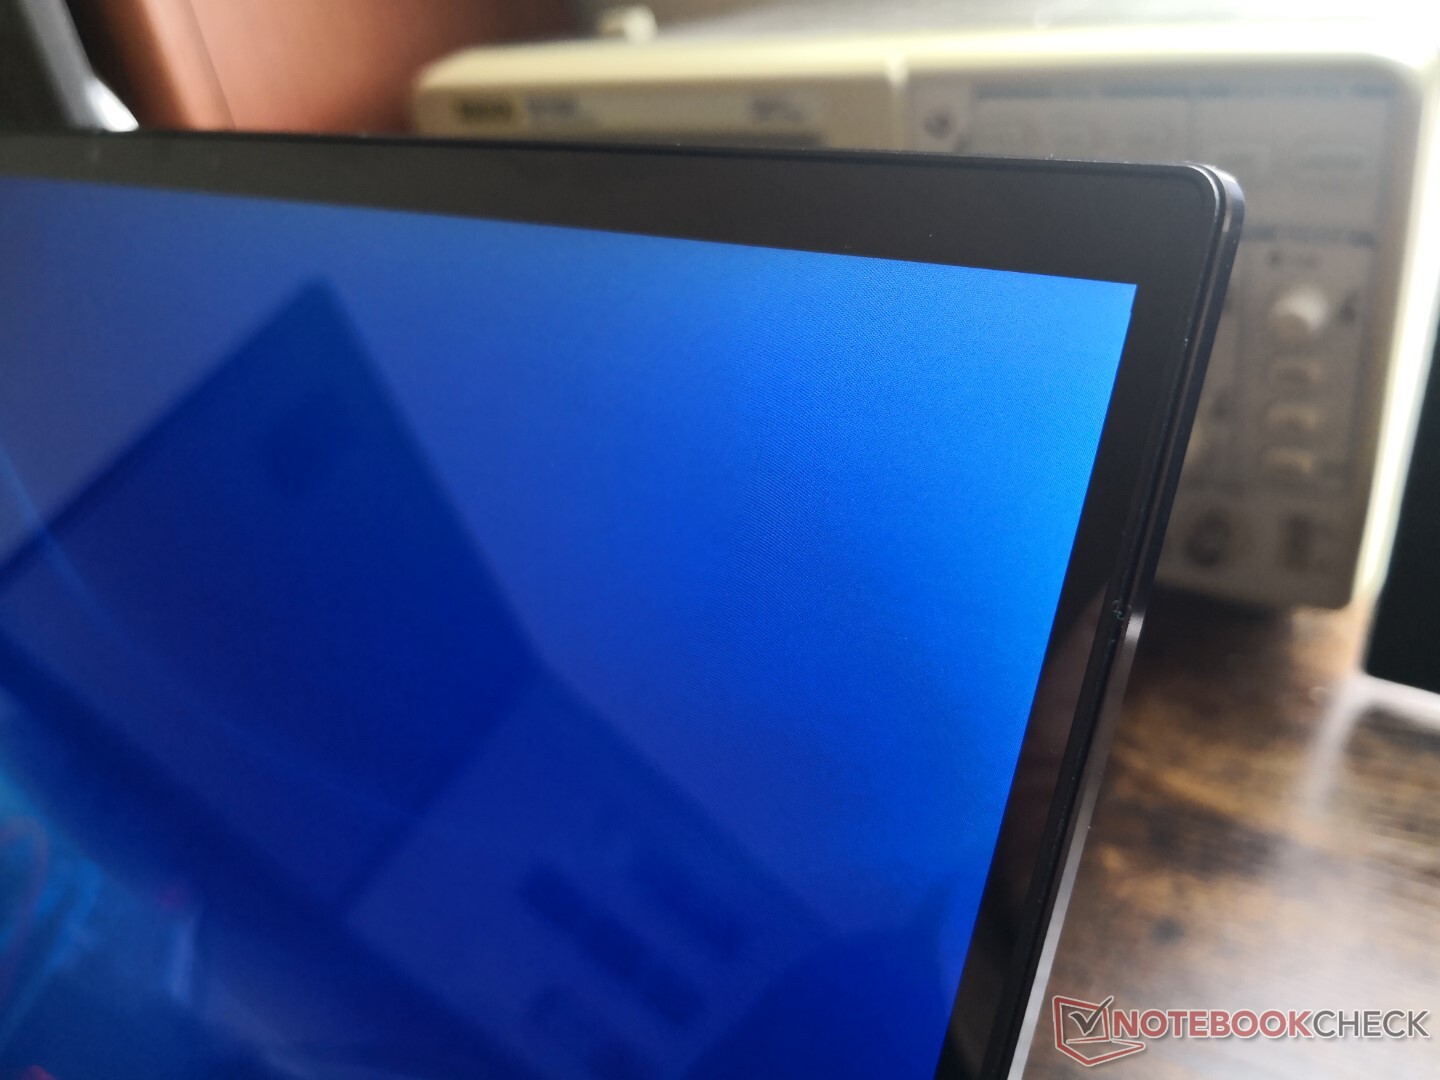
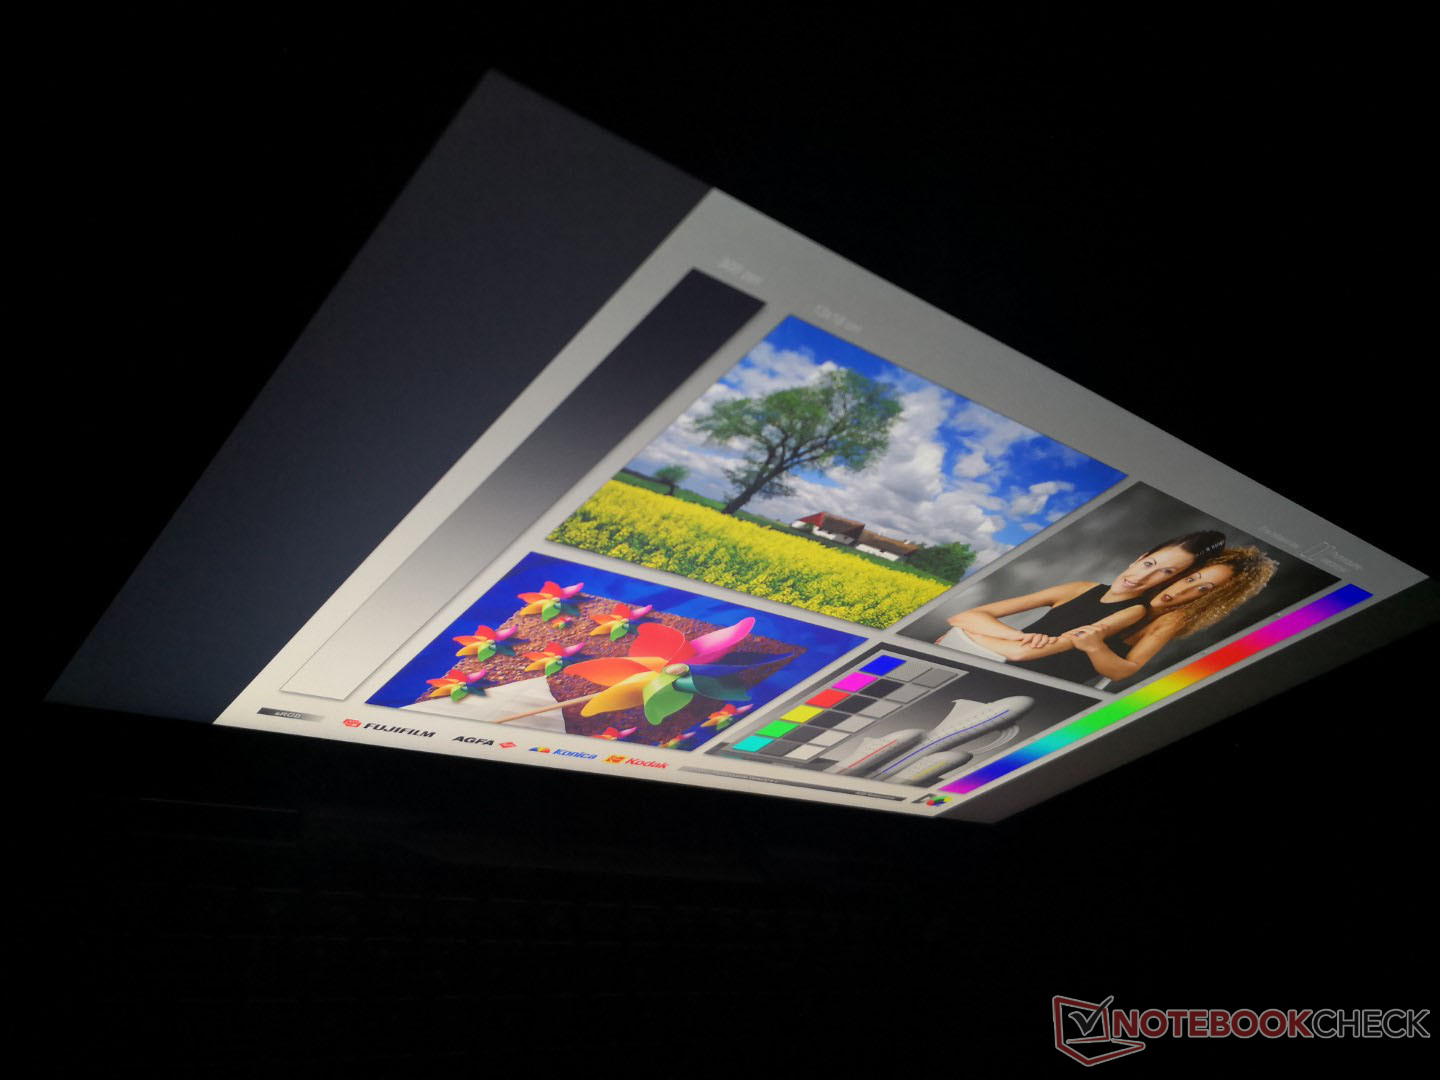
Versions of the AU Optronics B156ZAN IPS panel on our Inspiron Black Edition can also be found on the 4K Inspiron 15 7577 and 4K Precision 7550. Interestingly, however, color coverage is more similar to the Inspiron 7577 while being narrower than on the Precision 7550. Contrast ratio is high at over 1000:1 but the slow black-white and gray-gray response times lead to noticeable ghosting. When accounting for these attributes as whole, the 4K panel here is a mid-range offering that doesn't quite reach the same colors or brightness levels of an XPS 15 but is still better than the base 1080p options on most other laptops.
| |||||||||||||||||||||||||
Brightness Distribution: 93 %
Center on Battery: 303.8 cd/m²
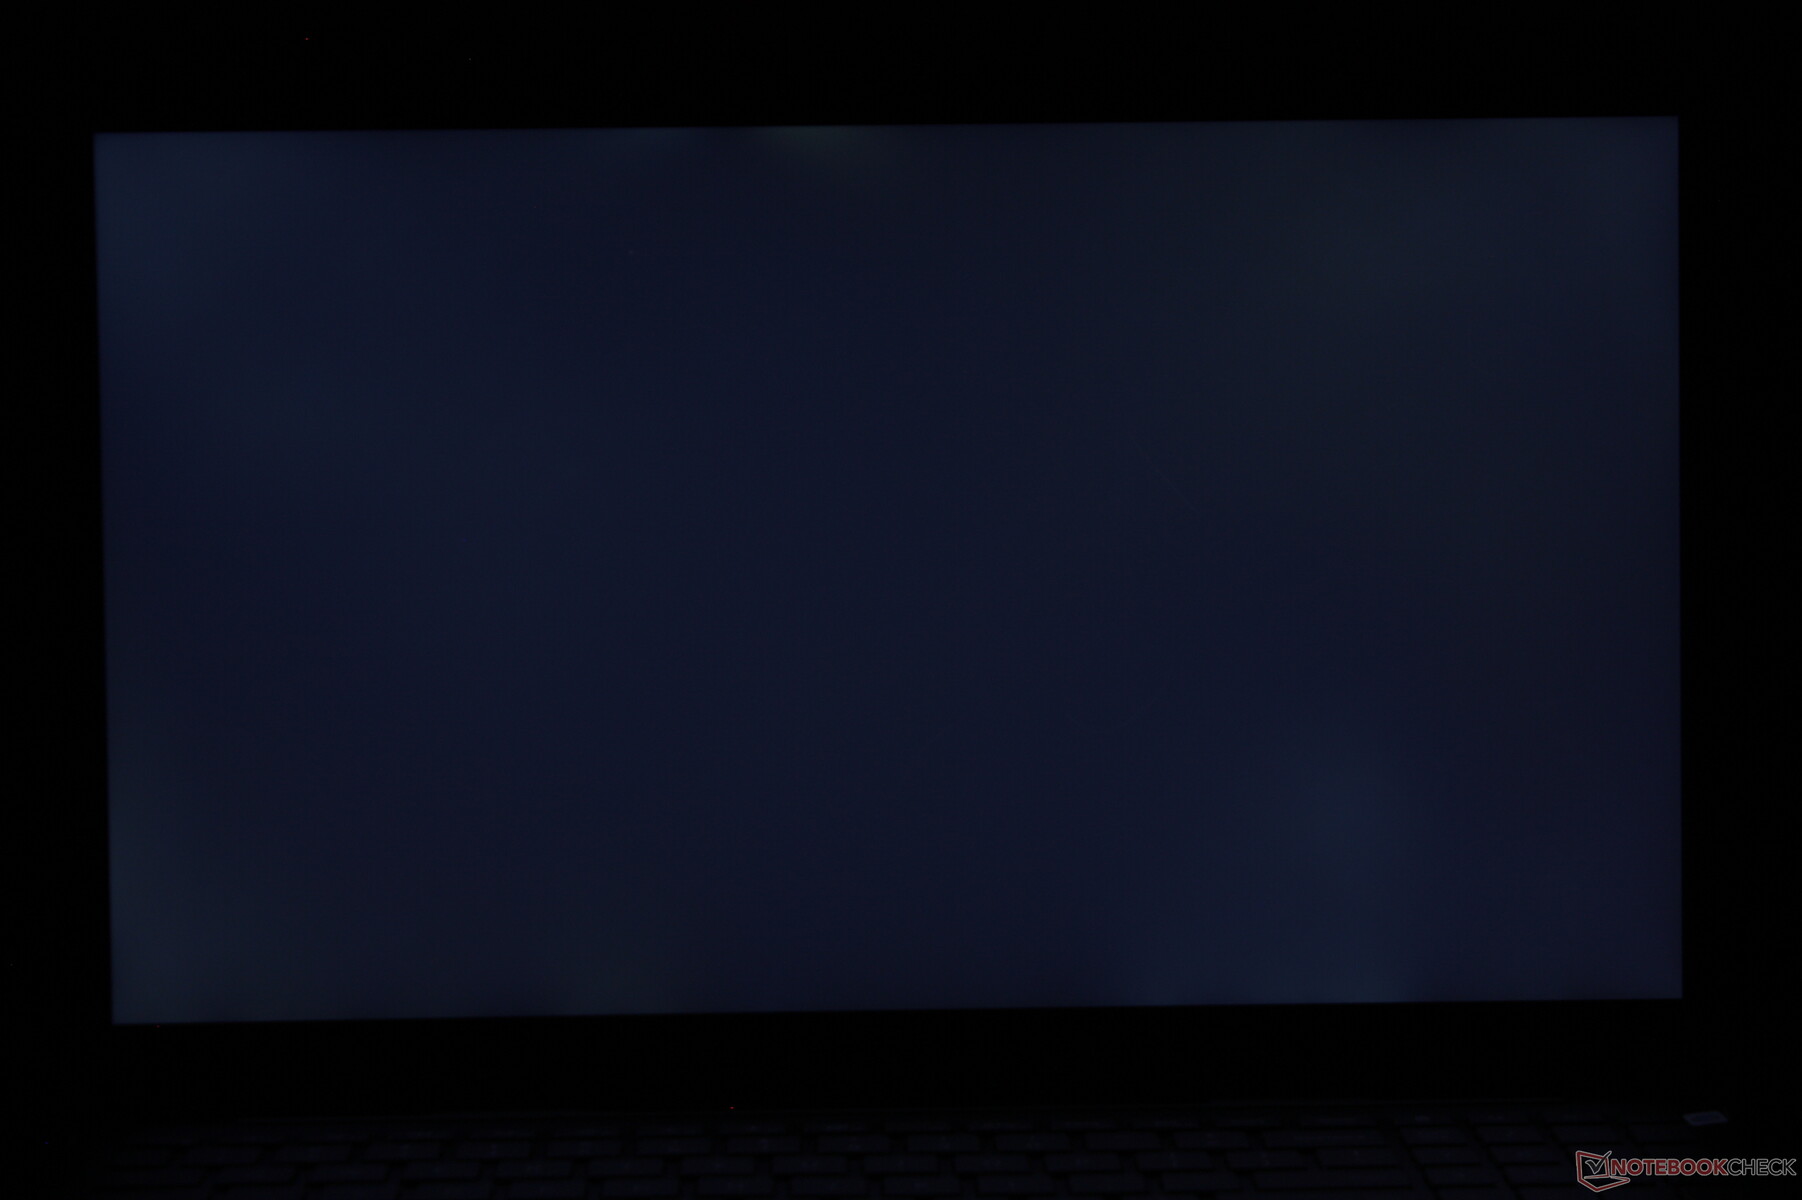
Contrast: 1266:1 (Black: 0.24 cd/m²)
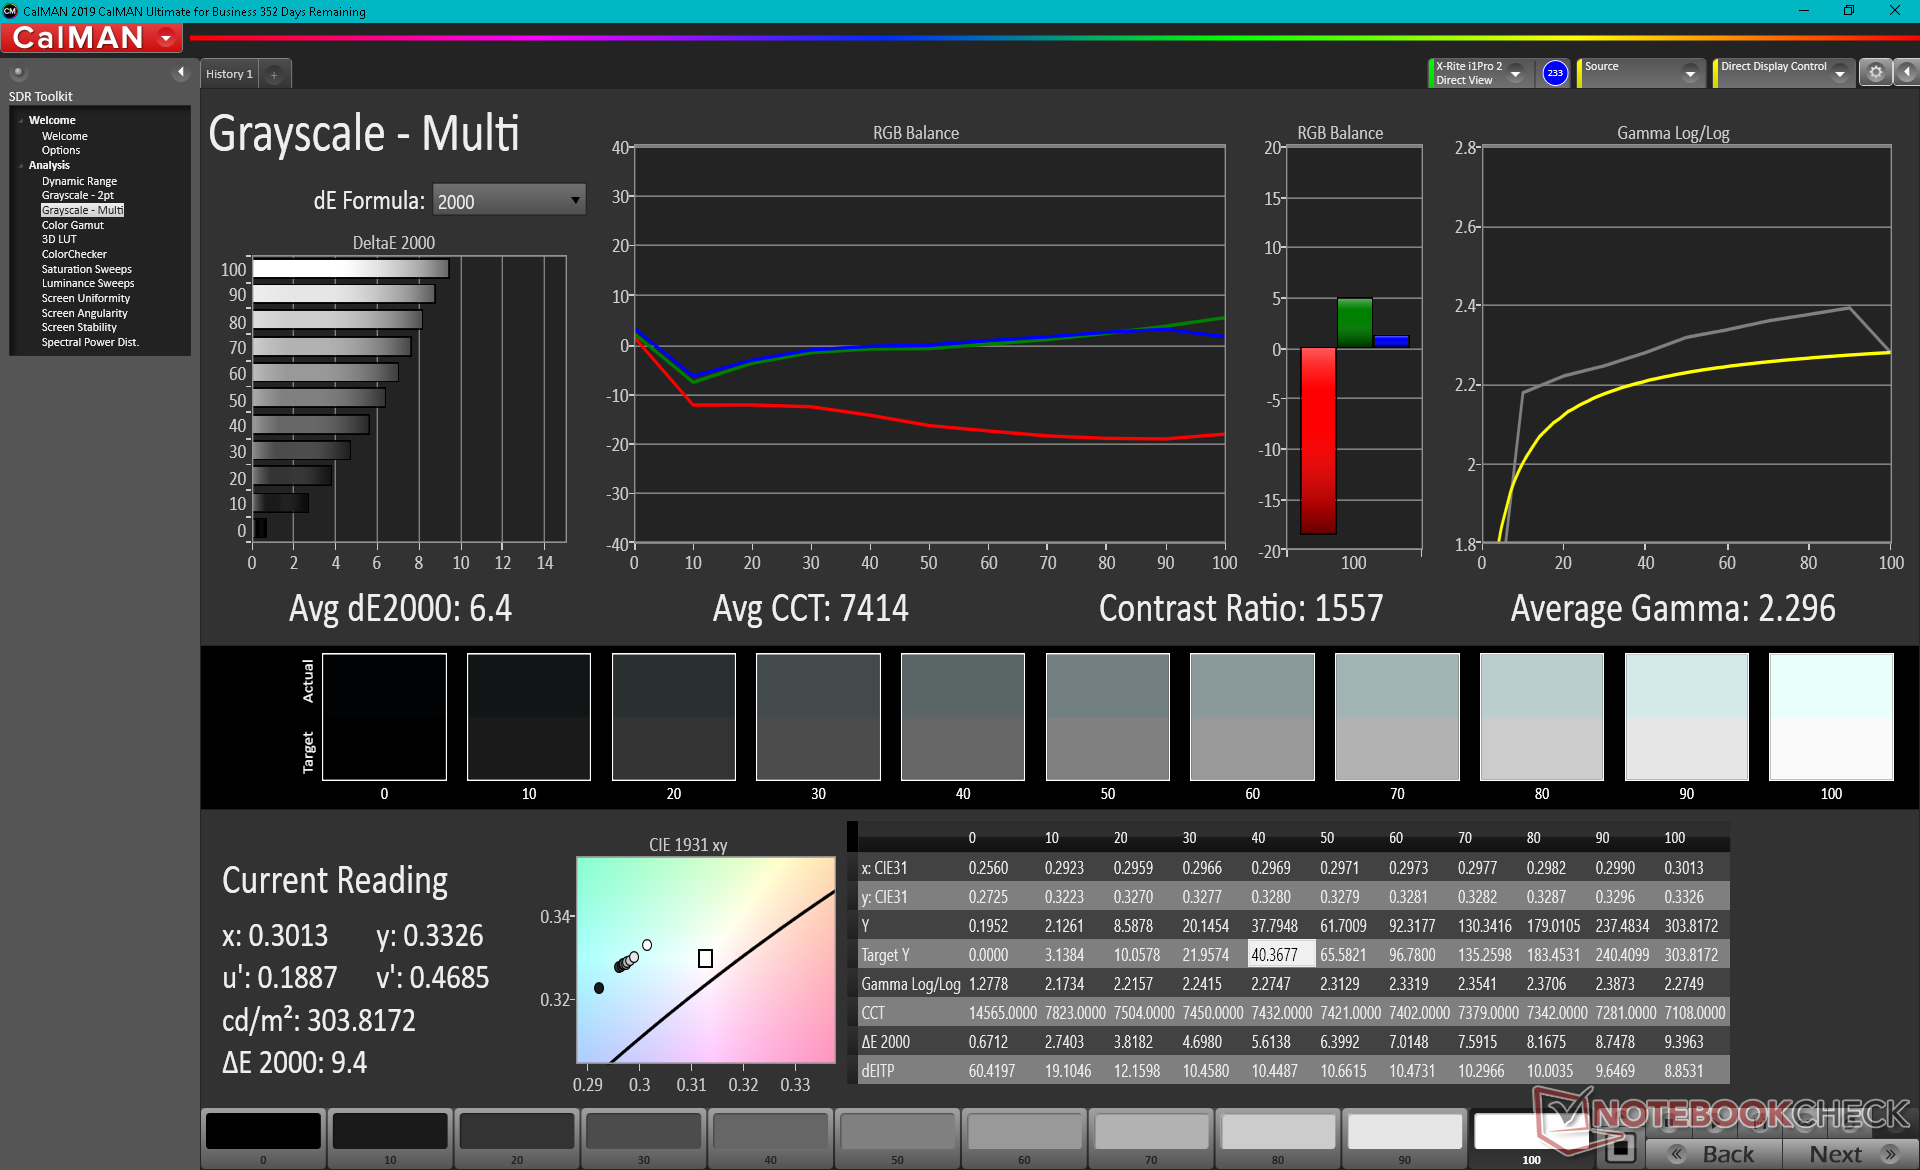
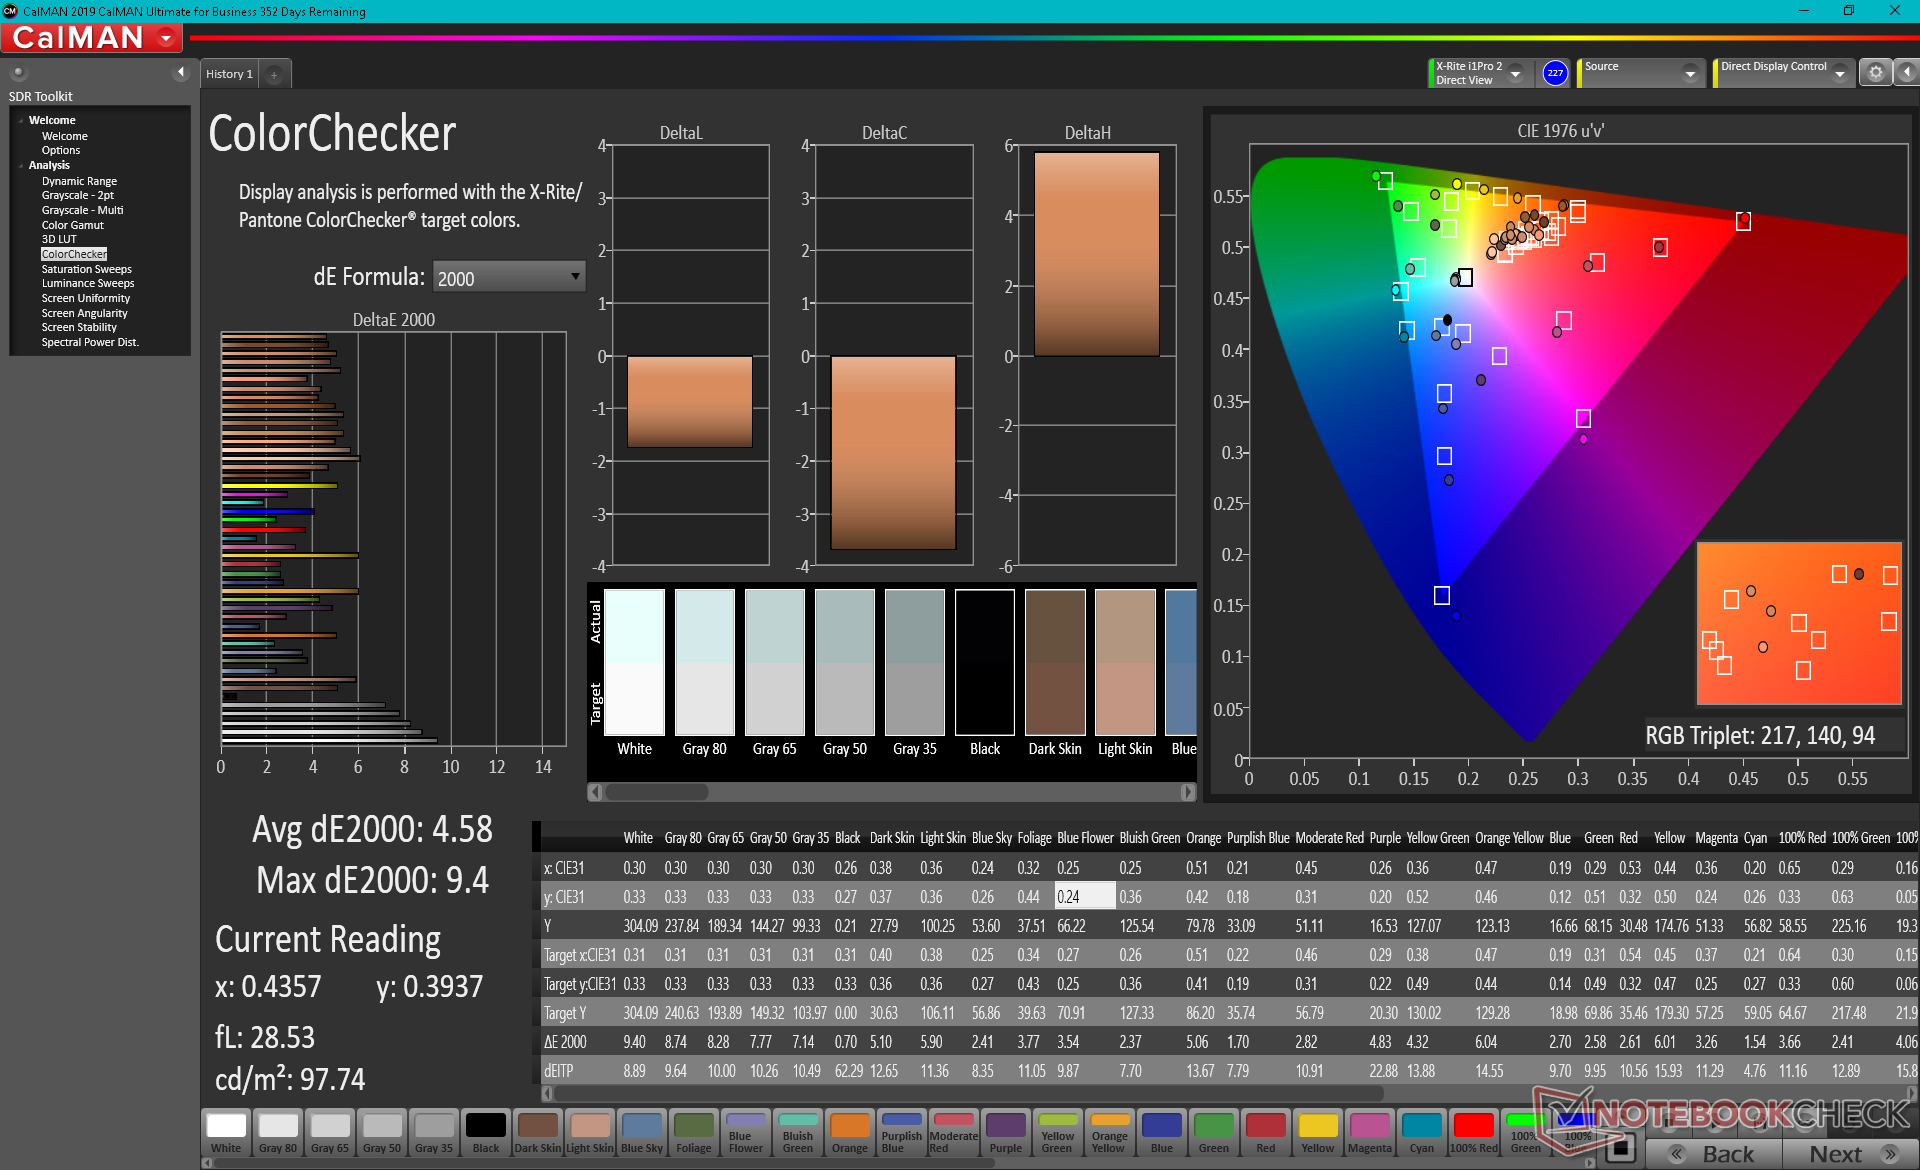
ΔE ColorChecker Calman: 4.58 | ∀{0.5-29.43 Ø4.71}
calibrated: 2.17
ΔE Greyscale Calman: 6.4 | ∀{0.09-98 Ø4.96}
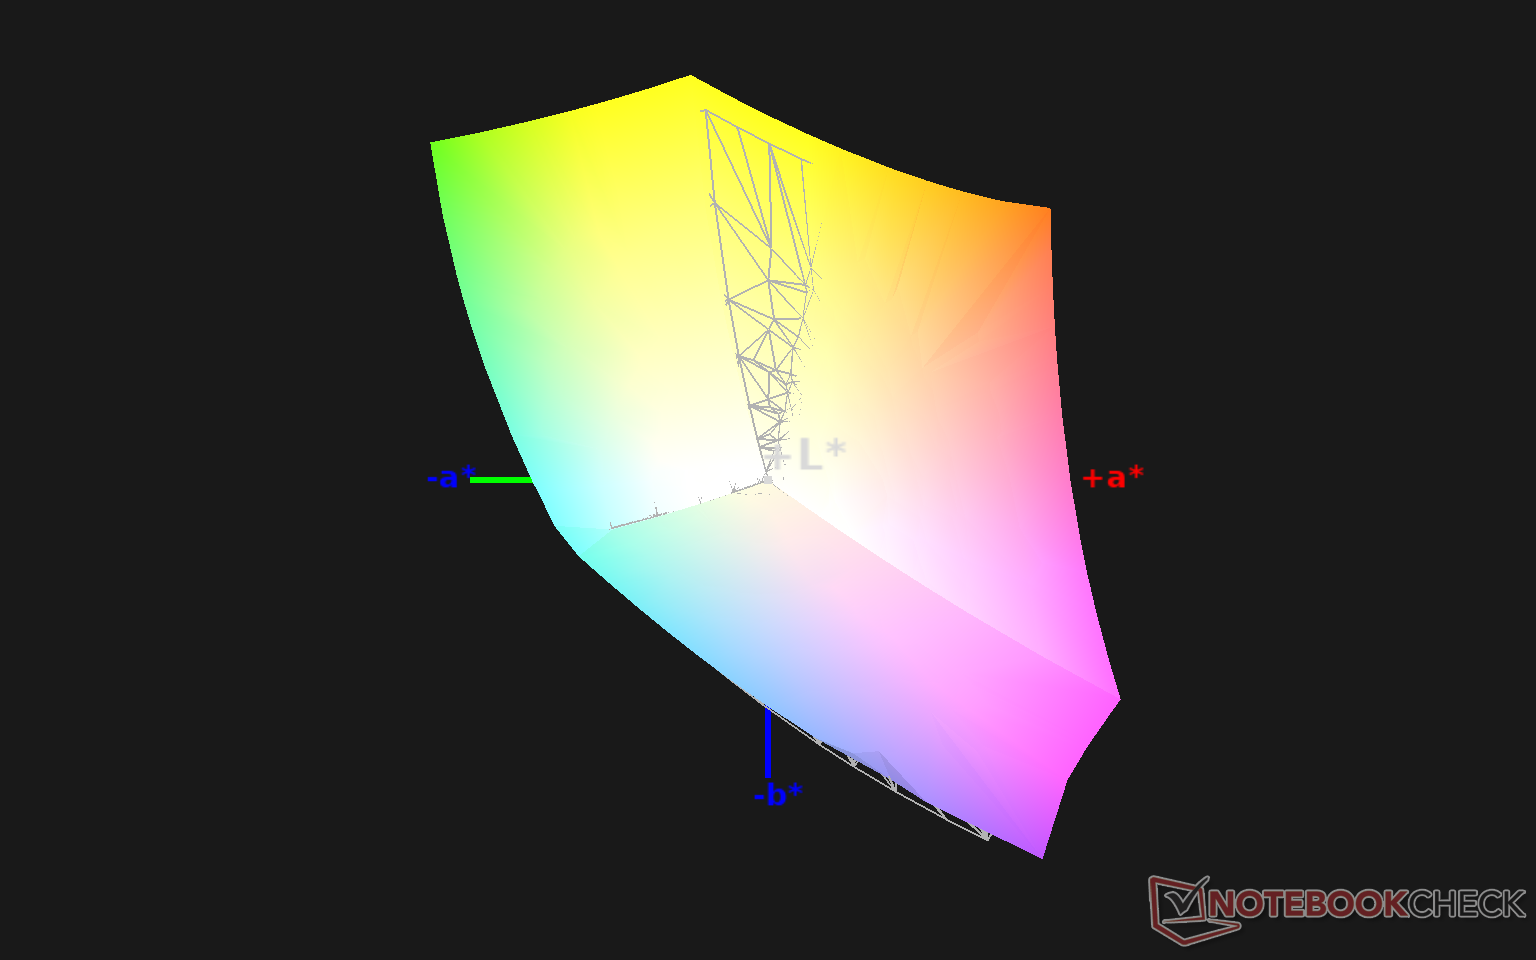
99% sRGB (Argyll 1.6.3 3D)
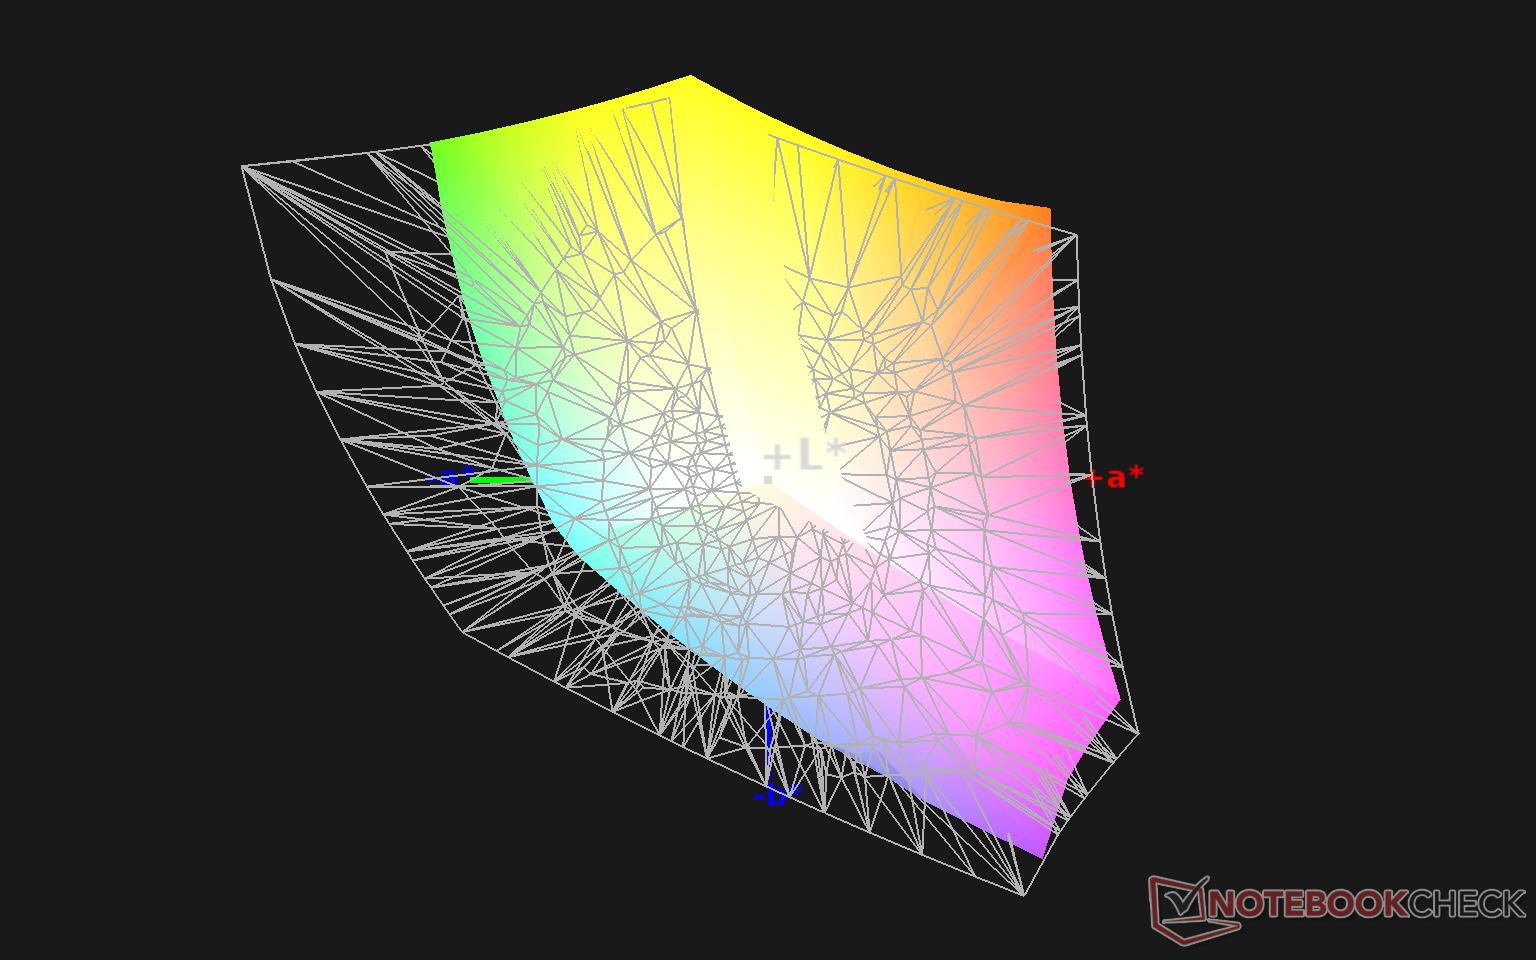
66.7% AdobeRGB 1998 (Argyll 1.6.3 3D)
74.6% AdobeRGB 1998 (Argyll 3D)
99% sRGB (Argyll 3D)
74.3% Display P3 (Argyll 3D)
Gamma: 2.3
CCT: 7414 K
| Dell Inspiron 15 7000 7506 2-in-1 Black Edition AU Optronics B156ZAN, IPS, 15.6", 3840x2160 | HP Envy x360 15-ee0257ng BOE NV156FHM-N4T, IPS, 15.6", 1920x1080 | Microsoft Surface Book 3 15 LG Philips LGD0554, IPS, 15", 3240x2160 | Asus ZenBook Flip 15 UX563FD-A1027T BOE HF NE156QUM-N64, IPS, 15.6", 3840x2160 | Lenovo Yoga C740-15IML B156HAN02.5, IPS LED, 15.6", 1920x1080 | Dell Inspiron 15 7000 7577 4K Name: AU Optronics B156ZAN, IPS, 15.6", 3840x2160 | |
|---|---|---|---|---|---|---|
| Display | -43% | -13% | -7% | -45% | -6% | |
| Display P3 Coverage (%) | 74.3 | 40.43 -46% | 61.5 -17% | 66.2 -11% | 39.04 -47% | 68.4 -8% |
| sRGB Coverage (%) | 99 | 59.6 -40% | 92.7 -6% | 97.2 -2% | 57.9 -42% | 97.1 -2% |
| AdobeRGB 1998 Coverage (%) | 74.6 | 41.77 -44% | 63.6 -15% | 68.3 -8% | 40.33 -46% | 69.6 -7% |
| Response Times | 38% | 29% | -6% | 7% | 26% | |
| Response Time Grey 50% / Grey 80% * (ms) | 55.2 ? | 34 ? 38% | 38 ? 31% | 60 ? -9% | 50.8 ? 8% | 35.2 ? 36% |
| Response Time Black / White * (ms) | 34 ? | 21 ? 38% | 25 ? 26% | 35 ? -3% | 32.4 ? 5% | 28.4 ? 16% |
| PWM Frequency (Hz) | 250 ? | |||||
| Screen | -34% | 24% | 17% | -38% | -5% | |
| Brightness middle (cd/m²) | 303.8 | 314 3% | 428 41% | 351 16% | 286 -6% | 322.9 6% |
| Brightness (cd/m²) | 296 | 280 -5% | 413 40% | 335 13% | 268 -9% | 309 4% |
| Brightness Distribution (%) | 93 | 72 -23% | 89 -4% | 87 -6% | 83 -11% | 90 -3% |
| Black Level * (cd/m²) | 0.24 | 0.275 -15% | 0.23 4% | 0.31 -29% | 0.2 17% | 0.36 -50% |
| Contrast (:1) | 1266 | 1142 -10% | 1861 47% | 1132 -11% | 1430 13% | 897 -29% |
| Colorchecker dE 2000 * | 4.58 | 5.94 -30% | 2.65 42% | 1.74 62% | 7.3 -59% | 3.99 13% |
| Colorchecker dE 2000 max. * | 9.4 | 21.71 -131% | 8.12 14% | 2.76 71% | 21.7 -131% | 8.97 5% |
| Colorchecker dE 2000 calibrated * | 2.17 | 5.15 -137% | 0.92 58% | 5.1 -135% | ||
| Greyscale dE 2000 * | 6.4 | 2.97 54% | 3.99 38% | 2.22 65% | 7 -9% | 5.3 17% |
| Gamma | 2.3 96% | 2.4 92% | 3.12 71% | 2.35 94% | 2.35 94% | 2.041 108% |
| CCT | 7414 88% | 6581 99% | 6309 103% | 6667 97% | 5847 111% | 6941 94% |
| Color Space (Percent of AdobeRGB 1998) (%) | 66.7 | 38.1 -43% | 58 -13% | 62 -7% | 36.9 -45% | 62.9 -6% |
| Color Space (Percent of sRGB) (%) | 99 | 59.1 -40% | 93 -6% | 97 -2% | 57.5 -42% | 96.8 -2% |
| Total Average (Program / Settings) | -13% /
-27% | 13% /
18% | 1% /
9% | -25% /
-34% | 5% /
-1% |
* ... smaller is better
Color space is nearly identical to the FHD panel on the standard Silver Edition at 99 percent of sRGB. Thus, moving up to the 4K panel option will result in crisper texts and images but not deeper colors.
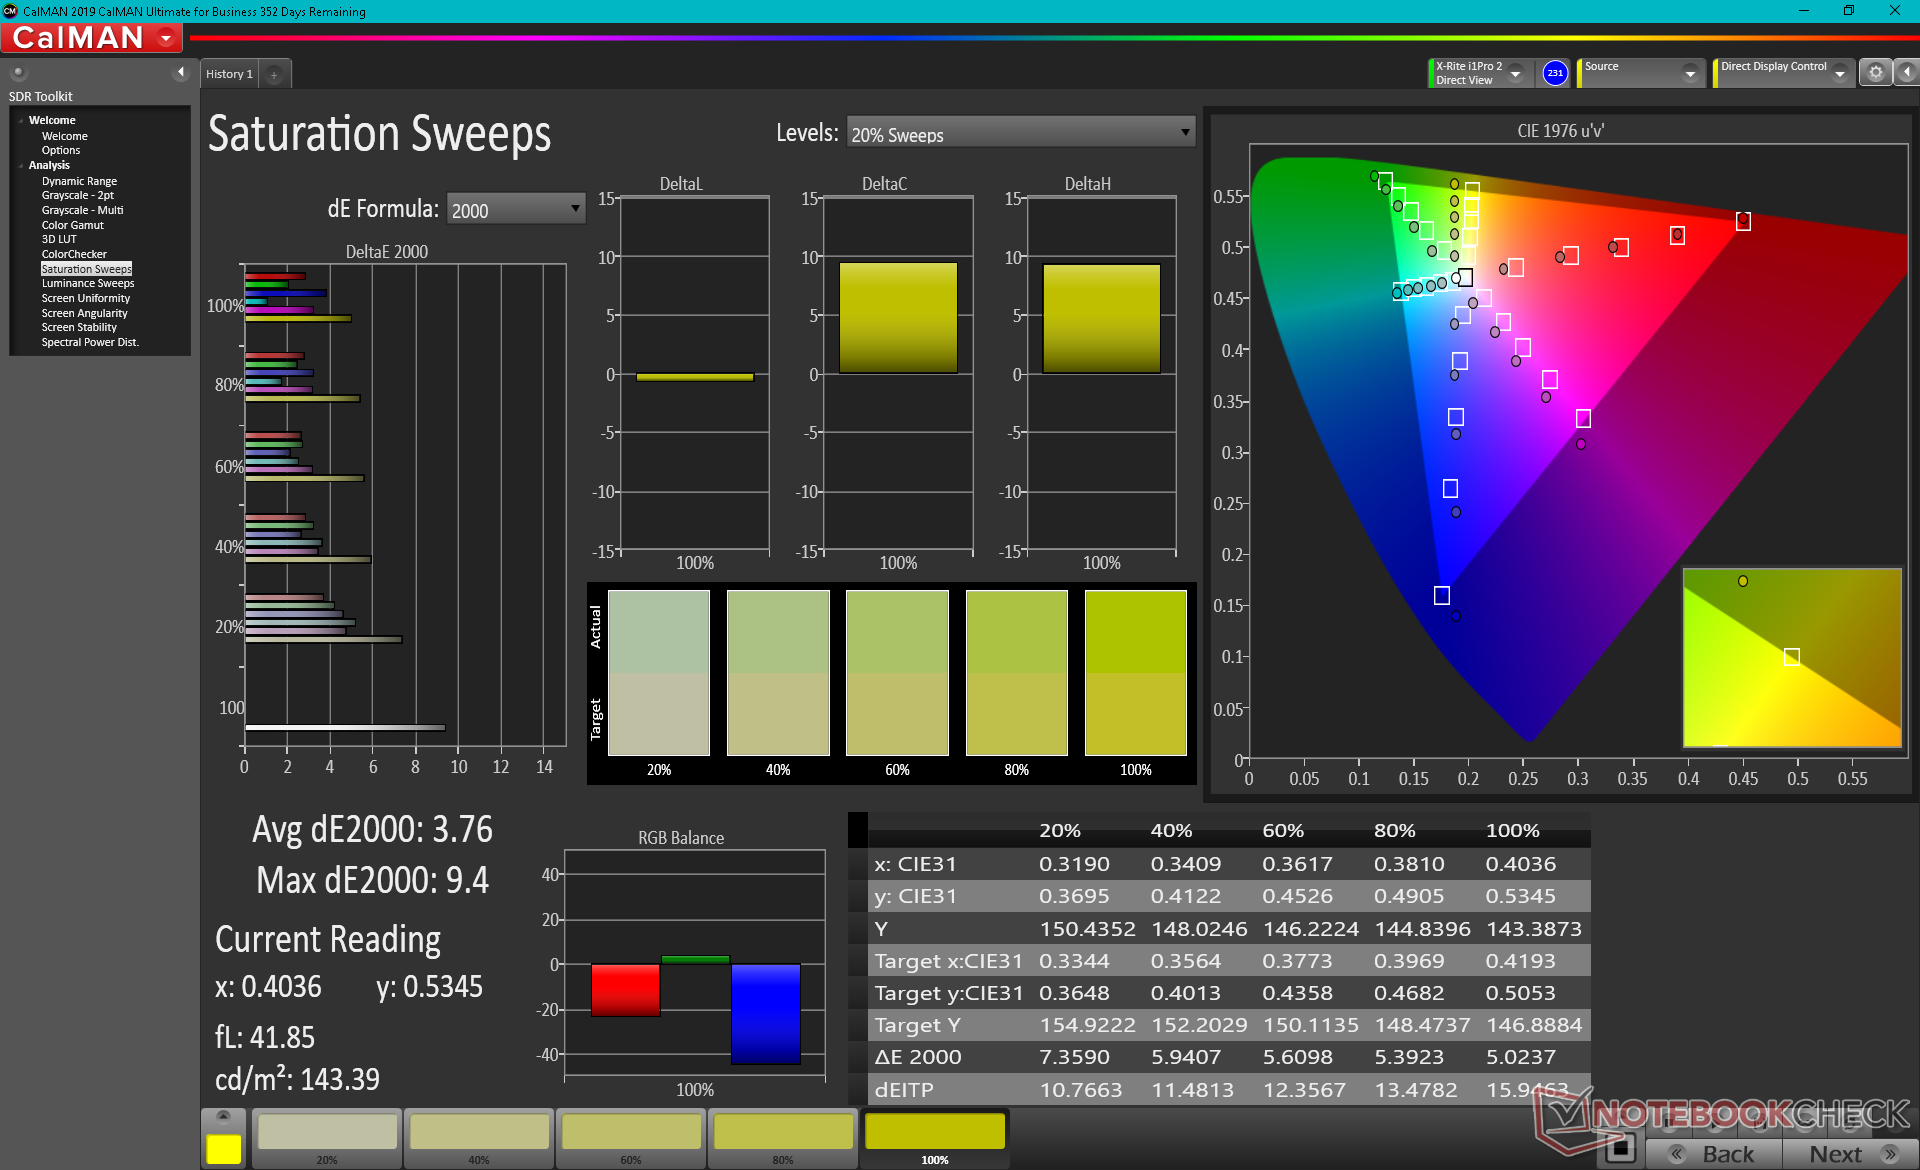
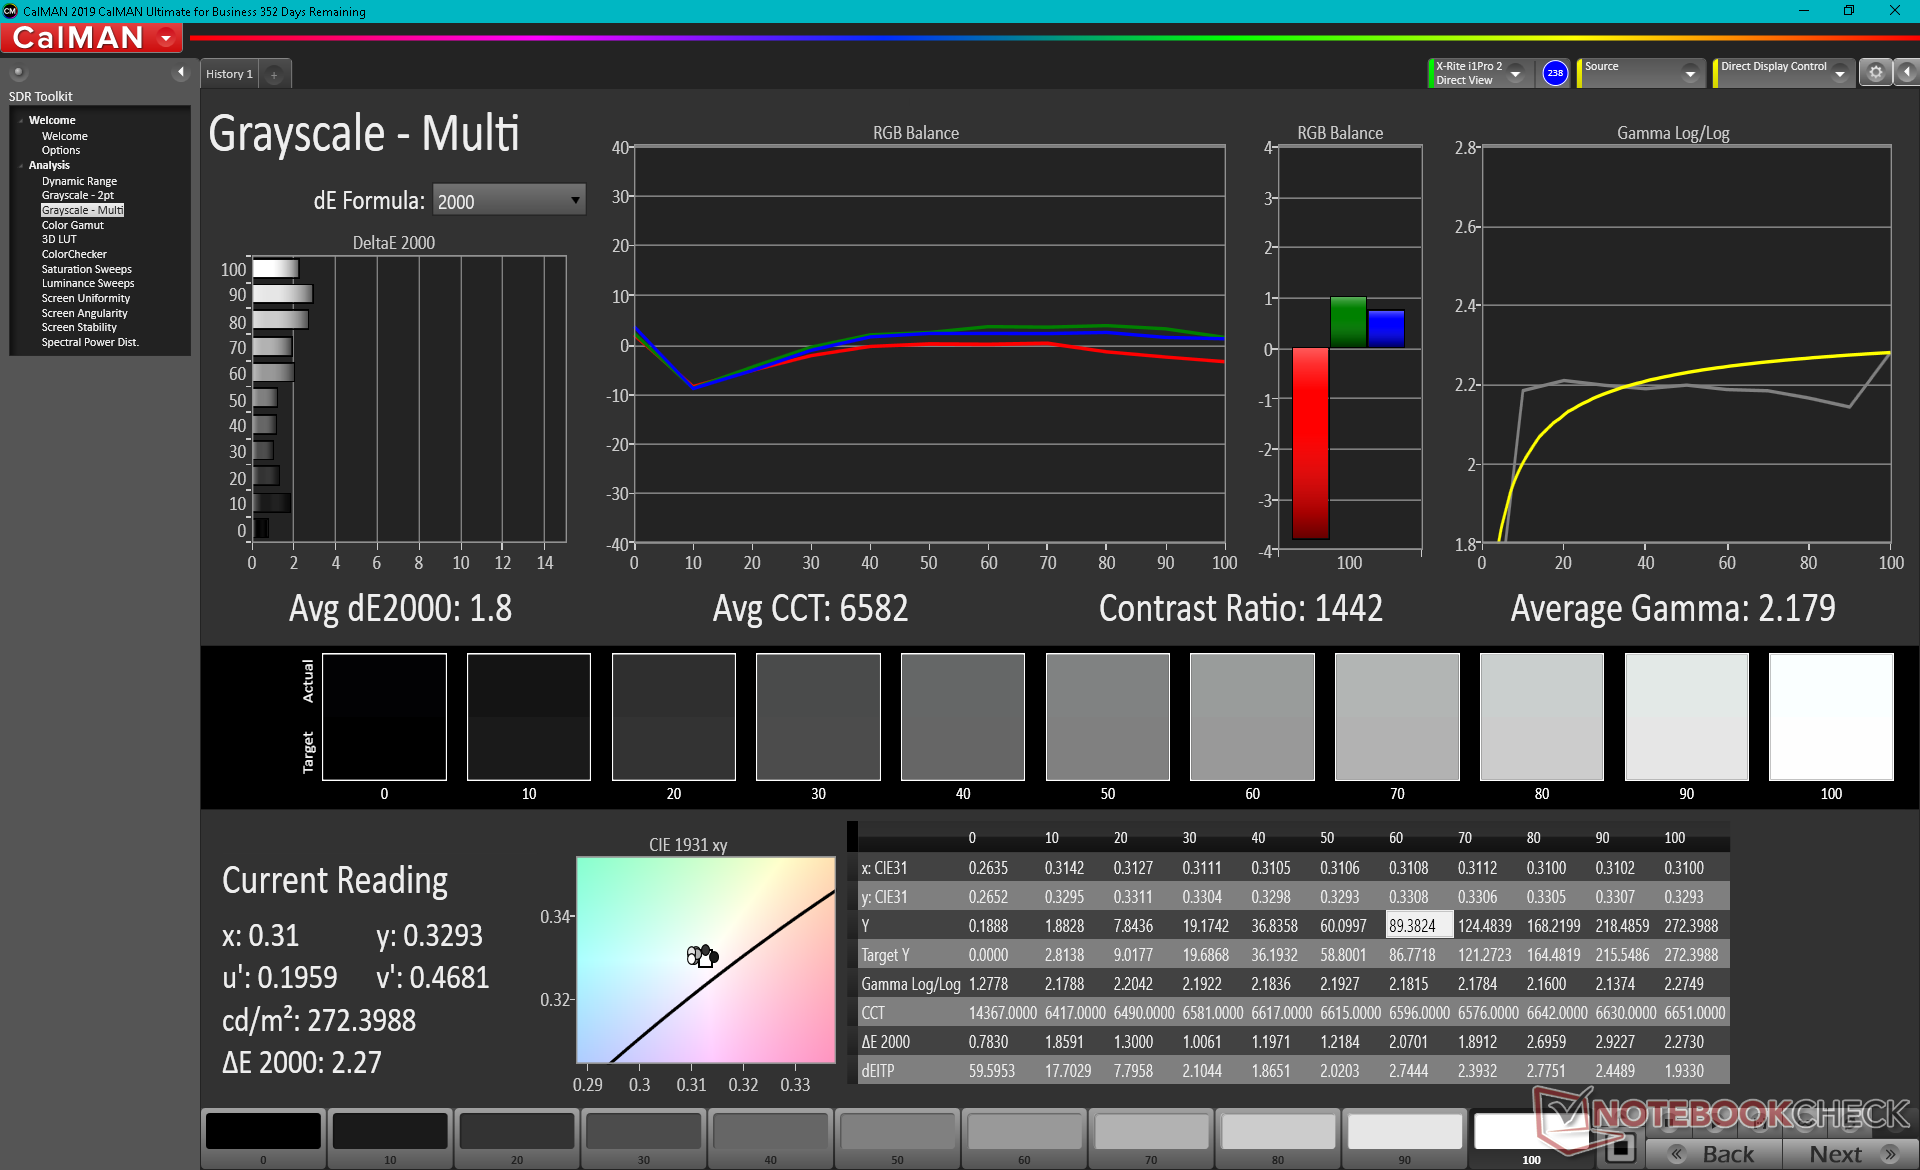
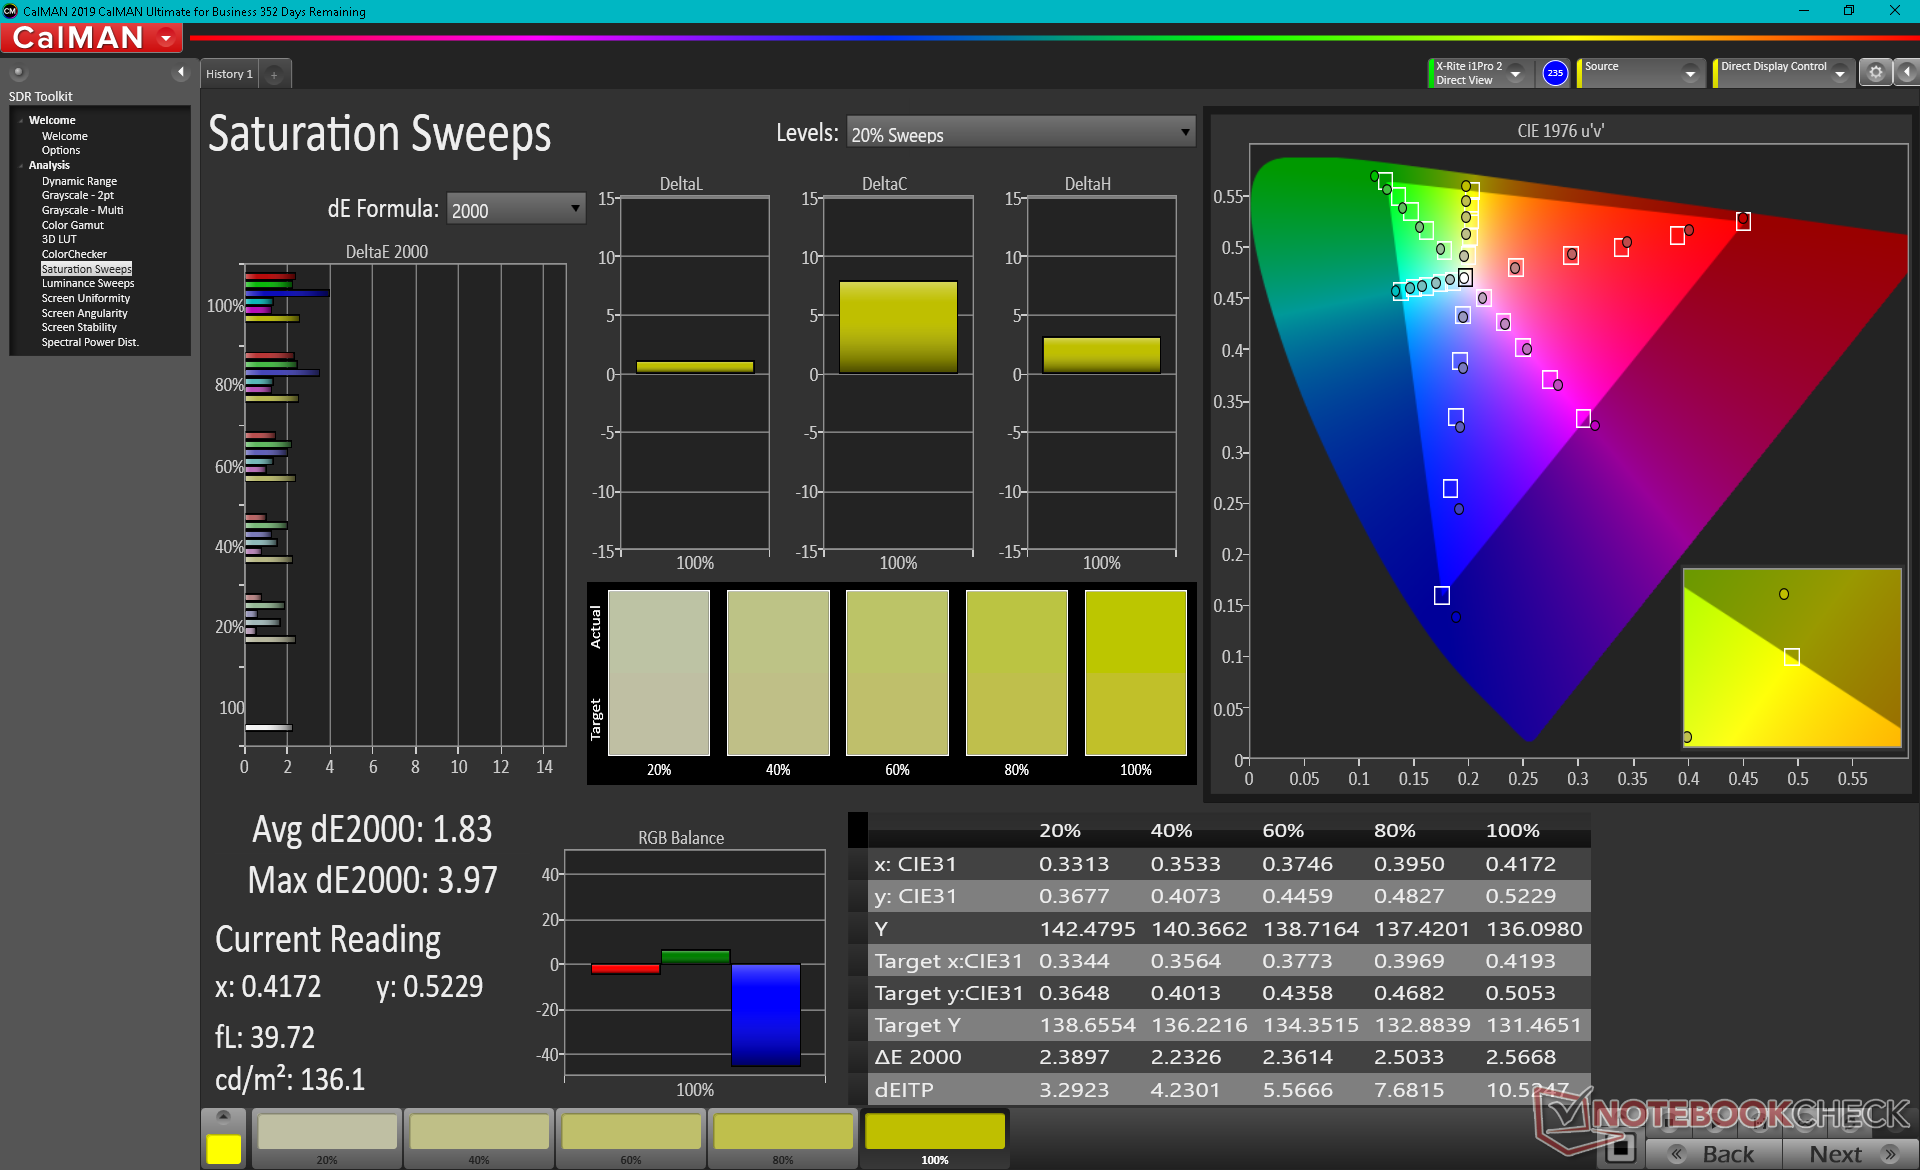
Color temperature is far too cool out of the box for a poor average grayscale DeltaE value of 6.4. Calibrating the panel ourselves addresses this drawback for much more accurate colors as shown by our CalMan measurements below. We recommend applying our calibrated ICC profile above to get the most out of the display if you don't have a colorimeter of your own.

Display Response Times
| ↔ Response Time Black to White | ||
|---|---|---|
| 34 ms ... rise ↗ and fall ↘ combined | ↗ 19.2 ms rise | 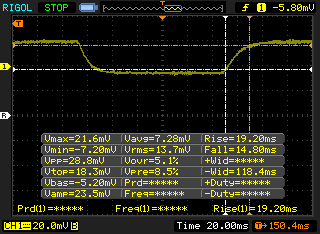 |
| ↘ 14.8 ms fall | ||
| The screen shows slow response rates in our tests and will be unsatisfactory for gamers. In comparison, all tested devices range from 0.1 (minimum) to 240 (maximum) ms. » 91 % of all devices are better. This means that the measured response time is worse than the average of all tested devices (19.8 ms). | ||
| ↔ Response Time 50% Grey to 80% Grey | ||
| 55.2 ms ... rise ↗ and fall ↘ combined | ↗ 26.8 ms rise | 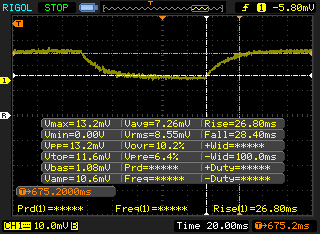 |
| ↘ 28.4 ms fall | ||
| The screen shows slow response rates in our tests and will be unsatisfactory for gamers. In comparison, all tested devices range from 0.165 (minimum) to 636 (maximum) ms. » 92 % of all devices are better. This means that the measured response time is worse than the average of all tested devices (31 ms). | ||
Screen Flickering / PWM (Pulse-Width Modulation)
| Screen flickering / PWM not detected | 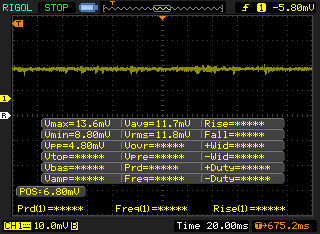 | ||
In comparison: 52 % of all tested devices do not use PWM to dim the display. If PWM was detected, an average of 7754 (minimum: 5 - maximum: 343500) Hz was measured. | |||
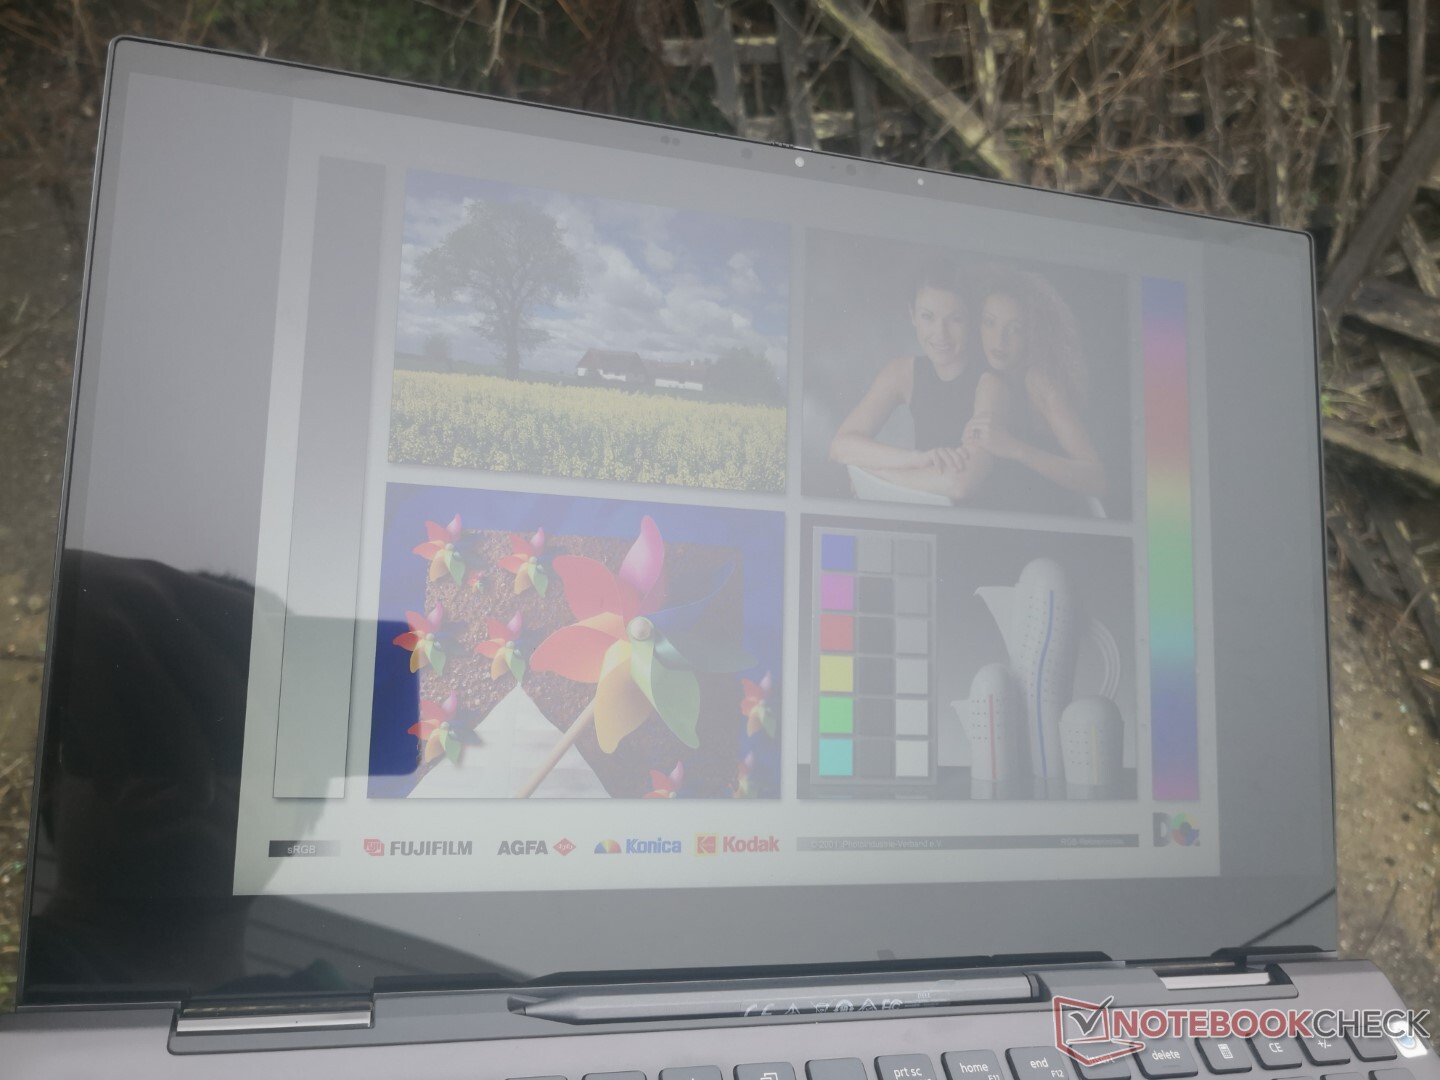
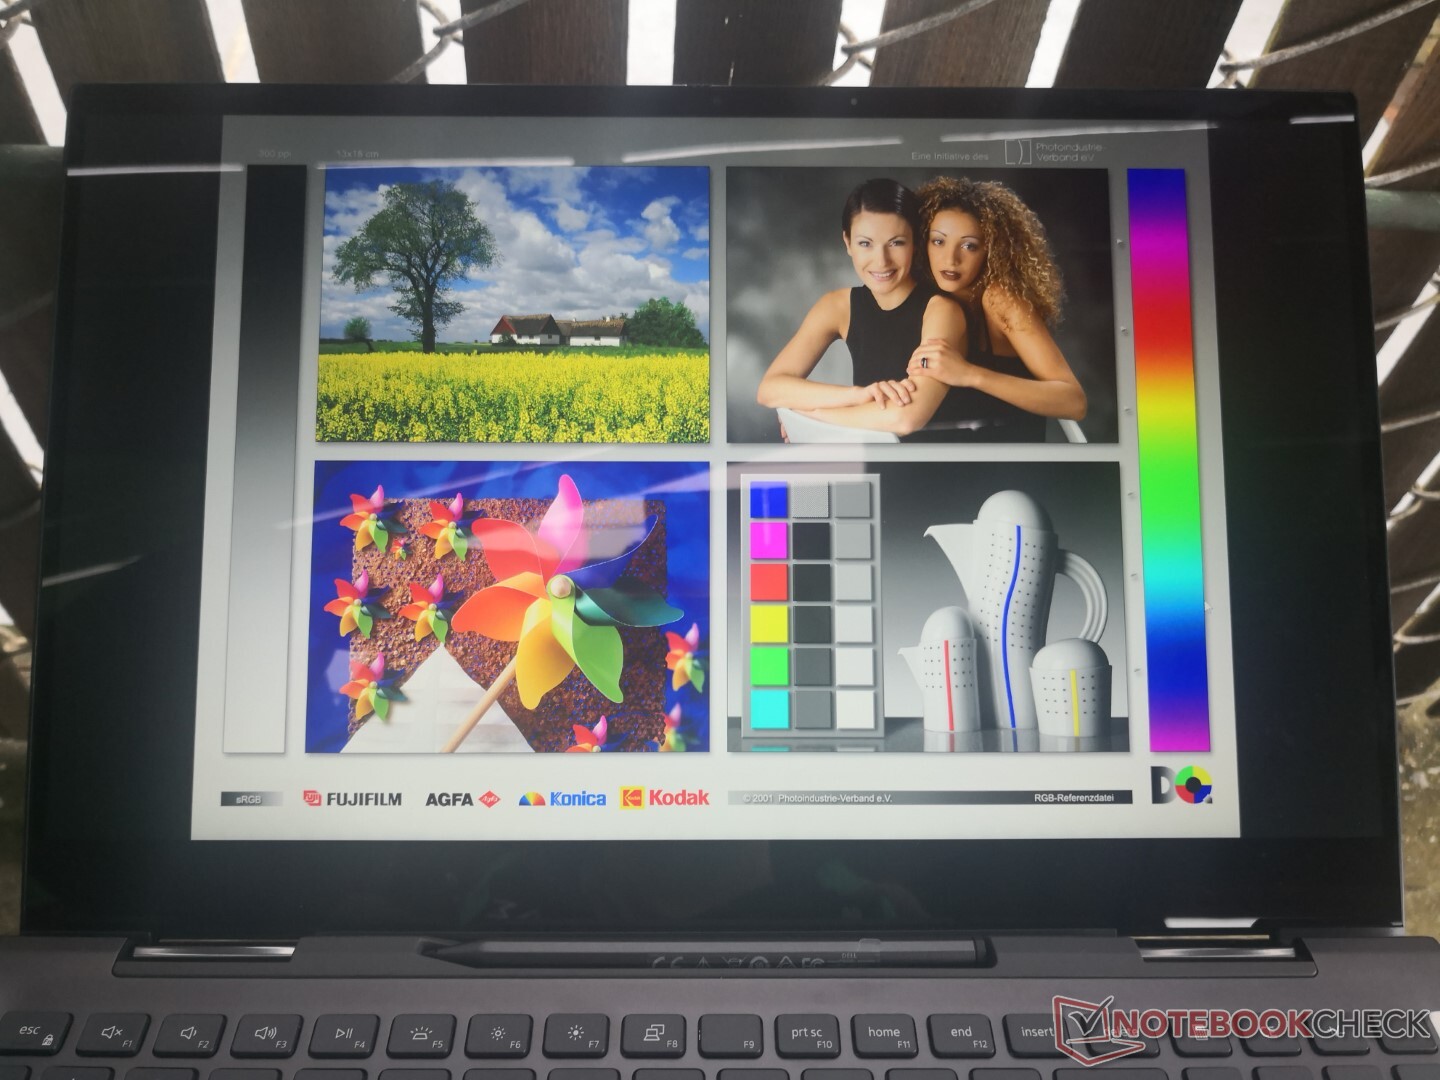
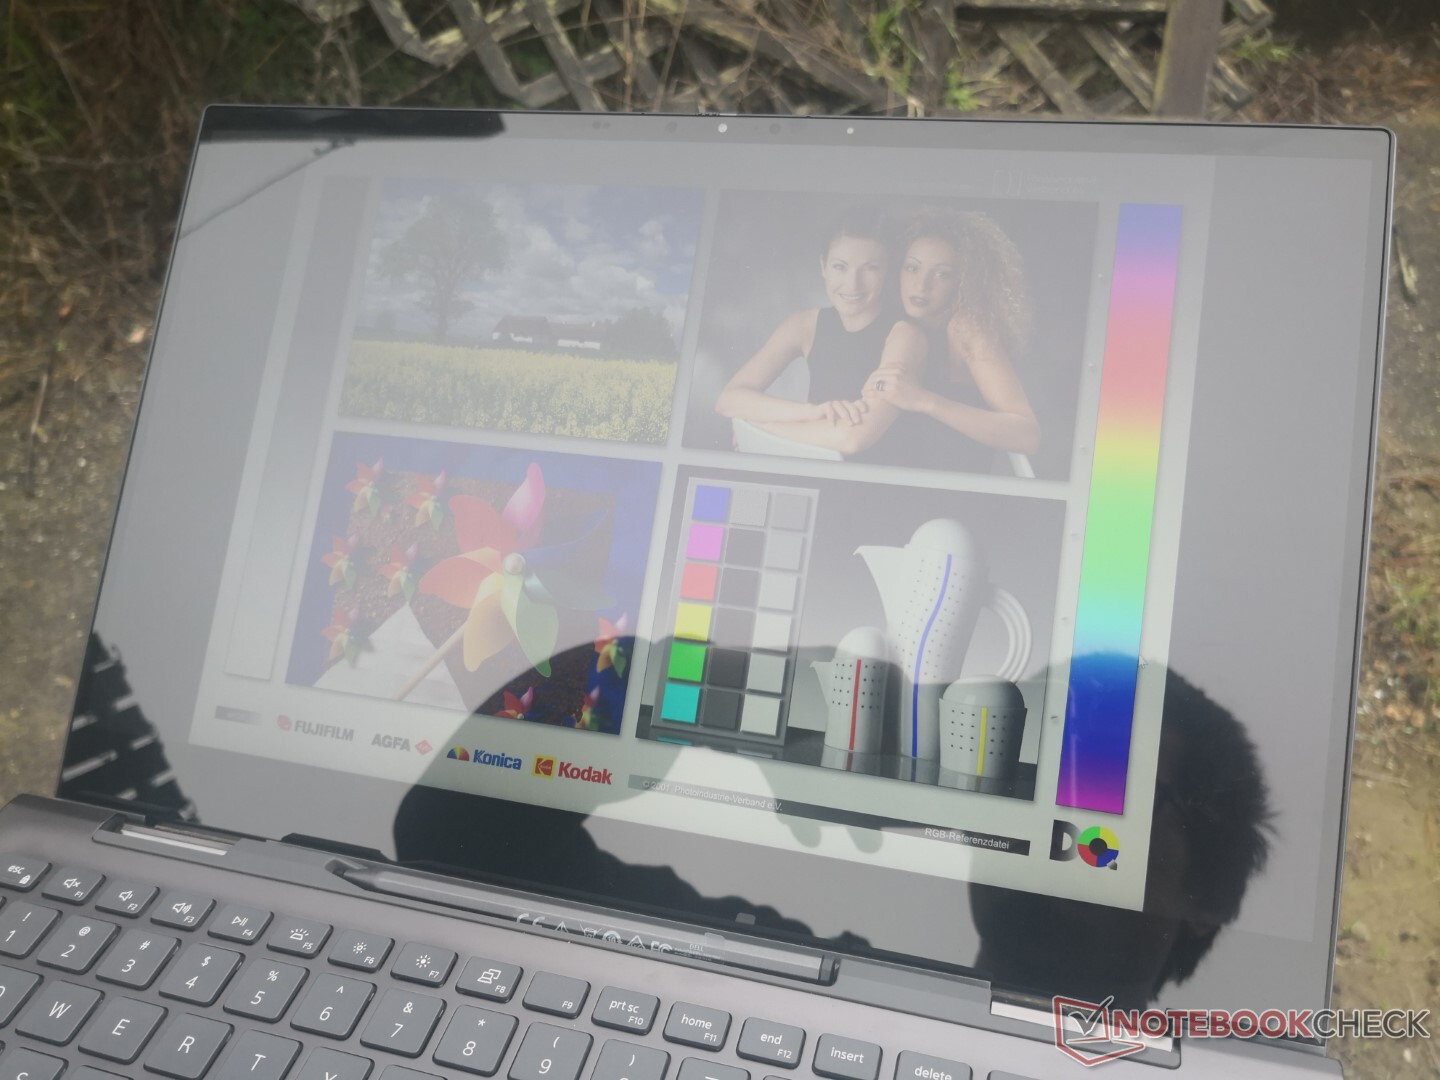
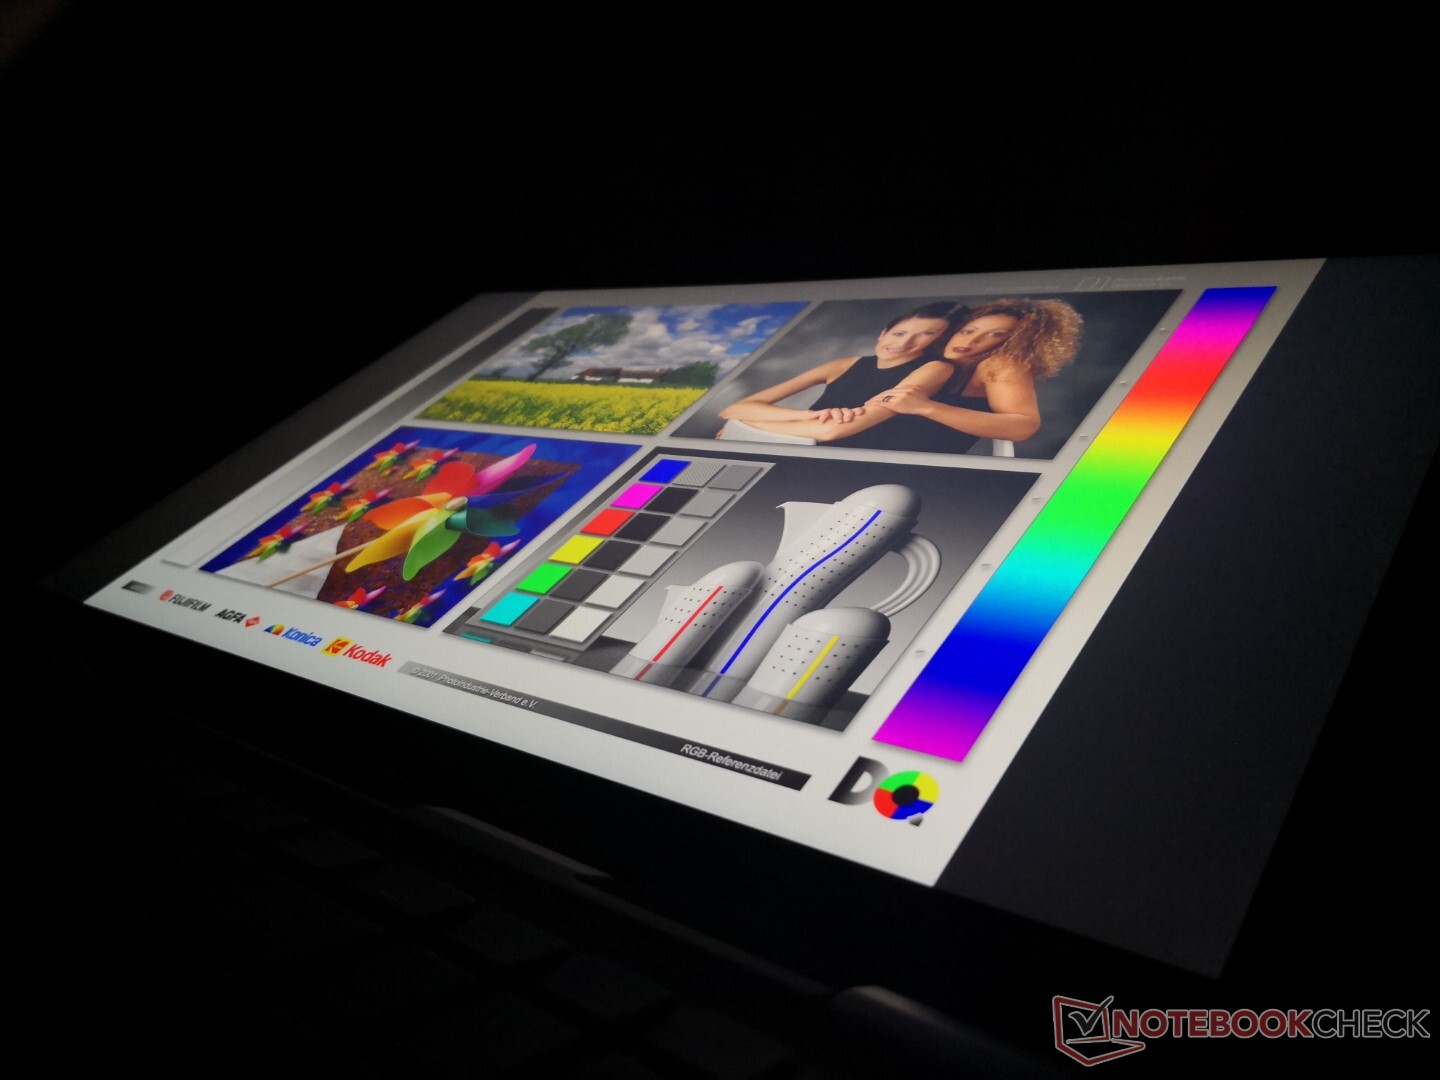
Outdoor visibility is similar to the Silver Edition since both share almost the same brightness levels and color reproduction despite their native resolution differences. However, Black Edition owners will likely want to bump up the text scaling to avoid squinting at small letters.
Performance
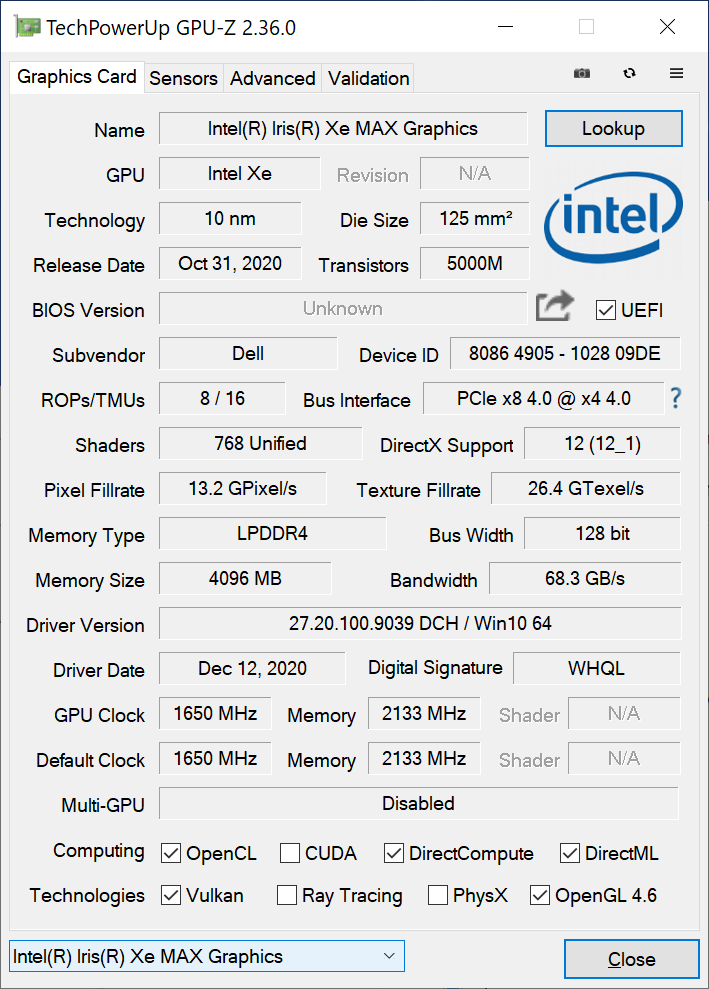
The biggest feature of the Inspiron 15 7506 2-in-1 Black Edition is its Iris Xe Max discrete GPU as there are currently very few laptops with such an option. Intel has made it clear that the GPU was designed primarily for editors and prosumers rather than gamers which our benchmarks below will show. Though there are no AMD variants available at the moment, users can still configure the Silver Edition with the GeForce MX330 instead if they wish.
It's worth noting that we ran into a handful of software issues and crashes when the unit first shipped to us. Fortunately, most of these problems were addressed after updating to the latest graphics driver at the time of review (27.20.100.9039). Owners should definitely become familiar with the Intel Graphics Command Center software for updating and fine-tuning the Xe Max GPU.
All benchmarks below were performed on Dell Ultra Performance mode for the highest possible scores.
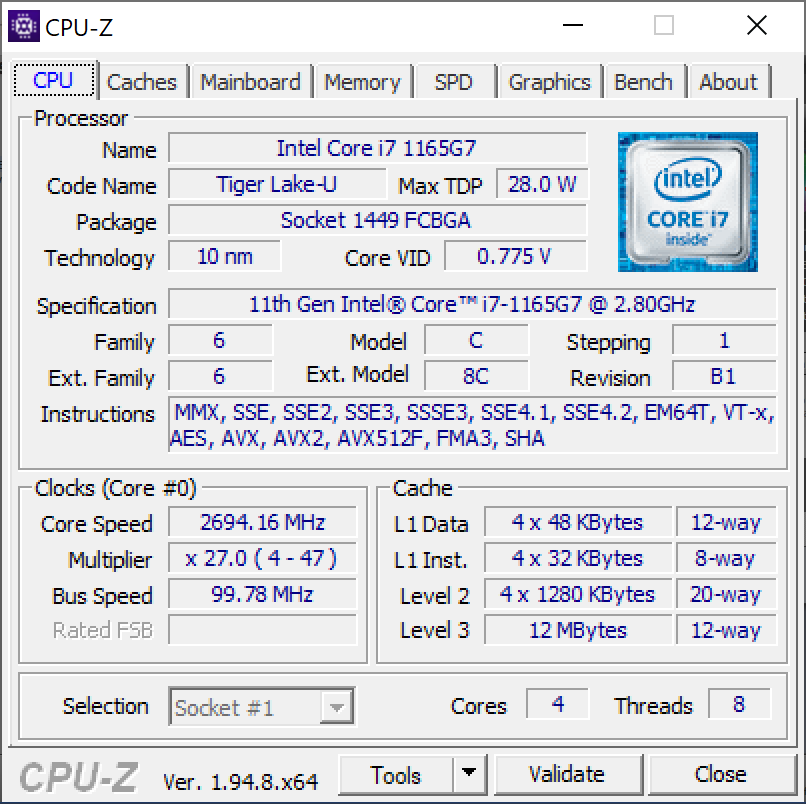
Processor
Raw CPU performance is about 5 to 8 percent slower than the average Core i7-1165G7 in our database. Though minor, this is enough to put it slightly below the Core i5-1135G7 in the Inspiron 15 7506 2-in-1 Silver Edition even though the Black Edition is supposed to house the faster processor. Multi-thread performance is still about 20 to 25 percent faster than the last generation Core i7-1065G7 in the Microsoft Surface Book 3.
The less expensive AMD Ryzen 5 4500U offers similar multi-thread performance as our Core i7-1165G7 while being 10 to 15 percent slower in single-threaded workloads.
Cinebench R15: CPU Multi 64Bit | CPU Single 64Bit
Blender: v2.79 BMW27 CPU
7-Zip 18.03: 7z b 4 -mmt1 | 7z b 4
Geekbench 5.5: Single-Core | Multi-Core
HWBOT x265 Benchmark v2.2: 4k Preset
LibreOffice : 20 Documents To PDF
R Benchmark 2.5: Overall mean
| HWBOT x265 Benchmark v2.2 / 4k Preset | |
| Lenovo ThinkPad E15 Gen2-20T9S00K00 | |
| Dell Inspiron 15 7506 2-in-1 P97F | |
| Dell Inspiron 15 7000 7506 2-in-1 Black Edition | |
| Average Intel Core i7-1165G7 (1.39 - 8.47, n=80) | |
| HP Envy x360 15-ee0257ng | |
| Microsoft Surface Book 3 15 | |
| Durabook S15ABG2 | |
| Dell Inspiron 15 5000 5502 | |
| Asus Vivobook 15 F512DA-SH31 | |
| LibreOffice / 20 Documents To PDF | |
| Asus Vivobook 15 F512DA-SH31 | |
| HP Envy x360 15-ee0257ng | |
| Durabook S15ABG2 | |
| Microsoft Surface Book 3 15 | |
| Dell Inspiron 15 5000 5502 | |
| Lenovo ThinkPad E15 Gen2-20T9S00K00 | |
| Dell Inspiron 15 7506 2-in-1 P97F | |
| Average Intel Core i7-1165G7 (21.5 - 88.1, n=78) | |
| Dell Inspiron 15 7000 7506 2-in-1 Black Edition | |
* ... smaller is better
System Performance
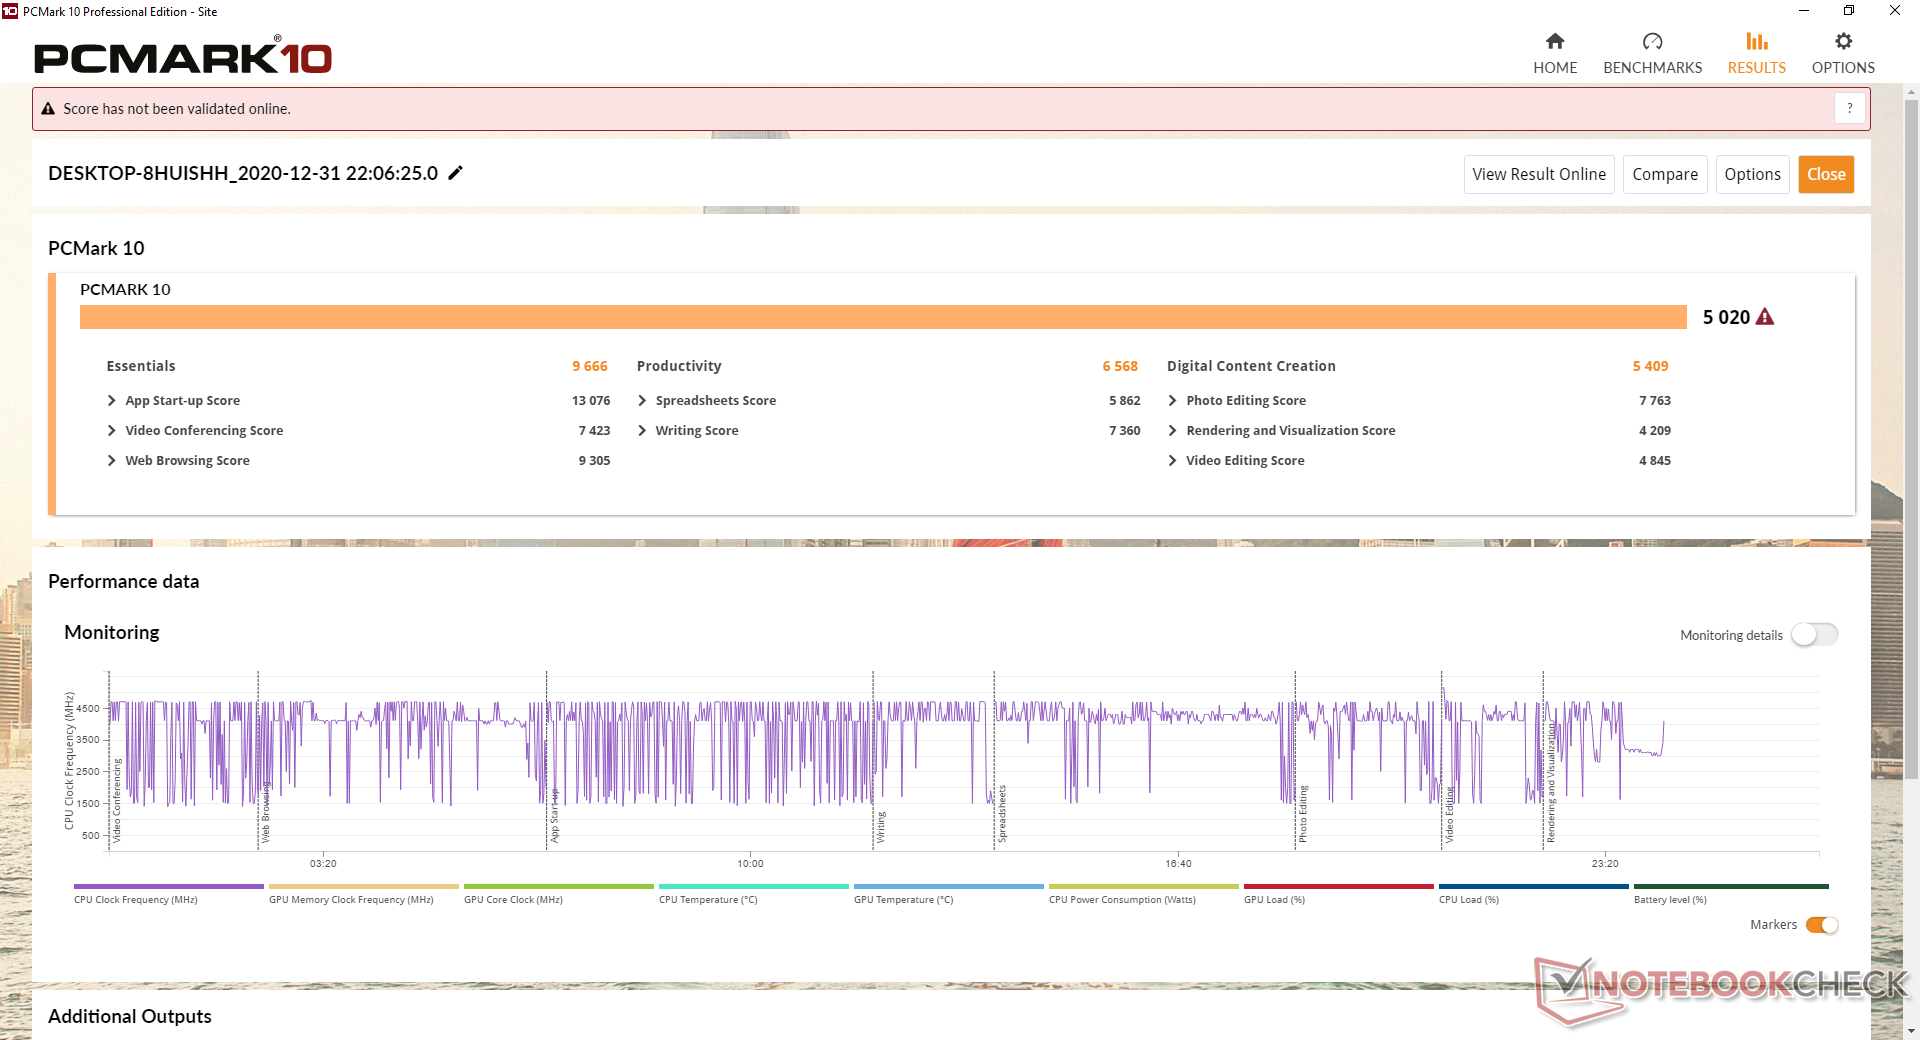
PCMark 10 scores are high when compared to other convertibles with integrated GPUs especially in Digital Content Creation likely because of the Xe Max GPU.
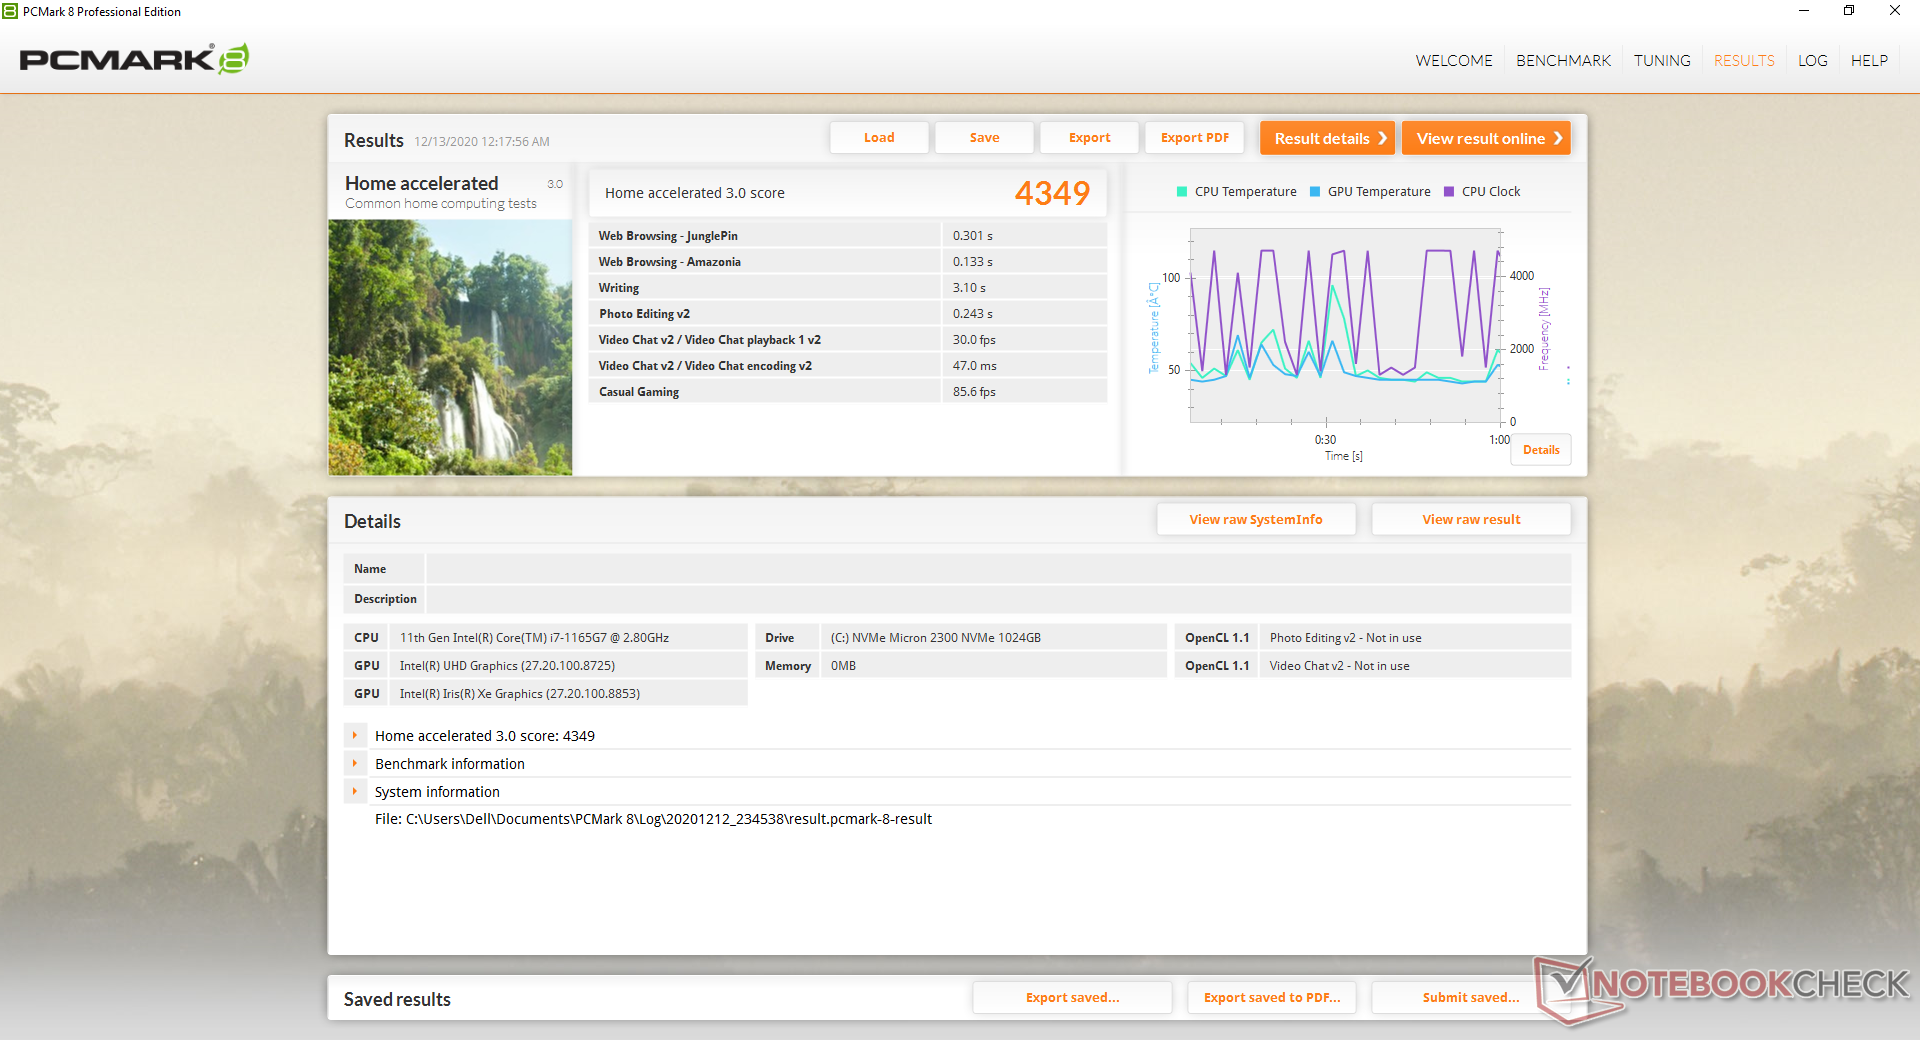
| PCMark 8 Home Score Accelerated v2 | 4349 points | |
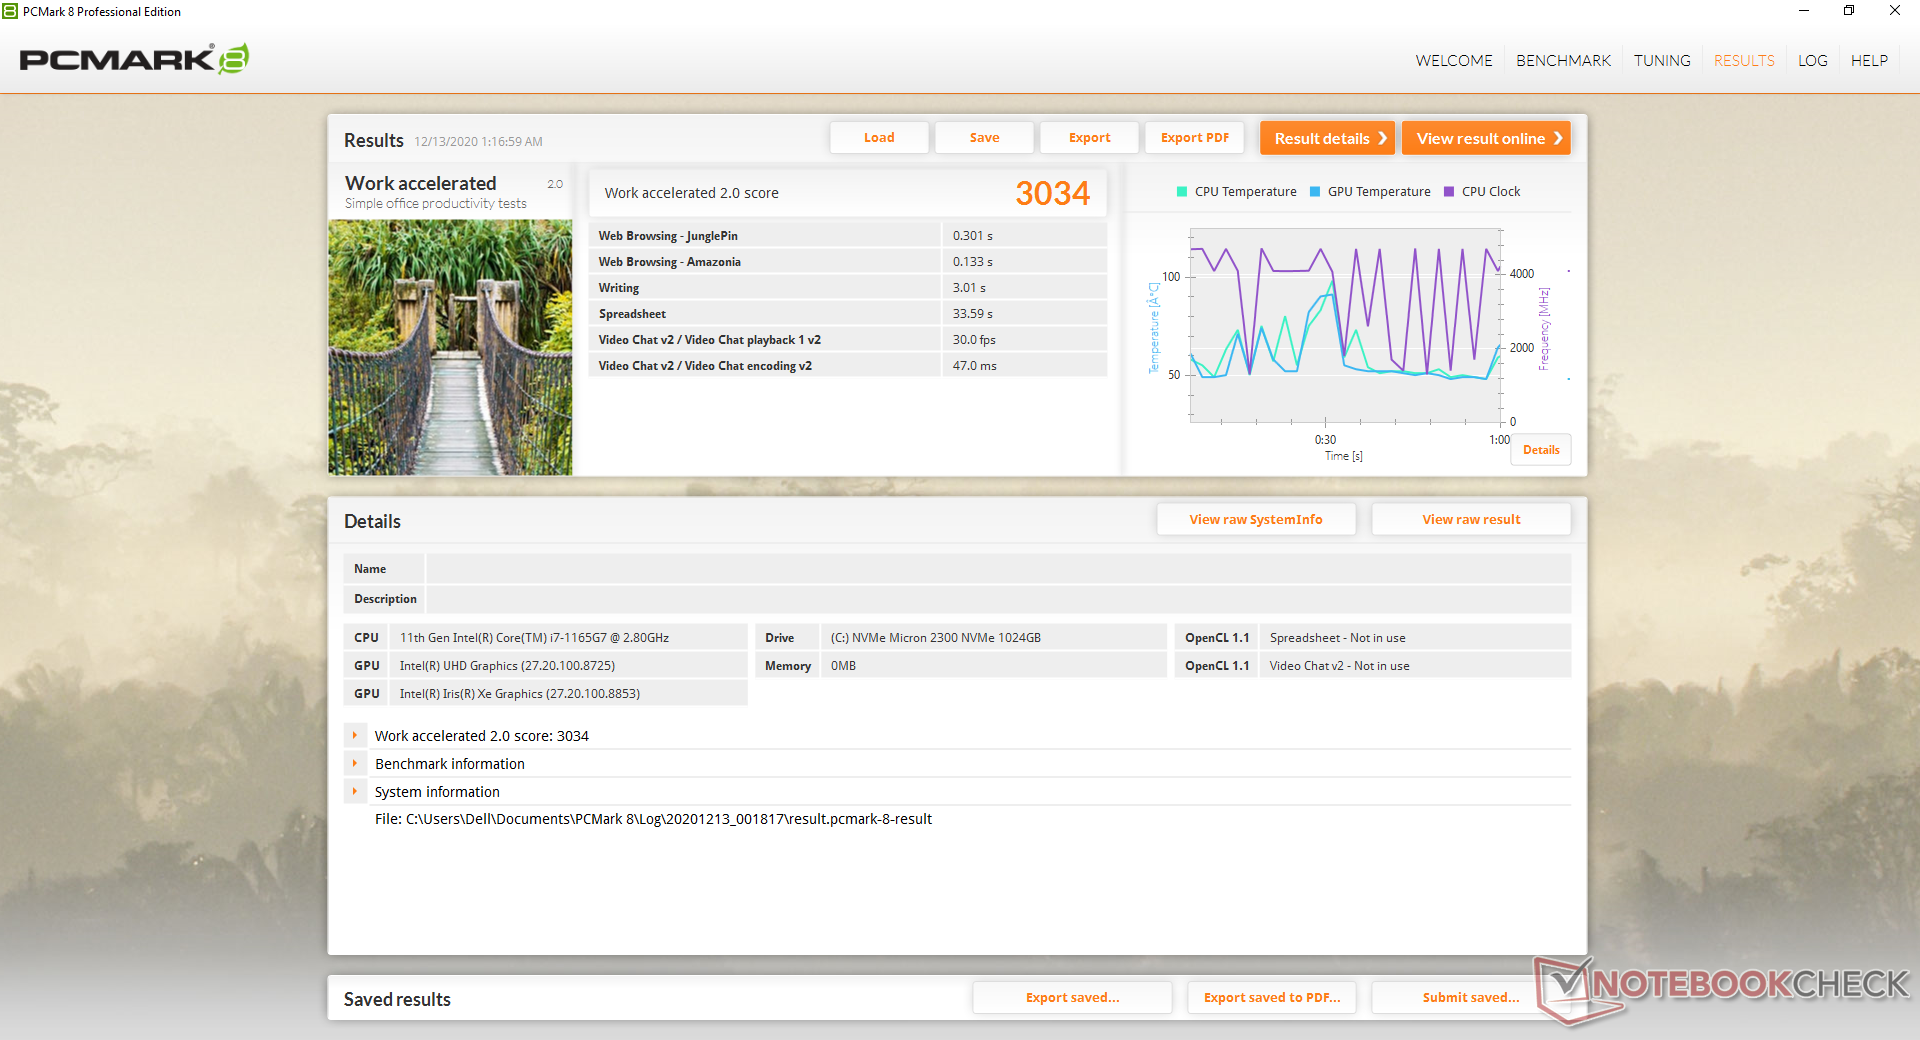
| PCMark 8 Work Score Accelerated v2 | 3034 points | |
| PCMark 10 Score | 5020 points | |
Help | ||
DPC Latency
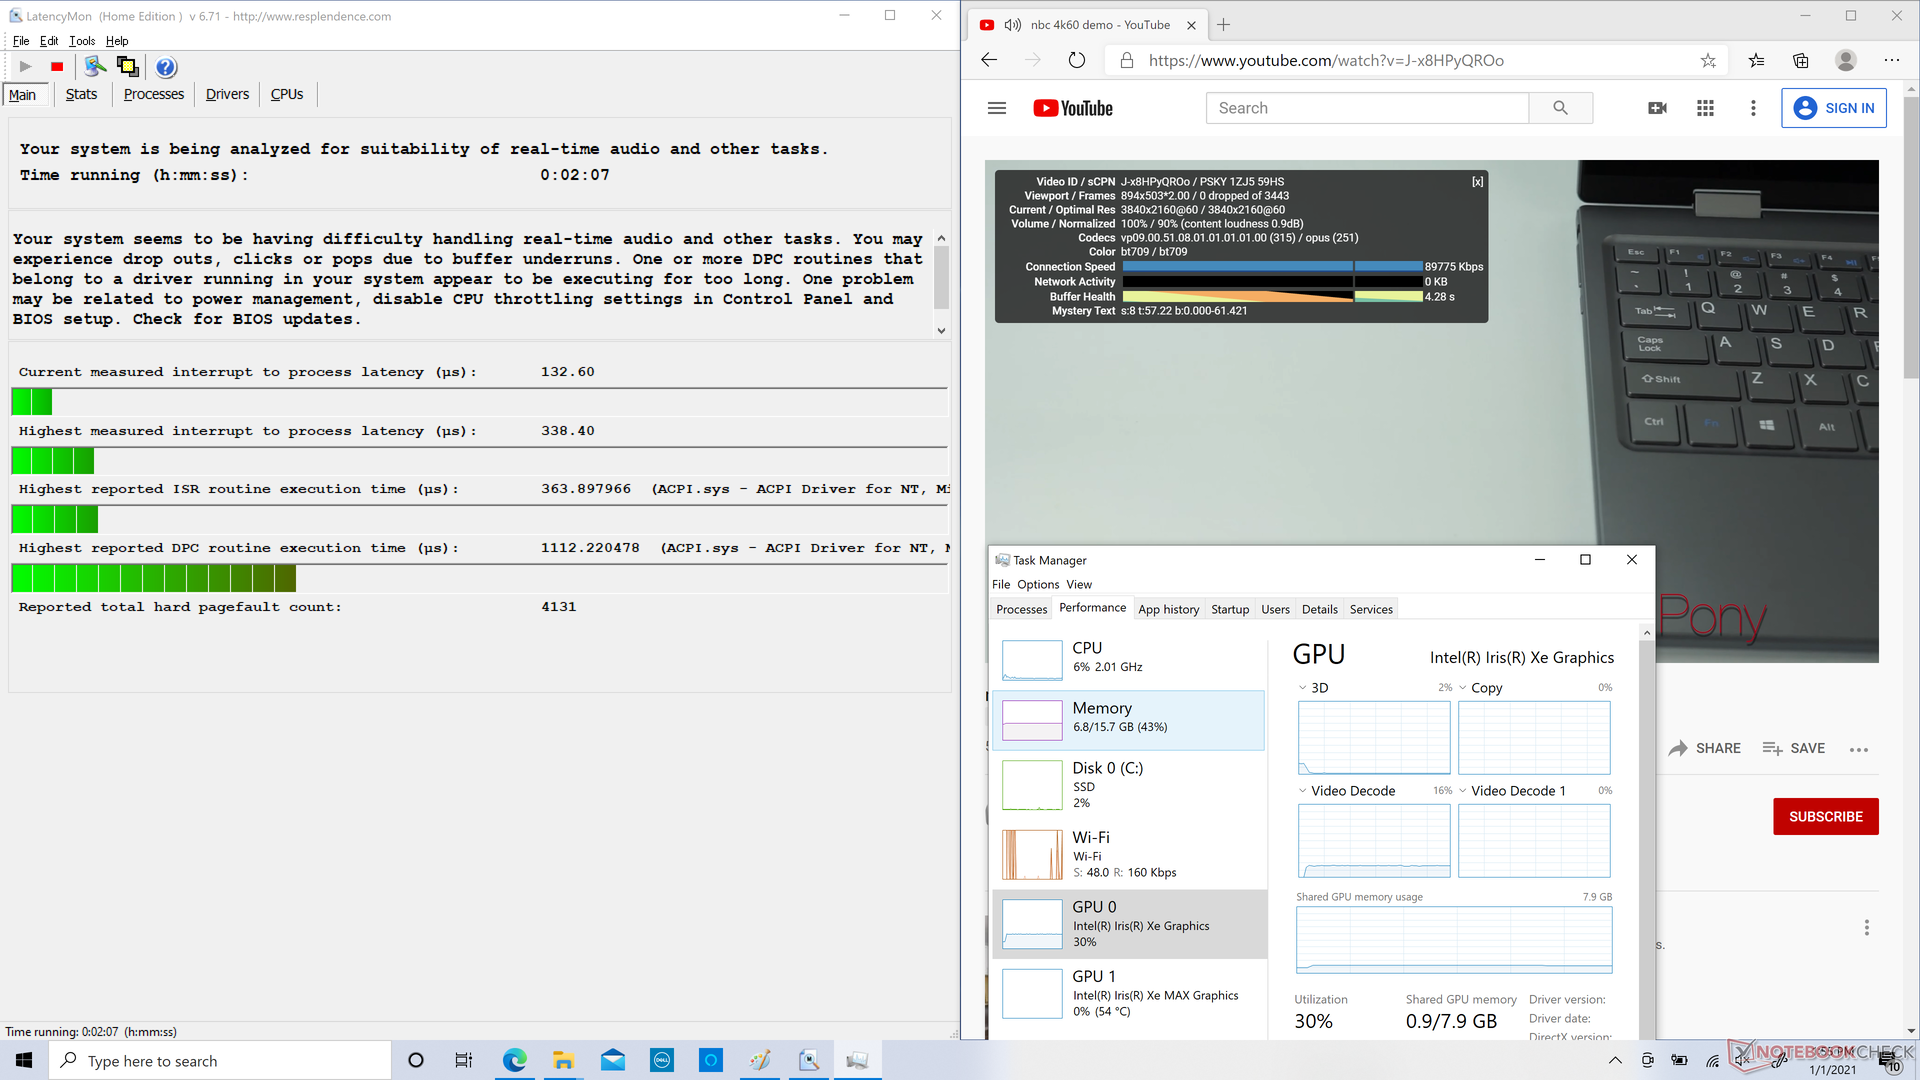
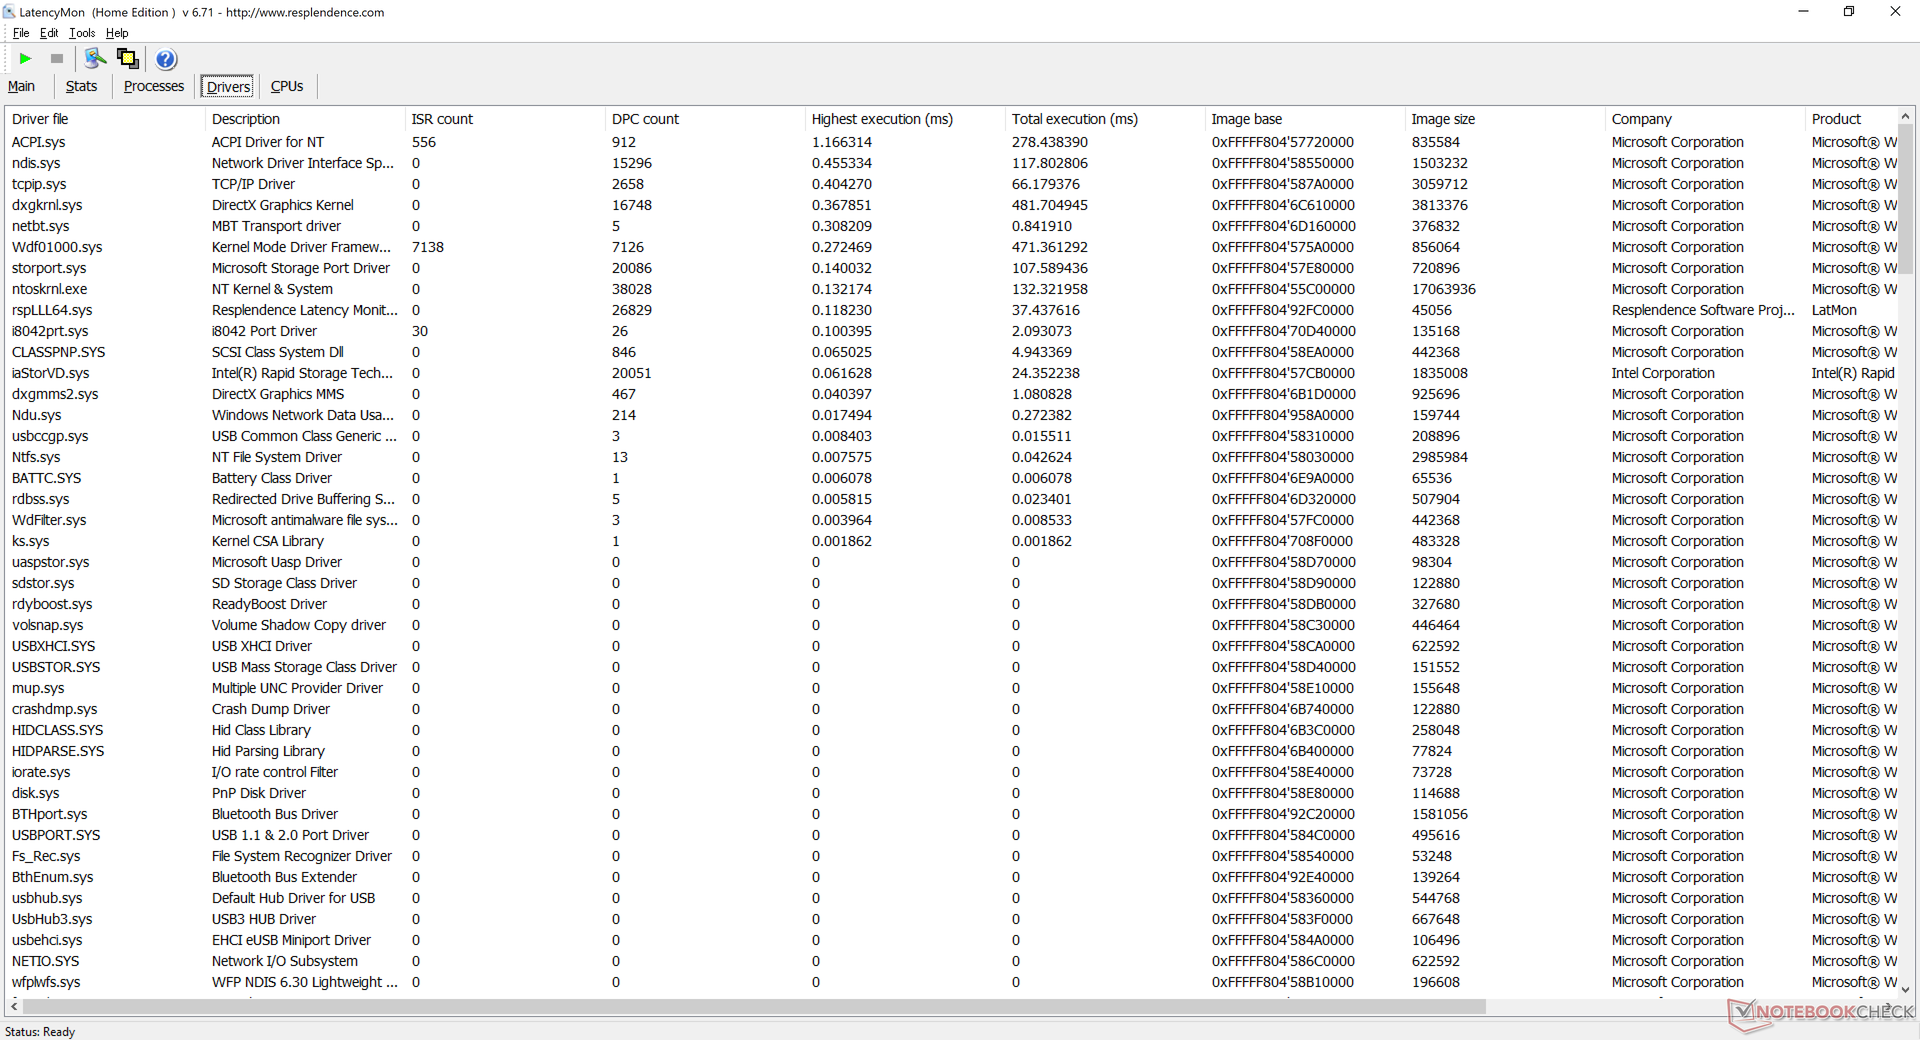
LatencyMon shows minor DPC latency issues related to ACPI.sys. 4K UHD video playback at 60 FPS is otherwise smooth and with no dropped frames during our minute-long test. GPU utilization sits at 30 percent compared to ~50 percent on last year's Iris Plus G7 platform.
| DPC Latencies / LatencyMon - interrupt to process latency (max), Web, Youtube, Prime95 | |
| Dell Inspiron 15 7506 2-in-1 P97F | |
| Microsoft Surface Book 3 15 | |
| Samsung Galaxy Book Flex 15-NP950 | |
| HP Envy x360 15-ee0257ng | |
| Dell Inspiron 15 7000 7506 2-in-1 Black Edition | |
* ... smaller is better
Storage Devices
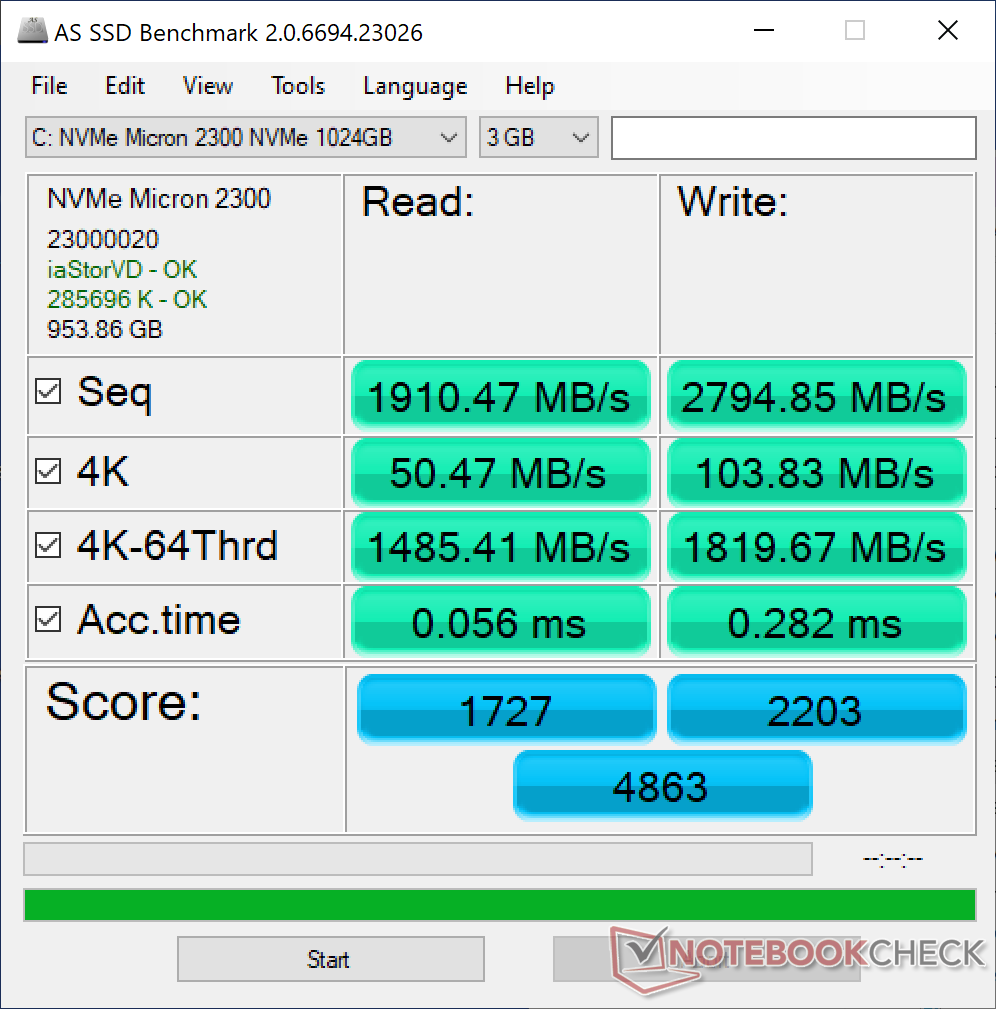
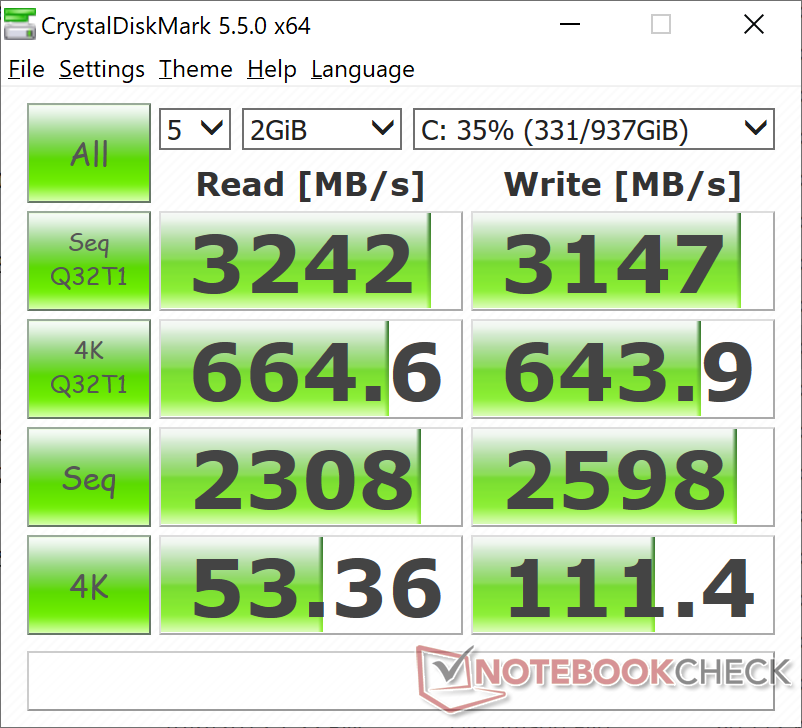
Our test unit comes with a Micron 2300 NVMe SSD with theoretical read and write rates of up to 3300 MB/s and 2700 MB/s, respectively. In comparison, our base Silver Edition unit comes with a Toshiba drive and so Dell may be sourcing from multiple drive makers for its Inspiron 15 7506 2-in-1 series.
The Micron drive may have problems reaching its full potential. When running DiskSpd in a loop, read rates would top out at just 1090 MB/s possibly due to interrupting background activity or reaching thermal limits.
More HDD and SSD benchmark comparisons can be found on our table here.
| Dell Inspiron 15 7000 7506 2-in-1 Black Edition Micron 2300 1TB MTFDHBA1T0TDV | HP Envy x360 15-ee0257ng Intel SSD 660p SSDPEKNW512G8 | Microsoft Surface Book 3 15 SK hynix BC501 HFM256GDGTNG | Asus ZenBook Flip 15 UX563FD-A1027T Samsung SSD PM981 MZVLB1T0HALR | Lenovo Yoga C740-15IML Samsung SSD PM981 MZVLB512HAJQ | Dell Inspiron 15 7506 2-in-1 P97F Toshiba KBG40ZNS256G NVMe | |
|---|---|---|---|---|---|---|
| AS SSD | -37% | -39% | -9% | 0% | -70% | |
| Seq Read (MB/s) | 1910 | 1587 -17% | 1625 -15% | 2739 43% | 2732 43% | 1470 -23% |
| Seq Write (MB/s) | 2795 | 864 -69% | 461.3 -83% | 1307 -53% | 1477 -47% | 324.2 -88% |
| 4K Read (MB/s) | 50.5 | 51.6 2% | 37.2 -26% | 47.43 -6% | 57.7 14% | 37.25 -26% |
| 4K Write (MB/s) | 103.8 | 125.1 21% | 100.9 -3% | 126 21% | 136.3 31% | 98 -6% |
| 4K-64 Read (MB/s) | 1485 | 323.1 -78% | 501 -66% | 1013 -32% | 1021 -31% | 796 -46% |
| 4K-64 Write (MB/s) | 1820 | 724 -60% | 311.7 -83% | 1371 -25% | 1651 -9% | 152.6 -92% |
| Access Time Read * (ms) | 0.056 | 0.101 -80% | 0.072 -29% | 0.082 -46% | 0.062 -11% | 0.146 -161% |
| Access Time Write * (ms) | 0.282 | 0.046 84% | 0.036 87% | 0.029 90% | 0.028 90% | 0.577 -105% |
| Score Read (Points) | 1727 | 533 -69% | 701 -59% | 1335 -23% | 1352 -22% | 980 -43% |
| Score Write (Points) | 2203 | 935 -58% | 459 -79% | 1628 -26% | 1935 -12% | 283 -87% |
| Score Total (Points) | 4863 | 1725 -65% | 1470 -70% | 3582 -26% | 3929 -19% | 1714 -65% |
| Copy ISO MB/s (MB/s) | 1892 | 1323 -30% | 1931 2% | 1972 4% | 353.5 -81% | |
| Copy Program MB/s (MB/s) | 649 | 340.8 -47% | 457.9 -29% | 642 -1% | 194.1 -70% | |
| Copy Game MB/s (MB/s) | 1558 | 823 -47% | 1242 -20% | 1090 -30% | 239 -85% | |
| CrystalDiskMark 5.2 / 6 | -39% | -51% | -14% | -7% | -53% | |
| Write 4K (MB/s) | 111.4 | 104.5 -6% | 87.4 -22% | 137.8 24% | 142.3 28% | 99.3 -11% |
| Read 4K (MB/s) | 53.4 | 49.7 -7% | 38.14 -29% | 44.15 -17% | 47.56 -11% | 32.1 -40% |
| Write Seq (MB/s) | 2598 | 981 -62% | 610 -77% | 2073 -20% | 2185 -16% | 353.1 -86% |
| Read Seq (MB/s) | 2308 | 1517 -34% | 1029 -55% | 2165 -6% | 2235 -3% | 1370 -41% |
| Write 4K Q32T1 (MB/s) | 644 | 398.8 -38% | 280.3 -56% | 431.9 -33% | 515 -20% | 171.1 -73% |
| Read 4K Q32T1 (MB/s) | 665 | 338.4 -49% | 259.6 -61% | 427.7 -36% | 413.4 -38% | 350.8 -47% |
| Write Seq Q32T1 (MB/s) | 3147 | 982 -69% | 829 -74% | 2253 -28% | 2981 -5% | 325.9 -90% |
| Read Seq Q32T1 (MB/s) | 3242 | 1650 -49% | 2037 -37% | 3480 7% | 3565 10% | 2197 -32% |
| Total Average (Program / Settings) | -38% /
-38% | -45% /
-44% | -12% /
-11% | -4% /
-3% | -62% /
-64% |
* ... smaller is better

Disk Throttling: DiskSpd Read Loop, Queue Depth 8
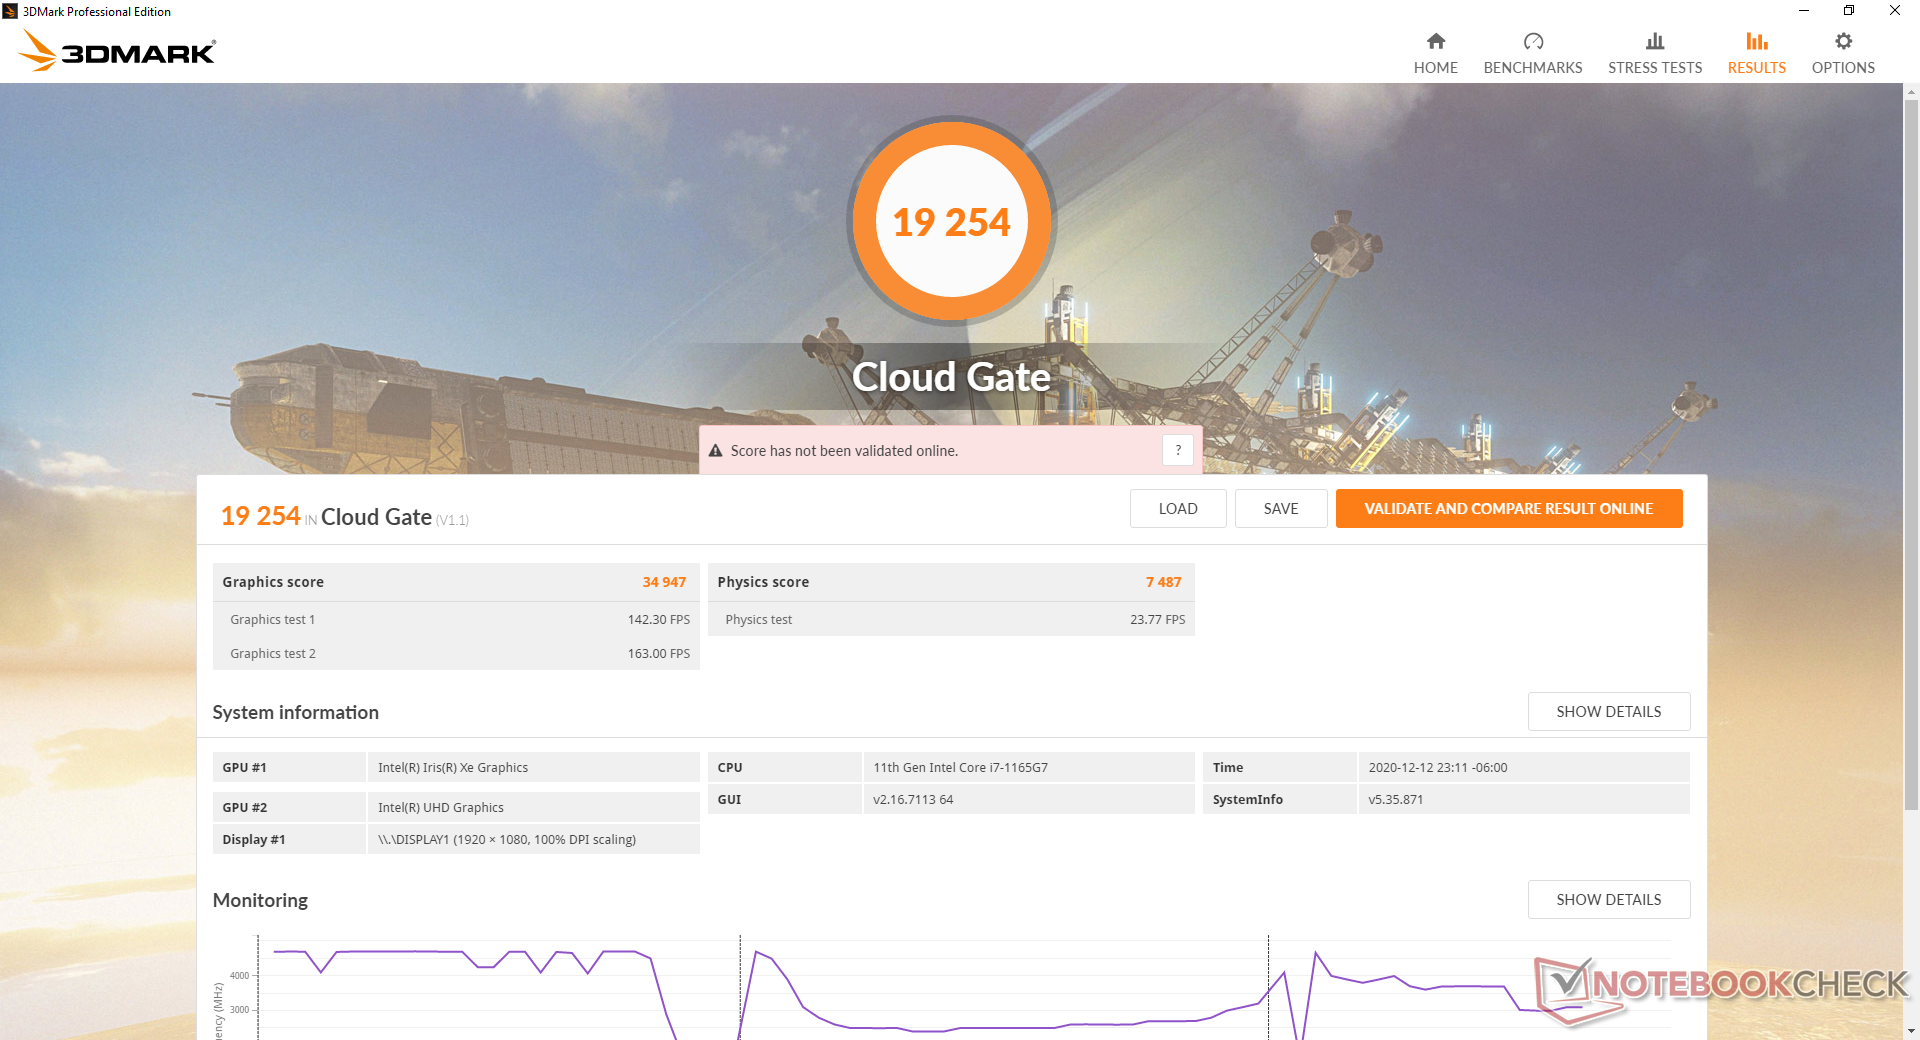
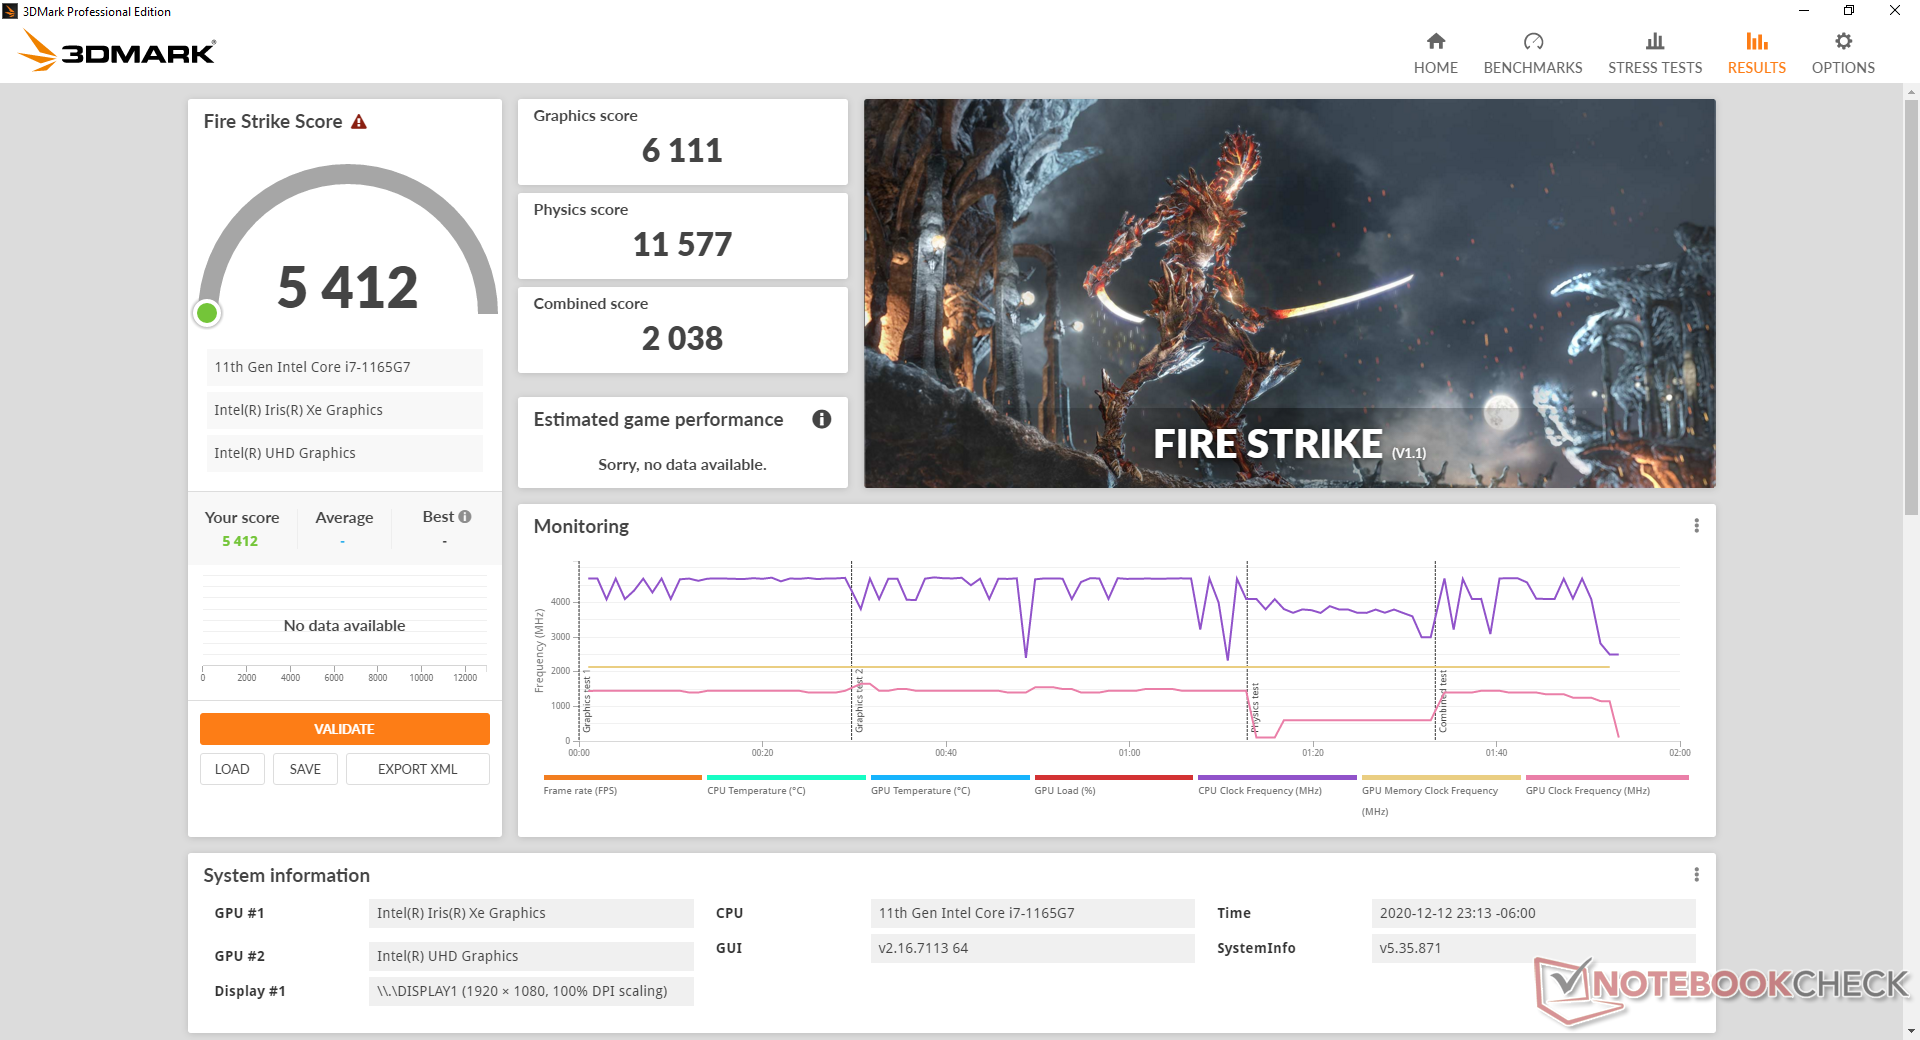
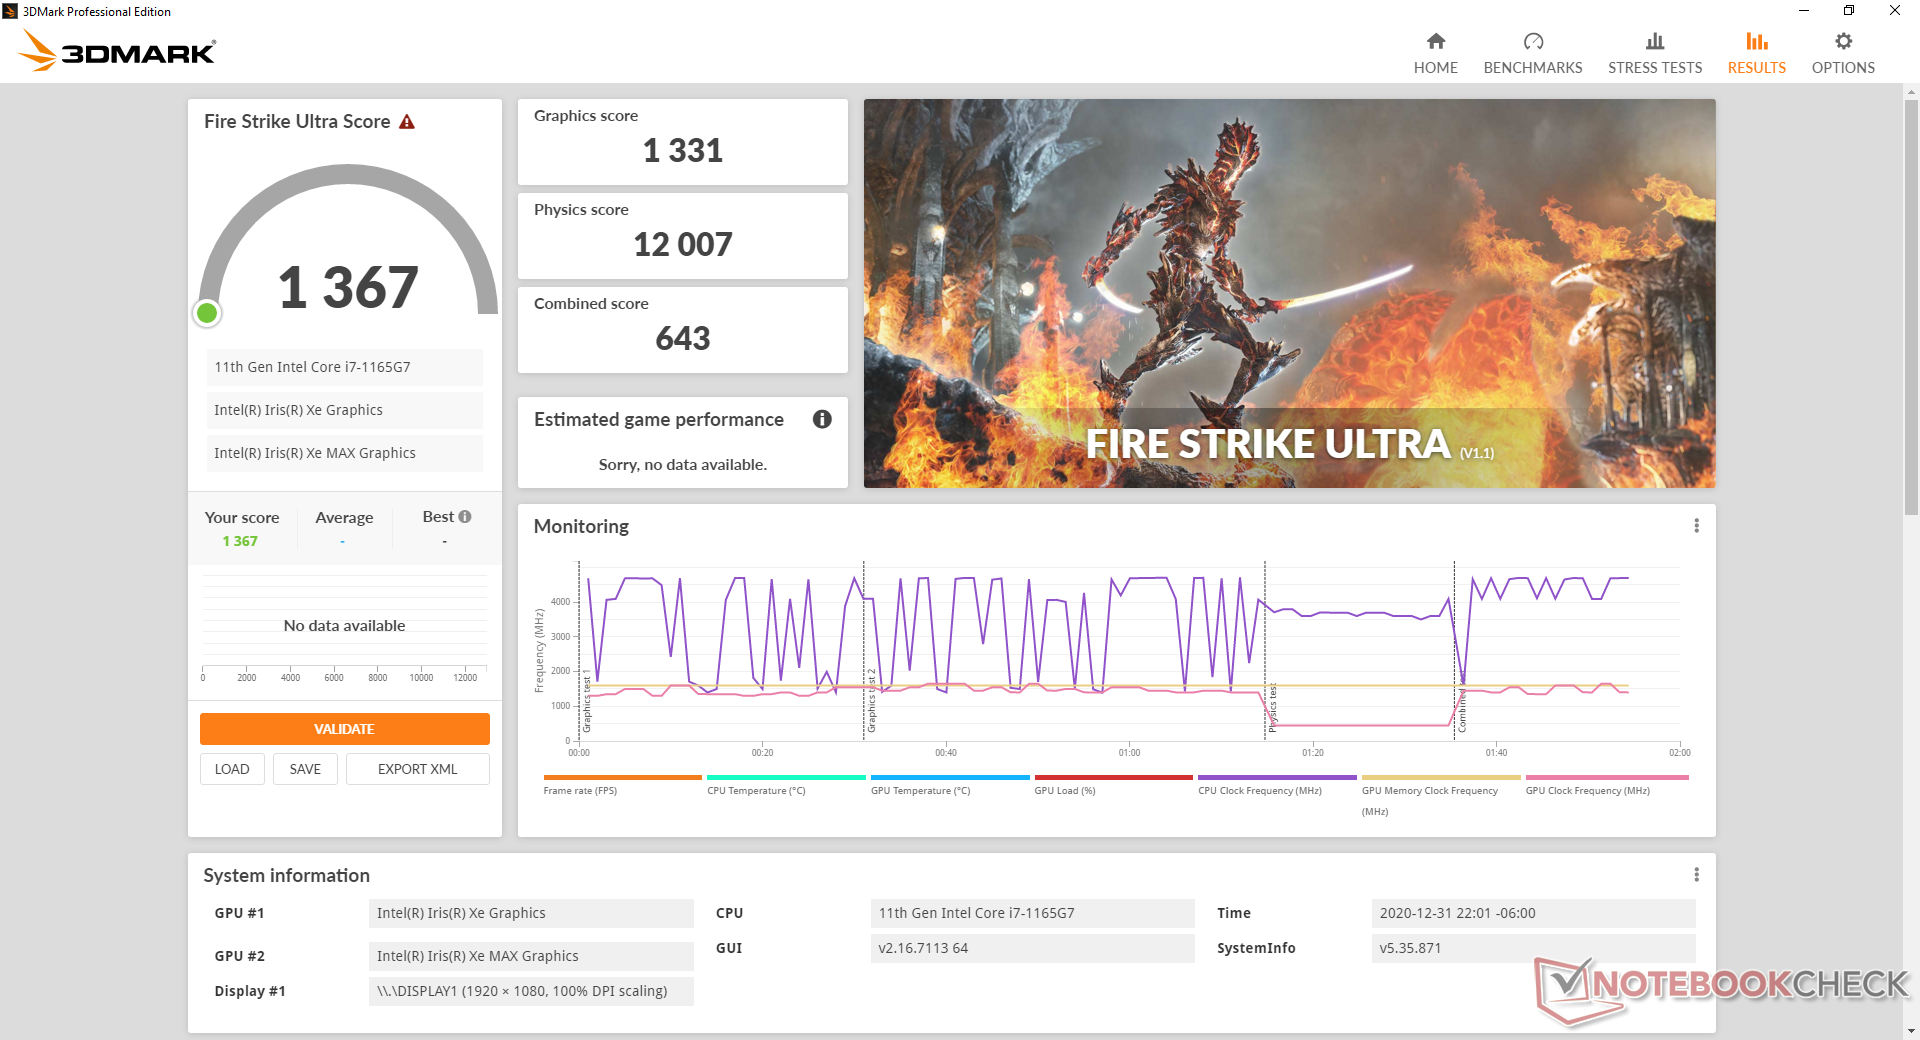
GPU Performance
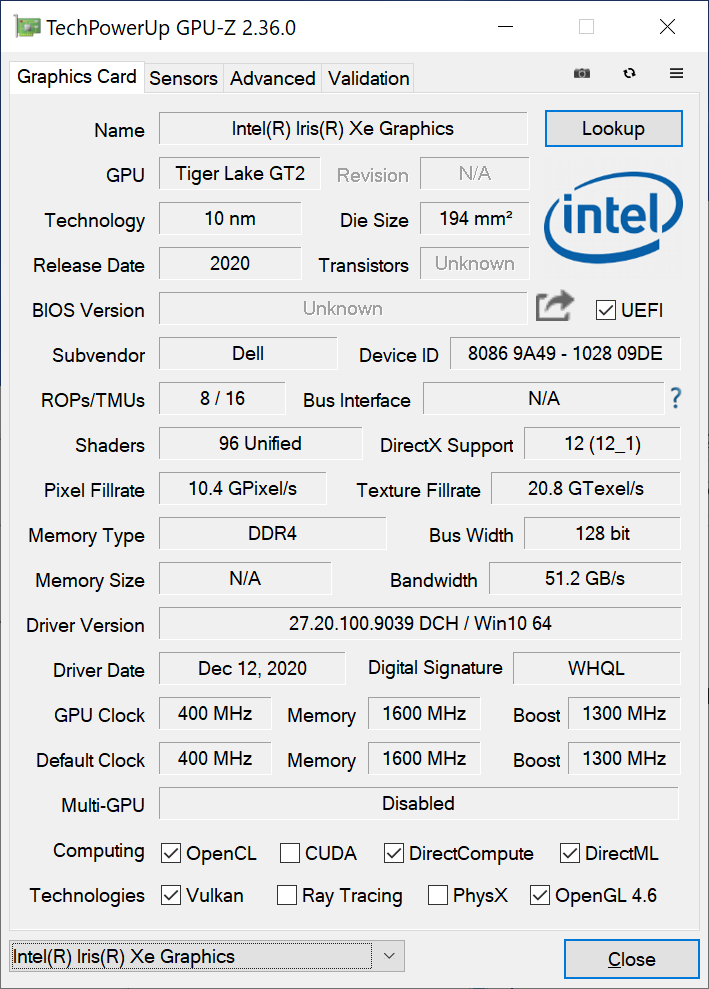
Raw graphics performance is about 10 to 15 percent faster than the Iris Xe 96 EUs or 60 to 70 percent faster than the GeForce MX330 according to 3DMark benchmarks. Intel says the GPU isn't designed for gaming and the benchmarks prove this with frame rates that can be up to 50 percent slower than the GeForce MX350 in popular titles like GTA V or DOTA 2. Even in games where Intel comes out ahead, the unsteady frame rates and lack of adaptive sync impact the overall experience. The Iris Xe Max feels more like an overclocked integrated Iris Xe rather than a proper discrete GPU at least from a gaming perspective.

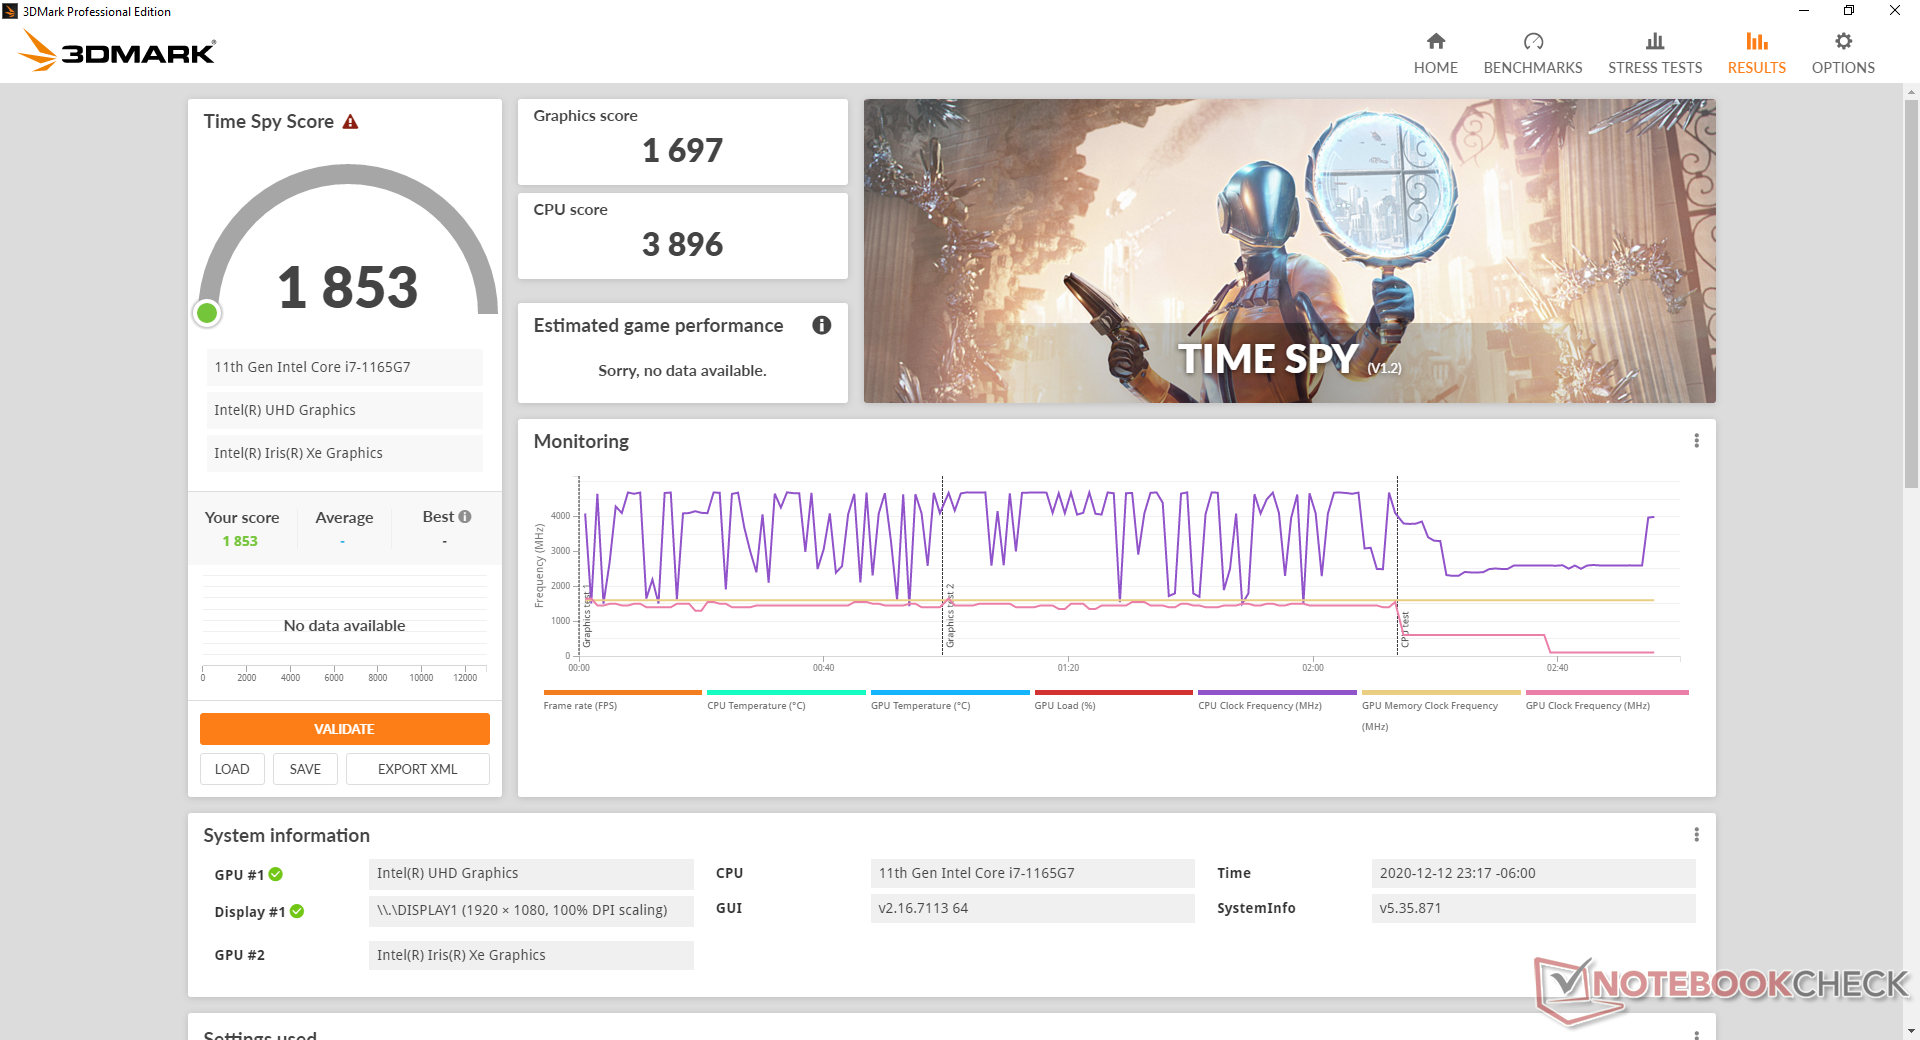
| 3DMark 06 Standard Score | 22466 points | |
| 3DMark 11 Performance | 7720 points | |
| 3DMark Cloud Gate Standard Score | 19254 points | |
| 3DMark Fire Strike Score | 5412 points | |
| 3DMark Time Spy Score | 1853 points | |
Help | ||
| low | med. | high | ultra | QHD | 4K | |
|---|---|---|---|---|---|---|
| GTA V (2015) | 65.9 | 60.7 | 24 | |||
| The Witcher 3 (2015) | 54.2 | 53.7 | 33.8 | 17.7 | 11.2 | |
| Dota 2 Reborn (2015) | 59.1 | 40.3 | 38.3 | 38.4 | 20.1 | |
| Final Fantasy XV Benchmark (2018) | 46.1 | 24.2 | 17 | |||
| X-Plane 11.11 (2018) | 33.4 | 34.4 | 29.7 | |||
| Strange Brigade (2018) | 87.4 | 39.1 | 33 | 28.5 | 20.1 | 11 |
Emissions
System Noise
Like the Silver Edition, the fan in the Black Edition is almost always silent or quiet during low loads like browsing or video streaming. Fan noise would typically top out at just 30.3 dB(A) or 32.8 dB(A) against a silent background of 27.3 dB(A) when under such scenarios.
If running higher loads, the Black Edition will become noisier faster than the Silver Edition. Running the first 90-second benchmark scene in 3DMark 06, for example, would induce a fan noise of 47.4 dB(A) whereas the Silver Edition would remain silent. Maximum fan noise is otherwise the same between the two laptops; it just takes a bit longer for the Silver Edition to reach that point.
| Dell Inspiron 15 7000 7506 2-in-1 Black Edition Xe MAX, i7-1165G7, Micron 2300 1TB MTFDHBA1T0TDV | Samsung Galaxy Book Flex 15-NP950 GeForce MX250, i7-1065G7, Samsung SSD PM981a MZVLB512HBJQ | HP Envy x360 15-ee0257ng Vega 6, R5 4500U, Intel SSD 660p SSDPEKNW512G8 | Microsoft Surface Book 3 15 GeForce GTX 1660 Ti Max-Q, i7-1065G7, SK hynix BC501 HFM256GDGTNG | Asus ZenBook Flip 15 UX563FD-A1027T GeForce GTX 1050 Max-Q, i7-10510U, Samsung SSD PM981 MZVLB1T0HALR | Lenovo Yoga C740-15IML UHD Graphics 620, i7-10510U, Samsung SSD PM981 MZVLB512HAJQ | Dell Inspiron 15 7506 2-in-1 P97F Iris Xe G7 80EUs, i5-1135G7, Toshiba KBG40ZNS256G NVMe | |
|---|---|---|---|---|---|---|---|
| Noise | 13% | 4% | 3% | 3% | 6% | 9% | |
| off / environment * (dB) | 27.3 | 24.9 9% | 27 1% | 30.2 -11% | 30.3 -11% | 29.3 -7% | 27.1 1% |
| Idle Minimum * (dB) | 27.3 | 24.9 9% | 27 1% | 30.2 -11% | 30.3 -11% | 29.3 -7% | 27.1 1% |
| Idle Average * (dB) | 27.3 | 24.9 9% | 27 1% | 30.2 -11% | 30.3 -11% | 29.3 -7% | 27.1 1% |
| Idle Maximum * (dB) | 27.3 | 24.9 9% | 27 1% | 30.2 -11% | 30.3 -11% | 29.6 -8% | 27.1 1% |
| Load Average * (dB) | 47.4 | 38.4 19% | 43.2 9% | 30.9 35% | 33.7 29% | 32.4 32% | 31.5 34% |
| Witcher 3 ultra * (dB) | 47.4 | 38.4 19% | 45.1 5% | 37.4 21% | 37.4 21% | ||
| Load Maximum * (dB) | 47.5 | 38.5 19% | 43.2 9% | 34.3 28% | 38.9 18% | 33.3 30% | 47.2 1% |
* ... smaller is better
Noise level
| Idle |
| 27.3 / 27.3 / 27.3 dB(A) |
| Load |
| 47.4 / 47.5 dB(A) |
 | ||
30 dB silent 40 dB(A) audible 50 dB(A) loud |
||
min: | ||
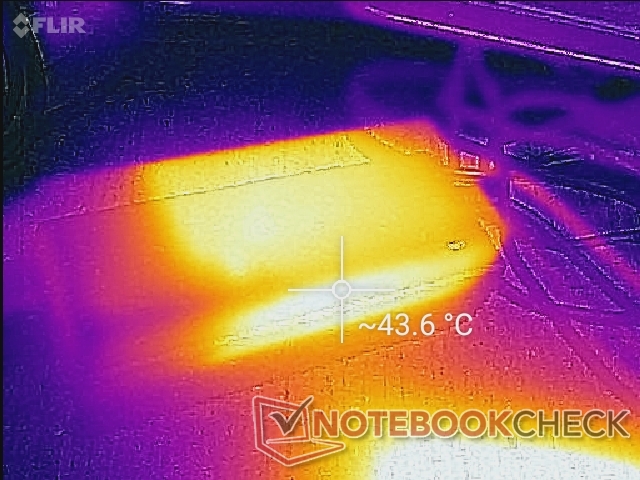
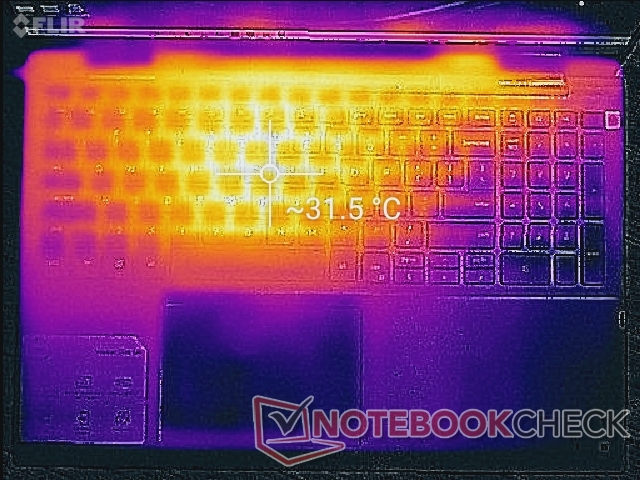
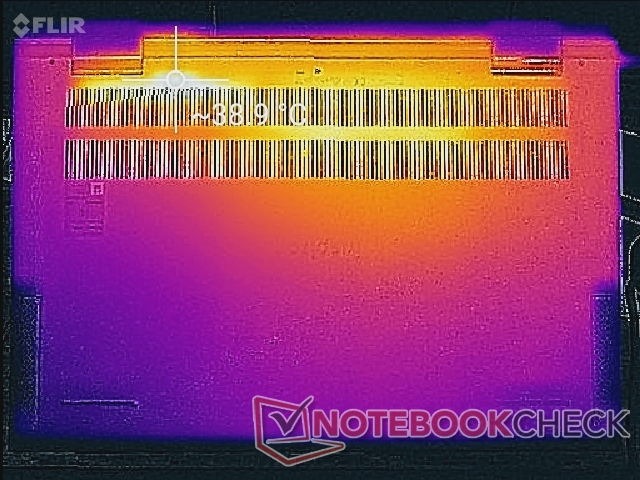
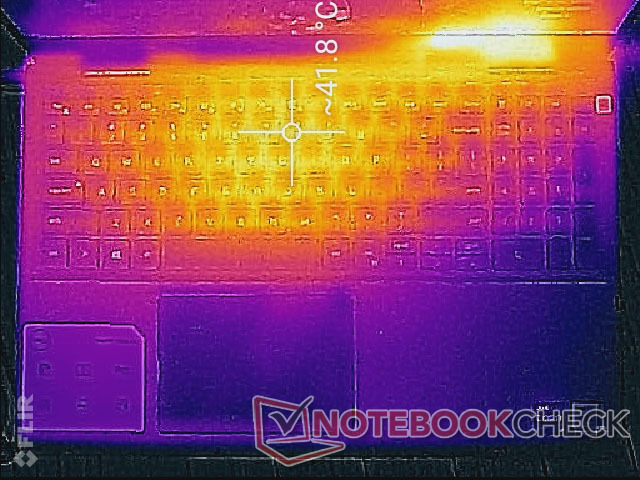
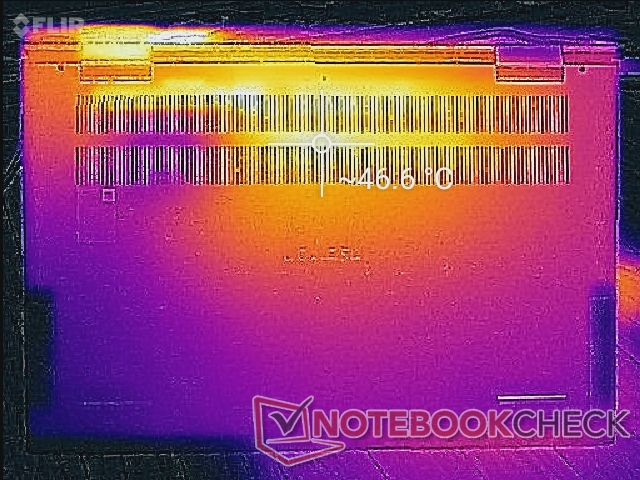
Temperature
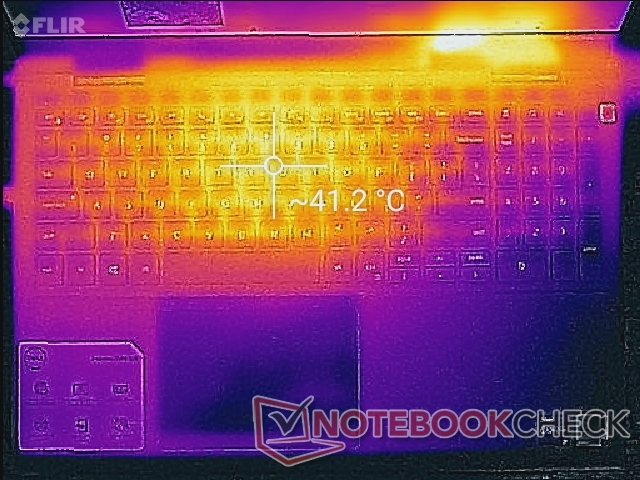
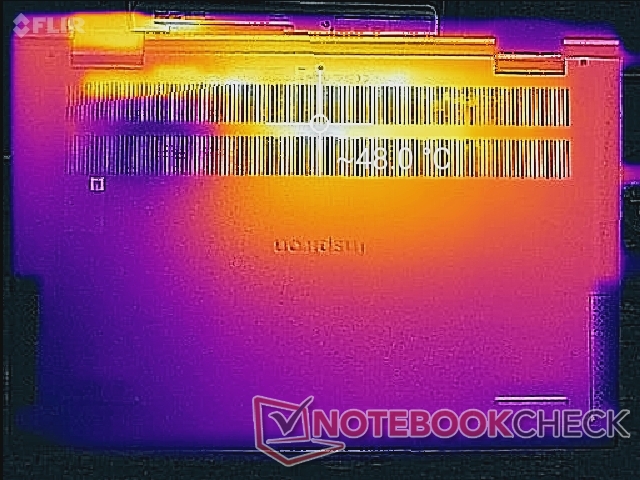
Surface temperatures when under load can be warmer than on the Inspiron 15 7506 2-in-1 Silver Edition. The keyboard hot spot, for example, reaches almost 42 C when running Prime95 and FurMark compared to only 35 C on the regular Inspiron 15 7506 2-in-1. The presence of a discrete GPU is definitely part of the equation.
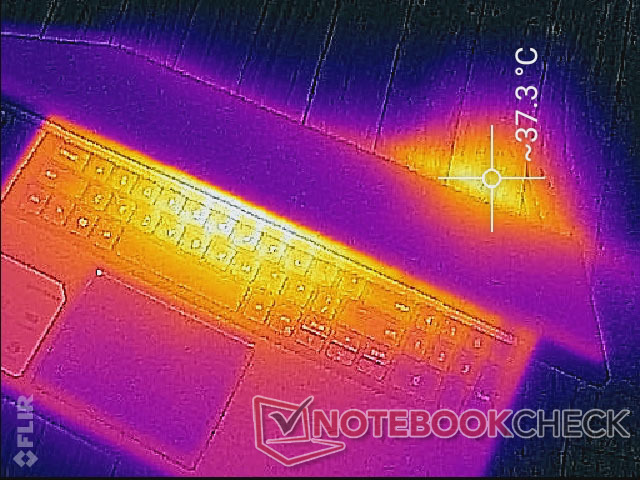
(±) The maximum temperature on the upper side is 43 °C / 109 F, compared to the average of 36.8 °C / 98 F, ranging from 21 to 71 °C for the class Multimedia.
(-) The bottom heats up to a maximum of 48.8 °C / 120 F, compared to the average of 39.1 °C / 102 F
(+) In idle usage, the average temperature for the upper side is 25.6 °C / 78 F, compared to the device average of 31.3 °C / 88 F.
(±) Playing The Witcher 3, the average temperature for the upper side is 32.4 °C / 90 F, compared to the device average of 31.3 °C / 88 F.
(+) The palmrests and touchpad are cooler than skin temperature with a maximum of 29.2 °C / 84.6 F and are therefore cool to the touch.
(±) The average temperature of the palmrest area of similar devices was 28.7 °C / 83.7 F (-0.5 °C / -0.9 F).
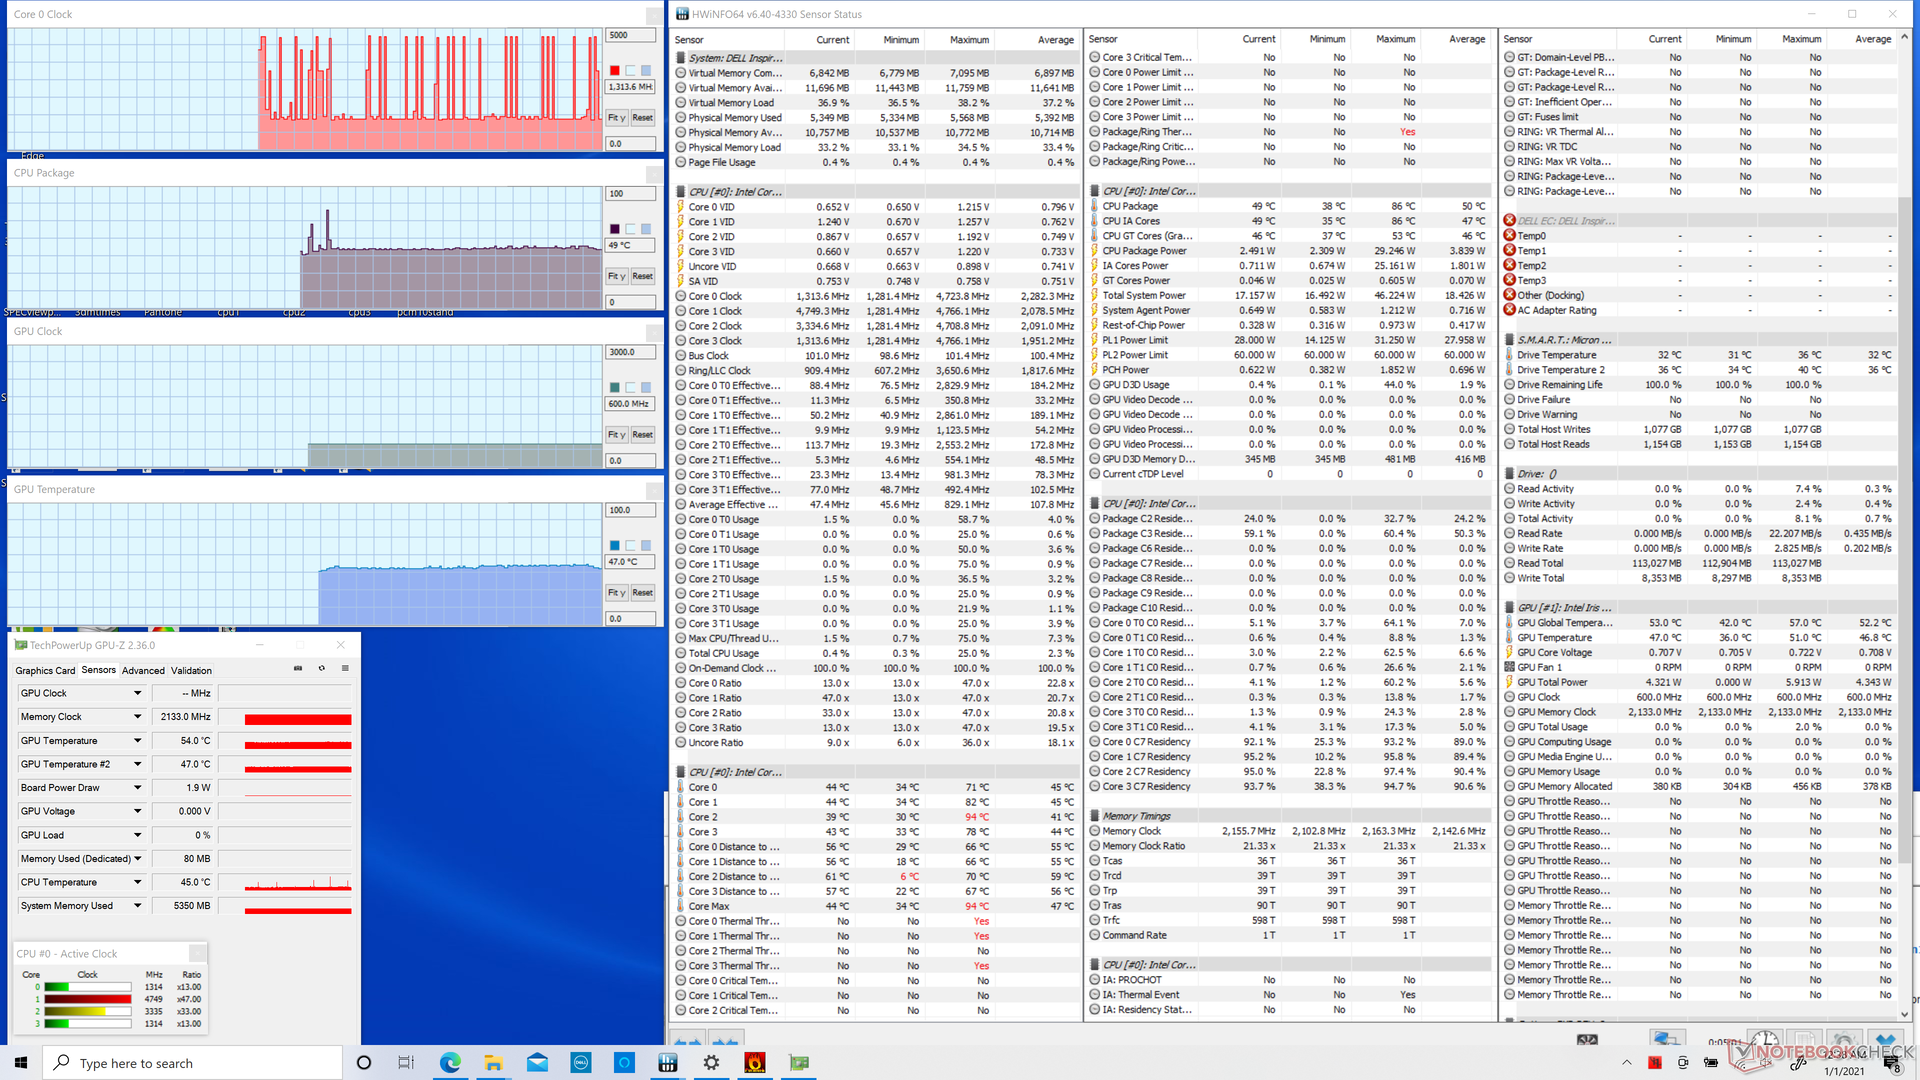
Stress Test
When running Prime95, CPU clock rates would boost to 3.4 GHz for the first few seconds and at a core temperature of 100 C. However, this falls very quickly to the 2.5 to 3.0 GHz range for a slightly cooler core temperature of 93 C to 96 C. These sustained clock rates are even lower than what we recorded on the Silver Edition which stabilizes at about 3.0 to 3.2 GHz instead when subjected to similar conditions.
Running on battery power will limit CPU performance. A 3DMark 11 run on batteries would return Physics and Graphics scores of 6483 and 7784 points, respectively, compared to 9885 and 7804 points when on mains.
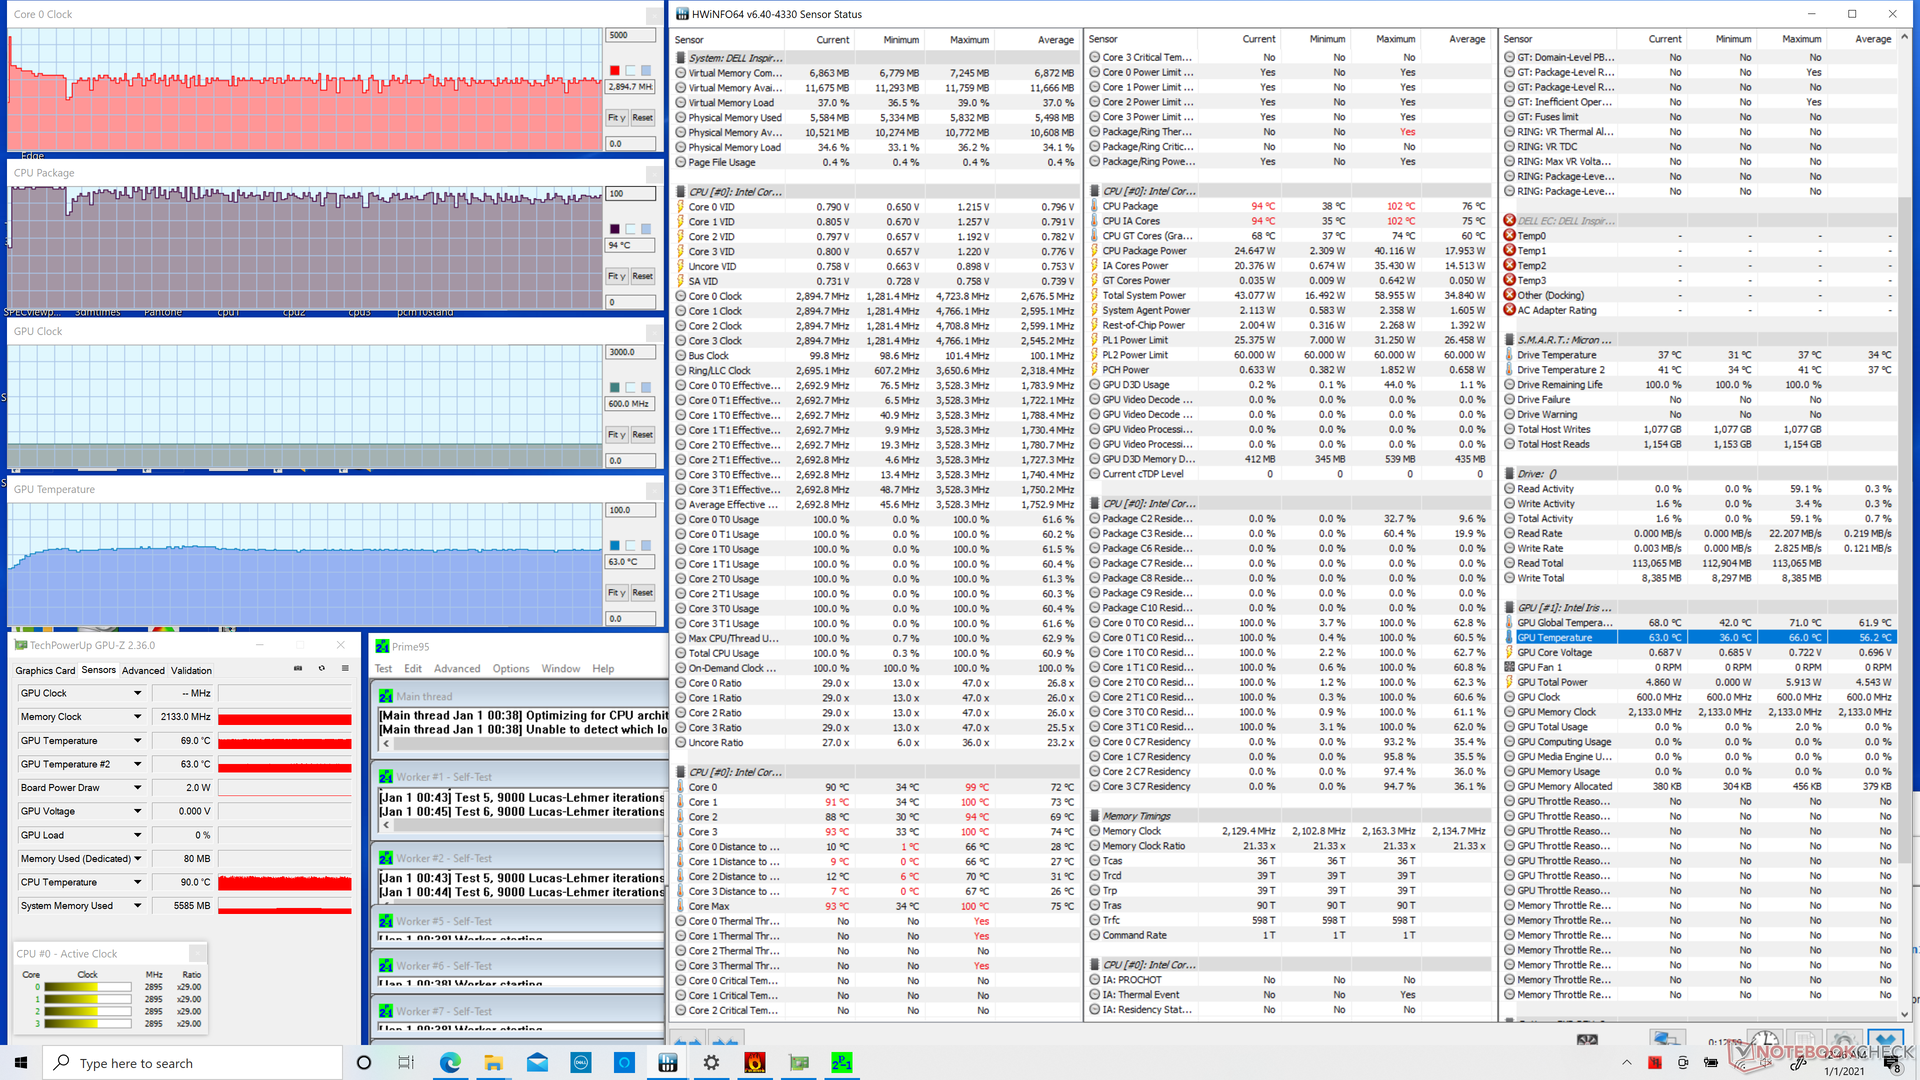
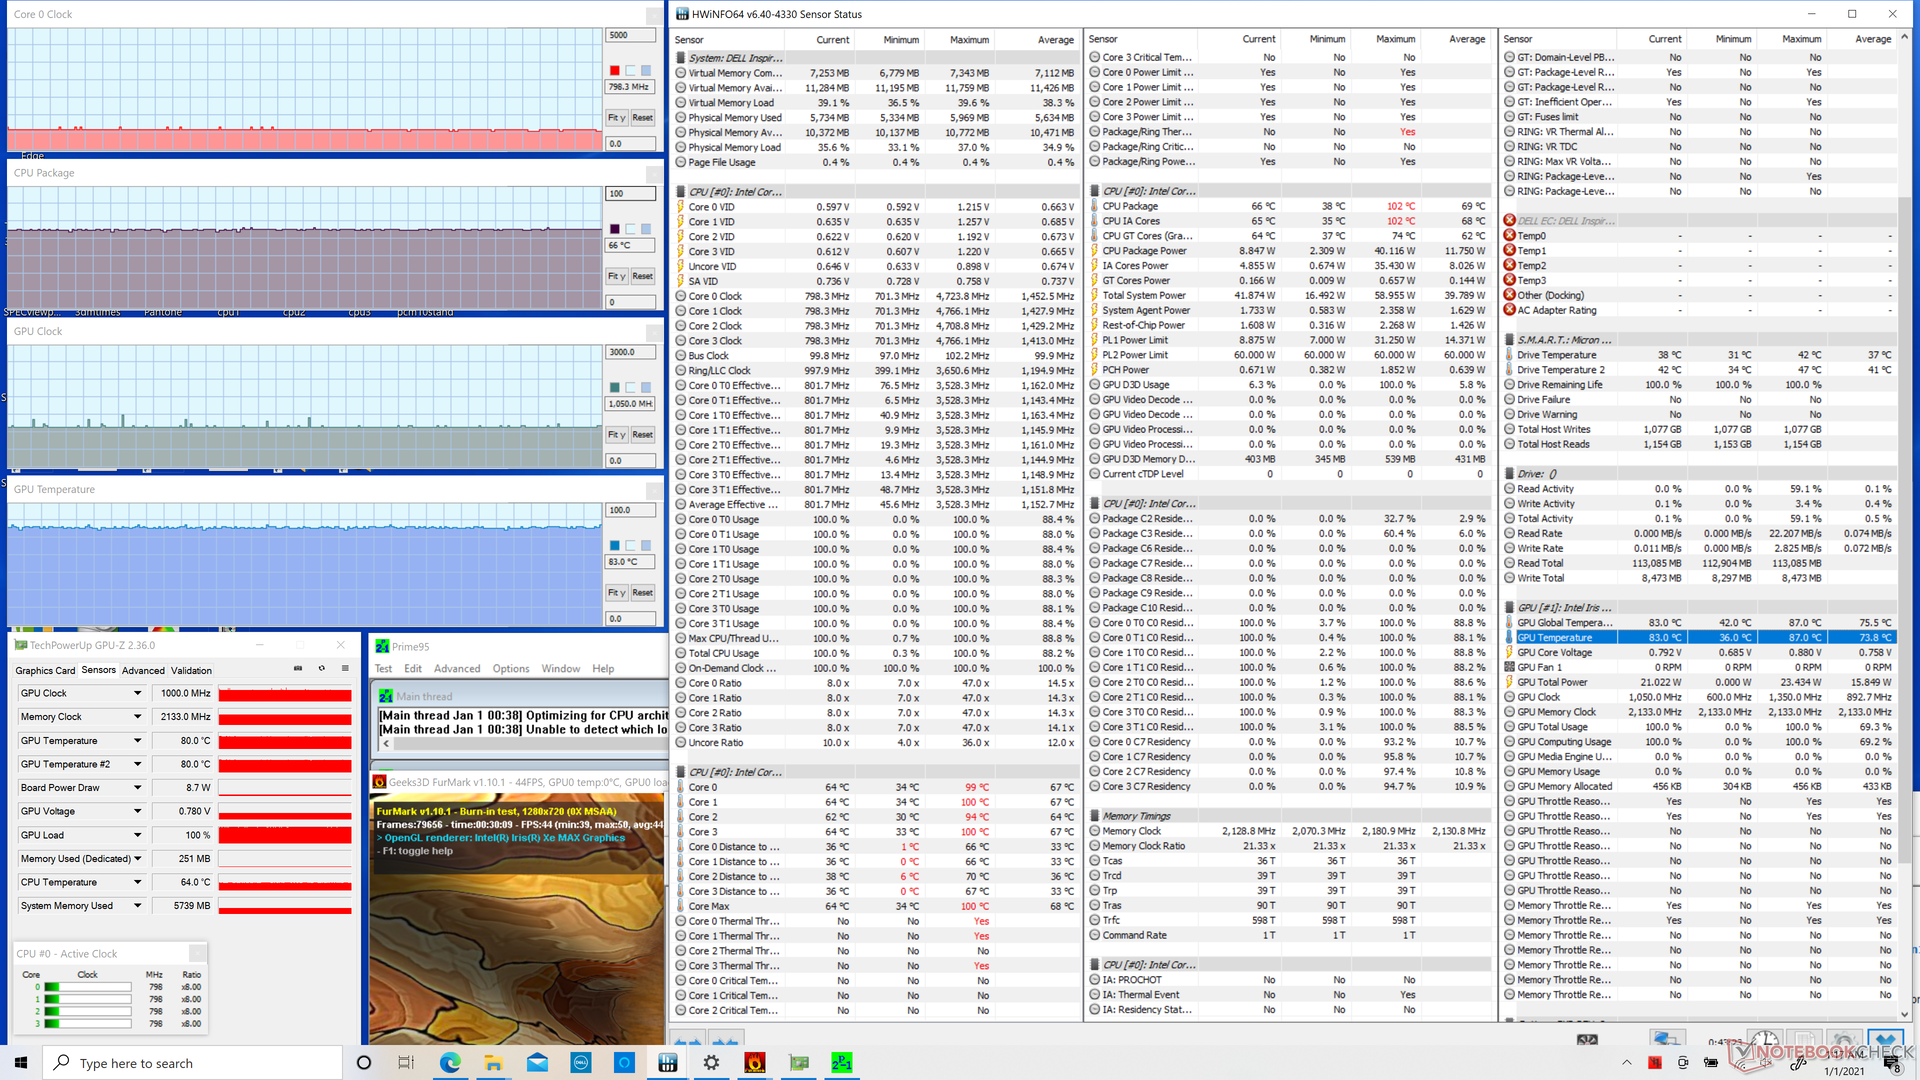
| CPU Clock (GHz) | GPU Clock (MHz) | Average CPU Temperature (°C) | Average GPU Temperature (°C) | |
| System Idle | -- | -- | 49 | 47 |
| Prime95 Stress | 2.5 - 3.0 | -- | 94 | 63 |
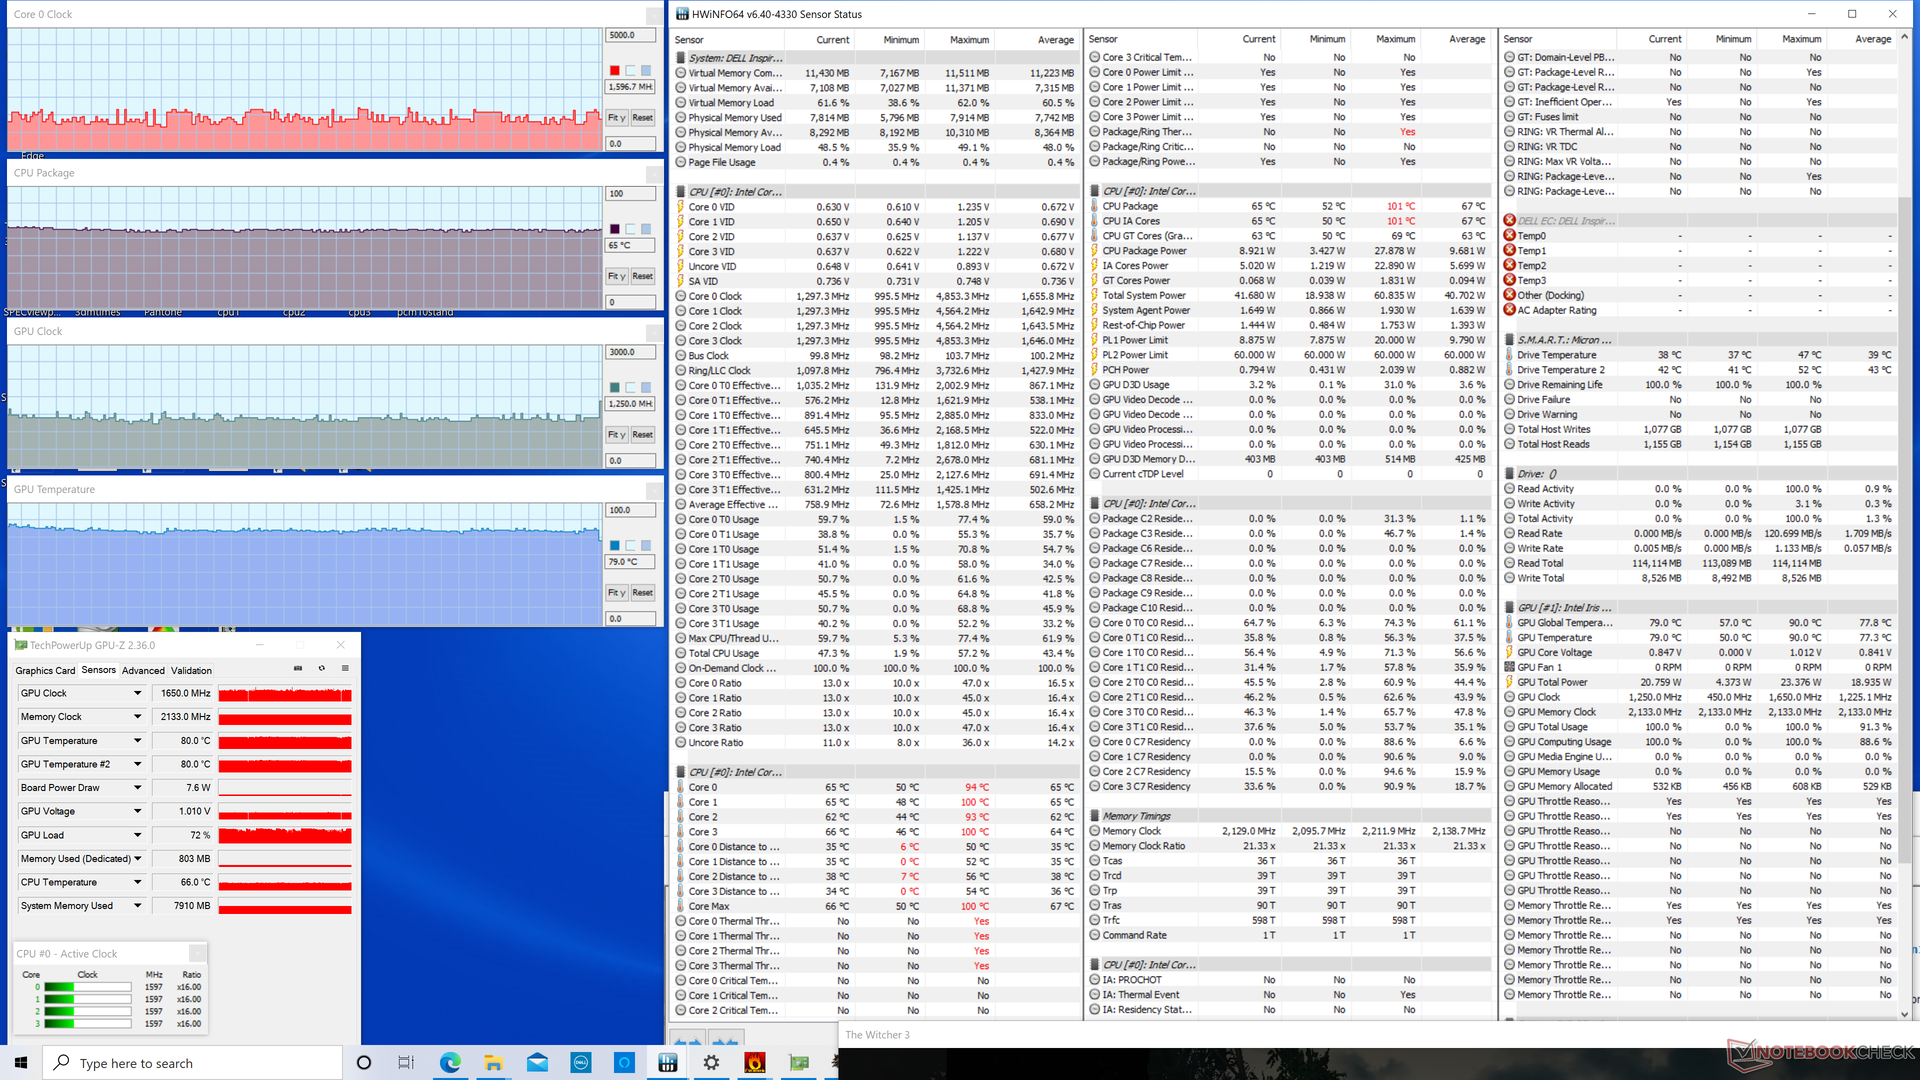
| Prime95 + FurMark Stress | 0.8 - 0.9 | 1050 | 66 | 83 |
| Witcher 3 Stress | ~1.6 | 1250 | 65 | 79 |
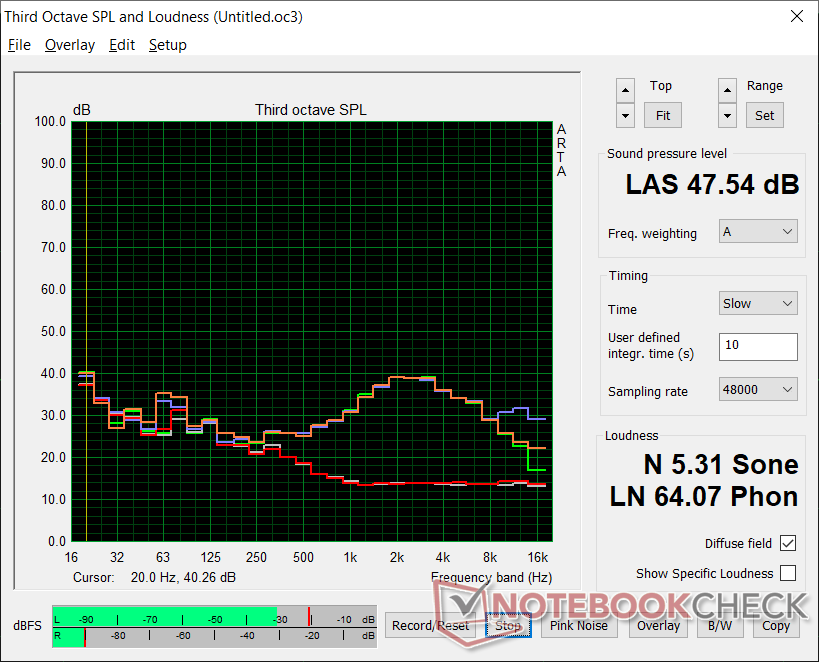
Speakers


Dell Inspiron 15 7000 7506 2-in-1 Black Edition audio analysis
(±) | speaker loudness is average but good (81.6 dB)
Bass 100 - 315 Hz
(-) | nearly no bass - on average 22.7% lower than median
(±) | linearity of bass is average (11% delta to prev. frequency)
Mids 400 - 2000 Hz
(±) | higher mids - on average 8.4% higher than median
(±) | linearity of mids is average (8.6% delta to prev. frequency)
Highs 2 - 16 kHz
(+) | balanced highs - only 3.4% away from median
(+) | highs are linear (6.2% delta to prev. frequency)
Overall 100 - 16.000 Hz
(±) | linearity of overall sound is average (21.2% difference to median)
Compared to same class
» 73% of all tested devices in this class were better, 7% similar, 20% worse
» The best had a delta of 5%, average was 17%, worst was 45%
Compared to all devices tested
» 59% of all tested devices were better, 7% similar, 34% worse
» The best had a delta of 4%, average was 23%, worst was 134%
Apple MacBook 12 (Early 2016) 1.1 GHz audio analysis
(+) | speakers can play relatively loud (83.6 dB)
Bass 100 - 315 Hz
(±) | reduced bass - on average 11.3% lower than median
(±) | linearity of bass is average (14.2% delta to prev. frequency)
Mids 400 - 2000 Hz
(+) | balanced mids - only 2.4% away from median
(+) | mids are linear (5.5% delta to prev. frequency)
Highs 2 - 16 kHz
(+) | balanced highs - only 2% away from median
(+) | highs are linear (4.5% delta to prev. frequency)
Overall 100 - 16.000 Hz
(+) | overall sound is linear (10.2% difference to median)
Compared to same class
» 7% of all tested devices in this class were better, 2% similar, 90% worse
» The best had a delta of 5%, average was 18%, worst was 53%
Compared to all devices tested
» 5% of all tested devices were better, 1% similar, 94% worse
» The best had a delta of 4%, average was 23%, worst was 134%
Energy Management
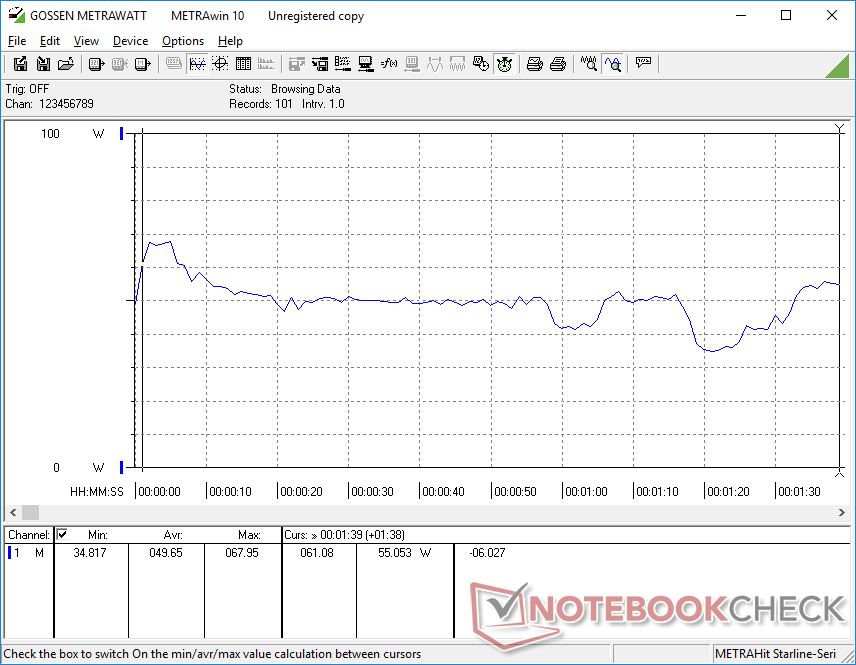
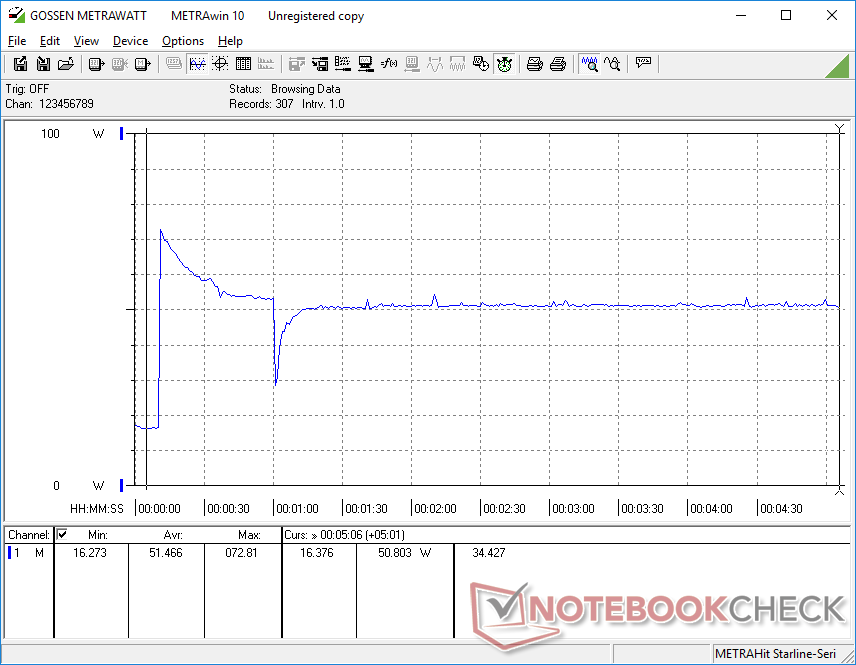
Power Consumption
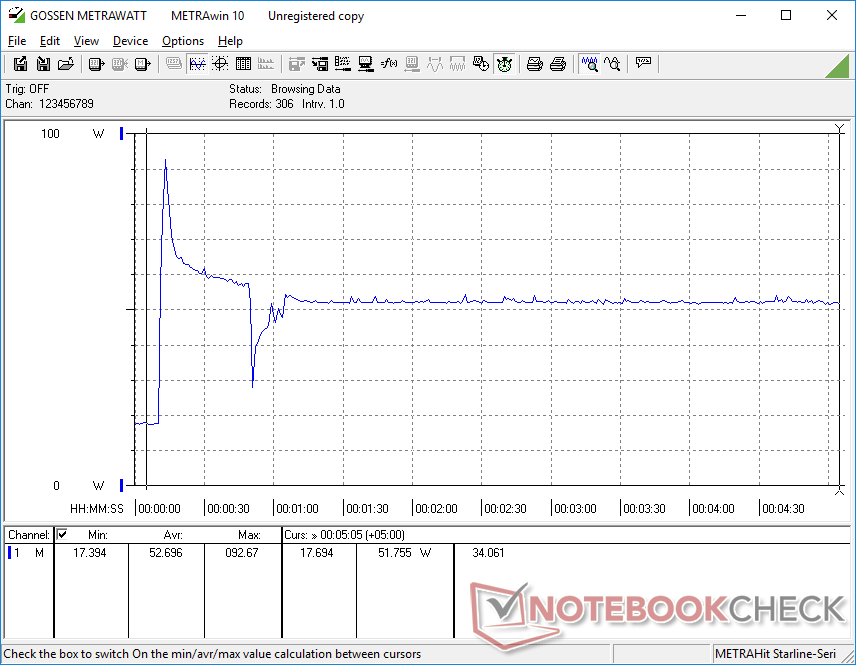
Unsurprisingly, the Black Edition will be more demanding than the base Silver Edition option with no discrete GPU. Simply idling on desktop can draw up to 16 W on the Black Edition compared to just 9 W on the lesser Silver Edition. Running higher loads like 3DMark 06 or games can result in up to 70 percent higher power consumption than the Silver Edition. Of course, Black Edition owners get to enjoy 60 to 90 percent faster raw graphics performance than owners of the base Silver Edition model.
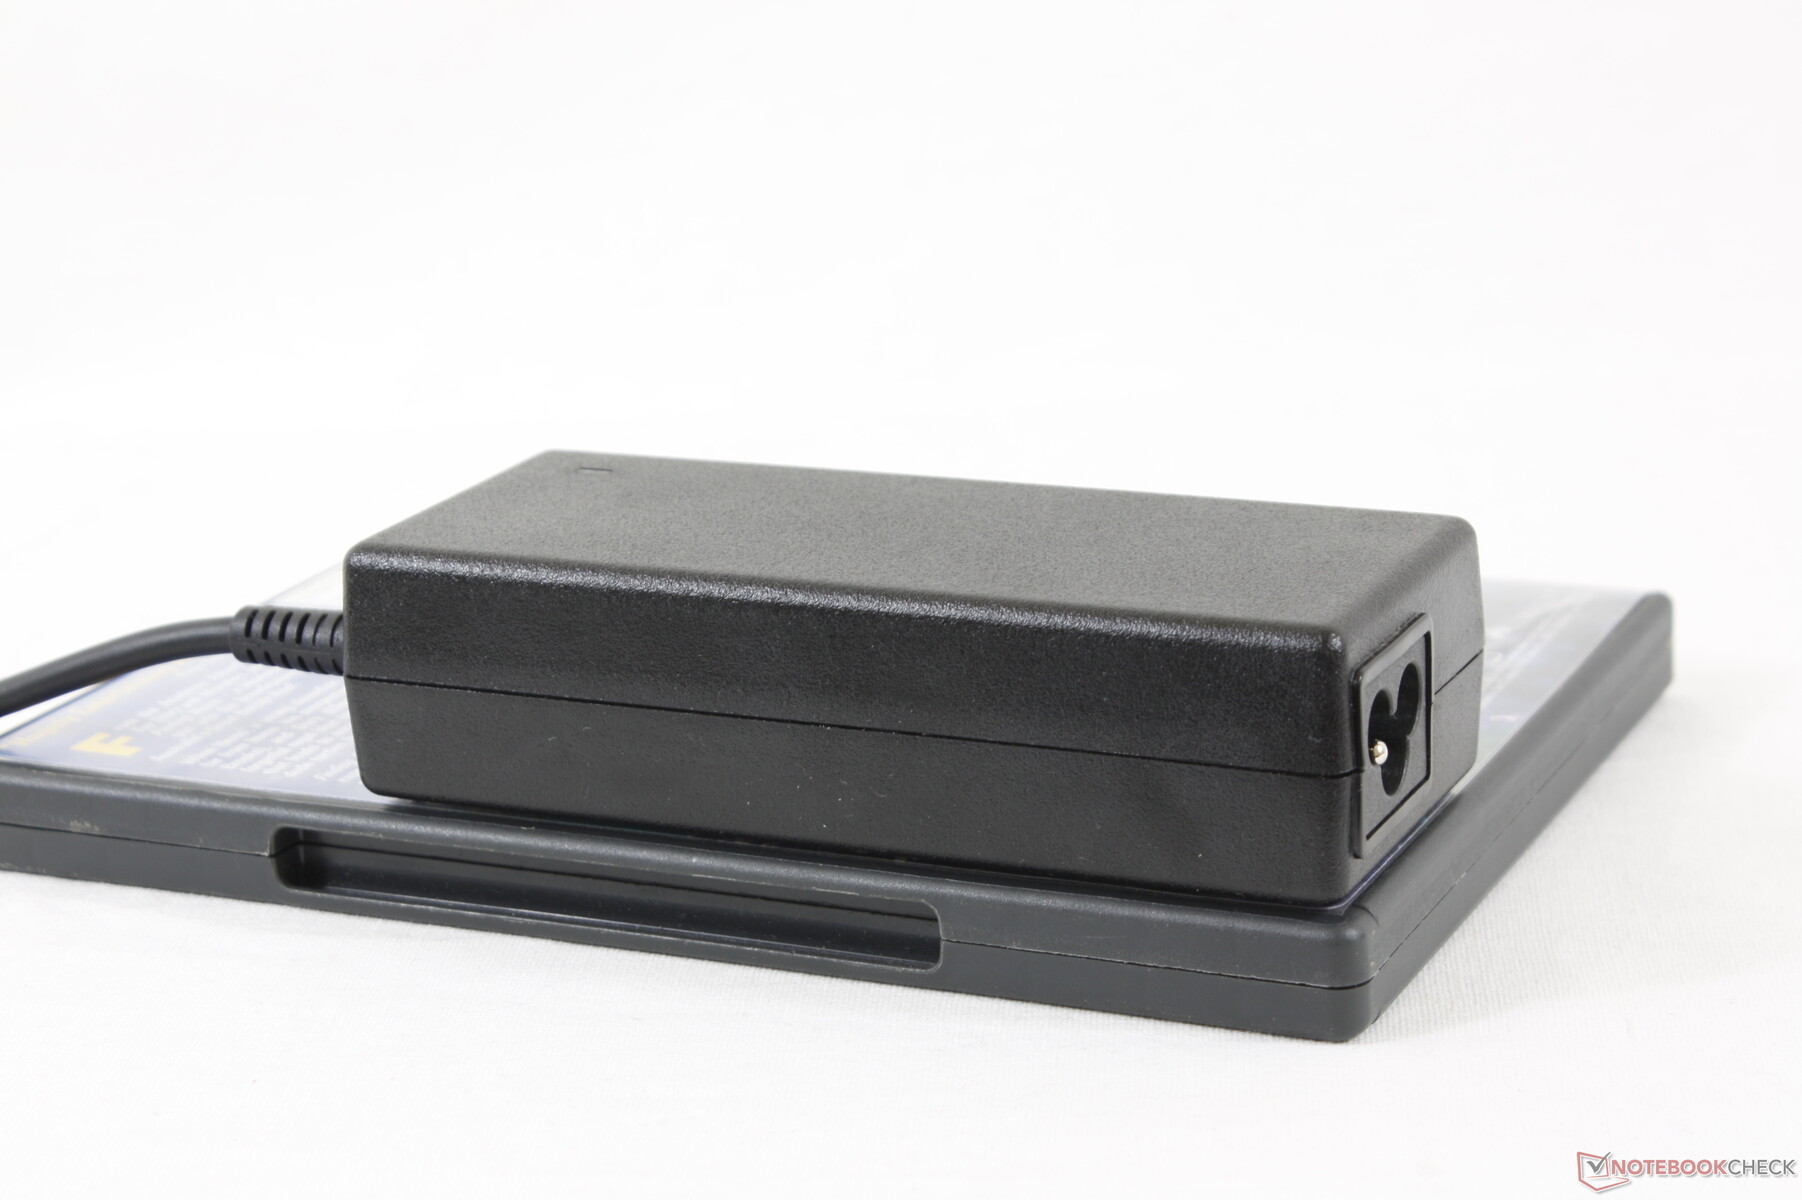
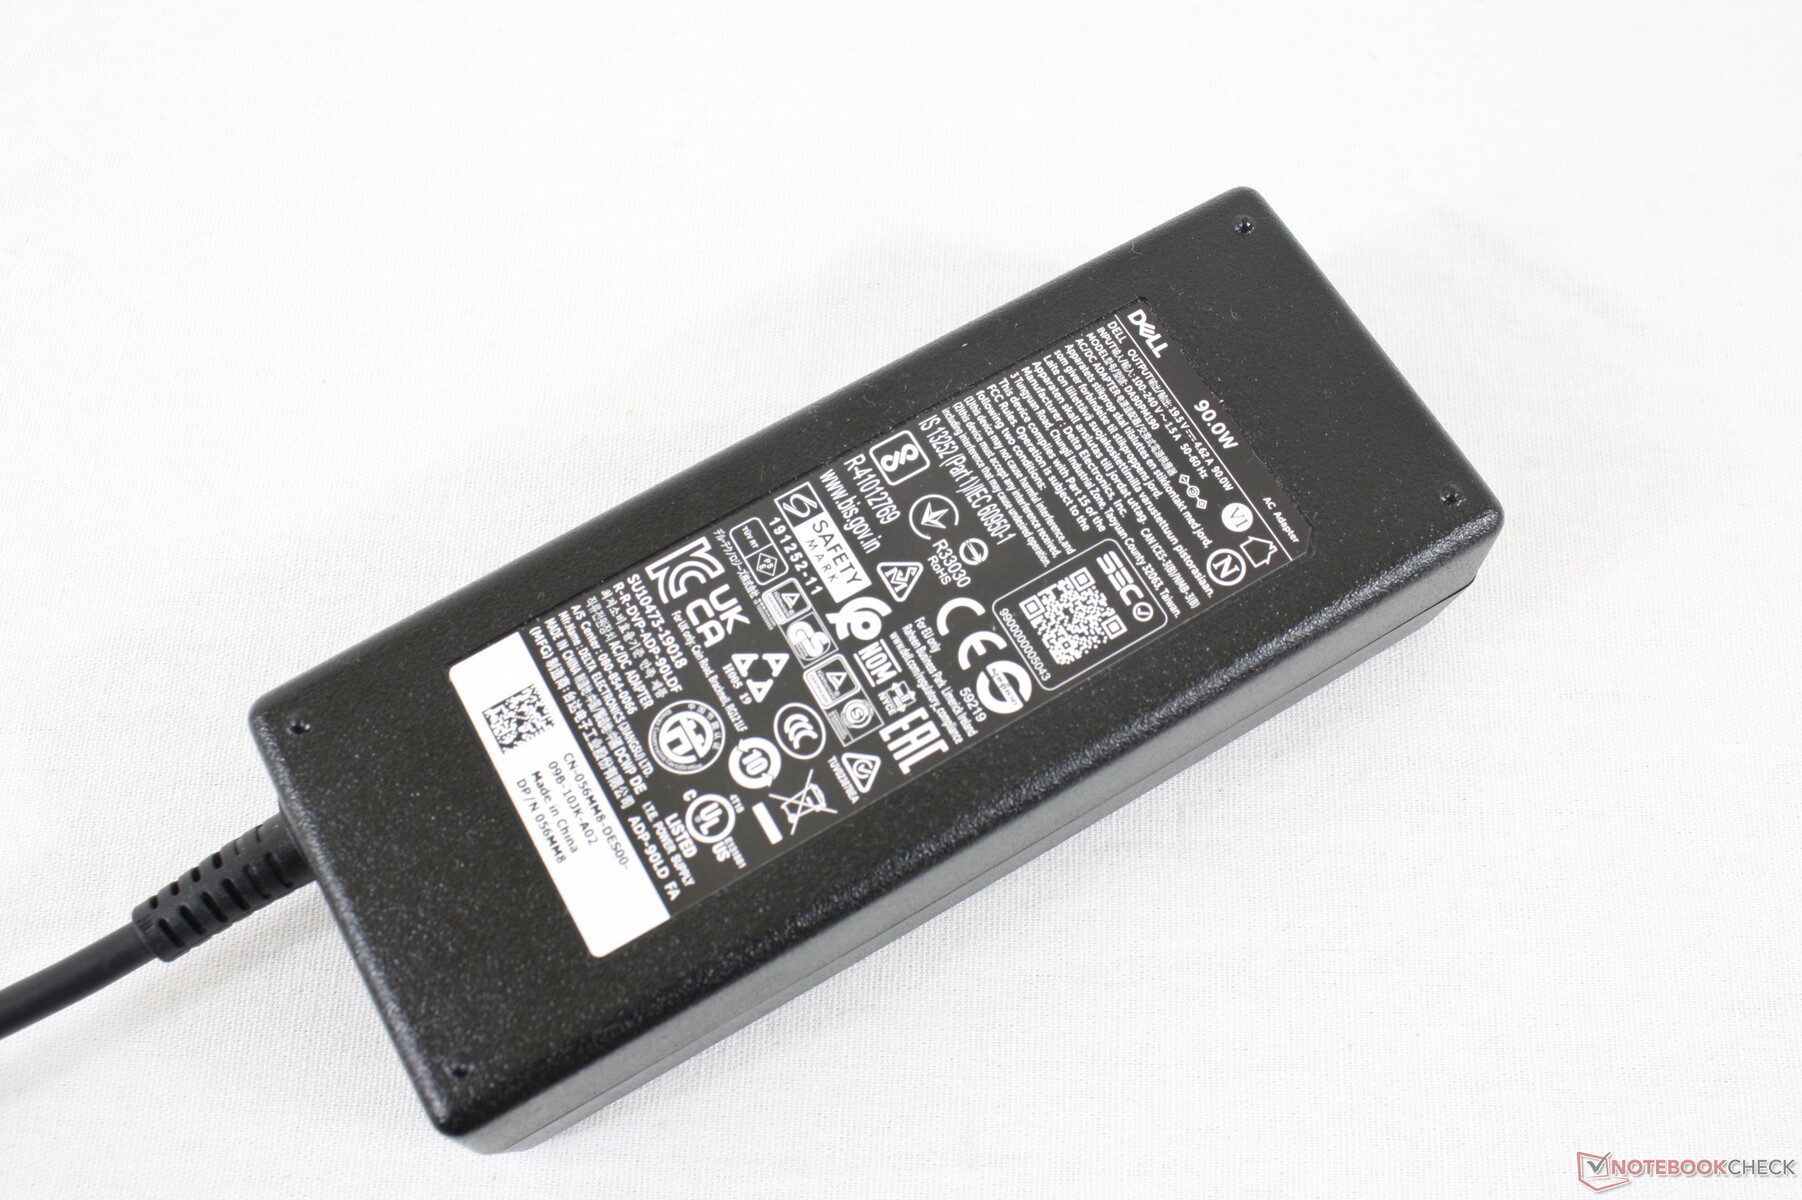
The Black Edition comes with a slightly larger (~12.5 x 5 x 3.2 cm) 90 W AC adapter compared to the 65 W adapter for the Silver Edition. We're able to measure a maximum draw of 92.7 W when running extreme loads, but this rate is only temporary as shown by the graphs below due to thermal limitations. The behavior mirrors our clock rate observations mentioned above in our Stress Test section.

| Off / Standby | |
| Idle | |
| Load |
|
Key:
min: | |
| Dell Inspiron 15 7000 7506 2-in-1 Black Edition i7-1165G7, Xe MAX, Micron 2300 1TB MTFDHBA1T0TDV, IPS, 3840x2160, 15.6" | Samsung Galaxy Book Flex 15-NP950 i7-1065G7, GeForce MX250, Samsung SSD PM981a MZVLB512HBJQ, IPS, QLED, 1920x1080, 15.6" | HP Envy x360 15-ee0257ng R5 4500U, Vega 6, Intel SSD 660p SSDPEKNW512G8, IPS, 1920x1080, 15.6" | Microsoft Surface Book 3 15 i7-1065G7, GeForce GTX 1660 Ti Max-Q, SK hynix BC501 HFM256GDGTNG, IPS, 3240x2160, 15" | Asus ZenBook Flip 15 UX563FD-A1027T i7-10510U, GeForce GTX 1050 Max-Q, Samsung SSD PM981 MZVLB1T0HALR, IPS, 3840x2160, 15.6" | Lenovo Yoga C740-15IML i7-10510U, UHD Graphics 620, Samsung SSD PM981 MZVLB512HAJQ, IPS LED, 1920x1080, 15.6" | Dell Inspiron 15 7506 2-in-1 P97F i5-1135G7, Iris Xe G7 80EUs, Toshiba KBG40ZNS256G NVMe, IPS, 1920x1080, 15.6" | |
|---|---|---|---|---|---|---|---|
| Power Consumption | 16% | 25% | -11% | -1% | 33% | 31% | |
| Idle Minimum * (Watt) | 4 | 4.2 -5% | 3.9 2% | 4.2 -5% | 2.3 43% | 2.97 26% | 3.9 2% |
| Idle Average * (Watt) | 15.5 | 8.7 44% | 7 55% | 7.4 52% | 10.3 34% | 7.2 54% | 6.9 55% |
| Idle Maximum * (Watt) | 16.2 | 11.3 30% | 10.5 35% | 9 44% | 11 32% | 9.9 39% | 8.5 48% |
| Load Average * (Watt) | 49.7 | 58 -17% | 48 3% | 78 -57% | 77 -55% | 40.8 18% | 30.5 39% |
| Witcher 3 ultra * (Watt) | 52.2 | 44.6 15% | 94.2 -80% | 68 -30% | 42.6 18% | ||
| Load Maximum * (Watt) | 92.7 | 67 28% | 65 30% | 108 -17% | 118 -27% | 64.7 30% | 69.7 25% |
* ... smaller is better
Battery Life
Battery capacity is almost 30 percent larger than on the regular Inspiron 15 7506 2-in-1. When subjected to the same WLAN conditions, our Black Edition unit would last about an hour longer at almost 10 hours.
Charging from empty to full capacity takes just under 2 hours. The system can also recharge via USB-C.
| Dell Inspiron 15 7000 7506 2-in-1 Black Edition i7-1165G7, Xe MAX, 68 Wh | Samsung Galaxy Book Flex 15-NP950 i7-1065G7, GeForce MX250, 69.7 Wh | HP Envy x360 15-ee0257ng R5 4500U, Vega 6, 51 Wh | Microsoft Surface Book 3 15 i7-1065G7, GeForce GTX 1660 Ti Max-Q, 82 Wh | Asus ZenBook Flip 15 UX563FD-A1027T i7-10510U, GeForce GTX 1050 Max-Q, 71 Wh | Lenovo Yoga C740-15IML i7-10510U, UHD Graphics 620, 60.3 Wh | Dell Inspiron 15 7506 2-in-1 P97F i5-1135G7, Iris Xe G7 80EUs, 53 Wh | |
|---|---|---|---|---|---|---|---|
| Battery runtime | 21% | -3% | 14% | 10% | 16% | -19% | |
| Reader / Idle (h) | 25 | 16.2 -35% | 19.5 -22% | 18.8 -25% | |||
| WiFi v1.3 (h) | 9.7 | 11.7 21% | 9.4 -3% | 8.5 -12% | 9.4 -3% | 10.4 7% | 8.3 -14% |
| Load (h) | 1.6 | 3 88% | 2.5 56% | 2 25% | 1.3 -19% |
Pros
Cons
Verdict
The Inspiron 7506 2-in-1 Black Edition currently starts at $1500 USD compared to $700 or $800 for the Silver Edition. When even the Core i5 CPU in the Silver Edition can outperform our Core i7 Black Edition, however, the performance-per-dollar for this particular configuration just isn't the best to say the least. At that price point, Dell's own XPS 15 is arguably a more solid buy especially for graphics editors or content creators who can make use of the extra horsepower and better colors.
The Inspiron Black Edition targets a very niche audience who wants both a touchscreen convertible and the discrete Iris Xe Max GPU. Users who don't fall in that category might be better off spending their 1.5K on the Dell XPS 15 instead.
Users considering the Black Edition will likely want it mostly for the Iris Xe Max GPU. If so, keep in mind that its usage scenarios are much narrower when compared to the GeForce series. If you do even a bit of gaming, then the GeForce MX series is still recommended for its superior drivers, stability and compatibility. If you do a ton of encoding or Adobe Lightroom work, then the specialized Xe Max would be the better bet. Until prices start coming down, however, the Inspiron Black Edition is going to be a hard sell when compared to its Silver Edition counterpart or the XPS 15 series.
Price and availability
The Dell Inspiron 7506 2-in-1 Black Edition is now shipping at Best Buy for $1400 USD with similar specifications as our reviewed unit.
Amazon has a configuration as well, but the reseller is pricing it at almost $2000 USD.
Dell Inspiron 15 7000 7506 2-in-1 Black Edition
- 01/04/2021 v7 (old)
Allen Ngo
Price comparison
