Core i7-1165G7 vs. Core i7-1185G7: Dell XPS 13 9310 4K Laptop Review
")
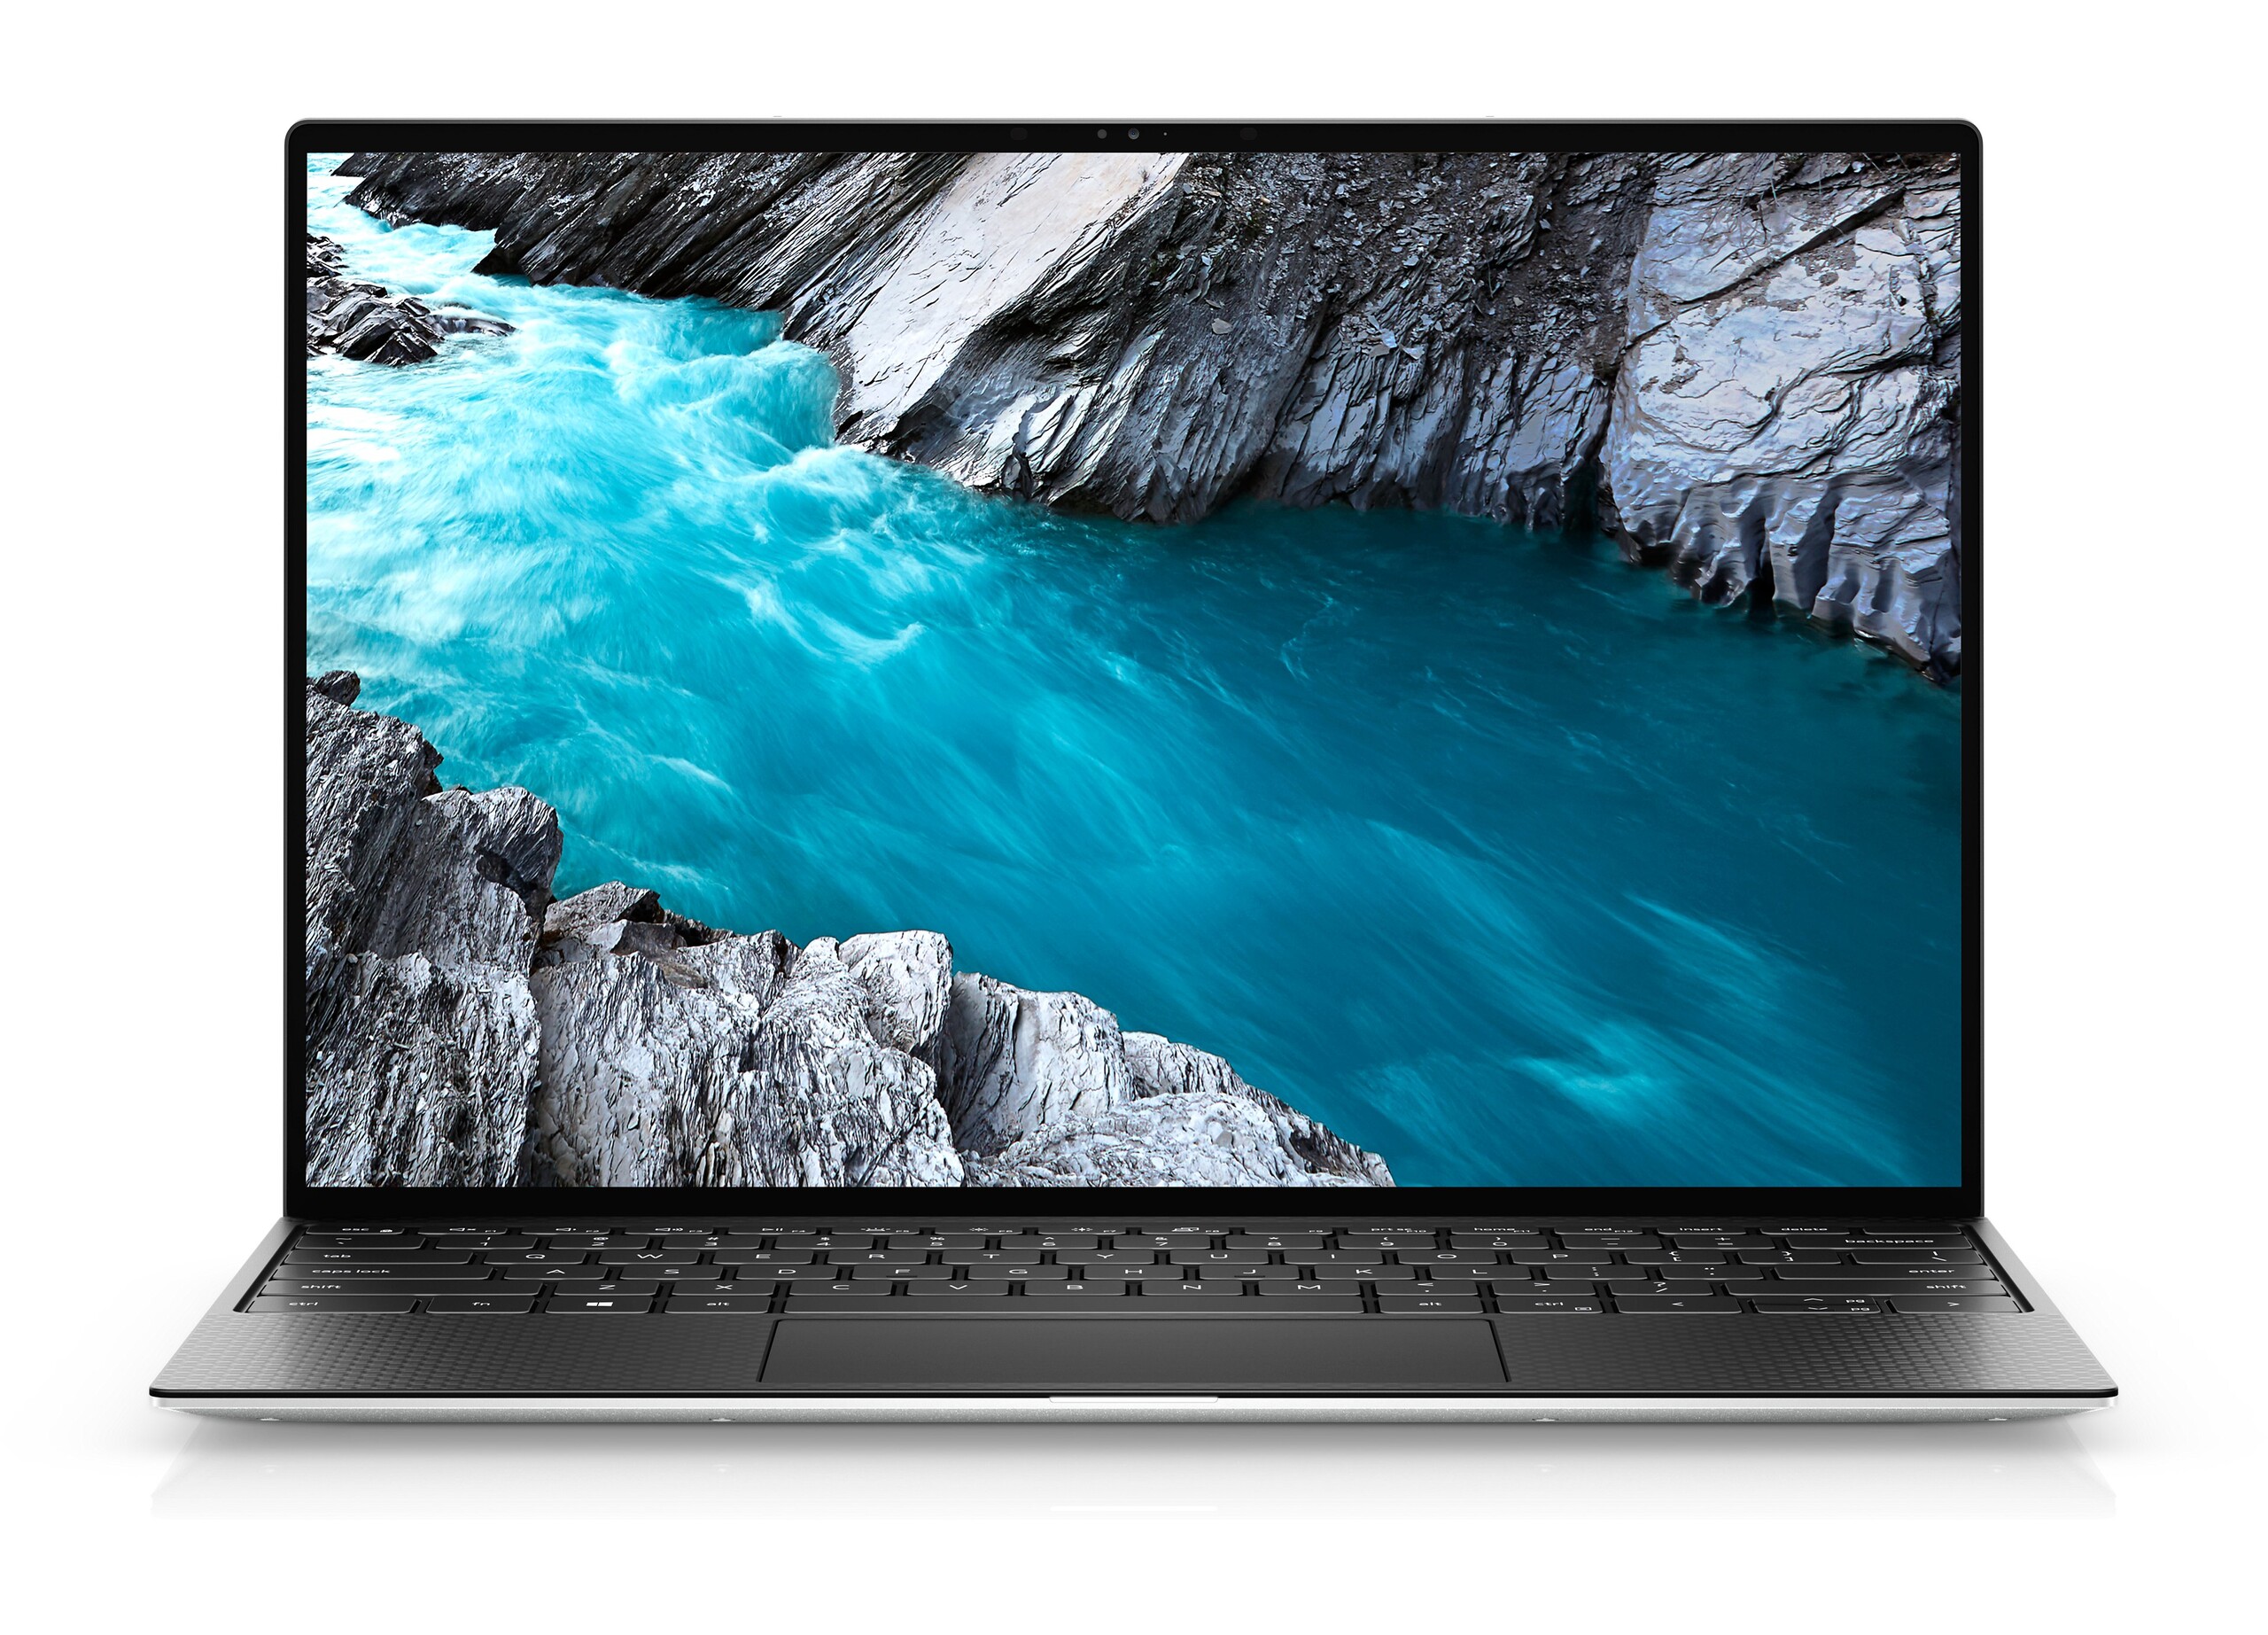
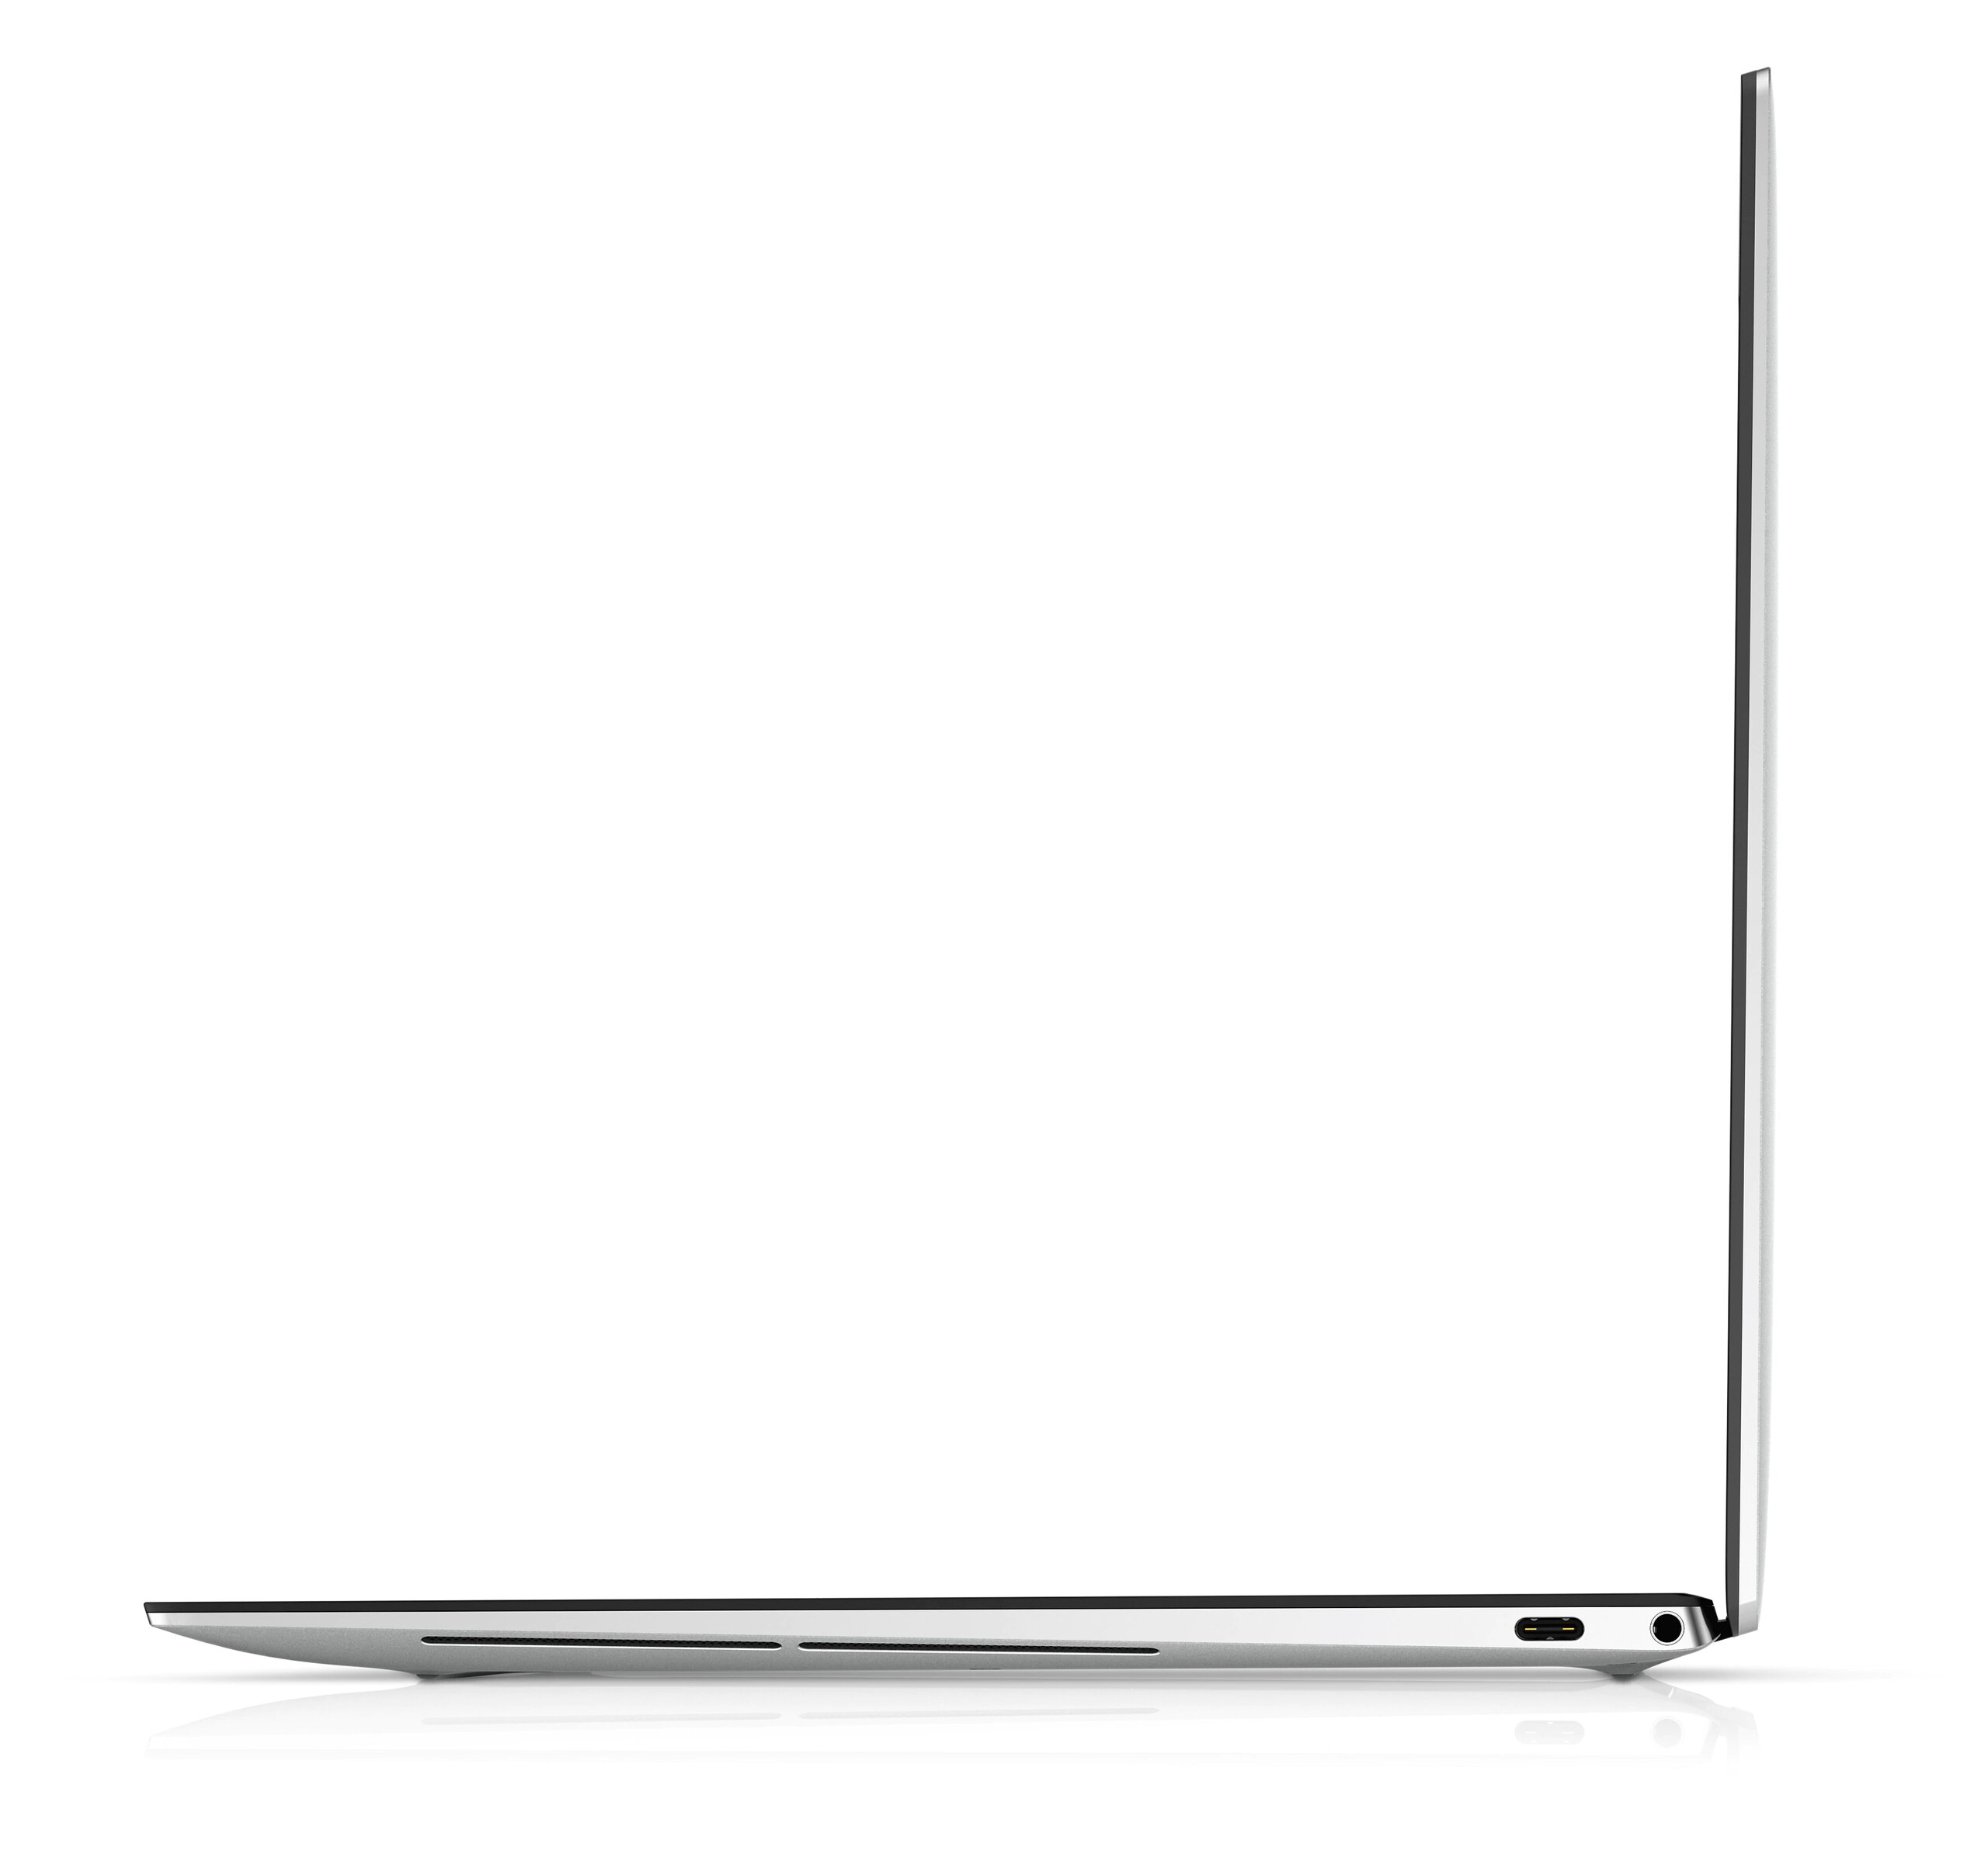
The Dell XPS 13 9310 launched just a couple of months ago alongside Intel's brand new 11th gen Tiger Lake-U platform. Based on our time with a unit, performance proved to be a noticeable upgrade from the XPS 13 9300 especially in terms of graphics even though there were no changes to the external design. If you owned an older XPS model or could use the graphics boost, then an upgrade to the XPS 13 9310 would make a lot of sense.
This time, Dell has sent us a higher-end second XPS 13 9310 unit equipped with the Core i7-1185G7 CPU and 4K UHD display in contrast to our first unit equipped with the Core i7-1165G7 and FHD display. The configuration currently retails for about $1600 USD or roughly $300 more than the Core i7-1165G7/FHD option. See our existing reviews on the XPS 13 9300 and XPS 13 9310 to learn more about the chassis and its features as our review here will focus on the differences between the Core i7-1165G7/FHD and Core i7-1185G7/4K XPS 13 9310 SKUs. Is the costlier option worth the extra Benjamins?
More Dell reviews:
potential competitors in comparison
Rating | Date | Model | Weight | Height | Size | Resolution | Price |
|---|---|---|---|---|---|---|---|
| 87.4 % v7 (old) | 12 / 2020 | Dell XPS 13 9310 Core i7 4K i7-1185G7, Iris Xe G7 96EUs | 1.3 kg | 14.8 mm | 13.40" | 3840x2400 | |
| 85.1 % v7 (old) | 10 / 2020 | Asus Zenbook S UX393JA i7-1065G7, Iris Plus Graphics G7 (Ice Lake 64 EU) | 1.4 kg | 15.7 mm | 13.90" | 3300x2200 | |
| 87.4 % v7 (old) | 06 / 2020 | Huawei MateBook X Pro 2020 i7 i7-10510U, GeForce MX250 | 1.3 kg | 14.6 mm | 13.90" | 3000x2000 | |
| 88.9 % v7 (old) | 03 / 2020 | Dell XPS 13 9300 Core i7-1065G7 i7-1065G7, Iris Plus Graphics G7 (Ice Lake 64 EU) | 1.2 kg | 14.8 mm | 13.40" | 1920x1200 | |
| 85.3 % v7 (old) | 08 / 2020 | Lenovo Yoga Slim 7-14ARE R7 4800U, Vega 8 | 1.4 kg | 14.9 mm | 14.00" | 1920x1080 | |
| 88.4 % v7 (old) | 12 / 2019 | HP Spectre x360 13-aw0013dx i7-1065G7, Iris Plus Graphics G7 (Ice Lake 64 EU) | 1.2 kg | 16.9 mm | 13.30" | 1920x1080 |
Case
SD Card Reader
| SD Card Reader | |
| average JPG Copy Test (av. of 3 runs) | |
| Dell XPS 13 9310 Core i7 4K (Toshiba Exceria Pro M501 32 GB UHS-II) | |
| HP Spectre x360 13-aw0013dx (Toshiba Exceria Pro M501 microSDXC 64GB) | |
| Dell XPS 13 9300 Core i7-1065G7 (Toshiba Exceria Pro M501 64 GB UHS-II) | |
| Asus Zenbook S UX393JA (Toshiba Exceria Pro M501 64 GB UHS-II) | |
| Lenovo Yoga Slim 7-14ARE (Toshiba Exceria Pro M501 64 GB UHS-II) | |
| maximum AS SSD Seq Read Test (1GB) | |
| Dell XPS 13 9310 Core i7 4K (Toshiba Exceria Pro M501 32 GB UHS-II) | |
| Dell XPS 13 9300 Core i7-1065G7 (Toshiba Exceria Pro M501 64 GB UHS-II) | |
| HP Spectre x360 13-aw0013dx (Toshiba Exceria Pro M501 microSDXC 64GB) | |
| Lenovo Yoga Slim 7-14ARE (Toshiba Exceria Pro M501 64 GB UHS-II) | |
| Asus Zenbook S UX393JA (Toshiba Exceria Pro M501 64 GB UHS-II) | |
Communication
Webcam


Display
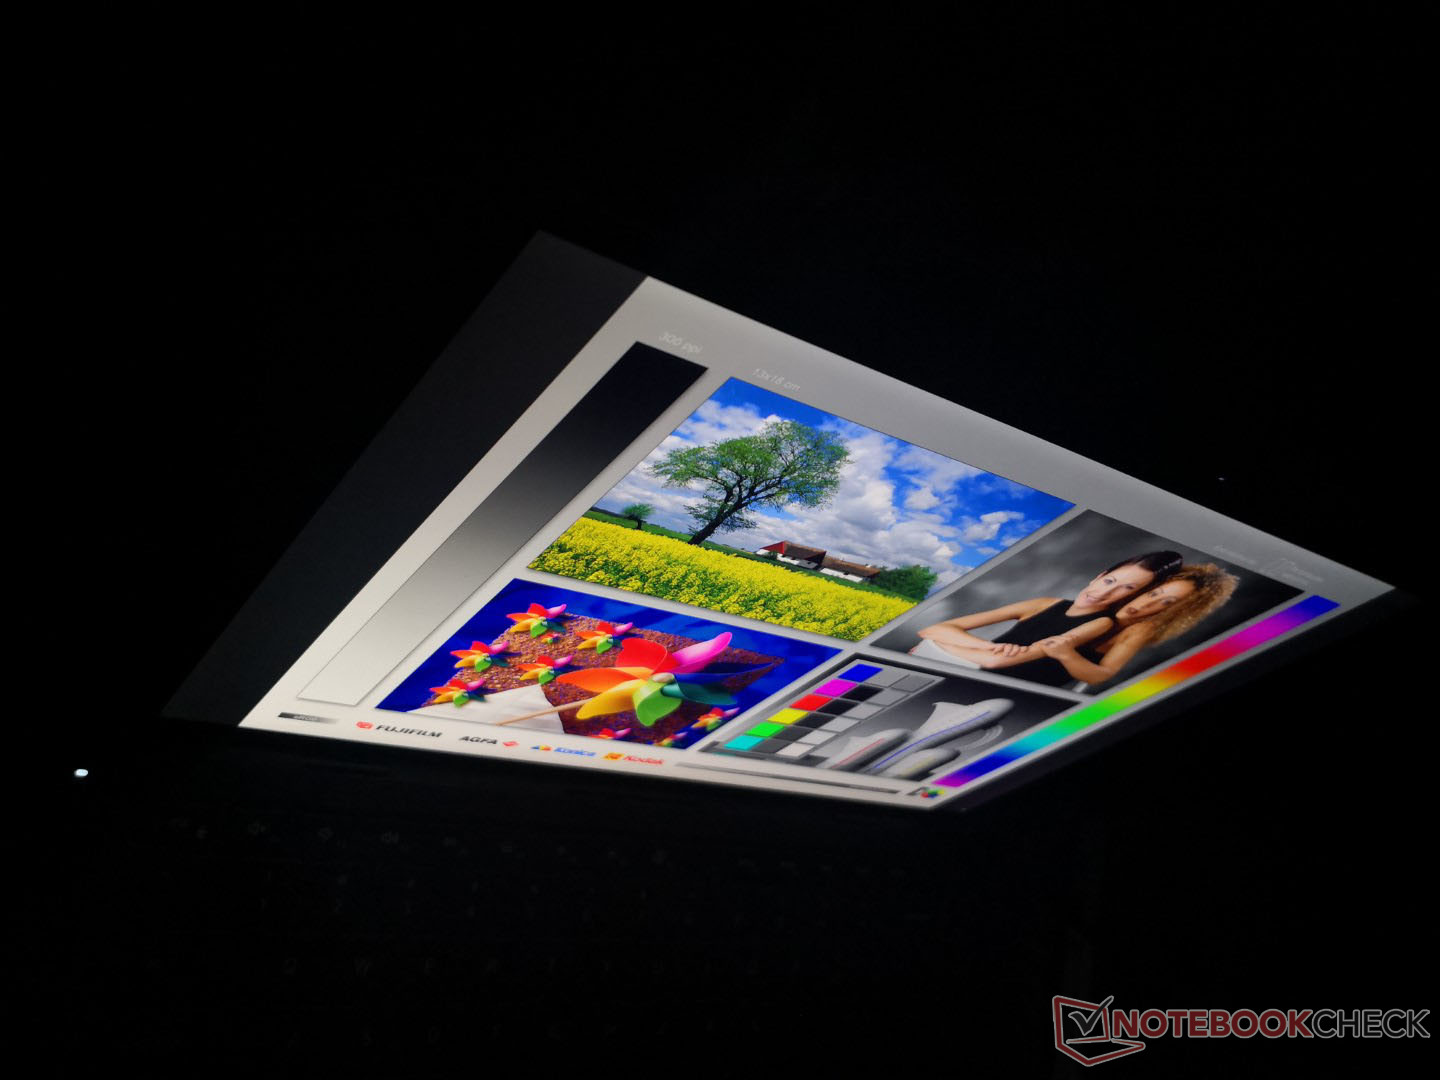
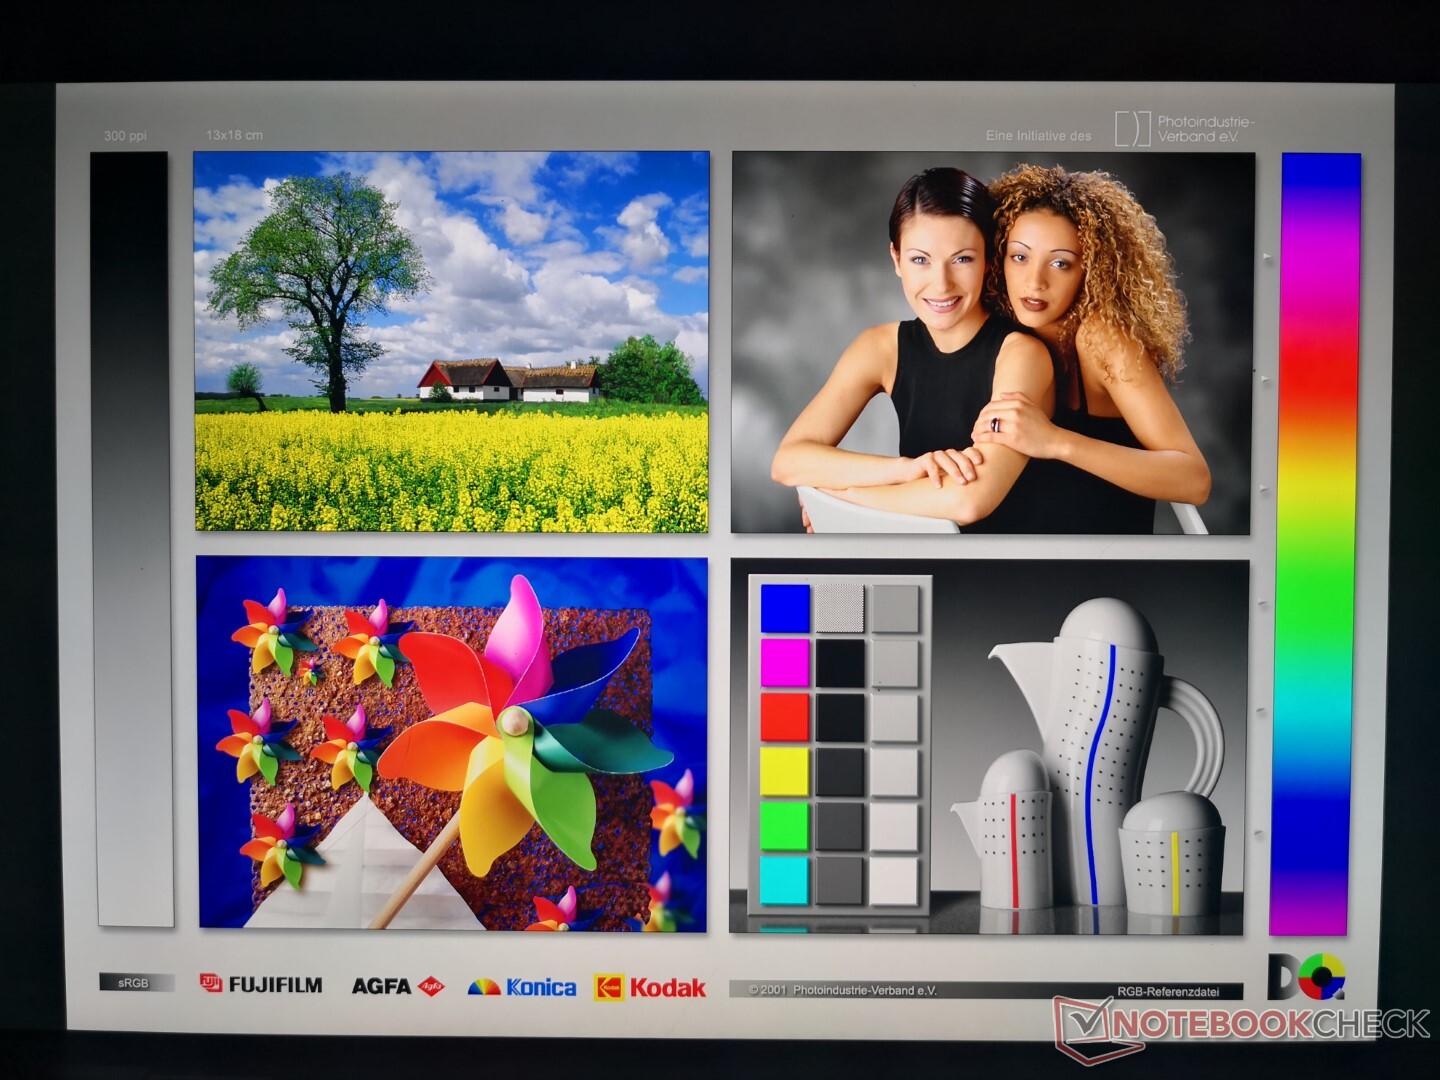
Dell uses the same Sharp LQ134R1 IPS panel for its last generation XPS 13 9300 4K and current generation XPS 13 9310 4K for a similar gen-to-gen visual experience. A major difference we've noticed between our two units, however, relates to the brighter display on the newer XPS 13 9310 (479 nits vs 401 nits). Pulse-width modulation is also present on the newer model whereas it was absent on the older XPS 13 9300 4K to suggest that Dell may be using a different backlight this time around.
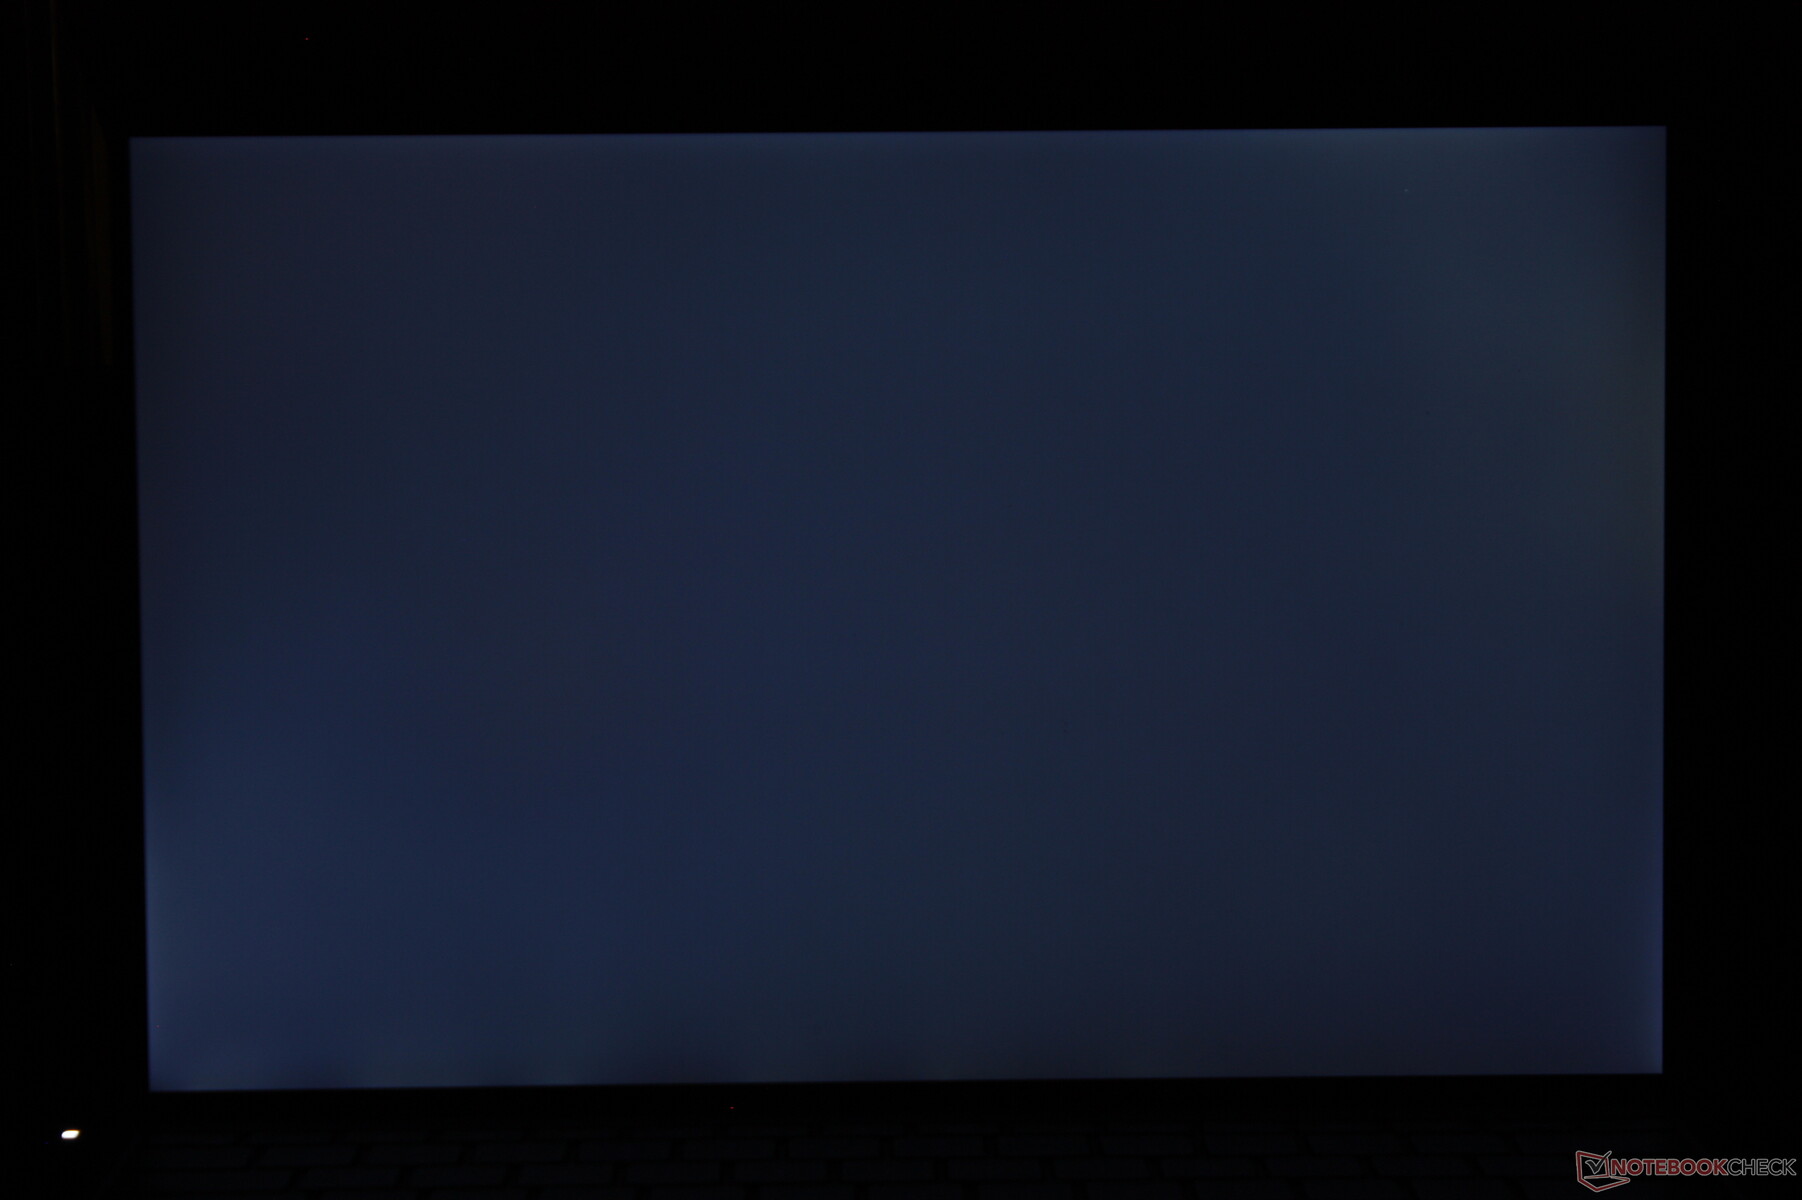
Brightness uniformity could be a bit better on our unit. The top left corner of our display is slightly dimmer than it should be as shown by our measurements below. It's not enough to be all that noticeable, but we do expect better from a flagship series like the XPS.


| |||||||||||||||||||||||||
Brightness Distribution: 84 %
Center on Battery: 508.7 cd/m²
Contrast: 1696:1 (Black: 0.3 cd/m²)
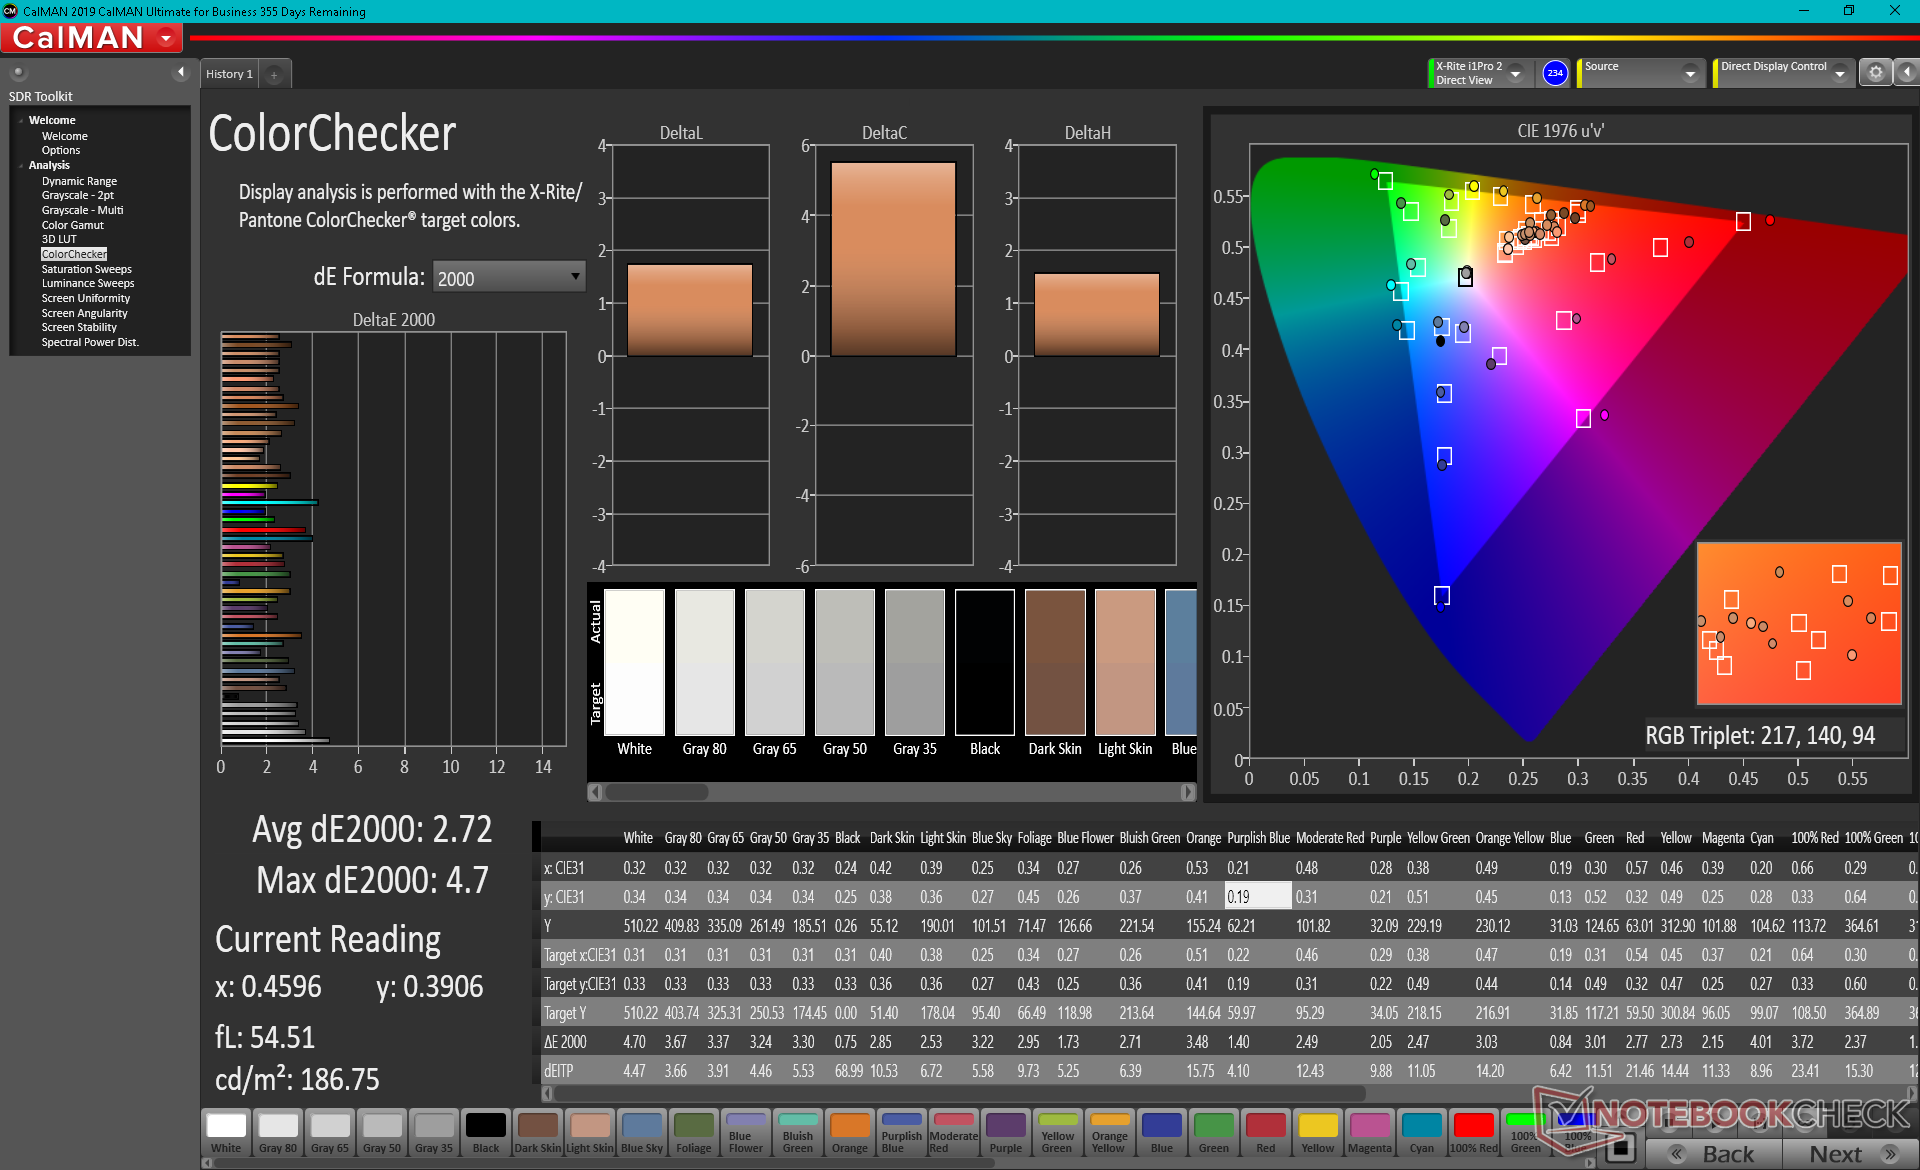
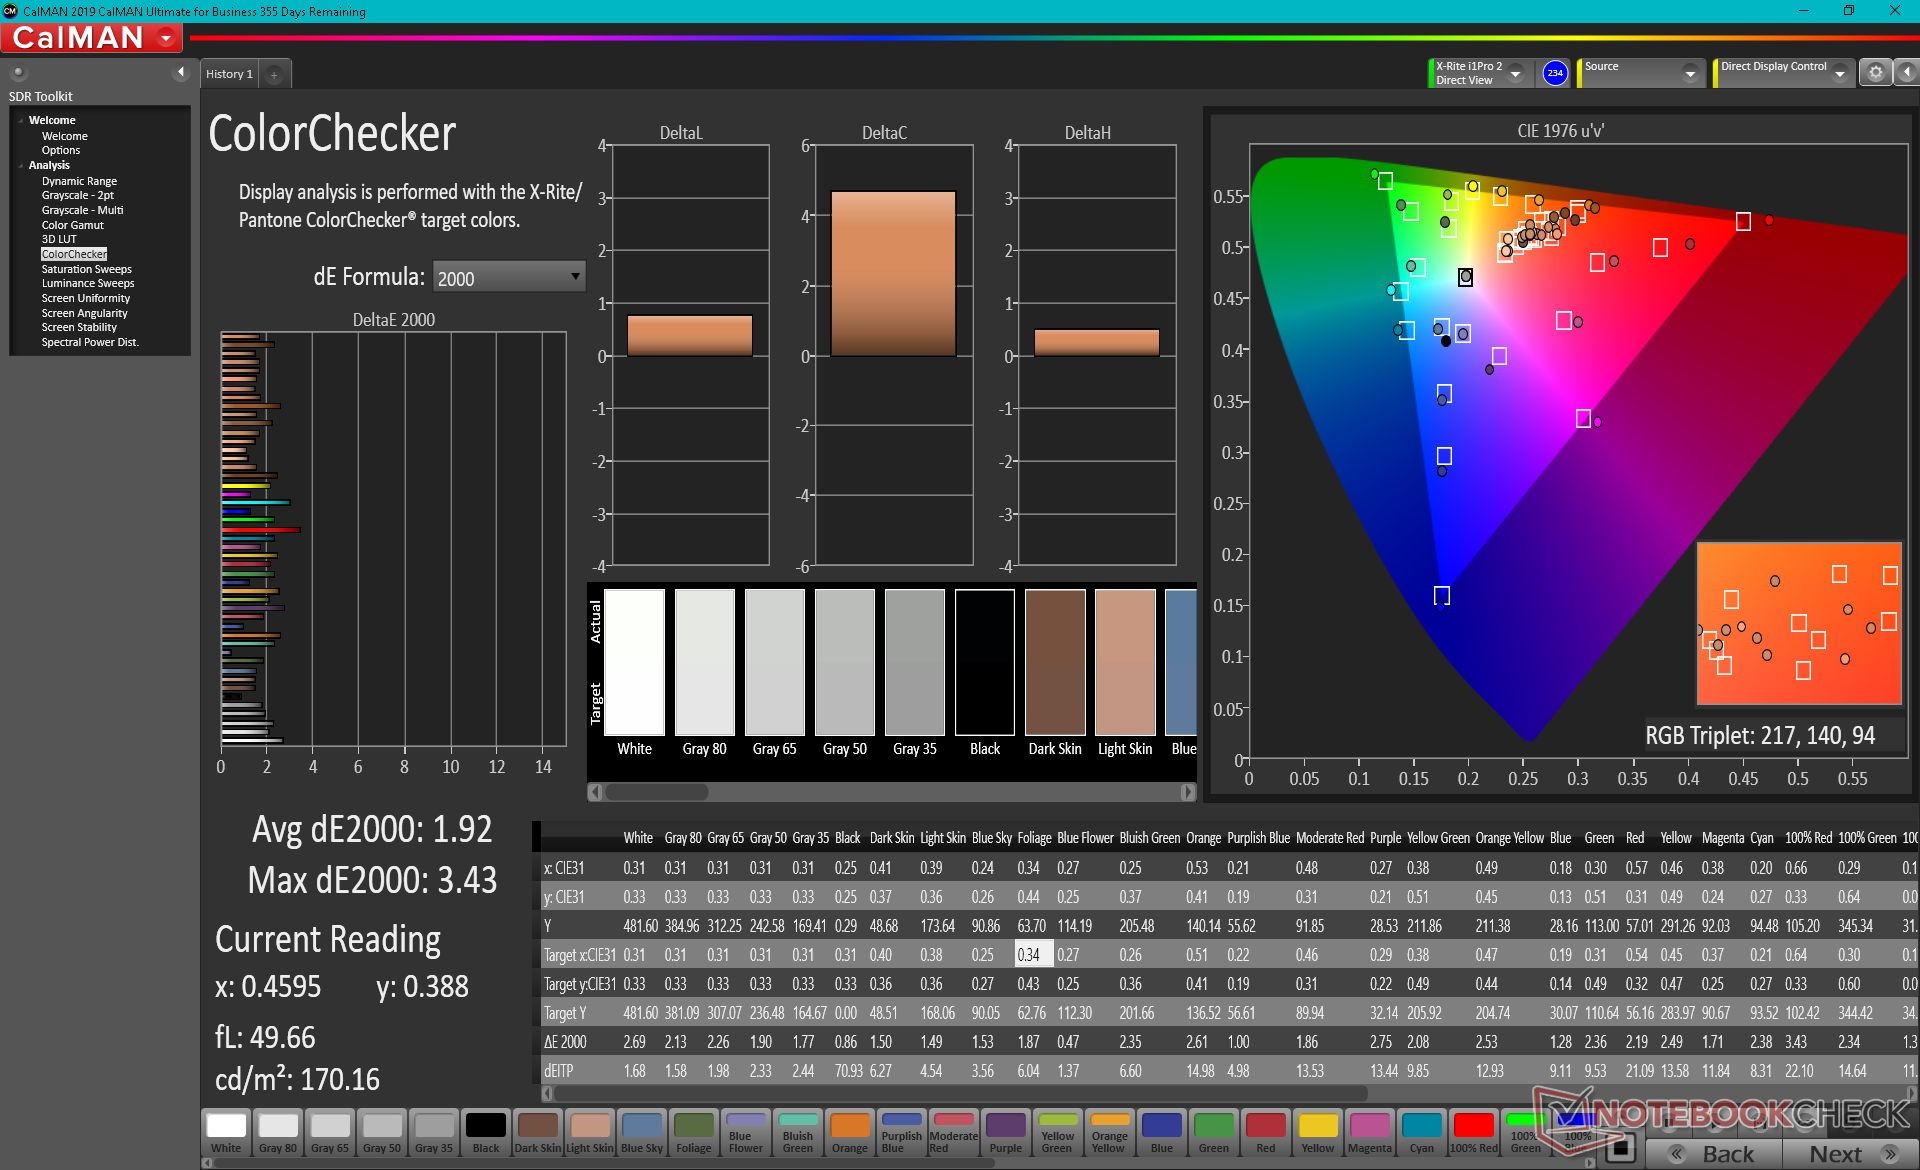
ΔE ColorChecker Calman: 2.72 | ∀{0.5-29.43 Ø4.72}
calibrated: 1.92
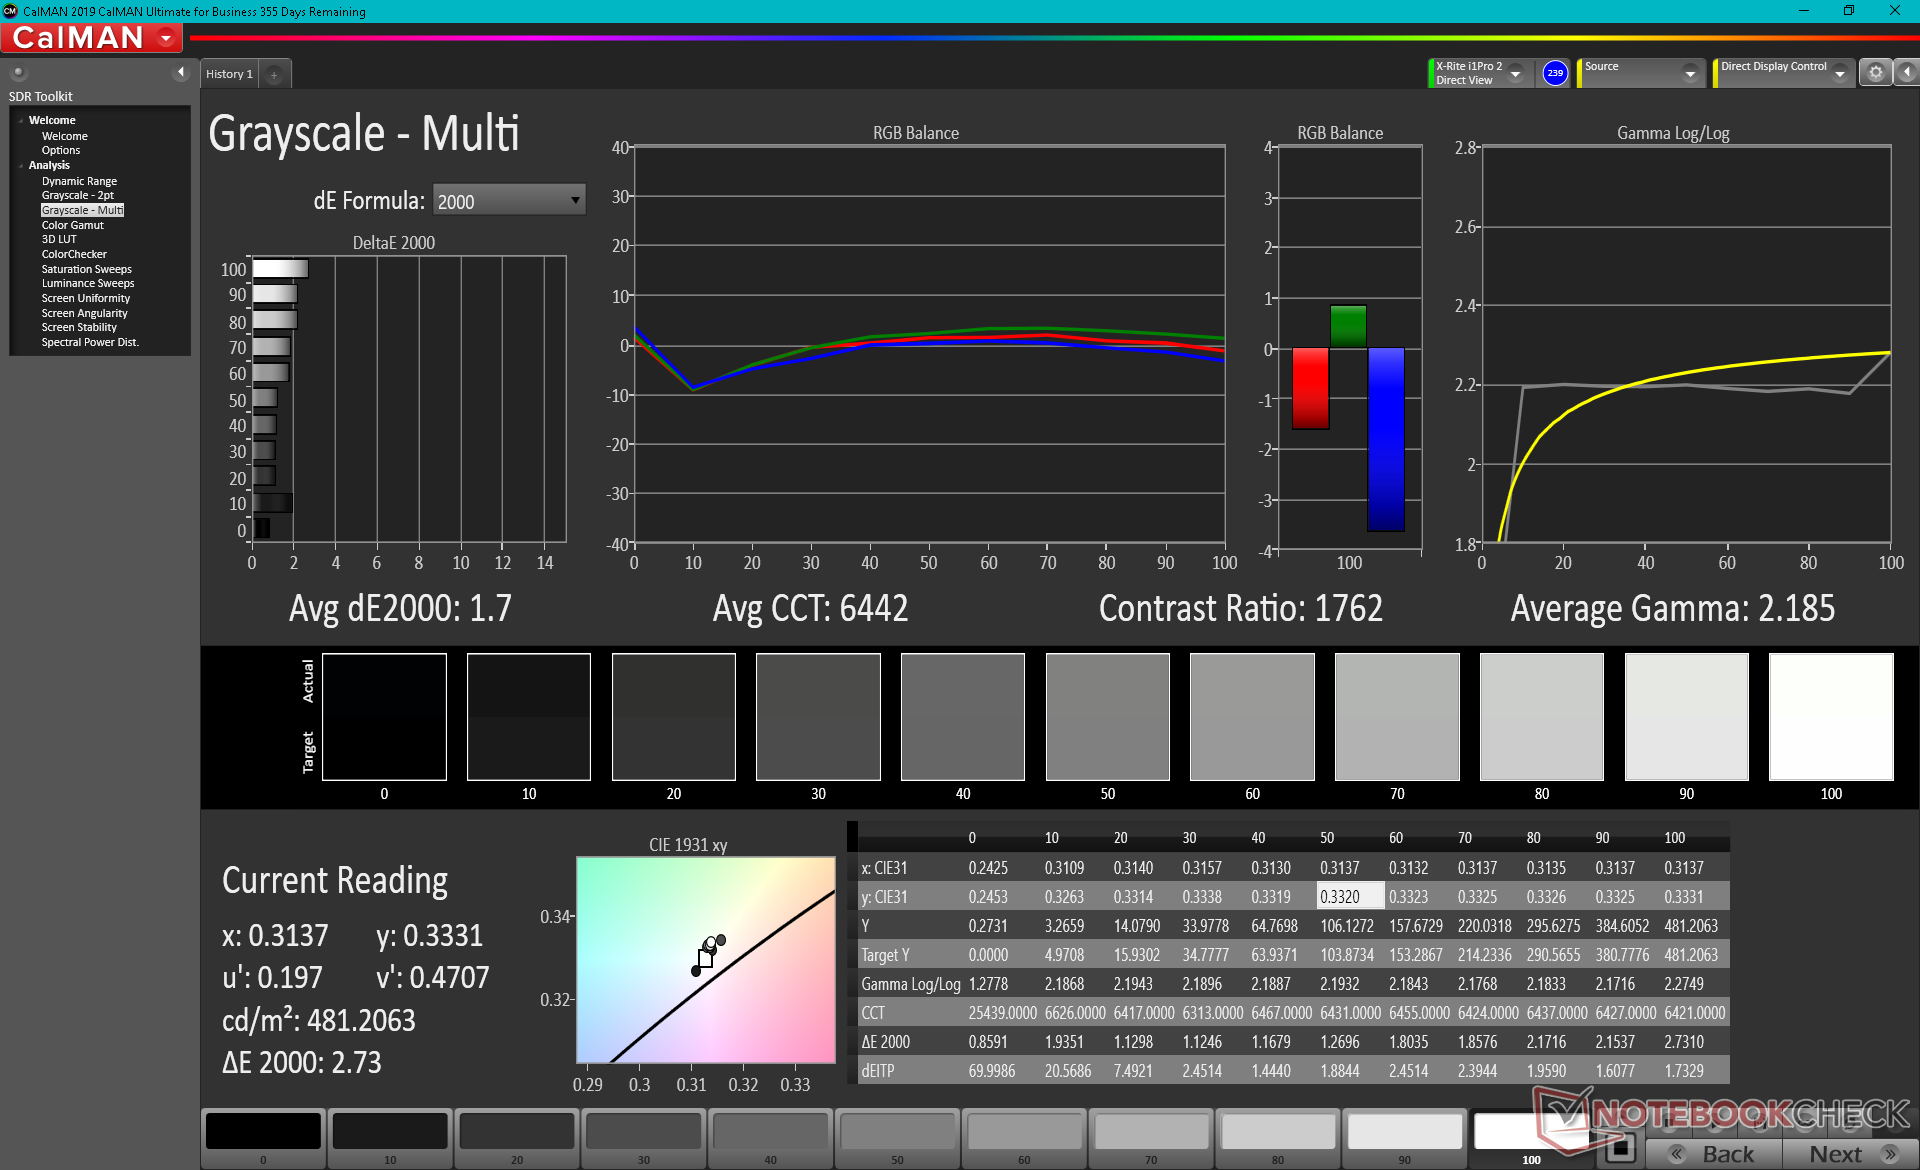
ΔE Greyscale Calman: 3.4 | ∀{0.09-98 Ø4.97}
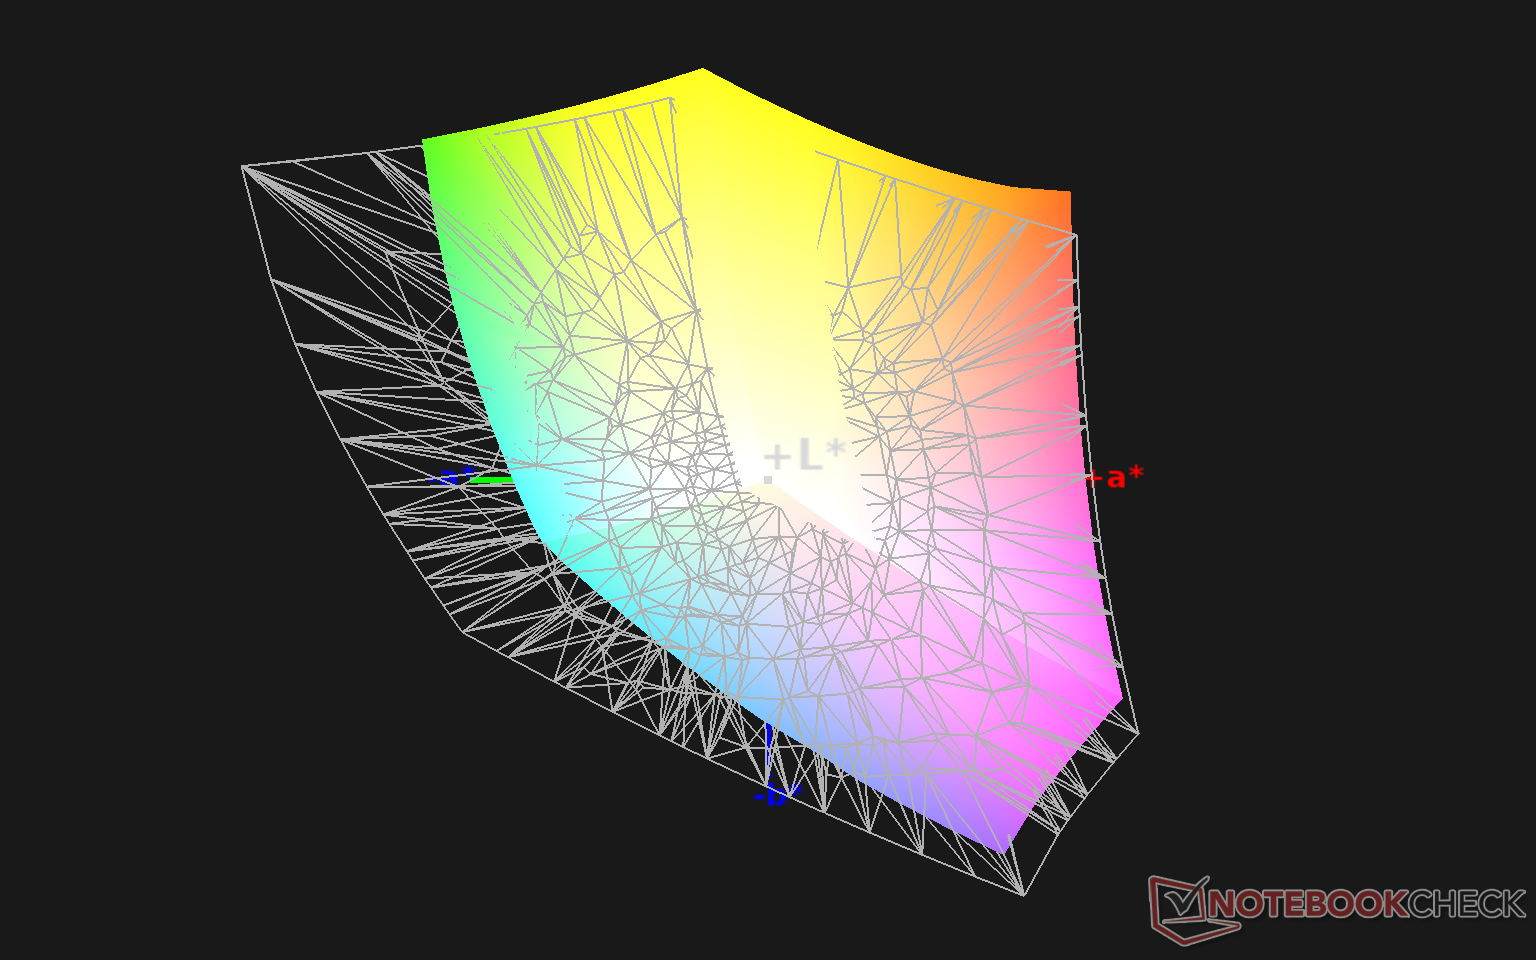
100% sRGB (Argyll 1.6.3 3D)
70.7% AdobeRGB 1998 (Argyll 1.6.3 3D)
78.9% AdobeRGB 1998 (Argyll 3D)
100% sRGB (Argyll 3D)
80.2% Display P3 (Argyll 3D)
Gamma: 2.11
CCT: 6245 K
| Dell XPS 13 9310 Core i7 4K Sharp LQ134R1, IPS, 13.4", 3840x2400 | Asus Zenbook S UX393JA AU Optronics B139KAN01.0, IPS, 13.9", 3300x2200 | Huawei MateBook X Pro 2020 i7 JDI LPM139M422A, LTPS, 13.9", 3000x2000 | Dell XPS 13 9300 Core i7-1065G7 Sharp LQ134N1, IPS, 13.4", 1920x1200 | Lenovo Yoga Slim 7-14ARE AU Optronics B140HAN06.8, IPS, 14", 1920x1080 | HP Spectre x360 13-aw0013dx AU Optronics AUO5E2D, IPS, 13.3", 1920x1080 | |
|---|---|---|---|---|---|---|
| Display | 11% | -10% | -11% | -7% | -8% | |
| Display P3 Coverage (%) | 80.2 | 97.7 22% | 66.6 -17% | 66.3 -17% | 71.7 -11% | 69.6 -13% |
| sRGB Coverage (%) | 100 | 99.8 0% | 99.4 -1% | 97.3 -3% | 99.3 -1% | 98.9 -1% |
| AdobeRGB 1998 Coverage (%) | 78.9 | 87.9 11% | 68.6 -13% | 68.5 -13% | 72.9 -8% | 71.5 -9% |
| Response Times | 5% | 20% | 17% | 25% | 3% | |
| Response Time Grey 50% / Grey 80% * (ms) | 59.2 ? | 56.4 ? 5% | 49.6 ? 16% | 50 ? 16% | 45.6 ? 23% | 60.8 ? -3% |
| Response Time Black / White * (ms) | 40.4 ? | 38.8 ? 4% | 30.8 ? 24% | 33.2 ? 18% | 29.6 ? 27% | 36.8 ? 9% |
| PWM Frequency (Hz) | 2137 ? | 29070 ? | 2500 ? | |||
| Screen | -15% | 18% | -11% | -17% | -23% | |
| Brightness middle (cd/m²) | 508.7 | 444.1 -13% | 557 9% | 607.6 19% | 399.6 -21% | 447.4 -12% |
| Brightness (cd/m²) | 479 | 423 -12% | 532 11% | 595 24% | 385 -20% | 420 -12% |
| Brightness Distribution (%) | 84 | 89 6% | 87 4% | 96 14% | 89 6% | 85 1% |
| Black Level * (cd/m²) | 0.3 | 0.37 -23% | 0.33 -10% | 0.4 -33% | 0.37 -23% | 0.31 -3% |
| Contrast (:1) | 1696 | 1200 -29% | 1688 0% | 1519 -10% | 1080 -36% | 1443 -15% |
| Colorchecker dE 2000 * | 2.72 | 2.94 -8% | 1.4 49% | 3.23 -19% | 3.2 -18% | 4.23 -56% |
| Colorchecker dE 2000 max. * | 4.7 | 7.37 -57% | 2.5 47% | 8.67 -84% | 6.44 -37% | 9.34 -99% |
| Colorchecker dE 2000 calibrated * | 1.92 | 3.05 -59% | 0.7 64% | 1.01 47% | 1.73 10% | 1.32 31% |
| Greyscale dE 2000 * | 3.4 | 2.9 15% | 2 41% | 5.5 -62% | 4.7 -38% | 6.1 -79% |
| Gamma | 2.11 104% | 2.1 105% | 2.14 103% | 2.12 104% | 2.21 100% | 2.11 104% |
| CCT | 6245 104% | 6766 96% | 6689 97% | 6413 101% | 7184 90% | 6136 106% |
| Color Space (Percent of AdobeRGB 1998) (%) | 70.7 | 78.2 11% | 62.5 -12% | 63 -11% | 66.3 -6% | 64.8 -8% |
| Color Space (Percent of sRGB) (%) | 100 | 99.8 0% | 99.5 0% | 97.5 -2% | 99.5 0% | 98.9 -1% |
| Total Average (Program / Settings) | 0% /
-8% | 9% /
13% | -2% /
-7% | 0% /
-10% | -9% /
-17% |
* ... smaller is better
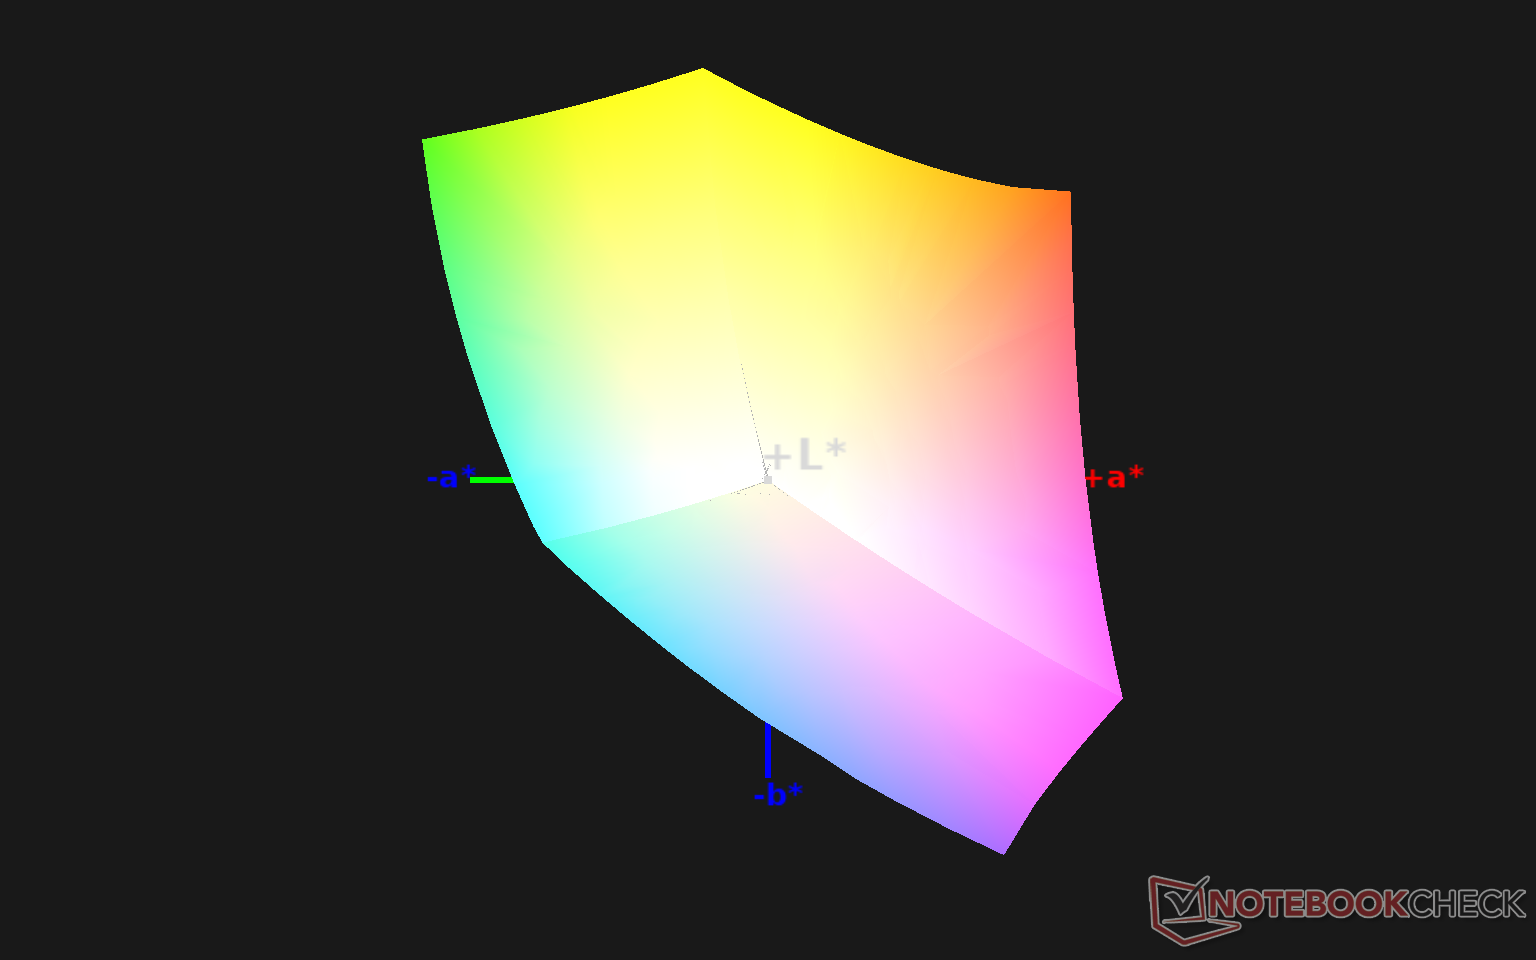
Color space covers all of sRGB and approximately 70 percent of AdobeRGB. There are no AMOLED or full AdobeRGB/DCI-P3 options likely because such panels are not widely available in the 16:10 13.4-inch screen size.
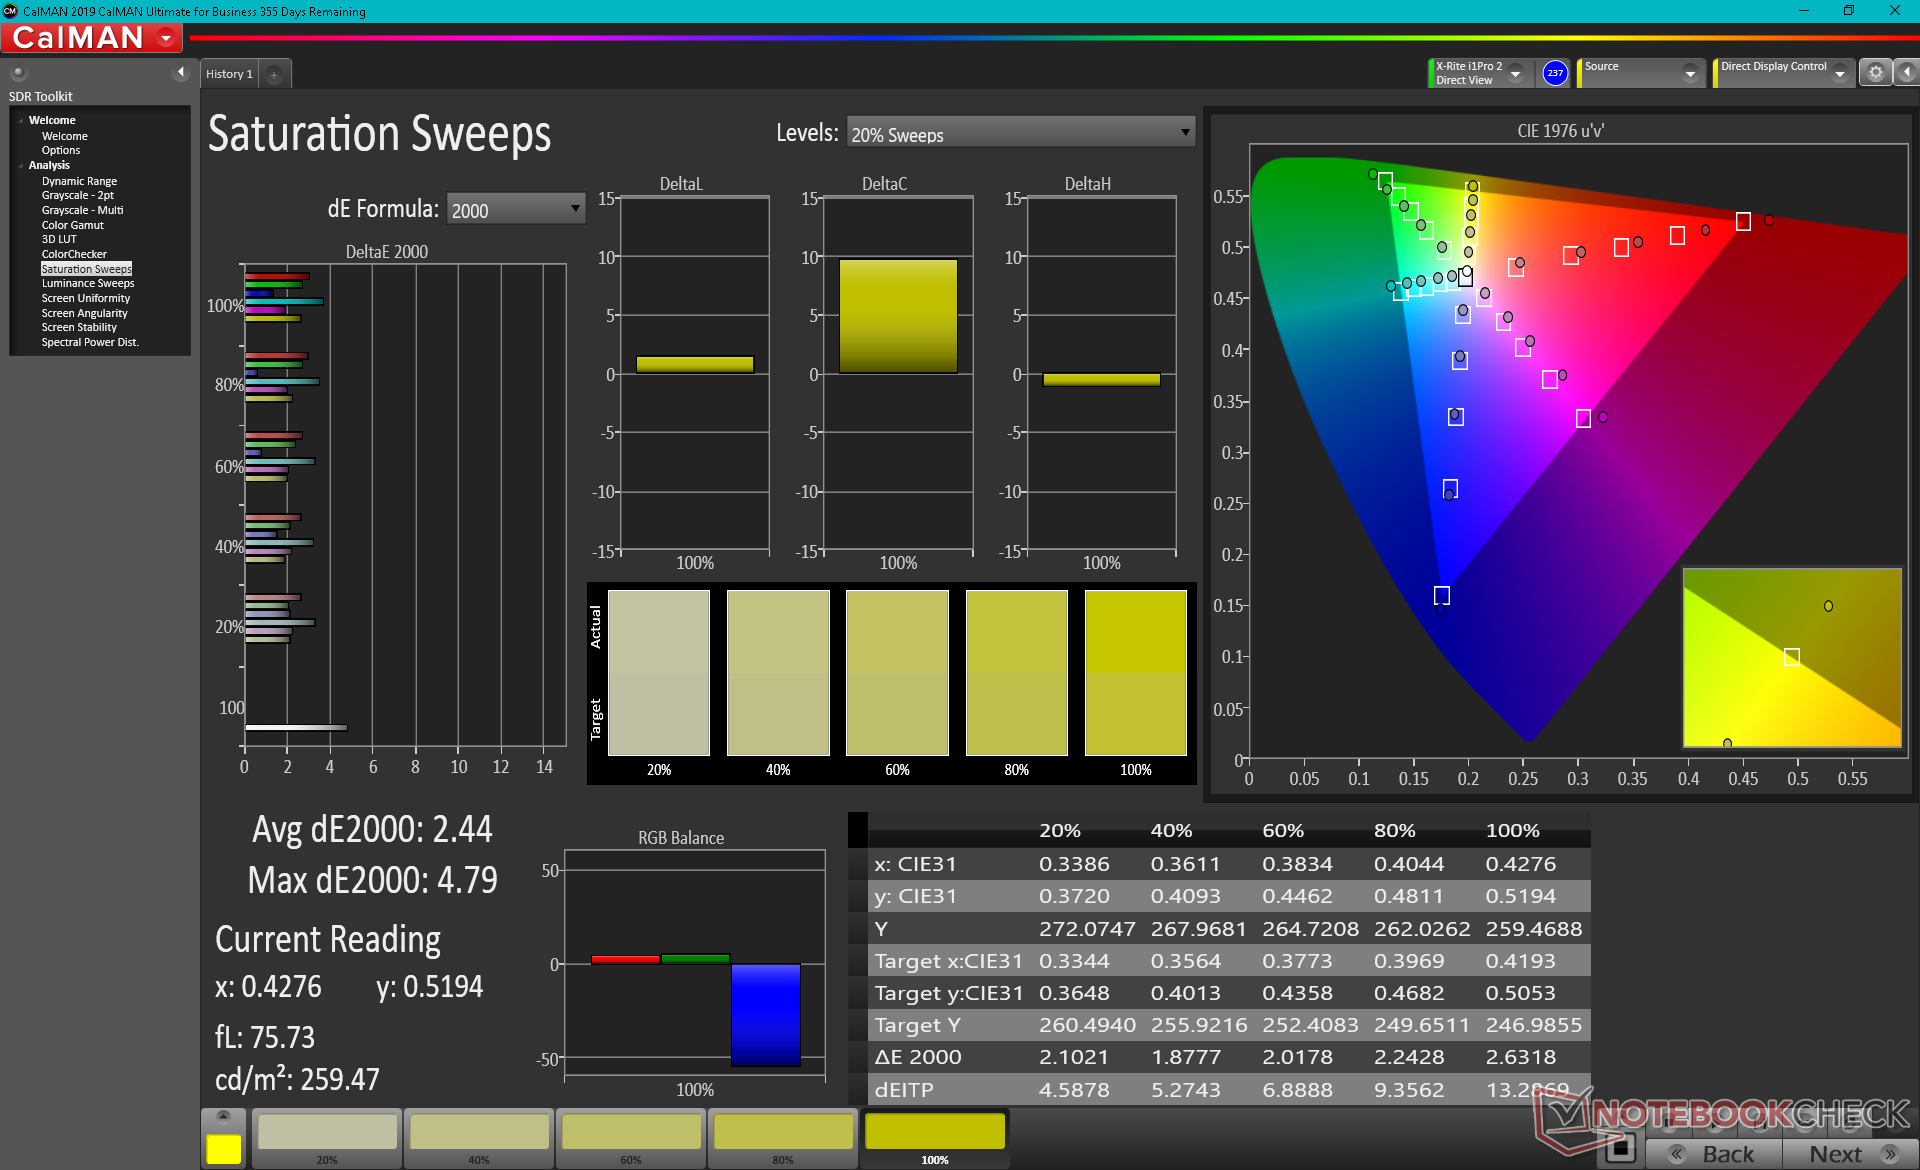
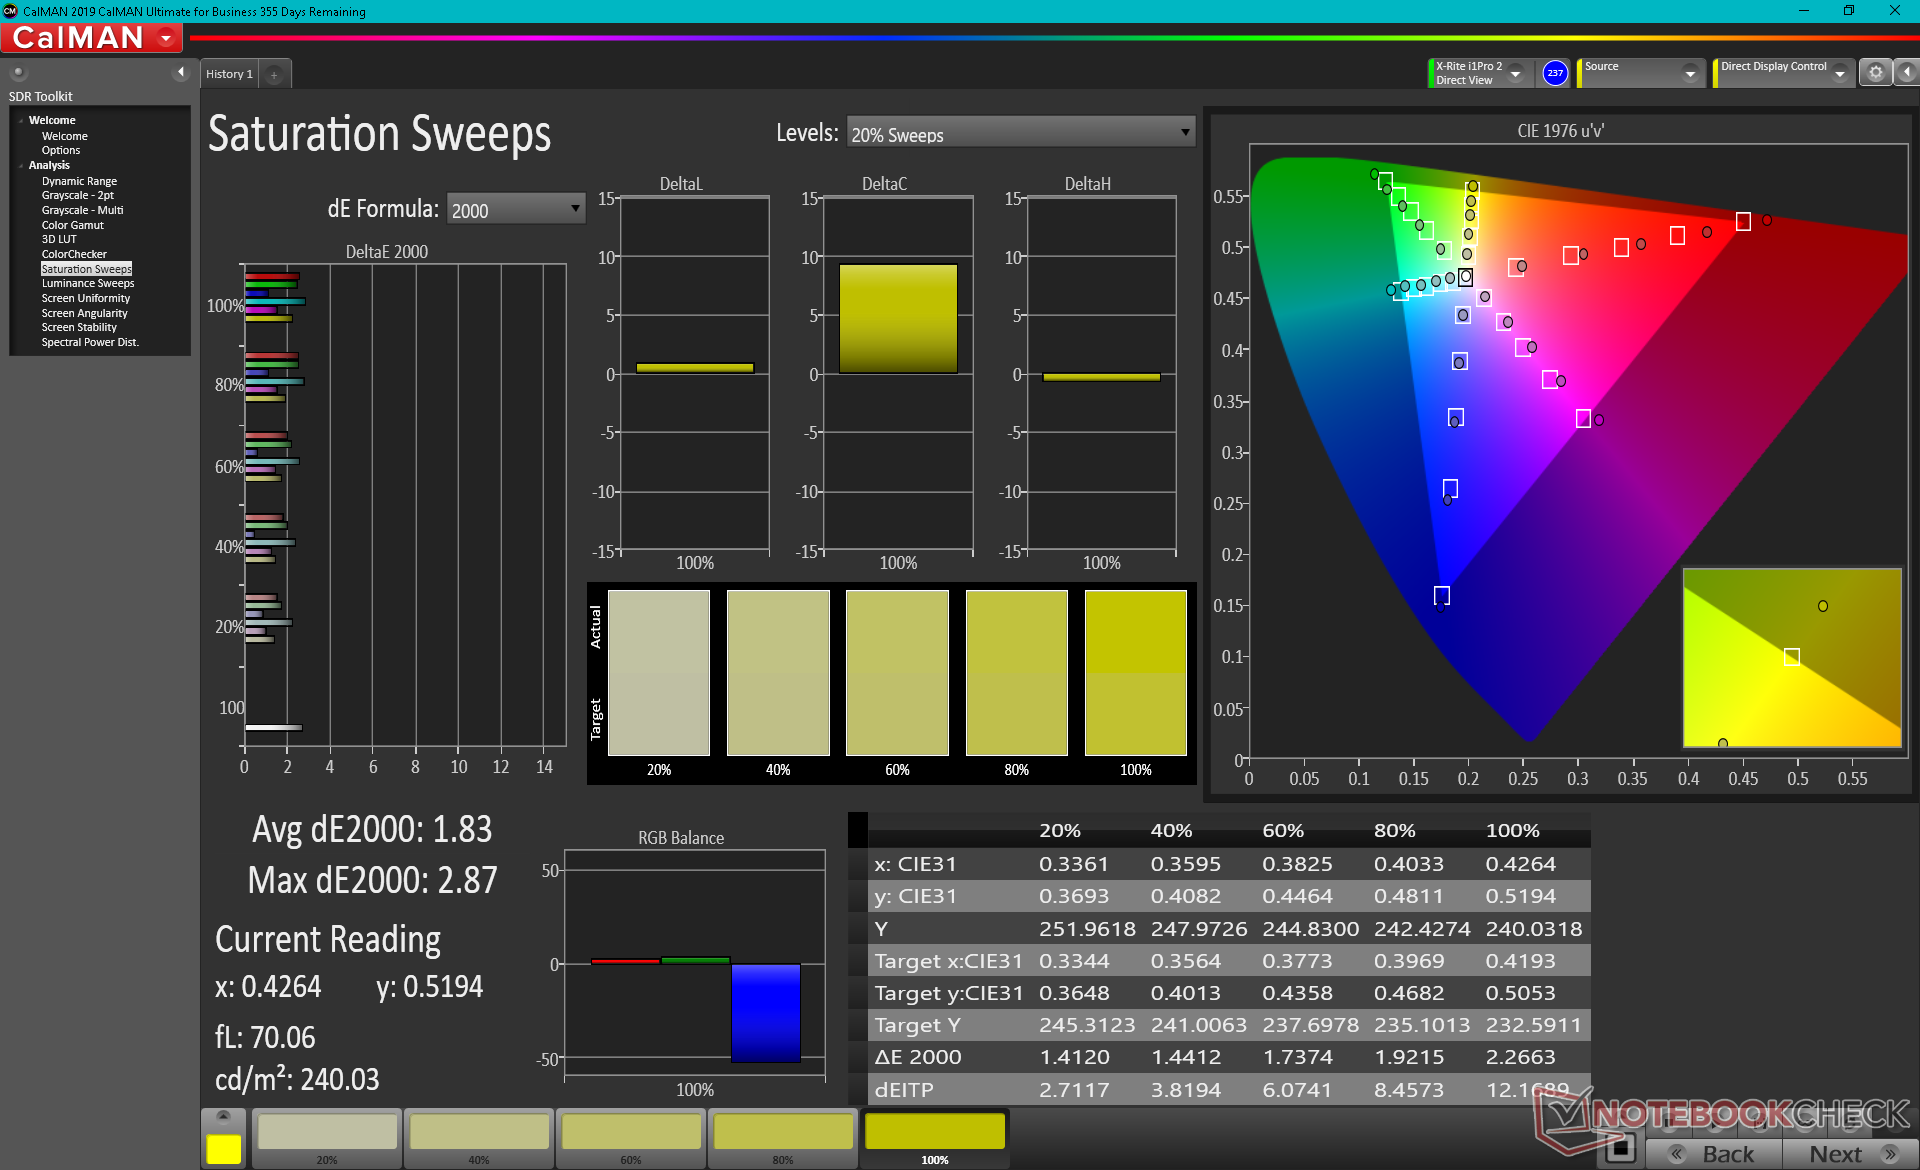
Color temperature is slightly too warm out of the box, but this is nothing our X-Rite colorimeter couldn't fix after a calibration (6245 to 6442 CCT). Average Color and grayscale DeltaE values would also improve just marginally after a bit of tweaking not unlike our experience with the XPS 13 9310 FHD or XPS 13 9300 4K configurations.

Display Response Times
| ↔ Response Time Black to White | ||
|---|---|---|
| 40.4 ms ... rise ↗ and fall ↘ combined | ↗ 22.4 ms rise | 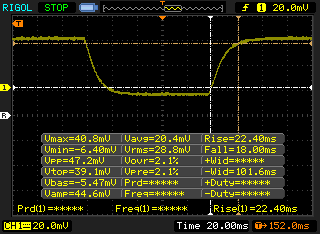 |
| ↘ 18 ms fall | ||
| The screen shows slow response rates in our tests and will be unsatisfactory for gamers. In comparison, all tested devices range from 0.1 (minimum) to 240 (maximum) ms. » 97 % of all devices are better. This means that the measured response time is worse than the average of all tested devices (19.8 ms). | ||
| ↔ Response Time 50% Grey to 80% Grey | ||
| 59.2 ms ... rise ↗ and fall ↘ combined | ↗ 30 ms rise | 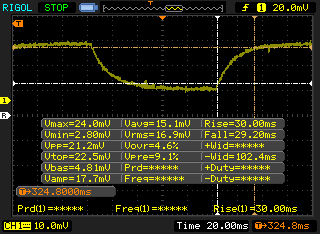 |
| ↘ 29.2 ms fall | ||
| The screen shows slow response rates in our tests and will be unsatisfactory for gamers. In comparison, all tested devices range from 0.165 (minimum) to 636 (maximum) ms. » 95 % of all devices are better. This means that the measured response time is worse than the average of all tested devices (31 ms). | ||
Screen Flickering / PWM (Pulse-Width Modulation)
| Screen flickering / PWM detected | 2137 Hz | ≤ 31 % brightness setting | 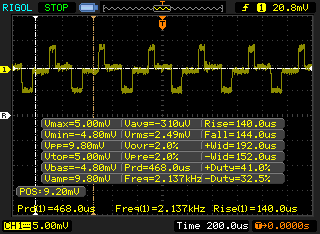 |
The display backlight flickers at 2137 Hz (worst case, e.g., utilizing PWM) Flickering detected at a brightness setting of 31 % and below. There should be no flickering or PWM above this brightness setting. The frequency of 2137 Hz is quite high, so most users sensitive to PWM should not notice any flickering. In comparison: 52 % of all tested devices do not use PWM to dim the display. If PWM was detected, an average of 7753 (minimum: 5 - maximum: 343500) Hz was measured. | |||
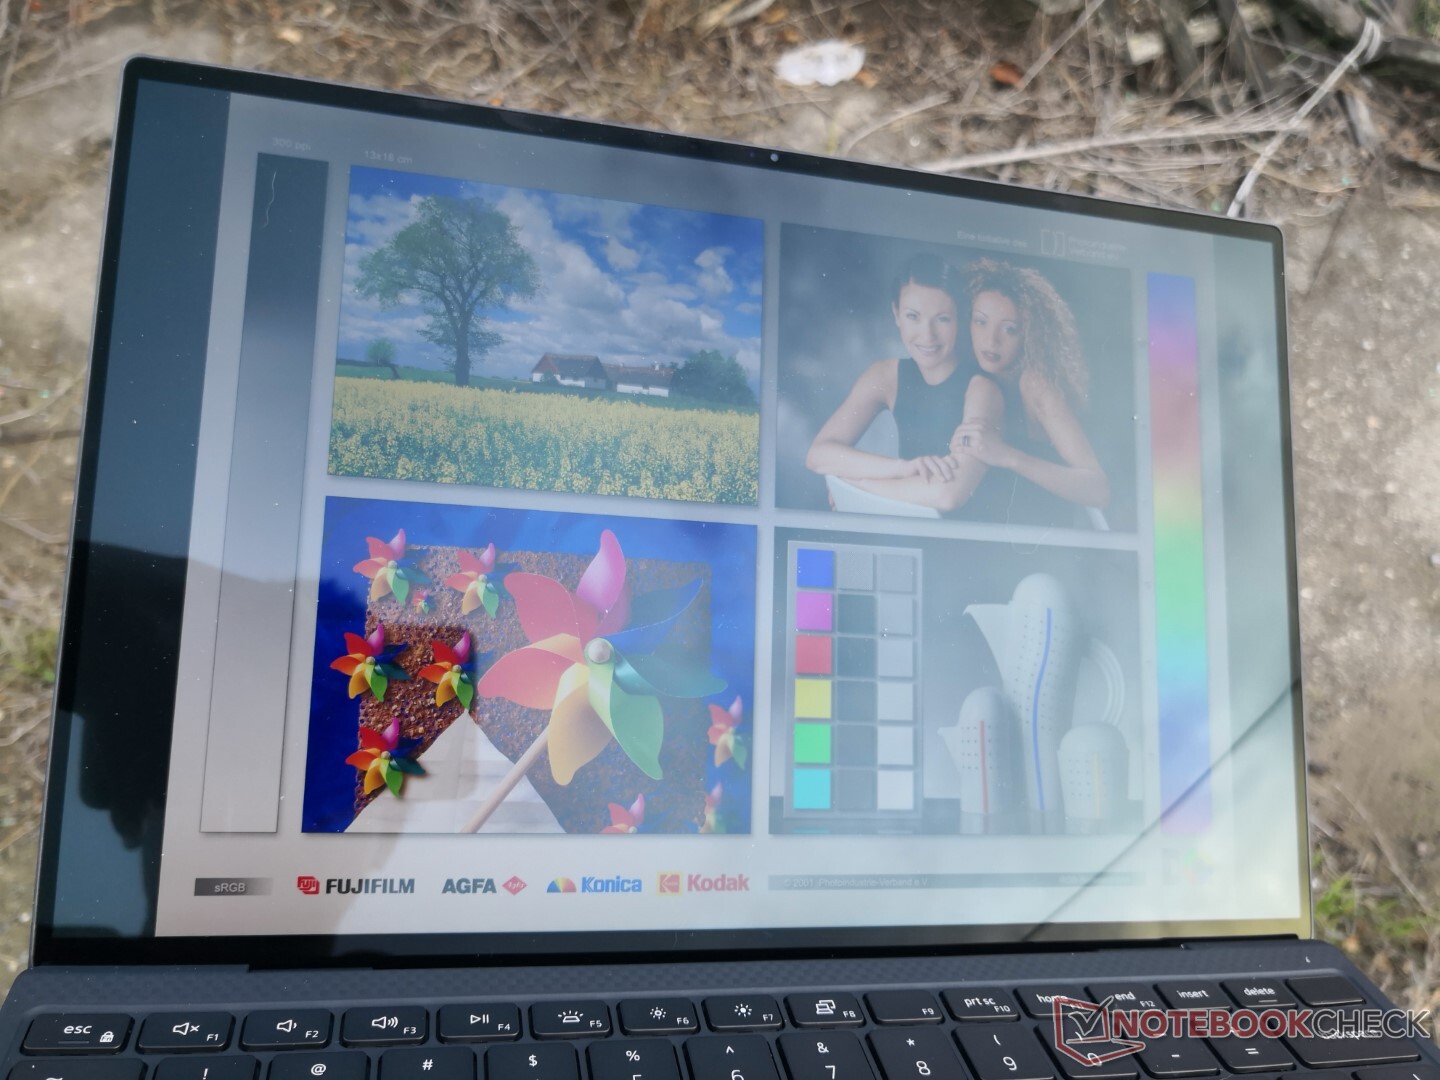
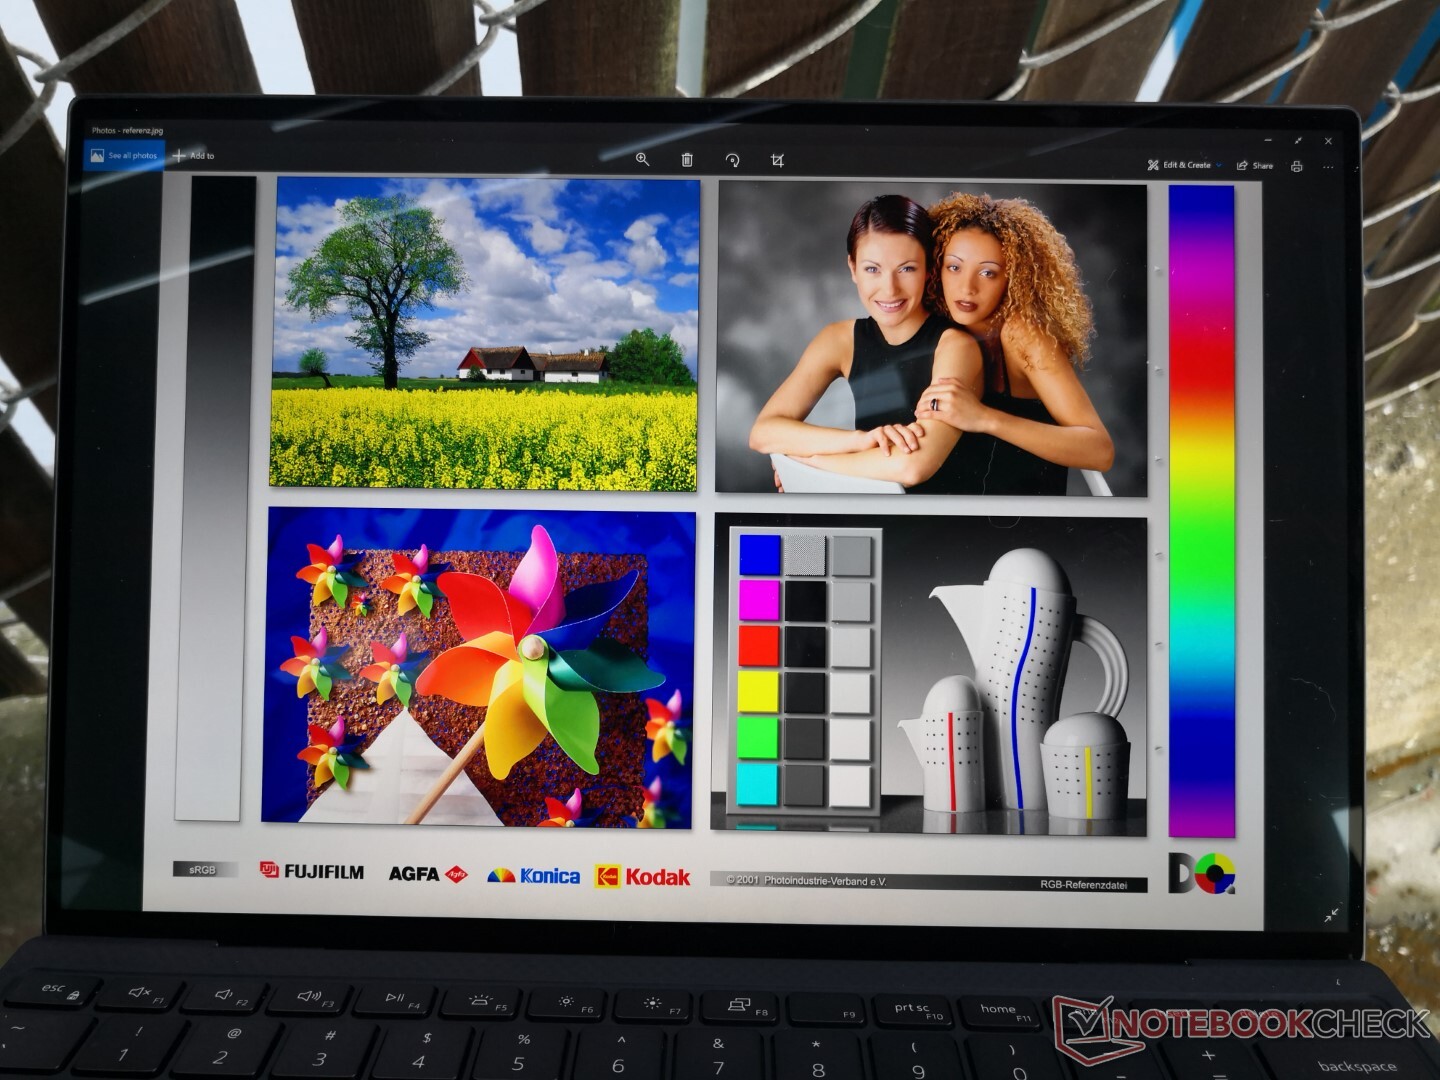
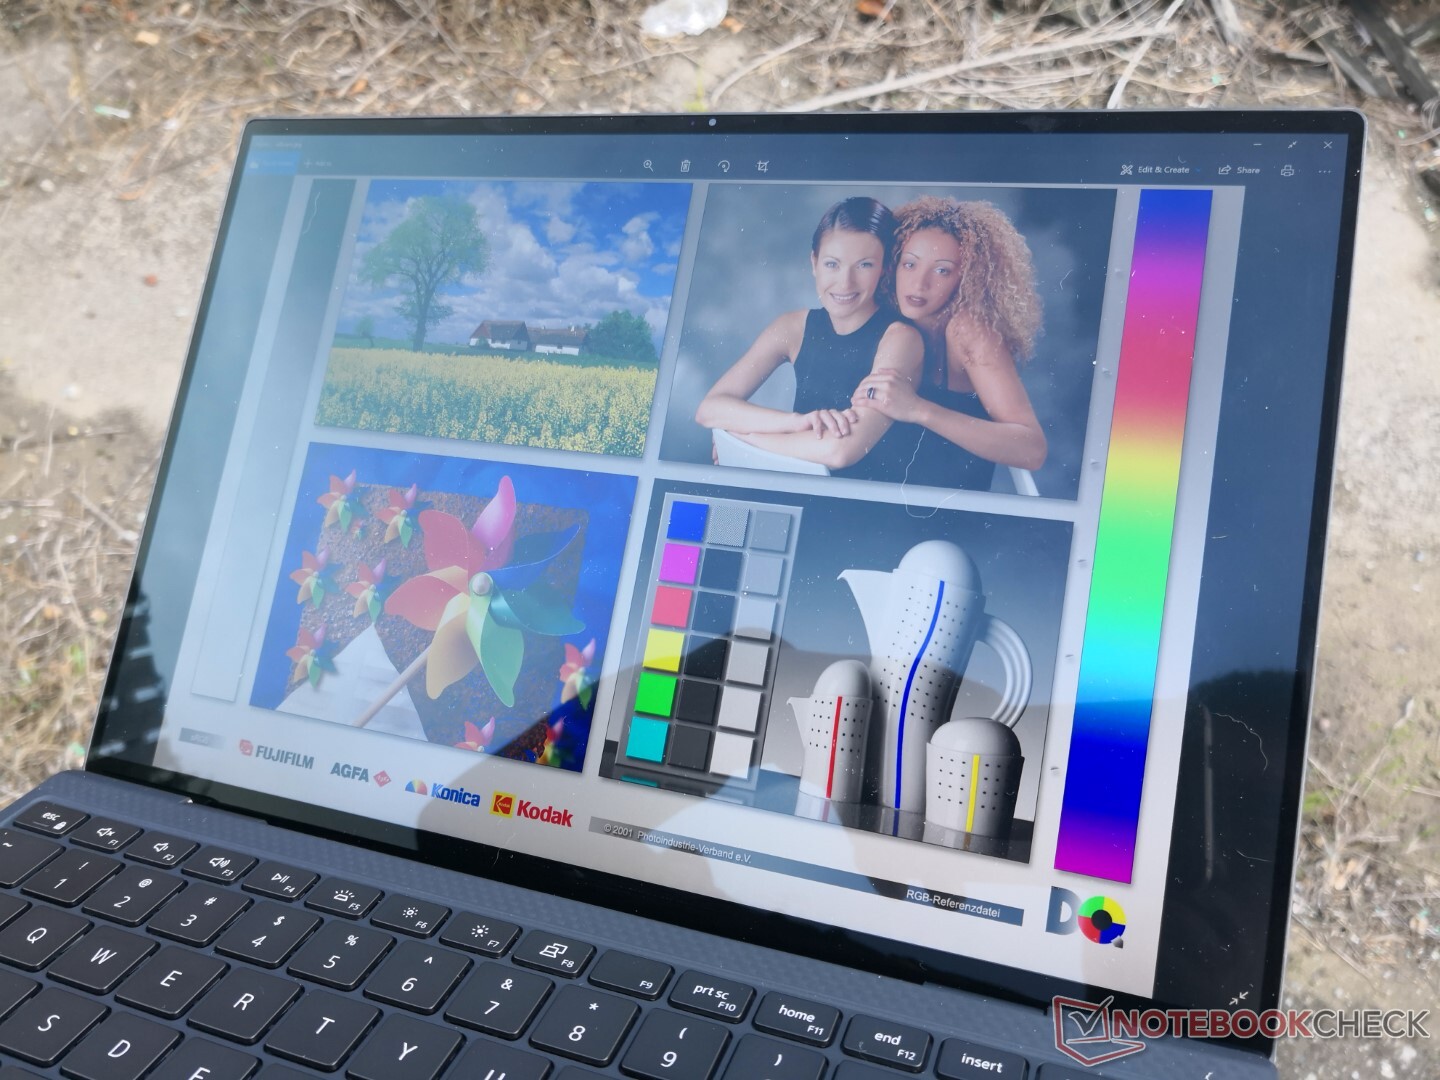
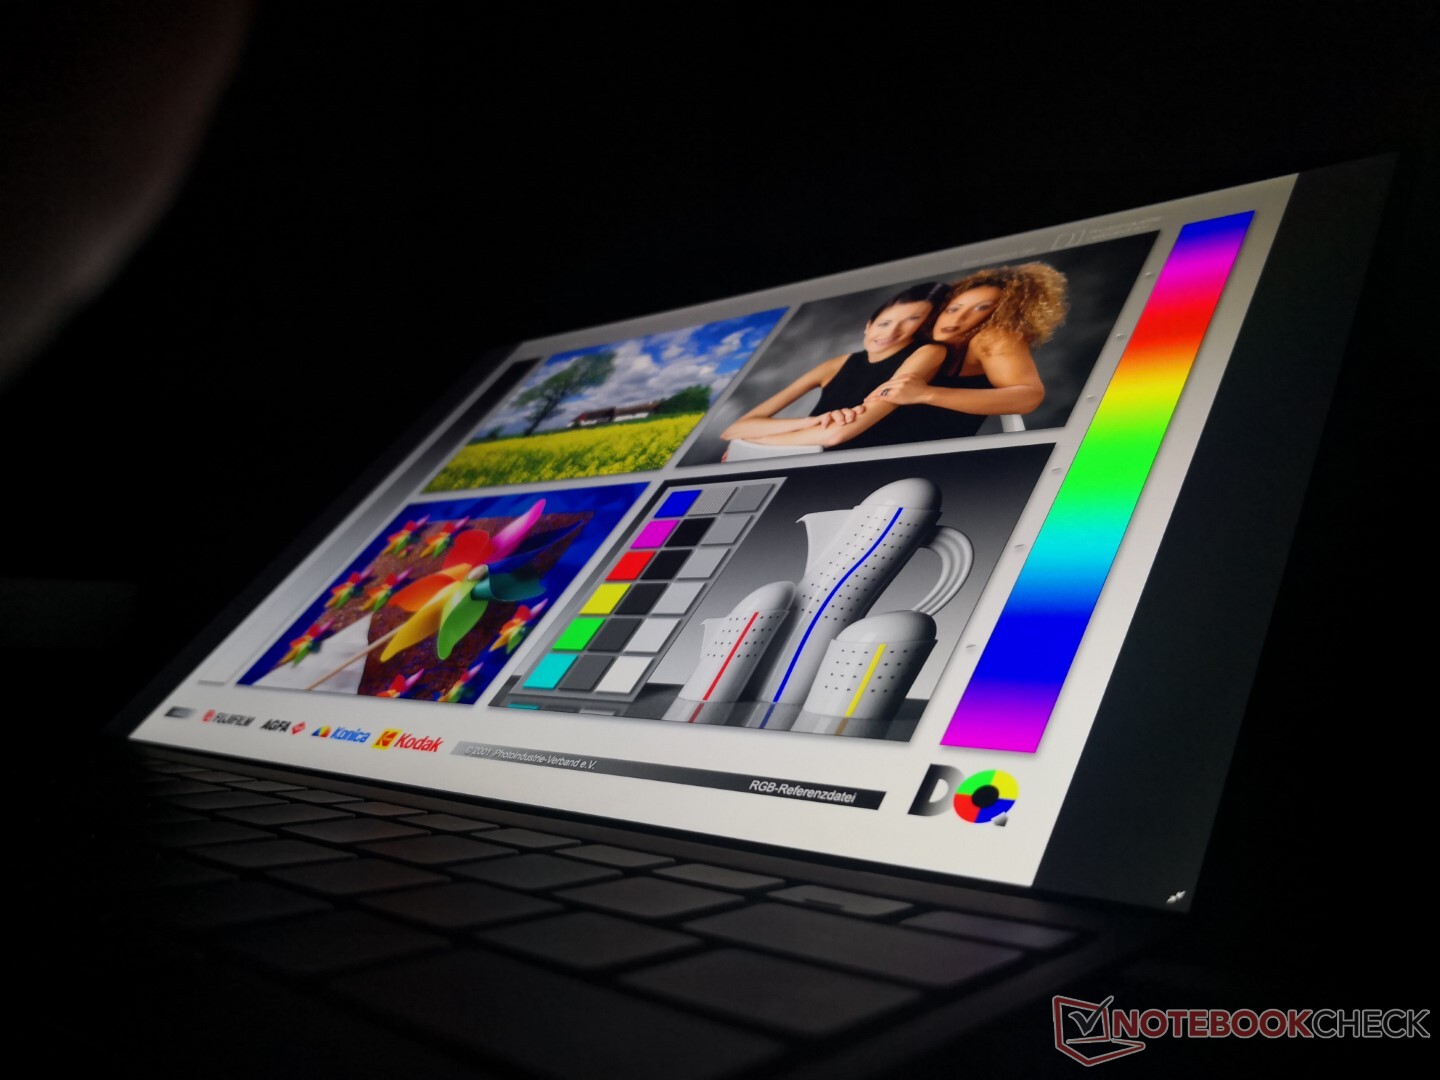
Outdoor visibility is not great if on a bright day due to the glossy panel. Unlike some older XPS 13 models, Dell offers no matte option for its XPS 13 9310 series. However, the display is generally bright enough for comfortable viewing if working under shade.
Performance
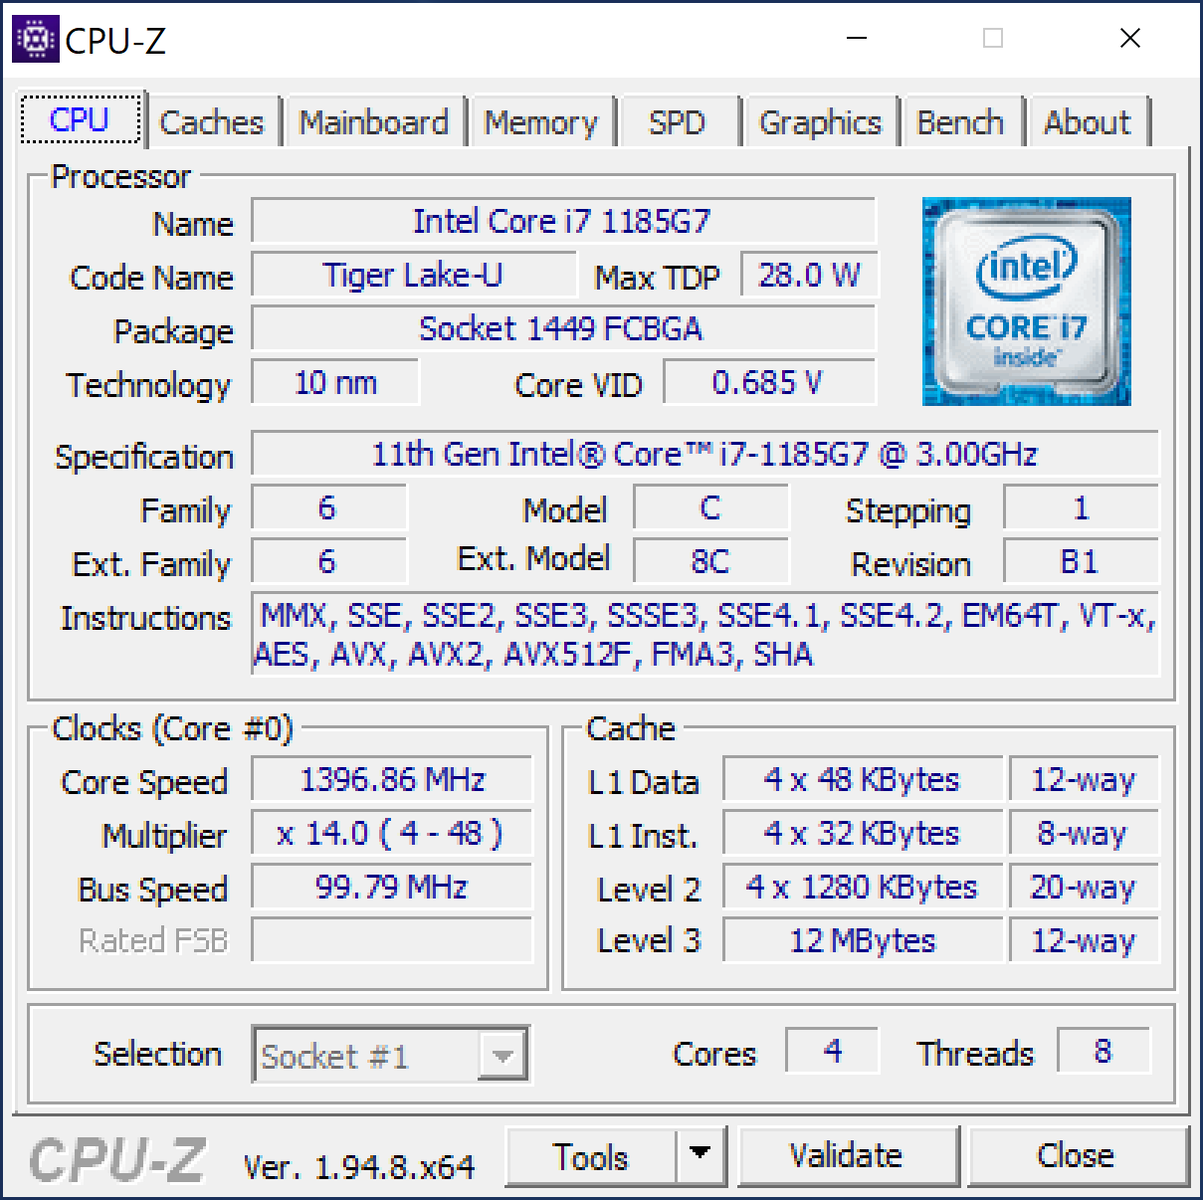
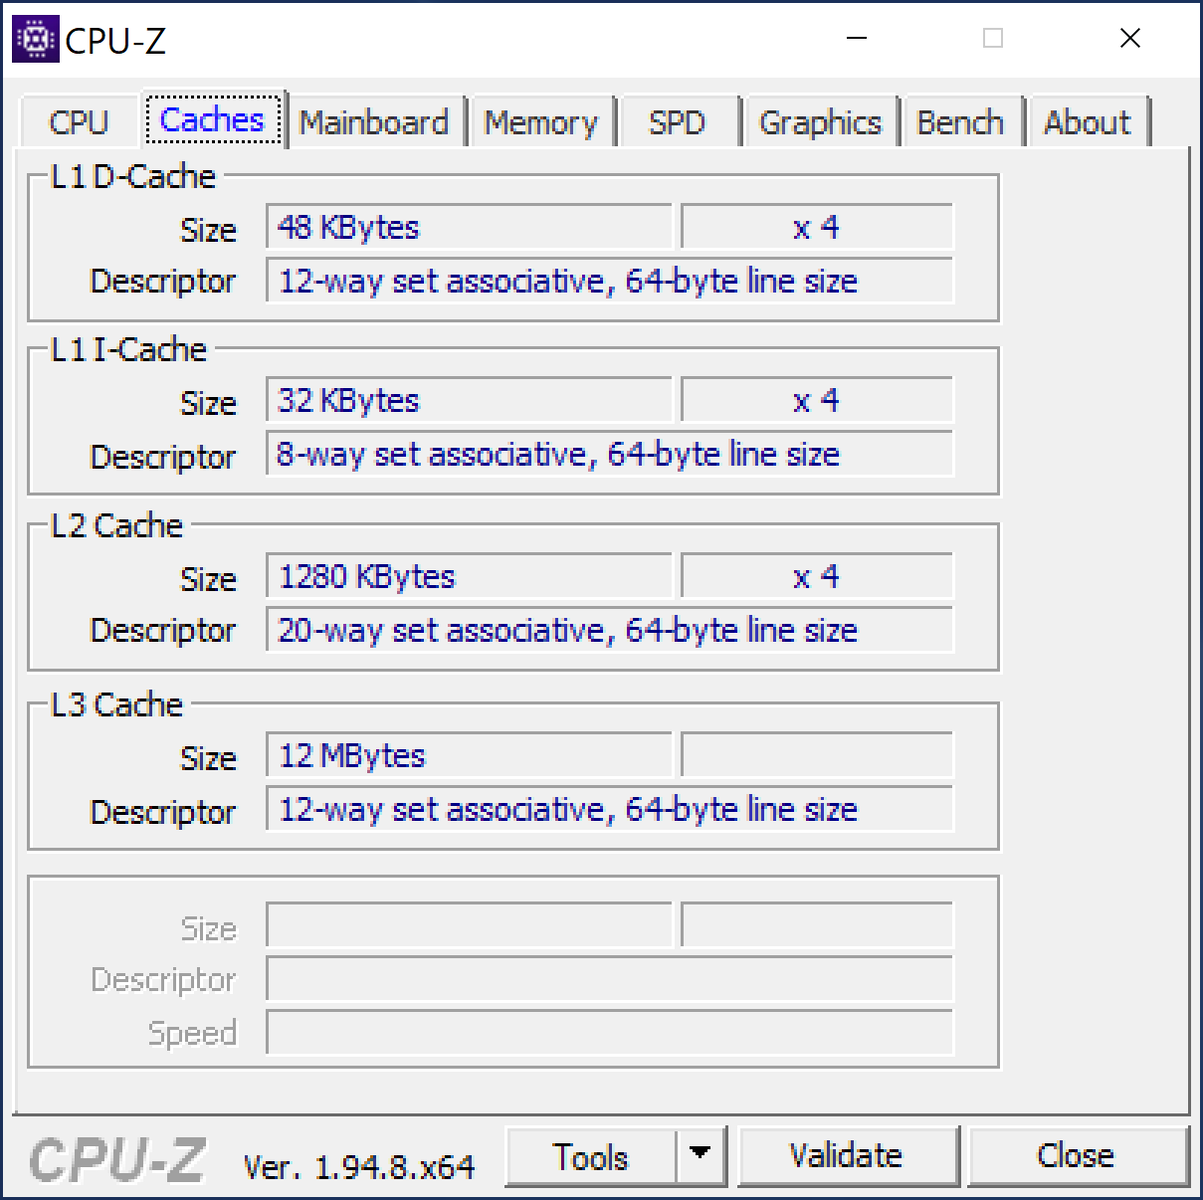
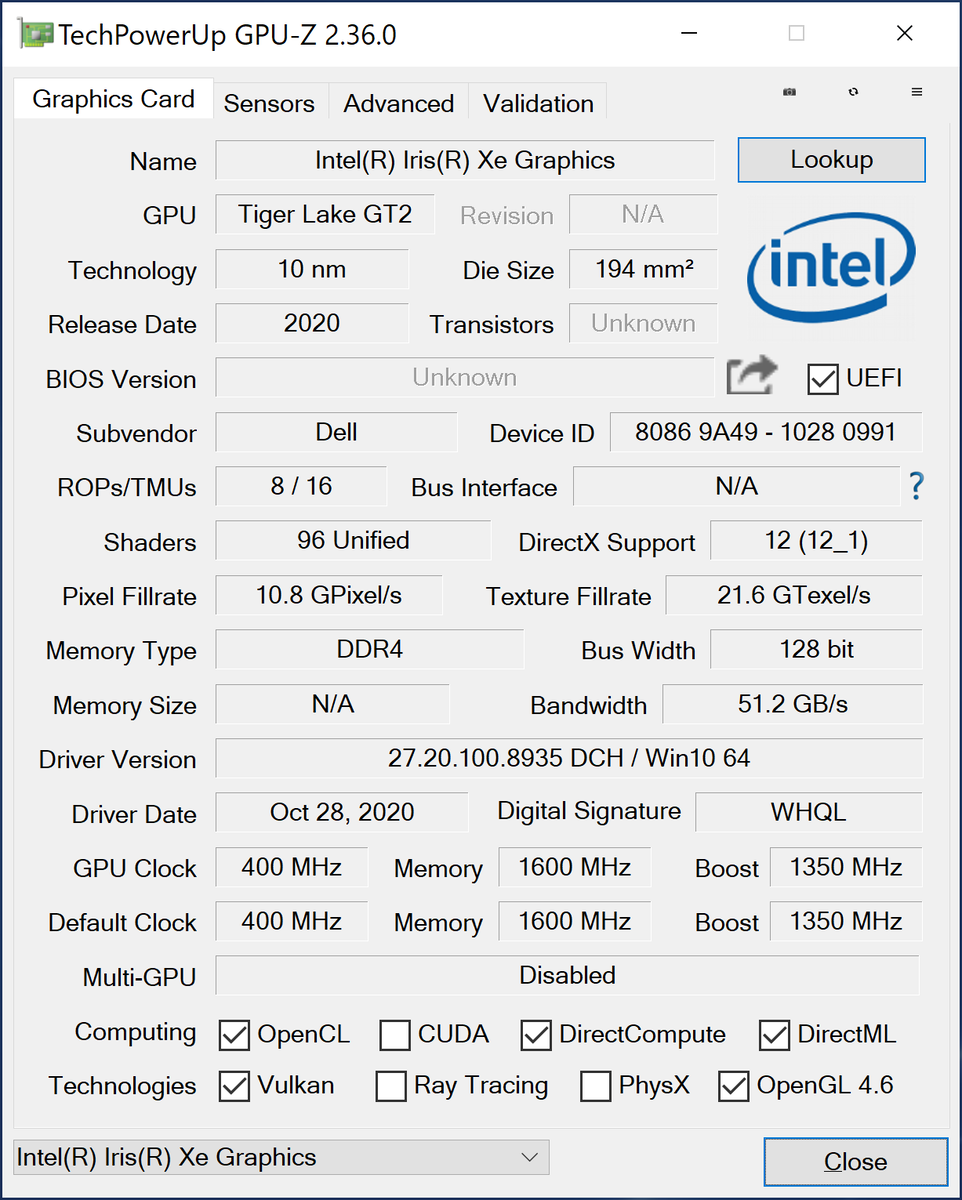
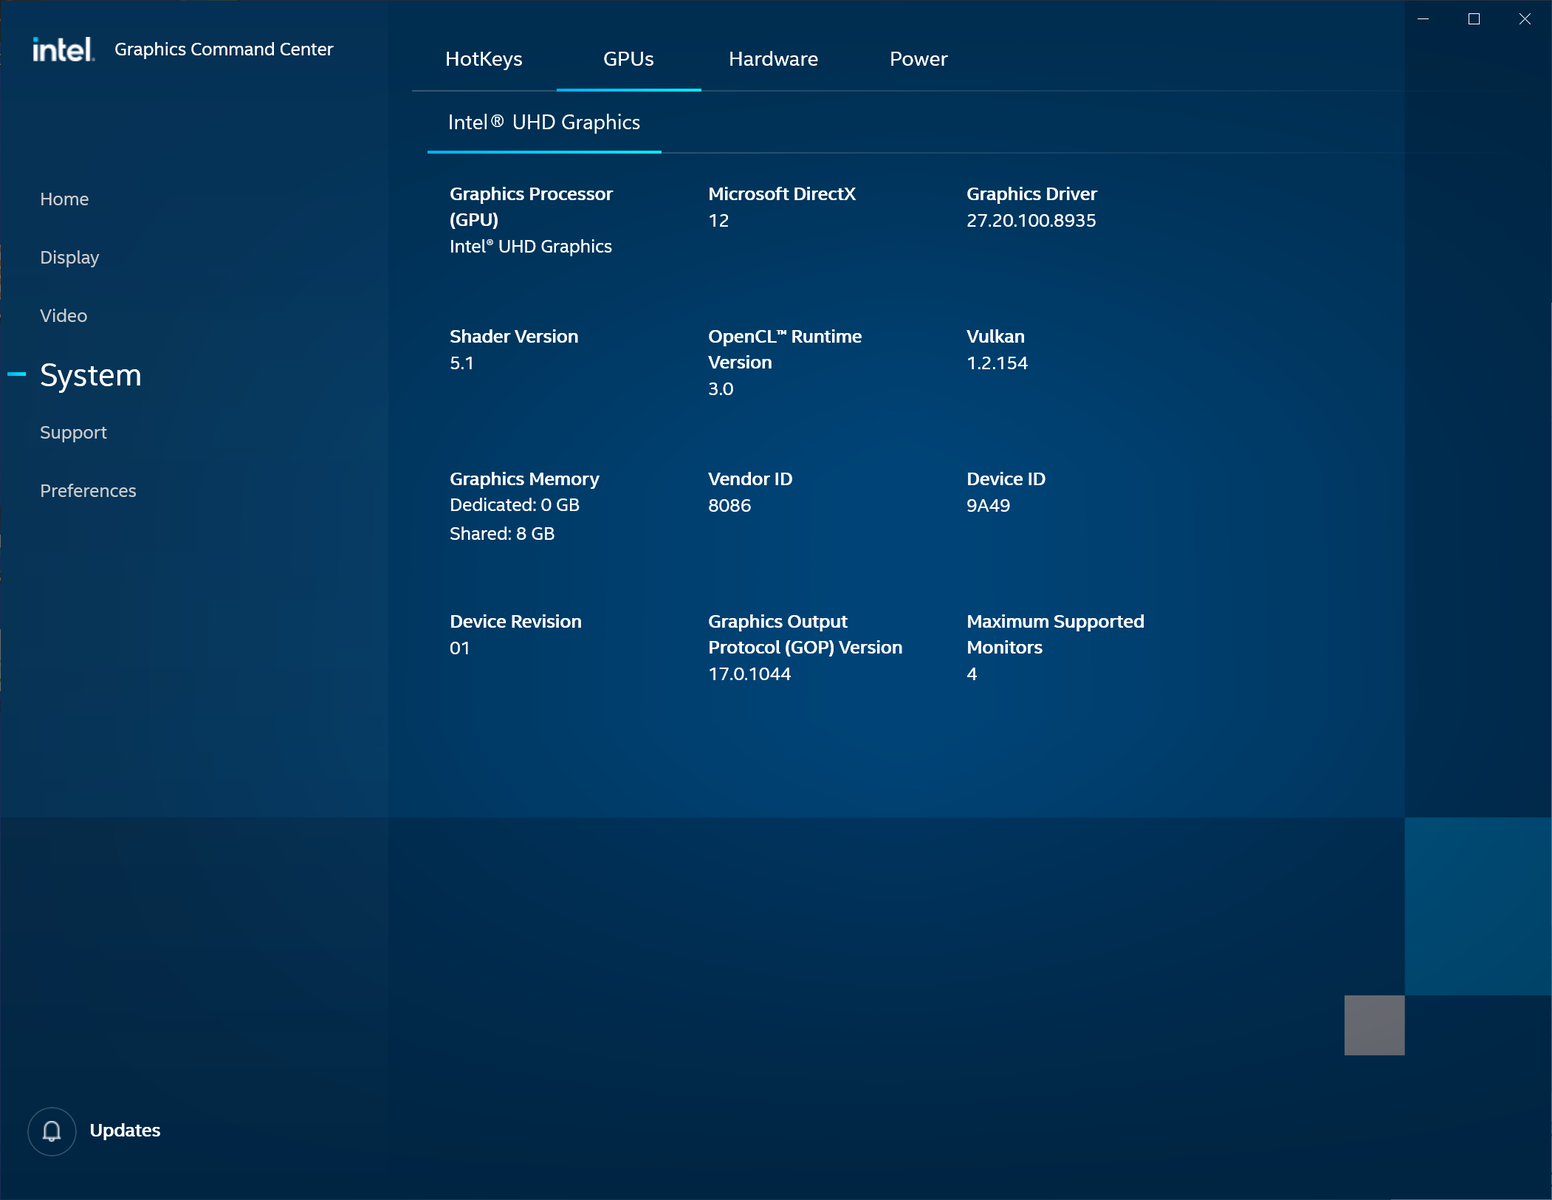
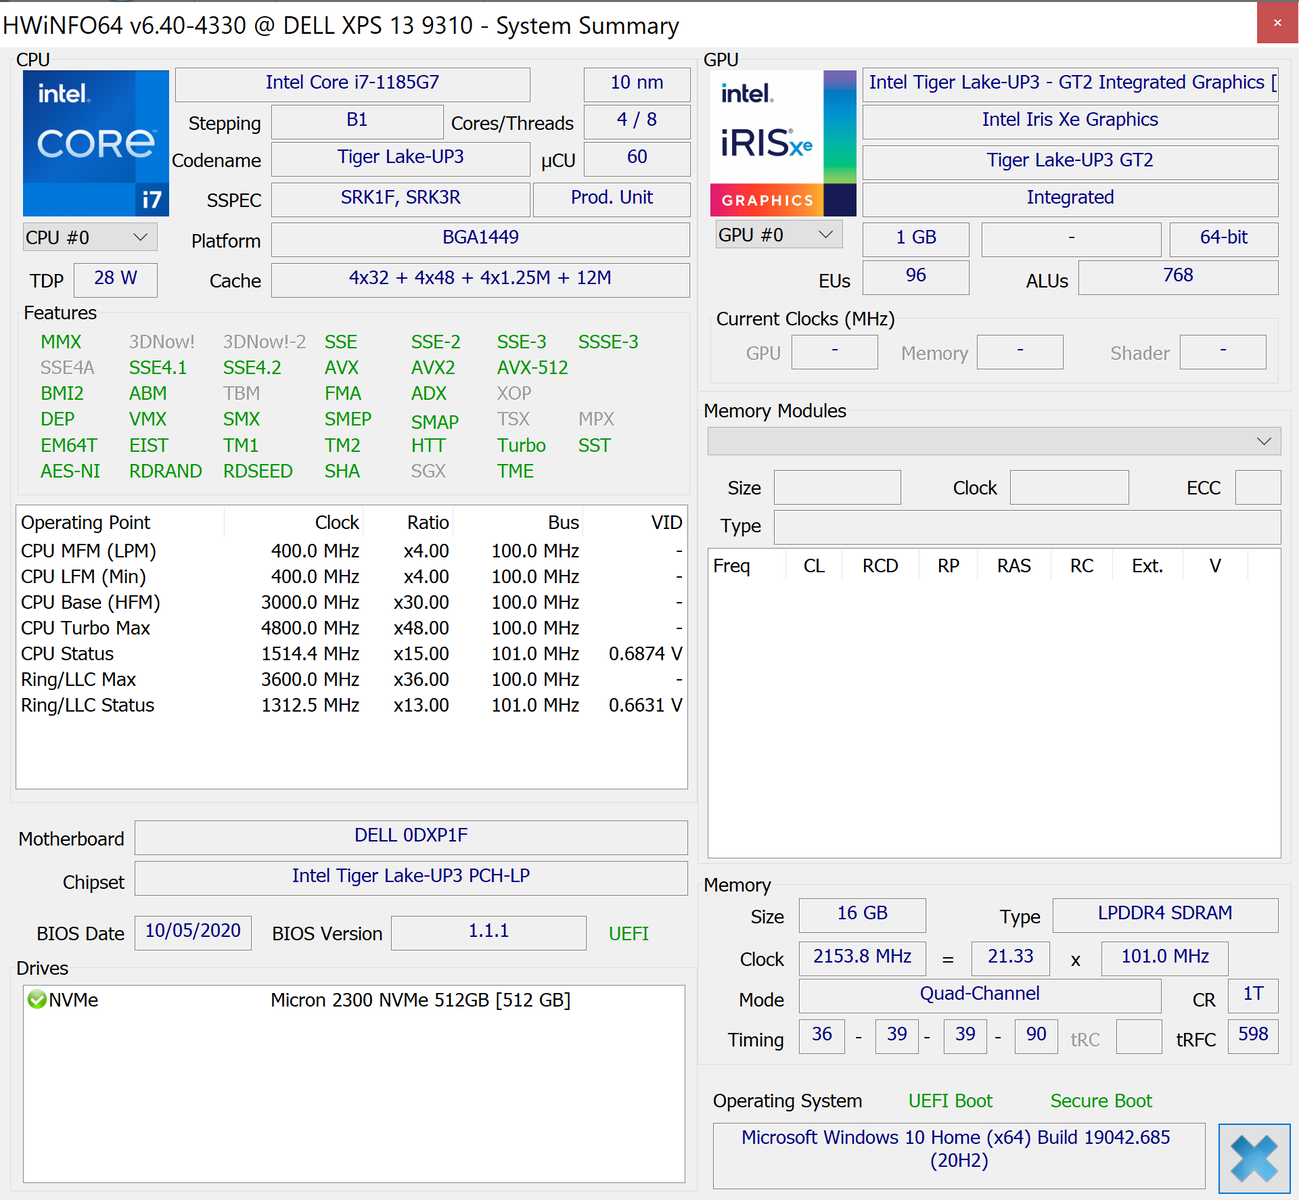
On paper, the Core i7-1185G7 has slightly faster base clock rates and Turbo Boost clock rates than the Core i7-1165G7 (3.0 to 4.8 GHz vs. 2.8 to 4.7 GHz). In practice, however, we're going to show that these printed specifications don't really mean much when both processors are at the mercy of the same chassis cooling solution. There are no other major differences between the two processors as their cache sizes, TDP range and core count are identical. GPU-Z reports some slight fillrate differences between the integrated Iris Xe GPU, but nothing significant.
We set our unit to Ultra Performance mode via the Dell Power Manager software prior to running any performance tests below for the best possible numbers. Owners should become familiar with this software since many XPS-specific options are found here.
Processor
Much like what we observed between the XPS 15 Core i7-8750H and XPS 15 Core i9-8950HK, performance differences between our XPS 13 Core i7-1185G7 and Core i7-1165G7 configurations are minimal at best. Benchmark results are almost identical between them to the point where the Core i7-1165G7 can sometimes even edge out ahead of the Core i7-1185G7 like in HWBOT x265 encoding. When running CineBench R15 xT in a loop, the same clock rate fluctuations occur for unsteady scores due to Dell's Dynamic Power Policy implementation.
It's too bad that the XPS 13 doesn't offer AMD Ryzen options as the Ryzen 5 4500U or Ryzen 7 4700U have even faster multi-thread performance than these Intel Tiger Lake CPUs albeit at the cost of slower single-thread performance.
Cinebench R15: CPU Multi 64Bit | CPU Single 64Bit
Blender: v2.79 BMW27 CPU
7-Zip 18.03: 7z b 4 -mmt1 | 7z b 4
Geekbench 5.5: Single-Core | Multi-Core
HWBOT x265 Benchmark v2.2: 4k Preset
LibreOffice : 20 Documents To PDF
R Benchmark 2.5: Overall mean
| LibreOffice / 20 Documents To PDF | |
| Dell XPS 13 9300 4K UHD | |
| Lenovo Yoga Slim 7 14ARE05 82A20008GE | |
| HP Envy x360 13-ay0010nr | |
| Lenovo Yoga Slim 7-14ARE | |
| Huawei MateBook X Pro 2020 i7 | |
| Average Intel Core i7-1185G7 (41.3 - 61.7, n=26) | |
| Razer Book 13 FHD | |
| Asus Zenbook S UX393JA | |
| Dell XPS 13 9310 Core i7 4K | |
| Dell XPS 13 9310 Core i7 FHD | |
Cinebench R15: CPU Multi 64Bit | CPU Single 64Bit
Blender: v2.79 BMW27 CPU
7-Zip 18.03: 7z b 4 -mmt1 | 7z b 4
Geekbench 5.5: Single-Core | Multi-Core
HWBOT x265 Benchmark v2.2: 4k Preset
LibreOffice : 20 Documents To PDF
R Benchmark 2.5: Overall mean
* ... smaller is better
System Performance
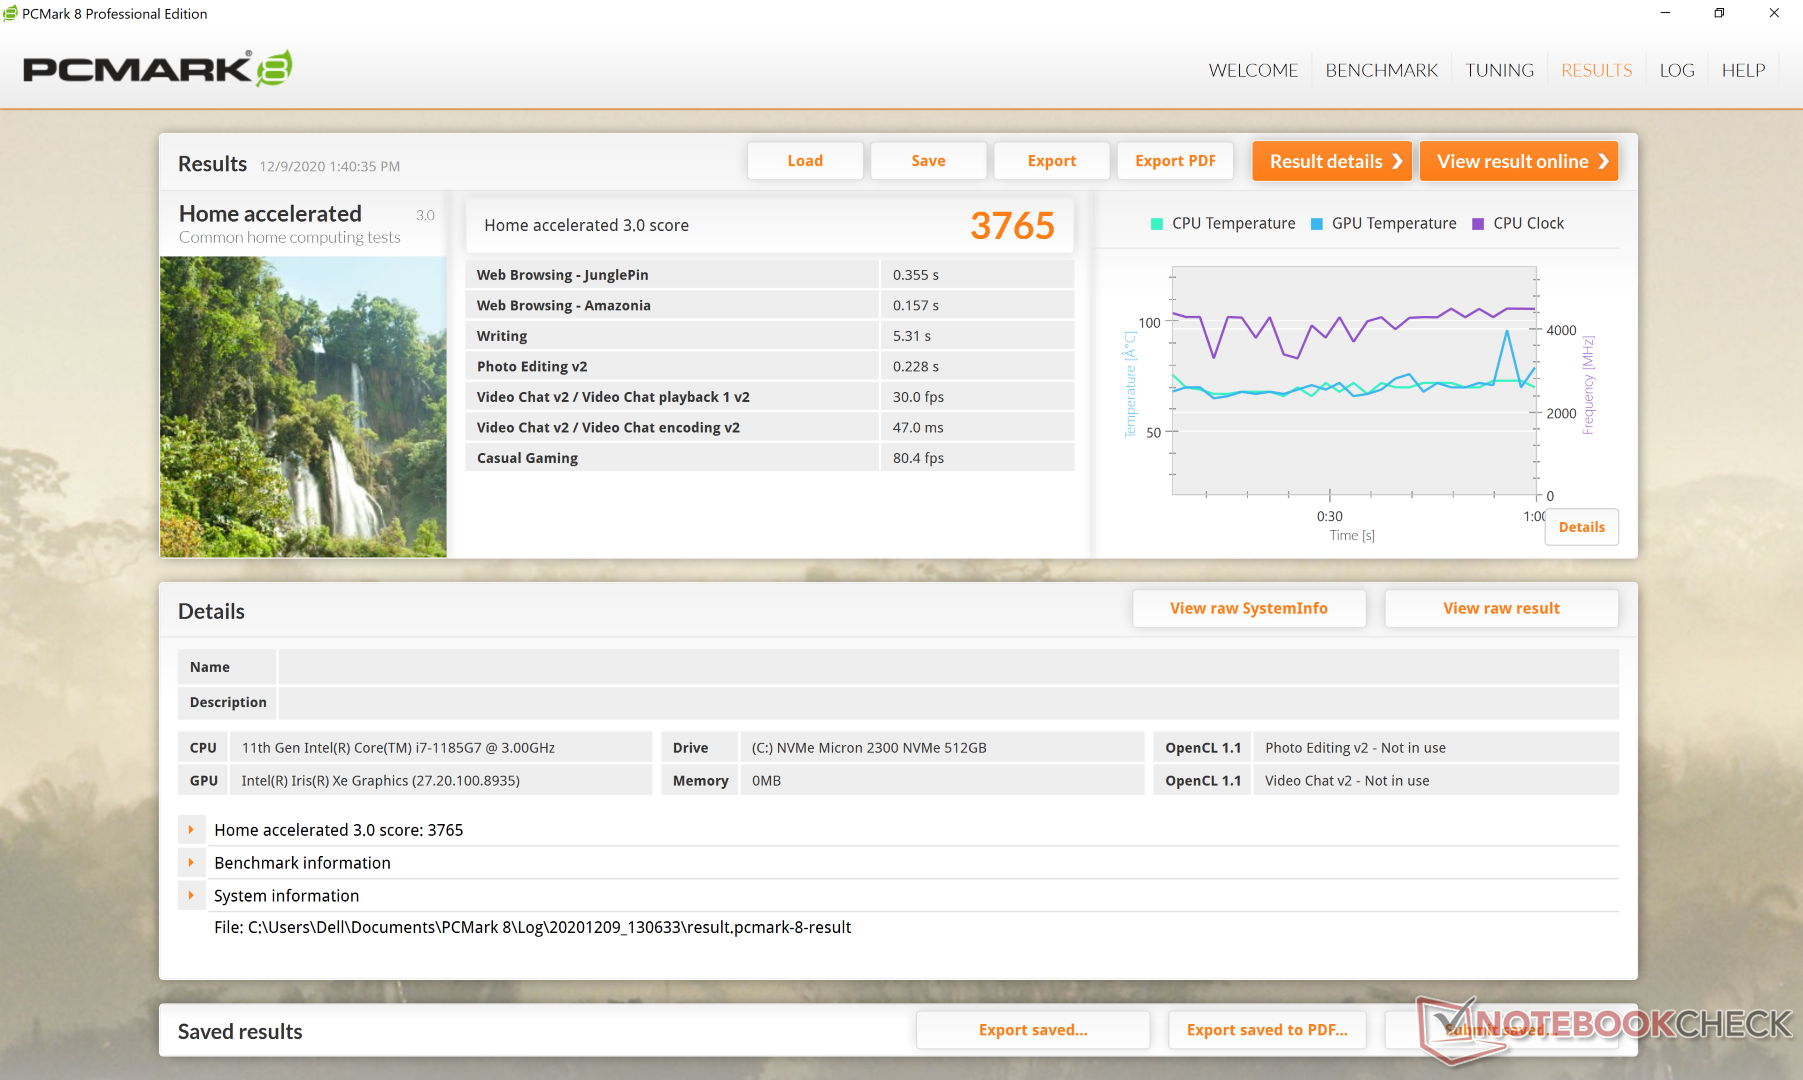
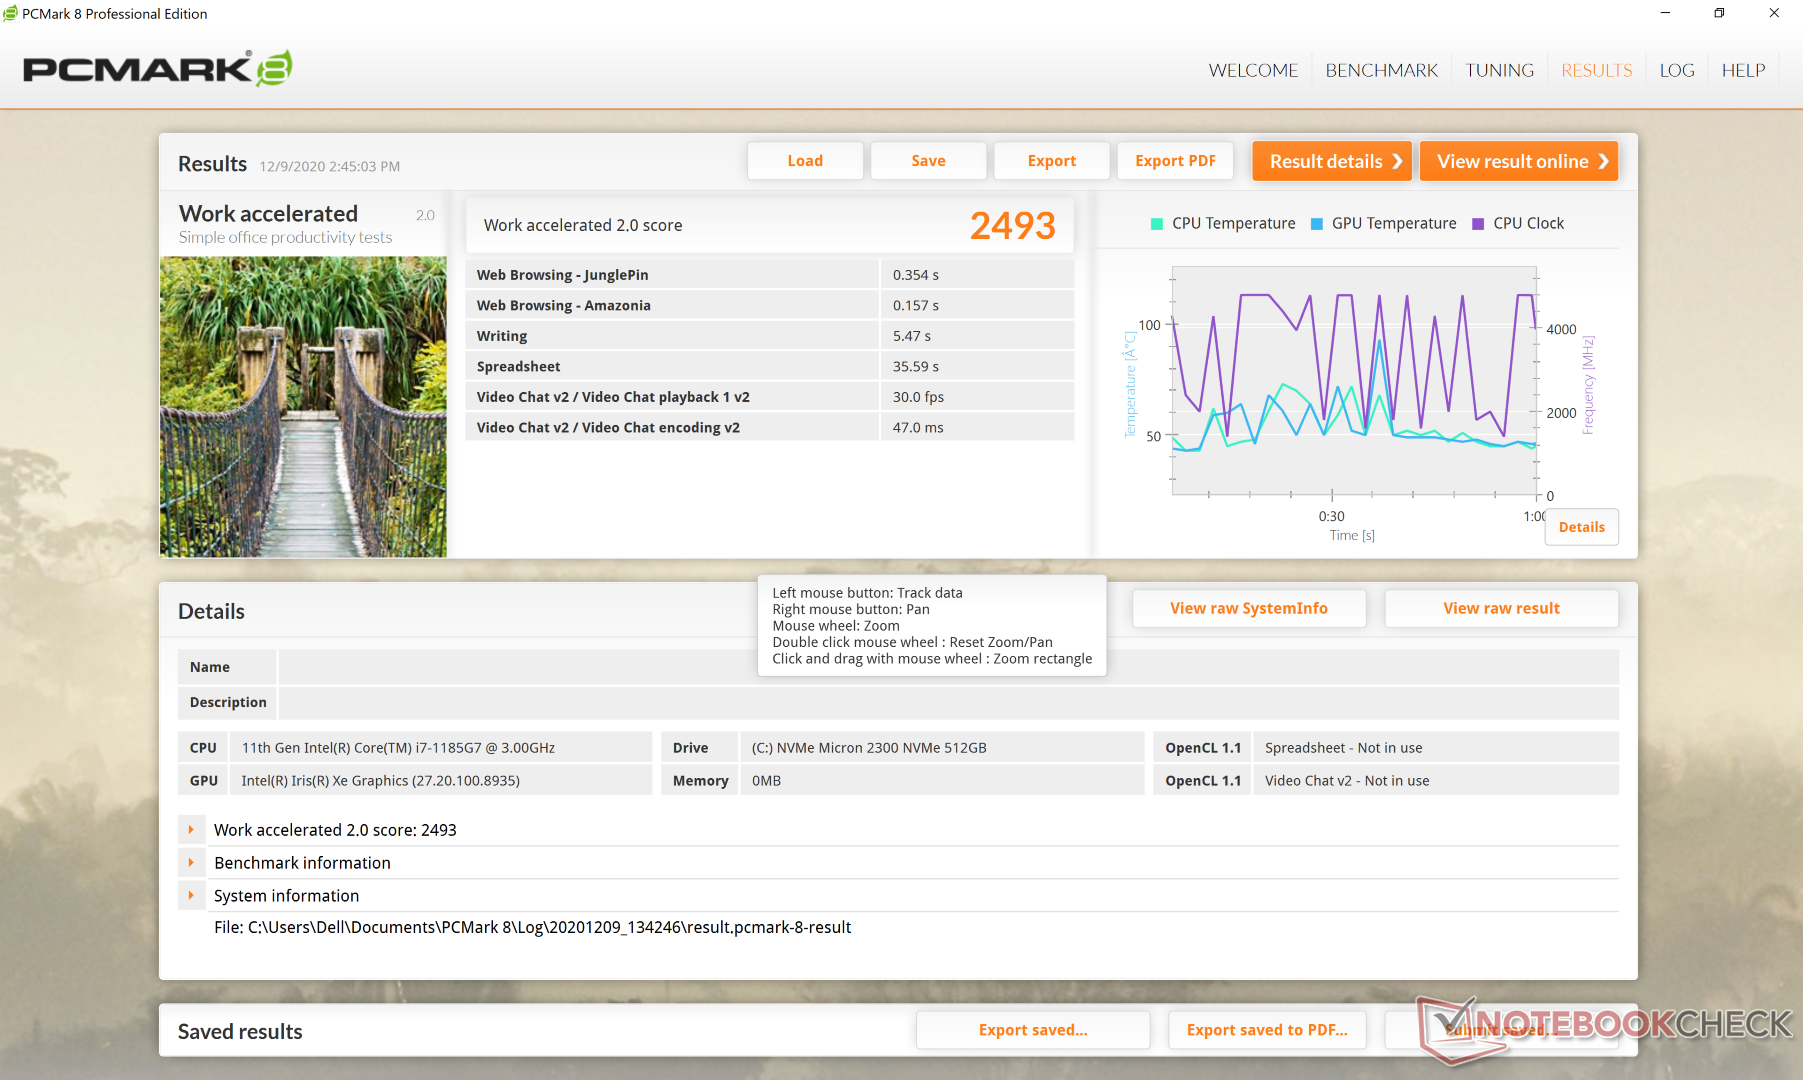
| PCMark 8 Home Score Accelerated v2 | 3765 points | |
| PCMark 8 Work Score Accelerated v2 | 2493 points | |
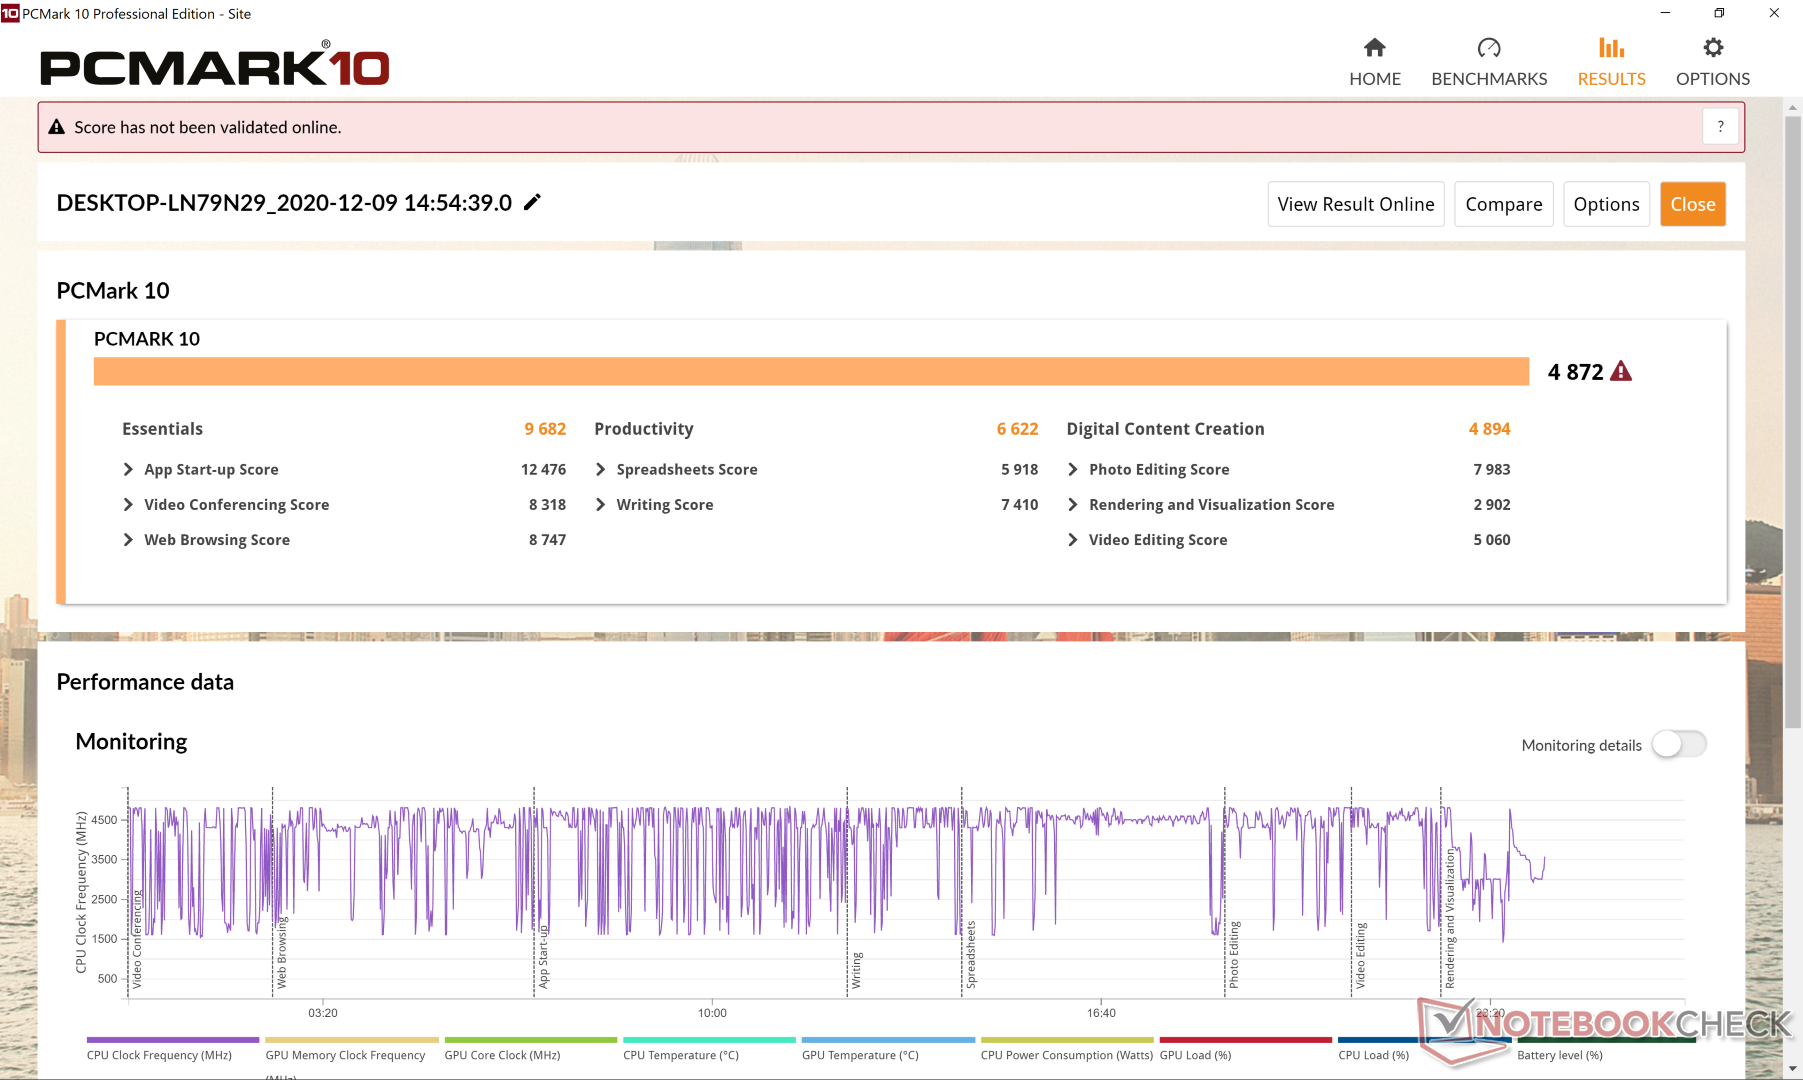
| PCMark 10 Score | 4872 points | |
Help | ||
DPC Latency
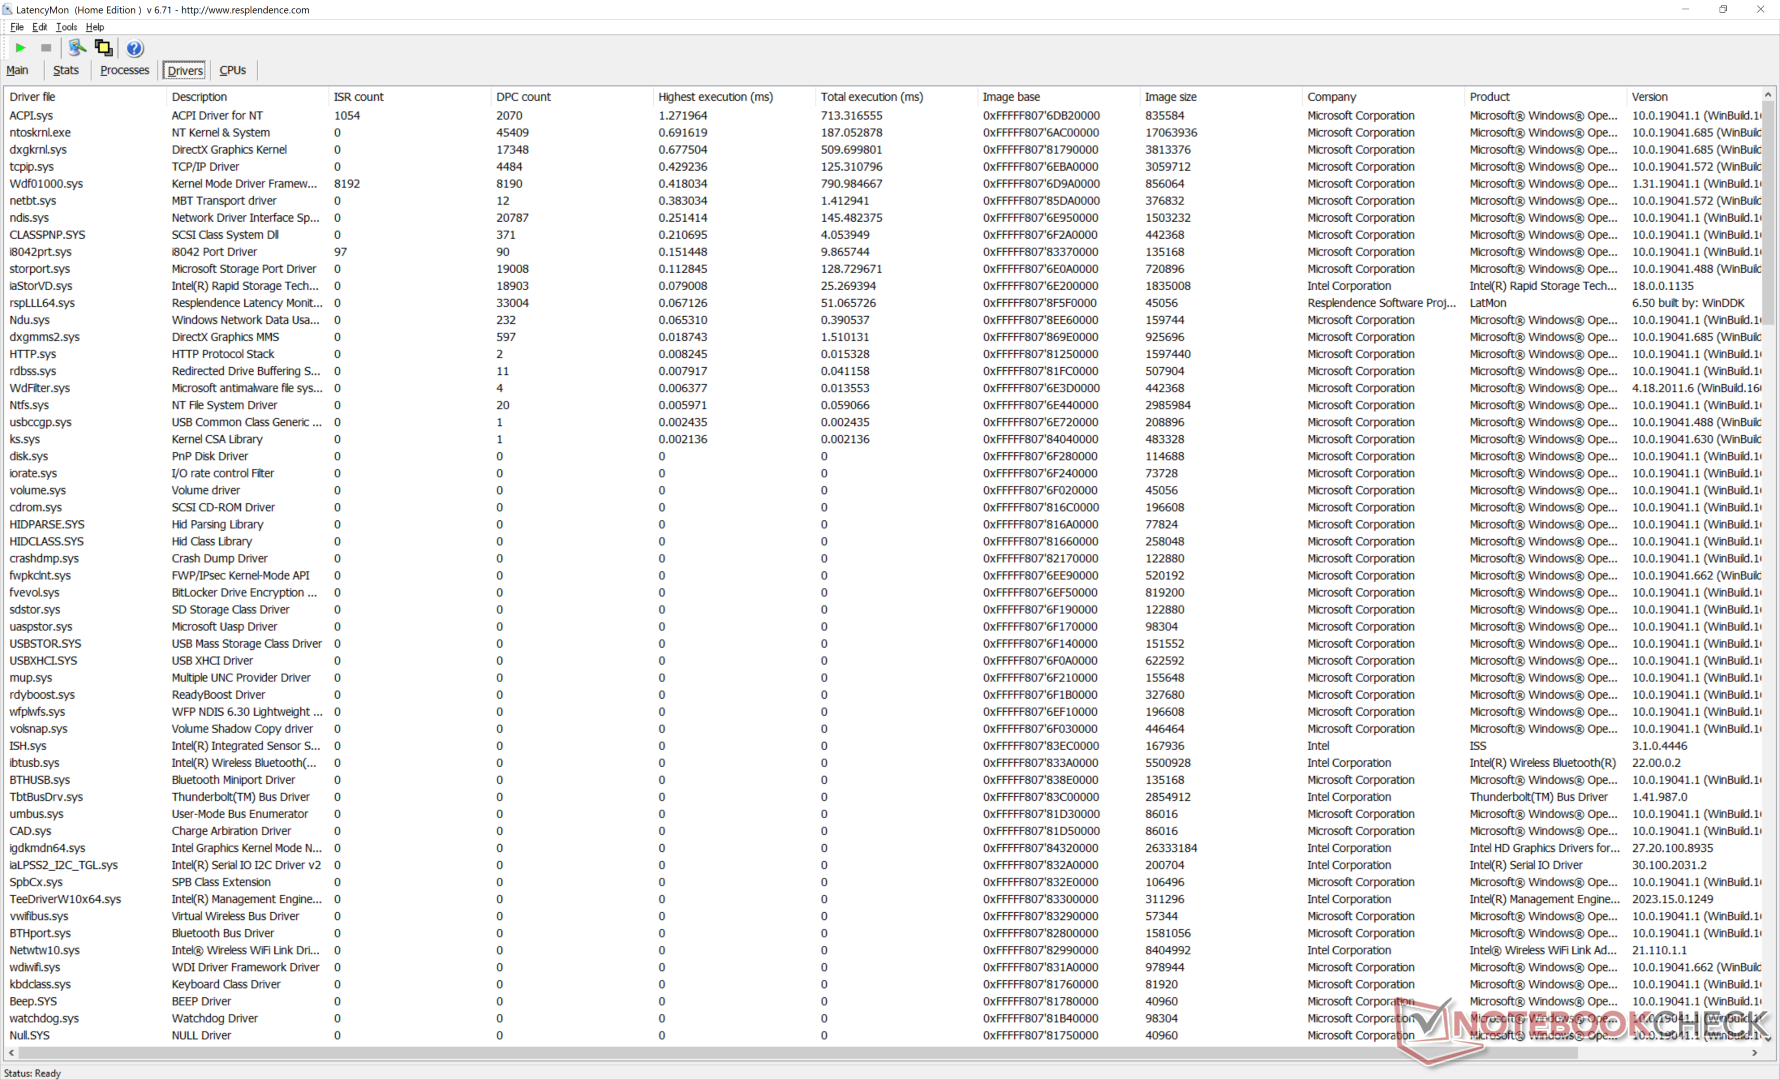
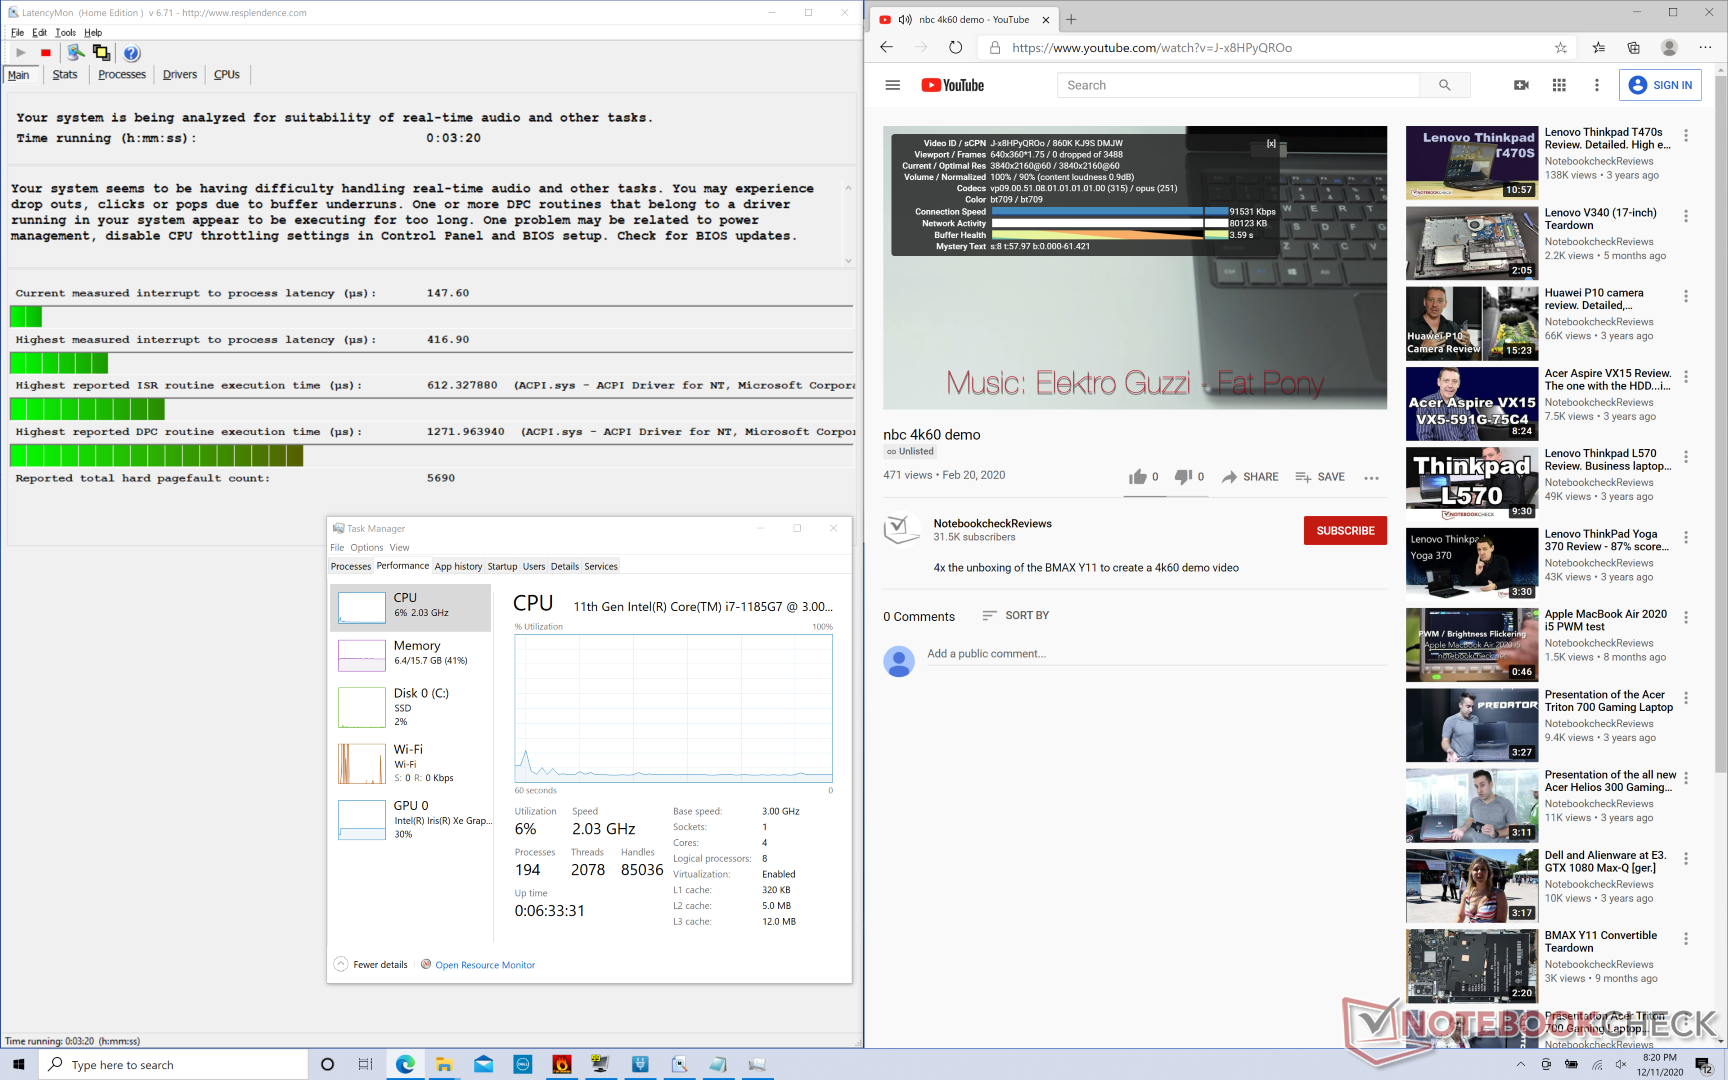
| DPC Latencies / LatencyMon - interrupt to process latency (max), Web, Youtube, Prime95 | |
| Dell XPS 13 9300 Core i7-1065G7 | |
| Asus Zenbook S UX393JA | |
| Lenovo Yoga Slim 7-14ARE | |
| Dell XPS 13 9310 Core i7 4K | |
| Dell XPS 13 9310 Core i7 FHD | |
* ... smaller is better
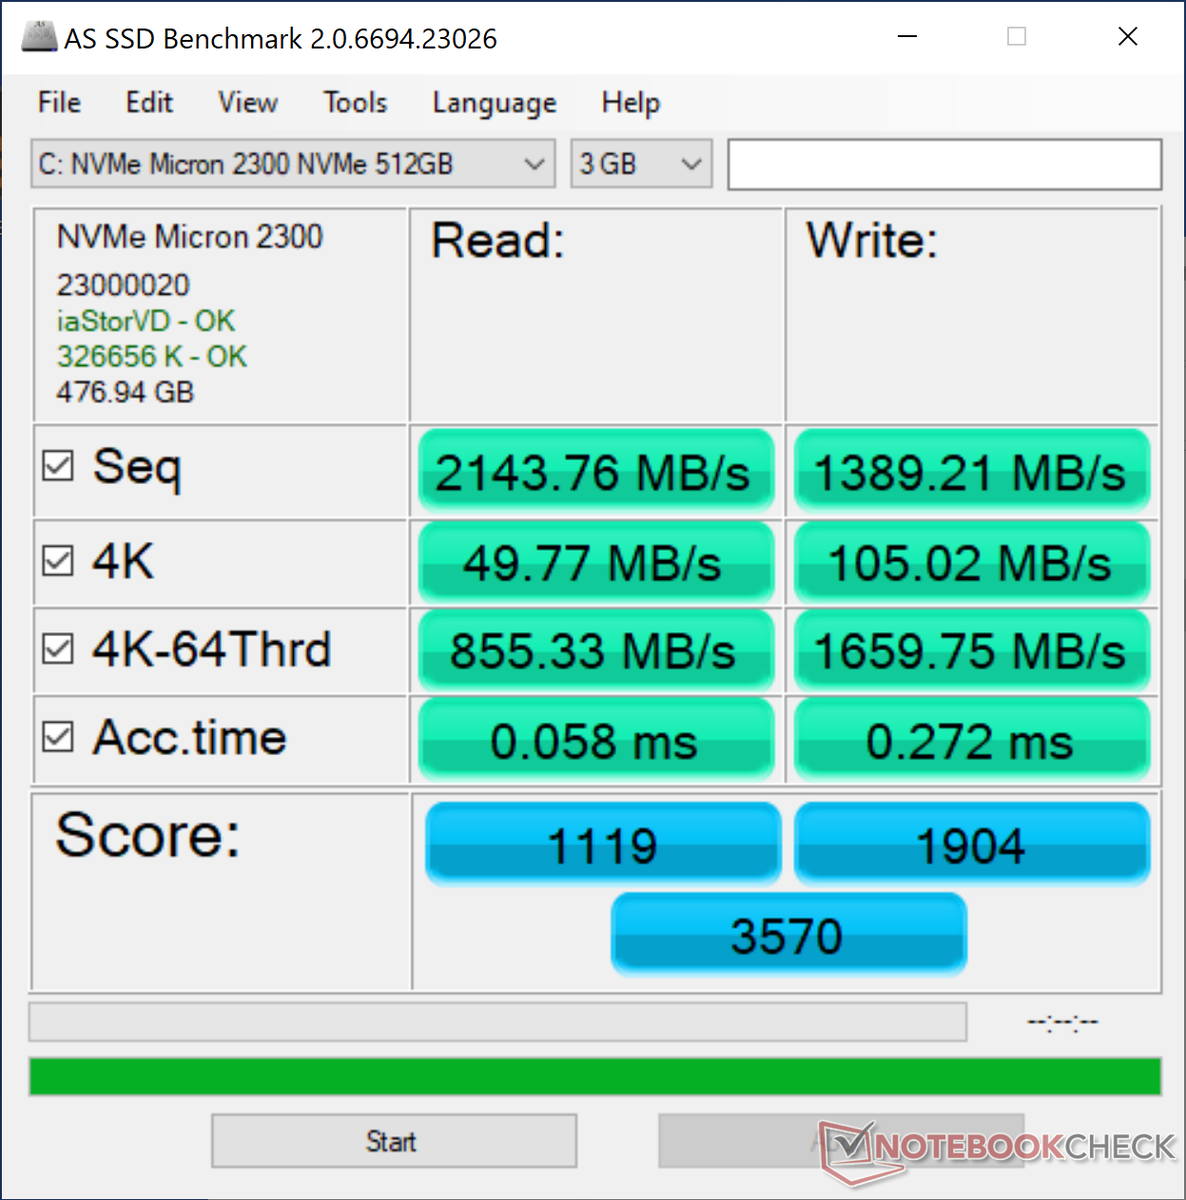
Storage Devices
| Dell XPS 13 9310 Core i7 4K Micron 2300 512GB MTFDHBA512TDV | Asus Zenbook S UX393JA Intel SSD 660p 1TB SSDPEKNW010T8 | Huawei MateBook X Pro 2020 i7 Samsung PM981a MZVLB1T0HBLR | Dell XPS 13 9300 Core i7-1065G7 Intel SSDPEMKF512G8 NVMe SSD | Lenovo Yoga Slim 7-14ARE Samsung SSD PM981a MZVLB512HBJQ | HP Spectre x360 13-aw0013dx Intel Optane Memory H10 with Solid State Storage 32GB + 512GB HBRPEKNX0202A(L/H) | |
|---|---|---|---|---|---|---|
| AS SSD | -16% | 45% | -21% | 23% | -36% | |
| Seq Read (MB/s) | 2144 | 1405 -34% | 2737 28% | 1956 -9% | 1658 -23% | 1039 -52% |
| Seq Write (MB/s) | 1389 | 1062 -24% | 2530 82% | 1227 -12% | 2464 77% | 310.1 -78% |
| 4K Read (MB/s) | 49.77 | 50.8 2% | 54 8% | 63 27% | 59.5 20% | 76 53% |
| 4K Write (MB/s) | 105 | 124.9 19% | 152.5 45% | 156.6 49% | 128.6 22% | 118 12% |
| 4K-64 Read (MB/s) | 855 | 590 -31% | 2011 135% | 475.6 -44% | 1576 84% | 371.8 -57% |
| 4K-64 Write (MB/s) | 1660 | 840 -49% | 1260 -24% | 539 -68% | 1986 20% | 469.5 -72% |
| Access Time Read * (ms) | 0.058 | 0.041 29% | 0.066 -14% | 0.042 28% | 0.049 16% | 0.067 -16% |
| Access Time Write * (ms) | 0.272 | 0.118 57% | 0.024 91% | 0.105 61% | 0.087 68% | 0.138 49% |
| Score Read (Points) | 1119 | 781 -30% | 2339 109% | 734 -34% | 1802 61% | 552 -51% |
| Score Write (Points) | 1904 | 1071 -44% | 1666 -12% | 818 -57% | 2361 24% | 618 -68% |
| Score Total (Points) | 3570 | 2251 -37% | 5191 45% | 1915 -46% | 5133 44% | 1448 -59% |
| Copy ISO MB/s (MB/s) | 1929 | 1459 -24% | 1022 -47% | 1588 -18% | 764 -60% | |
| Copy Program MB/s (MB/s) | 1012 | 600 -41% | 302.8 -70% | 550 -46% | 465.8 -54% | |
| Copy Game MB/s (MB/s) | 1737 | 1411 -19% | 491.4 -72% | 1329 -23% | 764 -56% | |
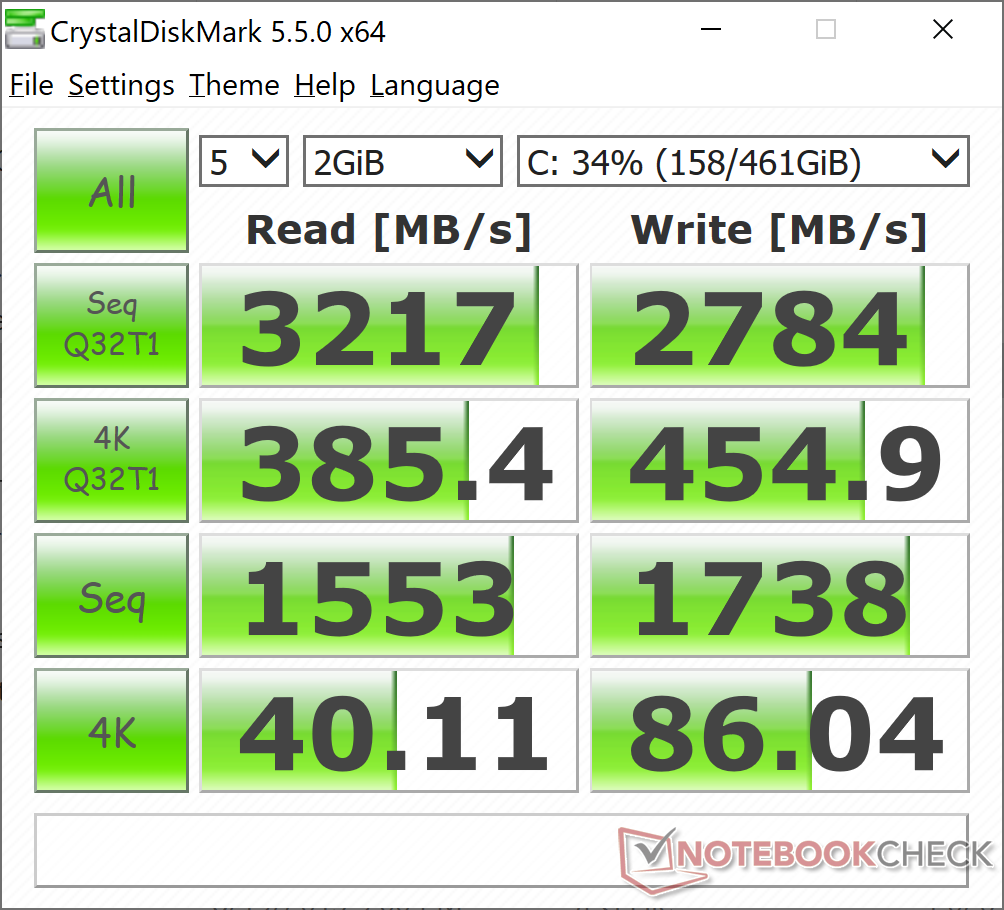
| CrystalDiskMark 5.2 / 6 | -6% | 24% | 27% | 35% | 6% | |
| Write 4K (MB/s) | 86 | 129.5 51% | 165.6 93% | 186.8 117% | 146.1 70% | 112.6 31% |
| Read 4K (MB/s) | 40.11 | 54 35% | 50.2 25% | 71.4 78% | 47.18 18% | 131 227% |
| Write Seq (MB/s) | 1738 | 1265 -27% | 1905 10% | 1203 -31% | 2896 67% | 458.9 -74% |
| Read Seq (MB/s) | 1553 | 1410 -9% | 1669 7% | 2600 67% | 2754 77% | 1355 -13% |
| Write 4K Q32T1 (MB/s) | 454.9 | 420.3 -8% | 474.6 4% | 514 13% | 425.8 -6% | 341.3 -25% |
| Read 4K Q32T1 (MB/s) | 385.4 | 357.7 -7% | 508 32% | 570 48% | 514 33% | 320.6 -17% |
| Write Seq Q32T1 (MB/s) | 2784 | 1799 -35% | 3007 8% | 786 -72% | 2989 7% | 1219 -56% |
| Read Seq Q32T1 (MB/s) | 3217 | 1616 -50% | 3556 11% | 2947 -8% | 3568 11% | 2462 -23% |
| Total Average (Program / Settings) | -11% /
-13% | 35% /
36% | 3% /
-4% | 29% /
27% | -15% /
-21% |
* ... smaller is better

Disk Throttling: DiskSpd Read Loop, Queue Depth 8
GPU Performance
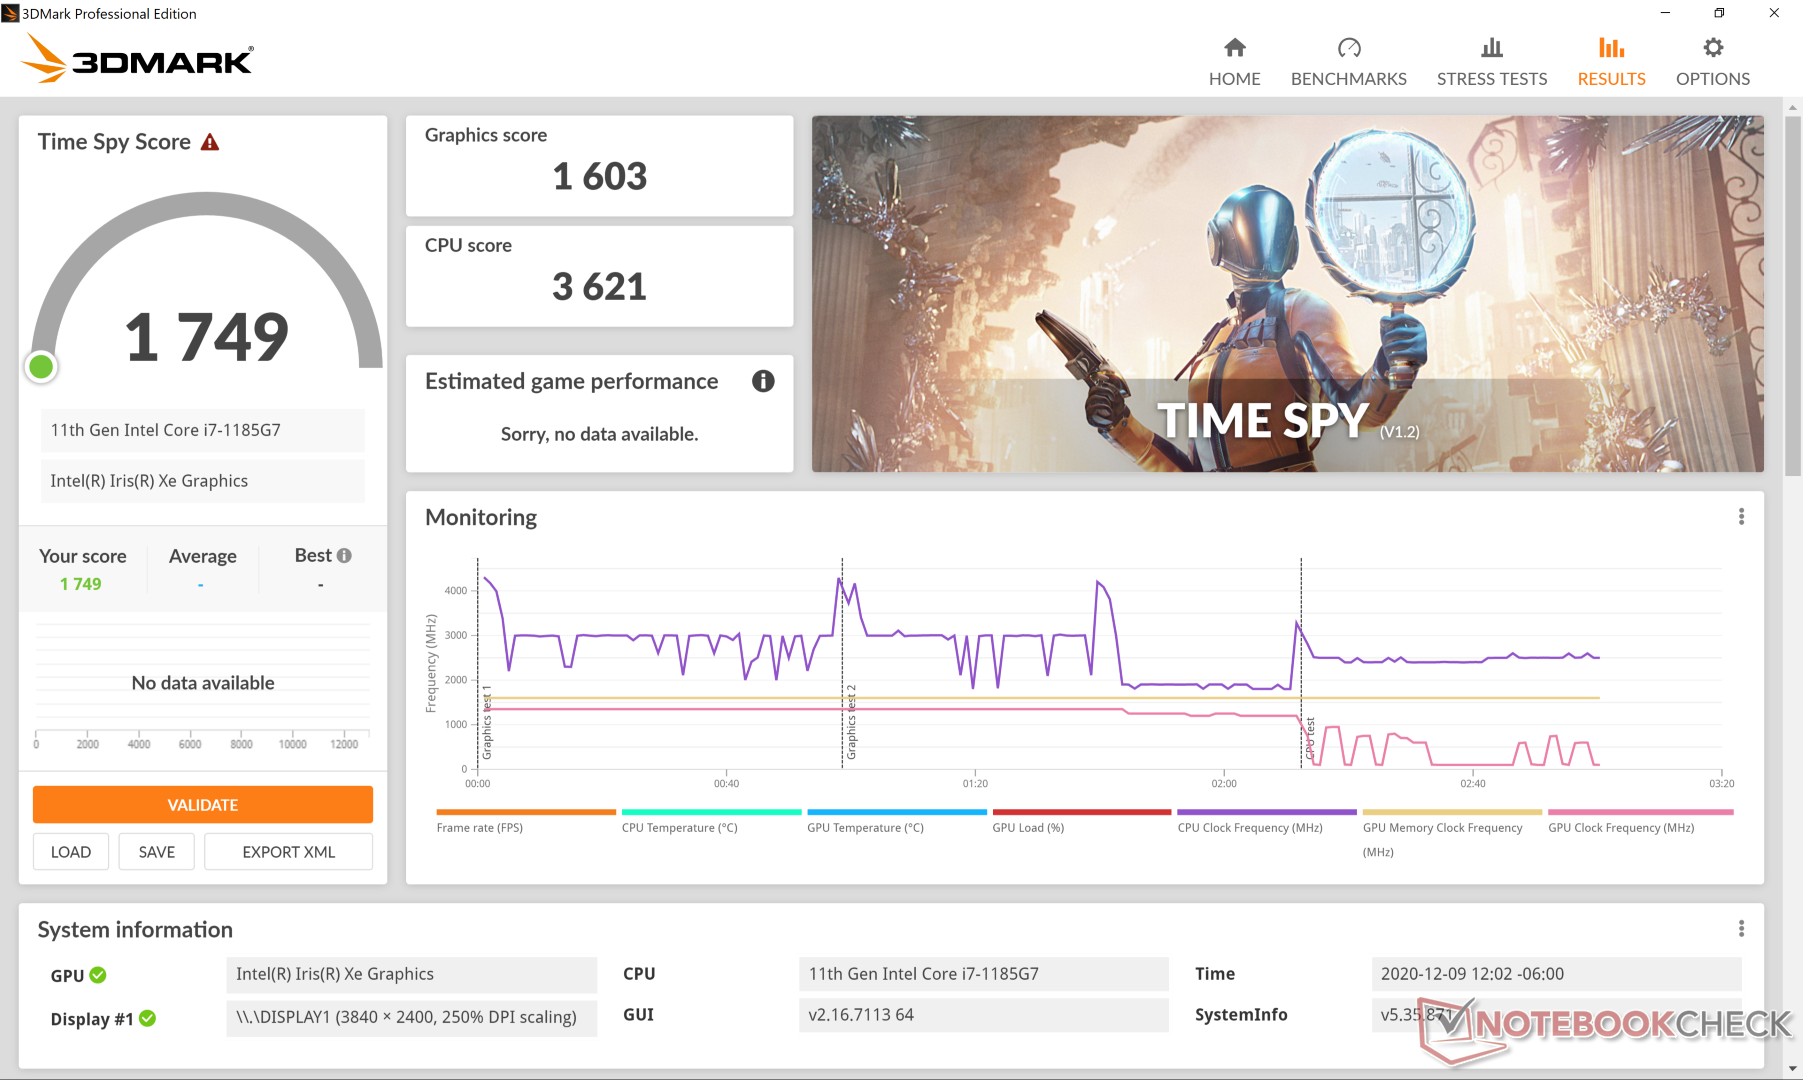
Strangely, 3DMark results are consistently higher than what we recorded on the XPS 13 Core i7-1165G7 even though games seem to run a bit faster on the latter configuration. Time Spy graphics, for example, is 30 percent higher for our XPS 13 Core i7-1185G7 SKU while frame rates when running games like DOTA 2, Final Fantasy XV, and GTA V are a few frames lower than on the XPS 13 Core i7-1165G7. We don't have a firm explanation on the discrepancies, but they do mean that users should expect about the same graphics performance as the XPS 13 Core i7-1165G7 in more real-world scenarios outside of 3DMark. We suspect that the fluctuating clock rates and differences in cold state prior to running the tests may have influenced the final scores.
Idling on Witcher 3 at low settings shows the same sinusoidal fluctuations in frame rates much like what we observed on the XPS 13 9310 Core i7-1165G7 and CineBench R15 xT loop test above. In this example, frame rates would cycle between 50 FPS and 90 FPS due to the cycling clock rates.
See our dedicated page on the Iris Xe for more technical information and benchmark comparisons.
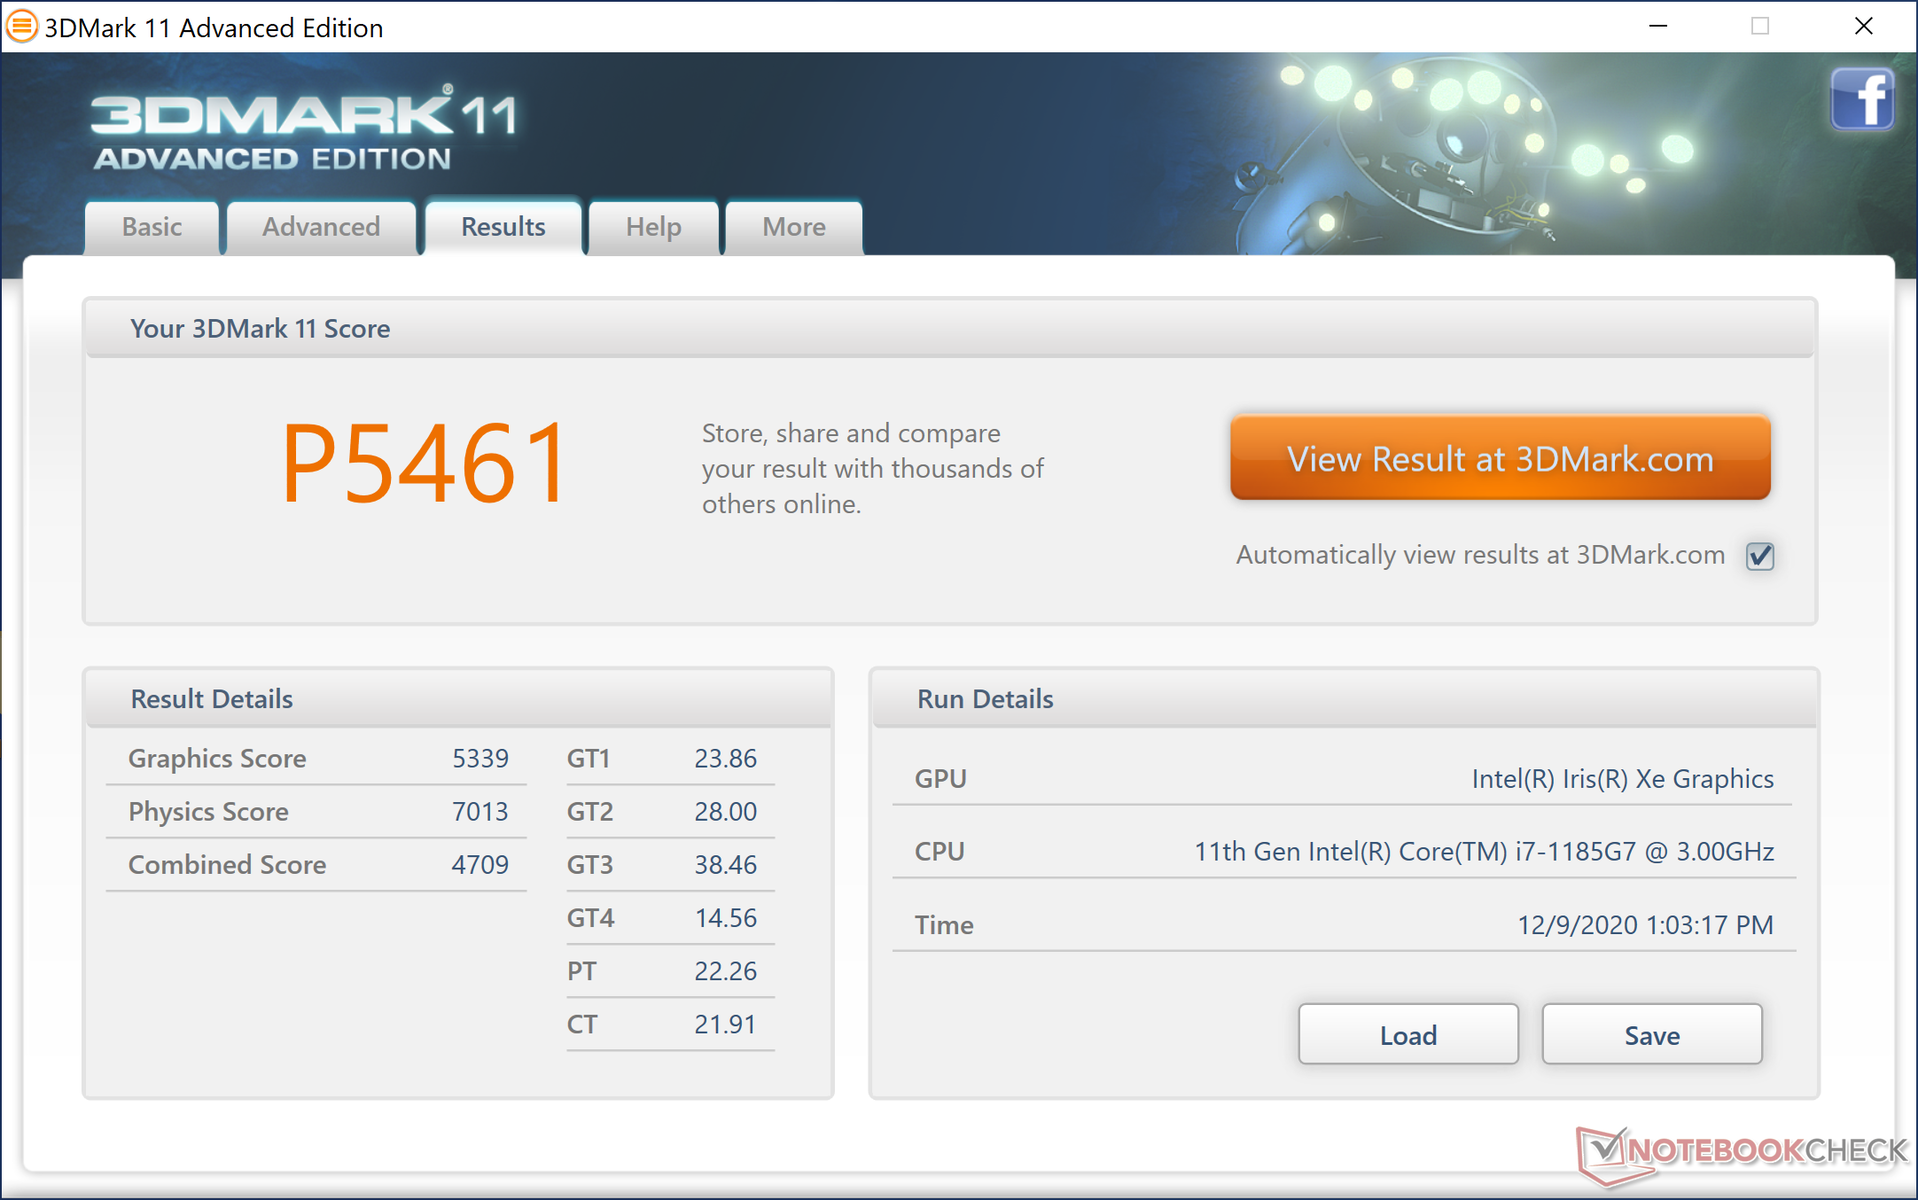

| 3DMark 11 Performance | 5461 points | |
| 3DMark Cloud Gate Standard Score | 15779 points | |
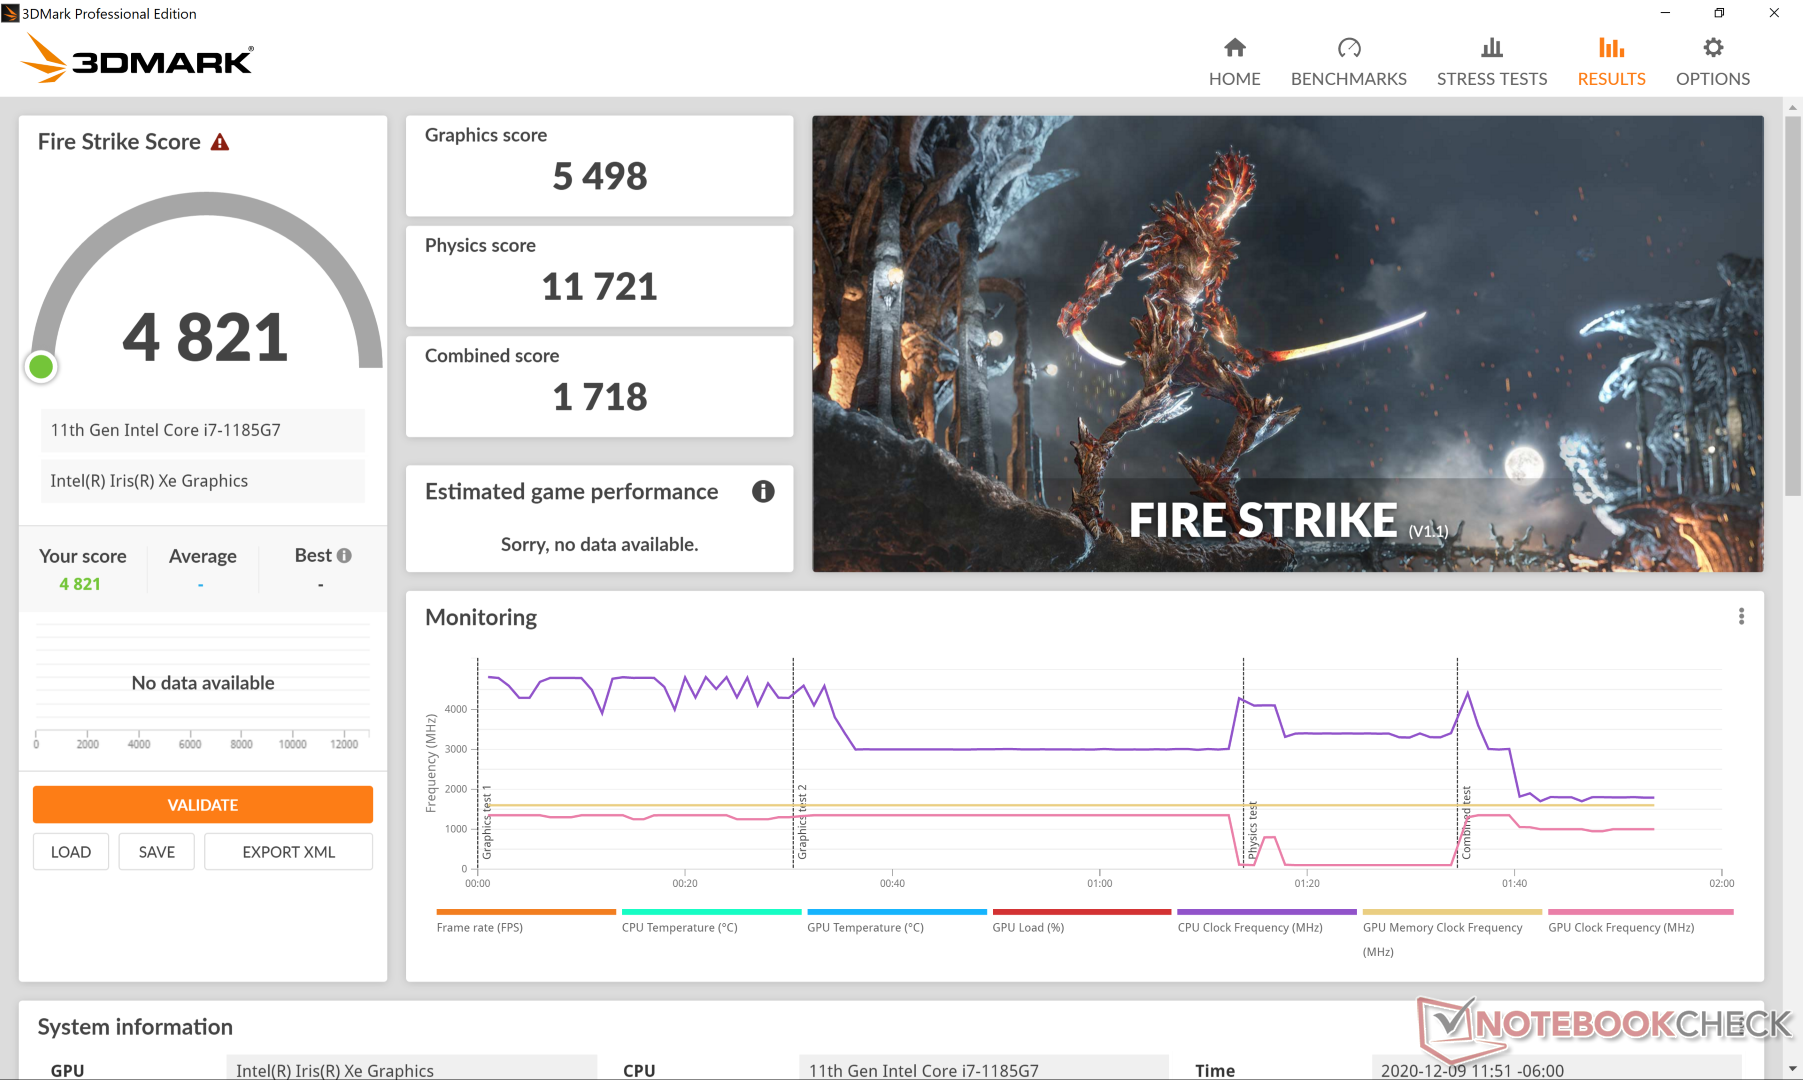
| 3DMark Fire Strike Score | 4821 points | |
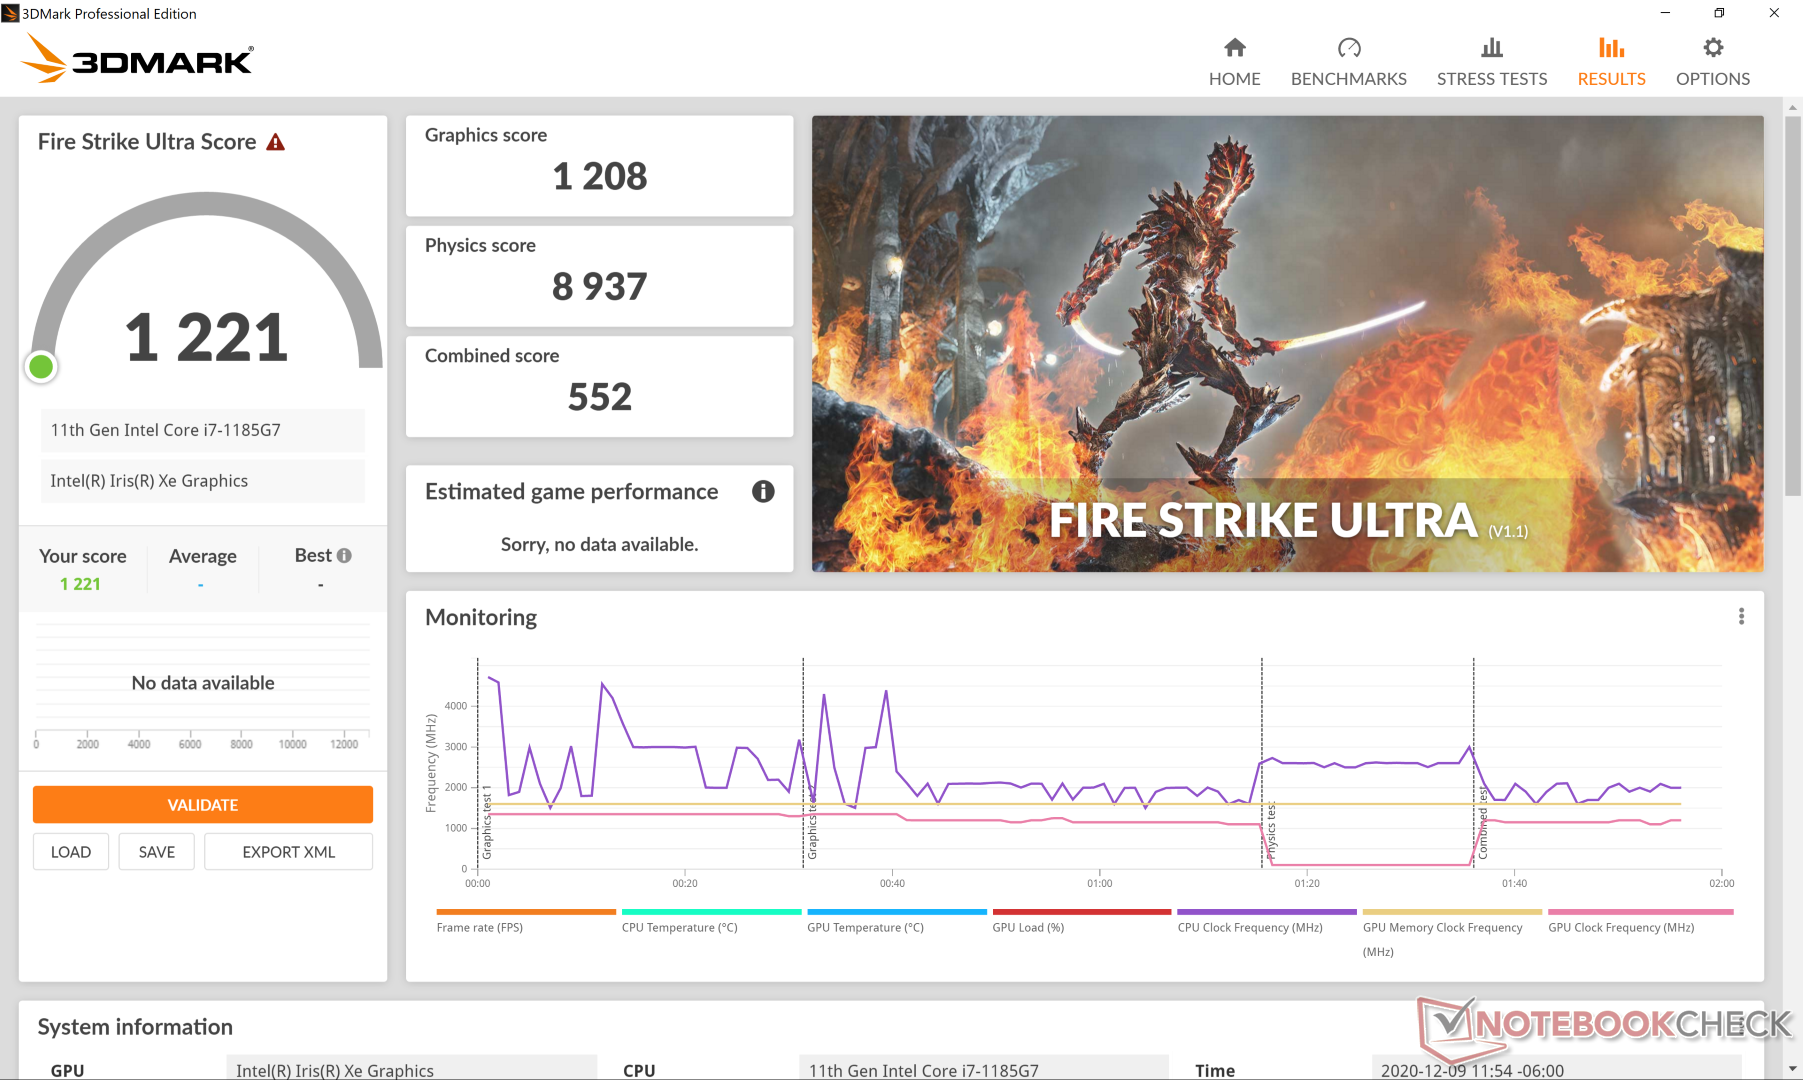
| 3DMark Time Spy Score | 1749 points | |
Help | ||
| GTA V | |
| 1024x768 Lowest Settings possible | |
| Lenovo Yoga Slim 7-14ARE | |
| Razer Book 13 FHD | |
| Average Intel Iris Xe Graphics G7 96EUs (52 - 166.4, n=168) | |
| Dell XPS 13 9310 Core i7 FHD | |
| Dell XPS 13 9310 Core i7 4K | |
| 1920x1080 Lowest Settings possible | |
| Average Intel Iris Xe Graphics G7 96EUs (34.7 - 132.1, n=141) | |
| Dell XPS 13 9310 Core i7 FHD | |
| Razer Book 13 FHD | |
| Lenovo Yoga Slim 7-14ARE | |
| Dell XPS 13 9310 Core i7 4K | |
| 1920x1080 Normal/Off AF:4x | |
| Lenovo Yoga Slim 7-14ARE | |
| Dell XPS 13 9310 Core i7 FHD | |
| Average Intel Iris Xe Graphics G7 96EUs (20 - 119.3, n=142) | |
| Razer Book 13 FHD | |
| Dell XPS 13 9310 Core i7 4K | |
| 1920x1080 High/On (Advanced Graphics Off) AA:2xMSAA + FX AF:8x | |
| Lenovo Yoga Slim 7-14ARE | |
| Razer Book 13 FHD | |
| Dell XPS 13 9310 Core i7 FHD | |
| Average Intel Iris Xe Graphics G7 96EUs (9.39 - 51.6, n=162) | |
| Dell XPS 13 9310 Core i7 4K | |
| 1920x1080 Highest AA:4xMSAA + FX AF:16x | |
| Razer Book 13 FHD | |
| Lenovo Yoga Slim 7-14ARE | |
| Dell XPS 13 9310 Core i7 FHD | |
| Dell XPS 13 9310 Core i7 4K | |
| Average Intel Iris Xe Graphics G7 96EUs (4.13 - 22.9, n=156) | |
| low | med. | high | ultra | QHD | 4K | |
|---|---|---|---|---|---|---|
| GTA V (2015) | 80.8 | 64.6 | 20.5 | 9.75 | ||
| The Witcher 3 (2015) | 107 | 61.9 | 34.5 | 15.3 | ||
| Dota 2 Reborn (2015) | 80.7 | 51.4 | 38.2 | 38.6 | 20 | |
| Final Fantasy XV Benchmark (2018) | 31.3 | 18.8 | 14.6 | 11.4 | 7.54 | |
| X-Plane 11.11 (2018) | 26 | 27.8 | 31.8 | 14.9 |
Emissions
System Noise
Though clock rates are always fluctuating when under load, fan noise thankfully remains steady. In fact, the system is always quiet or inaudible until heavier loads like gaming are introduced. Realistically, most users won't hear anything beyond 33 dB(A) unless if the processor is stressed to maximum for longer periods.
| Dell XPS 13 9310 Core i7 4K Iris Xe G7 96EUs, i7-1185G7, Micron 2300 512GB MTFDHBA512TDV | Asus Zenbook S UX393JA Iris Plus Graphics G7 (Ice Lake 64 EU), i7-1065G7, Intel SSD 660p 1TB SSDPEKNW010T8 | Huawei MateBook X Pro 2020 i7 GeForce MX250, i7-10510U, Samsung PM981a MZVLB1T0HBLR | Dell XPS 13 9300 Core i7-1065G7 Iris Plus Graphics G7 (Ice Lake 64 EU), i7-1065G7, Intel SSDPEMKF512G8 NVMe SSD | Lenovo Yoga Slim 7-14ARE Vega 8, R7 4800U, Samsung SSD PM981a MZVLB512HBJQ | HP Spectre x360 13-aw0013dx Iris Plus Graphics G7 (Ice Lake 64 EU), i7-1065G7, Intel Optane Memory H10 with Solid State Storage 32GB + 512GB HBRPEKNX0202A(L/H) | |
|---|---|---|---|---|---|---|
| Noise | -10% | -12% | -7% | 0% | -2% | |
| off / environment * (dB) | 27.7 | 26.9 3% | 29.6 -7% | 28.3 -2% | 26.3 5% | 28.5 -3% |
| Idle Minimum * (dB) | 27.8 | 26.9 3% | 29.6 -6% | 28.3 -2% | 26.5 5% | 28.5 -3% |
| Idle Average * (dB) | 27.8 | 29 -4% | 29.6 -6% | 28.3 -2% | 26.5 5% | 28.5 -3% |
| Idle Maximum * (dB) | 27.8 | 31.1 -12% | 30.3 -9% | 28.3 -2% | 26.5 5% | 28.5 -3% |
| Load Average * (dB) | 27.9 | 37.7 -35% | 38 -36% | 32.5 -16% | 31.8 -14% | 28.5 -2% |
| Witcher 3 ultra * (dB) | 32.8 | 40.2 -23% | 38 -16% | 39.3 -20% | 35.9 -9% | 35.3 -8% |
| Load Maximum * (dB) | 37 | 38.1 -3% | 38 -3% | 39.3 -6% | 35.9 3% | 35.3 5% |
* ... smaller is better
Noise level
| Idle |
| 27.8 / 27.8 / 27.8 dB(A) |
| Load |
| 27.9 / 37 dB(A) |
 | ||
30 dB silent 40 dB(A) audible 50 dB(A) loud |
||
min: | ||
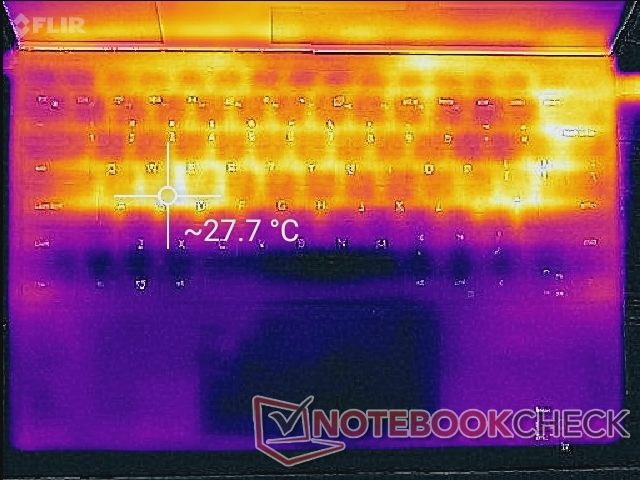
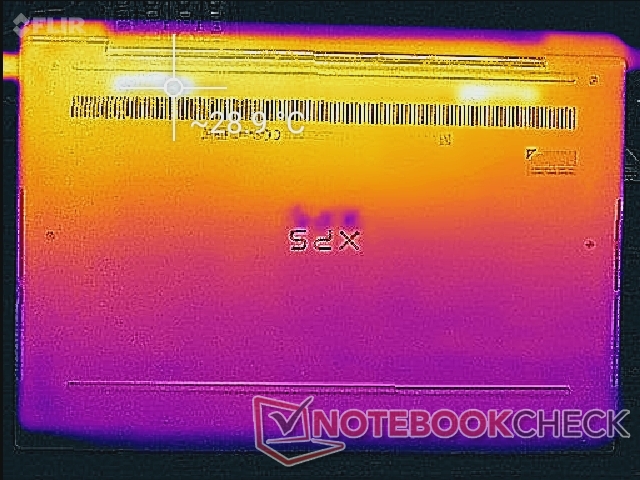
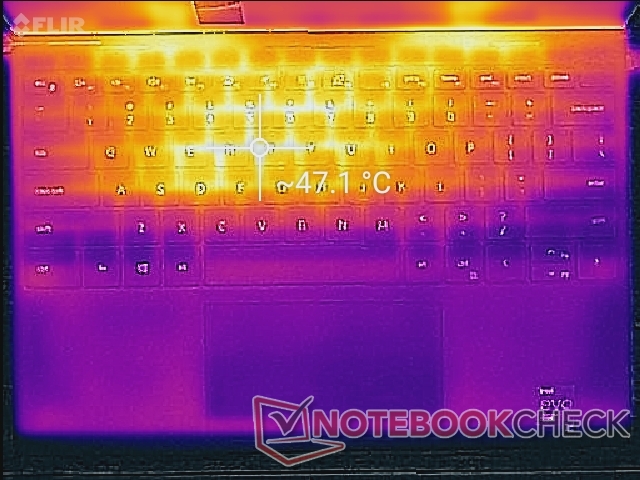
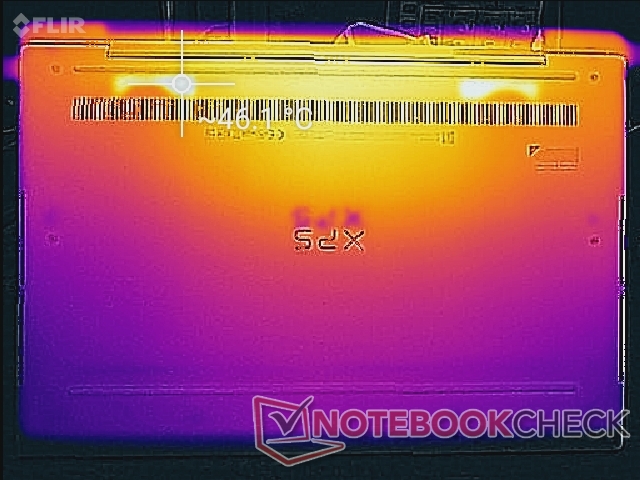
Temperature
Hot spots are almost the same as what we recorded on the XPS 13 9310 with the lesser Core i7-1165G7 CPU. Thus, upgrading to the Core i7-1185G7 option won't necessarily mean that the laptop will feel warmer to the touch.
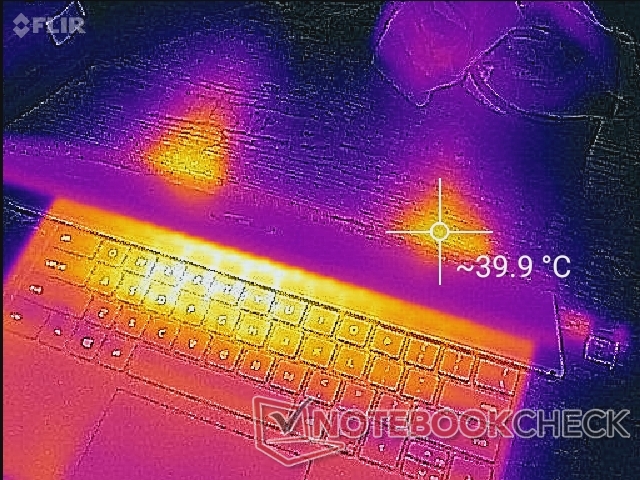
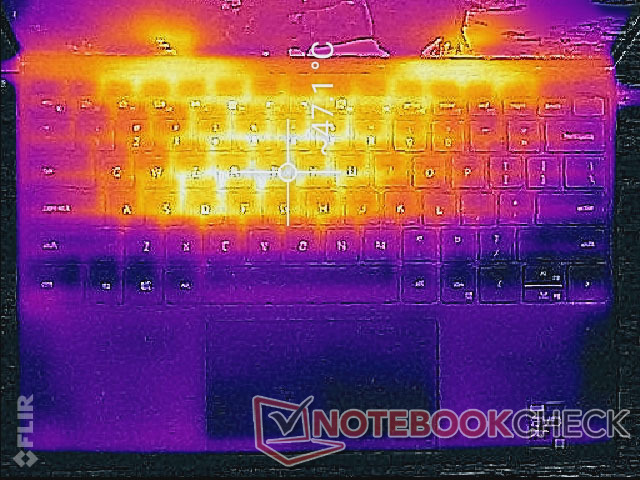
(-) The maximum temperature on the upper side is 47 °C / 117 F, compared to the average of 35.9 °C / 97 F, ranging from 21.4 to 59 °C for the class Subnotebook.
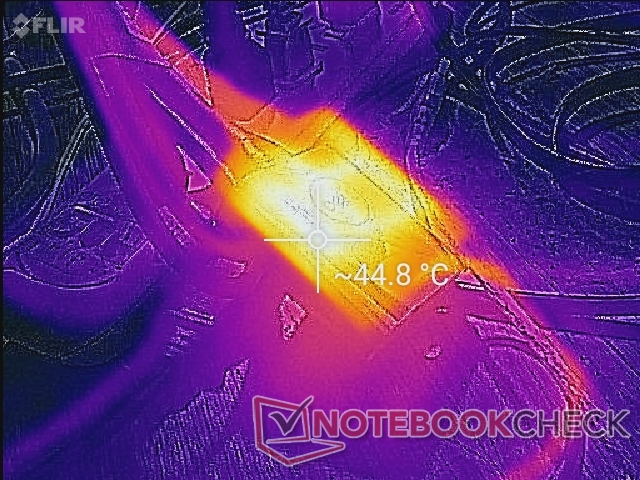
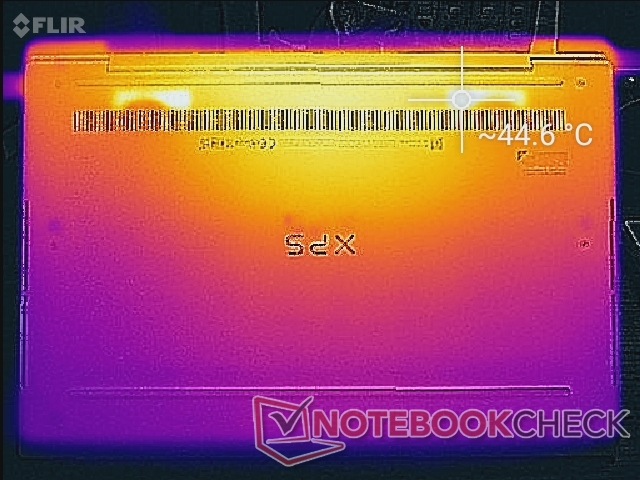
(±) The bottom heats up to a maximum of 45 °C / 113 F, compared to the average of 39.2 °C / 103 F
(+) In idle usage, the average temperature for the upper side is 26.1 °C / 79 F, compared to the device average of 30.8 °C / 87 F.
(±) Playing The Witcher 3, the average temperature for the upper side is 34.4 °C / 94 F, compared to the device average of 30.8 °C / 87 F.
(+) The palmrests and touchpad are cooler than skin temperature with a maximum of 28.8 °C / 83.8 F and are therefore cool to the touch.
(±) The average temperature of the palmrest area of similar devices was 28.2 °C / 82.8 F (-0.6 °C / -1 F).
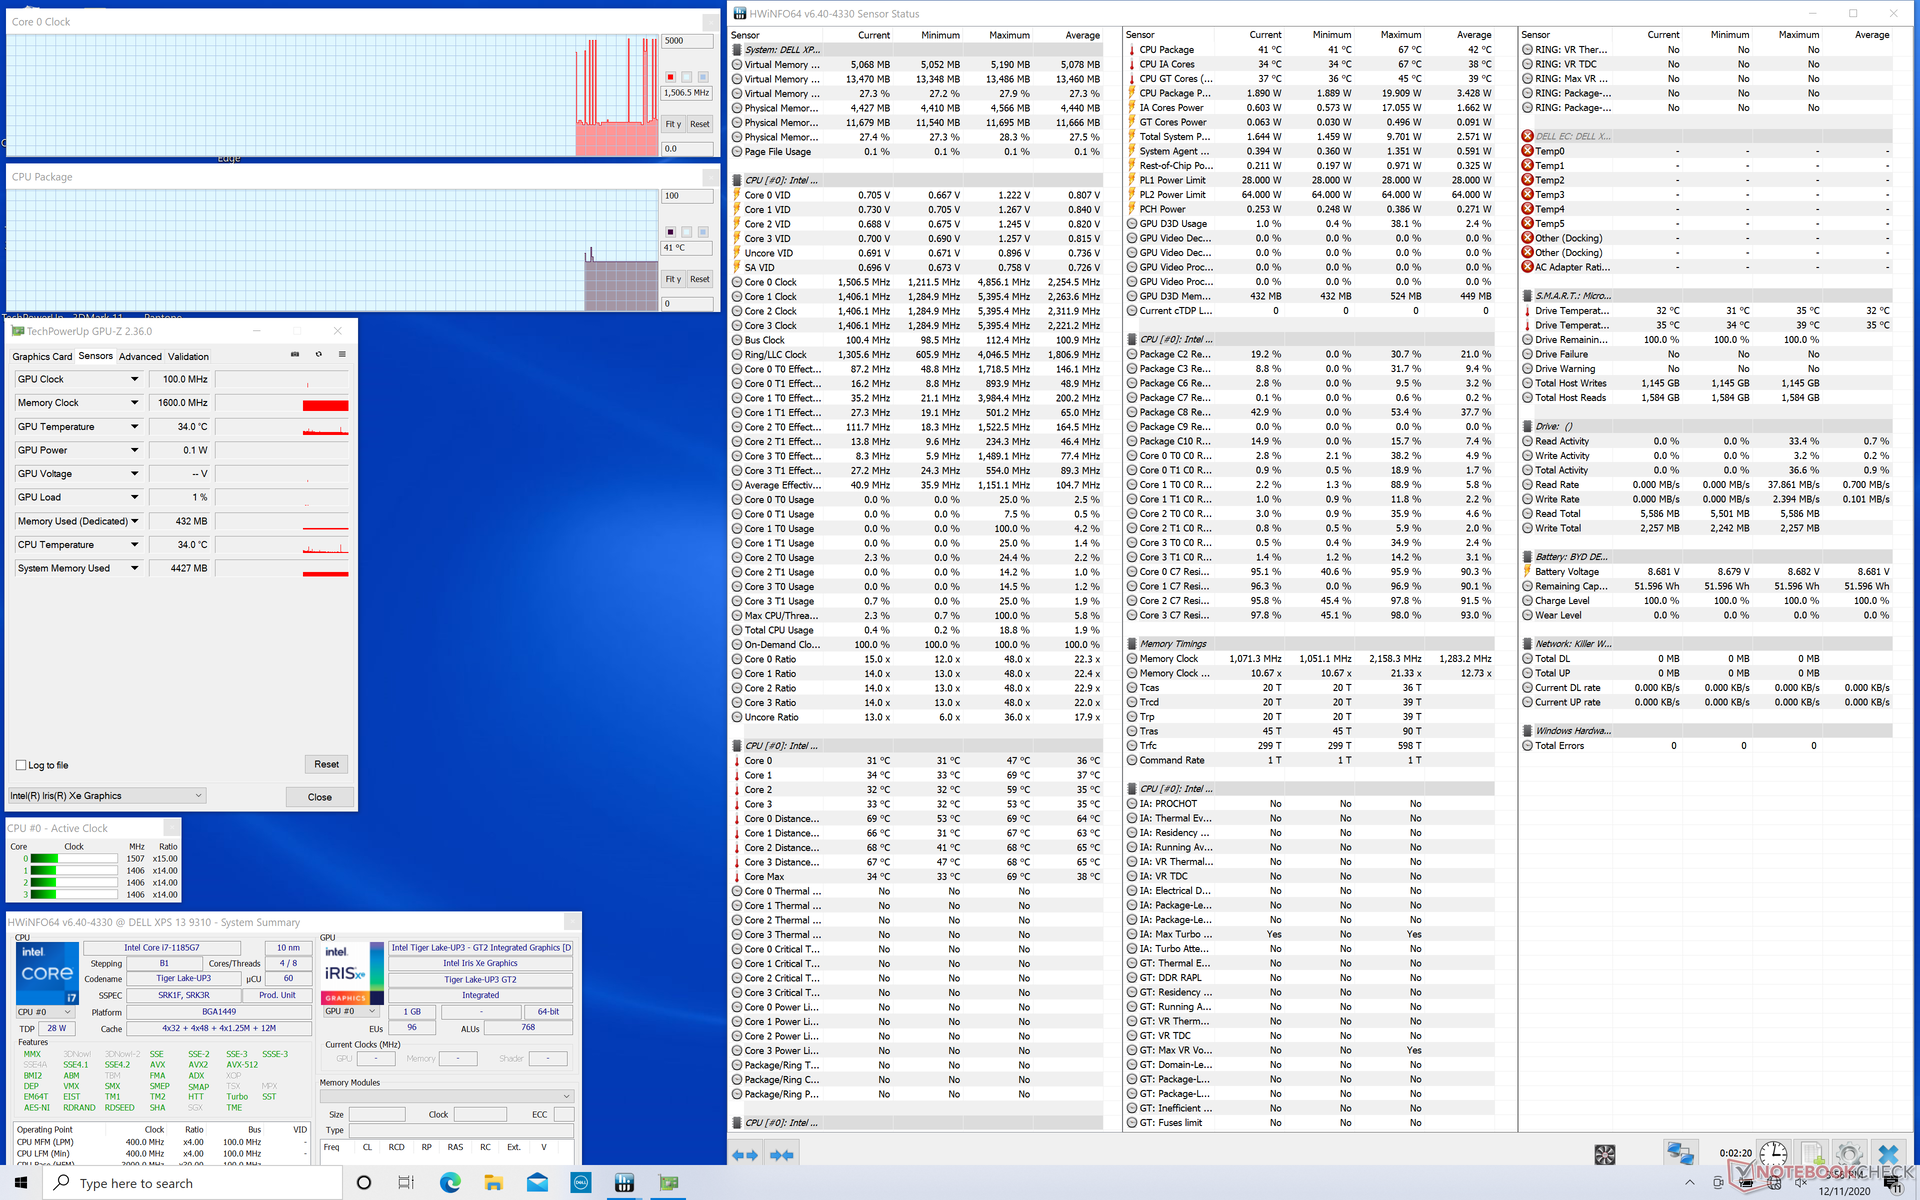
Stress Test
When stressed with Prime95, the system would boost to the 3.9 GHz to 4.3 GHz range for just a few seconds until hitting a core temperature of 101 C. Thereafter, clock rates would steadily fall until they begin cycling indefinitely between 2.1 GHz to 3 GHz and 63 C to 81 C. These rates are very close to what we observed on the XPS 13 Core i7-1165G7 where clock rates would cycle between 1.9 GHz and 3.1 GHz at the 71 C to 78 C core temperature range.
CPU and GPU clock rates would cycle heavily when running Witcher 3 as well which have profound effects on frame rates as mentioned above. GPU power would fluctate between 5.7 W and 9.2 W as well according to GPU-Z.
There are no major performance deficits if running on battery power. A 3DMark 11 test on batteries would return Physics and Graphics scores of 10181 and 6463 points, respectively, compared to 7013 and 5339 points when on mains. The higher scores on battery power may be attributed to a colder system state prior to running the test.
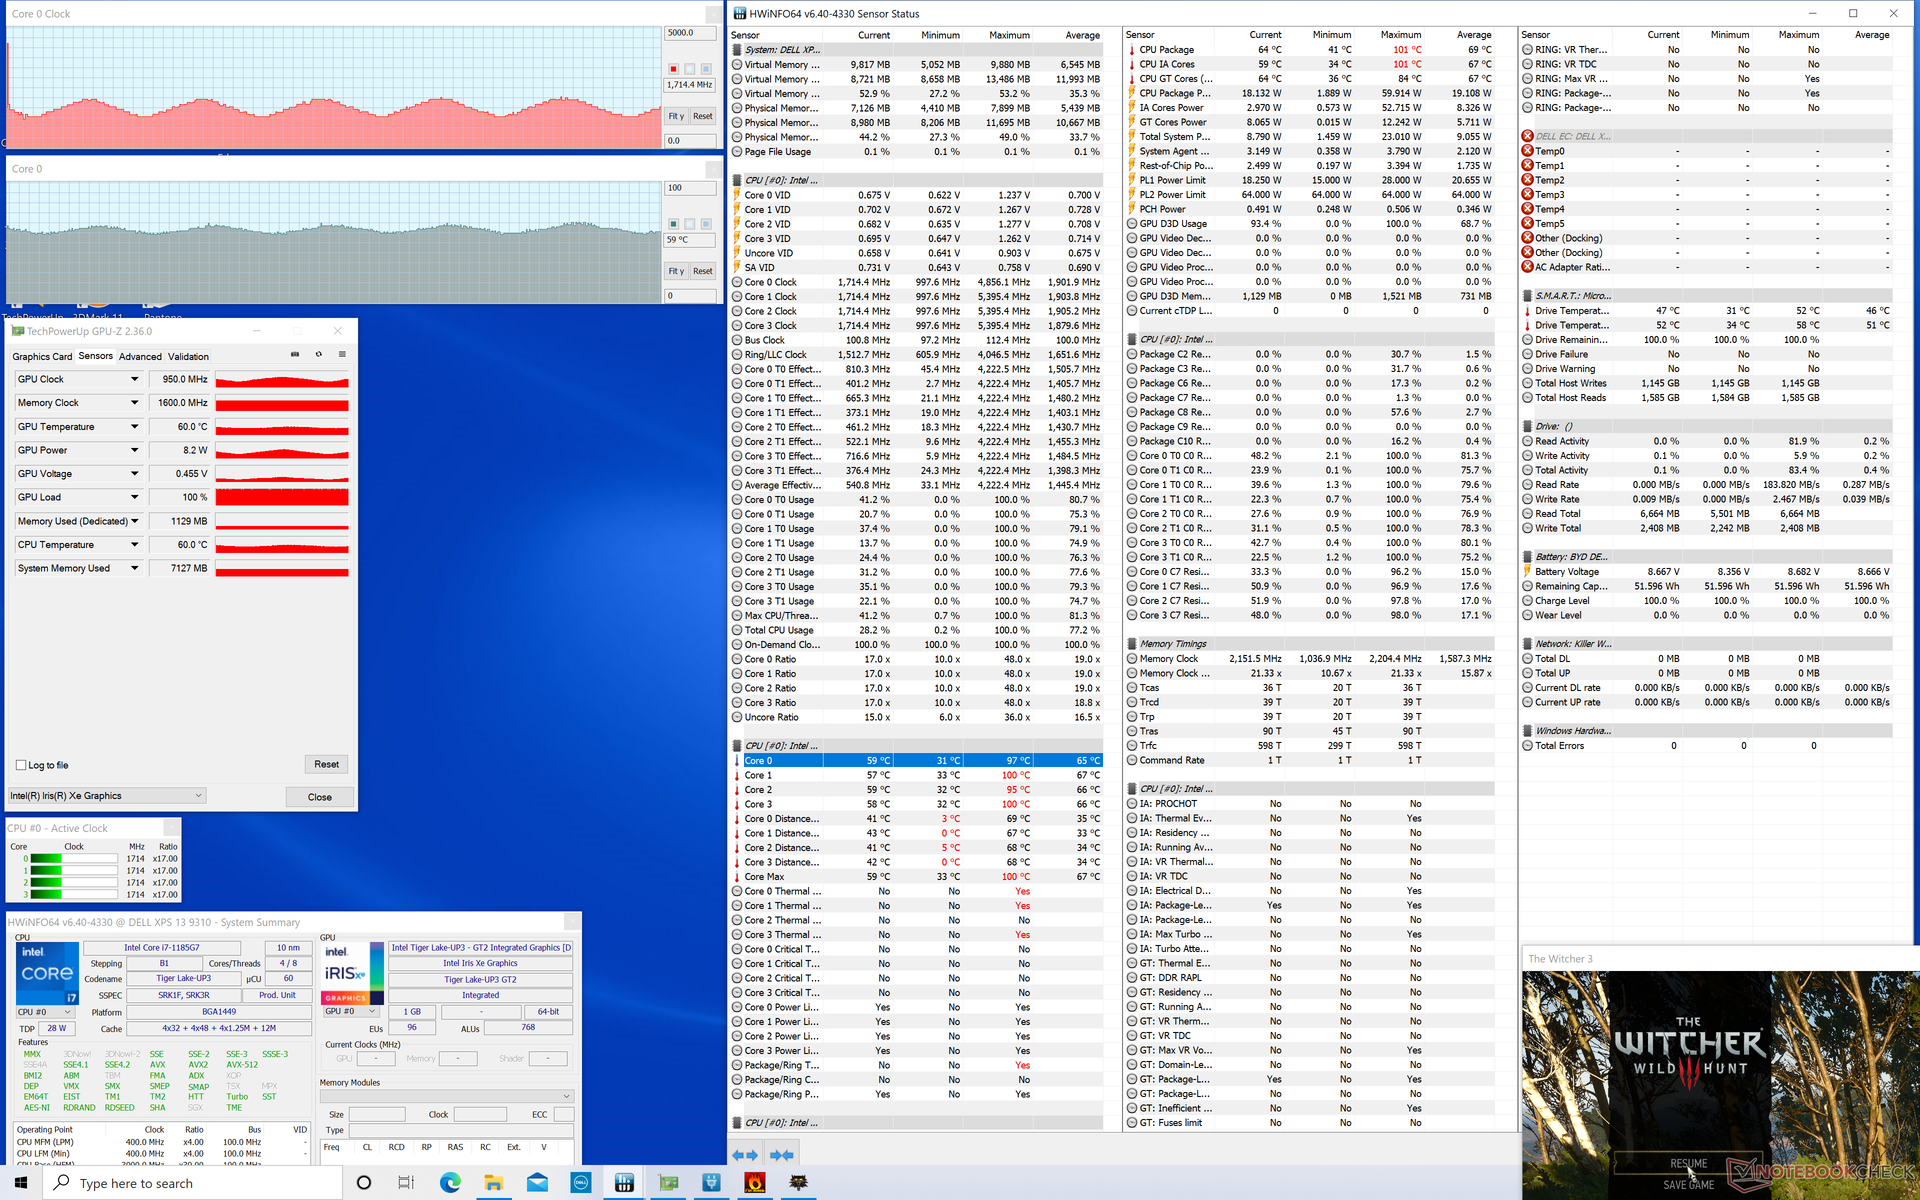
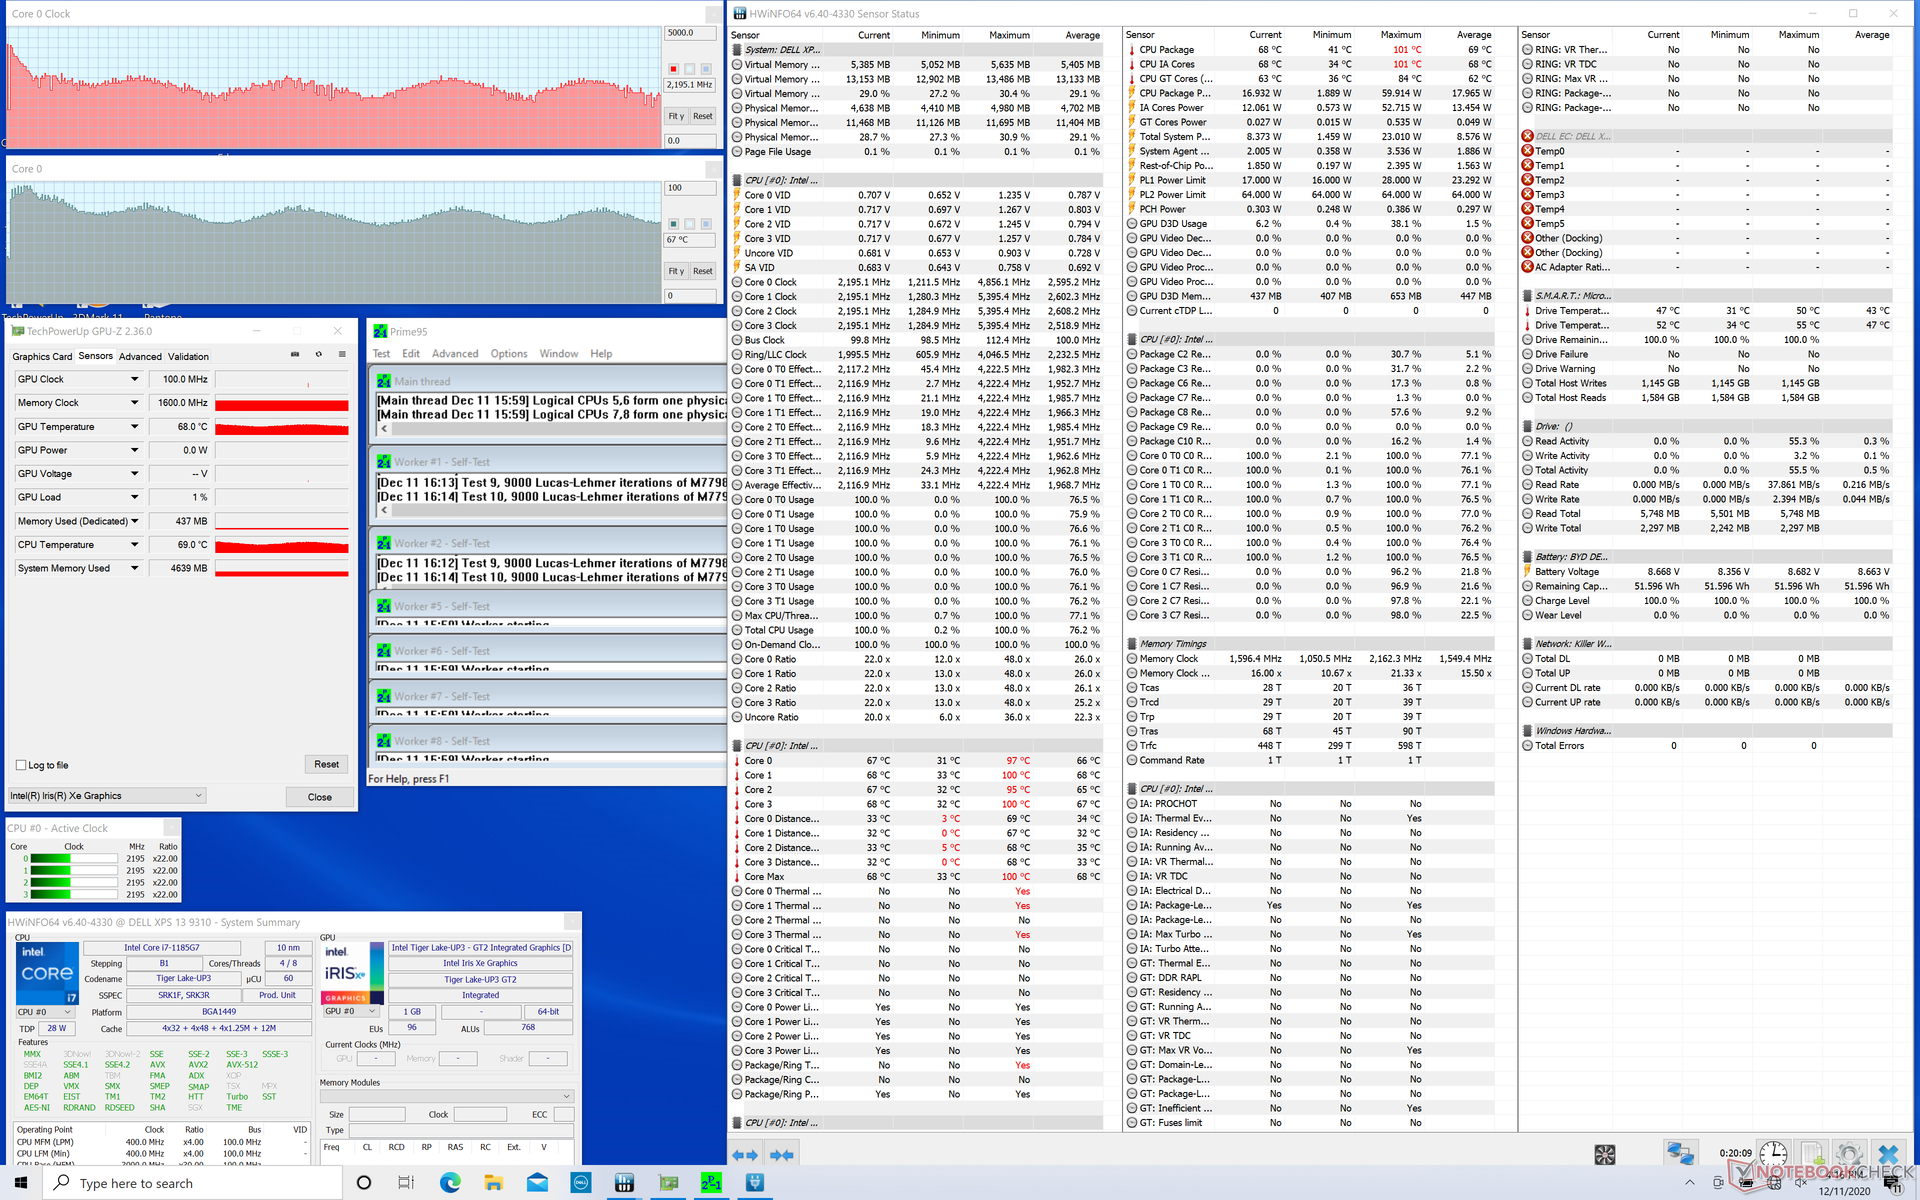
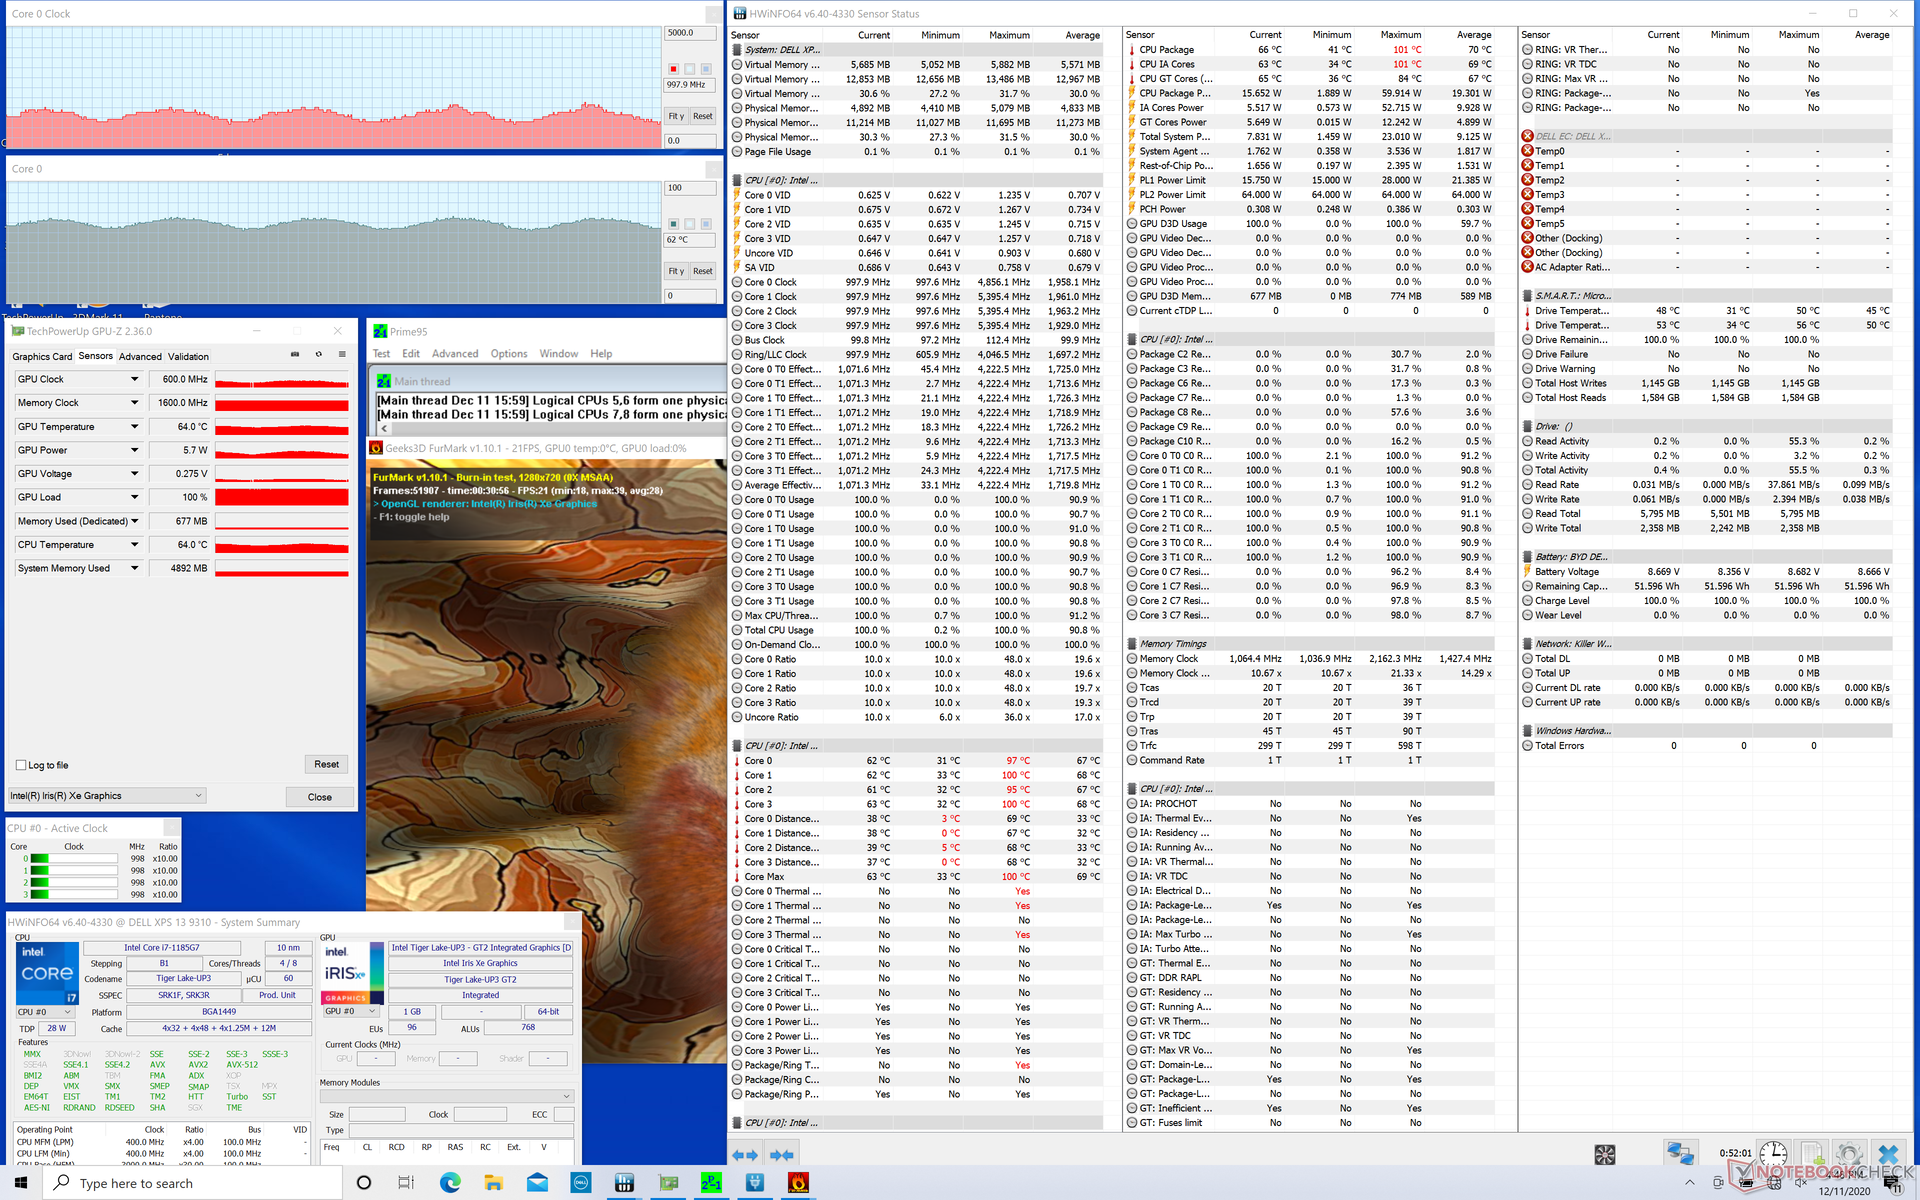
| CPU Clock (GHz) | GPU Clock (MHz) | Average CPU Temperature (°C) | |
| System Idle | -- | -- | 41 |
| Prime95 Stress | 2.1 - 3 | -- | 63 - 81 |
| Prime95 + FurMark Stress | 0.9 - 1.8 | 600 - 1000 | 61 - 71 |
| Witcher 3 Stress | 1.3 - 2.1 | 700 - 1150 | 58 - 65 |
Speakers
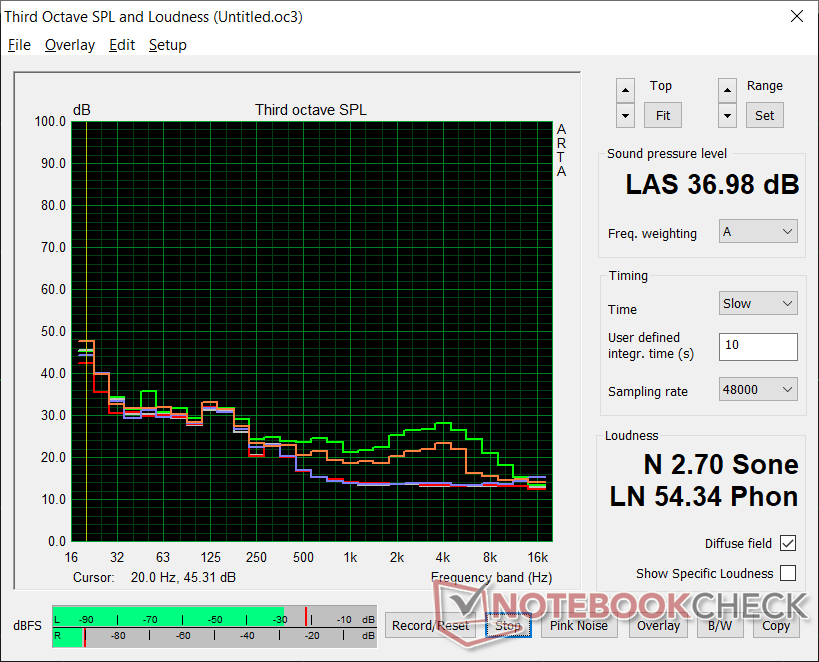
Dell XPS 13 9310 Core i7 4K audio analysis
(+) | speakers can play relatively loud (84.6 dB)
Bass 100 - 315 Hz
(±) | reduced bass - on average 13.1% lower than median
(±) | linearity of bass is average (11.1% delta to prev. frequency)
Mids 400 - 2000 Hz
(+) | balanced mids - only 4.3% away from median
(+) | mids are linear (4.2% delta to prev. frequency)
Highs 2 - 16 kHz
(+) | balanced highs - only 1.5% away from median
(+) | highs are linear (3.8% delta to prev. frequency)
Overall 100 - 16.000 Hz
(+) | overall sound is linear (10.9% difference to median)
Compared to same class
» 9% of all tested devices in this class were better, 3% similar, 88% worse
» The best had a delta of 5%, average was 18%, worst was 53%
Compared to all devices tested
» 6% of all tested devices were better, 2% similar, 92% worse
» The best had a delta of 4%, average was 23%, worst was 134%
Apple MacBook 12 (Early 2016) 1.1 GHz audio analysis
(+) | speakers can play relatively loud (83.6 dB)
Bass 100 - 315 Hz
(±) | reduced bass - on average 11.3% lower than median
(±) | linearity of bass is average (14.2% delta to prev. frequency)
Mids 400 - 2000 Hz
(+) | balanced mids - only 2.4% away from median
(+) | mids are linear (5.5% delta to prev. frequency)
Highs 2 - 16 kHz
(+) | balanced highs - only 2% away from median
(+) | highs are linear (4.5% delta to prev. frequency)
Overall 100 - 16.000 Hz
(+) | overall sound is linear (10.2% difference to median)
Compared to same class
» 7% of all tested devices in this class were better, 2% similar, 91% worse
» The best had a delta of 5%, average was 18%, worst was 53%
Compared to all devices tested
» 5% of all tested devices were better, 1% similar, 94% worse
» The best had a delta of 4%, average was 23%, worst was 134%
Energy Management
Power Consumption
Idling on desktop at the highest brightness setting consumes about 8.3 W to 8.8 W compared to 5.9 W to 6.3 W on the FHD configuration. The slight increase is likely partly attributed to the more demanding 4K resolution panel.
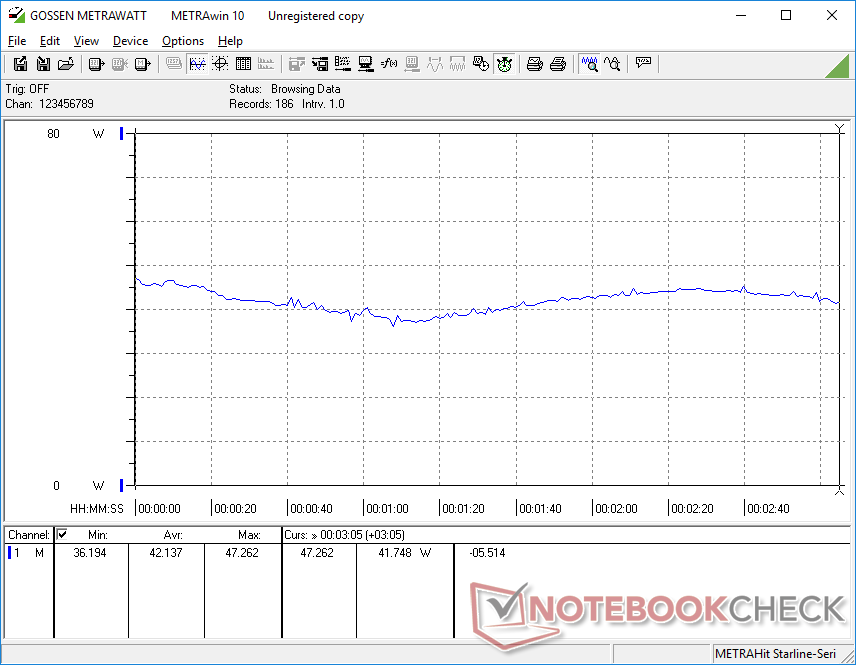
Power consumption is generally higher than other Core i7 Ultrabooks powered by integrated graphics when 3DMark 06. We're able to measure an average of 46 W compared to just 32 W to 37 W on the HP Spectre x360 13, ZenBook S, or XPS 13 9310 each equipped with last year's slower Core i7-1065G7. Nonetheless, performance-per-watt is still incredible when compared to older Whiskey Lake-U or Comet Lake-U systems.
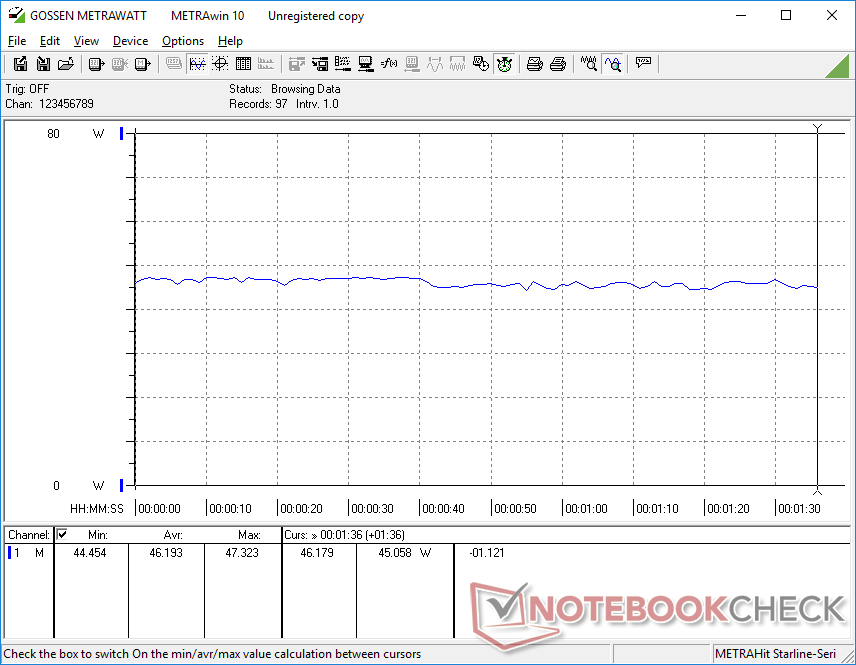
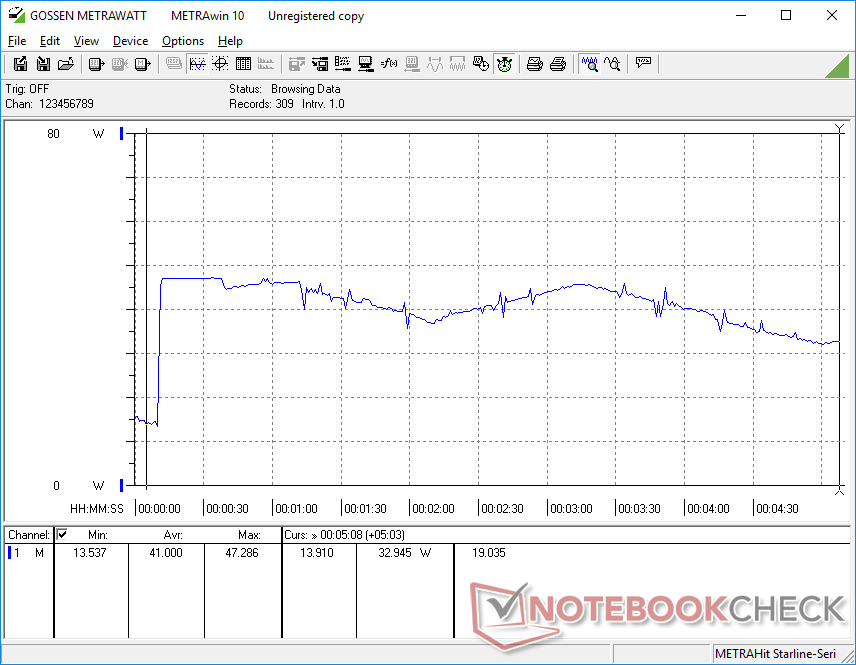
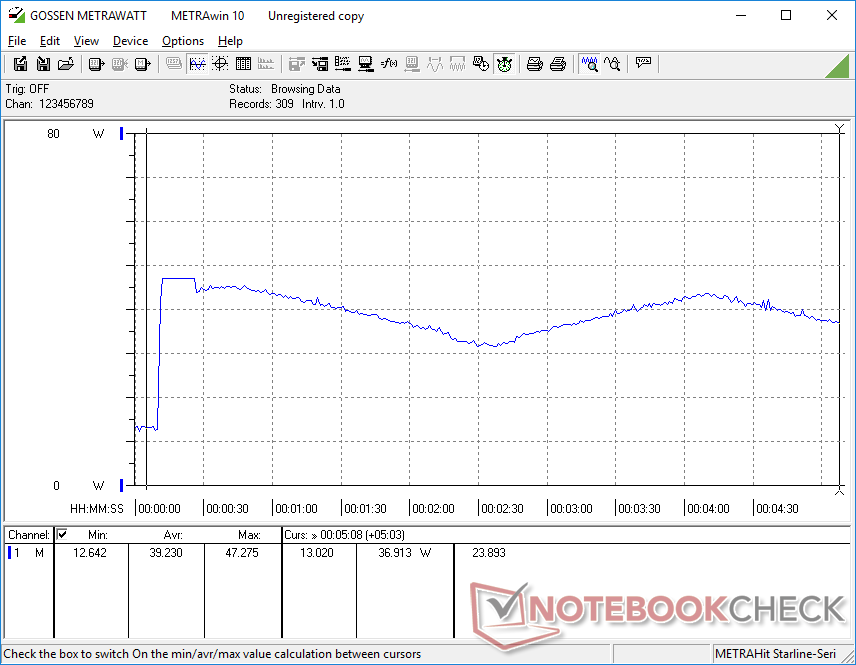
Running Prime95 would draw 47 W from the small (~6 x 5.5 x 2.3 cm) 45 W AC adapter. However, this rate would only lasts for a few seconds before cycling begins as shown by our graphs below to match our Stress Test clock rate observations from above.
| Off / Standby | |
| Idle | |
| Load |
|
Key:
min: | |
| Dell XPS 13 9310 Core i7 4K i7-1185G7, Iris Xe G7 96EUs, Micron 2300 512GB MTFDHBA512TDV, IPS, 3840x2400, 13.4" | Asus Zenbook S UX393JA i7-1065G7, Iris Plus Graphics G7 (Ice Lake 64 EU), Intel SSD 660p 1TB SSDPEKNW010T8, IPS, 3300x2200, 13.9" | Huawei MateBook X Pro 2020 i7 i7-10510U, GeForce MX250, Samsung PM981a MZVLB1T0HBLR, LTPS, 3000x2000, 13.9" | Dell XPS 13 9300 Core i7-1065G7 i7-1065G7, Iris Plus Graphics G7 (Ice Lake 64 EU), Intel SSDPEMKF512G8 NVMe SSD, IPS, 1920x1200, 13.4" | Lenovo Yoga Slim 7-14ARE R7 4800U, Vega 8, Samsung SSD PM981a MZVLB512HBJQ, IPS, 1920x1080, 14" | HP Spectre x360 13-aw0013dx i7-1065G7, Iris Plus Graphics G7 (Ice Lake 64 EU), Intel Optane Memory H10 with Solid State Storage 32GB + 512GB HBRPEKNX0202A(L/H), IPS, 1920x1080, 13.3" | |
|---|---|---|---|---|---|---|
| Power Consumption | 3% | -17% | 12% | 0% | 17% | |
| Idle Minimum * (Watt) | 4.3 | 4.1 5% | 4.3 -0% | 4.2 2% | 4 7% | 3.9 9% |
| Idle Average * (Watt) | 8.3 | 7.5 10% | 8.5 -2% | 6.9 17% | 6.3 24% | 6.3 24% |
| Idle Maximum * (Watt) | 8.8 | 8.5 3% | 12 -36% | 7.5 15% | 7.7 12% | 6.8 23% |
| Load Average * (Watt) | 46.2 | 36.8 20% | 54.8 -19% | 33.3 28% | 48.3 -5% | 32.6 29% |
| Witcher 3 ultra * (Watt) | 42.2 | 39.2 7% | 47.1 -12% | 37.1 12% | 49 -16% | 25.6 39% |
| Load Maximum * (Watt) | 47.3 | 61.6 -30% | 61.5 -30% | 48.4 -2% | 57.6 -22% | 59 -25% |
* ... smaller is better
Battery Life
Runtimes are much shorter than what we recorded on the XPS 13 FHD. Whereas our FHD unit would last for over 12 hours of real-world WLAN usage, our 4K unit would only last for 7 hours when on the same Dell Optimized performance profile and brightness setting. We even reran our battery life test just to check for any discrepancies, but the approximate 7-hour runtime didn't change.
Charging from empty to full capacity is slow at 2.5 to 3 hours. Many other Ultrabooks can recharge almost two times faster like the Razer Book 13.
| Dell XPS 13 9310 Core i7 4K i7-1185G7, Iris Xe G7 96EUs, 52 Wh | Asus Zenbook S UX393JA i7-1065G7, Iris Plus Graphics G7 (Ice Lake 64 EU), 67 Wh | Huawei MateBook X Pro 2020 i7 i7-10510U, GeForce MX250, 57.4 Wh | Dell XPS 13 9300 Core i7-1065G7 i7-1065G7, Iris Plus Graphics G7 (Ice Lake 64 EU), 52 Wh | Lenovo Yoga Slim 7-14ARE R7 4800U, Vega 8, 61 Wh | HP Spectre x360 13-aw0013dx i7-1065G7, Iris Plus Graphics G7 (Ice Lake 64 EU), 60 Wh | |
|---|---|---|---|---|---|---|
| Battery runtime | 15% | 44% | 76% | 43% | 38% | |
| WiFi v1.3 (h) | 7.2 | 8.3 15% | 10.4 44% | 12.7 76% | 10.3 43% | 9.9 38% |
| Reader / Idle (h) | 38.4 | 27.1 | 37.1 | |||
| Load (h) | 2.7 | 2.4 | 1.3 | 2.7 |
Pros
Cons
Verdict

From a performance perspective, the Core i7-1185G7 doesn't offer much of an upgrade over the Core i7-1165G7 and so we recommend saving a few bucks by going with the Core i7-1165G7. The money saved can instead go towards additional RAM or storage or the higher resolution 4K option where the upgrades are more tangible. Battery life will be a couple hours shorter than the FHD option, however, which is the price to pay for those denser pixels.
If we could make one change to the XPS 13 9310, then it would be to include an option for more steady clock rates on High Performance mode. The cycling clock rates work well for maximizing average CPU performance when the cooling solution is the limiting factor, but the resulting performance fluctuations may be unfavorable for certain applications.
Investing in more RAM or storage or the higher resolution 4K display would be more worthwhile than the Core i7-1185G7 as the performance gains are minimal at best over the Core i7-1165G7.
Dell XPS 13 9310 Core i7 4K
- 05/31/2021 v7 (old)
Allen Ngo
Price comparison
