Lenovo ThinkPad P43s laptop review: The mobile workstation's display and performance disappoint

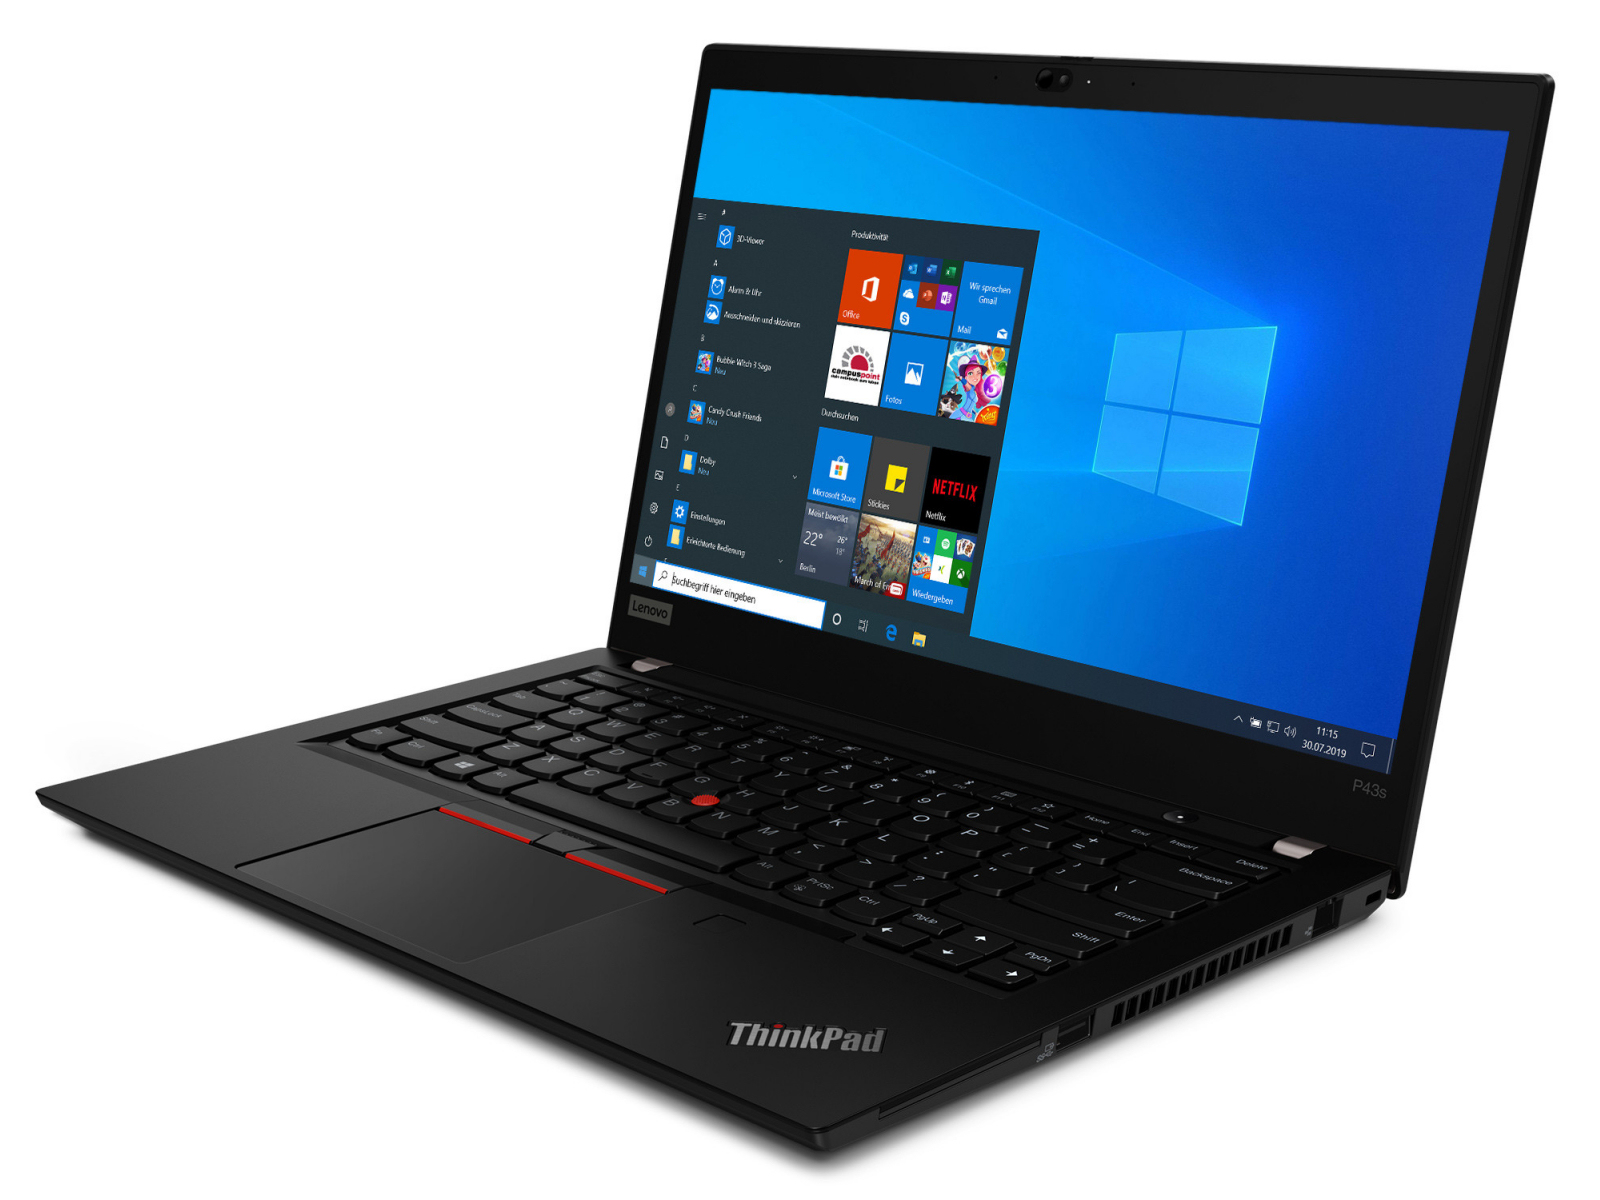
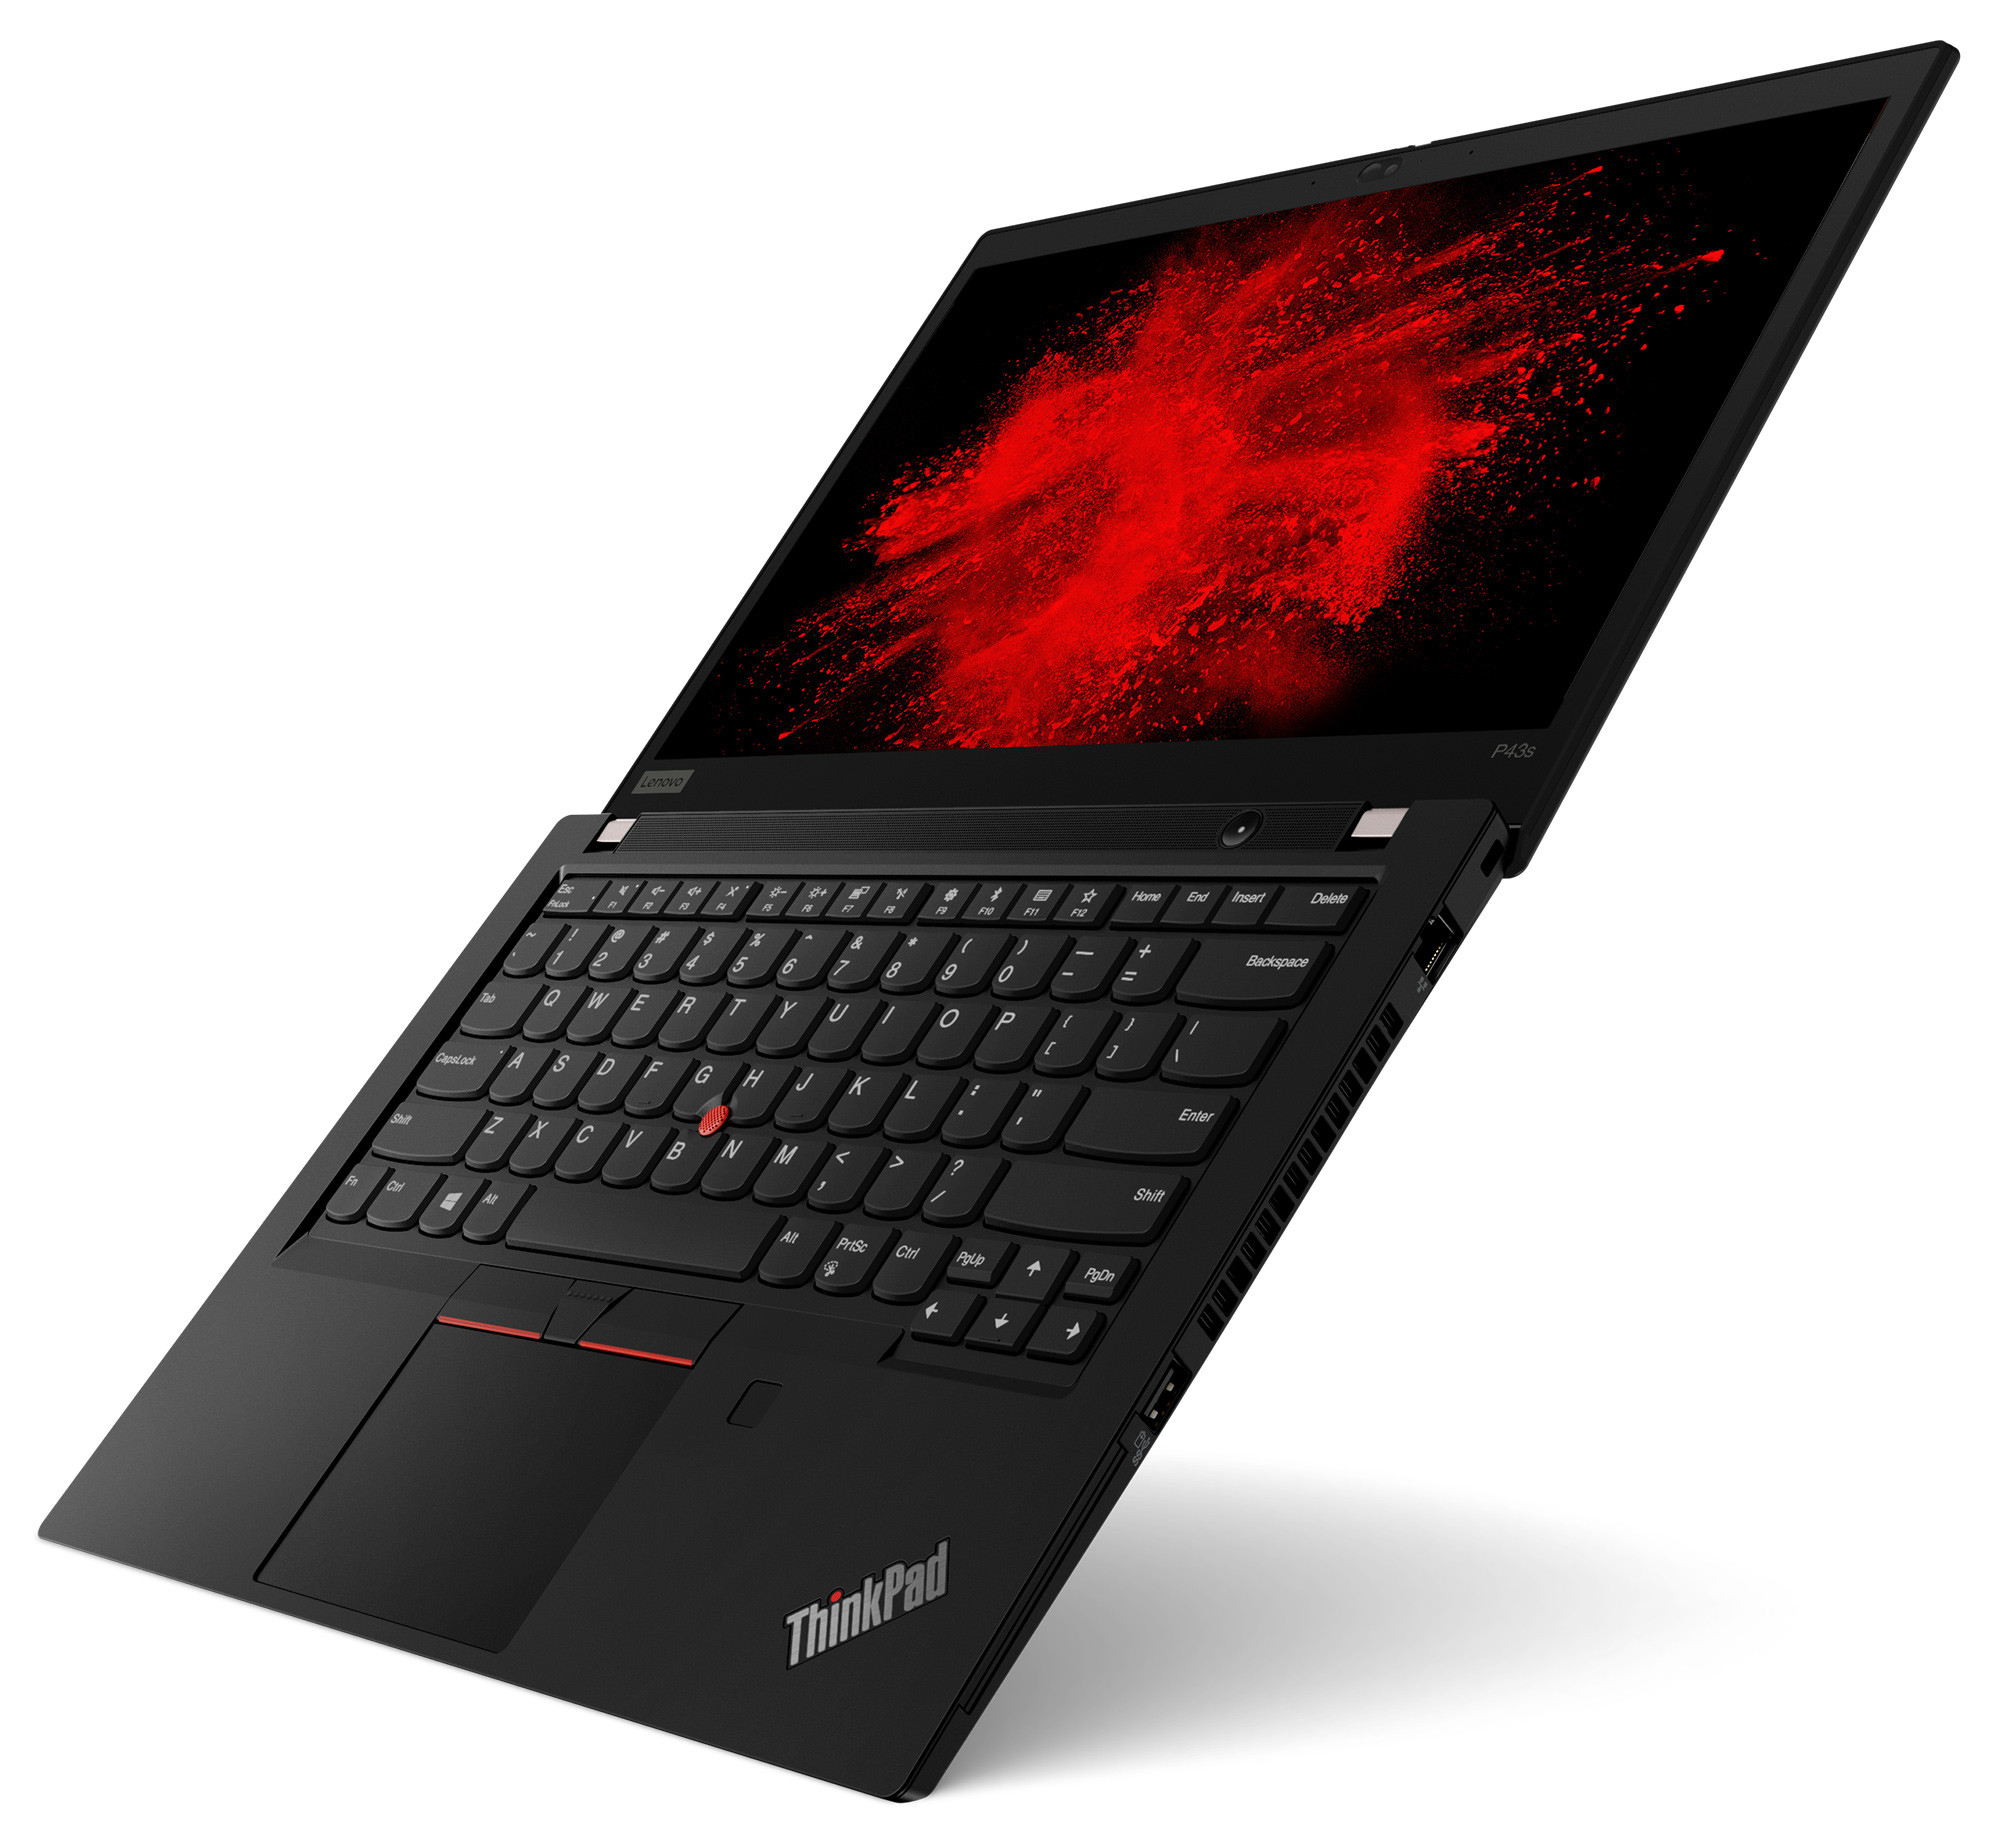
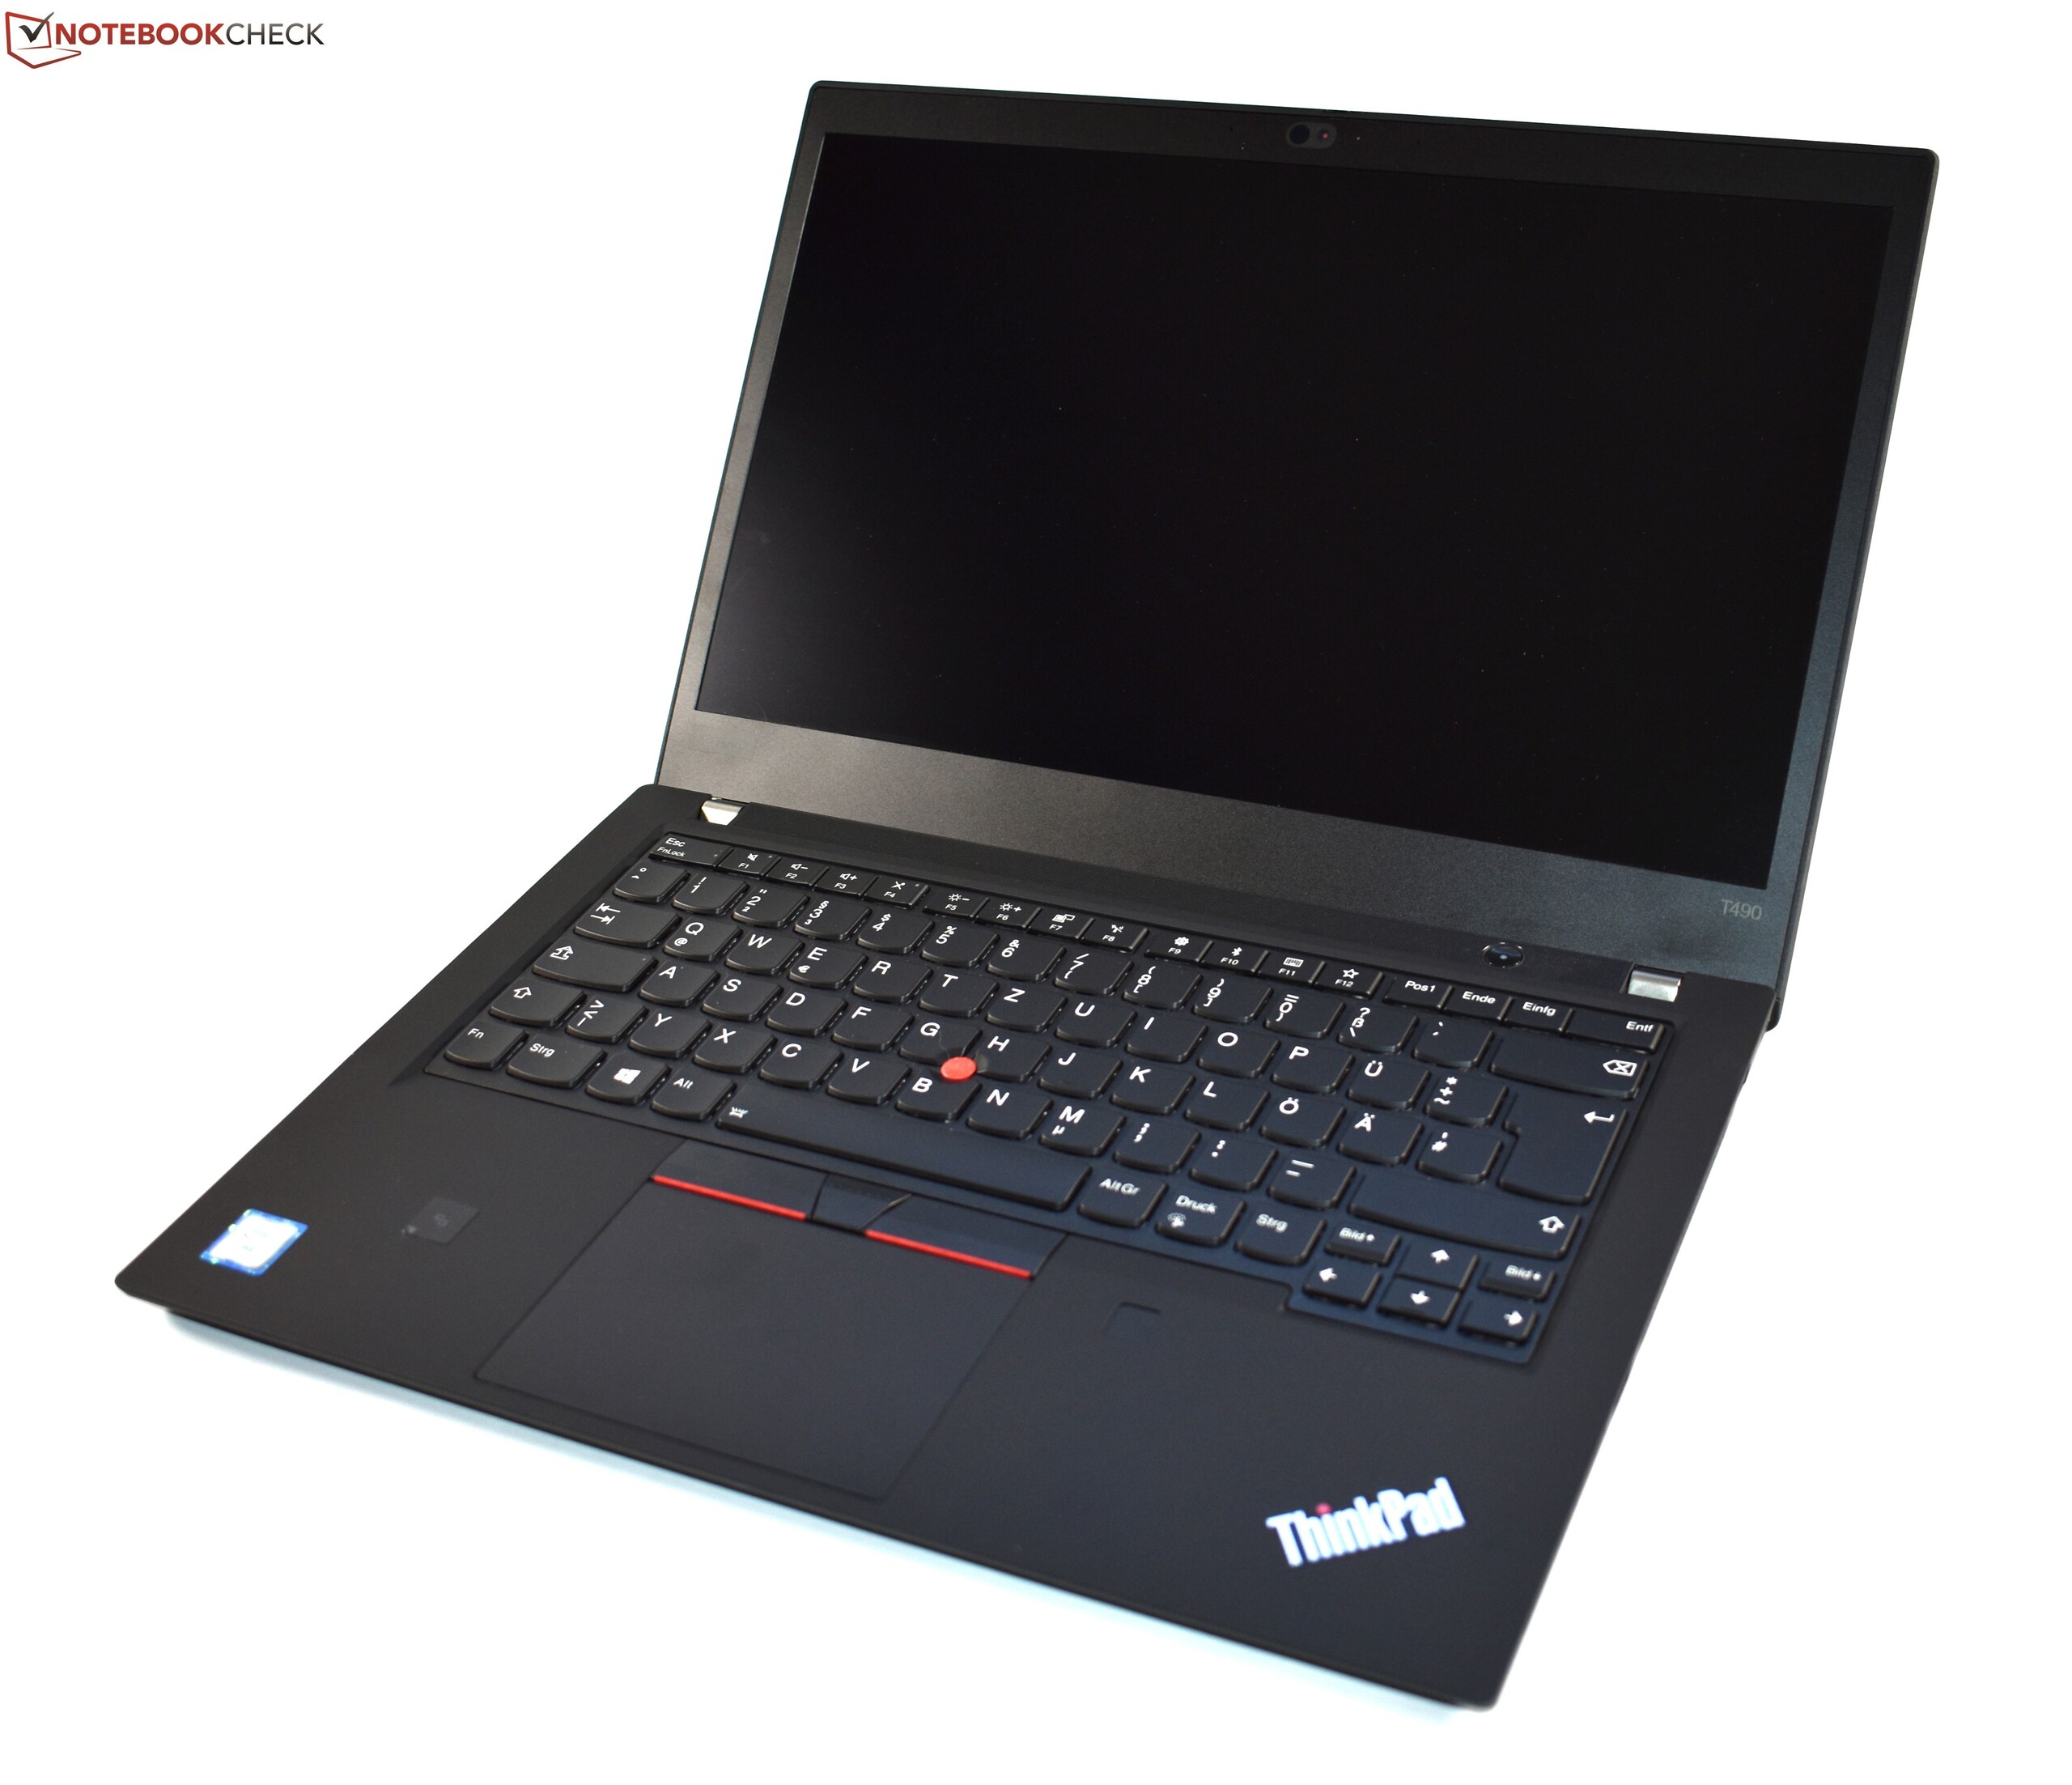
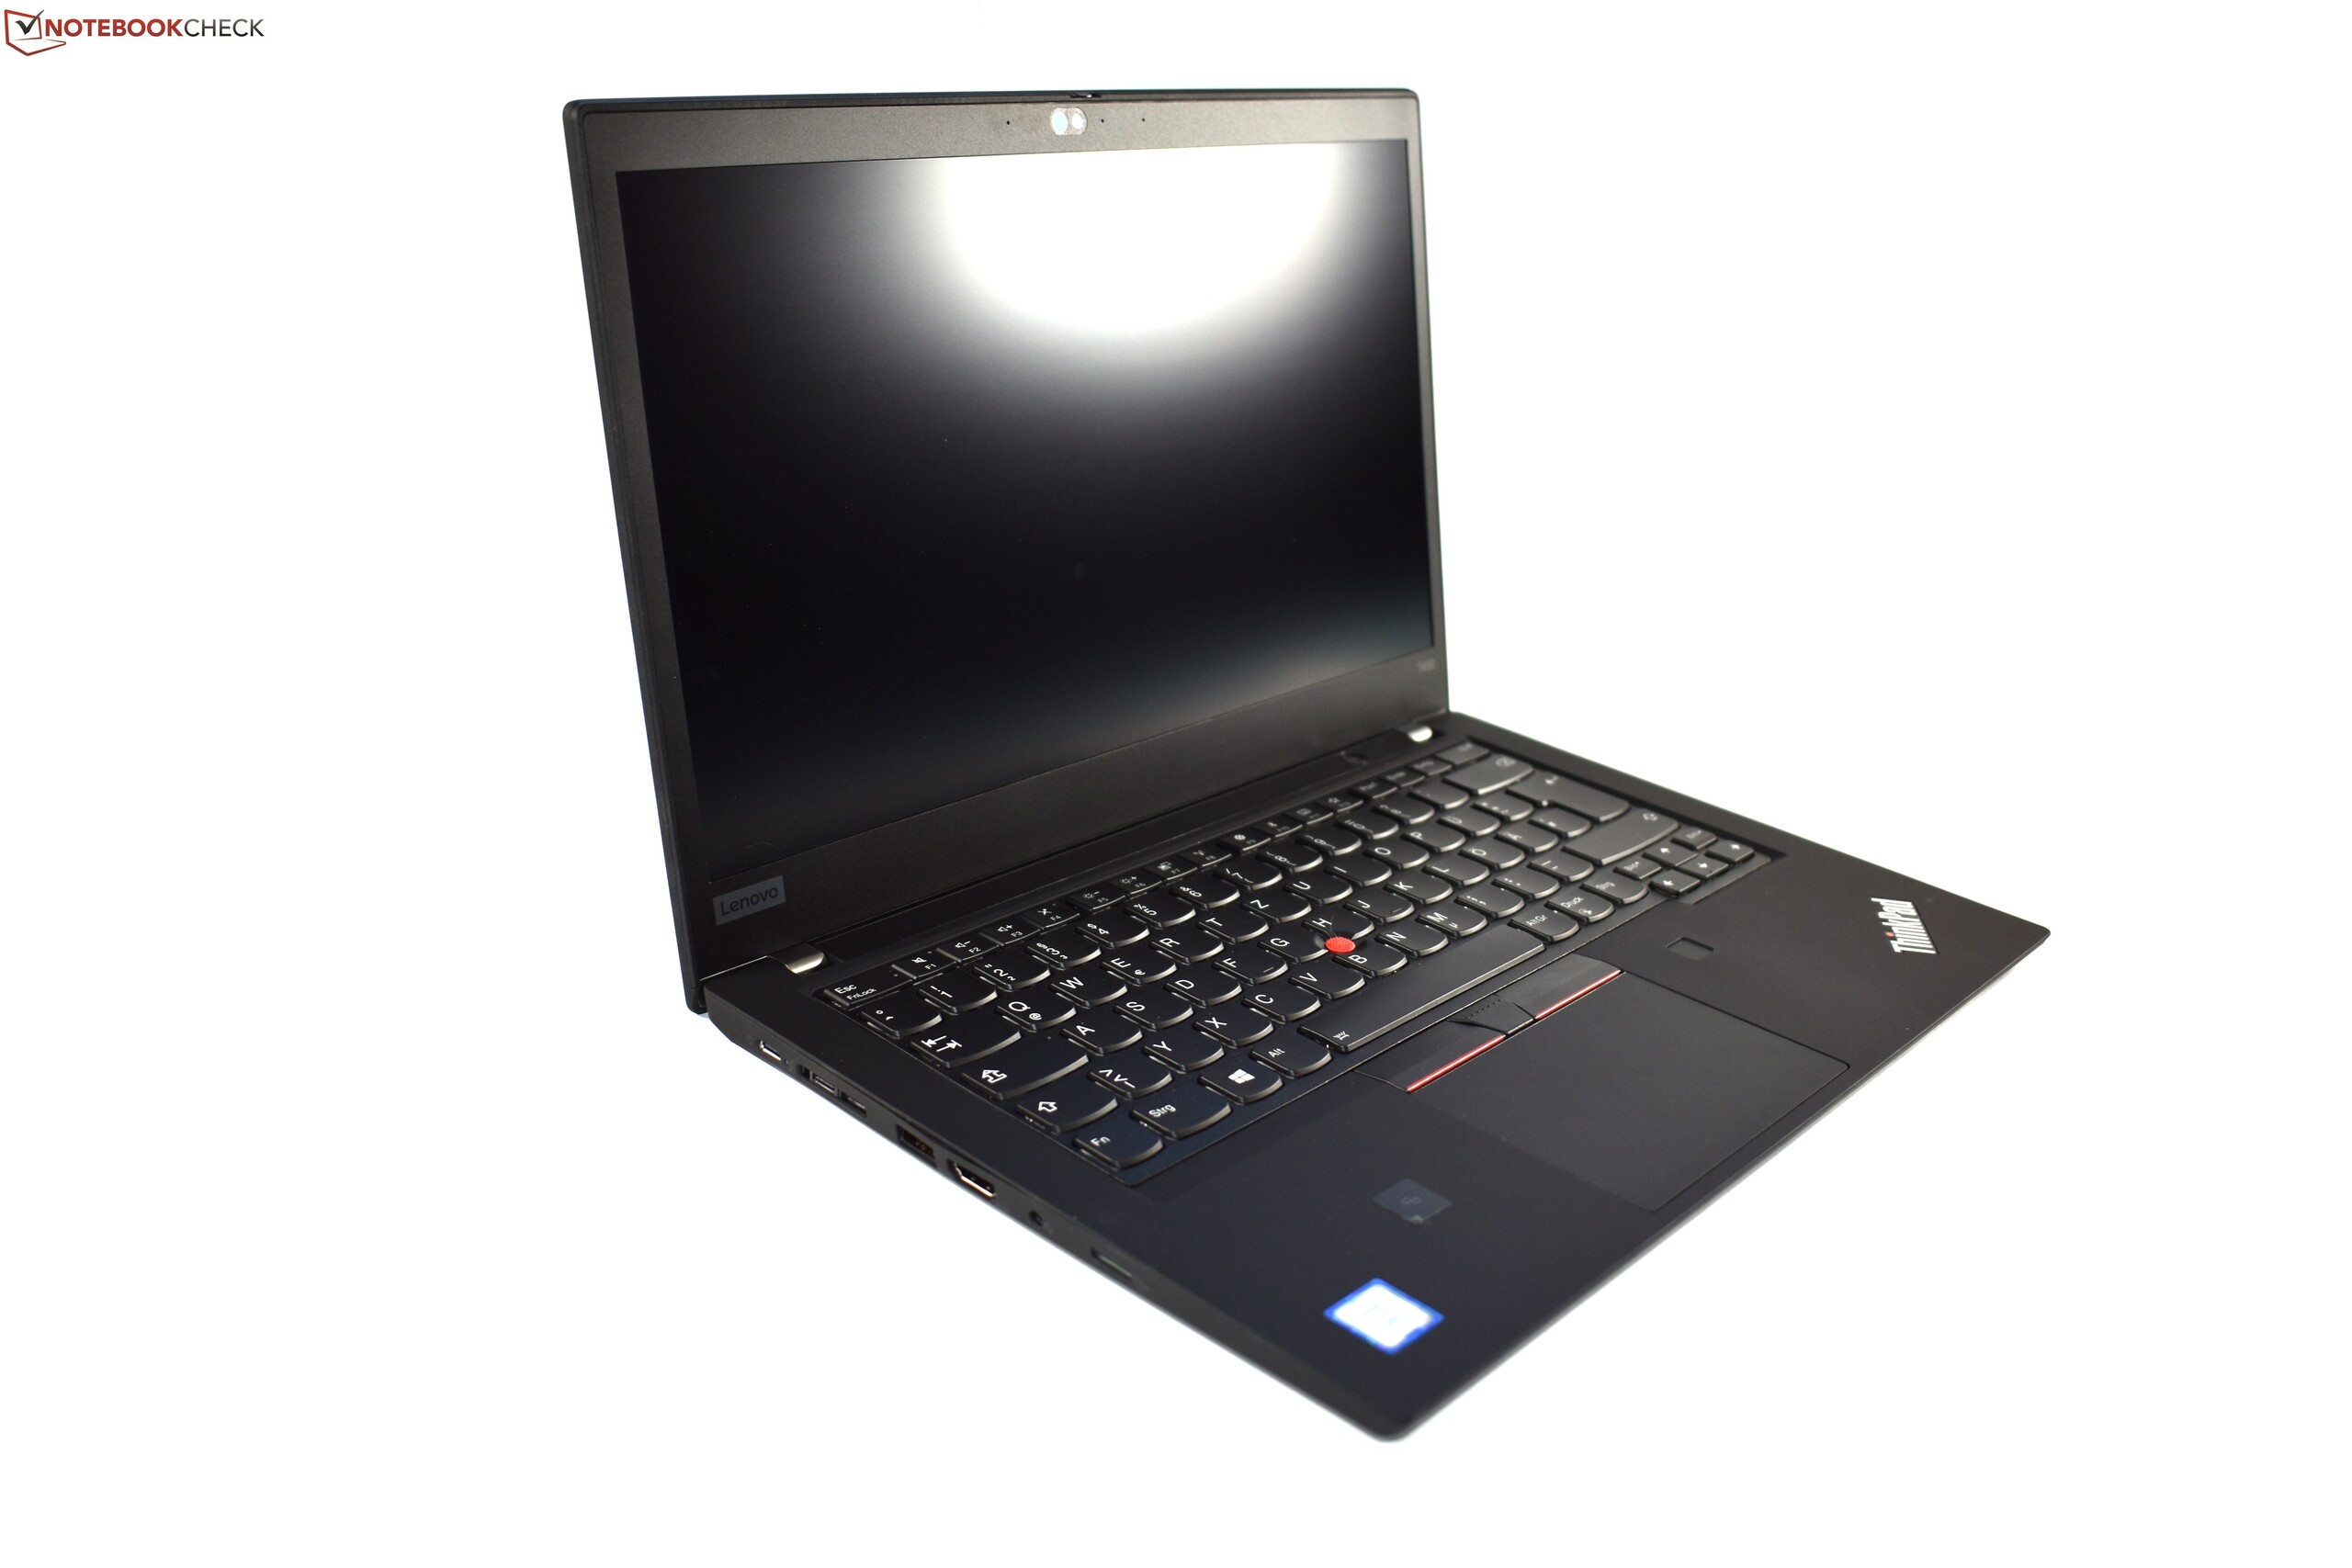
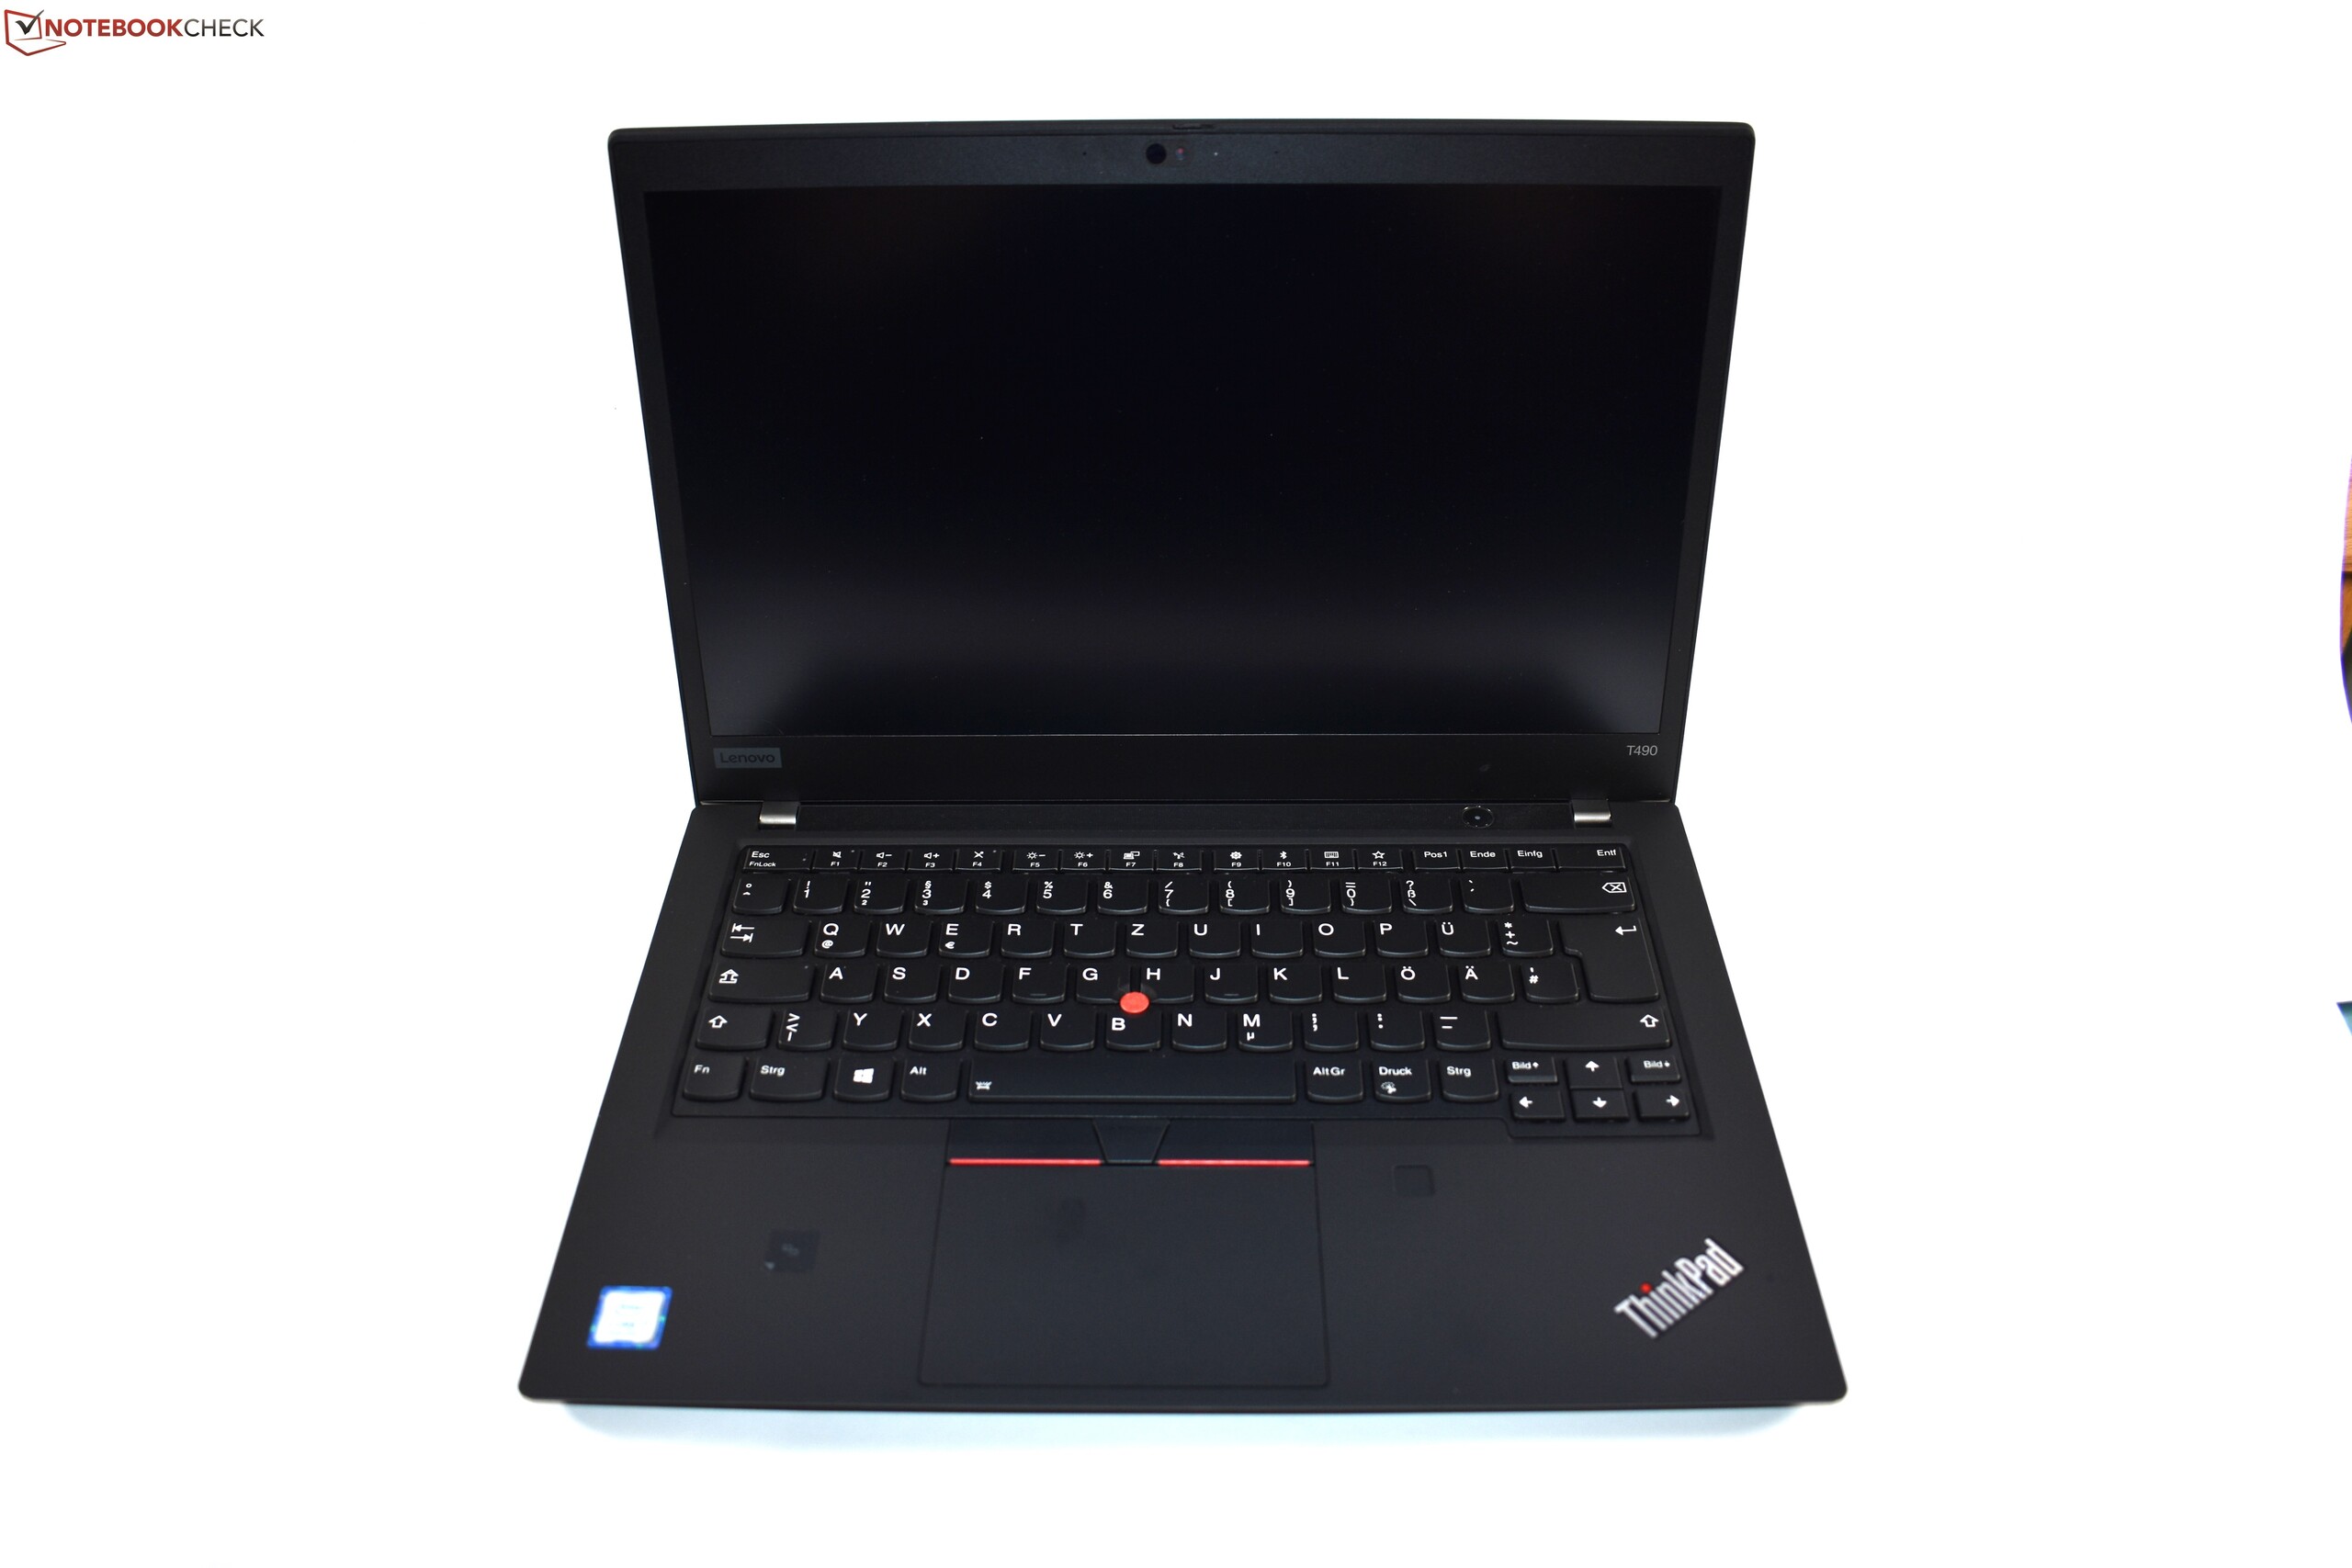
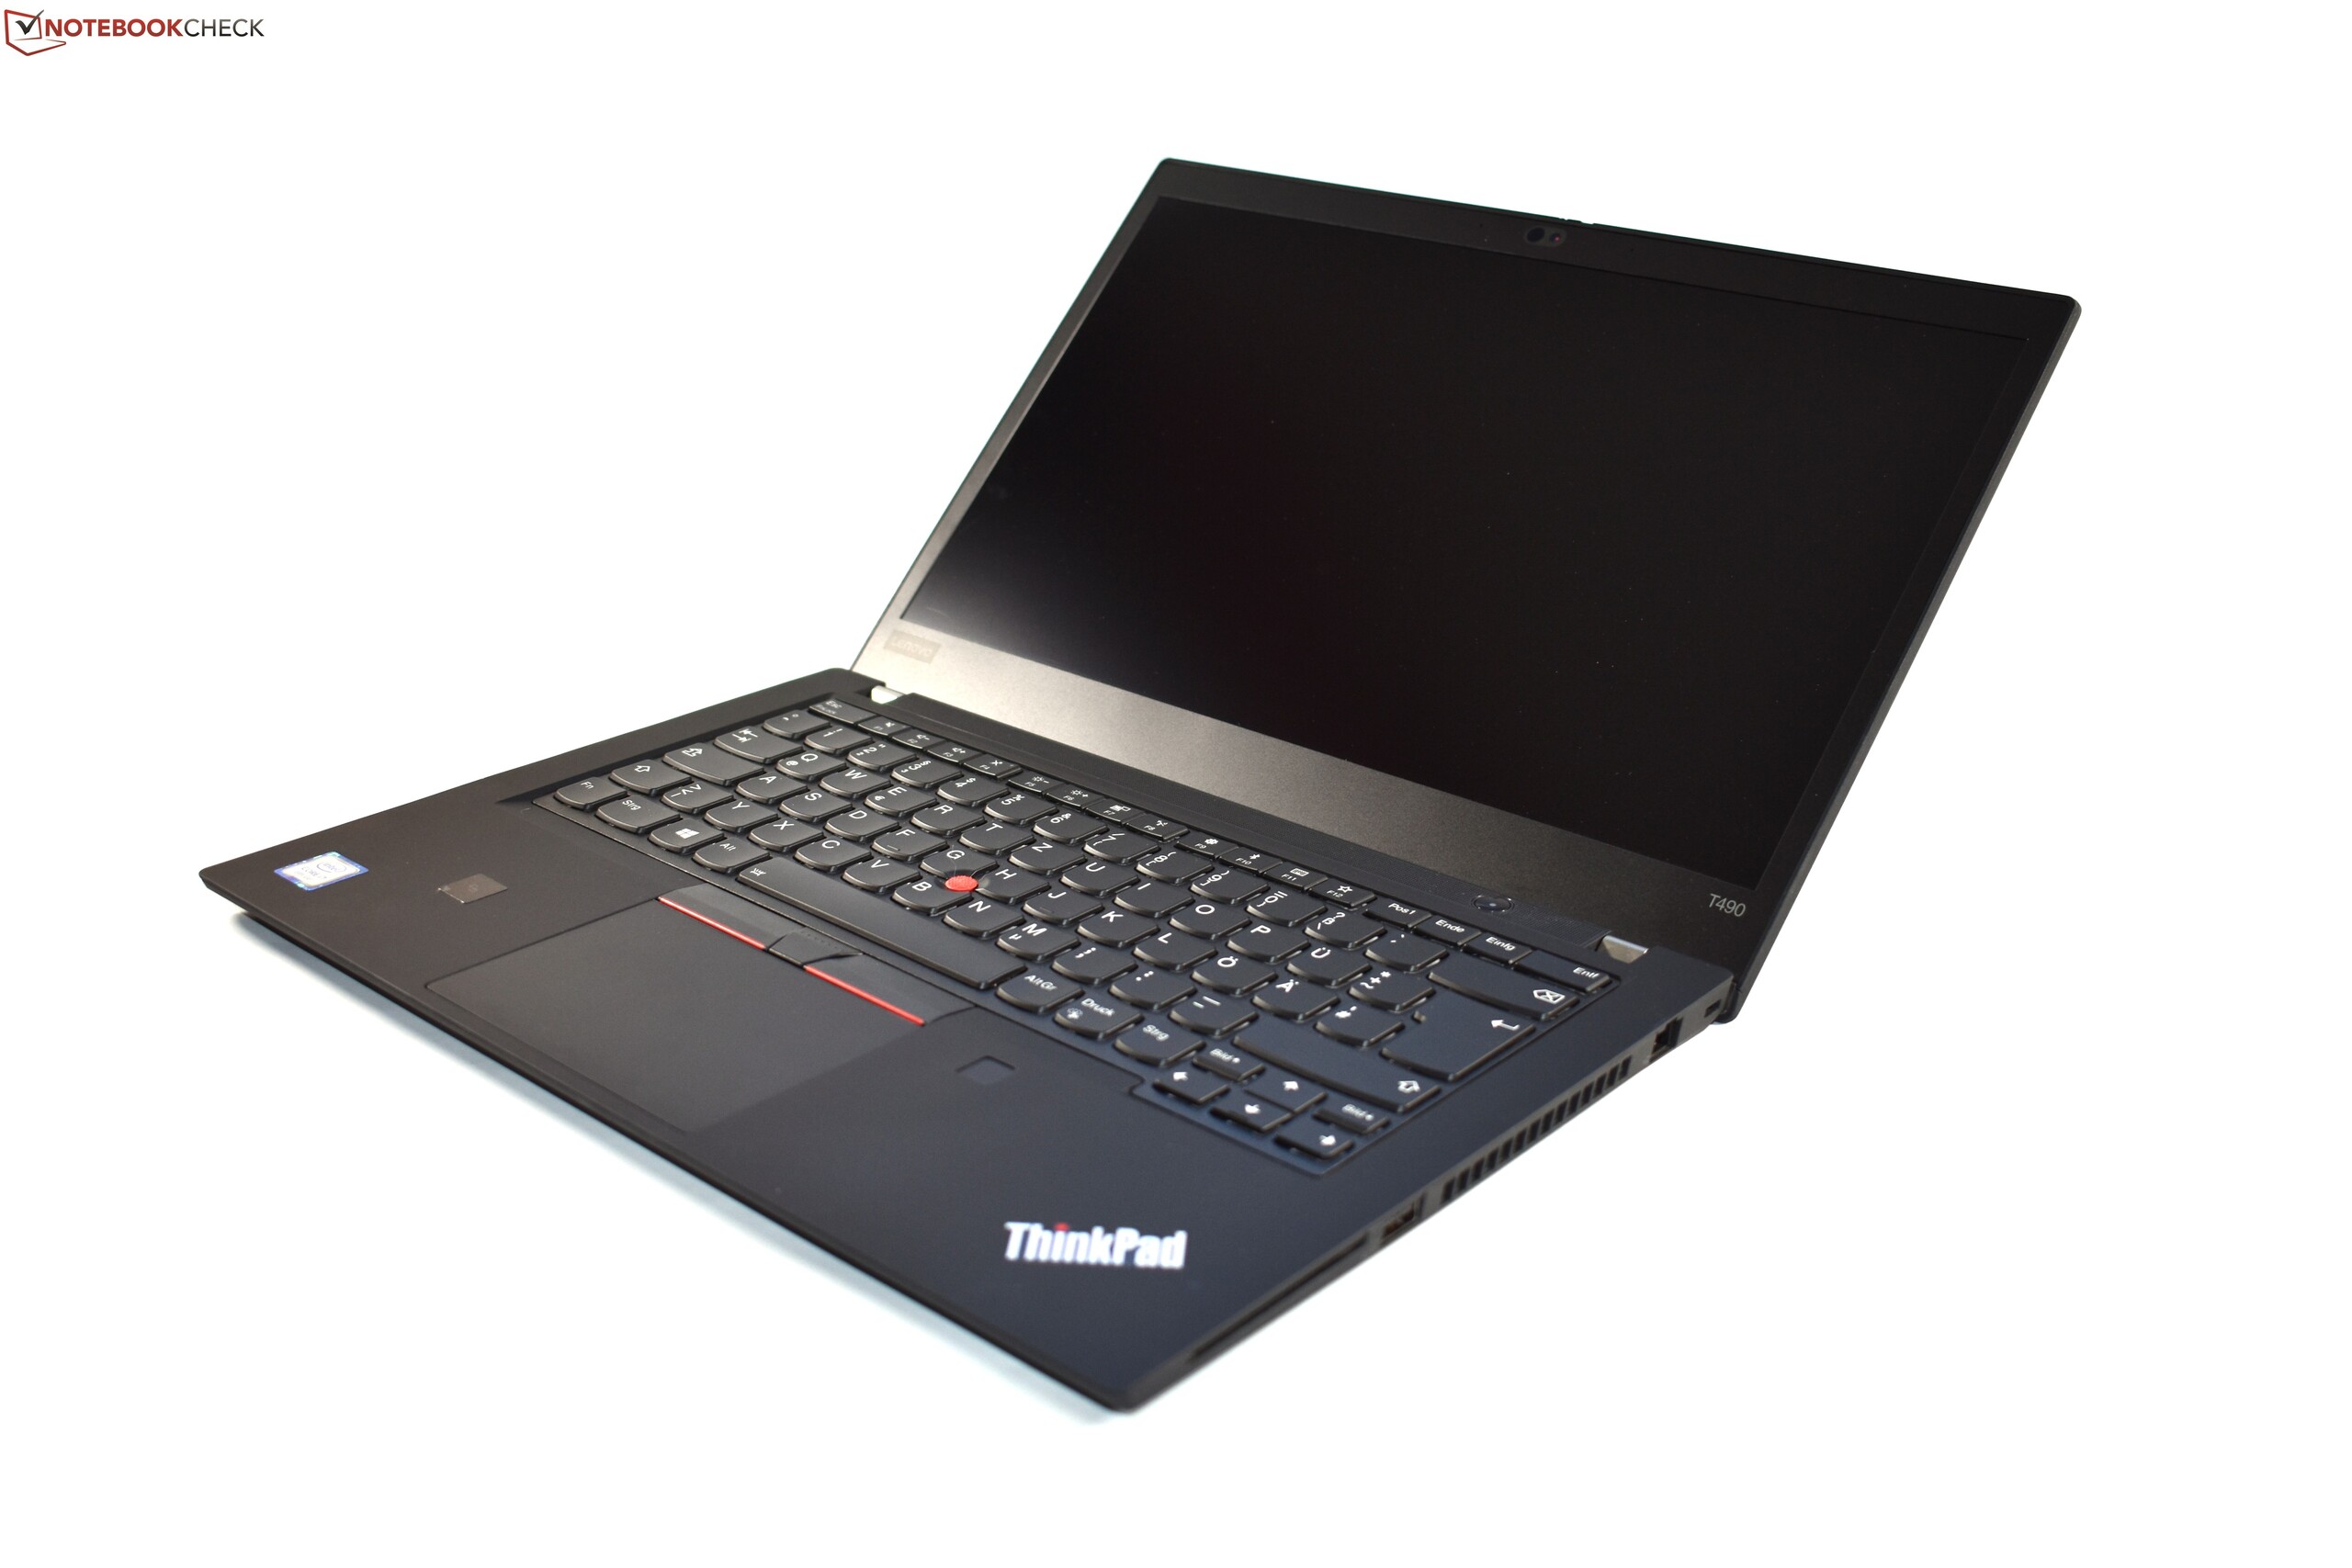
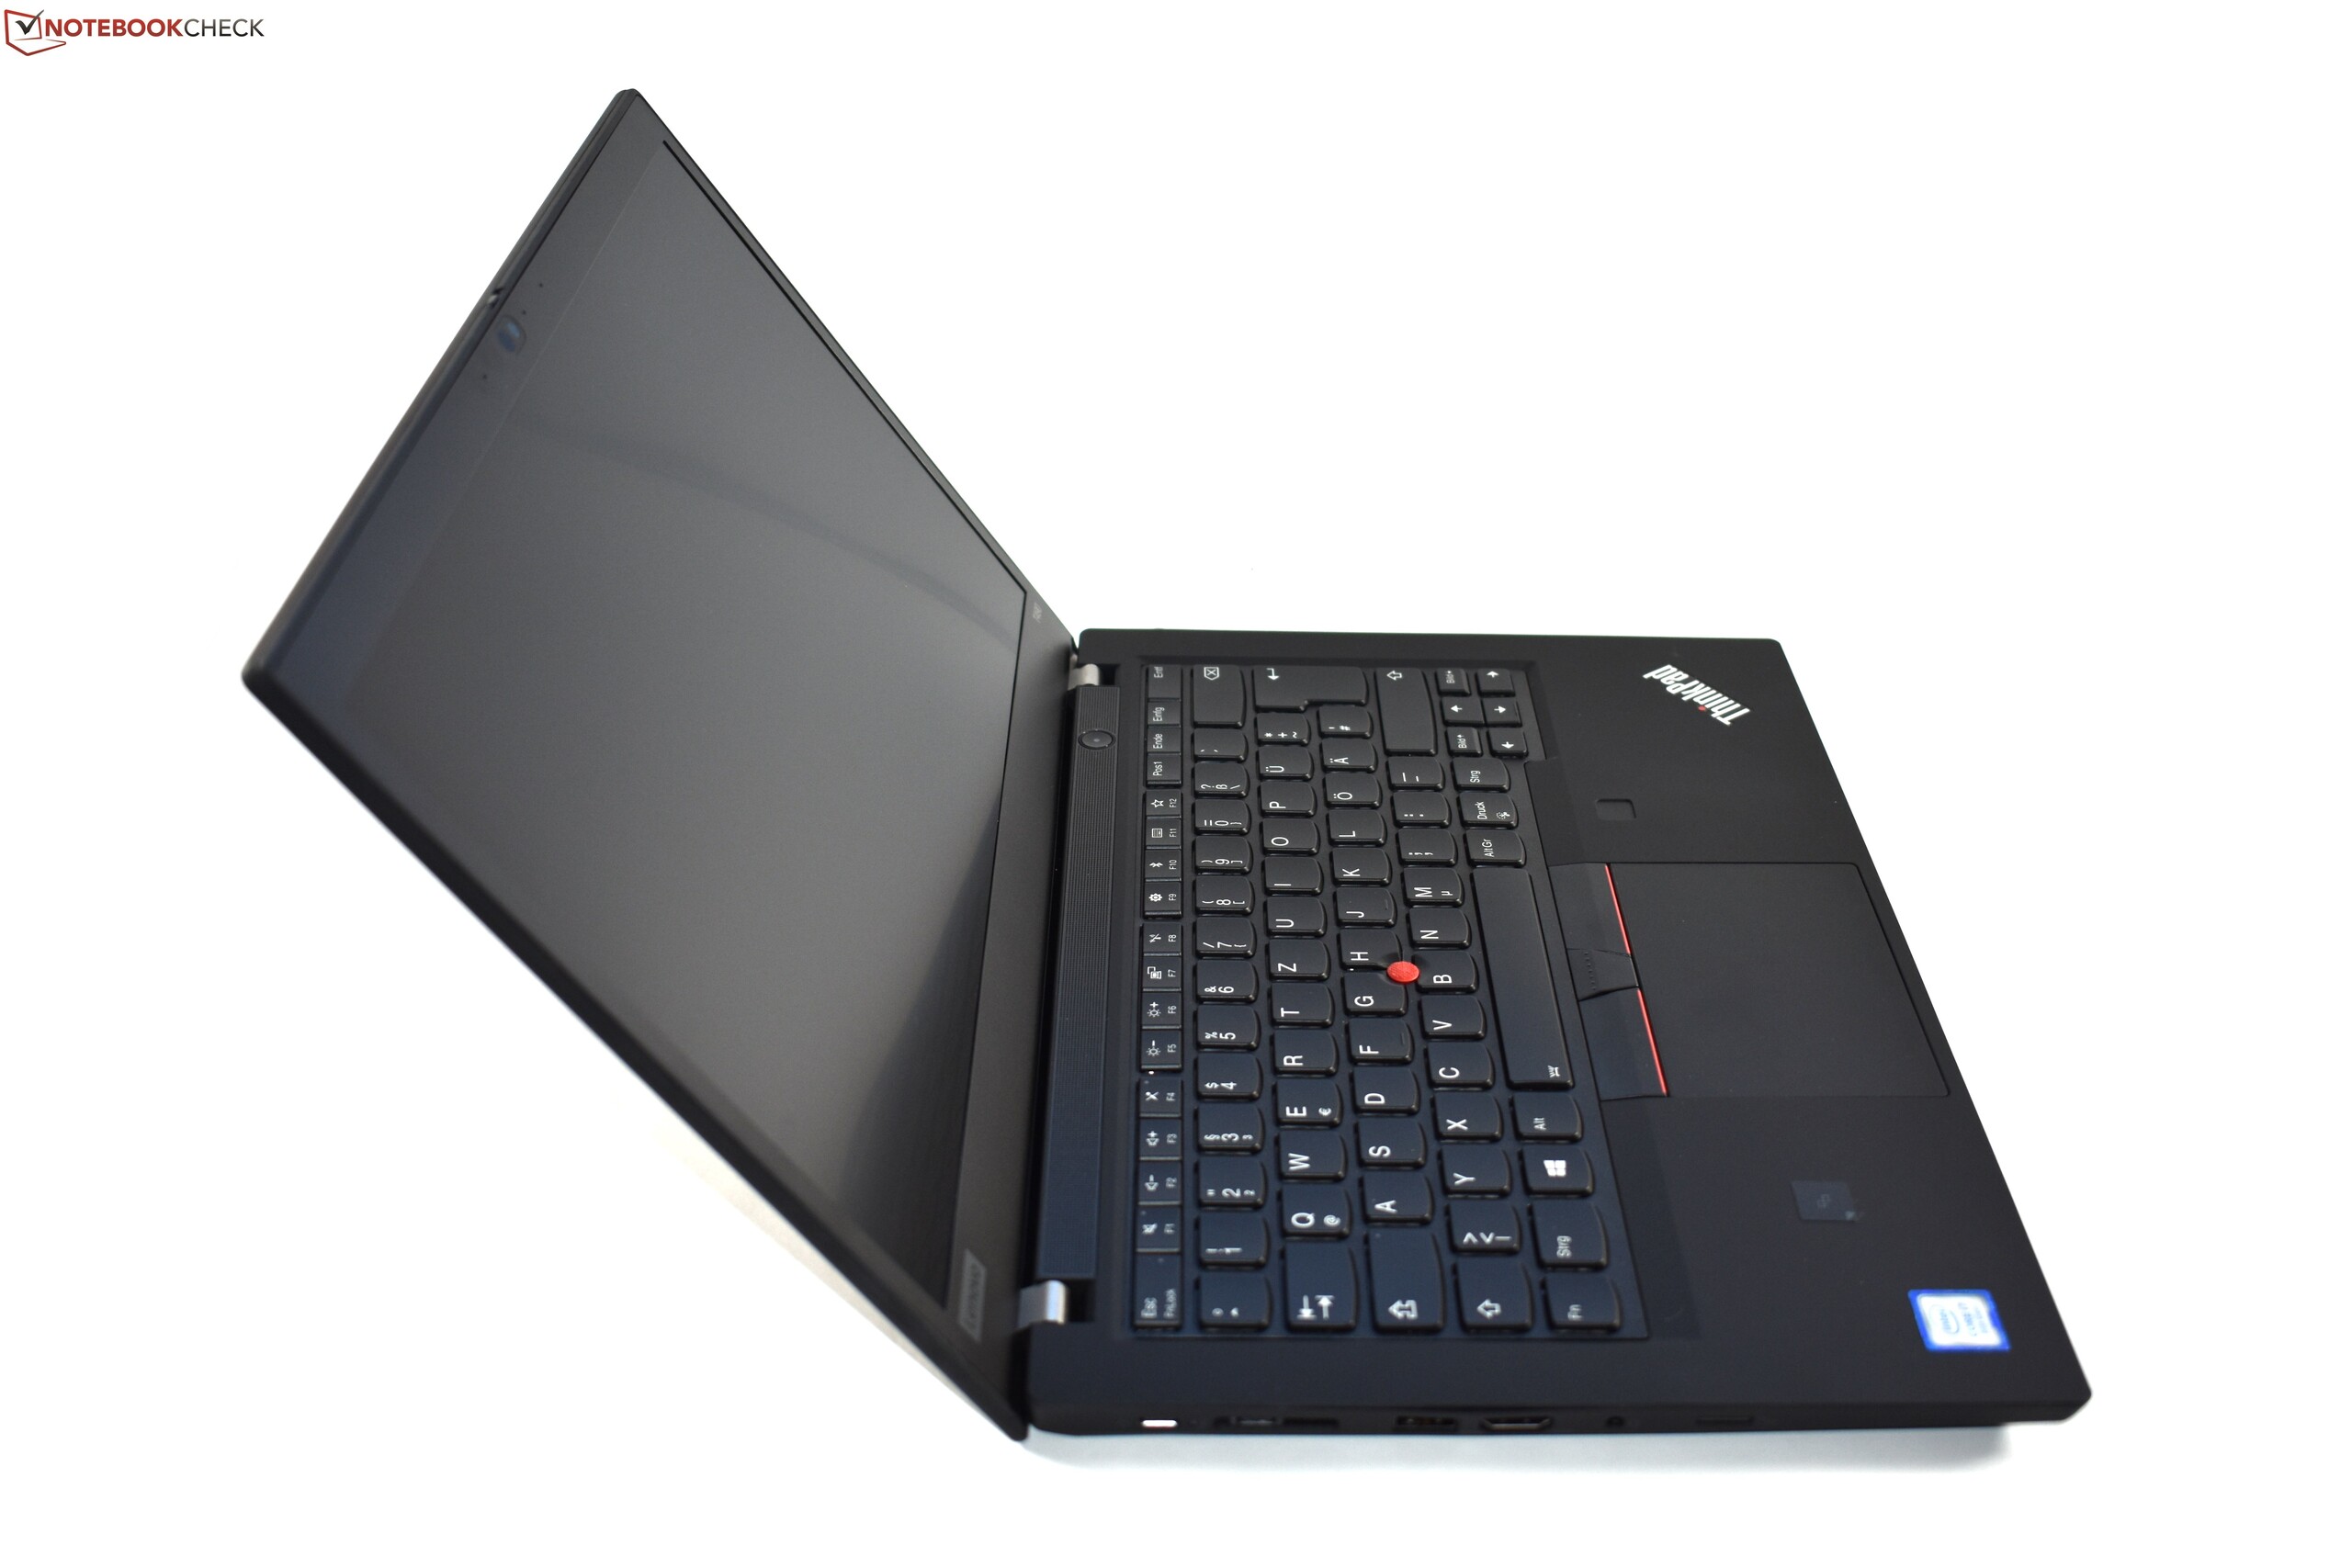
The Lenovo ThinkPad P43s belongs to the category of slim, 14-inch mobile workstations. The device is identical in construction to the ThinkPad T490 sister model. A Core i7-8565U processor and a Quadro P520 graphics core are on board. The laptop's rival is the recently reviewed HP ZBook 14u G6.
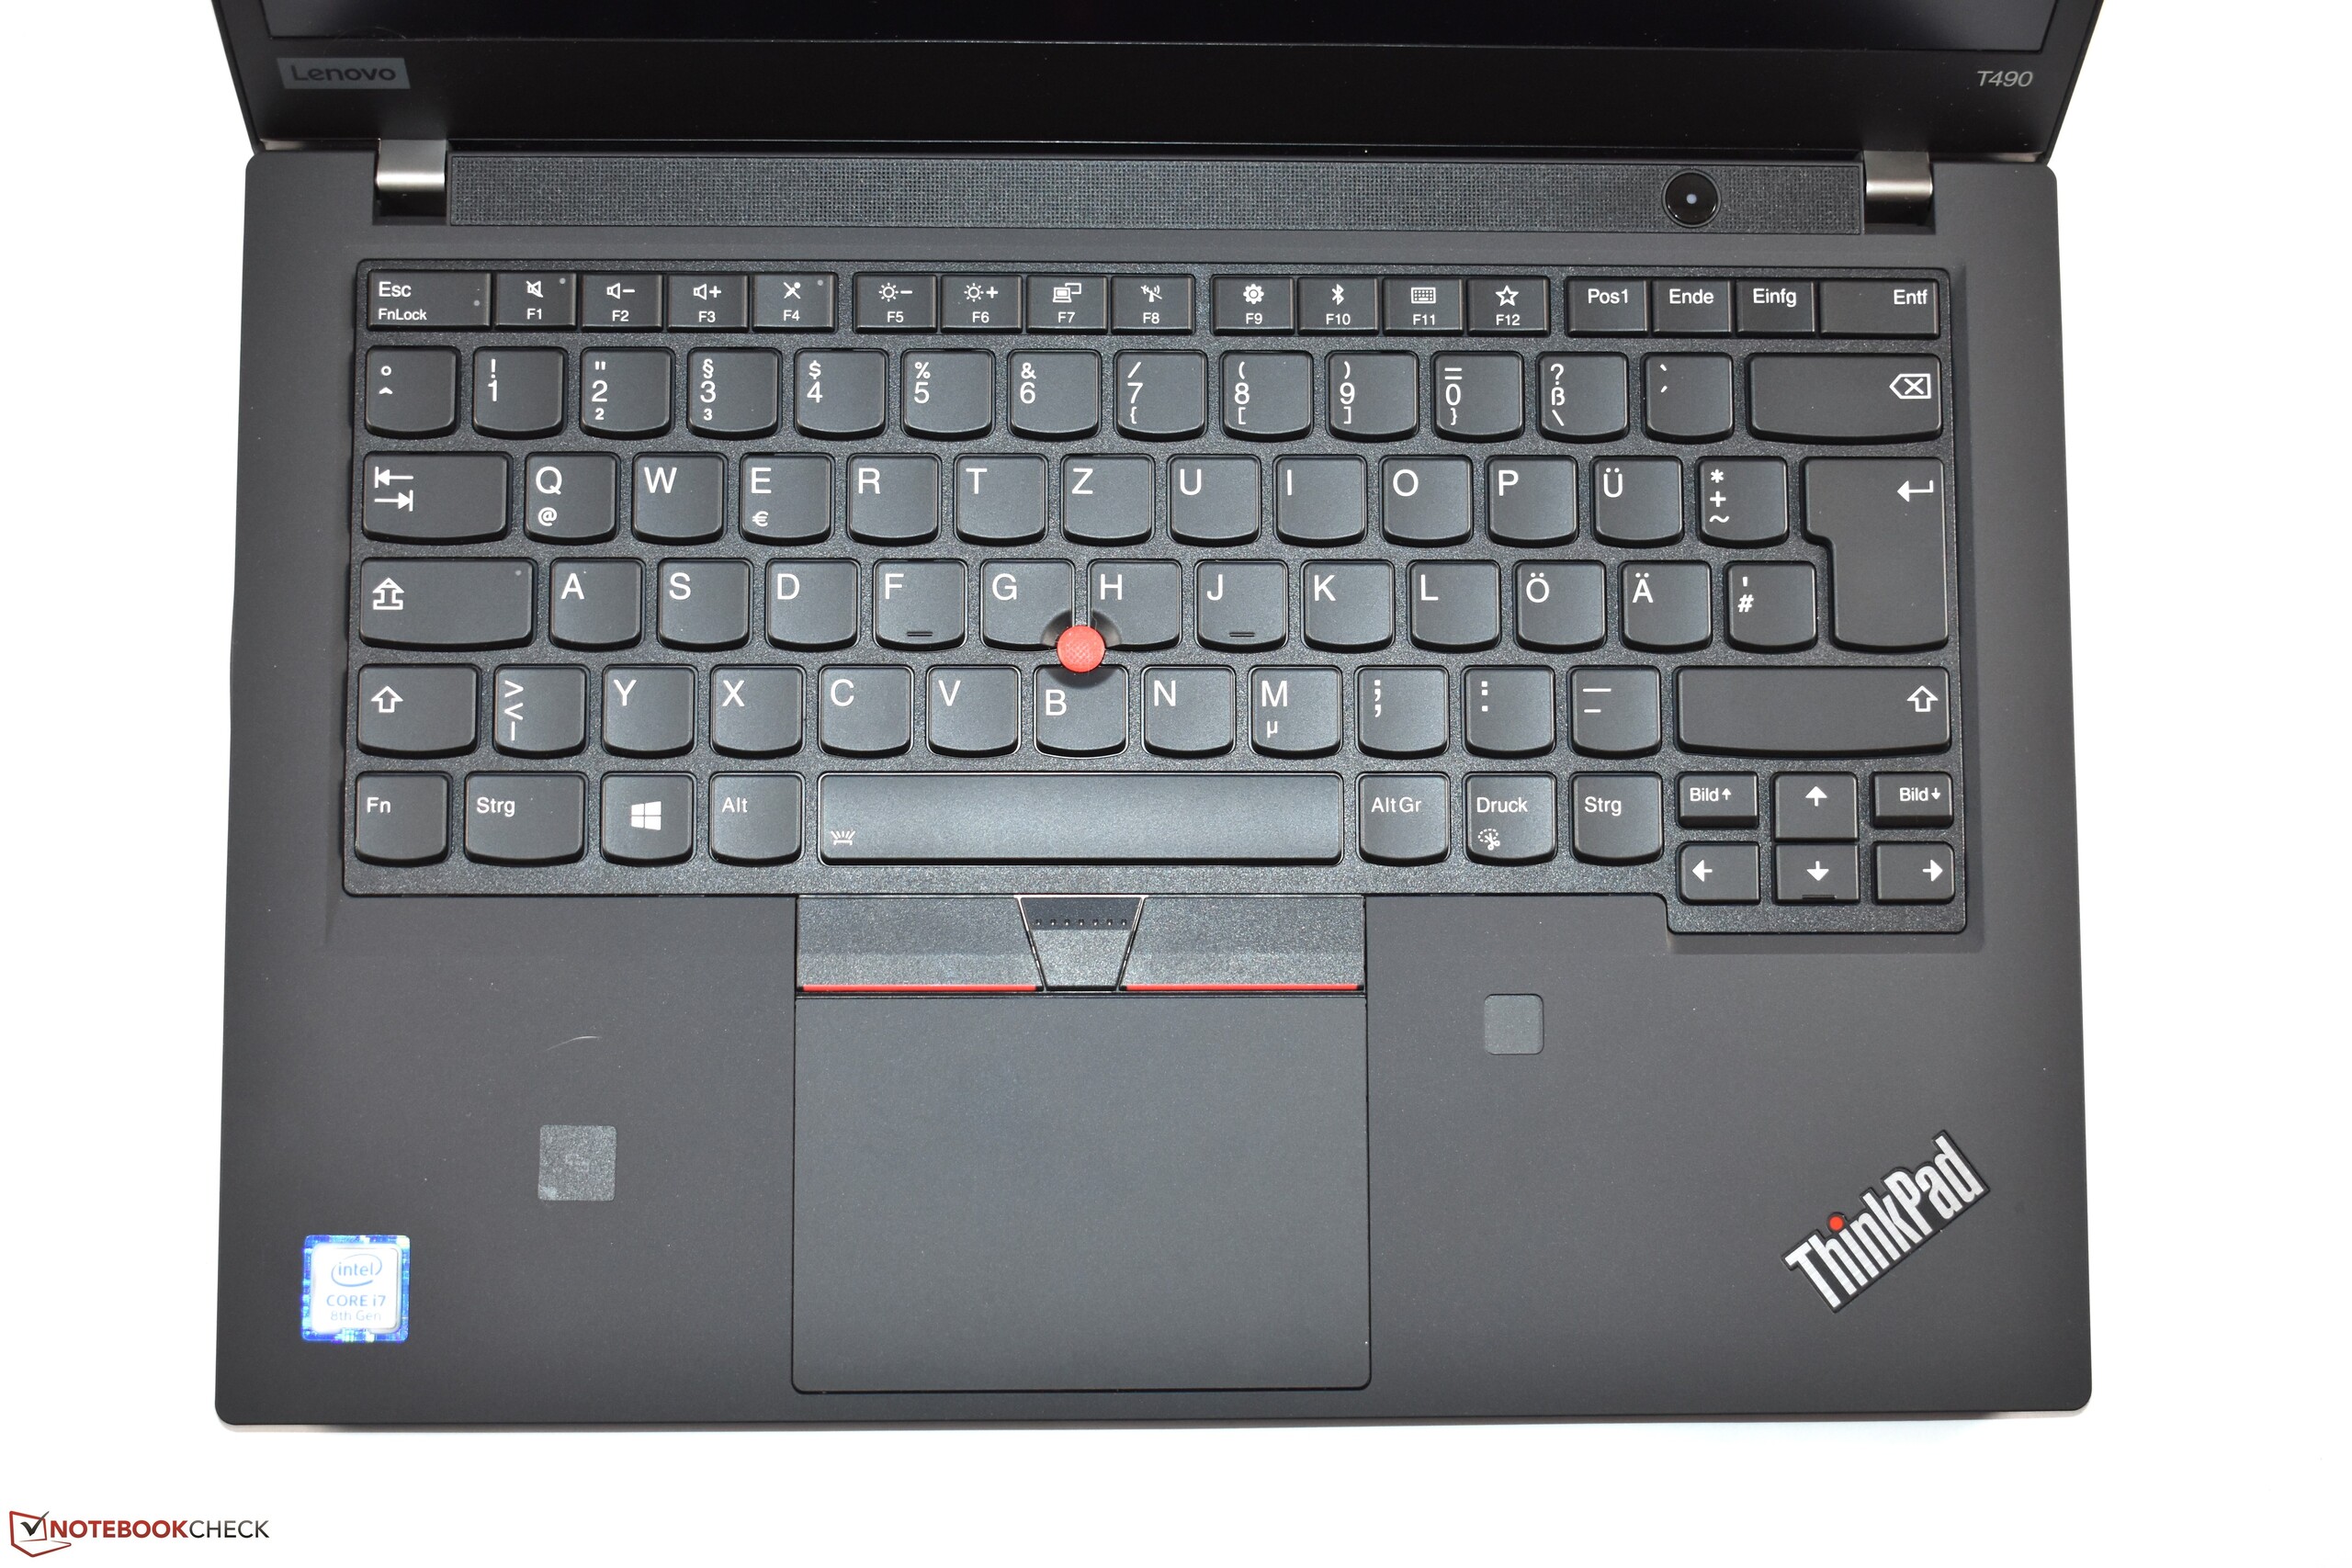
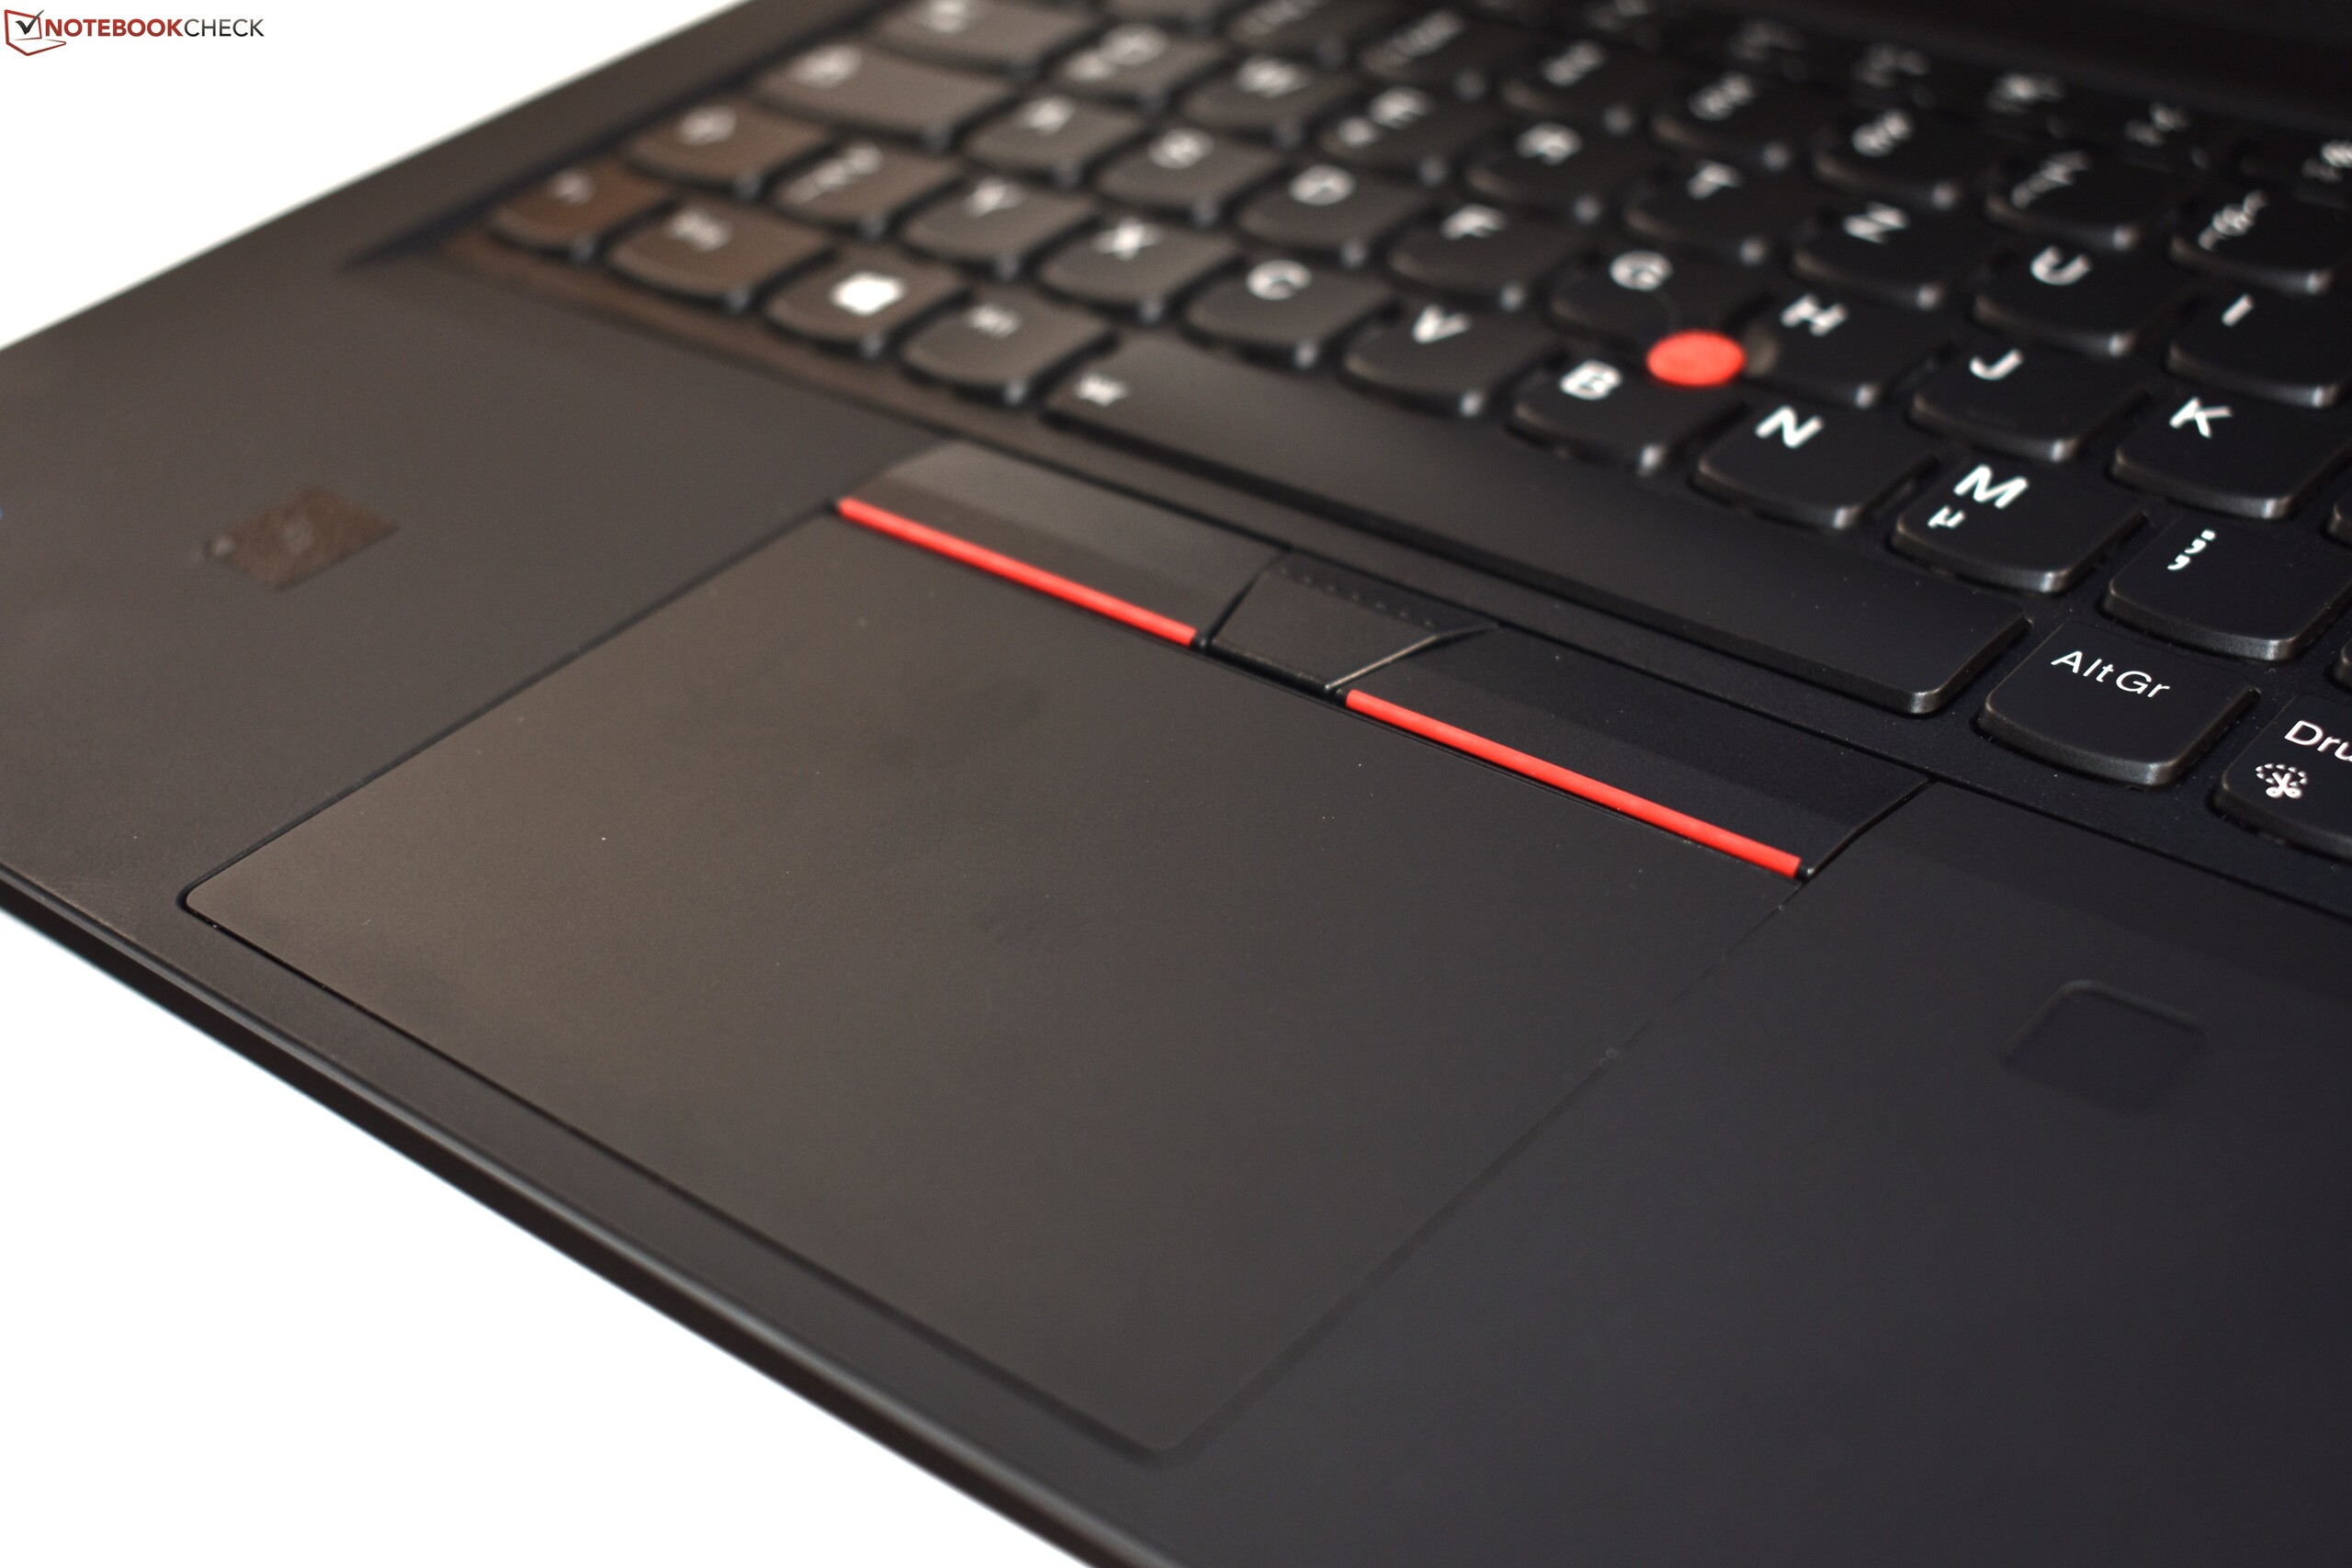
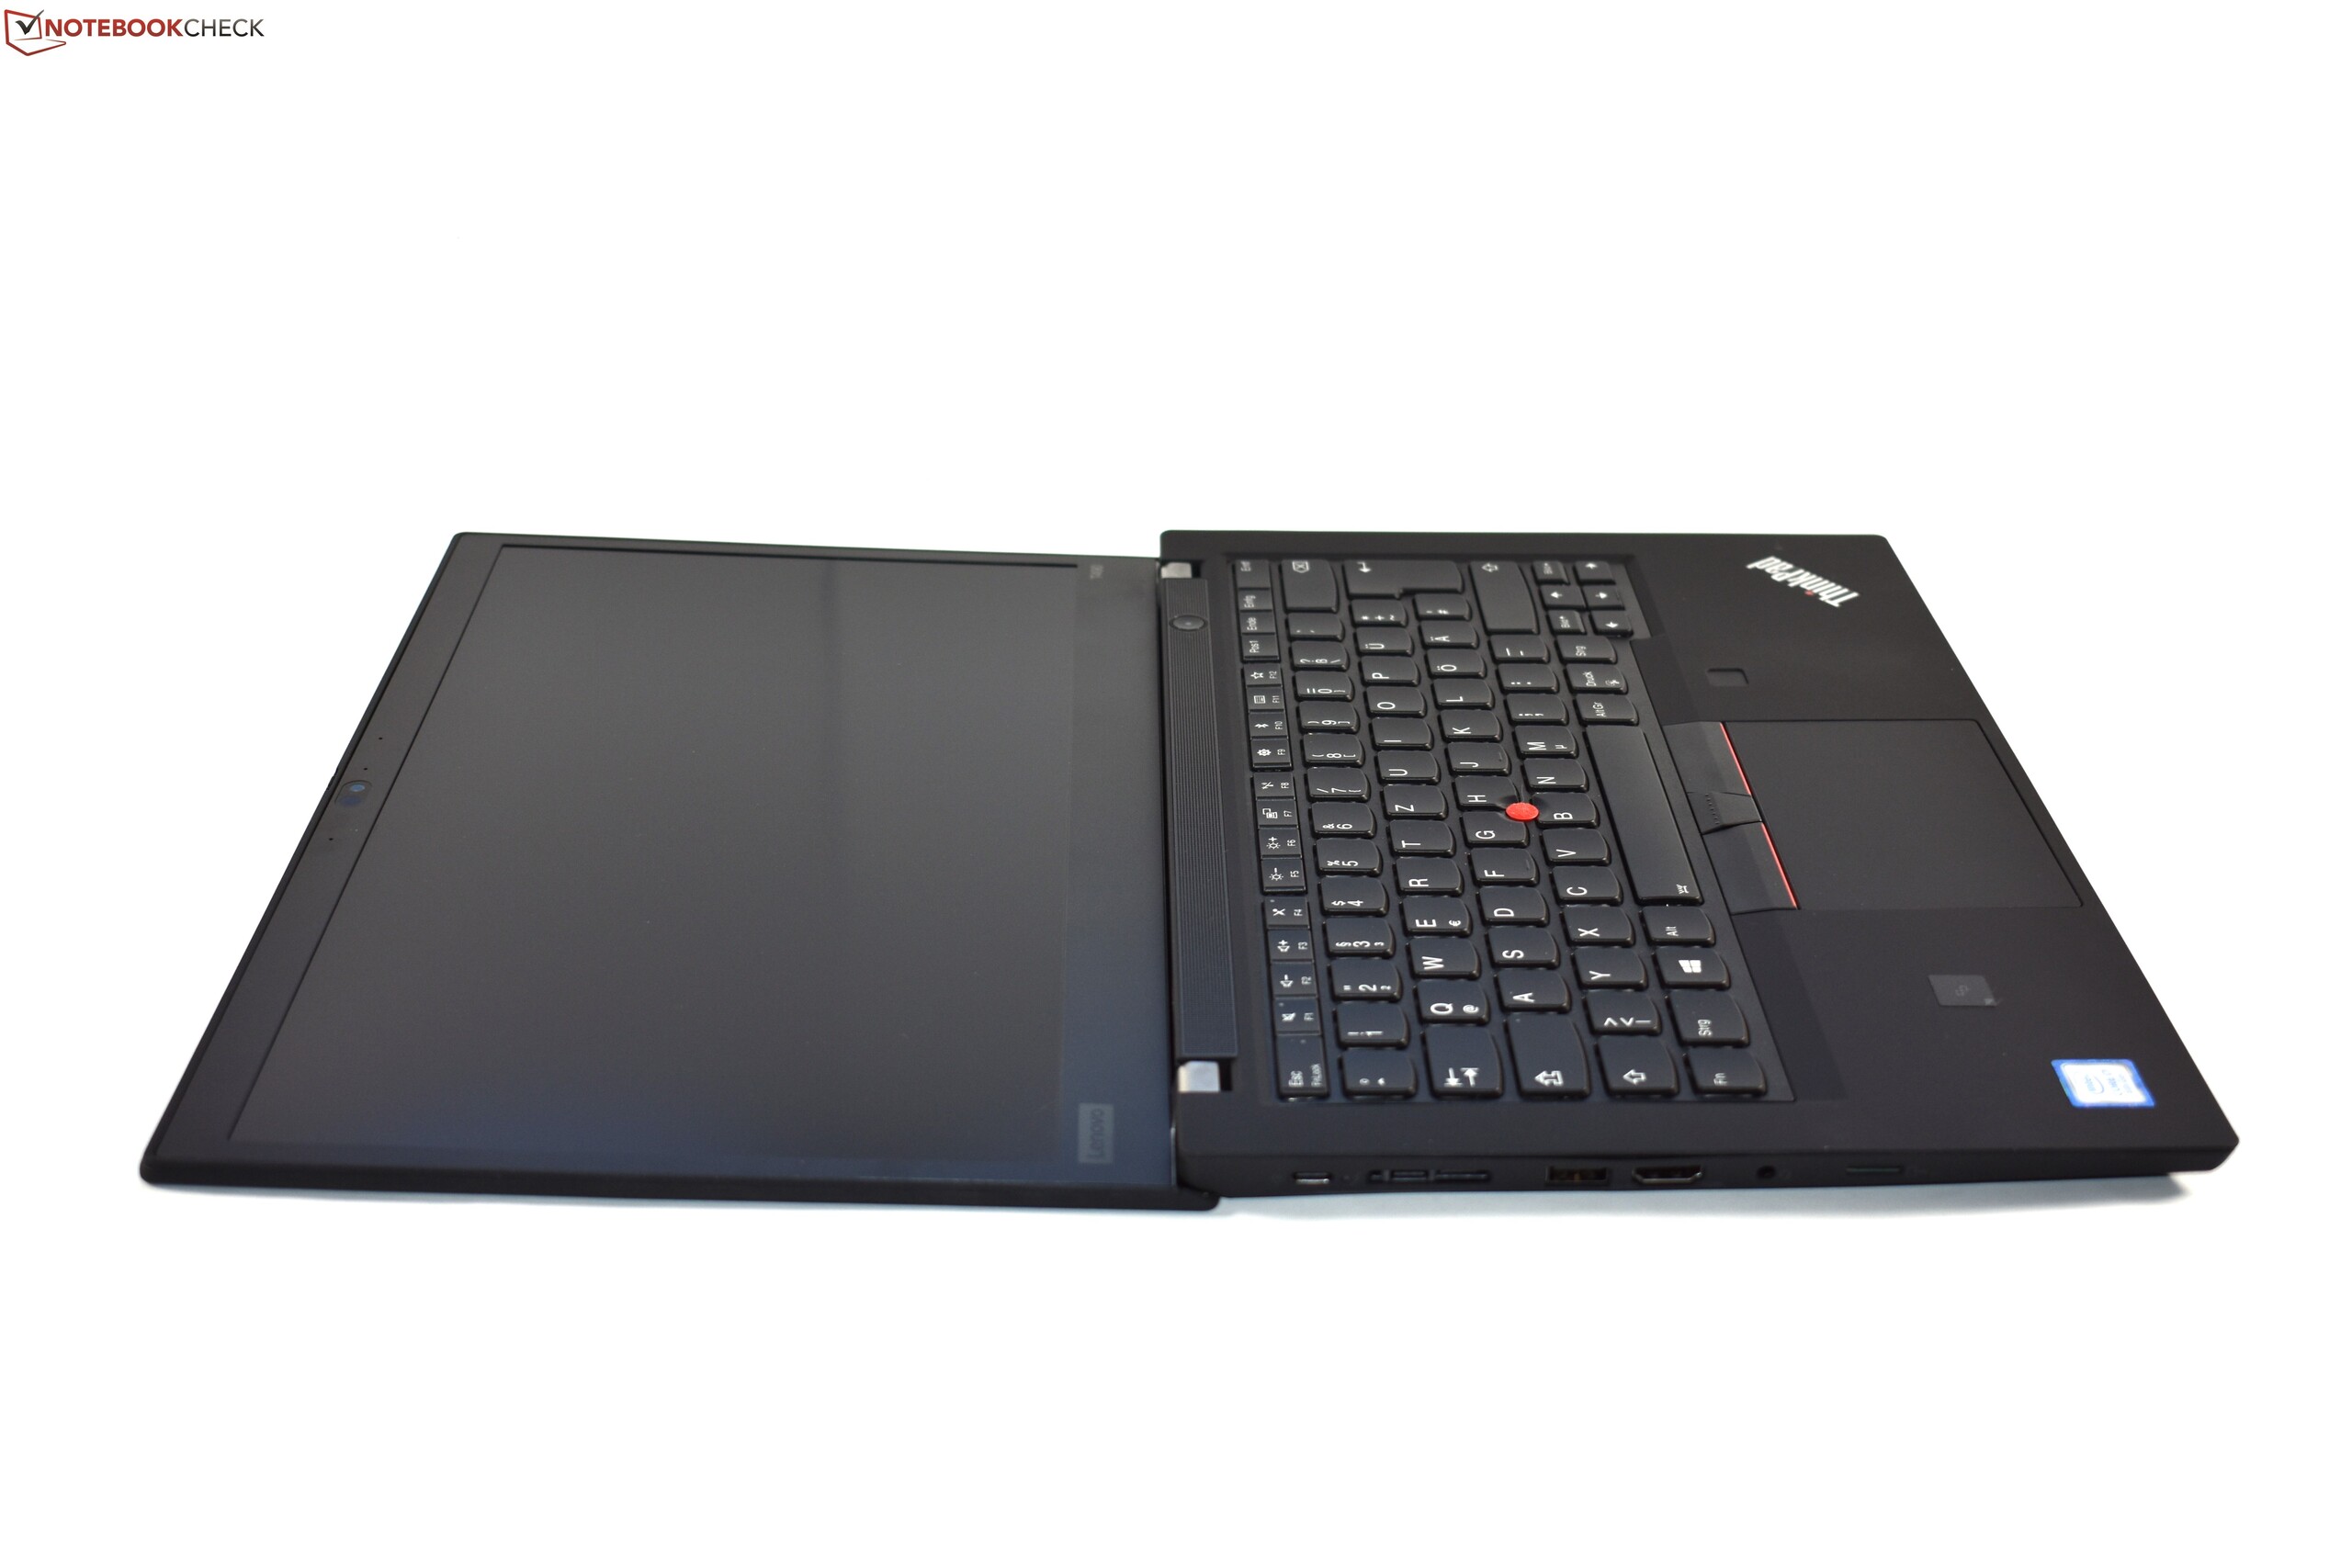
Since the T490 and P43s are built identically, we won't go into the case, the connectivity, the input devices and the speakers. The corresponding information can be found in our review of the ThinkPad T490.
Rating | Date | Model | Weight | Height | Size | Resolution | Price |
|---|---|---|---|---|---|---|---|
| 80.1 % v7 (old) | 10 / 2019 | Lenovo ThinkPad P43s-20RH001FGE i7-8565U, Quadro P520 | 1.5 kg | 18.9 mm | 14.00" | 1920x1080 | |
| 81 % v7 (old) | 10 / 2019 | HP ZBook 14u G6 6TP71EA i7-8565U, Radeon Pro WX 3200 | 1.5 kg | 17.9 mm | 14.00" | 1920x1080 |

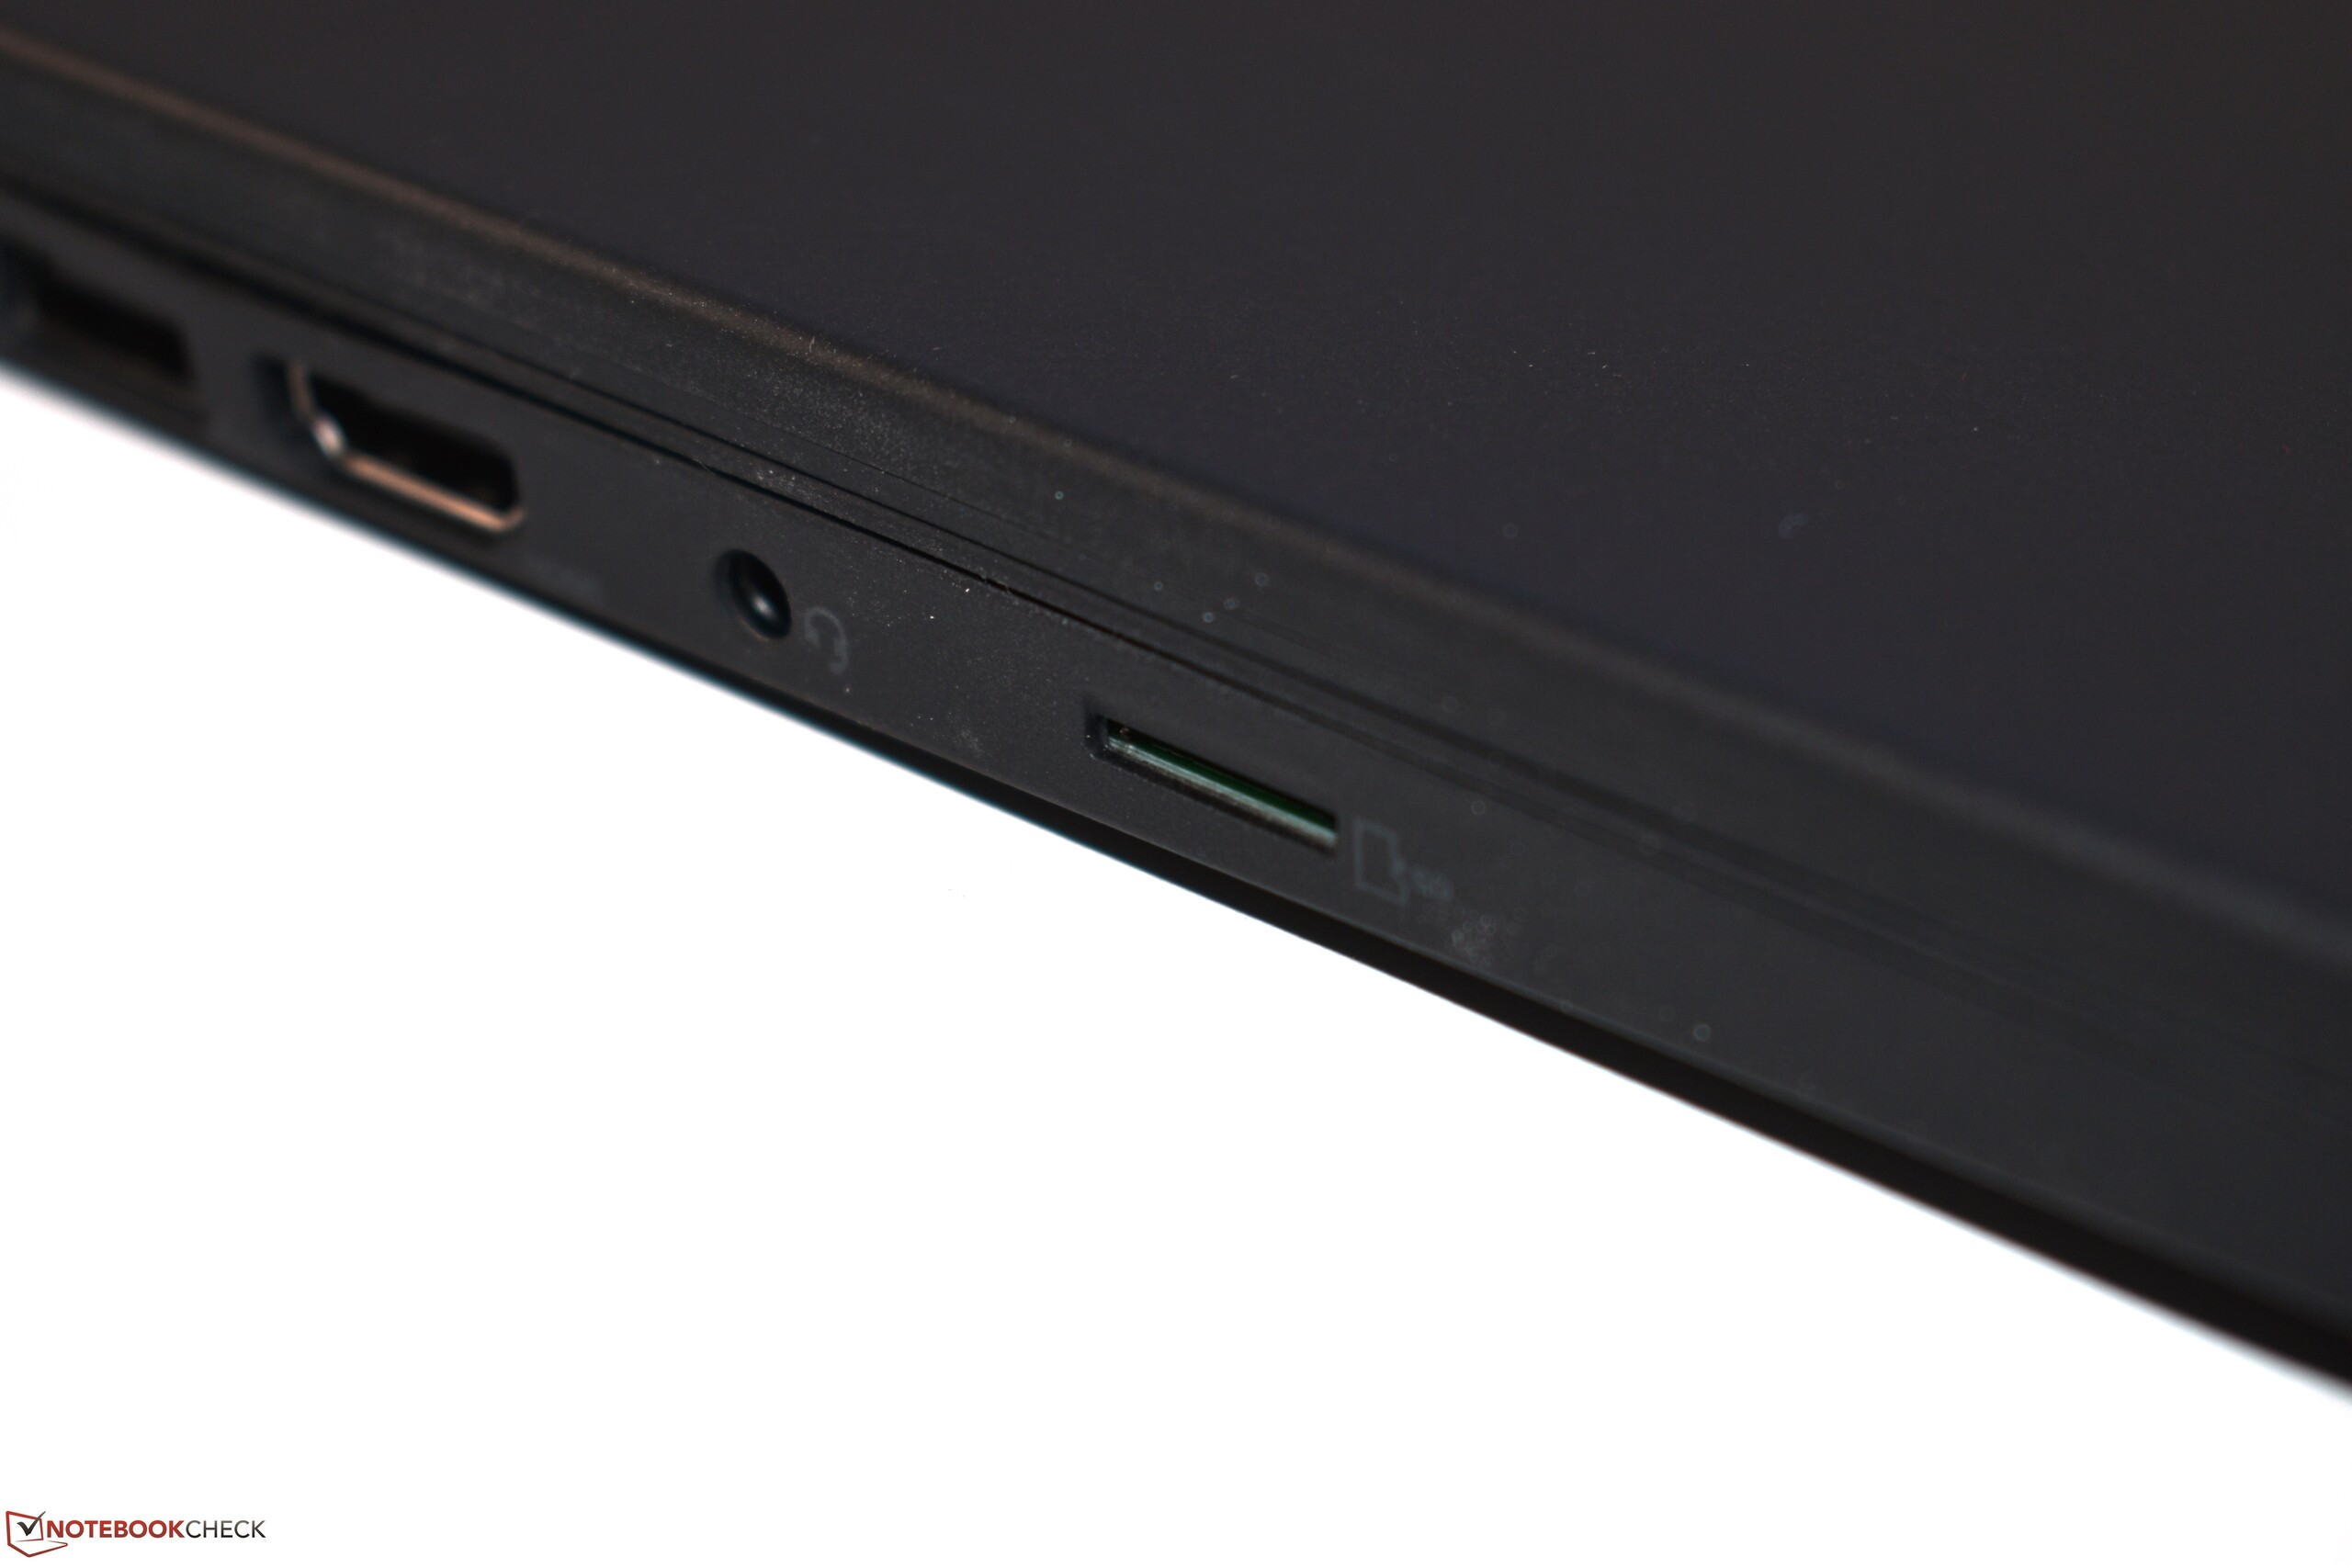
| SD Card Reader | |
| average JPG Copy Test (av. of 3 runs) | |
| Average of class Workstation (49.6 - 681, n=13, last 2 years) | |
| Dell Precision 5530 2-in-1 (Toshiba Exceria Pro M501 UHS-II) | |
| Lenovo ThinkPad P43s-20RH001FGE (Toshiba Exceria Pro M501 64 GB UHS-II) | |
| Lenovo ThinkPad T490-20N3S02L00 (Toshiba Exceria Pro M501) | |
| maximum AS SSD Seq Read Test (1GB) | |
| Average of class Workstation (87.6 - 1455, n=13, last 2 years) | |
| Dell Precision 5530 2-in-1 (Toshiba Exceria Pro M501 UHS-II) | |
| Lenovo ThinkPad T490-20N3S02L00 (Toshiba Exceria Pro M501) | |
| Lenovo ThinkPad P43s-20RH001FGE (Toshiba Exceria Pro M501 64 GB UHS-II) | |
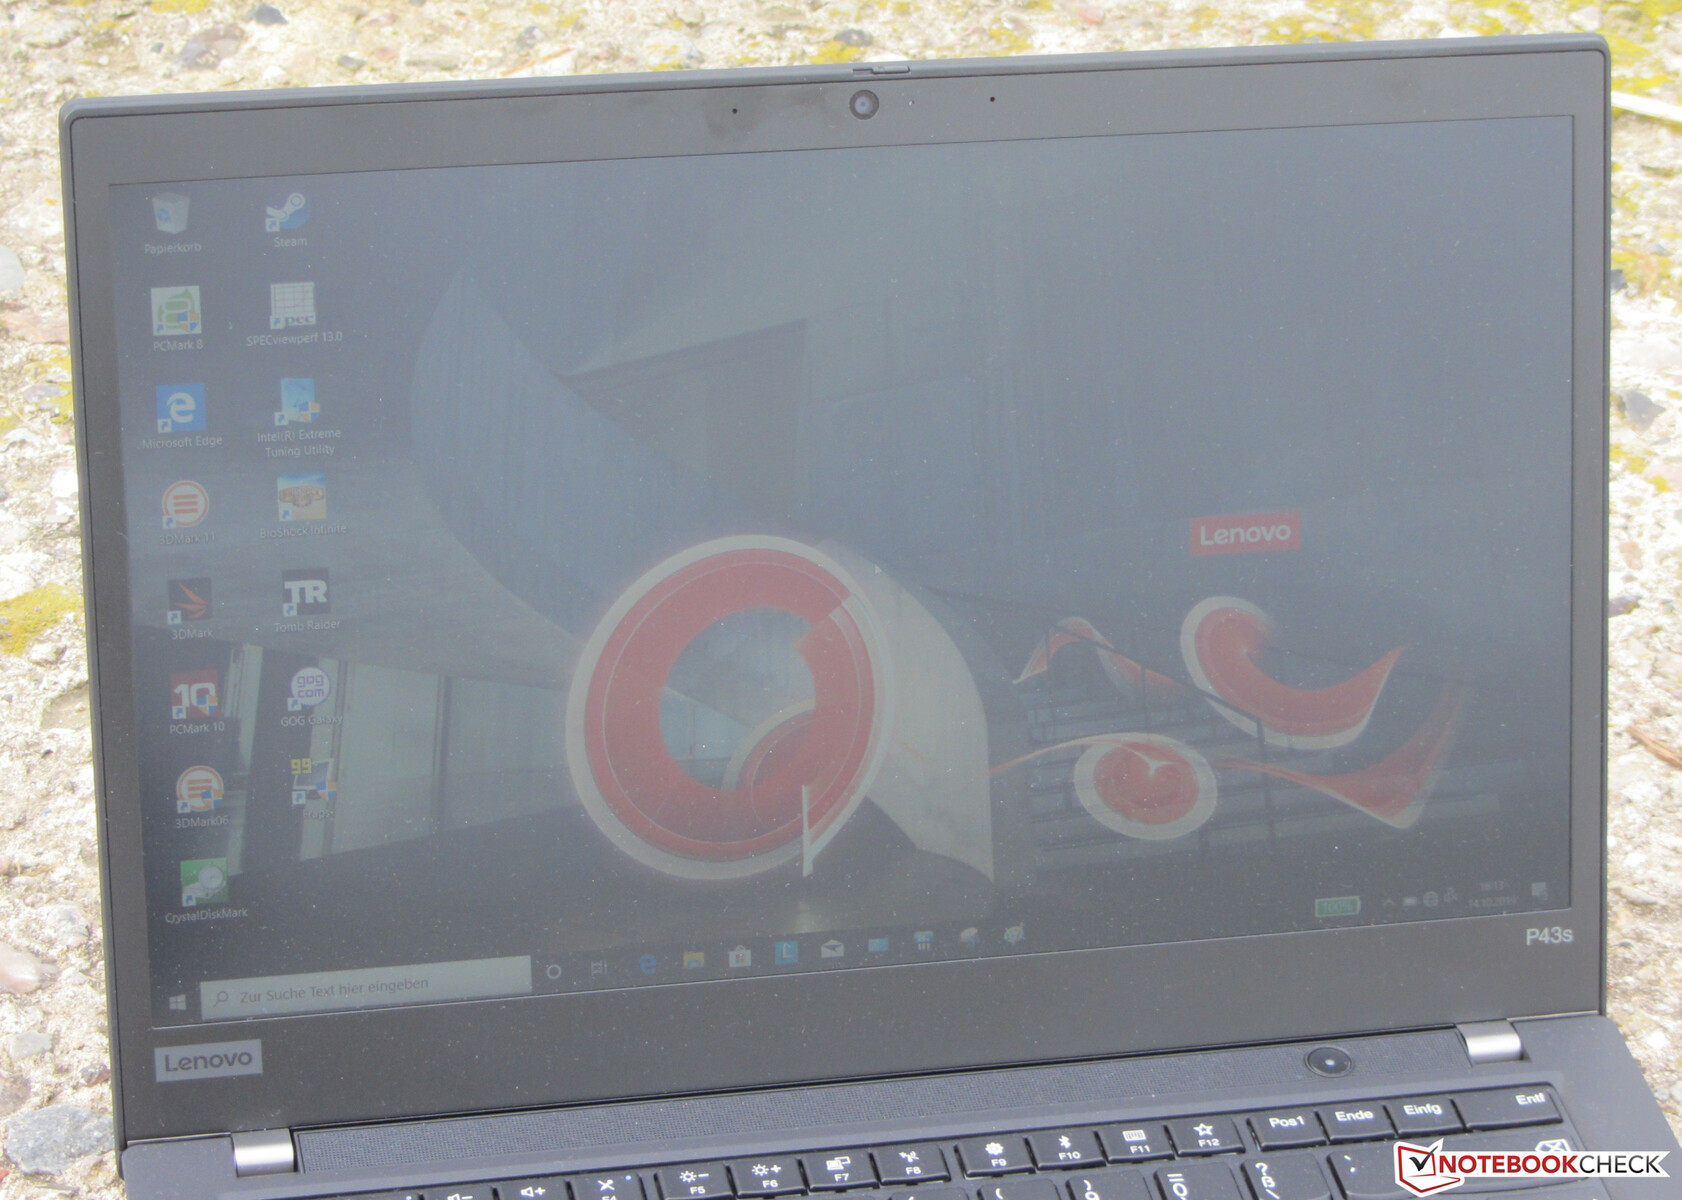
Display - P43s with dim IPS display
The 14-inch screen of the Lenovo P43s works at a native resolution of 1920x1080 pixels. While the display provides a good contrast (1365:1), the brightness (213.6 cd/m²) is far too low. We expect a value beyond 300 cd/m² here. This is particularly demanded by the laptop's price point.
Unfortunately, the display flickers at a frequency of 24,750 Hz at brightness levels of 40% and below. At this high frequency, even sensitive users shouldn't be troubled by headaches and/or eye problems.

| |||||||||||||||||||||||||
Brightness Distribution: 89 %
Center on Battery: 232 cd/m²
Contrast: 1365:1 (Black: 0.17 cd/m²)
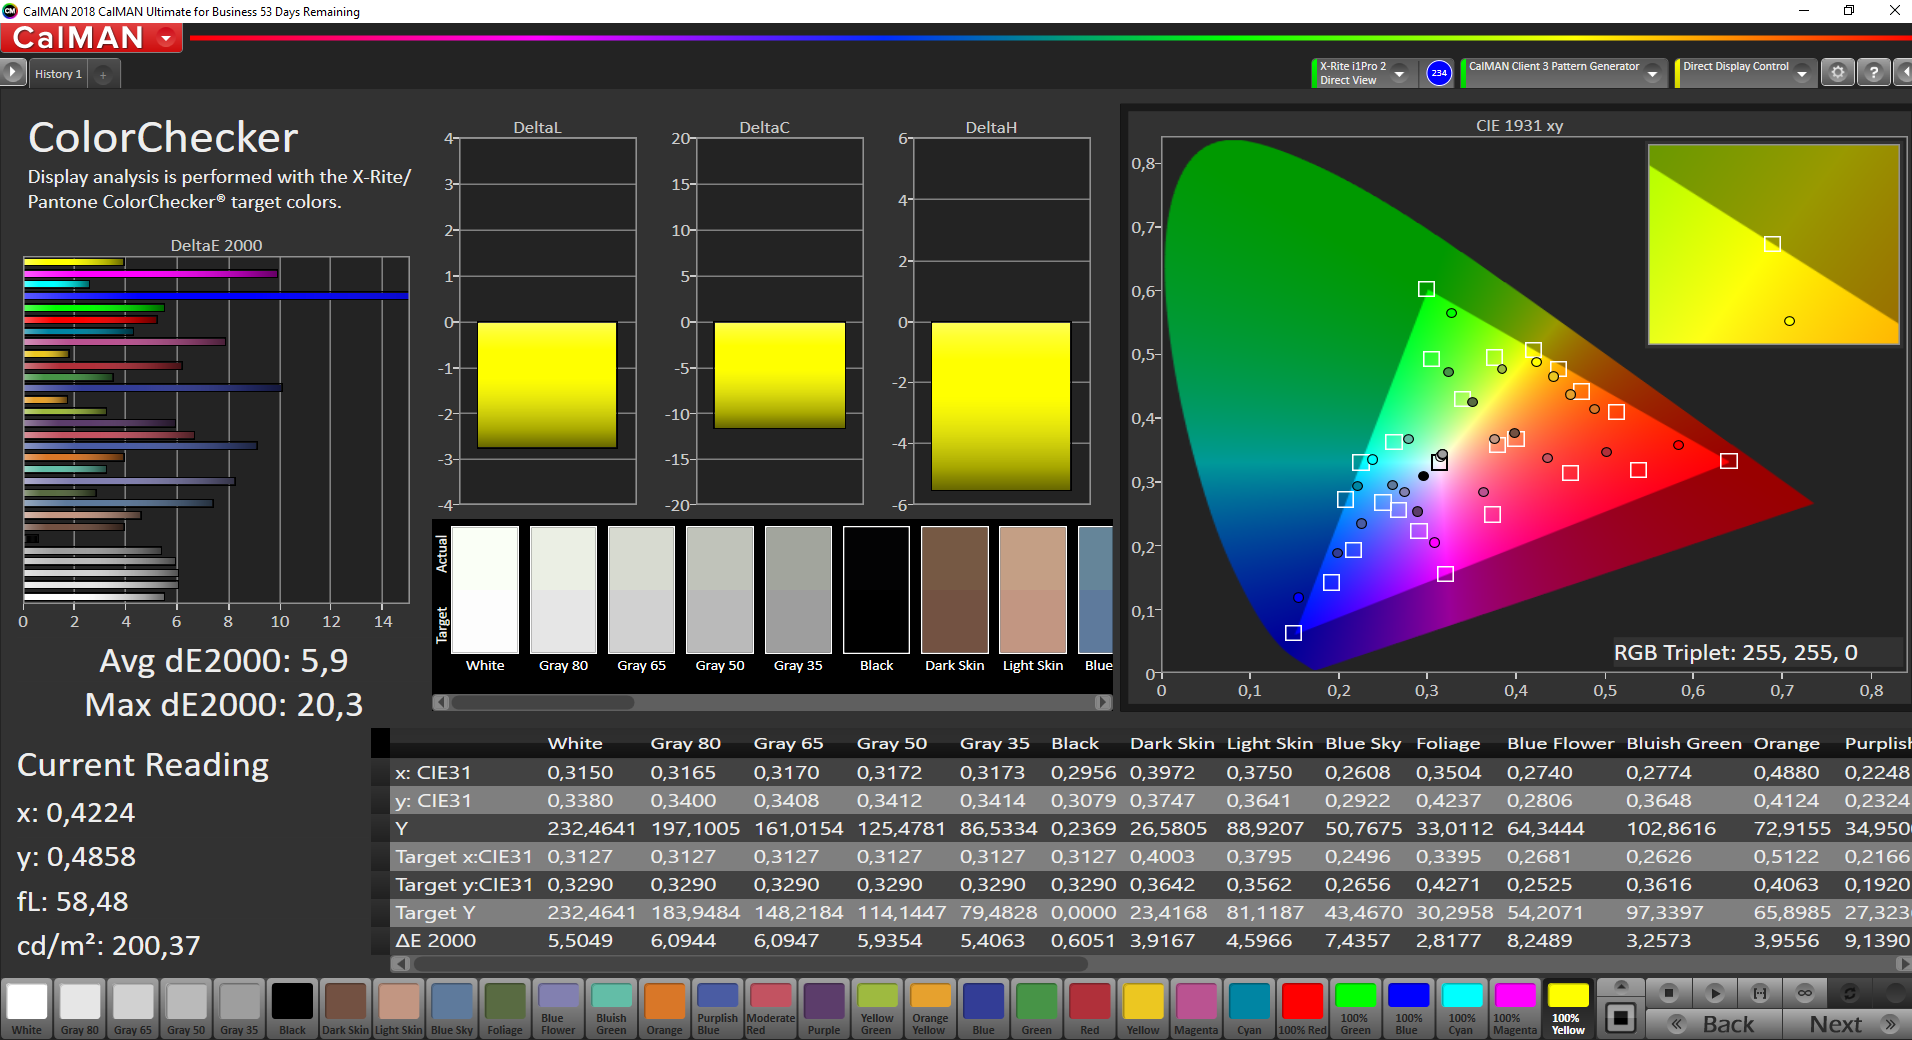
ΔE ColorChecker Calman: 5.9 | ∀{0.5-29.43 Ø4.75}
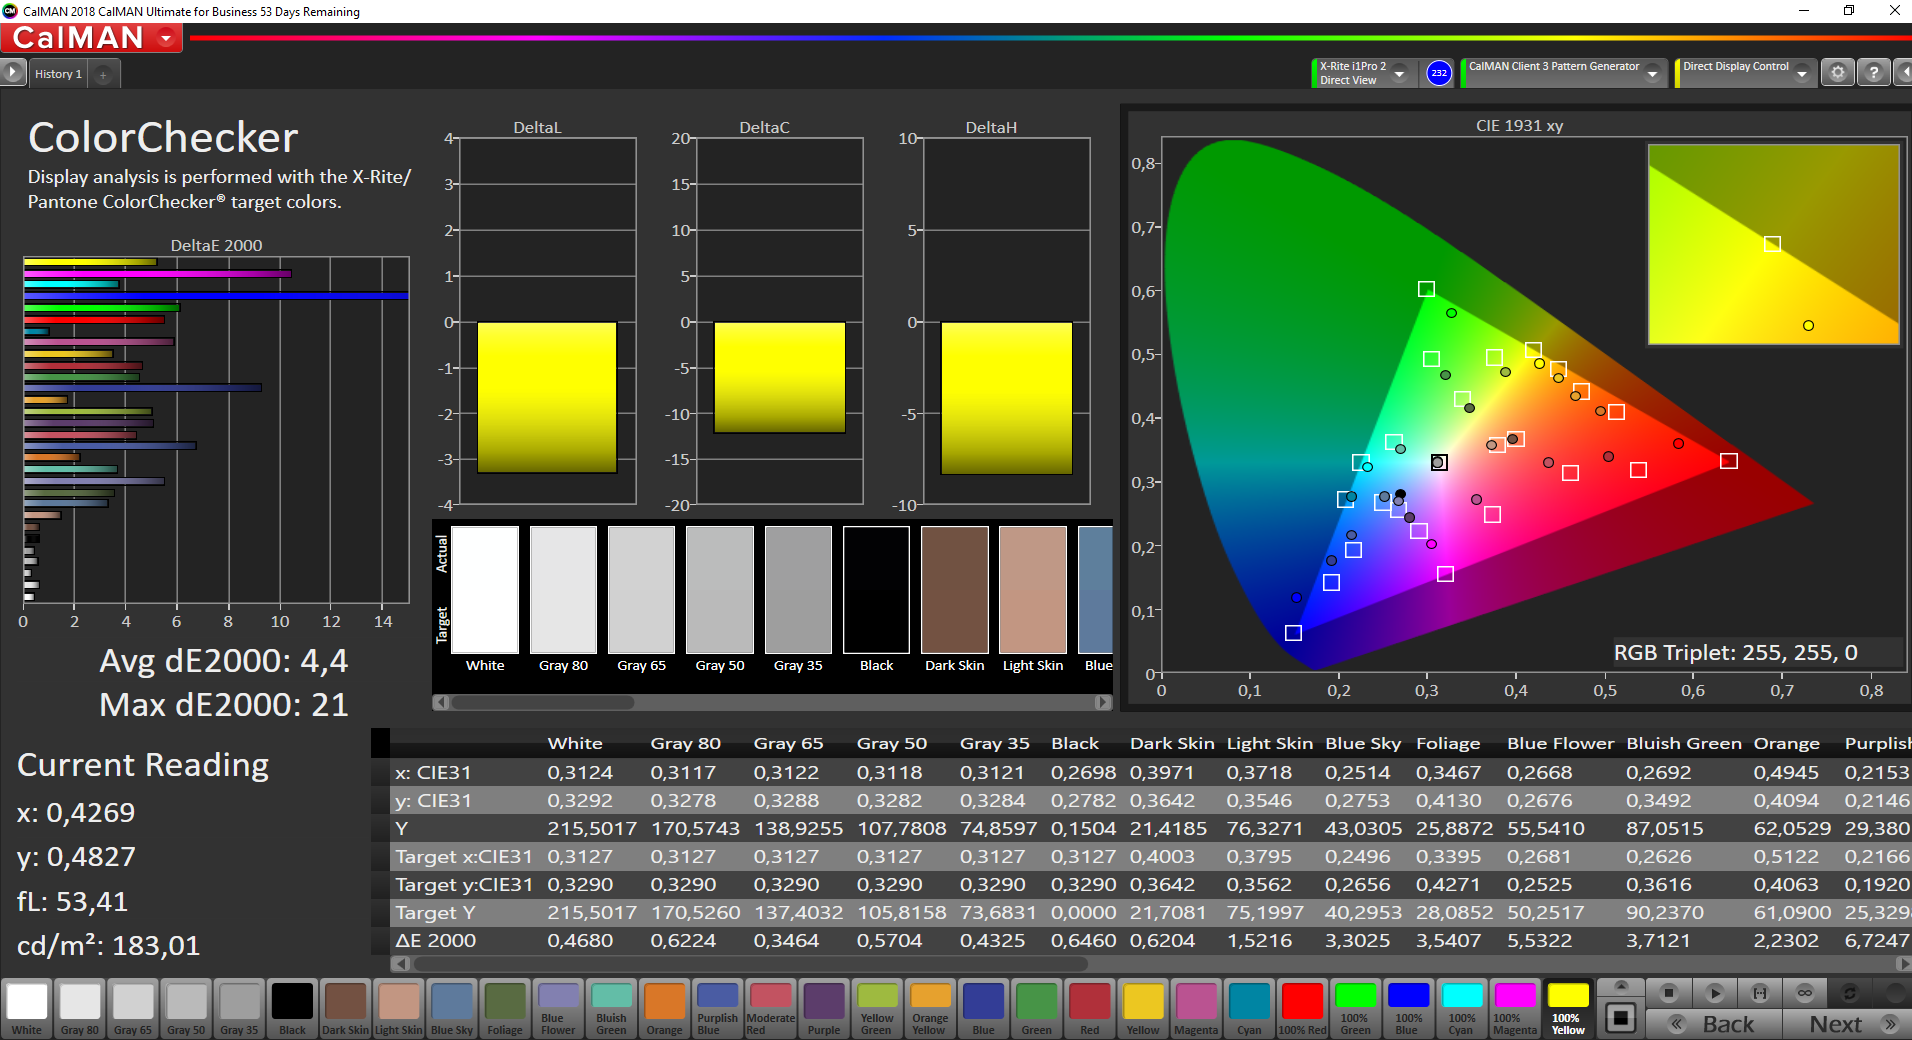
calibrated: 4.4
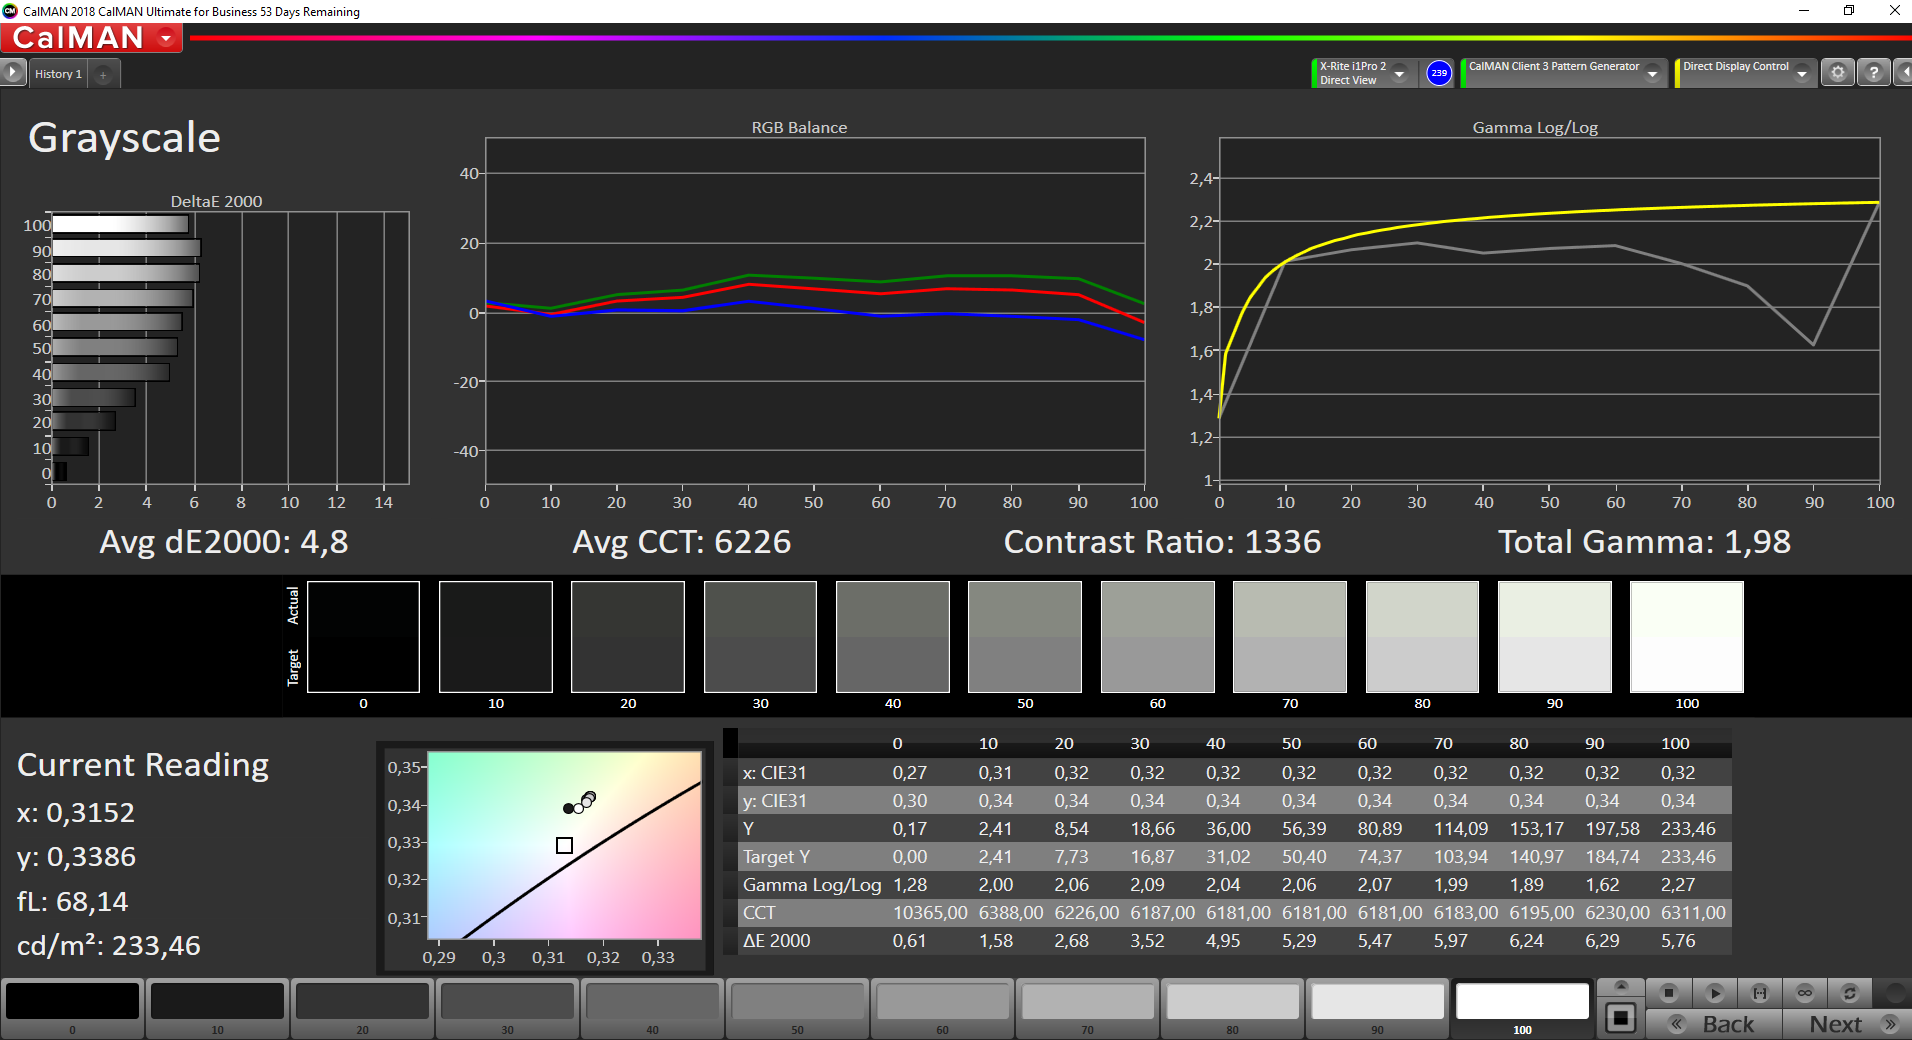
ΔE Greyscale Calman: 4.8 | ∀{0.09-98 Ø5}
62.8% sRGB (Argyll 1.6.3 3D)
40.2% AdobeRGB 1998 (Argyll 1.6.3 3D)
43.68% AdobeRGB 1998 (Argyll 3D)
63.1% sRGB (Argyll 3D)
42.23% Display P3 (Argyll 3D)
Gamma: 1.98
CCT: 6226 K
| Lenovo ThinkPad P43s-20RH001FGE IPS, 1920x1080, 14" | HP ZBook 14u G6 6TP71EA IPS, 1920x1080, 14" | Lenovo ThinkPad T490-20N3S02L00 IGZO IPS LED, 1920x1080, 14" | Dell Precision 5530 2-in-1 IPS, 3840x2160, 15.6" | |
|---|---|---|---|---|
| Display | 63% | 55% | 101% | |
| Display P3 Coverage (%) | 42.23 | 69.7 65% | 69.3 64% | 91.2 116% |
| sRGB Coverage (%) | 63.1 | 99.6 58% | 92.2 46% | 99.9 58% |
| AdobeRGB 1998 Coverage (%) | 43.68 | 71.9 65% | 67.4 54% | 99.4 128% |
| Response Times | 20% | -64% | -22% | |
| Response Time Grey 50% / Grey 80% * (ms) | 42.6 ? | 40.4 ? 5% | 74 ? -74% | 49.6 ? -16% |
| Response Time Black / White * (ms) | 29.6 ? | 19.2 ? 35% | 45.6 ? -54% | 37.6 ? -27% |
| PWM Frequency (Hz) | 24750 ? | 2451 ? | 990 ? | |
| Screen | 40% | 32% | 36% | |
| Brightness middle (cd/m²) | 232 | 437 88% | 418 80% | 430.9 86% |
| Brightness (cd/m²) | 214 | 420 96% | 400 87% | 398 86% |
| Brightness Distribution (%) | 89 | 92 3% | 88 -1% | 79 -11% |
| Black Level * (cd/m²) | 0.17 | 0.31 -82% | 0.24 -41% | 0.35 -106% |
| Contrast (:1) | 1365 | 1410 3% | 1742 28% | 1231 -10% |
| Colorchecker dE 2000 * | 5.9 | 2.6 56% | 4.7 20% | 3.29 44% |
| Colorchecker dE 2000 max. * | 20.3 | 6.5 68% | 8.7 57% | 7.46 63% |
| Colorchecker dE 2000 calibrated * | 4.4 | 0.8 82% | 2.1 52% | 3.58 19% |
| Greyscale dE 2000 * | 4.8 | 4.5 6% | 5.9 -23% | 2.6 46% |
| Gamma | 1.98 111% | 2.2 100% | 2.06 107% | 2.19 100% |
| CCT | 6226 104% | 6809 95% | 7350 88% | 6870 95% |
| Color Space (Percent of AdobeRGB 1998) (%) | 40.2 | 65.4 63% | 59.9 49% | 87.2 117% |
| Color Space (Percent of sRGB) (%) | 62.8 | 99.6 59% | 92.1 47% | 100 59% |
| Total Average (Program / Settings) | 41% /
42% | 8% /
24% | 38% /
41% |
* ... smaller is better
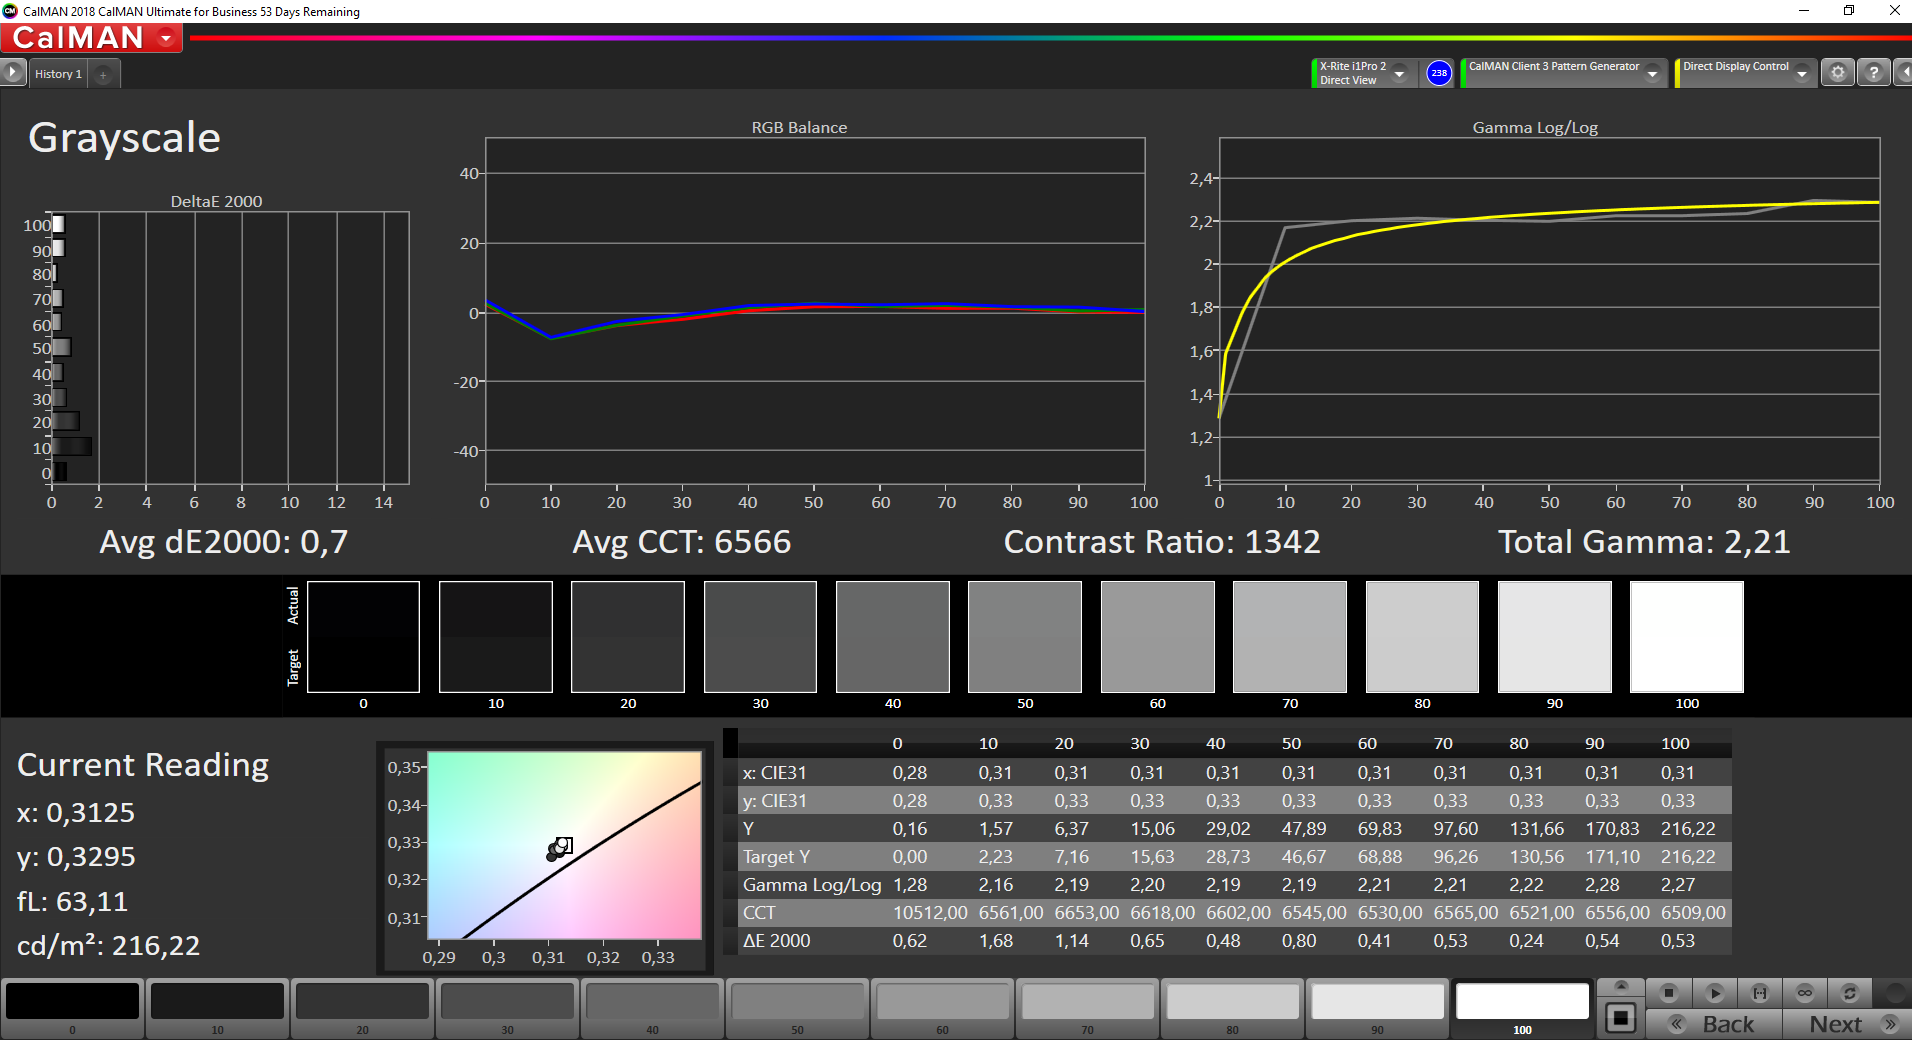
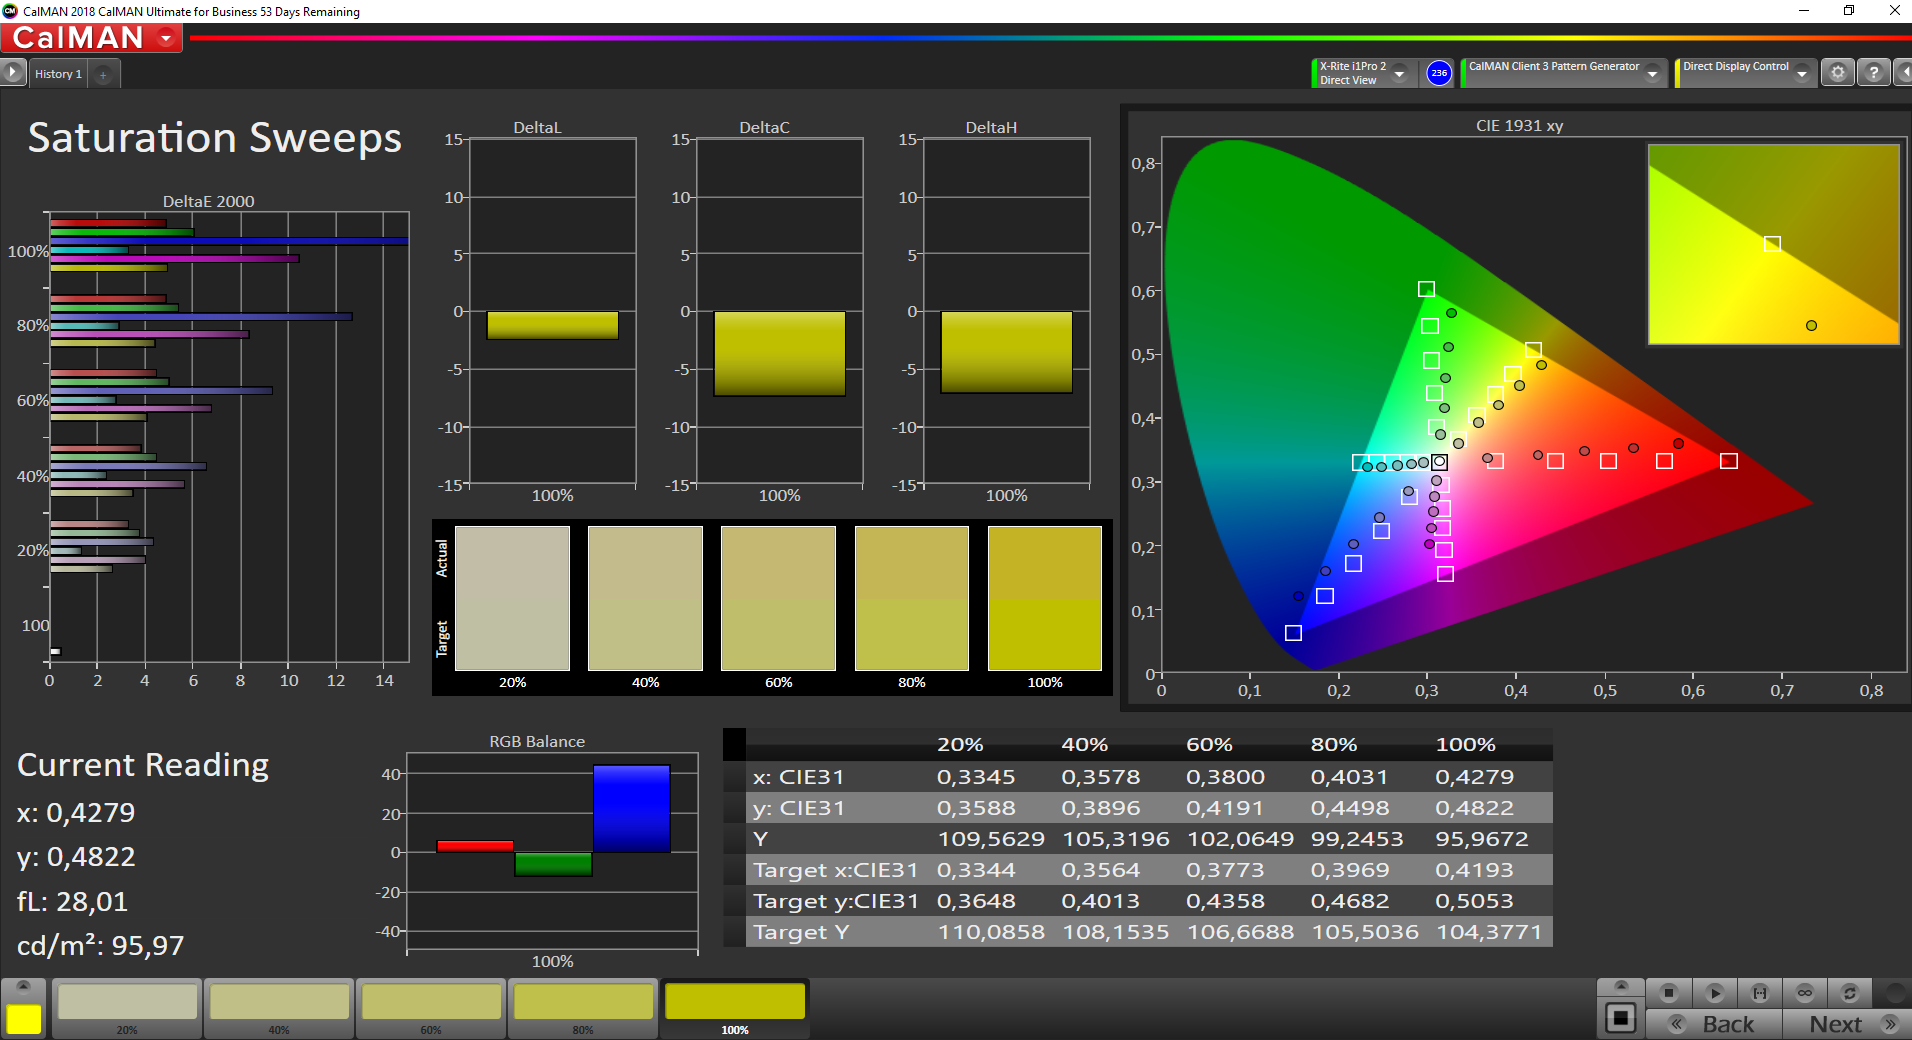
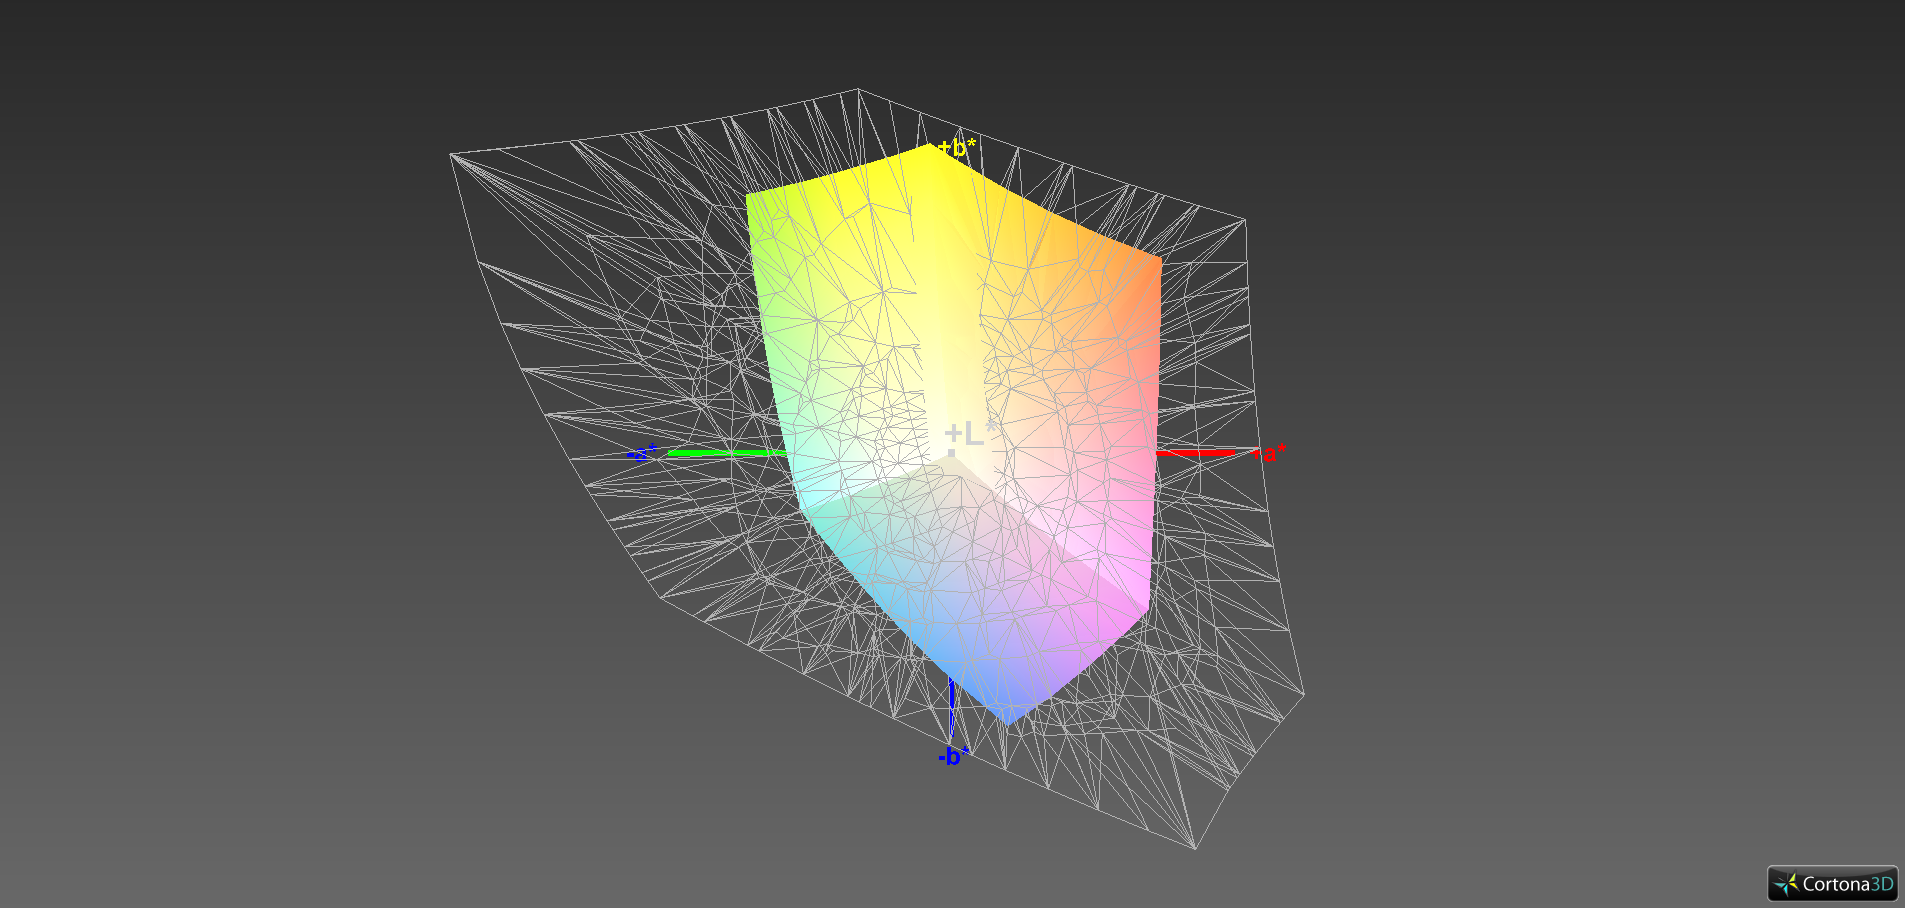
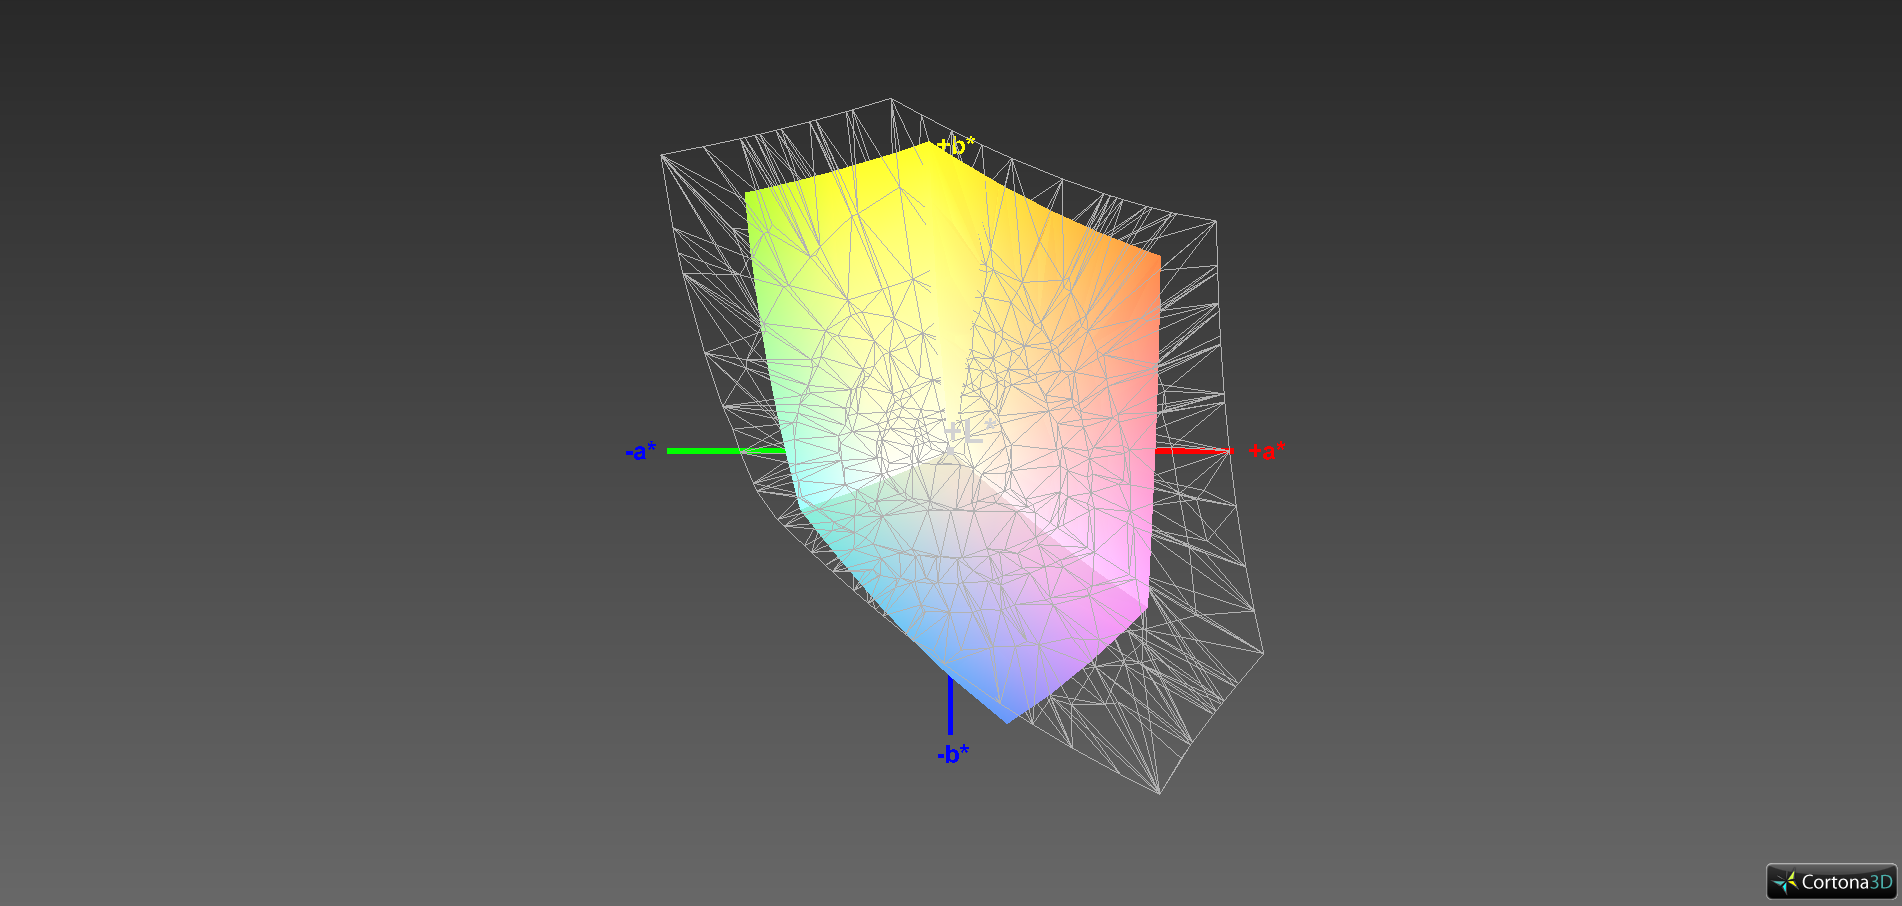
Out of the box, the ThinkPad's display shows a very acceptable color reproduction. However, with a DeltaE 2000 color deviation of 5.9, the target (DeltaE less than 3) is missed. Calibration can be used to slightly improve color reproduction, making the color deviation drop to a value of 4.4 and the grayscales be displayed in a much more balanced way. The AdobeRGB and sRGB color spaces are not fully mapped. The coverage rates are 40.2% (AdobeRGB) and 62.8% (sRGB), respectively.

Display Response Times
| ↔ Response Time Black to White | ||
|---|---|---|
| 29.6 ms ... rise ↗ and fall ↘ combined | ↗ 17.2 ms rise | 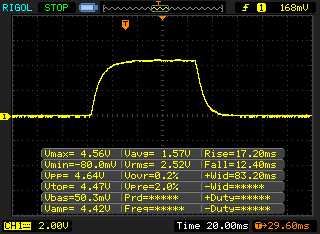 |
| ↘ 12.4 ms fall | ||
| The screen shows relatively slow response rates in our tests and may be too slow for gamers. In comparison, all tested devices range from 0.1 (minimum) to 240 (maximum) ms. » 78 % of all devices are better. This means that the measured response time is worse than the average of all tested devices (20.1 ms). | ||
| ↔ Response Time 50% Grey to 80% Grey | ||
| 42.6 ms ... rise ↗ and fall ↘ combined | ↗ 22 ms rise | 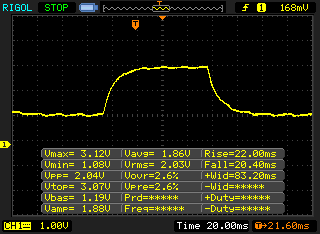 |
| ↘ 20.4 ms fall | ||
| The screen shows slow response rates in our tests and will be unsatisfactory for gamers. In comparison, all tested devices range from 0.165 (minimum) to 636 (maximum) ms. » 70 % of all devices are better. This means that the measured response time is worse than the average of all tested devices (31.4 ms). | ||
Screen Flickering / PWM (Pulse-Width Modulation)
| Screen flickering / PWM detected | 24750 Hz | ≤ 40 % brightness setting | 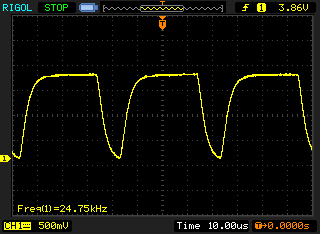 |
The display backlight flickers at 24750 Hz (worst case, e.g., utilizing PWM) Flickering detected at a brightness setting of 40 % and below. There should be no flickering or PWM above this brightness setting. The frequency of 24750 Hz is quite high, so most users sensitive to PWM should not notice any flickering. In comparison: 53 % of all tested devices do not use PWM to dim the display. If PWM was detected, an average of 7986 (minimum: 5 - maximum: 343500) Hz was measured. | |||
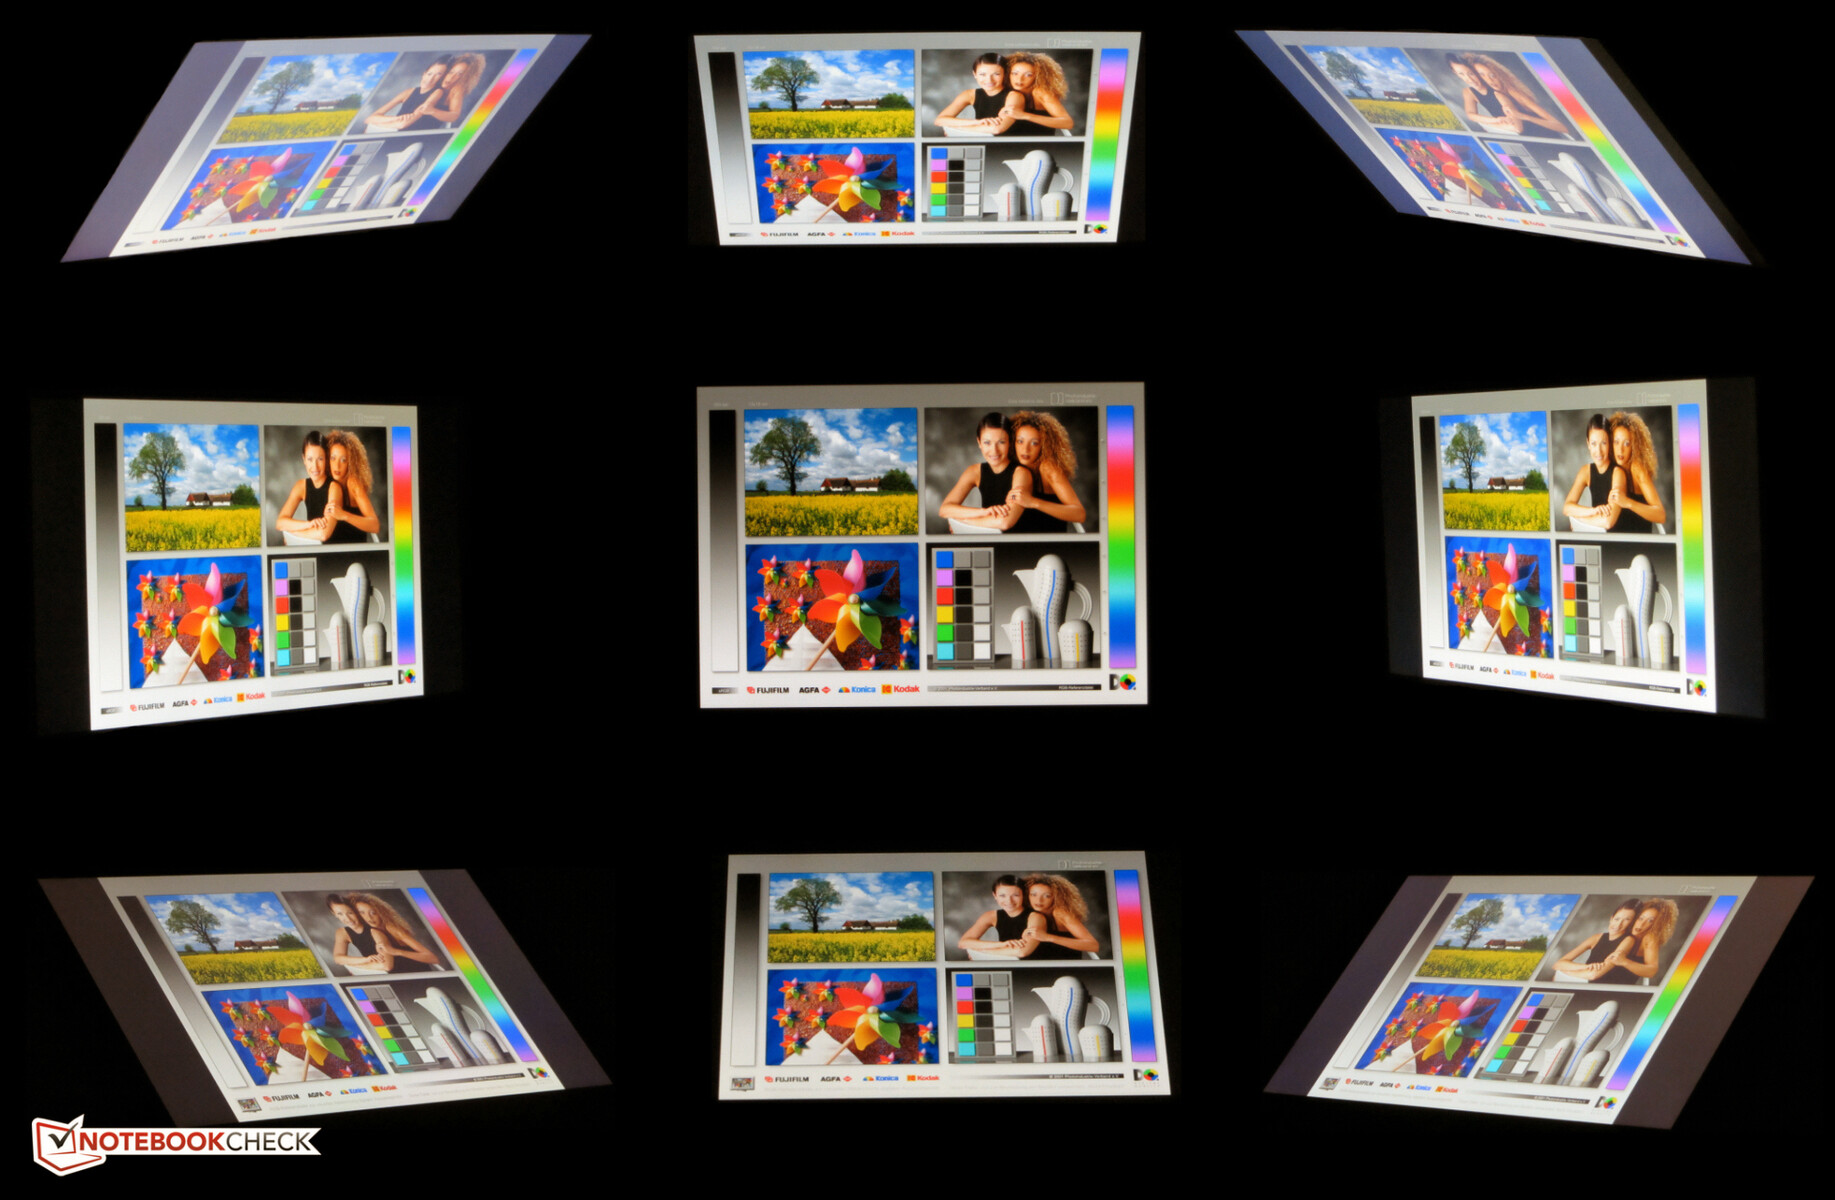
Lenovo has equipped the ThinkPad with an IPS panel that has stable viewing angles. In this way, the screen can be read from any position. Outdoors, the display can only be read when the sun isn't shining too brightly due to the low display brightness.
Performance - The ThinkPad is unable to reach its full potential
With the ThinkPad P43s, Lenovo has a 14-inch workstation in its range. The review device provided to us is available for about 1,700 Euros (~$1,891). Other configuration variants are available, and prices start at around 1,350 Euros (~$1,502).

Processor
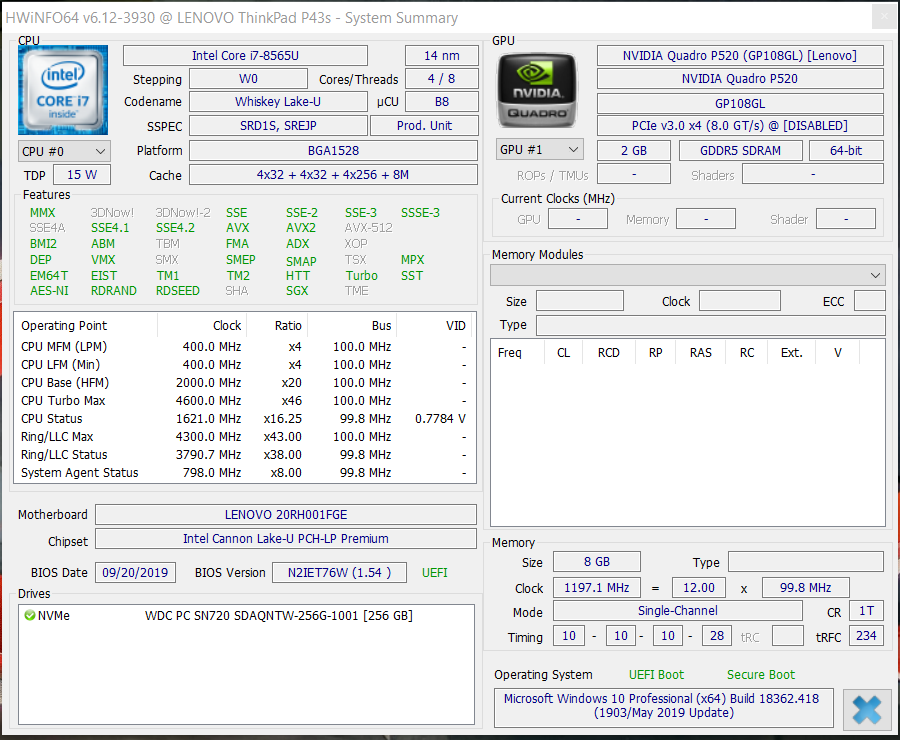
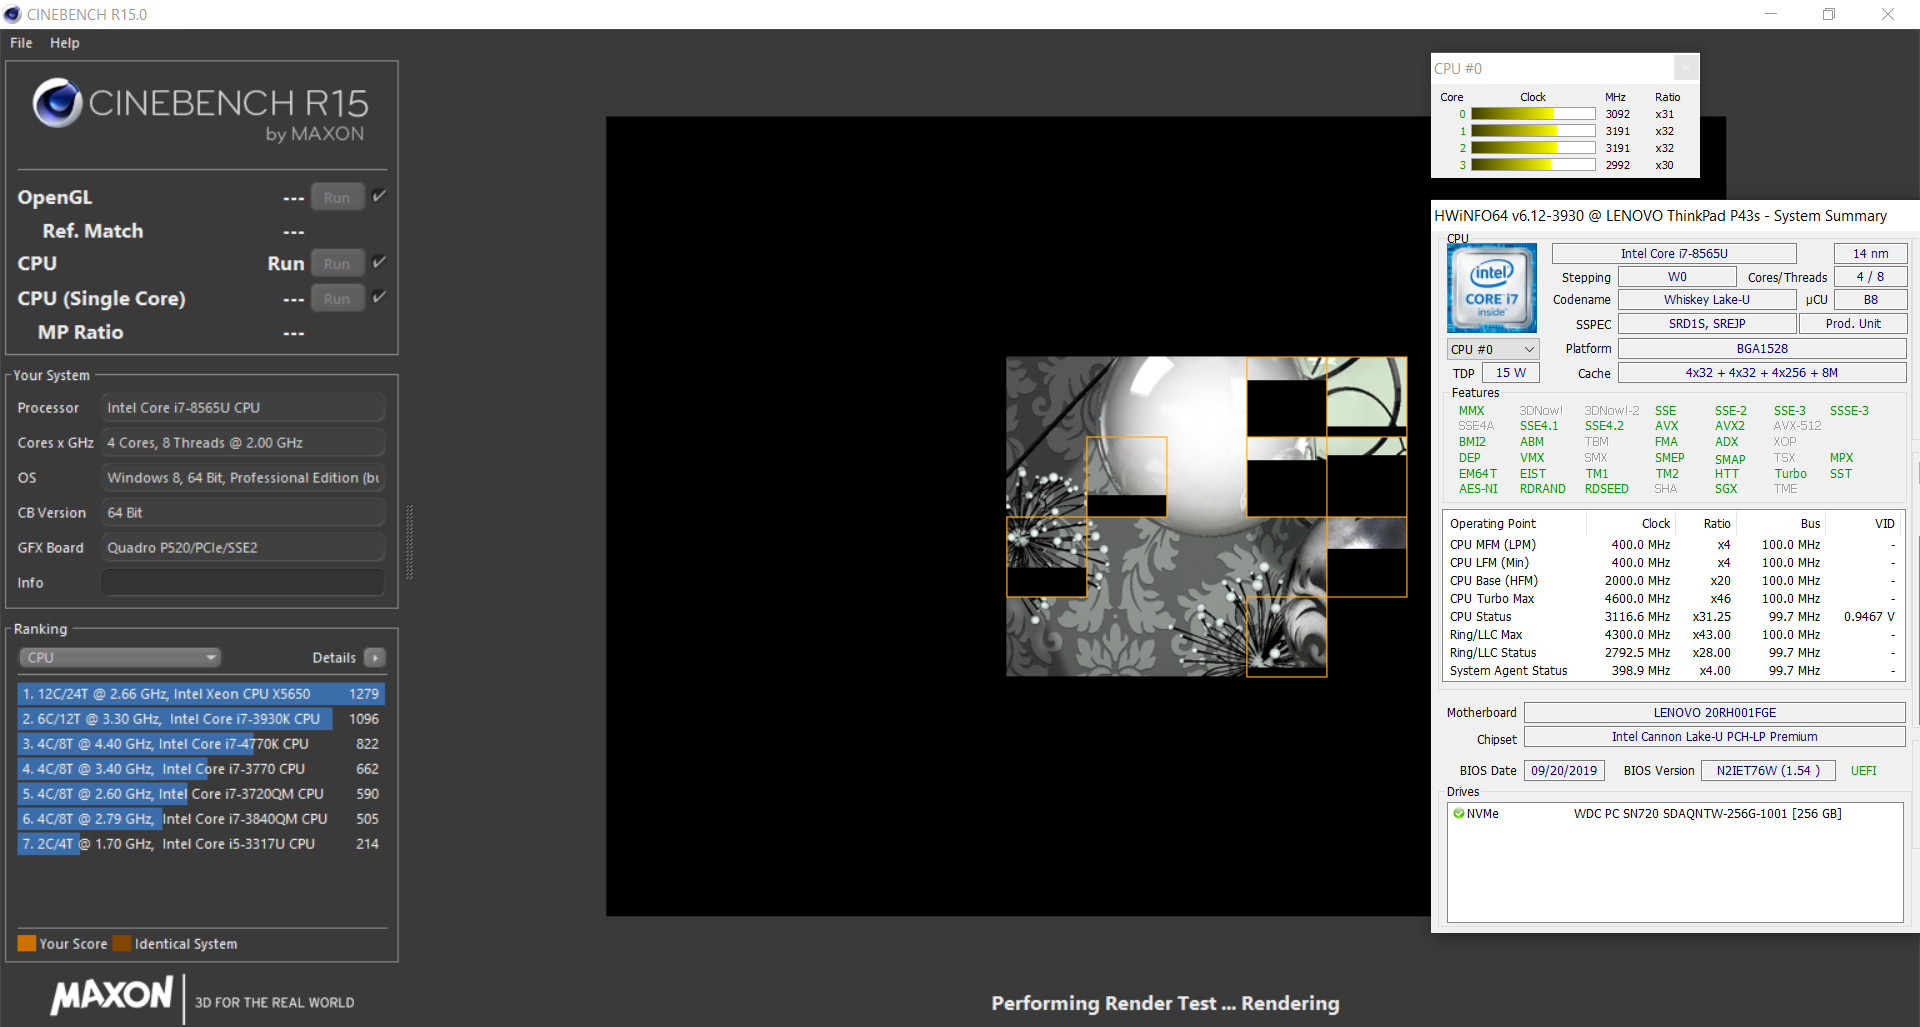
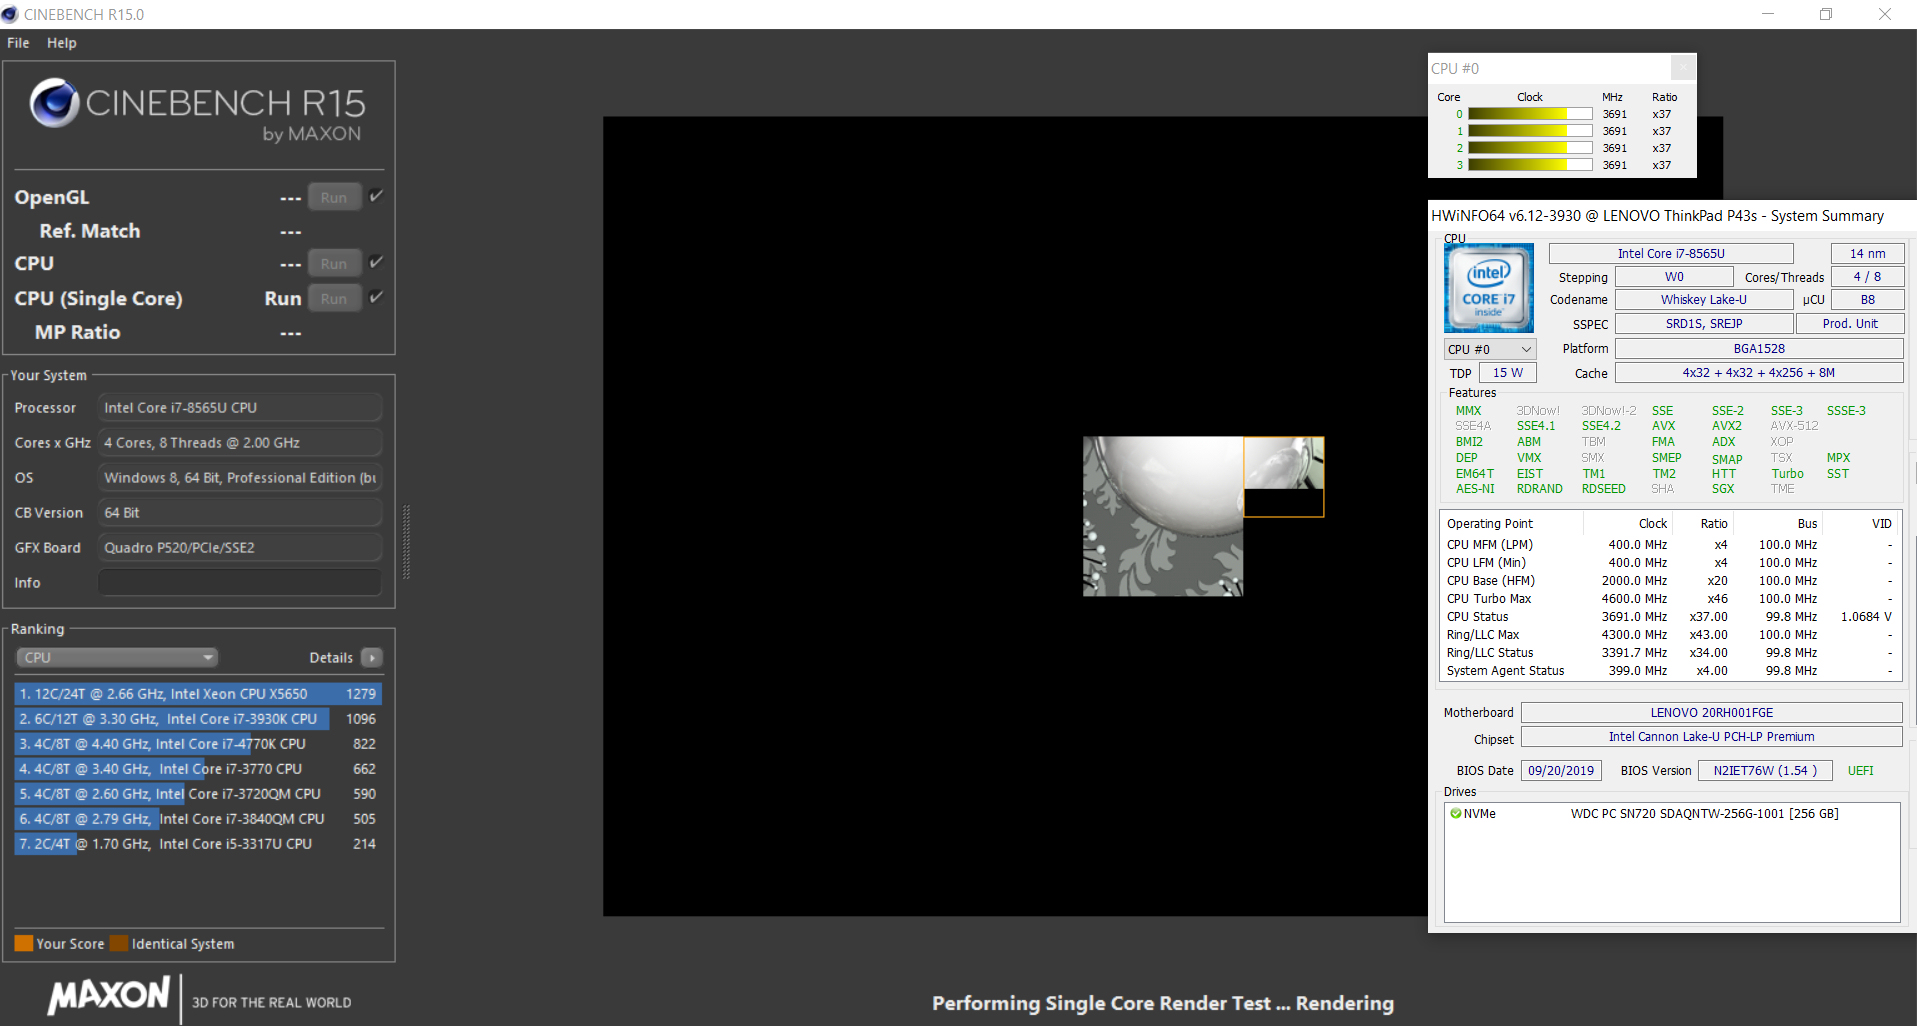
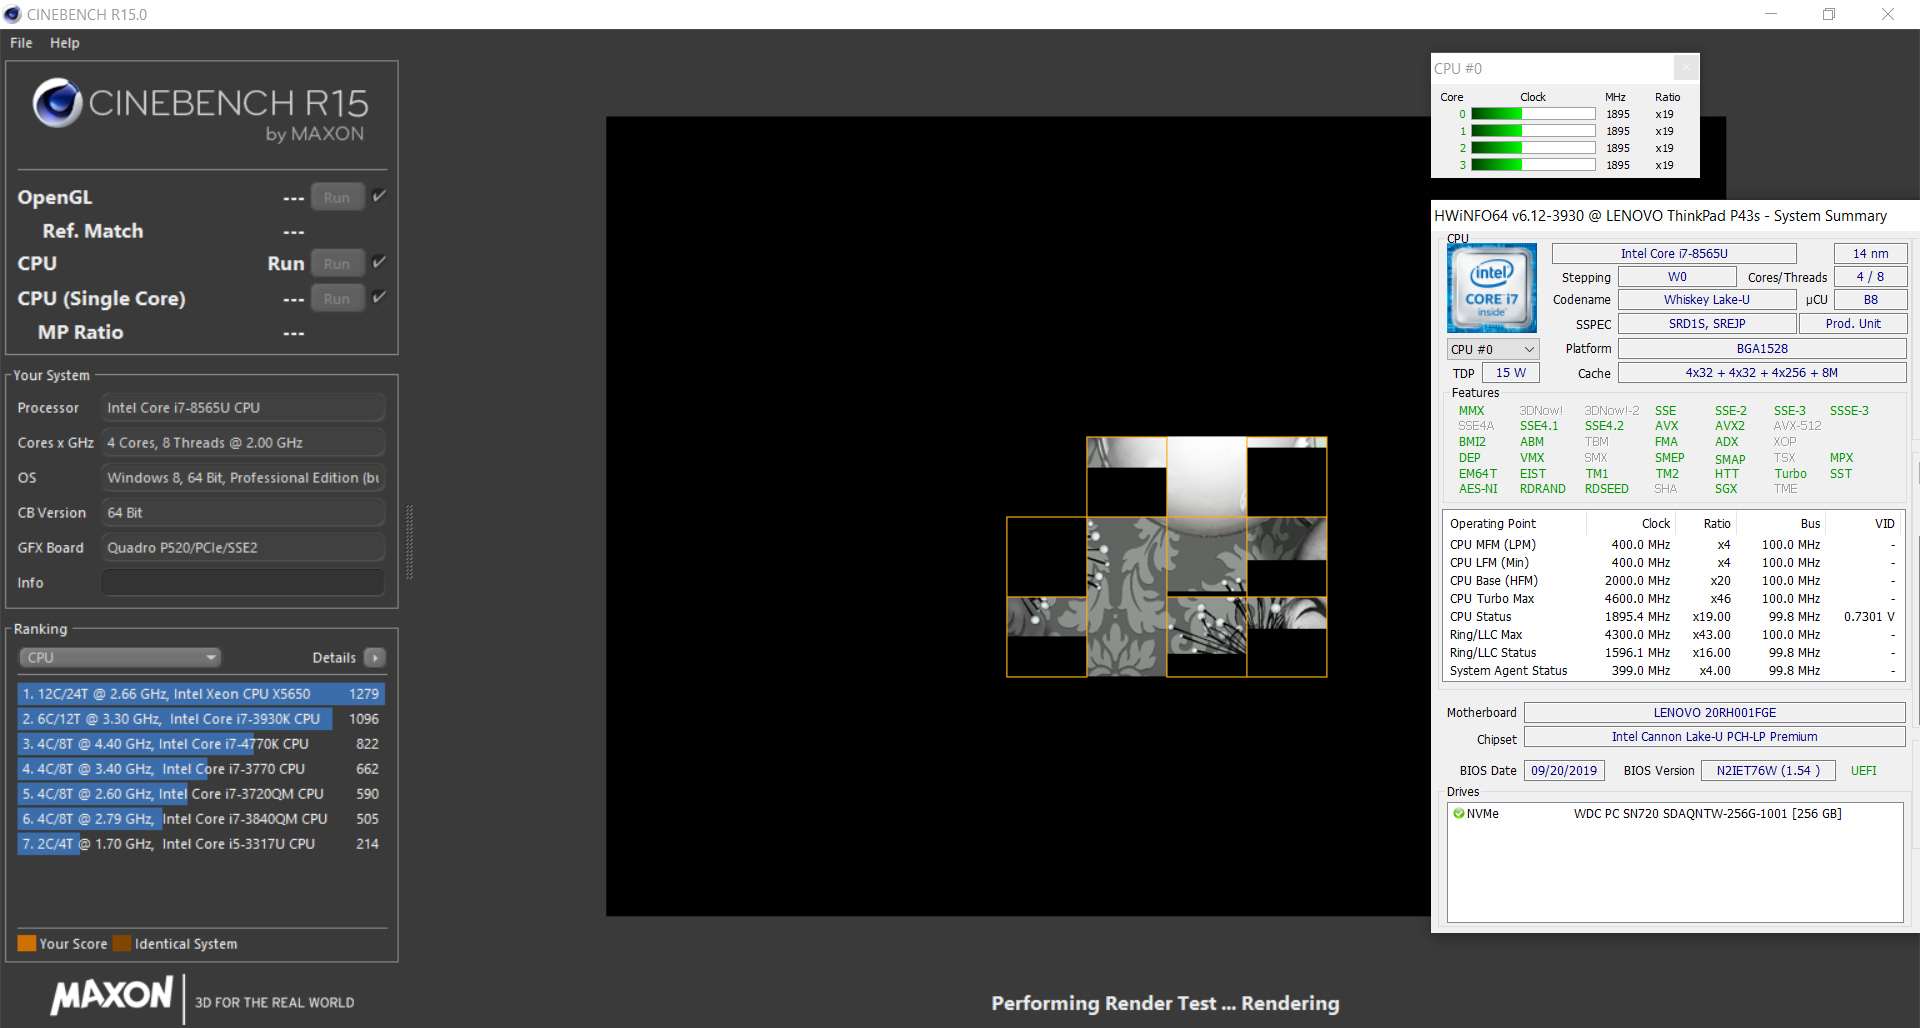
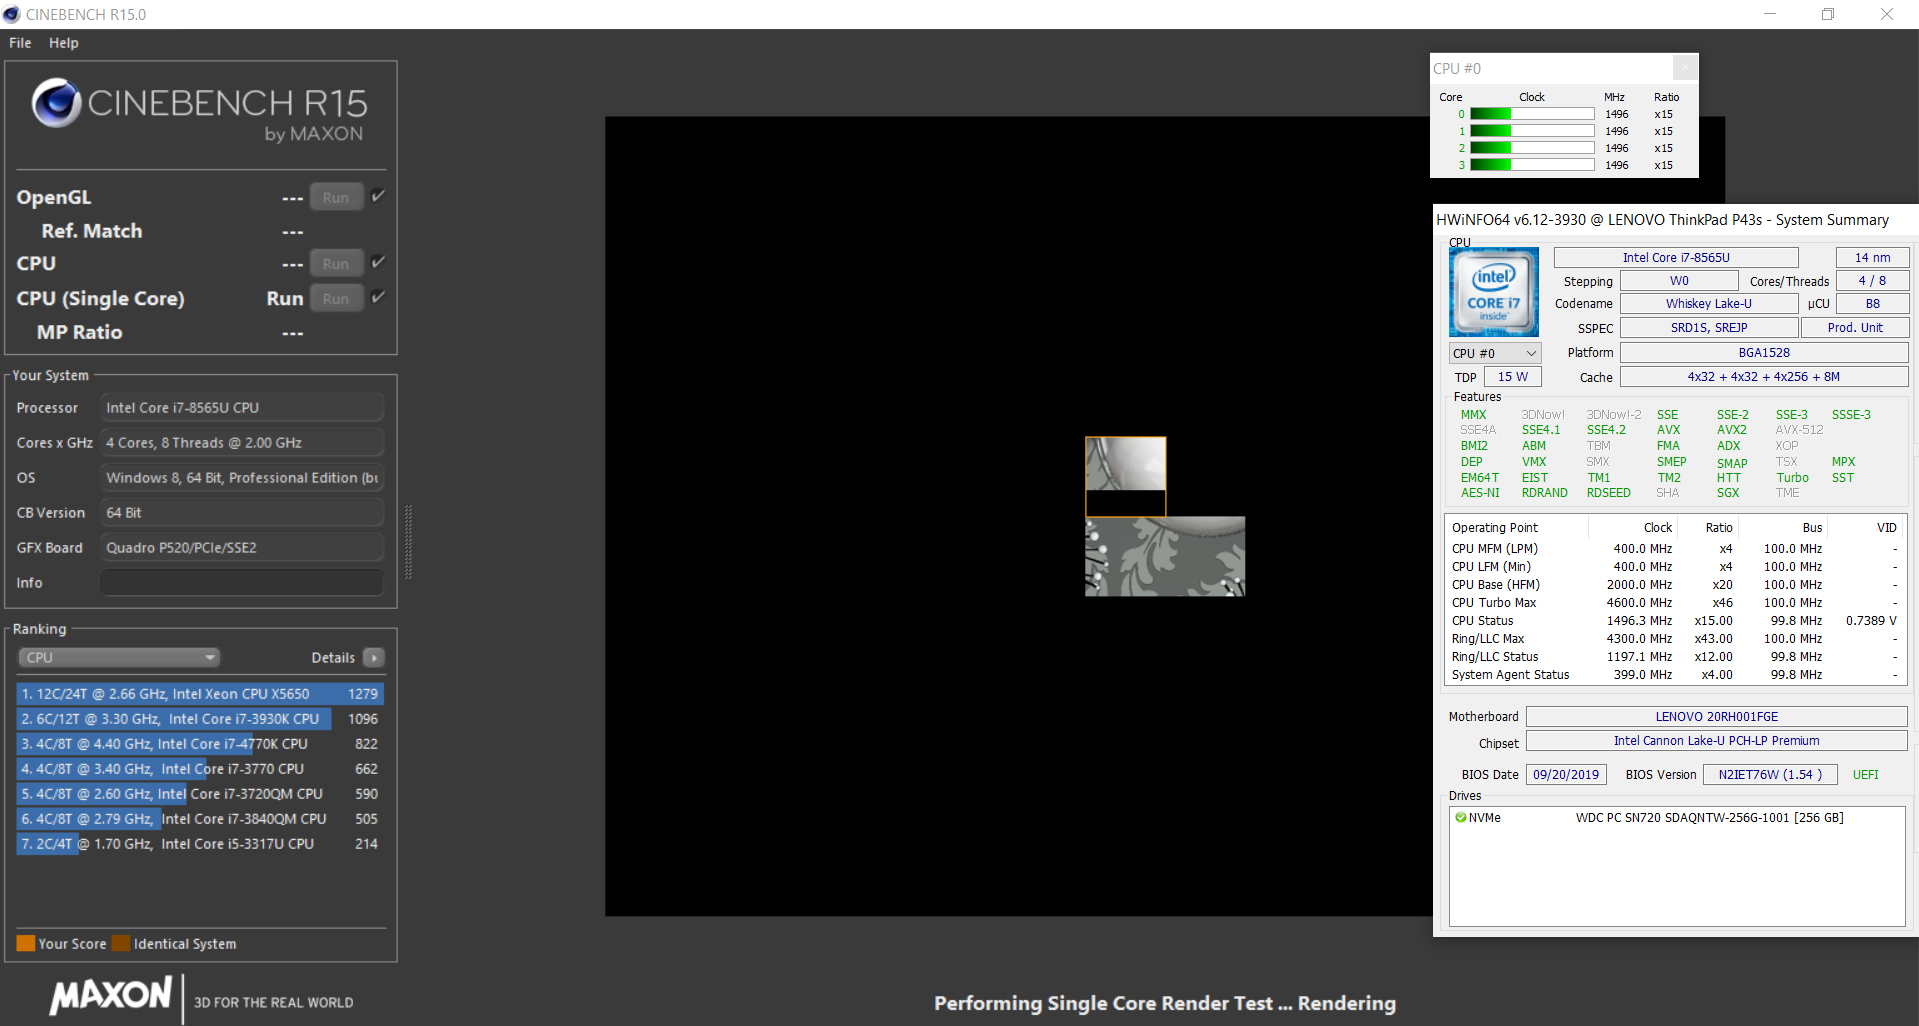
The ThinkPad comes with a Core i7-8565U (Whiskey Lake) quad-core processor. The CPU runs at a base speed of 1.8 GHz. Turbo can be used to increase it to 4.1 GHz (all four cores), 4.5 GHz (two cores) and 4.6 GHz (one core), respectively.
The multithread tests of the Cinebench benchmarks are run for a few seconds at 3.1 to 3.3 GHz. The clock speed then drops to 1.8 to 2 GHz. The single-thread tests are processed for a short time at 3.8 to 4.2 GHz. Afterwards, the speed drops to 3.5 to 3.6 GHz. On battery power, the speeds are 1.9 GHz (multithread) and 1.5 to 1.9 GHz (single-thread), respectively.
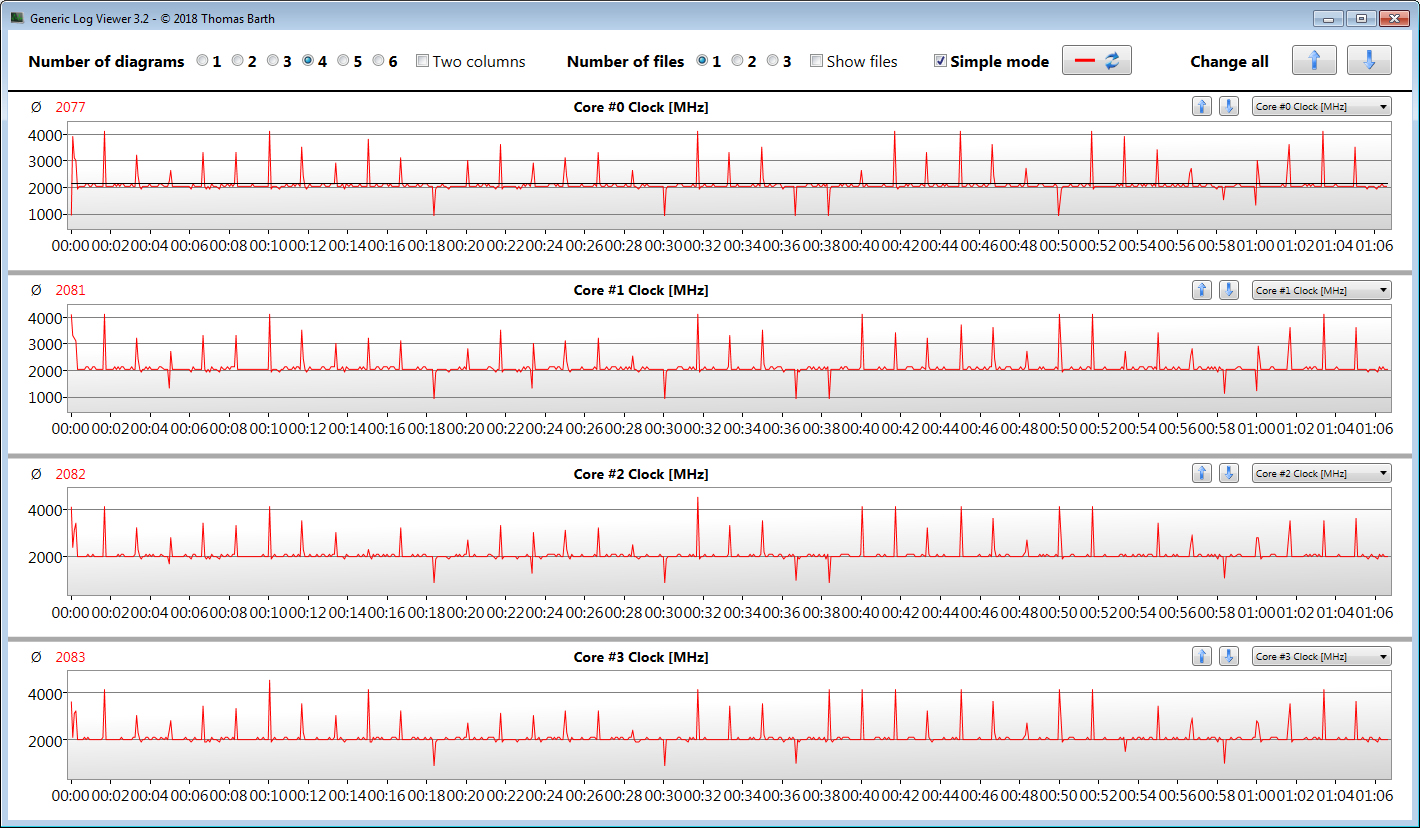
We test whether Turbo is also used consistently when plugged in by running Cinebench's R15 multithread test continuously in a loop for a minimum of 30 minutes. The results fall slightly from the first to the second run and then remain at a constant level. Turbo is used to a very small extent. Furthermore, the ThinkPad manages to undercut the already poor results of the HP ZBook 14 G6.
| Geekbench 3 | |
| 32 Bit Multi-Core Score | |
| HP ZBook 14u G6 6TP71EA | |
| Average Intel Core i7-8565U (10521 - 13703, n=12) | |
| Lenovo ThinkPad P43s-20RH001FGE | |
| 32 Bit Single-Core Score | |
| Average Intel Core i7-8565U (3340 - 4820, n=12) | |
| HP ZBook 14u G6 6TP71EA | |
| Lenovo ThinkPad P43s-20RH001FGE | |
| Mozilla Kraken 1.1 - Total | |
| Lenovo ThinkPad P43s-20RH001FGE (Edge 44) | |
| HP ZBook 14u G6 6TP71EA (Edge 44) | |
| Dell Precision 5530 2-in-1 (Edge 42.17134.1.0) | |
| Average Intel Core i7-8565U (730 - 2622, n=43) | |
| Lenovo ThinkPad T490-20N3S02L00 (Edge) | |
| Average of class Workstation (411 - 538, n=28, last 2 years) | |
| Octane V2 - Total Score | |
| Average of class Workstation (92715 - 129420, n=4, last 2 years) | |
| Lenovo ThinkPad T490-20N3S02L00 (Edge) | |
| Average Intel Core i7-8565U (13935 - 49795, n=42) | |
| HP ZBook 14u G6 6TP71EA (Edge 44) | |
| Lenovo ThinkPad P43s-20RH001FGE (Edge 44) | |
| Dell Precision 5530 2-in-1 (Edge 42.17134.1.0) | |
| JetStream 1.1 - Total Score | |
| Dell Precision 5530 2-in-1 (Edge 42.17134.1.0) | |
| HP ZBook 14u G6 6TP71EA (Edge 44) | |
| Average Intel Core i7-8565U (107.6 - 277, n=37) | |
| Lenovo ThinkPad P43s-20RH001FGE (Edge 44) | |
* ... smaller is better
System performance
In everyday use, the deficiencies in performance aren't noticeable. The system runs well and smoothly. However, the unsatisfactory results of the PCMark benchmarks illustrate the problems of the P43s. In this way, the results lag behind those of comparable laptops. The workstation is clearly beaten by its sister model - the devices should be on par.
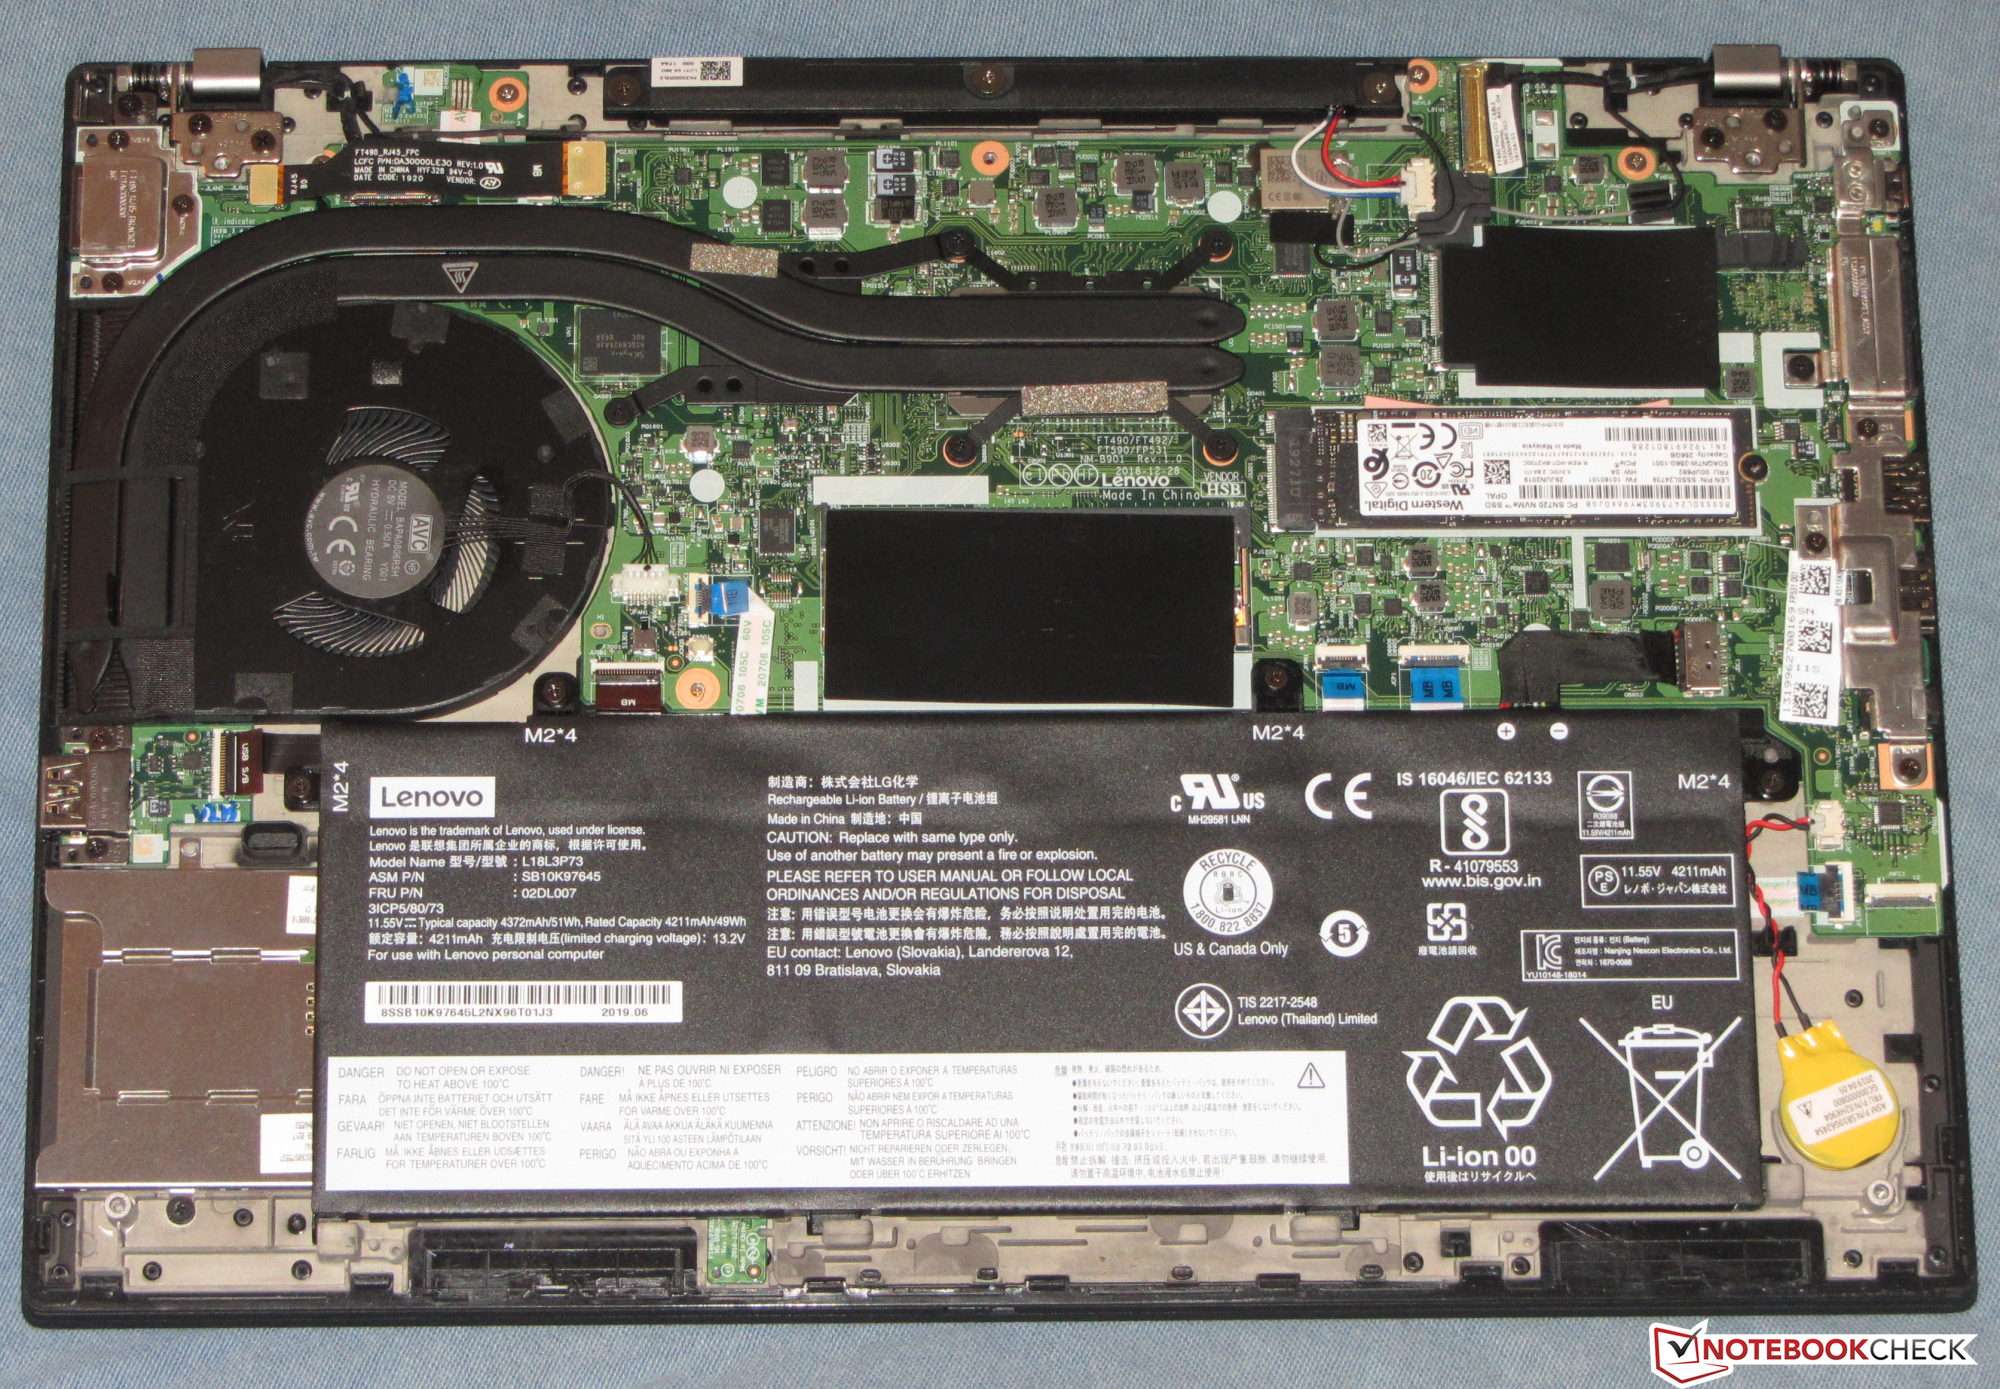
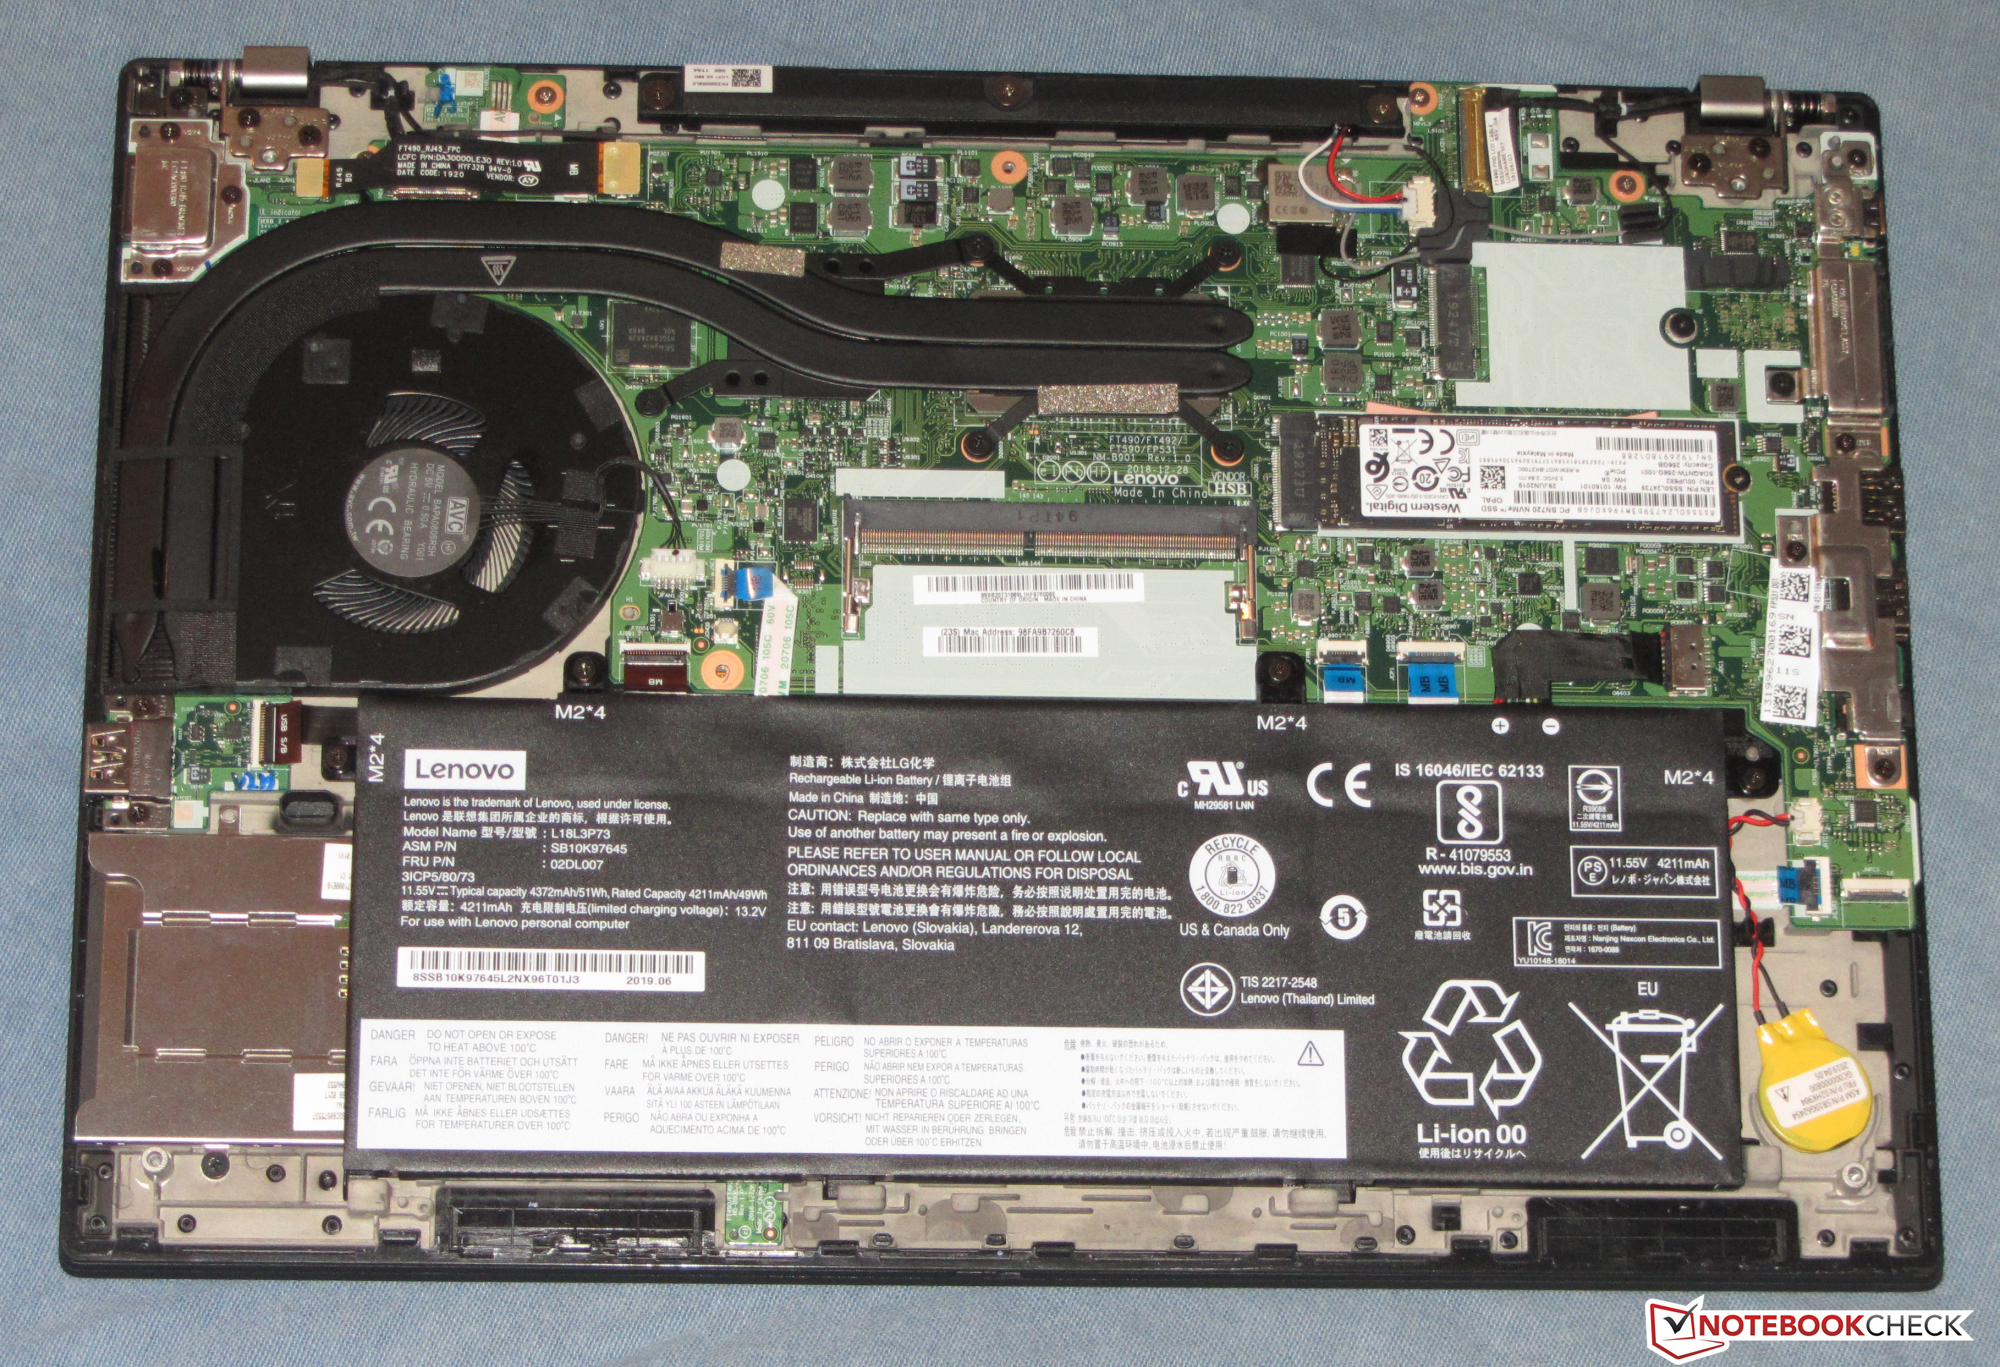
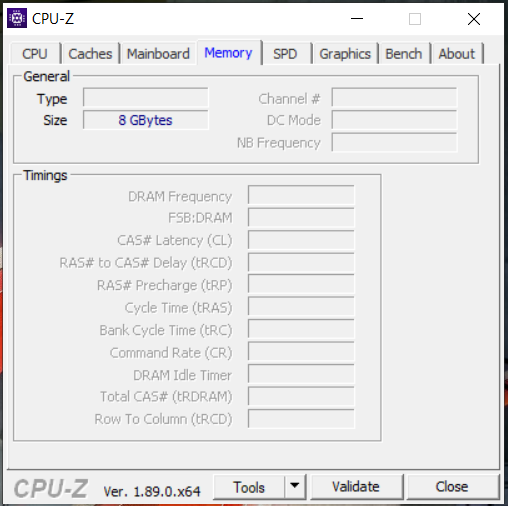
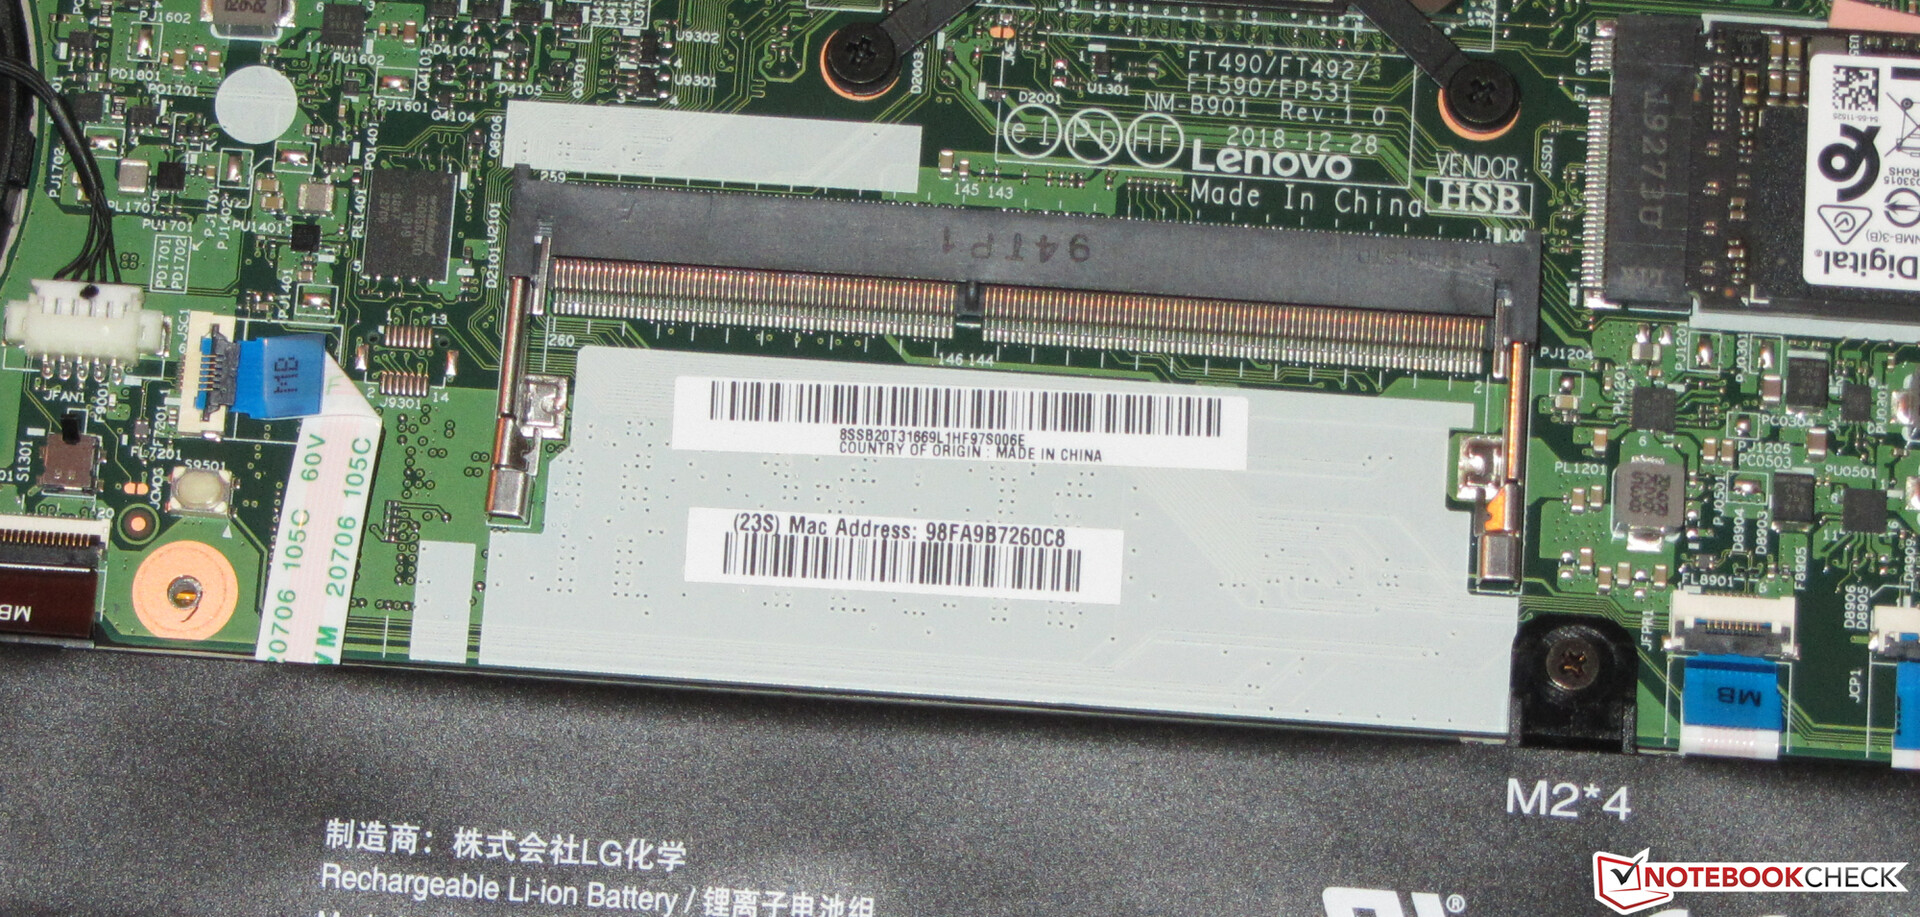
In addition, Lenovo has left some of the performance unused since it's done without the usage of dual-channel mode. The latter could be activated by installing an additional memory module.
| PCMark 8 Home Score Accelerated v2 | 3313 points | |
| PCMark 8 Creative Score Accelerated v2 | 3501 points | |
| PCMark 8 Work Score Accelerated v2 | 4918 points | |
| PCMark 10 Score | 3092 points | |
Help | ||
Storage
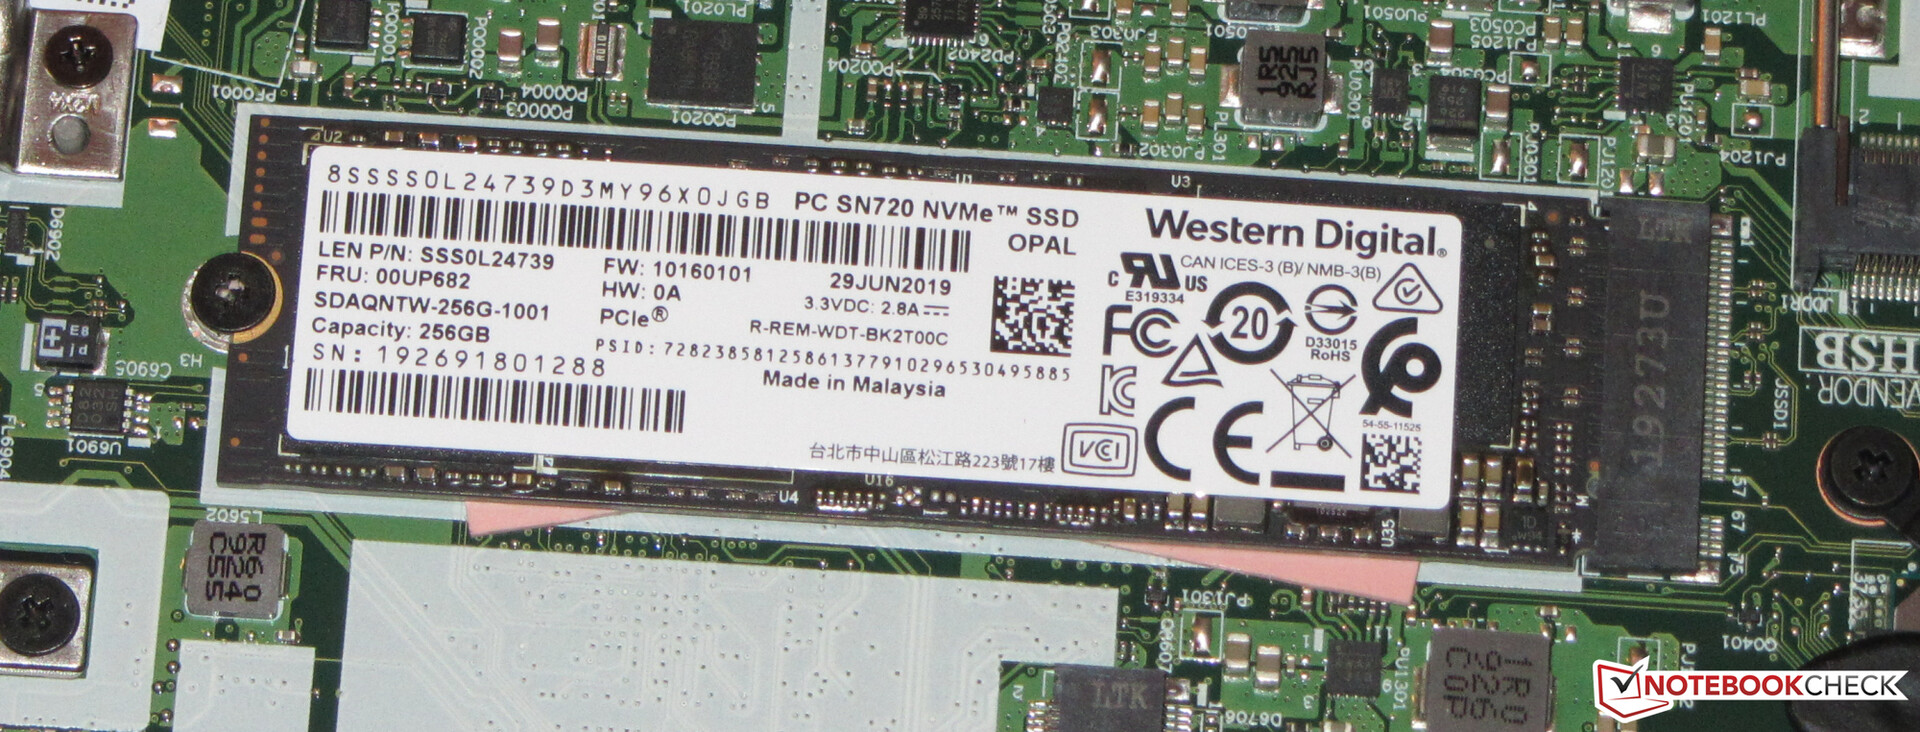
The system drive is an NVMe SSD from Western Digital. This M.2 2280 model has a total capacity of 256 GB. Out of the box, approximately 211 GB can be used. The remaining storage space is distributed between the Windows installation and the recovery partition. Moreover, the transfer speeds are good.

| Lenovo ThinkPad P43s-20RH001FGE WDC PC SN720 SDAQNTW-256G | HP ZBook 14u G6 6TP71EA Samsung SSD PM981 MZVLB512HAJQ | Lenovo ThinkPad T490-20N3S02L00 Toshiba XG5 KXG50ZNV512G | Dell Precision 5530 2-in-1 SK Hynix PC401 512GB M.2 (HFS512GD9TNG) | Average WDC PC SN720 SDAQNTW-256G | |
|---|---|---|---|---|---|
| CrystalDiskMark 5.2 / 6 | 16% | 4% | -12% | 0% | |
| Write 4K (MB/s) | 135.3 | 173.7 28% | 126.6 -6% | 128.9 -5% | 135.3 ? 0% |
| Read 4K (MB/s) | 45.09 | 50.6 12% | 43.61 -3% | 45.7 1% | 45.1 ? 0% |
| Write Seq (MB/s) | 1576 | 1100 -30% | 1342 -15% | 635 -60% | 1576 ? 0% |
| Read Seq (MB/s) | 1457 | 1072 -26% | 1251 -14% | 2065 42% | 1457 ? 0% |
| Write 4K Q32T1 (MB/s) | 356.3 | 555 56% | 297.7 -16% | 336.6 -6% | 356 ? 0% |
| Read 4K Q32T1 (MB/s) | 385.4 | 625 62% | 376.4 -2% | 393.6 2% | 385 ? 0% |
| Write Seq Q32T1 (MB/s) | 1613 | 1892 17% | 2969 84% | 662 -59% | 1613 ? 0% |
| Read Seq Q32T1 (MB/s) | 3017 | 3233 7% | 3228 7% | 2664 -12% | 3017 ? 0% |
Graphics card
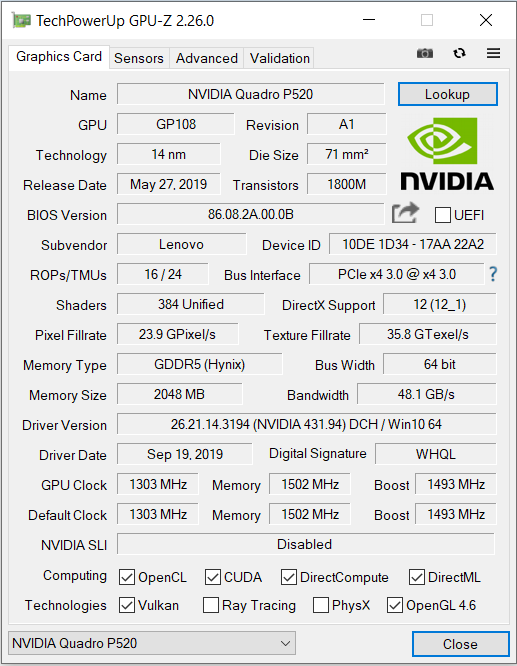
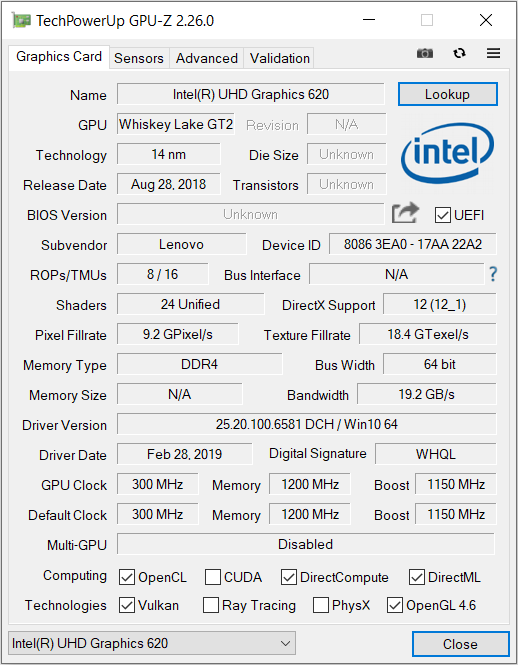
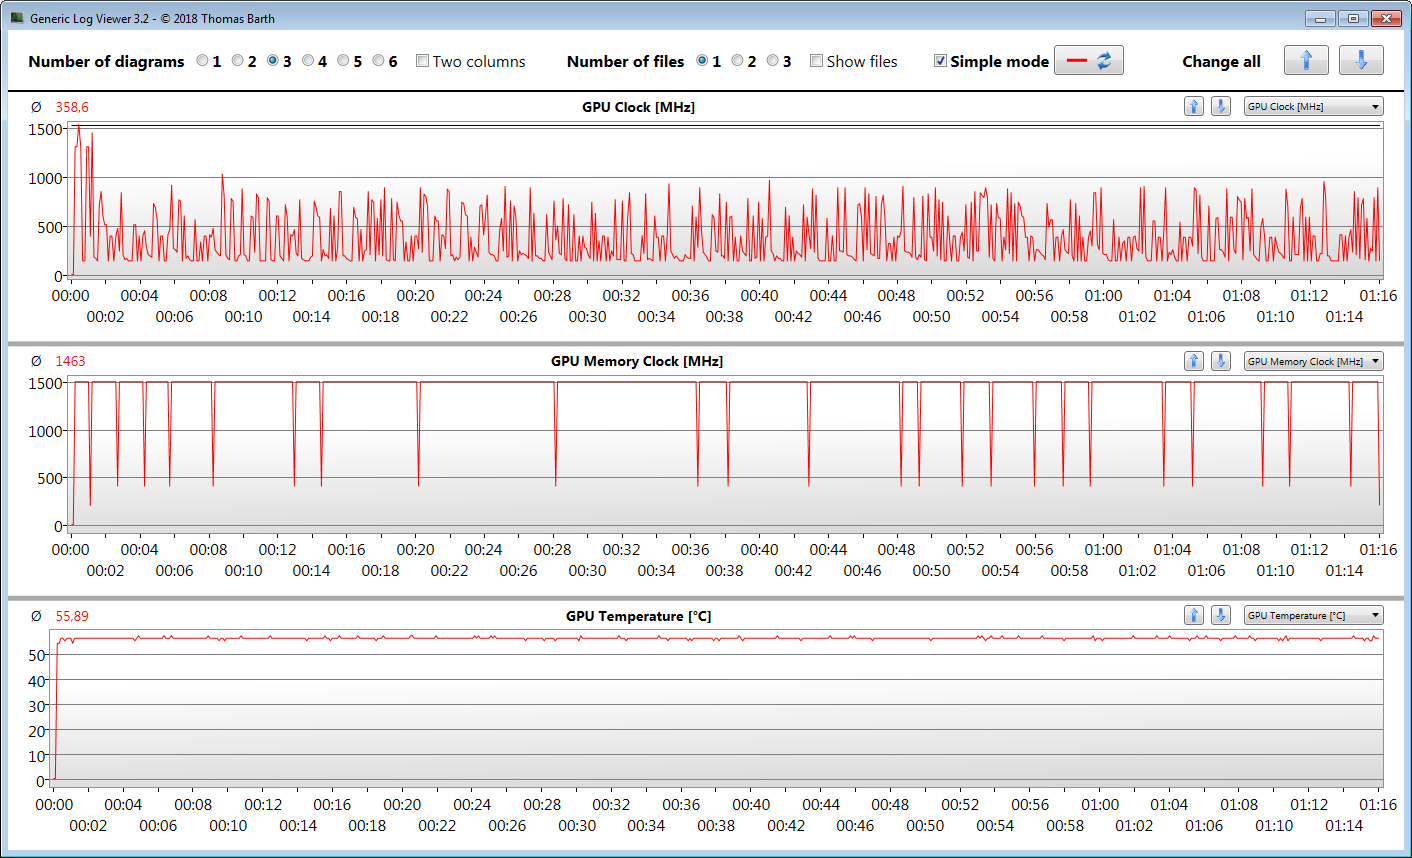
The ThinkPad is equipped with a Quadro P520 graphics core from Nvidia. The GPU is based on the Pascal architecture and is the professional version of the GeForce MX150/MX250 GPU. The P520 supports DirectX 12 and reaches speeds of up to 1,493 MHz. The GPU is able to access fast GDDR5 memory (2,048 MB). The UHD Graphics 620 GPU that's integrated into the processor is active and the laptop works with Nvidia's Optimus graphics-switching solution.
The results in the 3DMark benchmarks are disappointing. The P520 lags behind the results of MX150/MX250 laptops such as the identical ThinkPad T490 sister model. The distance is too large to blame the slightly lower speed level of the P520. It can't be because of the memory that's running in single-channel mode either. The T490's memory also works in single-channel mode. The results of the Quadro GPU are rather on par with those of the lower-performance power-saving versions of the MX150 and MX250 GPUs, respectively.
The solution to the puzzle is provided by the measurement data of the various benchmarks we perform: The GPU is throttled as soon as it reaches a temperature of 56 °C (~133 °F), which is an unusually low value for this Pascal graphics core. We can't say whether this is a decision made deliberately by Lenovo or a defect/error.
| 3DMark 06 Standard Score | 15127 points | |
| 3DMark 11 Performance | 3622 points | |
| 3DMark Ice Storm Standard Score | 43462 points | |
| 3DMark Cloud Gate Standard Score | 7839 points | |
| 3DMark Fire Strike Score | 2666 points | |
| 3DMark Time Spy Score | 964 points | |
Help | ||
Gaming performance
Although the built-in hardware would theoretically allow playing of computer games, this doesn't really work in practice. Since the GPU is throttled at a temperature of 56 °C (~133 °F), frame rates fluctuate strongly and spoil the gaming experience. The following The Witcher 3 test illustrates it. We conducted our various game tests with intervals in between so that the hardware could cool down.
| The Witcher 3 - 1024x768 Low Graphics & Postprocessing | |
| Average of class Workstation (134.6 - 411, n=6, last 2 years) | |
| Dell Precision 5530 2-in-1 | |
| Lenovo ThinkPad T490-20N3S02L00 | |
| HP ZBook 14u G6 6TP71EA | |
| Average NVIDIA Quadro P520 (42.7 - 61.9, n=6) | |
| Lenovo ThinkPad P43s-20RH001FGE | |
| Lenovo ThinkPad P52s-20LB000HGE | |
In order to verify that the frame rates also remain largely constant over a prolonged period of time, we let the game The Witcher 3 run for about 60 minutes at HD resolution (1024x768 pixels) and minimum quality settings. The character embodied by the player isn't moved over this entire period. The frame rates fluctuate a lot.
| low | med. | high | ultra | |
|---|---|---|---|---|
| Tomb Raider (2013) | 154.2 | 112.8 | 76.8 | 35.3 |
| BioShock Infinite (2013) | 115.7 | 88.1 | 78.4 | 31.2 |
| The Witcher 3 (2015) | 47.2 | 32 | 18.9 | 8.4 |
| Dota 2 Reborn (2015) | 114 | 102 | 53.2 | 47.6 |
| X-Plane 11.11 (2018) | 66 | 40.7 | 34.9 | |
| Darksiders III (2018) | 46.1 | 23 | 19.1 | 15.5 |
| Metro Exodus (2019) | 26.4 | 7.3 | 6.3 | 5.3 |
| Total War: Three Kingdoms (2019) | 50.4 | 16.9 | 7.2 | 3.6 |
| F1 2019 (2019) | 30 | 16 | 14 | 9 |
| Control (2019) | 38.2 | 11.9 | 5.5 | |
| Borderlands 3 (2019) | 24.2 | 10.1 | 4.9 |
Emissions - The Lenovo workstation operates quietly
Noise emissions
The ThinkPad doesn't produce a lot of noise over the entire load range. When idle, the fan is often off and silence prevails. However, it turns up a bit under load. During the stress test, we measure a sound pressure level of only 33.3 dB(A).
Noise level
| Idle |
| 29.2 / 29.2 / 29.2 dB(A) |
| Load |
| 33.3 / 33.3 dB(A) |
 | ||
30 dB silent 40 dB(A) audible 50 dB(A) loud |
||
min: | ||
| Lenovo ThinkPad P43s-20RH001FGE i7-8565U, Quadro P520 | HP ZBook 14u G6 6TP71EA i7-8565U, Radeon Pro WX 3200 | Lenovo ThinkPad T490-20N3S02L00 i7-8565U, GeForce MX250 | Dell Precision 5530 2-in-1 i7-8706G, WX Vega M GL | Average NVIDIA Quadro P520 | Average of class Workstation | |
|---|---|---|---|---|---|---|
| Noise | -3% | -3% | -9% | -2% | -3% | |
| off / environment * (dB) | 29.2 | 29.7 -2% | 29.4 -1% | 28.6 2% | 29.4 ? -1% | 24.1 ? 17% |
| Idle Minimum * (dB) | 29.2 | 29.7 -2% | 29.4 -1% | 28.6 2% | 29.4 ? -1% | 24.7 ? 15% |
| Idle Average * (dB) | 29.2 | 29.7 -2% | 29.4 -1% | 28.6 2% | 29.4 ? -1% | 25.3 ? 13% |
| Idle Maximum * (dB) | 29.2 | 30.4 -4% | 29.4 -1% | 29.1 -0% | 30 ? -3% | 26.8 ? 8% |
| Load Average * (dB) | 33.3 | 32.7 2% | 34.7 -4% | 39.8 -20% | 33.4 ? -0% | 39.3 ? -18% |
| Load Maximum * (dB) | 33.3 | 35.9 -8% | 37.2 -12% | 47 -41% | 34.7 ? -4% | 50.3 ? -51% |
| Witcher 3 ultra * (dB) | 35.3 | 34.7 | 47 |
* ... smaller is better
Temperature
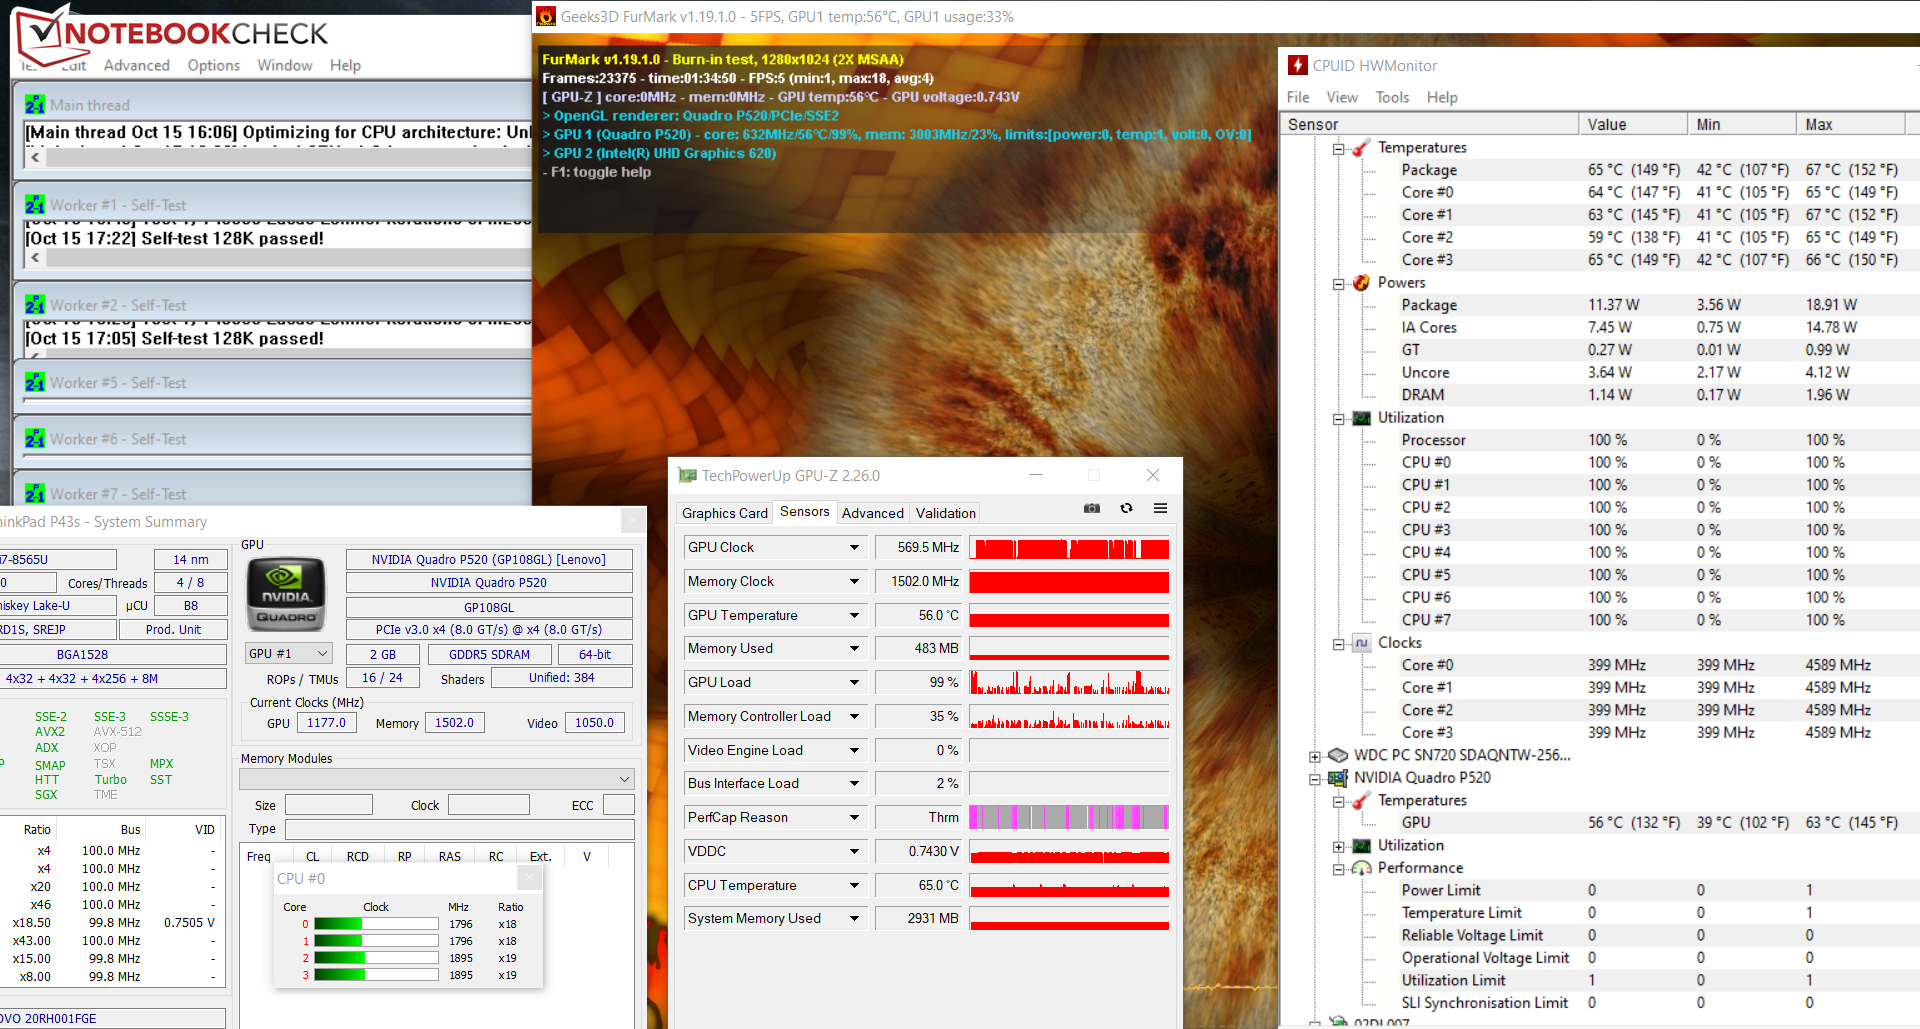
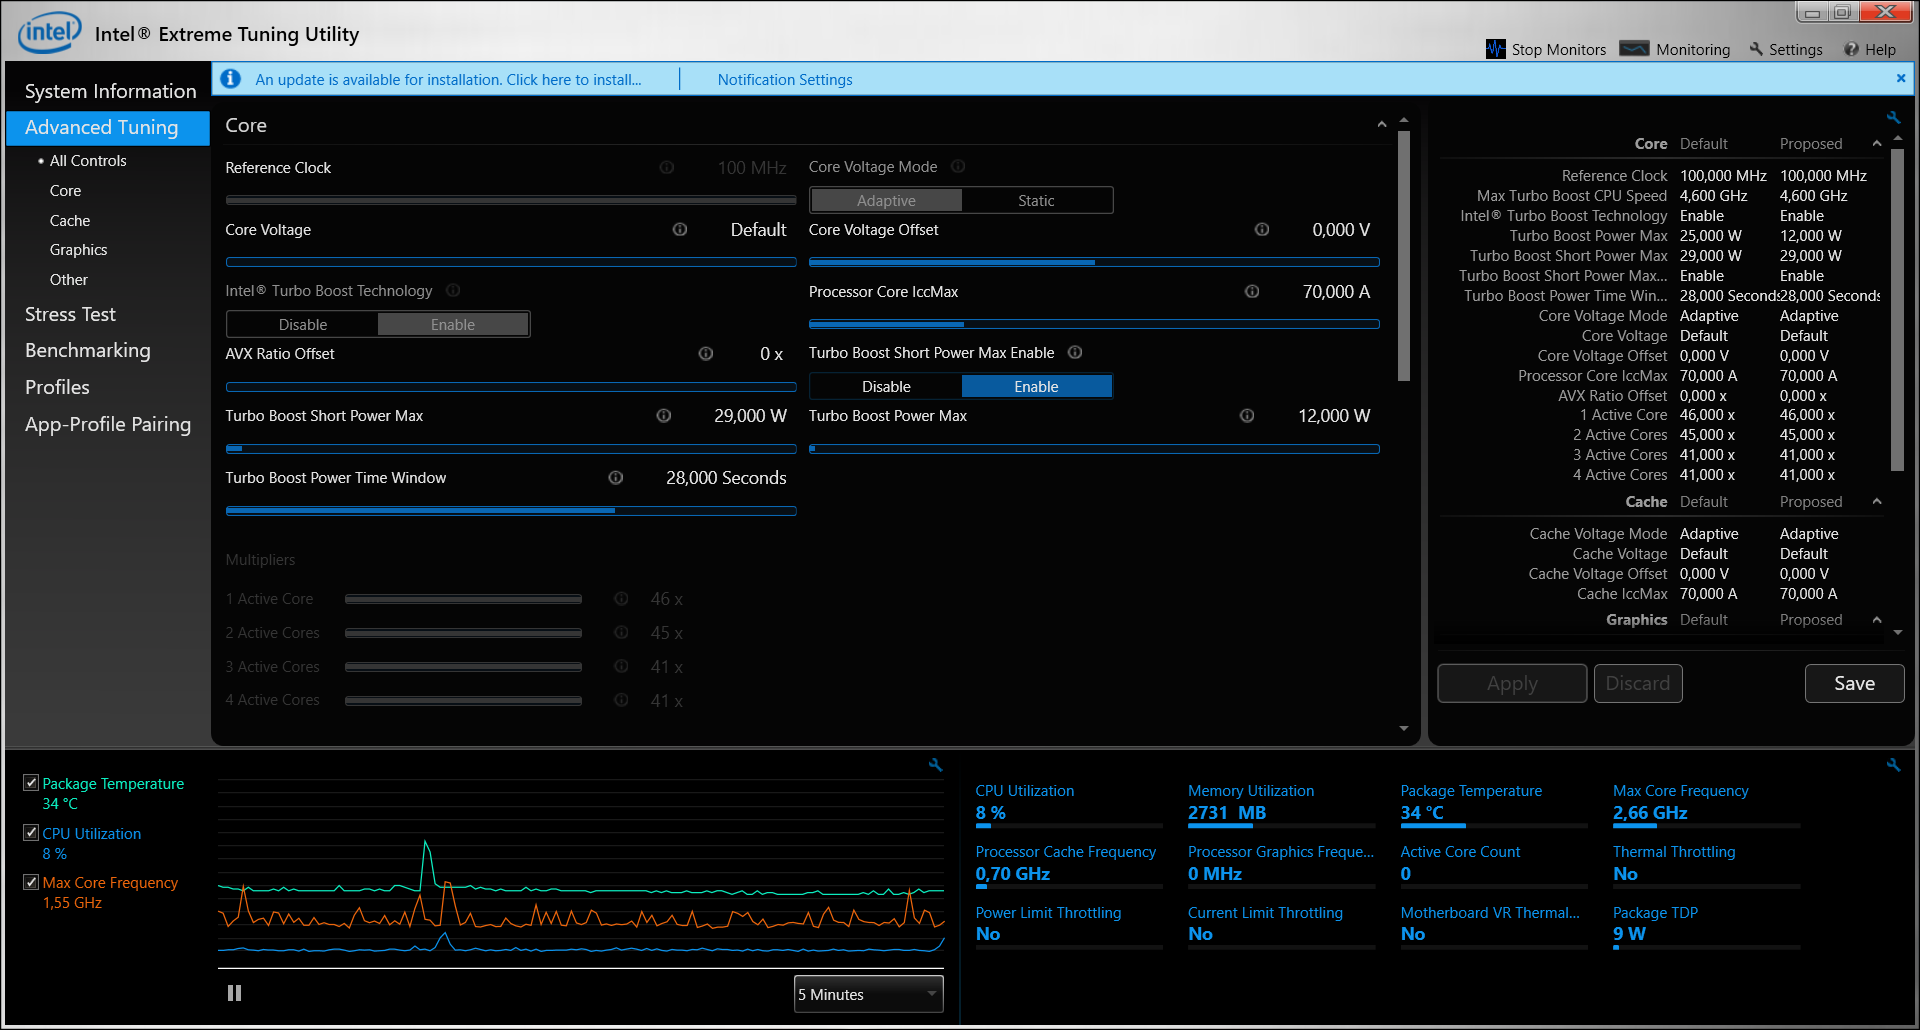
The P43s completes our stress test (Prime95 and FurMark run for at least an hour) on battery power and plugged-in in the same way. Curiously, the graphics core can work at high speed (1,531 MHz) for a very long time. Only later in the test does it reach the limit temperature of 56 °C (~133 °F) and is throttled. As soon as the GPU is throttled, the processor's clock speed repeatedly goes up to 1.9 GHz. Otherwise, the CPU mainly runs at 400 to 900 MHz. The stress test represents an extreme scenario that doesn't occur in everyday life. With this test we verify that the system remains stable even under full load.
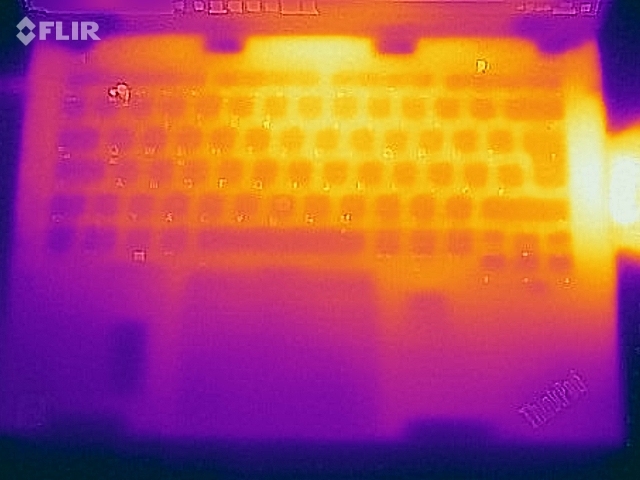
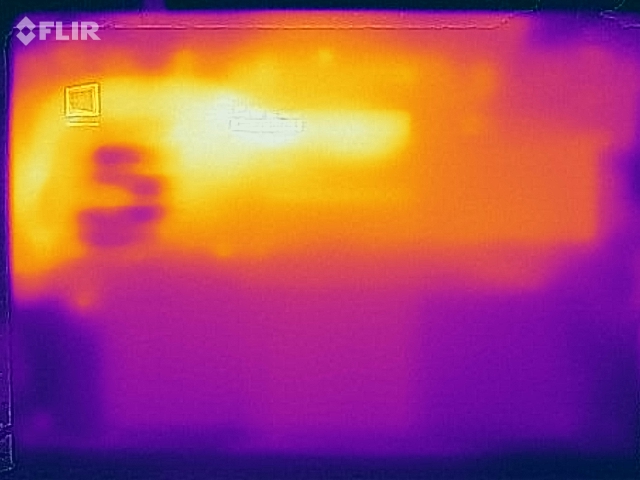
The ThinkPad gets significantly warm. During the stress test, we register temperatures well above 50 °C (~122 °F) at several measuring points on the bottom. The device should not be placed on the lap then. In idle usage, the temperatures are in the green area.
(-) The maximum temperature on the upper side is 48.9 °C / 120 F, compared to the average of 38.2 °C / 101 F, ranging from 22.2 to 69.8 °C for the class Workstation.
(-) The bottom heats up to a maximum of 58.9 °C / 138 F, compared to the average of 41.1 °C / 106 F
(+) In idle usage, the average temperature for the upper side is 23.5 °C / 74 F, compared to the device average of 32 °C / 90 F.
(+) The palmrests and touchpad are reaching skin temperature as a maximum (35.3 °C / 95.5 F) and are therefore not hot.
(-) The average temperature of the palmrest area of similar devices was 27.8 °C / 82 F (-7.5 °C / -13.5 F).
| Lenovo ThinkPad P43s-20RH001FGE i7-8565U, Quadro P520 | HP ZBook 14u G6 6TP71EA i7-8565U, Radeon Pro WX 3200 | Lenovo ThinkPad T490-20N3S02L00 i7-8565U, GeForce MX250 | Dell Precision 5530 2-in-1 i7-8706G, WX Vega M GL | Average NVIDIA Quadro P520 | Average of class Workstation | |
|---|---|---|---|---|---|---|
| Heat | 12% | 8% | -9% | -2% | -5% | |
| Maximum Upper Side * (°C) | 48.9 | 40.8 17% | 45.2 8% | 48.6 1% | 50.5 ? -3% | 44.3 ? 9% |
| Maximum Bottom * (°C) | 58.9 | 43 27% | 56.6 4% | 42.2 28% | 61.5 ? -4% | 44.5 ? 24% |
| Idle Upper Side * (°C) | 23.7 | 24.1 -2% | 22.1 7% | 31.6 -33% | 23.9 ? -1% | 30.7 ? -30% |
| Idle Bottom * (°C) | 25.6 | 24.4 5% | 22.1 14% | 33.2 -30% | 25 ? 2% | 31.5 ? -23% |
* ... smaller is better
Speakers
Lenovo ThinkPad P43s-20RH001FGE audio analysis
(±) | speaker loudness is average but good (72.7 dB)
Bass 100 - 315 Hz
(±) | reduced bass - on average 14.9% lower than median
(±) | linearity of bass is average (11.3% delta to prev. frequency)
Mids 400 - 2000 Hz
(±) | higher mids - on average 6.4% higher than median
(±) | linearity of mids is average (9% delta to prev. frequency)
Highs 2 - 16 kHz
(+) | balanced highs - only 4.2% away from median
(+) | highs are linear (5% delta to prev. frequency)
Overall 100 - 16.000 Hz
(±) | linearity of overall sound is average (26.1% difference to median)
Compared to same class
» 88% of all tested devices in this class were better, 6% similar, 6% worse
» The best had a delta of 7%, average was 17%, worst was 35%
Compared to all devices tested
» 80% of all tested devices were better, 4% similar, 16% worse
» The best had a delta of 4%, average was 24%, worst was 134%
Energy management - The ThinkPad doesn't lack stamina
Energy consumption
When idle, we register a maximum demand of 7.92 watts (6.36 watts when key lighting is deactivated). During our stress test, the value rises for a short time to up to 68.2 watts but decreases to 40 watts later in the test. The P43s is therefore on par with the ThinkPad T490 over the entire load range. The included USB Type-C power adapter has an output of 65 watts.
| Off / Standby | |
| Idle | |
| Load |
|
Key:
min: | |
| Lenovo ThinkPad P43s-20RH001FGE i7-8565U, Quadro P520 | HP ZBook 14u G6 6TP71EA i7-8565U, Radeon Pro WX 3200 | Lenovo ThinkPad T490-20N3S02L00 i7-8565U, GeForce MX250 | Dell Precision 5530 2-in-1 i7-8706G, WX Vega M GL | Average NVIDIA Quadro P520 | Average of class Workstation | |
|---|---|---|---|---|---|---|
| Power Consumption | -29% | 2% | -89% | -18% | -141% | |
| Idle Minimum * (Watt) | 2.9 | 4.2 -45% | 2.16 26% | 7.4 -155% | 3.14 ? -8% | 8.89 ? -207% |
| Idle Average * (Watt) | 4.94 | 7.93 -61% | 5.04 -2% | 12.4 -151% | 7.3 ? -48% | 13.5 ? -173% |
| Idle Maximum * (Watt) | 7.92 | 10.9 -38% | 8.64 -9% | 13.3 -68% | 10.4 ? -31% | 17.6 ? -122% |
| Load Average * (Watt) | 60.8 | 59.1 3% | 63.2 -4% | 79.2 -30% | 60.7 ? -0% | 93.9 ? -54% |
| Load Maximum * (Watt) | 68.2 | 70.5 -3% | 67.5 1% | 96.5 -41% | 68.9 ? -1% | 171.1 ? -151% |
| Witcher 3 ultra * (Watt) | 50.4 | 50 | 82.2 |
* ... smaller is better
Battery life
The Lenovo computer reaches a runtime of 8:30 h in our practical Wi-Fi test. We use a script to simulate the load caused by accessing websites. The "Balanced" profile is active, and the display brightness is adjusted to about 150 cd/m². At maximum display brightness, the device turns off almost an hour earlier (7:33 h).
The workstation completes our video test after 12:41 h. We let the short film Big Buck Bunny (H.264 encoding, 1920x1080 pixels) run in a continuous loop here. The radio module is deactivated, and the display brightness is reduced to 150 cd/m².
| Lenovo ThinkPad P43s-20RH001FGE i7-8565U, Quadro P520, 51 Wh | HP ZBook 14u G6 6TP71EA i7-8565U, Radeon Pro WX 3200, 50 Wh | Lenovo ThinkPad T490-20N3S02L00 i7-8565U, GeForce MX250, 50 Wh | Dell Precision 5530 2-in-1 i7-8706G, WX Vega M GL, 75 Wh | Average of class Workstation | |
|---|---|---|---|---|---|
| Battery runtime | -16% | -22% | -30% | -21% | |
| H.264 (h) | 12.7 | 11 -13% | 8.7 -31% | 9.51 ? -25% | |
| WiFi v1.3 (h) | 8.5 | 8.5 0% | 9.1 7% | 7.3 -14% | 8.55 ? 1% |
| Load (h) | 2.2 | 1.4 -36% | 1.3 -41% | 1.2 -45% | 1.364 ? -38% |
| Reader / Idle (h) | 17.7 | 12.3 | 26.1 ? |
Pros
Cons
Verdict

With the ThinkPad P43s, Lenovo has a compact 14-inch mobile workstation in its range. The device is powered by a Core i7-8565U processor and a Quadro P520 graphics core. However, both components can't reach their full performance potential.
The ThinkPad P43s can only develop its performance potential to a limited extent.
The processor achieves stable high working speeds only in single-thread operation; in multithread operation, Turbo is hardly used or not even used at all. The graphics core is throttled after a short time because the threshold responsible for it (GPU temperature > 56 °C (~133 °F)) was chosen unusually low. Therefore, the laptop is primarily suitable for applications that only put a brief strain on the graphics core.
Not only does the P43s inherit the great case from the identical ThinkPad T490 sister model, but it also has the excellent keyboard (backlit). Unfortunately, our test device doesn't come with the IGZO panel found in the ThinkPad T490 that we reviewed. However, the panel is available within the P43s series. The latter would have been the obvious better choice. The existing display is one of the weaknesses of the P43s. It only provides a low maximum brightness. In addition, the color-space coverage is no cause for enthusiasm. Both shortcomings shouldn't be found at the price level of the P43s.
Battery life is good, and an NVMe SSD makes for a fast system. This is complemented by a three-year warranty. The Thunderbolt 3 slot should be mentioned too, which allows the connection of an external GPU.
Lenovo ThinkPad P43s-20RH001FGE
- 10/19/2019 v7 (old)
Sascha Mölck
Price comparison
