Dell Precision 5530 2-in-1 (i7-8706G, Radeon WX Vega M GL, 4K UHD) Workstation Review
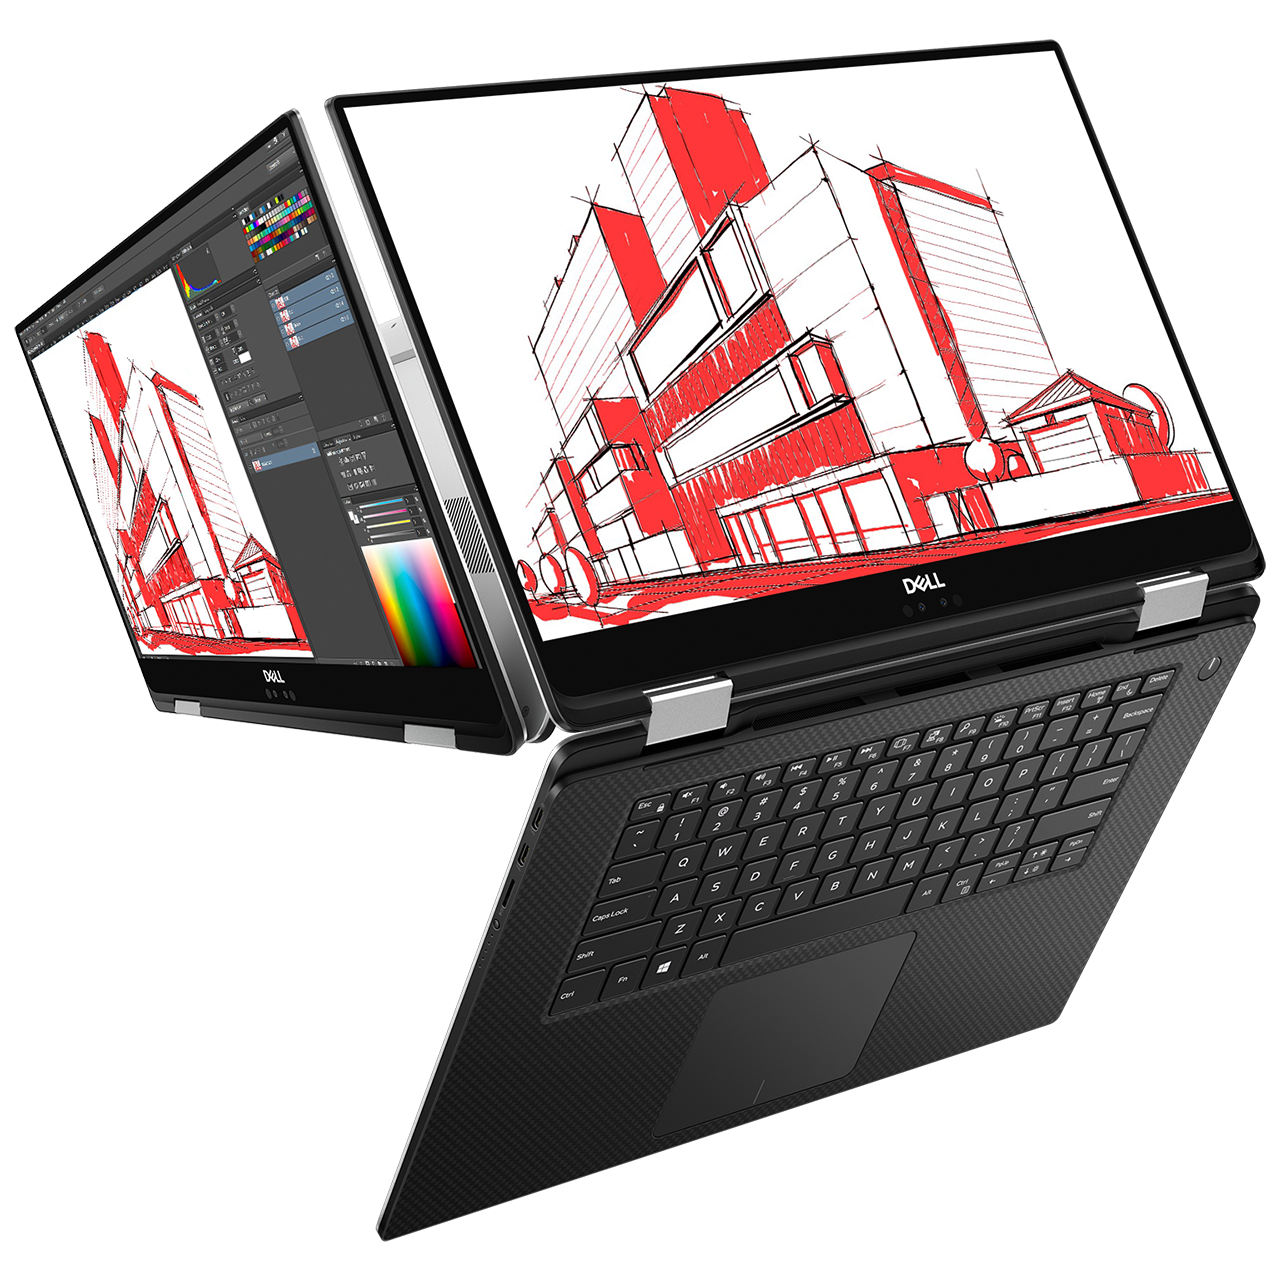
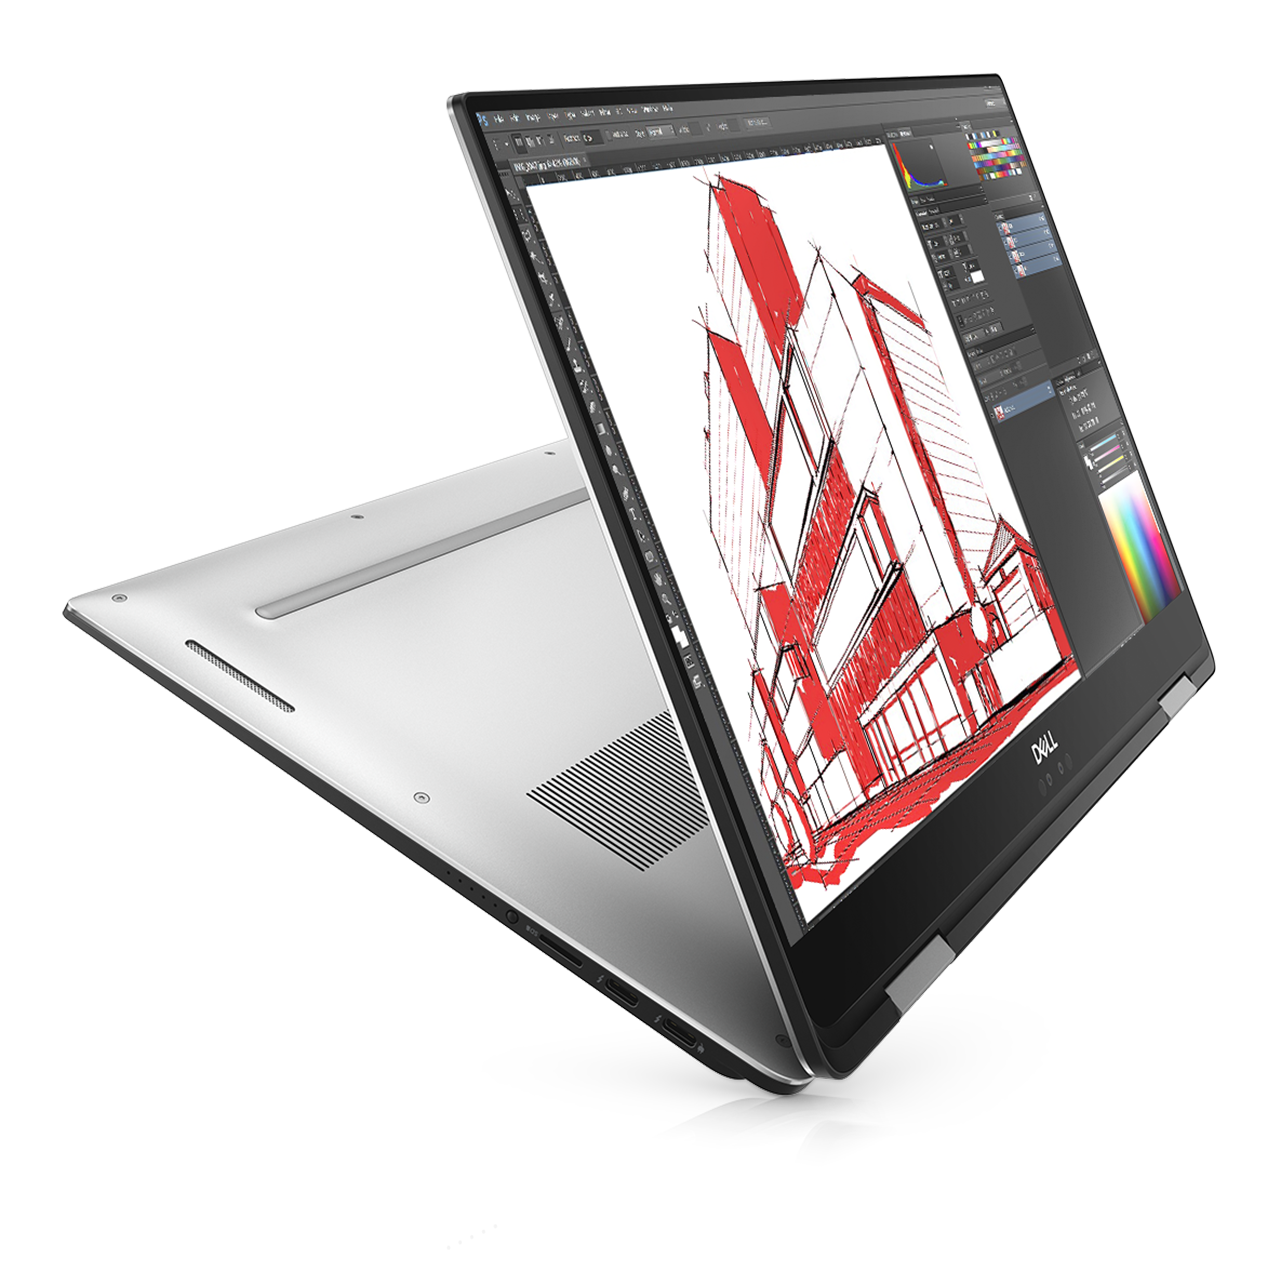
Much like how the Precision 5530 is a workstation variant of the consumer XPS 15 9560/9570, the Precision 5530 2-in-1 is a workstation variant of the XPS 15 9575. The XPS 15 9575 was marketed as "the world's fastest convertible laptop" and it carried a few unique characteristics not found on nearly any other notebook including its MagLev keys, GORE insulation, and Kaby Lake-G processor. All of these traits are returning on the Precision 5530 2-in-1 to create a one-of-a-kind workstation that Dell is marketing as "the world's smallest convertible mobile workstation".
The major difference between the Precision 5530 2-in-1 and the XPS 15 9575 lies at the heart. The Precision utilizes a Core i7-8706G CPU and a Radeon Pro WX Vega M GL GPU which are not found on current SKUs of the XPS 15. In fact, the Precision 2-in-1 is one of the only laptops shipping with such a processor at the time of writing.
Despite what the name may suggest, the Precision 5530 2-in-1 is not just a standard Precision 5530 with tacked-on 360-degree hinges. Components are very different both inside and out as our full Precision 5530 review details.
Current configurations come with the choice between a Core i5-8305G or i7-8706G, 8 GB or 16 GB of DDR4 RAM, and a 1080p or 4K UHD touchscreen with a starting price of $1700 up to $2500 USD. The Radeon Pro WX GPU remains fixed at all levels.
The chassis of the Precision 5530 2-in-1 is otherwise identical to the XPS 15 9575 down to the keyboard keys and even display panel. As such, we recommend checking out our original reviews on the XPS 15 9575 for more information on the chassis, keyboard, speakers, and other features. Our review on the Precision 5530 2-in-1 will instead focus on its performance and how the uncommon Core i7-8706G and WX Vega compares to the competition.
Related reviews:
Case
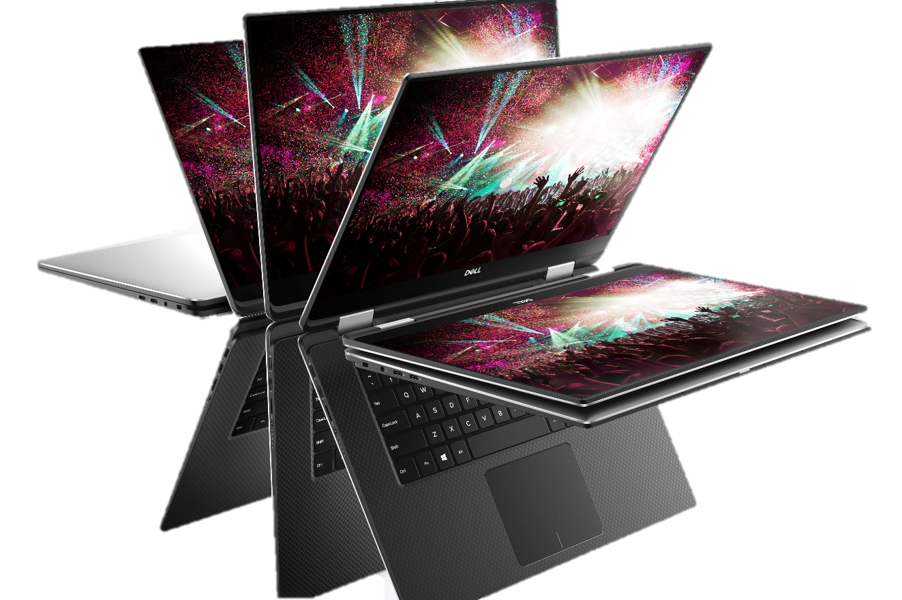
The Precision convertible is part of a growing lineup of thin-and-light workstations that challenge what a traditional workstation should be. Key competitors in this field are the super-thin 15.6-inch MSI WS63VR and Lenovo ThinkPad P1 which all sacrifice common connectivity features often associated with workstations for a sleeker and more attractive profile. Impressively, Dell manages to beat both of the aforementioned alternatives by not just being smaller and thinner, but also with more versatile 360-degree hinges. The OEM has definitely carved itself a unique design edge in a relatively small playing field.

Connectivity
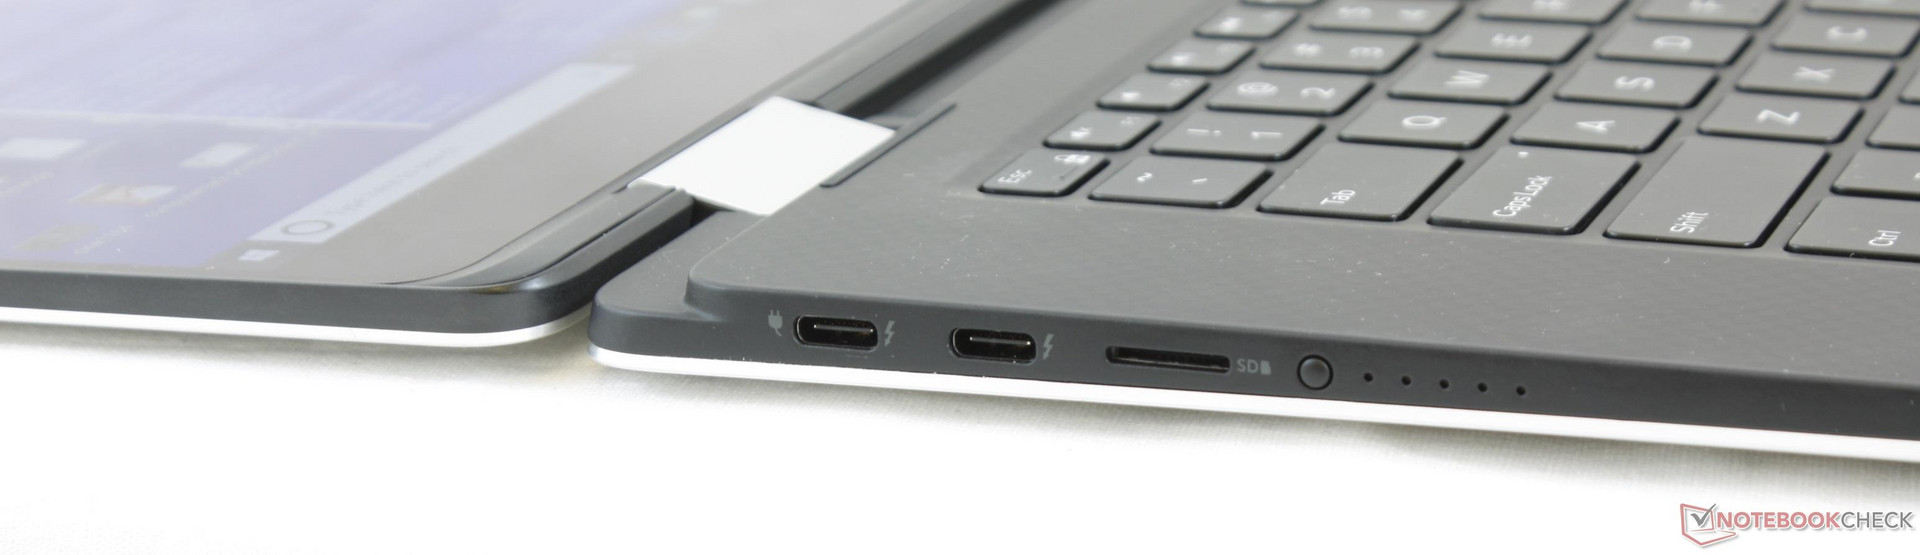
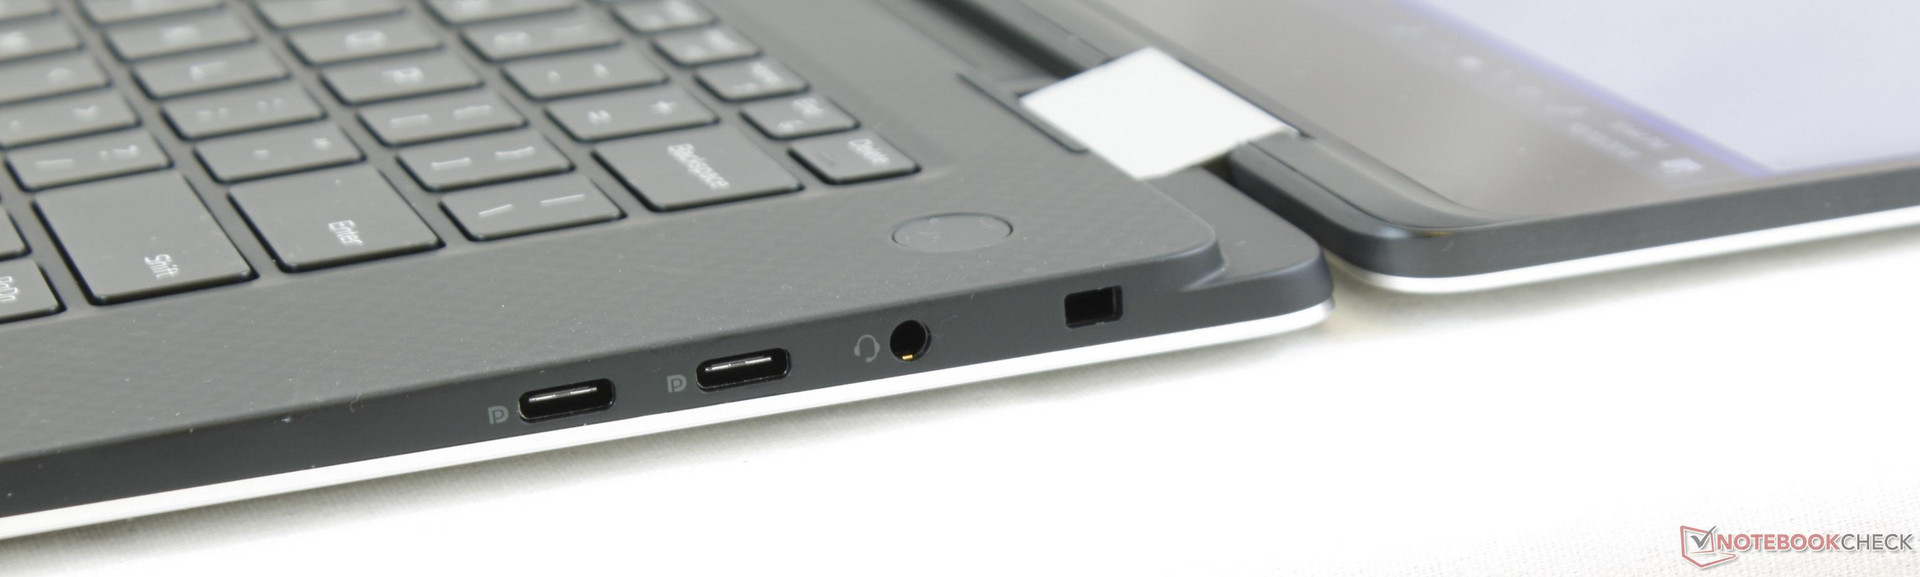
Users have just four USB Type-C ports and no other options. The two ports on the left are also Thunderbolt 3 ports for compatibility with a wide range of external devices. It's possible to charge the system via a compatible external monitor such as the Dell S2718D, but charging will be much slower than the dedicated 130 W AC adapter.
SD Card Reader
Unlike the XPS 15 9570 or Precision 5530, the Precision 5530 2-in-1 drops the full-size SD reader for a MicroSD reader. Performance is thankfully nearly as fast with sequential read rates above 200 MB/s. Transfer rates, however, are about 20 to 30 percent slower than the full-size SD readers of the Precision 5530 or ThinkPad X1 Extreme.
| SD Card Reader | |
| average JPG Copy Test (av. of 3 runs) | |
| Gigabyte Aero 15X v8 (Toshiba Exceria Pro SDXC 64 GB UHS-II) | |
| Lenovo ThinkPad X1 Extreme-20MF000XGE (Toshiba Exceria Pro SDXC 64 GB UHS-II) | |
| Dell Precision 5530 Xeon E-2176M (Toshiba Exceria Pro SDXC 64 GB UHS-II) | |
| Dell Precision 5530 2-in-1 (Toshiba Exceria Pro M501 UHS-II) | |
| maximum AS SSD Seq Read Test (1GB) | |
| Gigabyte Aero 15X v8 (Toshiba Exceria Pro SDXC 64 GB UHS-II) | |
| Lenovo ThinkPad X1 Extreme-20MF000XGE (Toshiba Exceria Pro SDXC 64 GB UHS-II) | |
| Dell Precision 5530 2-in-1 (Toshiba Exceria Pro M501 UHS-II) | |
| Dell Precision 5530 Xeon E-2176M (Toshiba Exceria Pro SDXC 64 GB UHS-II) | |
Communication
The Precision 5530 2-in-1 swaps out the gamer-centric Killer 1435 in the XPS 15 9575 for an Intel 8265 module. General performance and reliability are otherwise no different for browsing or streaming. Unlike the ThinkPad X1 Extreme, Dell is offering no configurations with the Intel 9560 which is capable of up to two times the theoretical transfer rate of our Intel 8265 (1.73 Gbps vs. 867 Mbps).
No WAN or 4G LTE options exist which would have paired well with the portability of the convertible.
Accessories
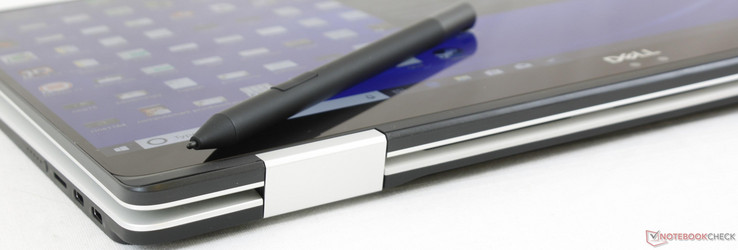
Included extras are a USB Type-C to USB 3.0 Type-A adapter, USB Type-C to RJ-45 adapter, and a PN579X active stylus.
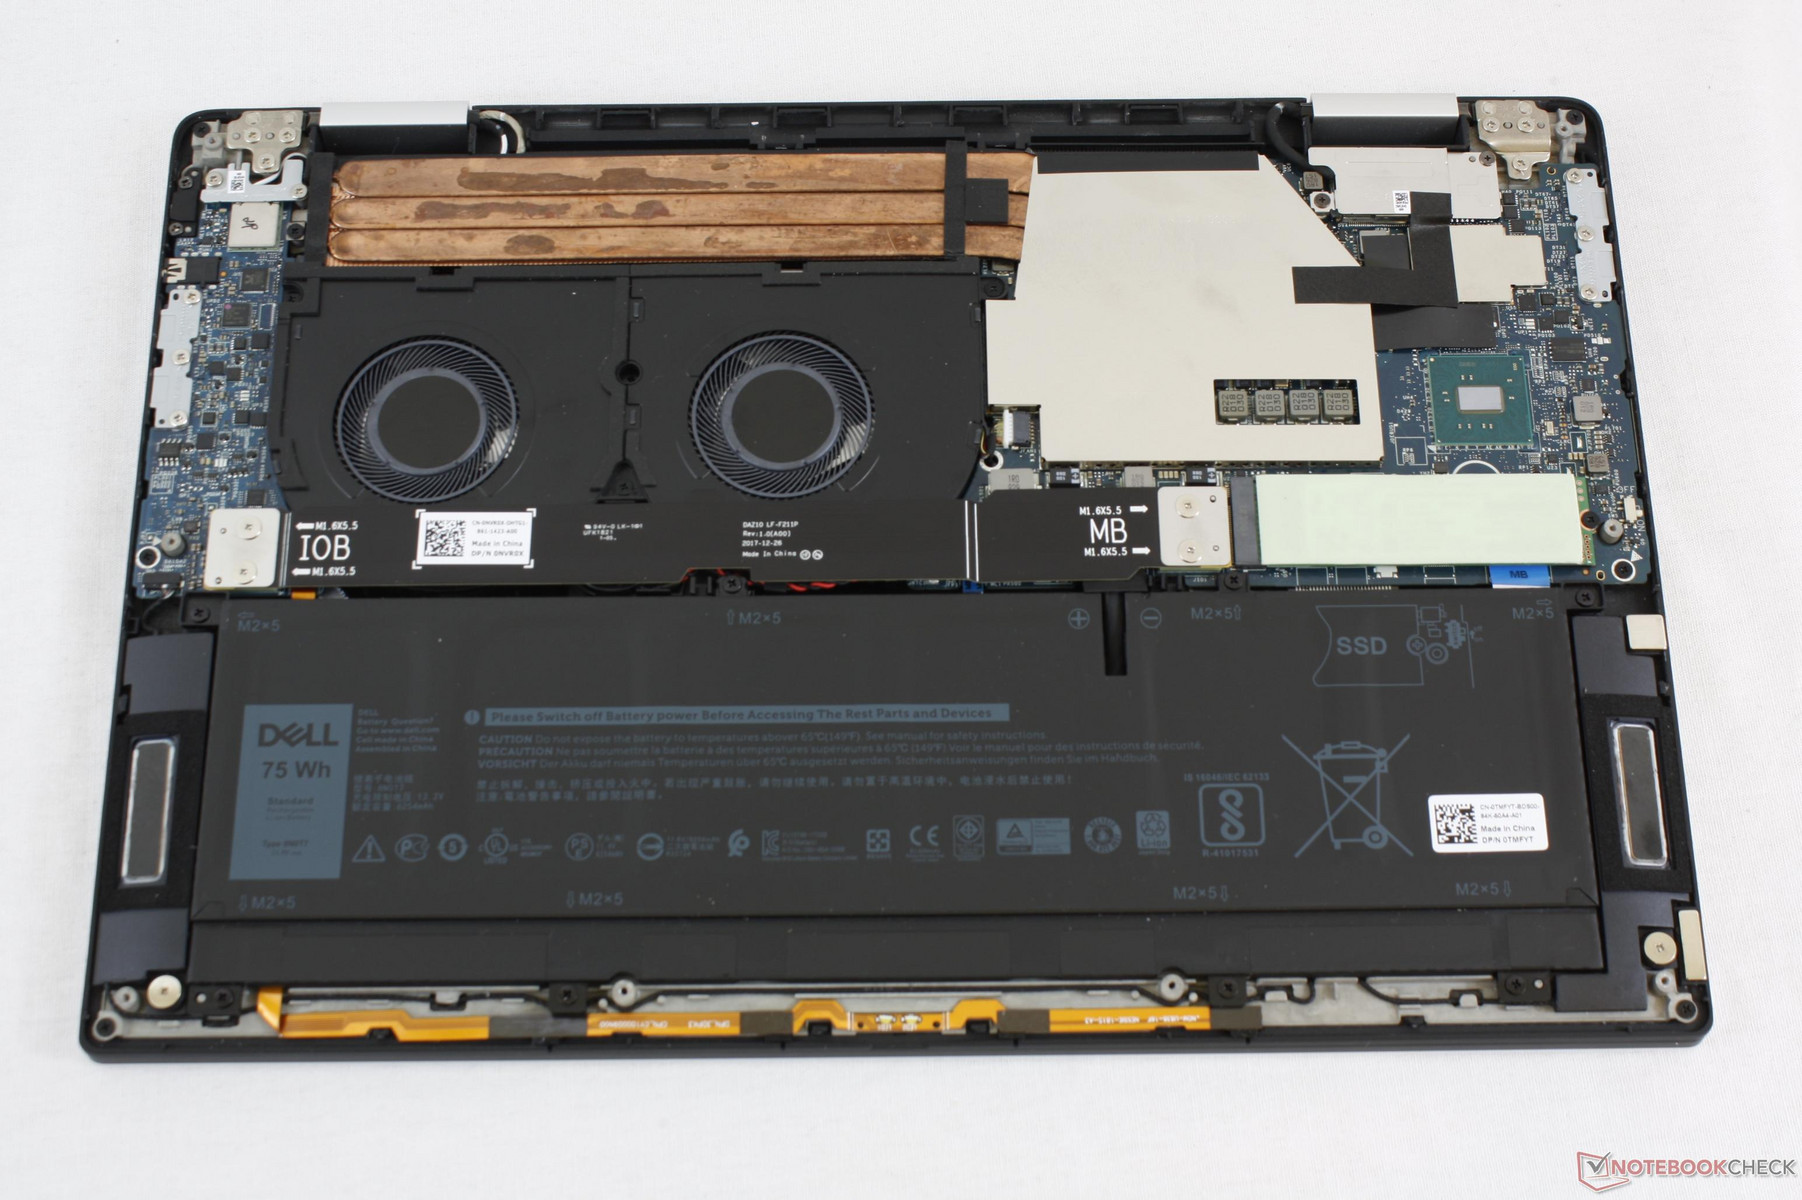
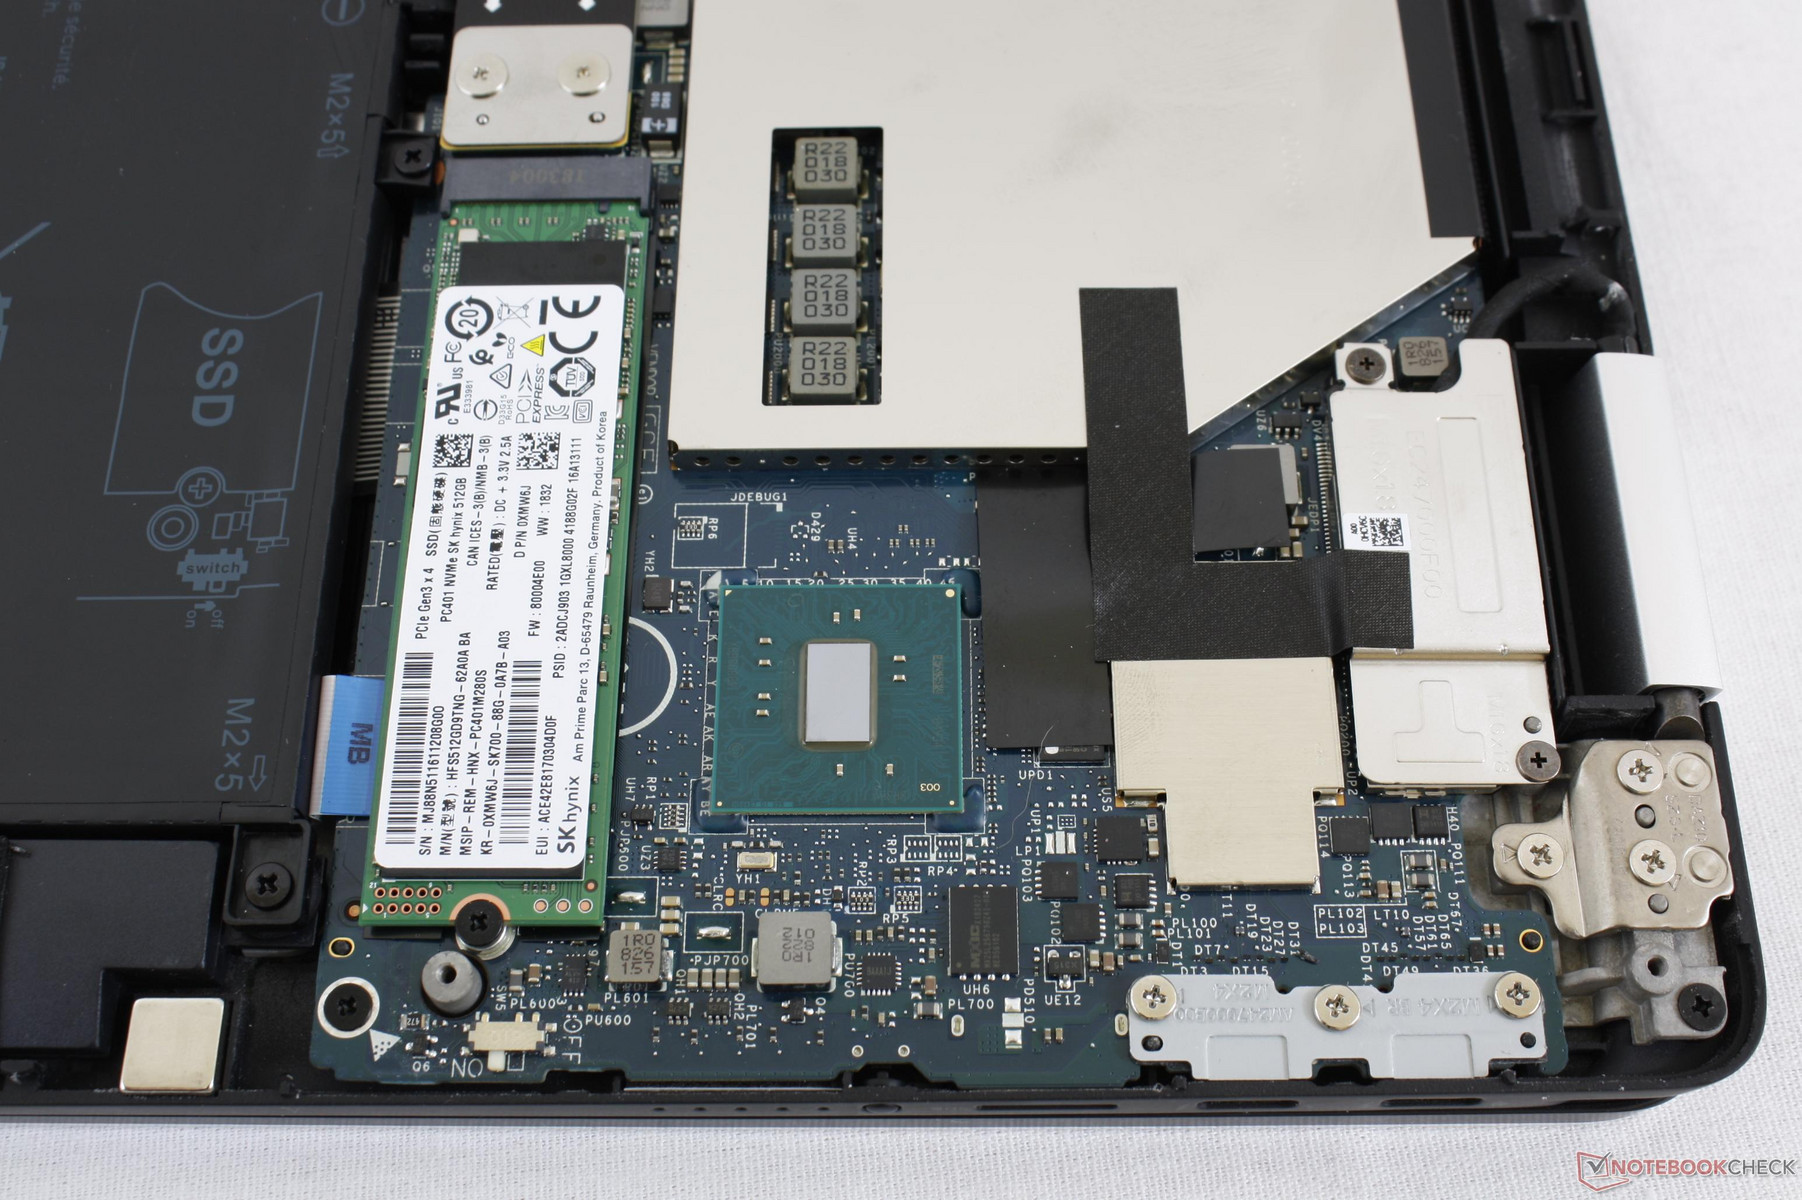
Maintenance
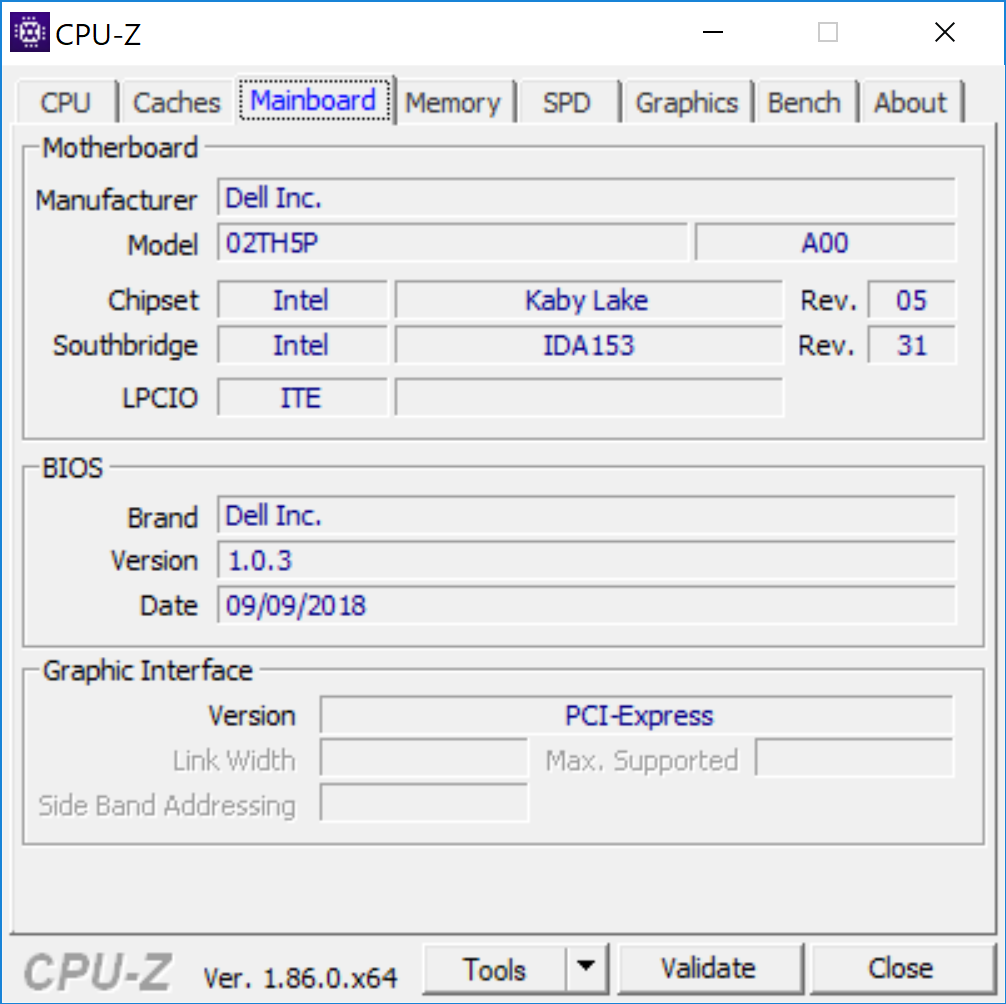
Serviceability requires only a Philips screwdriver and a sharp edge. Unlike on most other workstations, however, many components are not end-user upgradeable including the RAM. "Proper" Dell workstations like the Precision 7720 are more user-friendly in terms of serviceability.
Warranty
The standard one-year limited warranty applies with options to extend up to five years. We're disappointed to not see a baseline two-year warranty since this is a workstation after all. Please see our Guarantees, Return policies and Warranties FAQ for country-specific information.
Input Devices
Keyboard and Touchpad
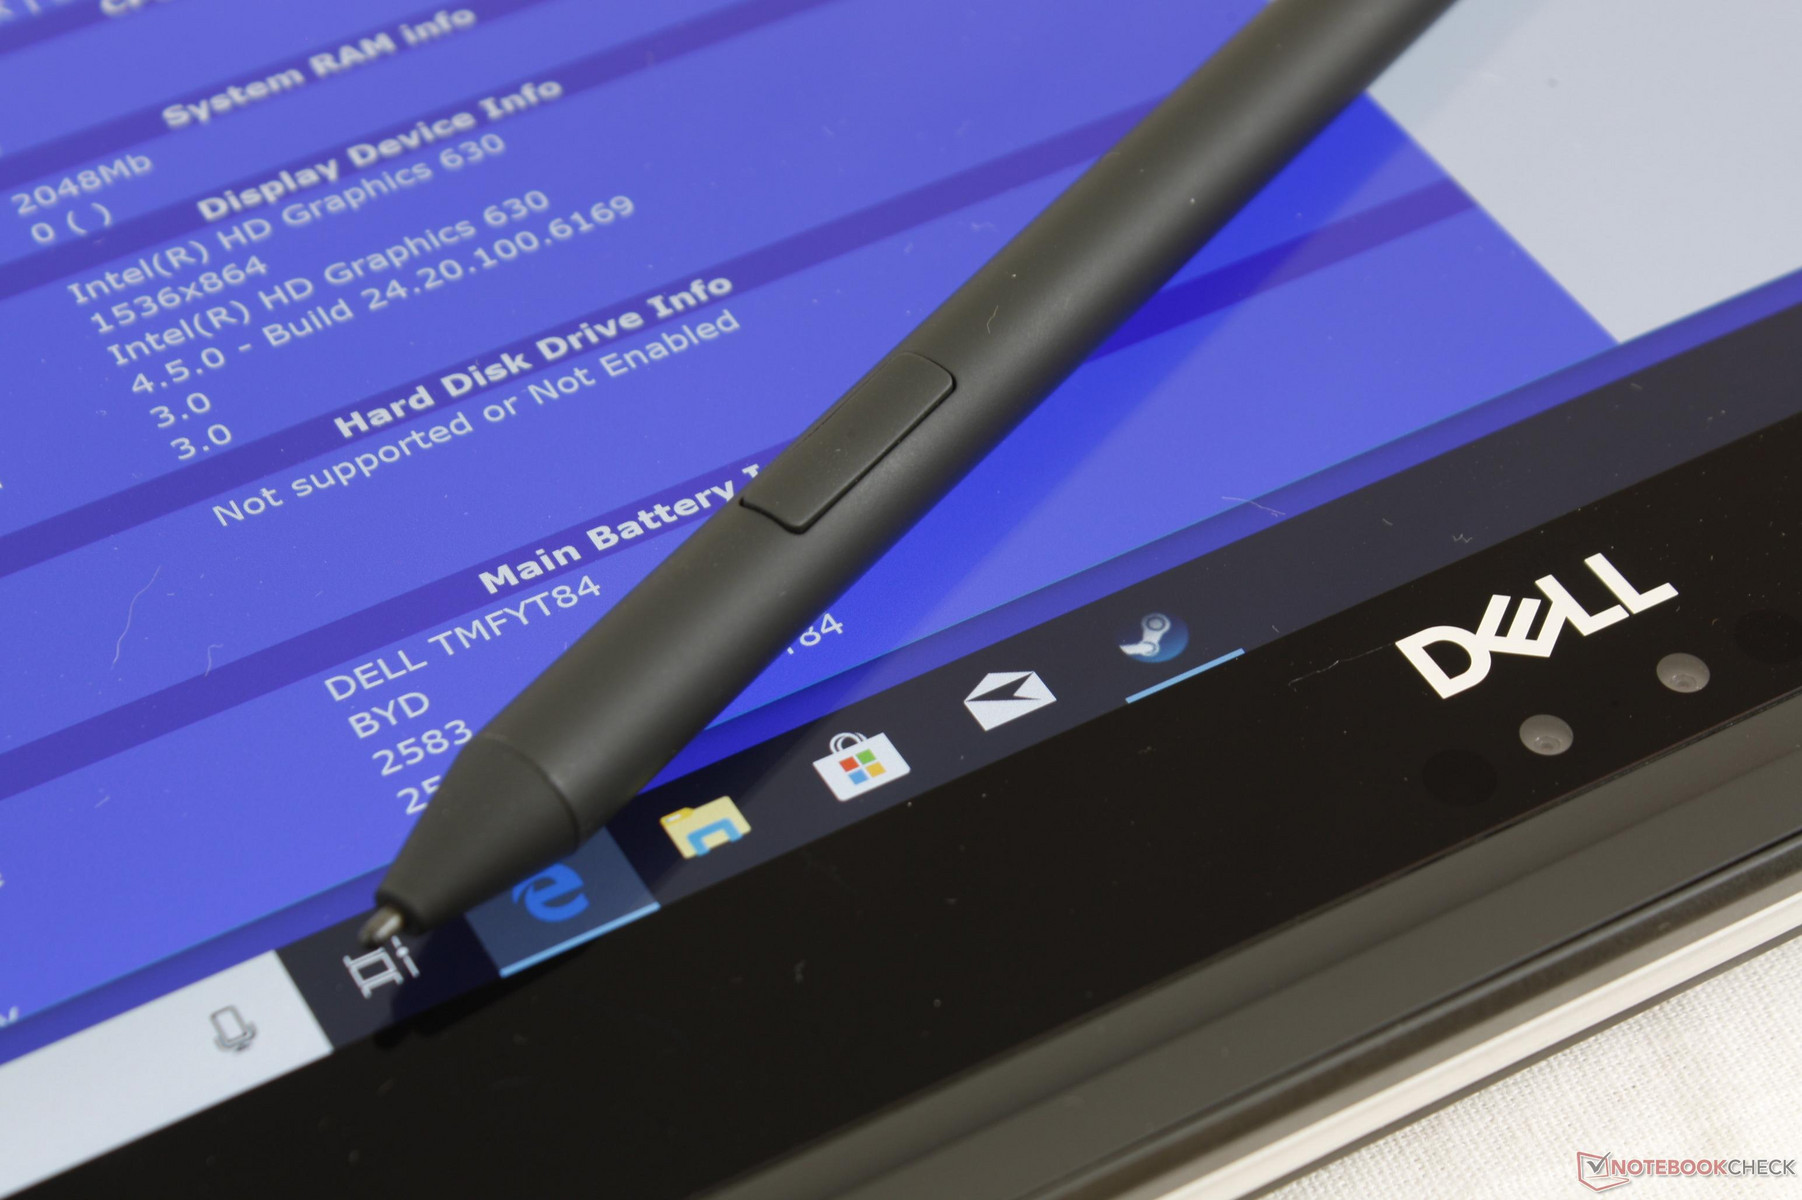
See our original review on the XPS 15 9575 for more information on the keyboard and trackpad. As for the Dell Premium Active WACOM Pen, it is unfortunately not a hassle-free experience. The two side buttons are too soft with narrow travel and poor feedback when compared to the Surface Pro alternative. Replacing the writing tip can be tricky because there are threads inside that can very easily fall out or become unaligned. While there are no issues when writing with the pen, we find that its buttons are just too finicky to rely on.

Display
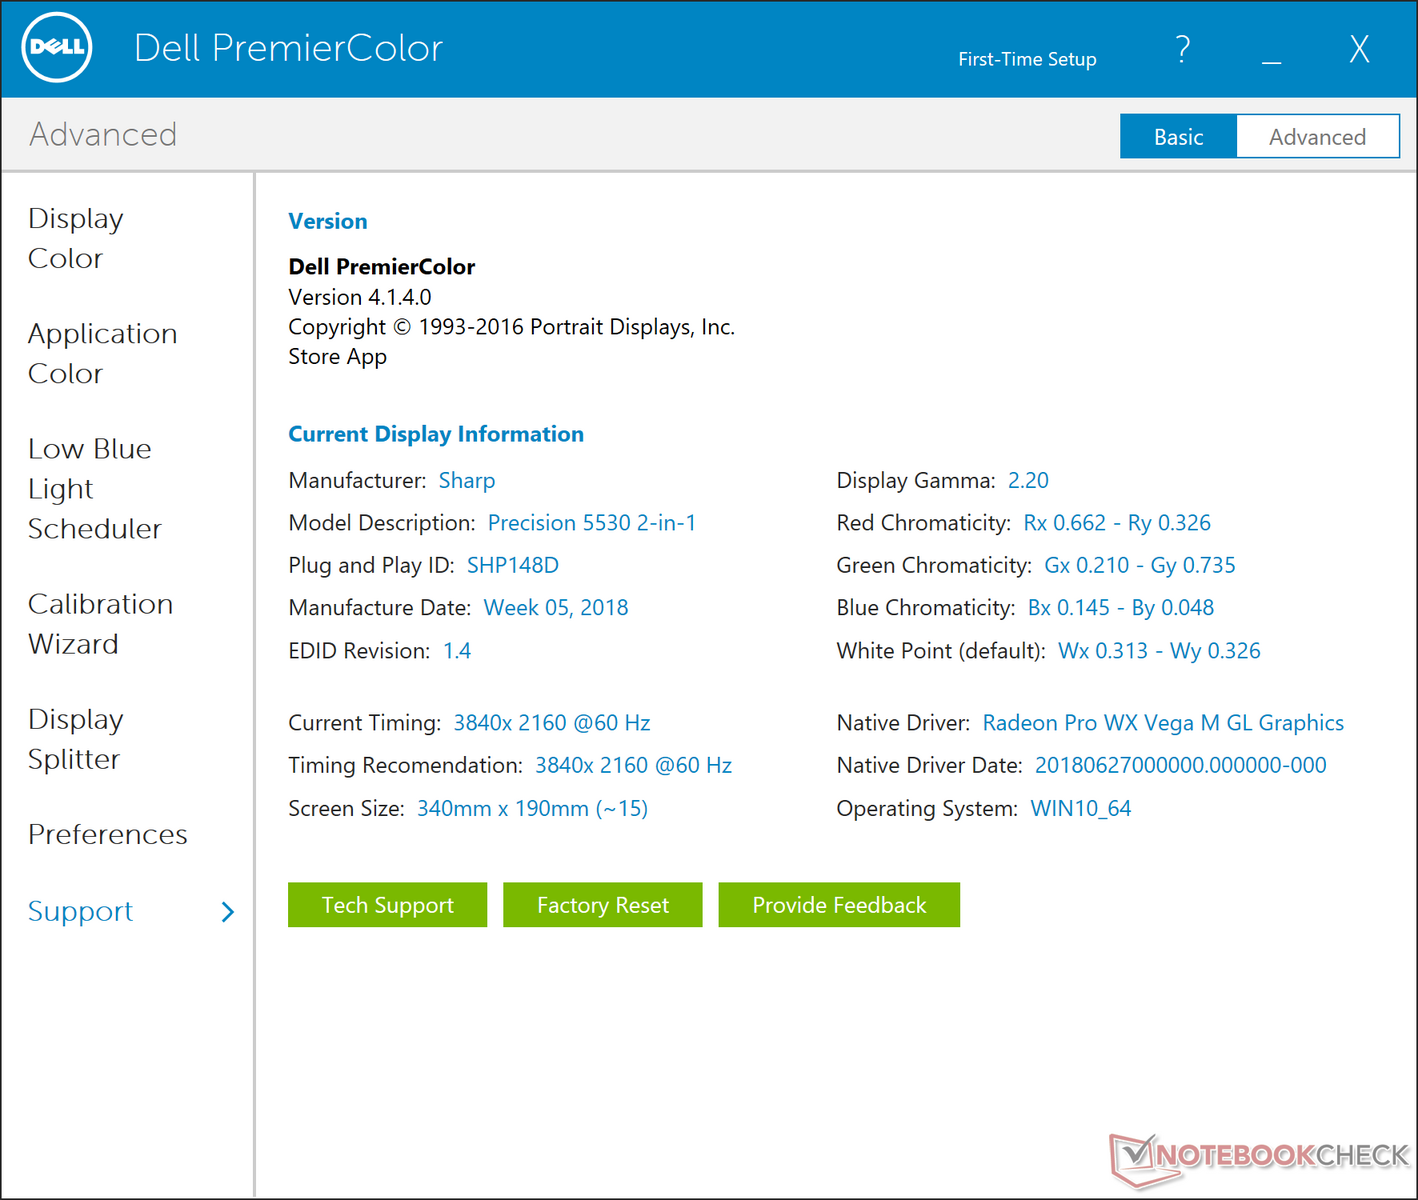
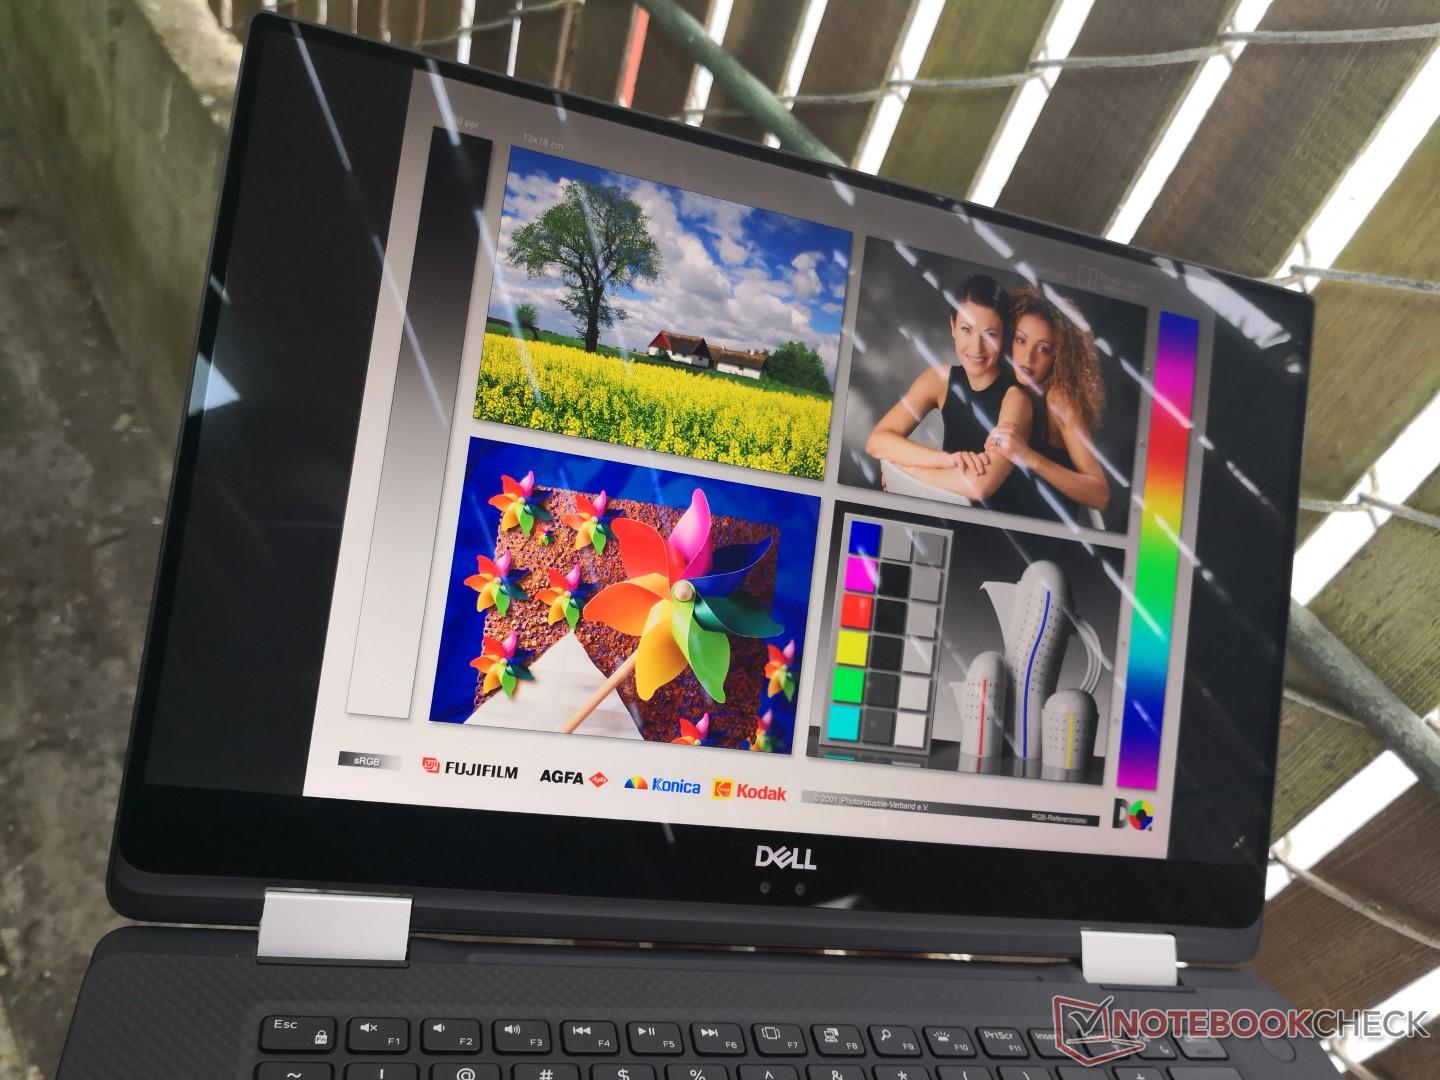
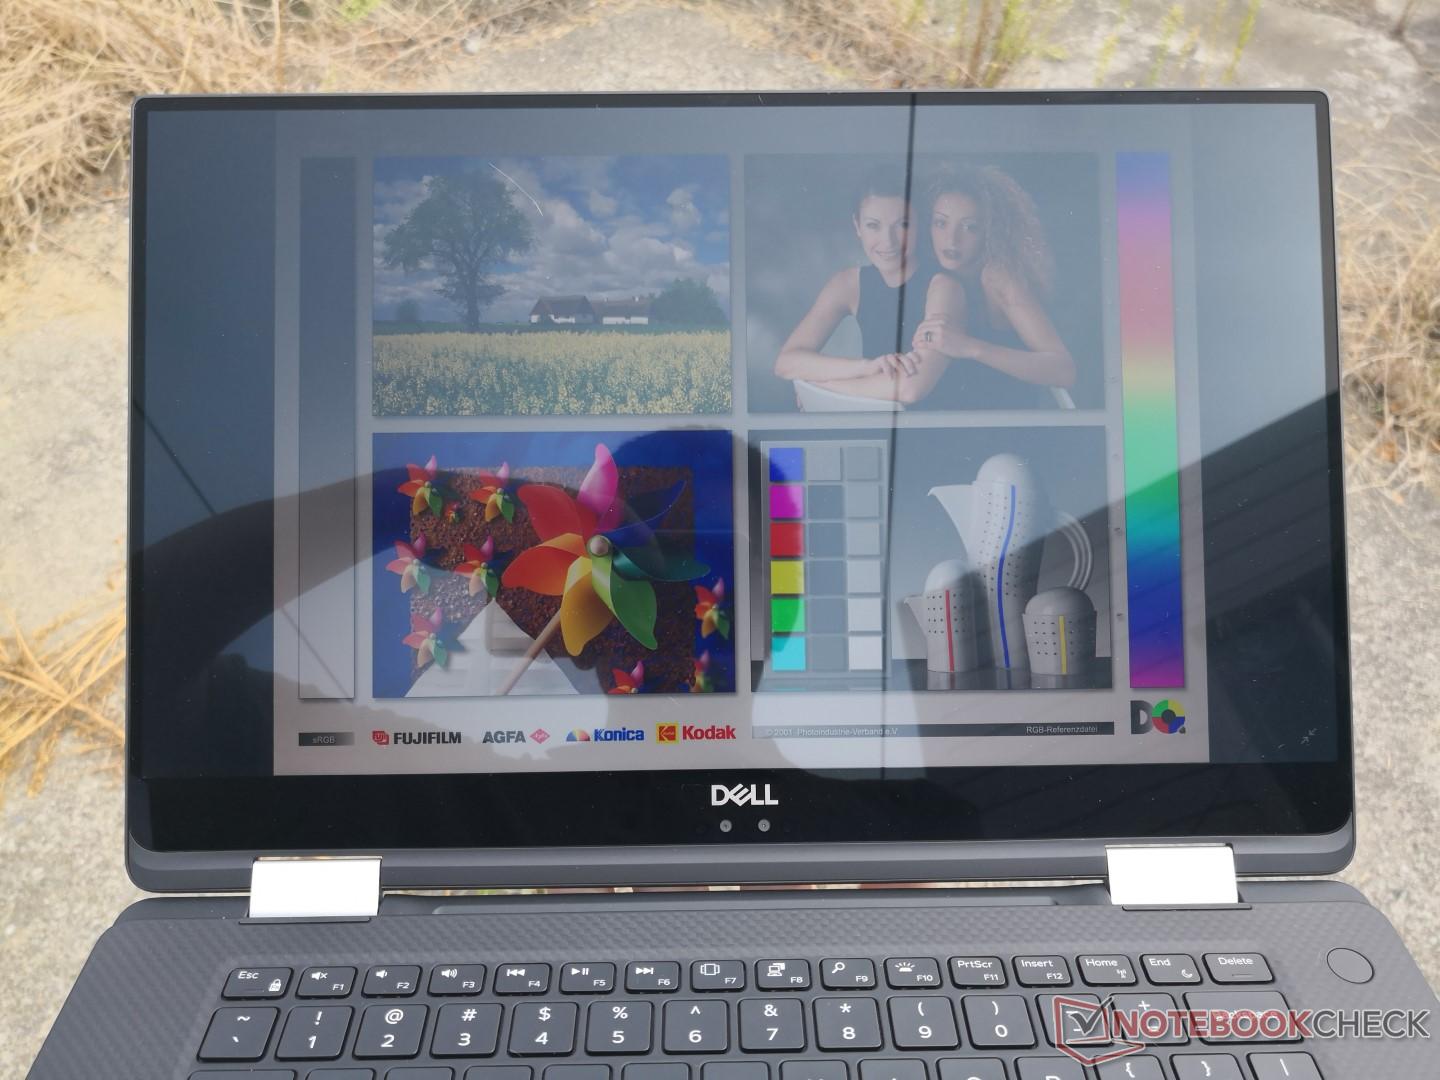
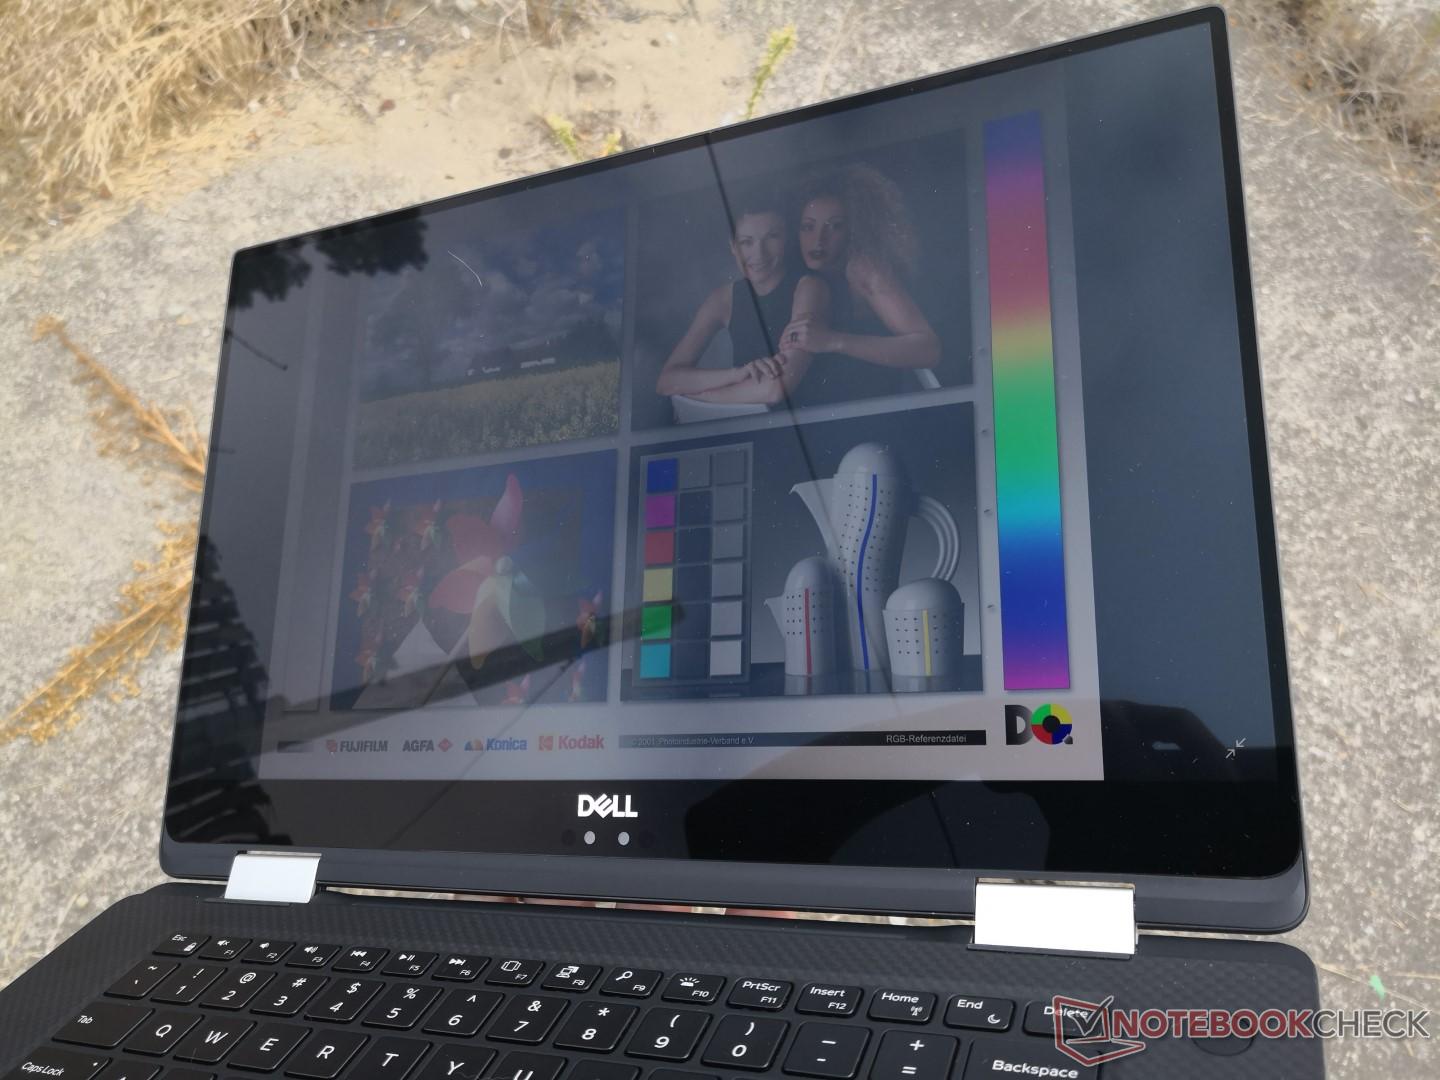
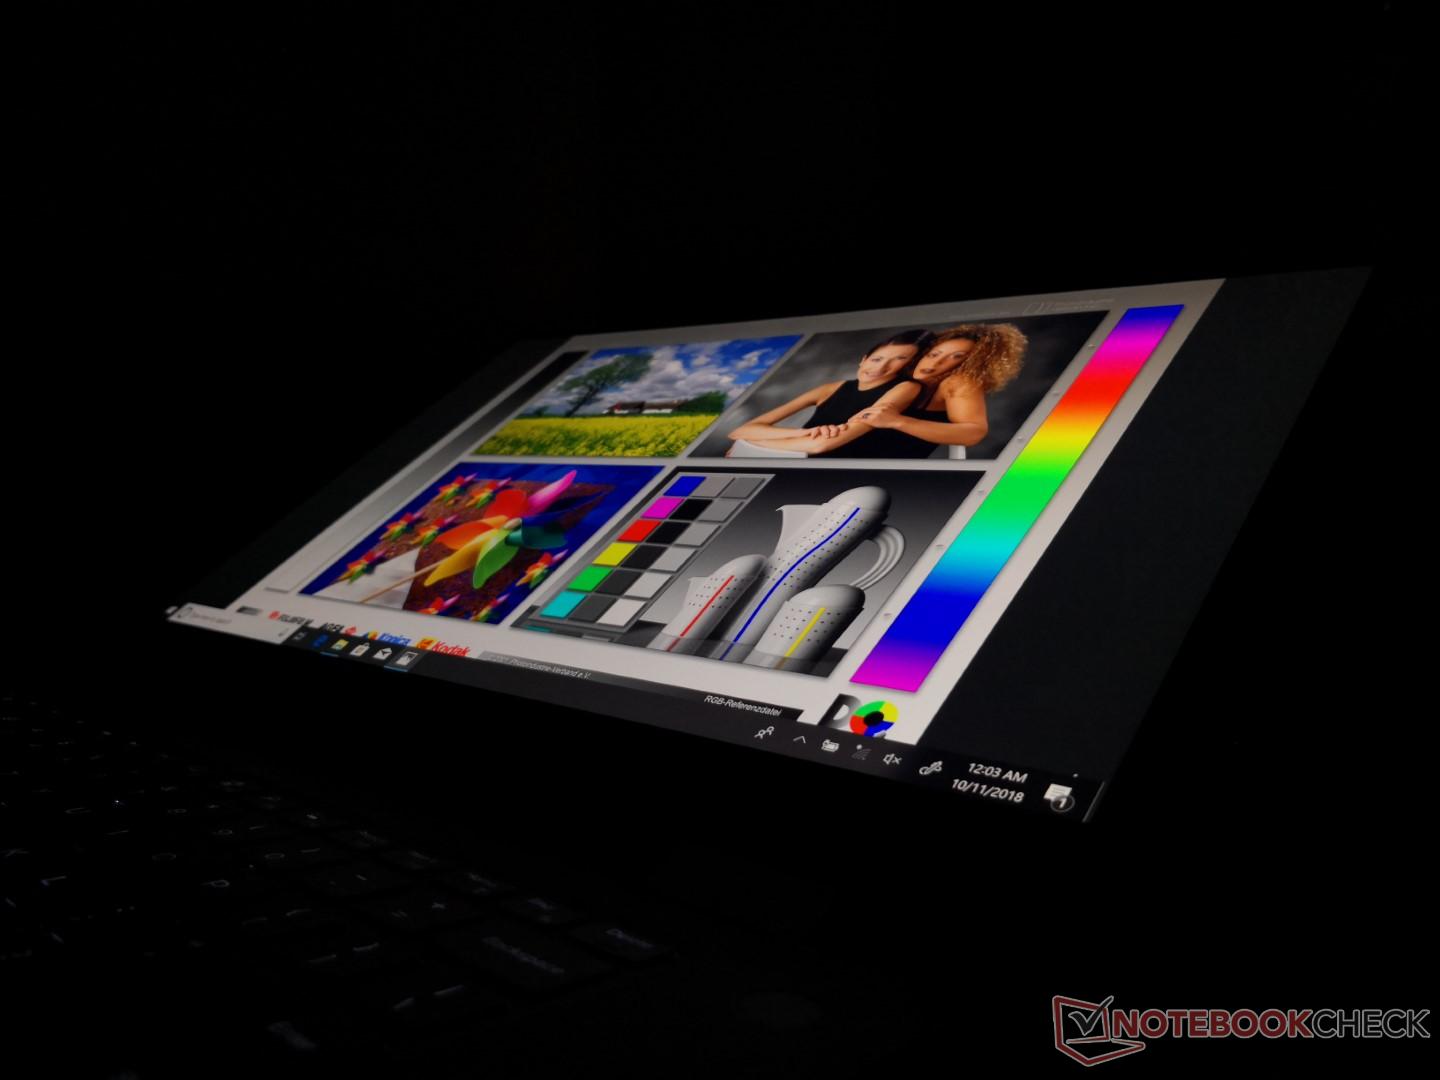
The Precision 5530 2-in-1 utilizes the same 4K UHD Sharp SHP148D/LQ156D1 IGZO panel as on the Precision 5530 and XPS 15 9575. As a result, all three systems share similar response time characteristics and color profiles. The crisp panel here is easily the highlight of the system. Even the 4K BOE panel on the X1 Extreme is quite similar albeit less color accurate out of the box.
One notable difference is that screen brightness appears to be dimmer this time around but not by a significant margin. Pulse-width modulation still occurs at the exact same settings as what we measured on the XPS 15 9575.
Interestingly, Dell is not marketing the Precision 5530 2-in-1 as being "HDR Ready" whereas the aforementioned ThinkPad X1 Extreme is advertised with HDR capabilities. According to our measurements, the Dell display is comparable to the Lenovo display in brightness, contrast, and color coverage - if not better. We suspect it could be a licensing hurdle involving Dell or Sharp.
Users who prefer native FHD instead of 4K UHD can opt for the 1080p IGZO configuration instead. While we've yet to personally test such a SKU, the 1080p panel will likely be identical to the 1080p XPS 15 9575.
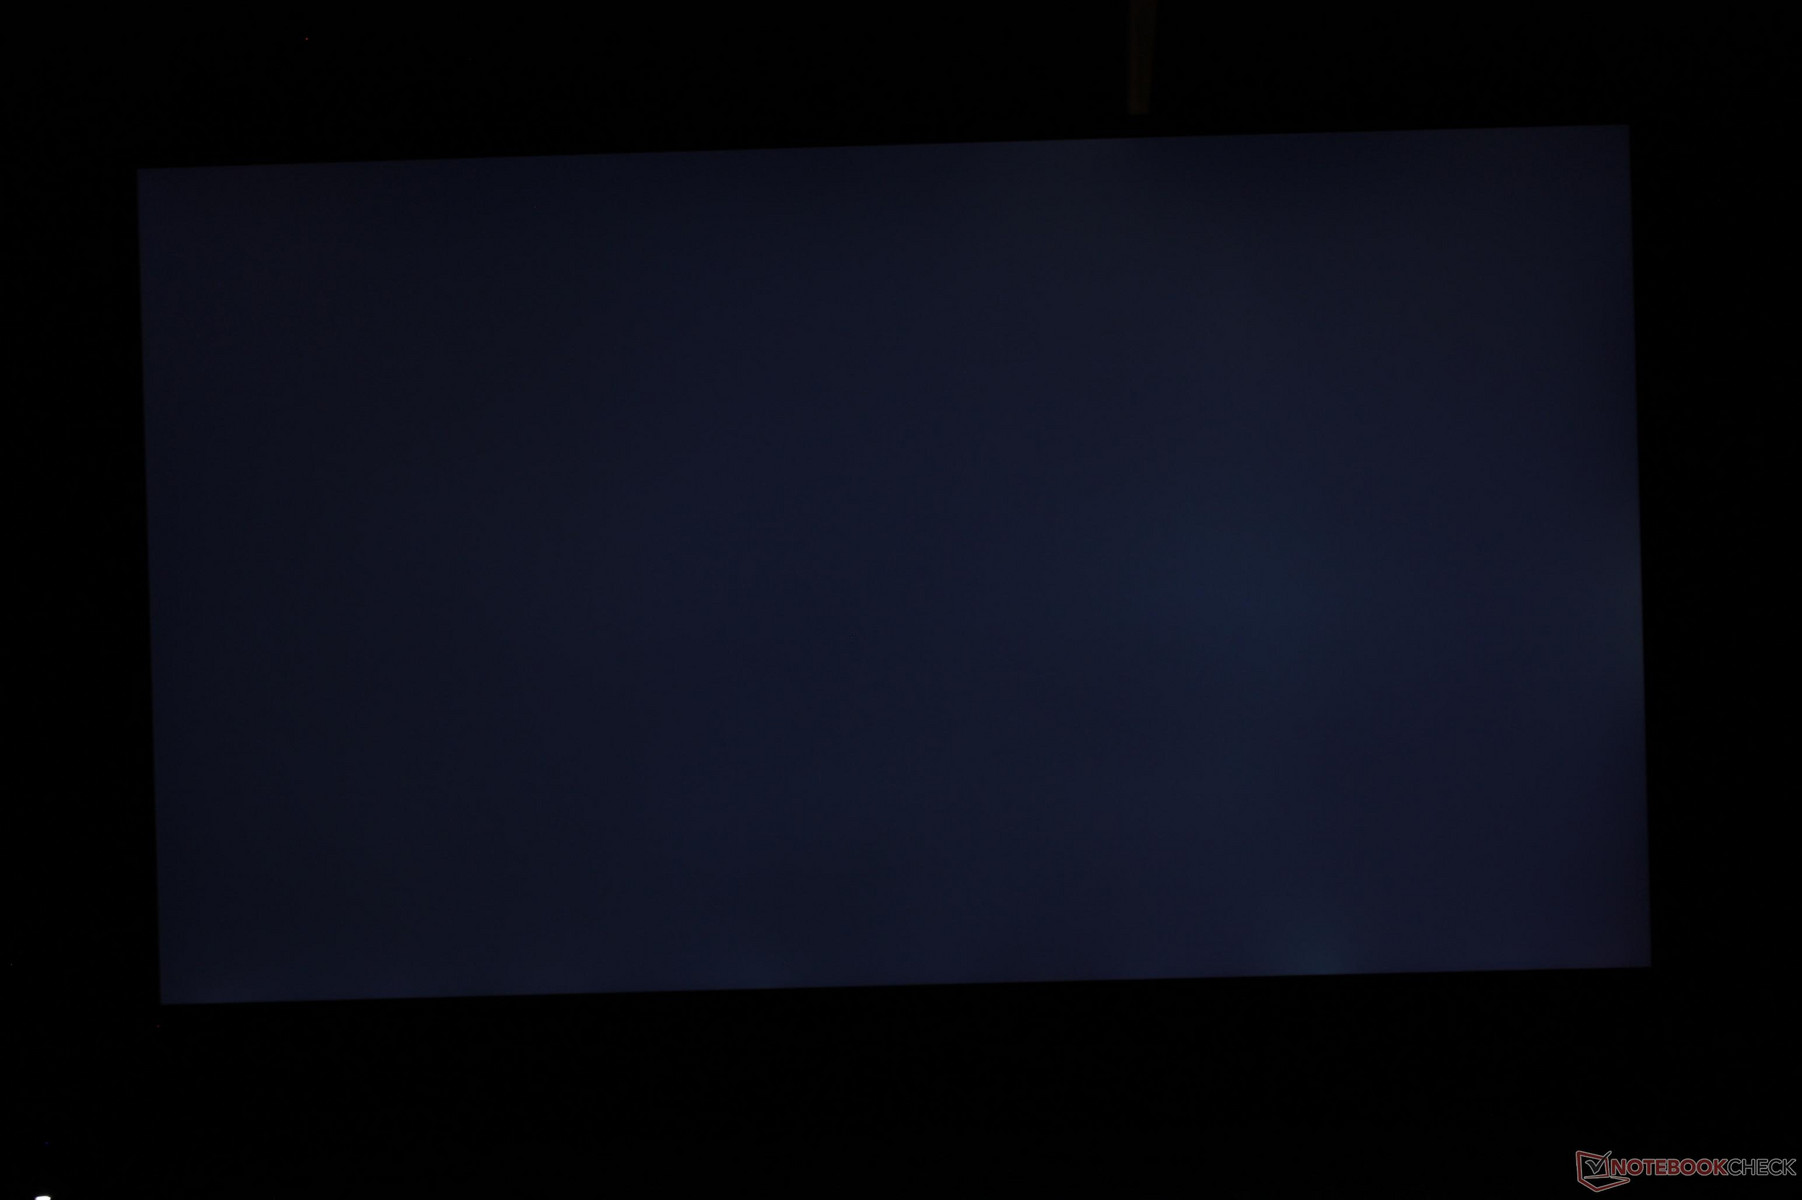
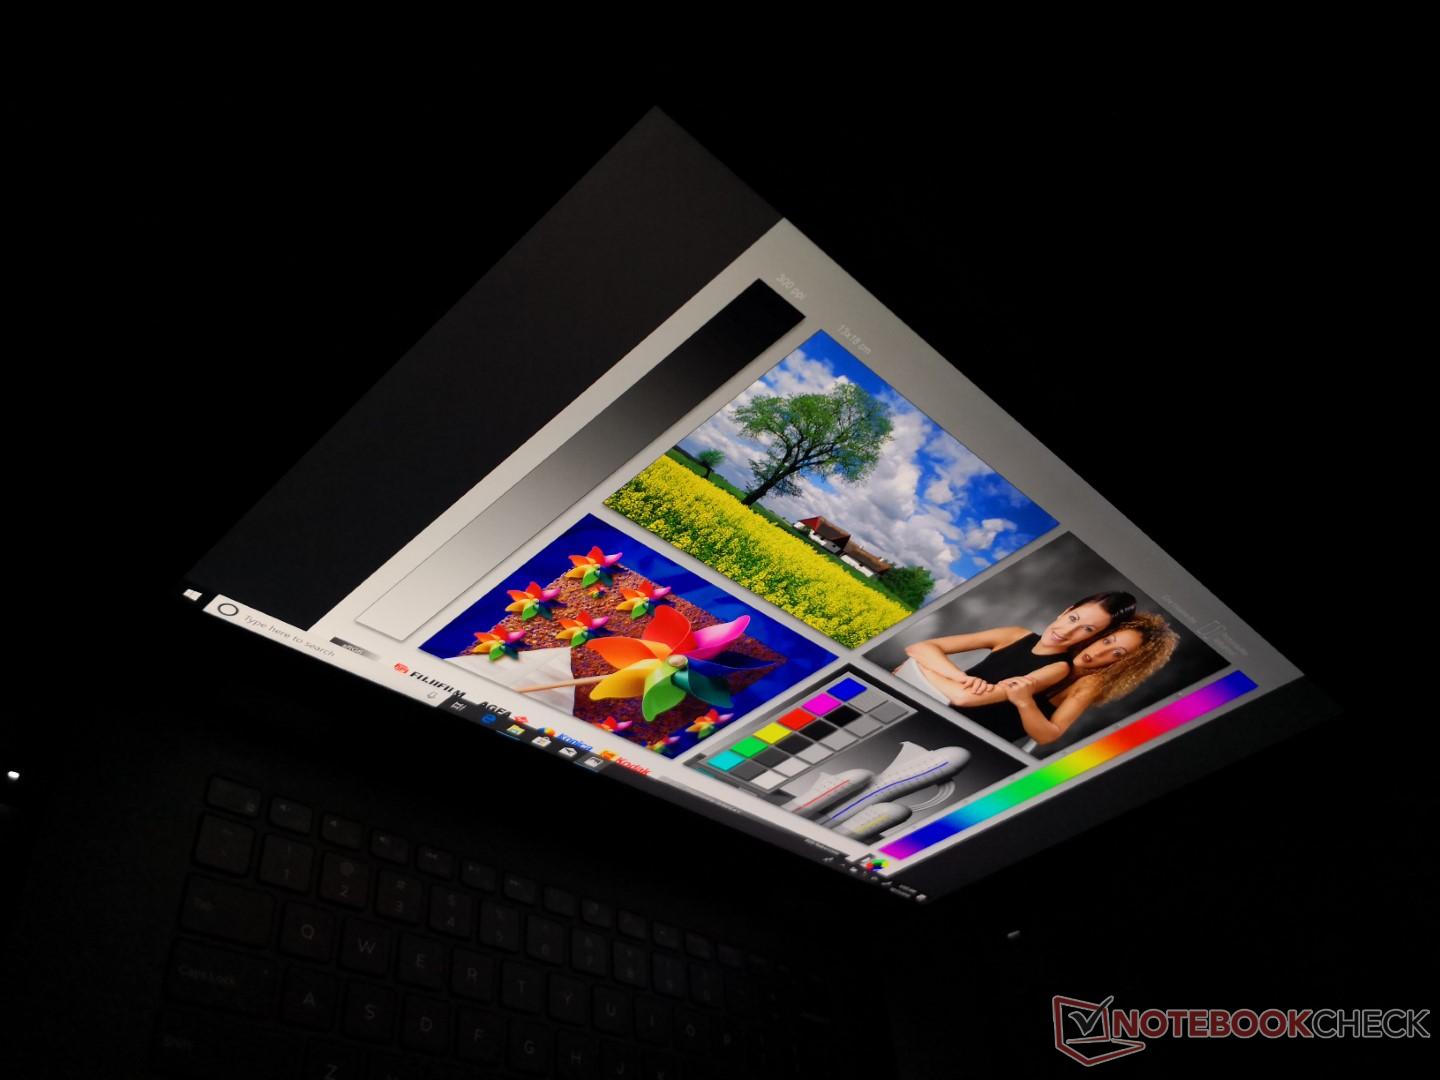
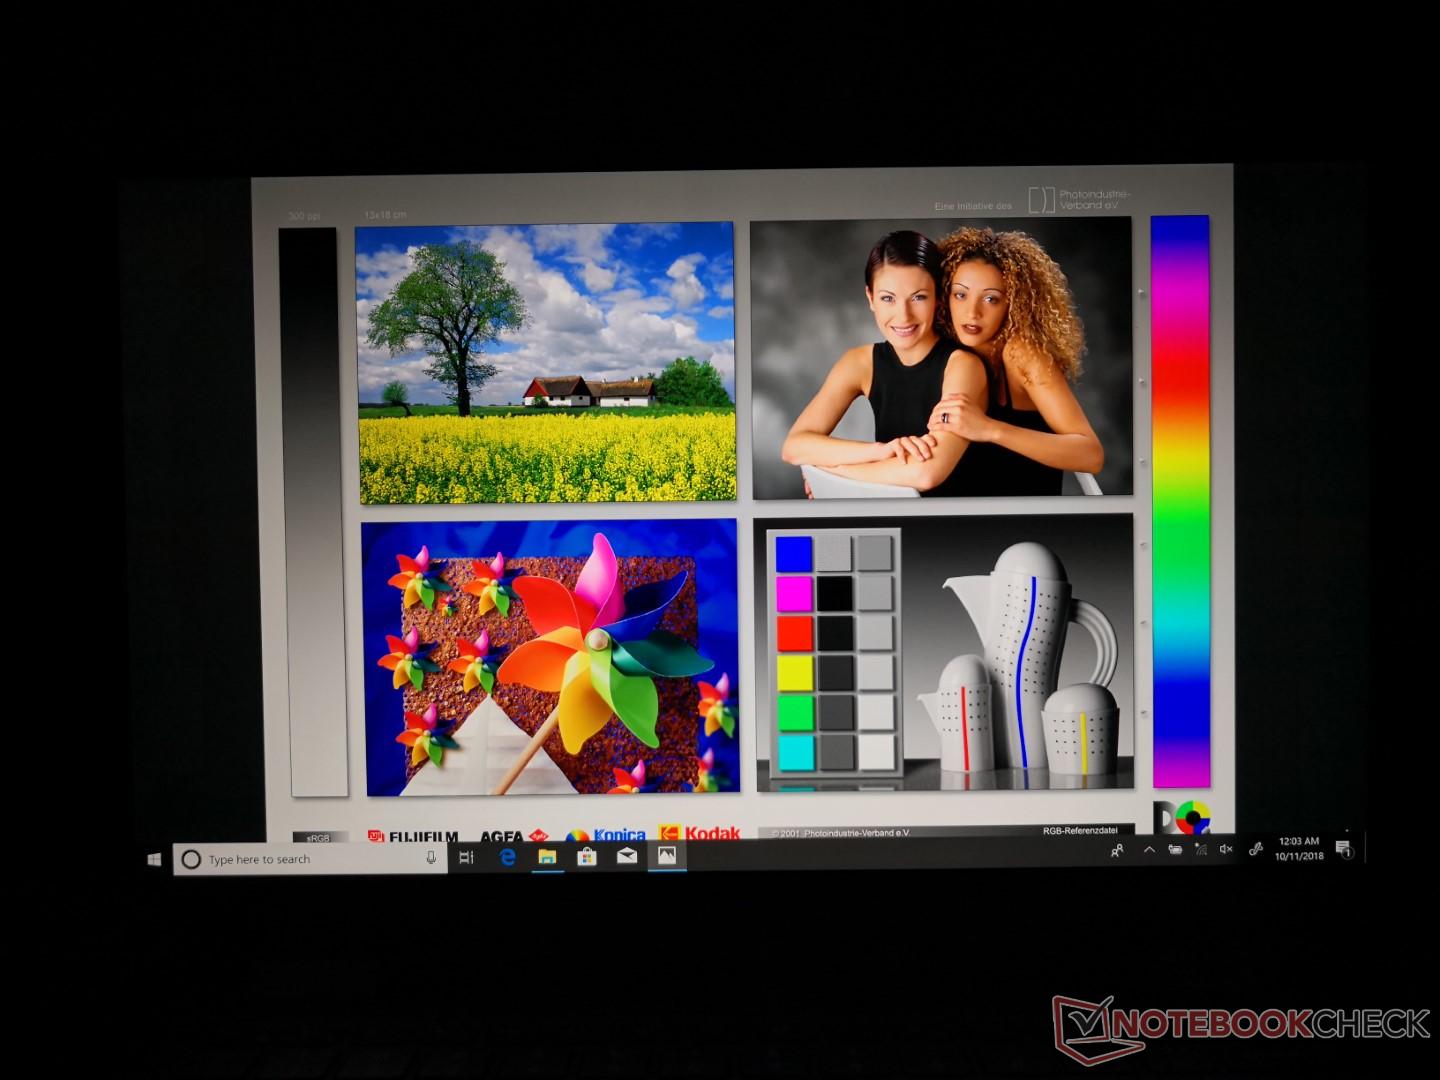
Backlight bleeding is minimal and largely unnoticeable even during movie playback with black borders.

| |||||||||||||||||||||||||
Brightness Distribution: 79 %
Center on Battery: 430.9 cd/m²
Contrast: 1231:1 (Black: 0.35 cd/m²)
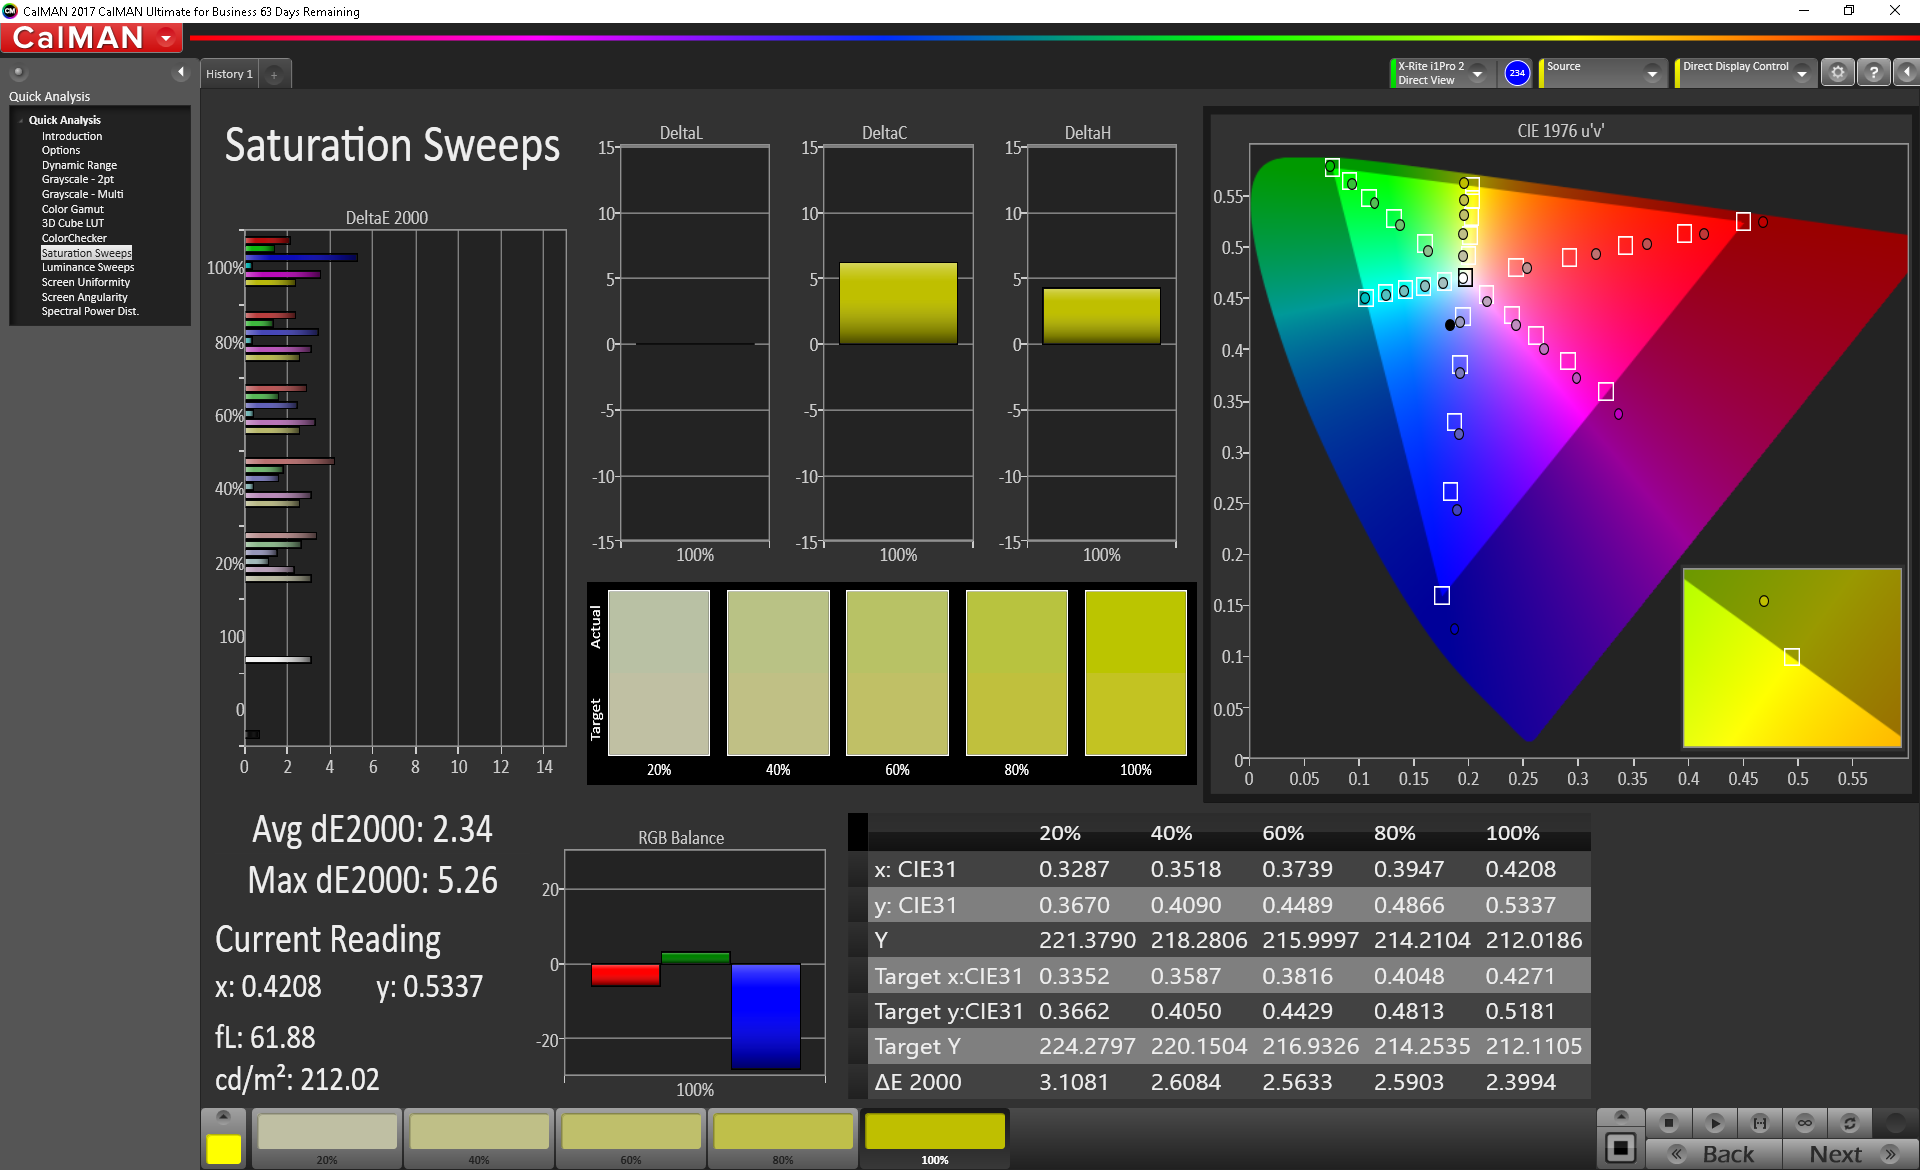
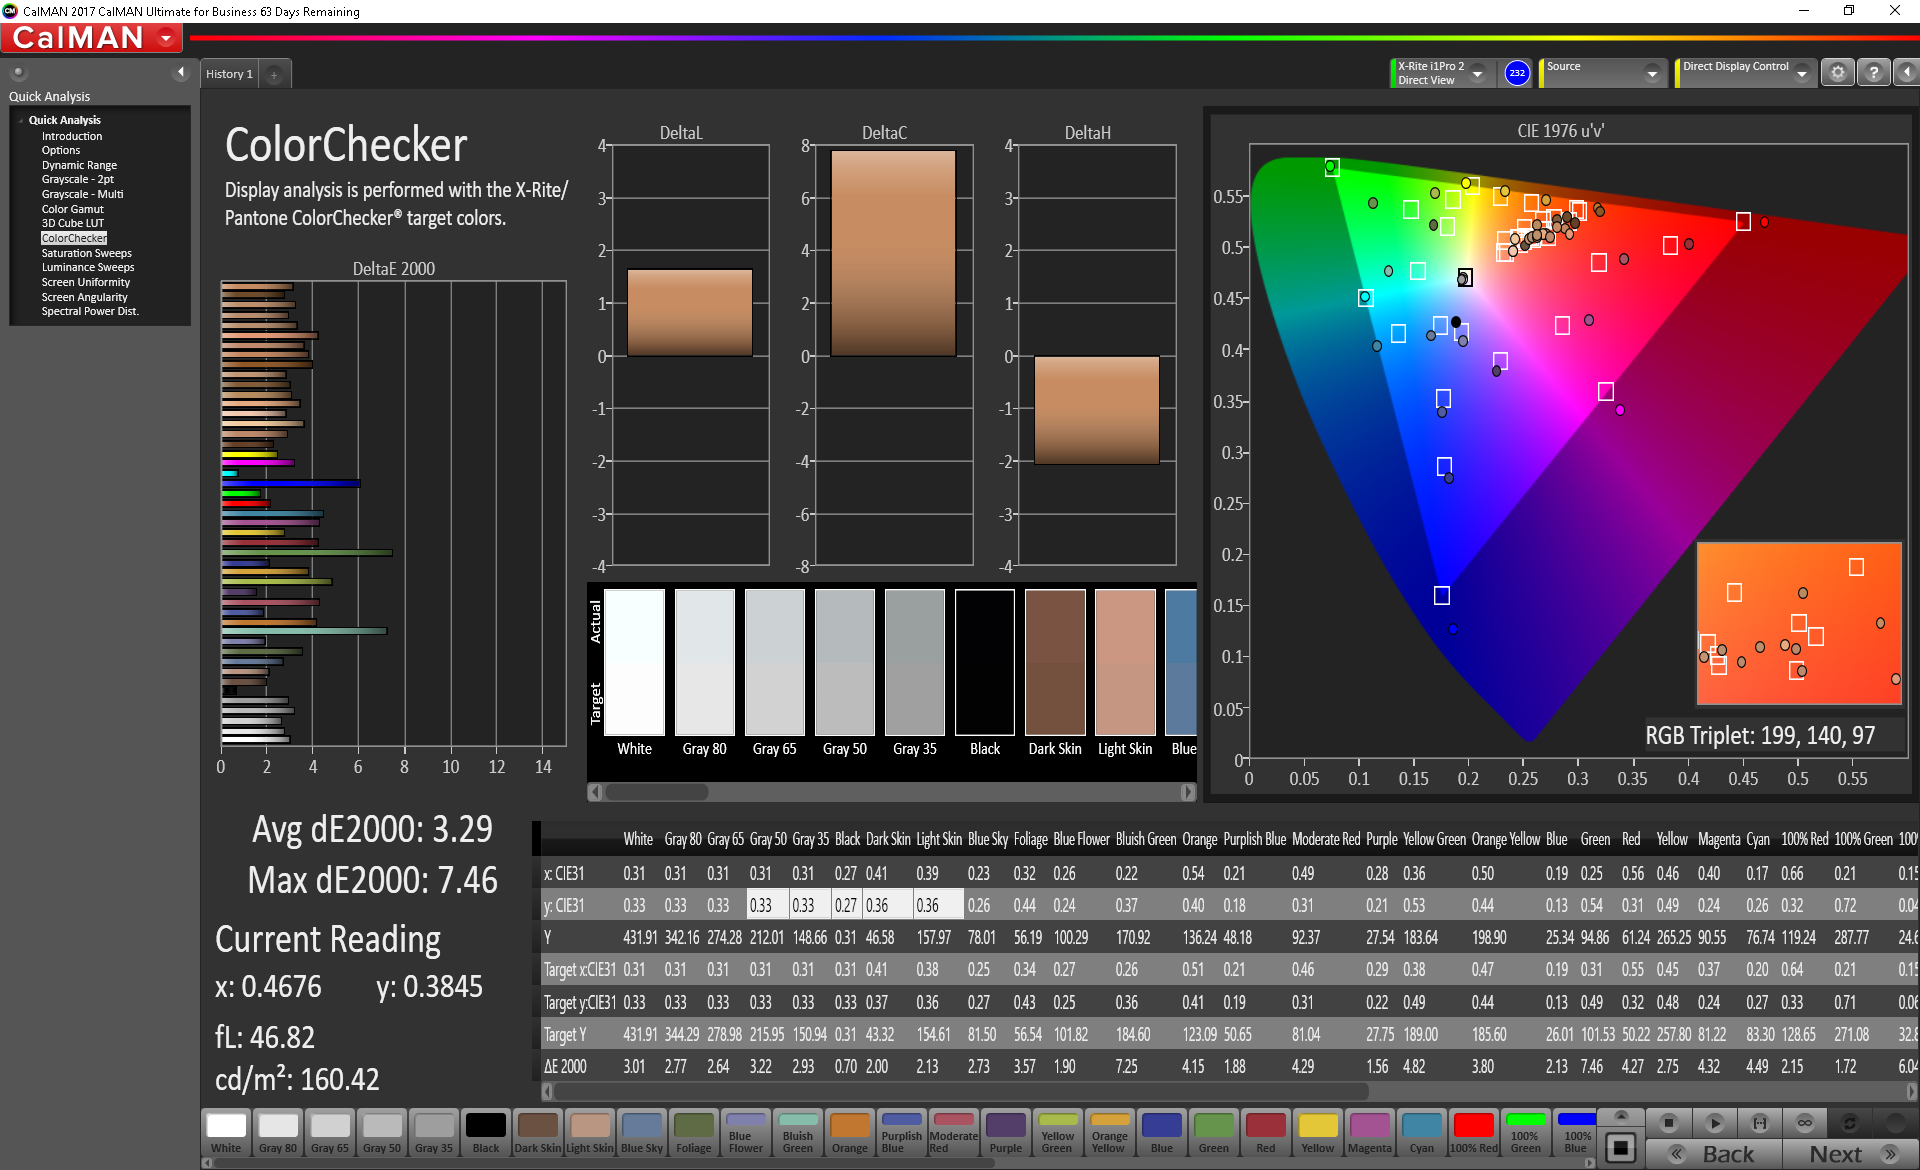
ΔE ColorChecker Calman: 3.29 | ∀{0.5-29.43 Ø4.71}
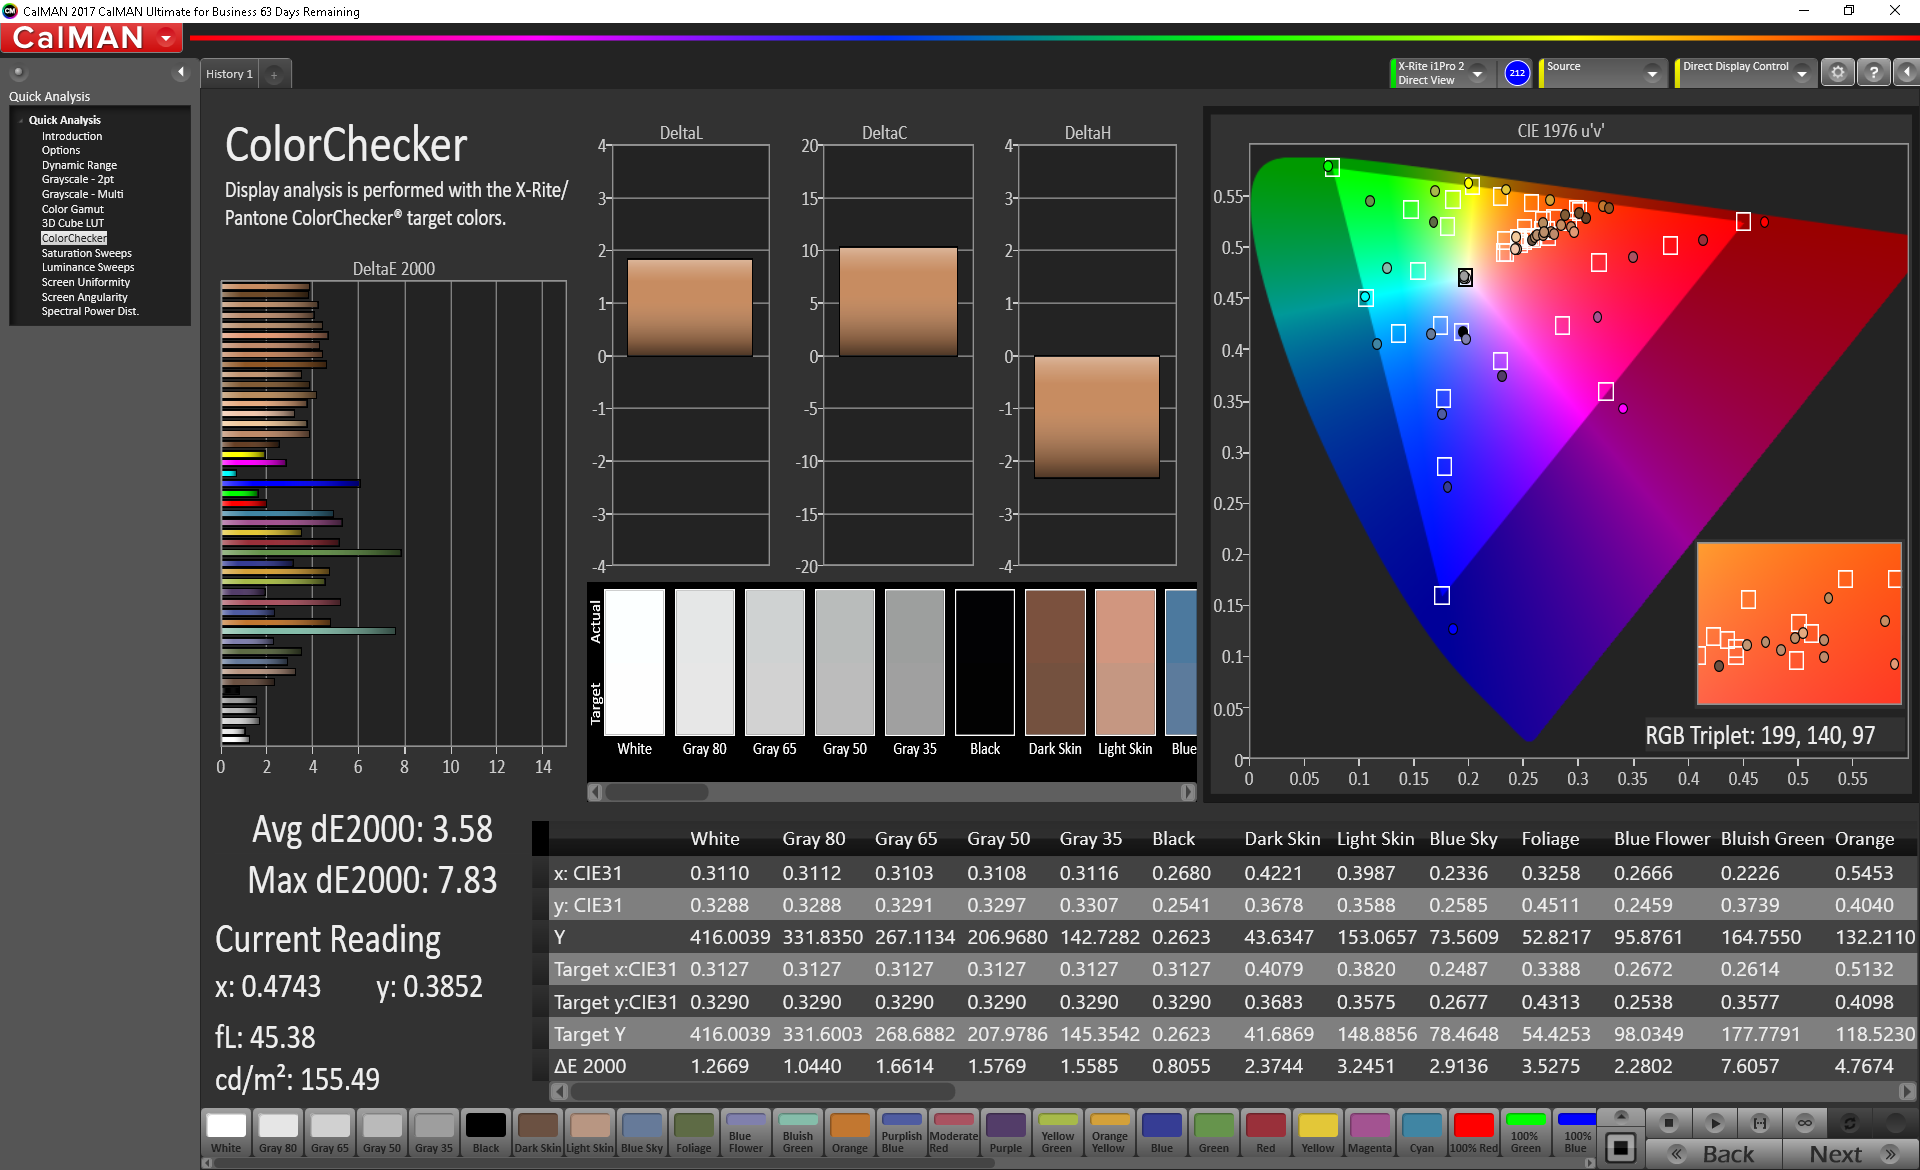
calibrated: 3.58
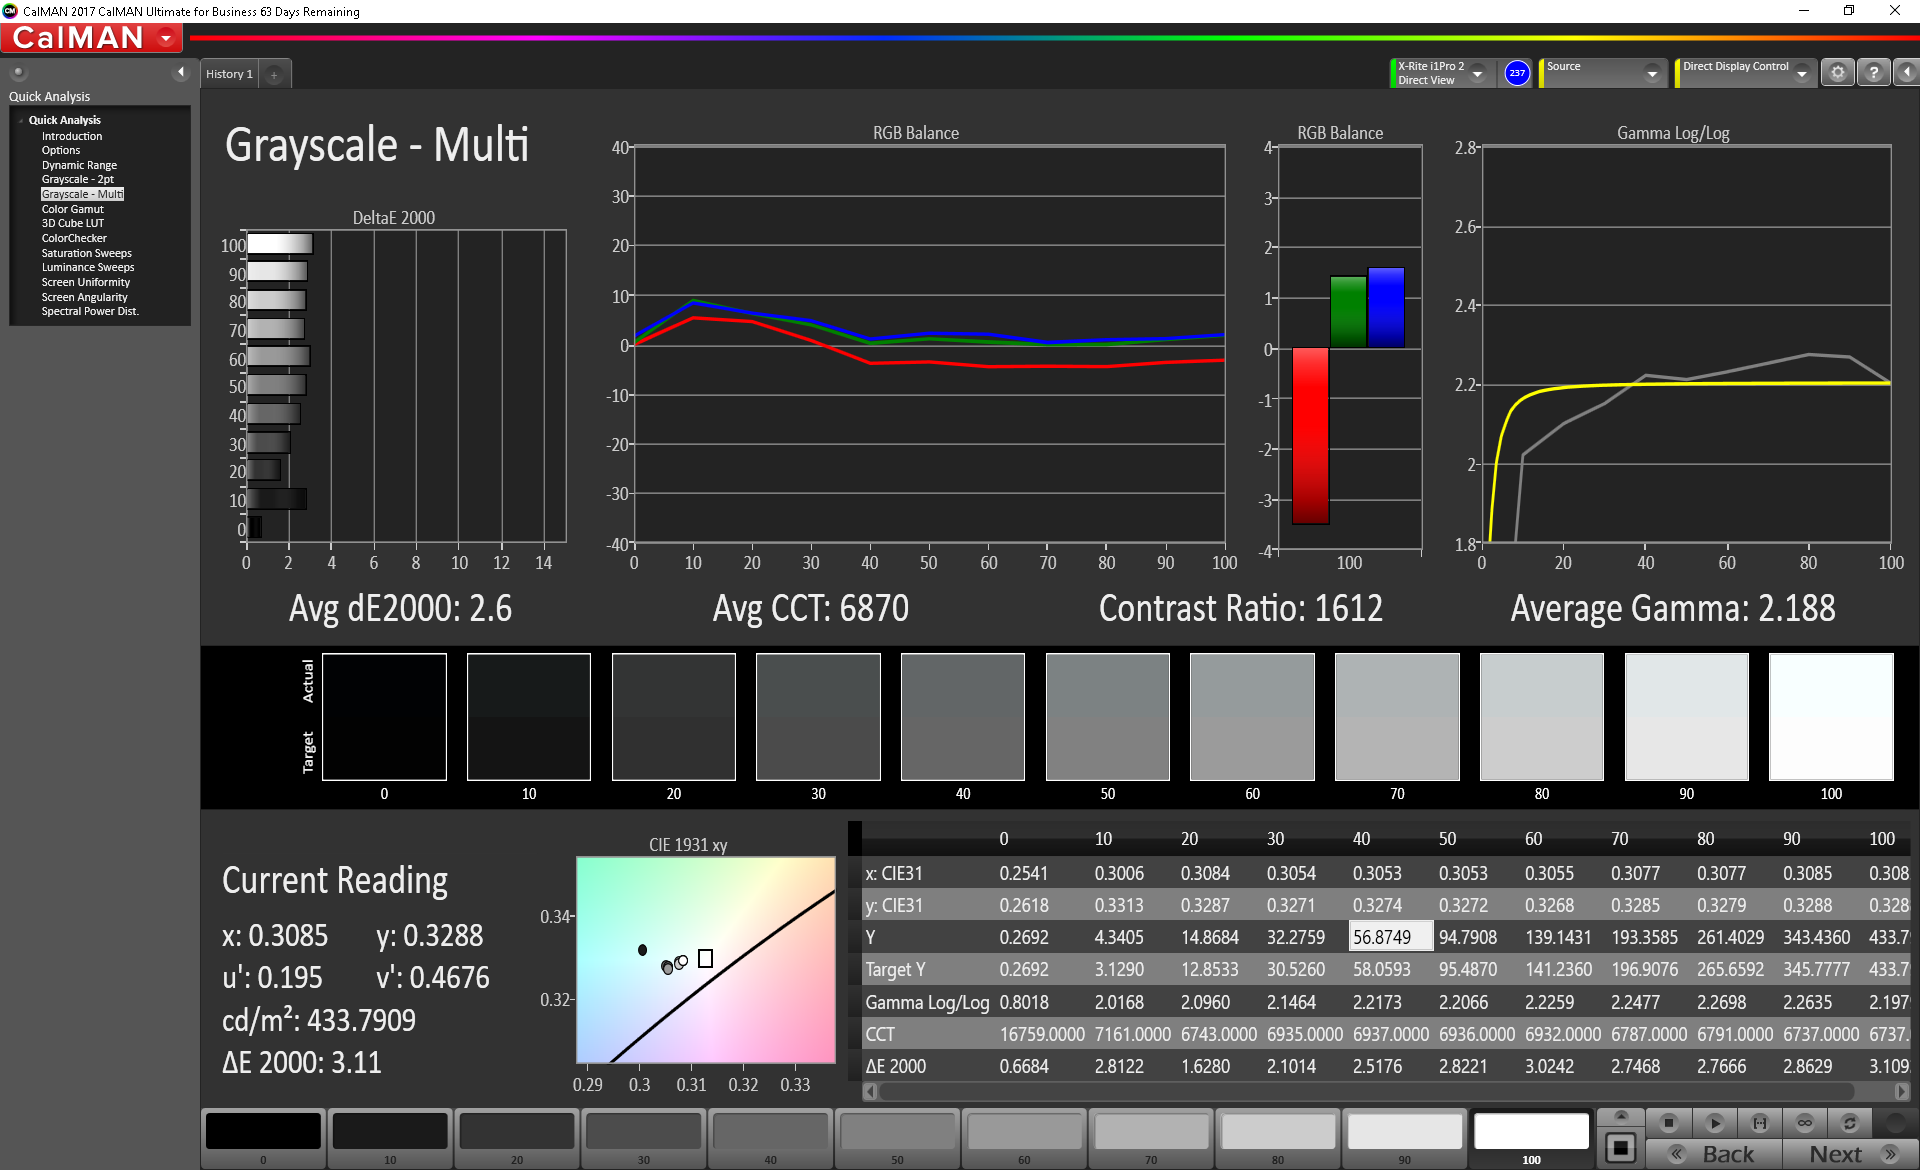
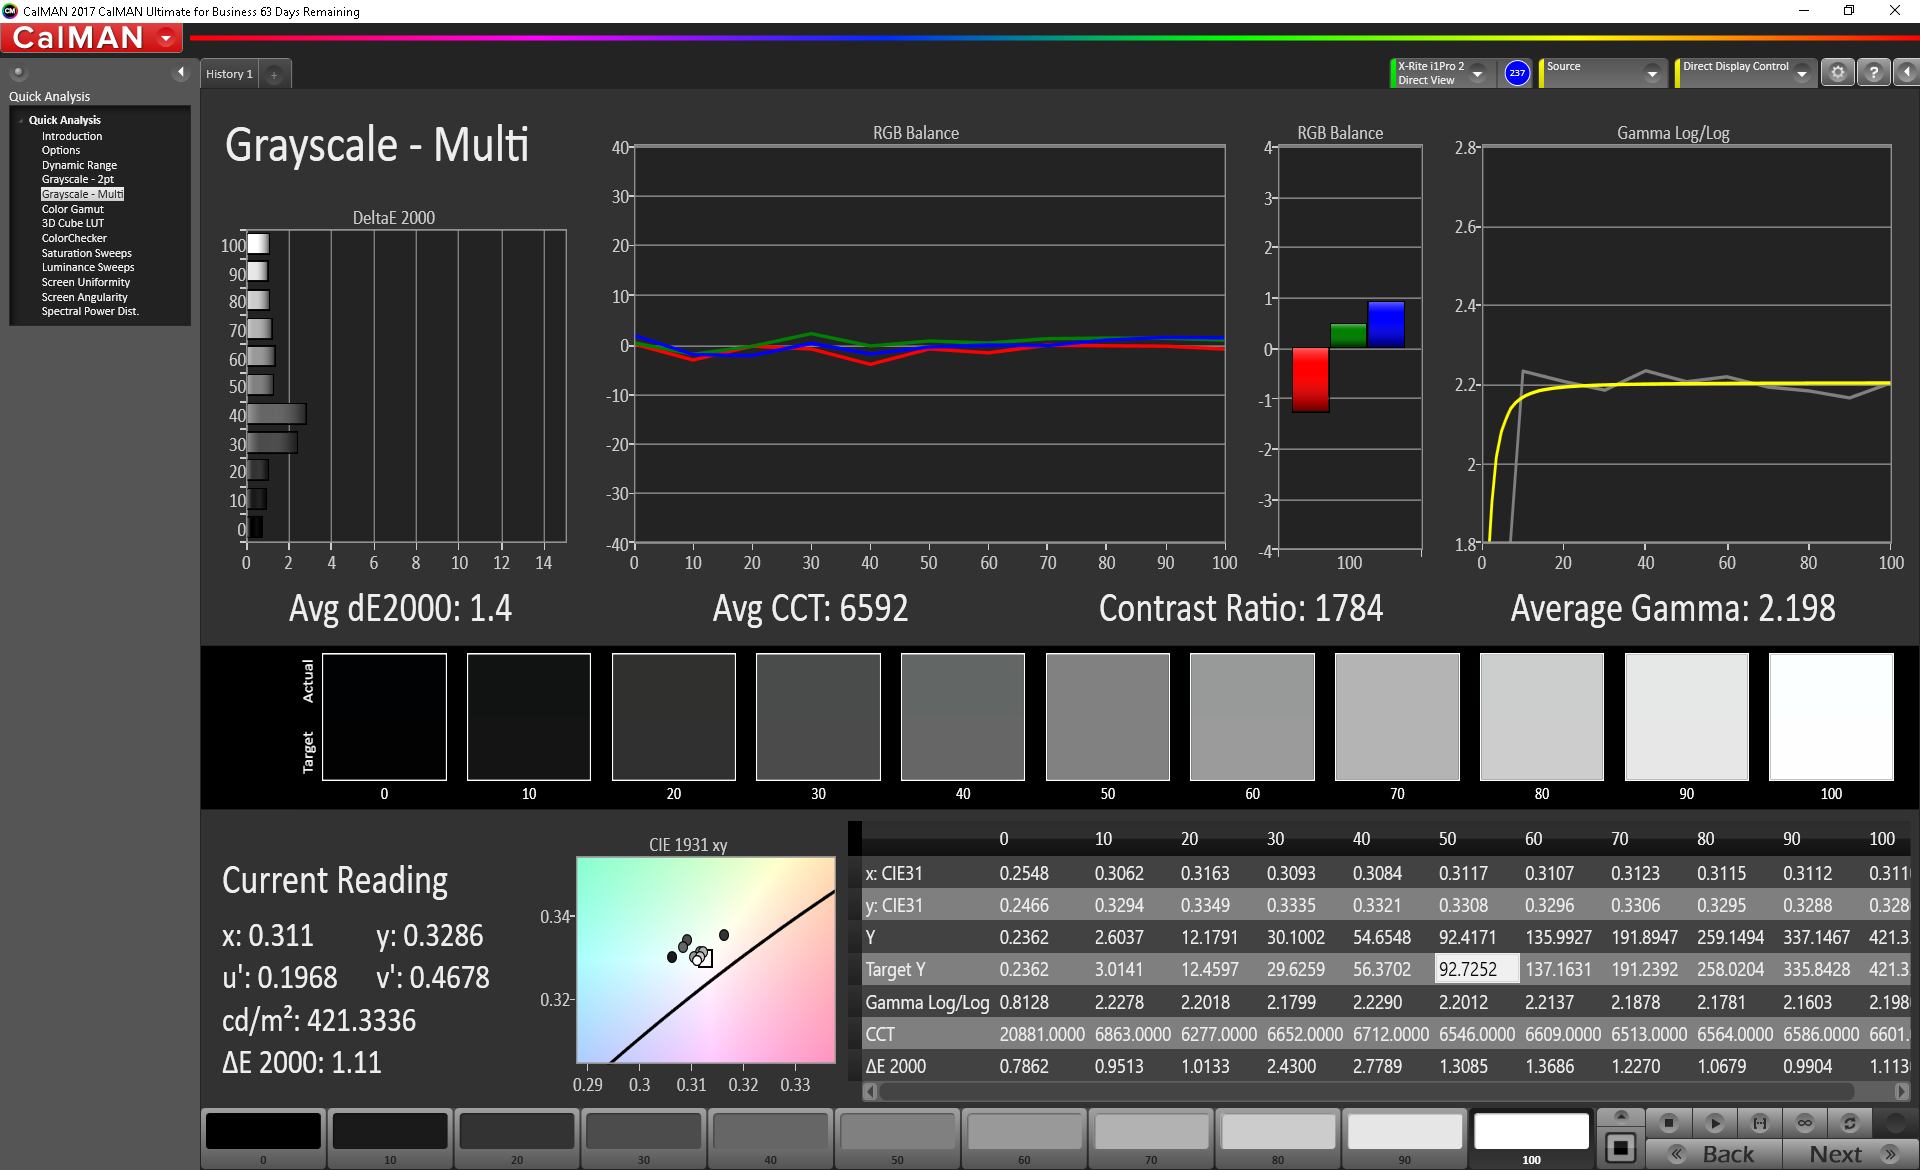
ΔE Greyscale Calman: 2.6 | ∀{0.09-98 Ø4.96}
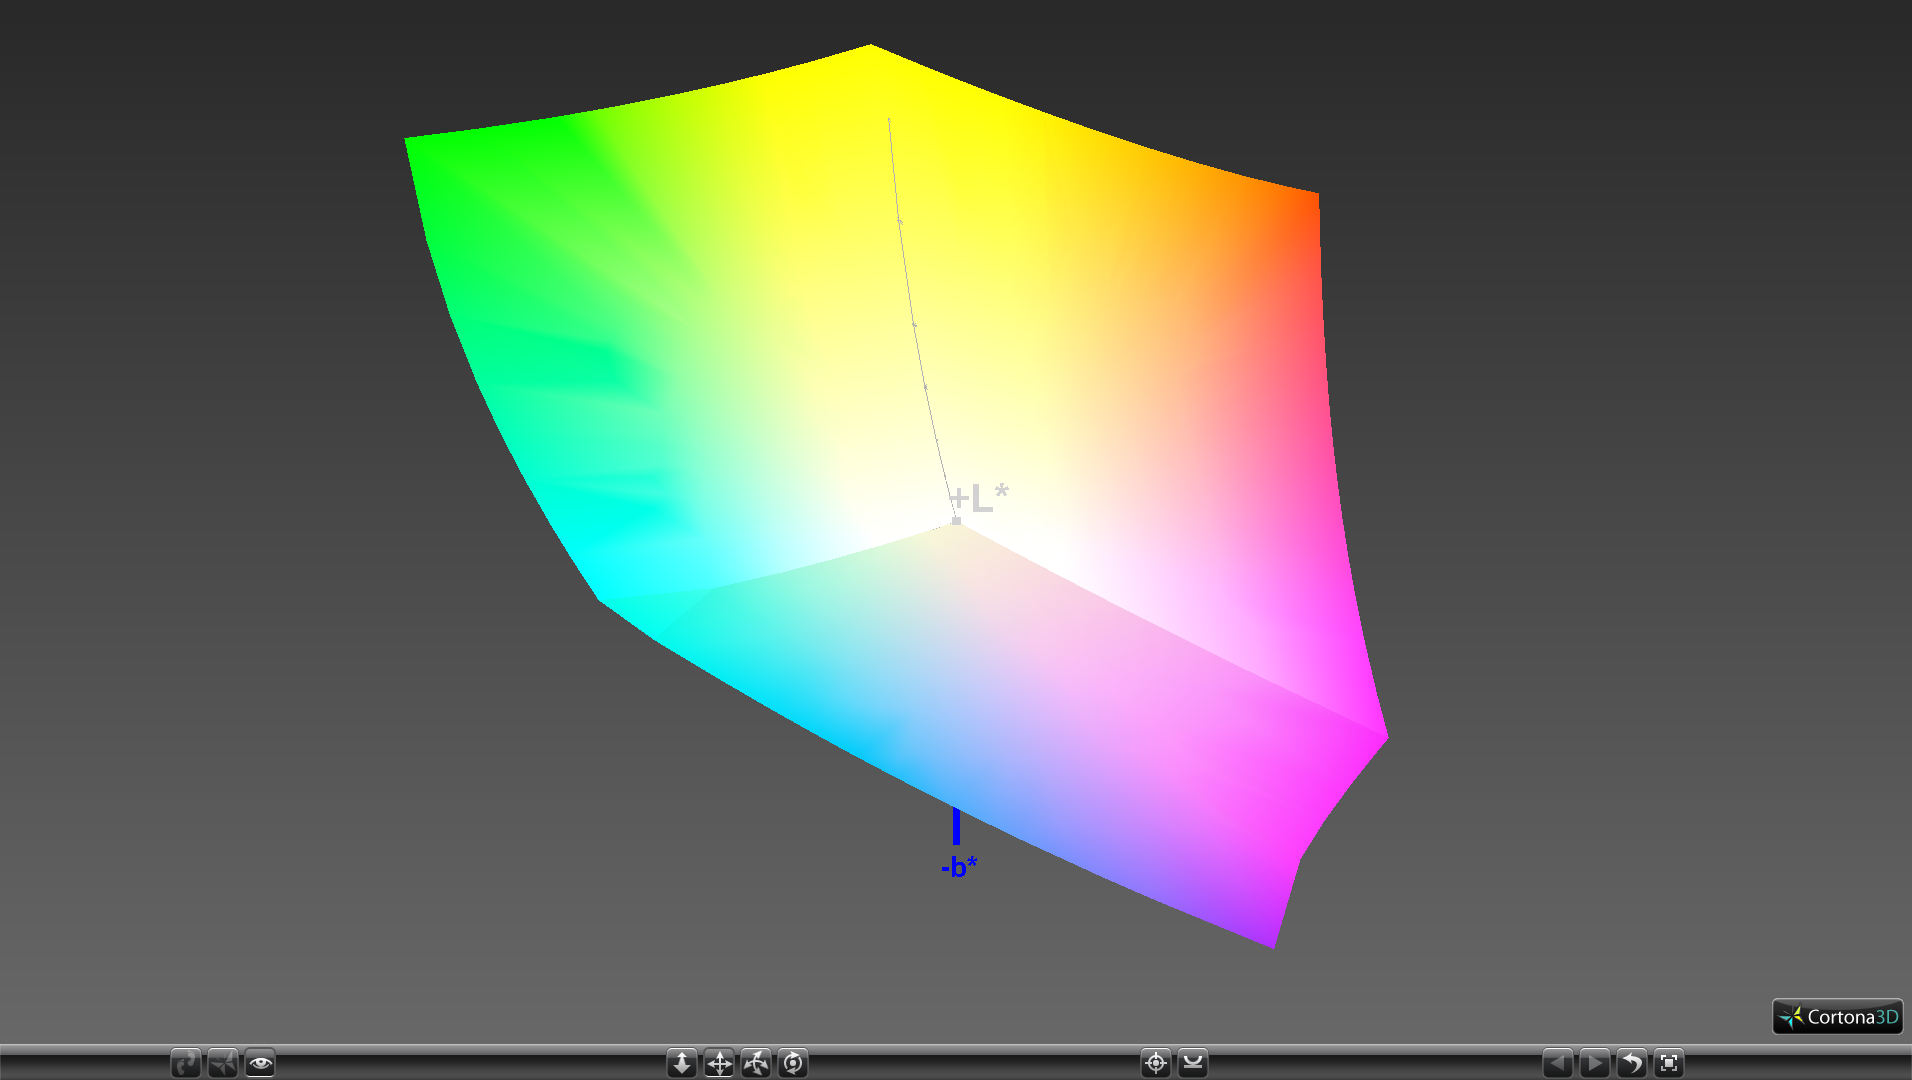
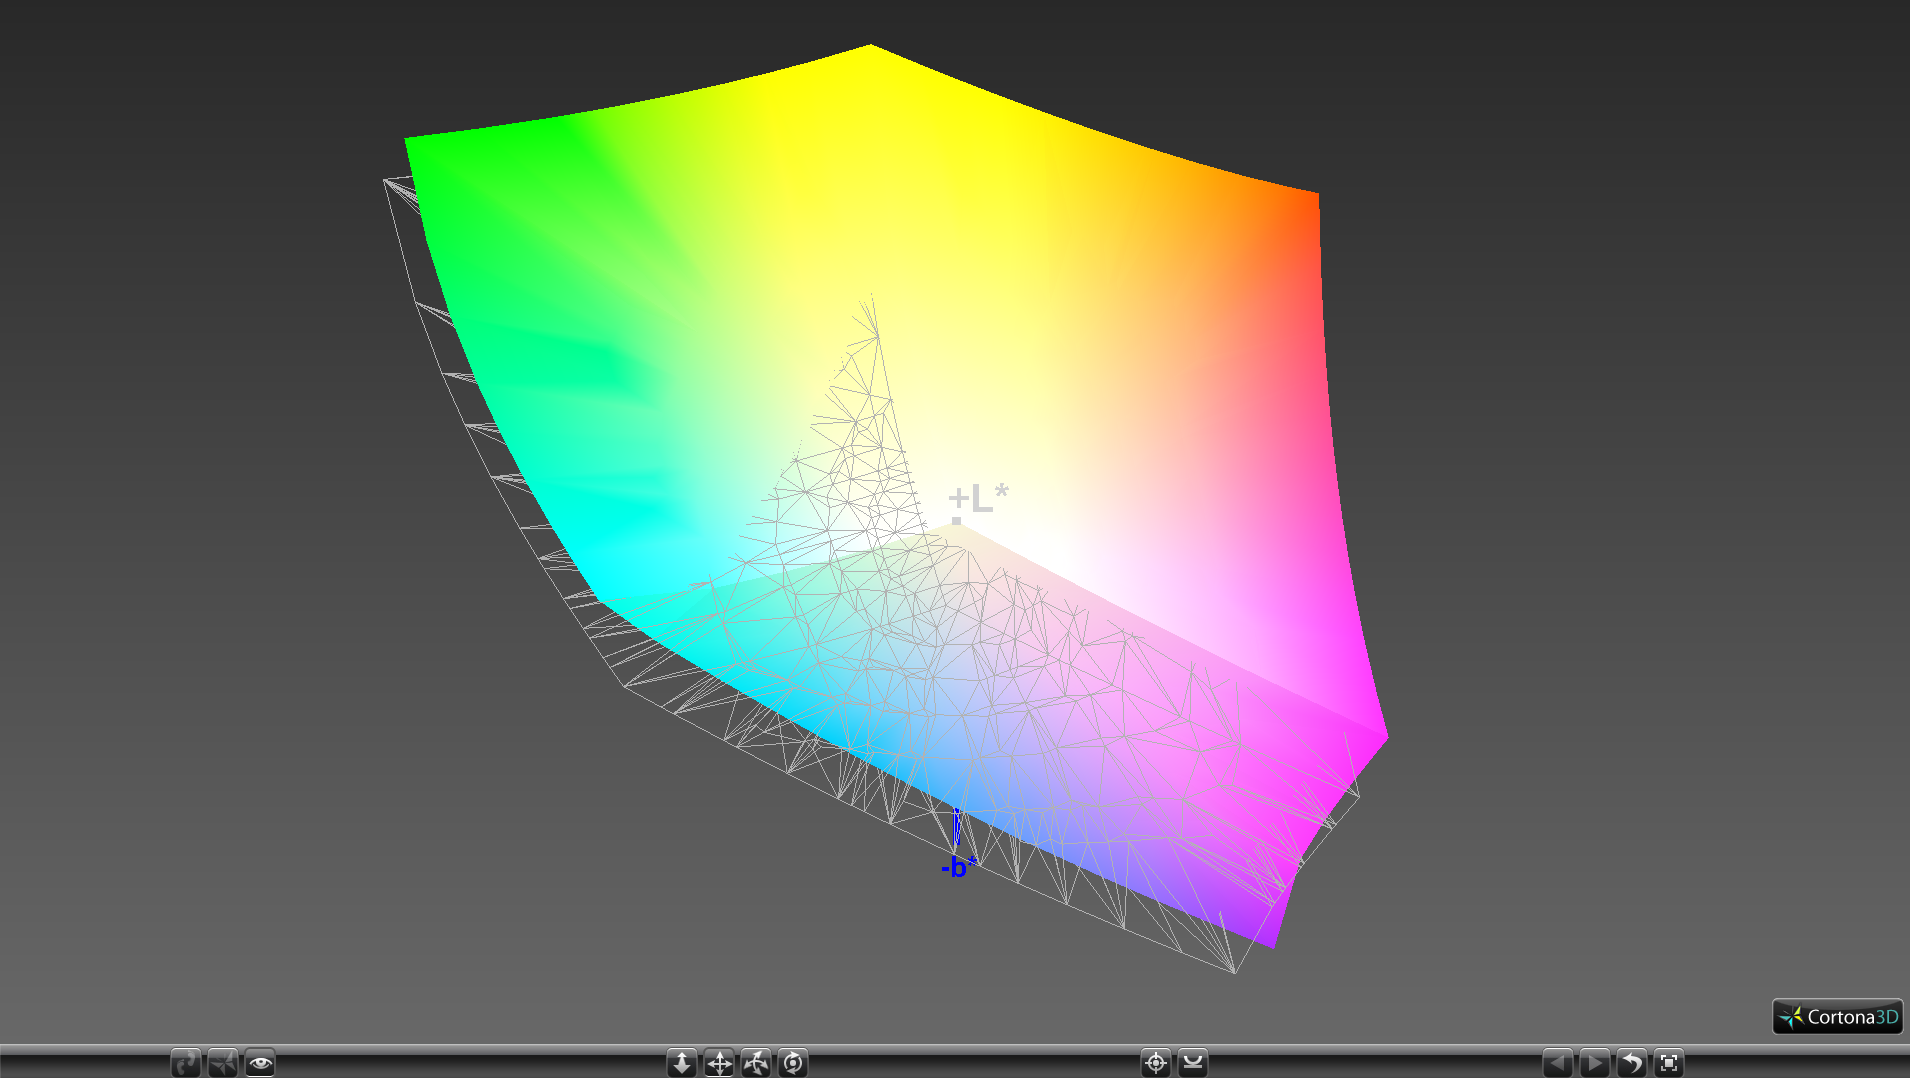
100% sRGB (Argyll 1.6.3 3D)
87.2% AdobeRGB 1998 (Argyll 1.6.3 3D)
99.4% AdobeRGB 1998 (Argyll 3D)
99.9% sRGB (Argyll 3D)
91.2% Display P3 (Argyll 3D)
Gamma: 2.19
CCT: 6870 K
| Dell Precision 5530 2-in-1 Sharp SHP148D, IPS, 15.6", 3840x2160 | MSI GS65 Stealth Thin 8RE-051US AUO80ED, IPS, 15.6", 1920x1080 | Lenovo ThinkPad X1 Extreme-20MF000XGE B156ZAN03.2, IPS, 15.6", 3840x2160 | Dell Precision 5530 Xeon E-2176M Sharp SHP148D / LQ156D1, IGZO, 15.6", 3840x2160 | Gigabyte Aero 15X v8 LGD05C0, IPS, 15.6", 1920x1080 | HP ZBook 15u G5 2ZC05EA CMN15E7, IPS LED, 15.6", 1920x1080 | Dell XPS 15 9575 i7-8705G Sharp SHP148D, IPS, 15.6", 3840x2160 | |
|---|---|---|---|---|---|---|---|
| Display | -23% | -2% | -14% | -24% | -48% | -12% | |
| Display P3 Coverage (%) | 91.2 | 65.8 -28% | 86.3 -5% | 76.5 -16% | 63.6 -30% | 43.05 -53% | 78.7 -14% |
| sRGB Coverage (%) | 99.9 | 92.1 -8% | 100 0% | 98.4 -2% | 93.8 -6% | 64.7 -35% | 97.9 -2% |
| AdobeRGB 1998 Coverage (%) | 99.4 | 67 -33% | 99.4 0% | 76.4 -23% | 64.9 -35% | 44.5 -55% | 79.2 -20% |
| Response Times | 64% | -5% | 7% | 68% | 20% | 5% | |
| Response Time Grey 50% / Grey 80% * (ms) | 49.6 ? | 20 ? 60% | 61.6 ? -24% | 48 ? 3% | 16.8 ? 66% | 41.6 ? 16% | 48.4 ? 2% |
| Response Time Black / White * (ms) | 37.6 ? | 12 ? 68% | 32 ? 15% | 33.6 ? 11% | 11.2 ? 70% | 28.8 ? 23% | 34.8 ? 7% |
| PWM Frequency (Hz) | 990 ? | 1000 | 25770 ? | 1000 ? | |||
| Screen | -11% | -4% | -5% | 10% | -29% | 1% | |
| Brightness middle (cd/m²) | 430.9 | 250.9 -42% | 396 -8% | 451.7 5% | 313 -27% | 229 -47% | 488 13% |
| Brightness (cd/m²) | 398 | 257 -35% | 380 -5% | 440 11% | 300 -25% | 212 -47% | 440 11% |
| Brightness Distribution (%) | 79 | 83 5% | 90 14% | 90 14% | 78 -1% | 88 11% | 81 3% |
| Black Level * (cd/m²) | 0.35 | 0.32 9% | 0.28 20% | 0.4 -14% | 0.33 6% | 0.23 34% | 0.3 14% |
| Contrast (:1) | 1231 | 784 -36% | 1414 15% | 1129 -8% | 948 -23% | 996 -19% | 1627 32% |
| Colorchecker dE 2000 * | 3.29 | 2.77 16% | 4 -22% | 3.11 5% | 1.29 61% | 4.2 -28% | 3.16 4% |
| Colorchecker dE 2000 max. * | 7.46 | 5.89 21% | 7.6 -2% | 8.62 -16% | 2.04 73% | 18 -141% | 8.8 -18% |
| Colorchecker dE 2000 calibrated * | 3.58 | 2.5 30% | 0.9 75% | 3.07 14% | 4.2 -17% | ||
| Greyscale dE 2000 * | 2.6 | 4 -54% | 6.1 -135% | 3.7 -42% | 0.69 73% | 2 23% | 3.3 -27% |
| Gamma | 2.19 100% | 2.27 97% | 2.25 98% | 2.11 104% | 2.43 91% | 2.23 99% | 2.178 101% |
| CCT | 6870 95% | 6901 94% | 7786 83% | 6492 100% | 6550 99% | 6292 103% | 6811 95% |
| Color Space (Percent of AdobeRGB 1998) (%) | 87.2 | 60 -31% | 88.5 1% | 69 -21% | 60 -31% | 41 -53% | 71.7 -18% |
| Color Space (Percent of sRGB) (%) | 100 | 92 -8% | 100 0% | 98 -2% | 94 -6% | 64.5 -35% | 97.9 -2% |
| Total Average (Program / Settings) | 10% /
-4% | -4% /
-4% | -4% /
-5% | 18% /
11% | -19% /
-26% | -2% /
-1% |
* ... smaller is better
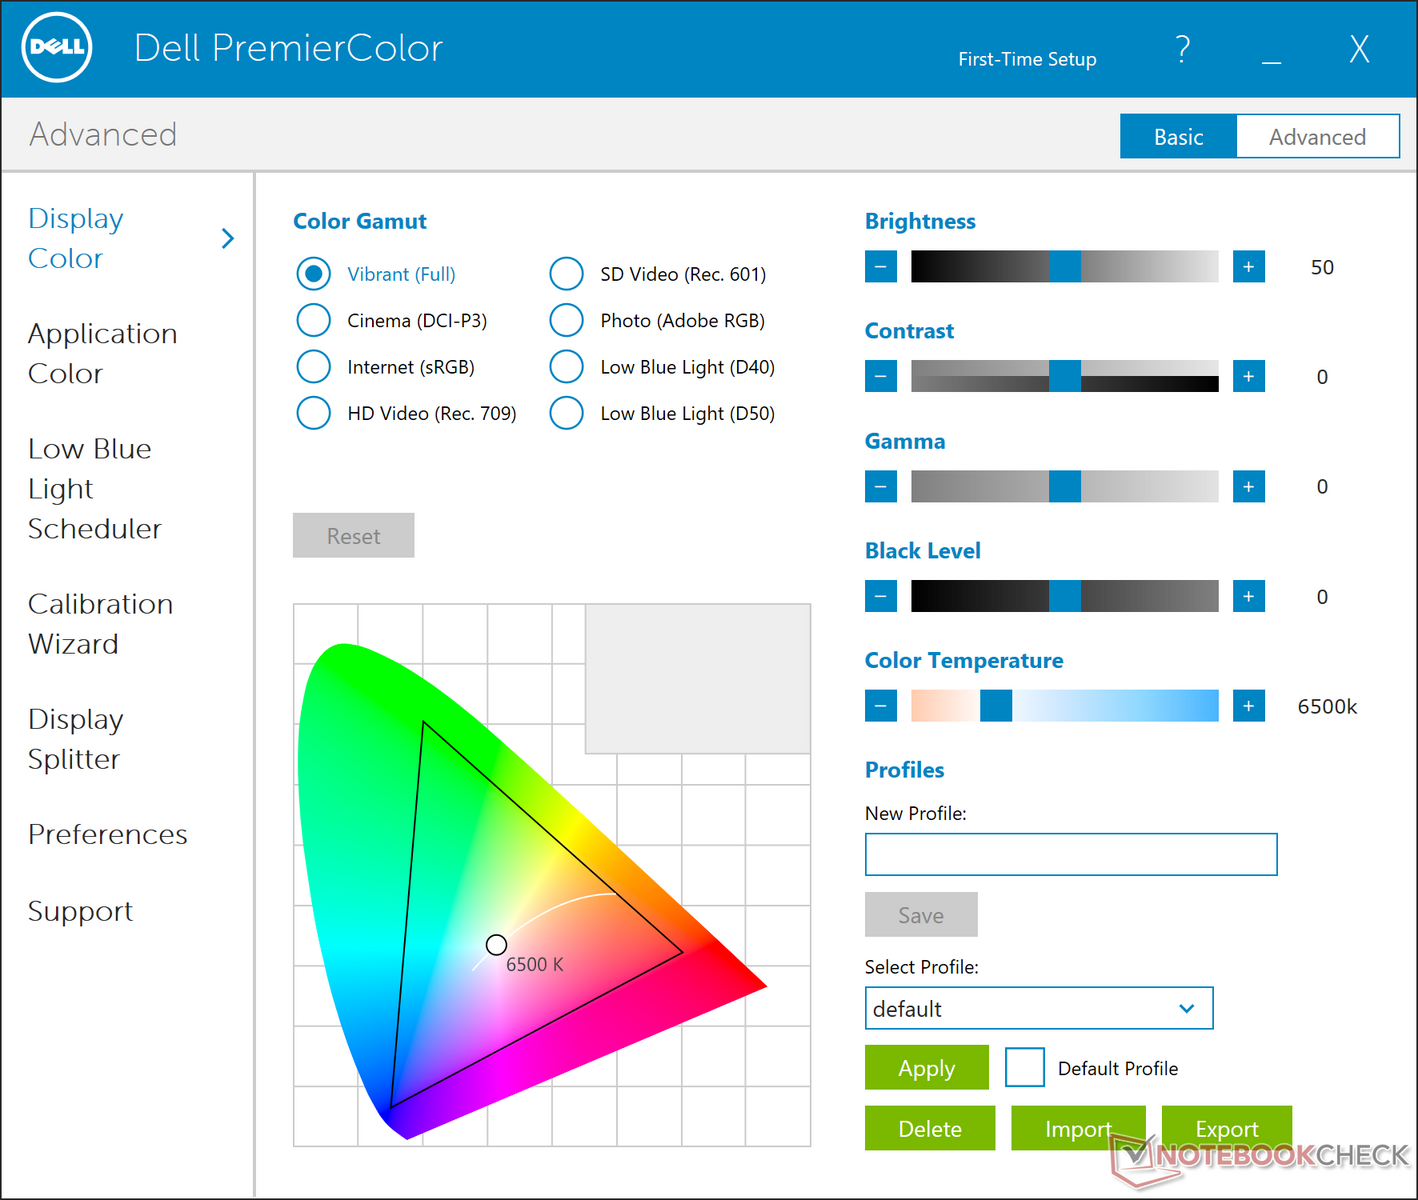
Color space covers AdobeRGB almost in its entirety. Strangely, color space is a bit wider than what we measured on both the Precision 5530 and XPS 15 9575 likely due to differences in PremierColor settings. Nonetheless, graphic designers and CAD users will appreciate the wide gamut.
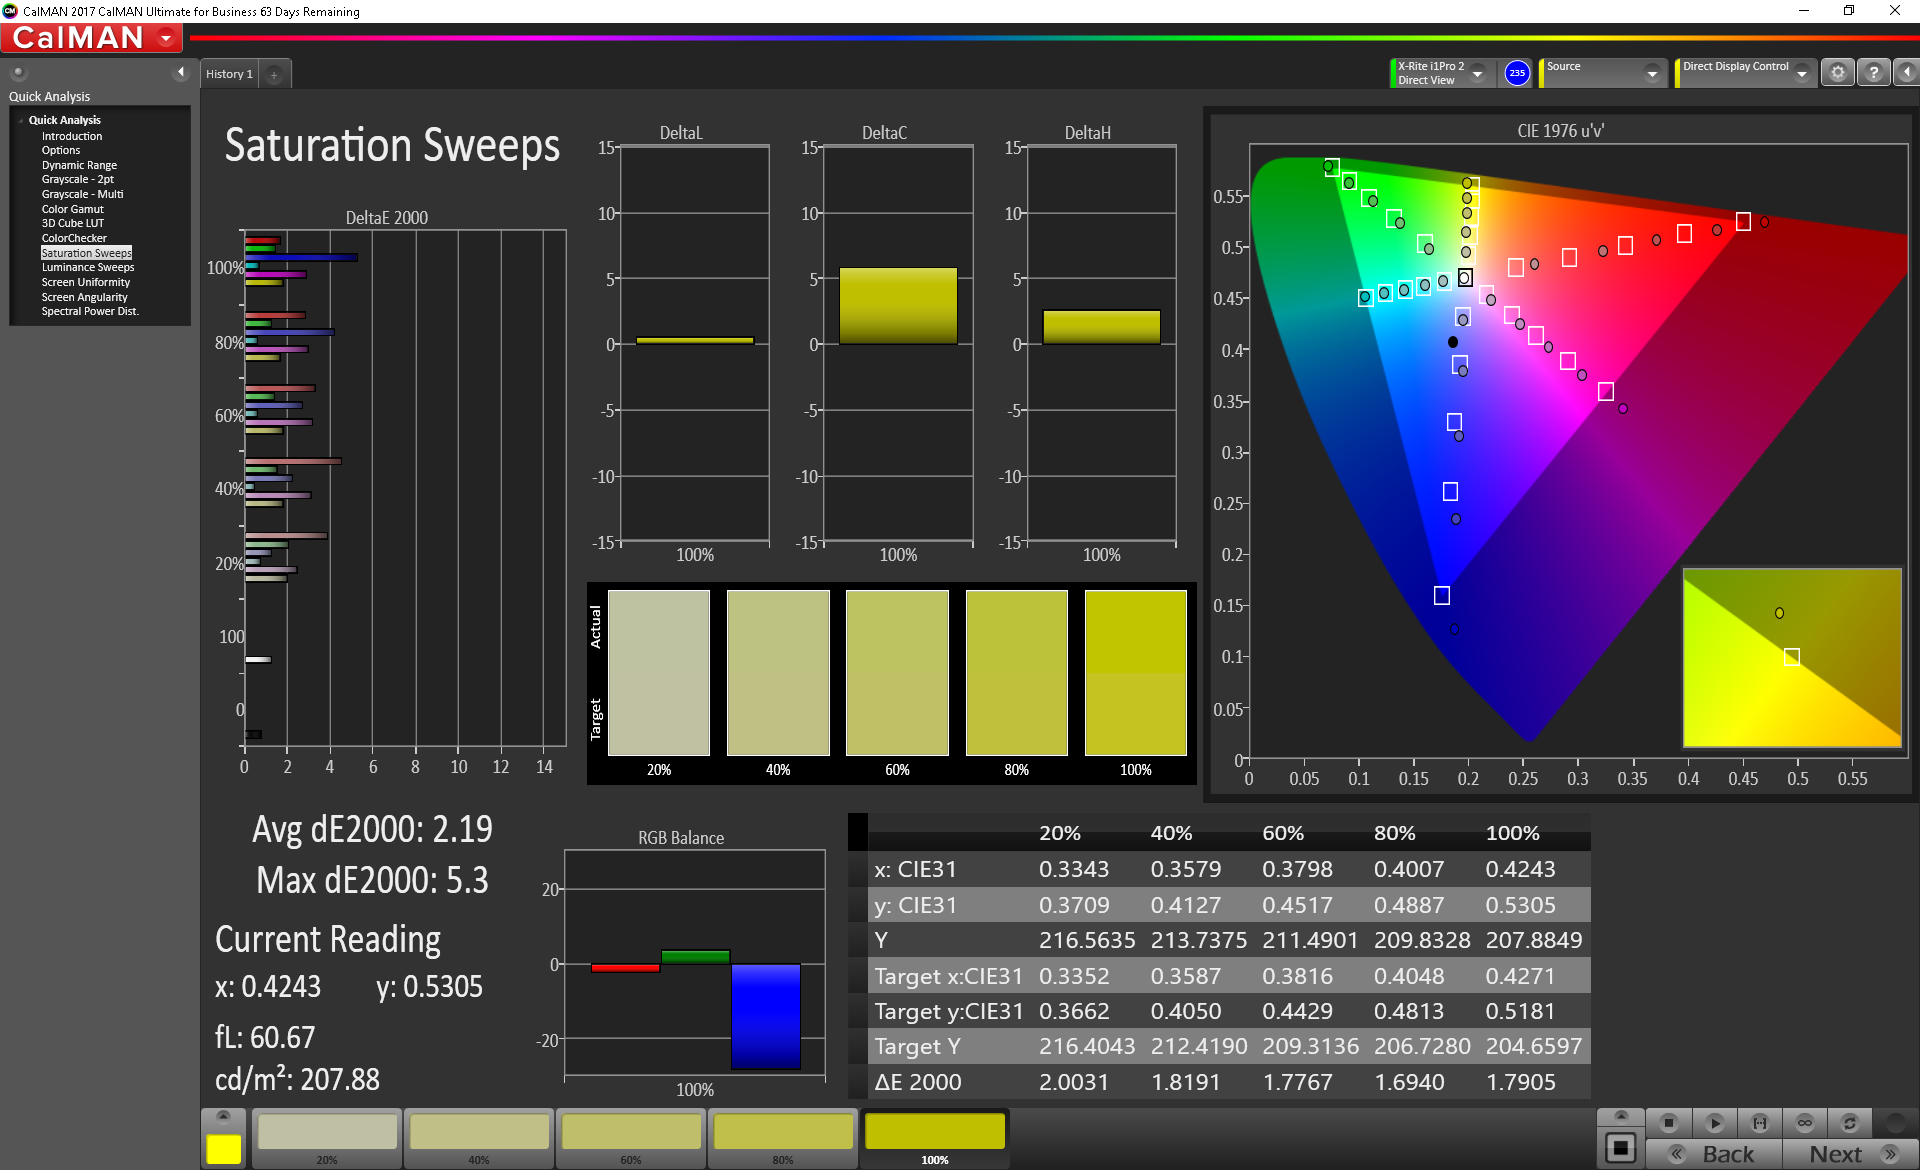
Further analyses with a spectrophotometer reveal accurate grayscale and colors when compared to the AdobeRGB standard. Our calibration attempt improves both grayscale and RGB balance just slightly to suggest that Dell's AdobeRGB preset may not be absolutely perfect.
Display Response Times
| ↔ Response Time Black to White | ||
|---|---|---|
| 37.6 ms ... rise ↗ and fall ↘ combined | ↗ 20.4 ms rise | 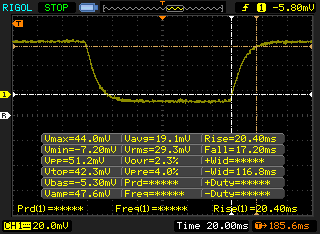 |
| ↘ 17.2 ms fall | ||
| The screen shows slow response rates in our tests and will be unsatisfactory for gamers. In comparison, all tested devices range from 0.1 (minimum) to 240 (maximum) ms. » 95 % of all devices are better. This means that the measured response time is worse than the average of all tested devices (19.8 ms). | ||
| ↔ Response Time 50% Grey to 80% Grey | ||
| 49.6 ms ... rise ↗ and fall ↘ combined | ↗ 25.2 ms rise | 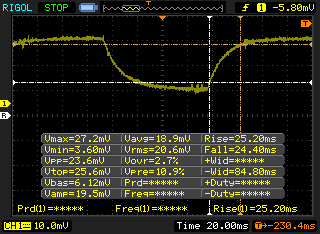 |
| ↘ 24.4 ms fall | ||
| The screen shows slow response rates in our tests and will be unsatisfactory for gamers. In comparison, all tested devices range from 0.165 (minimum) to 636 (maximum) ms. » 86 % of all devices are better. This means that the measured response time is worse than the average of all tested devices (31 ms). | ||
Screen Flickering / PWM (Pulse-Width Modulation)
| Screen flickering / PWM detected | 990 Hz | ≤ 25 % brightness setting | 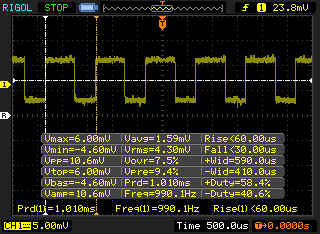 |
The display backlight flickers at 990 Hz (worst case, e.g., utilizing PWM) Flickering detected at a brightness setting of 25 % and below. There should be no flickering or PWM above this brightness setting. The frequency of 990 Hz is quite high, so most users sensitive to PWM should not notice any flickering. In comparison: 52 % of all tested devices do not use PWM to dim the display. If PWM was detected, an average of 7747 (minimum: 5 - maximum: 343500) Hz was measured. | |||
Performance
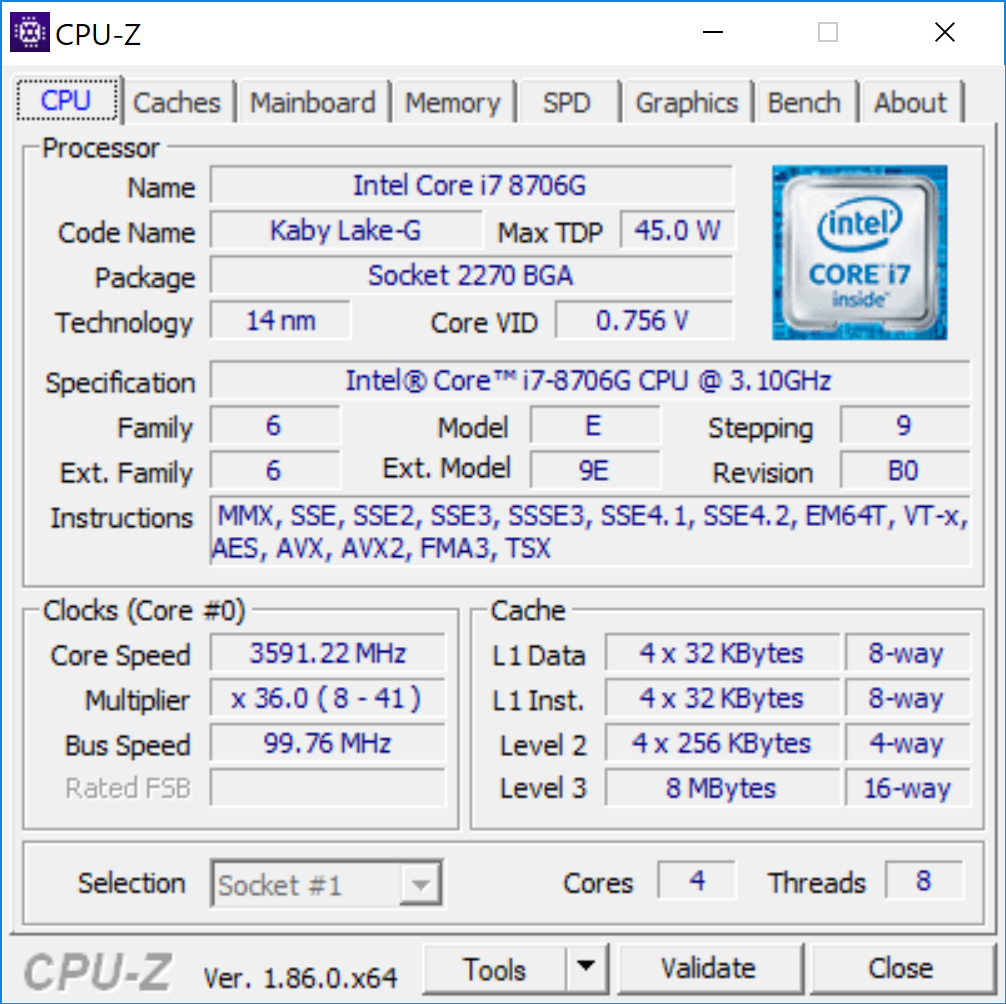
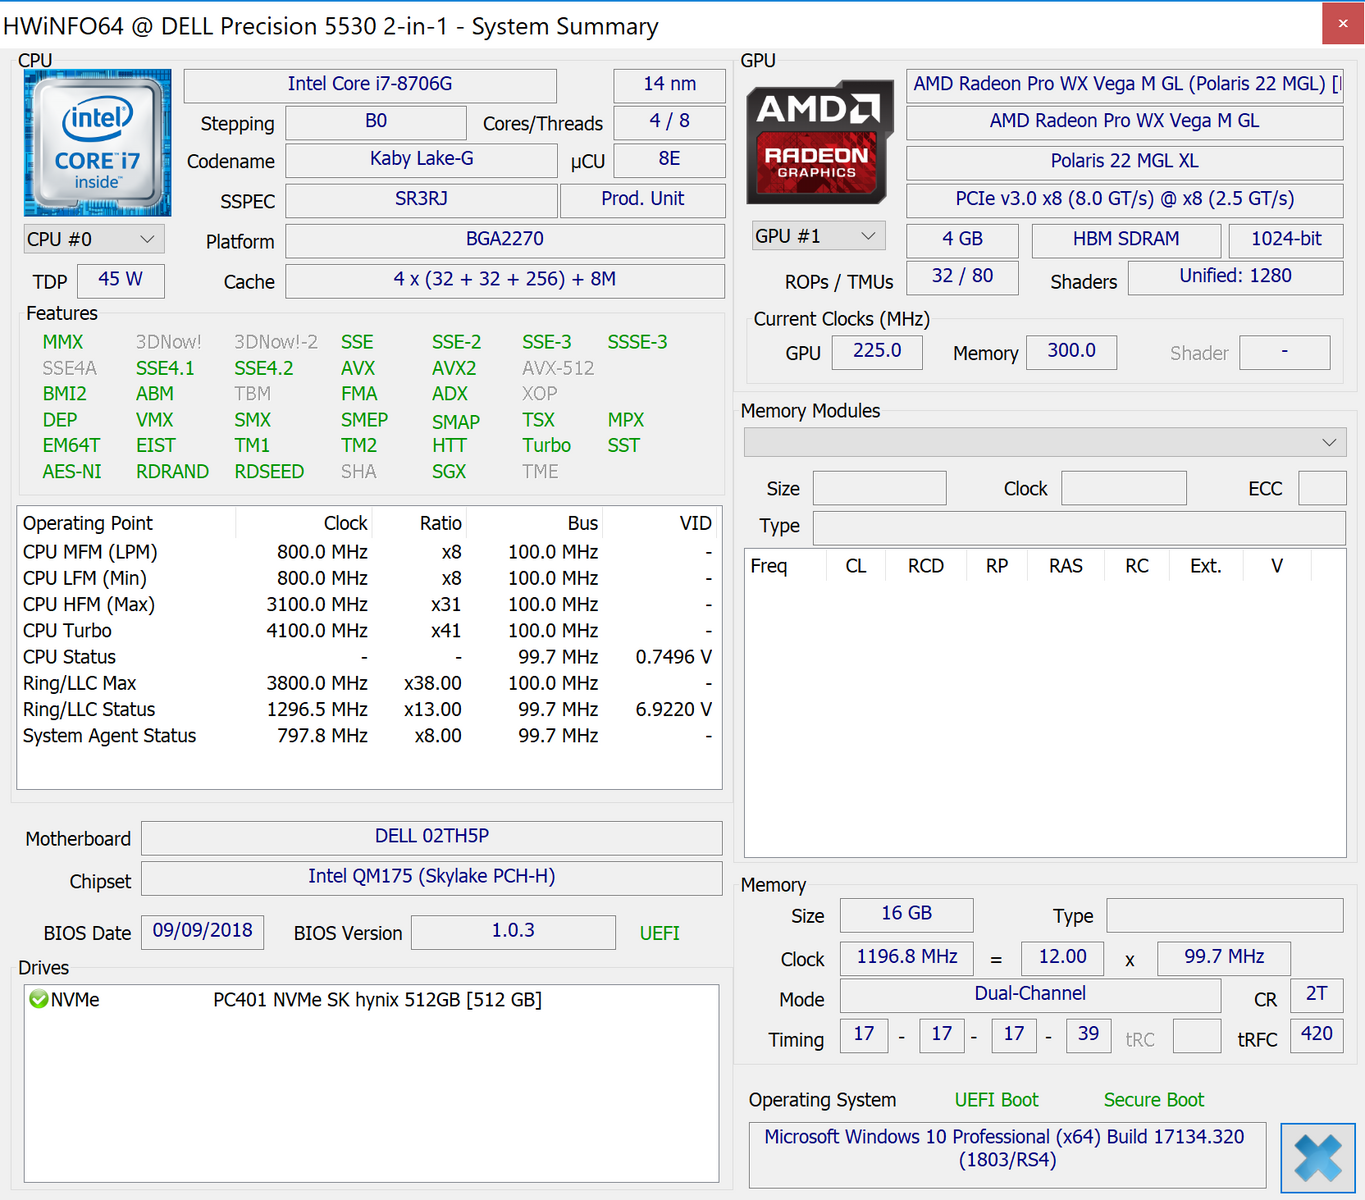
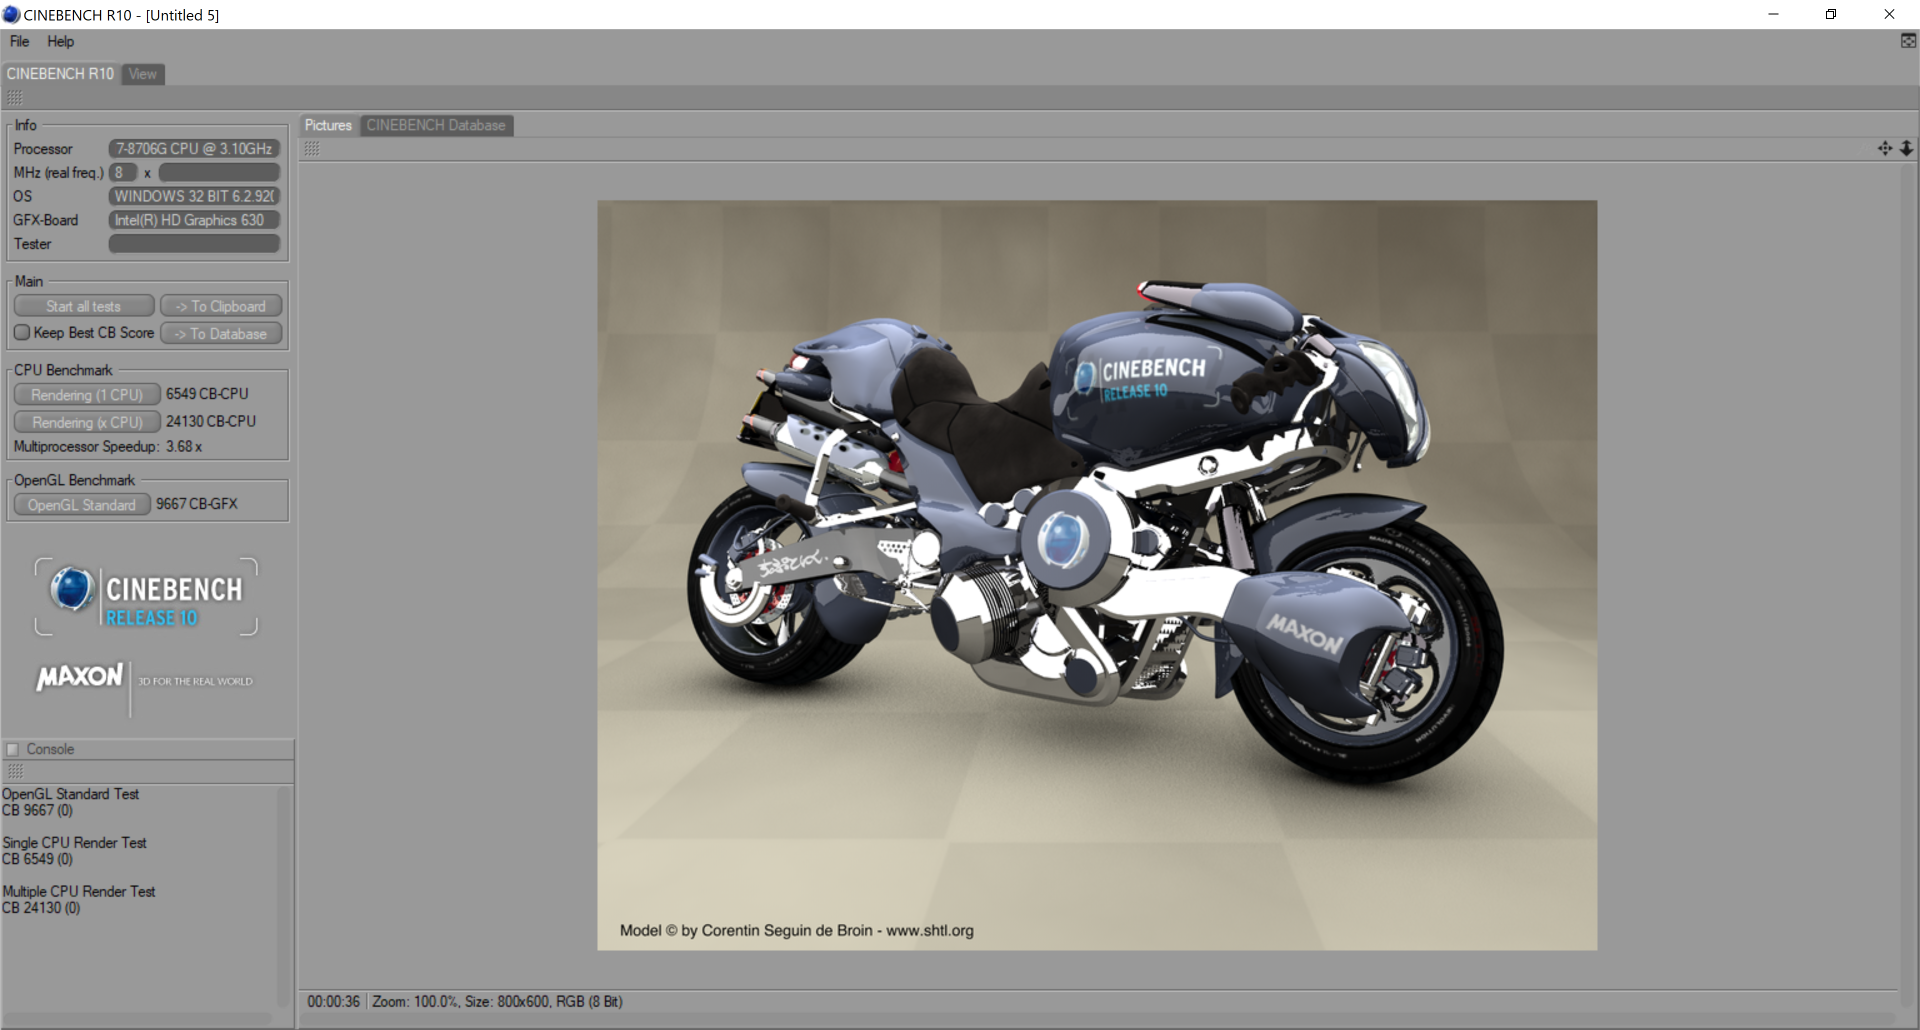
A defining feature of the Precision 5530 2-in-1 is its Kaby Lake-G CPU. Unlike the XPS 15 9575 series, however, the Precision convertible uses the Core i7-8706G with vPro support whereas the XPS convertibles are limited to the i5-8305G and i7-8705G. Nonetheless, all three processors are still limited by a 65 W TDP whereas the i7-8809G is faster and more demanding with its 100 W power envelope.
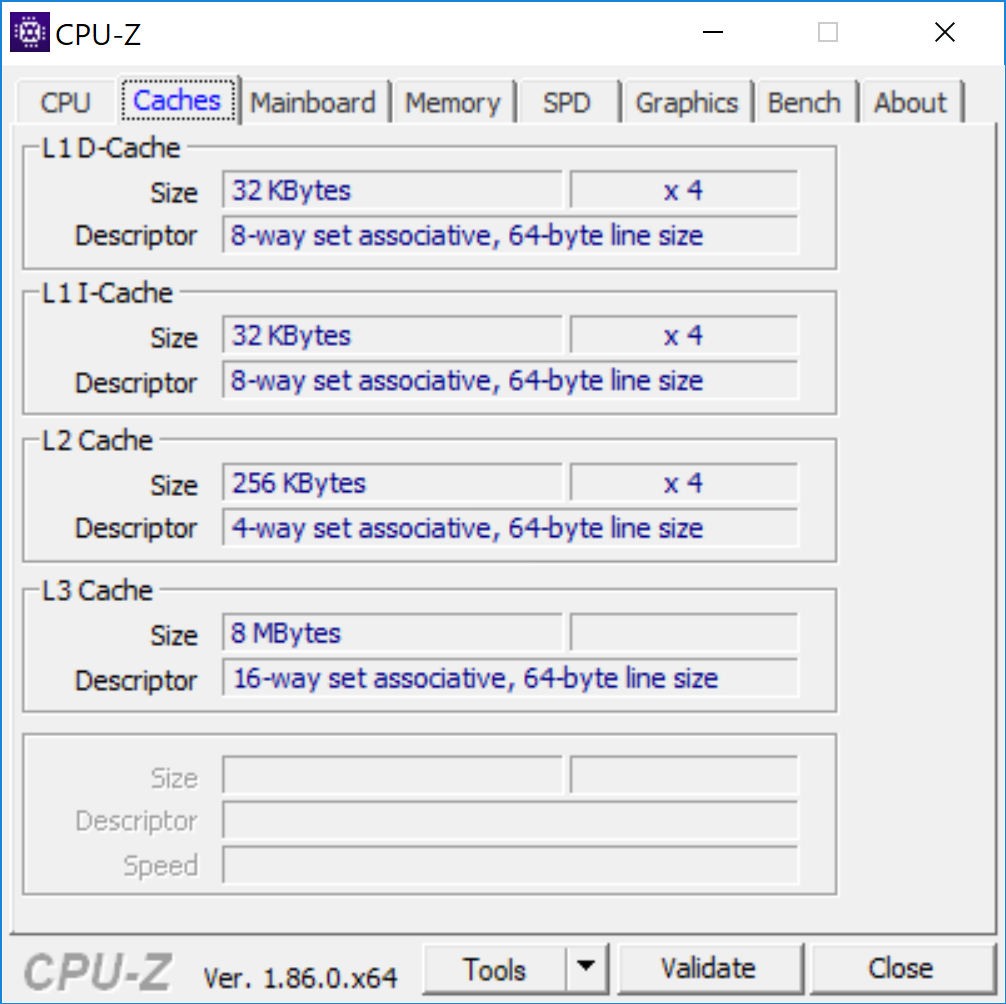
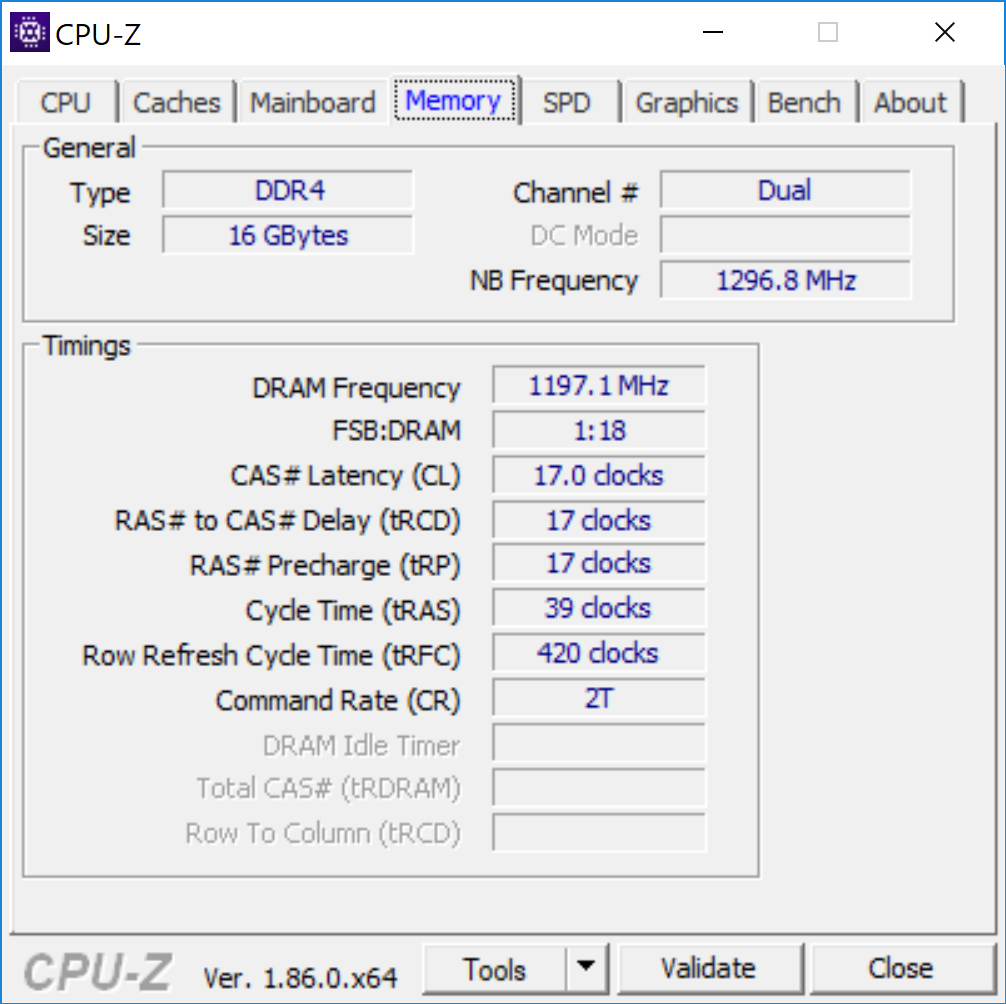
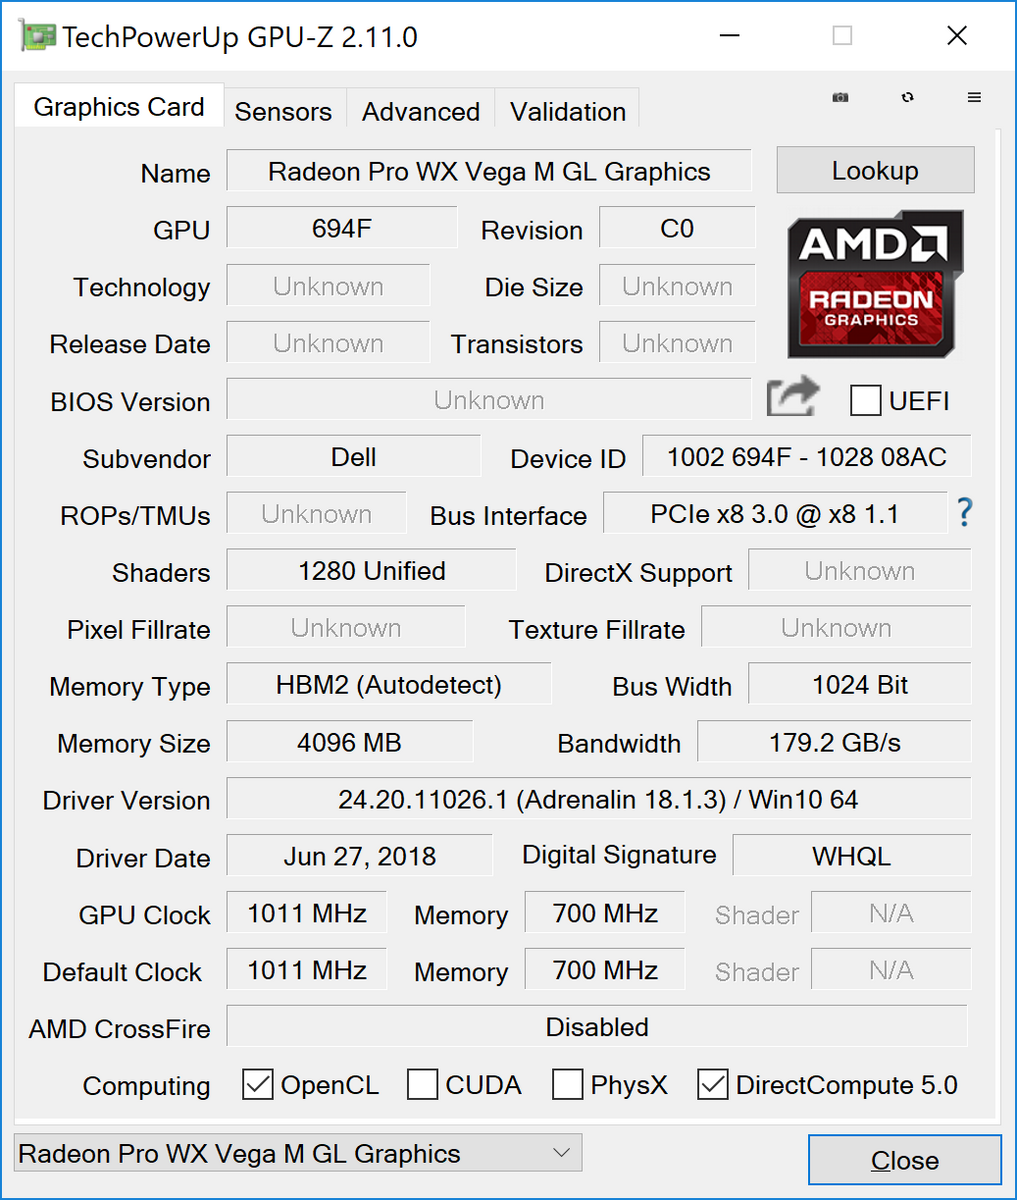
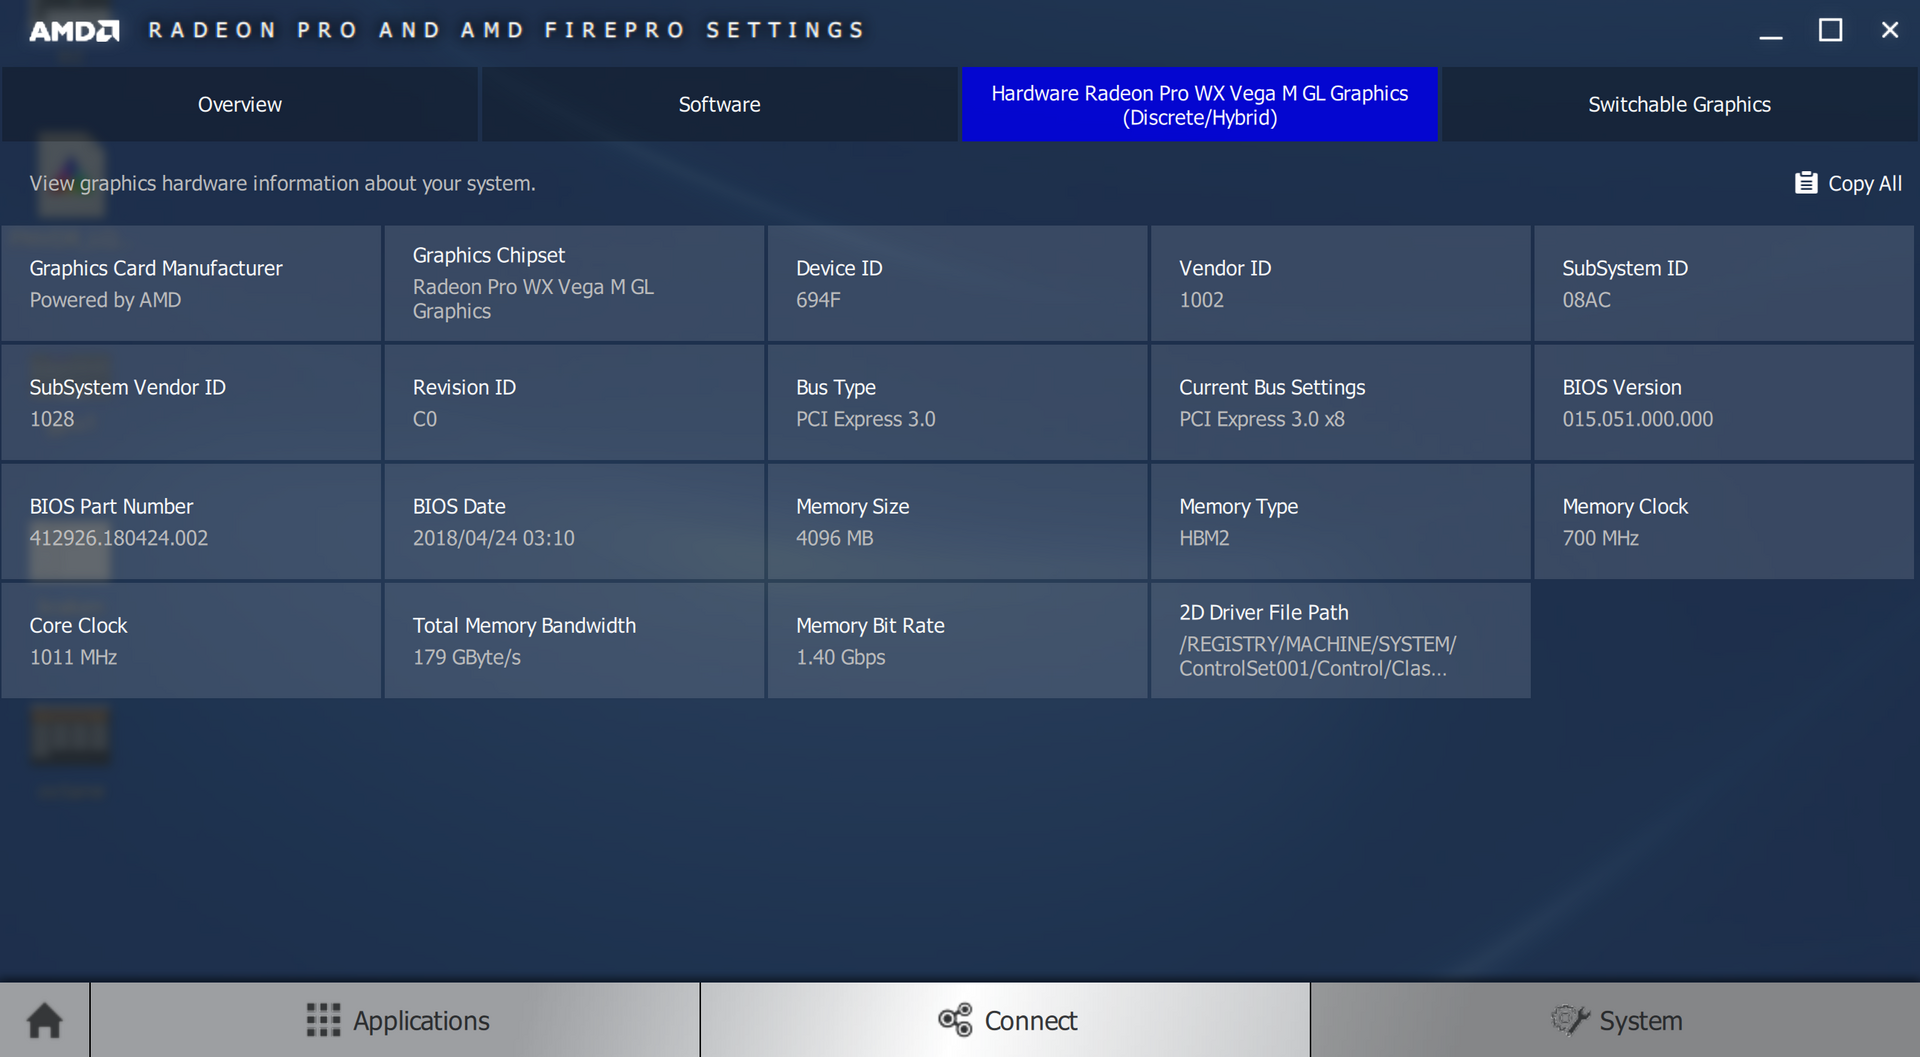
Since this is a workstation, the hybrid GPU has been changed from the Radeon RX Vega M GL to the Radeon Pro WX Vega M GL. Core specifications between the two GPUs are otherwise identical according to GPU-Z including clock rate (1011 MHz), memory clock rate (700 MHz), bandwidth (179.2 GB/s), number of shader cores (1280), and memory (4 GB HBM2). Even HWiNFO continues to label the GPU as a Polaris 22 microarchitecture instead of Vega. Consequently, performance should be on a similar level to the GeForce GTX 1050 Ti.
Current RAM options offer no ECC features which may upset some workstation users.
Processor
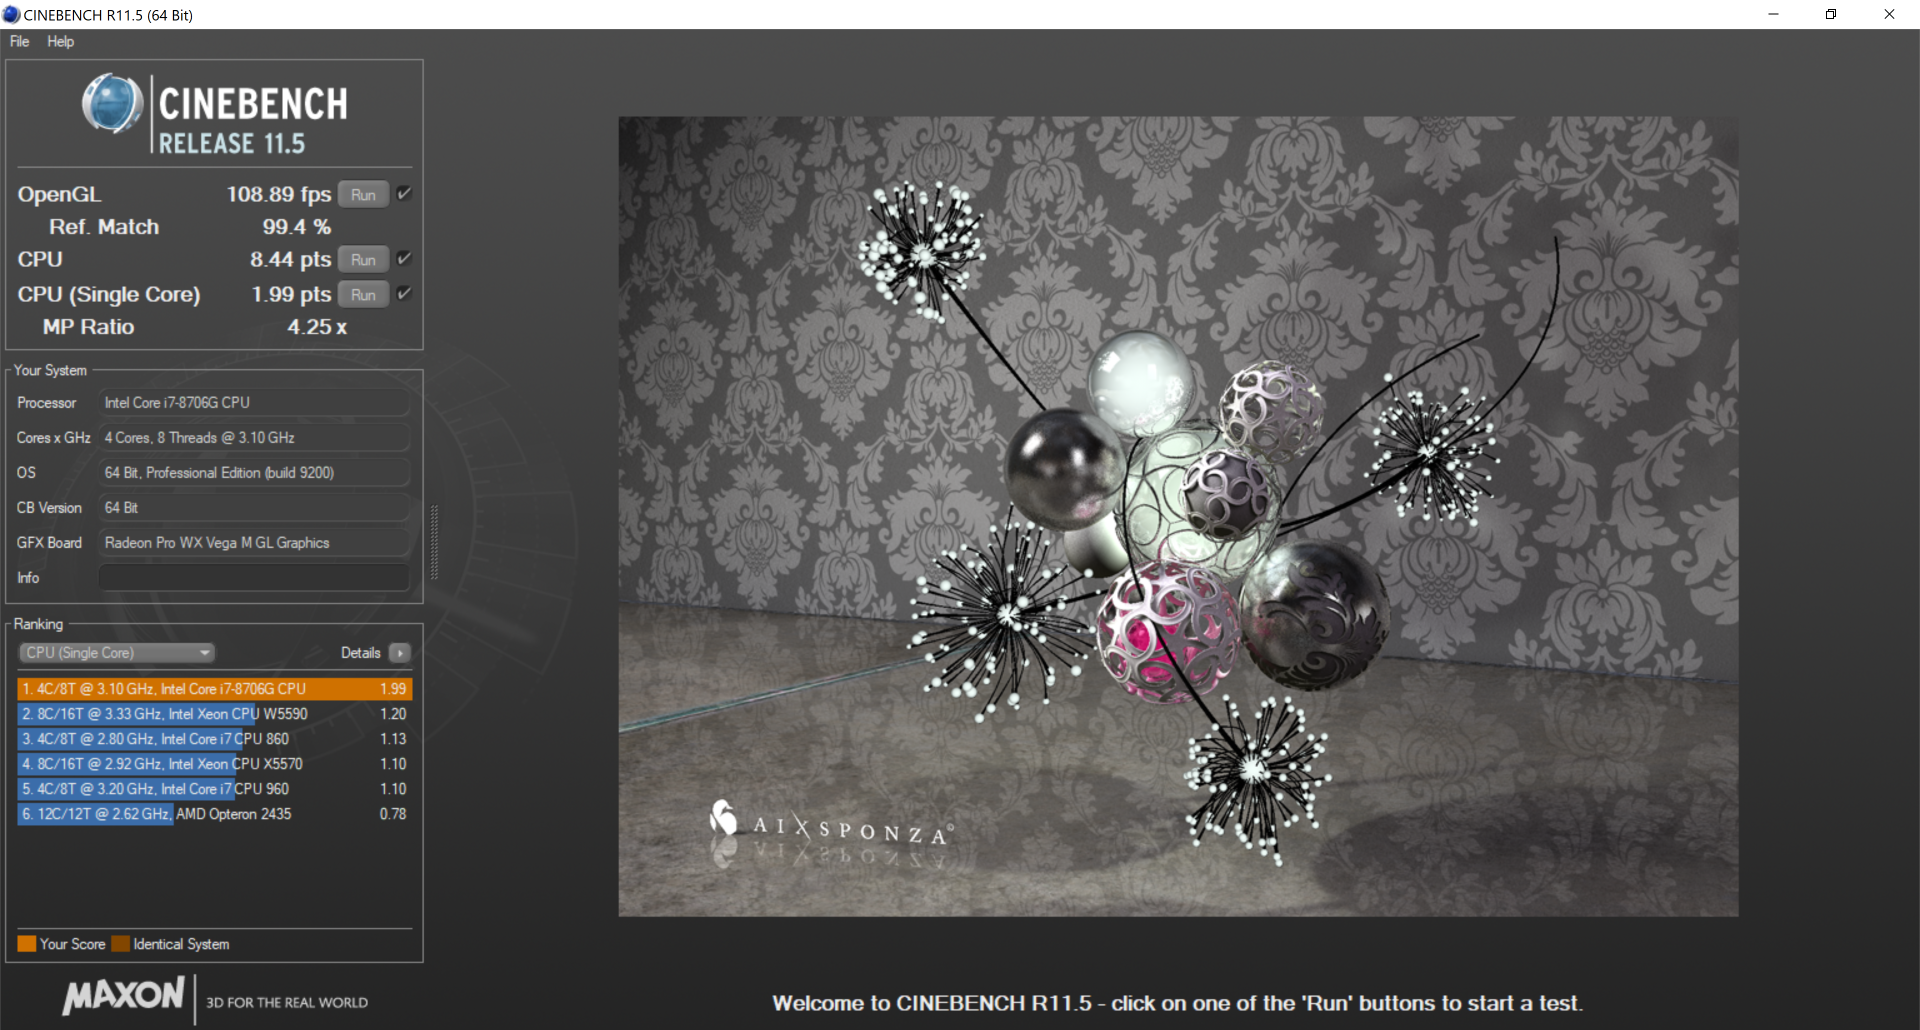
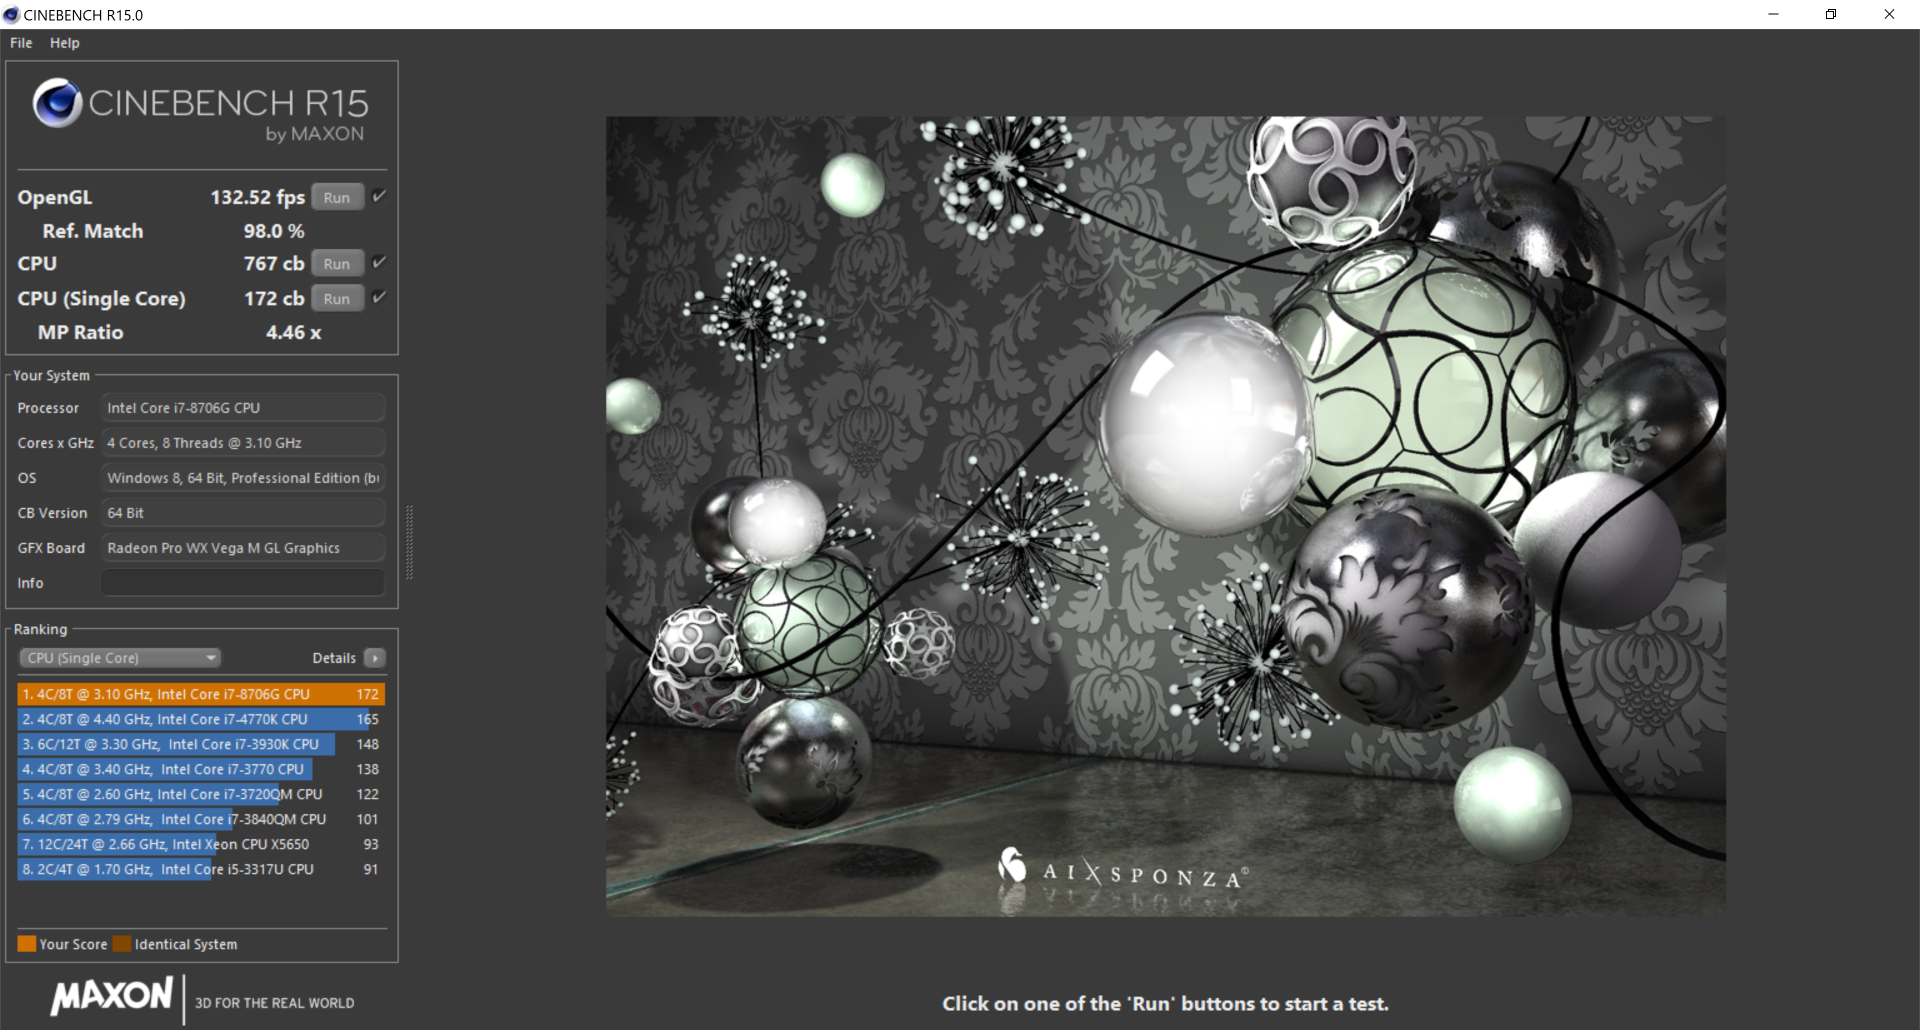
This is the fourth Kaby Lake-G processor in our database after the i5-8305G, i7-8705G, and i7-8809G. While the i5-8305G and i7-8705G are disappointingly very similar in terms of raw performance, the i7-8706G in our Precision 2-in-1 is decently faster by about 10 percent over the i7-8705G according to CineBench R15 Multi-Thread. The results put the i7-8706G just slightly ahead of the i7-7700HQ which is an impressive feat considering that the Kaby Lake-G processor also incorporates a discrete GPU under its thermal envelope. The Coffee Lake Xeon E-2176M in the standard Precision 5530, however, is still significantly faster by almost 45 percent.
Running CineBench R15 Multi-Thread in a loop is a good indicator of performance sustainability over time. As shown by the graph below, the first loop results in a score of 781 points before eventually stabilizing at around 750 points to represent a performance dip of just 4 percent.
See our dedicated page on the Core i7-8706G for more technical information and benchmark comparisons.
| wPrime 2.10 - 1024m | |
| Average of class Workstation (n=1last 2 years) | |
| MSI WS63VR 7RL-023US | |
| Dell Precision 5530 2-in-1 | |
| Dell XPS 15 9575 i7-8705G | |
| Intel Hades Canyon NUC8i7HVK | |
| Dell Precision 5530 Xeon E-2176M | |
* ... smaller is better
System Performance
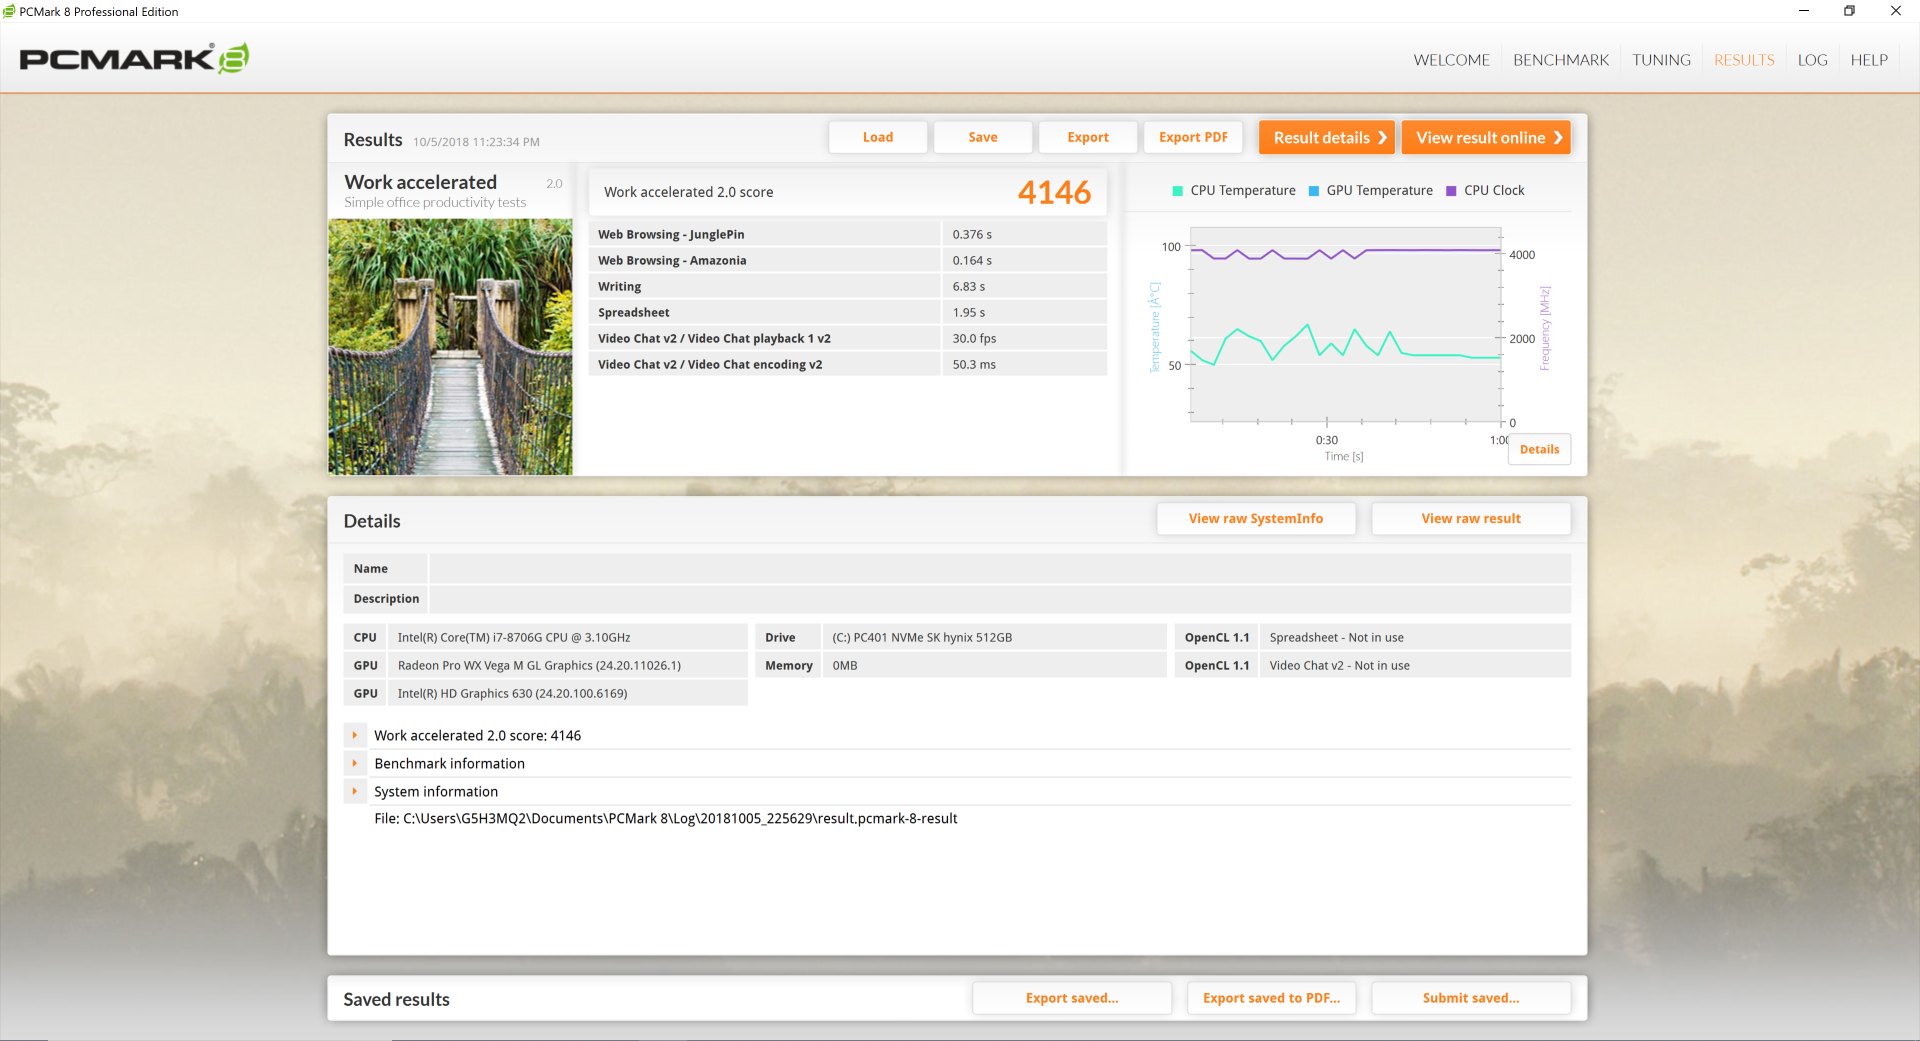
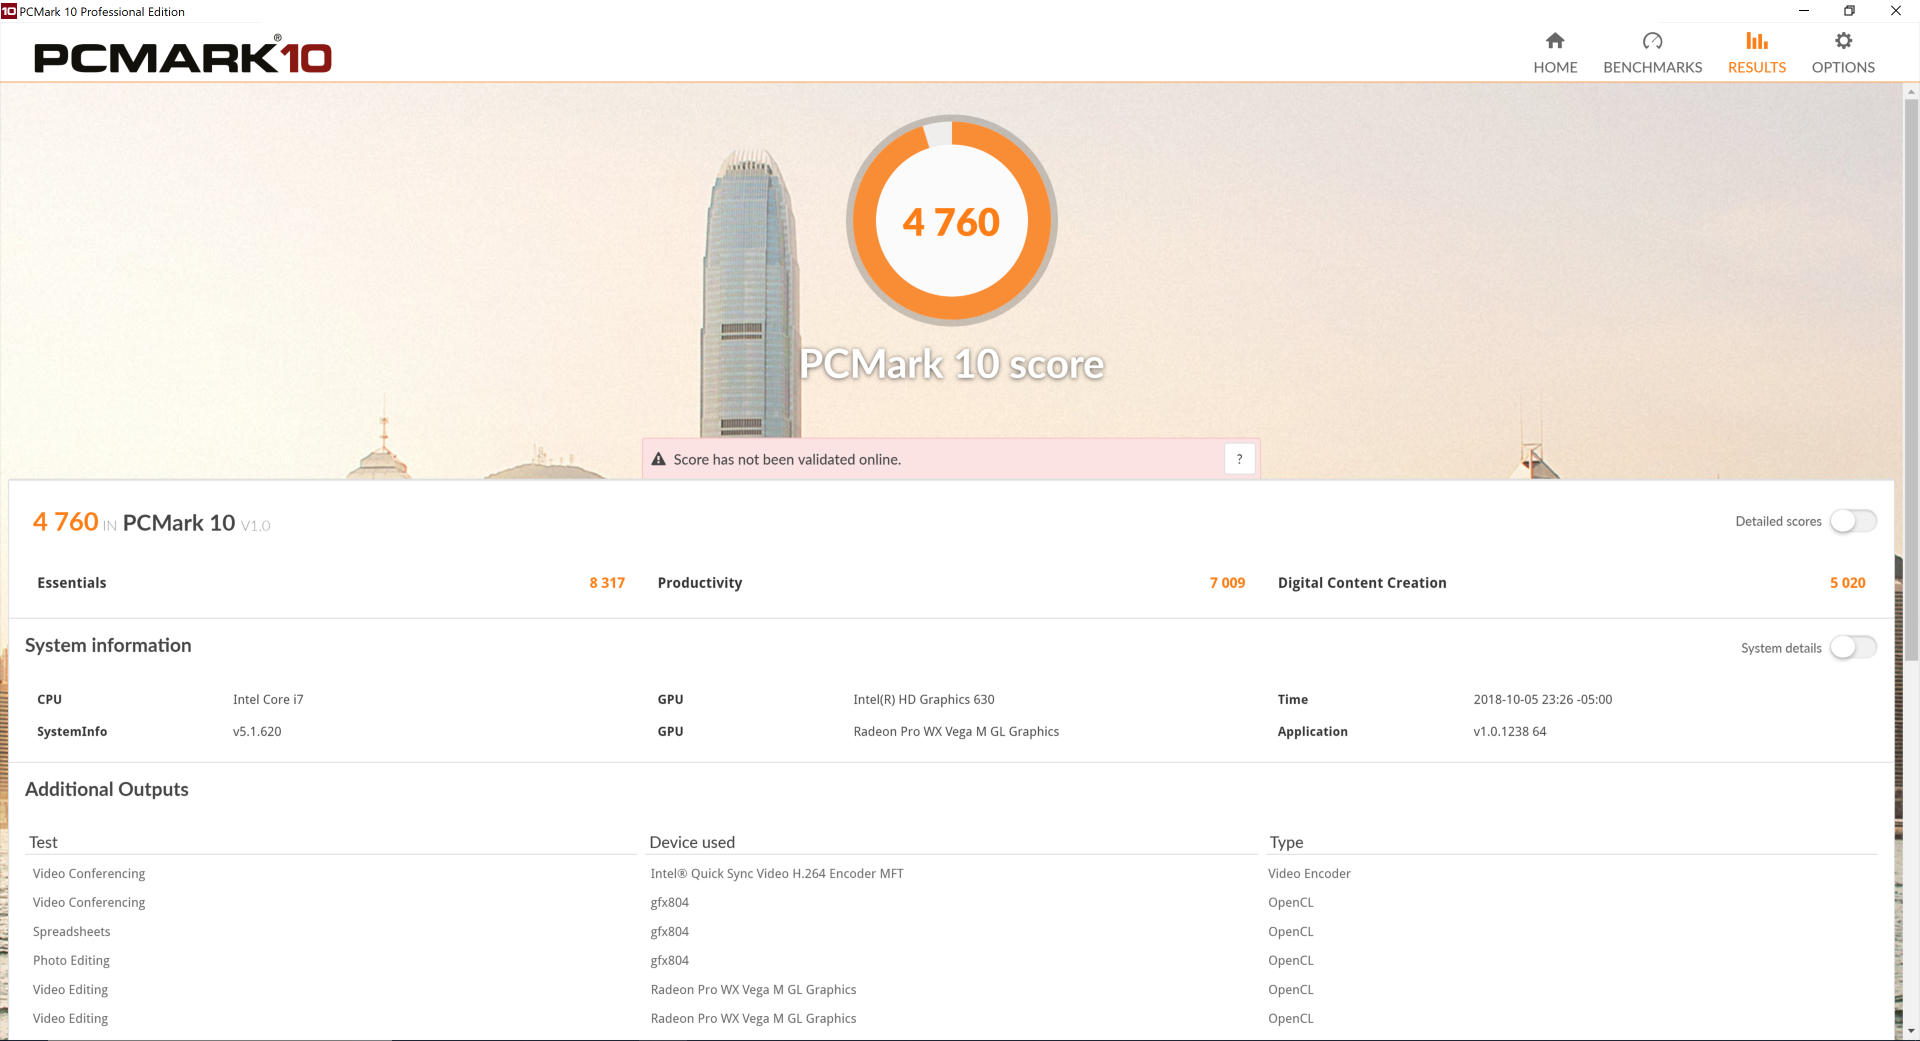
PCMark 10 ranks our Precision 5530 2-in-1 within single-digit percentages from the ThinkPad X1 Extreme and XPS 15 9575. On the other hand, older PCMark 8 benchmarks show it falling behind against many of its 15-inch workstation peers as shown by the chart below.
Attempting to reset Windows results in a boot loop on our machine. We're unsure if this is a widespread issue, but we recommend caution if refreshing or reinstalling Windows for this reason.
Dell offers an optional AI-based Precision Optimizer software (DPO) for workstations that "leans app behavior" and "takes the guesswork out of customizing settings" to get the best performance from a specific application. In other words, it will automatically tune system settings and hardware to maximize performance when running commonly used applications or workloads. DPO comes free with Precision PCs but its touted AI features require a license to use.
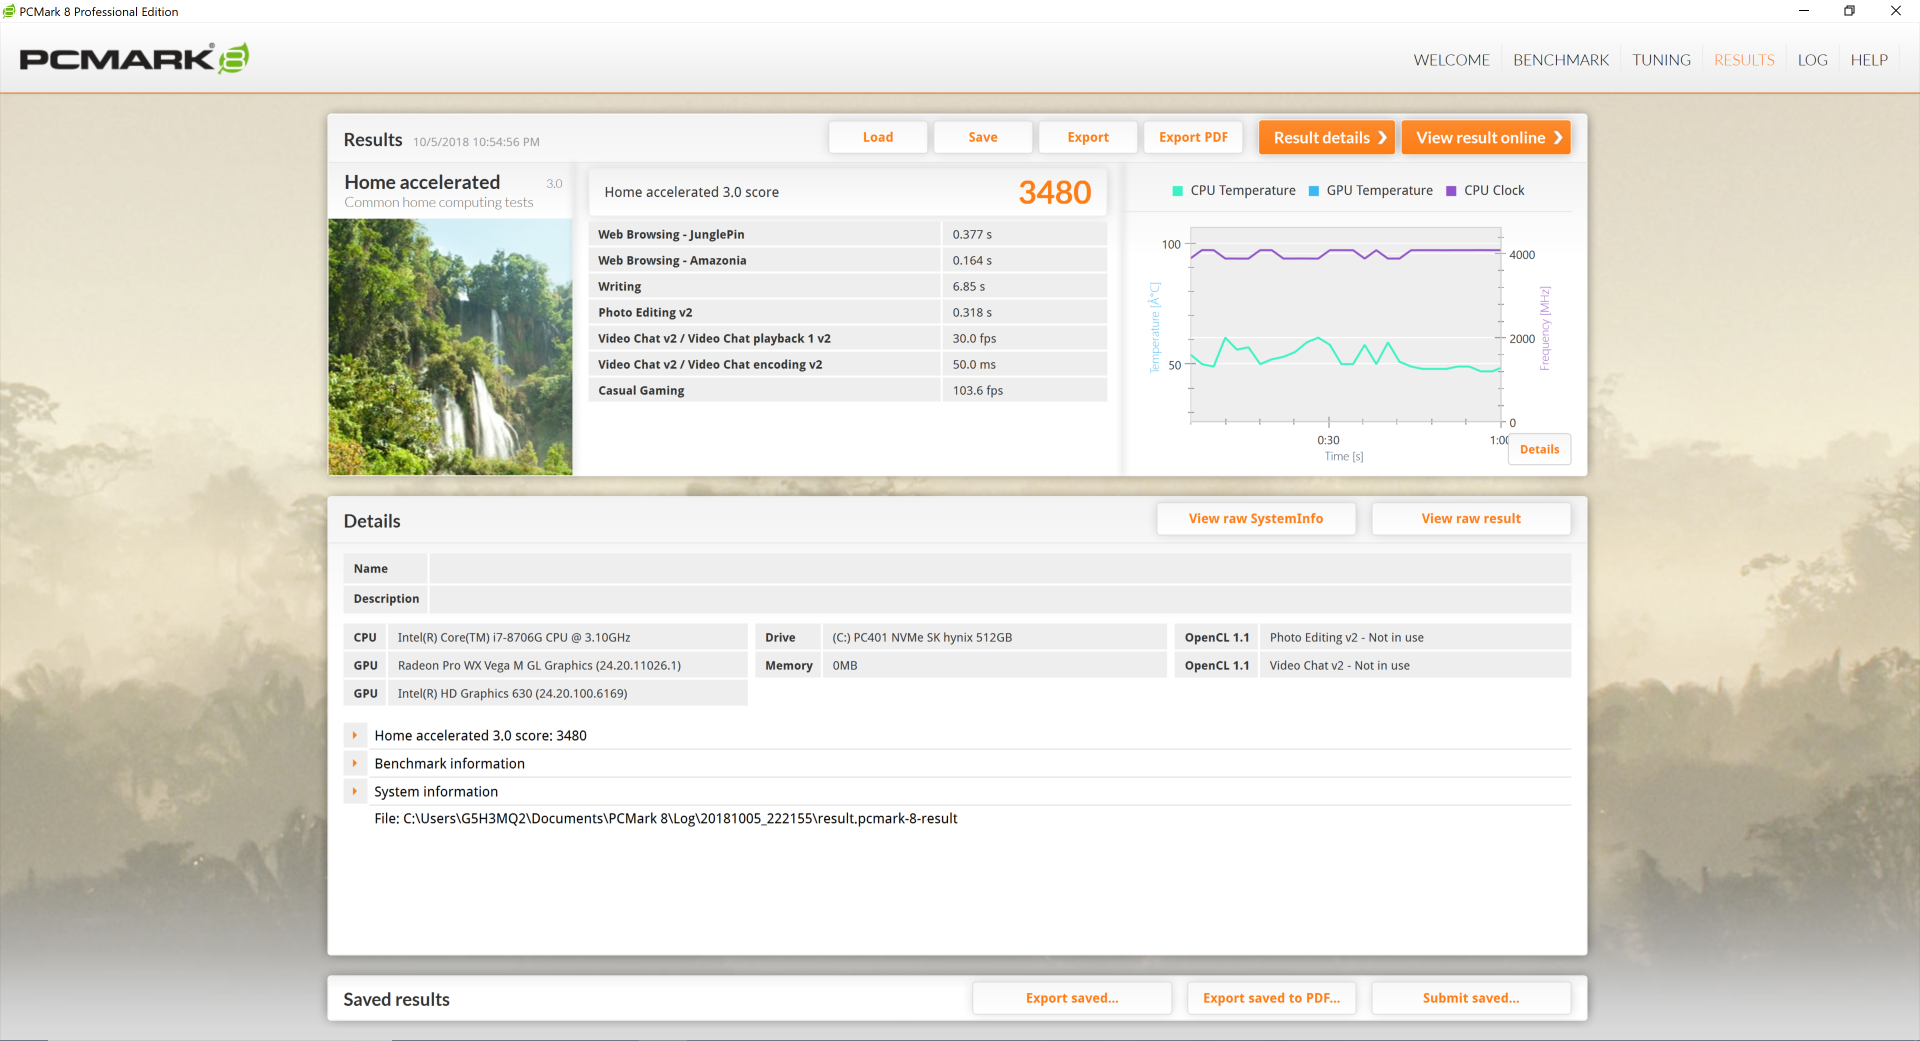
| PCMark 8 Home Score Accelerated v2 | 3480 points | |
| PCMark 8 Work Score Accelerated v2 | 4146 points | |
| PCMark 10 Score | 4760 points | |
Help | ||
Storage Devices
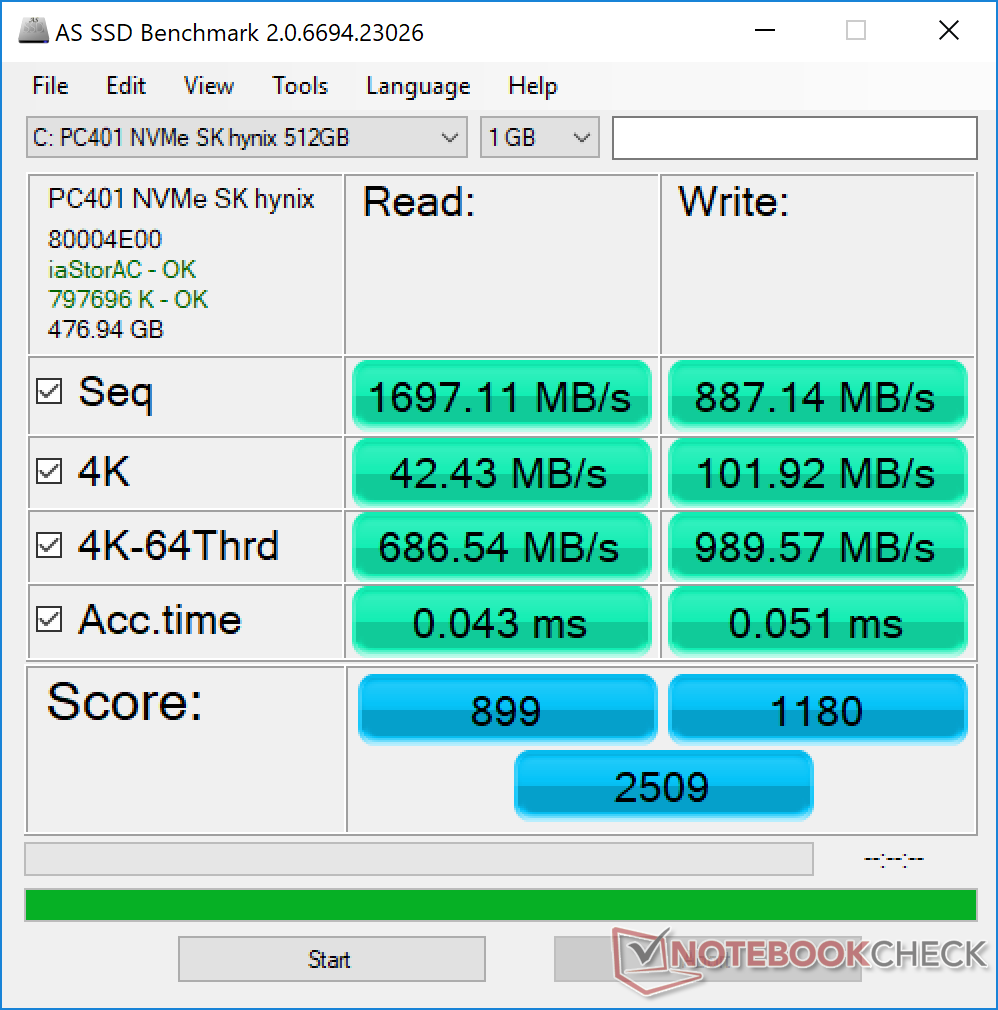
There is only one internal M.2 storage bay with options ranging from a 128 GB SATA SSD up to a 2 TB NVMe SSD. The 512 GB SK Hynix in our unit is the same drive as found on the XPS 15 9575 and overall performance is more or less the same. Samsung solutions like the PM981 are faster while Toshiba XG5 SSDs are generally slower. Most larger workstations, like the HP ZBook or Precision 7000 series, have multiple internal storage bays for much higher storage capacities.
See our table of HDDs and SSDs for more benchmark comparisons.
| Dell Precision 5530 2-in-1 SK Hynix PC401 512GB M.2 (HFS512GD9TNG) | Lenovo ThinkPad X1 Extreme-20MF000XGE Samsung SSD PM981 MZVLB1T0HALR | Dell Precision 5530 Xeon E-2176M SK hynix PC400 512 GB | HP ZBook 15u G5 2ZC05EA Toshiba XG5 KXG50ZNV256G | Average SK Hynix PC401 512GB M.2 (HFS512GD9TNG) | |
|---|---|---|---|---|---|
| AS SSD | 84% | 3% | -27% | 13% | |
| Copy Game MB/s (MB/s) | 741 | 742 0% | 837 ? 13% | ||
| Copy Program MB/s (MB/s) | 435.5 | 324.8 -25% | 470 ? 8% | ||
| Copy ISO MB/s (MB/s) | 913 | 1146 26% | 1286 ? 41% | ||
| Score Total (Points) | 2509 | 5355 113% | 2922 16% | 1697 -32% | 2787 ? 11% |
| Score Write (Points) | 1180 | 2147 82% | 1121 -5% | 710 -40% | 1188 ? 1% |
| Score Read (Points) | 899 | 2132 137% | 1226 36% | 689 -23% | 1089 ? 21% |
| Access Time Write * (ms) | 0.051 | 0.028 45% | 0.053 -4% | 0.051 -0% | 0.04845 ? 5% |
| Access Time Read * (ms) | 0.043 | 0.034 21% | 0.073 -70% | 0.103 -140% | 0.04909 ? -14% |
| 4K-64 Write (MB/s) | 990 | 1782 80% | 926 -6% | 564 -43% | 956 ? -3% |
| 4K-64 Read (MB/s) | 685 | 1805 164% | 970 42% | 488.4 -29% | 819 ? 20% |
| 4K Write (MB/s) | 101.9 | 130.9 28% | 92.8 -9% | 101.5 0% | 118.8 ? 17% |
| 4K Read (MB/s) | 42.43 | 56.8 34% | 38.43 -9% | 31.28 -26% | 43.2 ? 2% |
| Seq Write (MB/s) | 887 | 2336 163% | 1022 15% | 441 -50% | 1137 ? 28% |
| Seq Read (MB/s) | 1697 | 2703 59% | 2169 28% | 1696 0% | 2266 ? 34% |
* ... smaller is better

GPU Performance
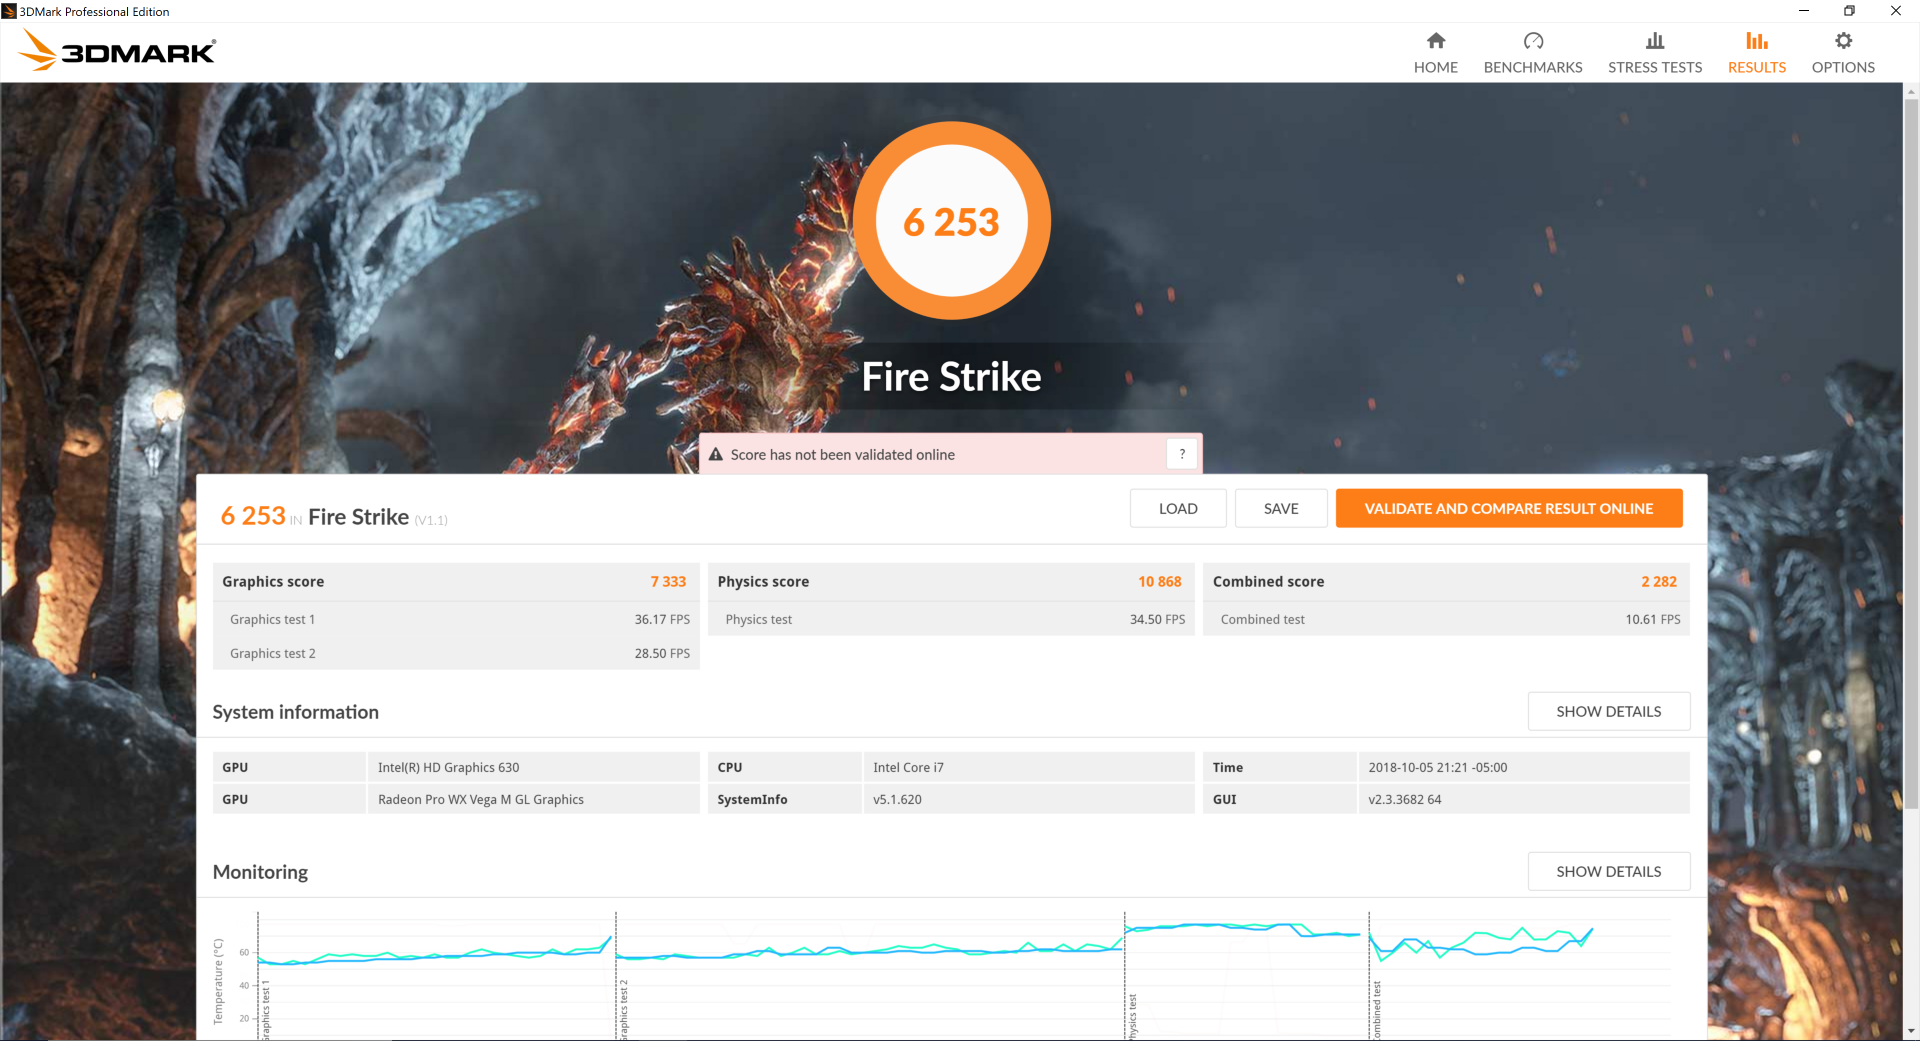
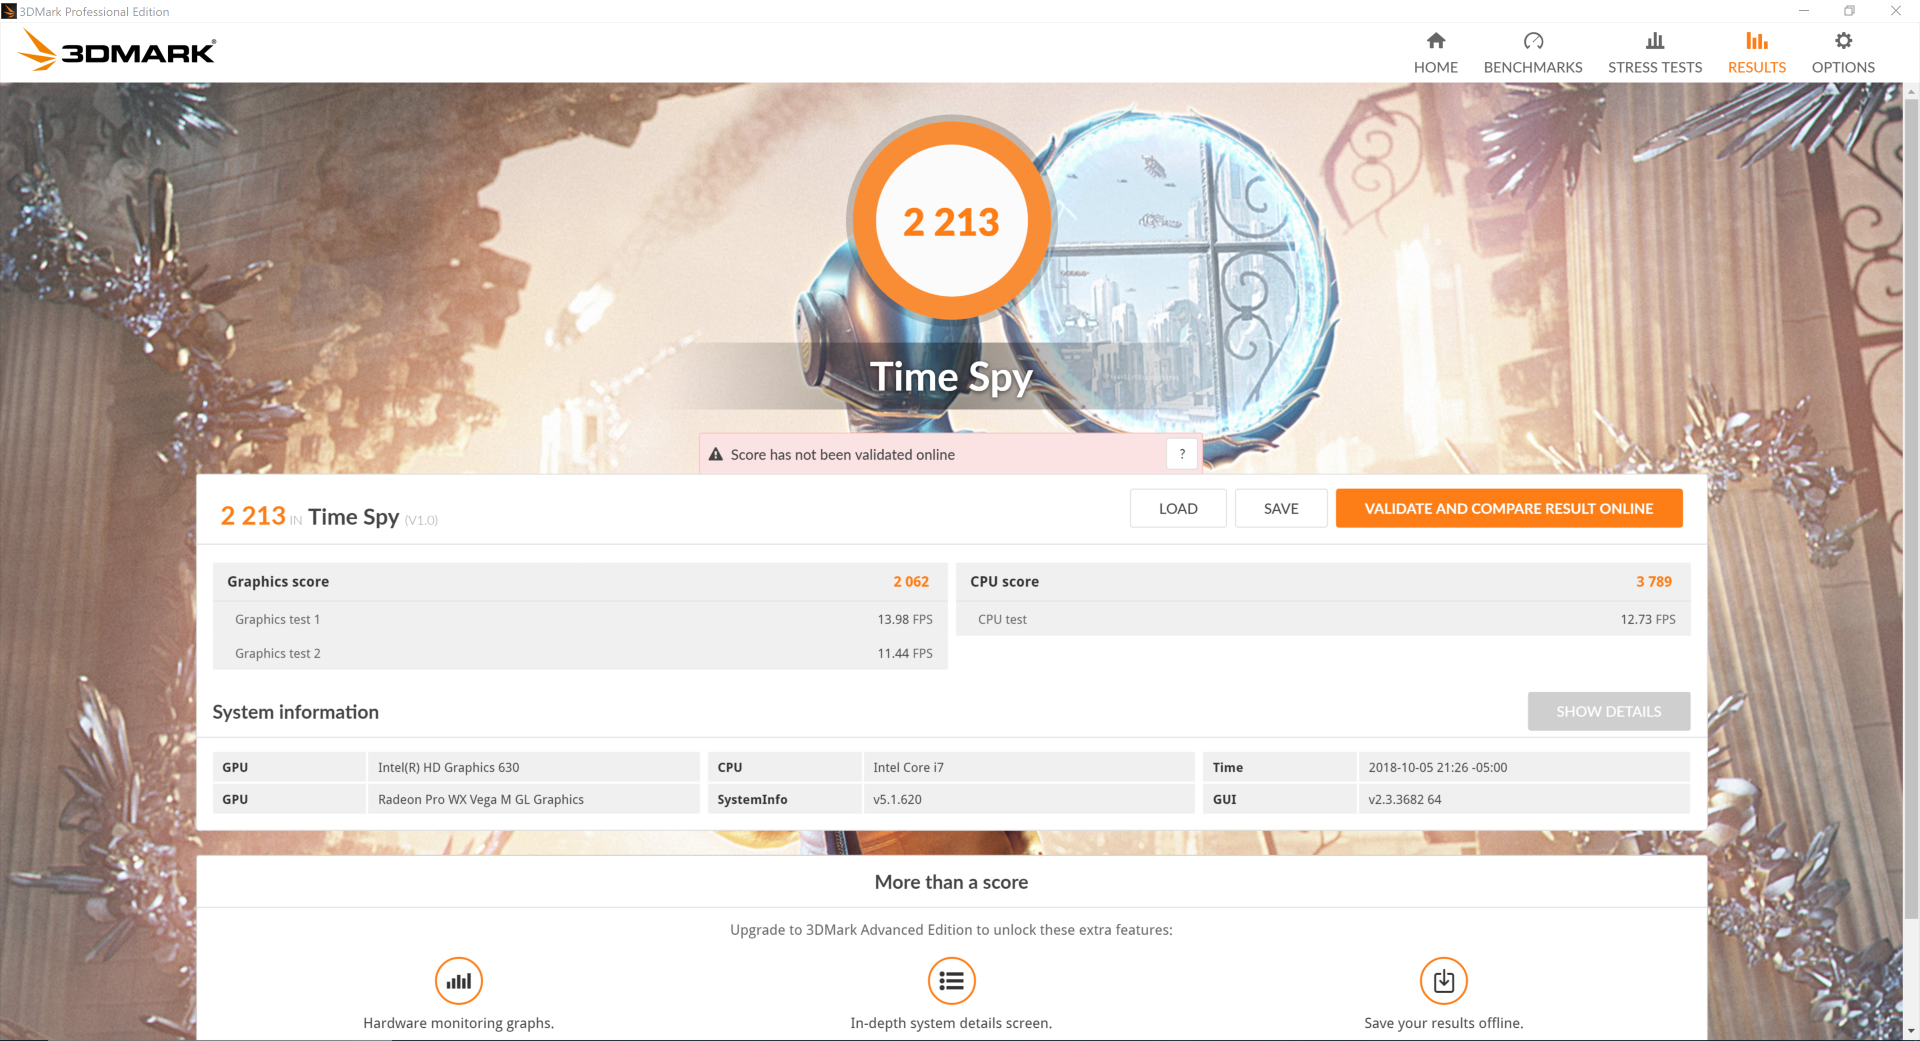
Raw graphics performance is essentially identical to the Radeon RX Vega M GL in the XPS 15 9575 according to 3DMark benchmarks. Consequently, the GPU is on par with the GTX 1050 Ti in the ThinkPad X1 Extreme.
When compared to Quadro GPUs, the Radeon Pro WX Vega M GL is about 9 percent faster than the P2000 in the standard Precision 5530 and 23 percent slower than the Quadro P3000 in the MSI WS63VR. Much faster options exist such as the Quadro P4000 or P5000, but none are available in as small of a convertible form factor as our Dell.
See our dedicated page on the Radeon Pro WX Vega M GL for more technical information and benchmark comparisons.

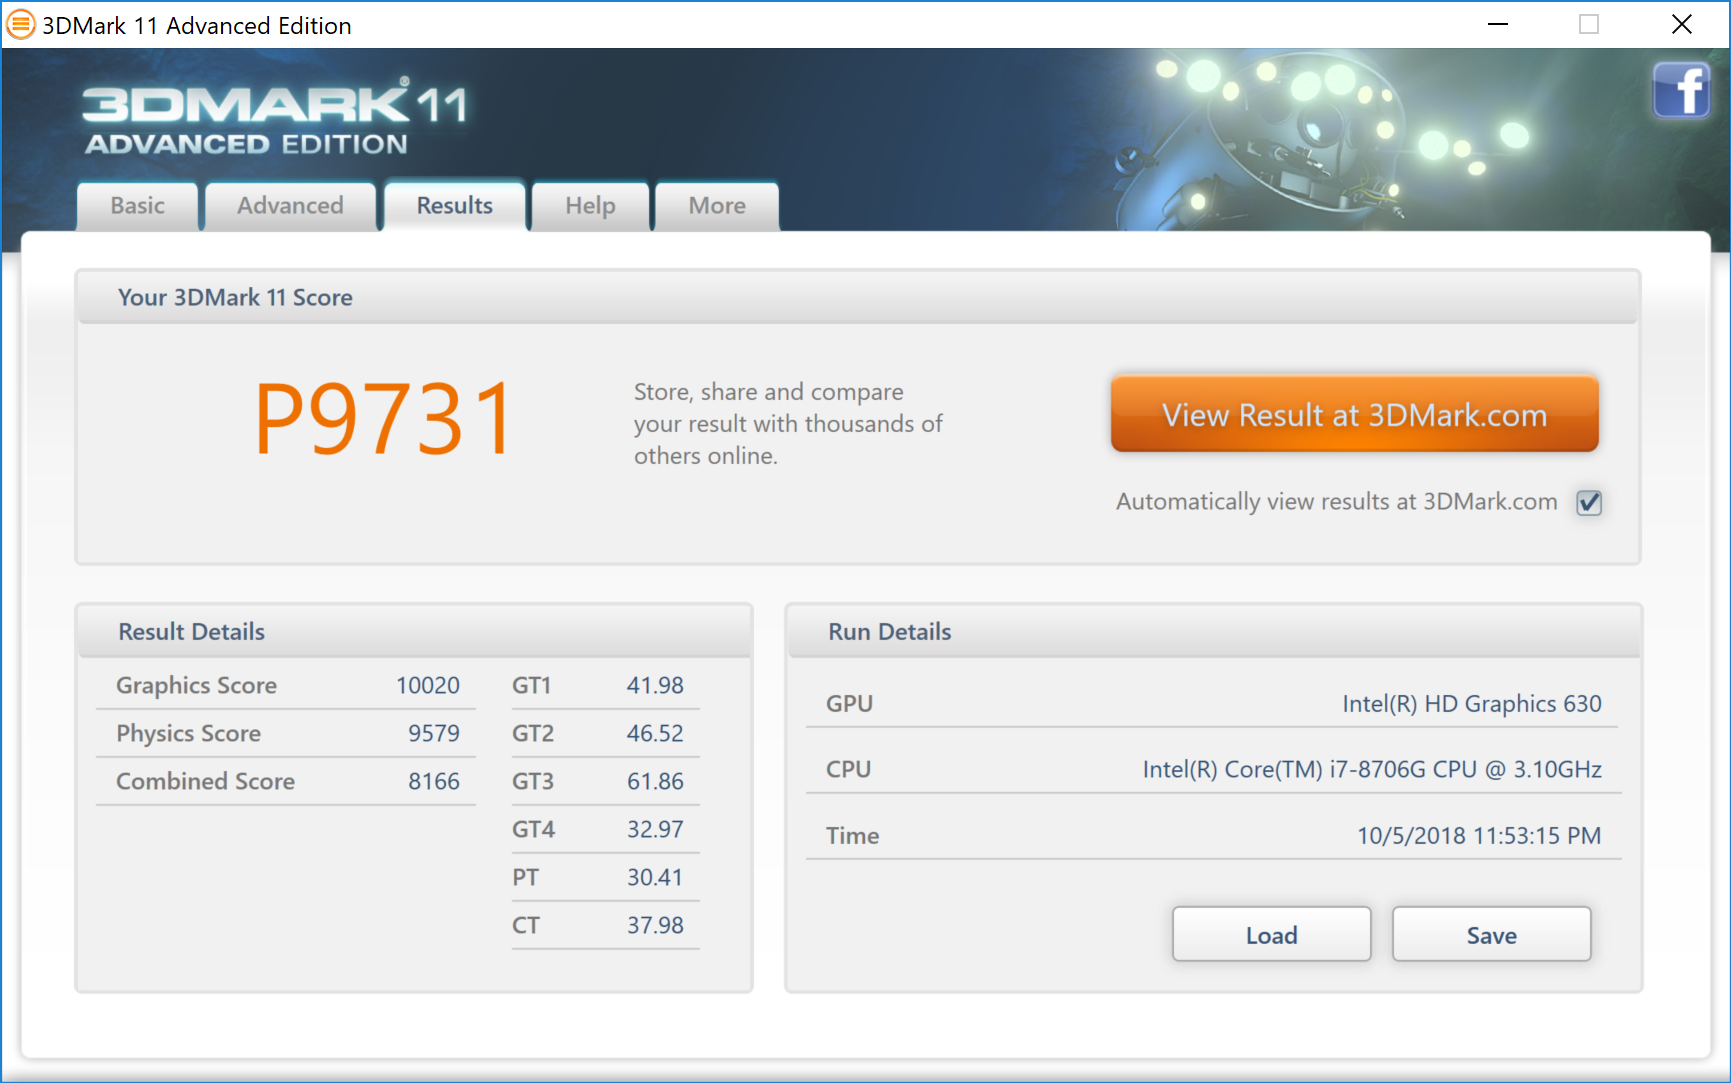
| 3DMark 11 Performance | 9731 points | |
| 3DMark Ice Storm Standard Score | 49024 points | |
| 3DMark Cloud Gate Standard Score | 19765 points | |
| 3DMark Fire Strike Score | 6253 points | |
| 3DMark Time Spy Score | 2213 points | |
Help | ||
Gaming Performance
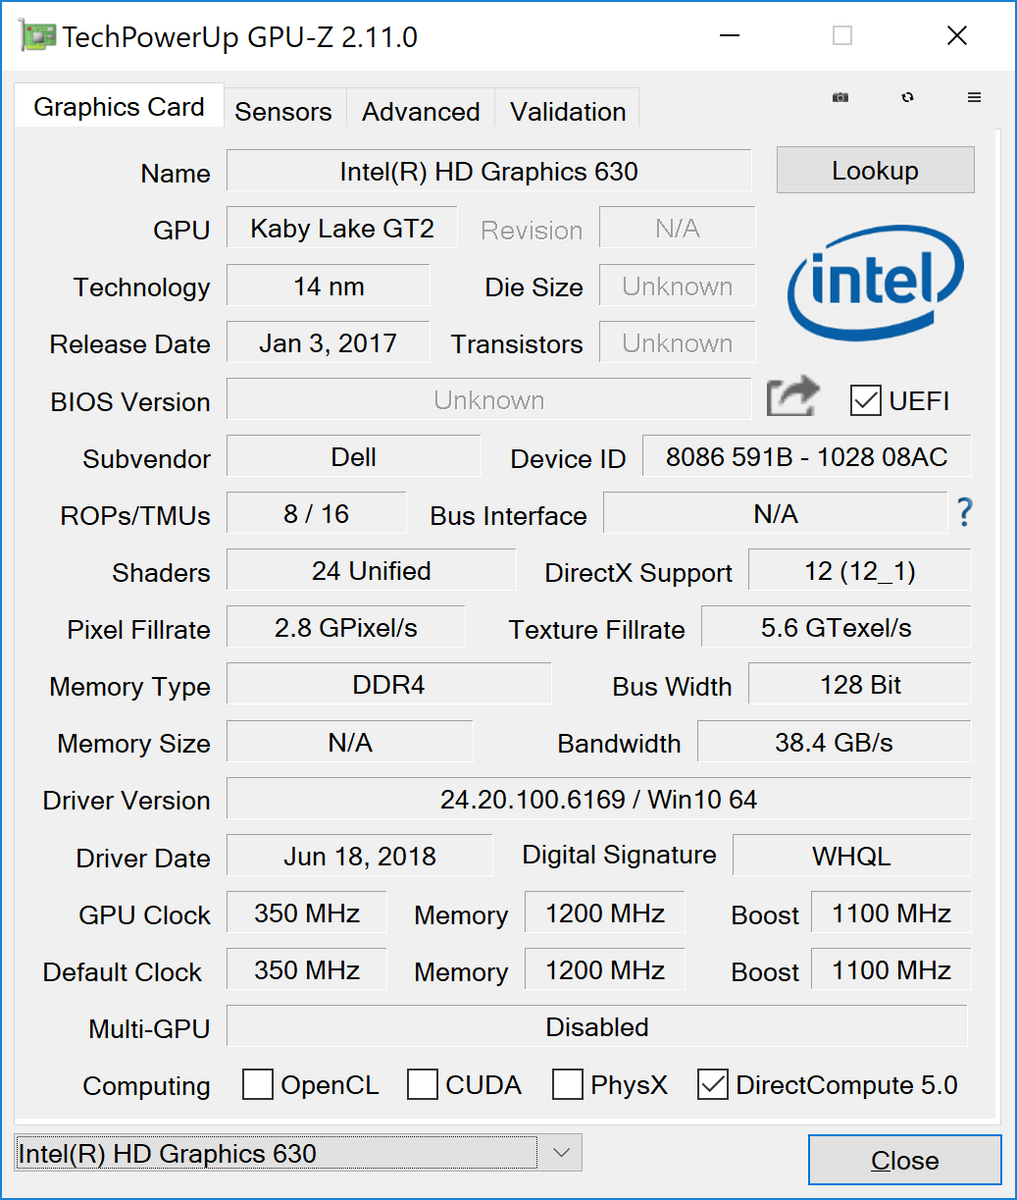
Playing modern demanding games on the Radeon Pro WX Vega M GL is possible but not ideal. While performance is similar to the Radeon RX Vega M GL as one would expect, minor bugs are not uncommon on newer titles. As examples, Final Fantasy 15 would initially fail to recognize the Radeon GPU and run on the UHD Graphics 630 instead while Assassin's Creed Odyssey would give a warning about unsupported video drivers upon launch. Additionally, while many games are able to reach 60 FPS at lower settings, the slow response times of the display lead to more noticeable ghosting than gamers would like.
More casual titles like Rocket League, Fortnite, LoL, and PUBG are less demanding and a better fit for the occasional gaming session. Be sure to avoid resolutions greater than 1080p as frame rates begin to tank from the limited bandwidth available.
| low | med. | high | ultra | 4K | |
|---|---|---|---|---|---|
| Sleeping Dogs (2012) | 113.1 | 95.9 | 84.6 | 36 | |
| StarCraft II: Heart of the Swarm (2013) | 254 | 146 | 134.1 | 71.4 | |
| BioShock Infinite (2013) | 106.5 | 101.2 | 102.9 | 59.6 | |
| Metro: Last Light (2013) | 98.2 | 94.8 | 77.5 | 41 | |
| Thief (2014) | 68.6 | 67.1 | 64.3 | 42.7 | |
| The Witcher 3 (2015) | 94.7 | 79 | 44.2 | 23.9 | 15.1 |
| Batman: Arkham Knight (2015) | 73 | 73 | 50 | 16 | |
| Metal Gear Solid V (2015) | 60 | 60 | 60 | 50 | 25.1 |
| Fallout 4 (2015) | 106.9 | 80.4 | 49.8 | 35.5 | 14.7 |
| Rise of the Tomb Raider (2016) | 74.4 | 77.6 | 40.4 | 31.8 | 13.8 |
| Ashes of the Singularity (2016) | 50.3 | 34.8 | 16 | ||
| Overwatch (2016) | 193.7 | 173.4 | 109.8 | 52.3 | 32.9 |
| Prey (2017) | 116.1 | 91.3 | 74.9 | 65.5 | 19.9 |
| Rocket League (2017) | 185.6 | 146.2 | 100.2 | 34.3 | |
| Dirt 4 (2017) | 194.3 | 97.1 | 54.5 | 31.3 | 18.3 |
| F1 2017 (2017) | 122 | 78 | 65 | 40 | 17 |
| Final Fantasy XV Benchmark (2018) | 63 | 32.5 | 21.8 | 8.3 | |
| F1 2018 (2018) | 107 | 65 | 54 | 34 | 15 |
| Shadow of the Tomb Raider (2018) | 82 | 37 | 33 | 28 | 8 |
| Assassin´s Creed Odyssey (2018) | 44 | 33 | 27 | 17 | 10 |
Stress Test
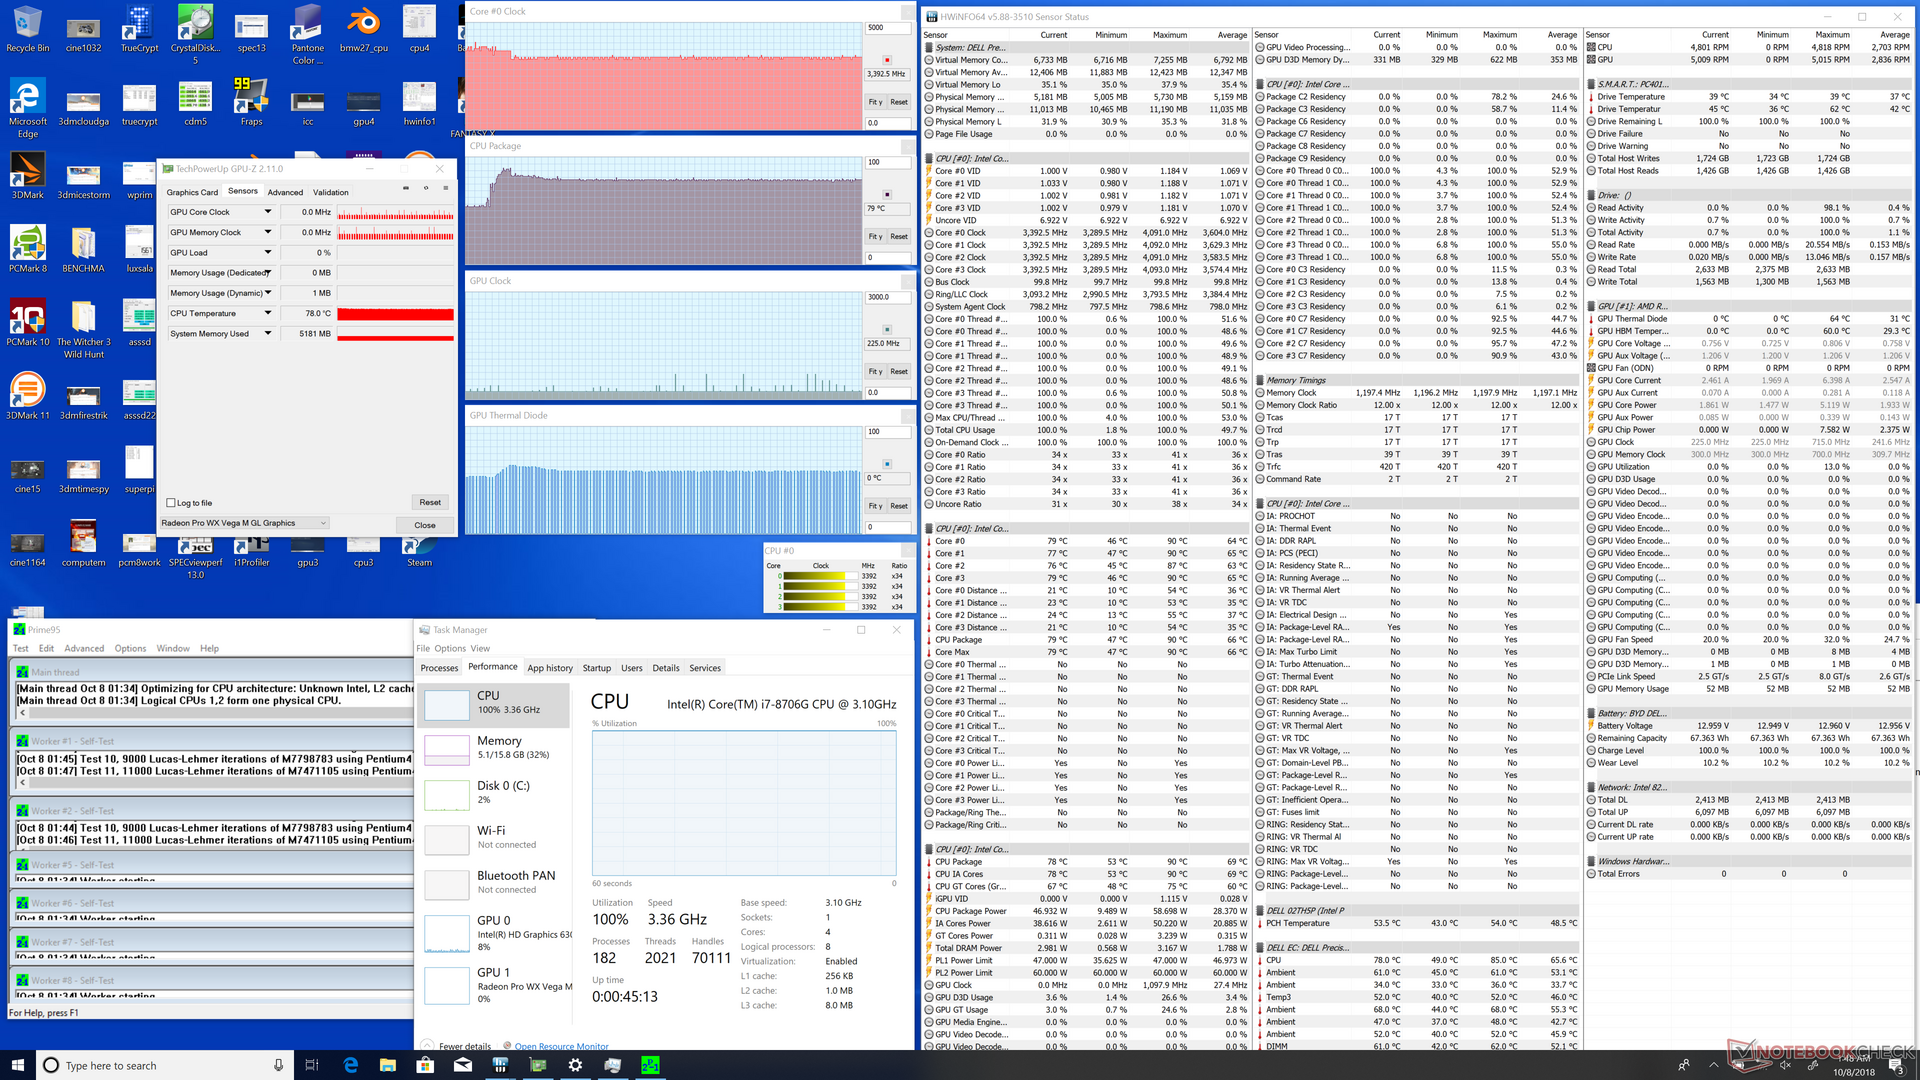
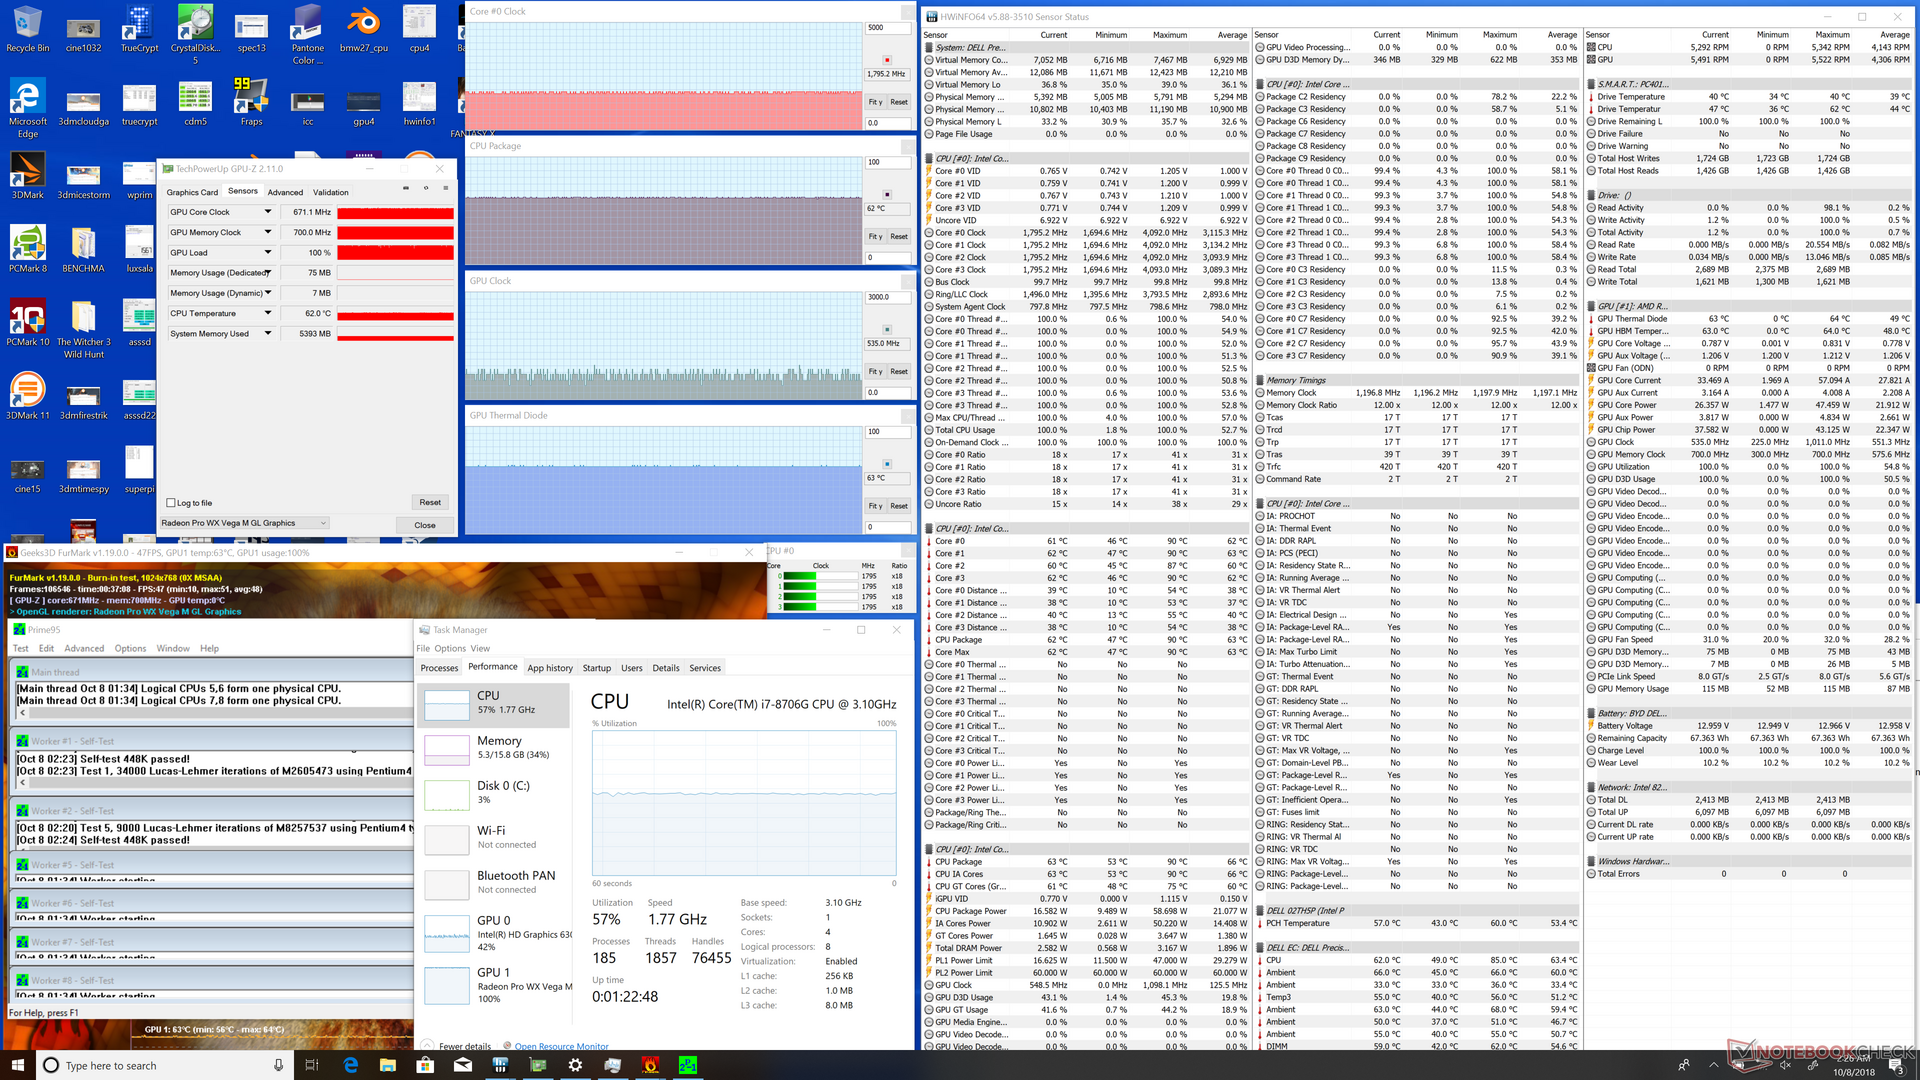
We stress the system with synthetic loads in order to identify for any potential throttling or stability issues. When subjected to Prime95 stress, the CPU can be observed running at up to 3.7 GHz for the first few seconds before core temperature reaches 90 C. Once this ceiling is reached, clock rates drop to 3.4 GHz in order to maintain a cooler core temperature of 79 C. Since the base clock rate of the i7-8706G is 3.1 GHz, the CPU in the Precision 2-in-1 is able to maintain a +300 MHz Turbo Boost even when under extreme processing stress to be faster than many gaming laptops equipped with the Core i7-7700HQ. Running both Prime95 and FurMark simultaneously will throttle the CPU down to just 1.8 GHz.
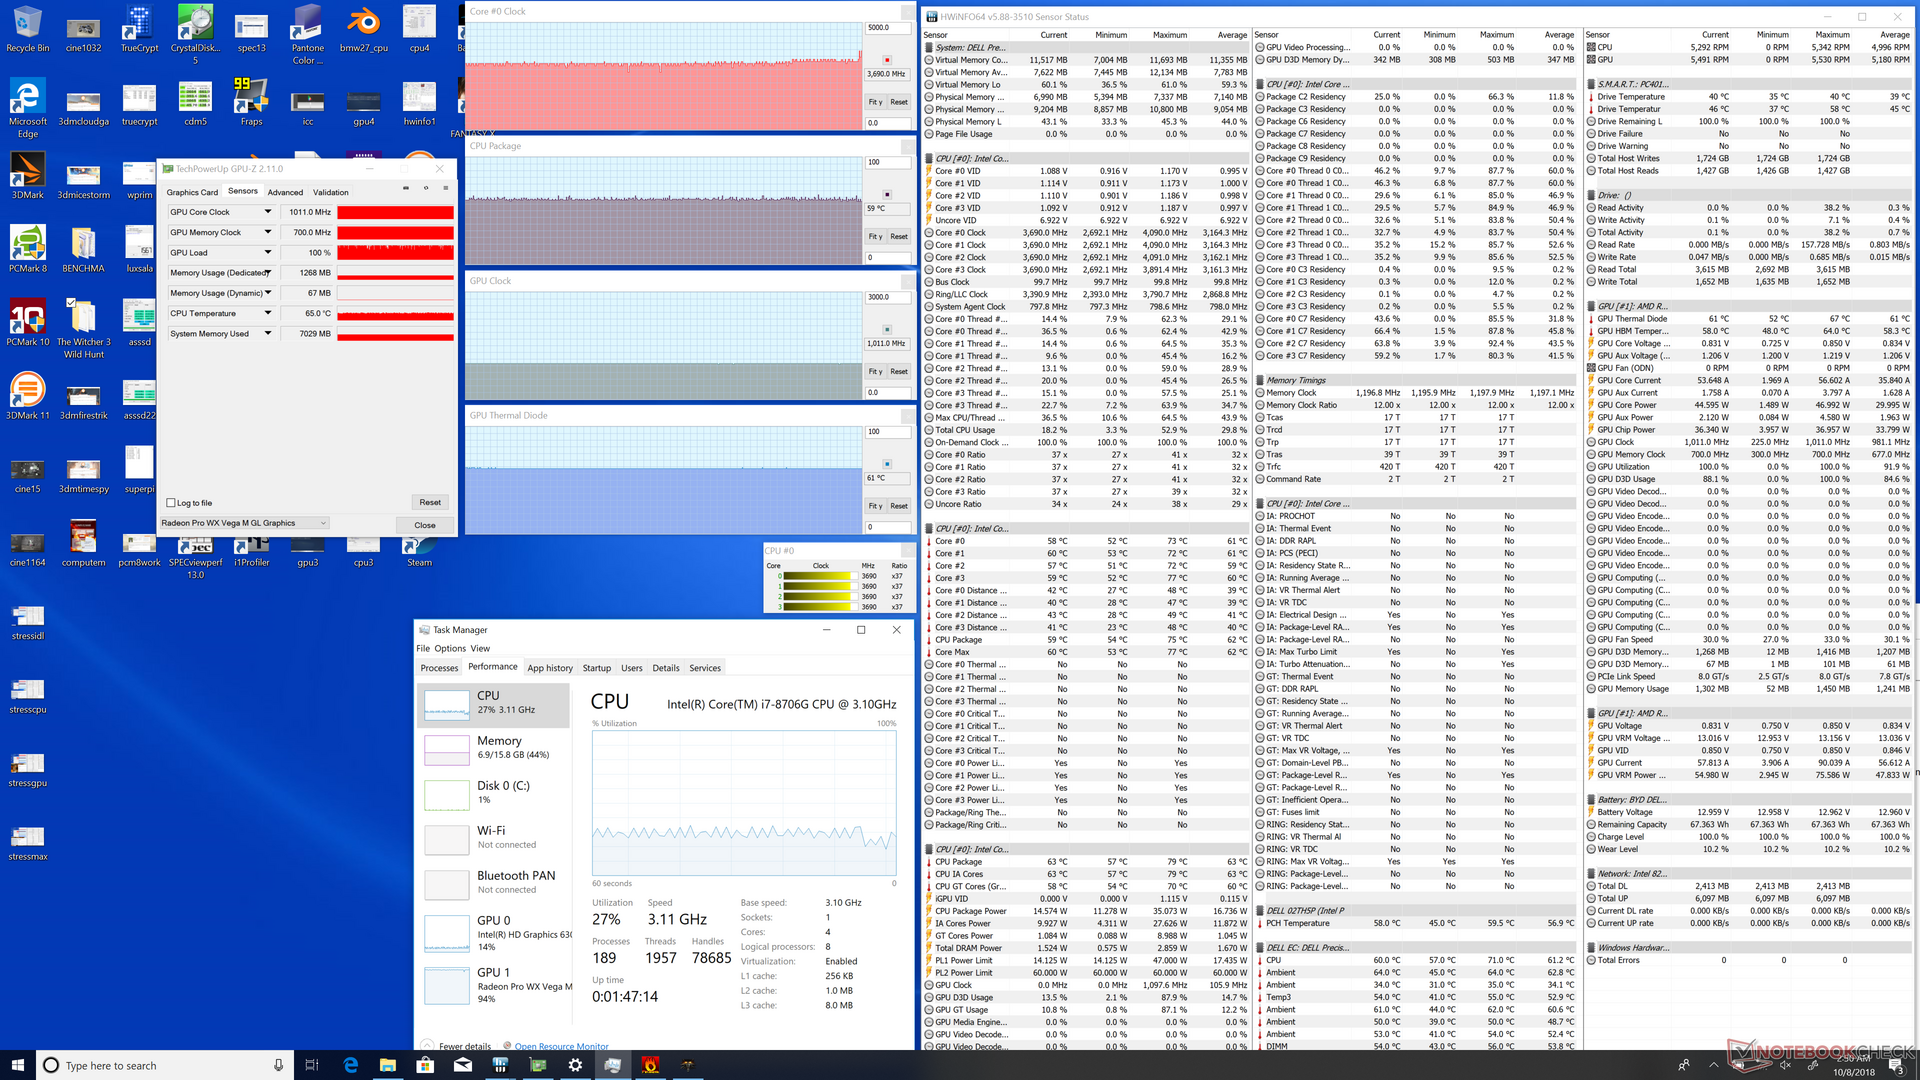
When under gaming loads, the GPU will run at its rated clock rate of 1011 MHz without a single hitch. Core temperatures are also quite cool at about 60 C which is impressive for a convertible capable of playing games.
Running on battery power reduces overall performance. A 3DMark 11 run on batteries returns Physics and Graphics scores of only 8309 and 5644 points, respectively, compared to 9579 and 10020 points when on mains.
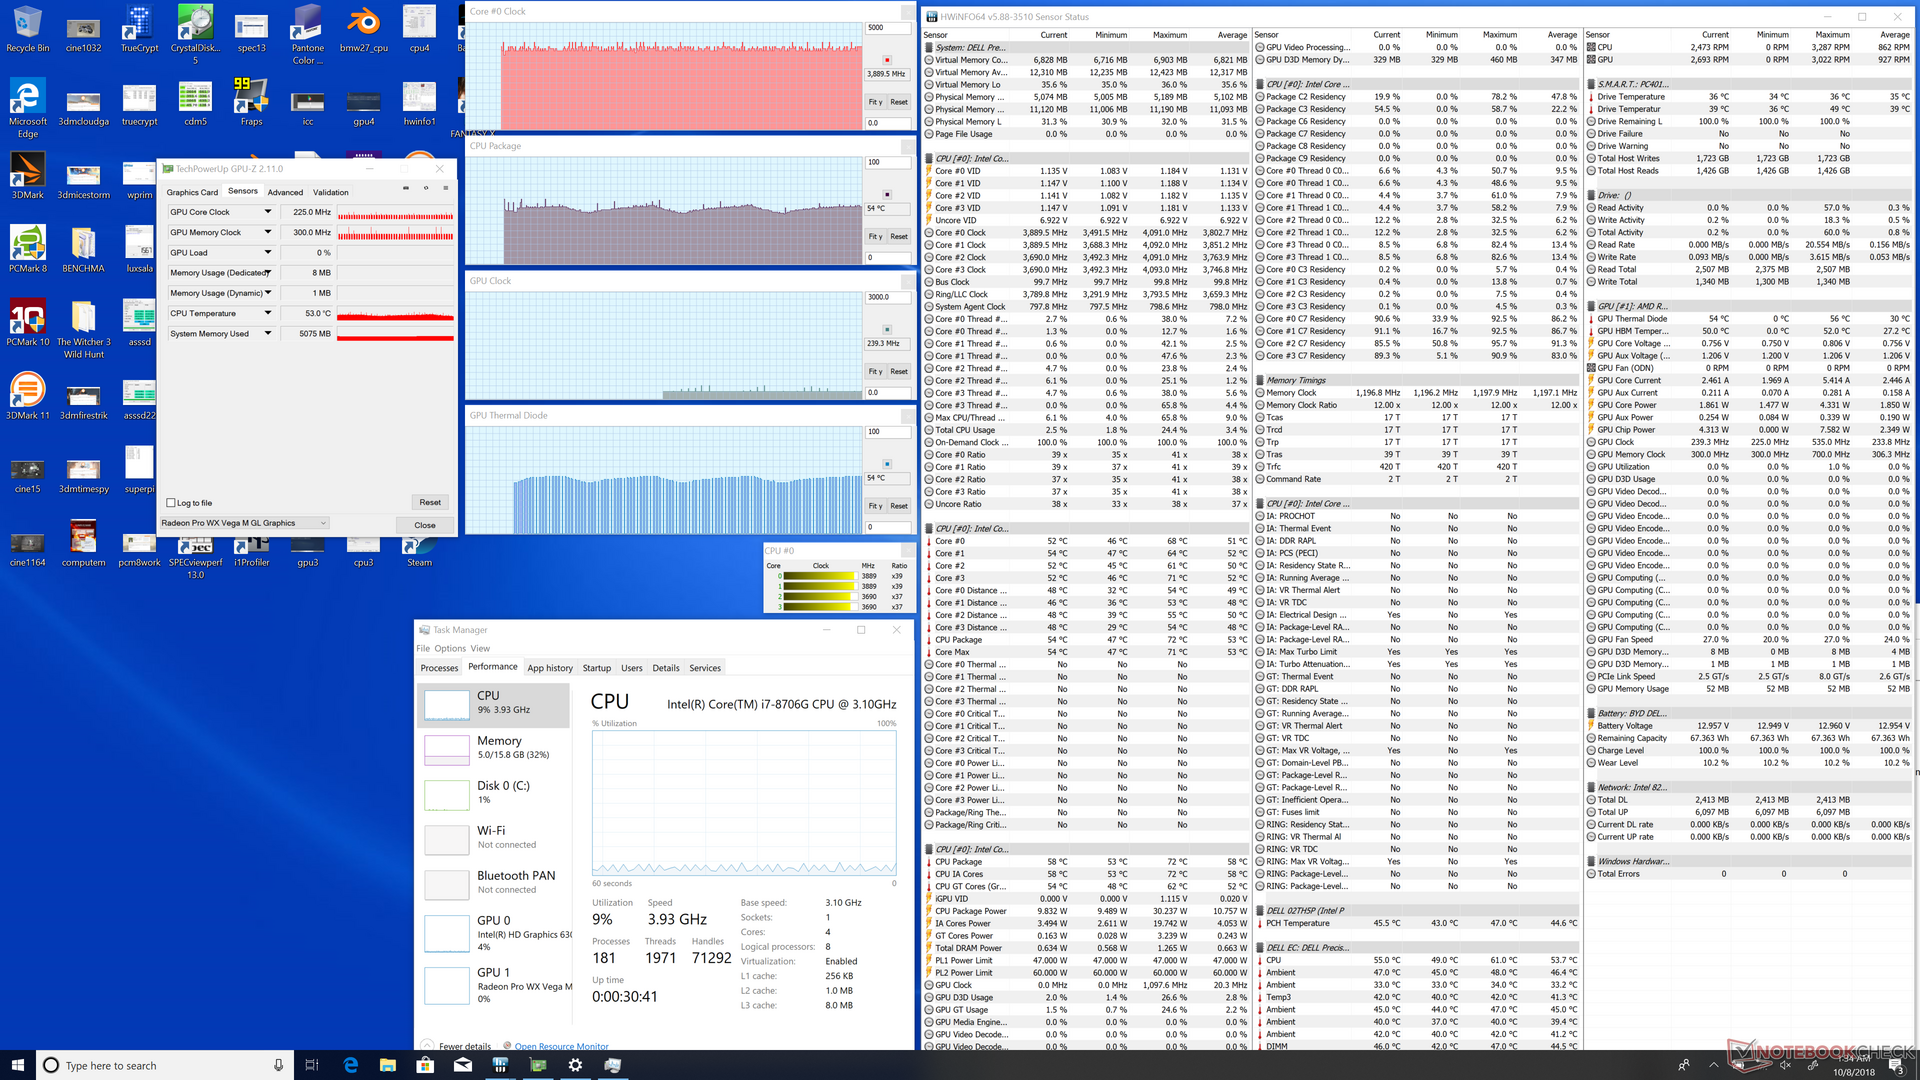
| CPU Clock (GHz) | GPU Clock (MHz) | Average CPU Temperature (°C) | Average GPU Temperature (°C) | |
| System Idle | -- | -- | 53 | 53 |
| Prime95 Stress | 3.4 | -- | 79 | -- |
| FurMark Stress | -- | 535 - 868 | -- | 63 |
| Prime95 + FurMark Stress | 1.8 | 535 - 671 | 62 | 63 |
| Witcher 3 Stress | 3.7 | 1011 | 59 | 61 |
Emissions
System Noise
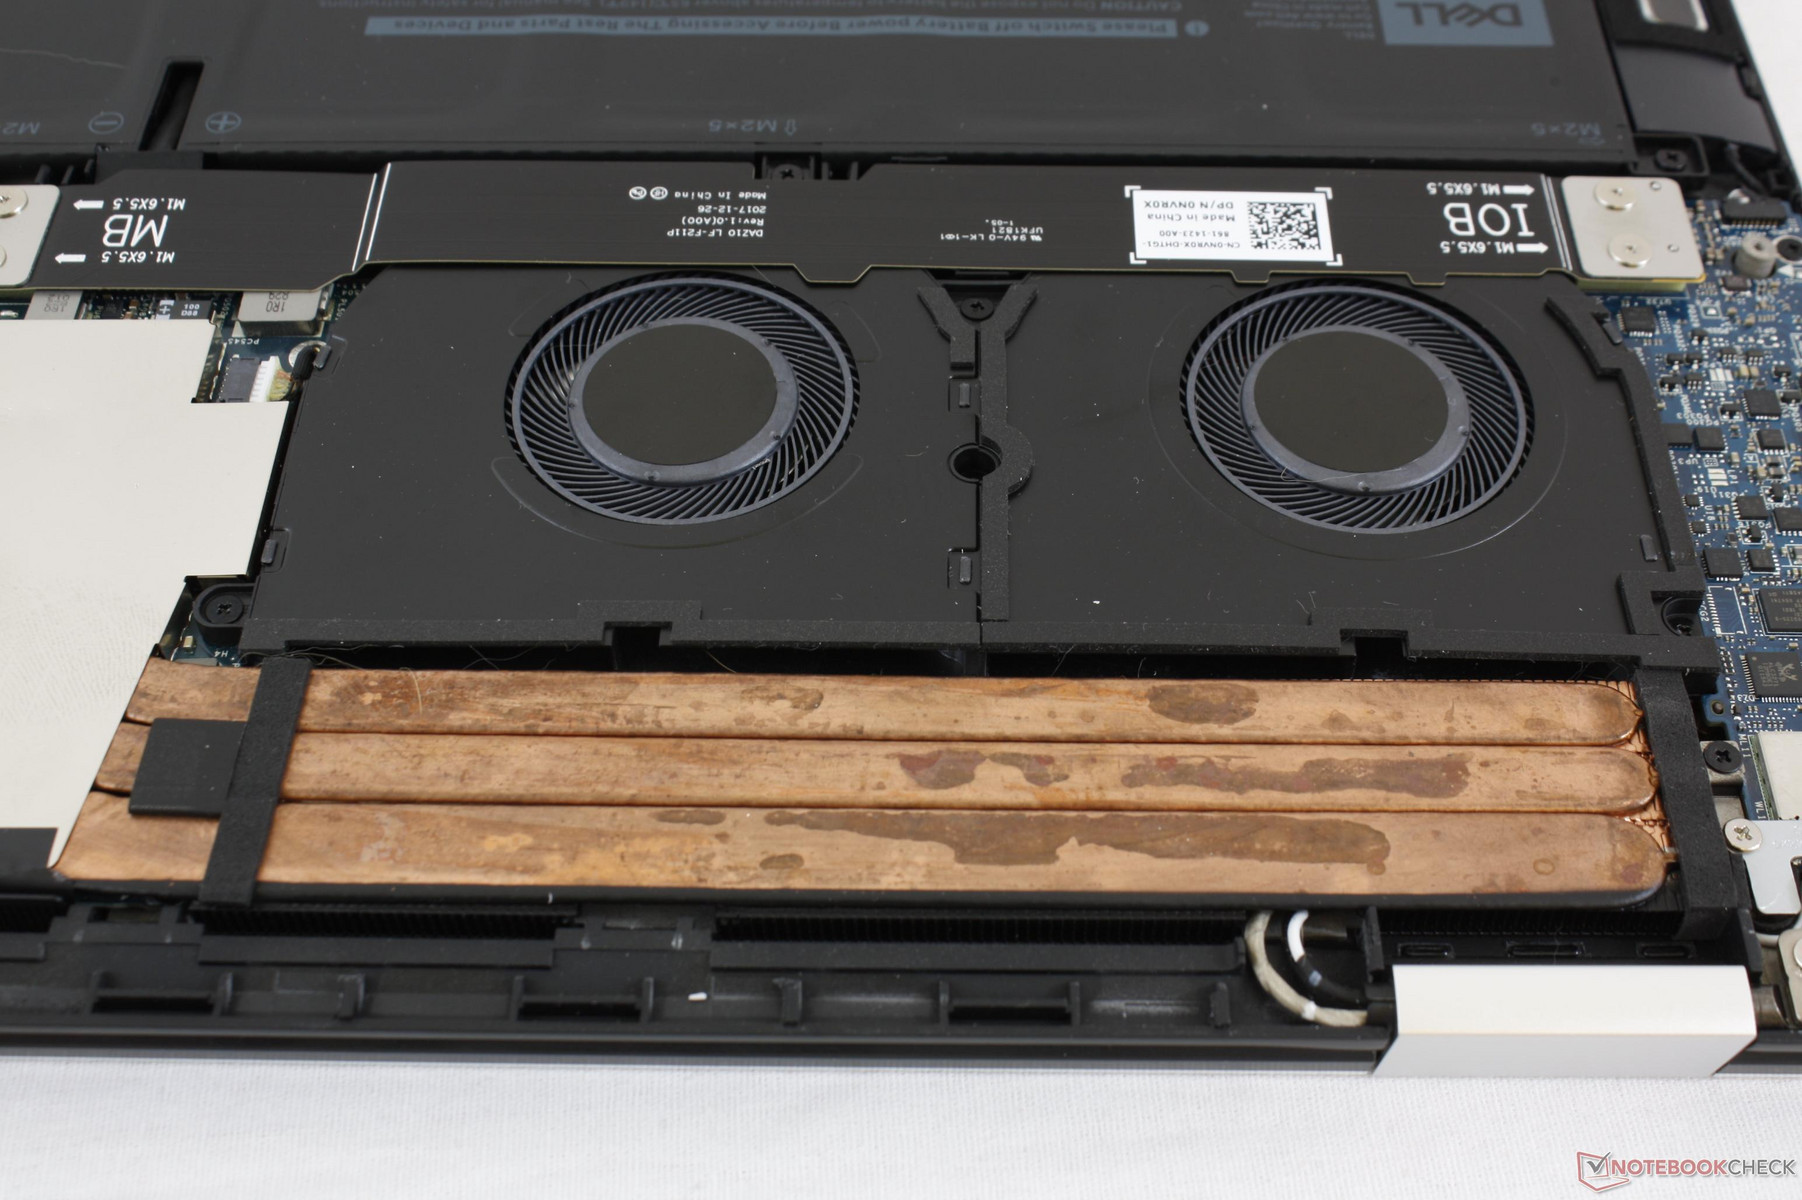
Fan noise is similar to the standard Precision 5530 despite the vast differences in hardware. The twin fans are idle when on desktop and can boost just slightly during very low loads like video streaming. Unfortunately, it doesn't take very much to bump fan noise to 40 dB(A) or higher. Expect a loud machine when running games or other similarly demanding workloads.
We can notice no electronic noise or coil whine from our test unit.
Noise level
| Idle |
| 28.6 / 28.6 / 29.1 dB(A) |
| Load |
| 39.8 / 47 dB(A) |
 | ||
30 dB silent 40 dB(A) audible 50 dB(A) loud |
||
min: | ||
| Dell Precision 5530 2-in-1 WX Vega M GL, i7-8706G, SK Hynix PC401 512GB M.2 (HFS512GD9TNG) | MSI WS63VR 7RL-023US Quadro P4000 Max-Q, i7-7700HQ, Toshiba NVMe THNSN5512GPU7 | Lenovo ThinkPad X1 Extreme-20MF000XGE GeForce GTX 1050 Ti Max-Q, i7-8750H, Samsung SSD PM981 MZVLB1T0HALR | Dell Precision 5530 Xeon E-2176M Quadro P2000, E-2176M, SK hynix PC400 512 GB | HP ZBook 15u G5 2ZC05EA Radeon Pro WX 3100, i5-8550U, Toshiba XG5 KXG50ZNV256G | Dell XPS 15 9575 i7-8705G Vega M GL / 870, i7-8705G, SK hynix PC401 NVMe 500 GB | |
|---|---|---|---|---|---|---|
| Noise | -3% | 5% | -1% | 6% | 5% | |
| off / environment * (dB) | 28.6 | 28 2% | 28.8 -1% | 28.4 1% | 29.8 -4% | 28.2 1% |
| Idle Minimum * (dB) | 28.6 | 33.2 -16% | 28.8 -1% | 28.4 1% | 29.8 -4% | 28.2 1% |
| Idle Average * (dB) | 28.6 | 33.2 -16% | 28.8 -1% | 28.4 1% | 29.8 -4% | 28.2 1% |
| Idle Maximum * (dB) | 29.1 | 33.2 -14% | 31.3 -8% | 28.4 2% | 30.8 -6% | 28.2 3% |
| Load Average * (dB) | 39.8 | 41.4 -4% | 36.4 9% | 46.5 -17% | 32.9 17% | 29 27% |
| Witcher 3 ultra * (dB) | 47 | 38.4 18% | 36.4 23% | 46.5 1% | 36.5 22% | 44.7 5% |
| Load Maximum * (dB) | 47 | 43.5 7% | 39.2 17% | 46.5 1% | 36.5 22% | 47.4 -1% |
* ... smaller is better
Temperature
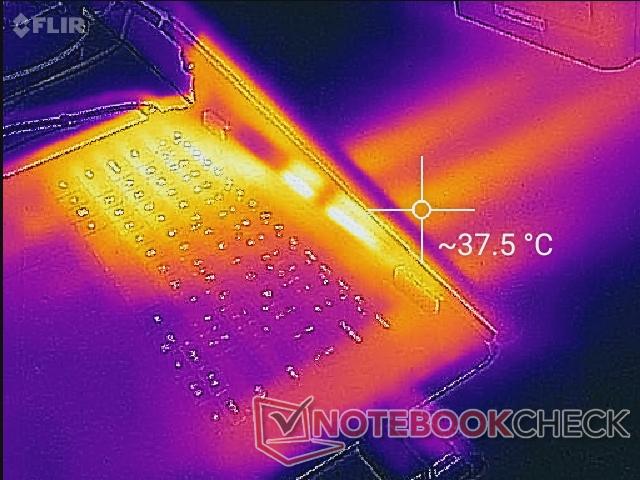
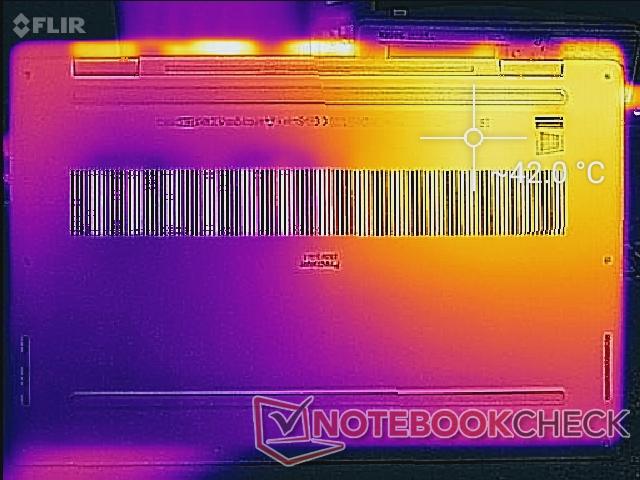
Unlike on the HP Spectre x360 15, Dell Precision 5530, or Lenovo ThinkPad X1 Extreme, surface temperature development on the Precision 5530 2-in-1 is not symmetrical. Our temperature maps below show that the left half of the system will always be warmer than the right half by as much as 10 to 16 degrees when under extreme processing stress. Fortunately, the palm rests remain relatively cool, but expect some very warm WASD keys after prolonged stress. Surface temperatures are otherwise more or less uniform during low loads like browsing or word processing.

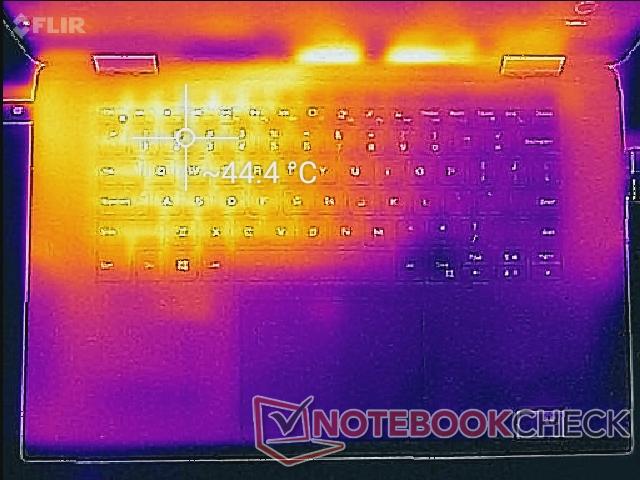
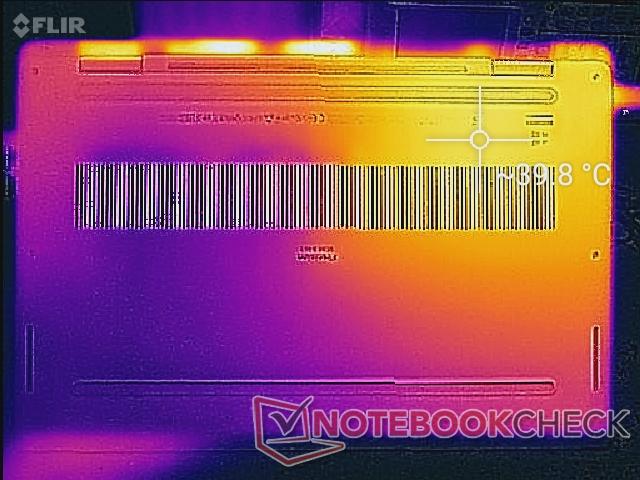
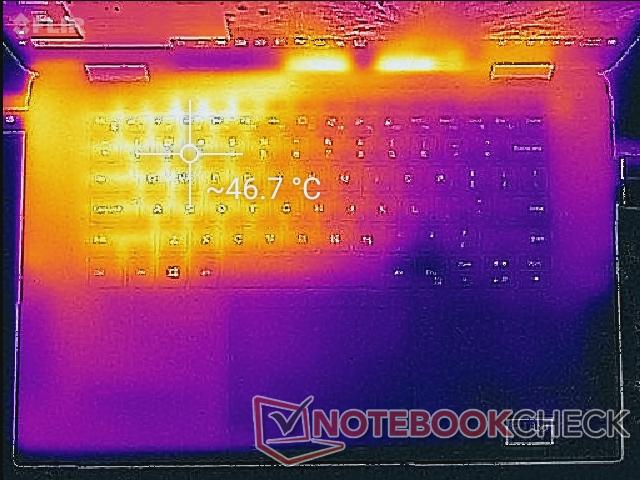
(-) The maximum temperature on the upper side is 48.6 °C / 119 F, compared to the average of 38.2 °C / 101 F, ranging from 22.2 to 69.8 °C for the class Workstation.
(±) The bottom heats up to a maximum of 42.2 °C / 108 F, compared to the average of 41.1 °C / 106 F
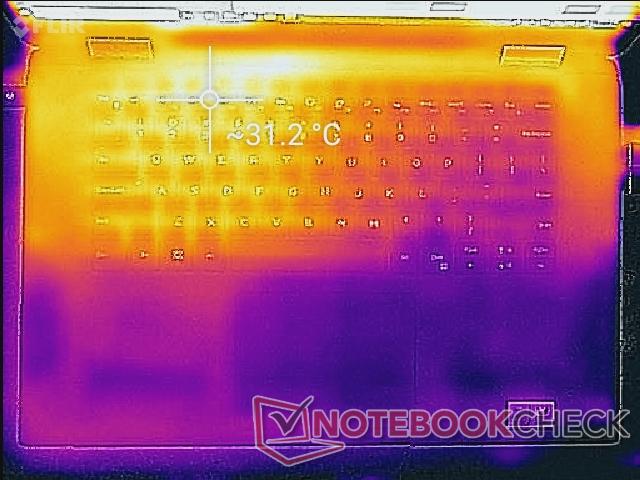
(+) In idle usage, the average temperature for the upper side is 29.1 °C / 84 F, compared to the device average of 32 °C / 90 F.
(±) Playing The Witcher 3, the average temperature for the upper side is 35.1 °C / 95 F, compared to the device average of 32 °C / 90 F.
(+) The palmrests and touchpad are cooler than skin temperature with a maximum of 31.2 °C / 88.2 F and are therefore cool to the touch.
(-) The average temperature of the palmrest area of similar devices was 27.8 °C / 82 F (-3.4 °C / -6.2 F).
Speakers


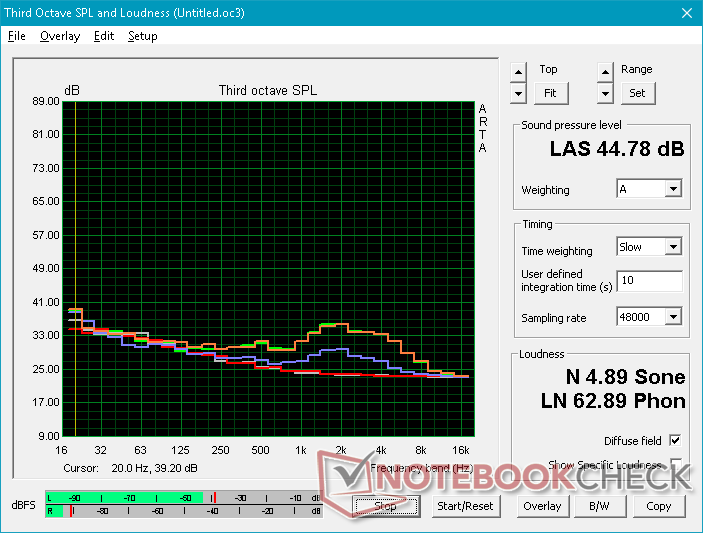
Dell Precision 5530 2-in-1 audio analysis
(±) | speaker loudness is average but good (72.5 dB)
Bass 100 - 315 Hz
(±) | reduced bass - on average 9.6% lower than median
(±) | linearity of bass is average (13% delta to prev. frequency)
Mids 400 - 2000 Hz
(+) | balanced mids - only 3.2% away from median
(+) | mids are linear (6.9% delta to prev. frequency)
Highs 2 - 16 kHz
(+) | balanced highs - only 2.8% away from median
(±) | linearity of highs is average (9.7% delta to prev. frequency)
Overall 100 - 16.000 Hz
(+) | overall sound is linear (13.9% difference to median)
Compared to same class
» 28% of all tested devices in this class were better, 4% similar, 67% worse
» The best had a delta of 7%, average was 17%, worst was 35%
Compared to all devices tested
» 16% of all tested devices were better, 4% similar, 80% worse
» The best had a delta of 4%, average was 23%, worst was 134%
Apple MacBook 12 (Early 2016) 1.1 GHz audio analysis
(+) | speakers can play relatively loud (83.6 dB)
Bass 100 - 315 Hz
(±) | reduced bass - on average 11.3% lower than median
(±) | linearity of bass is average (14.2% delta to prev. frequency)
Mids 400 - 2000 Hz
(+) | balanced mids - only 2.4% away from median
(+) | mids are linear (5.5% delta to prev. frequency)
Highs 2 - 16 kHz
(+) | balanced highs - only 2% away from median
(+) | highs are linear (4.5% delta to prev. frequency)
Overall 100 - 16.000 Hz
(+) | overall sound is linear (10.2% difference to median)
Compared to same class
» 7% of all tested devices in this class were better, 2% similar, 90% worse
» The best had a delta of 5%, average was 18%, worst was 53%
Compared to all devices tested
» 5% of all tested devices were better, 1% similar, 94% worse
» The best had a delta of 4%, average was 23%, worst was 134%
Energy Management
Power Consumption
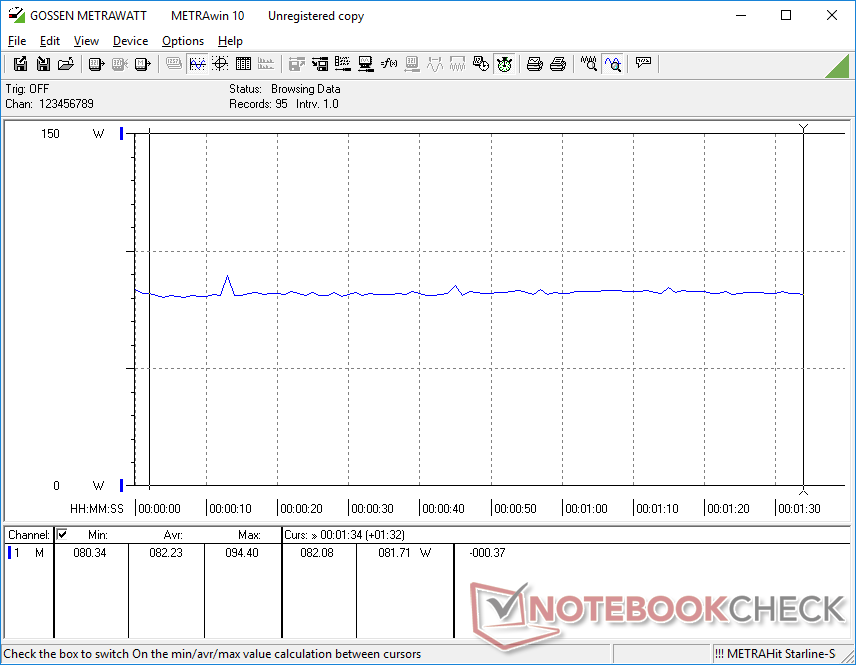
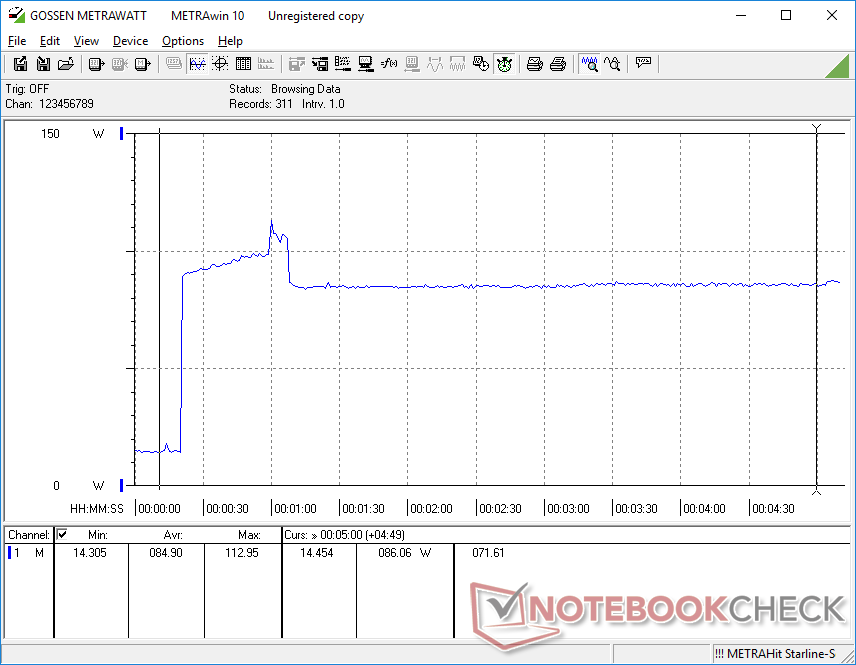
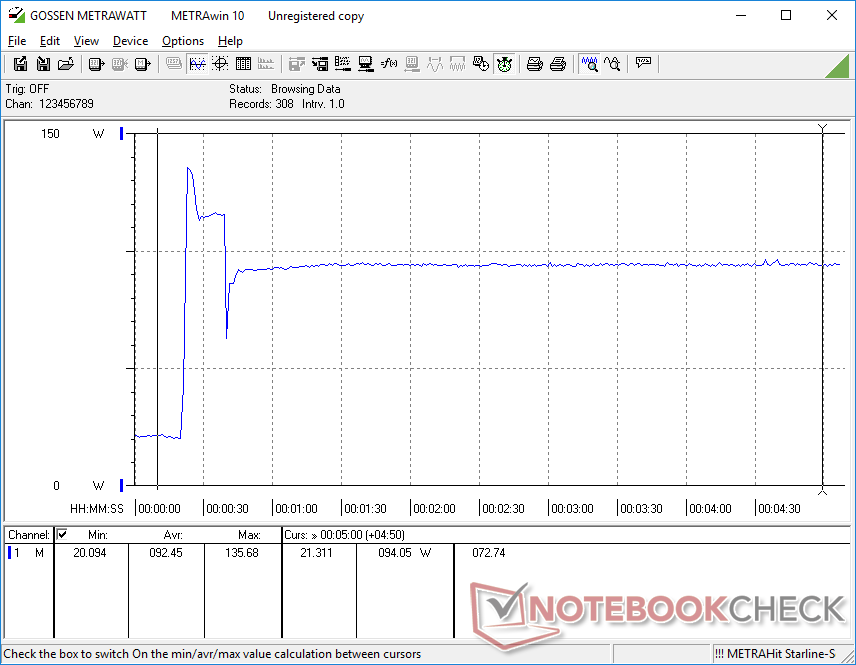
Dell's hybrid Intel-AMD solution is very similar to the ThinkPad X1 Extreme in terms of power consumption when subjected to gaming-level loads. When subjected to maximum 100 percent loads, the Lenovo is able to draw more power than the Dell (119 W vs. 97 W) to suggest that it's better able at sustaining higher performance over time. This is indeed the case because the Core i7-8750H is about 30 percent more powerful than the i7-8706G in multi-threaded CPU tasks and it subsequently demands more power from the outlet when stressed. When simply idling on desktop, however, the XPS 9575 is definitely the one to beat in terms of efficiency.
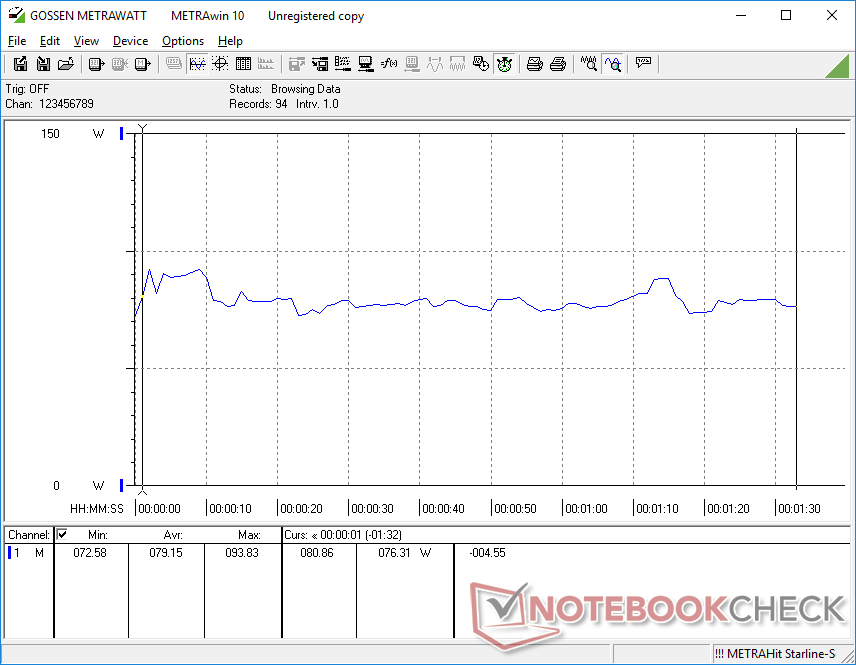
We are able to measure a maximum consumption of 136 W from the medium-sized (~14.3 x 6.5 x 2.2 cm) 130 W AC adapter when subjected to Prime95 and FurMark load. As our graph below shows, this very high power demand is short-lived as the system eventually settles to a steady 94 W after just a few seconds. In other words, the system is unable to maintain maximum Turbo Boost for very long which corroborate with our CineBench loop test from above.
| Off / Standby | |
| Idle | |
| Load |
|
Key:
min: | |
| Dell Precision 5530 2-in-1 i7-8706G, WX Vega M GL, SK Hynix PC401 512GB M.2 (HFS512GD9TNG), IPS, 3840x2160, 15.6" | MSI WS63VR 7RL-023US i7-7700HQ, Quadro P4000 Max-Q, Toshiba NVMe THNSN5512GPU7, IPS, 3840x2160, 15.6" | Lenovo ThinkPad X1 Extreme-20MF000XGE i7-8750H, GeForce GTX 1050 Ti Max-Q, Samsung SSD PM981 MZVLB1T0HALR, IPS, 3840x2160, 15.6" | Dell Precision 5530 Xeon E-2176M E-2176M, Quadro P2000, SK hynix PC400 512 GB, IGZO, 3840x2160, 15.6" | Gigabyte Aero 15X v8 i7-8750H, GeForce GTX 1070 Max-Q, Toshiba NVMe THNSN5512GPU7, IPS, 1920x1080, 15.6" | HP ZBook 15u G5 2ZC05EA i5-8550U, Radeon Pro WX 3100, Toshiba XG5 KXG50ZNV256G, IPS LED, 1920x1080, 15.6" | |
|---|---|---|---|---|---|---|
| Power Consumption | -34% | -15% | -23% | -61% | 38% | |
| Idle Minimum * (Watt) | 7.4 | 13.3 -80% | 7.6 -3% | 9.8 -32% | 14 -89% | 3.2 57% |
| Idle Average * (Watt) | 12.4 | 17.2 -39% | 14.8 -19% | 16.8 -35% | 18 -45% | 6.1 51% |
| Idle Maximum * (Watt) | 13.3 | 17.9 -35% | 17.6 -32% | 16.9 -27% | 22 -65% | 9.7 27% |
| Load Average * (Watt) | 79.2 | 83.7 -6% | 86 -9% | 102.3 -29% | 91 -15% | 62 22% |
| Witcher 3 ultra * (Watt) | 82.2 | 101.9 -24% | 85 -3% | 76.5 7% | 142 -73% | 48 42% |
| Load Maximum * (Watt) | 96.5 | 114.3 -18% | 118.9 -23% | 114.5 -19% | 173 -79% | 71 26% |
* ... smaller is better
Battery Life
Runtimes are unsurprisingly similar to the XPS 15 9575 and so users can expect just over 7 hours of real-world WLAN use before needing to recharge. On the other hand, expect a battery life of under 70 minutes if running demanding tasks. The ThinkPad X1 Extreme has slightly shorter runtimes overall.
Any of the four USB Type-C ports can be used to charge the system.
| Dell Precision 5530 2-in-1 i7-8706G, WX Vega M GL, 75 Wh | MSI WS63VR 7RL-023US i7-7700HQ, Quadro P4000 Max-Q, 48 Wh | Lenovo ThinkPad X1 Extreme-20MF000XGE i7-8750H, GeForce GTX 1050 Ti Max-Q, 80 Wh | Dell Precision 5530 Xeon E-2176M E-2176M, Quadro P2000, 97 Wh | Gigabyte Aero 15X v8 i7-8750H, GeForce GTX 1070 Max-Q, 94.24 Wh | HP ZBook 15u G5 2ZC05EA i5-8550U, Radeon Pro WX 3100, 56 Wh | |
|---|---|---|---|---|---|---|
| Battery runtime | -51% | 16% | 33% | 46% | 90% | |
| Reader / Idle (h) | 12.3 | 3.9 -68% | 11.5 -7% | 16.5 34% | 12.7 3% | 21.7 76% |
| WiFi v1.3 (h) | 7.3 | 2.9 -60% | 6.4 -12% | 8.4 15% | 8.6 18% | 8.6 18% |
| Load (h) | 1.2 | 0.9 -25% | 2 67% | 1.8 50% | 2.6 117% | 3.3 175% |
| Witcher 3 ultra (h) | 1.1 |
Pros
Cons
Verdict
If you're a traditional workstation user who wants integrated VGA, full-size ports, thicker chassis, ECC memory, Smart Card readers, more storage space, E-Port compatibility, and easier serviceability, then the Precision 5530 2-in-1 is not for you. A Precision 7000 series laptop like the 7720 would be the better fit in such stationary scenarios.
On the other hand, professionals who are constantly taking their work on-the-road and are drawn in by the versatile 360-degrees hinges should consider the Precision 5530 2-in-1. Its CPU and GPU strike a great balance in terms of individual performance and its bright IGZO display has the range required to accurately reproduce both sRGB and AdobeRGB. It's a deceivingly powerful workstation despite the high portability and very thin form factor.
Users who want a portable workstation but are otherwise uninterested in touchscreen features or tablet mode may want to look at the Precision 5530 or MSI WS63VR as alternative options. The MSI chassis may not be as rigid as the Dell, but it offers faster Quadro P3000 and P4000 Max-Q graphics options that demanding workstation users may appreciate.
The Precision 5530 2-in-1 is a mobile powerhouse that finely balances performance and portability. If it's ports and ease of service you are after, however, then the the more traditional Precision 7720 would be the stronger and faster option.
Dell Precision 5530 2-in-1
- 10/12/2018 v6 (old)
Allen Ngo
