MSI GS65 Stealth Thin 8RE-051US (GTX 1060) Laptop Review

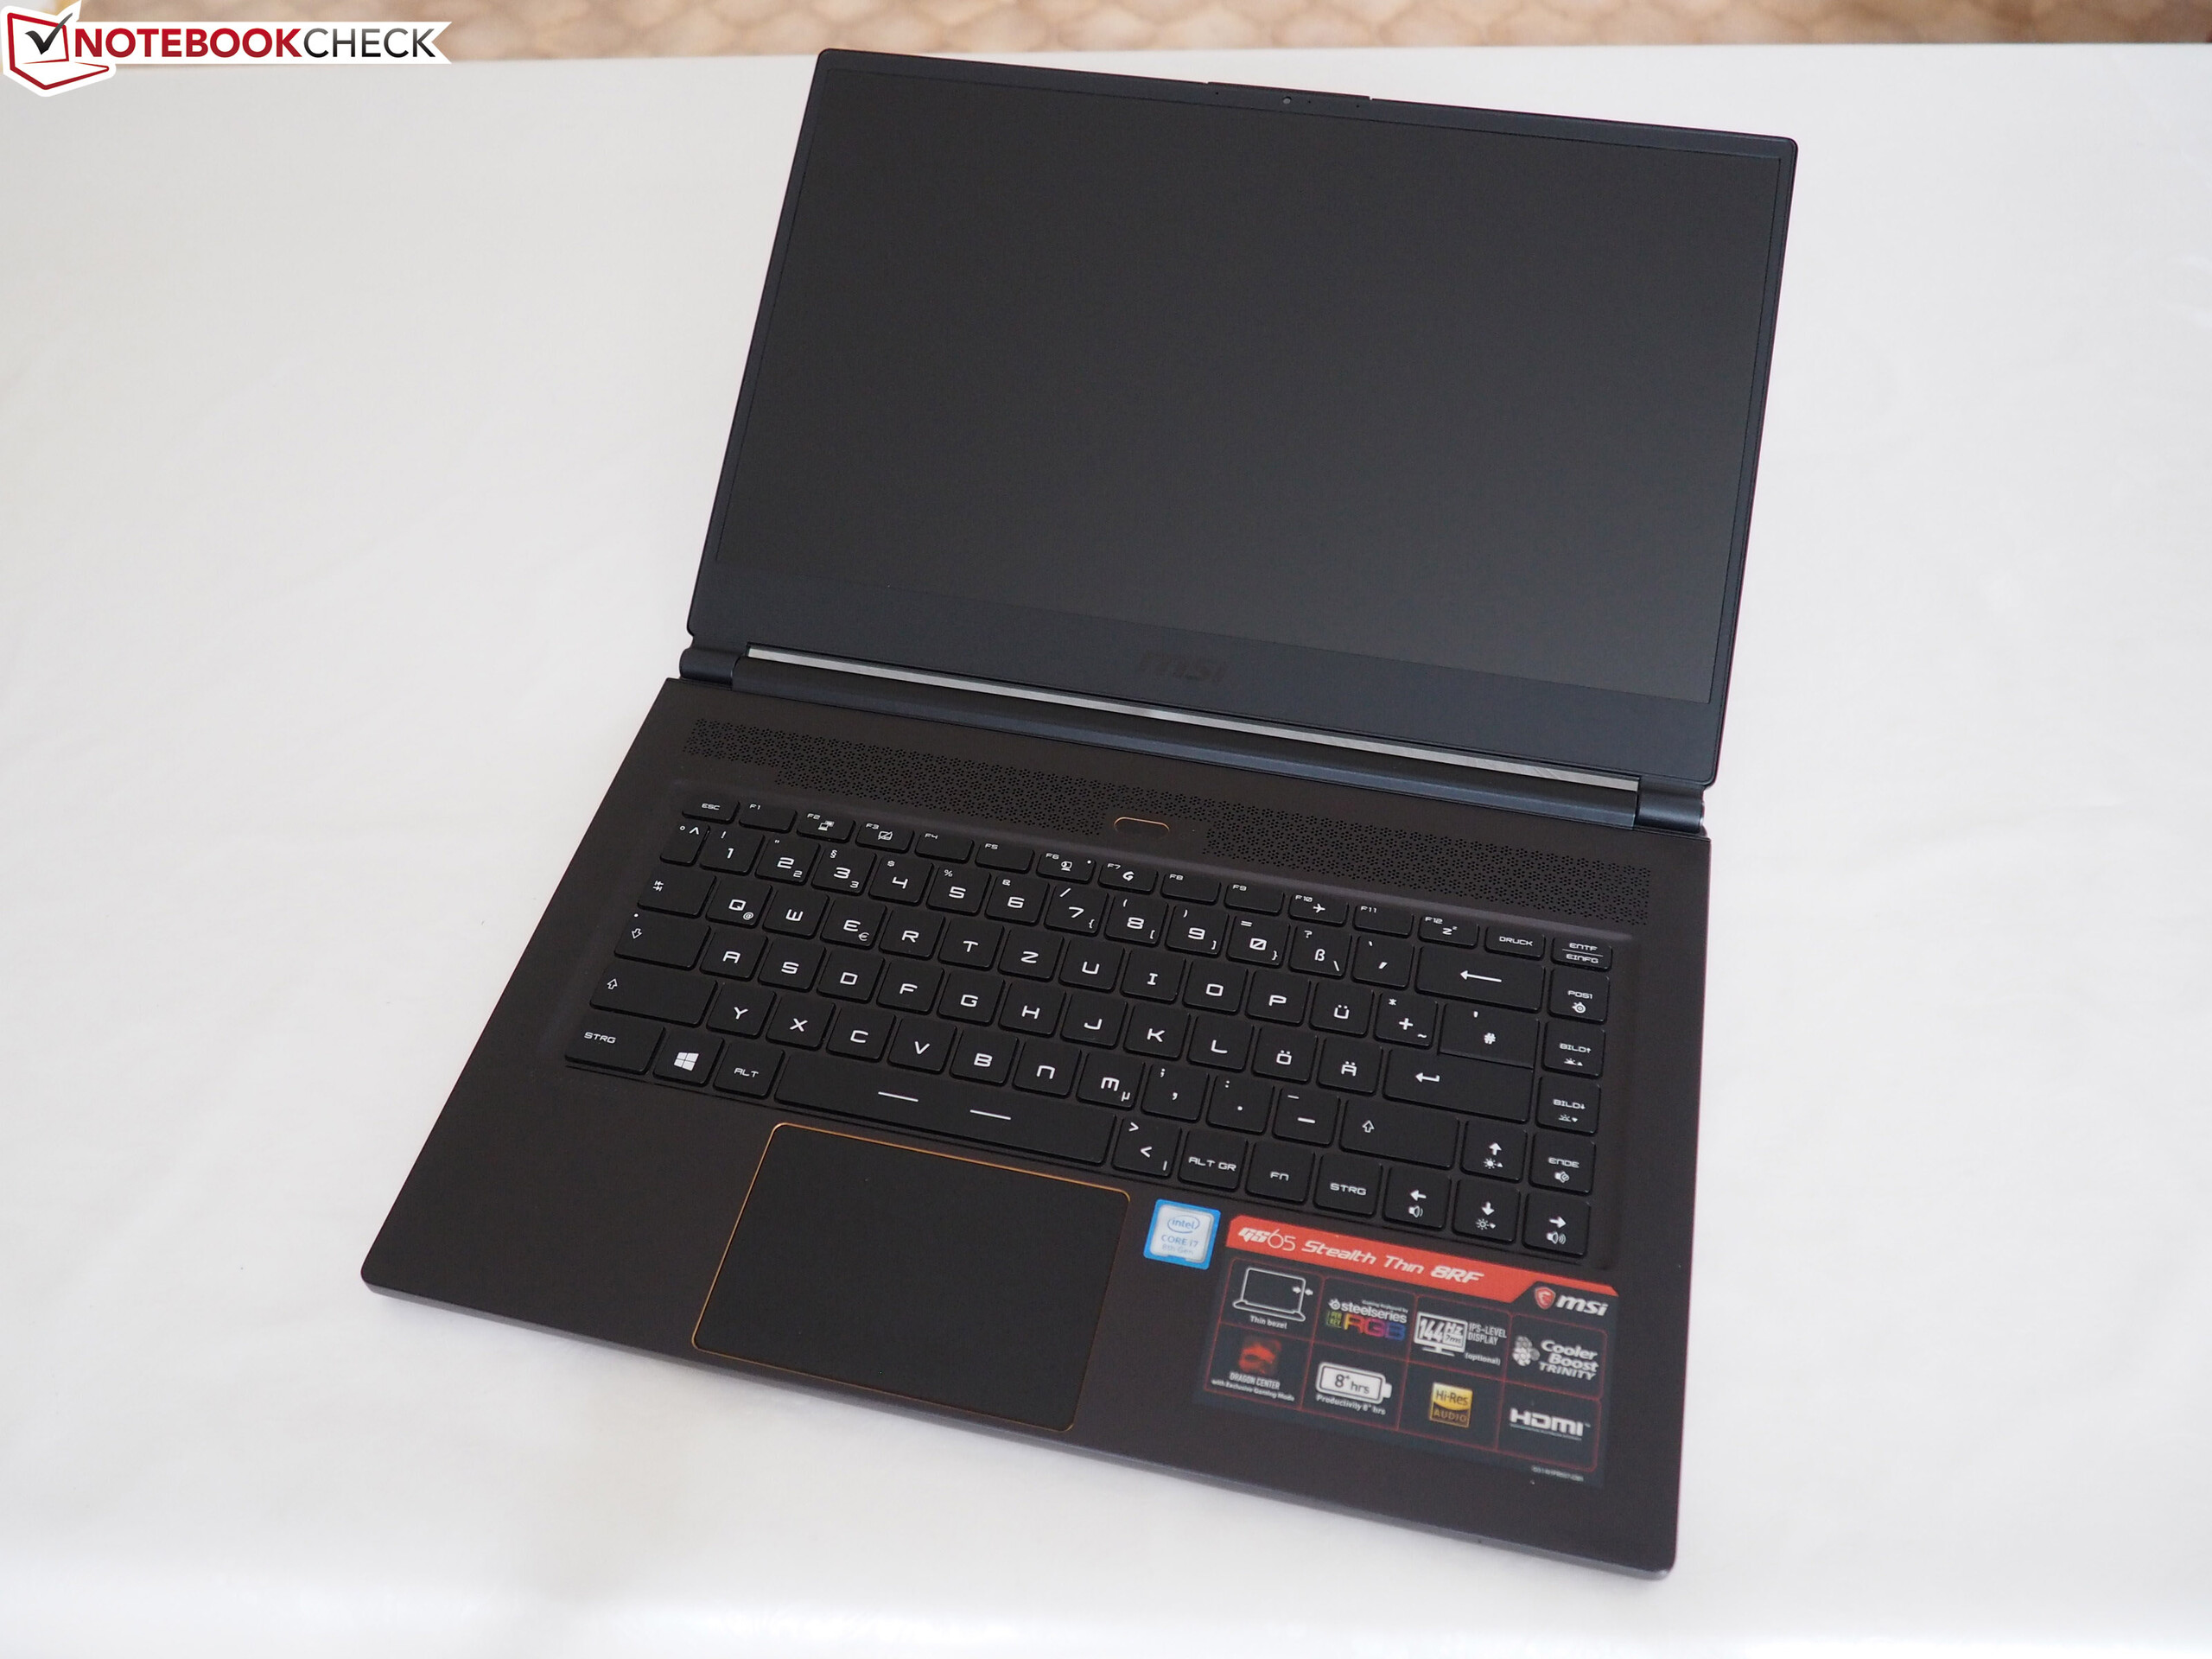
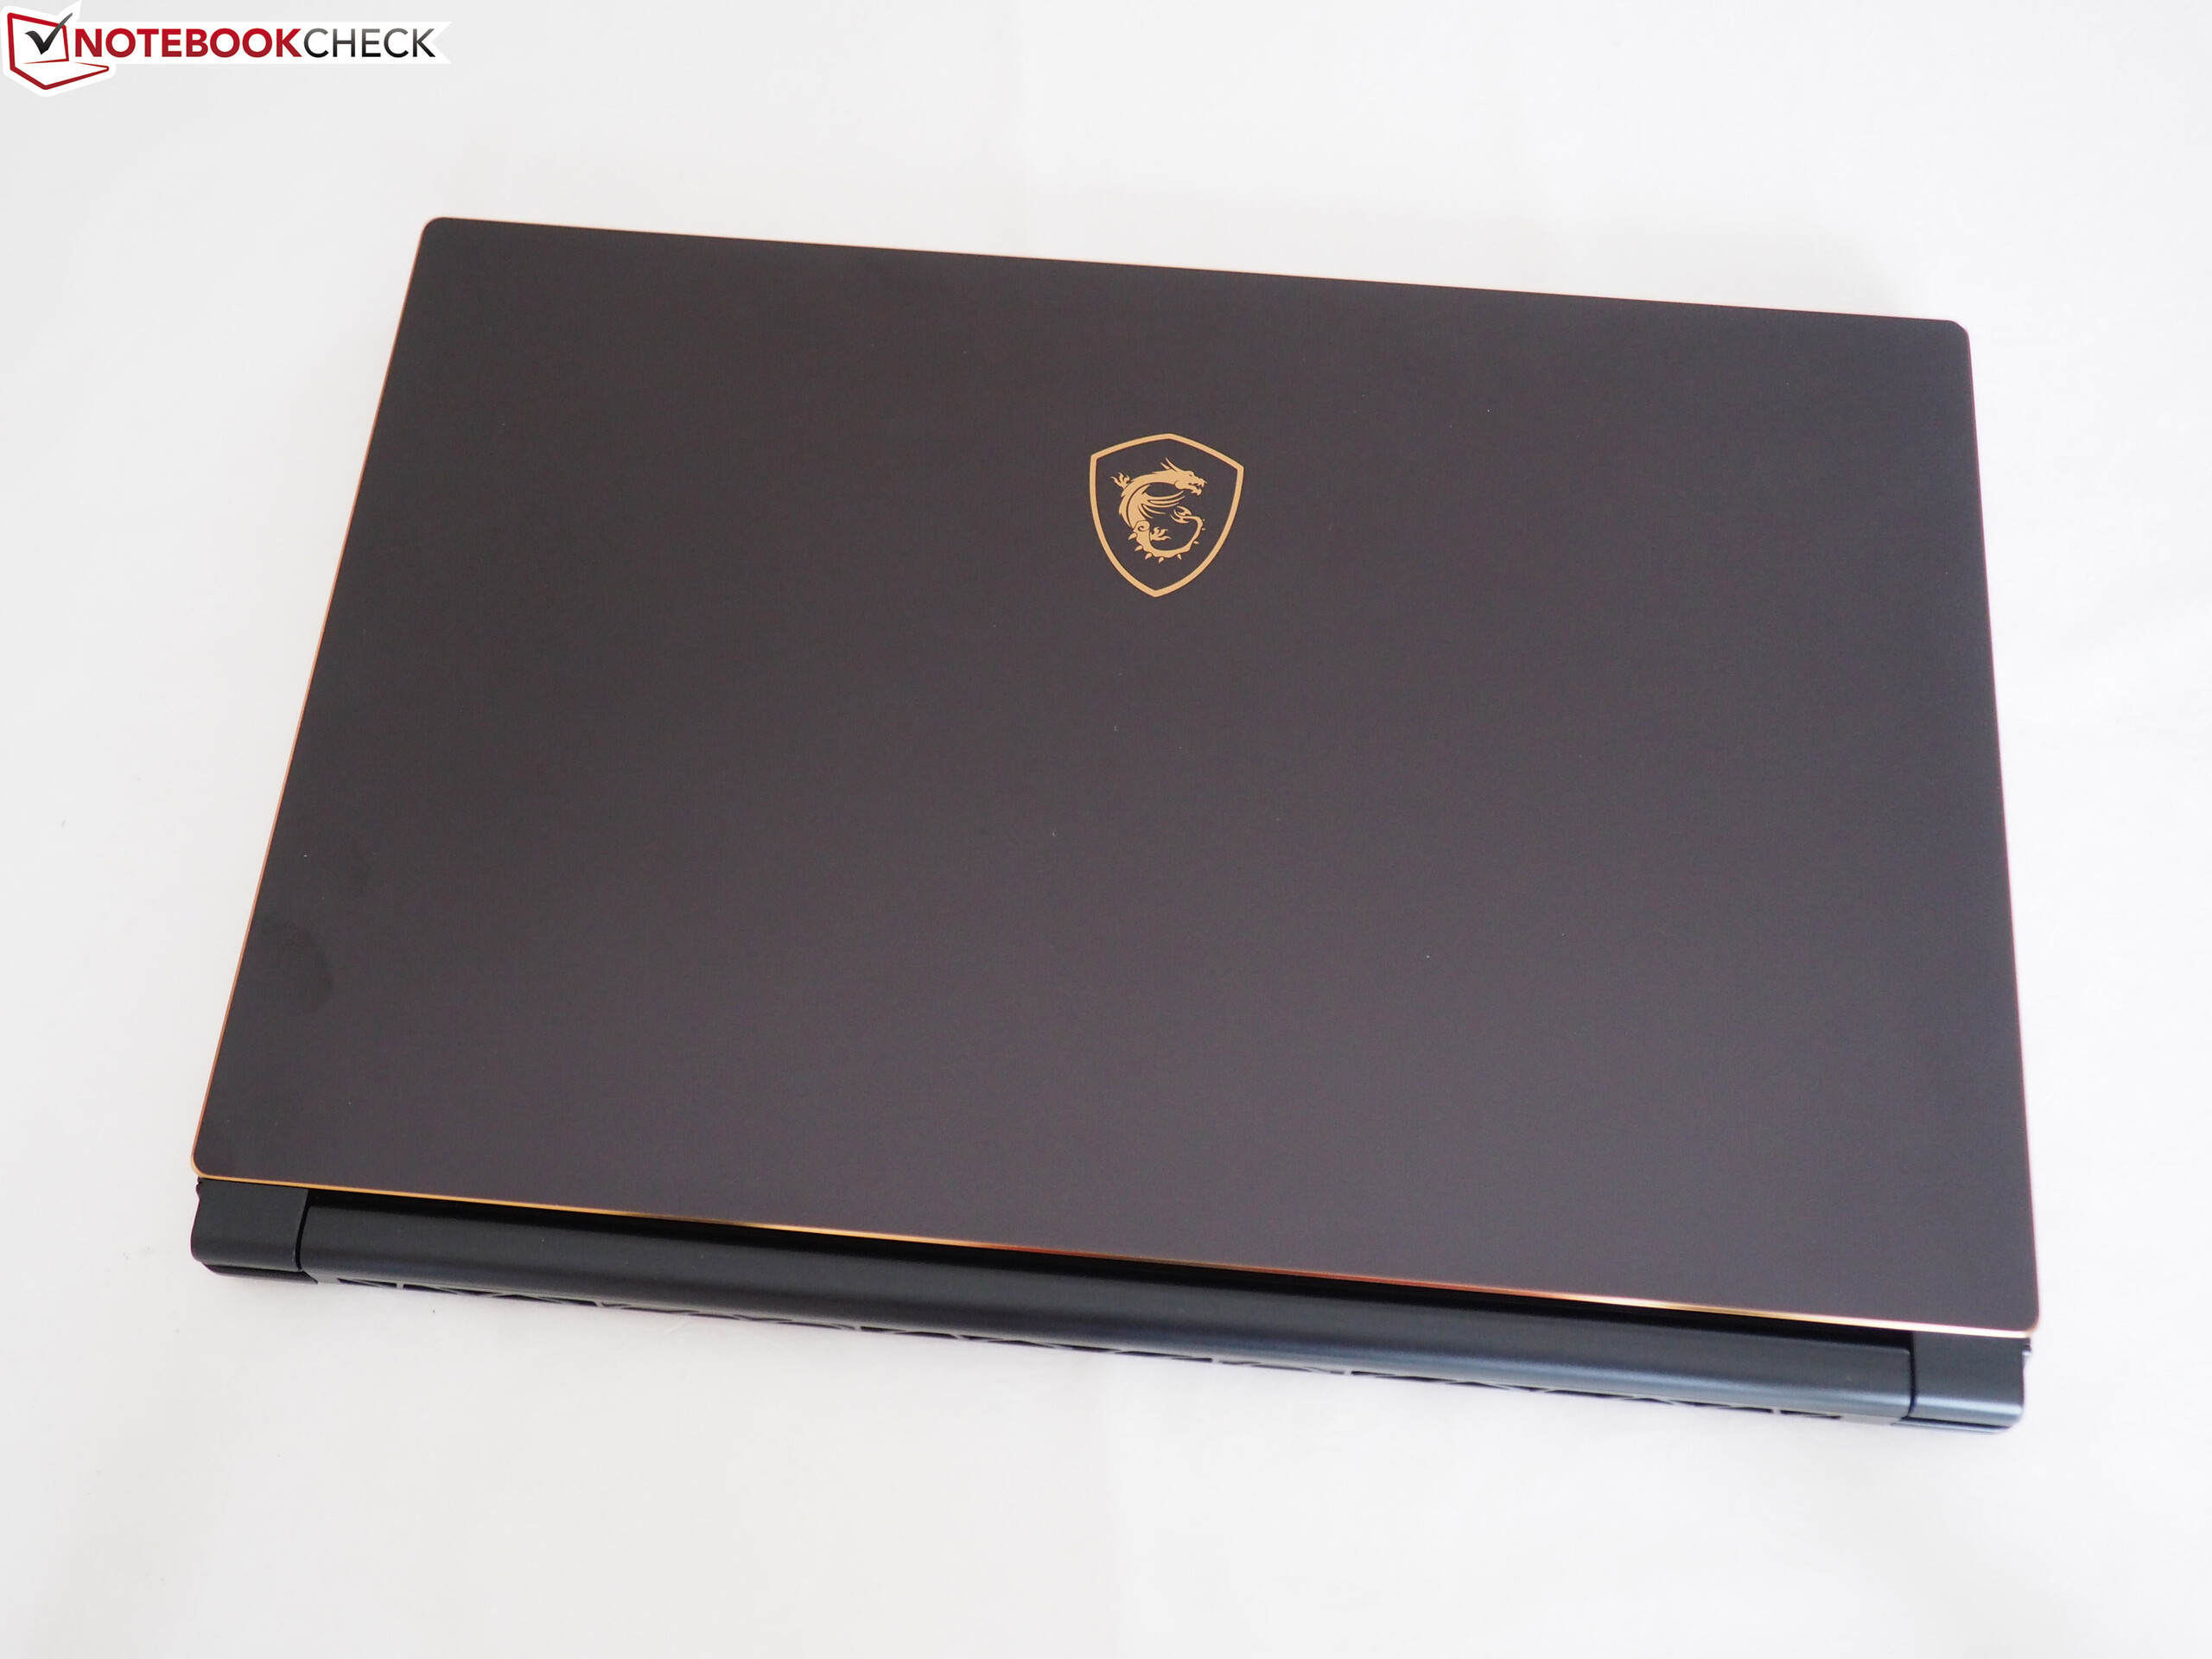
In May, we reviewed the GS65-8RF Stealth Thin notebook, complete with Core i7 CPU, GTX 1070 Max-Q GPU, and NVMe storage. This thin-and-light gaming machine is both portable and attractive, managing reasonably good battery runtimes for its class while sporting a sleek aluminum casing that resembles pricier models. Likewise, we found the per-key RGB backlighting, thin screen bezels, color-accurate 144 Hz display, and generally good performance pleasantly surprising. However, given its $2,100 price tag, we also had expected better build quality and case stability, functional power-saving options, and superior maintainability.
Today’s configuration is only slightly different: it’s some $250 less expensive for starters, with a price tag of just $1,849 currently. What do you lose in exchange for that discount? Specifically, the GPU has withdrawn to a GTX 1060 6 GB and the SSD capacity has been cut in half to 256 GB. Practically all other amenities remain, however, including the high-end 144 Hz display and Core i7 CPU. How does the machine stack up with these revisions in place?
Preliminary Notes
Since we’ve already covered the introductory basics (case, connectivity, input devices, etc.) in our previous review, please refer to it for any detailed impressions of those items. However, we’ll quickly summarize the major themes here.
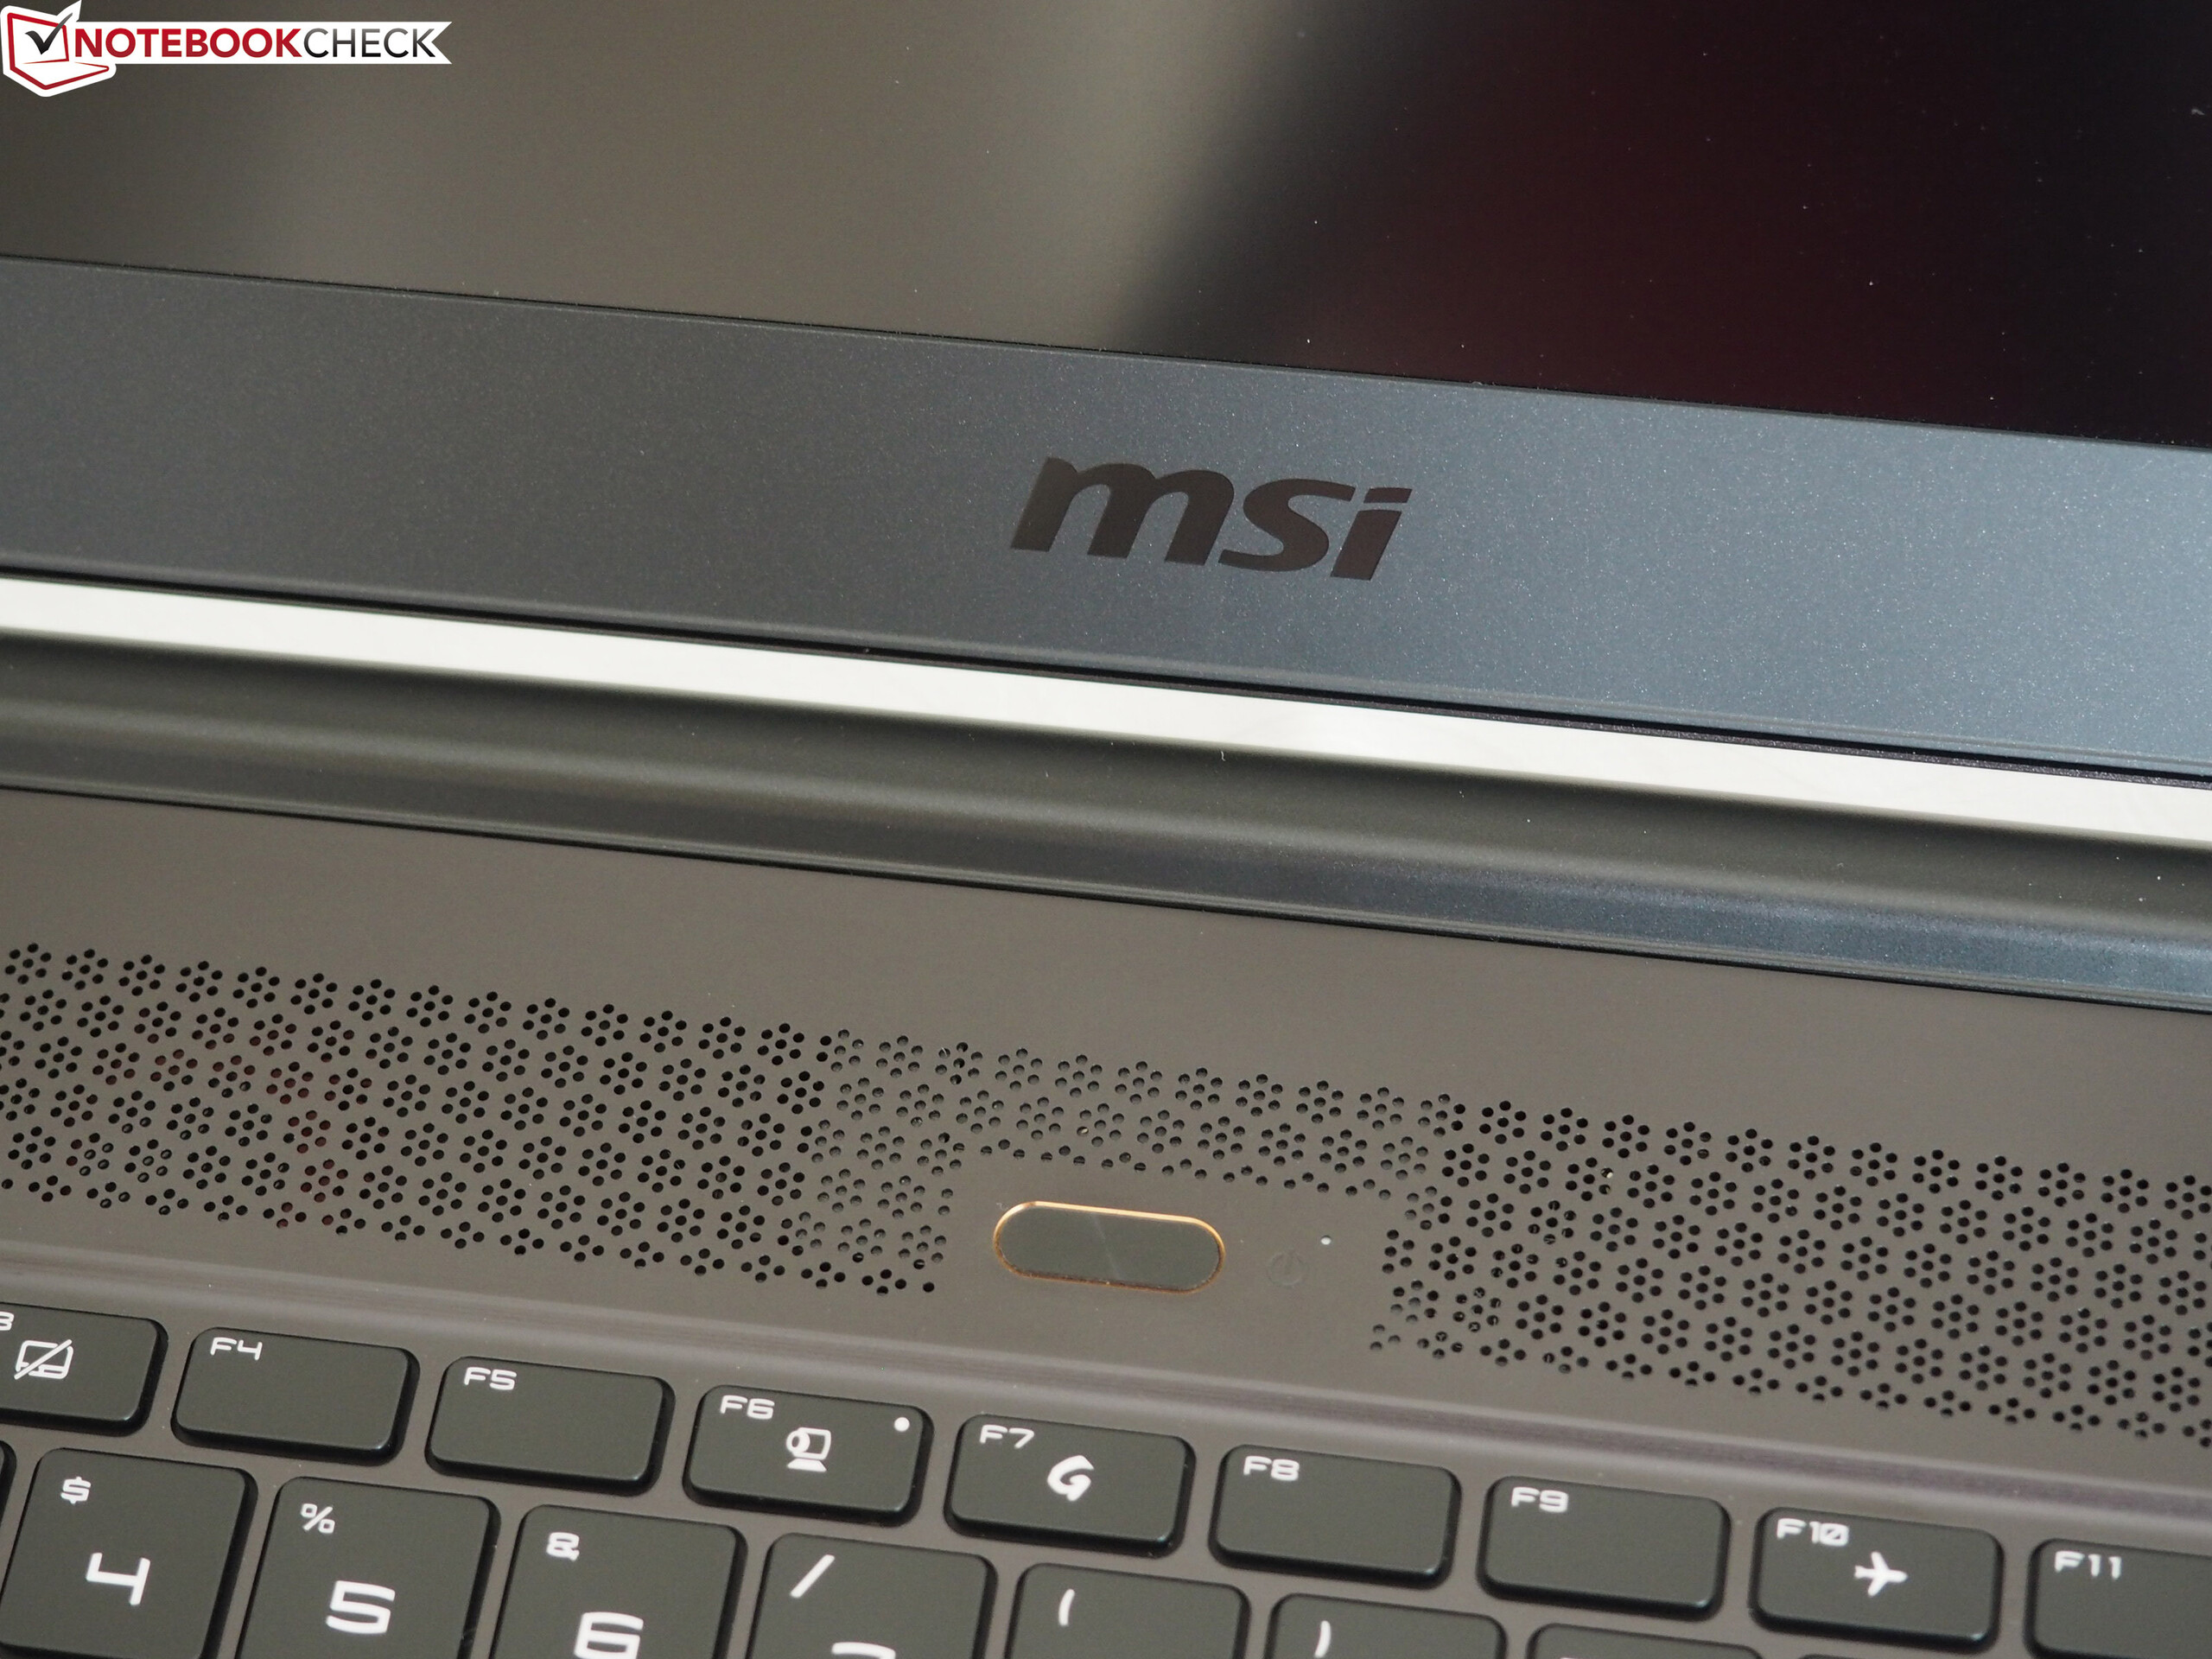
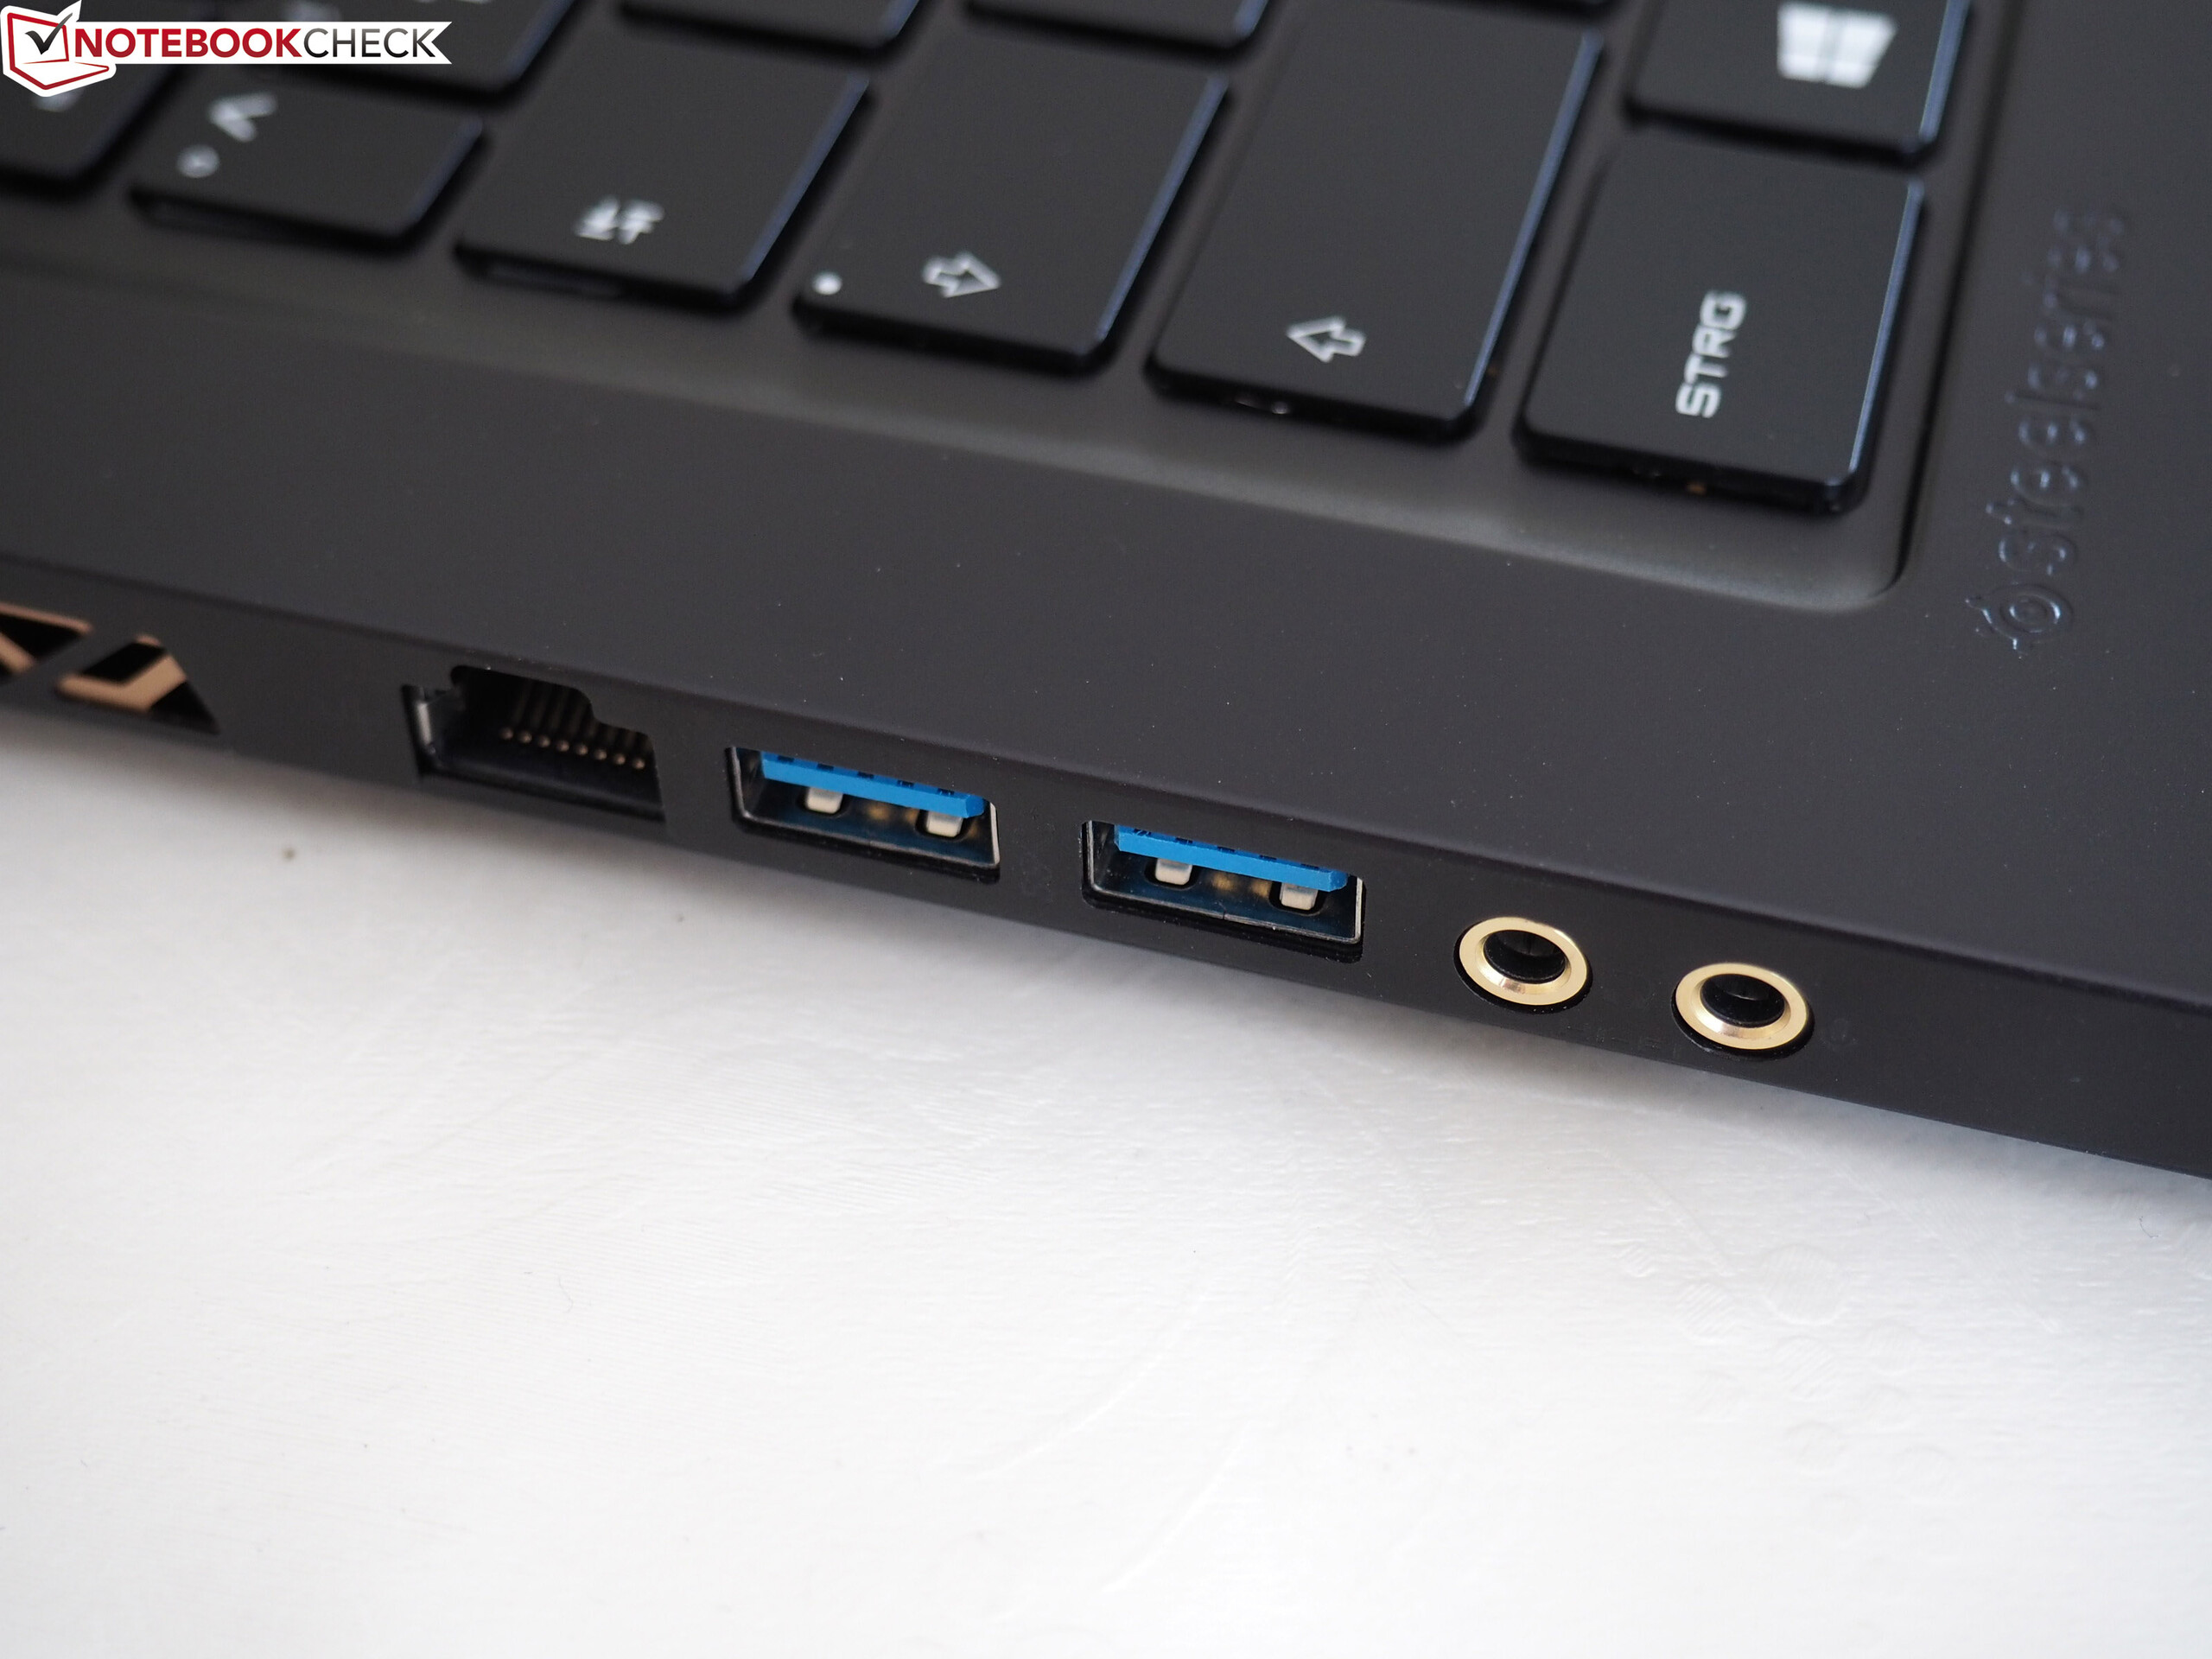
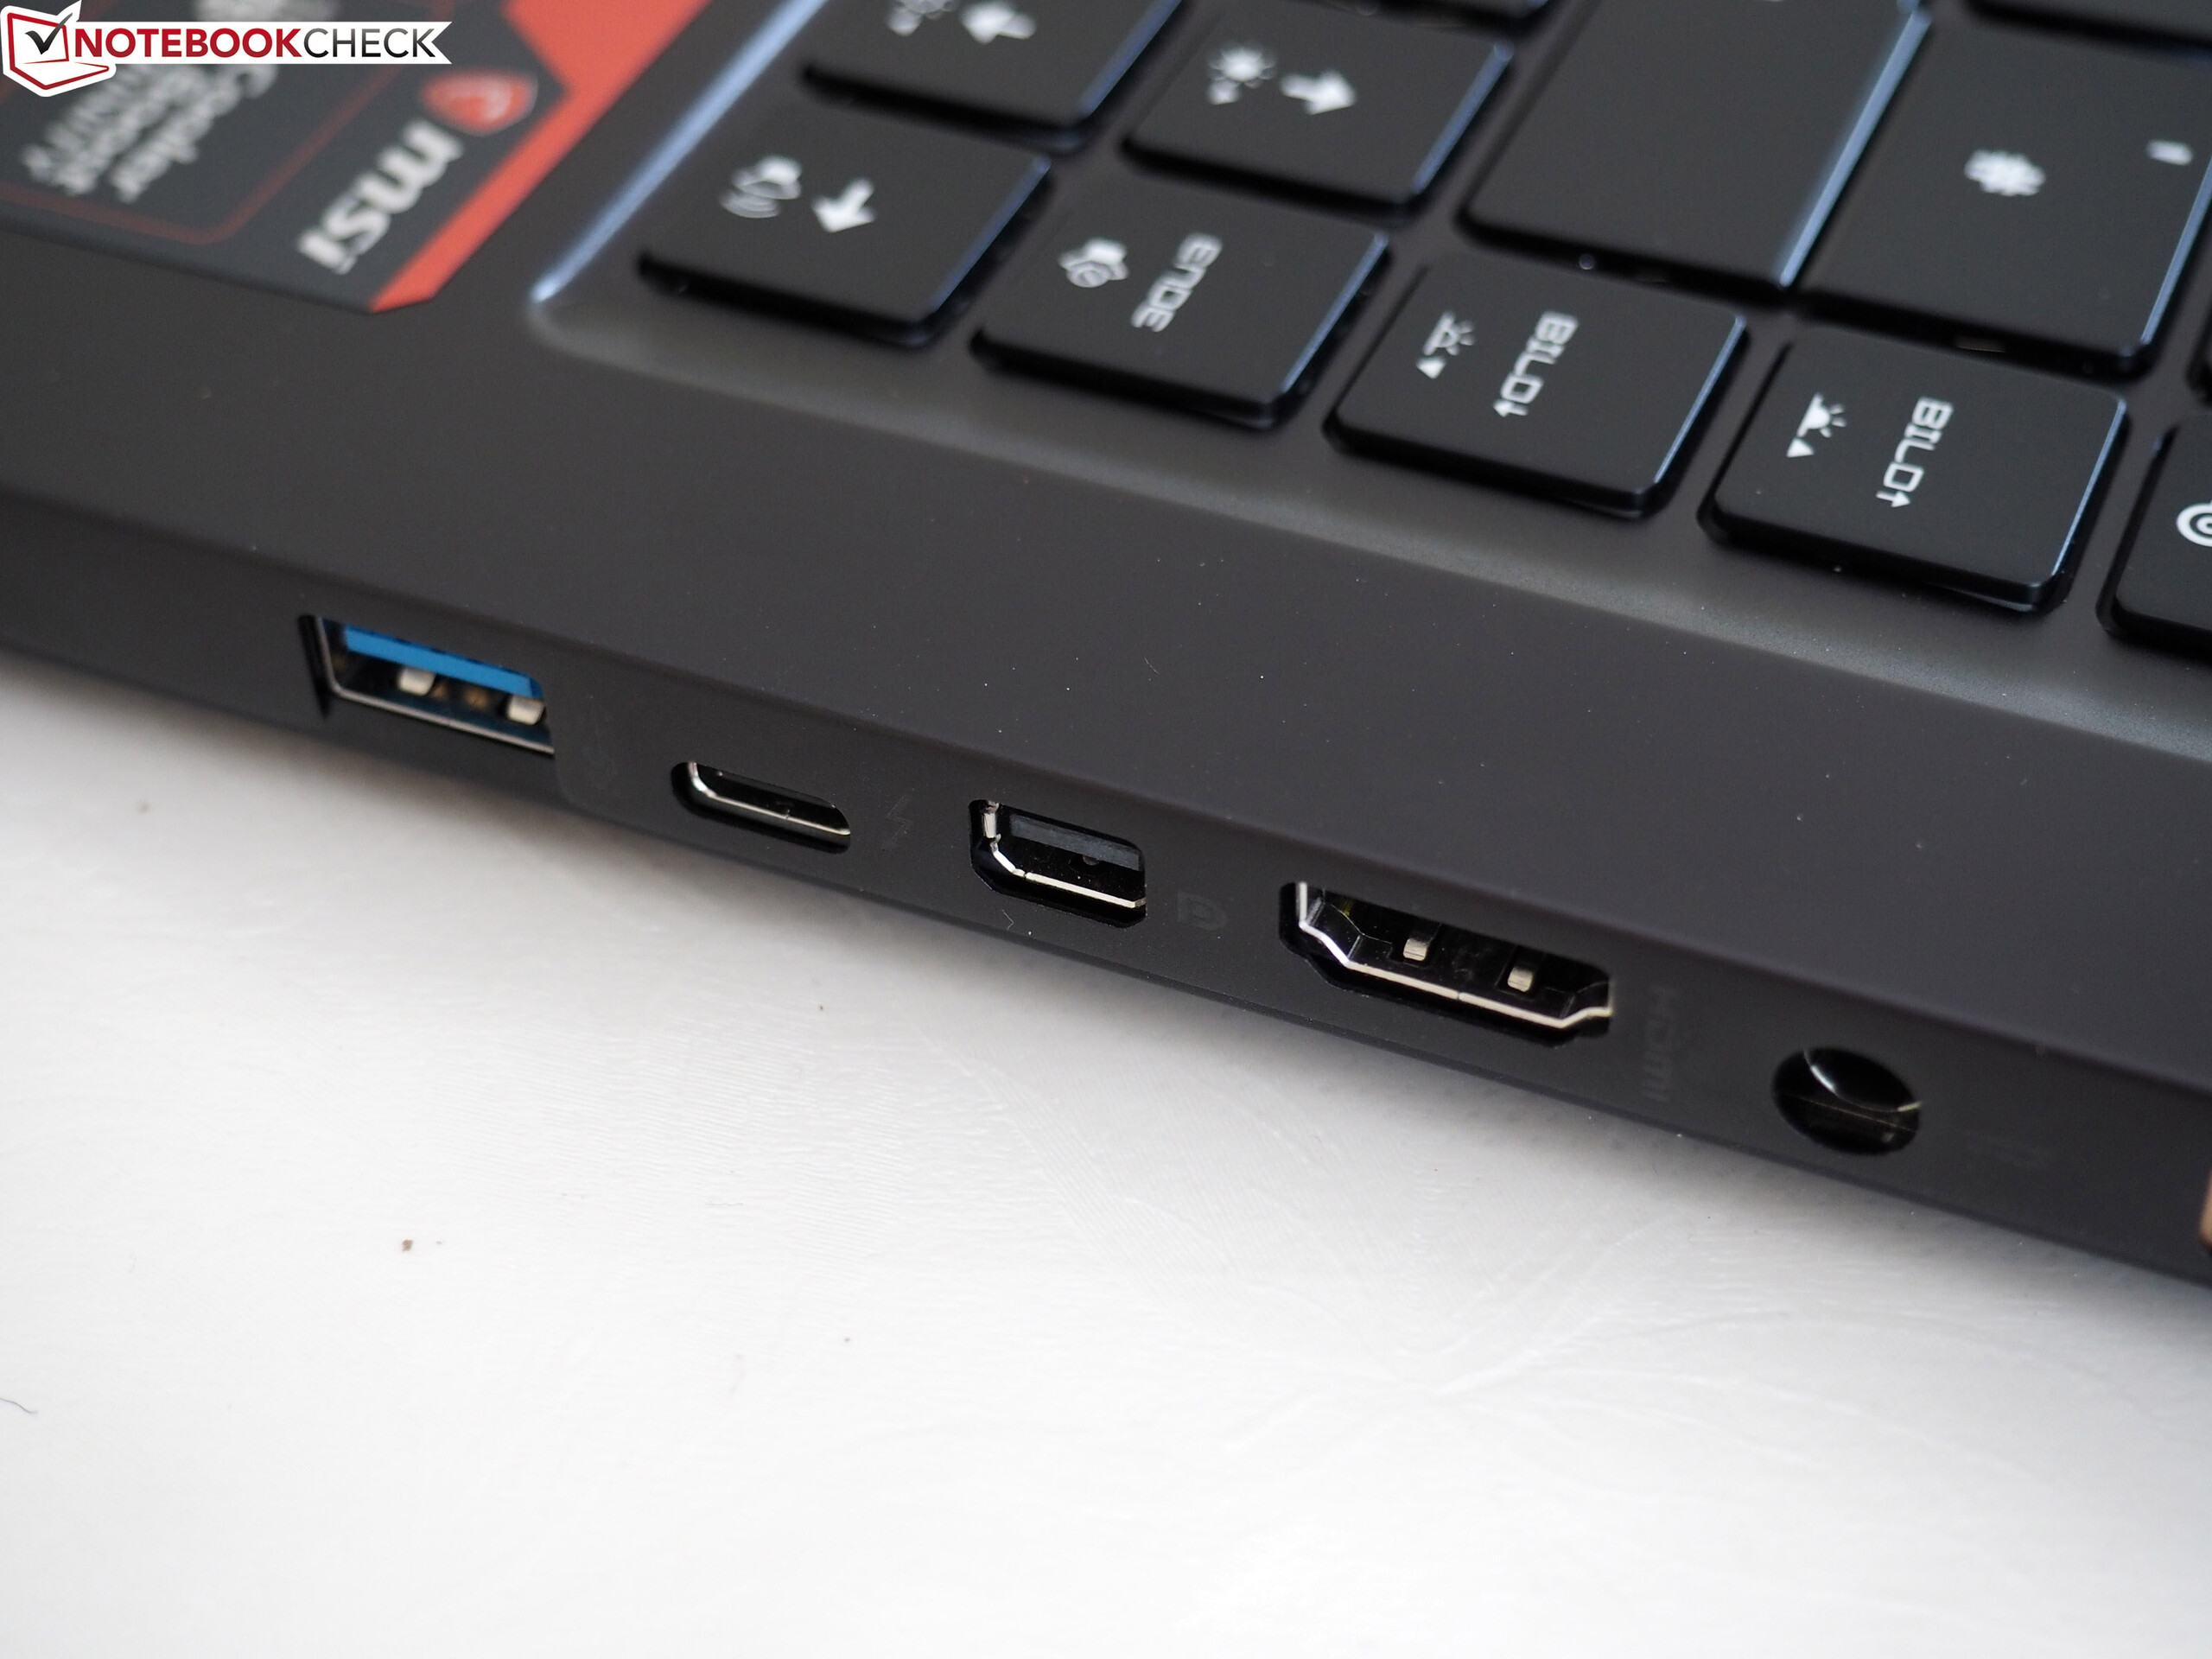
While the casing certainly looks the part, it’s soon evident how it manages such reasonable weight: the metal is thin. Moreover, the case exhibits unignorable creaking and popping noises under even light pressure, which truly cheapens the overall feel of the design. Connectivity is decent, but the lack of a card reader and the suboptimal positioning of the ports is a bit of an irritation. Networking speeds from today’s review unit remain as strong as those from the previous configuration thanks to the use of the Intel Wireless-AC 9560.
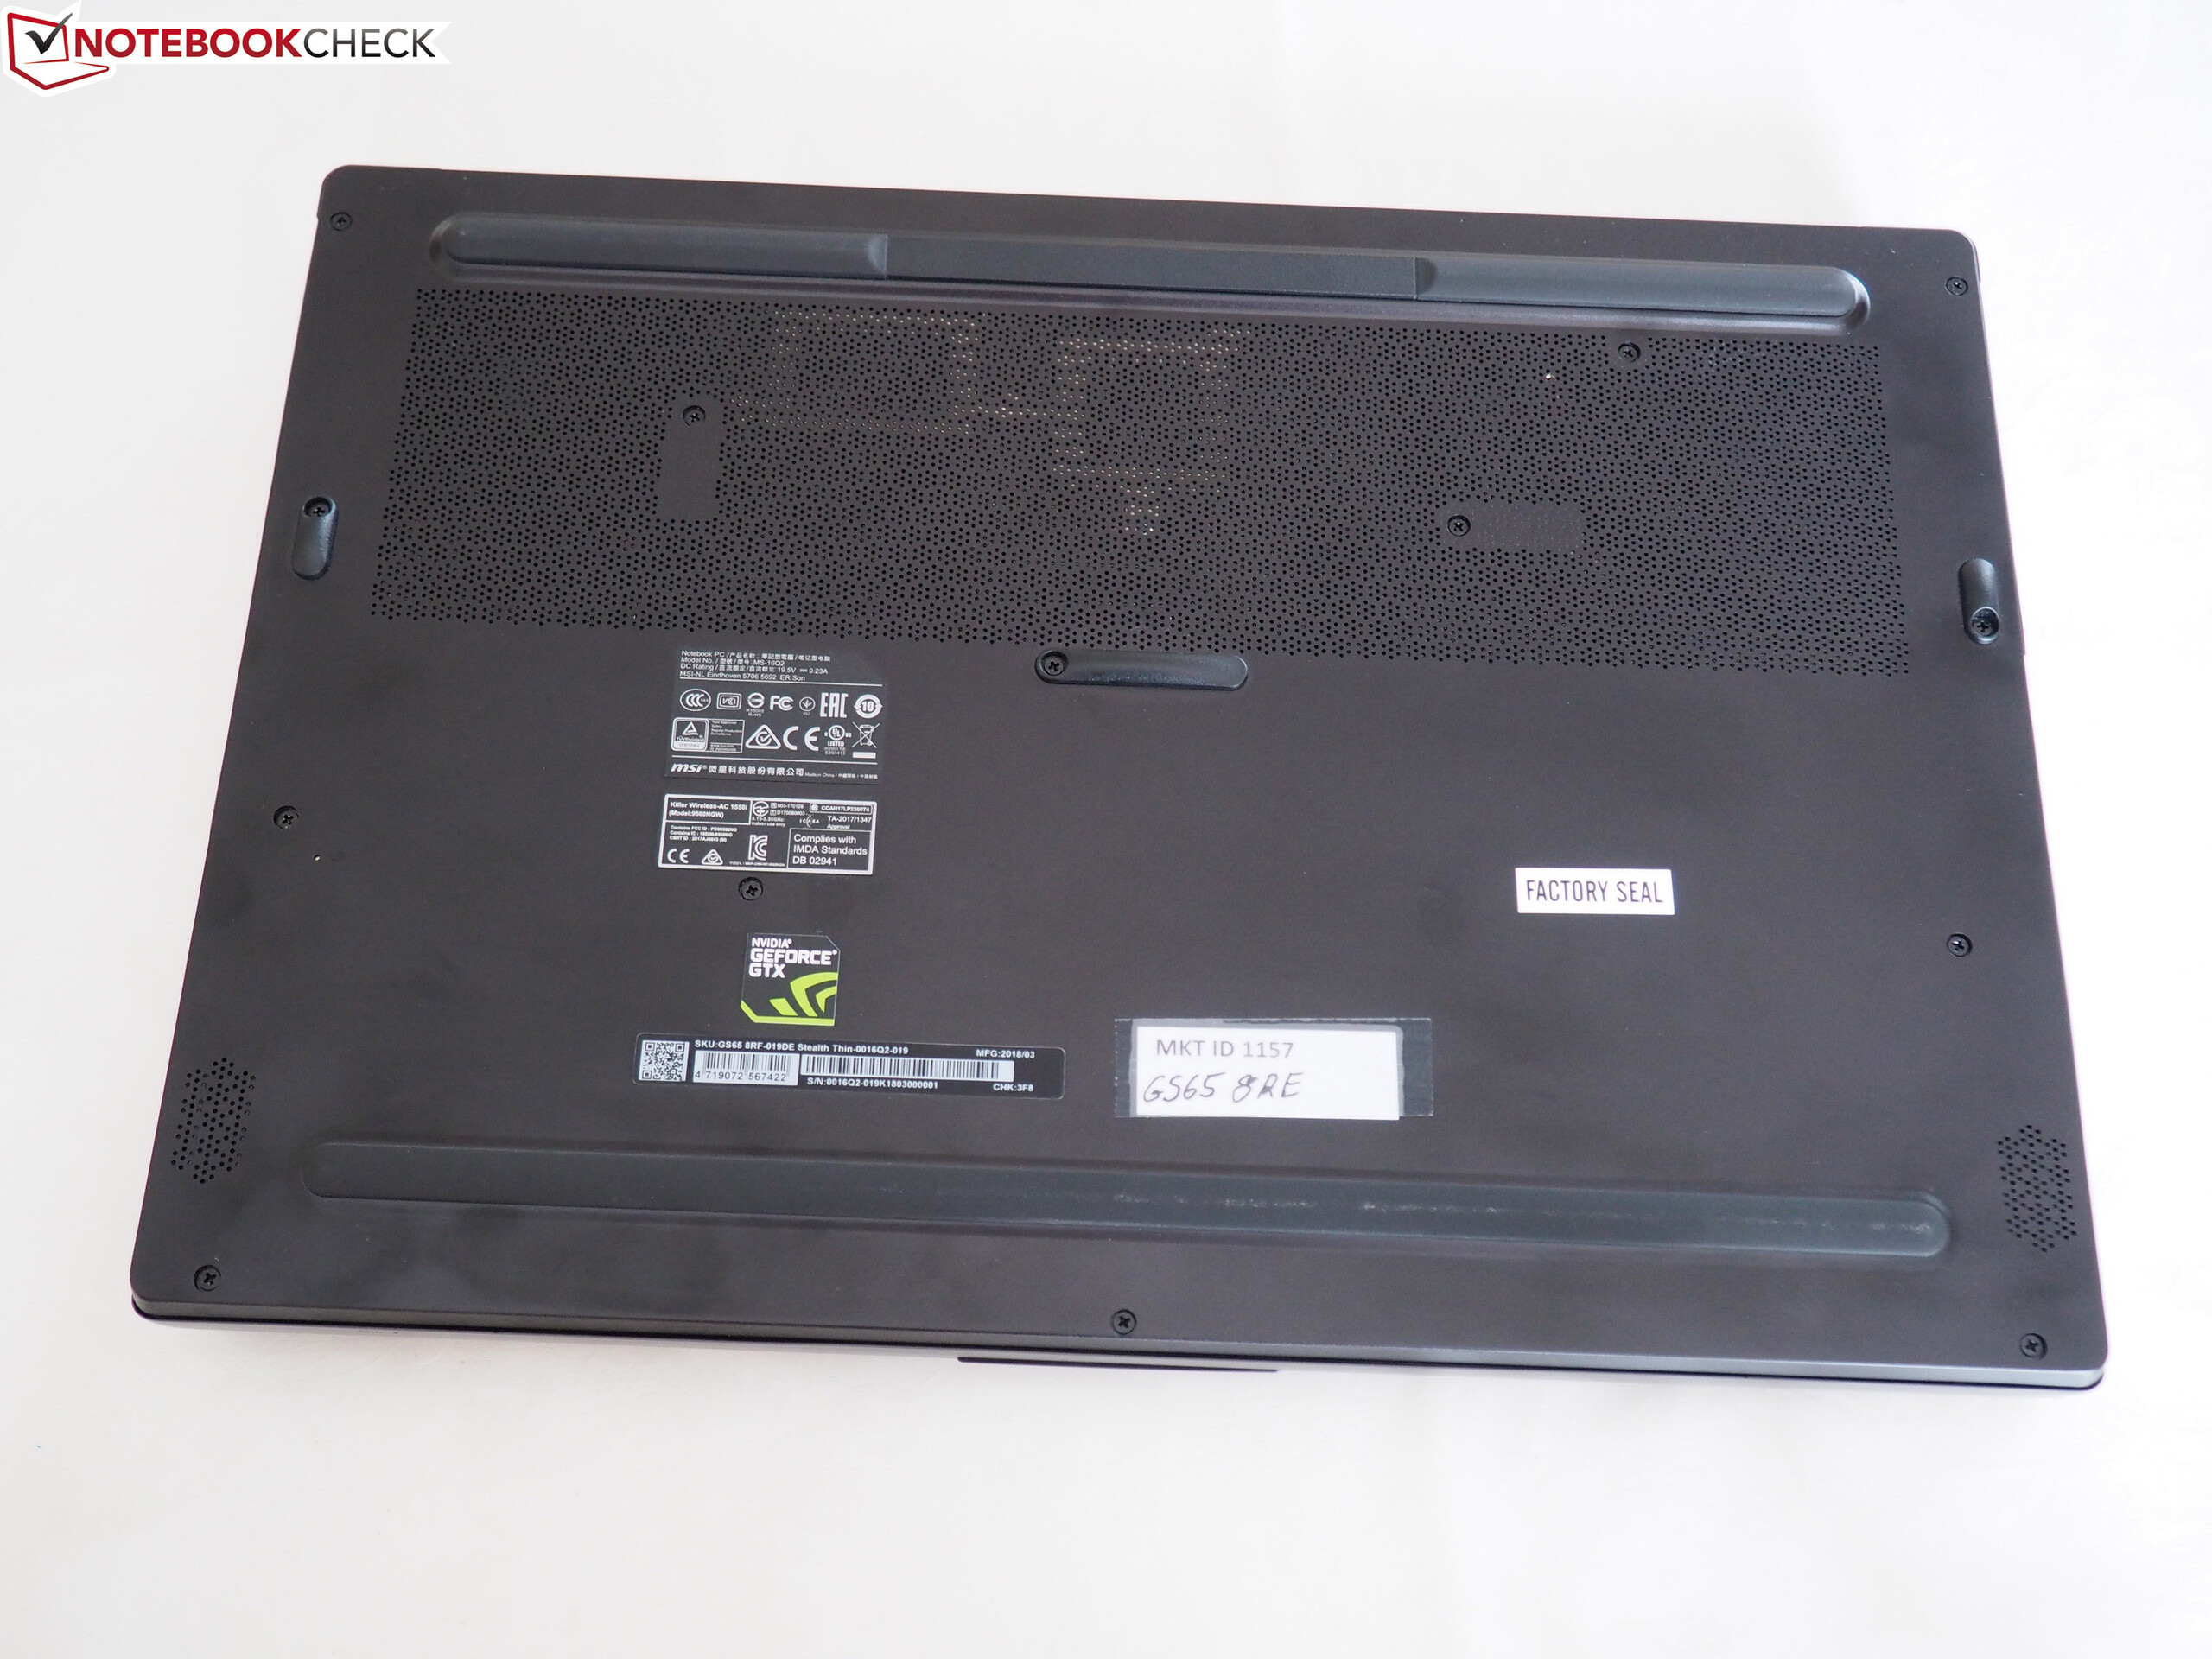
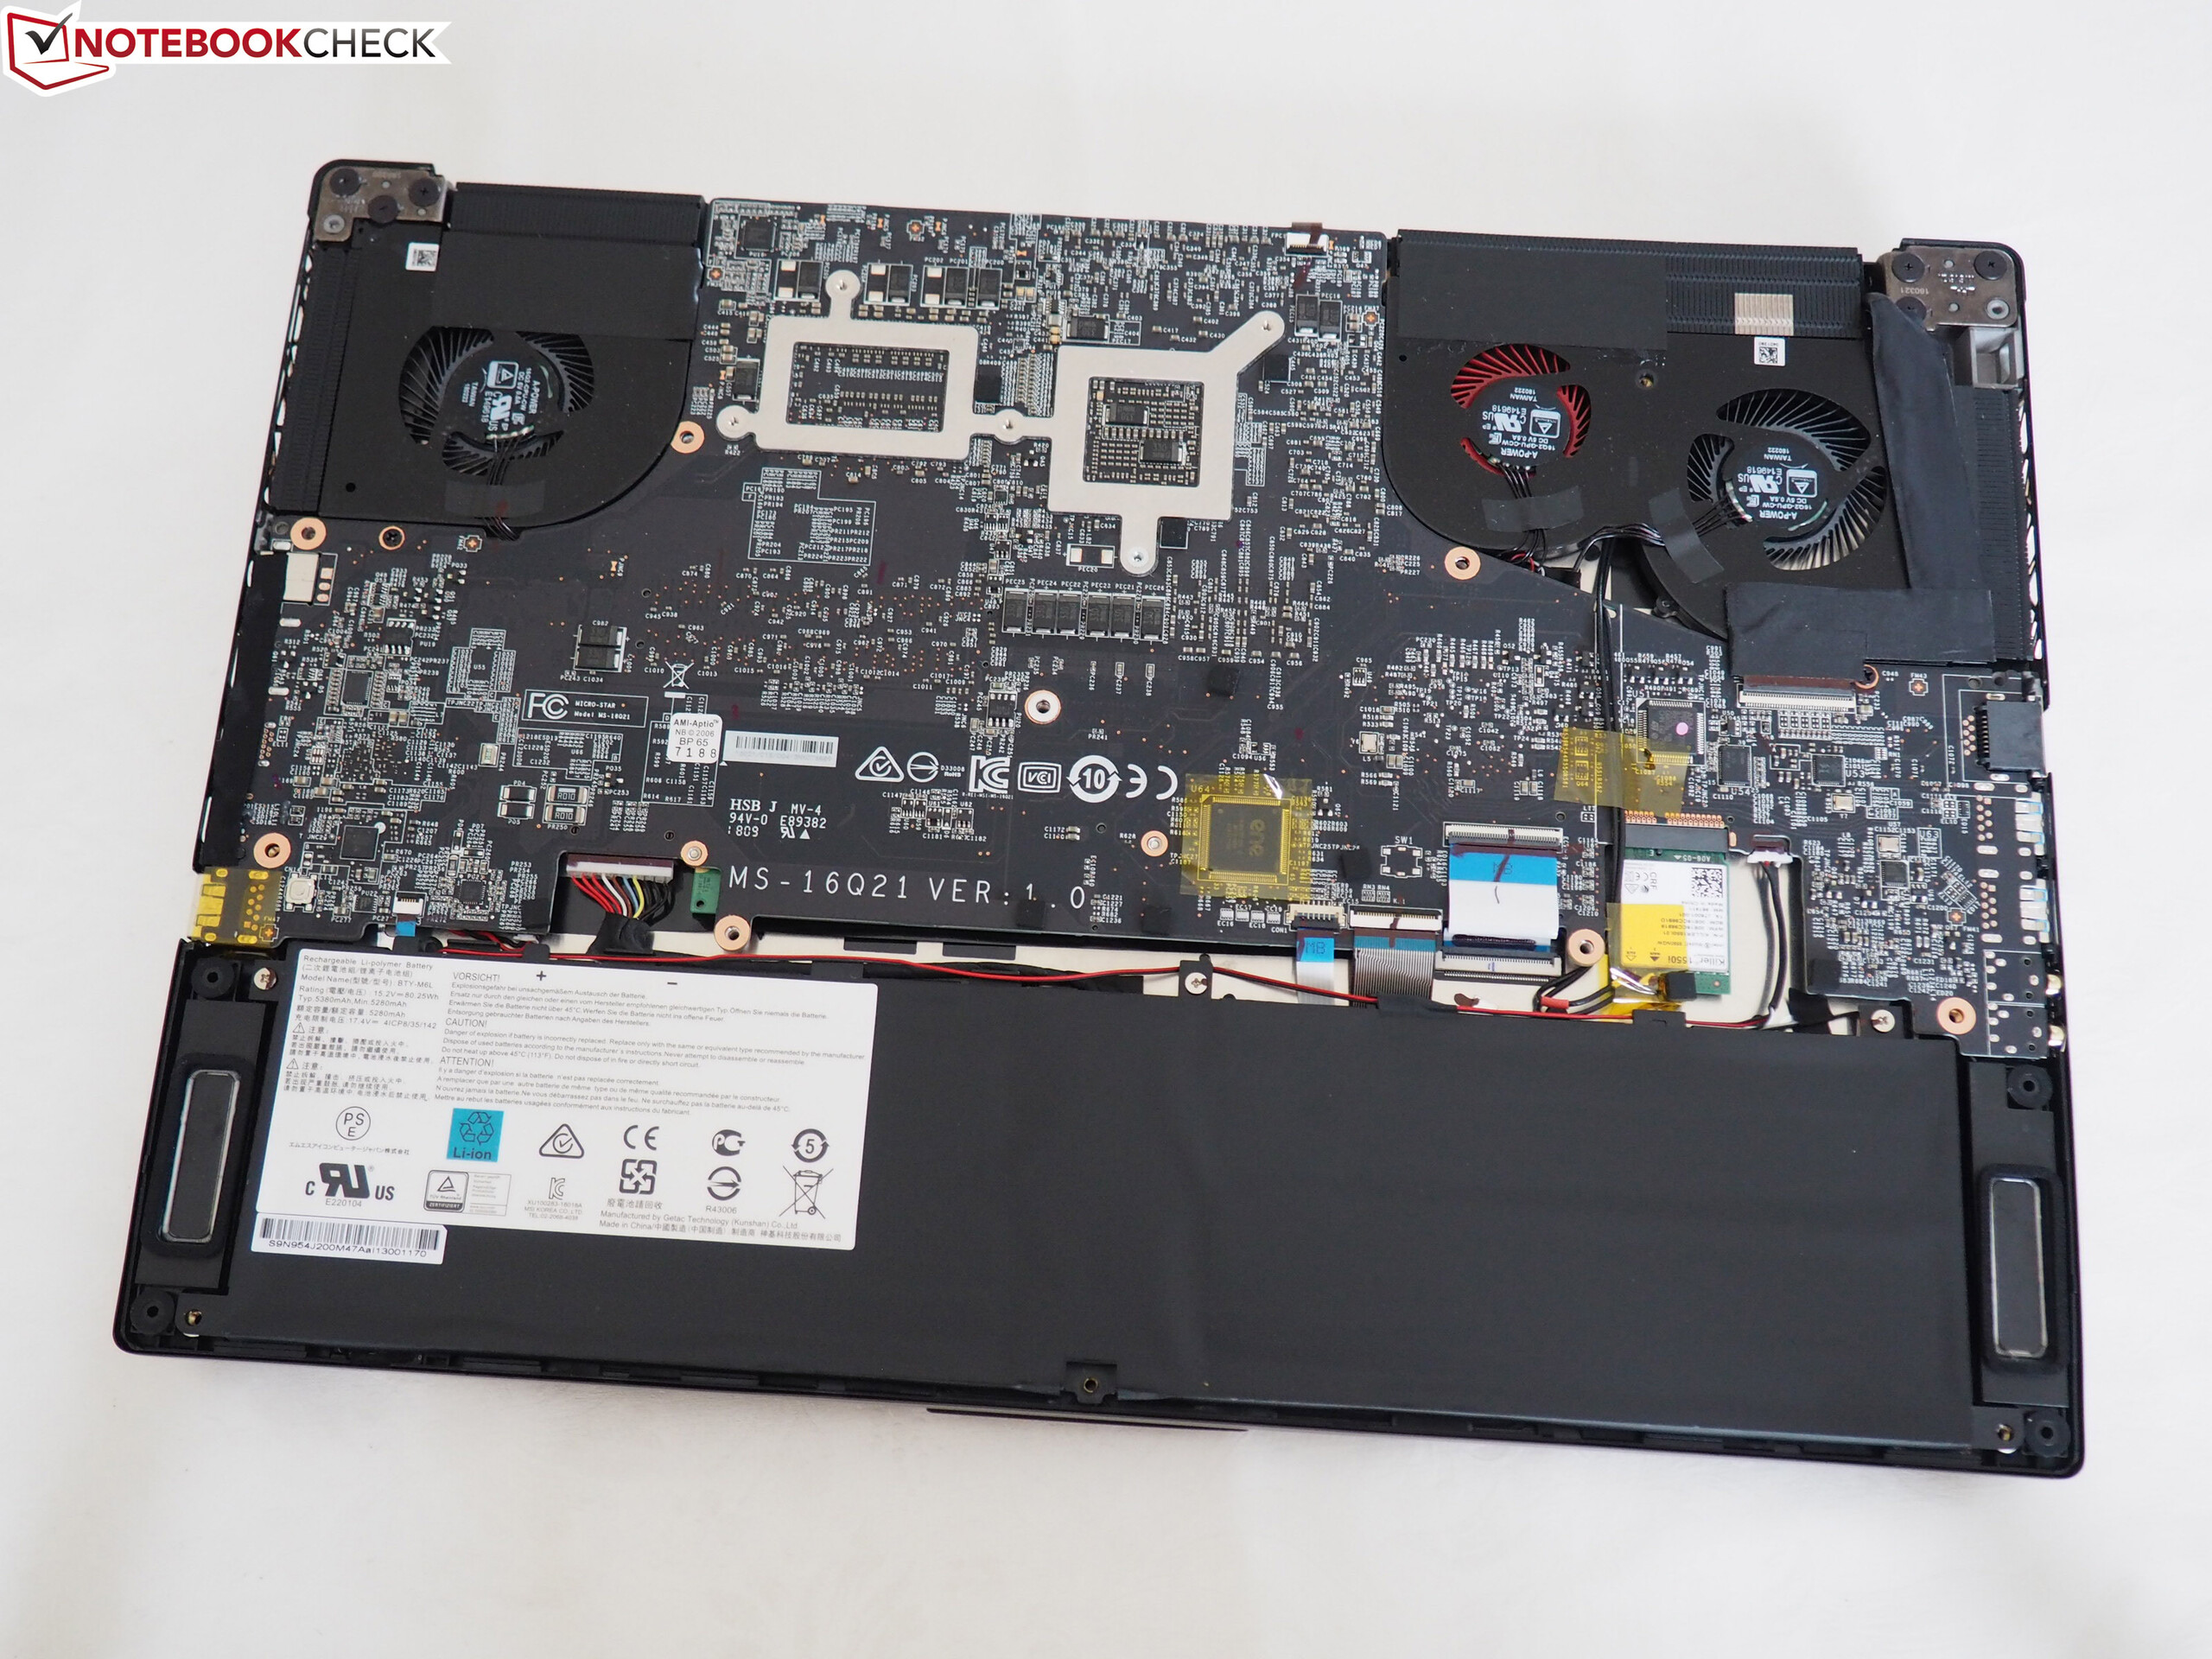
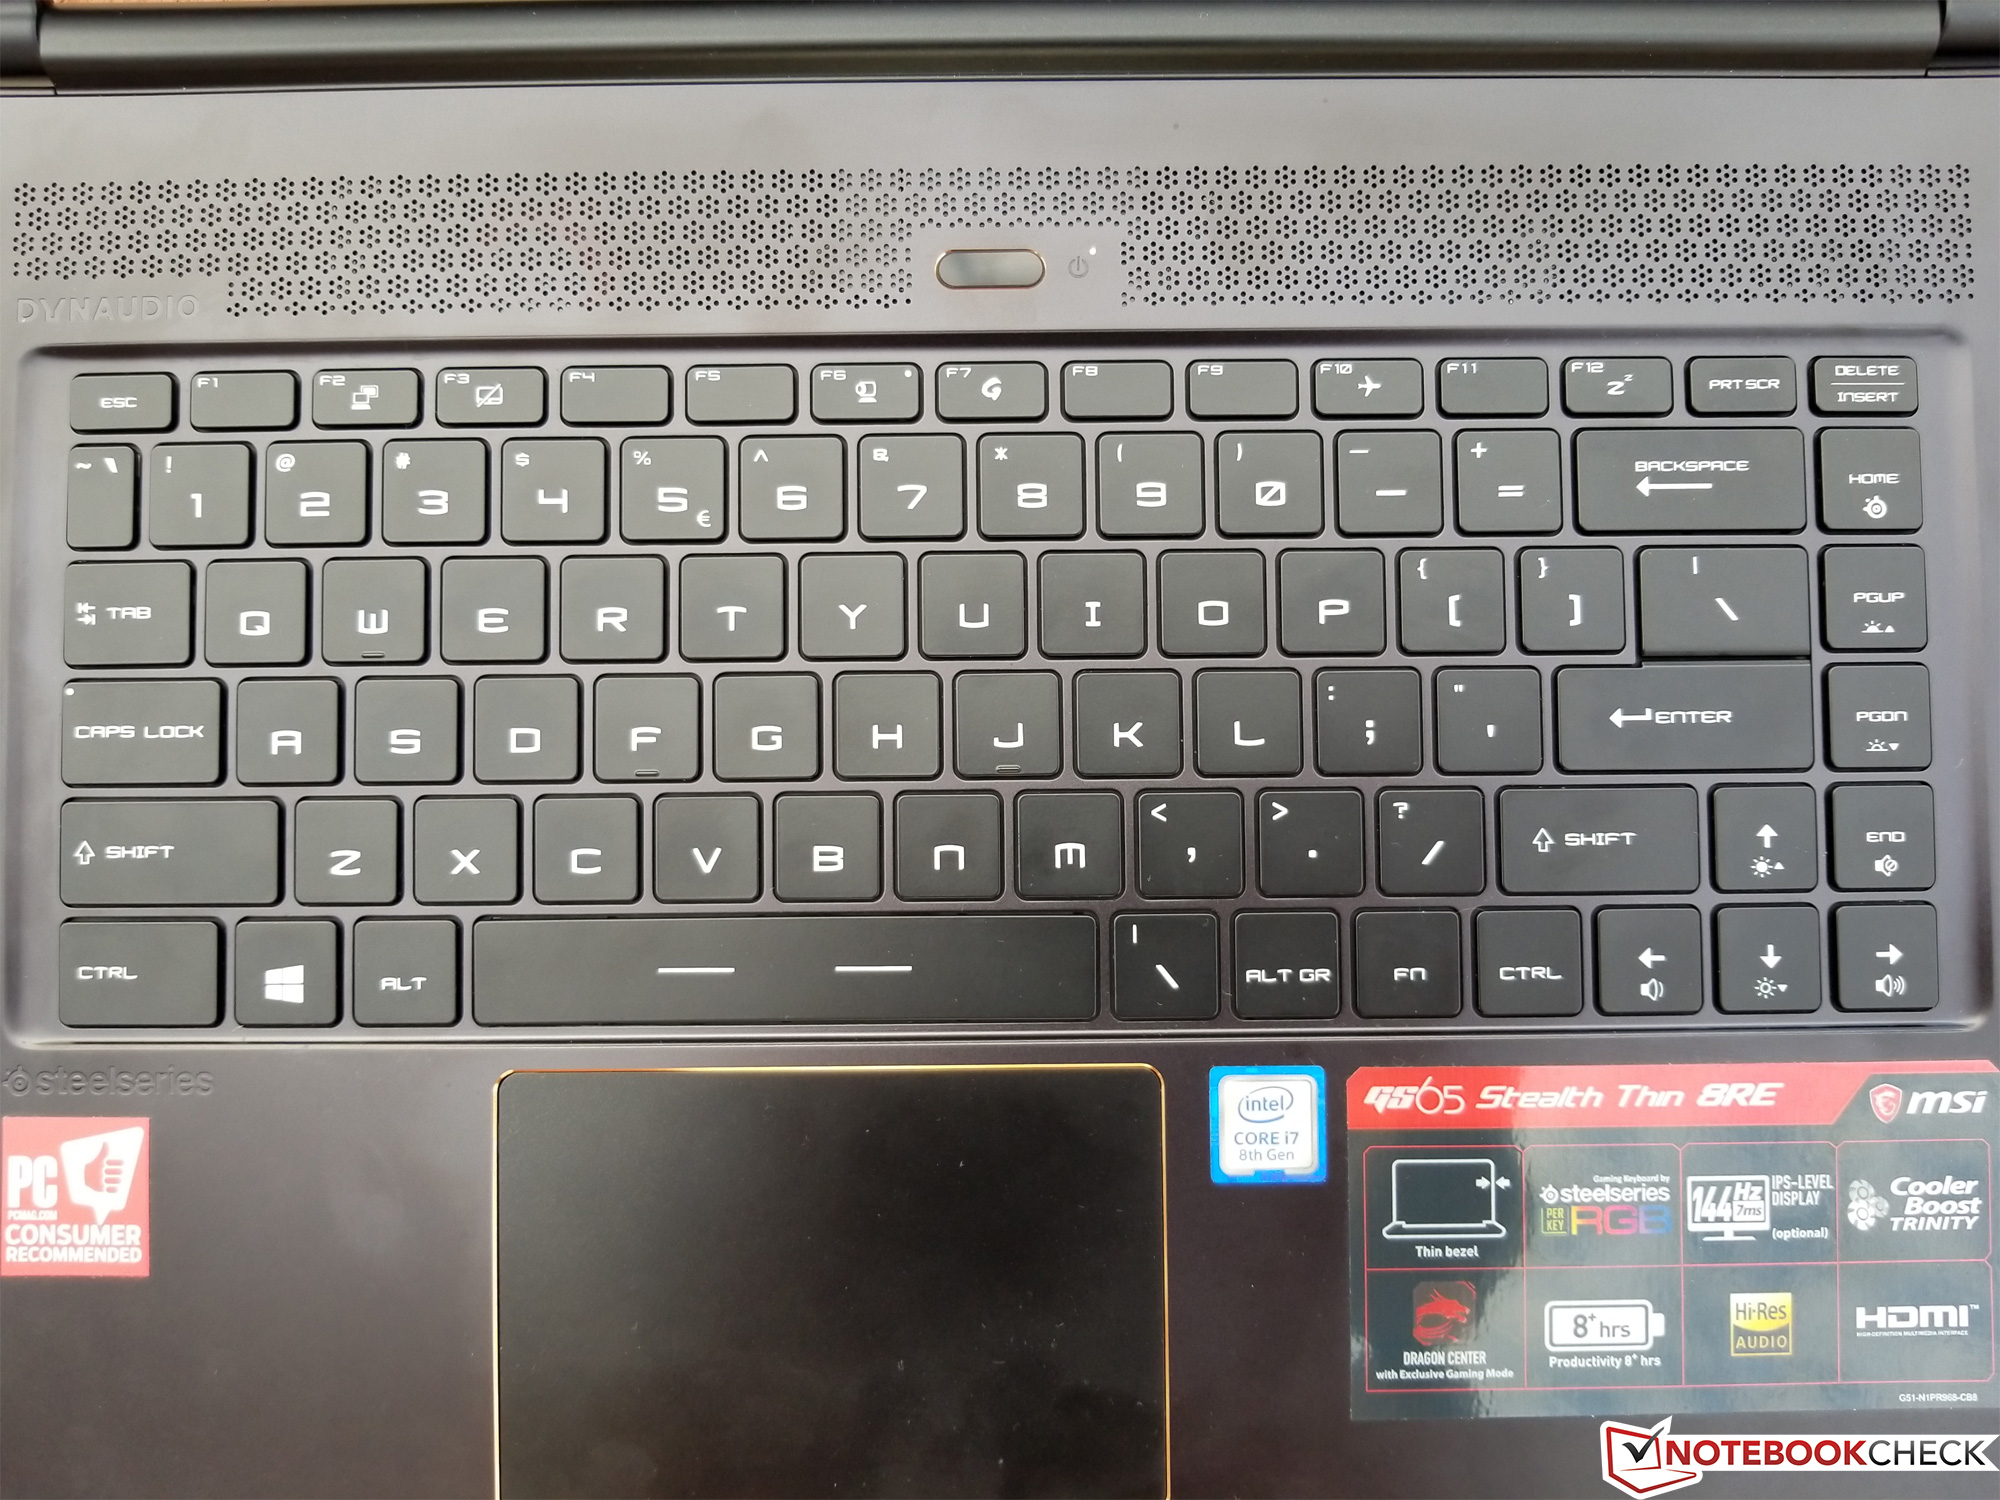
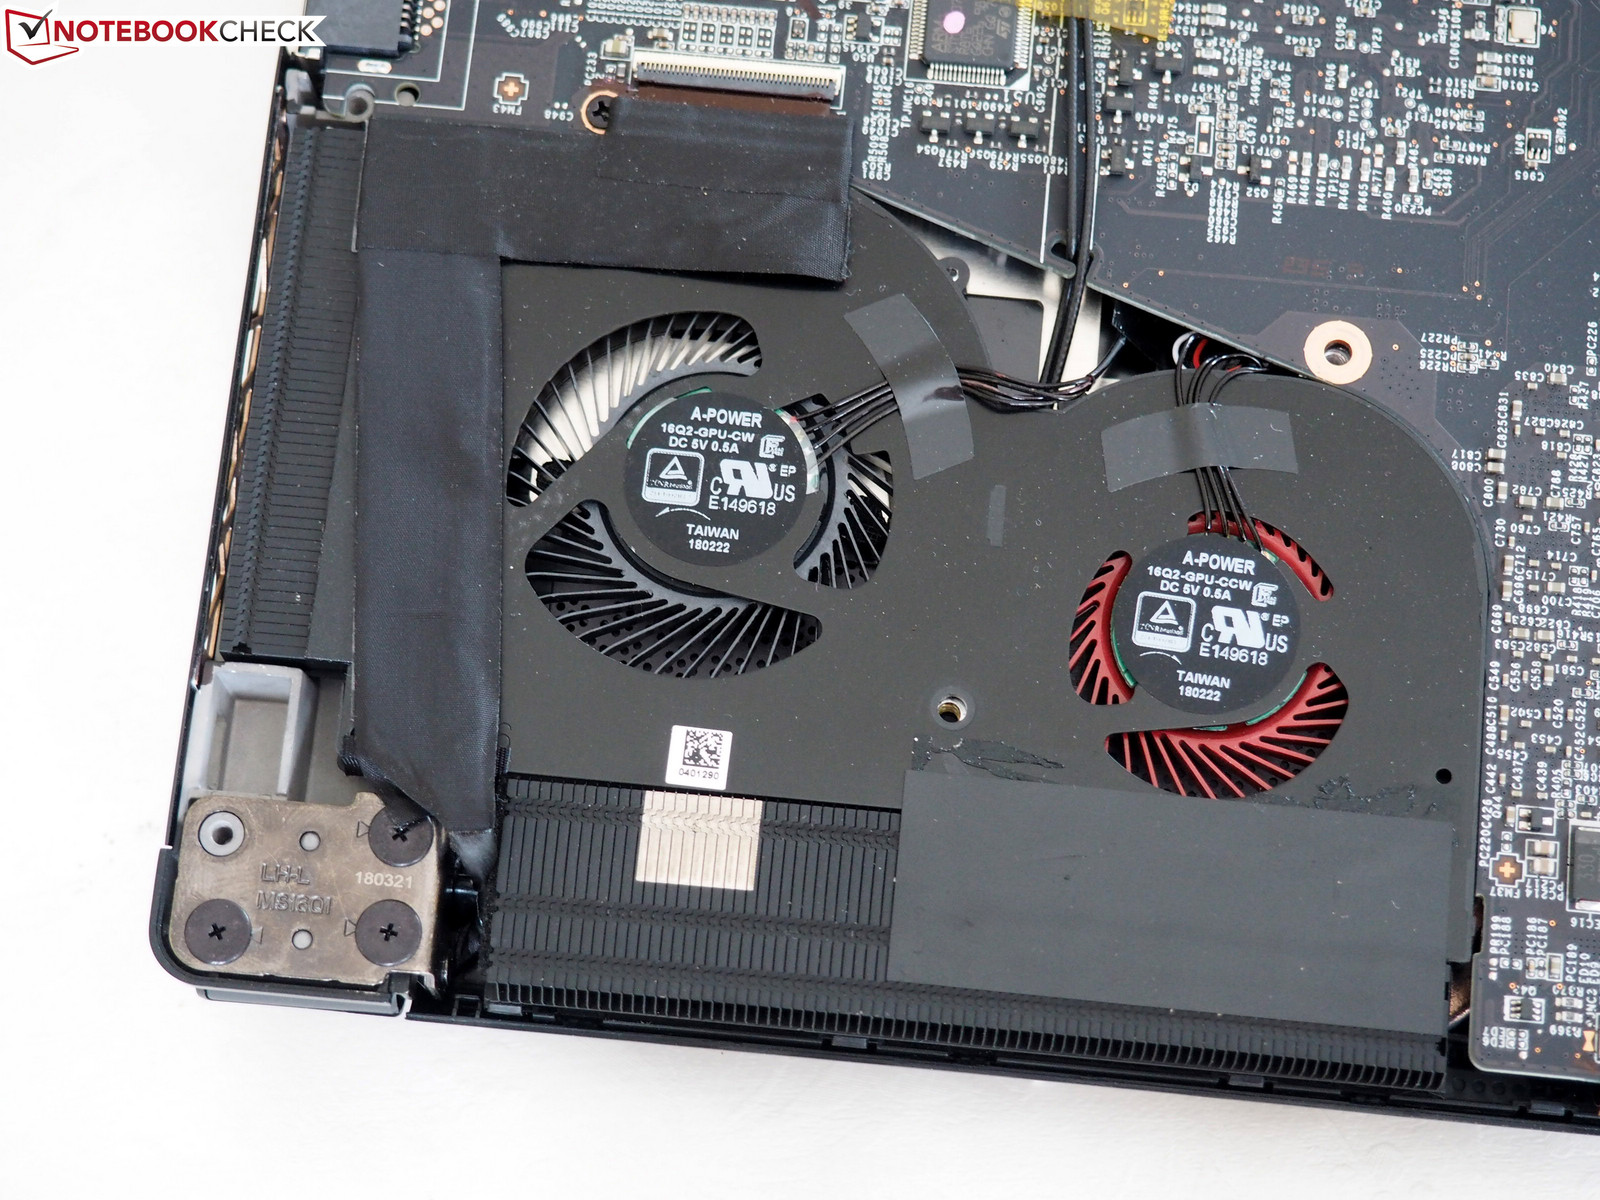
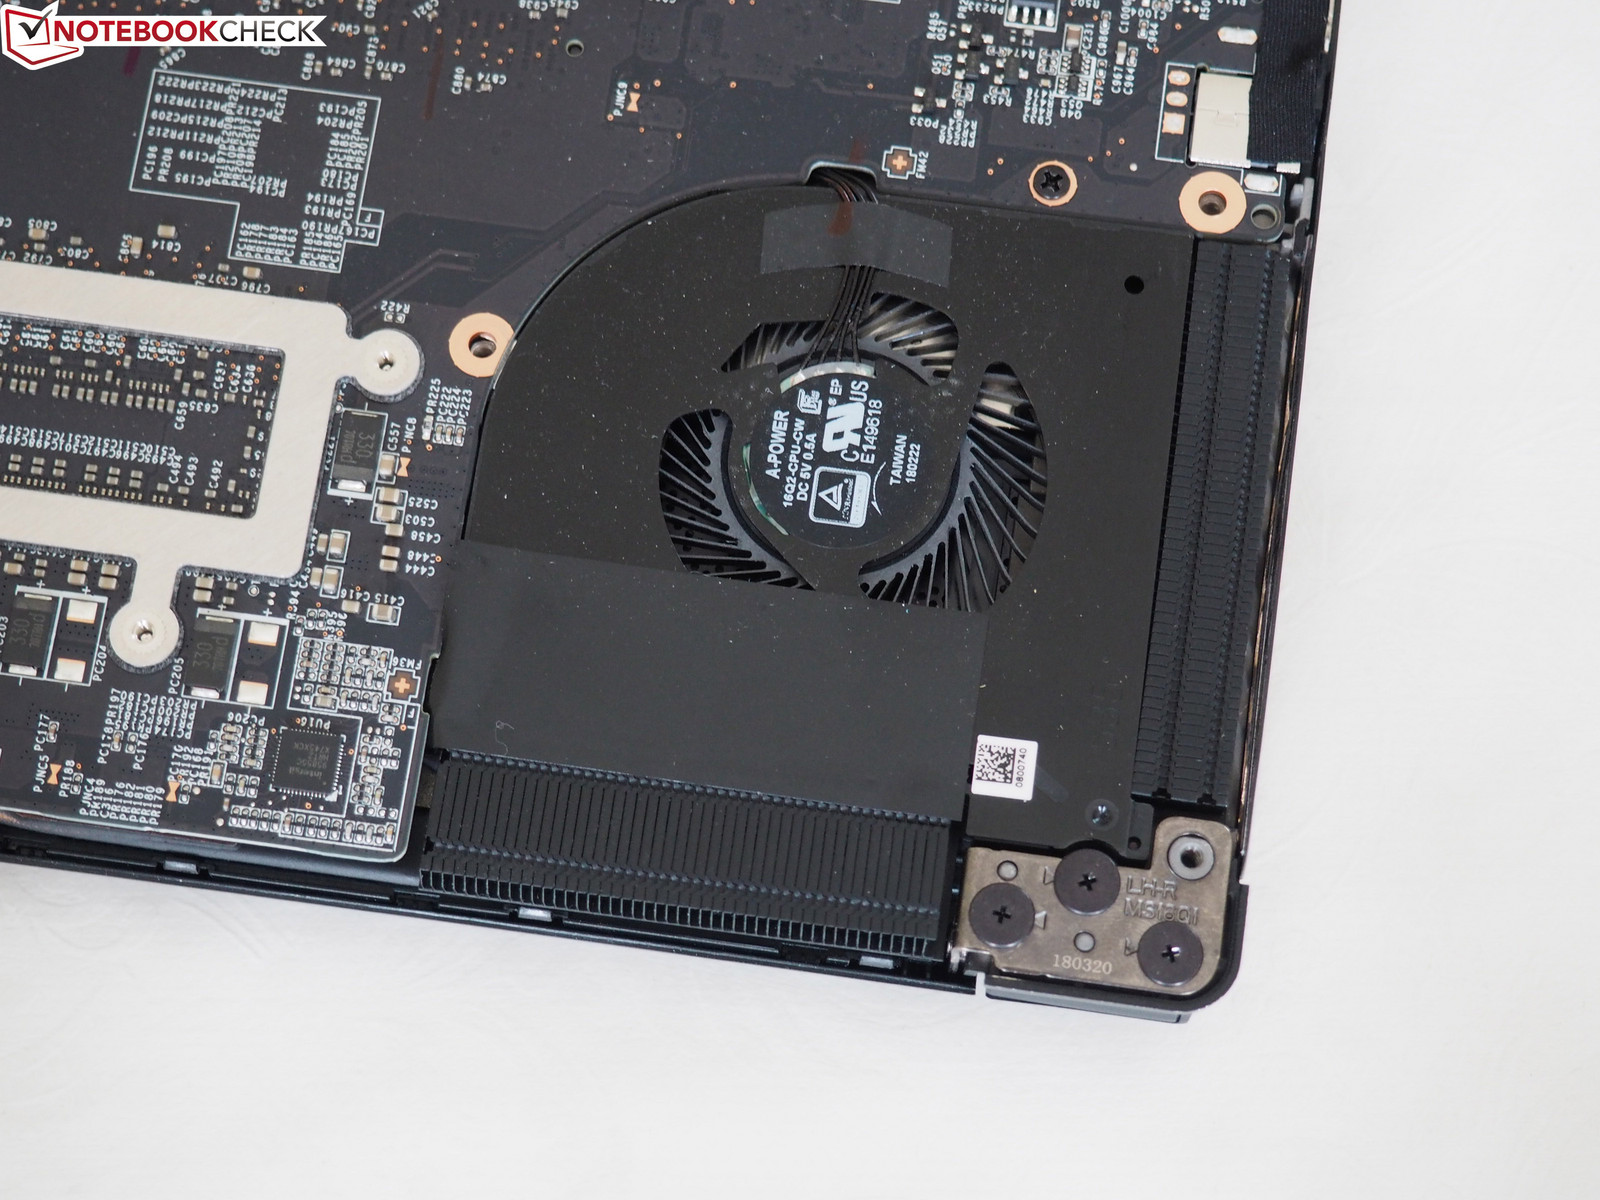
Maintenance is a major disappointment, meanwhile, given that the entire bottom of the machine must be unscrewed/pried off and that even following that procedure, only the fans, battery, and WLAN adapter are accessible. Accessing the remaining components requires much riskier further disassembly, an unacceptable compromise given the pricing and lineage of the GS65. Finally, the input devices are merely average overall.

Display
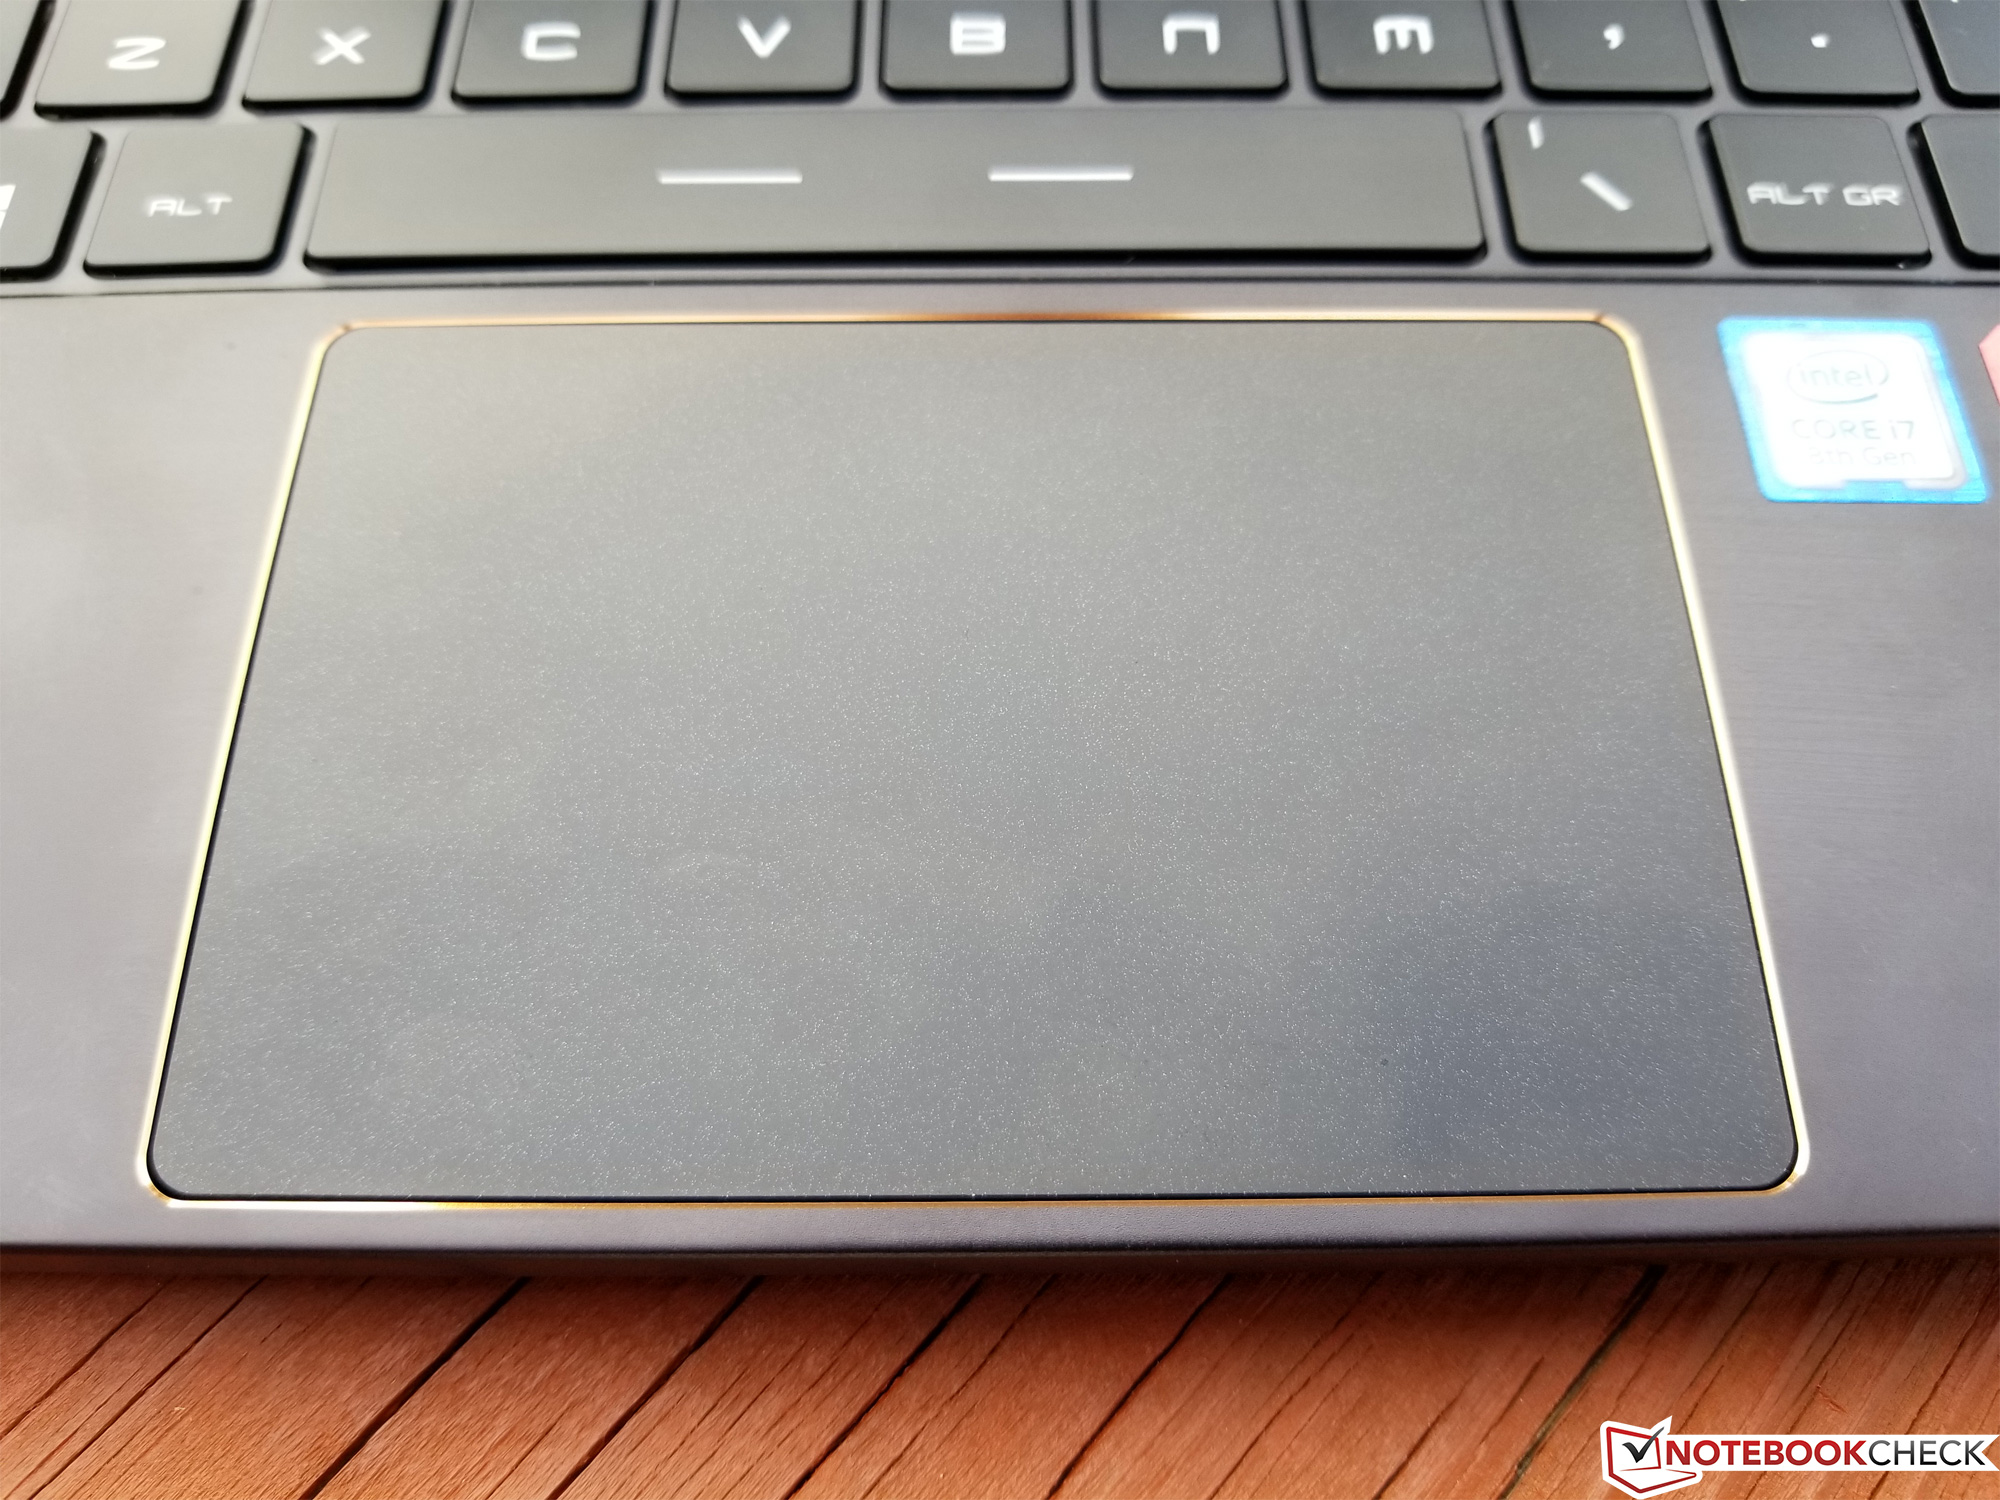
Today’s GS65 review unit retains the same 15.6-inch matte IPS 1920x1080 display, which features a 144 Hz refresh rate that is immediately obvious at first glance due to the fluidity of even such mundane motions as pointer movement. Subjectively, brightness and contrast seem average and colors pop fairly vividly.

| |||||||||||||||||||||||||
Brightness Distribution: 83 %
Center on Battery: 250.9 cd/m²
Contrast: 784:1 (Black: 0.32 cd/m²)
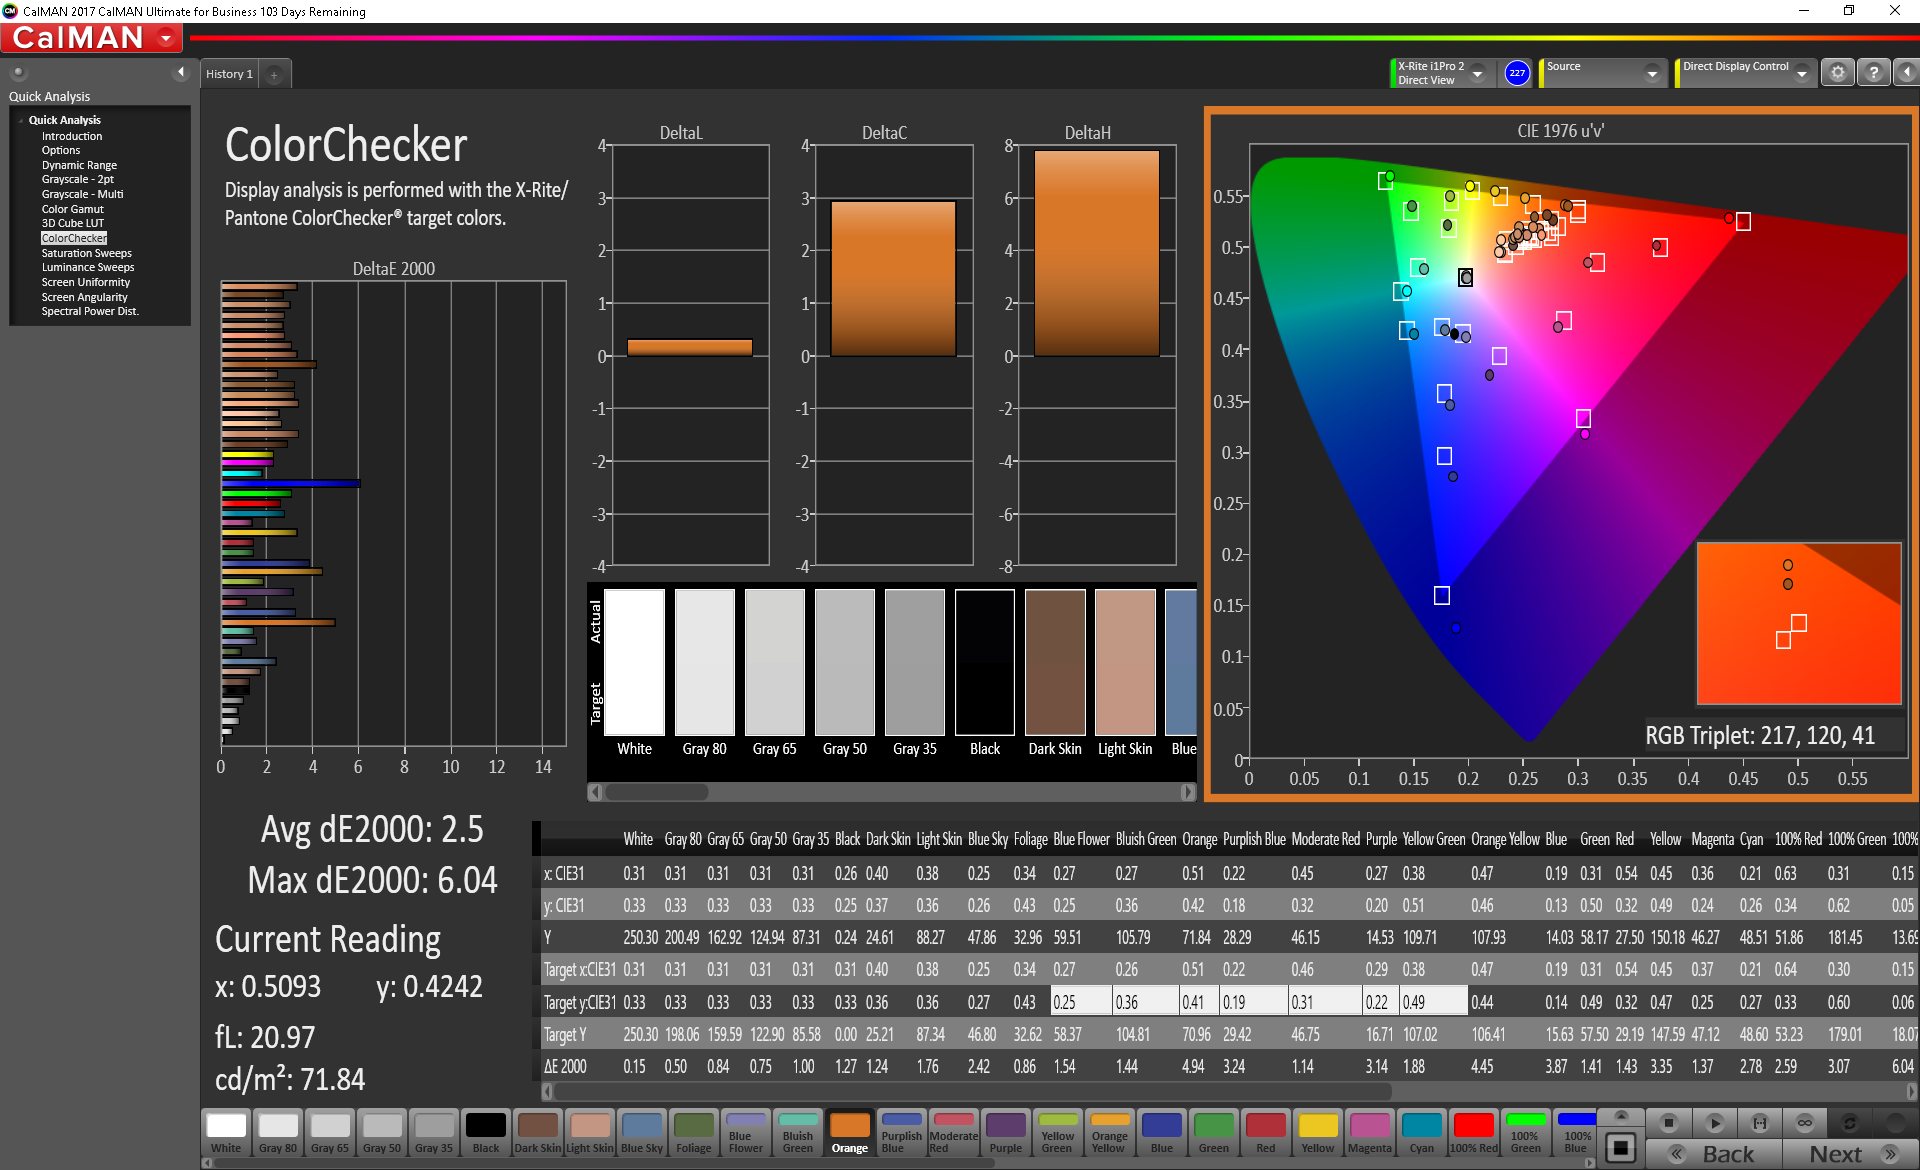
ΔE ColorChecker Calman: 2.77 | ∀{0.5-29.43 Ø4.71}
calibrated: 2.5
ΔE Greyscale Calman: 4 | ∀{0.09-98 Ø4.96}
92% sRGB (Argyll 1.6.3 3D)
60% AdobeRGB 1998 (Argyll 1.6.3 3D)
67% AdobeRGB 1998 (Argyll 3D)
92.1% sRGB (Argyll 3D)
65.8% Display P3 (Argyll 3D)
Gamma: 2.27
CCT: 6901 K
| MSI GS65 Stealth Thin 8RE-051US AUO80ED, IPS, 15.6", 1920x1080 | MSI GS65 8RF-019DE Stealth Thin AU Optronics B156HAN08.0 (AUO80ED), IPS, 15.6", 1920x1080 | Gigabyte Aero 15X v8 LGD05C0, IPS, 15.6", 1920x1080 | Asus Zephyrus M GM501 AUO B156HAN07.1 (AUO71ED), IPS, 15.6", 1920x1080 | Dell XPS 15 9570 i7 UHD LQ156D1, IPS, 15.6", 3840x2160 | Razer Blade 15 GTX 1060 LGD05C0, IPS, 15.6", 1920x1080 | |
|---|---|---|---|---|---|---|
| Display | 0% | -1% | 0% | 15% | -1% | |
| Display P3 Coverage (%) | 65.8 | 66.2 1% | 63.6 -3% | 66.1 0% | 79.1 20% | 64.4 -2% |
| sRGB Coverage (%) | 92.1 | 92.1 0% | 93.8 2% | 92.7 1% | 98.8 7% | 93.4 1% |
| AdobeRGB 1998 Coverage (%) | 67 | 67.2 0% | 64.9 -3% | 67.2 0% | 79.2 18% | 65.5 -2% |
| Response Times | 3% | 12% | 40% | -150% | 16% | |
| Response Time Grey 50% / Grey 80% * (ms) | 20 ? | 17.6 ? 12% | 16.8 ? 16% | 6.6 ? 67% | 46.4 ? -132% | 13.6 ? 32% |
| Response Time Black / White * (ms) | 12 ? | 12.8 ? -7% | 11.2 ? 7% | 10.4 ? 13% | 32 ? -167% | 12 ? -0% |
| PWM Frequency (Hz) | 980 ? | |||||
| Screen | 19% | 26% | -10% | 3% | 16% | |
| Brightness middle (cd/m²) | 250.9 | 254 1% | 313 25% | 307 22% | 494 97% | 304.3 21% |
| Brightness (cd/m²) | 257 | 262 2% | 300 17% | 296 15% | 457 78% | 293 14% |
| Brightness Distribution (%) | 83 | 89 7% | 78 -6% | 89 7% | 88 6% | 80 -4% |
| Black Level * (cd/m²) | 0.32 | 0.22 31% | 0.33 -3% | 0.25 22% | 0.34 -6% | 0.38 -19% |
| Contrast (:1) | 784 | 1155 47% | 948 21% | 1228 57% | 1453 85% | 801 2% |
| Colorchecker dE 2000 * | 2.77 | 2.37 14% | 1.29 53% | 5.74 -107% | 5.2 -88% | 1.79 35% |
| Colorchecker dE 2000 max. * | 5.89 | 4.71 20% | 2.04 65% | 11.32 -92% | 17.5 -197% | 3.69 37% |
| Colorchecker dE 2000 calibrated * | 2.5 | 1.84 26% | 1.94 22% | |||
| Greyscale dE 2000 * | 4 | 1.58 60% | 0.69 83% | 6.44 -61% | 2.7 32% | 1.1 72% |
| Gamma | 2.27 97% | 2.48 89% | 2.43 91% | 2.48 89% | 2.1 105% | 2.27 97% |
| CCT | 6901 94% | 6785 96% | 6550 99% | 8395 77% | 7038 92% | 6665 98% |
| Color Space (Percent of AdobeRGB 1998) (%) | 60 | 60 0% | 60 0% | 60 0% | 71.2 19% | 59.8 0% |
| Color Space (Percent of sRGB) (%) | 92 | 92 0% | 94 2% | 93 1% | 98.8 7% | 92.8 1% |
| Total Average (Program / Settings) | 7% /
13% | 12% /
18% | 10% /
-2% | -44% /
-15% | 10% /
13% |
* ... smaller is better
As expected (since both panels are identical), our measurements are nearly the same as those we witnessed from the previous unit. We record a mere 256.8 cd/m² average brightness (distribution: 83%) with a decent contrast of 784:1 (spurred by a black level of 0.32 cd/m²). That’s well below the close to 300 cd/m² average we see from all other competitors in our field, and the contrast is also the lowest overall.
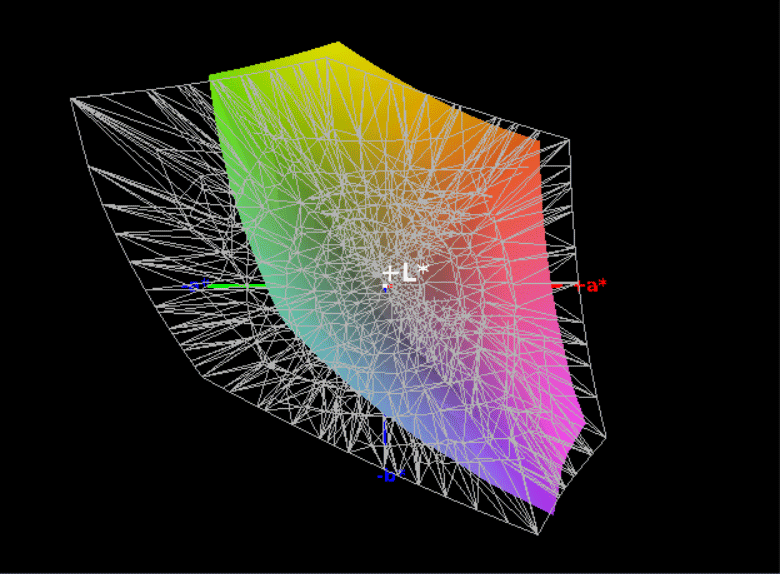
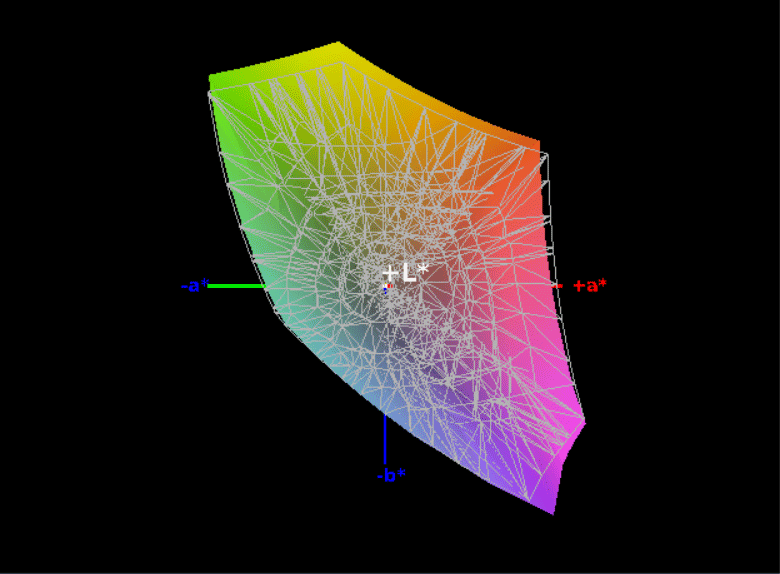
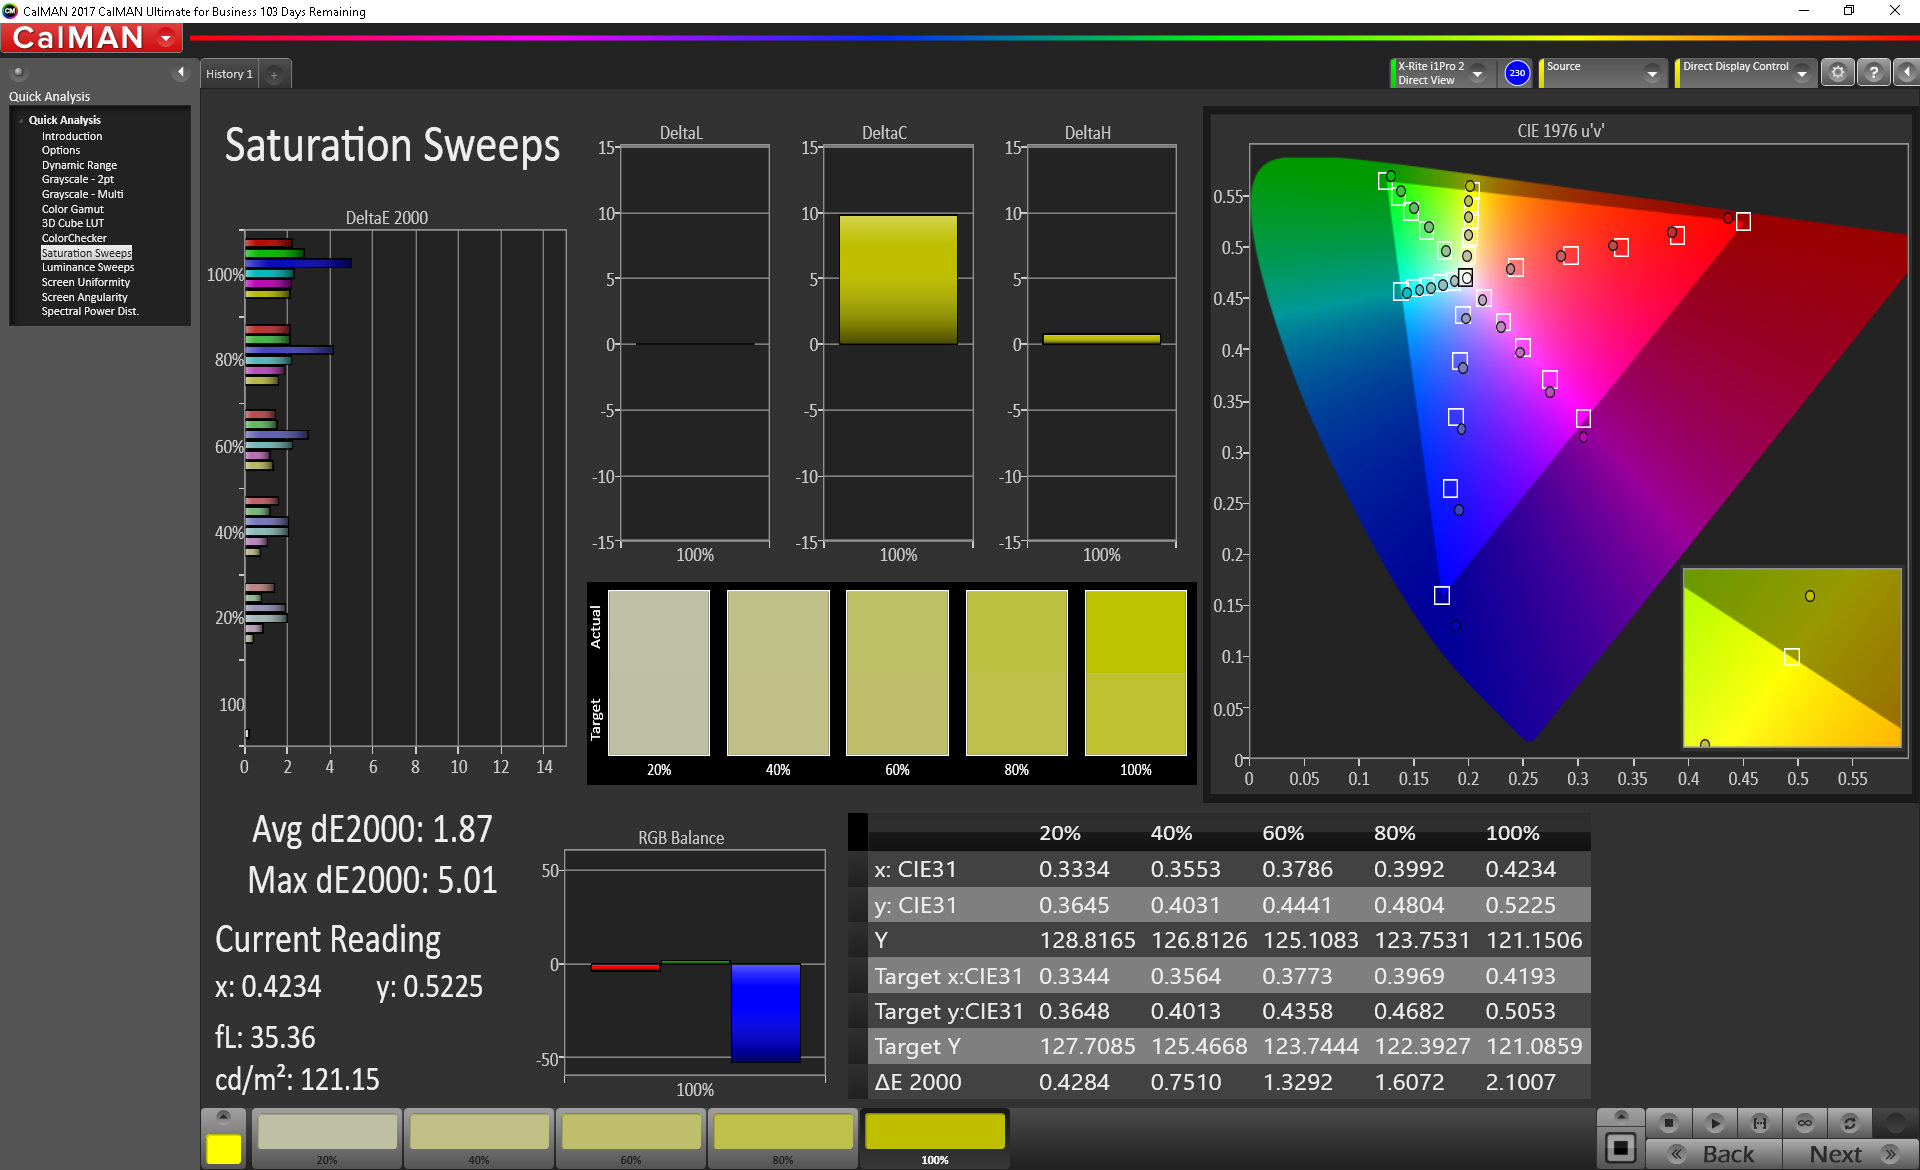
Color coverage from the display is decent, managing 92% of sRGB and 60% of AdobeRGB. This isn’t sufficient for serious photographers or anyone doing graphic design, but for practically everyone else, it’s perfectly adequate. Most competitors post similar numbers, with only the XPS 15 faring better with 99% / 71% respectively.

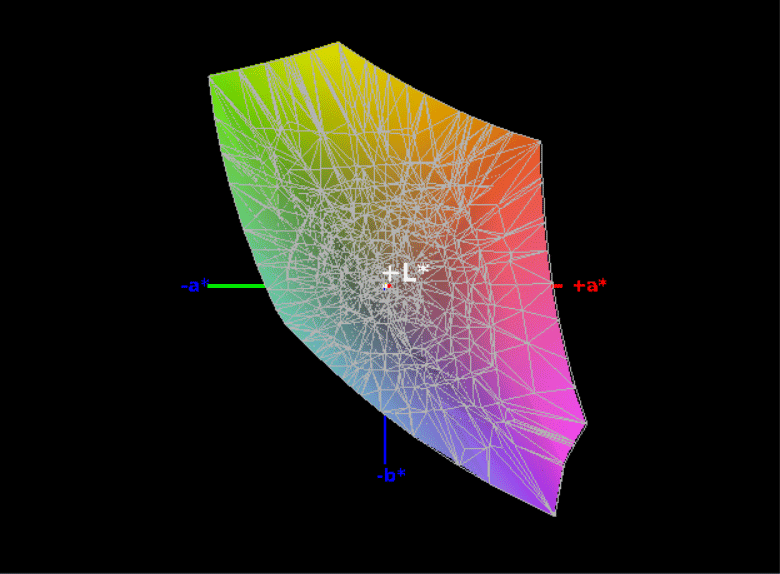
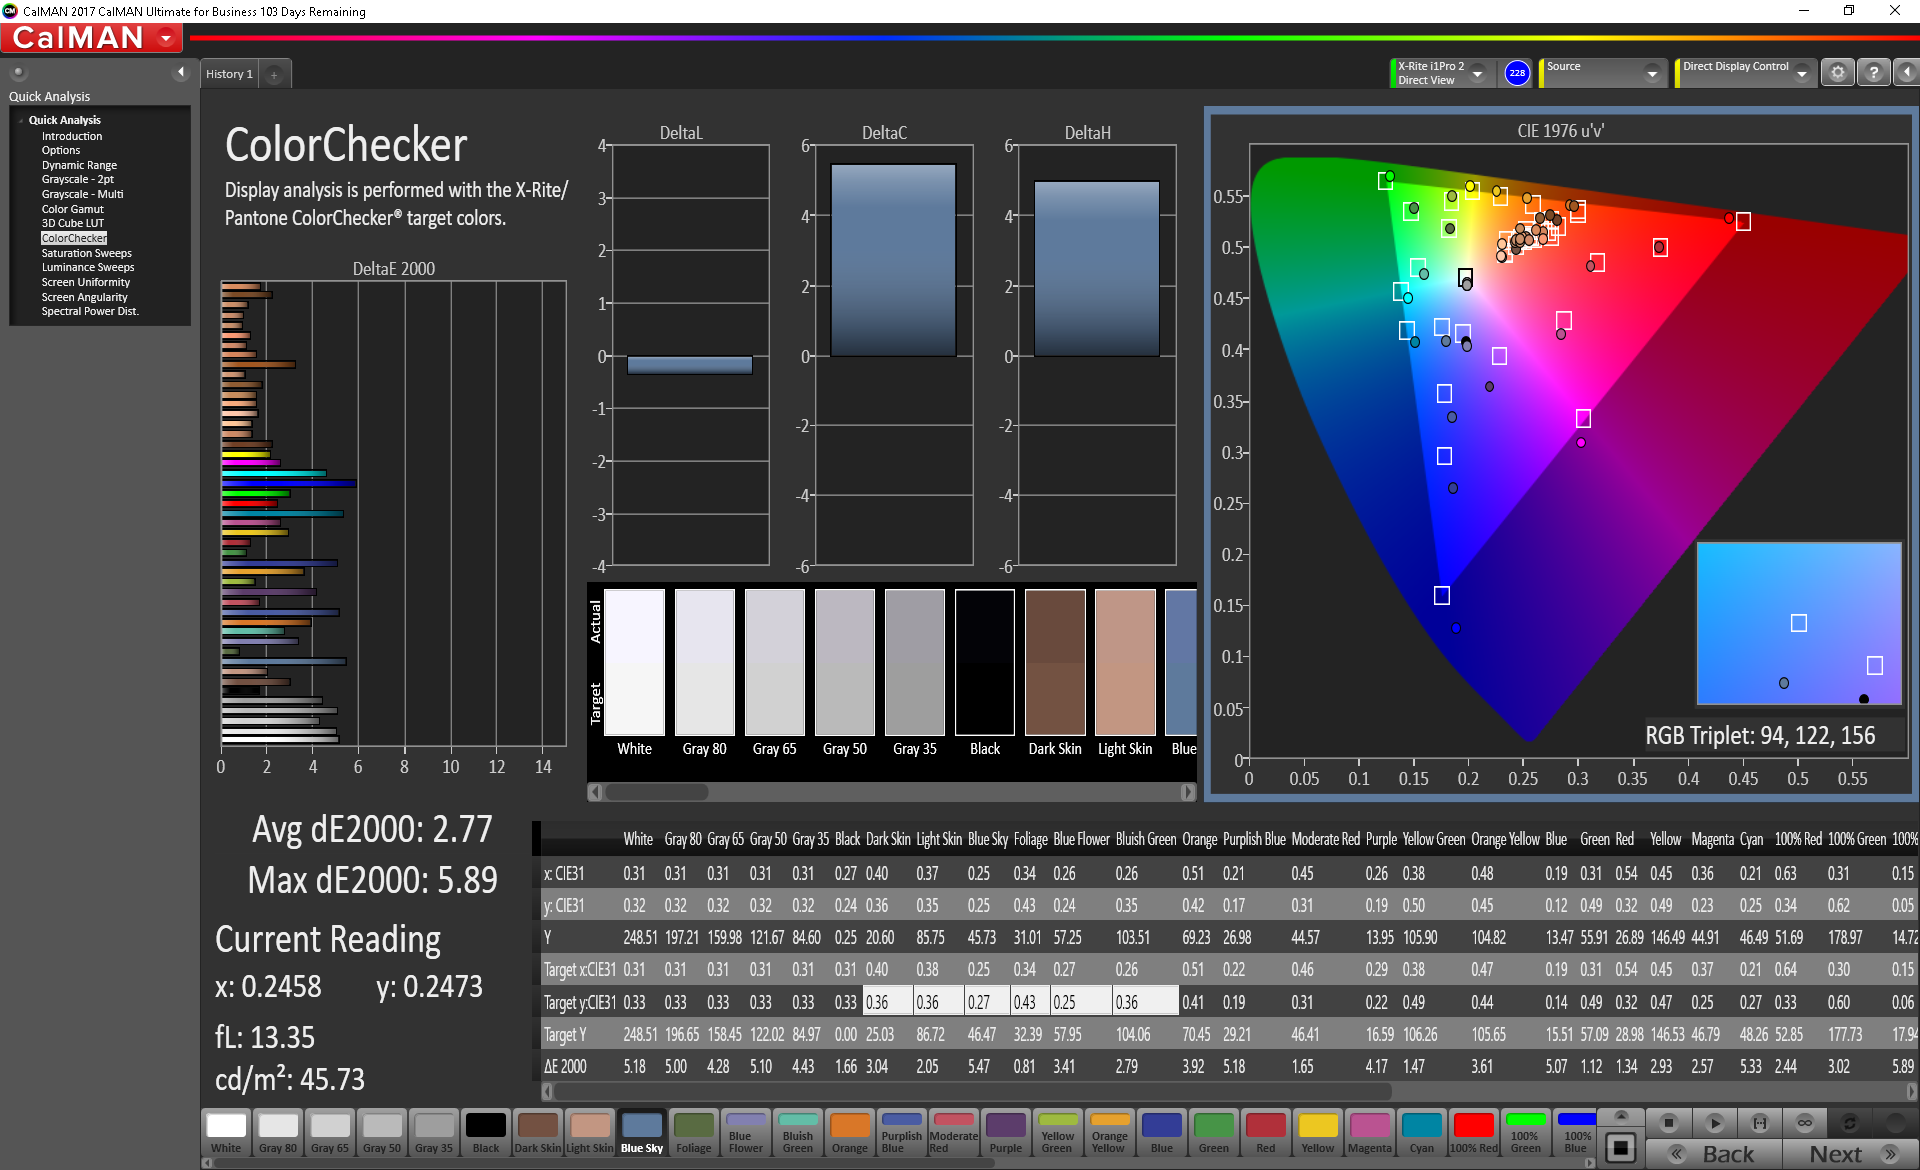
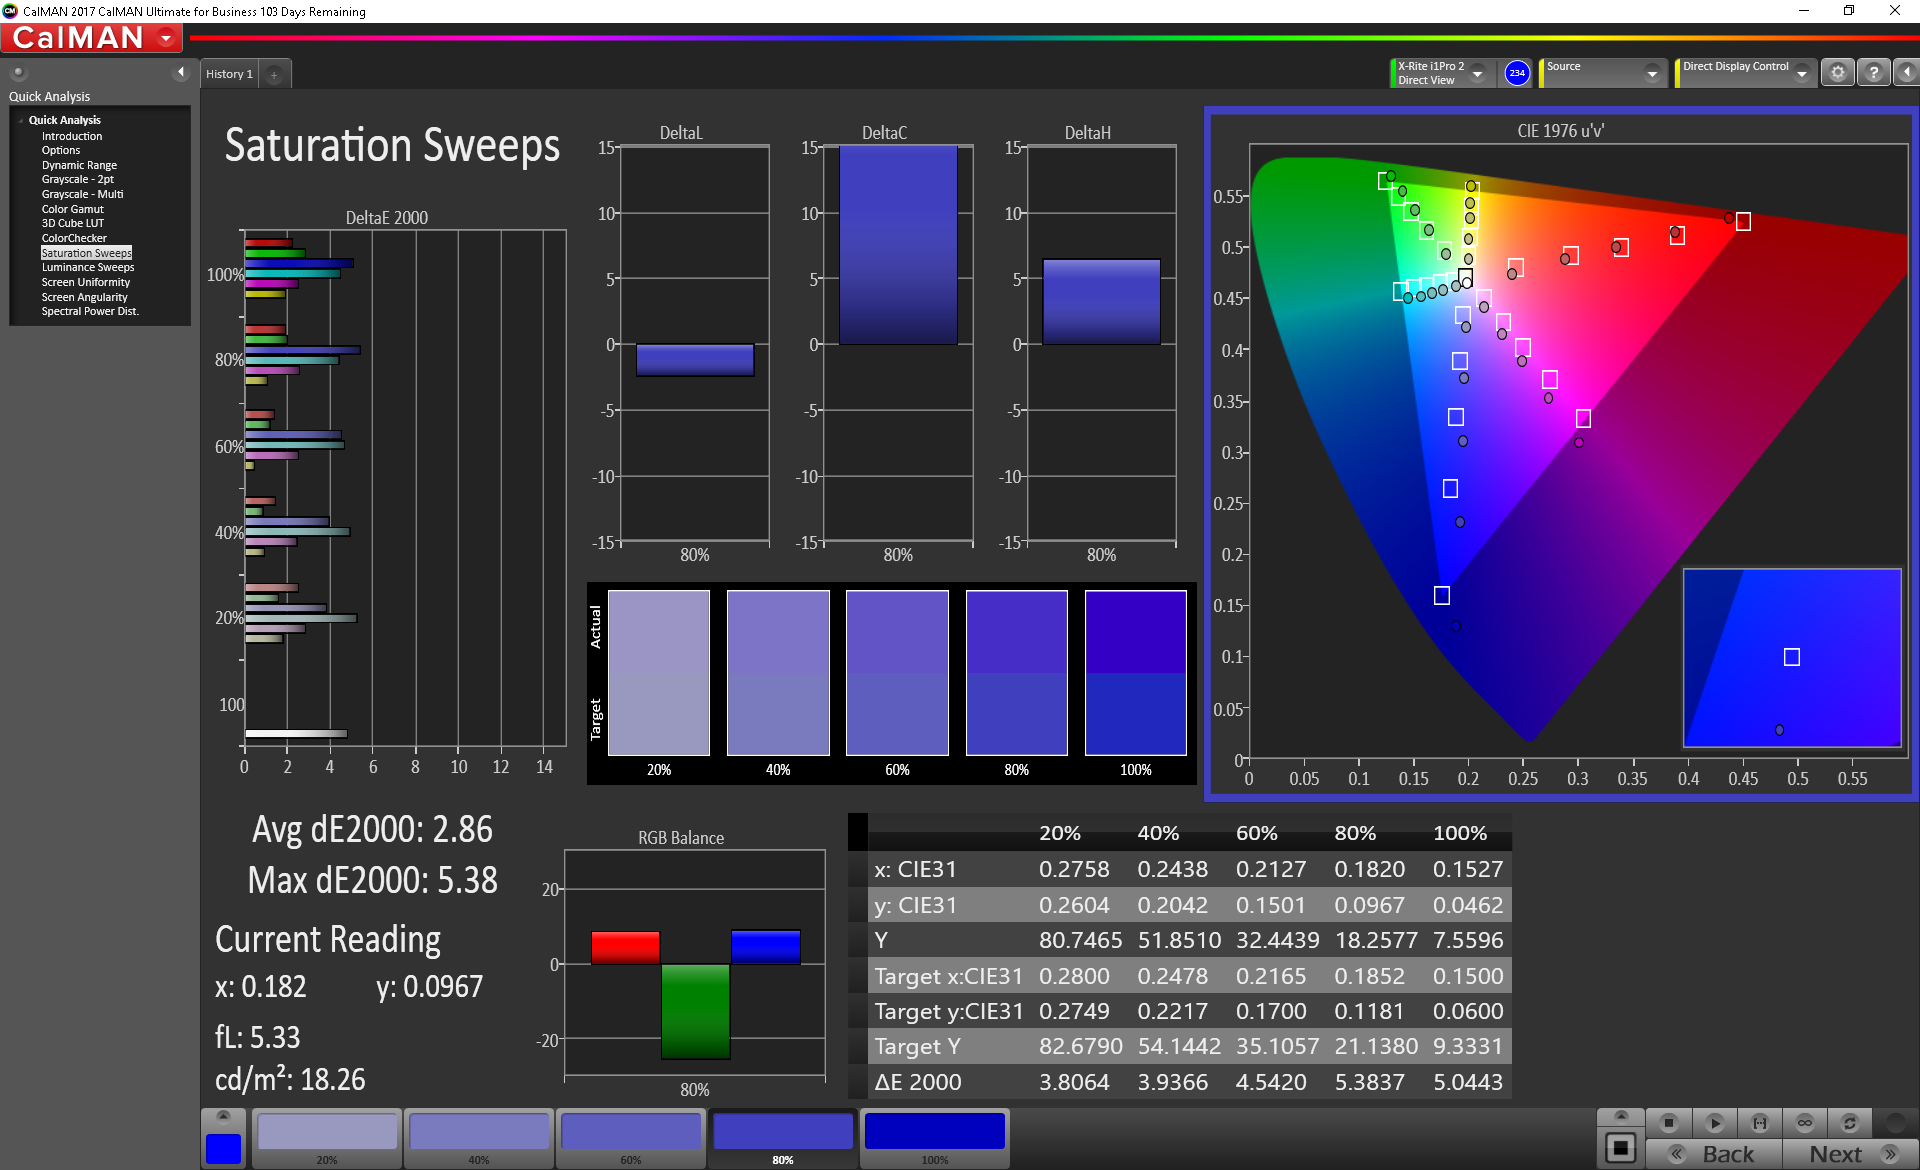
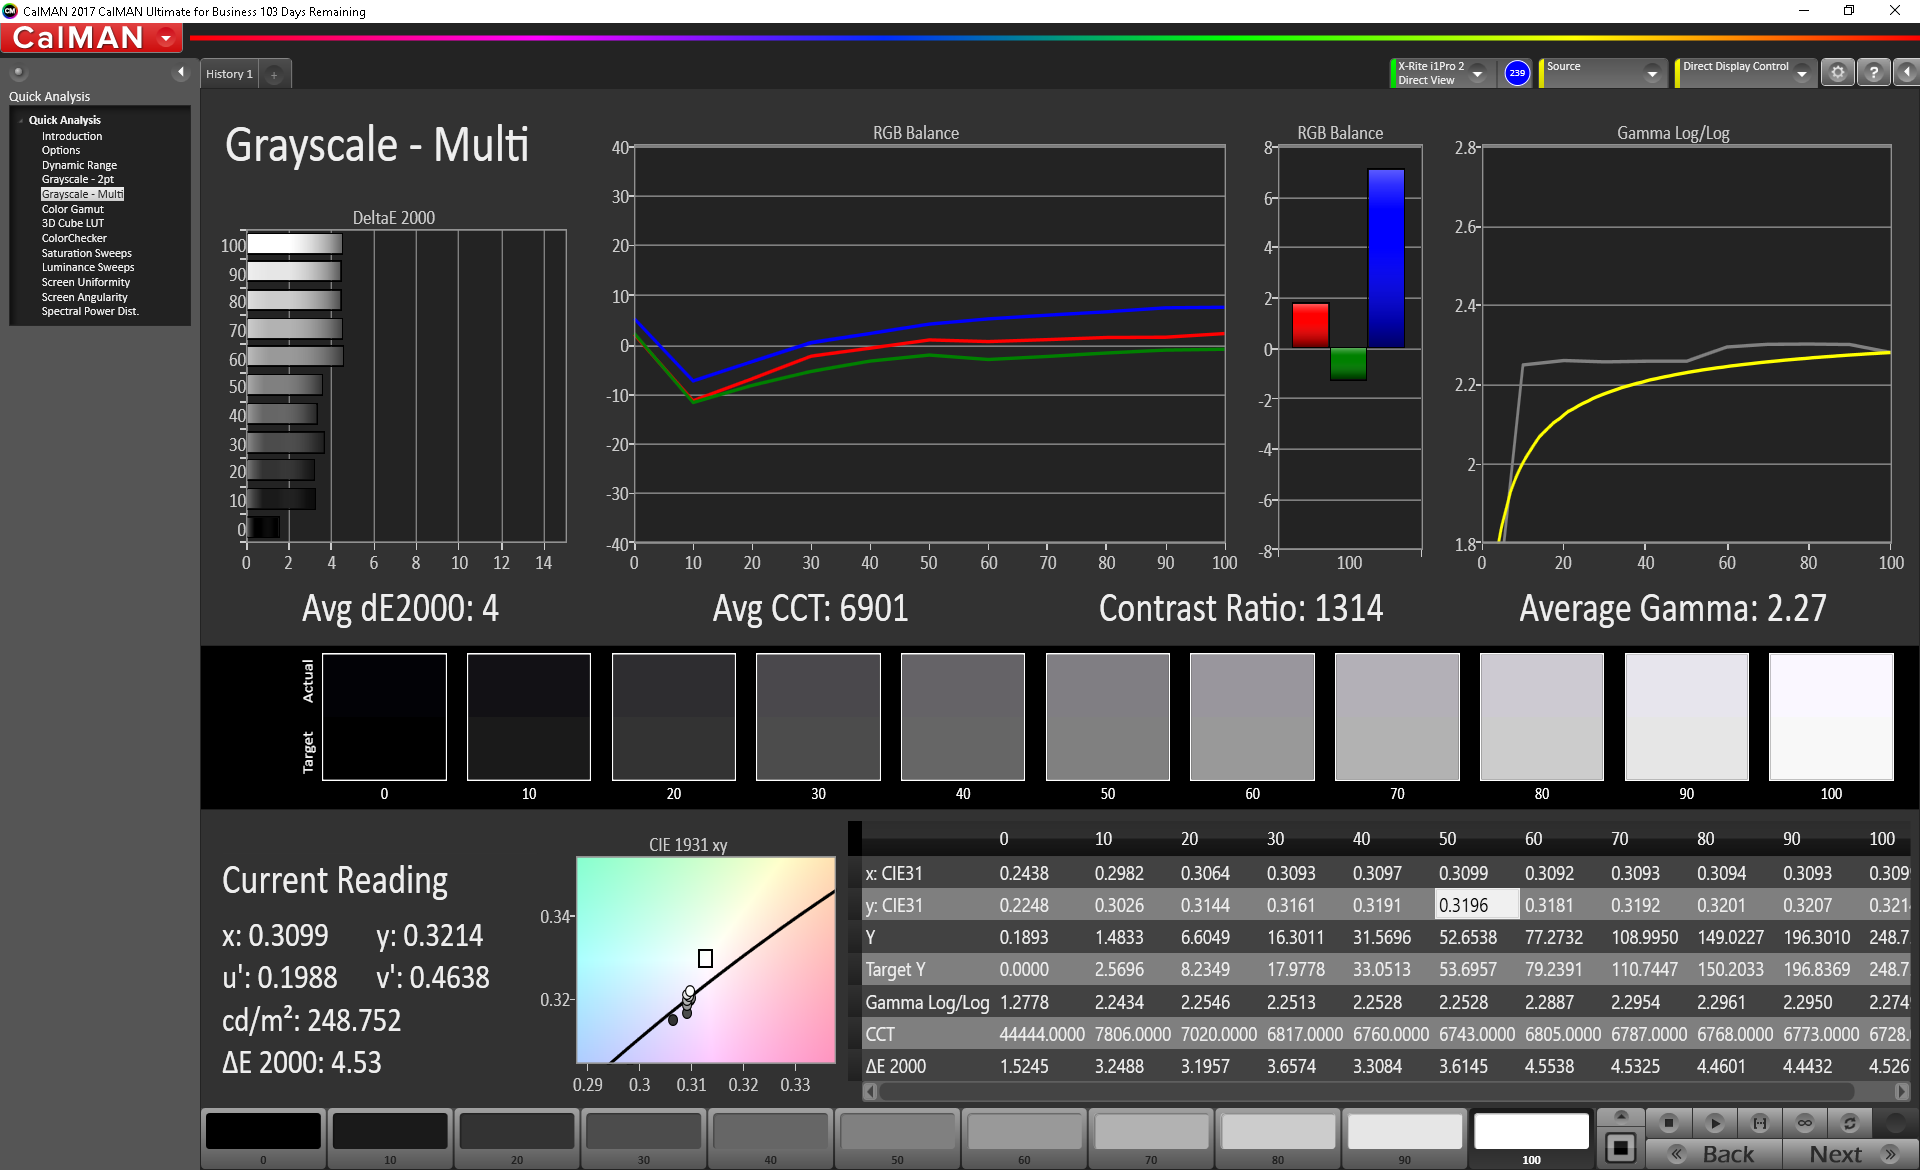
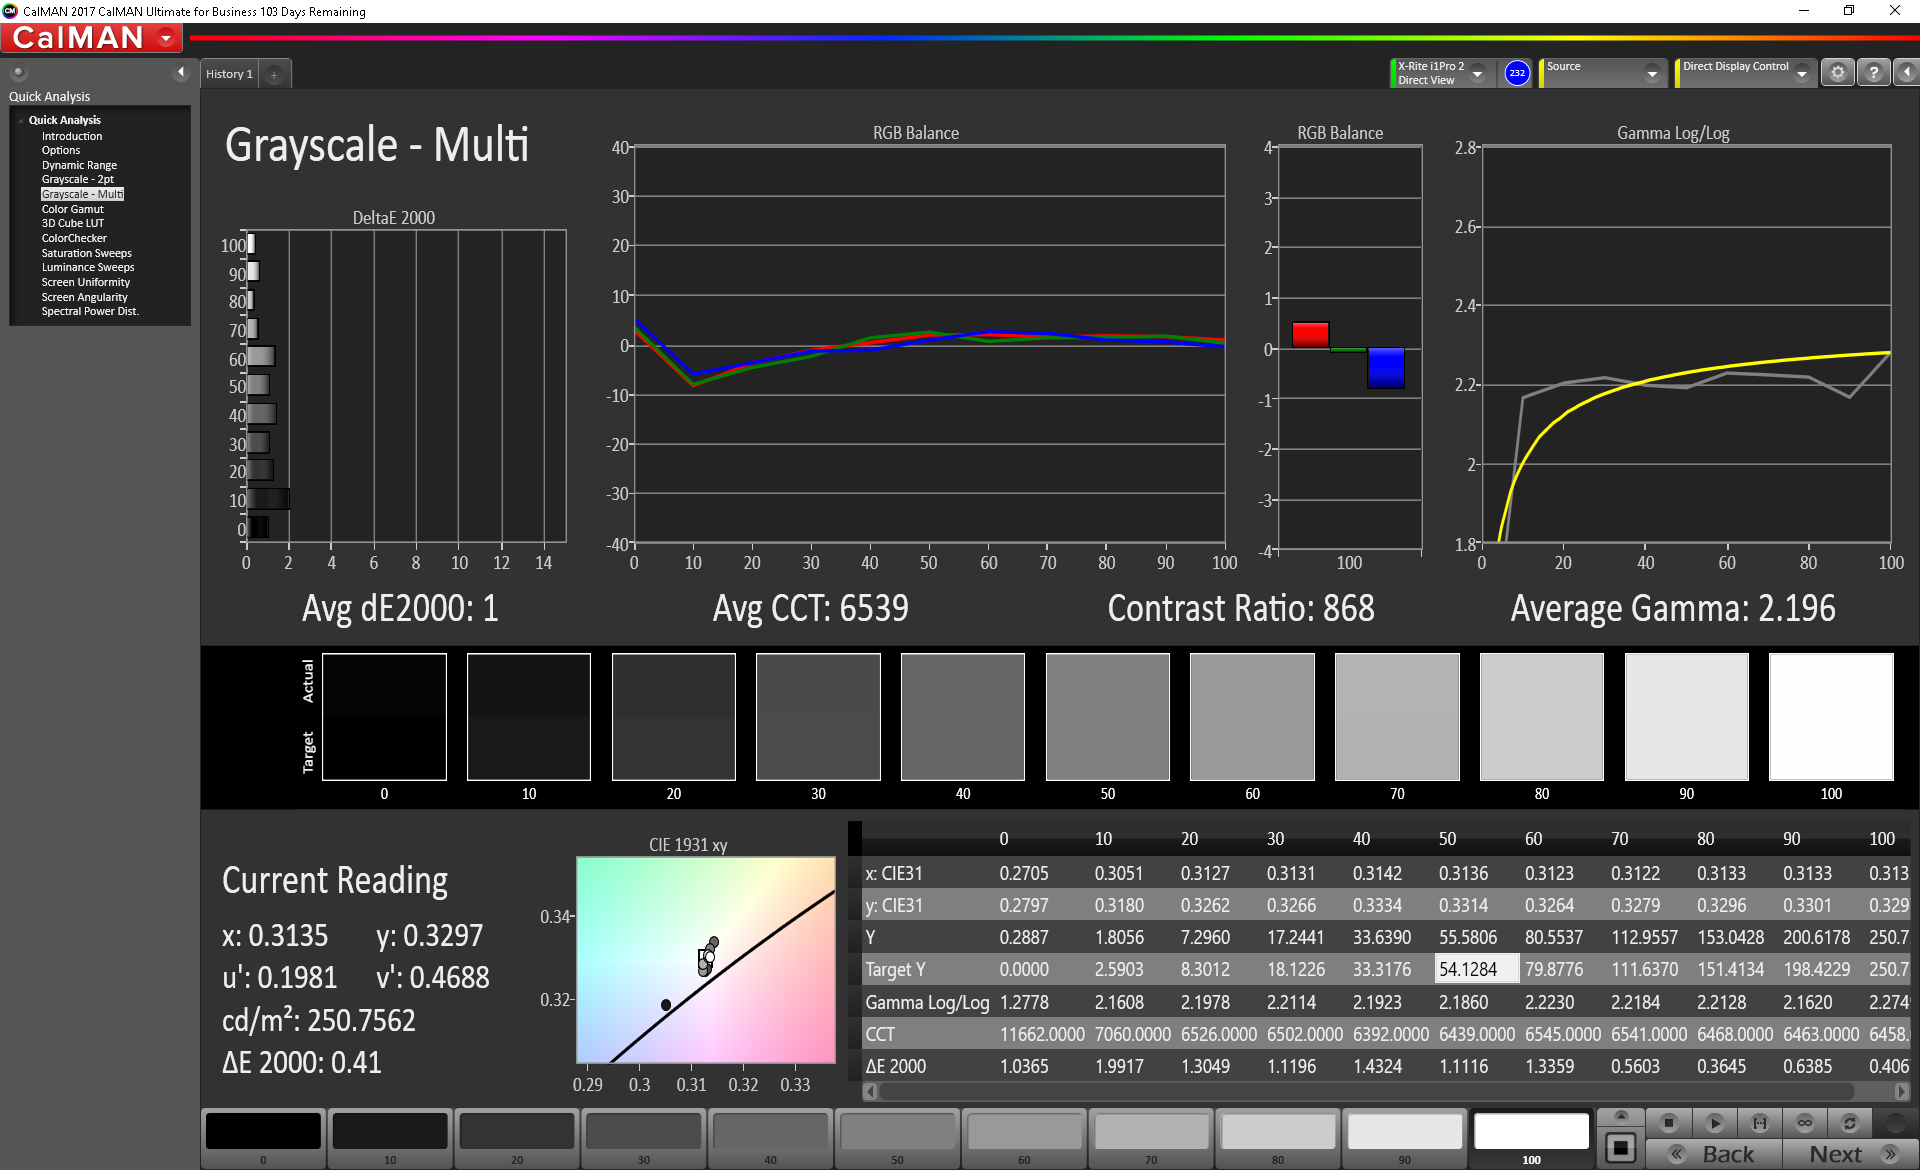
Color accuracy is also a reasonably strong suit for the GS65; our CalMAN measurements reveal ColorChecker/Greyscale DeltaE averages of just 2.77 / 4 and a ColorChecker maximum of still just 5.89 (Blue). The Total Gamma of 2.27 and CCT Average of 6901 are also good results.
Display Response Times
| ↔ Response Time Black to White | ||
|---|---|---|
| 12 ms ... rise ↗ and fall ↘ combined | ↗ 6.8 ms rise | 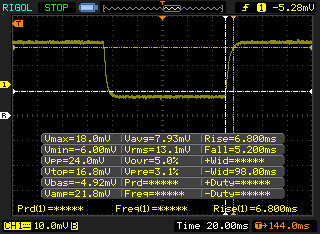 |
| ↘ 5.2 ms fall | ||
| The screen shows good response rates in our tests, but may be too slow for competitive gamers. In comparison, all tested devices range from 0.1 (minimum) to 240 (maximum) ms. » 32 % of all devices are better. This means that the measured response time is better than the average of all tested devices (19.8 ms). | ||
| ↔ Response Time 50% Grey to 80% Grey | ||
| 20 ms ... rise ↗ and fall ↘ combined | ↗ 10 ms rise |  |
| ↘ 10 ms fall | ||
| The screen shows good response rates in our tests, but may be too slow for competitive gamers. In comparison, all tested devices range from 0.165 (minimum) to 636 (maximum) ms. » 33 % of all devices are better. This means that the measured response time is better than the average of all tested devices (30.9 ms). | ||
Screen Flickering / PWM (Pulse-Width Modulation)
| Screen flickering / PWM not detected |  | ||
In comparison: 52 % of all tested devices do not use PWM to dim the display. If PWM was detected, an average of 7748 (minimum: 5 - maximum: 343500) Hz was measured. | |||
We detect no PWM from the display at any brightness. Meanwhile, response times are very close to the promised values, and within the top 8% of all machines we’ve measured.
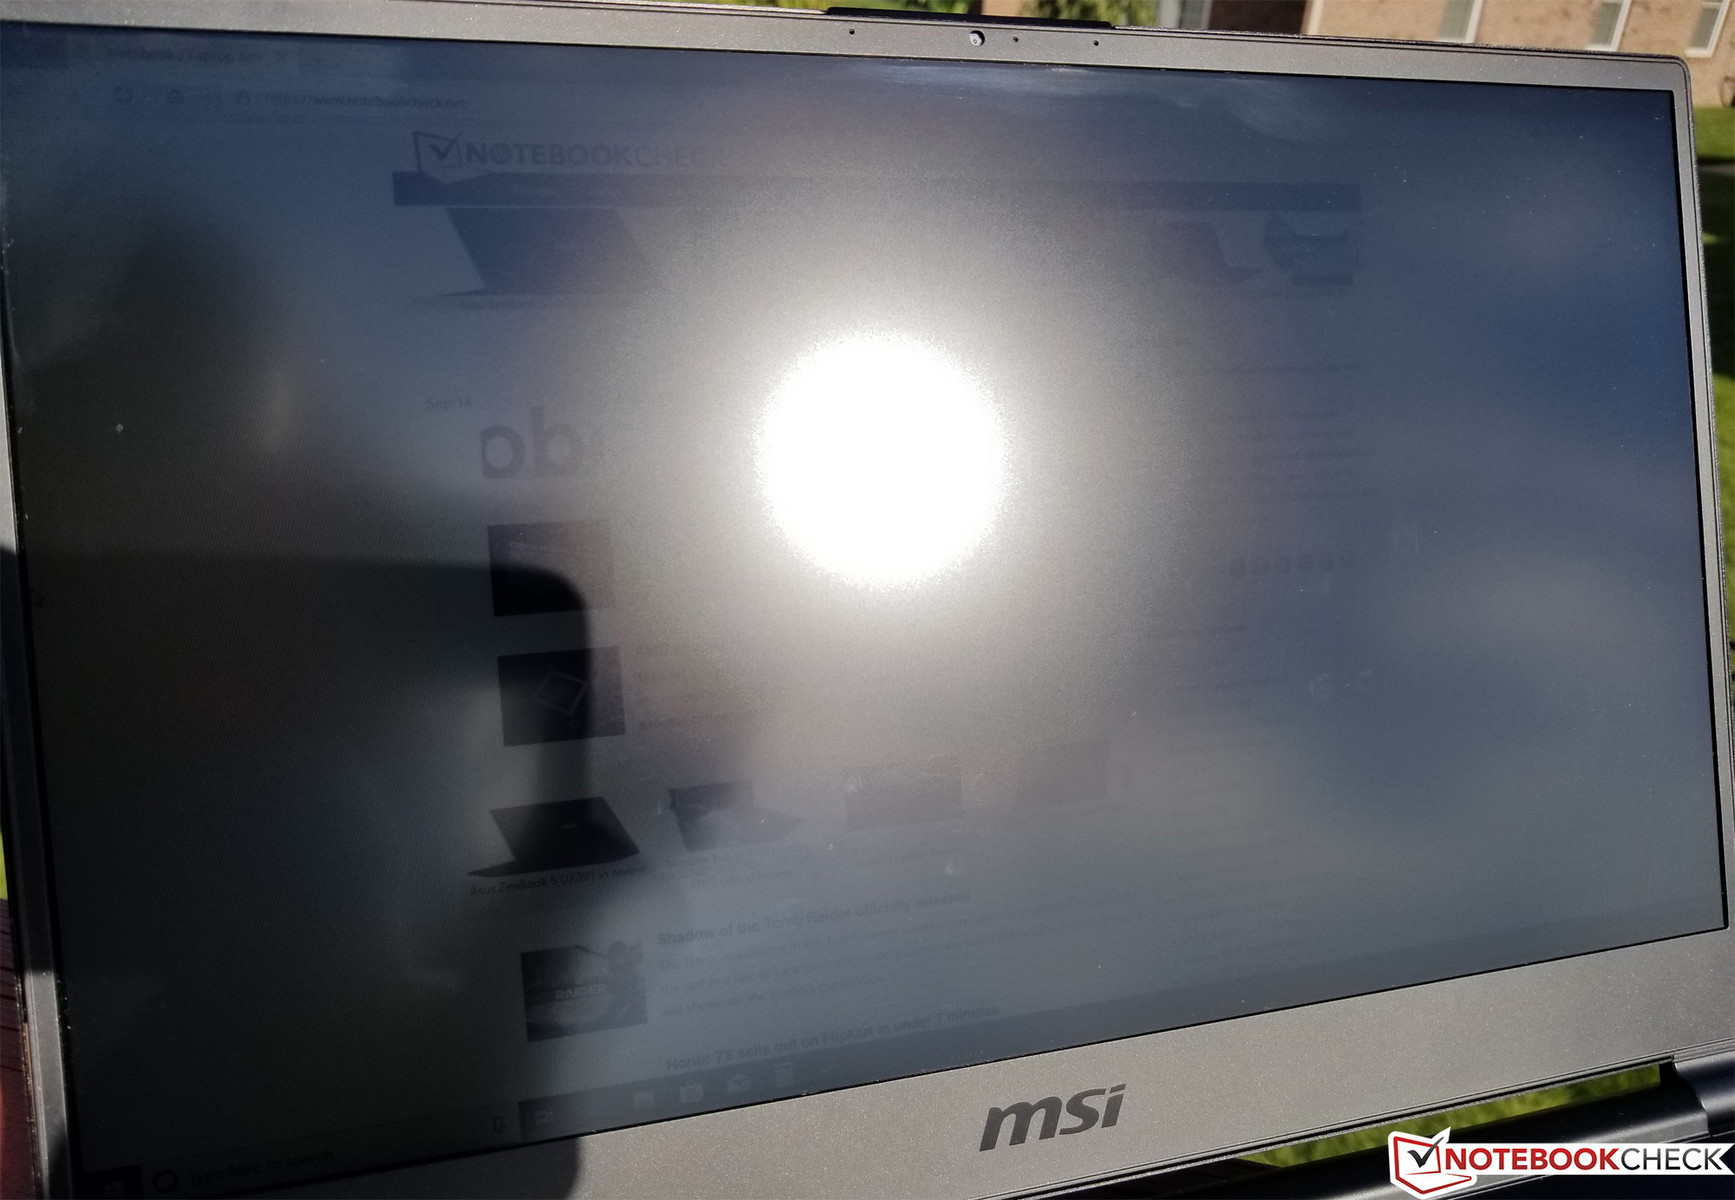
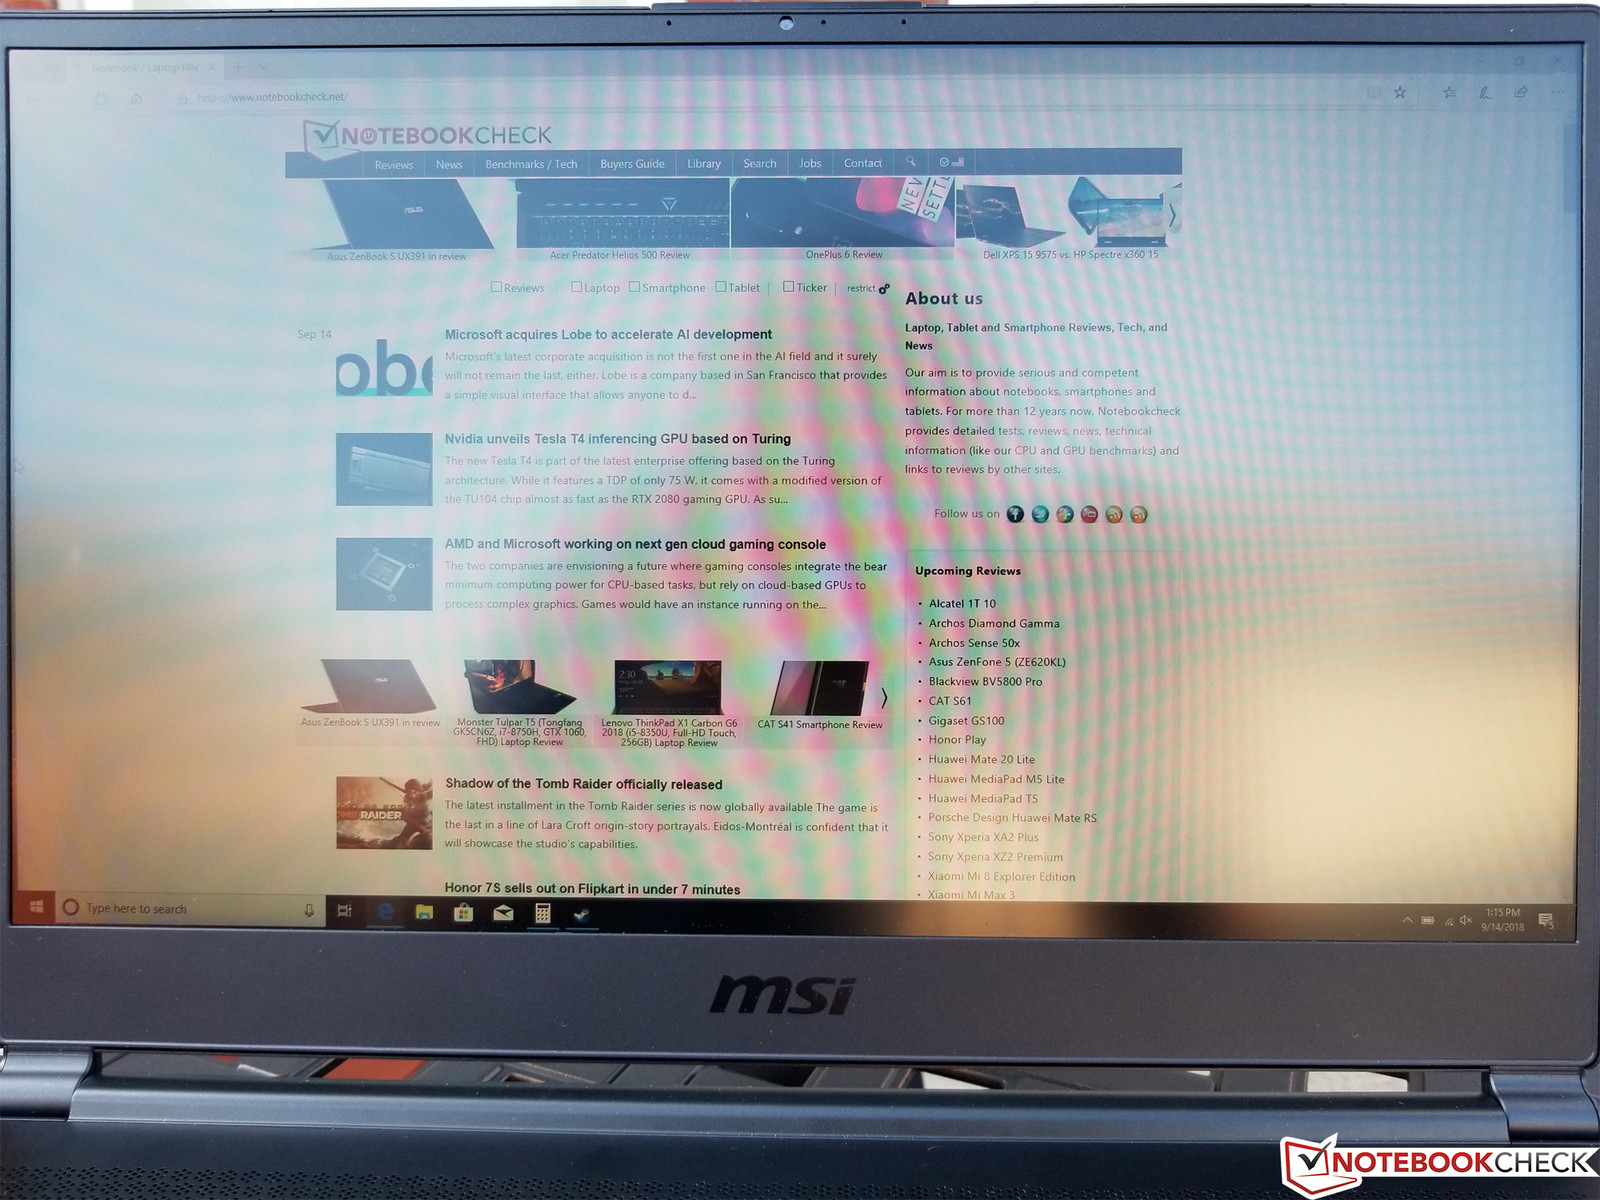
Outdoors, the panel struggles thanks to its weak brightness and middling contrast values (though the anti-glare finish certainly does help to make usage in the shade at least possible). Viewing angles are excellent from all sides.

Performance
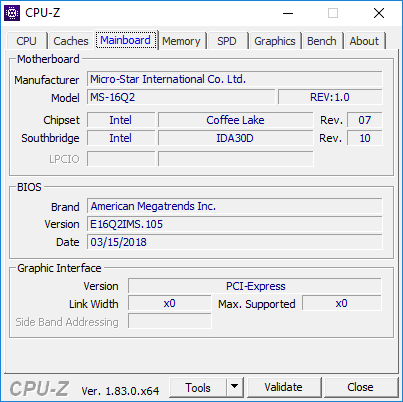
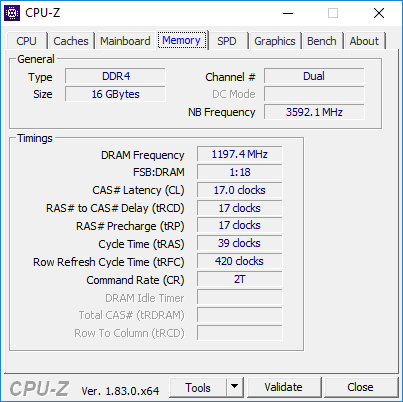
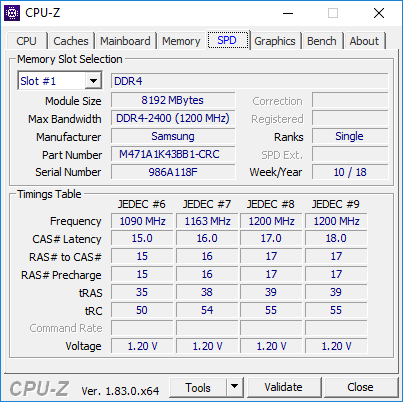
All MSI GS65 notebooks are powered by an Intel Core i7-8750H CPU and either 16 GB or 32 GB of DDR4-2400 MHz dual-channel RAM. Two different GPU options are available: the NVIDIA GeForce GTX 1060 (6 GB) and GTX 1070 Max-Q (8 GB). Finally, storage ranges between 256 GB and 1 TB, all solid-state—some SATA, some NVMe, and even a 1 TB option termed “Super RAID 4” (which actually just refers to dual 512 GB NVMe SSDs in a RAID-0 configuration).
Our review unit is just a step below the previous machine we tested, featuring an Intel Core i7-8750H, GTX 1060 GPU, 16 GB DDR4 dual-channel memory, and a 256 GB NVMe SSD.
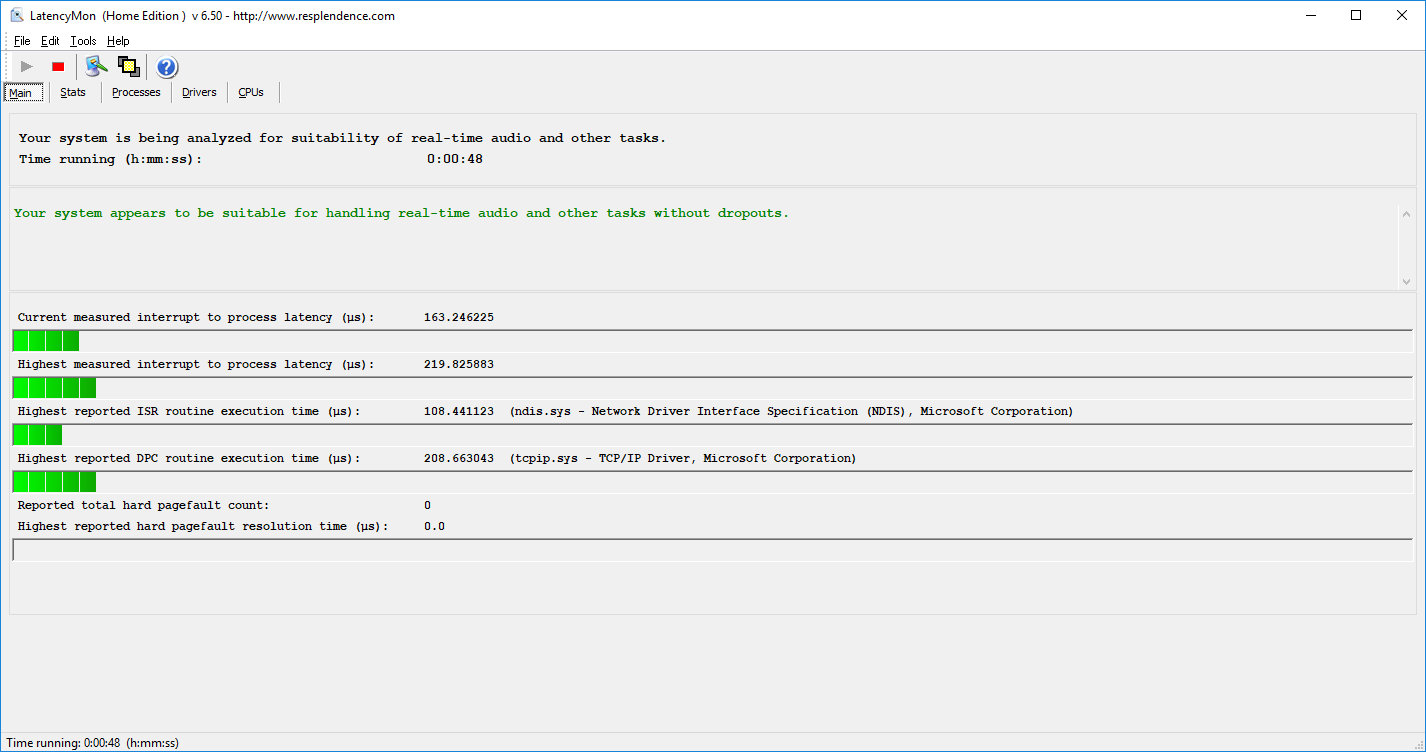
As one might expect, performance while unplugged is notably below that while plugged in; a secondary run of 3DMark 11 while operating on battery power yields a score of just 5758. Elsewhere, LatencyMon reveals no issues with DPC Latencies.
Processor
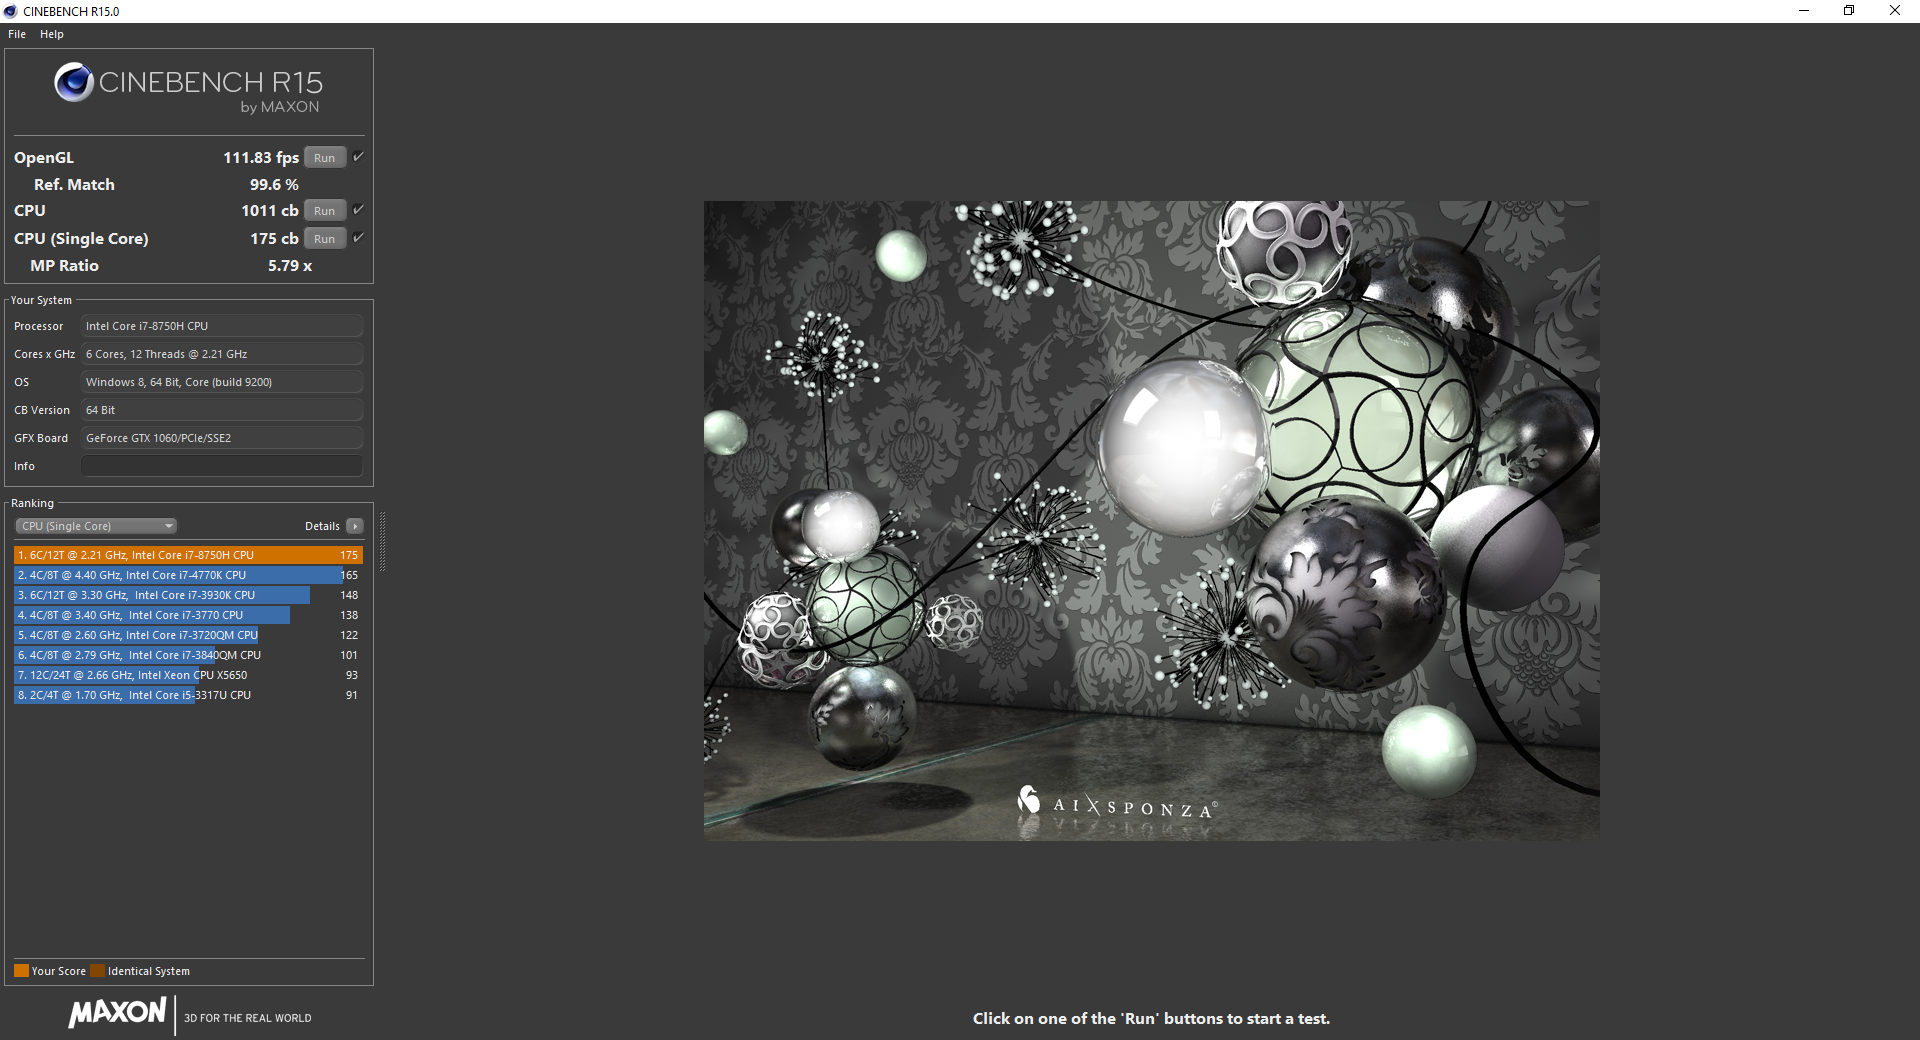
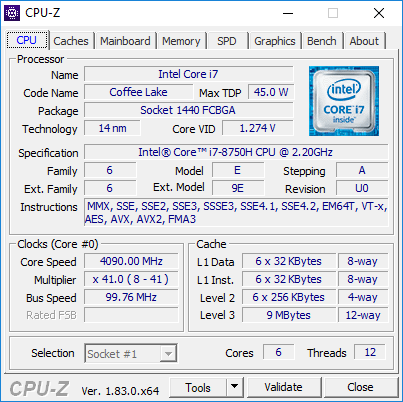
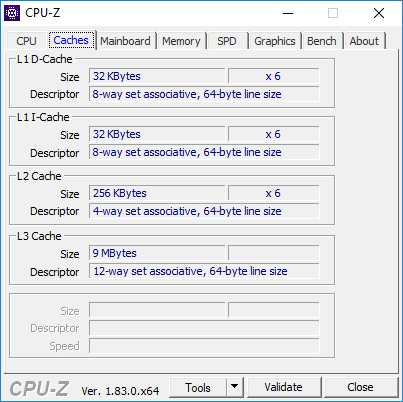
The Intel Core i7-8750H is the same hexa-core CPU that powered our previous GS65 candidate—as well as the majority of the machines against which we’re comparing today. This CPU is produced using the Coffee Lake “14 nm++” process and boasts clock rates ranging from 2.2 and 4.1 GHz (3.9 GHz with 6 cores). It carries a TDP of 45 W. We’ve covered it extensively in the past, so check out our dedicated CPU page for much more information about its general performance.
While Turbo Boost capability is somewhat lacking in the GS65 (as before)—which leads to lower performance than its i7-8750H-equipped peers by around 12% to 16% in multi-core measurements—performance is nonetheless strong, beating the Razer Blade 15 by around 9% and trampling the 7th-gen quad-core CPU competitors by some 27%.
Sustained performance as tested by our Cinebench R15 multi-core loop test isn’t terribly surprising; we witness a drop from an initial result of 1083 down to 974/1009 in the next couple of runs, followed by relatively stable values in the 980—1000 range subsequently. While this is reasonably good considering the machine’s size and comparatively quiet profile, it indicates a considerably weaker sustained performance capability than either the Asus ROG Zephyrus GM501 or Gigabyte Aero 15X, which post long-term consistent scores of around 1050 and 1110 in this same test respectively.
System Performance
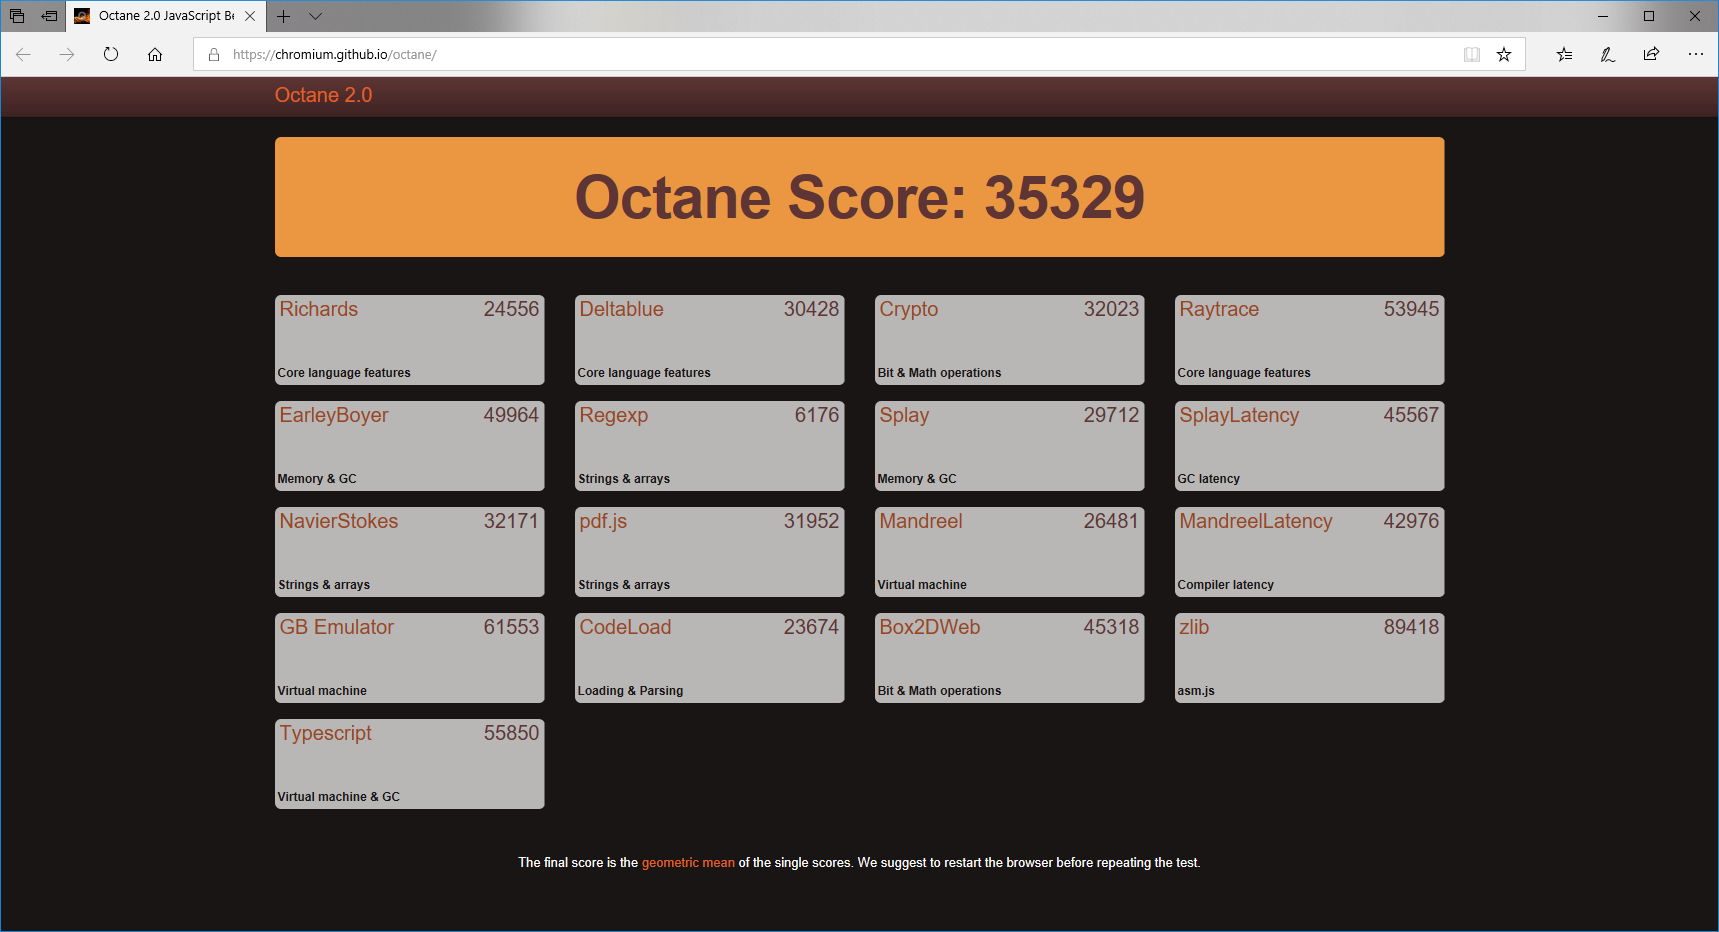
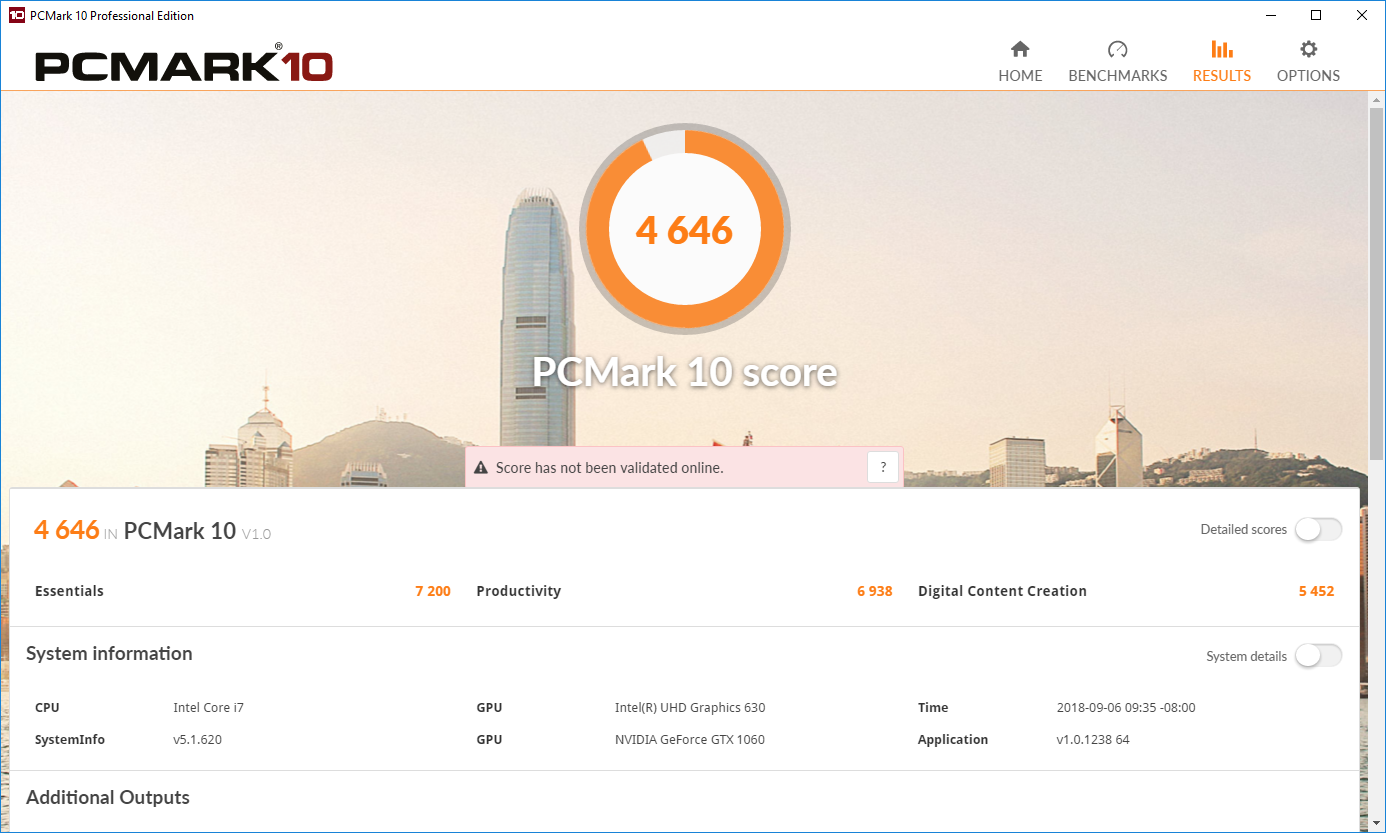
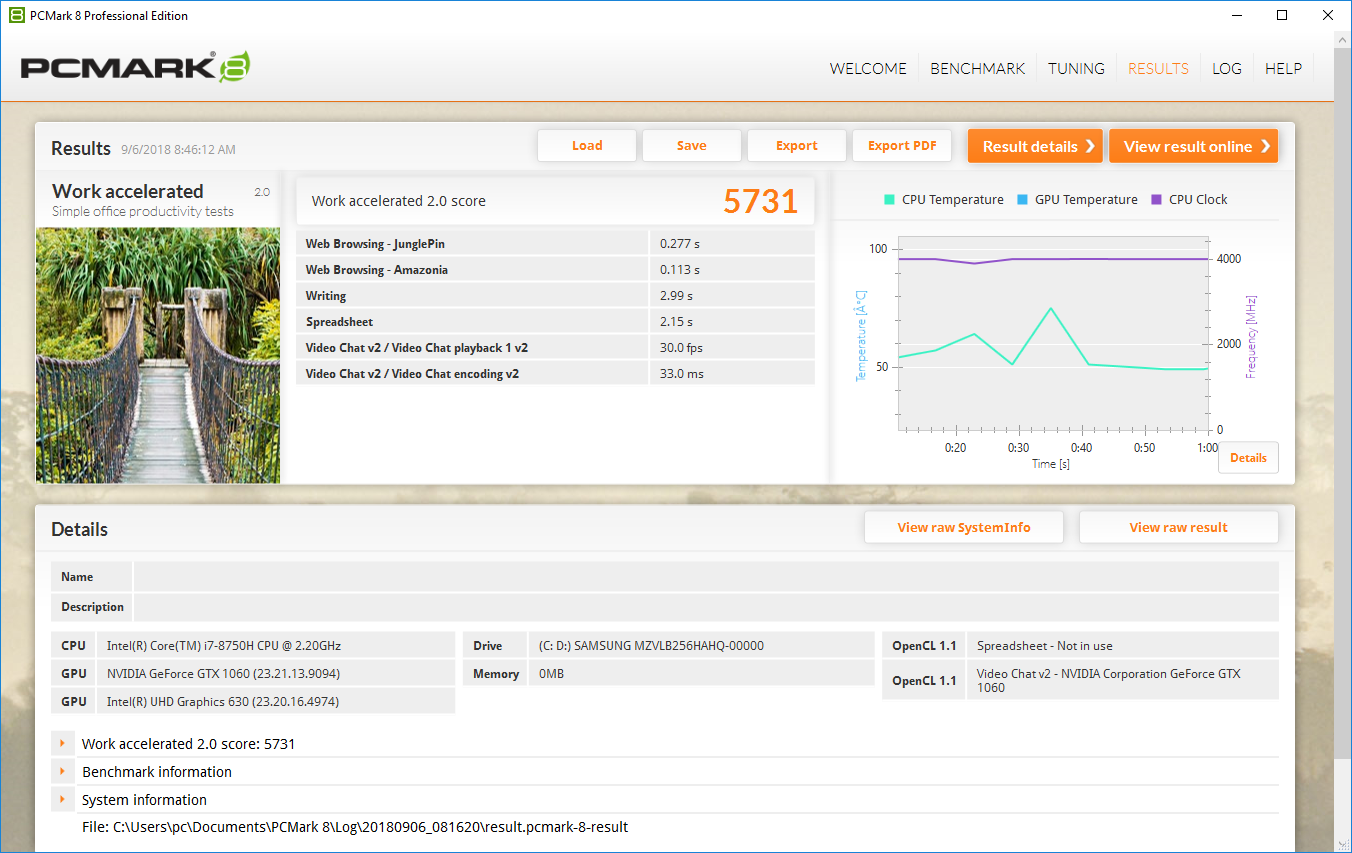
The GS65 is a very fast machine in general performance, and as is typically the case, when we get to analyzing (via synthetic benchmarks and resulting scores) the relative performance of direct competitors with such high-powered parts, there’s very little realistic disparity between them at such a high level. Speaking of which, the GS65 manages a strong PCMark 10 overall score of 4646, which—although some 14% below what we received from the top dog in today’s comparison chart, the Acer Predator Triton 700—is still indicative of a very capable machine. PCMark 8 scores are actually even better, with results near the top of the charts in both the Work and Home benchmarks. Subjectively, the machine is indeed very fast; we encountered no notable hiccups during our time with it.
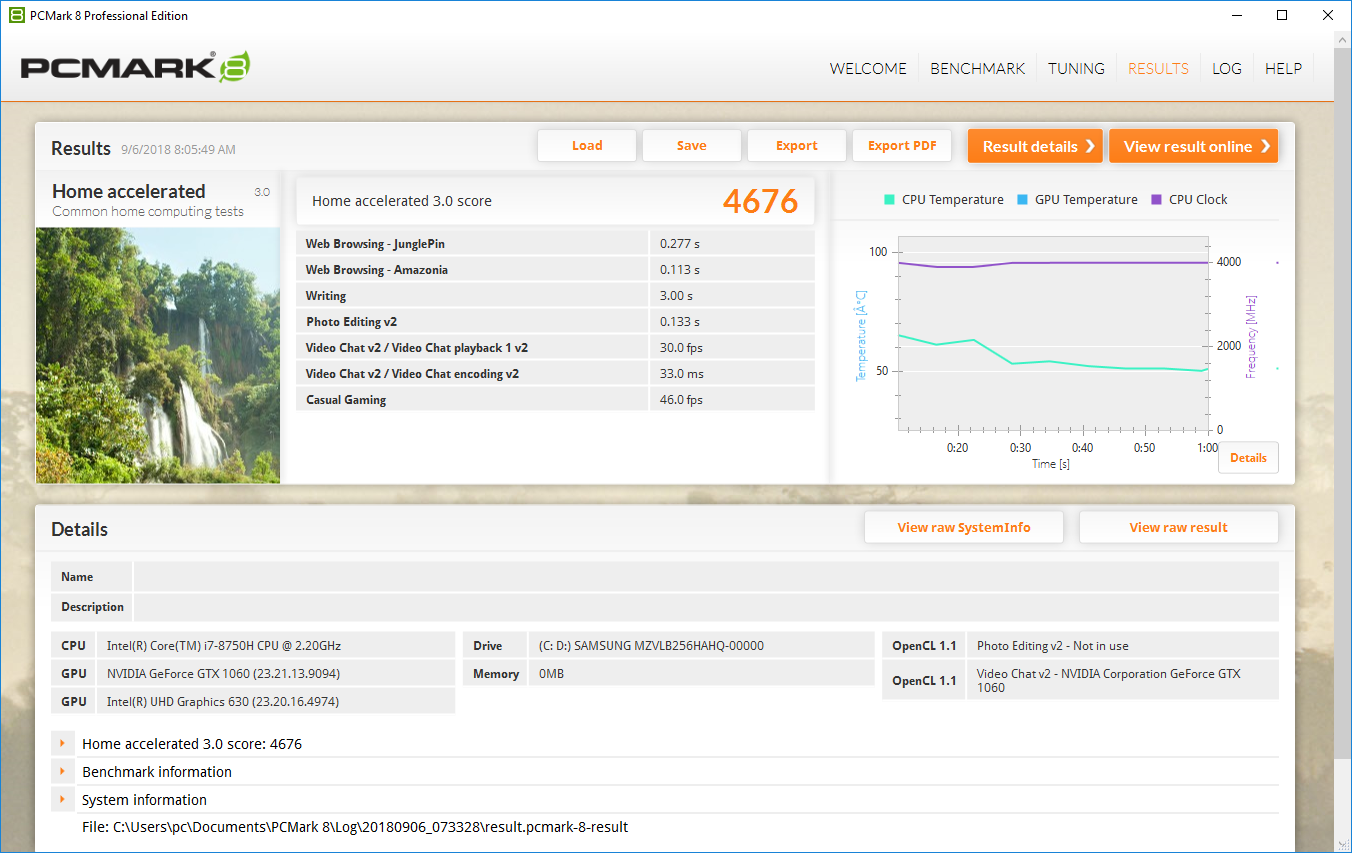
| PCMark 8 Home Score Accelerated v2 | 4676 points | |
| PCMark 8 Work Score Accelerated v2 | 5731 points | |
| PCMark 10 Score | 4646 points | |
Help | ||
Storage Devices
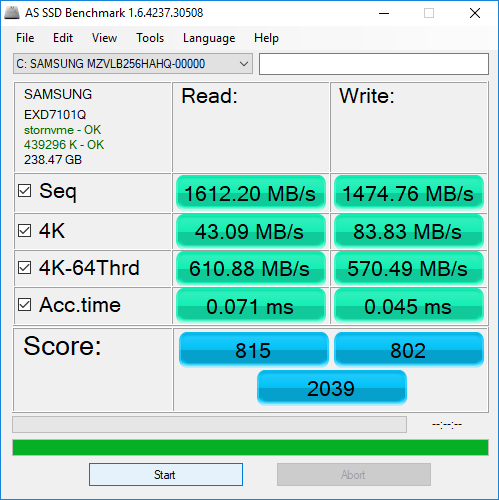
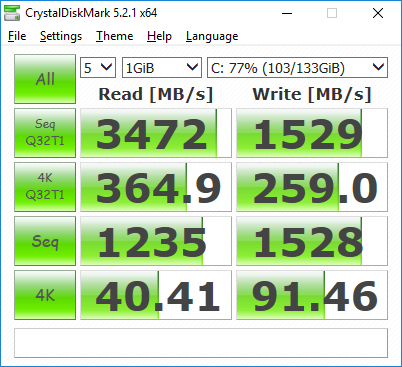
Powering the GS65 is a Samsung PM981 256 GB NVMe SSD, a very popular and quite fast SSD that we find in many top-end notebooks. Our previous review unit featured the same SSD but with a 512 GB capacity—and while our testing reveals that the 256 GB capacity does perform slower in today’s device, it still produces a respectable AS SSD Score of 2039 (based on read/write scores of 815/802 and speeds of 1612.2/1474.76 MB/s). CrystalDiskMark 5.2 reports much higher still Q32T1 Sequential read/write values of 3472/1529 MB/s.
| MSI GS65 Stealth Thin 8RE-051US Samsung SSD PM981 MZVLB256HAHQ | Gigabyte Aero 15X v8 Toshiba NVMe THNSN5512GPU7 | Asus Zephyrus M GM501 Samsung SM961 MZVKW512HMJP m.2 PCI-e | Acer Predator Triton 700 2x SK Hynix Canvas SC300 512GB M.2 (HFS512G39MND) (RAID 0) | Razer Blade 15 GTX 1060 Samsung SSD PM981 MZVLB512HAJQ | |
|---|---|---|---|---|---|
| AS SSD | |||||
| Score Total (Points) | 2039 | 2536 24% | 3649 79% | 3282 61% | 4095 101% |
| Score Write (Points) | 802 | 939 17% | 1446 80% | 1243 55% | 1955 144% |
| Score Read (Points) | 815 | 1092 34% | 1471 80% | 1350 66% | 1407 73% |
| Access Time Write * (ms) | 0.045 | 0.046 -2% | 0.041 9% | 0.041 9% | 0.037 18% |
| Access Time Read * (ms) | 0.071 | 0.119 -68% | 0.046 35% | 0.062 13% | 0.05 30% |
| 4K-64 Write (MB/s) | 570 | 742 30% | 1198 110% | 913 60% | 1664 192% |
| 4K-64 Read (MB/s) | 611 | 847 39% | 1218 99% | 1057 73% | 1177 93% |
| 4K Write (MB/s) | 83.8 | 80.4 -4% | 90.2 8% | 93 11% | 99.2 18% |
| 4K Read (MB/s) | 43.09 | 23.36 -46% | 43.42 1% | 41.47 -4% | 48.56 13% |
| Seq Write (MB/s) | 1475 | 1163 -21% | 1580 7% | 2372 61% | 1917 30% |
| Seq Read (MB/s) | 1612 | 2213 37% | 2091 30% | 2517 56% | 1820 13% |
* ... smaller is better

GPU Performance
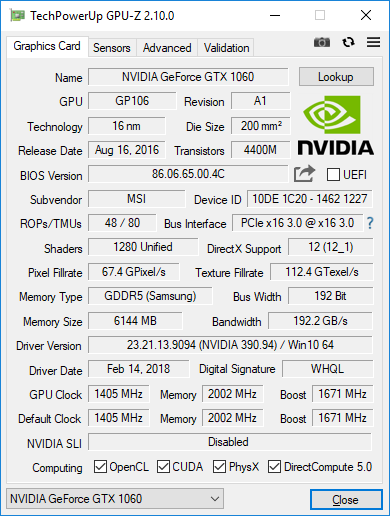
As previously mentioned, today’s GS65 review unit steps the GPU down to a GTX 1060 (from the previous GTX 1070 Max-Q) in exchange for a bit of cost savings. Gaming performance is where it counts, however, and here—subject to the constraints of its hardware—the GS65 delivers. It outperforms both the Razer Blade 15 (GTX 1060 Max-Q) and Dell XPS 15 9570 by around 4% and 59% respectively, though it rests some 25% below the GTX 1070 Max-Q equipped GS65 configuration. For those less interested in blistering graphical performance, this is more than enough to handle most modern games at reasonable settings. However, it is worth mentioning that the alluring 144 Hz display won’t be able to flex its true capabilities on anything other than low settings (or older games), though technically anything above 60 frames per second will still benefit from the higher refresh rate.
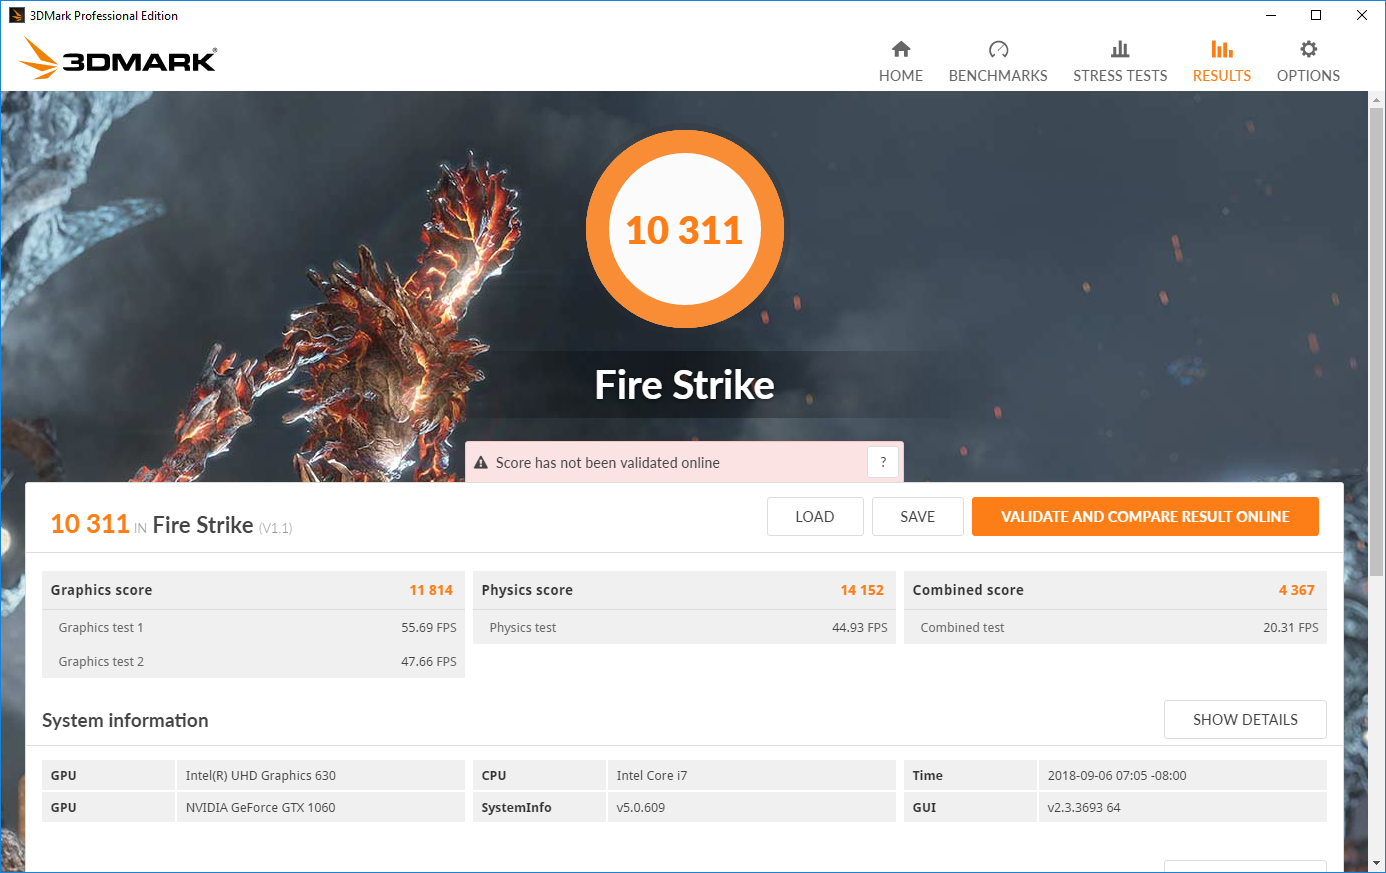

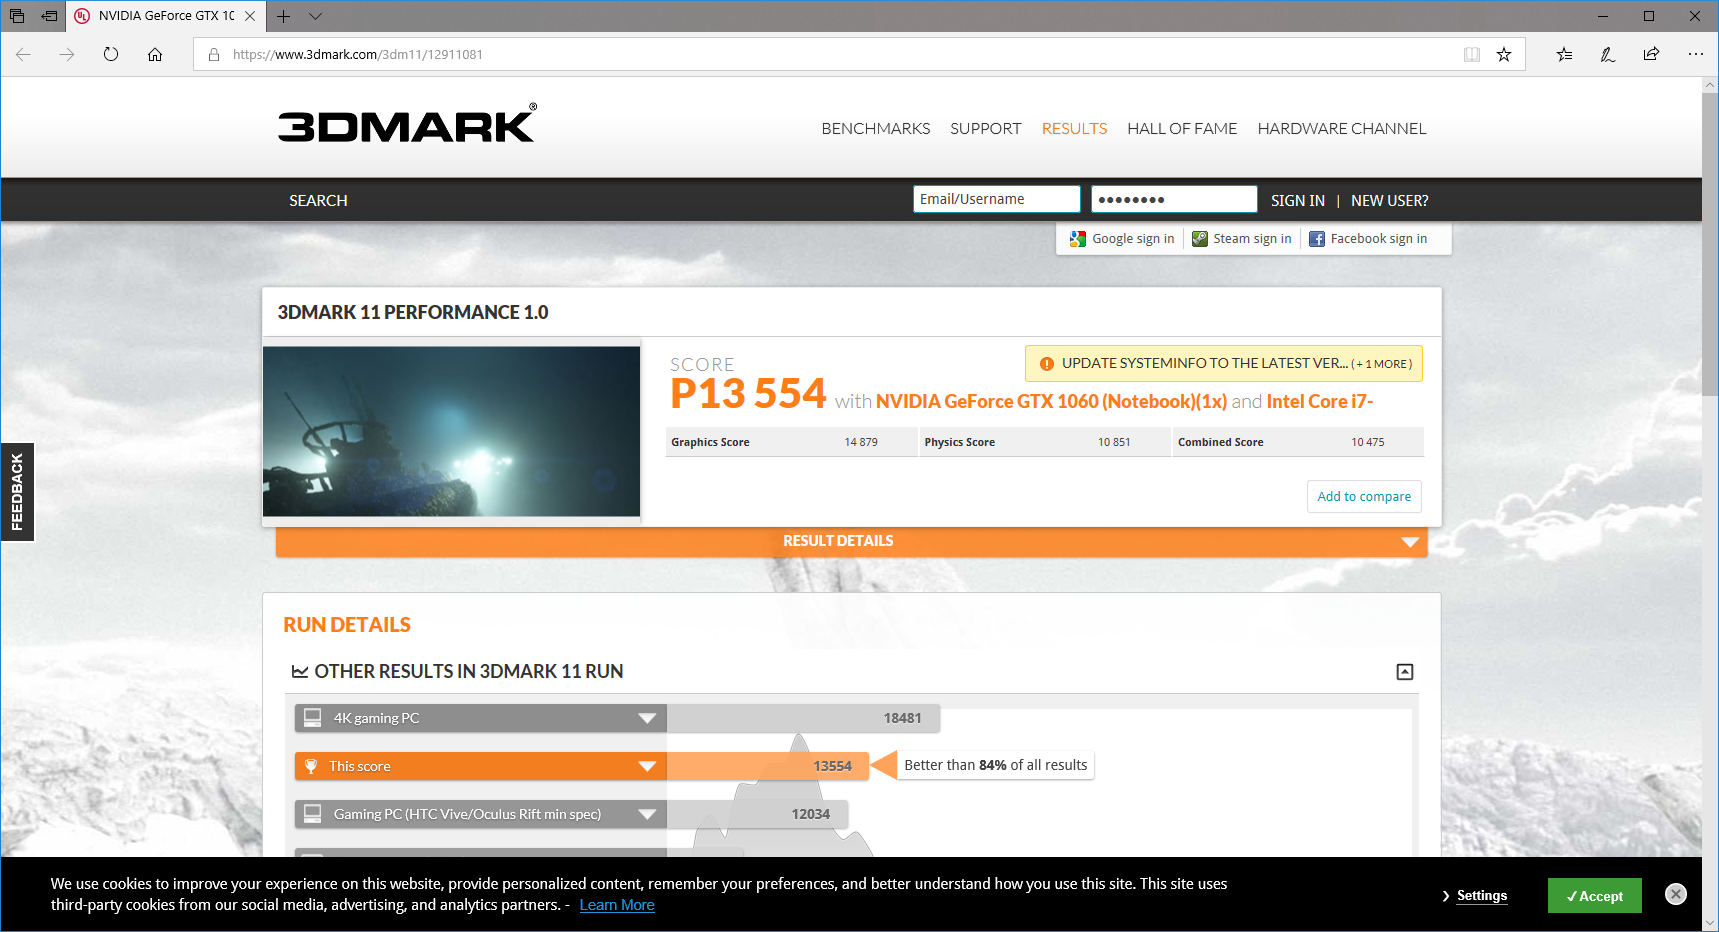
| 3DMark 11 Performance | 13554 points | |
| 3DMark Cloud Gate Standard Score | 29930 points | |
| 3DMark Fire Strike Score | 10311 points | |
Help | ||
Gaming Performance
Unsurprisingly, the GTX 1060-equipped GS65 can handle most modern games at high settings at smooth frame rates. However, it isn't likely that the 144 Hz display will see its full potential with just a GTX 1060 at the helm going forward, so keep that in mind before opting for the lower-end GPU configuration if butter-smooth gameplay into the next few years is something you seek.
| low | med. | high | ultra | |
|---|---|---|---|---|
| BioShock Infinite (2013) | 274 | 223 | 220 | 159 |
| Metro: Last Light (2013) | 139 | 135 | 132 | 78 |
| The Witcher 3 (2015) | 40 | |||
| Rise of the Tomb Raider (2016) | 113 | 101 | 73 | 62 |
Stress Test
Our stress testing reveals the machine’s thermal limitations, which manifest during full synthetic CPU stress as a middling stable CPU frequency of just 3.0 – 3.1 GHz following around 30 seconds of testing (at which point the temperature drops from the maximum of 90 °C down to 81 °C, where it remains semi-permanently thereafter). GPU stress results in a clock rate of still just 1265 - 1304 MHz in our tests, with a temperature climbing steadily up to around 75 °C.
Combined stress breaks the GPU into a higher range of 1366 – 1531 MHz, while the CPU drops to 2.793 GHz. Both of these values are above the base frequencies of the CPU/GPU, however, and thus the GTX 1060-equipped configuration of the GS65 does not throttle under load (unlike the GTX 1070 Max-Q version). The CPU performance is quite clearly capped by the 90 °C core thermal limit, while the GPU remains well within reasonable temperature ranges (max: 70 °C).
Under Witcher 3 stress, the CPU is stable at 3.9 GHz (76 °C) and GPU clock rates hover around 1579 MHz (74 °C). Frame rates are stable (as we saw earlier during our GPU sustained performance test) and temperatures are perfectly in check.
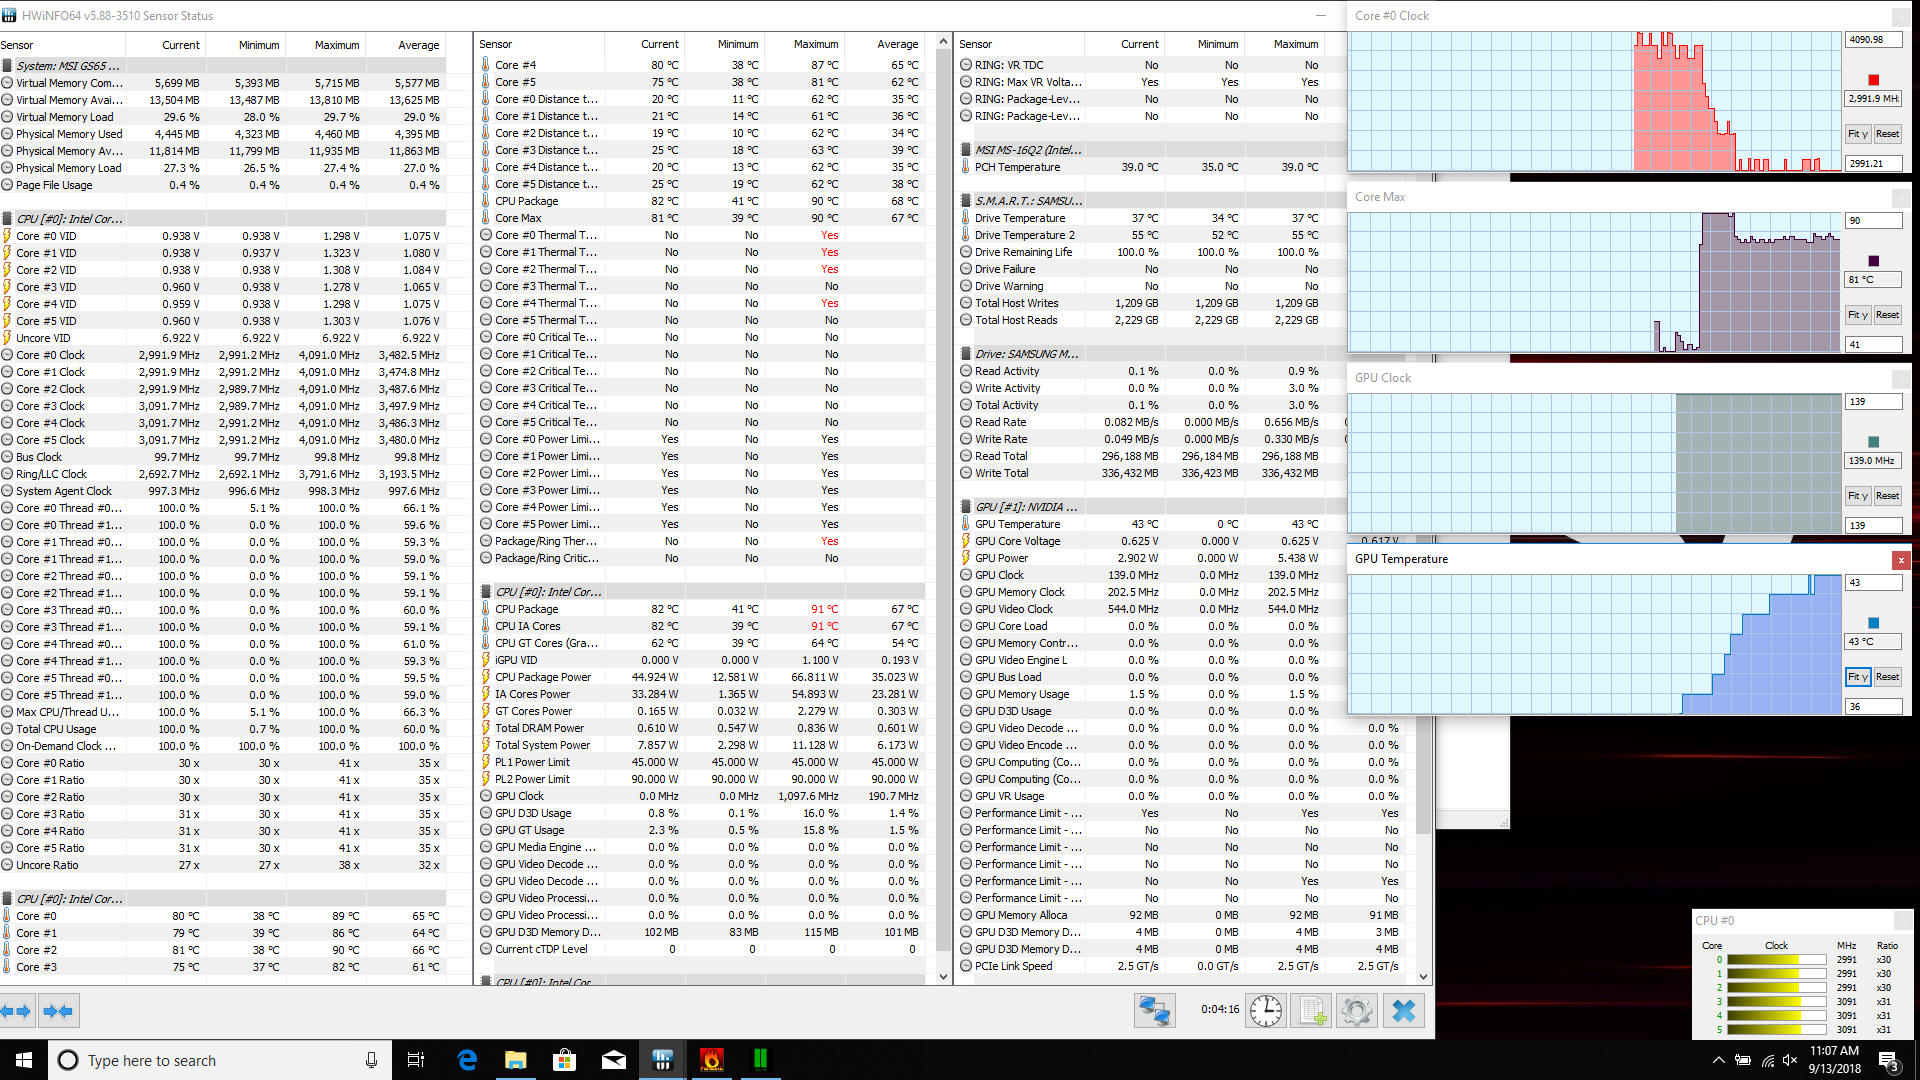
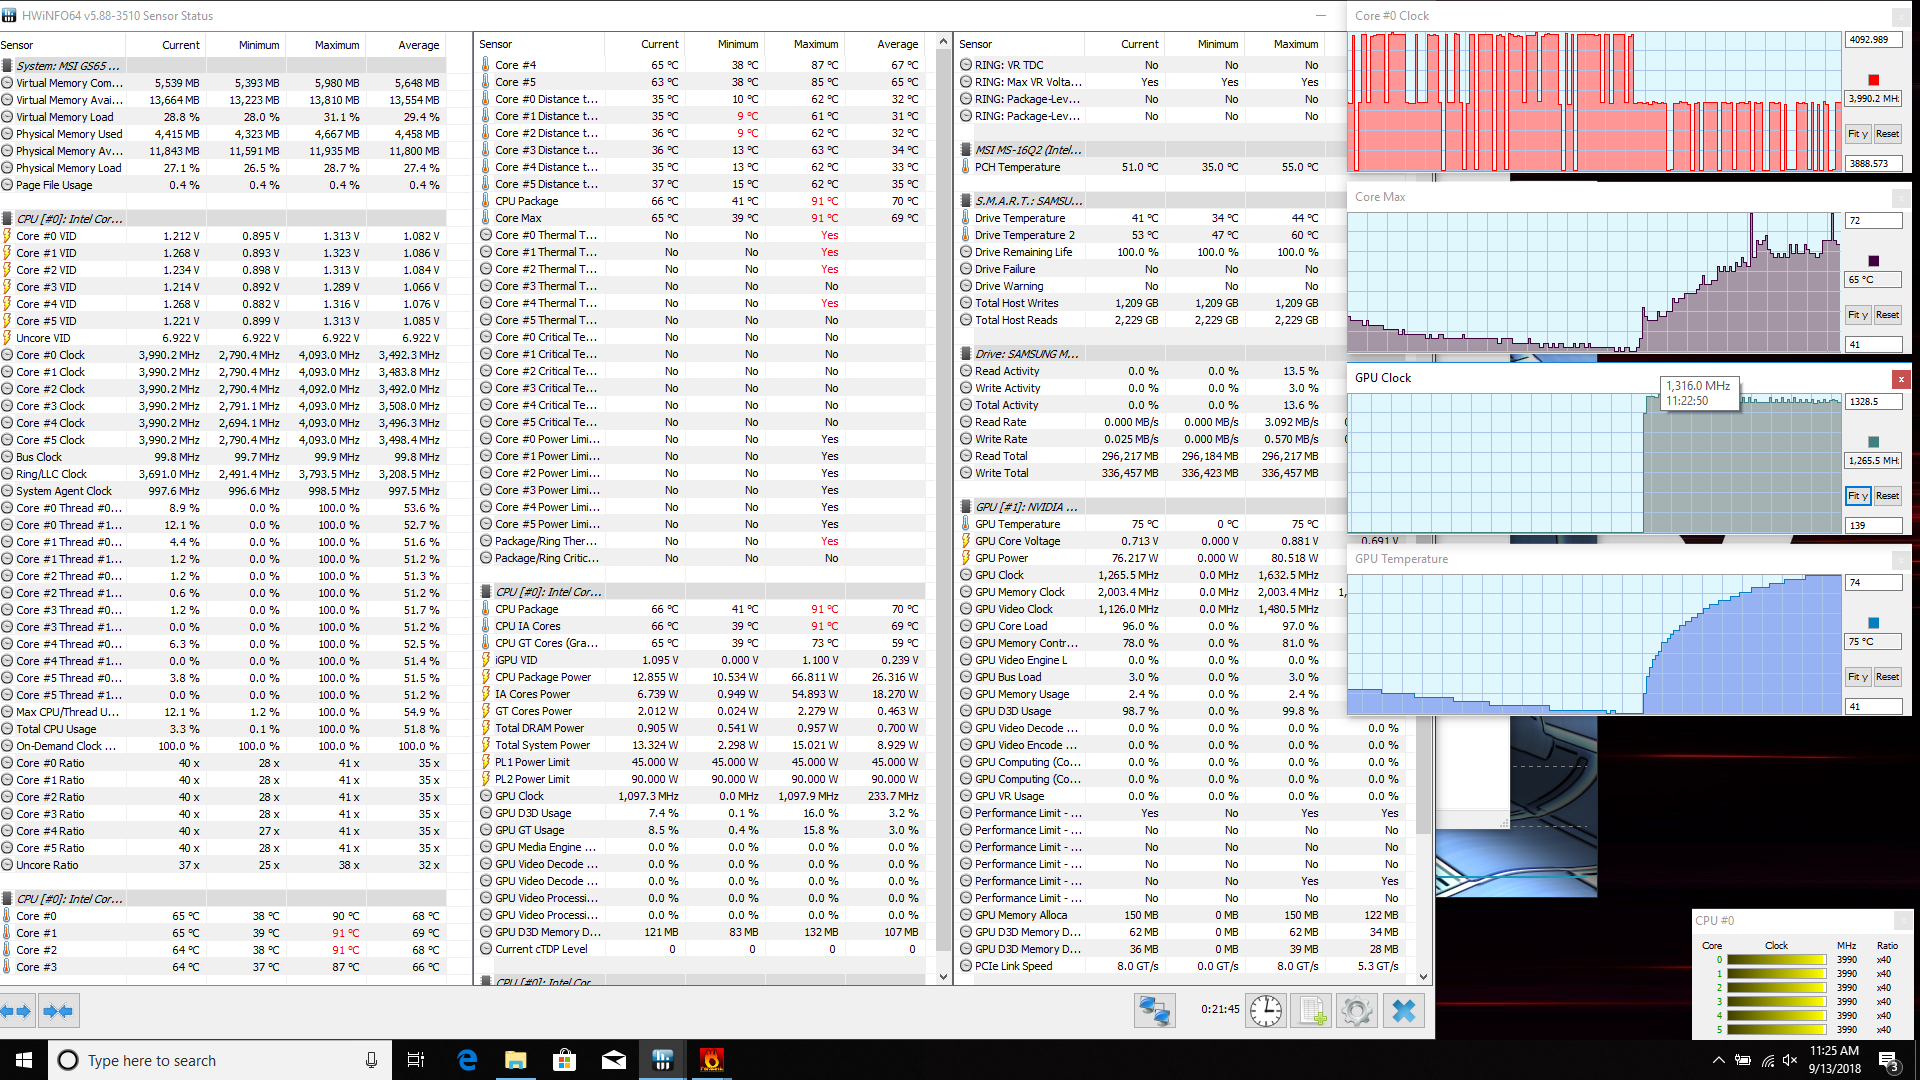
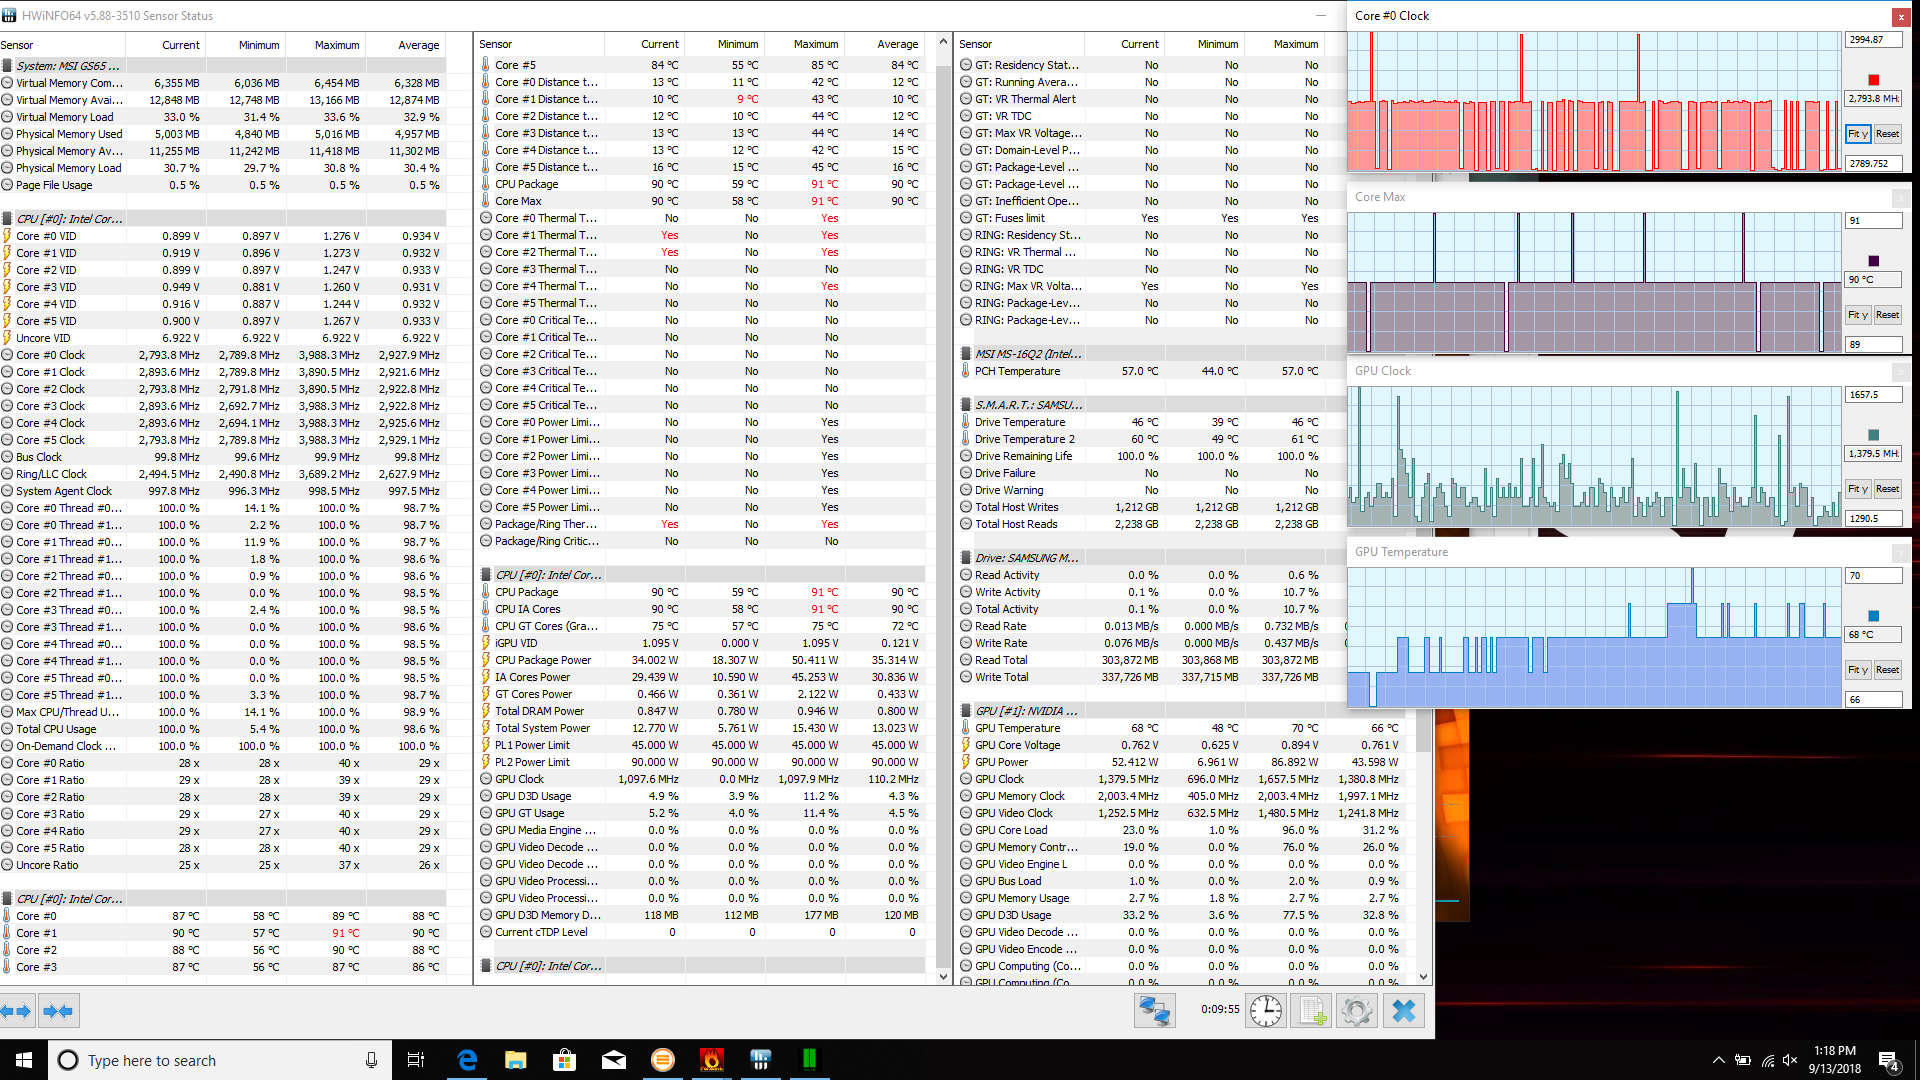
| CPU Clock (GHz) | GPU Clock (MHz) | Average CPU Temperature (°C) | Average GPU Temperature (°C) | |
| Prime95 Stress | 3.0 - 3.1 | - | 81 | - |
| FurMark Stress | - | 1265 - 1304 | - | 75 |
| Prime95 + FurMark Stress | 2.8 | 1366 - 1531 | 90 | 70 |
| Witcher 3 Stress | 3.9 | 1579 | 76 | 74 |
Emissions
System Noise
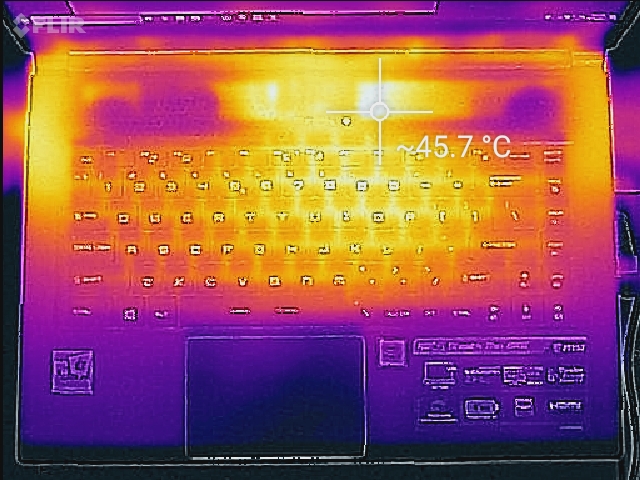
While the GS65 is still a relatively quiet machine (even under load), the noise level has ticked upward in our measurements since the GTX 1070 Max-Q equipped version passed through our labs. Today’s GTX 1060 unit is almost silent while idling (with a maximum reading of just 1.2 dB(A) above environmental noise levels), but under load, it’s quite a bit noisier with an average of 43.5 dB(A) up to a maximum of 45.7 dB(A). Though noticeable (and perhaps a bit more so thanks to the small diameter of the cooling fans producing a higher-pitched whir than larger-diameter counterparts), this isn’t a terribly obtrusive reading. Audio from gaming for the most part overpowers it—especially, of course, with headphones in play.
We notice no coil whine or electrical noise coming from our review unit.
Noise level
| Idle |
| 28.4 / 28.4 / 29.6 dB(A) |
| Load |
| 43.5 / 45.7 dB(A) |
 | ||
30 dB silent 40 dB(A) audible 50 dB(A) loud |
||
min: | ||
| MSI GS65 Stealth Thin 8RE-051US GeForce GTX 1060 Mobile, i7-8750H, Samsung SSD PM981 MZVLB256HAHQ | Gigabyte Aero 15X v8 GeForce GTX 1070 Max-Q, i7-8750H, Toshiba NVMe THNSN5512GPU7 | Asus Zephyrus M GM501 GeForce GTX 1070 Mobile, i7-8750H, Samsung SM961 MZVKW512HMJP m.2 PCI-e | Acer Predator Triton 700 GeForce GTX 1080 Max-Q, i7-7700HQ, 2x SK Hynix Canvas SC300 512GB M.2 (HFS512G39MND) (RAID 0) | MSI GS65 8RF-019DE Stealth Thin GeForce GTX 1070 Max-Q, i7-8750H, Samsung SSD PM981 MZVLB512HAJQ | Razer Blade 15 GTX 1060 GeForce GTX 1060 Max-Q, i7-8750H, Samsung SSD PM981 MZVLB512HAJQ | |
|---|---|---|---|---|---|---|
| Noise | -11% | -9% | -10% | -3% | -3% | |
| off / environment * (dB) | 28.4 | 29 -2% | 29 -2% | 31 -9% | 30 -6% | 28.1 1% |
| Idle Minimum * (dB) | 28.4 | 30 -6% | 30 -6% | 33 -16% | 30 -6% | 28.1 1% |
| Idle Average * (dB) | 28.4 | 31 -9% | 31 -9% | 34 -20% | 31 -9% | 33 -16% |
| Idle Maximum * (dB) | 29.6 | 35 -18% | 33 -11% | 40 -35% | 34 -15% | 33.5 -13% |
| Load Average * (dB) | 43.5 | 49 -13% | 49 -13% | 41 6% | 43 1% | 42.2 3% |
| Witcher 3 ultra * (dB) | 45.7 | 51 -12% | 50 -9% | 43 6% | 42 8% | 45.3 1% |
| Load Maximum * (dB) | 45.7 | 54 -18% | 52 -14% | 48 -5% | 44 4% | 45.7 -0% |
* ... smaller is better
Temperature
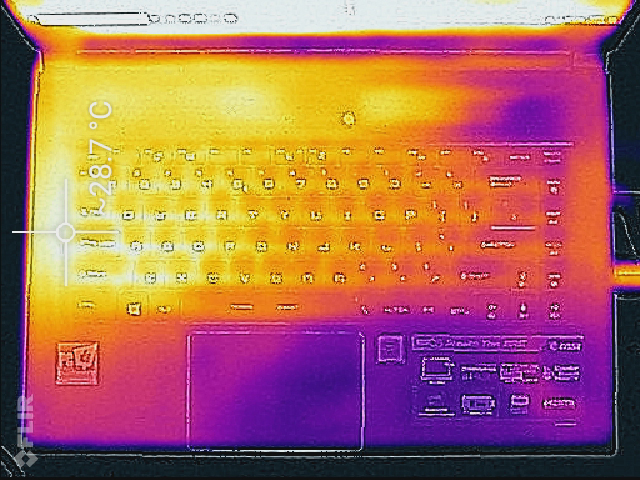
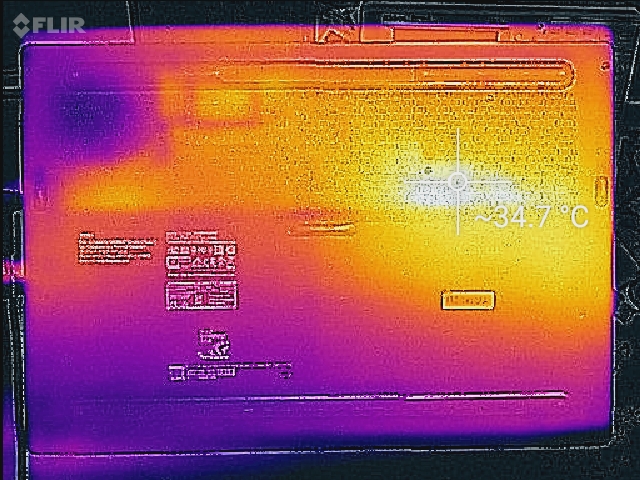
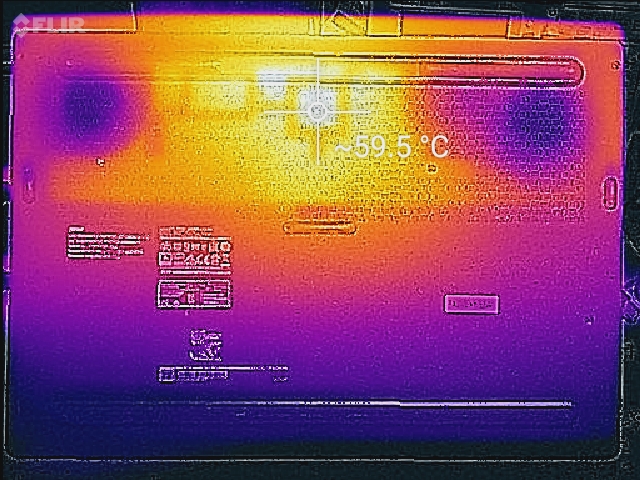
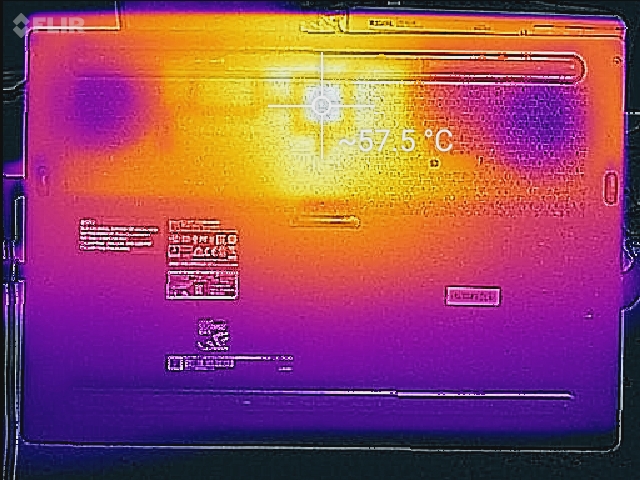
Surely thanks to both the reduced GPU power demands and slightly higher fan noise levels, temperatures have plummeted since the previous GS65 review unit. Today’s machine reaches averages of just 35.9 °C / 40.4 °C on top/bottom under load, with hot spots of 46.8 °C and 59.8 °C in the center of the top/bottom rear quadrants respectively. While those hot spots obviously preclude the operation of the machine while on the lap, the overall temperature development is well below what it was before, and completely reasonable.
(-) The maximum temperature on the upper side is 46.8 °C / 116 F, compared to the average of 40.4 °C / 105 F, ranging from 21.2 to 68.8 °C for the class Gaming.
(-) The bottom heats up to a maximum of 59.8 °C / 140 F, compared to the average of 43.2 °C / 110 F
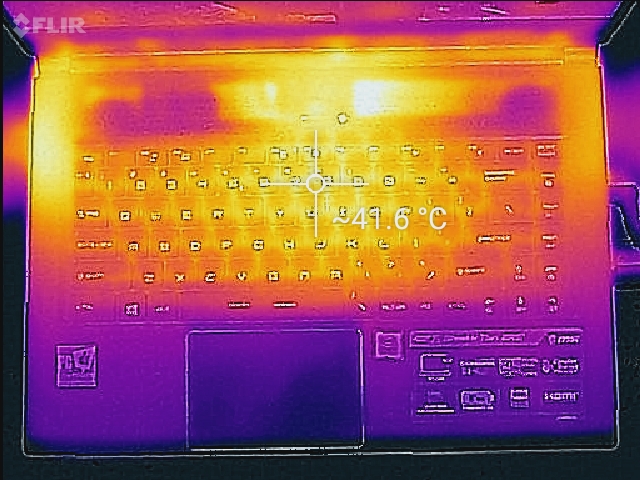
(+) In idle usage, the average temperature for the upper side is 26.9 °C / 80 F, compared to the device average of 33.9 °C / 93 F.
(±) Playing The Witcher 3, the average temperature for the upper side is 35.4 °C / 96 F, compared to the device average of 33.9 °C / 93 F.
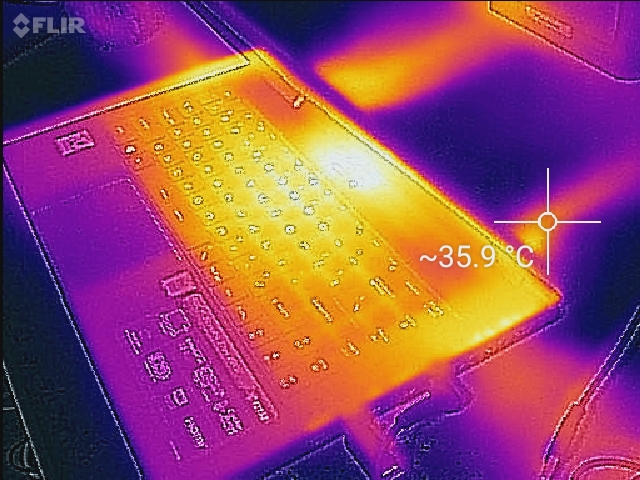
(+) The palmrests and touchpad are cooler than skin temperature with a maximum of 28.2 °C / 82.8 F and are therefore cool to the touch.
(±) The average temperature of the palmrest area of similar devices was 28.8 °C / 83.8 F (+0.6 °C / 1 F).
Speakers
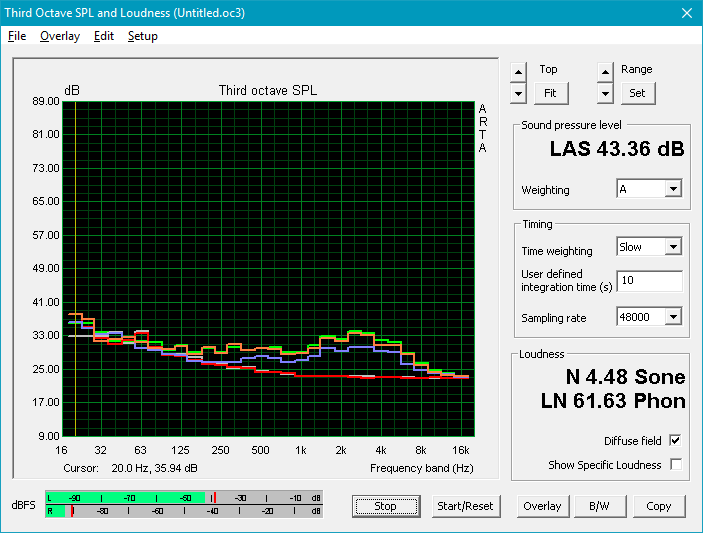
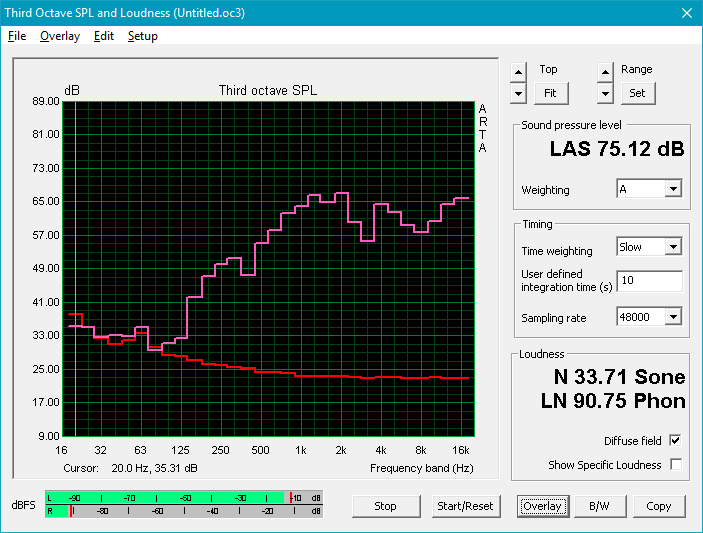
The speakers haven’t changed since our previous review unit; that is to say, they’re still relatively loud (at 75.12 dB) and feature average linearity across the breadth of the audio spectrum. Balancing could be improved, and bass is nearly nonexistent, but all in all, for a slim laptop, the audio is pretty decent.
MSI GS65 Stealth Thin 8RE-051US audio analysis
(±) | speaker loudness is average but good (75.1 dB)
Bass 100 - 315 Hz
(-) | nearly no bass - on average 17% lower than median
(±) | linearity of bass is average (10.1% delta to prev. frequency)
Mids 400 - 2000 Hz
(±) | higher mids - on average 5.7% higher than median
(±) | linearity of mids is average (9.3% delta to prev. frequency)
Highs 2 - 16 kHz
(+) | balanced highs - only 2.1% away from median
(±) | linearity of highs is average (11.7% delta to prev. frequency)
Overall 100 - 16.000 Hz
(±) | linearity of overall sound is average (23.8% difference to median)
Compared to same class
» 86% of all tested devices in this class were better, 5% similar, 10% worse
» The best had a delta of 6%, average was 18%, worst was 132%
Compared to all devices tested
» 71% of all tested devices were better, 6% similar, 22% worse
» The best had a delta of 4%, average was 23%, worst was 134%
Gigabyte Aero 15X v8 audio analysis
(±) | speaker loudness is average but good (78 dB)
Bass 100 - 315 Hz
(-) | nearly no bass - on average 16.8% lower than median
(±) | linearity of bass is average (11.6% delta to prev. frequency)
Mids 400 - 2000 Hz
(+) | balanced mids - only 4.3% away from median
(+) | mids are linear (5% delta to prev. frequency)
Highs 2 - 16 kHz
(+) | balanced highs - only 3.6% away from median
(±) | linearity of highs is average (9.1% delta to prev. frequency)
Overall 100 - 16.000 Hz
(±) | linearity of overall sound is average (18.4% difference to median)
Compared to same class
» 59% of all tested devices in this class were better, 9% similar, 32% worse
» The best had a delta of 6%, average was 18%, worst was 132%
Compared to all devices tested
» 41% of all tested devices were better, 8% similar, 51% worse
» The best had a delta of 4%, average was 23%, worst was 134%
Energy Management
Power Consumption
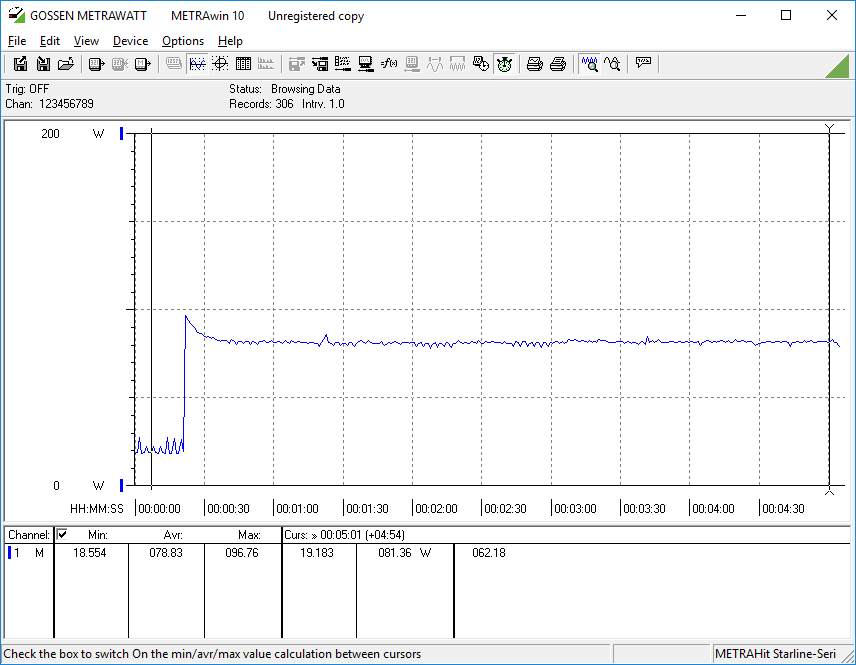
Power consumption has also dropped when compared to the GTX 1070 Max-Q configuration—again, which is to be expected. Under load, the device pulls a maximum of 151.5 W in our measurements, with an average of just 107.4 W. Idling sees just 13 W average on the other hand. As compared with the Razer Blade 15 (powered by a GTX 1060 Max-Q), these values are just a bit higher overall.
The power consumption is only marginally lower than the GTX 1070 Max-Q configuration when gaming due to improved performance per watt on the Max-Q GPU. We only witness the delta widen further under extreme benchmarks, where consumption begins to expose the TDP differences more plainly (60 - 70 W for the GTX 1060 vs. 80 to 90 W for the GTX 1070 Max-Q). This explains why the Load Maximum reading is so much lower than the GTX 1070 Max-Q value, whereas the Witcher 3 and Load Average values are merely several watts apart.
| Off / Standby | |
| Idle | |
| Load |
|
Key:
min: | |
| MSI GS65 Stealth Thin 8RE-051US i7-8750H, GeForce GTX 1060 Mobile, Samsung SSD PM981 MZVLB256HAHQ, IPS, 1920x1080, 15.6" | Gigabyte Aero 15X v8 i7-8750H, GeForce GTX 1070 Max-Q, Toshiba NVMe THNSN5512GPU7, IPS, 1920x1080, 15.6" | Asus Zephyrus M GM501 i7-8750H, GeForce GTX 1070 Mobile, Samsung SM961 MZVKW512HMJP m.2 PCI-e, IPS, 1920x1080, 15.6" | MSI GS63VR 7RG-005 i7-7700HQ, GeForce GTX 1070 Max-Q, Samsung SM961 MZVPW256HEGL, TN LED, 1920x1080, 15.6" | Acer Predator Triton 700 i7-7700HQ, GeForce GTX 1080 Max-Q, 2x SK Hynix Canvas SC300 512GB M.2 (HFS512G39MND) (RAID 0), IPS, 1920x1080, 15.6" | MSI GS65 8RF-019DE Stealth Thin i7-8750H, GeForce GTX 1070 Max-Q, Samsung SSD PM981 MZVLB512HAJQ, IPS, 1920x1080, 15.6" | Dell XPS 15 9570 i7 UHD i7-8750H, GeForce GTX 1050 Ti Max-Q, Toshiba XG5 KXG50ZNV512G, IPS, 3840x2160, 15.6" | Razer Blade 15 GTX 1060 i7-8750H, GeForce GTX 1060 Max-Q, Samsung SSD PM981 MZVLB512HAJQ, IPS, 1920x1080, 15.6" | |
|---|---|---|---|---|---|---|---|---|
| Power Consumption | -27% | -47% | -16% | -104% | -3% | -5% | -20% | |
| Idle Minimum * (Watt) | 8.7 | 14 -61% | 16 -84% | 12 -38% | 28 -222% | 7 20% | 9.48 -9% | 14.9 -71% |
| Idle Average * (Watt) | 13 | 18 -38% | 19 -46% | 16 -23% | 33 -154% | 11 15% | 16.1 -24% | 17.5 -35% |
| Idle Maximum * (Watt) | 14.3 | 22 -54% | 26 -82% | 21 -47% | 41 -187% | 20 -40% | 16.9 -18% | 19.2 -34% |
| Load Average * (Watt) | 107.4 | 91 15% | 103 4% | 85 21% | 94 12% | 98 9% | 90.8 15% | 103.2 4% |
| Witcher 3 ultra * (Watt) | 129 | 142 -10% | 164 -27% | 128 1% | 160 -24% | 132 -2% | 123.1 5% | |
| Load Maximum * (Watt) | 151.5 | 173 -14% | 223 -47% | 162 -7% | 222 -47% | 182 -20% | 134.4 11% | 132.7 12% |
* ... smaller is better
Battery Life
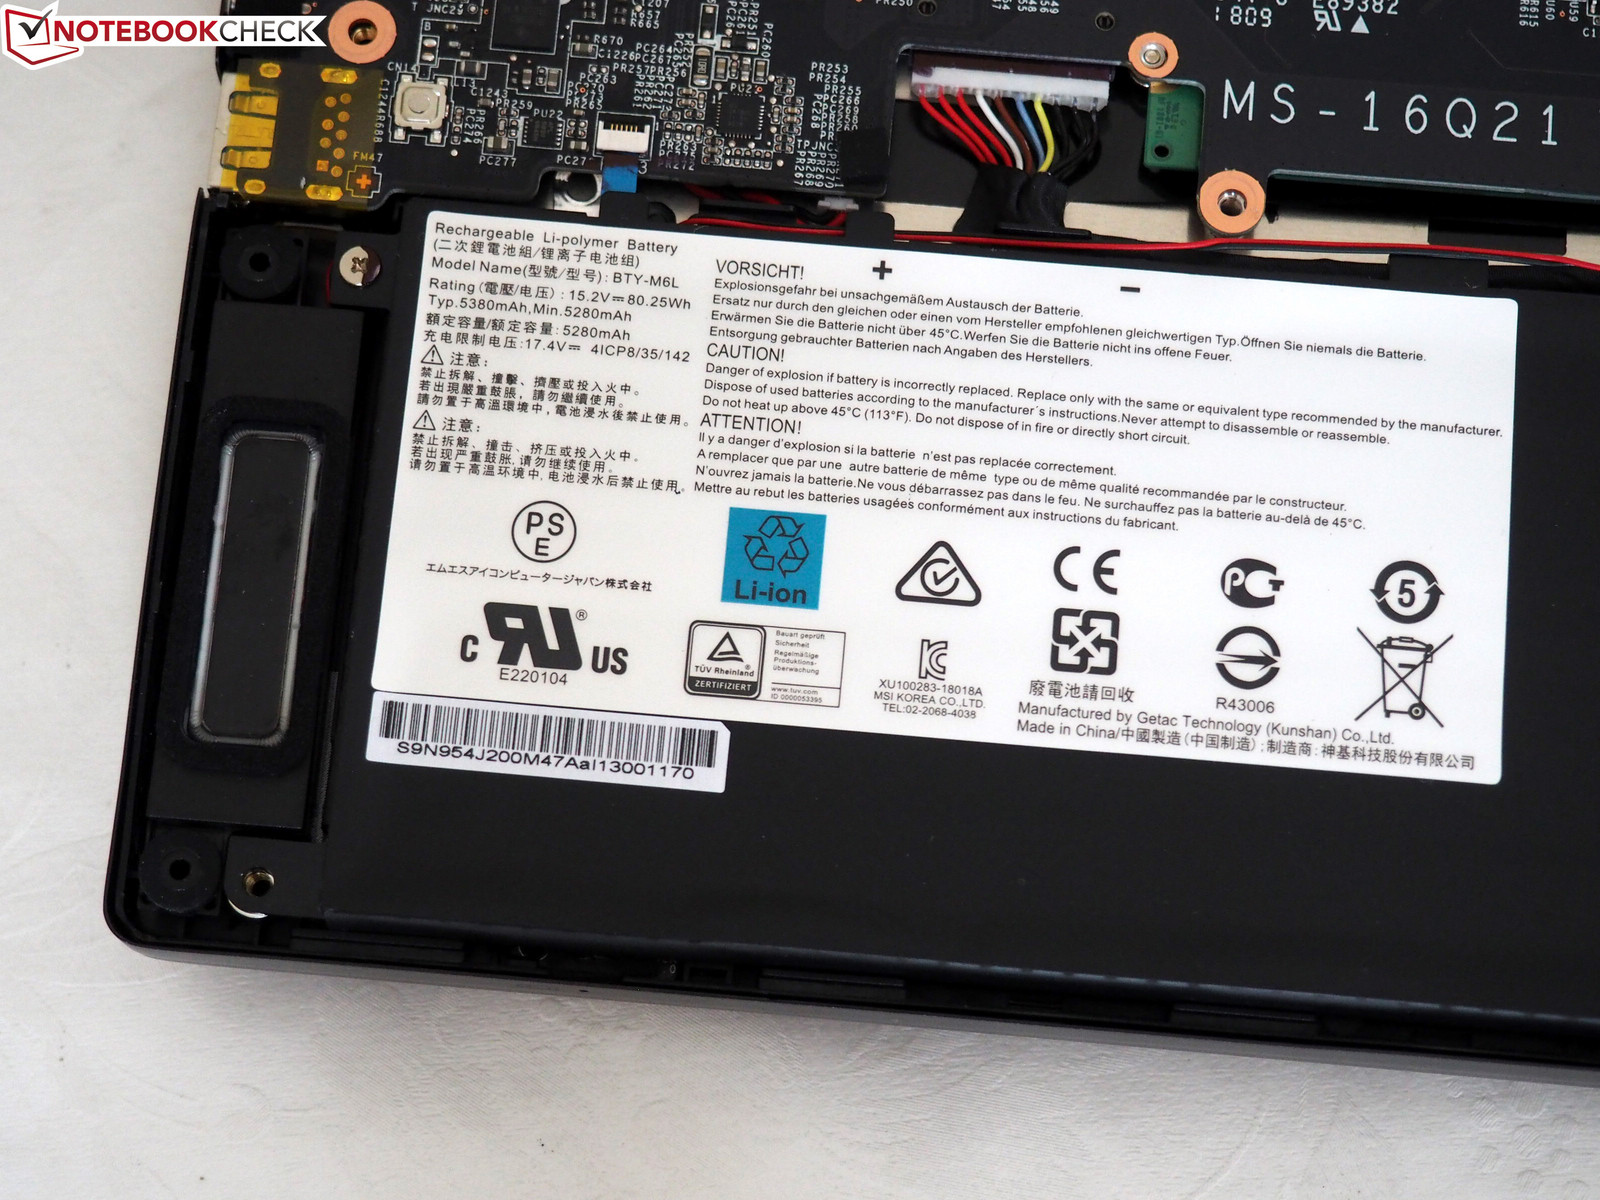
Despite a marginal drop in power consumption, we don’t see much better runtimes out of the 82 Wh battery—though that’s okay, as they were acceptable to begin with (even if they can’t match those of the Gigabyte Aero 15X and Razer Blade 15). 6 hours and 12 minutes of life during our Wi-Fi web surfing benchmark is pretty reasonable for a gaming laptop, even if it’s some 38% below what’s managed by the Aero 15X (8 hours and 33 minutes).
| MSI GS65 Stealth Thin 8RE-051US i7-8750H, GeForce GTX 1060 Mobile, 82 Wh | Gigabyte Aero 15X v8 i7-8750H, GeForce GTX 1070 Max-Q, 94.24 Wh | Asus Zephyrus M GM501 i7-8750H, GeForce GTX 1070 Mobile, 55 Wh | MSI GS63VR 7RG-005 i7-7700HQ, GeForce GTX 1070 Max-Q, 52.4 Wh | Acer Predator Triton 700 i7-7700HQ, GeForce GTX 1080 Max-Q, 54 Wh | MSI GS65 8RF-019DE Stealth Thin i7-8750H, GeForce GTX 1070 Max-Q, 82 Wh | Dell XPS 15 9570 i7 UHD i7-8750H, GeForce GTX 1050 Ti Max-Q, 97 Wh | Razer Blade 15 GTX 1060 i7-8750H, GeForce GTX 1060 Max-Q, 80 Wh | |
|---|---|---|---|---|---|---|---|---|
| Battery runtime | 78% | -28% | -27% | -31% | 7% | 32% | 8% | |
| WiFi v1.3 (h) | 6.2 | 8.6 39% | 2.7 -56% | 3.9 -37% | 2.4 -61% | 6 -3% | 9.6 55% | 6.7 8% |
| Load (h) | 1.2 | 2.6 117% | 1.2 0% | 1 -17% | 1.2 0% | 1.4 17% | 1.3 8% | |
| Reader / Idle (h) | 12.7 | 4 | 5.7 | 2.5 | 8.5 | |||
| Witcher 3 ultra (h) | 1 |
Pros
Cons
Verdict
To be quite frank, today’s MSI GS65 configuration does little to address the complaints we explicated in May’s review of the previous SKU. The biggest drawbacks remain the questionable workmanship and disappointing rigidity (resulting in unavoidable case creaks during use), as well as the unnecessarily difficult maintenance procedures and mediocre input devices. However, today’s comparatively lower-end configuration, powered by a GTX 1060 and Core i7-8750H (and smaller 256 GB NVMe SSD), does manage to survive our synthetic stress tests without resorting to throttling on either the CPU or GPU side, which is a welcomed improvement over the GTX 1070 Max-Q model we reviewed previously. Correspondingly, surface temperatures also see a significant drop, as a result of what appears to be slightly more aggressive cooling in conjunction with a notably less power-hungry GPU.
The rest of the package is primarily positive however. The GS65 is deceptively lightweight and relatively quiet under load. The 144 Hz anti-glare display features good color accuracy and saturation alongside excellent viewing angles (even if brightness and contrast could be better). Apart from the spacing and the lack of a card reader, connectivity is mostly on par with the Aero 15X. And finally, the machine manages strong performance given its configuration—even though the GTX 1060 isn’t powerful enough to take full advantage of the splendor of a 144 Hz refresh rate in modern games (still, anything above 60 frames per second benefits).
From a purely statistical standpoint, even despite its notable weaknesses, the MSI GS65 remains one of the best thin-and-light gaming notebooks currently available.
At $1,849, it’s certainly not cheap—but pricing is consistent with that of its peers, and perhaps even a bit below. Before committing to a purchase, it’s also worth considering better-built competitors such as the Gigabyte Aero 15X v8 and Razer Blade 15—but bear in mind that you’ll pay a bit more for the privilege.
MSI GS65 Stealth Thin 8RE-051US
- 09/14/2018 v6 (old)
Steve Schardein
Price comparison
