MSI GS65 8RF Stealth Thin (i7-8750H, GTX 1070 Max-Q, Full HD) Laptop Review

The trend towards ever more compact high-end laptops seems unstoppable. Manufacturers, having spent years on making laptops lighter and smaller, now have screen bezels squarely in their sights. While Dell has led the way with the XPS 15 in terms of multimedia laptops, Gigabyte has led the charge with gaming laptops. Their latest Aero 15X continues this race towards slimmer bezels, scoring a first-rate 88% in our recent review.
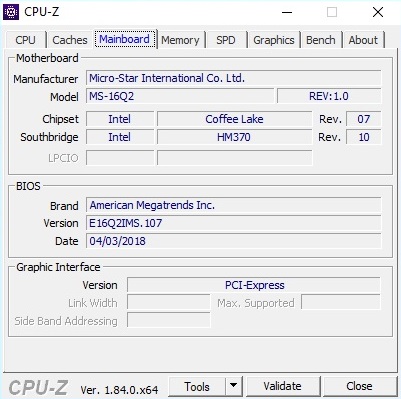
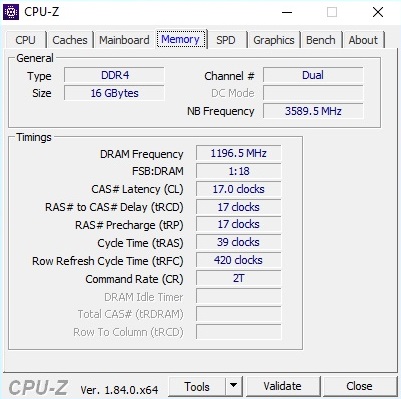
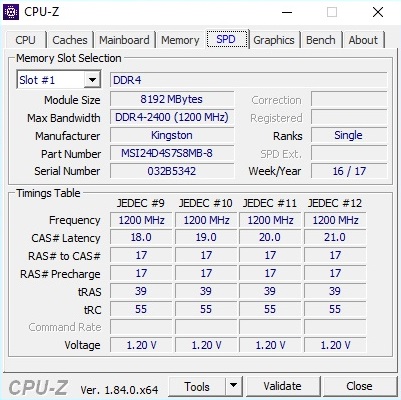
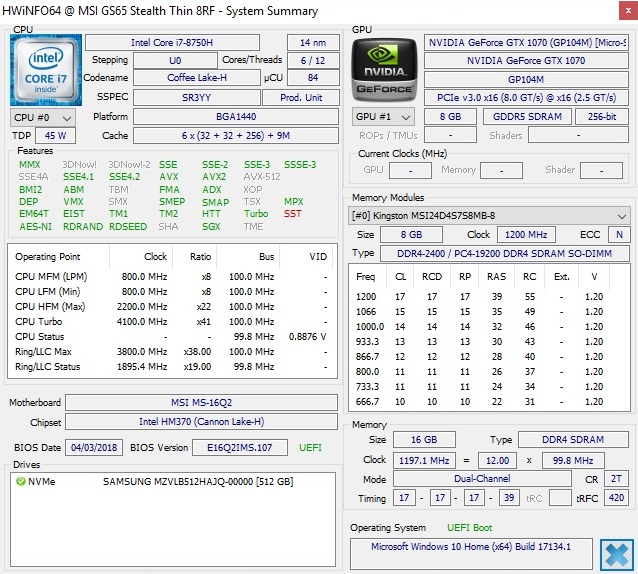
The GS65 is MSI’s attempt at competing with Gigabyte and the Aero 15X. The GS65 is the indirect successor to the GS63 and will be available in Germany from 1,999 Euros (~$2,387). This gets you a device with an Intel Core i7-8750H hexa-core Coffee Lake processor, a 512 GB NVMe SSD, and 16 GB of dual-channel DDR4-2400 RAM.
There is a choice of dedicated graphics cards, namely either a GeForce GTX 1060 or a GeForce GTX 1070 Max-Q. Our test device is equipped with the latter. The GS65 is rounded off with a 1080p 144 Hz display. MSI has done away with G-Sync to preserve battery life but includes Nvidia Optimus technology. This allows the GS65 to dynamically switch from the integrated Intel UHD Graphics 620 to its dedicated GeForce GPU when necessary.
We have chosen not only the MSI GS63 and the Gigabyte Aero 15X as comparison devices but also the Asus ROG Zephyrus M GM501 and the Acer Predator Triton 700, the latter of which is powered by the older Intel Core i7-7700HQ processor. It is worth keeping in mind that the Asus and Acer devices are powered by more powerful GeForce GTX 1070 and GeForce GTX 1080 Max-Q GPUs.
Case
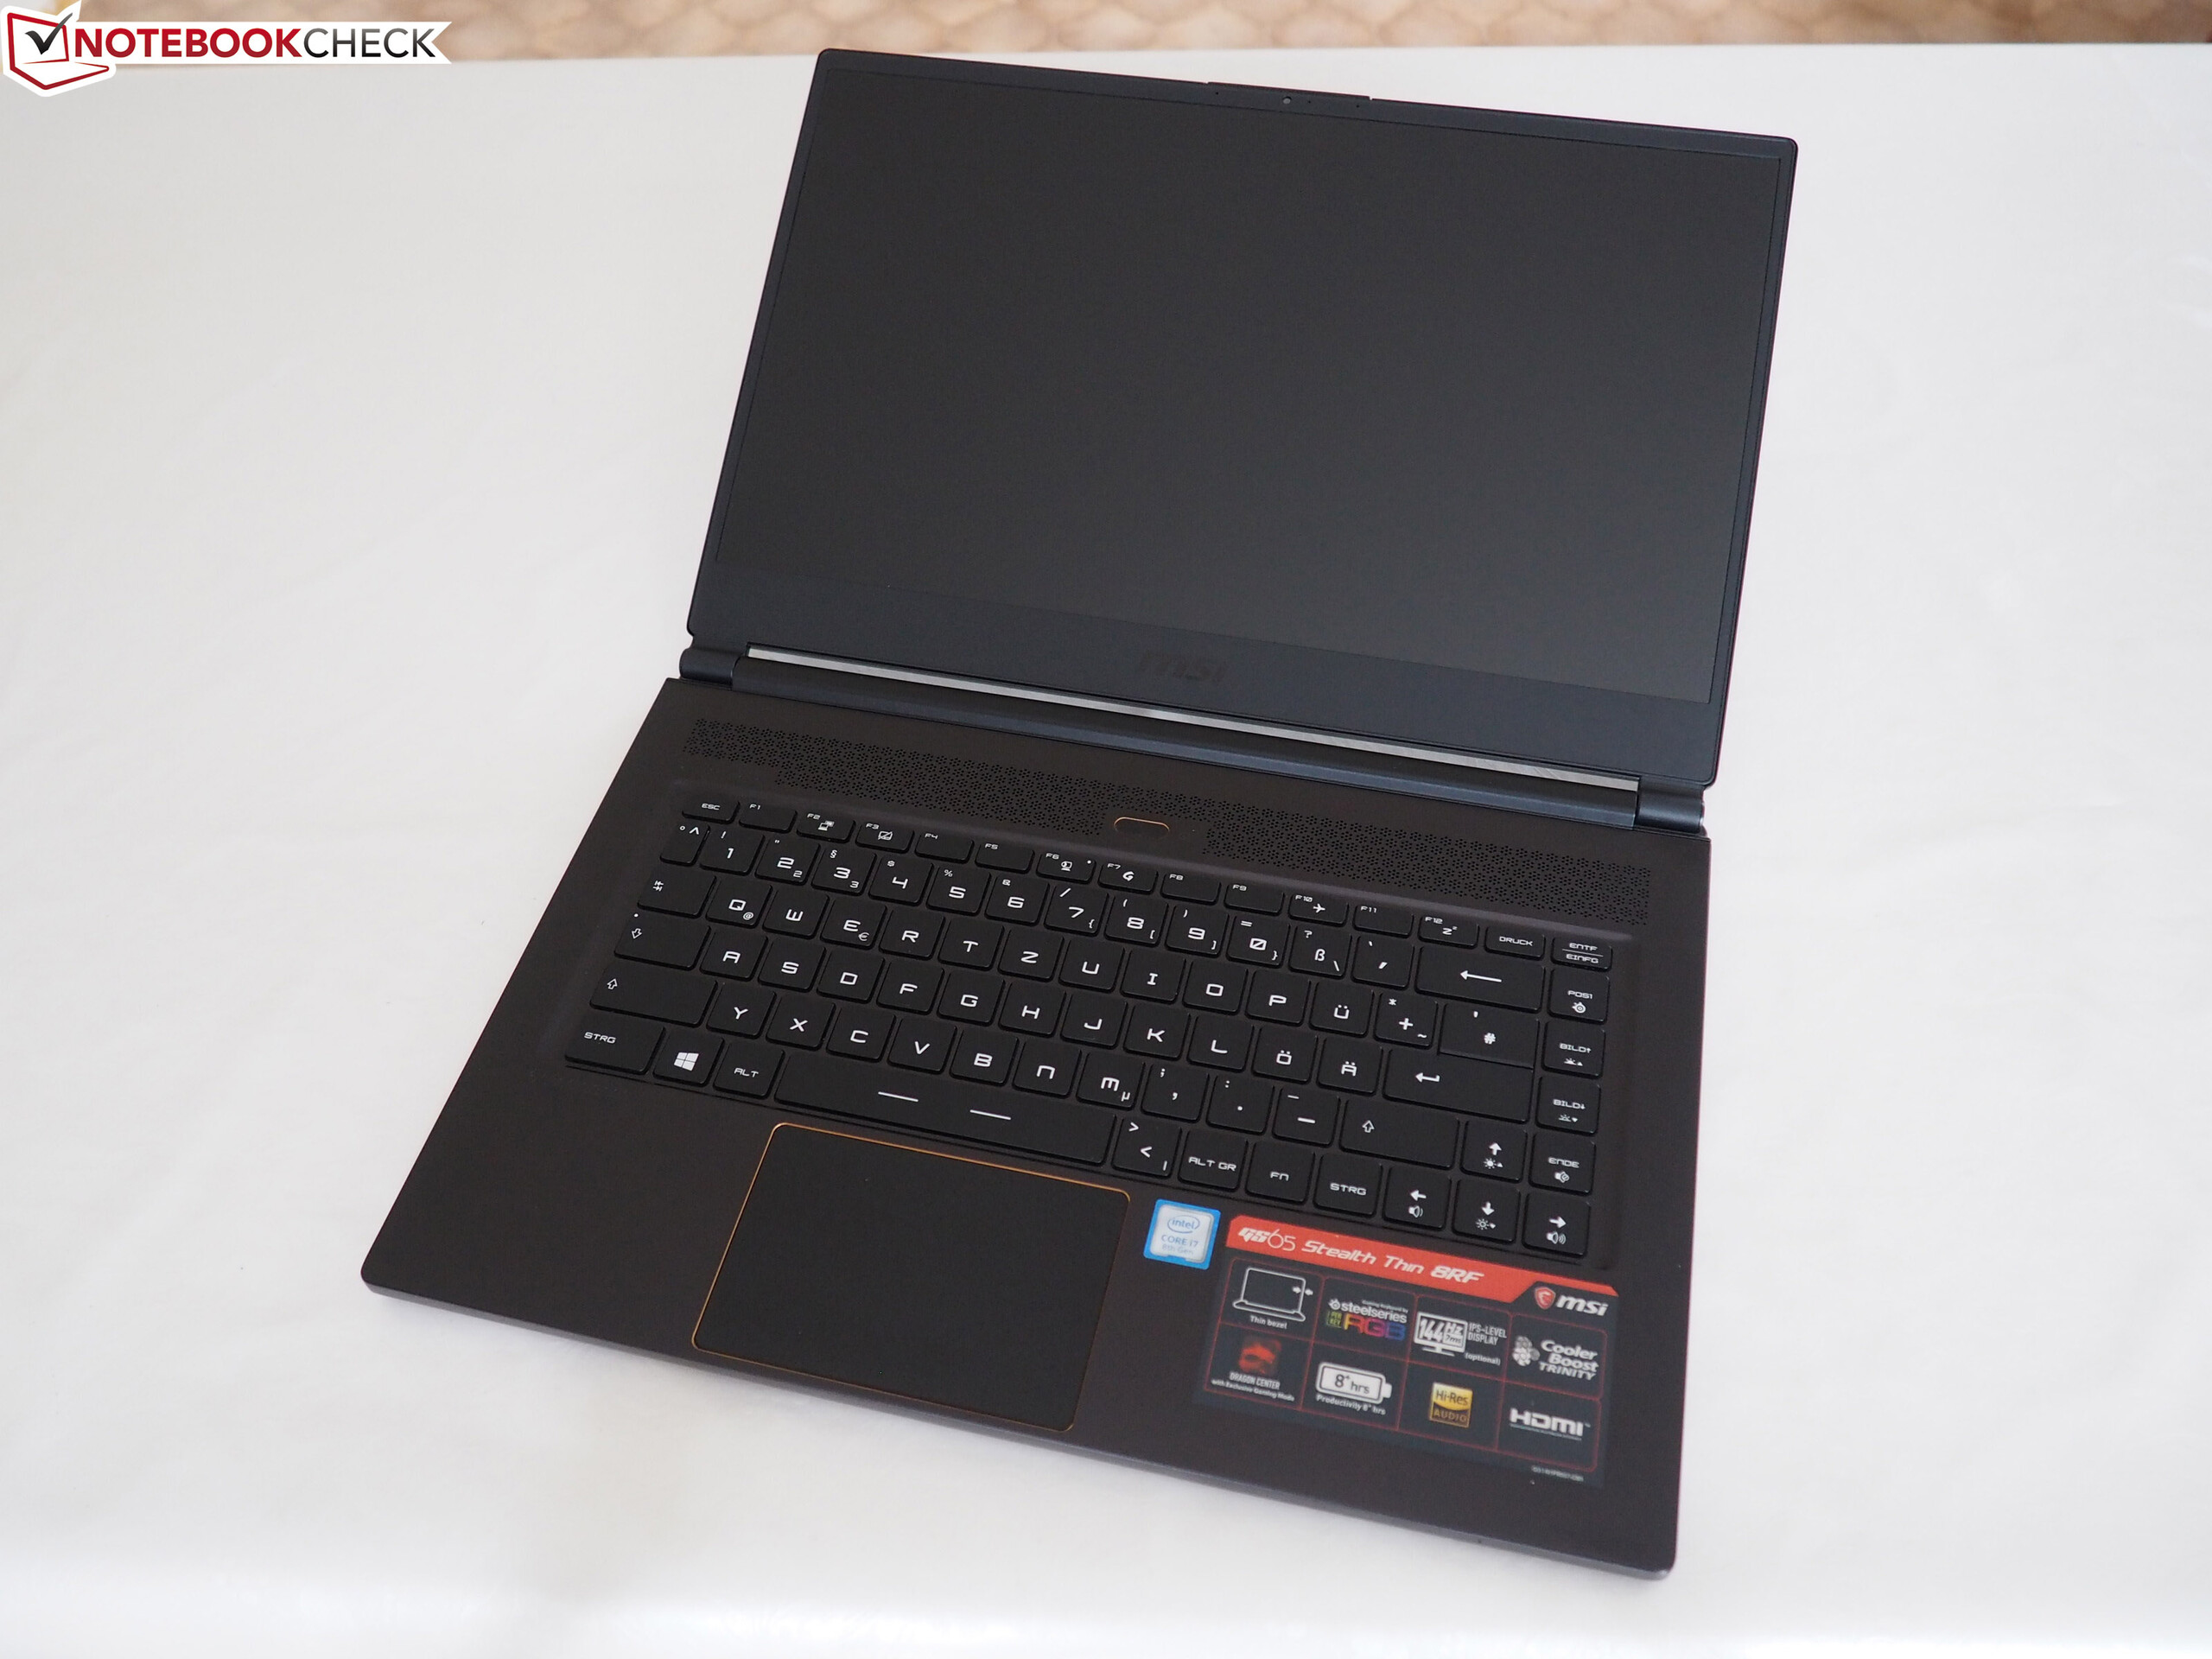
The GS65 cannot compete with the Aero 15X in terms of case quality. At first glance, the GS65 impresses with its metal case and display lid. The case looks stylish, with a discreet look and as though it is made from high-quality materials. However, on closer inspection, we have noticed some flaws.
Firstly, the case lacks the level of rigidity that the Aero 15X has. The display and base unit give way and can be twisted under somewhat forceful pressure. Frustratingly, the case tends to make creaking and popping sounds in many places. Moreover, some elements fit together poorly, like the power button and the top case, or have different gaps, such as between the top and bottom case. Equally, the hinges look worse than those on the Aero 15X. Overall, the workmanship of our review unit does not do the 1,999-Euro (~$2,387) price tag justice.
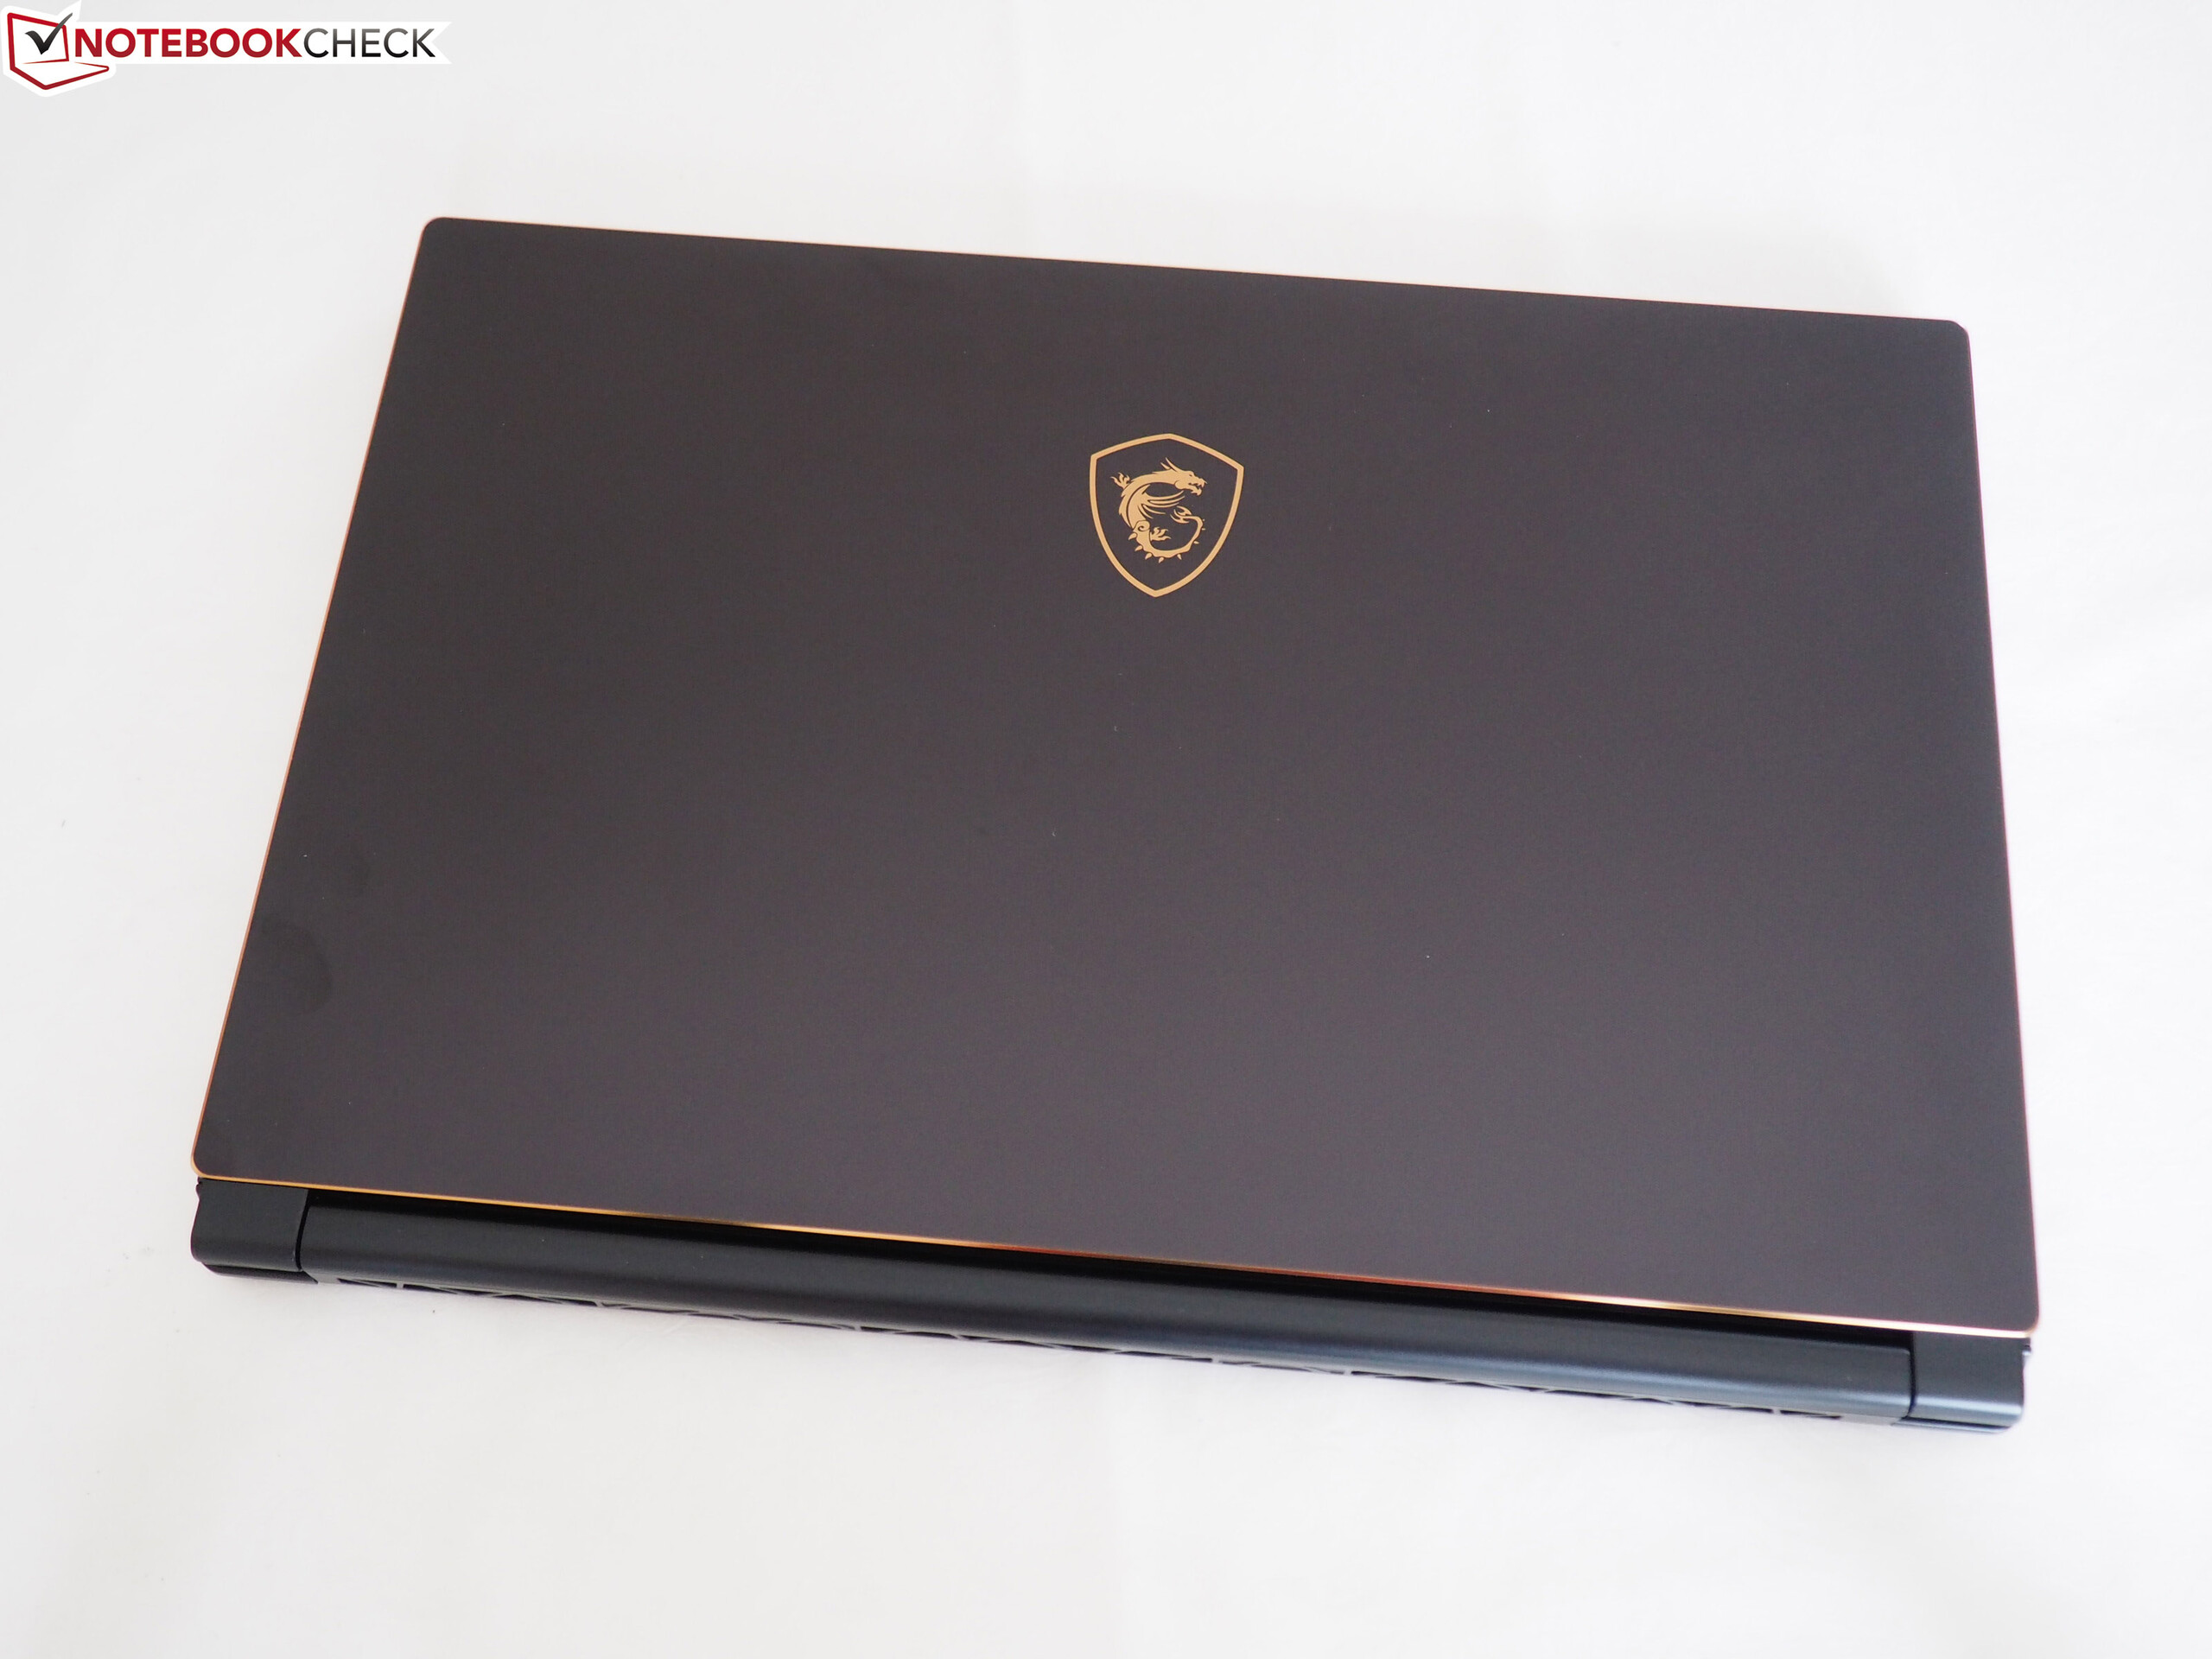
We applaud MSI for the compact design though. At just 1.8 cm tall, the GS65 is one of the thinnest gaming notebooks currently on the market; albeit our comparison devices are well matched here. The GS65 is even more impressive in terms of comparative weight and shows the competition what is possible in 2018. While the GS65 is easy to transport with a weight of 1.8 kg, the ASUS GM501 and Acer Triton 700 weigh in at a hefty 2.5 kg and 2.4 kg, respectively. Likewise, the Aero 15X is heavier than the GS65 too, tipping the scales at 2.1 kg.
Connectivity
I/O
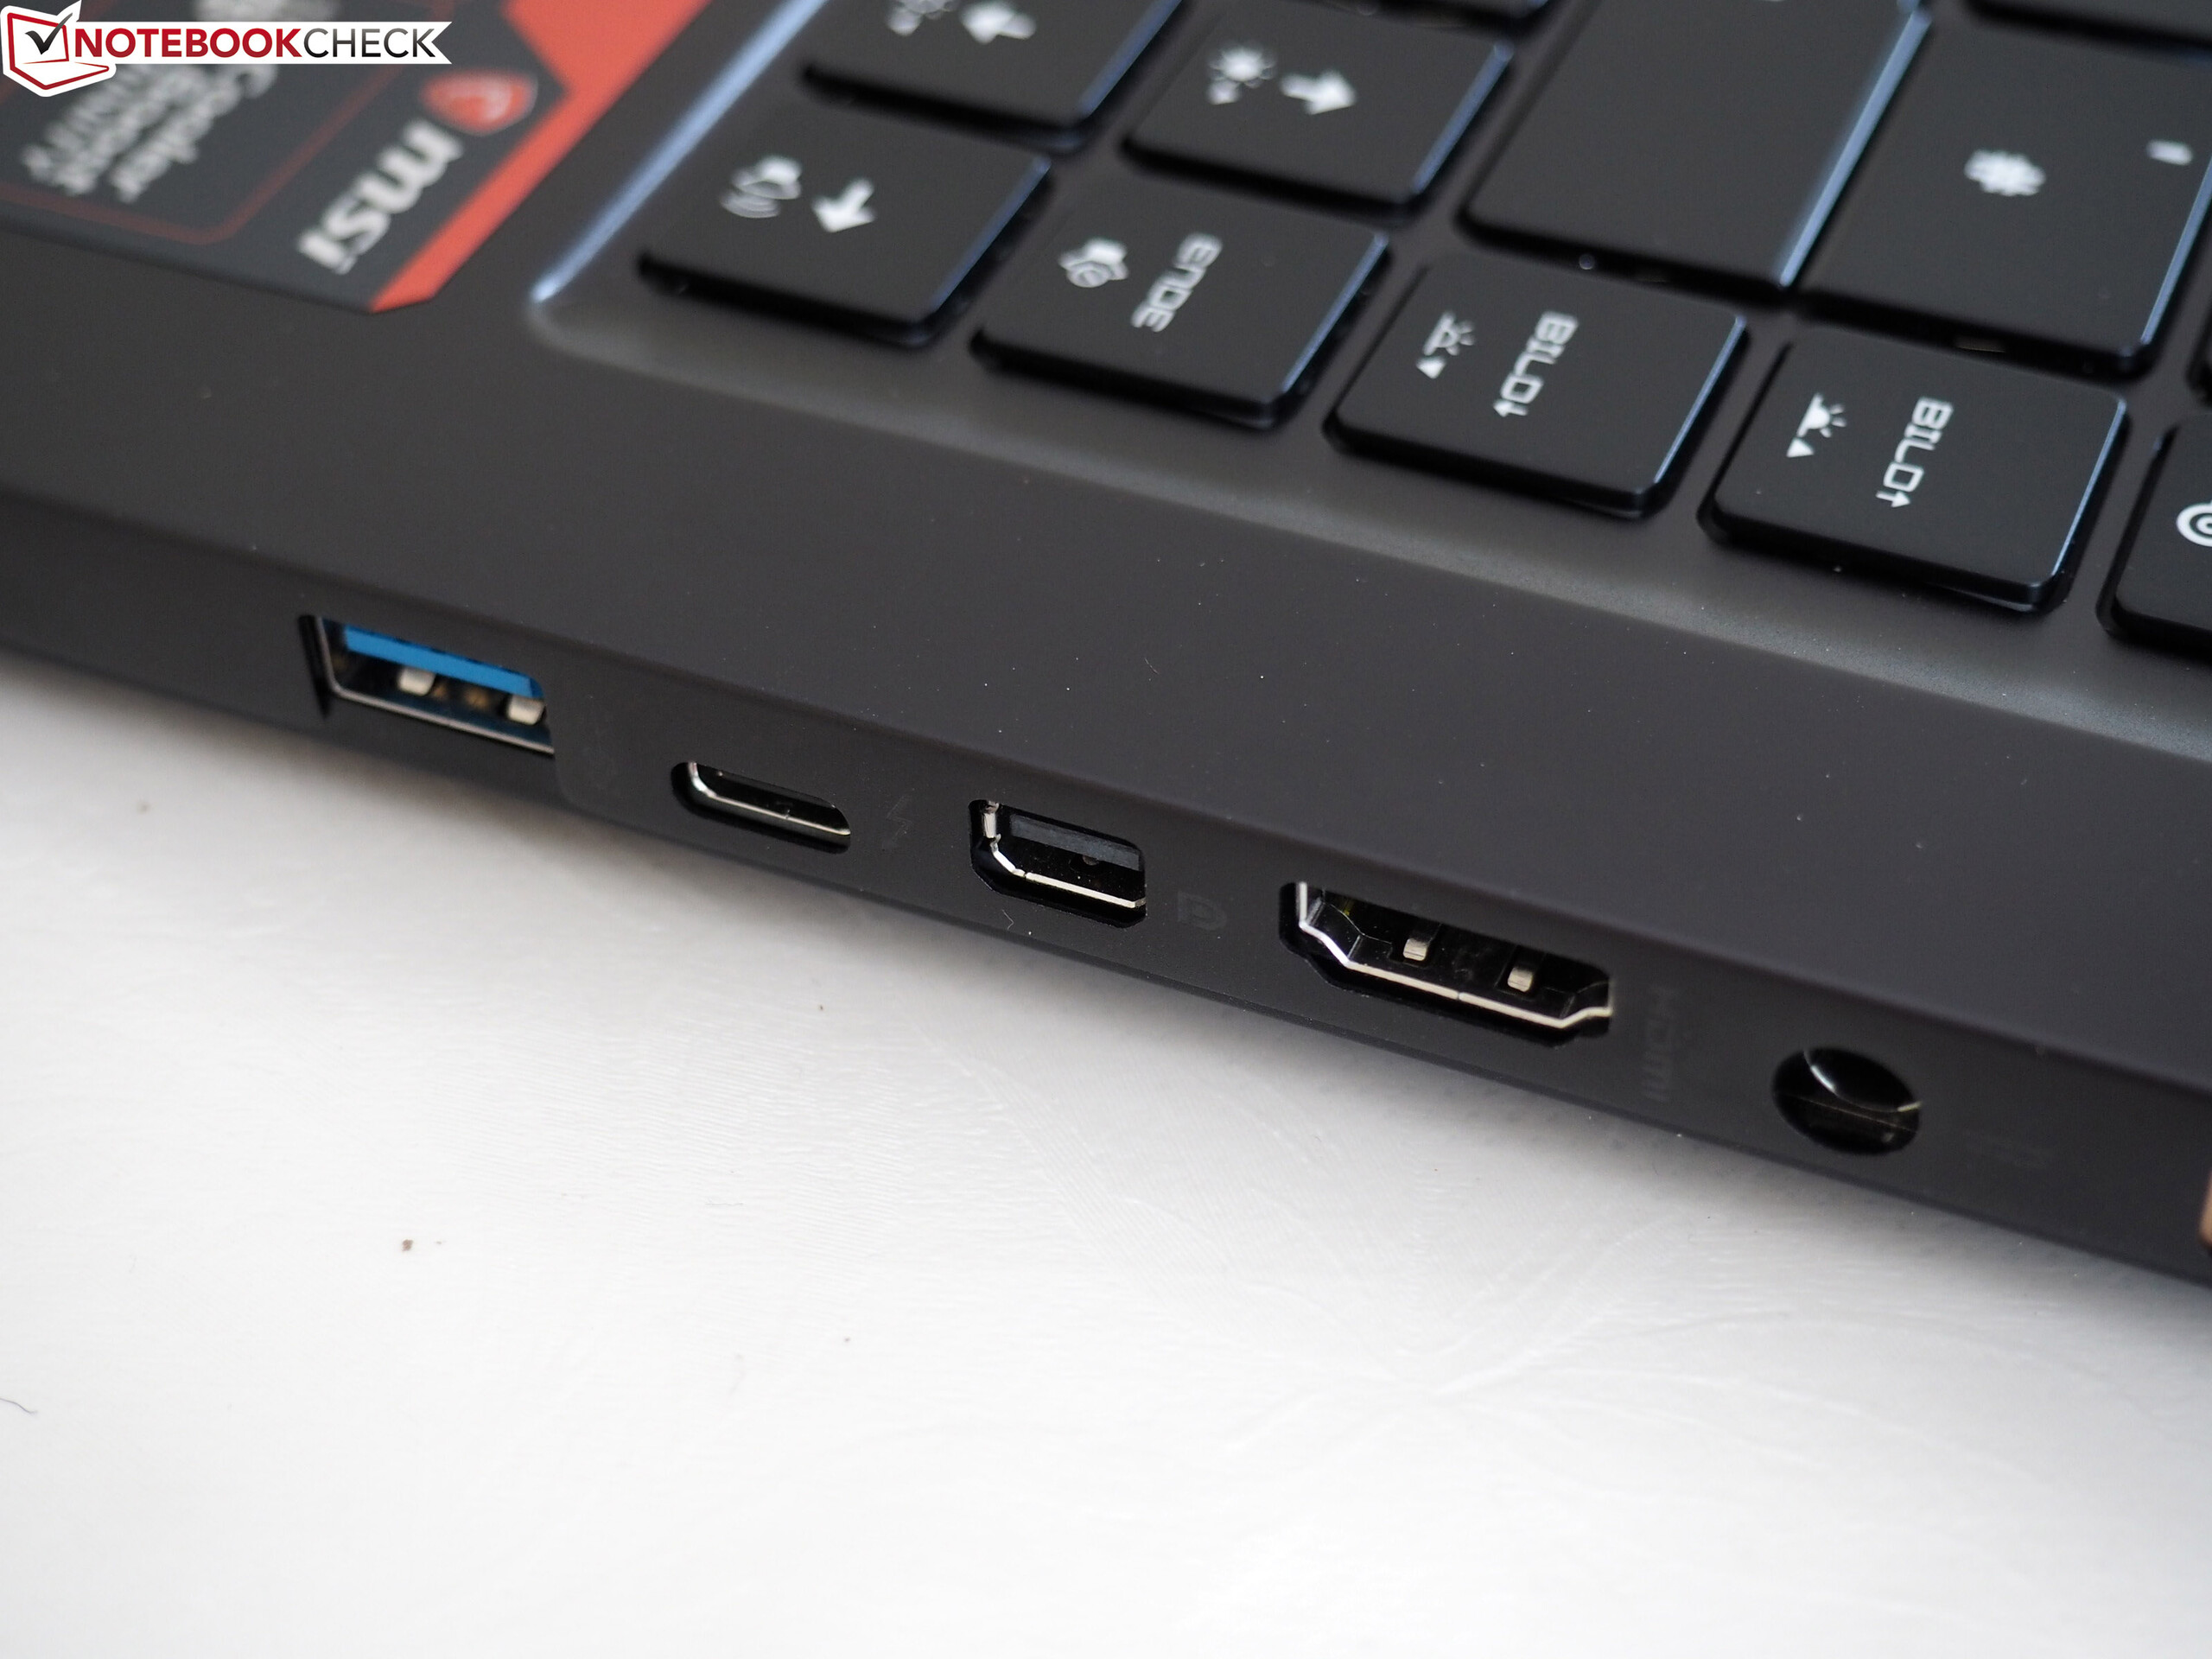
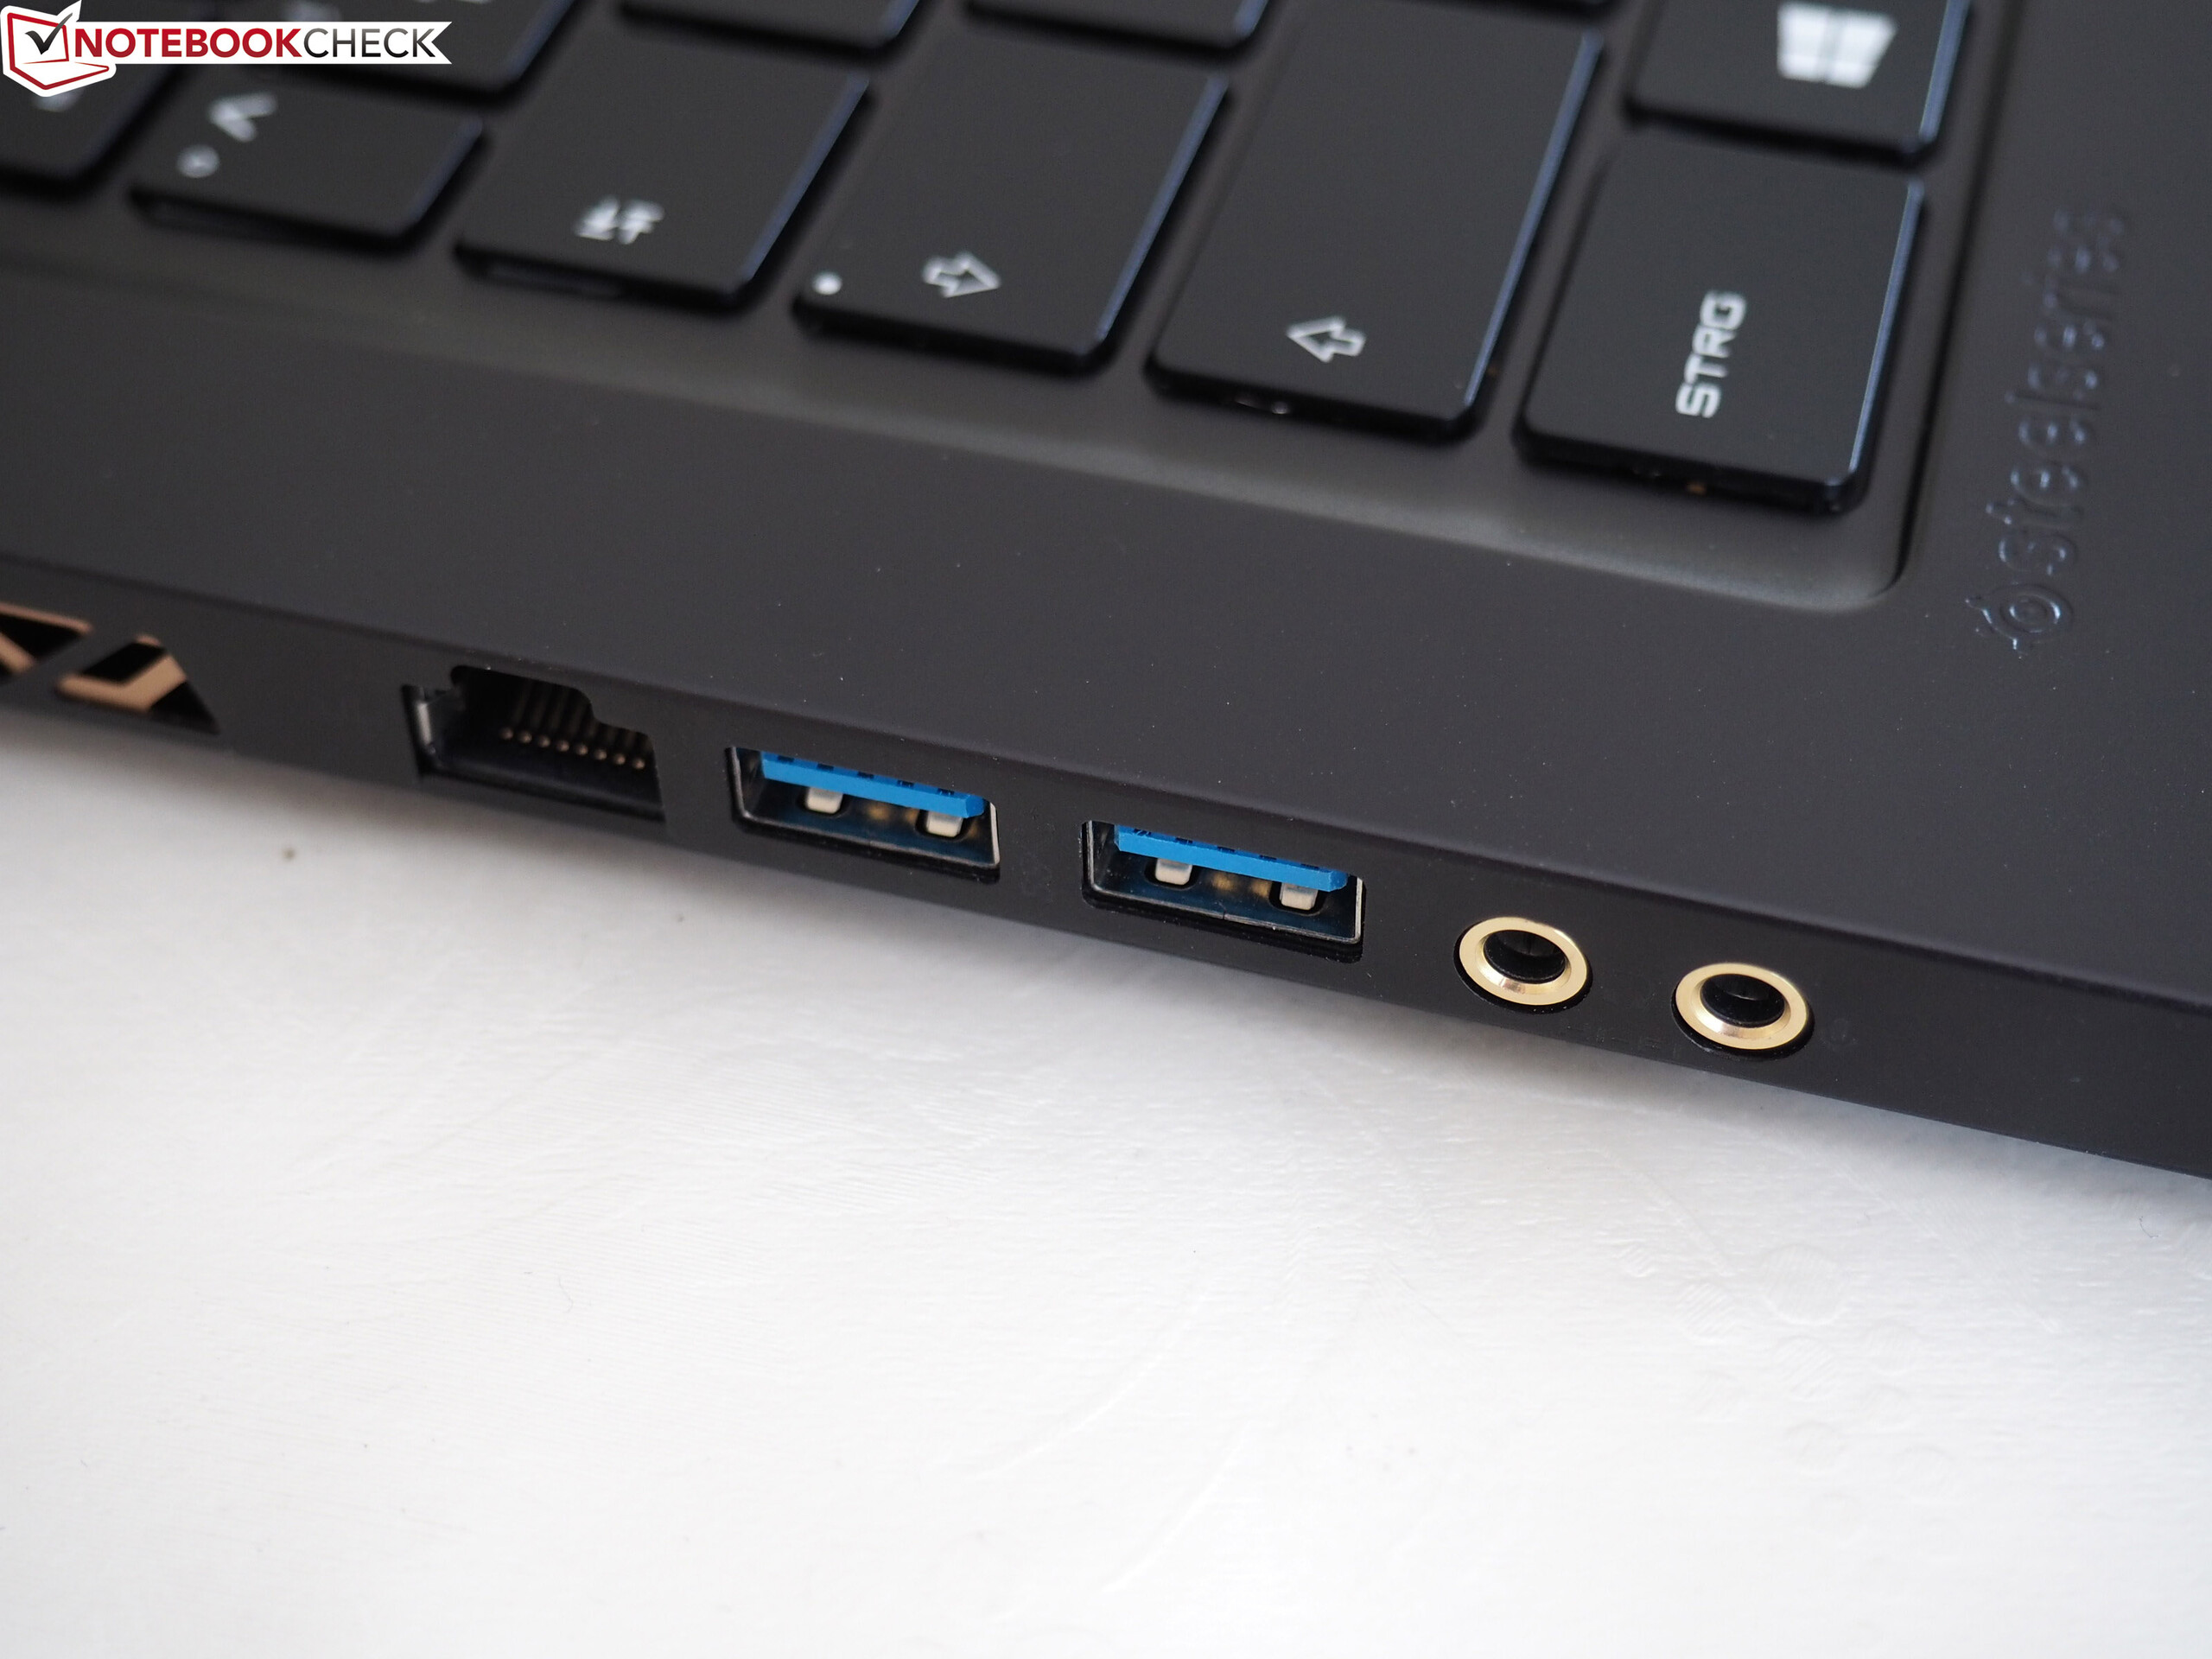
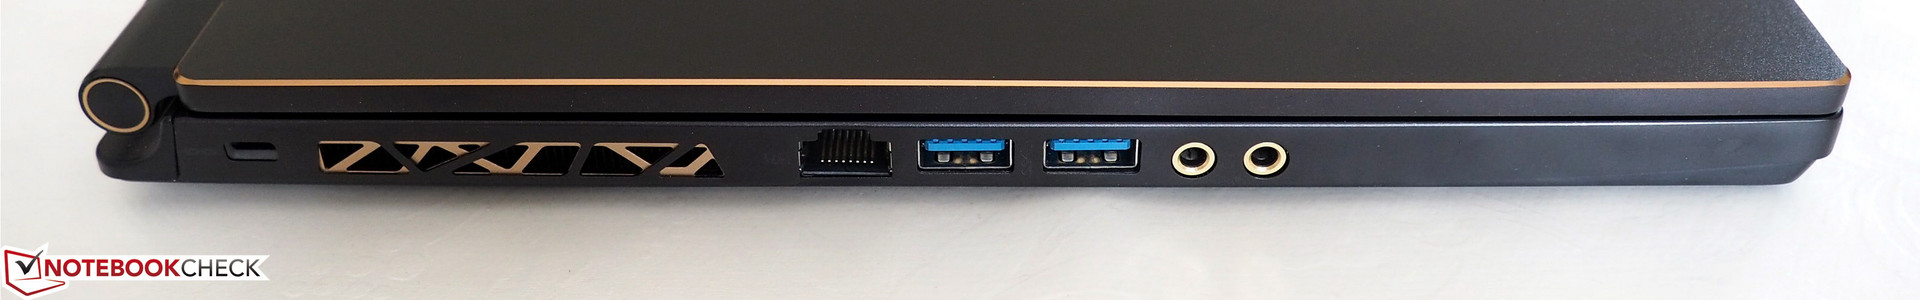
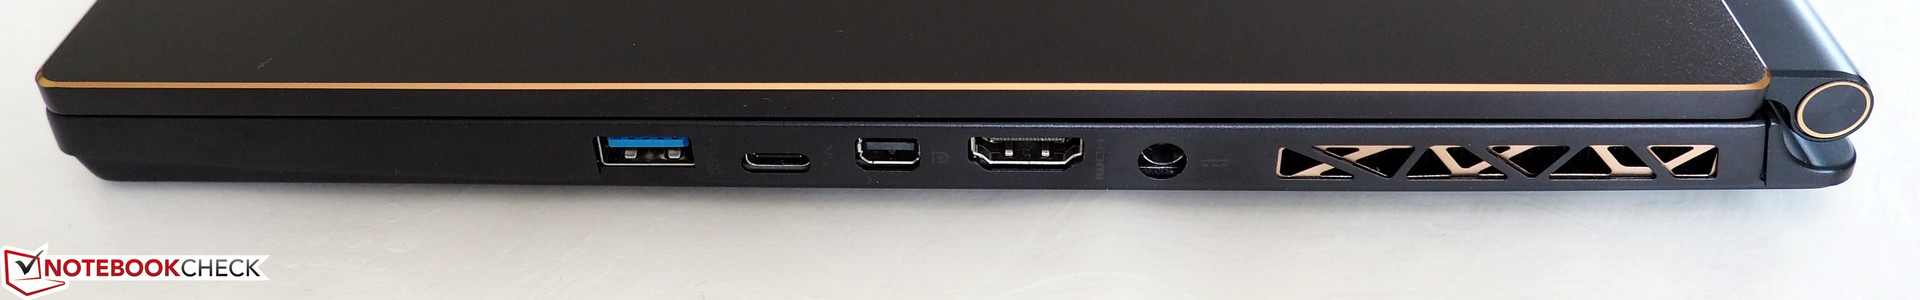
The GS65 falls behind the Aero 15X in terms of connectivity. Despite having separate headphone and microphone ports, the lack of a card reader will annoy some people. The selection of other ports is like that of the Aero 15X: an RJ45 Ethernet port, HDMI and Mini DisplayPort connections, three USB Type-A 3.1 Gen 2 ports, one Thunderbolt USB Type-C port, and a Kensington lock slot.
Unfortunately, the ports are positioned relatively far forward on either side thanks to the twin fan vents which are in the spot where the I/O is typically situated on most other laptops. This means that an external mouse tends to collide with the cables from any other attached peripherals thereby restricting your range of motion. What’s more, the ports are more closely positioned than on the Aero 15X, with little room for bulkier cables to be connected simultaneously. Overall, the GS65 has a poorer distribution of ports compared with the Aero 15X.
Communication
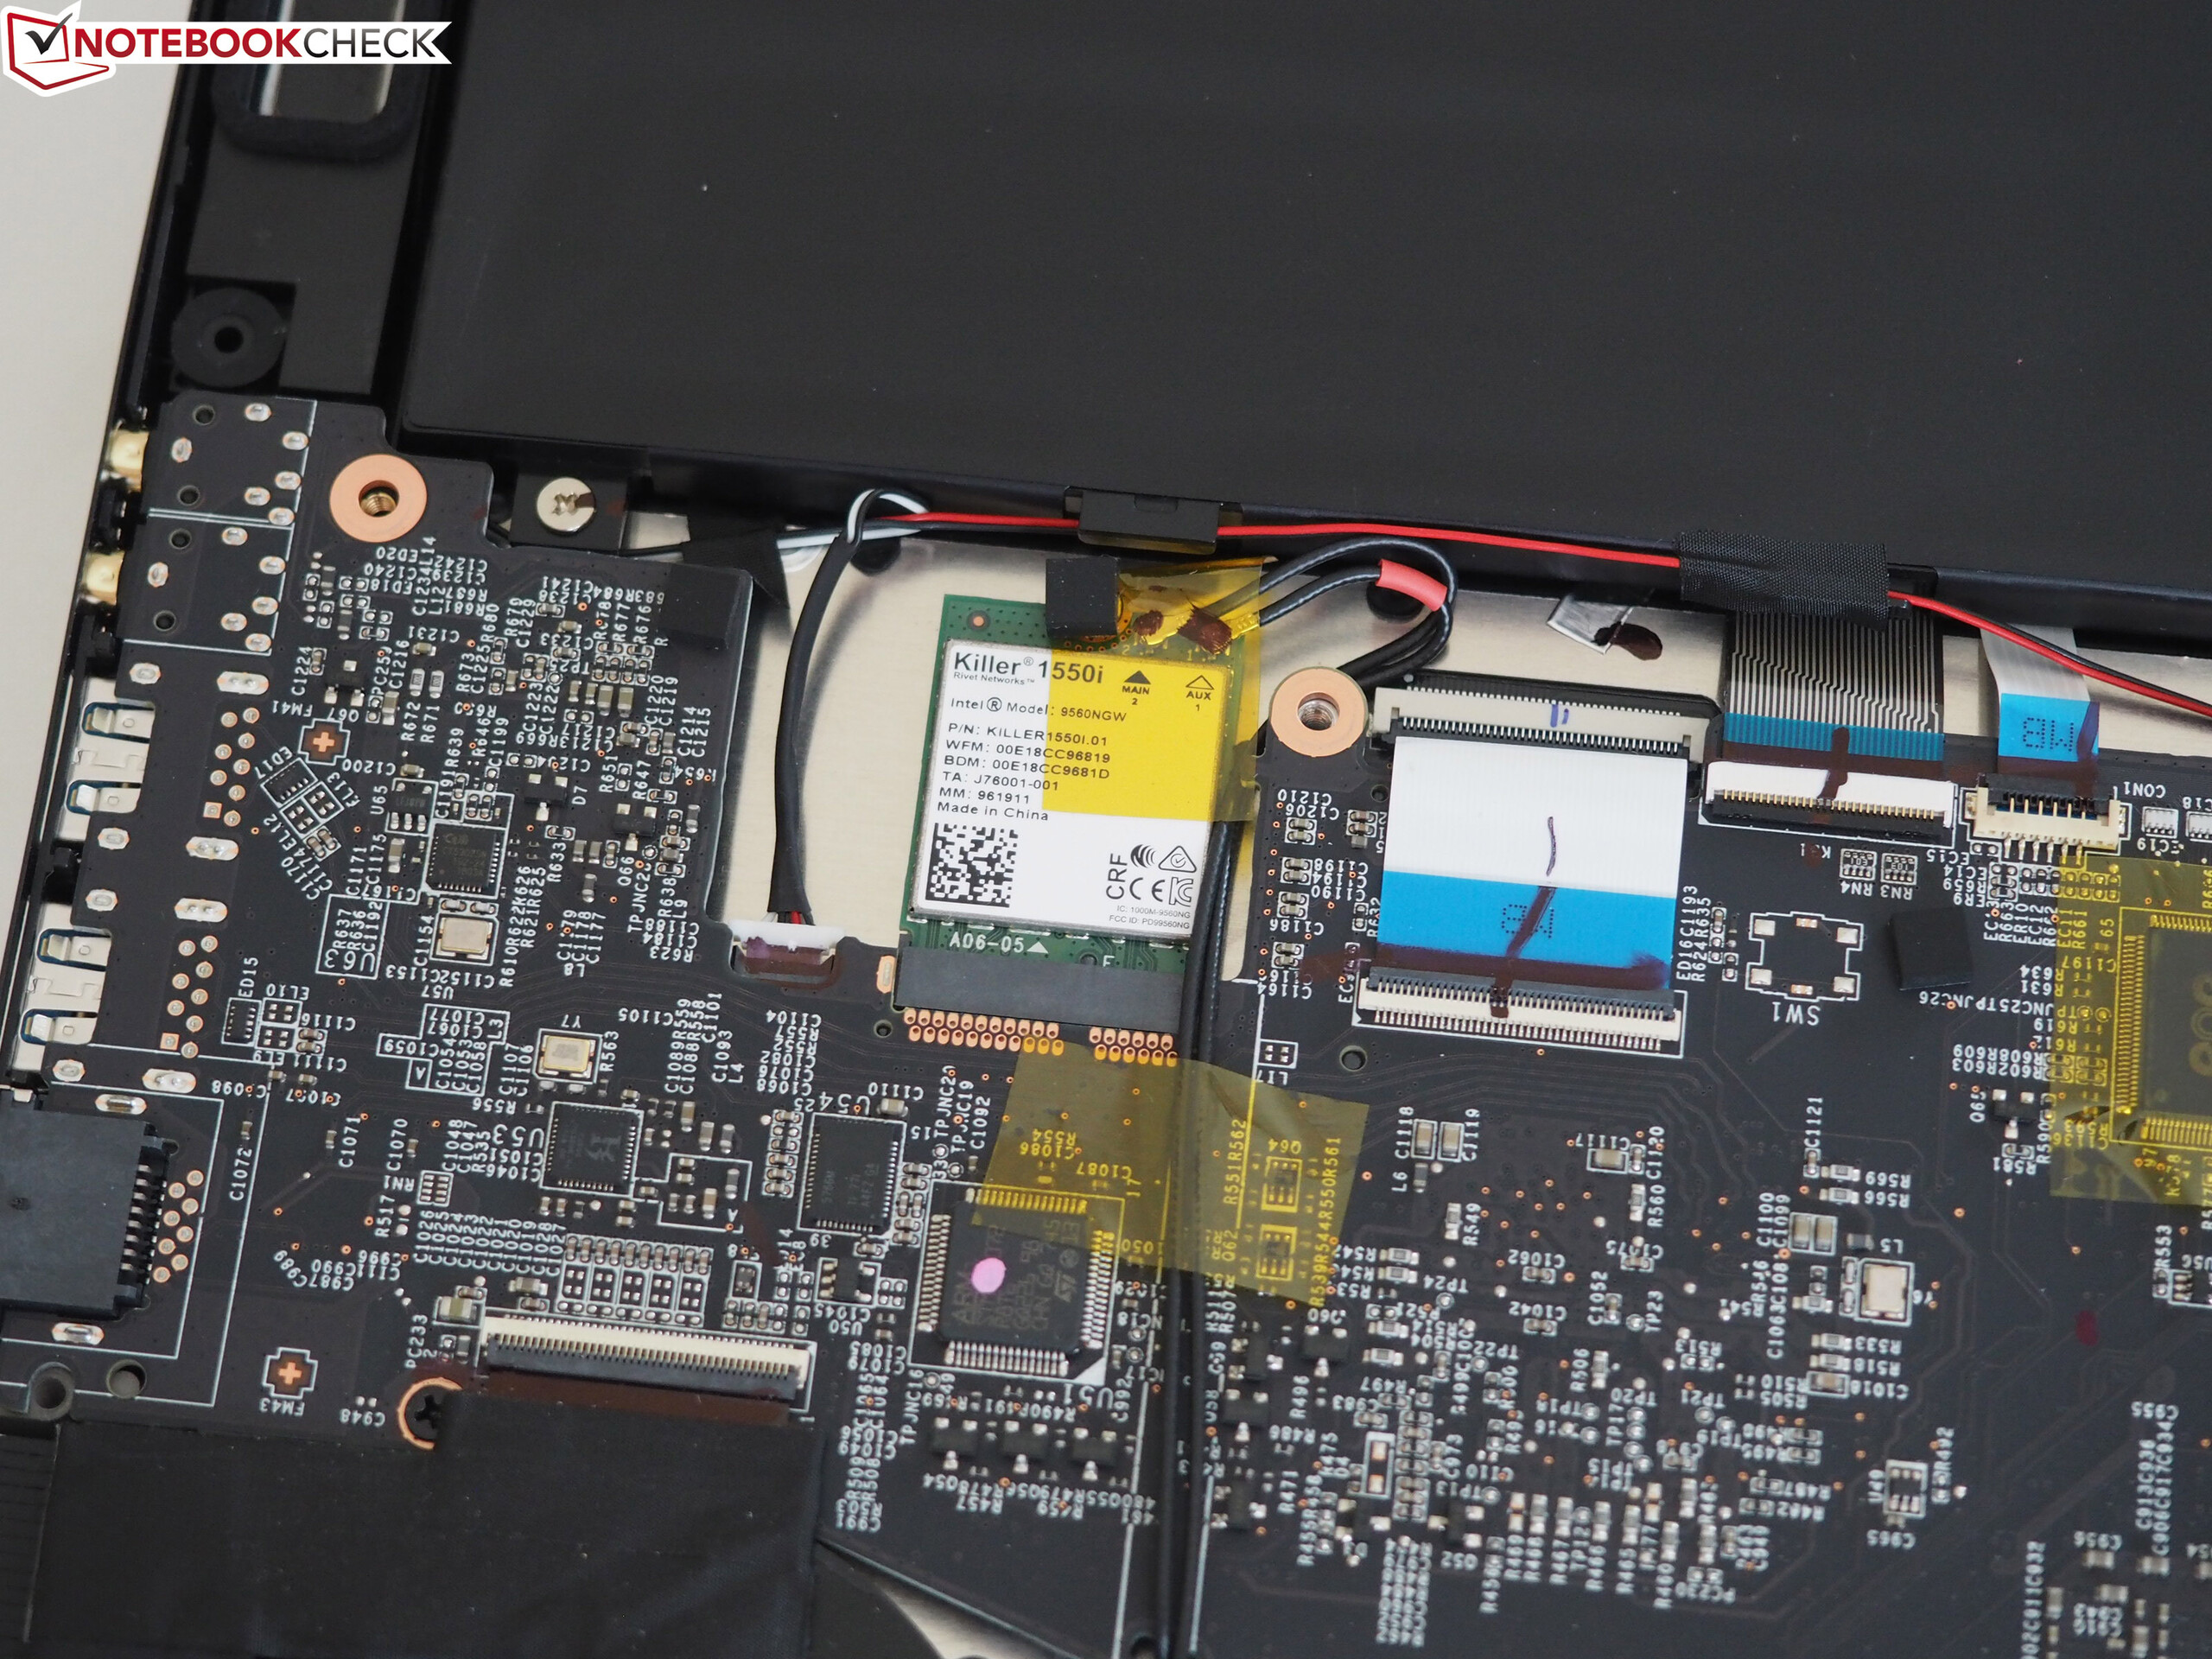
The GS65 wipes the floor with the Aero 15X with Wi-Fi performance though. While the GS65 does not have award-winning receive speeds, its send speeds are impressive at 662 Mbit/s. By contrast, the Aero 15X only managed 379 Mbit/s, some 75% worse than the GS65. This gulf in performance is because of their respective wireless cards. The GS65 uses the brand-new Killer Wireless AC 1550 chip, which performs equally well in the MSI GT75 too. Meanwhile, the Aero 15X makes do with the older Intel Dual Band Wireless AC 8265 chip.
Software
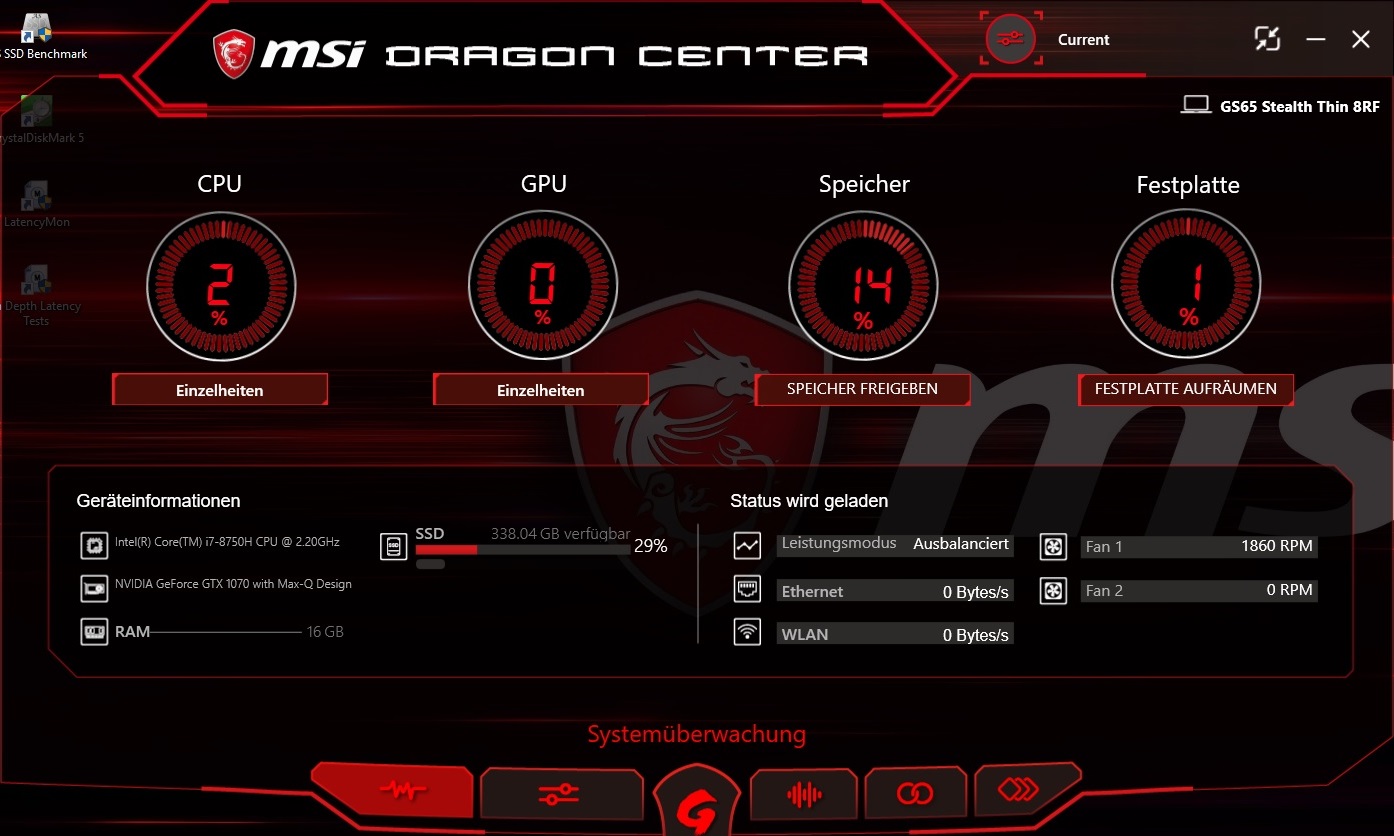
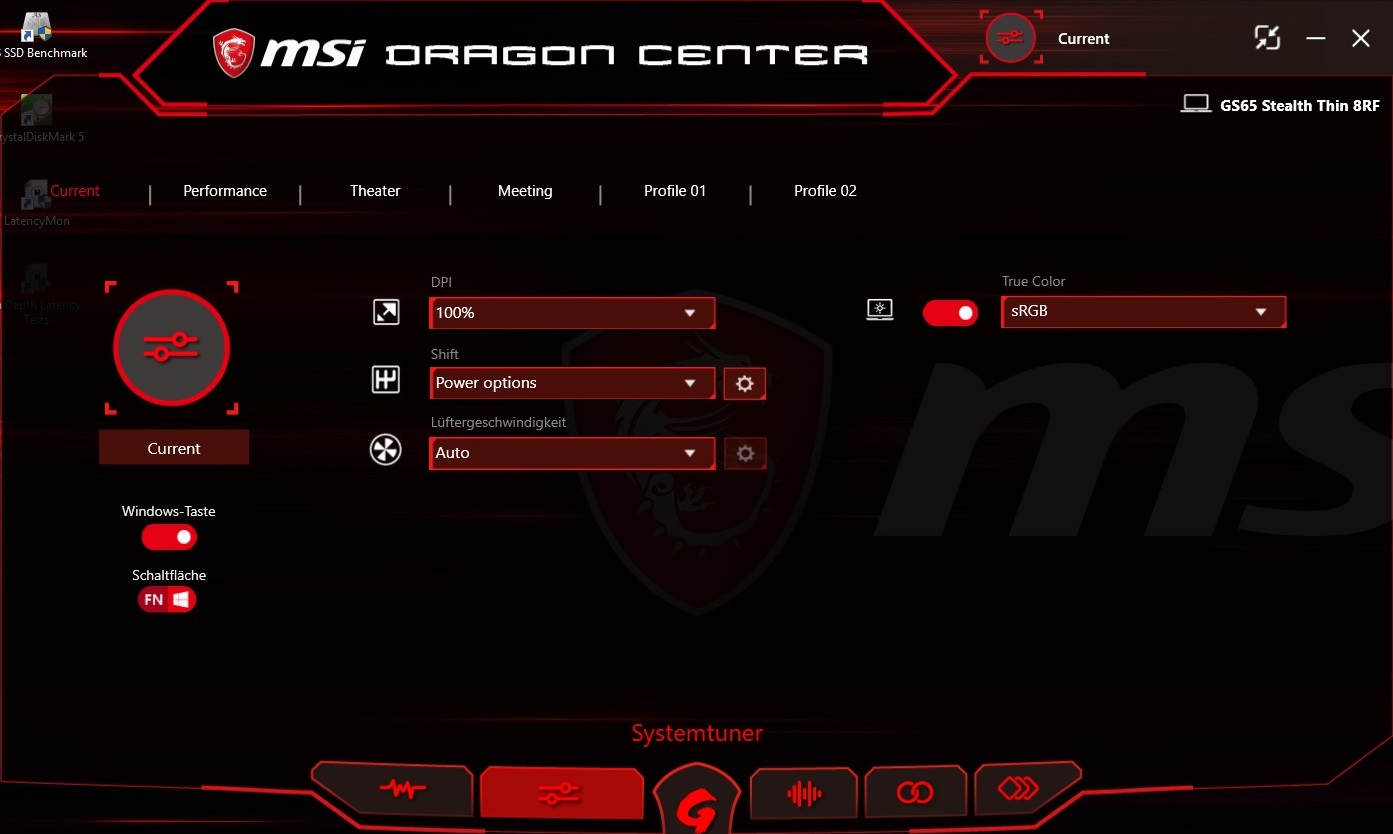
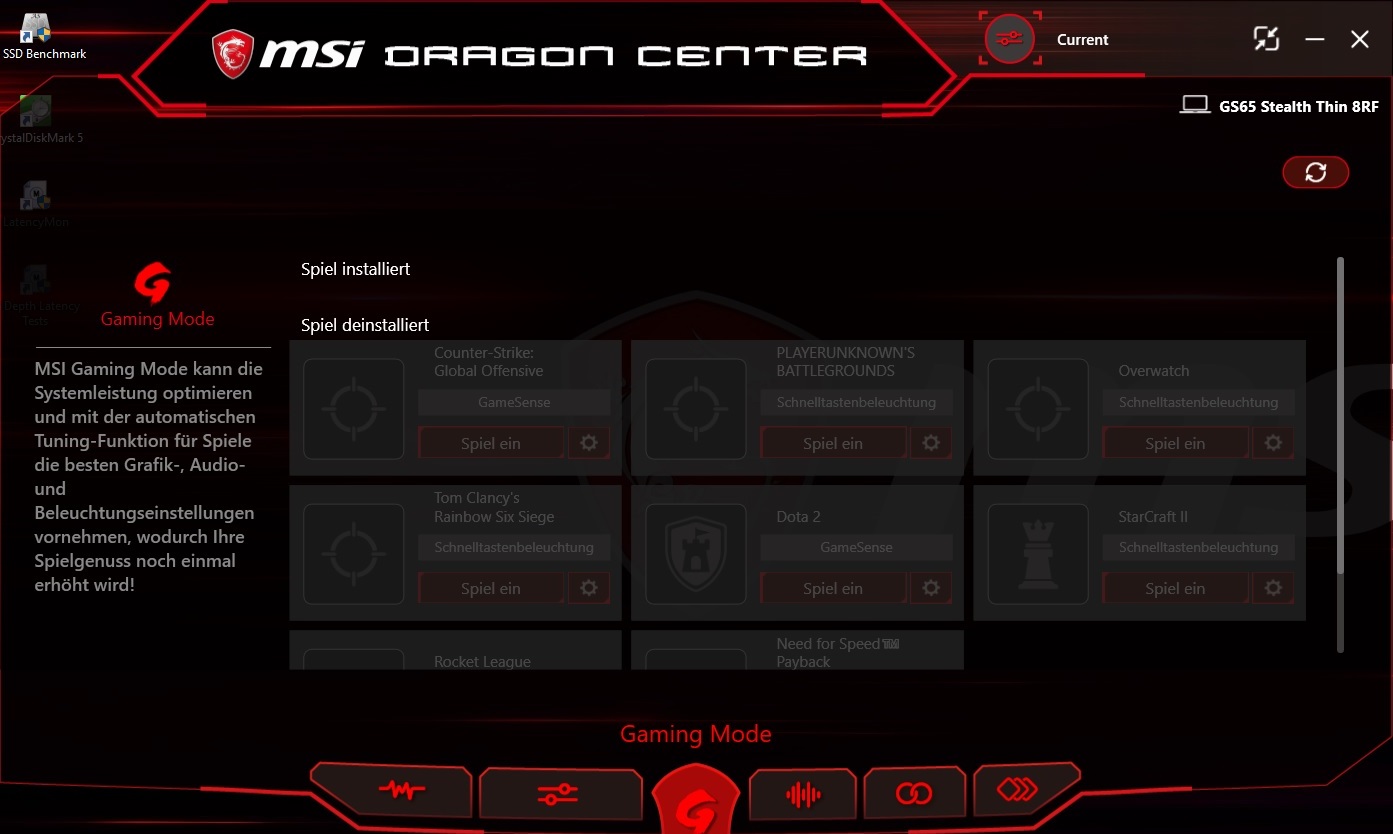
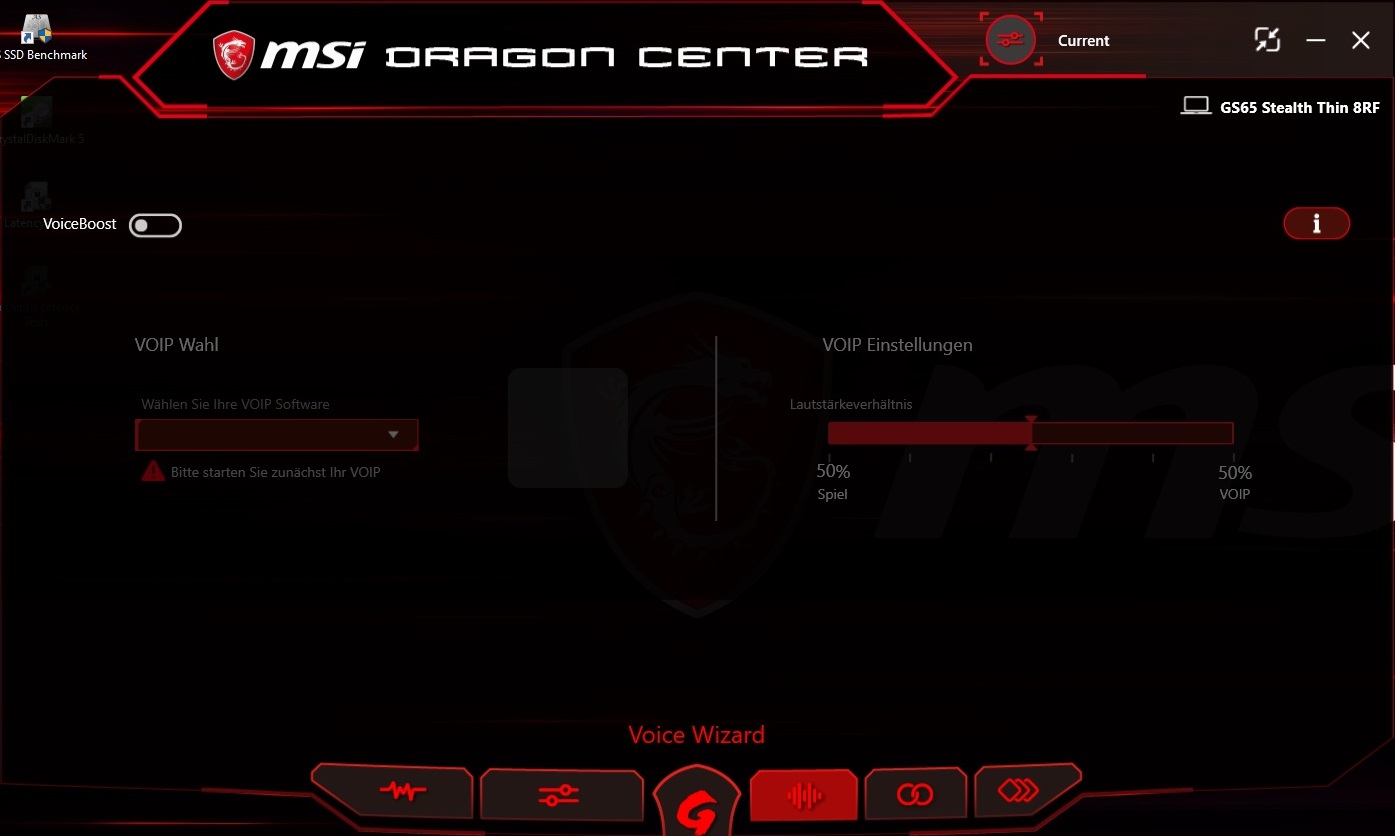
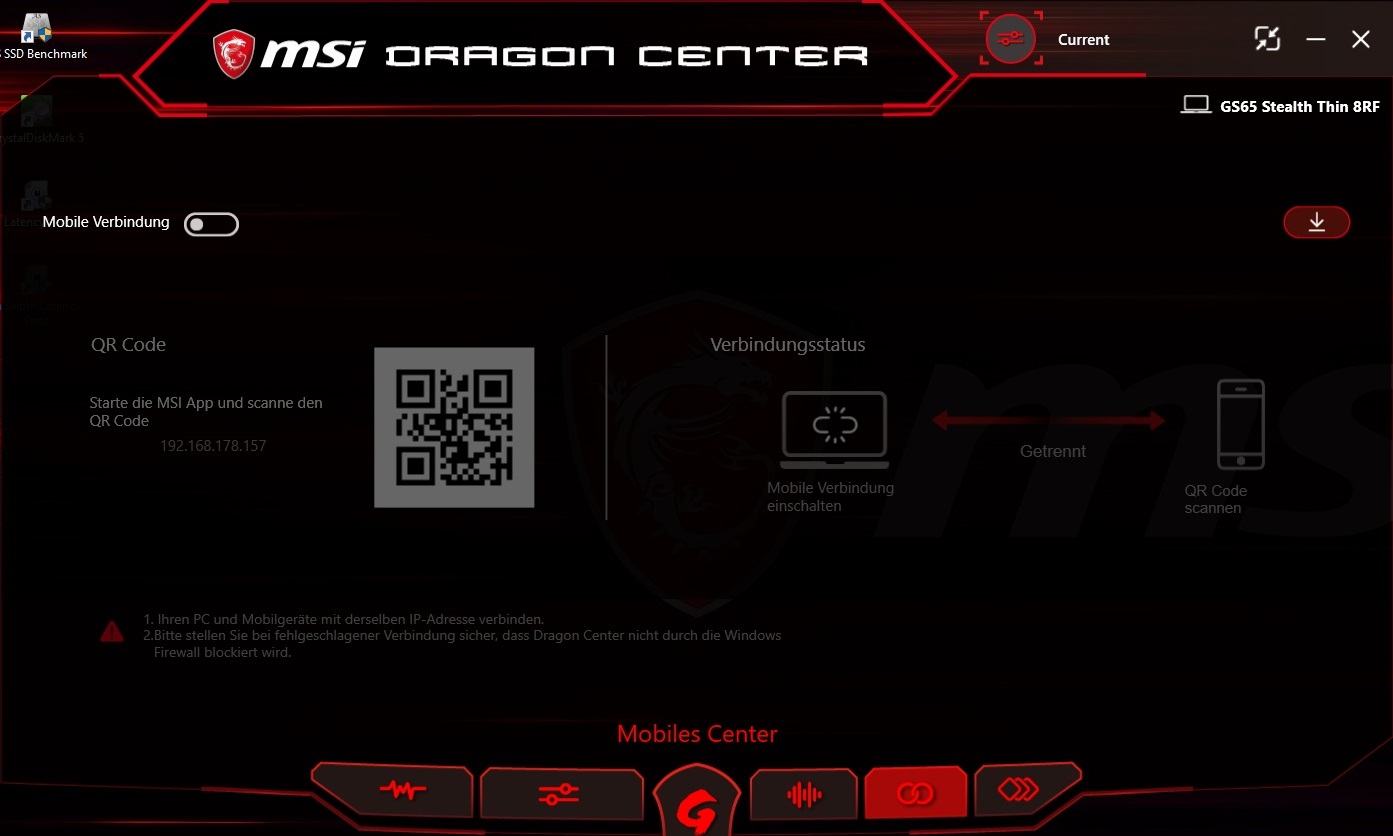
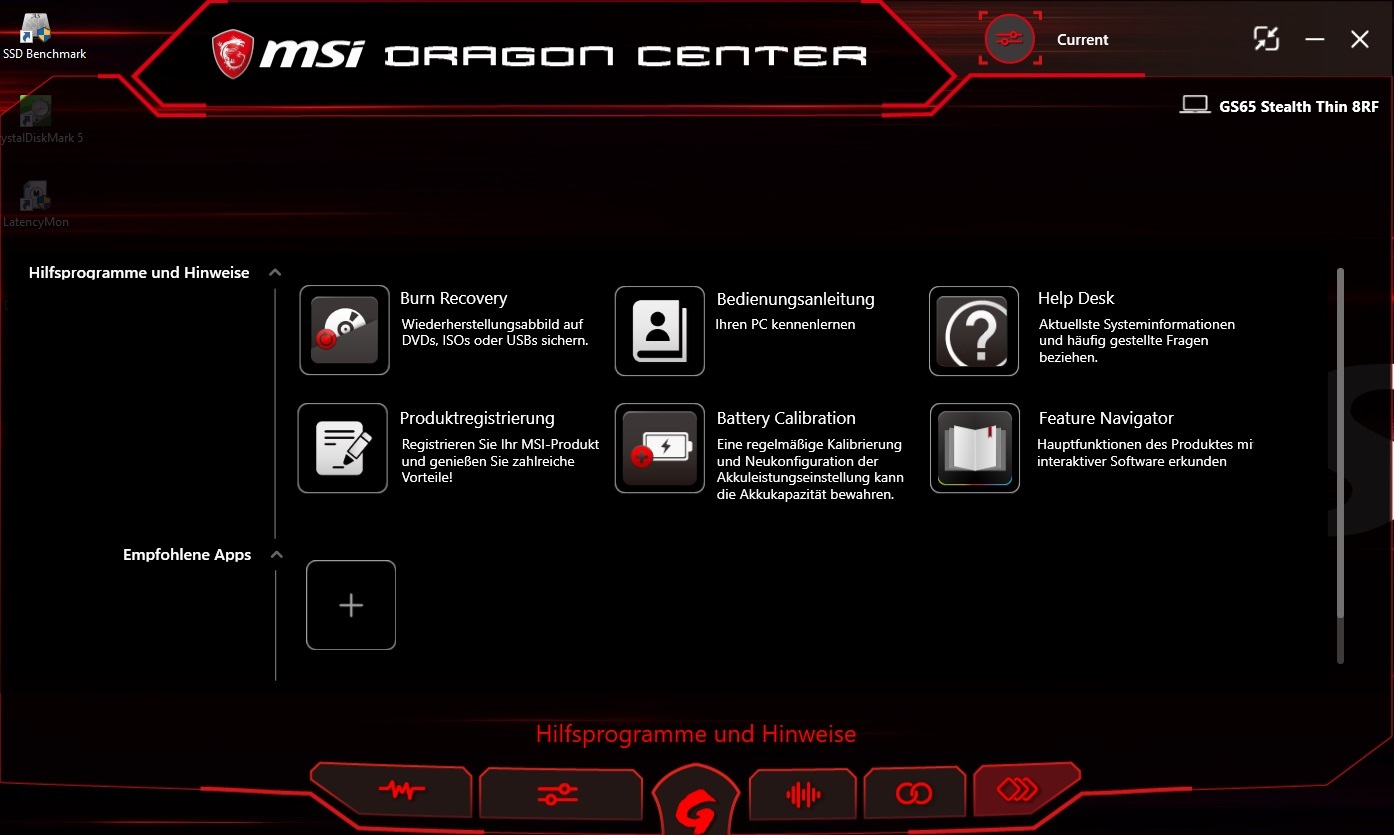
The GS65 comes with MSI’s Dragon Center installed, a device utility akin to Gigabyte’s Smart Manager, within which there are multiple power profiles and fan modes including a manual mode. The Dragon Center has been significantly redesigned compared with its previous version. During our GS65 tests, we set the shift setting to “Power Options” and the fan speed to “Auto”.
Accessories
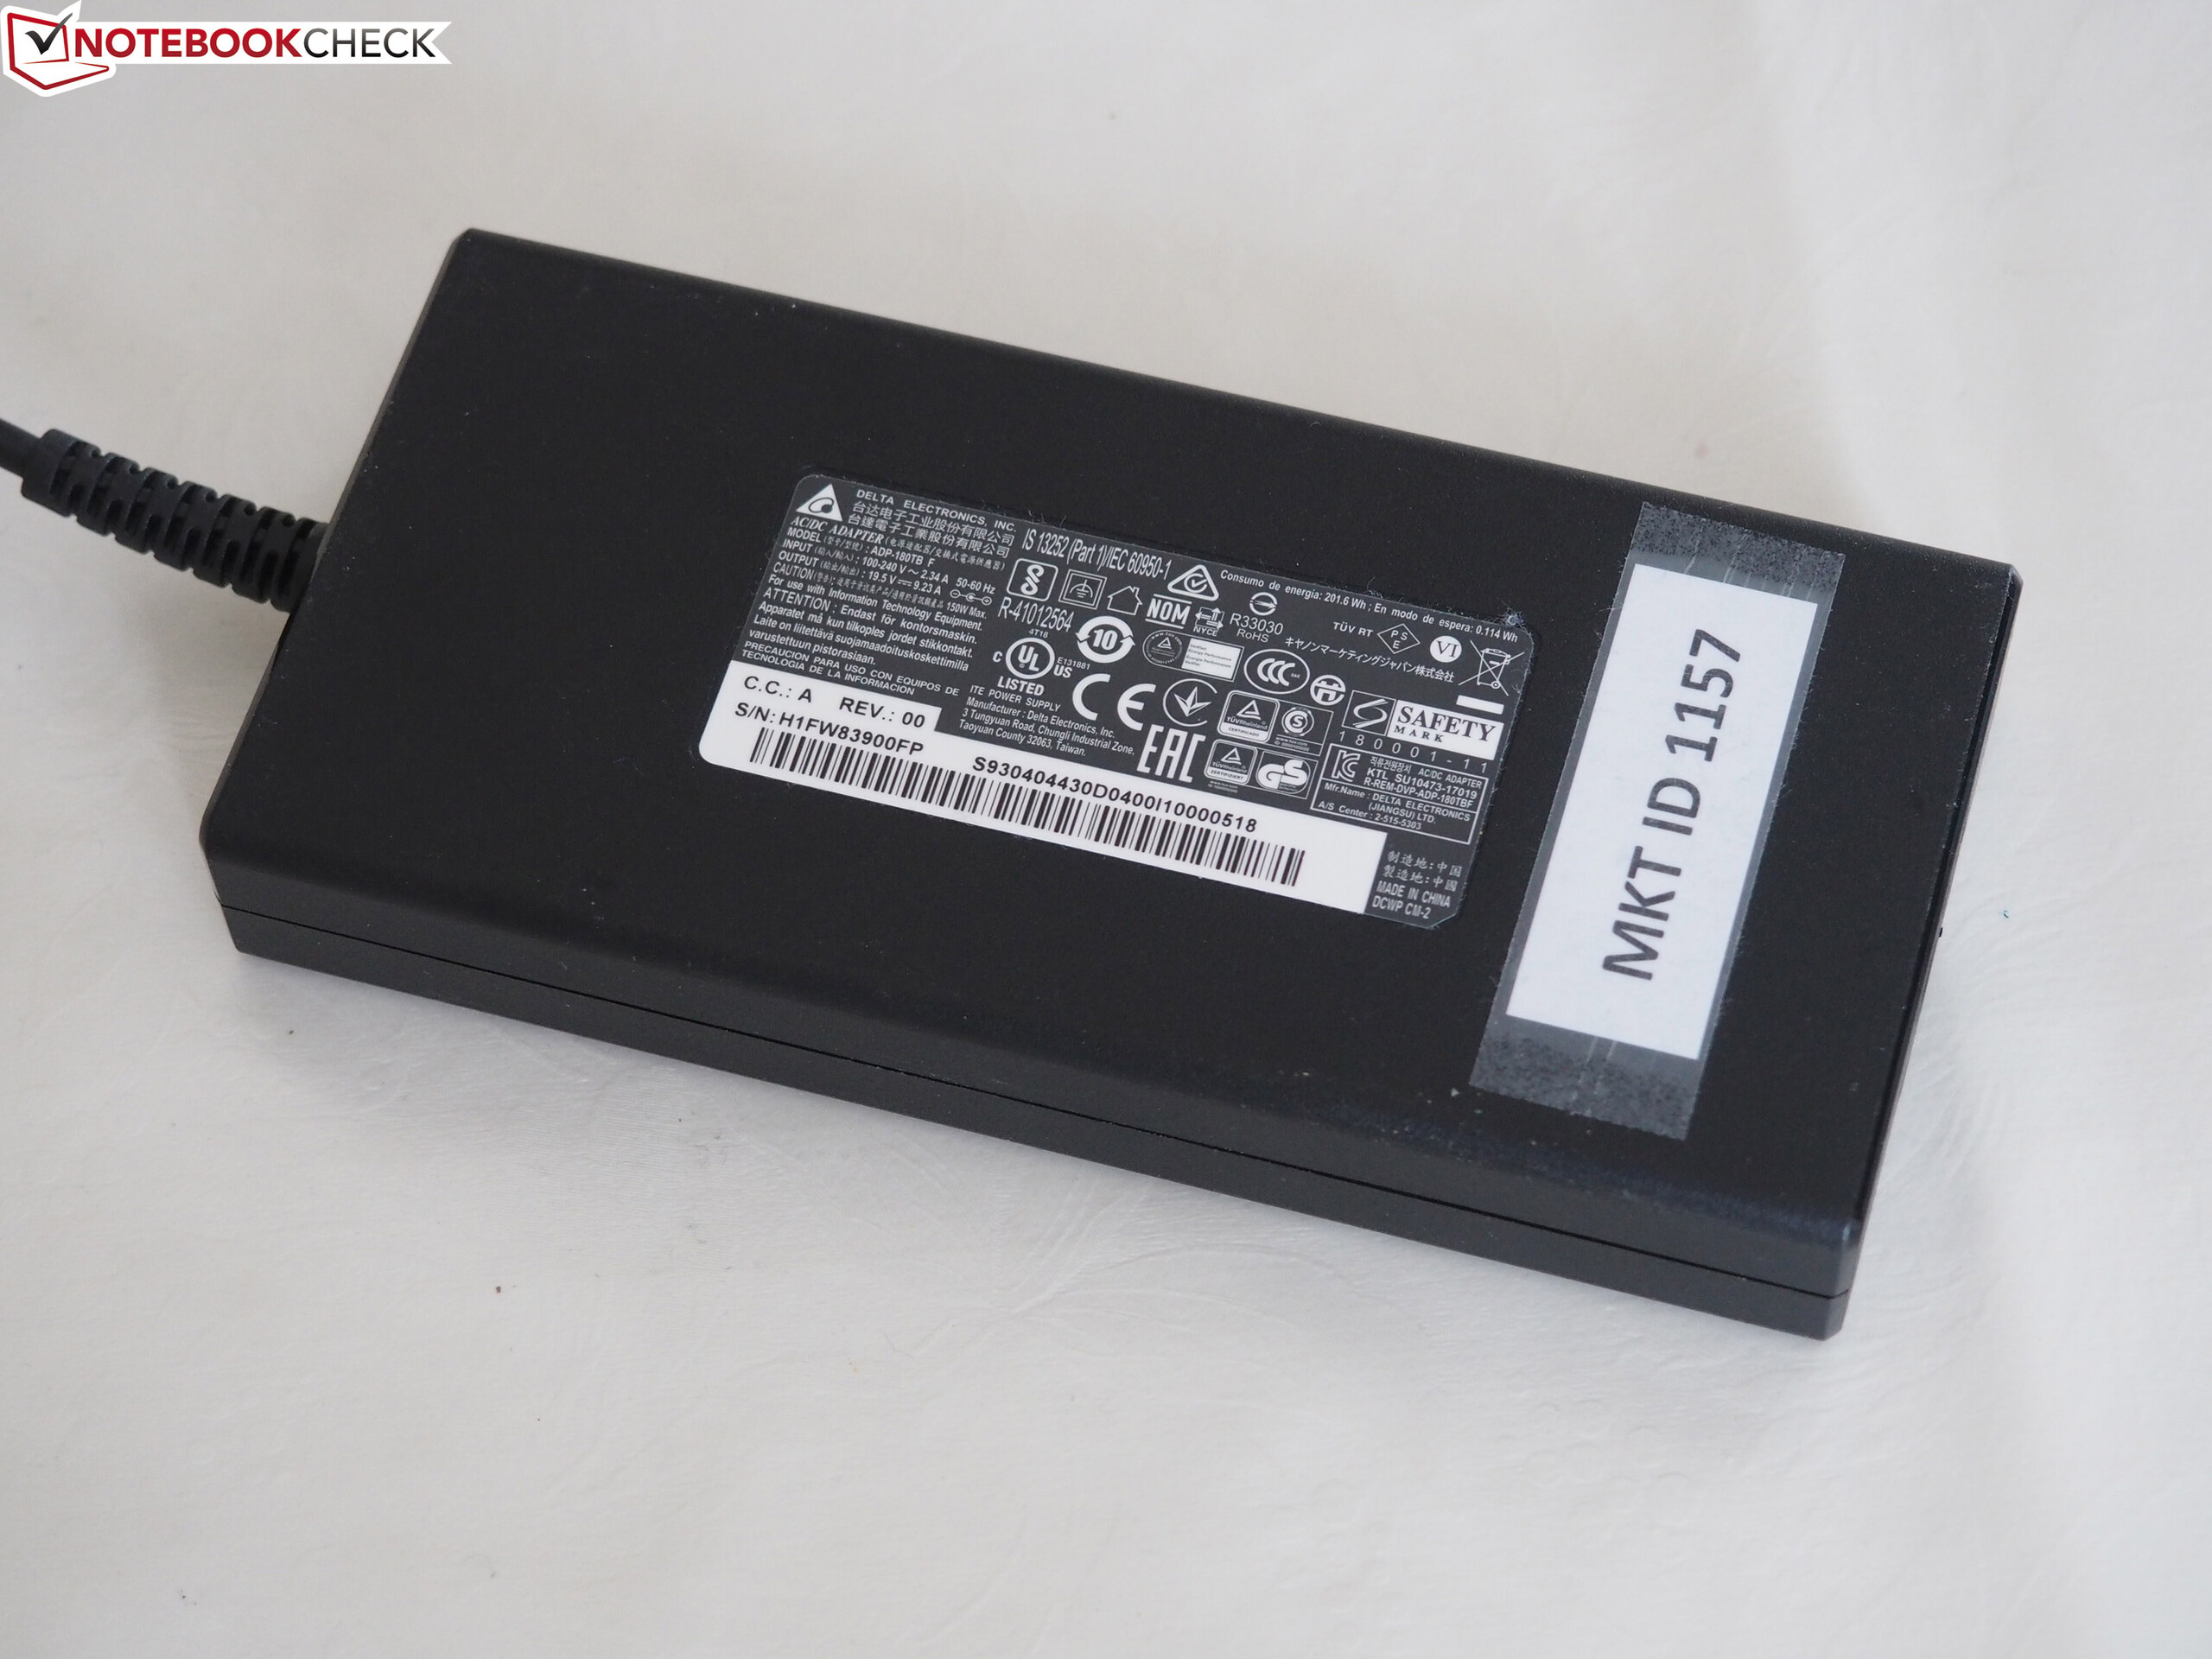
The GS65 is bundled with a quick-start guide, a warranty card and a 180 W power supply. At 420 g and 15 x 7 x 2 cm, the power supply is remarkably small for a gaming notebook. By contrast, the Aero 15X’s 215 W power supply is much longer at 19 cm.
Maintenance
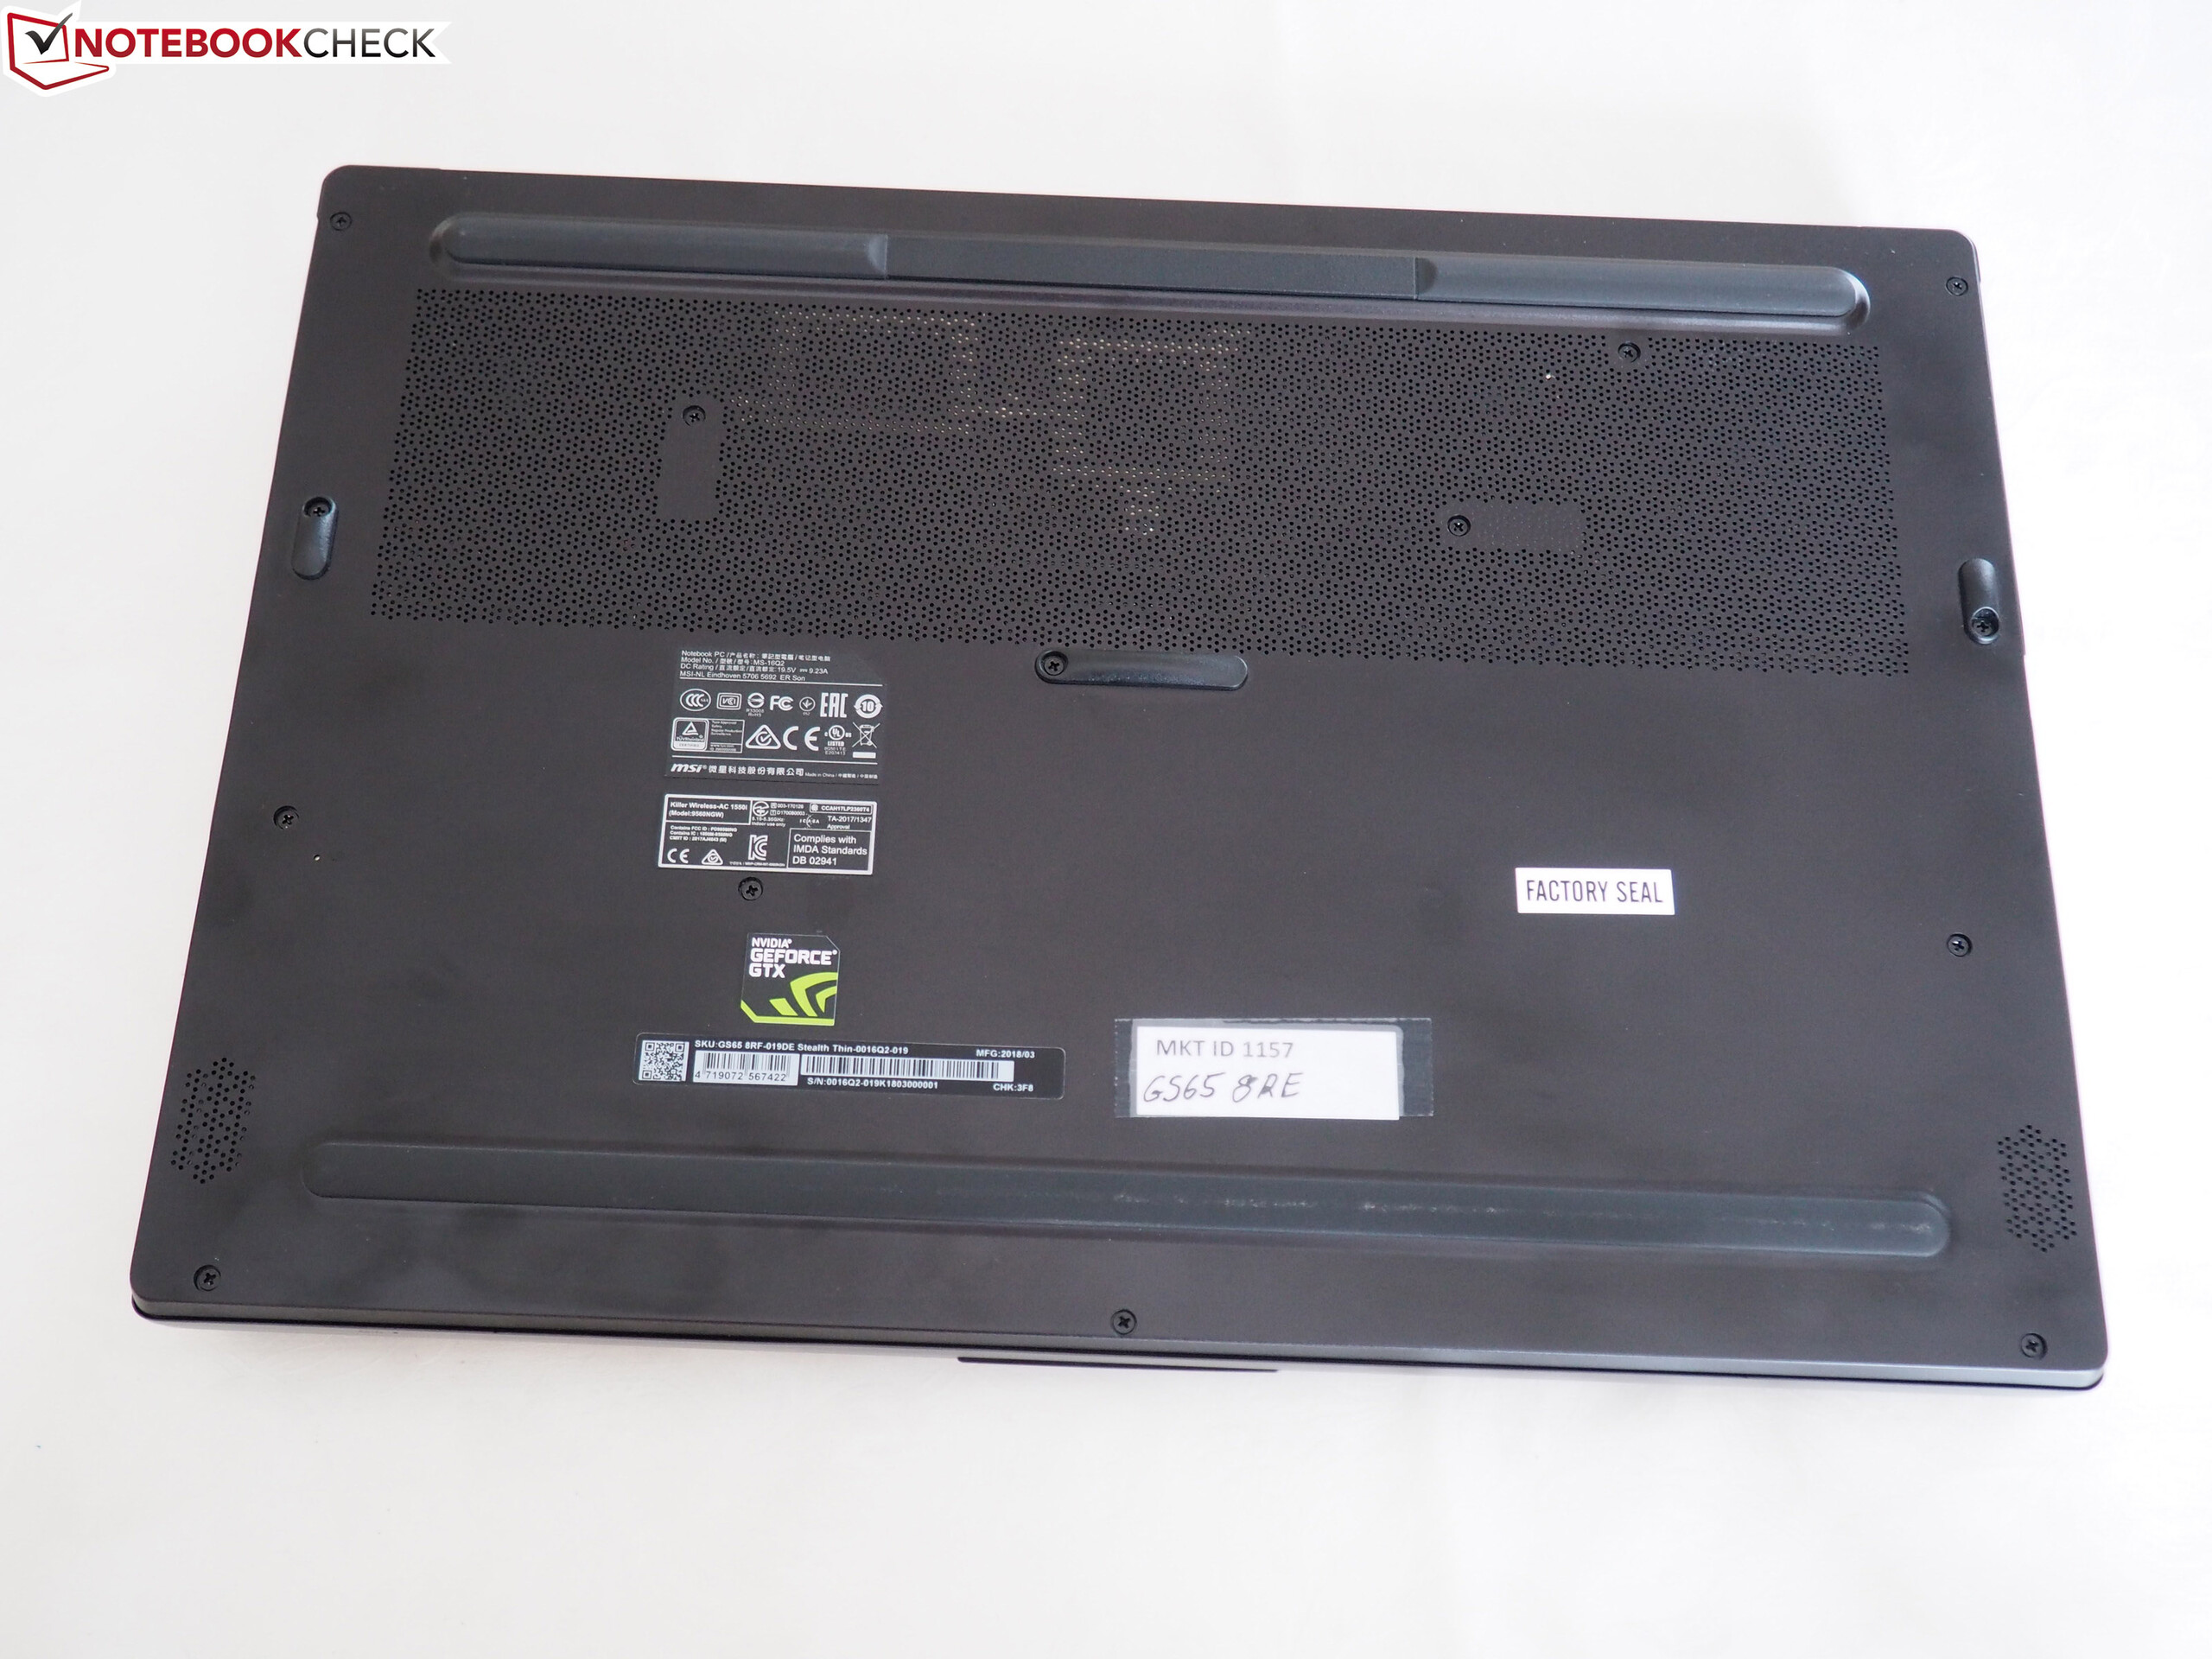
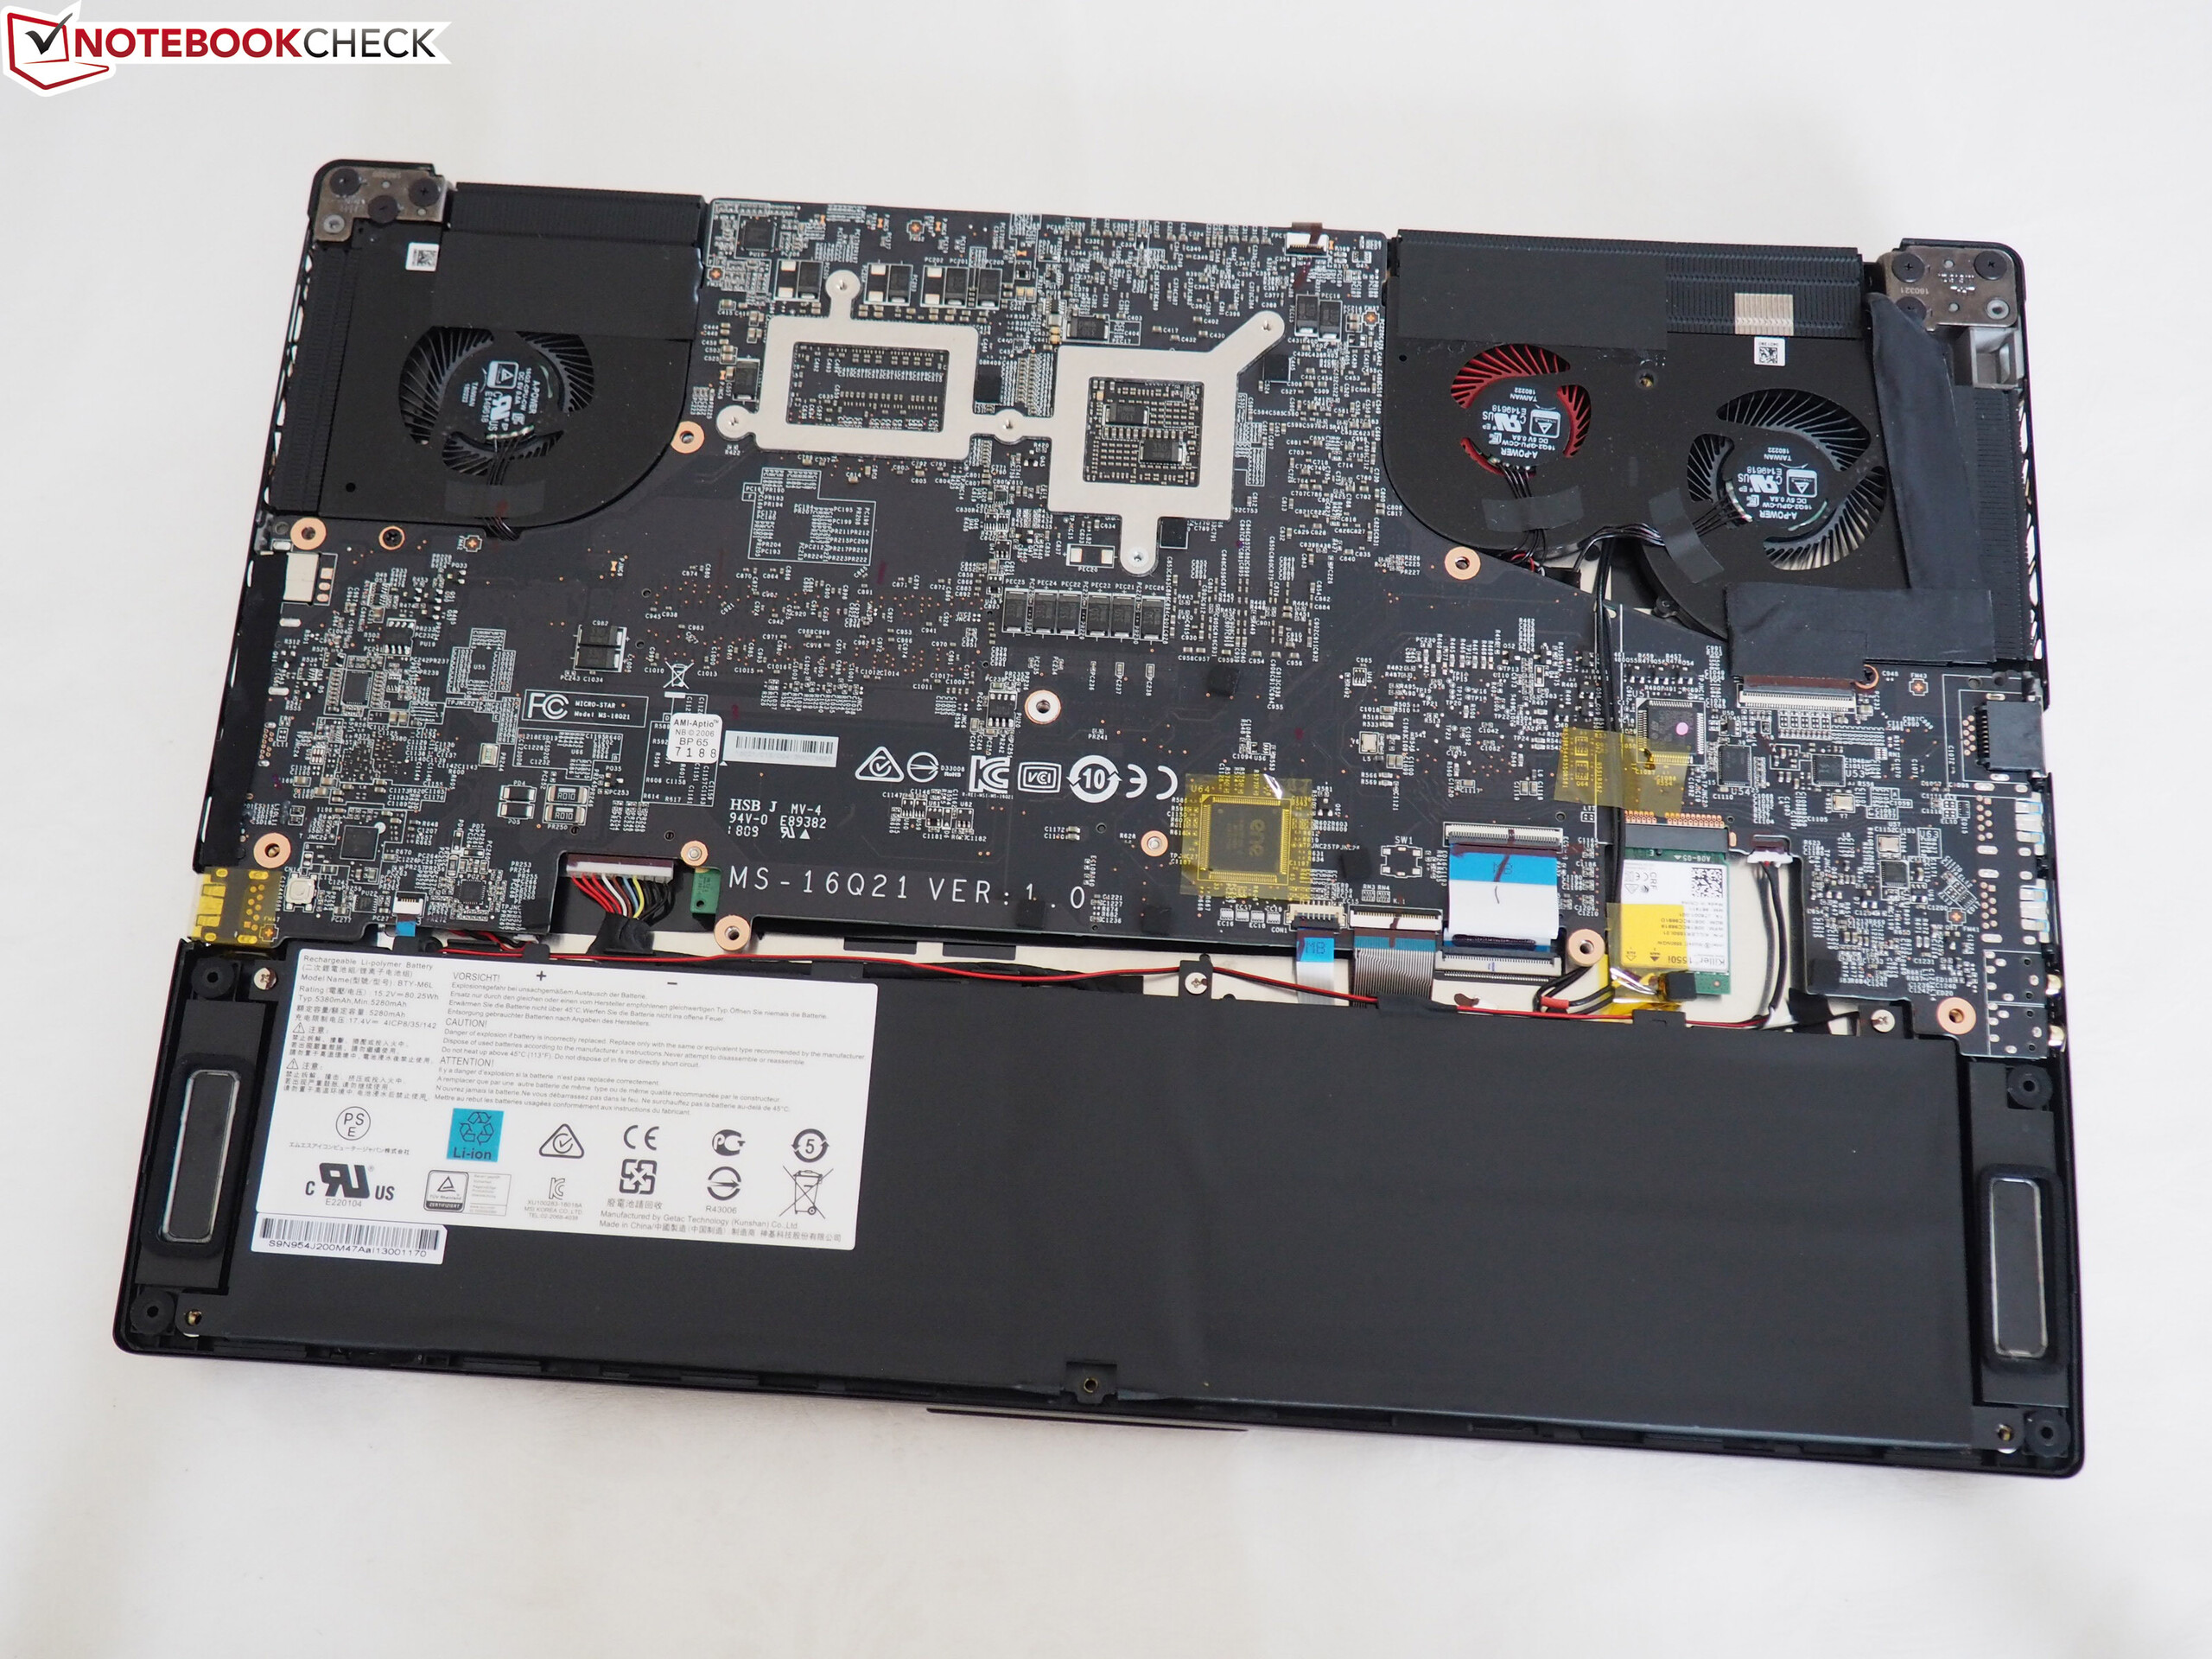
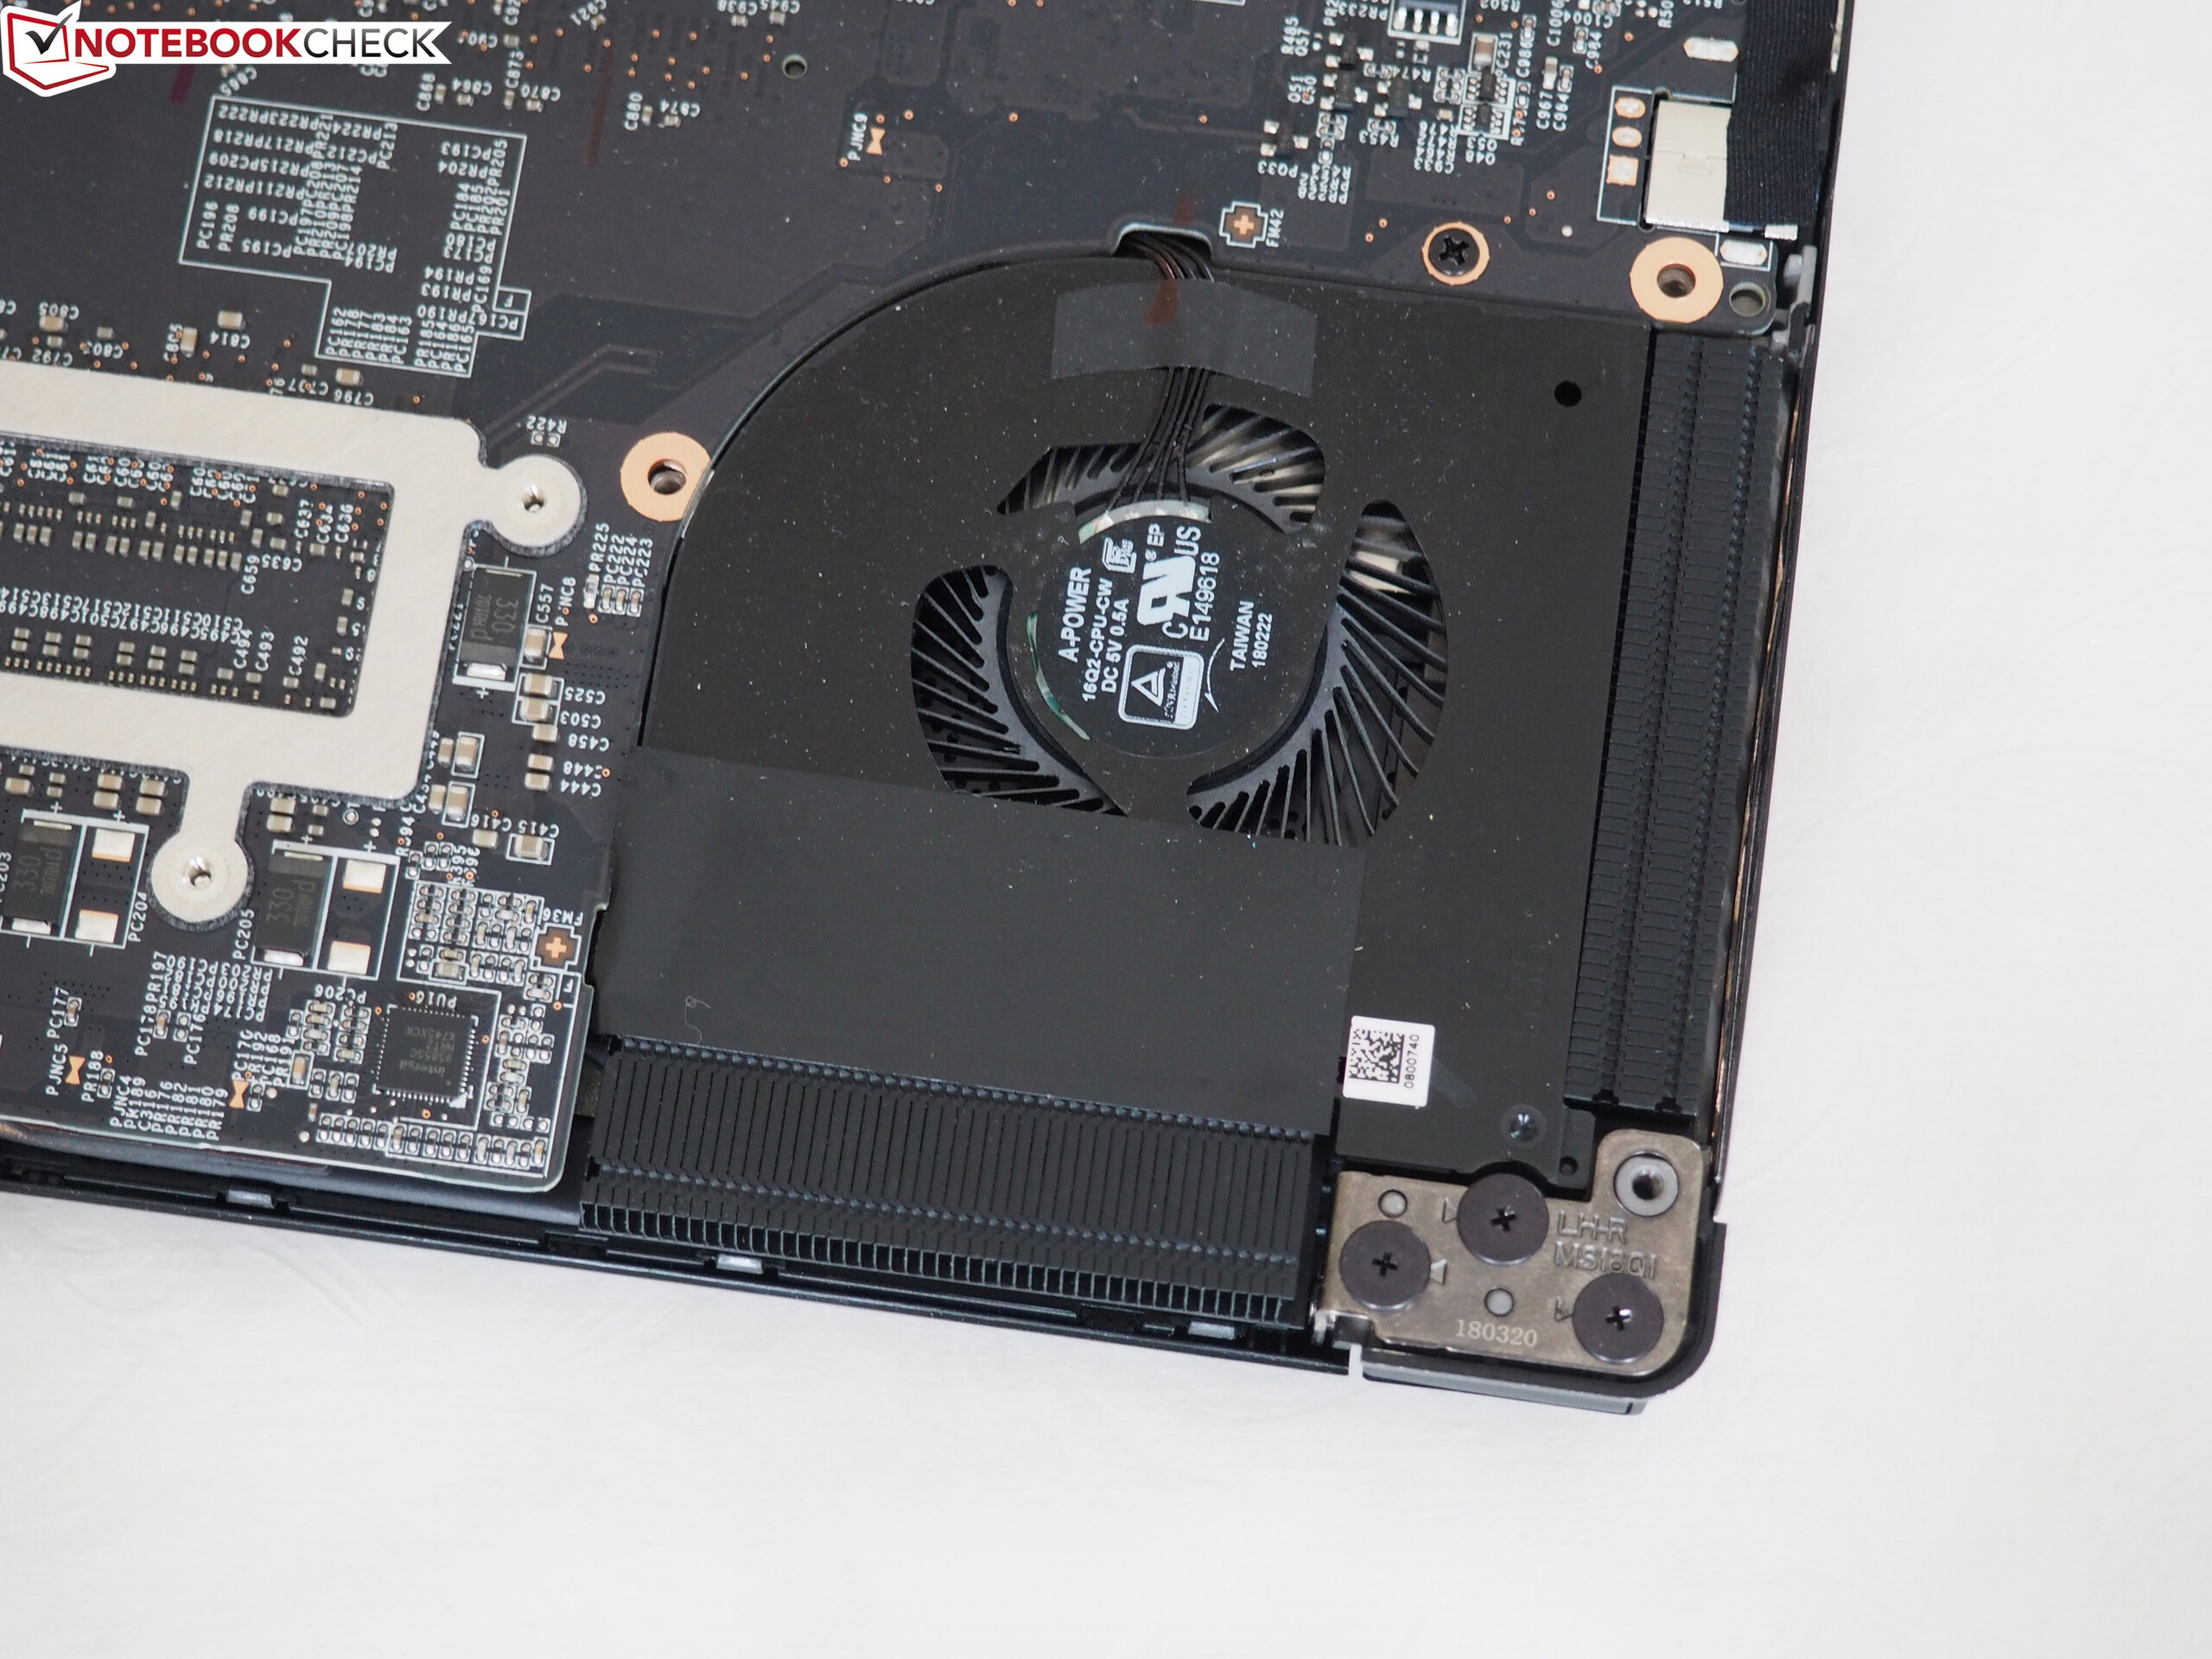
The GS65 has limited maintenance options compared with the Aero 15X, the latter of which provides access to all major components. The GS65 has no maintenance cover, so you will need to remove the bottom cover to access any internal components. This requires removing 15 Phillips screws and then carefully prying the bottom cover from the rest of the case. However, as our photo demonstrates, you will only be able to repair and maintain the fans, the battery and the wireless card.
Accessing the graphics card, processor, RAM or internal storage requires unscrewing the motherboard and flipping it over. While this is not a difficult task, the risk of damaging cables will rightfully deter some people. The complex nature of accessing core components only reduces the GS65’s case score.
Warranty
MSI's warranty covers the GS65 for 24 months. This is a pick-up and return warranty service. Please see our Guarantees, Return policies and Warranties FAQ for country-specific information.
Input Devices
Keyboard
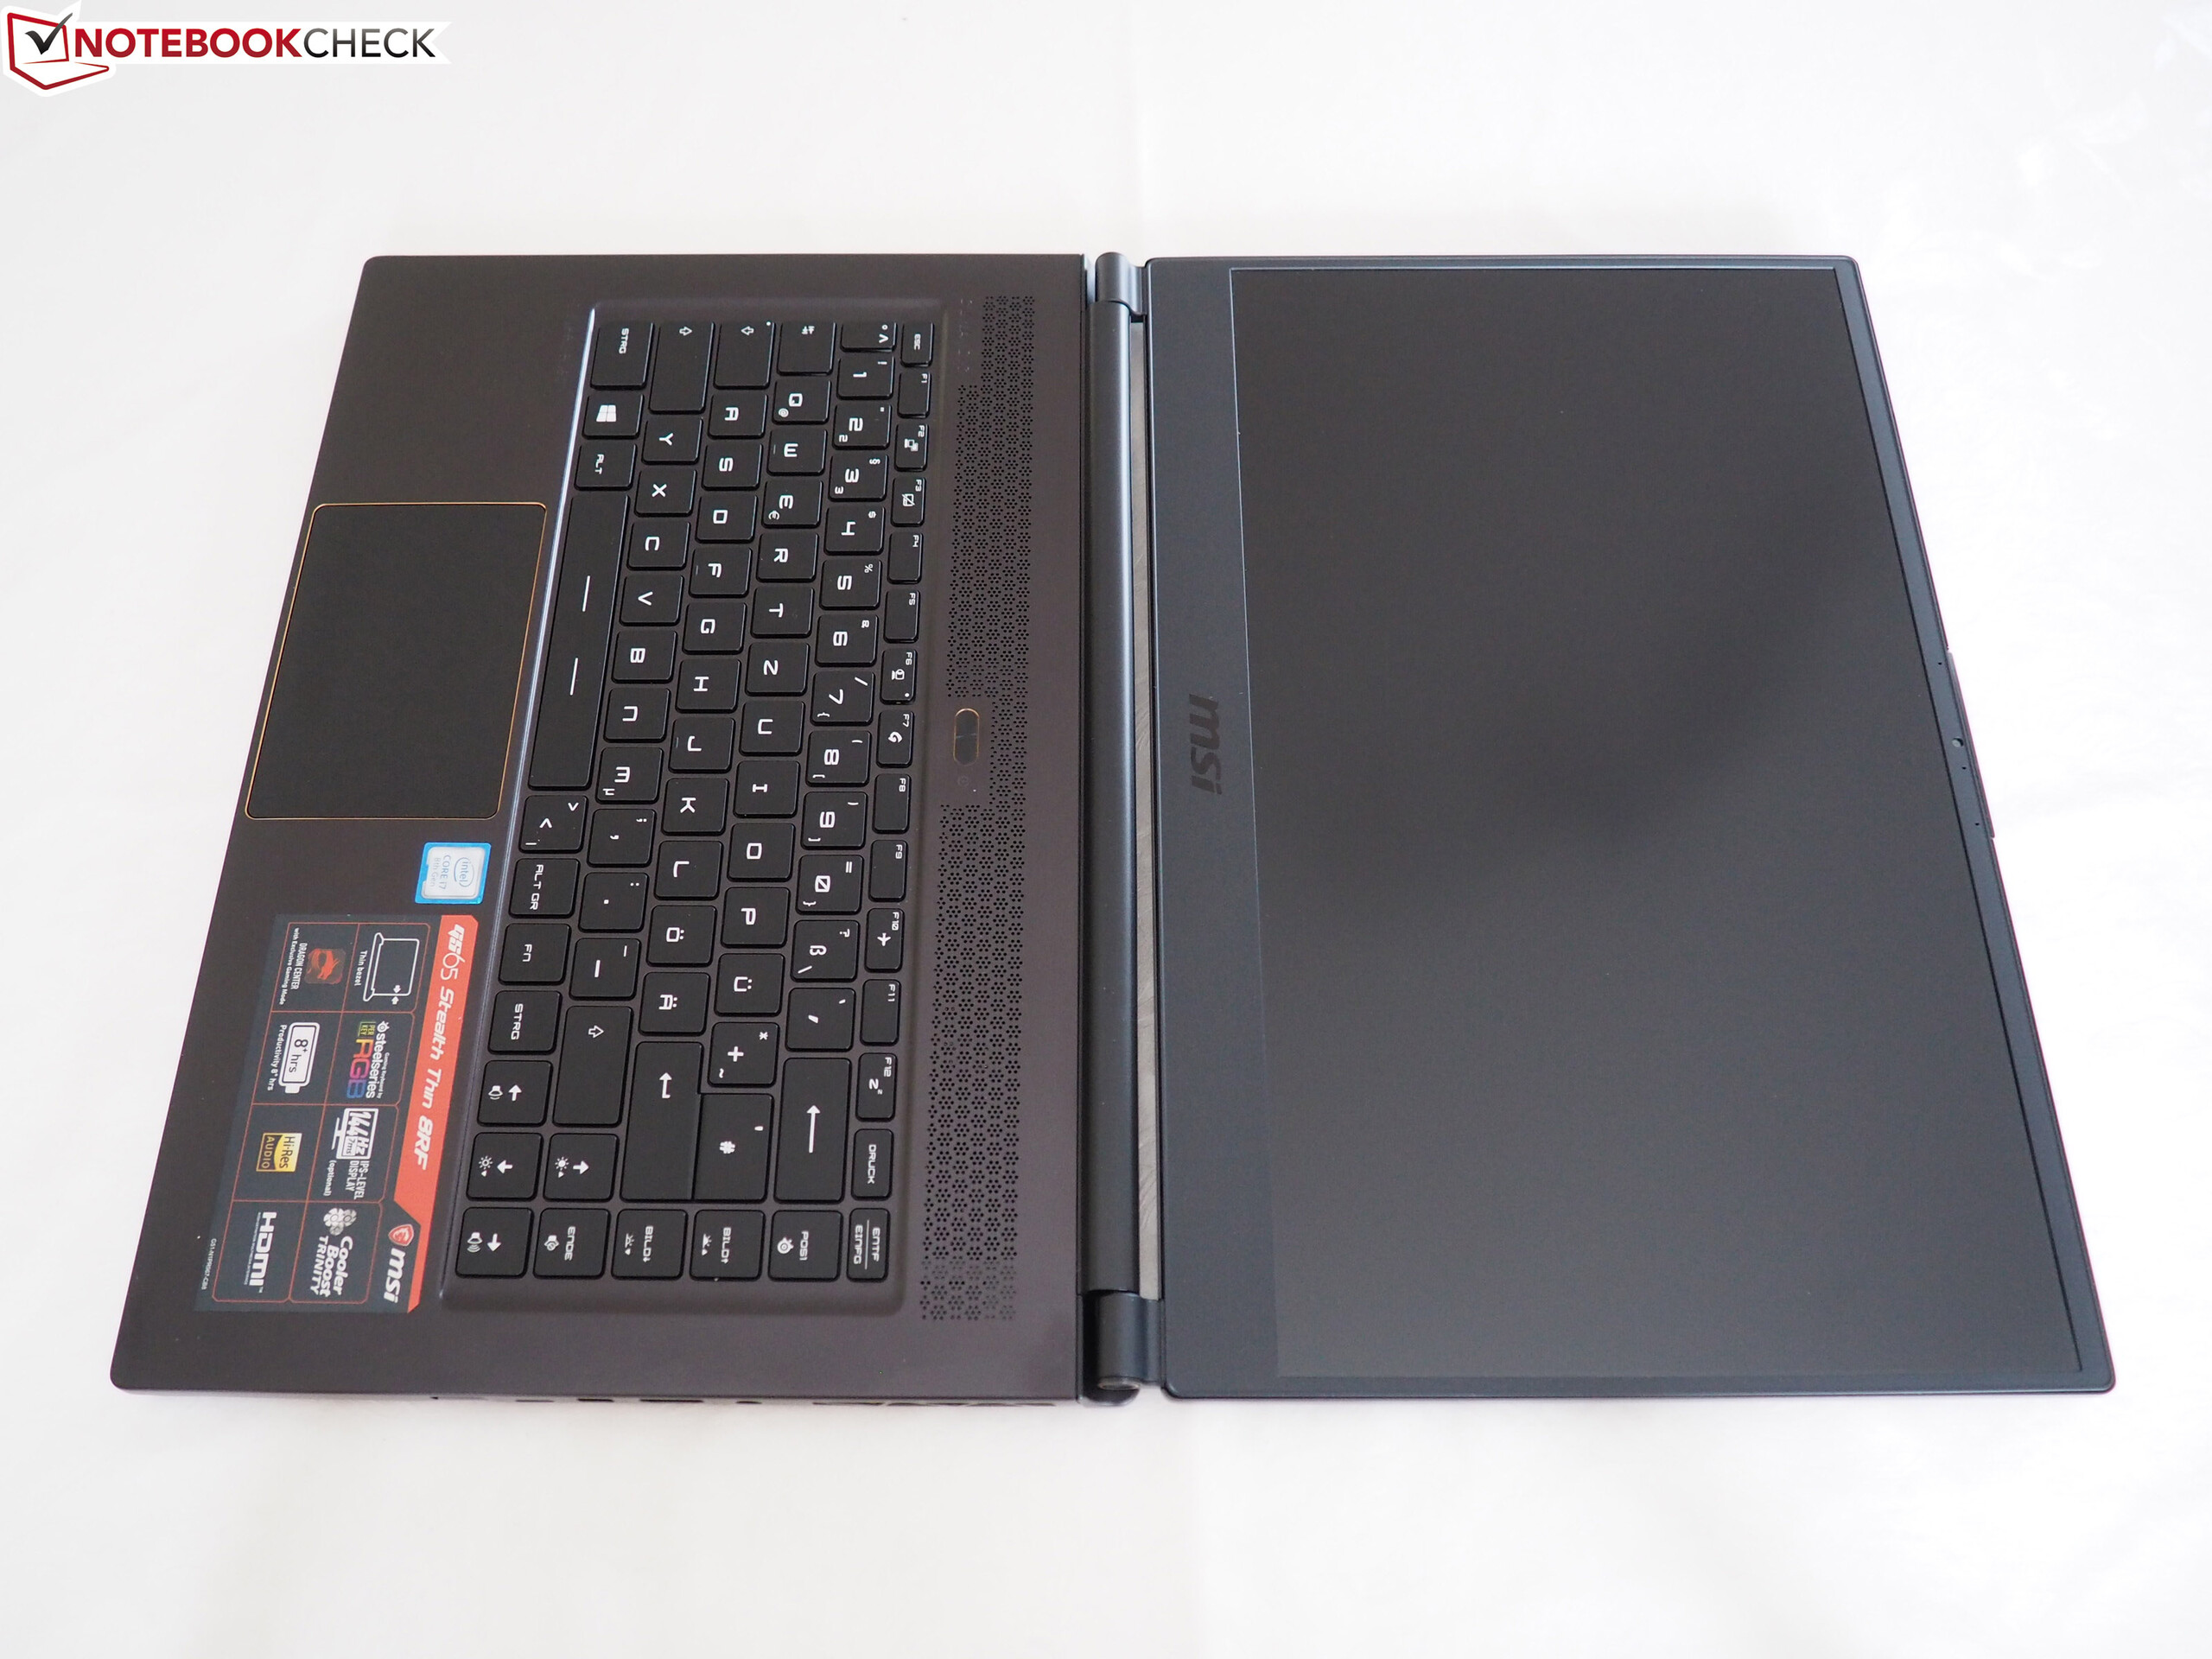
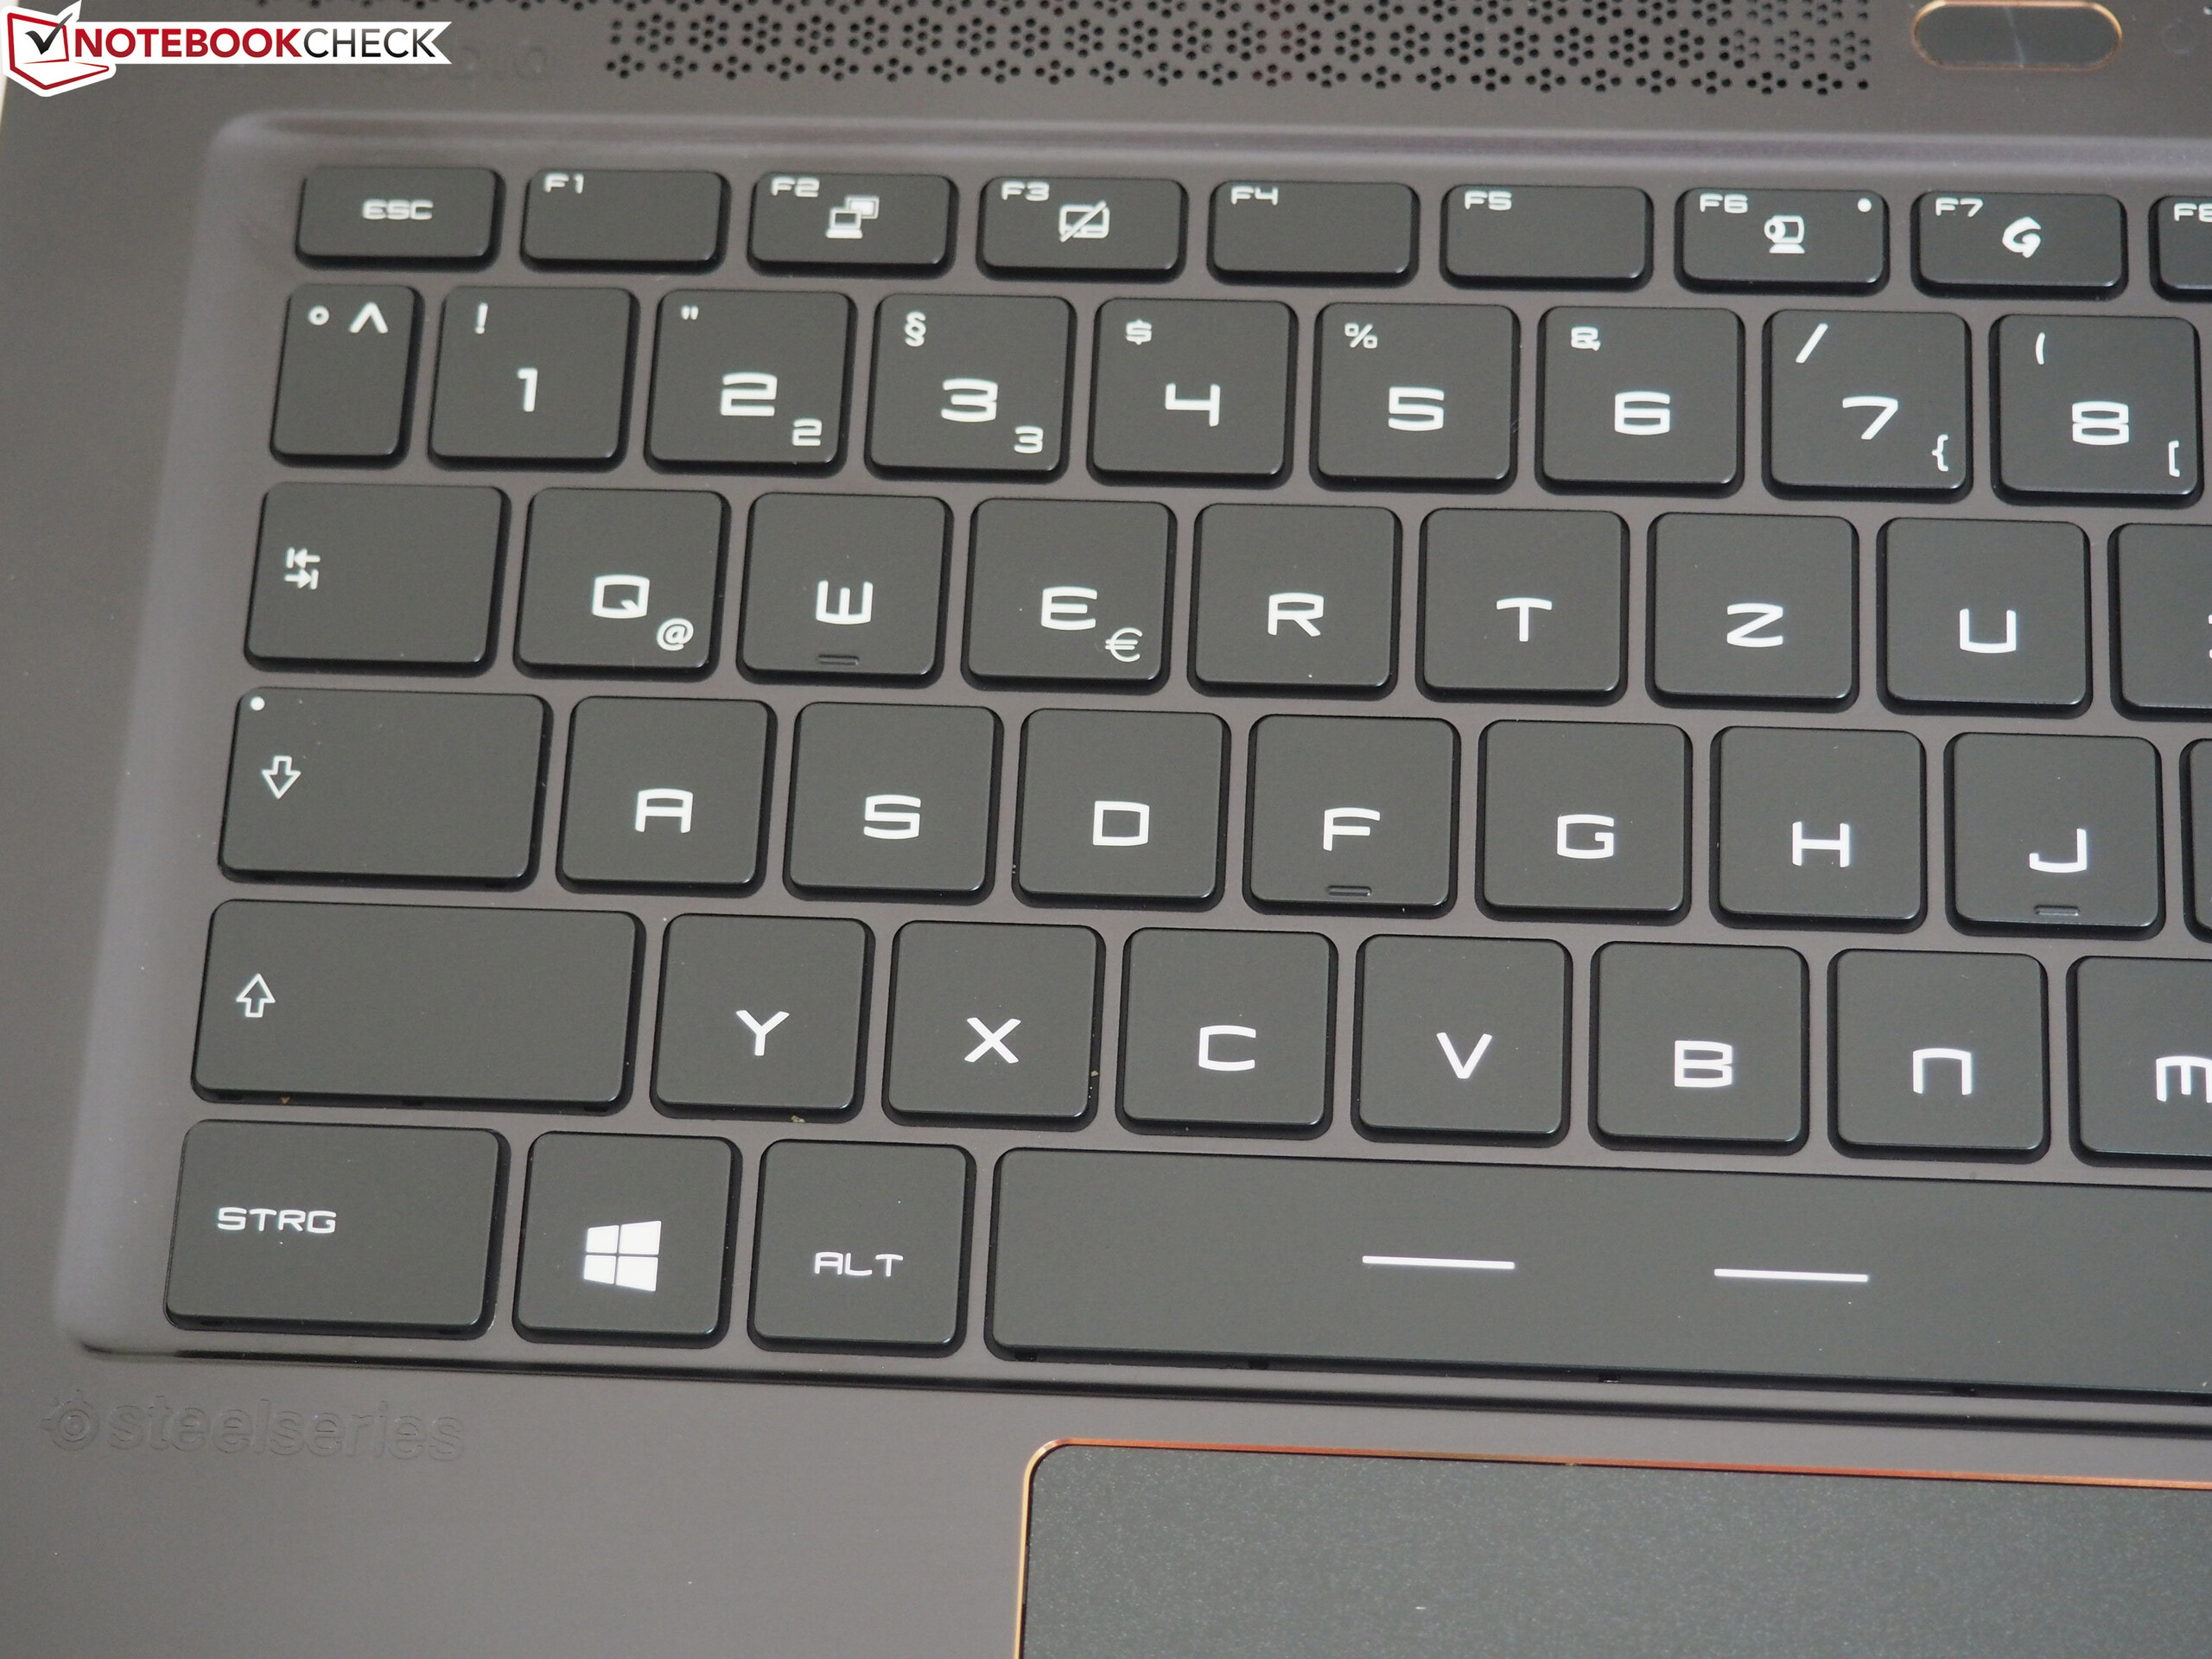
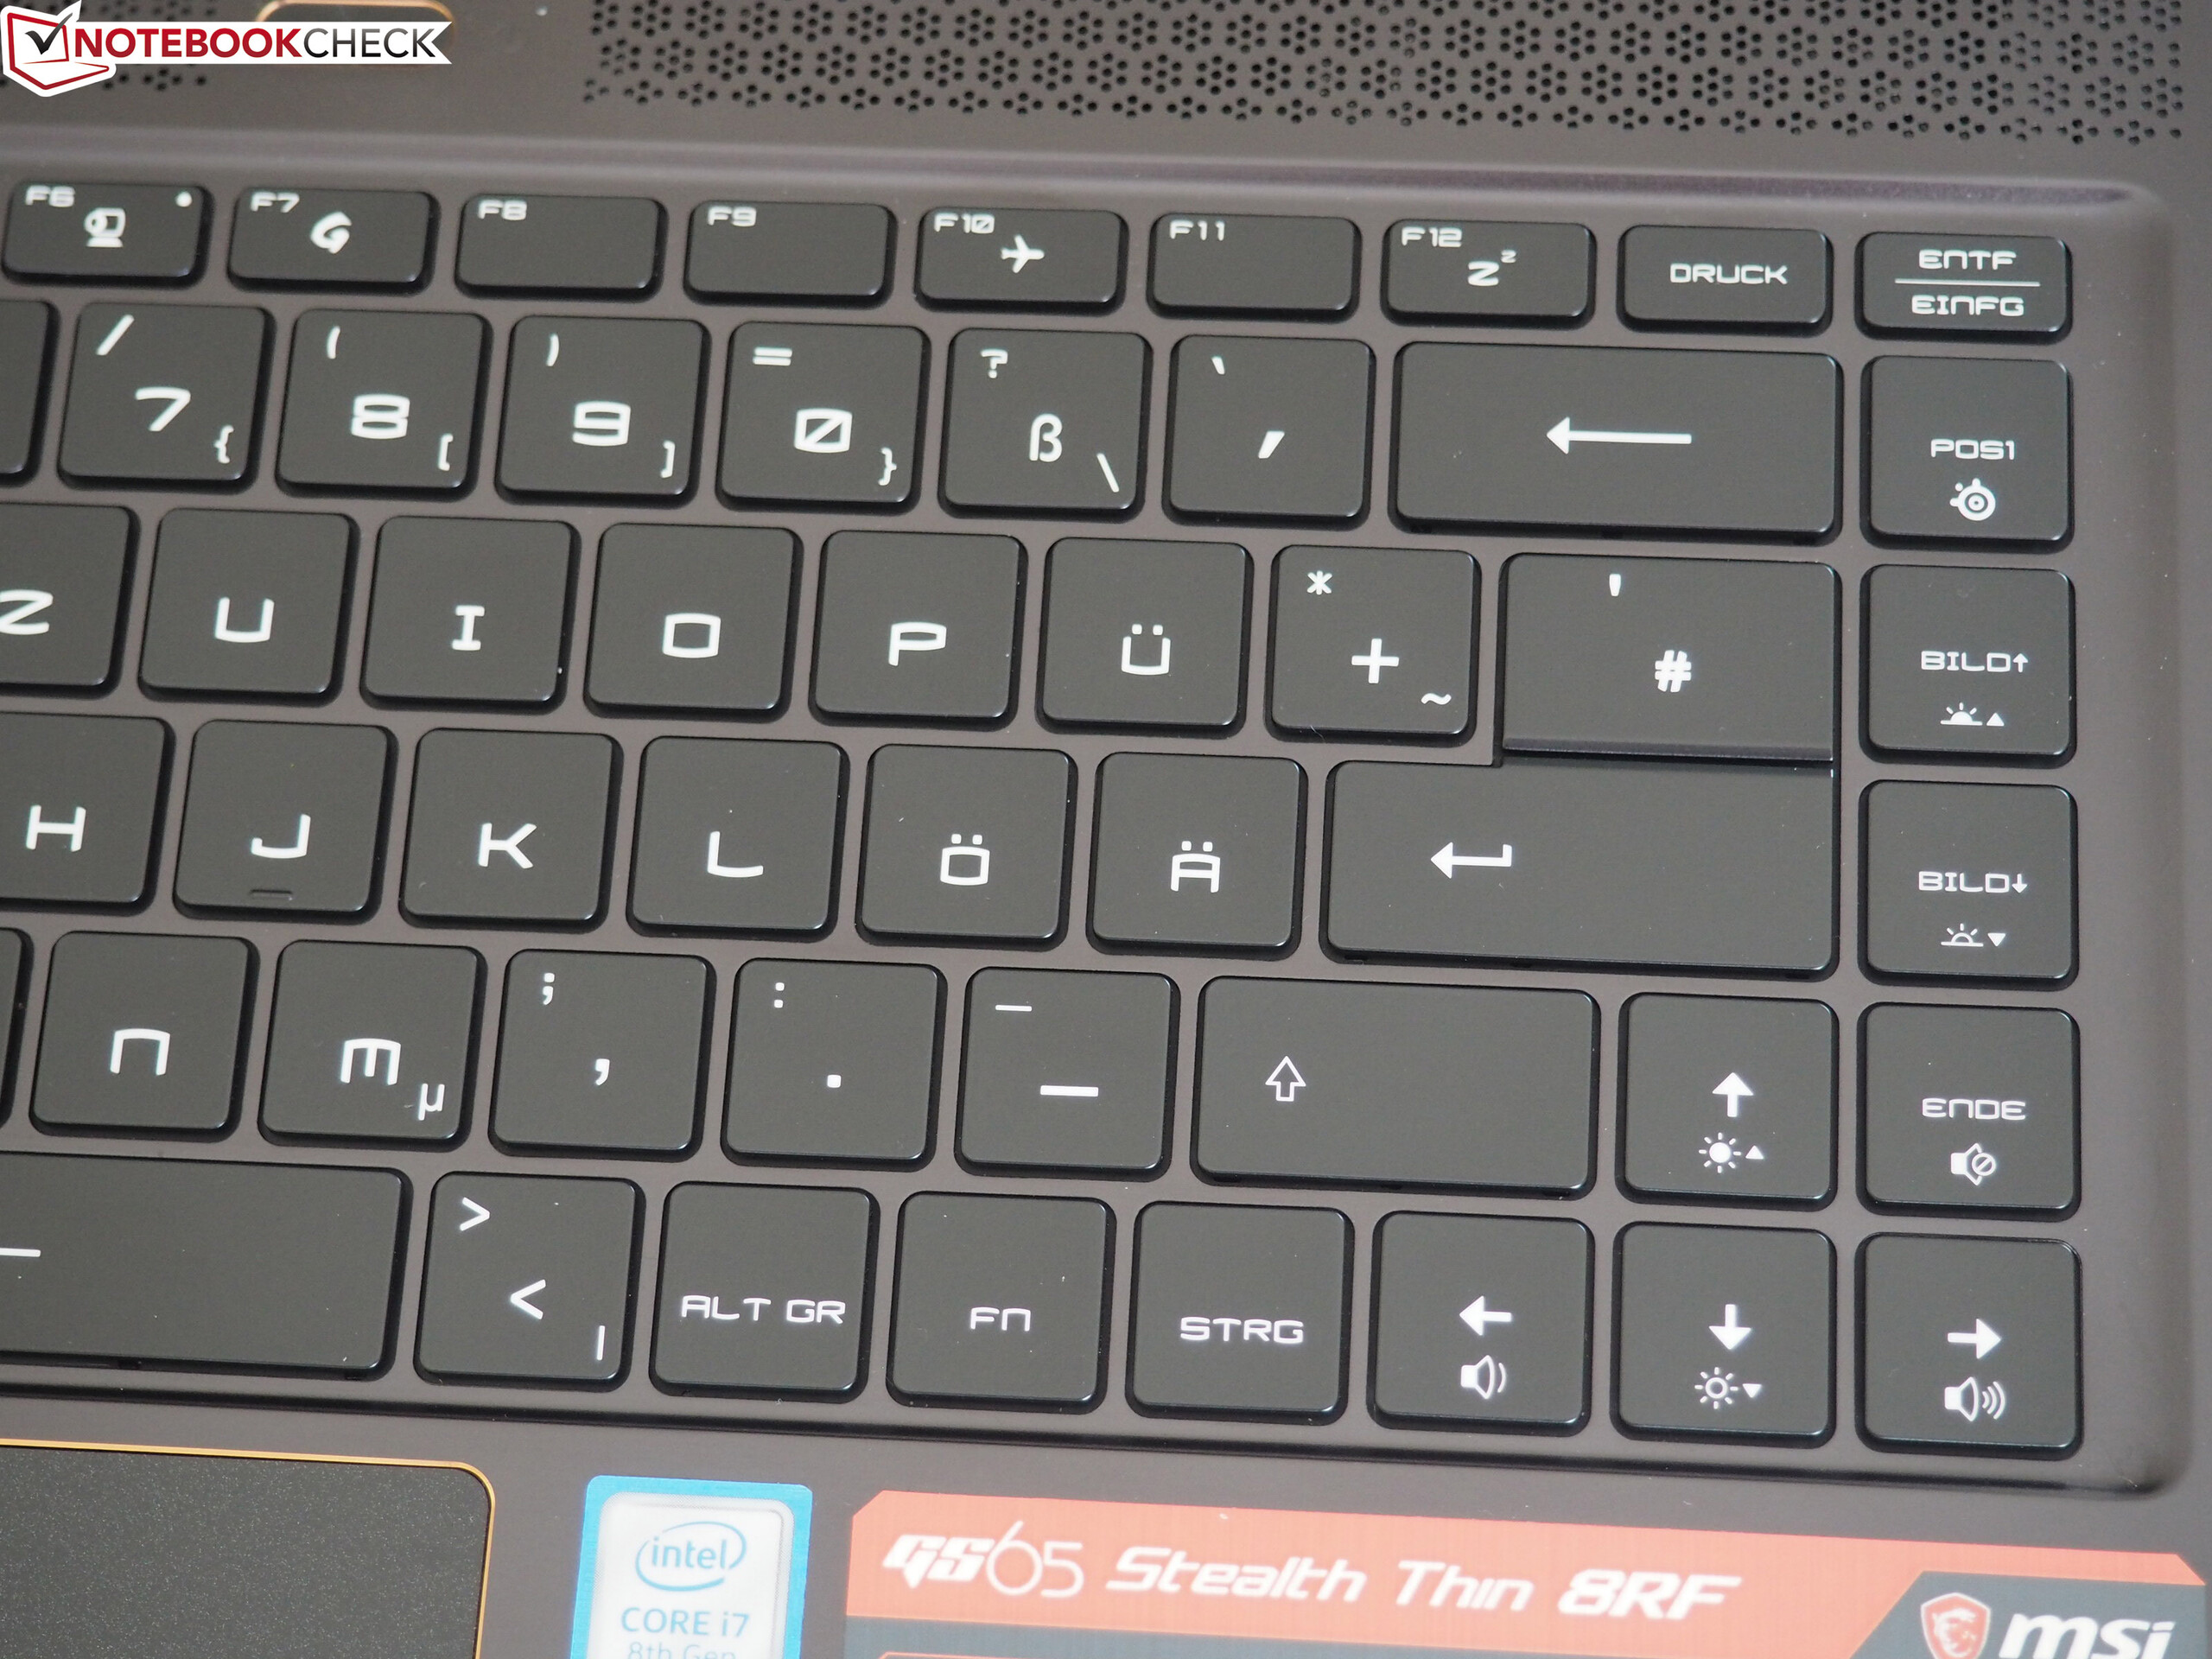
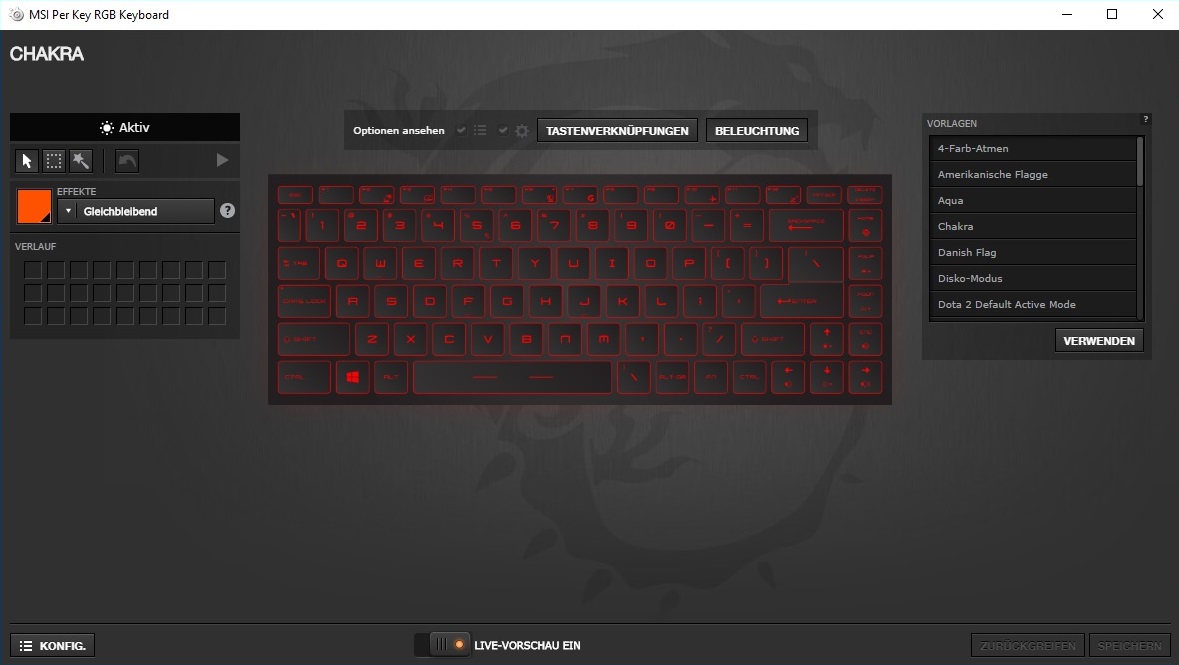
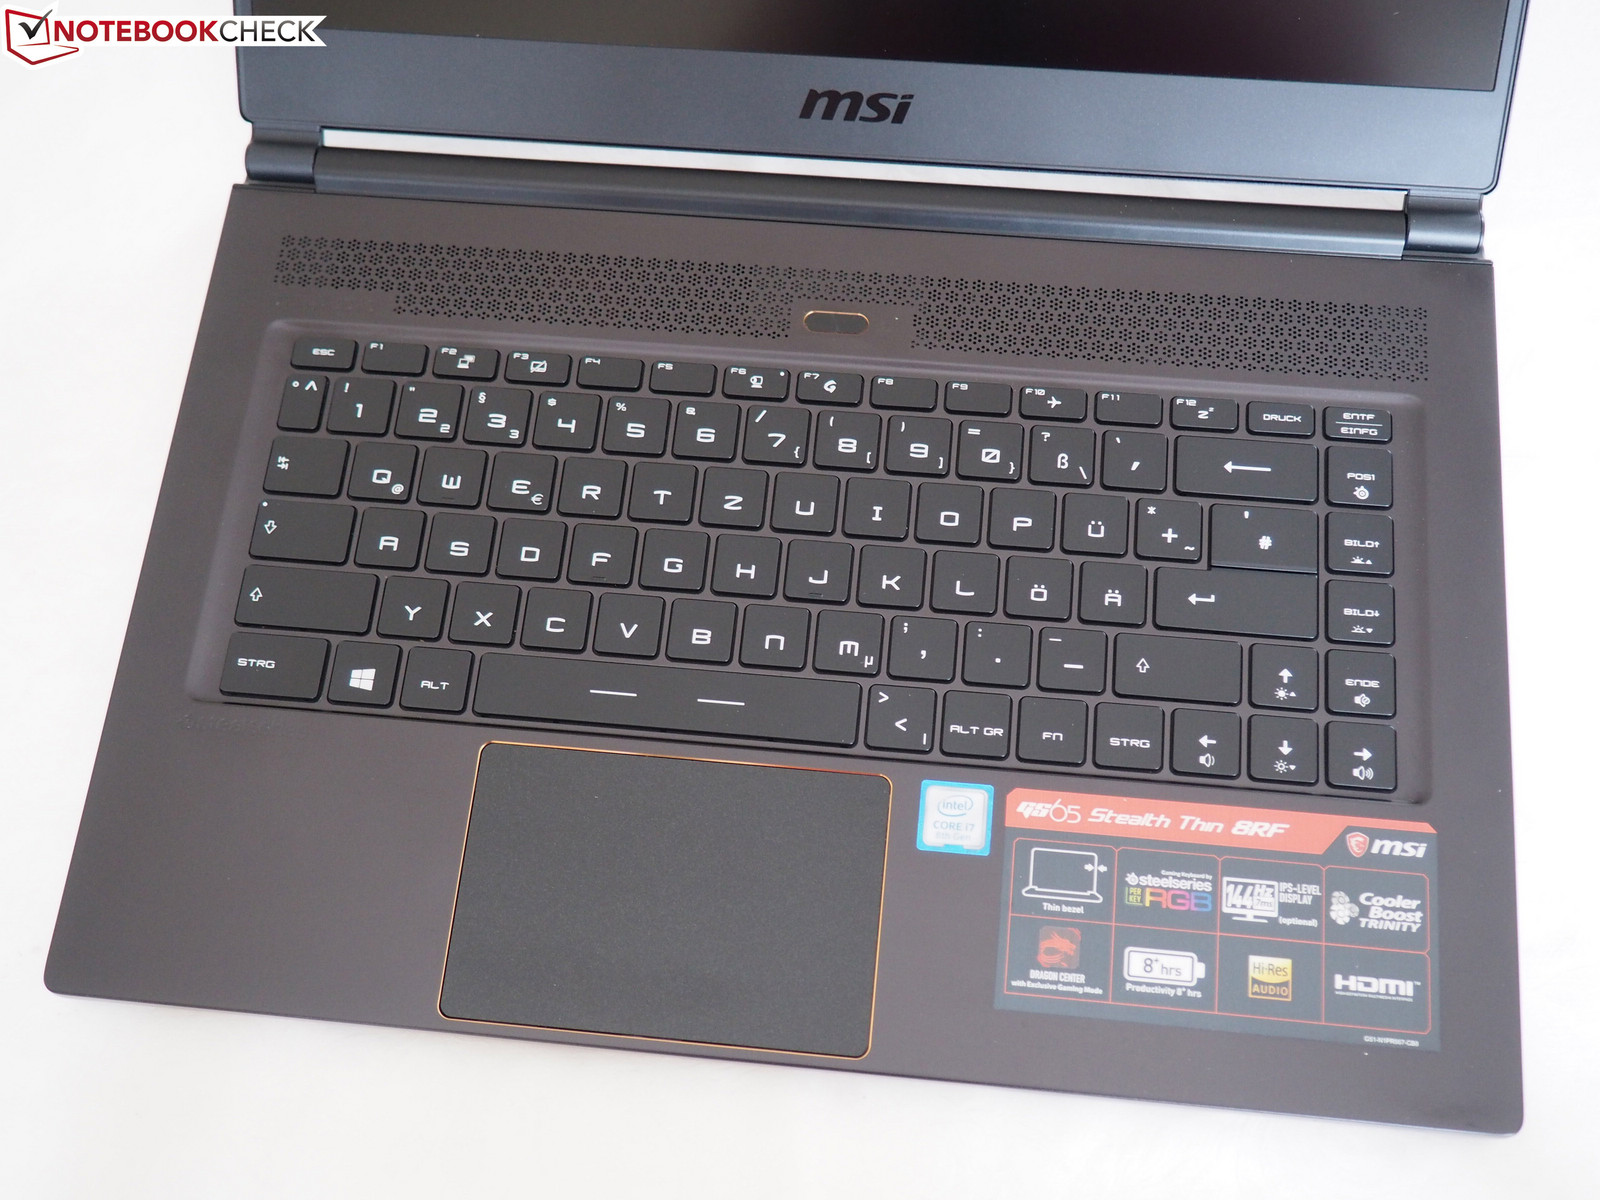
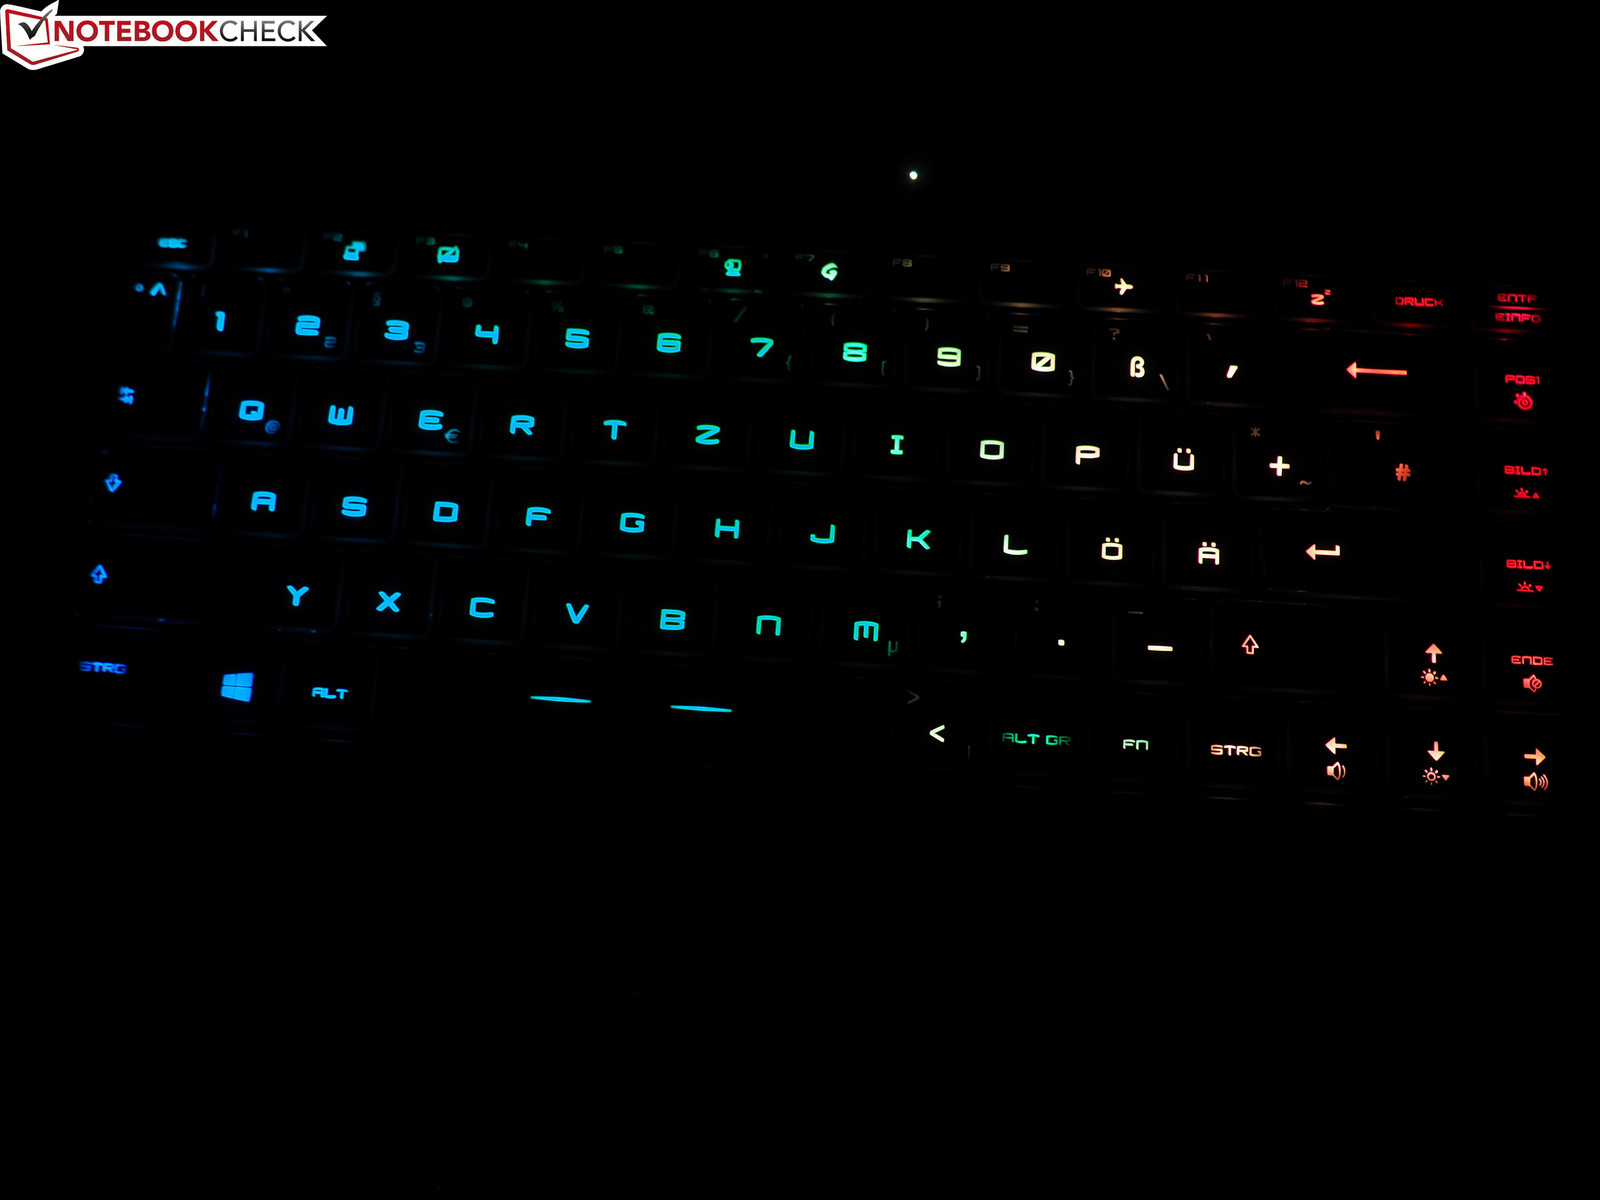
MSI has developed the GS65’s chiclet keyboard in collaboration with SteelSeries, a gaming peripherals manufacturer. For better or worse, the keyboard looks and feels like other GS or GE series keyboards, namely the GS73, GS43, GE73 or the GE63. The GS65 has RGB keyboard backlighting, the intensity, and colors of which can be set for each individual key. This level of customization is a nice touch.
Overall, the typing experience is reasonable. We would have preferred the keys to have had a stronger pressure point though as the poor case stability makes the keyboard feel somewhat spongy when typing. Our biggest criticism is with MSI’s choice of the keyboard layout, which differs from the typical German layout. Specifically, we dislike that MSI has condensed < and > to one key and that the enter key is only one row wide. Likewise, MSI could have theoretically included a number pad too, despite the GS65’s narrow footprint.
Touchpad
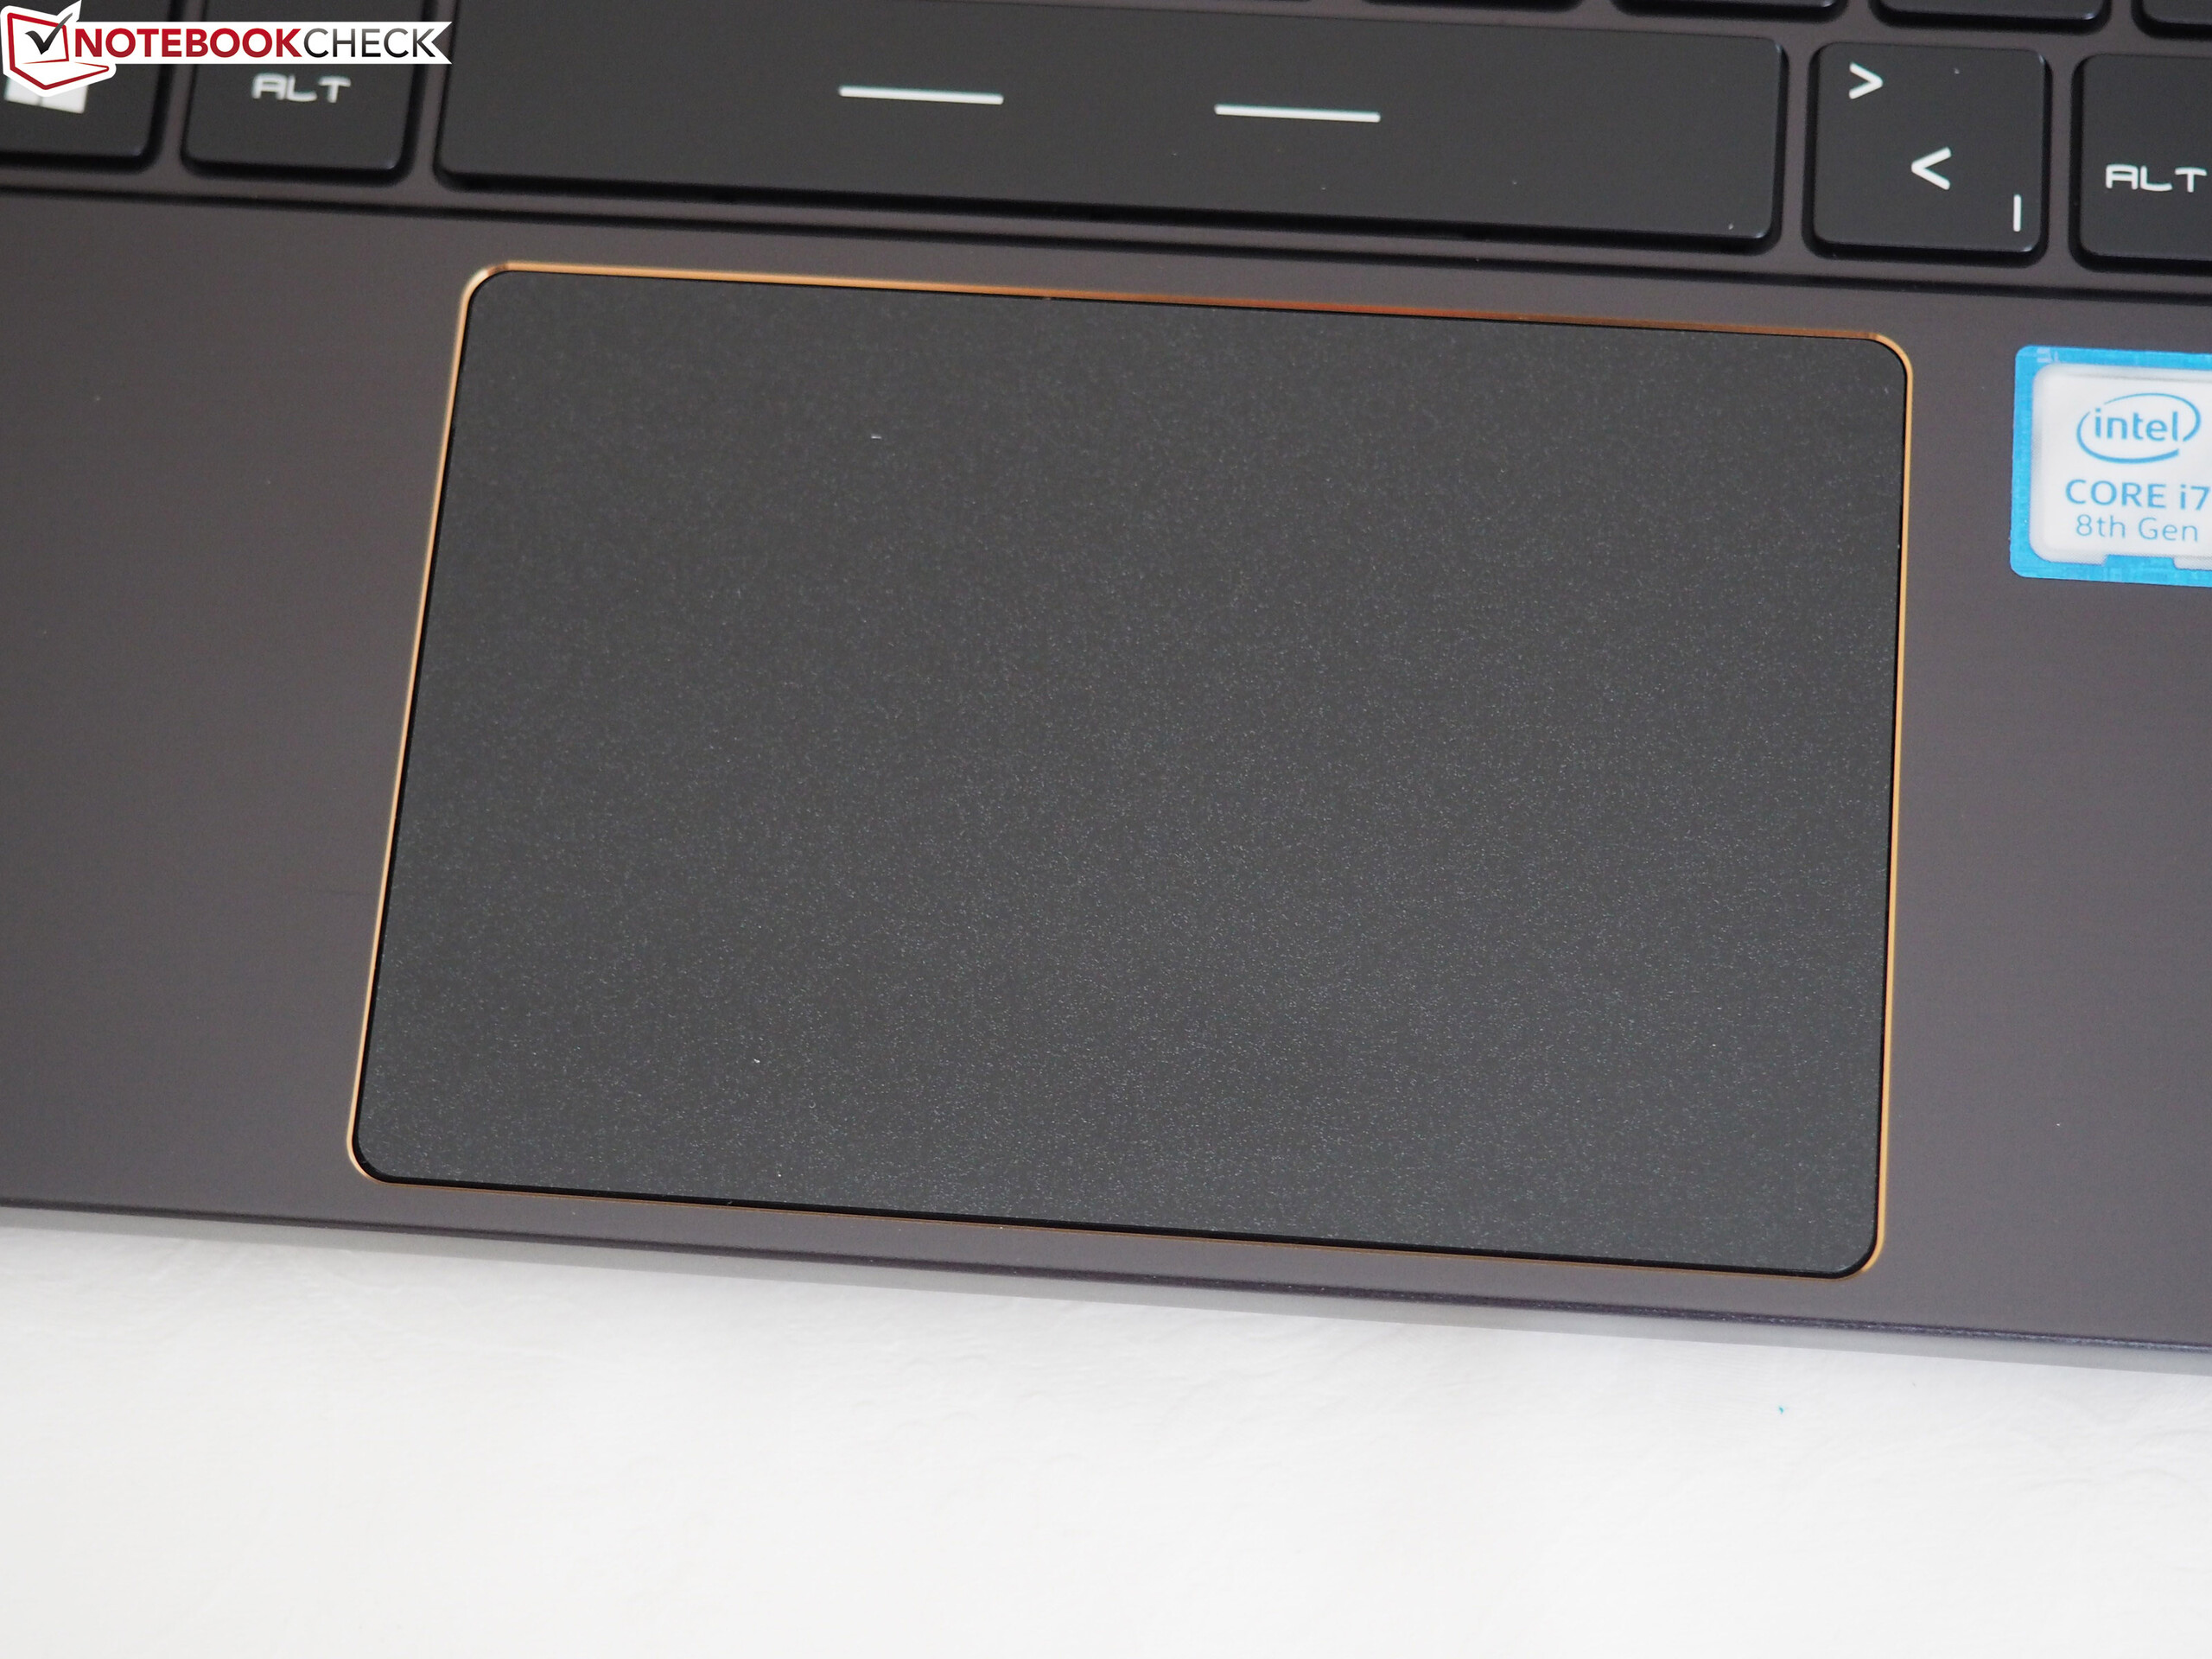
The GS65 has a good touchpad. It is sufficiently large at 10.5 x 7 cm, while its smooth surface makes it easy to slide your fingers across unless they happen to be greasy or wet. The touchpad is precise and has a pleasant click to it.
The GS65 has decent multi-finger gesture support too. Two-finger scrolling and zooming worked perfectly during our tests. We tend to prefer classic touchpads with dedicated mouse buttons as they are often more reliable at clicking than those that are integrated within modern touchpads. This comes down to taste though as the GS65’s touchpad has problems here.
Display
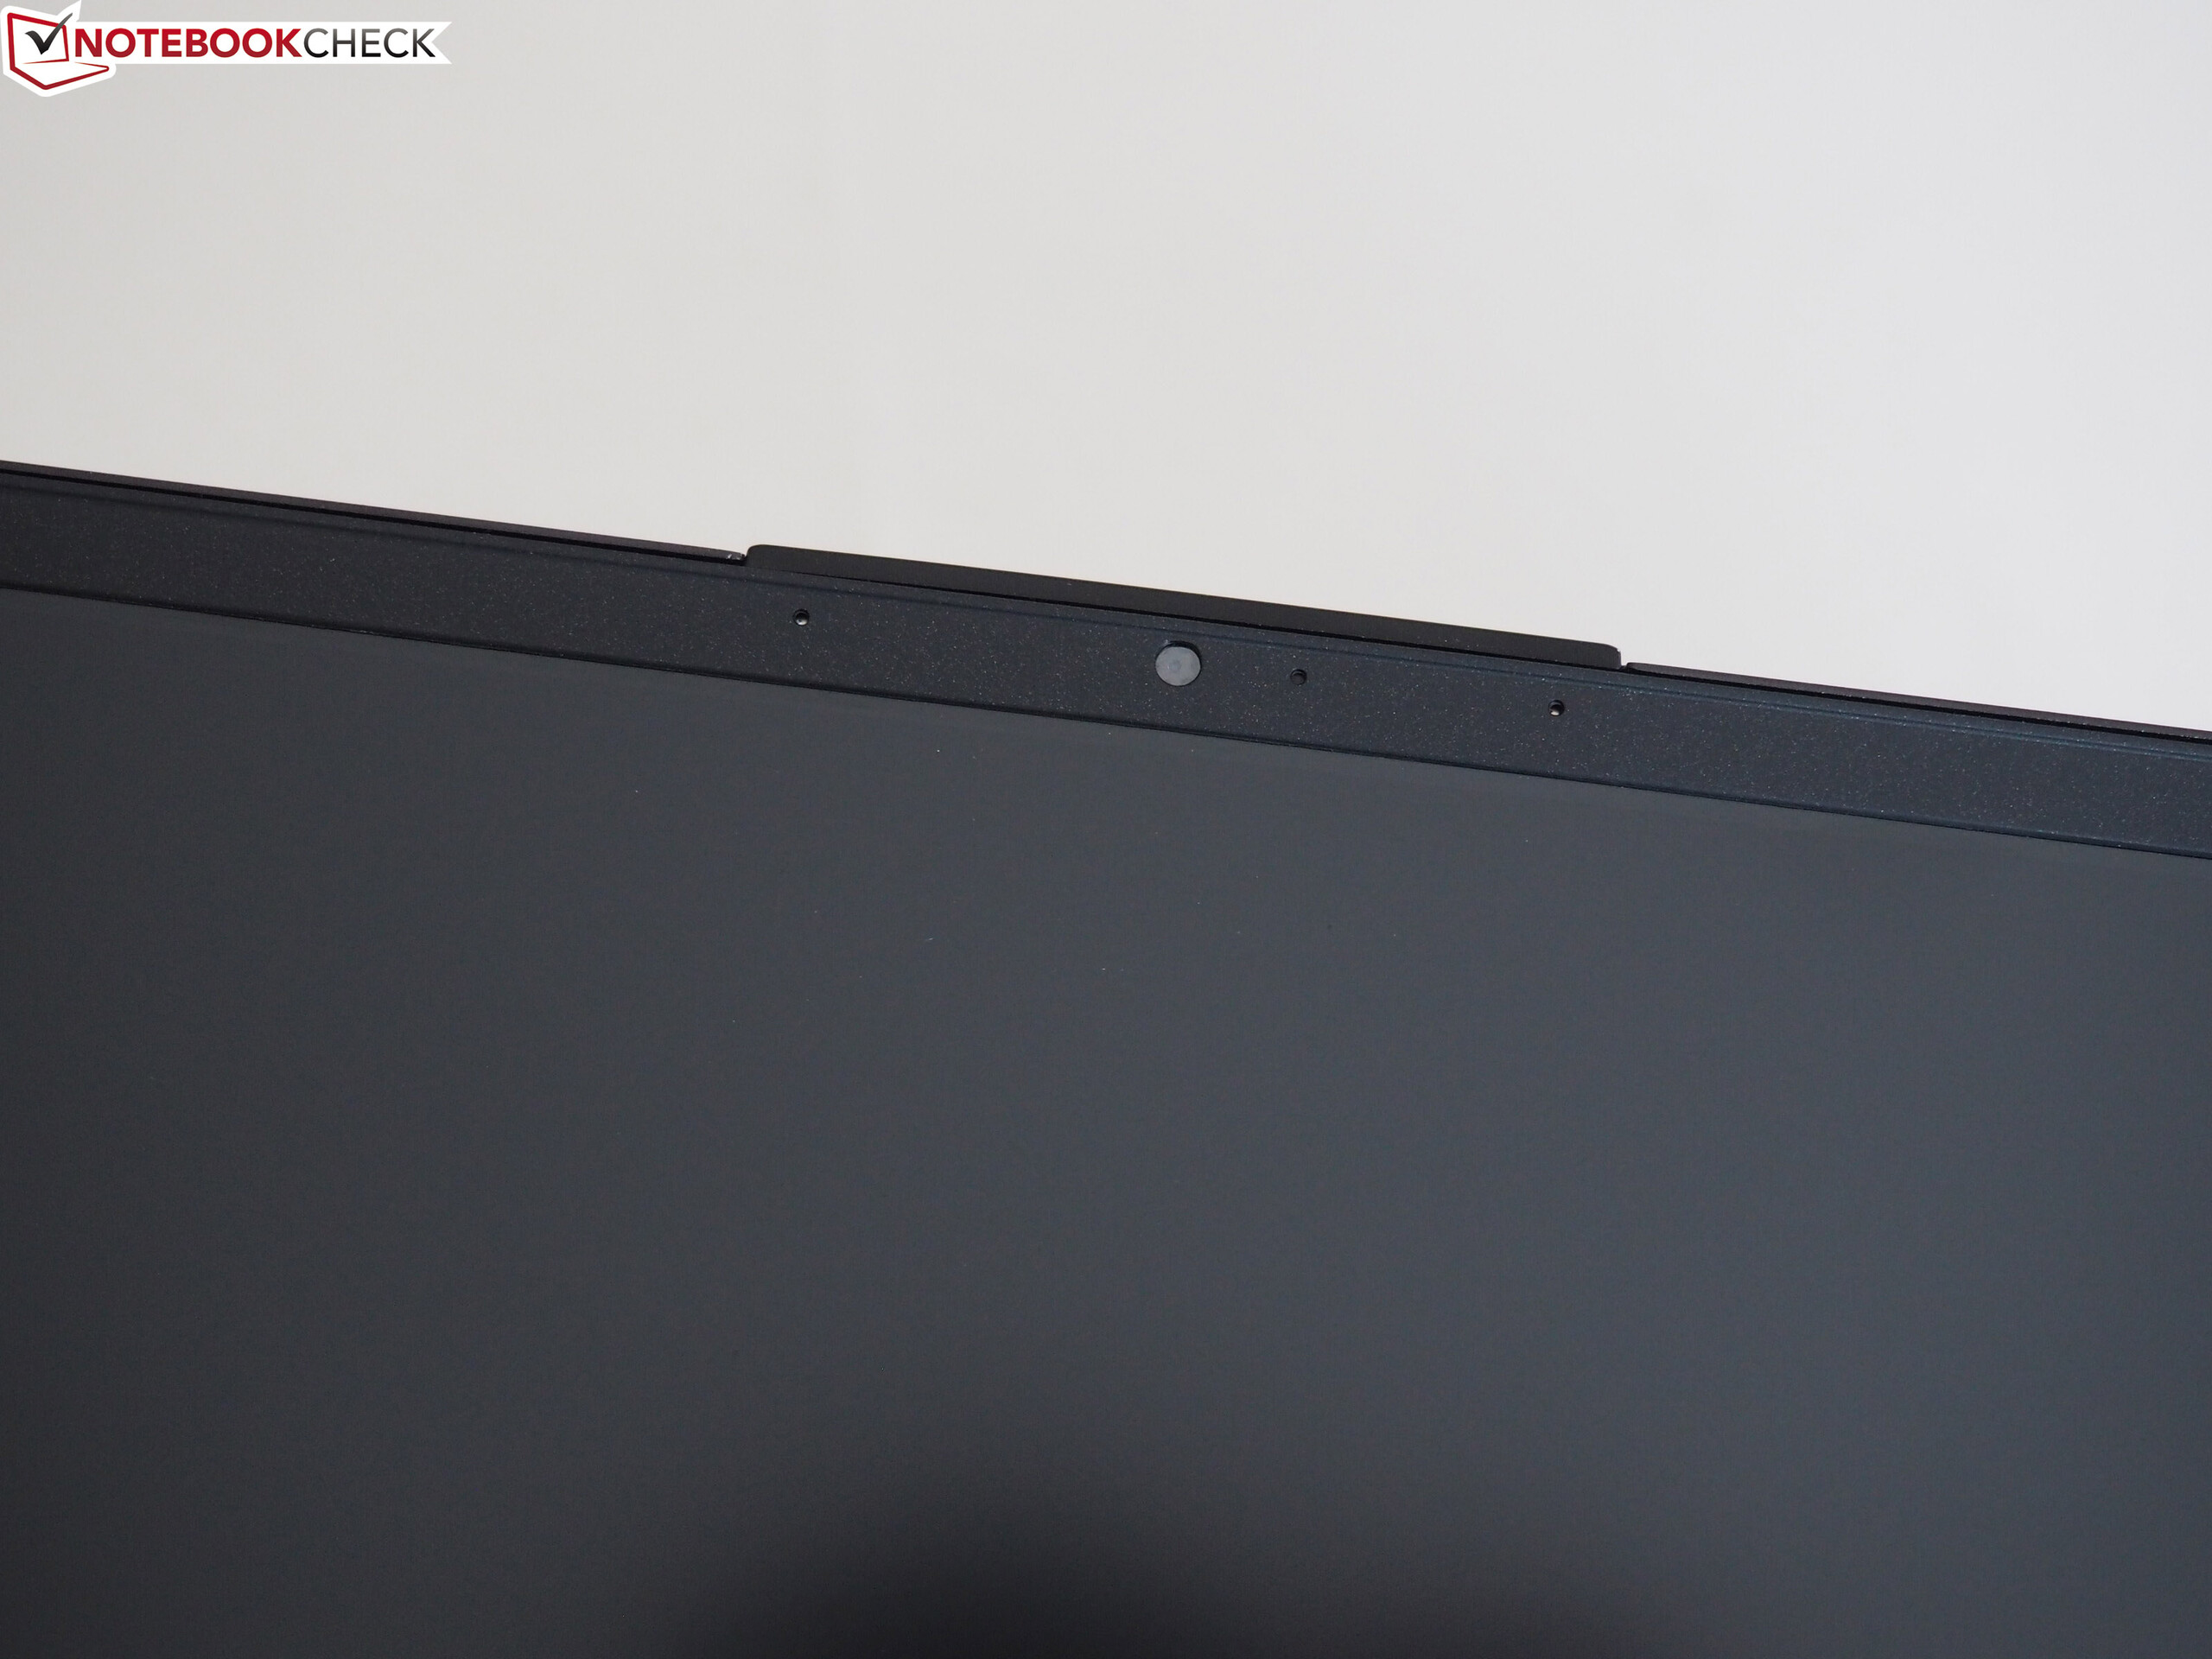
The GS65 has a matte 15.6-inch IPS display with a 1920x1080 resolution. Images look smoother than conventional 60 Hz notebooks thanks to its 144 Hz refresh rate. You may notice a difference when playing games, but frame rates must be high enough to benefit from the higher refresh rate. Nvidia G-Sync would have further improved things, but that would have been at a cost to battery life.
| |||||||||||||||||||||||||
Brightness Distribution: 89 %
Center on Battery: 222 cd/m²
Contrast: 1155:1 (Black: 0.22 cd/m²)
ΔE ColorChecker Calman: 2.37 | ∀{0.5-29.43 Ø4.73}
calibrated: 1.84
ΔE Greyscale Calman: 1.58 | ∀{0.09-98 Ø4.97}
92% sRGB (Argyll 1.6.3 3D)
60% AdobeRGB 1998 (Argyll 1.6.3 3D)
67.2% AdobeRGB 1998 (Argyll 3D)
92.1% sRGB (Argyll 3D)
66.2% Display P3 (Argyll 3D)
Gamma: 2.48
CCT: 6785 K
| MSI GS65 8RF-019DE Stealth Thin AU Optronics B156HAN08.0 (AUO80ED), IPS, 1920x1080 | MSI GS63VR 7RG-005 Chi Mei N156HHE-GA1 (CMN15F4), TN LED, 1920x1080 | Gigabyte Aero 15X v8 LGD05C0, IPS, 1920x1080 | Asus Zephyrus M GM501 AUO B156HAN07.1 (AUO71ED), IPS, 1920x1080 | Acer Predator Triton 700 AUO B156HAN04.2 (AUO42ED), IPS, 1920x1080 | |
|---|---|---|---|---|---|
| Display | 25% | -2% | 0% | -5% | |
| Display P3 Coverage (%) | 66.2 | 91.6 38% | 63.6 -4% | 66.1 0% | 62.5 -6% |
| sRGB Coverage (%) | 92.1 | 100 9% | 93.8 2% | 92.7 1% | 88.7 -4% |
| AdobeRGB 1998 Coverage (%) | 67.2 | 86.6 29% | 64.9 -3% | 67.2 0% | 63.5 -6% |
| Response Times | 45% | 9% | 41% | -143% | |
| Response Time Grey 50% / Grey 80% * (ms) | 17.6 ? | 10.4 ? 41% | 16.8 ? 5% | 6.6 ? 63% | 44.8 ? -155% |
| Response Time Black / White * (ms) | 12.8 ? | 6.6 ? 48% | 11.2 ? 13% | 10.4 ? 19% | 29.6 ? -131% |
| PWM Frequency (Hz) | 25510 ? | ||||
| Screen | -10% | 12% | -52% | -55% | |
| Brightness middle (cd/m²) | 254 | 269 6% | 313 23% | 307 21% | 291 15% |
| Brightness (cd/m²) | 262 | 254 -3% | 300 15% | 296 13% | 277 6% |
| Brightness Distribution (%) | 89 | 85 -4% | 78 -12% | 89 0% | 84 -6% |
| Black Level * (cd/m²) | 0.22 | 0.21 5% | 0.33 -50% | 0.25 -14% | 0.22 -0% |
| Contrast (:1) | 1155 | 1281 11% | 948 -18% | 1228 6% | 1323 15% |
| Colorchecker dE 2000 * | 2.37 | 3 -27% | 1.29 46% | 5.74 -142% | 5.52 -133% |
| Colorchecker dE 2000 max. * | 4.71 | 5.62 -19% | 2.04 57% | 11.32 -140% | 10.72 -128% |
| Colorchecker dE 2000 calibrated * | 1.84 | 1.94 -5% | |||
| Greyscale dE 2000 * | 1.58 | 3.18 -101% | 0.69 56% | 6.44 -308% | 6.59 -317% |
| Gamma | 2.48 89% | 2.25 98% | 2.43 91% | 2.48 89% | 2.44 90% |
| CCT | 6785 96% | 7274 89% | 6550 99% | 8395 77% | 7816 83% |
| Color Space (Percent of AdobeRGB 1998) (%) | 60 | 77 28% | 60 0% | 60 0% | 58 -3% |
| Color Space (Percent of sRGB) (%) | 92 | 100 9% | 94 2% | 93 1% | 89 -3% |
| Total Average (Program / Settings) | 20% /
5% | 6% /
9% | -4% /
-30% | -68% /
-57% |
* ... smaller is better
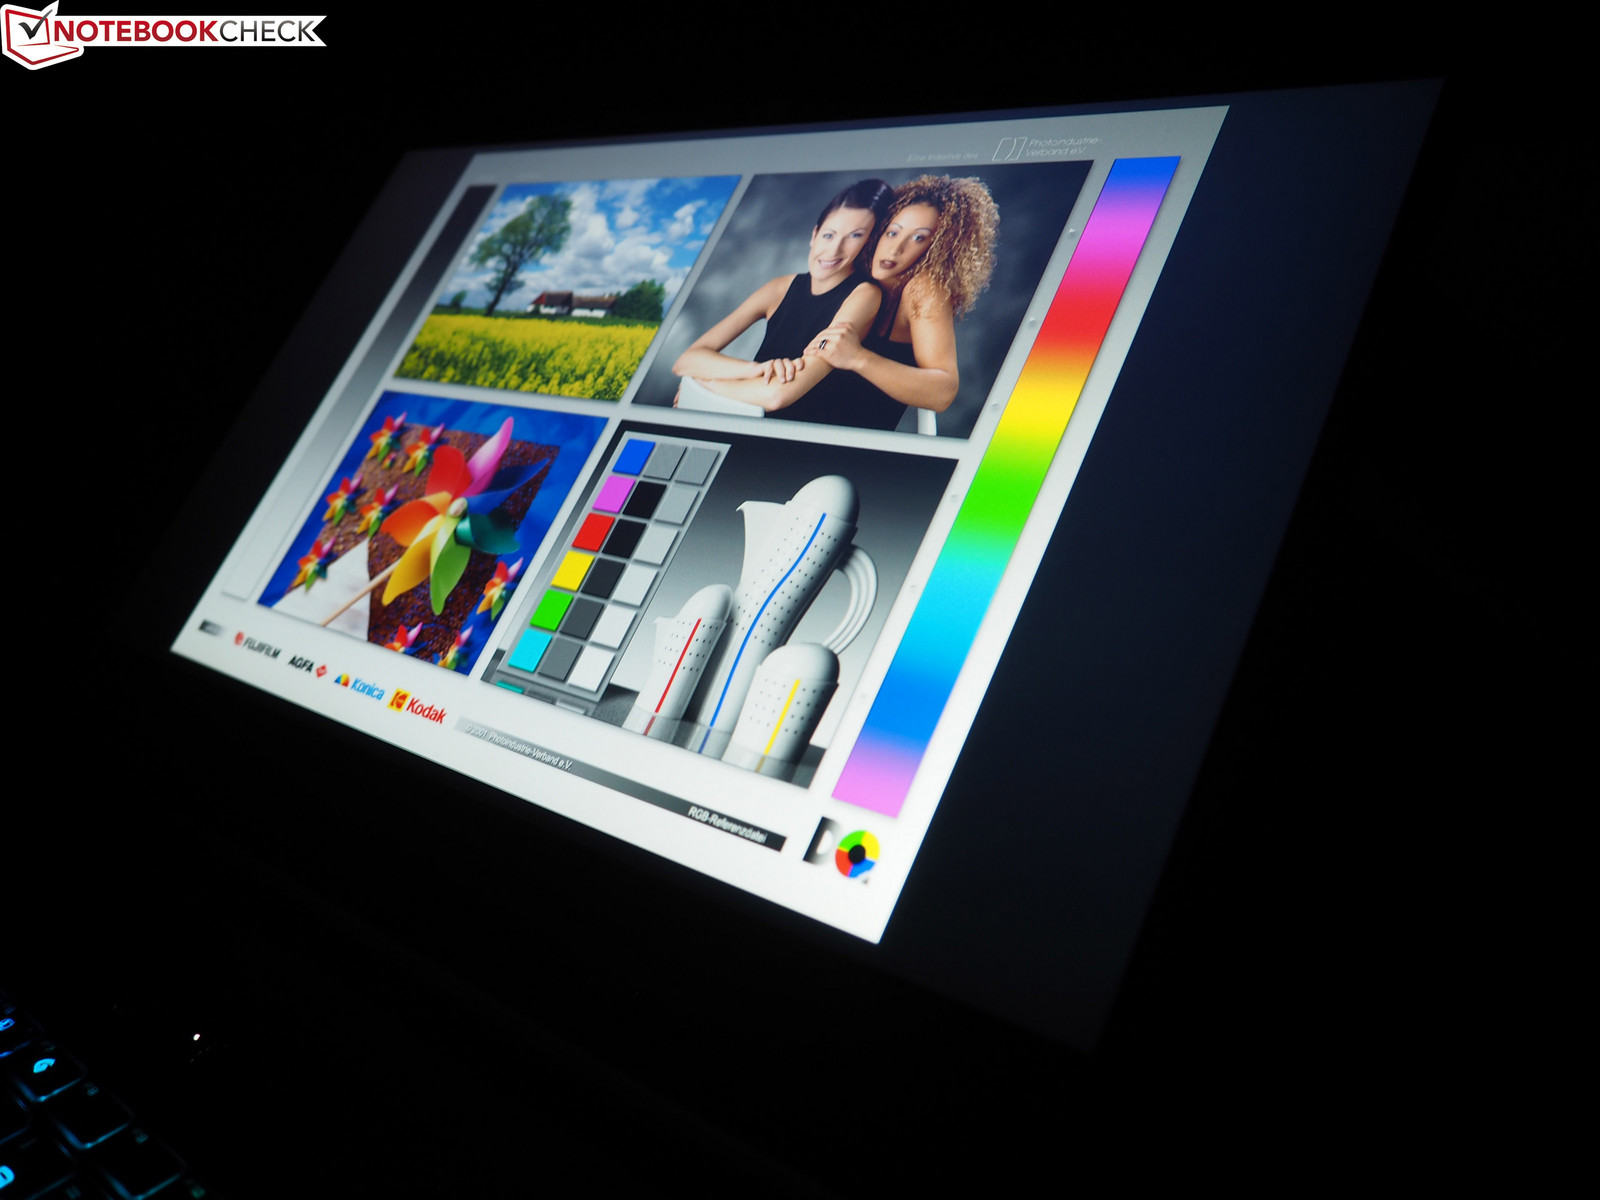
Our review unit has an AU Optronics B156HAN08.0 panel, which performed well in our tests. We measured a 1,150:1 contrast ratio, which is around 20% better than the Aero 15X’s score of 950:1. The GS65 cannot match the Aero 15X for screen brightness though. While the Aero 15X achieved an average of 300 cd/m², the GS65 can only manage an average of 262 cd/m². This makes the Aero 15X better for outdoor use. Both devices have good viewing angles, with images looking natural even at acute viewing angles.
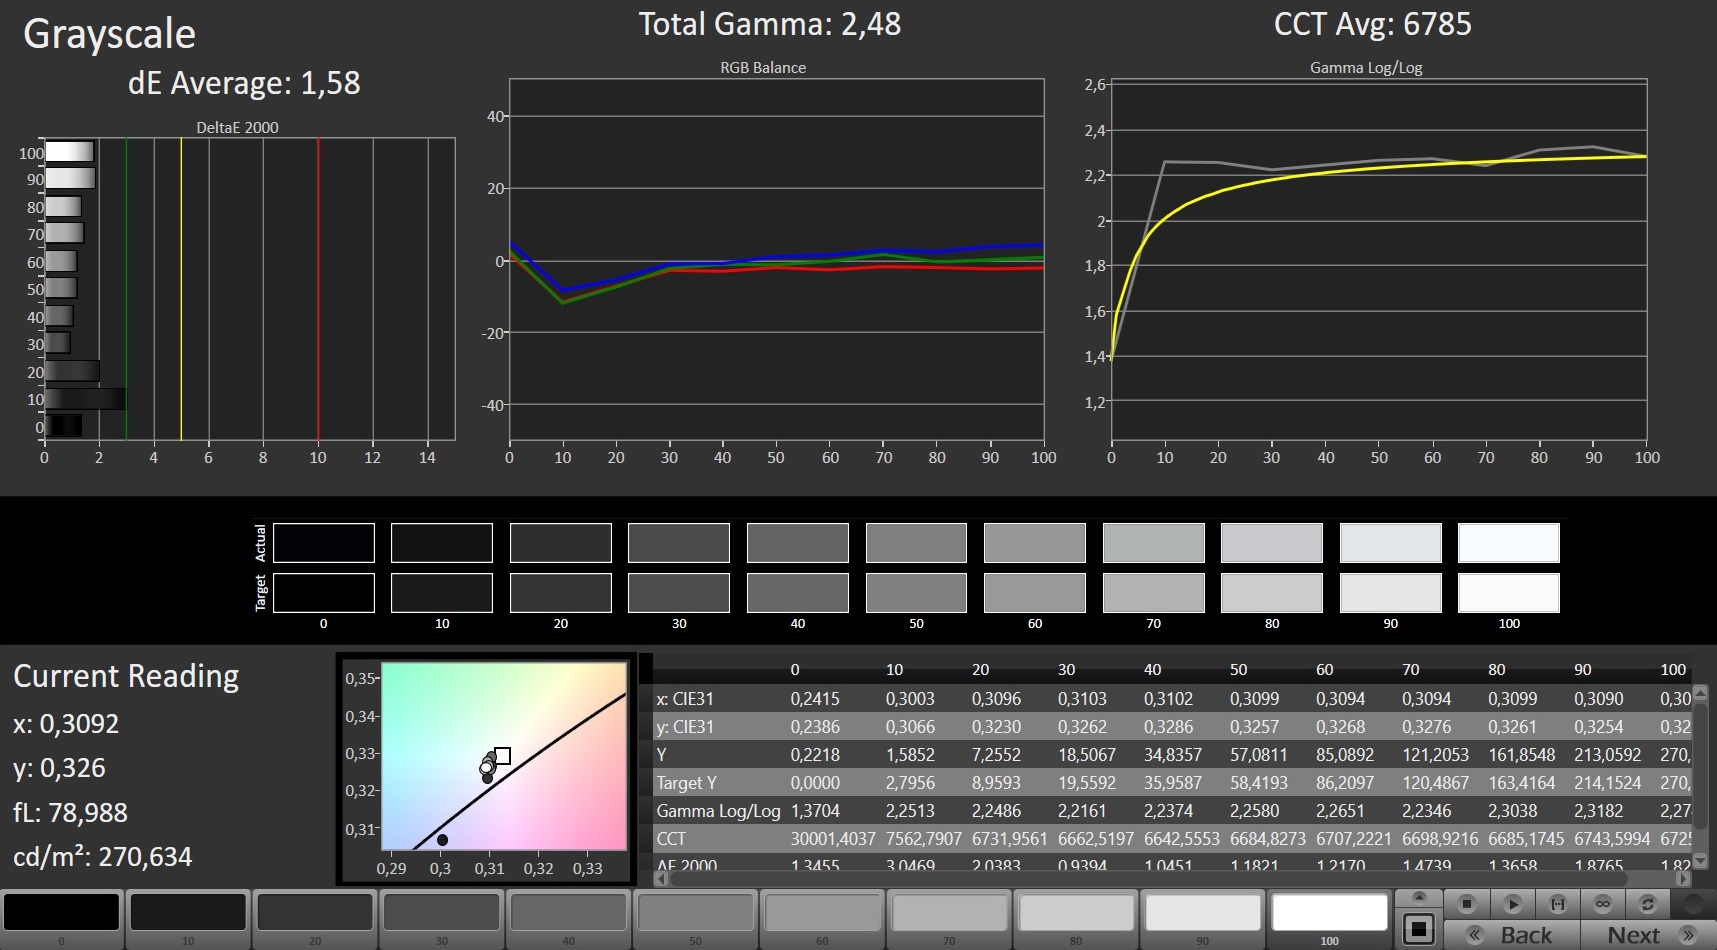
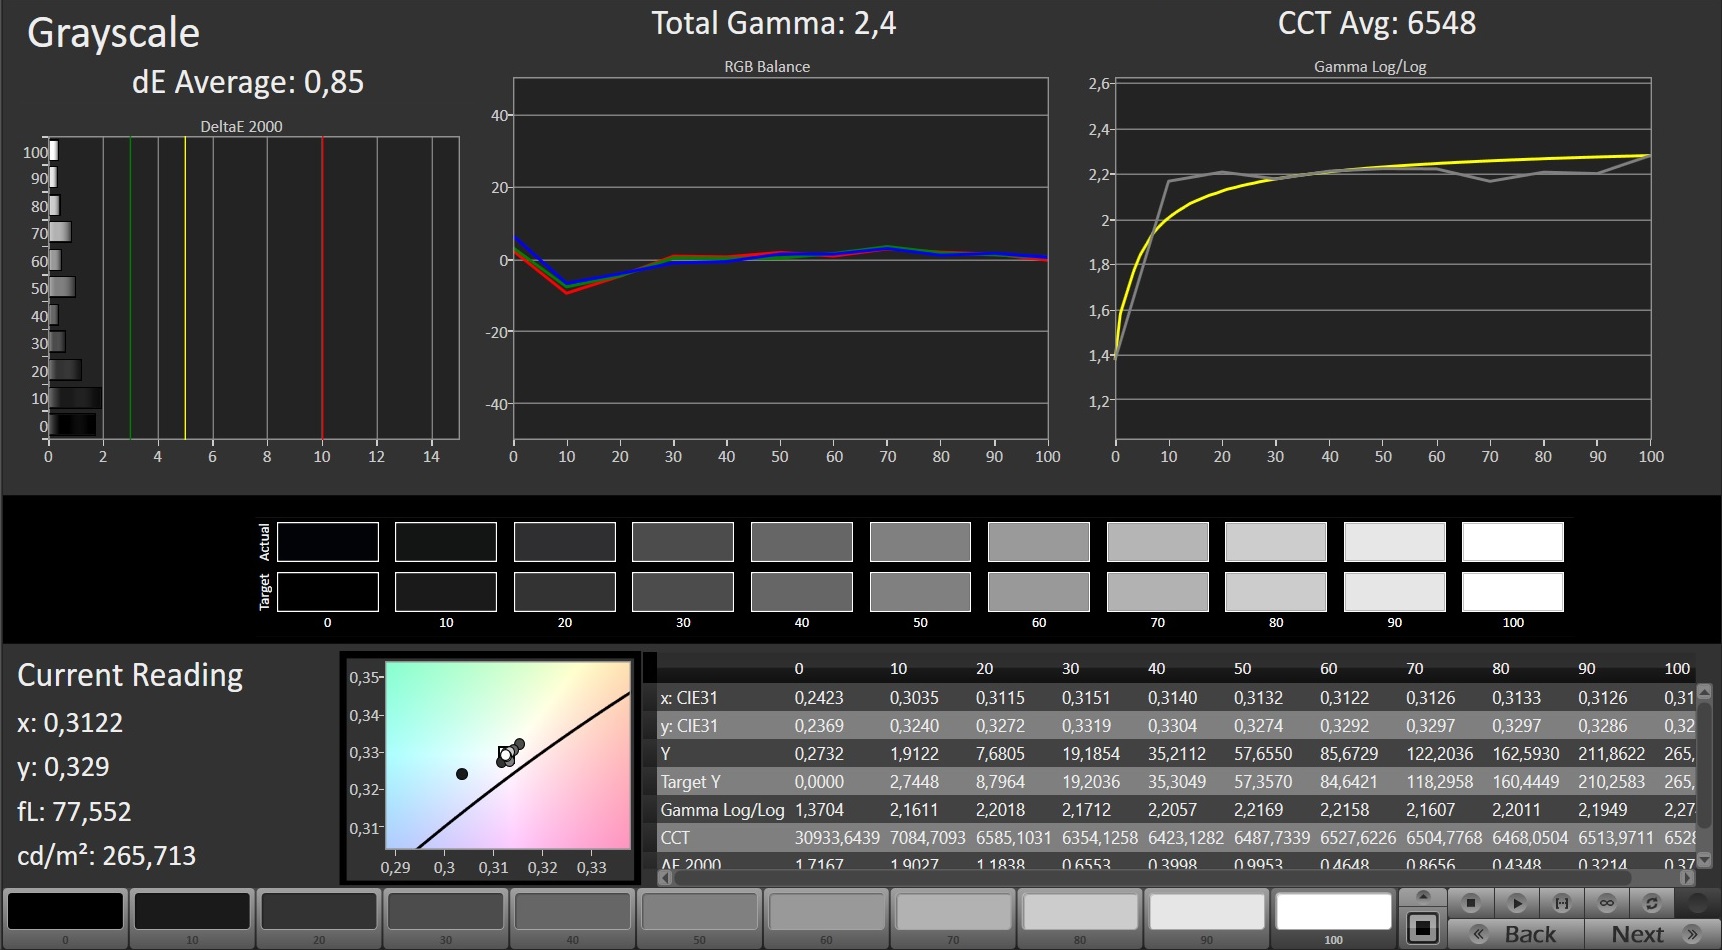
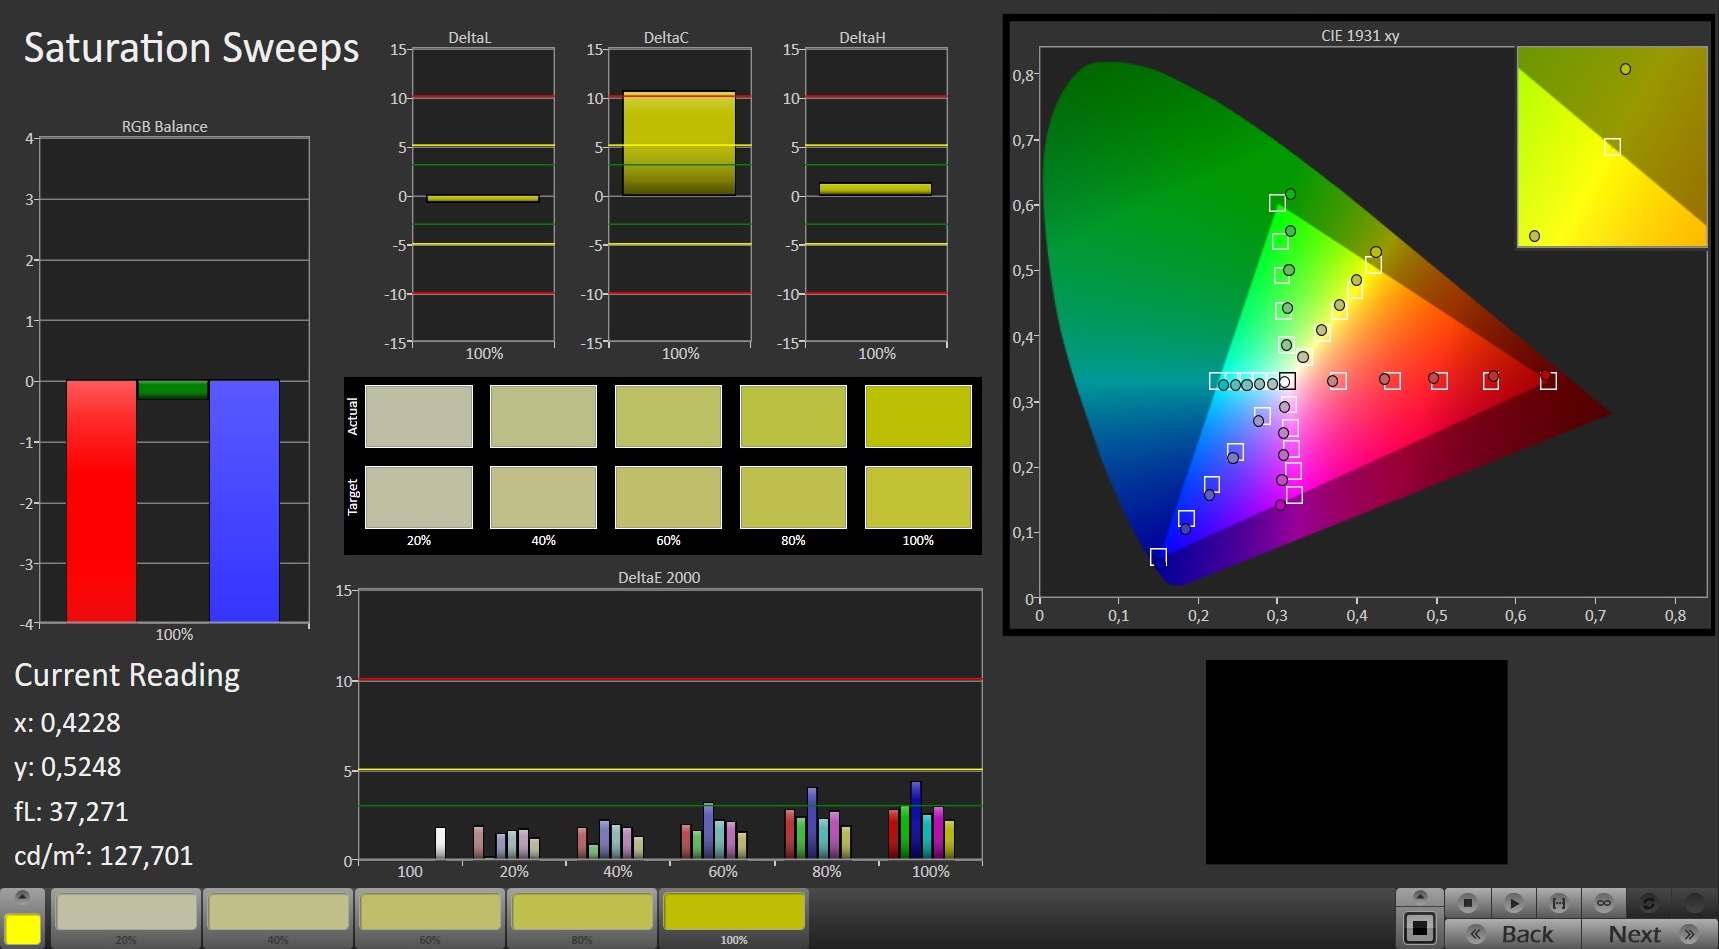
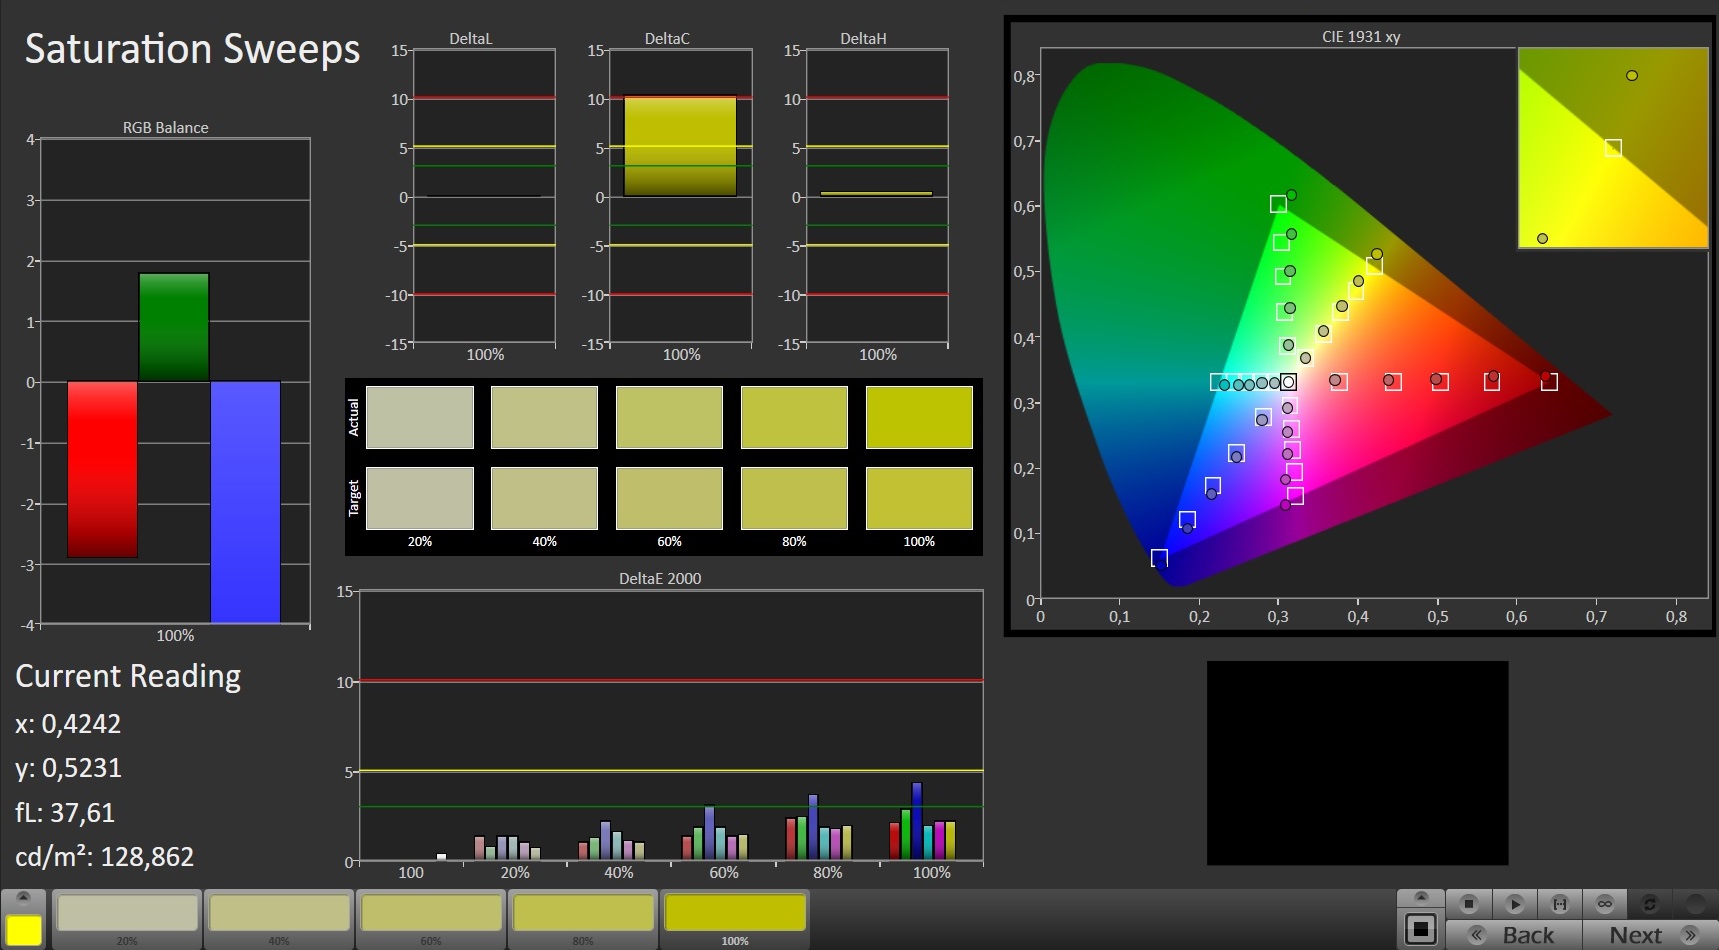
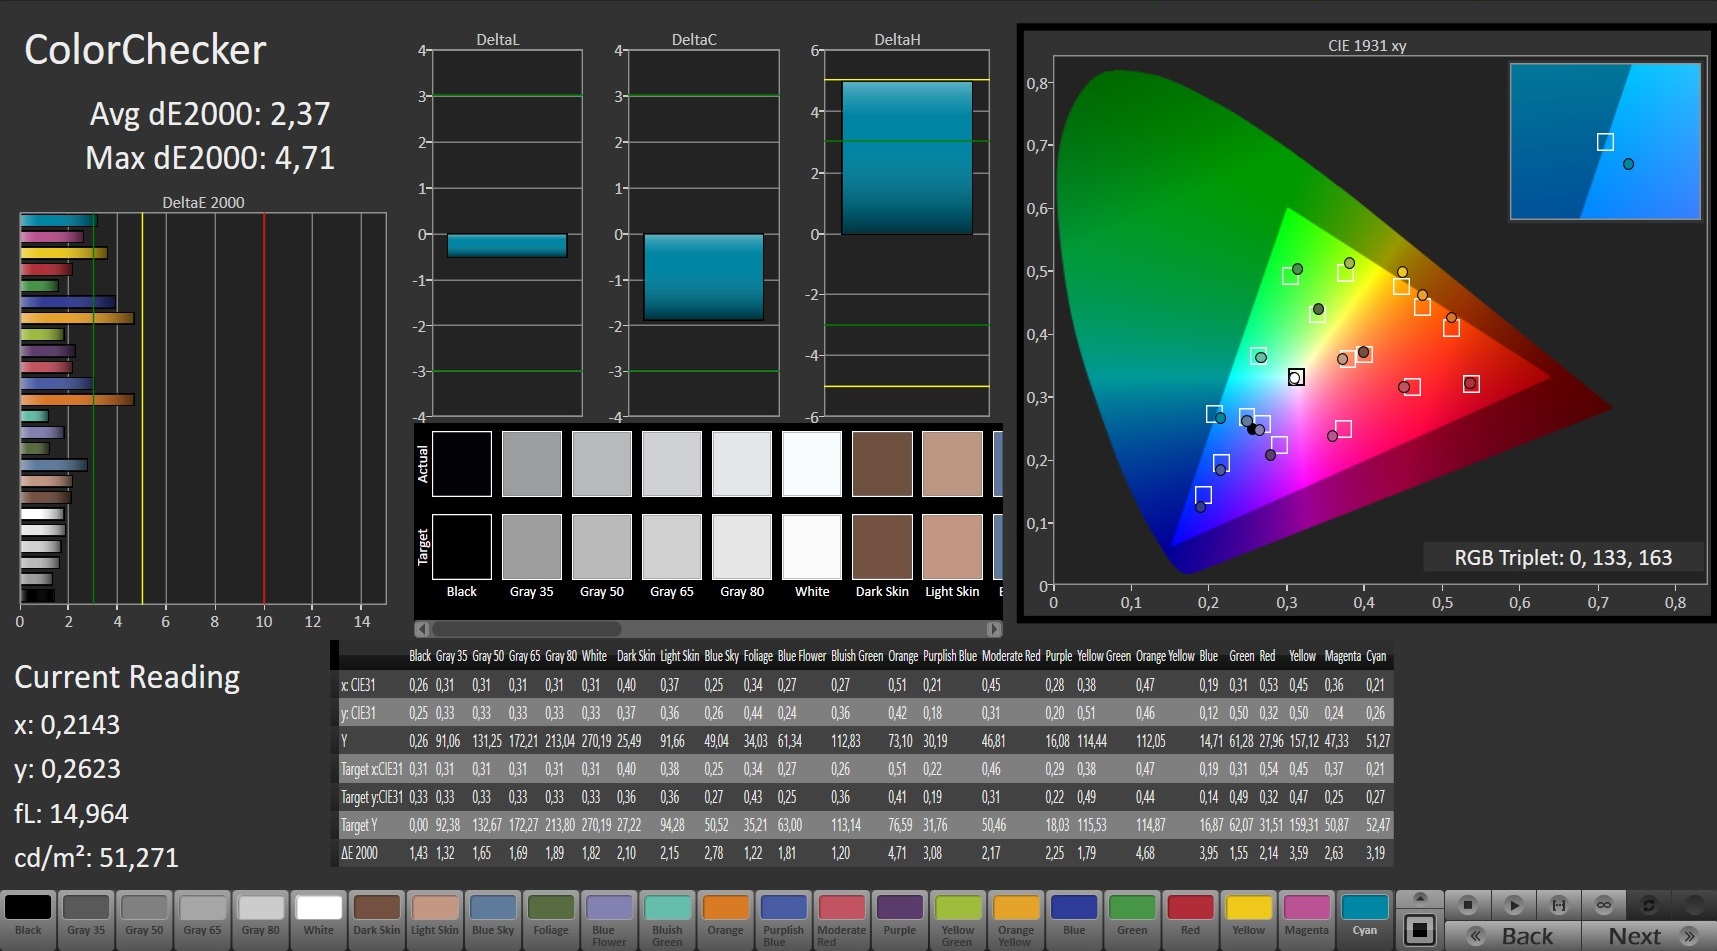
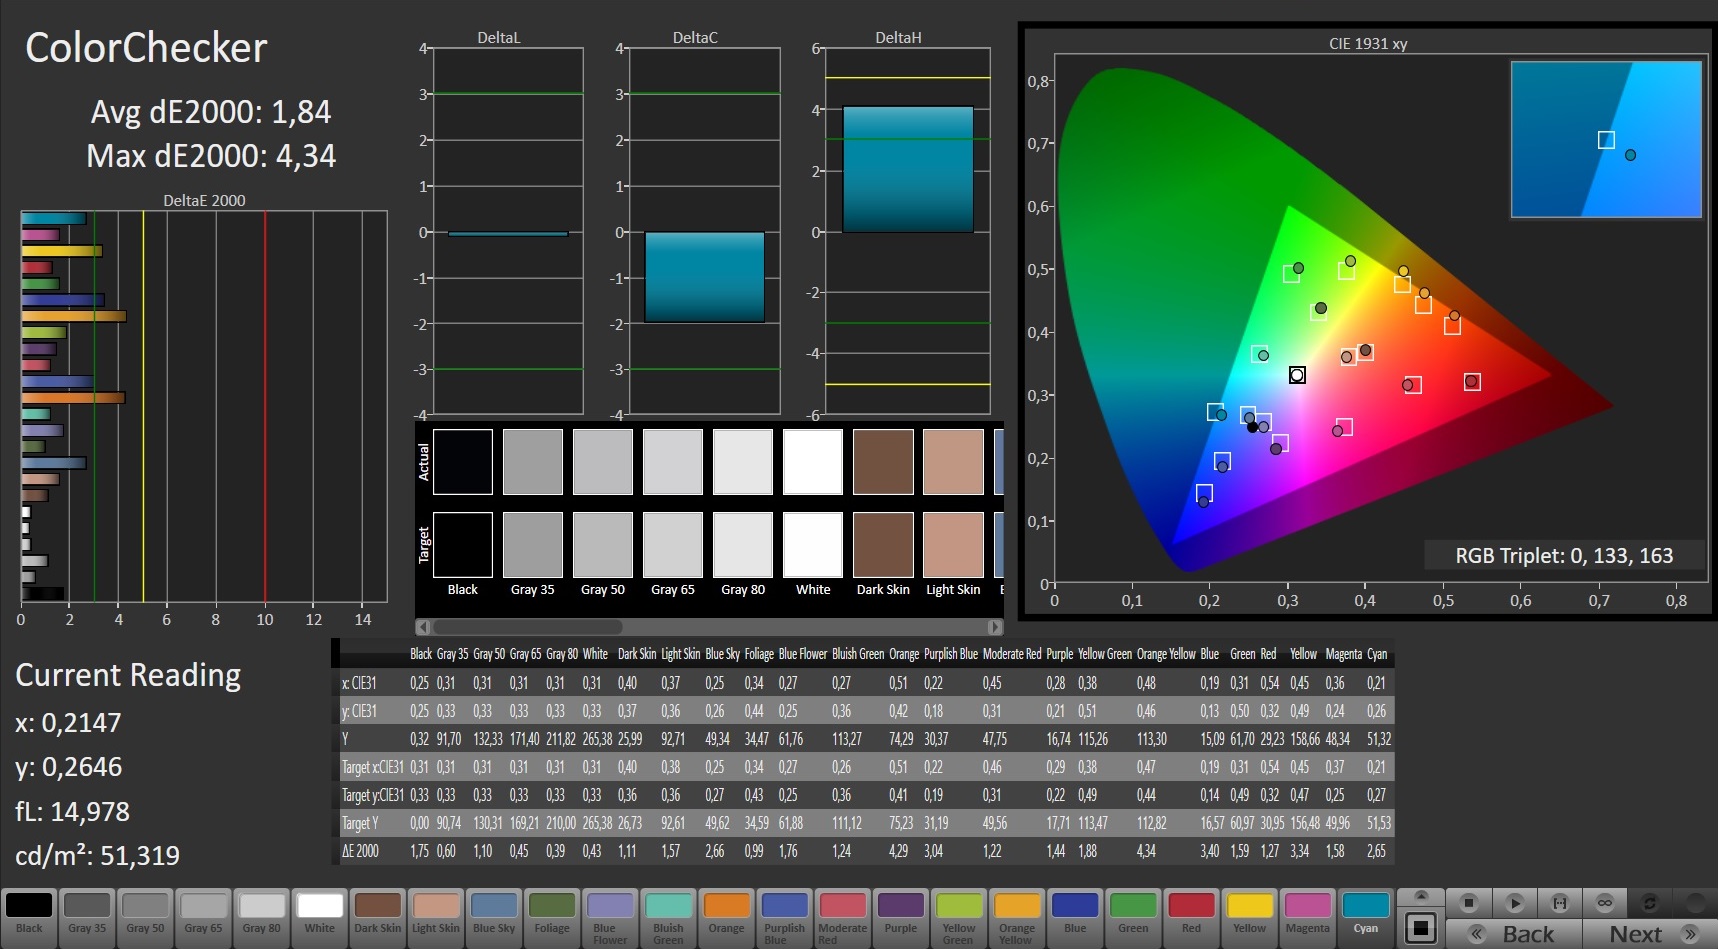

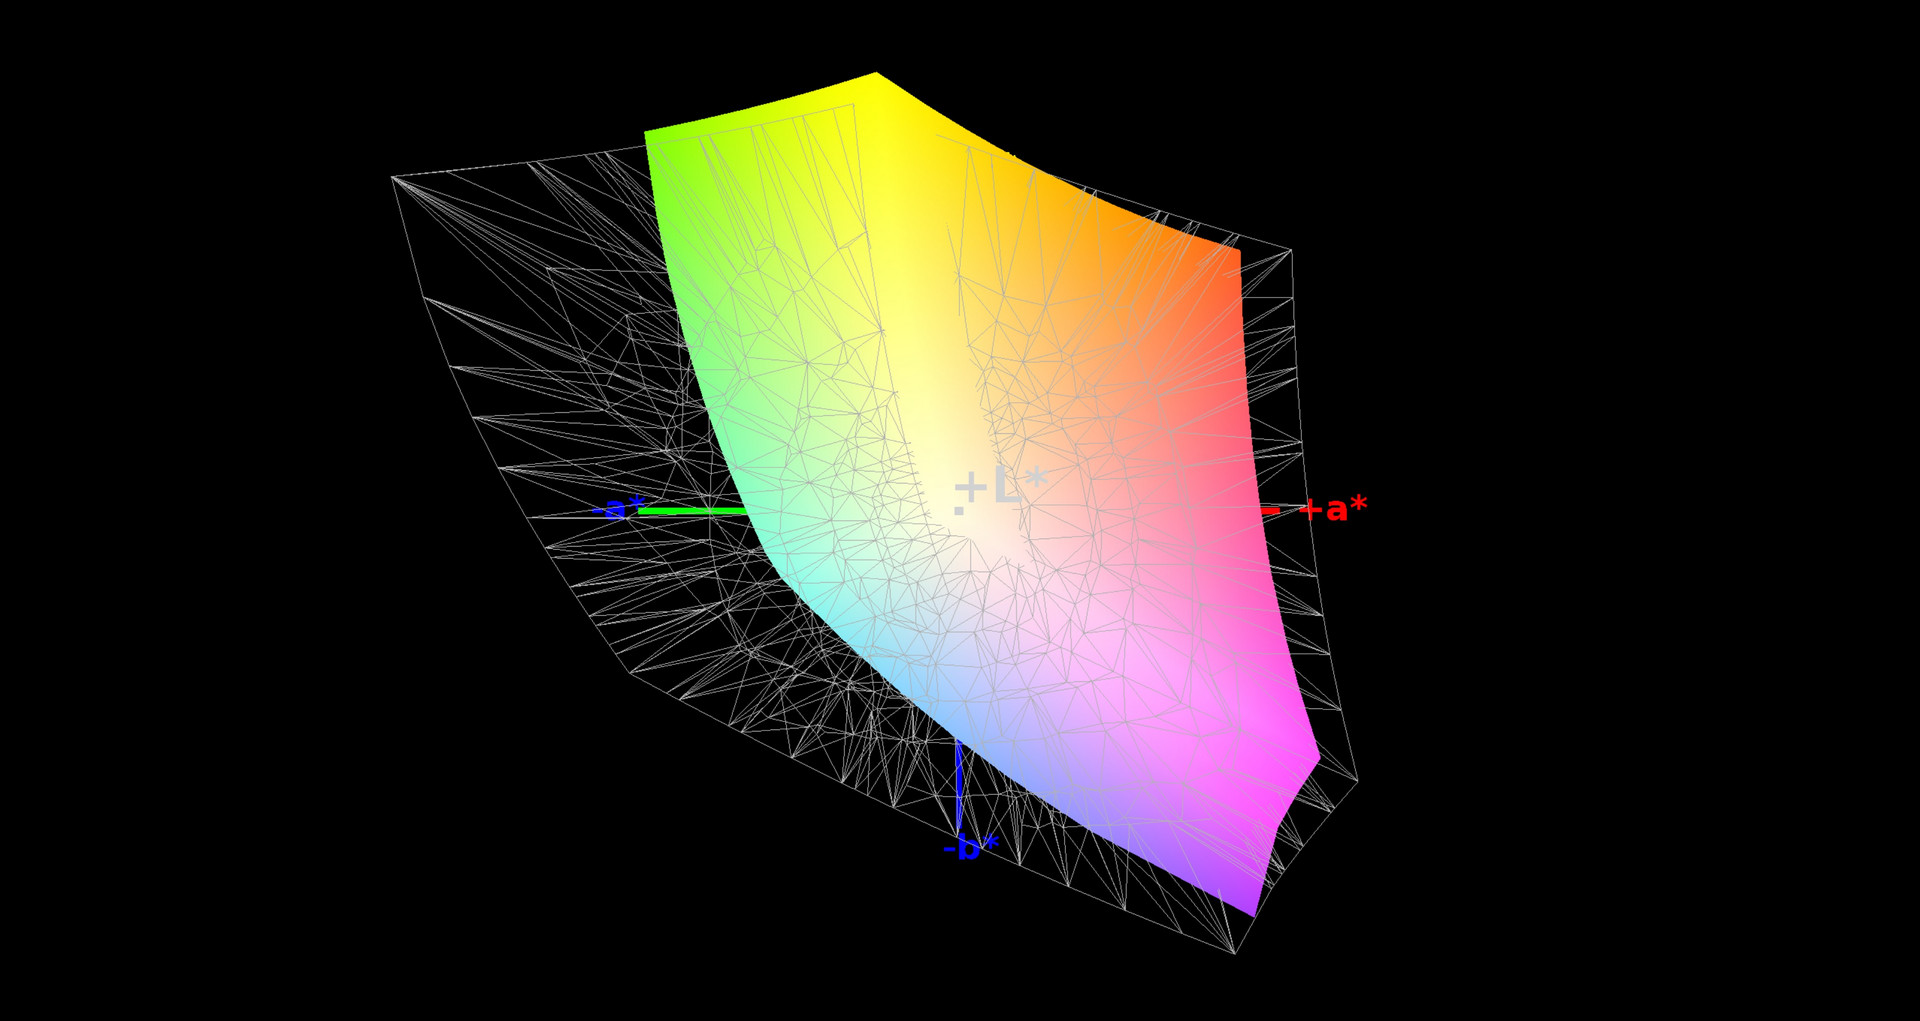
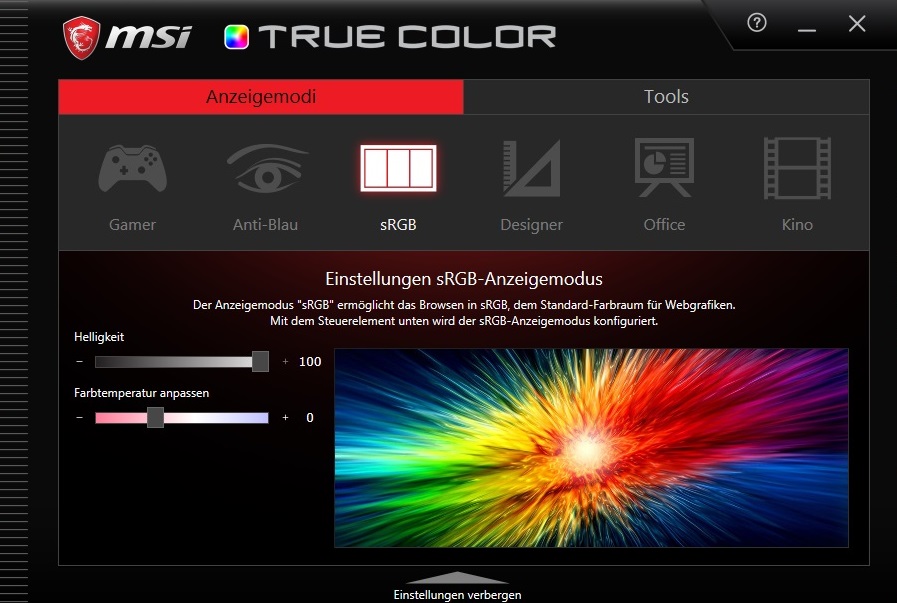
MSI has done a good job at factory calibrating the display; to the extent that we could barely calibrate the display even better ourselves. This also applies to the Aero 15X, which boasts an X-Rite Pantone certification. The GS65 has impressive sRGB color accuracy, scoring 92% in our True Color Software test. Likewise, our review unit achieved 60% AdobeRGB color accuracy. Overall, the display has good enough color accuracy for playing games and movies. Only semi-professional users will need better color accuracy than the GS65 provides.
The GS65 has good display reaction times, even if they are not as good as MSI advertise. We measured black to white reaction times at 12.8 ms and gray to gray at 17.6 ms. While this is impressive for an IPS panel, it does not match MSI’s claims of 7 ms. Nonetheless, we did not see image streaking when playing fast-paced games. Equally, our review unit has no noticeable backlight bleeding either.
Display Response Times
| ↔ Response Time Black to White | ||
|---|---|---|
| 12.8 ms ... rise ↗ and fall ↘ combined | ↗ 7.6 ms rise | 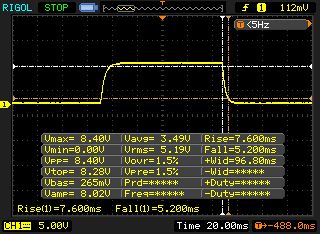 |
| ↘ 5.2 ms fall | ||
| The screen shows good response rates in our tests, but may be too slow for competitive gamers. In comparison, all tested devices range from 0.1 (minimum) to 240 (maximum) ms. » 33 % of all devices are better. This means that the measured response time is better than the average of all tested devices (19.9 ms). | ||
| ↔ Response Time 50% Grey to 80% Grey | ||
| 17.6 ms ... rise ↗ and fall ↘ combined | ↗ 9.2 ms rise | 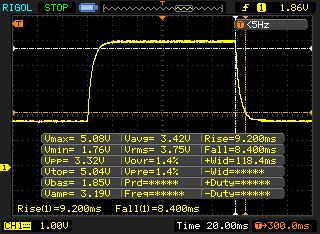 |
| ↘ 8.4 ms fall | ||
| The screen shows good response rates in our tests, but may be too slow for competitive gamers. In comparison, all tested devices range from 0.165 (minimum) to 636 (maximum) ms. » 31 % of all devices are better. This means that the measured response time is better than the average of all tested devices (31.1 ms). | ||
Screen Flickering / PWM (Pulse-Width Modulation)
| Screen flickering / PWM not detected | 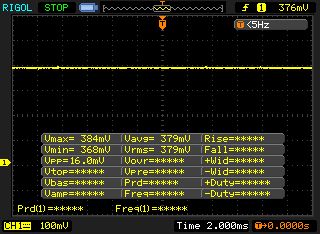 | ||
In comparison: 52 % of all tested devices do not use PWM to dim the display. If PWM was detected, an average of 7798 (minimum: 5 - maximum: 343500) Hz was measured. | |||
Performance
Despite its compact dimensions, the GS65 is a true gaming notebook that can easily play the most-demanding titles at maximum settings. The 16 GB DDR4-2400 RAM should be enough for the coming years. Our review unit came with Windows 10 Home 64-bit installed.
Processor
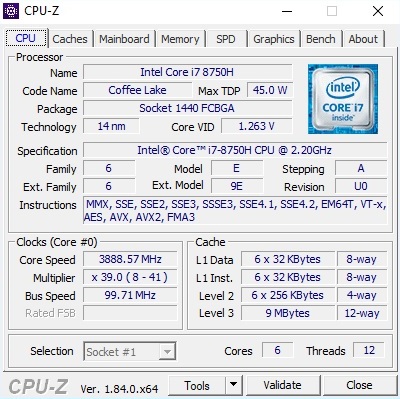
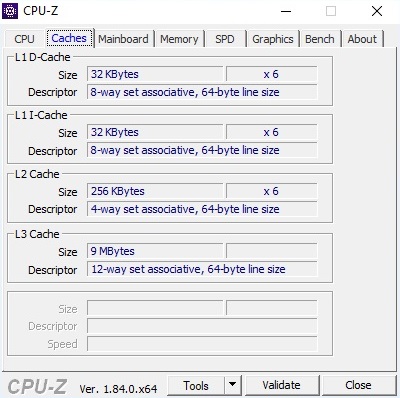
The GS65 is powered by an Intel Core I7-8750H processor that is based on Intel’s new Coffee Lake 14 nm architecture. The Core i7-8750H is a hexa-core processor that has 9 MB of L3 cache and 45 W TDP like its quad-core Kaby Lake predecessor.
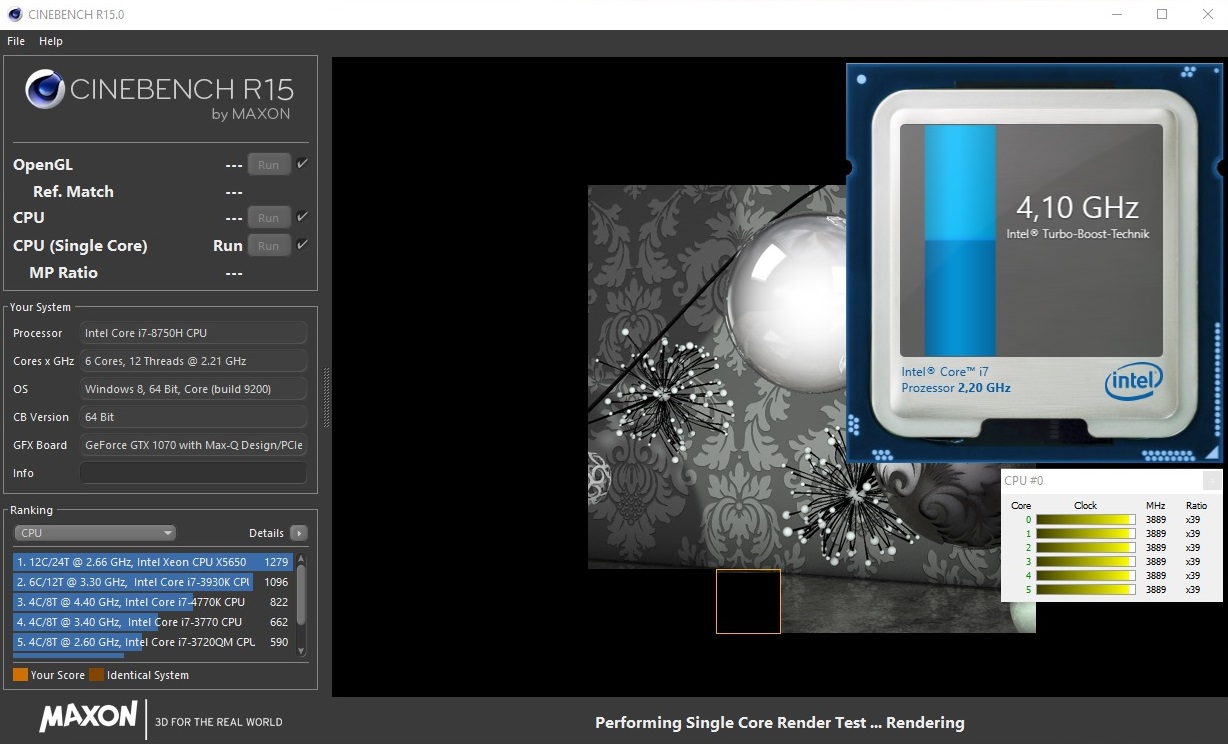
The Core i7-8750H performs particularly well in highly parallelized applications thanks to its six cores. This is reflected in multi-core performance in Cinebench R15 and R11.5, with the Core i7-8750H scoring over 40% higher than the older quad-core Core i7-7700HQ. The Aero 15X and Asus ROG Zephyrus M GM501 performed around 10% better than the GS65 in these benchmarks despite using the same processor, because of their better use of Turbo Boost.
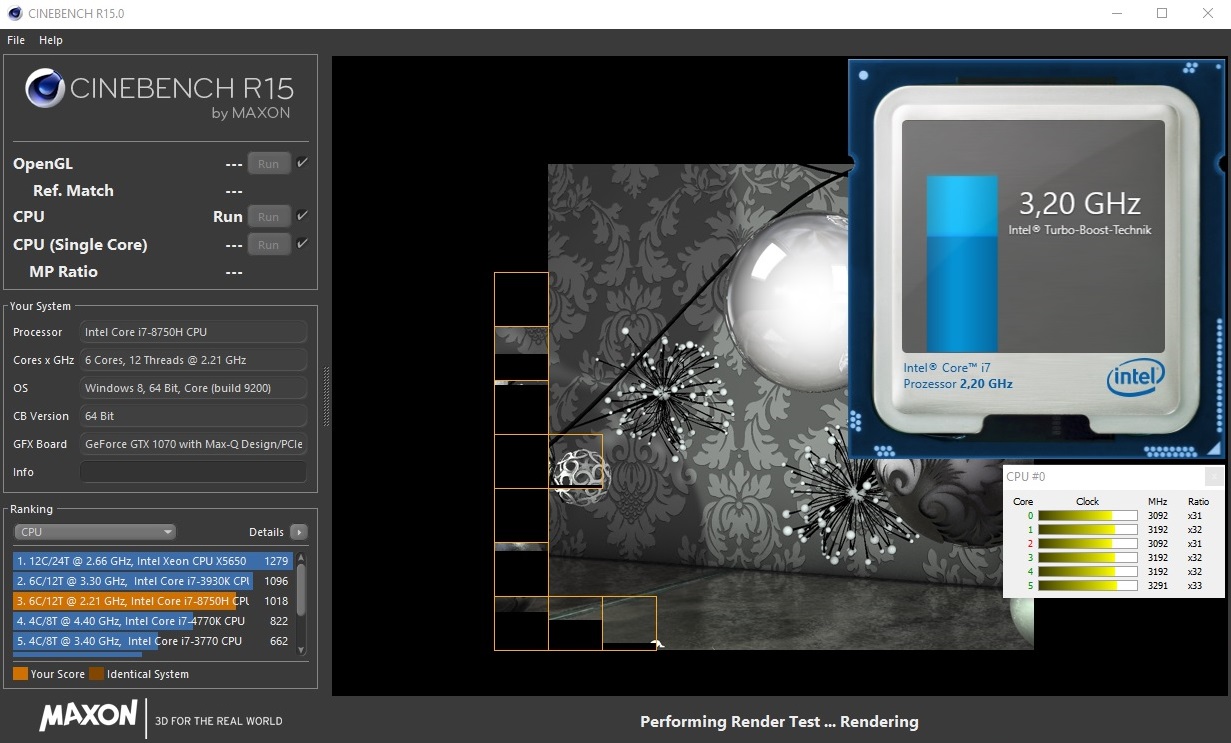
Thanks to Turbo Boost technology, the Core i7-8750H can increase its clock speed from 2.2 GHz to 4.1 GHz for single core loads and up to 3.9 GHz for hexa-core loads. The GS65 cannot maintain the Core i7-8750H’s Turbo Boost capabilities though. The best example of this is during our Cinebench loop where the CPU boosts up to between 3.0 GHz and 3.4 GHz in the first pass, but the performance drops by several percent from the second run onwards.
System Performance
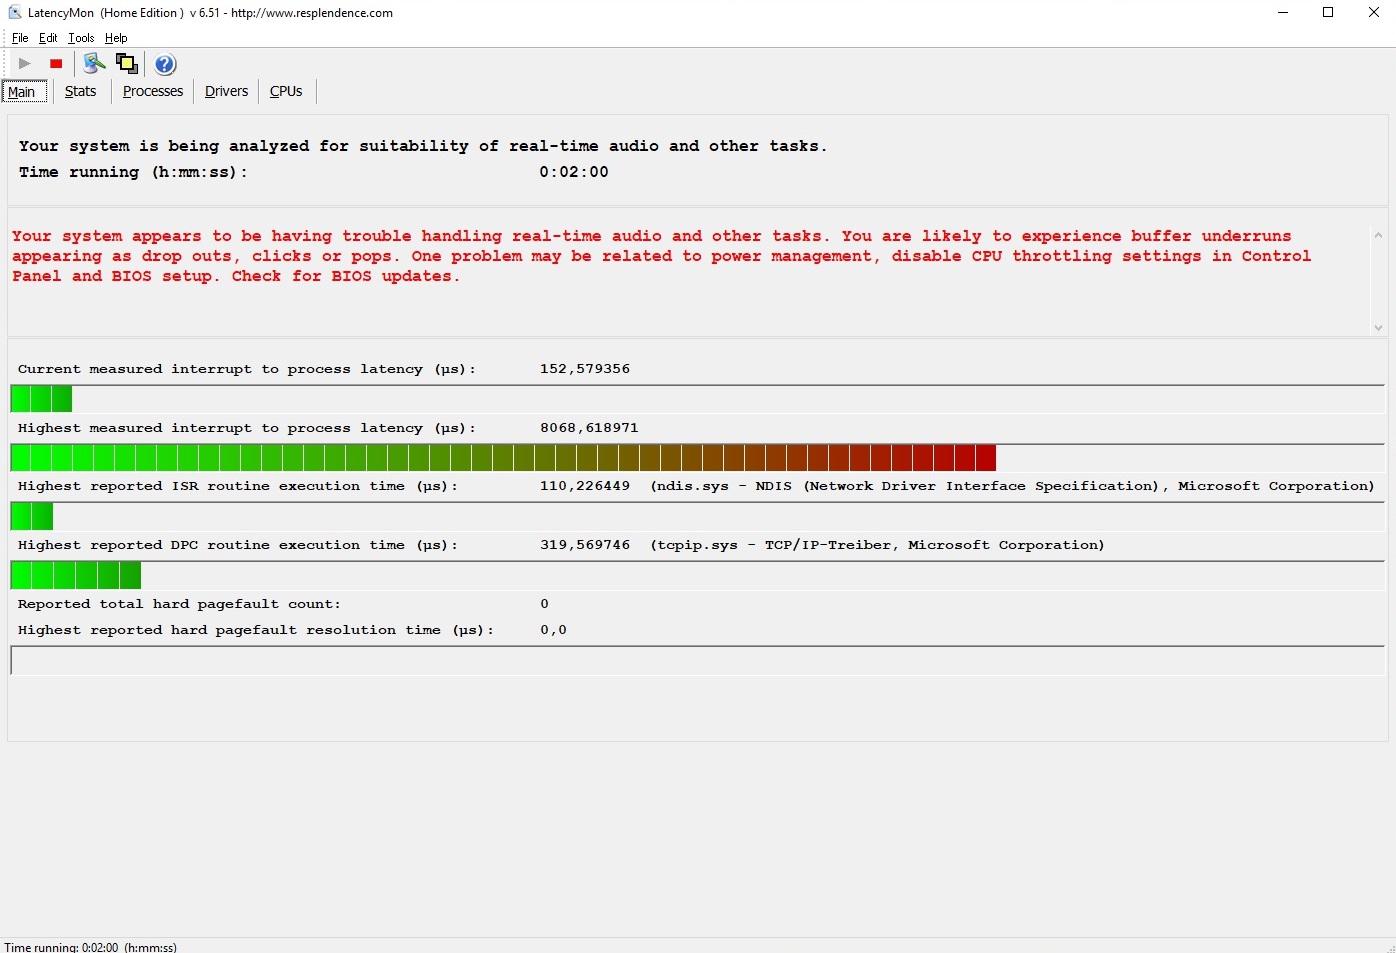
Despite not having the best Turbo Boost behavior, the GS65 performs at a very high level. This is reflected in the PCMark 10 scores where our review unit scored 5,095 points, placing it comfortably between the Asus GM501 with 5,194 points and the Aero 15X with 5,059 points.
MSI ensures that the GS65 runs smoothly by installing a fast NVMe SSD. Unfortunately, our review unit suffers from the same phenomenon that recently we have repeatedly seen in Optimus notebooks. Specifically, right-clicking on the desktop or tasks occasionally causes an annoying short system freeze. This infrequently applies to program starts too. We are unsure whether this an Intel, Nvidia or Microsoft issue, but it is a long-standing bug that remains unfixed by any manufacturer. To our knowledge, devices with G-Sync active are unaffected by this issue.
| PCMark 10 - Score | |
| Average of class Gaming (5828 - 11574, n=96, last 2 years) | |
| Acer Predator Triton 700 | |
| Asus Zephyrus M GM501 | |
| MSI GS65 8RF-019DE Stealth Thin | |
| Gigabyte Aero 15X v8 | |
| MSI GS63VR 7RG-005 | |
| PCMark 8 Home Score Accelerated v2 | 4665 points | |
| PCMark 8 Work Score Accelerated v2 | 5621 points | |
| PCMark 10 Score | 5095 points | |
Help | ||
Storage Devices
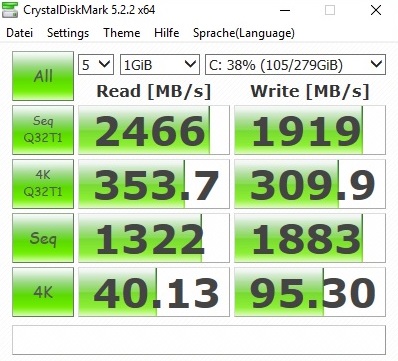
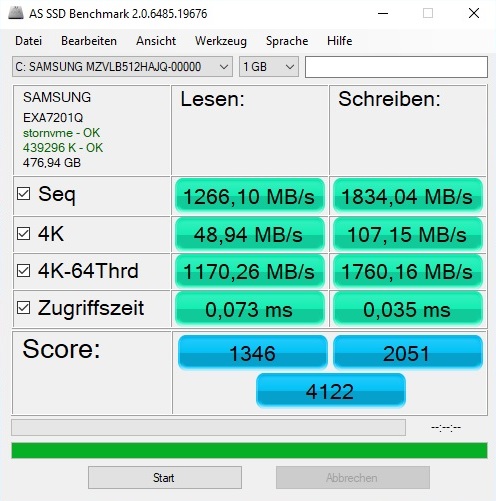
MSI has equipped the GS65 with a Samsung PM981 NVMe SSD, which is an upgrade of the PM961 used in the GS63. NVMe drives are much faster than their SATA III counterparts, the latter of which are limited to about 500 MB/s. While the PM981 easily bests the Toshiba XG3 series NVMe SSD in the Aero 15X, there is no tangible difference in daily use; both devices feel equally snappy.
| MSI GS65 8RF-019DE Stealth Thin Samsung SSD PM981 MZVLB512HAJQ | MSI GS63VR 7RG-005 Samsung SM961 MZVPW256HEGL | Gigabyte Aero 15X v8 Toshiba NVMe THNSN5512GPU7 | Asus Zephyrus M GM501 Samsung SM961 MZVKW512HMJP m.2 PCI-e | Acer Predator Triton 700 2x SK Hynix Canvas SC300 512GB M.2 (HFS512G39MND) (RAID 0) | |
|---|---|---|---|---|---|
| CrystalDiskMark 5.2 / 6 | -9% | -2% | 45% | ||
| Read Seq Q32T1 (MB/s) | 2466 | 2627 7% | 3157 28% | 3417 39% | |
| Write Seq Q32T1 (MB/s) | 1919 | 1375 -28% | 1659 -14% | 2771 44% | |
| Read 4K Q32T1 (MB/s) | 353.7 | 332.8 -6% | 325.6 -8% | 564 59% | |
| Write 4K Q32T1 (MB/s) | 309.9 | 268.6 -13% | 269.5 -13% | 460.6 49% | |
| Read Seq (MB/s) | 1322 | 1404 6% | 1104 -16% | 2664 102% | |
| Write Seq (MB/s) | 1883 | 1335 -29% | 1652 -12% | 2631 40% | |
| Read 4K (MB/s) | 40.13 | 37.65 -6% | 46.2 15% | 45.45 13% | |
| Write 4K (MB/s) | 95.3 | 94.4 -1% | 96 1% | 109.2 15% |

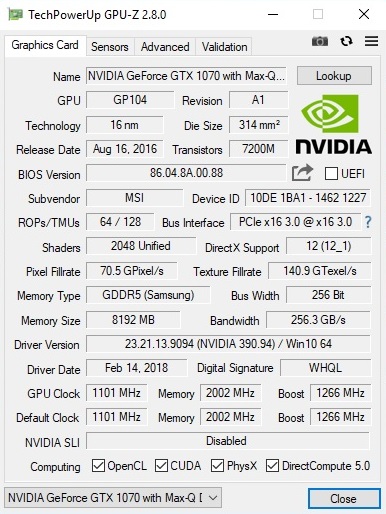
Graphics Card
MSI uses an Nvidia Max-Q GPU to allow the GS65 to be as thin as possible while maintaining high-end gaming performance. Nvidia markets Max-Q GPUs as GeForce GTX 1060, GTX 1070 and GTX 1080s that operate at "peak efficiency to deliver peak performance." In practical terms, this means that Max-Q-equipped notebooks should run cooler and quieter at the cost of slightly lower performance than their regular counterparts.
| 3DMark - 1920x1080 Fire Strike Graphics | |
| Average of class Gaming (12242 - 62849, n=121, last 2 years) | |
| Acer Predator Triton 700 | |
| Asus Zephyrus M GM501 | |
| Gigabyte Aero 15X v8 | |
| MSI GS65 8RF-019DE Stealth Thin | |
| MSI GS63VR 7RG-005 | |
This is reflected by the benchmarks results, whether it is 3DMark 11, 3DMark Fire Strike or 3DMark 13. For example, the Asus GM501 performs around 15% better in these benchmarks than the GS65 thanks to its regular GTX 1070 GPU. The GS65 matched the performance of the other GTX 1070 Max-Q-equipped notebooks in our tests, namely the Aero 15X and the GS63. By contrast, the 20-30% gap between the Acer Triton 700 and the GS65 highlights the difference in performance between the GTX 1070 Max-Q and its more powerful sibling, the GTX 1080 Max-Q.
| 3DMark 11 Performance | 15782 points | |
| 3DMark Cloud Gate Standard Score | 30373 points | |
| 3DMark Fire Strike Score | 12733 points | |
Help | ||
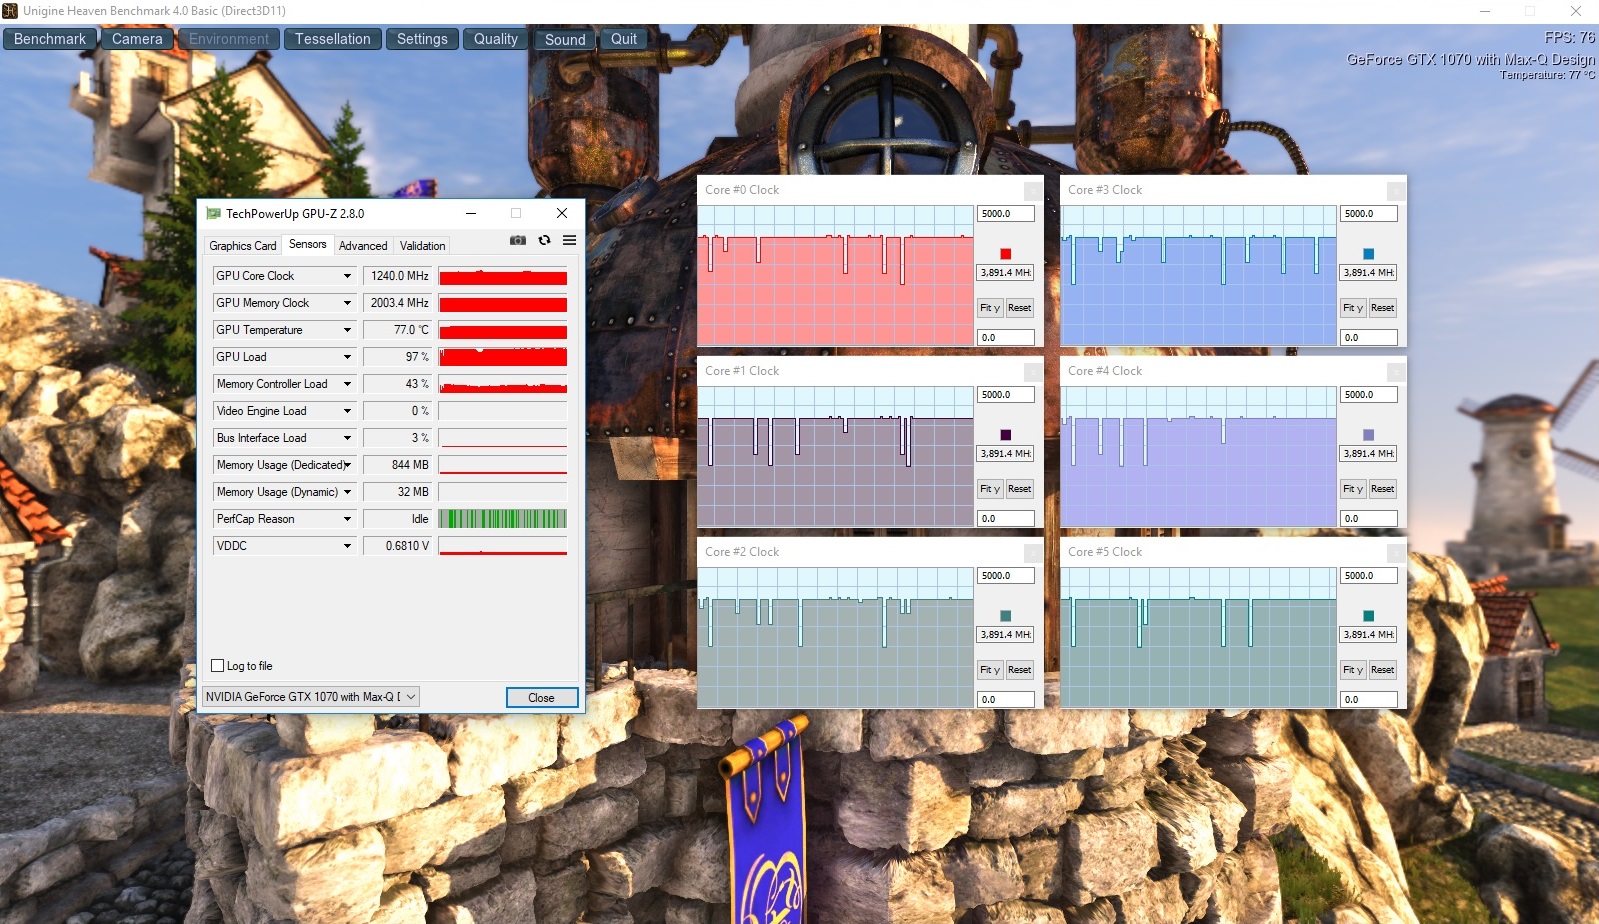
The GTX 1070 Max-Q has a base clock speed of 1,101 MHz which can increase up to 1,544 MHz. We tested the GPU and the extent to which it maintains its clock speed against The Witcher 3 set to Ultra in FHD. Our review unit performed well, achieving an average GPU frequency of 1,278 MHz over 60 minutes. The Witcher 3 is not a CPU-intensive game, so the Core i7-8750H maintained its 3.9 GHz boost clock speed. Correspondingly, we measured the GPU and CPU hitting 84 °C and 80 °C, respectively.
Gaming Performance
The GTX 1070 Max-Q is ideally suited for gaming despite its lower comparable performance. The DirectX 12 chip managed at least 50 FPS with maximum details in Full HD across all 15 games against which we tested the GS65. Some games even managed above 100 FPS, for which our review unit benefited from having a 144 Hz display.
| The Witcher 3 - 1920x1080 Ultra Graphics & Postprocessing (HBAO+) | |
| Average of class Gaming (95 - 240, n=8, last 2 years) | |
| Acer Predator Triton 700 | |
| Asus Zephyrus M GM501 | |
| MSI GS65 8RF-019DE Stealth Thin | |
| Gigabyte Aero 15X v8 | |
| MSI GS63VR 7RG-005 | |
The GS65 would need a more powerful GPU to play games at higher resolutions like WQHD and 4K. This would likely compromise the GS65’s slim design. Overall then, MSI has chosen the right GPU to deliver on the company's concept of a slim gaming notebook.
| low | med. | high | ultra | |
|---|---|---|---|---|
| The Witcher 3 (2015) | 95.5 | 52.7 | ||
| Resident Evil 7 (2017) | 135 | 116 | ||
| Rocket League (2017) | 196 | |||
| Playerunknown's Battlegrounds (PUBG) (2017) | 116 | 78.7 | ||
| FIFA 18 (2017) | 222 | 217 | ||
| The Evil Within 2 (2017) | 51.7 | 50.5 | ||
| Wolfenstein II: The New Colossus (2017) | 98.4 | 92.2 | ||
| Assassin´s Creed Origins (2017) | 71 | 61 | ||
| Call of Duty WWII (2017) | 115 | 101 | ||
| Need for Speed Payback (2017) | 92.5 | 88.6 | ||
| Star Wars Battlefront 2 (2017) | 89.2 | 75.9 | ||
| Fortnite (2018) | 127 | 105 | ||
| Final Fantasy XV Benchmark (2018) | 49.5 | |||
| Kingdom Come: Deliverance (2018) | 71.2 | 54.2 | ||
| Far Cry 5 (2018) | 83 | 78 |
Emissions
Fan Noise
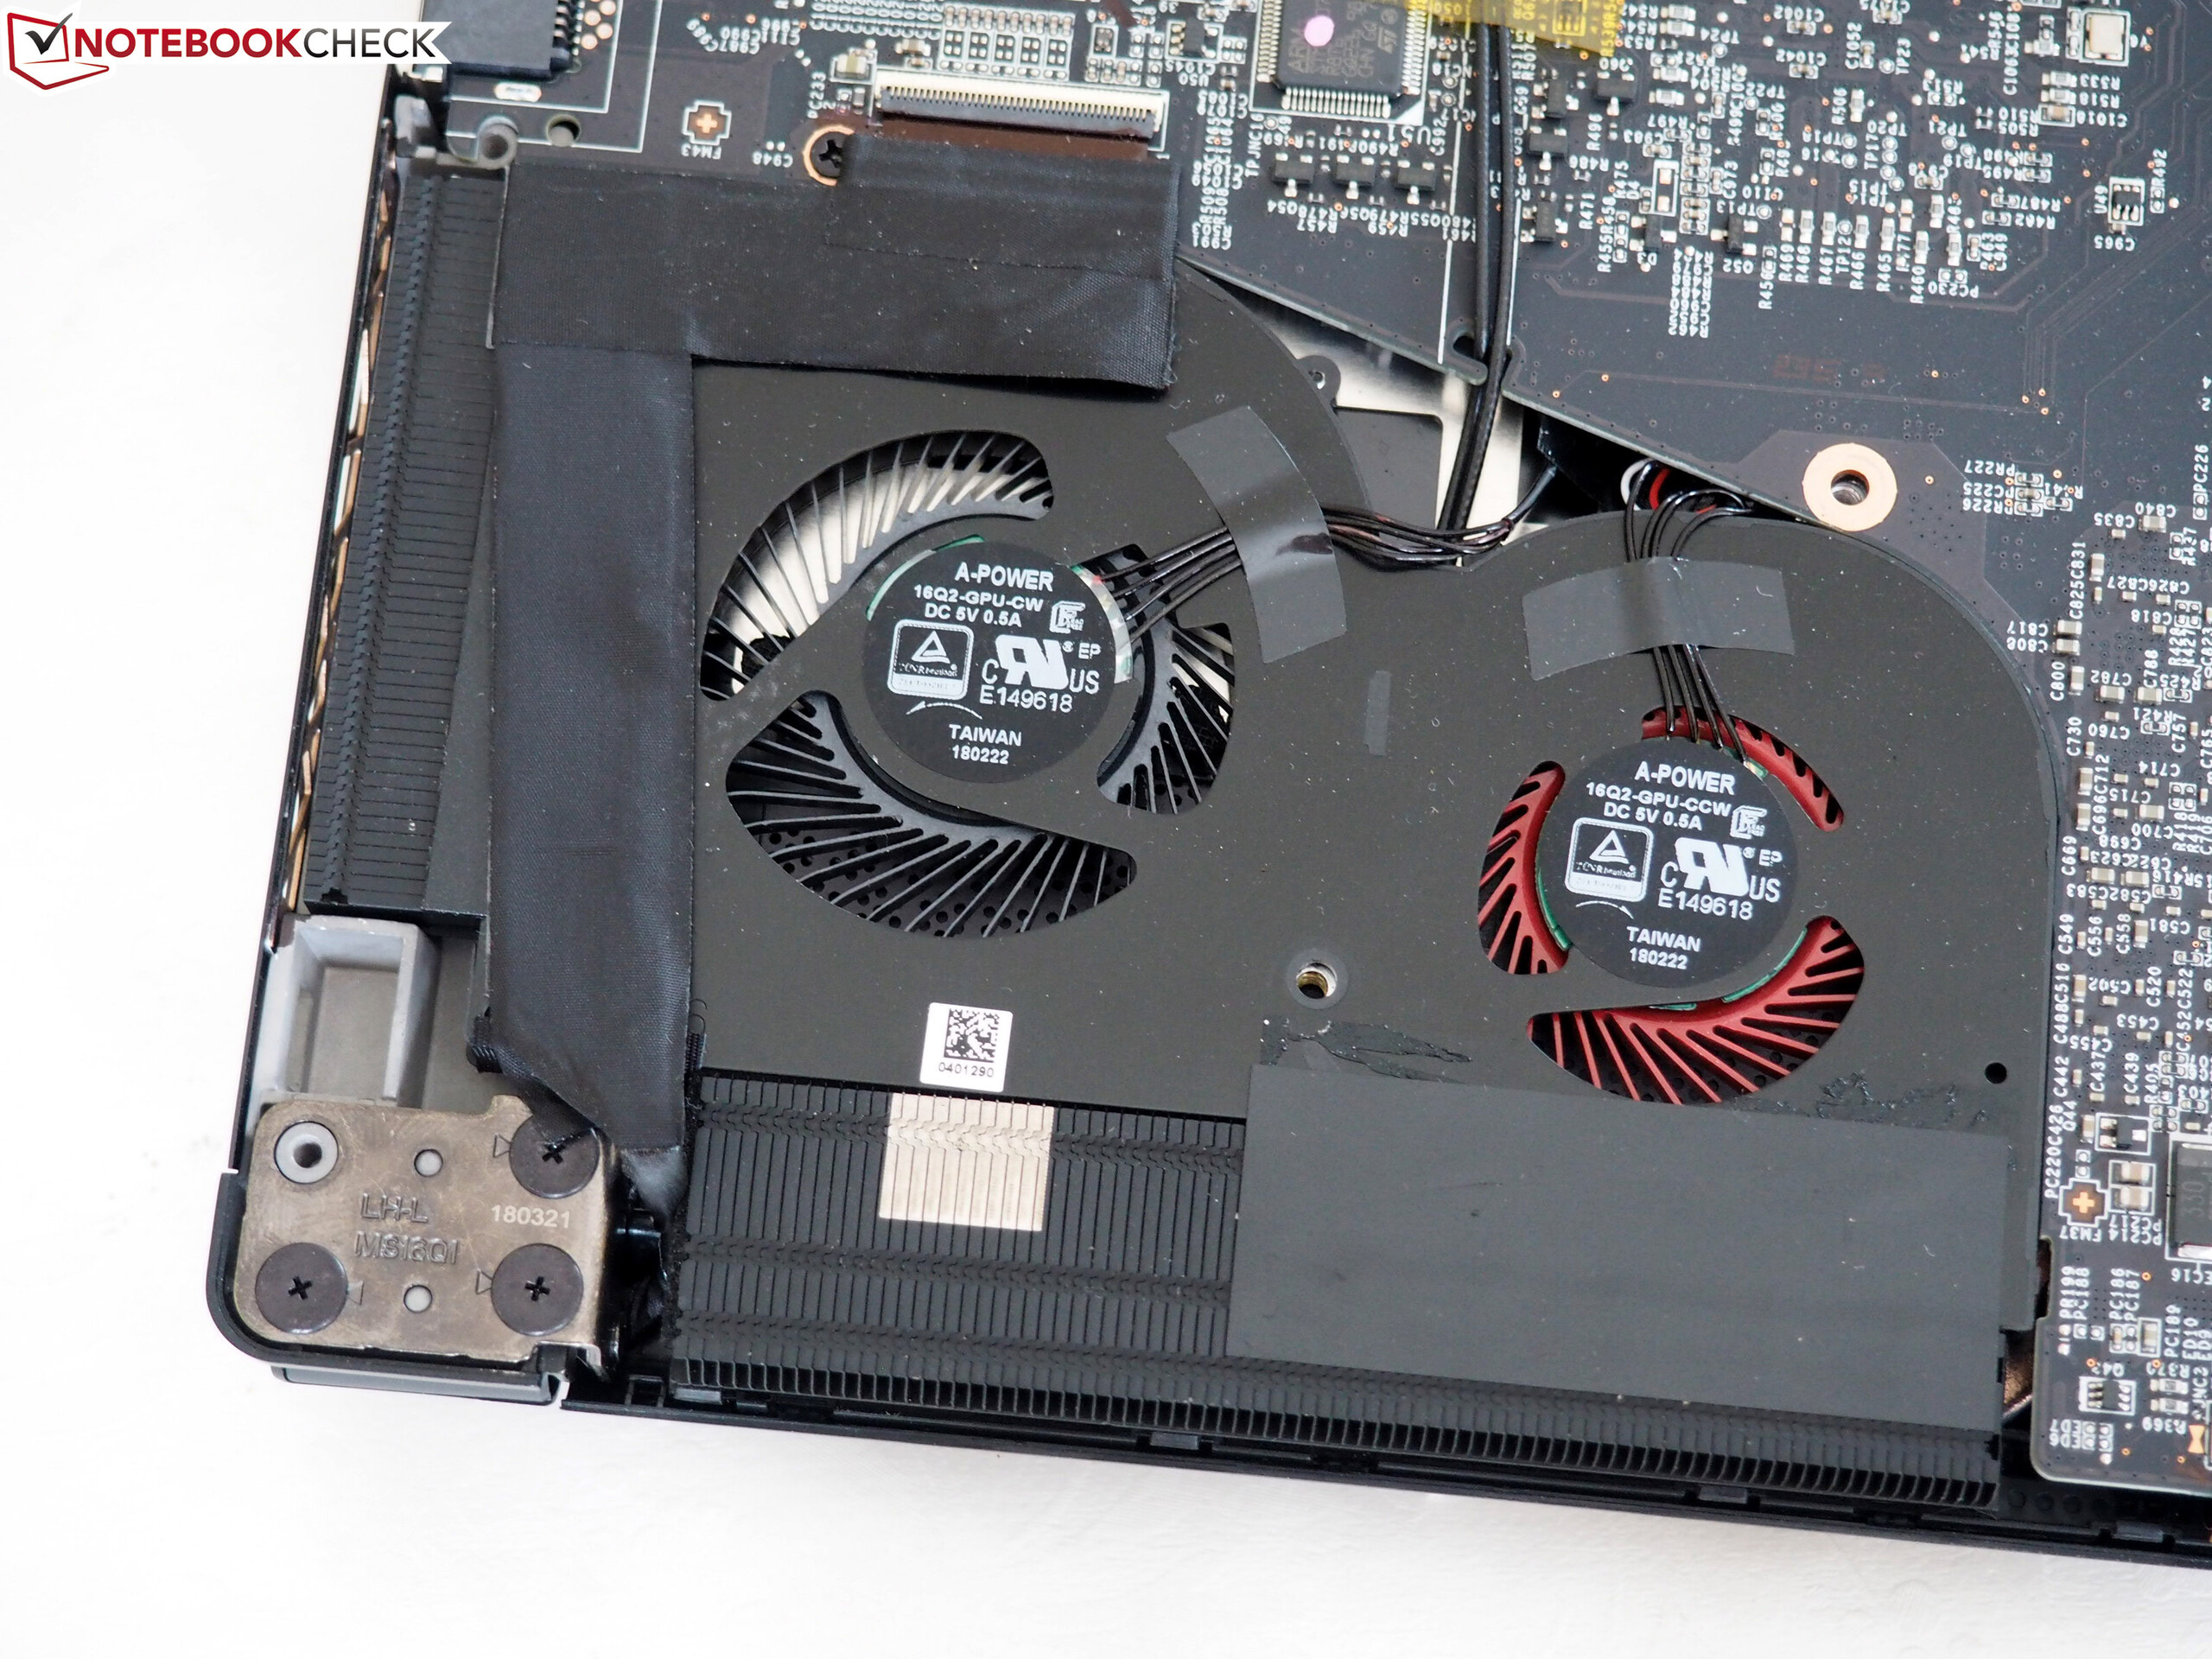
While the Aero 15X pulls ahead in some categories, the opposite is true for fan noise. It is worth bearing in mind that we did test the Aero 15X in the manufacturer default gaming mode which sets the fan at a higher speed than in standard mode. The GS65 still remains quieter even when set to comparable energy-saving settings.
Under ideal conditions, the GS65 will only turn on its right fan when it needs to at idle. This is practically inaudible when sat at a typical distance from the device. Whereas both devices idle at just under 30 dB(A), there are greater differences under load. The GS65 hits 42-44 dB(A) under load, which is relatively quiet for a gaming notebook; thereby demonstrating the advantages of the Max-Q design. By contrast, the Aero 15X was far louder when testing with 3DMark06, The Witcher 3 or a stress test.
The GS65 is far from perfect with its fan control or its fan characteristics. Unfortunately, the fans are rather high-pitched. This makes our review unit sound far louder than the dB(A) values otherwise suggest. We noticed that the fans tend to come on under light to medium intensity tasks like program installations, launches or Windows updates. This may bother some users, but this could be mitigated by using the manual fan curve.
Noise level
| Idle |
| 30 / 31 / 34 dB(A) |
| Load |
| 43 / 44 dB(A) |
 | ||
30 dB silent 40 dB(A) audible 50 dB(A) loud |
||
min: | ||
| MSI GS65 8RF-019DE Stealth Thin GeForce GTX 1070 Max-Q, i7-8750H | MSI GS63VR 7RG-005 GeForce GTX 1070 Max-Q, i7-7700HQ | Gigabyte Aero 15X v8 GeForce GTX 1070 Max-Q, i7-8750H | Asus Zephyrus M GM501 GeForce GTX 1070 Mobile, i7-8750H | Acer Predator Triton 700 GeForce GTX 1080 Max-Q, i7-7700HQ | Average of class Gaming | |
|---|---|---|---|---|---|---|
| Noise | -3% | -8% | -6% | -7% | 6% | |
| off / environment * (dB) | 30 | 30 -0% | 29 3% | 29 3% | 31 -3% | 24.1 ? 20% |
| Idle Minimum * (dB) | 30 | 31 -3% | 30 -0% | 30 -0% | 33 -10% | 25.8 ? 14% |
| Idle Average * (dB) | 31 | 34 -10% | 31 -0% | 31 -0% | 34 -10% | 27.5 ? 11% |
| Idle Maximum * (dB) | 34 | 35 -3% | 35 -3% | 33 3% | 40 -18% | 30 ? 12% |
| Load Average * (dB) | 43 | 42 2% | 49 -14% | 49 -14% | 41 5% | 43.1 ? -0% |
| Witcher 3 ultra * (dB) | 42 | 44 -5% | 51 -21% | 50 -19% | 43 -2% | |
| Load Maximum * (dB) | 44 | 46 -5% | 54 -23% | 52 -18% | 48 -9% | 54 ? -23% |
* ... smaller is better
Temperature
Likewise, the GS65 manages its temperatures better than the Aero 15X too. Despite the lower fan noise, surface temperatures remain cooler than the Aero 15X. At idle, the GS65 reached a maximum of 24 °C on the top and 25 °C on its underside. We measured maximum surface temperatures of 49 °C on the top and 53 °C on the bottom case. Compare this with the Aero 15X, which reached a far hotter 63 °C and 65 °C, respectively. Regardless, both devices get hot so neither should be used on your lap when gaming.
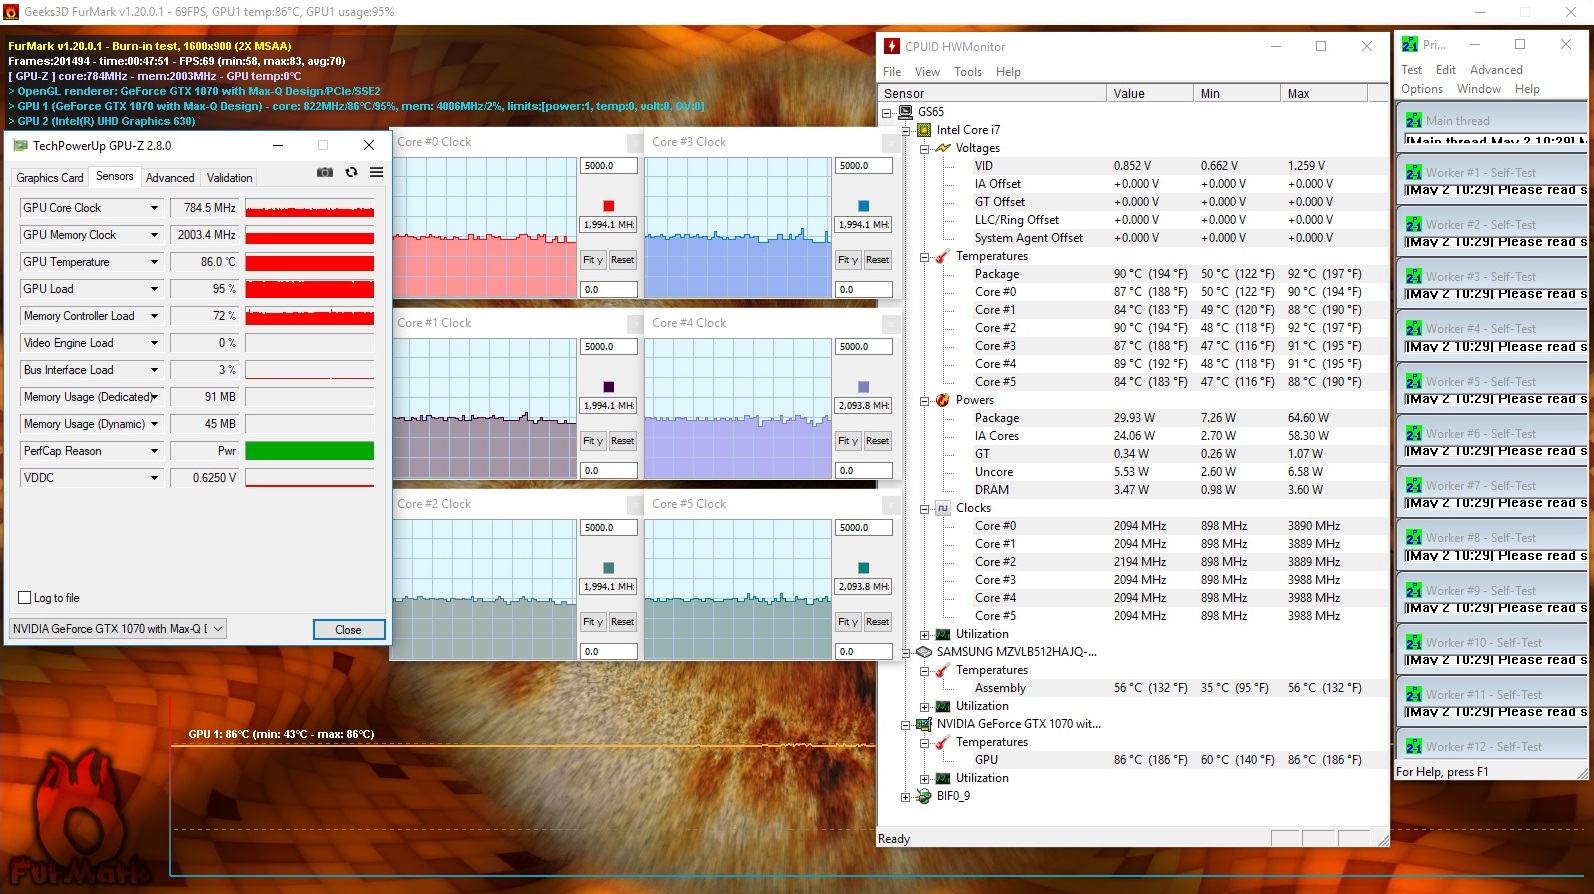
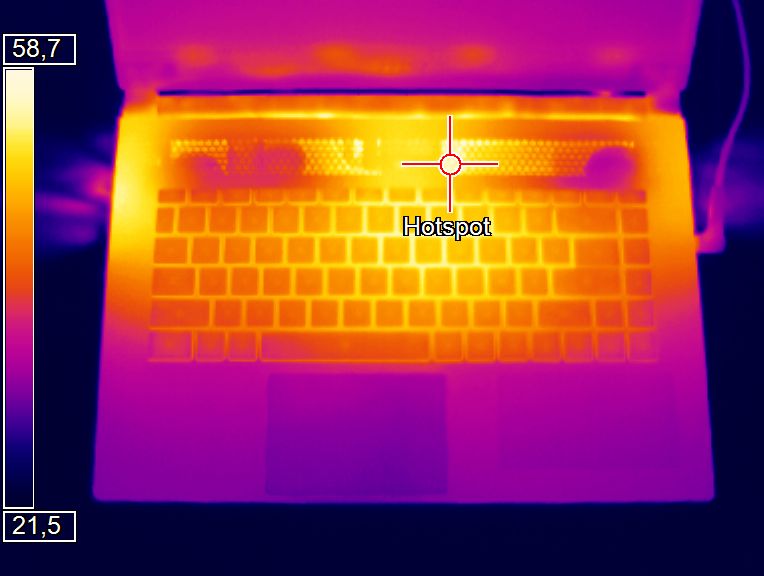
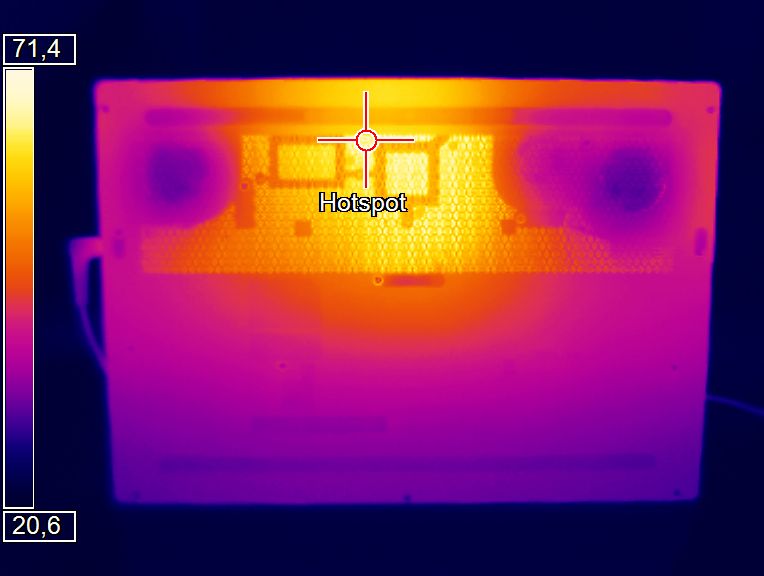
Unfortunately, the GS65’s heat management does not extend to the CPU and GPU. In our FurMark and Prime95 stress tests both the CPU and GPU thermal throttle below their base clock speed; this does not happen with the Aero 15X. We noticed that thermal throttling occurs at around 86 °C for the GPU and at 90 °C for the CPU. Fortunately, this degree of thermal throttling does not occur during everyday gaming.
(-) The maximum temperature on the upper side is 49 °C / 120 F, compared to the average of 40.4 °C / 105 F, ranging from 21.2 to 68.8 °C for the class Gaming.
(-) The bottom heats up to a maximum of 63 °C / 145 F, compared to the average of 43.2 °C / 110 F
(+) In idle usage, the average temperature for the upper side is 23.2 °C / 74 F, compared to the device average of 33.9 °C / 93 F.
(-) Playing The Witcher 3, the average temperature for the upper side is 44.4 °C / 112 F, compared to the device average of 33.9 °C / 93 F.
(±) The palmrests and touchpad can get very hot to the touch with a maximum of 37 °C / 98.6 F.
(-) The average temperature of the palmrest area of similar devices was 28.8 °C / 83.8 F (-8.2 °C / -14.8 F).
| MSI GS65 8RF-019DE Stealth Thin GeForce GTX 1070 Max-Q, i7-8750H | MSI GS63VR 7RG-005 GeForce GTX 1070 Max-Q, i7-7700HQ | Gigabyte Aero 15X v8 GeForce GTX 1070 Max-Q, i7-8750H | Asus Zephyrus M GM501 GeForce GTX 1070 Mobile, i7-8750H | Acer Predator Triton 700 GeForce GTX 1080 Max-Q, i7-7700HQ | Average of class Gaming | |
|---|---|---|---|---|---|---|
| Heat | -2% | -10% | -9% | -21% | -9% | |
| Maximum Upper Side * (°C) | 49 | 47 4% | 53 -8% | 52 -6% | 61 -24% | 45.2 ? 8% |
| Maximum Bottom * (°C) | 63 | 63 -0% | 65 -3% | 49 22% | 69 -10% | 48.2 ? 23% |
| Idle Upper Side * (°C) | 24 | 25 -4% | 26 -8% | 31 -29% | 29 -21% | 31.1 ? -30% |
| Idle Bottom * (°C) | 25 | 27 -8% | 30 -20% | 31 -24% | 32 -28% | 34.3 ? -37% |
* ... smaller is better
Speakers
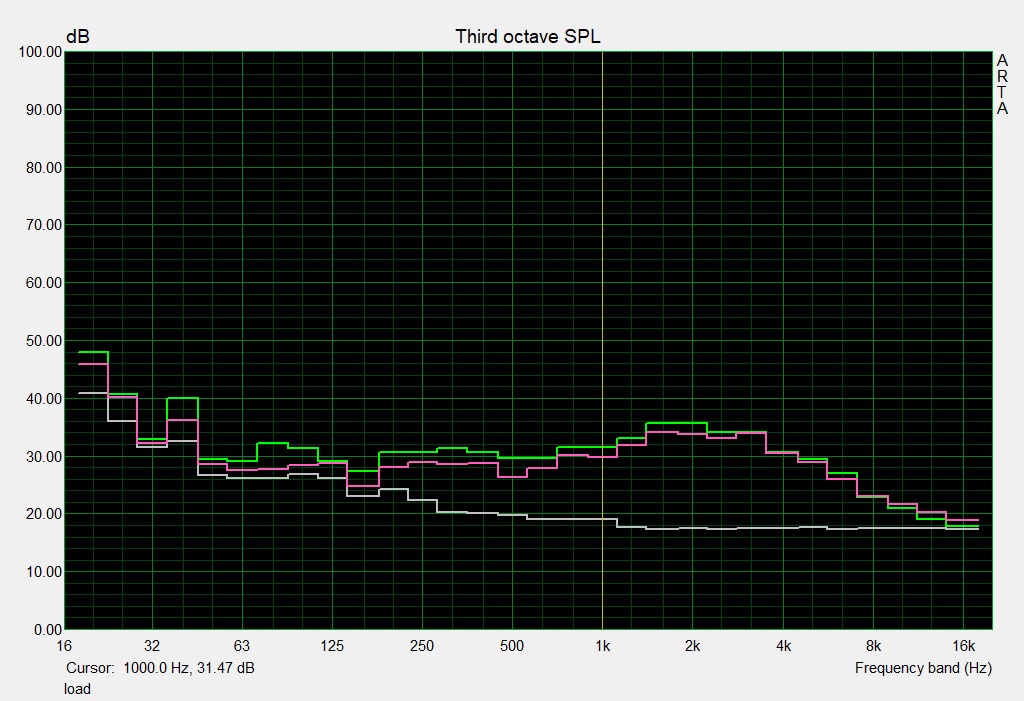
According to our audio analysis, the older GS63 has higher maximum volumes, with the GS65 improving in all other areas. The overall sound quality has improved though, with stronger bass performance and more balanced and linear mid-tones.
There is no clear winner between the GS65 and Aero 15X, with both devices performing equally well and they are fine for listening to music, playing games or watching movies. We would recommend using external speakers or headphones for better sound quality though, as is the case with most laptops.
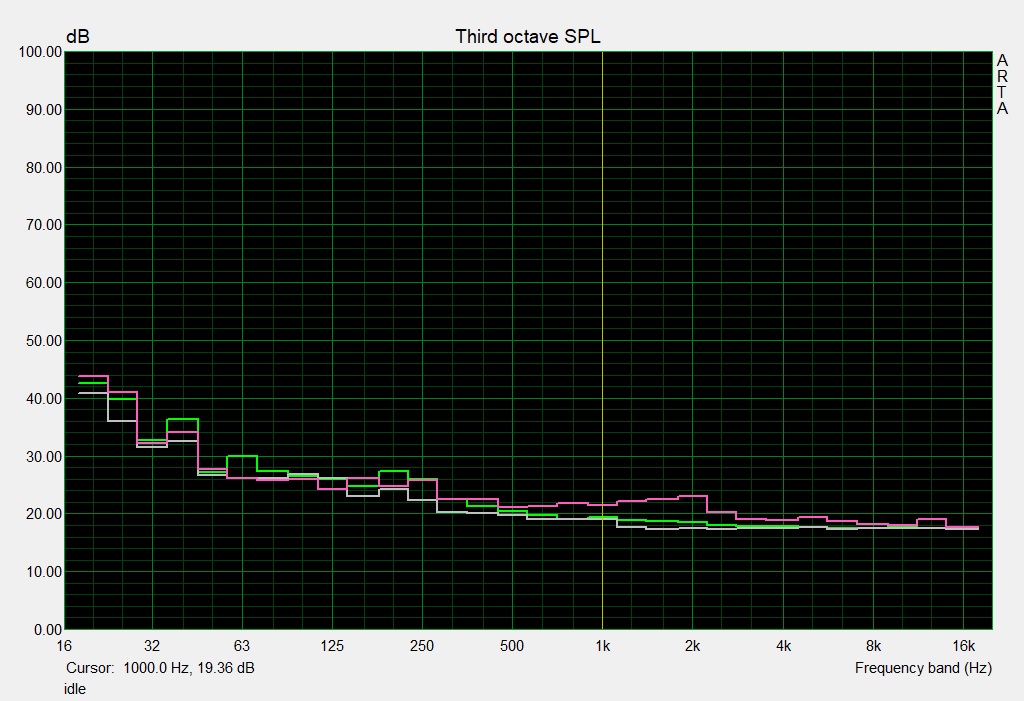
MSI GS65 8RF-019DE Stealth Thin audio analysis
(±) | speaker loudness is average but good (76 dB)
Bass 100 - 315 Hz
(-) | nearly no bass - on average 16.4% lower than median
(±) | linearity of bass is average (9.7% delta to prev. frequency)
Mids 400 - 2000 Hz
(+) | balanced mids - only 4.9% away from median
(+) | mids are linear (5.6% delta to prev. frequency)
Highs 2 - 16 kHz
(+) | balanced highs - only 2.5% away from median
(±) | linearity of highs is average (7.1% delta to prev. frequency)
Overall 100 - 16.000 Hz
(±) | linearity of overall sound is average (18.5% difference to median)
Compared to same class
» 60% of all tested devices in this class were better, 8% similar, 32% worse
» The best had a delta of 6%, average was 18%, worst was 132%
Compared to all devices tested
» 41% of all tested devices were better, 8% similar, 51% worse
» The best had a delta of 4%, average was 24%, worst was 134%
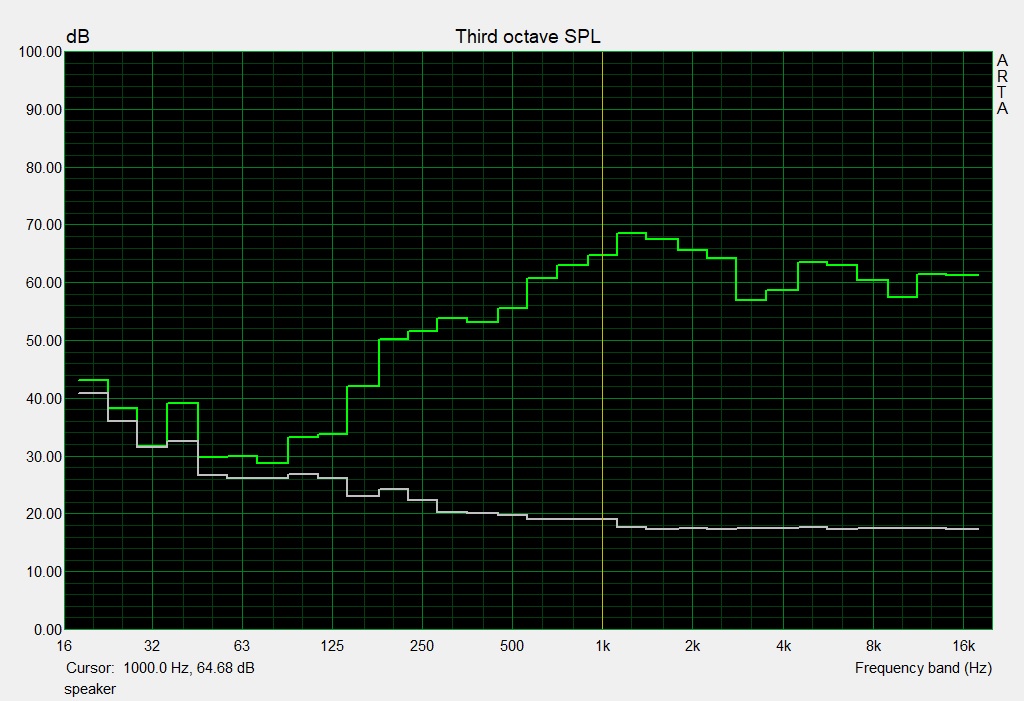
Gigabyte Aero 15X v8 audio analysis
(±) | speaker loudness is average but good (78 dB)
Bass 100 - 315 Hz
(-) | nearly no bass - on average 16.8% lower than median
(±) | linearity of bass is average (11.6% delta to prev. frequency)
Mids 400 - 2000 Hz
(+) | balanced mids - only 4.3% away from median
(+) | mids are linear (5% delta to prev. frequency)
Highs 2 - 16 kHz
(+) | balanced highs - only 3.6% away from median
(±) | linearity of highs is average (9.1% delta to prev. frequency)
Overall 100 - 16.000 Hz
(±) | linearity of overall sound is average (18.4% difference to median)
Compared to same class
» 59% of all tested devices in this class were better, 9% similar, 33% worse
» The best had a delta of 6%, average was 18%, worst was 132%
Compared to all devices tested
» 41% of all tested devices were better, 8% similar, 52% worse
» The best had a delta of 4%, average was 24%, worst was 134%
Power Management
Power Consumption
The GS65 is relatively economical thanks to Nvidia Optimus graphics-switching. We measured the GS65 consuming between 7 and 20 W at idle, which is significantly lower than the Aero 15X with 14 to 22 W. The GS65 and Aero 15X consume similar amounts under load. The GS65 has higher minimum and maximum values with 98-173 W compared to 91-173 W for the Aero 15X.
| Off / Standby | |
| Idle | |
| Load |
|
Key:
min: | |
| MSI GS65 8RF-019DE Stealth Thin GeForce GTX 1070 Max-Q, i7-8750H | MSI GS63VR 7RG-005 GeForce GTX 1070 Max-Q, i7-7700HQ | Gigabyte Aero 15X v8 GeForce GTX 1070 Max-Q, i7-8750H | Asus Zephyrus M GM501 GeForce GTX 1070 Mobile, i7-8750H | Acer Predator Triton 700 GeForce GTX 1080 Max-Q, i7-7700HQ | Average of class Gaming | |
|---|---|---|---|---|---|---|
| Power Consumption | -16% | -28% | -47% | -107% | -47% | |
| Idle Minimum * (Watt) | 7 | 12 -71% | 14 -100% | 16 -129% | 28 -300% | 13.3 ? -90% |
| Idle Average * (Watt) | 11 | 16 -45% | 18 -64% | 19 -73% | 33 -200% | 19 ? -73% |
| Idle Maximum * (Watt) | 20 | 21 -5% | 22 -10% | 26 -30% | 41 -105% | 24.5 ? -23% |
| Load Average * (Watt) | 98 | 85 13% | 91 7% | 103 -5% | 94 4% | 108.1 ? -10% |
| Witcher 3 ultra * (Watt) | 132 | 128 3% | 142 -8% | 164 -24% | 160 -21% | |
| Load Maximum * (Watt) | 182 | 162 11% | 173 5% | 223 -23% | 222 -22% | 254 ? -40% |
* ... smaller is better
Battery Life
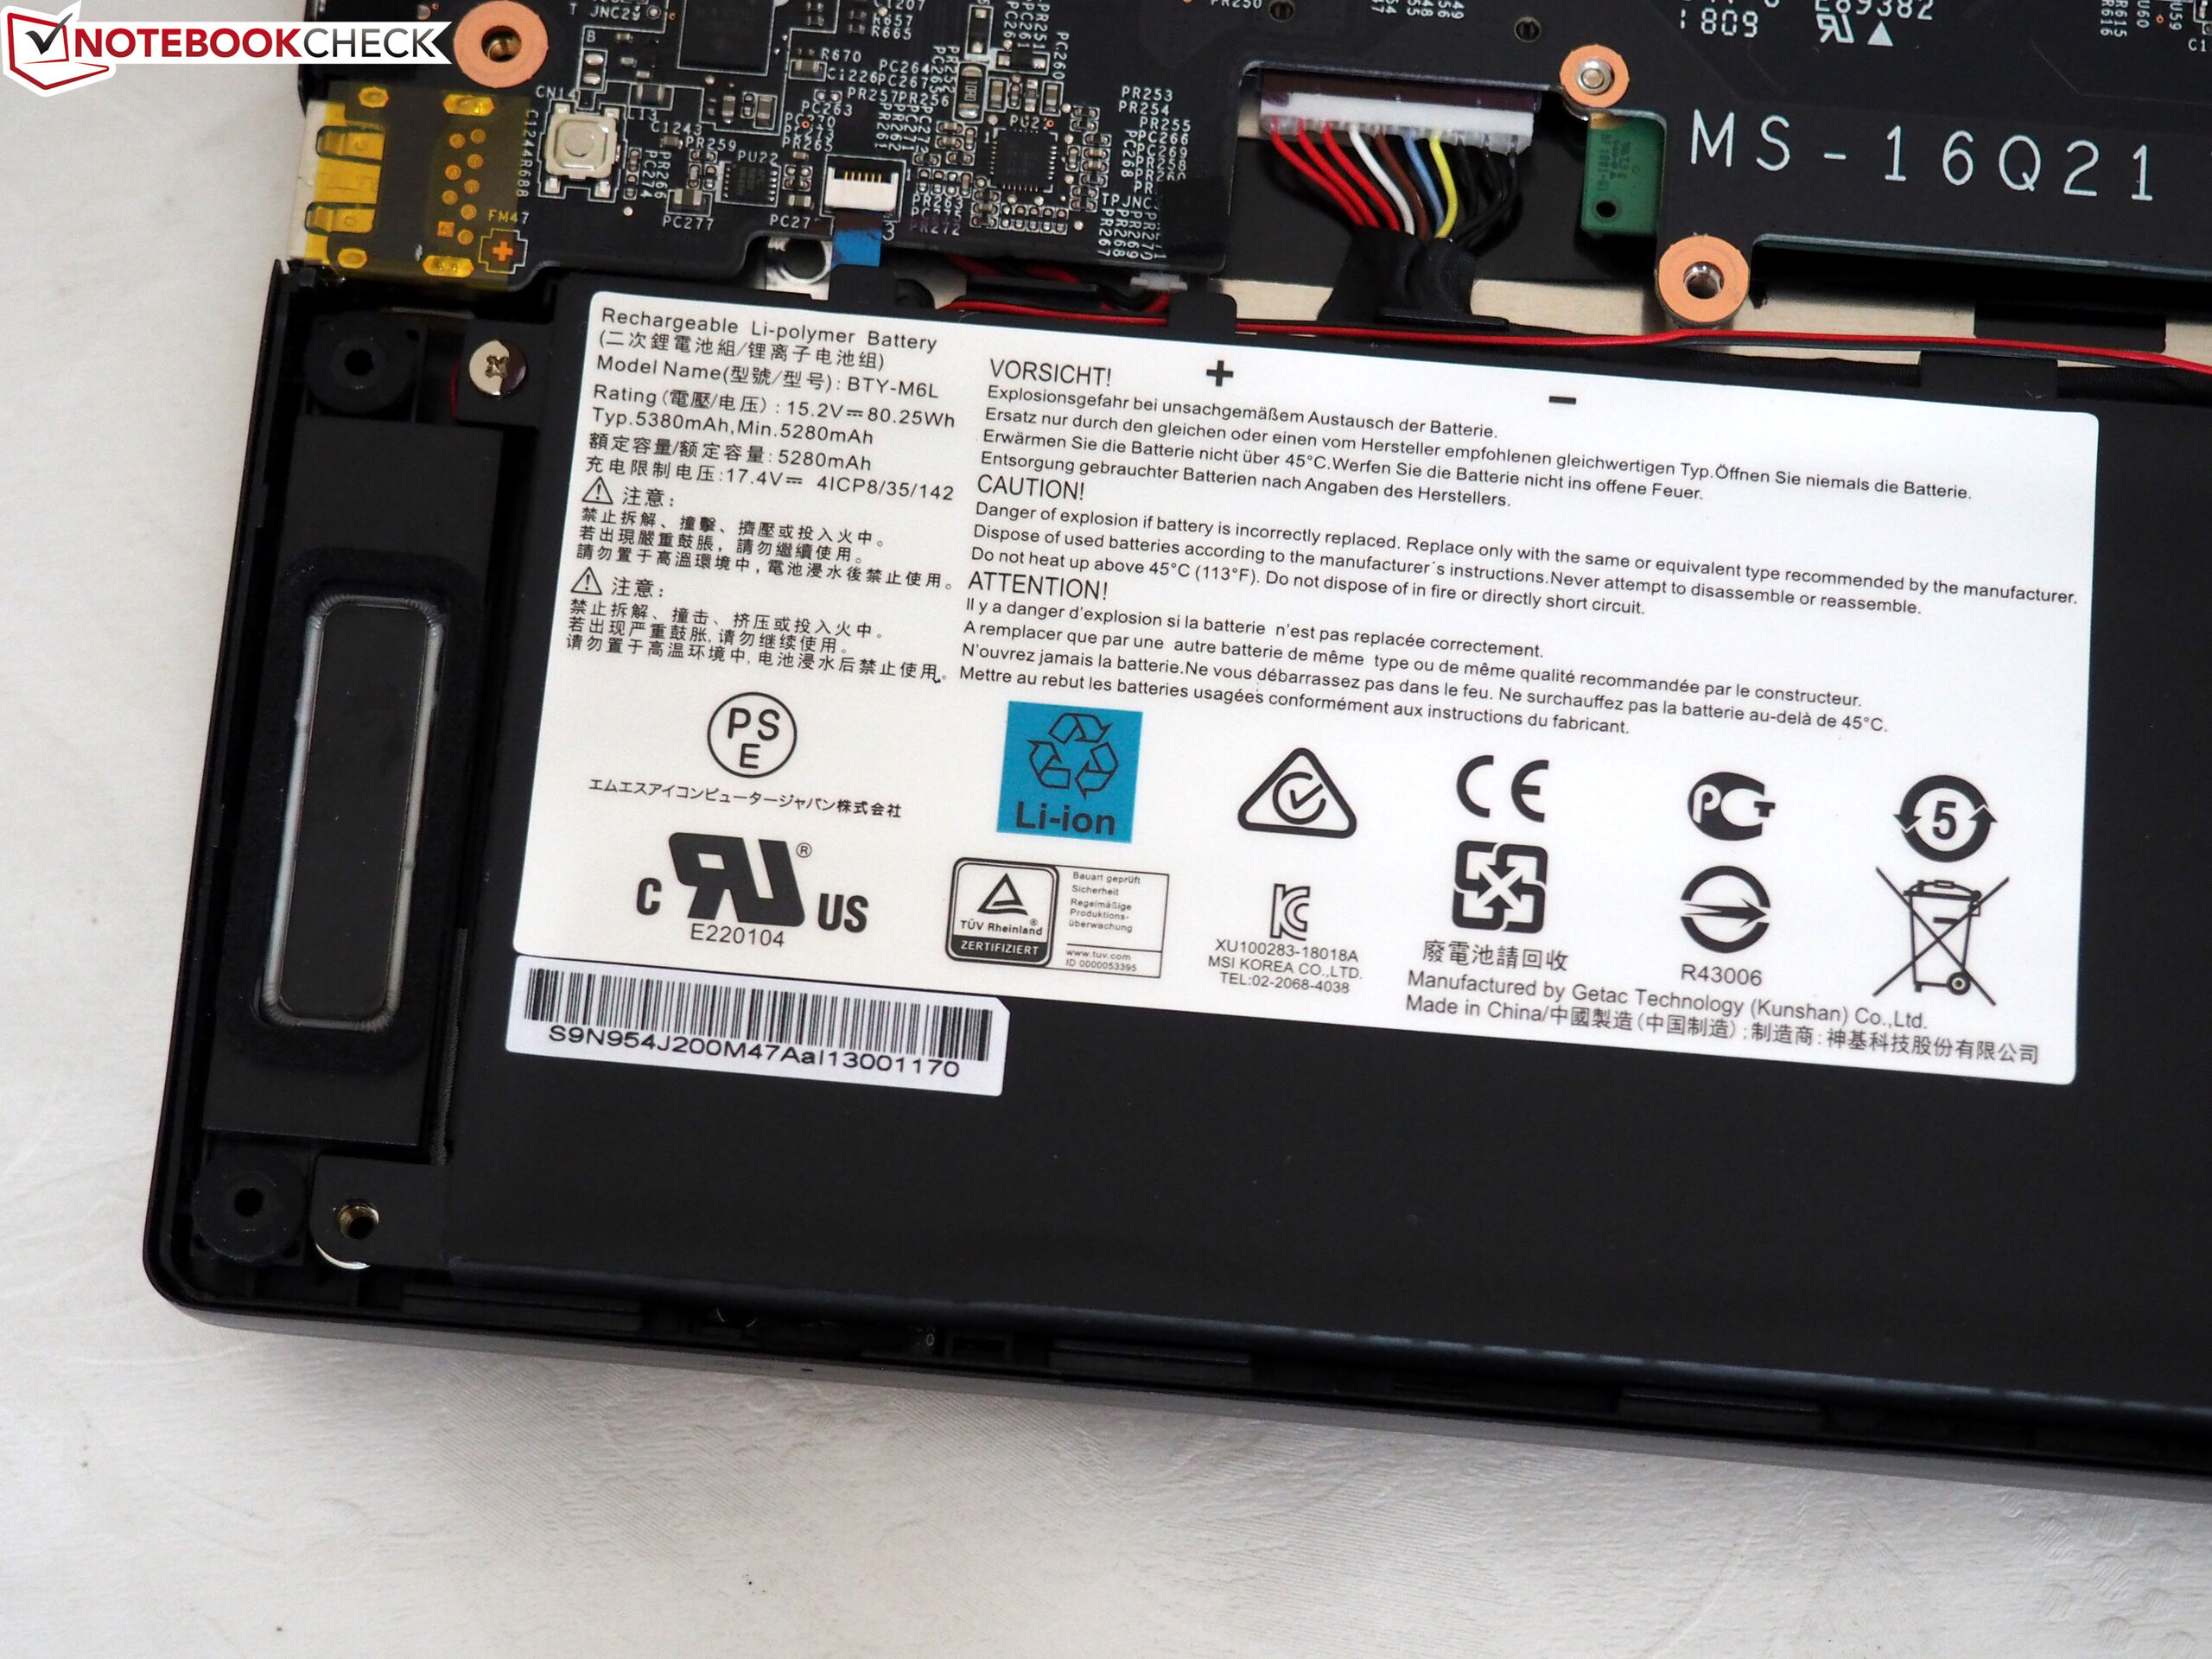
Although the average power consumption of the GS65 is lower compared to the Aero 15X, the Gigabyte laptop manages longer battery runtimes. One of the reasons is the smaller battery capacity of MSI's 15-inch system at "just" 82 instead of 94 Wh (52 Wh @GS63). While the Aero 15X lasts more than 12 hours in the Battery Eater Reader's Test at minimum brightness, the GS65 only lasts 8.5 hours. The MSI laptop does not last as long in the practical tests. We only determine 6 instead of 8.5 hours (medium luminance), which is still good for a gaming system. However, the battery capacity does not seem to be the only advantage of the Aero 15X. It looks like the power-saving mechanisms of the GS65 are not working properly yet. We noticed strange peaks in the power measurements every couple of seconds, which do not make much sense at first. An analysis of the CPU reveals the problem. Despite the right power settings, the Core i7-8750H did not always maintain its idle clock of 800 MHz, but we often saw more than 2 or 3 GHz.
Update 05/10/18: The battery runtime is a bit better compared to the Shift-Setting power options. We now determined 6.5 instead of 6 hours in the video test.
Important note for gamers: 3D performance drops by around 60% on battery. We checked this with The Witcher 3.
| MSI GS65 8RF-019DE Stealth Thin GeForce GTX 1070 Max-Q, i7-8750H, 82 Wh | MSI GS63VR 7RG-005 GeForce GTX 1070 Max-Q, i7-7700HQ, 52.4 Wh | Gigabyte Aero 15X v8 GeForce GTX 1070 Max-Q, i7-8750H, 94.24 Wh | Asus Zephyrus M GM501 GeForce GTX 1070 Mobile, i7-8750H, 55 Wh | Acer Predator Triton 700 GeForce GTX 1080 Max-Q, i7-7700HQ, 54 Wh | Average of class Gaming | |
|---|---|---|---|---|---|---|
| Battery runtime | -33% | 55% | -44% | -54% | 16% | |
| Reader / Idle (h) | 8.5 | 5.7 -33% | 12.7 49% | 4 -53% | 2.5 -71% | 8.71 ? 2% |
| H.264 (h) | 5.9 | 3.8 -36% | 8.4 42% | 2.7 -54% | 1.8 -69% | 8.26 ? 40% |
| WiFi v1.3 (h) | 6 | 3.9 -35% | 8.6 43% | 2.7 -55% | 2.4 -60% | 7.01 ? 17% |
| Load (h) | 1.4 | 1 -29% | 2.6 86% | 1.2 -14% | 1.2 -14% | 1.47 ? 5% |
Verdict
Pros
Cons
The GS65 cannot quite match the overall package that the Gigabyte Aero 15X offers, despite MSI’s best efforts.
While the GS65 looks stylish with its aluminum chassis, the Aero 15X is sturdier and is better built. Specifically, there are audible creaks and cracking sounds when the GS65 is subjected to strong physical pressure. Moreover, the larger battery, better maintainability, inclusion of a card reader and improved typing experience are all in the Aero 15X’s favor.
However, if you like it to be as quiet as possible when gaming, then you should pick up the GS65 as the fans are far quieter. Both devices have manual fan controls with which you could experiment.
Despite some weaknesses, the compact 15-inch device is one of the best gaming laptops under 2.5 kg, which puts the MSI GS65 among our Top 10 Thin & Light Gaming Notebooks.
MSI has made huge strides from the GS63 with the GS65.
MSI GS65 8RF-019DE Stealth Thin
- 05/08/2018 v6 (old)
Florian Glaser
Price comparison
