MSI P65 Creator 8RF (i7-8750H, GTX 1070 Max-Q, 512 GB SSD, 144 Hz) Laptop Review
With the P65 Creator 8RE, 8RD, and 8RF MSI introduced three new Prestige-series devices that are basically three different trim models of the same base unit. All three share some commonalities, such as the Intel Core i7-8750H CPU, 16 GB of RAM, and 512 GB of storage. This should make for a solid basis.
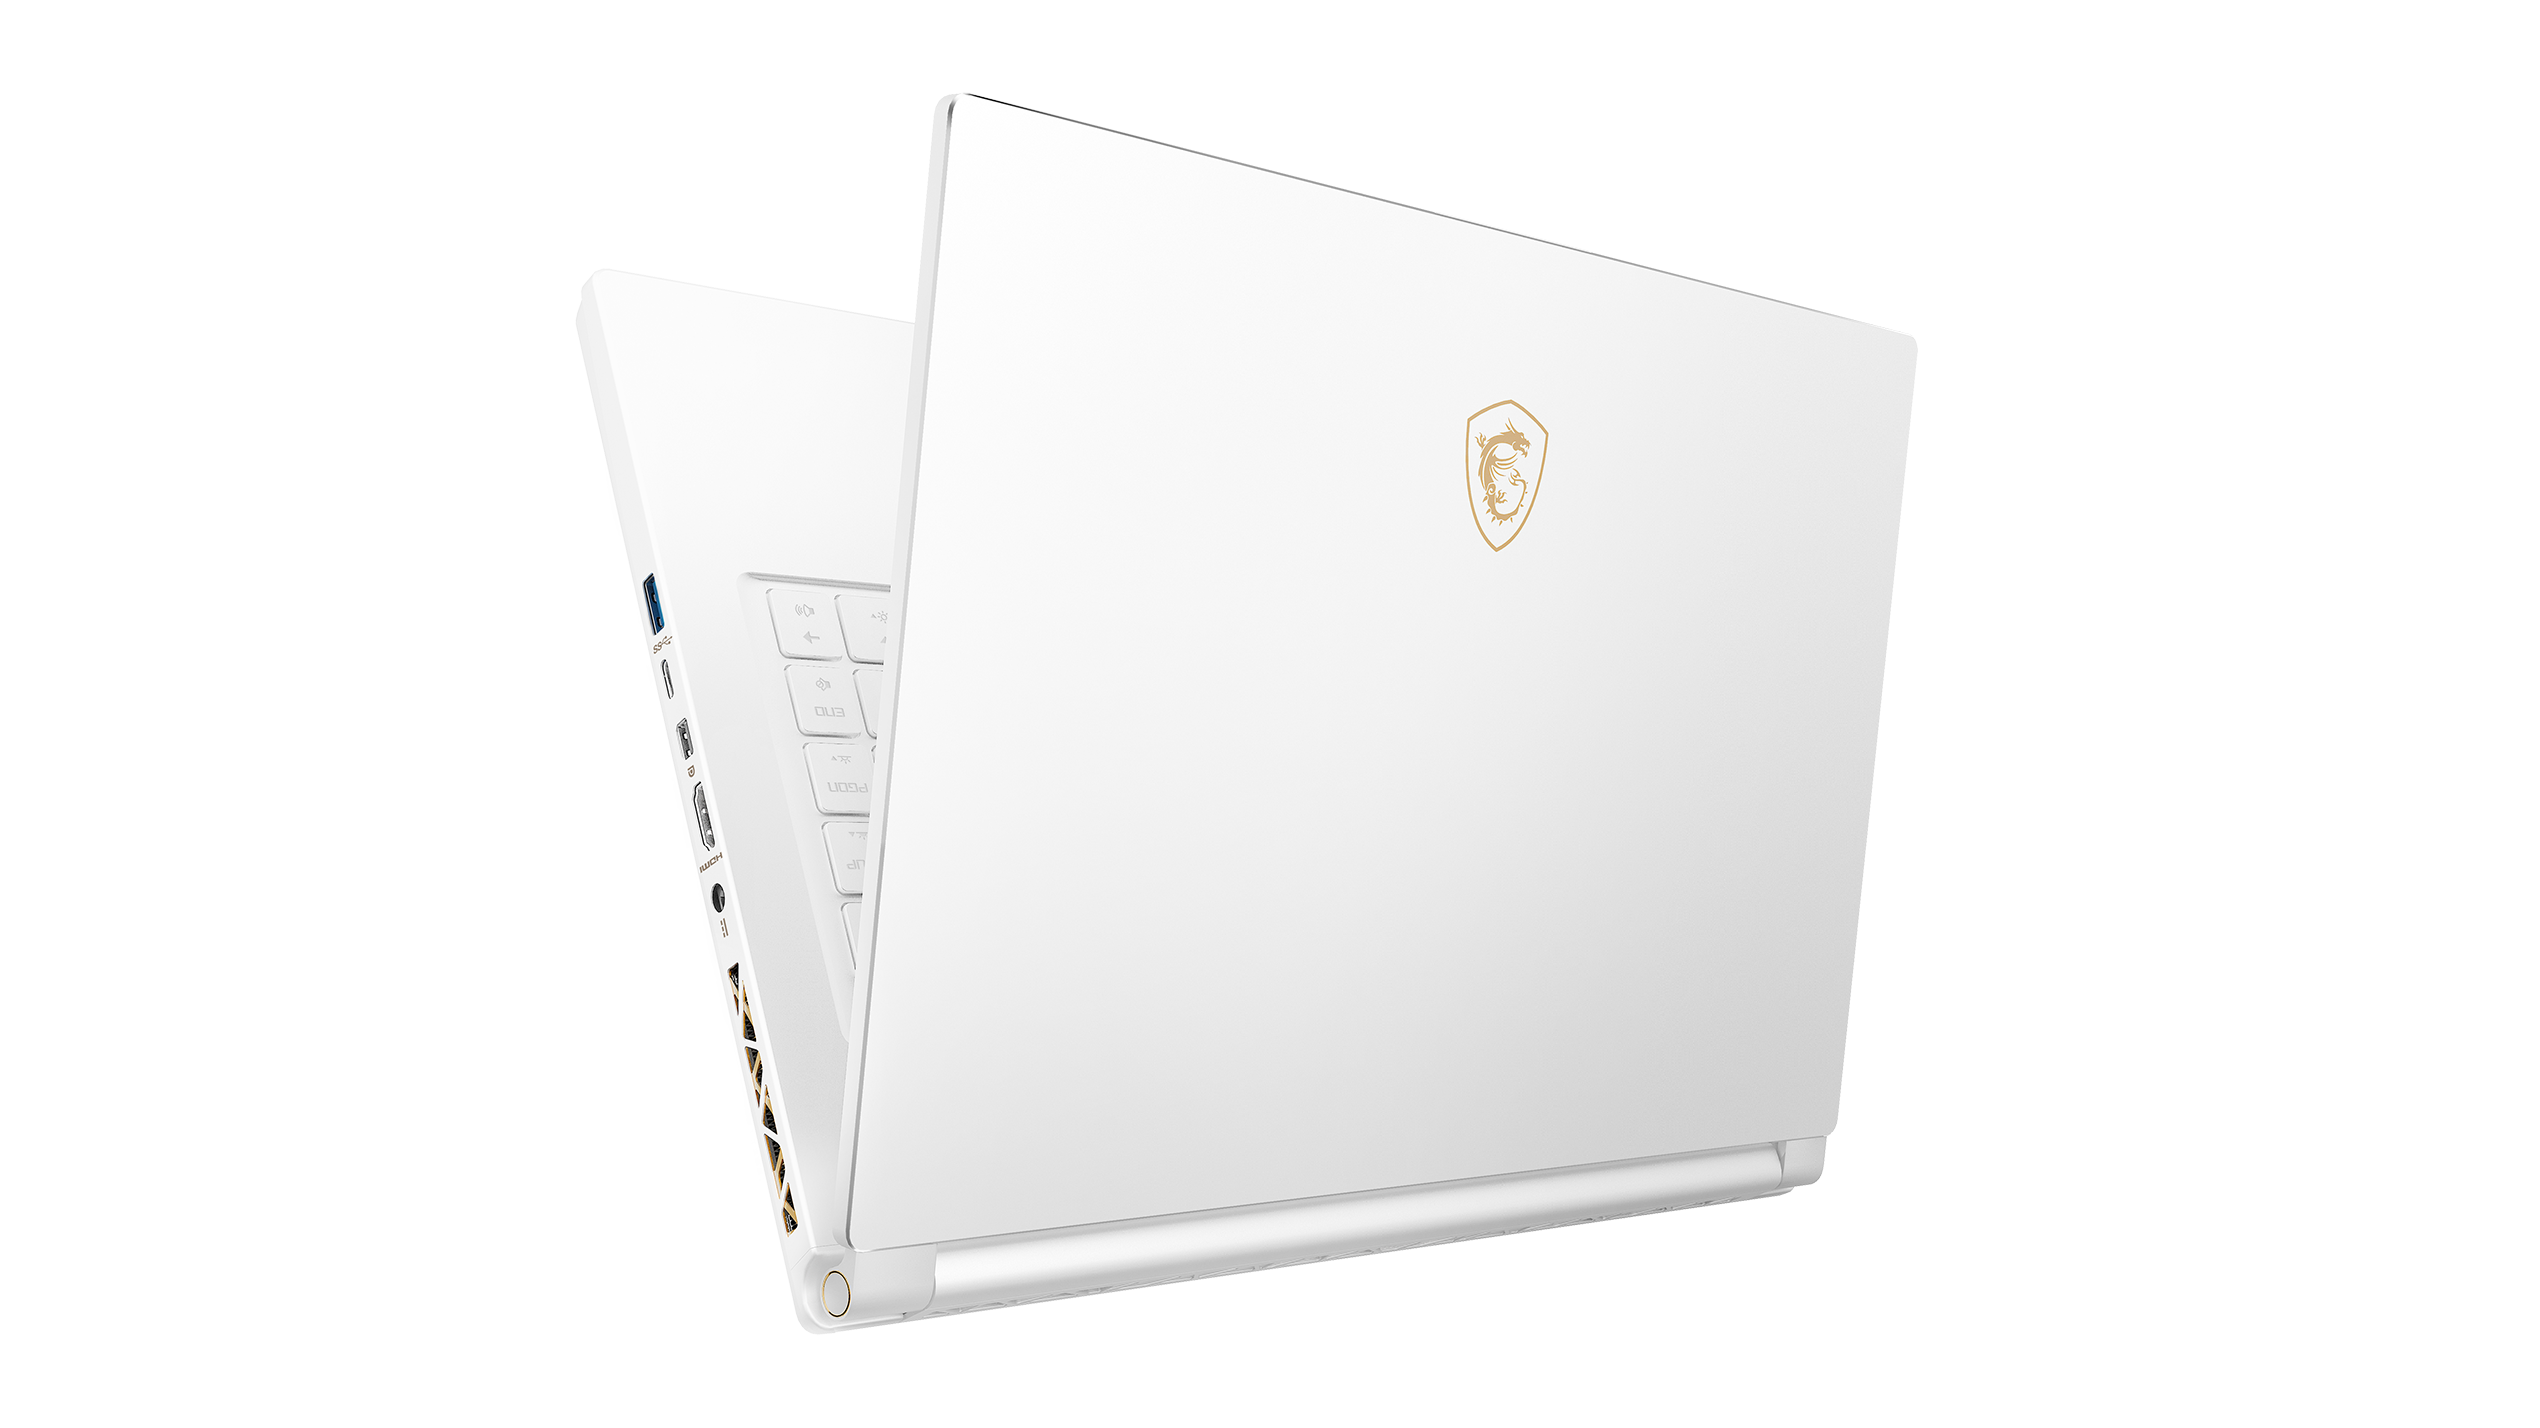
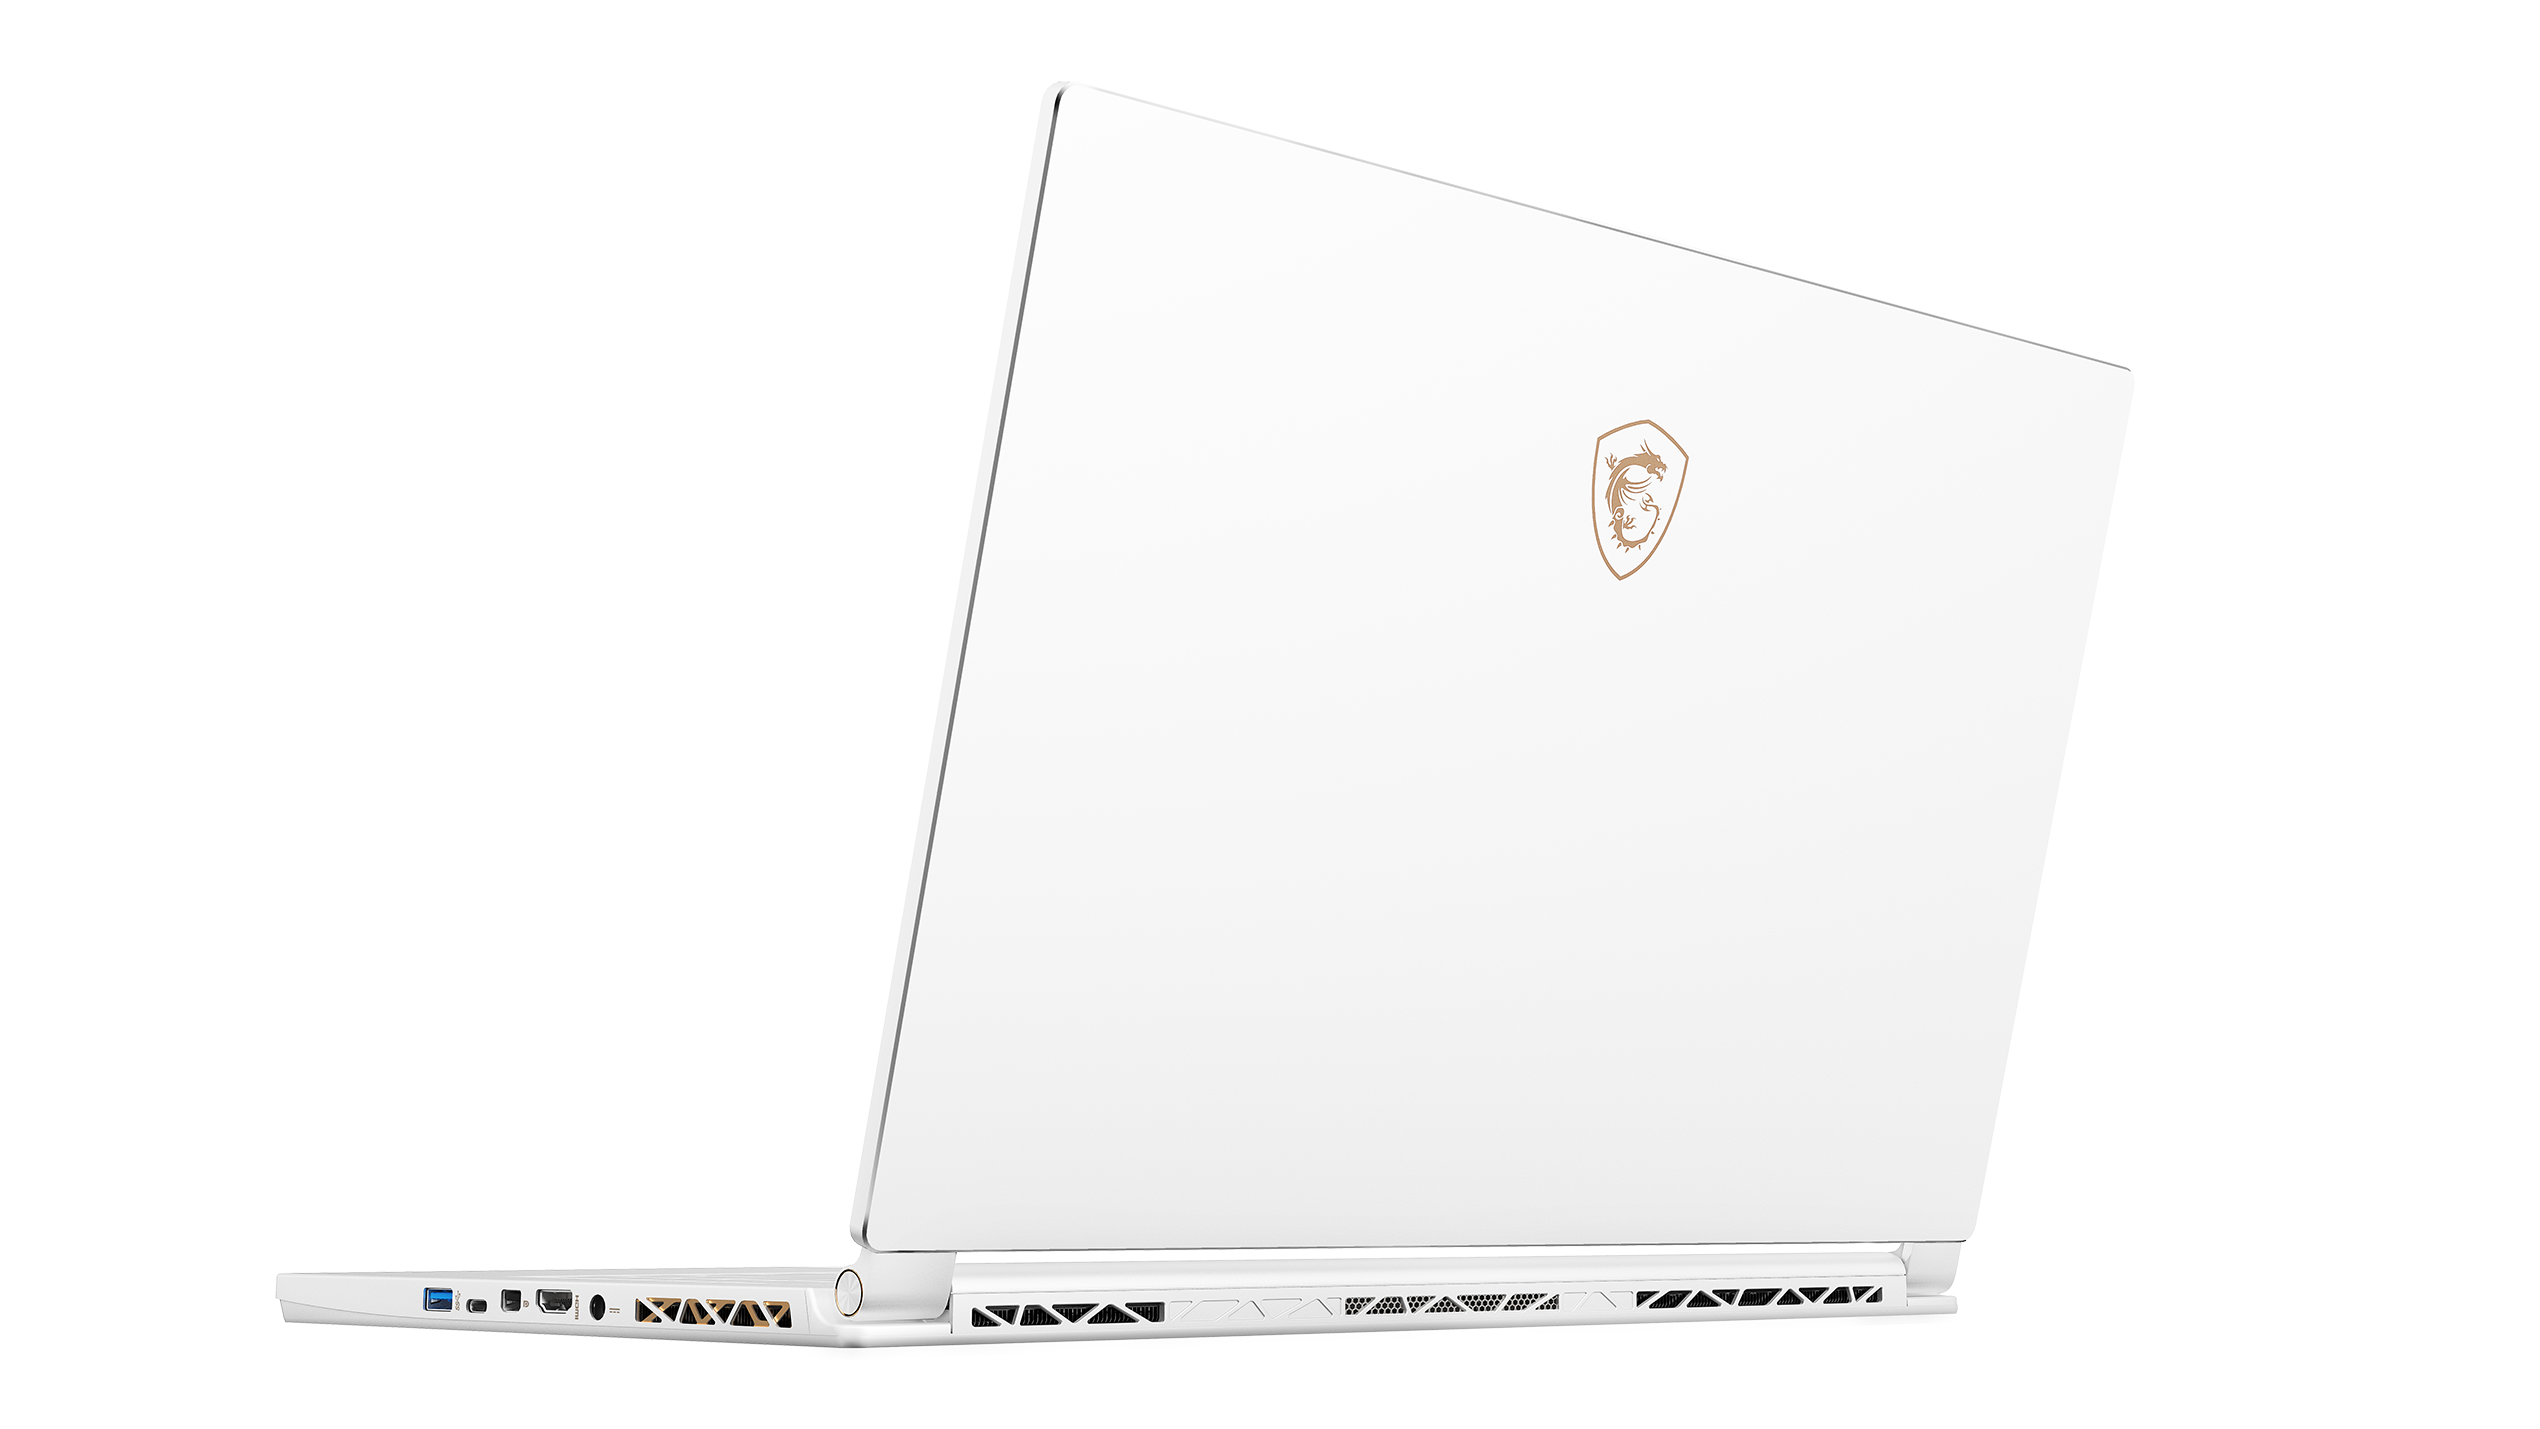
The most obvious difference is case color, and only the Limited Edition features a completely white aluminum case. The two less-expensive P65 models feature a low-key silver case. Another Limited Edition exclusive is the GPU, as it is the only one available with a GeForce GTX 1070 Max-Q with 8 GB of VRAM. The P65 Creator entry-level model features a GeForce GTX 1050 Ti instead, and it starts at around $1,600. At the time of writing, our review unit sold for more than $2,300.
In order to have an extensive range of comparability we have picked competitors from the realms of multimedia, gaming, and workstations. Keep in mind that the MSI P65 Creator is not a true workstation notebook, and MSI is offering a portable workstation as well (WS65).
Its primary competitors are the Asus ZenBook Pro 15 and the Lenovo ThinkPad X1 Extreme. From the realm of gaming, we picked the Gigabyte Aero 15X v8 and the Asus ROG Strix GL504.
Case
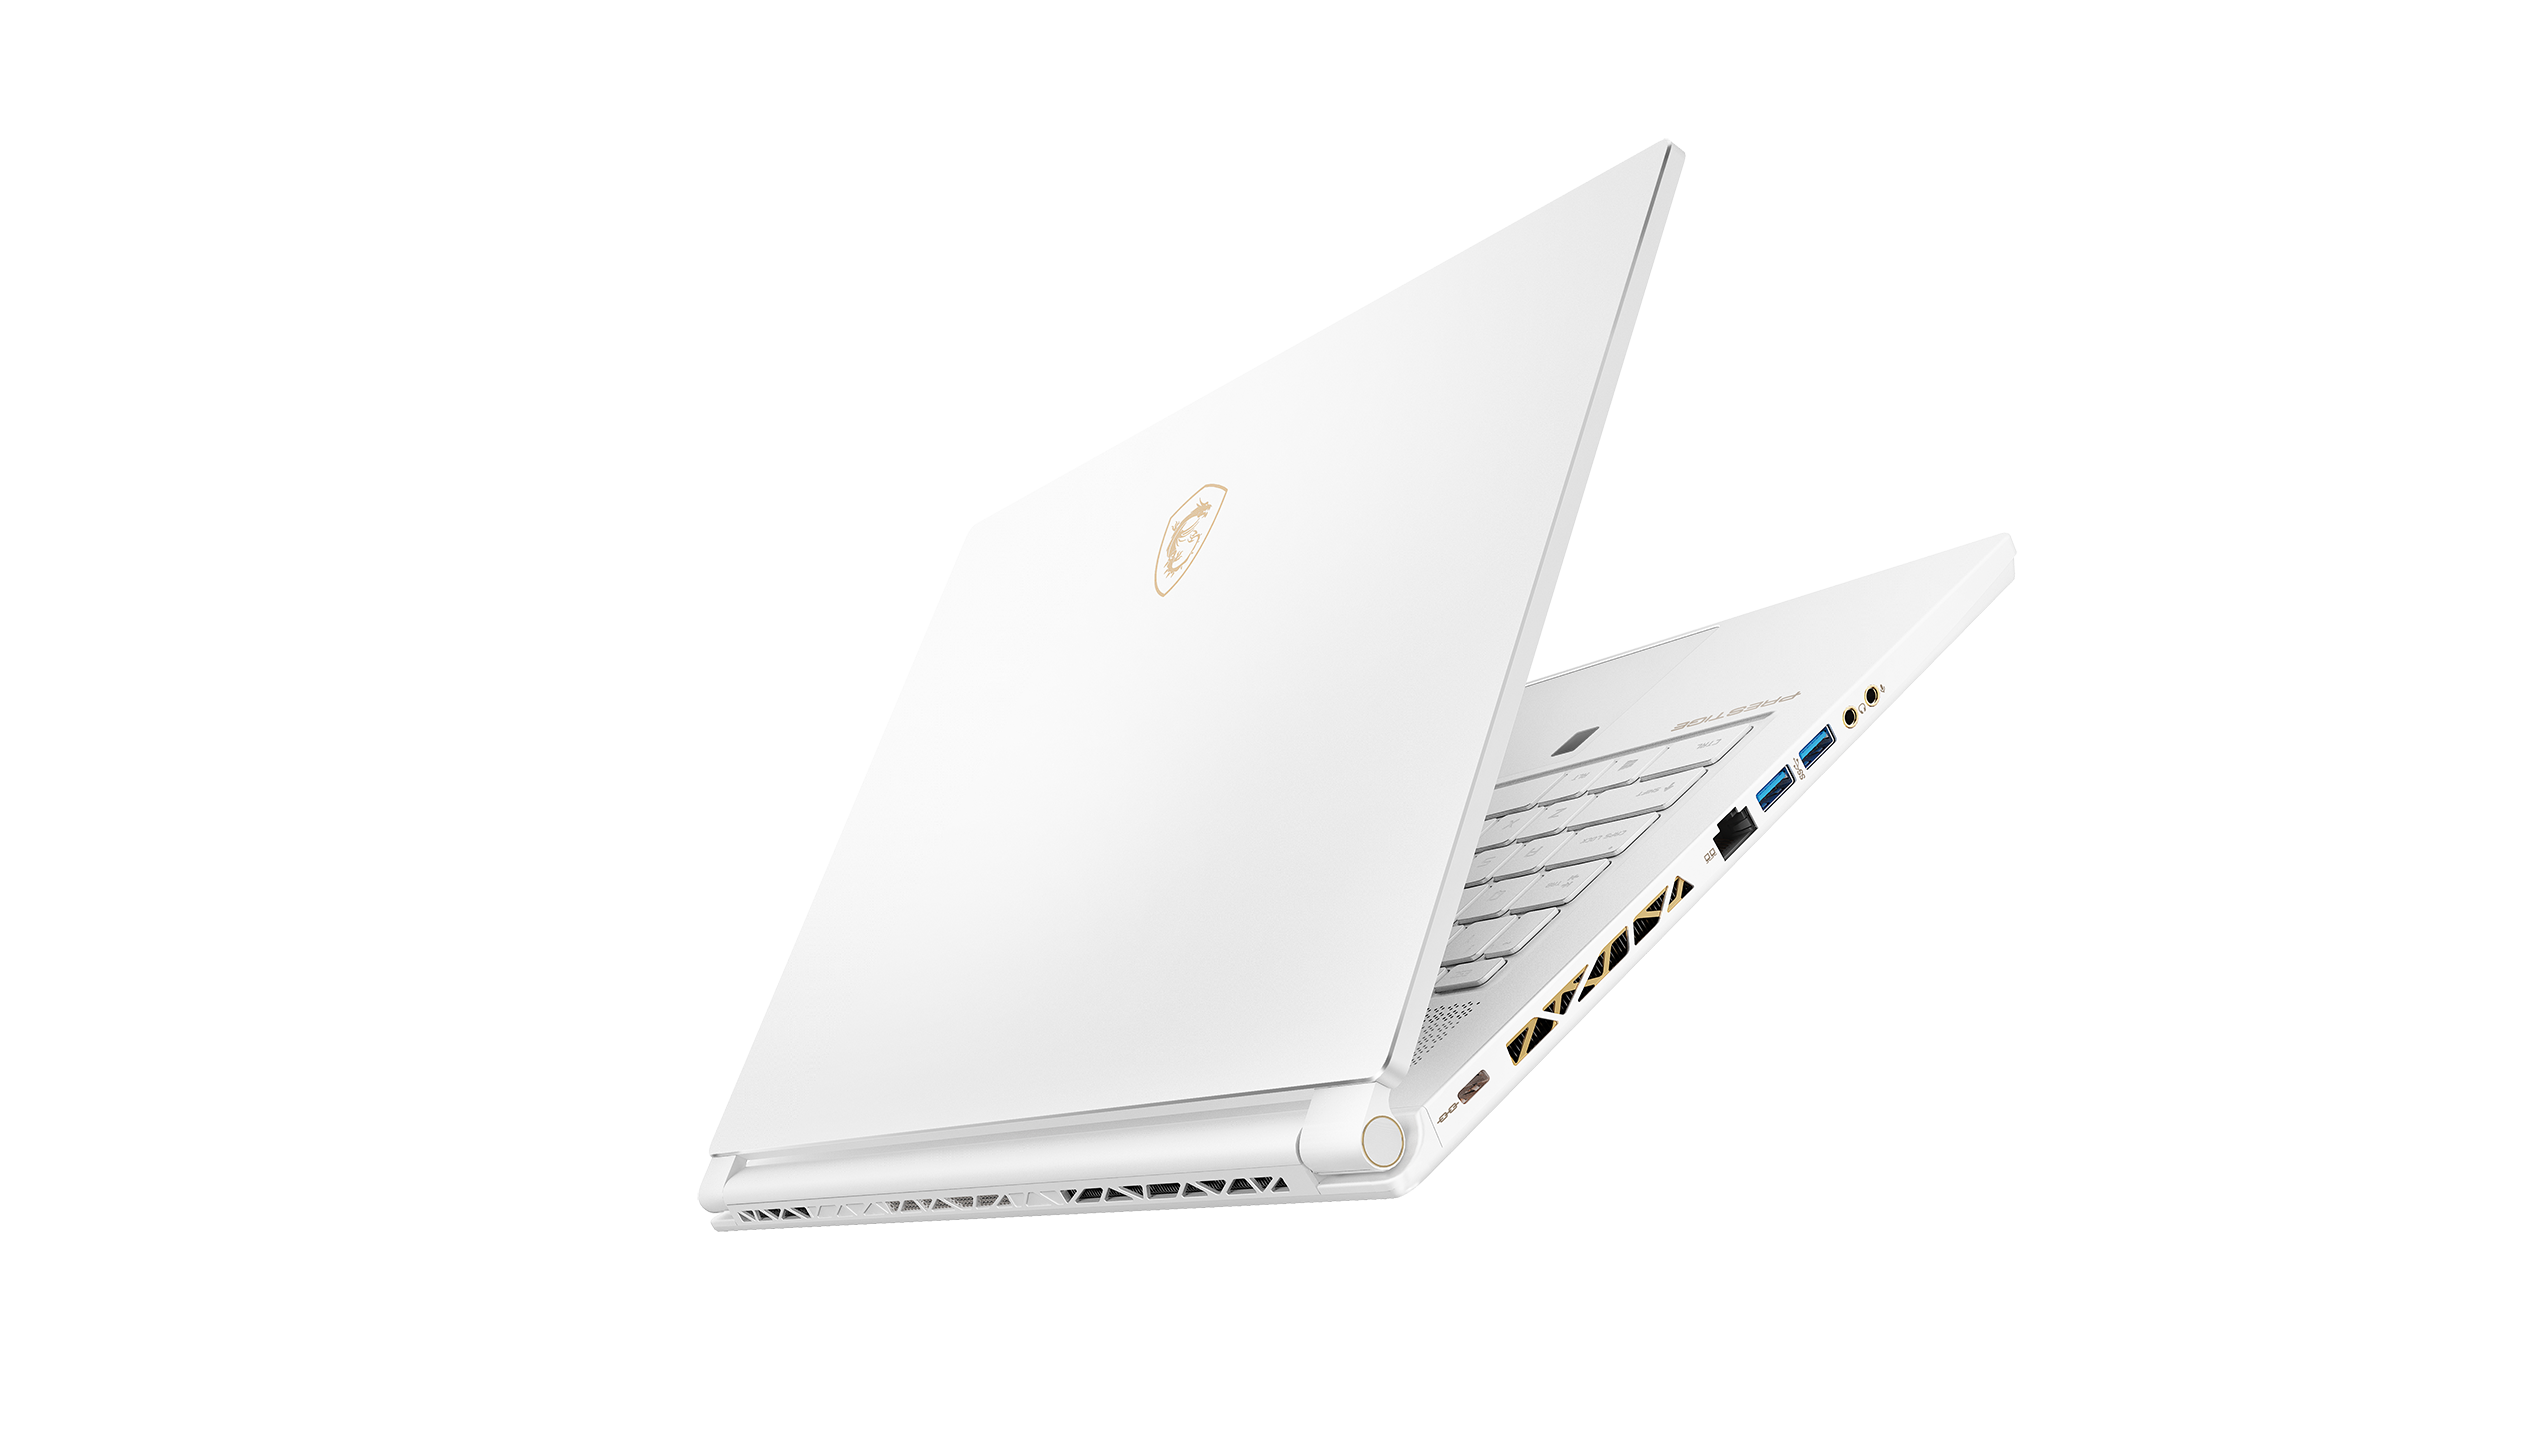
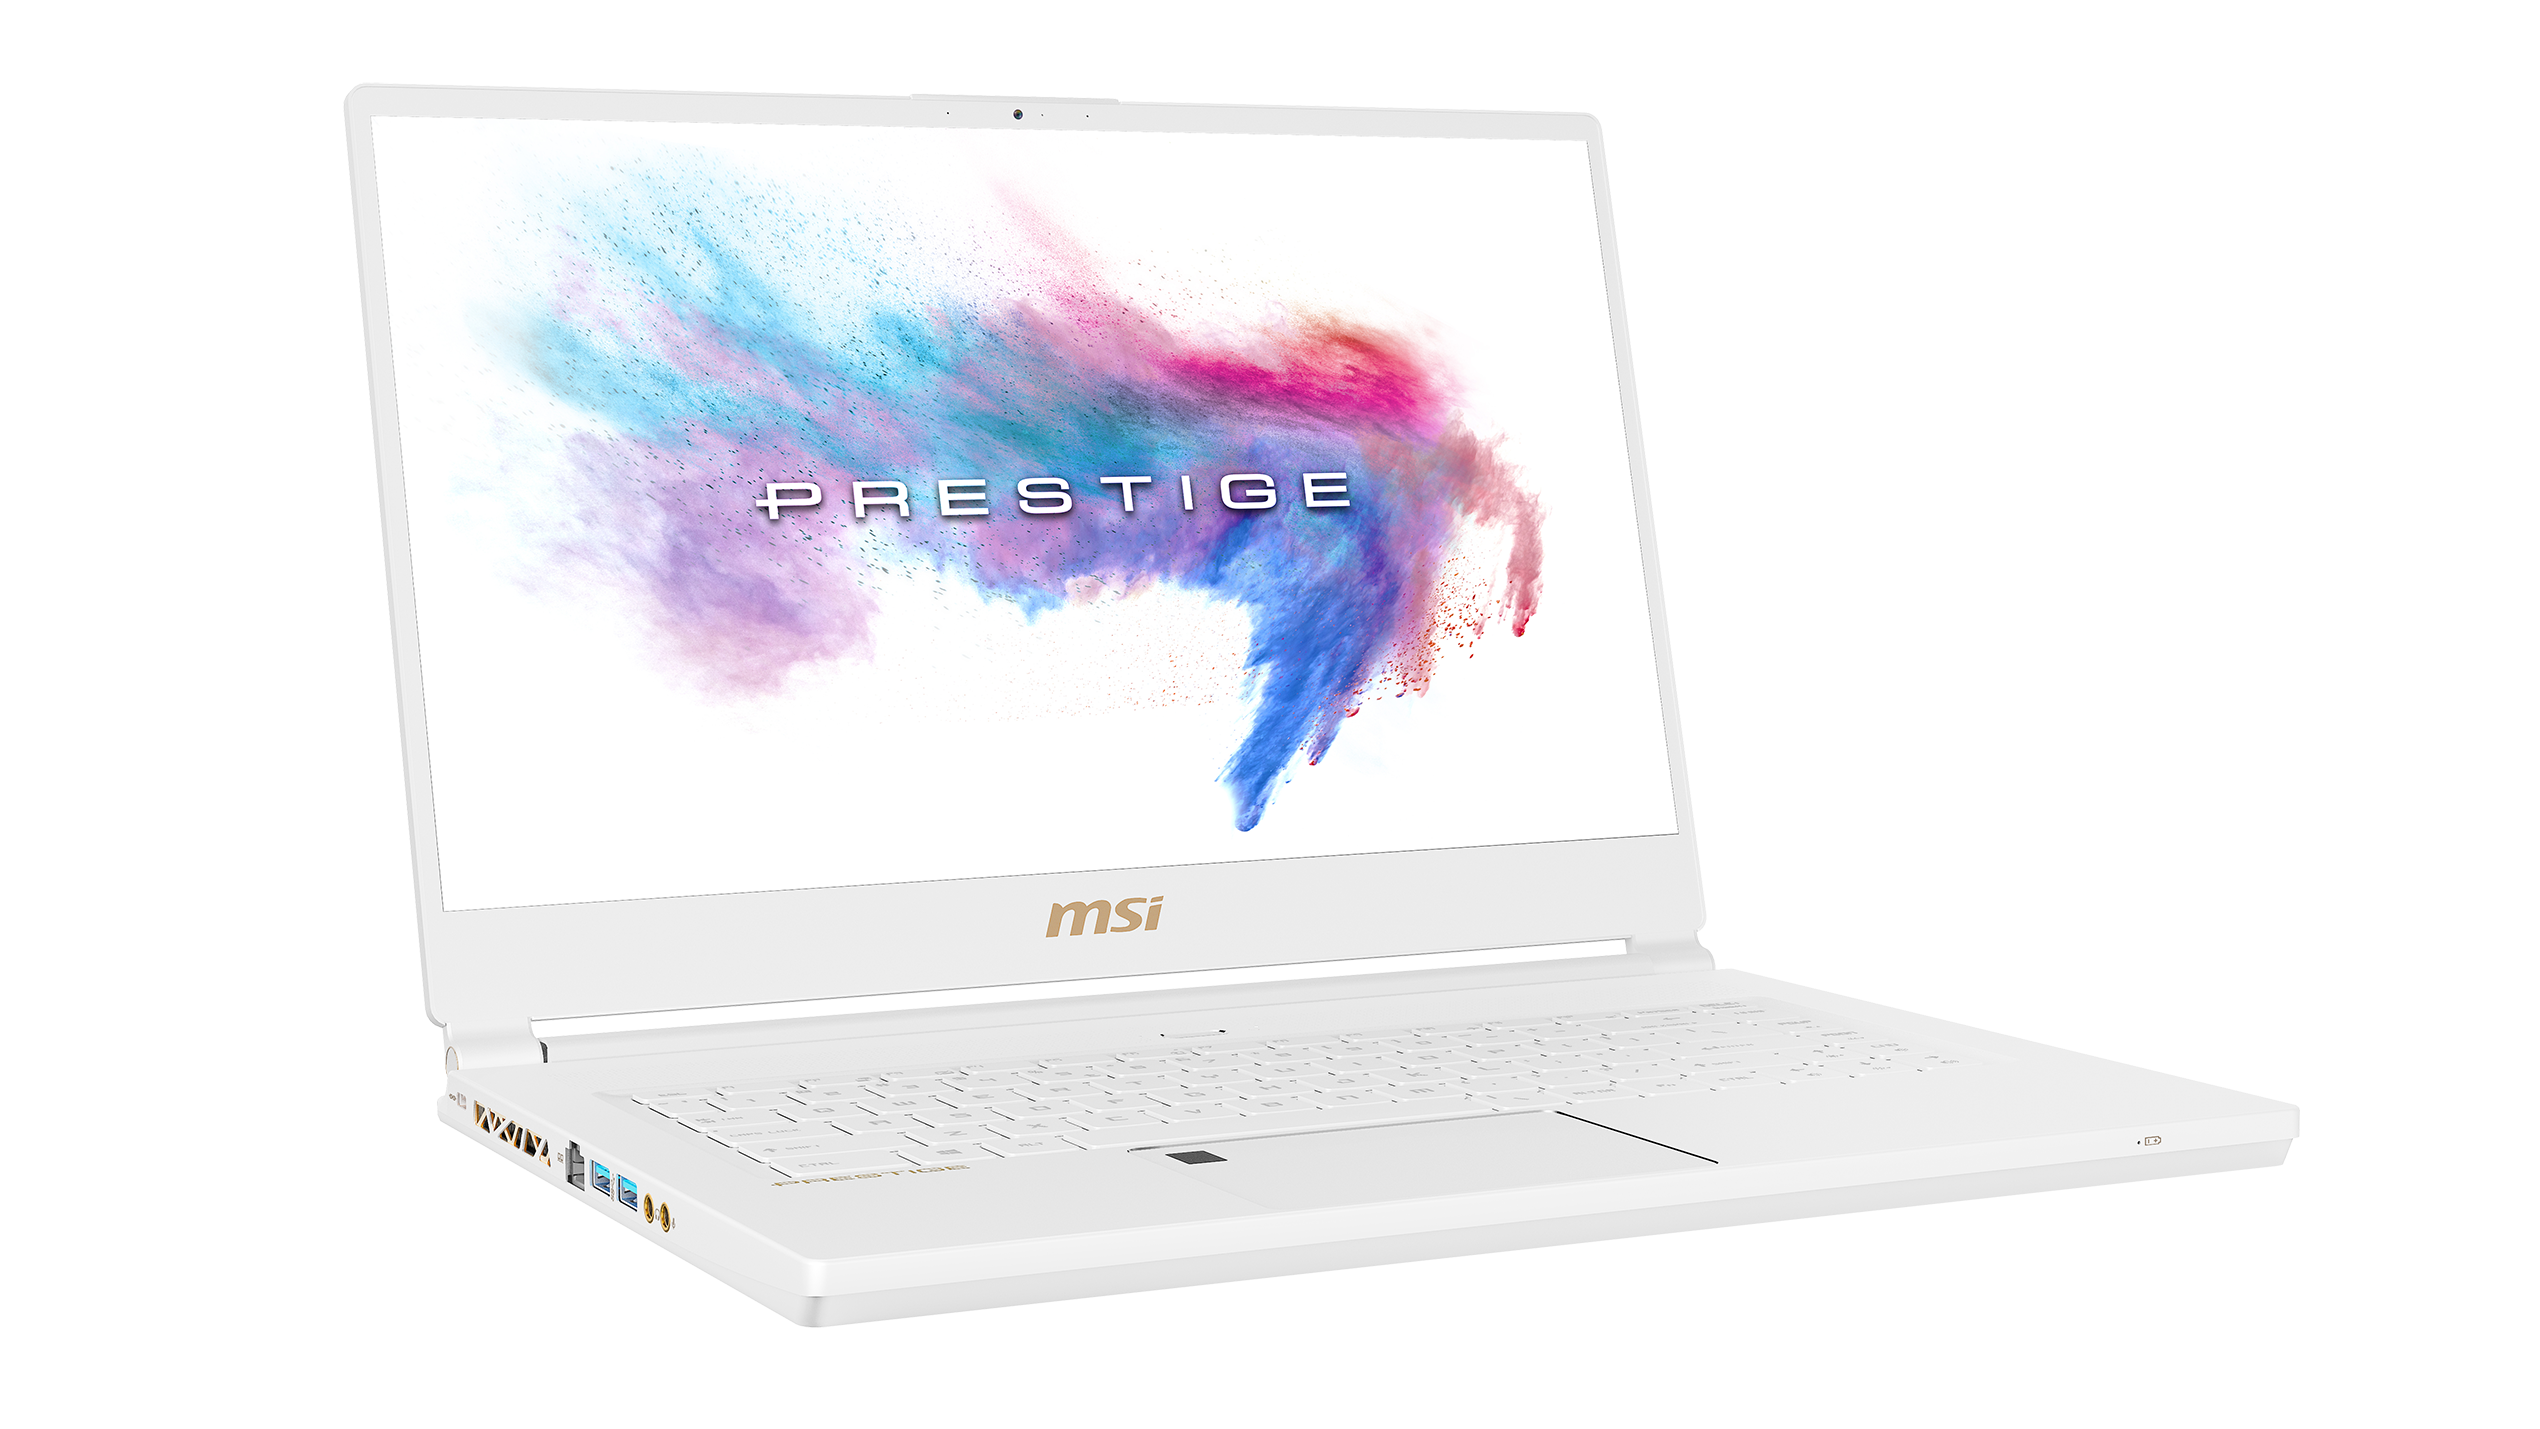
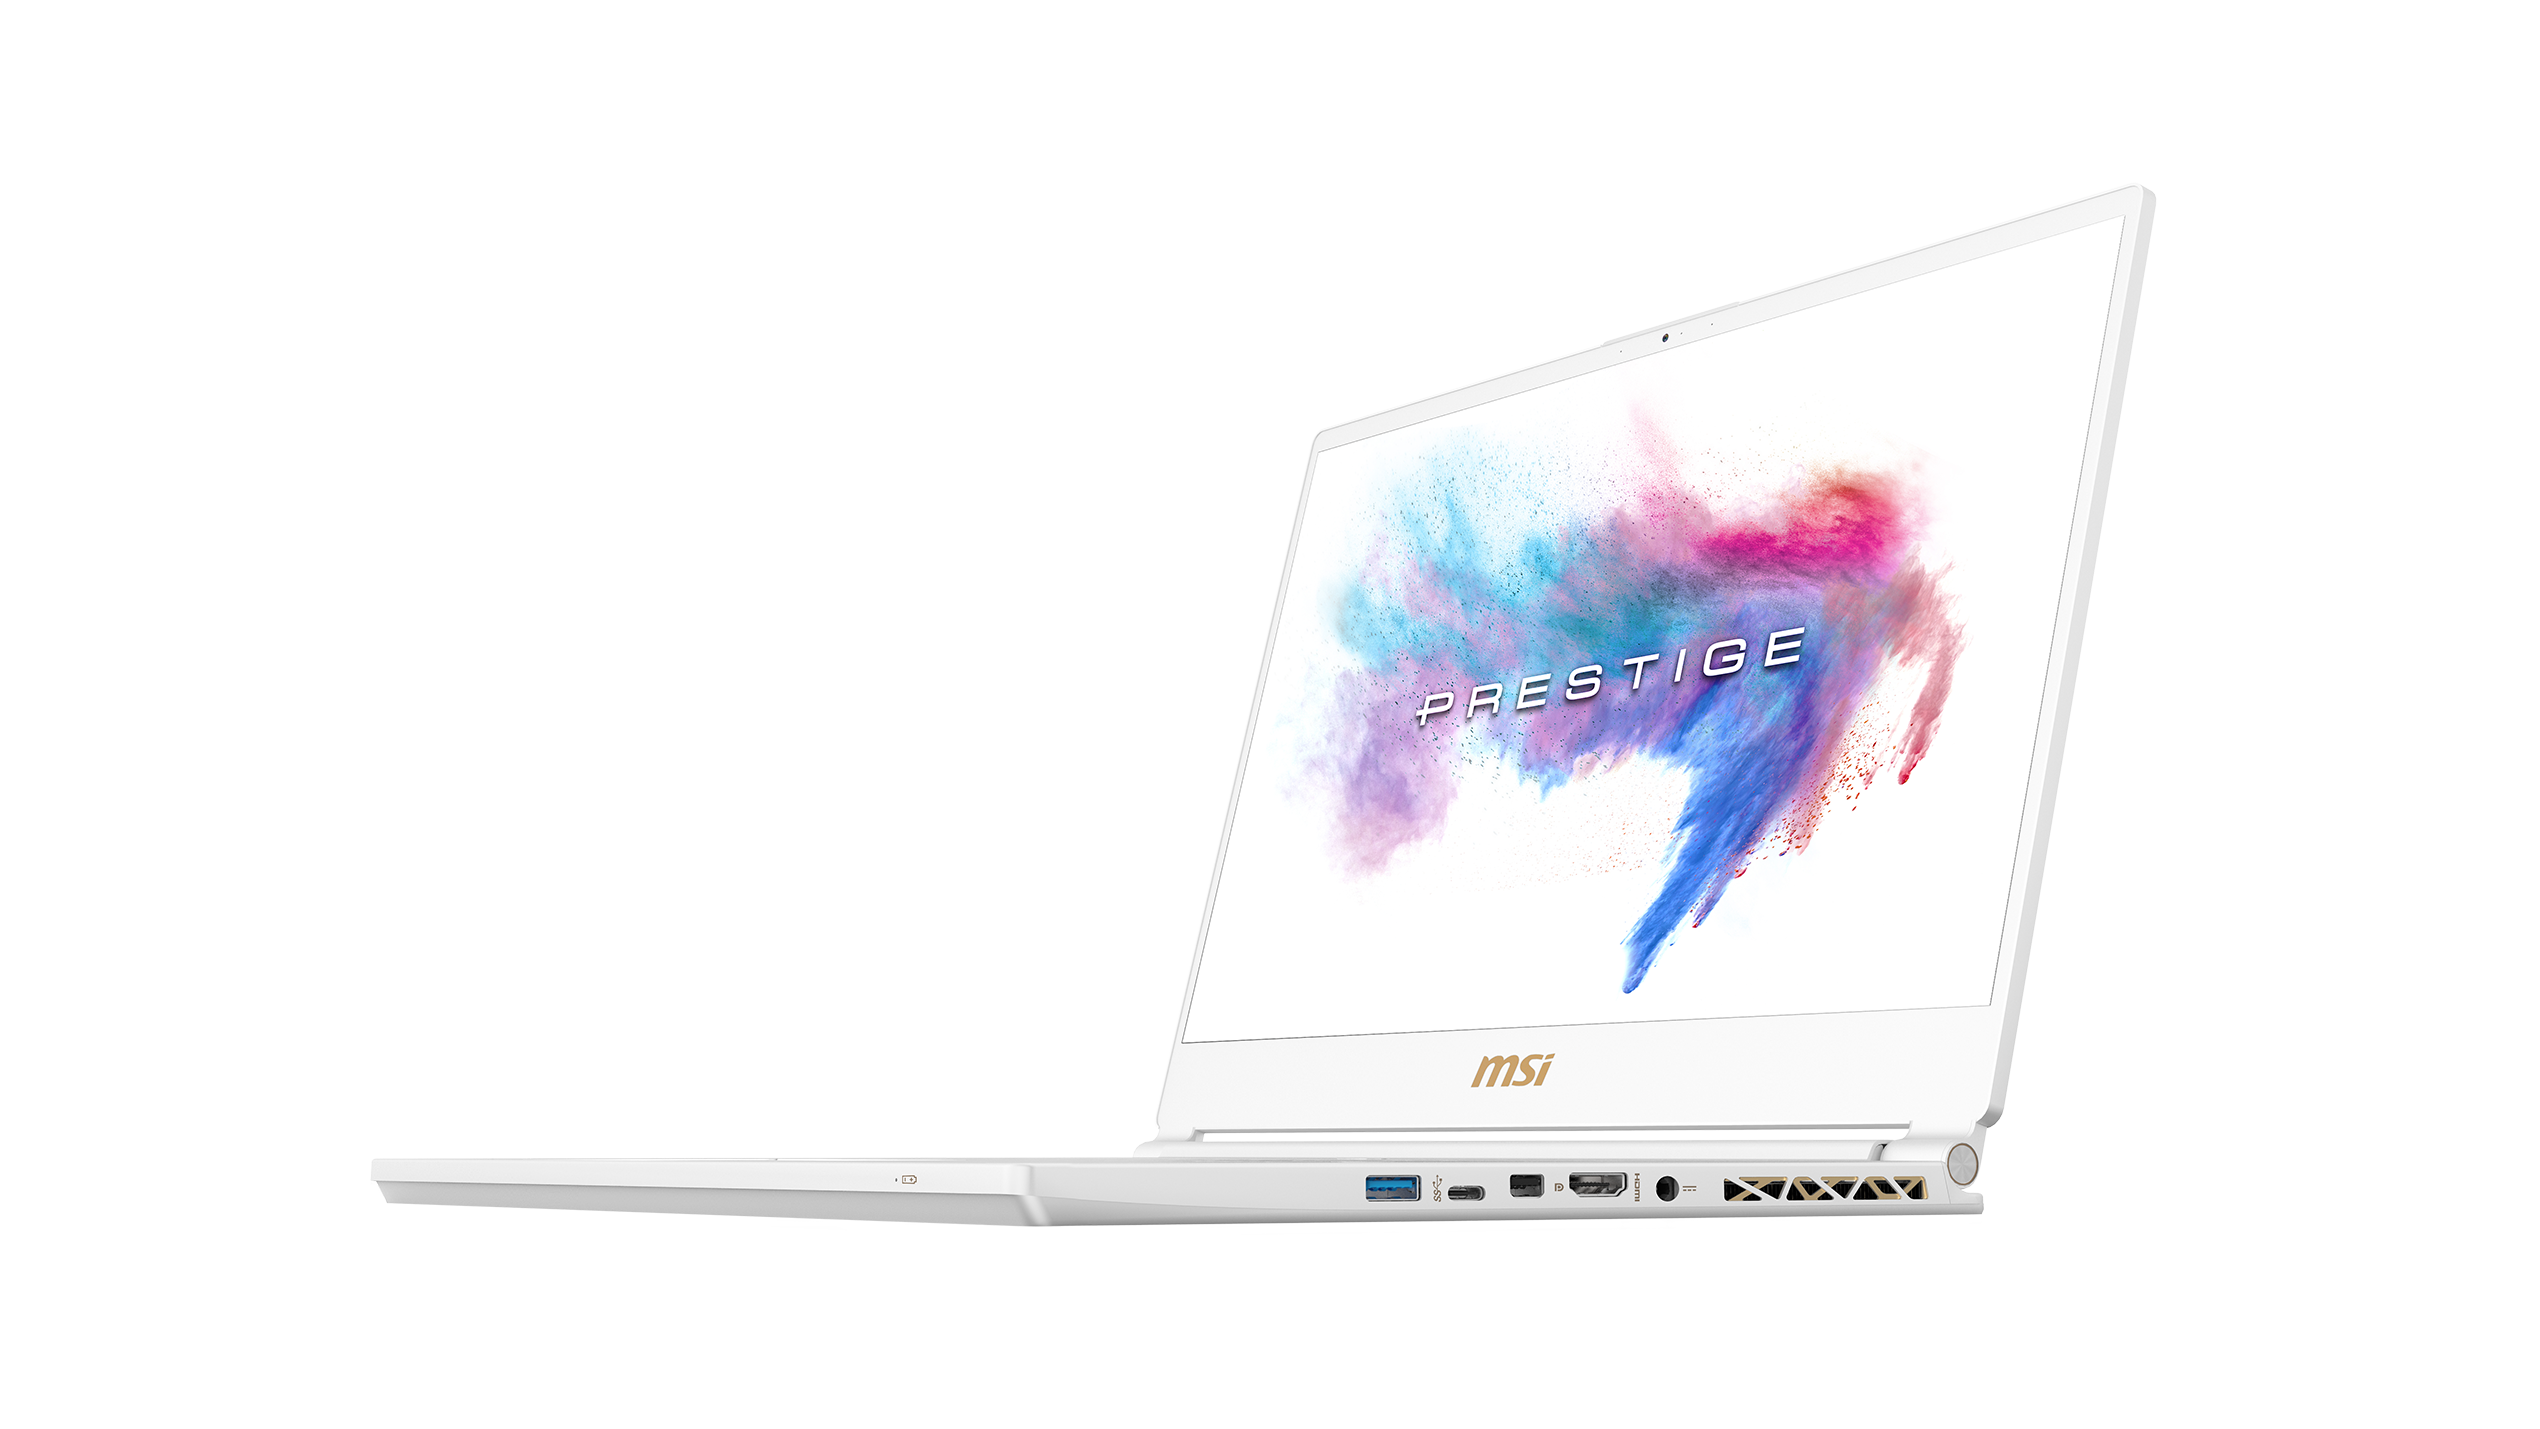
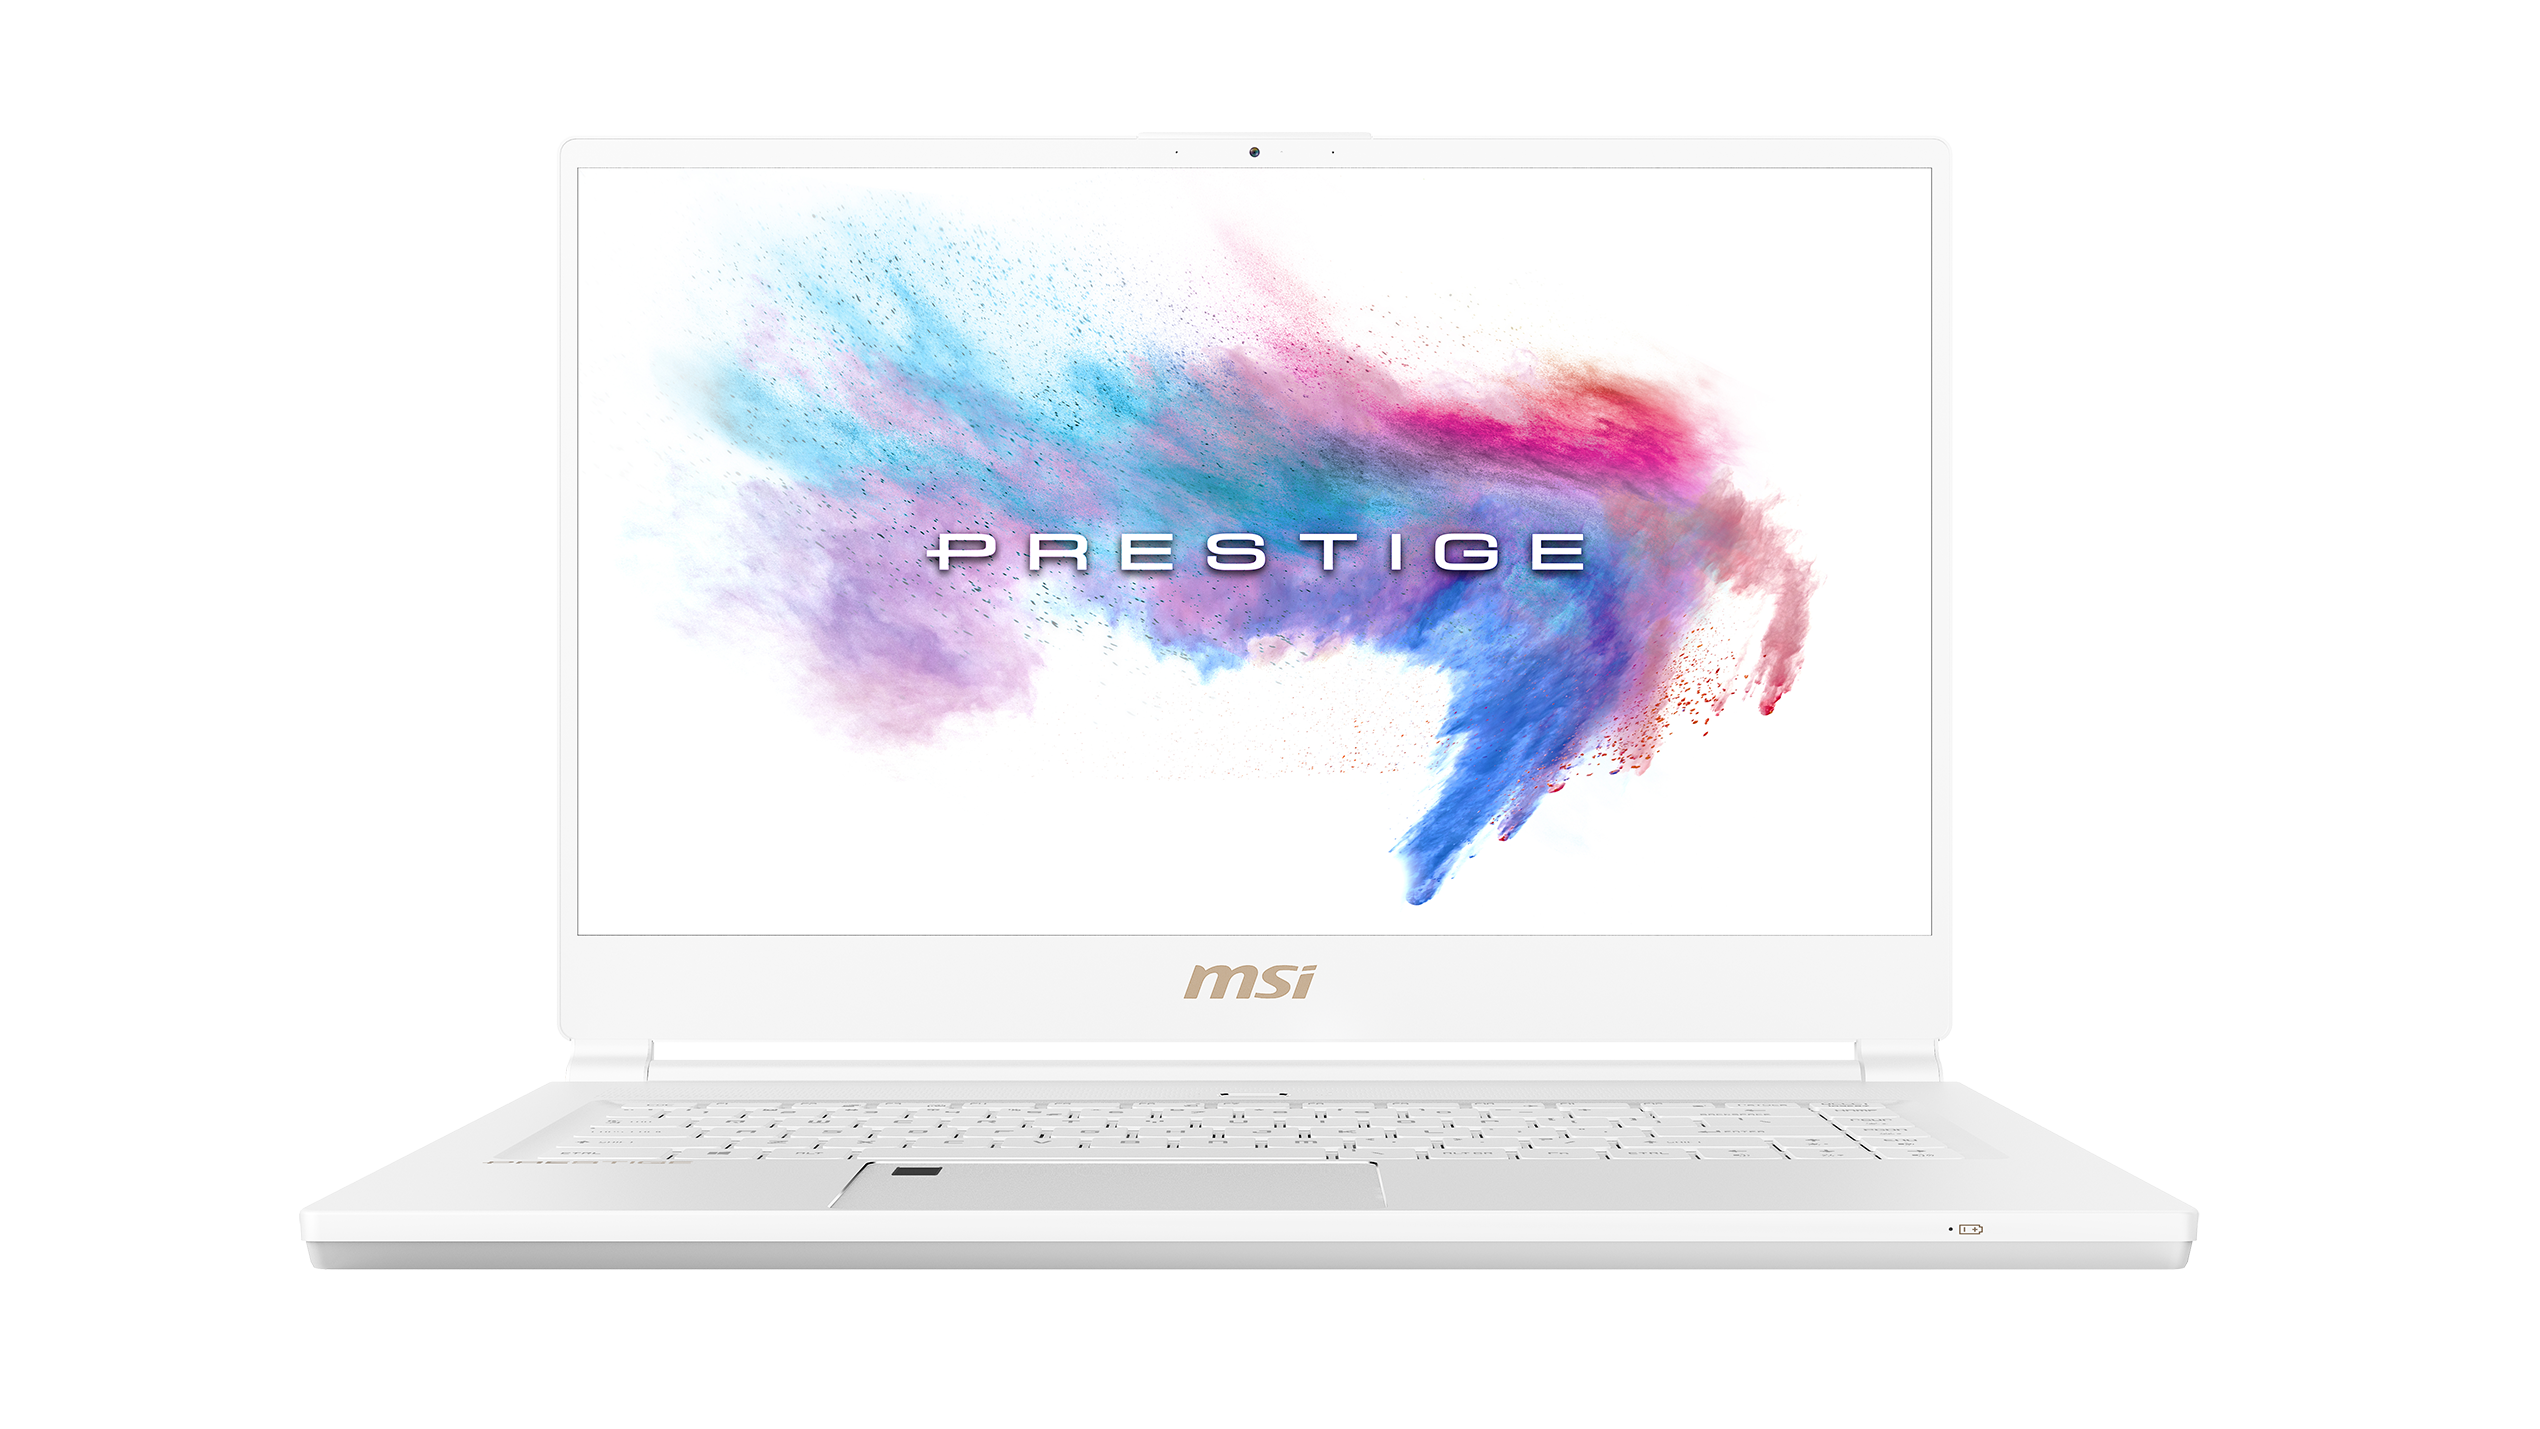
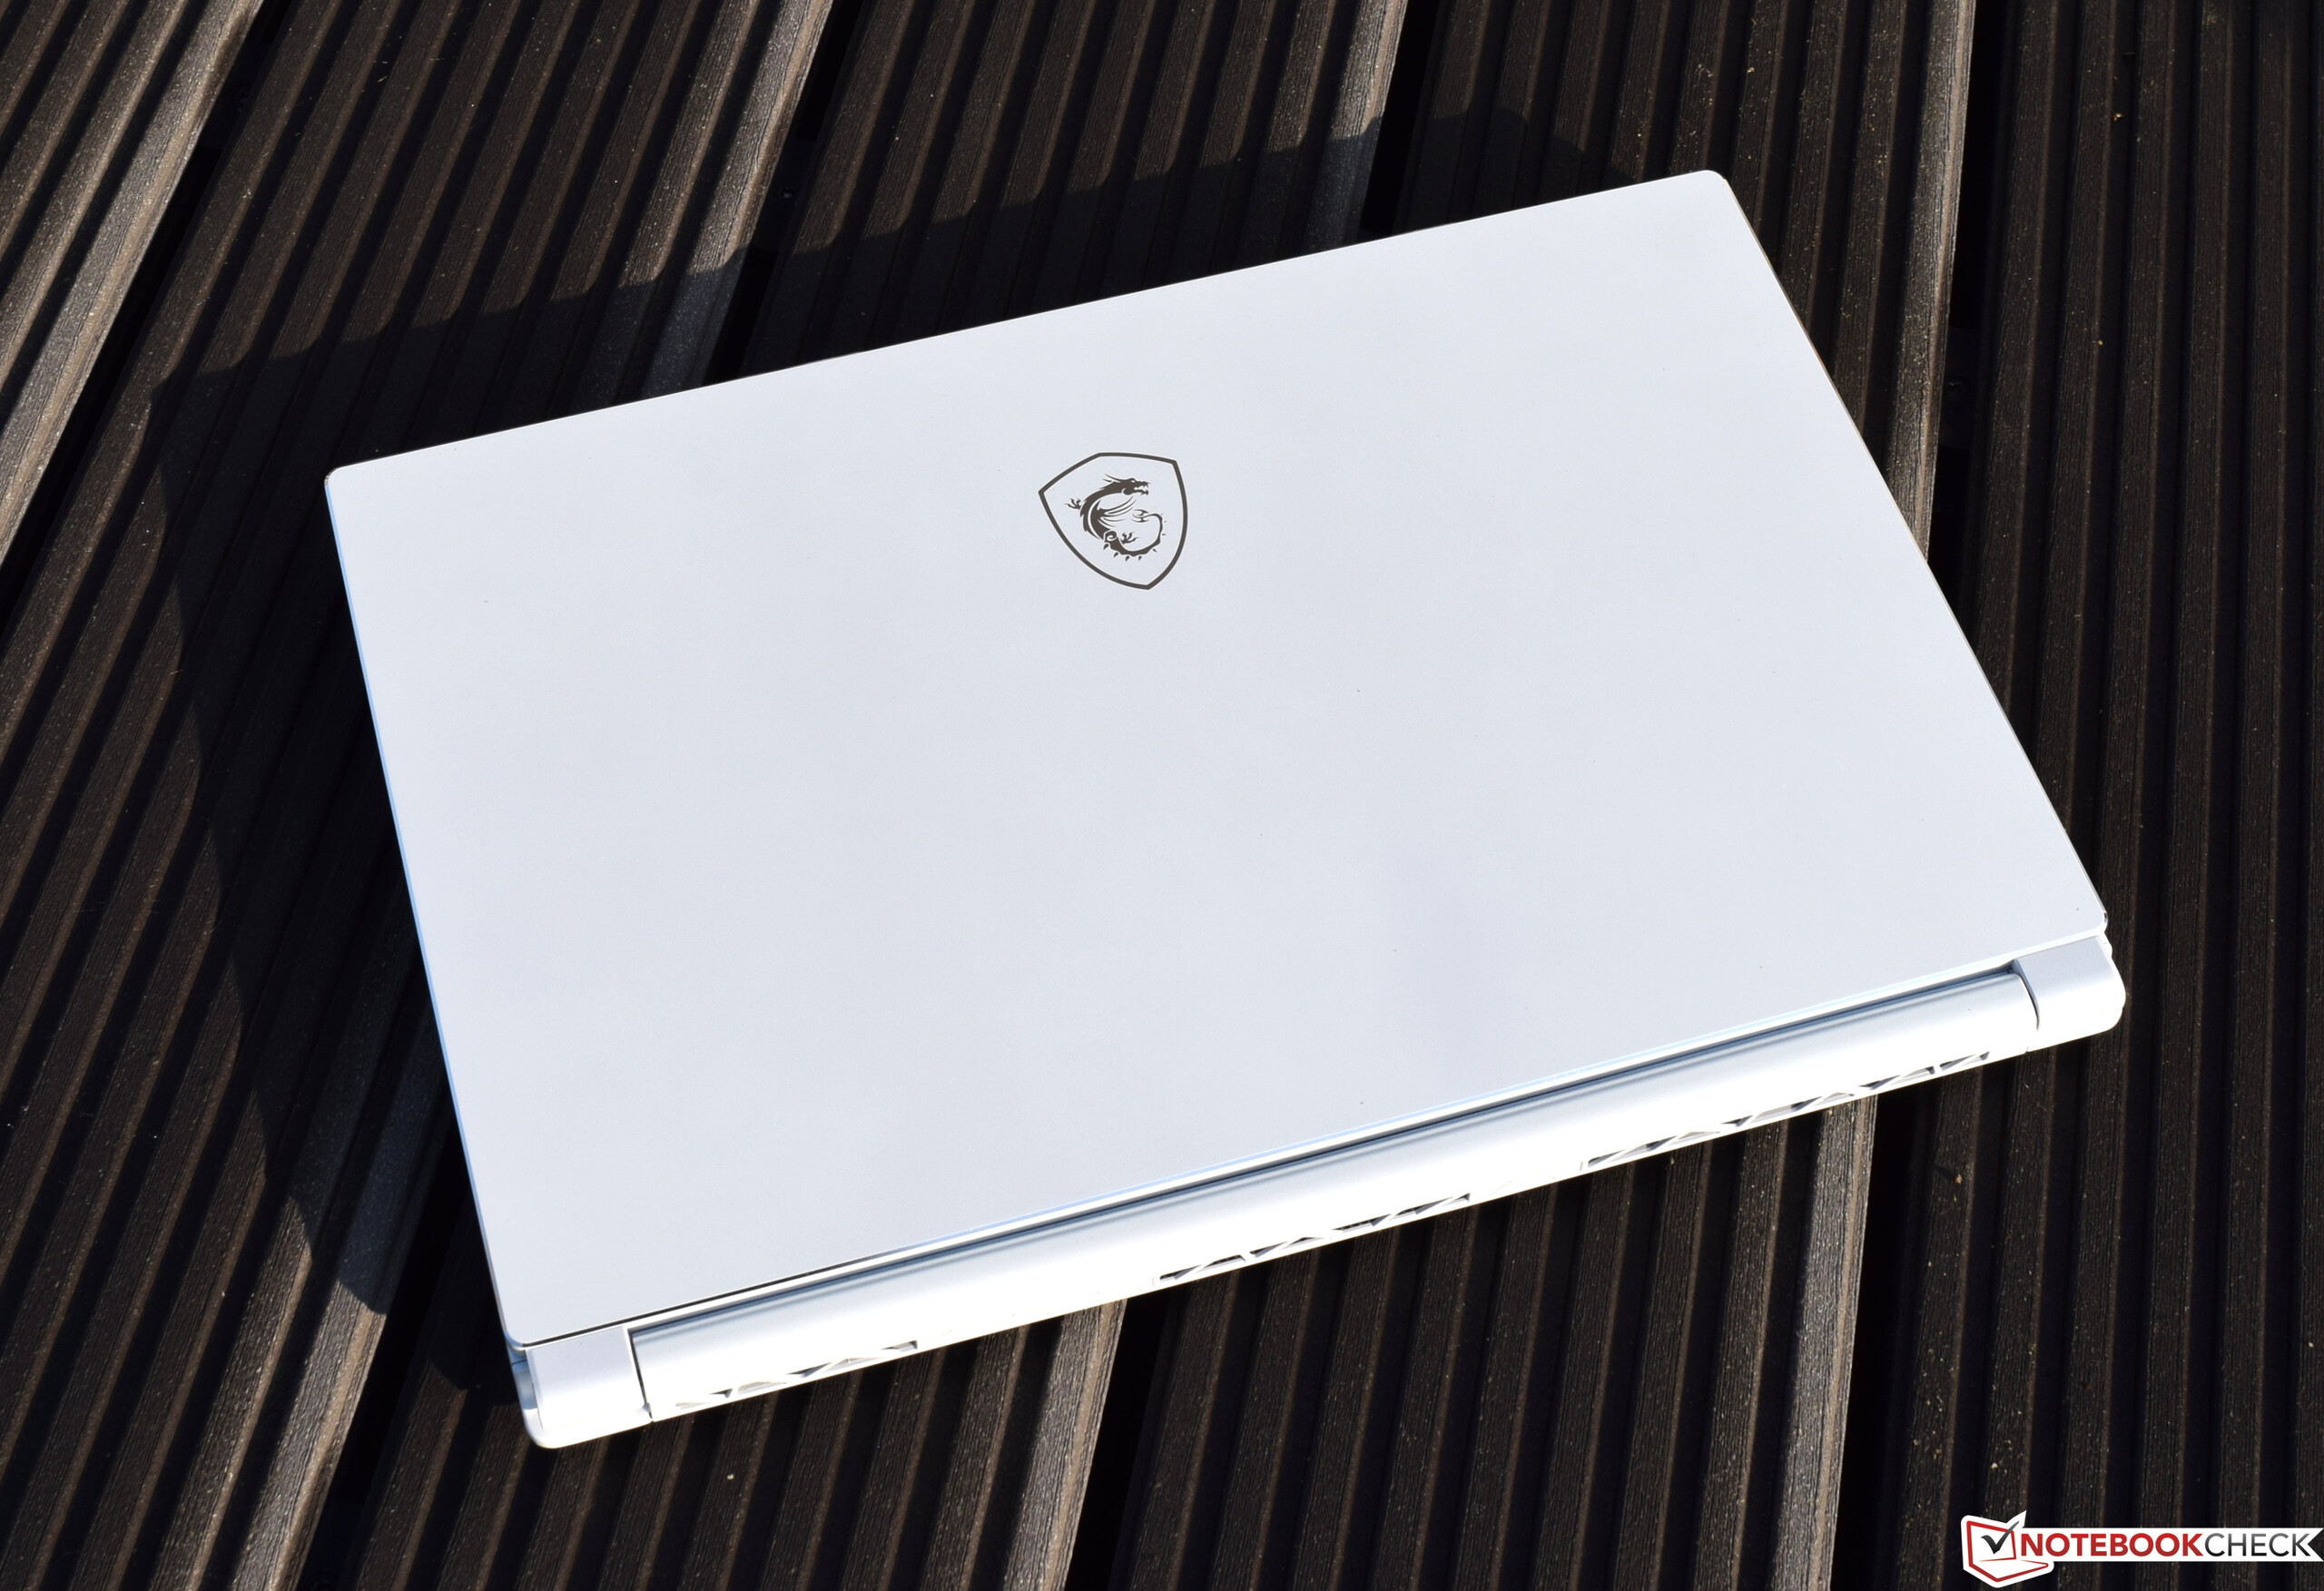
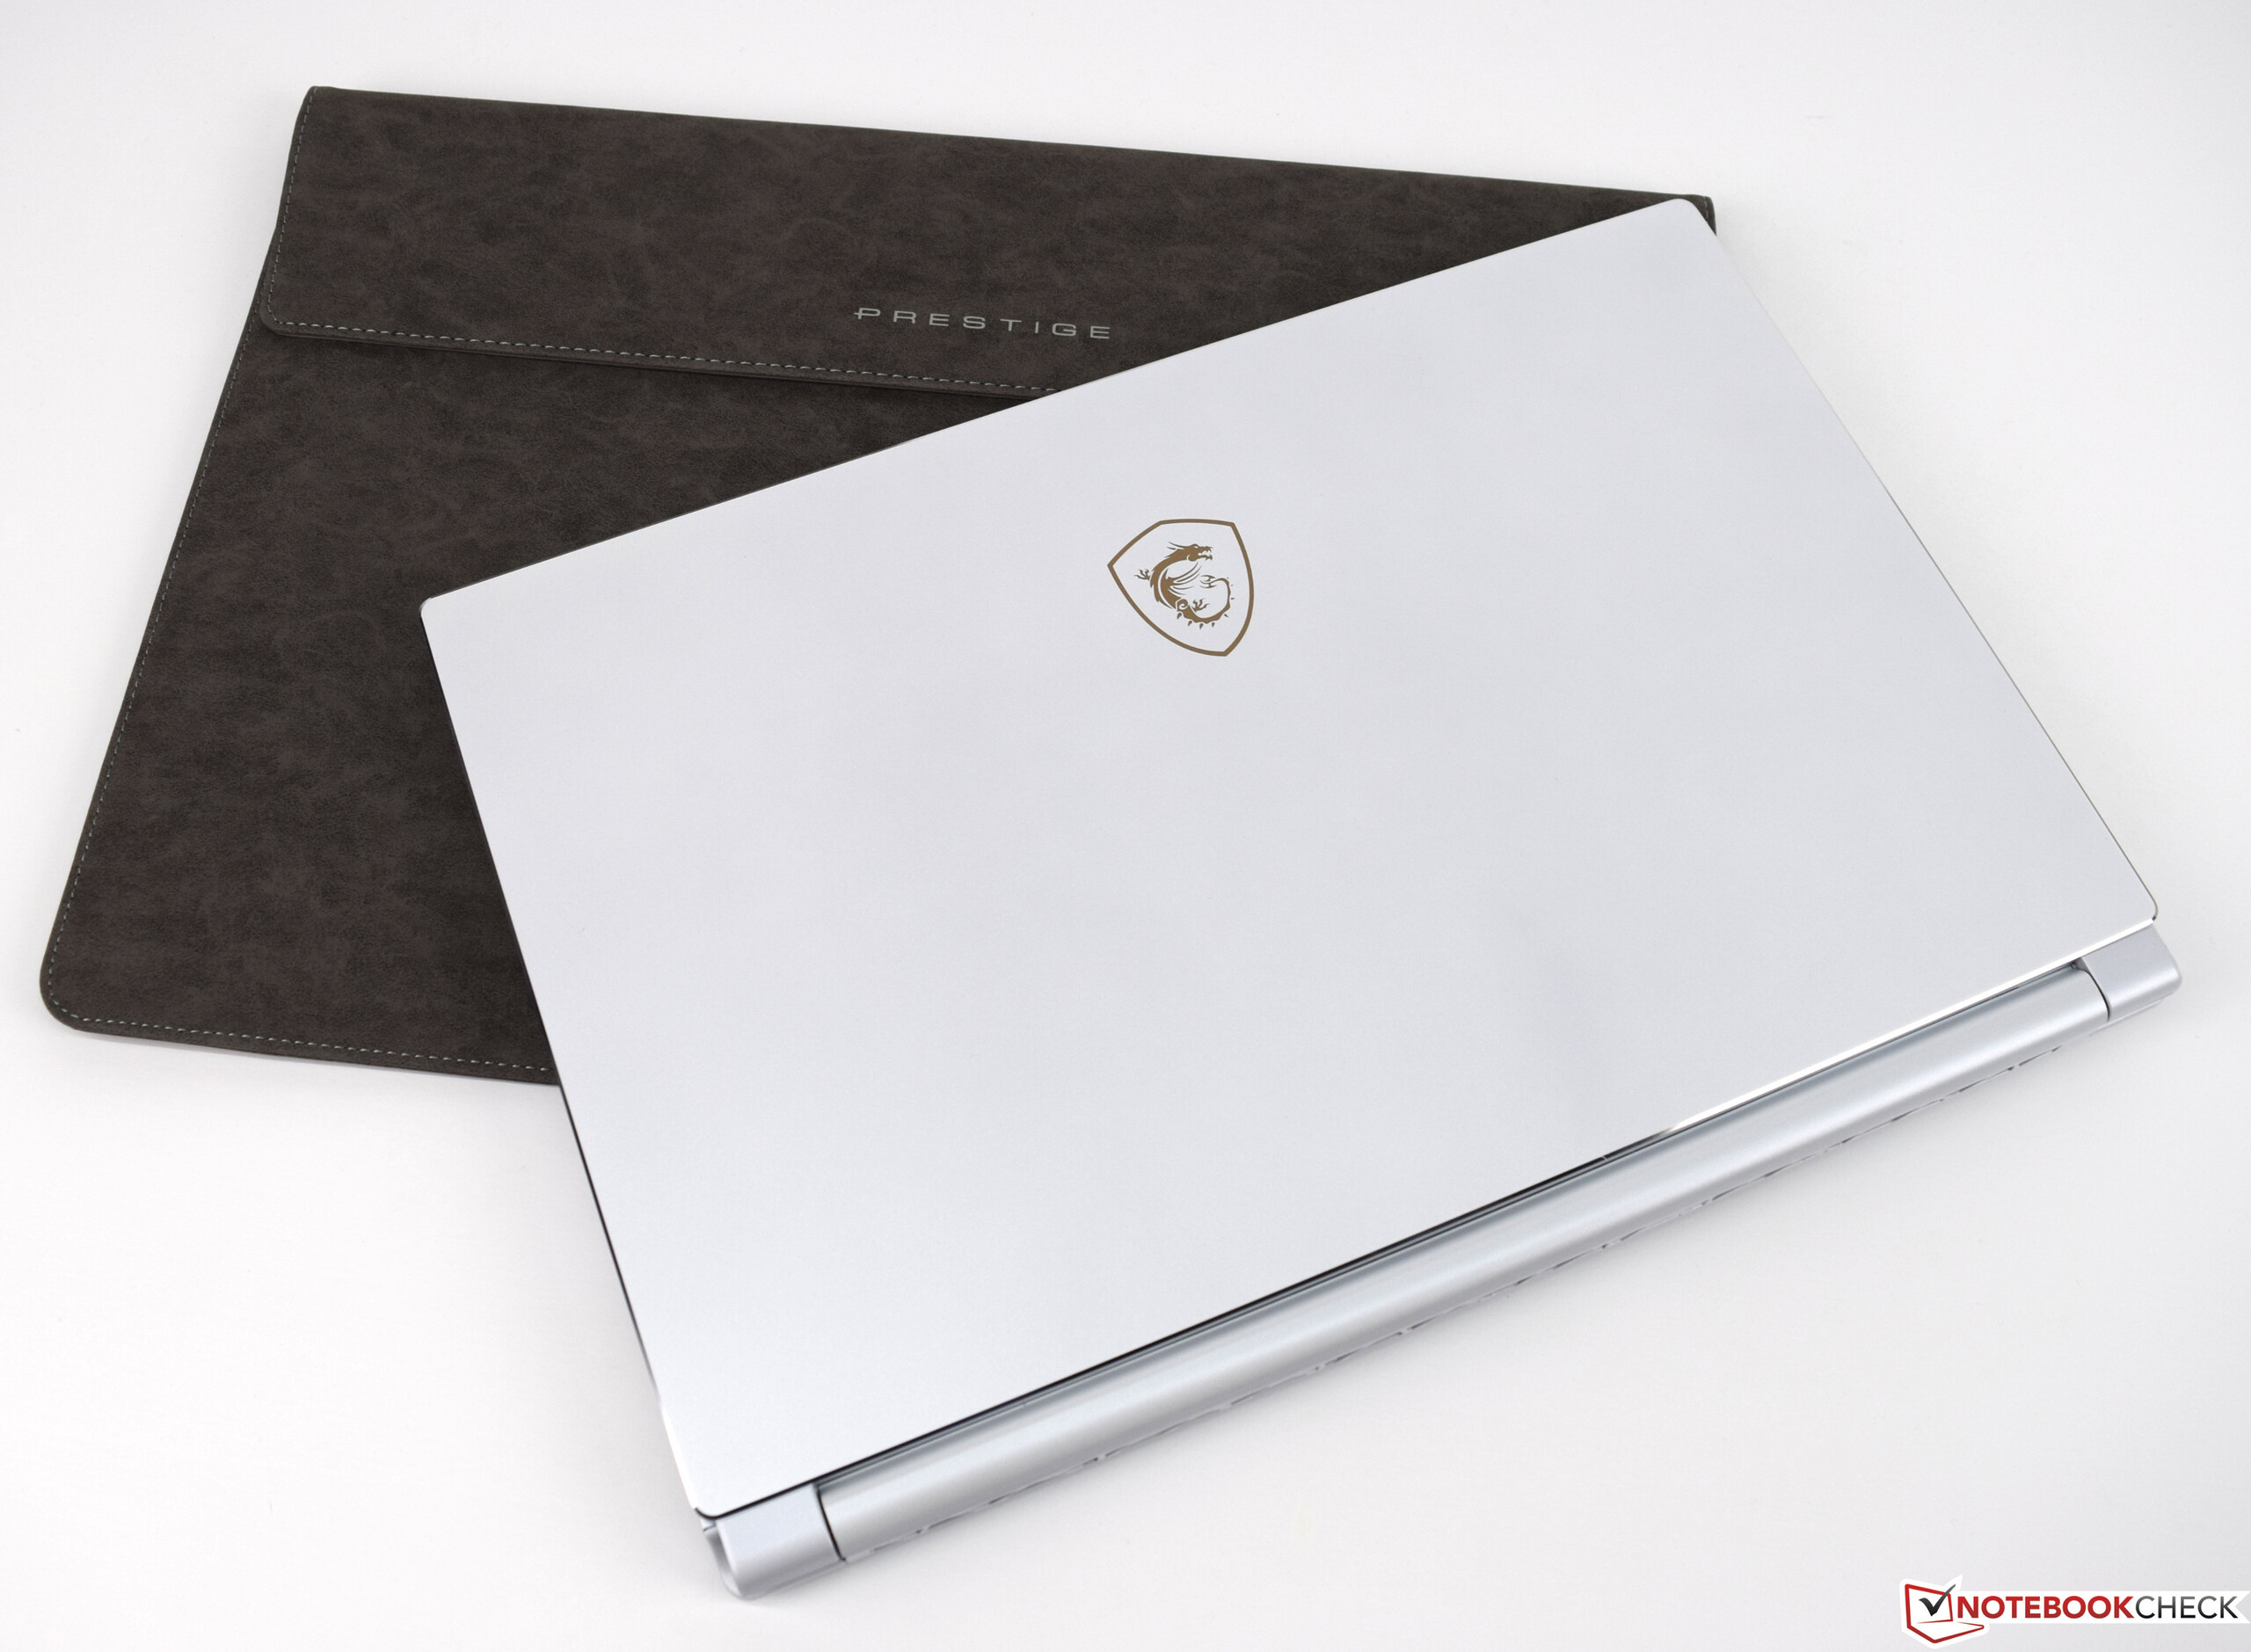
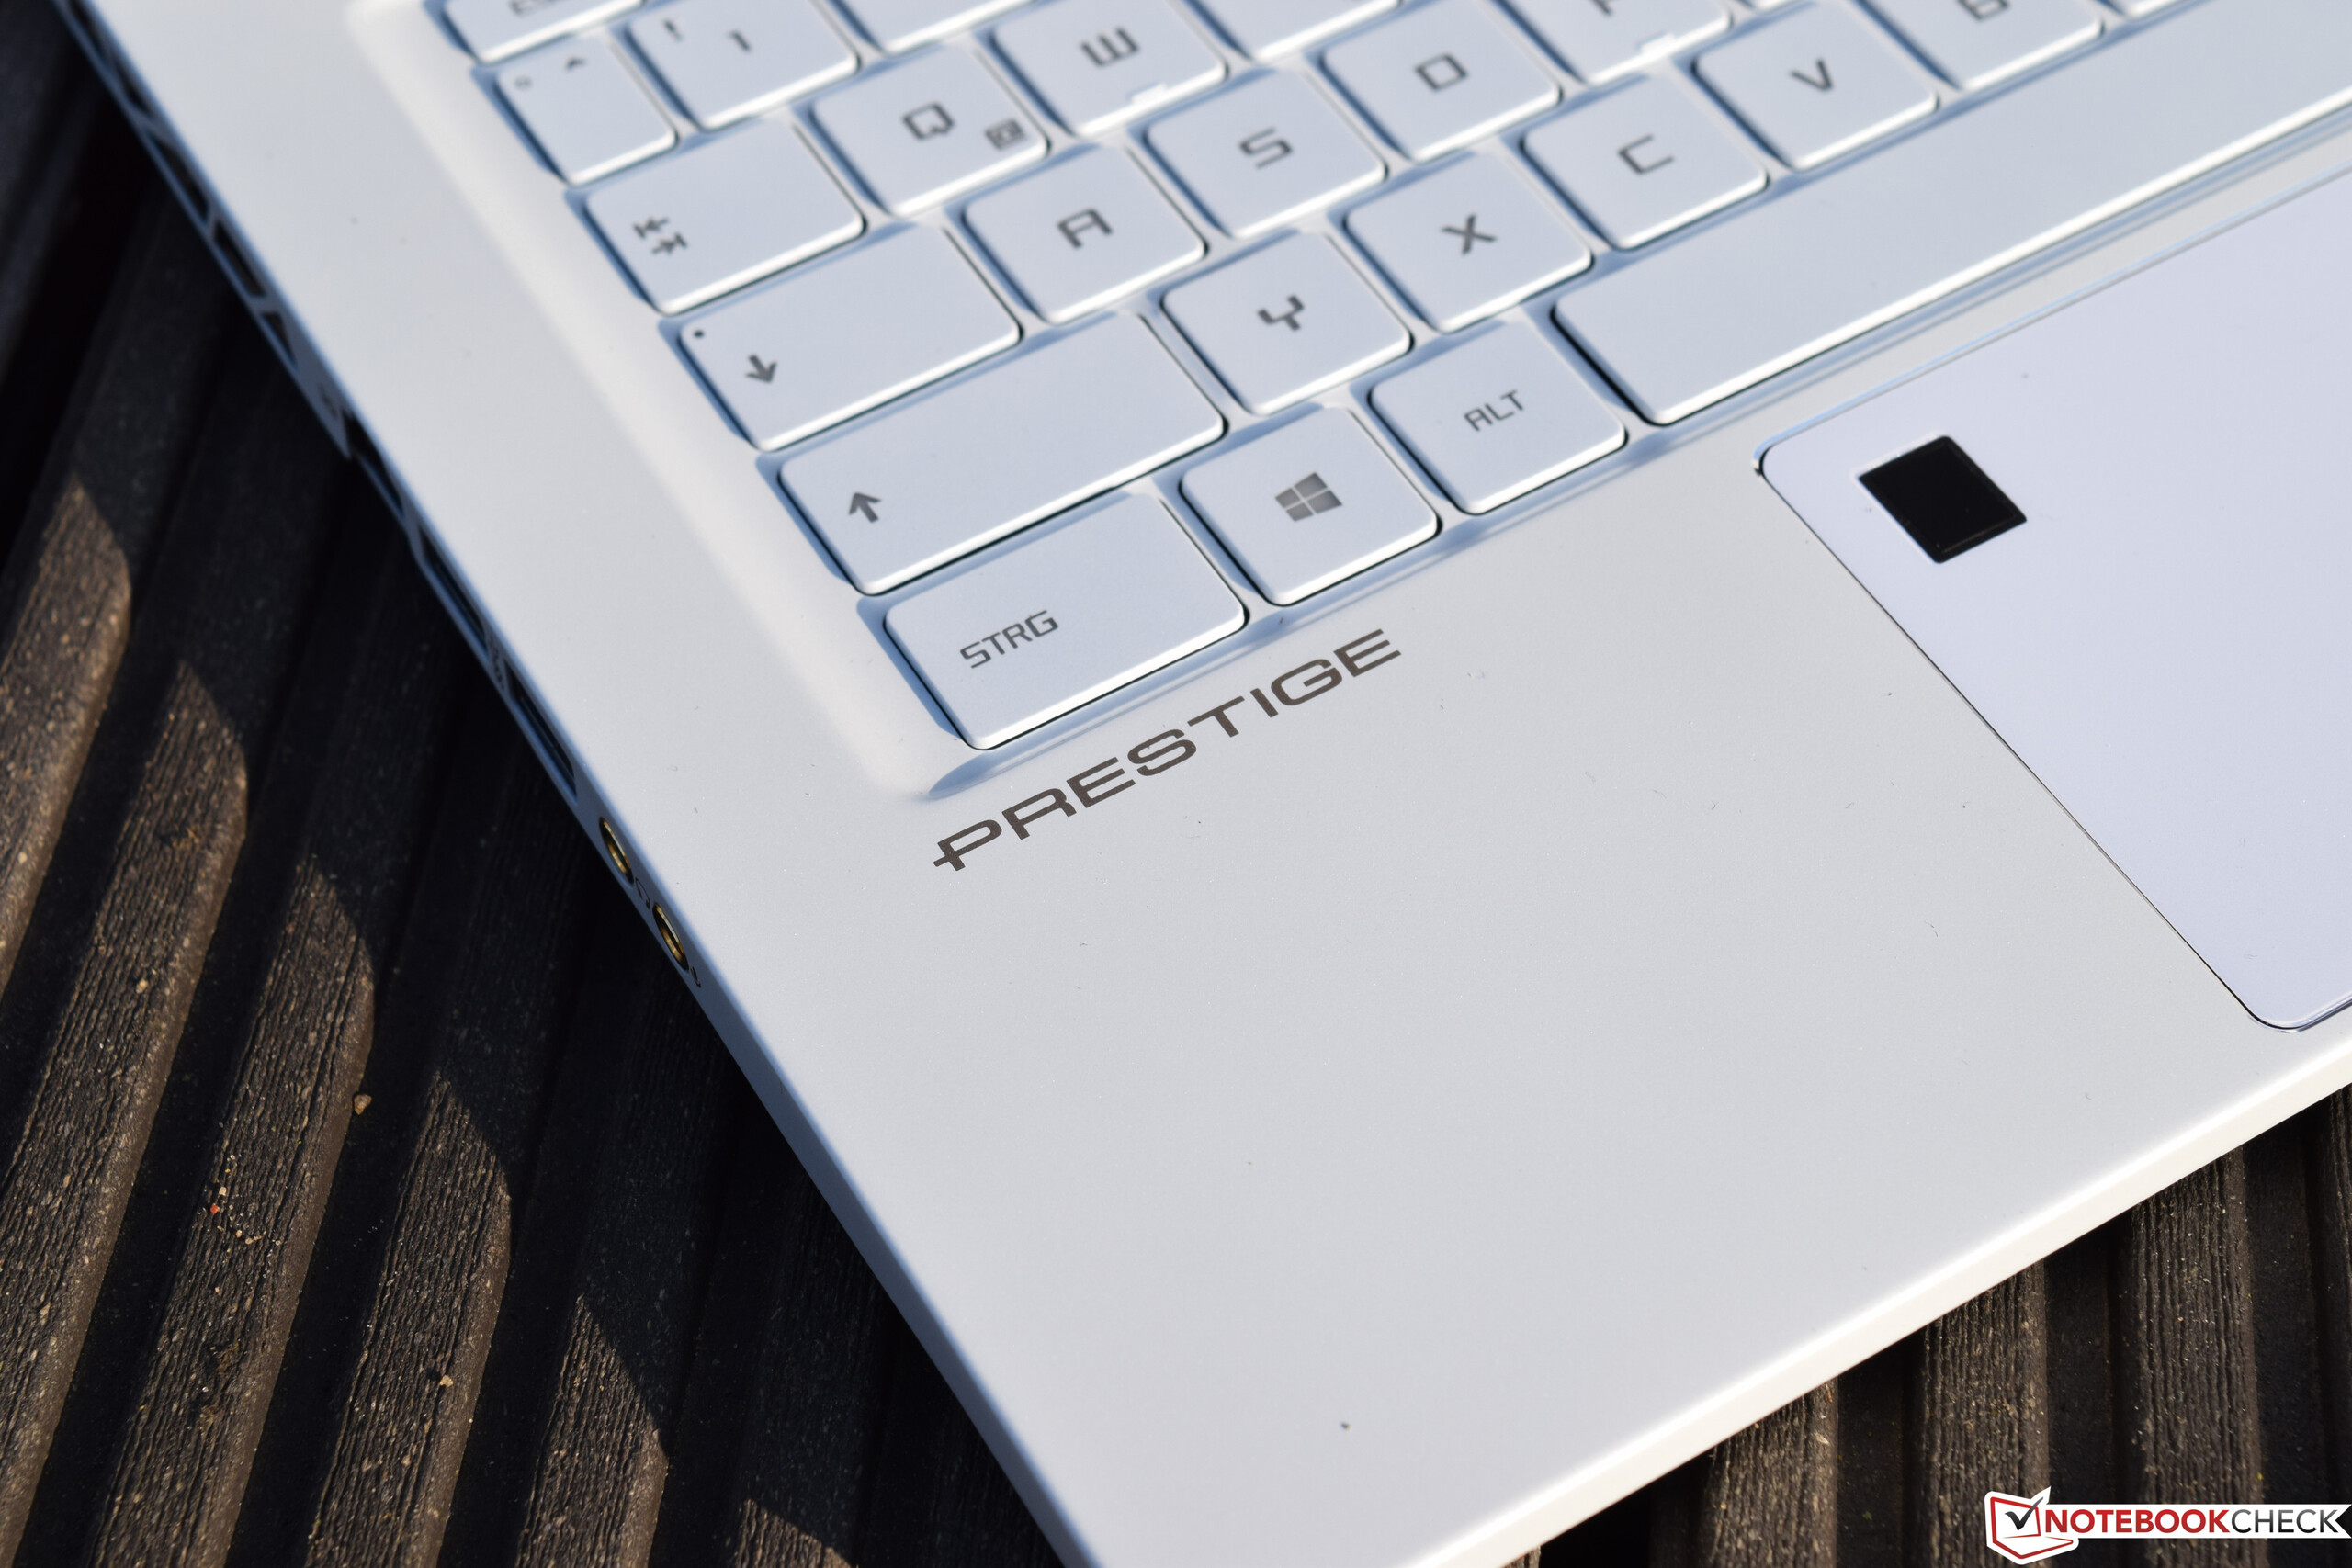
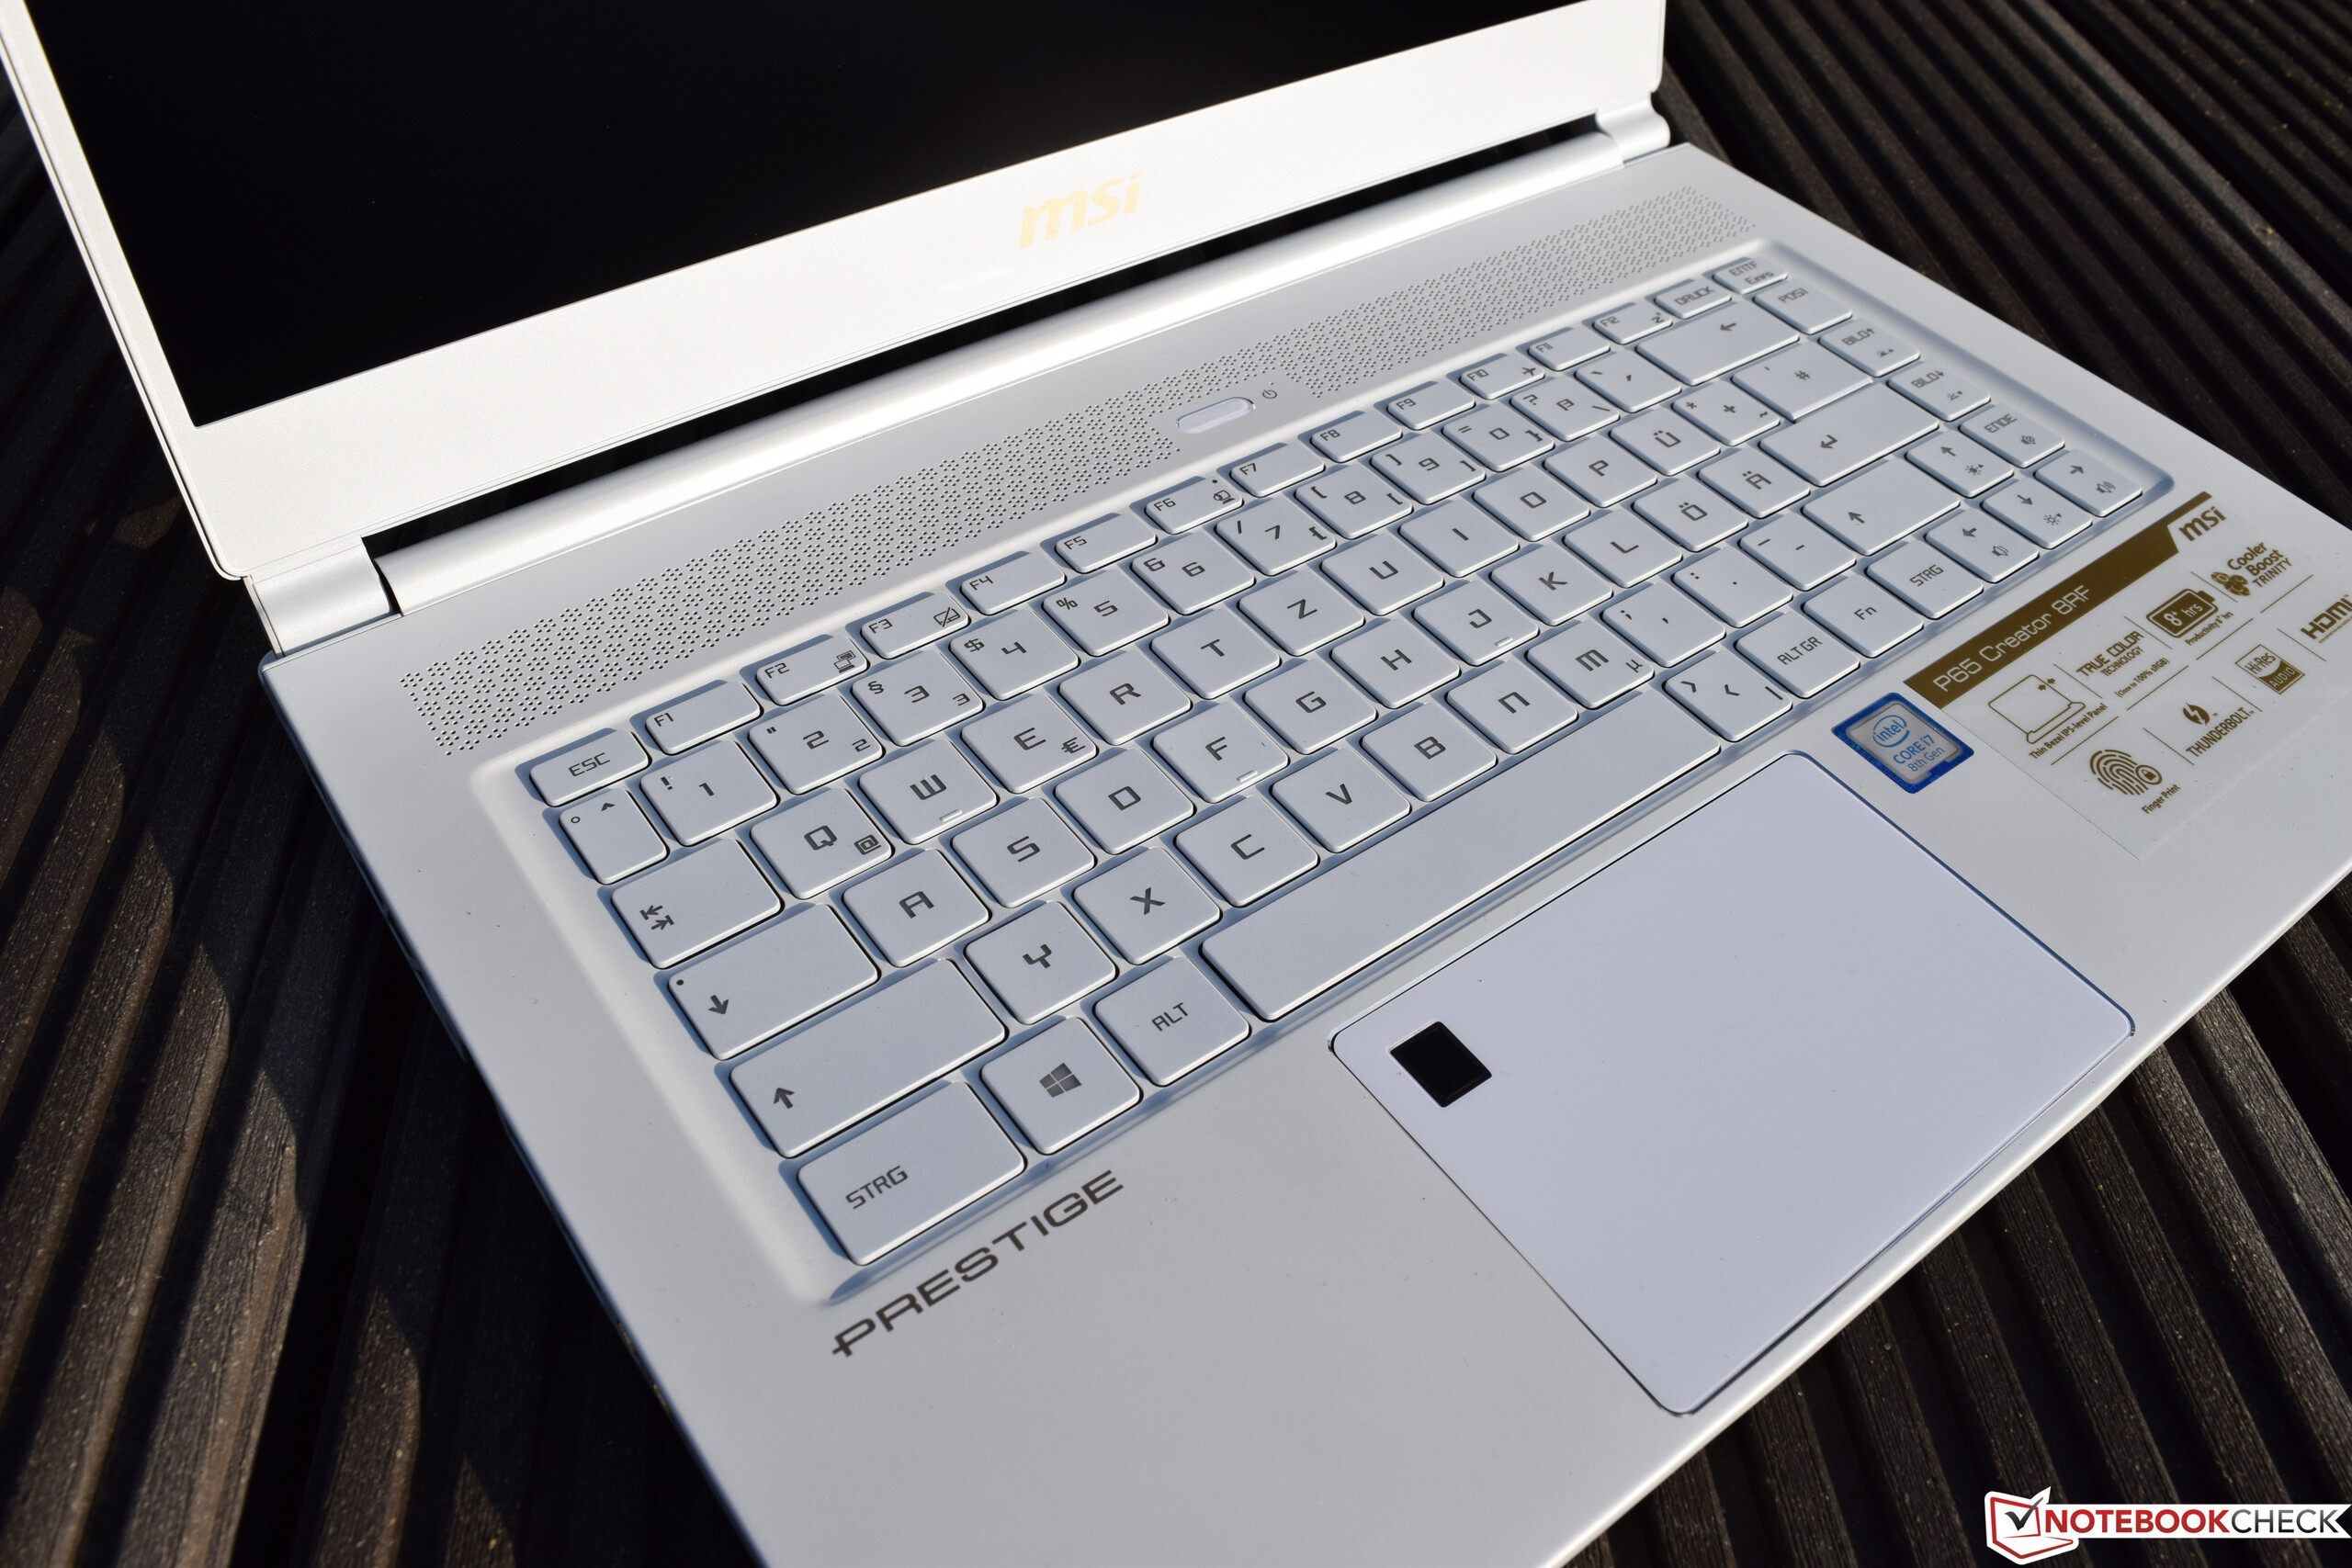
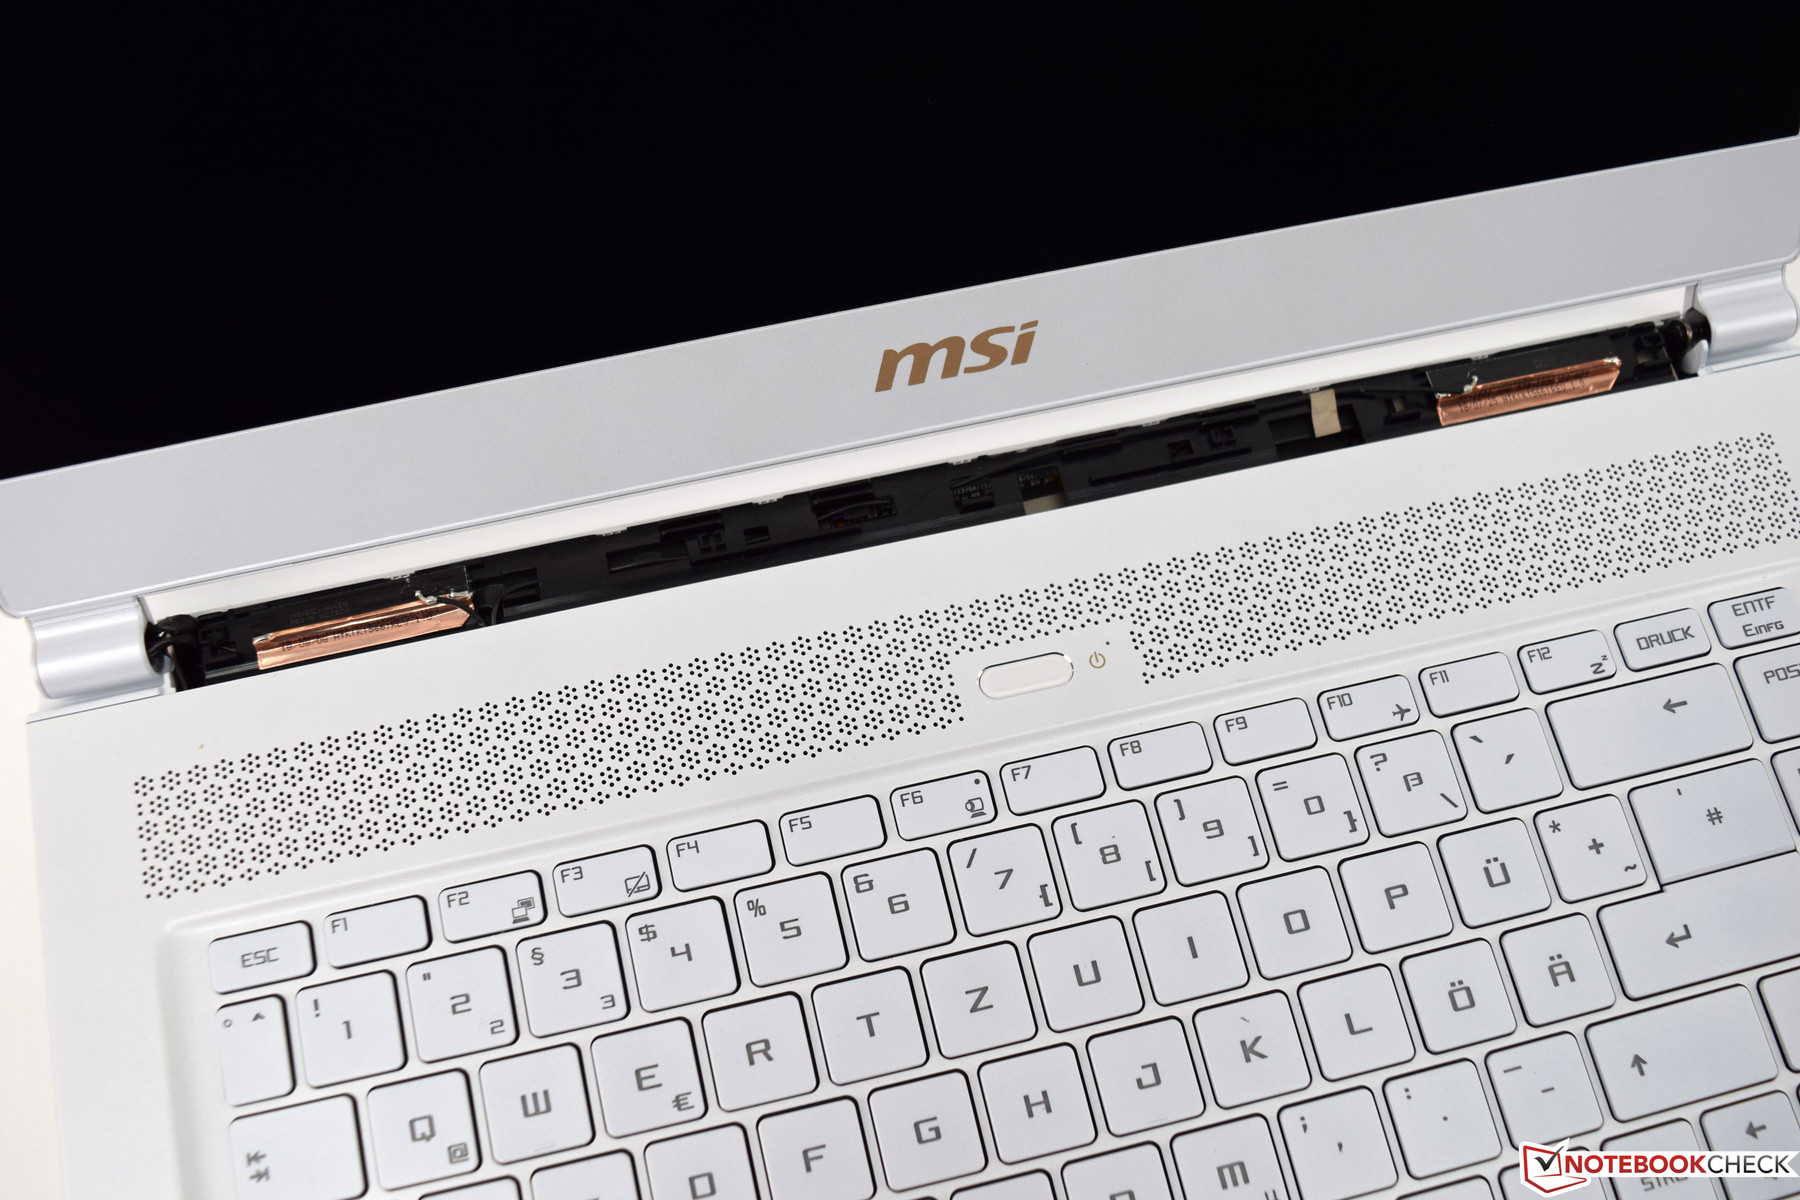
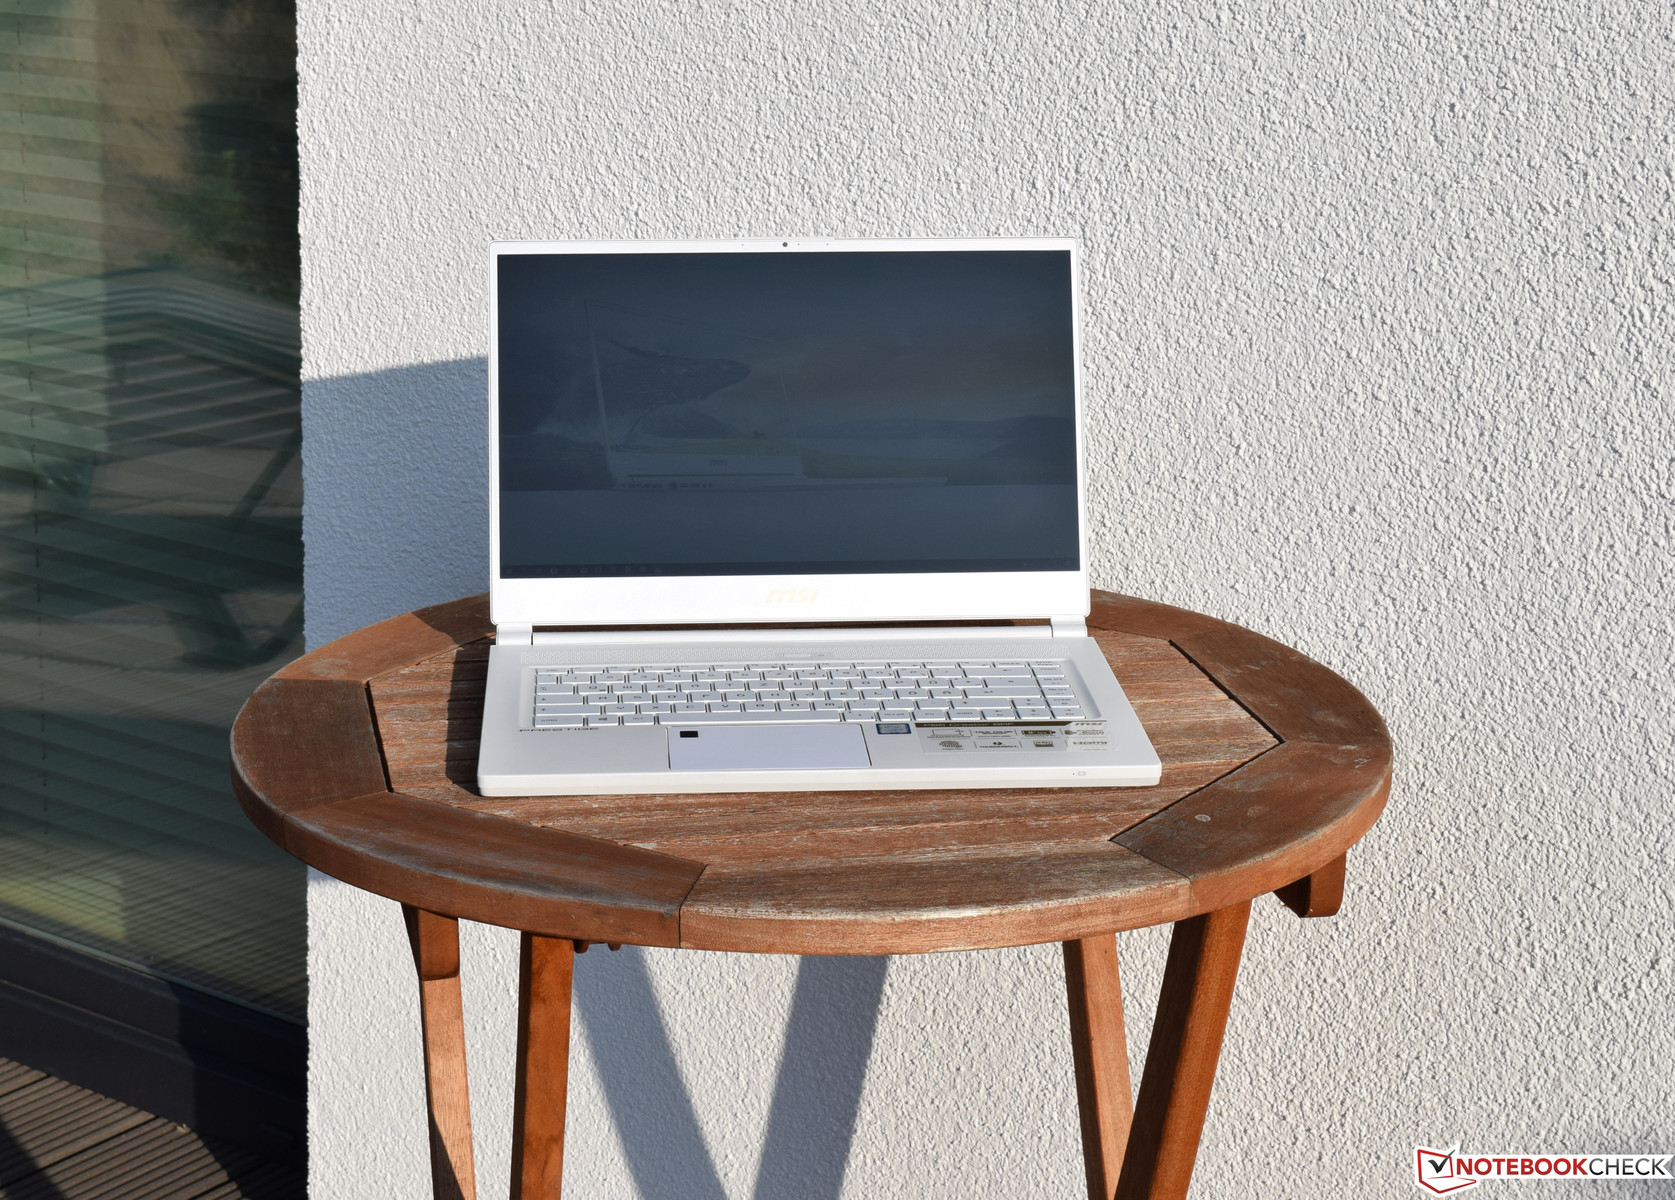
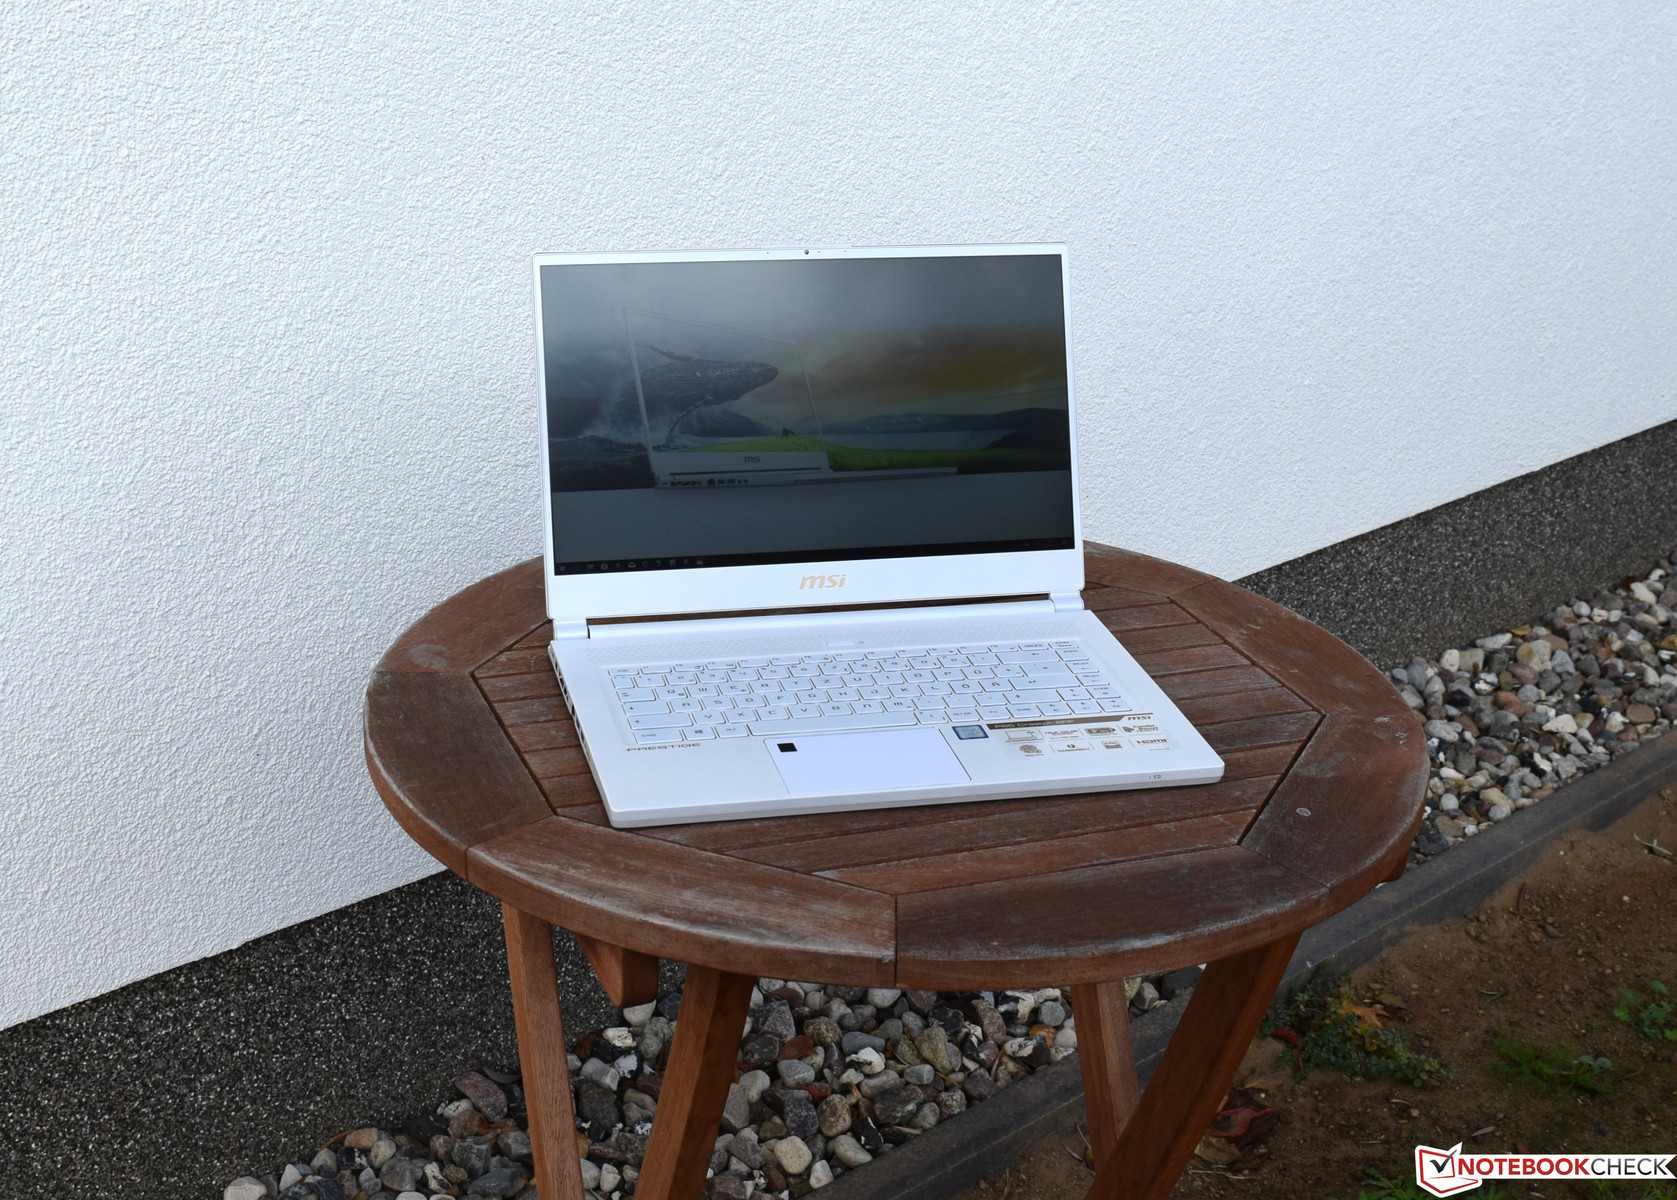
The basis for the P65 Creator is the MSI GS65 8RF. Where the GS65 is the gaming contender with flamboyant features such as an RGB-backlit keyboard, the P65 Creator is its more constrained and professional sibling, and the Limited Edition is completely white as well. The high-quality aluminum base and display lid look and feel very premium. However, we found some deficiencies upon closer inspection, for example uneven gaps as well as poor transitions between the top and the bottom parts of the base. While this may sound like a typical First-World problem we do expect top quality from any device that sells for more than $2,000.
Overall rigidity suffered slightly from its ultra-light design. For example, we have not had any trouble twisting and warping the base, and exerting punctiform force on the case led to minor creaking. To make matters worse the top case flexed noticeably at the top in the middle right above the power button.
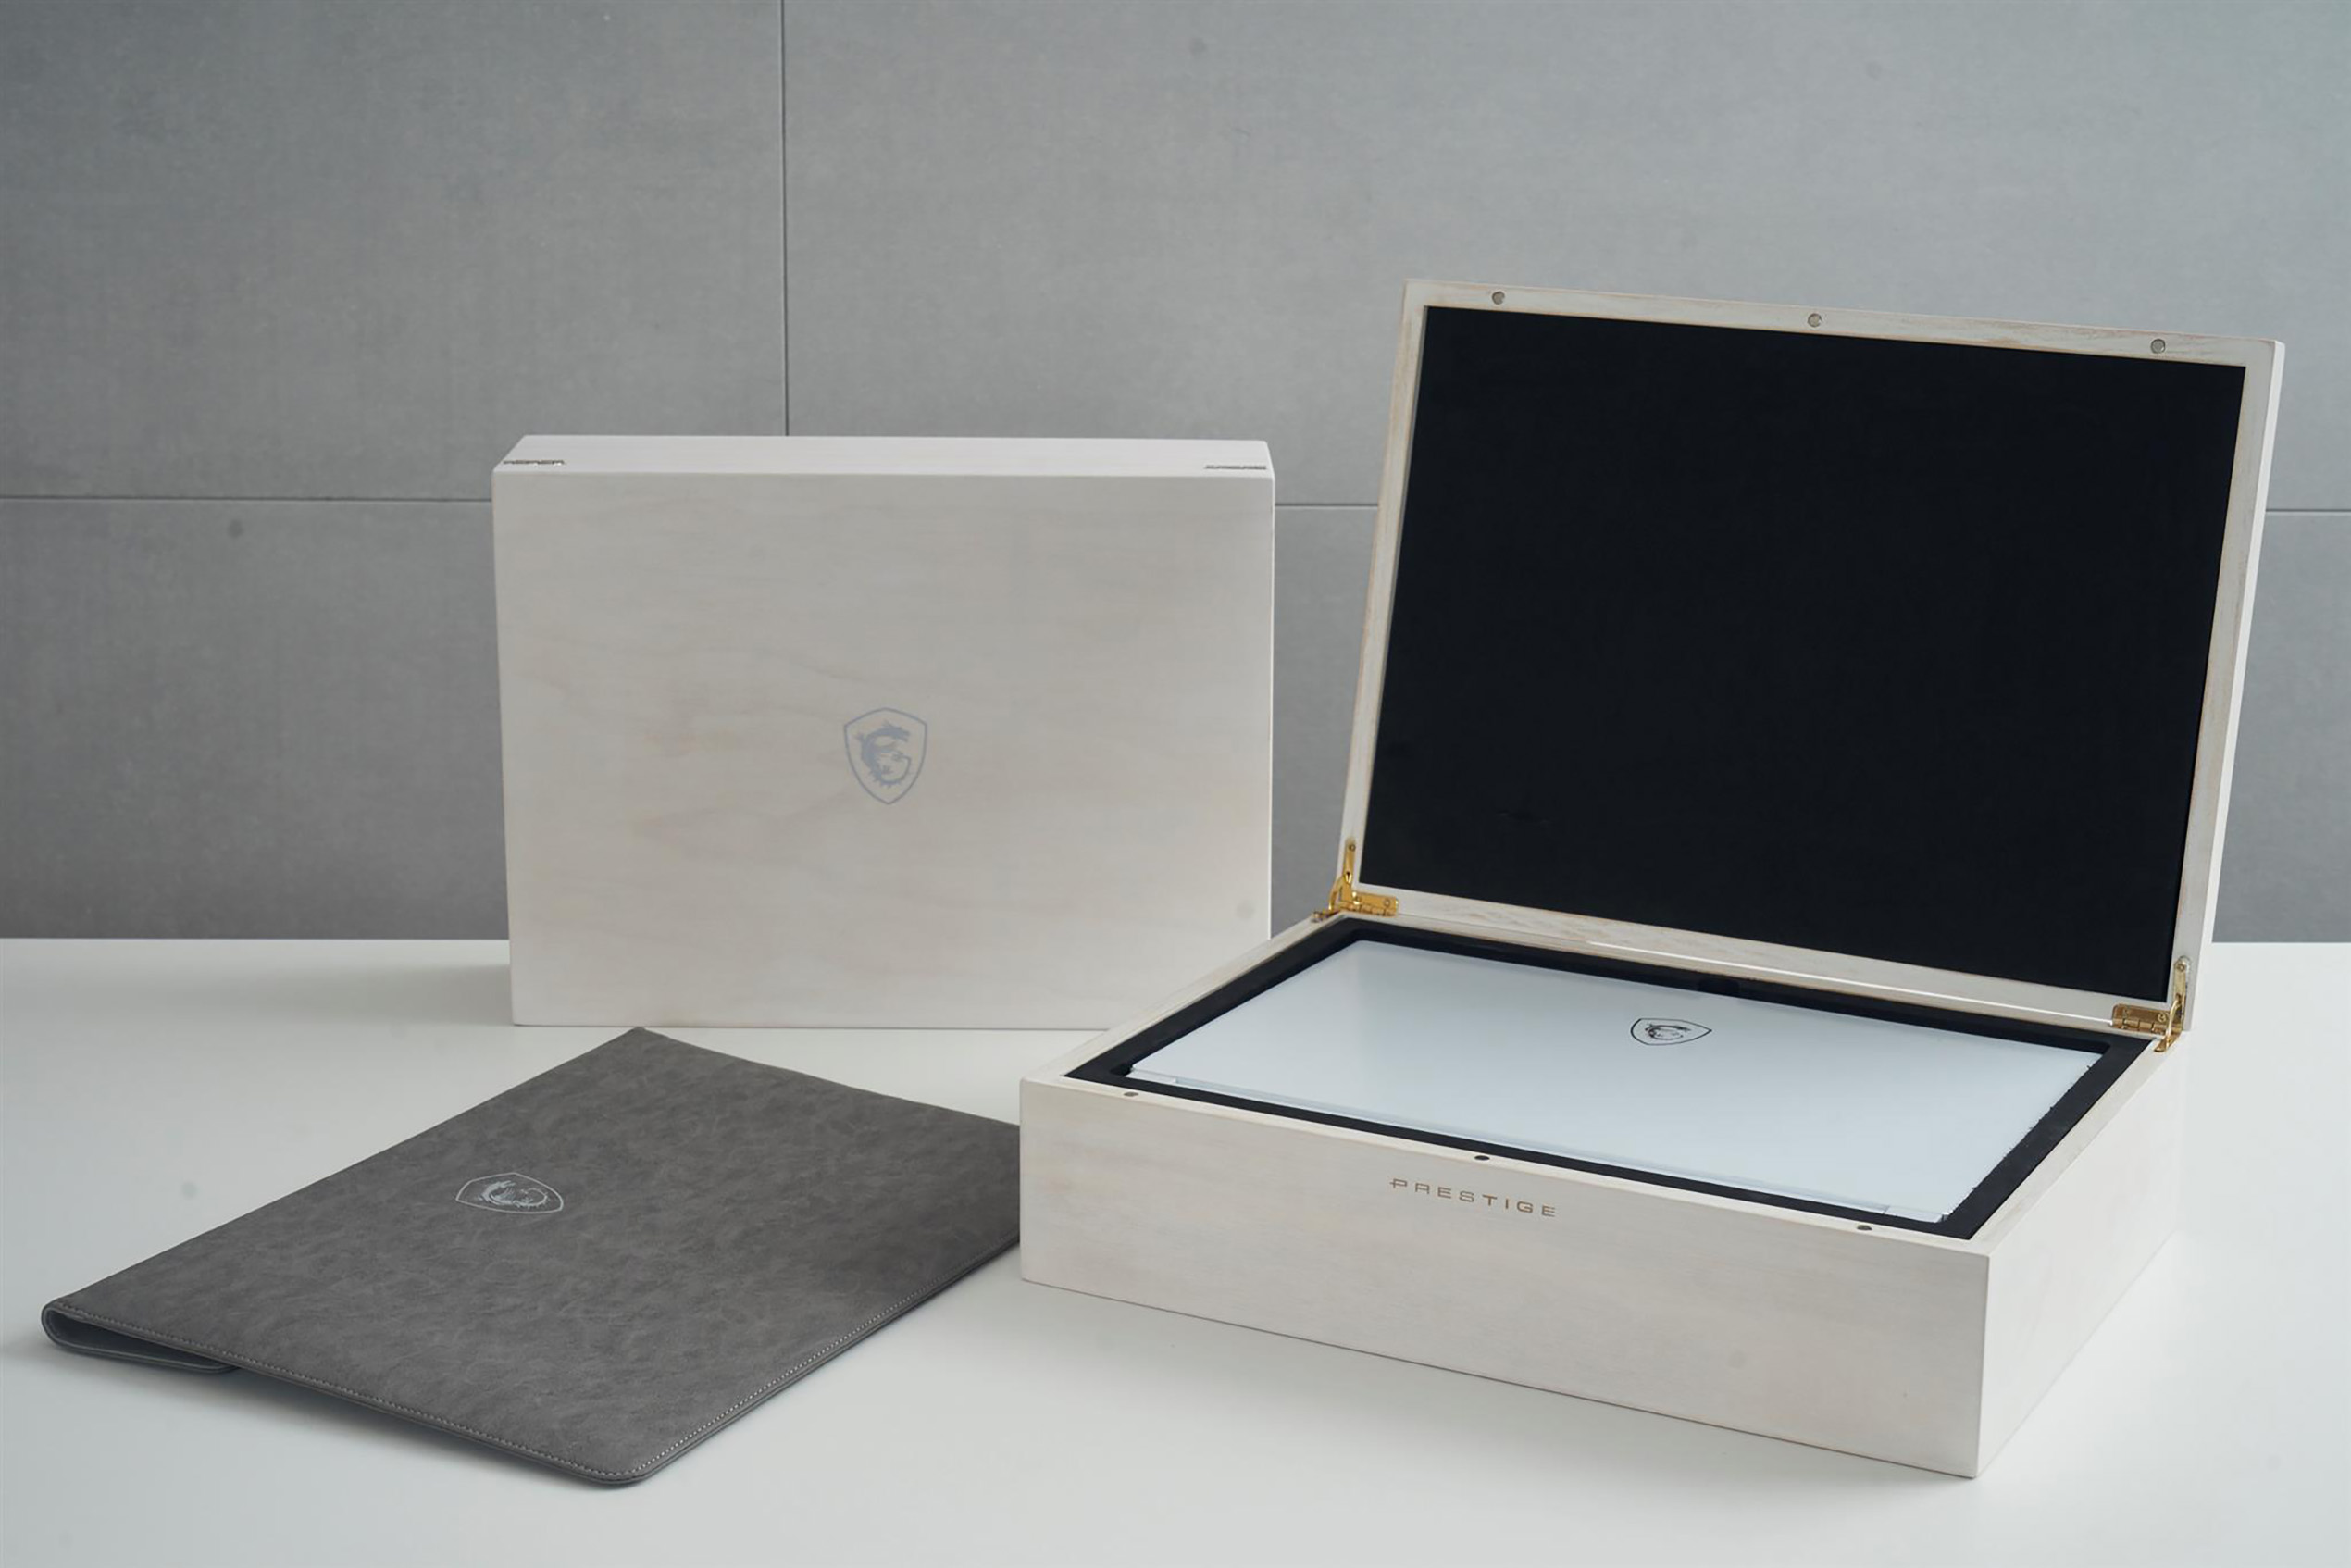
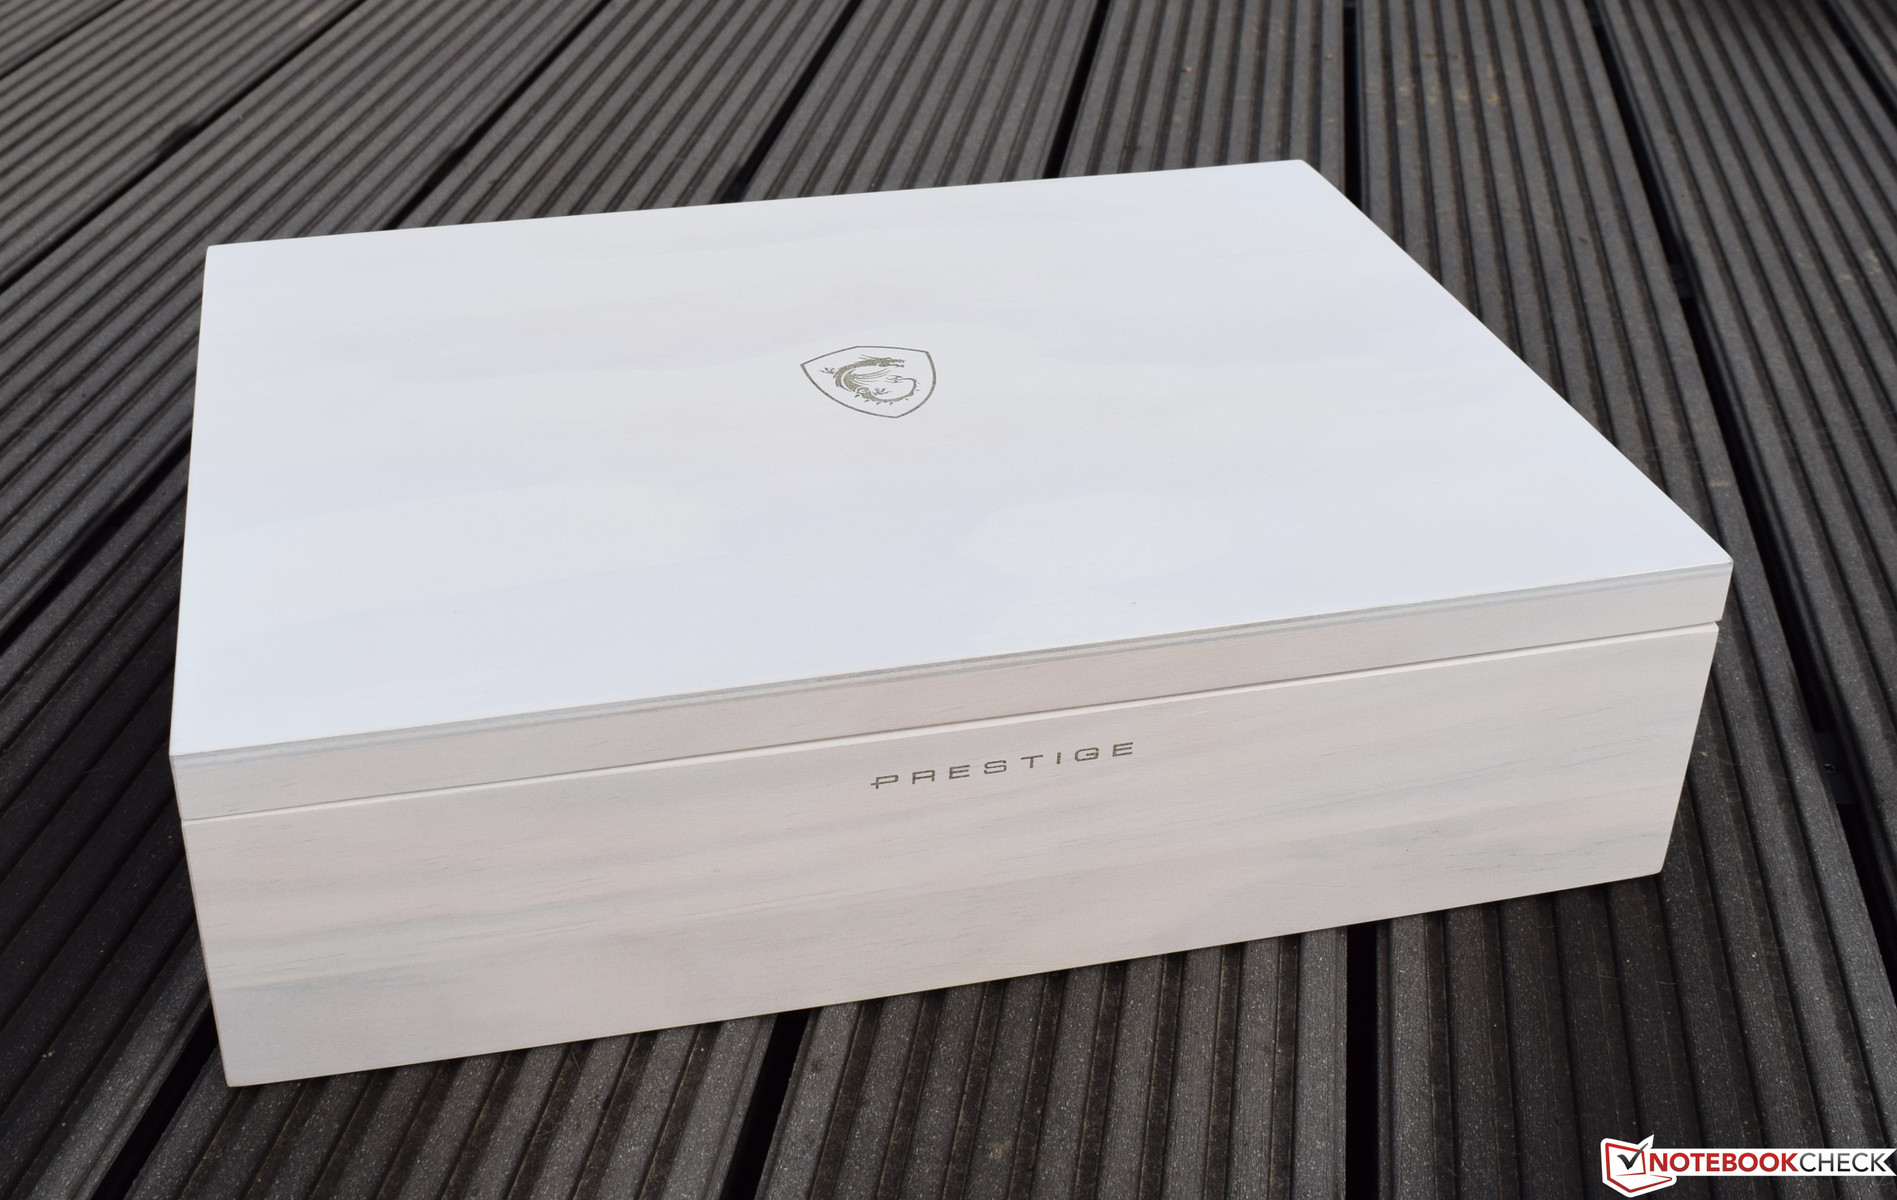
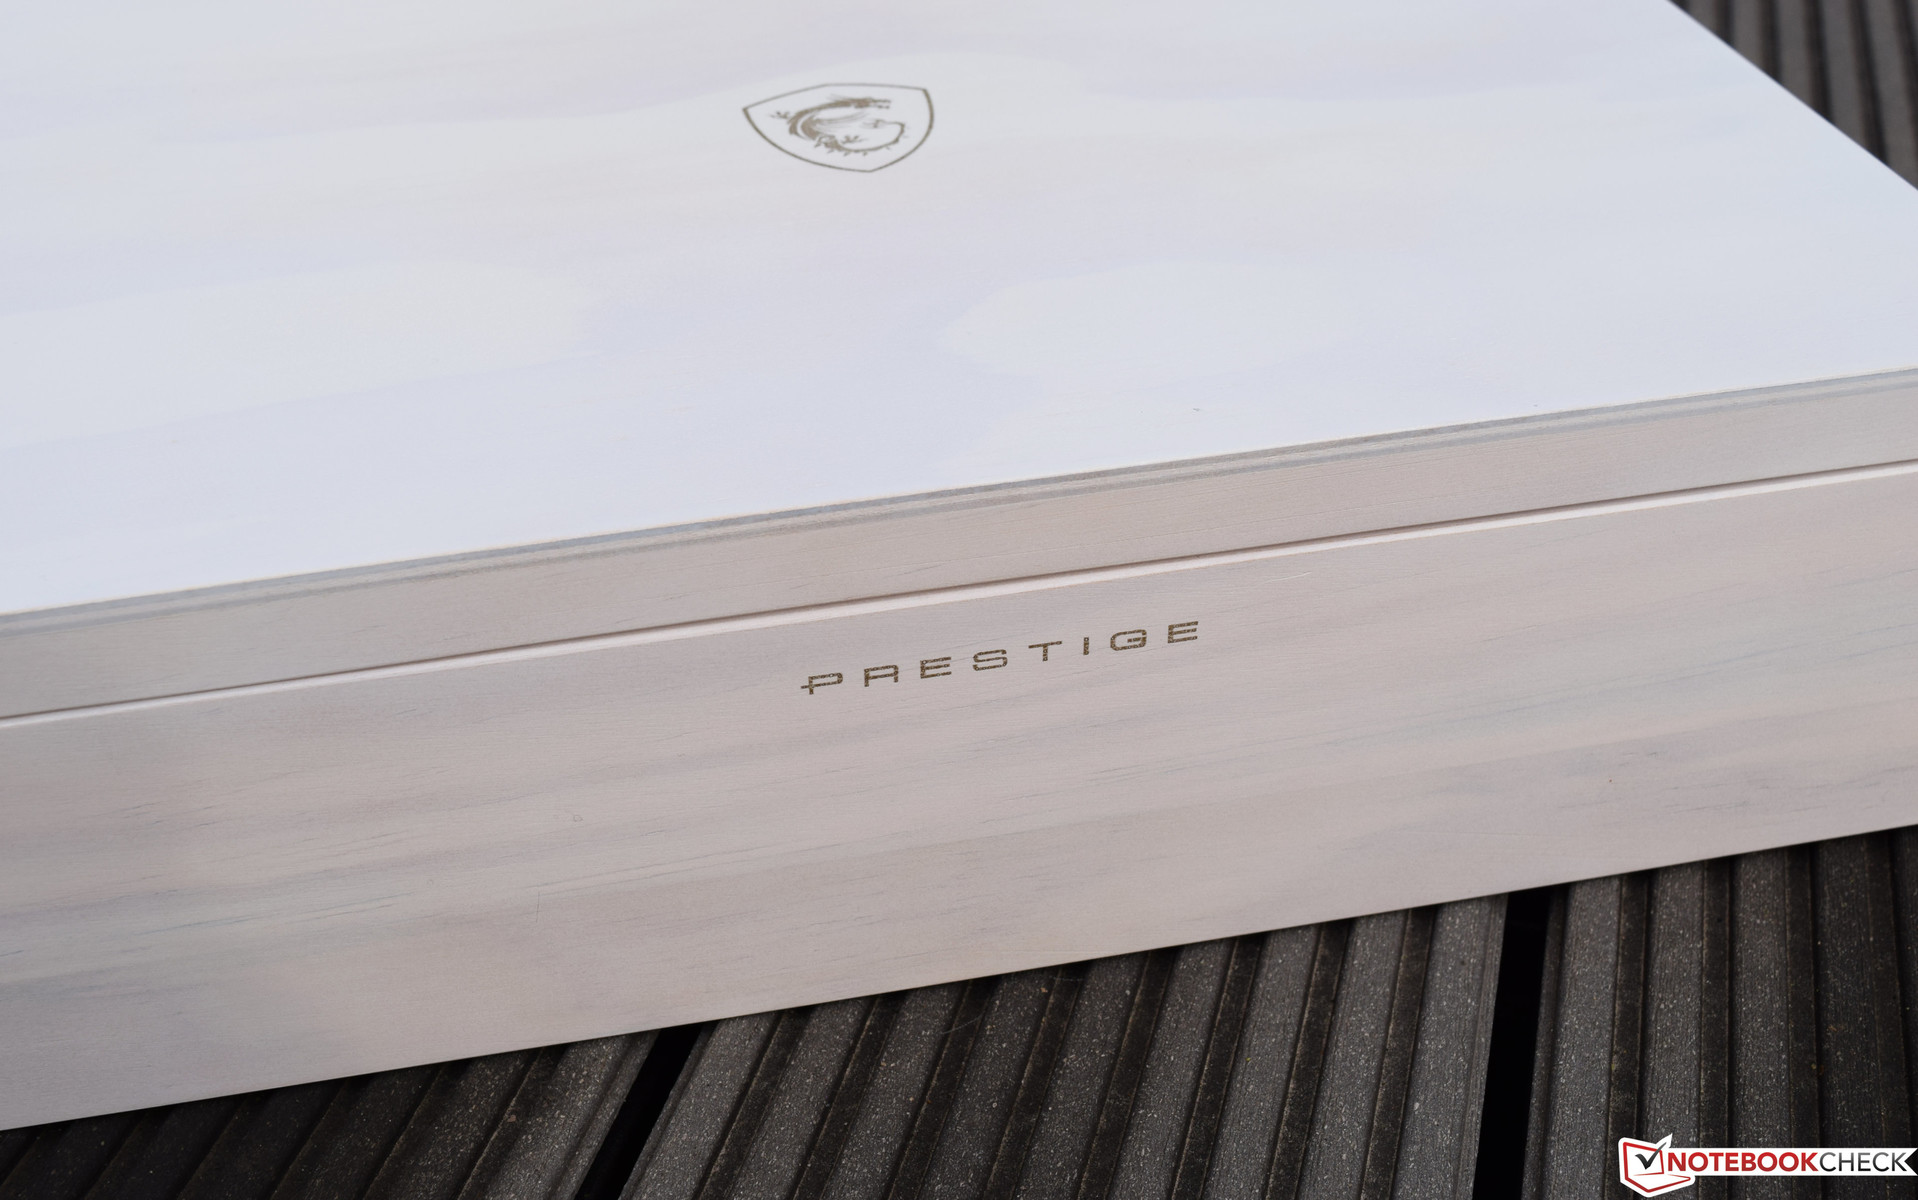
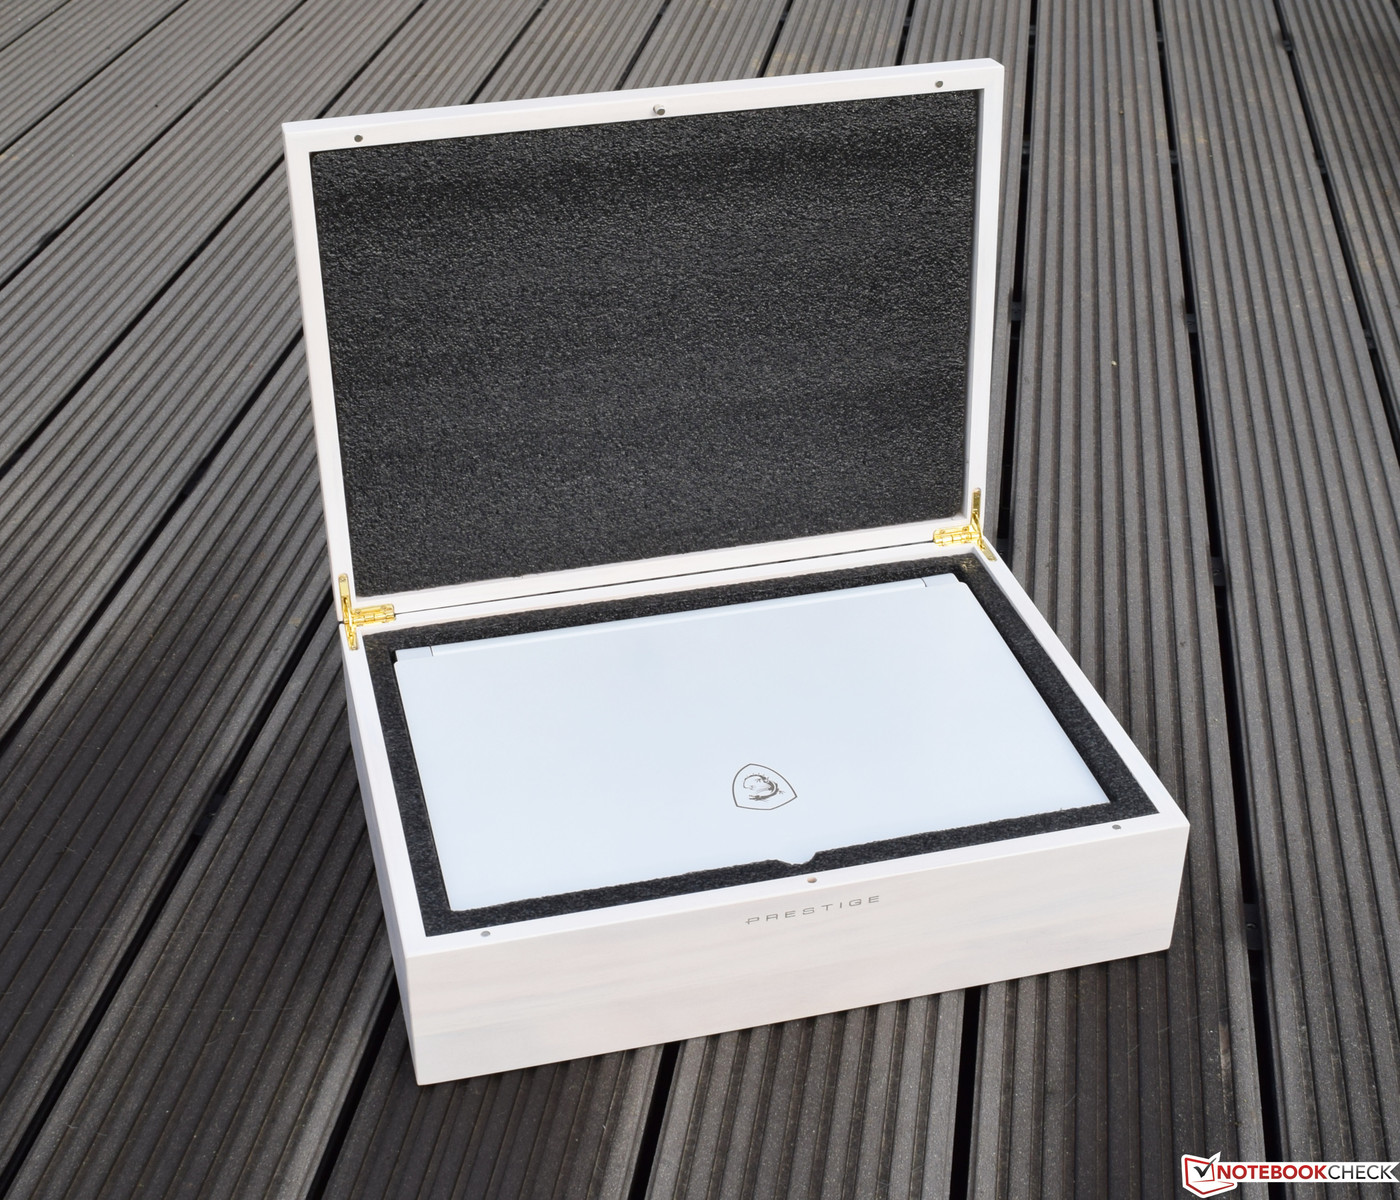
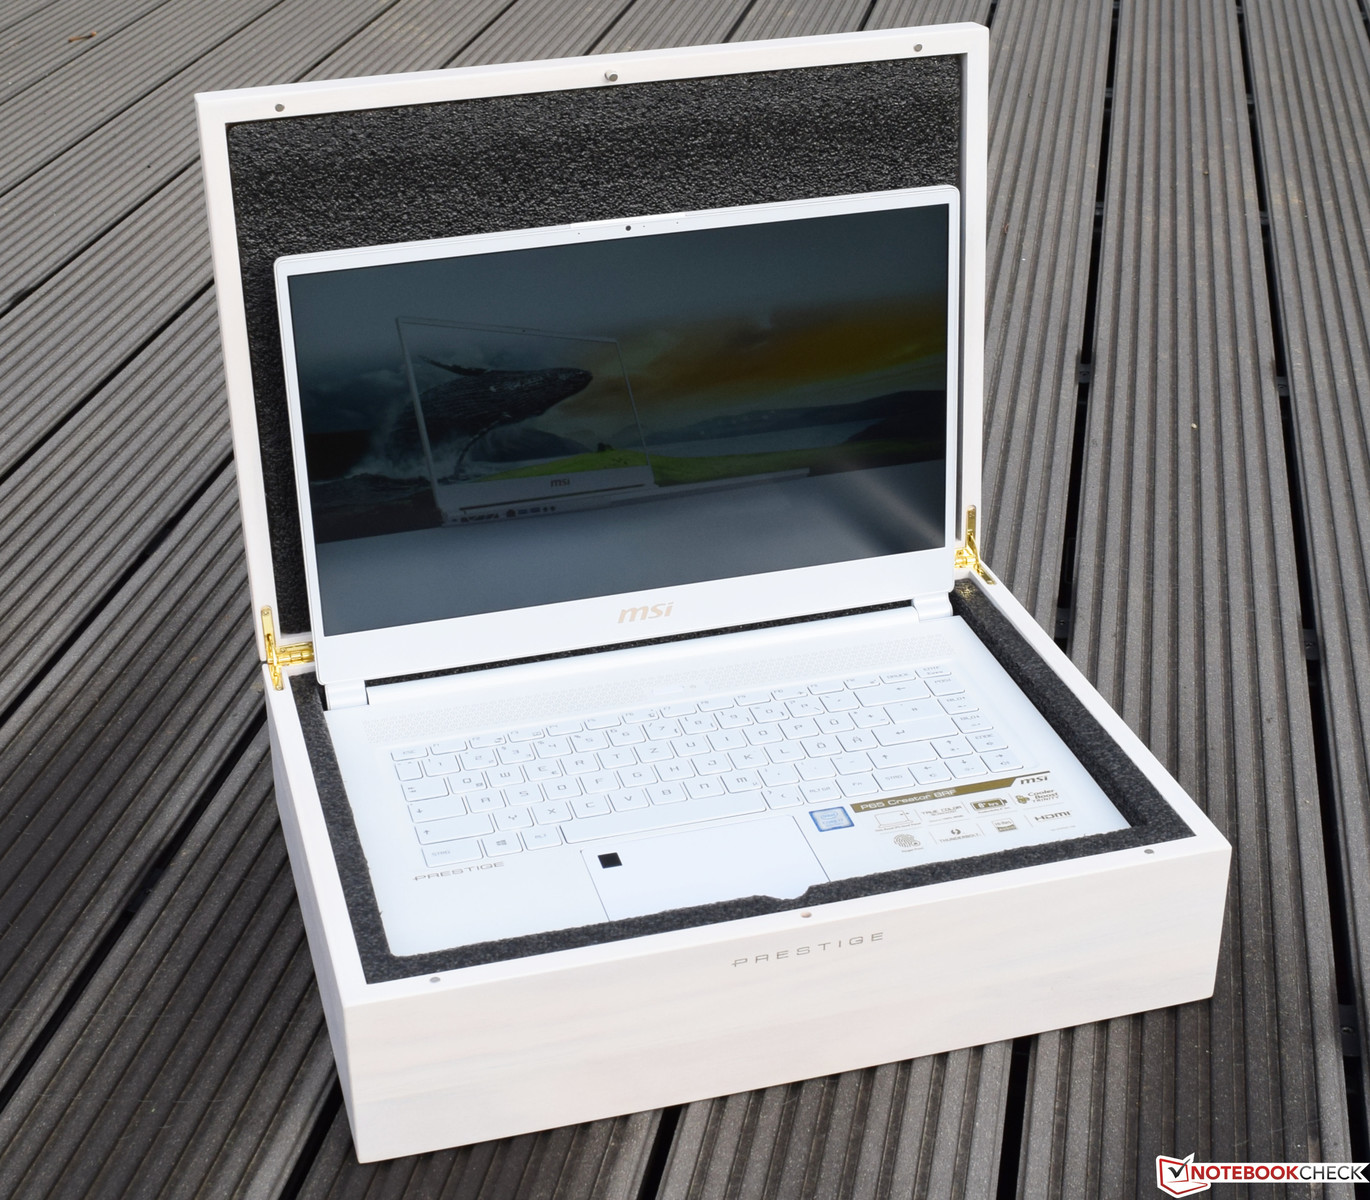
However, should you opt for an MSI P65 8RF Creator you are going to receive it in a very classy wooden box. This, unfortunately, is another Limited Edition exclusive.
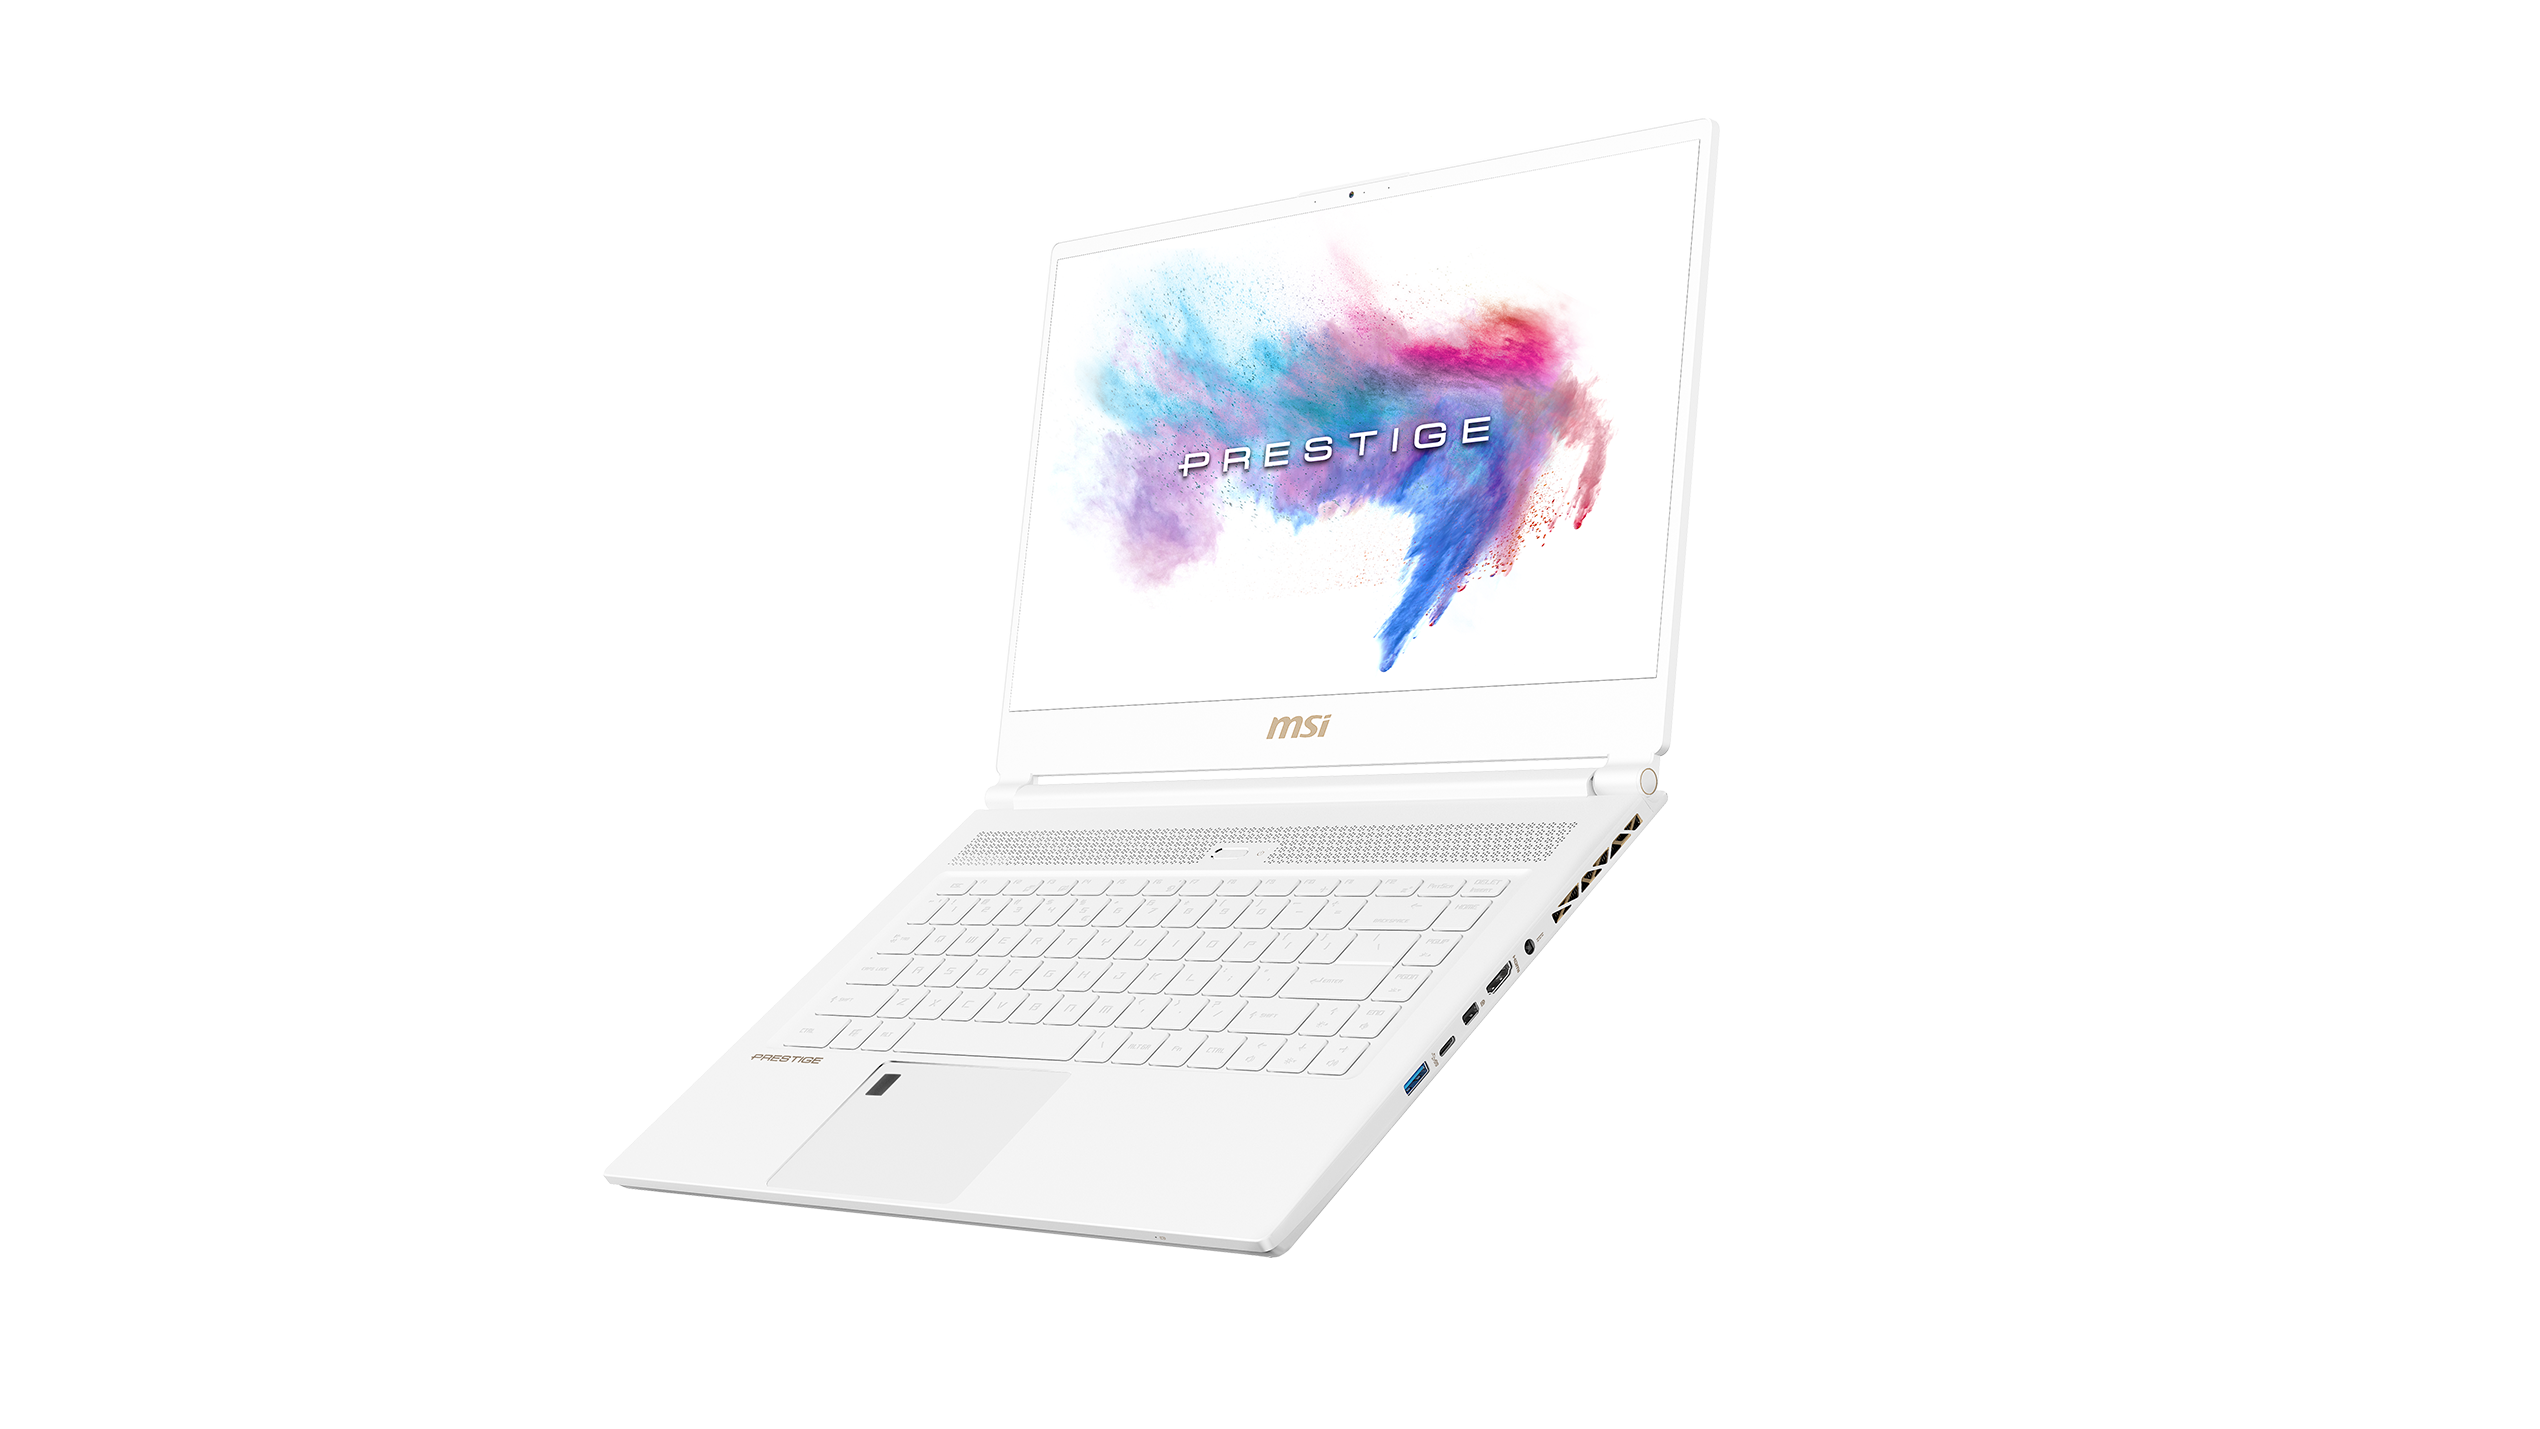
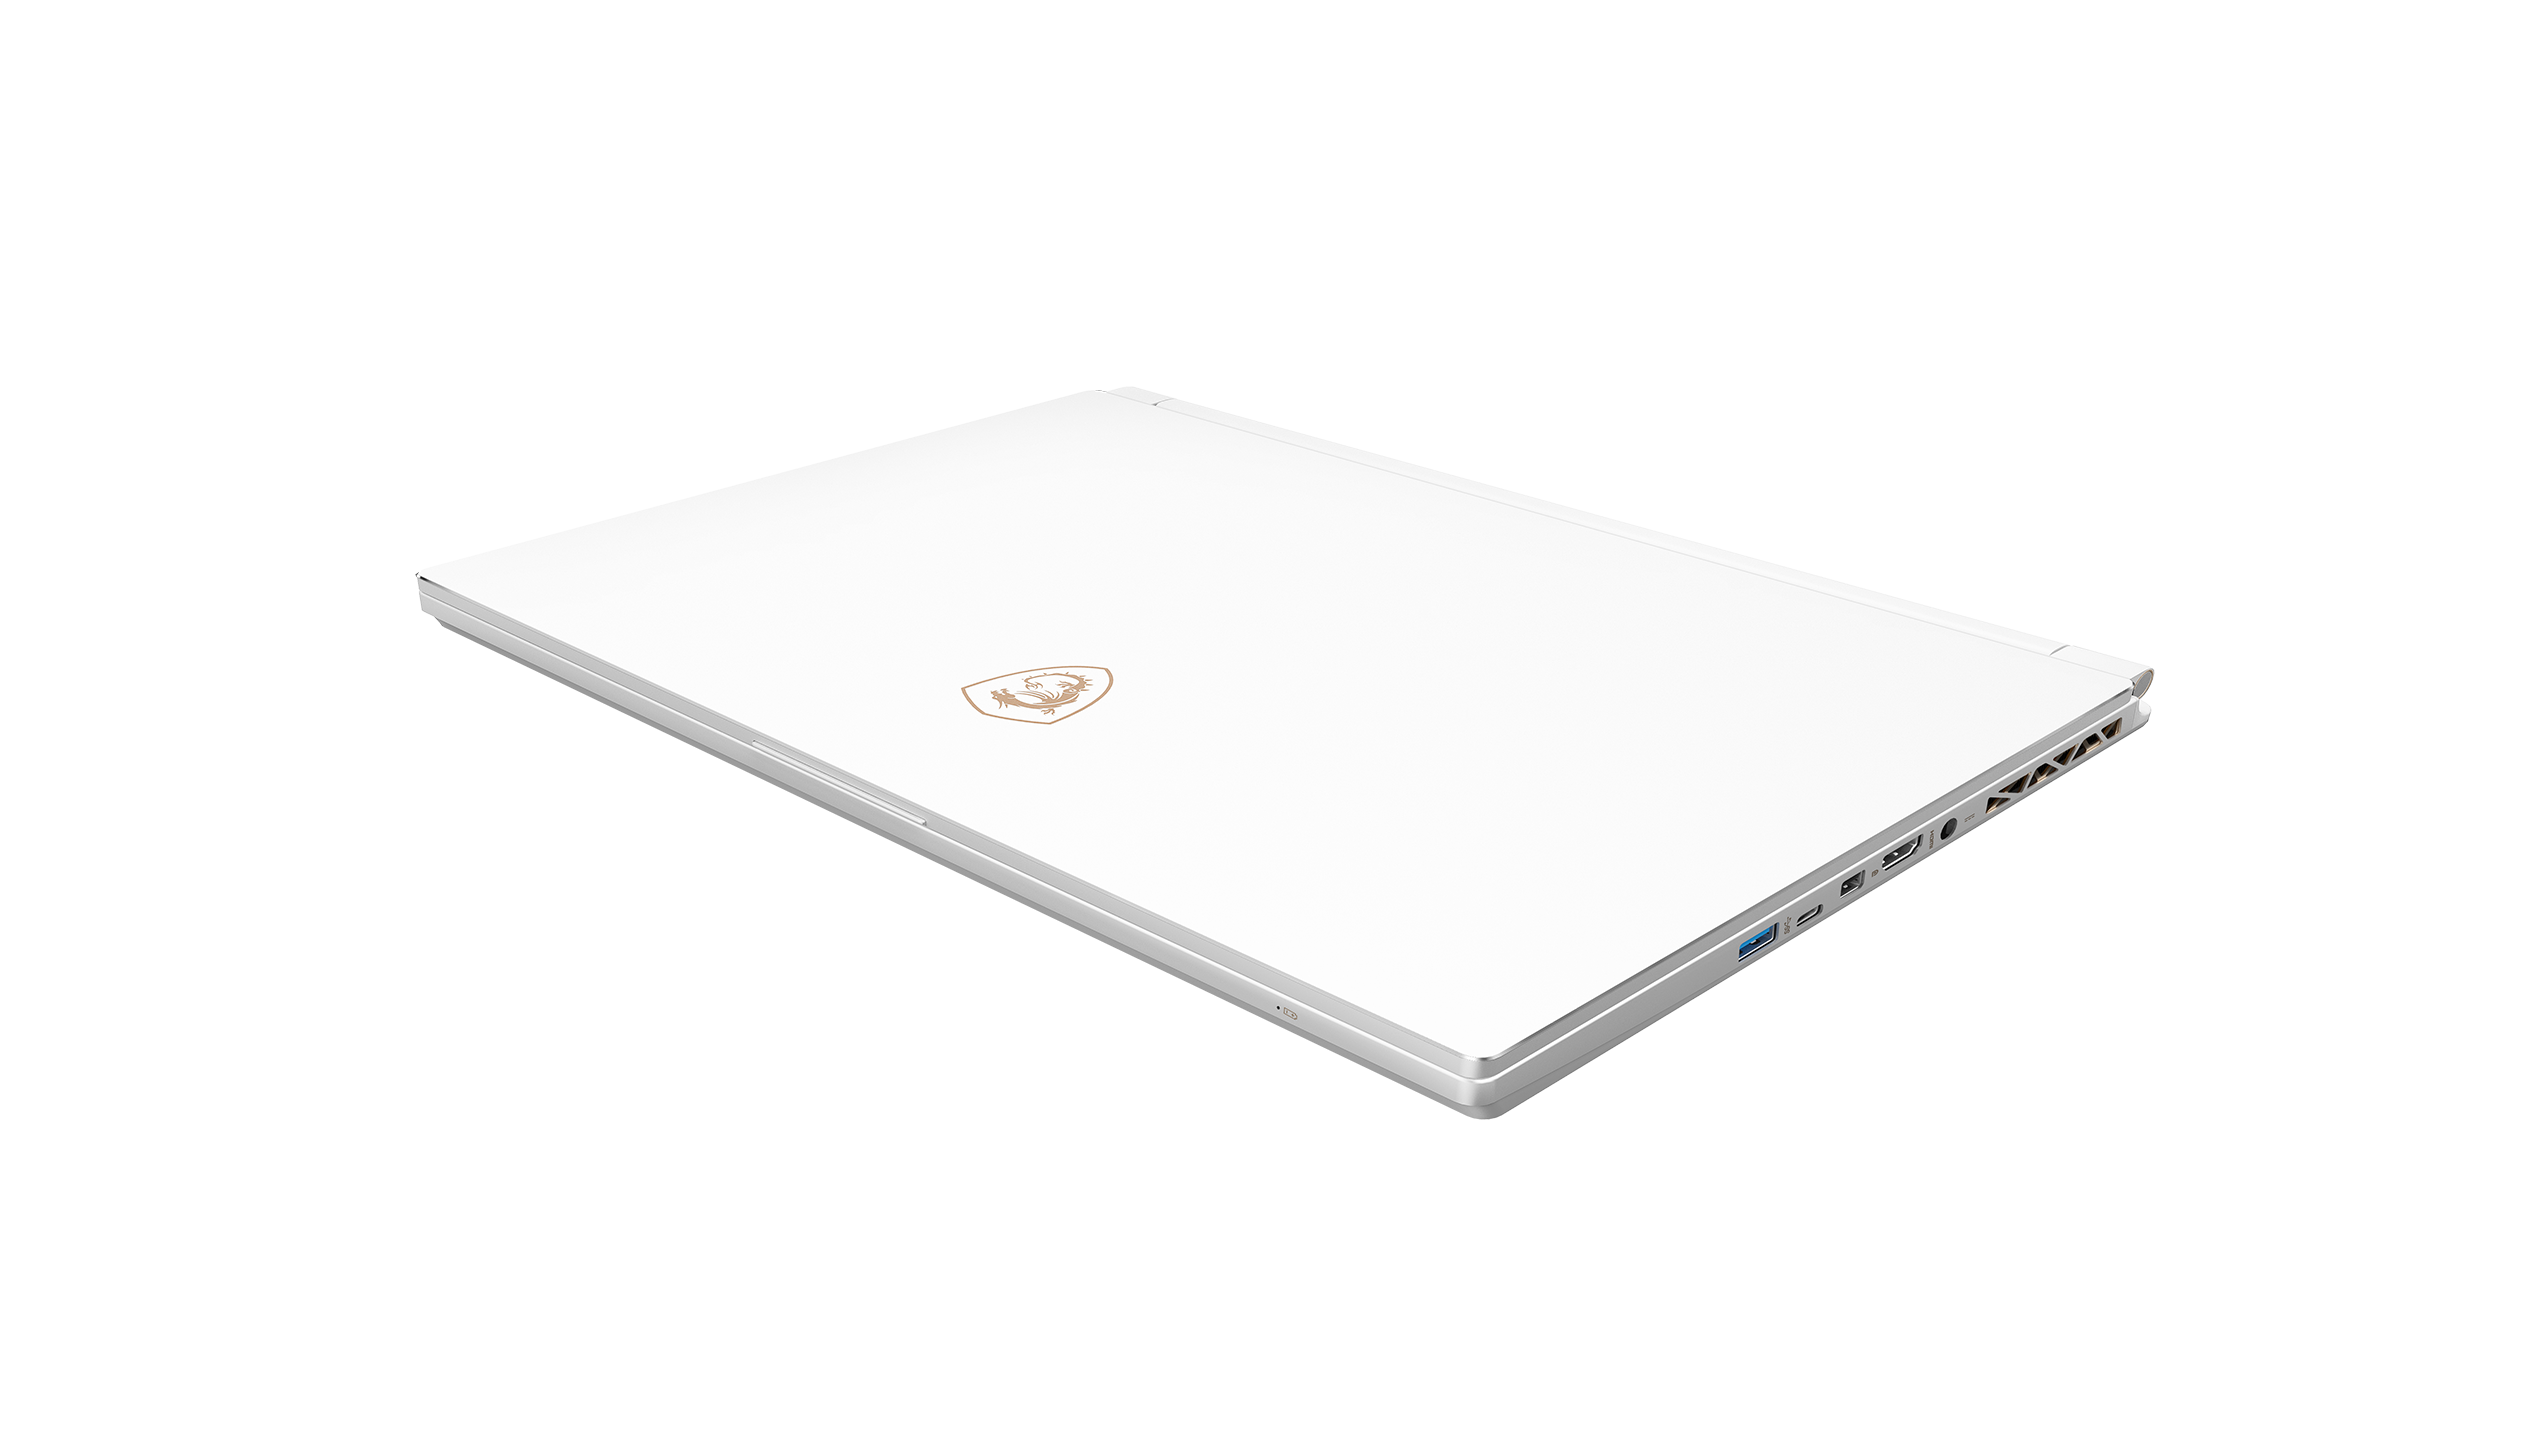

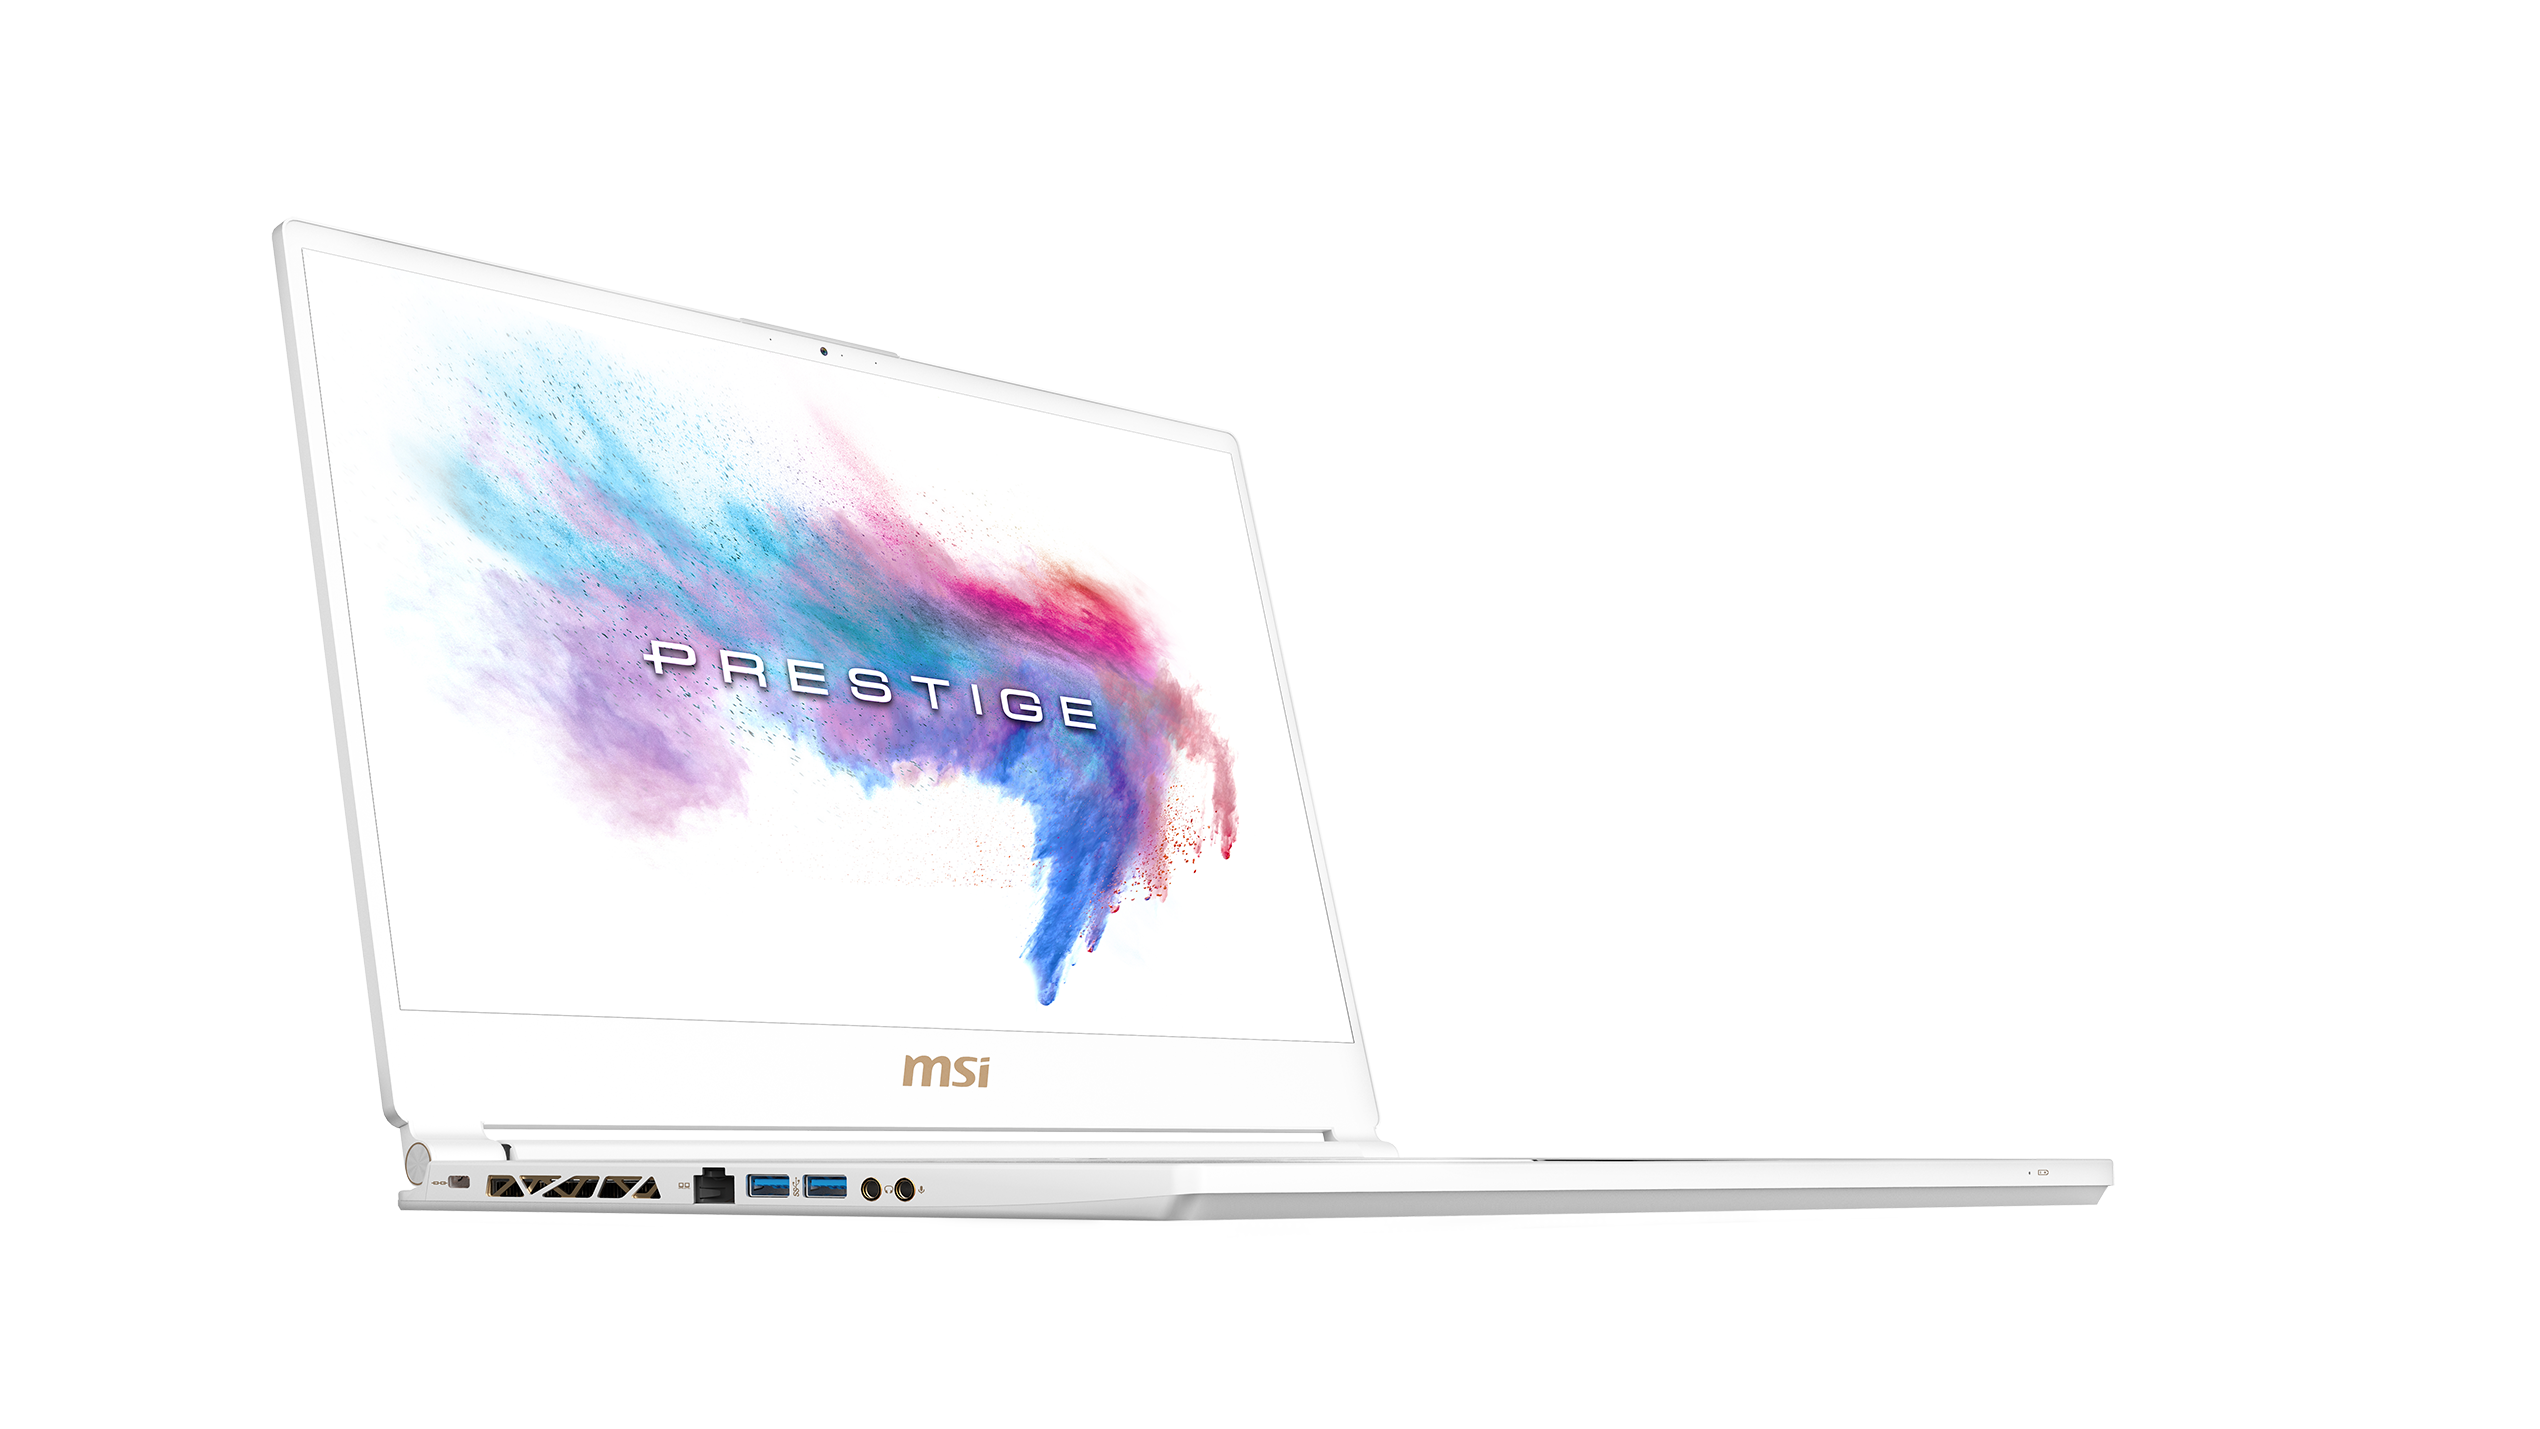
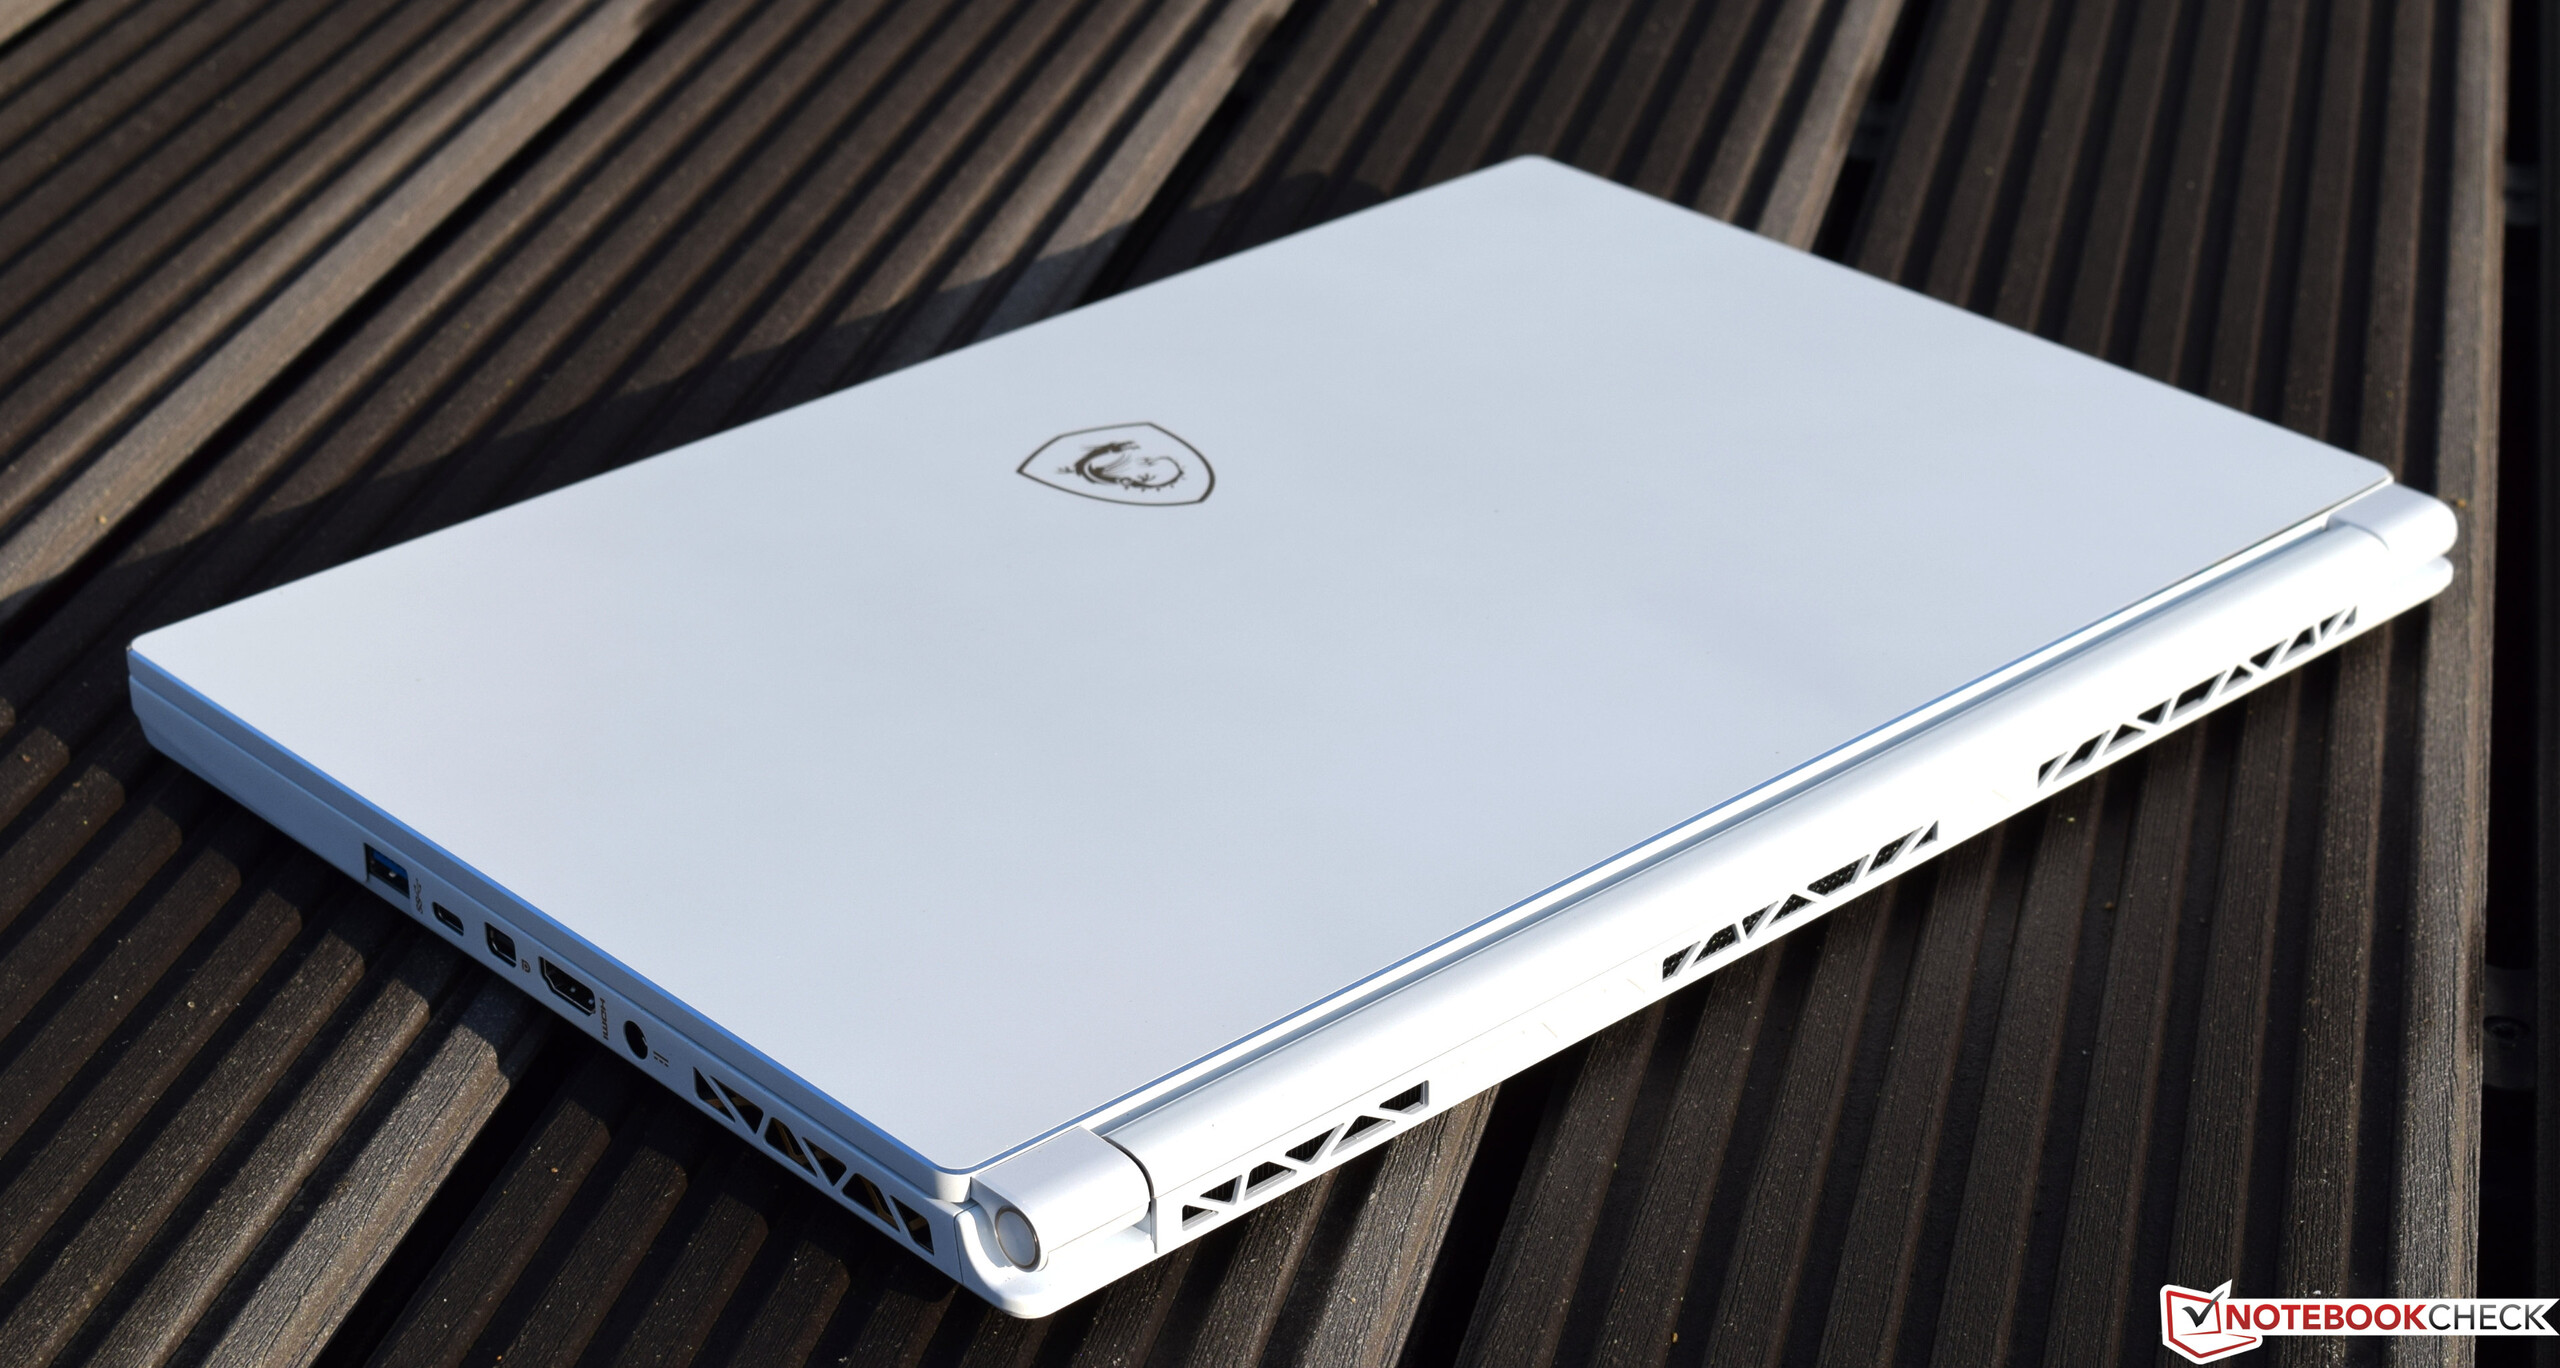
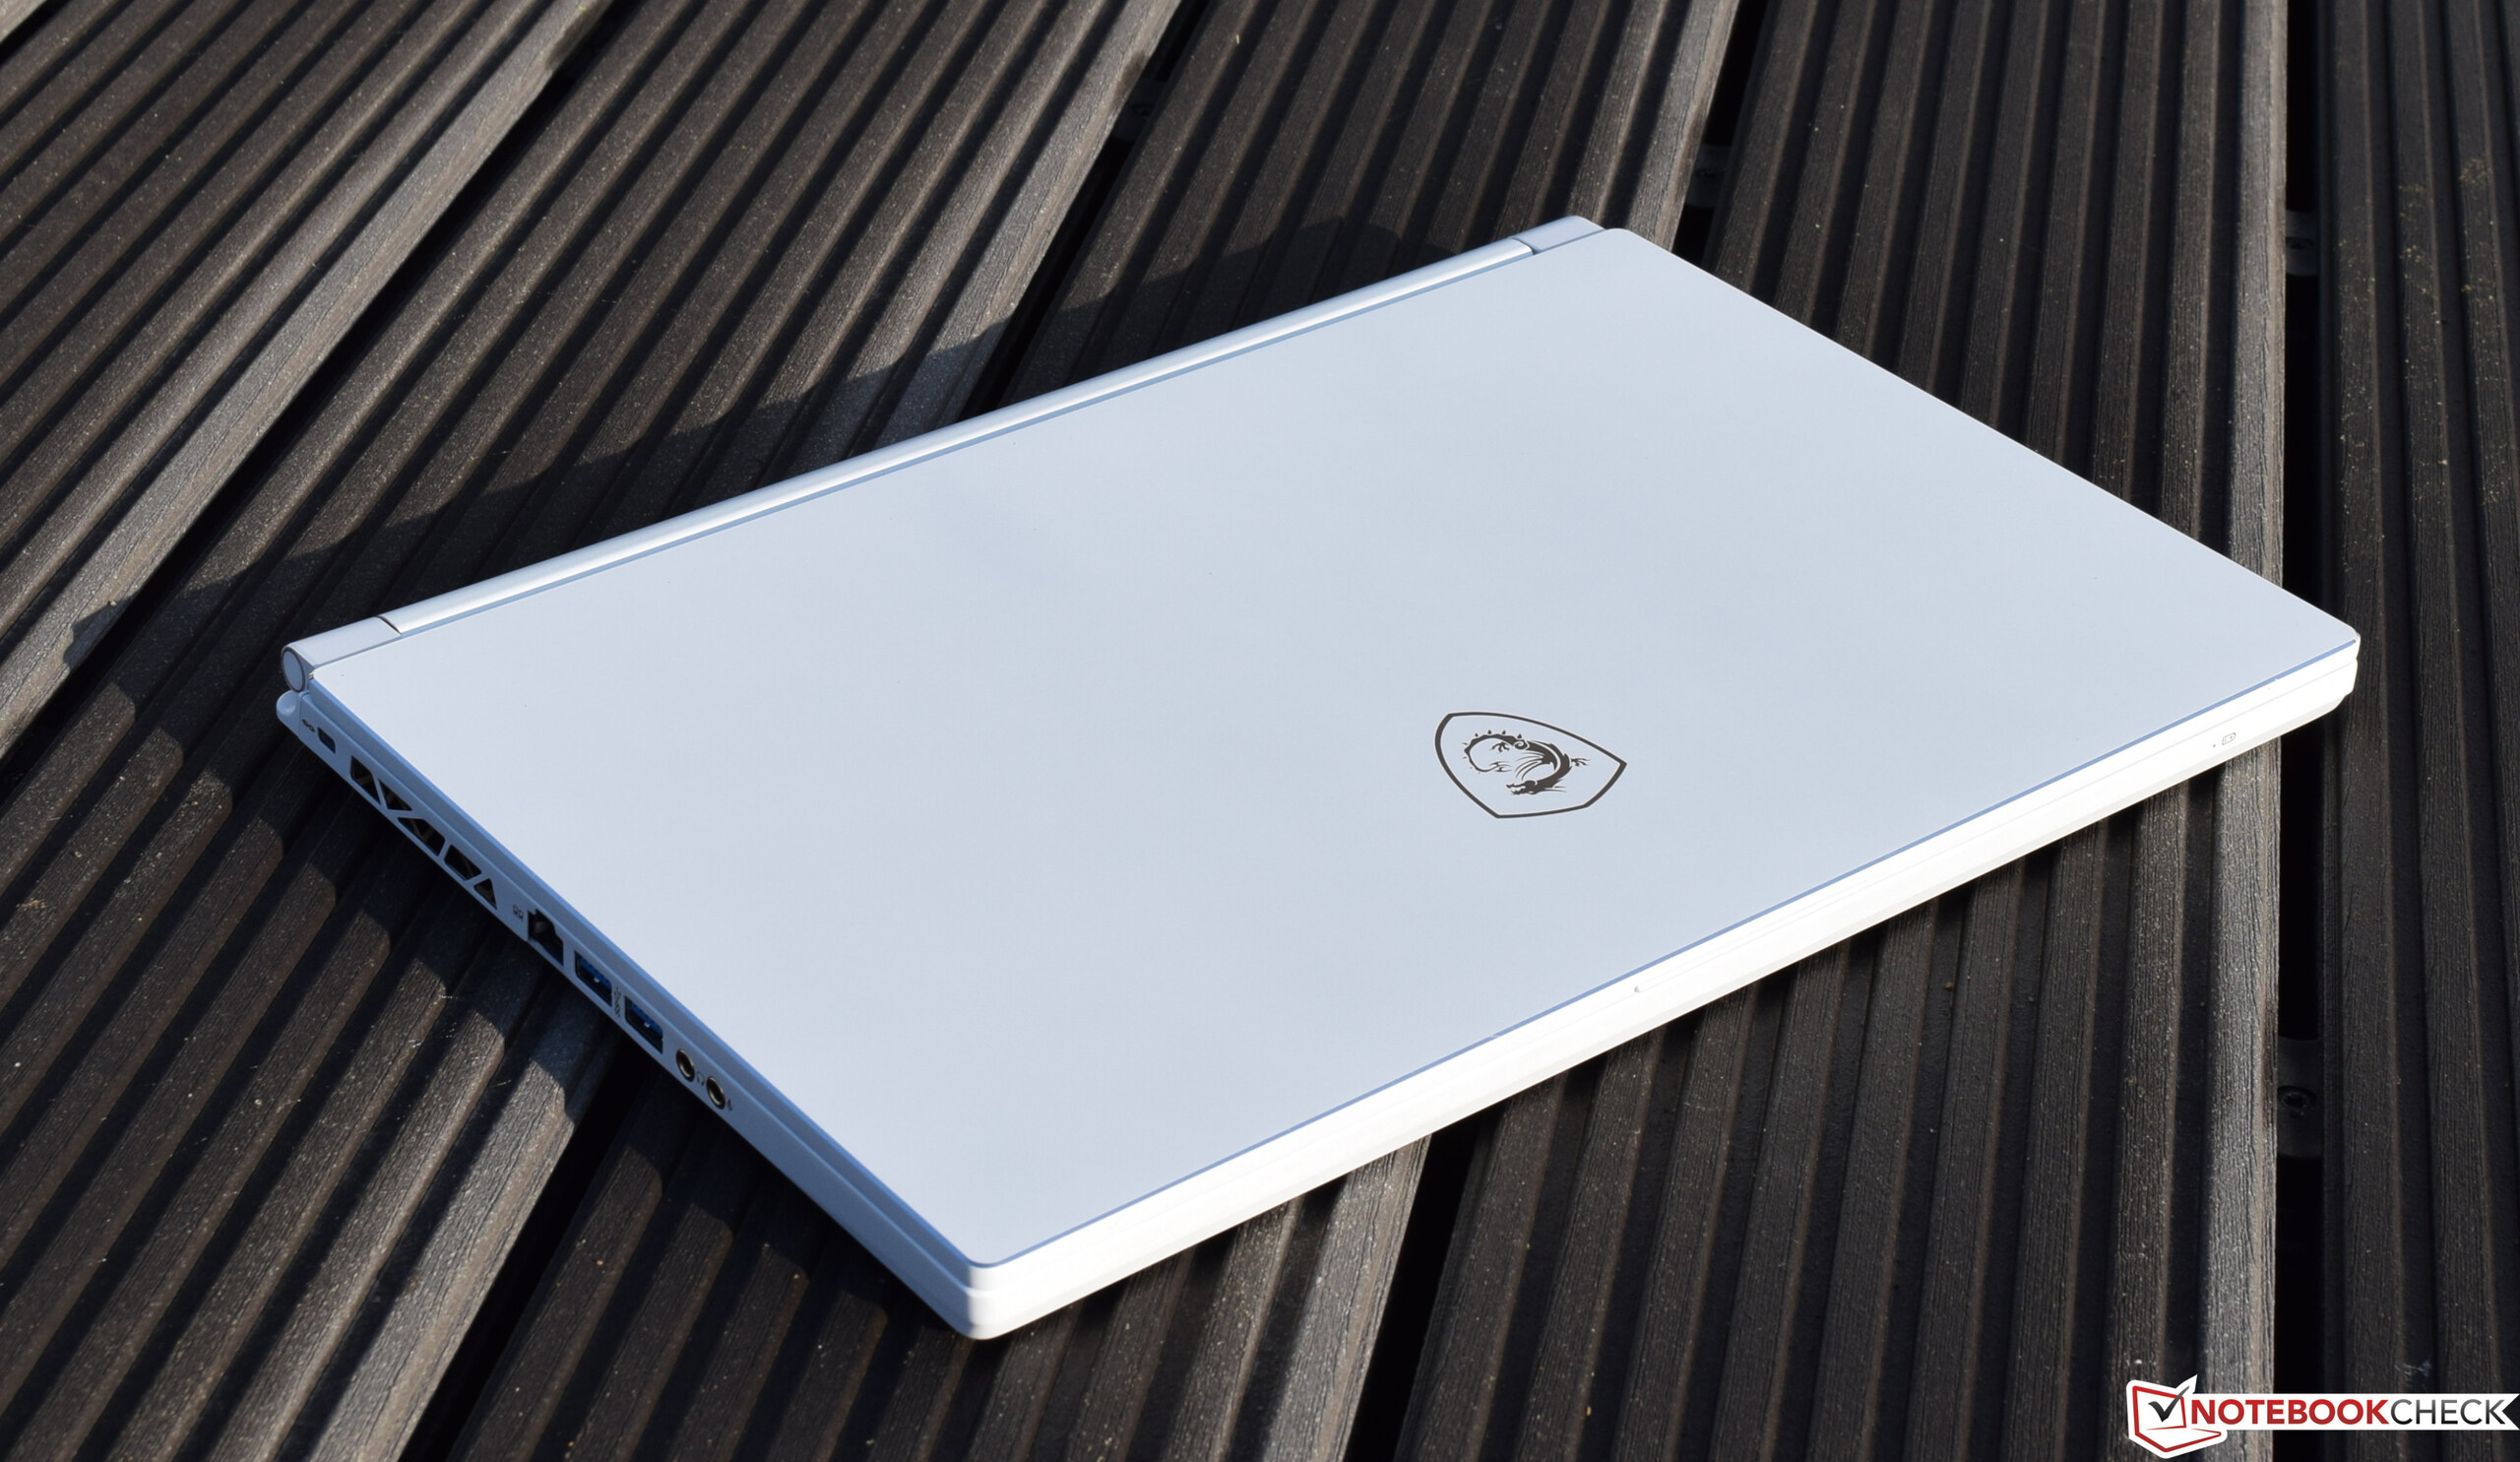
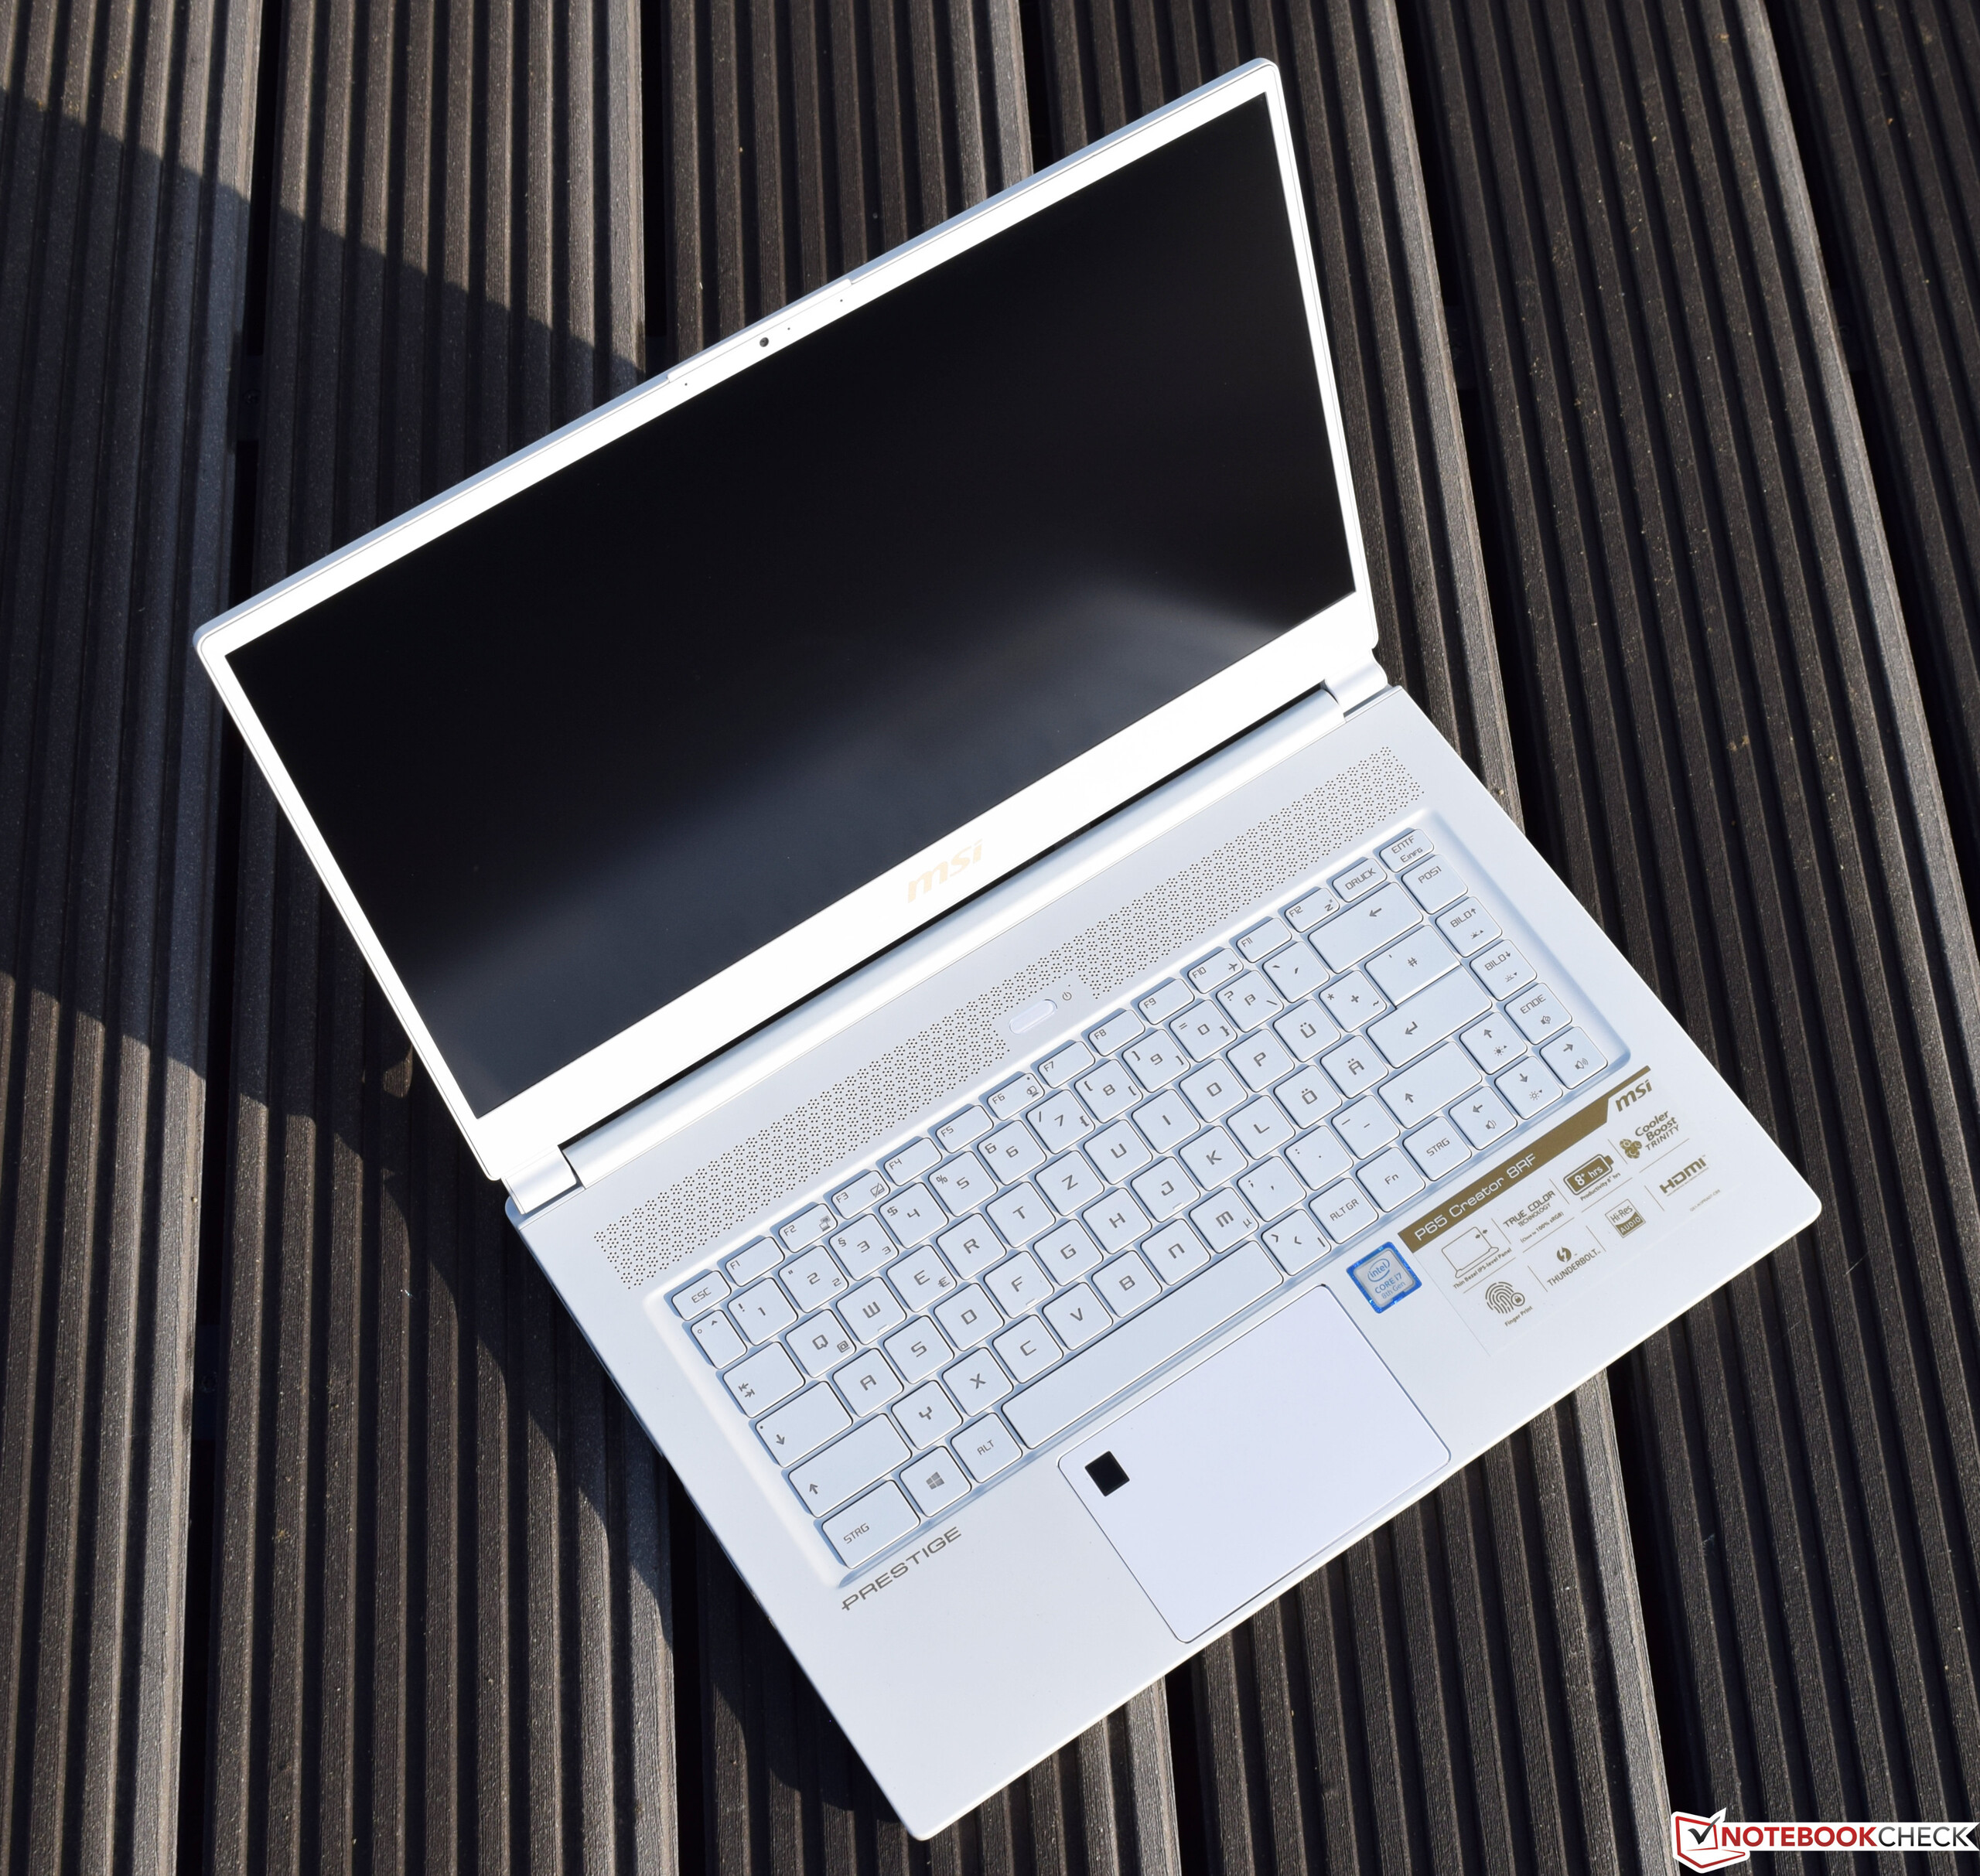
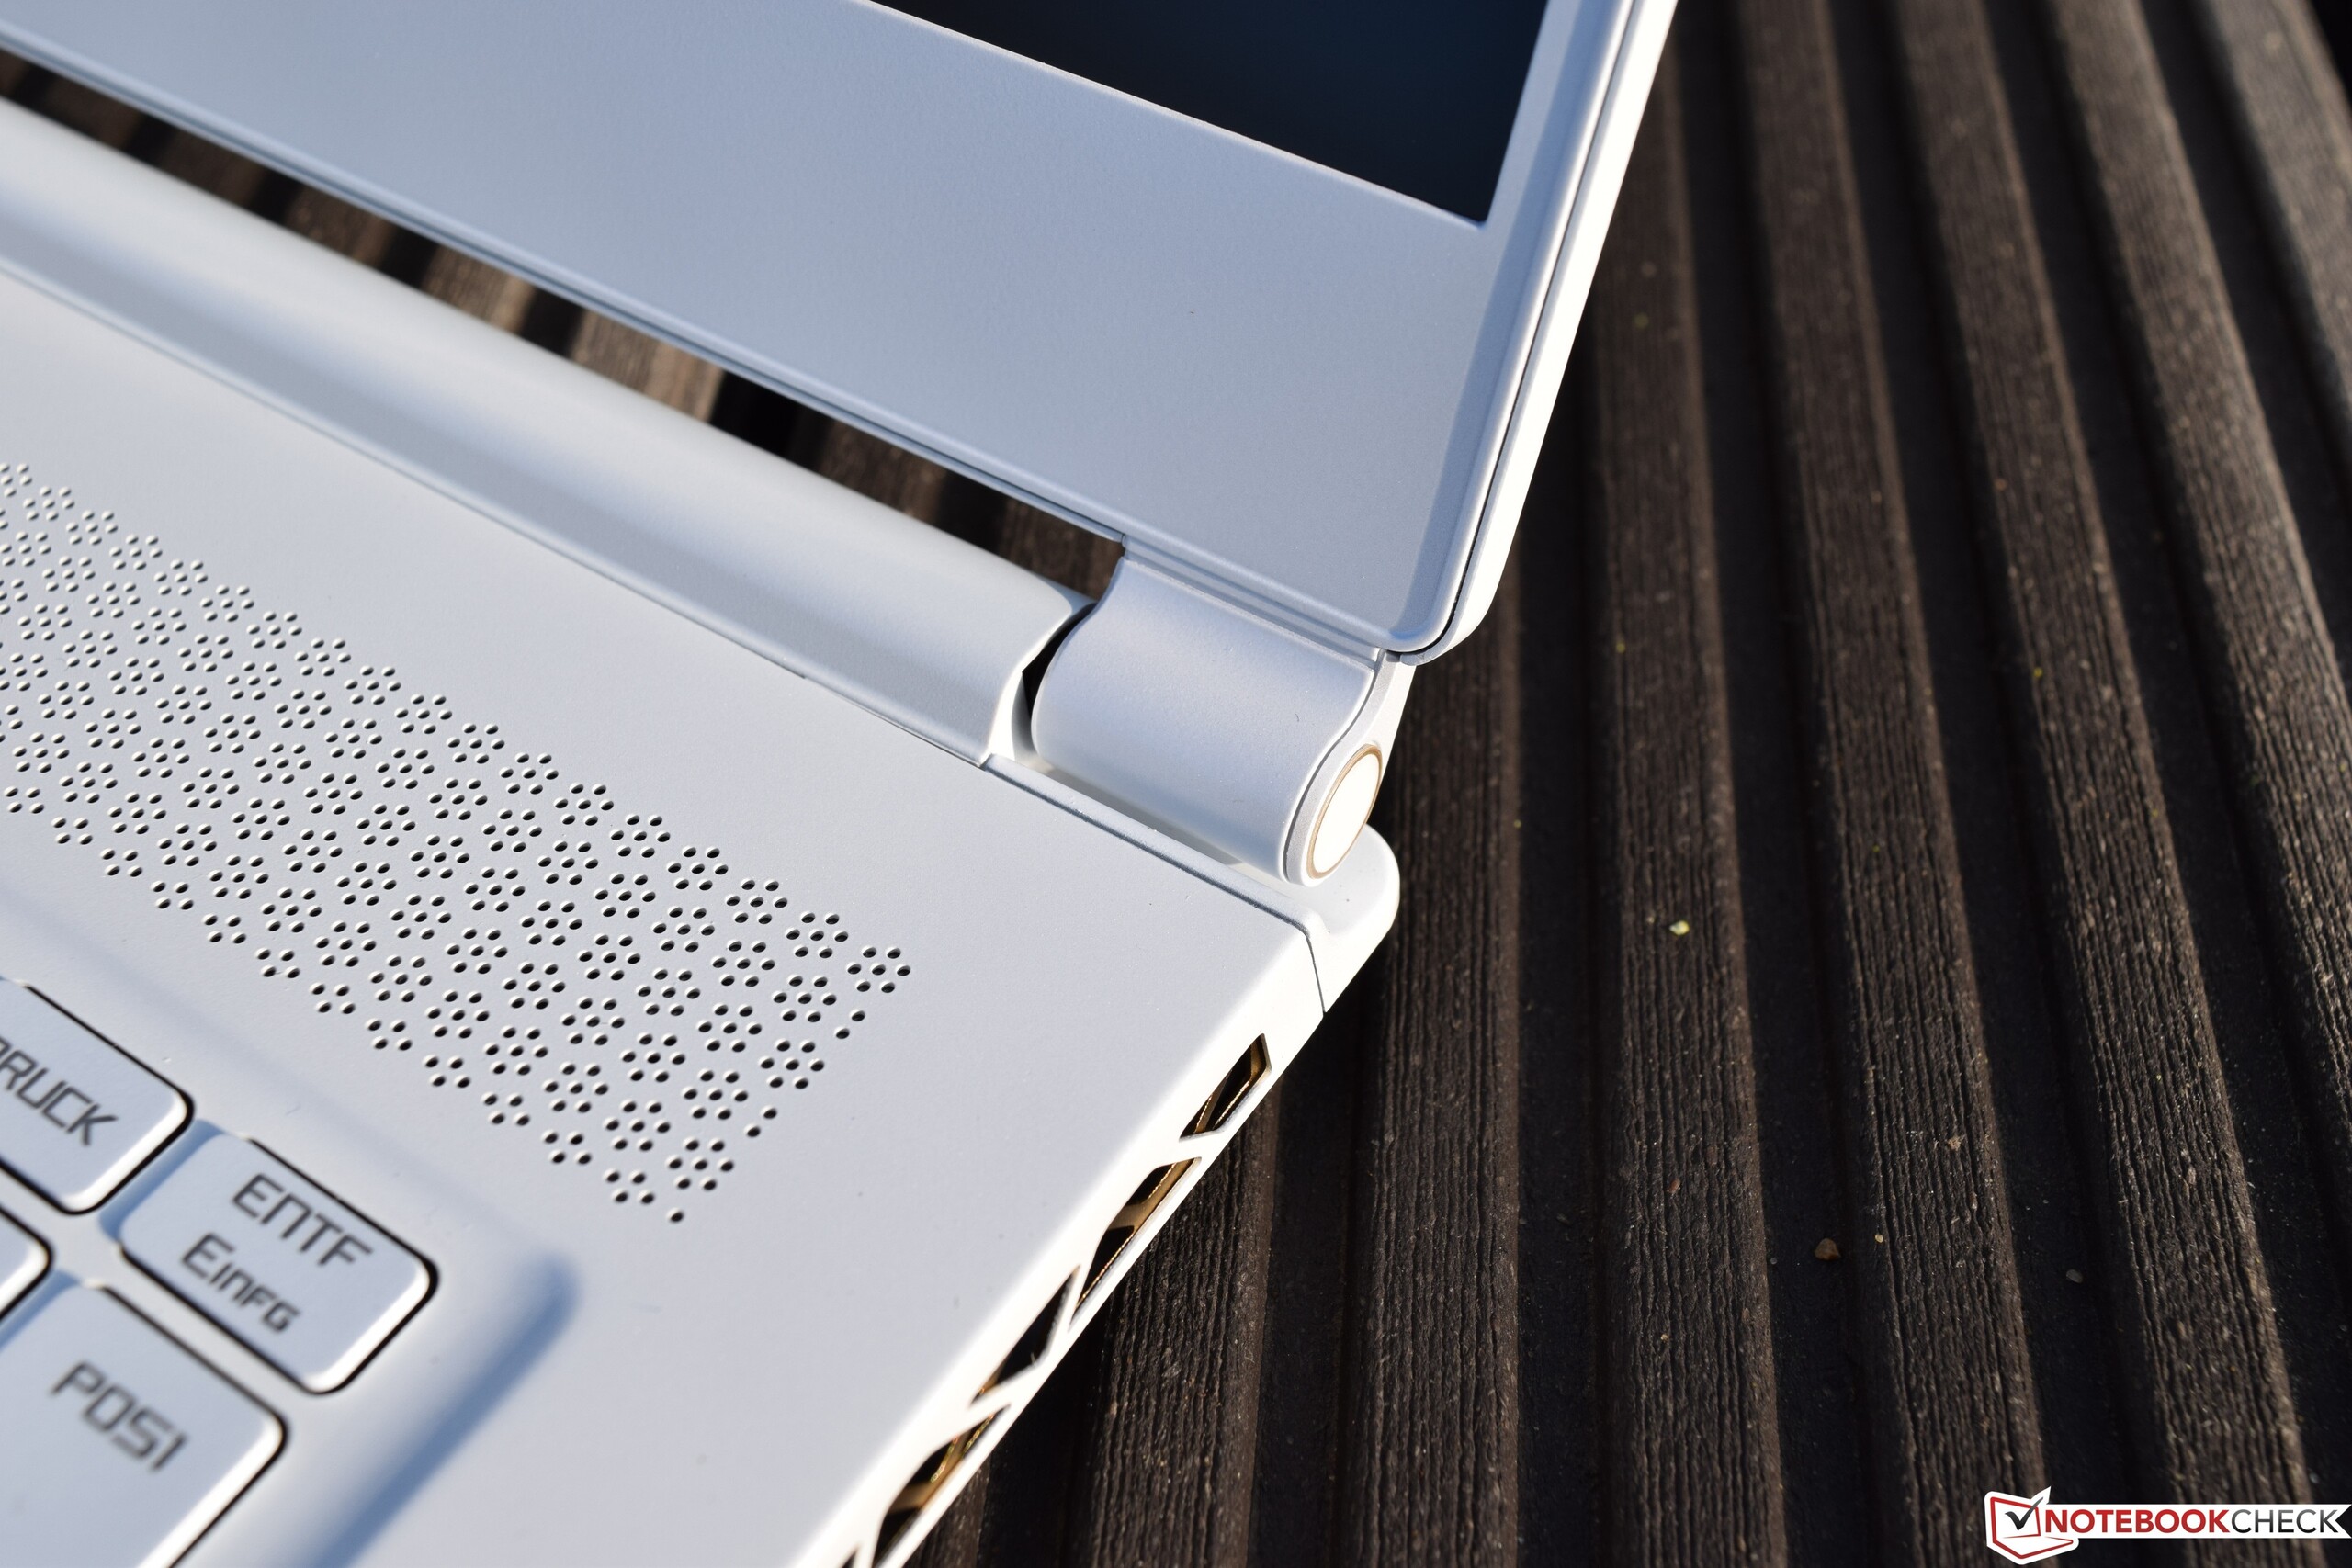

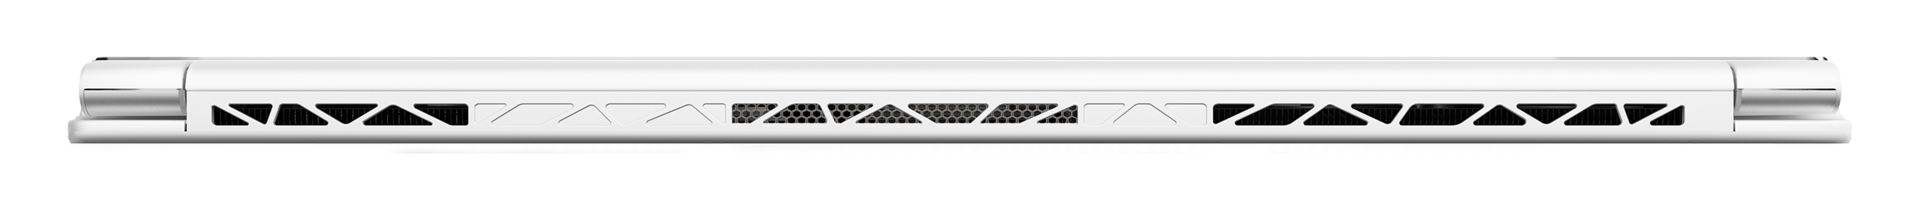
At just 1.8 kg the MSI P65 Creator is just as lightweight as the Lenovo ThinkPad X1 Extreme. More accurately, it weighs exactly 1,899 grams, which emphasizes MSI’s focus on mobility. The charger adds another 557 g. Due to its very narrow display bezels the P65’s footprint is rather small, and at just 18 mm the case is incredibly thin. None of its competitors gets even close.
Connectivity
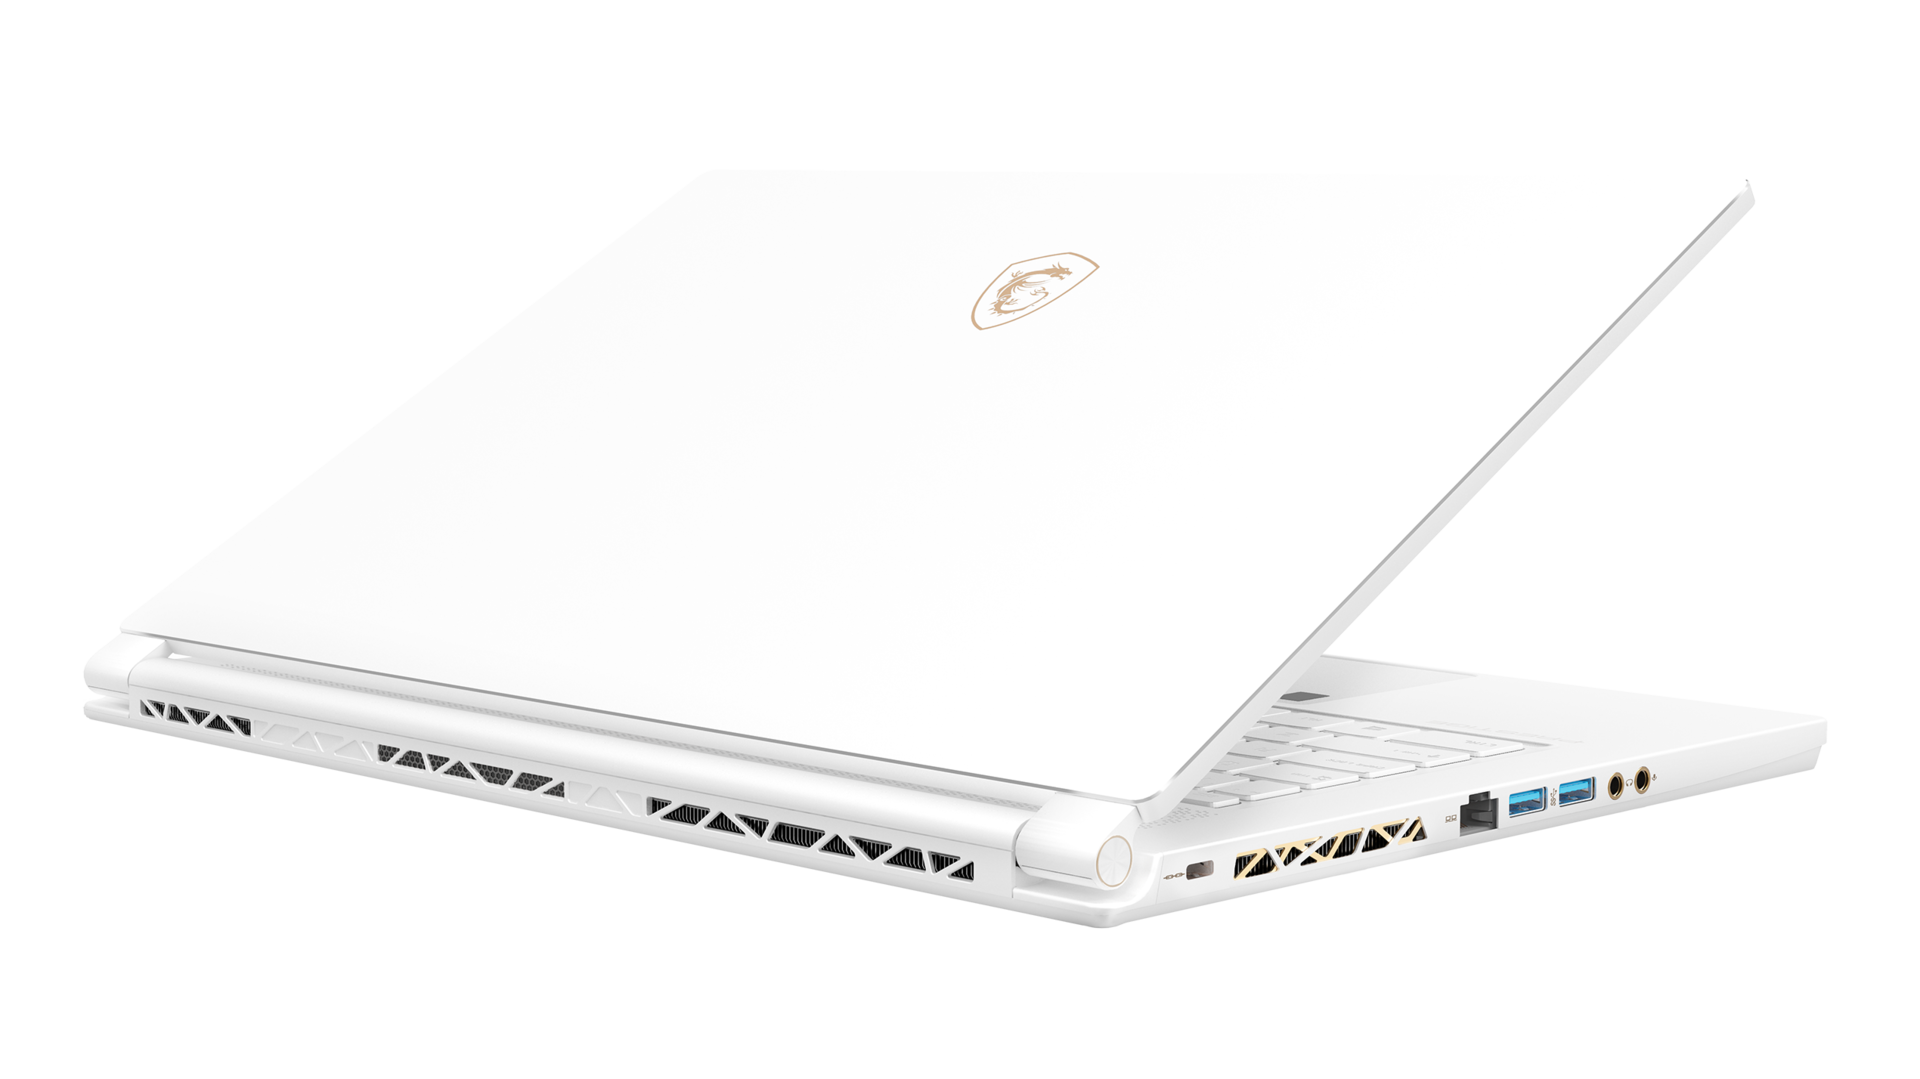
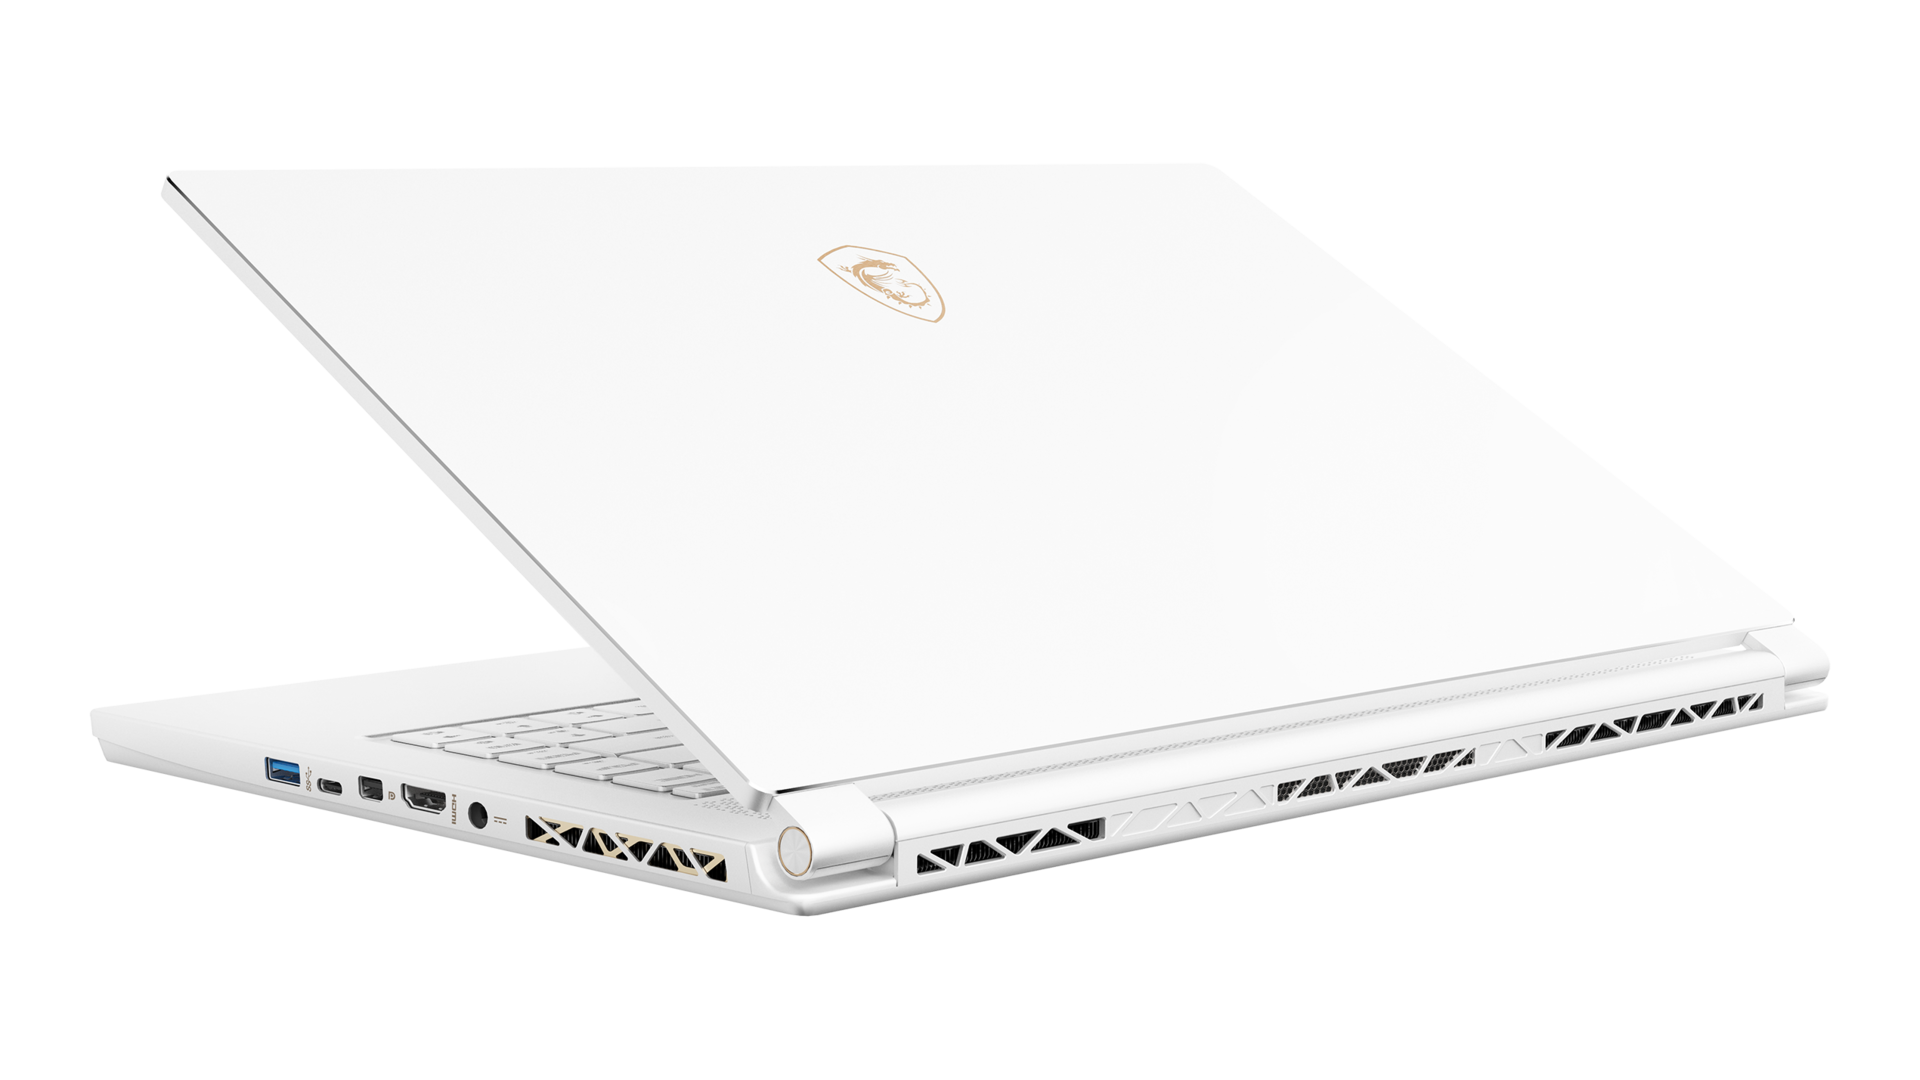
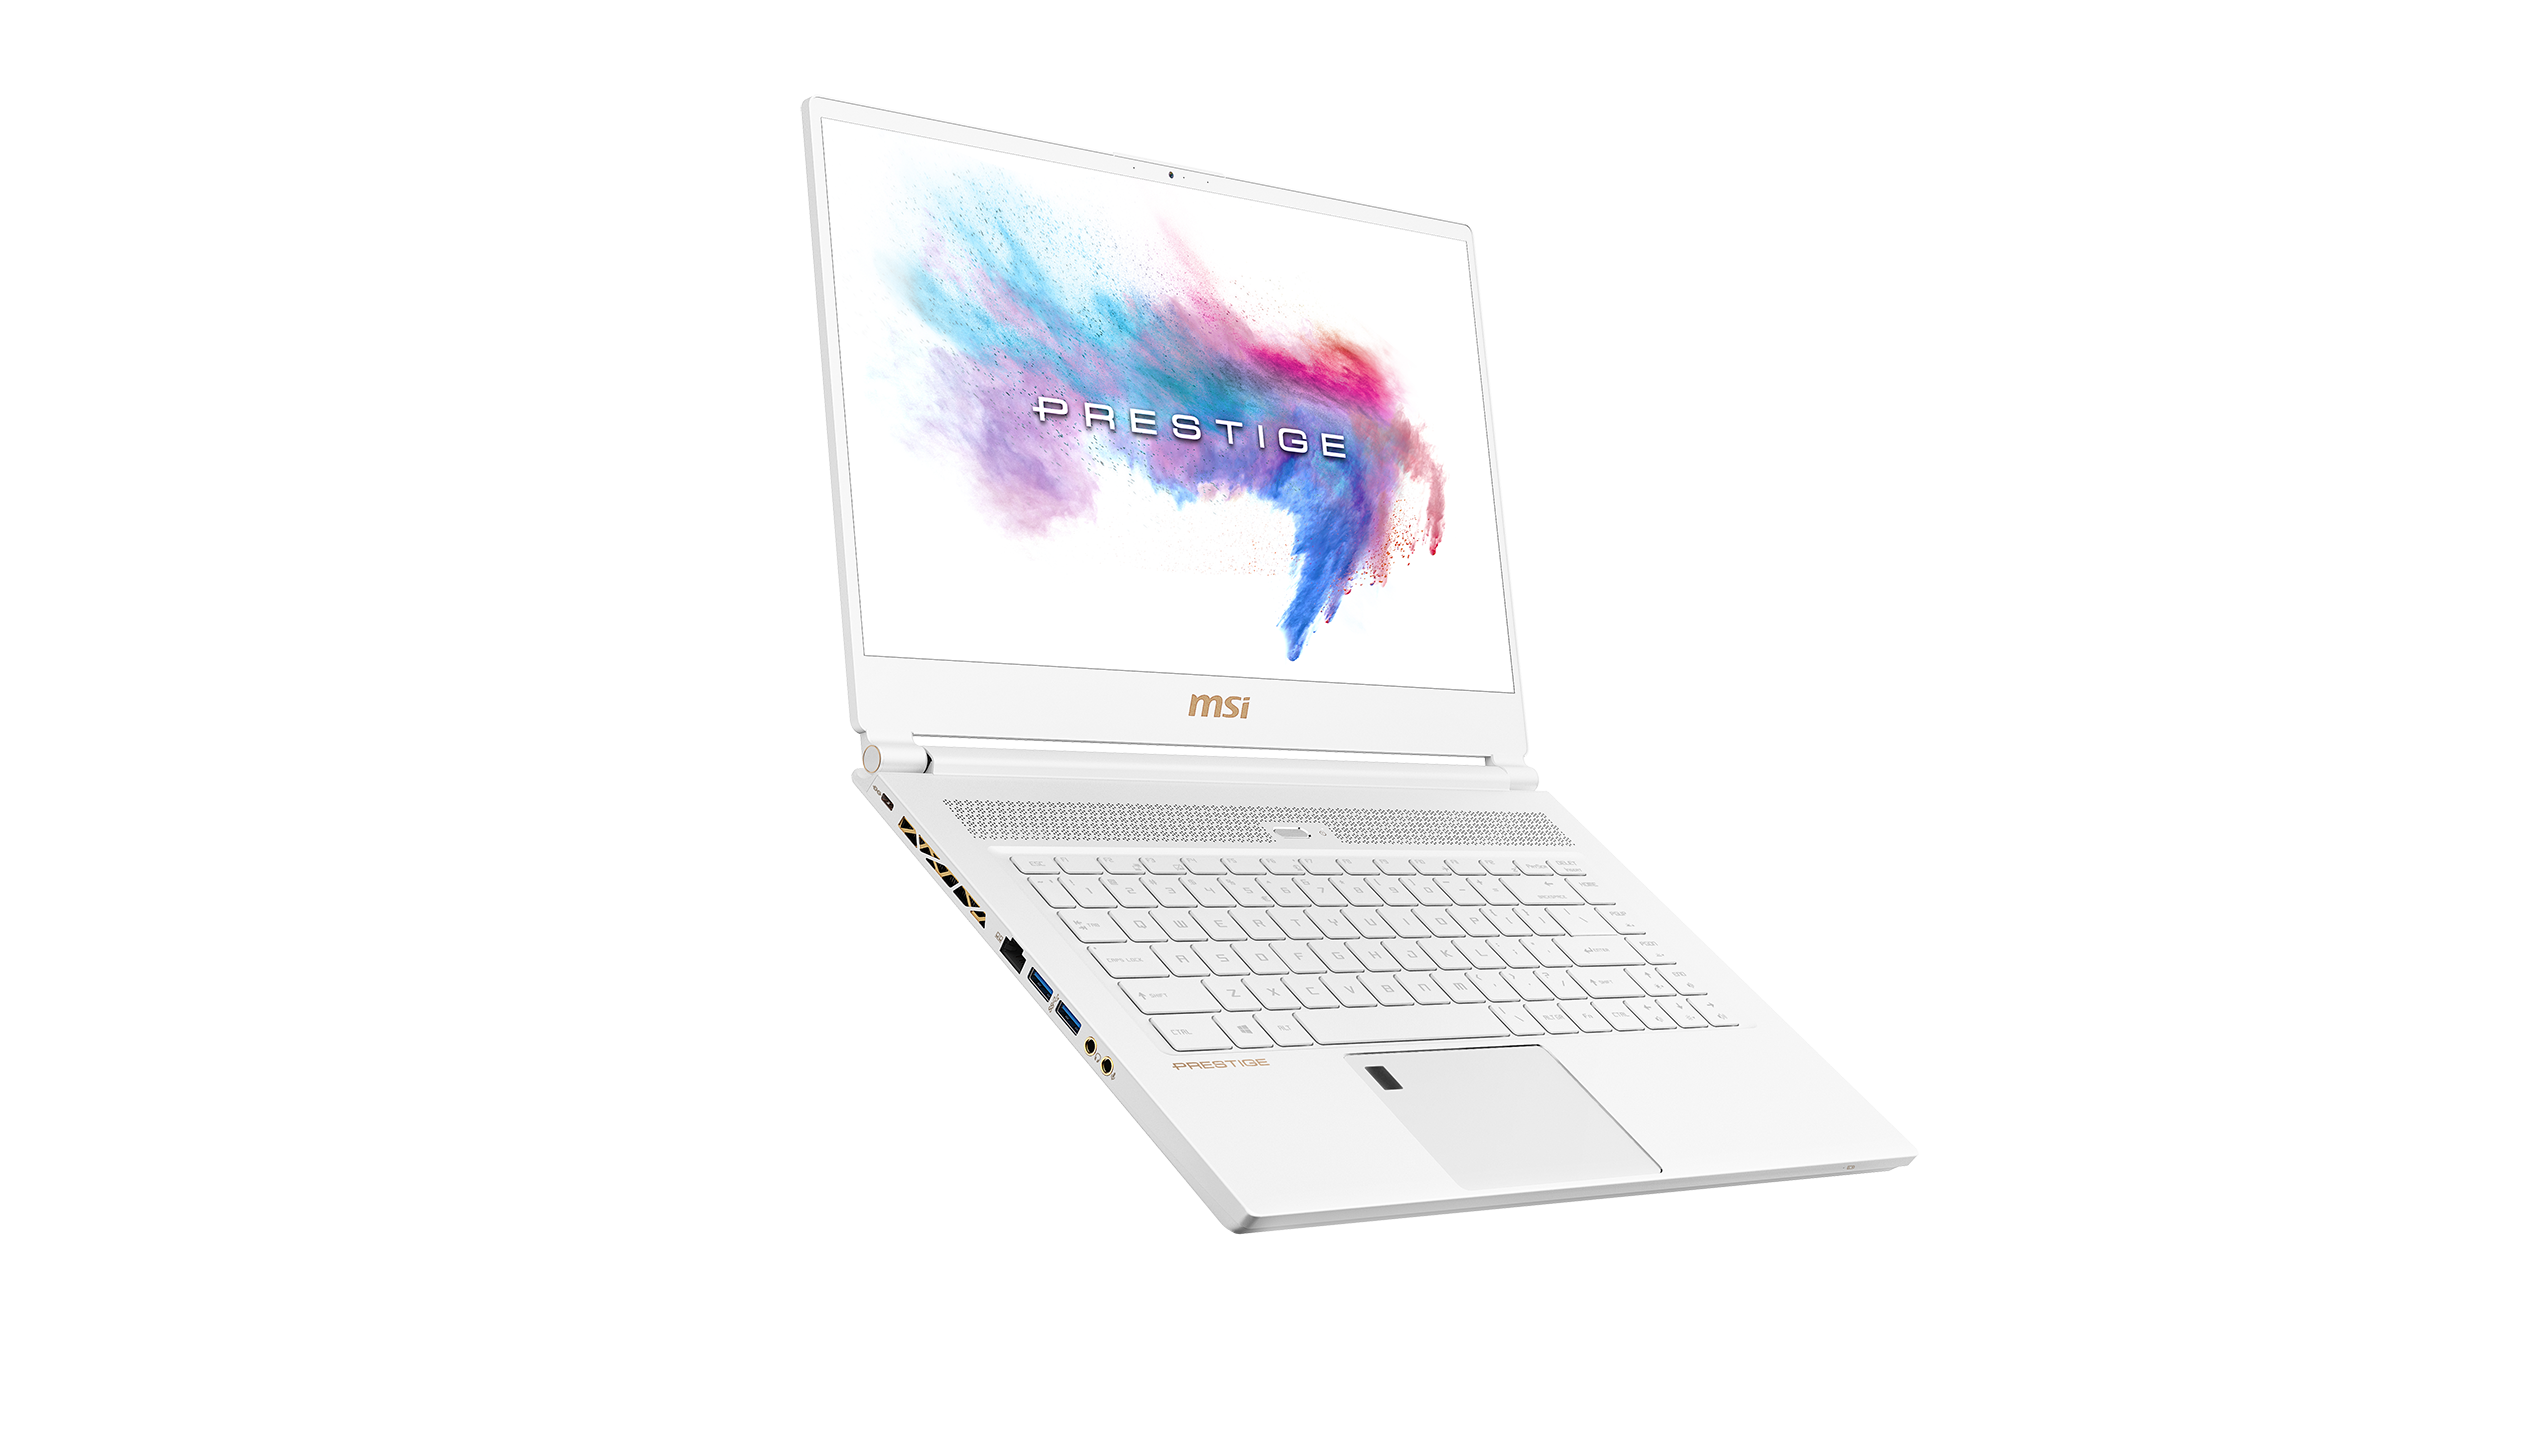
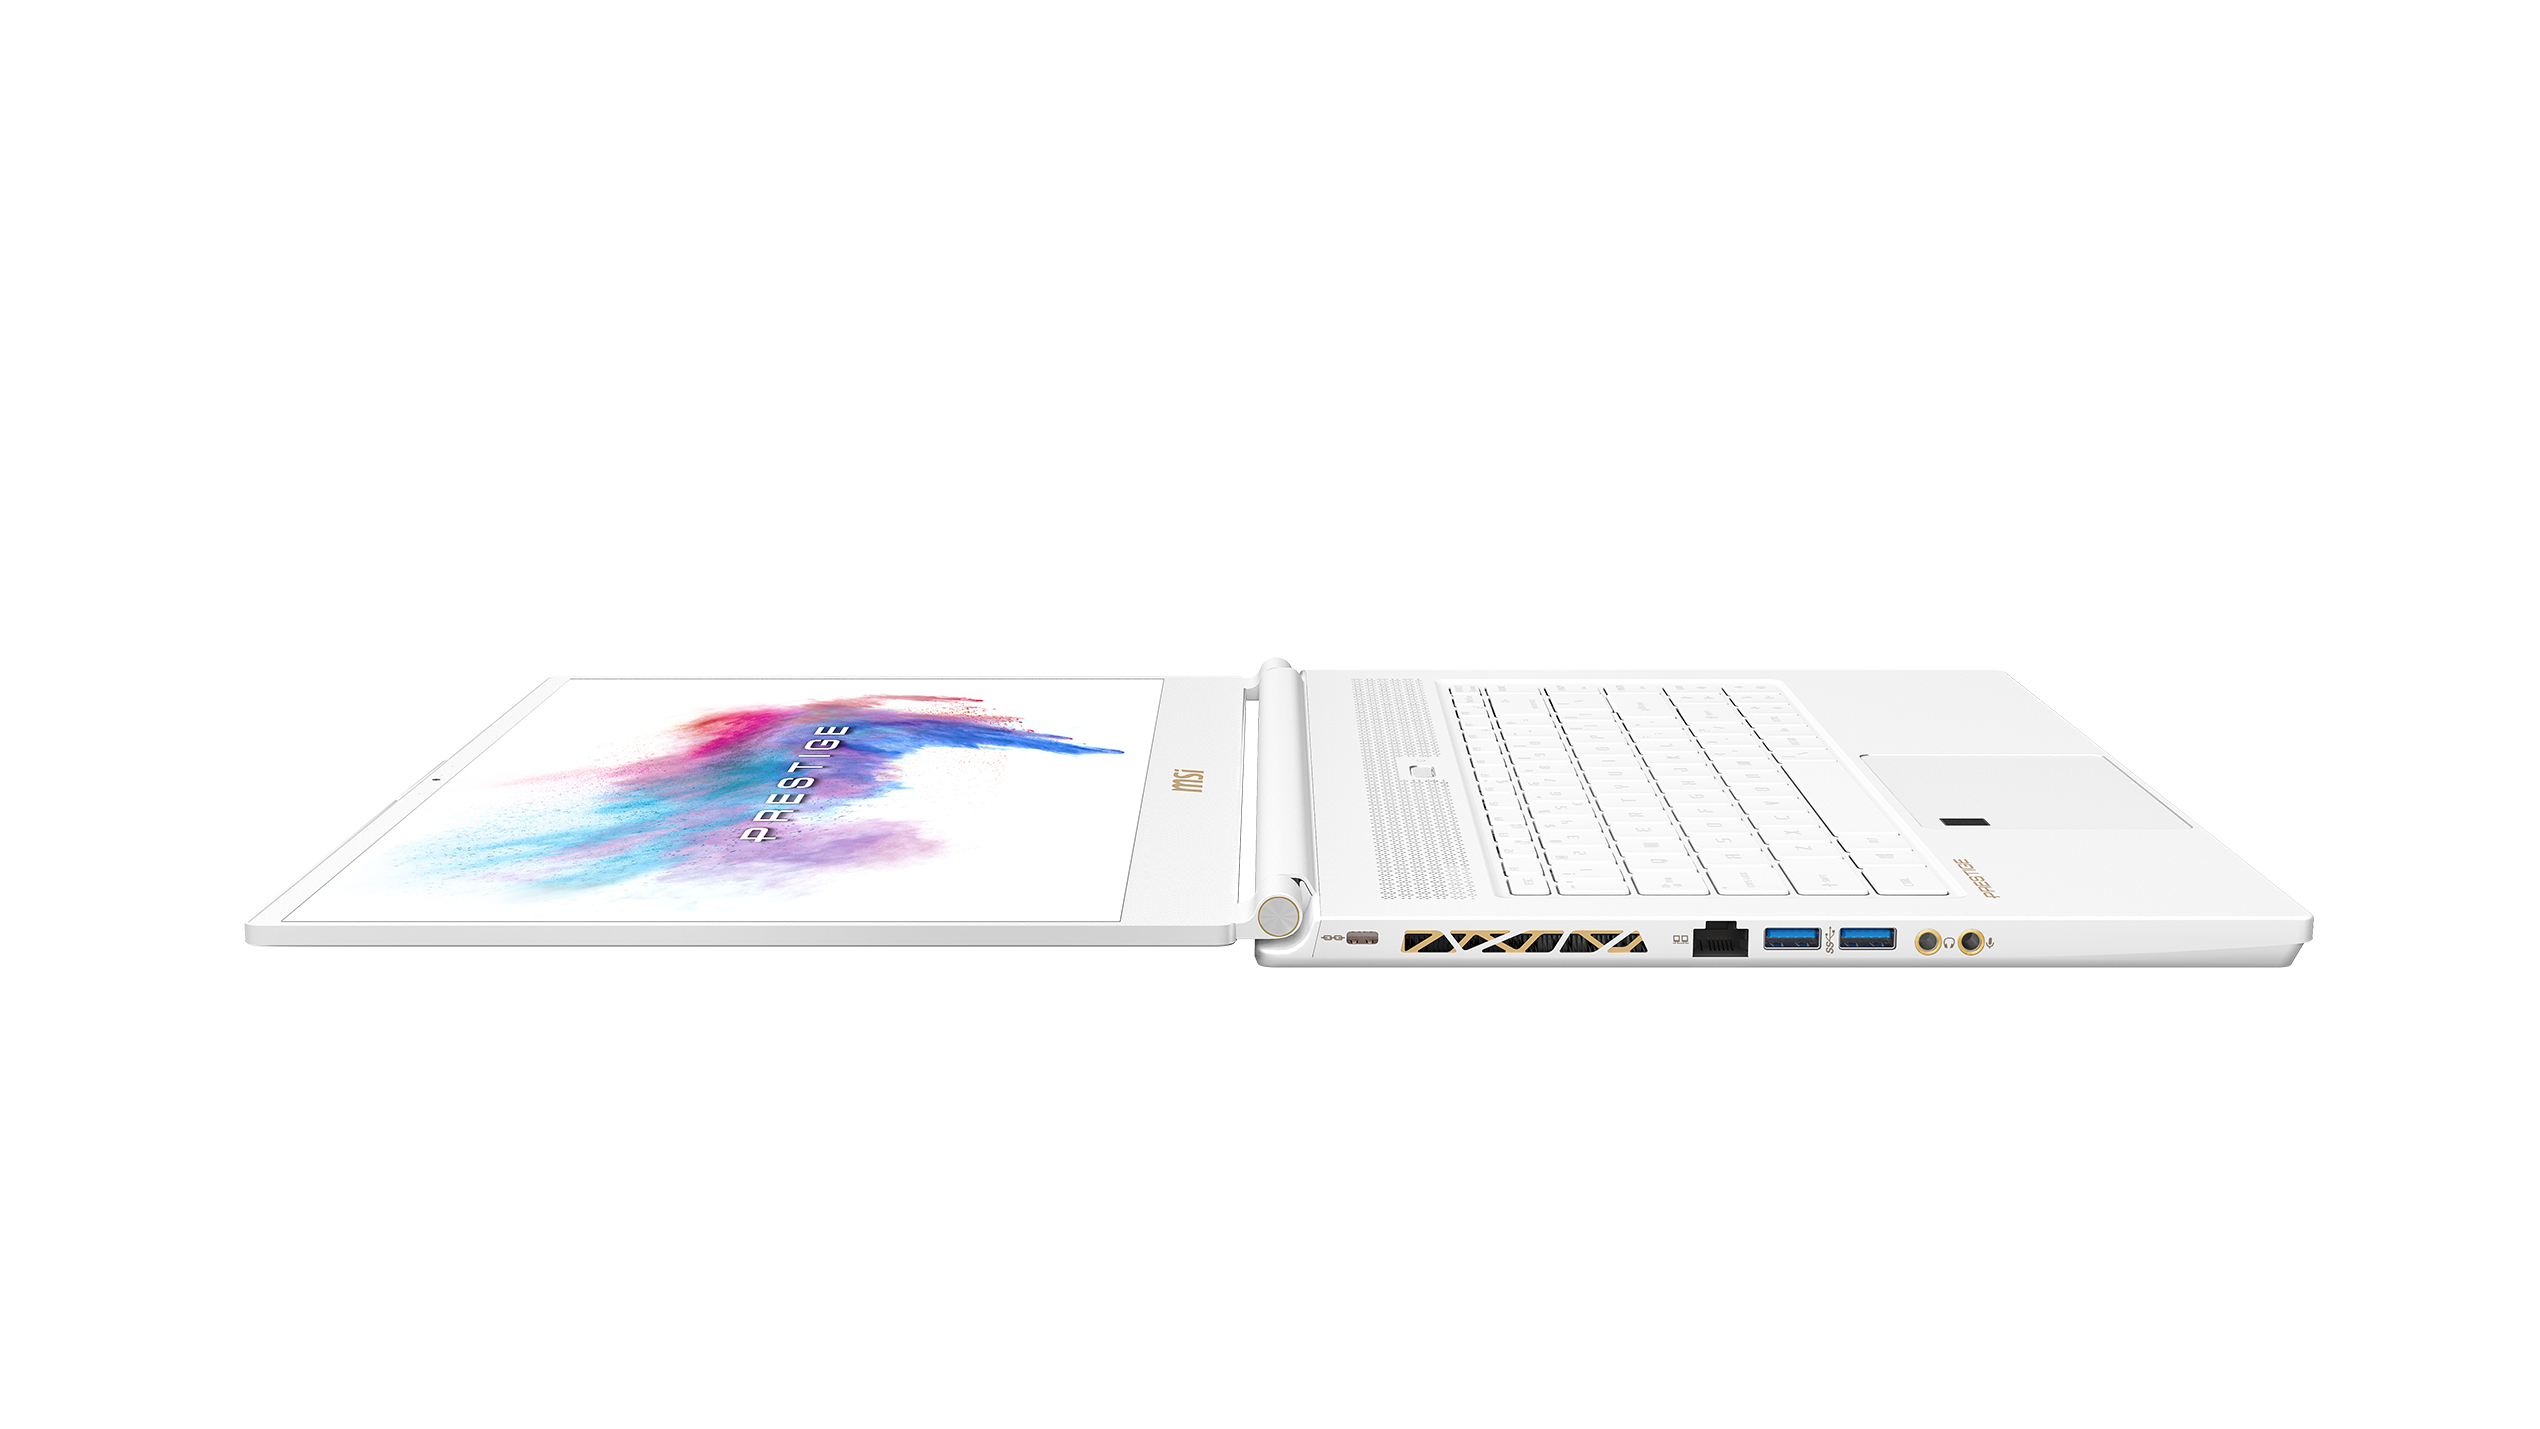
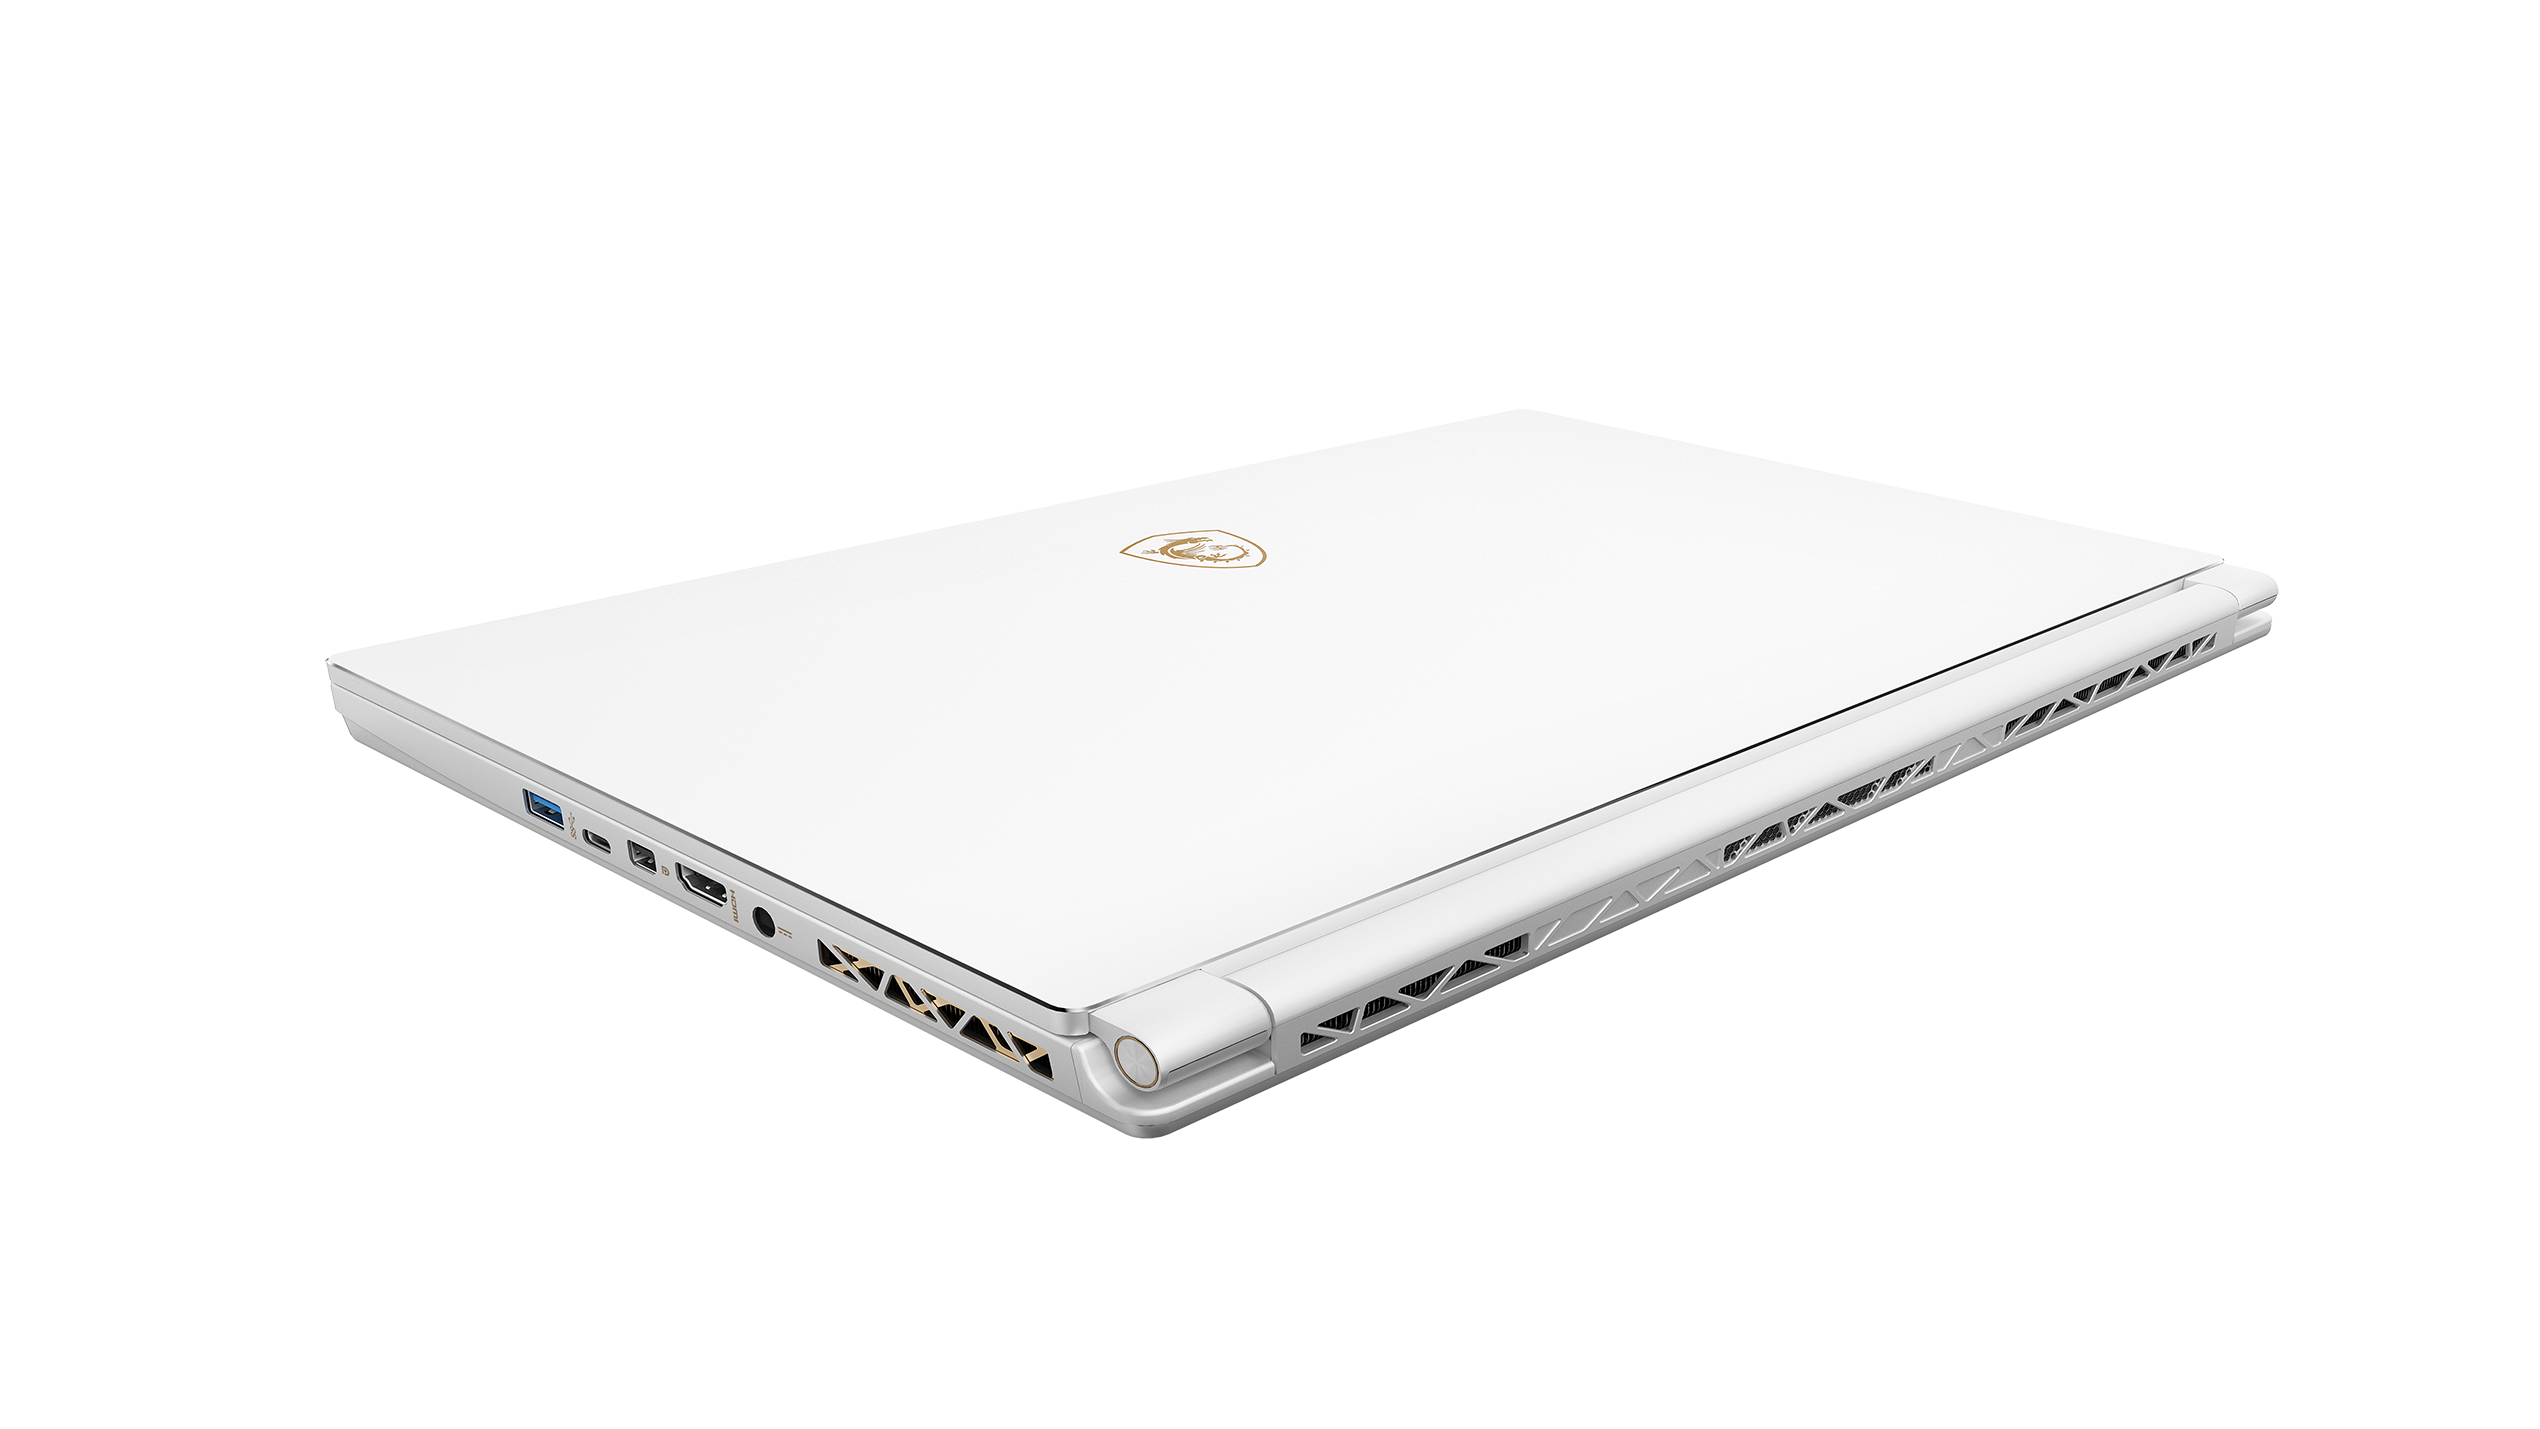
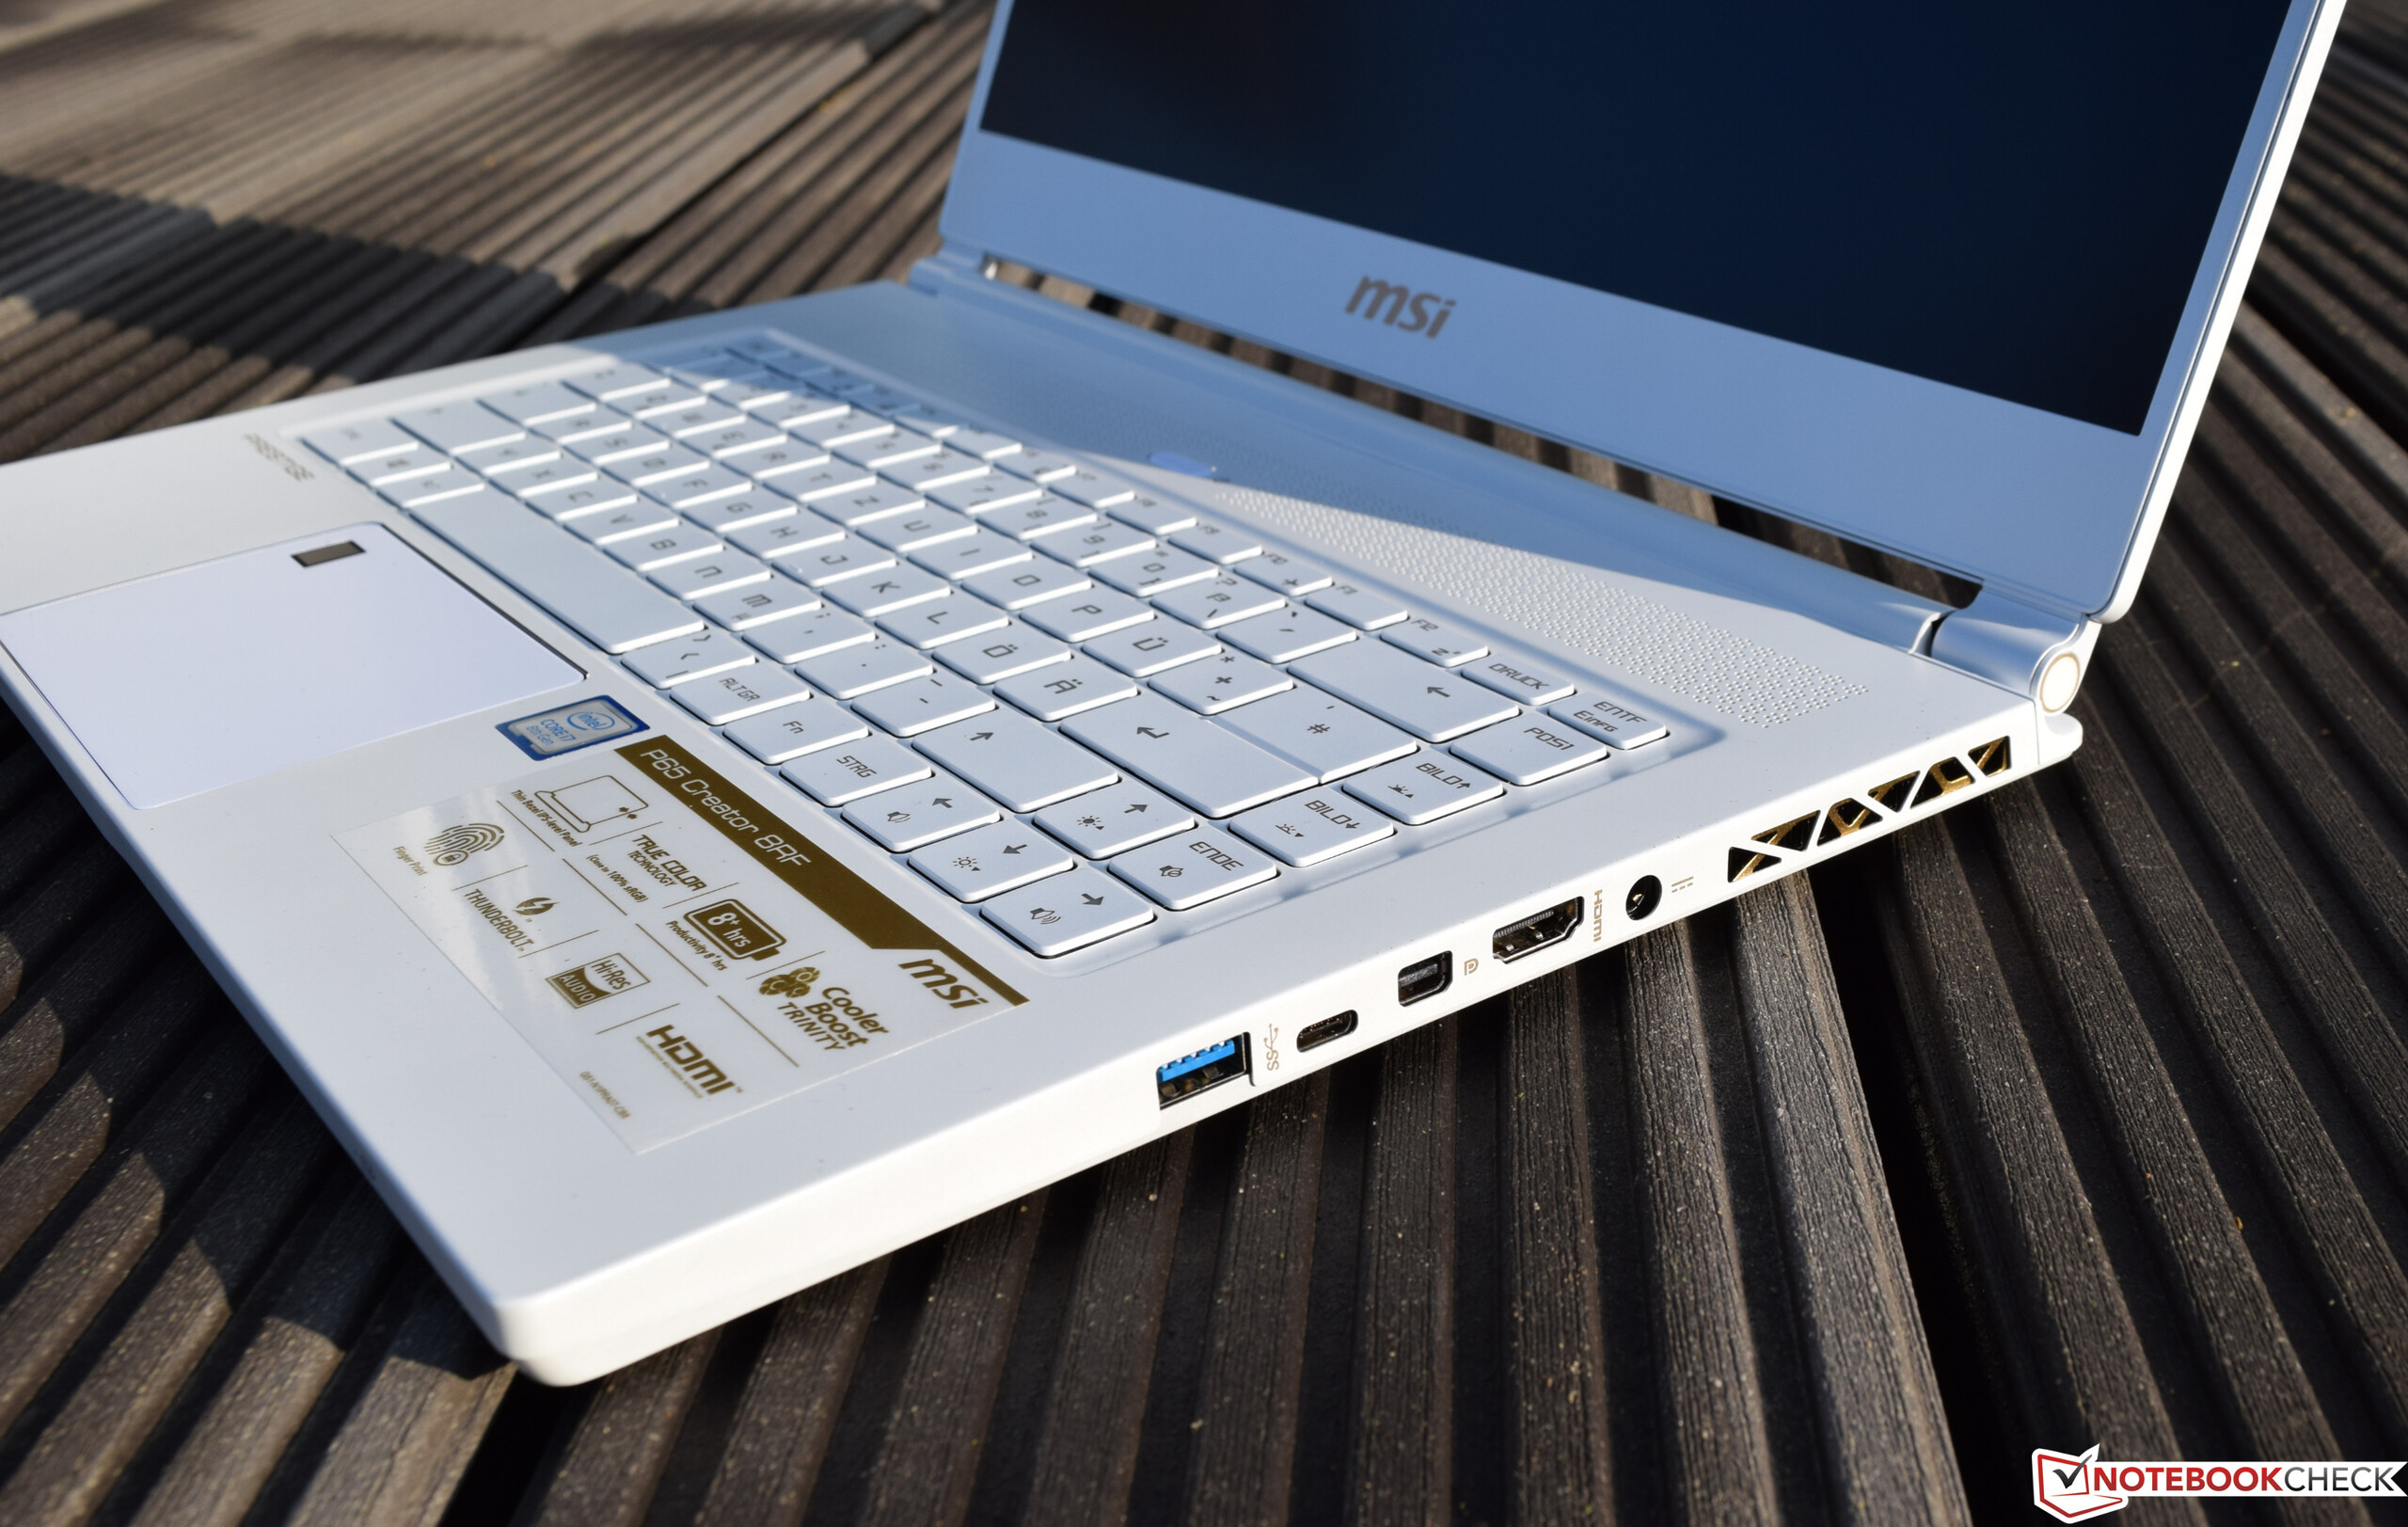
Connectivity is up-to-date and sufficient for most use cases even though the P65 follows the general trend of omitting the card reader altogether and requiring a USB adapter to be plugged into one of the device’s three USB-A ports. Multimedia users are going to be fond of the HDMI and DisplayPort connectors for external displays. Unfortunately, MSI opted for the smaller MiniDisplayPort instead of a full-sized specimen, and the HDMI port only supports UHD up to 30 Hz (4K@60 Hz is supported via MiniDisplayPort).
Due to the side-mounted fan vents port distribution is anything but ideal. We do like the angled power plug that allows the power cable to run straight towards the back, providing extra space for a mouse on the right-hand side of the device.


Communication
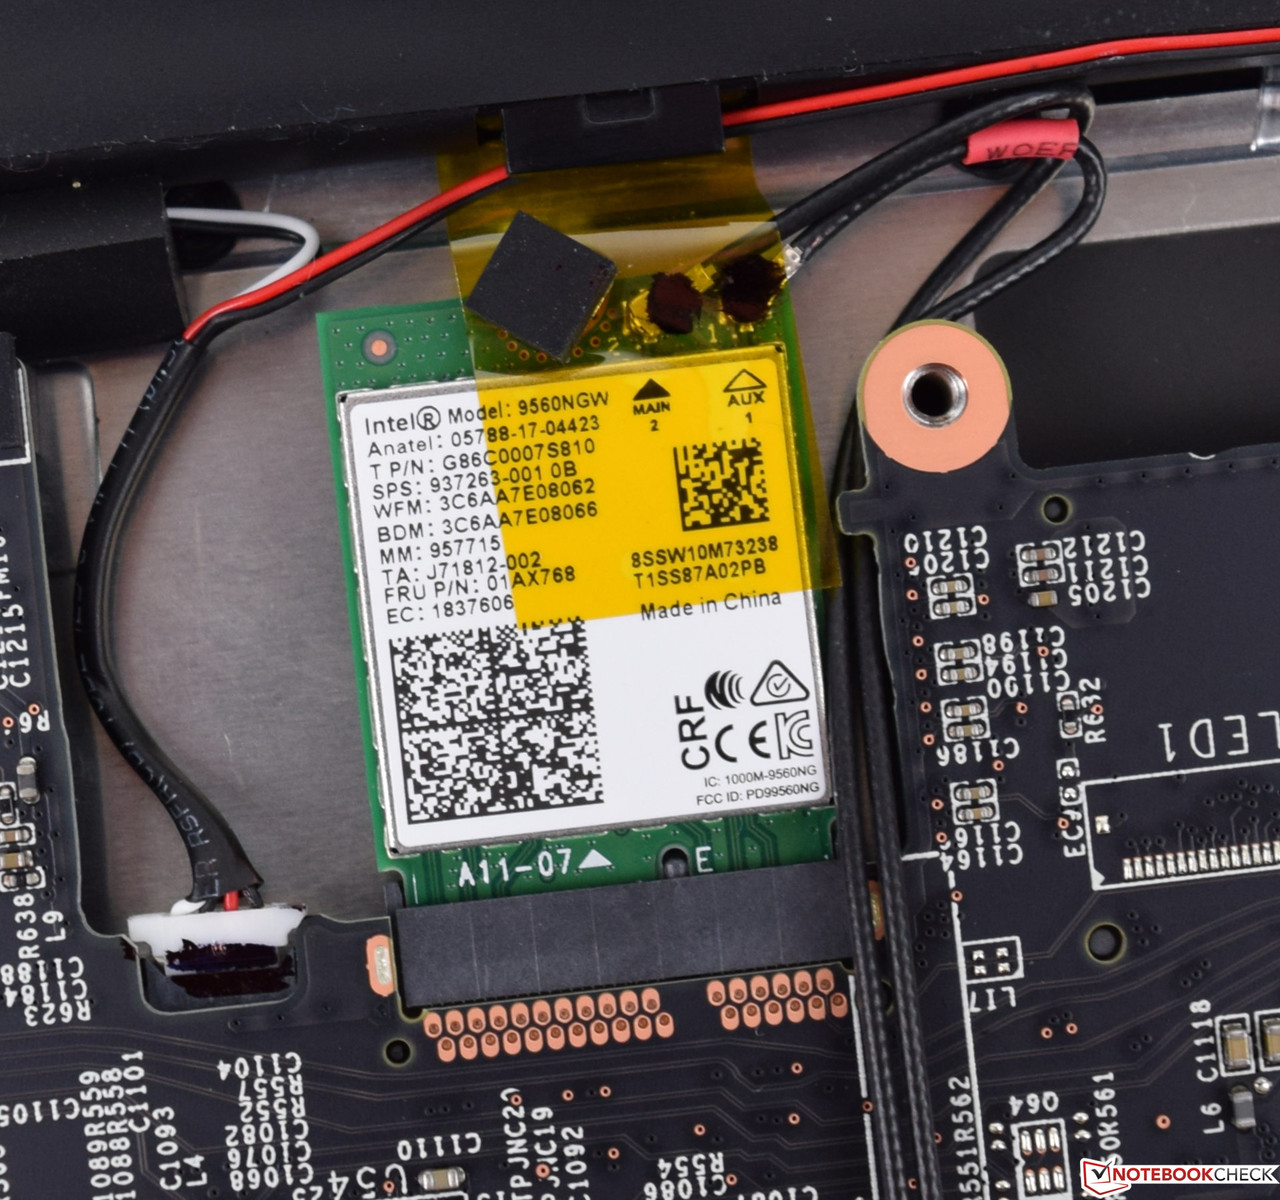
Unlike the gaming model the P65 Creator features an Intel Wireless-AC 9560 Wi-Fi modem that did fairly well in our tests. However, we should note that the very same modem performed significantly better in the Asus GL504GS most likely due to the latter’s better antenna design. Still, a 585 Mb/s downstream rate is not half bad. In addition to Wi-Fi, the 9560 also supports Bluetooth 5.0.
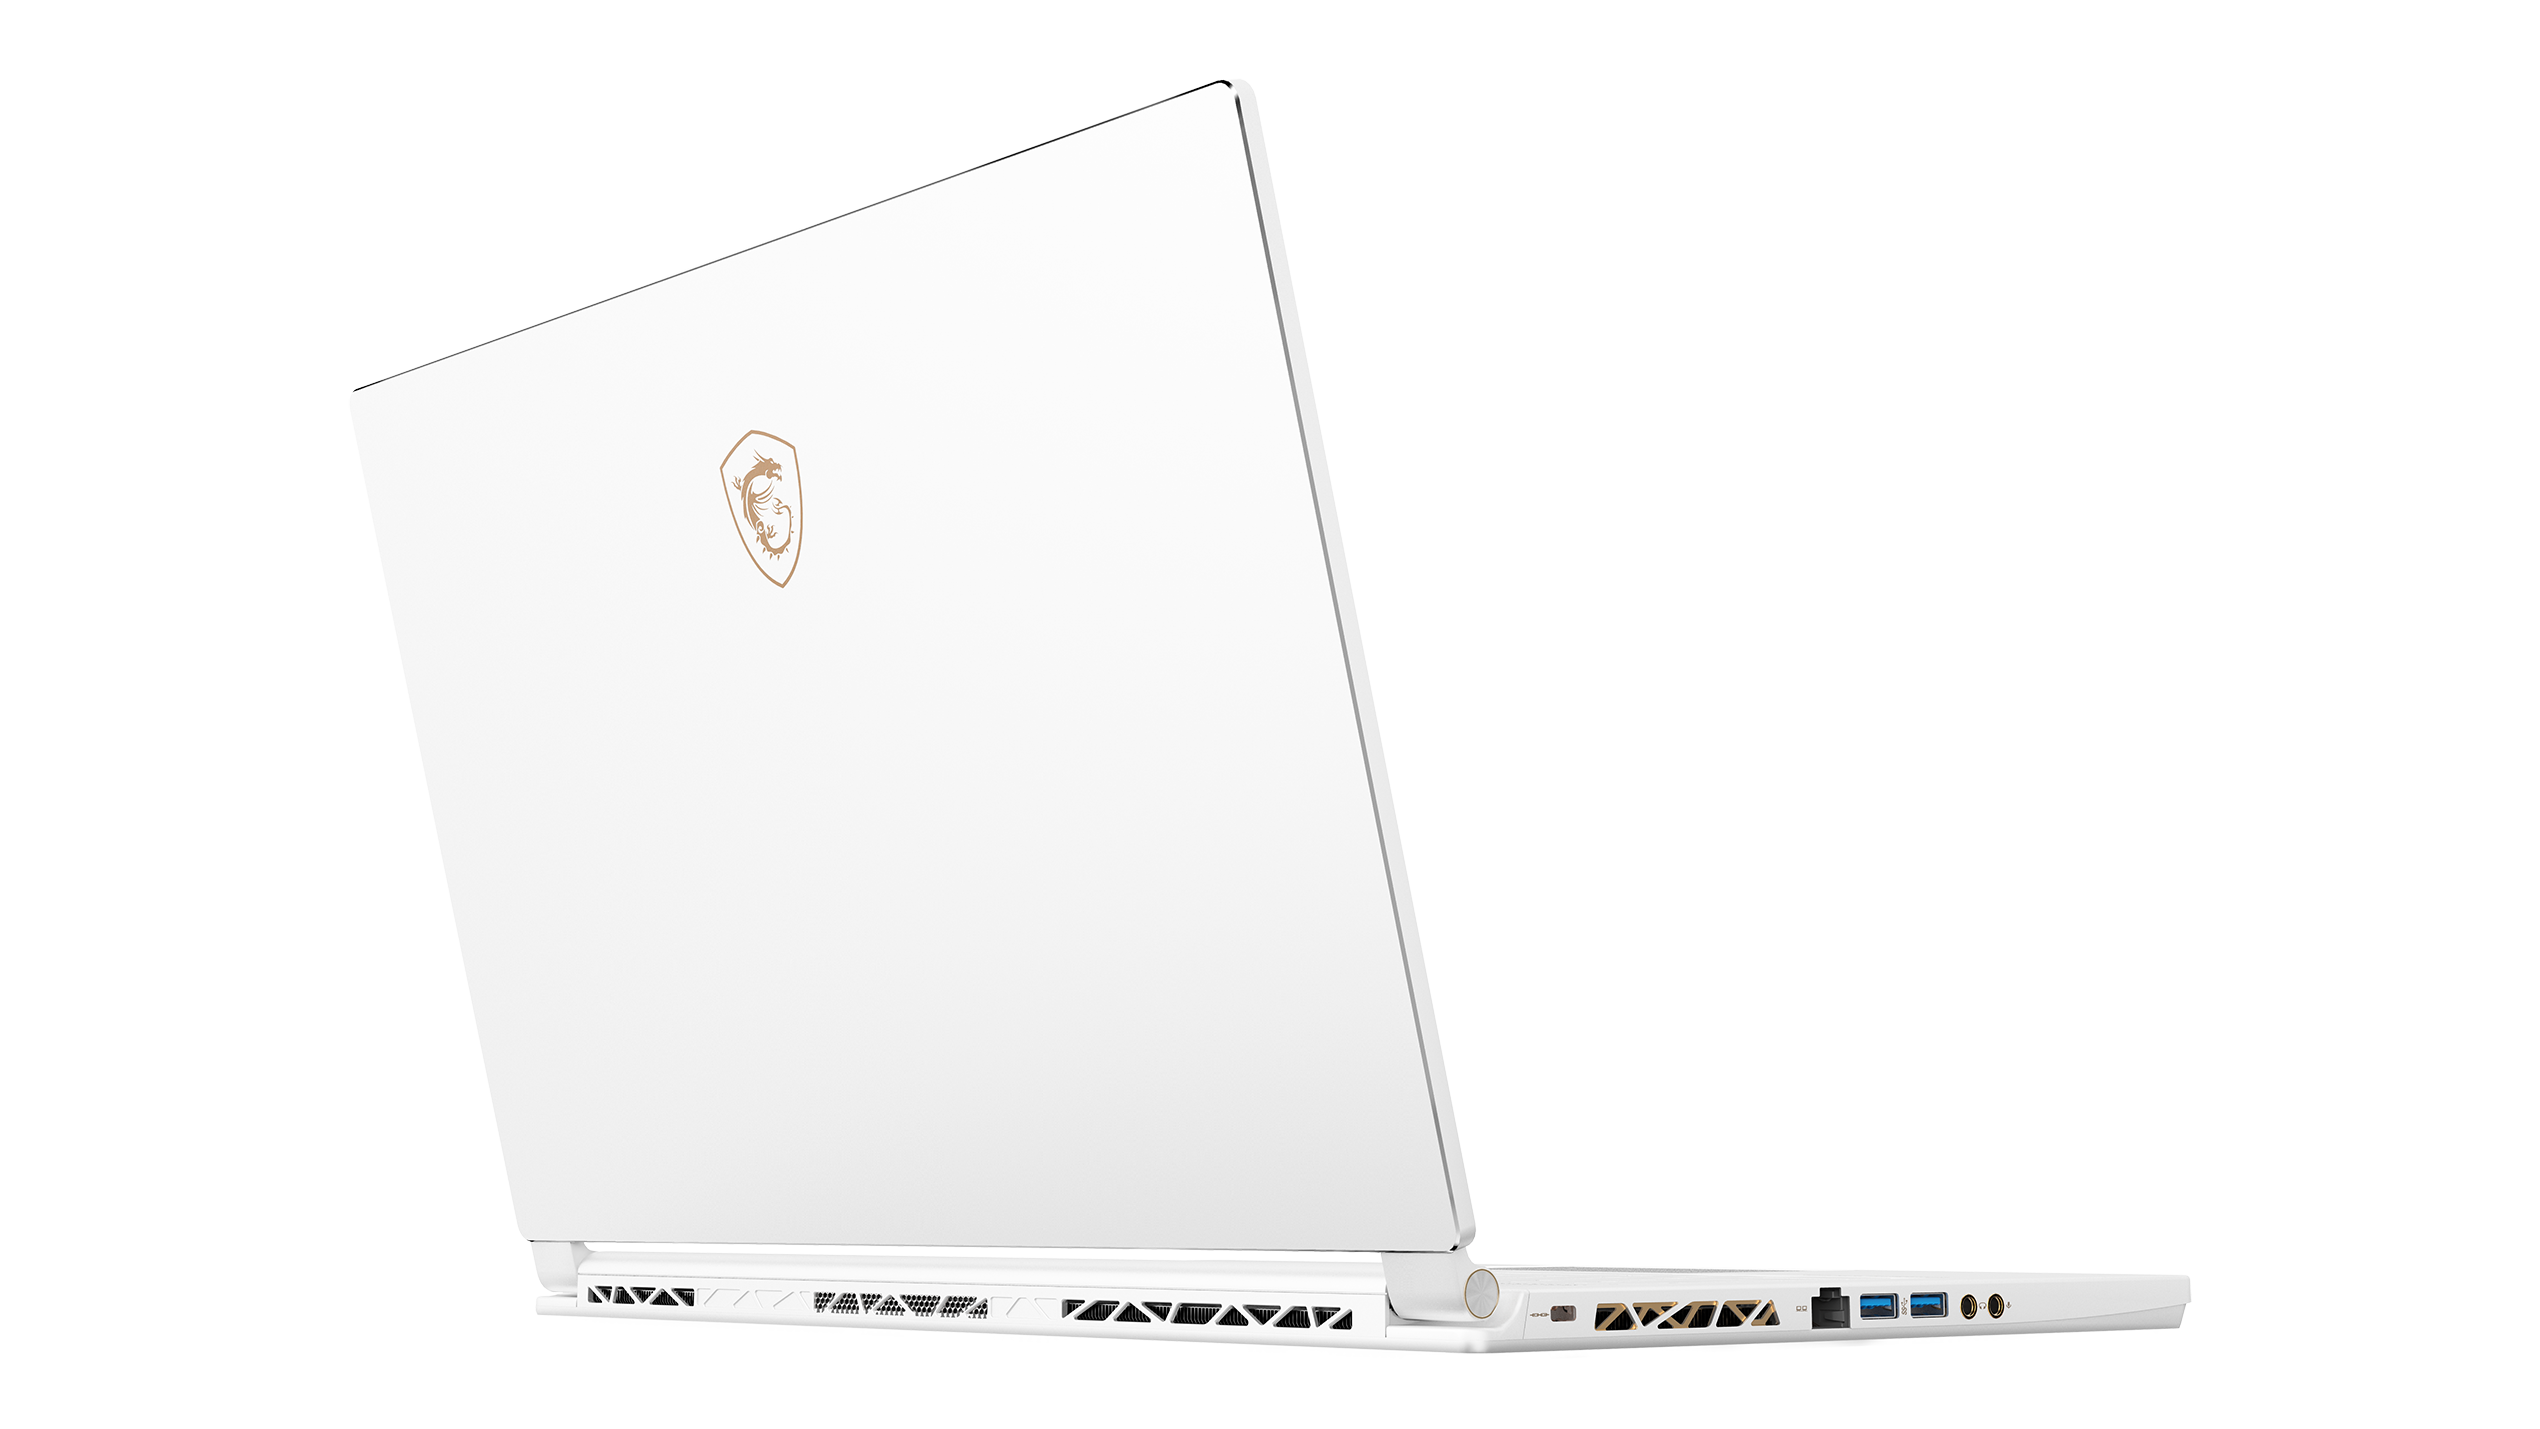
Those who prefer wired connections will be delighted to learn that the P65 Creator features an RJ45 port on the left-hand side. Both communication modules worked flawlessly during our tests, and we have not encountered any problems transferring large amounts of data from and to our NAS.
Unfortunately, the P65 Creator lacks an internal 4G/LTE modem, which cannot even be fitted optionally.
Please note that due to a mistake while running our transmit benchmarks we were unable to log these values. Due to time constraints we were unable to repeat these benchmarks.
Security
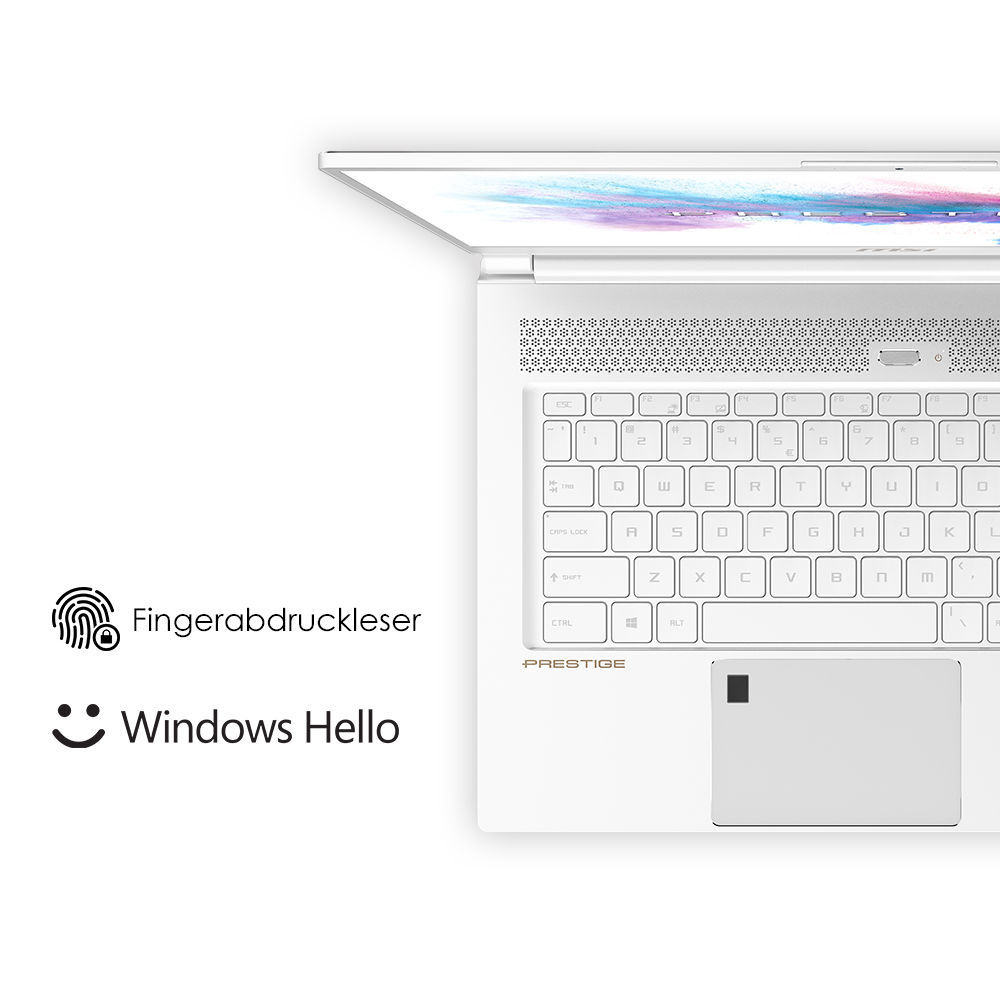
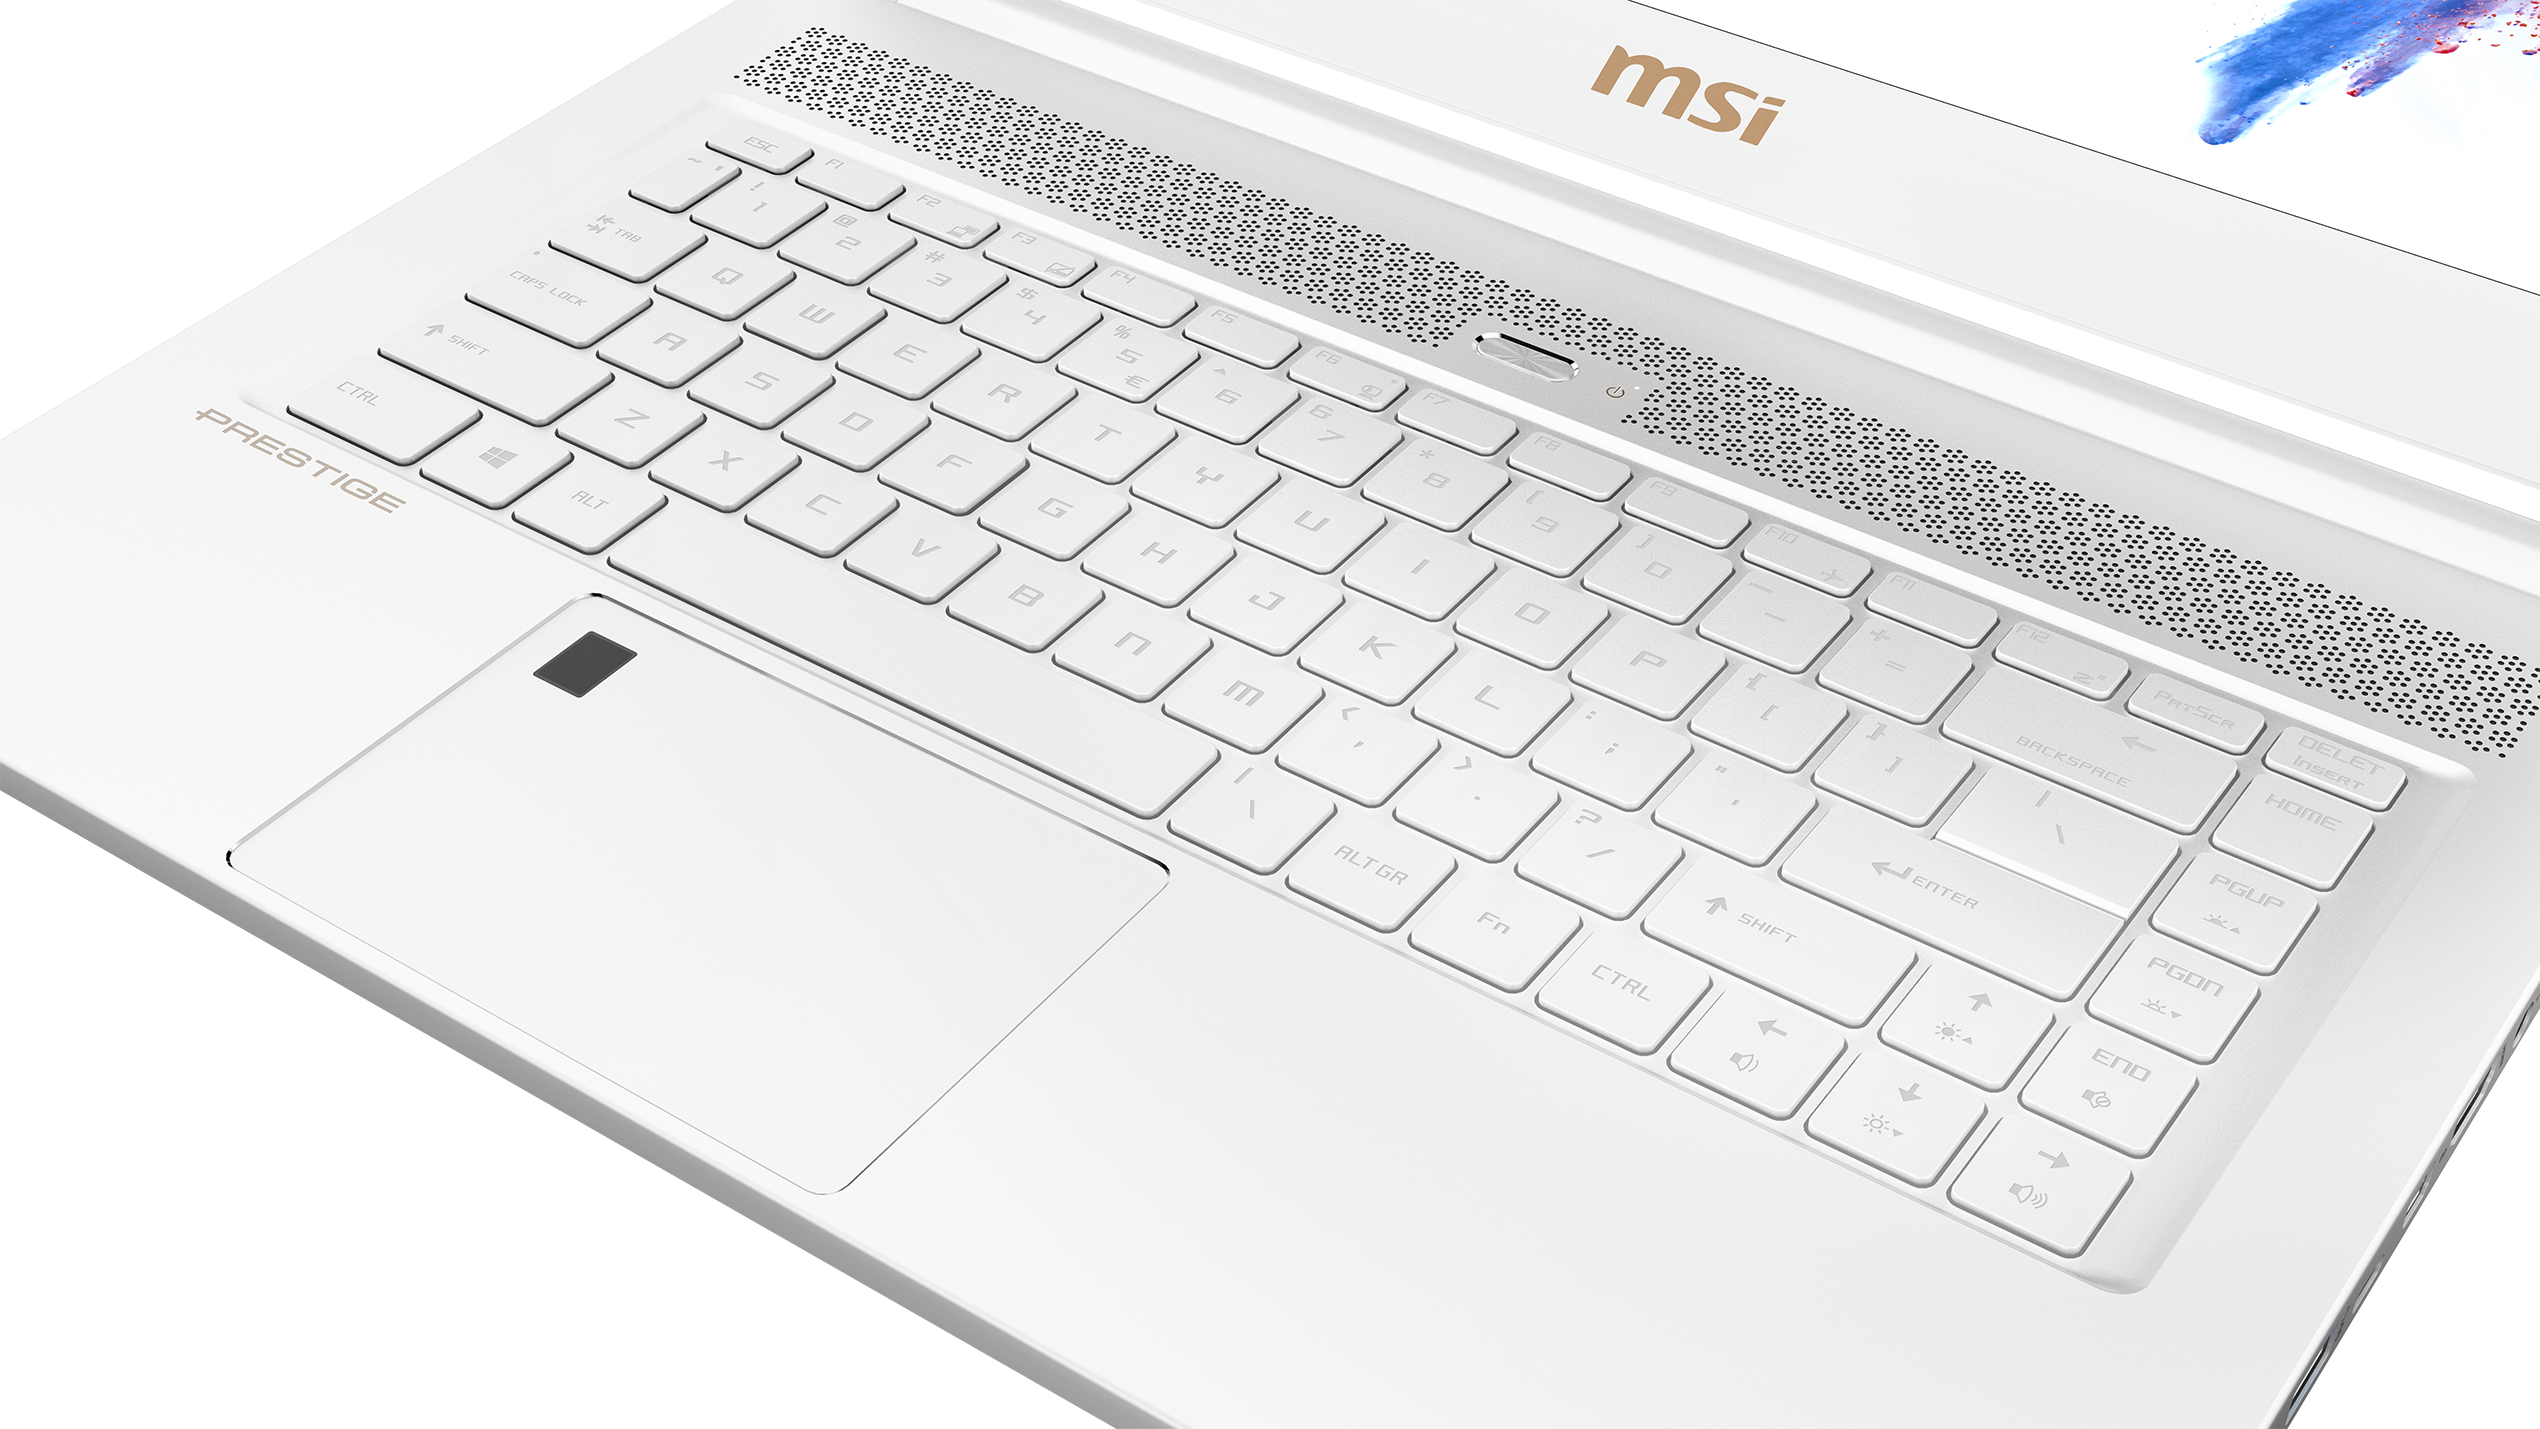
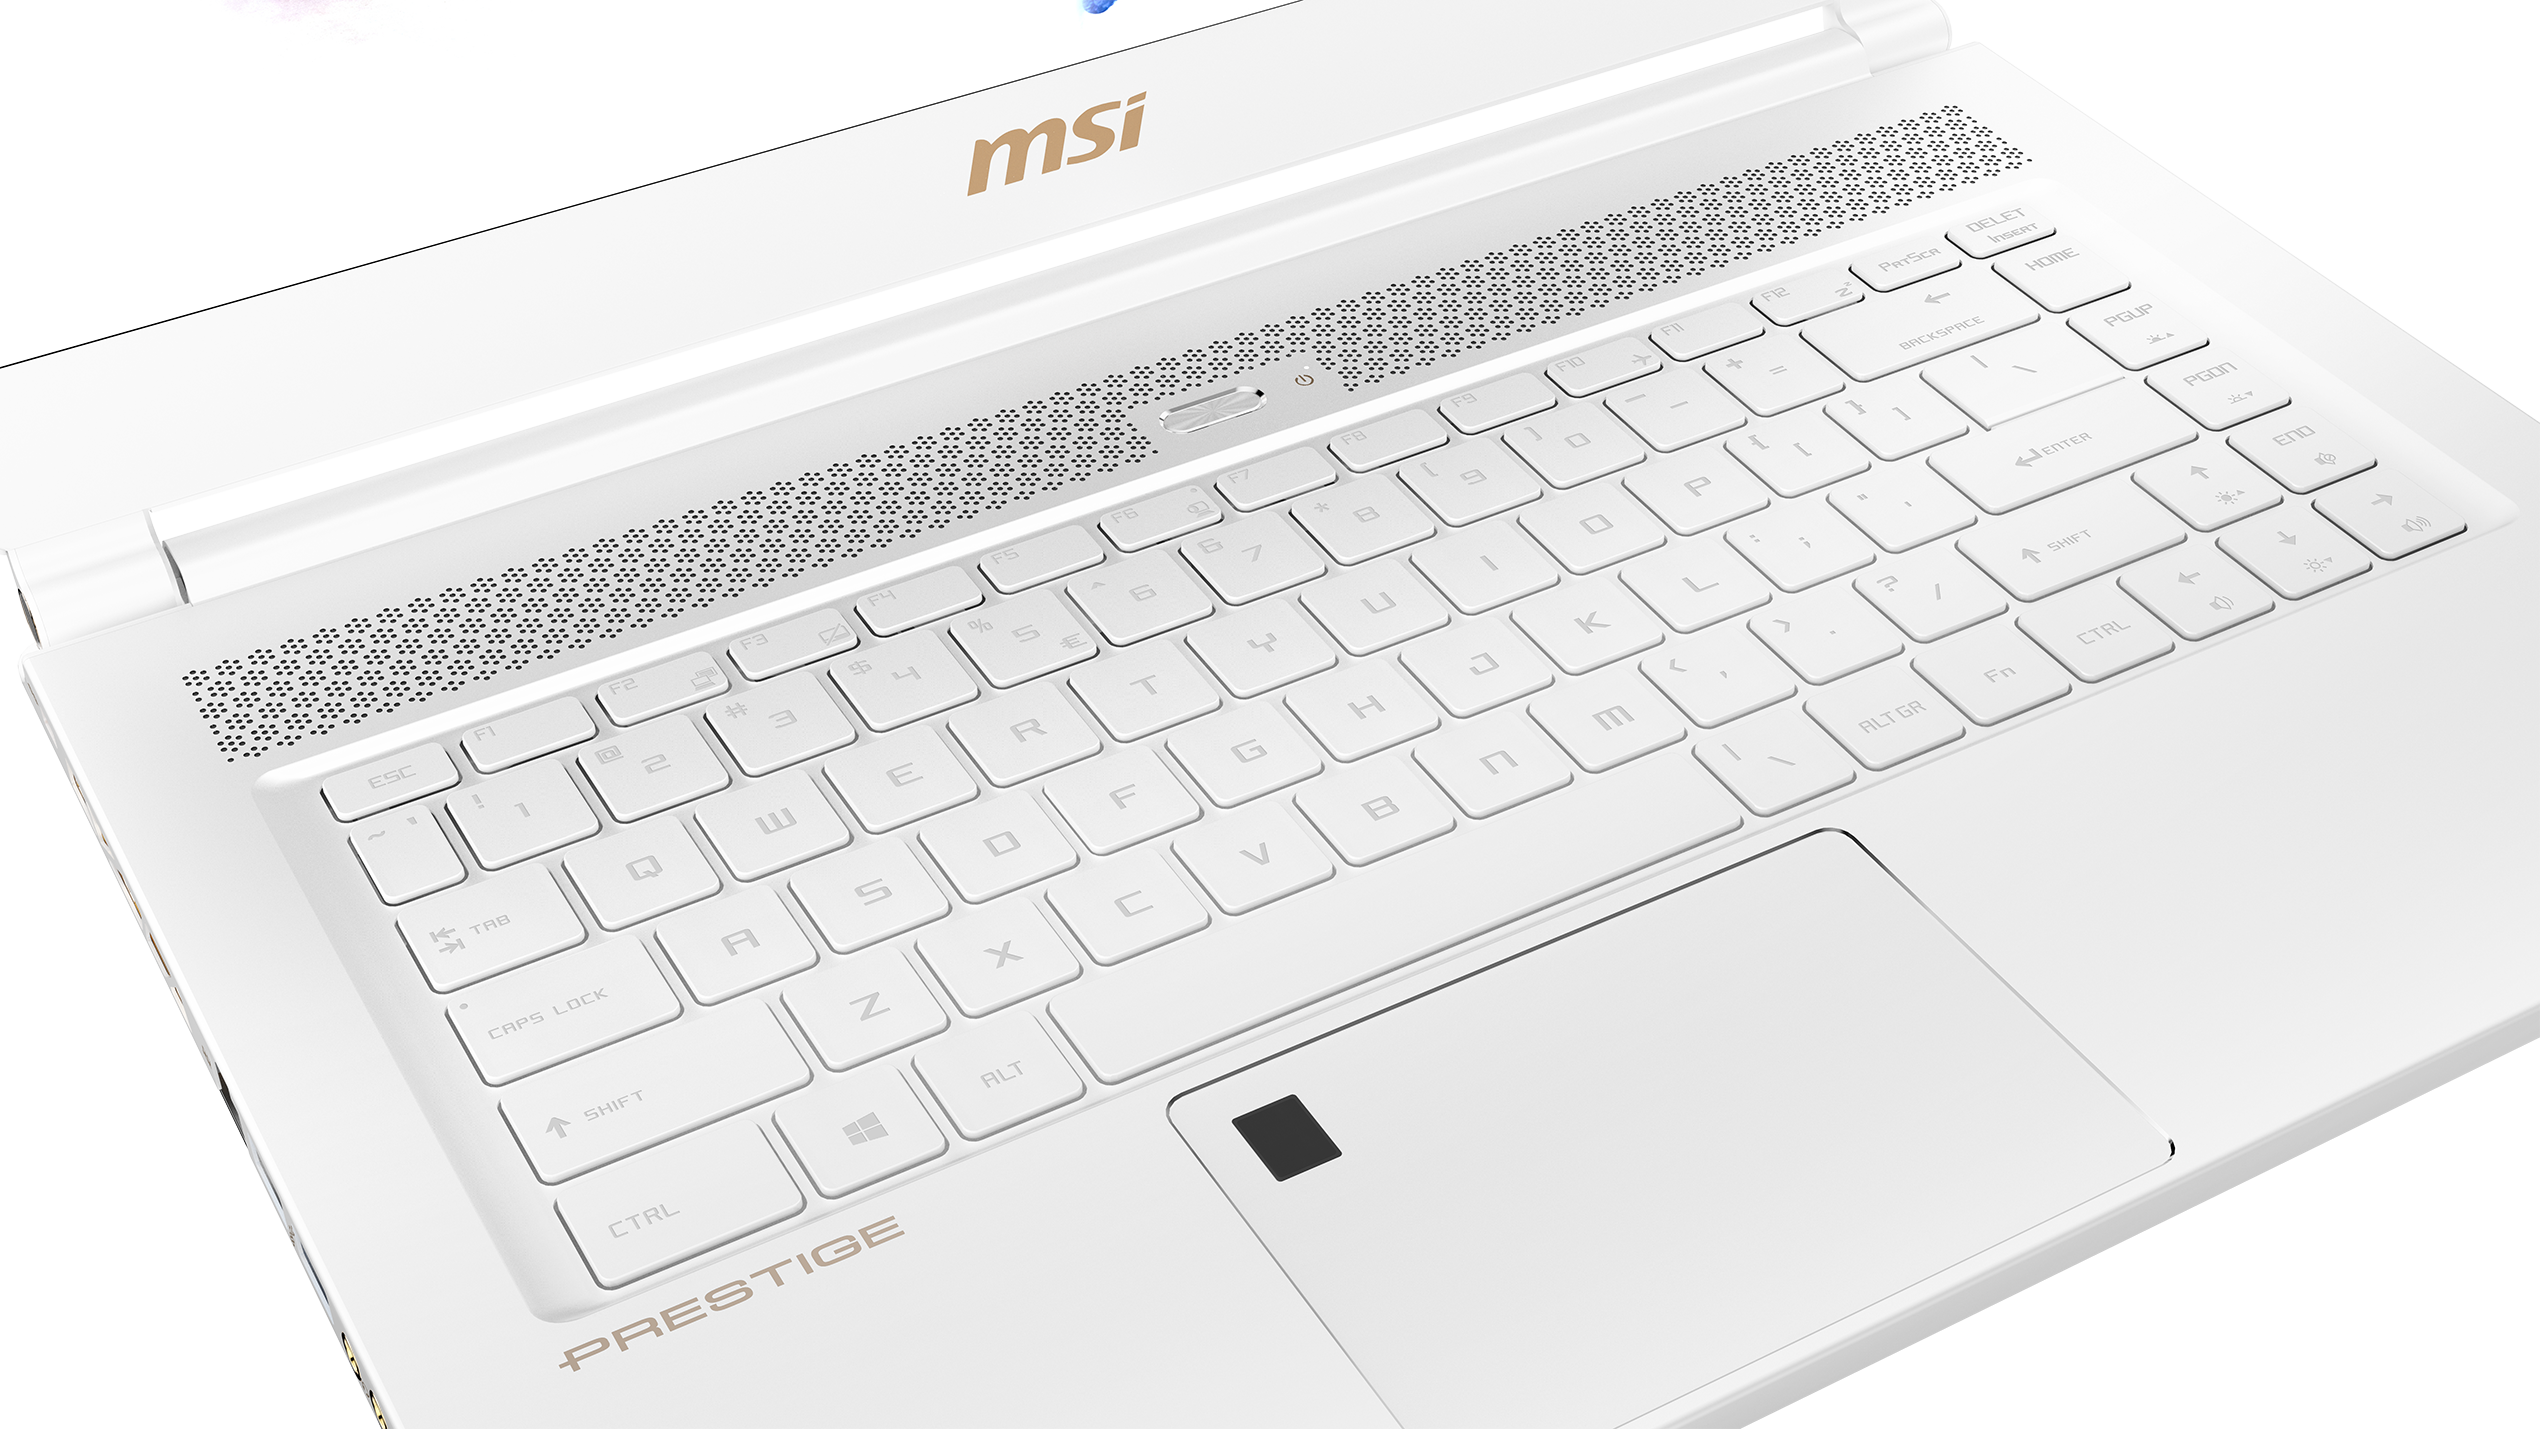
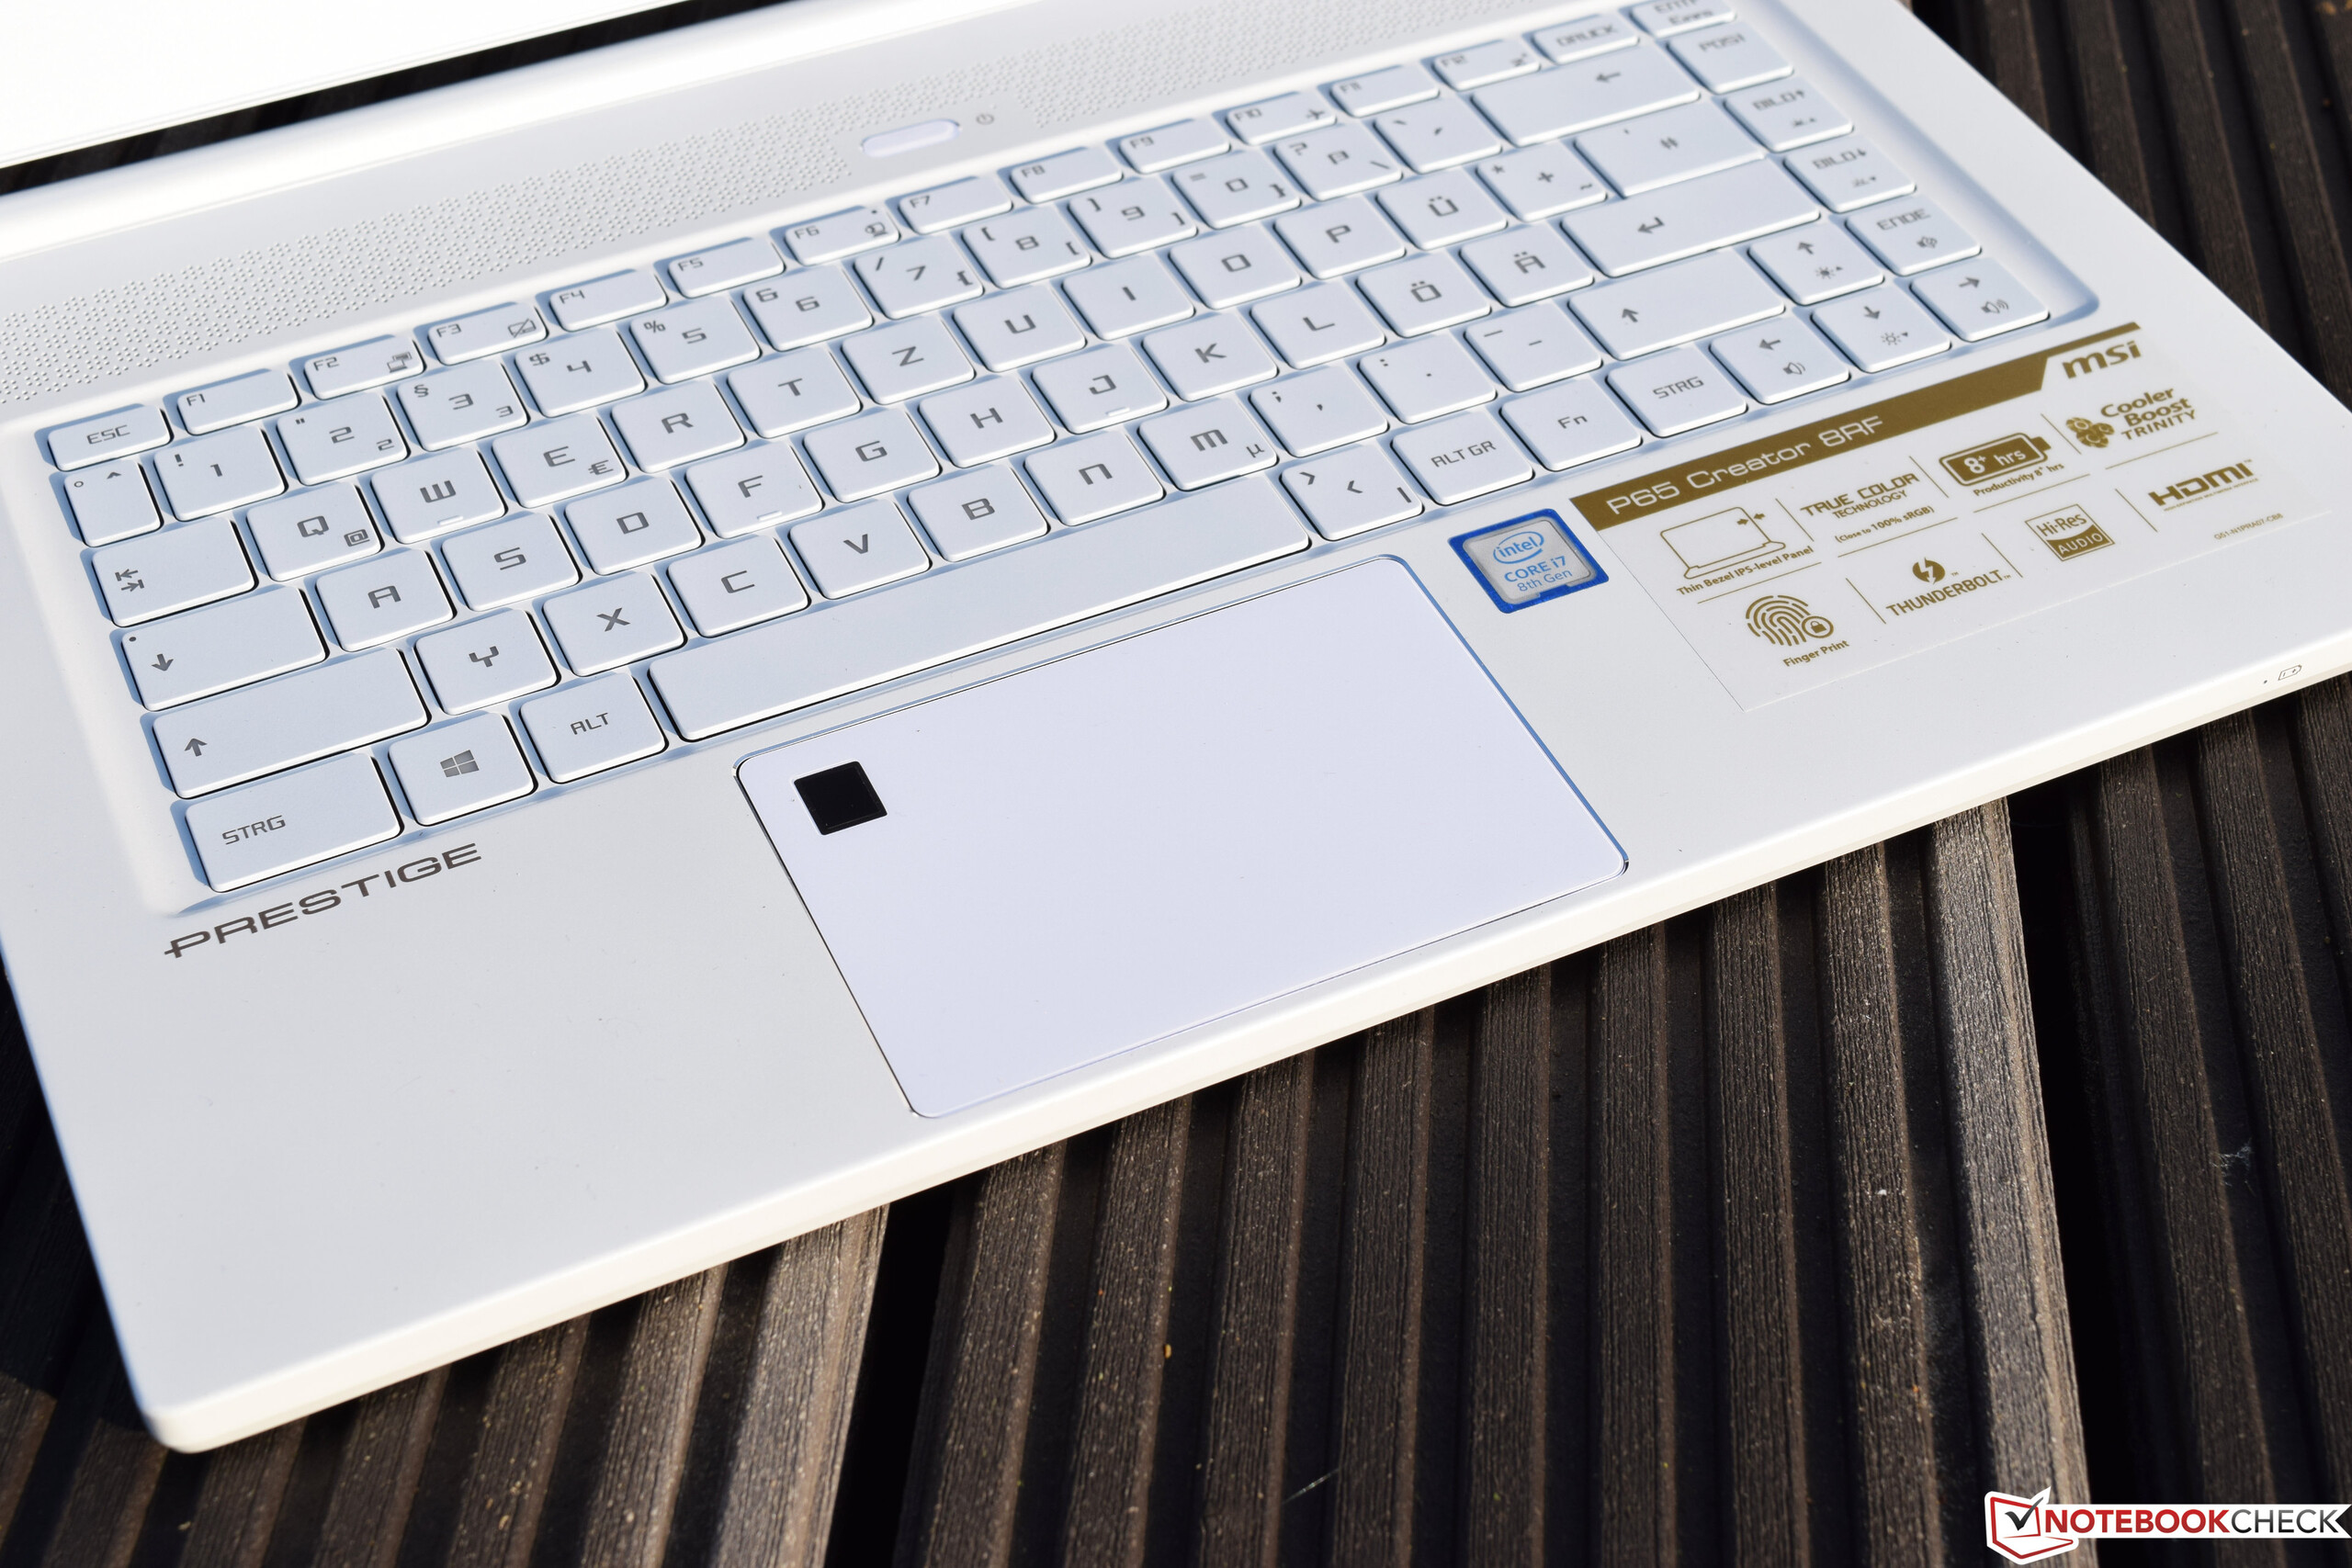
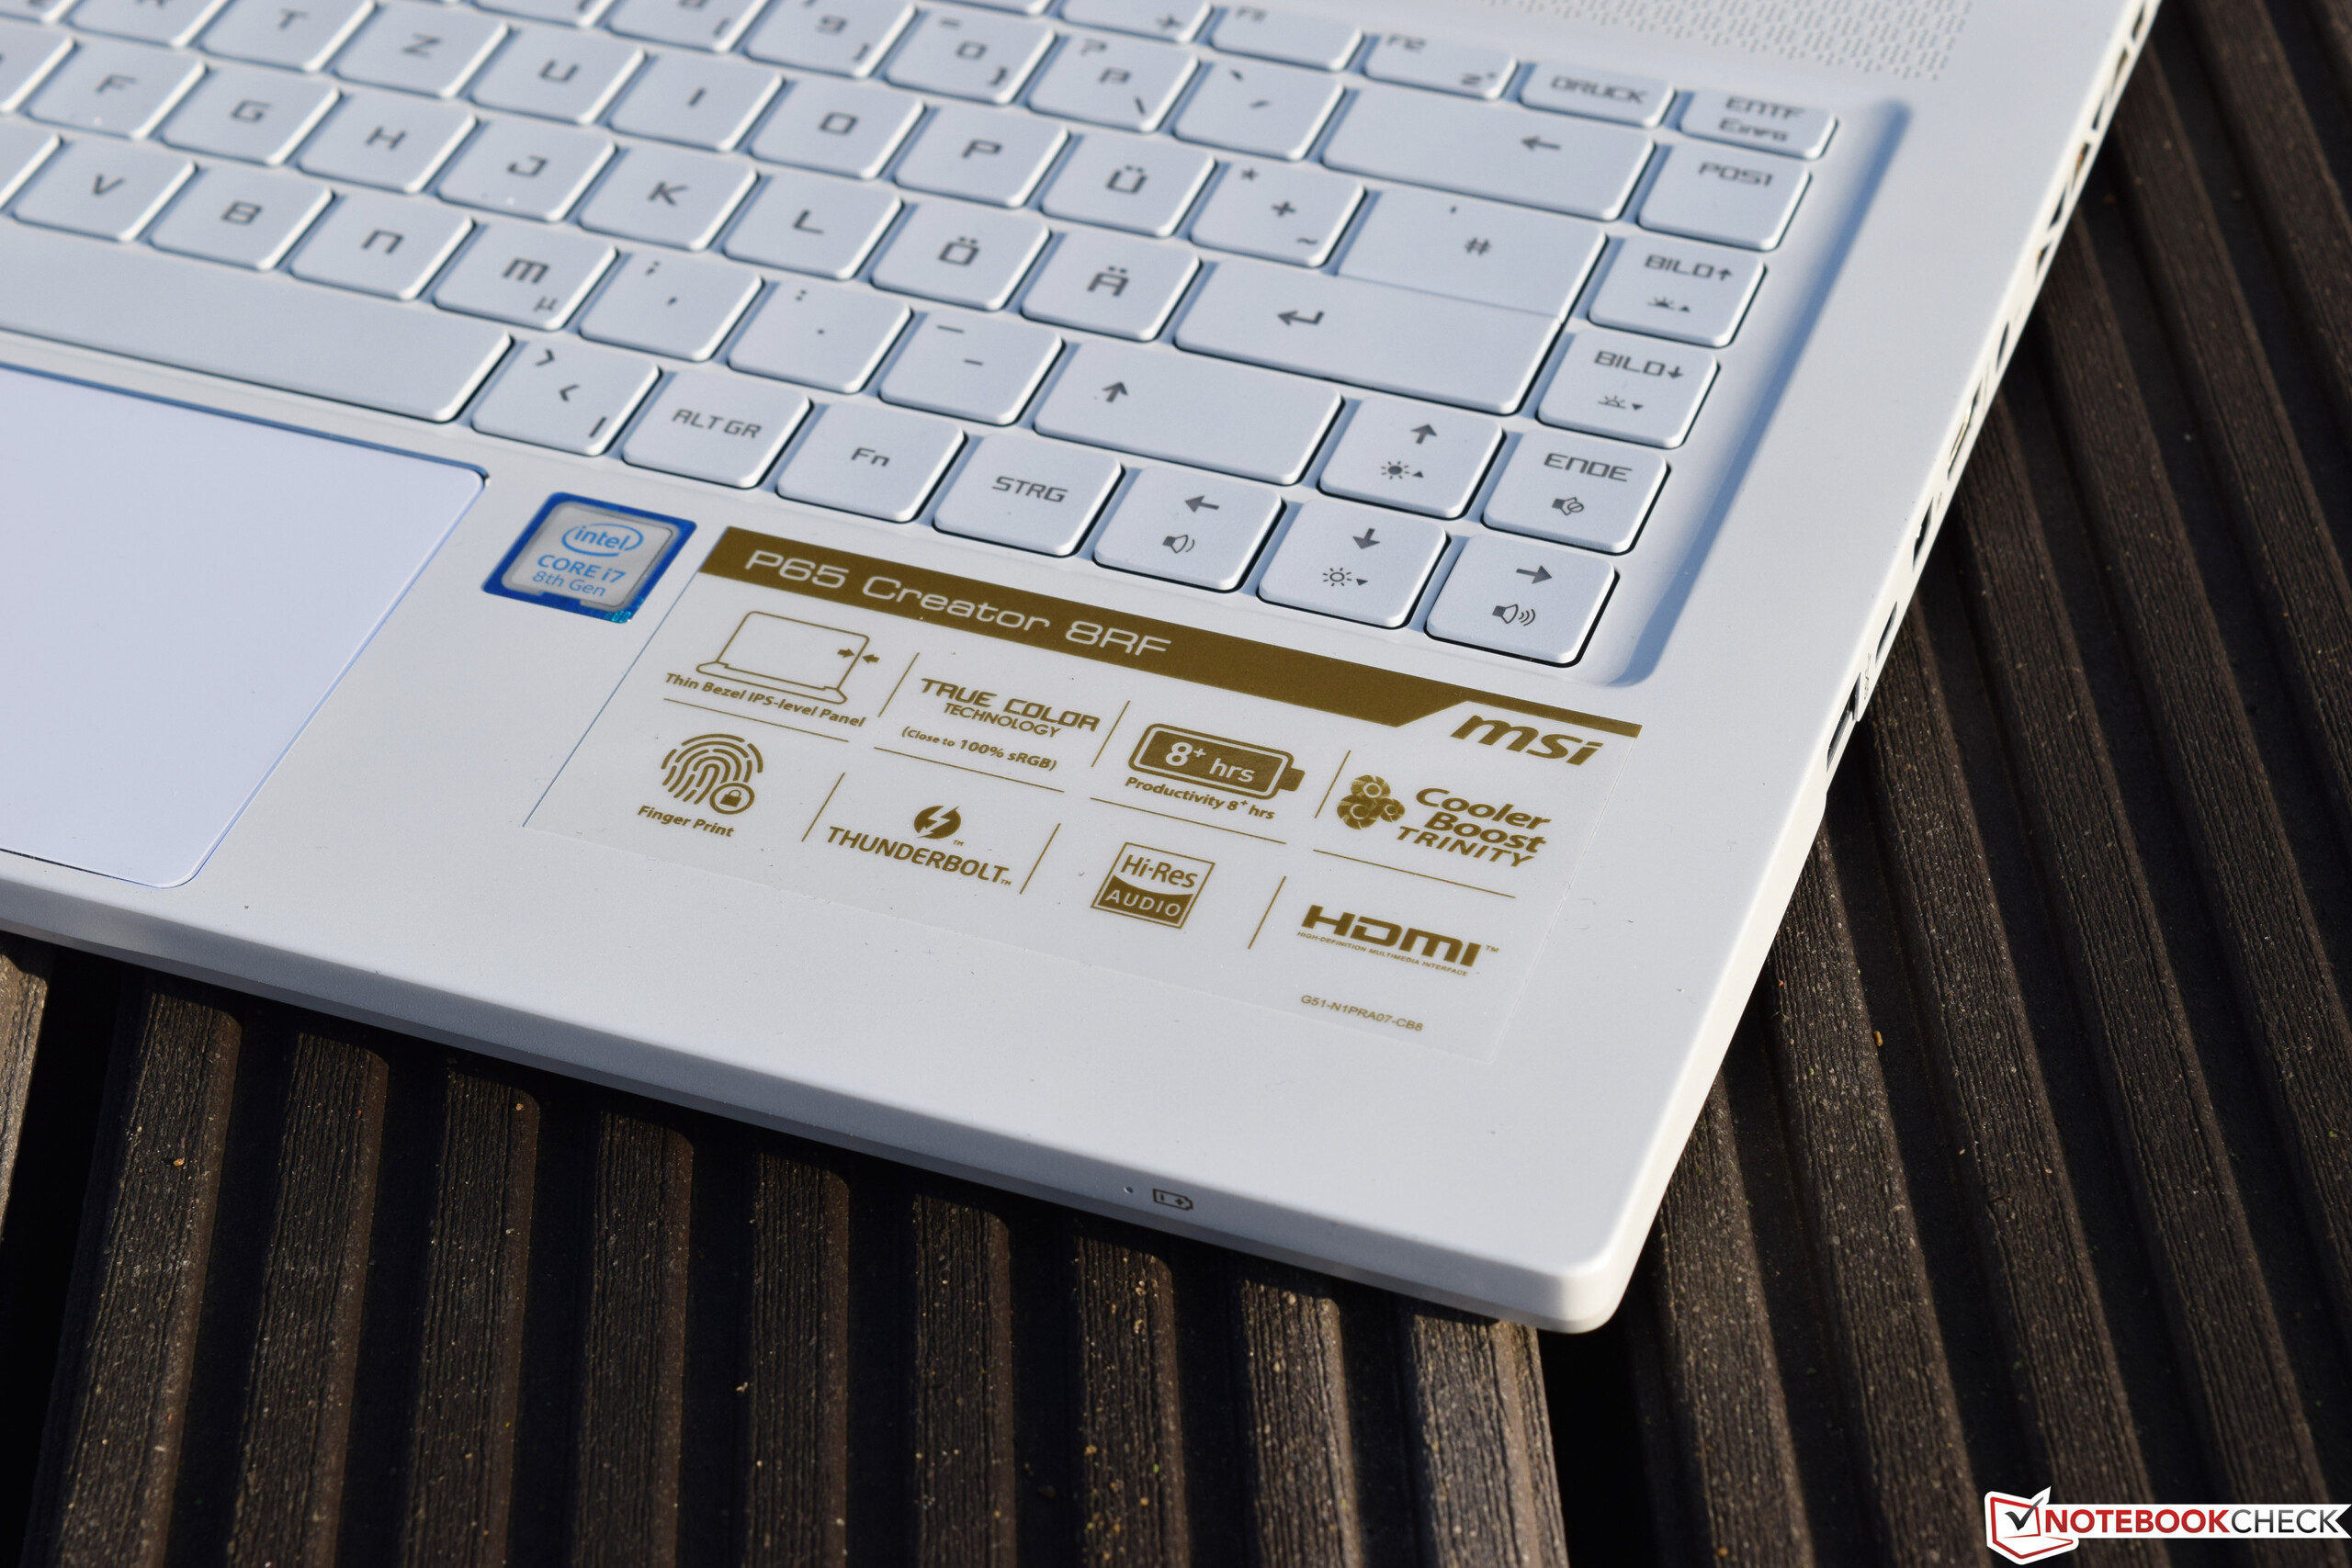
The major security feature on the P65 Creator is its fingerprint reader located in the top-left corner of the touchpad. Unfortunately, this also means that this bit of surface area is not usable for input. The fingerprint reader was very easy and comfortable to use and allowed for logging into Windows without typing in a password every time. A Kensington lock is also available for those who travel frequently.
Accessories
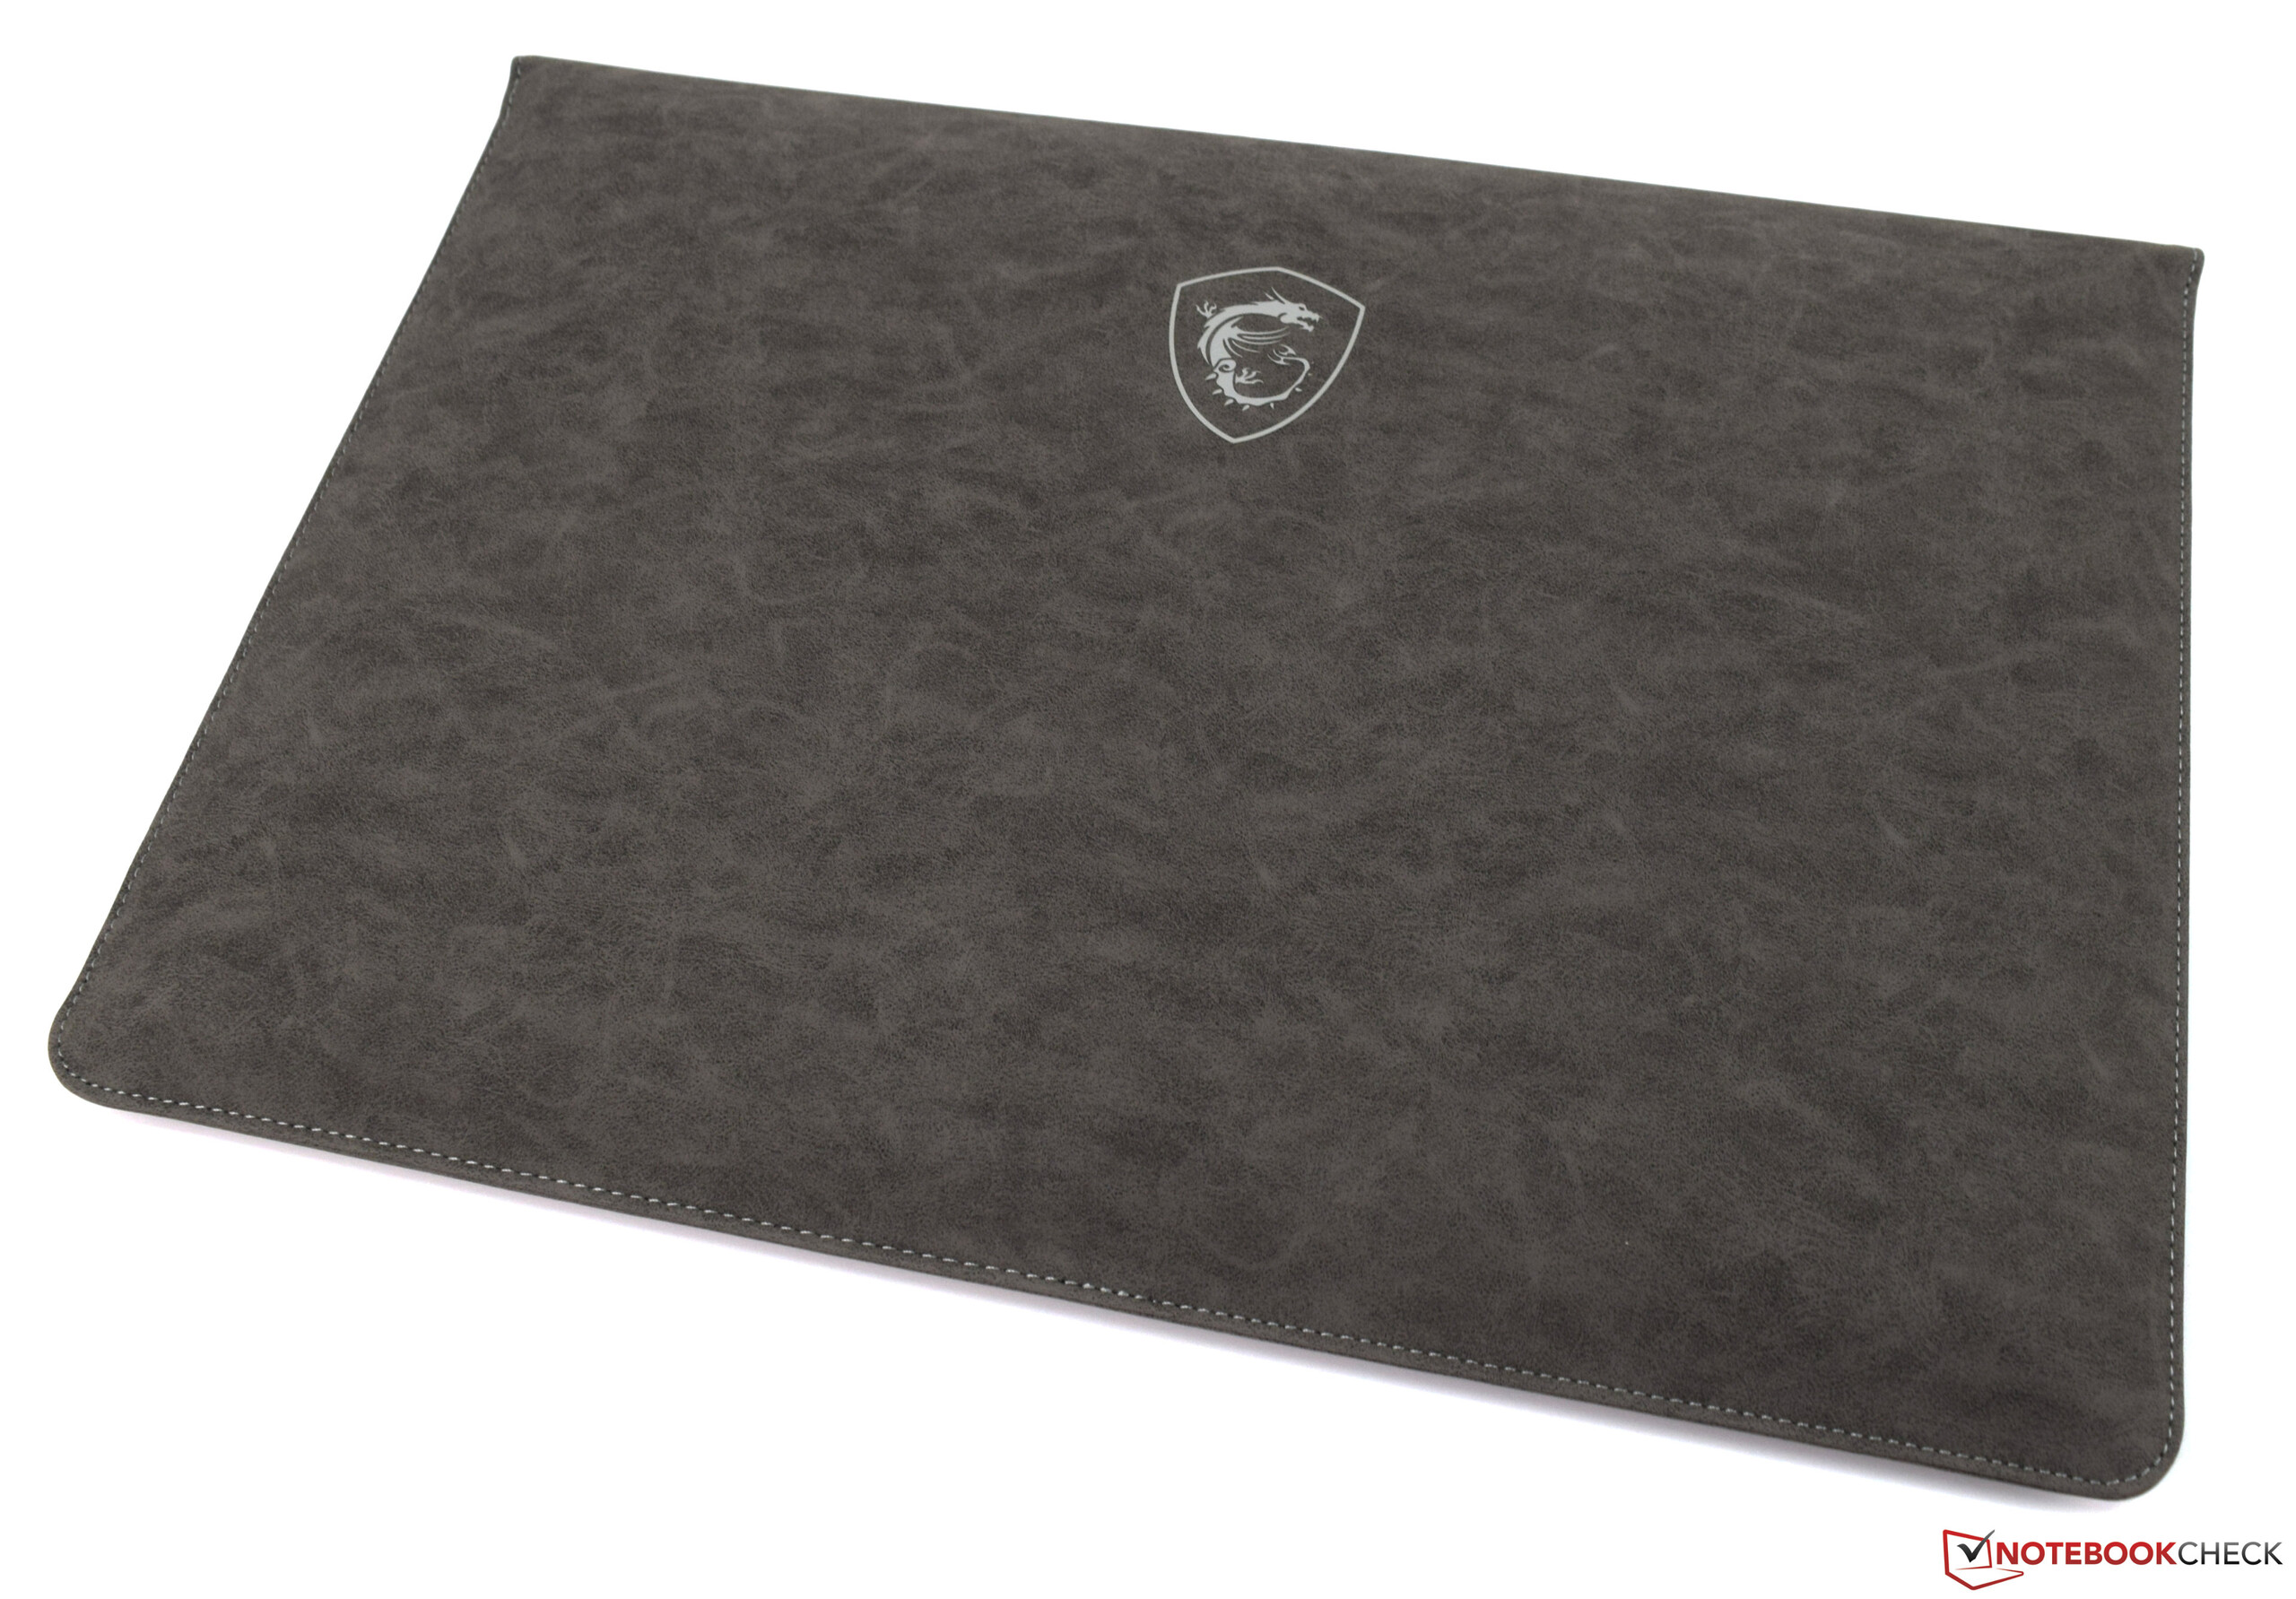
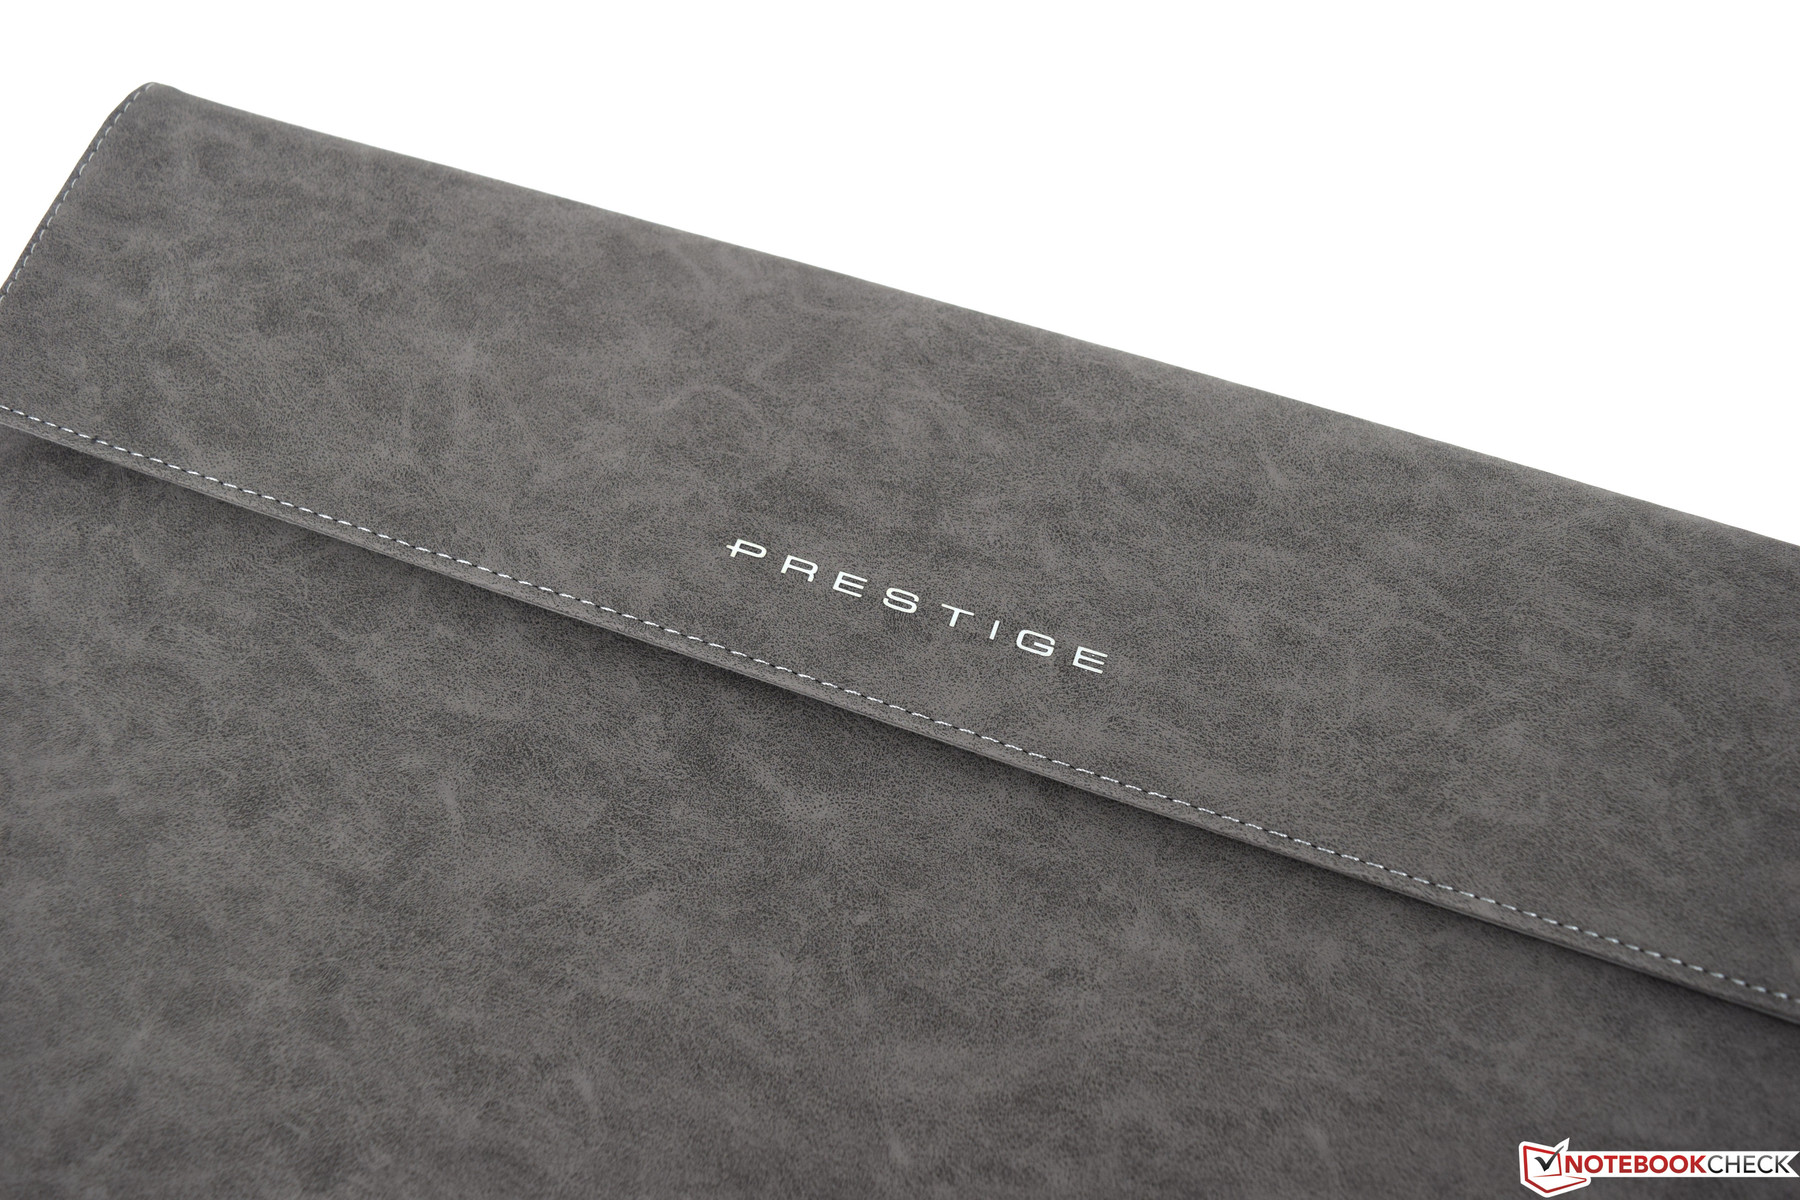
Should you happen to order an MSI P65 8RF you are going to receive it in a very classy wooden box with an MSI logo on its top and Prestige writing on the side. In addition to the notebook itself and the 180 W power supply, you will also find a quick-start guide, a warranty leaflet, and a matching sleeve protecting the P65 quite well during transport in the box.
Maintenance
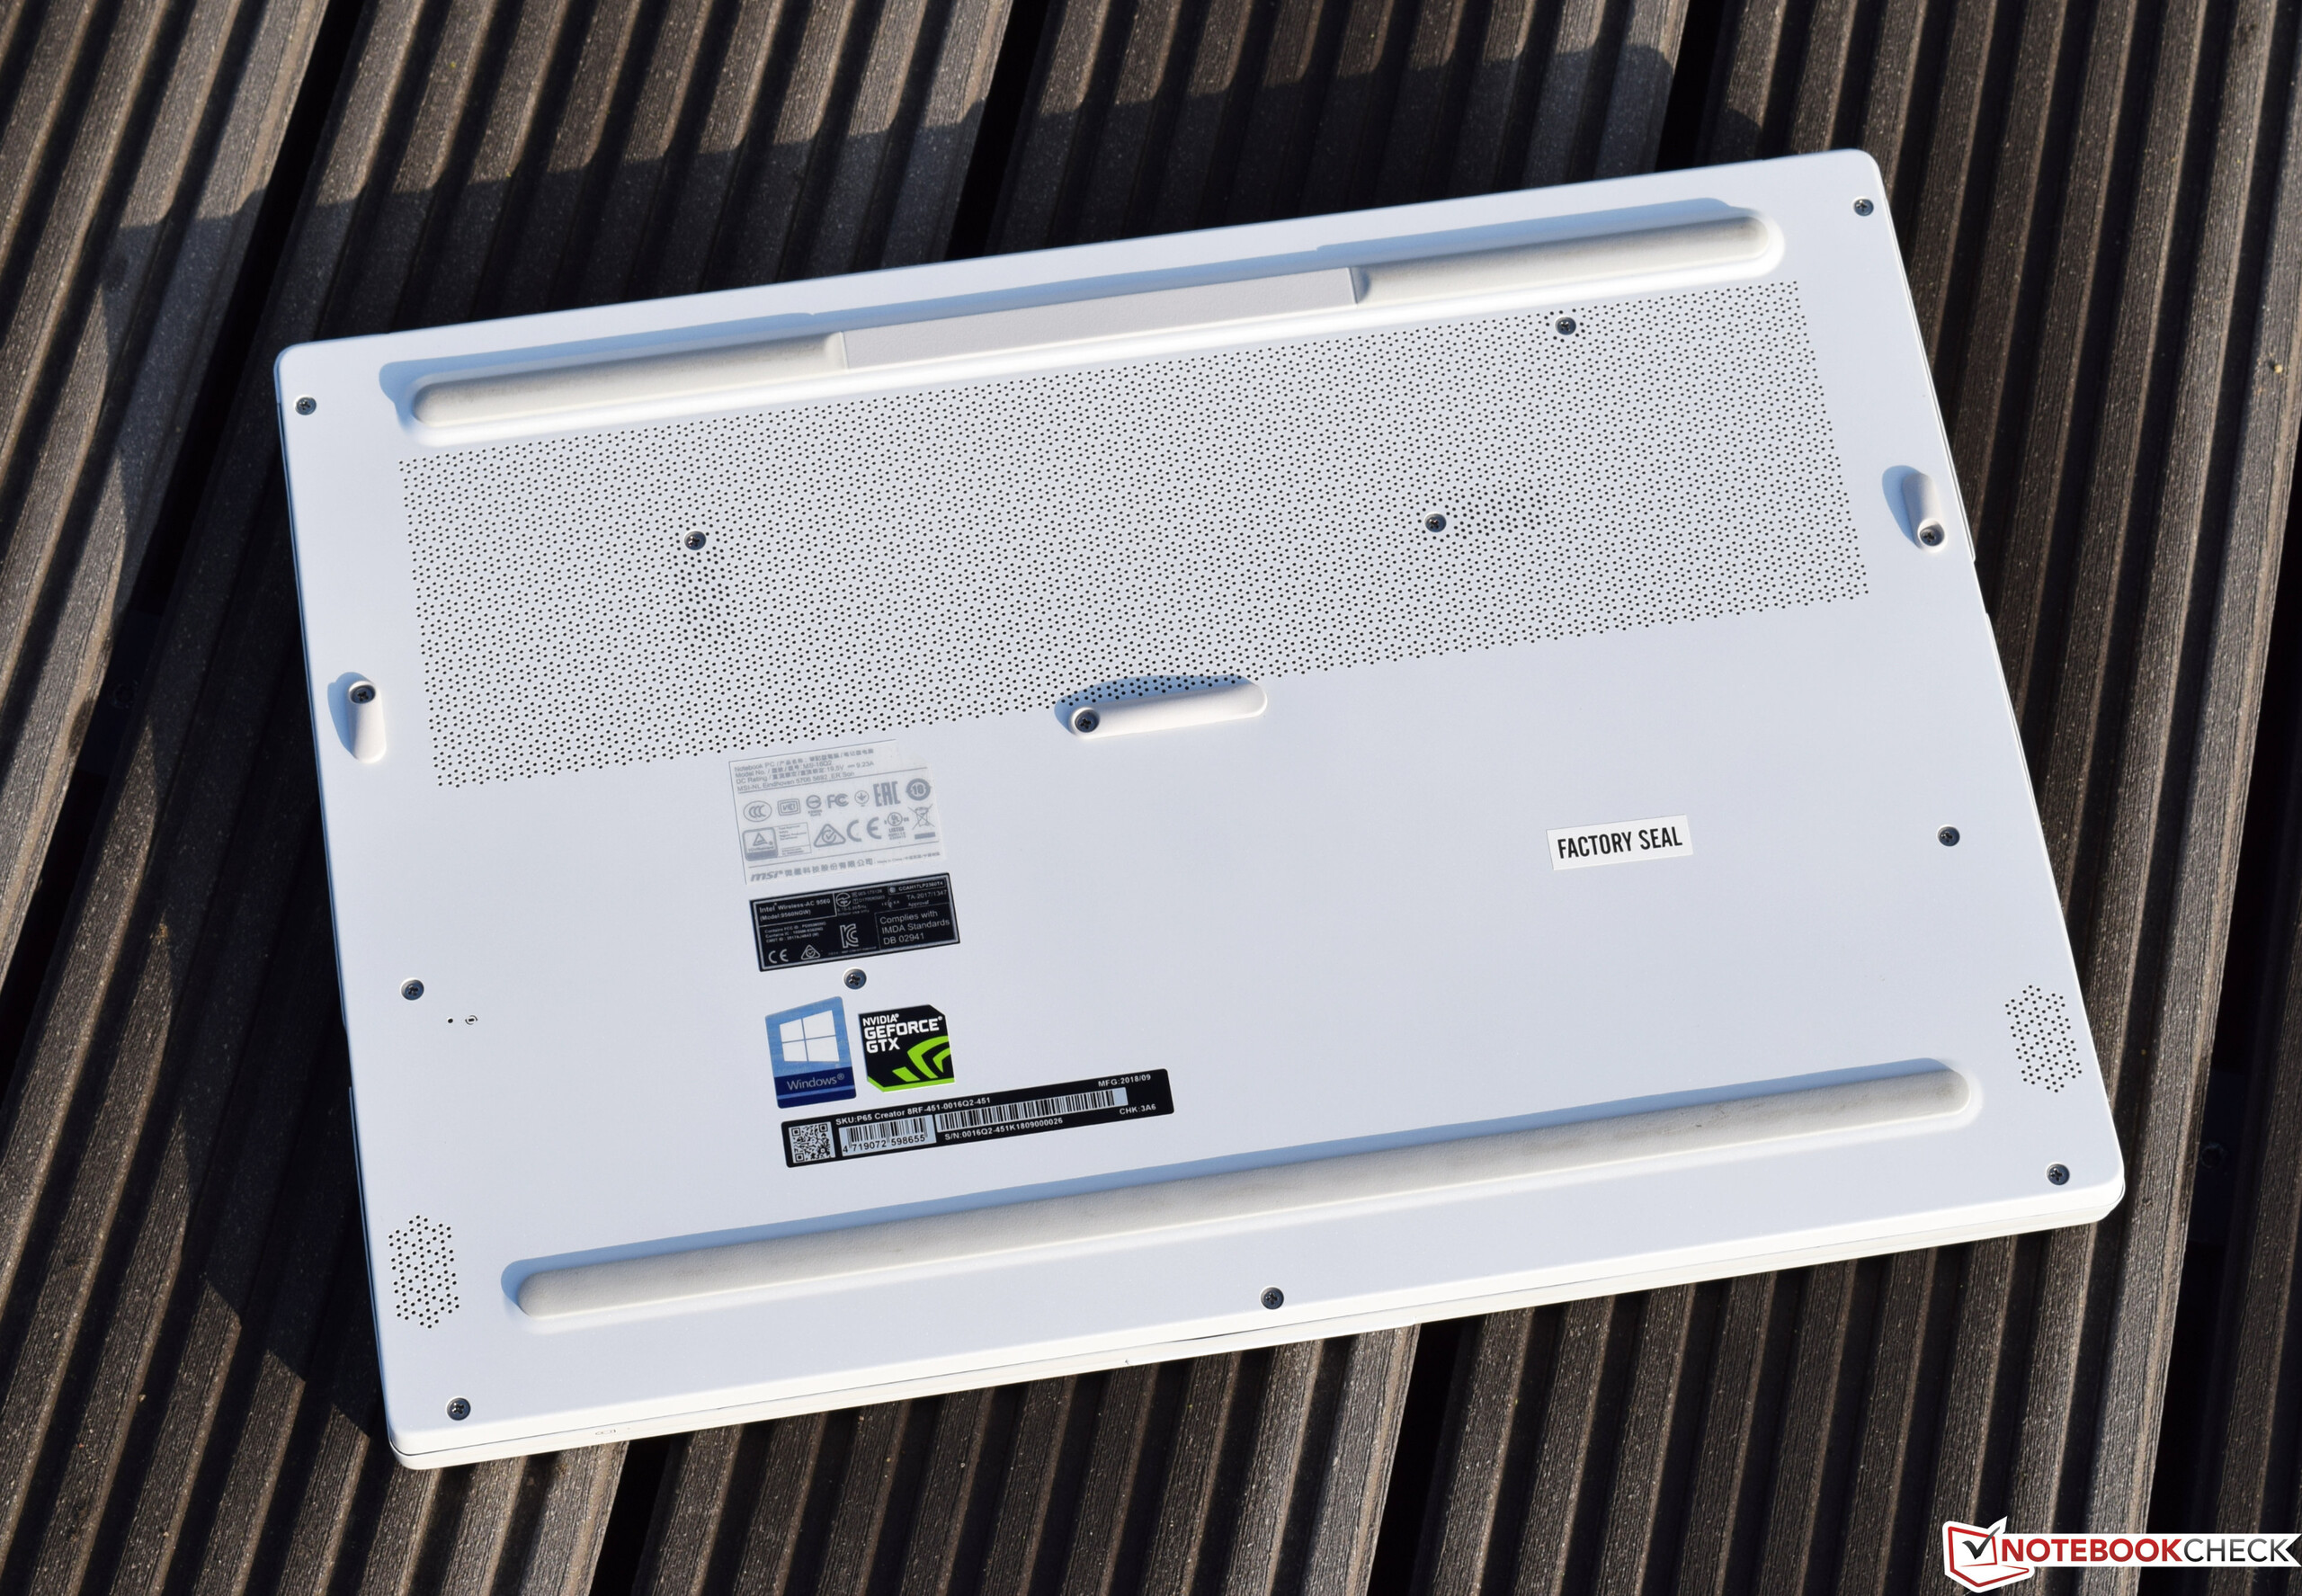
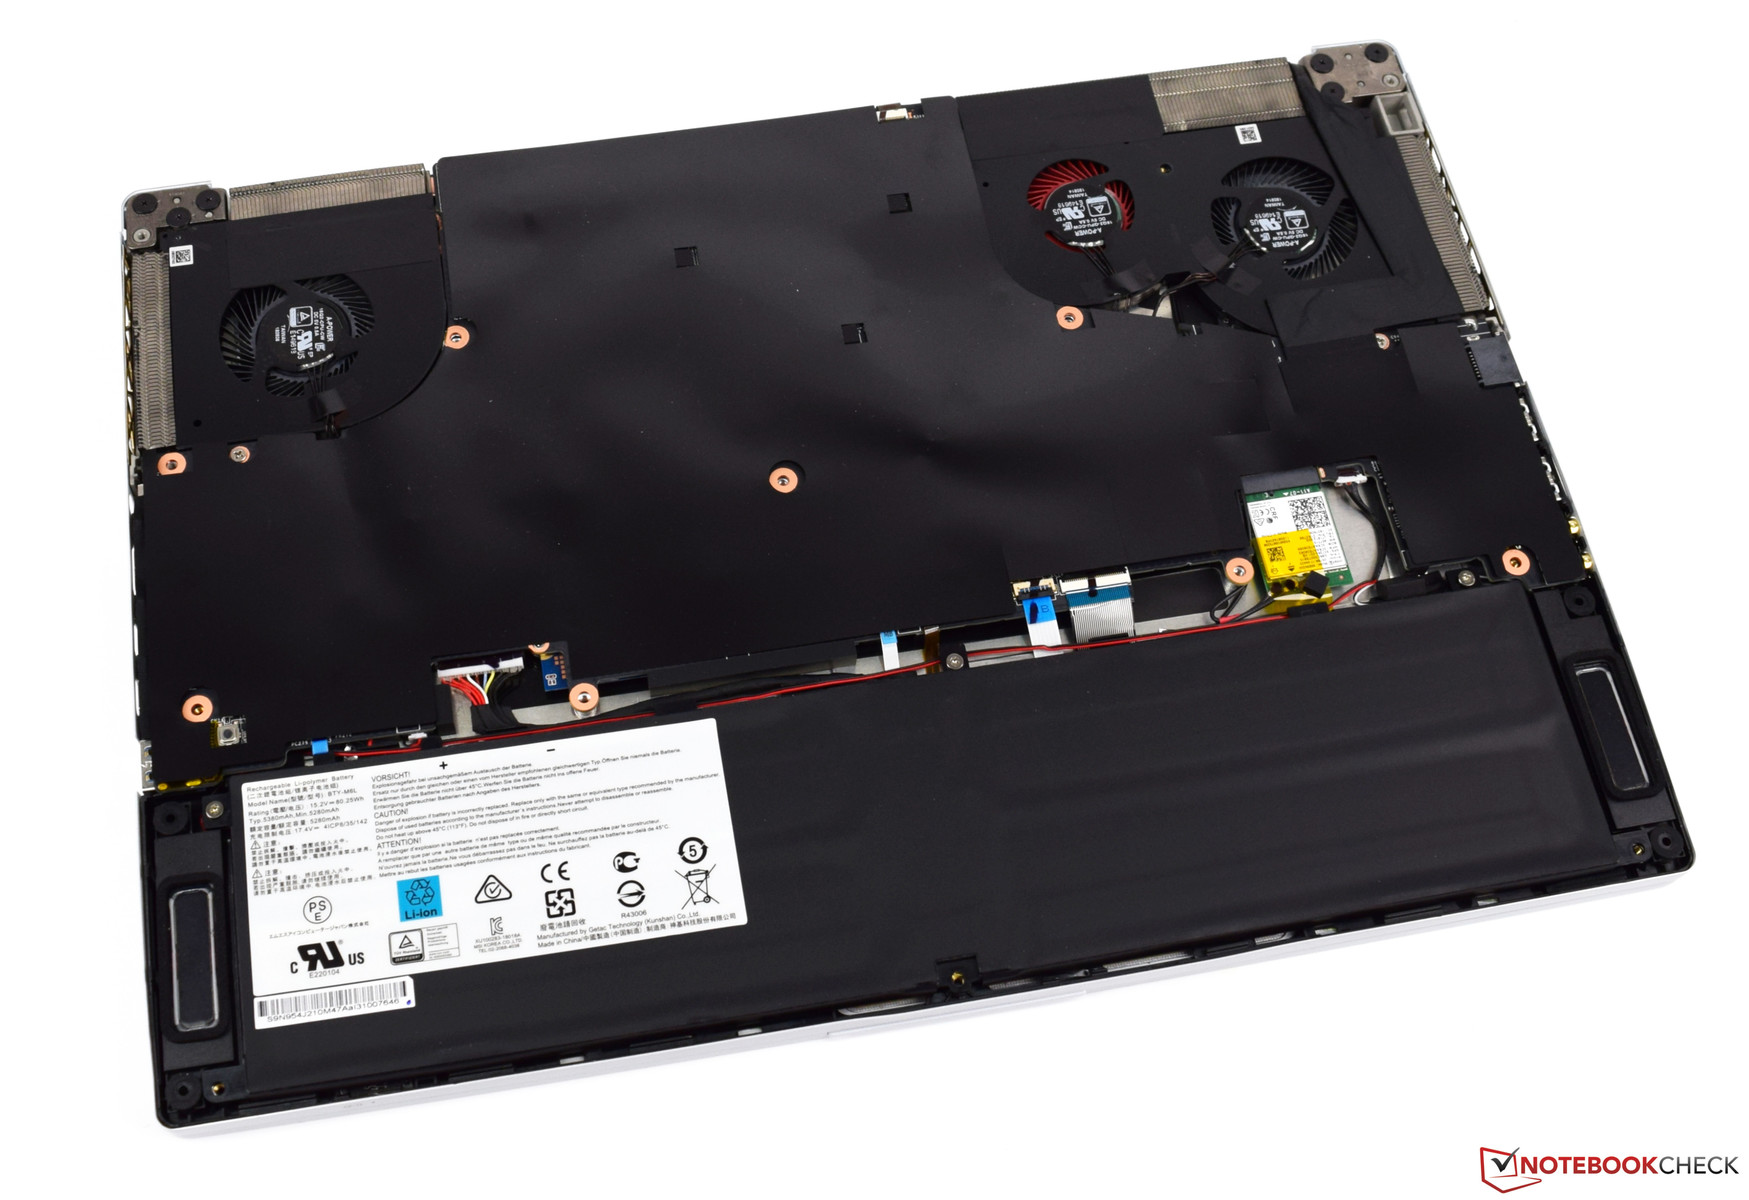
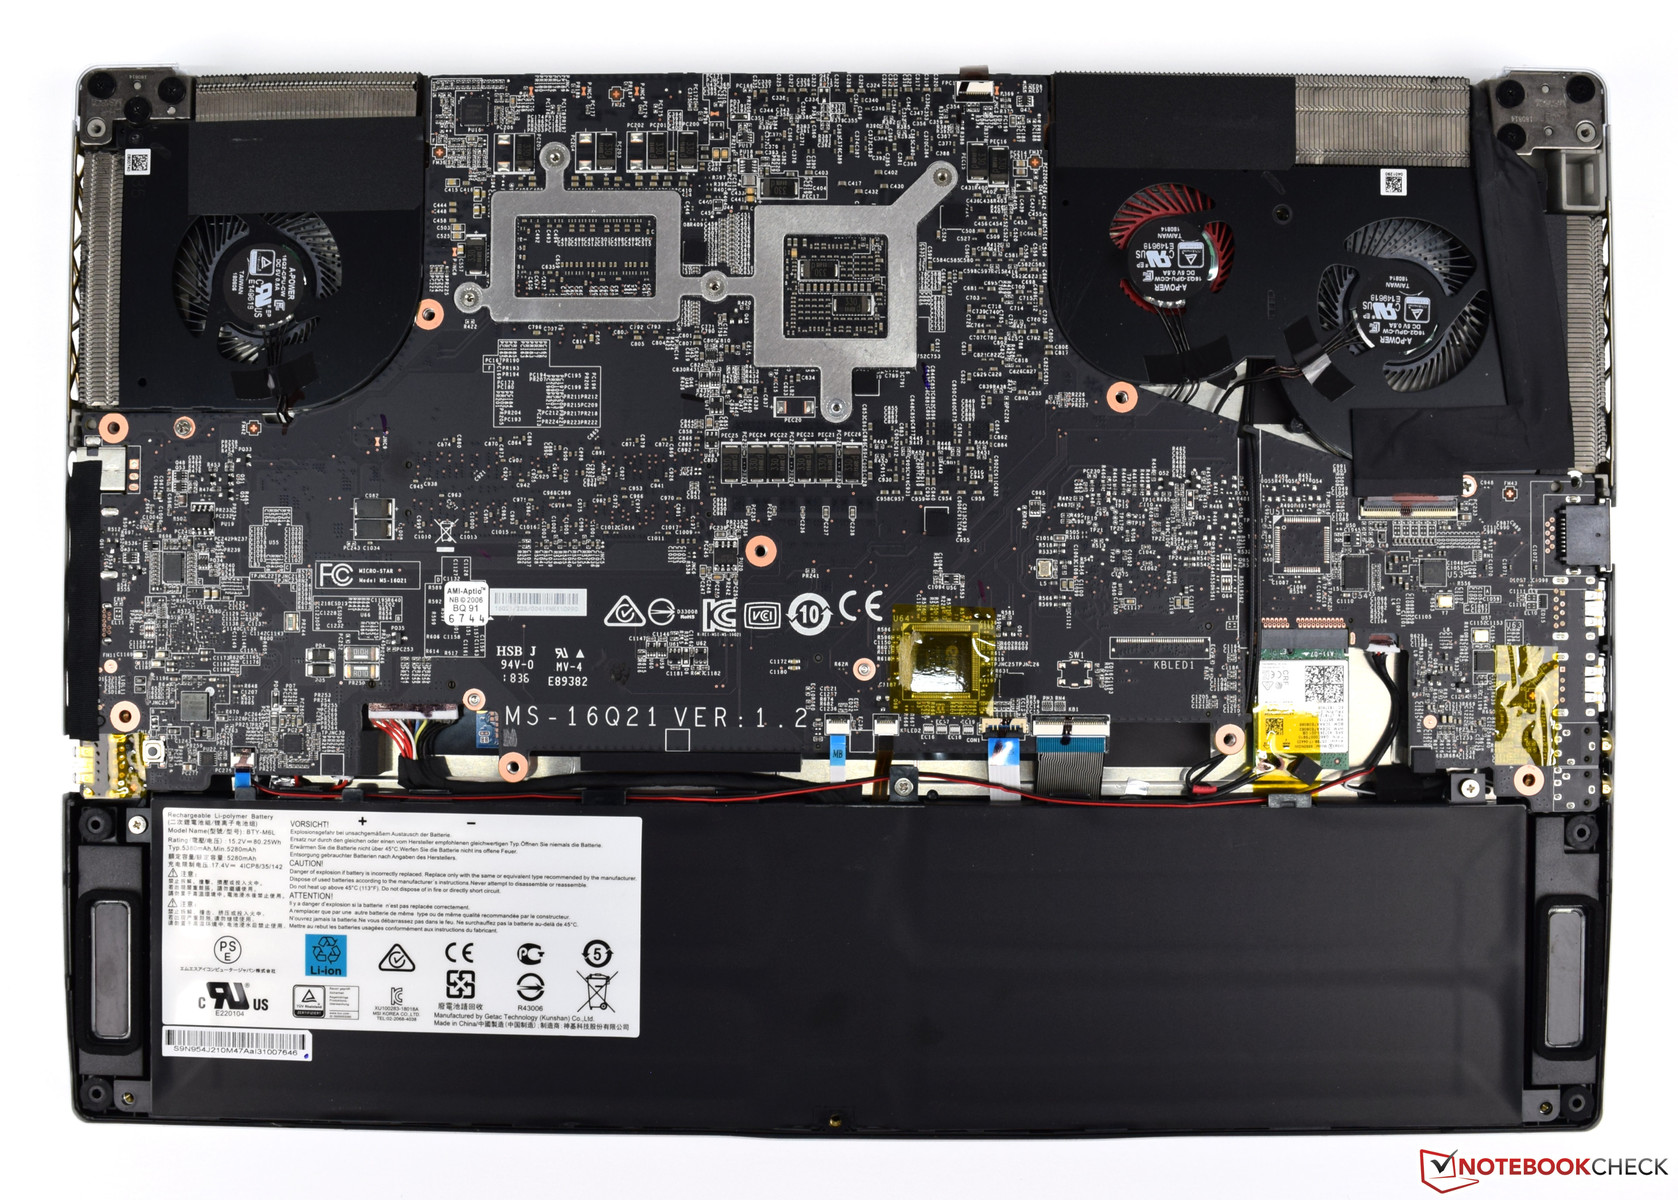
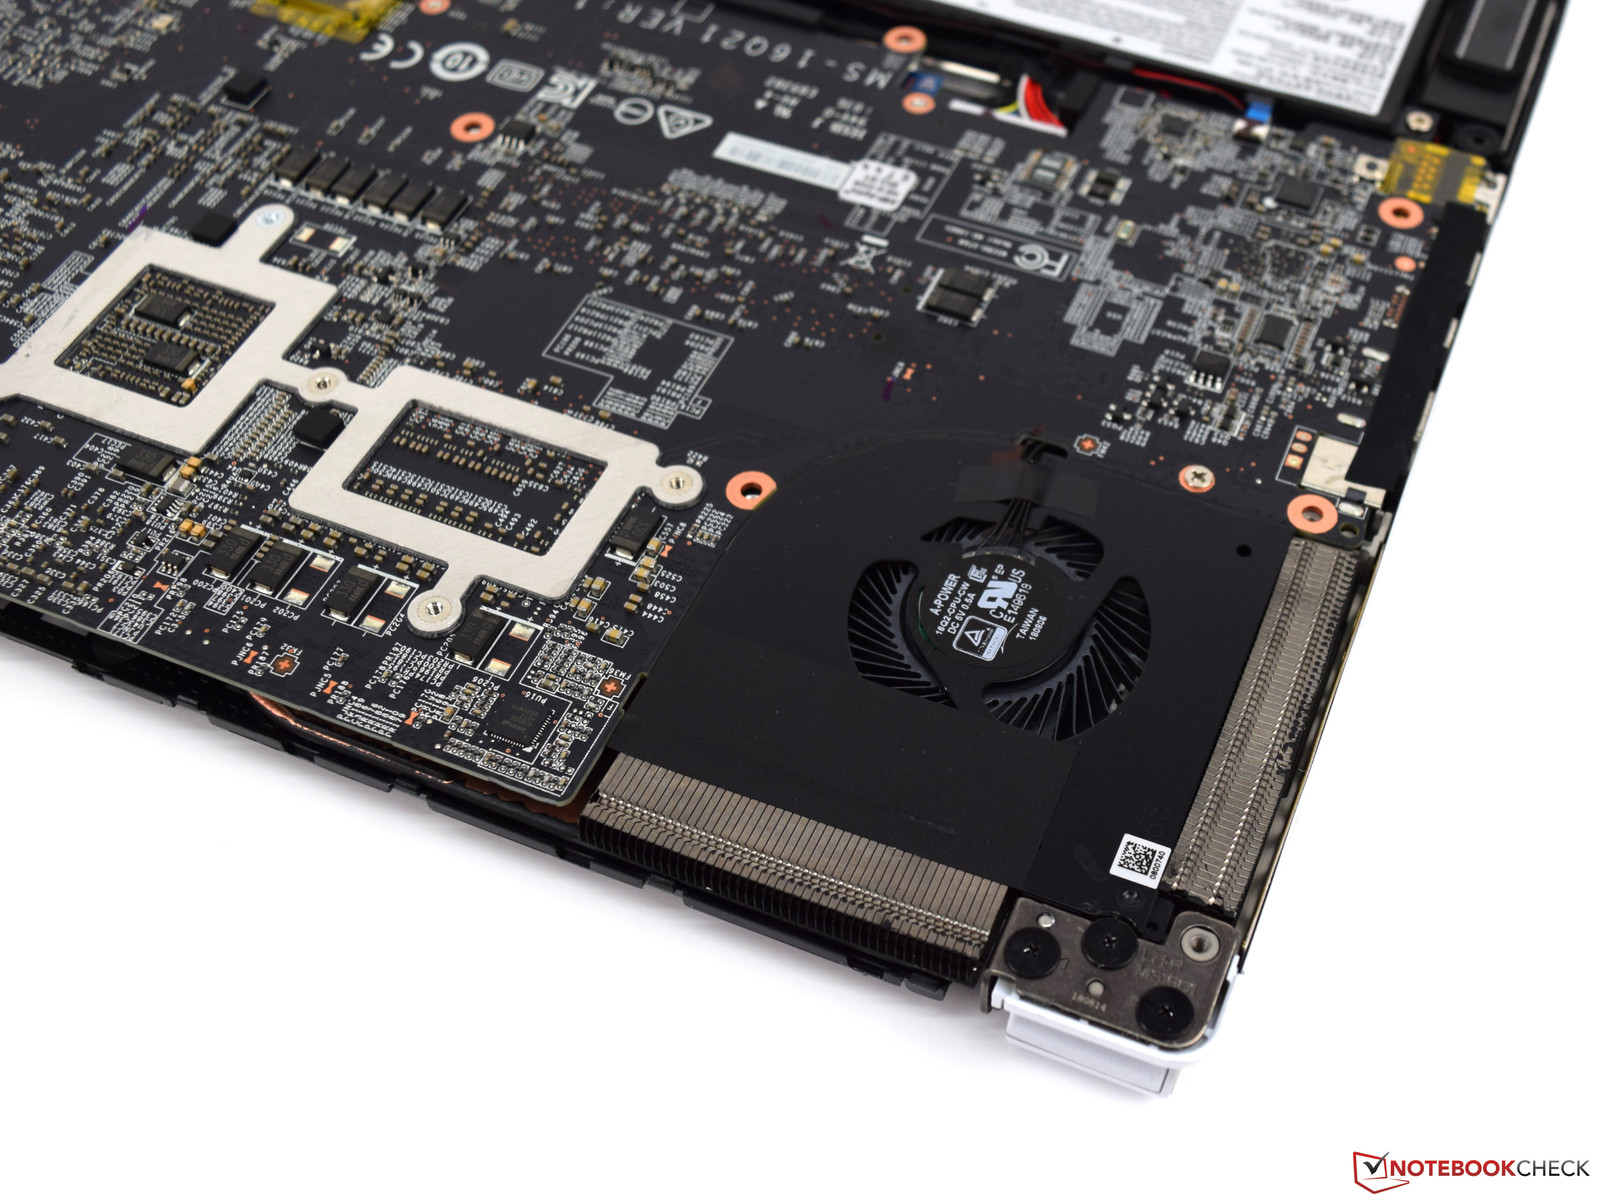
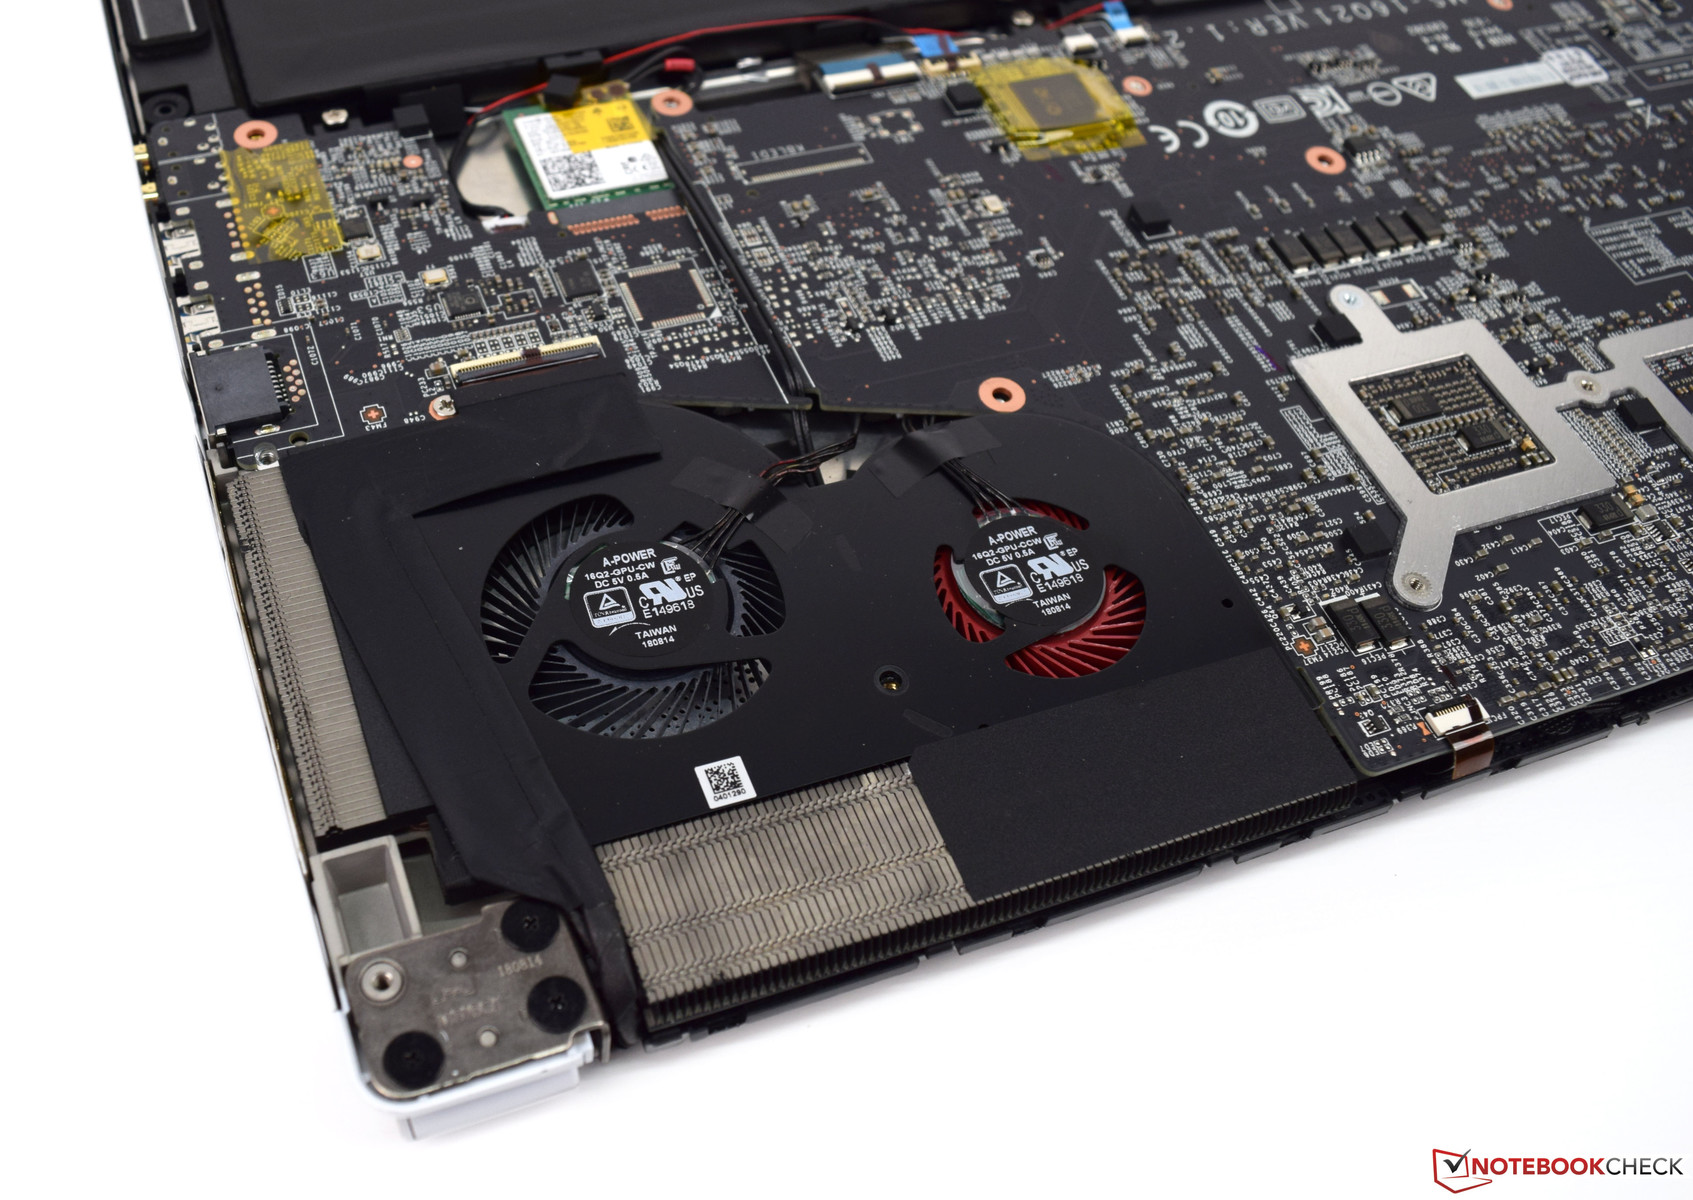
In general, the P65 is maintainable to a certain degree. However, MSI points out that it is going to get complicated due to the compact design of the device. This is a problem we have already encountered previously when reviewing the MSI GS65. Once the bottom cover has been removed you have access to the three fans, the battery, and the Wi-Fi modem. RAM and SSD are mounted on the other side of the motherboard. In other words: The entire motherboard must be removed in order to upgrade or replace either of these.
Warranty
While European customers are treated to a two-year limited pickup and return warranty when purchasing the P65 Creator, US customers are once again limited to just a single year. Optional warranty extensions are available. Please see our Guarantees, Return policies and Warranties FAQ for country-specific information.
Software
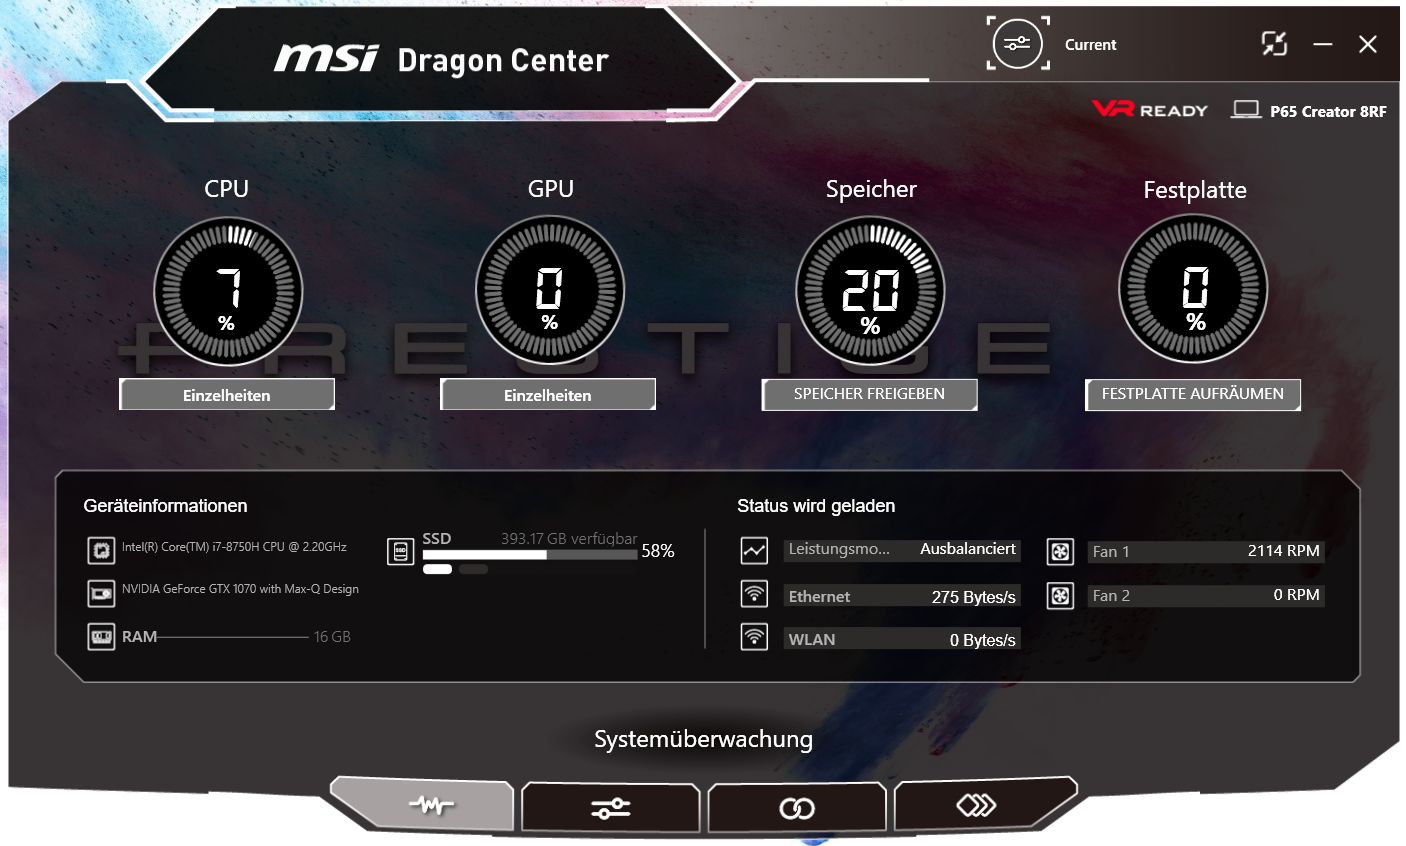
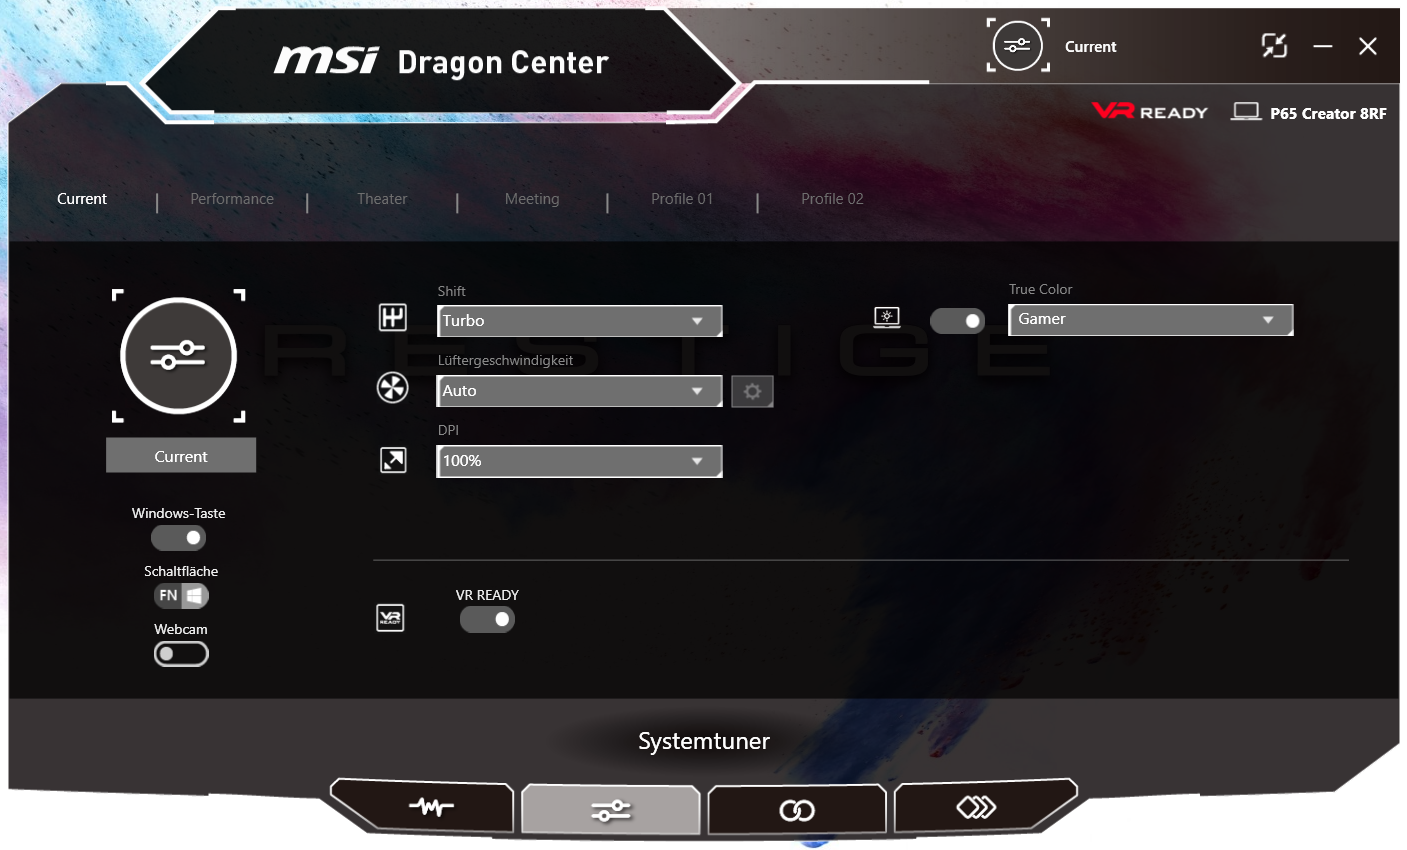
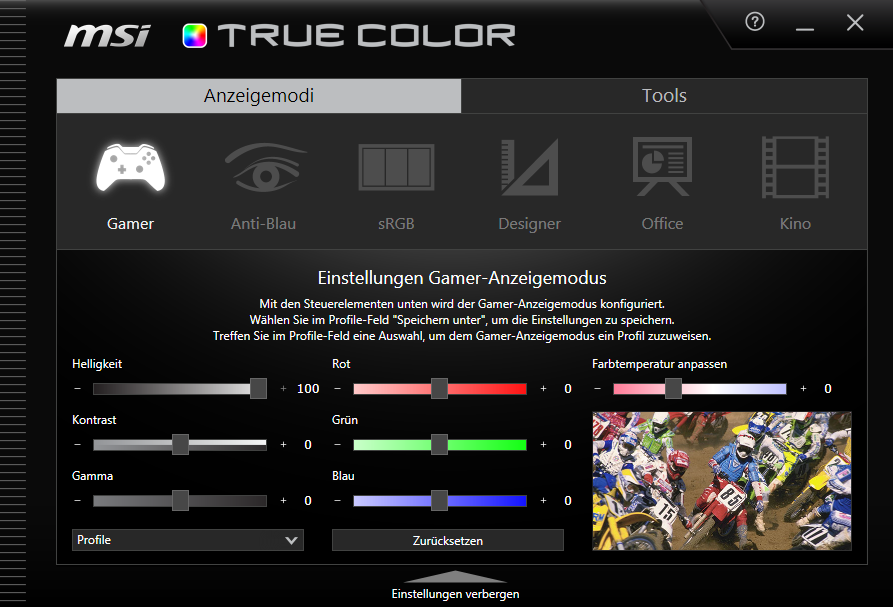
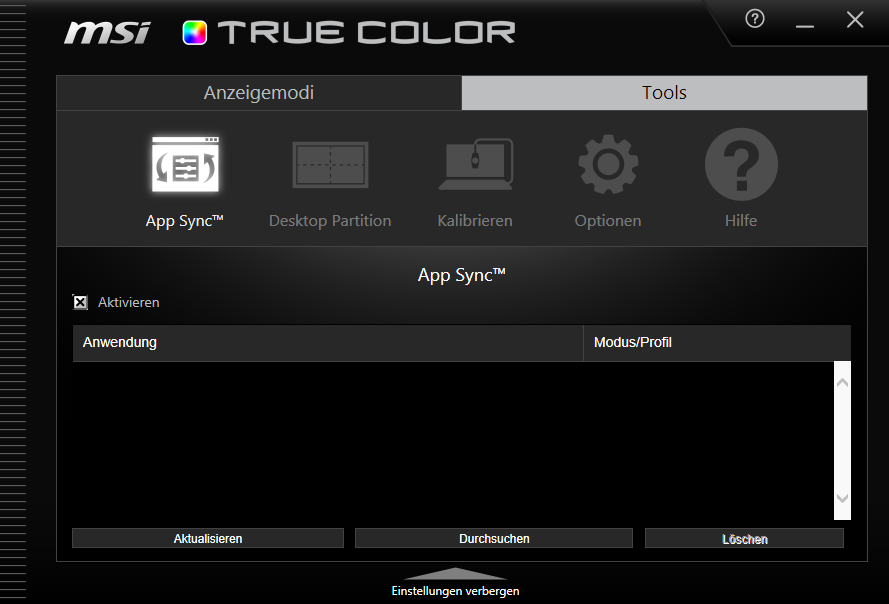
Like most MSI notebooks the P65 is supported by the Dragon Center software, albeit its GUI is much more restrained. In addition to offering a quick and extensive overview of the system itself the software can also be used to adjust the cooling system in order to avoid unnecessary noise during presentation or meetings. These features can also be accessed and adjusted via MSI’s Dragon Center smartphone app. The True Color tool features a total of five display presets.
MSI is currently offering a $300 software bundle for all P65 Creator buyers until the end of 2018.
Input Devices
Keyboard
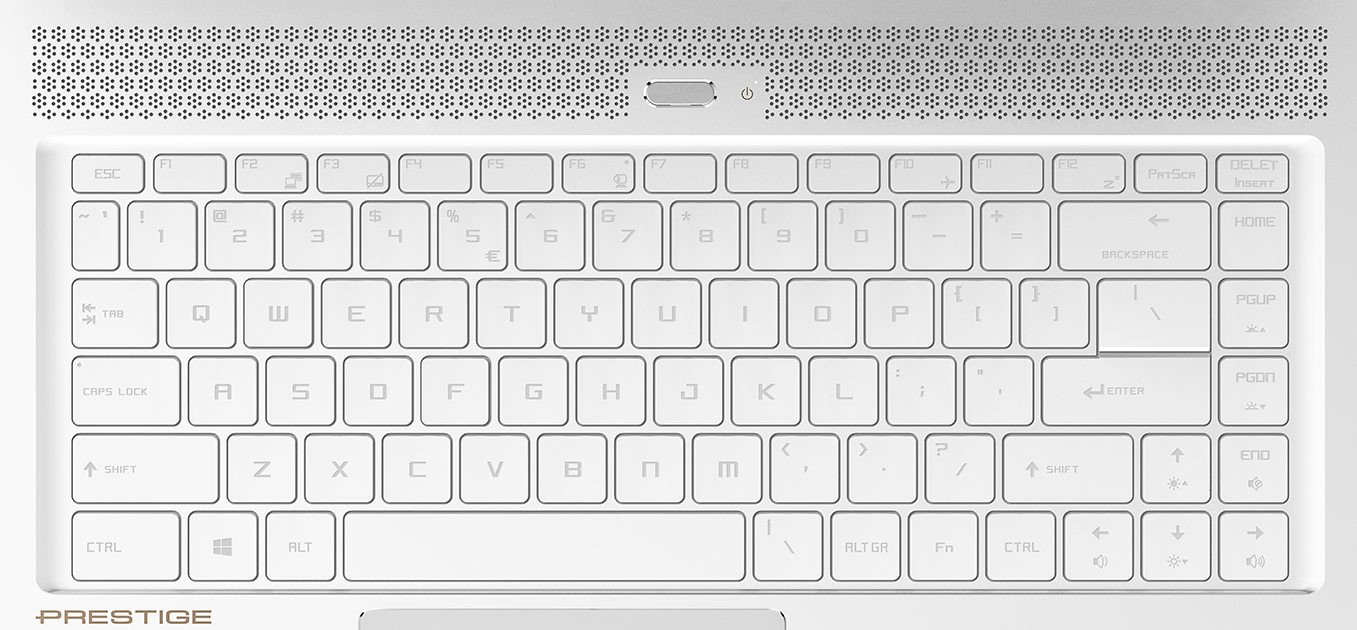
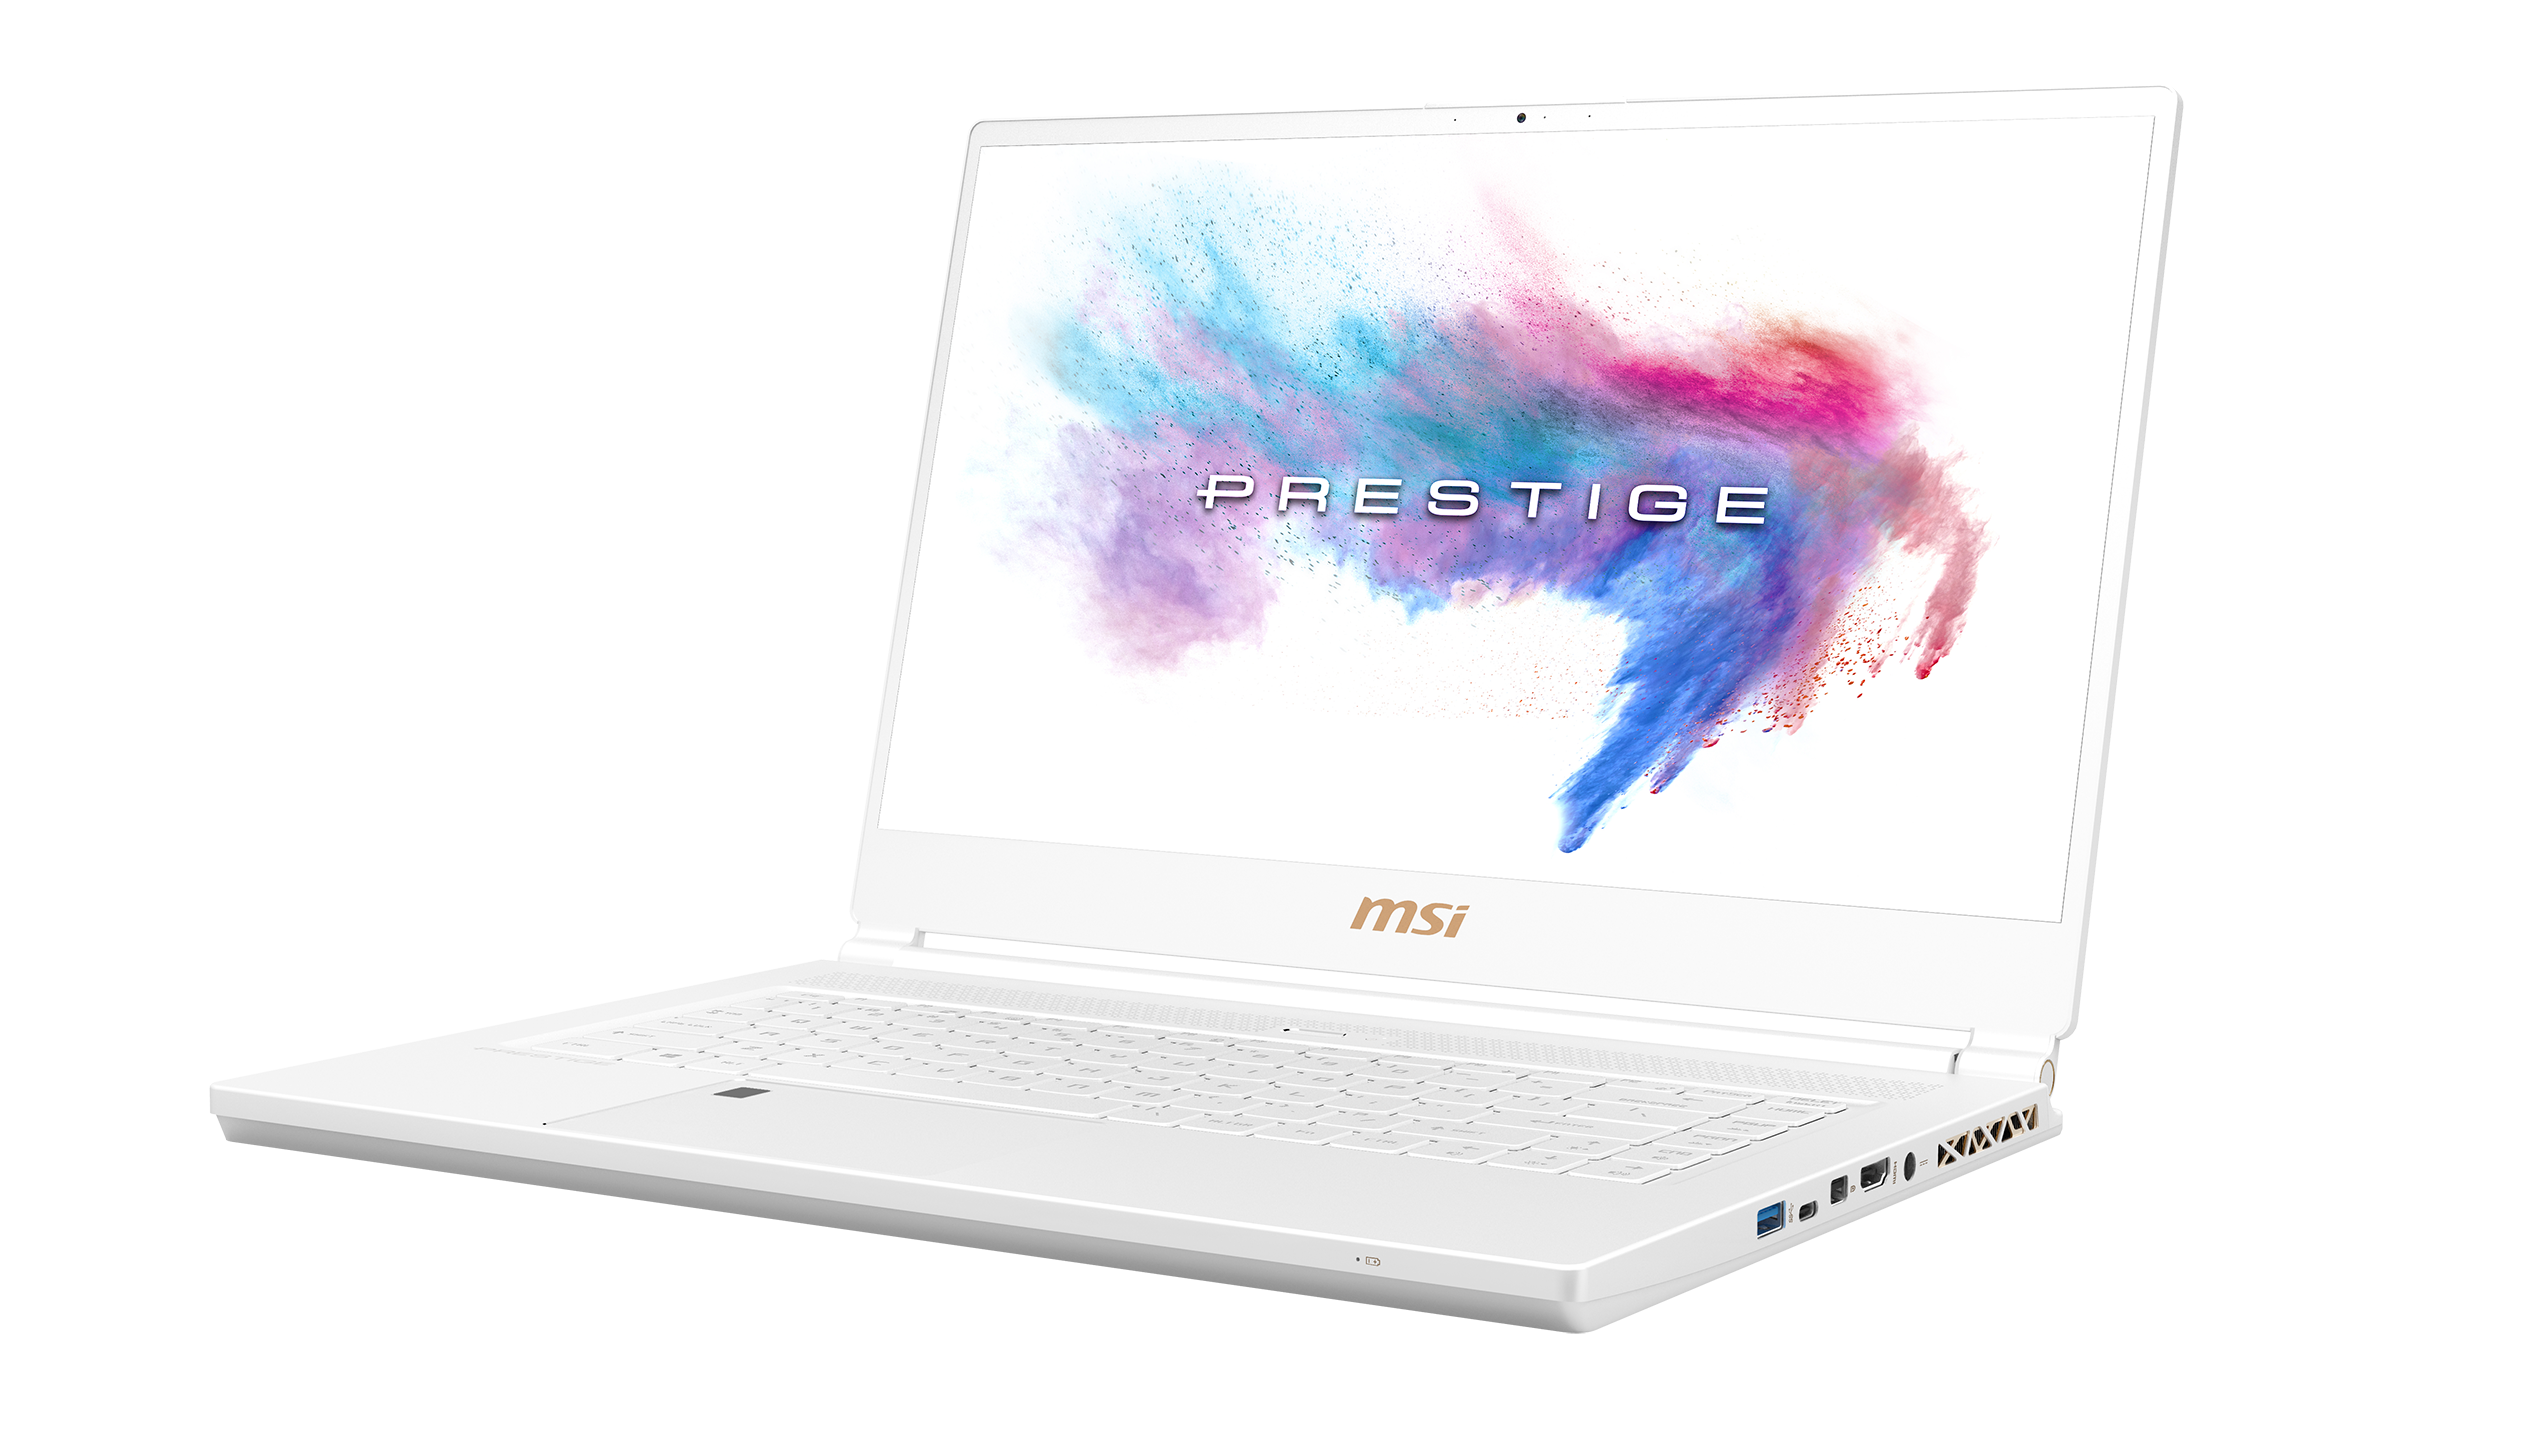
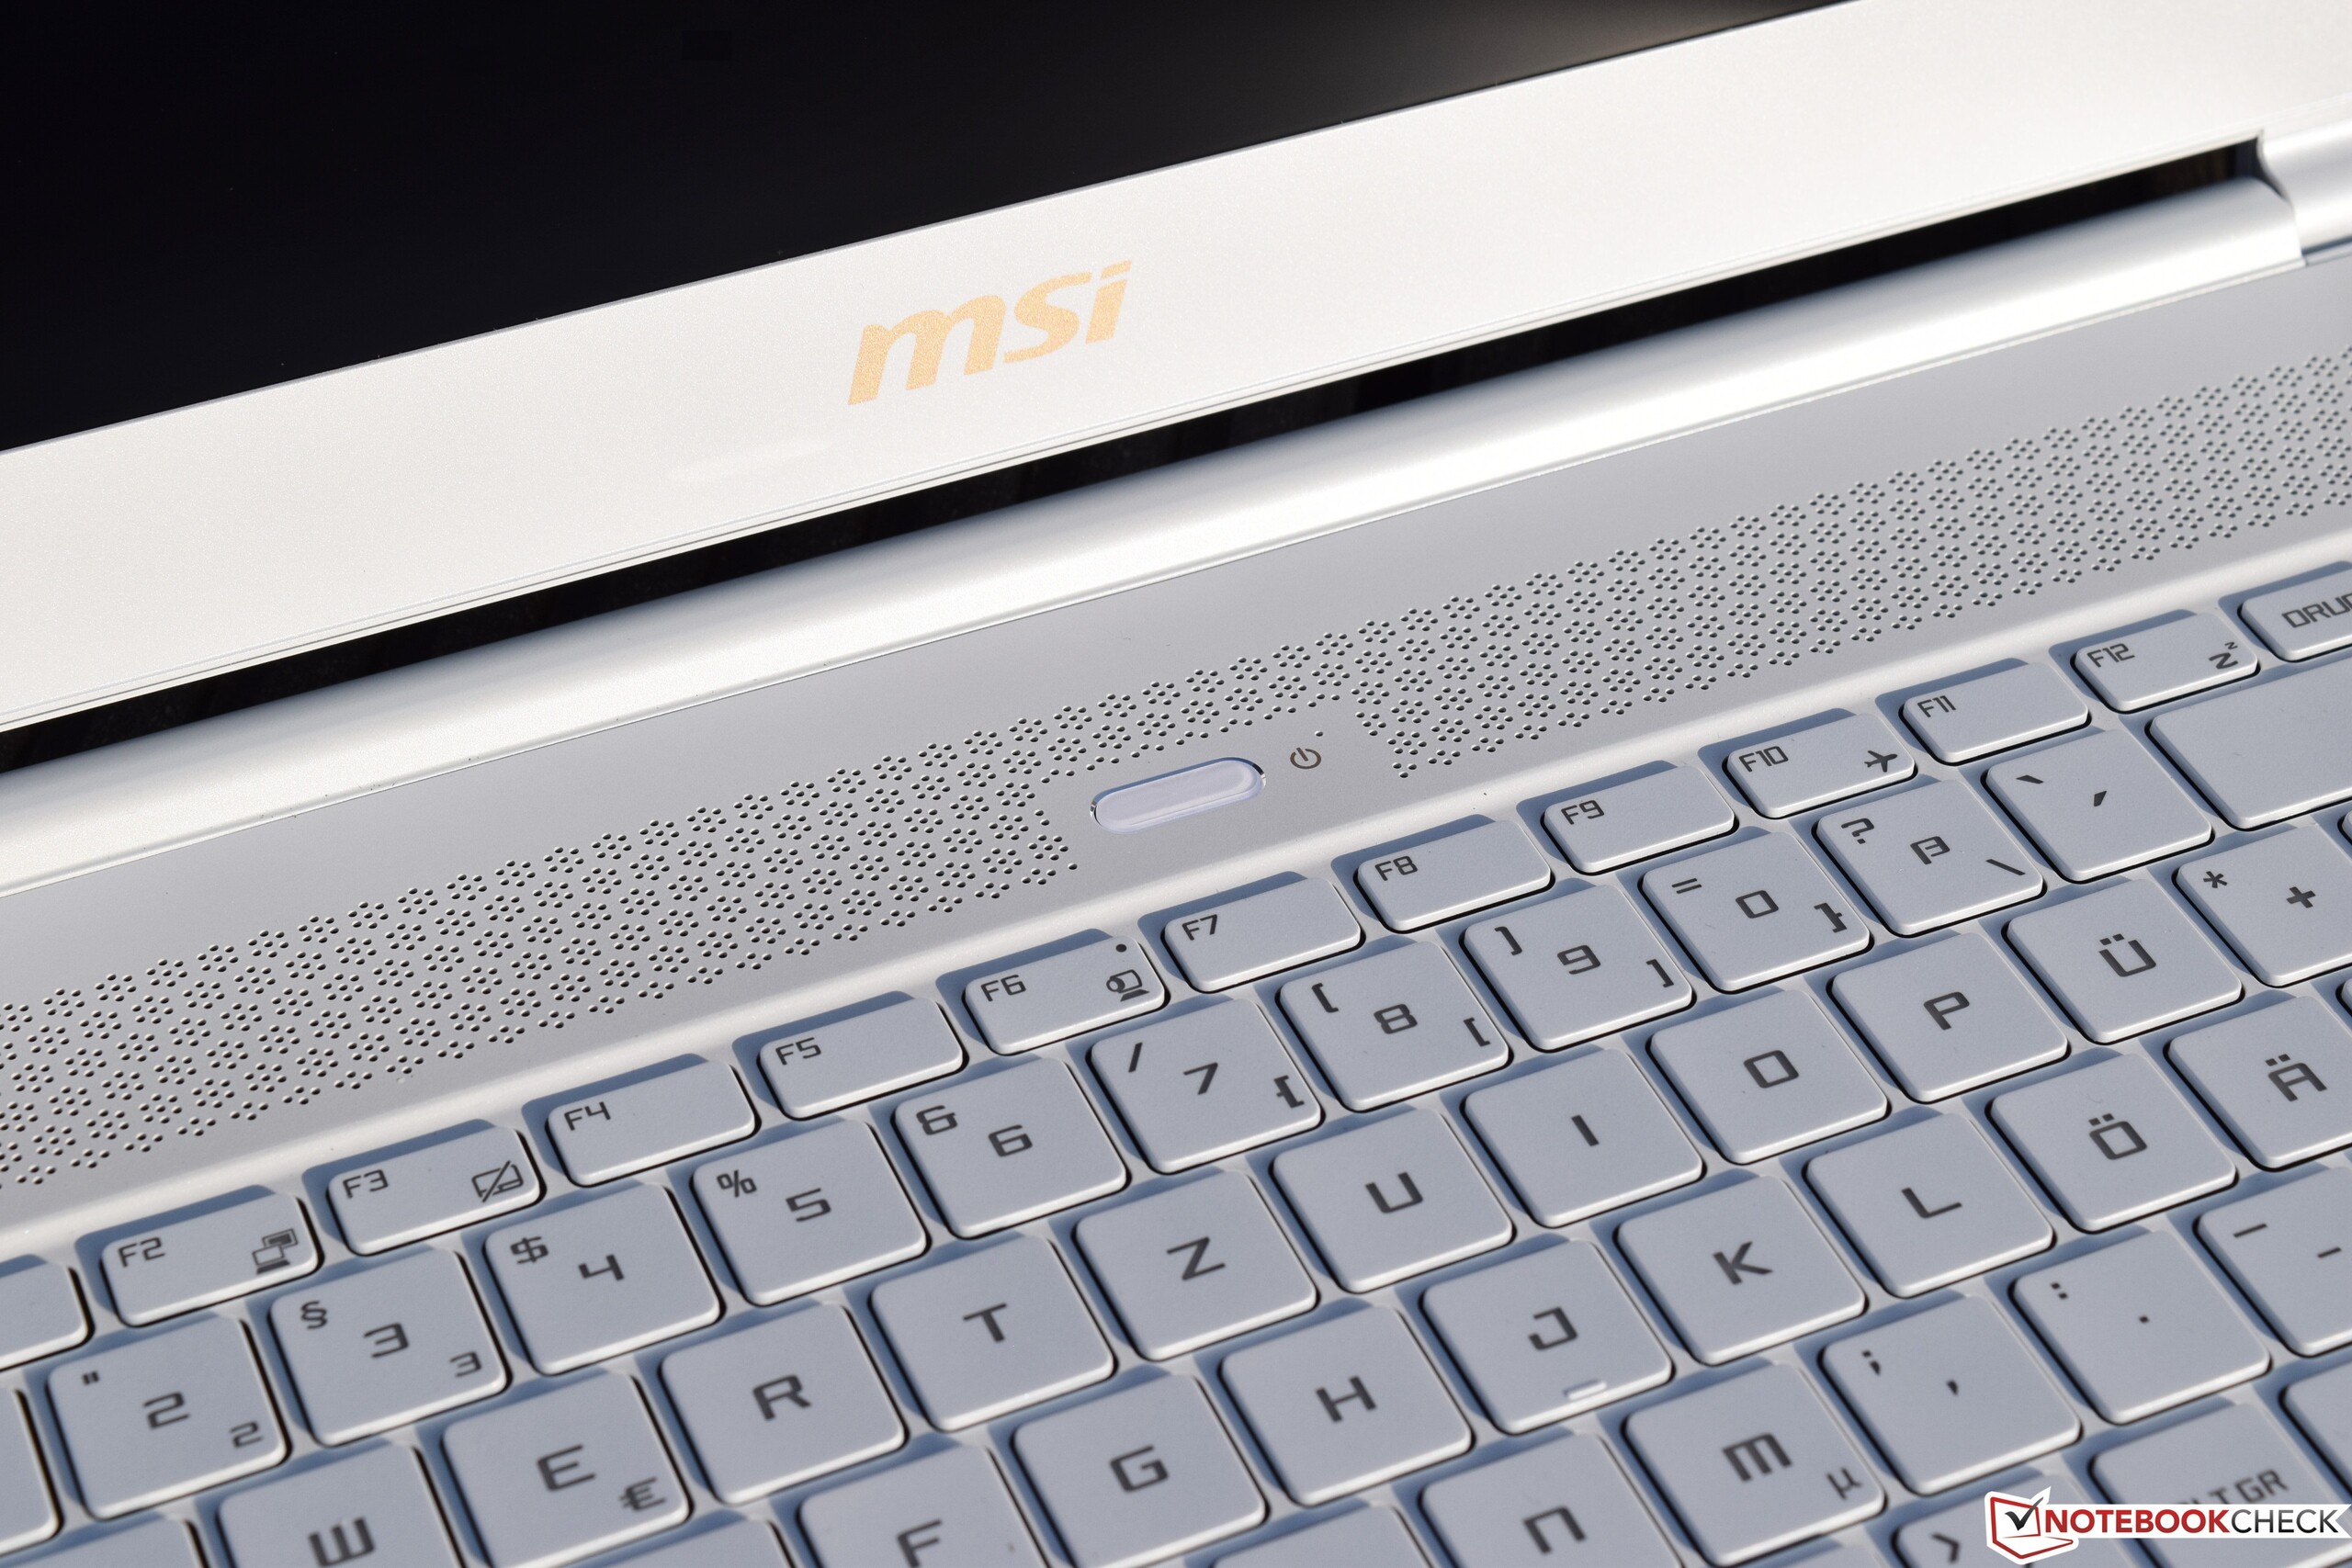
The keyboard is the most obvious feature showing the P65’s gaming heritage, and MSI has simply copied the layout and labeling without making any changes. Many international users will be bothered by the fact that the keyboard layout is going to be very different from their respective default layout and design.
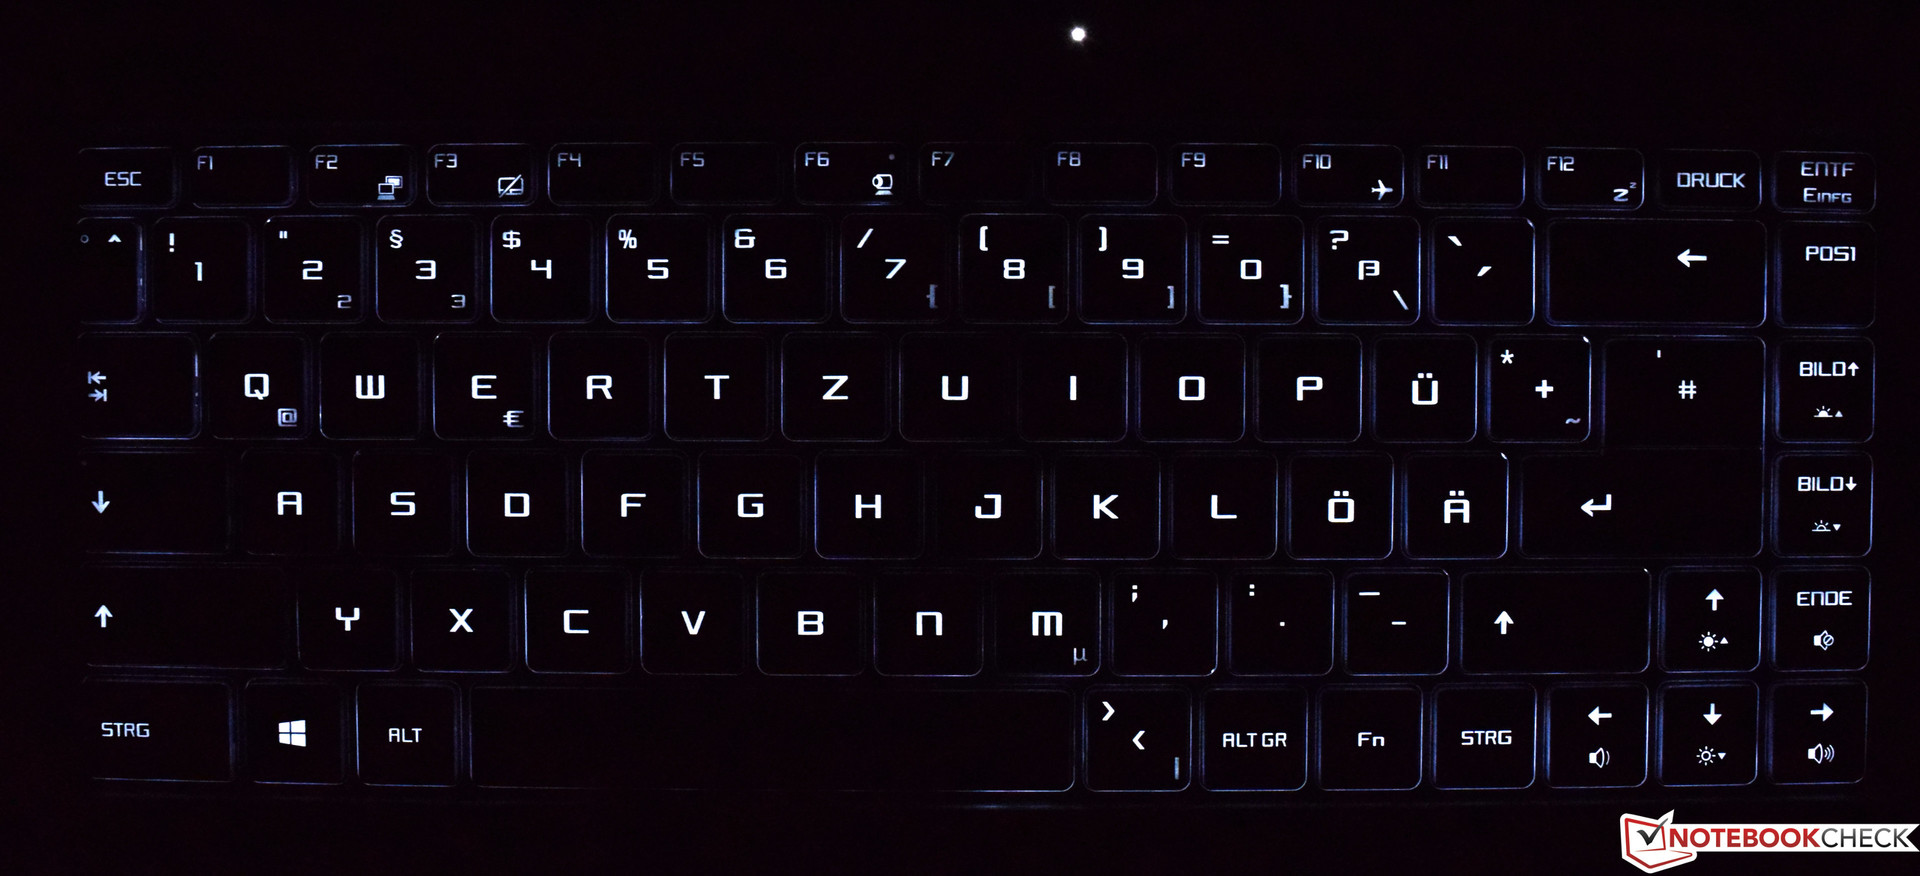
The chiclet keyboard sits flush with the palm rest, and we would have preferred a firmer keystroke. Since the keyboard deck flexes slightly while typing, it feels a bit spongy. A numpad is missing from the keyboard, which features a uni-color three-stage backlight for added inconspicuousness that can also be turned off completely. We highly suggest doing just that in dark environments since the contrast between the white keys and the white backlight, or rather the lack thereof, drastically impedes deciphering the actual labels on the keycaps.
Touchpad
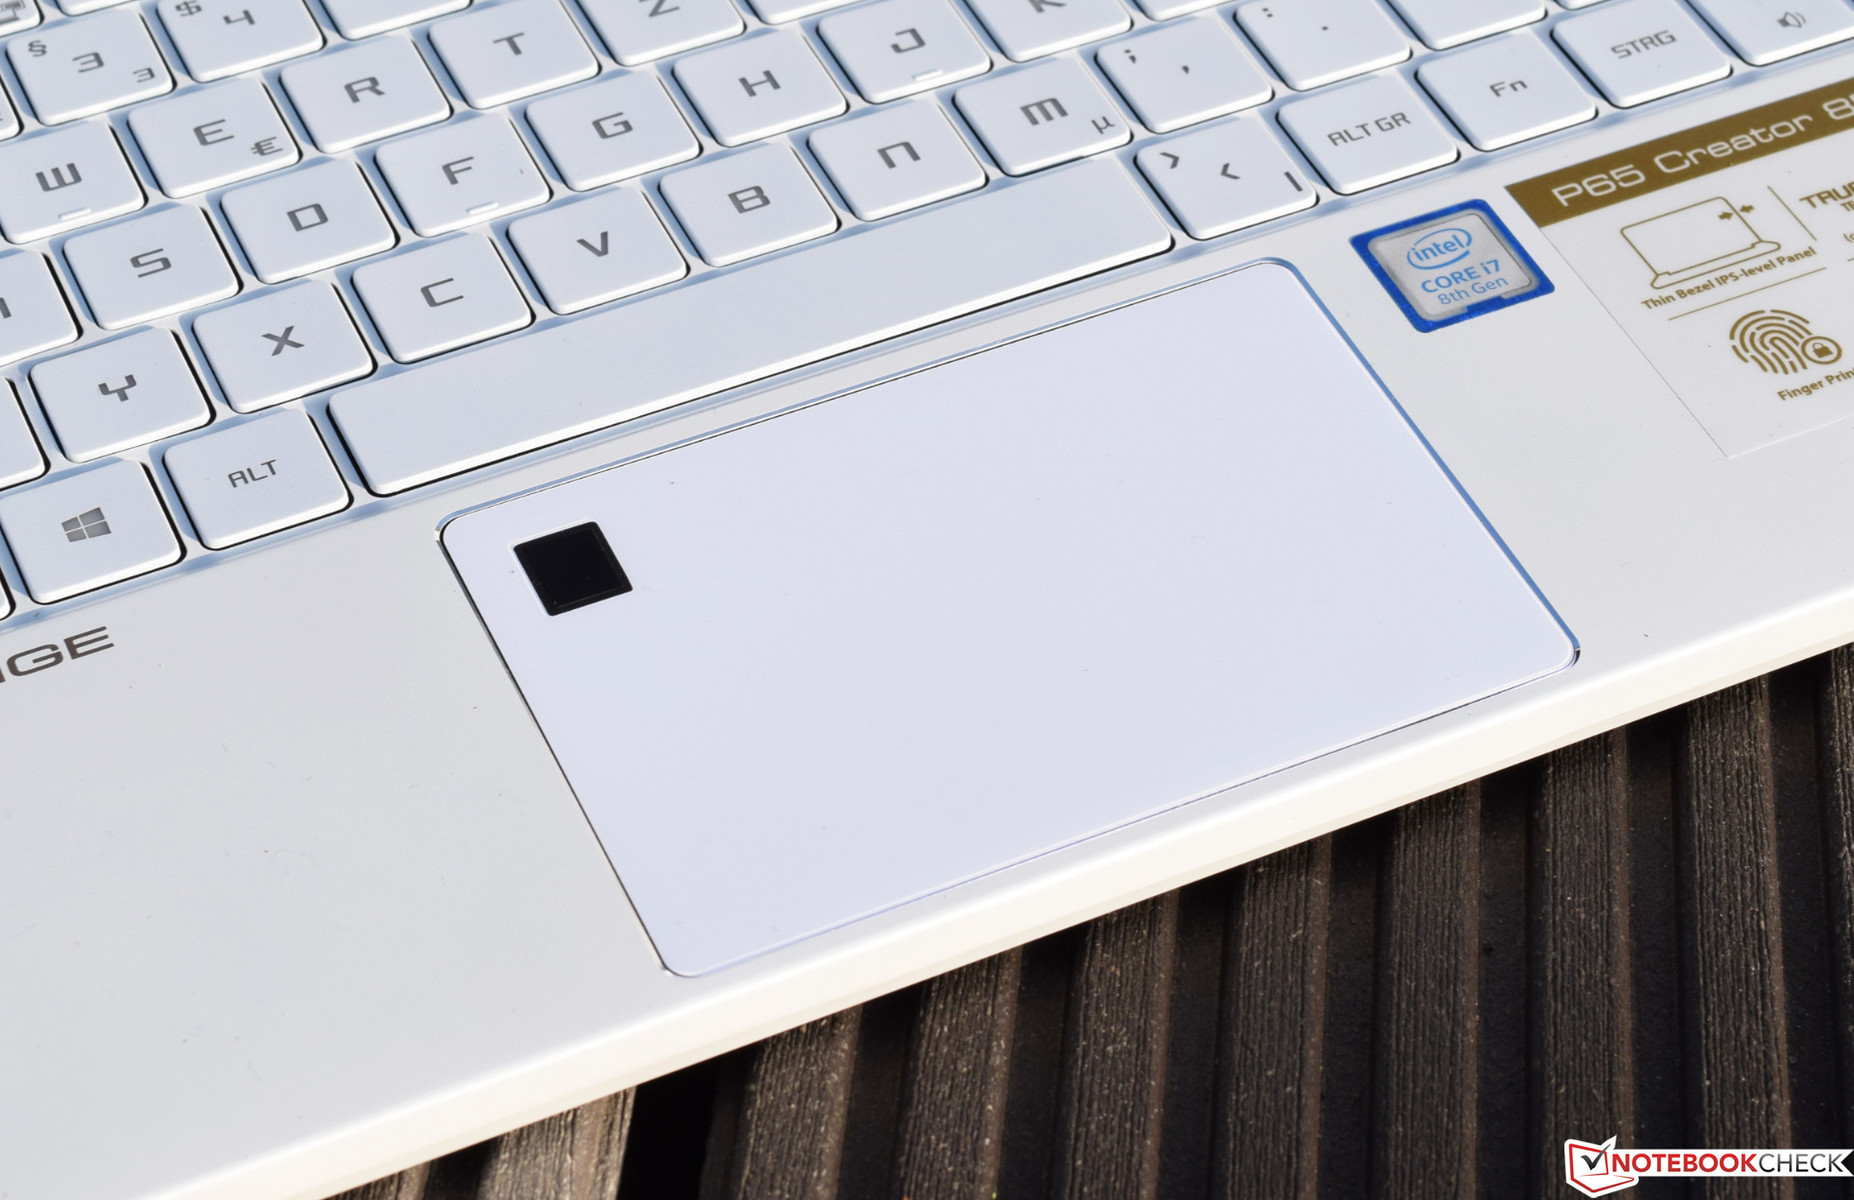
At 10.4 x 7 cm (4.1 x 2.76 inches) the touchpad fits snug in the space between the space bar and the bottom edge. Unfortunately, the top left corner is not available for input as MSI decided this would be an ideal place to put the fingerprint reader. We would have certainly preferred for the reader to be embedded into the case itself instead of the touchpad. Other than that the ClickPad worked well and turned out to be very precise, including in the remaining three corners.
The touchpad was mounted securely in the base and did not rattle or clatter. Clicking the hidden buttons resulted in a very clear and distinct acoustic feedback even though key travel turned out to be very short.
Display

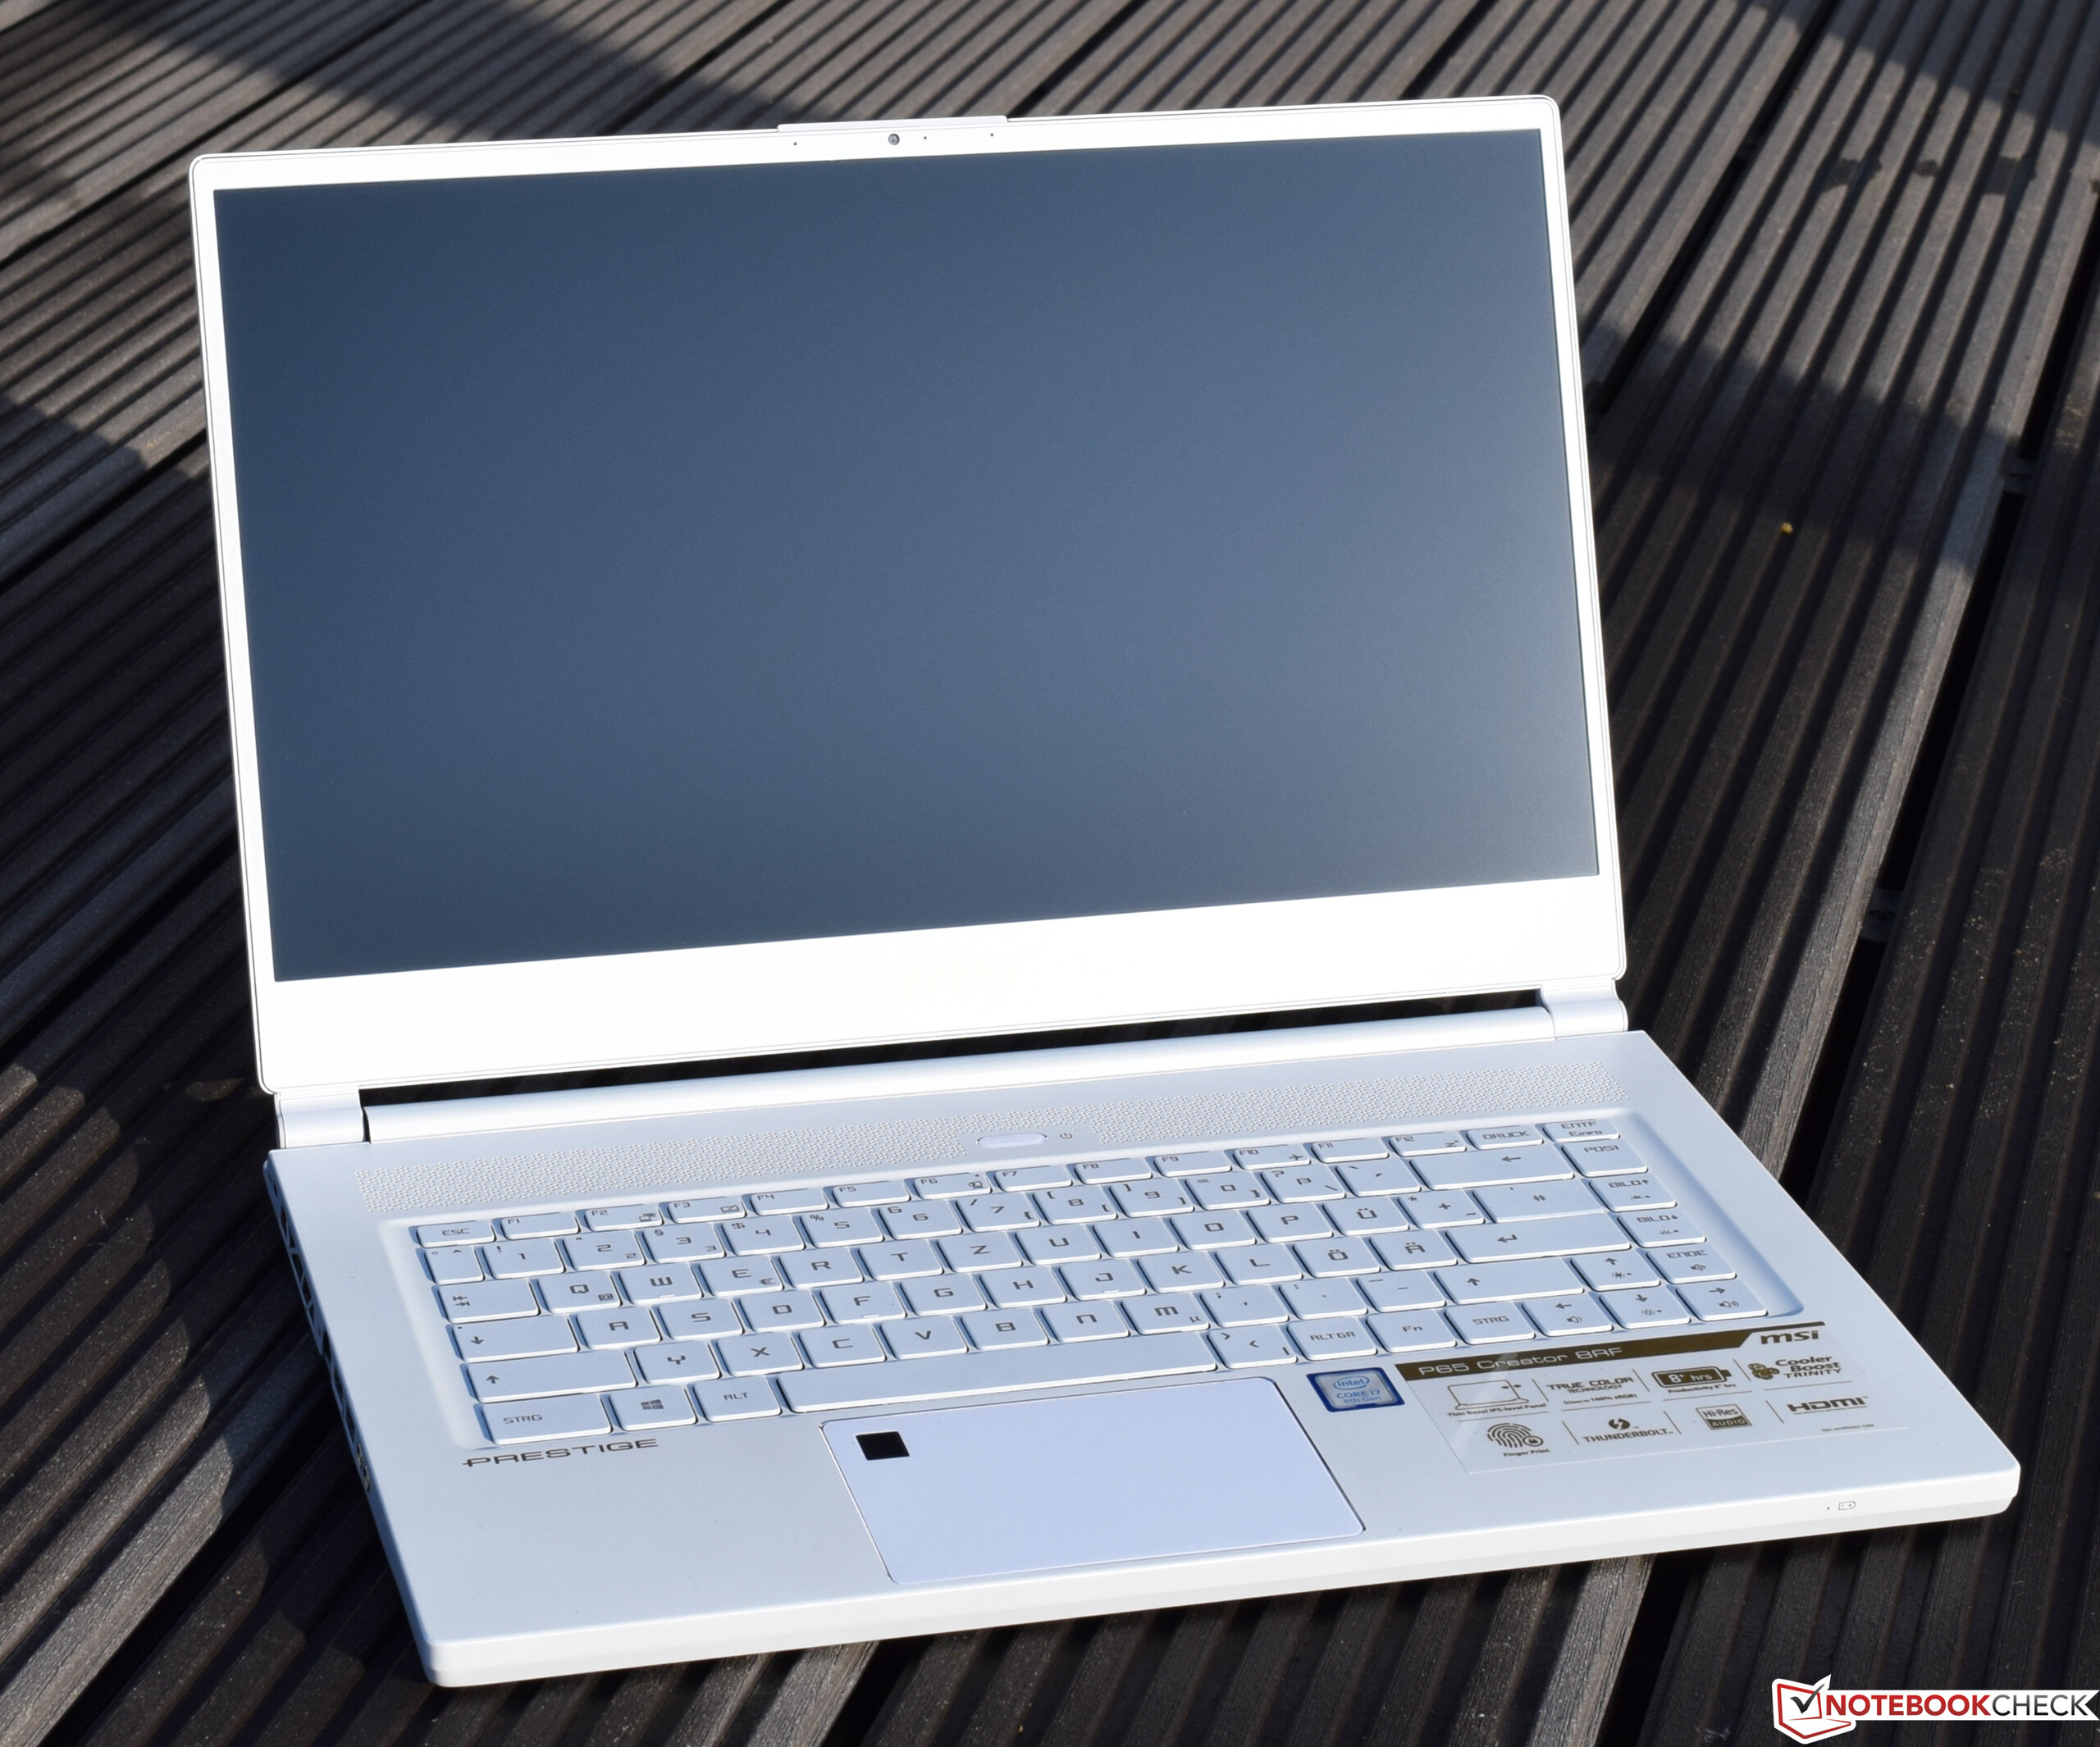
The P65 8RF’s display is a true gamer's delight - 15.6 inches of matte 144 Hz IPS goodness. Unfortunately, like so many other things this display is also a Limited Edition exclusive. The other two P65 models are equipped with a regular 60 Hz IPS display.
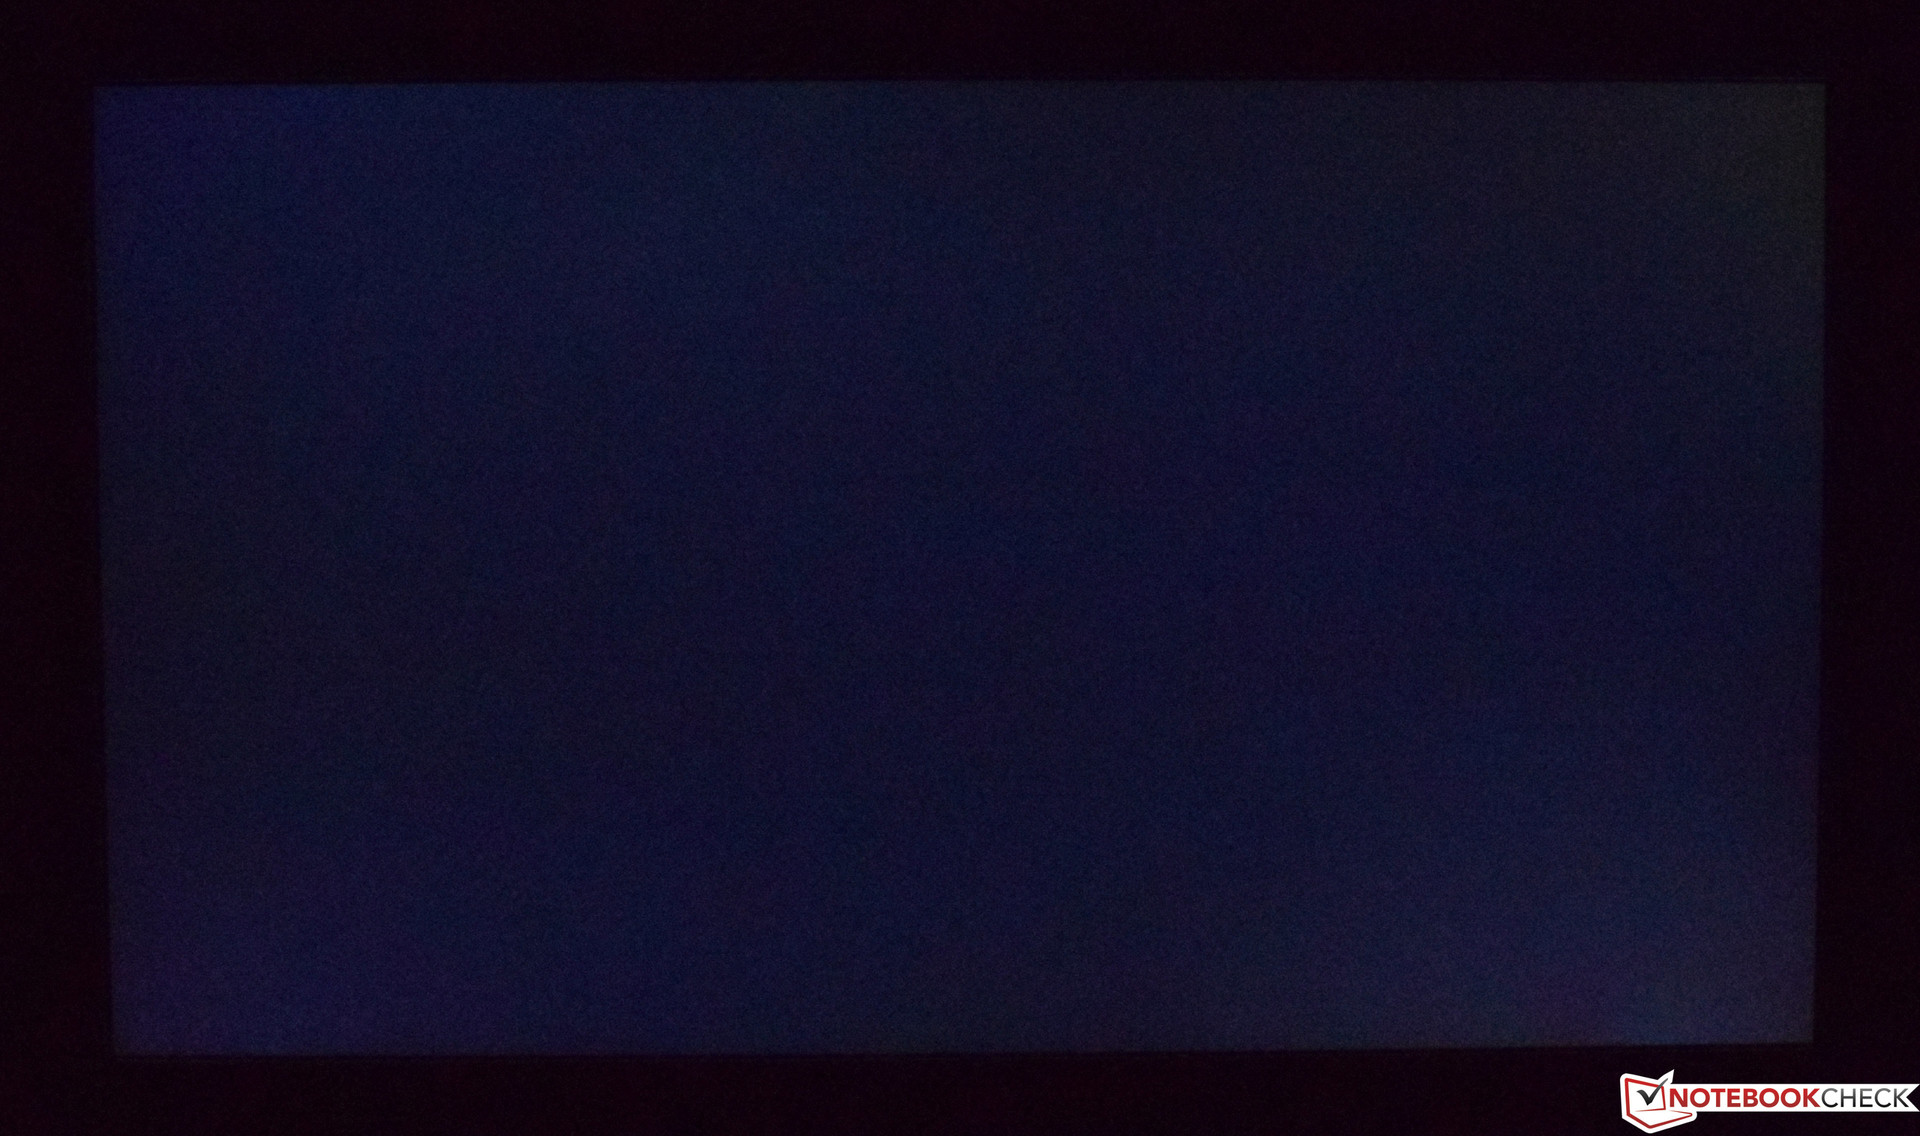
Sadly, we have to report that at just 235 nits the display turned out to be very dark and incapable of getting even close to the Asus ZenBook Pro 15’s 350 nits. Thanks to a low black-level of just 0.22 nits at least the contrast ratio was measured at a decent 1,068:1, and at 85% brightness distribution was decent enough to avoid halations. We also found neither PWM nor backlight bleeding on our review unit.
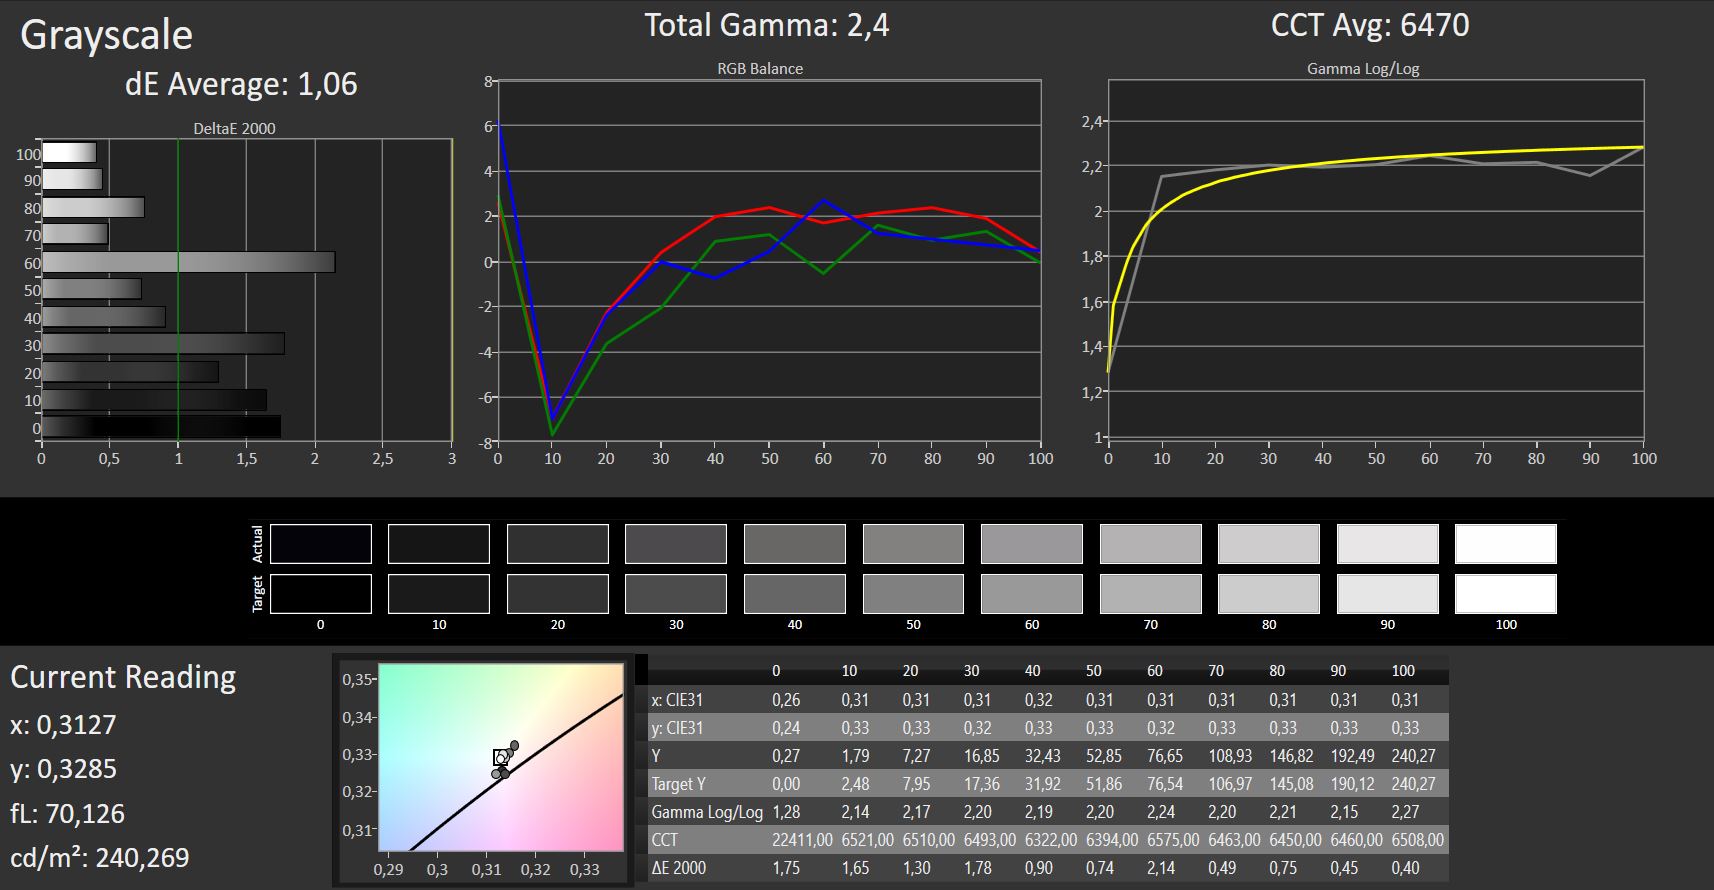
As mentioned before, MSI’s True Color software includes a total of five color presets for the display. All tests were performed with the sRGB profile activated.
| |||||||||||||||||||||||||
Brightness Distribution: 85 %
Center on Battery: 238 cd/m²
Contrast: 1068:1 (Black: 0.22 cd/m²)
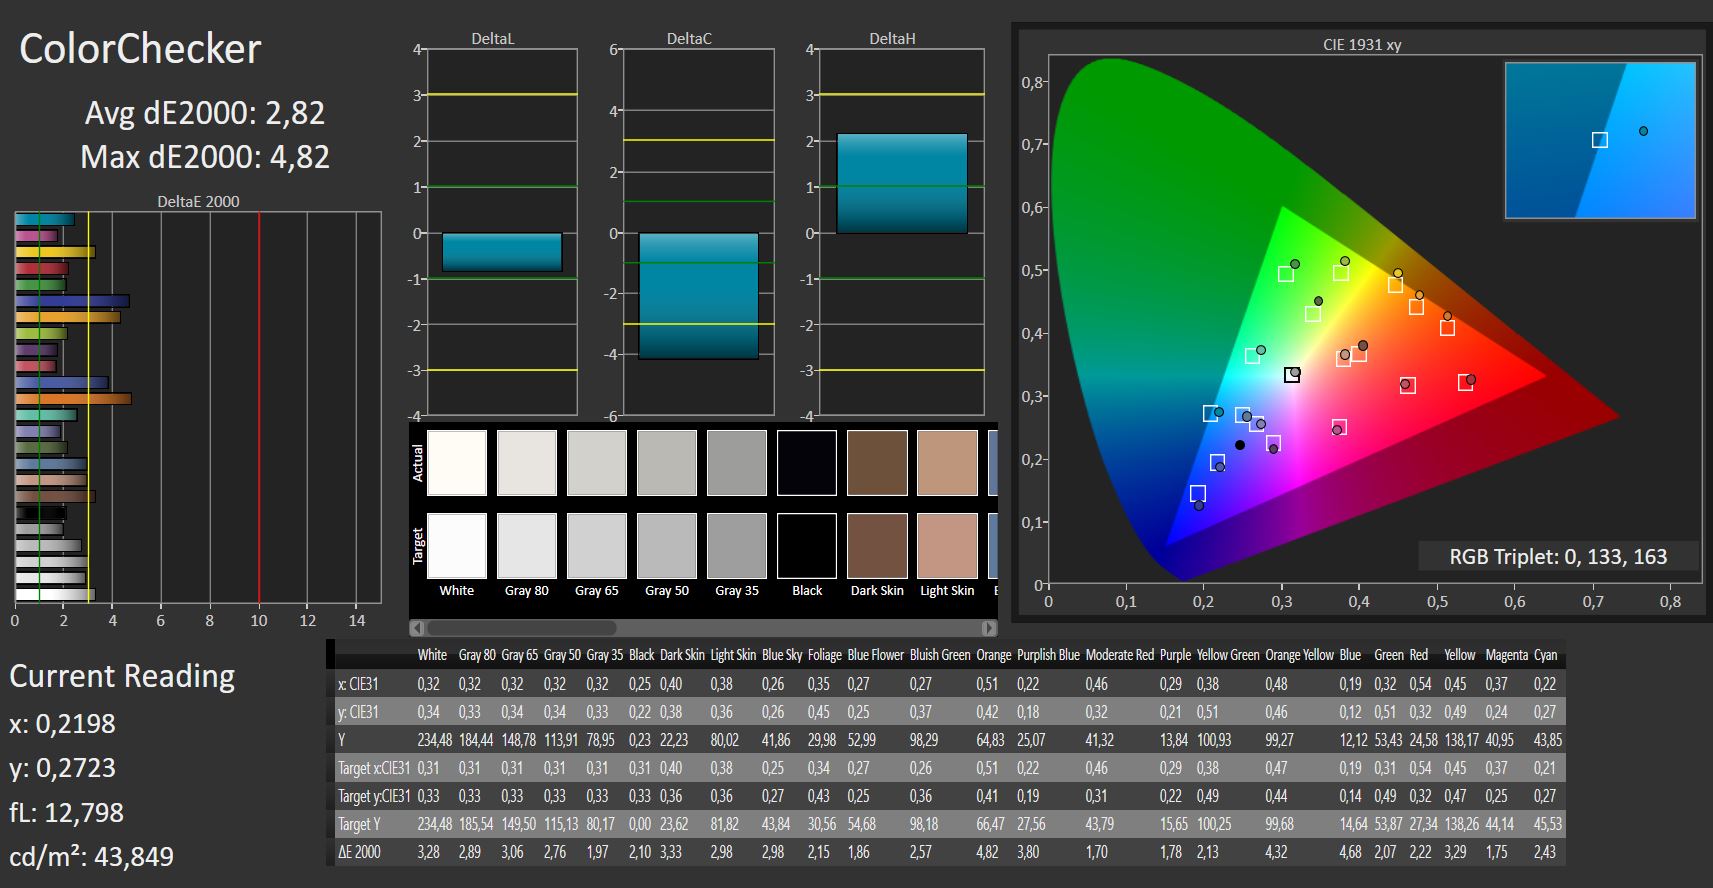
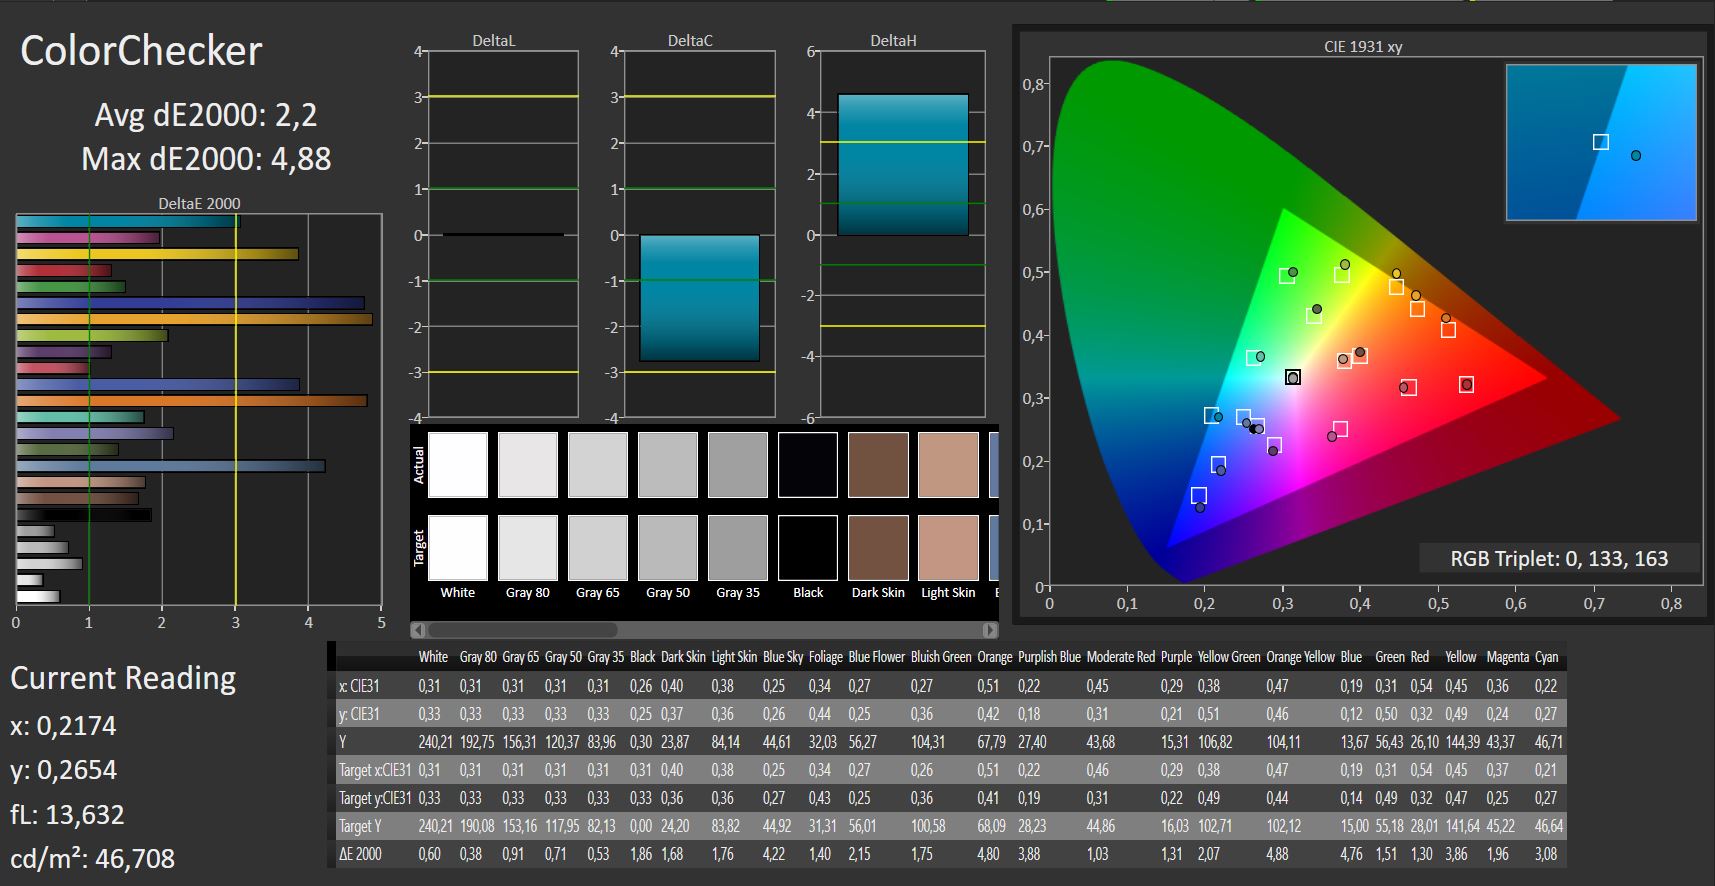
ΔE ColorChecker Calman: 2.82 | ∀{0.5-29.43 Ø4.71}
calibrated: 4.88
ΔE Greyscale Calman: 2.32 | ∀{0.09-98 Ø4.96}
92% sRGB (Argyll 1.6.3 3D)
59% AdobeRGB 1998 (Argyll 1.6.3 3D)
65.9% AdobeRGB 1998 (Argyll 3D)
91.1% sRGB (Argyll 3D)
65.1% Display P3 (Argyll 3D)
Gamma: 2.49
CCT: 6310 K
| MSI P65 8RF-451 - Creator AU Optronics B156HAN08.0 (AUO80ED), IPS, 1920x1080, 15.6" | Asus ZenBook Pro 15 UX580GE AU Optronics B156ZAN03.1, IPS, 3840x2160, 15.6" | Gigabyte Aero 15X v8 LGD05C0, IPS, 1920x1080, 15.6" | Asus GL504GS AU Optronics B156HAN08.2 (AUO82ED), IPS, 1920x1080, 15.6" | MSI GS65 8RF-019DE Stealth Thin AU Optronics B156HAN08.0 (AUO80ED), IPS, 1920x1080, 15.6" | Lenovo ThinkPad X1 Extreme-20MF000XGE B156ZAN03.2, IPS, 3840x2160, 15.6" | |
|---|---|---|---|---|---|---|
| Display | 31% | -0% | 0% | 2% | 31% | |
| Display P3 Coverage (%) | 65.1 | 85.9 32% | 63.6 -2% | 66.4 2% | 66.2 2% | 86.3 33% |
| sRGB Coverage (%) | 91.1 | 100 10% | 93.8 3% | 90.2 -1% | 92.1 1% | 100 10% |
| AdobeRGB 1998 Coverage (%) | 65.9 | 99.1 50% | 64.9 -2% | 66 0% | 67.2 2% | 99.4 51% |
| Response Times | -141% | -4% | 38% | -13% | -238% | |
| Response Time Grey 50% / Grey 80% * (ms) | 16 ? | 44 ? -175% | 16.8 ? -5% | 7.2 ? 55% | 17.6 ? -10% | 61.6 ? -285% |
| Response Time Black / White * (ms) | 11 ? | 22.8 ? -107% | 11.2 ? -2% | 8.8 ? 20% | 12.8 ? -16% | 32 ? -191% |
| PWM Frequency (Hz) | ||||||
| Screen | -2% | 18% | 3% | 13% | 2% | |
| Brightness middle (cd/m²) | 235 | 357.6 52% | 313 33% | 271 15% | 254 8% | 396 69% |
| Brightness (cd/m²) | 235 | 350 49% | 300 28% | 261 11% | 262 11% | 380 62% |
| Brightness Distribution (%) | 85 | 85 0% | 78 -8% | 86 1% | 89 5% | 90 6% |
| Black Level * (cd/m²) | 0.22 | 0.35 -59% | 0.33 -50% | 0.32 -45% | 0.22 -0% | 0.28 -27% |
| Contrast (:1) | 1068 | 1022 -4% | 948 -11% | 847 -21% | 1155 8% | 1414 32% |
| Colorchecker dE 2000 * | 2.82 | 4.12 -46% | 1.29 54% | 2.61 7% | 2.37 16% | 4 -42% |
| Colorchecker dE 2000 max. * | 4.82 | 9.91 -106% | 2.04 58% | 4.93 -2% | 4.71 2% | 7.6 -58% |
| Colorchecker dE 2000 calibrated * | 4.88 | 4.23 13% | 2.33 52% | 1.84 62% | 0.9 82% | |
| Greyscale dE 2000 * | 2.32 | 1.8 22% | 0.69 70% | 1.97 15% | 1.58 32% | 6.1 -163% |
| Gamma | 2.49 88% | 2.17 101% | 2.43 91% | 2.4 92% | 2.48 89% | 2.25 98% |
| CCT | 6310 103% | 6613 98% | 6550 99% | 6398 102% | 6785 96% | 7786 83% |
| Color Space (Percent of AdobeRGB 1998) (%) | 59 | 87.5 48% | 60 2% | 59 0% | 60 2% | 88.5 50% |
| Color Space (Percent of sRGB) (%) | 92 | 100 9% | 94 2% | 90 -2% | 92 0% | 100 9% |
| Total Average (Program / Settings) | -37% /
-13% | 5% /
11% | 14% /
7% | 1% /
8% | -68% /
-23% |
* ... smaller is better

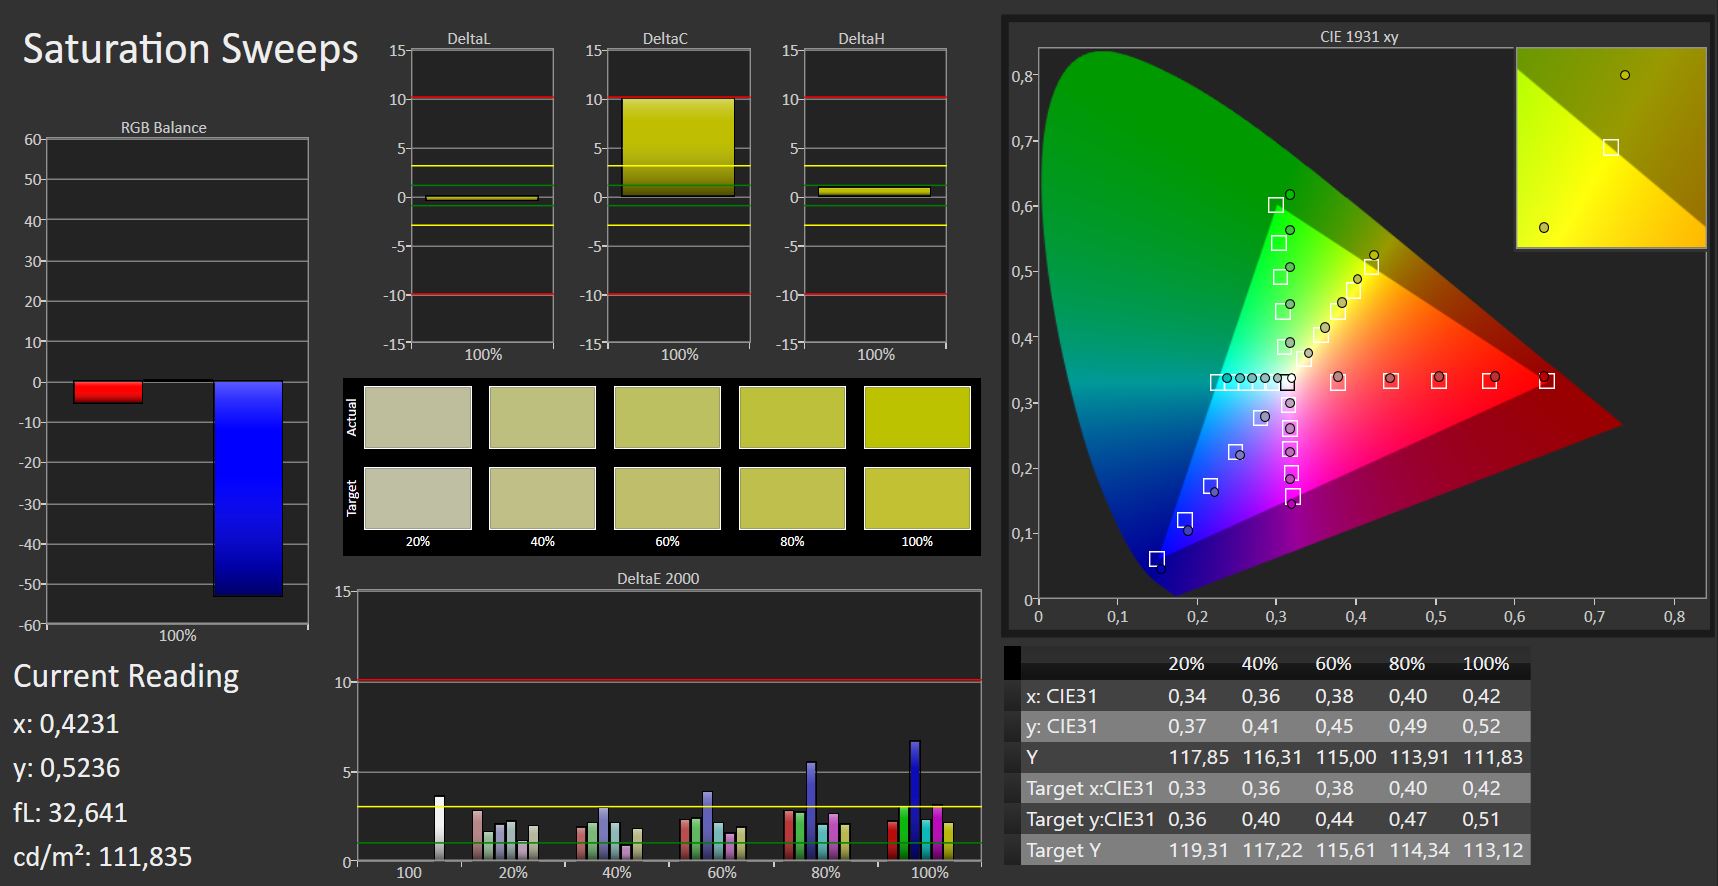
Color quality was very decent overall, and the low DeltaE deviation hints at calibration ex factory. Out of the box, the P65’s DeltaE for colors was just 3, and our retroactive calibration efforts were fruitless. As always, the resulting ICC profile can be found for download in the box above.
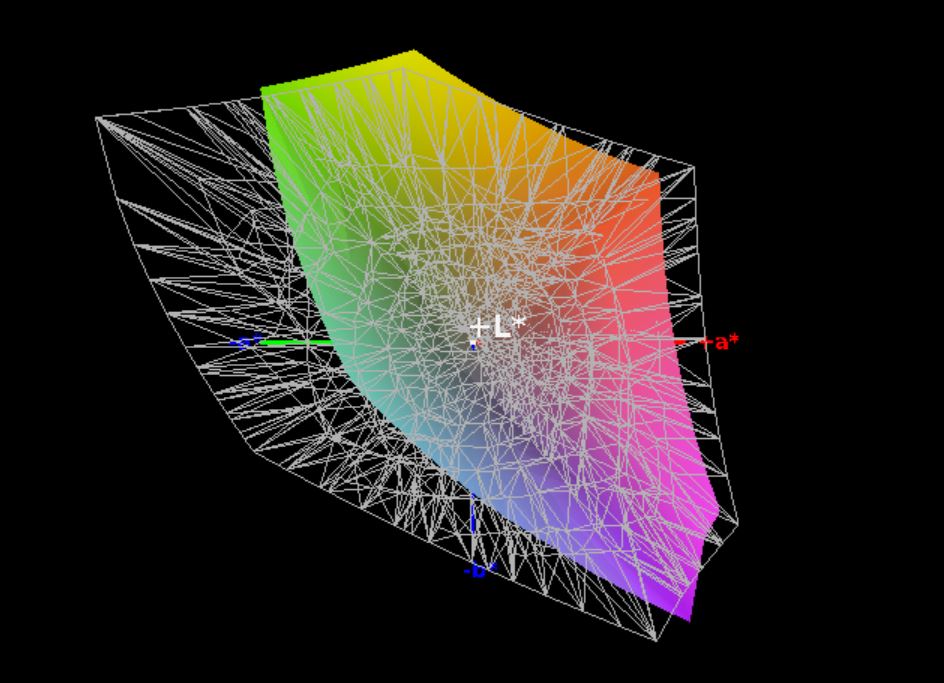
MSI claims 100% sRGB coverage, which we are unable to attest. However, 92% sRGB and 59% AdobeRGB are still quite decent. We should note that we use a different 3D measuring technique than the industry’s default 2D calculation. While Lenovo's ThinkPad X1 and Asus' ZenBook Pro 15 did much better in this category the display should not stand in the way of semi-professional photo-editing ambitions.


Outdoor usability is severely limited by the display’s poor brightness, but at least it remains somewhat usable in the shade thanks to its matte coating. If at all possible we suggest avoiding using the MSI P65 8RF outdoors.
Display Response Times
| ↔ Response Time Black to White | ||
|---|---|---|
| 11 ms ... rise ↗ and fall ↘ combined | ↗ 7 ms rise | 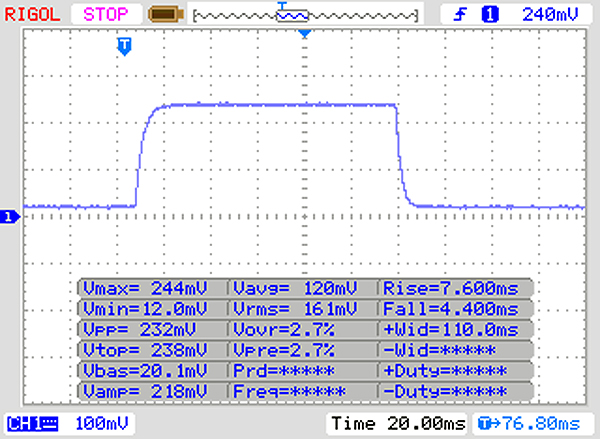 |
| ↘ 4 ms fall | ||
| The screen shows good response rates in our tests, but may be too slow for competitive gamers. In comparison, all tested devices range from 0.1 (minimum) to 240 (maximum) ms. » 30 % of all devices are better. This means that the measured response time is better than the average of all tested devices (19.8 ms). | ||
| ↔ Response Time 50% Grey to 80% Grey | ||
| 16 ms ... rise ↗ and fall ↘ combined | ↗ 9 ms rise | 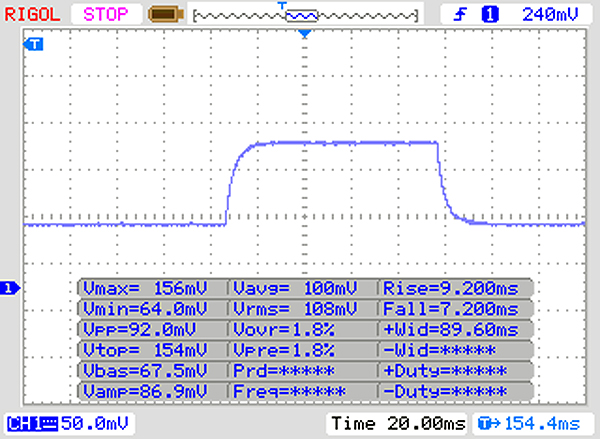 |
| ↘ 7 ms fall | ||
| The screen shows good response rates in our tests, but may be too slow for competitive gamers. In comparison, all tested devices range from 0.165 (minimum) to 636 (maximum) ms. » 30 % of all devices are better. This means that the measured response time is better than the average of all tested devices (31 ms). | ||
Screen Flickering / PWM (Pulse-Width Modulation)
| Screen flickering / PWM not detected | 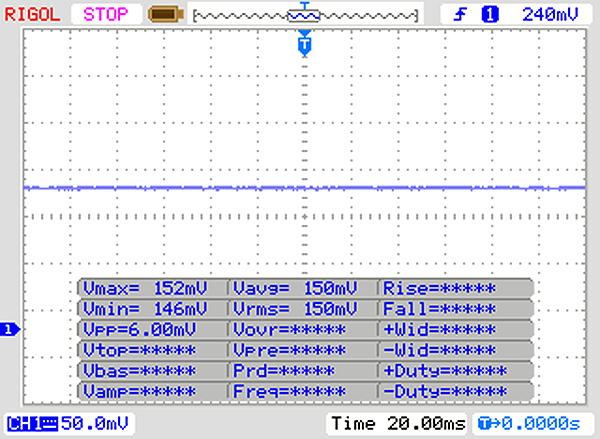 | ||
In comparison: 52 % of all tested devices do not use PWM to dim the display. If PWM was detected, an average of 7754 (minimum: 5 - maximum: 343500) Hz was measured. | |||
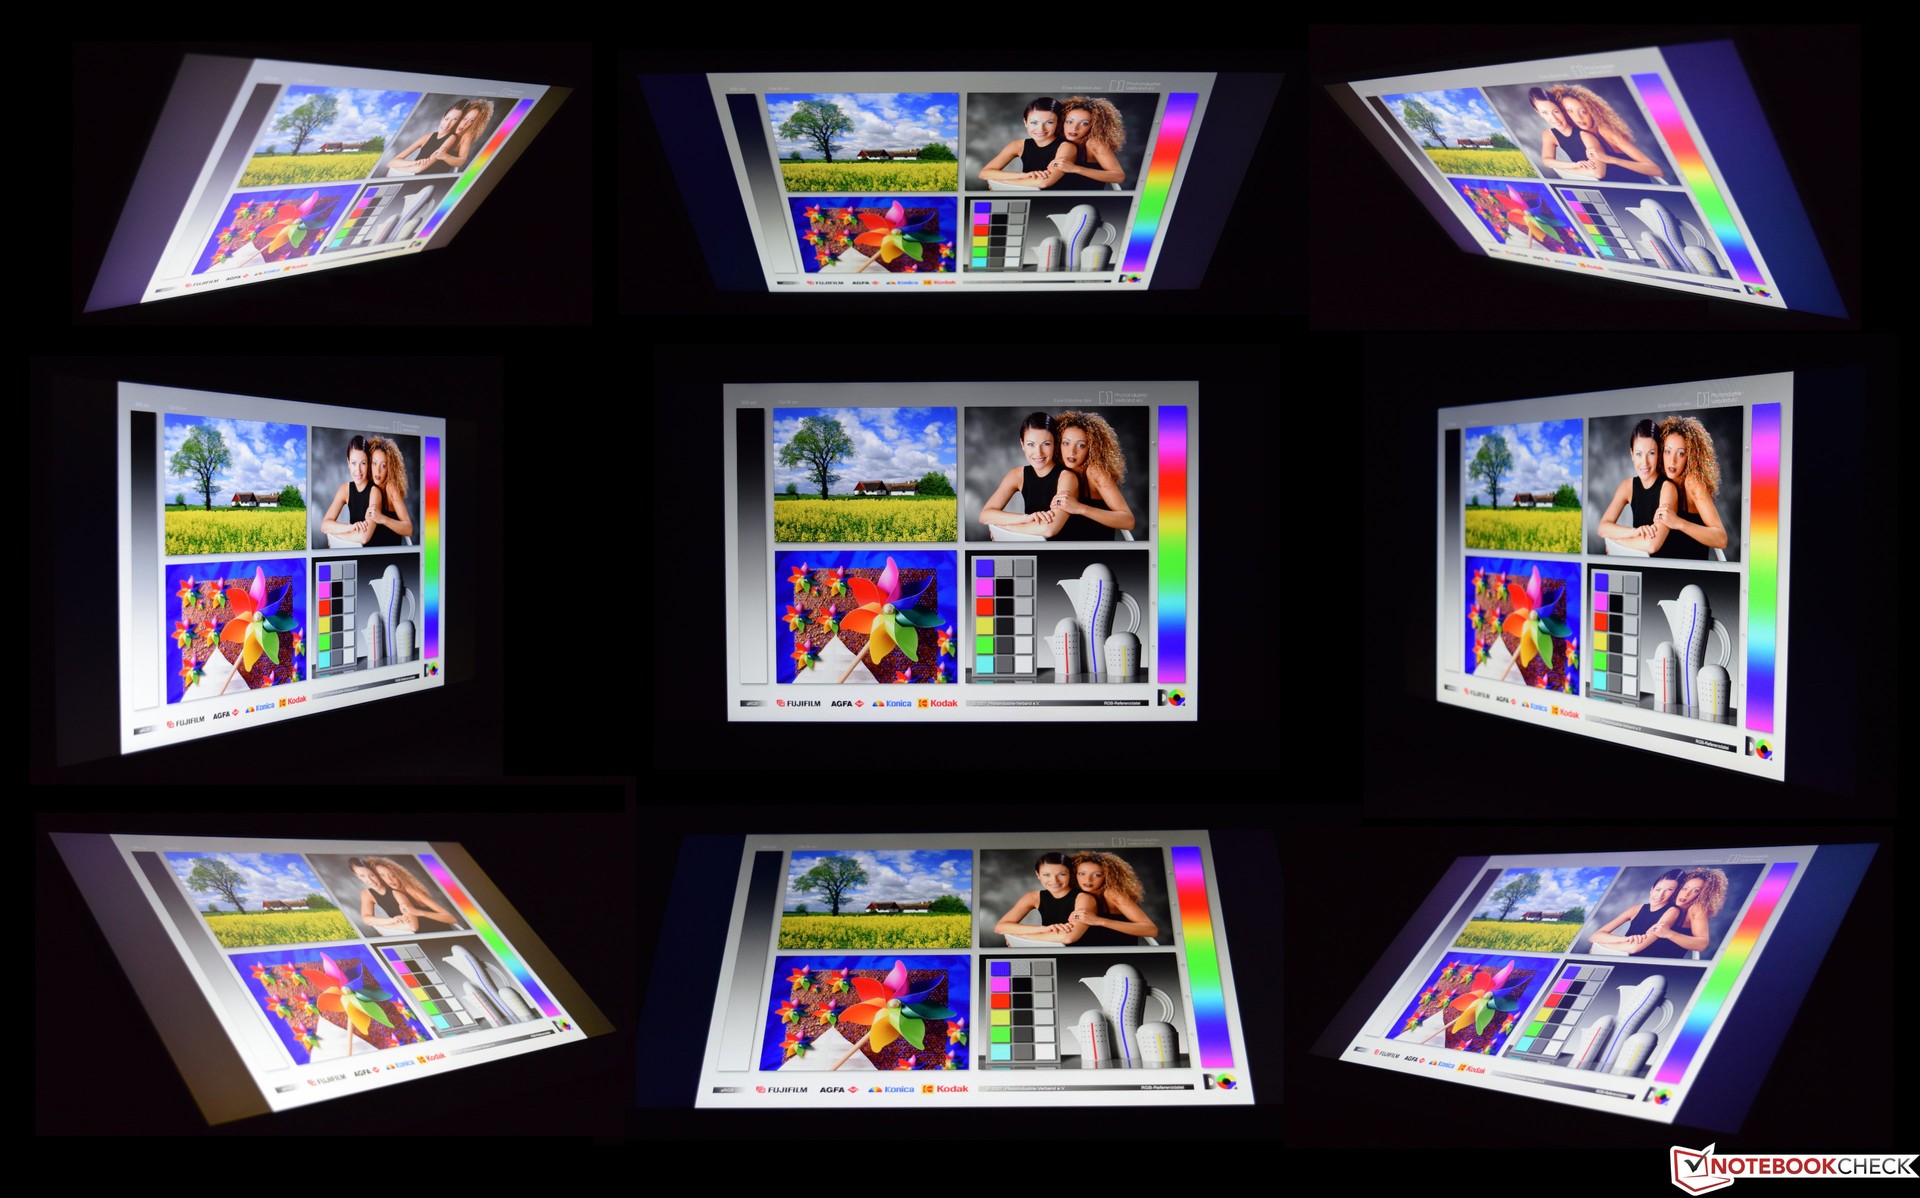
As expected, viewing angles were superb thanks to the IPS panel. We did notice very minor shifts in color representation at extreme angles that were unnoticeable during normal everyday use.
Performance

Performance-wise, the three P65 models differ mainly in their 3D performance. While the entry-level model features a GeForce GTX 1050 Ti, the mid-range and top-tier units are equipped with a GeForce GTX 1060 Max-Q and a GeForce GTX 1070 Max-Q, respectively. All three feature the exact same Intel Core i7-8750H CPU with no other options available.
Content Creation with Adobe Photoshop or Adobe Premiere is a breeze on this device, and it handled even the most demanding applications just fine. Thanks to its low-key design and lack of RGB bling it is very business-compatible.
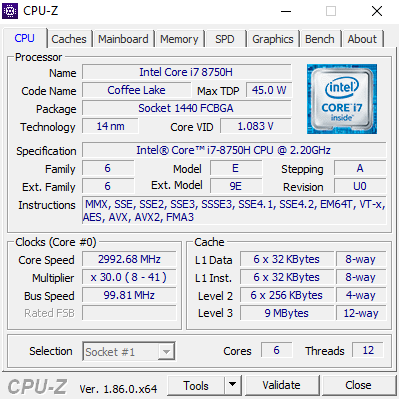


Processor
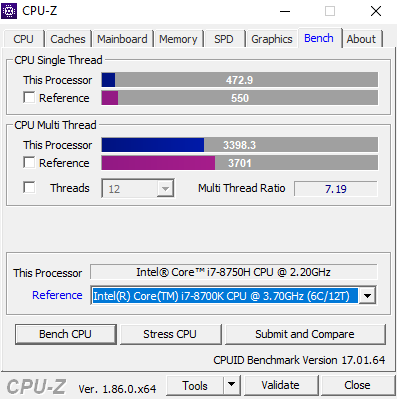
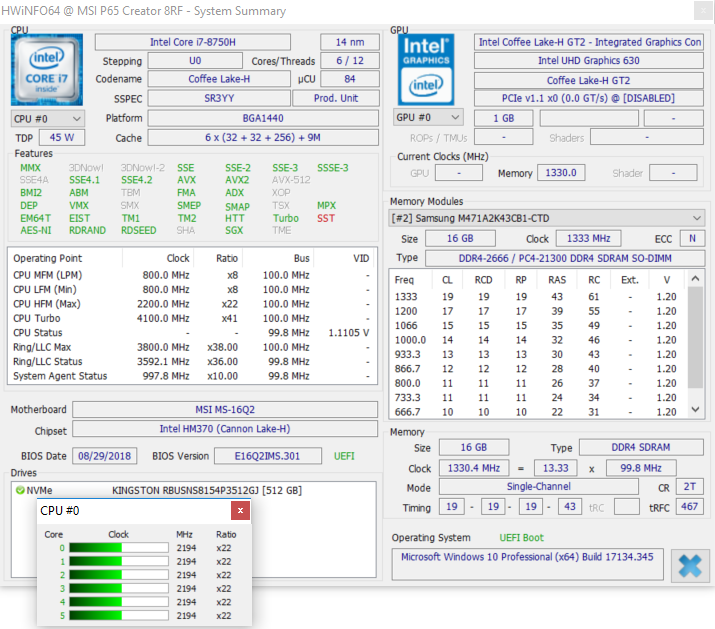
Intel’s Core i7-8750H is a high-end notebook processor that can be mostly found in expensive multimedia and gaming laptops. It features six physical cores with up to 12 threads, is specified at 45 W, and it includes an integrated GPU to keep power consumption low. Its base clock of 2.2 GHz can boost up to 4.1 GHz. Additional information can be found here.
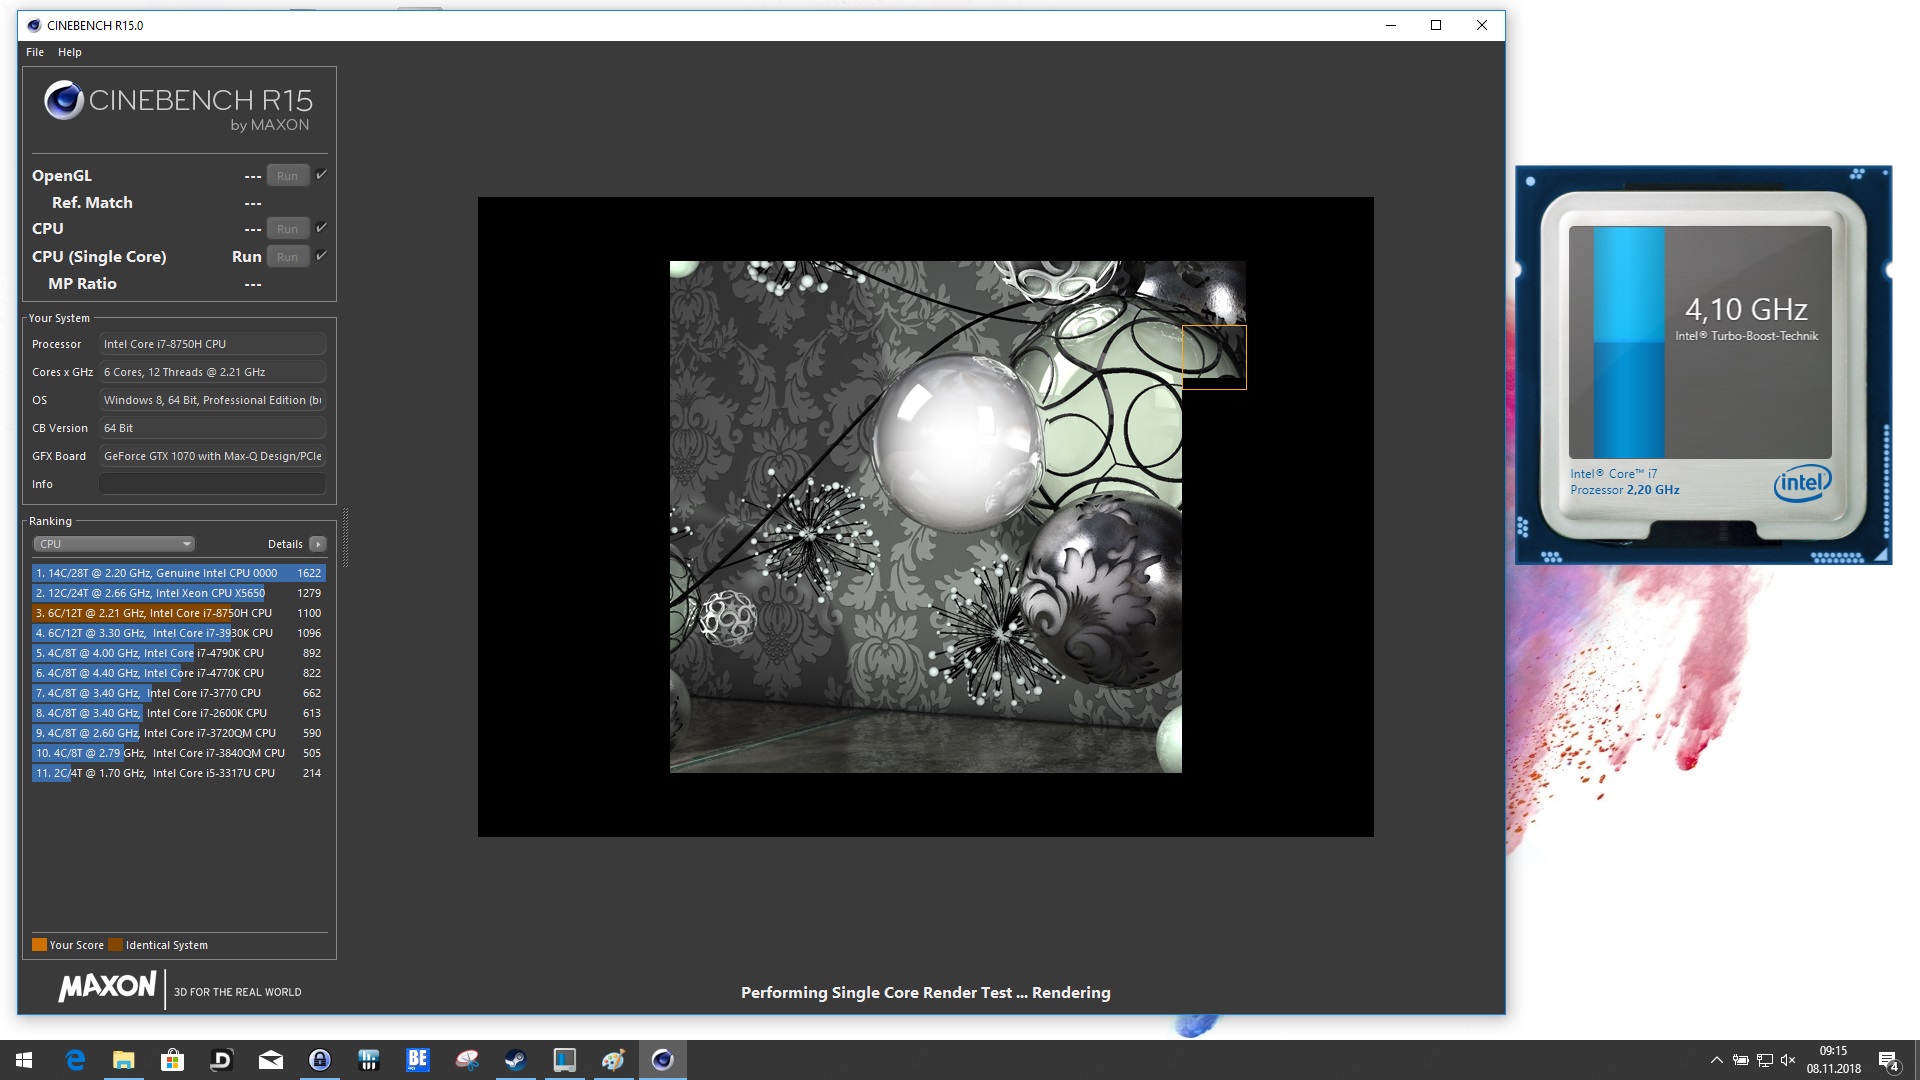
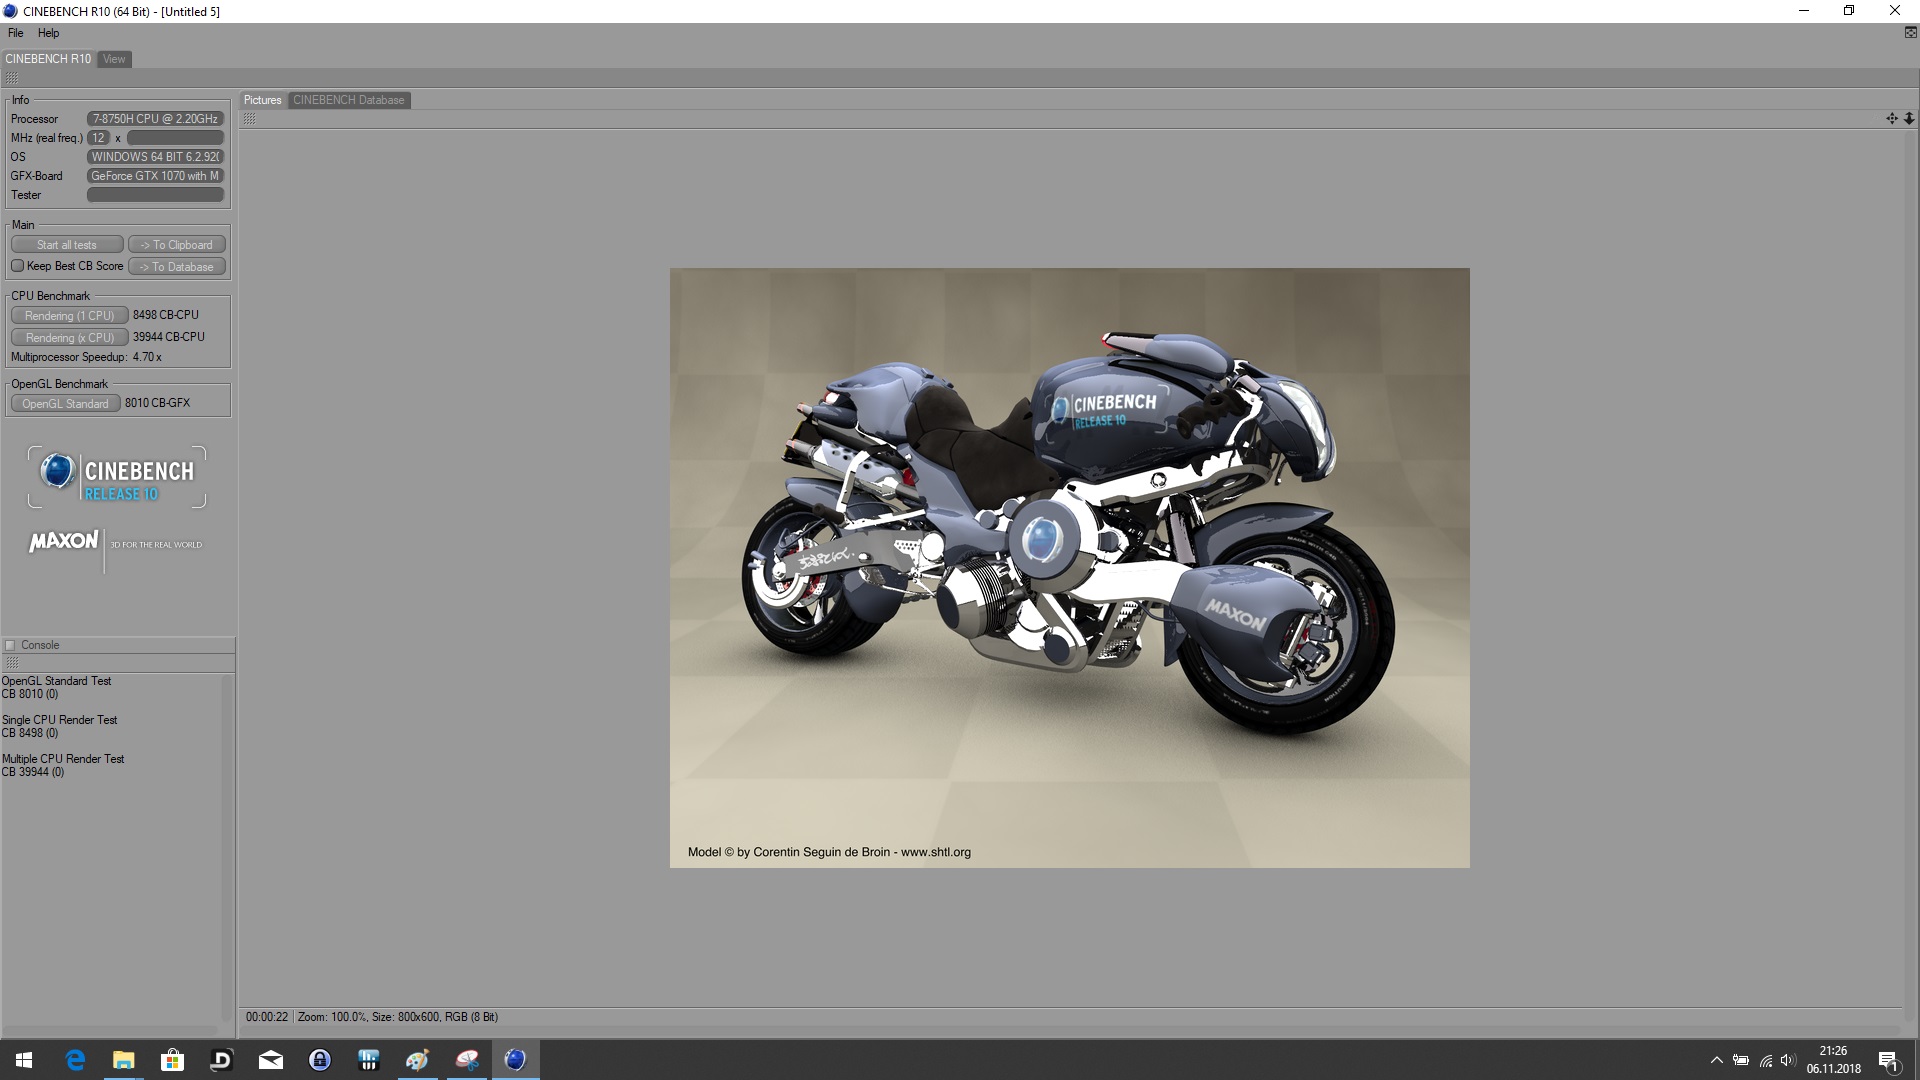
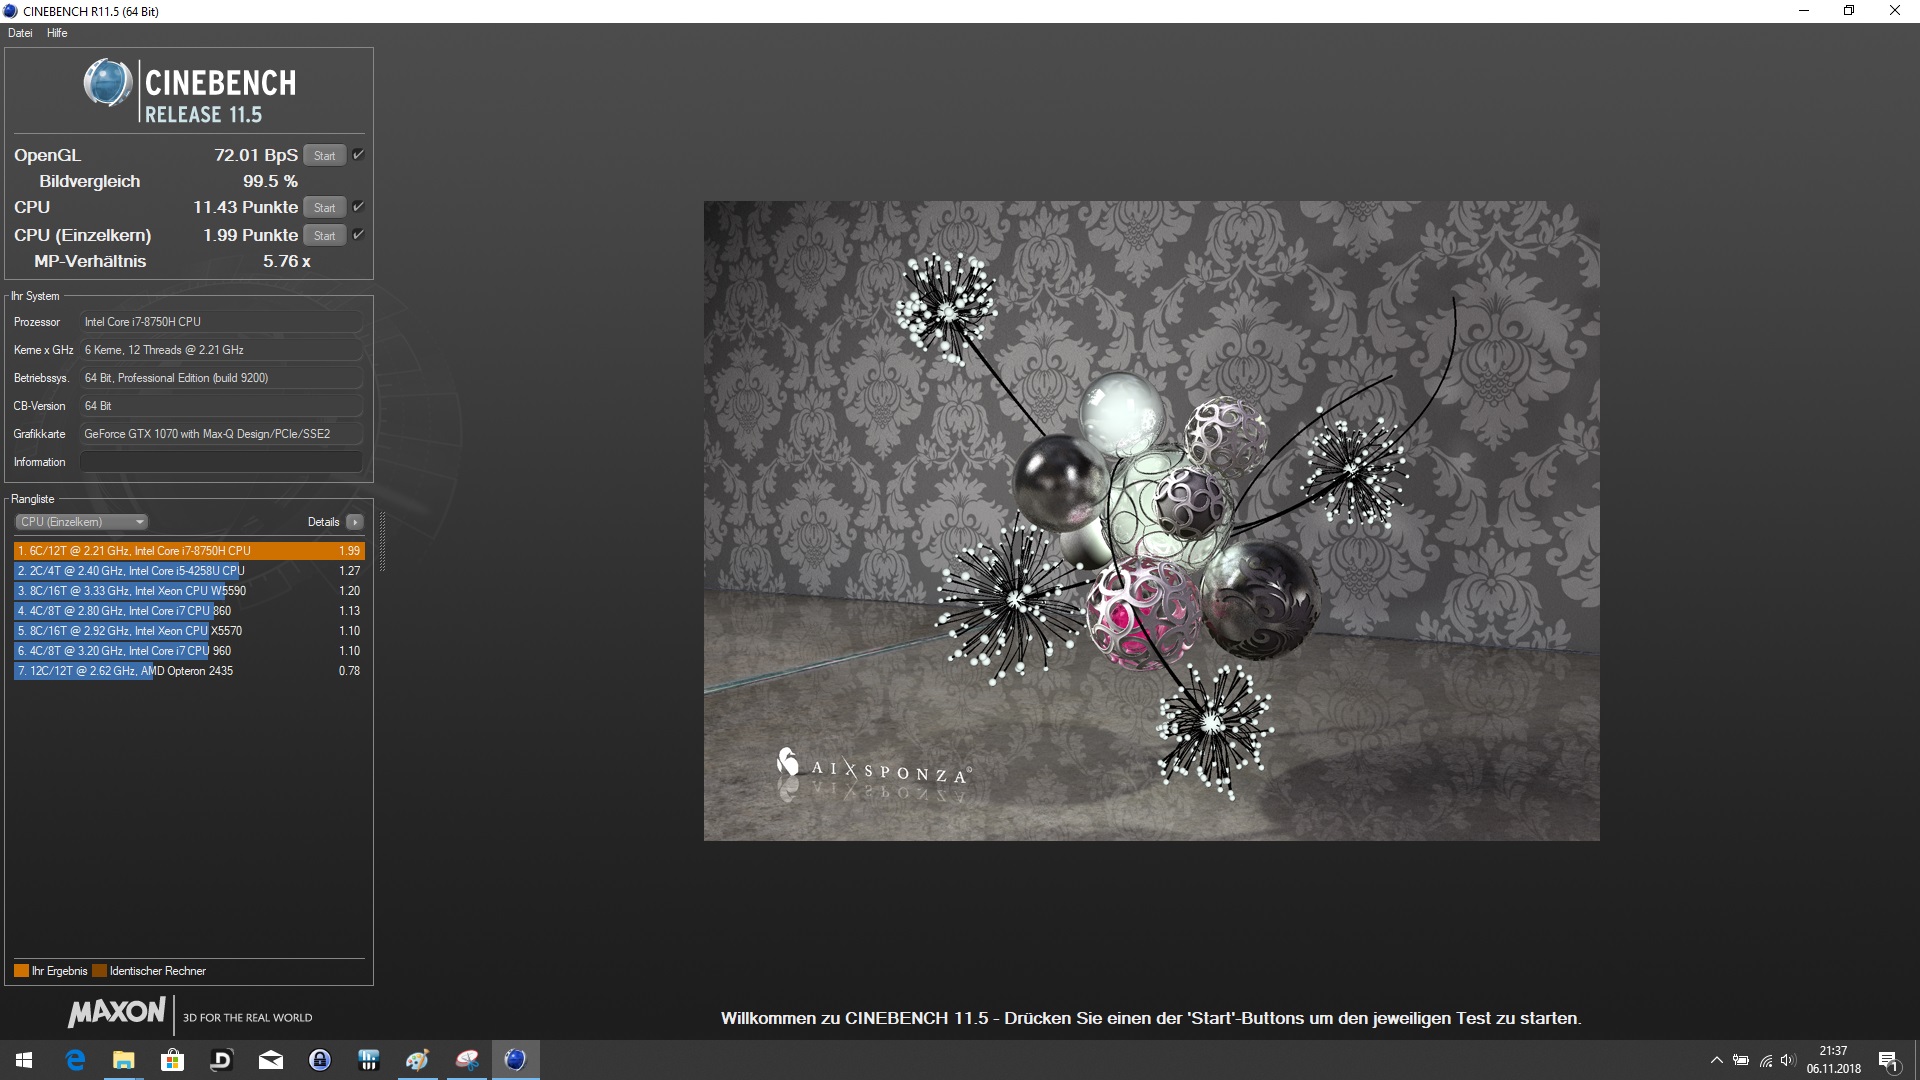
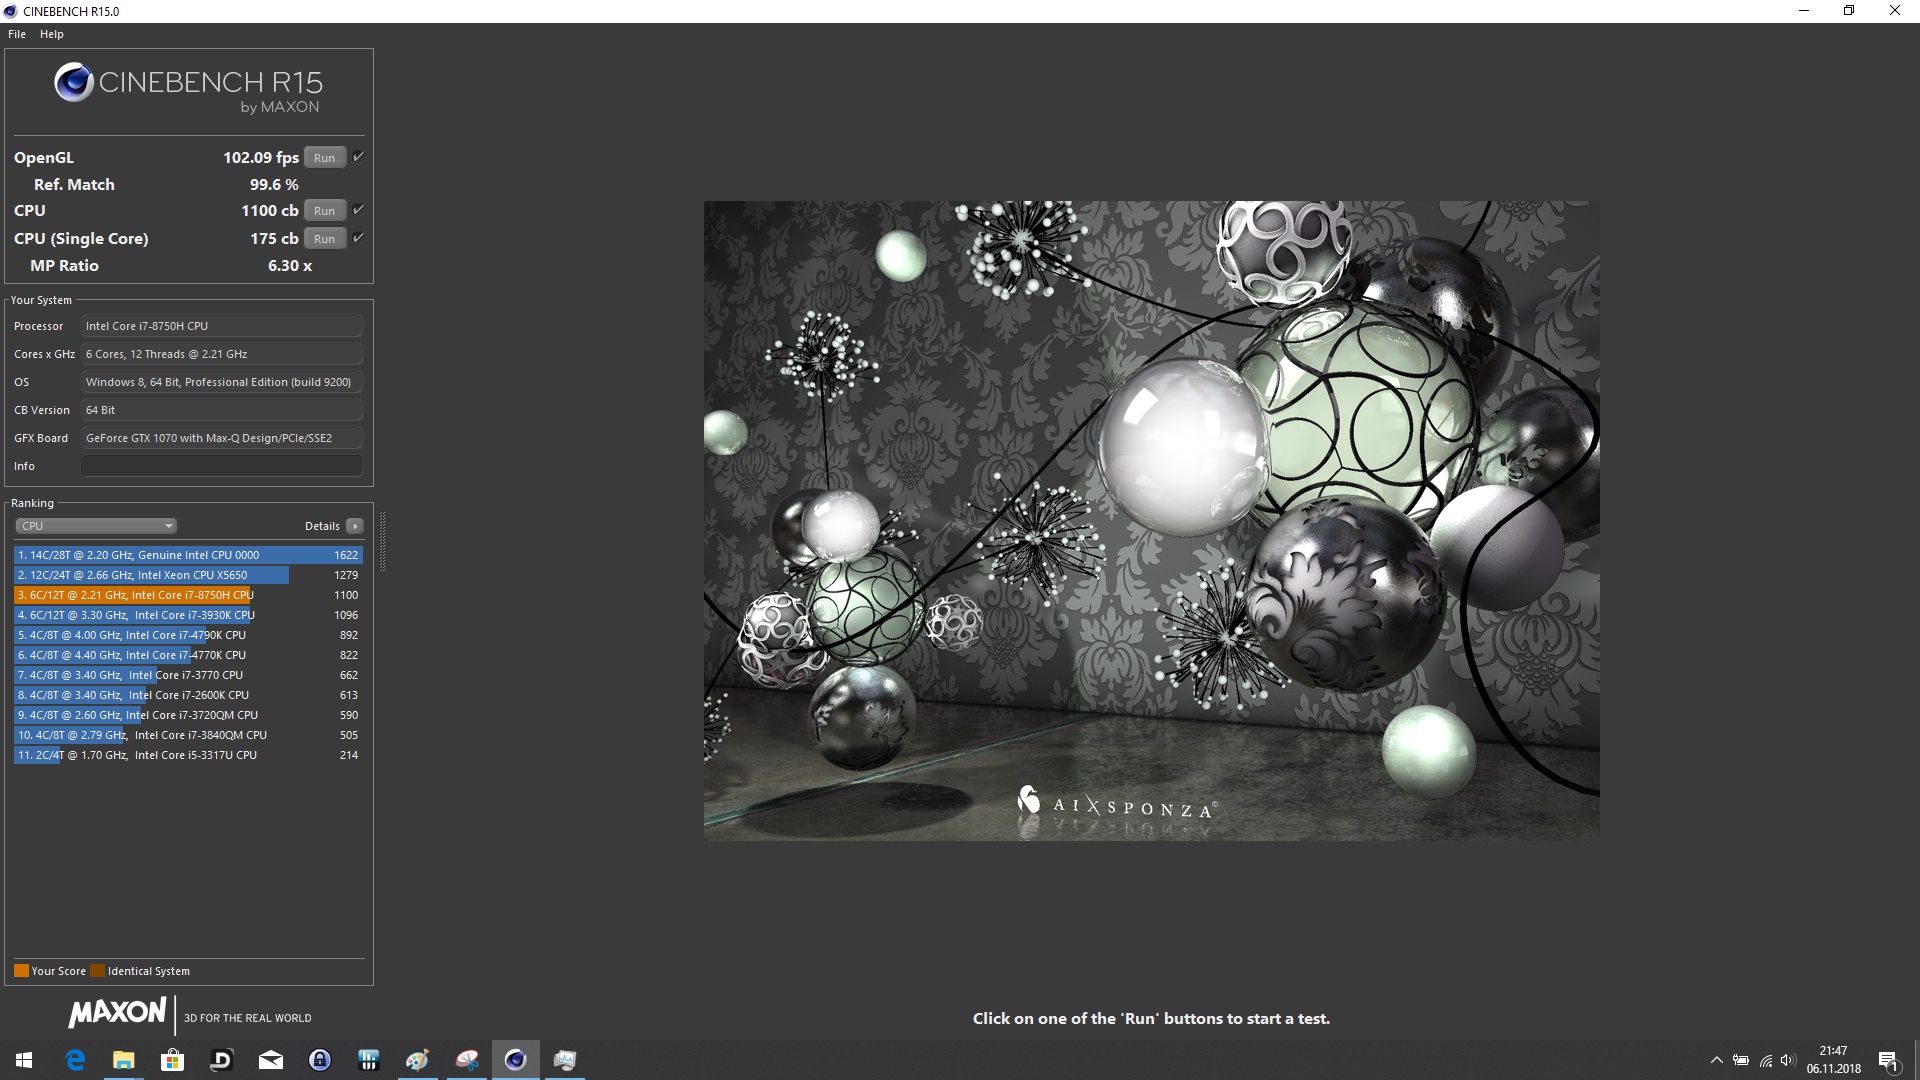
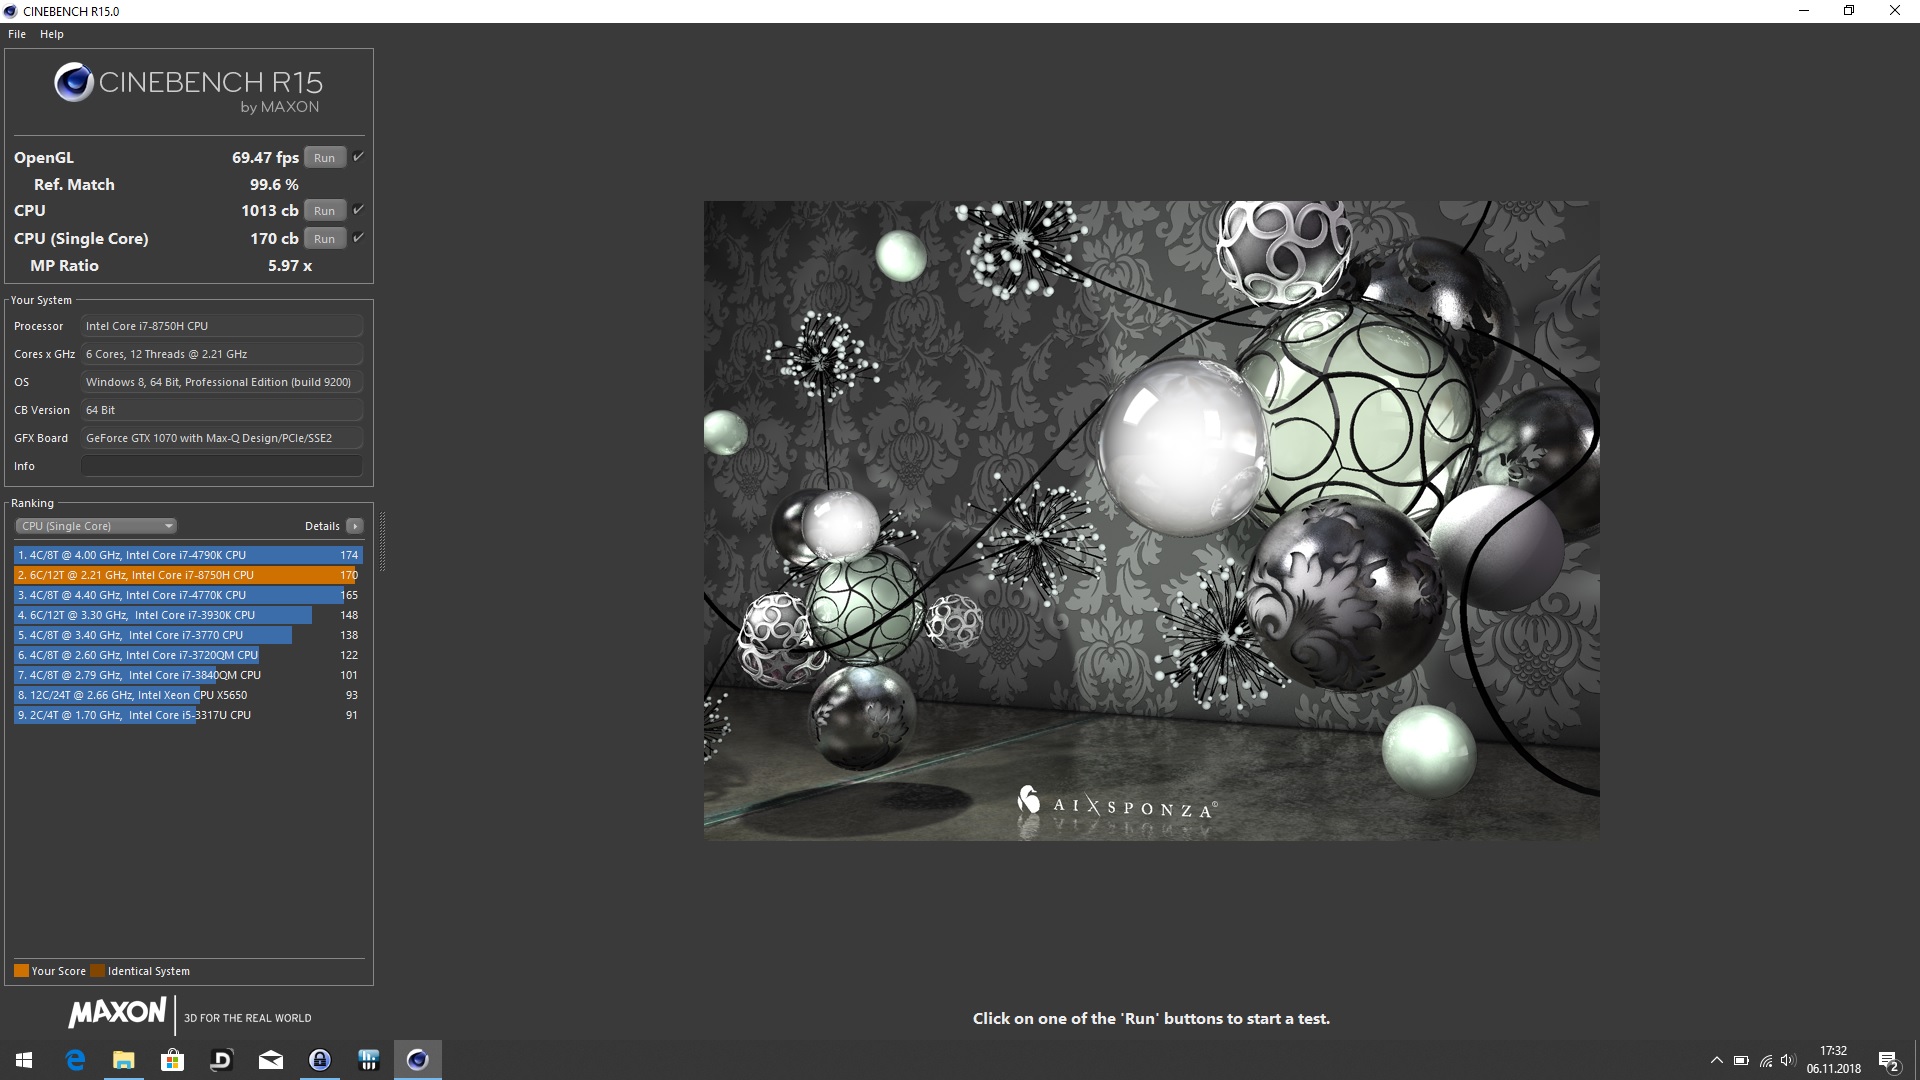
In our benchmarks, the P65’s Core i7-8750H performed very well overall, and it was on a par with its similarly equipped competitors. In CineBench R15 multi it even outperformed the Asus ZenBook Pro 15 with its Core i9-8950HK and scored an impressive 1,100 points.
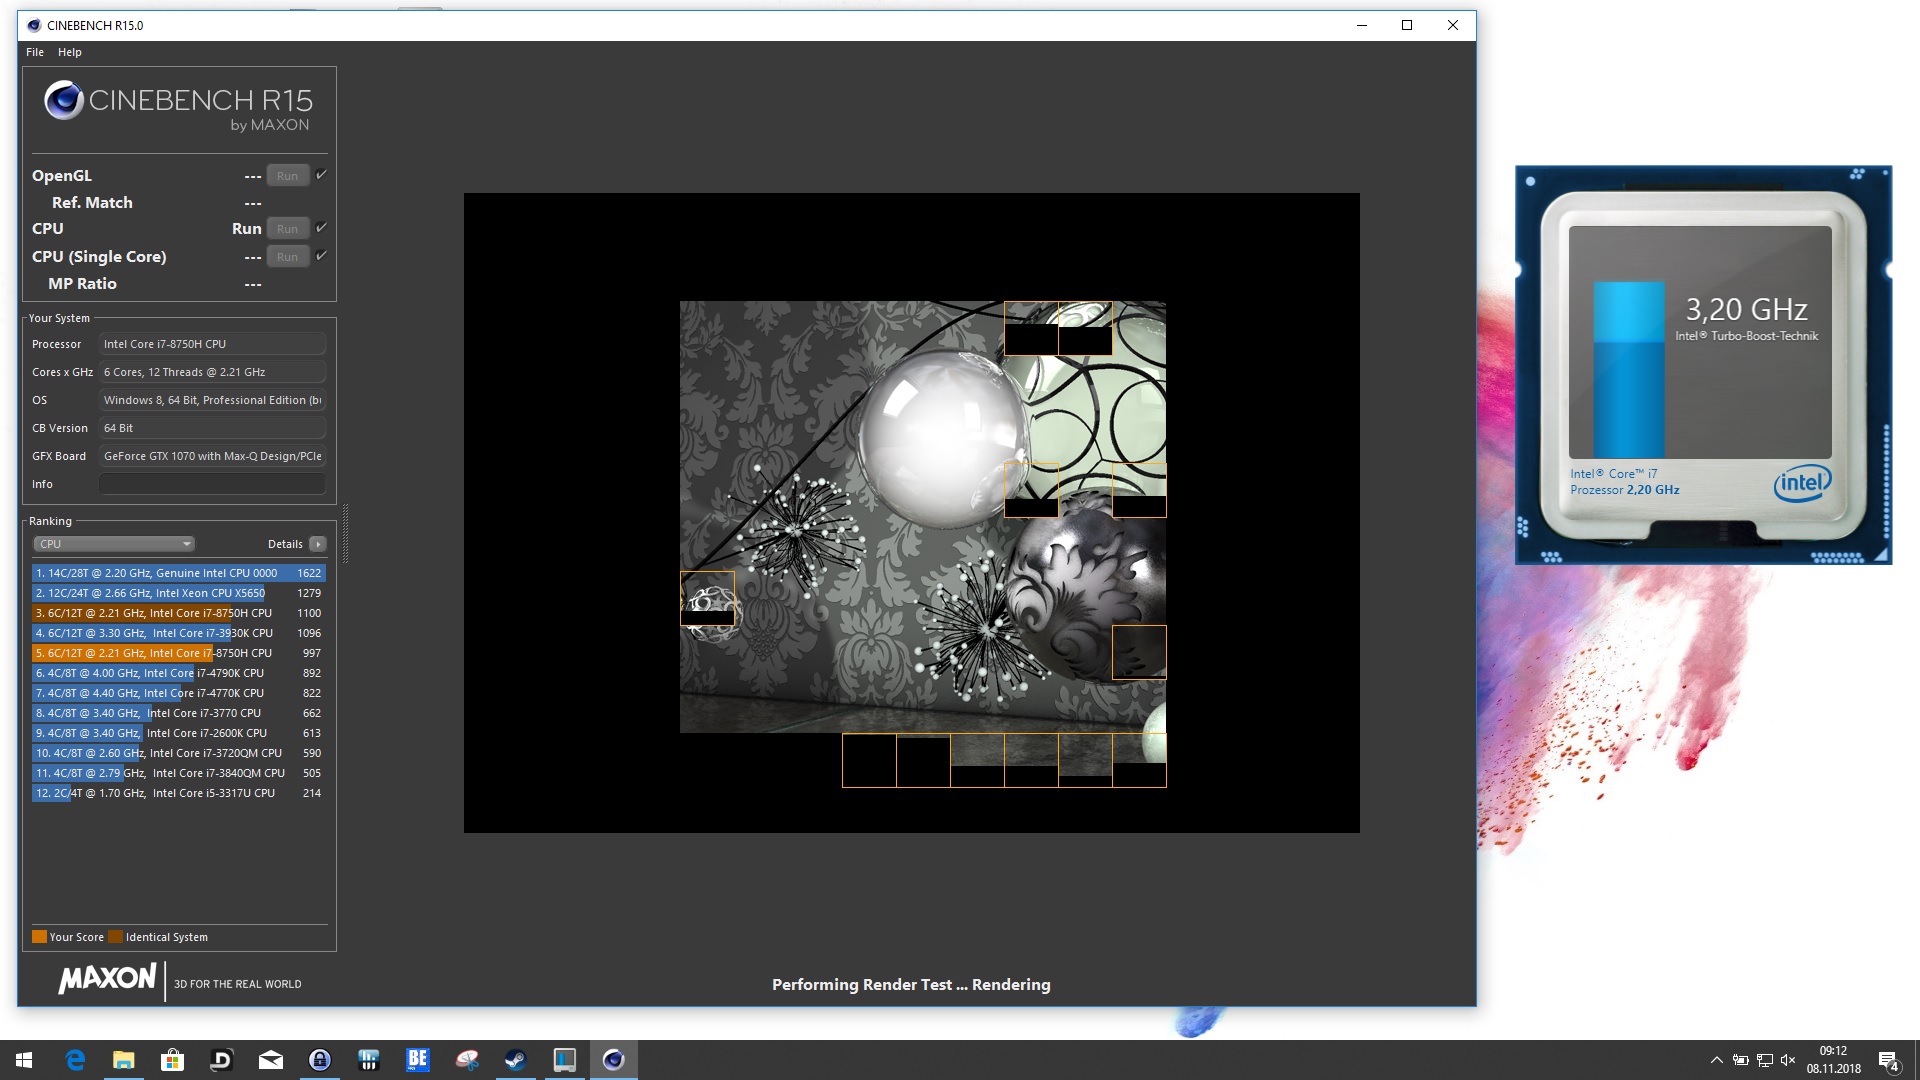
Persistent load, however, is not its best friend, and like the ZenBook Pro 15 the P65 started to reduce clock speeds after a short while. In the long run, CineBench R15 scores settled at around 993 points, which is acceptable. Lenovo's ThinkPad X1 played in its own league and performed much better than the entire competition when undervolted.
| HWBOT x265 Benchmark v2.2 - 4k Preset | |
| Average of class Multimedia (5.26 - 36.1, n=56, last 2 years) | |
| Average Intel Core i7-8750H (7.56 - 9.55, n=5) | |
| MSI P65 8RF-451 - Creator | |
| Blender - v2.79 BMW27 CPU | |
| MSI P65 8RF-451 - Creator | |
| Average Intel Core i7-8750H (396 - 486, n=6) | |
| Average of class Multimedia (100 - 557, n=58, last 2 years) | |
* ... smaller is better
System Performance
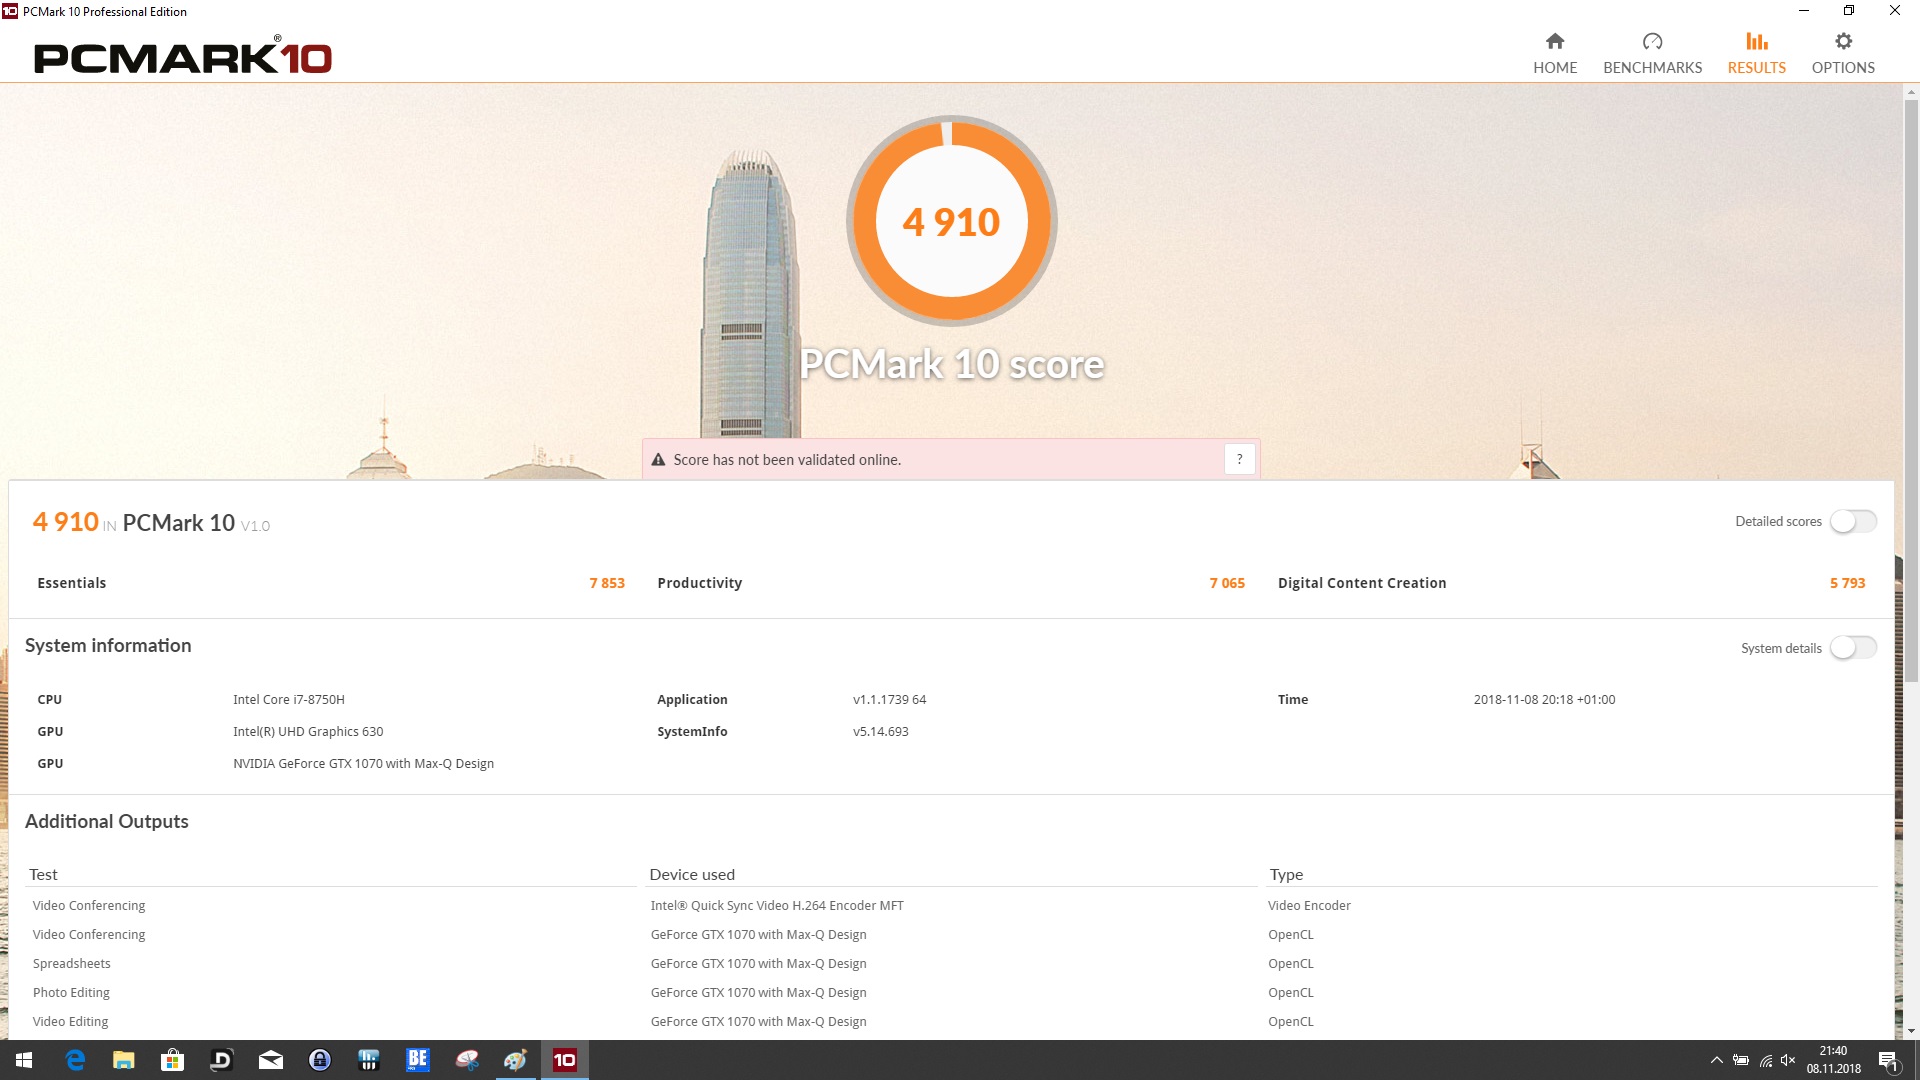
In our PCMark 10 benchmarks the P65 Creator scored somewhere mid-field and was around 9% slower than the front-runner in this category. All devices performed very similarly overall, and the scores were very close to each other without any clear-cut winners or losers.
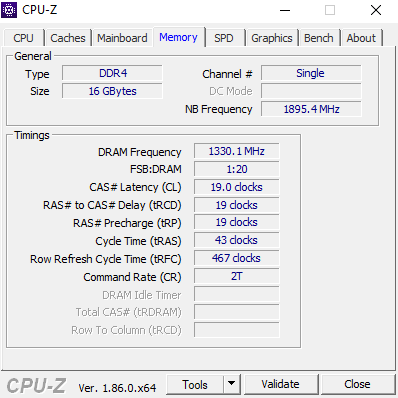
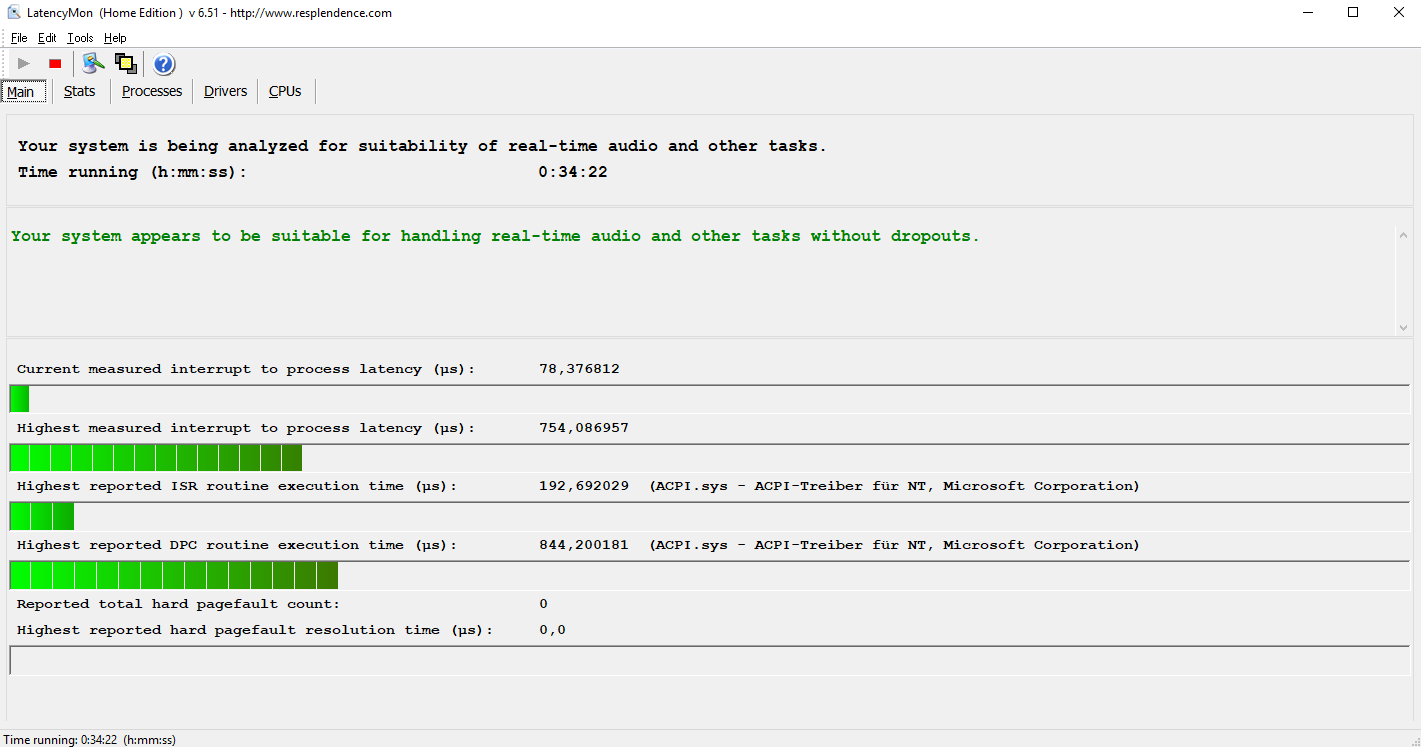
We experienced no hiccups or other irregularities during our entire review period with the P65. The hardware seems to be well balanced, and LatencyMon failed to detect any significant latencies. With 16 GB of RAM and its 512 GB SSD the stylish device was sufficiently well-equipped for office use as well as for the latest games.
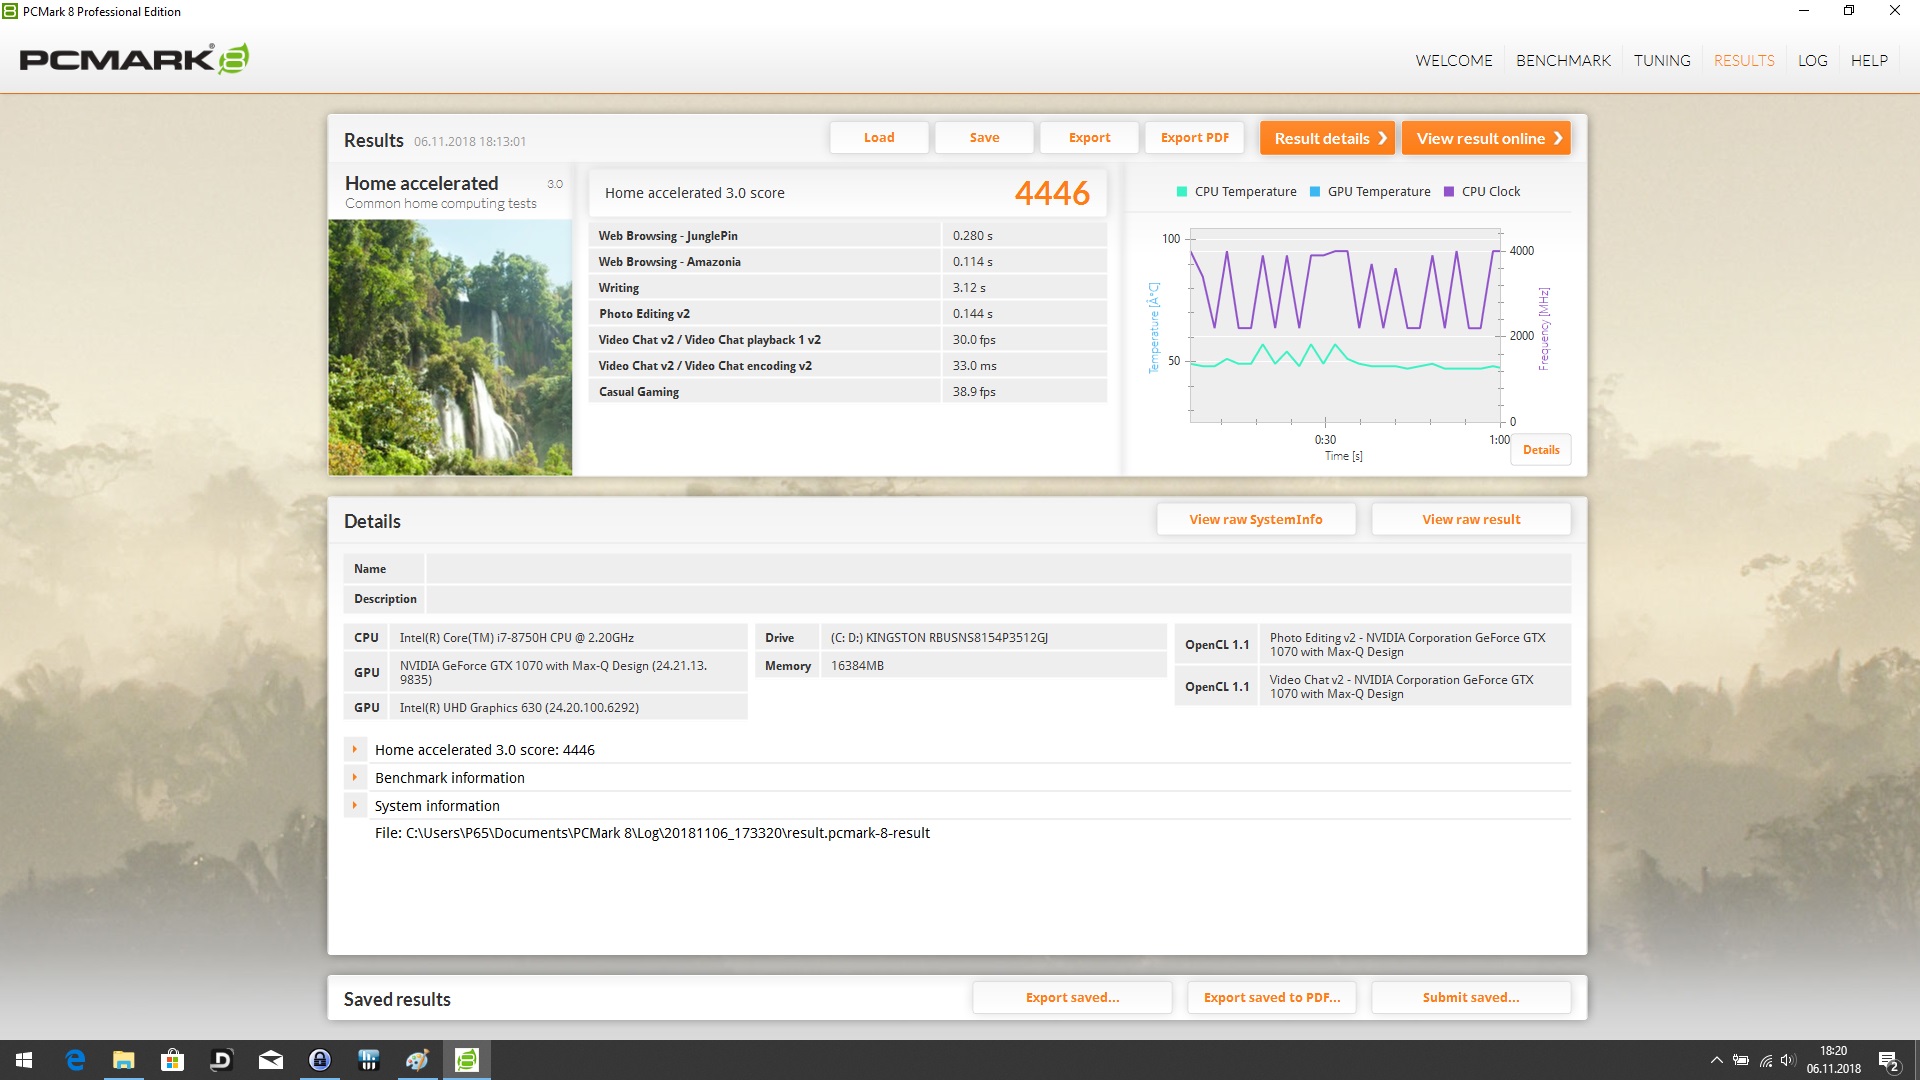
| PCMark 8 Home Score Accelerated v2 | 4446 points | |
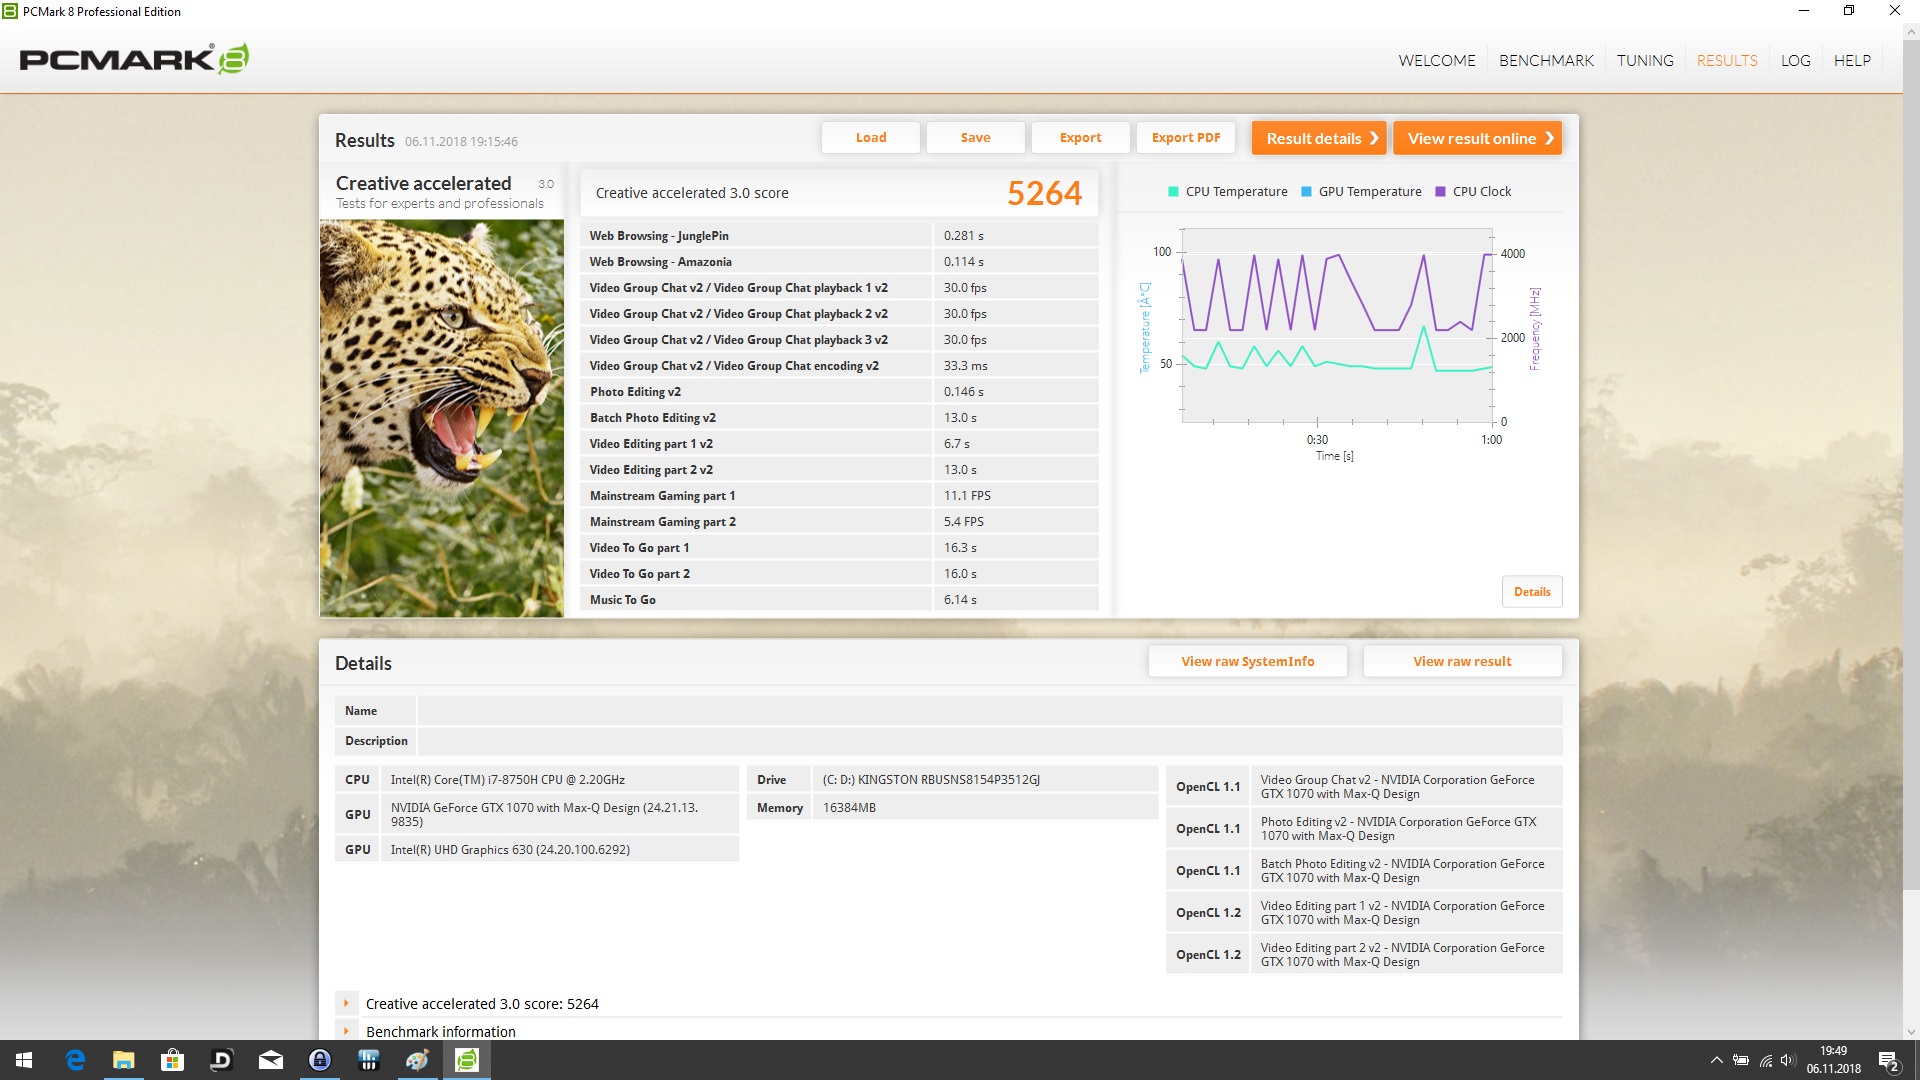
| PCMark 8 Creative Score Accelerated v2 | 5264 points | |
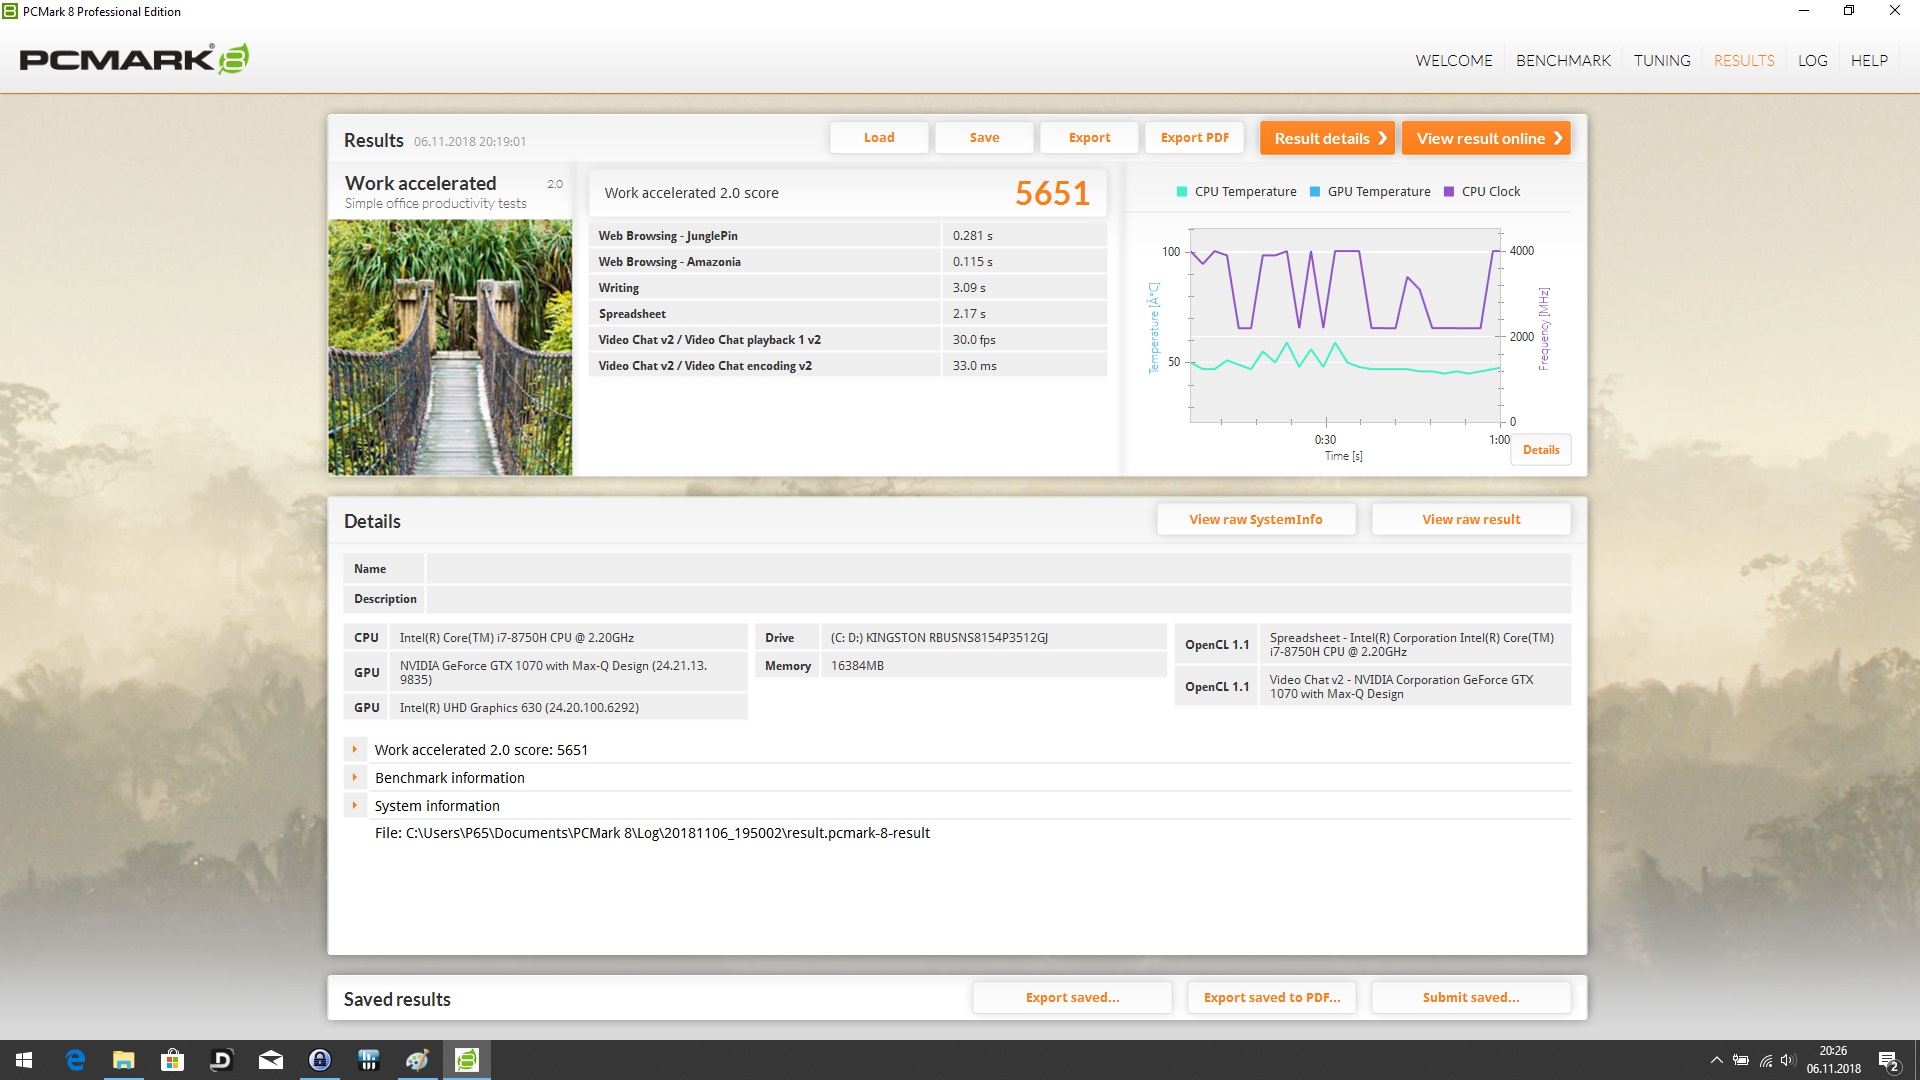
| PCMark 8 Work Score Accelerated v2 | 5651 points | |
| PCMark 10 Score | 4910 points | |
Help | ||
Storage Devices
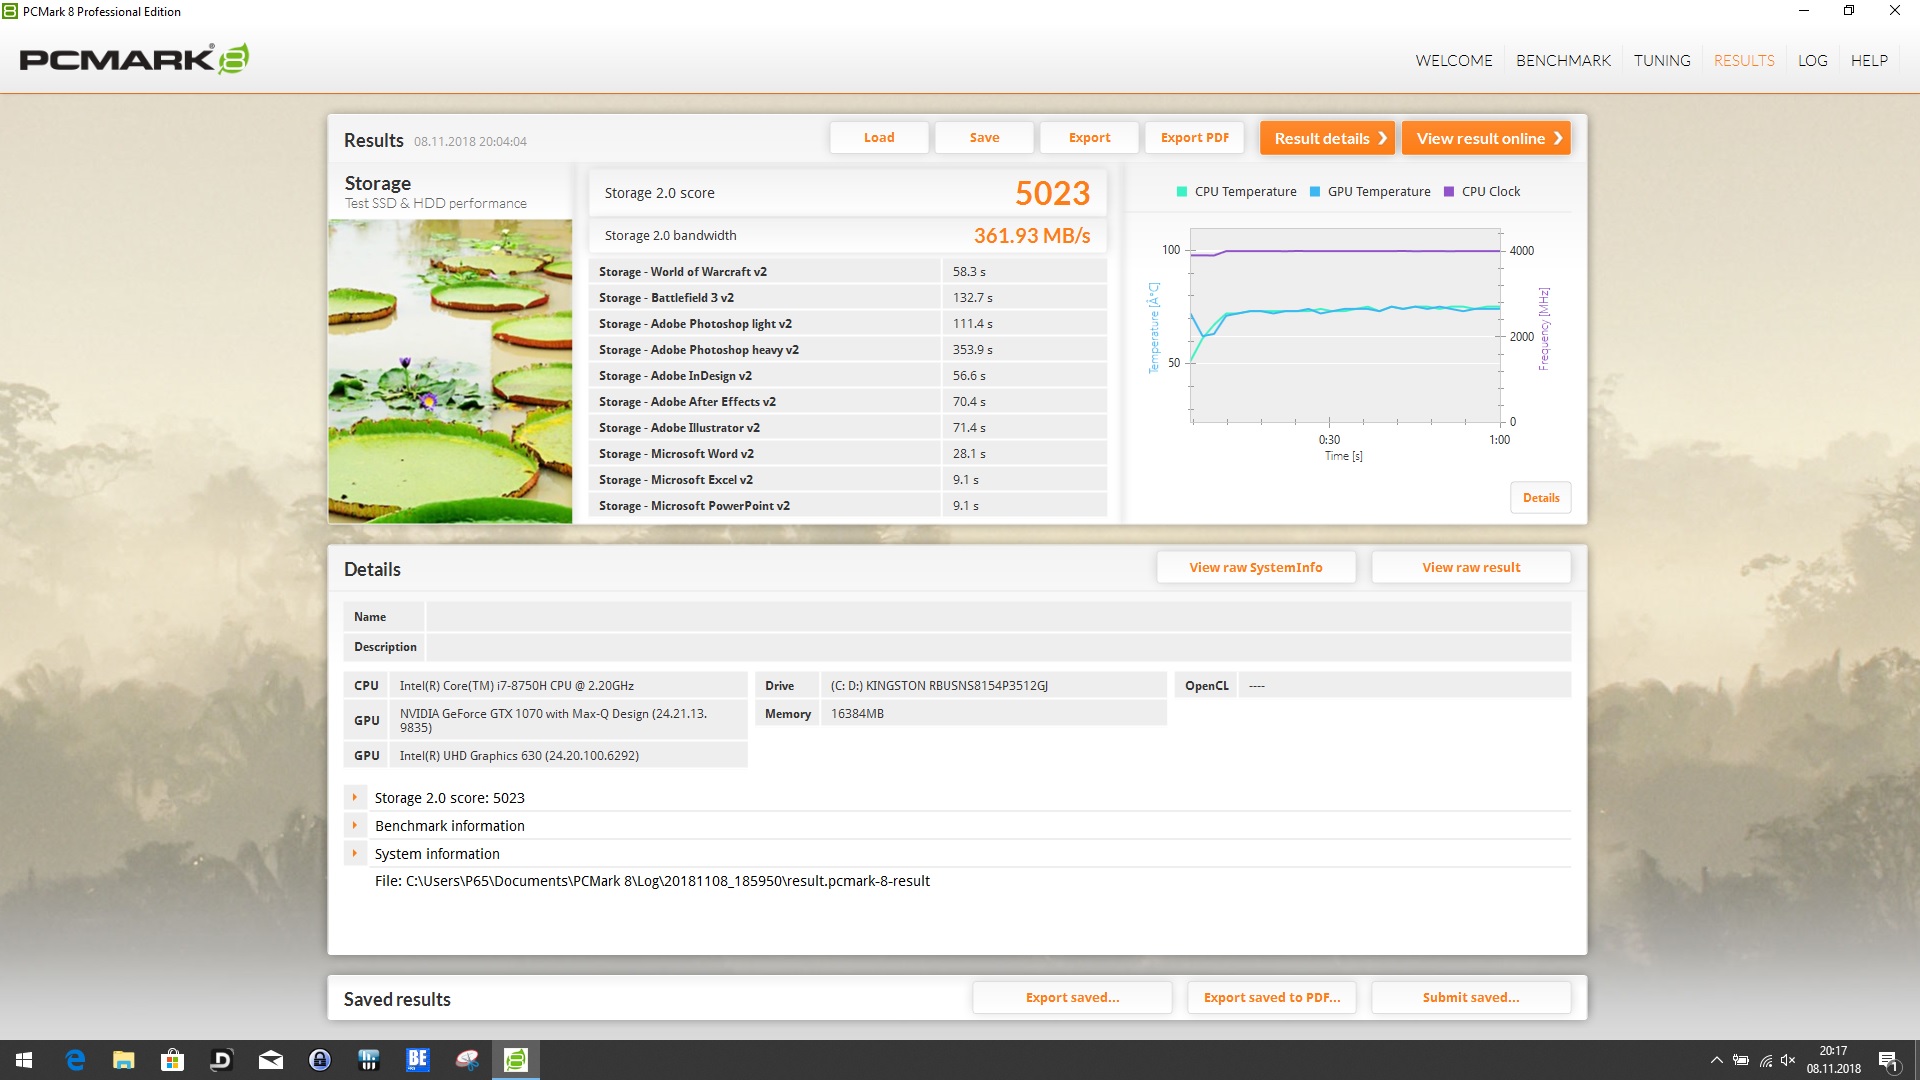
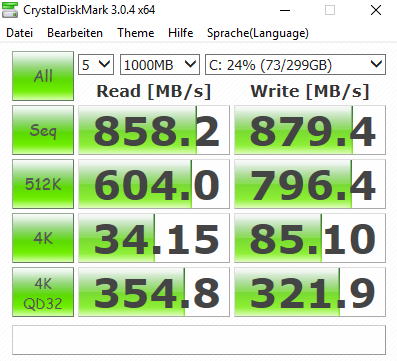
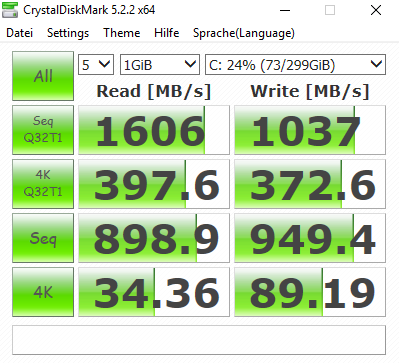
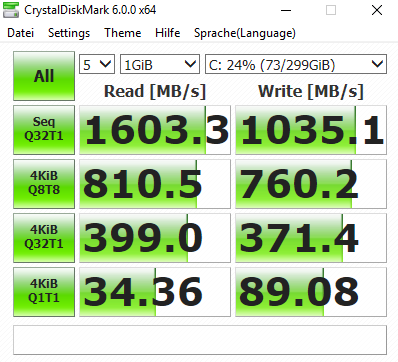
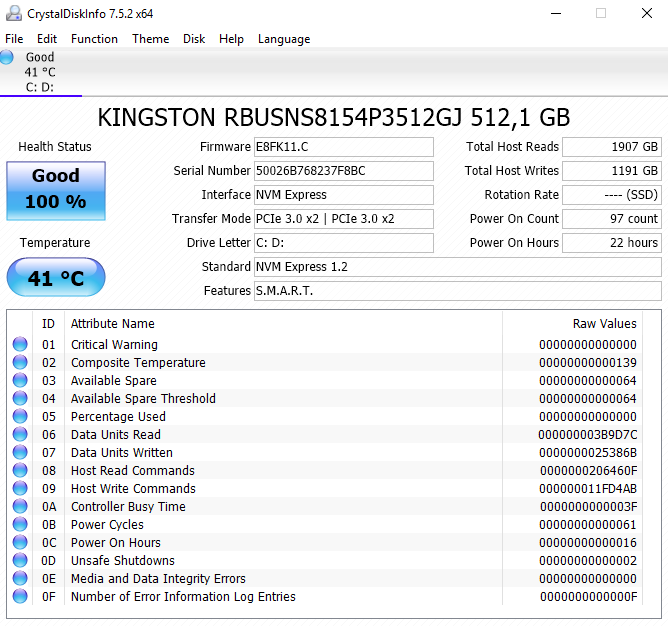
European P65 Creator models can only be purchased with a 512 GB NVMe-SSD. In other parts of the world, including the US, the 512 GB SSD is an optional upgrade and the devices are equipped with a 256 GB SSD by default. Our review unit came with a Kingston M.2 SSD that performed very well in our tests. Keep in mind though that many NVMe SSDs reach upwards of 1,000 MB/s in sequential read and write. At 849 and 869 MB/s our review unit’s SSD performed much faster than any SATA III SSD (usually limited to around 500 MB/s).
We were particularly impressed with its 4K read performance of 36 MB/s. Boot time and application launch times benefit the most from this capability. Unfortunately, the device lacks a secondary storage bay, and we would have loved to see at least a second M.2 slot.

| MSI P65 8RF-451 - Creator Kingston RBUSNS8154P3512GJ | Asus ZenBook Pro 15 UX580GE Samsung SSD PM961 1TB M.2 PCIe 3.0 x4 NVMe (MZVLW1T0) | Gigabyte Aero 15X v8 Toshiba NVMe THNSN5512GPU7 | Asus GL504GS Samsung SSD PM981 MZVLB512HAJQ | MSI GS65 8RF-019DE Stealth Thin Samsung SSD PM981 MZVLB512HAJQ | Lenovo ThinkPad X1 Extreme-20MF000XGE Samsung SSD PM981 MZVLB1T0HALR | |
|---|---|---|---|---|---|---|
| CrystalDiskMark 5.2 / 6 | 33% | 21% | 42% | 35% | 71% | |
| Write 4K (MB/s) | 89.2 | 125 40% | 94.4 6% | 97.9 10% | 95.3 7% | 123.7 39% |
| Read 4K (MB/s) | 34.36 | 44.68 30% | 37.65 10% | 41.23 20% | 40.13 17% | 44.07 28% |
| Write Seq (MB/s) | 949 | 1059 12% | 1335 41% | 1852 95% | 1883 98% | 2215 133% |
| Read Seq (MB/s) | 899 | 772 -14% | 1404 56% | 1761 96% | 1322 47% | 2242 149% |
| Write 4K Q32T1 (MB/s) | 371.4 | 507 37% | 268.6 -28% | 297.7 -20% | 309.9 -17% | 313.9 -15% |
| Read 4K Q32T1 (MB/s) | 399 | 614 54% | 332.8 -17% | 344.2 -14% | 353.7 -11% | 359.8 -10% |
| Write Seq Q32T1 (MB/s) | 1035 | 1763 70% | 1375 33% | 1864 80% | 1919 85% | 2404 132% |
| Read Seq Q32T1 (MB/s) | 1603 | 2171 35% | 2627 64% | 2738 71% | 2466 54% | 3333 108% |
| AS SSD | 72% | 19% | 83% | 72% | 123% | |
| Seq Read (MB/s) | 850 | 2099 147% | 2213 160% | 1837 116% | 1266 49% | 2703 218% |
| Seq Write (MB/s) | 869 | 1729 99% | 1163 34% | 1730 99% | 1834 111% | 2336 169% |
| 4K Read (MB/s) | 36.43 | 37.78 4% | 23.36 -36% | 53.3 46% | 48.94 34% | 56.8 56% |
| 4K Write (MB/s) | 84.4 | 100.9 20% | 80.4 -5% | 105.7 25% | 107.2 27% | 130.9 55% |
| 4K-64 Read (MB/s) | 839 | 1431 71% | 847 1% | 1305 56% | 1170 39% | 1805 115% |
| 4K-64 Write (MB/s) | 602 | 1273 111% | 742 23% | 1704 183% | 1760 192% | 1782 196% |
| Access Time Read * (ms) | 0.104 | 0.04 62% | 0.119 -14% | 0.049 53% | 0.073 30% | 0.034 67% |
| Access Time Write * (ms) | 0.044 | 0.036 18% | 0.046 -5% | 0.035 20% | 0.035 20% | 0.028 36% |
| Score Read (Points) | 960 | 1679 75% | 1092 14% | 1542 61% | 1346 40% | 2132 122% |
| Score Write (Points) | 773 | 1547 100% | 939 21% | 1983 157% | 2051 165% | 2147 178% |
| Score Total (Points) | 2233 | 4065 82% | 2536 14% | 4318 93% | 4122 85% | 5355 140% |
| Total Average (Program / Settings) | 53% /
55% | 20% /
20% | 63% /
66% | 54% /
56% | 97% /
101% |
* ... smaller is better

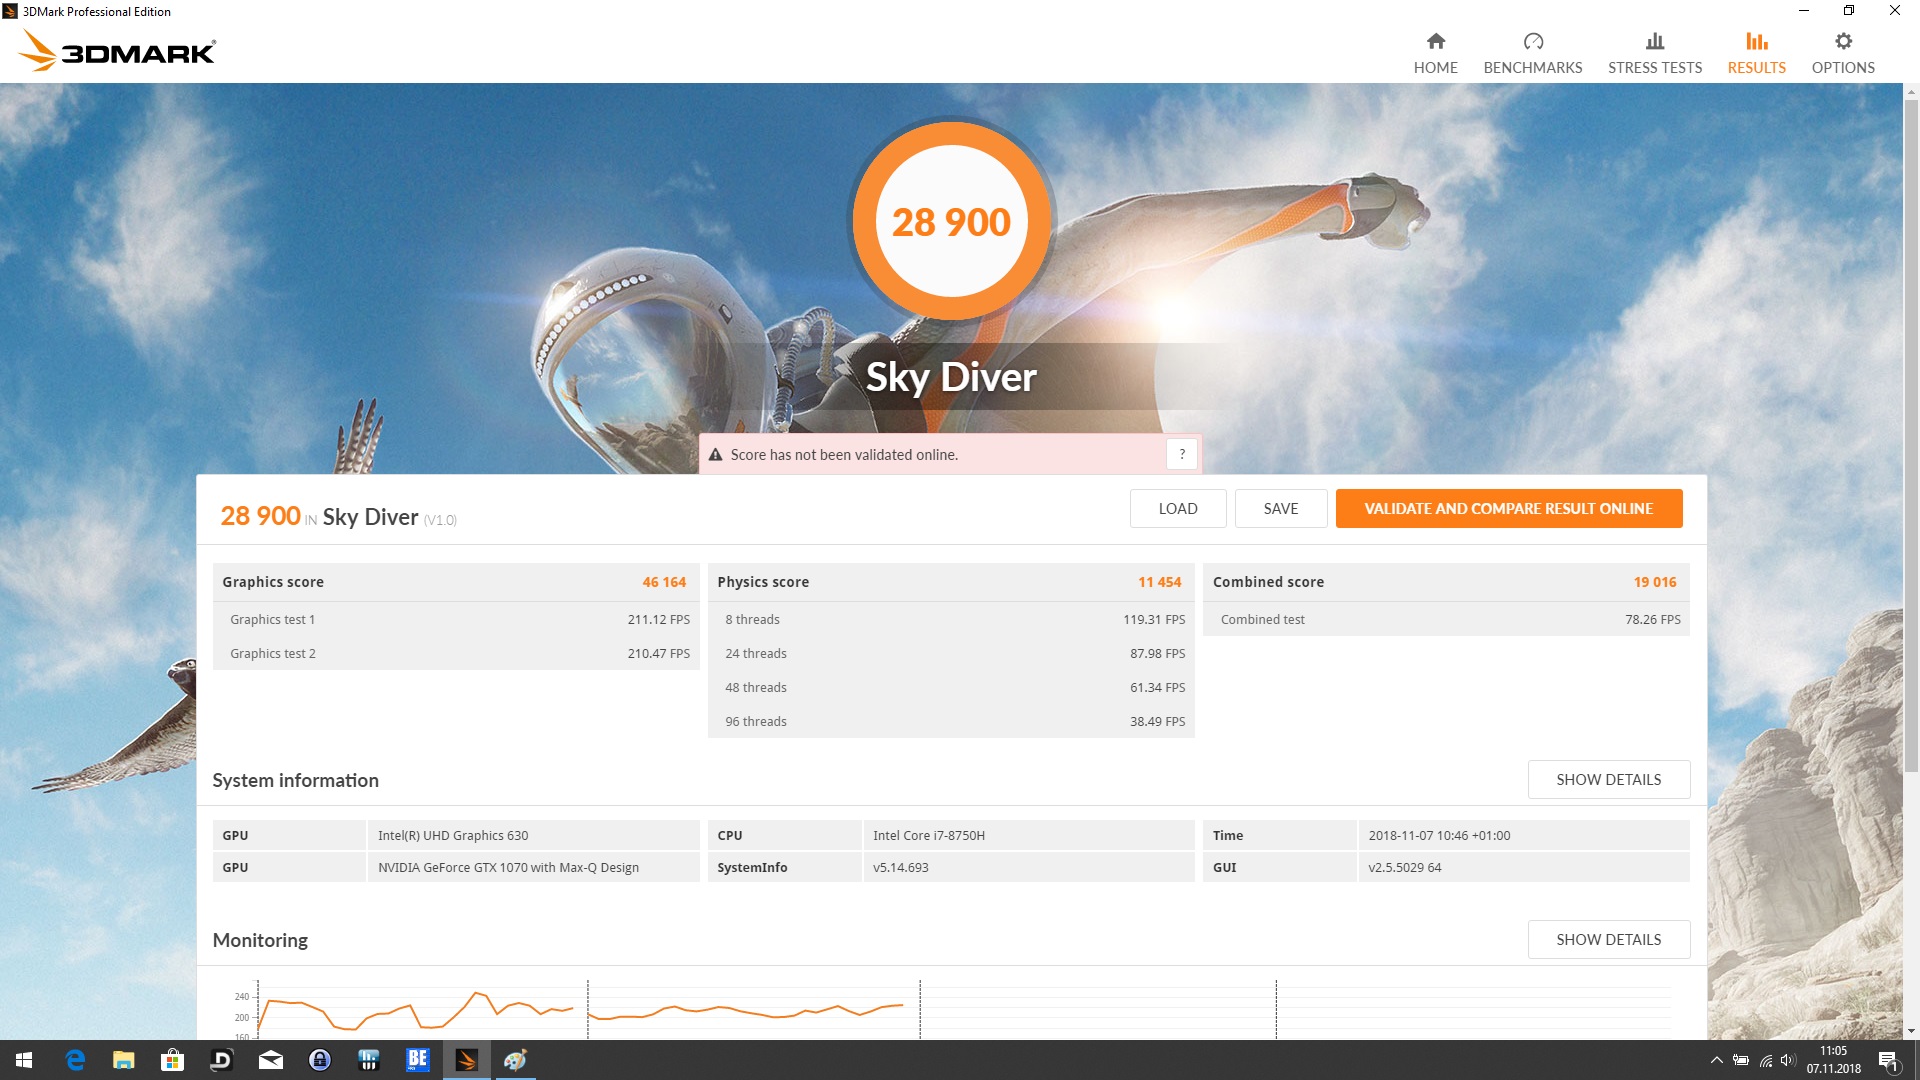
GPU Performance
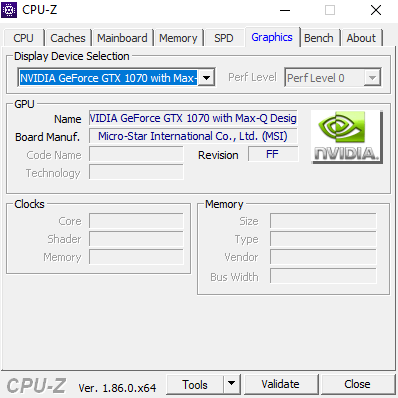
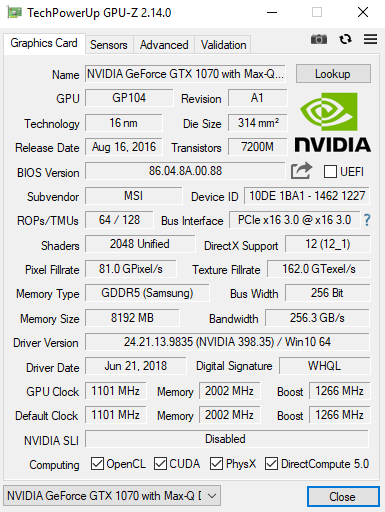
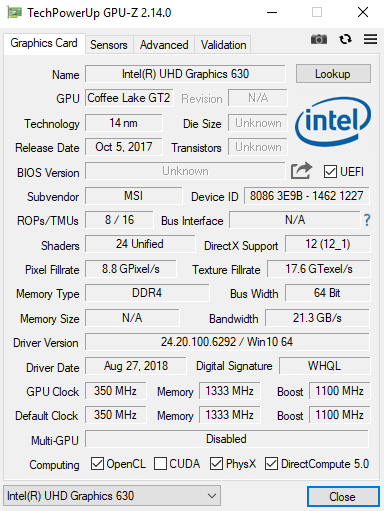
In addition to the integrated Intel UHD Graphics 630 the P65 Creator also features a dedicated Nvidia GeForce GTX 1070 Max-Q. This particular GPU is only available on the top model. The decision to opt for the more efficient Max-Q design is a very welcome one considering the device’s thin design. It comes at a price, though, as the regular GTX 1070 is faster than its Max-Q equivalent. Since they are practically identical, the P65 and GS65 performed almost identically in our benchmarks.
If you intend to use the device for professional workloads you may want to take a closer look at the MSI WS63 workstation notebook. It features a Quadro P3000 GPU that cannot keep up with its gaming counterparts in 3DMark but outperforms every single one of them in the SPECviewperf tests by quite significant margins. This workstation is thus truly made for professional 3D workloads.
Additional GeForce GTX 1070 Max-Q benchmarks can be found here.

| 3DMark 06 Standard Score | 33475 points | |
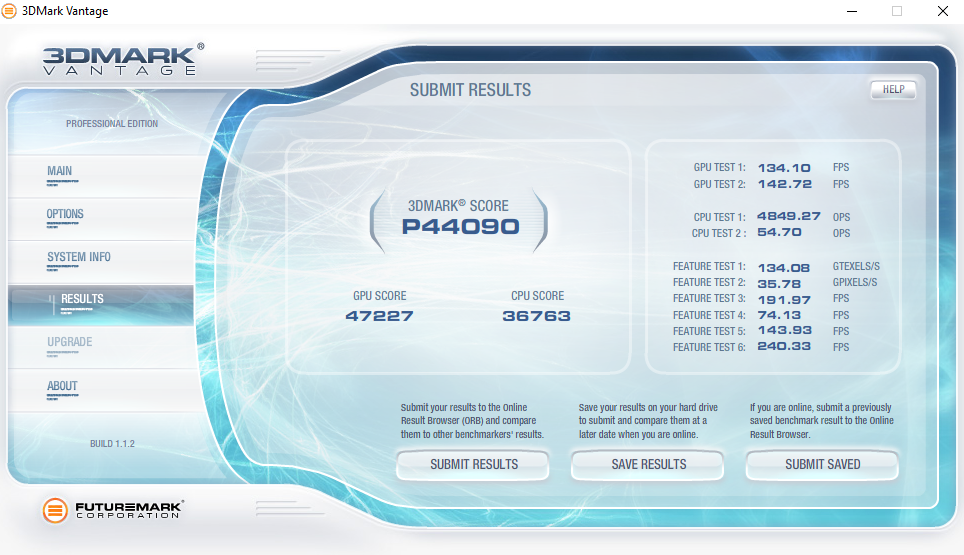
| 3DMark Vantage P Result | 44090 points | |
| 3DMark 11 Performance | 14492 points | |
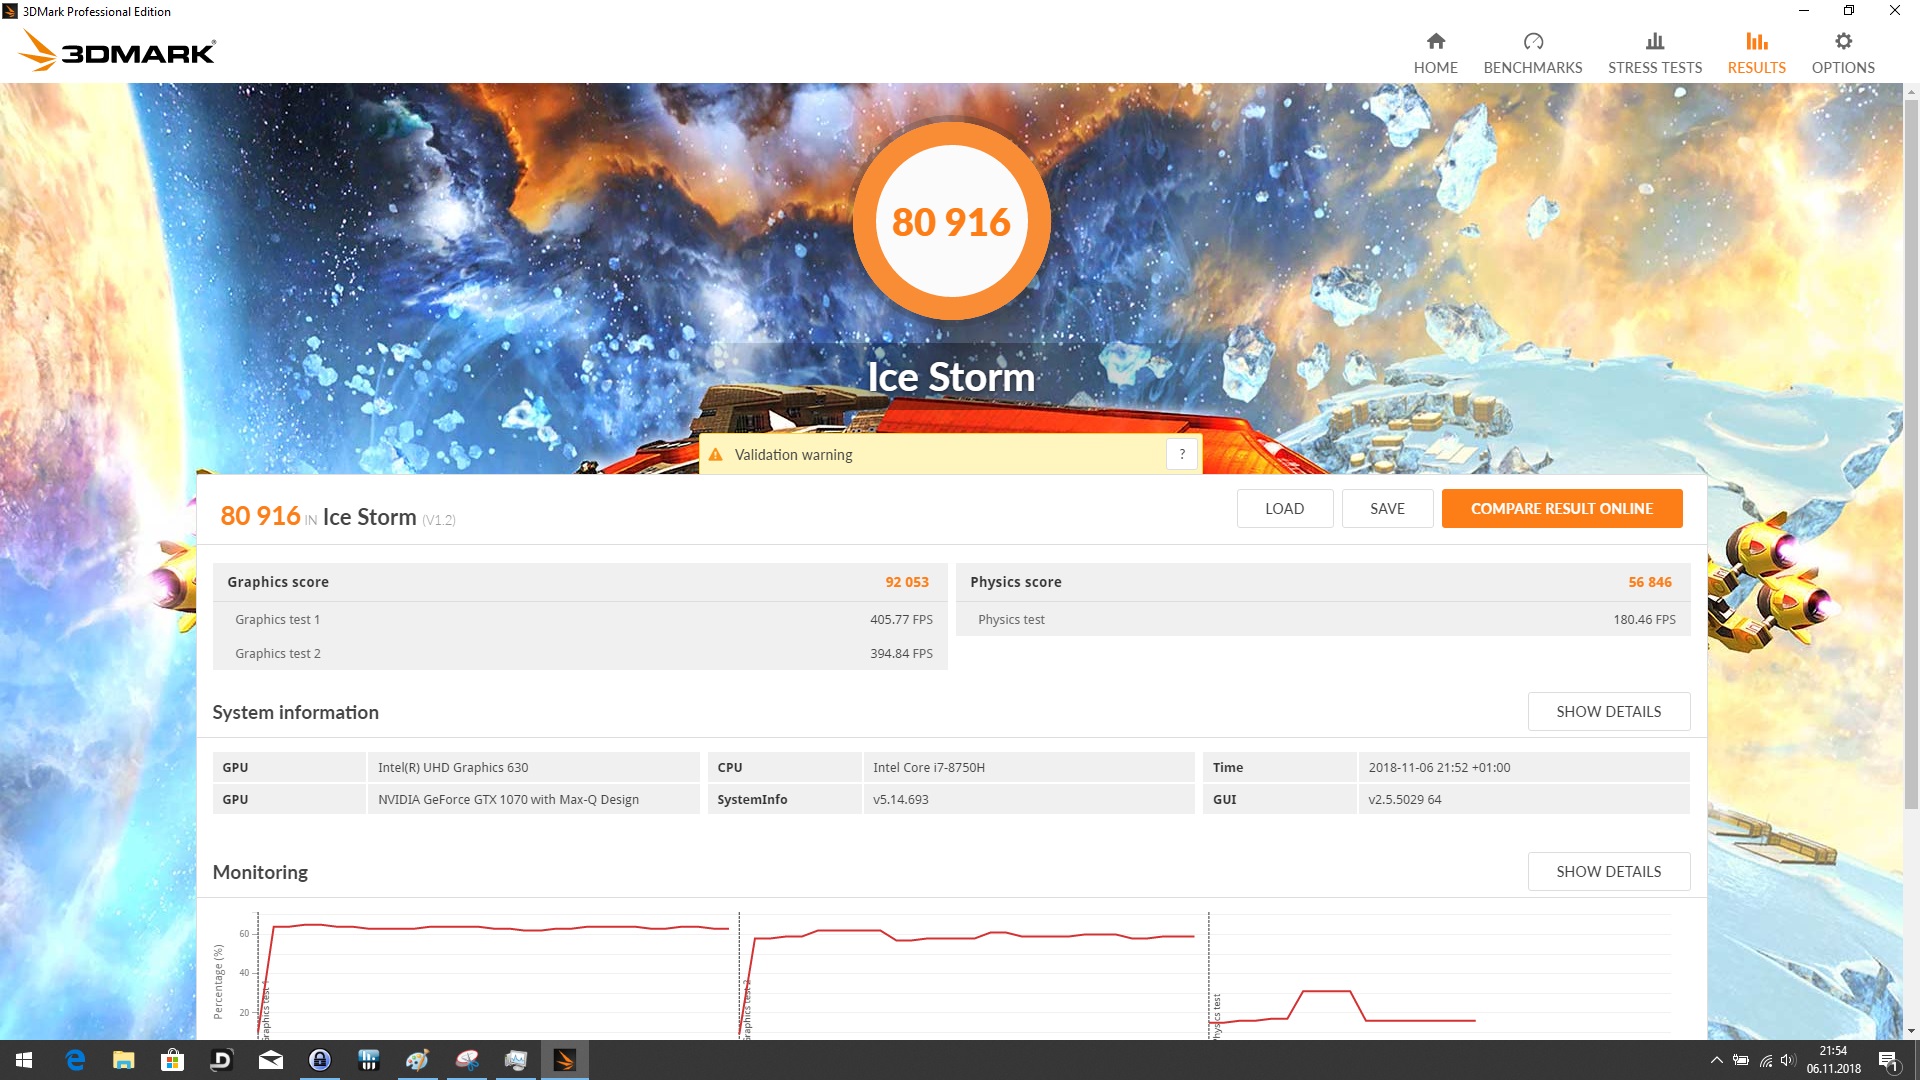
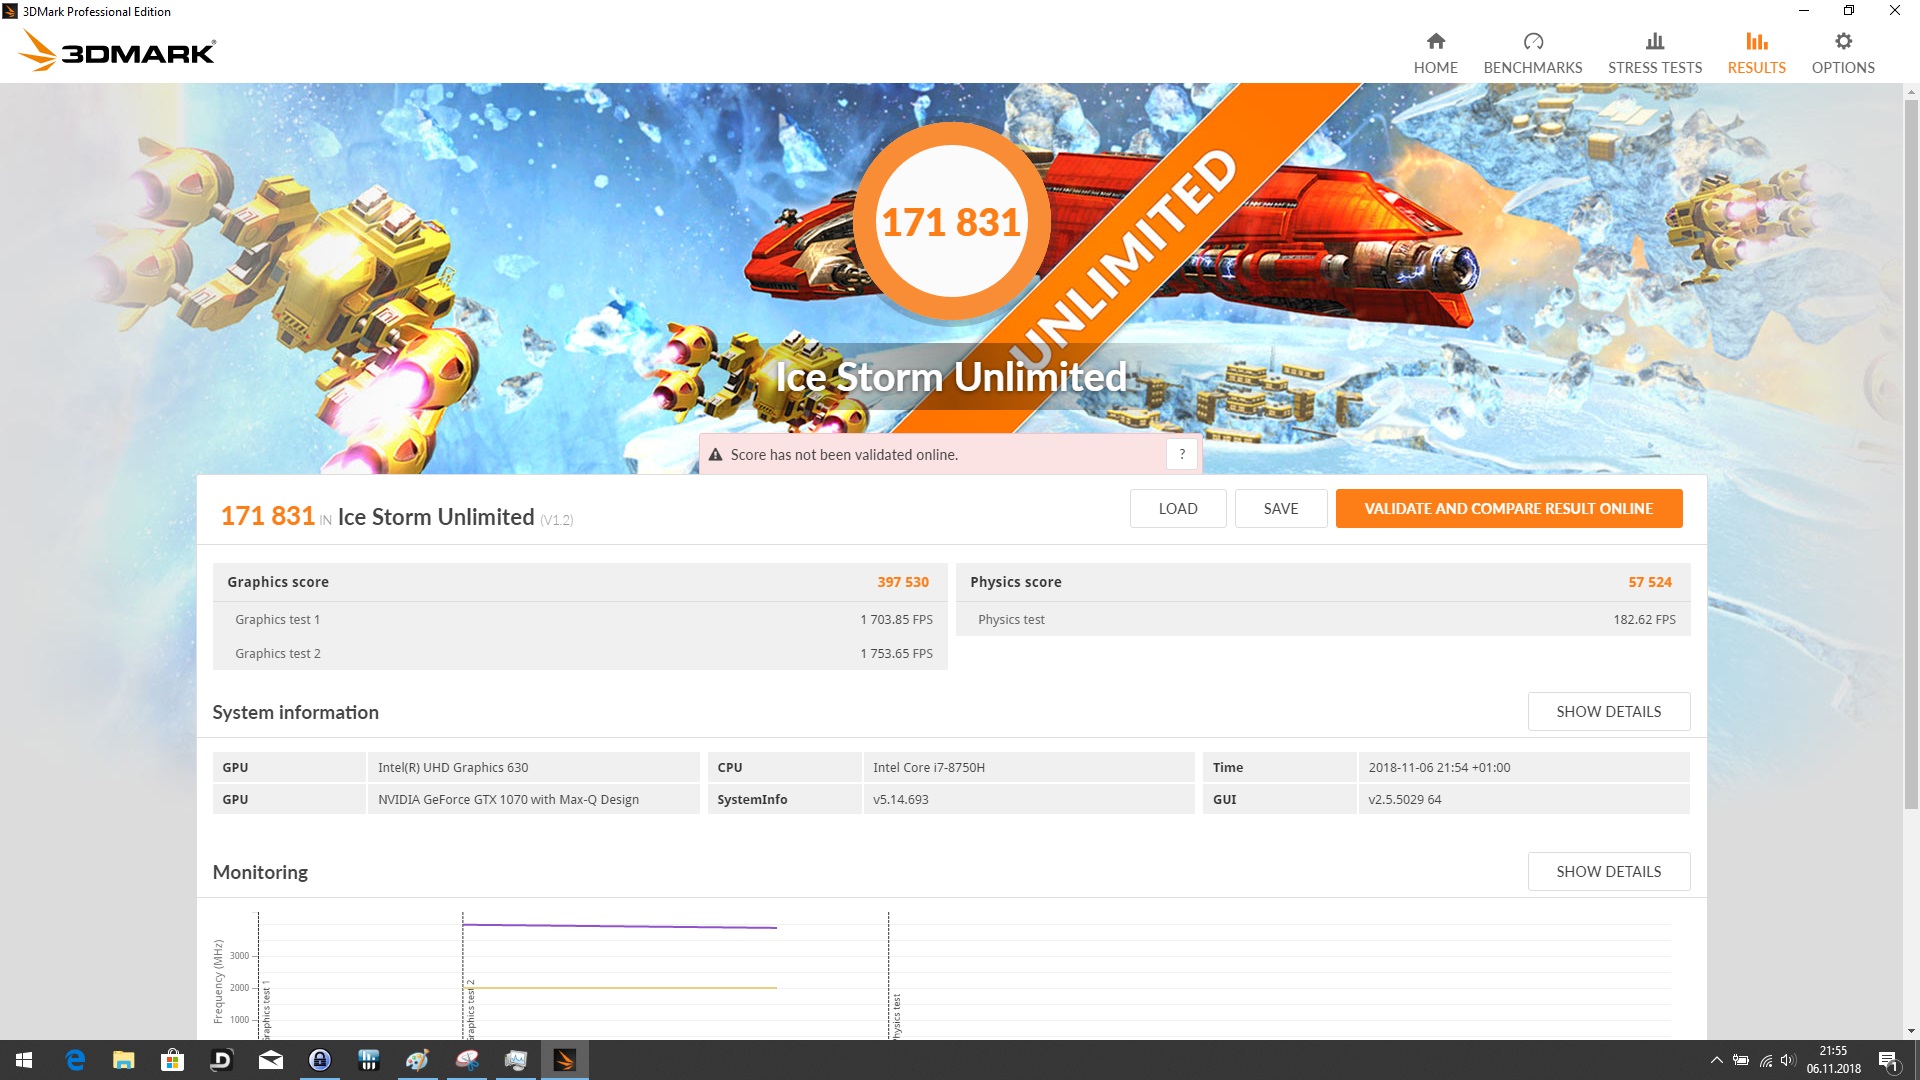
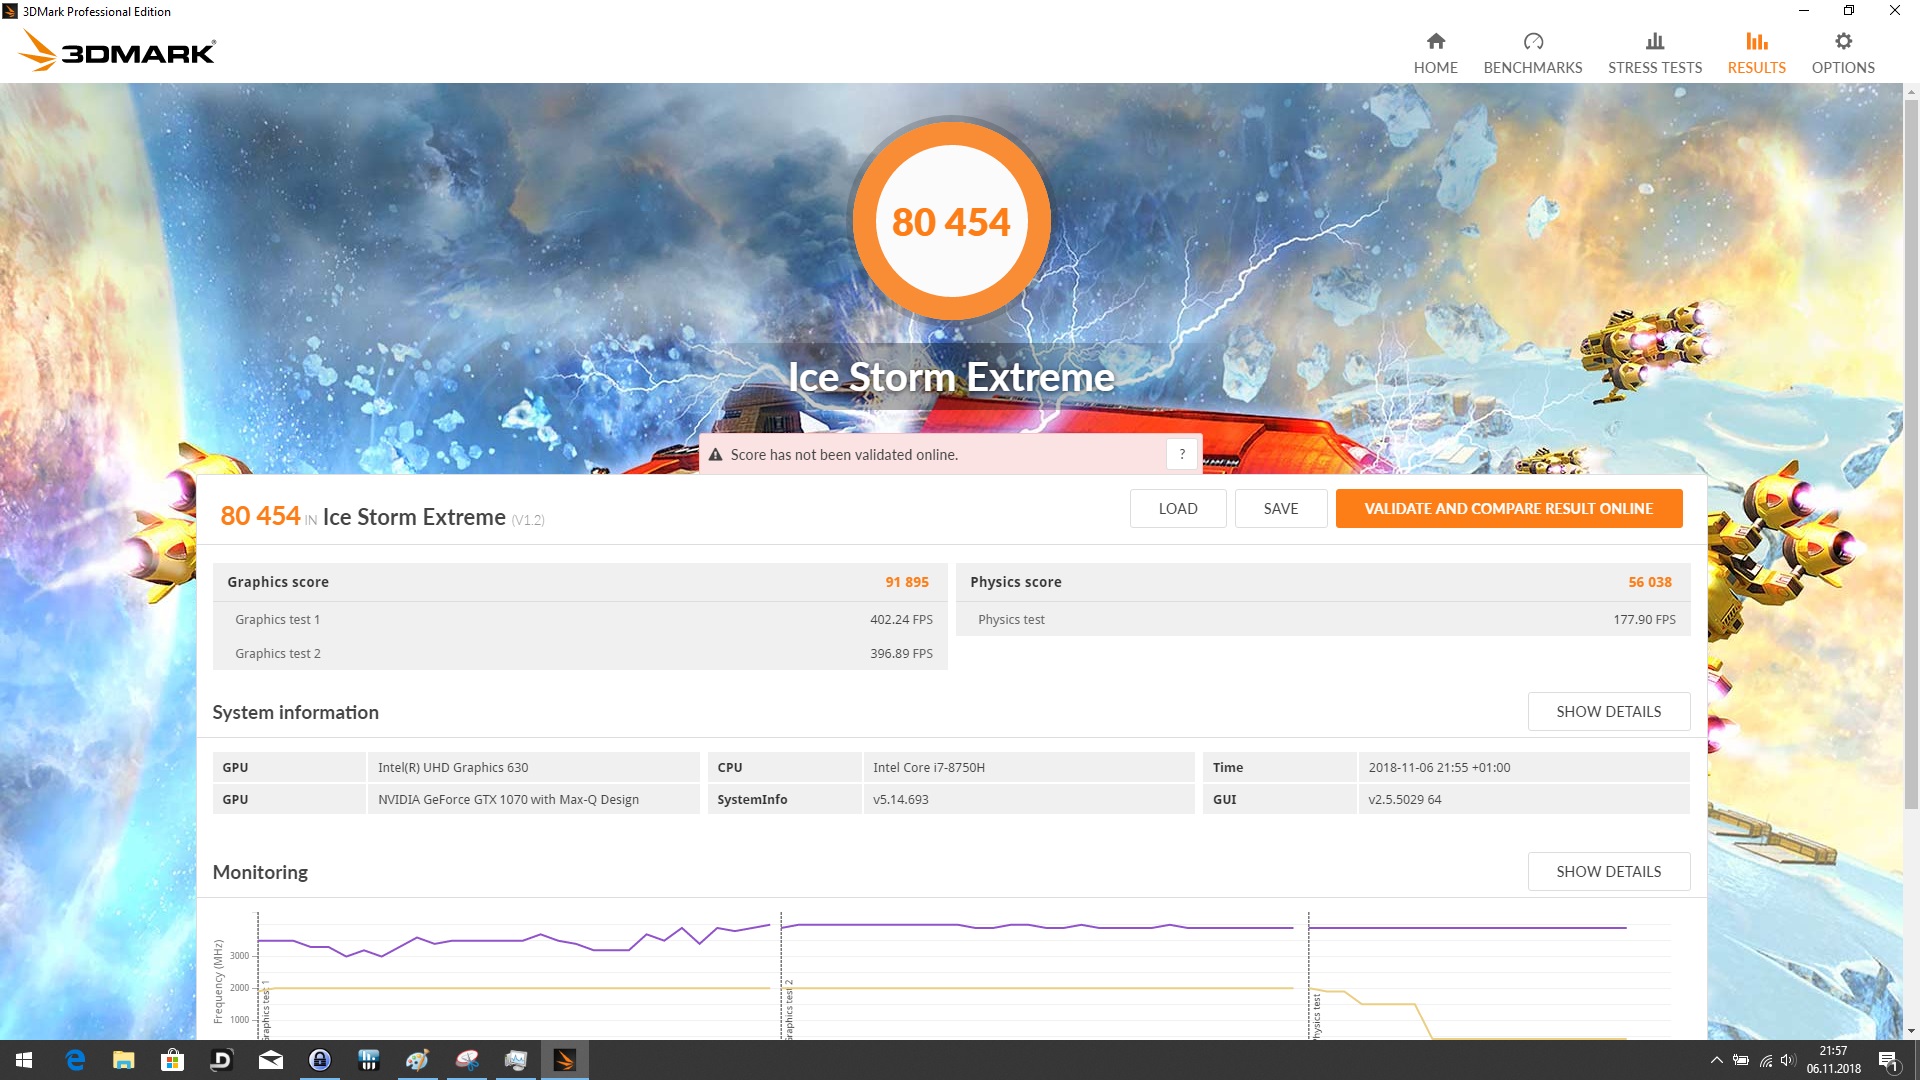
| 3DMark Ice Storm Standard Score | 80916 points | |
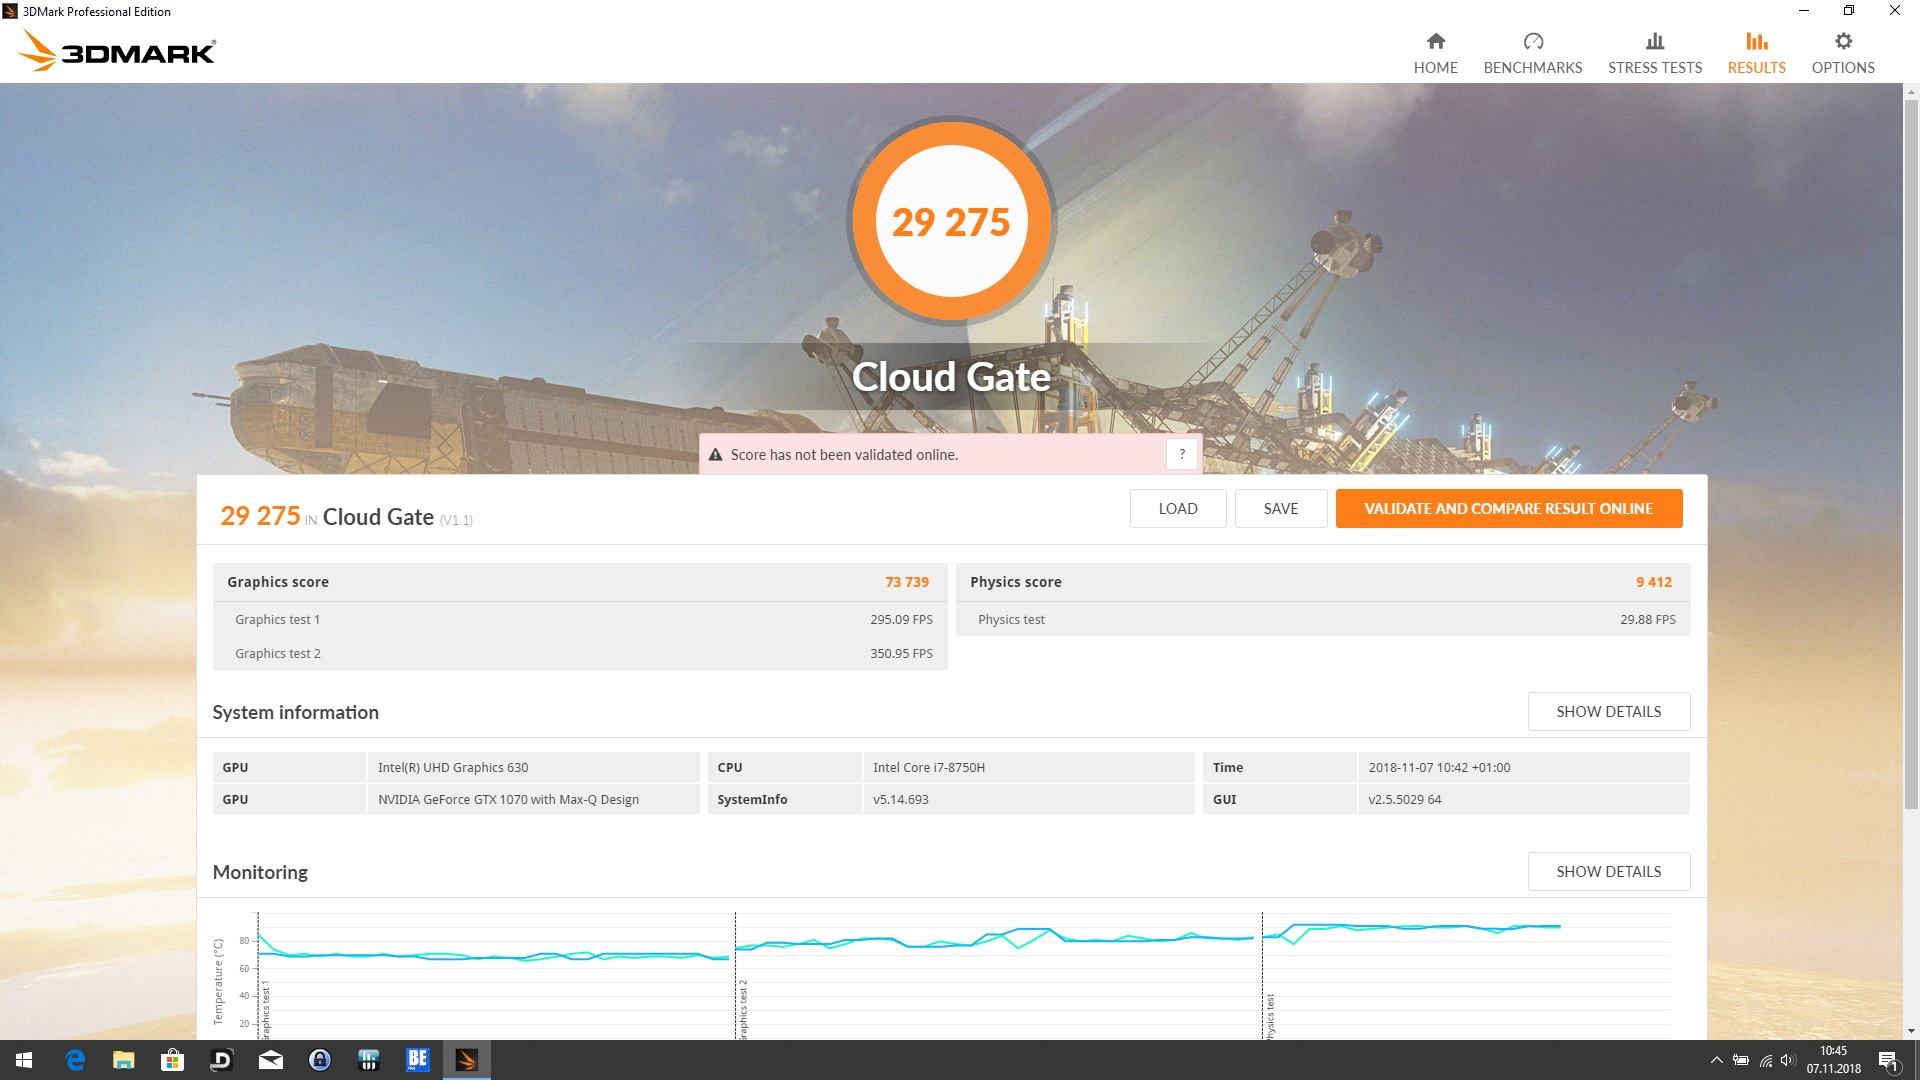
| 3DMark Cloud Gate Standard Score | 29275 points | |
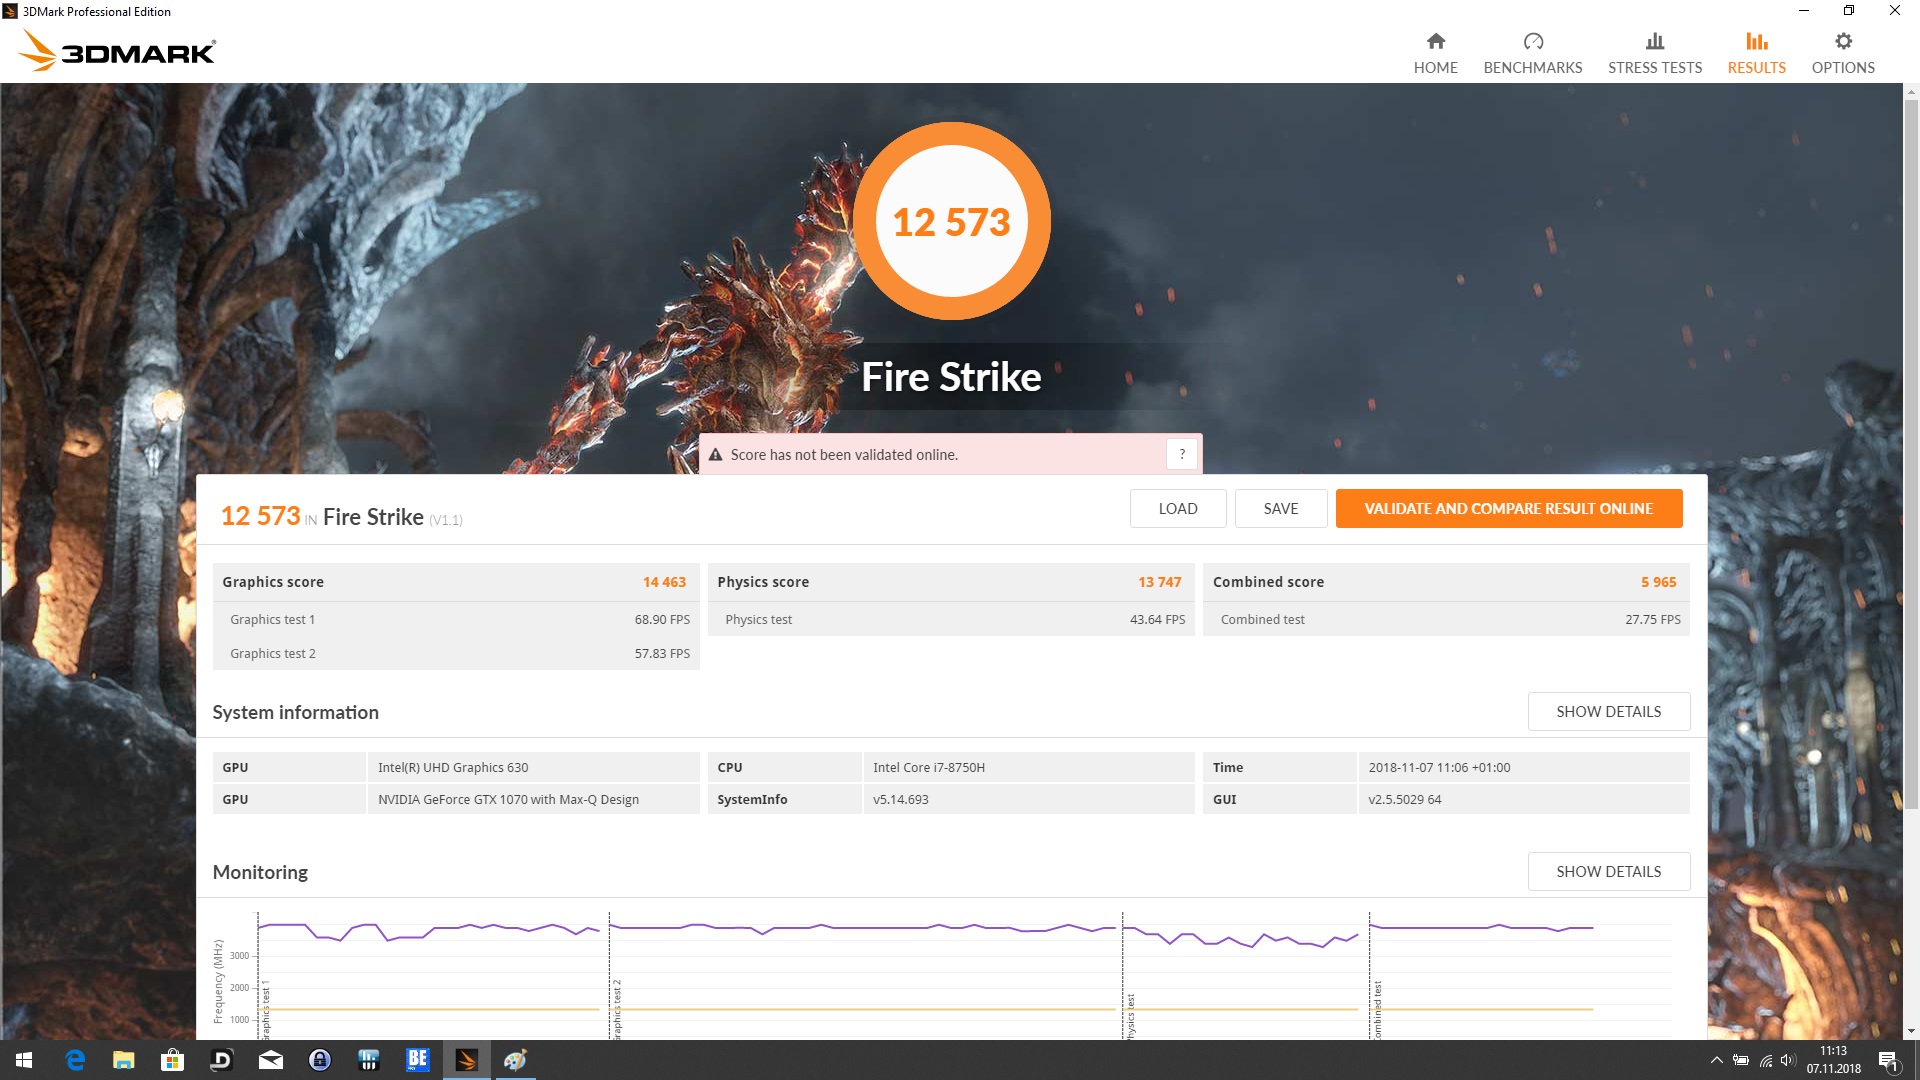
| 3DMark Fire Strike Score | 12573 points | |
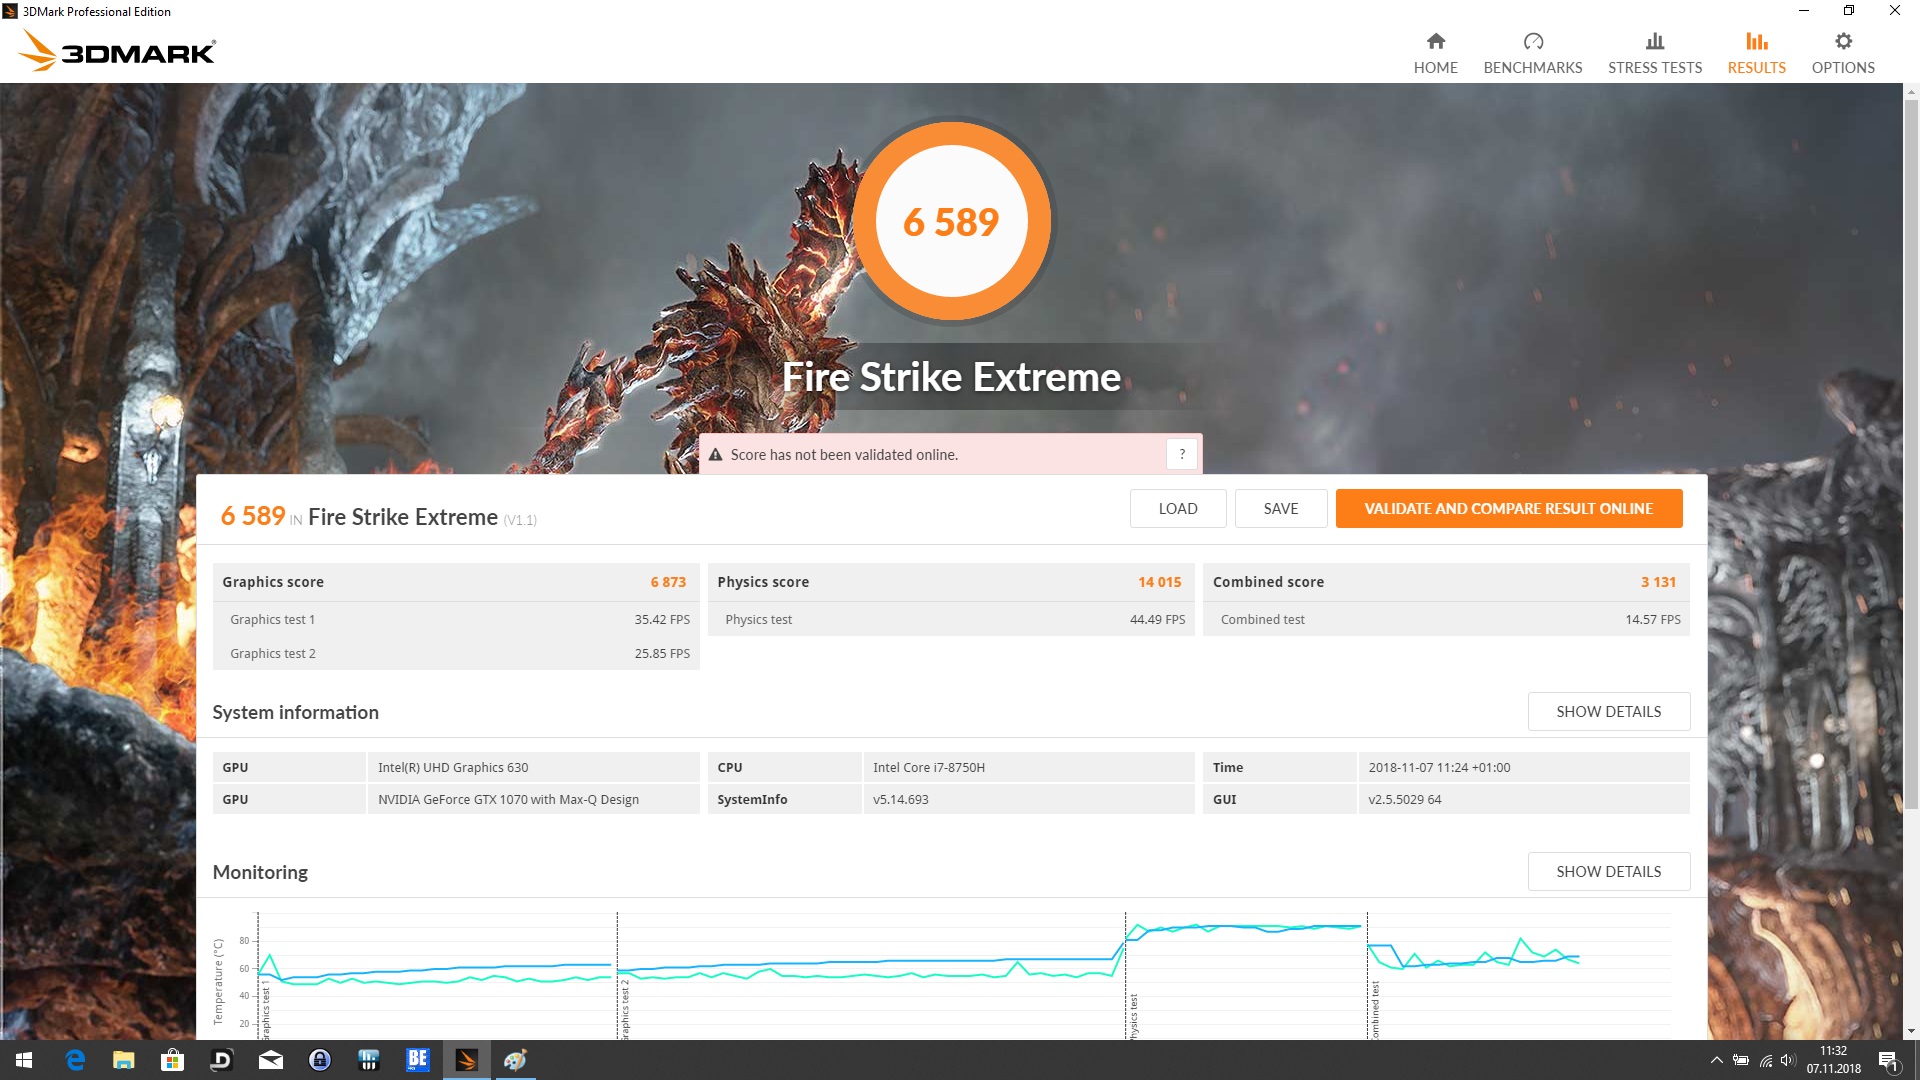
| 3DMark Fire Strike Extreme Score | 6589 points | |
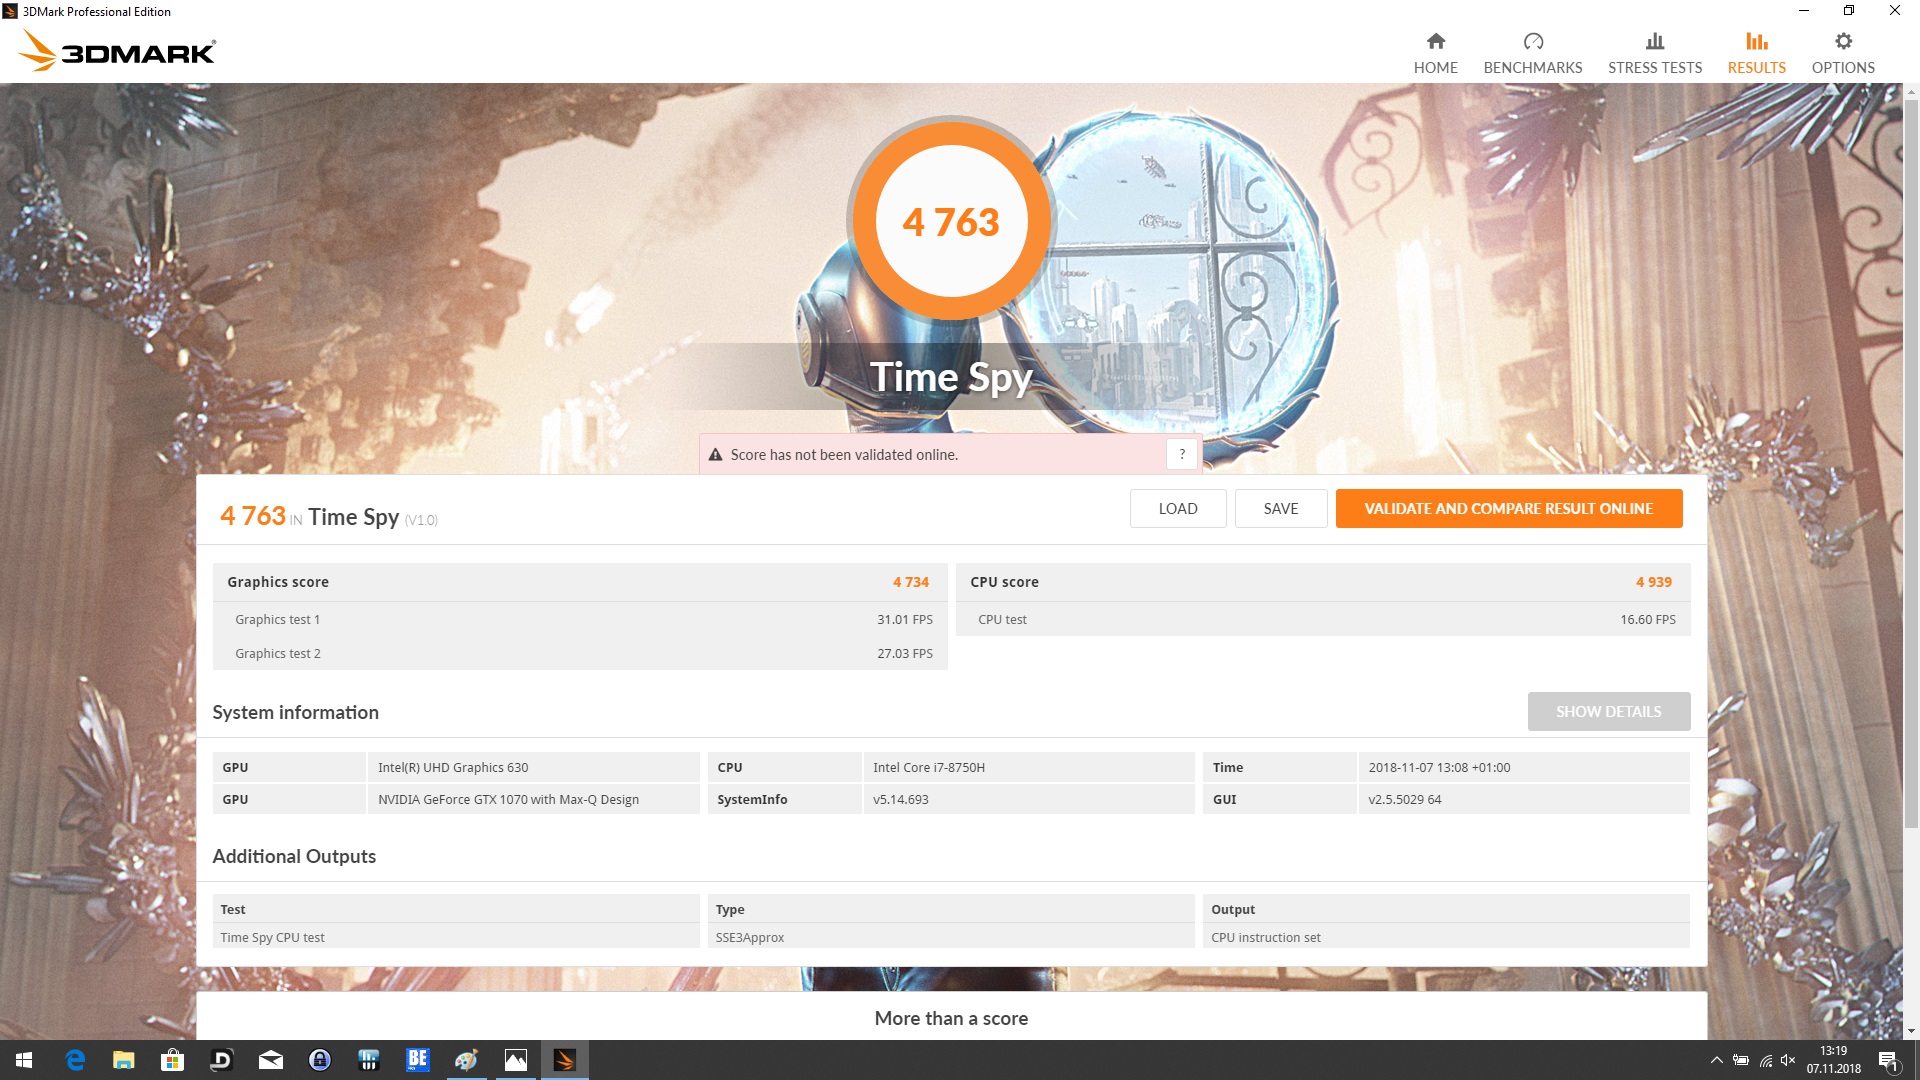
| 3DMark Time Spy Score | 4763 points | |
Help | ||
Gaming Performance
Even though the MSI P65 Creator was made with professional workloads in mind it is capable of running the latest games perfectly smooth in 1080p thanks to its hexa-core CPU and its GeForce GTX 1070 Max-Q GPU. Higher resolutions require a faster GPU, though.
In our sustained load The Witcher 3 test the P65 8RF performed admirably even though we were able to determine a slight drop in performance, from 53 FPS at the beginning to 49.9 FPS after around 30 minutes. The minimum of 45 FPS means that we did not experience any annoying frame drops whatsoever.
Additional GeForce GTX 1070 Max-Q gaming benchmarks can be found here.
| The Witcher 3 - 1920x1080 Ultra Graphics & Postprocessing (HBAO+) | |
| Asus GL504GS | |
| Average of class Multimedia (11 - 121, n=7, last 2 years) | |
| MSI GS65 8RF-019DE Stealth Thin | |
| Gigabyte Aero 15X v8 | |
| MSI P65 8RF-451 - Creator | |
| Average NVIDIA GeForce GTX 1070 Max-Q (46 - 55.3, n=19) | |
| MSI WS63 7RF-290US | |
| Lenovo ThinkPad X1 Extreme-20MF000XGE | |
| Asus ZenBook Pro 15 UX580GE | |
| Shadow of the Tomb Raider - 1920x1080 Highest Preset AA:T | |
| Average of class Multimedia (23 - 129, n=8, last 2 years) | |
| Average NVIDIA GeForce GTX 1070 Max-Q (58 - 61, n=3) | |
| MSI P65 8RF-451 - Creator | |
| Lenovo ThinkPad X1 Extreme-20MF000XGE | |
| F1 2018 - 1920x1080 Ultra High Preset AA:T AF:16x | |
| MSI P65 8RF-451 - Creator | |
| Average NVIDIA GeForce GTX 1070 Max-Q (70 - 76, n=3) | |
| Lenovo ThinkPad X1 Extreme-20MF000XGE | |
| Forza Horizon 4 - 1920x1080 Ultra Preset AA:2xMS | |
| Average NVIDIA GeForce GTX 1070 Max-Q (78 - 80, n=2) | |
| MSI P65 8RF-451 - Creator | |
| low | med. | high | ultra | 4K | |
|---|---|---|---|---|---|
| BioShock Infinite (2013) | 249.1 | 222.1 | 204.7 | 118 | |
| The Witcher 3 (2015) | 218.5 | 156.7 | 93.2 | 51.5 | 27.7 |
| Rise of the Tomb Raider (2016) | 131.1 | 126.7 | 85.7 | 77.1 | 32.1 |
| Battlefield 1 (2016) | 123.2 | 105.5 | 91.5 | 90.7 | 39.1 |
| Assassin´s Creed Origins (2017) | 70 | 64 | 62 | 53 | 26 |
| Far Cry 5 (2018) | 103 | 81 | 77 | 74 | 27 |
| F1 2018 (2018) | 163 | 130 | 100 | 76 | 59 |
| Shadow of the Tomb Raider (2018) | 91 | 65 | 62 | 58 | 20 |
| Forza Horizon 4 (2018) | 127 | 101 | 95 | 78 | 43 |
| Assassin´s Creed Odyssey (2018) | 64 | 62 | 52 | 39 | 21 |
Emissions
System Noise
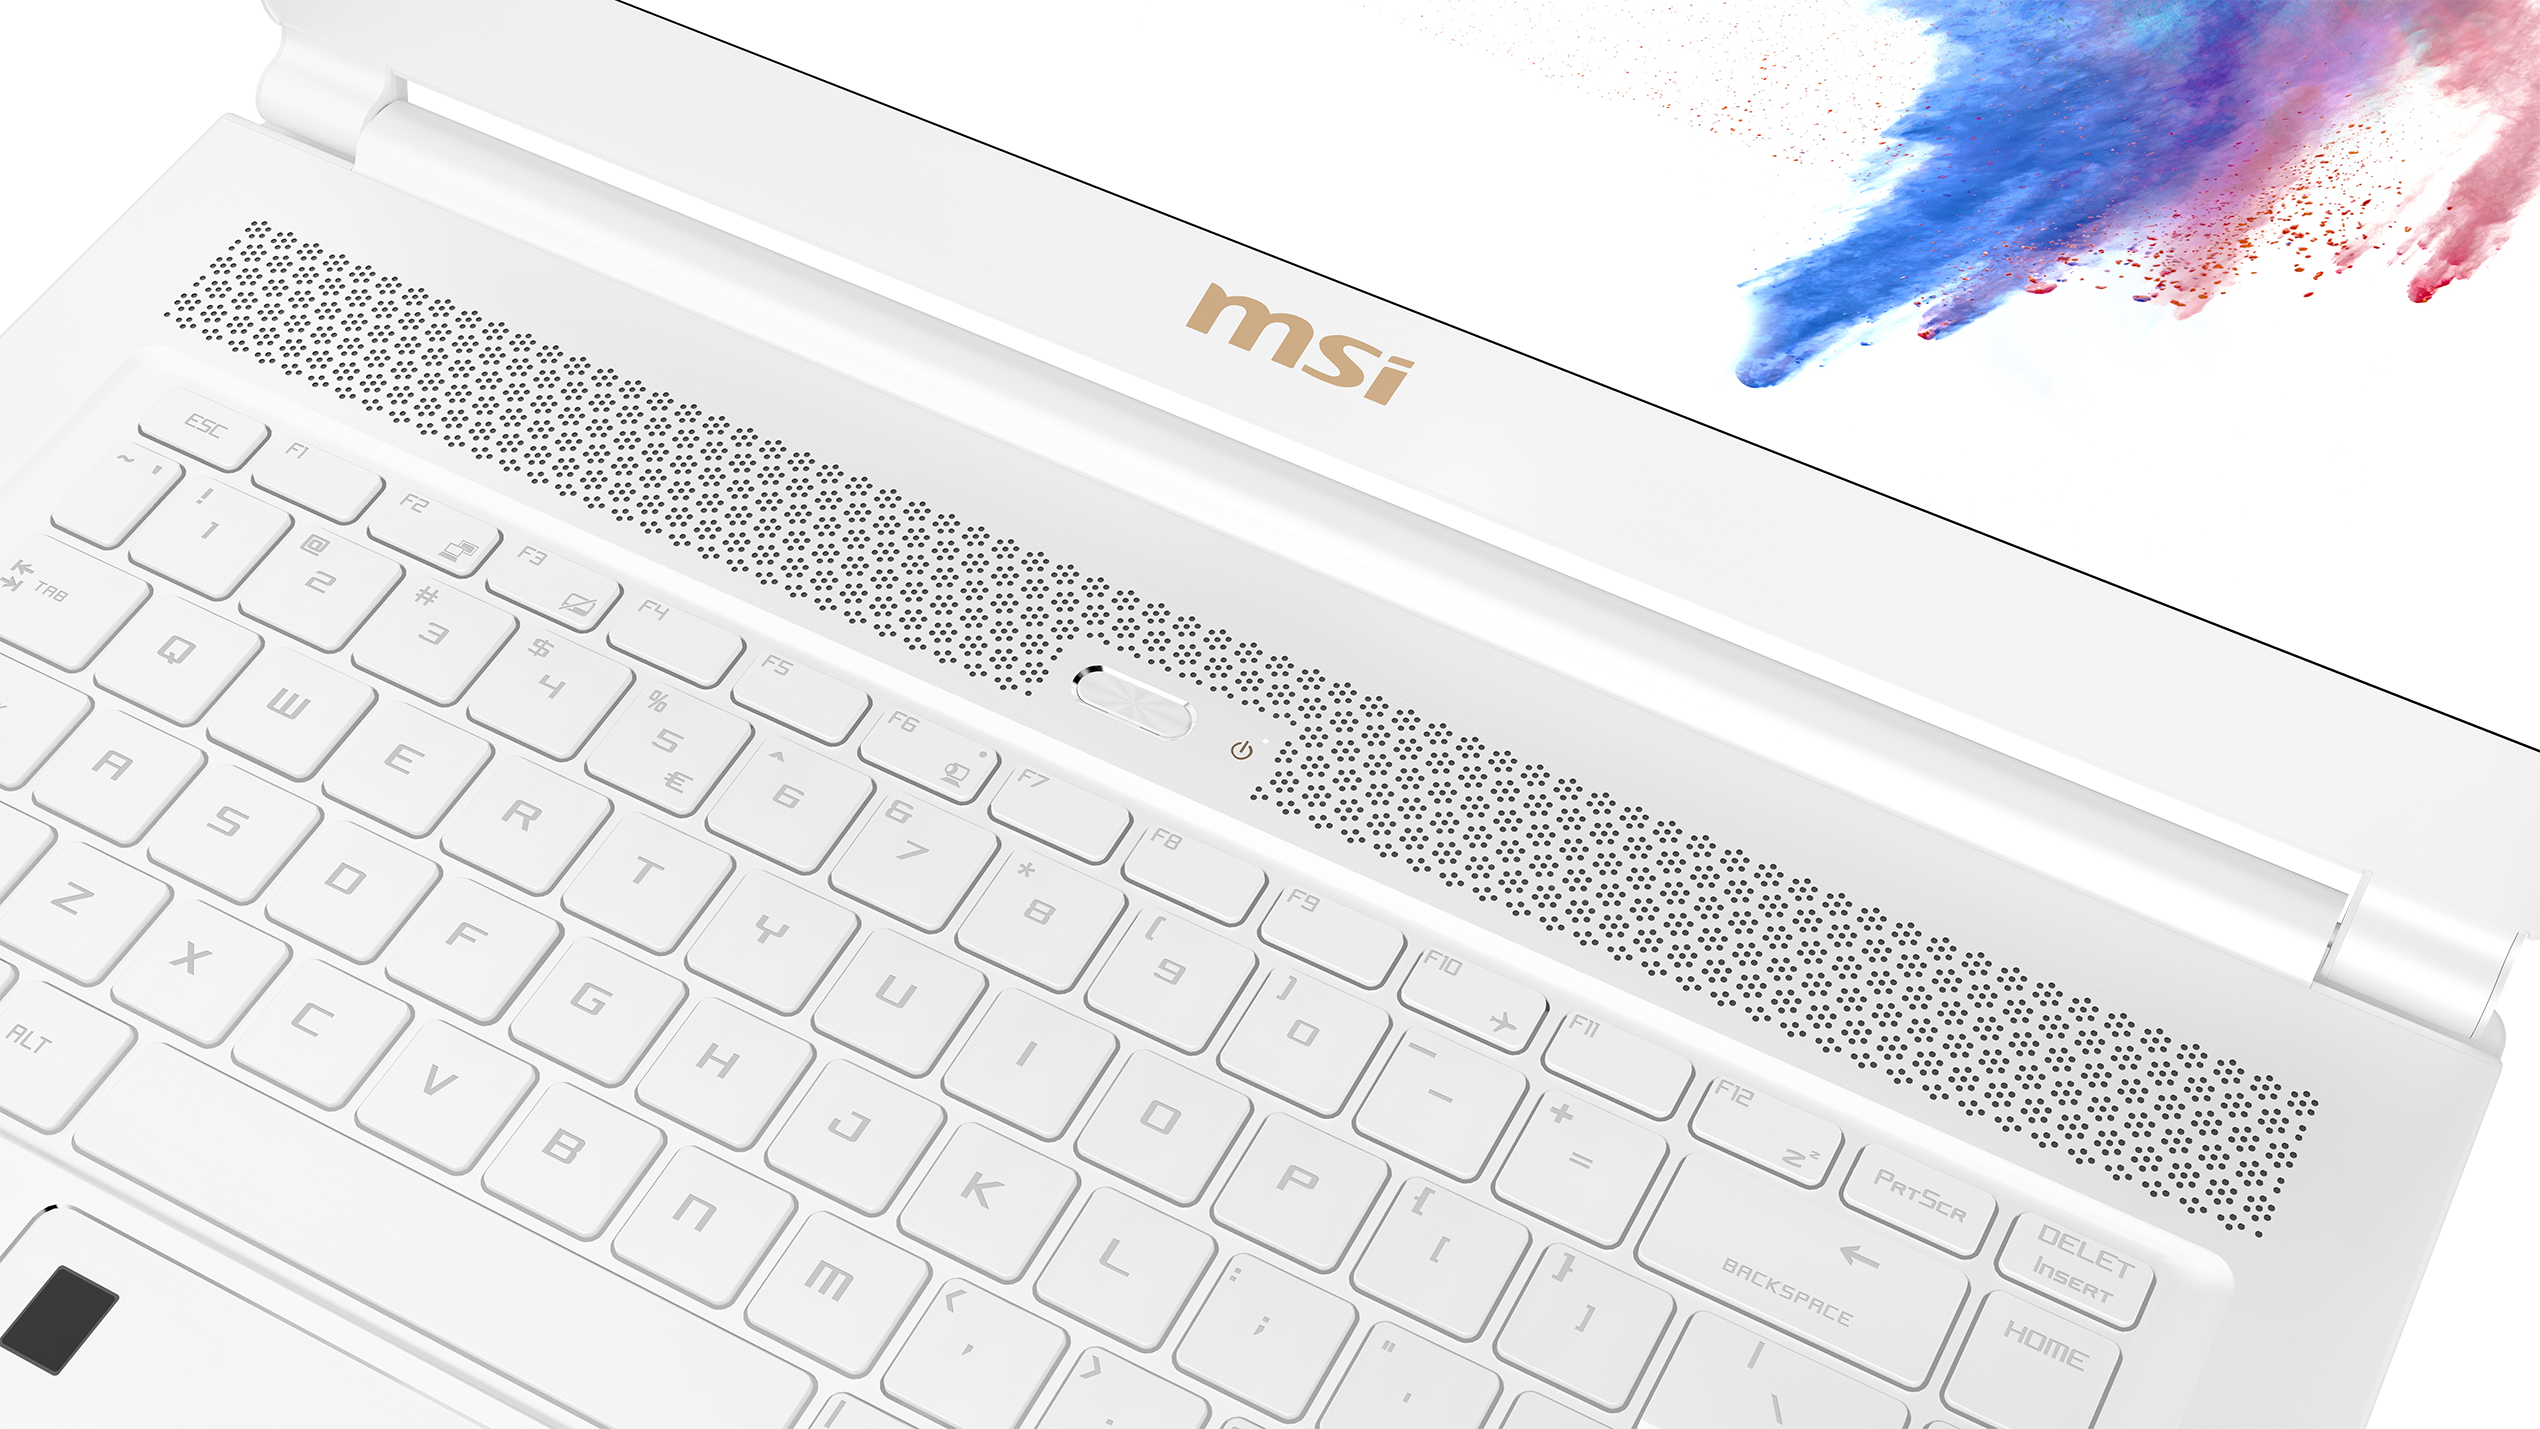
The MSI P65 Creator proved to be a fairly quiet notebook by and large. However, since the fans are always running it is not a silent device by any means. Accordingly, we measured a sound pressure level of 32.1 dB(A) when idle and a maximum of 40.2 dB(A) with an acceptable average of 39 dB(A) under load. The only contender even quieter was the Lenovo ThinkPad X1. Compared to its gaming brethren, the P65 did very well despite the fact that its CPU and GPU performance were on a par.
The objective measurements and numbers show a good balance. Sadly, subjective impressions painted a very different picture. Due to its thin design the fans had to be designed extremely small and thin. Accordingly, their high-pitched frequency made them seem louder than the numbers suggest. The three fans were also very quick to rev up and down continuously depending on load. Using the Dragon Center software you can fine-tune the fans to your liking to a certain degree.
Noise level
| Idle |
| 32.1 / 32.1 / 32.4 dB(A) |
| Load |
| 39 / 40.2 dB(A) |
 | ||
30 dB silent 40 dB(A) audible 50 dB(A) loud |
||
min: | ||
| MSI P65 8RF-451 - Creator Intel Core i7-8750H, NVIDIA GeForce GTX 1070 Max-Q | Asus ZenBook Pro 15 UX580GE Intel Core i9-8950HK, NVIDIA GeForce GTX 1050 Ti Mobile | Lenovo ThinkPad X1 Extreme-20MF000XGE Intel Core i7-8750H, NVIDIA GeForce GTX 1050 Ti Max-Q | Gigabyte Aero 15X v8 Intel Core i7-8750H, NVIDIA GeForce GTX 1070 Max-Q | Asus GL504GS Intel Core i7-8750H, NVIDIA GeForce GTX 1070 Mobile | MSI GS65 8RF-019DE Stealth Thin Intel Core i7-8750H, NVIDIA GeForce GTX 1070 Max-Q | MSI WS63 7RF-290US Intel Core i7-7700HQ, NVIDIA Quadro P3000 | |
|---|---|---|---|---|---|---|---|
| Noise | 2% | 6% | -9% | -13% | -2% | 3% | |
| off / environment * (dB) | 30.7 | 28 9% | 28.8 6% | 29 6% | 29 6% | 30 2% | 28.1 8% |
| Idle Minimum * (dB) | 32.1 | 28.6 11% | 28.8 10% | 30 7% | 32 -0% | 30 7% | 28.1 12% |
| Idle Average * (dB) | 32.1 | 29.9 7% | 28.8 10% | 31 3% | 33 -3% | 31 3% | 28.1 12% |
| Idle Maximum * (dB) | 32.4 | 30.5 6% | 31.3 3% | 35 -8% | 40 -23% | 34 -5% | 32 1% |
| Load Average * (dB) | 39 | 42.5 -9% | 36.4 7% | 49 -26% | 49 -26% | 43 -10% | 38 3% |
| Load Maximum * (dB) | 40.2 | 44.8 -11% | 39.2 2% | 54 -34% | 53 -32% | 44 -9% | 47.2 -17% |
| Witcher 3 ultra * (dB) | 44.8 | 36.4 | 51 | 51 | 42 | 35.8 |
* ... smaller is better
Temperature
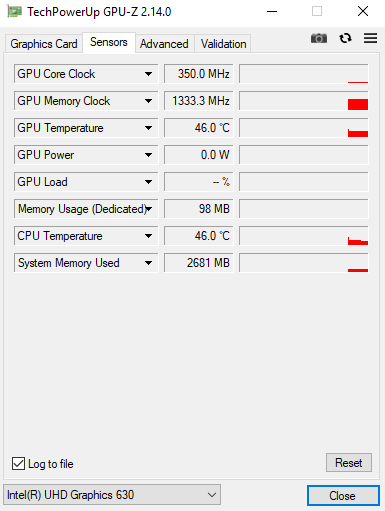
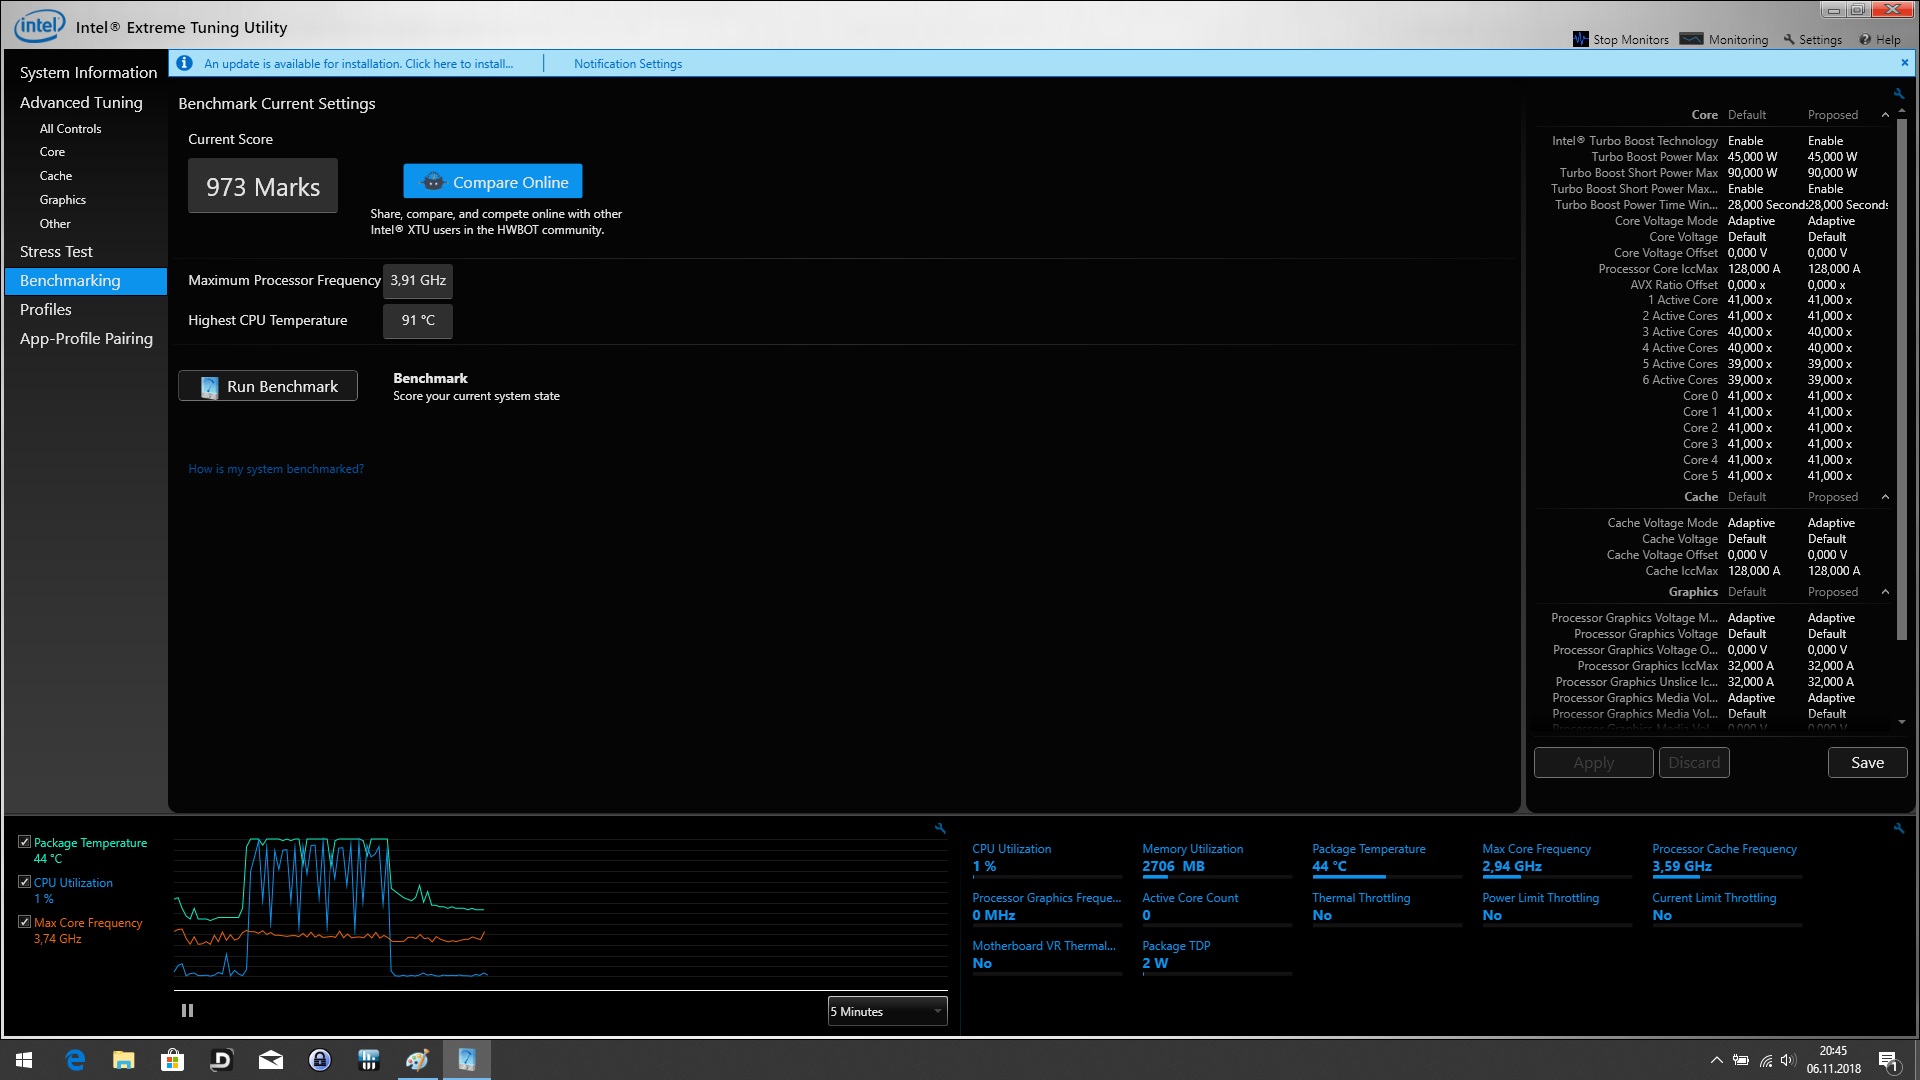
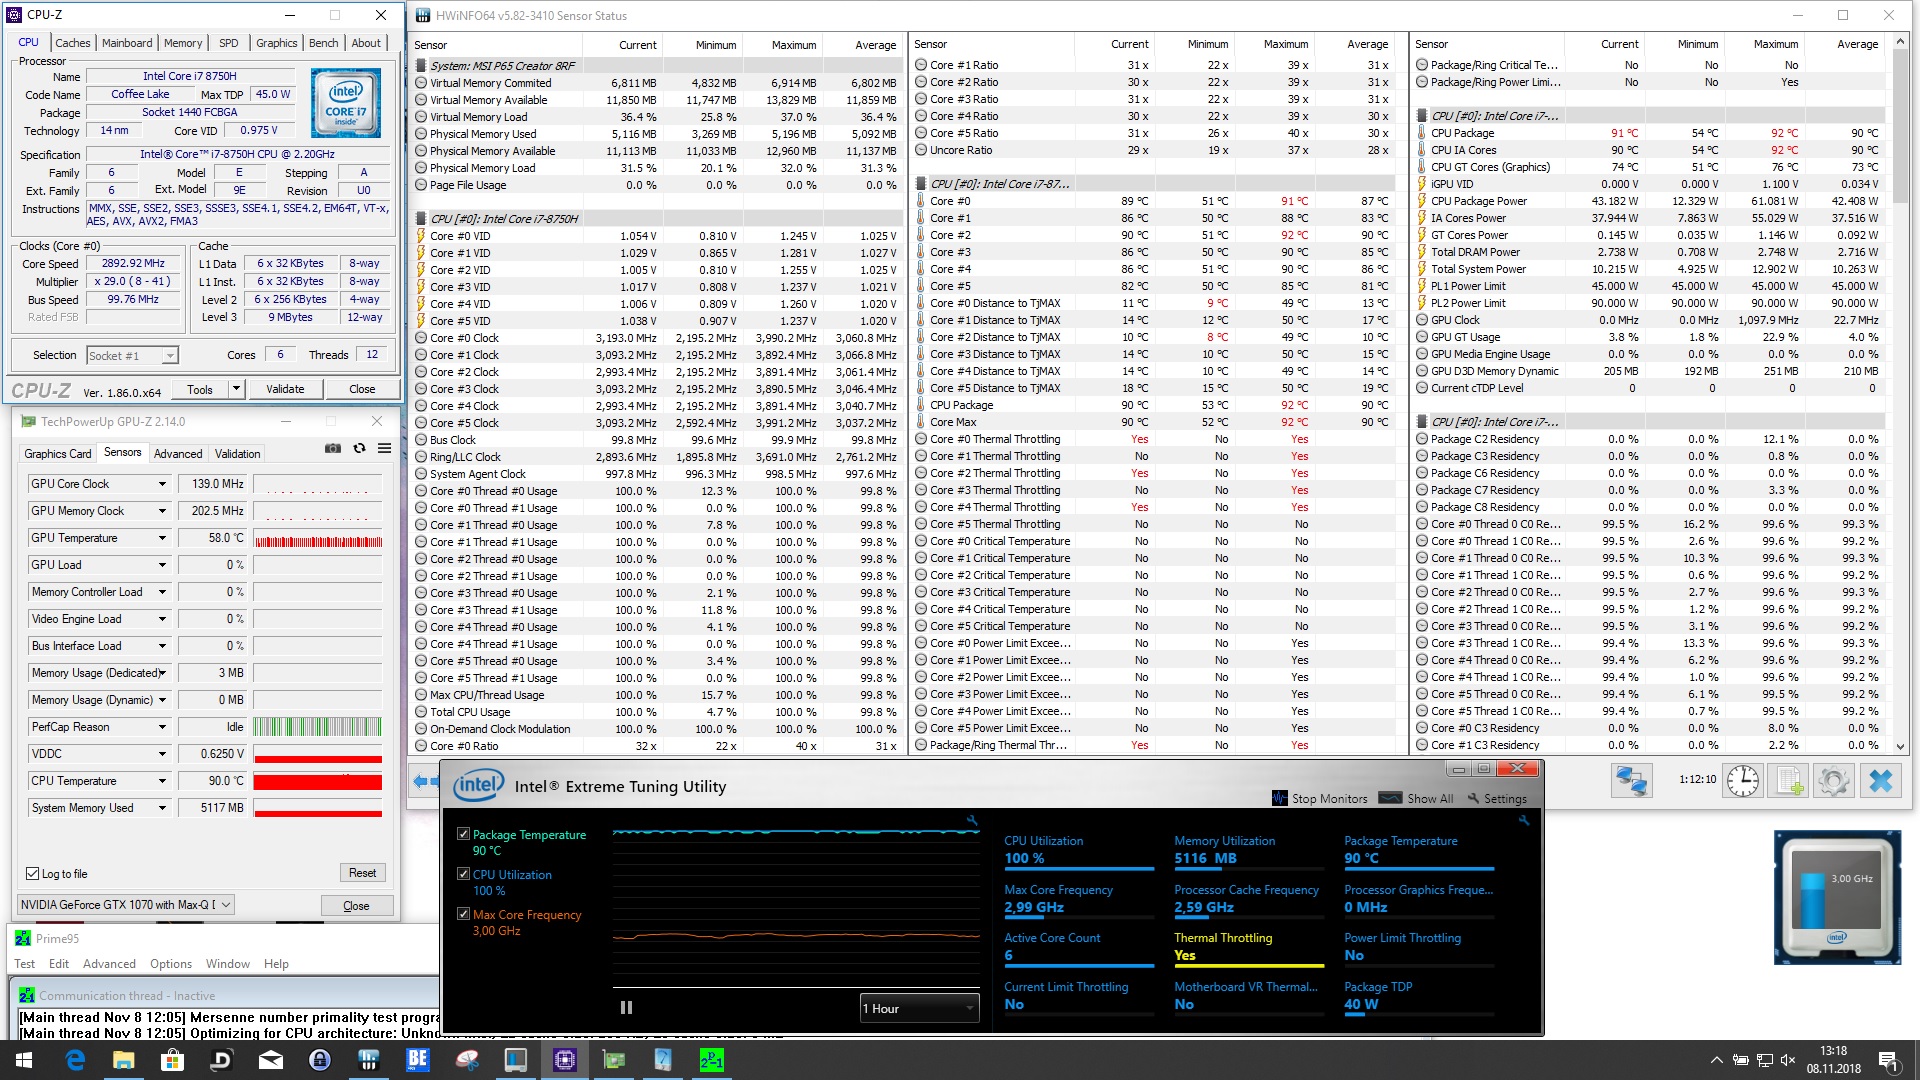
By running our stress test we take a closer look at thermal characteristics under load. While running Prime95, temperatures shot up to 92 °C very quickly, a point at which the CPU started to thermal throttle in order to prevent damage. Eventually, the Core i7-8750H settled at 3 GHz and thus still significantly above its base clock frequency.
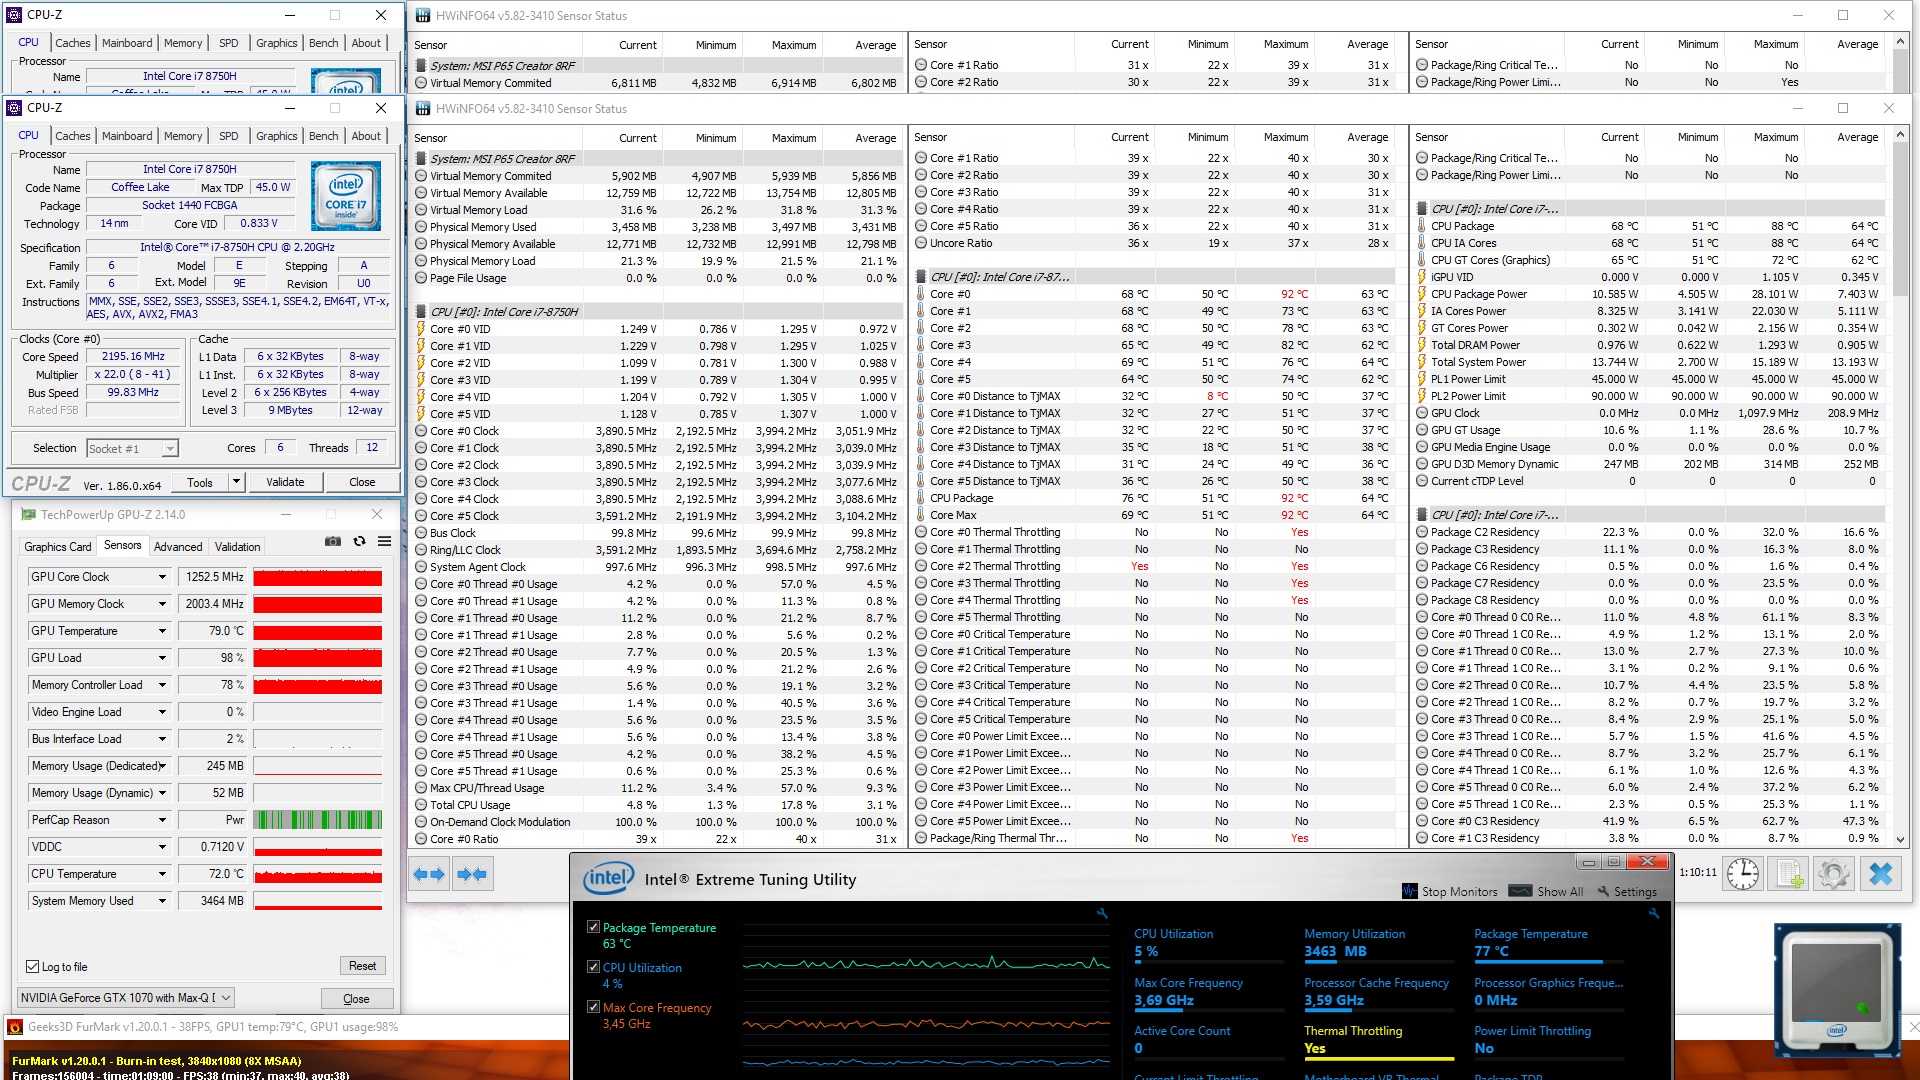
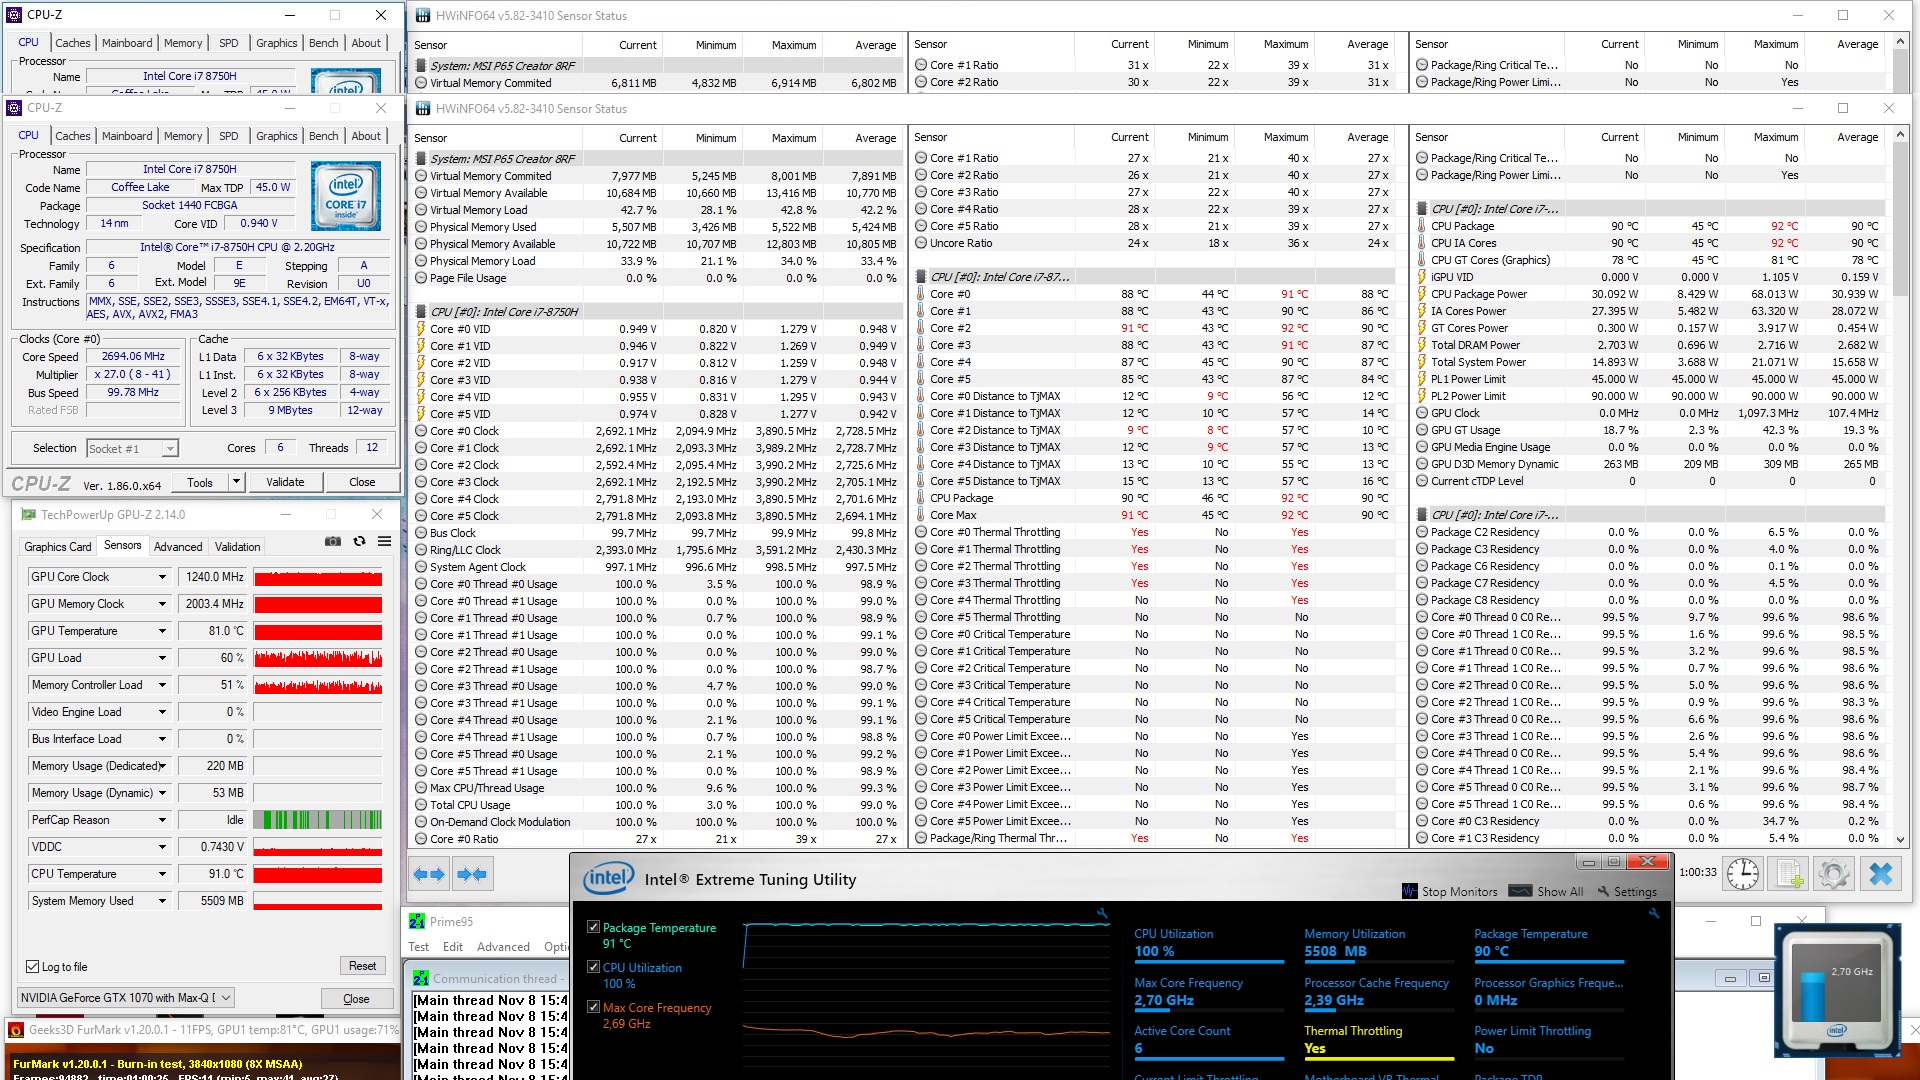
Our GPU stress test consists of running FurMark for at least a full hour. During this test, the maximum GPU temperature recorded was 79 °C. However, due to the compact design of the case the high GPU temperature had an effect on CPU temperature as well, and it once again topped out at 92 °C. Running Prime95 and FurMark simultaneously resulted in a CPU temperature of 92 °C and a GPU temperature of 81 °C.
By running 3DMark 11 immediately following our stress test without giving the device any time to cool off we attempt to determine possible detrimental effects of maximum load on overall performance. To our surprise it performed almost identical to a cold start.
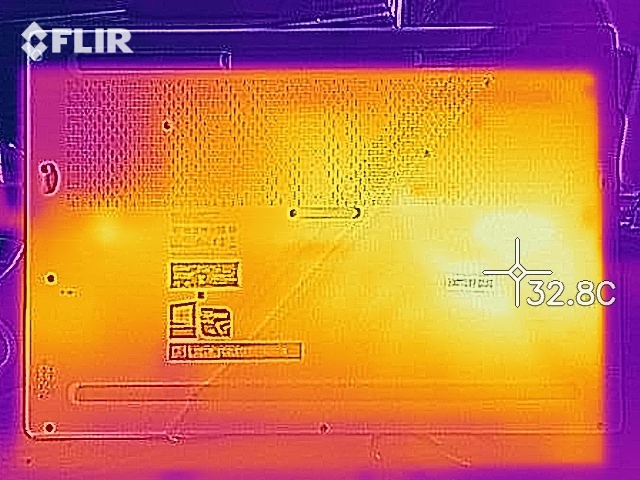
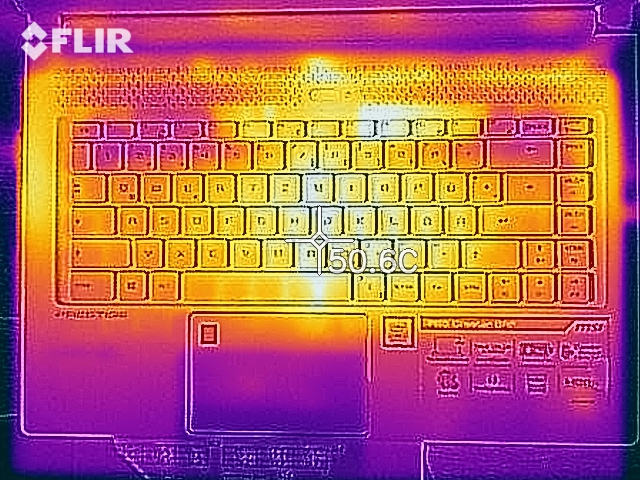
(-) The maximum temperature on the upper side is 46.6 °C / 116 F, compared to the average of 36.8 °C / 98 F, ranging from 21 to 71 °C for the class Multimedia.
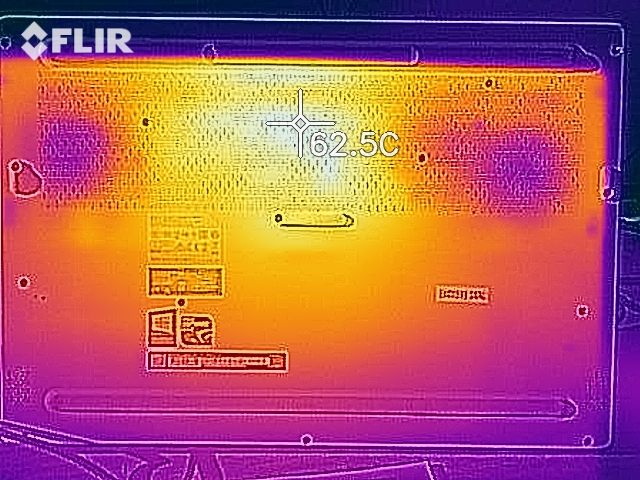
(-) The bottom heats up to a maximum of 56.6 °C / 134 F, compared to the average of 39.1 °C / 102 F
(+) In idle usage, the average temperature for the upper side is 27 °C / 81 F, compared to the device average of 31.3 °C / 88 F.
(-) The palmrests and touchpad can get very hot to the touch with a maximum of 41.7 °C / 107.1 F.
(-) The average temperature of the palmrest area of similar devices was 28.7 °C / 83.7 F (-13 °C / -23.4 F).
| MSI P65 8RF-451 - Creator GeForce GTX 1070 Max-Q, i7-8750H, Kingston RBUSNS8154P3512GJ | Asus ZenBook Pro 15 UX580GE GeForce GTX 1050 Ti Mobile, i9-8950HK, Samsung SSD PM961 1TB M.2 PCIe 3.0 x4 NVMe (MZVLW1T0) | Lenovo ThinkPad X1 Extreme-20MF000XGE GeForce GTX 1050 Ti Max-Q, i7-8750H, Samsung SSD PM981 MZVLB1T0HALR | Gigabyte Aero 15X v8 GeForce GTX 1070 Max-Q, i7-8750H, Toshiba NVMe THNSN5512GPU7 | Asus GL504GS GeForce GTX 1070 Mobile, i7-8750H, Samsung SSD PM981 MZVLB512HAJQ | MSI GS65 8RF-019DE Stealth Thin GeForce GTX 1070 Max-Q, i7-8750H, Samsung SSD PM981 MZVLB512HAJQ | MSI WS63 7RF-290US Quadro P3000, i7-7700HQ, Samsung SM961 MZVKW512HMJP m.2 PCI-e | |
|---|---|---|---|---|---|---|---|
| Heat | -5% | 7% | -6% | -17% | 3% | -2% | |
| Maximum Upper Side * (°C) | 46.6 | 42.4 9% | 45.4 3% | 53 -14% | 55 -18% | 49 -5% | 46.4 -0% |
| Maximum Bottom * (°C) | 56.6 | 50.8 10% | 53.4 6% | 65 -15% | 55 3% | 63 -11% | 62 -10% |
| Idle Upper Side * (°C) | 28.8 | 33 -15% | 26.3 9% | 26 10% | 36 -25% | 24 17% | 28.2 2% |
| Idle Bottom * (°C) | 28.5 | 35.2 -24% | 26.2 8% | 30 -5% | 36 -26% | 25 12% | 28.8 -1% |
* ... smaller is better

Speakers
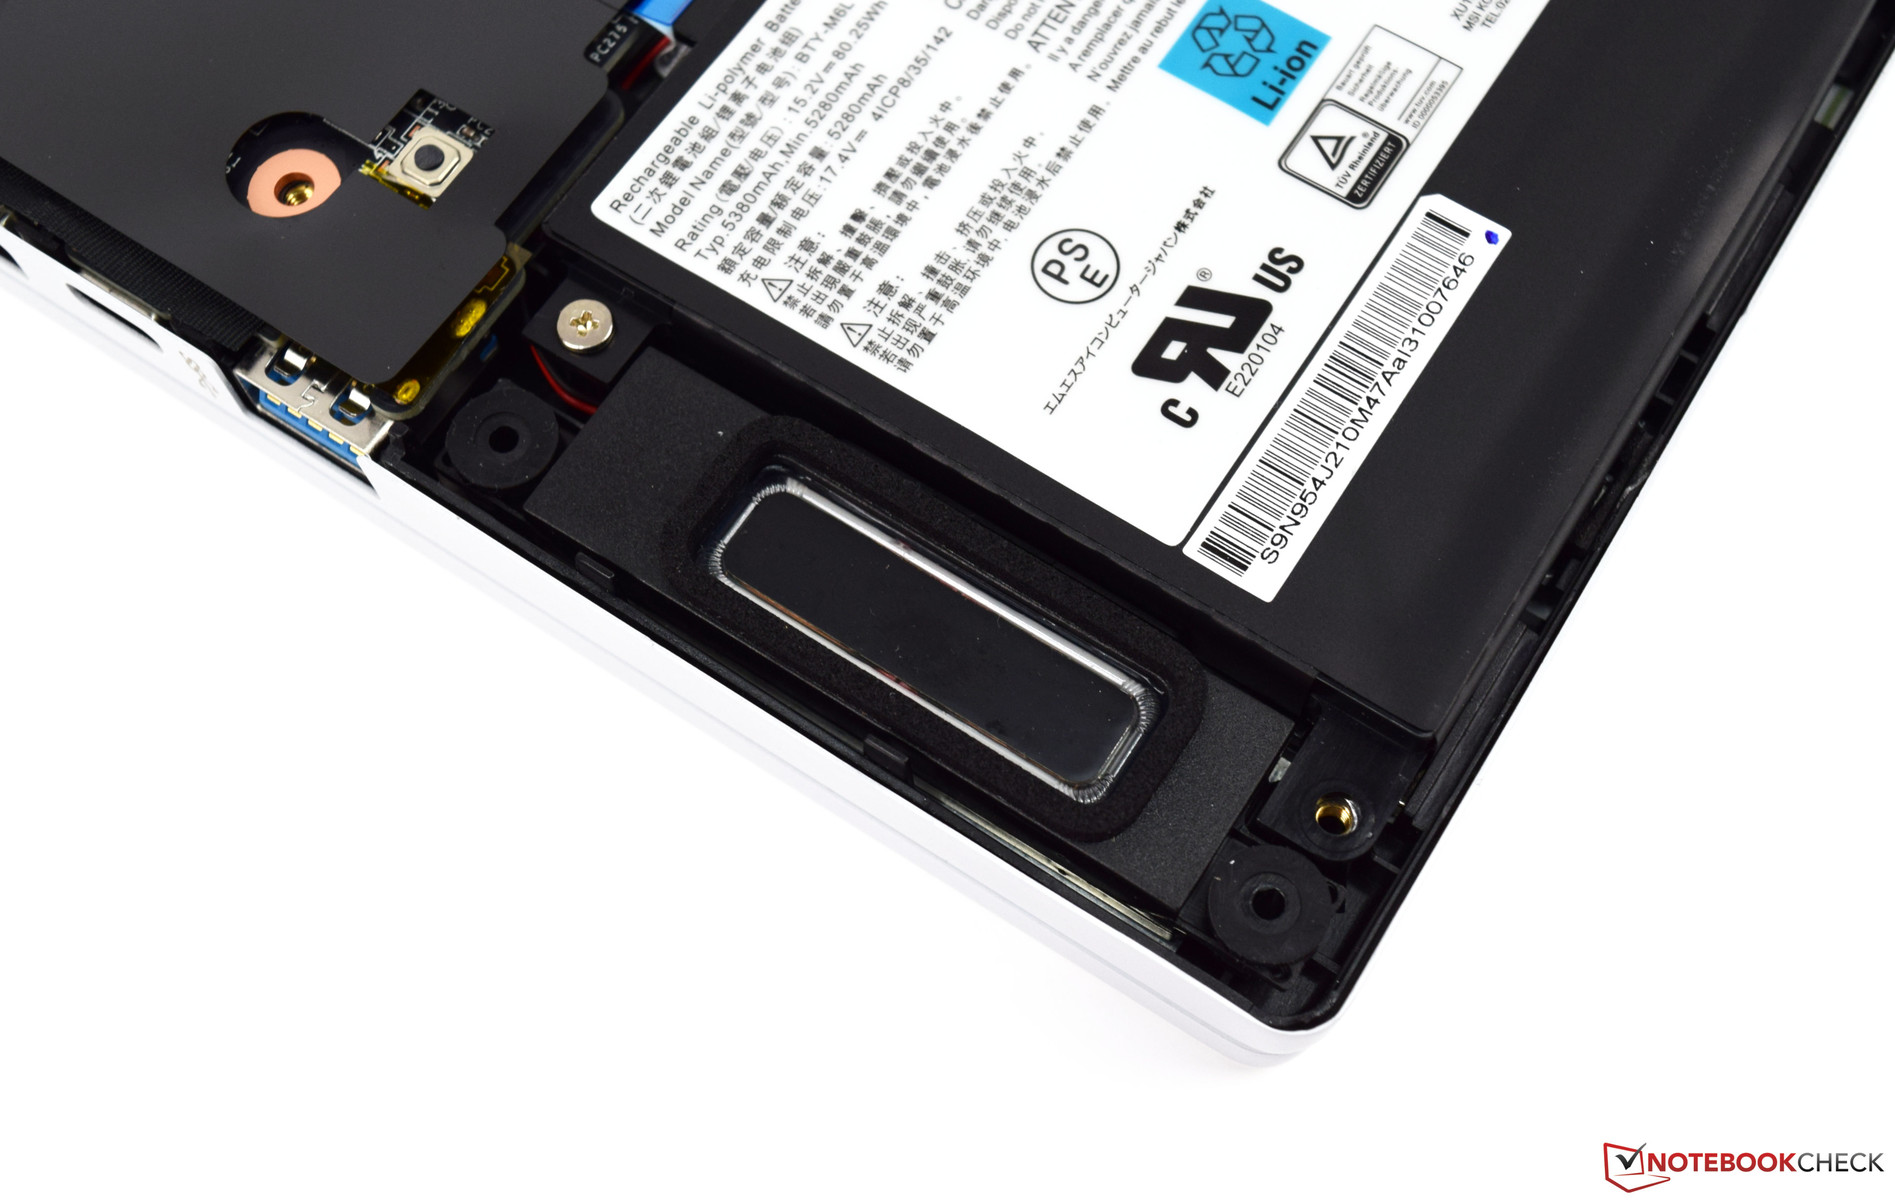
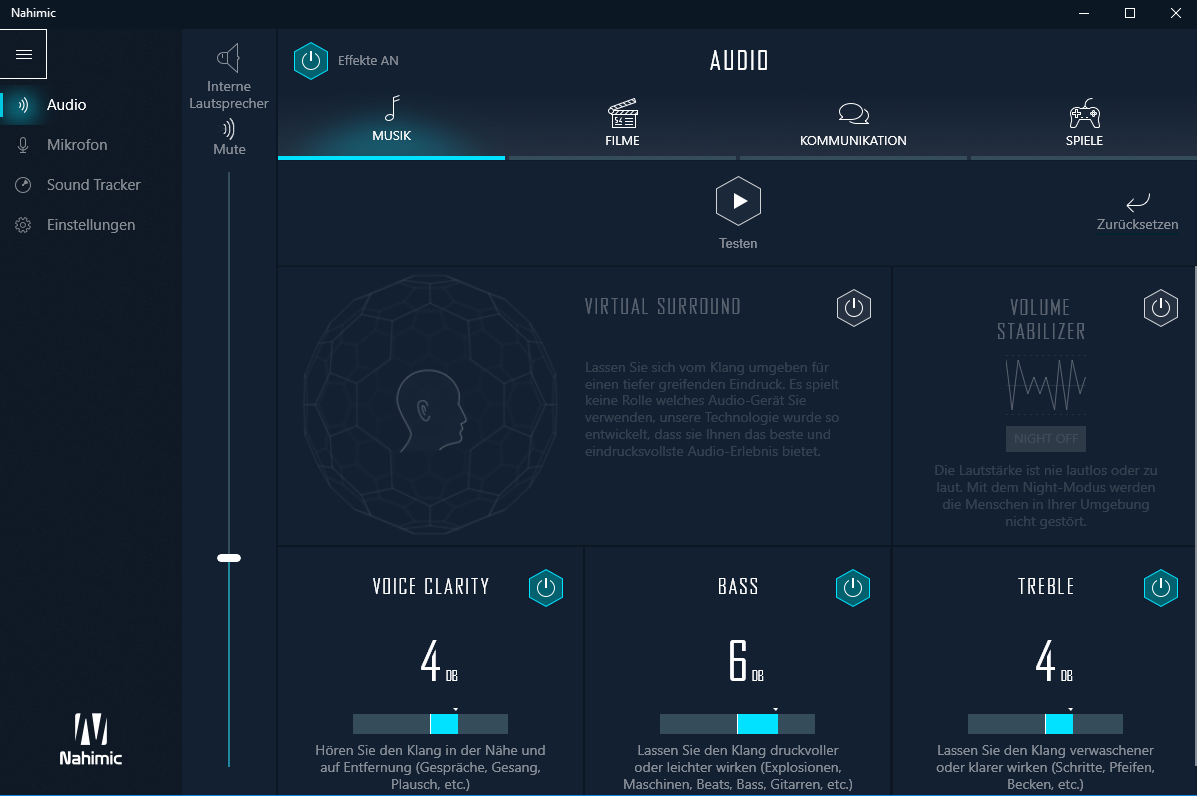
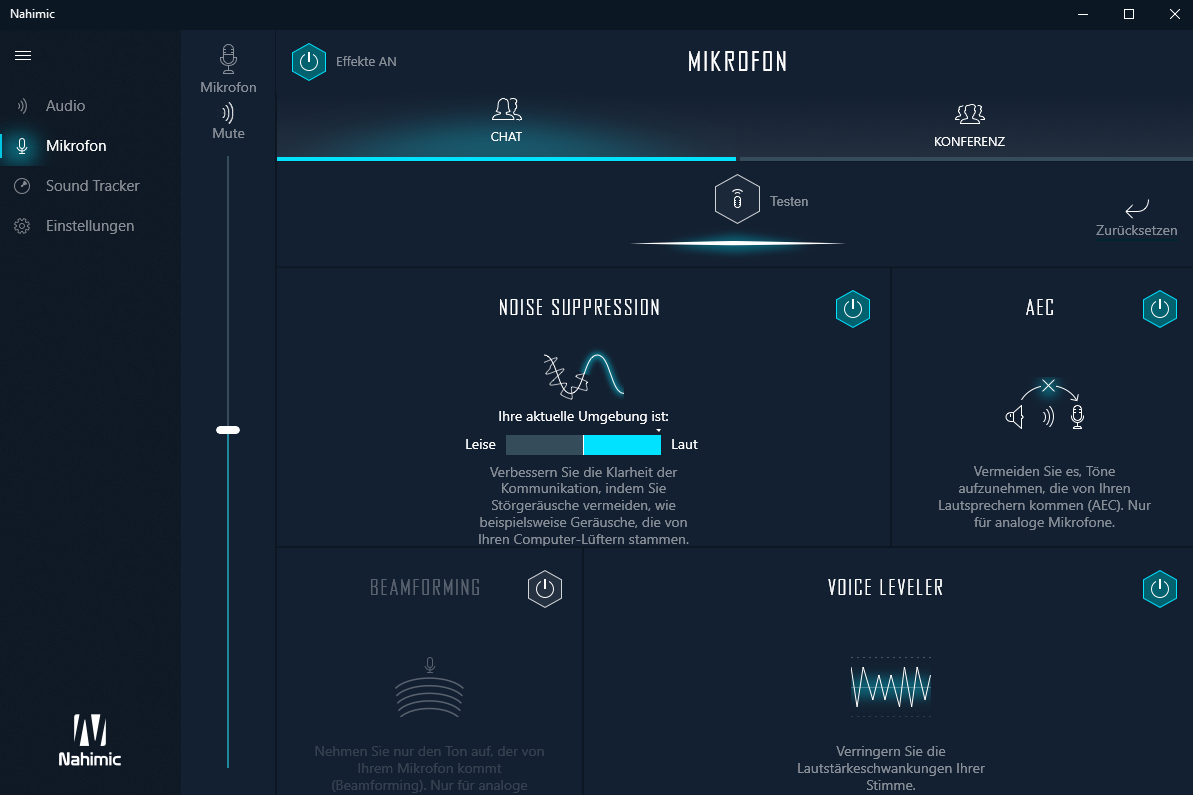
The P65 Creator is equipped with two bottom-firing speakers located at the front underneath the palm rest. Accordingly, placing the device on a soft surface will inevitably result in a muffled soundscape. Ideally, you want the device to be placed on a flat table-top surface that reflects the sound waves towards the user. The Nahimic software tool can be used to adjust sound performance to one’s liking. All things considered, sound performance was decent and voices were clear and easily understandable. Thus, the P65 Creator is well suited for phone and video conferences.
That said the integrated speakers are obviously not able to compete at eye level with external speakers or headphones that can be connected via the dedicated 3.5 mm headphone jack.
MSI P65 8RF-451 - Creator audio analysis
(±) | speaker loudness is average but good (76.8 dB)
Bass 100 - 315 Hz
(-) | nearly no bass - on average 15.5% lower than median
(+) | bass is linear (3.6% delta to prev. frequency)
Mids 400 - 2000 Hz
(±) | higher mids - on average 7.3% higher than median
(±) | linearity of mids is average (7.3% delta to prev. frequency)
Highs 2 - 16 kHz
(±) | higher highs - on average 7.1% higher than median
(+) | highs are linear (6.8% delta to prev. frequency)
Overall 100 - 16.000 Hz
(±) | linearity of overall sound is average (20.4% difference to median)
Compared to same class
» 69% of all tested devices in this class were better, 8% similar, 23% worse
» The best had a delta of 5%, average was 17%, worst was 45%
Compared to all devices tested
» 54% of all tested devices were better, 8% similar, 38% worse
» The best had a delta of 4%, average was 23%, worst was 134%
Asus ZenBook Pro 15 UX580GE audio analysis
(±) | speaker loudness is average but good (79.9 dB)
Bass 100 - 315 Hz
(-) | nearly no bass - on average 22.3% lower than median
(±) | linearity of bass is average (11.5% delta to prev. frequency)
Mids 400 - 2000 Hz
(+) | balanced mids - only 2.4% away from median
(±) | linearity of mids is average (7.5% delta to prev. frequency)
Highs 2 - 16 kHz
(+) | balanced highs - only 4% away from median
(+) | highs are linear (6.2% delta to prev. frequency)
Overall 100 - 16.000 Hz
(±) | linearity of overall sound is average (17.7% difference to median)
Compared to same class
» 51% of all tested devices in this class were better, 7% similar, 42% worse
» The best had a delta of 5%, average was 17%, worst was 45%
Compared to all devices tested
» 35% of all tested devices were better, 8% similar, 57% worse
» The best had a delta of 4%, average was 23%, worst was 134%
Energy Management
Power Consumption
Power consumption was inconspicuous by and large. When idle, the power meter read between 7.4 and 16.8 W, which was only undercut by the Lenovo ThinkPad X1. Gigabyte’s Aero 15X required much more energy despite its basically identical hardware.
Under load, power consumption peaked at 177 W and eventually settled at around 94 W - slightly higher than with the Aero 15X but significantly lower than the Asus GL504GS's 214 W. The latter was equipped with a standard GTX 1070 with a much higher thermal envelope.
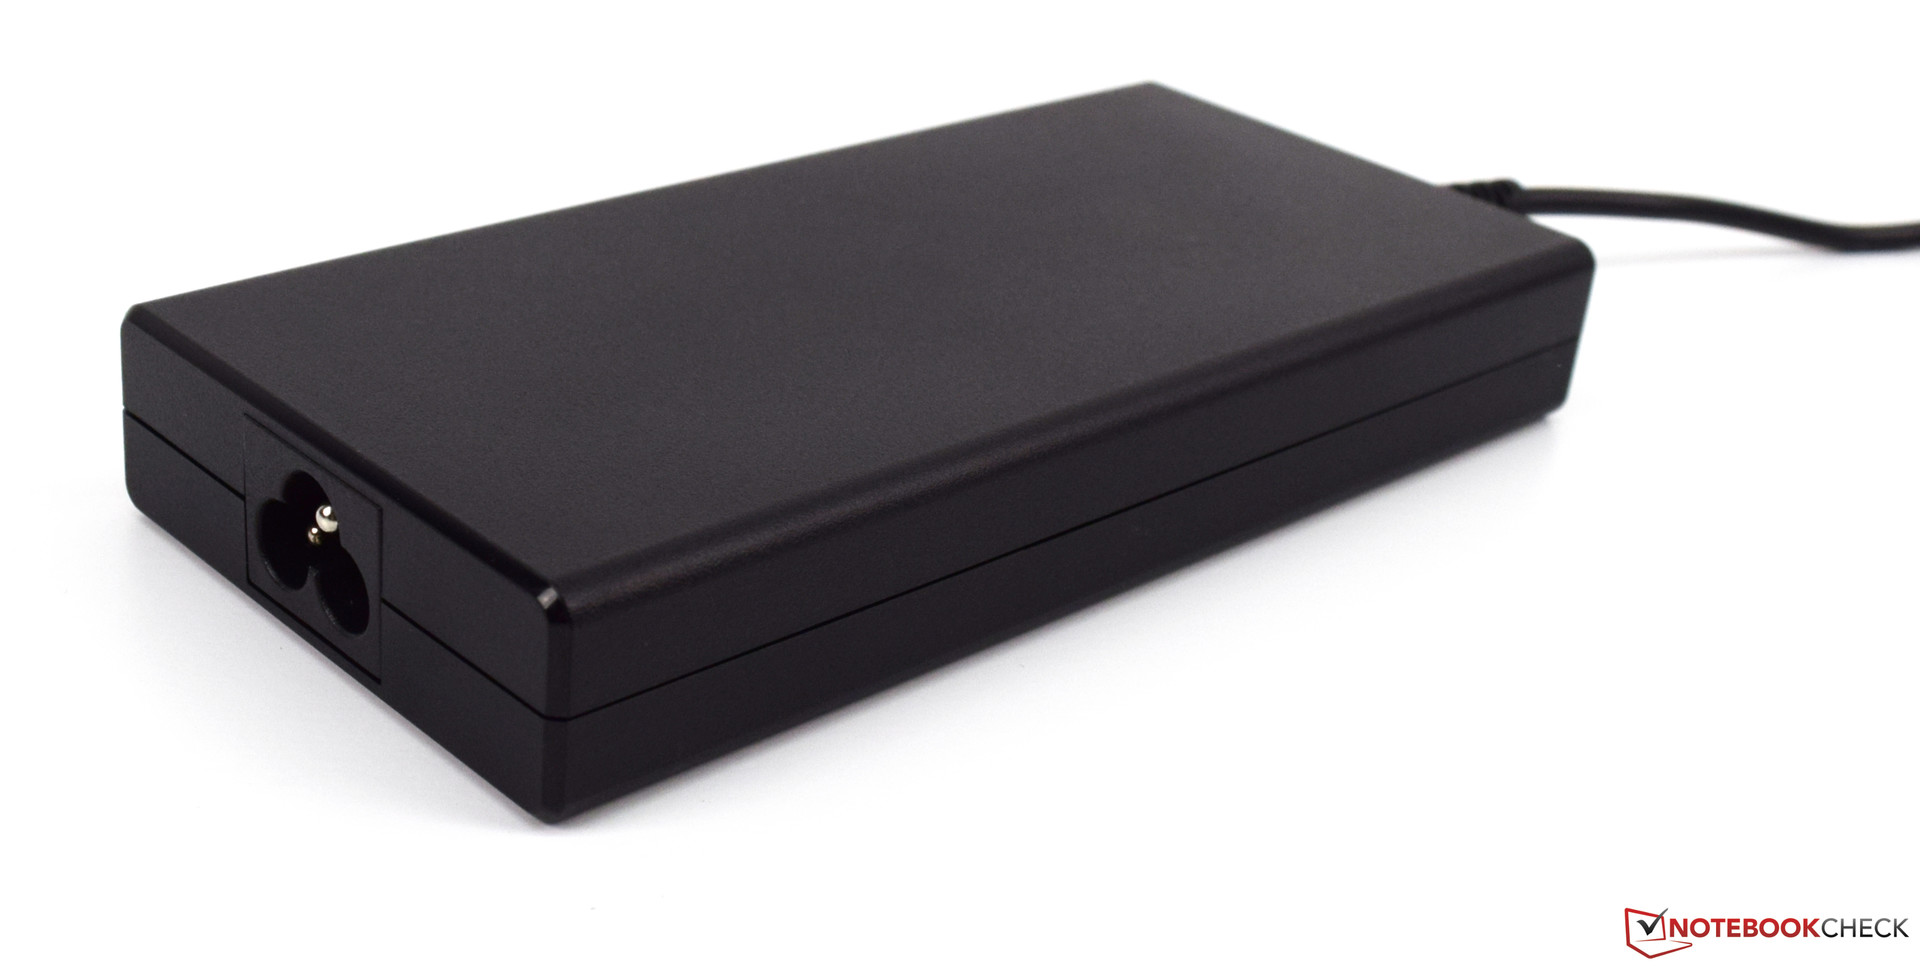
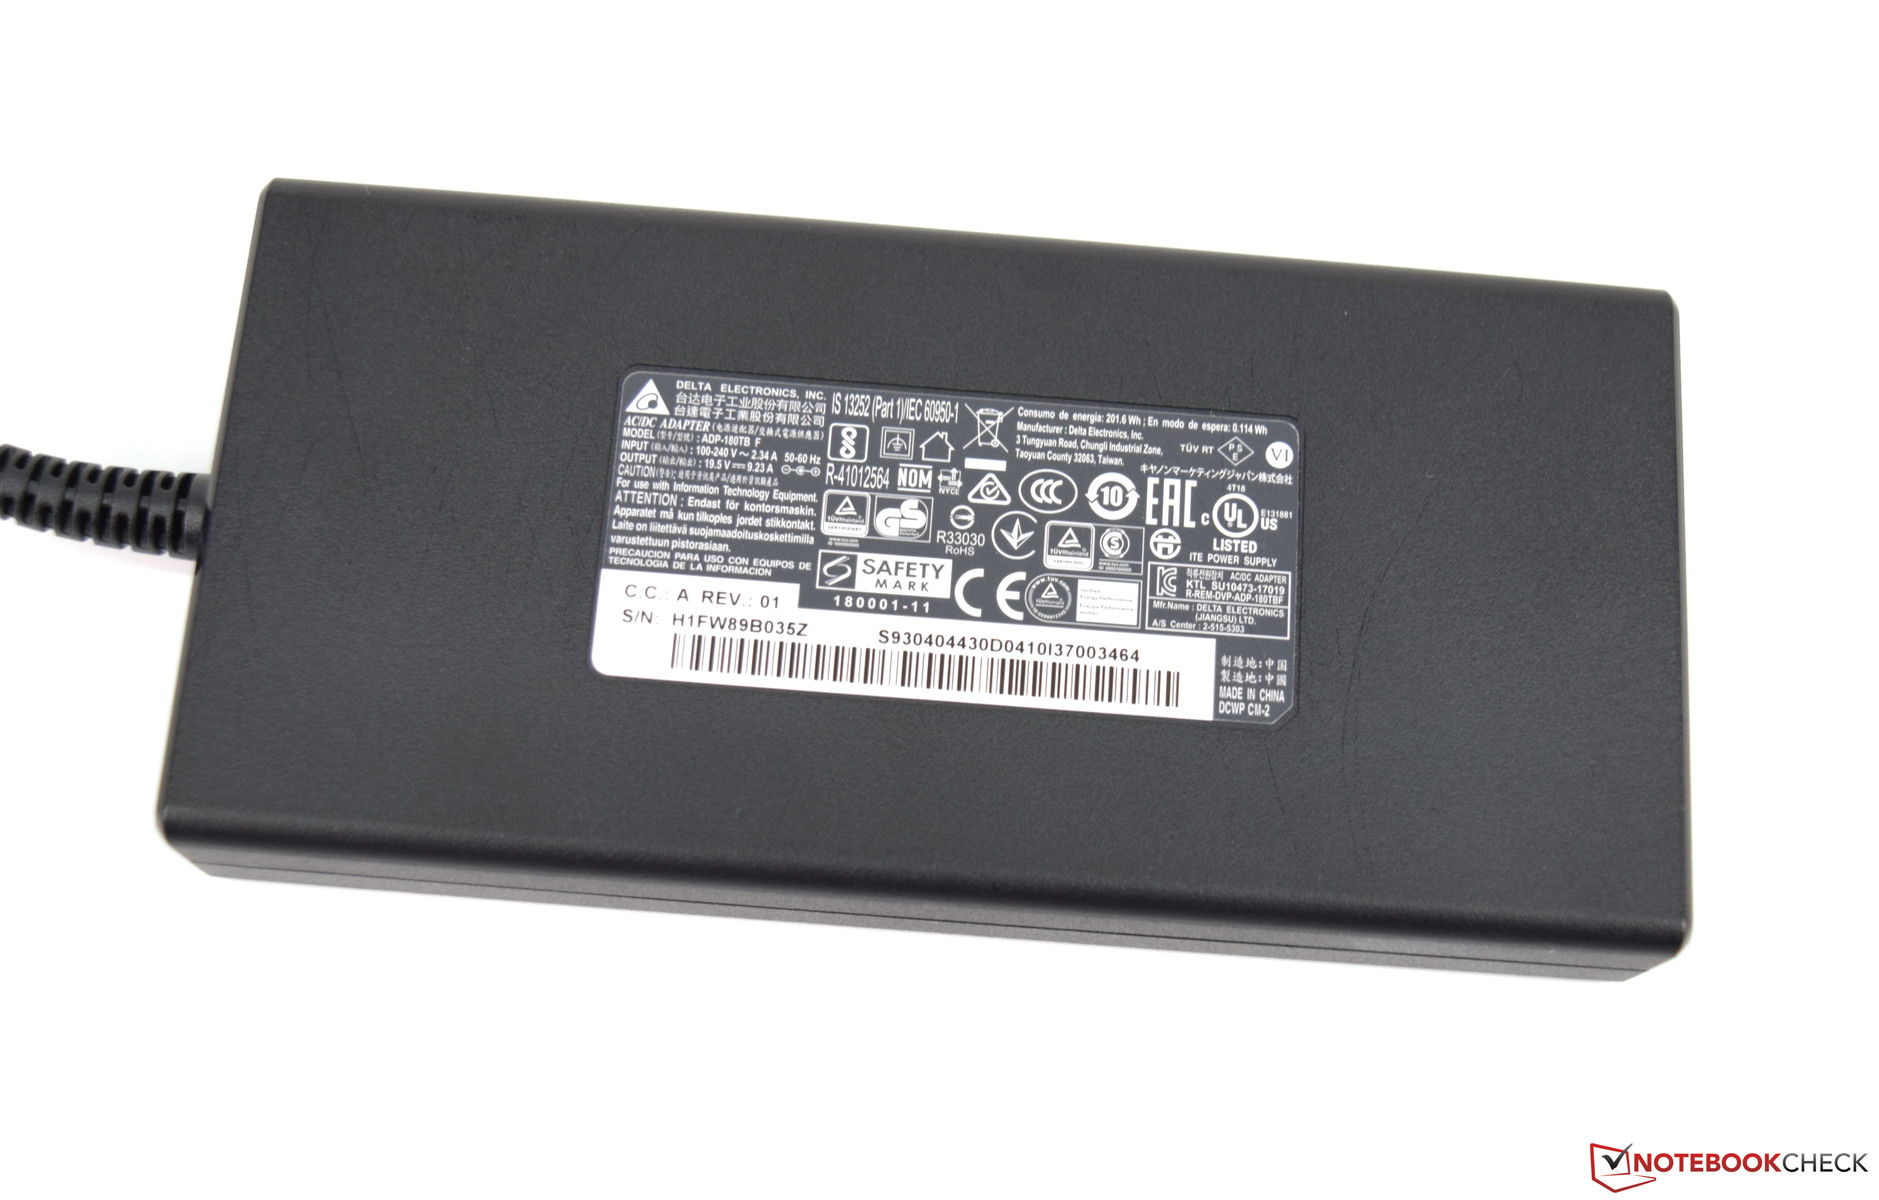
The compact and 550 g heavy 180 W power supply is amply dimensioned, and the P65’s battery did not discharge under load. It is worth noting that the other two P65 models are equipped with a smaller 150 W power supply since they don’t have to deal with a power-hungry GeForce GTX 1070 Max-Q GPU.
| Off / Standby | |
| Idle | |
| Load |
|
Key:
min: | |
| MSI P65 8RF-451 - Creator i7-8750H, GeForce GTX 1070 Max-Q, Kingston RBUSNS8154P3512GJ, IPS, 1920x1080, 15.6" | Asus ZenBook Pro 15 UX580GE i9-8950HK, GeForce GTX 1050 Ti Mobile, Samsung SSD PM961 1TB M.2 PCIe 3.0 x4 NVMe (MZVLW1T0), IPS, 3840x2160, 15.6" | Lenovo ThinkPad X1 Extreme-20MF000XGE i7-8750H, GeForce GTX 1050 Ti Max-Q, Samsung SSD PM981 MZVLB1T0HALR, IPS, 3840x2160, 15.6" | Gigabyte Aero 15X v8 i7-8750H, GeForce GTX 1070 Max-Q, Toshiba NVMe THNSN5512GPU7, IPS, 1920x1080, 15.6" | Asus GL504GS i7-8750H, GeForce GTX 1070 Mobile, Samsung SSD PM981 MZVLB512HAJQ, IPS, 1920x1080, 15.6" | MSI GS65 8RF-019DE Stealth Thin i7-8750H, GeForce GTX 1070 Max-Q, Samsung SSD PM981 MZVLB512HAJQ, IPS, 1920x1080, 15.6" | MSI WS63 7RF-290US i7-7700HQ, Quadro P3000, Samsung SM961 MZVKW512HMJP m.2 PCI-e, IPS, 1920x1080, 15.6" | Average NVIDIA GeForce GTX 1070 Max-Q | Average of class Multimedia | |
|---|---|---|---|---|---|---|---|---|---|
| Power Consumption | -24% | 2% | -34% | -124% | -3% | -6% | -23% | 26% | |
| Idle Minimum * (Watt) | 7.4 | 11.7 -58% | 7.6 -3% | 14 -89% | 29 -292% | 7 5% | 11 -49% | 11.4 ? -54% | 5.66 ? 24% |
| Idle Average * (Watt) | 11.7 | 18.5 -58% | 14.8 -26% | 18 -54% | 32 -174% | 11 6% | 14.2 -21% | 15.7 ? -34% | 10.2 ? 13% |
| Idle Maximum * (Watt) | 16.8 | 22.8 -36% | 17.6 -5% | 22 -31% | 38 -126% | 20 -19% | 14.6 13% | 20.7 ? -23% | 12.5 ? 26% |
| Load Average * (Watt) | 94 | 97.5 -4% | 86 9% | 91 3% | 100 -6% | 98 -4% | 77.7 17% | 98.1 ? -4% | 65.2 ? 31% |
| Load Maximum * (Watt) | 177 | 111.1 37% | 118.9 33% | 173 2% | 217 -23% | 182 -3% | 161.7 9% | 173.8 ? 2% | 113.5 ? 36% |
| Witcher 3 ultra * (Watt) | 102.9 | 85 | 142 | 170 | 132 | 89.1 |
* ... smaller is better
Battery Life

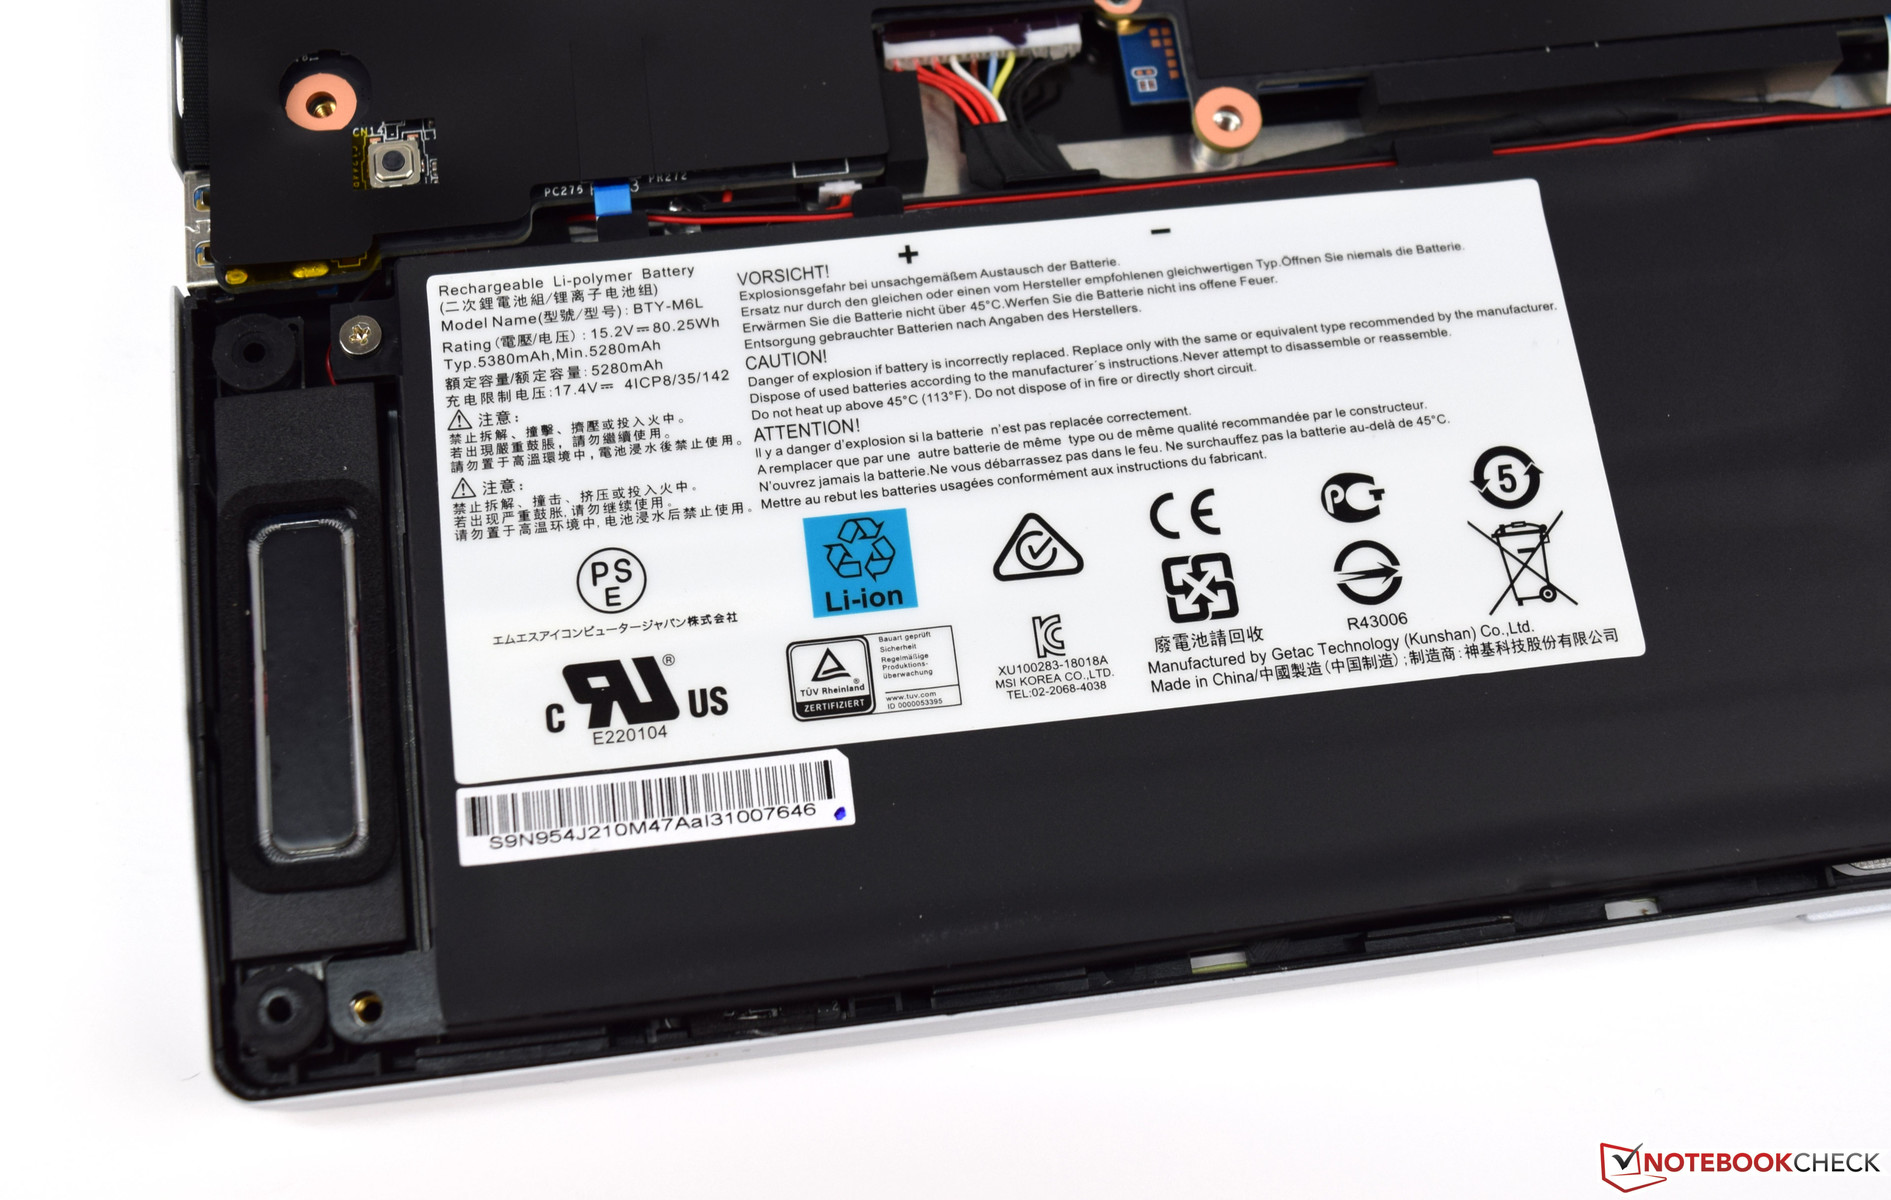
Unfortunately, the P65 does not benefit from its enormous 82 Wh battery. It was outperformed by both the Asus ZenBook Pro 15 and the Lenovo ThinkPad X1, except for the Wi-Fi benchmark where it lasted a very decent 7:08 hours. Still, it is not going to last a full day in the office. In this particular test, we normalize display brightness to 150 nits, which in the case of the P65 meant reducing it by four clicks.
Under load, the device ran out of juice after just 85 minutes. Charging the battery from near empty to full takes around 2.5 hours, which is longer than usual and courtesy of the large 82 Wh battery.
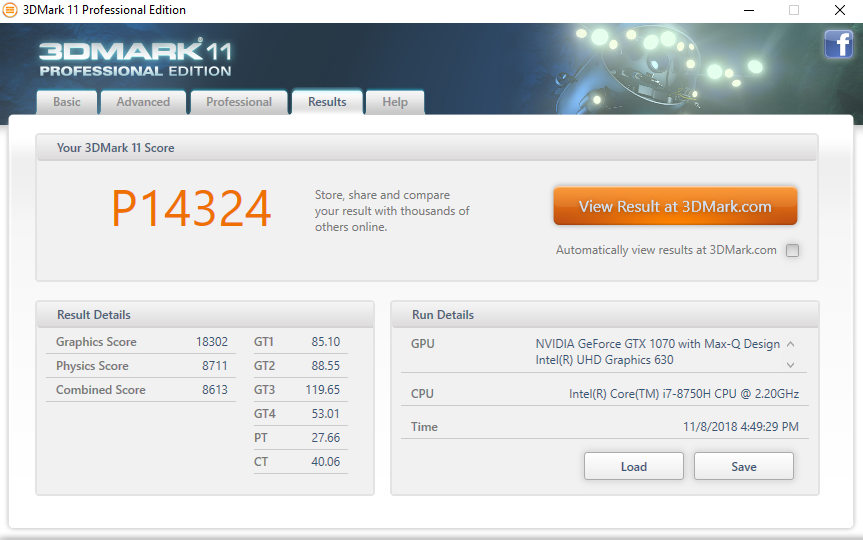
3D performance is throttled on battery, and 3DMark 11 scores decreased from more than 14,000 on mains to just 7,447 on battery. CPU performance did not suffer at all. In other words, MSI chose to throttle the GPU by roughly 50% on battery.

| MSI P65 8RF-451 - Creator i7-8750H, GeForce GTX 1070 Max-Q, 82 Wh | Asus ZenBook Pro 15 UX580GE i9-8950HK, GeForce GTX 1050 Ti Mobile, 71 Wh | Lenovo ThinkPad X1 Extreme-20MF000XGE i7-8750H, GeForce GTX 1050 Ti Max-Q, 80 Wh | Gigabyte Aero 15X v8 i7-8750H, GeForce GTX 1070 Max-Q, 94.24 Wh | Asus GL504GS i7-8750H, GeForce GTX 1070 Mobile, 66 Wh | MSI GS65 8RF-019DE Stealth Thin i7-8750H, GeForce GTX 1070 Max-Q, 82 Wh | Average of class Multimedia | |
|---|---|---|---|---|---|---|---|
| Battery runtime | 23% | 23% | 55% | -50% | -1% | 128% | |
| Reader / Idle (h) | 7.5 | 14 87% | 11.5 53% | 12.7 69% | 2.9 -61% | 8.5 13% | 24.9 ? 232% |
| H.264 (h) | 5.9 | 6.2 5% | 8.4 42% | 2.5 -58% | 5.9 0% | 17.1 ? 190% | |
| WiFi v1.3 (h) | 7.1 | 6.3 -11% | 6.4 -10% | 8.6 21% | 2.4 -66% | 6 -15% | 12.2 ? 72% |
| Load (h) | 1.4 | 1.3 -7% | 2 43% | 2.6 86% | 1.2 -14% | 1.4 0% | 1.664 ? 19% |
| Witcher 3 ultra (h) | 1.1 |
Verdict
Pros
Cons

As the name already suggests, MSI’s P65 8RF Creator is based on the GS65 8RF. However, it is aimed primarily at the creative crowd running software like Adobe Photoshop or Adobe Premiere on the go. The Limited Edition offers more than just its white case, such as a powerful GPU and high-quality packaging, including a protective sleeve. In addition, a free warranty extension to 36 months total is available upon registering the product with MSI.
The question is: Who was this device made for? If you are looking for a stylish and seldom-spotted device, the P65 8RF might be the right notebook for you. It looks great during presentations without sacrificing gaming performance, and its lack of gaming bling makes for a very serious appearance. This is where the P65 8RF truly shines.
The MSI P65 8RF is like having your cake and eating it too. During the day, it plays its role as stylish business underdog. At night, it can be used to run even the latest games smoothly in 1080p on maximum details.
The case is a well-made compromise between mobility and rigidity. The material used is very premium, however we would have wished for a more robust design. The display is a mixed bag. On the one hand it offers a 144 Hz panel and fast response times. On the other it is too dark and practically unusable outdoors. The keyboard was also not the greatest. The labeling was incredibly hard to read and the unusual layout takes more getting used to than we felt comfortable with.
Performance, on the other hand, is without a doubt on a level you would never expect from a device this thin and light. Intel’s Core i7-8750H worked well despite the fact that its performance suffered a bit under sustained load, and Nvidia’s GeForce GTX 1070 Max-Q offered incredible performance, considering the thin design.
At over $2,300 it costs about as much as the GS65 8RF, but it offers a few extras such as the fingerprint reader or the extended warranty. If you wish to avoid the typical black design and RGB bling you may want to take the P65 into consideration.
If you decide to purchase the P65 Creator, MSI will throw in a software bundle worth more than $300 in order to start your trip down content creation lane (valid until 31 December, 2018).
MSI P65 8RF-451 - Creator
- 11/10/2018 v6 (old)
Sebastian Bade
Price comparison

