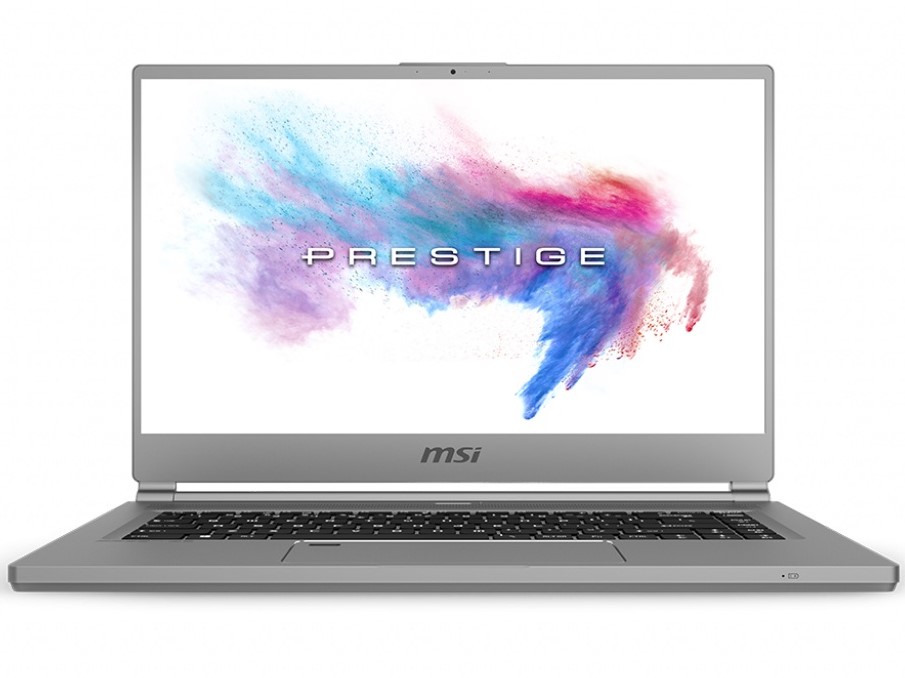
MSI P65 Creator 9SF (i9-9880H, RTX2070 Max-Q) Laptop Review

The MSI Prestige series is characterized by its modern, slim design that is combined with powerful hardware. For example, the MSI P65 Creator 8RF did not only score a lot of points in terms of performance, but was also praised for its design. We had to criticize the case itself, however, for its workmanship and limited maintenance options.
Our current test unit is an MSI P65 Creator 9SF-657 and offers a slightly altered design, an Intel Core i9-9880H CPU and 32 GB of RAM. The device uses a Nvidia GeForce RTX 2070 Max-Q to display graphics, and two Samsung SSDs (RAID) offer 1 TB of storage.
The competition for this device is made up not only of other high performing multimedia notebooks, but also of one or two gaming laptops equipped with modern hardware. We have therefore chosen to compare the MSI P65 Creator with the Razer Blade 15 Advanced Model, the Gigabyte Aero 15-X9, the Schenker XMG Ultra 15 and the ASUS ROG Zephyrus S GX502GW. You are welcome to add further devices from our database to any of our comparison tables via the search bar at the bottom.
Case - P65 Creator with compact design
MSI has decided to make the P65 Creator 9SF entirely out of aluminum. This ensures that the base unit is very stable and warp resistant while the screen can be opened from a corner using one hand without being bent. However, the area around the power button does give way a little when it is pressed. The surface did not give way in other areas, including the bottom of the base unit. The MSI notebook is definitely stable and the only areas users should avoid putting too much pressure on is the back, below the screen.
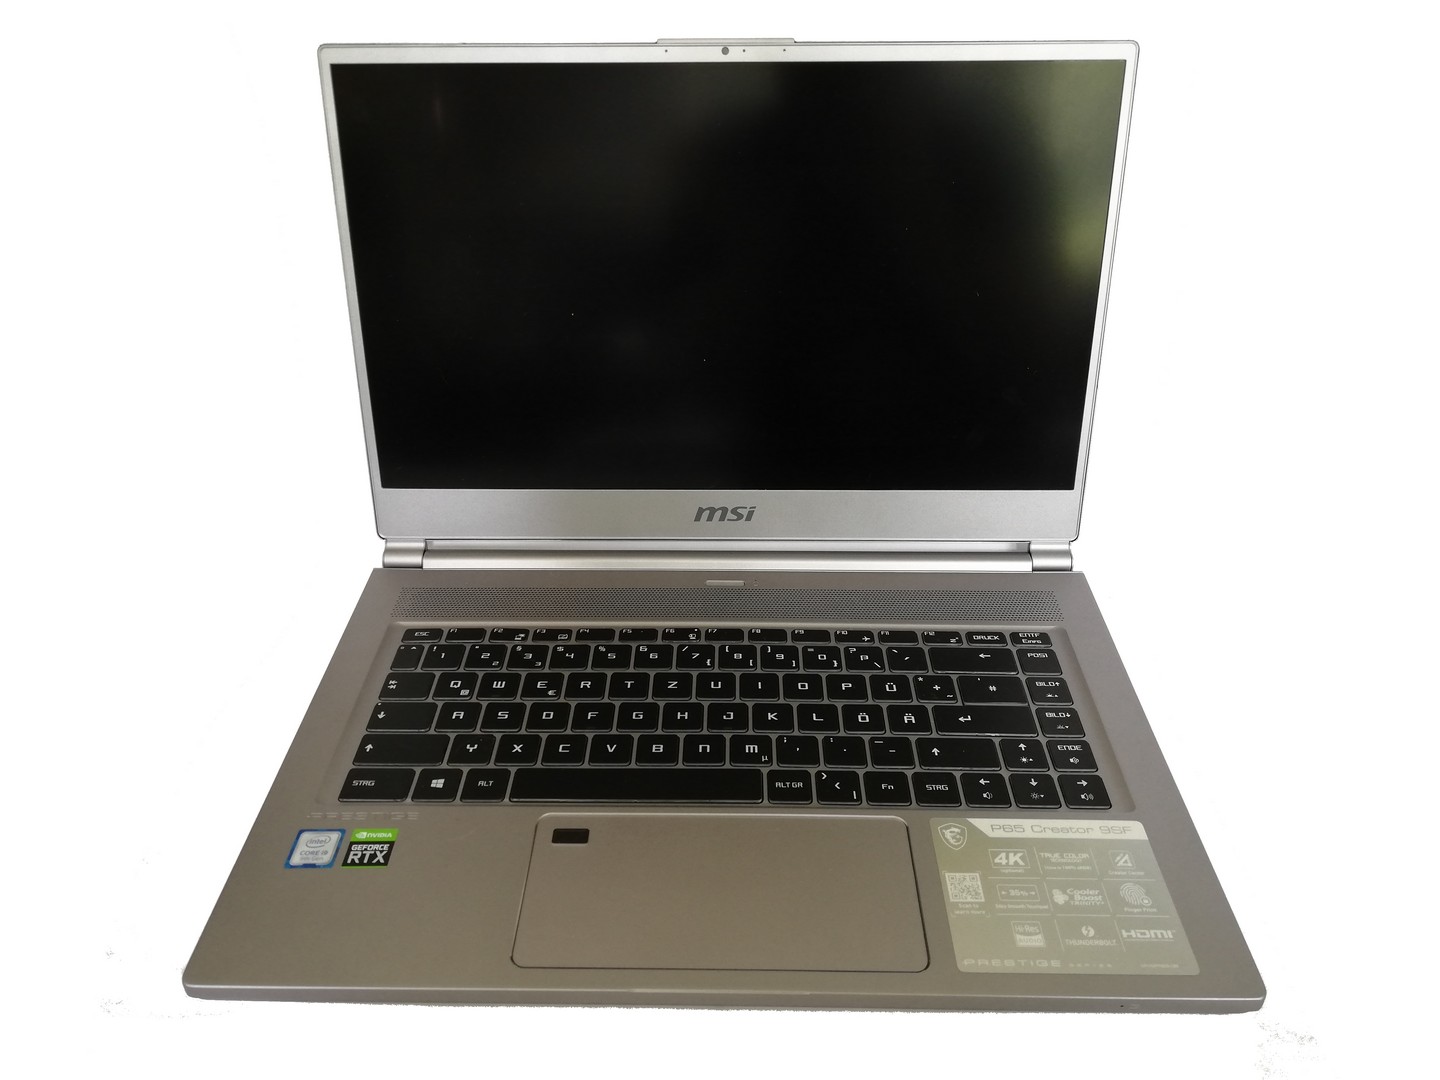
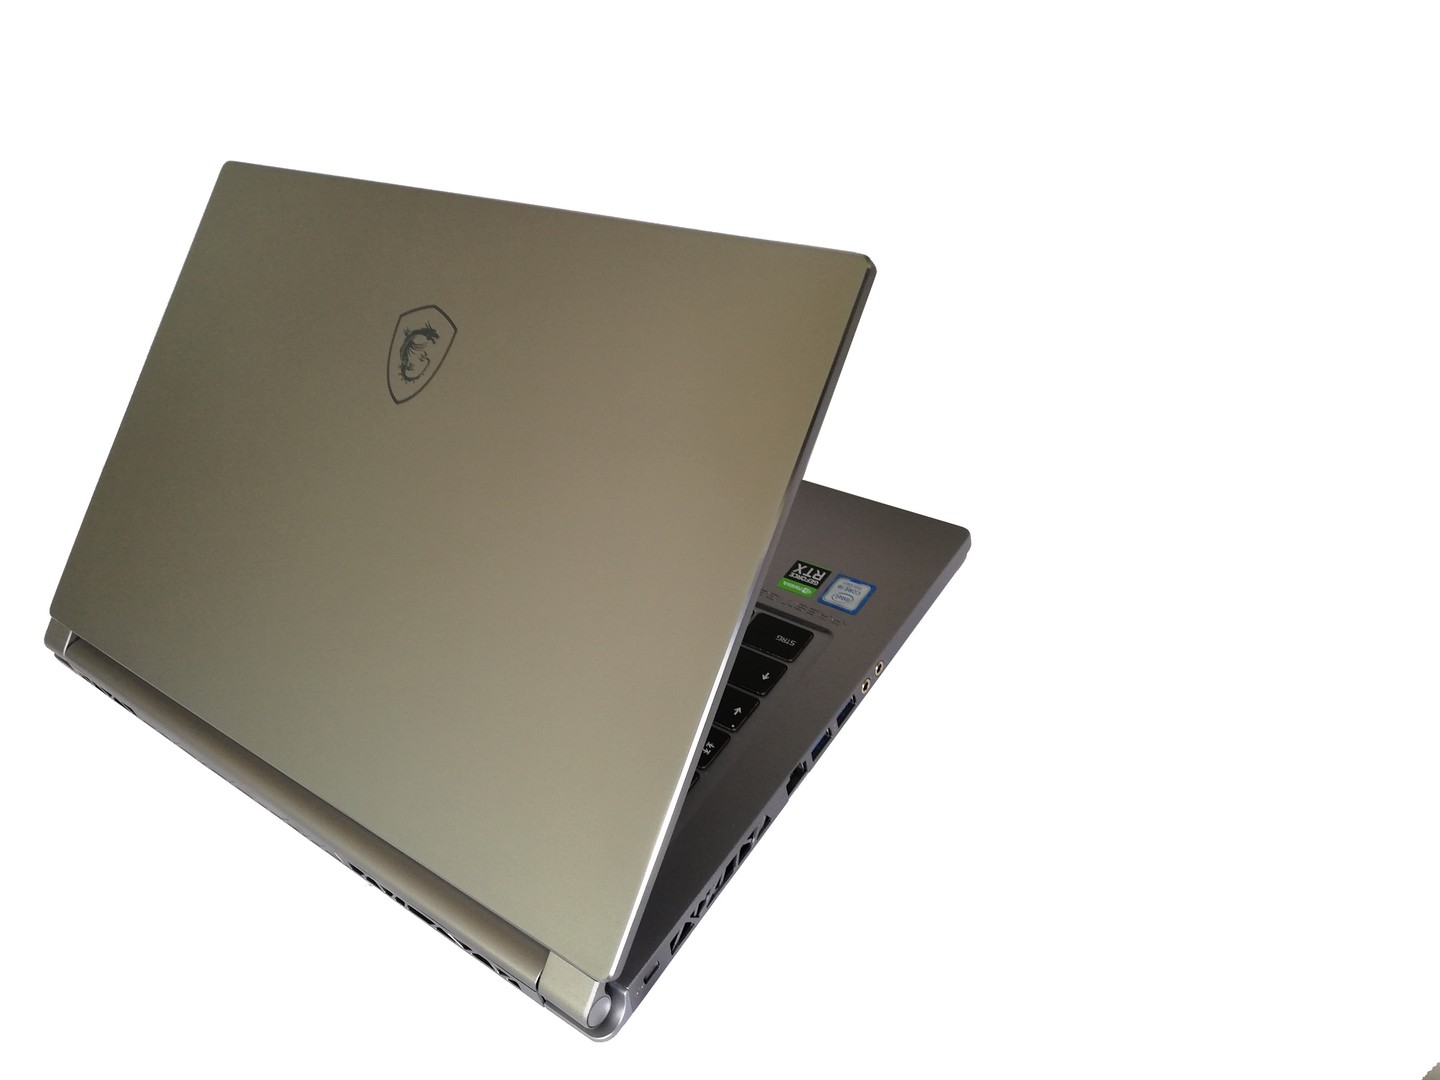
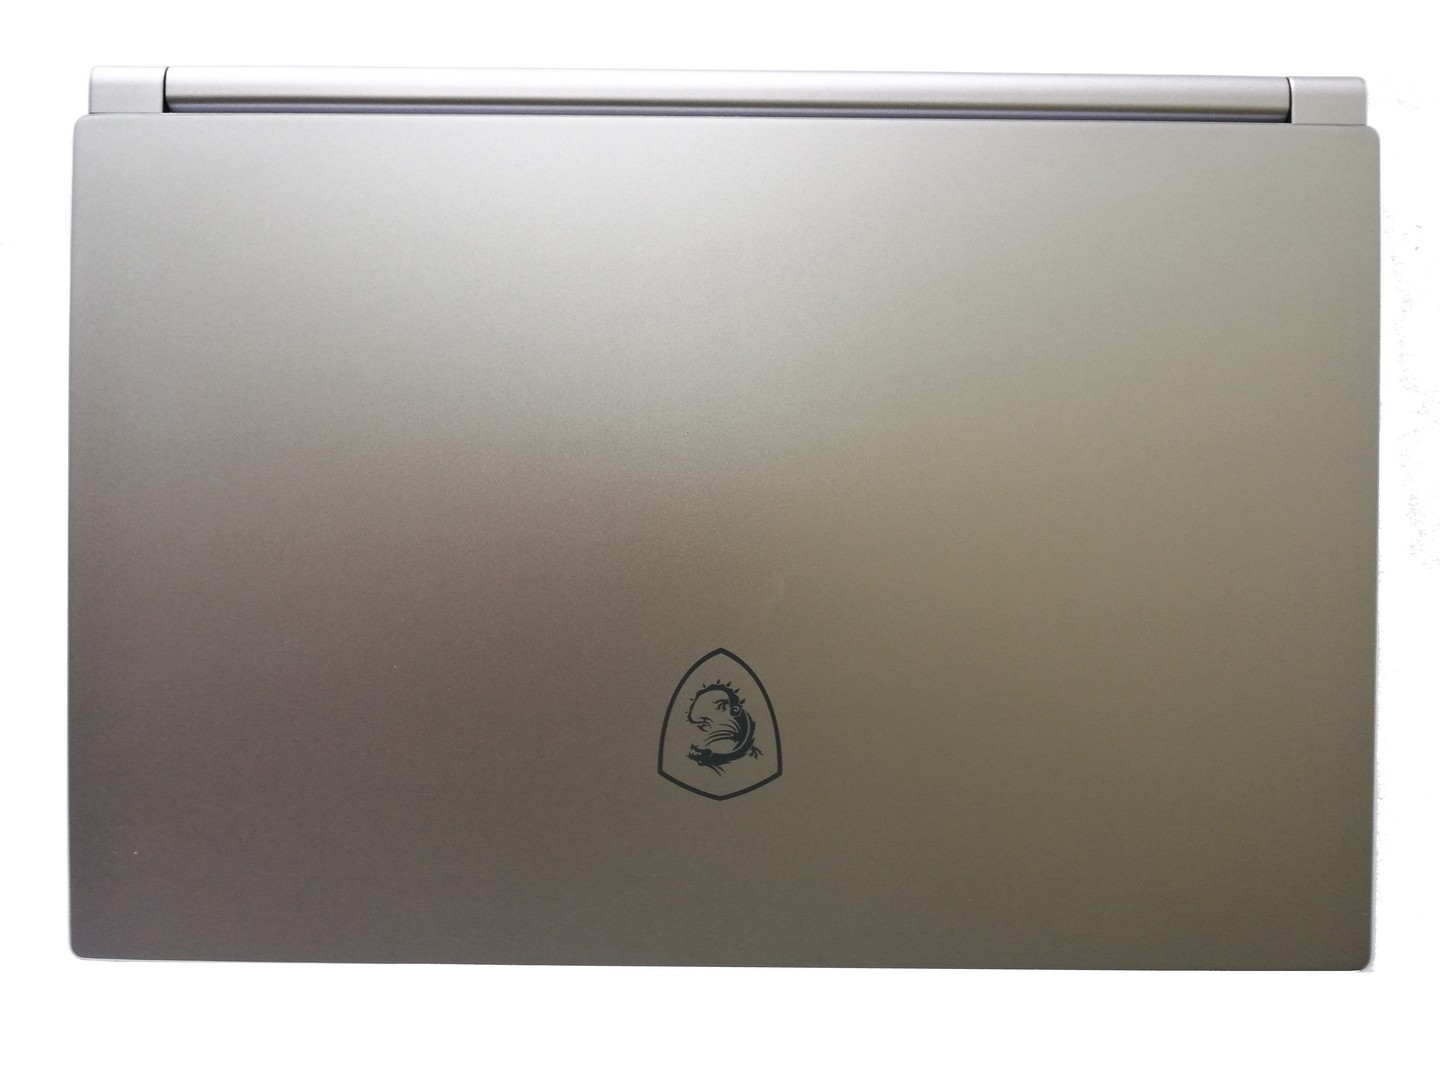
The stable metal case is reflected in the device's weight - although the Creator 9SF is actually one of the lighter notebooks in our comparison field at 1.9 kg (~4.2 lb). The narrow bezels also make the device very compact. Its size is comparable to multimedia laptops that also focus on a slim build.
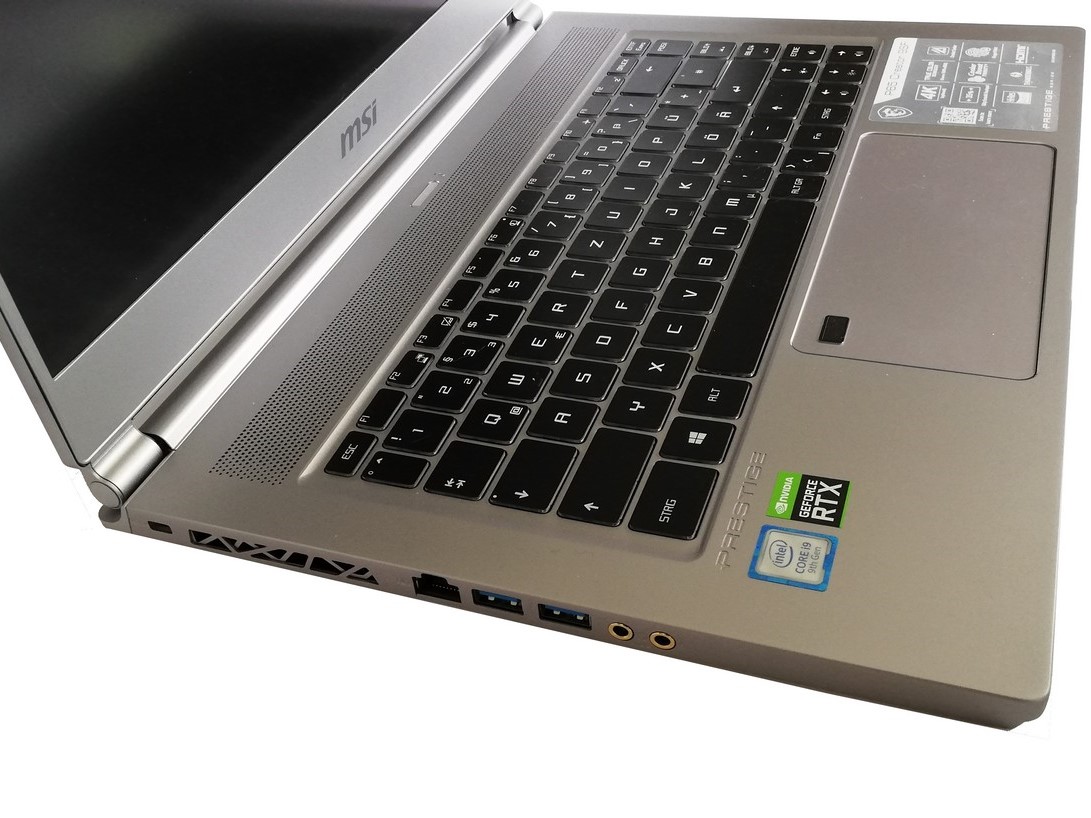
Connectivity - MSI notebook with Thunderbolt 3
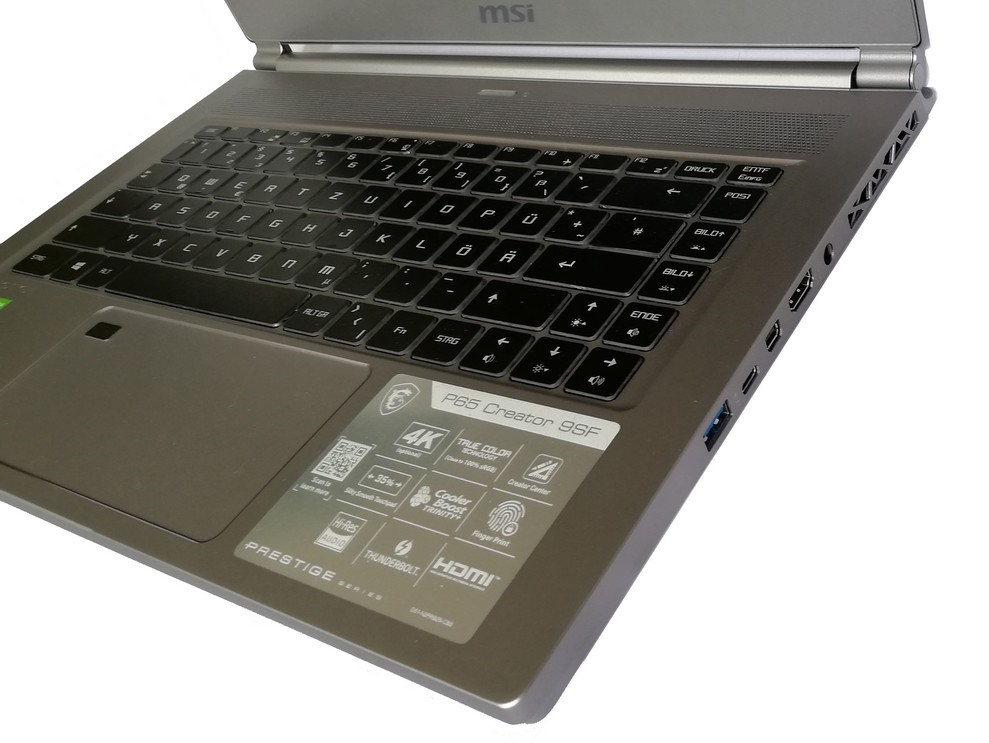
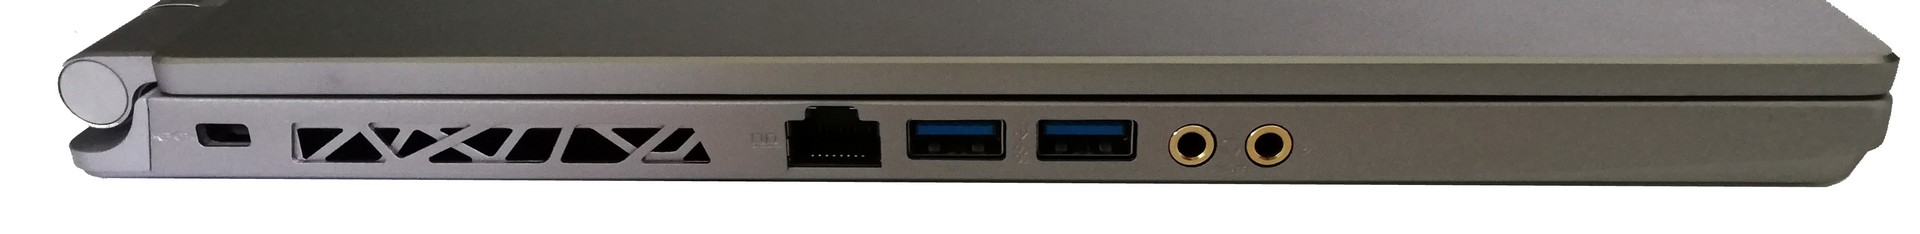
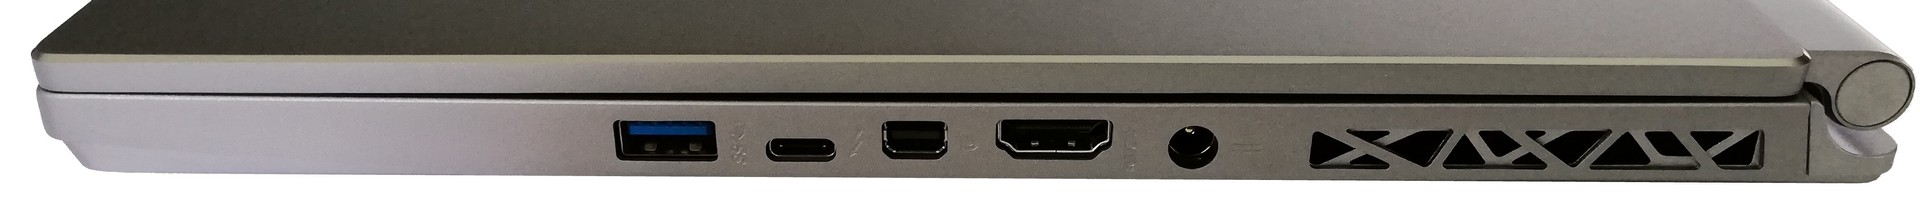
The MSI P65 Creator 9SF offers a decent amount of modern ports and should therefore fulfill most needs. The only thing missing is a card reader. But thanks to the Thunderbolt 3, any missing ports can easily be connected via a docking station. On the predecessor, P65 Creator 8RF, only the MiniDisplay port supported 4K outputs at 60 Hz. Today's unit is supposed to support 4K@60Hz through the HDMI port as well.
MSI has positioned its connectors towards the front of the device on either side, in order to make more room for the ventilation grilles at the back. This choice means that users might be bothered by cables when working in small spaces - particularly when using an external mouse.
Communication
The P65 Creator 9SF connects to wireless networks using the standards 802.11 a, b, g, n and ac and has fast transfer rates thanks to its 2x2 MIMO technology. The MSI completed our Wi-Fi test at an average of 490 MBit/s when receiving and 650 MBit/s when transmitting data. The competition is faster, which places our test unit in the last place in this test.
Security
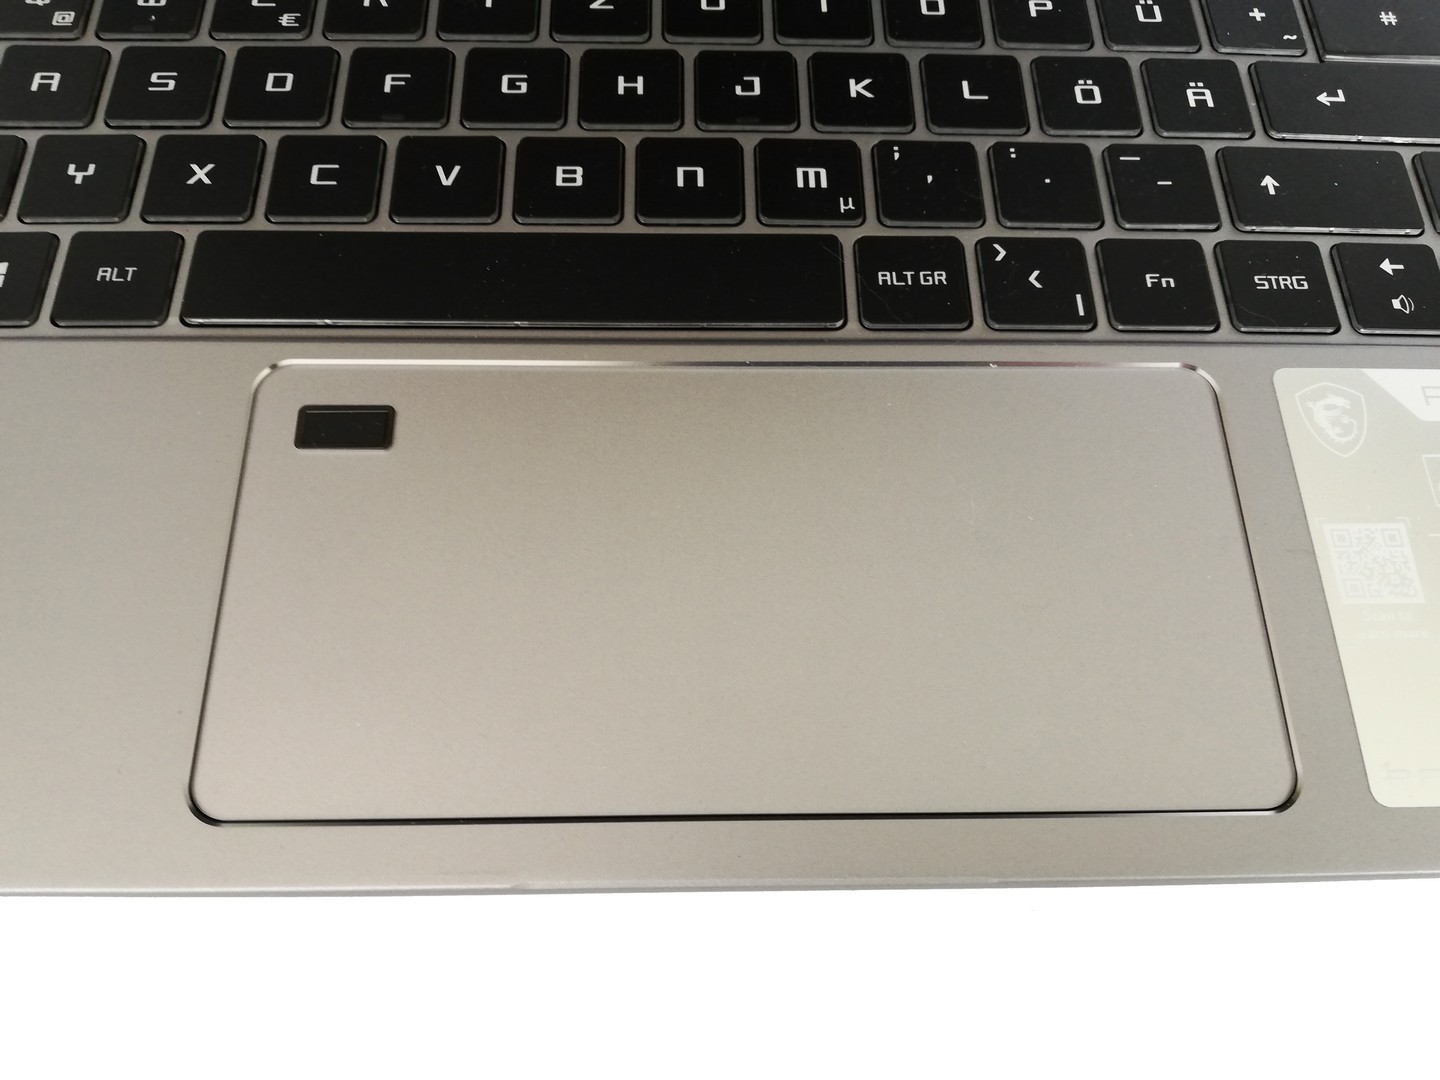
Users of the MSI P65 Creator 9SF can protect their notebook via a Kensington Lock and with their fingerprint. The fingerprint reader is integrated into the top left corner of the touchpad, which means users loose some space for navigation and gesture control. Setting up the reader is easy using Windows Hello and the device recognizes stored fingerprints reliably.
Accessories
Only the notebook itself and a suitable 230-watt AC adapter are included in the scope of delivery. MSI has not developed any accessories for the P65 Creator specifically. The MSI website offers various general equipment such as headsets, mice, keyboards and more.
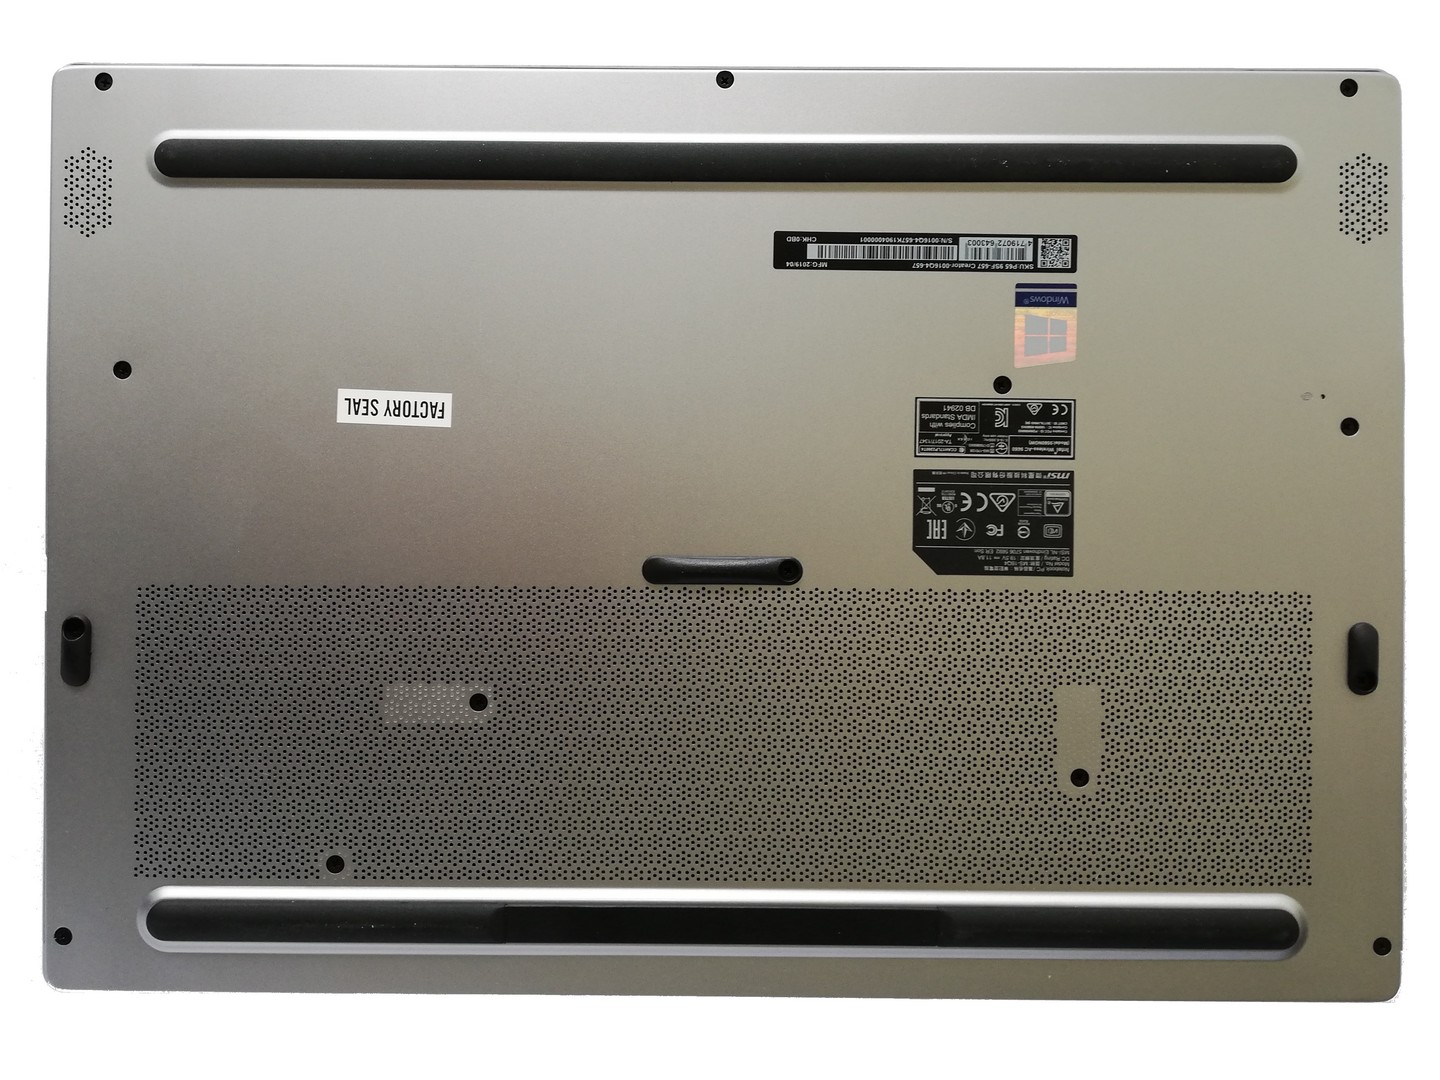
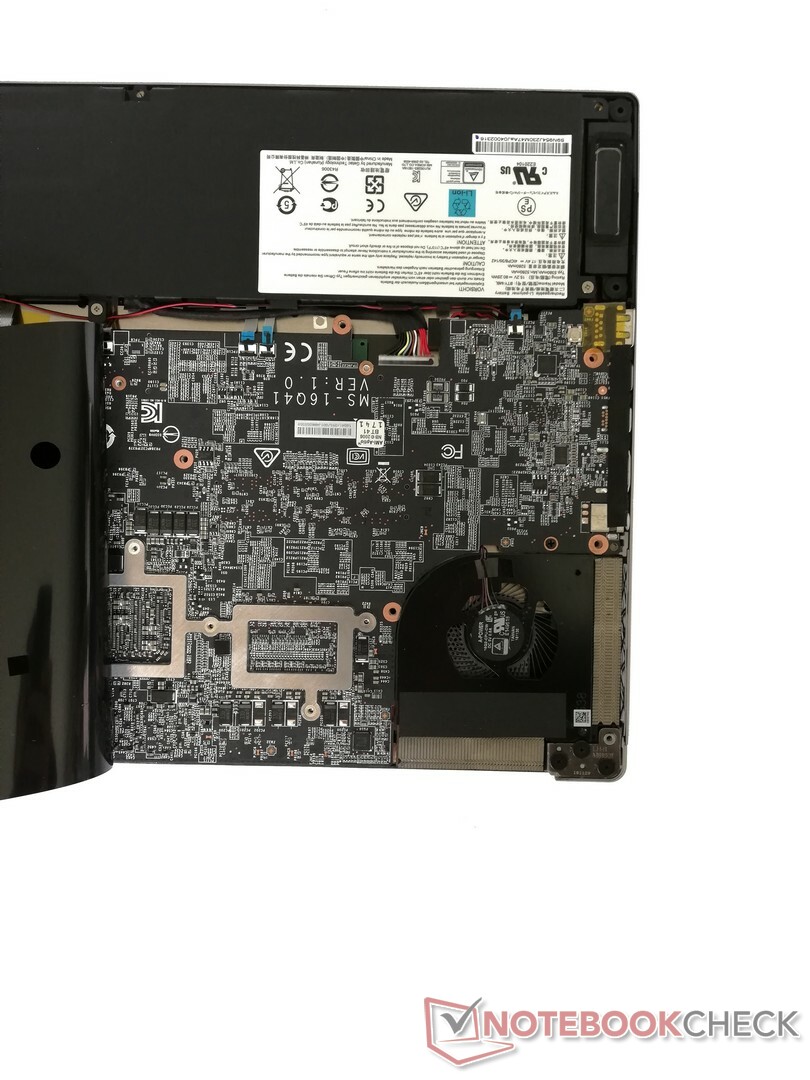
Maintenance
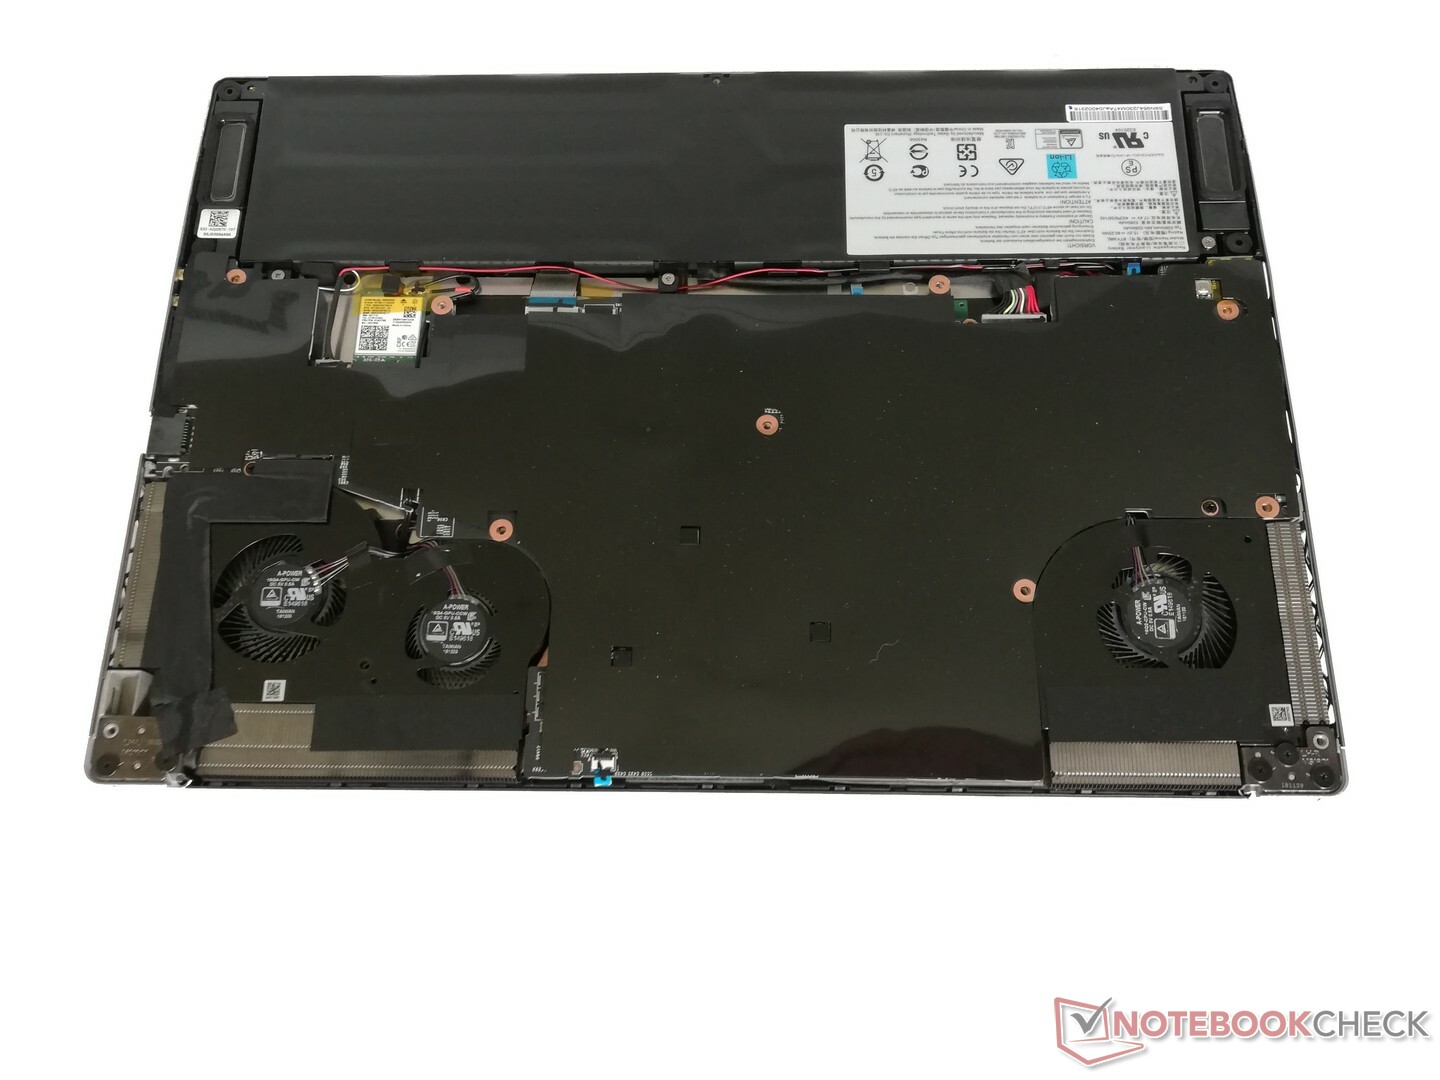
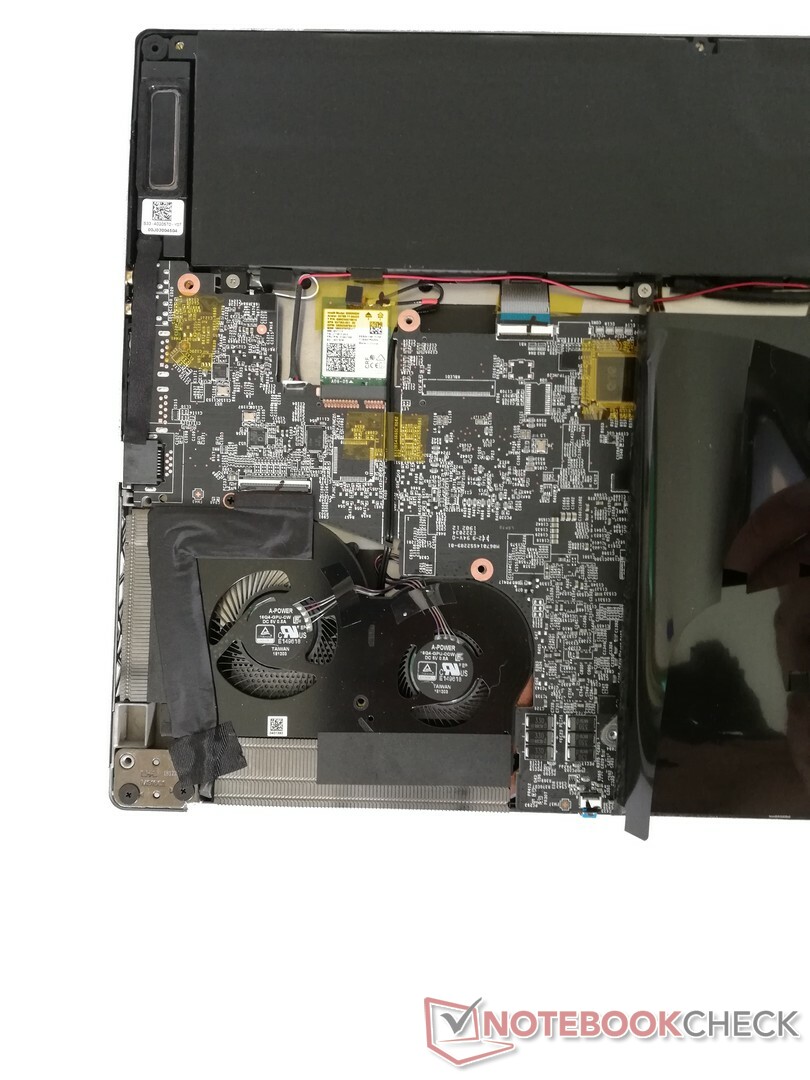
The MSI P65 Creator 9SF offers limited maintenance options. While the bottom cover is easy to remove after loosening all the screws, users will only have direct access to the Wi-Fi module once inside. The SSD seems to be positioned below the main board and cannot be reached without taking apart the entire device. The RAM cannot be exchanged or expanded - but at least the cooling fans are easy to reach for cleaning purposes.
Warranty
Buyers of the P65 Creator 9SF are given a warranty of 24 months.
Input Devices - touchpad with silk touch surface
Keyboard
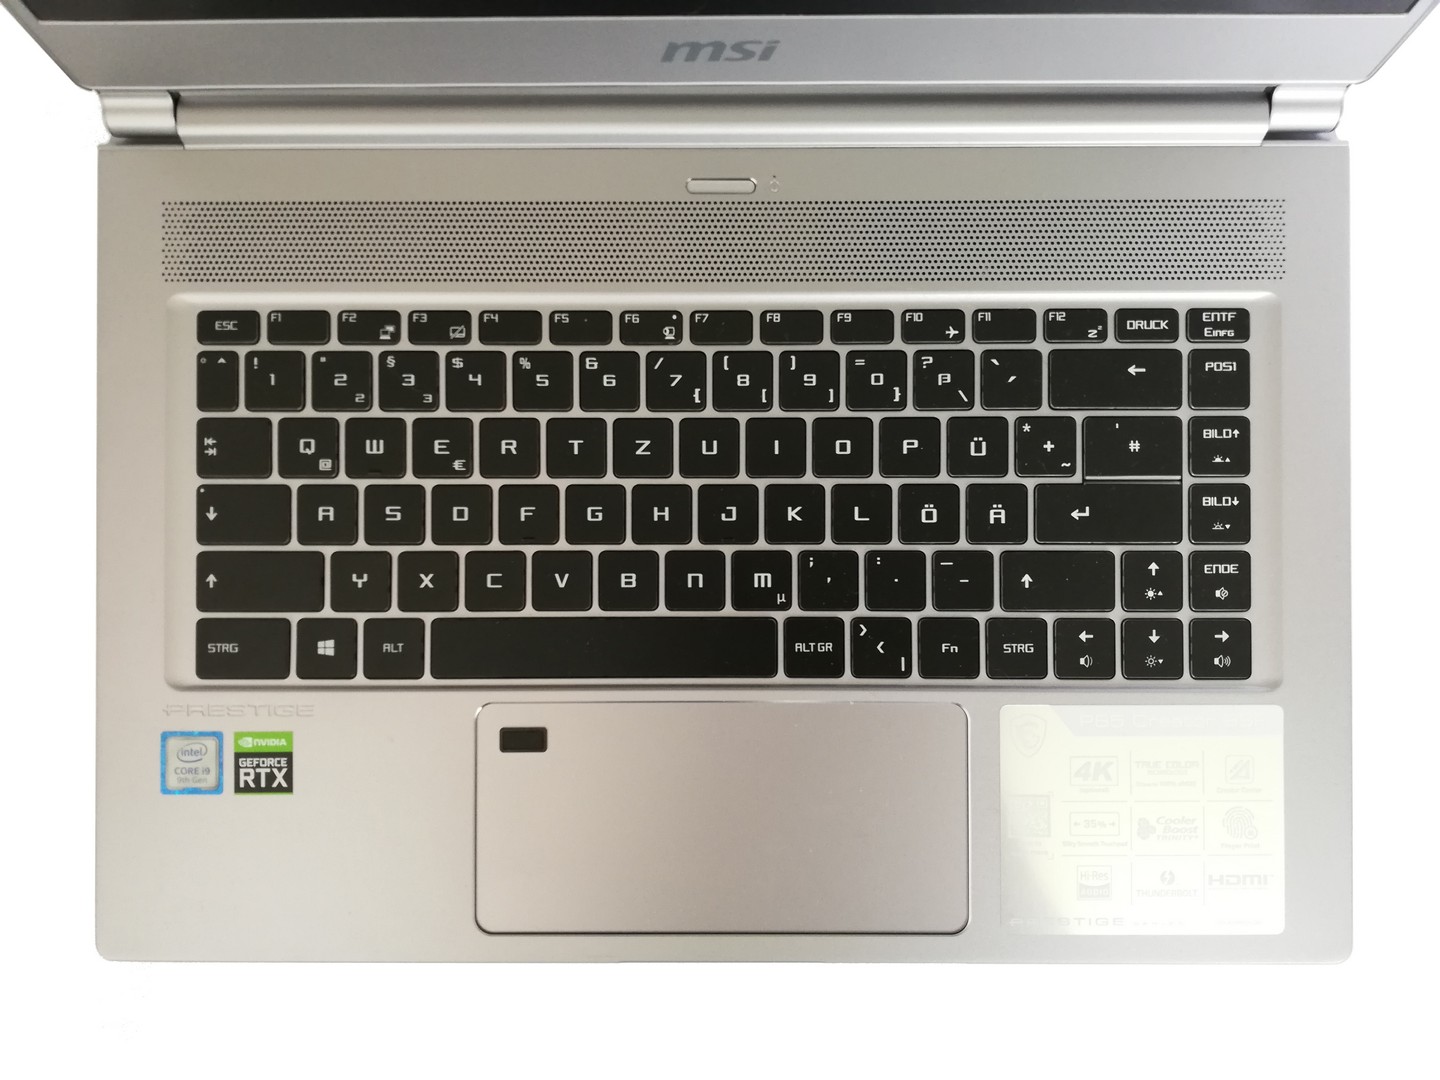
The keyboard of the P65 Creator has very low travel but a significant pressure point. This makes it comfortable to type and the comparably large keys ensure accuracy even when typing quickly. Only the small enter key is a little disappointing as it is easy to hit the hash key above by mistake. The three-level keyboard backlight is not blinding, but easily illuminates both the edges of the keys and the lettering on top. The noise the keyboard makes when typing is quiet and should only be bothersome in very sensitive surroundings.
Touchpad
The touchpad of the P65 Creator offers a very smooth silk touch surface and soft feedback. We noticed that there were some hiccups when navigating with slightly damp fingers. The fingerprint reader also takes up some space of the touchpad - although this is not really an issue, thanks to the large dimensions of the touchpad. Clicks can be made by pressing the touchpad in the bottom left or bottom right corners. Again, the feedback is rather soft, but the pressure point is firm enough.
Display - UHD panel with high color space coverage
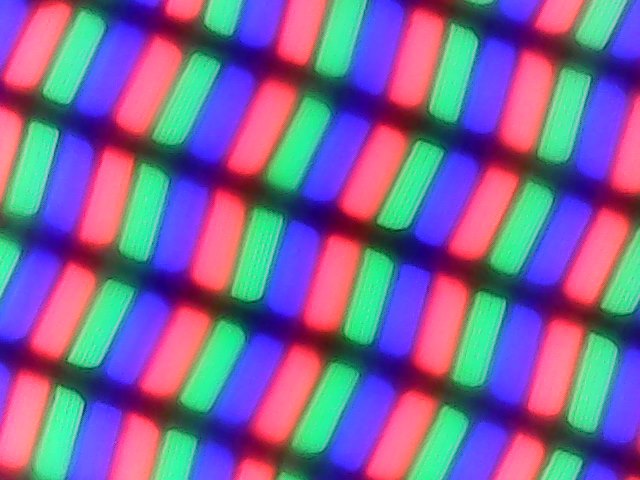
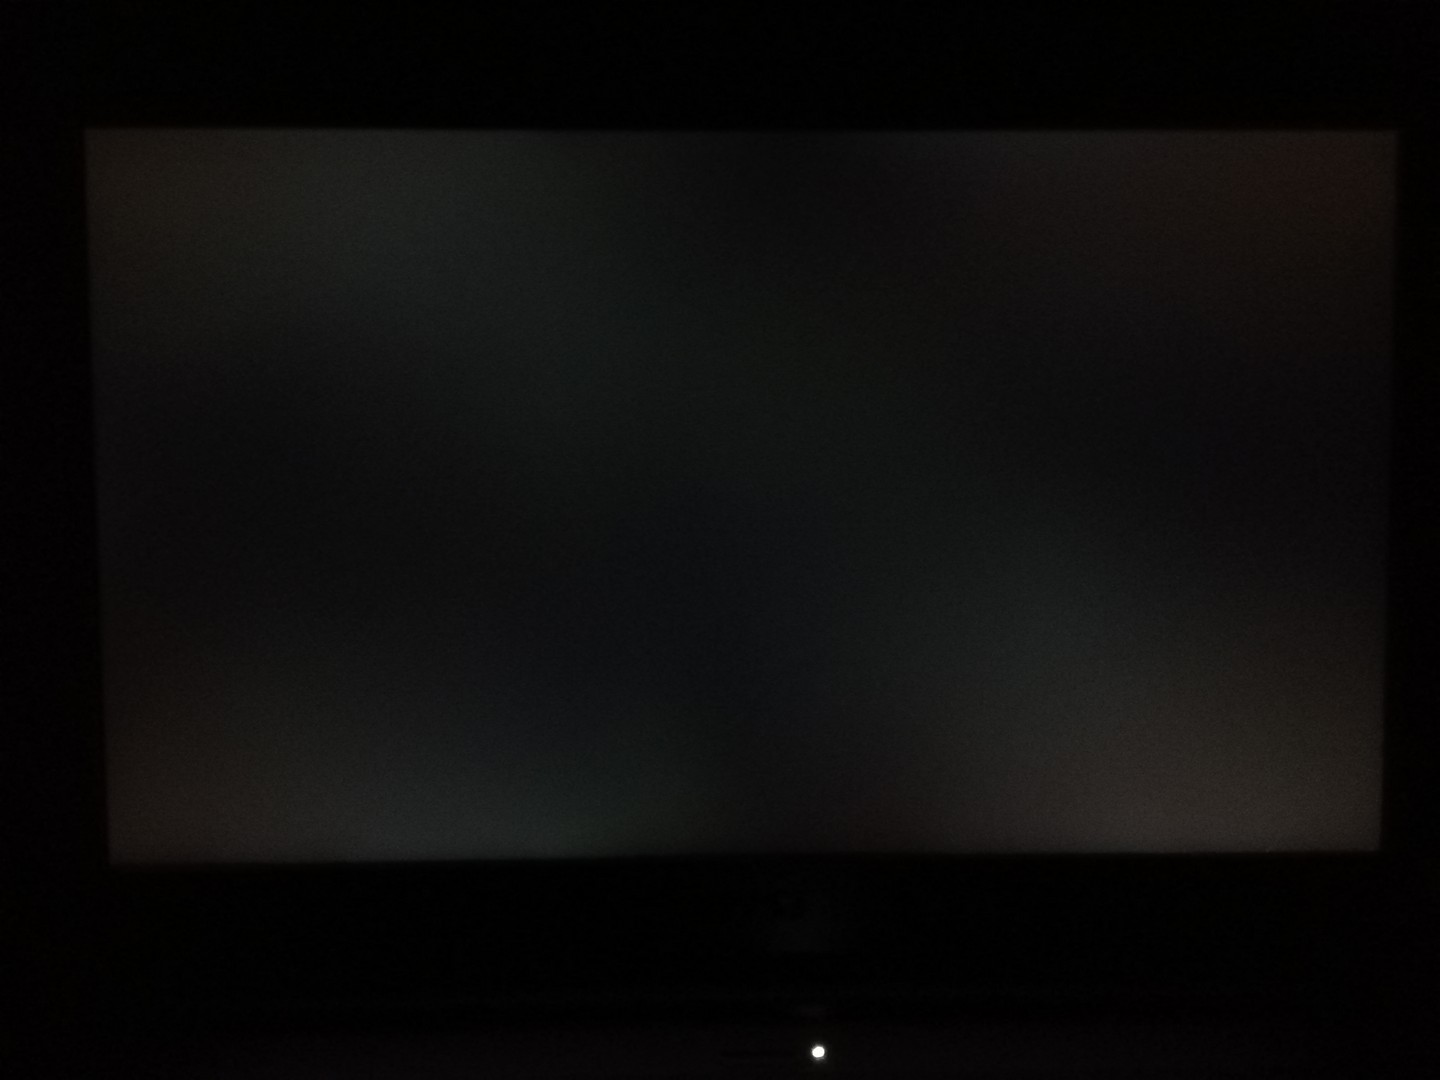
The screen of the P65 Creator is made up of a 15.6-inch IPS panel with a resolution of 3840x2160 pixels. The average brightness is 462 cd/m², which is higher than that of other devices in our comparison field. Users with sensitive eyes will be happy to hear that the brightness is regulated without the use of PWM. The brightness distribution is below average at 83 percent, which results in significant backlight bleeding. Alternatively, the MSI P65 is also available with a Full HD display.
| |||||||||||||||||||||||||
Brightness Distribution: 83 %
Center on Battery: 476 cd/m²
Contrast: 890:1 (Black: 0.5 cd/m²)
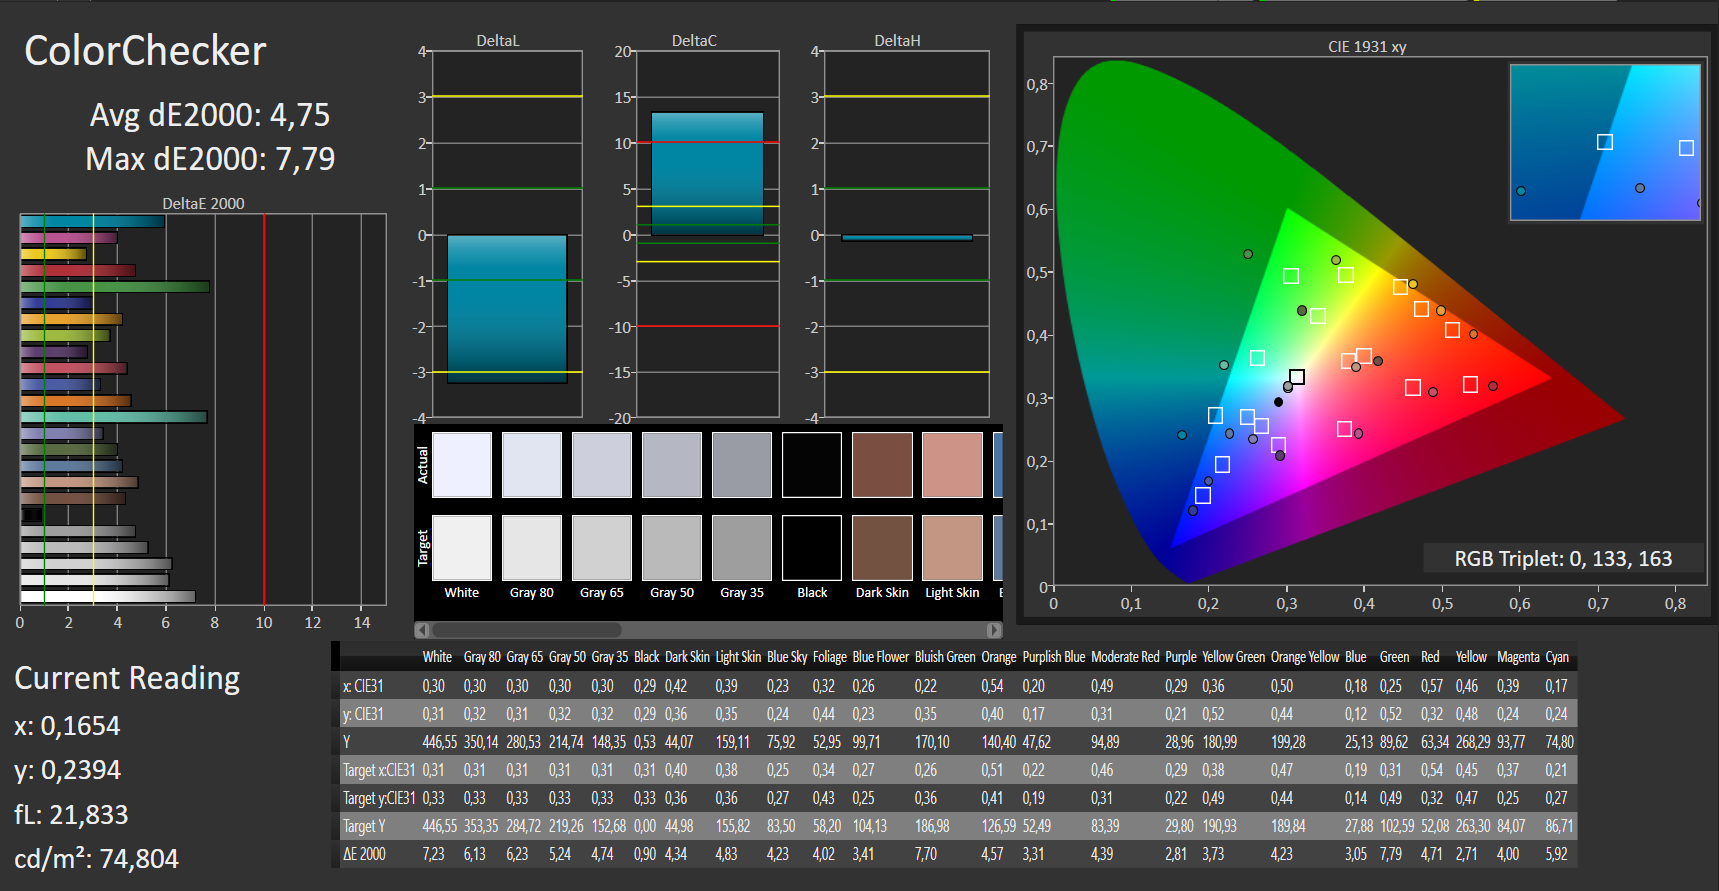
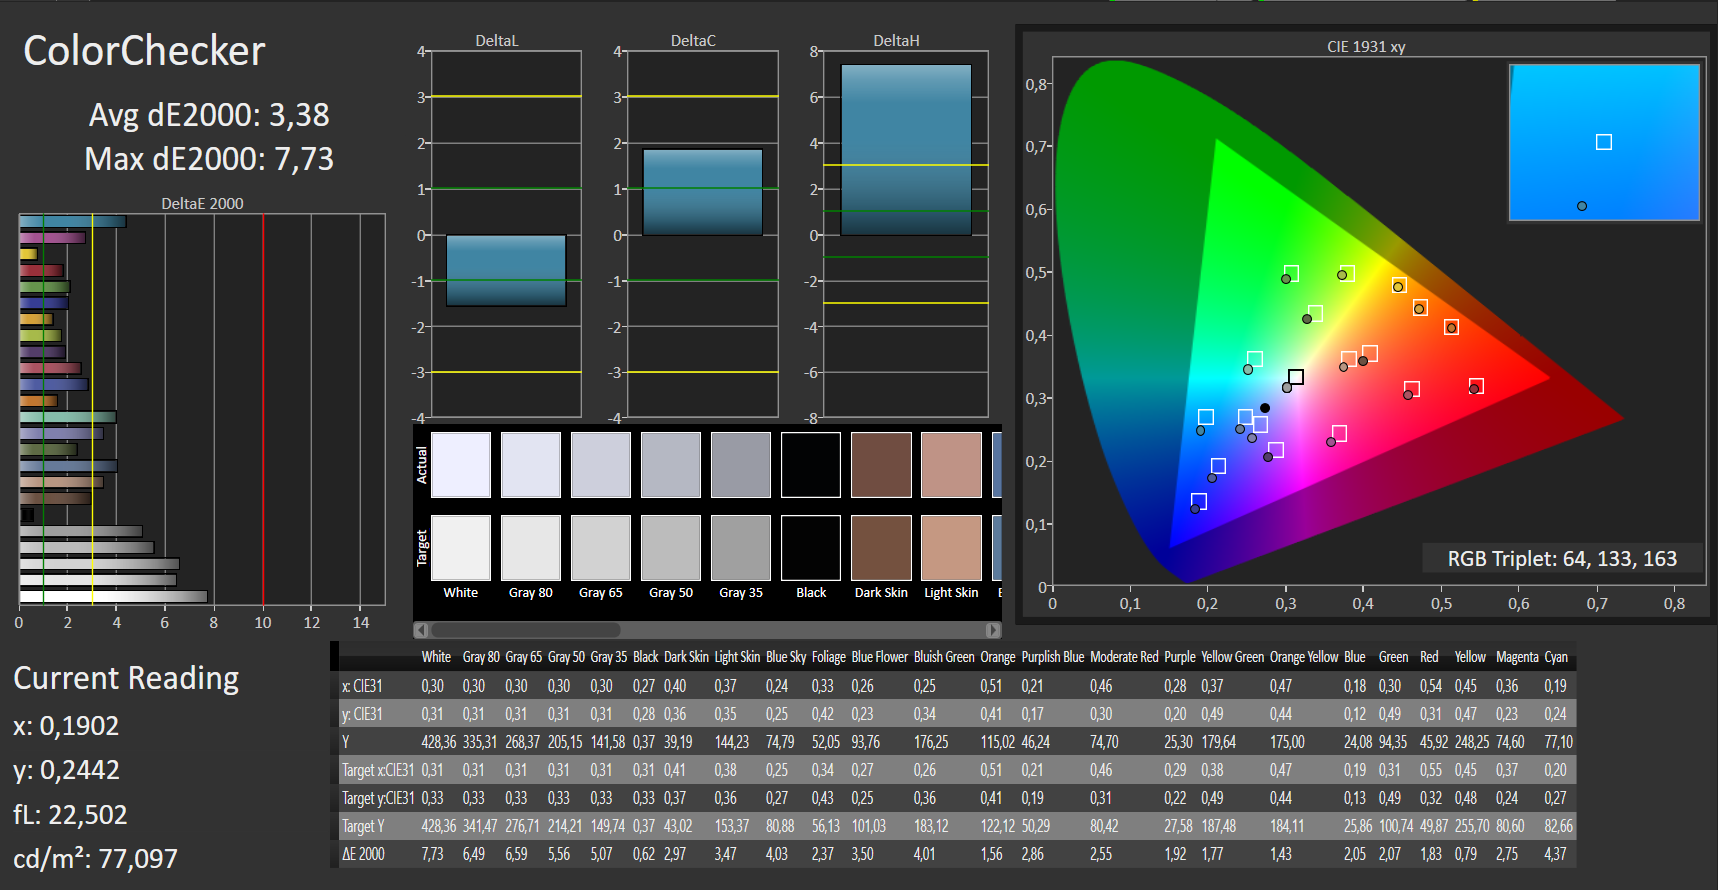
ΔE ColorChecker Calman: 4.75 | ∀{0.5-29.43 Ø4.71}
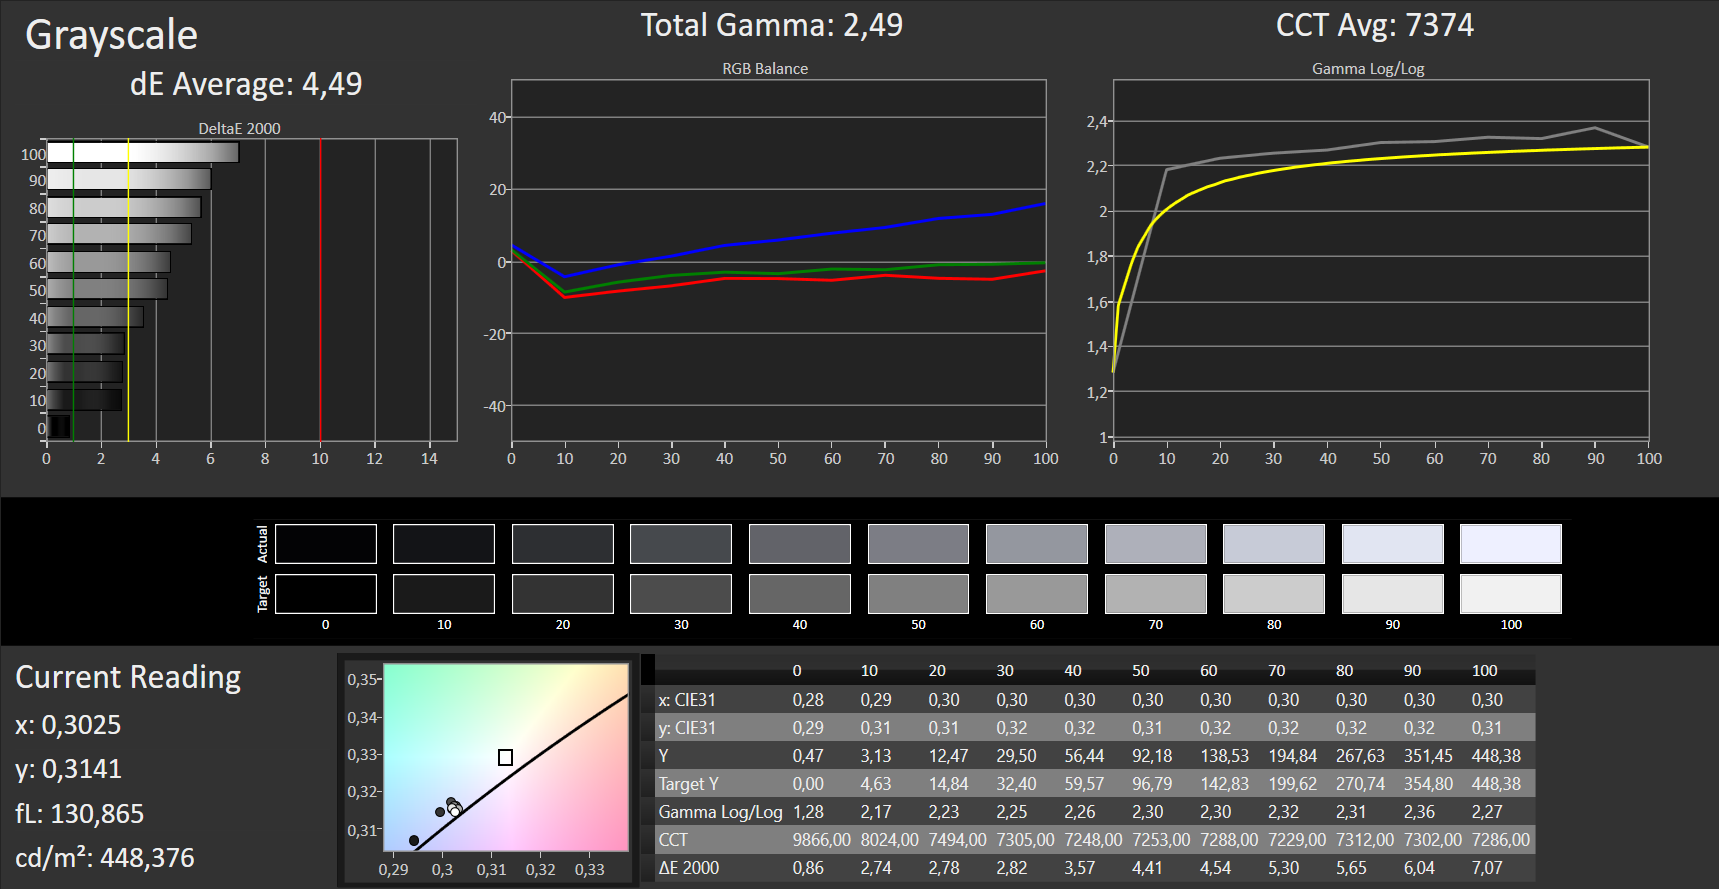
ΔE Greyscale Calman: 4.49 | ∀{0.09-98 Ø4.96}
100% sRGB (Argyll 1.6.3 3D)
87% AdobeRGB 1998 (Argyll 1.6.3 3D)
98.5% AdobeRGB 1998 (Argyll 3D)
100% sRGB (Argyll 3D)
84.4% Display P3 (Argyll 3D)
Gamma: 2.49
CCT: 7374 K
| MSI P65 Creator 9SF-657 AU Optronics AUO41EB, , 3840x2160, 15.6" | Razer Blade 15 RTX 2070 Max-Q LG Philips LGD05C0, , 1920x1080, 15.6" | Asus Zephyrus S GX502GW AU Optronics B156HAN08.2 (AUO82ED), , 1920x1080, 15.6" | Schenker XMG Ultra 15 Turing AU Optronics B156HAN07.0 (AUO70ED), , 1920x1080, 15.6" | Gigabyte Aero 15-X9 LGD05C0, , 1920x1080, 15.6" | |
|---|---|---|---|---|---|
| Display | -20% | -22% | -20% | -22% | |
| Display P3 Coverage (%) | 84.4 | 65.3 -23% | 64.9 -23% | 66.1 -22% | 63.5 -25% |
| sRGB Coverage (%) | 100 | 94.9 -5% | 91 -9% | 92.6 -7% | 93.1 -7% |
| AdobeRGB 1998 Coverage (%) | 98.5 | 66.3 -33% | 65.9 -33% | 67.1 -32% | 64.5 -35% |
| Response Times | 65% | 79% | 62% | 62% | |
| Response Time Grey 50% / Grey 80% * (ms) | 51 ? | 16.8 ? 67% | 7.2 ? 86% | 17.6 ? 65% | 16.4 ? 68% |
| Response Time Black / White * (ms) | 31 ? | 11.6 ? 63% | 8.8 ? 72% | 12.8 ? 59% | 13.6 ? 56% |
| PWM Frequency (Hz) | |||||
| Screen | 4% | 5% | 2% | 12% | |
| Brightness middle (cd/m²) | 445 | 314.7 -29% | 286 -36% | 263 -41% | 250 -44% |
| Brightness (cd/m²) | 462 | 312 -32% | 275 -40% | 264 -43% | 235 -49% |
| Brightness Distribution (%) | 83 | 90 8% | 90 8% | 89 7% | 85 2% |
| Black Level * (cd/m²) | 0.5 | 0.38 24% | 0.37 26% | 0.17 66% | 0.29 42% |
| Contrast (:1) | 890 | 828 -7% | 773 -13% | 1547 74% | 862 -3% |
| Colorchecker dE 2000 * | 4.75 | 2.56 46% | 2.19 54% | 4.45 6% | 1.46 69% |
| Colorchecker dE 2000 max. * | 7.79 | 4.89 37% | 4.4 44% | 8.33 -7% | 2.47 68% |
| Greyscale dE 2000 * | 4.49 | 3.4 24% | 2.2 51% | 4.77 -6% | 1.27 72% |
| Gamma | 2.49 88% | 2.3 96% | 2.41 91% | 2.52 87% | 2.4 92% |
| CCT | 7374 88% | 6435 101% | 6405 101% | 7767 84% | 6749 96% |
| Color Space (Percent of AdobeRGB 1998) (%) | 87 | 60.7 -30% | 59 -32% | 60 -31% | 60 -31% |
| Color Space (Percent of sRGB) (%) | 100 | 94.6 -5% | 91 -9% | 93 -7% | 93 -7% |
| Colorchecker dE 2000 calibrated * | 1.71 | 2.27 | 1.93 | ||
| Total Average (Program / Settings) | 16% /
7% | 21% /
10% | 15% /
5% | 17% /
12% |
* ... smaller is better
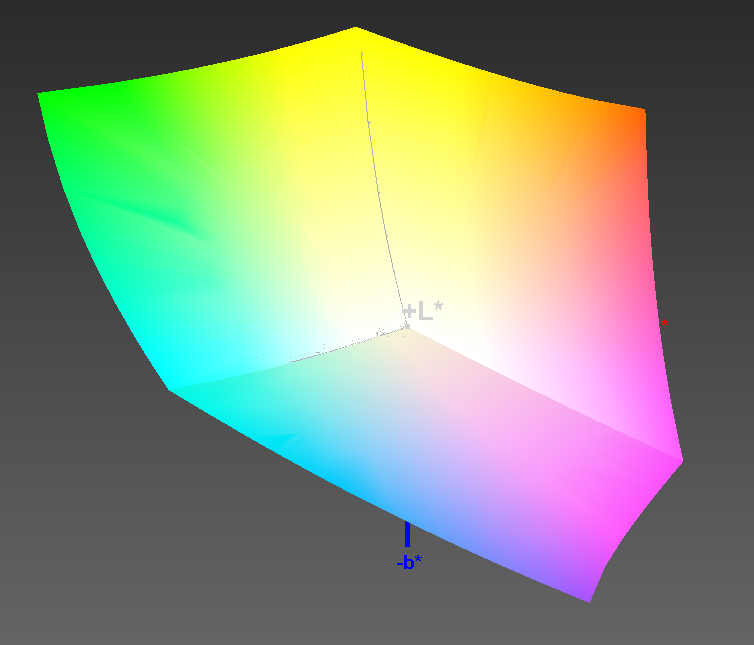
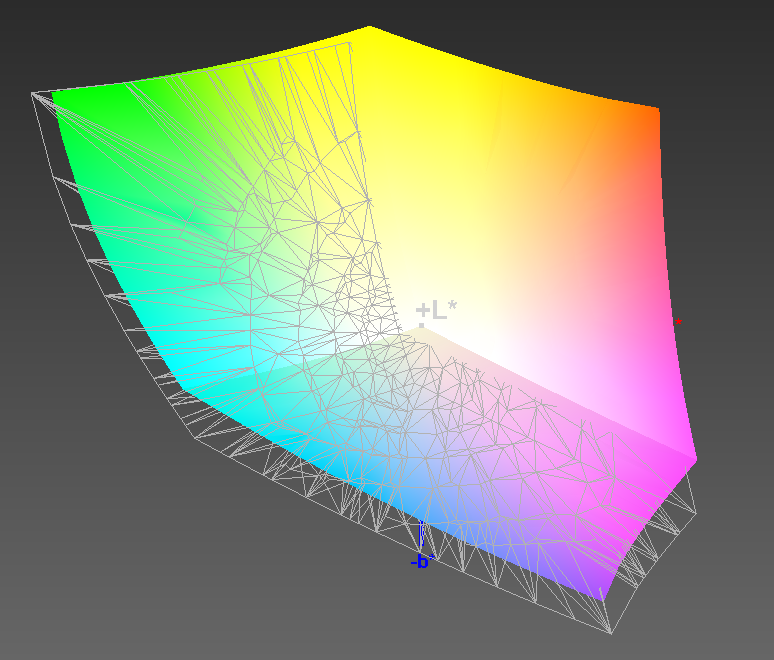
Our measurements show that the MSI notebook has an average contrast ratio of 890:1 and a relatively high black value of 0.5 cd/m². While the former value is on par with other devices in this price range, the black value is higher than that of the competition. This makes black areas appear to be covered by a gray film. The color space coverage of the P65 Creator is very good, however, and covers 100 percent of the sRGB and 87 percent of the AdobeRGB color space.
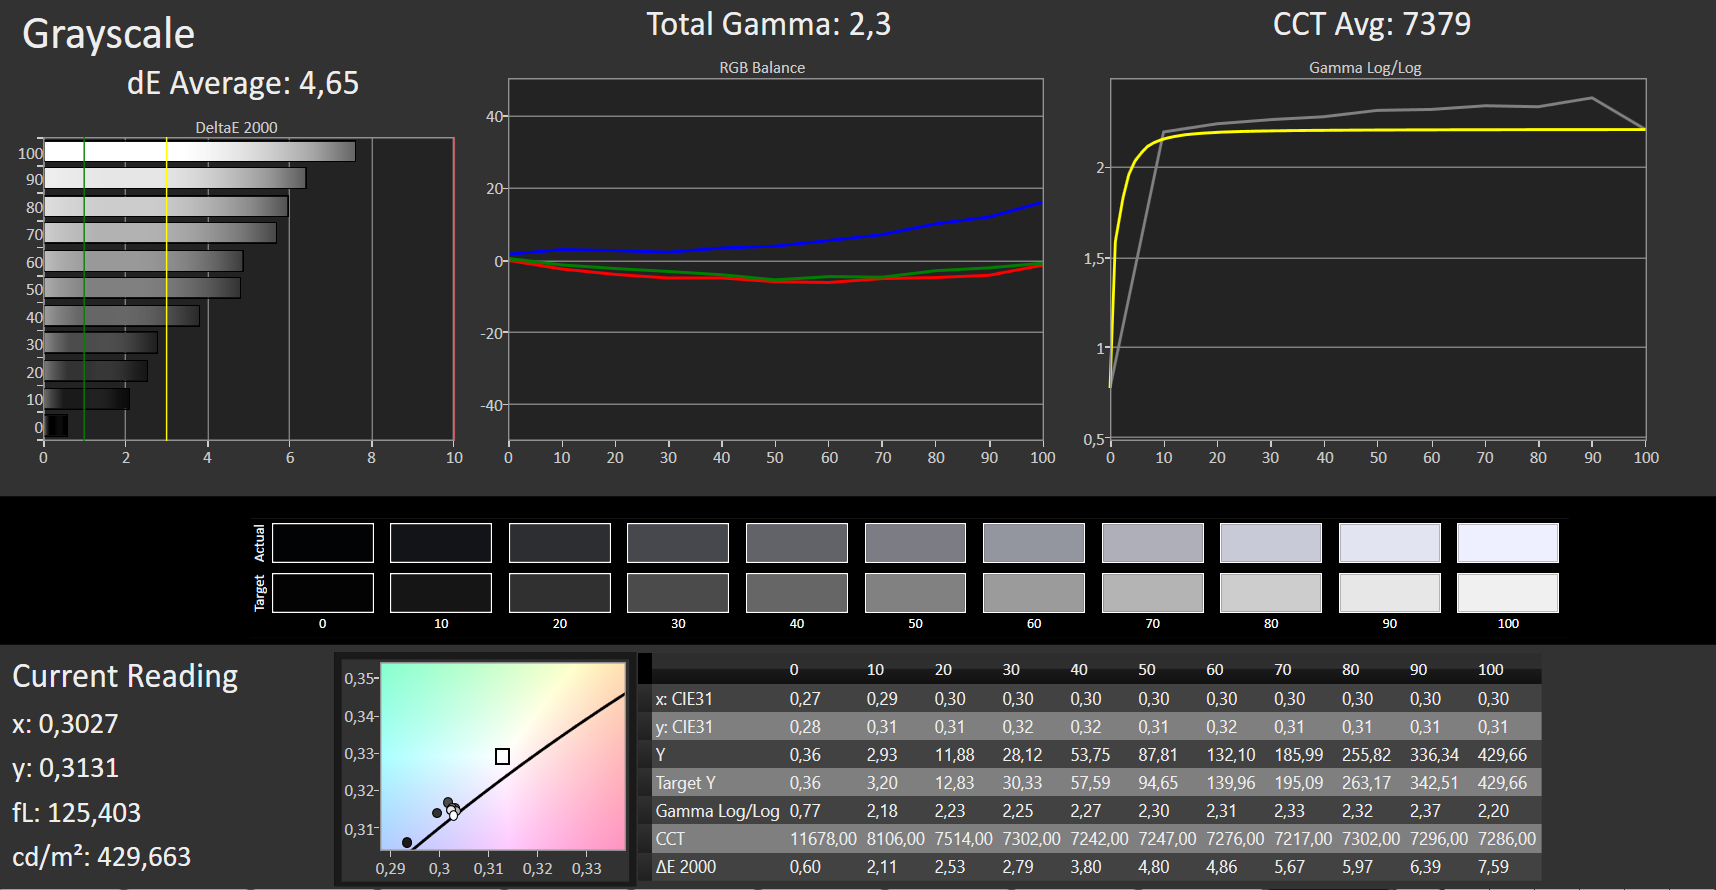
Users can easily adapt the color temperature and color space by opening a drop-down menu or via the MSI True Color app. This offers various preset modes that can then be further adapted (color temperature and brightness). The CalMAN analysis shows that the panel has a blue cast ex-works when using the AdobeRGB color space.


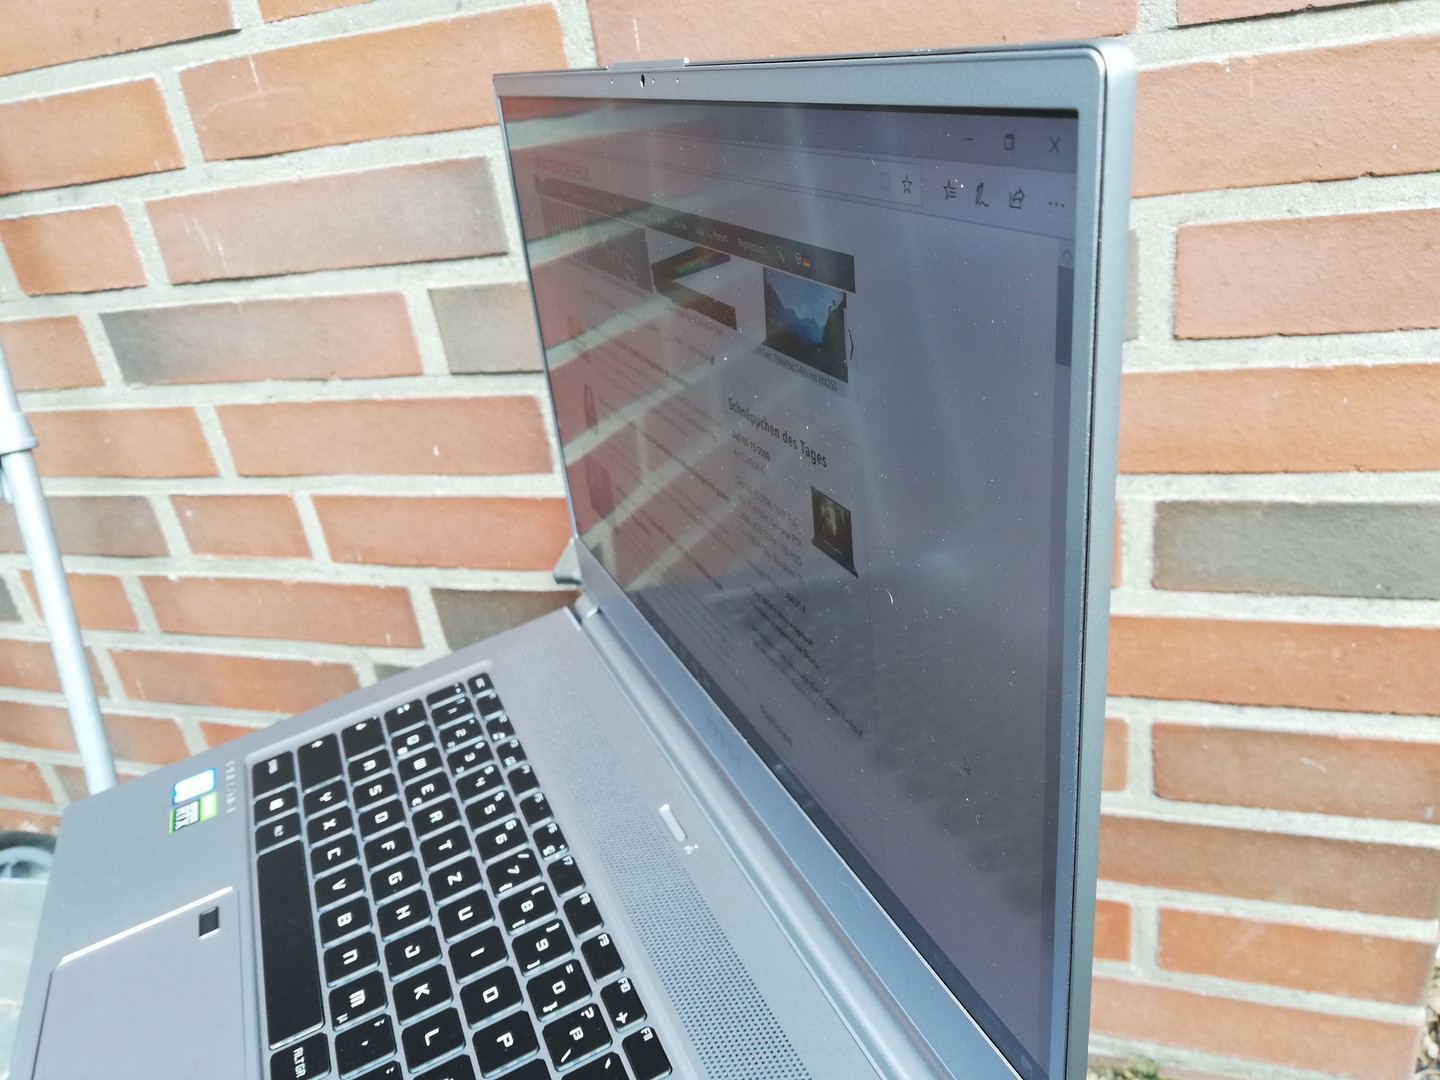
The MSI P65 Creator is easy to use outdoors. It offers sufficient brightness to read the screen content even on bright days. The semi-matte display does show reflections of the surroundings, but these can be mostly avoided by adjusting the opening angle of the screen.
Display Response Times
| ↔ Response Time Black to White | ||
|---|---|---|
| 31 ms ... rise ↗ and fall ↘ combined | ↗ 18 ms rise | 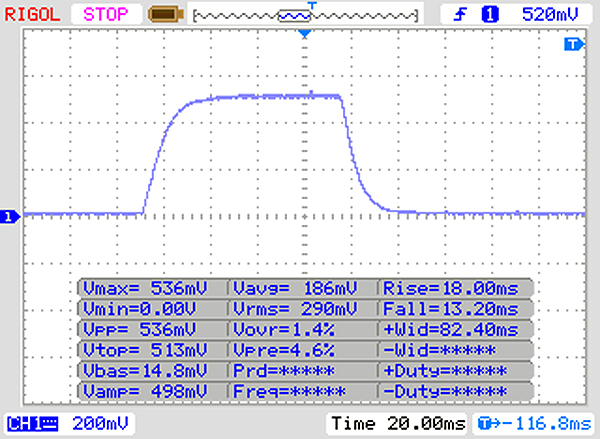 |
| ↘ 13 ms fall | ||
| The screen shows slow response rates in our tests and will be unsatisfactory for gamers. In comparison, all tested devices range from 0.1 (minimum) to 240 (maximum) ms. » 84 % of all devices are better. This means that the measured response time is worse than the average of all tested devices (19.8 ms). | ||
| ↔ Response Time 50% Grey to 80% Grey | ||
| 51 ms ... rise ↗ and fall ↘ combined | ↗ 24 ms rise | 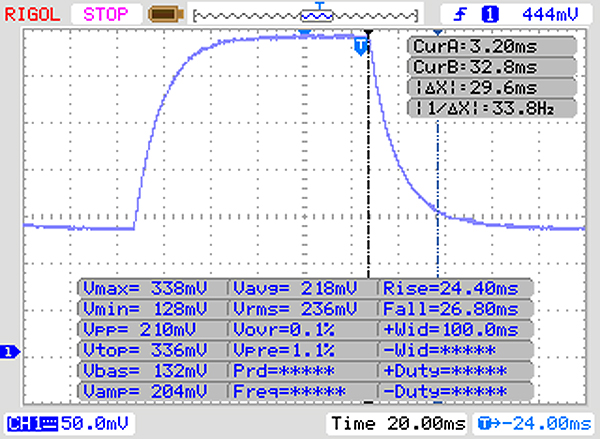 |
| ↘ 27 ms fall | ||
| The screen shows slow response rates in our tests and will be unsatisfactory for gamers. In comparison, all tested devices range from 0.165 (minimum) to 636 (maximum) ms. » 87 % of all devices are better. This means that the measured response time is worse than the average of all tested devices (30.9 ms). | ||
Screen Flickering / PWM (Pulse-Width Modulation)
| Screen flickering / PWM not detected | 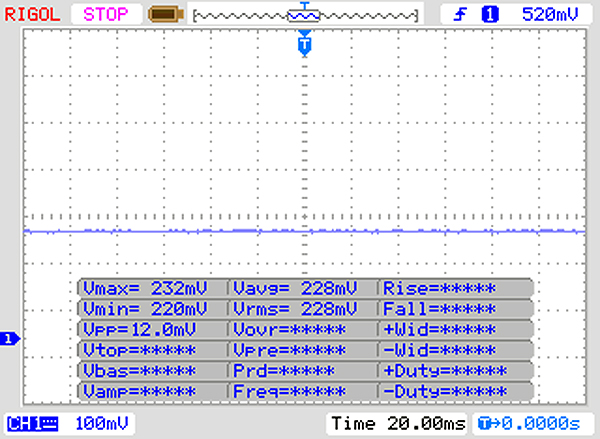 | ||
In comparison: 52 % of all tested devices do not use PWM to dim the display. If PWM was detected, an average of 7744 (minimum: 5 - maximum: 343500) Hz was measured. | |||
The IPS panel of the P65 Creator 9SF has a very stable viewing angle. Content can be read from almost every angle without distortions or inverted colors. As long as there are no reflections that make reading the screen difficult, the MSI notebook can be used even in unusual positions.

Performance - good CPU performance in the P65 Creator 9SF
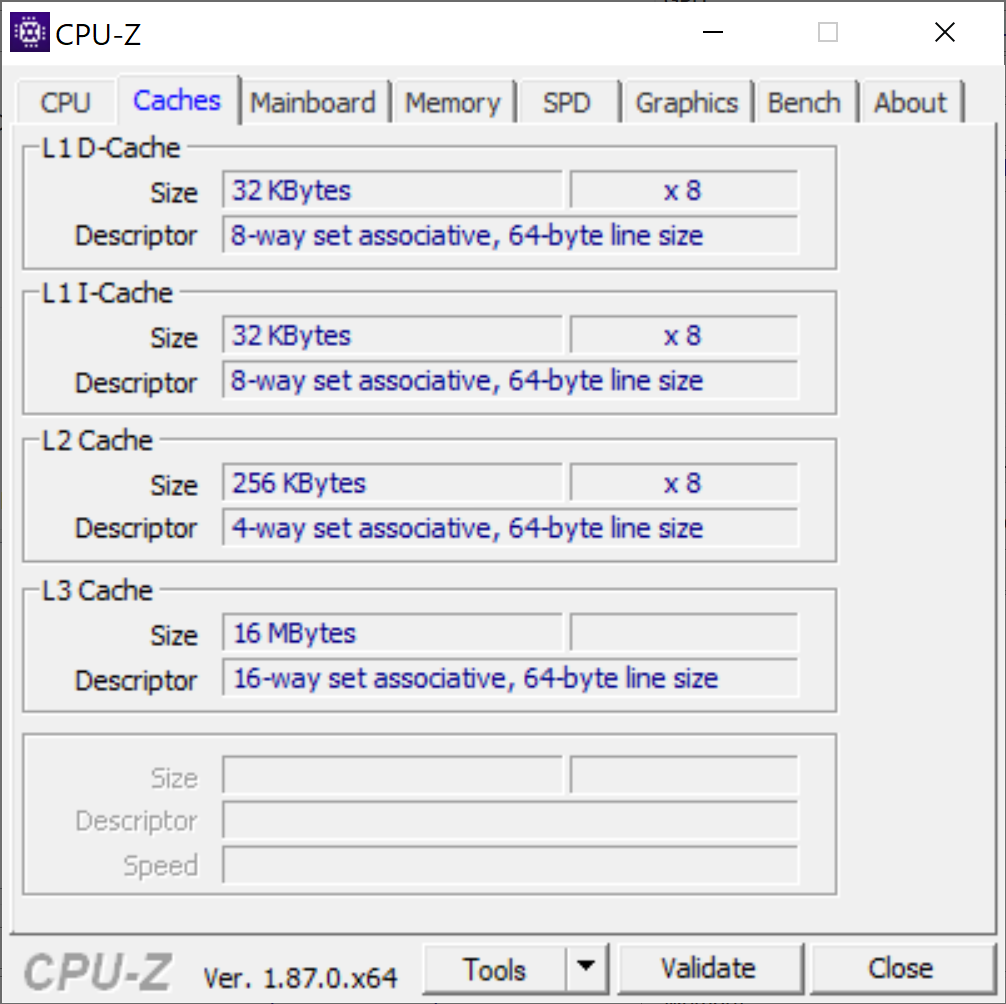
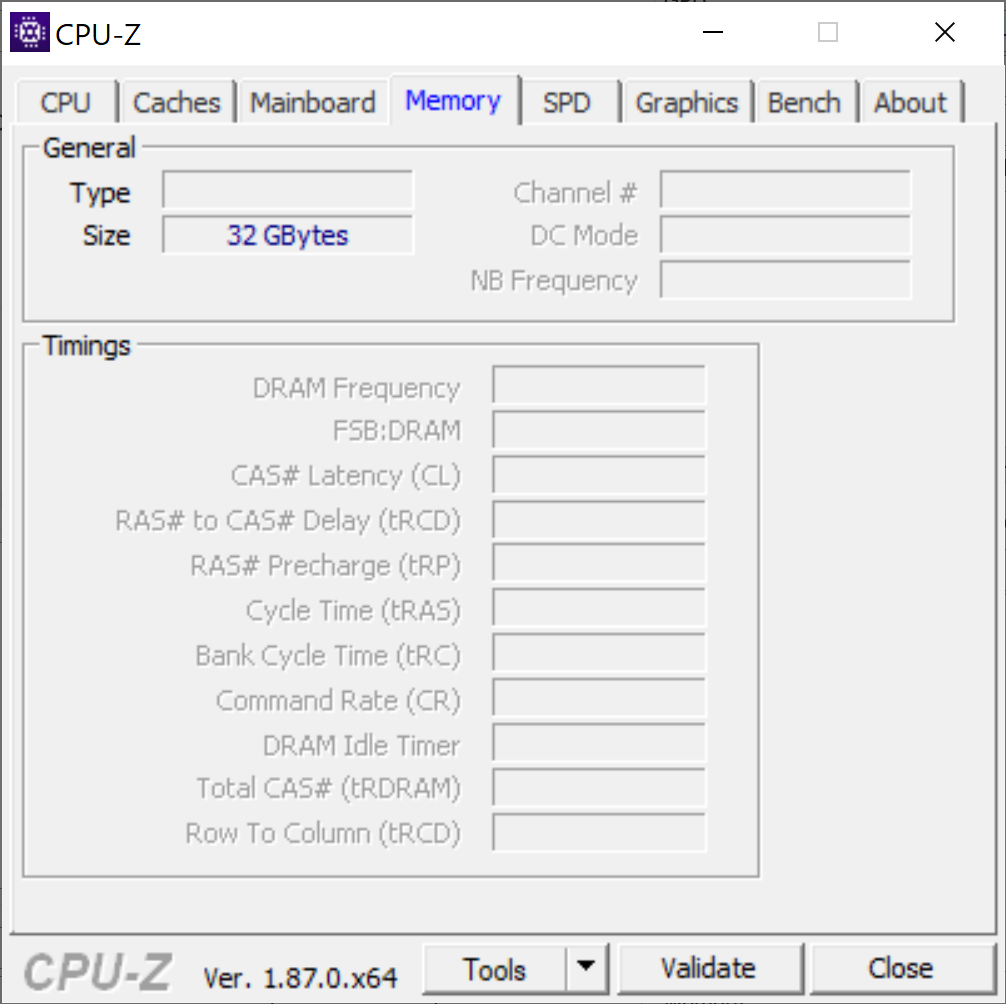
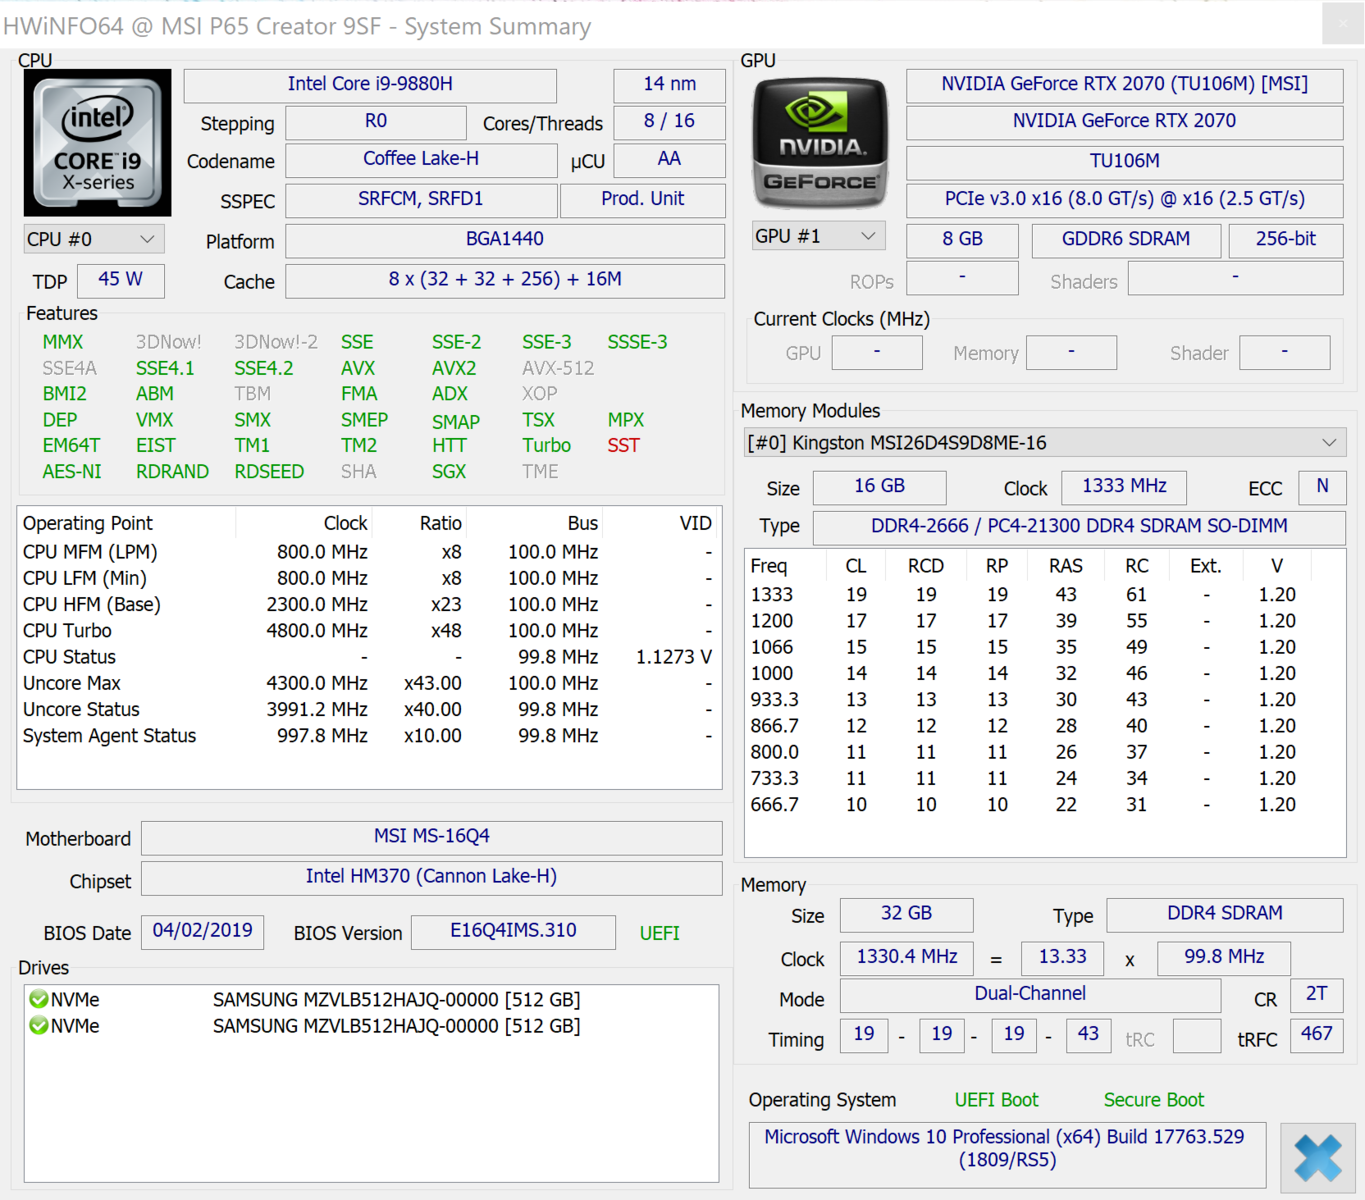
The MSI P65 Creator 9SF offers an Intel Core i9-9880H, an Nvidia GeForce RTX 2070 Max-Q, 32 GB of RAM and two 512-GB Samsung SSDs that are connected using the RAID system to offer a total of 1 TB of storage space. This makes the Creator 9SF suitable not only for creating demanding 3D content, but also for gamers.

Processor
The Intel Core i9-9880H is a processor that is based on Coffee Lake architecture and whose eight cores can work 16 threads simultaneously. The clock rates are between 2.3 GHz (base clock) and 4.8 GHz (turbo boost). However, the latter can only be reached via a thermal velocity boost with a maximum core temperature of 50 °C (~122 °F) . How long the clock rates can be kept up for depends on the performance of the cooling system.
Our CineBench R15 loop focuses on multi-core performance. The results are significantly higher than that of our competition. Nonetheless, the performance drops by around 7 percent quite quickly and then remains below that of the Schenker XMG Ultra 15 with its Intel Core i7-9700K for the remainder of the test. The CineBench R15 single core test again positions the MSI P65 Creator 9SF just beneath the i7-9700K. Users can expect a further drop in performance of 20 percent when working on battery.
System Performance
The PCMark benchmarks position the P65 Creator 9SF at the bottom of our comparison table for system performance. Nonetheless, its system performance is not bad and the PCMark 10 results are significantly higher than the average of all multimedia notebooks in our database. The difference is not quite as big for the PCMark 8 results, but it can still be considered above average.
The MSI notebook did not show any weaknesses in everyday use and impressed us with its smooth-running system. Even demanding programs are loaded quickly and we did not encounter any small judders or glitches during testing. Find out how the MSI P65 9SF fares compared to other devices in our database on our CPU benchmark page.
| PCMark 8 Home Score Accelerated v2 | 3505 points | |
| PCMark 8 Work Score Accelerated v2 | 4482 points | |
| PCMark 10 Score | 5211 points | |
Help | ||
Storage Devices
MSI has equipped the P65 Creator 9SF with two Samsung PM981 SSDs, connected using RAID. This means the device offers 936 GB of storage space available, of which users have around 880 GB available after initial set up.
Our P65 Creator reaches very good read and write speeds in our storage benchmarks. The Crystal DiskMark 5.2 even positions it in the first place among the competition. The AS SSD benchmark results place it in second place after the Schenker XMG Ultra 15.
Find out which performance levels other storage devices have to offer on our HDD/SSD comparison page.
| MSI P65 Creator 9SF-657 2x Samsung SSD PM981 MZVLB512HAJQ (RAID 0) | Razer Blade 15 RTX 2070 Max-Q Samsung SSD PM981 MZVLB512HAJQ | Asus Zephyrus S GX502GW 2x Intel SSD 660p SSDPEKNW512G8 (RAID 0) | Schenker XMG Ultra 15 Turing Samsung SSD 970 EVO Plus 1TB | Gigabyte Aero 15-X9 Intel SSD 760p SSDPEKKW010T8 | Average 2x Samsung SSD PM981 MZVLB512HAJQ (RAID 0) | |
|---|---|---|---|---|---|---|
| CrystalDiskMark 5.2 / 6 | -32% | -24% | -17% | -31% | -7% | |
| Write 4K (MB/s) | 105.6 | 93.9 -11% | 97 -8% | 129.9 23% | 97.1 -8% | 98.6 ? -7% |
| Read 4K (MB/s) | 46.32 | 40.56 -12% | 49.58 7% | 47.15 2% | 53.7 16% | 42.5 ? -8% |
| Write Seq (MB/s) | 2910 | 1468 -50% | 1838 -37% | 1840 -37% | 1526 -48% | 2804 ? -4% |
| Read Seq (MB/s) | 2820 | 1540 -45% | 2421 -14% | 1775 -37% | 2020 -28% | 2806 ? 0% |
| Write 4K Q32T1 (MB/s) | 545 | 293.5 -46% | 326.9 -40% | 294.5 -46% | 285.6 -48% | 446 ? -18% |
| Read 4K Q32T1 (MB/s) | 632 | 346 -45% | 372.9 -41% | 373.6 -41% | 321.8 -49% | 512 ? -19% |
| Write Seq Q32T1 (MB/s) | 3349 | 1941 -42% | 1894 -43% | 3295 -2% | 1533 -54% | 3252 ? -3% |
| Read Seq Q32T1 (MB/s) | 3333 | 3266 -2% | 2828 -15% | 3535 6% | 2351 -29% | 3324 ? 0% |
| AS SSD | -4% | -24% | 19% | -34% | -5% | |
| Seq Read (MB/s) | 2860 | 1840 -36% | 2506 -12% | 2739 -4% | 2113 -26% | 2811 ? -2% |
| Seq Write (MB/s) | 2604 | 1822 -30% | 1712 -34% | 2650 2% | 1471 -44% | 2627 ? 1% |
| 4K Read (MB/s) | 45.15 | 52.3 16% | 48.32 7% | 27.86 -38% | 55 22% | 42.4 ? -6% |
| 4K Write (MB/s) | 100.2 | 110.7 10% | 103.6 3% | 134.7 34% | 107.1 7% | 97.5 ? -3% |
| 4K-64 Read (MB/s) | 1428 | 1126 -21% | 624 -56% | 1651 16% | 914 -36% | 1382 ? -3% |
| 4K-64 Write (MB/s) | 1401 | 1717 23% | 1253 -11% | 2190 56% | 703 -50% | 1245 ? -11% |
| Access Time Read * (ms) | 0.049 | 0.047 4% | 0.08 -63% | 0.031 37% | 0.114 -133% | 0.05367 ? -10% |
| Access Time Write * (ms) | 0.037 | 0.033 11% | 0.04 -8% | 0.028 24% | 0.034 8% | 0.038 ? -3% |
| Score Read (Points) | 1759 | 1362 -23% | 923 -48% | 1953 11% | 1180 -33% | 1706 ? -3% |
| Score Write (Points) | 1762 | 2010 14% | 1528 -13% | 2590 47% | 957 -46% | 1605 ? -9% |
| Score Total (Points) | 4411 | 4079 -8% | 2896 -34% | 5529 25% | 2722 -38% | 4176 ? -5% |
| Copy ISO MB/s (MB/s) | 1975 | 2031 | 1864 | |||
| Copy Program MB/s (MB/s) | 526 | 452.1 | 362.6 | |||
| Copy Game MB/s (MB/s) | 1200 | 1043 | 936 | |||
| Total Average (Program / Settings) | -18% /
-15% | -24% /
-24% | 1% /
4% | -33% /
-32% | -6% /
-6% |
* ... smaller is better

Graphics Performance
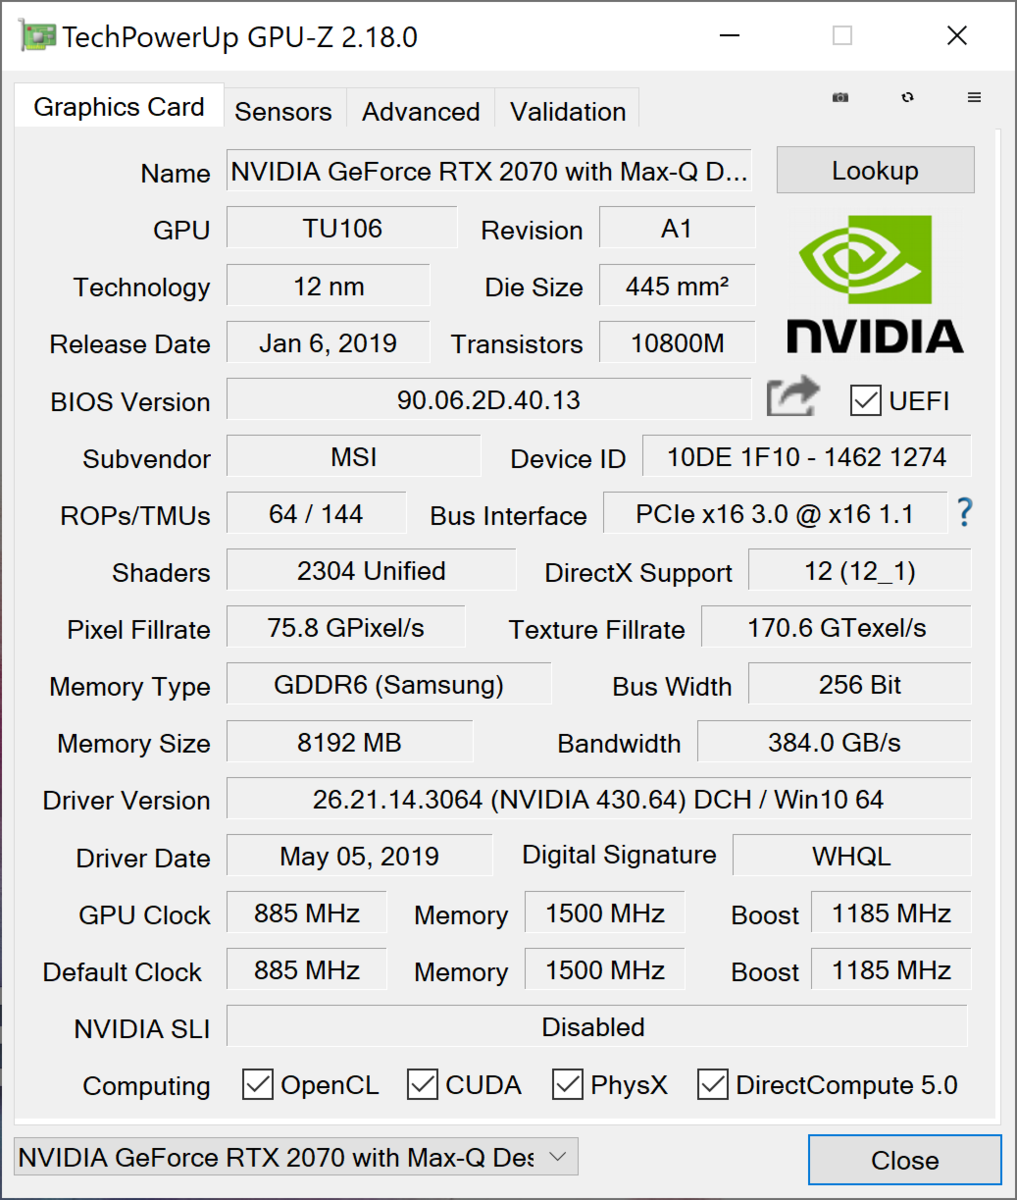
Our test unit of the MSI P65 is equipped with an Nvidia GeForce RTX 2070 Max-Q, which is responsible for displaying images. The Max-Q design makes the chip a lot more efficient than the usual RTX 2070. But this also means that the clock rates are lower. The RTX 2070 Max-Q is available with two different TDP settings and therefore different levels of performance.
MSI has chosen to go with the lower-clocked version of the RTX 2070 Max-Q, which has a TDP of 80 watts and clock rates of 885-1185 MHz. This means that the multimedia notebook only makes the last place in our comparison field. The results are below average compared to the notebooks equipped with an RTX 2070 Max-Q chip in our database in the 3DMark 11, 3DMark Fire Strike and Cloud Gate benchmarks.
Find out what level of performance other GPUs reach compared to the Nvidia GeForce RTX 2070 Max-Q on our GPU benchmark page.
| 3DMark 11 Performance | 19440 points | |
| 3DMark Cloud Gate Standard Score | 36379 points | |
| 3DMark Fire Strike Score | 14946 points | |
Help | ||
Gaming Performance
A look at the hardware in the MSI P65 Creator 9SF shows that the multimedia notebook is also suitable for gamers. The included Nvidia GeForce RTX 2070 Max-Q can display most modern games easily and smoothly, although not always at UHD resolution and high details. If you limit the details to medium, almost every current game should be playable on this device. The games tested by us all reached high refresh rates and we did not encounter drops in performance even during long gaming sessions.
Our list of GPUs for gaming shows what level of performance you can expect for various games.
| Thief | |
| 1920x1080 Very High Preset AA:FXAA & High SS AF:8x | |
| Average NVIDIA GeForce RTX 2070 Max-Q (99 - 103, n=2) | |
| MSI P65 Creator 9SF-657 | |
| 1366x768 High Preset AA:FXAA & Low SS AF:4x | |
| MSI P65 Creator 9SF-657 | |
| Average NVIDIA GeForce RTX 2070 Max-Q (n=1) | |
| 1366x768 Normal Preset AA:FX | |
| MSI P65 Creator 9SF-657 | |
| Average NVIDIA GeForce RTX 2070 Max-Q (n=1) | |
| 1024x768 Very Low Preset | |
| MSI P65 Creator 9SF-657 | |
| Average NVIDIA GeForce RTX 2070 Max-Q (n=1) | |
| Dota 2 Reborn | |
| 1920x1080 ultra (3/3) best looking | |
| Average NVIDIA GeForce RTX 2070 Max-Q (105.8 - 126, n=13) | |
| MSI P65 Creator 9SF-657 | |
| Average of class Multimedia (29 - 179.9, n=57, last 2 years) | |
| 1920x1080 high (2/3) | |
| Average NVIDIA GeForce RTX 2070 Max-Q (111.4 - 135, n=13) | |
| MSI P65 Creator 9SF-657 | |
| Average of class Multimedia (31.1 - 196.9, n=57, last 2 years) | |
| 1366x768 med (1/3) | |
| Average NVIDIA GeForce RTX 2070 Max-Q (117.4 - 141, n=13) | |
| MSI P65 Creator 9SF-657 | |
| Average of class Multimedia (49.1 - 208, n=57, last 2 years) | |
| 1280x720 min (0/3) fastest | |
| Average NVIDIA GeForce RTX 2070 Max-Q (126.5 - 164, n=13) | |
| MSI P65 Creator 9SF-657 | |
| Average of class Multimedia (77.2 - 233, n=57, last 2 years) | |
"The Witcher 3" load test shows that the performance of the MSI P65 Creator 9SF drops slightly after a while. We did notice a slight increase in frame rates towards the end of the test, which indicates that the performance was slowly starting to increase again.
| low | med. | high | ultra | 4K | |
|---|---|---|---|---|---|
| BioShock Infinite (2013) | 369.7 | 291.8 | 277.2 | 148.8 | |
| Thief (2014) | 134.8 | 131.6 | 128.7 | 99 | |
| The Witcher 3 (2015) | 295.7 | 205.8 | 116.5 | 80.8 | 42.3 |
| Dota 2 Reborn (2015) | 142.2 | 131.4 | 122.9 | 117.4 |
Emissions - decent speakers and loud fans
System Noise
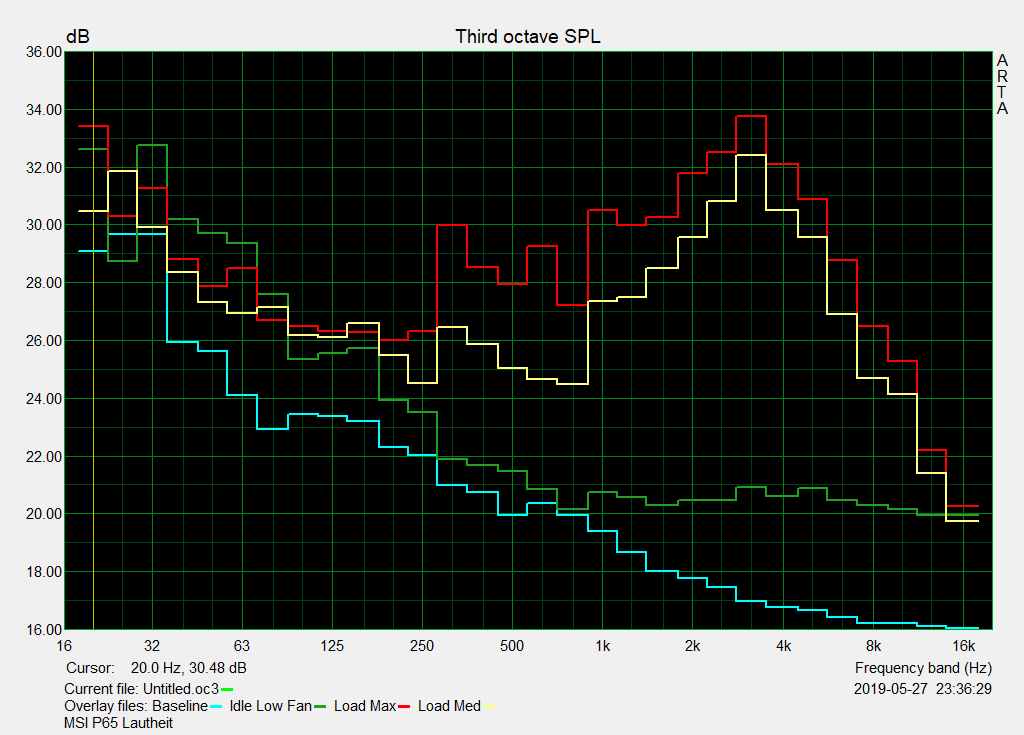
The MSI P65 Creator 9SF is very quiet when under low load (Office) and should therefore be suitable for use in quiet surroundings. The three fans turn on quickly when running graphically demanding applications and become very audible. The fan noise can be described as a steady humming and is accompanied by a high-frequency noise, that is, however, very quiet.
Noise level
| Idle |
| 32.8 / 32.8 / 33.6 dB(A) |
| Load |
| 40.9 / 42.7 dB(A) |
 | ||
30 dB silent 40 dB(A) audible 50 dB(A) loud |
||
min: | ||
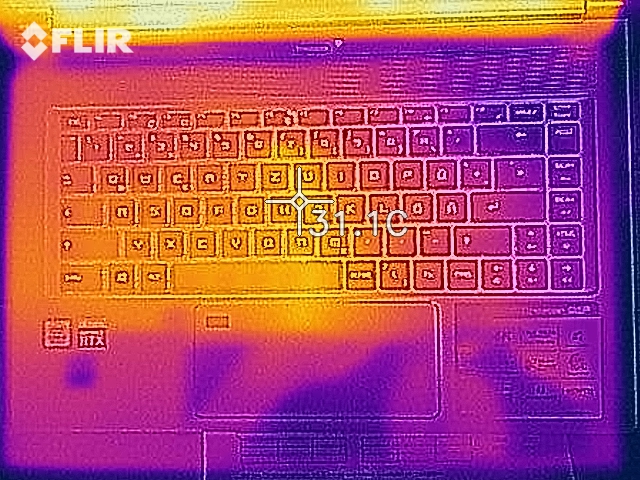
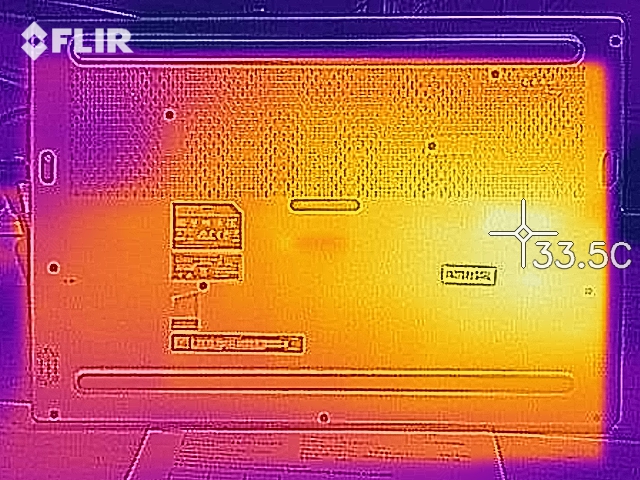
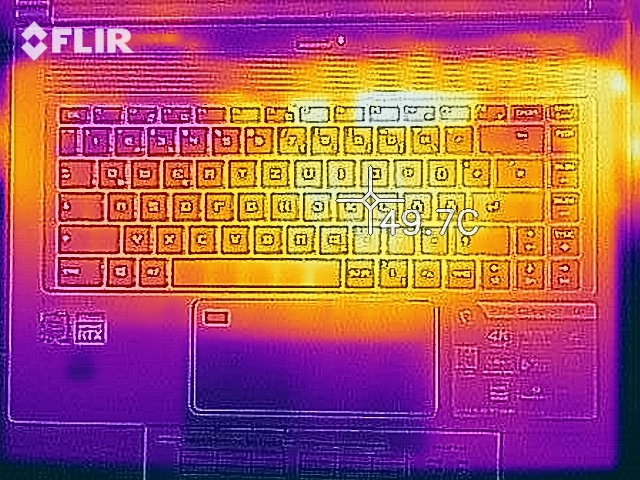
Temperature
According to our measurements the MSI notebook reaches maximum surface temperatures of 29.2 °C (~85 °F) while idling and 60.4 °C (~141 °F) while under load. The hotspots are positioned towards the back on the bottom of the P65 Creator, which might make it uncomfortable to use the device on your lap when under load.
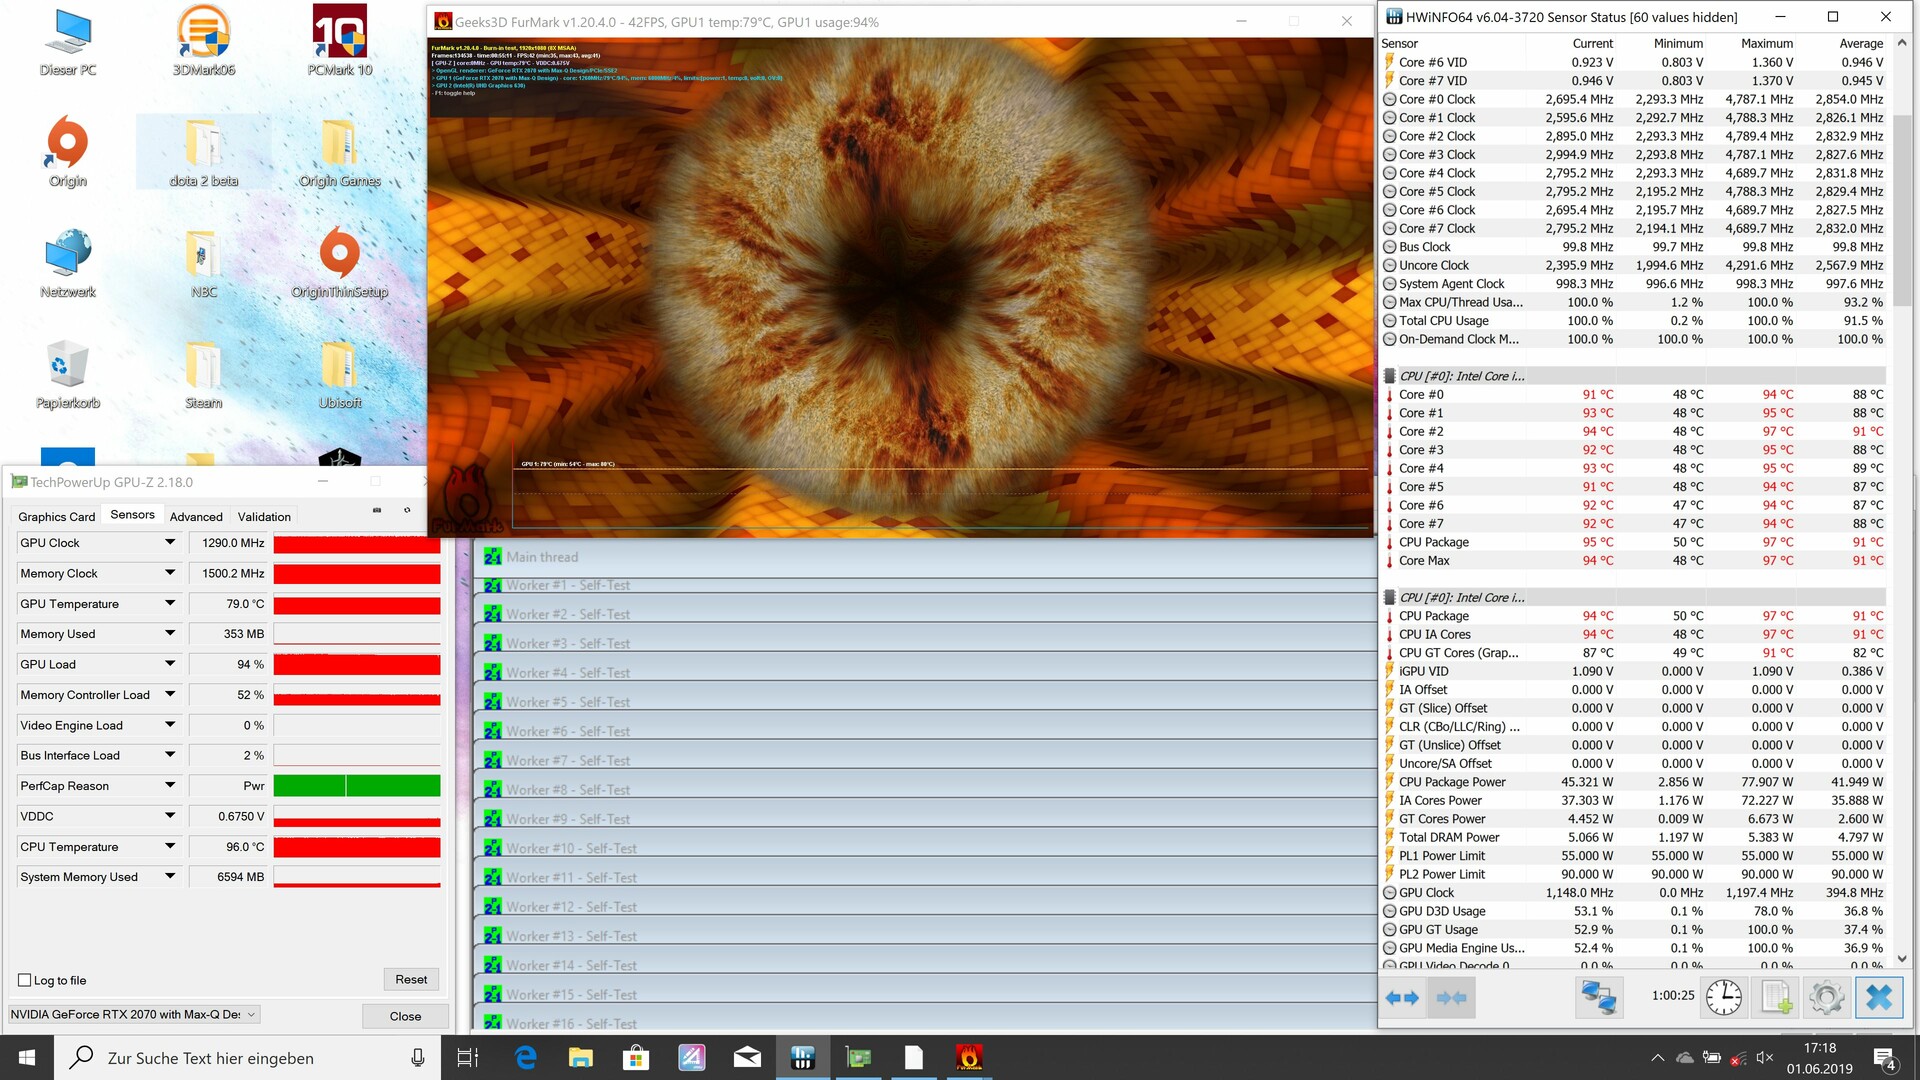
Our continual load test makes the core temperatures increase to 90 °C (~194 °F) almost immediately. The fans also turn on straight away and manage to decrease temperatures to around 88 °C (~190 °F), where they remain for the remainder of the one-hour test. The clock rate only drops just below the base rate of 2.3 GHz shortly and then remains at the base rate for the remainder of the test. Users do not need to expect any drops in performance due to high temperatures inside the MSI P65 Creator 9SF.
(-) The maximum temperature on the upper side is 49.7 °C / 121 F, compared to the average of 36.8 °C / 98 F, ranging from 21 to 71 °C for the class Multimedia.
(-) The bottom heats up to a maximum of 60.4 °C / 141 F, compared to the average of 39.1 °C / 102 F
(+) In idle usage, the average temperature for the upper side is 26.8 °C / 80 F, compared to the device average of 31.3 °C / 88 F.
(+) The palmrests and touchpad are reaching skin temperature as a maximum (34.9 °C / 94.8 F) and are therefore not hot.
(-) The average temperature of the palmrest area of similar devices was 28.7 °C / 83.7 F (-6.2 °C / -11.1 F).

Speakers
The speakers in the P65 Creator 9SF offer average volume and a sound spectrum that is focused on mids and mid highs. The speakers can be used in quiet surroundings, but we would recommend using headphones or external speakers when playing audio for a long time. These can be connected via the 3.5-mm audio jack, which does not have a negative impact on sound quality.
MSI P65 Creator 9SF-657 audio analysis
(±) | speaker loudness is average but good (77.4 dB)
Bass 100 - 315 Hz
(-) | nearly no bass - on average 23.6% lower than median
(±) | linearity of bass is average (9.9% delta to prev. frequency)
Mids 400 - 2000 Hz
(±) | higher mids - on average 8.4% higher than median
(±) | linearity of mids is average (7.8% delta to prev. frequency)
Highs 2 - 16 kHz
(±) | higher highs - on average 6% higher than median
(±) | linearity of highs is average (9.3% delta to prev. frequency)
Overall 100 - 16.000 Hz
(±) | linearity of overall sound is average (28.3% difference to median)
Compared to same class
» 94% of all tested devices in this class were better, 2% similar, 5% worse
» The best had a delta of 5%, average was 17%, worst was 45%
Compared to all devices tested
» 86% of all tested devices were better, 3% similar, 12% worse
» The best had a delta of 4%, average was 23%, worst was 134%
Apple MacBook 12 (Early 2016) 1.1 GHz audio analysis
(+) | speakers can play relatively loud (83.6 dB)
Bass 100 - 315 Hz
(±) | reduced bass - on average 11.3% lower than median
(±) | linearity of bass is average (14.2% delta to prev. frequency)
Mids 400 - 2000 Hz
(+) | balanced mids - only 2.4% away from median
(+) | mids are linear (5.5% delta to prev. frequency)
Highs 2 - 16 kHz
(+) | balanced highs - only 2% away from median
(+) | highs are linear (4.5% delta to prev. frequency)
Overall 100 - 16.000 Hz
(+) | overall sound is linear (10.2% difference to median)
Compared to same class
» 7% of all tested devices in this class were better, 2% similar, 90% worse
» The best had a delta of 5%, average was 18%, worst was 53%
Compared to all devices tested
» 5% of all tested devices were better, 1% similar, 94% worse
» The best had a delta of 4%, average was 23%, worst was 134%
Energy Management - P65 with average battery runtime
Power Consumption
According to our measurements, the MSI P65 Creator 9SF consumes at least 9.4 watts while idling and a maximum of 216 watts under load. While the multimedia notebook is one of the most efficient devices of our comparison field while idling, its consumption under load is average.
The included AC adapter has a rated output of 230 watts and is therefore large enough to always supply the Creator 9SF with sufficient power.
| Off / Standby | |
| Idle | |
| Load |
|
Key:
min: | |
| MSI P65 Creator 9SF-657 i9-9880H, GeForce RTX 2070 Max-Q, 2x Samsung SSD PM981 MZVLB512HAJQ (RAID 0), IPS, 3840x2160, 15.6" | Razer Blade 15 RTX 2070 Max-Q i7-8750H, GeForce RTX 2070 Max-Q, Samsung SSD PM981 MZVLB512HAJQ, IPS, 1920x1080, 15.6" | Asus Zephyrus S GX502GW i7-9750H, GeForce RTX 2070 Mobile, 2x Intel SSD 660p SSDPEKNW512G8 (RAID 0), IPS, 1920x1080, 15.6" | Schenker XMG Ultra 15 Turing i7-9700K, GeForce RTX 2070 Mobile, Samsung SSD 970 EVO Plus 1TB, IPS, 1920x1080, 15.6" | Gigabyte Aero 15-X9 i7-8750H, GeForce RTX 2070 Max-Q, Intel SSD 760p SSDPEKKW010T8, IPS, 1920x1080, 15.6" | Average NVIDIA GeForce RTX 2070 Max-Q | Average of class Multimedia | |
|---|---|---|---|---|---|---|---|
| Power Consumption | 10% | -61% | -118% | -10% | -22% | 40% | |
| Idle Minimum * (Watt) | 9.4 | 10.4 -11% | 24 -155% | 35 -272% | 16 -70% | 15.4 ? -64% | 5.62 ? 40% |
| Idle Average * (Watt) | 17.4 | 14.6 16% | 27 -55% | 39 -124% | 18 -3% | 20 ? -15% | 10.2 ? 41% |
| Idle Maximum * (Watt) | 19.6 | 16.3 17% | 33 -68% | 47 -140% | 23 -17% | 26.7 ? -36% | 12.5 ? 36% |
| Load Average * (Watt) | 103 | 88.5 14% | 129 -25% | 117 -14% | 88 15% | 105.2 ? -2% | 65 ? 37% |
| Load Maximum * (Watt) | 216 | 182.4 16% | 216 -0% | 299 -38% | 167 23% | 201 ? 7% | 111.9 ? 48% |
| Witcher 3 ultra * (Watt) | 155.4 | 176 | 196 | 120 |
* ... smaller is better
Battery Runtime
The MSI P65 Creator 9SF manages to run for just over six hours in our practical Wi-Fi test. This is average for the multimedia devices we have tested so far and is long enough to place the device in the upper mid-range of today's comparison field. The MSI device has to be connected to power supply after 65 minutes of load - only one other device in our comparison field has an even shorter runtime in this scenario.
| MSI P65 Creator 9SF-657 i9-9880H, GeForce RTX 2070 Max-Q, 82 Wh | Razer Blade 15 RTX 2070 Max-Q i7-8750H, GeForce RTX 2070 Max-Q, 80 Wh | Asus Zephyrus S GX502GW i7-9750H, GeForce RTX 2070 Mobile, 76 Wh | Schenker XMG Ultra 15 Turing i7-9700K, GeForce RTX 2070 Mobile, 82 Wh | Gigabyte Aero 15-X9 i7-8750H, GeForce RTX 2070 Max-Q, 94.24 Wh | Average of class Multimedia | |
|---|---|---|---|---|---|---|
| Battery runtime | 21% | -29% | -32% | 56% | 105% | |
| Reader / Idle (h) | 9.6 | 11.4 19% | 5.9 -39% | 3.2 -67% | 9.2 -4% | 24.9 ? 159% |
| WiFi v1.3 (h) | 6 | 6.5 8% | 3.7 -38% | 2.6 -57% | 6.4 7% | 12.3 ? 105% |
| Load (h) | 1.1 | 1.5 36% | 1 -9% | 1.4 27% | 2.9 164% | 1.645 ? 50% |
| H.264 (h) | 2.6 | 6.1 | 16.8 ? |
Pros
Cons
Verdict - compact multimedia notebook with a lot of power
Our review has shown that the MSI P65 Creator 9SF is a compact powerhouse with a vivid display. Its case perfectly suits business-like surroundings and the workmanship is good. The Thunderbolt 3 port ensures that users will continue to be well-equipped for any future port needs.
The MSI P65 Creator 9SF is striking with its attractive design and great performance. The manufacturer could have chosen the version of the Nvidia GeForce RTX 2070 Max-Q with a higher TDP, however.
The system performance is good and can easily keep up with that of most of its competitors. Other manufacturers, however, manage to get a little more out of the GPU - although, of course, the P65 Creator is equipped with the lower-TDP version of the RTX 2070 Max-Q. As with the previous model, maintenance options are basically nonexistent. Our test unit also continues to feature a fingerprint reader that is integrated into the touchpad. The latter is significantly wider than before and therefore offers more room for gesture navigation.
MSI P65 Creator 9SF-657
- 10/25/2019 v7 (old)
Mike Wobker
Price comparison

