ASUS ROG Zephyrus S GX502GW (Core i7-9750H, RTX 2070) Laptop Review

ASUS’ gaming portfolio is becoming confusing. The Zephyrus series alone, which the company gears towards mobility, now has countless models vying for attention, including the GX531 and the GX701, both of which ASUS equips with RTX 2080 Max-Q GPUs.
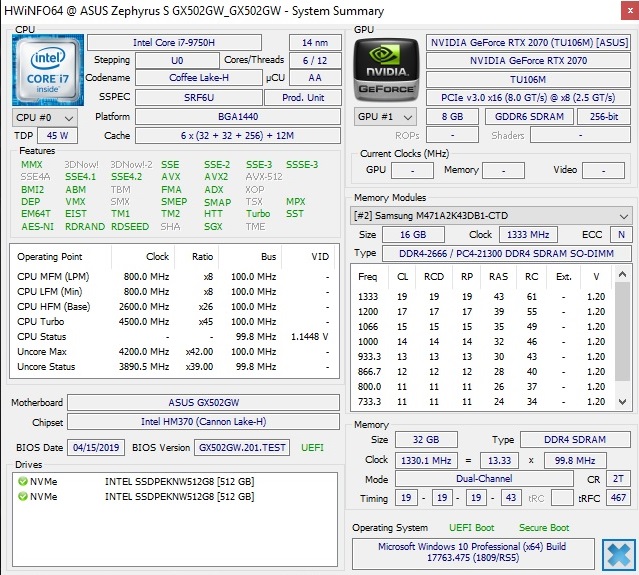
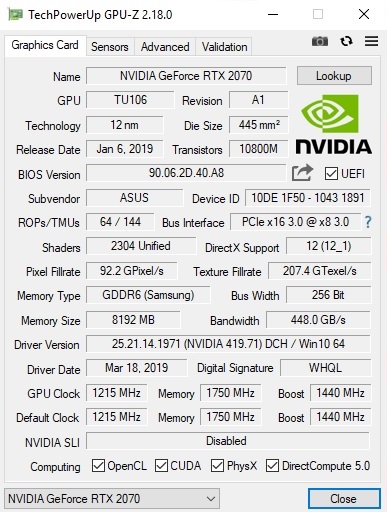
Now the company has released a refreshed GX502, which comes with non-Max-Q RTX 20 series GPUs, to further confuse things. ASUS sells the GX502 with either the GeForce RTX 2060 or GeForce RTX 2070, but currently offers a single CPU option, the Core i7-9750H.
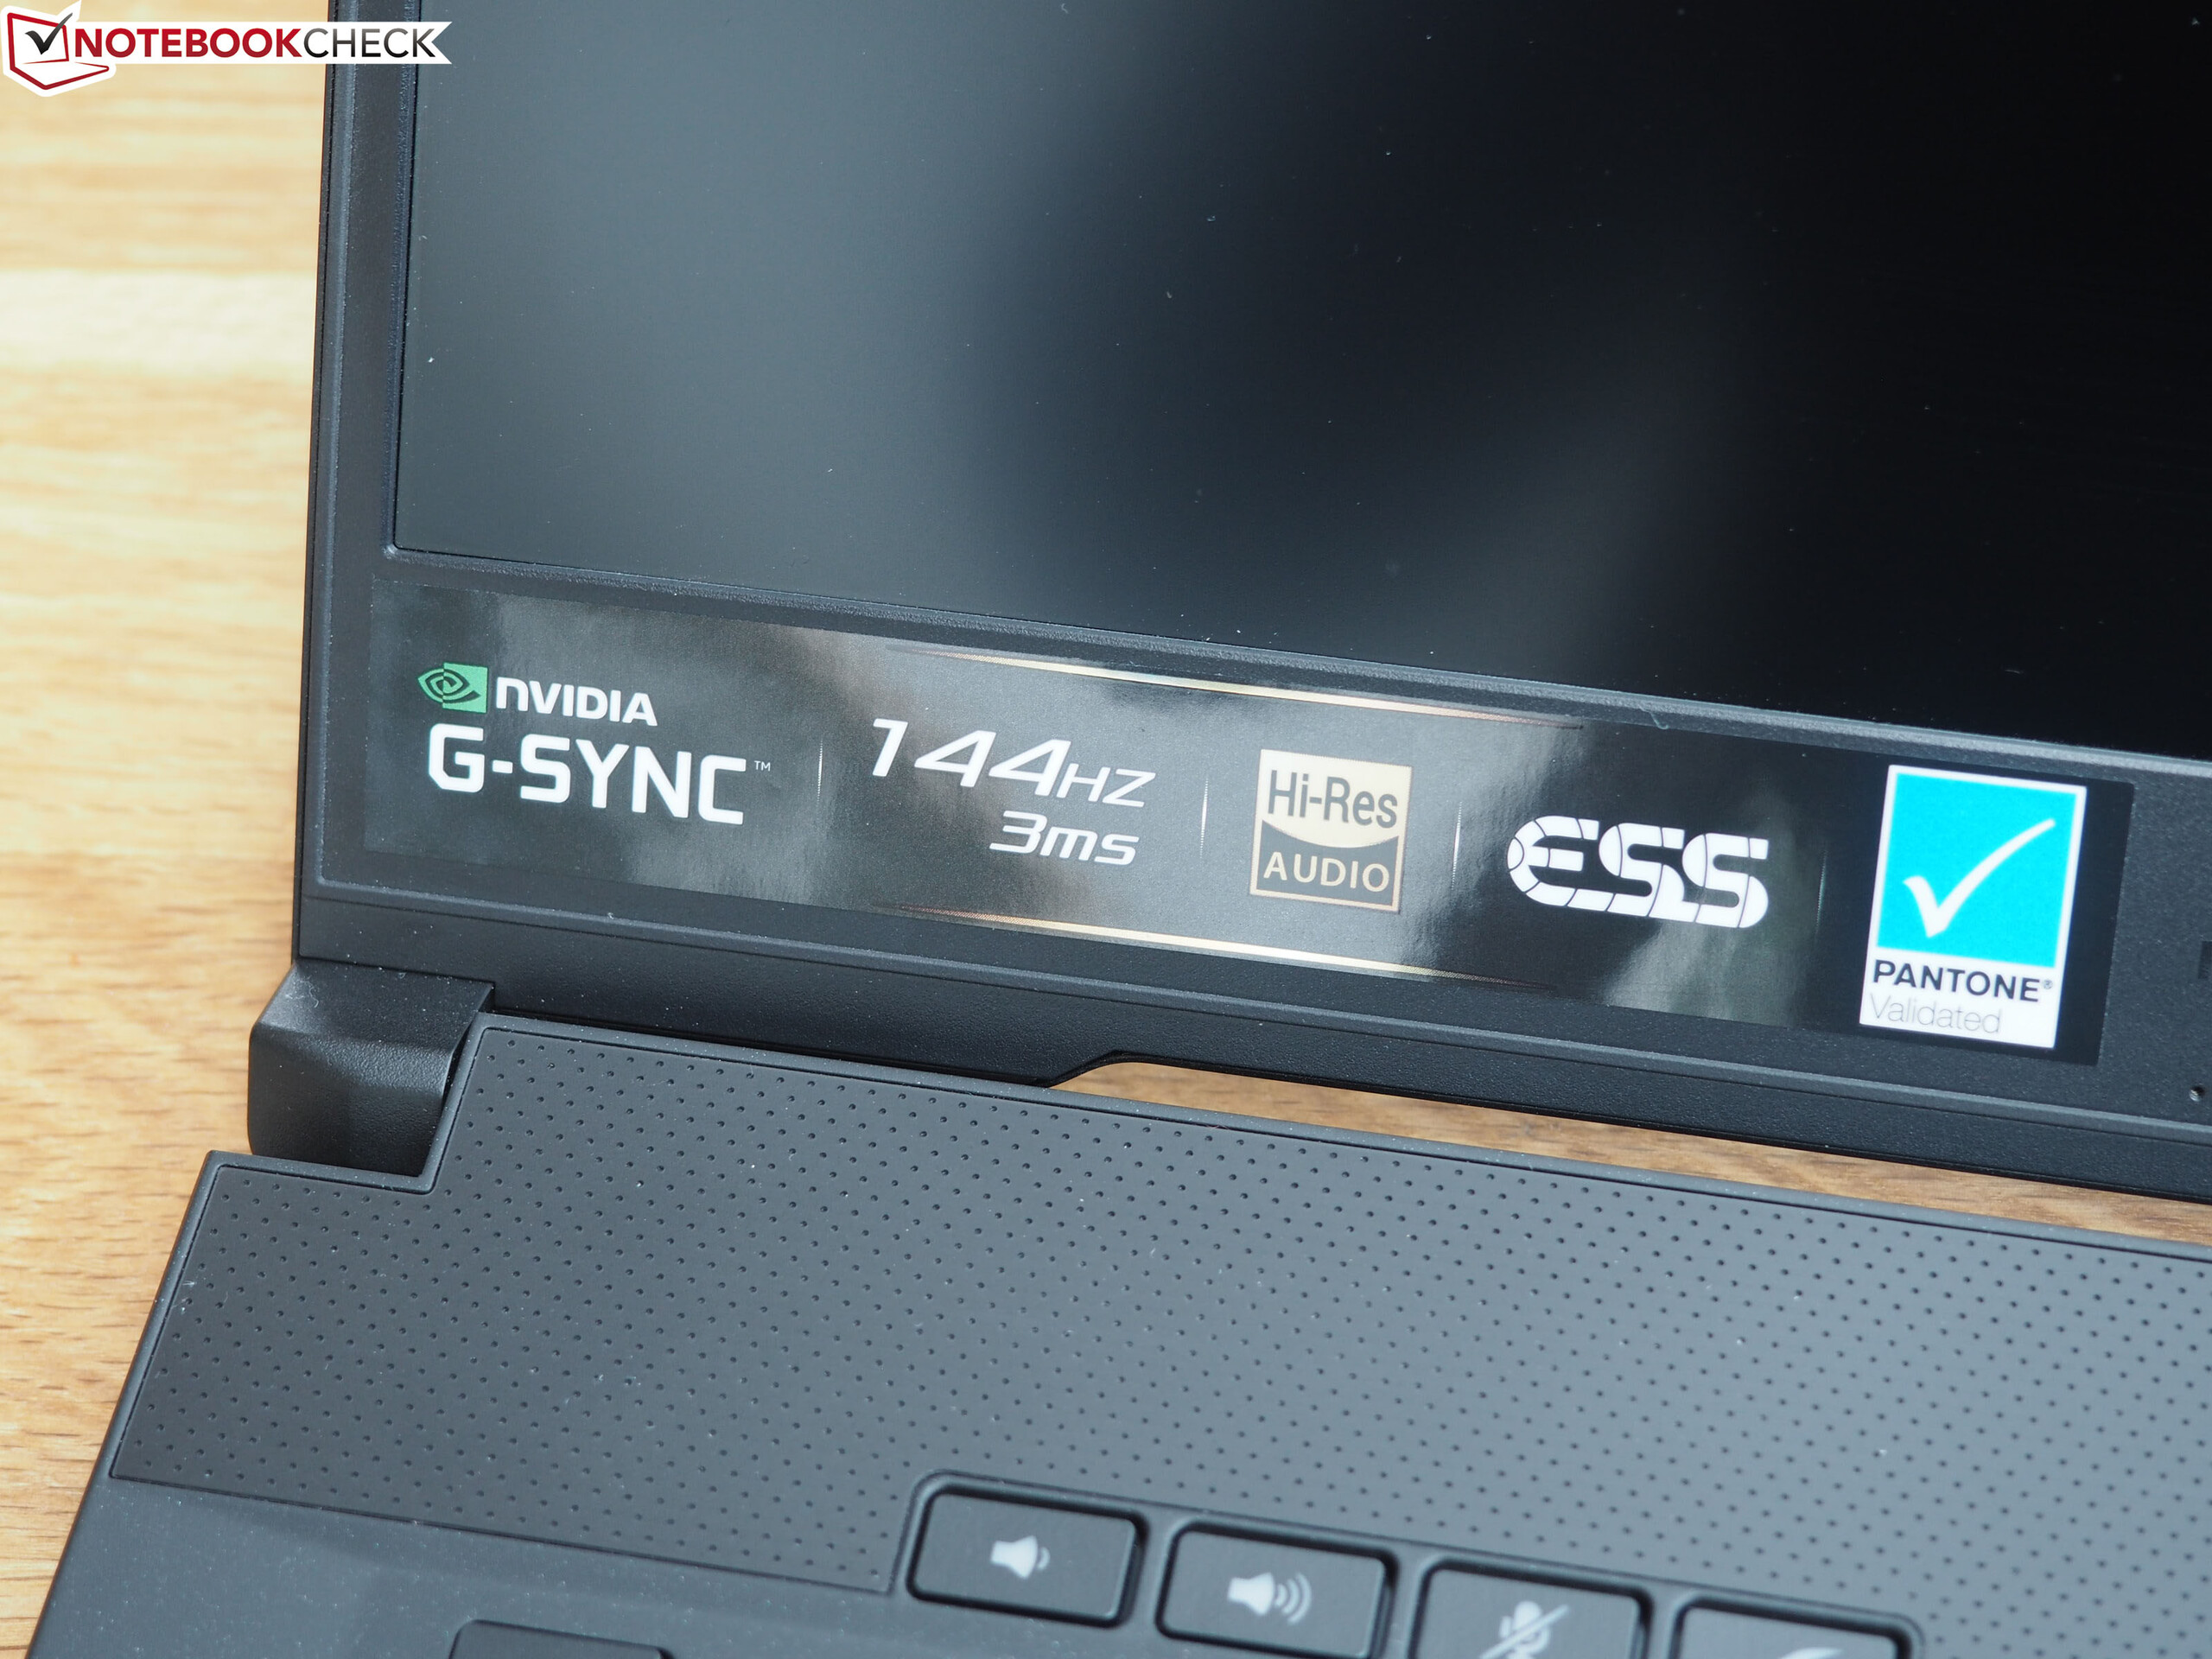
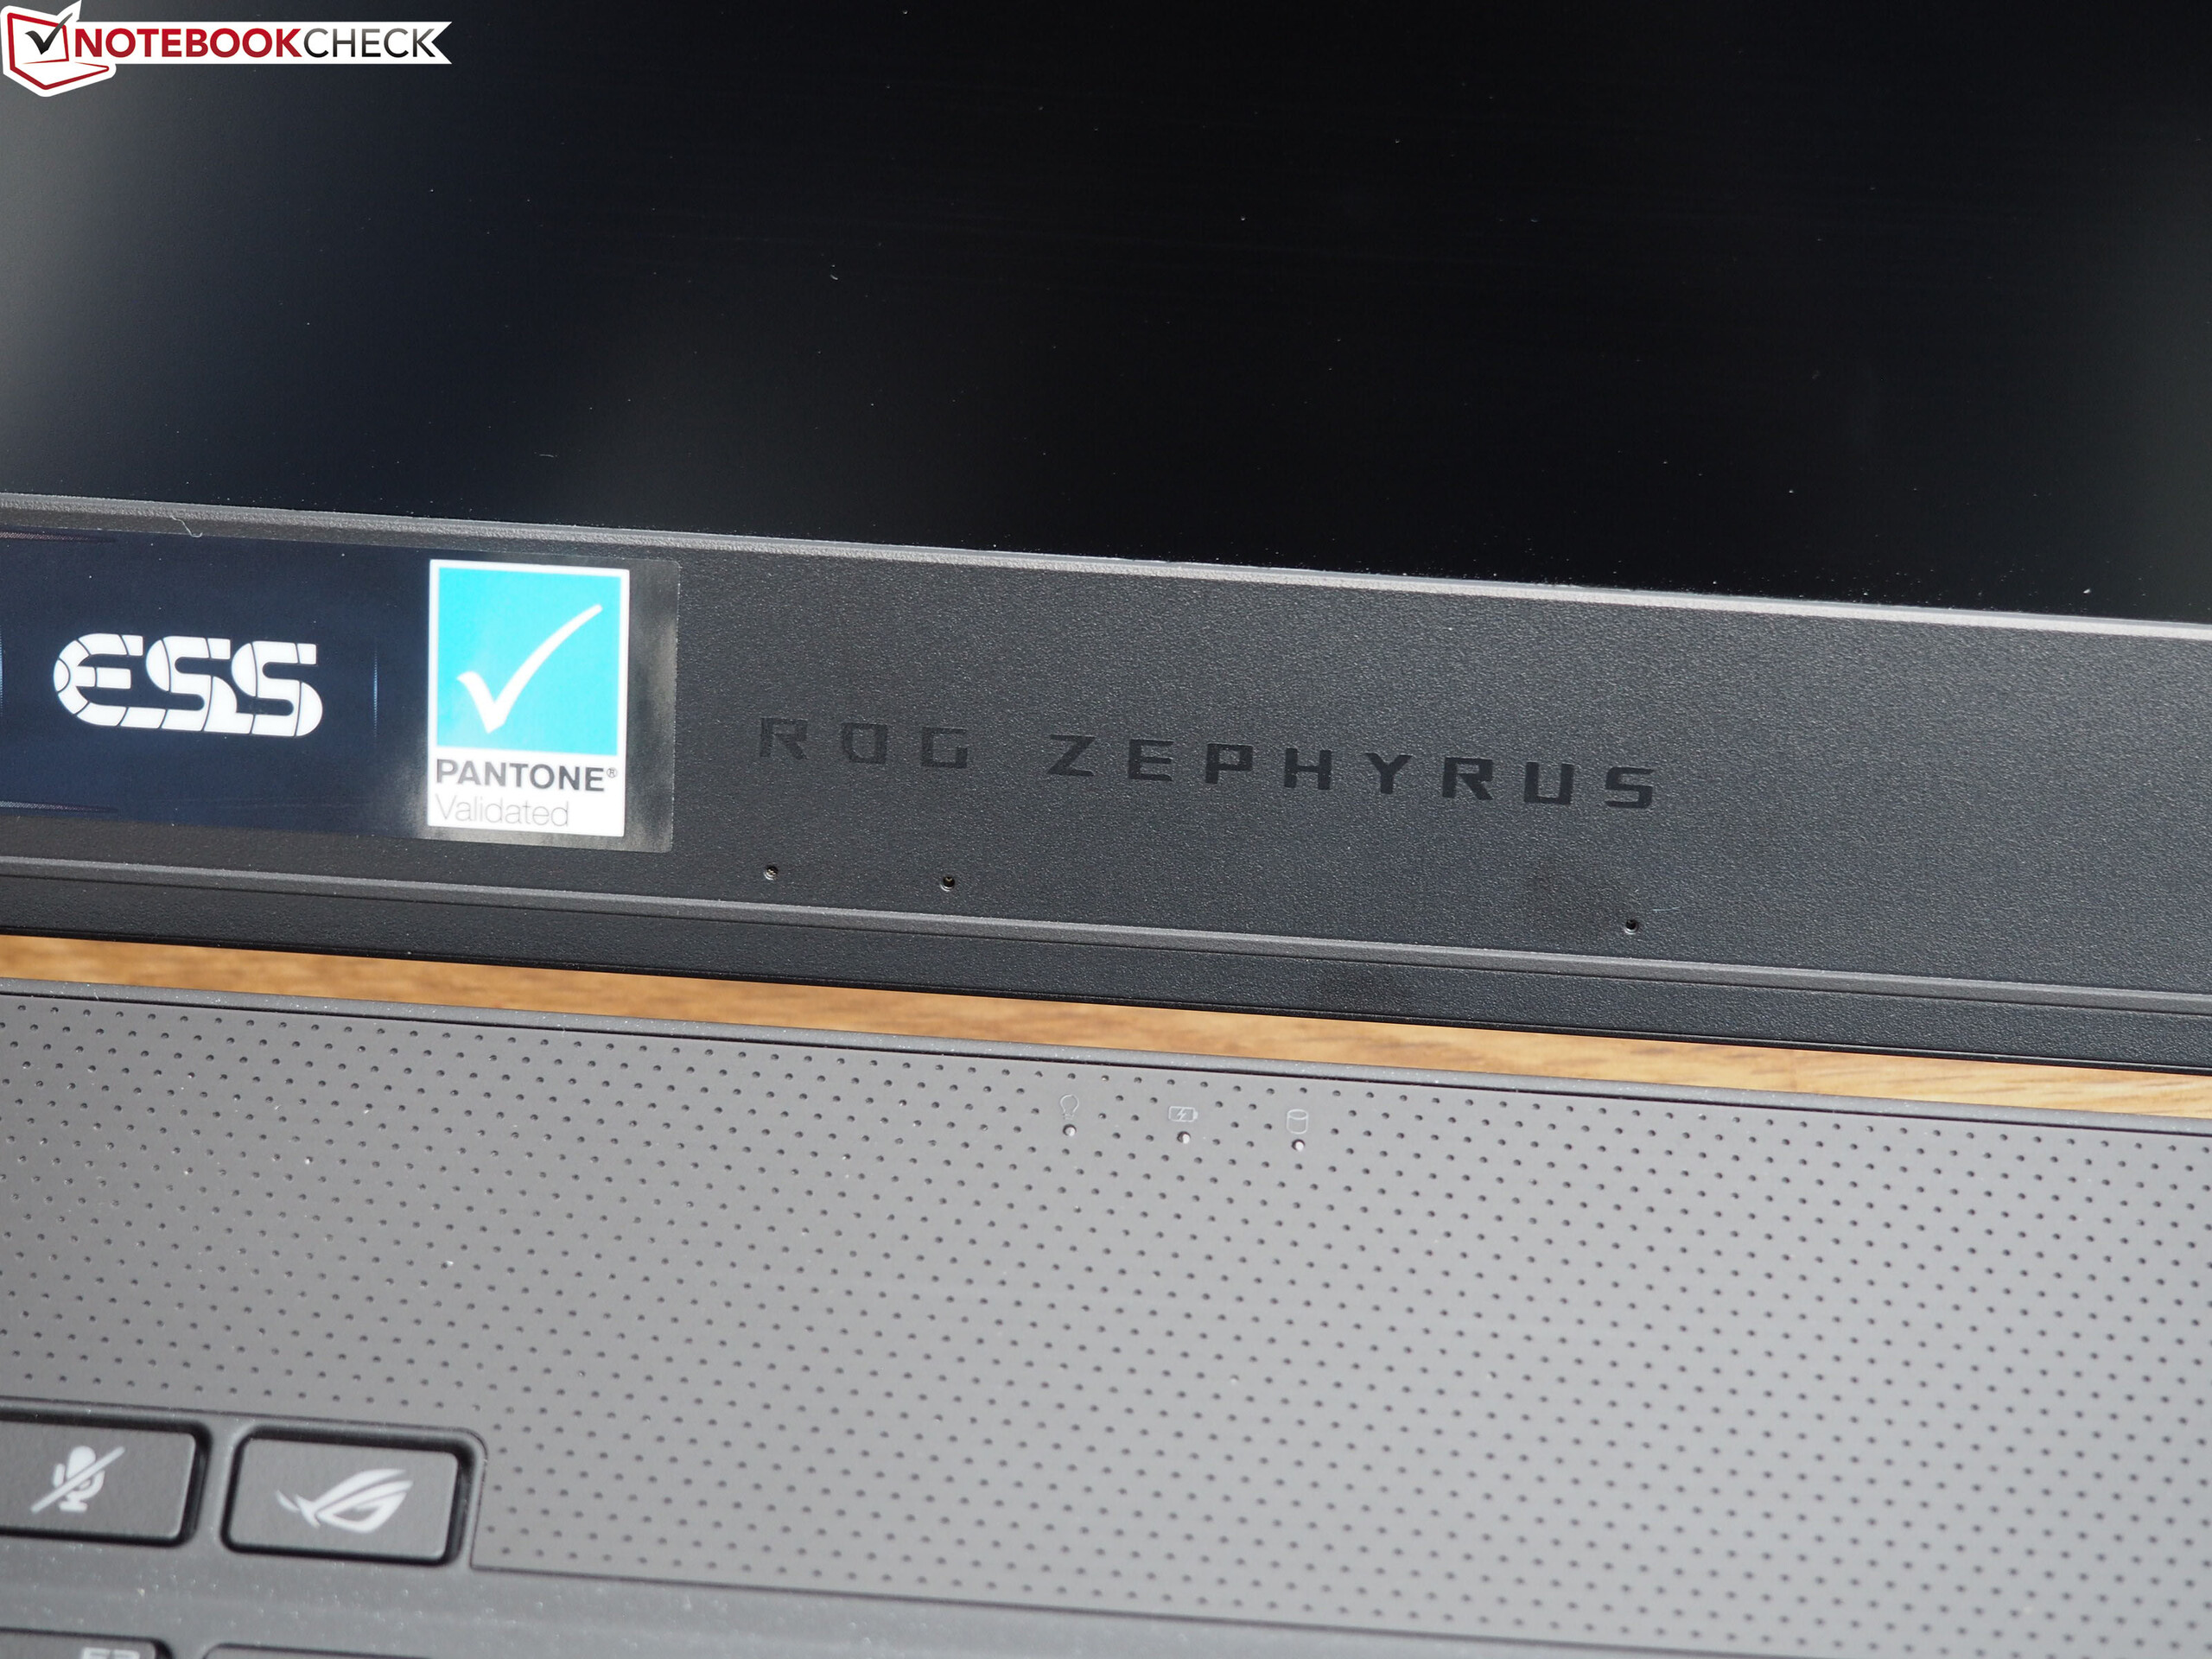
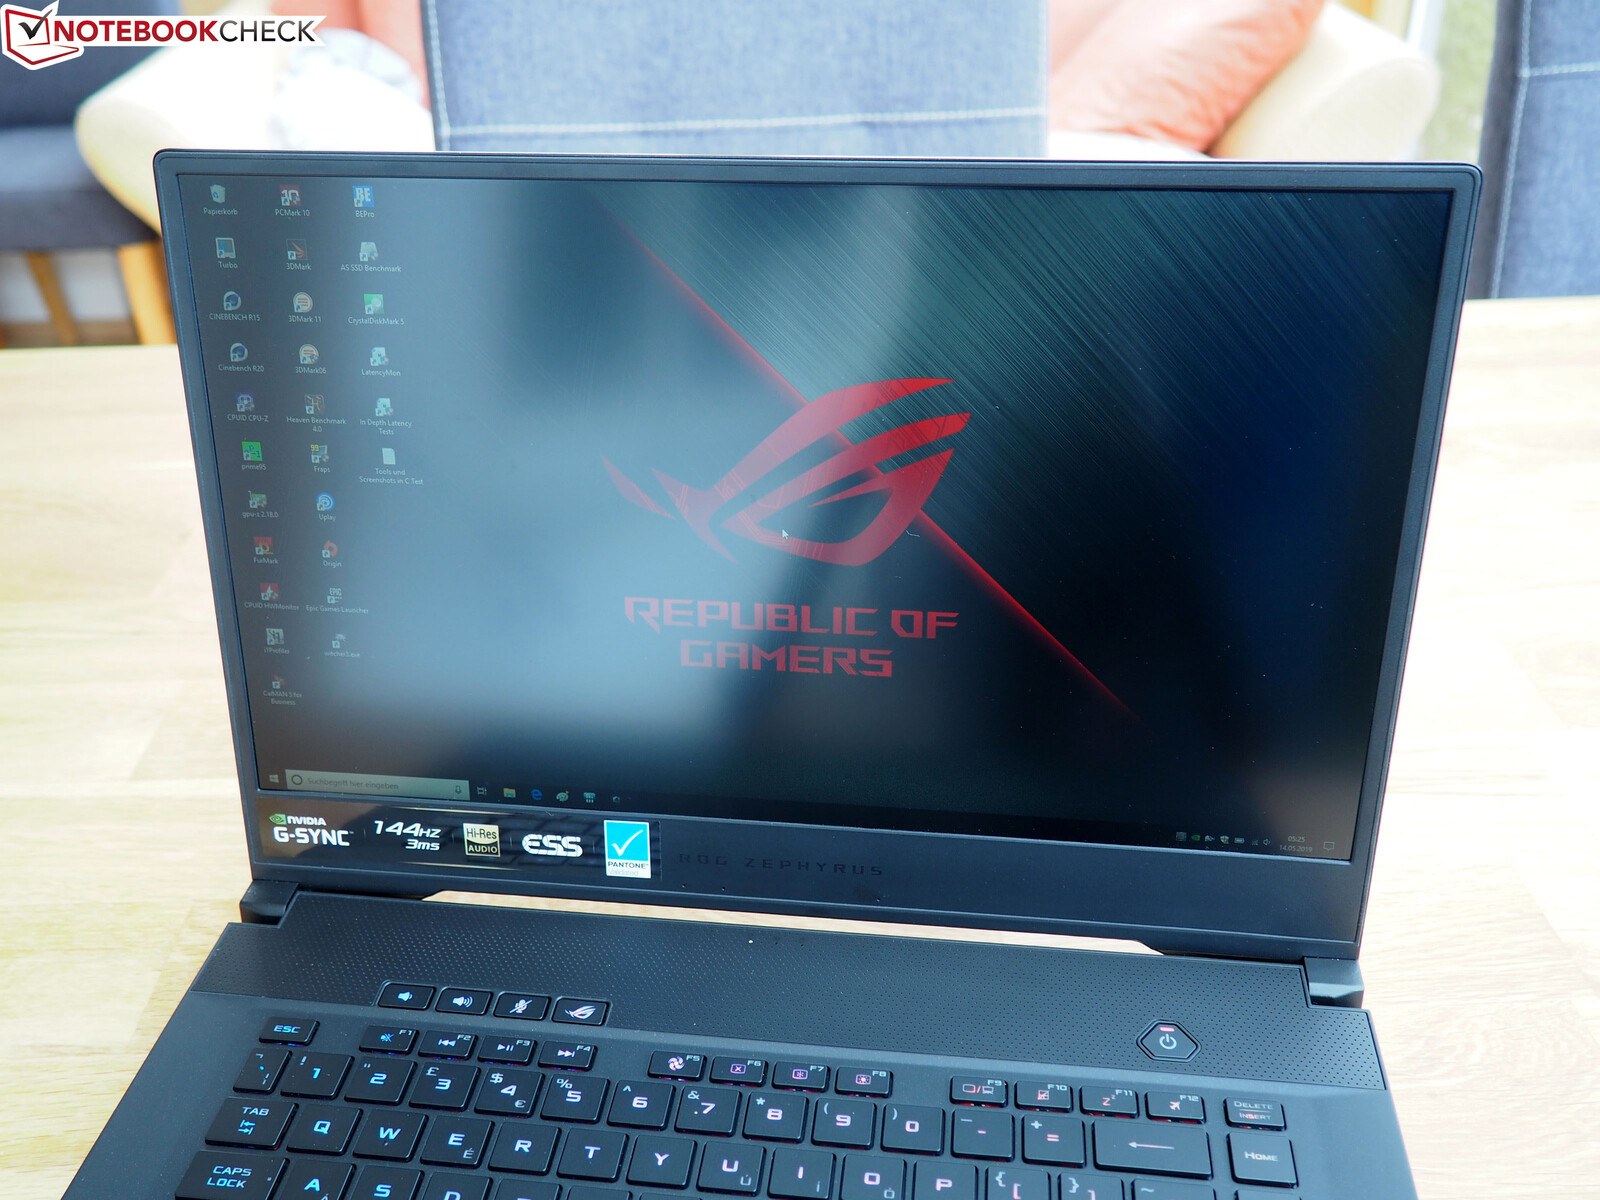
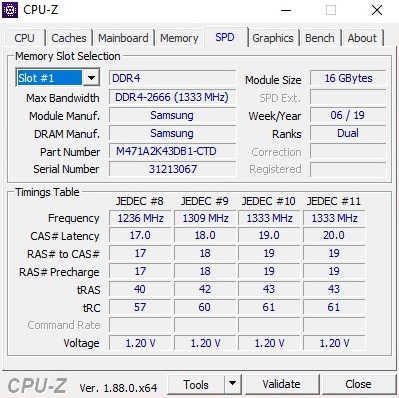
Our UK review unit, which ASUS calls the GX502GW, comes with a GeForce RTX 2070 along with 32 GB of DDR4 RAM and two 512 GB SSDs in a RAID configuration. Disappointingly, ASUS has soldered half the RAM to the motherboard, so you can only run the system in dual-channel mode if you stick with 32 GB RAM. The decision seems a strange one because a second SO-DIMM slot would not have taken up much additional room, and ASUS will need to replace a whole motherboard if the soldered RAM fails for whatever reason. The omission of a 2.5-inch drive bay makes sense though. SSDs offer much faster transfer speeds than 2.5-inch drives and have smaller footprints, although they still cost more per GB. The GX502 also has a 15.6-inch Full HD display, with ASUS offering a choice between 144 Hz and 240 Hz panels. Both versions are Nvidia Optimus and G-Sync capable, which makes the GX502GW one of the few laptops that supports both technologies. More on that later.
We have chosen to compare the GX502GW against other slim 15.6-inch gaming laptops equipped with Turing GPUs. Our comparison devices will include the Acer Predator Triton 500, the Gigabyte Aero 15-X9 and the Razer Blade 15.
Case
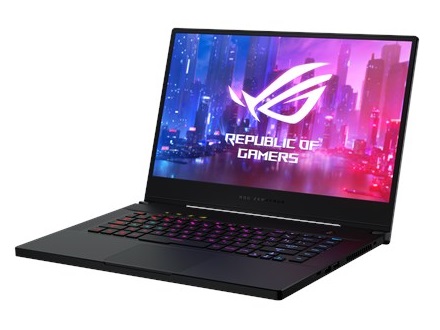
The GX502 is one of the most stylish gaming laptops currently on the market, in our opinion. Its thin display bezels help make the device feel modern. Many OEMs like Gigabyte equip their gaming laptops with thin bezels too, but few look as understated as the GX502 does. The design of devices like the Aero 15-X9 and Razer Blade 15 still make them look like gaming laptops, whether that be the former’s notification LEDs and angular design or the latter’s imposing Razer logo. By contrast, the GX502 looks rather plain except for its brushed aluminium display lid. ASUS has still included an RGB backlit keyboard and ROG logo though.
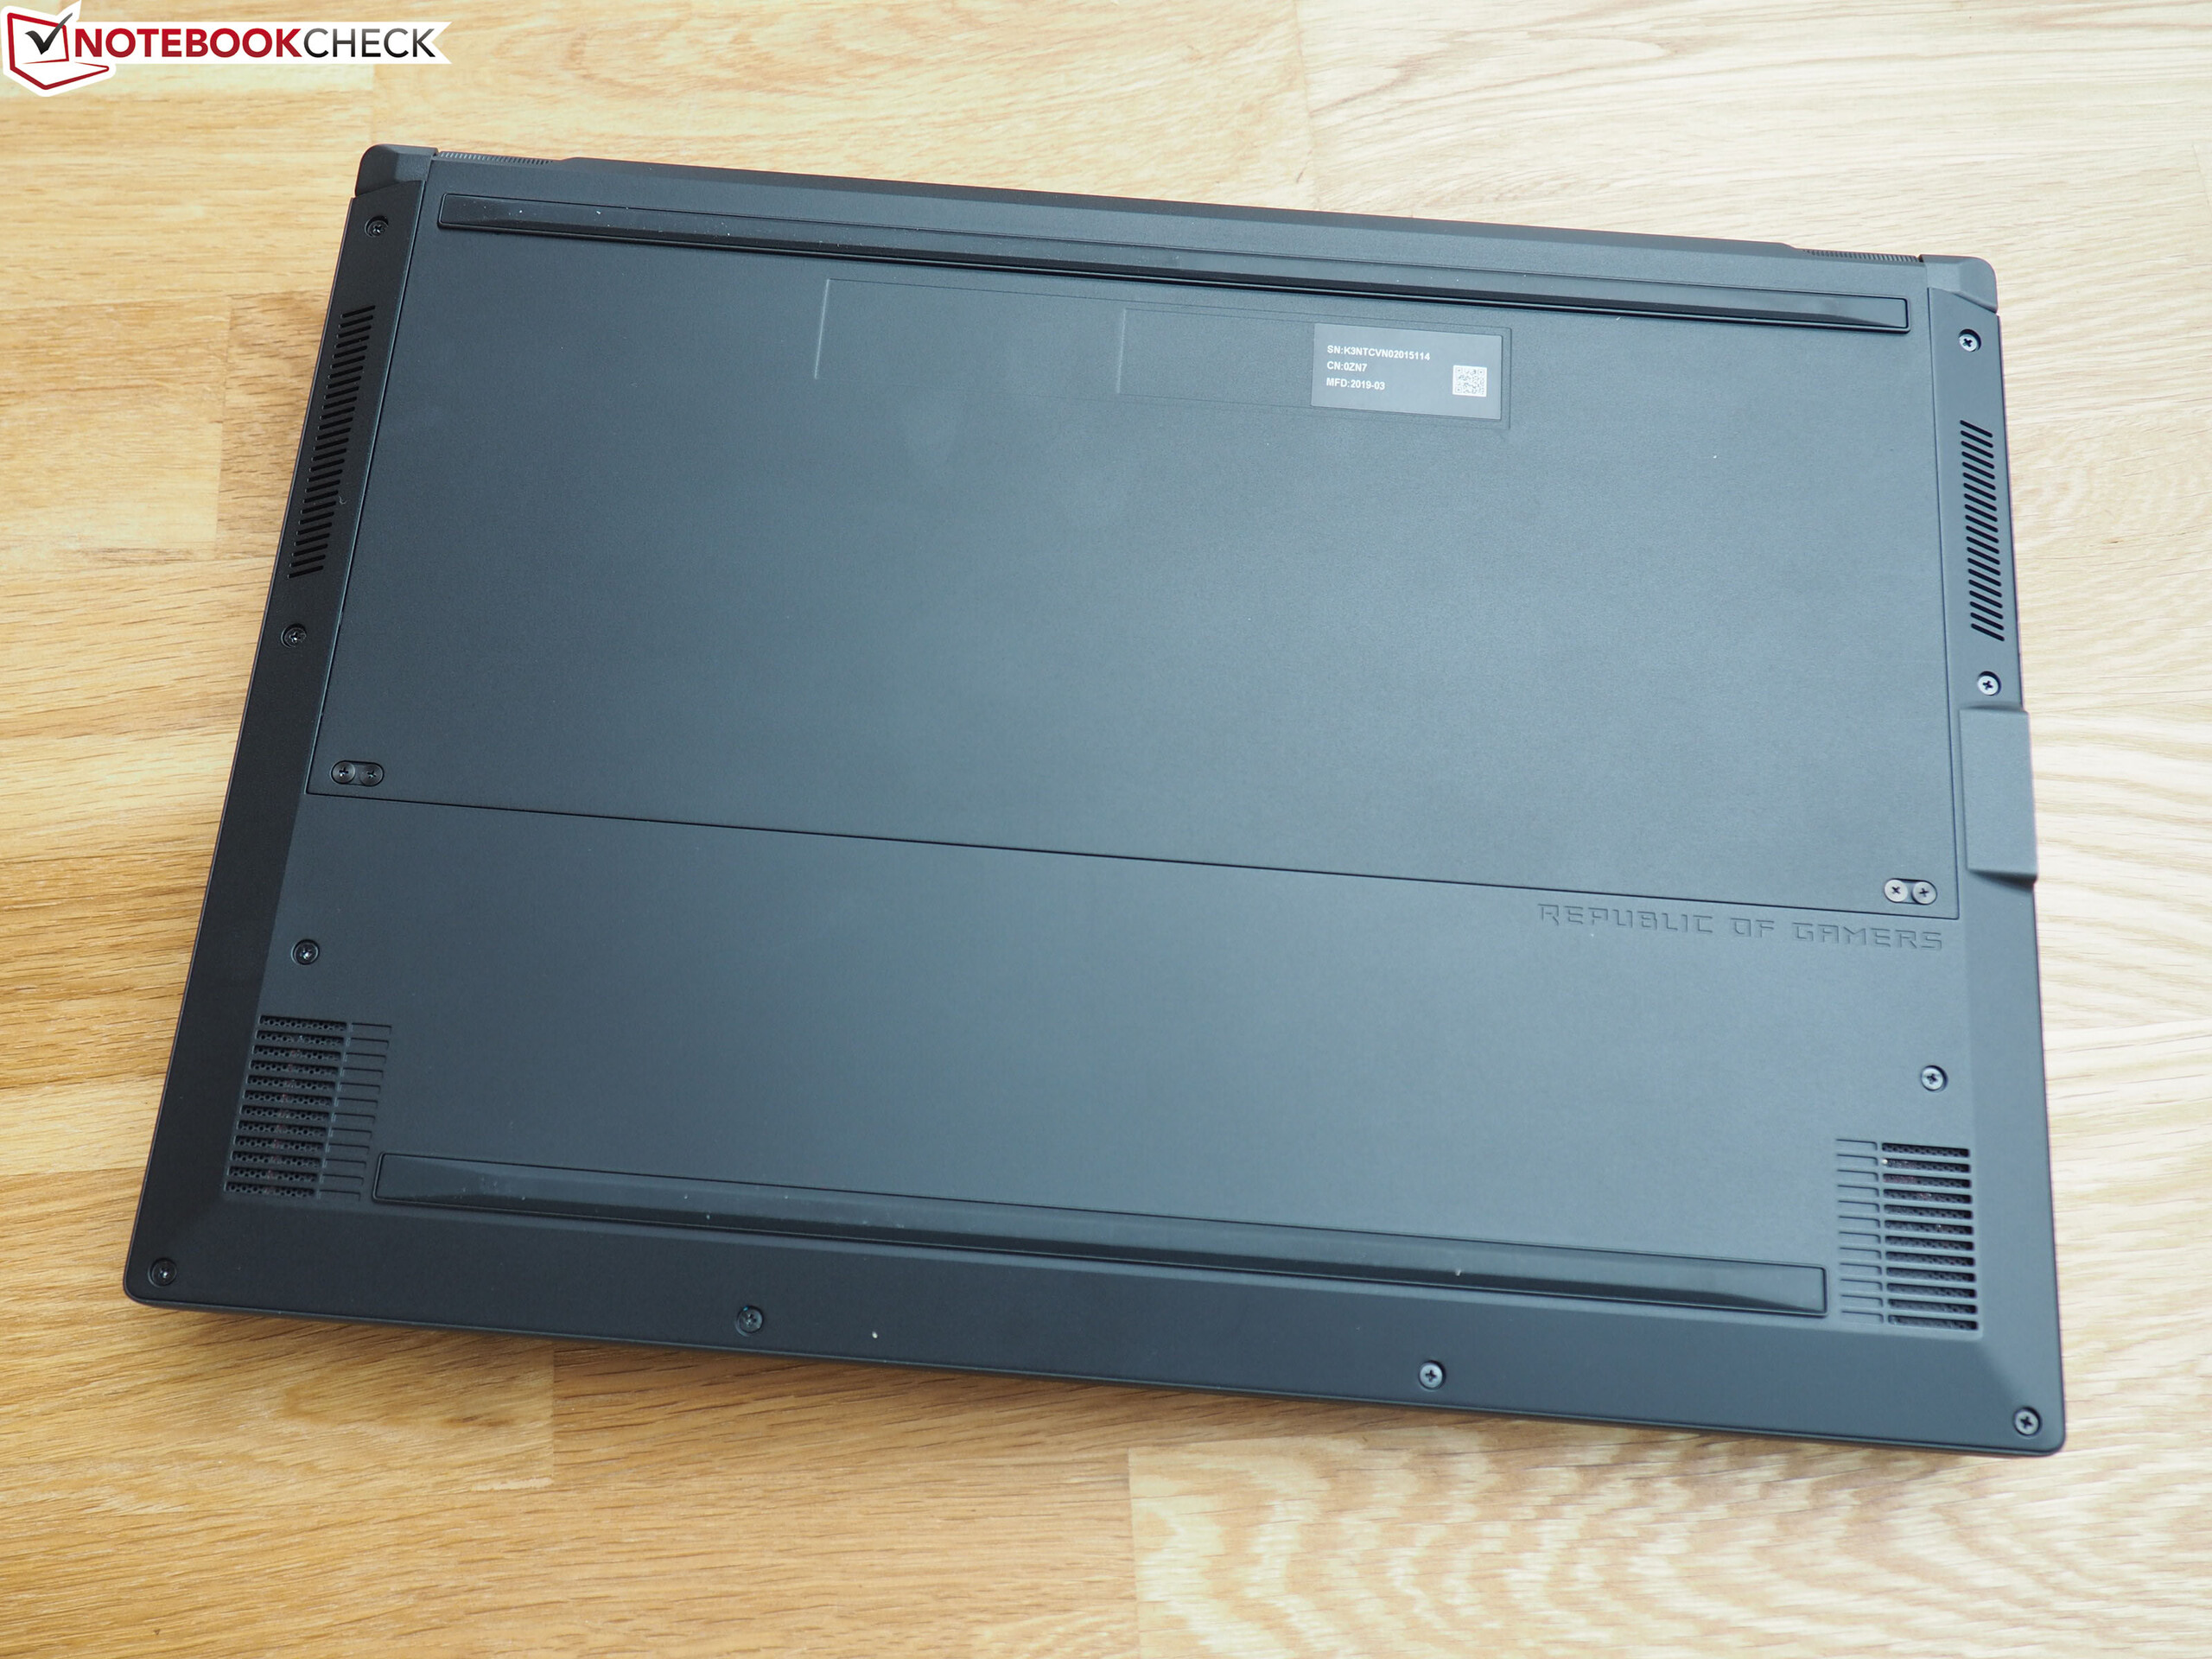
Our review unit is well-built too. ASUS has equipped the device with a plastic bottom cover, but it has opted for a wafer-thin rubber coating instead for the palm rest.
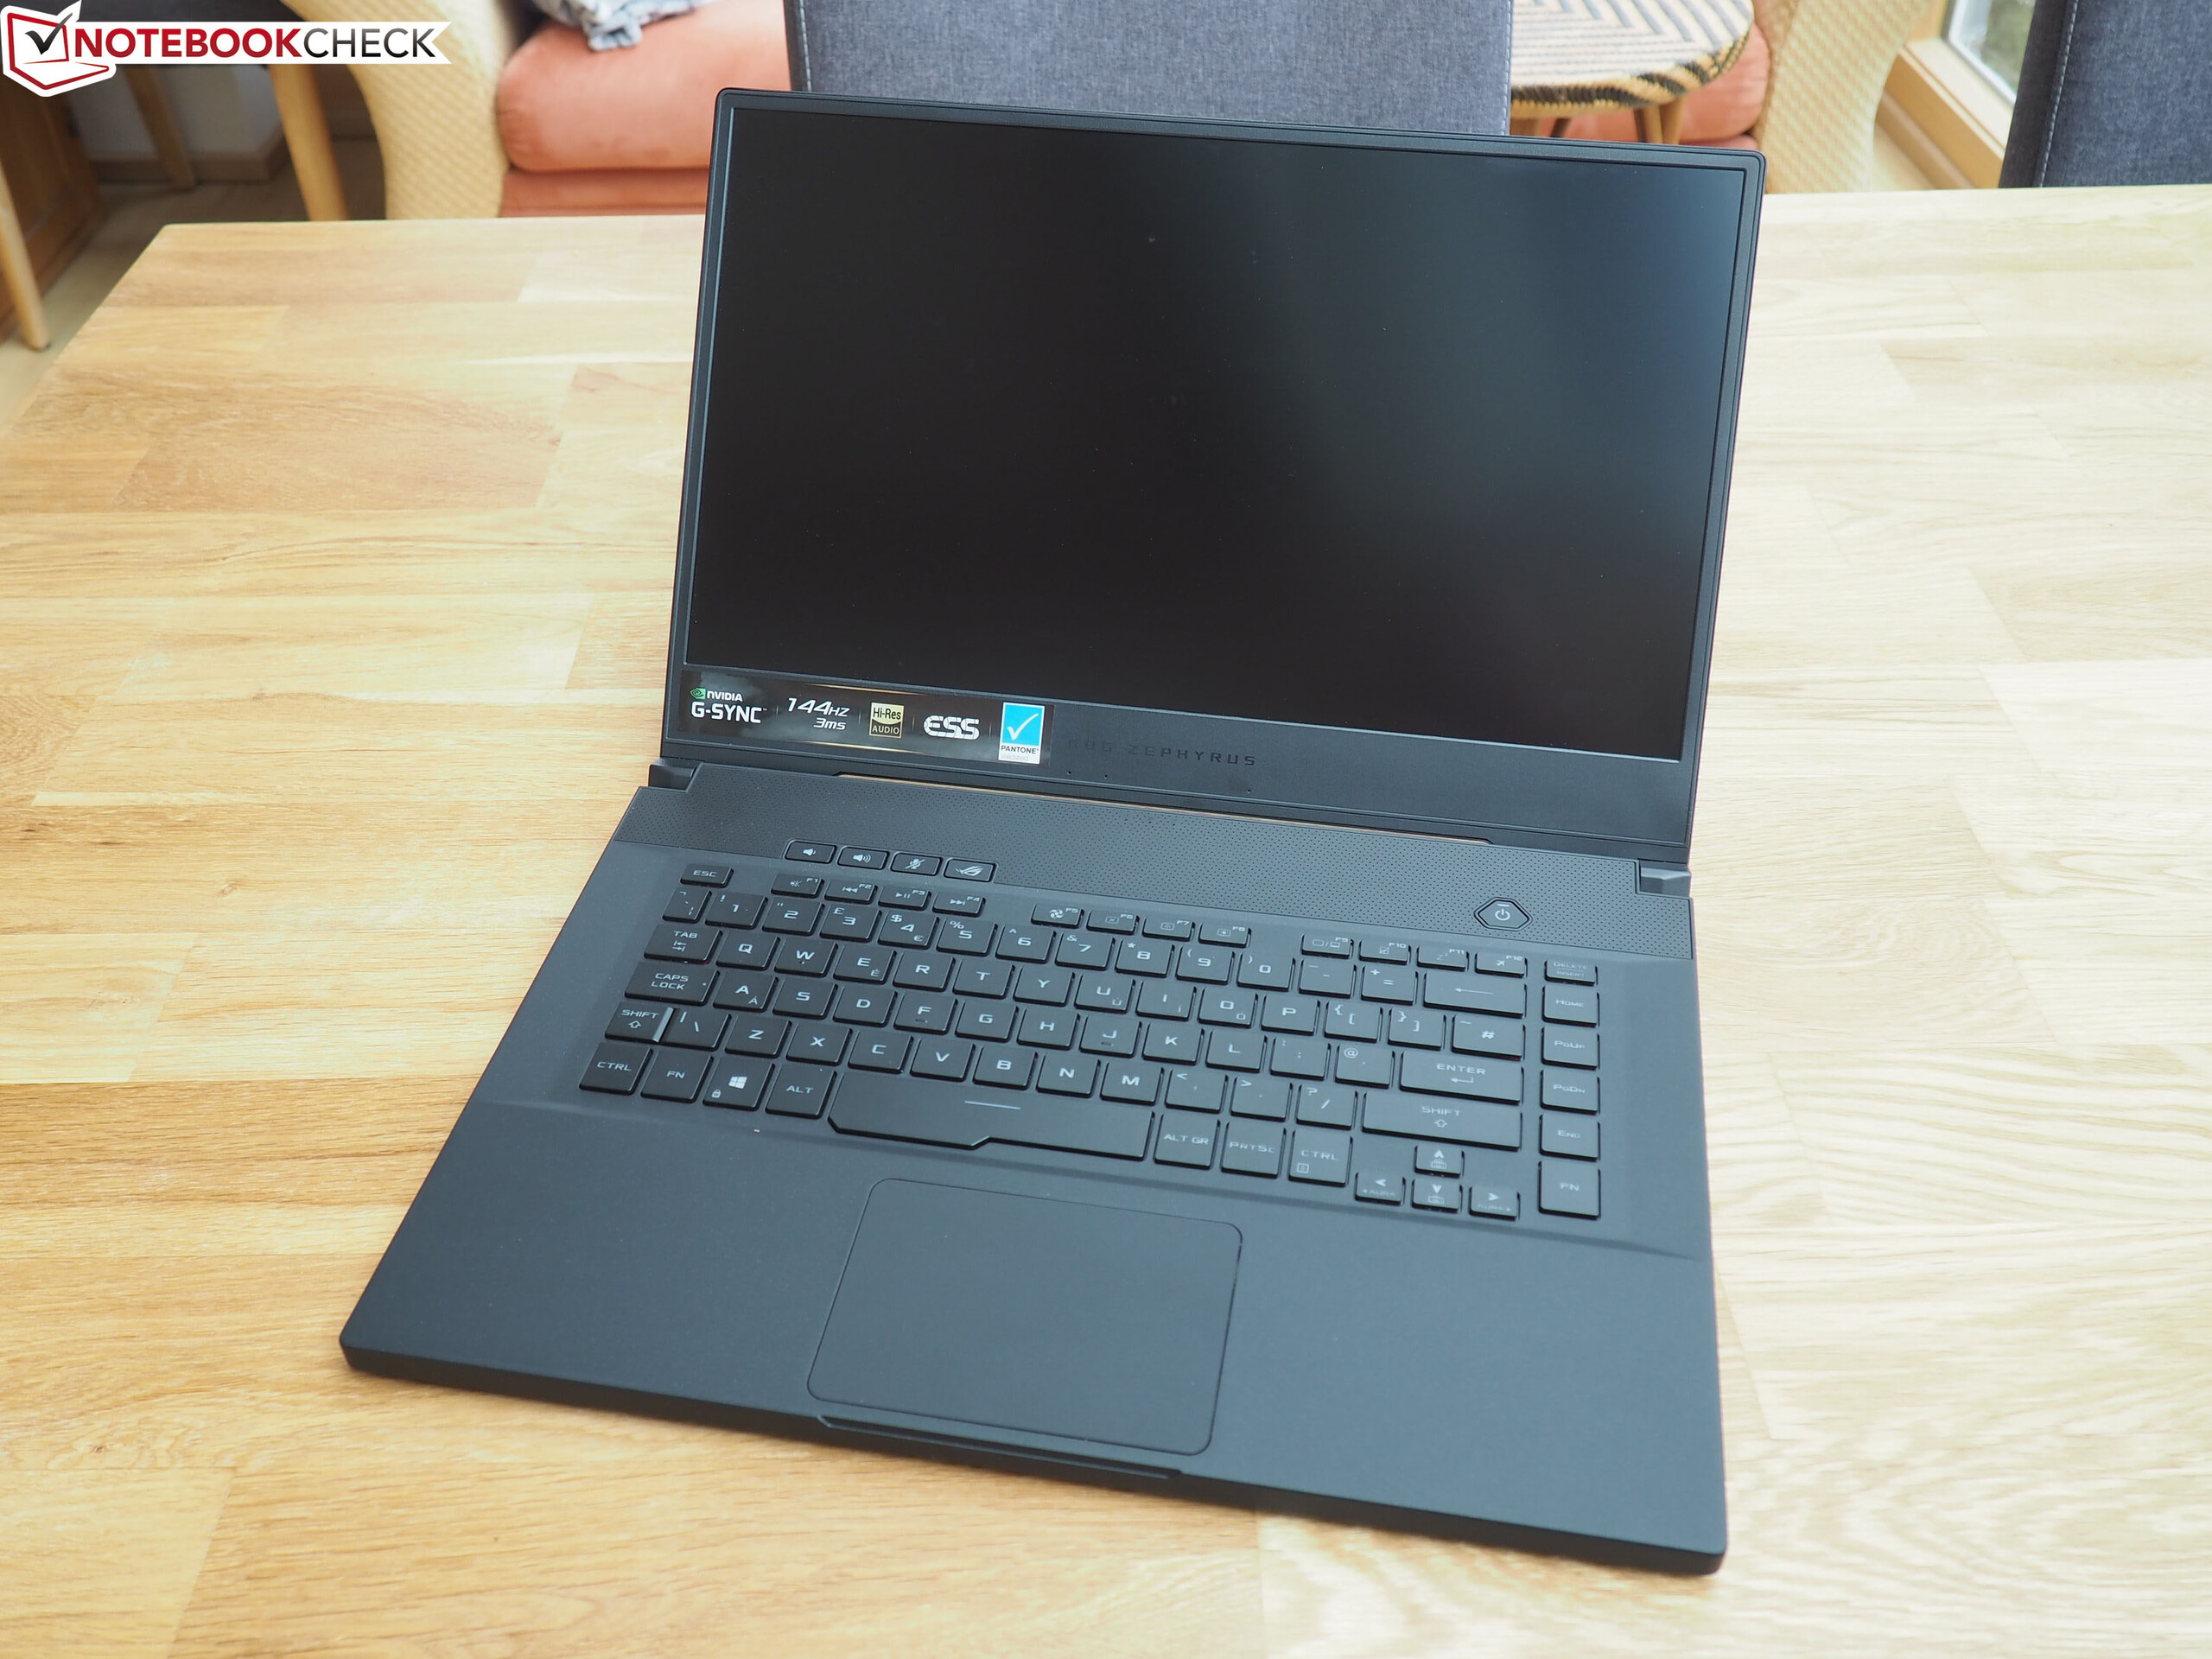
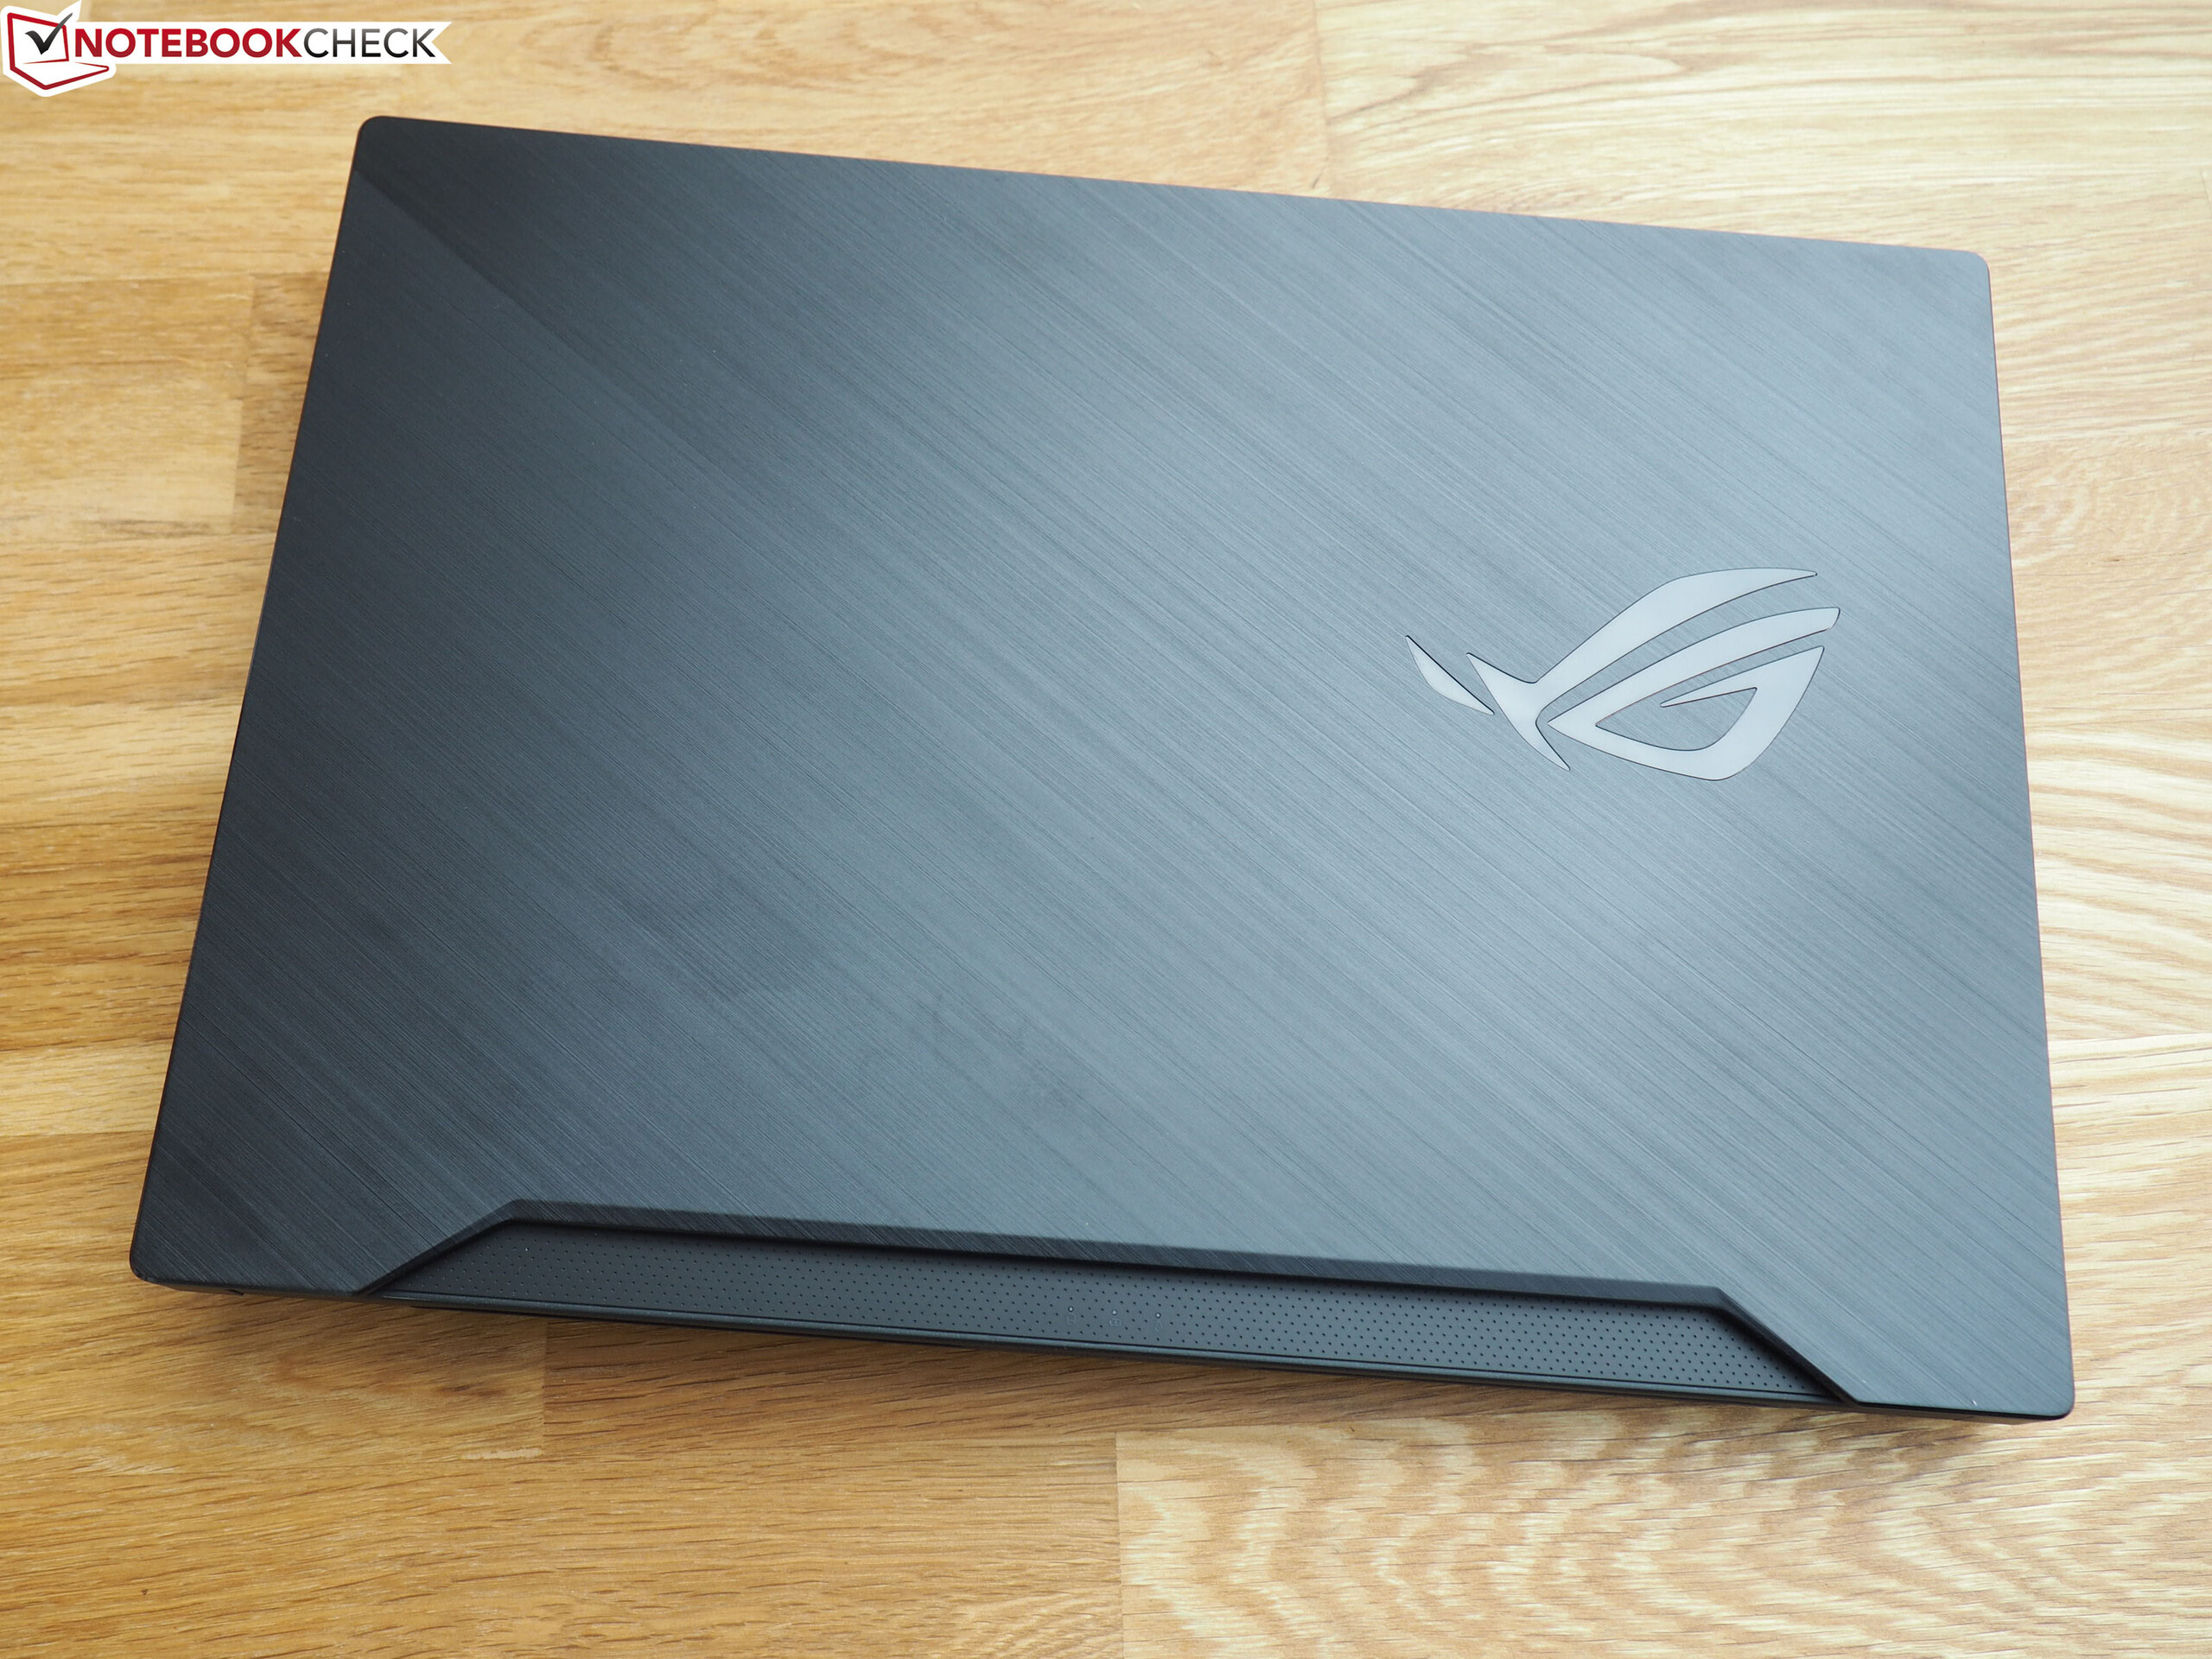
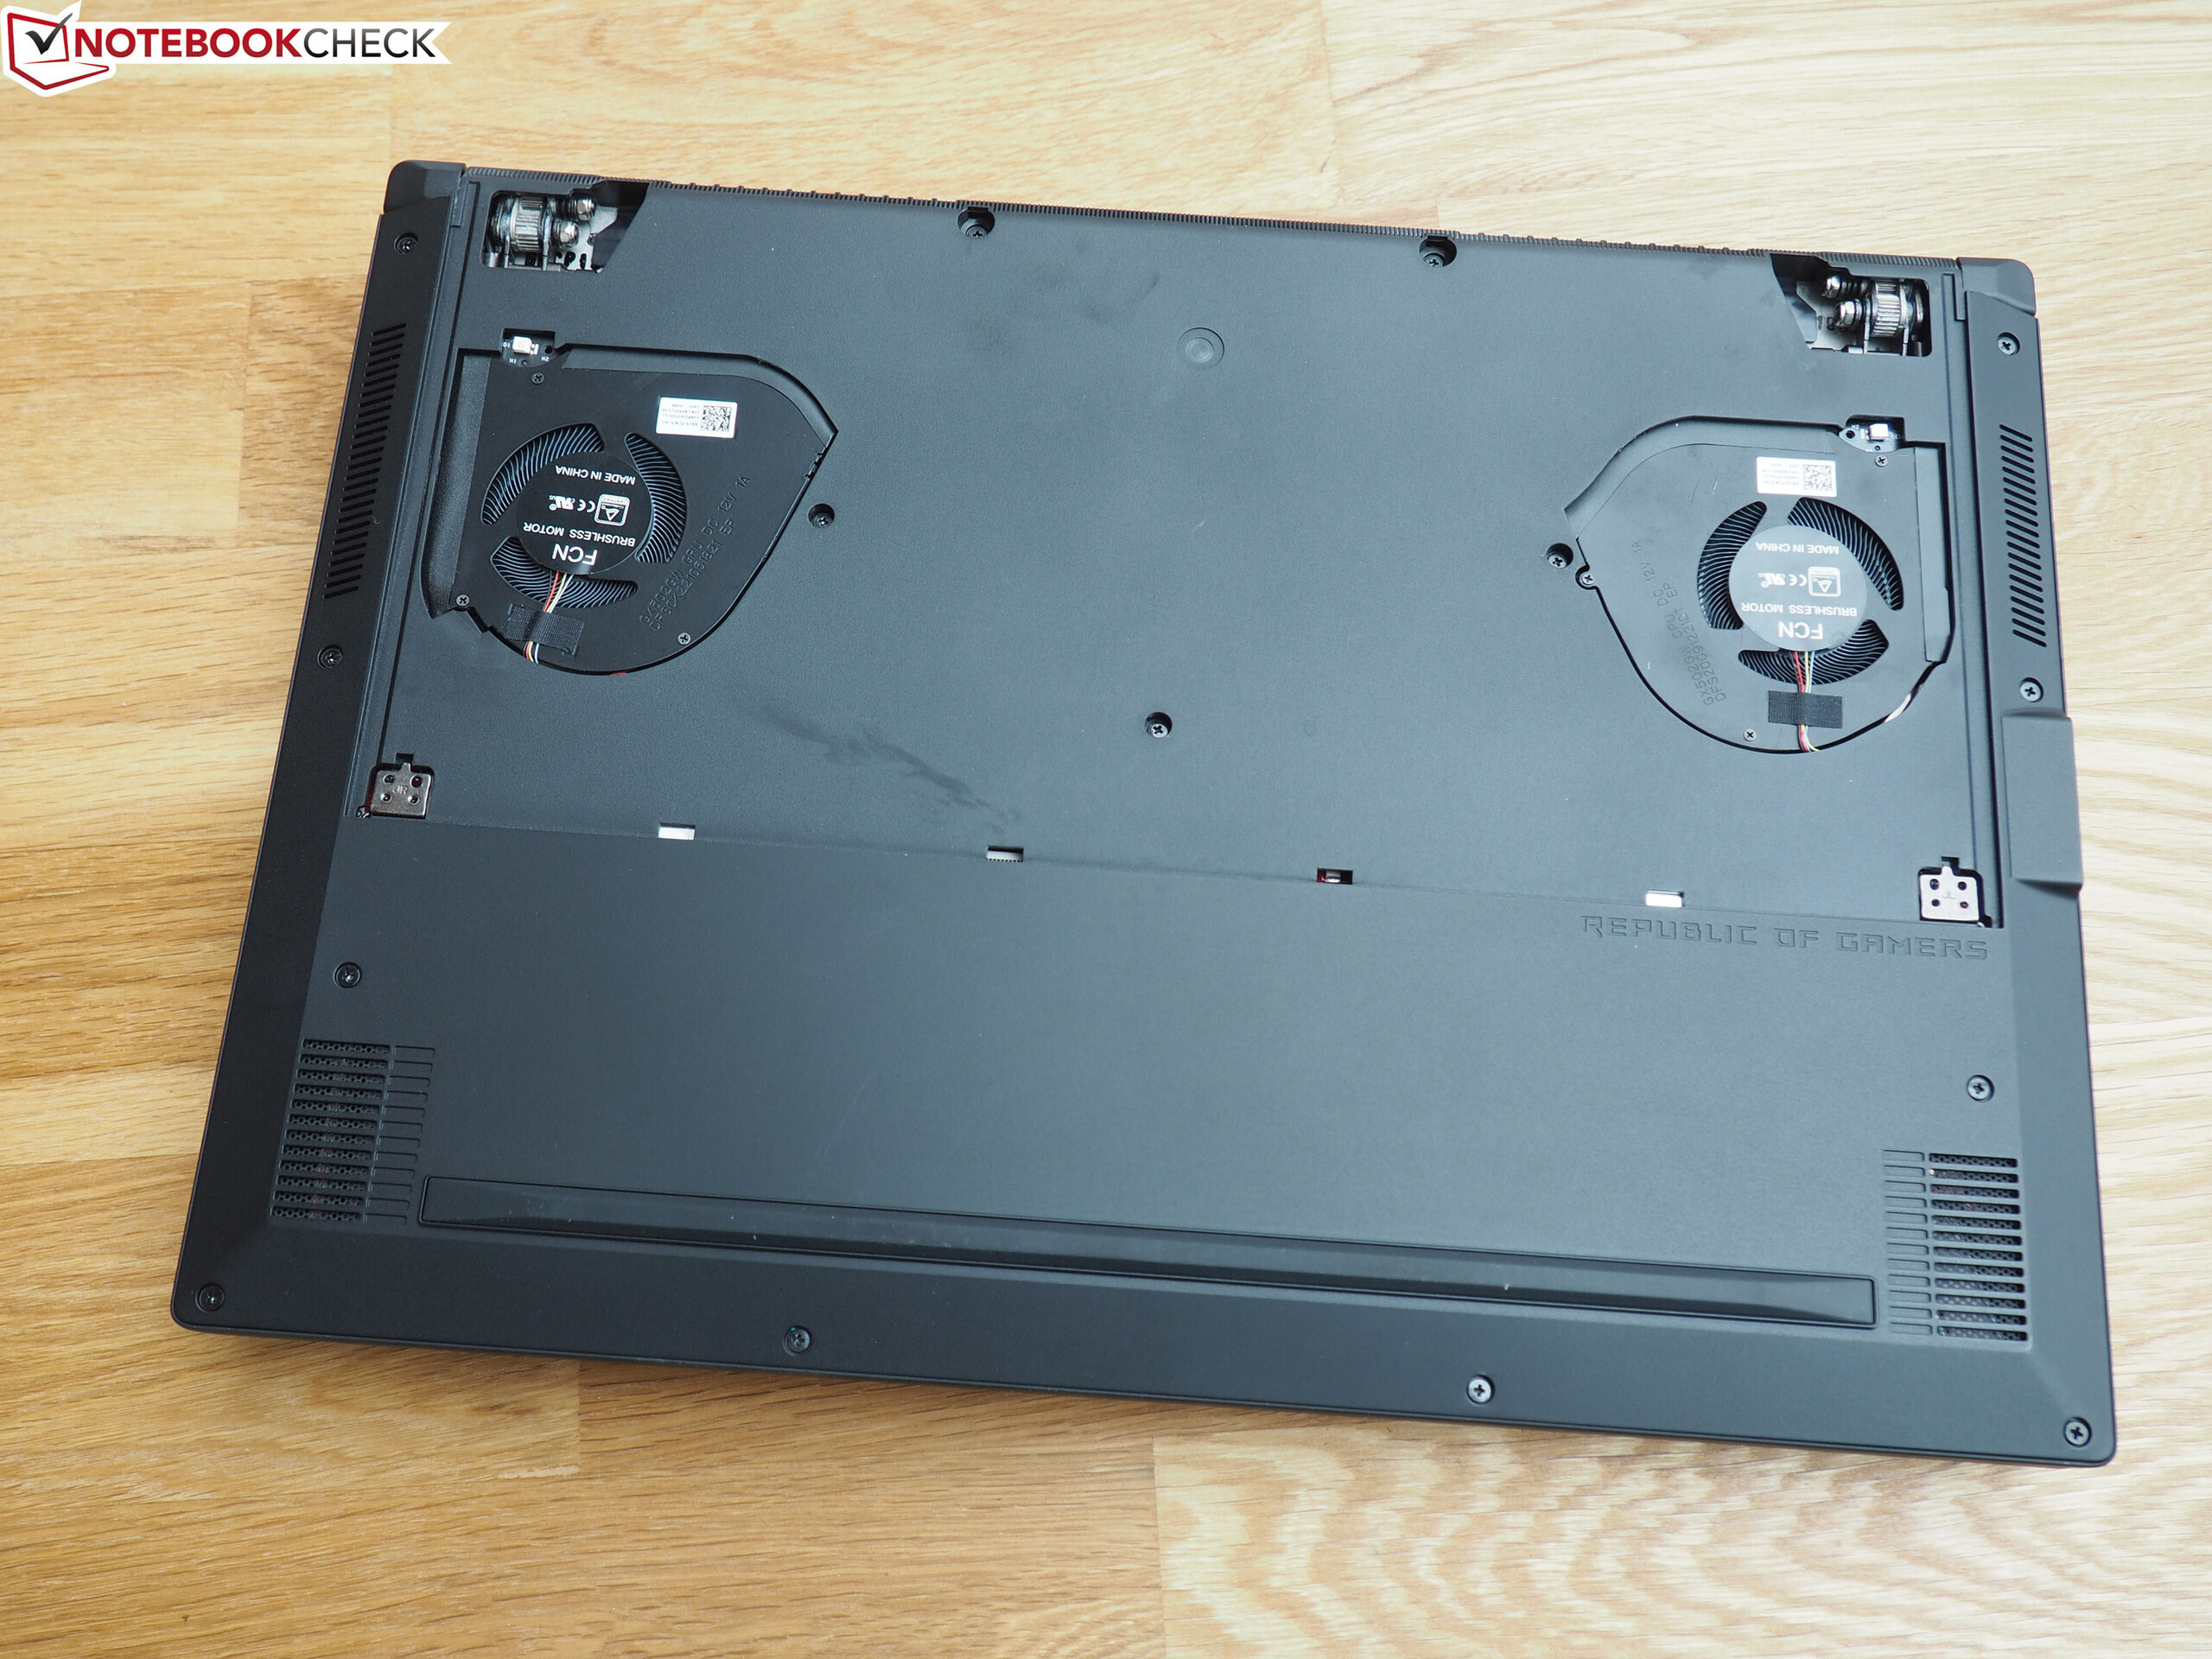
Visually, the best thing about the GX502 is its compact design. Our review unit is 19 mm thick, which is slightly thicker than our comparison devices. This measurement only applies to when the display is closed though because ASUS has engineered the bottom cover to rise when the lid is open. The intention behind this is to improve airflow and reduce internal temperatures, which should then help minimise thermal throttling. ASUS uses this style of bottom plate in its other Zephyrus laptops too.
The GX502 weighs 2.1 kg, which is coincidentally the same weight as all our comparison devices. Overall, our review unit has a smaller footprint than its predecessor and the Acer Predator Triton 500. The Aero 15-X9 is a touch smaller than the GX502, while the Razer Blade 15 is our only comparison device that is noticeably smaller the ASUS.
Connectivity
I/O
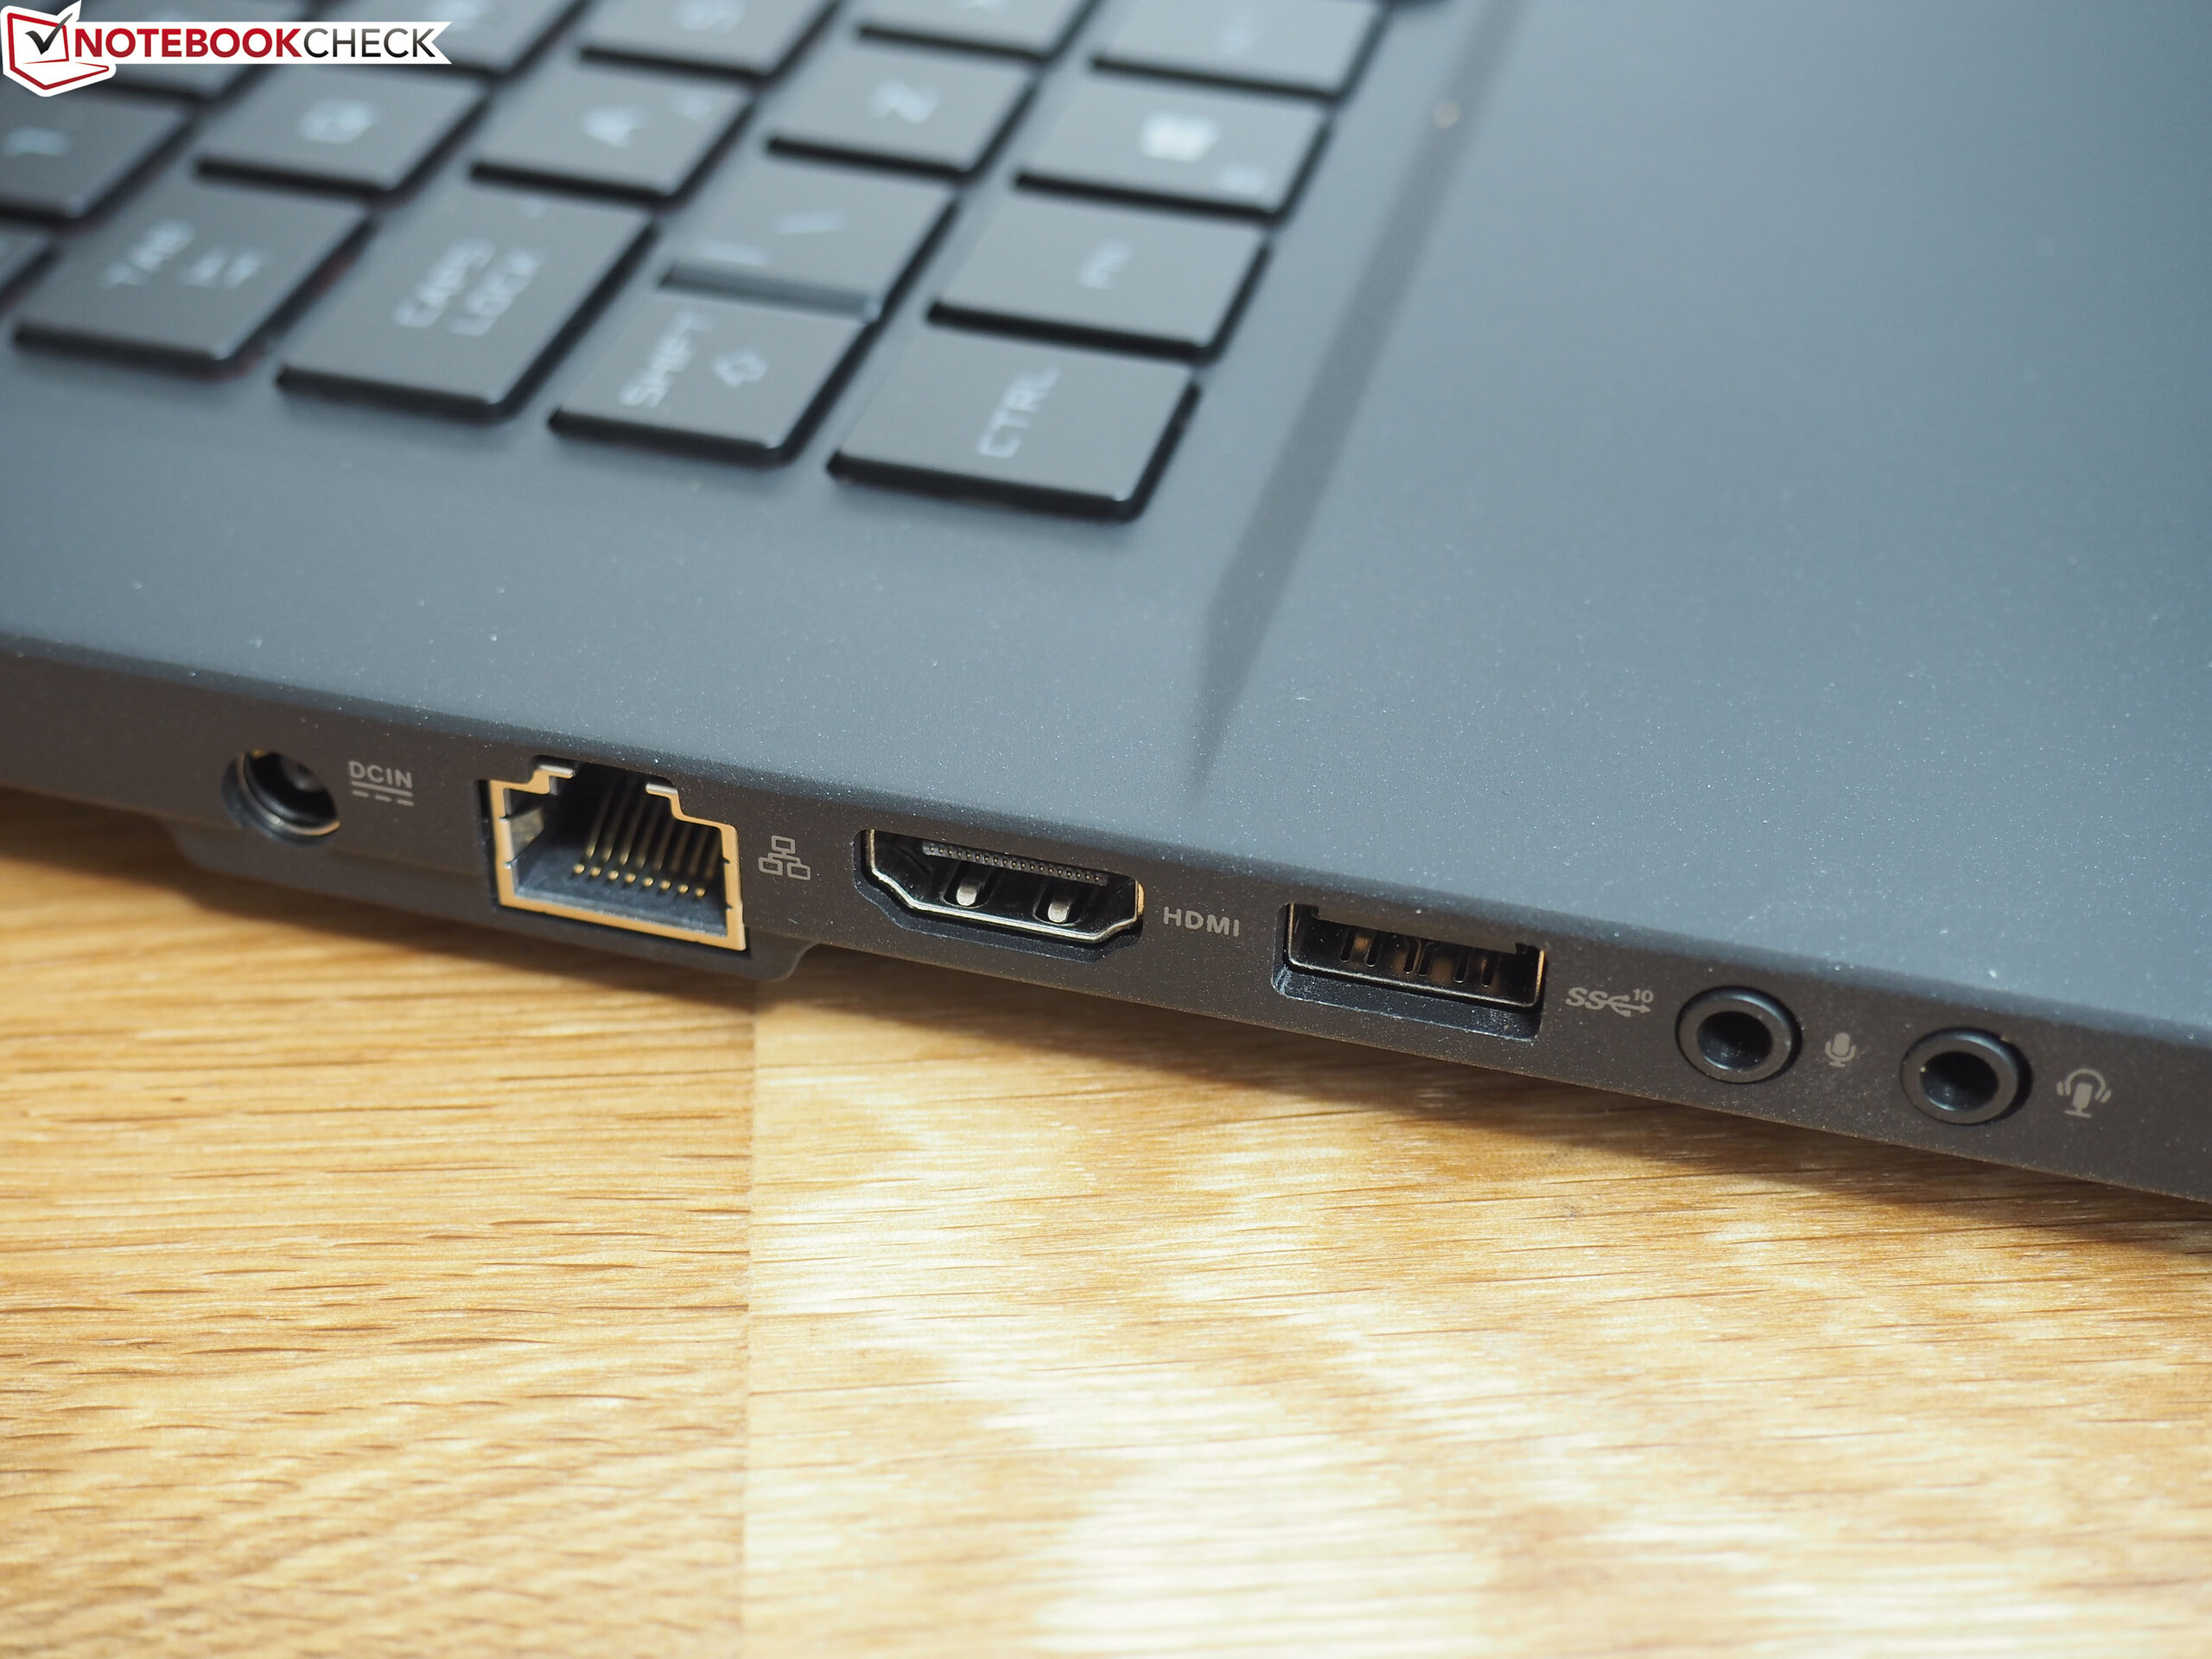
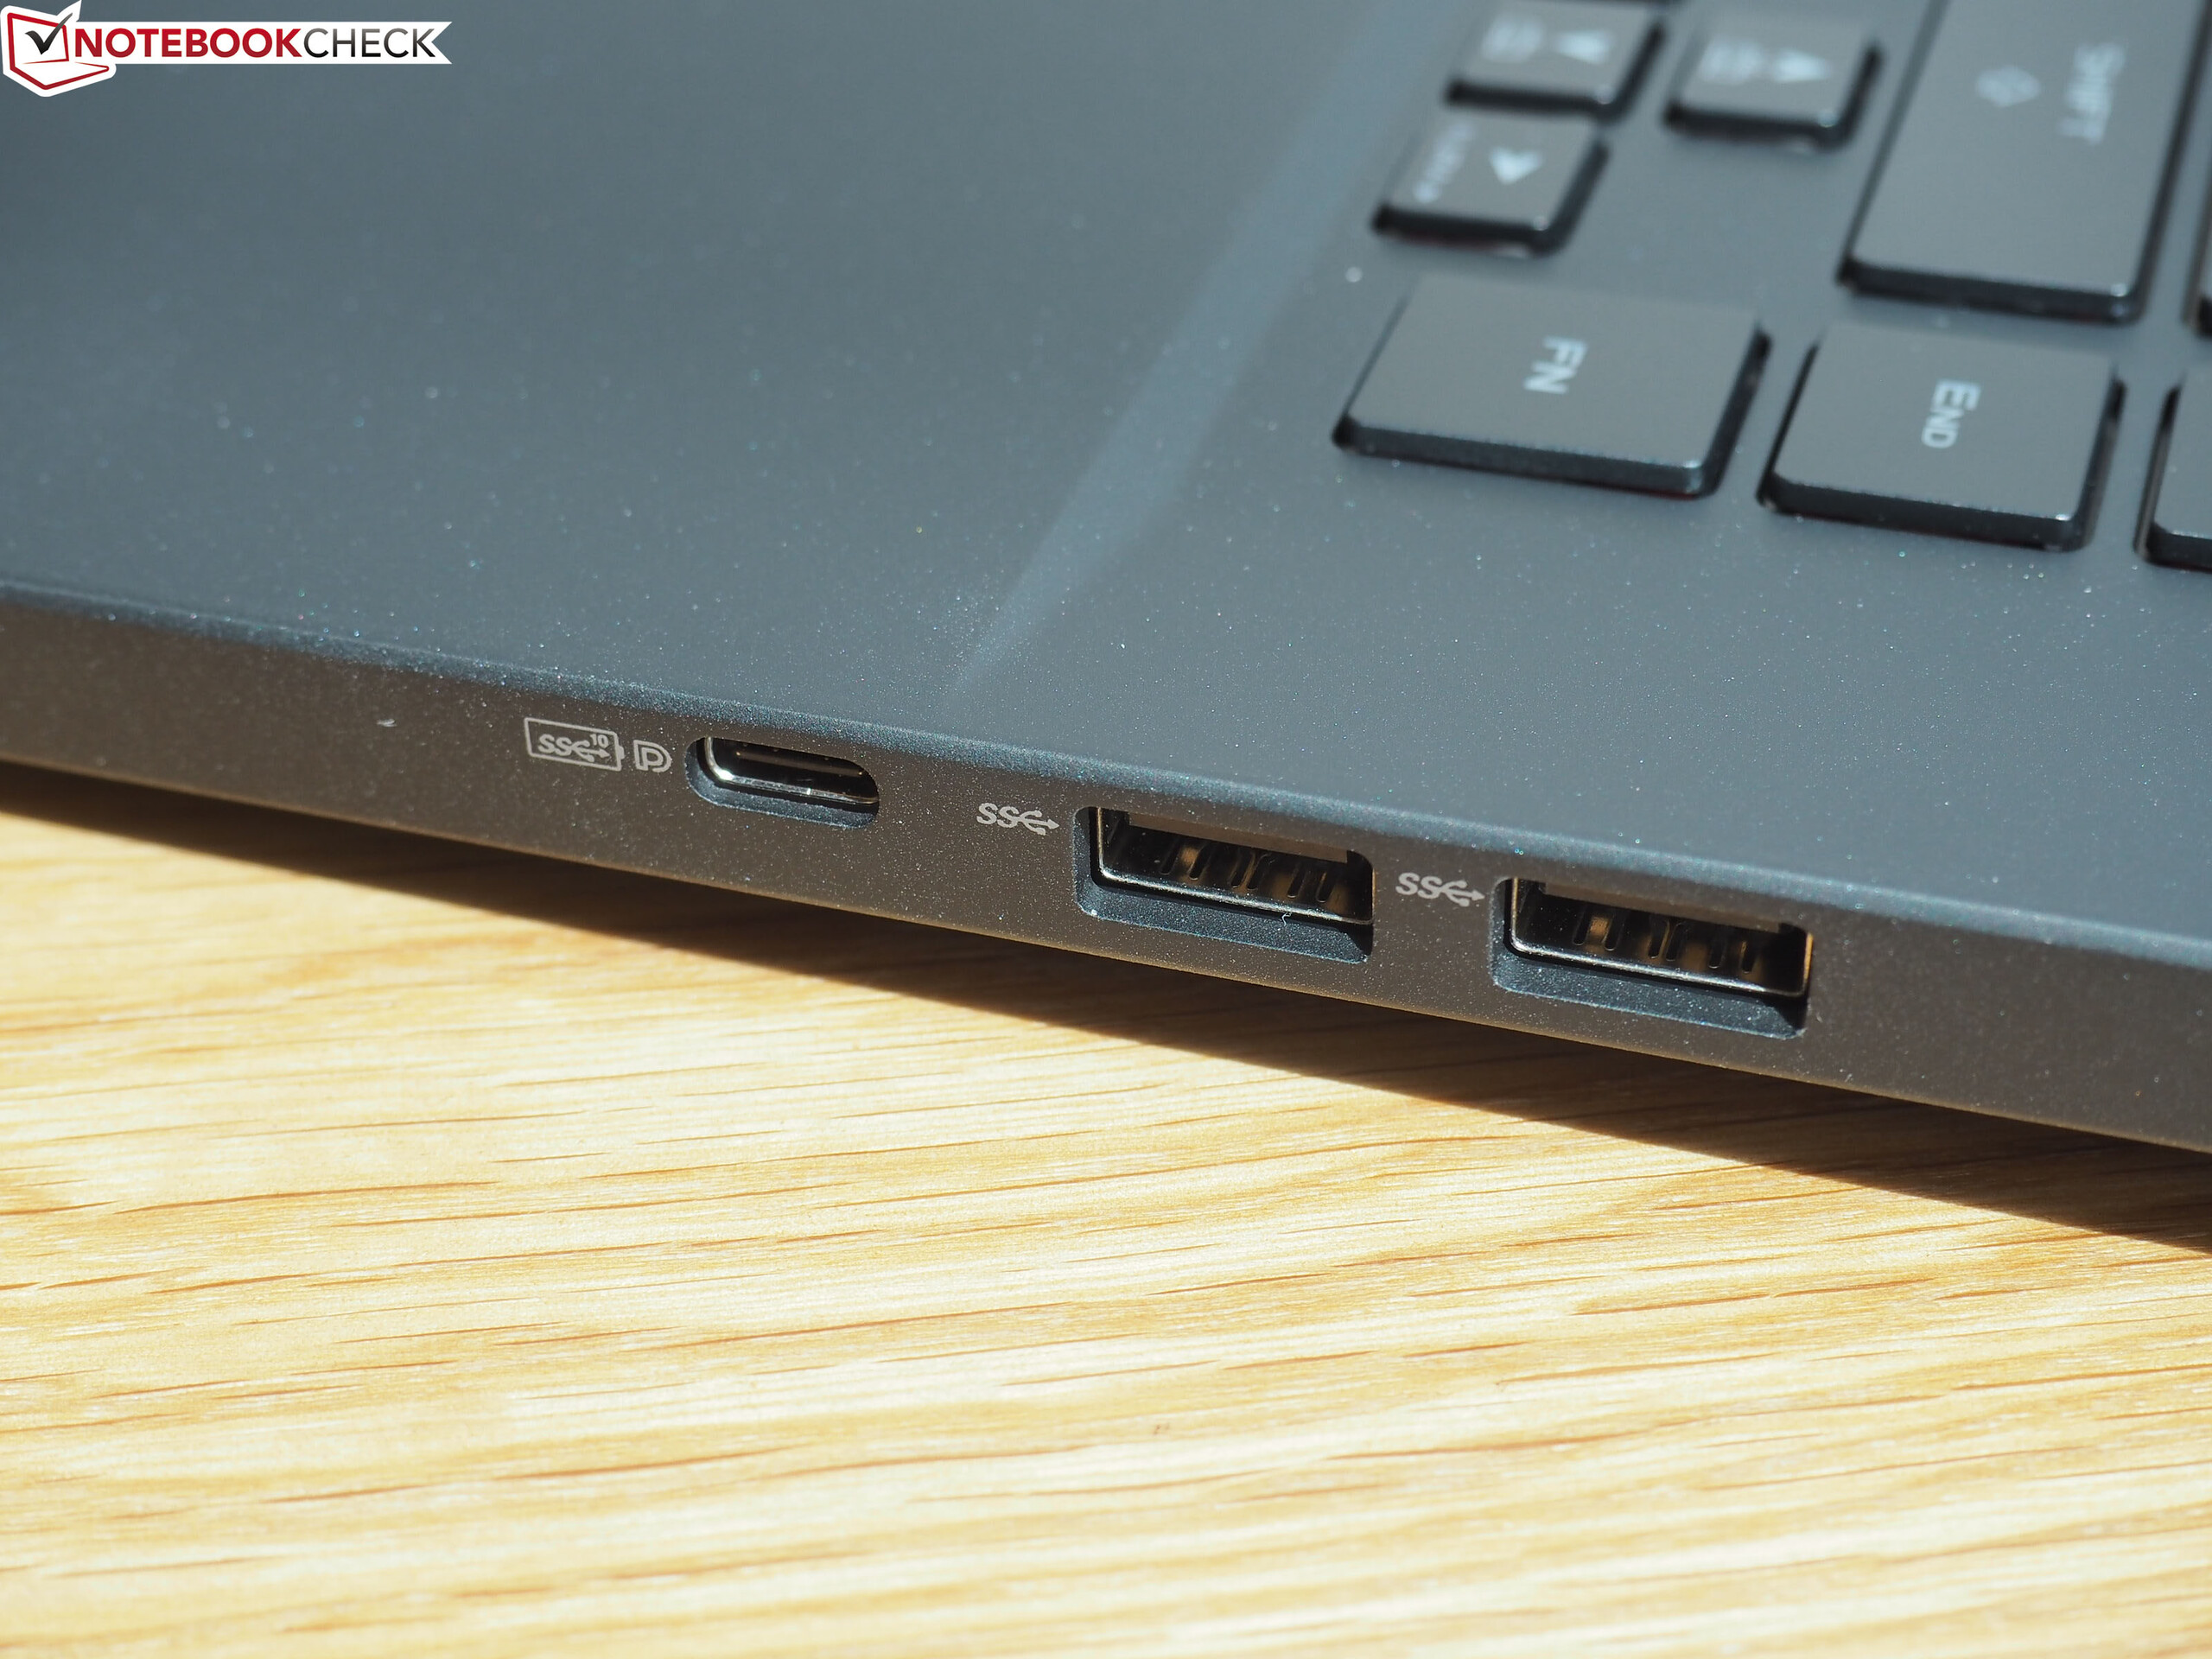
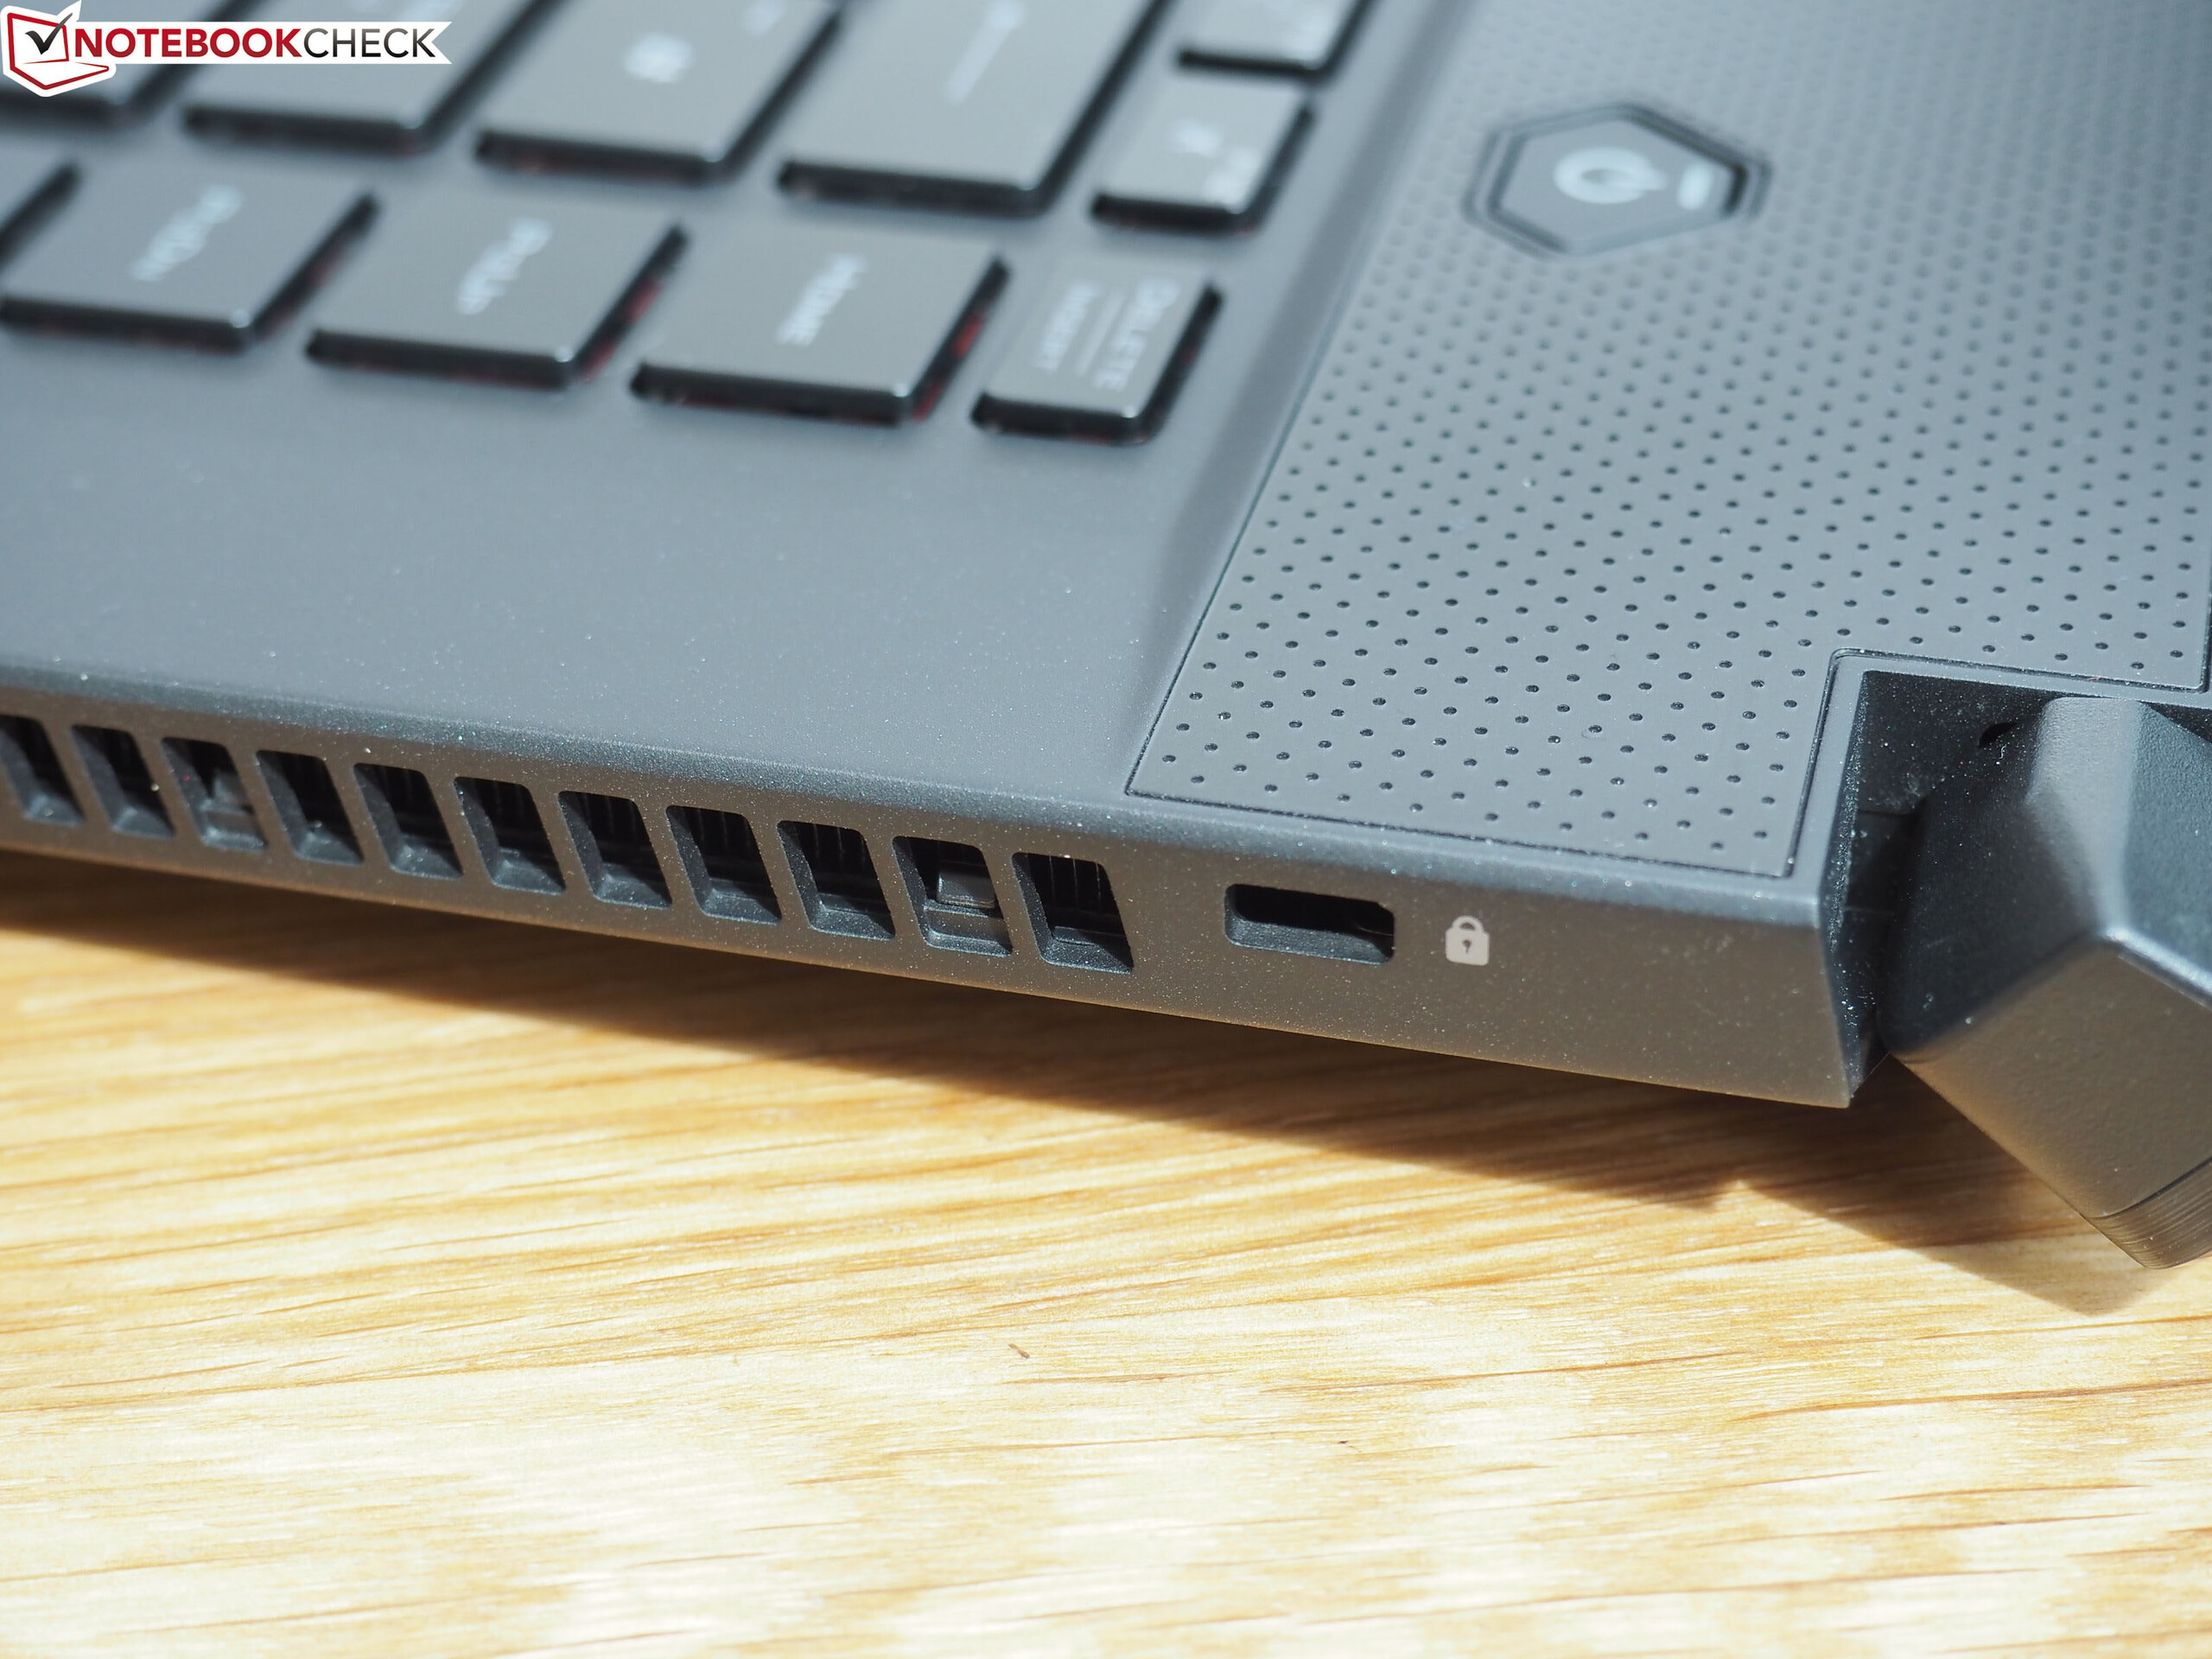
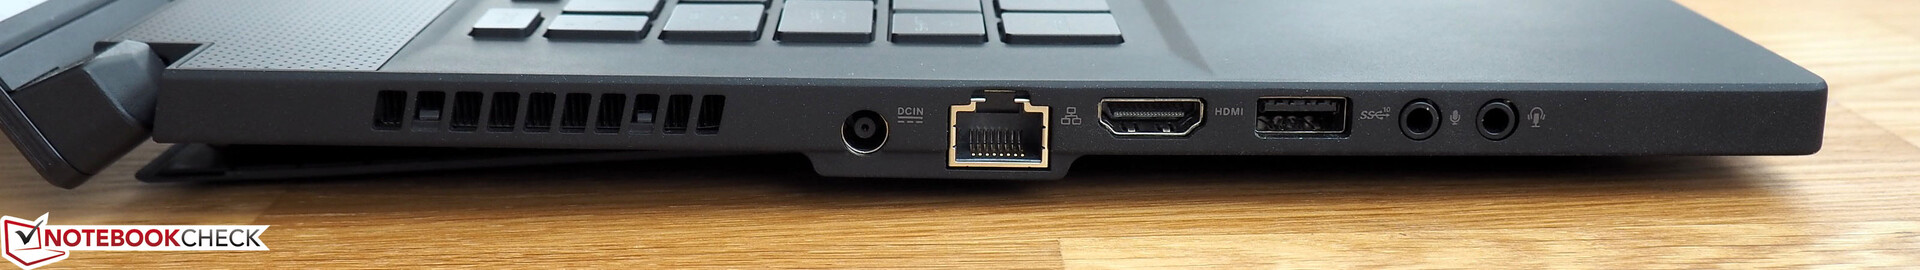
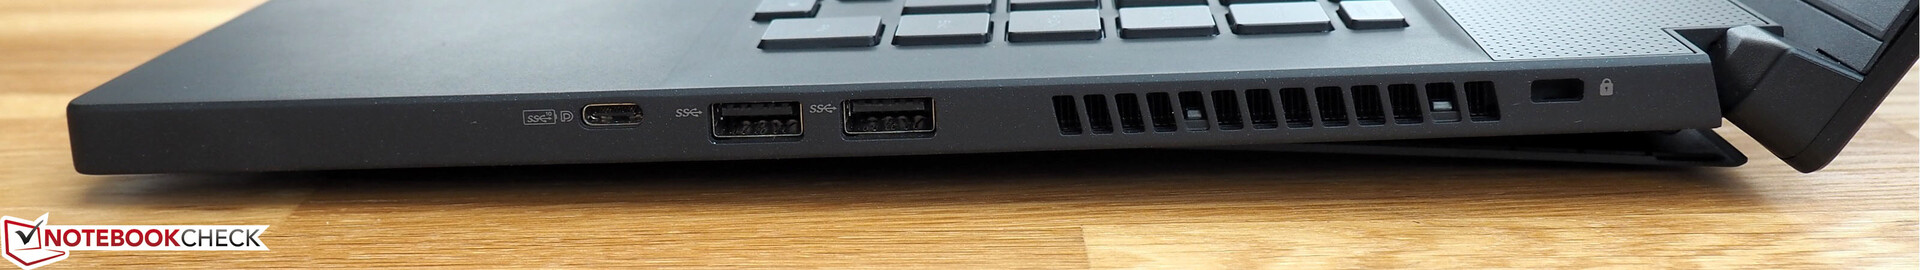
The GX502 has plenty of ports, but there are two notable omissions that we wish ASUS had included. We like that the company has included an HDMI 2.0 port along with dedicated headphone and microphone jacks while having an RJ45 LAN port is always useful. ASUS has also equipped the device with three USB ports, two of which are Type-A with the other being Type-C. The latter supports DisplayPort too, but it seems rather cheap of ASUS not to have included a Thunderbolt 3 port. Likewise, the lack of a card reader, even a microSD one, seems like an odd decision.
ASUS has not helped matters with the distribution of the ports that it has included either. The company has positioned the ventilation grilles on the sides of the device, which is not necessarily a bad thing. However, these sit quite a distance from the edge of the device, which effectively forces all the ports closer to the front edge of the chassis. Correspondingly, you may find it difficult to use an external mouse with your right hand, especially a wired one, if you also have other USB devices plugged into the GX502.
Communication
Our review unit has the popular Intel Wireless-AC 9560 onboard, which handles Bluetooth and Wi-Fi. The one in our device averaged around 680 Mb/s in iperf3 Client tests, which we conducted with the GX502GW positioned approximately one metre away from our reference Linksys EA8500 router.
Software
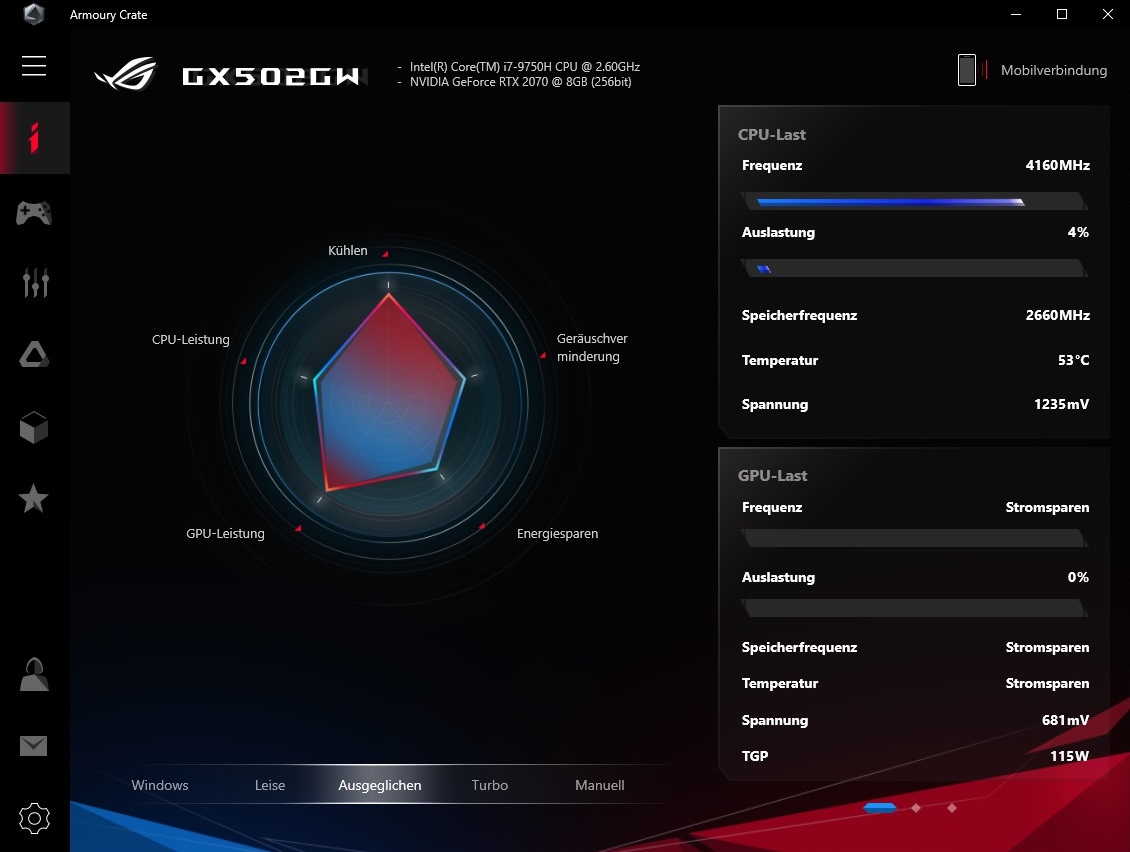
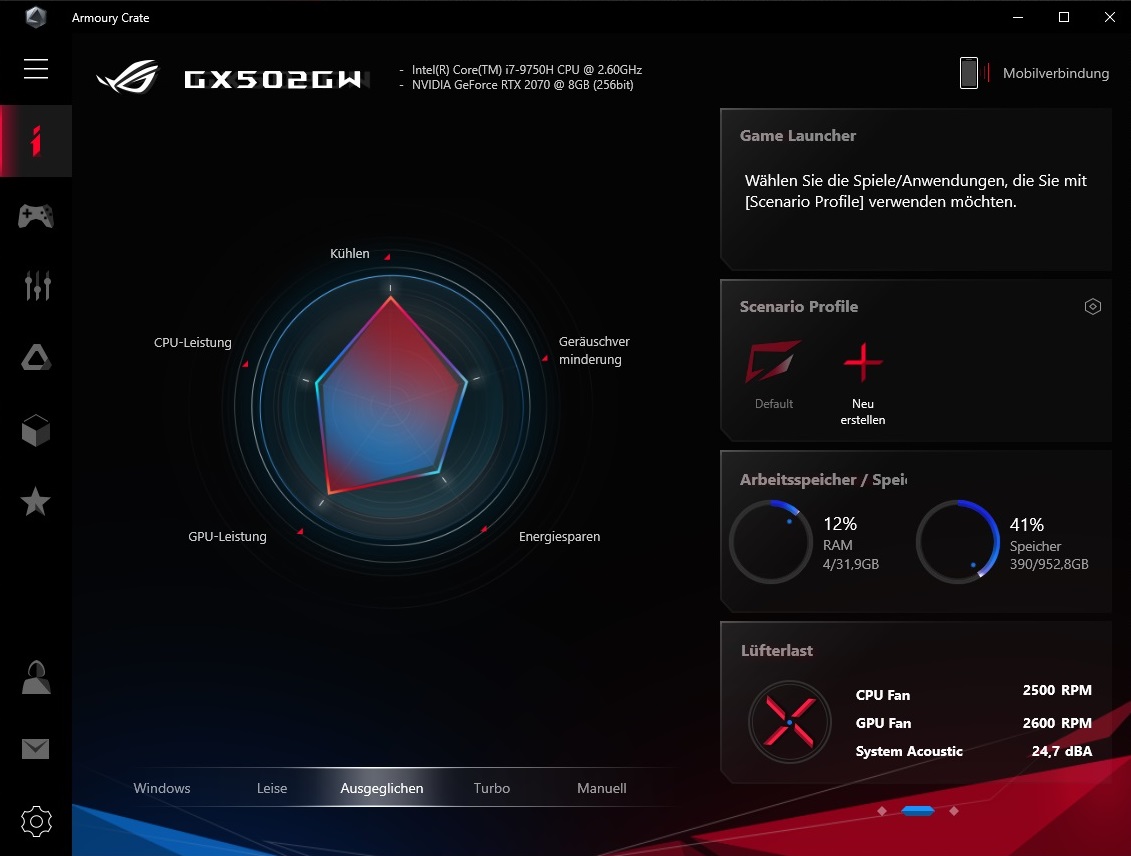
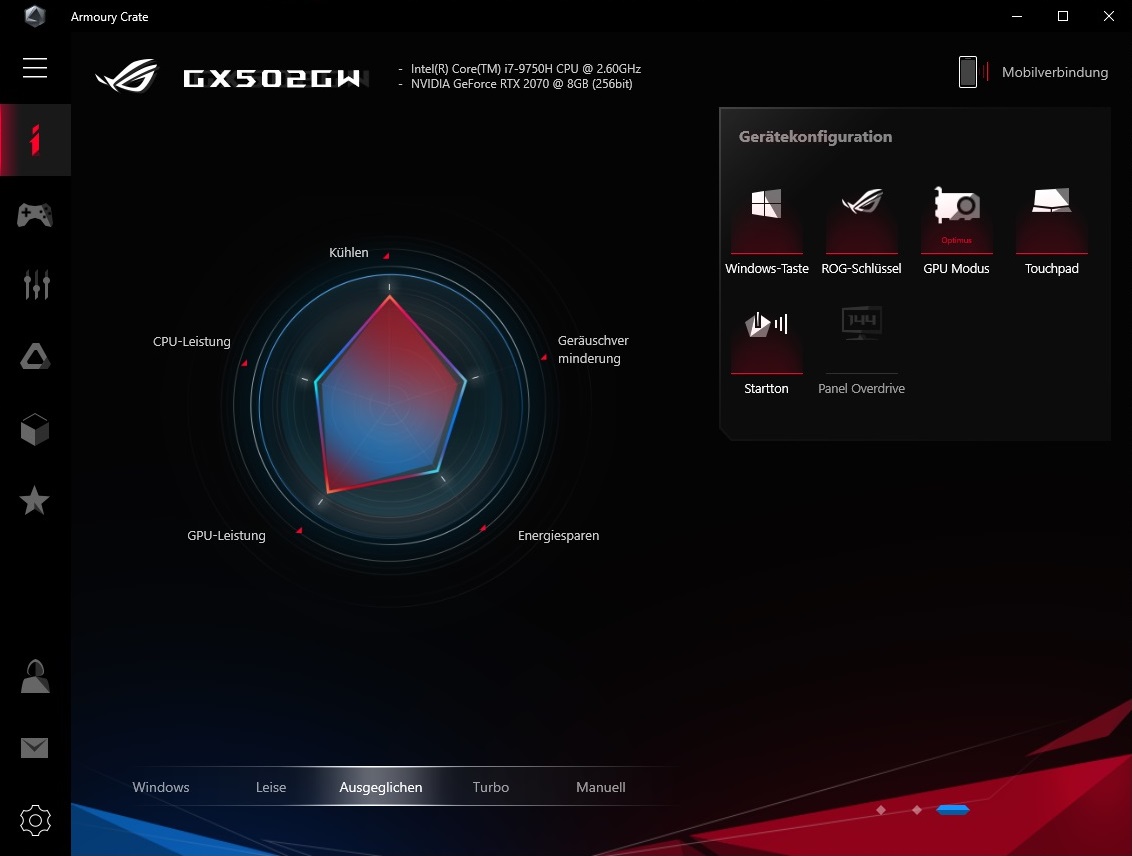
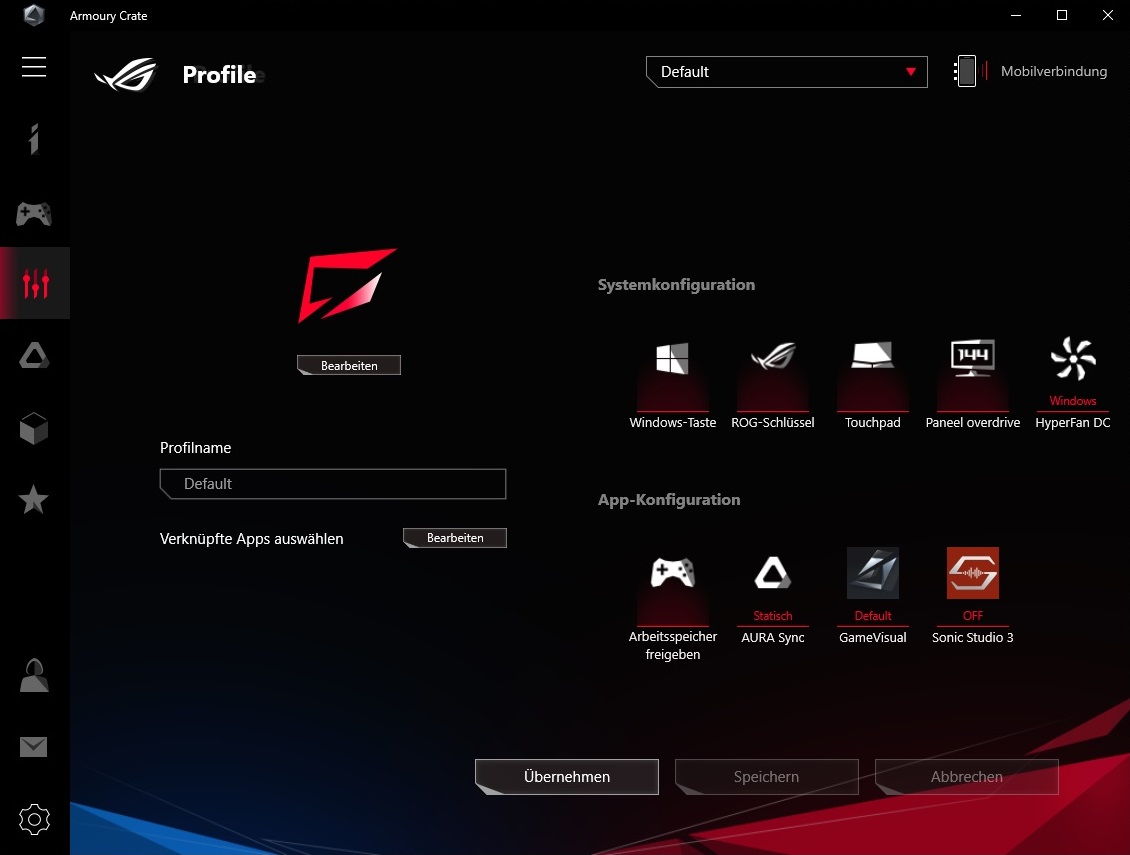
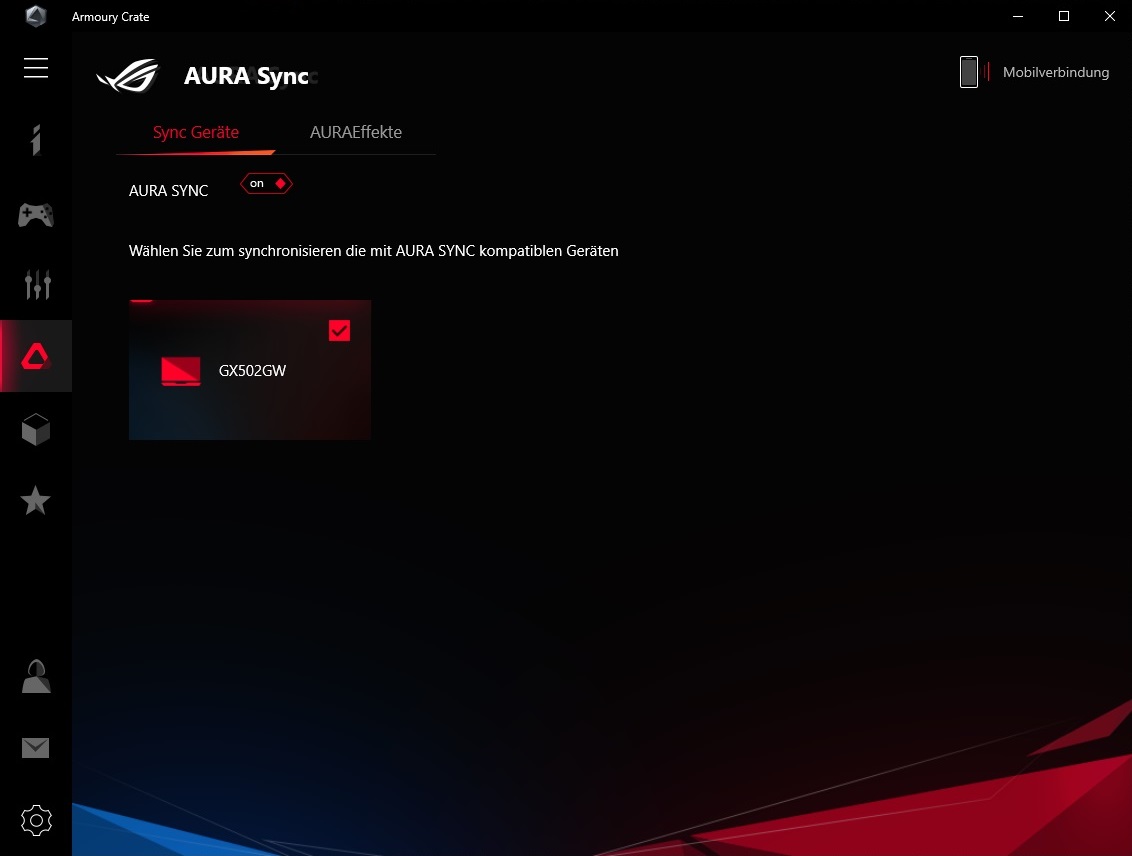
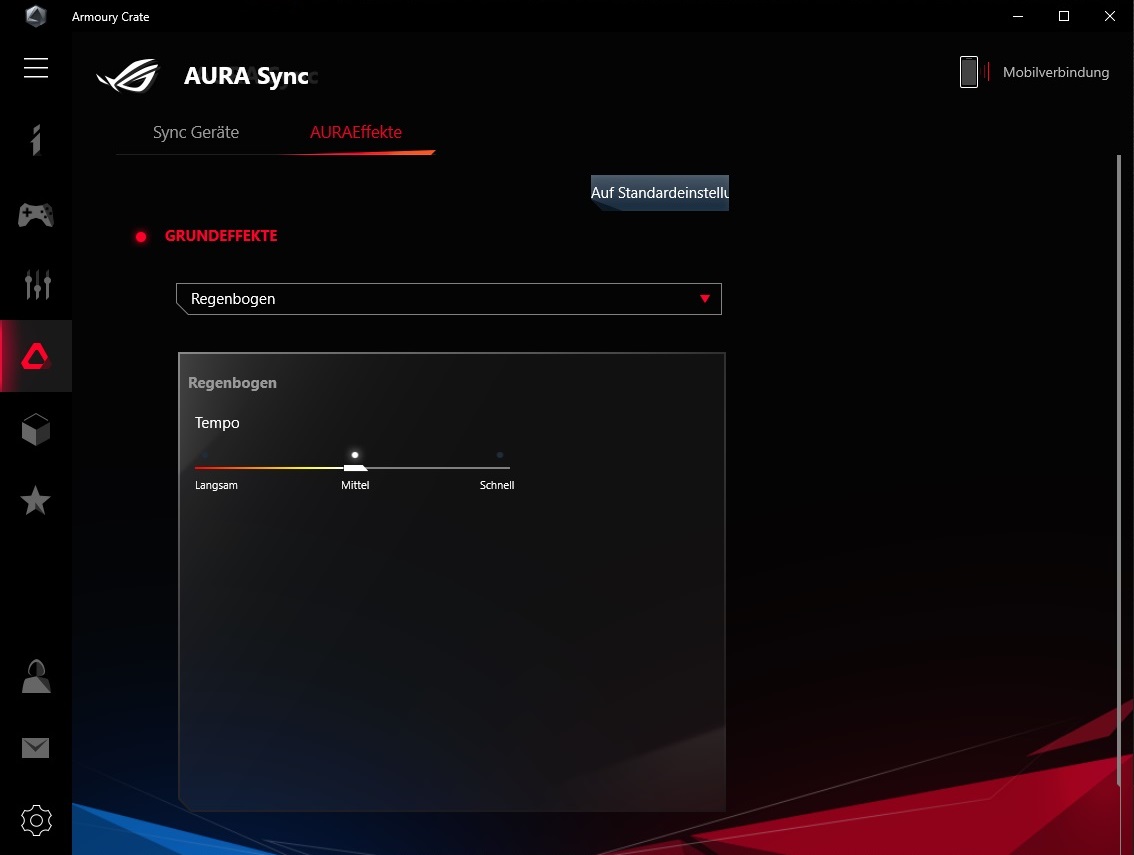
ASUS continues to preinstall its laptops with several in-house tools, the most important of which it calls Armory Crate. The program contains endless options for tweaking and monitoring your system, of which we have included screenshots below. There are also several profiles that affect CPU and GPU performance along with fan curves.
Interestingly, Armory Crate contains an option to switch between G-Sync and Optimus. Nvidia developed the former to limit image tearing in games, while the latter allows systems to switch between dedicated and integrated GPUs to reduce power consumption. It is rare to see an OEM include support for both though. We left our review unit on Optimus mode and set to the balanced power profile during our tests, for reference.
Accessories
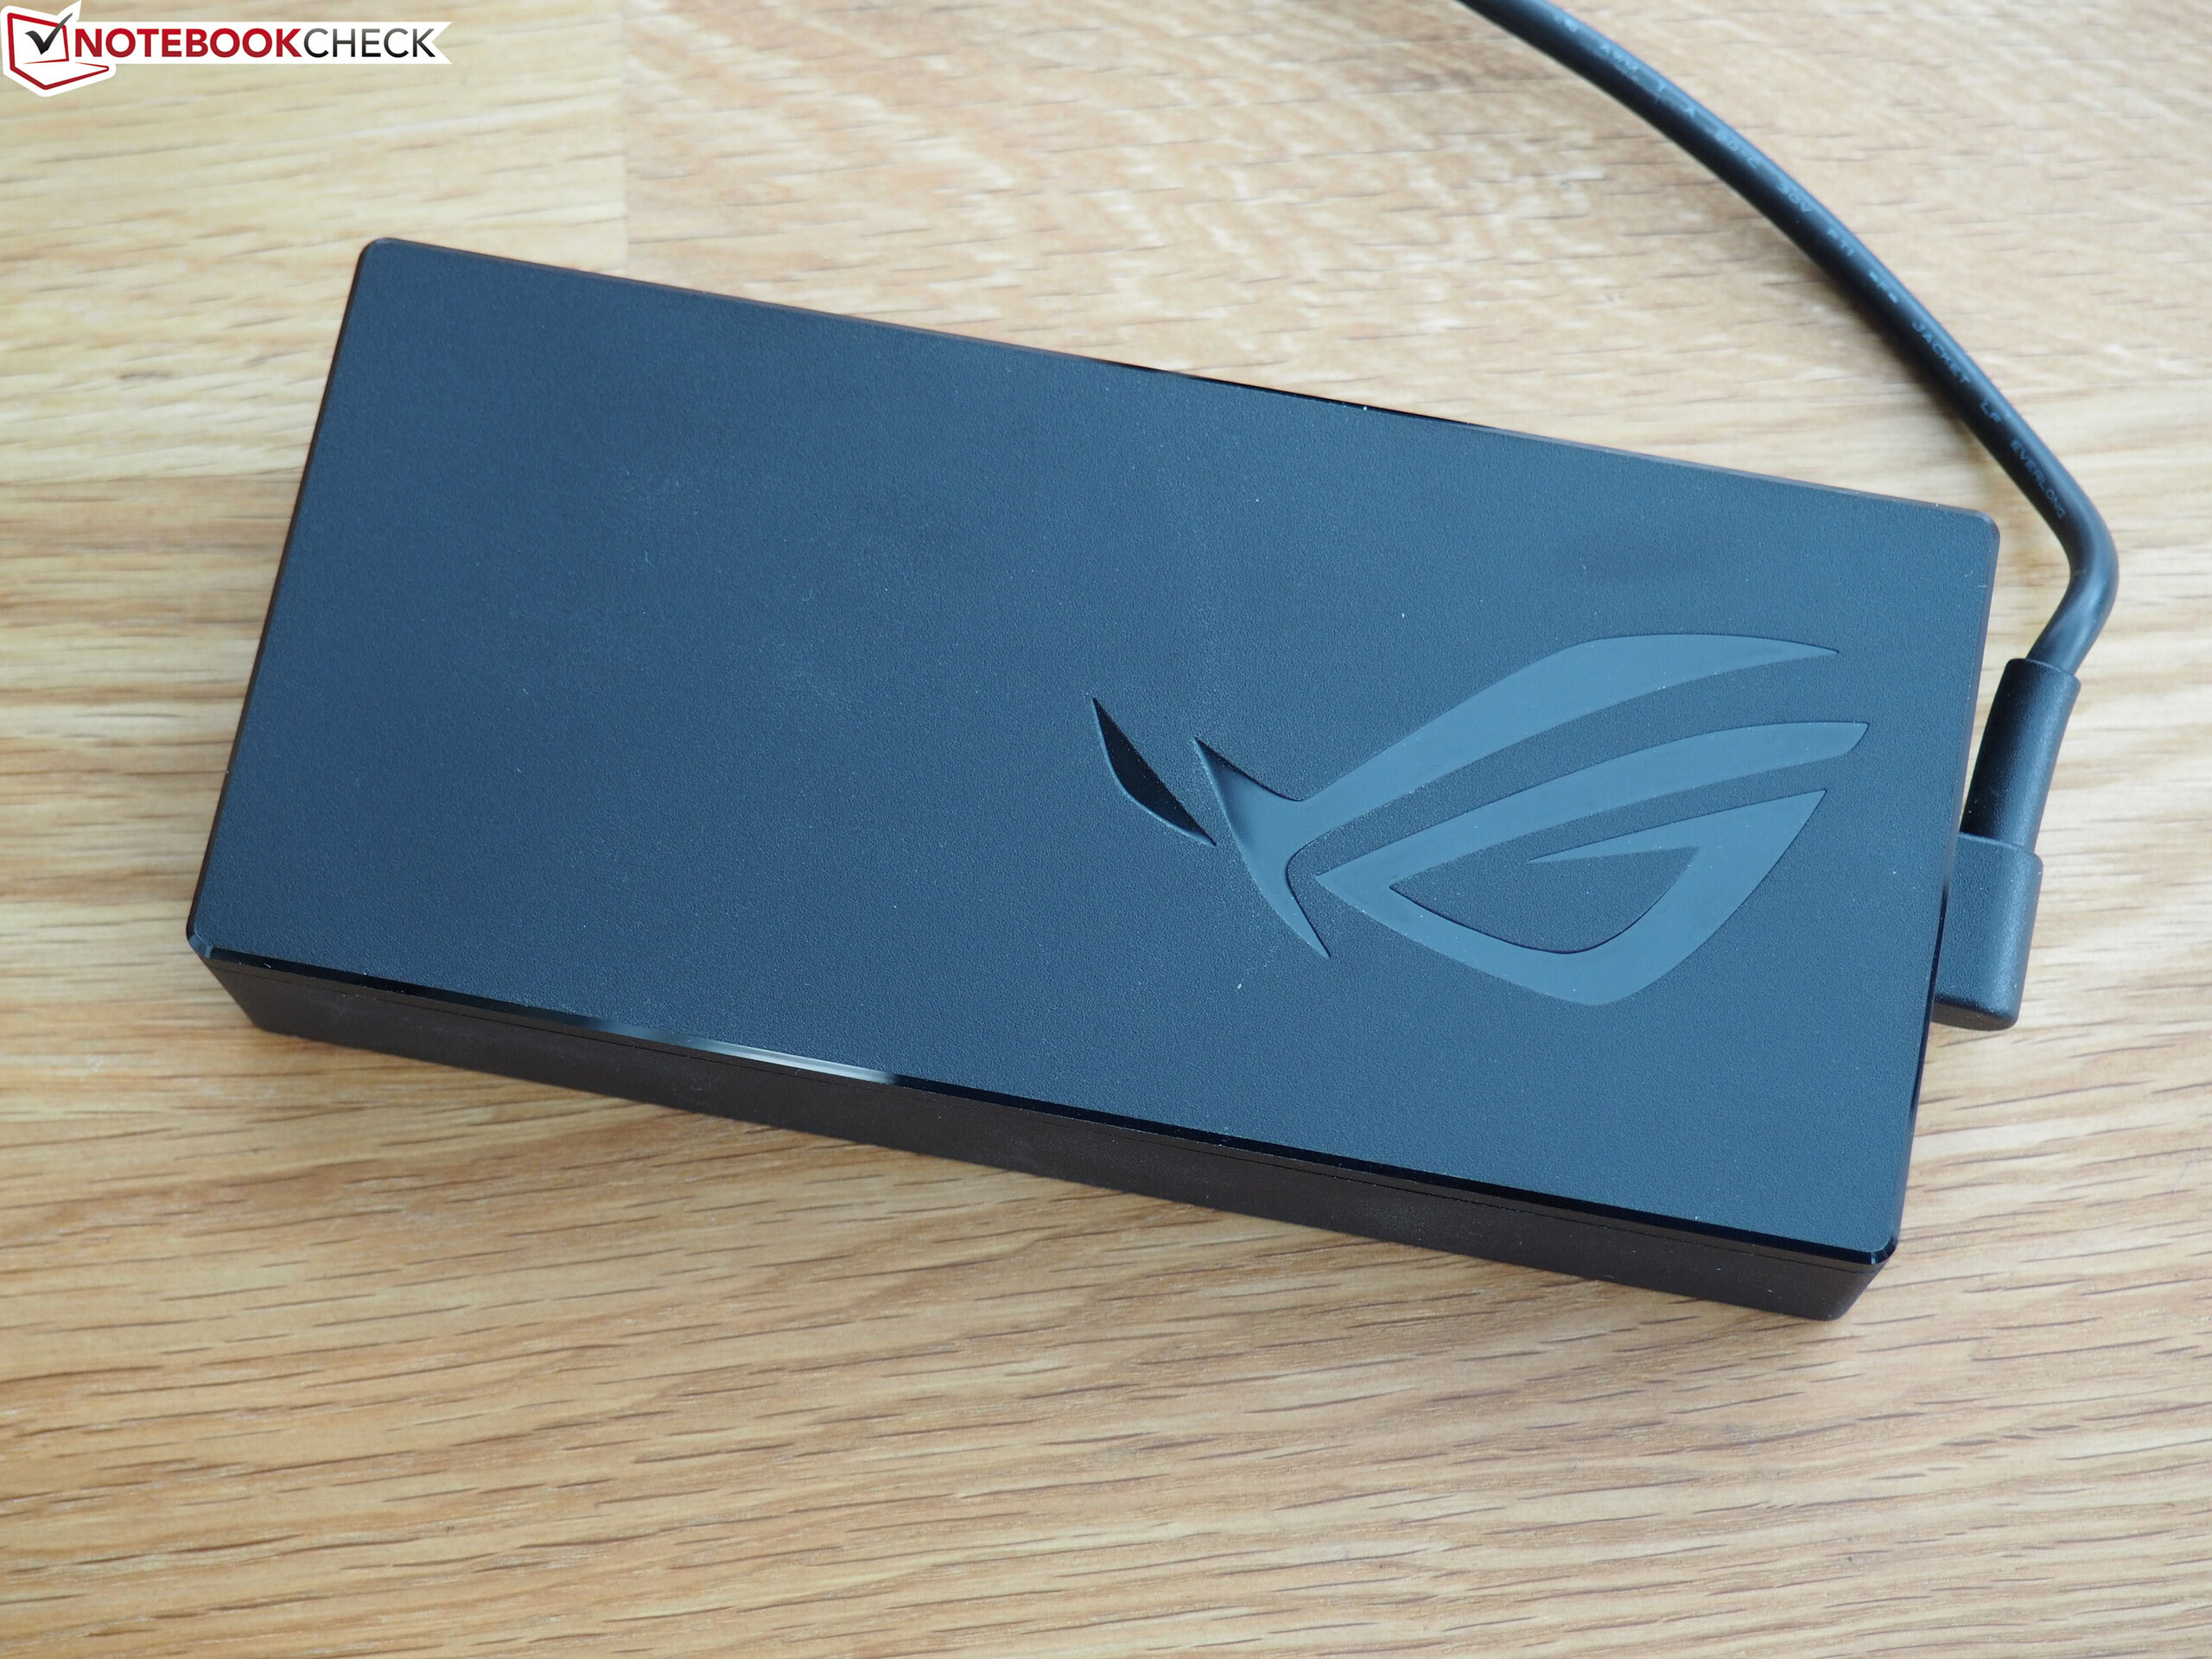
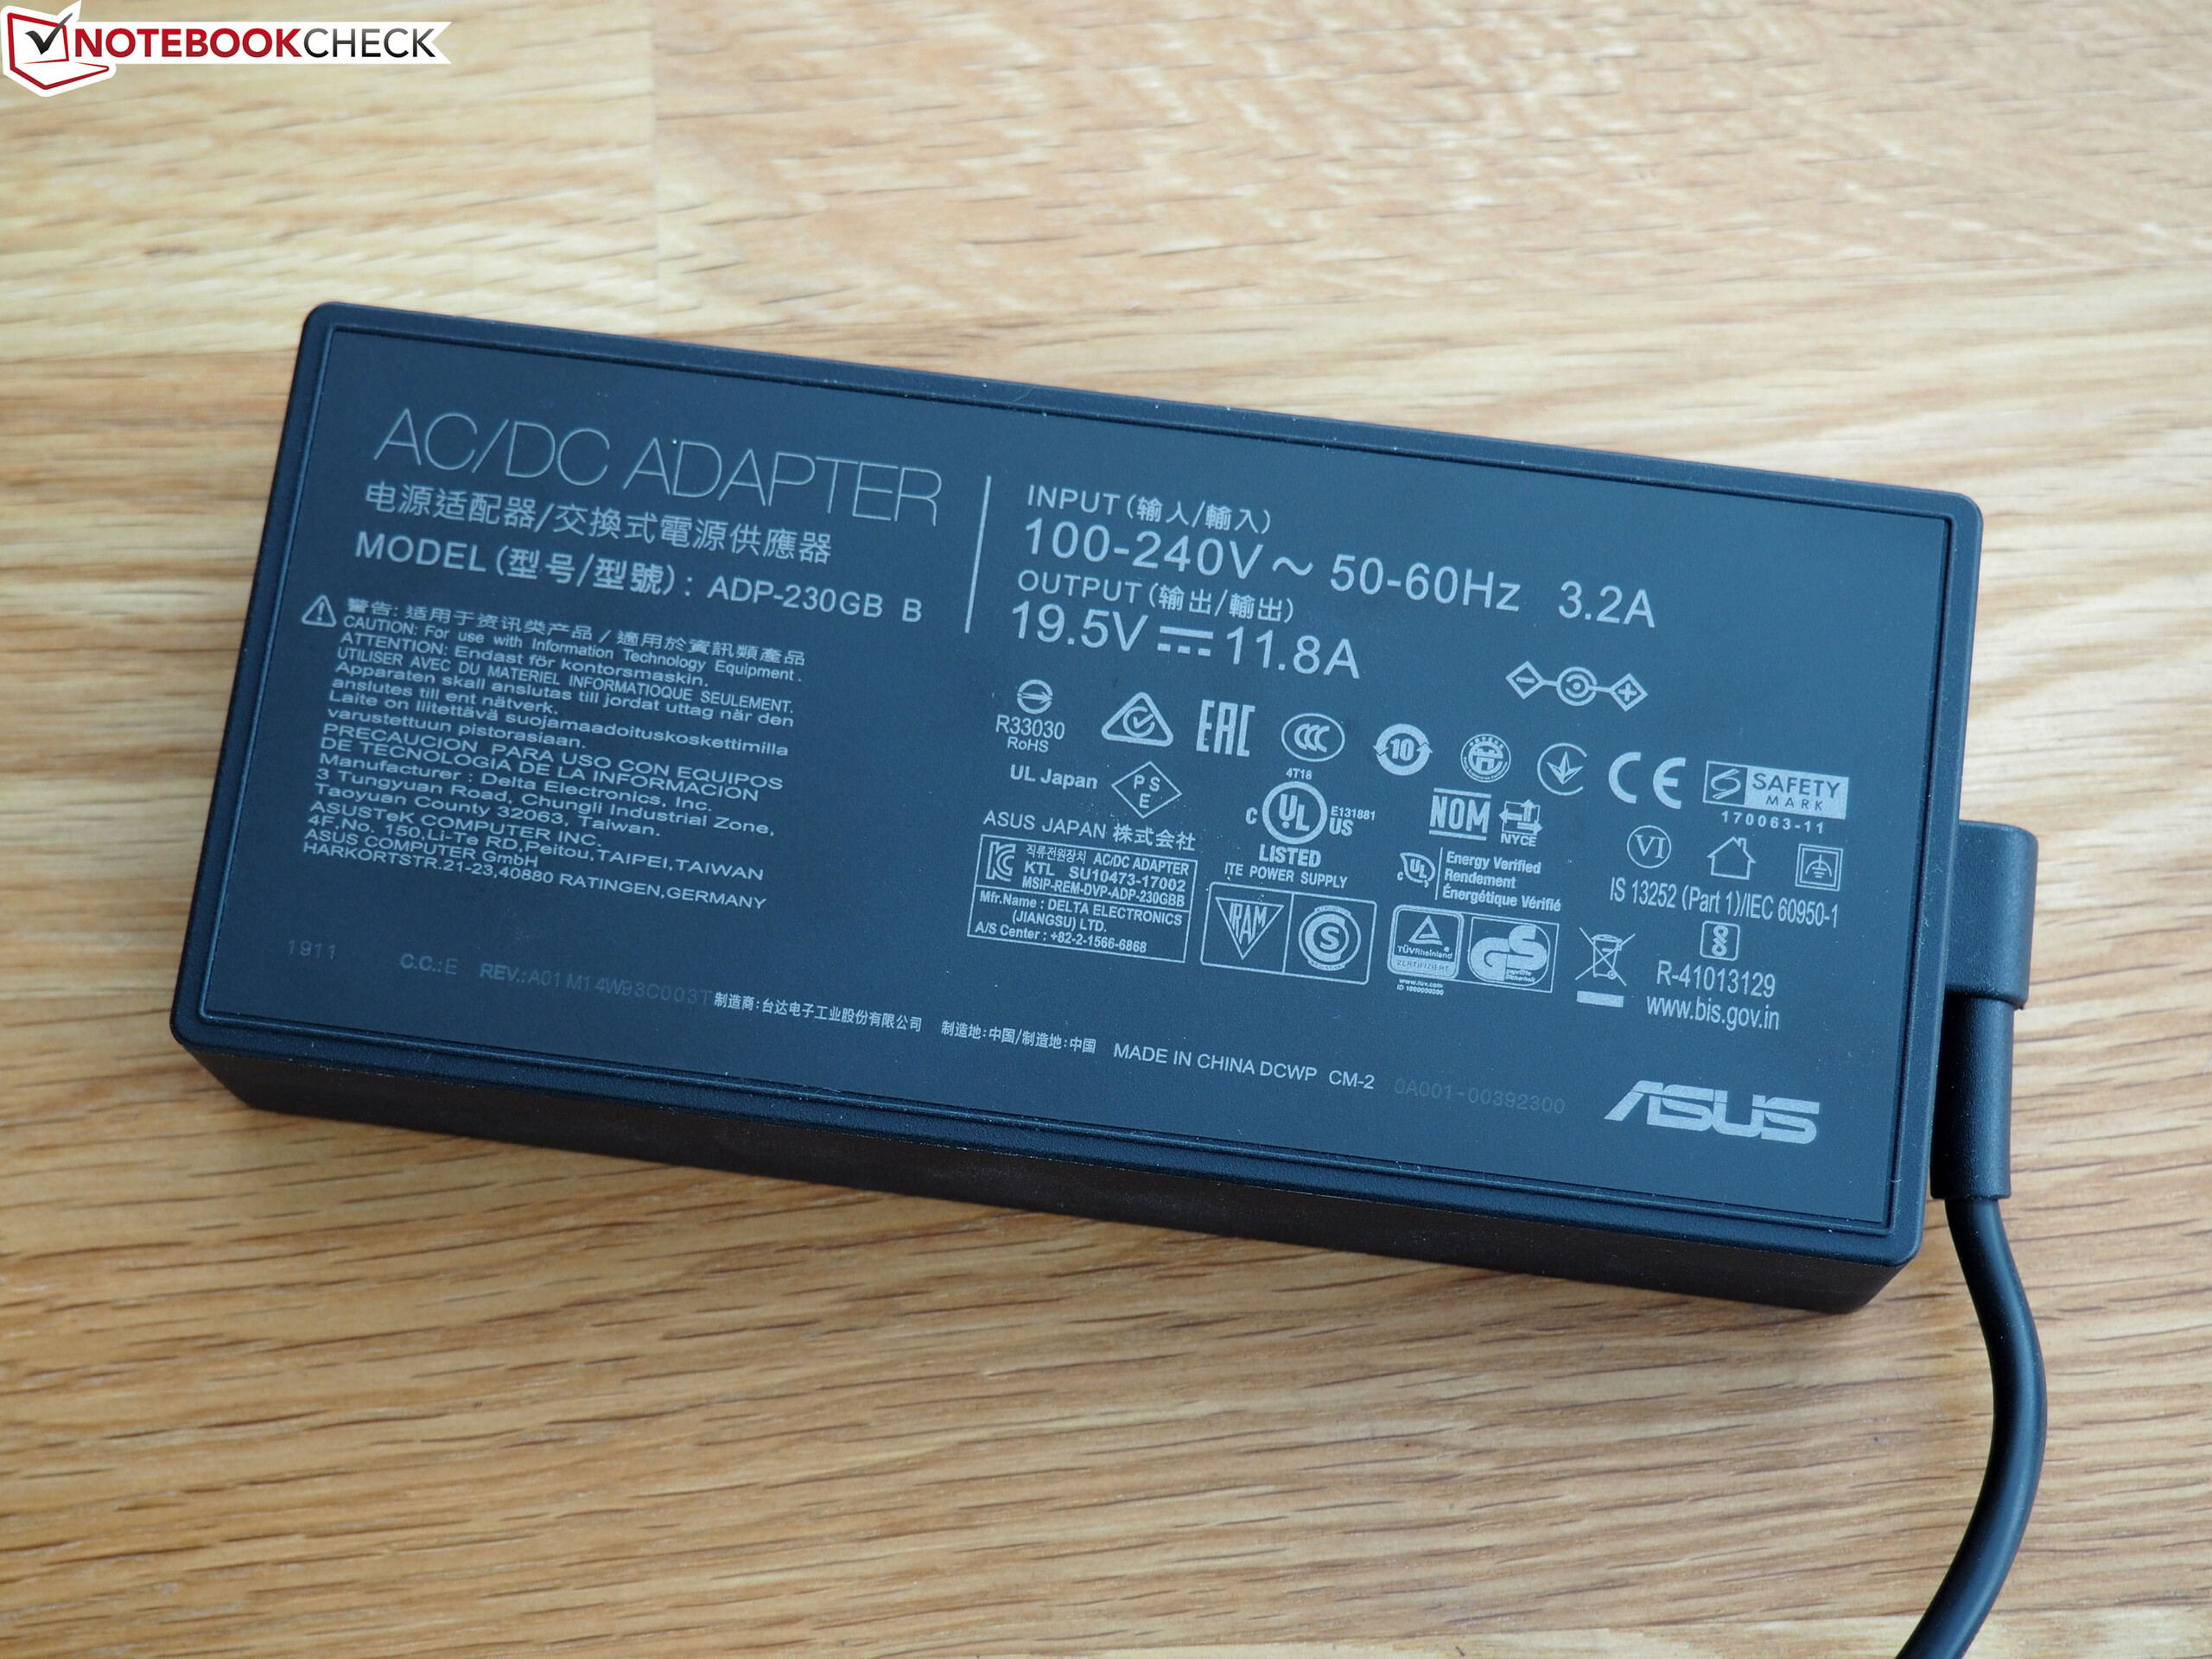
Our review unit arrived with just a power supply and a 3D model. ASUS includes an external camera in some regions, seeing as the GX502GW does not have one. GeForce RTX 2070-powered models, like our test device, have a 230 W charger that measures 16.5 x 7.5 x 3 cm and weighs approximately 0.6 kg. ASUS includes a smaller capacity charger with GeForce RTX 2060 models.
Maintenance
Accessing the internal components of the GX502 is not as easy as it looks. You would be forgiven for thinking that removing the moving bottom panel would allow you to access something, but all that it reveals is the bottom of the fans and part of the hinge assembly. Unfortunately, you must remove the whole bottom cover to access any internal components.
Warranty
The GX502GW comes with 24 months manufacturer’s warranty. Please see our Guarantees, Return Policies & Warranties FAQ for country-specific information.
Input Devices
Keyboard
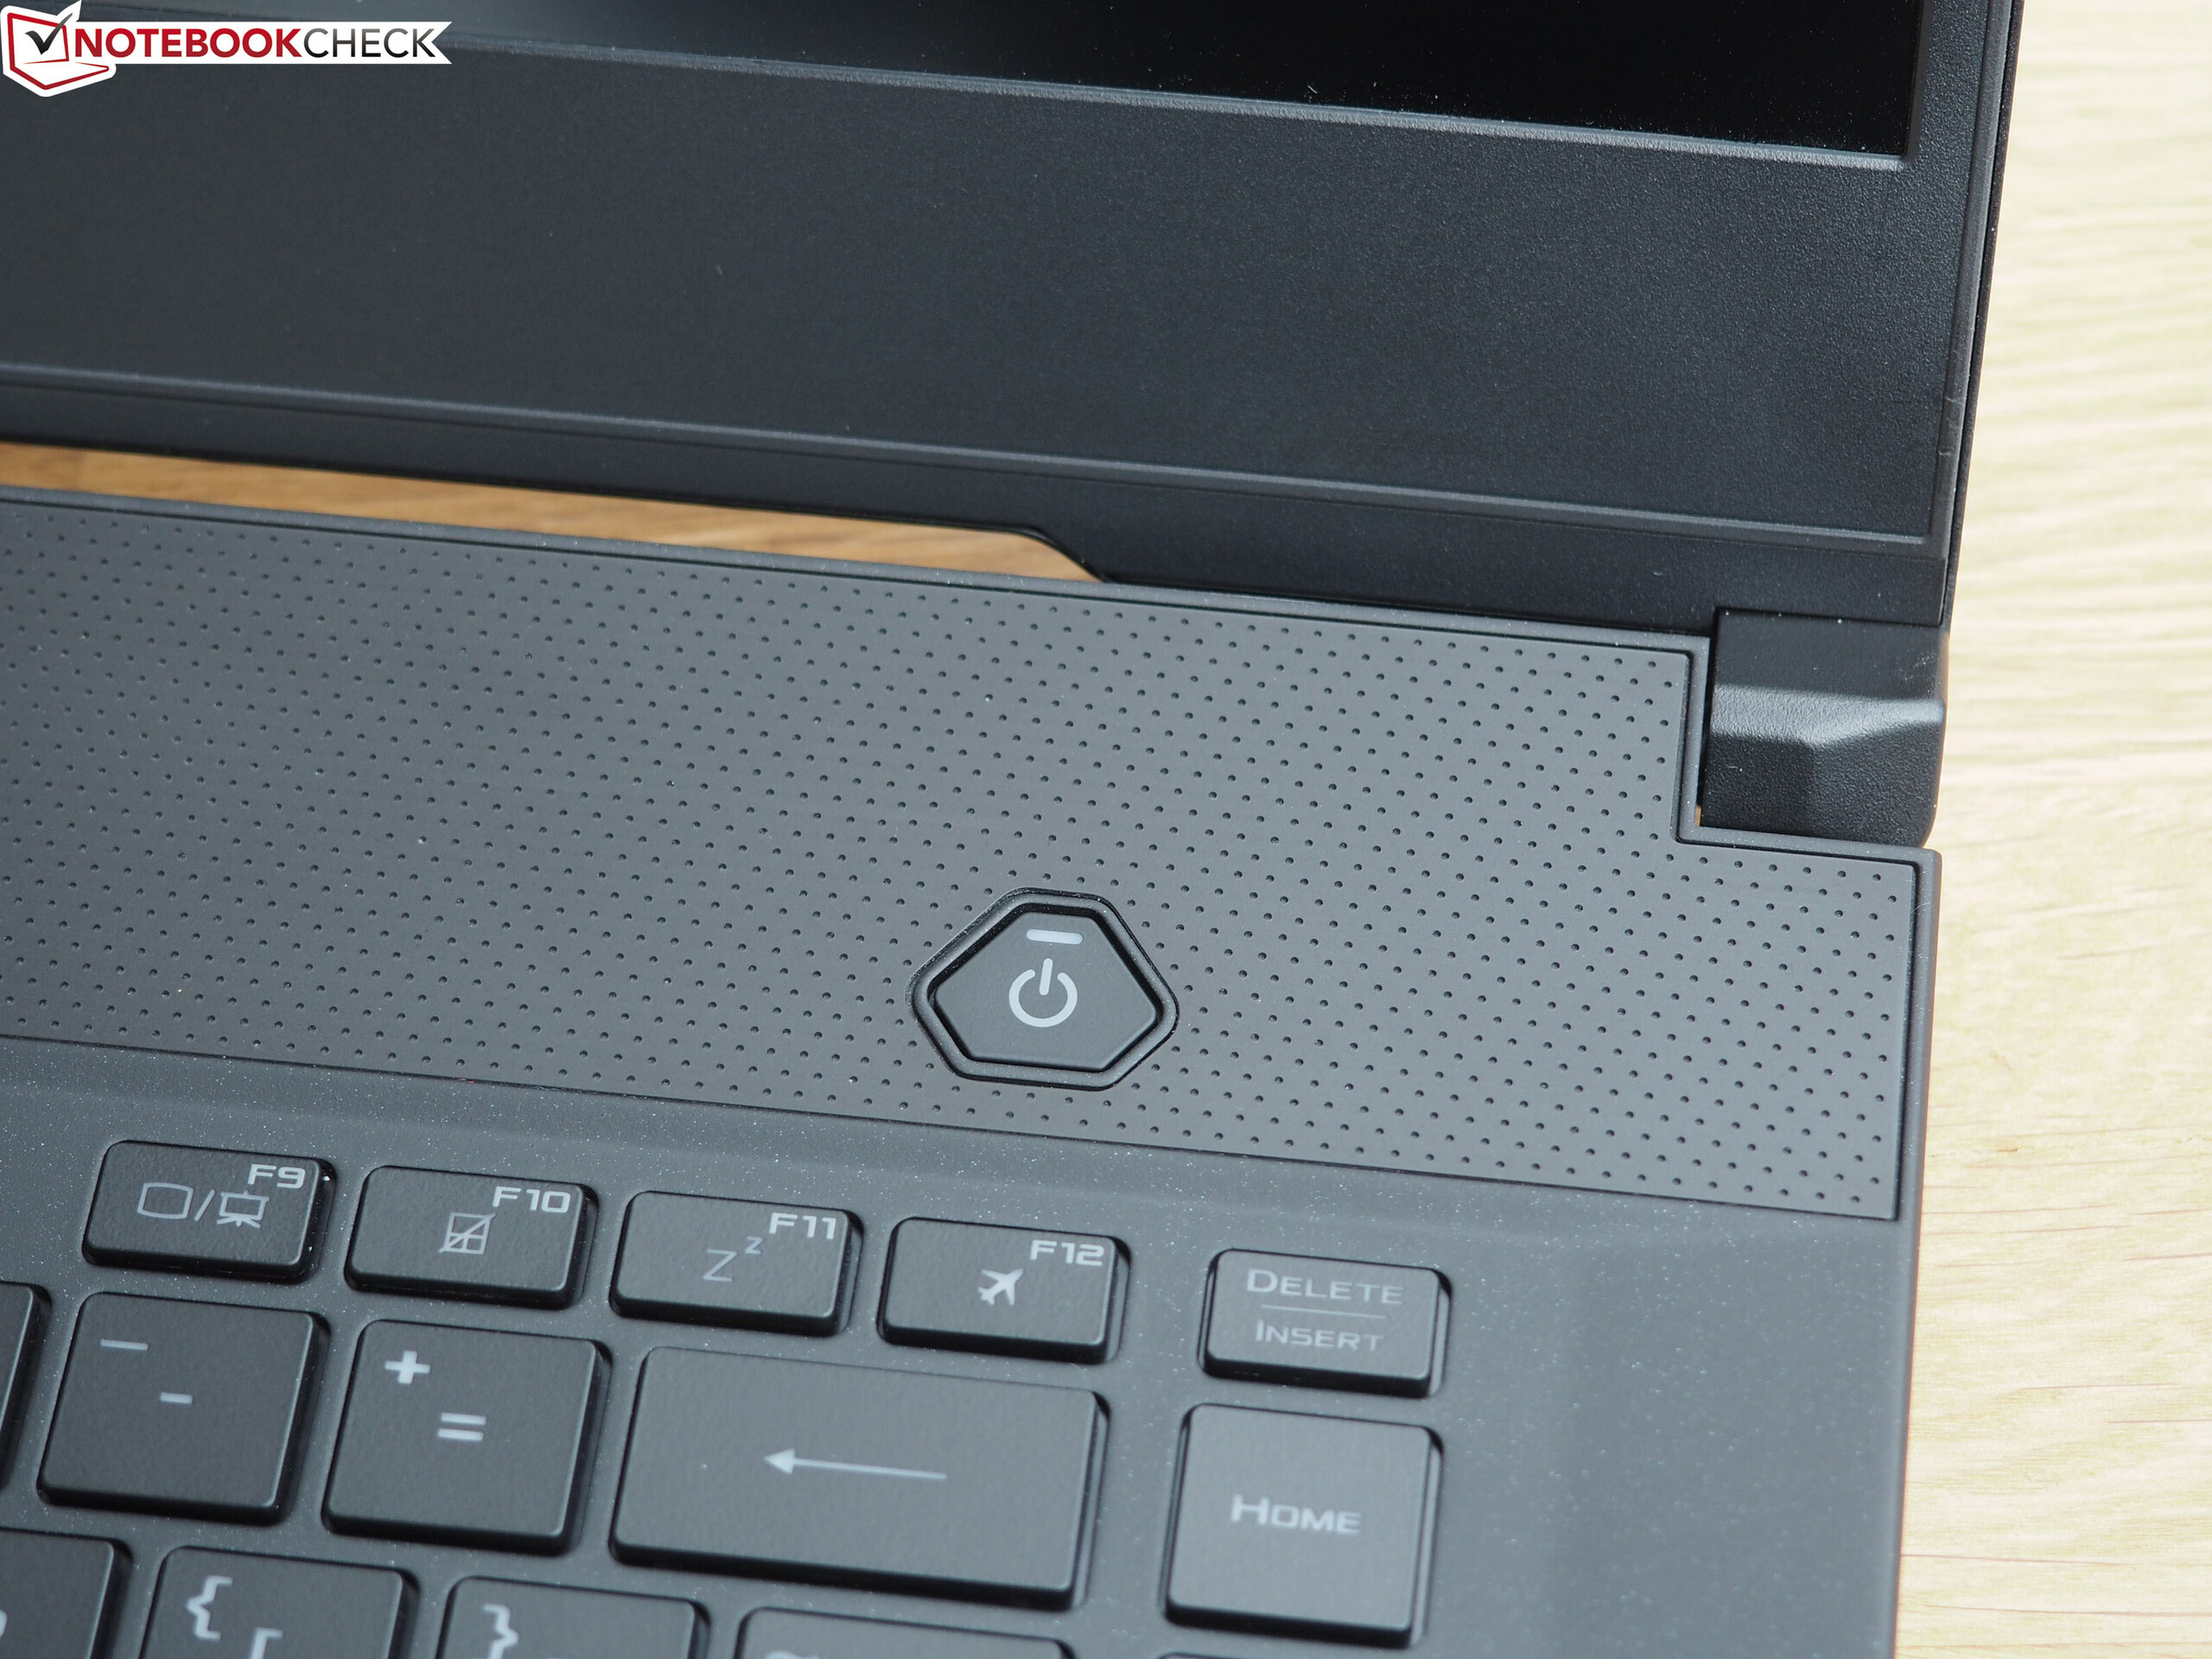
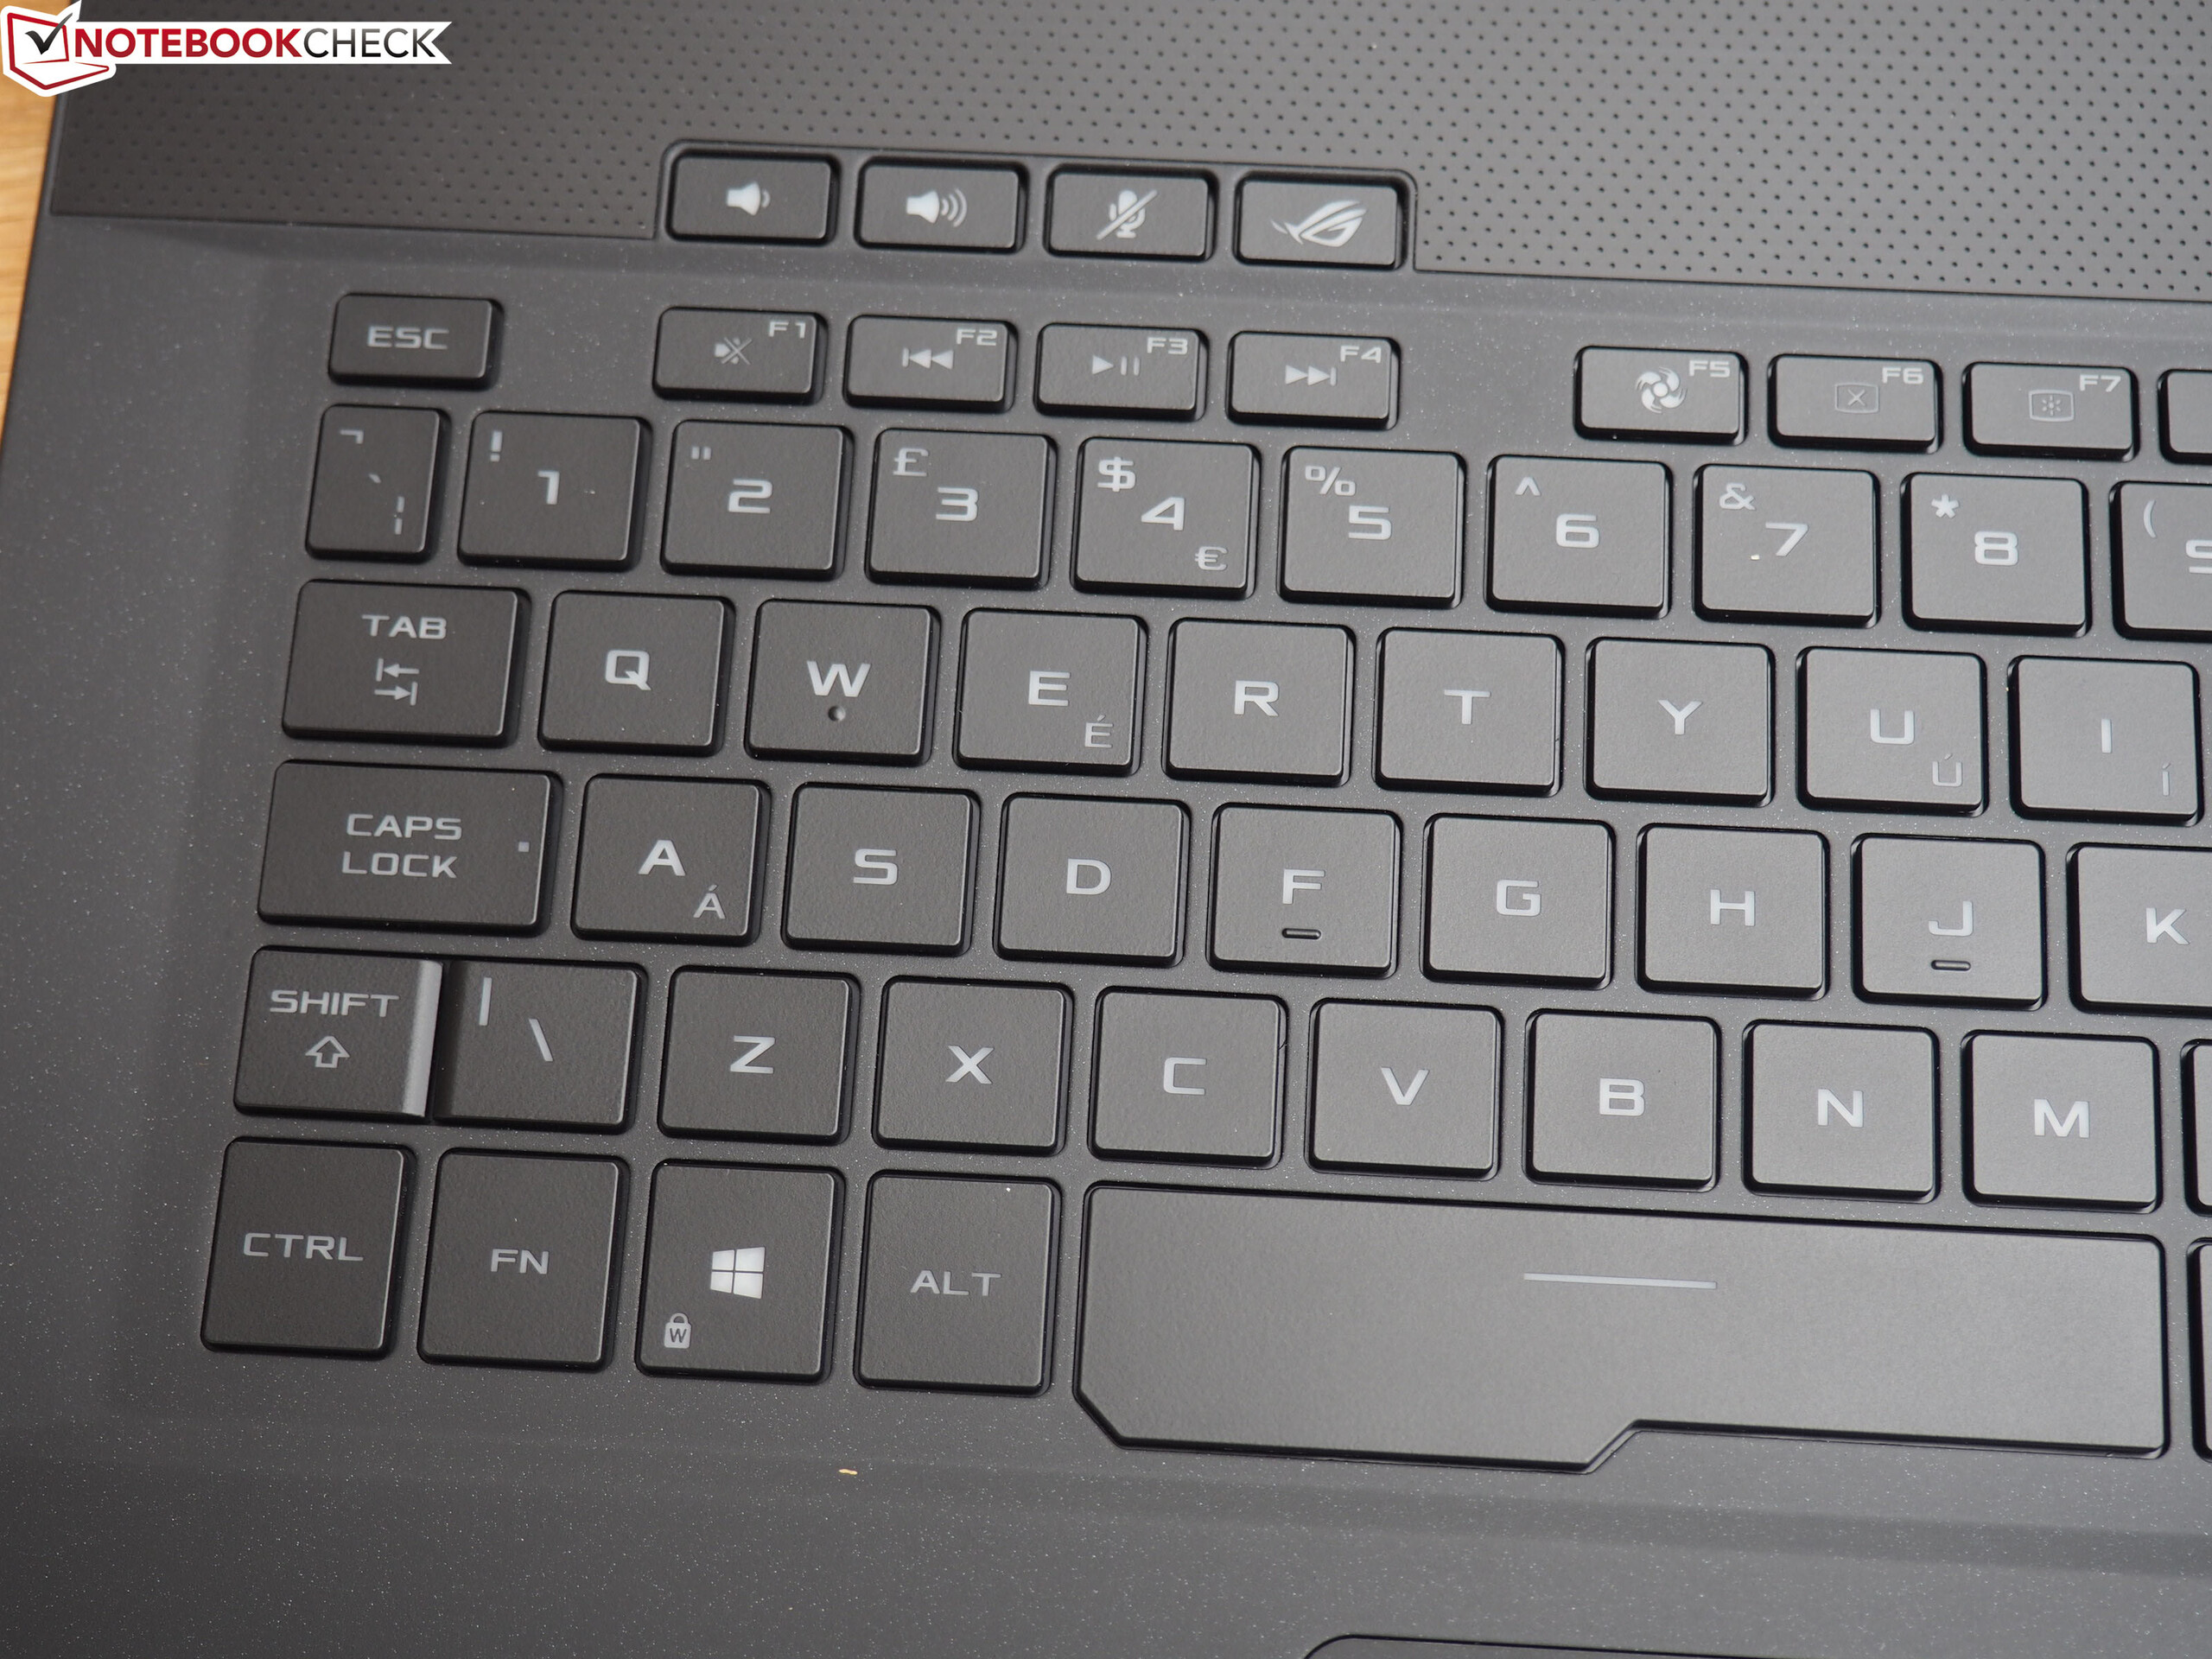
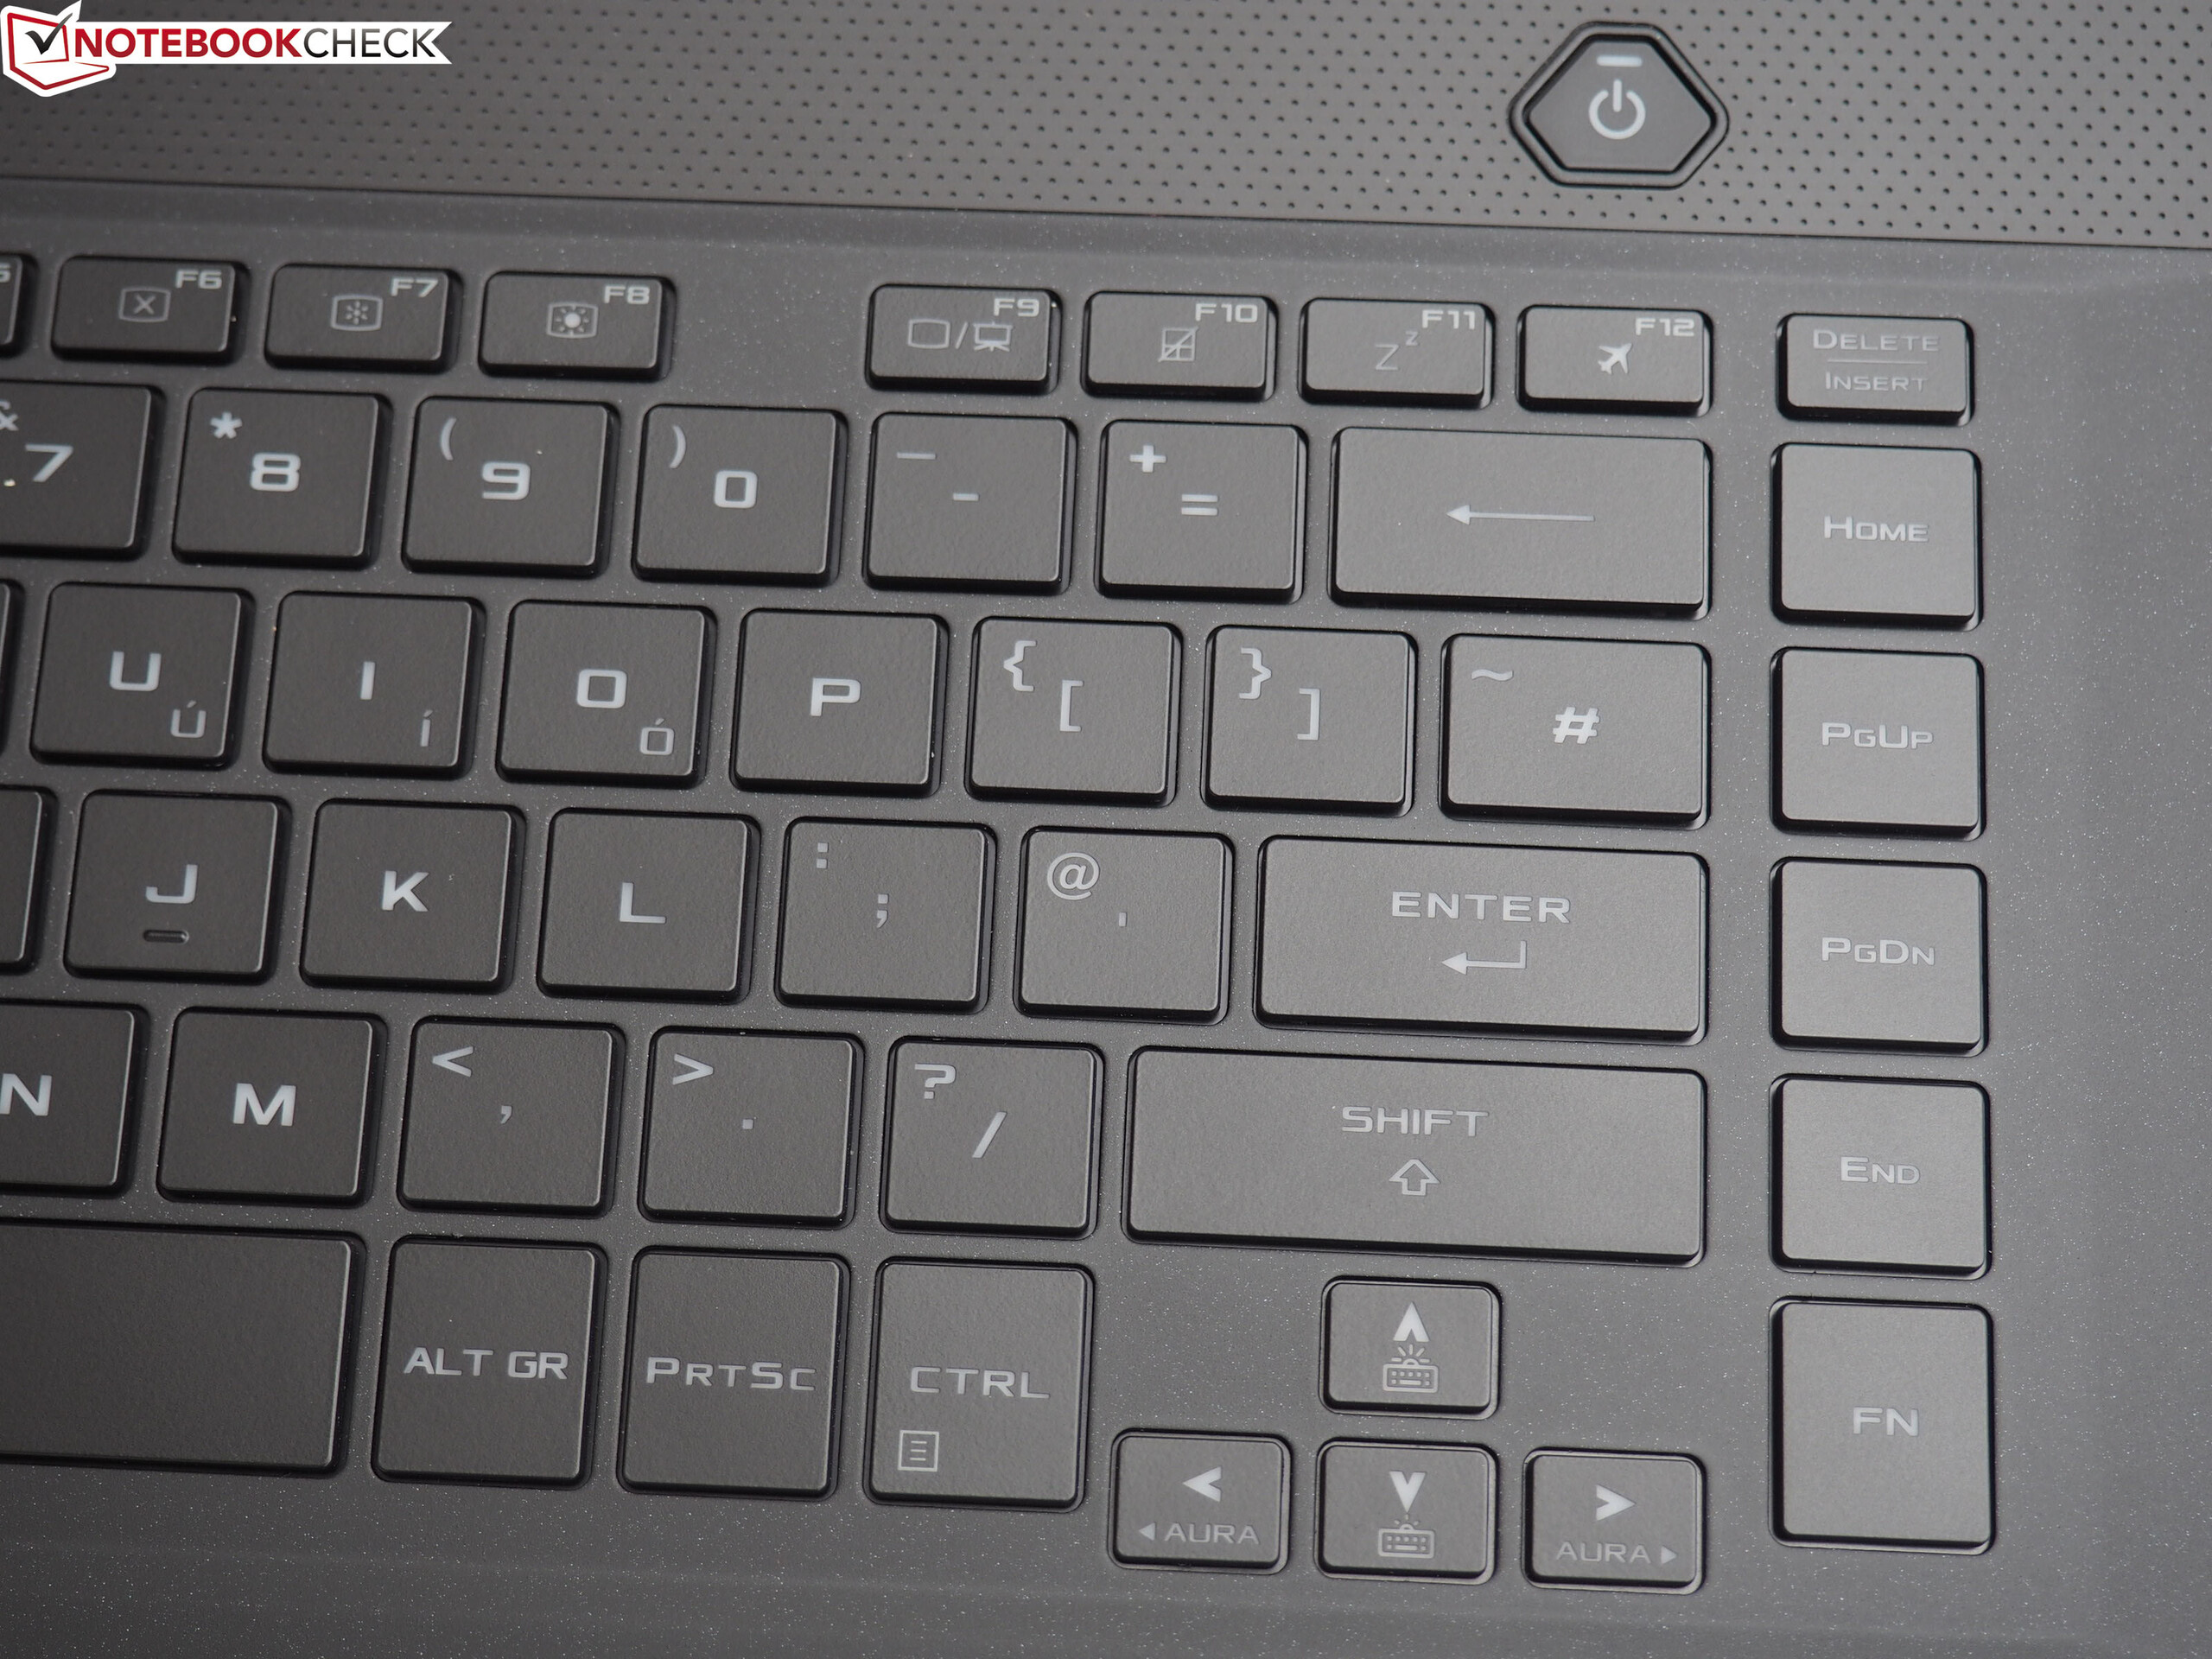
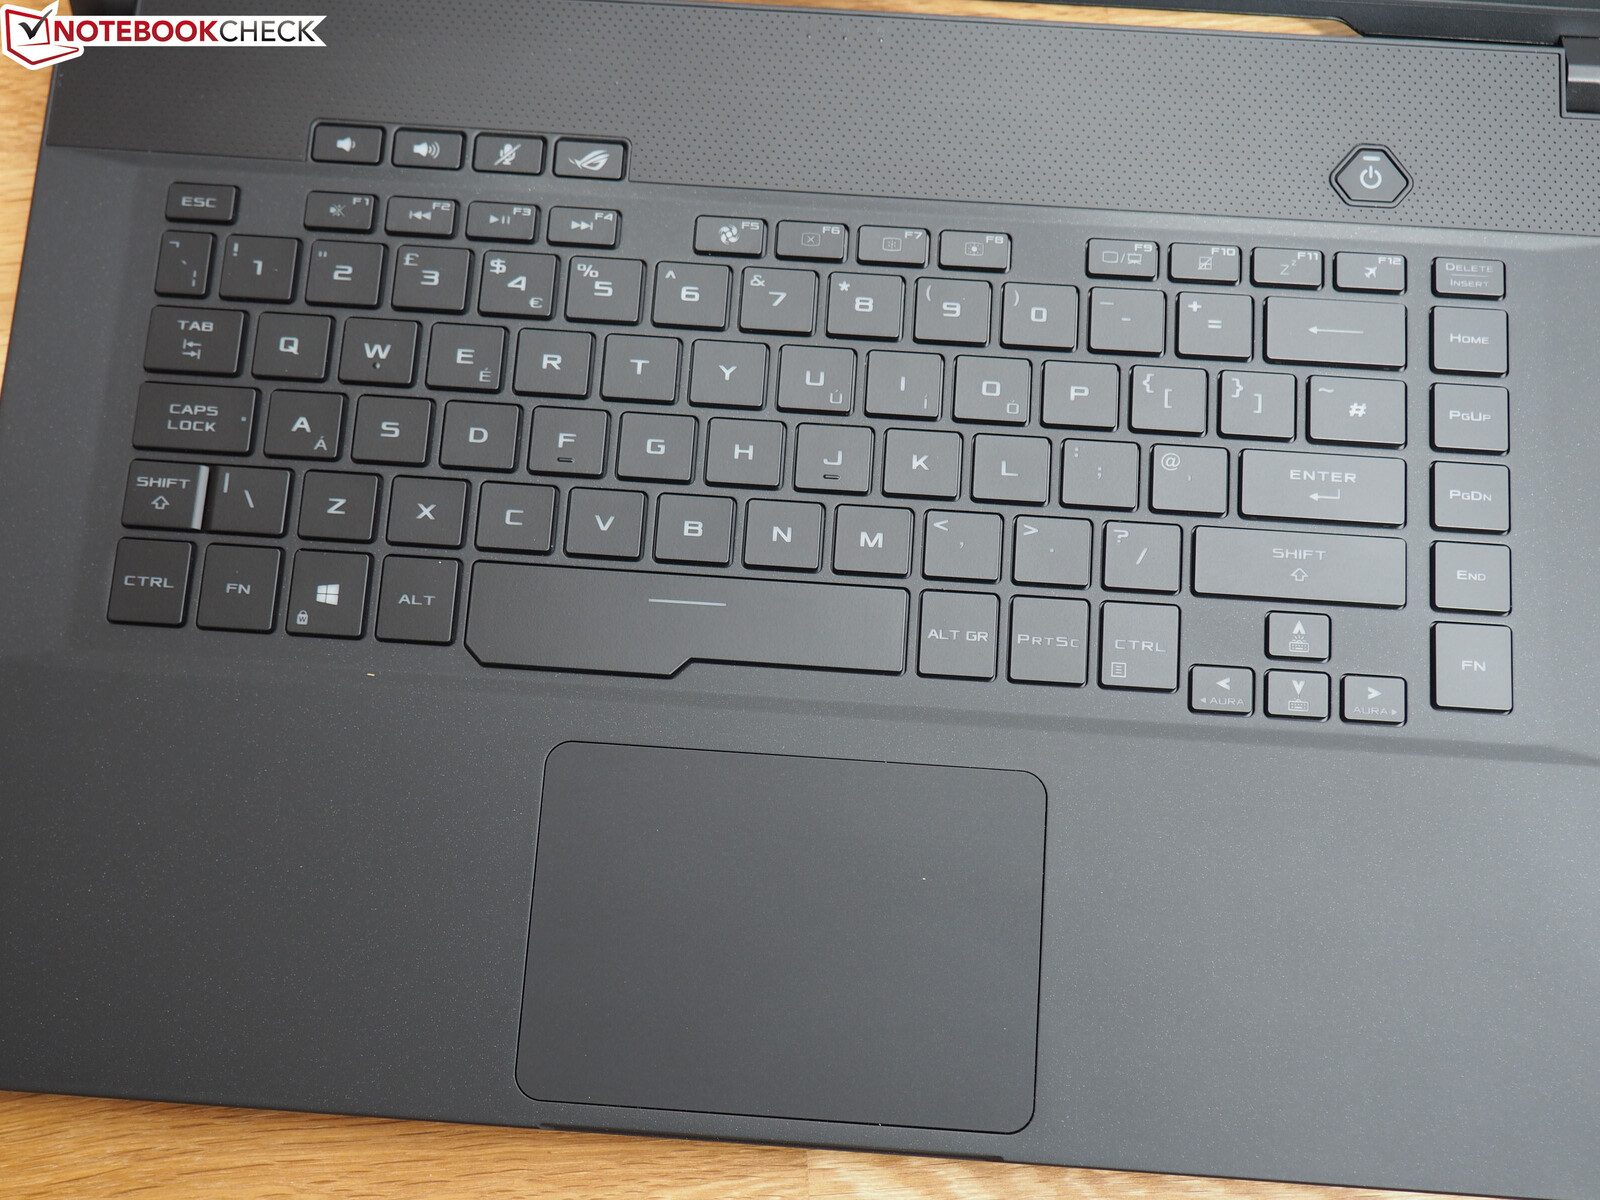
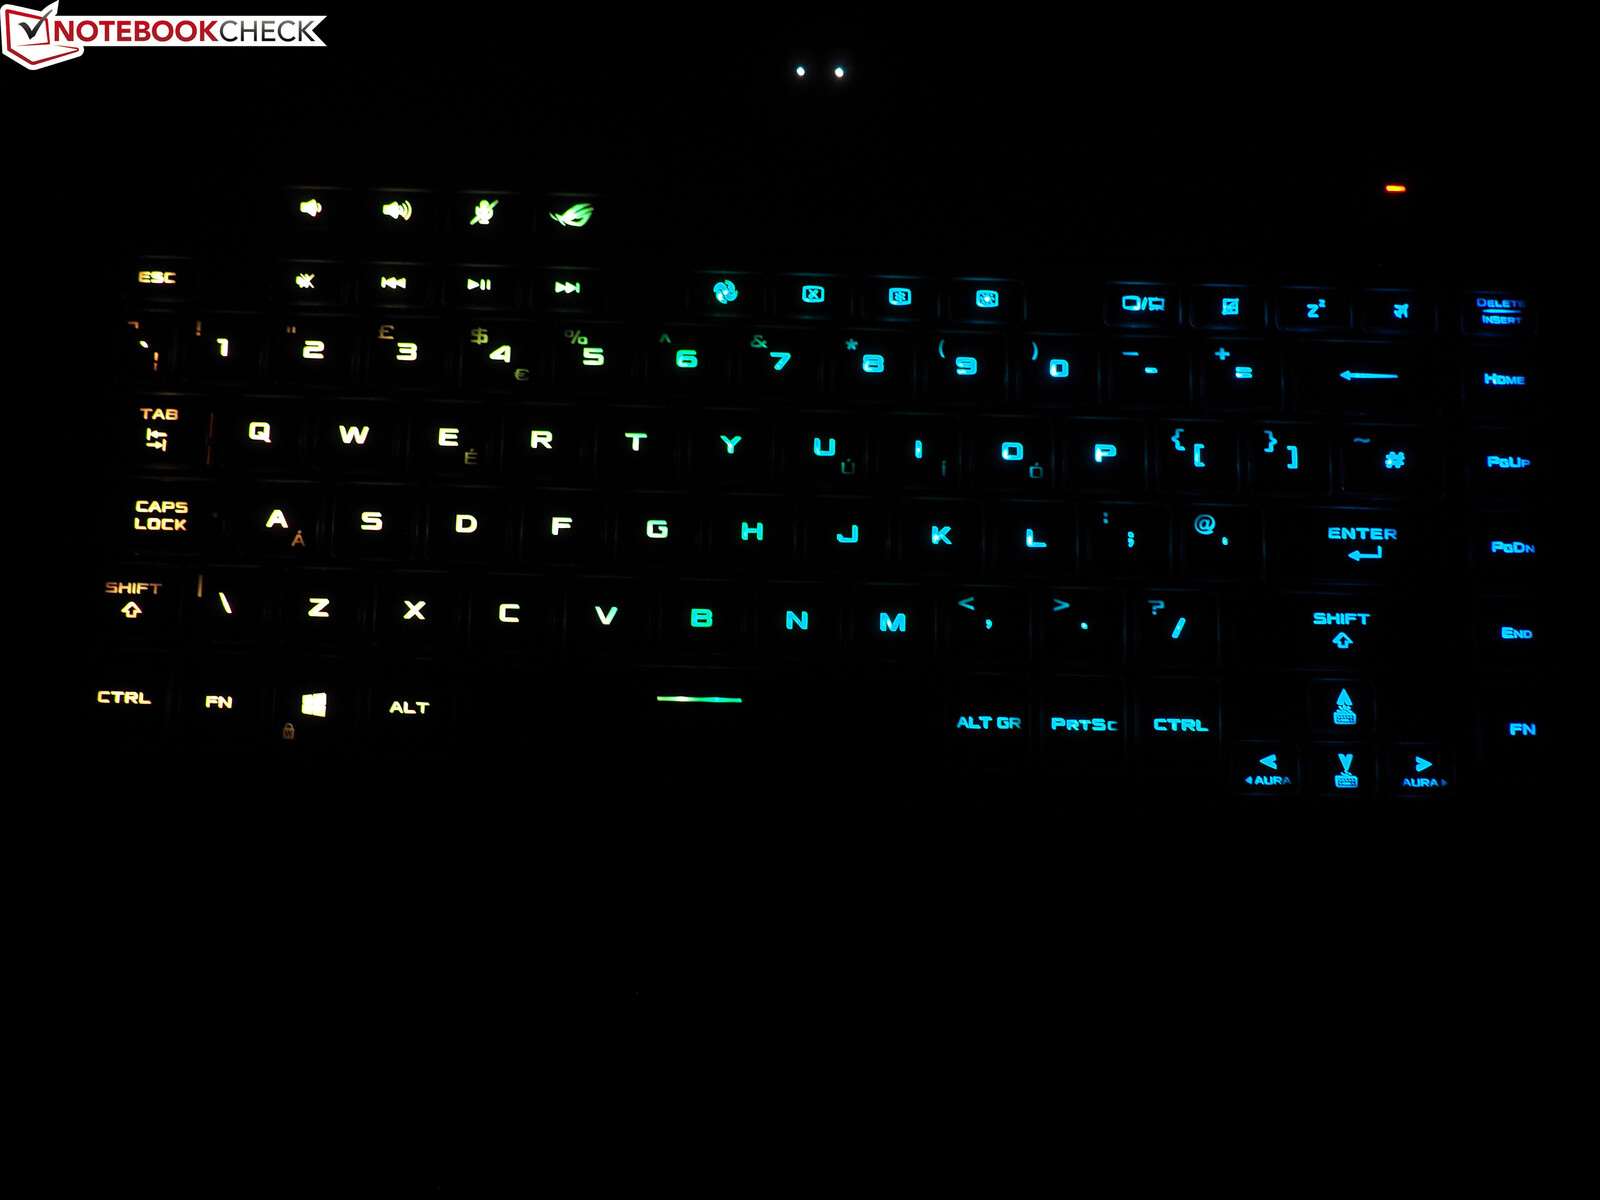
The CPU and GPU in the GX502 do not need hefty cooling solutions like the ones in the GX531 do, so ASUS has designed the device with a conventional keyboard and trackpad layout. The keys are RGB backlit, while its pressure points and strokes should satisfy most people. ASUS has placed four half-sized keys in a row above the Function keys, which should make it easier to adjust certain settings while gaming.
The company has also made some interesting layout decisions, which are likely to divide opinions. We would have liked larger arrows keys, for example, while the lack of a number pad will likely annoy some people. The keys have pale lettering too, which can make them difficult to read in bright lighting. Switching on the RGB backlighting does not help that much either, as the Function key numbers are not backlit. ASUS offers numerous backlight configurations though if that is any consolation.
Trackpad
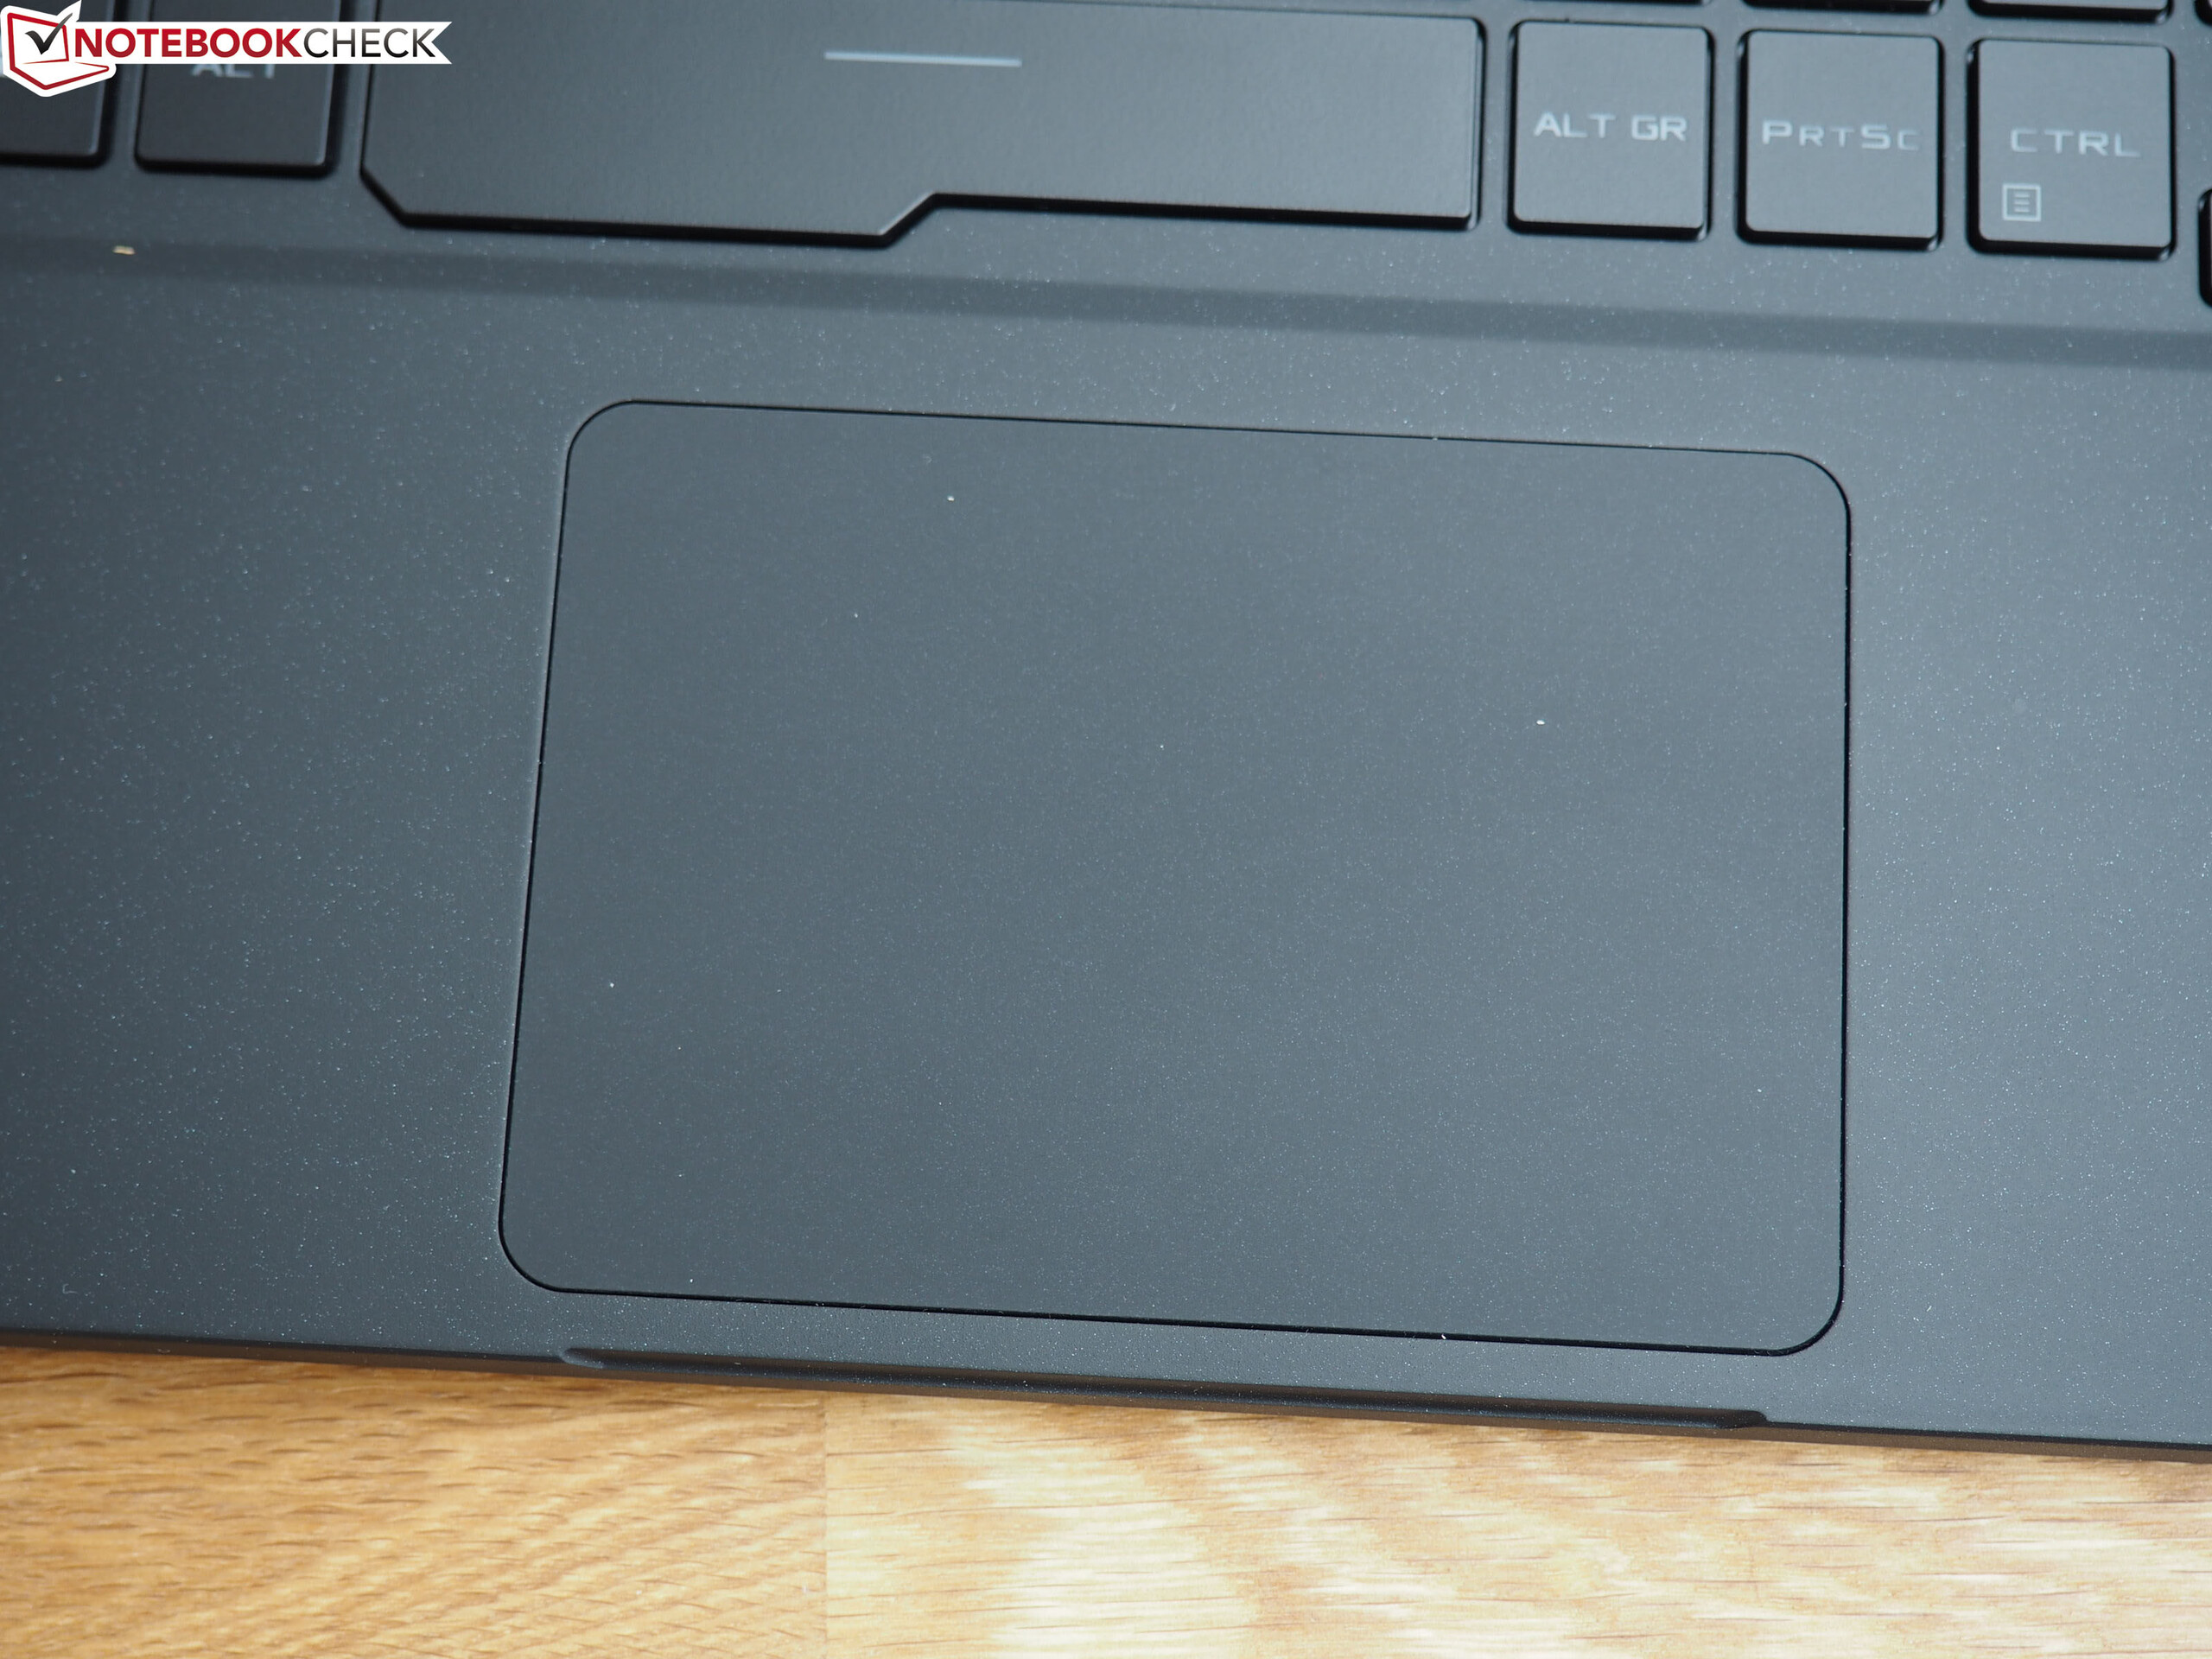
ASUS has equipped the GX502 with a 10.5 x 7.5 cm trackpad, which has become a standard size for 15-inch laptops. The precision and finish of the one in our review unit is decent for a Windows laptop, but other gaming laptops have better trackpads, like the Razer Blade 15. We experienced no issues with performing multi-finger gestures like scrolling and zooming during our tests either.
The trackpad is well-built too and hardly gives way even when subjected to intense pressure. Part of the reason for this is the rigidity of the case though. ASUS has also done a good job of positioning the trackpad. It sits far away from the spacebar, so you should not find yourself accidentally activating it while gaming with the keyboard and an external mouse.
Display
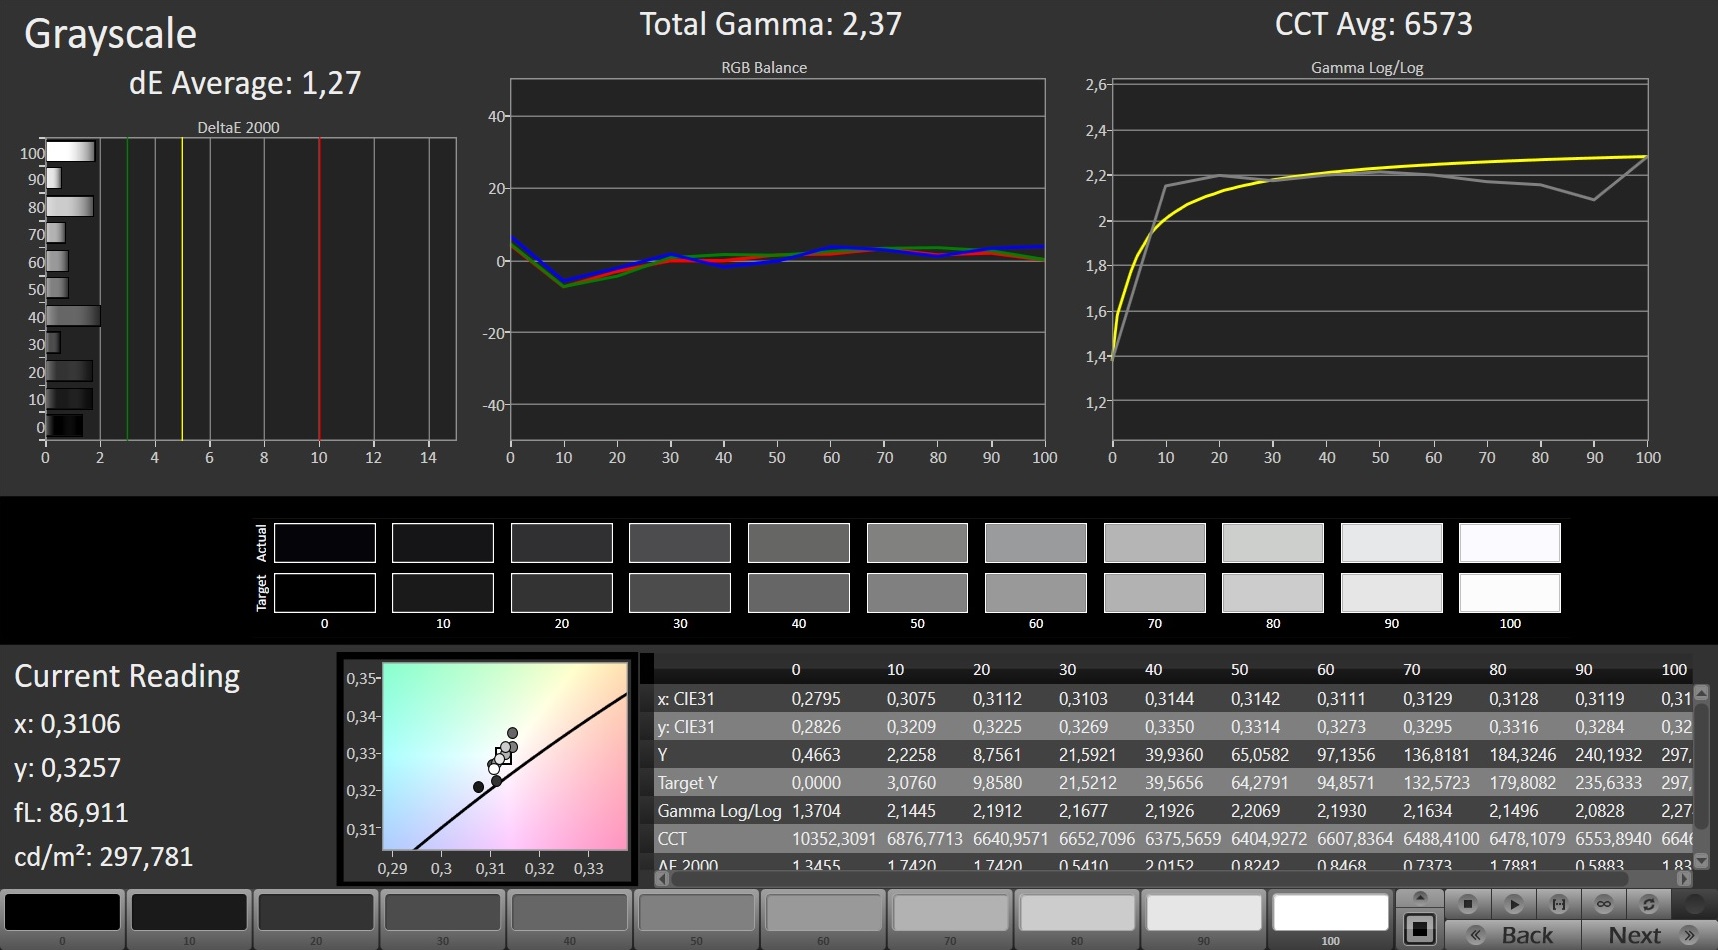
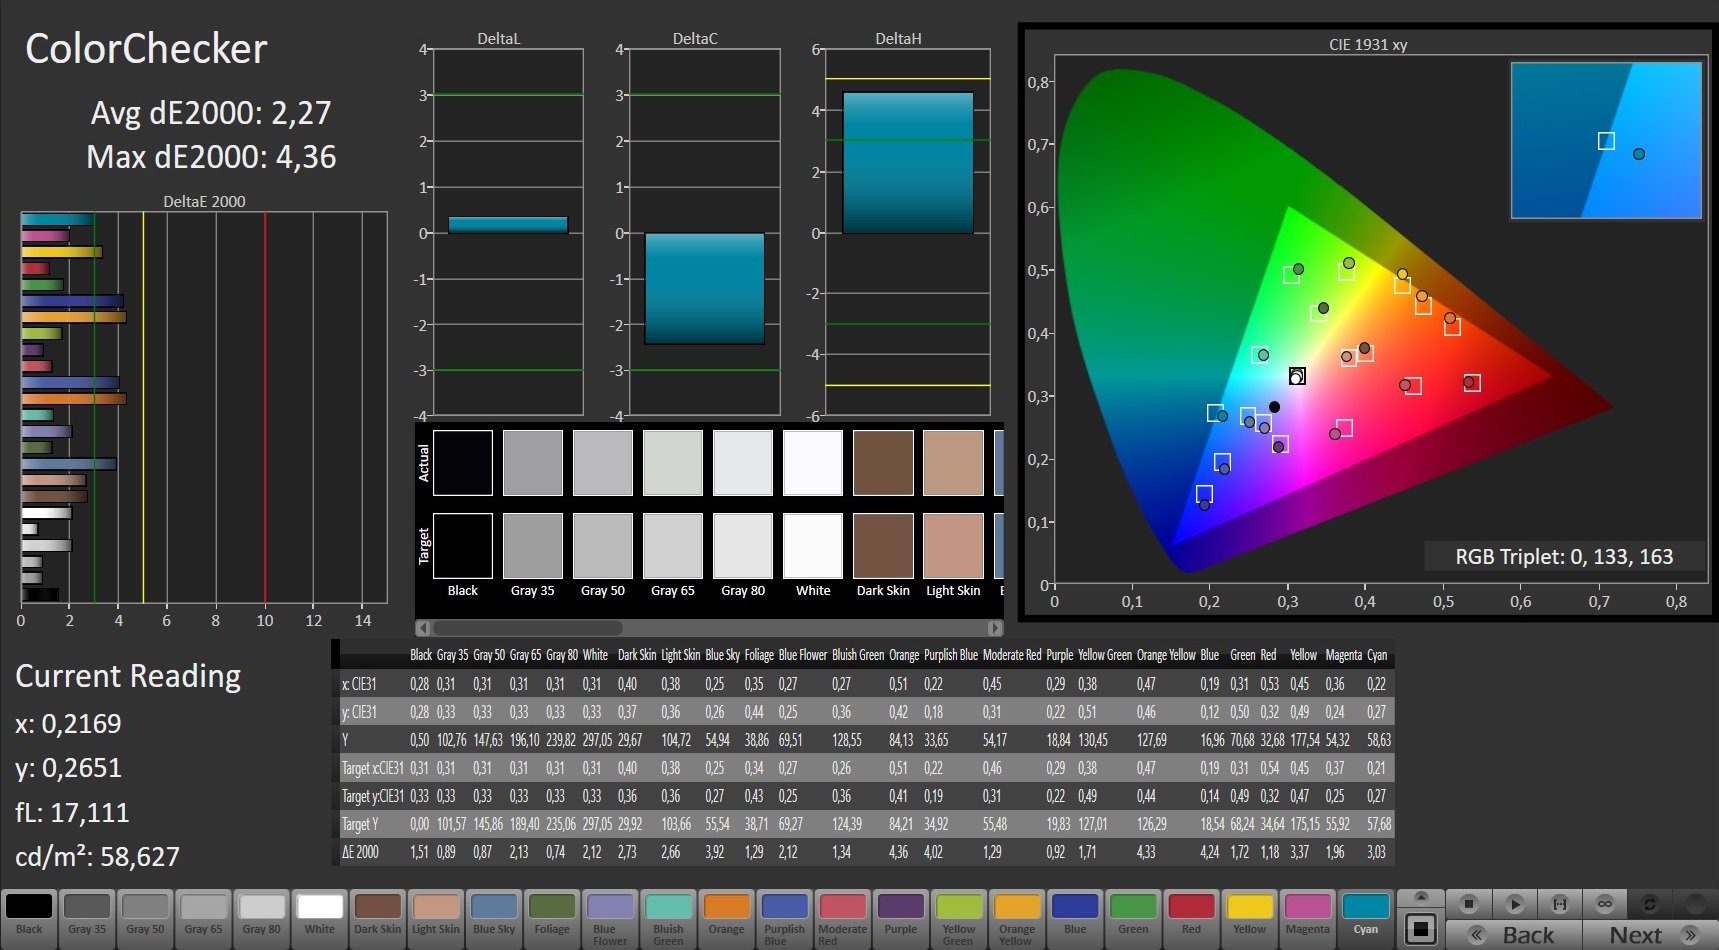
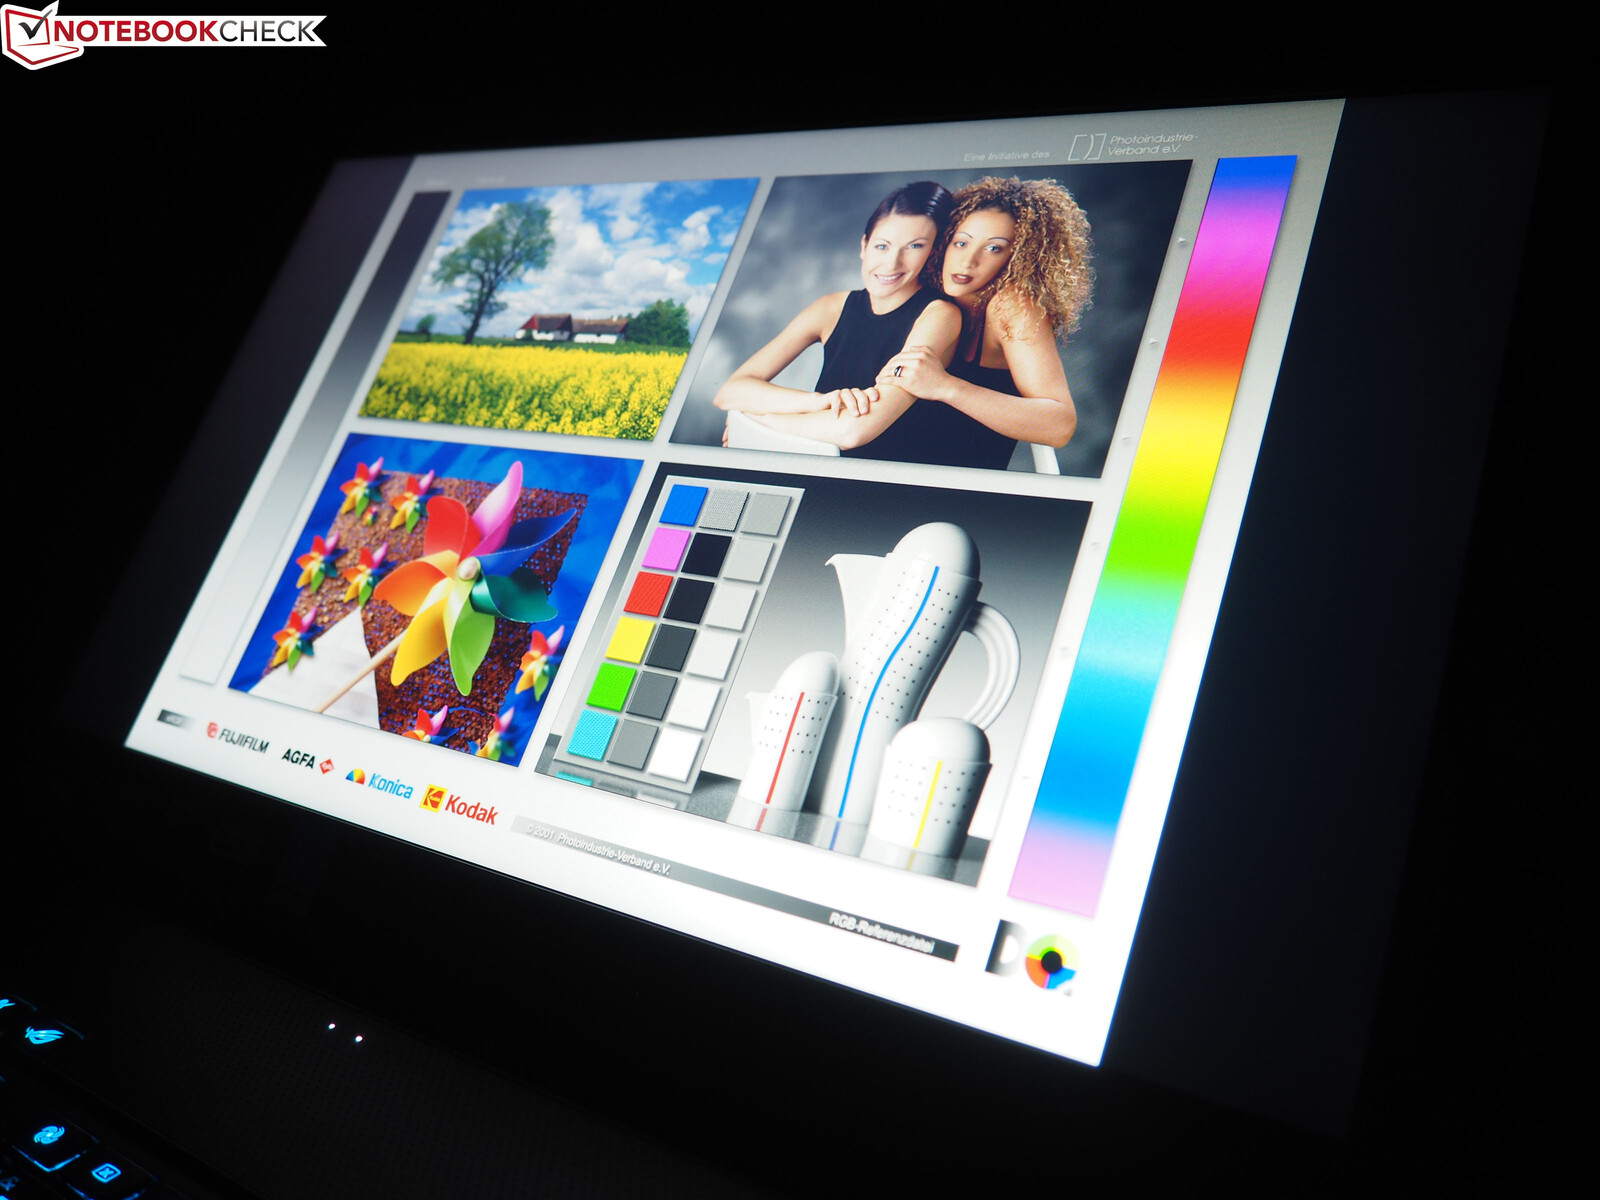
The GX502 comes with an X-Rite Pantone-certified display. ASUS now factory calibrates each model for better colour reproduction out of the box, which is something that Gigabyte has been doing with its Aero 15 series for a few years.
| |||||||||||||||||||||||||
Brightness Distribution: 90 %
Center on Battery: 286 cd/m²
Contrast: 773:1 (Black: 0.37 cd/m²)
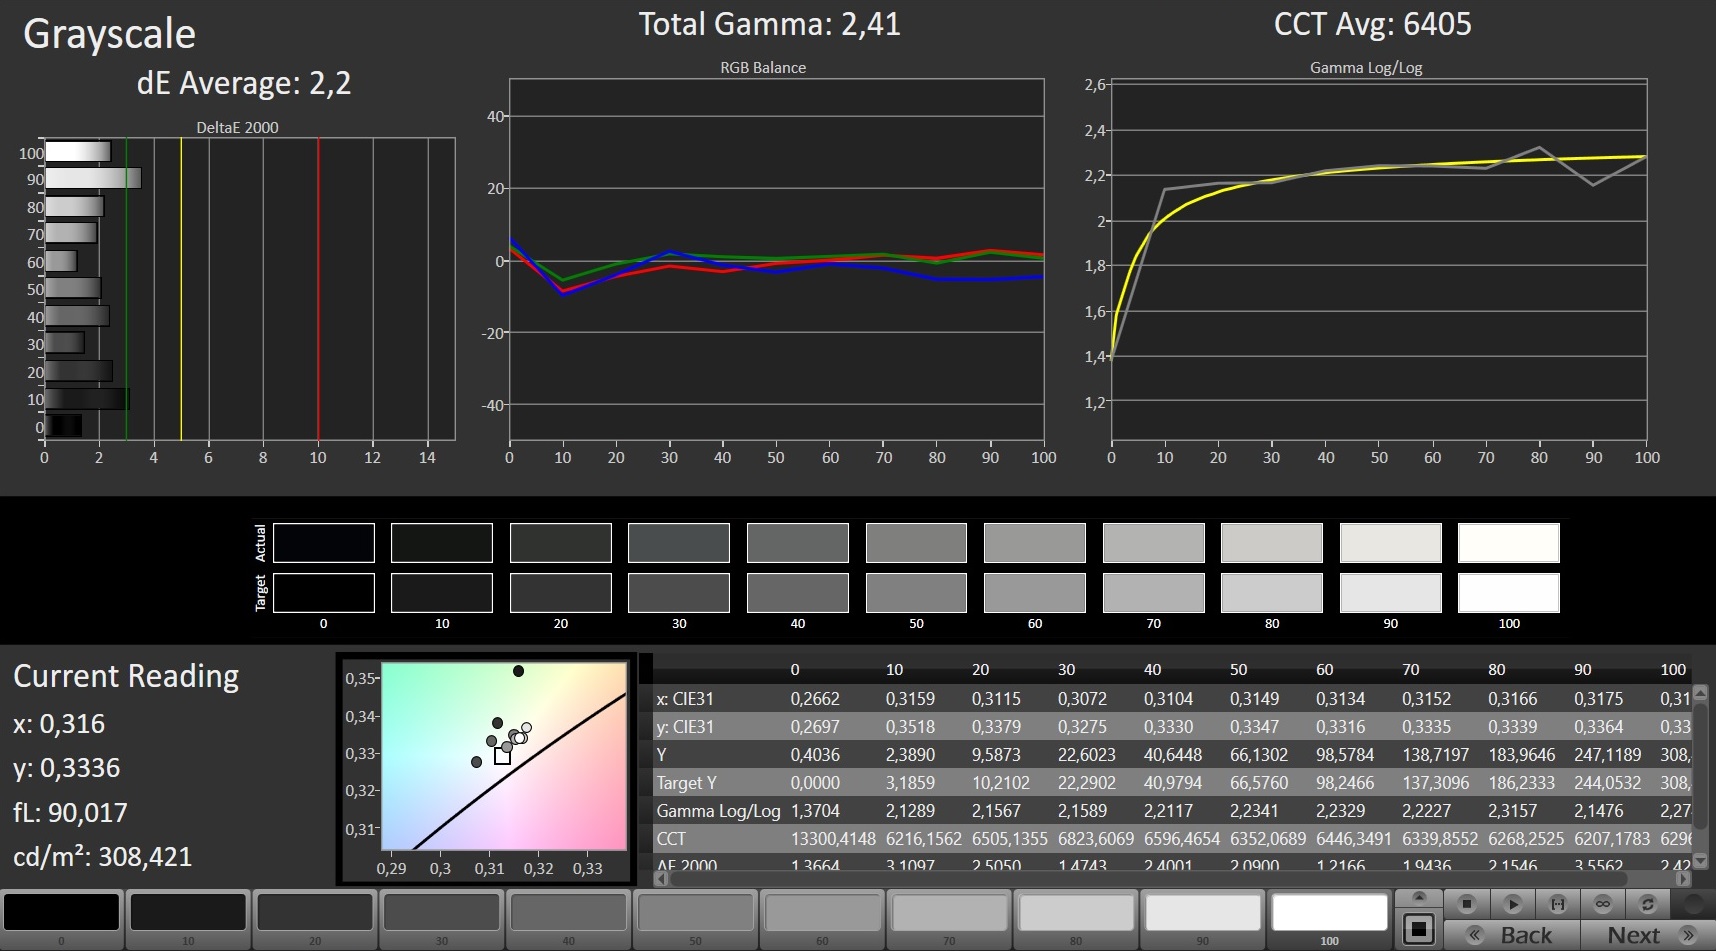
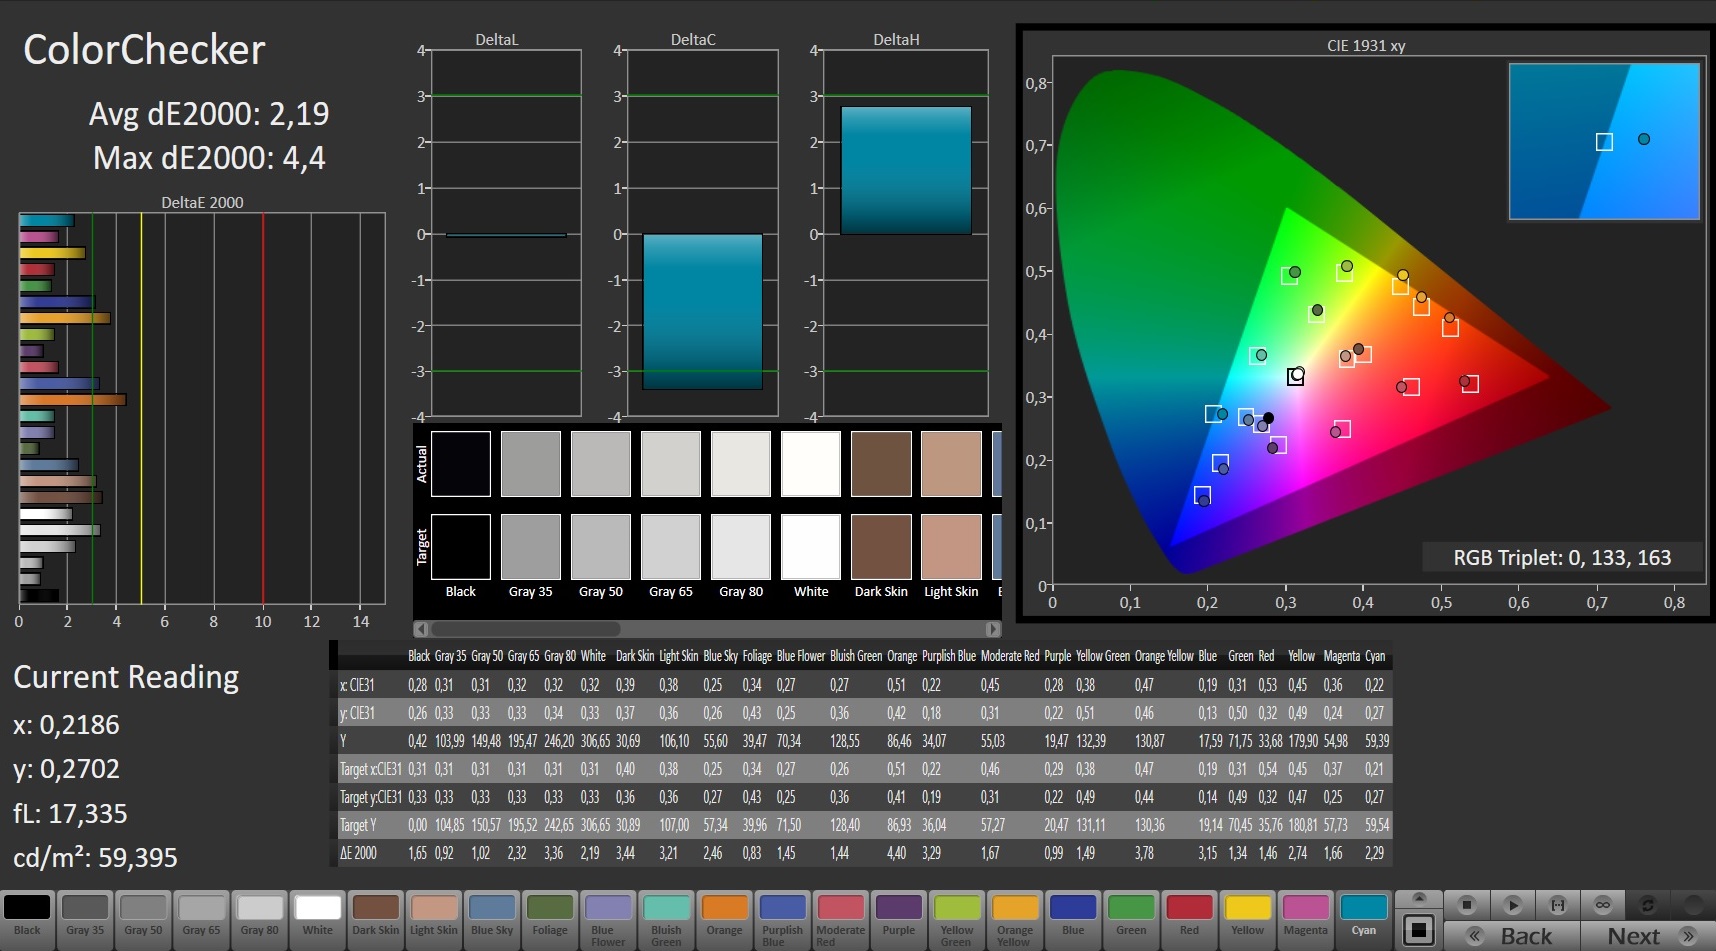
ΔE ColorChecker Calman: 2.19 | ∀{0.5-29.43 Ø4.71}
calibrated: 2.27
ΔE Greyscale Calman: 2.2 | ∀{0.09-98 Ø4.96}
91% sRGB (Argyll 1.6.3 3D)
59% AdobeRGB 1998 (Argyll 1.6.3 3D)
65.9% AdobeRGB 1998 (Argyll 3D)
91% sRGB (Argyll 3D)
64.9% Display P3 (Argyll 3D)
Gamma: 2.41
CCT: 6405 K
| Asus Zephyrus S GX502GW AU Optronics B156HAN08.2 (AUO82ED), IPS, 1920x1080 | Asus Zephyrus S GX531GX AU Optronics B156HAN08.2, IPS, 1920x1080 | Acer Predator Triton 500 AU Optronics B156HAN08.2 (AUO82ED), IPS, 1920x1080 | Razer Blade 15 RTX 2070 Max-Q LG Philips LGD05C0, IPS, 1920x1080 | Gigabyte Aero 15-X9 LGD05C0, IPS, 1920x1080 | |
|---|---|---|---|---|---|
| Display | 1% | 0% | 2% | -1% | |
| Display P3 Coverage (%) | 64.9 | 65.6 1% | 64.2 -1% | 65.3 1% | 63.5 -2% |
| sRGB Coverage (%) | 91 | 92.2 1% | 92.6 2% | 94.9 4% | 93.1 2% |
| AdobeRGB 1998 Coverage (%) | 65.9 | 66.9 2% | 65.7 0% | 66.3 1% | 64.5 -2% |
| Response Times | -3% | -19% | -83% | -92% | |
| Response Time Grey 50% / Grey 80% * (ms) | 7.2 ? | 7 ? 3% | 8 ? -11% | 16.8 ? -133% | 16.4 ? -128% |
| Response Time Black / White * (ms) | 8.8 ? | 9.6 ? -9% | 11.2 ? -27% | 11.6 ? -32% | 13.6 ? -55% |
| PWM Frequency (Hz) | |||||
| Screen | -3% | -24% | -2% | 12% | |
| Brightness middle (cd/m²) | 286 | 323.6 13% | 304 6% | 314.7 10% | 250 -13% |
| Brightness (cd/m²) | 275 | 315 15% | 299 9% | 312 13% | 235 -15% |
| Brightness Distribution (%) | 90 | 91 1% | 89 -1% | 90 0% | 85 -6% |
| Black Level * (cd/m²) | 0.37 | 0.29 22% | 0.27 27% | 0.38 -3% | 0.29 22% |
| Contrast (:1) | 773 | 1116 44% | 1126 46% | 828 7% | 862 12% |
| Colorchecker dE 2000 * | 2.19 | 3.31 -51% | 4.66 -113% | 2.56 -17% | 1.46 33% |
| Colorchecker dE 2000 max. * | 4.4 | 5.74 -30% | 9.65 -119% | 4.89 -11% | 2.47 44% |
| Colorchecker dE 2000 calibrated * | 2.27 | 2.73 -20% | 1.72 24% | 1.71 25% | |
| Greyscale dE 2000 * | 2.2 | 2.9 -32% | 5.53 -151% | 3.4 -55% | 1.27 42% |
| Gamma | 2.41 91% | 2.29 96% | 2.5 88% | 2.3 96% | 2.4 92% |
| CCT | 6405 101% | 6765 96% | 8028 81% | 6435 101% | 6749 96% |
| Color Space (Percent of AdobeRGB 1998) (%) | 59 | 59.7 1% | 60 2% | 60.7 3% | 60 2% |
| Color Space (Percent of sRGB) (%) | 91 | 91.8 1% | 93 2% | 94.6 4% | 93 2% |
| Total Average (Program / Settings) | -2% /
-2% | -14% /
-19% | -28% /
-11% | -27% /
-4% |
* ... smaller is better
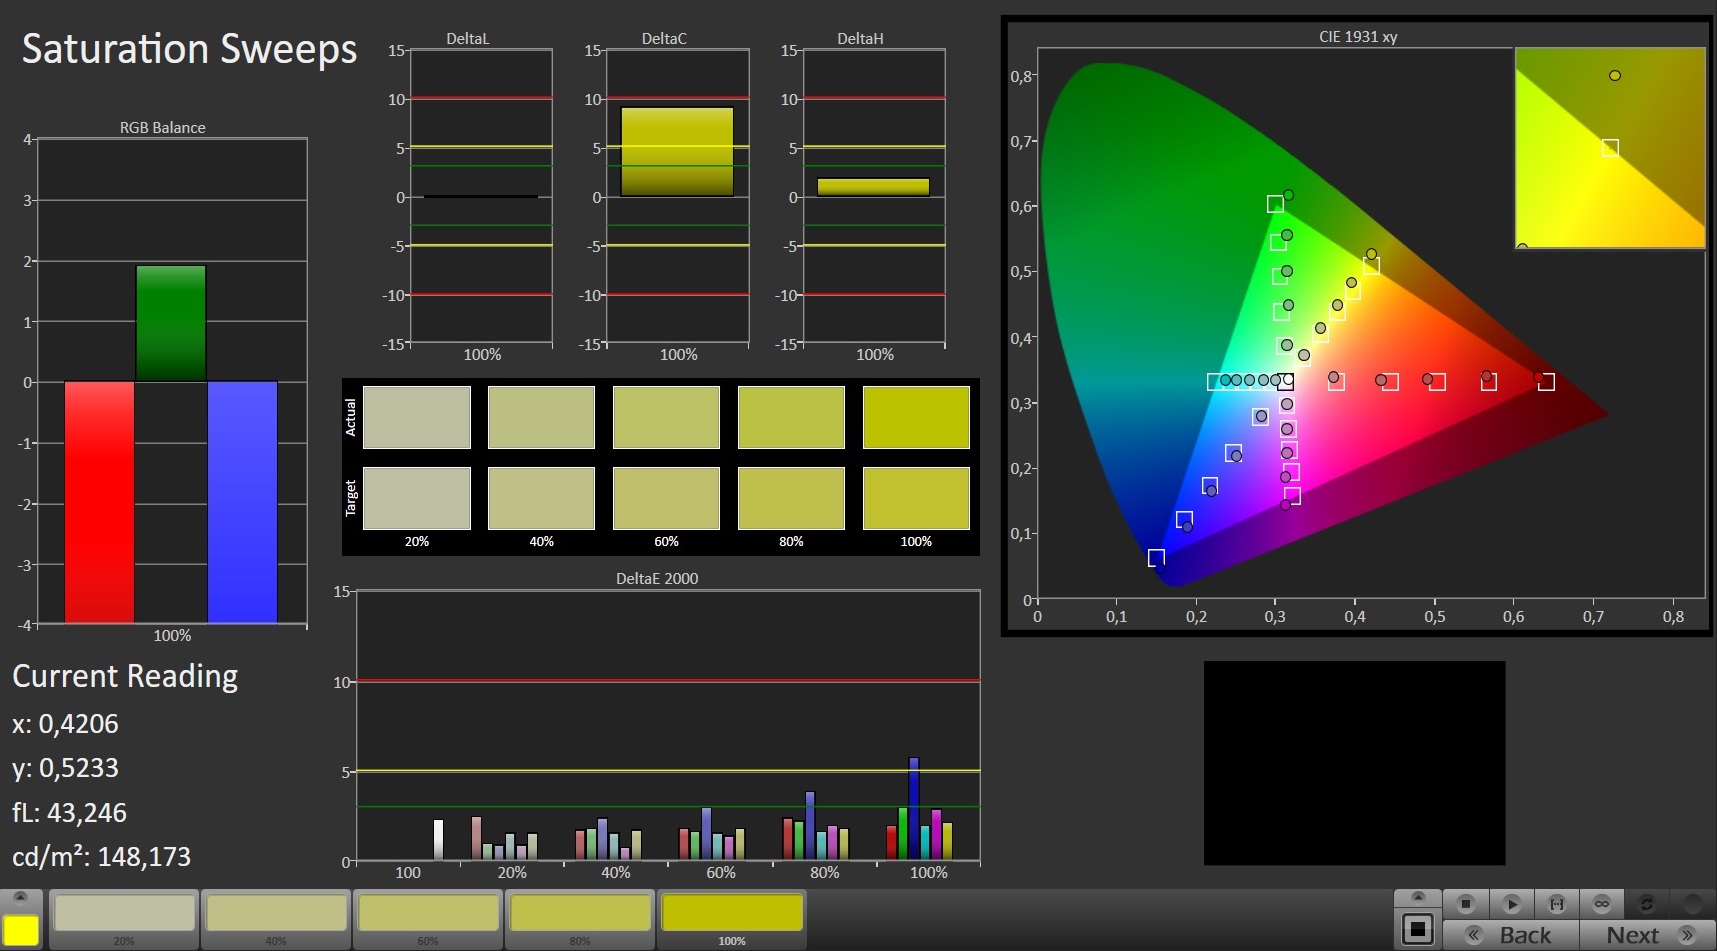
Correspondingly, our review unit has excellent colour accuracy. CalMAN reports that all DeltaE deviations are lower than the ideal value of 3 and that the display achieves 91% sRGB and 59% AdobeRGB colour-space coverages. The display has slightly lower colour-space coverages than most of our comparison devices, but it achieved respectable values, nonetheless.

The panel in our review unit also achieves lower than 10 ms response times, something which should please most gamers. These, combined with G-Sync support and the 144 Hz refresh rate, make games look buttery smooth. Moreover, the IPS panel gives the GX502 excellent viewing angles, so you should be able to see the screen from practically any angle without getting distracted by brightness or colour distortions.
It is not all good news for the display though. Our review unit has a comparatively high 0.37 cd/m² black value and a mediocre 275 cd/m² average maximum brightness, which results in a disappointingly low 770:1 contrast ratio. Curiously, ASUS has equipped the device with the AU Optronics (B156HAN08.2) panel, which we have seen get considerably brighter in other laptops that we have reviewed. Perhaps our review unit has a panel from a bad batch, but we hope that ASUS has not limited its maximum brightness with software. The display does not suffer from any noticeable backlight bleeding, at least.
Display Response Times
| ↔ Response Time Black to White | ||
|---|---|---|
| 8.8 ms ... rise ↗ and fall ↘ combined | ↗ 4.4 ms rise | 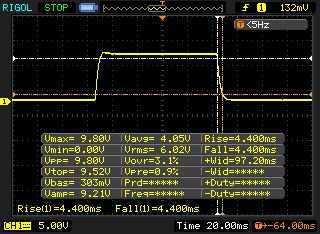 |
| ↘ 4.4 ms fall | ||
| The screen shows fast response rates in our tests and should be suited for gaming. In comparison, all tested devices range from 0.1 (minimum) to 240 (maximum) ms. » 25 % of all devices are better. This means that the measured response time is better than the average of all tested devices (19.8 ms). | ||
| ↔ Response Time 50% Grey to 80% Grey | ||
| 7.2 ms ... rise ↗ and fall ↘ combined | ↗ 3.8 ms rise | 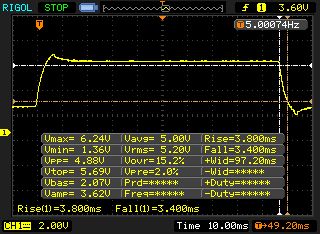 |
| ↘ 3.4 ms fall | ||
| The screen shows very fast response rates in our tests and should be very well suited for fast-paced gaming. In comparison, all tested devices range from 0.165 (minimum) to 636 (maximum) ms. » 20 % of all devices are better. This means that the measured response time is better than the average of all tested devices (31 ms). | ||
Screen Flickering / PWM (Pulse-Width Modulation)
| Screen flickering / PWM not detected | 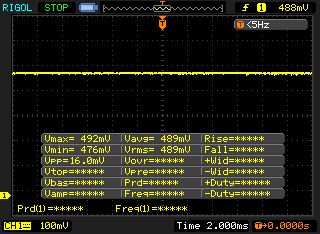 | ||
In comparison: 52 % of all tested devices do not use PWM to dim the display. If PWM was detected, an average of 7757 (minimum: 5 - maximum: 343500) Hz was measured. | |||
Performance
The GX502 is a high-end gaming laptop regardless of the version that you buy. Its hexa-core CPU and raytracing-capable GPU will be future-proofed for several years as will its NVMe SSD RAID and 32 GB of RAM.

Processor
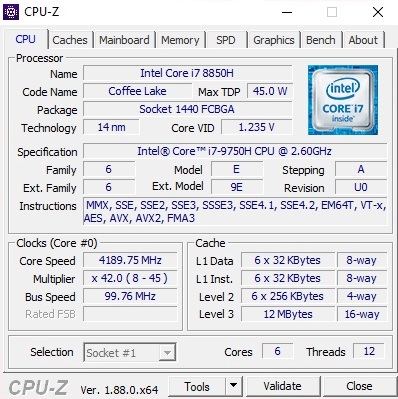
The Core i7-9750H is based on Intel’s Coffee Lake architecture and succeeds the popular Core i7-8750H. Both CPUs have six cores and support Intel Hyper-Threading, which allows them to execute up to 12 threads simultaneously.
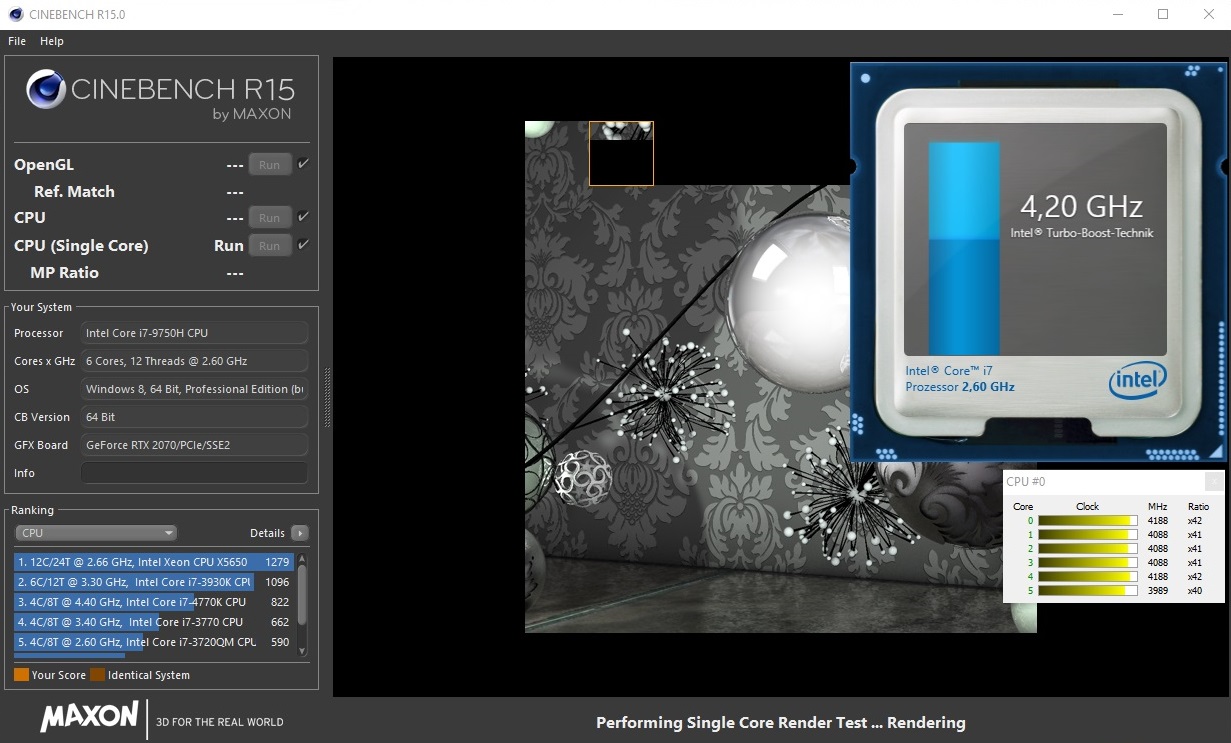
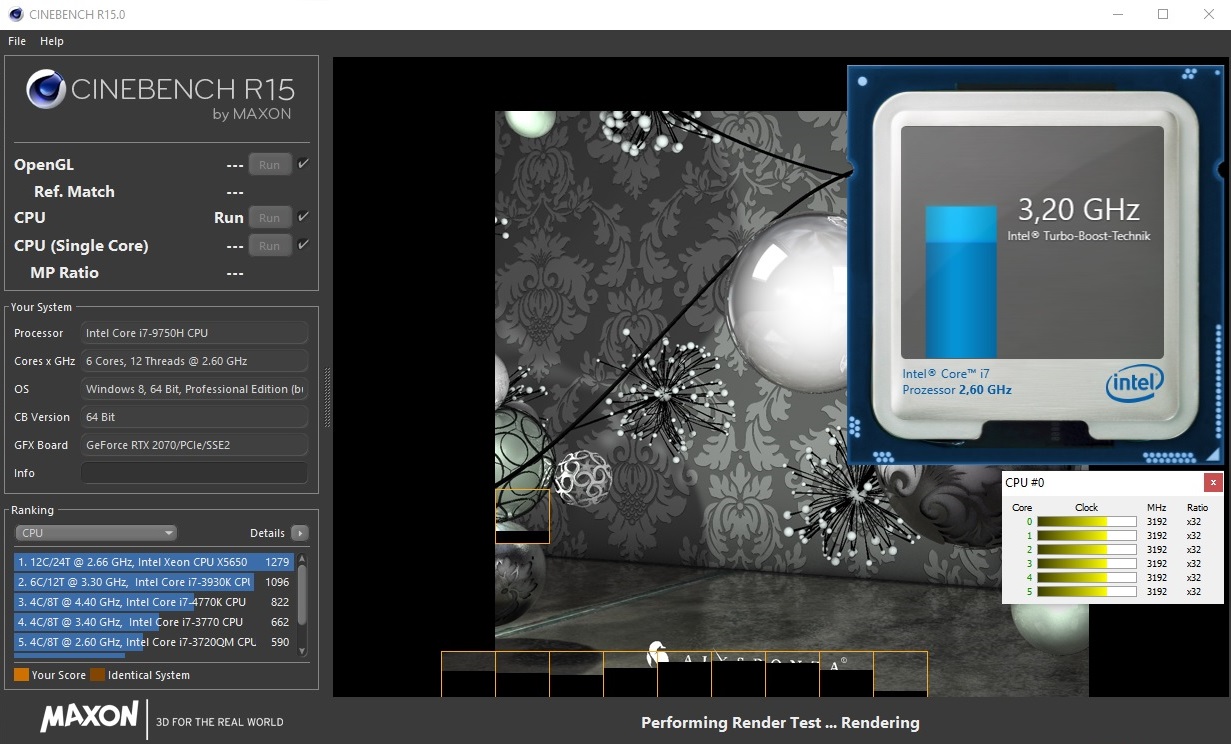
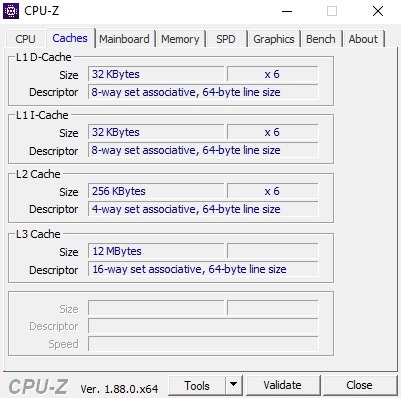
Intel has upped the L3 cache to 12 MB from 9 MB in the Core i7-8750H, along with increasing the base and Turbo Boost clock speeds by 400 MHz and 500 MHz, respectively. Our review unit cannot utilise the CPU’s theoretical maximum clock speeds though and instead fluctuates between 4.0 and 4.2 GHz in single-core benchmarks. Worse still, it can only average around 3.2 GHz in multi-core benchmarks. The CPU briefly achieves its peak clock speeds in the latter, before throttling back as it exhausts its turbo, which reduces performance by approximately 10%.
Correspondingly, the GX502GW outscores our Core i7-8750H-powered comparison devices by between 2% and 18% in Cinebench R15 Multi 64Bit if we run the benchmark once. However, running the benchmark on a loop causes the system to throttle below its predecessor, which is disappointing. This lacklustre CPU performance should not affect frame rates while gaming though, because the GX502GW does not throttle to extreme levels.
System Performance
The system performance of the GX502GW matches our expectations of a high-end gaming laptop. Our review unit scored 5,654 points overall in PCMark 10, which puts it second place in our comparison table. Only the Predator Triton 500 with its more-powerful GPU scores higher than the GX502GW here.
Storage Devices
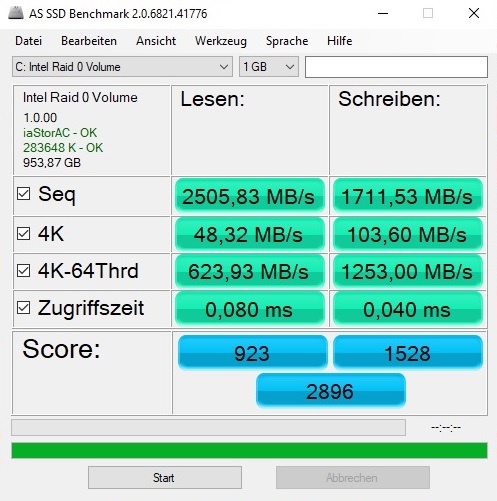
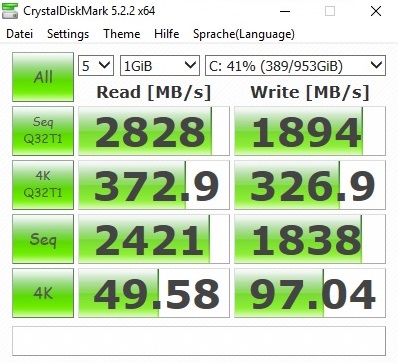
ASUS has equipped our review unit with two Intel SSD 660p drives, which it runs in RAID 0. The drives have no problem with meeting our expectations for NVMe PCIe SSDs, although they only achieved 10% quicker transfer speeds overall in CrystalDiskMark than the Samsung PM981 in the Razer Blade 15.
The Intel SSD 660p is no match for the PM981 though, as comparisons between the GX531GX and the Razer Blade 15 bear out. You must also replace one of the drives if you ever need to expand beyond 1 TB of storage. Regardless, the two drives should be fast and large enough for most people.
| Asus Zephyrus S GX502GW 2x Intel SSD 660p SSDPEKNW512G8 (RAID 0) | Asus Zephyrus S GX531GX Intel SSD 660p SSDPEKNW512G8 | Acer Predator Triton 500 2x WDC PC SN720 SDAPNTW-256G-1014 (RAID 0) | Razer Blade 15 RTX 2070 Max-Q Samsung SSD PM981 MZVLB512HAJQ | Gigabyte Aero 15-X9 Intel SSD 760p SSDPEKKW010T8 | |
|---|---|---|---|---|---|
| CrystalDiskMark 5.2 / 6 | -29% | 7% | -10% | -11% | |
| Write 4K (MB/s) | 97 | 93.9 -3% | 93.6 -4% | 93.9 -3% | 97.1 0% |
| Read 4K (MB/s) | 49.58 | 46.29 -7% | 38.82 -22% | 40.56 -18% | 53.7 8% |
| Write Seq (MB/s) | 1838 | 974 -47% | 2455 34% | 1468 -20% | 1526 -17% |
| Read Seq (MB/s) | 2421 | 1425 -41% | 2107 -13% | 1540 -36% | 2020 -17% |
| Write 4K Q32T1 (MB/s) | 326.9 | 259.4 -21% | 298.7 -9% | 293.5 -10% | 285.6 -13% |
| Read 4K Q32T1 (MB/s) | 372.9 | 296.5 -20% | 338.7 -9% | 346 -7% | 321.8 -14% |
| Write Seq Q32T1 (MB/s) | 1894 | 977 -48% | 2902 53% | 1941 2% | 1533 -19% |
| Read Seq Q32T1 (MB/s) | 2828 | 1666 -41% | 3536 25% | 3266 15% | 2351 -17% |

Graphics Card
ASUS sells the GX502 with either a GeForce RTX 2060 or GeForce RTX 2070. The latter not only has 384 more shader units but also has 2 GB more VRAM.
| 3DMark 11 Performance | 18686 points | |
| 3DMark Cloud Gate Standard Score | 30754 points | |
| 3DMark Fire Strike Score | 16290 points | |
| 3DMark Time Spy Score | 6890 points | |
Help | ||
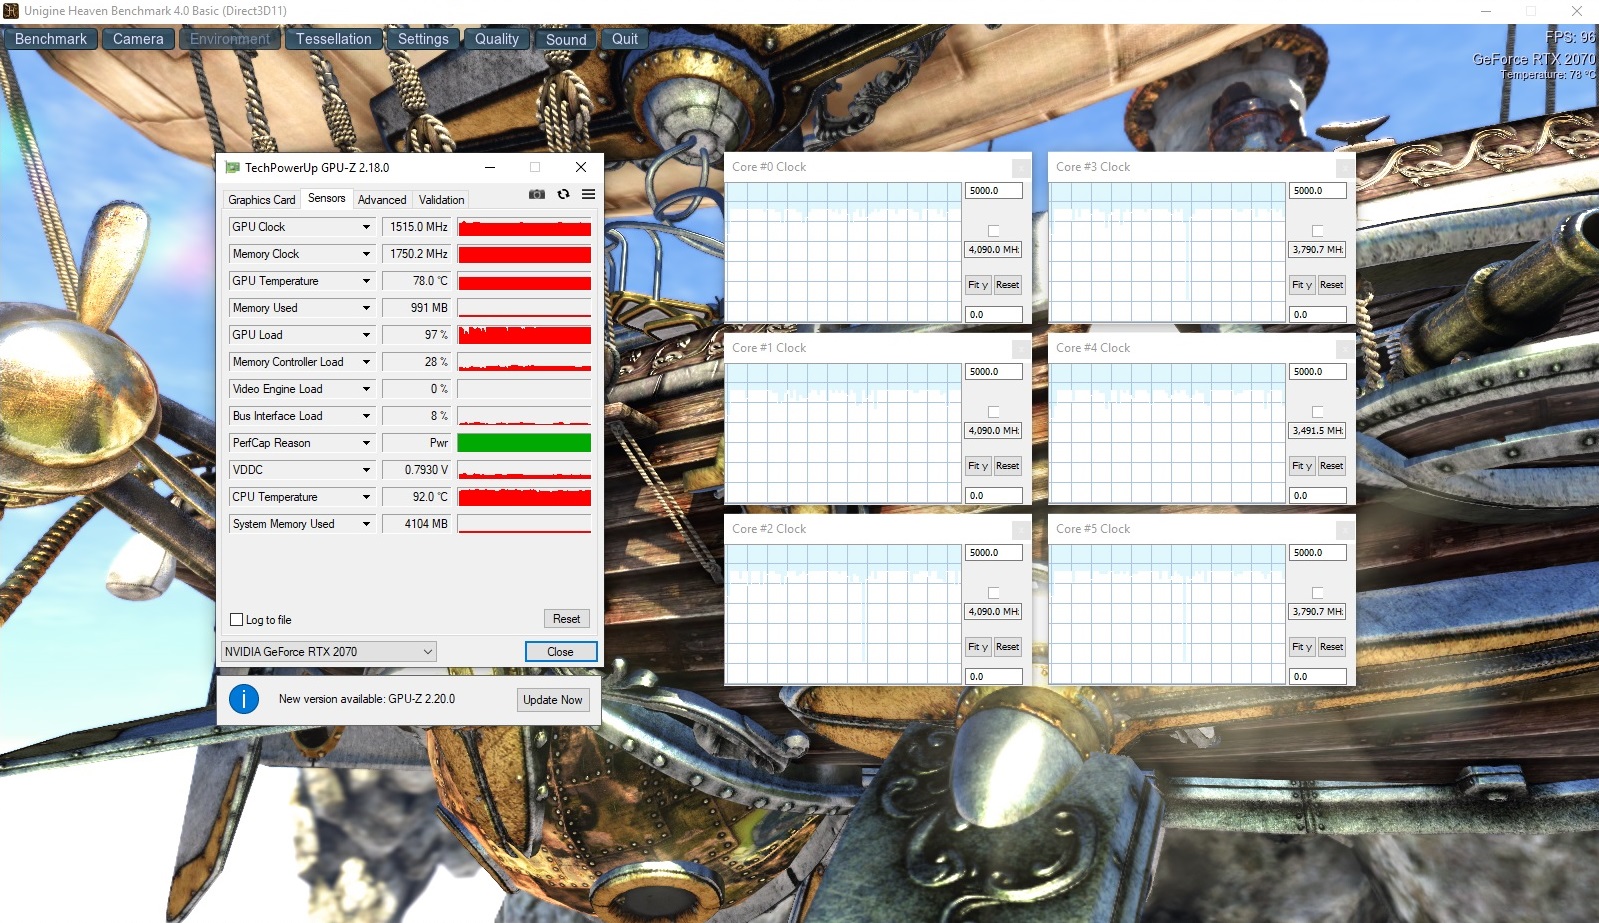
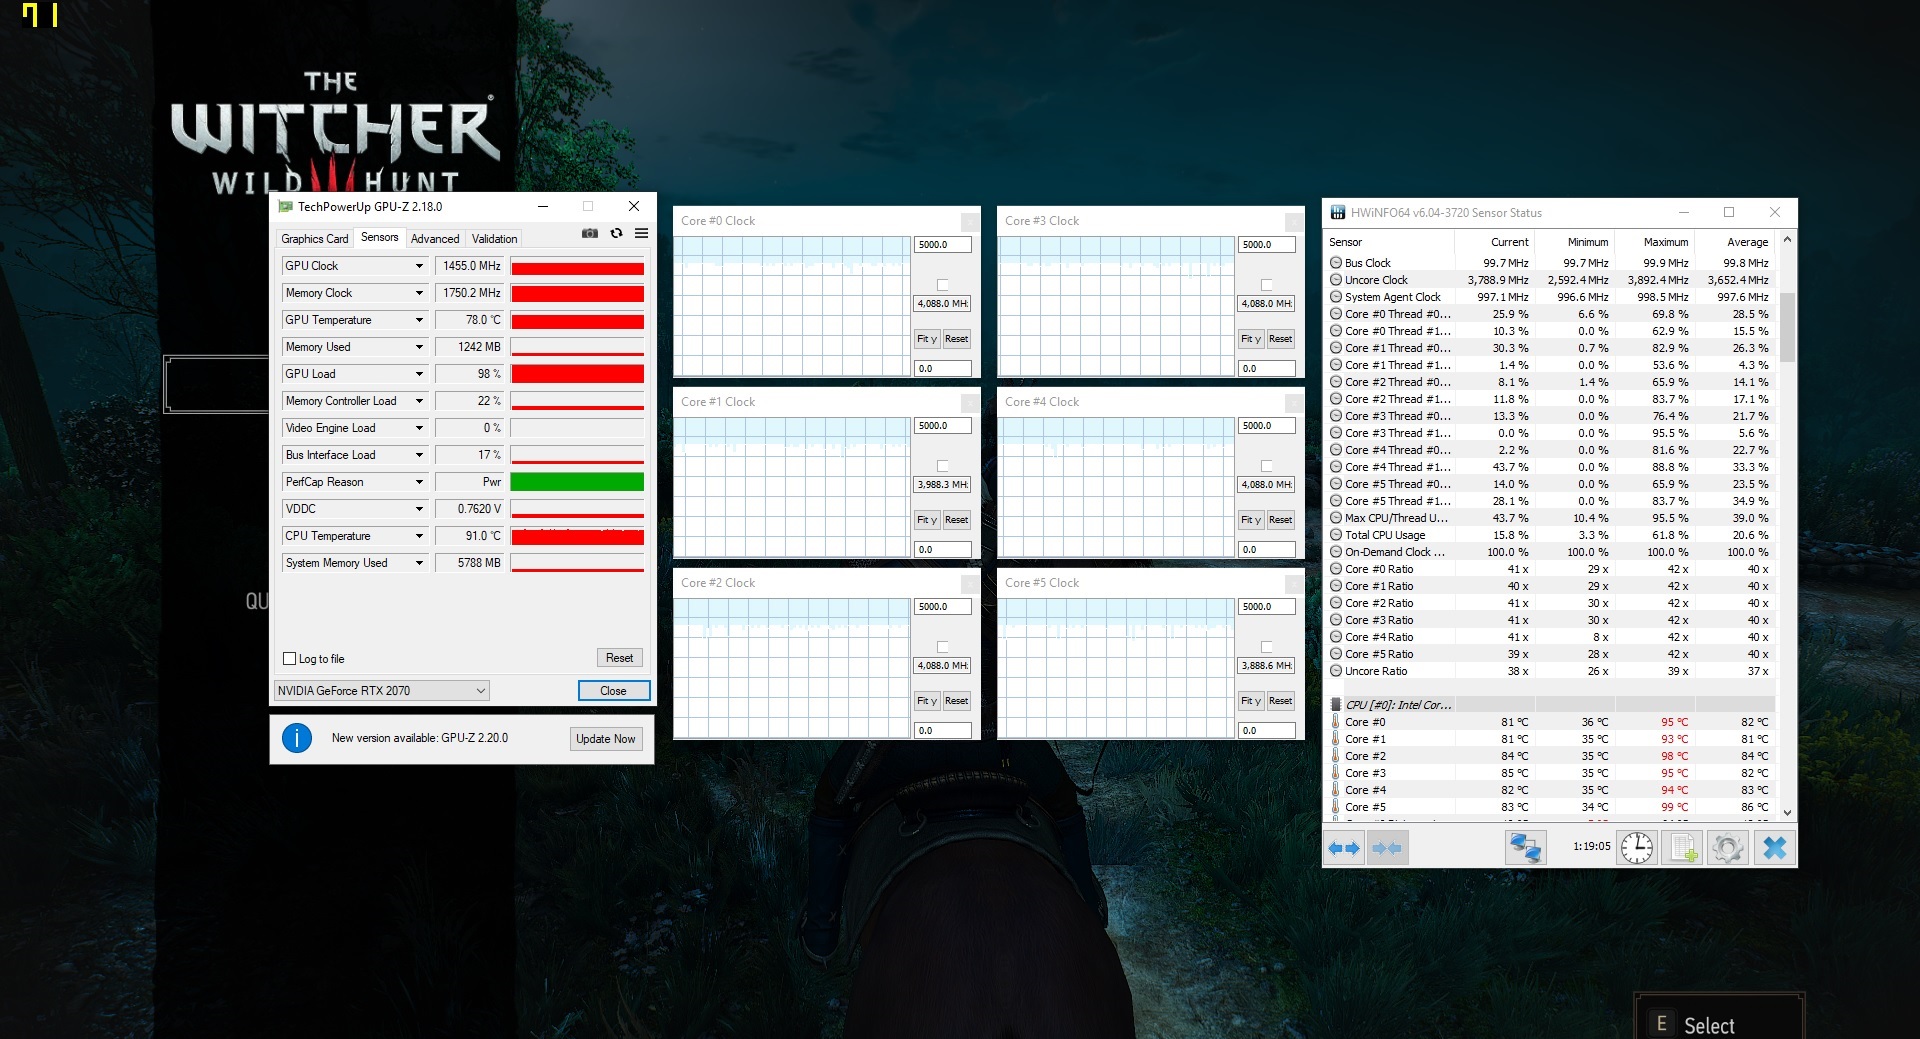
The GeForce RTX 2070 also operates at higher clock speeds than its smaller sibling. While Nvidia officially lists the GPU’s boost clock at 1,440 MHz, it can utilise a GPU boost, which functions like Intel Turbo Boost, to achieve up to 1,920 MHz in benchmarks like the GPU-Z render test. The GPU drops back to around 1,500 MHz in The Witcher 3 and the Unigine Heaven 4.0 benchmark, but this is still slightly above its official boost clock. Overall, the GX502GW performed impressively well in our hour-long loop of The Witcher 3, which we ran in 1080p at maximum graphics. Frame rates fluctuated between 63 and 76 FPS during this test, which should result in smooth-looking gameplay to most people’s eyes.
The GeForce RTX 2070 also comfortably sits between the RTX 2080 Max-Q and the RTX 2070 Max-Q in synthetic benchmarks like 3DMark 11 and 13.
Gaming Performance
If you would like to take advantage of the higher refresh rates associated with the 144 Hz panel, then get the GeForce RTX 2070 version and ignore the GeForce RTX 2060 model. While the latter is a powerful GPU, it will struggle to only average more than 60 FPS in triple-A titles at 1080p and maximum graphics. By contrast, the GeForce RTX 2070 averaged at least 70 FPS in all but two of our gaming tests though.
| The Witcher 3 - 1920x1080 Ultra Graphics & Postprocessing (HBAO+) | |
| Average of class Gaming (104.7 - 240, n=7, last 2 years) | |
| Asus Zephyrus S GX531GX | |
| Acer Predator Triton 500 | |
| Asus Zephyrus S GX502GW | |
| Razer Blade 15 RTX 2070 Max-Q | |
| Gigabyte Aero 15-X9 | |
Anno 1800 and Metro Exodus are exceptions, with our review unit averaging 39.5 FPS and 52.9 FPS, respectively, at 1080p and maximum graphics. The GeForce RTX 2070 is also usually powerful enough to render games in QHD at playable frame rates. It may be worth stepping up to a GeForce RTX 2080-powered laptop if you want to game in UHD though.
| low | med. | high | ultra | |
|---|---|---|---|---|
| The Witcher 3 (2015) | 130 | 70.2 | ||
| Shadow of the Tomb Raider (2018) | 91.3 | 86 | 80.3 | 74.2 |
| Apex Legends (2019) | 128 | 126 | ||
| Far Cry New Dawn (2019) | 91 | 83 | ||
| Metro Exodus (2019) | 91.1 | 82.6 | 66.3 | 54.6 |
| Anthem (2019) | 84 | 79 | ||
| Dirt Rally 2.0 (2019) | 121 | 75 | ||
| The Division 2 (2019) | 121 | 111 | 94 | 73 |
| Anno 1800 (2019) | 76.8 | 39.5 | ||
| Rage 2 (2019) | 180 | 122 | 103 | 101 |
| Control (2019) | 152 | 90 | 68 | |
| Borderlands 3 (2019) | 94 | 84 | 71 | 61 |
Emissions
Fan Noise
Fan noise remains one of the biggest weaknesses of the GX502 series. The fans in our review unit reached a maximum of 56 dB(A) during our gaming tests, which is intrusively loud. In short, we would recommend using headphones when gaming; the fans get so loud that they drown out the speakers.
By contrast, our comparison devices run much quieter than the GX502GW. This should come as no surprise though because they are all equipped with Max-Q GPUs, which Nvidia designs to run quieter and cooler than traditional GeForce cards.
The GX502GW can get loud at idle too. Typically, the fans whir away at between 31 and 33 dB(A), but they occasionally reach a maximum of 38 dB(A) during program installations and system updates.
Worse still, our review unit suffers from coil whine. We would recommend trying out a GX502GW before purchasing one as your ears may be more sensitive than ours.
Noise level
| Idle |
| 31 / 33 / 38 dB(A) |
| Load |
| 50 / 56 dB(A) |
 | ||
30 dB silent 40 dB(A) audible 50 dB(A) loud |
||
min: | ||
| Asus Zephyrus S GX502GW GeForce RTX 2070 Mobile, i7-9750H | Asus Zephyrus S GX531GX GeForce RTX 2080 Max-Q, i7-8750H | Acer Predator Triton 500 GeForce RTX 2080 Max-Q, i7-8750H | Razer Blade 15 RTX 2070 Max-Q GeForce RTX 2070 Max-Q, i7-8750H | Gigabyte Aero 15-X9 GeForce RTX 2070 Max-Q, i7-8750H | Average of class Gaming | |
|---|---|---|---|---|---|---|
| Noise | 4% | 9% | 17% | 7% | 15% | |
| off / environment * (dB) | 30 | 28.7 4% | 29 3% | 28.8 4% | 30 -0% | 24.1 ? 20% |
| Idle Minimum * (dB) | 31 | 29.8 4% | 30 3% | 28.8 7% | 32 -3% | 26 ? 16% |
| Idle Average * (dB) | 33 | 32.4 2% | 32 3% | 28.8 13% | 34 -3% | 27.4 ? 17% |
| Idle Maximum * (dB) | 38 | 38 -0% | 34 11% | 29.4 23% | 36 5% | 30.1 ? 21% |
| Load Average * (dB) | 50 | 38.2 24% | 44 12% | 35.7 29% | 42 16% | 43.6 ? 13% |
| Witcher 3 ultra * (dB) | 53 | 56.6 -7% | 46 13% | 42.5 20% | 44 17% | |
| Load Maximum * (dB) | 56 | 56.6 -1% | 47 16% | 45 20% | 48 14% | 54.2 ? 3% |
* ... smaller is better
Temperature
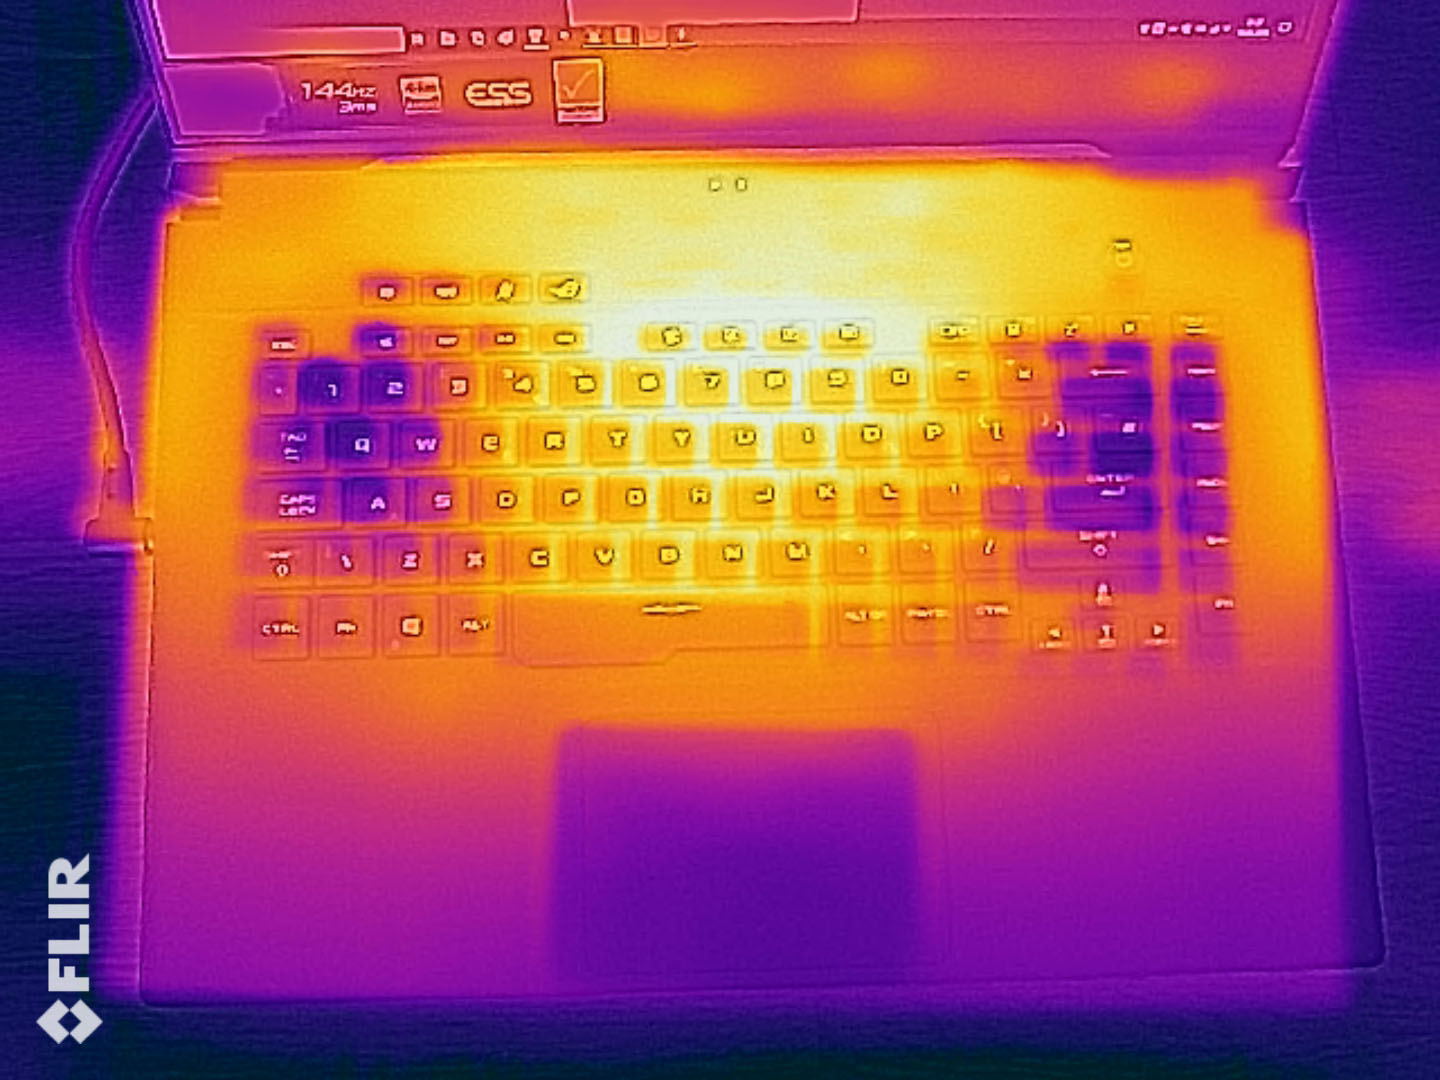
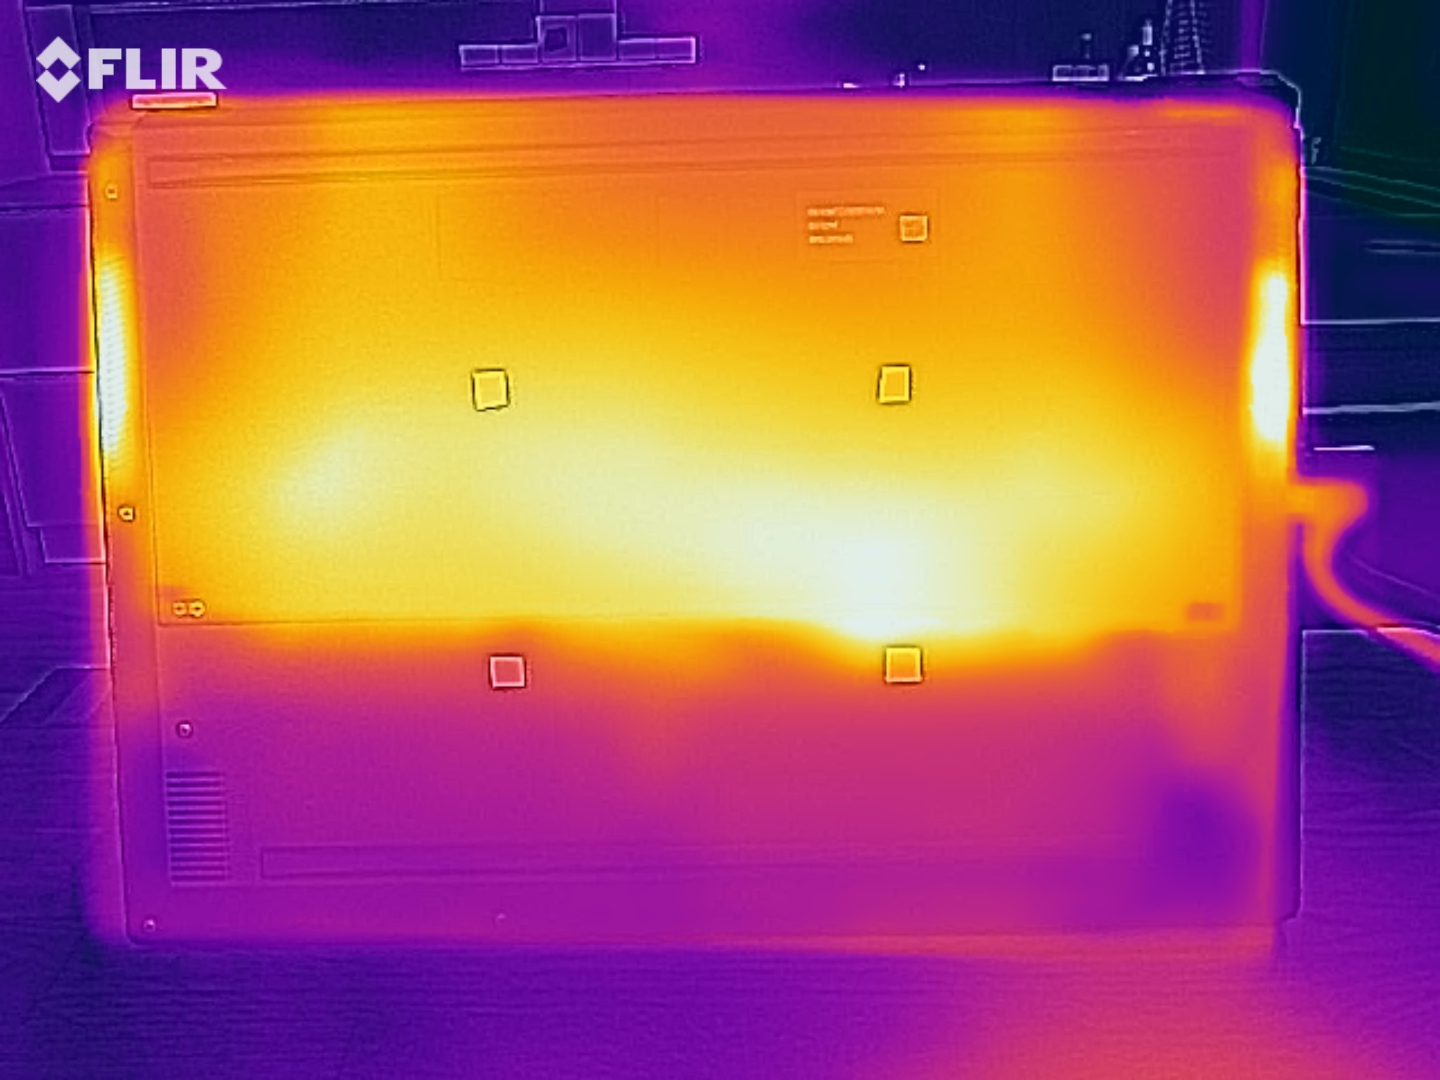
Our test device also gets dangerously hot in some places. The bottom case reached a maximum of 47 °C under full load, which will feel uncomfortable to the touch if you have it resting on your lap. Moreover, almost half the top case reaches and exceeds 50 °C. The GX502GW runs comparatively hot when idling too.
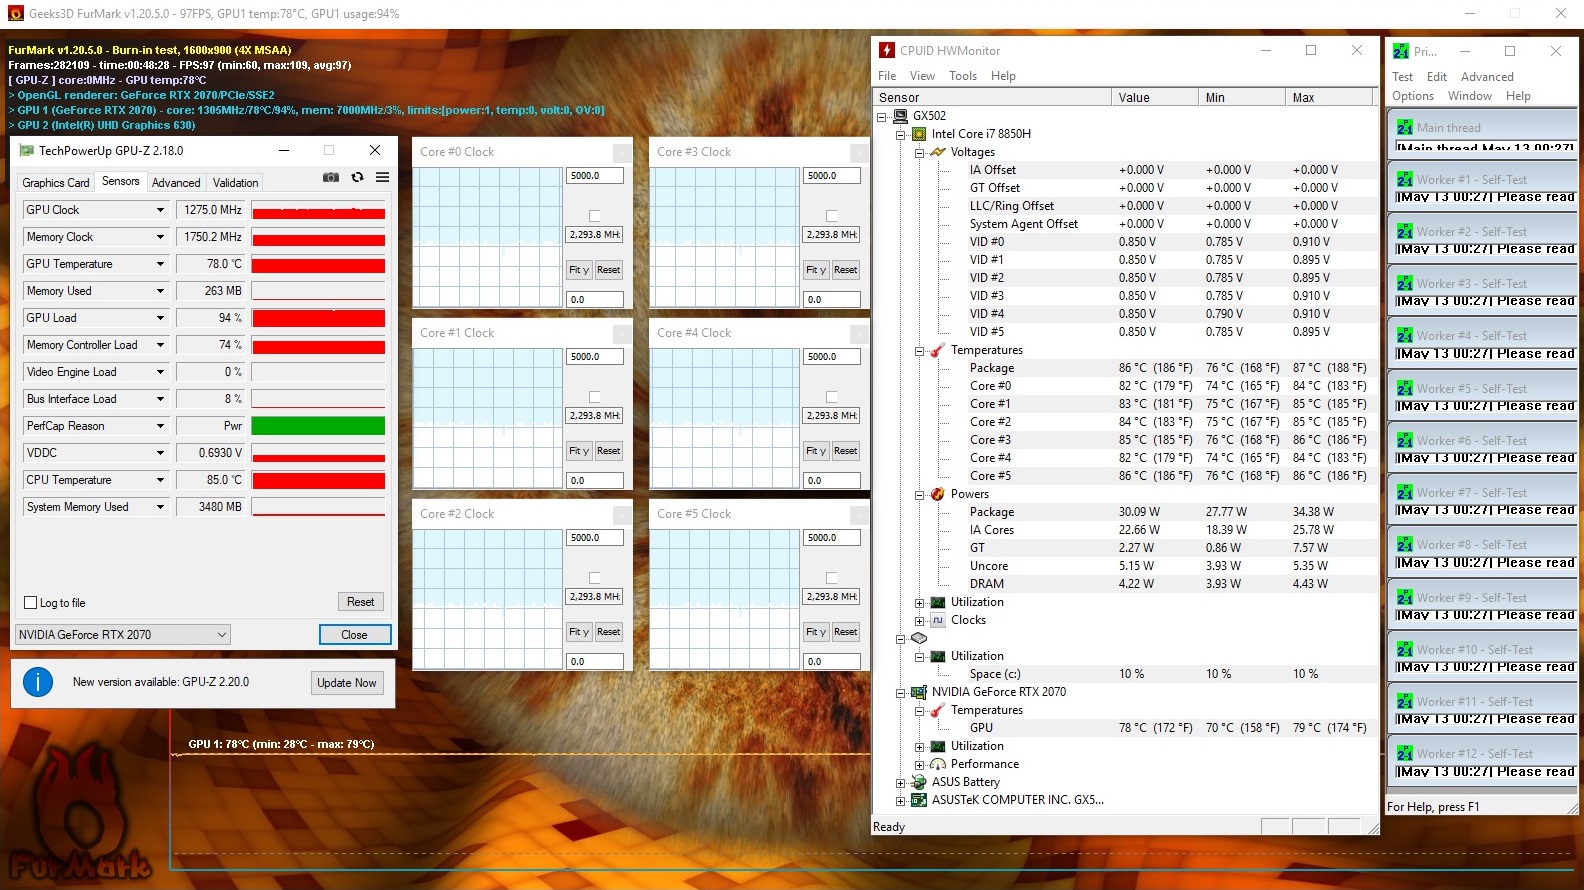
We also subjected our review unit to a 60-minute combined FurMark and Prime95 stress test to see how the device managed under extreme load conditions. CPU core temperatures reached a maximum of 87 °C and throttled to about 2.3 GHz, while the GPU remained around 10 °C cooler and maintained its maximum clock speed.
The CPU does not thermal throttle in games though. Core temperatures maxed out at 80 °C in our The Witcher 3 loop, during which it averaged a respectable 4.0 GHz. The GPU maintained its maximum performance here too.
(-) The maximum temperature on the upper side is 54 °C / 129 F, compared to the average of 40.4 °C / 105 F, ranging from 21.2 to 68.8 °C for the class Gaming.
(-) The bottom heats up to a maximum of 47 °C / 117 F, compared to the average of 43.2 °C / 110 F
(+) In idle usage, the average temperature for the upper side is 31.2 °C / 88 F, compared to the device average of 33.9 °C / 93 F.
(-) Playing The Witcher 3, the average temperature for the upper side is 44.1 °C / 111 F, compared to the device average of 33.9 °C / 93 F.
(±) The palmrests and touchpad can get very hot to the touch with a maximum of 38 °C / 100.4 F.
(-) The average temperature of the palmrest area of similar devices was 28.8 °C / 83.8 F (-9.2 °C / -16.6 F).
| Asus Zephyrus S GX502GW GeForce RTX 2070 Mobile, i7-9750H | Asus Zephyrus S GX531GX GeForce RTX 2080 Max-Q, i7-8750H | Acer Predator Triton 500 GeForce RTX 2080 Max-Q, i7-8750H | Razer Blade 15 RTX 2070 Max-Q GeForce RTX 2070 Max-Q, i7-8750H | Gigabyte Aero 15-X9 GeForce RTX 2070 Max-Q, i7-8750H | Average of class Gaming | |
|---|---|---|---|---|---|---|
| Heat | 6% | -3% | 12% | -1% | 5% | |
| Maximum Upper Side * (°C) | 54 | 47 13% | 49 9% | 49 9% | 56 -4% | 45.2 ? 16% |
| Maximum Bottom * (°C) | 47 | 48.6 -3% | 58 -23% | 49 -4% | 66 -40% | 48.1 ? -2% |
| Idle Upper Side * (°C) | 33 | 28.8 13% | 33 -0% | 25.4 23% | 27 18% | 31 ? 6% |
| Idle Bottom * (°C) | 34 | 33.2 2% | 33 3% | 27.2 20% | 27 21% | 34.2 ? -1% |
* ... smaller is better
Speakers
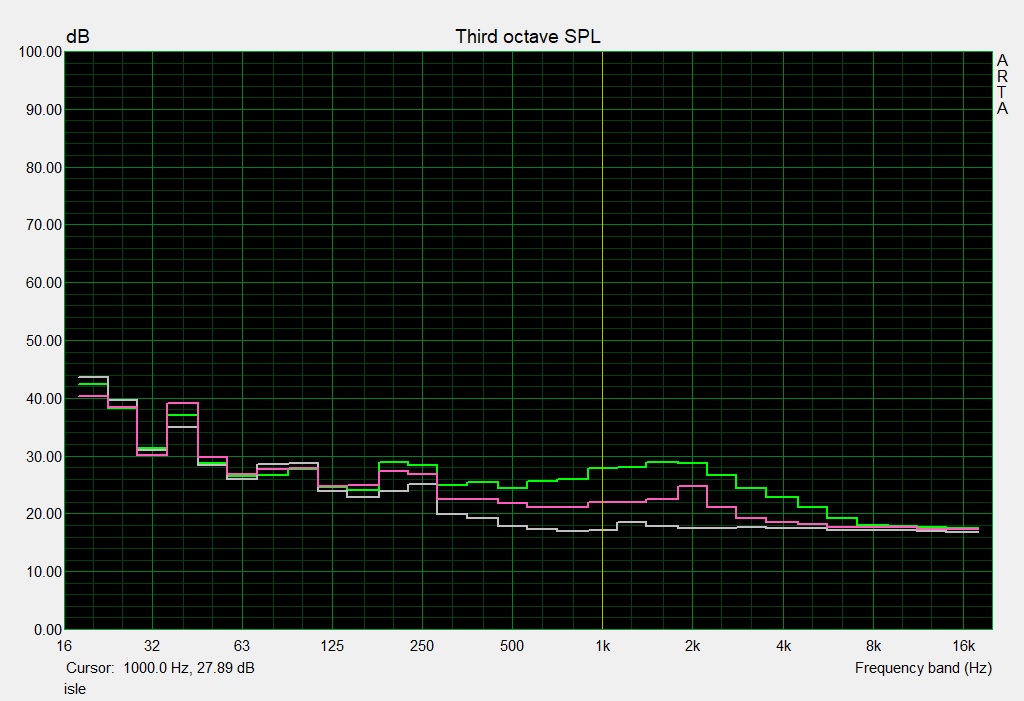
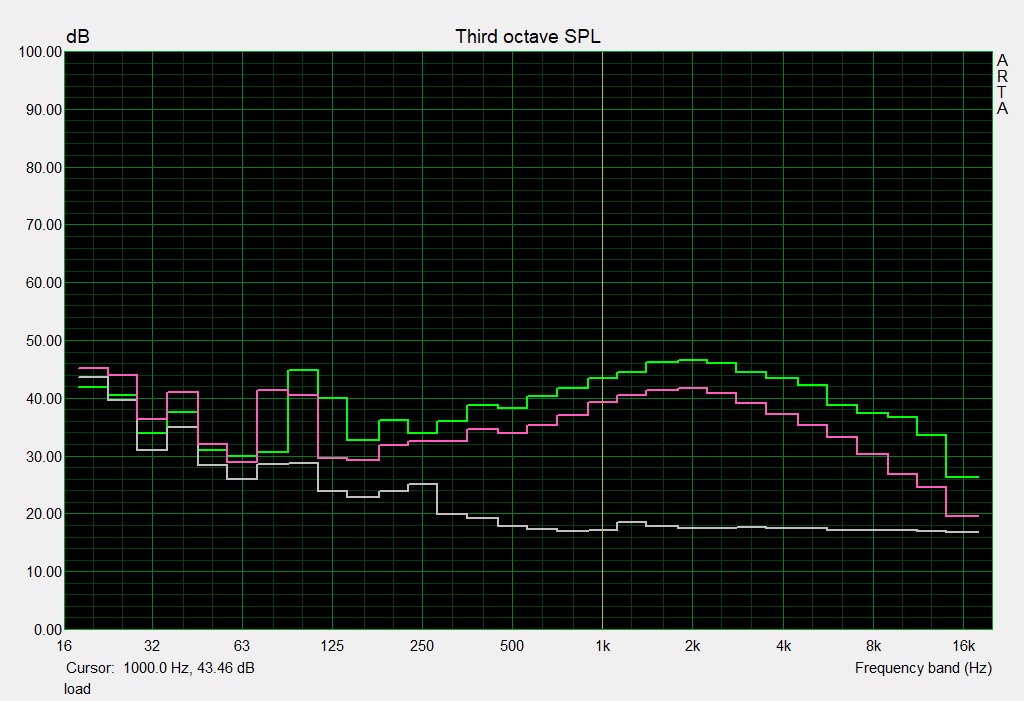
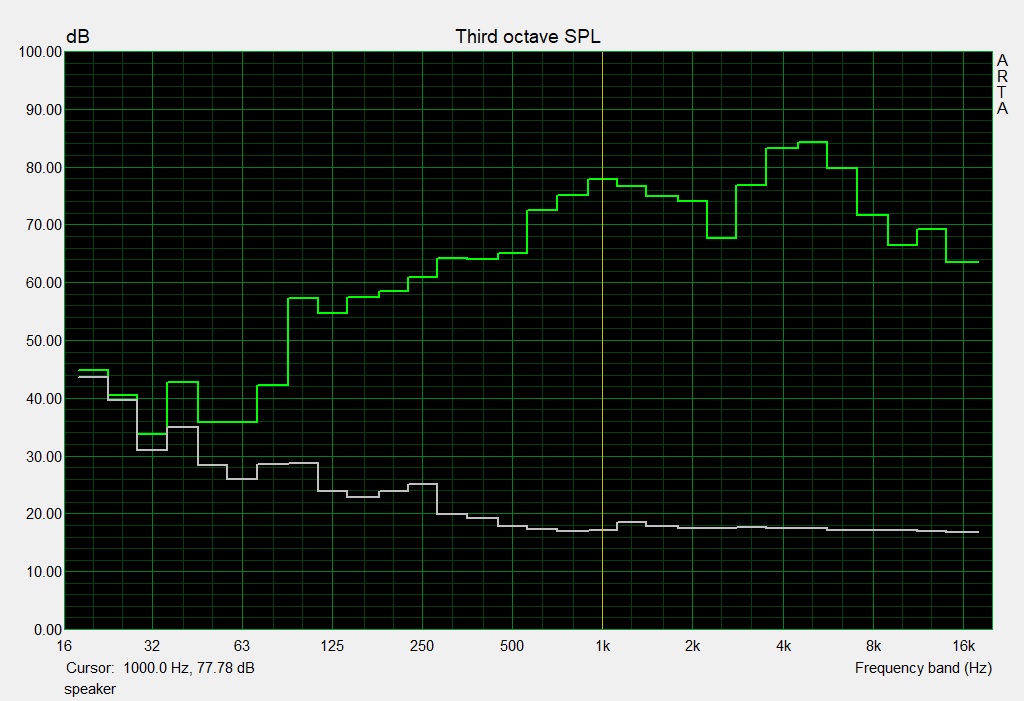
The GX502GW has stereo speakers that reached a maximum of 90.2 dB(A) during our tests. The speakers fire downwards from the bottom of the case and sound dull to our ears, but they have decent frequency response, as demonstrated by our audio analysis below.
The device comes with Sonic Studio software preinstalled, which allows you to customise how the speakers sound to your tastes. We conducted our tests with the speakers set to the music profile, for reference.
Asus Zephyrus S GX502GW audio analysis
(+) | speakers can play relatively loud (90 dB)
Bass 100 - 315 Hz
(±) | reduced bass - on average 12.7% lower than median
(±) | linearity of bass is average (8.5% delta to prev. frequency)
Mids 400 - 2000 Hz
(+) | balanced mids - only 4.5% away from median
(+) | mids are linear (4.1% delta to prev. frequency)
Highs 2 - 16 kHz
(±) | higher highs - on average 6.7% higher than median
(±) | linearity of highs is average (10.8% delta to prev. frequency)
Overall 100 - 16.000 Hz
(+) | overall sound is linear (14.6% difference to median)
Compared to same class
» 28% of all tested devices in this class were better, 7% similar, 65% worse
» The best had a delta of 6%, average was 18%, worst was 132%
Compared to all devices tested
» 19% of all tested devices were better, 4% similar, 77% worse
» The best had a delta of 4%, average was 23%, worst was 134%
Asus Zephyrus S GX531GX audio analysis
(±) | speaker loudness is average but good (73 dB)
Bass 100 - 315 Hz
(±) | reduced bass - on average 13.3% lower than median
(±) | linearity of bass is average (14.9% delta to prev. frequency)
Mids 400 - 2000 Hz
(+) | balanced mids - only 1.9% away from median
(+) | mids are linear (5.2% delta to prev. frequency)
Highs 2 - 16 kHz
(±) | higher highs - on average 5.6% higher than median
(±) | linearity of highs is average (10.8% delta to prev. frequency)
Overall 100 - 16.000 Hz
(±) | linearity of overall sound is average (18.3% difference to median)
Compared to same class
» 58% of all tested devices in this class were better, 9% similar, 33% worse
» The best had a delta of 6%, average was 18%, worst was 132%
Compared to all devices tested
» 40% of all tested devices were better, 8% similar, 52% worse
» The best had a delta of 4%, average was 23%, worst was 134%
Power Management
Power Consumption
The GX502GW has comparatively high power consumption, especially for an Nvidia Optimus-capable laptop. Our review unit consumes between 24 and 33 W at idle, which is at least 33% more than our comparison devices consume. The system also averages 129 W under load and consumes a maximum of 216 W. Again, the GX502GW consumes noticeably more than our comparison devices, but this is less surprising as they all have Max-Q GPUs. Incidentally, our test device consumes around 176 W while playing The Witcher 3.
| Off / Standby | |
| Idle | |
| Load |
|
Key:
min: | |
| Asus Zephyrus S GX502GW GeForce RTX 2070 Mobile, i7-9750H | Asus Zephyrus S GX531GX GeForce RTX 2080 Max-Q, i7-8750H | Acer Predator Triton 500 GeForce RTX 2080 Max-Q, i7-8750H | Razer Blade 15 RTX 2070 Max-Q GeForce RTX 2070 Max-Q, i7-8750H | Gigabyte Aero 15-X9 GeForce RTX 2070 Max-Q, i7-8750H | Average of class Gaming | |
|---|---|---|---|---|---|---|
| Power Consumption | 18% | 20% | 36% | 31% | 19% | |
| Idle Minimum * (Watt) | 24 | 16.1 33% | 16 33% | 10.4 57% | 16 33% | 13 ? 46% |
| Idle Average * (Watt) | 27 | 20.9 23% | 22 19% | 14.6 46% | 18 33% | 19 ? 30% |
| Idle Maximum * (Watt) | 33 | 27 18% | 32 3% | 16.3 51% | 23 30% | 24.6 ? 25% |
| Load Average * (Watt) | 129 | 93.4 28% | 89 31% | 88.5 31% | 88 32% | 110.7 ? 14% |
| Witcher 3 ultra * (Watt) | 176 | 168.2 4% | 147 16% | 155.4 12% | 120 32% | |
| Load Maximum * (Watt) | 216 | 215.3 -0% | 173 20% | 182.4 16% | 167 23% | 259 ? -20% |
* ... smaller is better
Battery Life
The GX502 has a 76 Wh battery, which is 26 Wh larger than the one in its predecessor. By contrast, our other comparison devices have between 80 Wh and 94.24 Wh batteries. It should come as no surprise that our review unit has underwhelming battery life considering its comparably high power consumption.
The GX502GW lasted just under 3.5 hours in our practical Wi-Fi test, during which we run a script that simulates the load required to render websites. We also set the display to approximately 150 cd/m². By contrast, the Aero 15-X9 and Razer Blade 15 lasted around 3 hours longer in the same test.
Our review unit needs recharging after just over an hour of gaming. However, we would not recommend gaming without the GX502 plugged into the mains as frame rates dropped from around 70 FPS in The Witcher 3 on mains power to a meagre maximum of 22 FPS on battery power.
| Asus Zephyrus S GX502GW GeForce RTX 2070 Mobile, i7-9750H, 76 Wh | Asus Zephyrus S GX531GX GeForce RTX 2080 Max-Q, i7-8750H, 50 Wh | Acer Predator Triton 500 GeForce RTX 2080 Max-Q, i7-8750H, 82 Wh | Razer Blade 15 RTX 2070 Max-Q GeForce RTX 2070 Max-Q, i7-8750H, 80 Wh | Gigabyte Aero 15-X9 GeForce RTX 2070 Max-Q, i7-8750H, 94.24 Wh | Average of class Gaming | |
|---|---|---|---|---|---|---|
| Battery runtime | -19% | 7% | 73% | 106% | 61% | |
| Reader / Idle (h) | 5.9 | 5.6 -5% | 11.4 93% | 9.2 56% | 8.27 ? 40% | |
| WiFi v1.3 (h) | 3.7 | 3 -19% | 3.2 -14% | 6.5 76% | 6.4 73% | 7.11 ? 92% |
| Load (h) | 1 | 1.4 40% | 1.5 50% | 2.9 190% | 1.502 ? 50% | |
| H.264 (h) | 6.1 | 8.32 ? |
Pros
Cons
Verdict
On the surface, the ASUS ROG Zephyrus S GX502GW is currently one of the best gaming laptops that you could buy. It has some frustrating weaknesses though that may put people off.
The device has a compact and slim design, yet it still manages to pack in incredibly powerful components. Its high-end CPU and GPU enable it to effortlessly power through every triple-A game released over the last few years at high to maximum graphics. Its low response times, G-Sync support and 144 Hz refresh rate should make games look buttery smooth too. However, you will have to put up with low contrast visuals and dreadful battery life. We still recommend activating Nvidia Optimus when you are not gaming though, as the GPU will eat through battery life if it is always enabled.
The ASUS ROG Zephyrus S GX502GW has a lot going for it. It is stylish, compact and delivers an excellent gaming experience. However, it is loud, is missing a few useful ports and it has awful battery life.
We cannot understand some of the decisions that ASUS has made though. Soldering half the RAM to the motherboard seems short-sighted, as does the decision to not include a card reader, a camera or a Thunderbolt 3 port. Ultimately, the GX502GW runs too loud and hot for a premium thin and light gaming laptop.
In short, there are few reasons to consider the GX502 series over the Aero 15-X9 or the Razer Blade 15. One may be its non-Max-Q GPU but having a full RTX 20 series laptop comes with drawbacks. The GX502GW is still a good option if you are looking for a 15.6-inch gaming laptop, but it just misses the bar that the likes of Gigabyte and Razer have set.
Asus Zephyrus S GX502GW
- 05/14/2020 v7 (old)
Florian Glaser
Price comparison

