Razer Blade 15 Advanced Model (RTX 2070 Max-Q, FHD) Laptop Review
Razer introduced its Blade 15 refresh with GeForce RTX Turing graphics at CES 2019 alongside 240 Hz and OLED display options. While these latter features will have to wait until Q2 2019, the Blade 15 RTX is already shipping with the GeForce RTX 2060, RTX 2070 Max-Q, and RTX 2080 Max-Q GPUs. This also marks the first time that an 80-class Nvidia GeForce GPU is available on the Blade 15 series as this was previously exclusive to the larger 17.3-inch Blade Pro series.
The test unit we have today is the RTX 2070 Max-Q SKU with a 512 GB NVMe Samsung SSD and 144 Hz matte FHD display. Users can choose to configure with a 256 GB NVMe SSD or 4K UHD glossy touchscreen instead. Either way, expect to pay $2400 to $2900 for the Blade 15 with RTX 2070 Max-Q graphics.
Direct competitors in this space have been growing rapidly. The 15.6-inch Gigabyte Aero 15 Y9, Dell Alienware m15, Aorus 15, MSI GS65, and Asus ROG GL504 are just a few examples also shipping with GeForce RTX graphics. For this review, we'll be comparing the differences between the Blade 15 RTX 2070 Max-Q and Blade 15 GTX 1070 Max-Q to see what kinds of performance upgrades the new model carries.
We recommend checking out our reviews on the existing Razer laptops below since many of our comments still apply here. The Blade 15 series has remained essentially the same in terms of design since its inception.
Additionally, see how the Blade 15 compares to the new Gigabyte Aero 15-X9 here,
Case
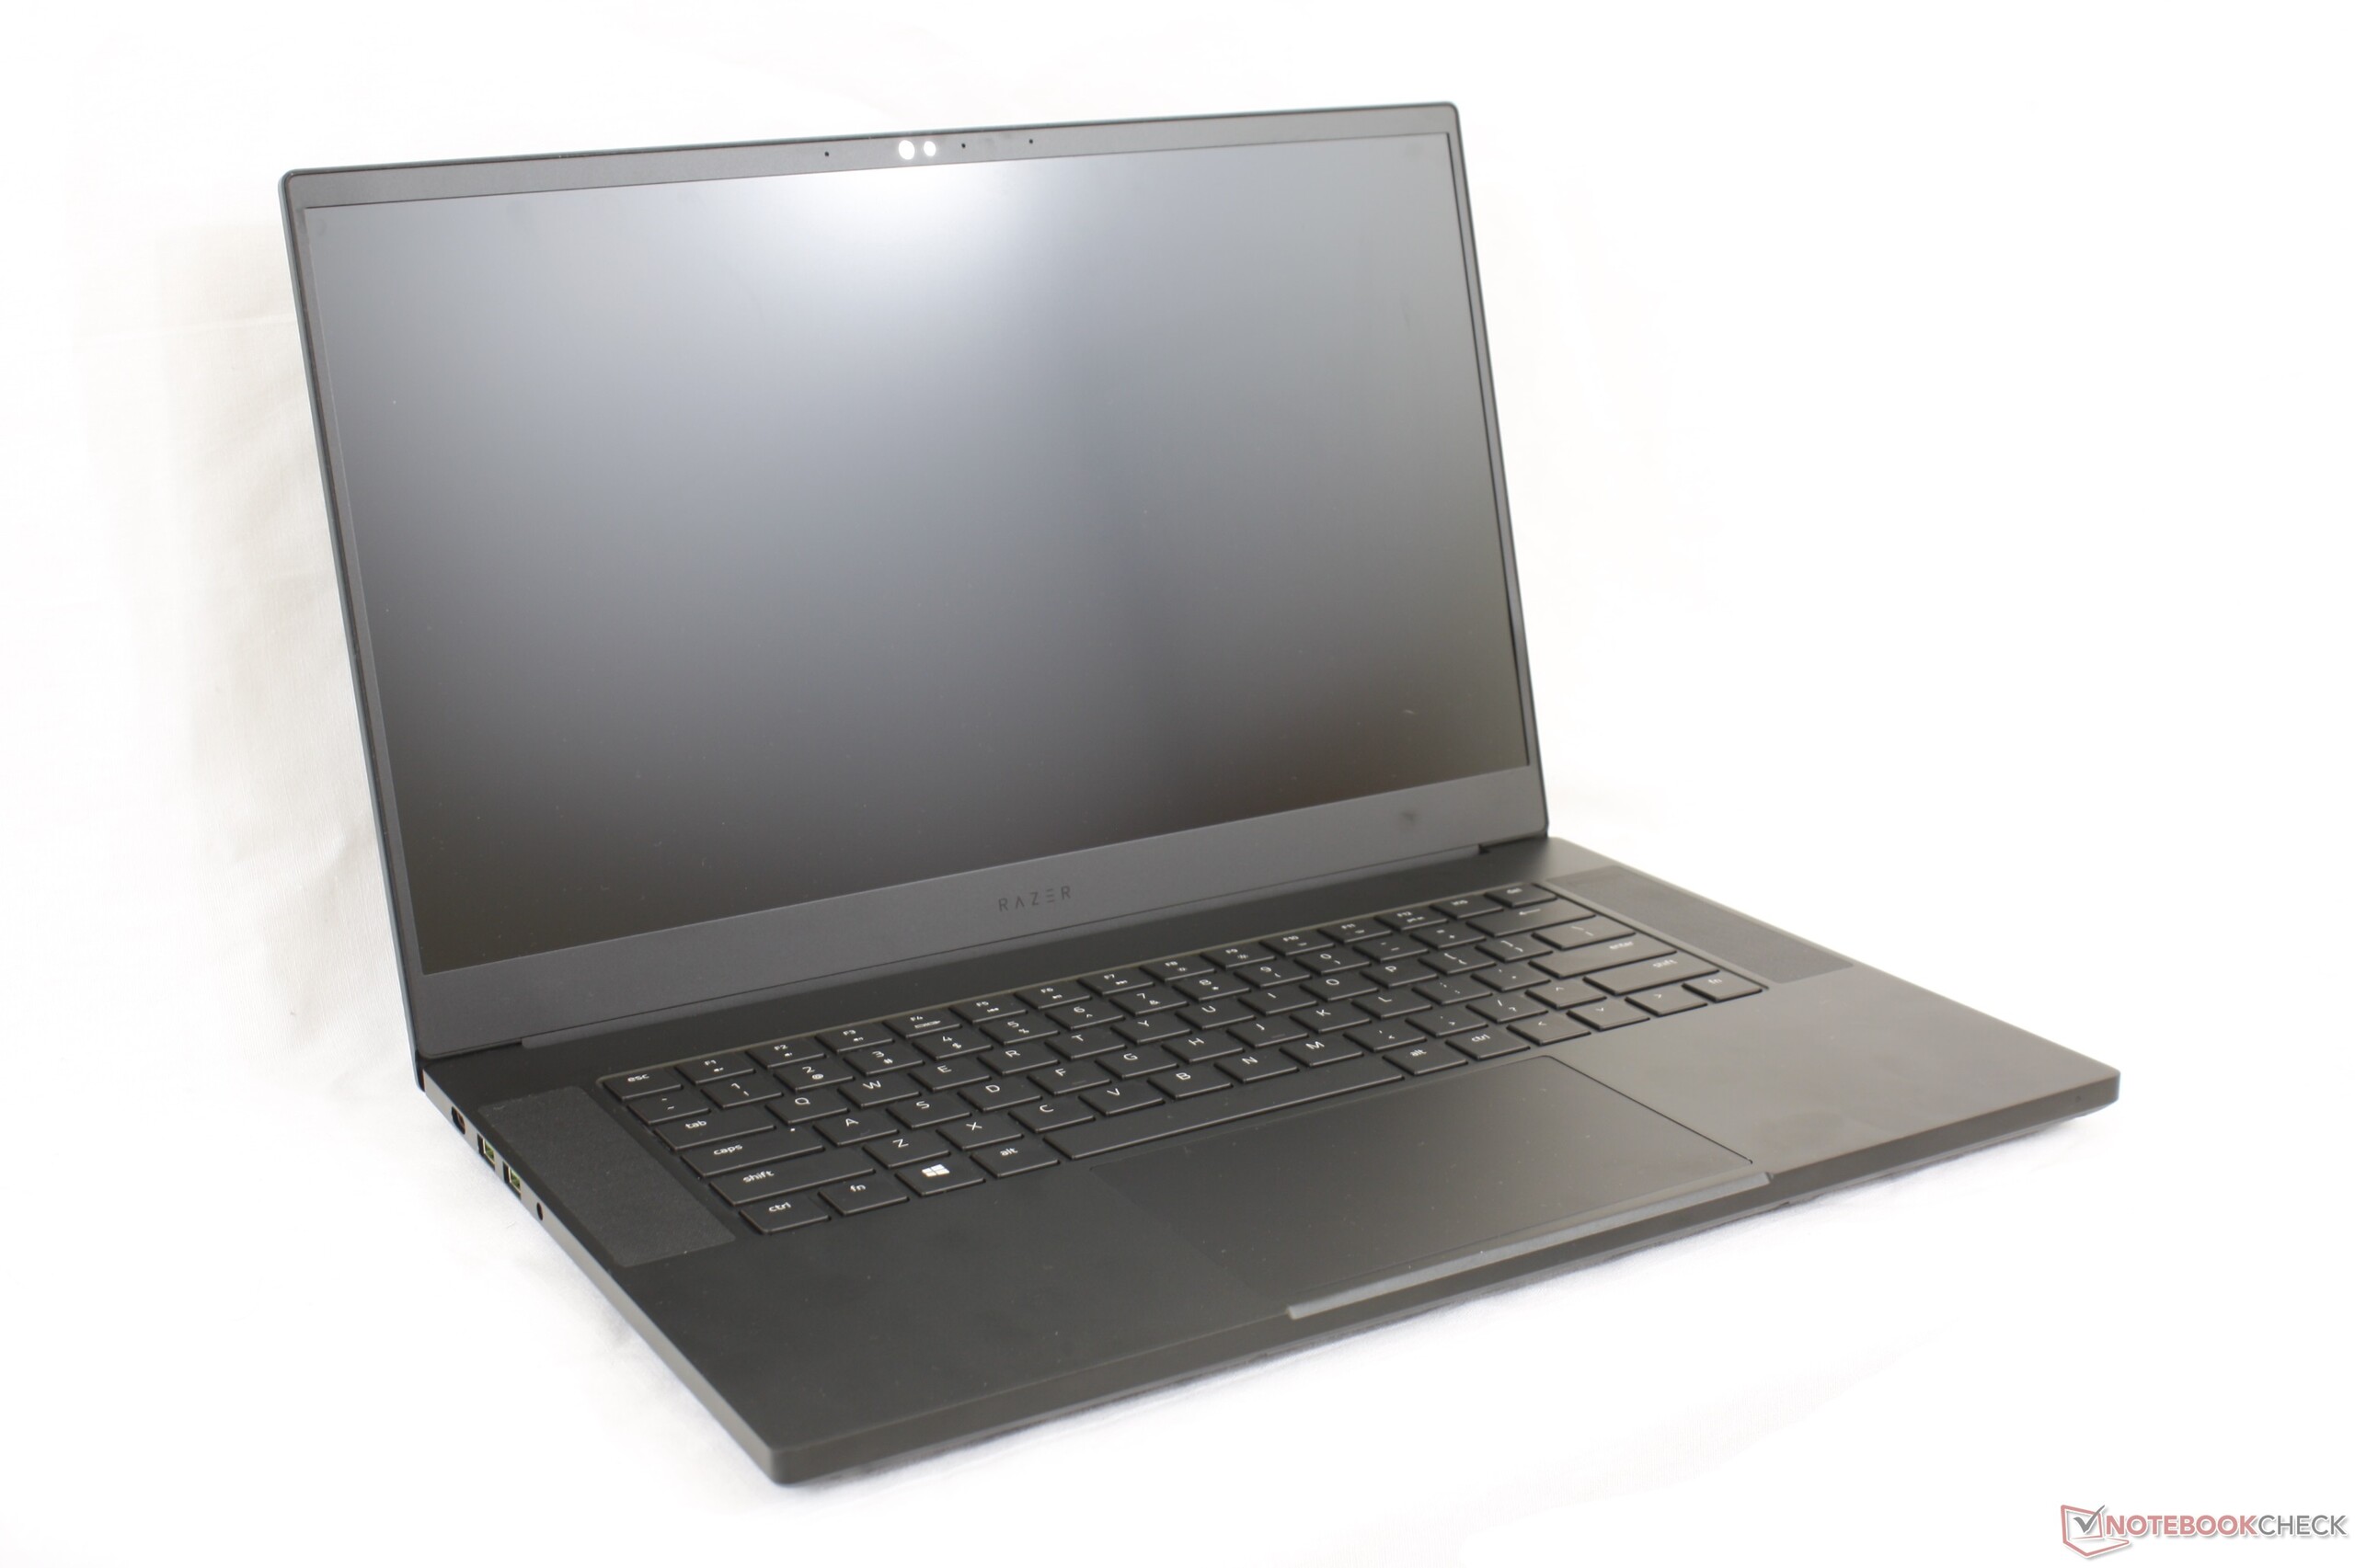
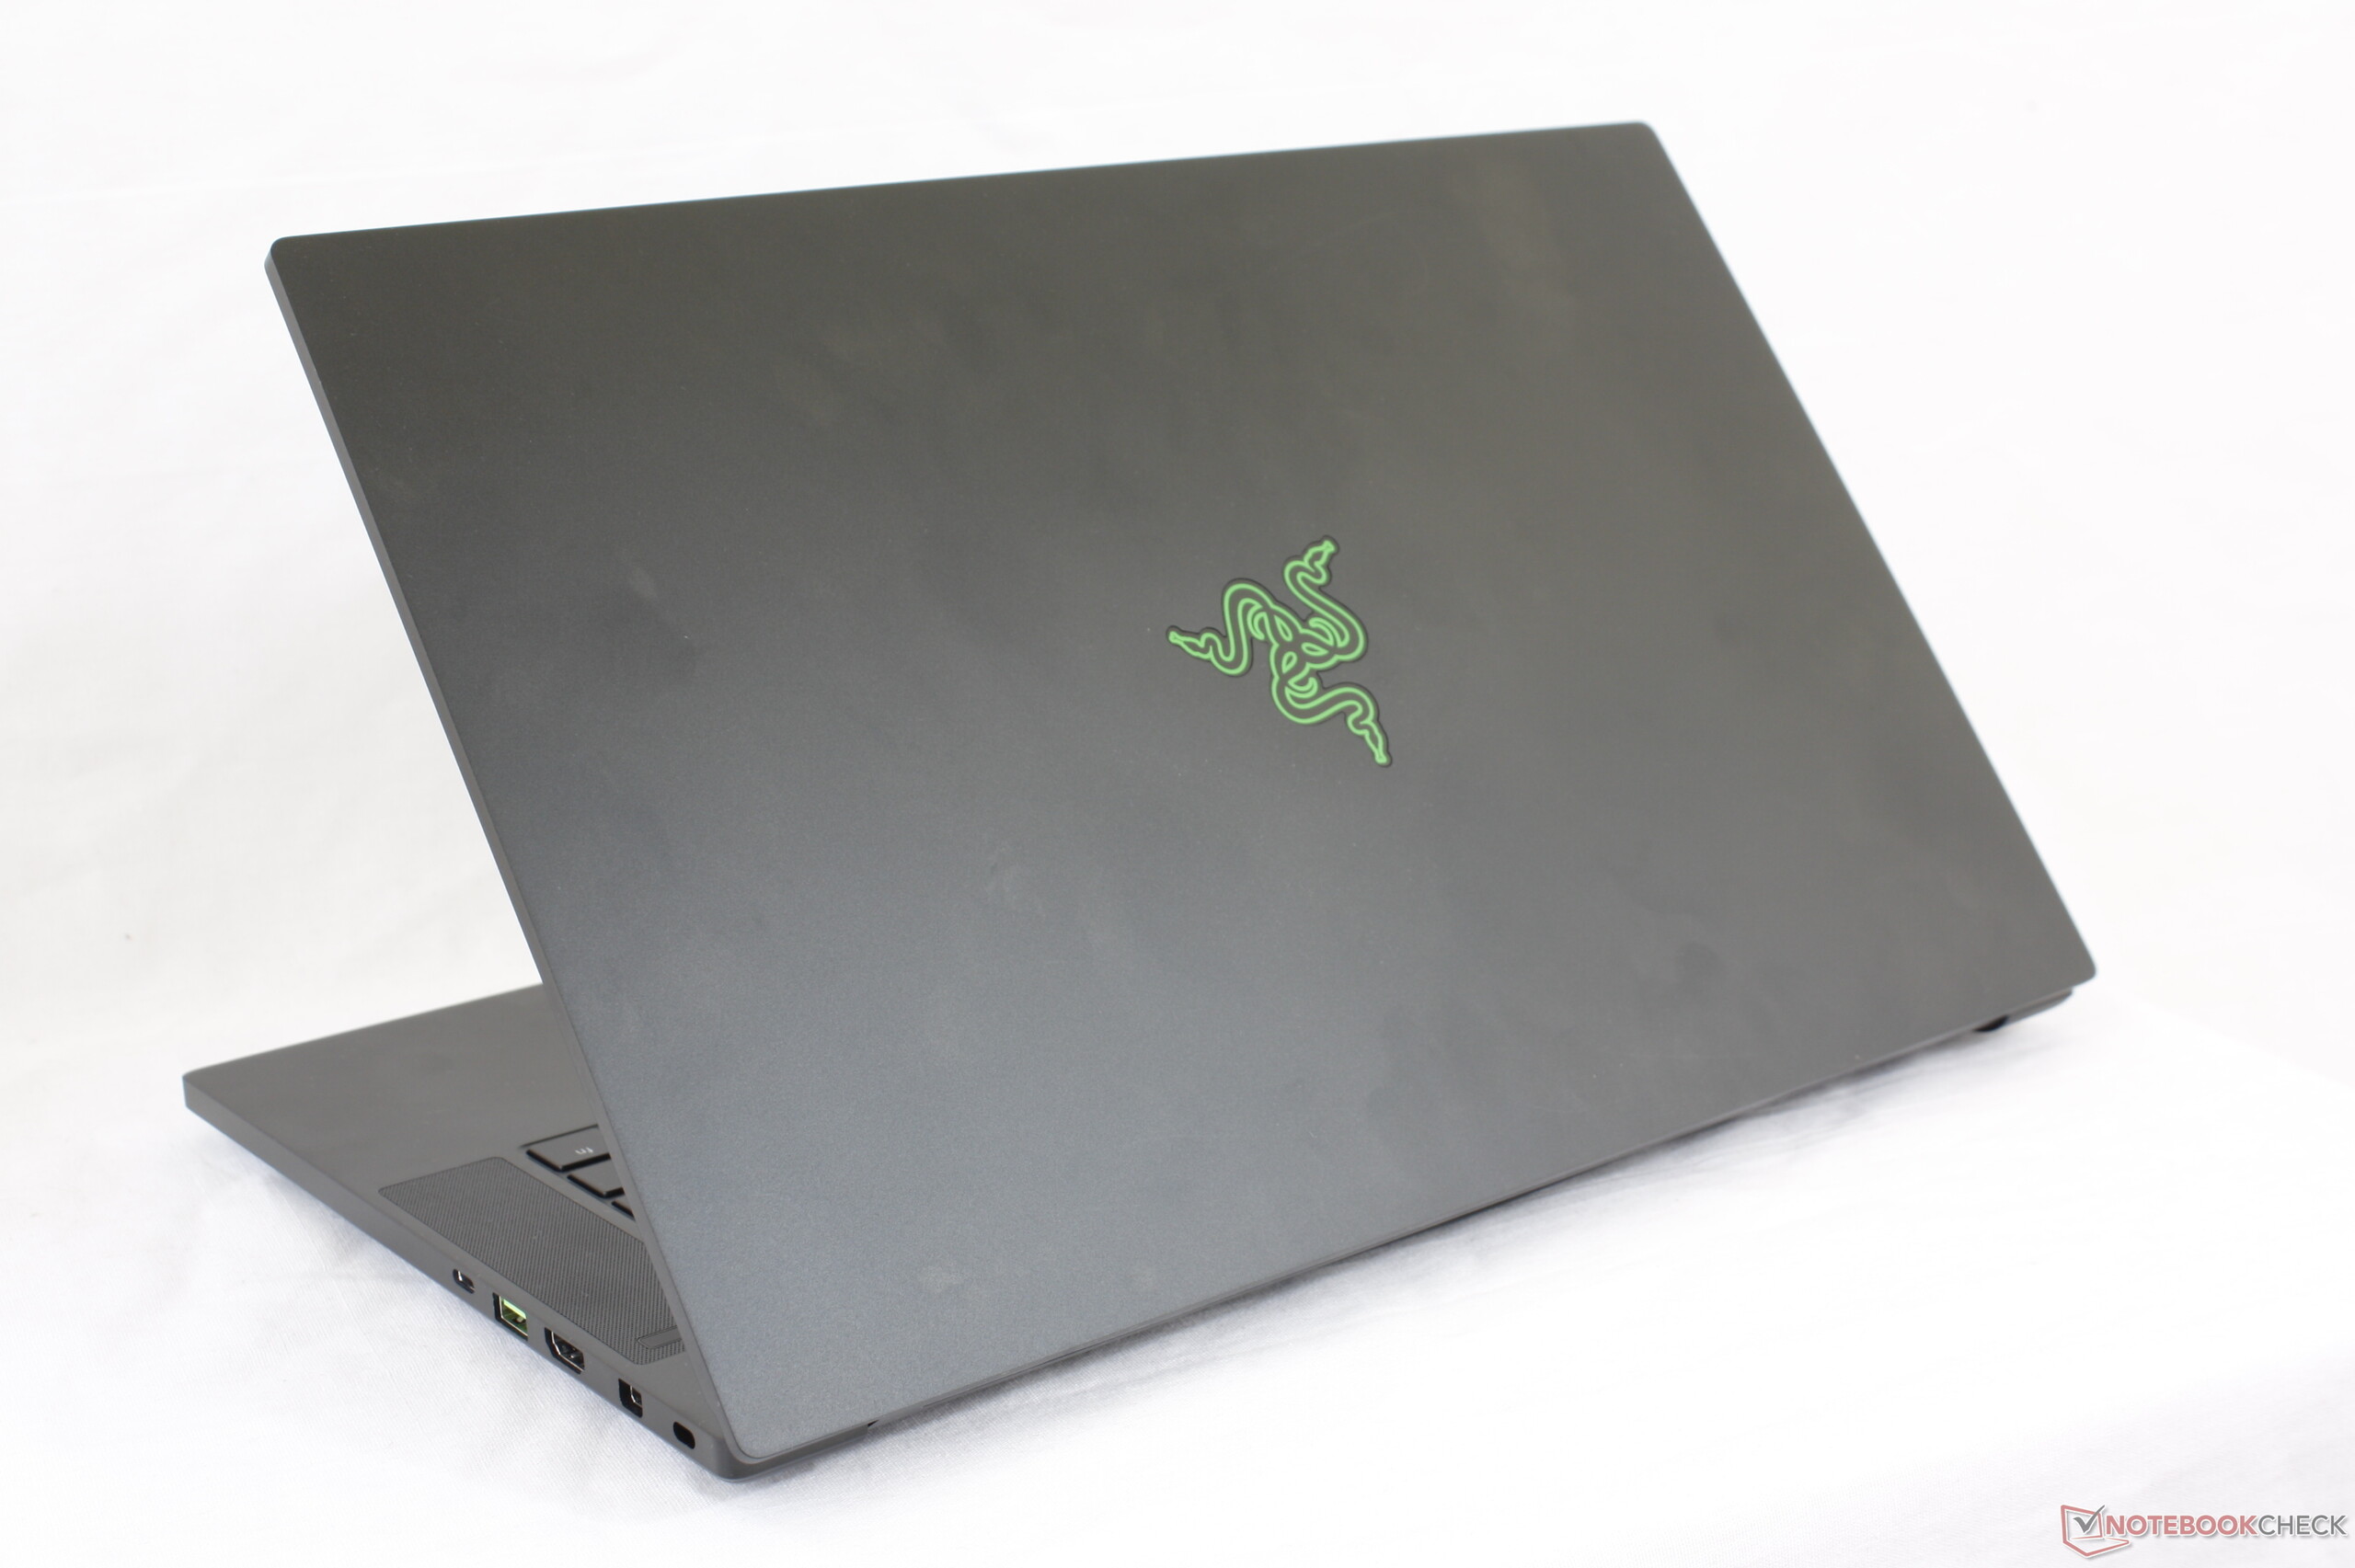
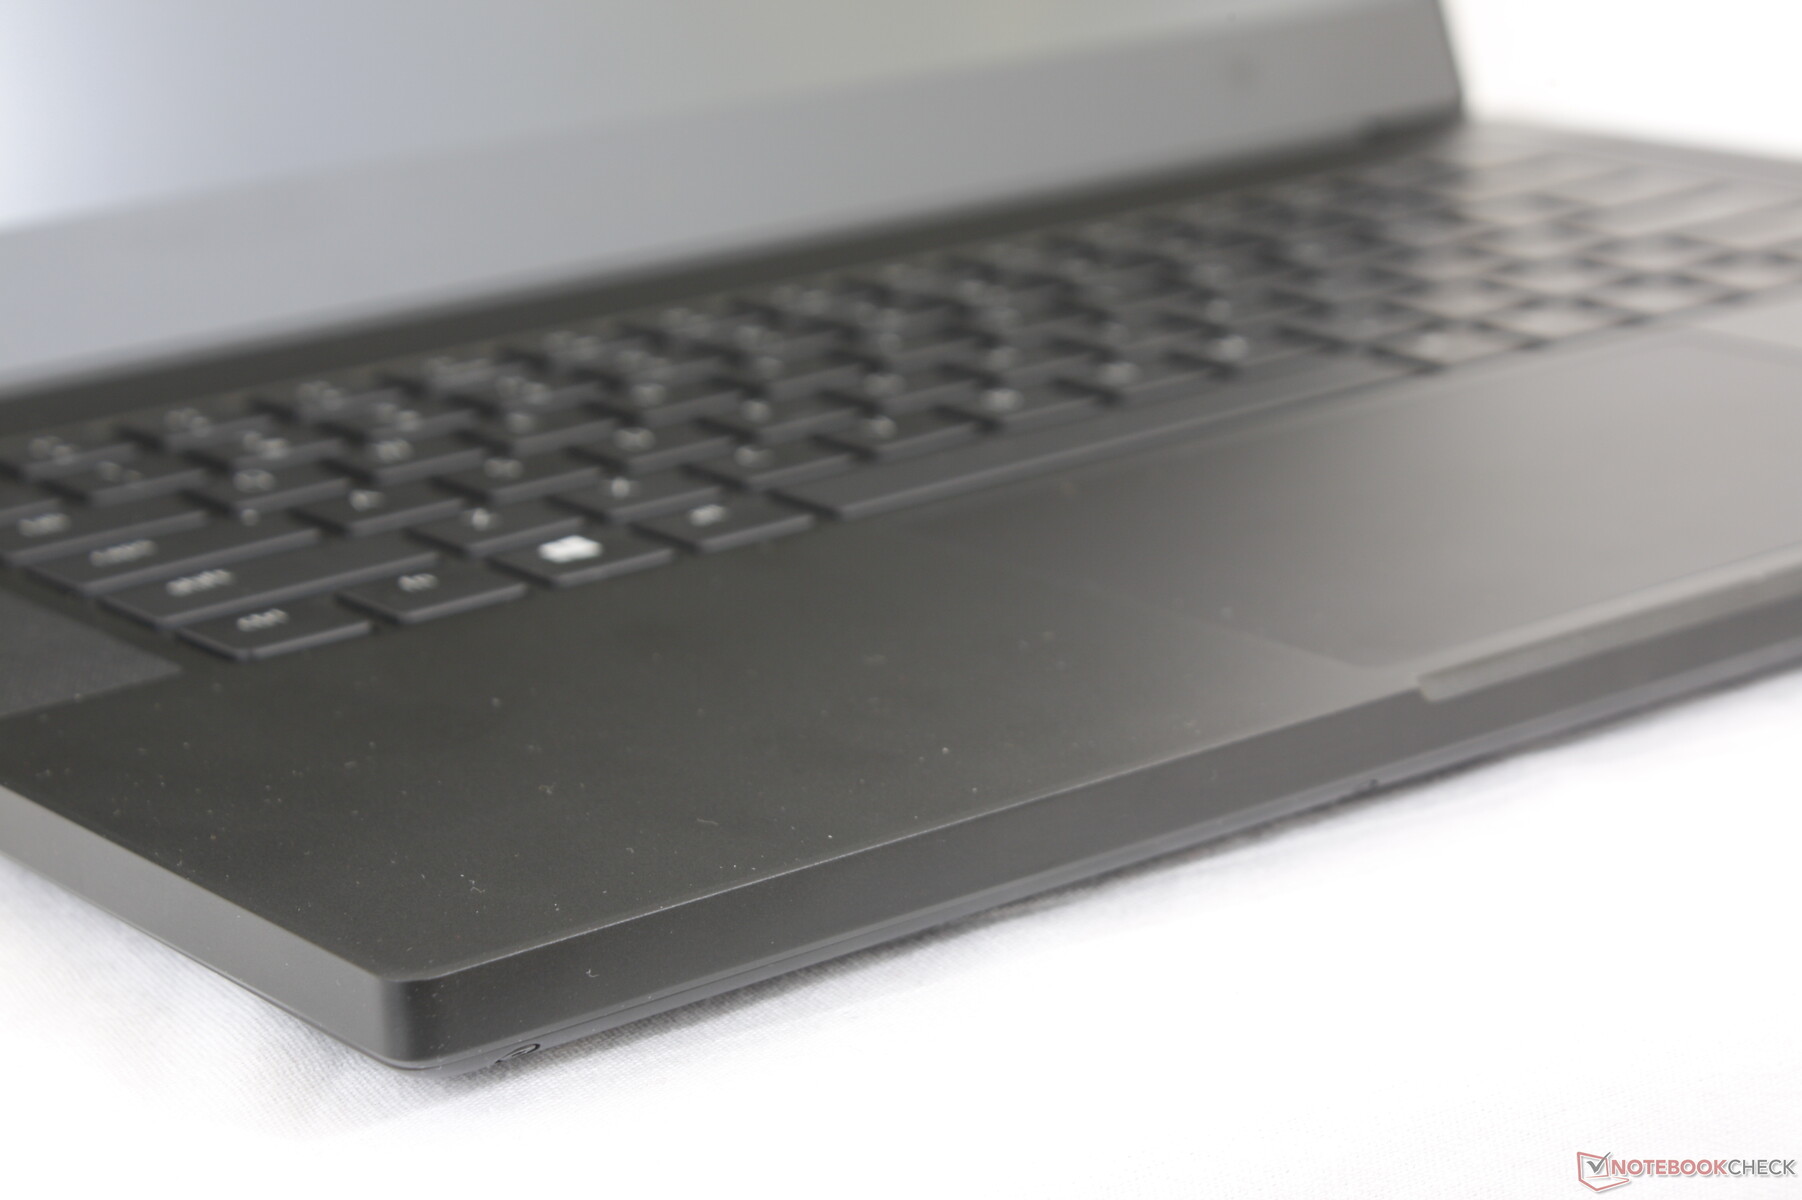
If Apple ever offered a Black MacBook Pro 15, then it would look a lot like the Blade 15. Razer laptops are often praised for their smooth, minimalist design and this remains true for the Blade 15 series. All our existing comments on older Blade 15 Advanced Model SKUs still apply here as nothing has changed in regard to chassis material, hinges, or quality. The system continues to feel stronger and more rigid than the Alienware m15, MSI GS65, and Gigabyte Aero 15 with no audible creaking for an undeniably captivating first impression to say the least.
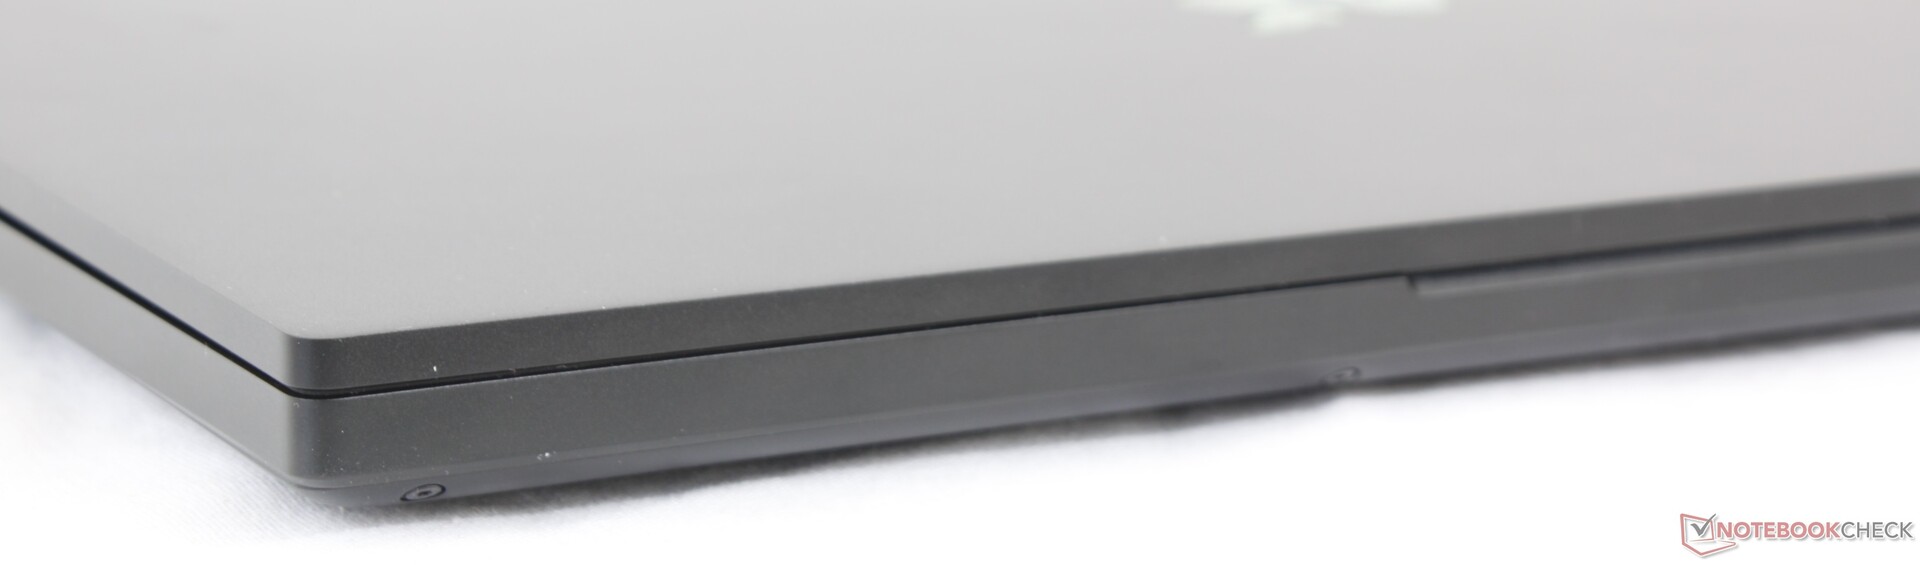
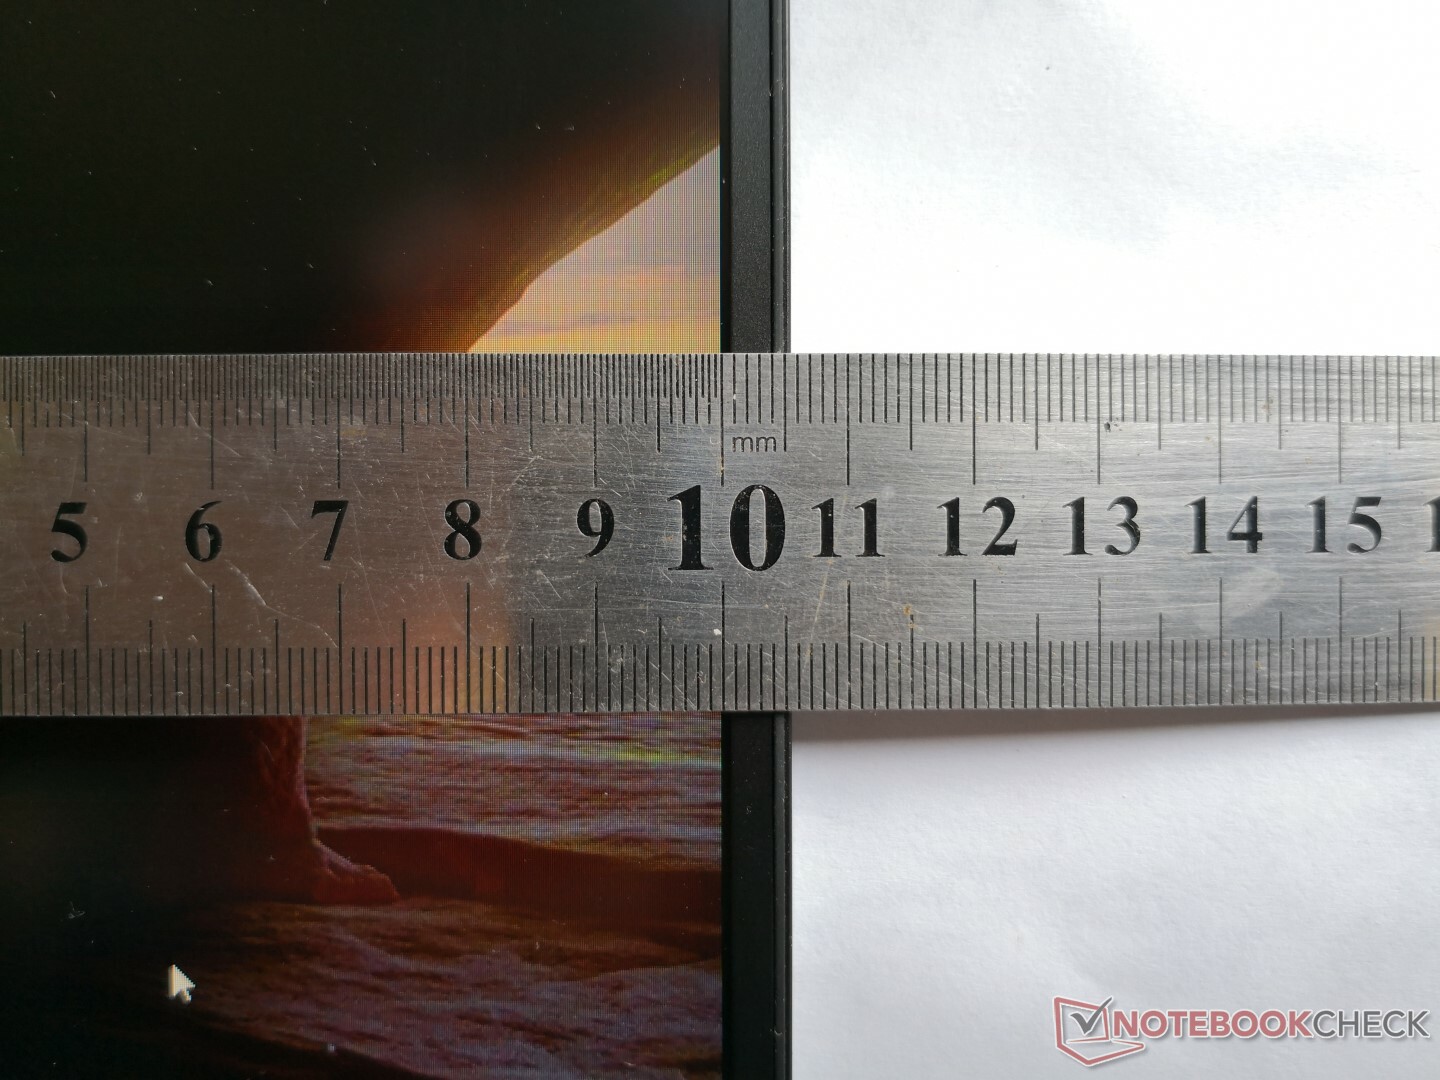
For future iterations, we'd like to see a stronger lid and a narrower bottom bezel for an even smaller footprint much like on the ZenBook 15 UX533. While not flimsy by any means, it's still more flexible than the lid of the XPS 15. These are merely nitpicks for an otherwise attractive and firm chassis.
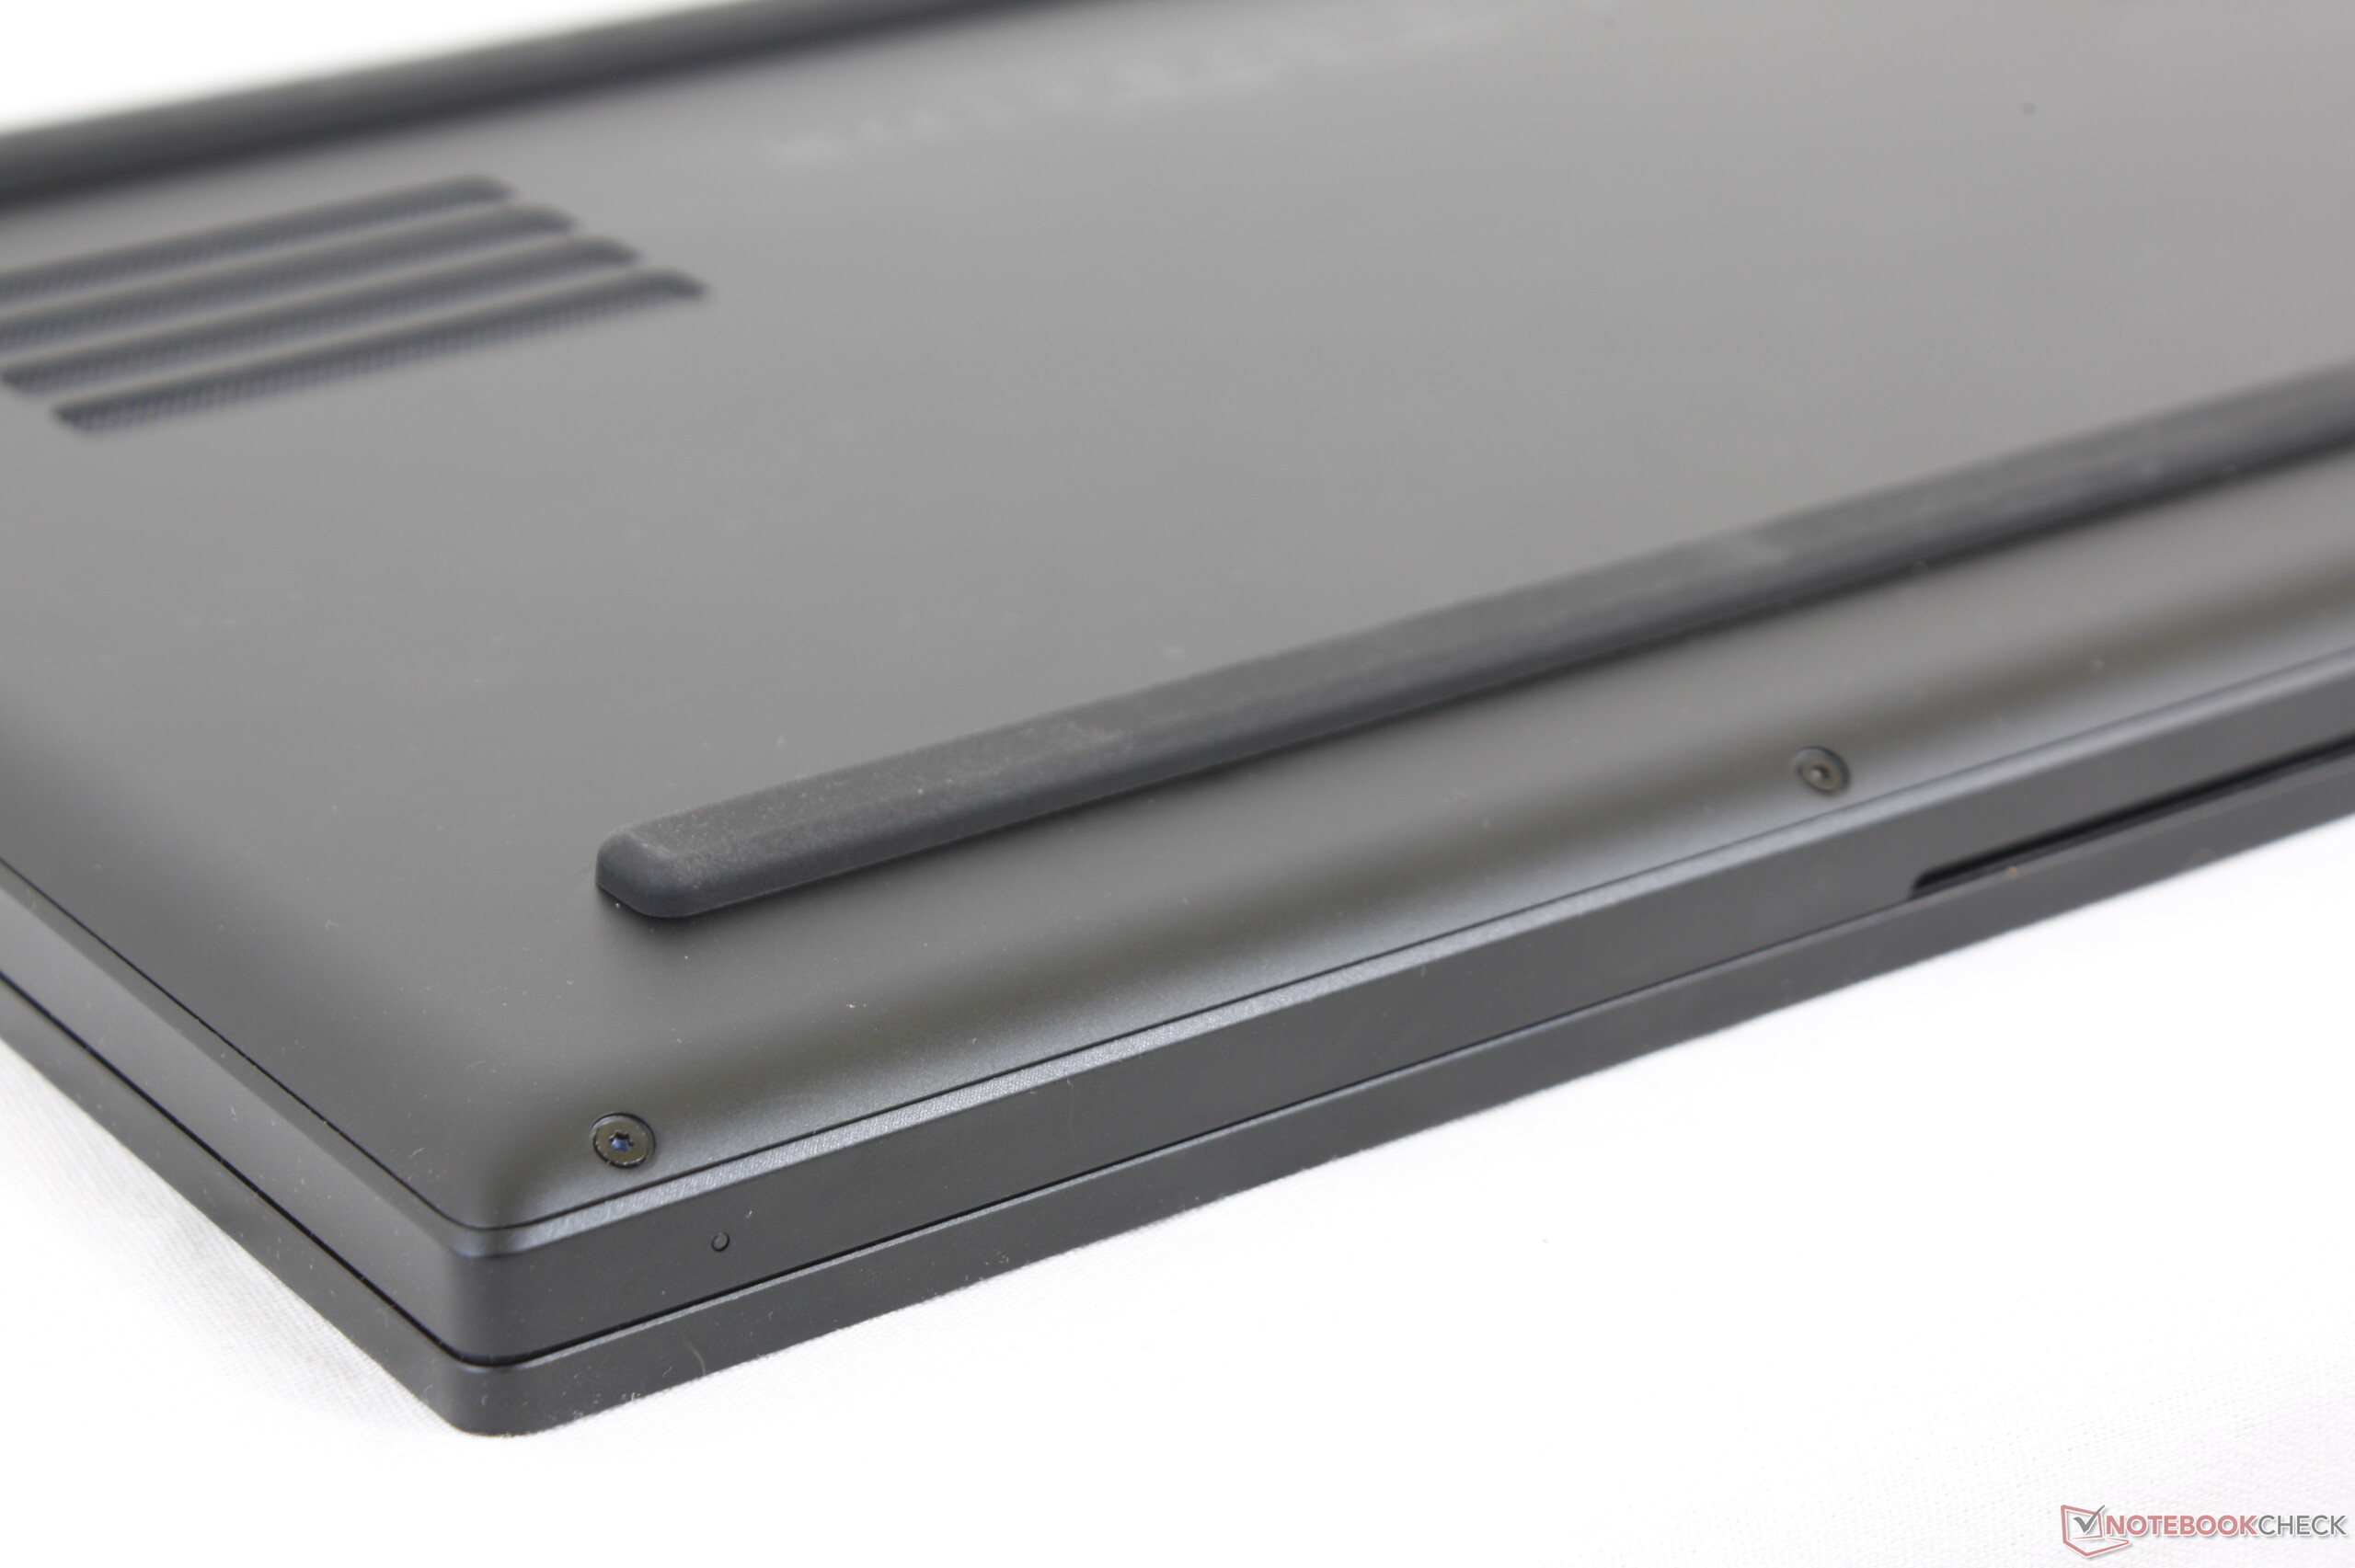
The RTX Blade 15 is ever-so-slightly thicker than last year's GTX Blade 15 as detailed on our page here. In short, Razer had to increase the Z height to accommodate the physically larger Nvidia Turing chip. Length and width are otherwise identical between all Blade 15 SKUs thus far and so it remains one of the smallest 15.6-inch gaming laptops available. Overall dimensions are actually very close to that of the XPS 15 but with a much more powerful GPU inside. Note that the Alienware m15 is significantly larger than the Razer even though it is marketed as a thin gaming laptop.
As for weight, the Blade 15 is heavier than the MSI GS65 while being smaller for a denser and hefty feel. It's still significantly lighter and more portable than thicker 15.6-inch gaming laptops like the MSI GT63 or Alienware 15. Note that the 4K UHD SKU will be slightly heavier because of the added glossy touchscreen.
| Blade 15 Original | Blade 15 Advanced Model | Blade 15 Base Model | Blade 15 RTX Advanced Model | |
|---|---|---|---|---|
| GPU | GTX 1060 Max-Q | GTX 1060 Max-Q, 1070 Max-Q | GTX 1060 Max-Q | RTX 2060, 2070 Max-Q, 2080 Max-Q |
| Dimensions | 355 x 235 x 16.8 mm (0.66") | 355 x 235 x 17.3 mm (0.68") | 355 x 235 x 19.9 mm (0.78") | 355 x 235 x 17.8 mm (0.70") |
| Weight | 2.07 kg (4.56 lbs) | 2.10 kg (4.63 lbs) | 2.03 kg (4.48 lbs) | 2.07 kg (4.56 lbs) up to 2.15 kg (4.73 lbs) |

Connectivity
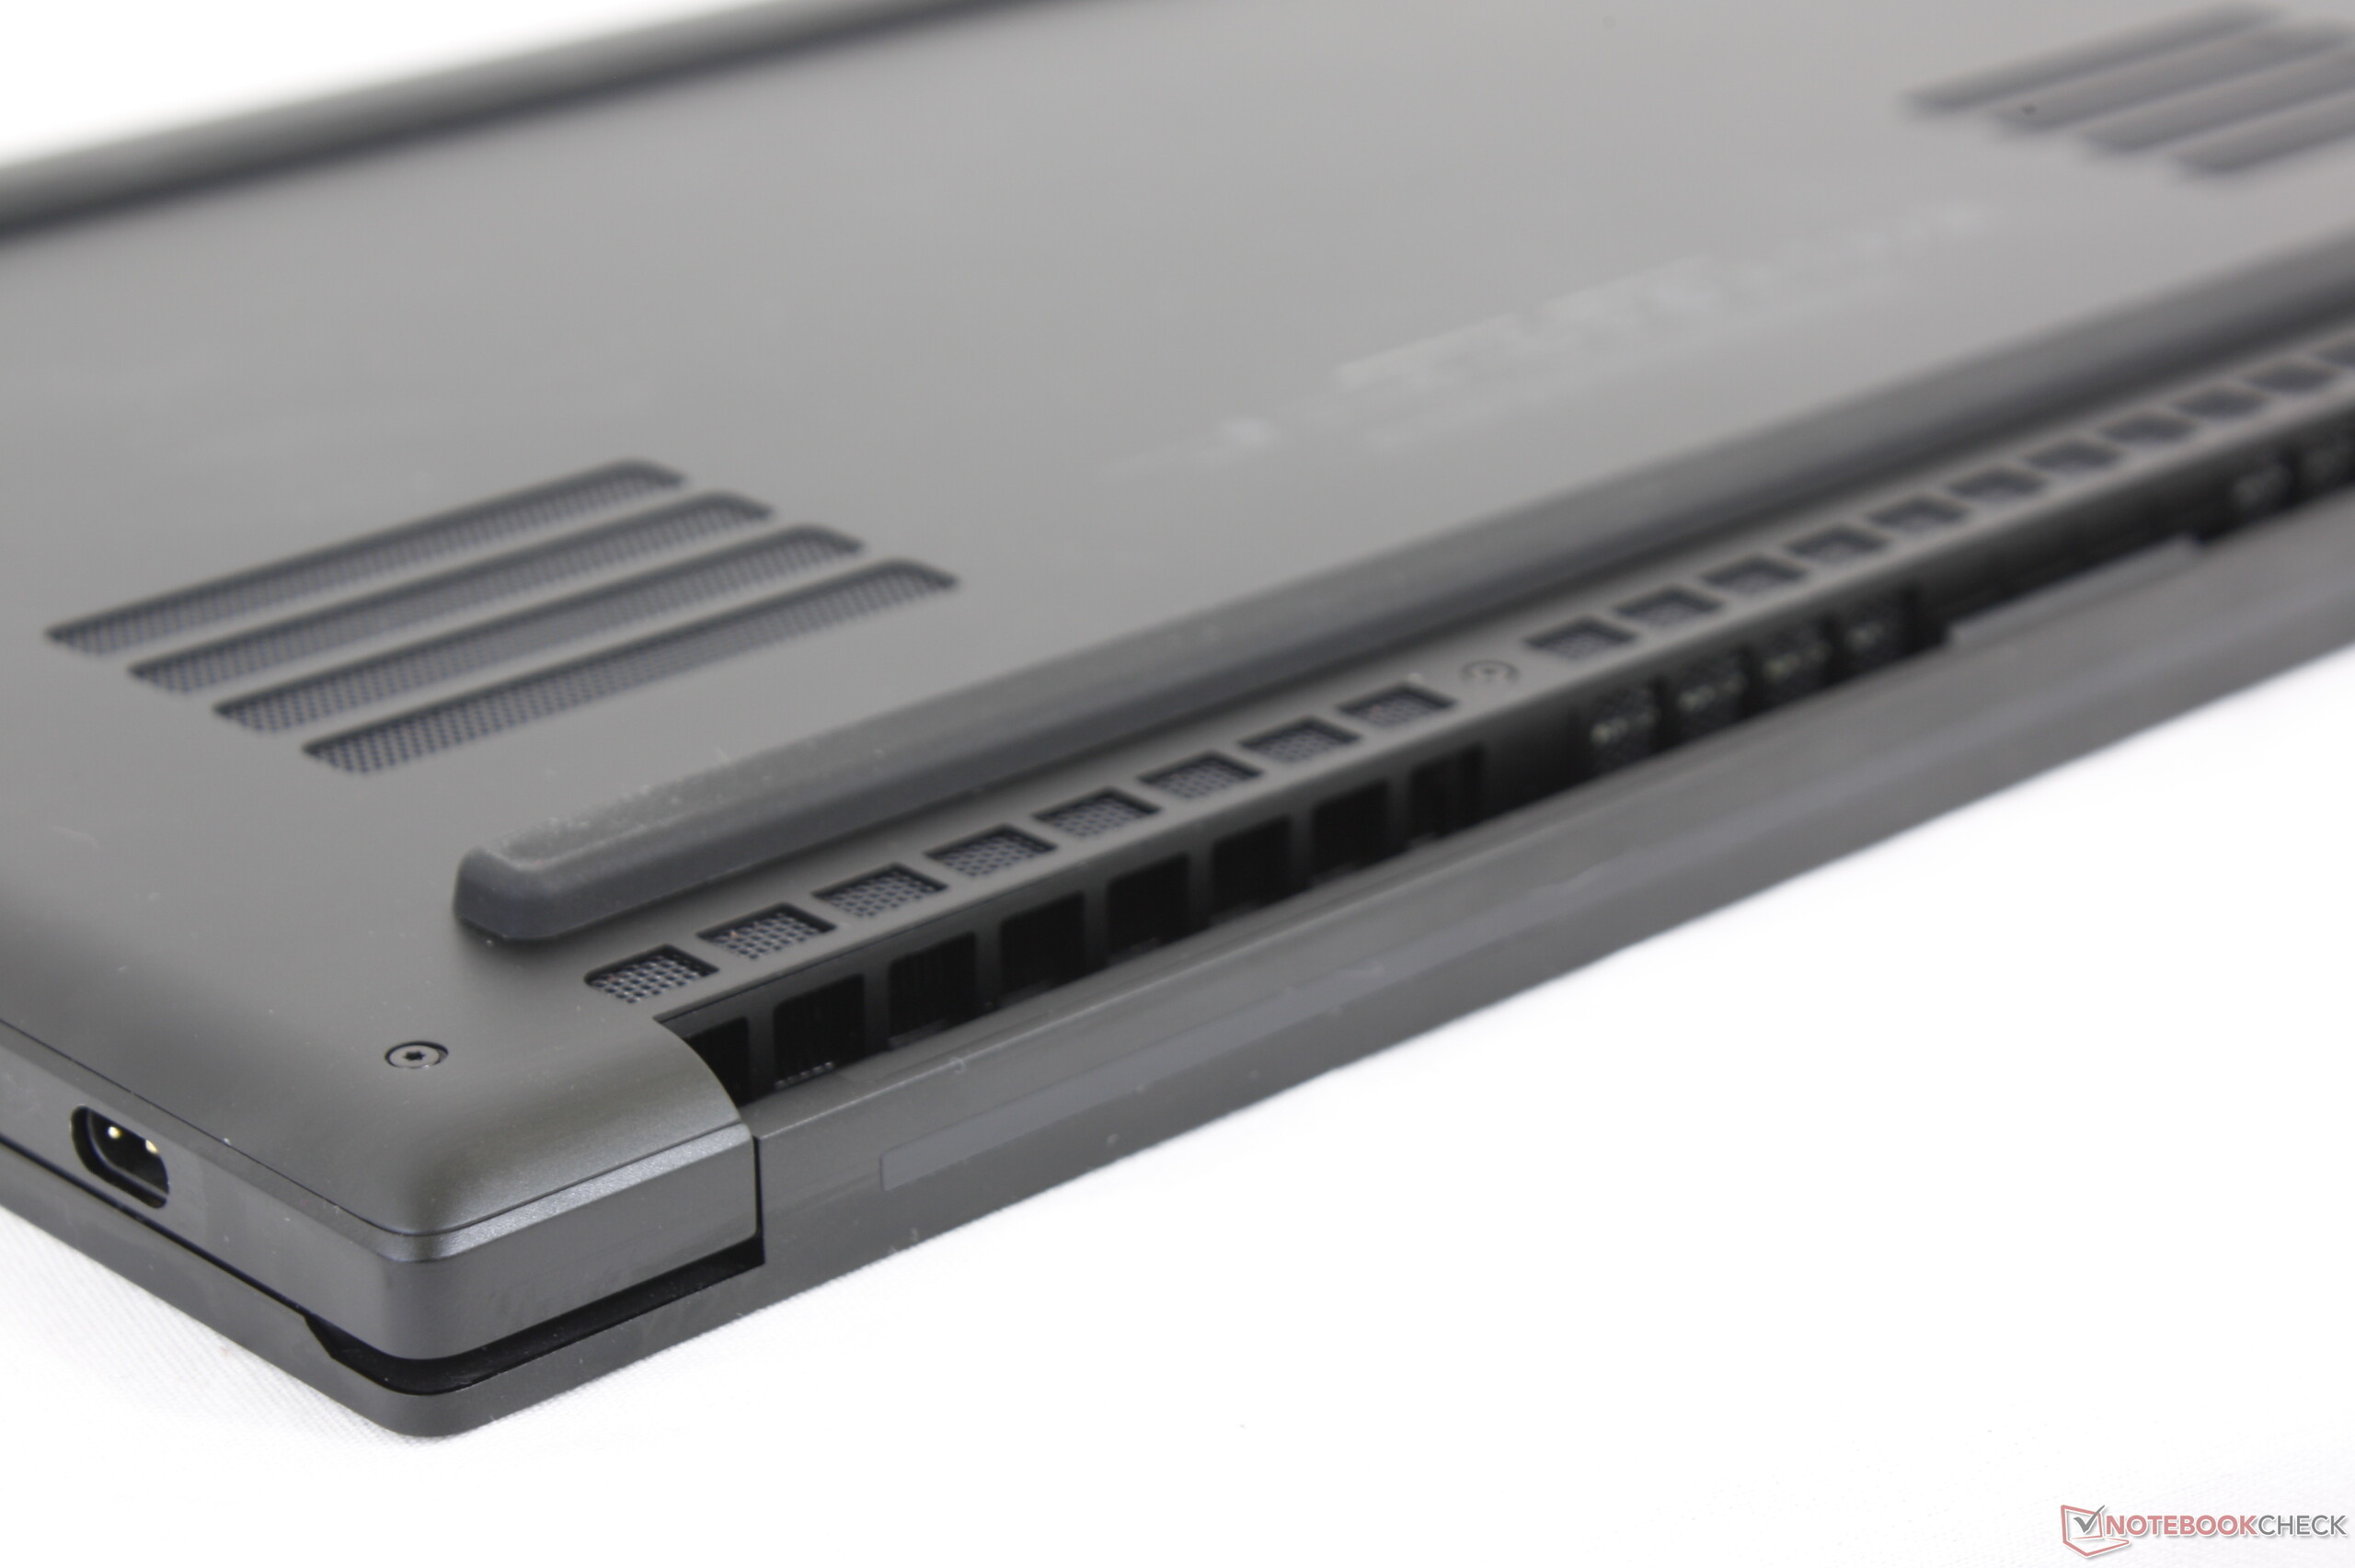
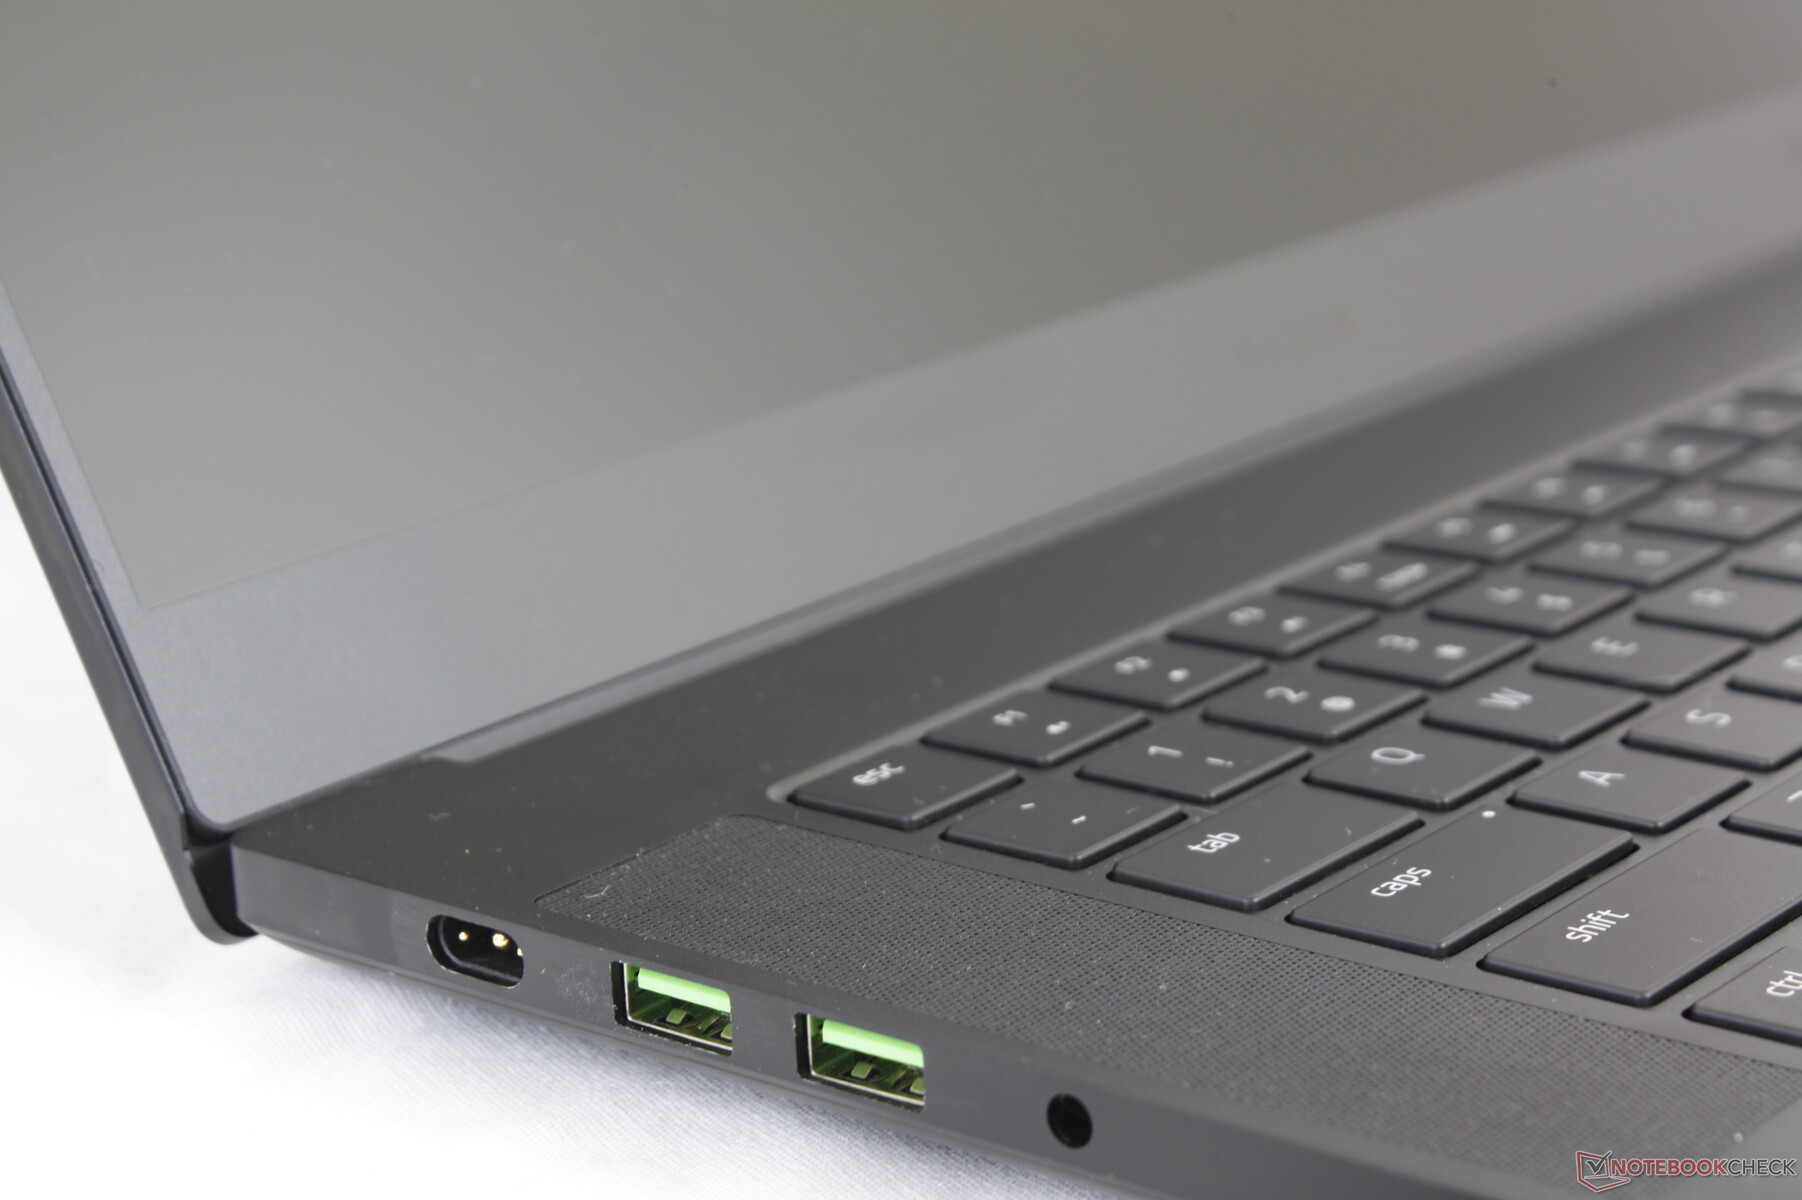
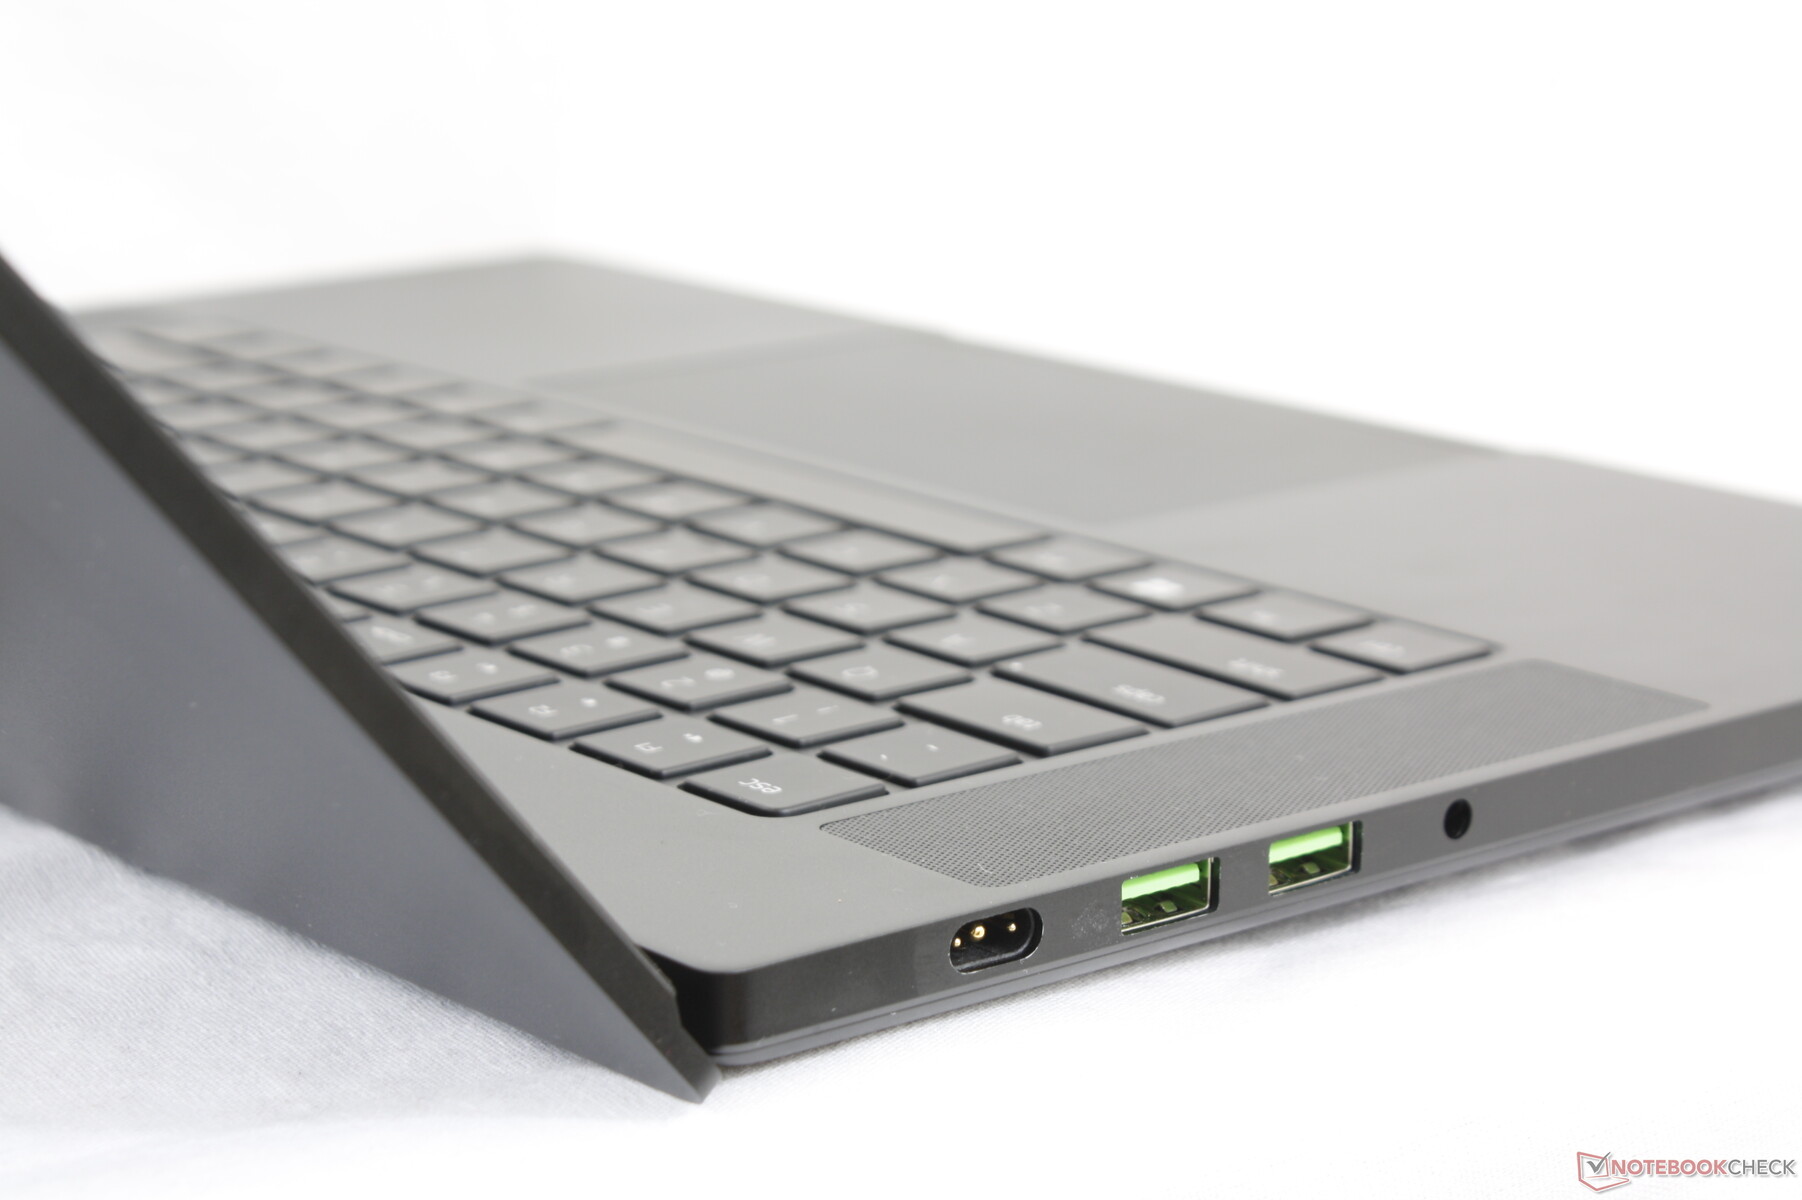
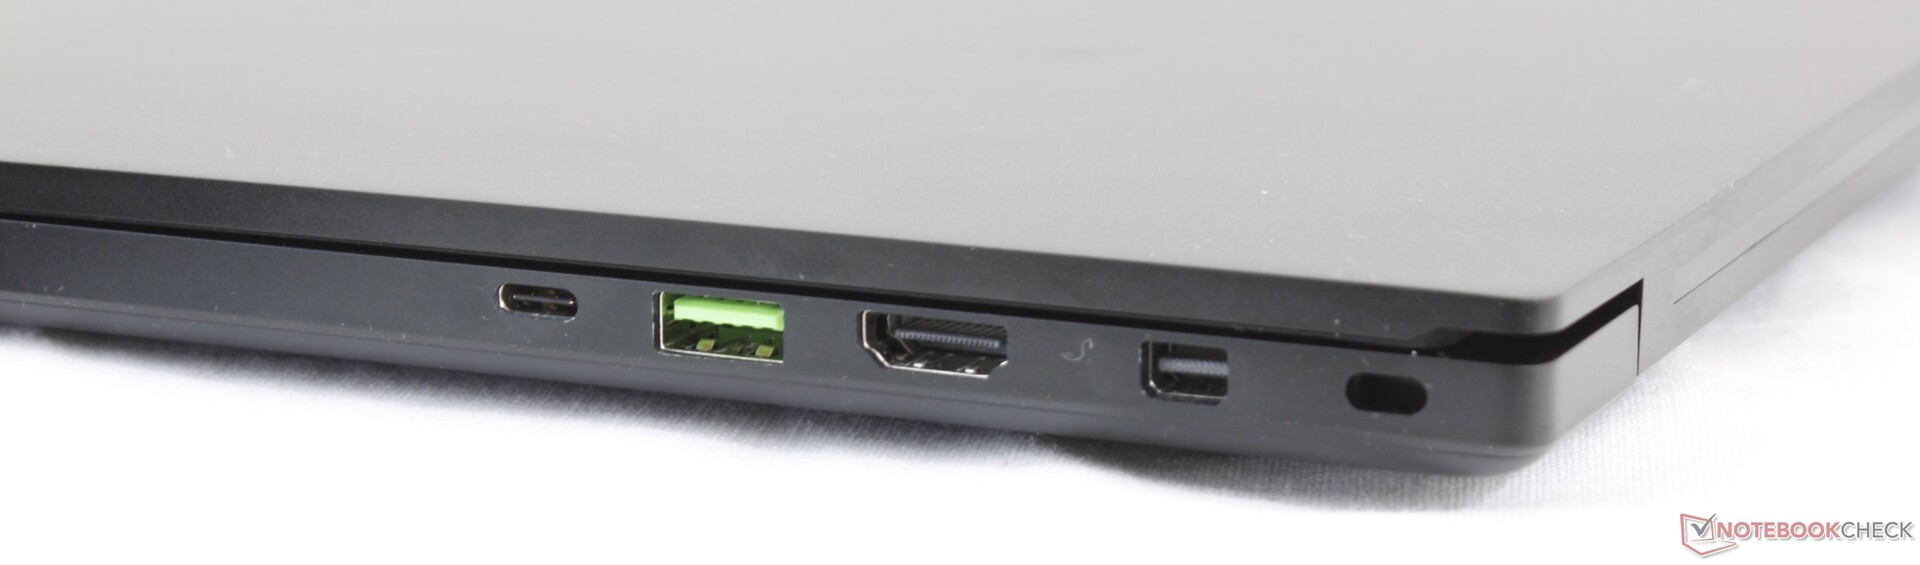
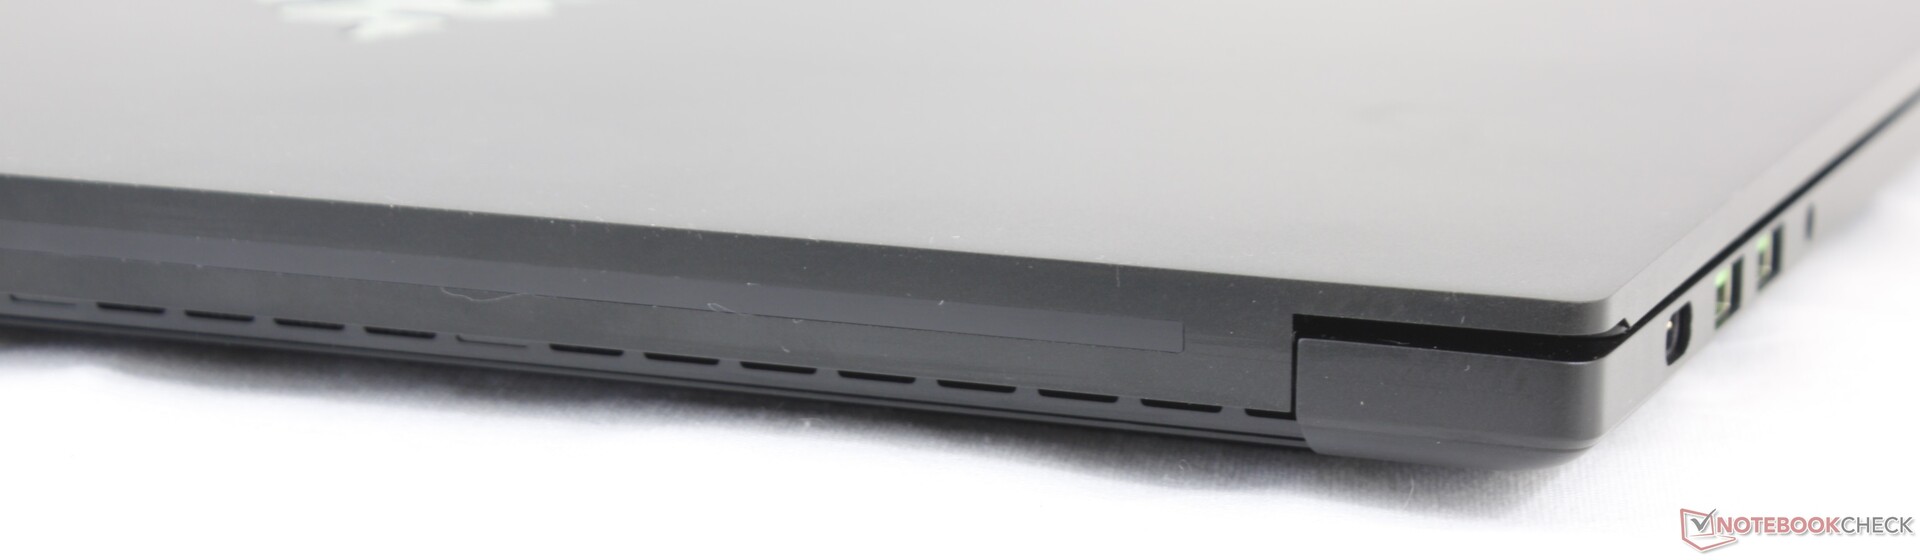
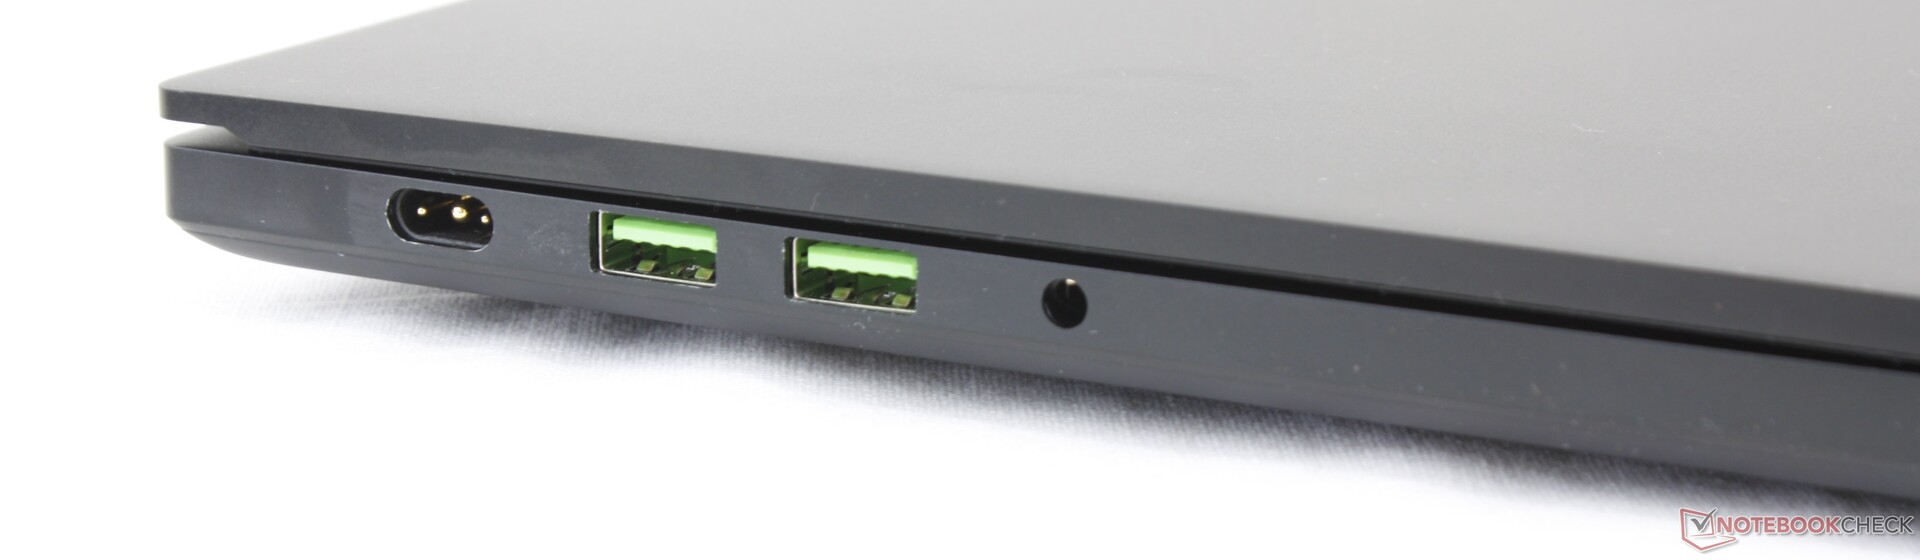
Port selection and positioning remain identical to last year's GTX Blade 15 Advanced Model despite the slight increase in thickness. Note that RJ-45 is only available on the GTX Blade 15 Base Model for now. Users hoping for an integrated SD card reader will have to cross their fingers for the next chassis iteration.
Communication
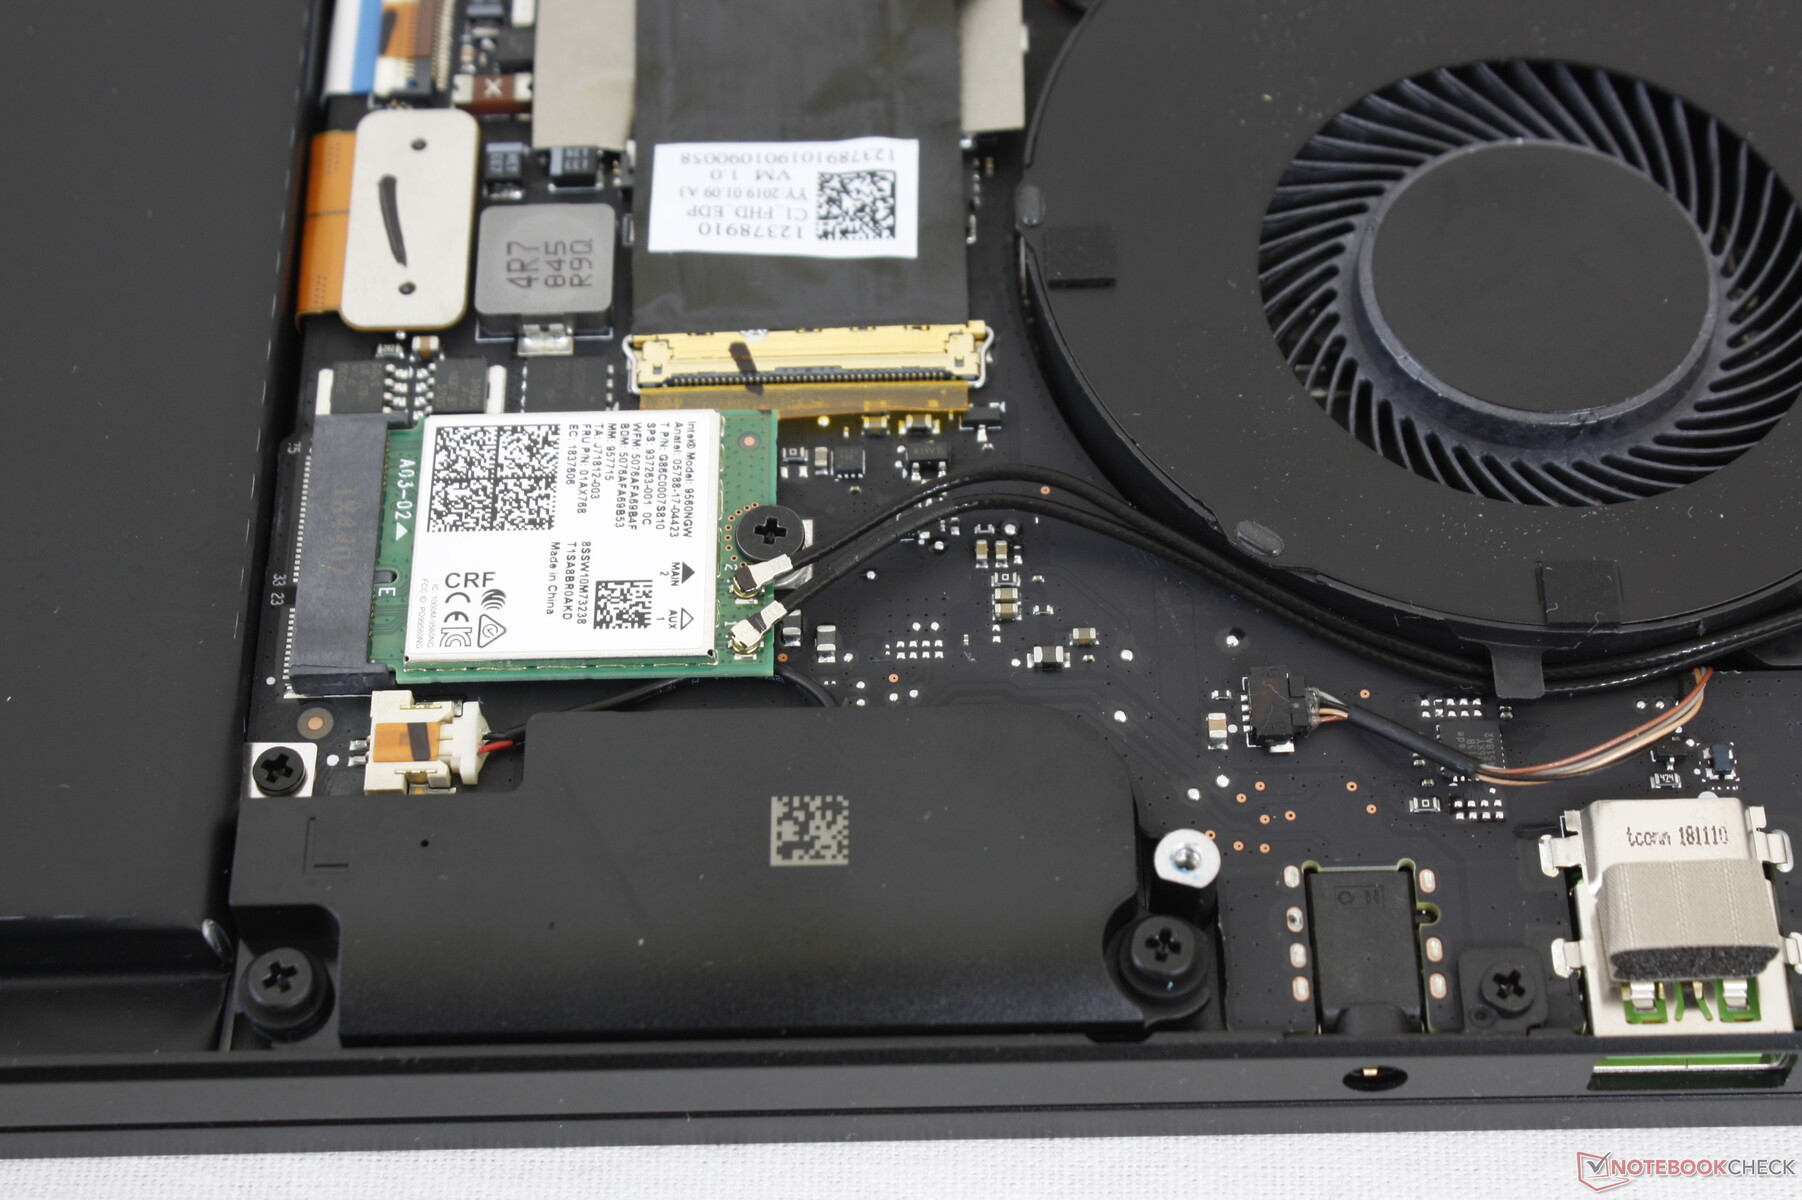
Razer has swapped out the Intel 9260 found on last year's GTX Blade 15 for the newer Intel 9560. Performance is otherwise identical between the two WiFi modules as both integrate Bluetooth 5 and are capable of WLAN transfer rates of up to 1.73 Gbps. The benefits of an Intel 9560 over the Intel 9260 are instead related to LTE coexistence which does not apply to the Razer system. Competing models like the Alienware m15 are equipped with Killer 1550 WiFi for more gamer-centric features than our Razer.
We did not experience any connectivity issues during our time with the test unit. Performance can be faster than what we've recorded below since our server setup is limited by a 1 Gbps line.
Maintenance
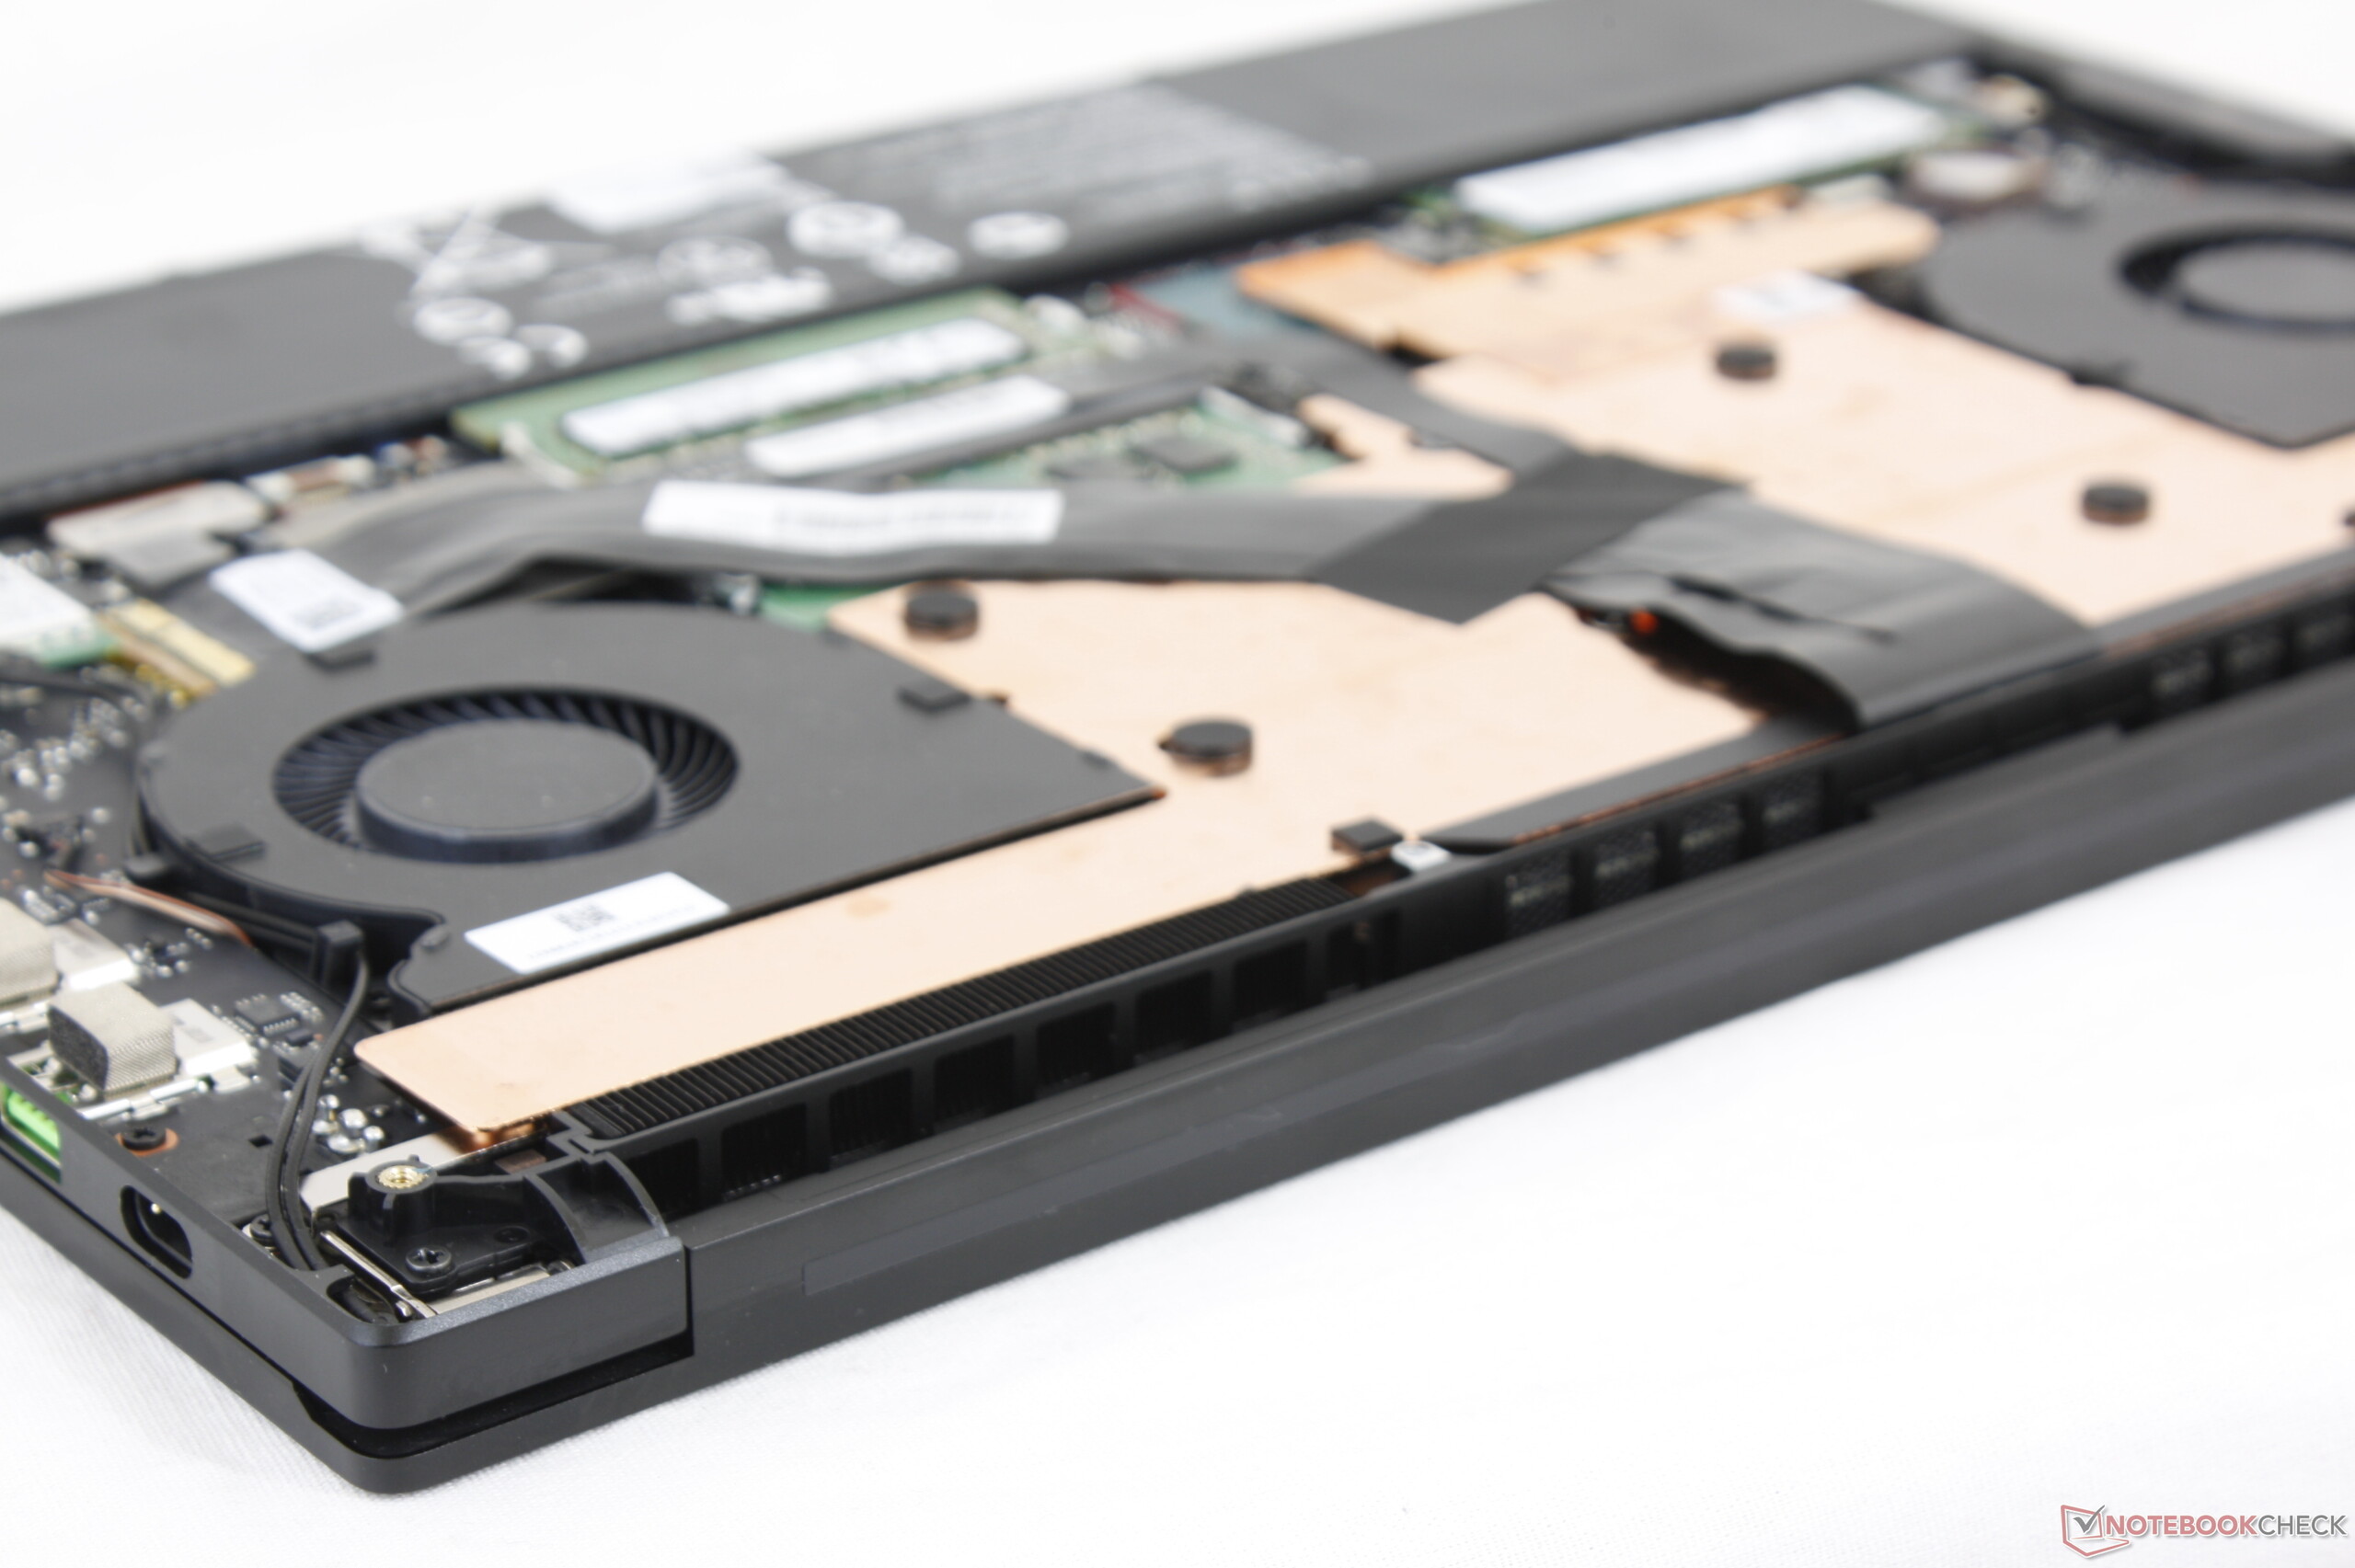
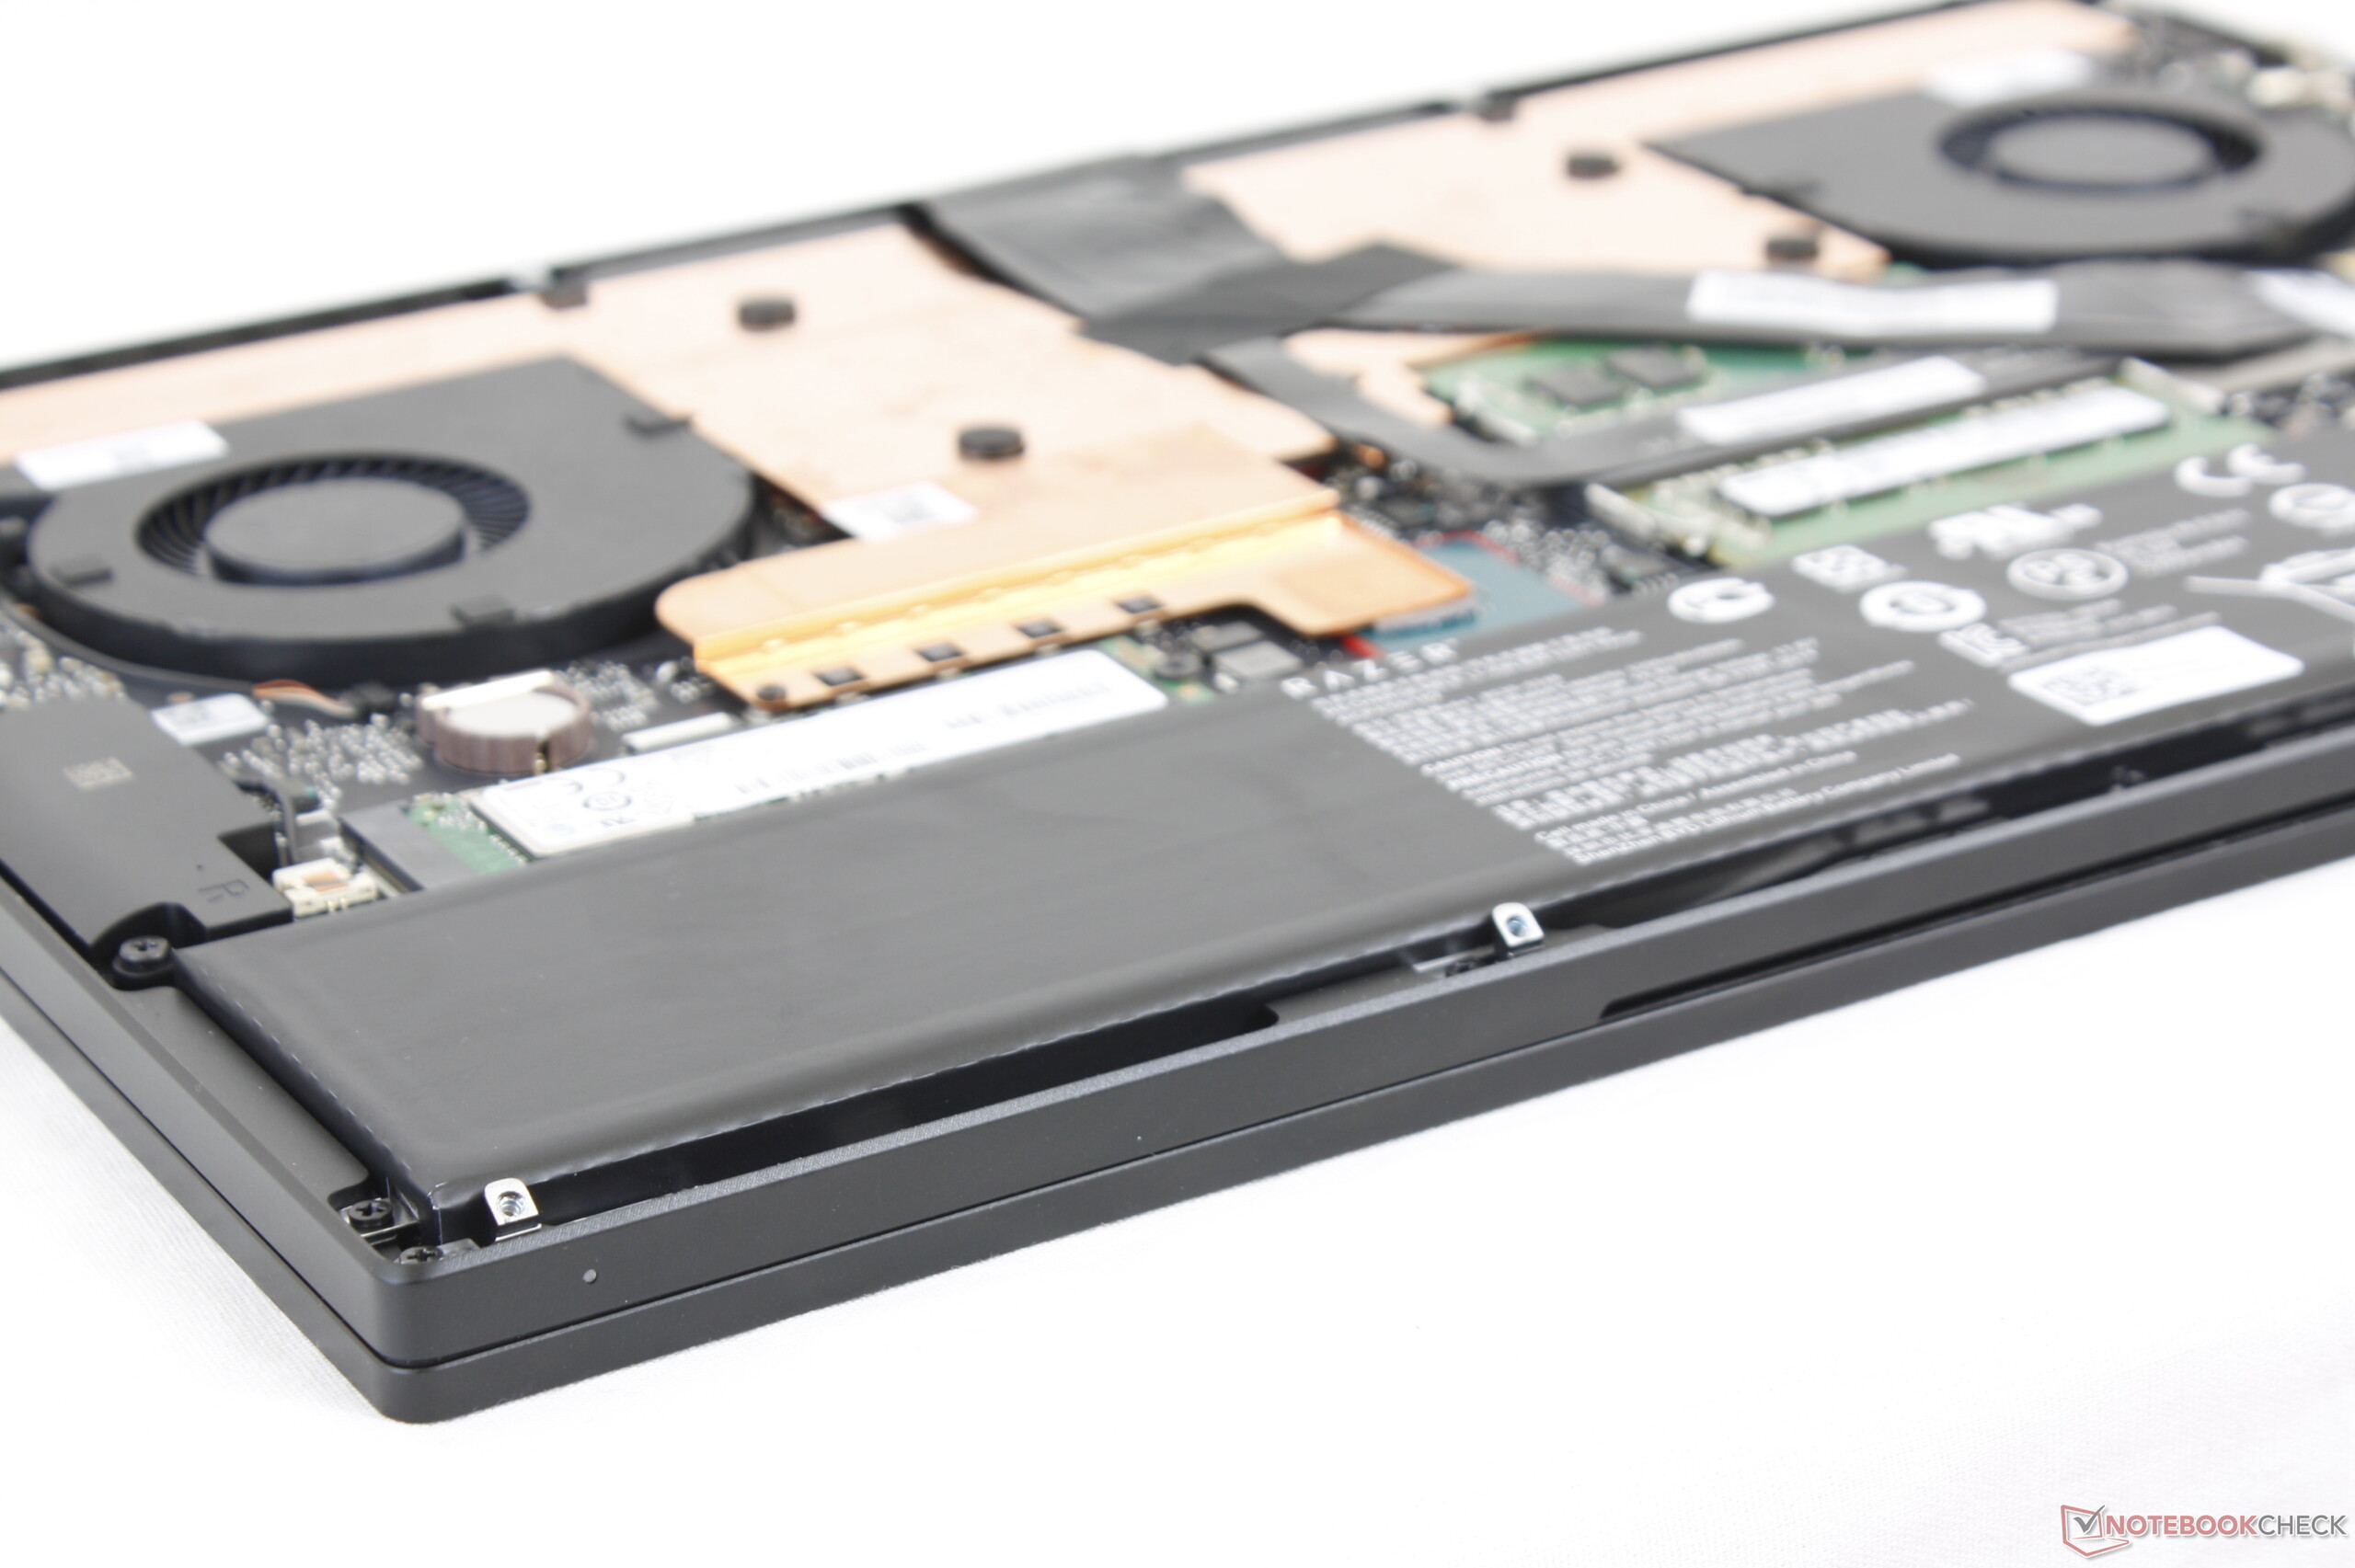
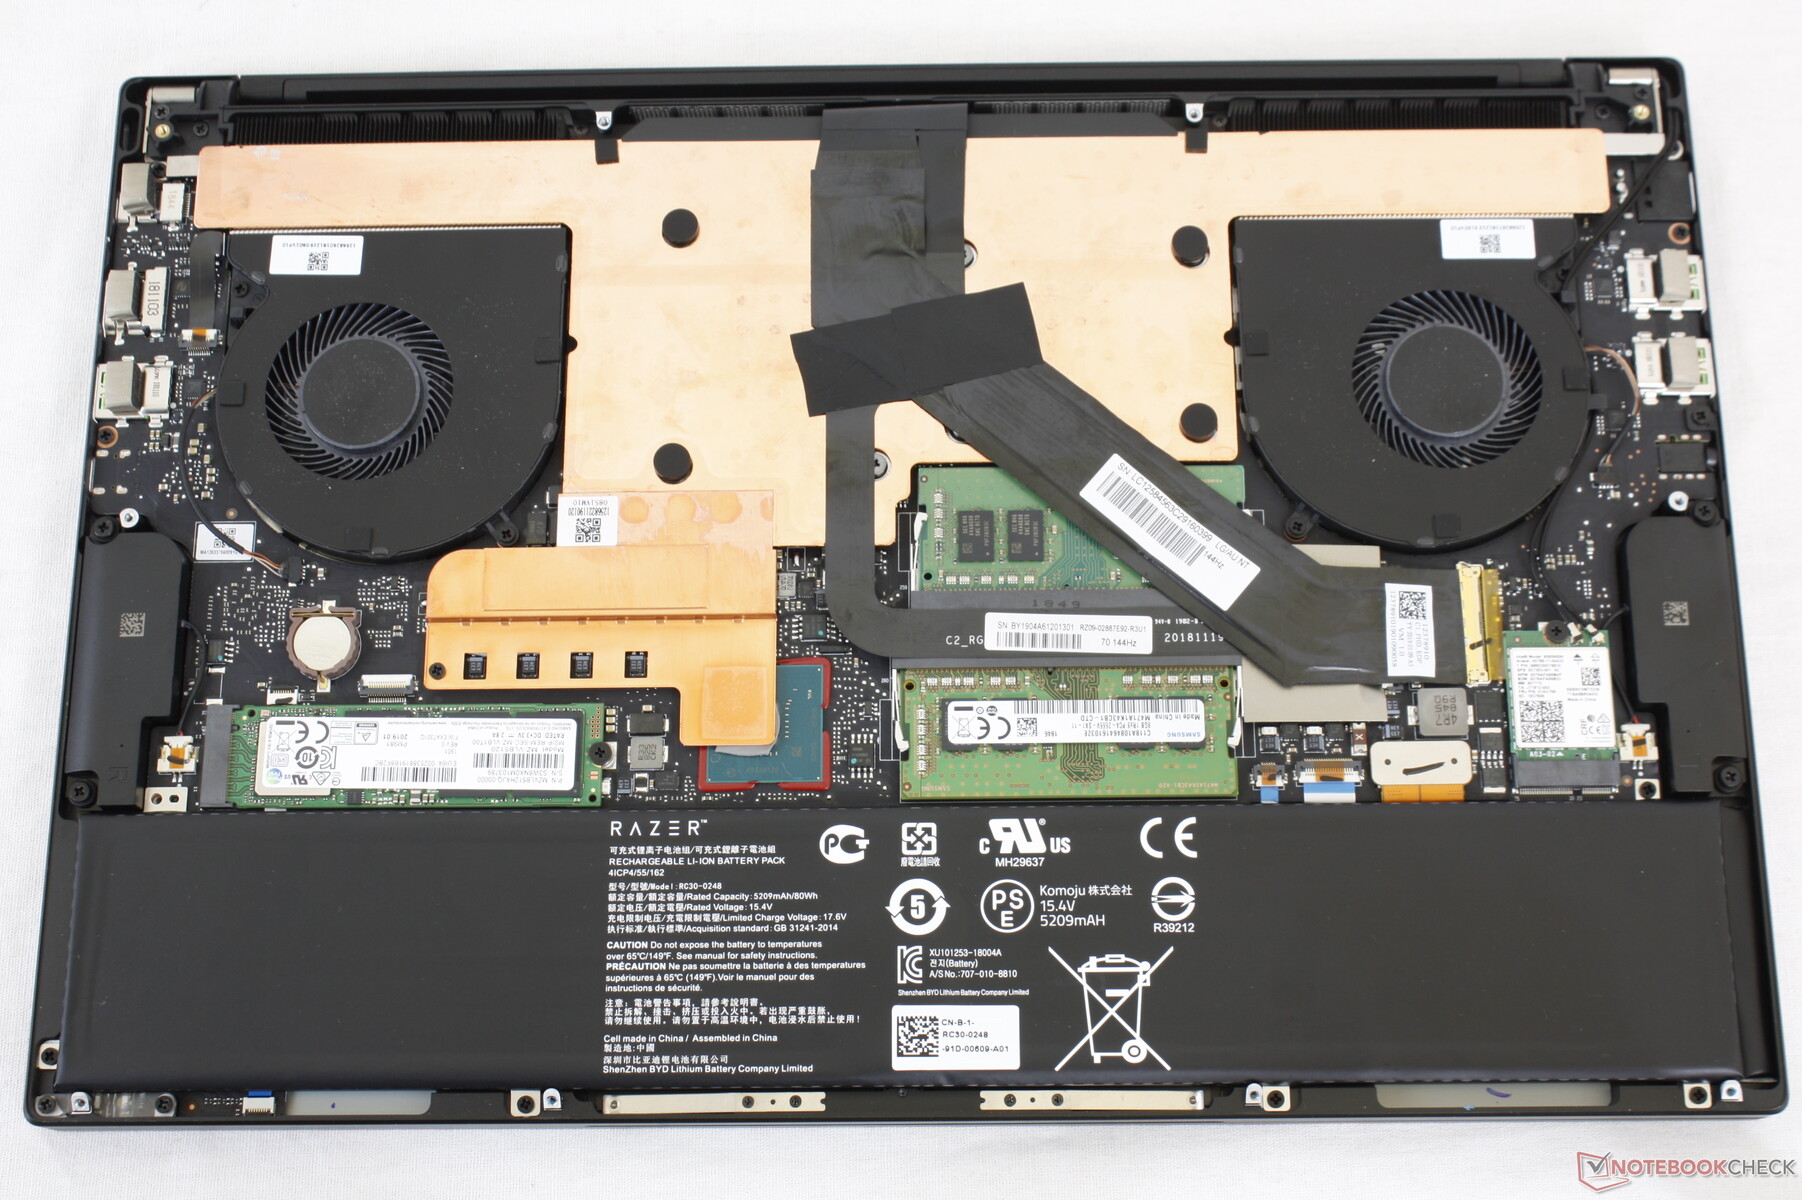
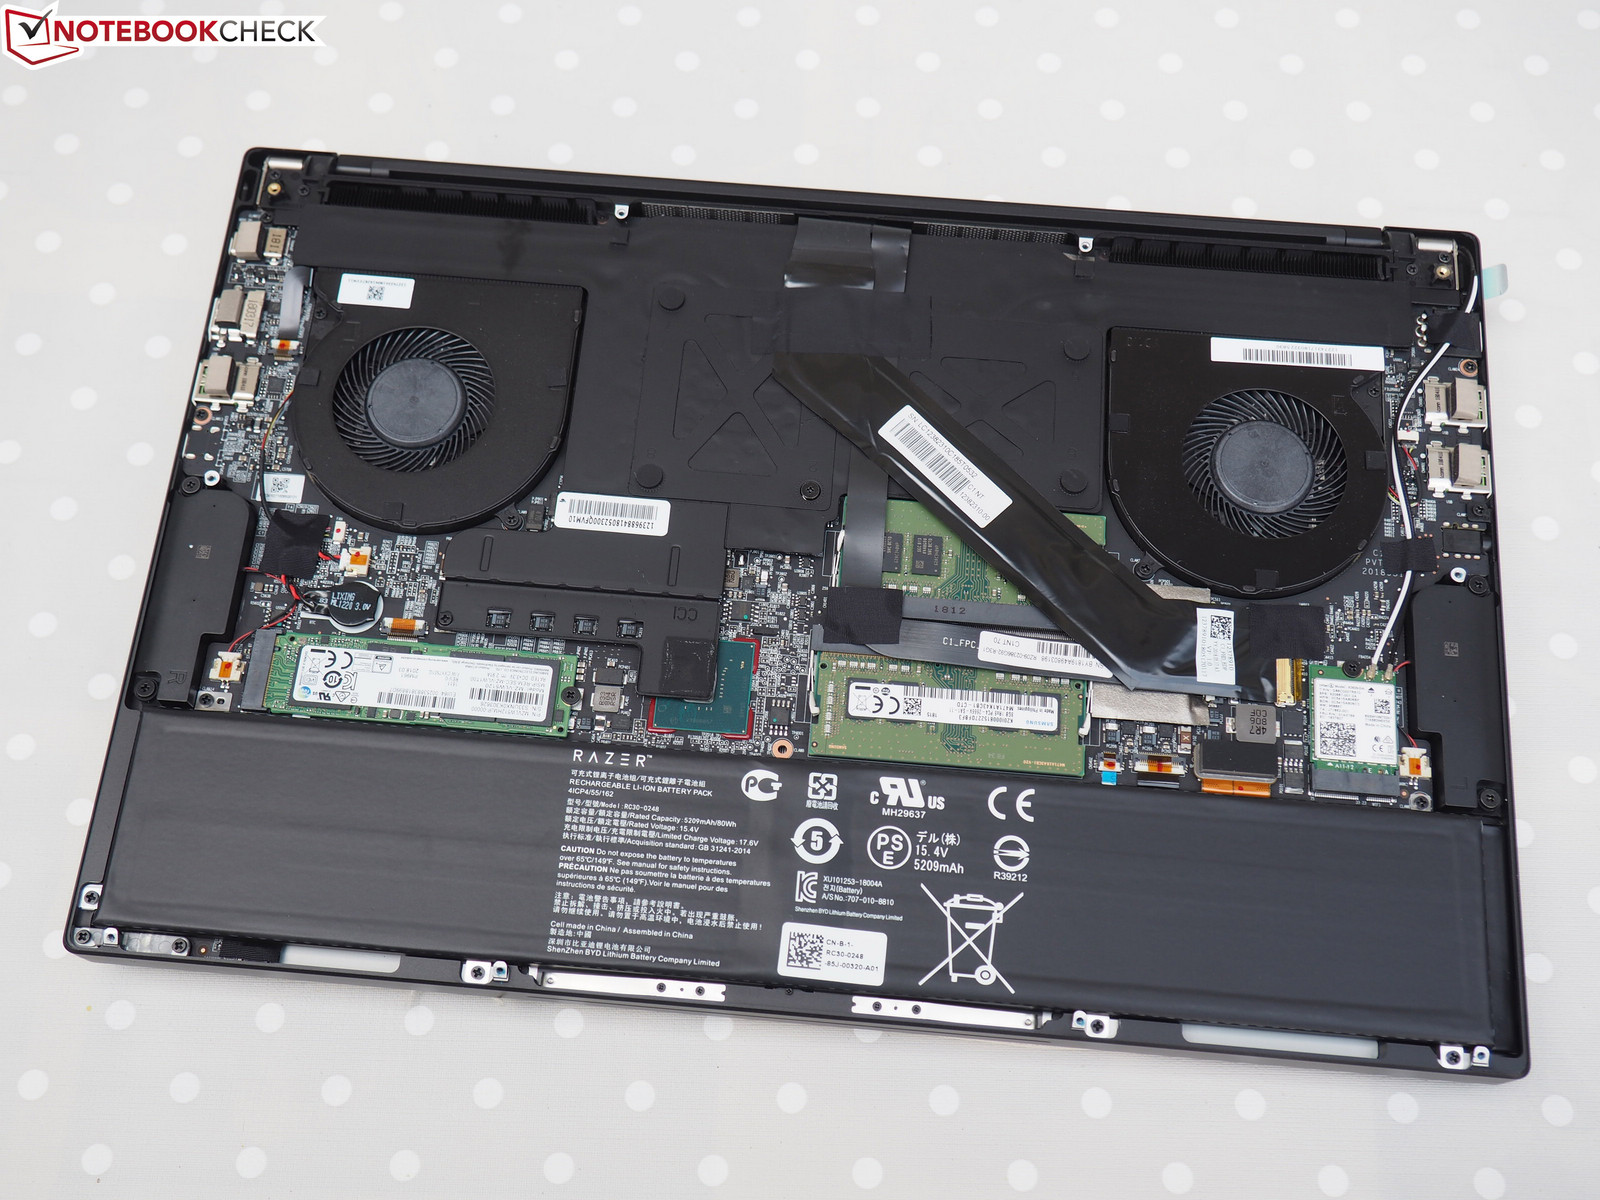
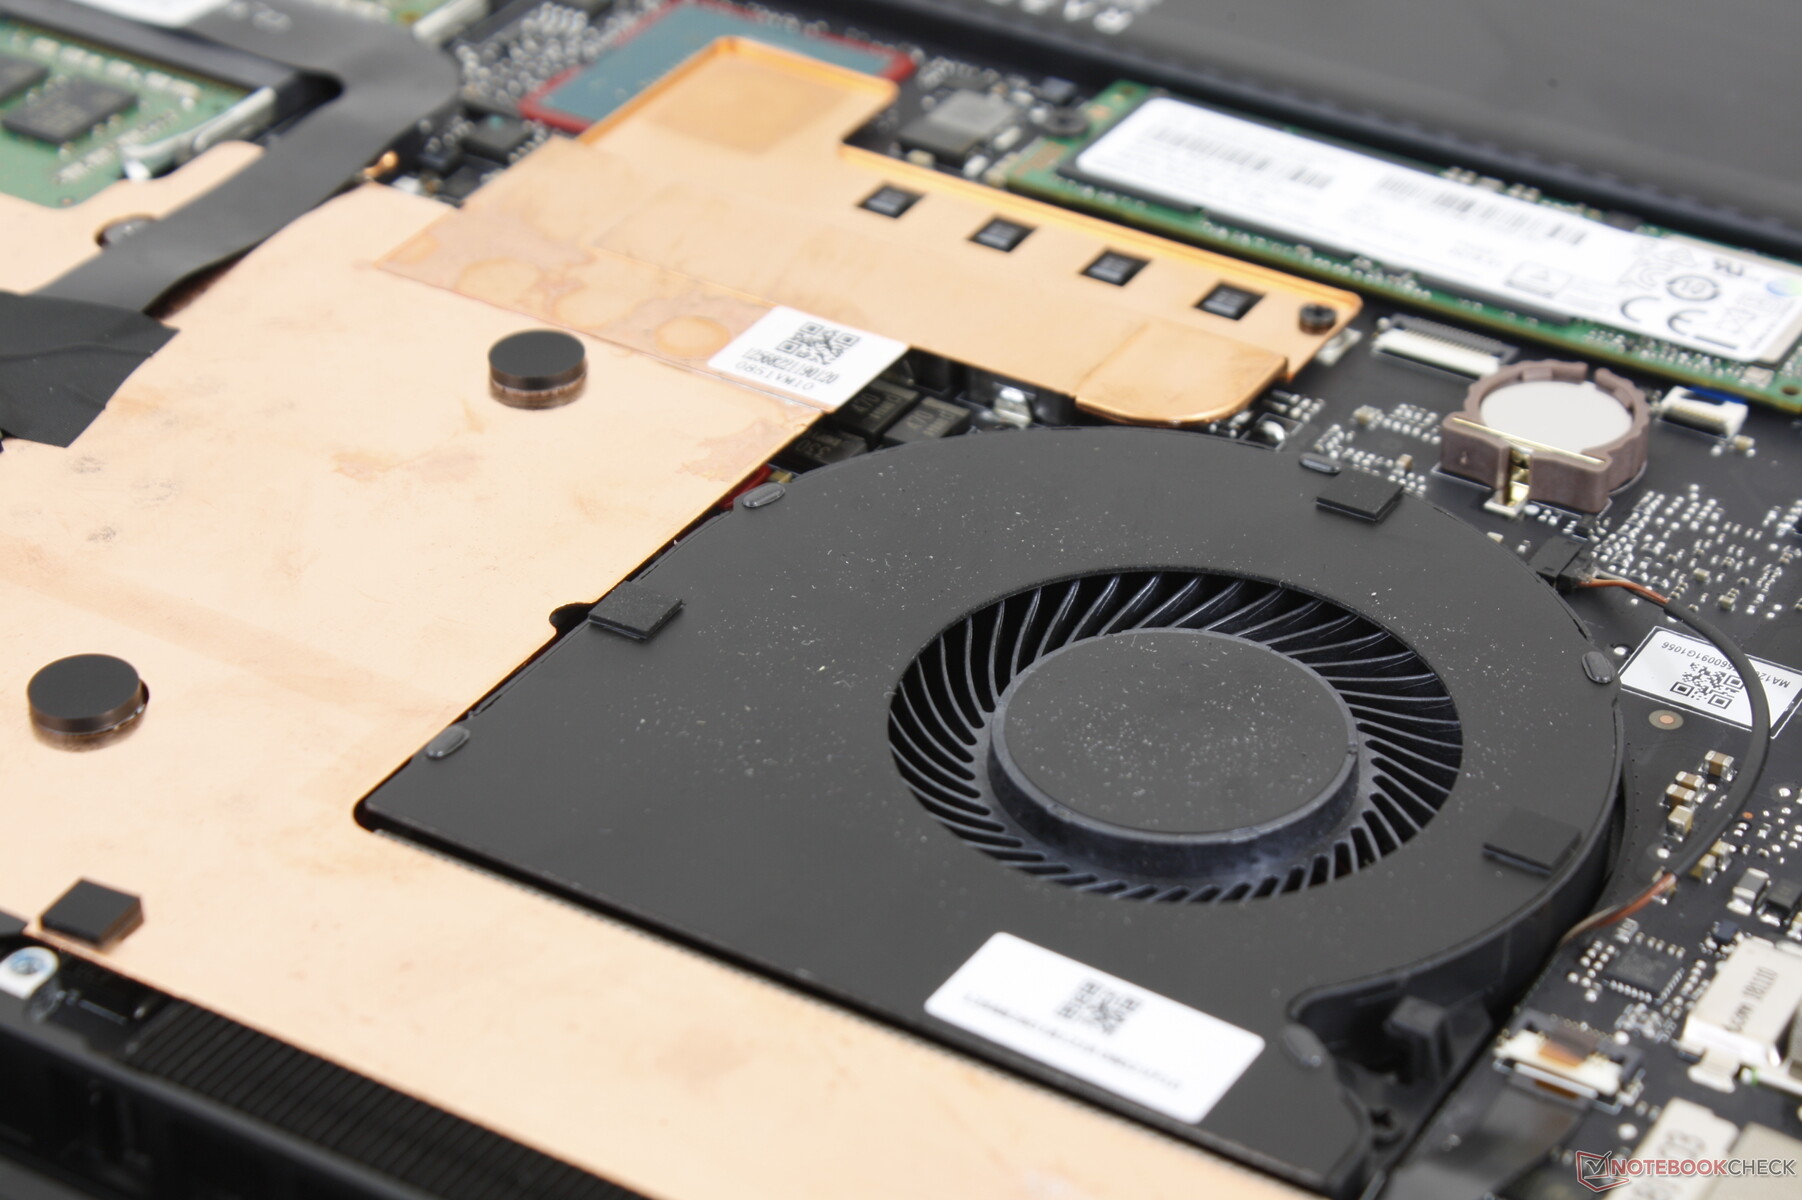
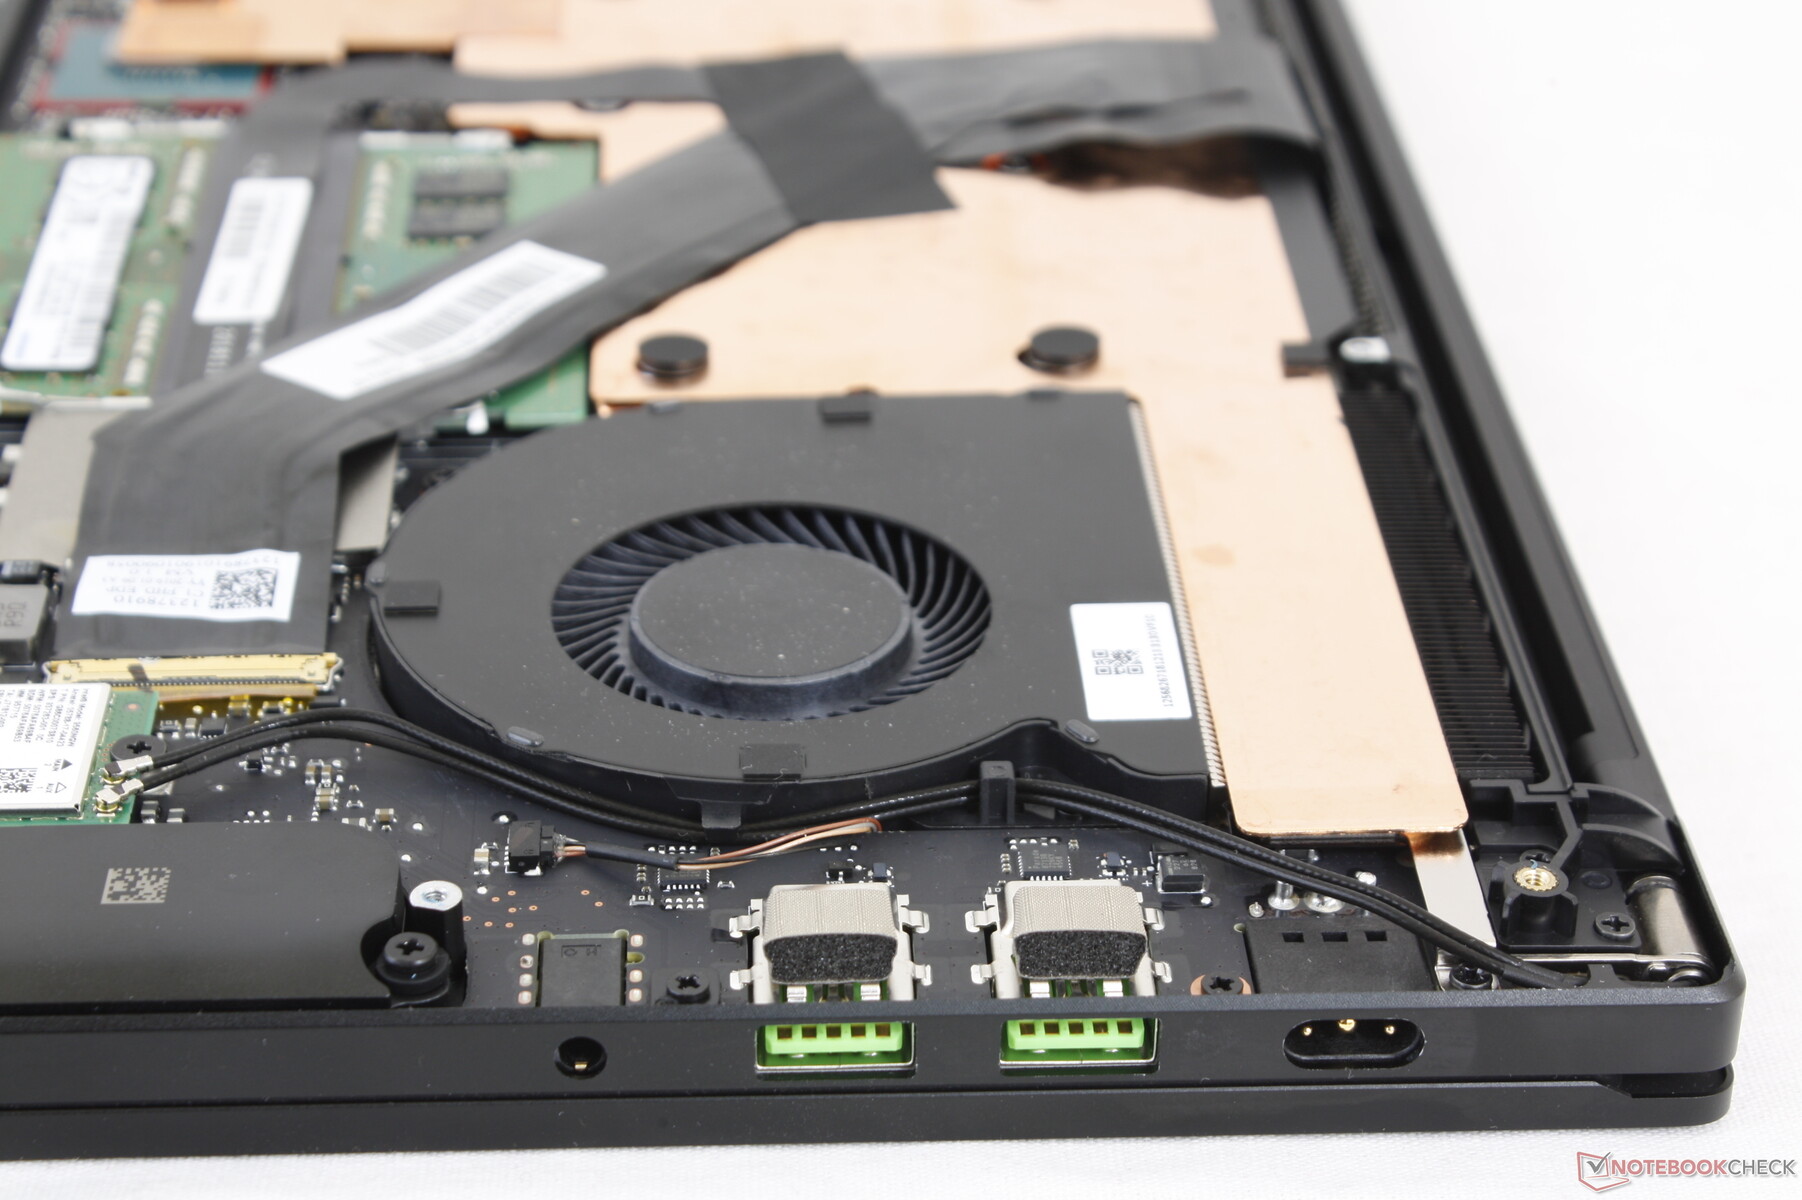
The bottom plate pops out without much effort once the T5 Torx screws are removed. Internal layout and upgrade options are almost the same as the 2018 Blade 15 Advanced Model as shown below.
Accessories and Warranty
Included extras are a warranty card, Quick Start guide, and a small cleaning cloth. We would have liked to see a USB-to-Ethernet adapter to make up for the lack of integrated RJ-45. The Razer Core eGPU docking station is supported via the Thunderbolt 3 port.
A one-year limited warranty applies if purchased in the United States. The optional RazerCare program extends warranty by two years for a total of three years of coverage. Please see our Guarantees, Return policies and Warranties article for country-specific information.
Input Devices
Keyboard
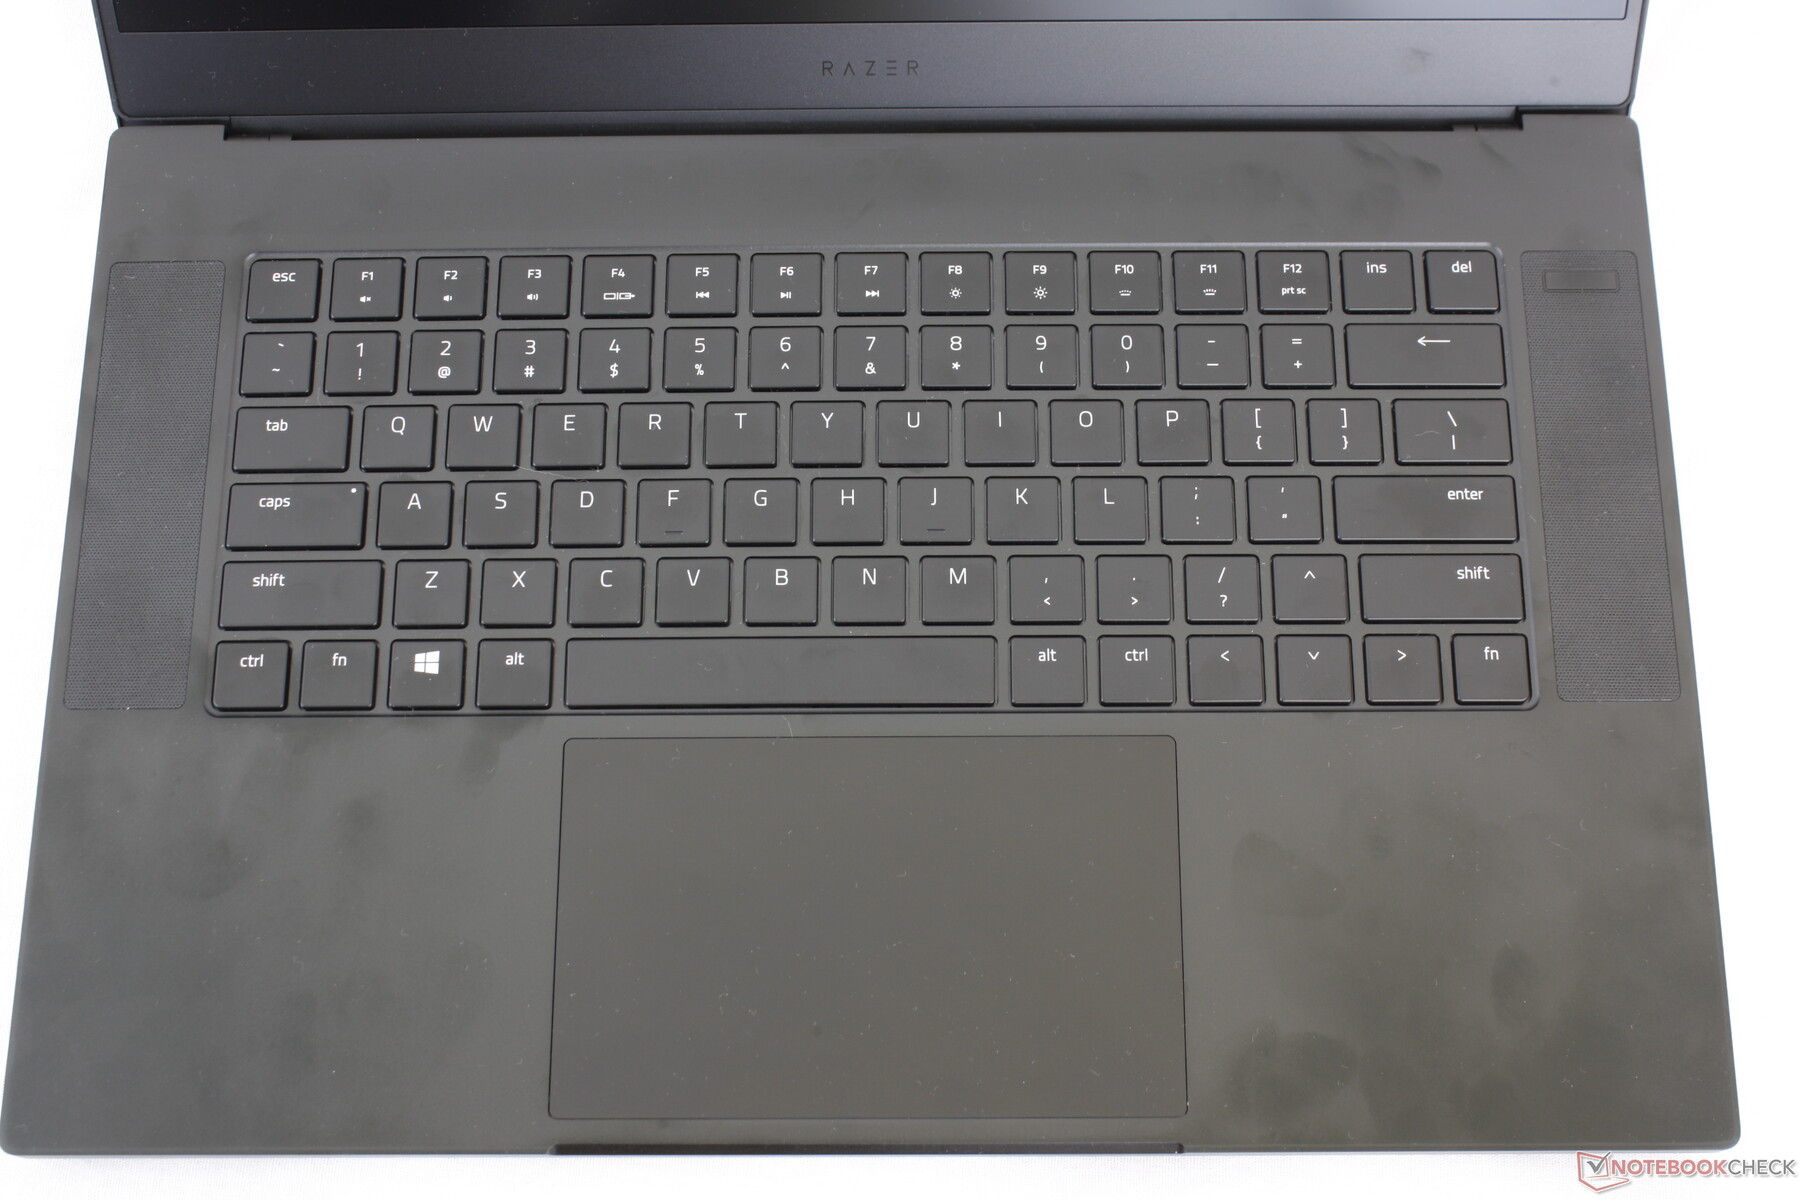
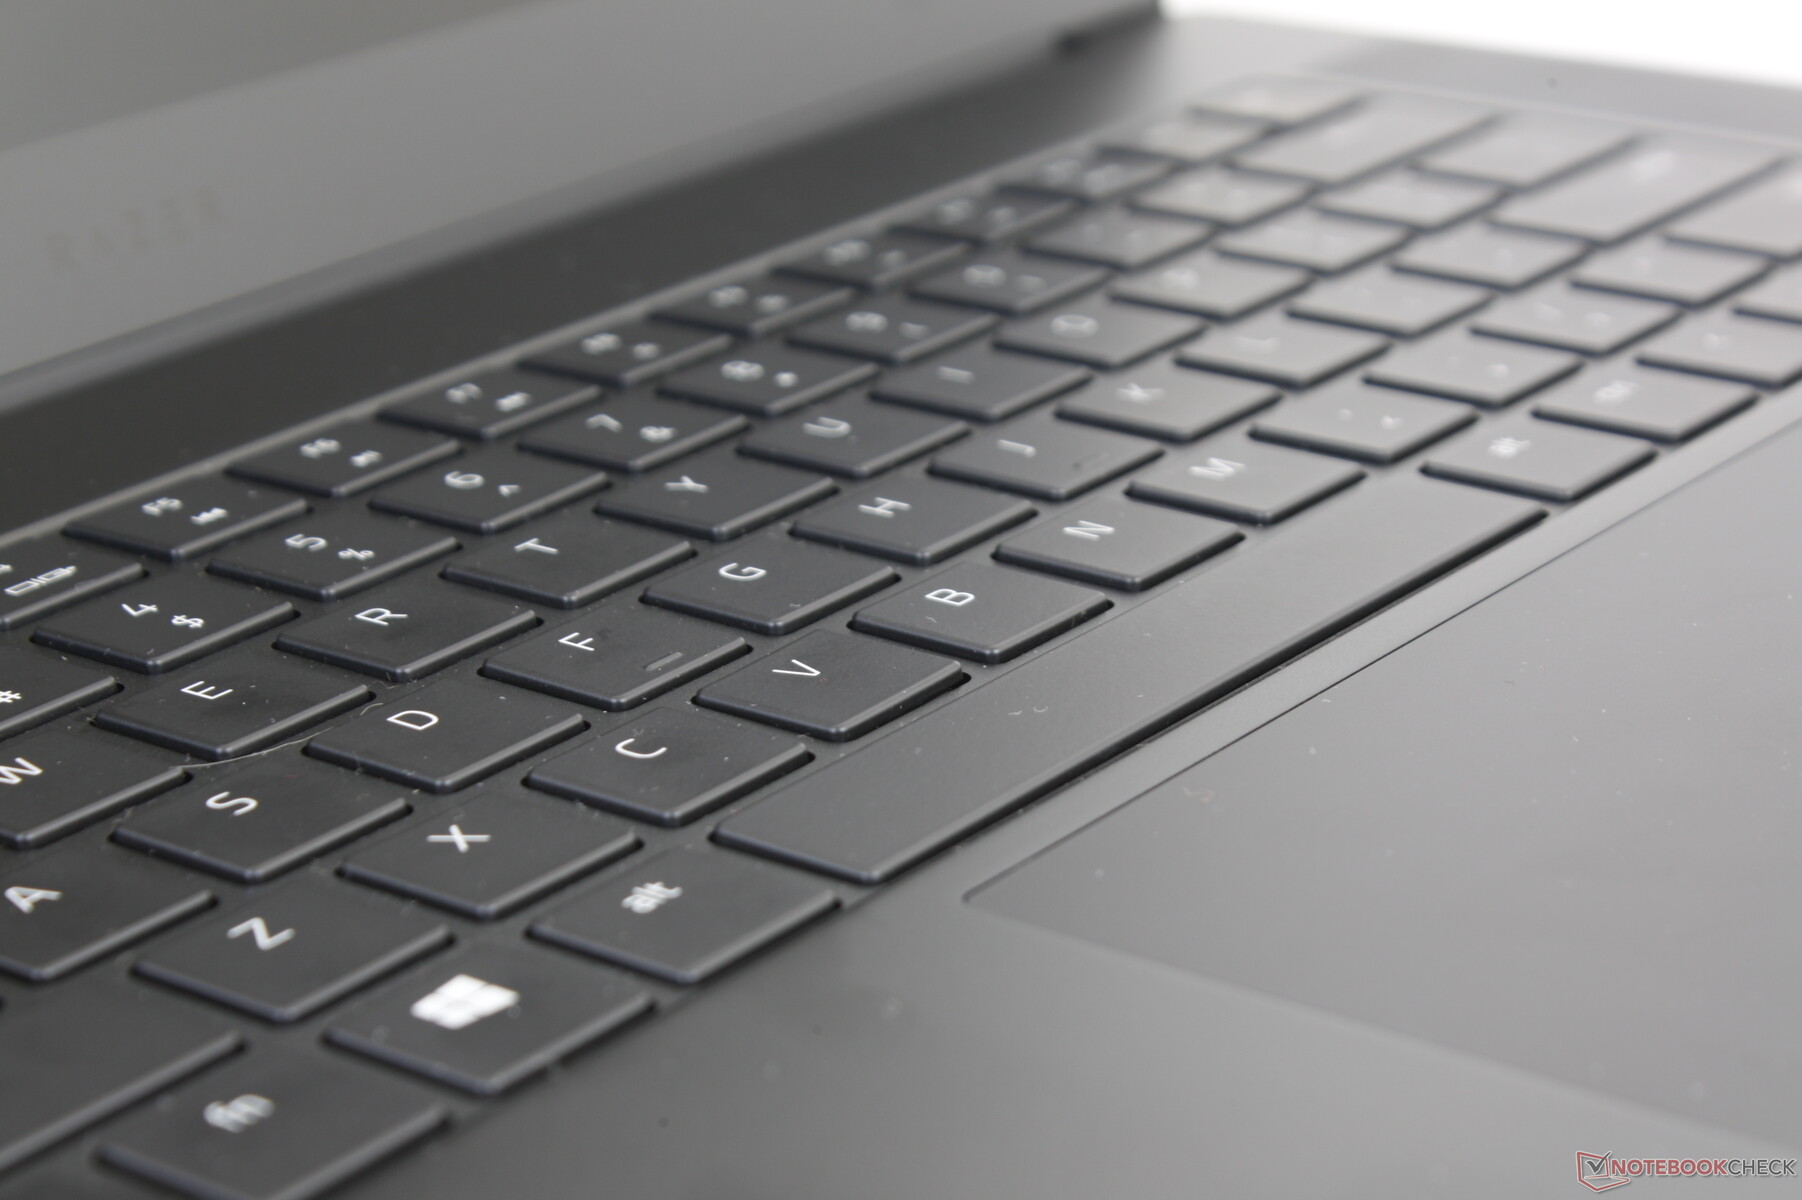
The Chroma-enabled keyboard has returned without any changes. We're hopeful that future models will add dedicated Macro keys or volume keys to make multimedia controls easier to access. Travel is still very shallow and light and so we prefer the stronger key feedback on competing models like the Alienware m15 or GS65.
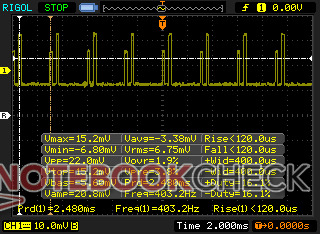
The per-key RGB backlight utilizes pulse-width modulation for brightness control. In other words, the LEDs flicker very quickly between on and off that could potentially cause eyestrain to a small subset of users. The phenomenon is related to display flickering on some laptops.
(April 7, 2019 update: The secondary function key icons are now backlit unlike on the last generation Blade 15 or Blade Pro. We apologize for not mentioning this earlier!)
Touchpad
The roomy trackpad (13 x 8 cm) is larger than the trackpads on the MSI GS65 (10.5 x 7 cm) and Alienware m15 (10.5 x 6.5) for more comfortable cursor control and multi-touch inputs no matter the speed. Cursor movement feels especially smooth because of the native 144 Hz panel refresh rate. The biggest drawback of the trackpad continues to be the soft feedback when pressed. The auditory feedback may be quiet, but we would have preferred a firmer and more satisfactory click.
Display
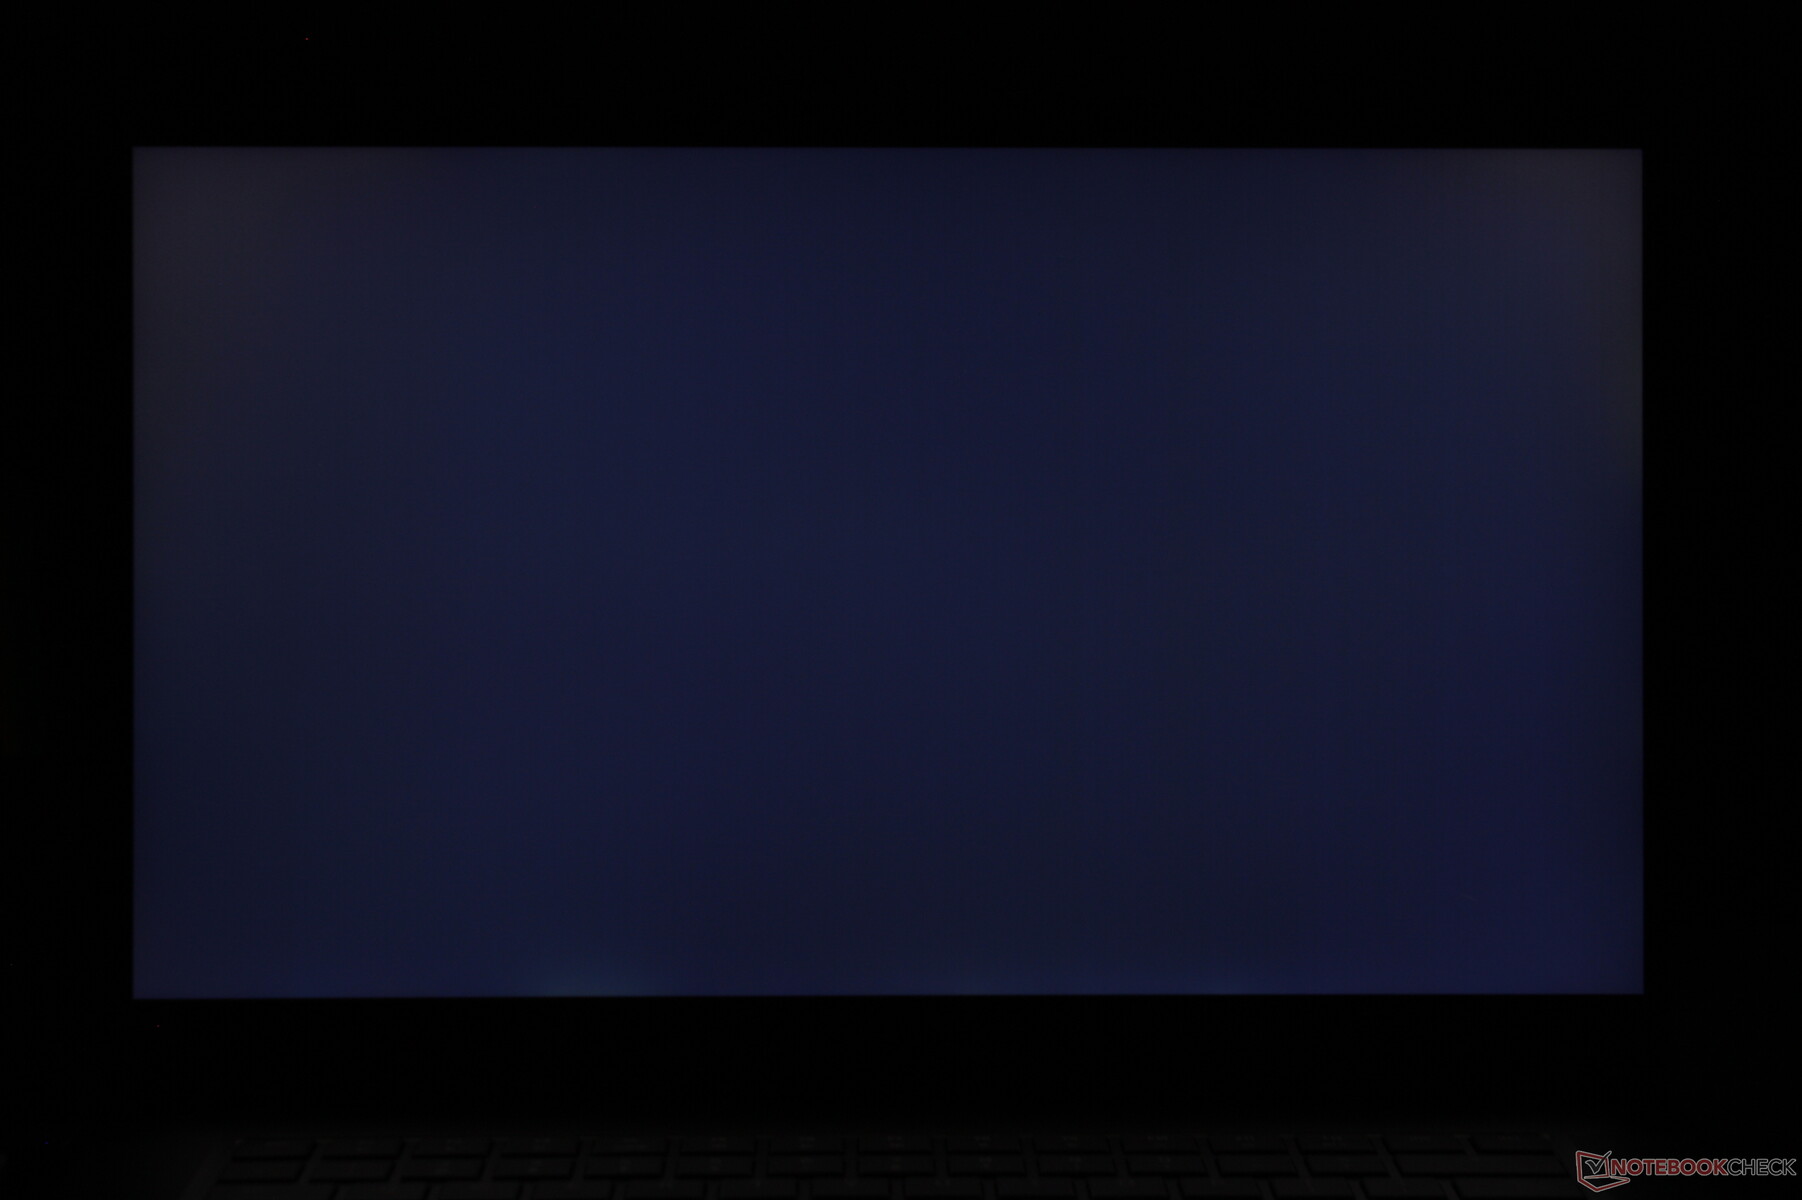
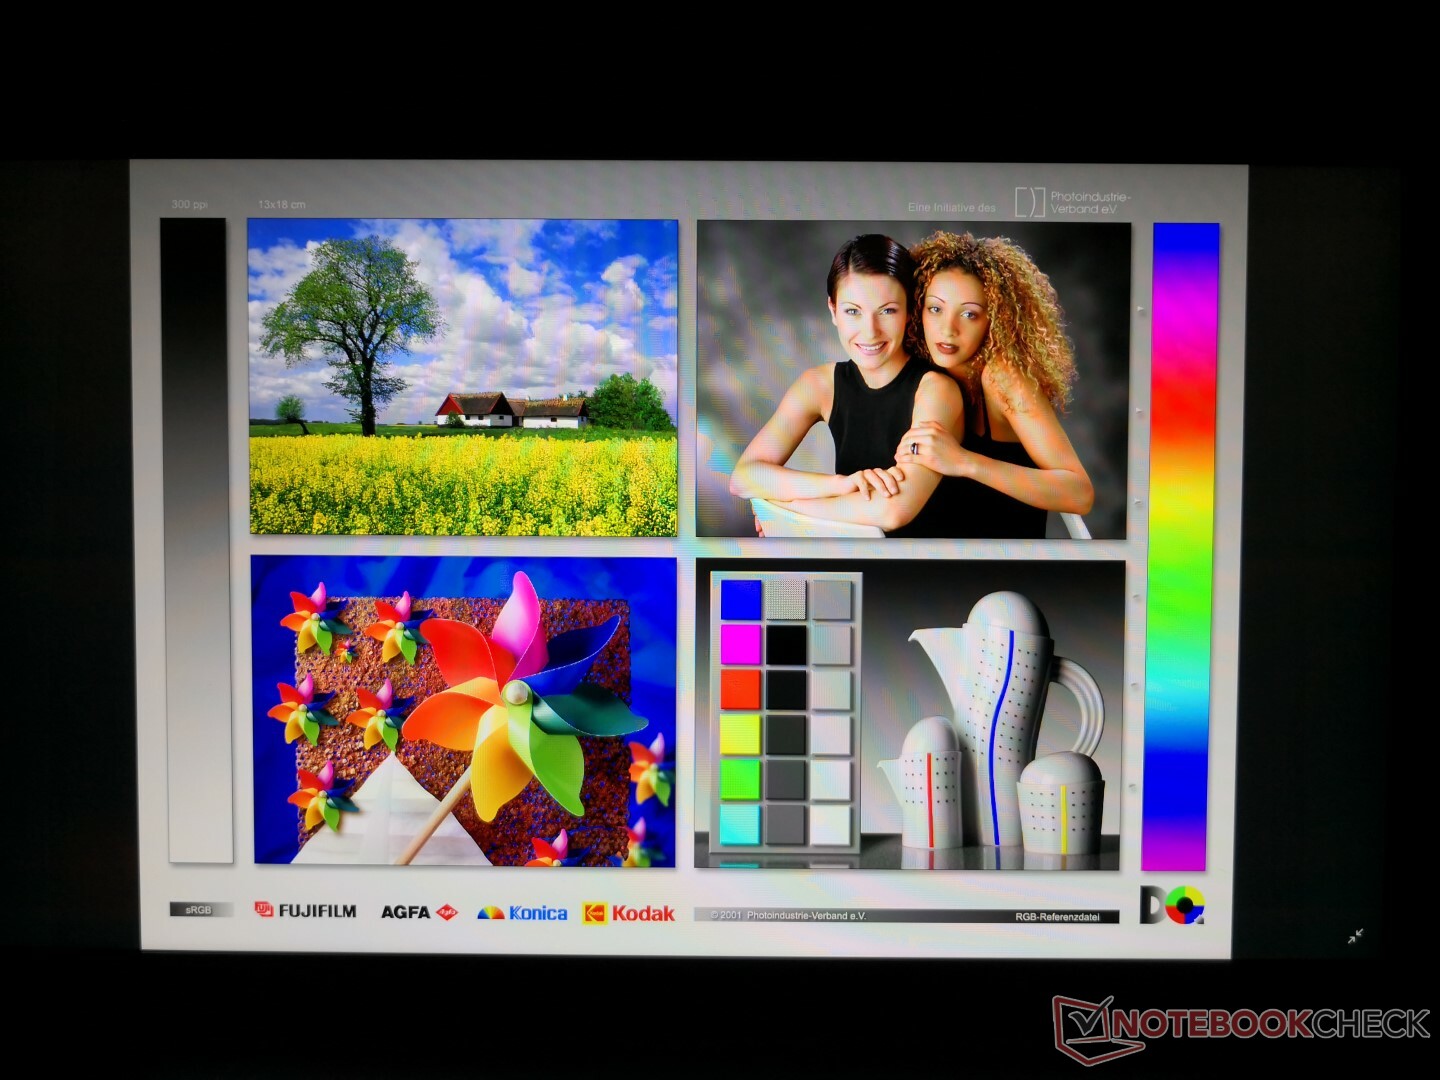
Razer has made no changes to the display when compared to last year's Advanced Model. In our case, the LG Philips LGD05C0 144 Hz IPS 1080p panel is the same panel as found on the Blade 15 GTX 1070 Max-Q and Gigabyte Aero 15x v8. Attributes like black-white response times, color coverage, and contrast are consequently excellent and very similar between these laptops. This is a high-end panel through and through with almost none of the graininess characteristics that often plague matte panels. The 60 Hz panel on last year's Blade 15 Base Model exhibited slower black-white response times for noticeably more ghosting than what we have here.
As noted earlier, future Blade 15 SKUs will include 240 Hz and OLED options for almost perfect black levels and even smoother movement.

| |||||||||||||||||||||||||
Brightness Distribution: 90 %
Center on Battery: 314.7 cd/m²
Contrast: 828:1 (Black: 0.38 cd/m²)
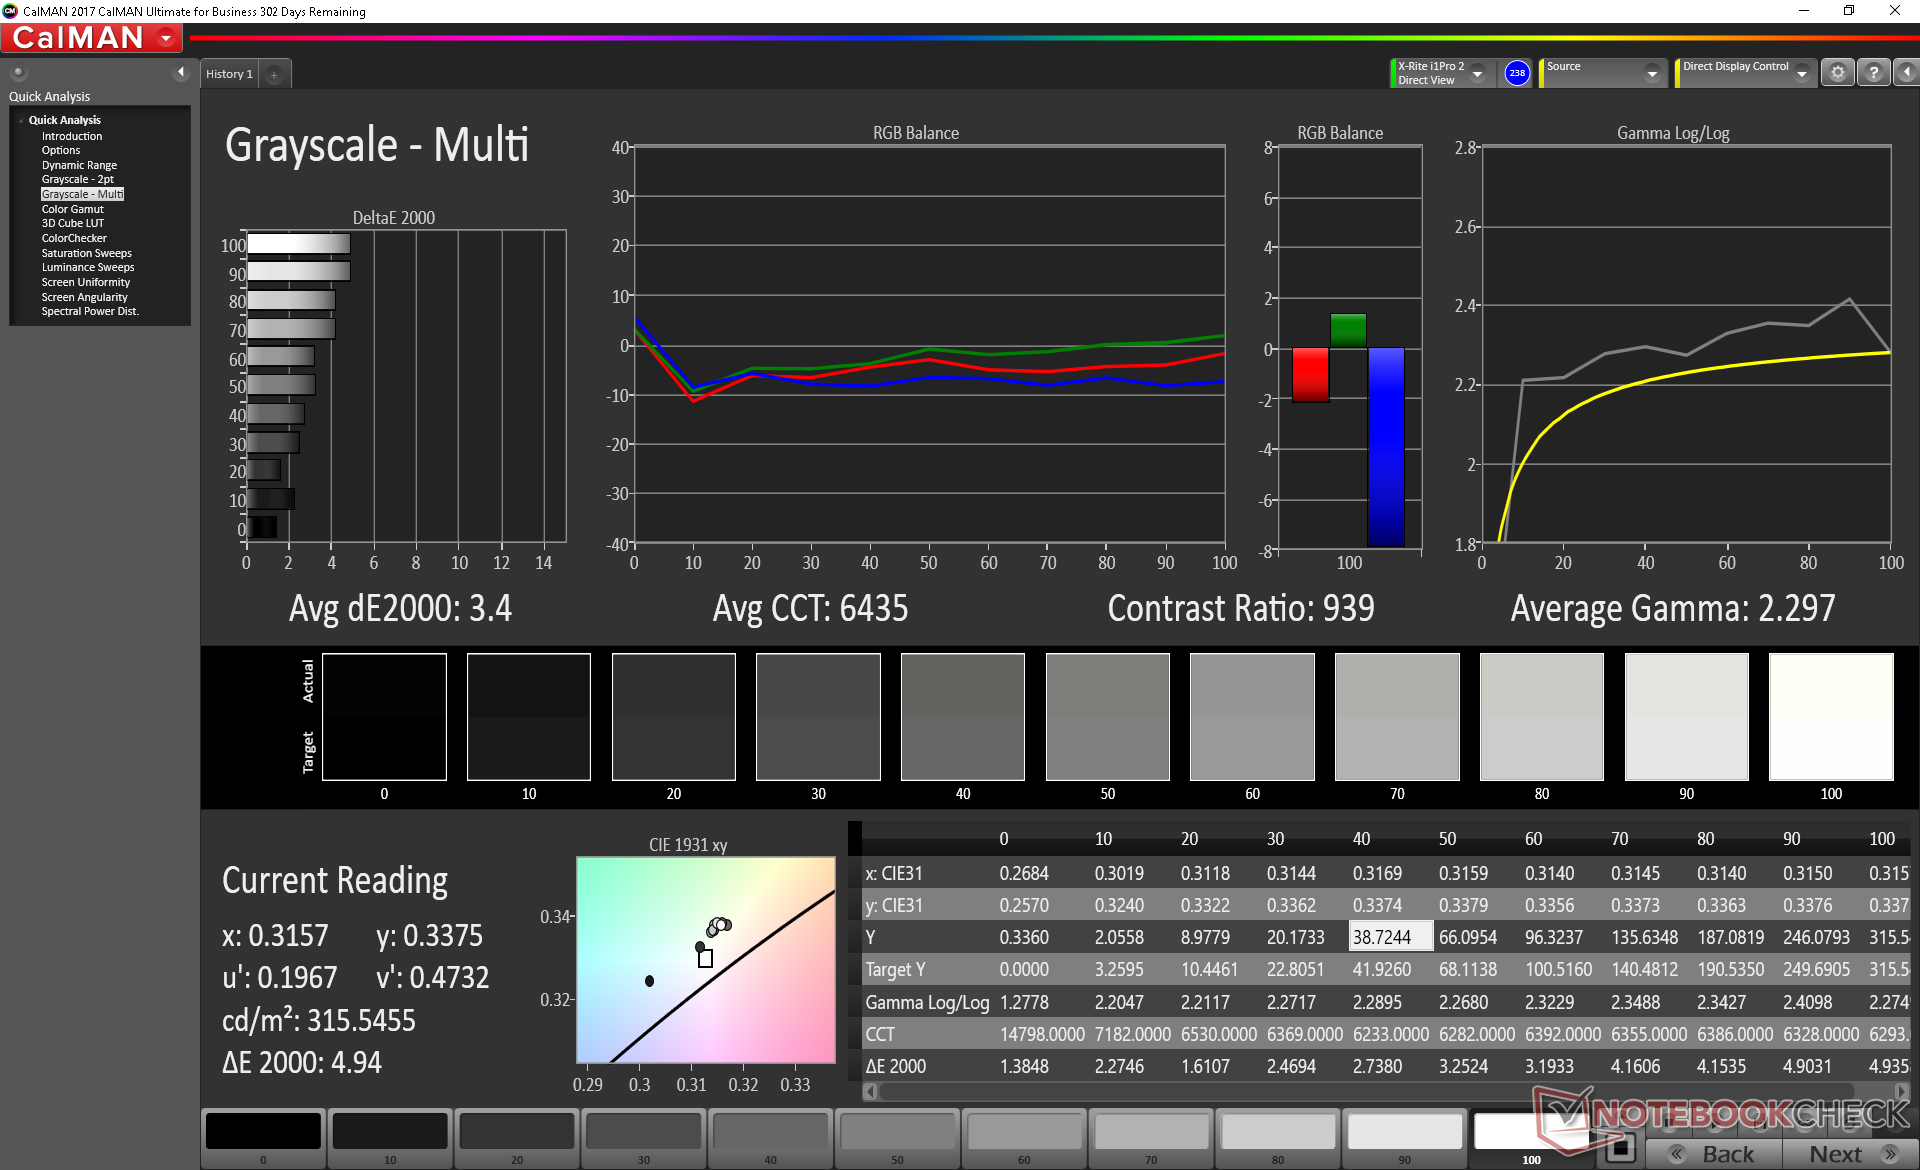
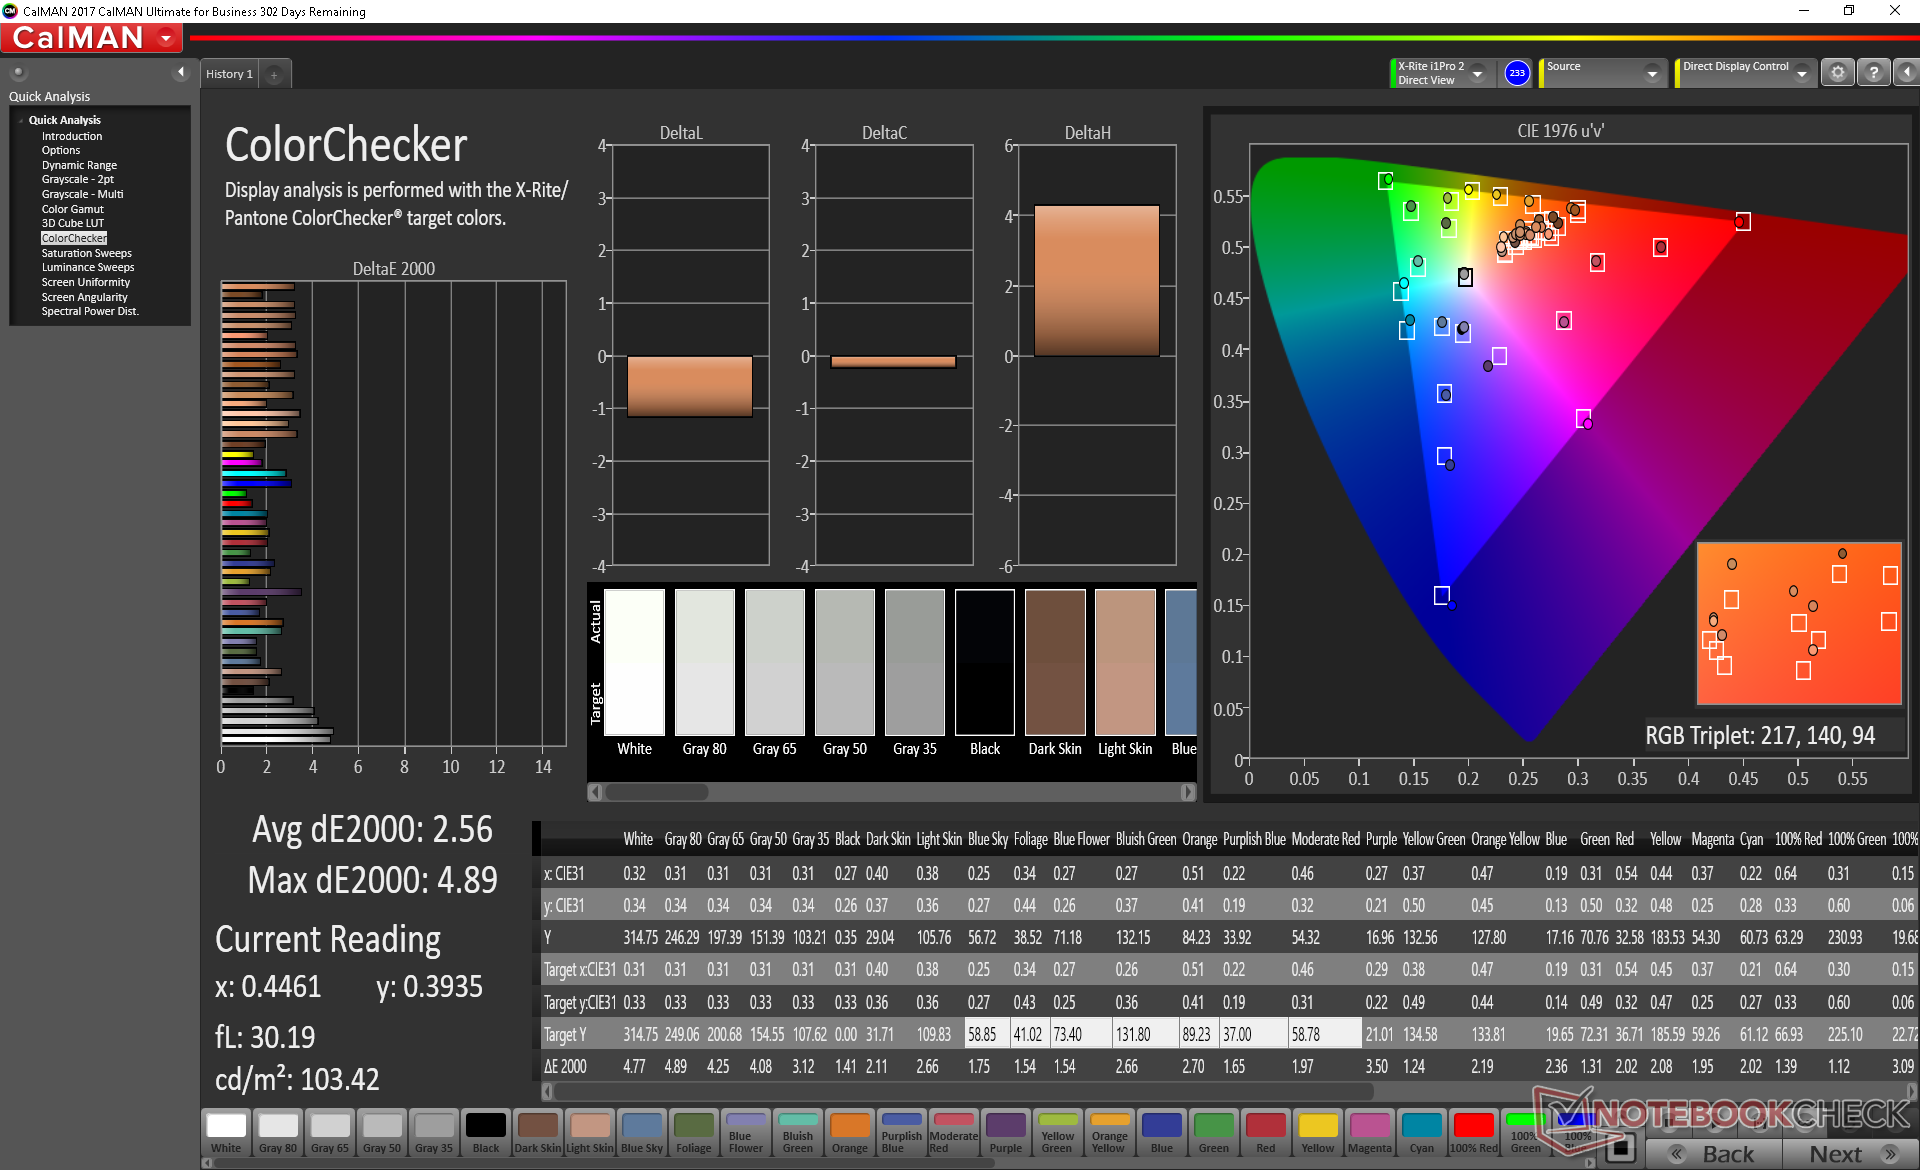
ΔE ColorChecker Calman: 2.56 | ∀{0.5-29.43 Ø4.71}
calibrated: 1.71
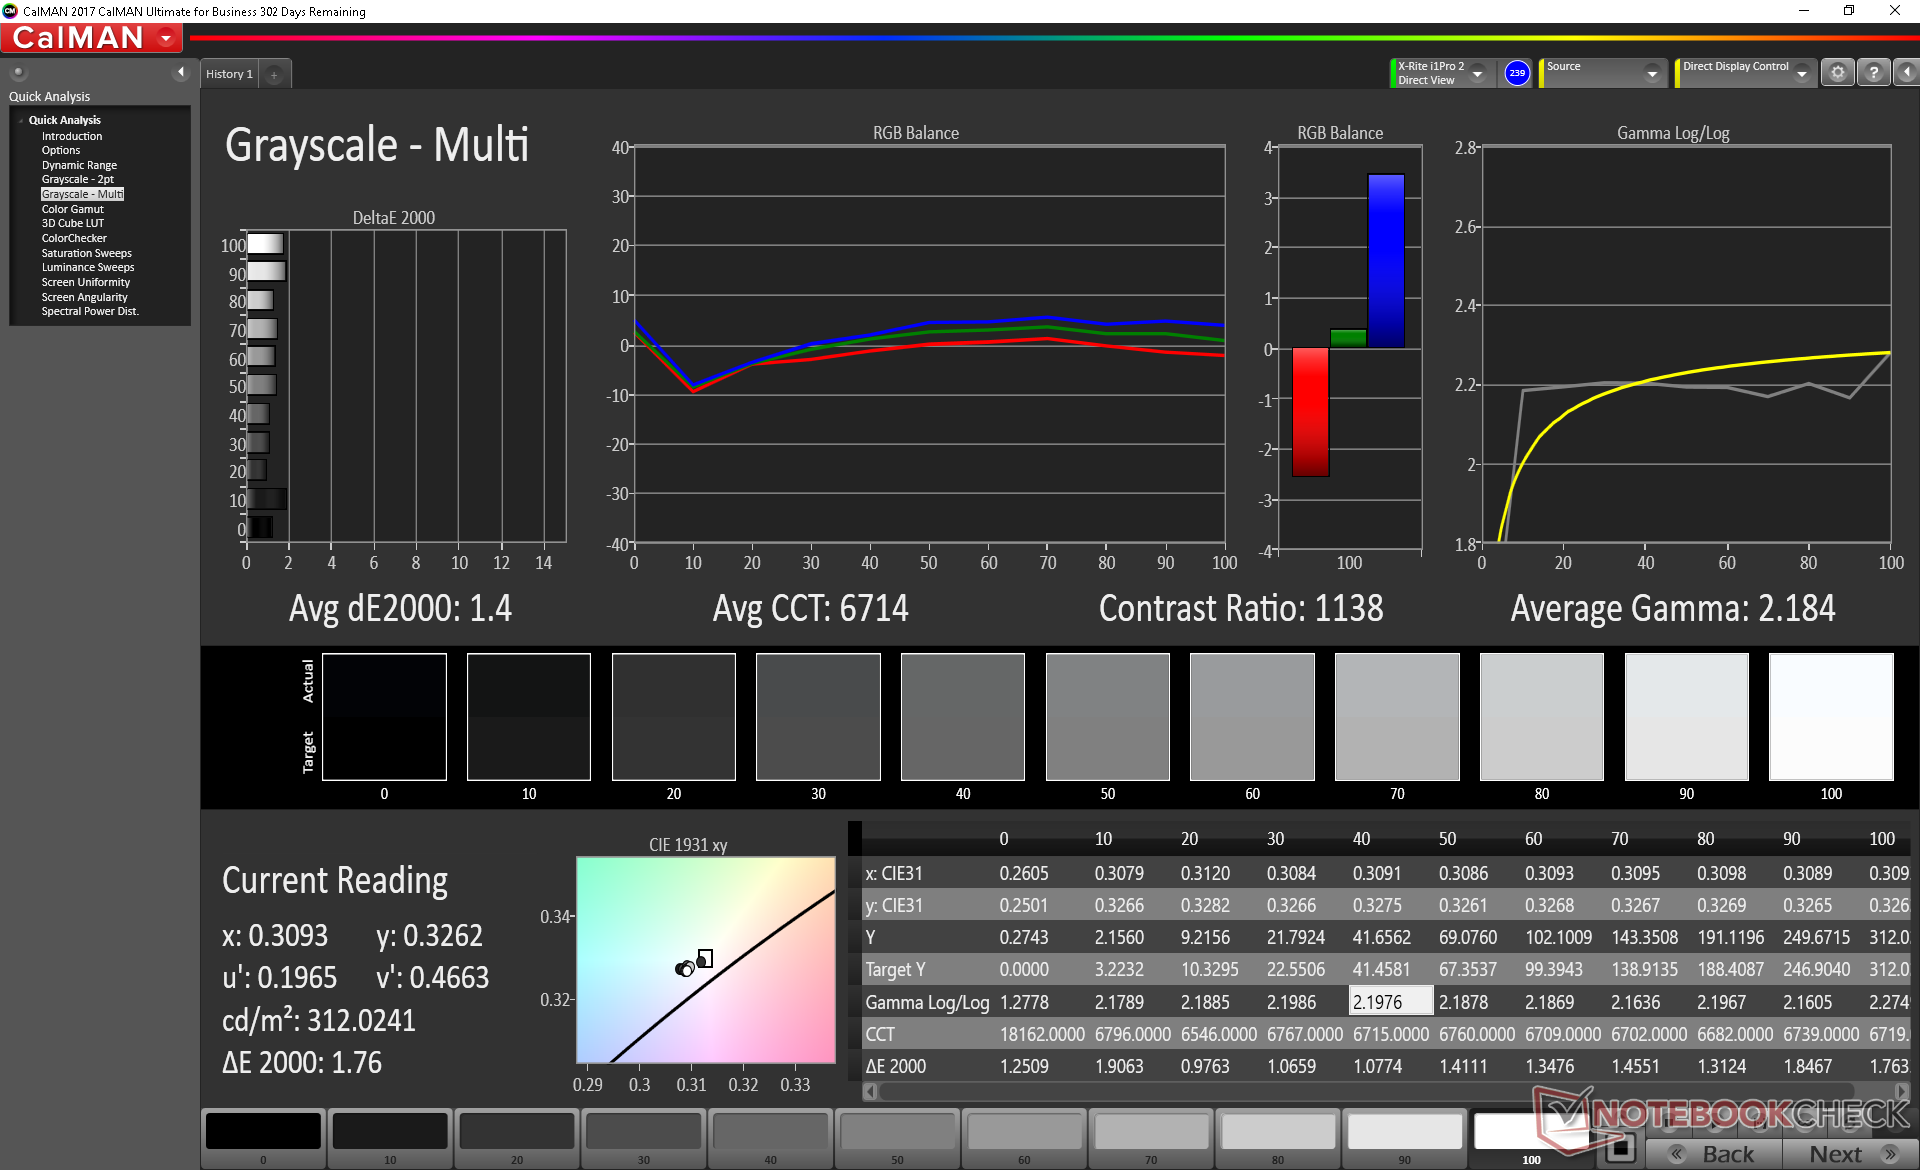
ΔE Greyscale Calman: 3.4 | ∀{0.09-98 Ø4.96}
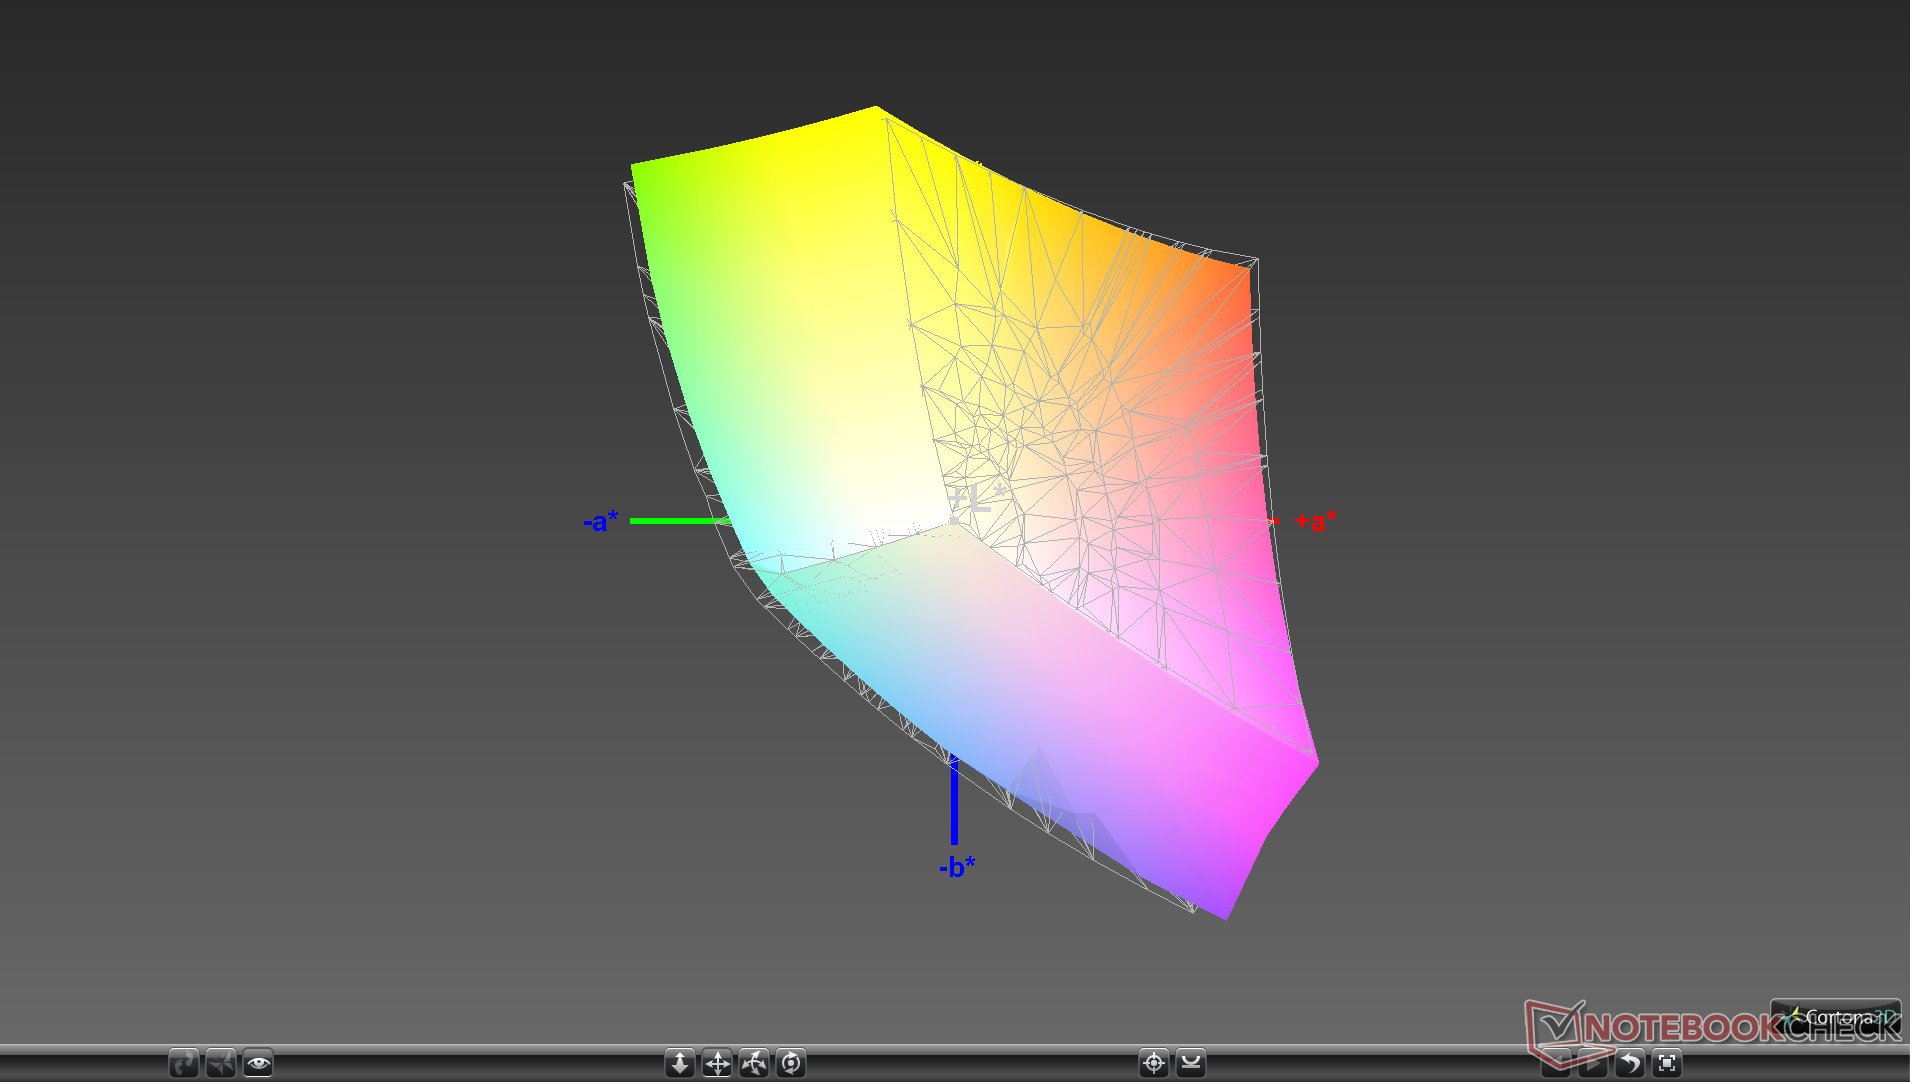
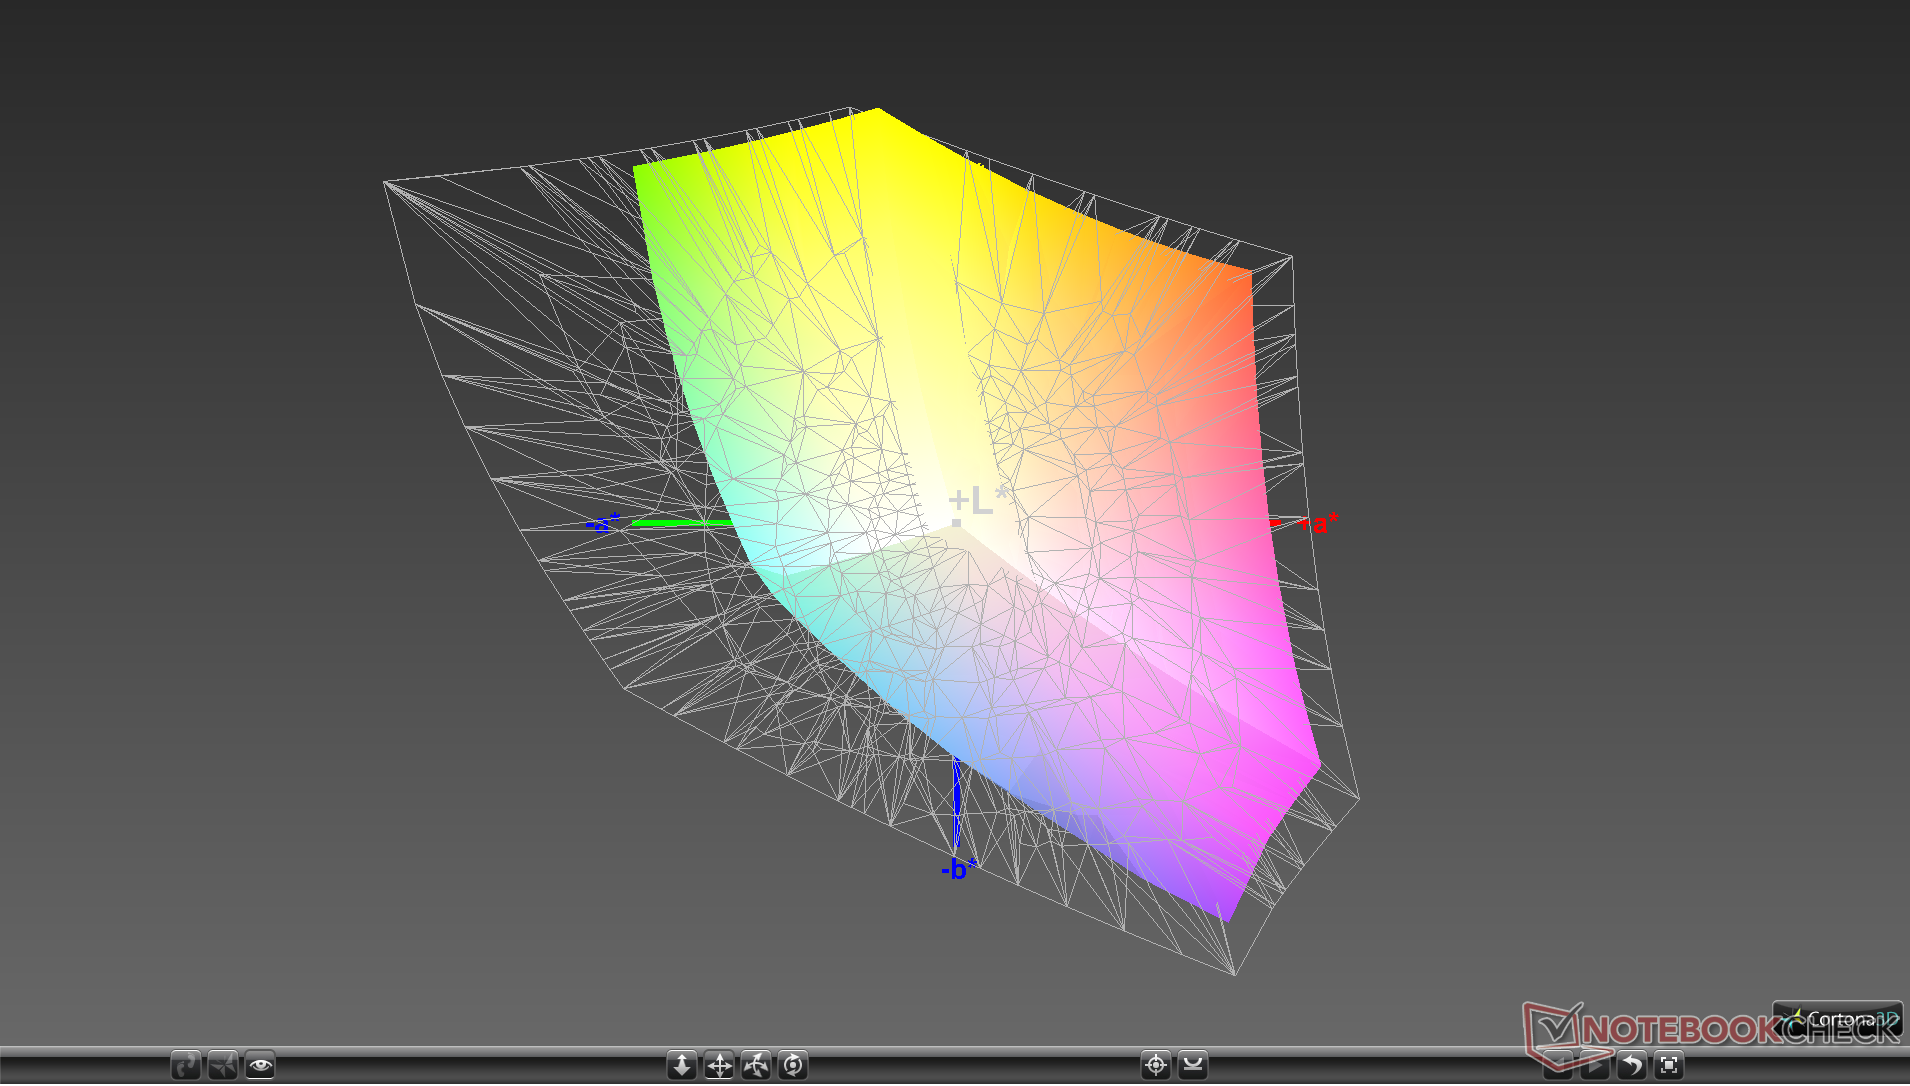
94.6% sRGB (Argyll 1.6.3 3D)
60.7% AdobeRGB 1998 (Argyll 1.6.3 3D)
66.3% AdobeRGB 1998 (Argyll 3D)
94.9% sRGB (Argyll 3D)
65.3% Display P3 (Argyll 3D)
Gamma: 2.3
CCT: 6435 K
| Razer Blade 15 RTX 2070 Max-Q LG Philips LGD05C0, IPS, 15.6", 1920x1080 | Alienware m15 GTX 1070 Max-Q AU Optronics B156HAN, IPS, 15.6", 1920x1080 | Razer Blade 15 2018 LGD05C0, IPS, 15.6", 1920x1080 | Apple MacBook Pro 15 2018 (2.6 GHz, 560X) APPA040, IPS, 15.4", 2880x1800 | MSI GS65 Stealth Thin 8RE-051US AUO80ED, IPS, 15.6", 1920x1080 | Gigabyte Aero 15X v8 LGD05C0, IPS, 15.6", 1920x1080 | |
|---|---|---|---|---|---|---|
| Display | -4% | -1% | 29% | -0% | -2% | |
| Display P3 Coverage (%) | 65.3 | 63.5 -3% | 64.3 -2% | 98.7 51% | 65.8 1% | 63.6 -3% |
| sRGB Coverage (%) | 94.9 | 89.4 -6% | 93.7 -1% | 99.9 5% | 92.1 -3% | 93.8 -1% |
| AdobeRGB 1998 Coverage (%) | 66.3 | 64.5 -3% | 65.5 -1% | 86.6 31% | 67 1% | 64.9 -2% |
| Response Times | -5% | -3% | -163% | -11% | 2% | |
| Response Time Grey 50% / Grey 80% * (ms) | 16.8 ? | 18 ? -7% | 17.2 ? -2% | 43.2 ? -157% | 20 ? -19% | 16.8 ? -0% |
| Response Time Black / White * (ms) | 11.6 ? | 12 ? -3% | 12 ? -3% | 31.2 ? -169% | 12 ? -3% | 11.2 ? 3% |
| PWM Frequency (Hz) | 117000 ? | |||||
| Screen | -17% | 2% | 43% | -12% | 20% | |
| Brightness middle (cd/m²) | 314.7 | 353.6 12% | 290 -8% | 520 65% | 250.9 -20% | 313 -1% |
| Brightness (cd/m²) | 312 | 346 11% | 281 -10% | 492 58% | 257 -18% | 300 -4% |
| Brightness Distribution (%) | 90 | 86 -4% | 82 -9% | 88 -2% | 83 -8% | 78 -13% |
| Black Level * (cd/m²) | 0.38 | 0.3 21% | 0.3 21% | 0.39 -3% | 0.32 16% | 0.33 13% |
| Contrast (:1) | 828 | 1179 42% | 967 17% | 1333 61% | 784 -5% | 948 14% |
| Colorchecker dE 2000 * | 2.56 | 4.55 -78% | 2.85 -11% | 1.2 53% | 2.77 -8% | 1.29 50% |
| Colorchecker dE 2000 max. * | 4.89 | 7.91 -62% | 6.27 -28% | 2.3 53% | 5.89 -20% | 2.04 58% |
| Colorchecker dE 2000 calibrated * | 1.71 | 3.37 -97% | 1.39 19% | 2.5 -46% | ||
| Greyscale dE 2000 * | 3.4 | 4.1 -21% | 2.4 29% | 1.3 62% | 4 -18% | 0.69 80% |
| Gamma | 2.3 96% | 2.27 97% | 2.34 94% | 2.18 101% | 2.27 97% | 2.43 91% |
| CCT | 6435 101% | 7434 87% | 6718 97% | 6738 96% | 6901 94% | 6550 99% |
| Color Space (Percent of AdobeRGB 1998) (%) | 60.7 | 57.9 -5% | 60 -1% | 60 -1% | 60 -1% | |
| Color Space (Percent of sRGB) (%) | 94.6 | 88.9 -6% | 94 -1% | 92 -3% | 94 -1% | |
| Total Average (Program / Settings) | -9% /
-13% | -1% /
1% | -30% /
8% | -8% /
-10% | 7% /
13% |
* ... smaller is better
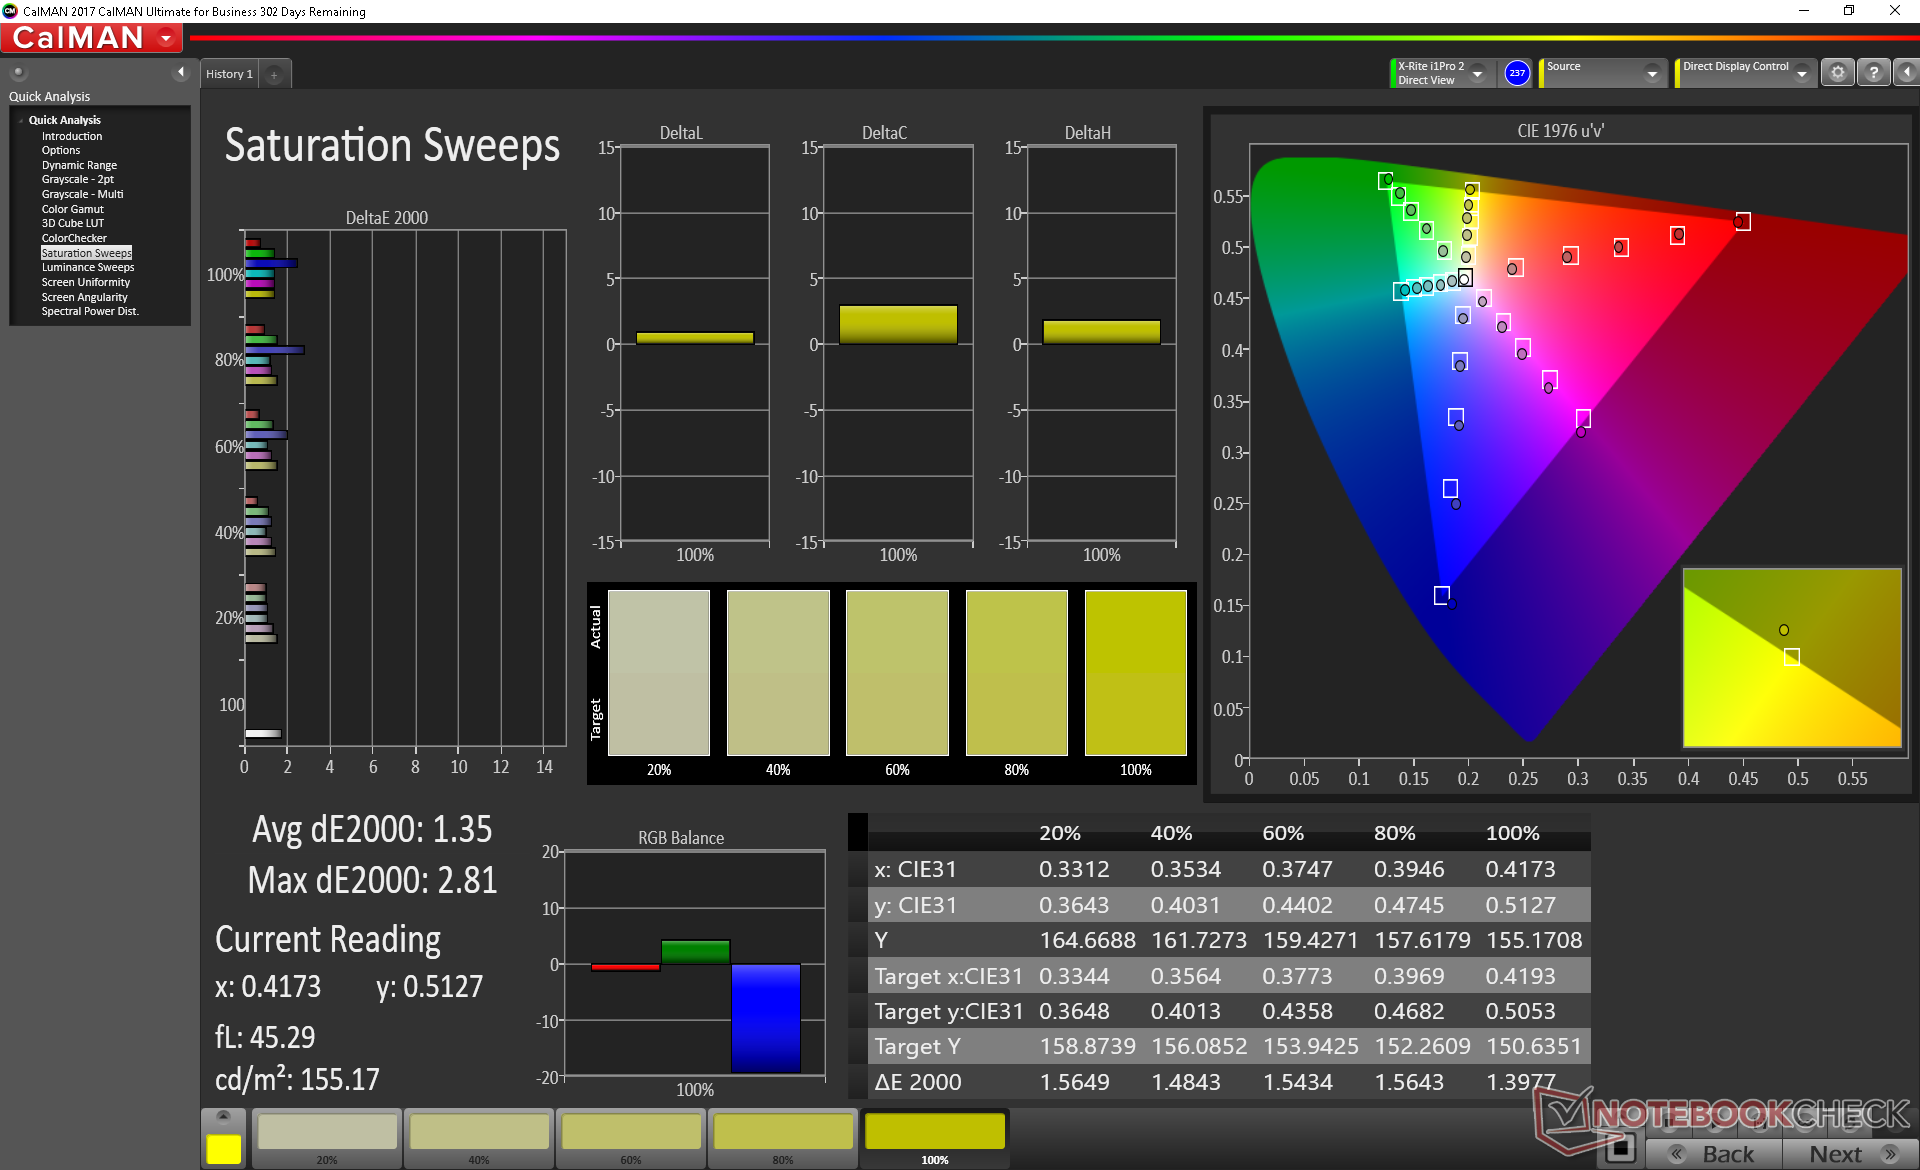
Razer claims 100 percent sRGB coverage for its FHD SKU and 100 percent AdobeRGB for its 4K UHD touchscreen SKU. Our own independent measurement shows 95 percent sRGB coverage to be similar to the MSI GS65 and Gigabyte Aero 15X v8. Users who want an even wider color gamut for professional applications will have to give up the 144 Hz native refresh rate until such a panel becomes available for laptops.
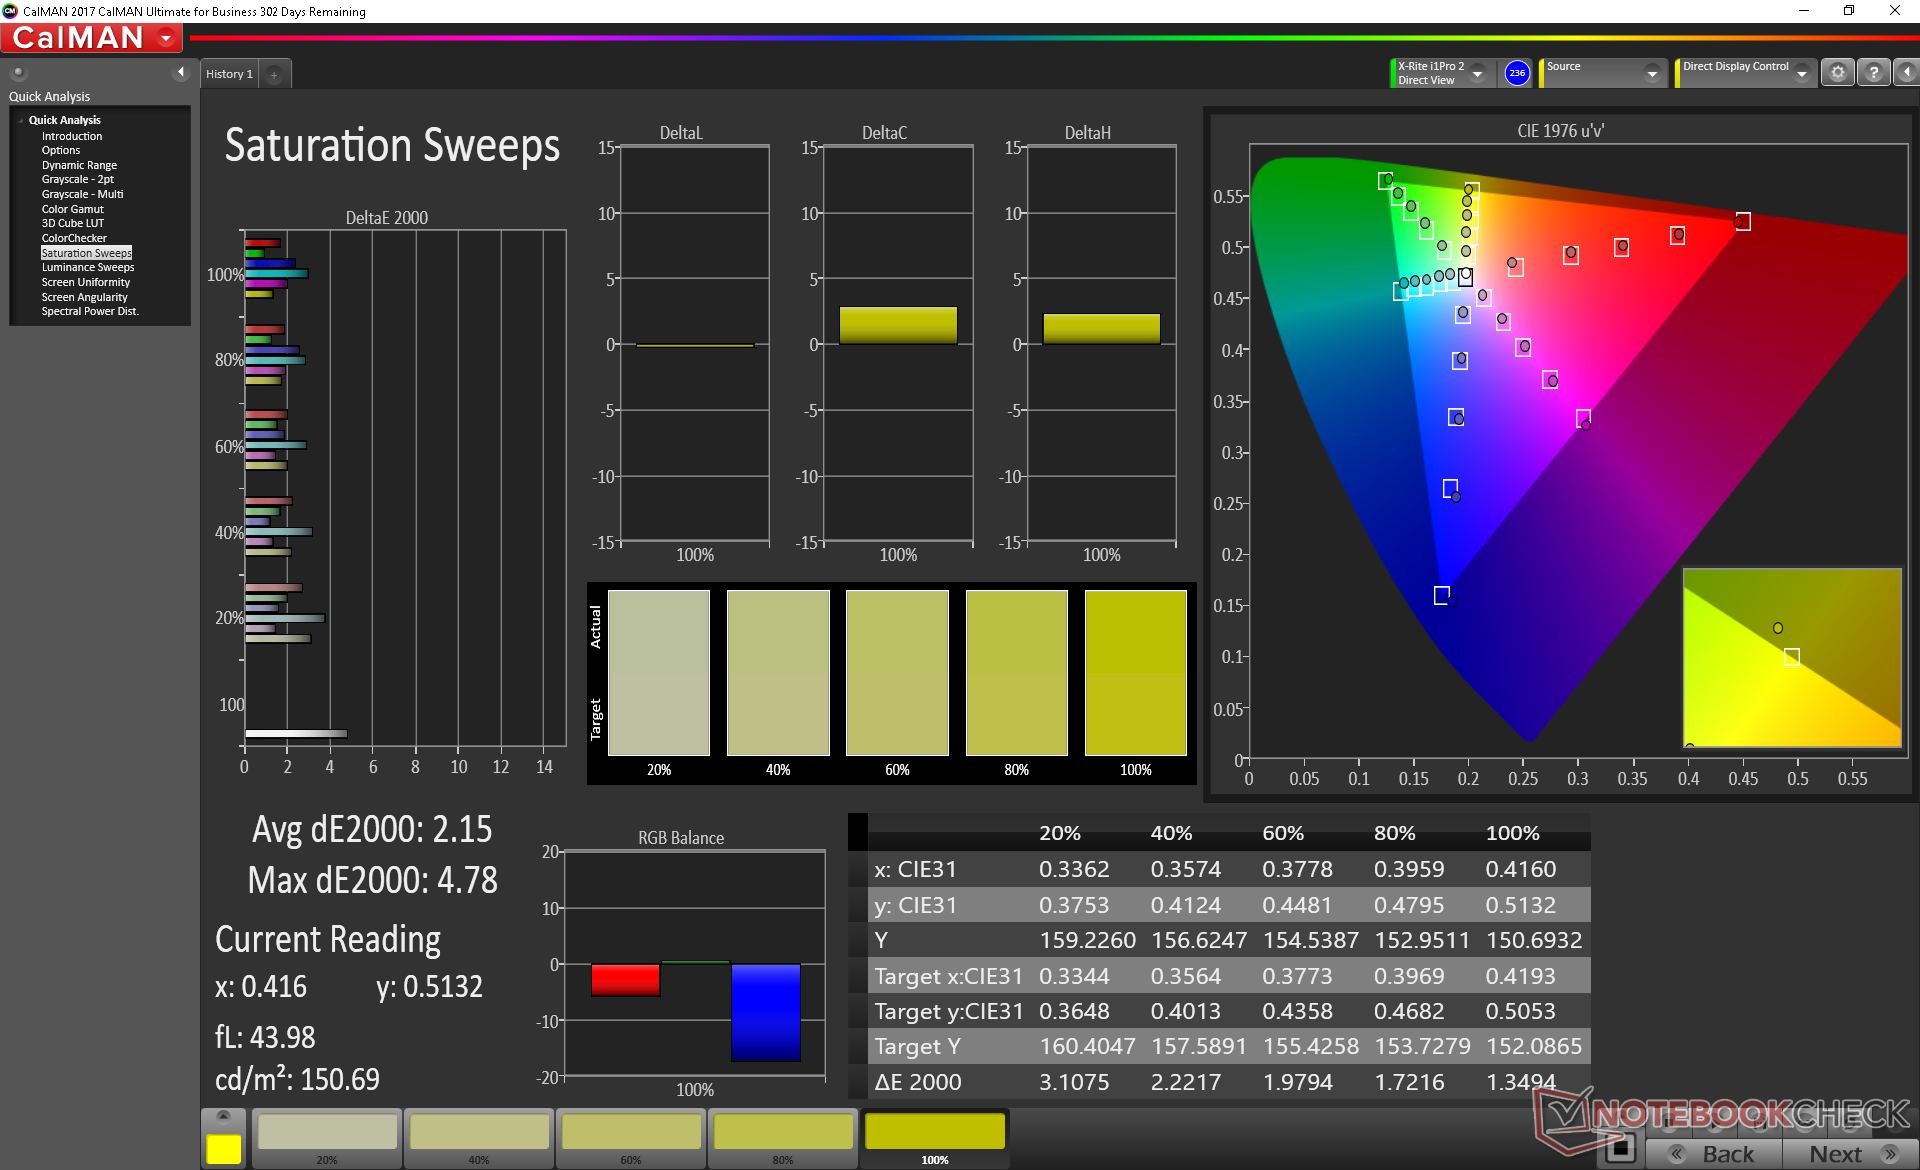
Further measurements with an X-Rite spectrophotometer reveal an accurate panel out of the box. Razer promises factory calibration on each unit before shipping to customers and this certainly shows in our Calman results below. Nonetheless, our own calibration attempts improve both grayscale and colors even further with final average DeltaE values of 1.4 and 1.71, respectively, to rival the MacBook Pro 15.

Display Response Times
| ↔ Response Time Black to White | ||
|---|---|---|
| 11.6 ms ... rise ↗ and fall ↘ combined | ↗ 7.2 ms rise | 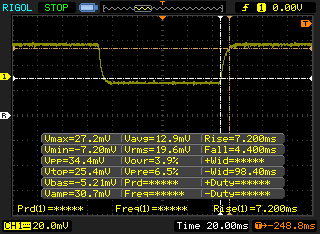 |
| ↘ 4.4 ms fall | ||
| The screen shows good response rates in our tests, but may be too slow for competitive gamers. In comparison, all tested devices range from 0.1 (minimum) to 240 (maximum) ms. » 31 % of all devices are better. This means that the measured response time is better than the average of all tested devices (19.8 ms). | ||
| ↔ Response Time 50% Grey to 80% Grey | ||
| 16.8 ms ... rise ↗ and fall ↘ combined | ↗ 9.2 ms rise | 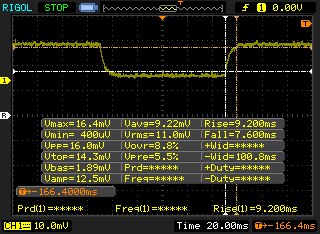 |
| ↘ 7.6 ms fall | ||
| The screen shows good response rates in our tests, but may be too slow for competitive gamers. In comparison, all tested devices range from 0.165 (minimum) to 636 (maximum) ms. » 31 % of all devices are better. This means that the measured response time is better than the average of all tested devices (30.9 ms). | ||
Screen Flickering / PWM (Pulse-Width Modulation)
| Screen flickering / PWM not detected | 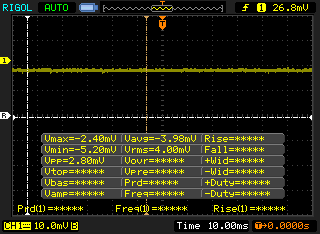 | ||
In comparison: 52 % of all tested devices do not use PWM to dim the display. If PWM was detected, an average of 7741 (minimum: 5 - maximum: 343500) Hz was measured. | |||
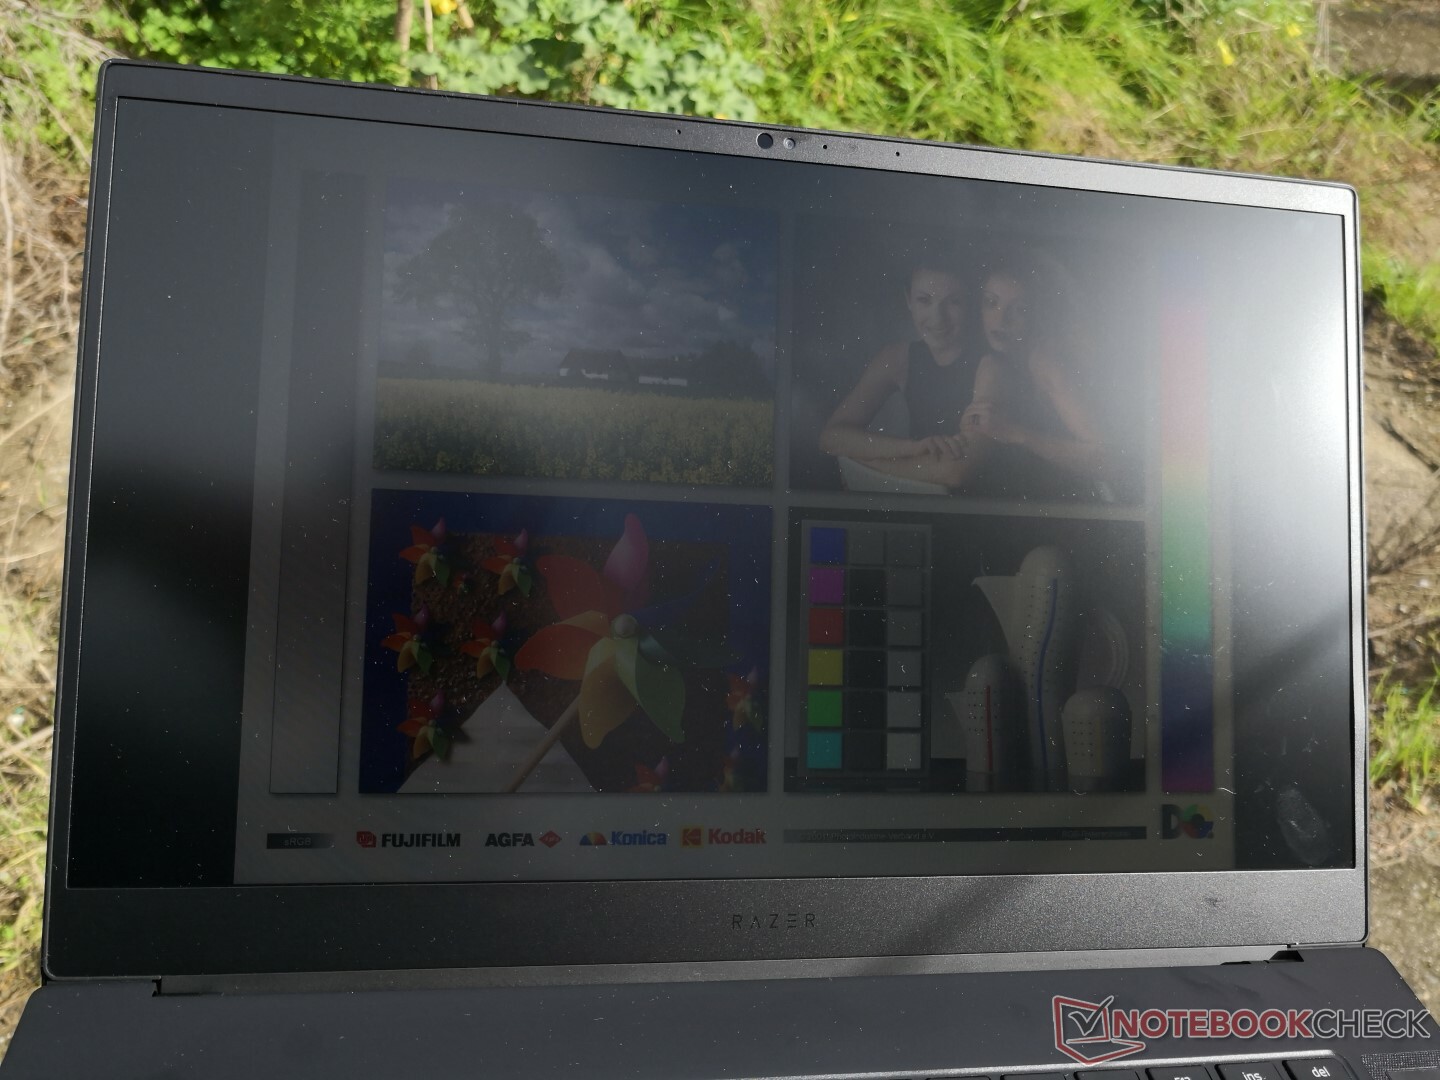
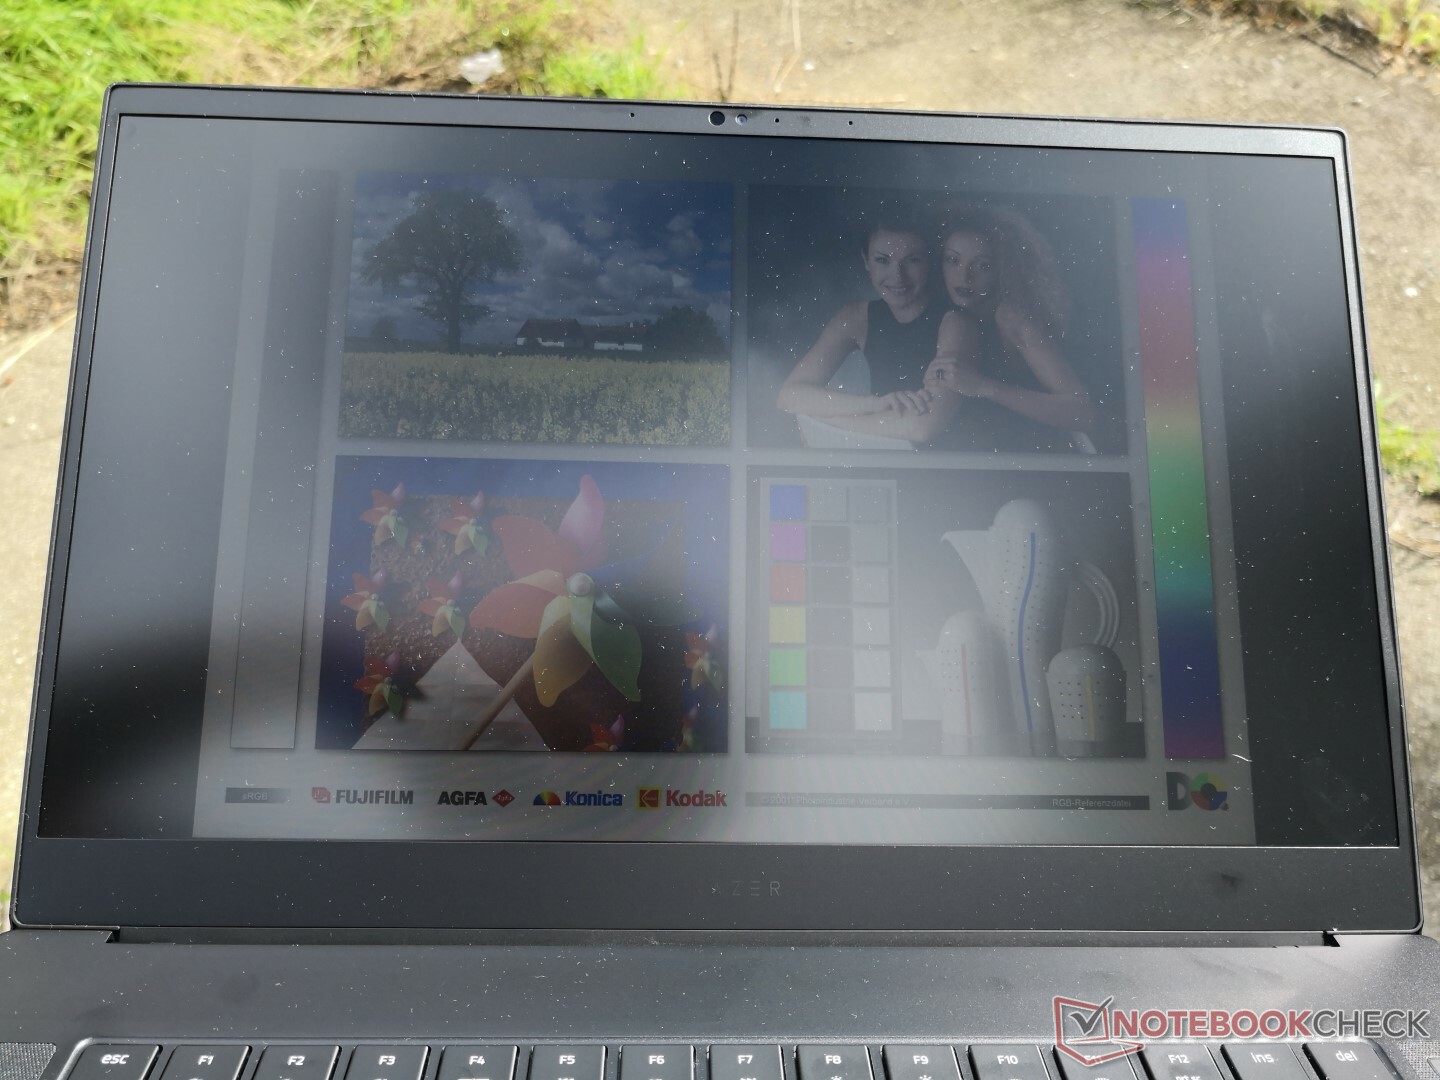
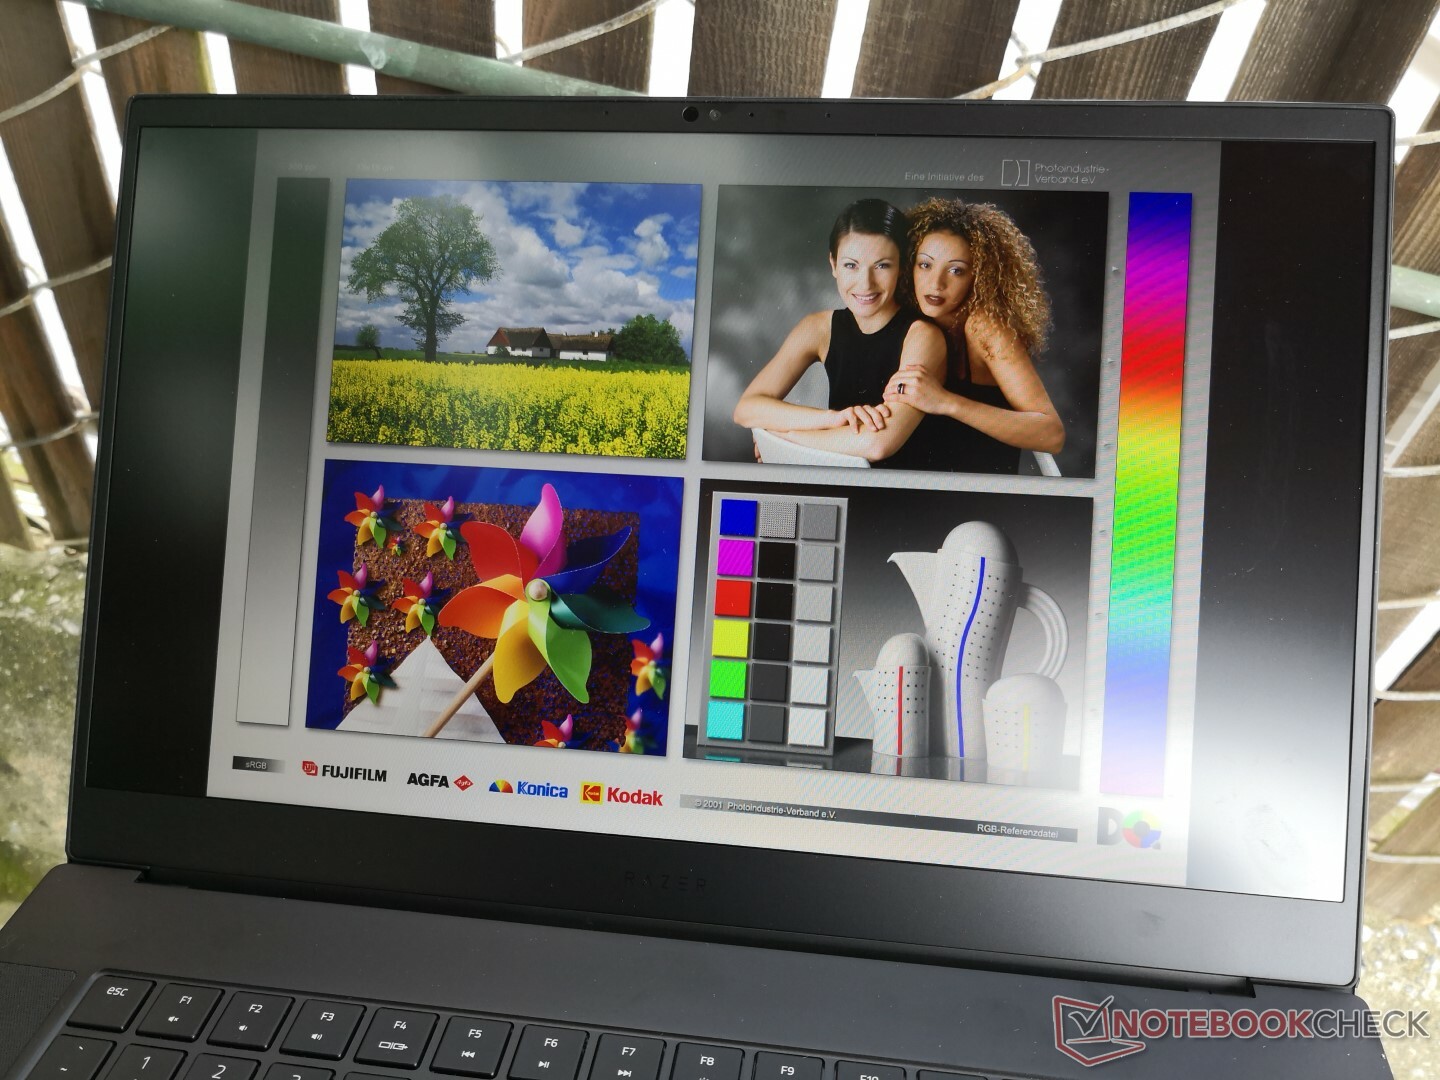
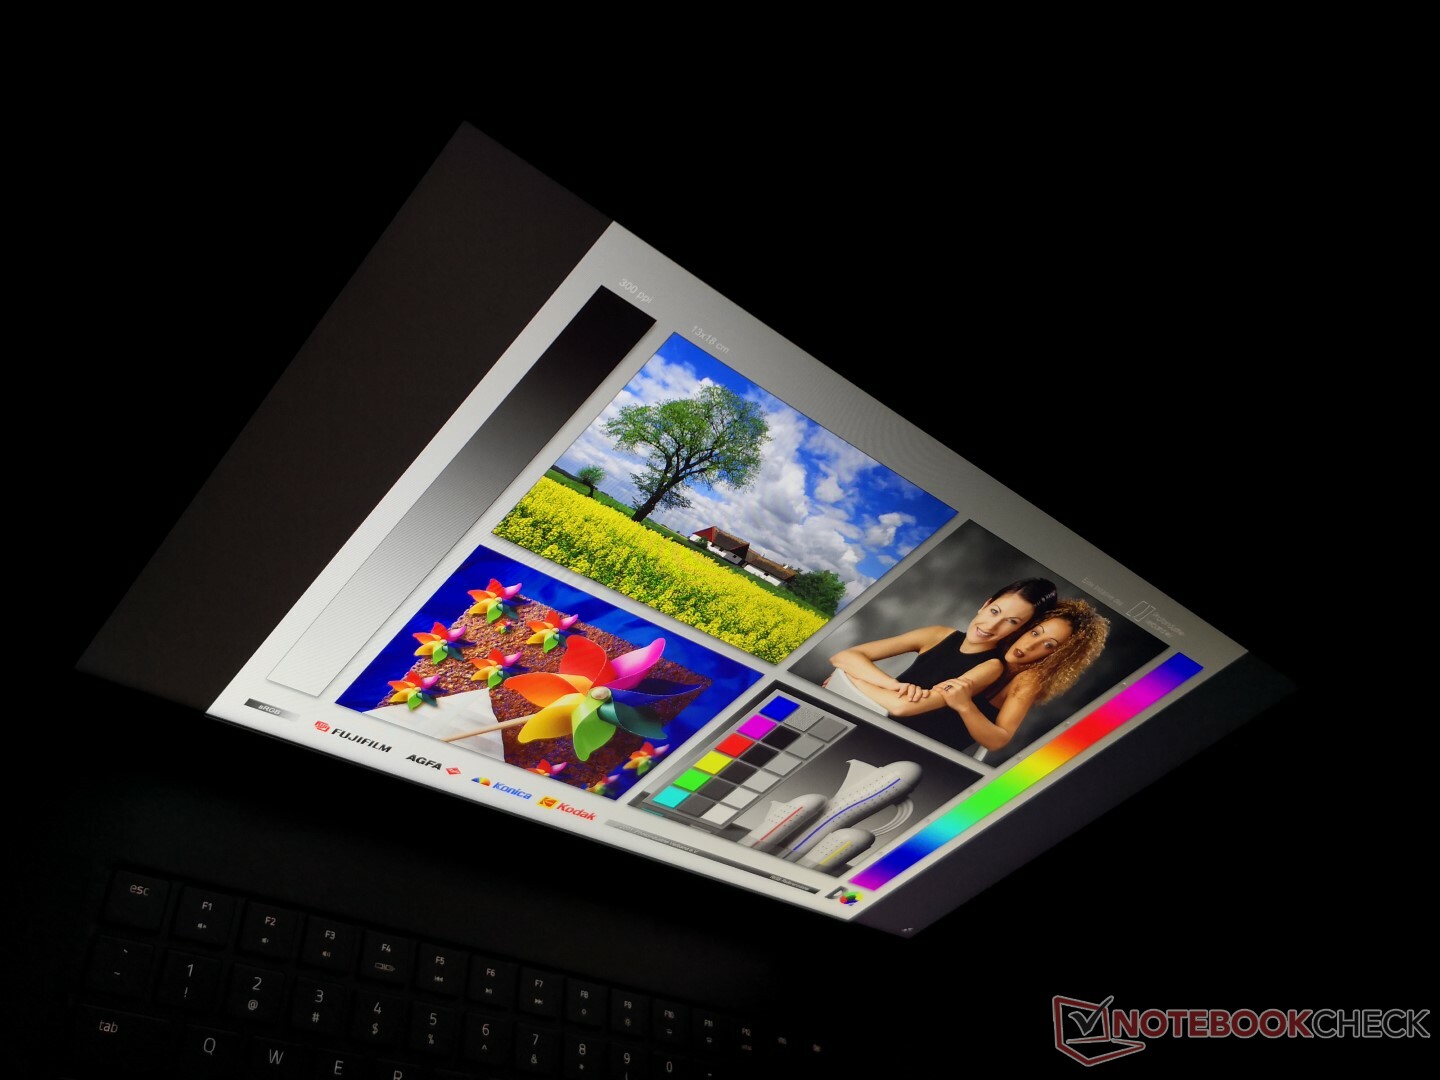
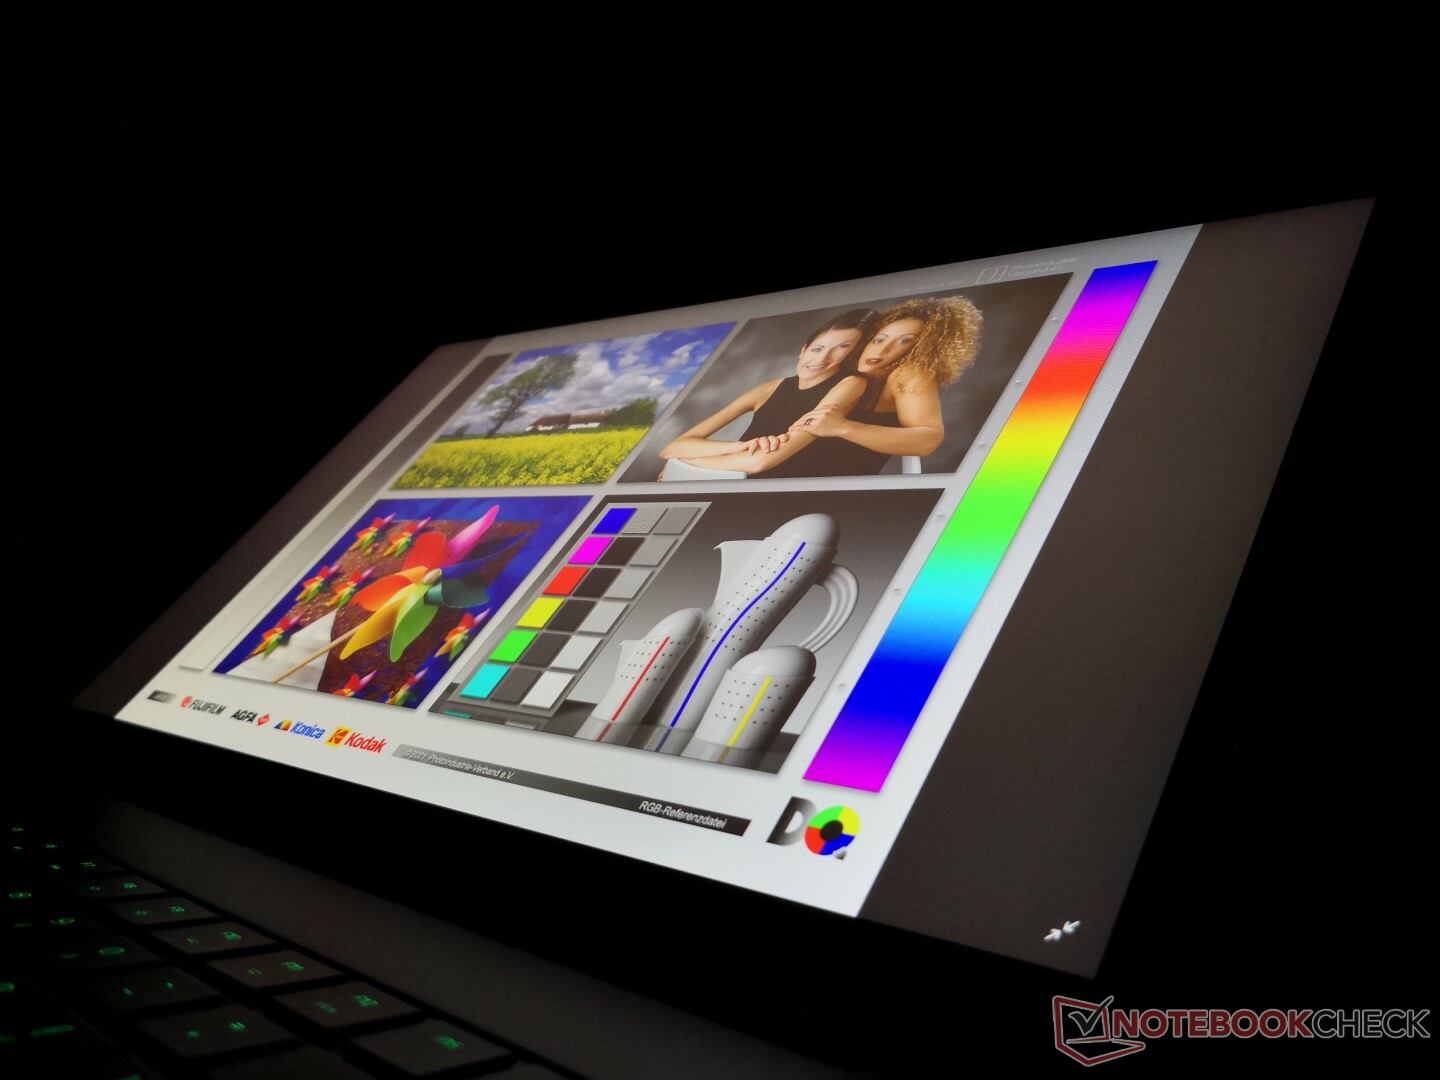
Outdoor visibility is not any better or worse than most other gaming laptops out there because of the typical 300-nit backlight and matte panel. It's a bit of a shame because the Blade 15 is thinner and more portable than many of its competitors and so Razer owners are more likely to use the laptop when on the go. Direct sunlight will wash out colors while glare can be reduced by exploiting the wide viewing angles of the screen. Colors and contrast are consistent unless if viewing from unusually extreme angles.
Performance
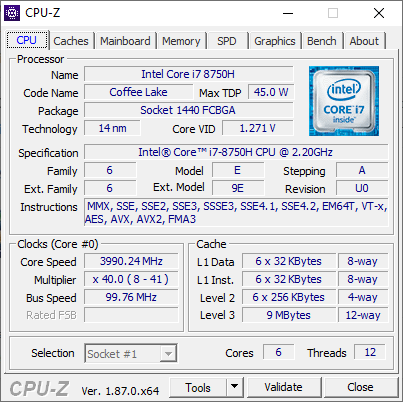
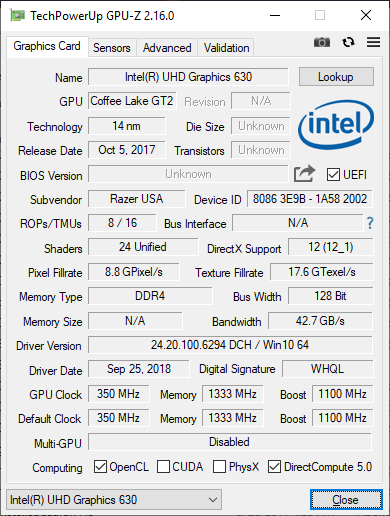
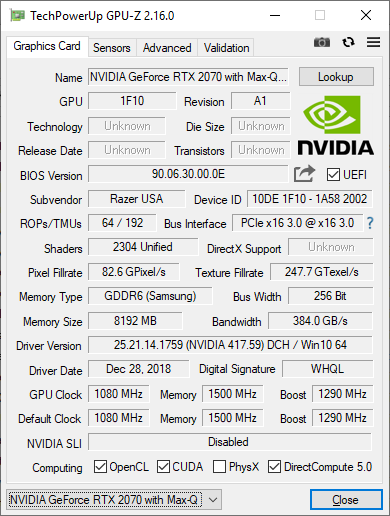
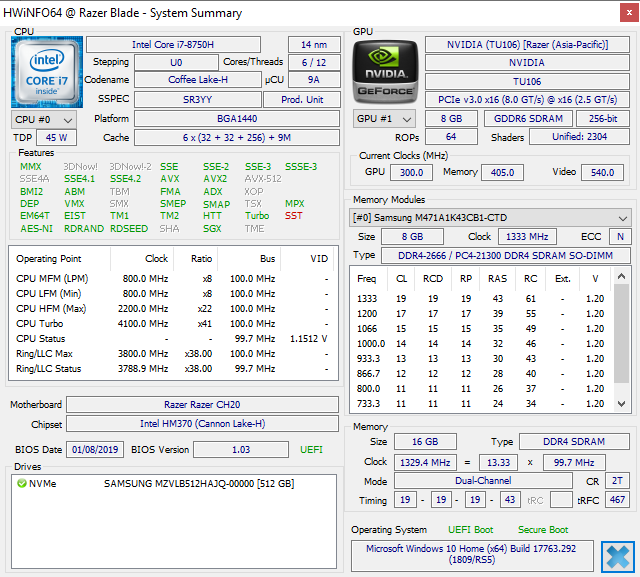
The Coffee Lake-H Core i7-8750H CPU returns alongside new GeForce RTX 2060, RTX 2070 Max-Q, and RTX 2080 Max-Q GPU options. There are no Core i5 or RAM options less than 16 GB to bring down the starting price unlike on many competing gaming laptops. Razer is laser-focused on offering high-end gaming laptops and their specifications reflect this approach.
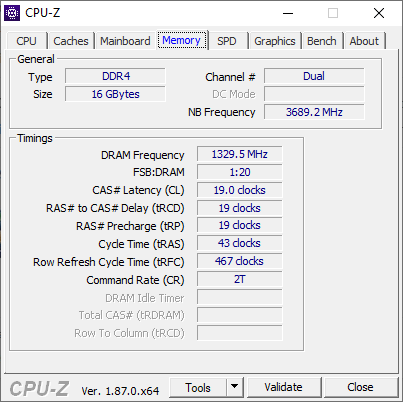
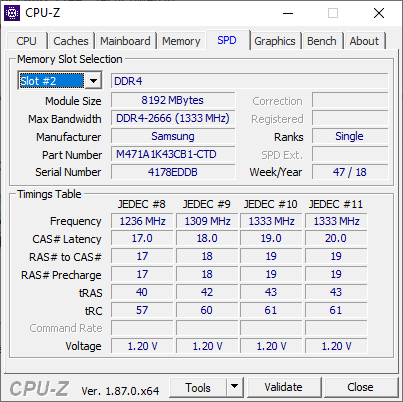
While system RAM remains identical to the 2018 Blade 15 (DDR4-2666), each SODIMM slot can now support up to 32 GB for a total of 64 GB. Previous models were limited to 32 GB total only. G-Sync is not supported as Optimus comes standard across all SKUs.
Processor
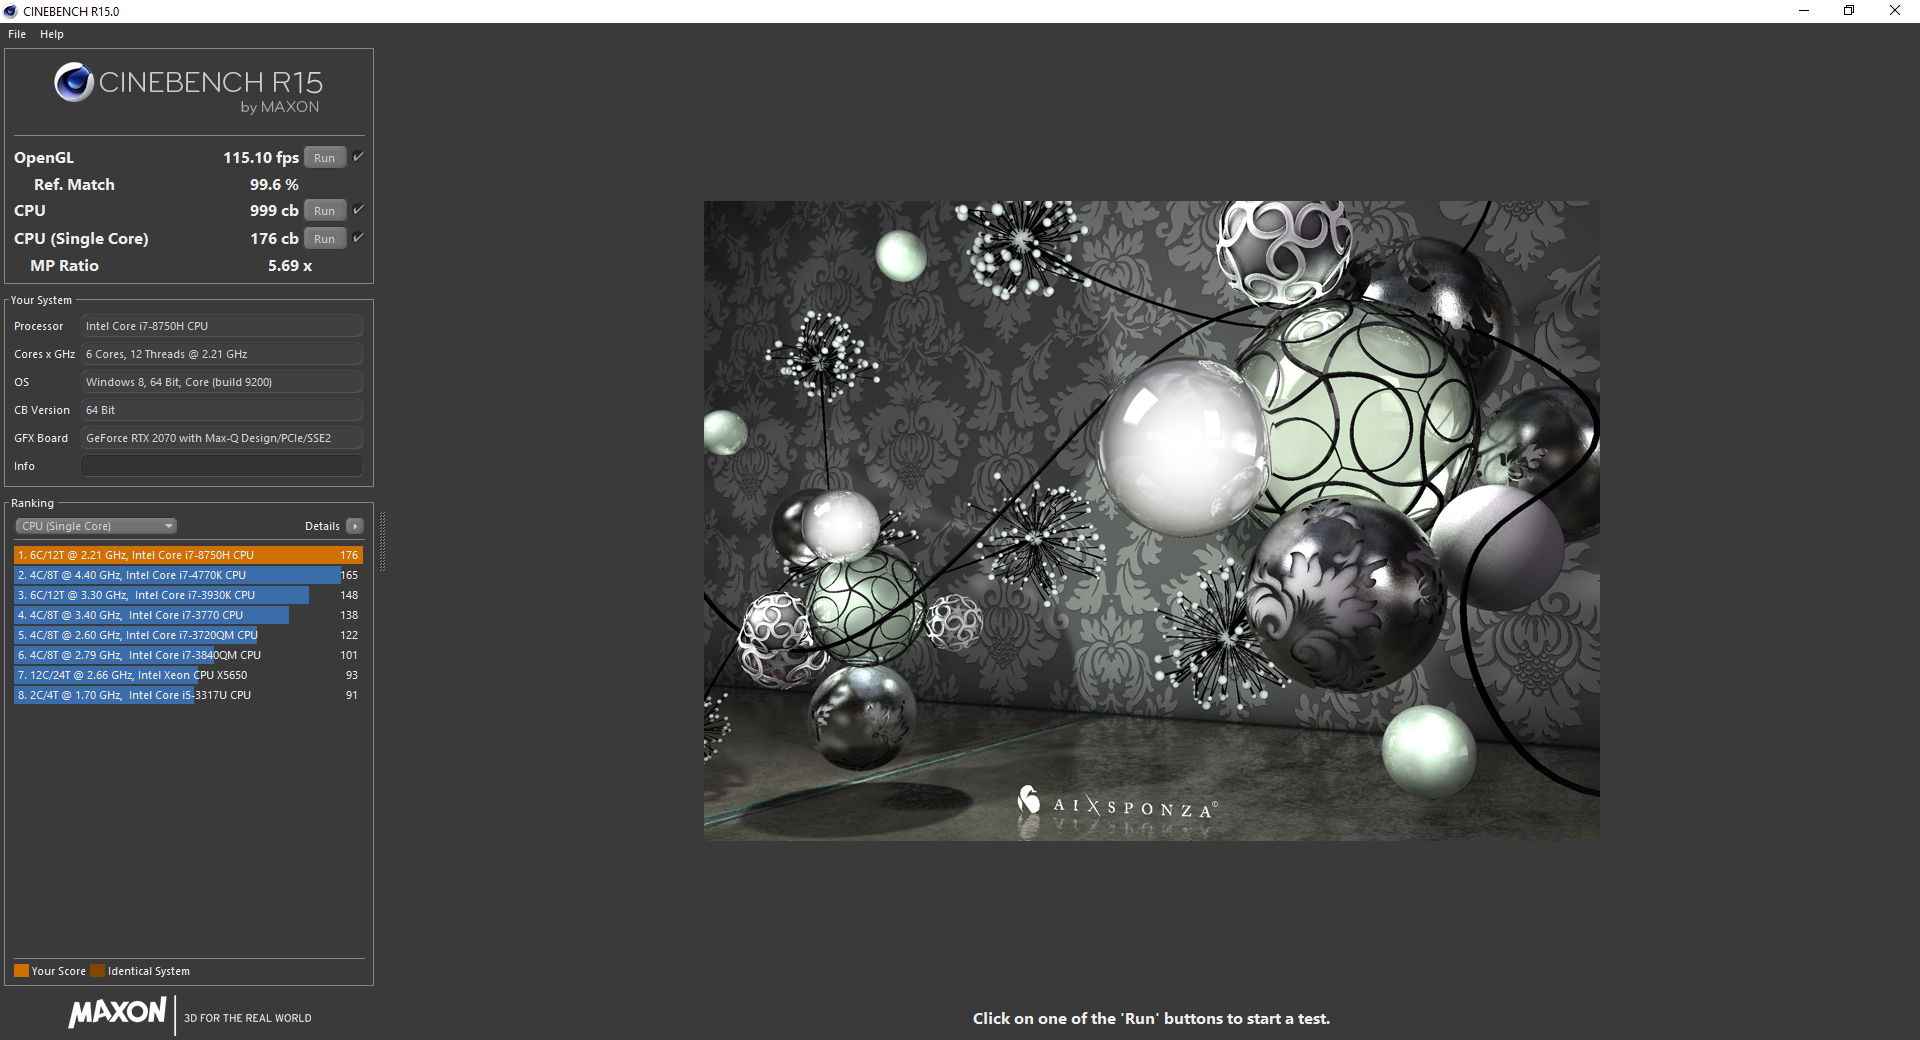
All Blade 15 SKUs as of this writing utilize the same Core i7-8750H CPU. Unfortunately, multi-thread performance on our Razer is 10 percent slower than the average i7-8750H in our database taken from 60 other laptops. The Alienware m15 with the exact same CPU, for example, outscores our Razer by 22 percent in the same CineBench benchmark. In fact, overall multi-core performance is closer to a Core i5-8300H. These disappointing results are due to poor Turbo Boost sustainability as detailed in our Stress Test section.
We can observe the effects of CPU throttling by running CineBench R15 Multi-Thread in a loop and recording the results as shown below. The initial score of 999 points drops to 825 points by the second loop. In comparison, the Alienware m15 is able to maintain higher scores averaging 1164 points. None of this is new as detailed on our comparison page here.
See our dedicated page on the Core i7-8750H for more technical information and benchmark comparisons.
| Cinebench R11.5 | |
| CPU Single 64Bit | |
| no name | |
| Average Intel Core i7-8750H (1.89 - 2, n=40) | |
| Razer Blade Pro RZ09-0220 | |
| Asus GL702ZC-GC104T | |
| CPU Multi 64Bit | |
| Asus GL702ZC-GC104T | |
| no name | |
| Average Intel Core i7-8750H (9.54 - 13.5, n=41) | |
| Razer Blade Pro RZ09-0220 | |
| Cinebench R10 | |
| Rendering Multiple CPUs 32Bit | |
| no name | |
| Average Intel Core i7-8750H (29664 - 35307, n=25) | |
| Asus GL702ZC-GC104T | |
| Razer Blade Pro RZ09-0220 | |
| Rendering Single 32Bit | |
| no name | |
| Average Intel Core i7-8750H (6236 - 6645, n=25) | |
| Razer Blade Pro RZ09-0220 | |
| Asus GL702ZC-GC104T | |
| wPrime 2.10 - 1024m | |
| Razer Blade Pro RZ09-0220 | |
| Average Intel Core i7-8750H (125.5 - 180.5, n=6) | |
| no name | |
* ... smaller is better
System Performance
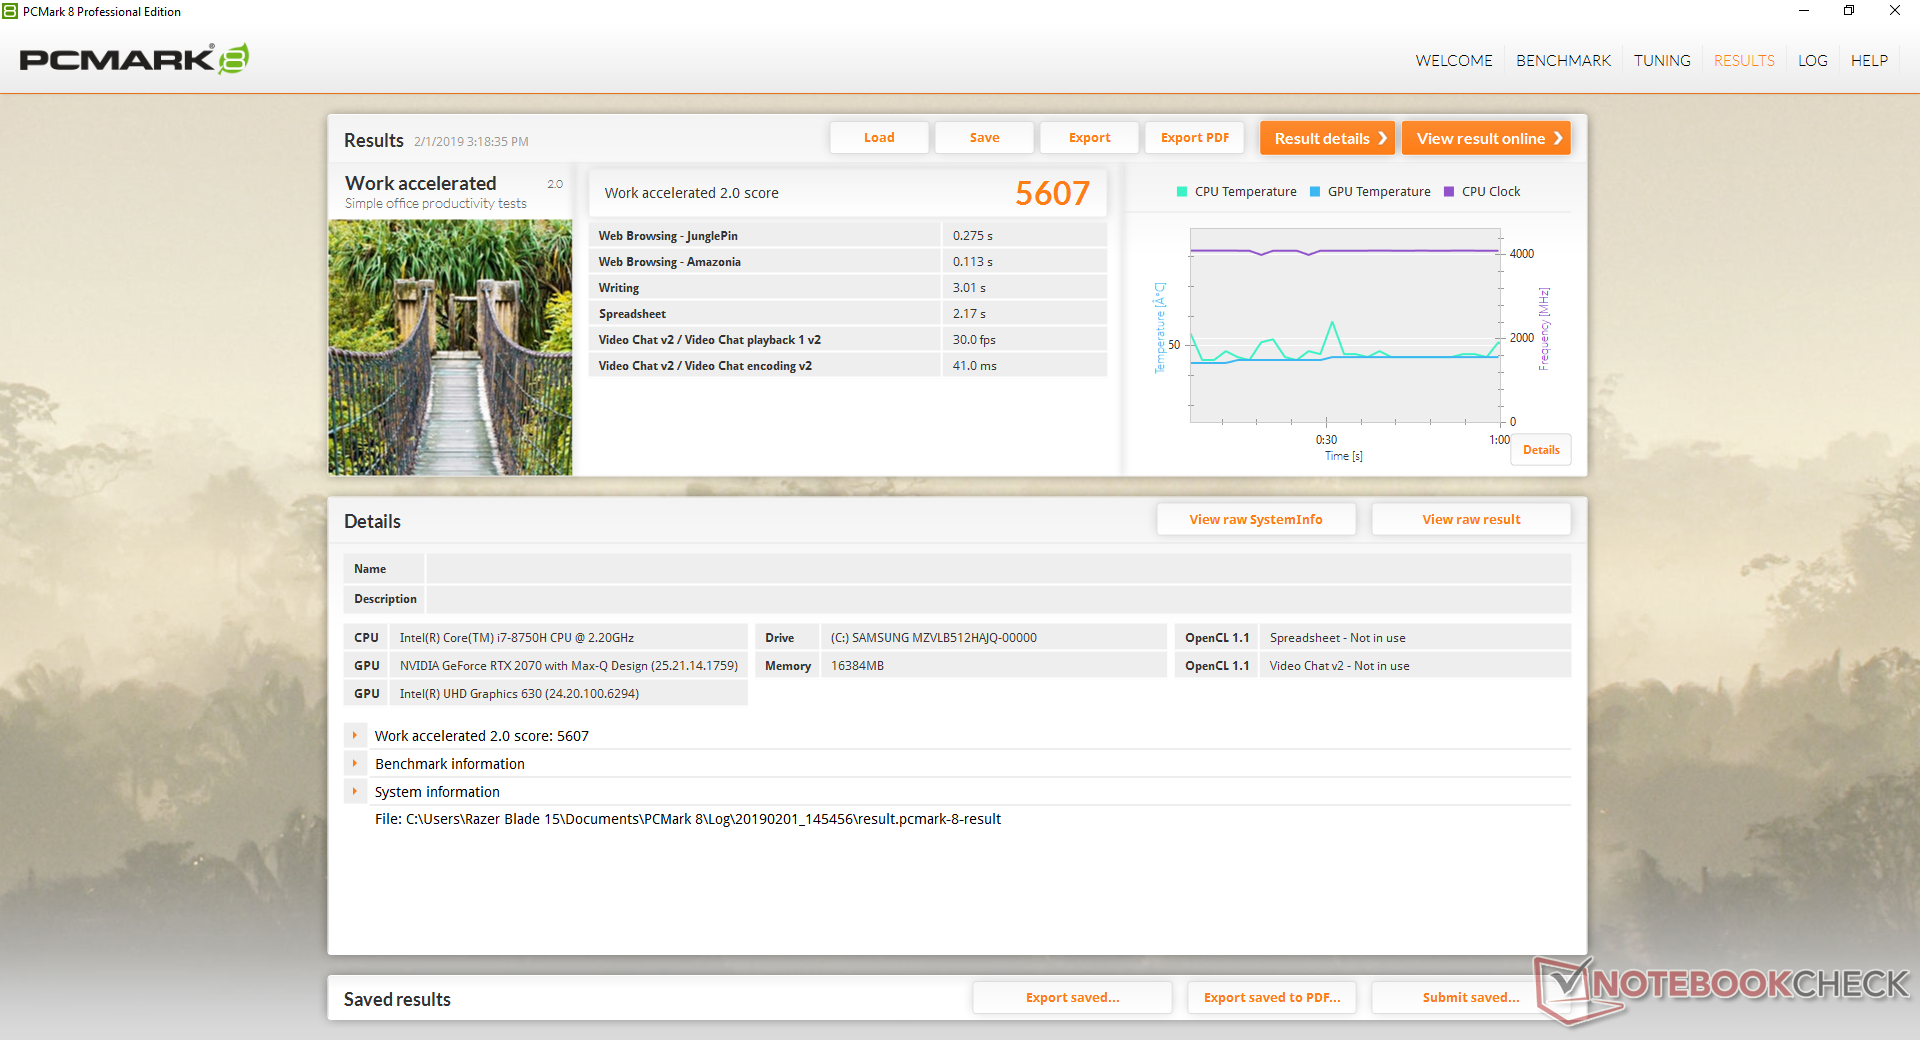
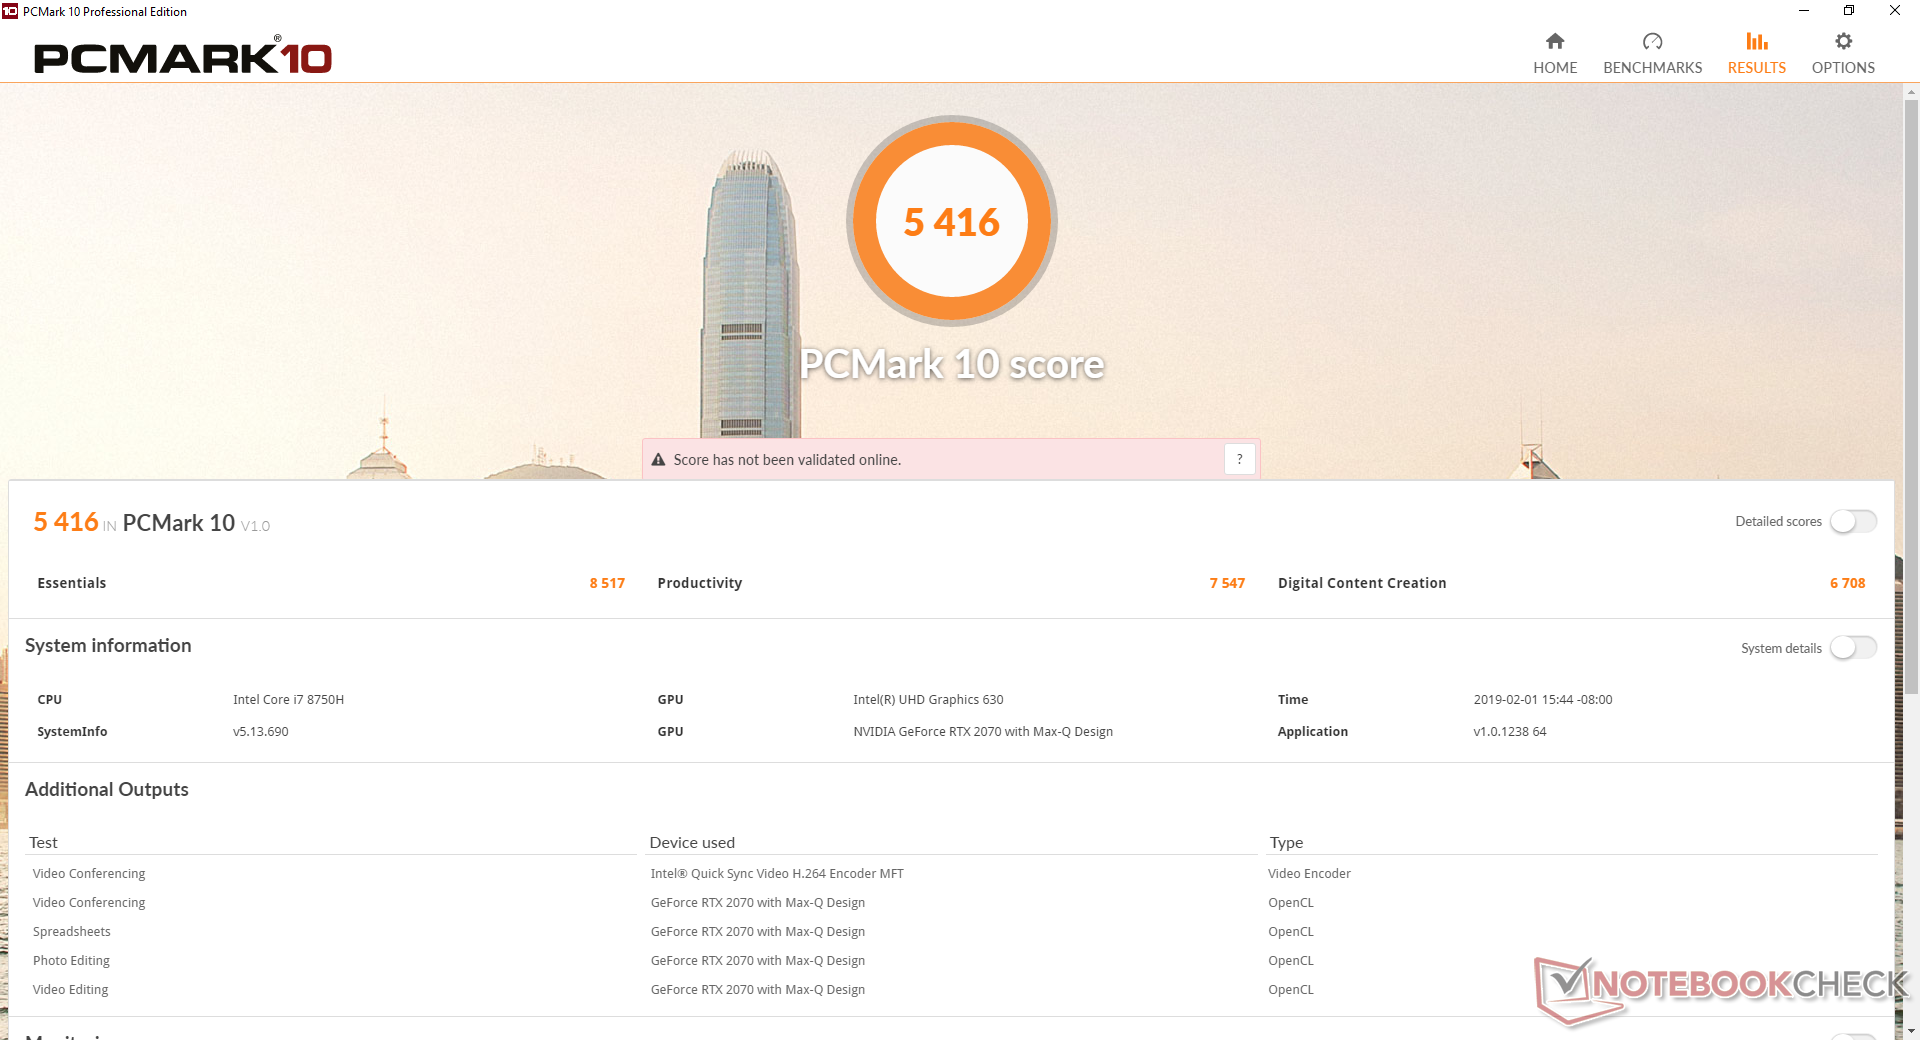
PCMark benchmarks rank our system within single-digit percentage points of last year's Blade 15 GTX 1070 Max-Q SKU. Thus, the upgrade to RTX from Pascal will have no major impact on day-to-day performance. Even the Digital Content Creation benchmark, which is more heavily influenced by GPU performance, is higher by only 11 percent on the new Blade 15.
We experienced no software or hardware issues on our Blade 15 test unit in contrast to the issues we noted on the latest Blade Stealth.
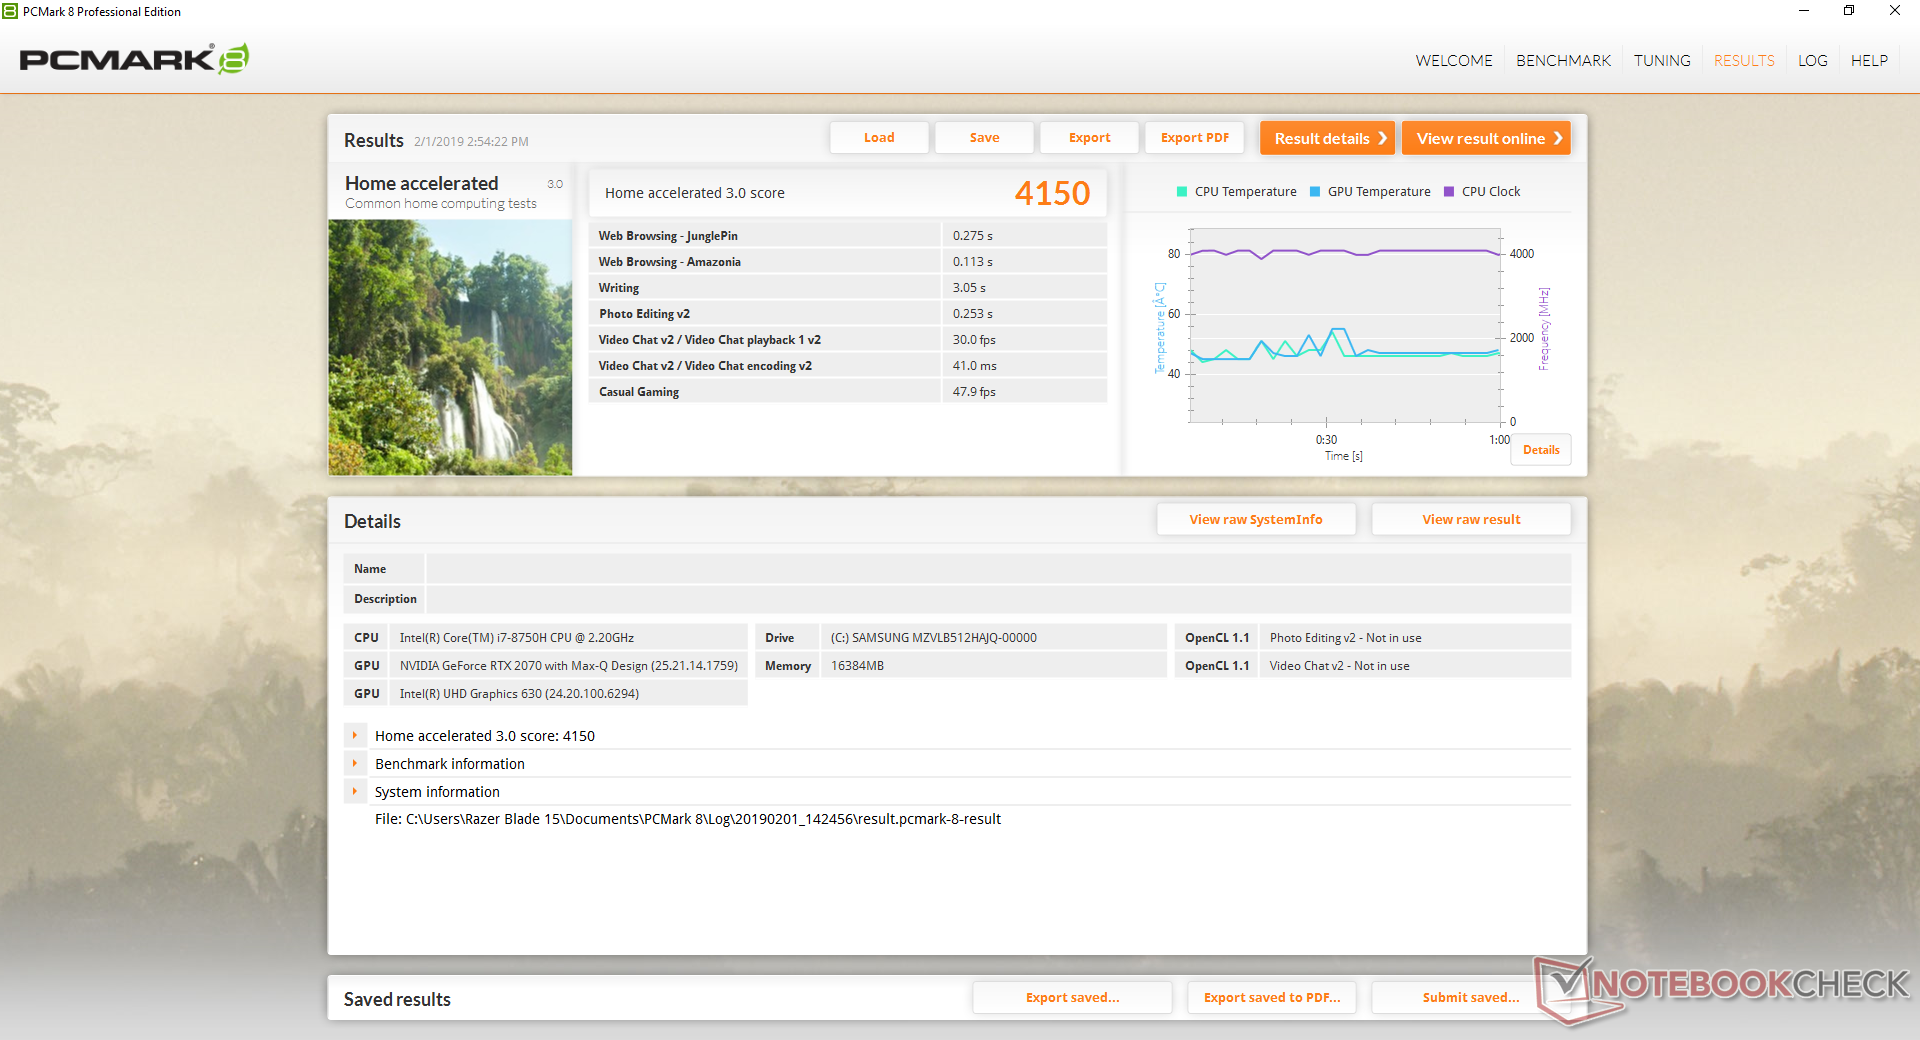
| PCMark 8 Home Score Accelerated v2 | 4150 points | |
| PCMark 8 Work Score Accelerated v2 | 5607 points | |
| PCMark 10 Score | 5416 points | |
Help | ||
Storage Devices
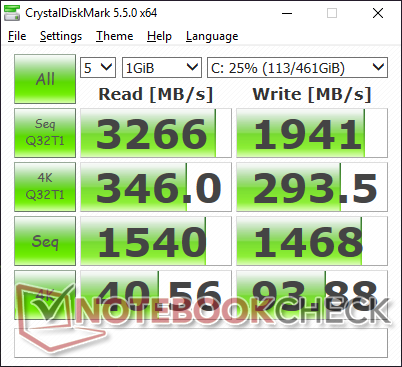
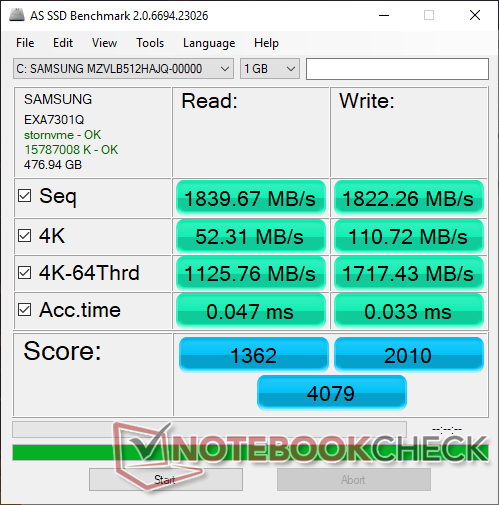
Our unit ships with a 512 GB Samsung PM981 NVMe SSD compared to the 512 GB Samsung PM961 on last year's Blade 15. Users who want a second storage slot will have to get the older Blade 15 Base Model for now or opt for the dual-storage MSI GS65 or Alienware m15.
The PM981 sports faster sequential write rates than the PM961 and most SSDs from competing manufacturers. The Toshiba XG5 in the Alienware m15, for example, is nearly 40 percent slower in sequential write rate. We applaud Razer for sticking with Samsung SSDs across its entire Blade 15 and Blade Pro families.
See our table of SSDs and HDDs for more benchmark comparisons.
| Razer Blade 15 RTX 2070 Max-Q Samsung SSD PM981 MZVLB512HAJQ | Razer Blade 15 2018 Samsung PM961 NVMe MZVLW512HMJP | Apple MacBook Pro 15 2018 (2.6 GHz, 560X) Apple SSD AP0512 | Dell XPS 15 9570 Core i9 UHD Samsung SSD PM981 MZVLB1T0HALR | Alienware m15 GTX 1070 Max-Q Toshiba XG5 KXG50ZNV512G | |
|---|---|---|---|---|---|
| AS SSD | -7% | -78% | -6% | -45% | |
| Seq Read (MB/s) | 1840 | 2376 29% | 2239 22% | 1320 -28% | 1967 7% |
| Seq Write (MB/s) | 1822 | 1521 -17% | 1644 -10% | 1500 -18% | 1135 -38% |
| 4K Read (MB/s) | 52.3 | 46.45 -11% | 9.46 -82% | 30.73 -41% | 29.17 -44% |
| 4K Write (MB/s) | 110.7 | 93.6 -15% | 18.78 -83% | 94.4 -15% | 93.4 -16% |
| 4K-64 Read (MB/s) | 1126 | 1300 15% | 965 -14% | 1453 29% | 995 -12% |
| 4K-64 Write (MB/s) | 1717 | 1204 -30% | 163.5 -90% | 1815 6% | 656 -62% |
| Access Time Read * (ms) | 0.047 | 0.051 -9% | 0.225 -379% | 0.061 -30% | 0.116 -147% |
| Access Time Write * (ms) | 0.033 | 0.038 -15% | 0.044 -33% | 0.063 -91% | |
| Score Read (Points) | 1362 | 1584 16% | 1199 -12% | 1616 19% | 1221 -10% |
| Score Write (Points) | 2010 | 1450 -28% | 347 -83% | 2059 2% | 862 -57% |
| Score Total (Points) | 4079 | 3806 -7% | 2119 -48% | 4507 10% | 2667 -35% |
| Copy ISO MB/s (MB/s) | 1975 | 2577 30% | 642 -67% | ||
| Copy Program MB/s (MB/s) | 526 | 515 -2% | 431.5 -18% | ||
| Copy Game MB/s (MB/s) | 1200 | 1120 -7% | 706 -41% |
* ... smaller is better

GPU Performance
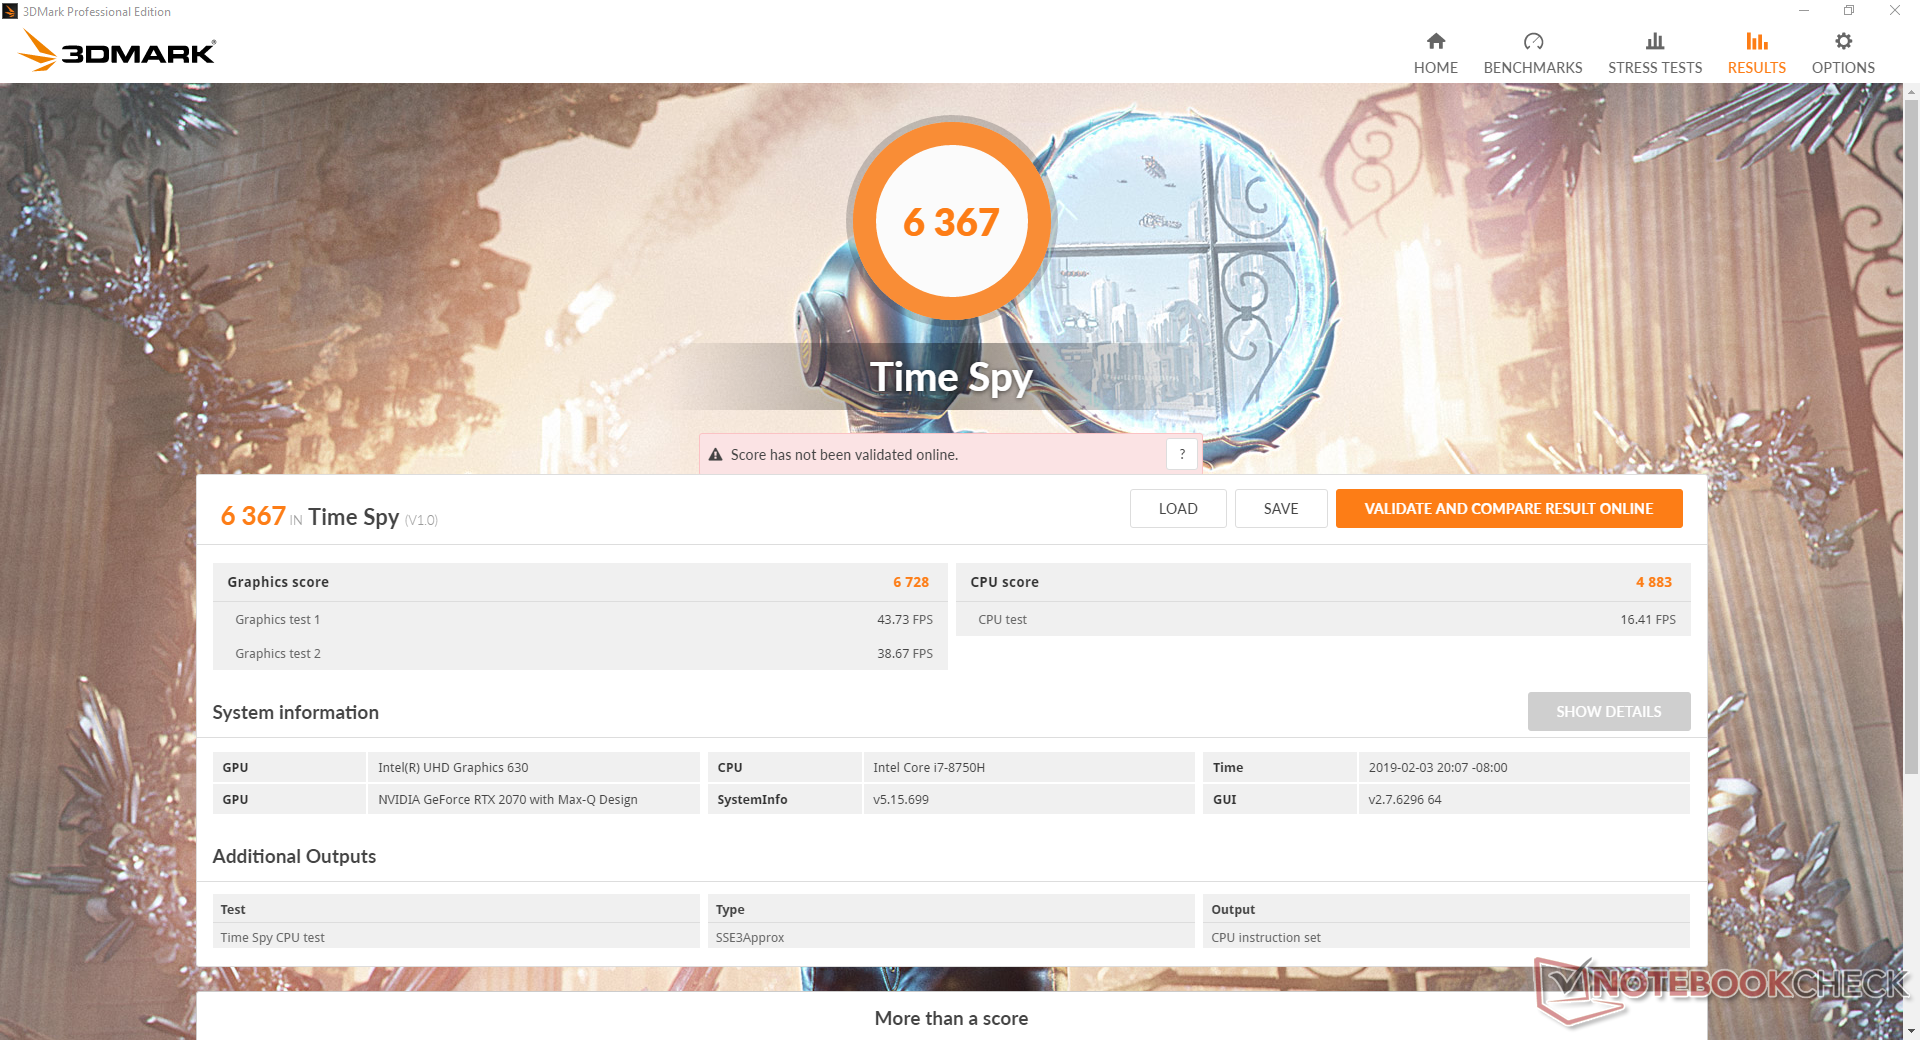
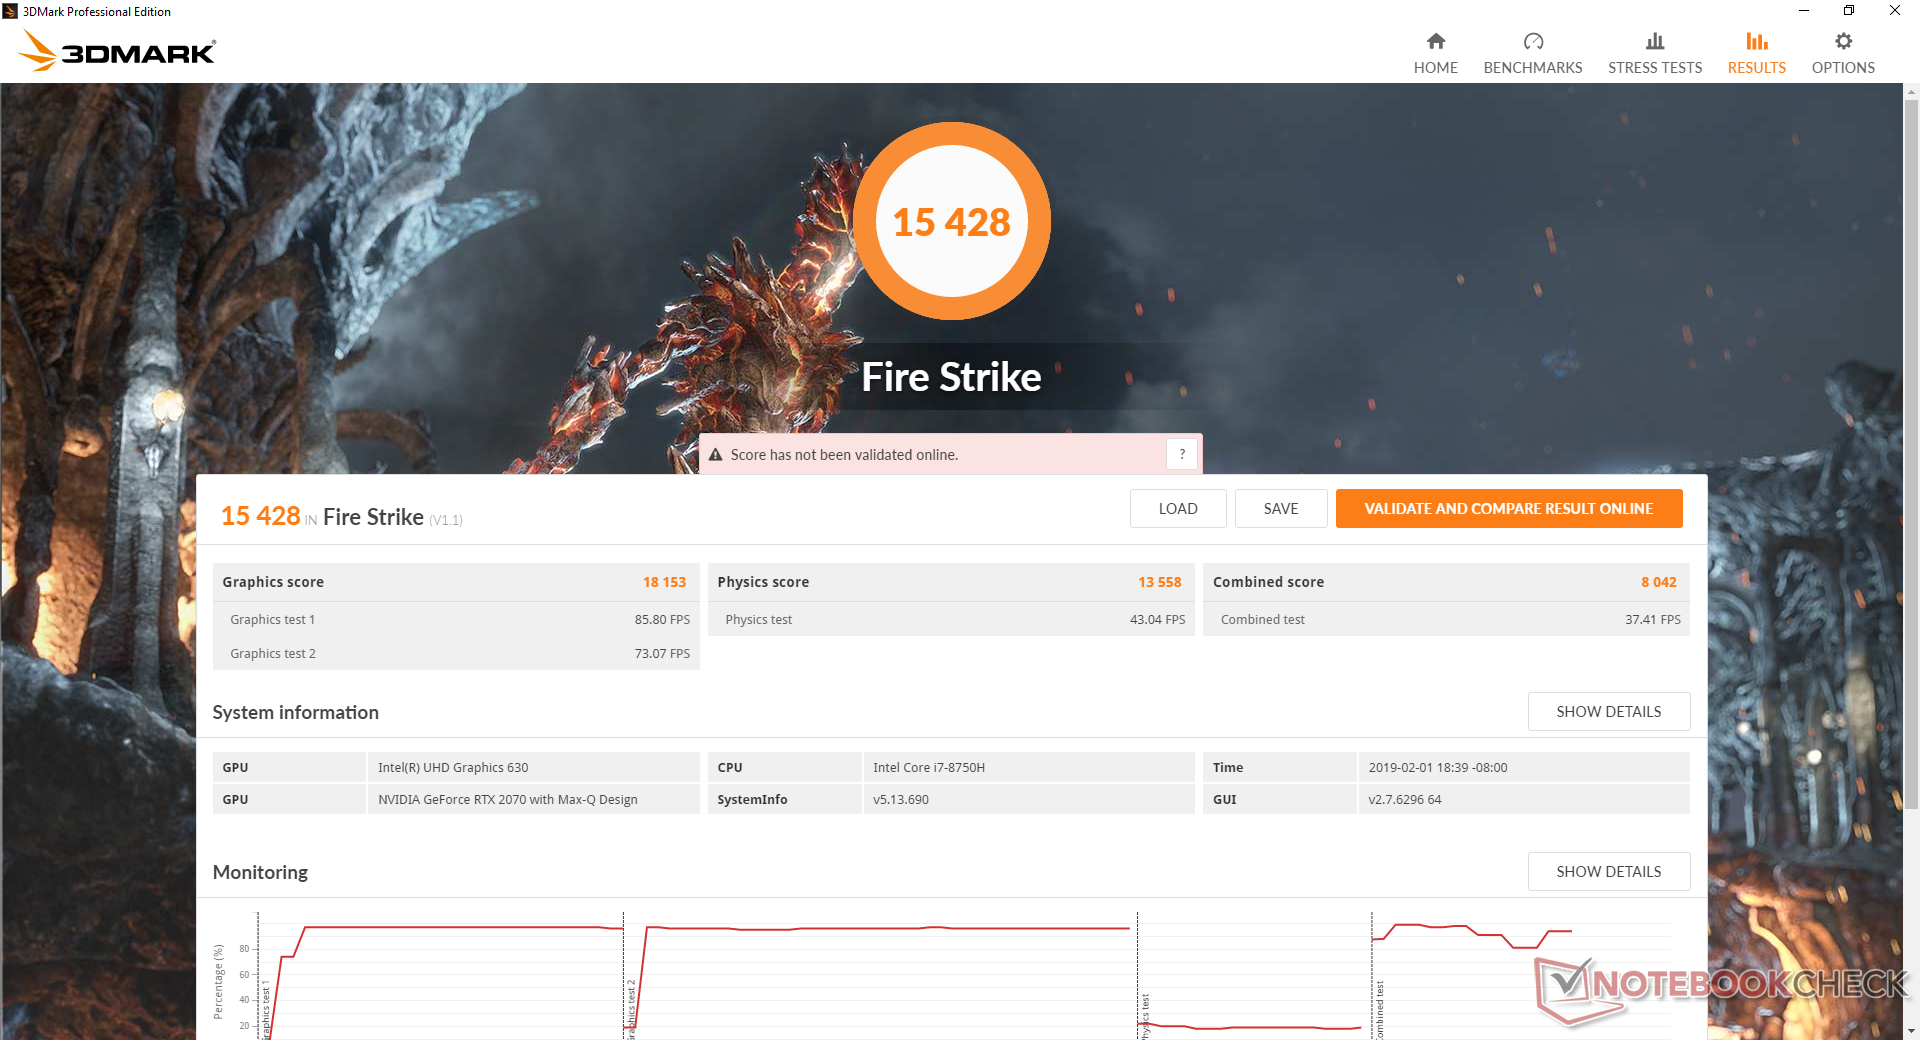
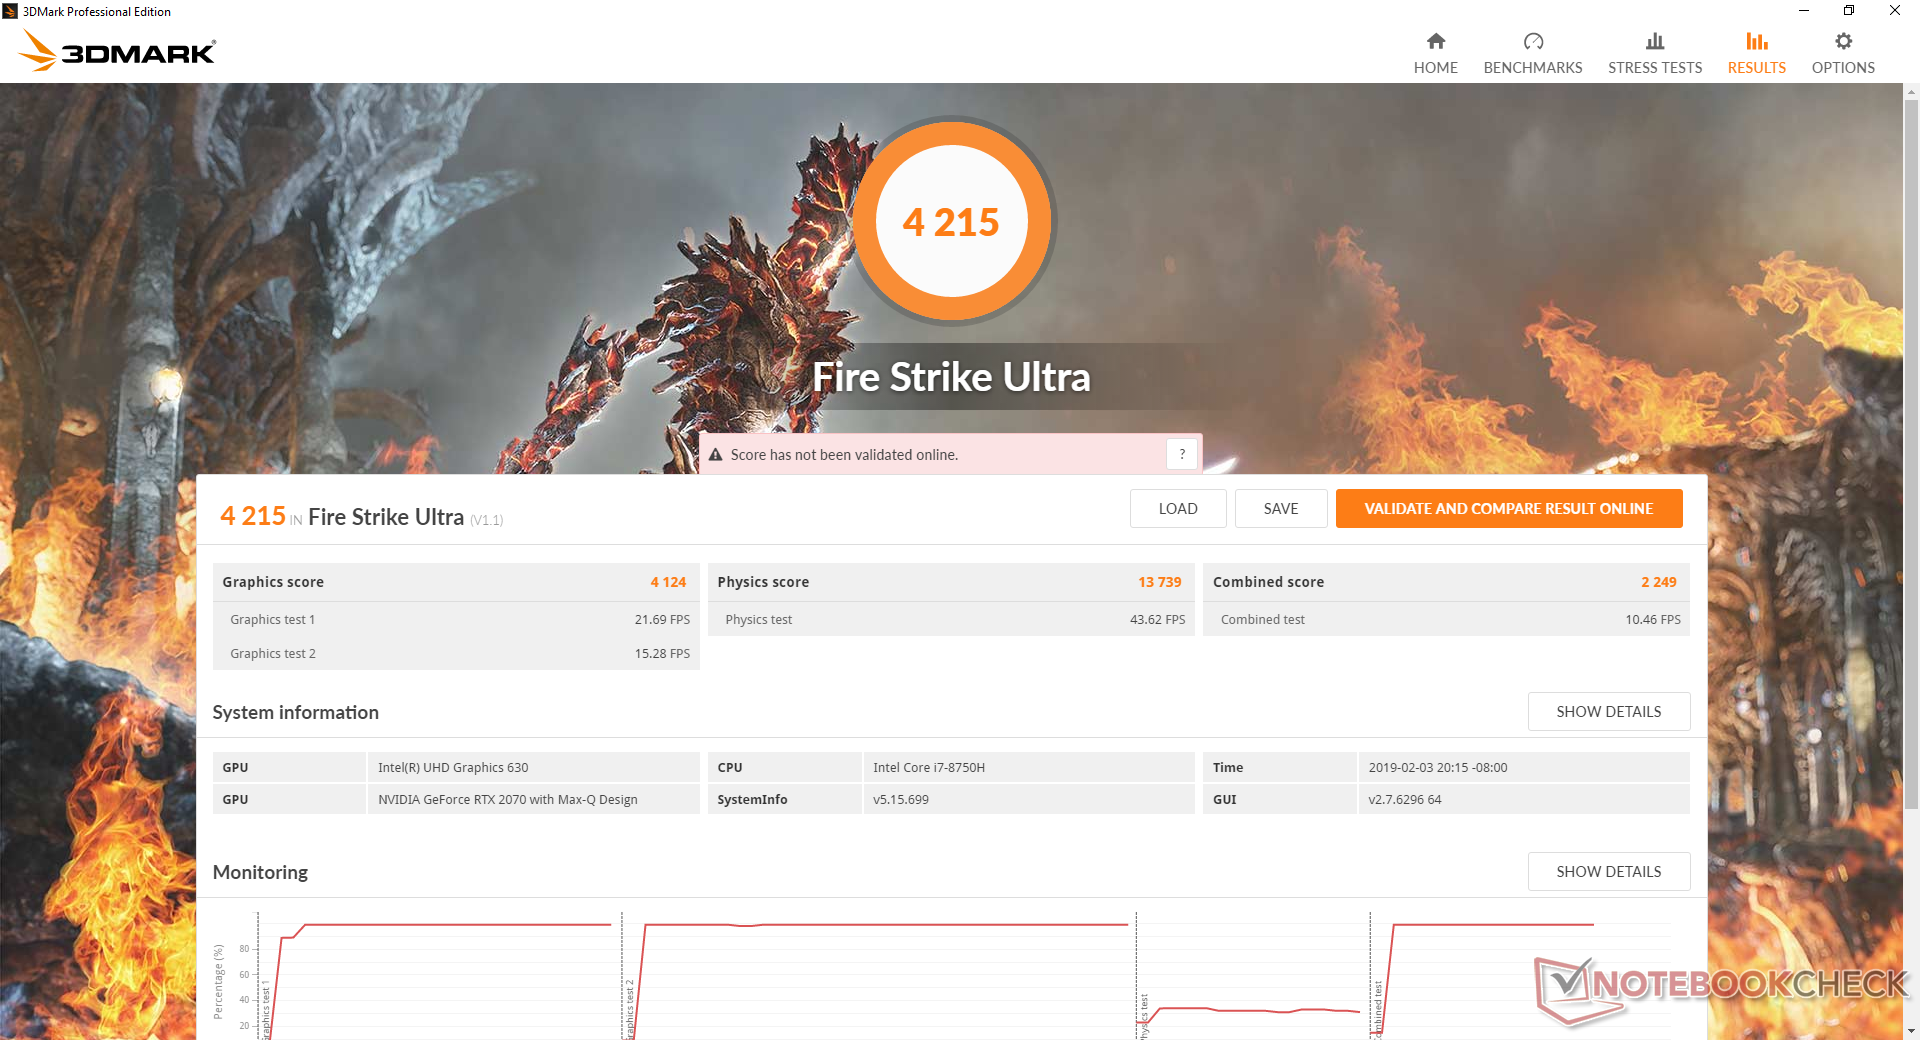
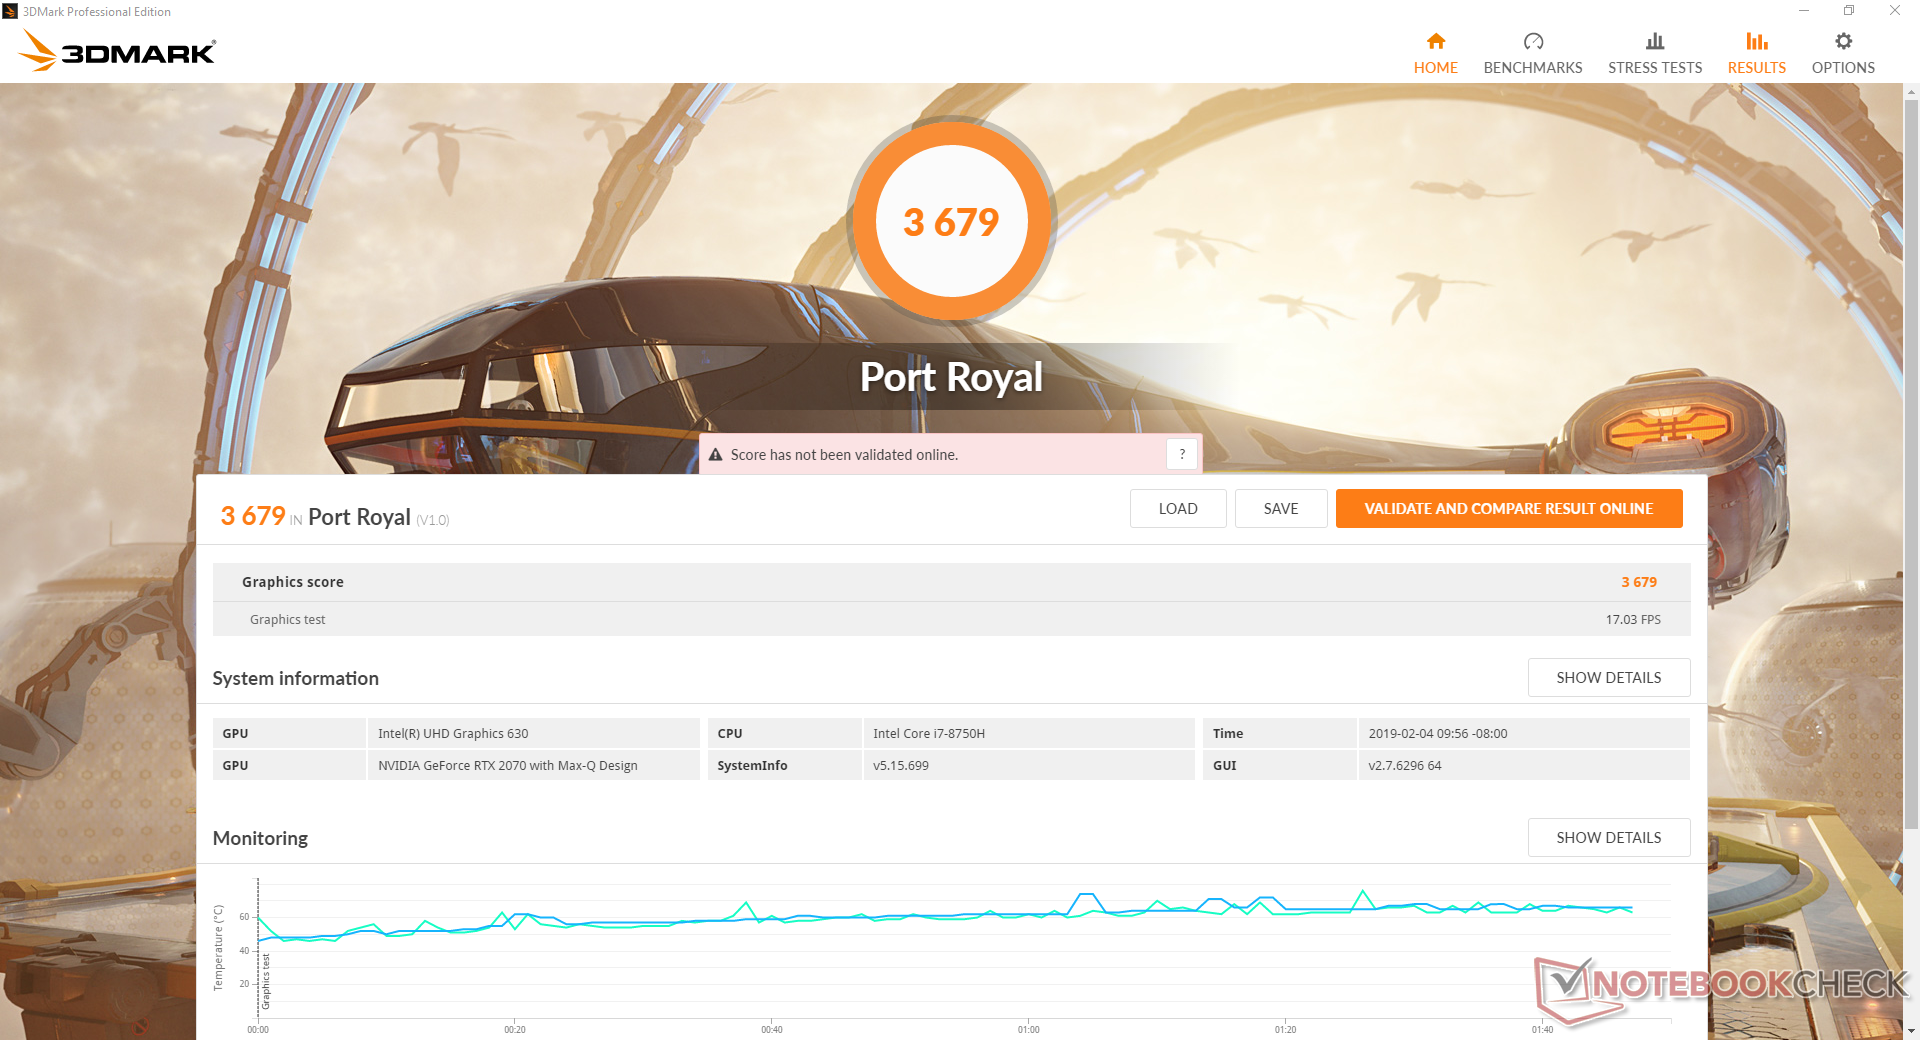
So, how much graphics performance can users expect when compared to the original Blade 15 GTX 1070 Max-Q? According to 3DMark Fire Strike and Time Spy, the new RTX 2070 Max-Q is about 15 percent faster to be essentially identical to the last generation GTX 1080 Max-Q. Meanwhile, ray-tracing performance in the new Port Royal benchmark is roughly 20 percent better than the standard RTX 2060 for laptops. The gen-to-gen improvement from Pascal to Turing is definitely smaller when compared to Kepler to Pascal in terms of raw gaming prowess. Users interested in the RTX 2070 Max-Q are encouraged to utilize its ray-tracing capabilities to make the most of the new GPU architecture.
DX12 games favor the new RTX GPU much more when compared to DX11. 3DMark Time Spy results, for example, are over 40 percent higher on our RTX 2070 Max-Q than the GTX 1070 Max-Q.
Since the Blade 15 is one of the very first RTX gaming laptops we've tested, our benchmark results are thin and so we don't yet have a sense of how it performs when compared to other RTX laptops. Our database will naturally grow over time as we test more gaming laptops to eventually give an idea of where the Blade 15 fits in the bigger picture.
Like the rest of the RTX family, the RTX 2070 Max-Q supports DLSS for improved gaming performance. It's up to the developers to implement this new Nvidia exclusive feature and only very few titles support it as of this writing.
| 3DMark | |
| 1920x1080 Fire Strike Graphics | |
| Asus ROG G703GX | |
| Asus ROG Strix RTX 2070 OC | |
| Acer Triton 500 | |
| Razer Blade Pro 2017 | |
| Asus Zephyrus GX501 | |
| Razer Blade 15 RTX 2070 Max-Q | |
| Average NVIDIA GeForce RTX 2070 Max-Q (11563 - 21191, n=31) | |
| Razer Blade 15 2018 | |
| Schenker XMG Ultra 15 | |
| MSI GS63VR 7RG-005 | |
| Razer Blade 15 Base Model | |
| Razer Blade (2017) UHD | |
| Lenovo Legion Y730-15ICH i5-8300H | |
| Dell XPS 15 9570 Core i9 UHD | |
| MSI GF63 8RC-040XPL | |
| 2560x1440 Port Royal Graphics | |
| Asus ROG G703GX | |
| Acer Triton 500 | |
| Average NVIDIA GeForce RTX 2070 Max-Q (3240 - 4742, n=23) | |
| Razer Blade 15 RTX 2070 Max-Q | |
| Schenker XMG Ultra 15 | |
| 2560x1440 Time Spy Graphics | |
| Asus ROG G703GX | |
| Asus ROG Strix RTX 2070 OC | |
| Acer Triton 500 | |
| Average NVIDIA GeForce RTX 2070 Max-Q (5948 - 8065, n=28) | |
| Razer Blade 15 RTX 2070 Max-Q | |
| Razer Blade Pro 2017 | |
| Schenker XMG Ultra 15 | |
| Asus Zephyrus GX501 | |
| MSI GS63VR 7RG-005 | |
| Razer Blade (2017) UHD | |
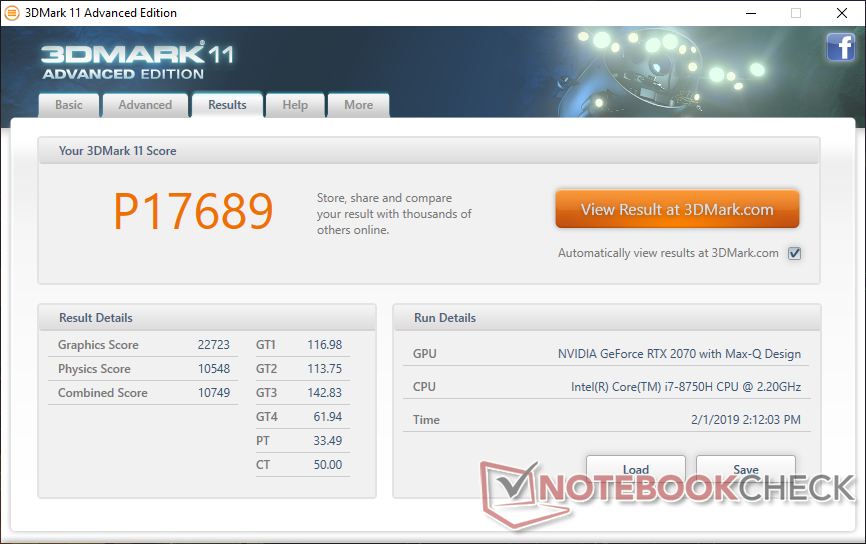
| 3DMark 11 Performance | 17689 points | |
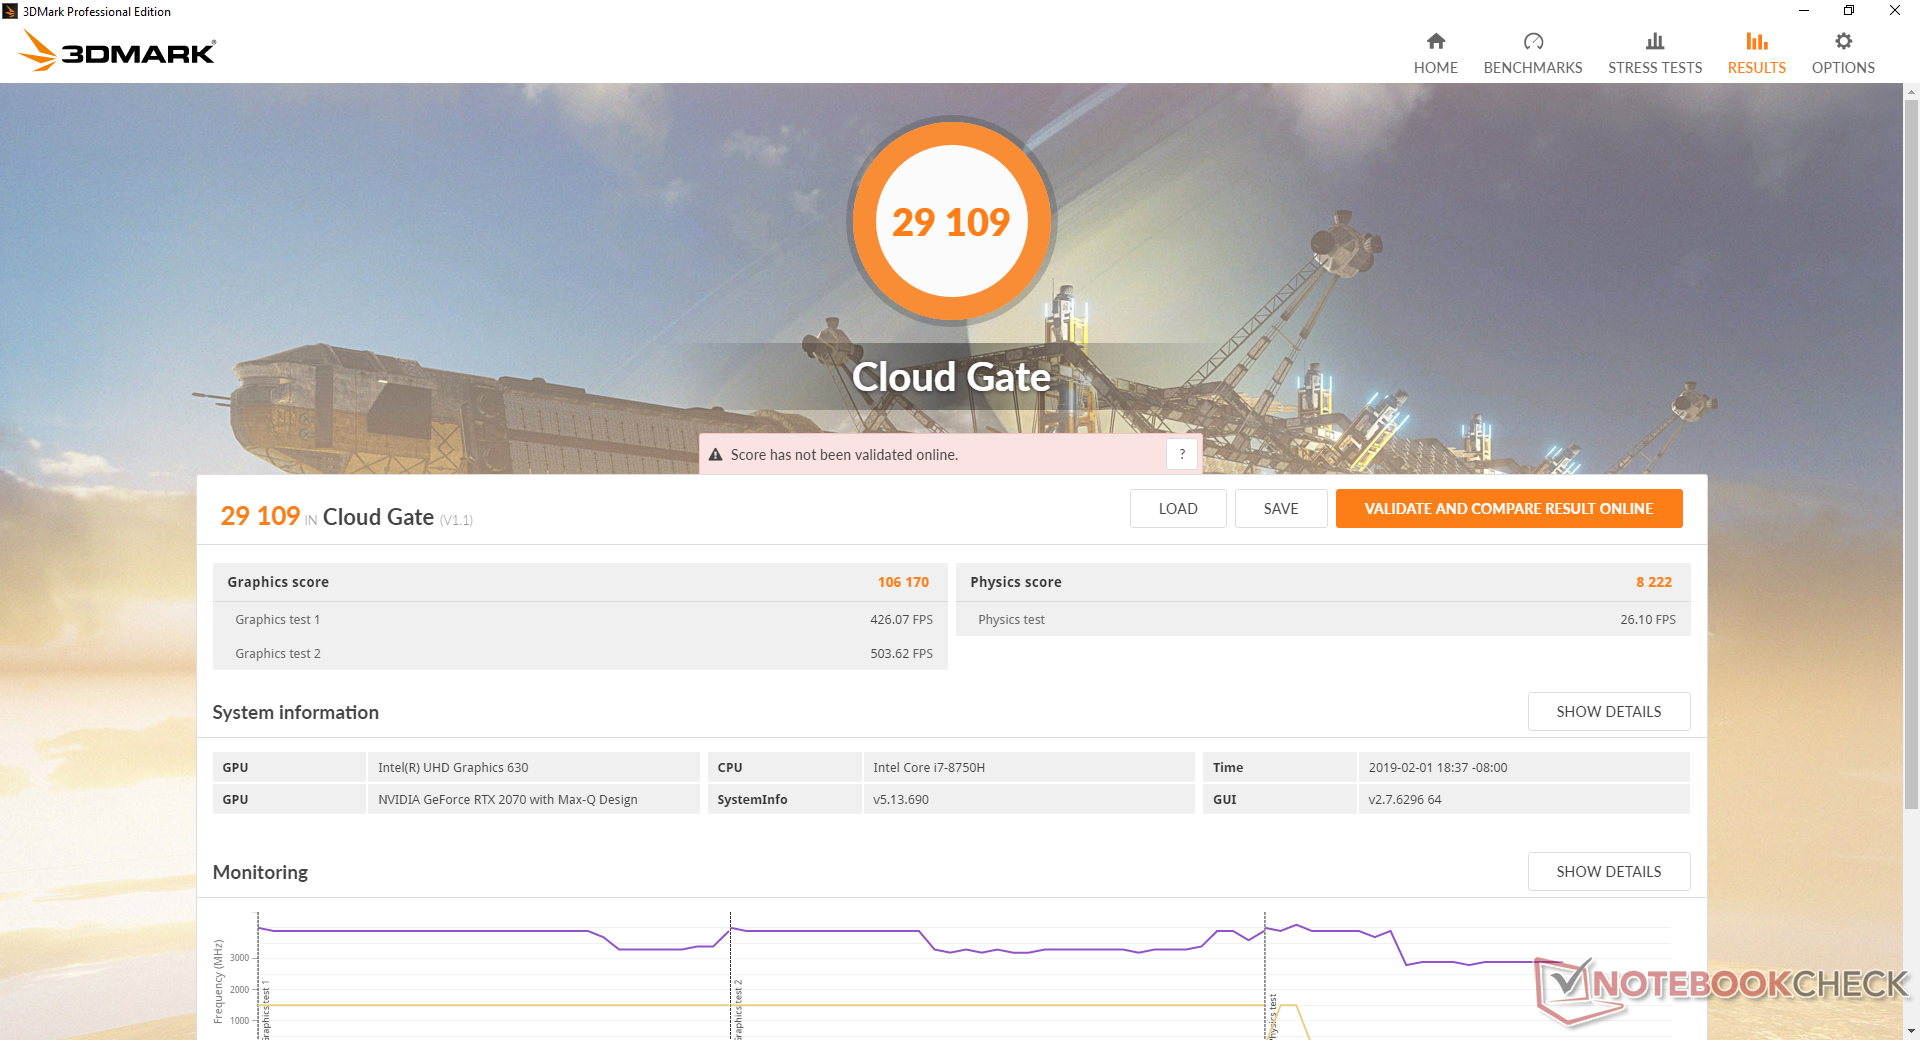
| 3DMark Cloud Gate Standard Score | 29109 points | |
| 3DMark Fire Strike Score | 15428 points | |
| 3DMark Fire Strike Extreme Score | 8041 points | |
| 3DMark Time Spy Score | 6367 points | |
Help | ||
Gaming Performance
Real-world gaming performance is close to a GTX 1080 Max-Q or about 30 to 35 percent slower than a standard RTX 2080 for desktop. To make the most of the 1080p 144 Hz display refresh rate, however, a stable 144 FPS is desired which is not easy to reach for demanding titles. Common eSports titles like DOTA 2, Rocket League, CS:GO, or Overwatch are otherwise perfect for this system.
As for 4K gaming, users can expect an average of 42 FPS on Battlefield 5 Ultra which is again comparable to a GTX 1080 Max-Q. Users who decide to upgrade to the pricier Blade 15 RTX 2080 Max-Q should expect a 20 to 30 percent boost in gaming performance over the RTX 2070 Max-Q.
Idling on Witcher 3 shows no recurring drops in frame rates to suggest no interrupting background activity during gameplay.
See our full review on the mobile GeForce RTX Turing series for more gaming benchmarks and ray-tracing comparisons in Battlefield 5.
| The Witcher 3 - 1920x1080 Ultra Graphics & Postprocessing (HBAO+) | |
| Asus ROG G703GX | |
| Asus ROG Strix RTX 2070 OC | |
| Acer Triton 500 | |
| MSI GS75 8SG Stealth | |
| Razer Blade 15 RTX 2070 Max-Q | |
| Razer Blade Pro 2017 | |
| Asus Zephyrus GX501 | |
| Alienware 17 R5 | |
| Schenker XMG Ultra 15 | |
| Razer Blade 15 2018 | |
| Razer Blade 15 Base Model | |
| Razer Blade Pro RZ09-0220 | |
| Asus GL702ZC-GC104T | |
| Lenovo Legion Y730-15ICH i5-8300H | |
| Lenovo ThinkPad X1 Extreme-20MF000RGE | |
| Apple MacBook Pro 15 2018 (2.6 GHz, 560X) | |
| Rise of the Tomb Raider - 1920x1080 Very High Preset AA:FX AF:16x | |
| Asus ROG Strix RTX 2070 OC | |
| Asus Zephyrus GX501 | |
| Razer Blade 15 RTX 2070 Max-Q | |
| Razer Blade 15 Base Model | |
| Razer Blade Pro RZ09-0220 | |
| Asus GL702ZC-GC104T | |
| Lenovo Legion Y730-15ICH i5-8300H | |
| Apple MacBook Pro 15 2018 (2.6 GHz, 560X) | |
| low | med. | high | ultra | |
|---|---|---|---|---|
| BioShock Infinite (2013) | 290.8 | 260.1 | 246.1 | 152.5 |
| The Witcher 3 (2015) | 252.5 | 208.9 | 130.1 | 68.9 |
| Rise of the Tomb Raider (2016) | 204.2 | 157.8 | 121.9 | 103.9 |
Emissions
System Noise
The cooling solution is visually identical to last year's Advanced Model despite the small increase in overall thickness. Both fans will idle during low loads like browsing or streaming on the Power Saver profile for silent operation. If on the High Performance profile, expect a fan noise of only 29.4 dB(A) against a background of 28.8 dB(A).
More interesting results can be observed when running higher loads as fan noise appears to be quieter than on the GTX 1070 Max-Q SKU. When running the first scene of 3DMark 06, for example, fan noise tops out at 35.7 dB(A) compared to 46 dB(A) on the last generation model and a similar delta occurs when running Witcher 3. The Razer is quieter than its competitors when gaming including the Alienware m15, MSI GS65, and especially the Gigabyte Aero 15x. At worst, we are only able to record a temporary fan noise of 45 dB(A) when running Prime95 and FurMark simultaneously.
Electronic noise or coil whine is not present on our test unit.
| Razer Blade 15 RTX 2070 Max-Q GeForce RTX 2070 Max-Q, i7-8750H, Samsung SSD PM981 MZVLB512HAJQ | Razer Blade 15 2018 GeForce GTX 1070 Max-Q, i7-8750H, Samsung PM961 NVMe MZVLW512HMJP | Alienware m15 GTX 1070 Max-Q GeForce GTX 1070 Max-Q, i7-8750H, Toshiba XG5 KXG50ZNV512G | Dell XPS 15 9570 Core i9 UHD GeForce GTX 1050 Ti Max-Q, i9-8950HK, Samsung SSD PM981 MZVLB1T0HALR | Gigabyte Aero 15X v8 GeForce GTX 1070 Max-Q, i7-8750H, Toshiba NVMe THNSN5512GPU7 | MSI GS65 Stealth Thin 8RE-051US GeForce GTX 1060 Mobile, i7-8750H, Samsung SSD PM981 MZVLB256HAHQ | |
|---|---|---|---|---|---|---|
| Noise | -12% | -5% | -2% | -16% | -4% | |
| off / environment * (dB) | 28.8 | 29 -1% | 28.6 1% | 28.2 2% | 29 -1% | 28.4 1% |
| Idle Minimum * (dB) | 28.8 | 29 -1% | 28.6 1% | 28.5 1% | 30 -4% | 28.4 1% |
| Idle Average * (dB) | 28.8 | 30 -4% | 28.6 1% | 28.6 1% | 31 -8% | 28.4 1% |
| Idle Maximum * (dB) | 29.4 | 38 -29% | 28.6 3% | 28.8 2% | 35 -19% | 29.6 -1% |
| Load Average * (dB) | 35.7 | 46 -29% | 40.8 -14% | 36.2 -1% | 49 -37% | 43.5 -22% |
| Witcher 3 ultra * (dB) | 42.5 | 49 -15% | 49.6 -17% | 47.6 -12% | 51 -20% | 45.7 -8% |
| Load Maximum * (dB) | 45 | 46 -2% | 49.6 -10% | 47.6 -6% | 54 -20% | 45.7 -2% |
* ... smaller is better
Noise level
| Idle |
| 28.8 / 28.8 / 29.4 dB(A) |
| Load |
| 35.7 / 45 dB(A) |
 | ||
30 dB silent 40 dB(A) audible 50 dB(A) loud |
||
min: | ||
Temperature
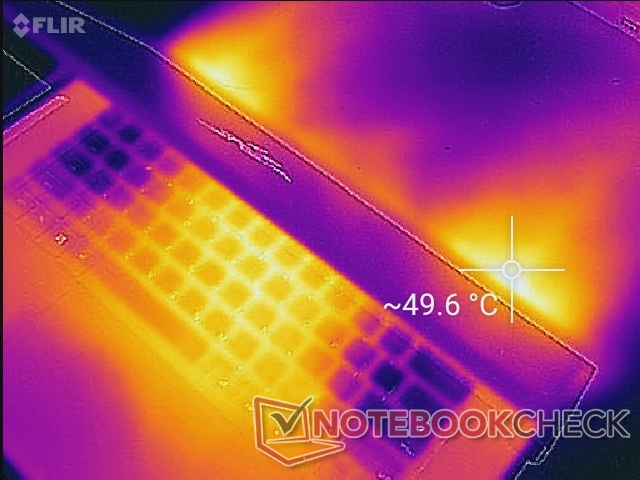
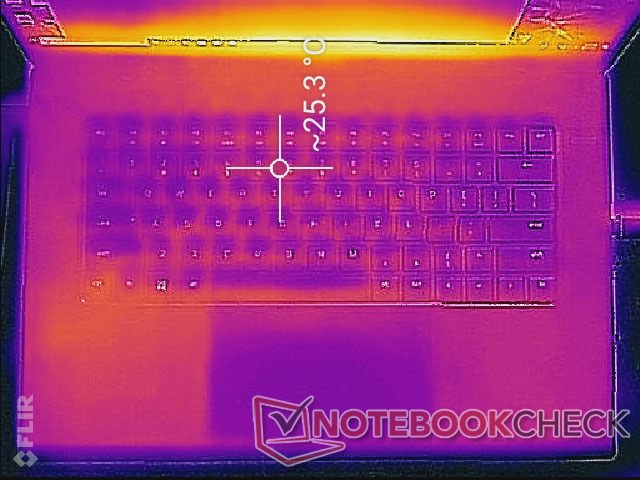
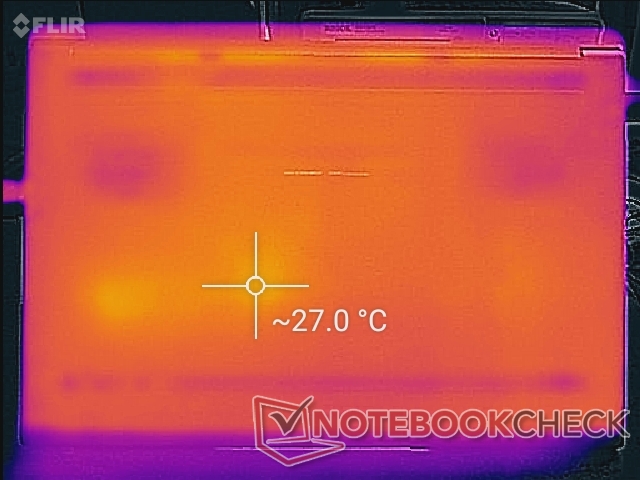
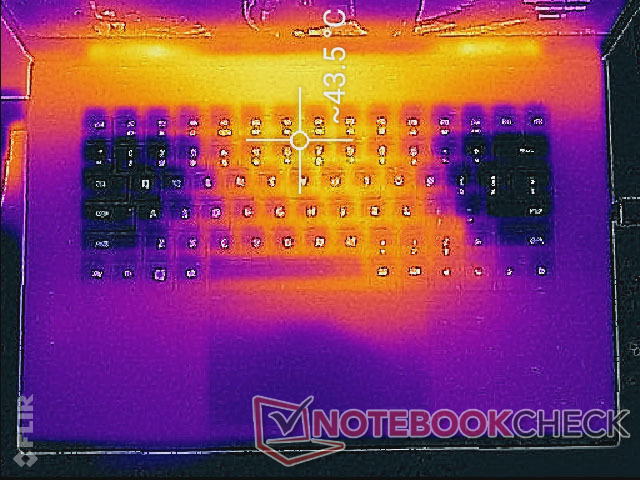
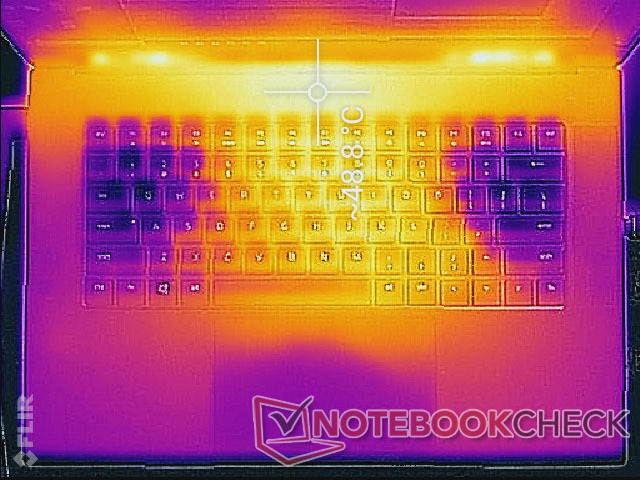
Surface temperatures are flat on both sides of the laptop when idling. The palm rests are always a few degrees above ambient and are thus always warm to the touch. When gaming, the WASD keys remain relatively cool compared to the center of the keyboard where the laptop becomes warmest at up to 48 C. The palm rests, however, will hover in the low 30 C range which we find to be quite warm. The palm rests on the Alienware m15 are slightly cooler than on the Razer when under similar gaming loads.
Fresh air is drawn from the edges of the keyboard and hot air exhausts from the rear. This approach keeps fingertips cool and it avoids blowing warm air towards an external mouse.

Stress Test
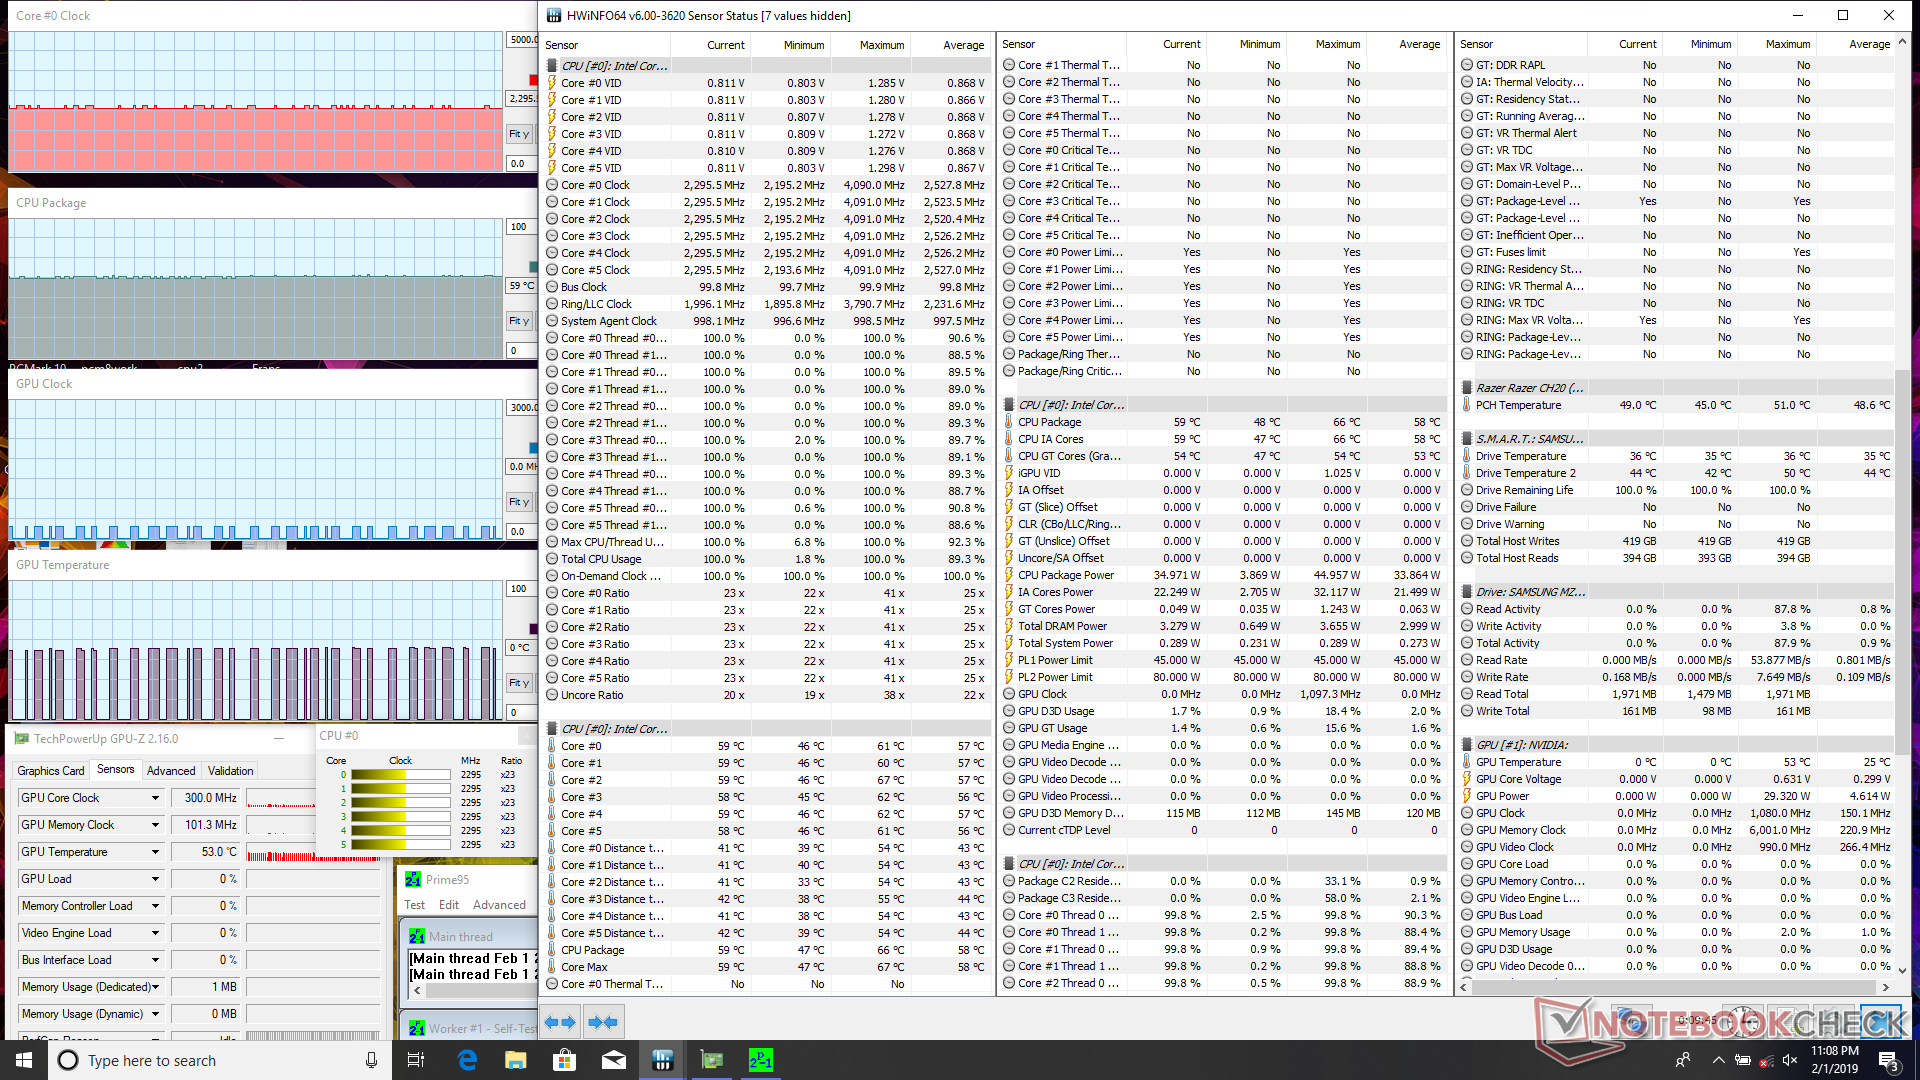
We stress the laptop with synthetic loads to test for stability and potential throttling issues. When subjected to Prime95 load, the CPU can be observed running at 2.8 GHz for the first few seconds before dropping to a steady 2.3 to 2.4 GHz. Since the base clock rate of the Core i7-8750H is 2.2 GHz, the Blade 15 is only able to maintain a Turbo Boot of +100 to +200 MHz. The results here are in line with our CineBench R15 loop test above where scores are below what we were expecting out of this particular CPU.
The slower-than-average clock rates have one major advantage: cooler core temperatures. The processor in the Blade 15 stabilizes at just 60 C compared to 80 C on the Alienware m15 even though the latter is equipped with the exact same i7-8750H CPU. Clock rates stabilize at a higher 3.6 GHz on the Alienware, however, for measurably faster processor performance.
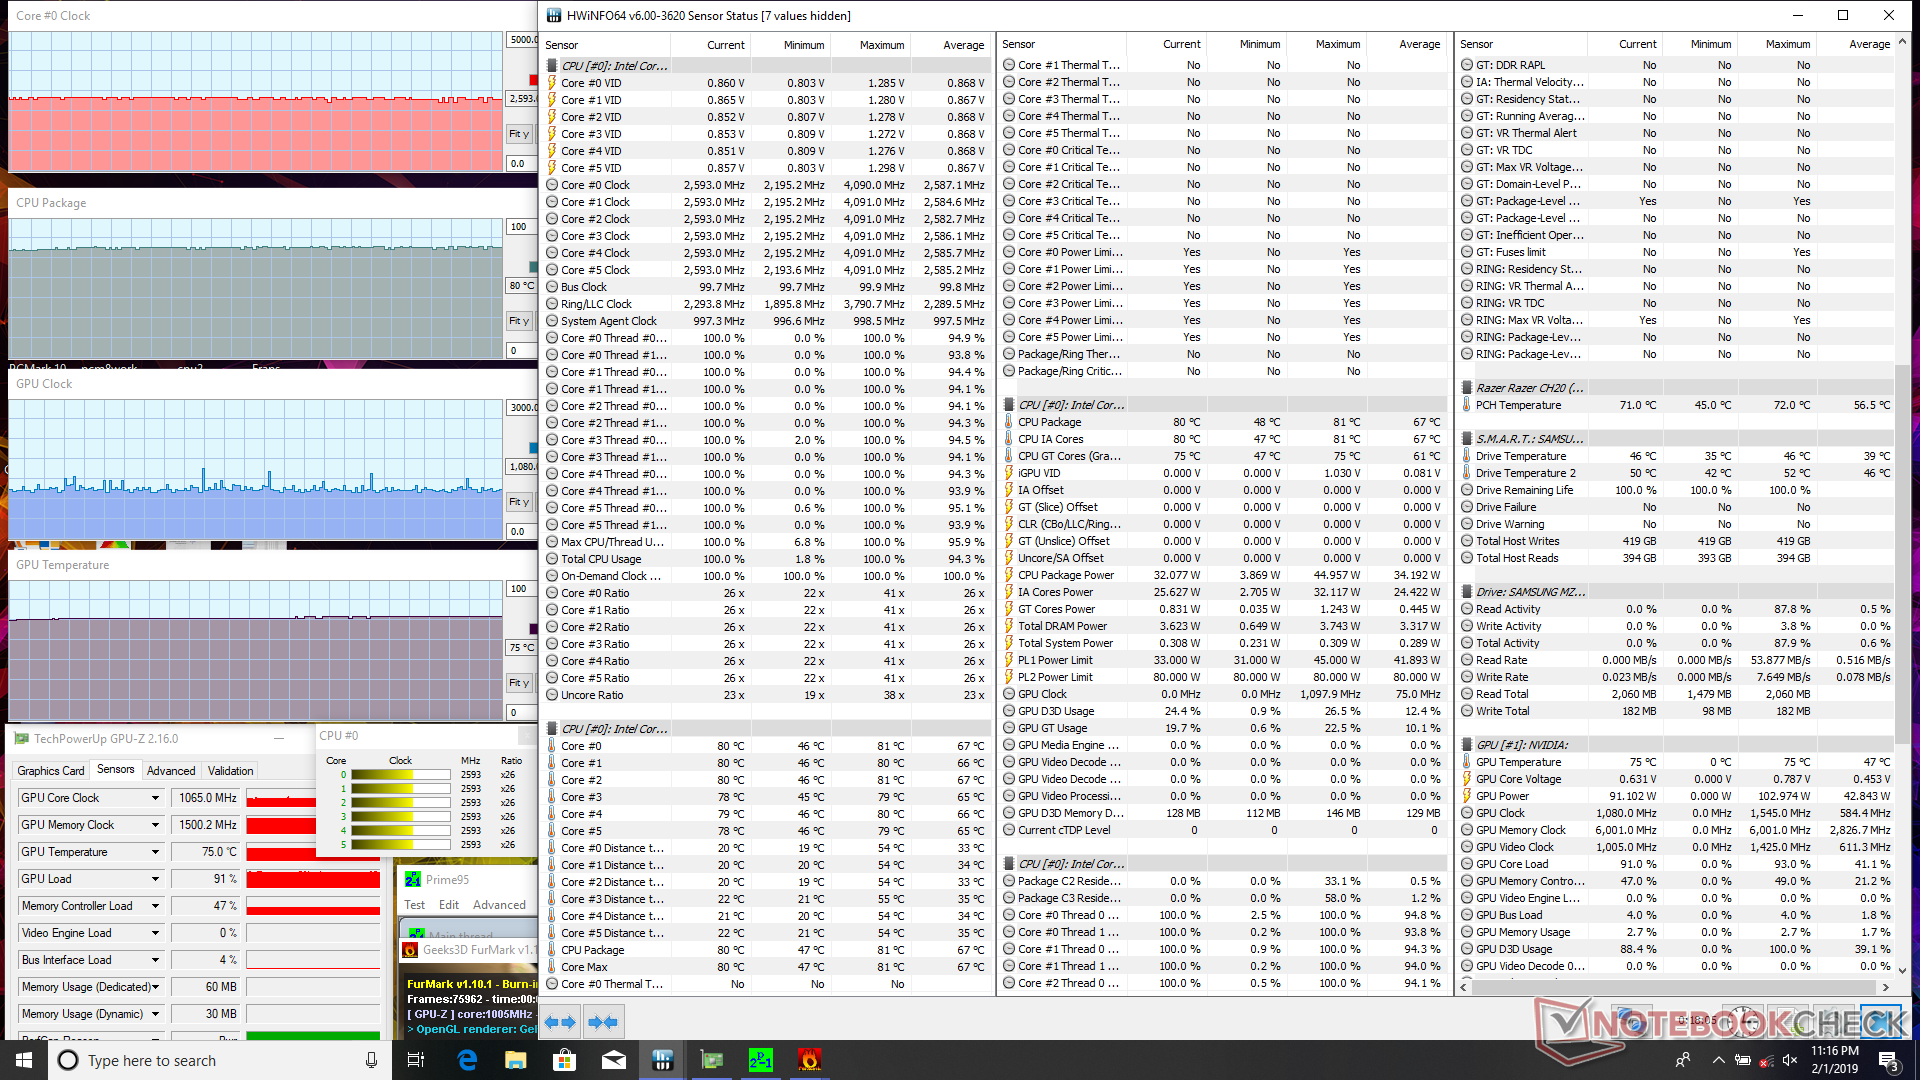
If running both Prime95 and FurMark simultaneously, the CPU and GPU will stabilize at 80 C and 75 C, respectively. Interestingly, the CPU runs faster at 2.6 GHz when under such extreme conditions. This is something we almost never observe as the CPU would typically run slower when both Prime95 and FurMrak are active.
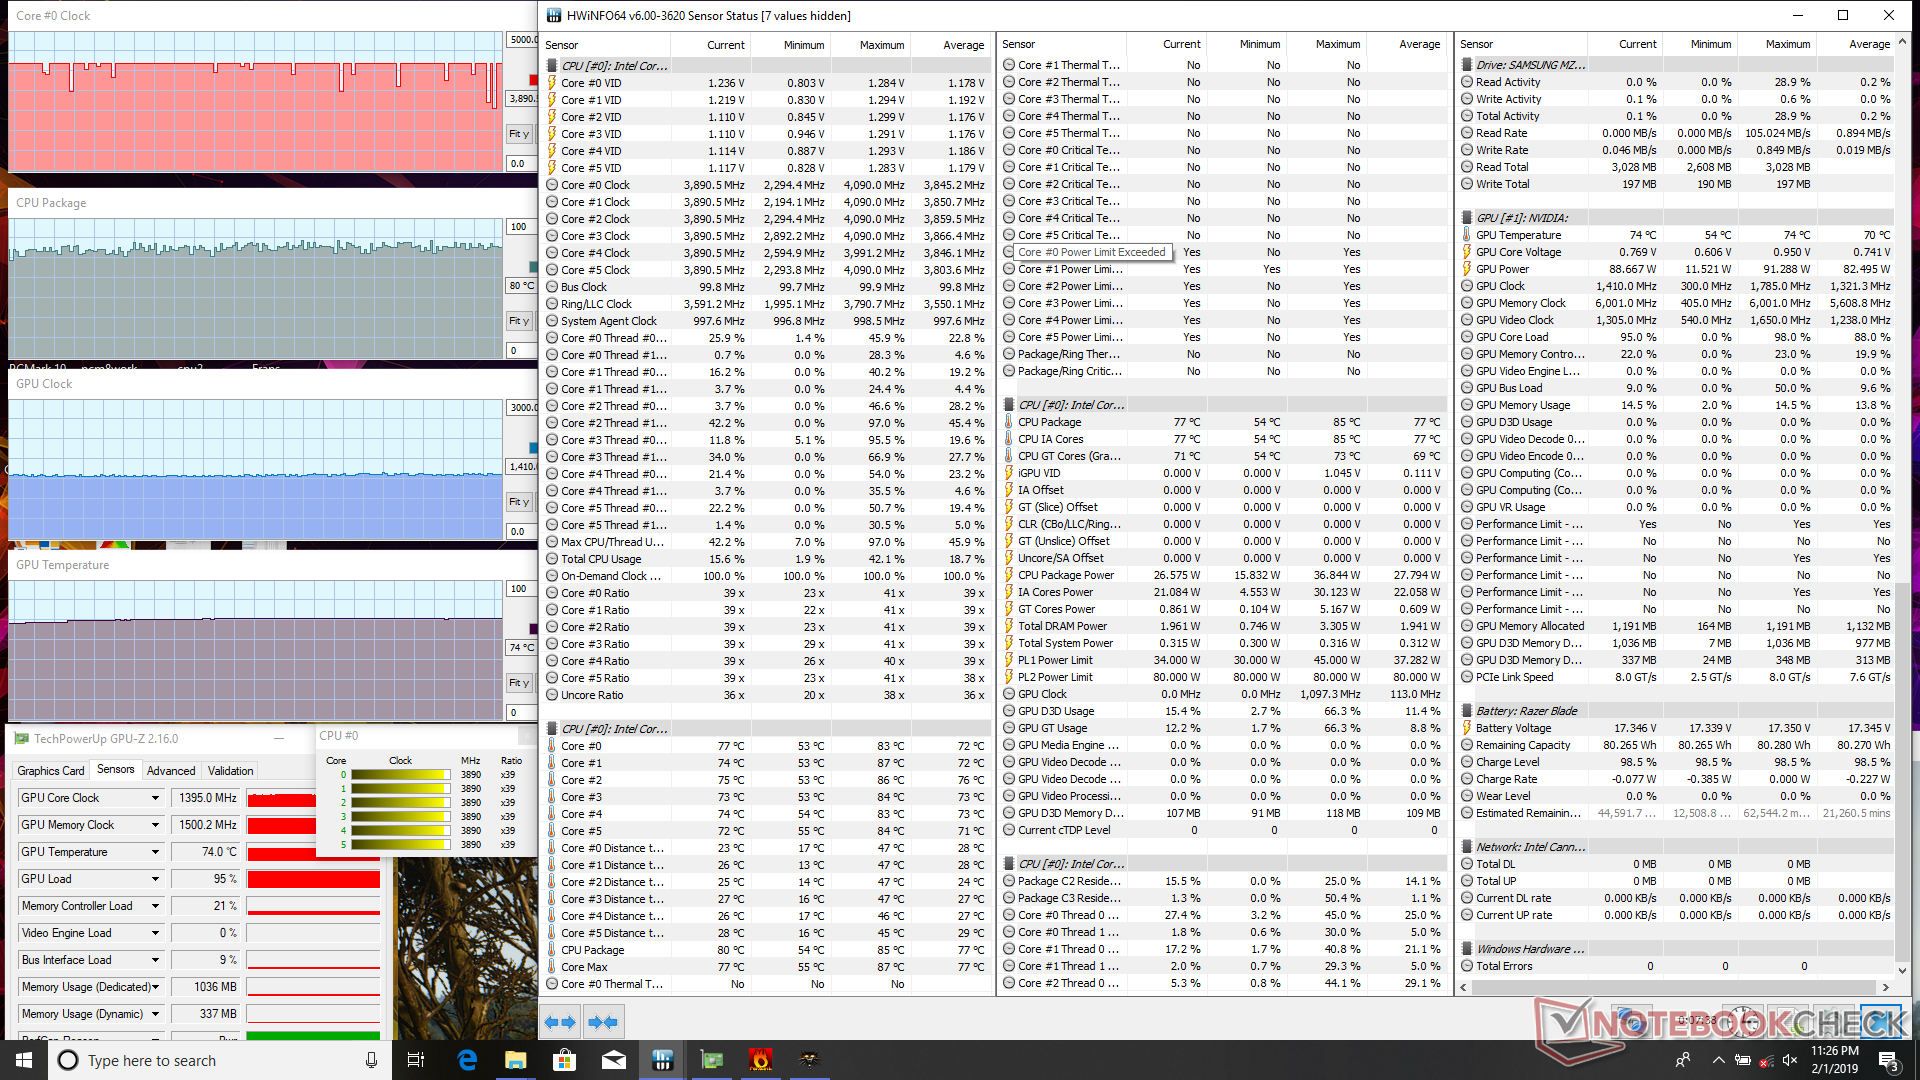
Running Witcher 3 is more representative of real-world gaming performance than the above benchmarks. The CPU and GPU stabilize at 80 C and 74 C, respectively, with the GPU maintaining a steady Boost clock rate of 1410 MHz. Thankfully, the slower CPU performance when under Prime95 or CineBench stress does not impact gaming performance.
Performance is reduced when running on battery power. Note that an FPS limiter of 60 is automatically enabled when gaming on batteries even if the GPU is set to 'prefer maximum performance' mode.
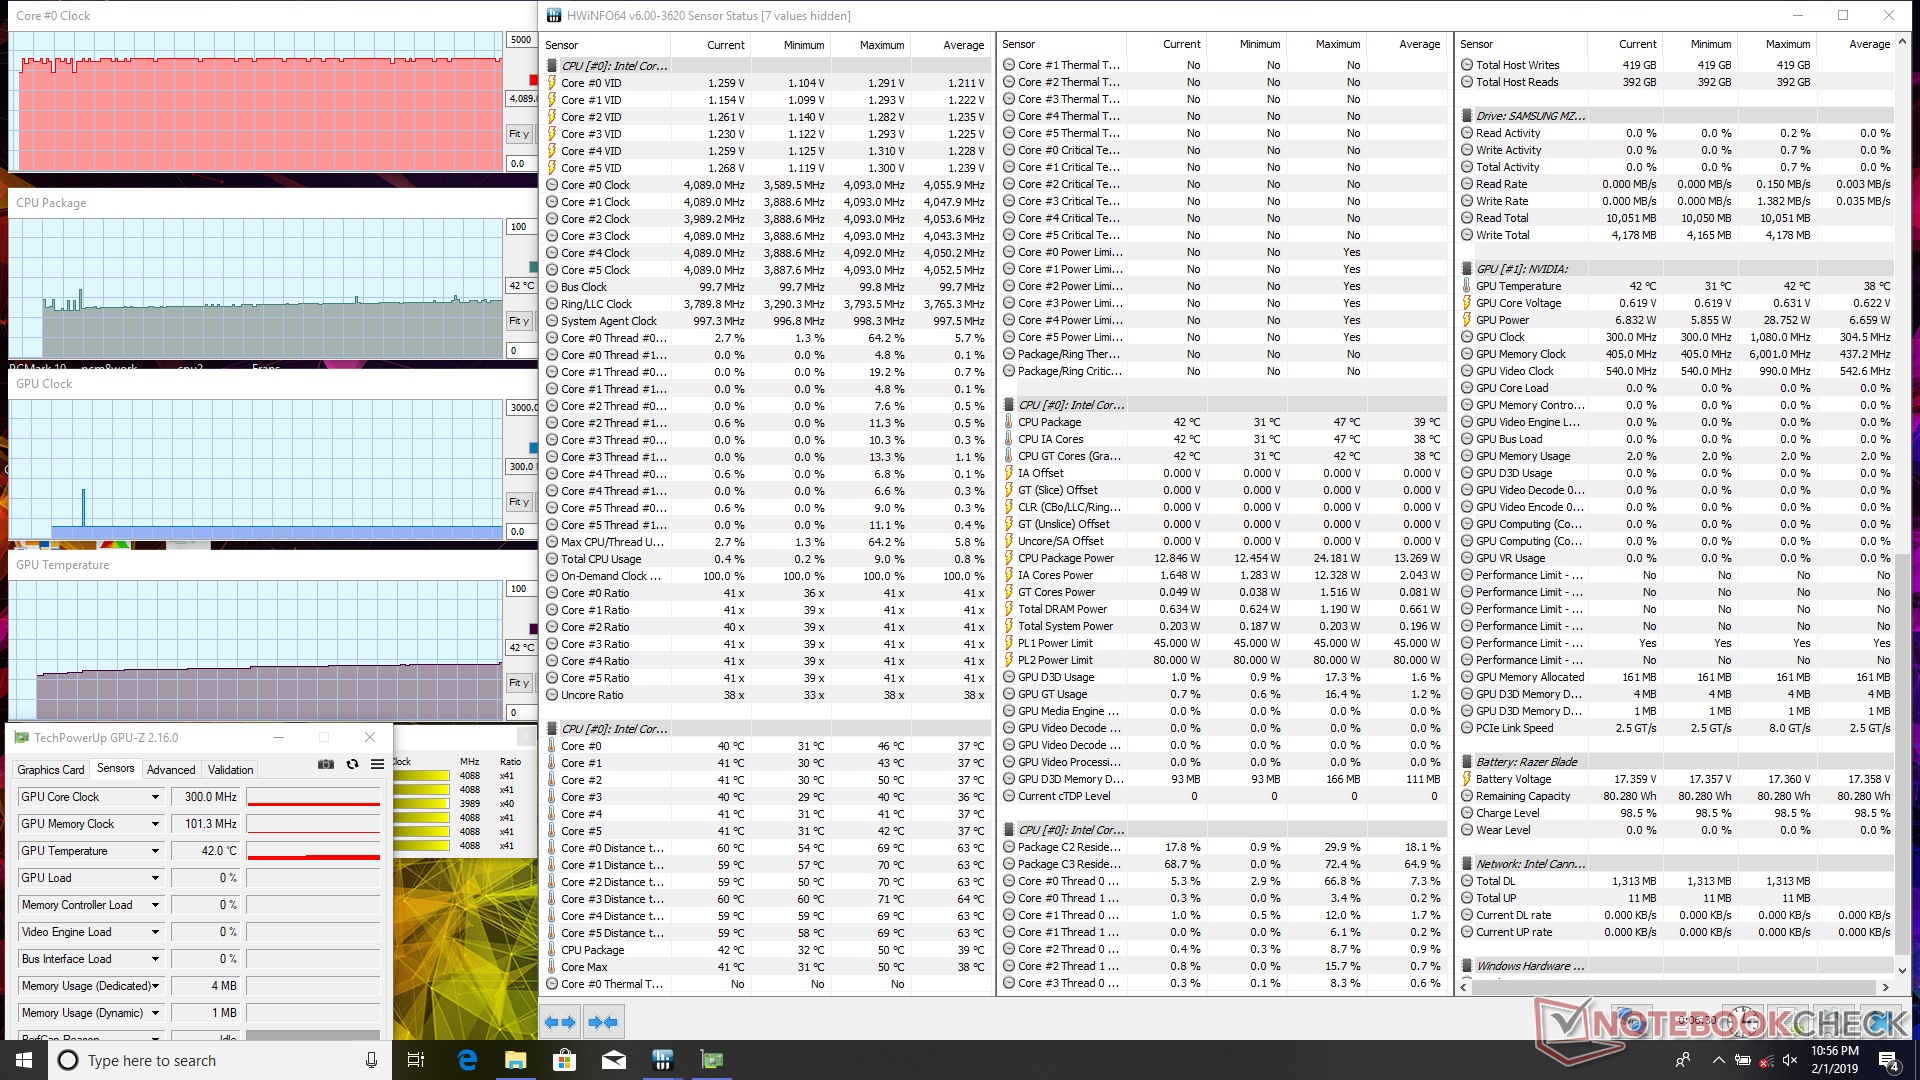
| CPU Clock (GHz) | GPU Clock (MHz) | Average CPU Temperature (°C) | Average GPU Temperature (°C) | |
| System Idle | -- | -- | 43 | 43 |
| Prime95 Stress | 2.3 | -- | 59 | 53 |
| Prime95 + FurMark Stress | 2.6 | 1080 | 80 | 75 |
| Witcher 3 Stress | 3.9 | 1410 | 80 | 74 |
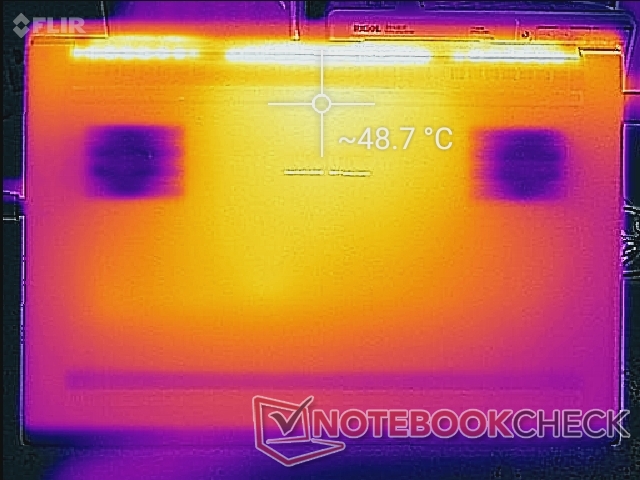
(-) The maximum temperature on the upper side is 49 °C / 120 F, compared to the average of 40.4 °C / 105 F, ranging from 21.2 to 68.8 °C for the class Gaming.
(-) The bottom heats up to a maximum of 49 °C / 120 F, compared to the average of 43.2 °C / 110 F
(+) In idle usage, the average temperature for the upper side is 24.9 °C / 77 F, compared to the device average of 33.9 °C / 93 F.
(±) Playing The Witcher 3, the average temperature for the upper side is 35.8 °C / 96 F, compared to the device average of 33.9 °C / 93 F.
(+) The palmrests and touchpad are reaching skin temperature as a maximum (34.2 °C / 93.6 F) and are therefore not hot.
(-) The average temperature of the palmrest area of similar devices was 28.8 °C / 83.8 F (-5.4 °C / -9.8 F).
Speakers
Audio quality remains identical to the 2018 Blade 15 Advanced Model.


Razer Blade 15 RTX 2070 Max-Q audio analysis
(-) | not very loud speakers (71.6 dB)
Bass 100 - 315 Hz
(±) | reduced bass - on average 7.7% lower than median
(±) | linearity of bass is average (11.1% delta to prev. frequency)
Mids 400 - 2000 Hz
(±) | higher mids - on average 7.8% higher than median
(±) | linearity of mids is average (9.5% delta to prev. frequency)
Highs 2 - 16 kHz
(+) | balanced highs - only 3% away from median
(±) | linearity of highs is average (7.2% delta to prev. frequency)
Overall 100 - 16.000 Hz
(±) | linearity of overall sound is average (23.9% difference to median)
Compared to same class
» 86% of all tested devices in this class were better, 5% similar, 9% worse
» The best had a delta of 6%, average was 18%, worst was 132%
Compared to all devices tested
» 72% of all tested devices were better, 6% similar, 22% worse
» The best had a delta of 4%, average was 23%, worst was 134%
Apple MacBook 12 (Early 2016) 1.1 GHz audio analysis
(+) | speakers can play relatively loud (83.6 dB)
Bass 100 - 315 Hz
(±) | reduced bass - on average 11.3% lower than median
(±) | linearity of bass is average (14.2% delta to prev. frequency)
Mids 400 - 2000 Hz
(+) | balanced mids - only 2.4% away from median
(+) | mids are linear (5.5% delta to prev. frequency)
Highs 2 - 16 kHz
(+) | balanced highs - only 2% away from median
(+) | highs are linear (4.5% delta to prev. frequency)
Overall 100 - 16.000 Hz
(+) | overall sound is linear (10.2% difference to median)
Compared to same class
» 7% of all tested devices in this class were better, 2% similar, 90% worse
» The best had a delta of 5%, average was 18%, worst was 53%
Compared to all devices tested
» 5% of all tested devices were better, 1% similar, 94% worse
» The best had a delta of 4%, average was 23%, worst was 134%
Energy Management
Power Consumption
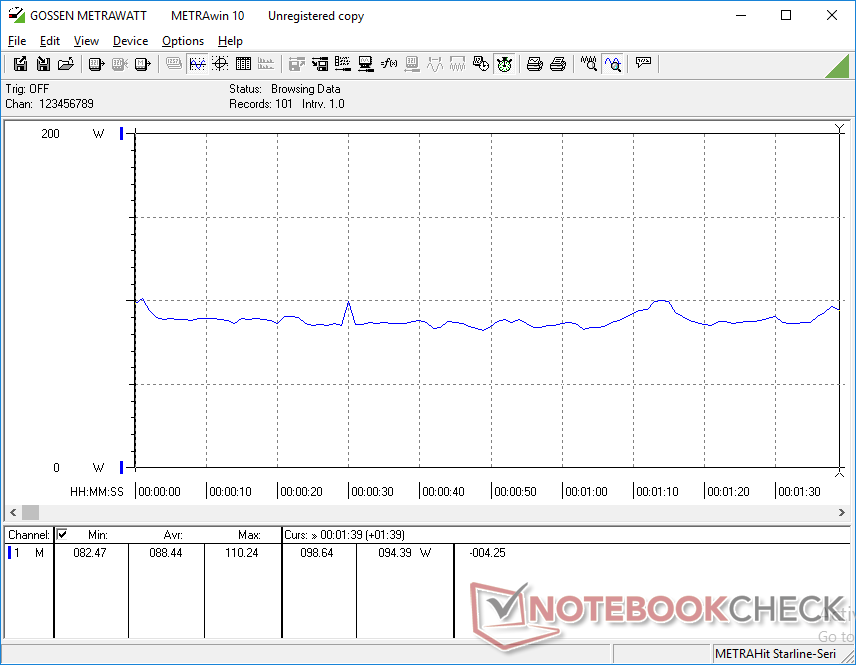
The system demands anywhere between 10 W and 17 W when idling on desktop depending on the brightness level and power profile. Perhaps more notably, results are about 3 W to 4 W lower than what we recorded on last year's Blade 15 even with the keyboard backlight turned off on both systems.
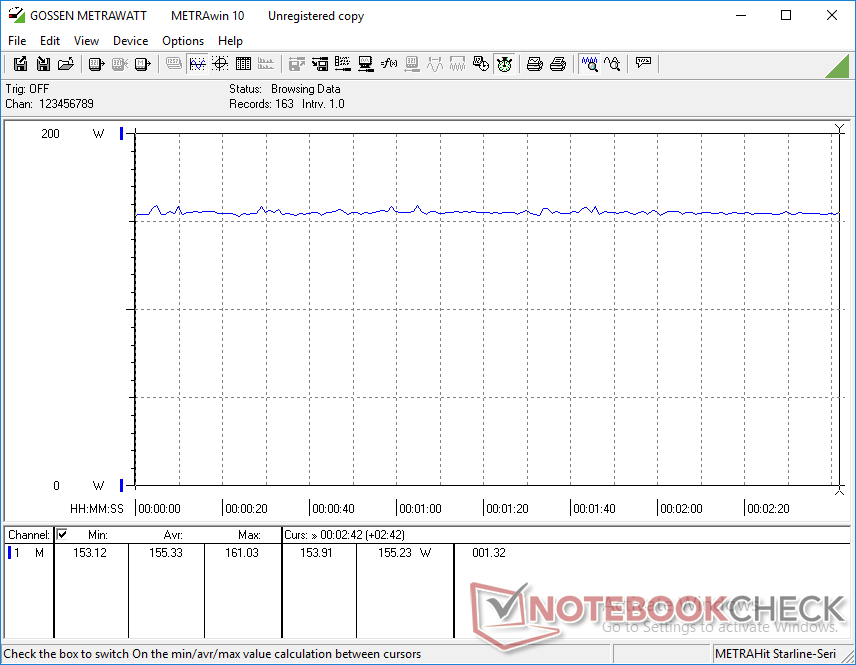
When running Witcher 3, power consumption becomes constant at 155 W to be slightly more demanding than other 15.6-inch laptops with GTX 1070 Max-Q graphics. The Gigabyte Aero 15X v8 and Alienware m15 GTX 1070 Max-Q, for example, each draw about 8 percent less than the Razer. The 15 percent boost in raw graphics power on the RTX 2070 Max-Q thus comes at the cost of slightly higher power consumption. In fact, both gaming performance and power consumption are close to that of the Alienware 15 with GTX 1080 Max-Q graphics.
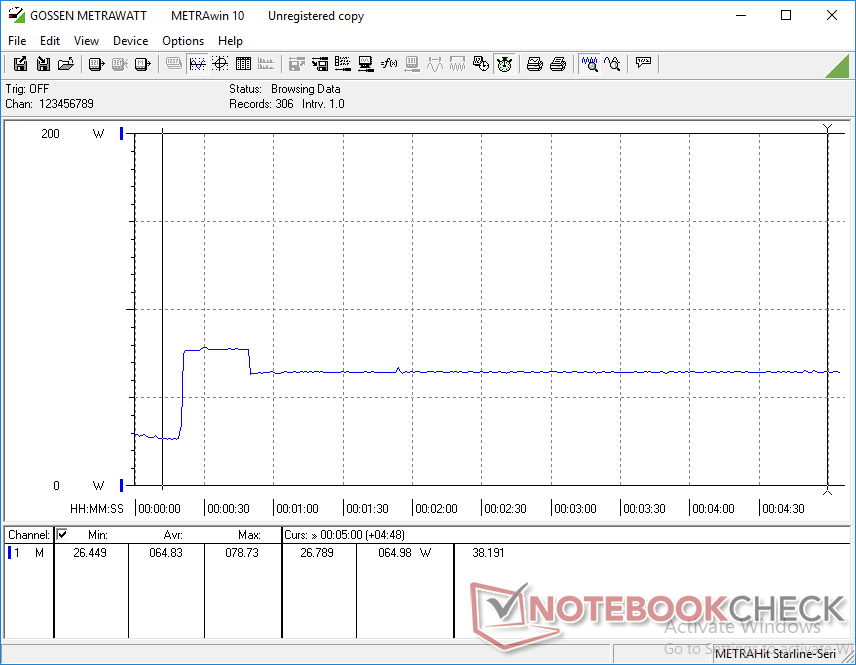
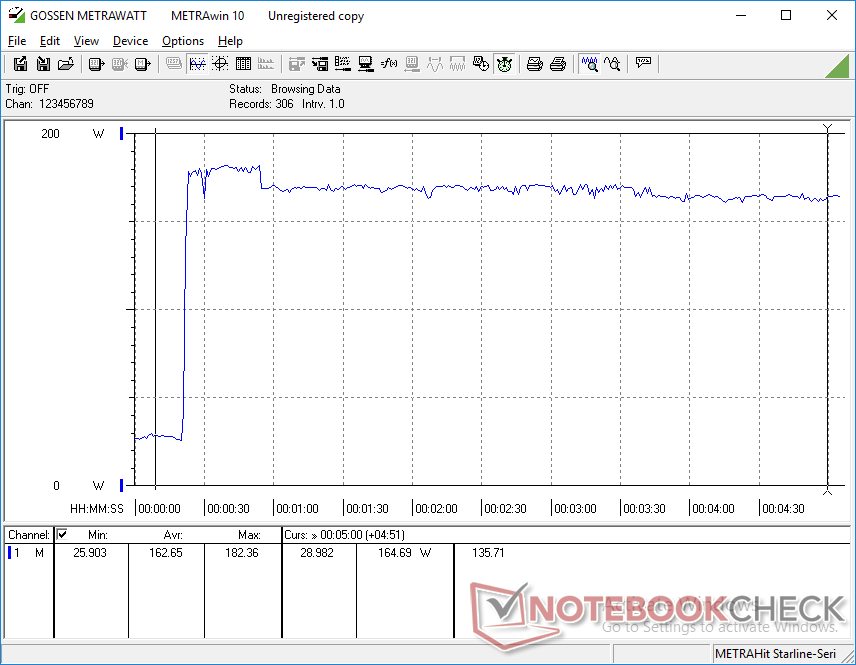
We are able to record a maximum consumption of 182 W from the medium-sized (17 x 7 x 2.5 cm) 230 W AC adapter. The high power overhead provided by the adapter is likely because this same adapter also ships with the more demanding Blade 15 RTX 2080 Max-Q SKU.
| Off / Standby | |
| Idle | |
| Load |
|
Key:
min: | |
| Razer Blade 15 RTX 2070 Max-Q i7-8750H, GeForce RTX 2070 Max-Q, Samsung SSD PM981 MZVLB512HAJQ, IPS, 1920x1080, 15.6" | Razer Blade 15 2018 i7-8750H, GeForce GTX 1070 Max-Q, Samsung PM961 NVMe MZVLW512HMJP, IPS, 1920x1080, 15.6" | Apple MacBook Pro 15 2018 (2.6 GHz, 560X) i7-8850H, Radeon Pro 560X, Apple SSD AP0512, IPS, 2880x1800, 15.4" | MSI GS65 Stealth Thin 8RE-051US i7-8750H, GeForce GTX 1060 Mobile, Samsung SSD PM981 MZVLB256HAHQ, IPS, 1920x1080, 15.6" | Gigabyte Aero 15X v8 i7-8750H, GeForce GTX 1070 Max-Q, Toshiba NVMe THNSN5512GPU7, IPS, 1920x1080, 15.6" | Alienware m15 GTX 1070 Max-Q i7-8750H, GeForce GTX 1070 Max-Q, Toshiba XG5 KXG50ZNV512G, IPS, 1920x1080, 15.6" | |
|---|---|---|---|---|---|---|
| Power Consumption | -13% | 32% | 9% | -14% | 7% | |
| Idle Minimum * (Watt) | 10.4 | 14 -35% | 3.4 67% | 8.7 16% | 14 -35% | 7.6 27% |
| Idle Average * (Watt) | 14.6 | 17 -16% | 11 25% | 13 11% | 18 -23% | 13.8 5% |
| Idle Maximum * (Watt) | 16.3 | 21 -29% | 14.9 9% | 14.3 12% | 22 -35% | 14.6 10% |
| Load Average * (Watt) | 88.5 | 95 -7% | 78.9 11% | 107.4 -21% | 91 -3% | 97.6 -10% |
| Witcher 3 ultra * (Watt) | 155.4 | 141 9% | 129 17% | 142 9% | 145.8 6% | |
| Load Maximum * (Watt) | 182.4 | 179 2% | 91.2 50% | 151.5 17% | 173 5% | 172.5 5% |
* ... smaller is better
Battery Life
Razer laptops have relatively large battery capacities despite being so thin. The Blade Pro GTX 1080, for example, integrates a 99 Wh battery not unlike the thicker Alienware 17.
Battery life is above average for a gaming laptop at approximately 6.5 hours of real-world WLAN use. At best, users can expect 11.5 hours when standing completely still on the desktop screen at the lowest brightness setting. Runtimes are actually longer than our previous GTX Blade 15 configuration possibly due to hardware optimizations or a reduction in background activity for the RTX model.
Charging from empty to full capacity takes 1.5 hours as is typical of most laptops. It is possible to charge and play games simultaneously unlike what we discovered on the MX150-powered Blade Stealth.
| Razer Blade 15 RTX 2070 Max-Q i7-8750H, GeForce RTX 2070 Max-Q, 80 Wh | Razer Blade 15 2018 i7-8750H, GeForce GTX 1070 Max-Q, 80 Wh | Apple MacBook Pro 15 2018 (2.6 GHz, 560X) i7-8850H, Radeon Pro 560X, 83 Wh | MSI GS65 Stealth Thin 8RE-051US i7-8750H, GeForce GTX 1060 Mobile, 82 Wh | Alienware m15 GTX 1070 Max-Q i7-8750H, GeForce GTX 1070 Max-Q, 90 Wh | Gigabyte Aero 15X v8 i7-8750H, GeForce GTX 1070 Max-Q, 94.24 Wh | |
|---|---|---|---|---|---|---|
| Battery runtime | -27% | 57% | -13% | 8% | 39% | |
| Reader / Idle (h) | 11.4 | 6.4 -44% | 10.5 -8% | 12.7 11% | ||
| WiFi v1.3 (h) | 6.5 | 5.4 -17% | 10.2 57% | 6.2 -5% | 7.7 18% | 8.6 32% |
| Load (h) | 1.5 | 1.2 -20% | 1.2 -20% | 1.7 13% | 2.6 73% | |
| Witcher 3 ultra (h) | 1.5 |
Verdict
Pros
Cons
(June 6, 2019 update: The RTX 2070 Max-Q can be over 40 percent faster than the GTX 1070 Max-Q when running DX12 titles. If you plan on playing the latest DX12 titles instead of older DX11 titles, then the RTX-equipped Blade 15 may be worth considering over the older GTX-equipped SKUs.)
We ranked the 2018 Blade 15 as one of the best ultrathin gaming laptops out there and this early 2019 model is no different. All the major advantages (thin and solid build, narrow bezels, pre-calibrated display) and disadvantages (shallow key travel, limited CPU Turbo Boost, no SD reader, RJ-45, or secondary storage) of last year's Blade 15 Advanced Model remain in effect for this latest iteration. Outside of the expected GPU swap, Razer has also silently updated the WLAN and storage from the Intel 9260 to the Intel 9560 and Samsung PM961 to the PM981, respectively.
As far as the GPU is concerned, the RTX 2070 Max-Q is faster than the GTX 1070 Max-Q without running any louder or warmer. Overall gaming performance is very similar to a GTX 1080 Max-Q laptop when not taking into account any ray tracing capabilities. Thus, unless if ray tracing or DLSS are must-have features (let's face it — 99 percent of PC titles don't even support these advanced options), performance is only about 15 percent faster than the much less expensive Blade 15 GTX 1070 Max-Q. Users in the market for an ultrathin gaming laptop will actually find the older Blade 15 Advanced Model to be more compelling for that reason.
Users who plan on playing mostly DX12 games will find the RTX 2070 Max-Q to be about 40 percent better than the GTX 1070 Max-Q instead of just 15 percent.
Not much has changed, but it doesn't have to. Everything great about the Blade 15 is now back in full force with Nvidia RTX. If ray tracing is of no interest, then the visually identical, yet cheaper 2018 Blade 15 Advanced Model can provide nearly the same gaming experience as the RTX 2070 Max-Q in most cases.
Razer Blade 15 RTX 2070 Max-Q
- 09/20/2019 v7 (old)
Allen Ngo
Price comparison
