Razer Blade Pro 17 RTX 2060 Laptop Review: How does it Compare to the RTX 2080 Max-Q?

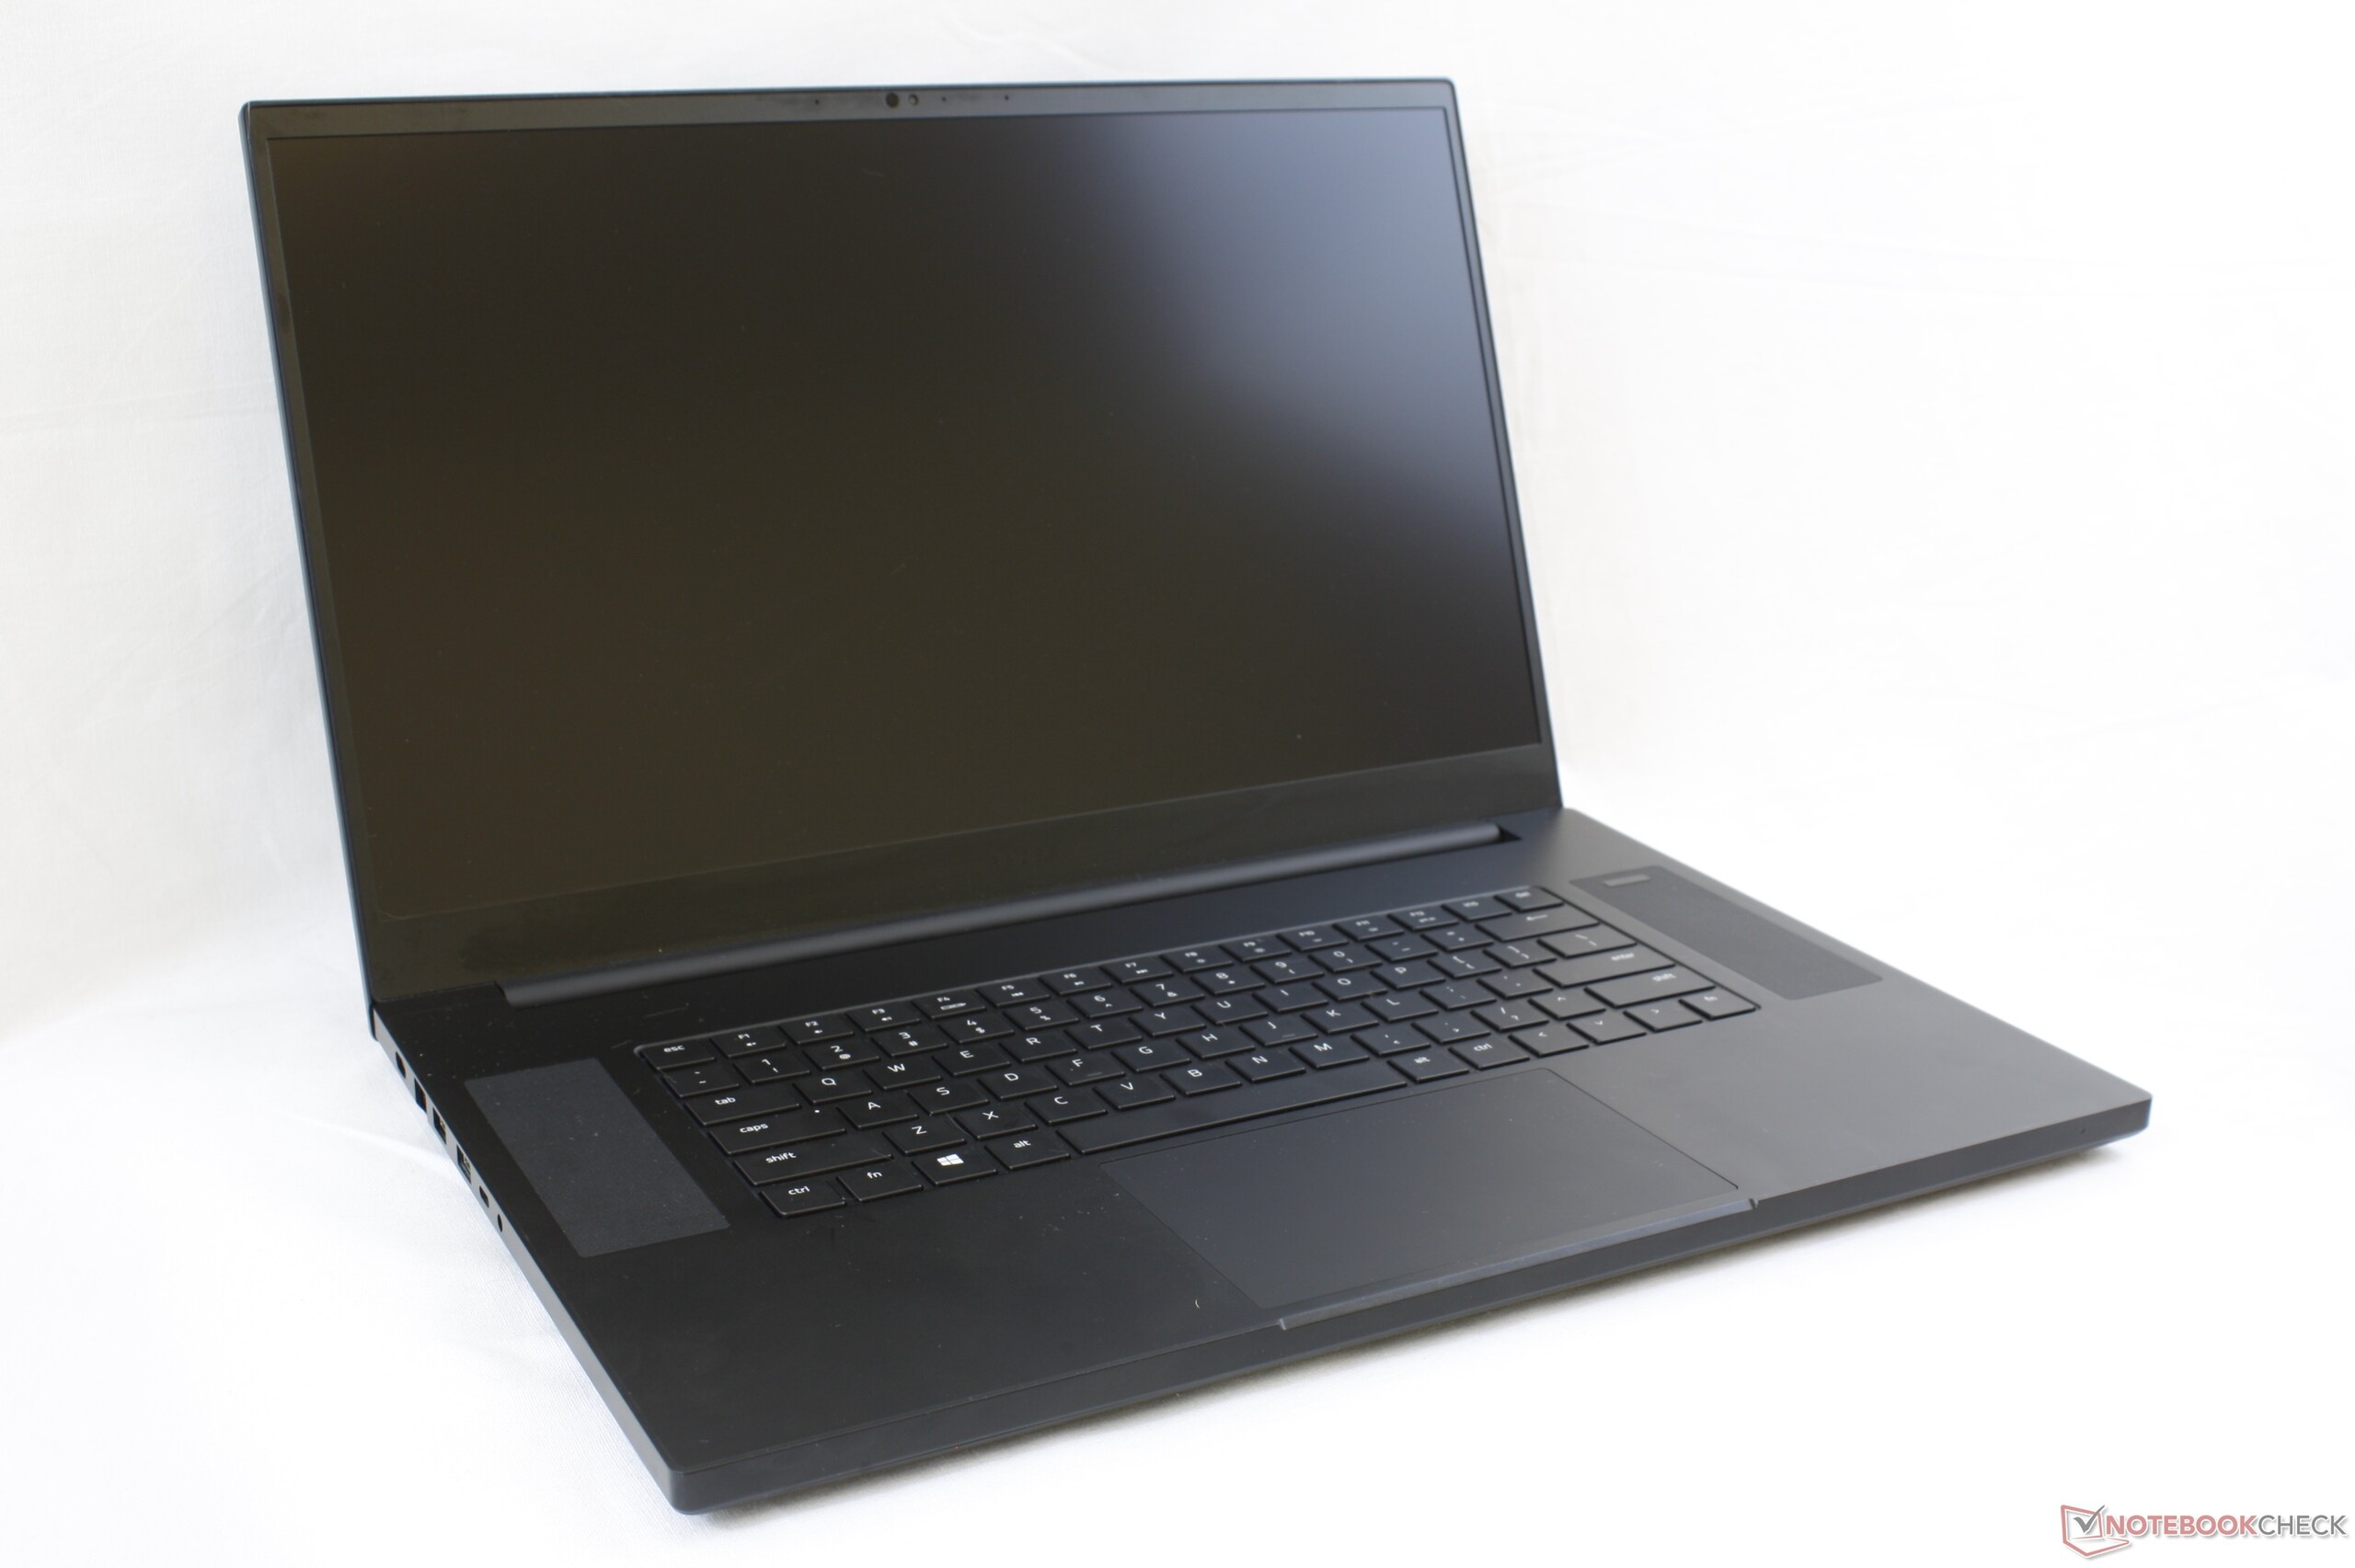
Razer refreshed its 17.3-inch Blade Pro series earlier this year to succeed the previous generation Blade Pro 2017. The 2019 Blade Pro 17 is a complete inside-out makeover as detailed in our existing review for the Blade Pro 17 RTX 2080 Max-Q. For this review, we'll be taking a look at a second configuration of the Blade Pro 17 with RTX 2060 graphics instead to see how it compares to the RTX 2080 Max-Q SKU in terms of performance, battery life, power consumption, noise, and temperature.
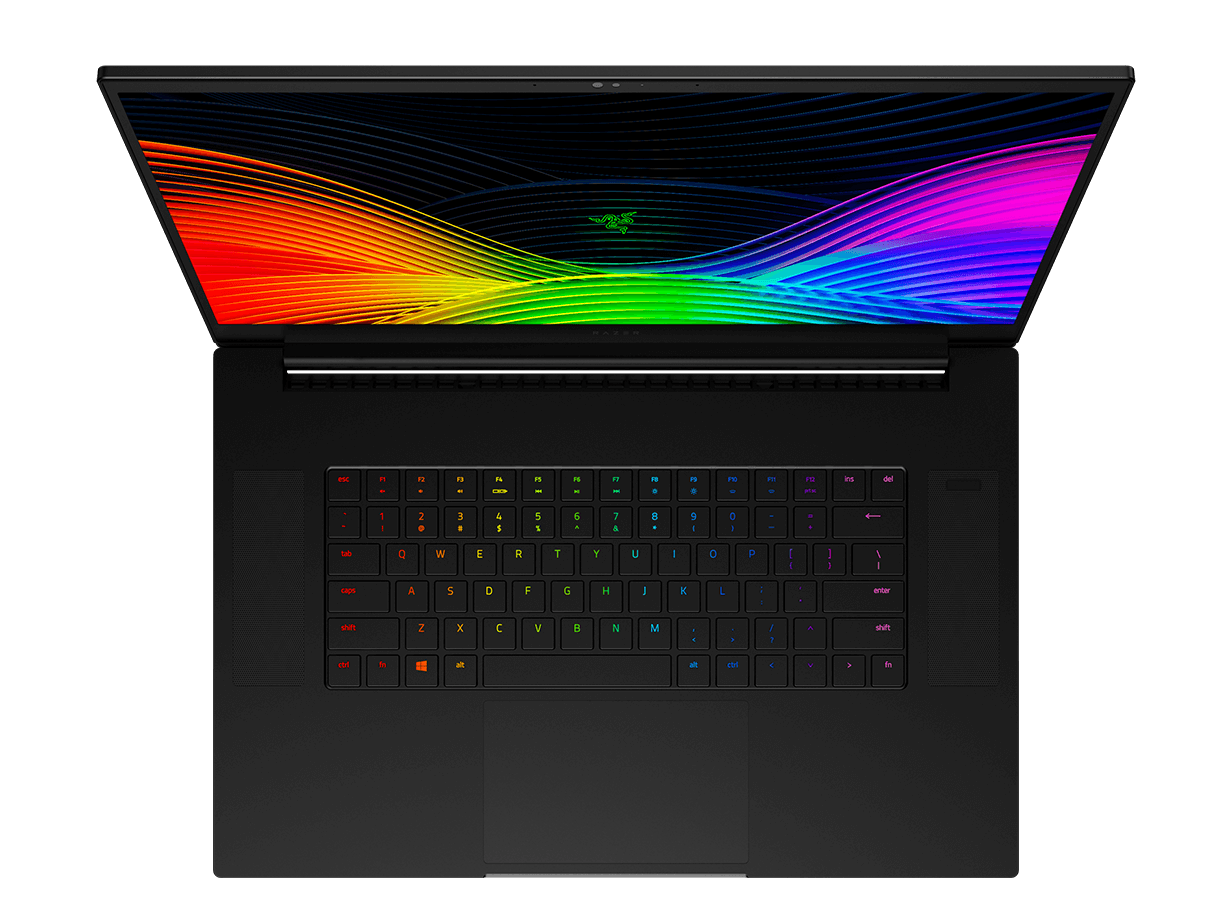
We recommend checking out the Blade Pro 17 RTX 2080 Max-Q to learn more about the chassis, ports, keyboard, display, and other physical properties since the Blade Pro 17 RTX 2060 is identical in hardware.
Razer offers the Blade Pro 17 with RTX 2060, RTX 2070 Max-Q, and RTX 2080 Max-Q graphics with a fixed Core i7-9750H CPU and 1080p144 display. The series competes directly with other ultra-thin 17.3-inch gaming notebooks including the Lenovo Legion Y740, Asus Zephyrus S GX701, MSI GS75, Acer Predator Triton, and even the new Gigabyte Aero 17 to a degree.
More Razer reviews:
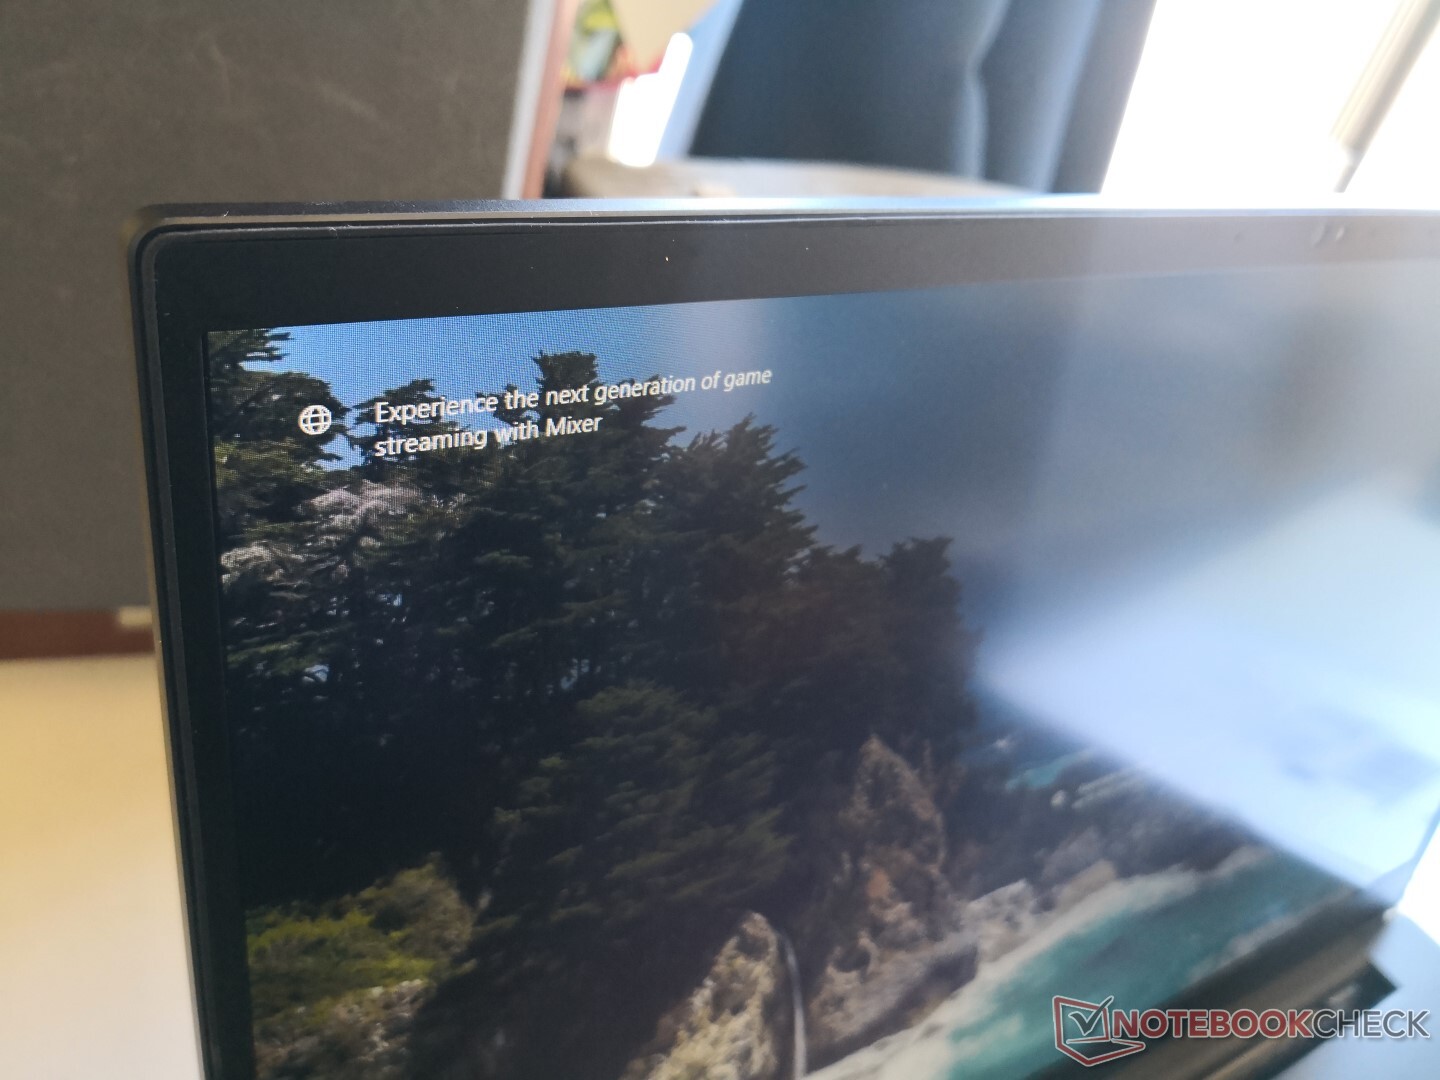
Case
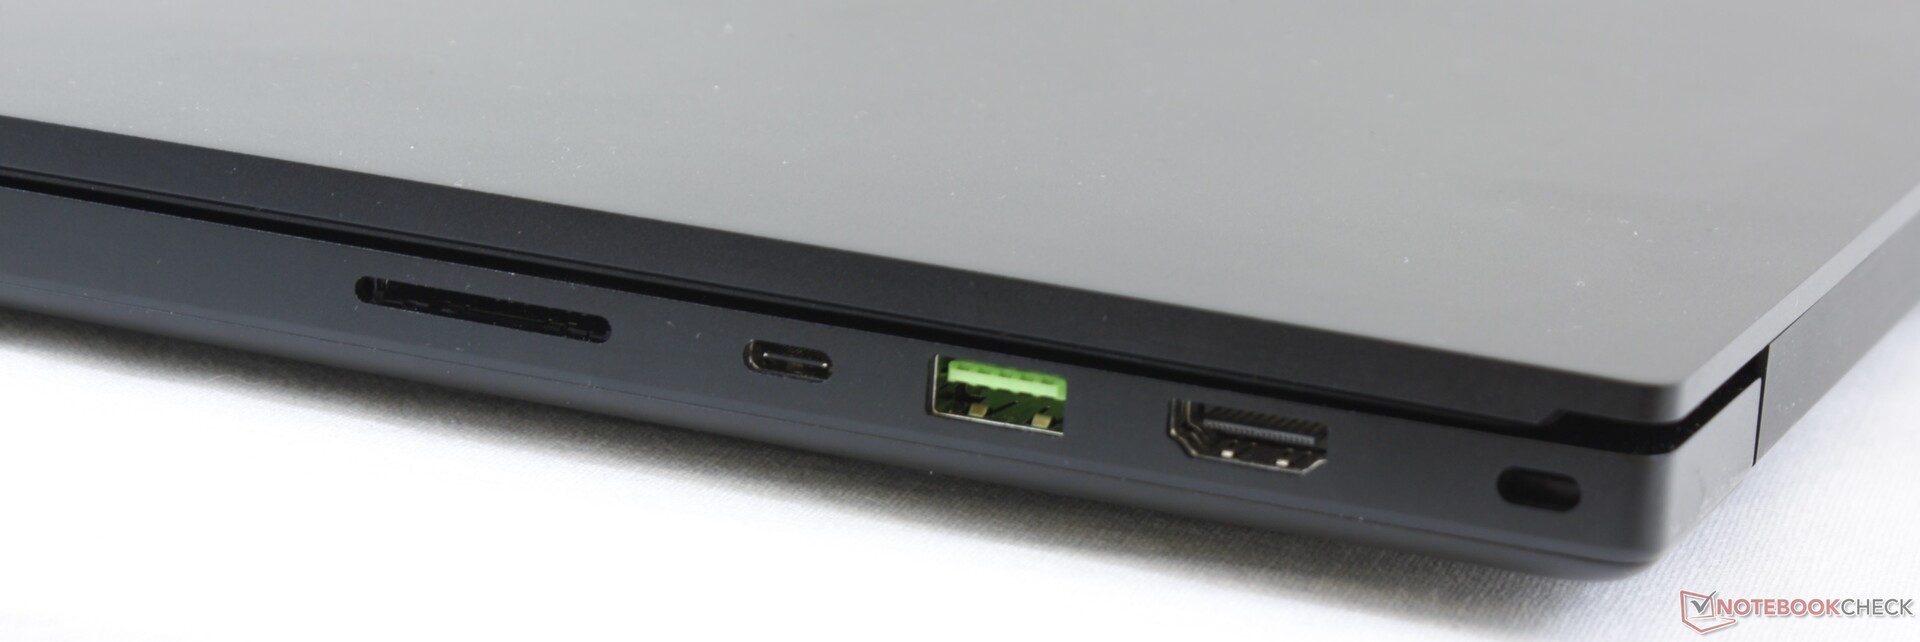
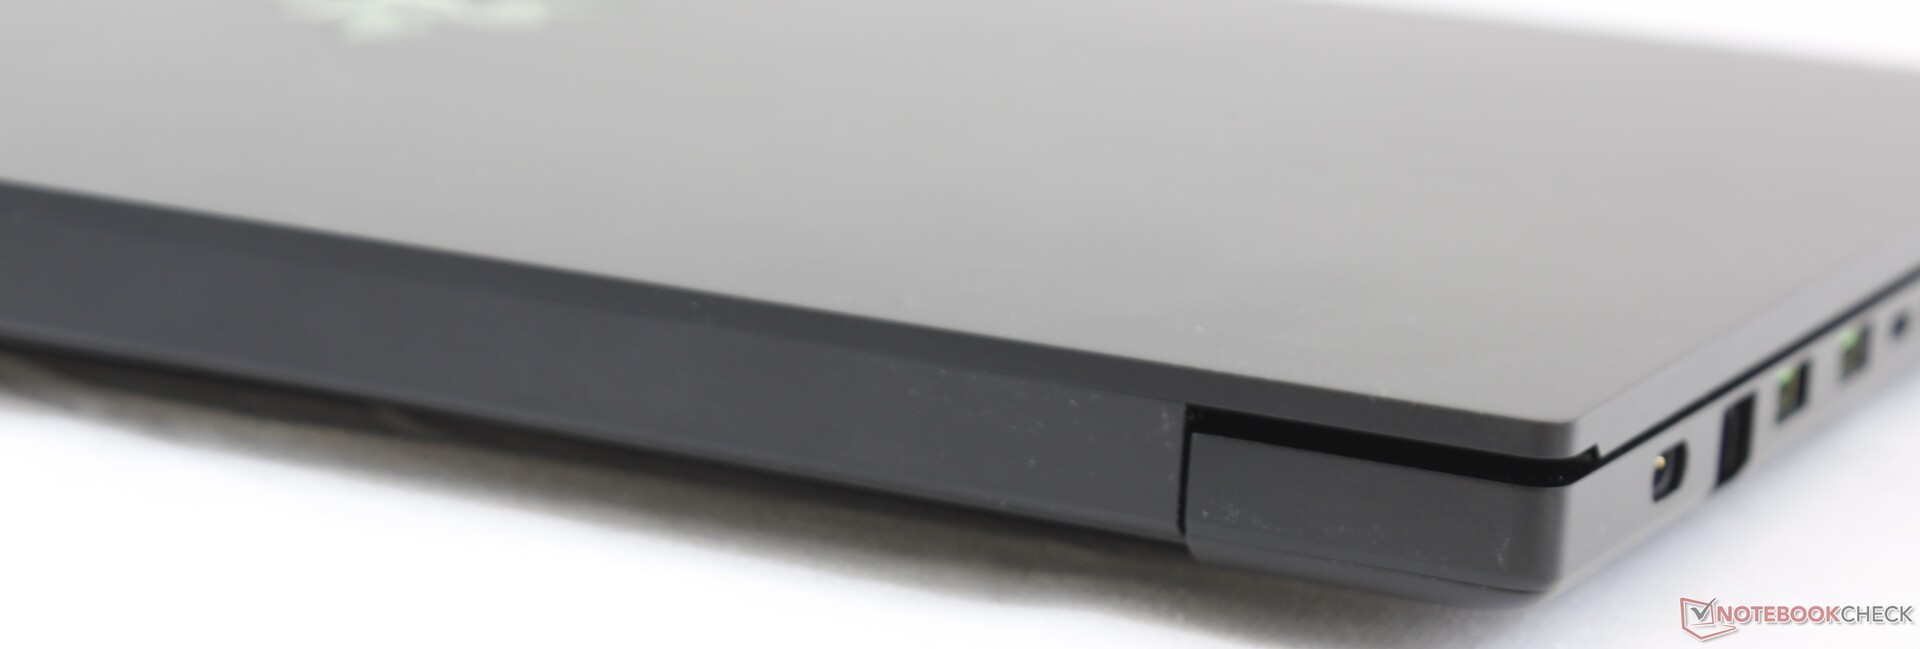
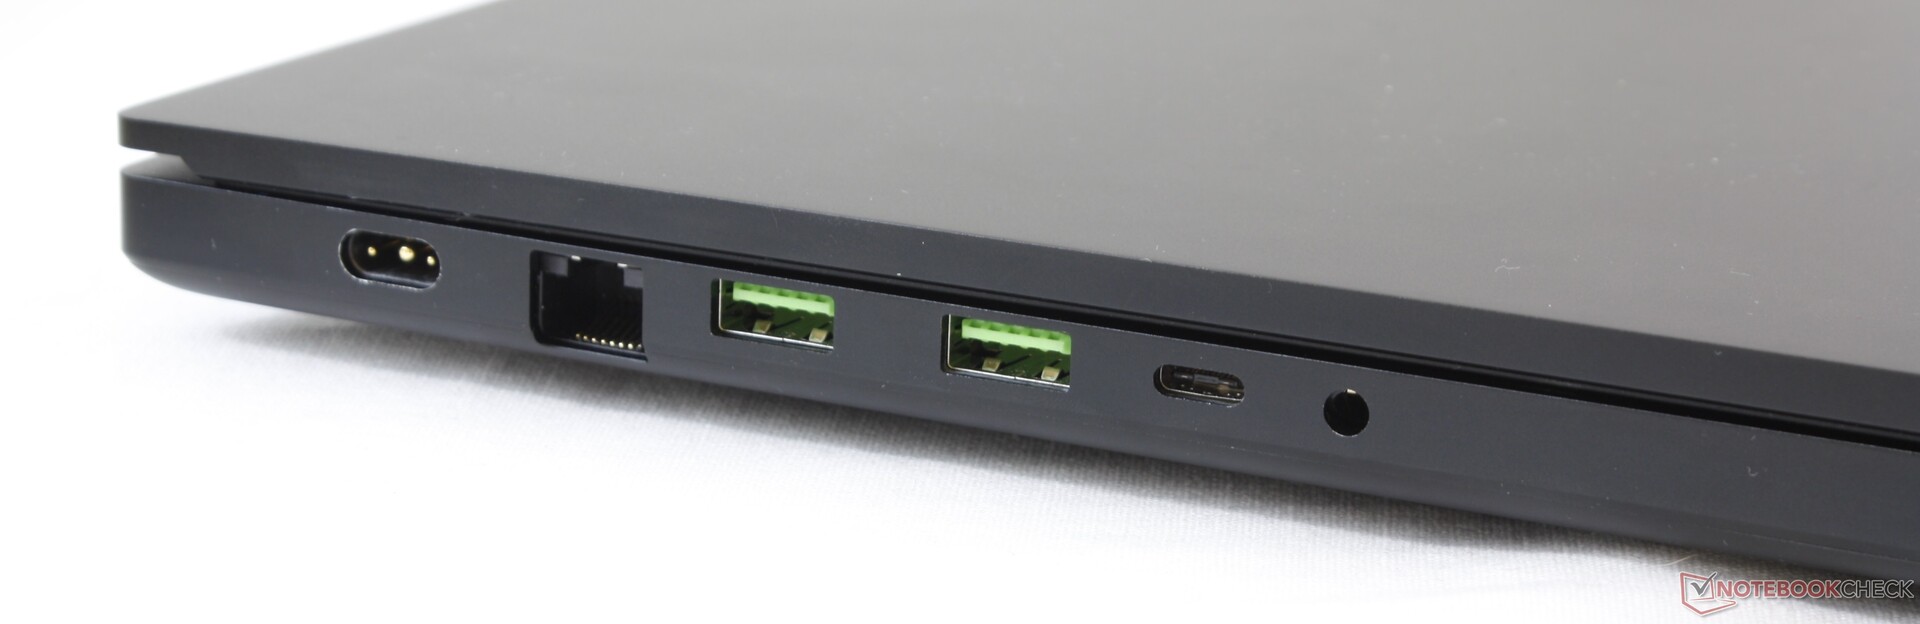
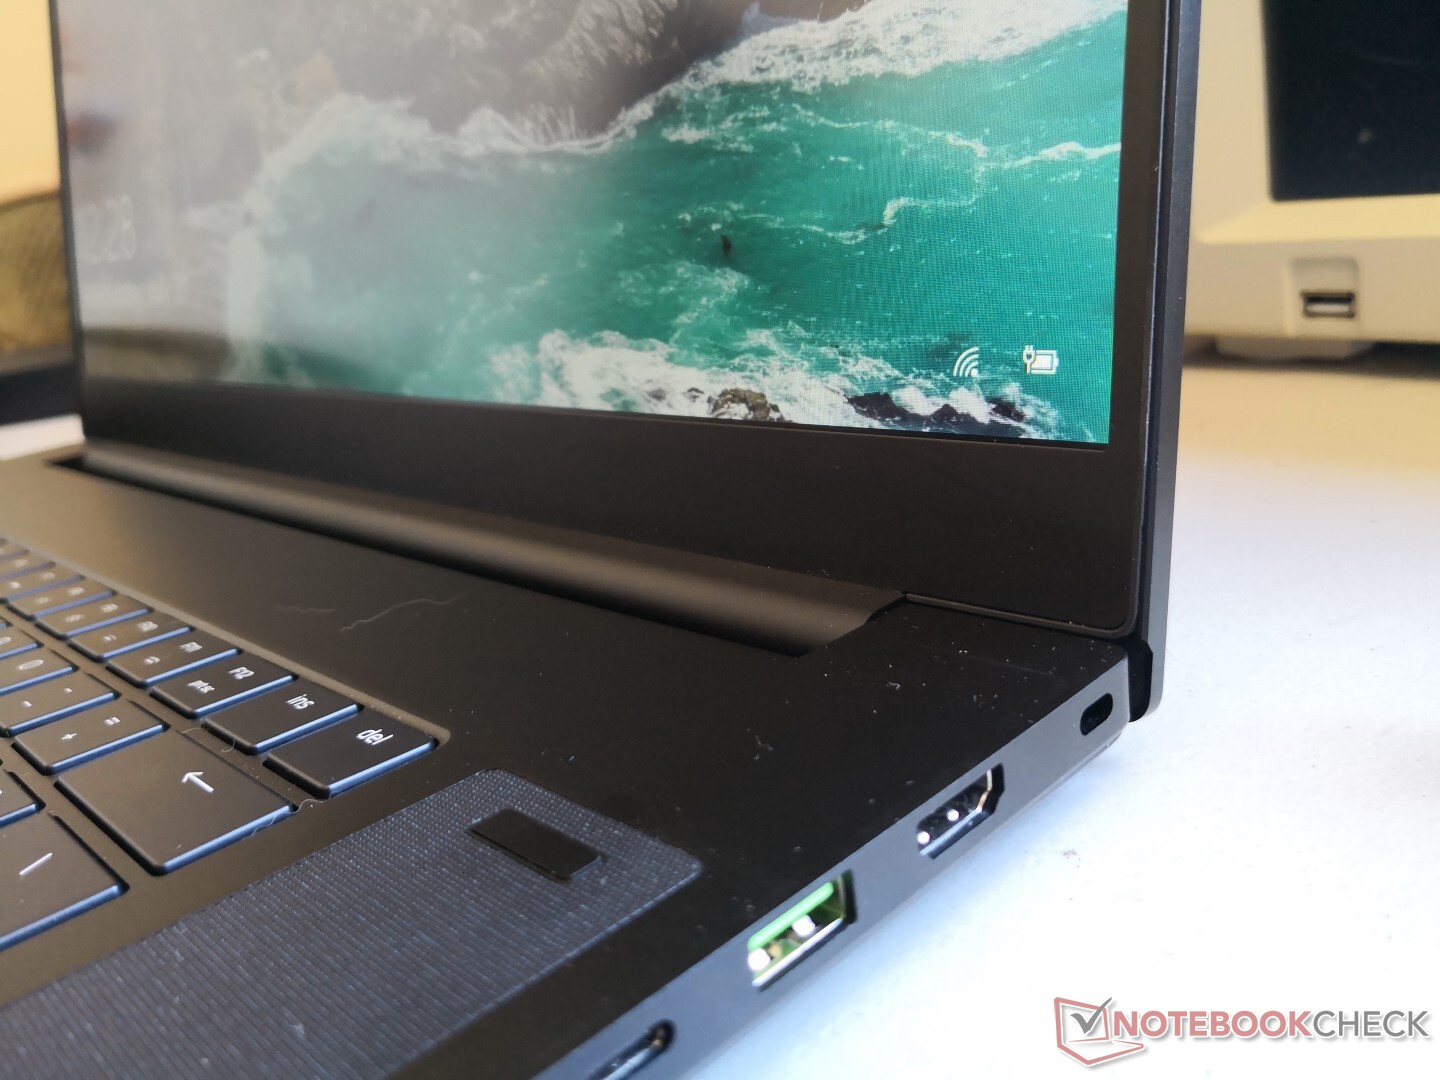
Connectivity
SD Card Reader
| SD Card Reader | |
| average JPG Copy Test (av. of 3 runs) | |
| Razer Blade Pro 17 RTX 2060 (Toshiba Exceria Pro SDXC 64 GB UHS-II) | |
| Razer Blade Pro 2017 (Toshiba Exceria Pro SDXC 64 GB UHS-II) | |
| maximum AS SSD Seq Read Test (1GB) | |
| Razer Blade Pro 17 RTX 2060 (Toshiba Exceria Pro SDXC 64 GB UHS-II) | |
| Razer Blade Pro 2017 (Toshiba Exceria Pro SDXC 64 GB UHS-II) | |
Communication
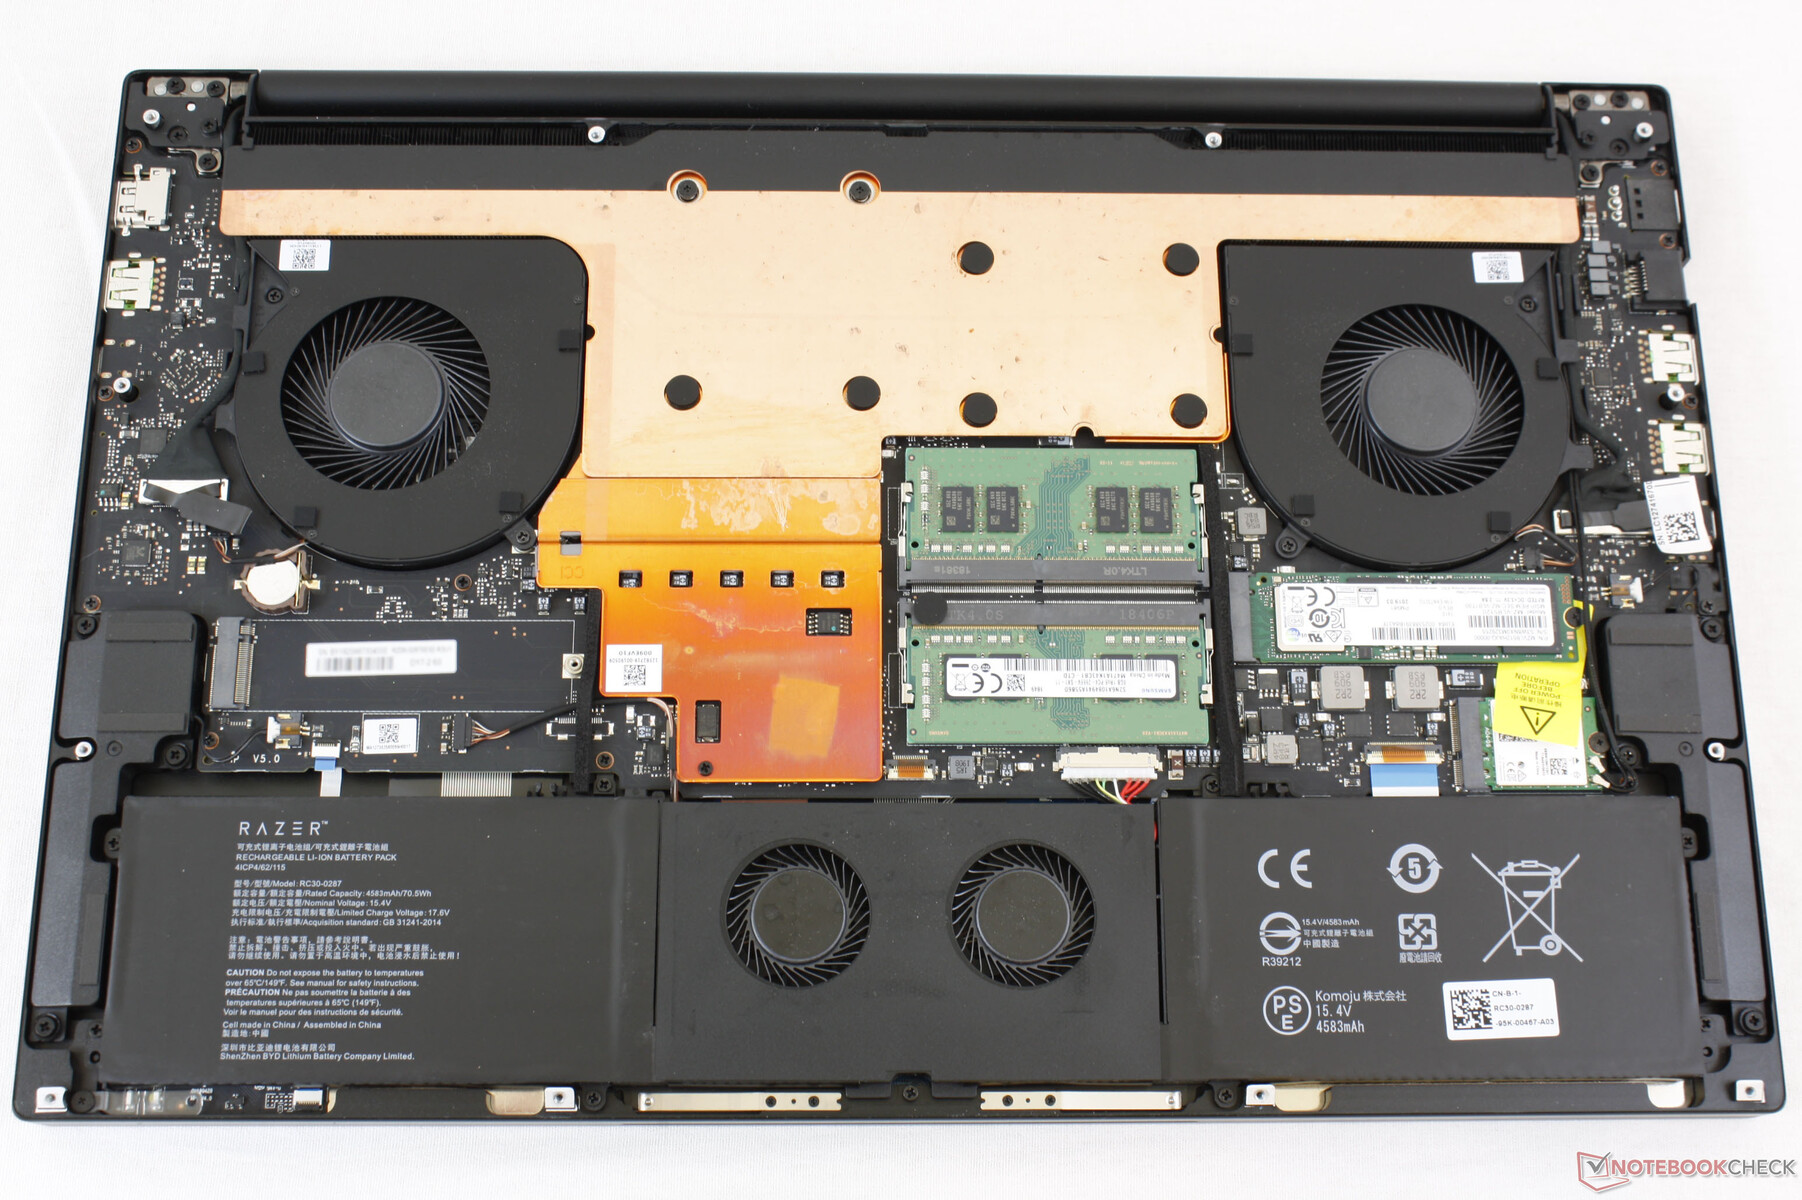
Maintenance
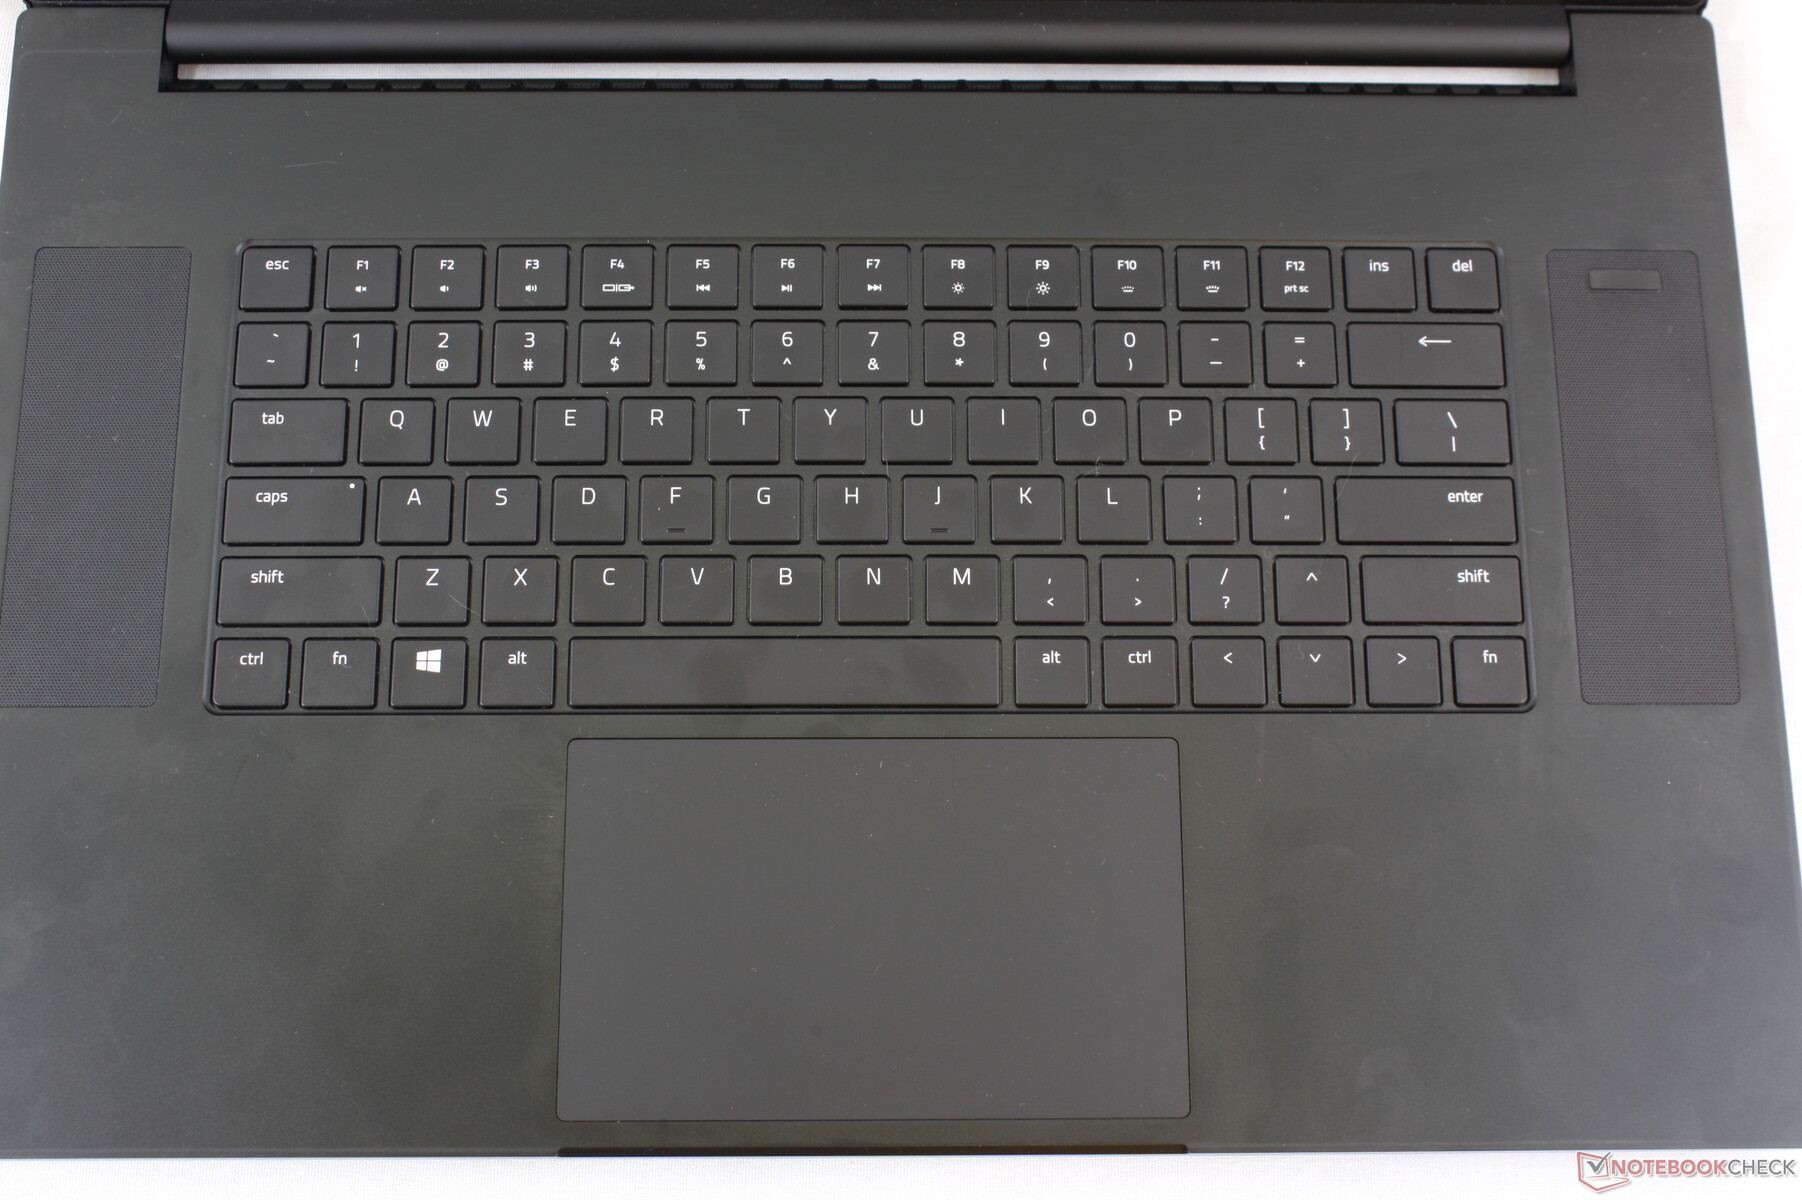
Input Devices
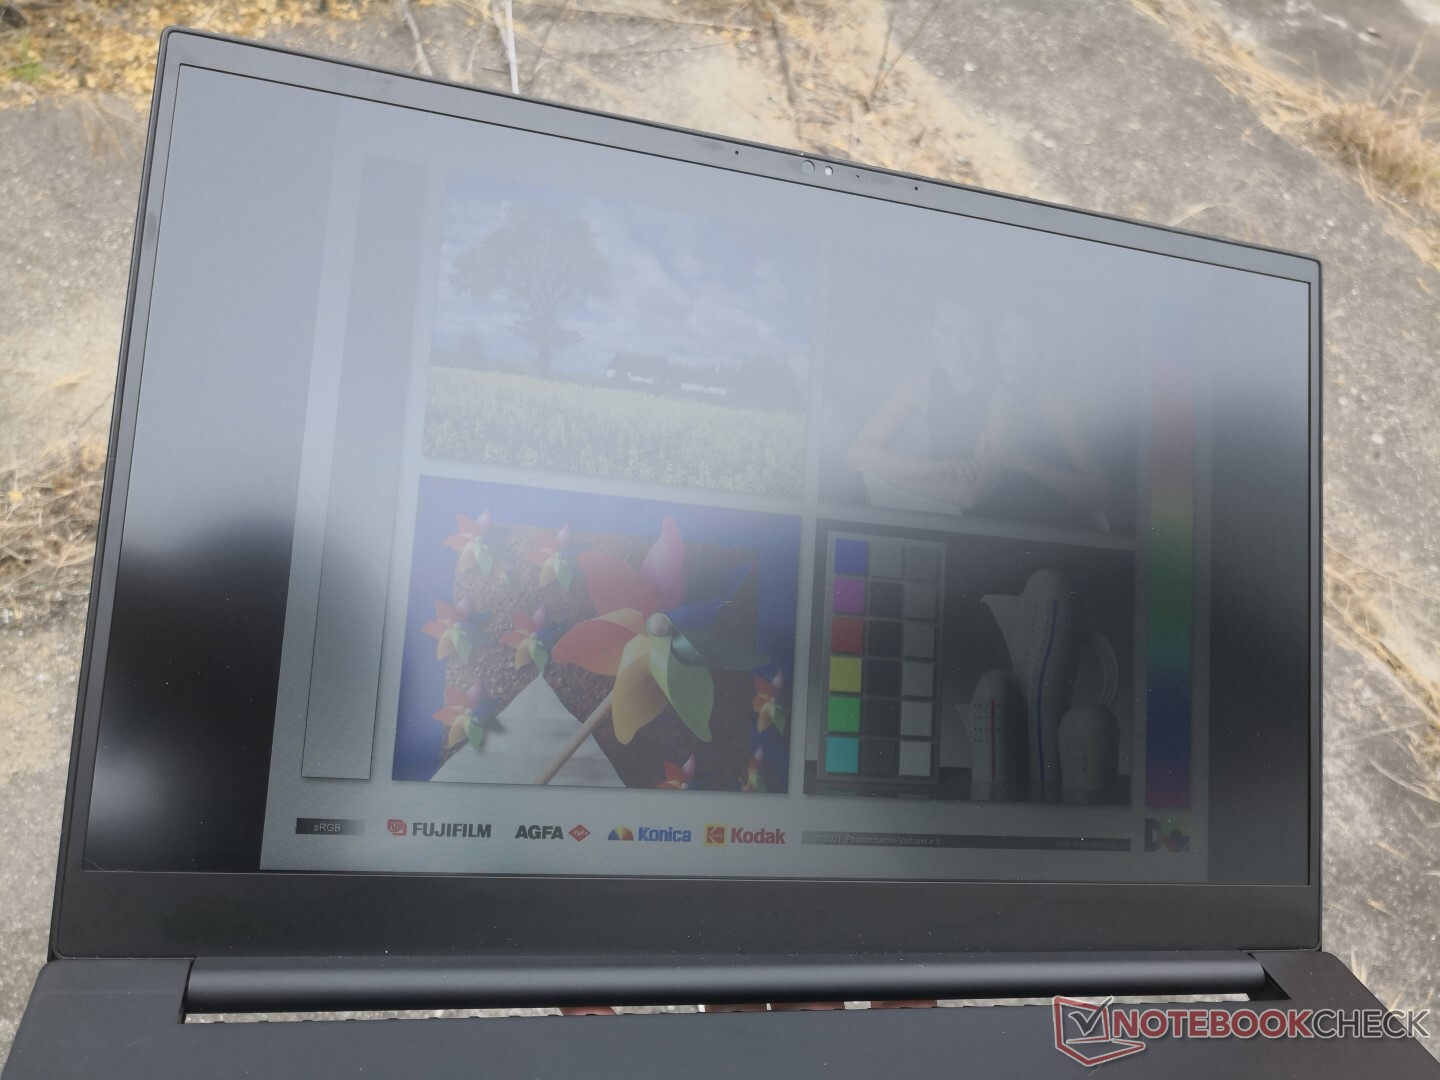
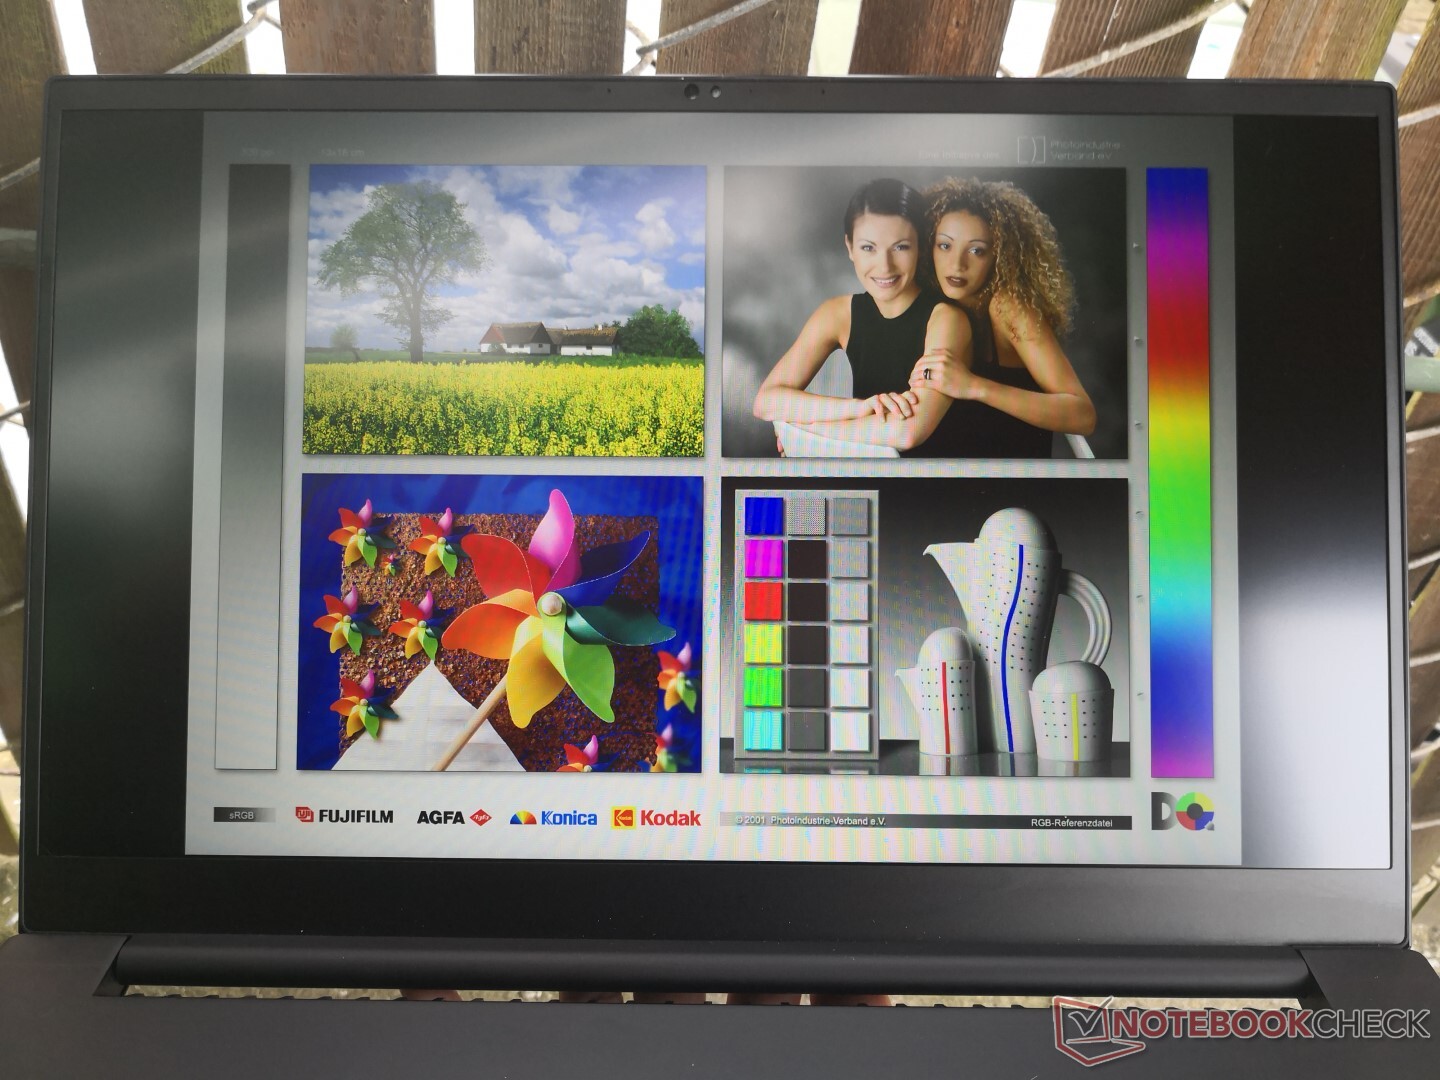
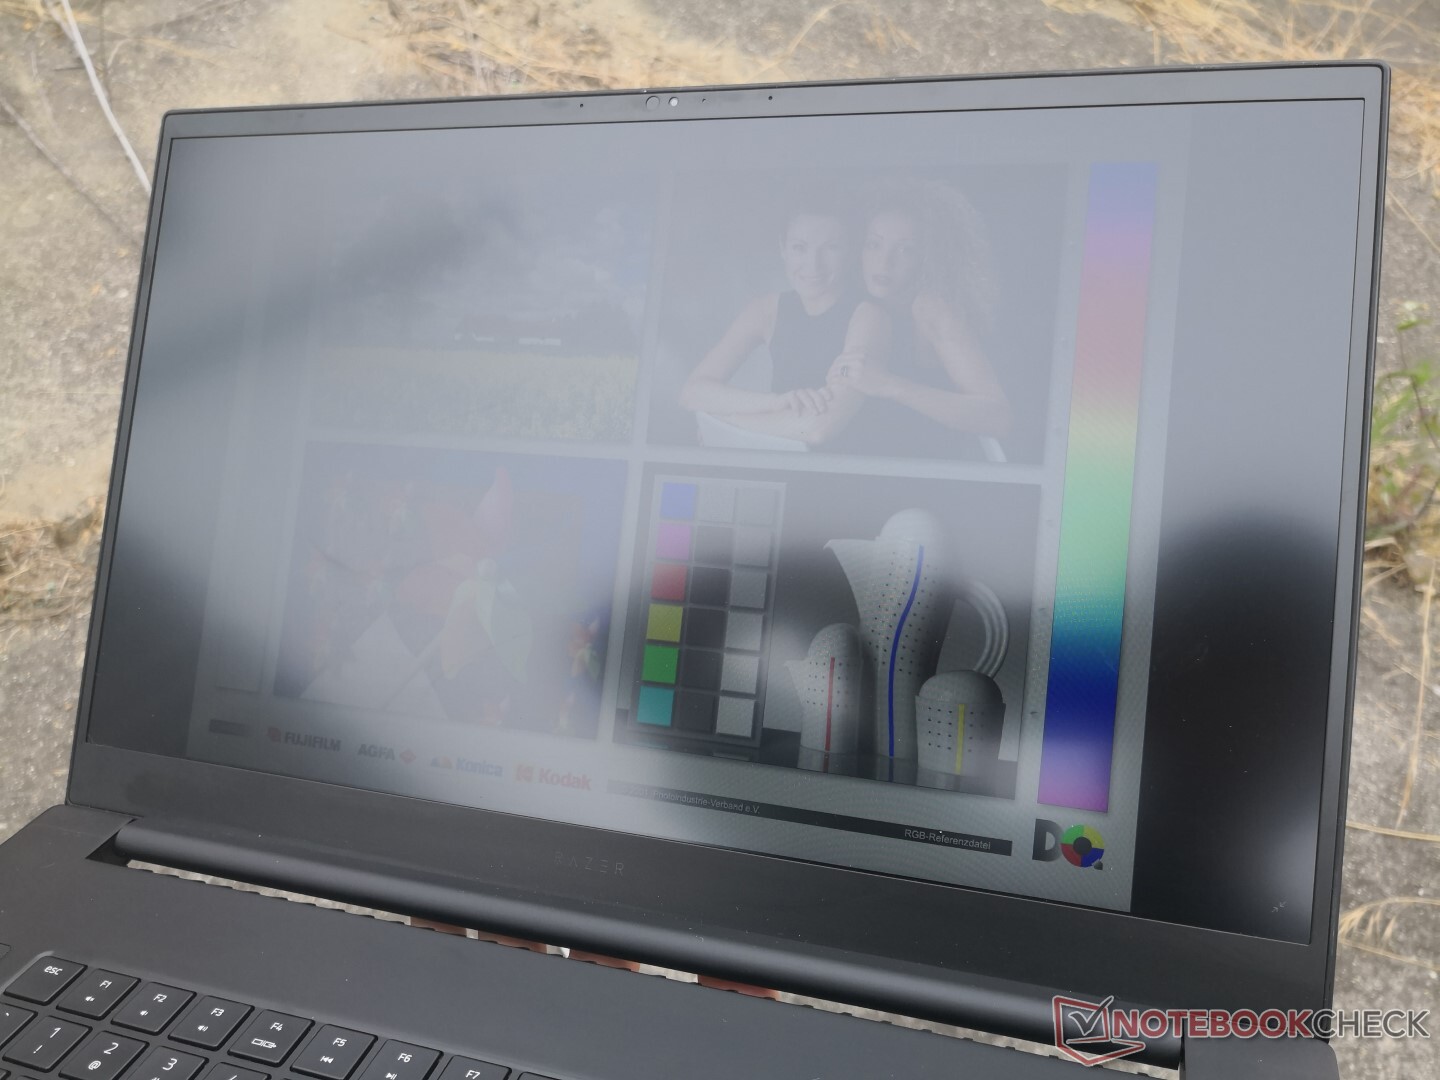
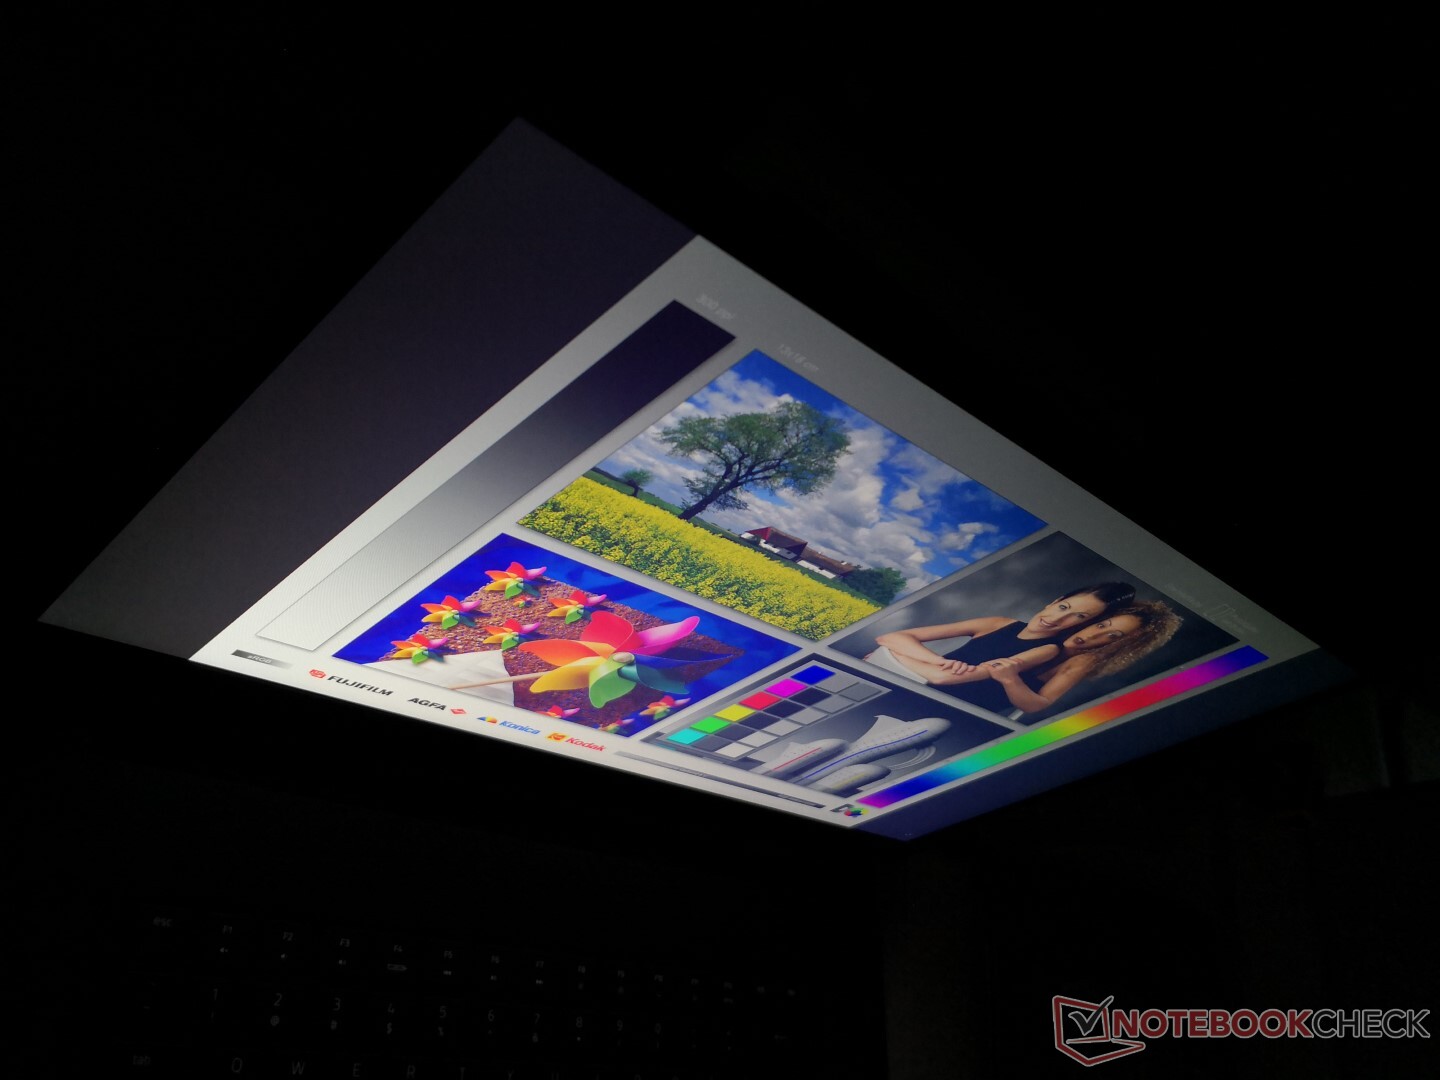
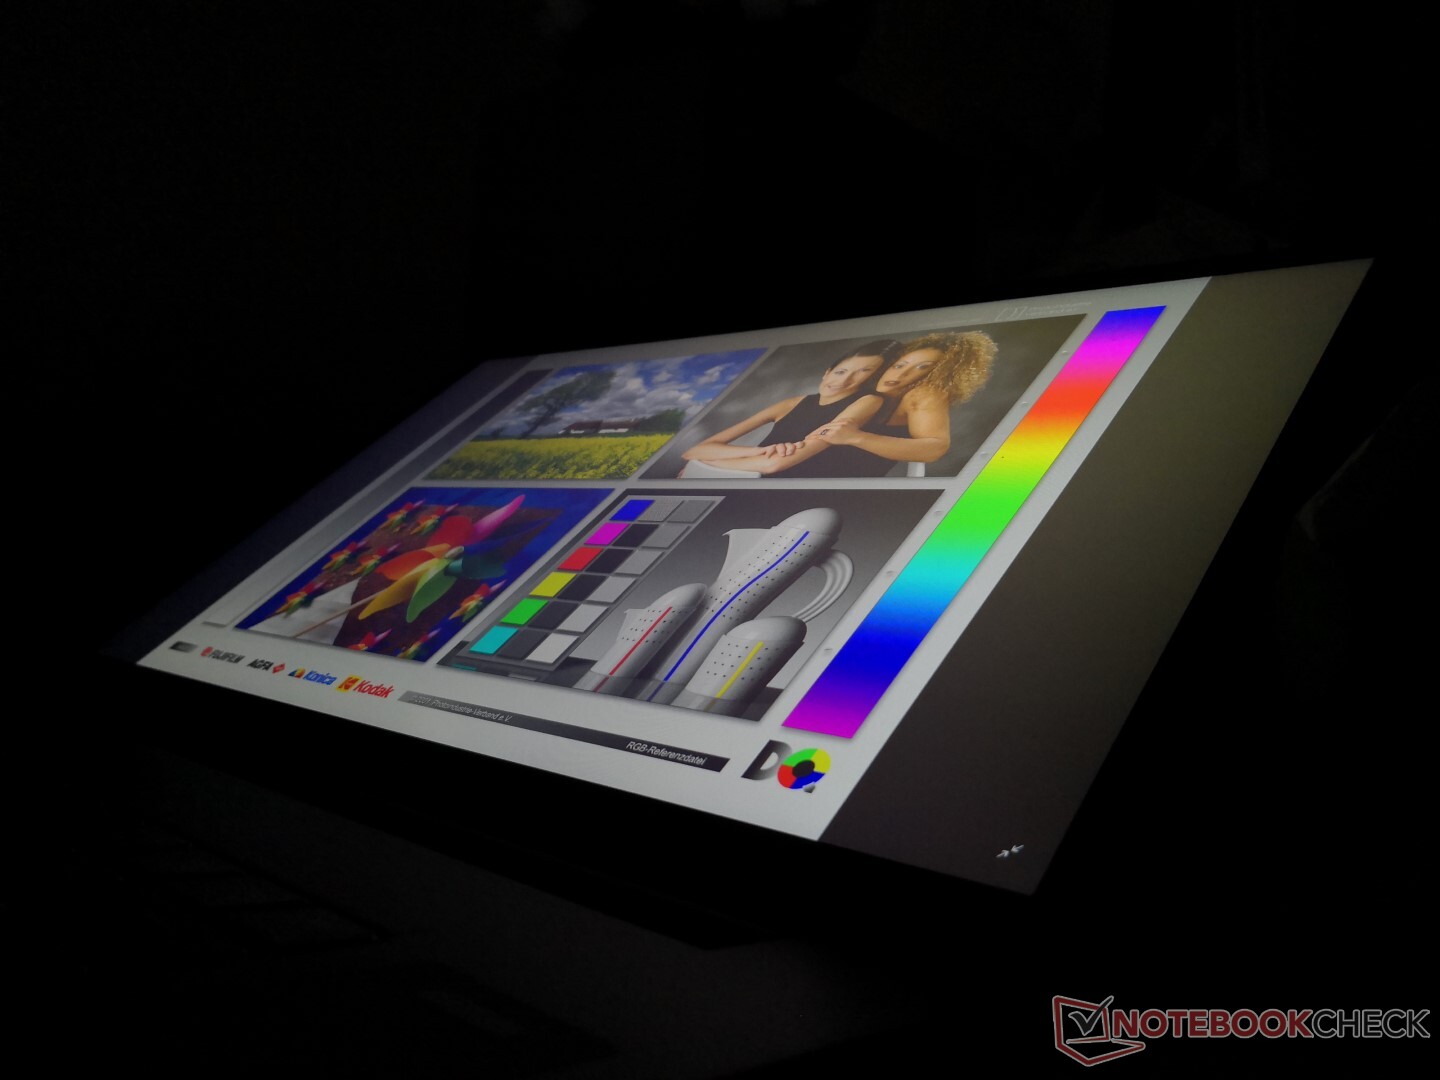
Display
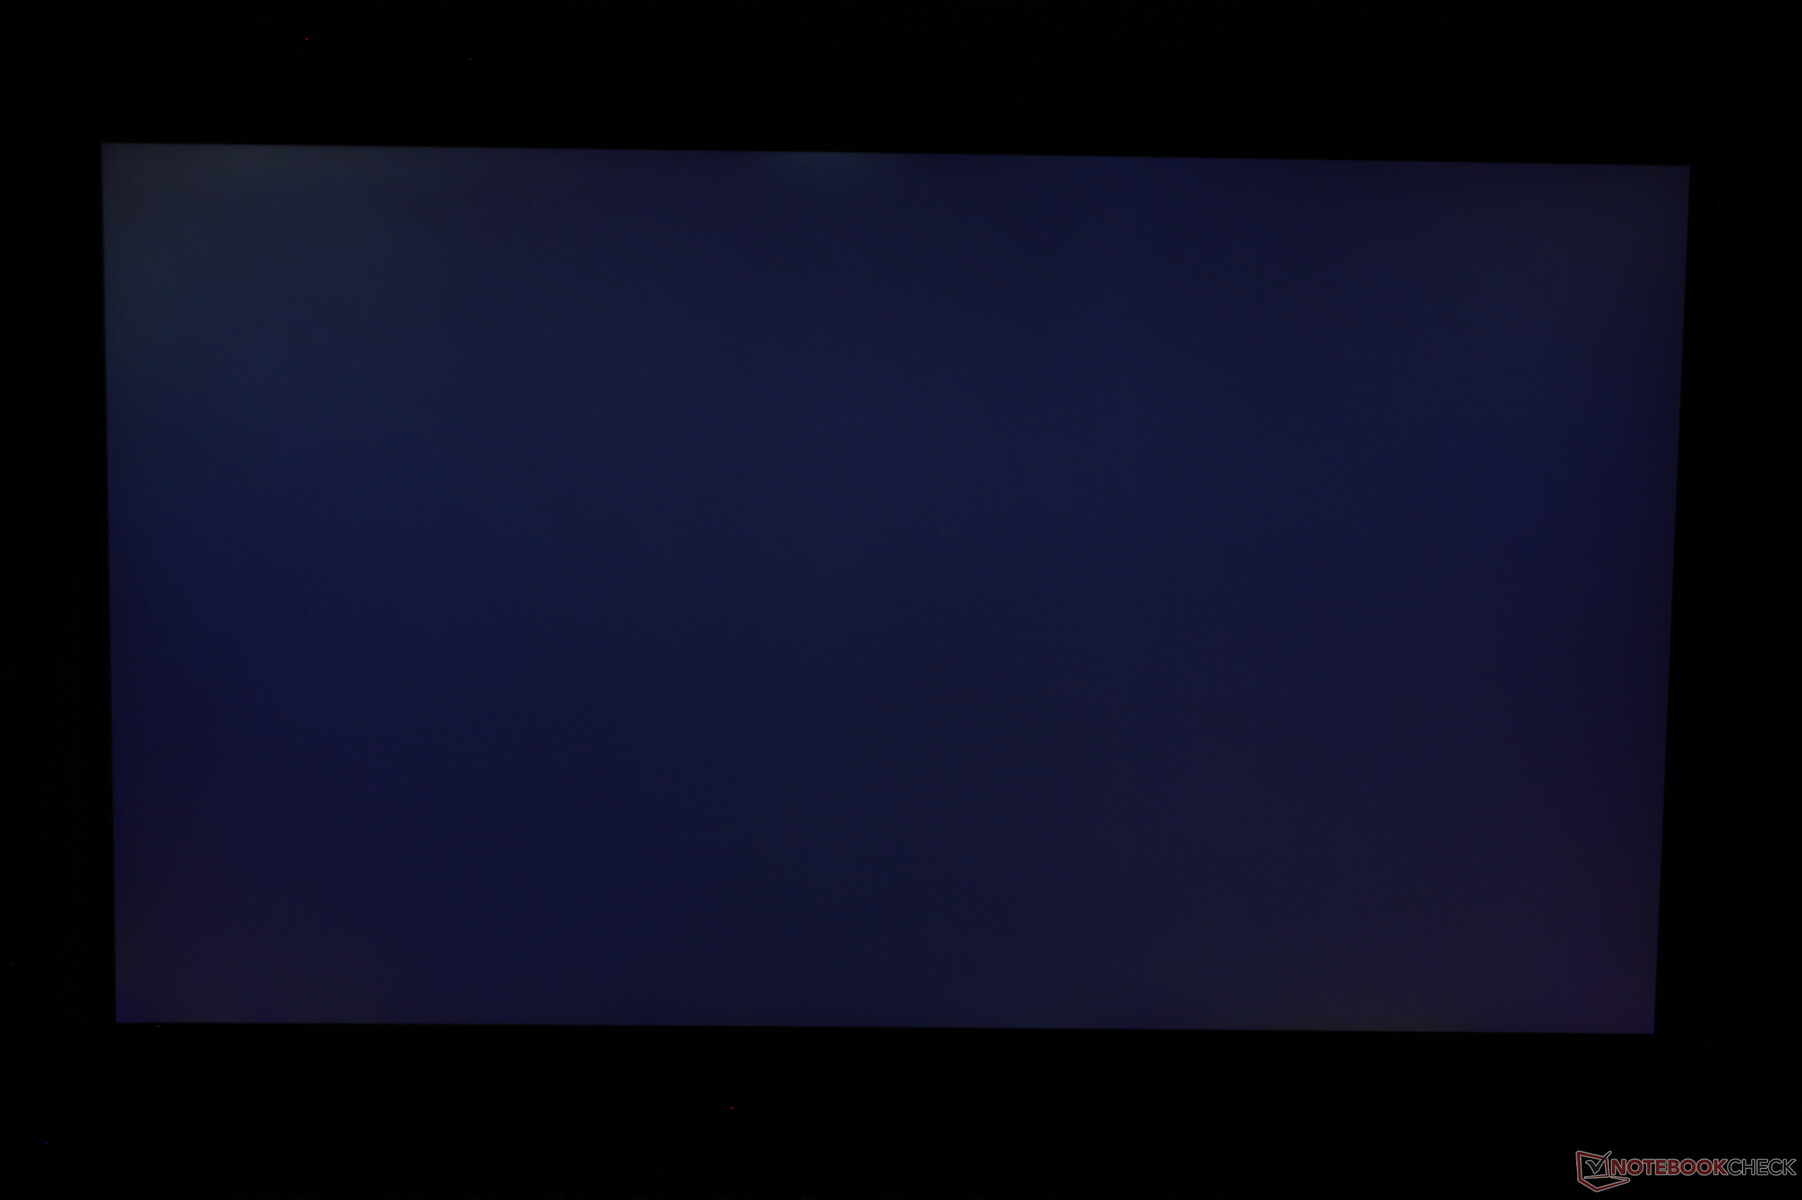
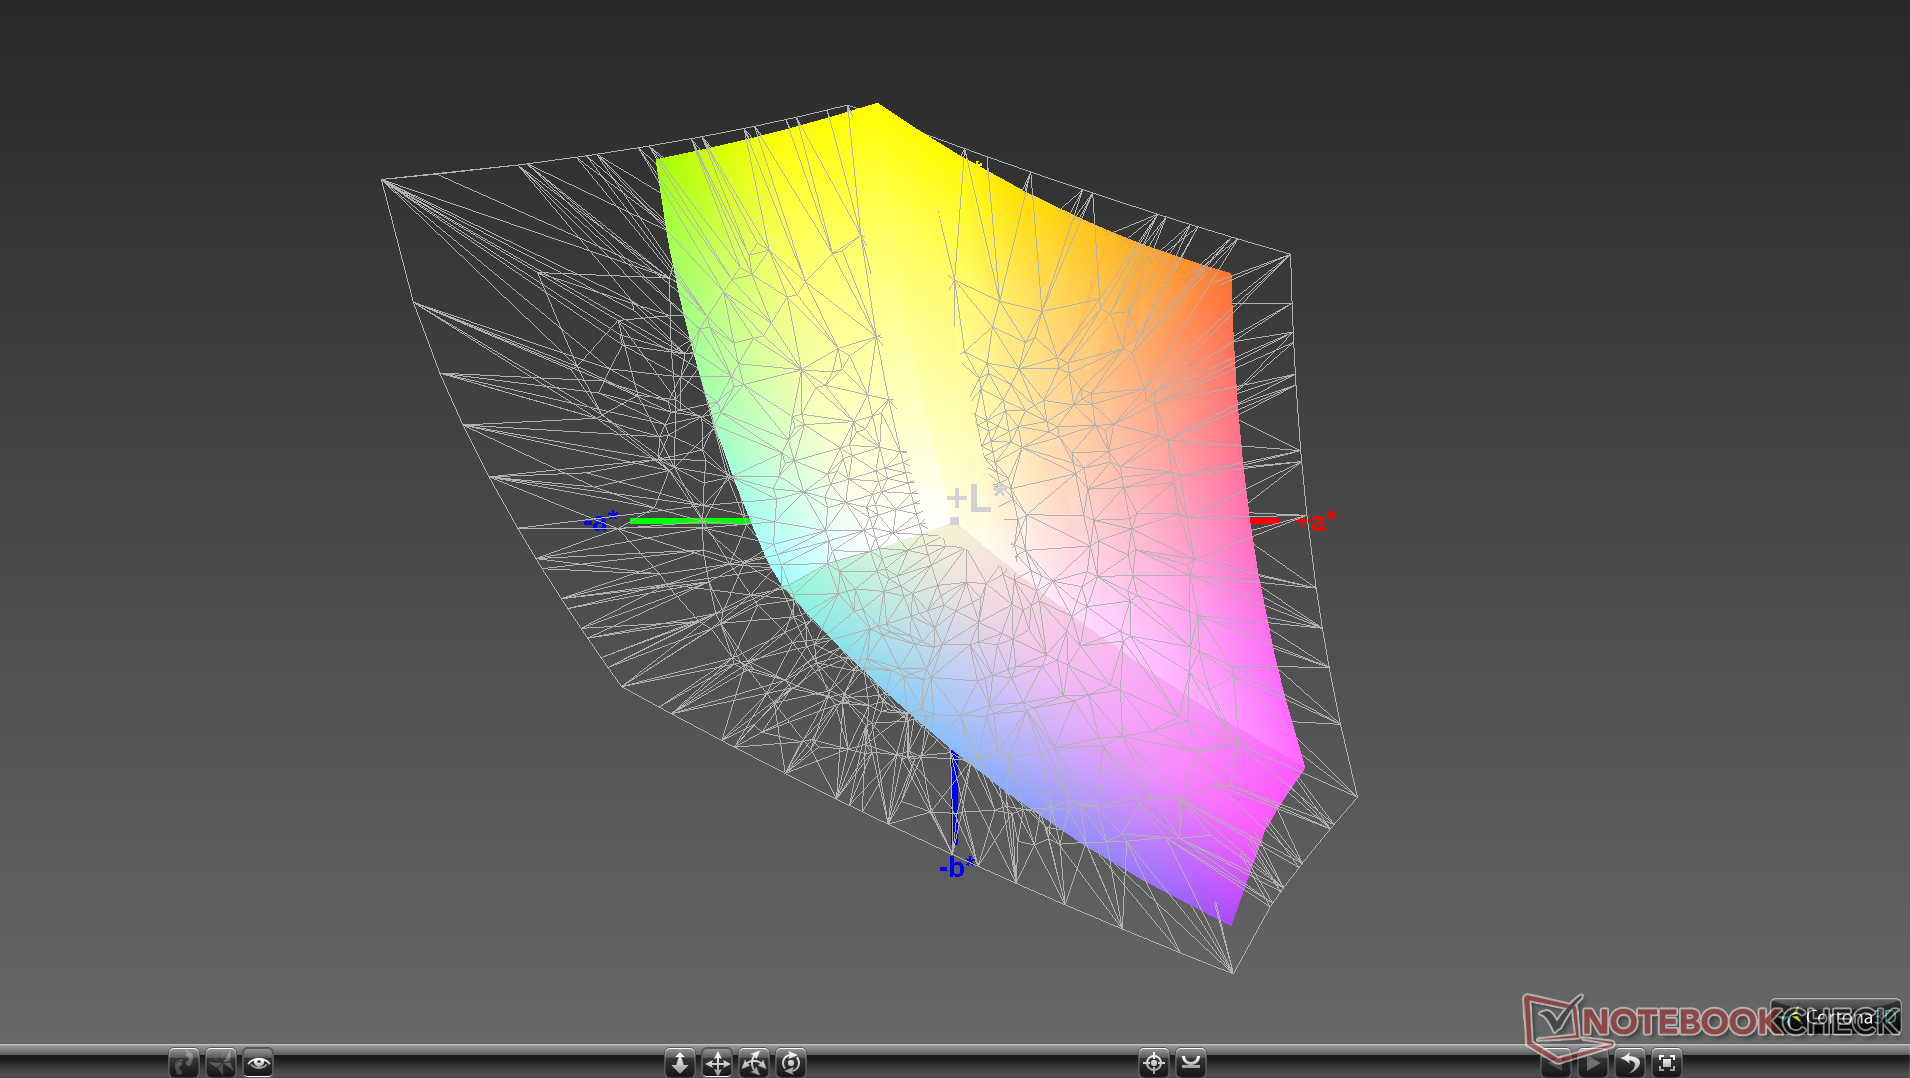
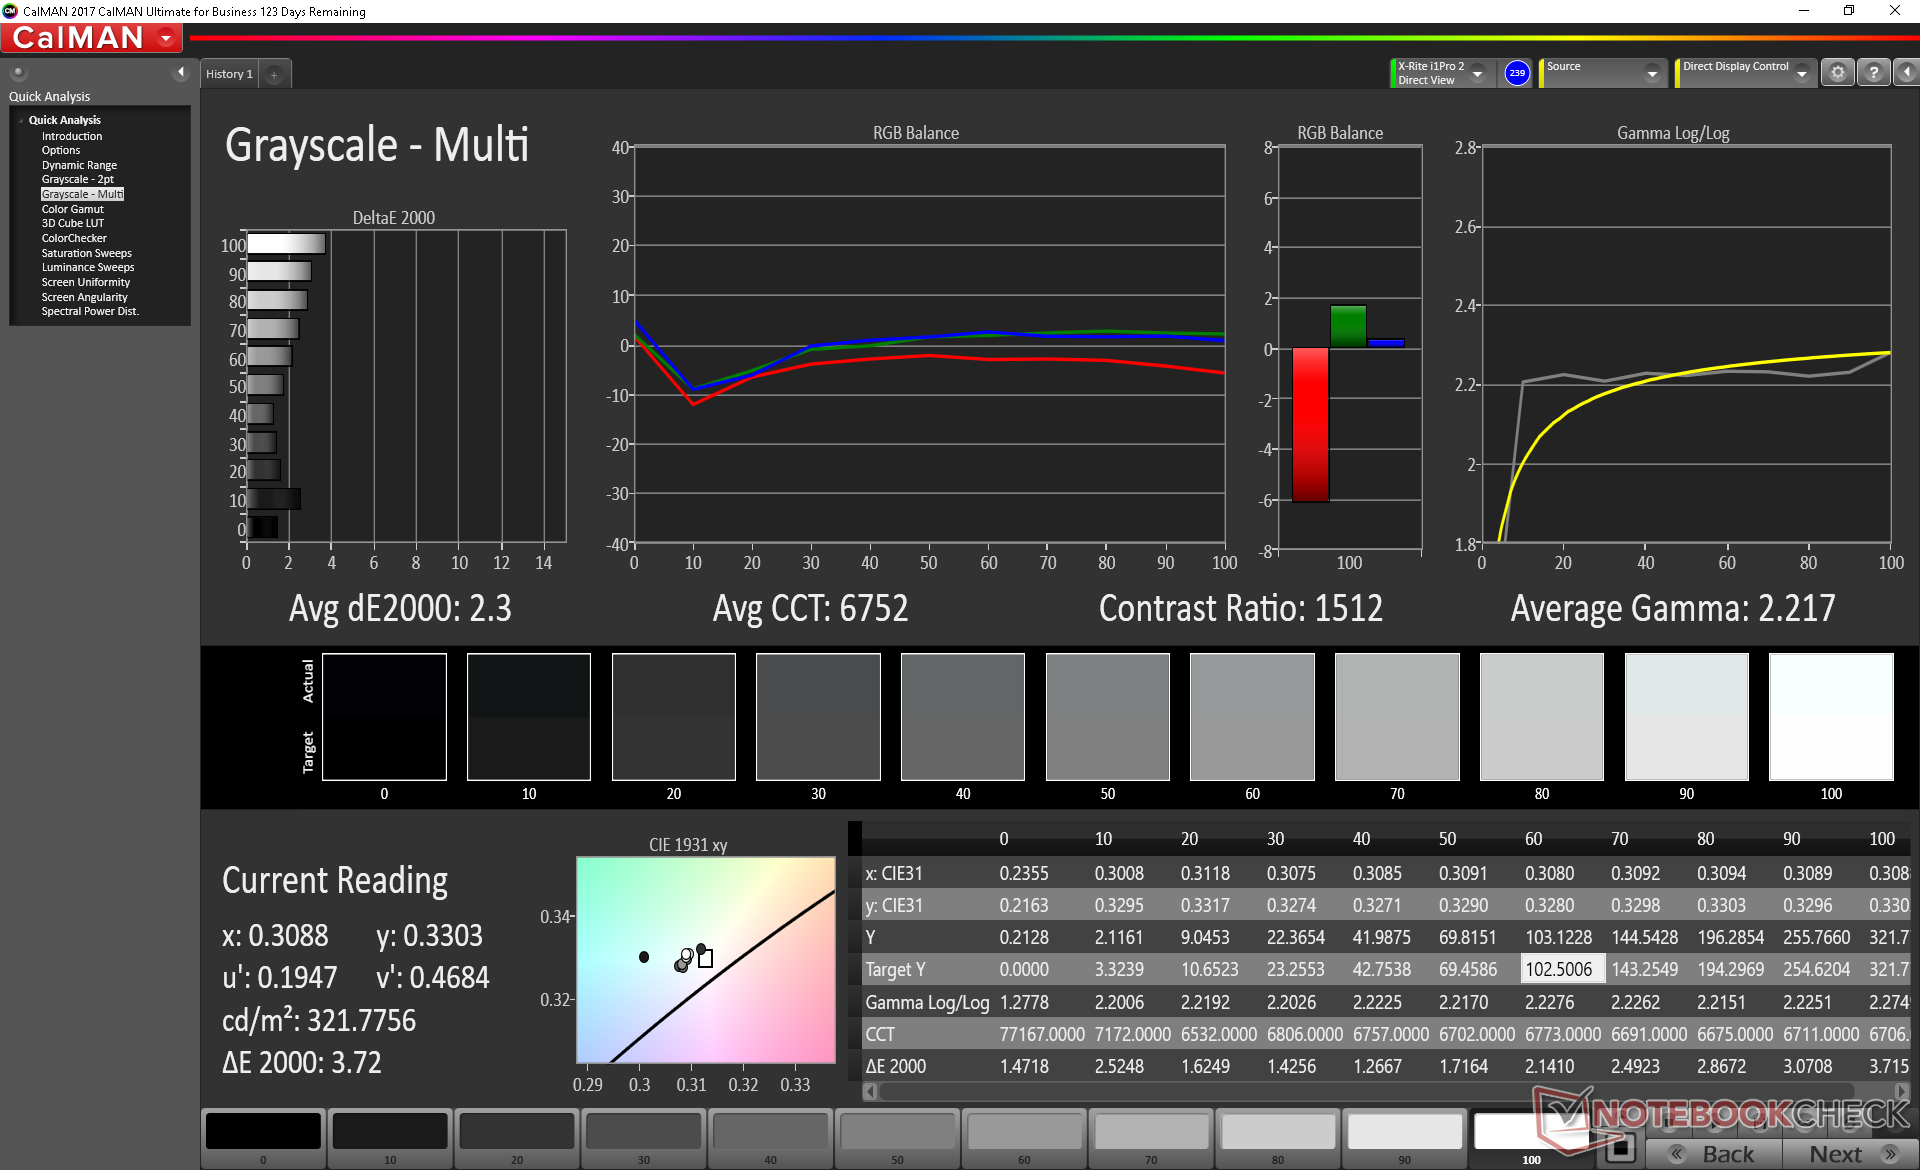
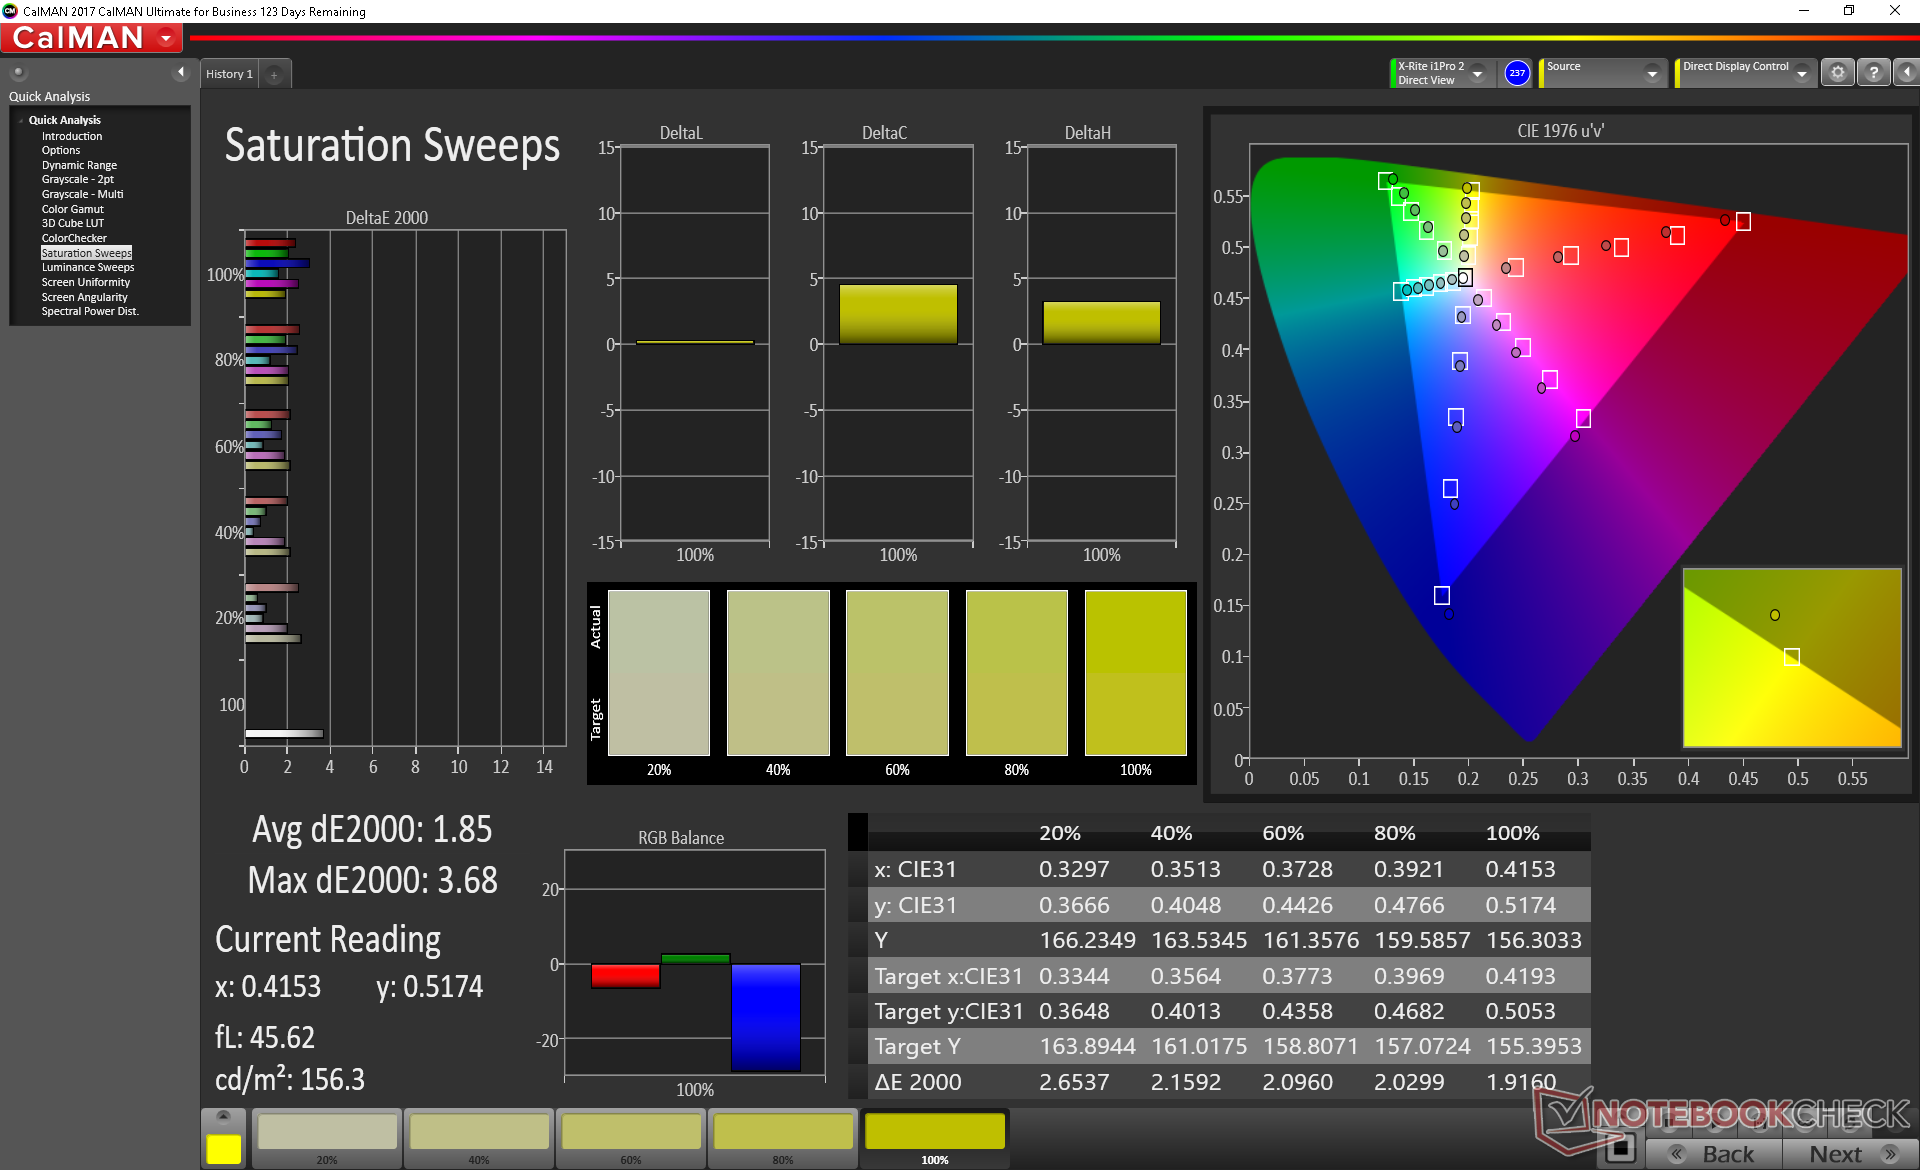
All current SKUs of the Blade Pro 17 come with the same 1080p 144 Hz AU Optronics B173HAN04.0 IPS panel for the same visual experience between even the lowest-end and highest-end configurations. Our measurements for contrast, colors, brightness, and response times show similar results to our Blade Pro 17 RTX 2080 Max-Q as we expected.
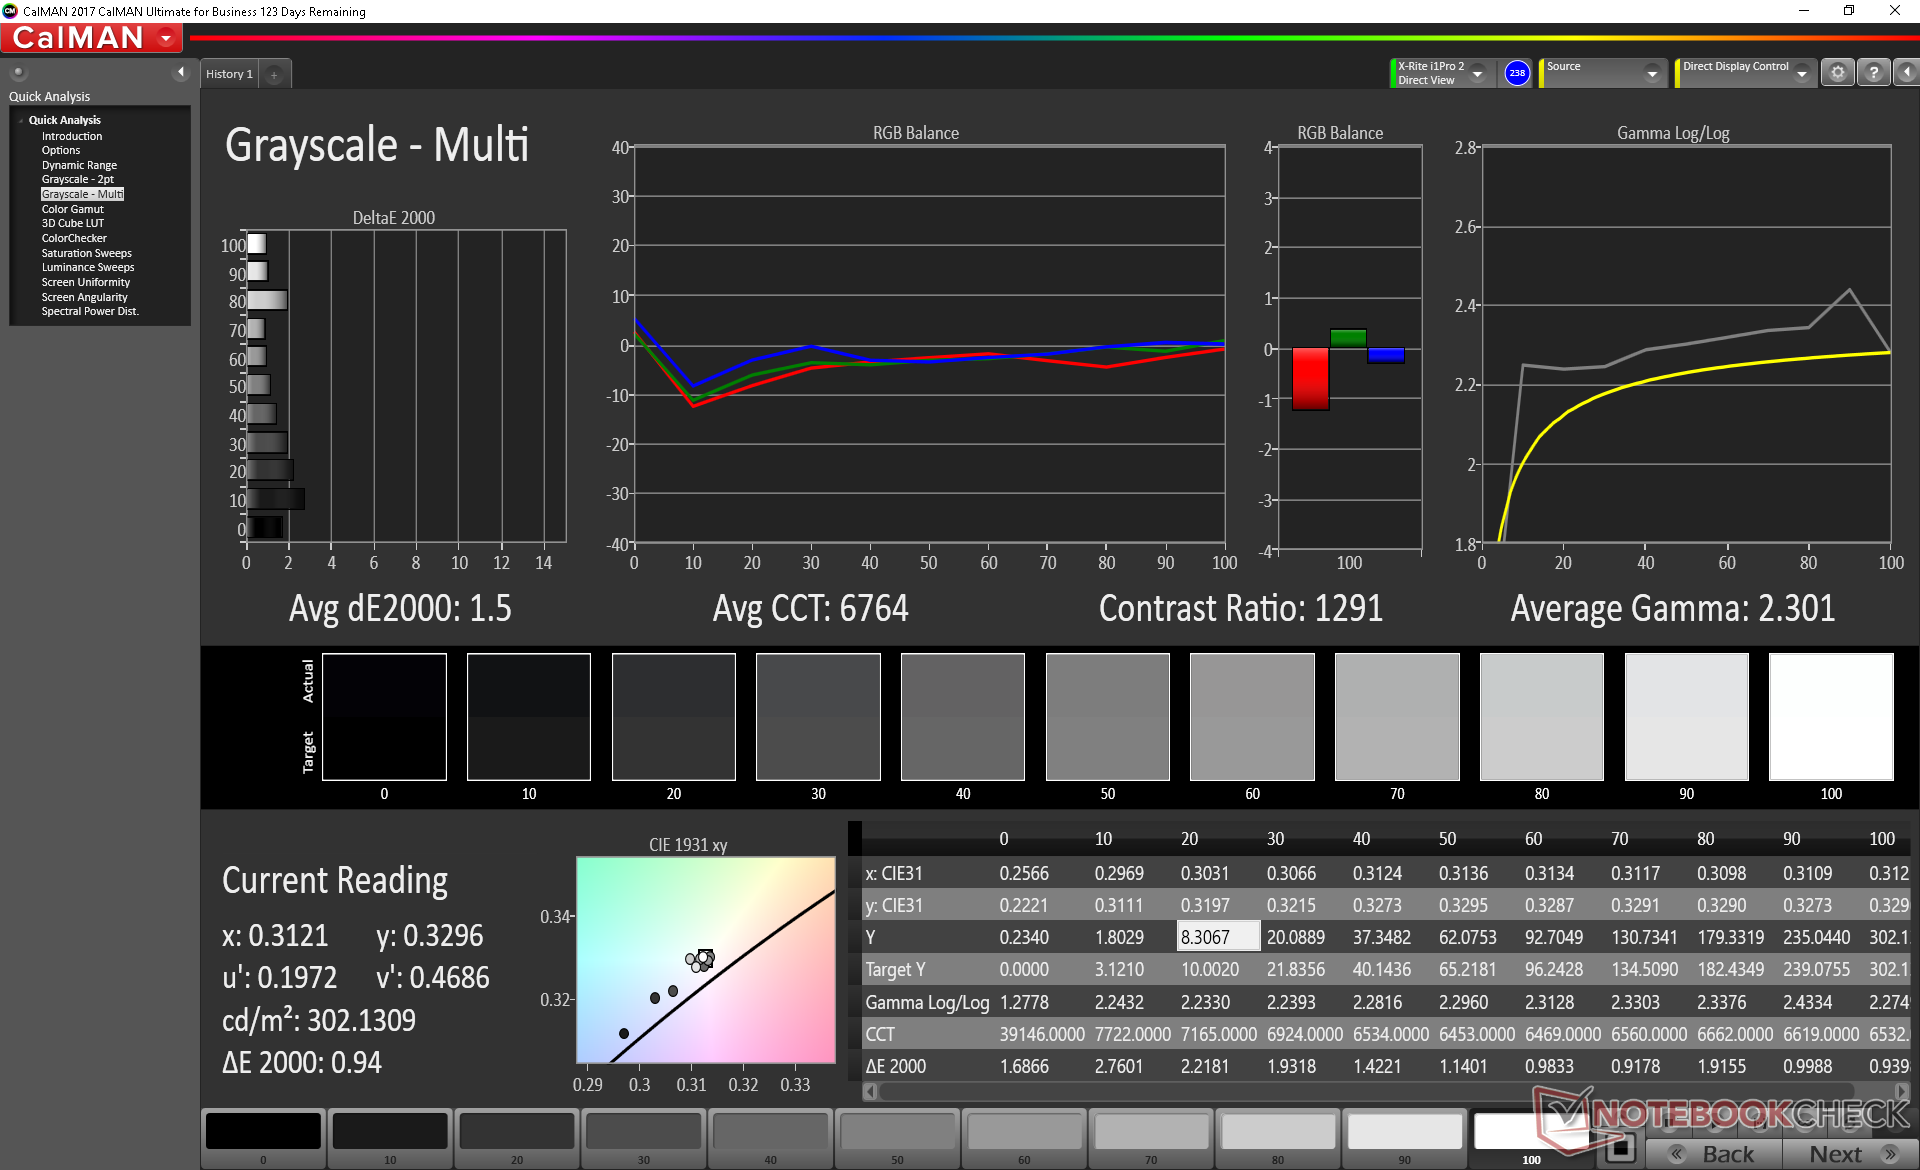
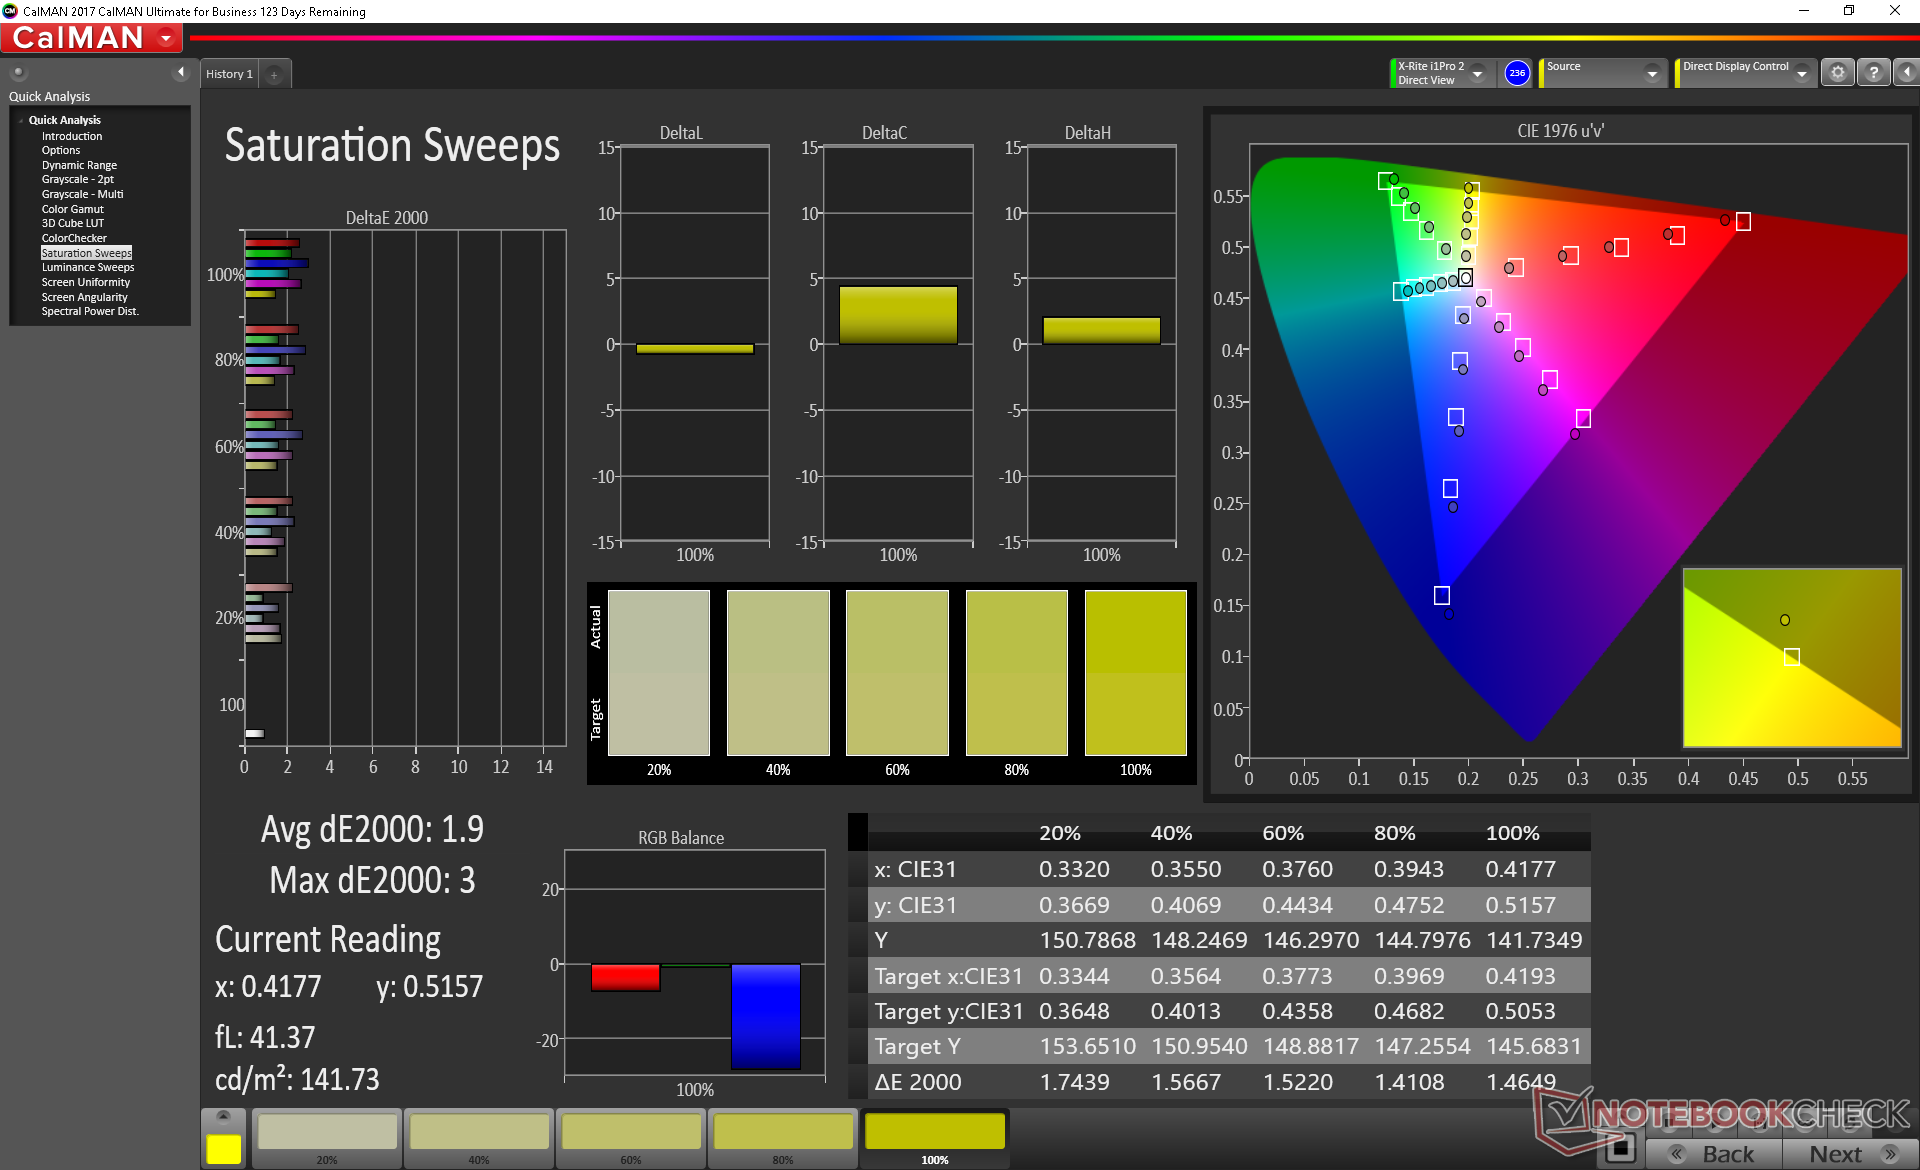
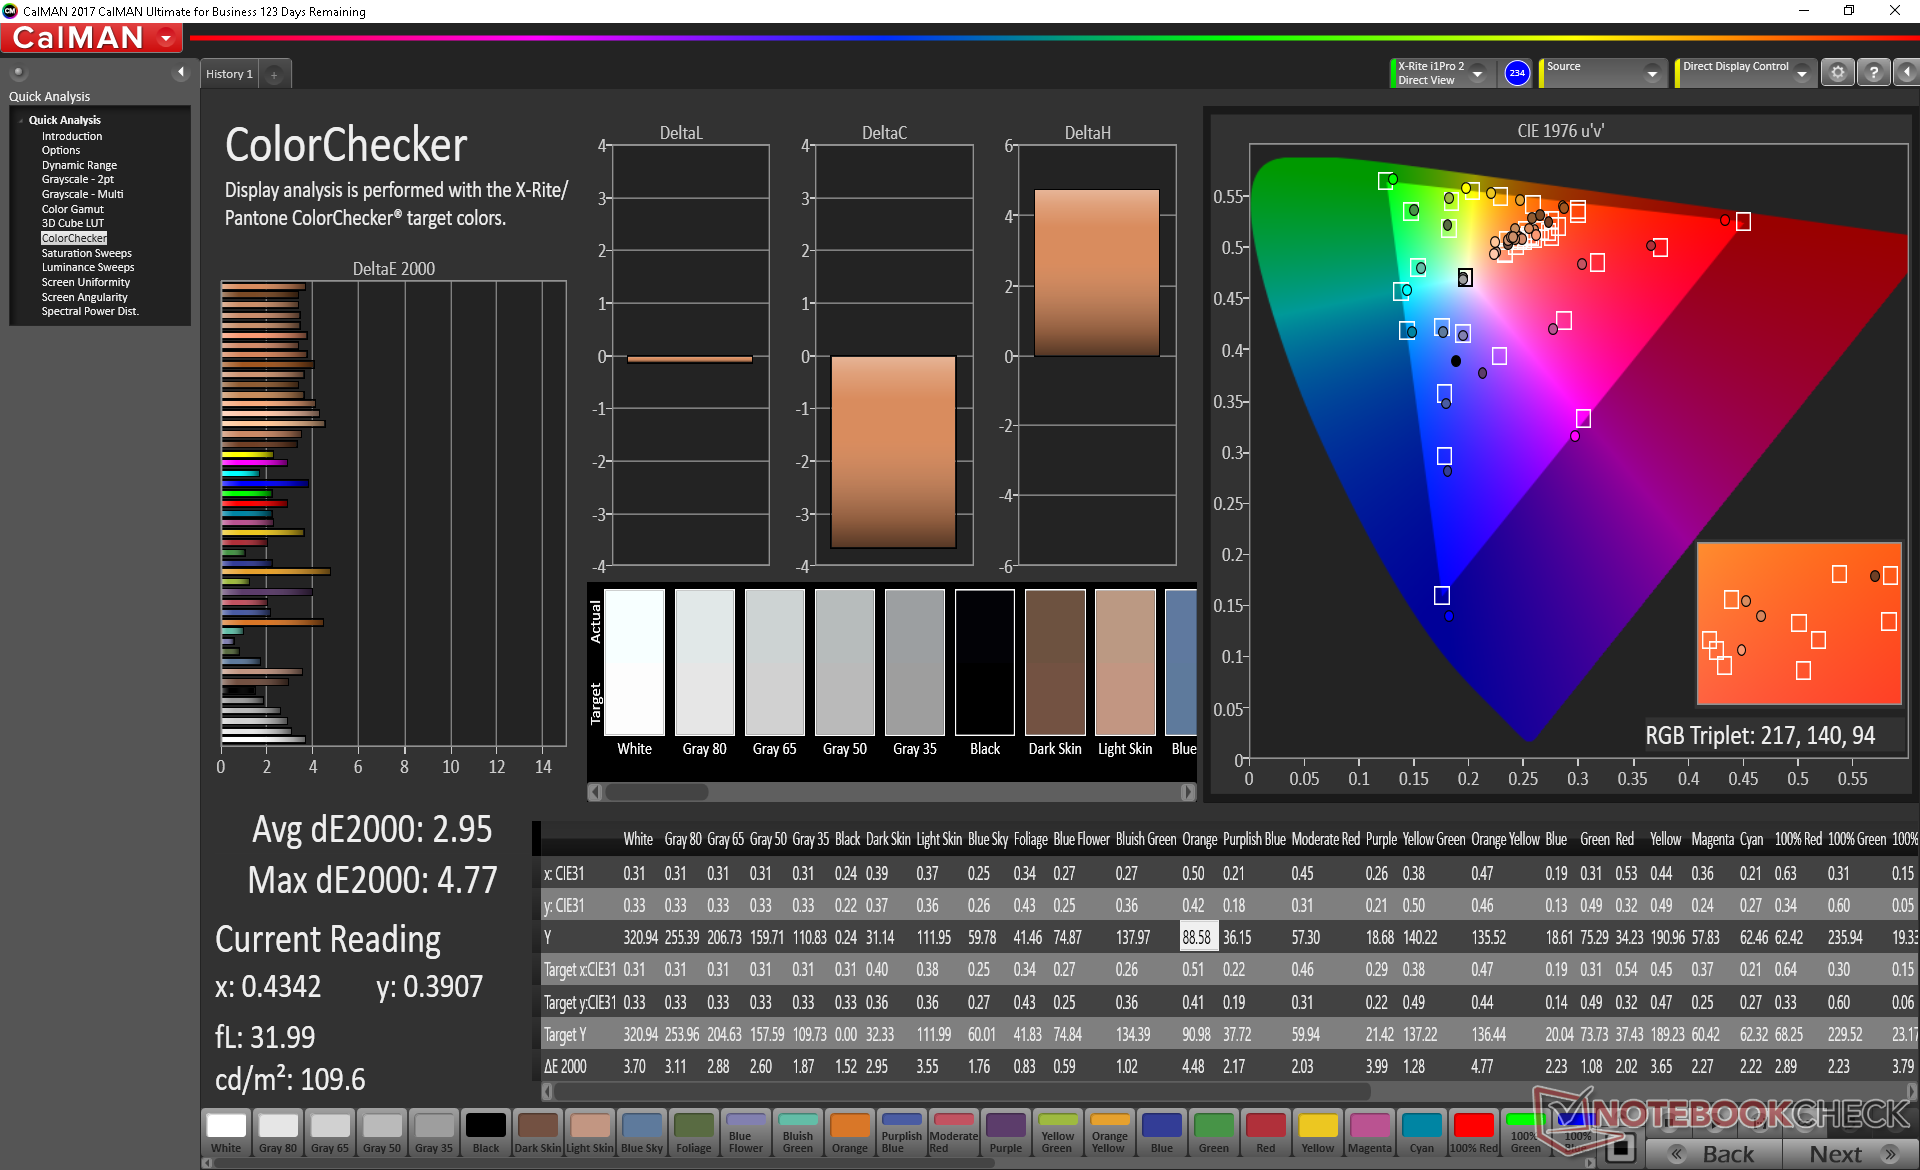
Interestingly, grayscale and color accuracy are slightly better this time around, but the differences are still minor in the grand scheme of things. Razer calibrates the display of each unit at factory much like on the Gigabyte Aero 15 series and so our attempts to calibrate the display even further result in no real gains.
Note that this very same AUO panel can also be found on a number of other high-end 17.3-inch gaming laptops like the Asus Zephyrus S GX701.

| |||||||||||||||||||||||||
Brightness Distribution: 93 %
Center on Battery: 300.4 cd/m²
Contrast: 939:1 (Black: 0.32 cd/m²)
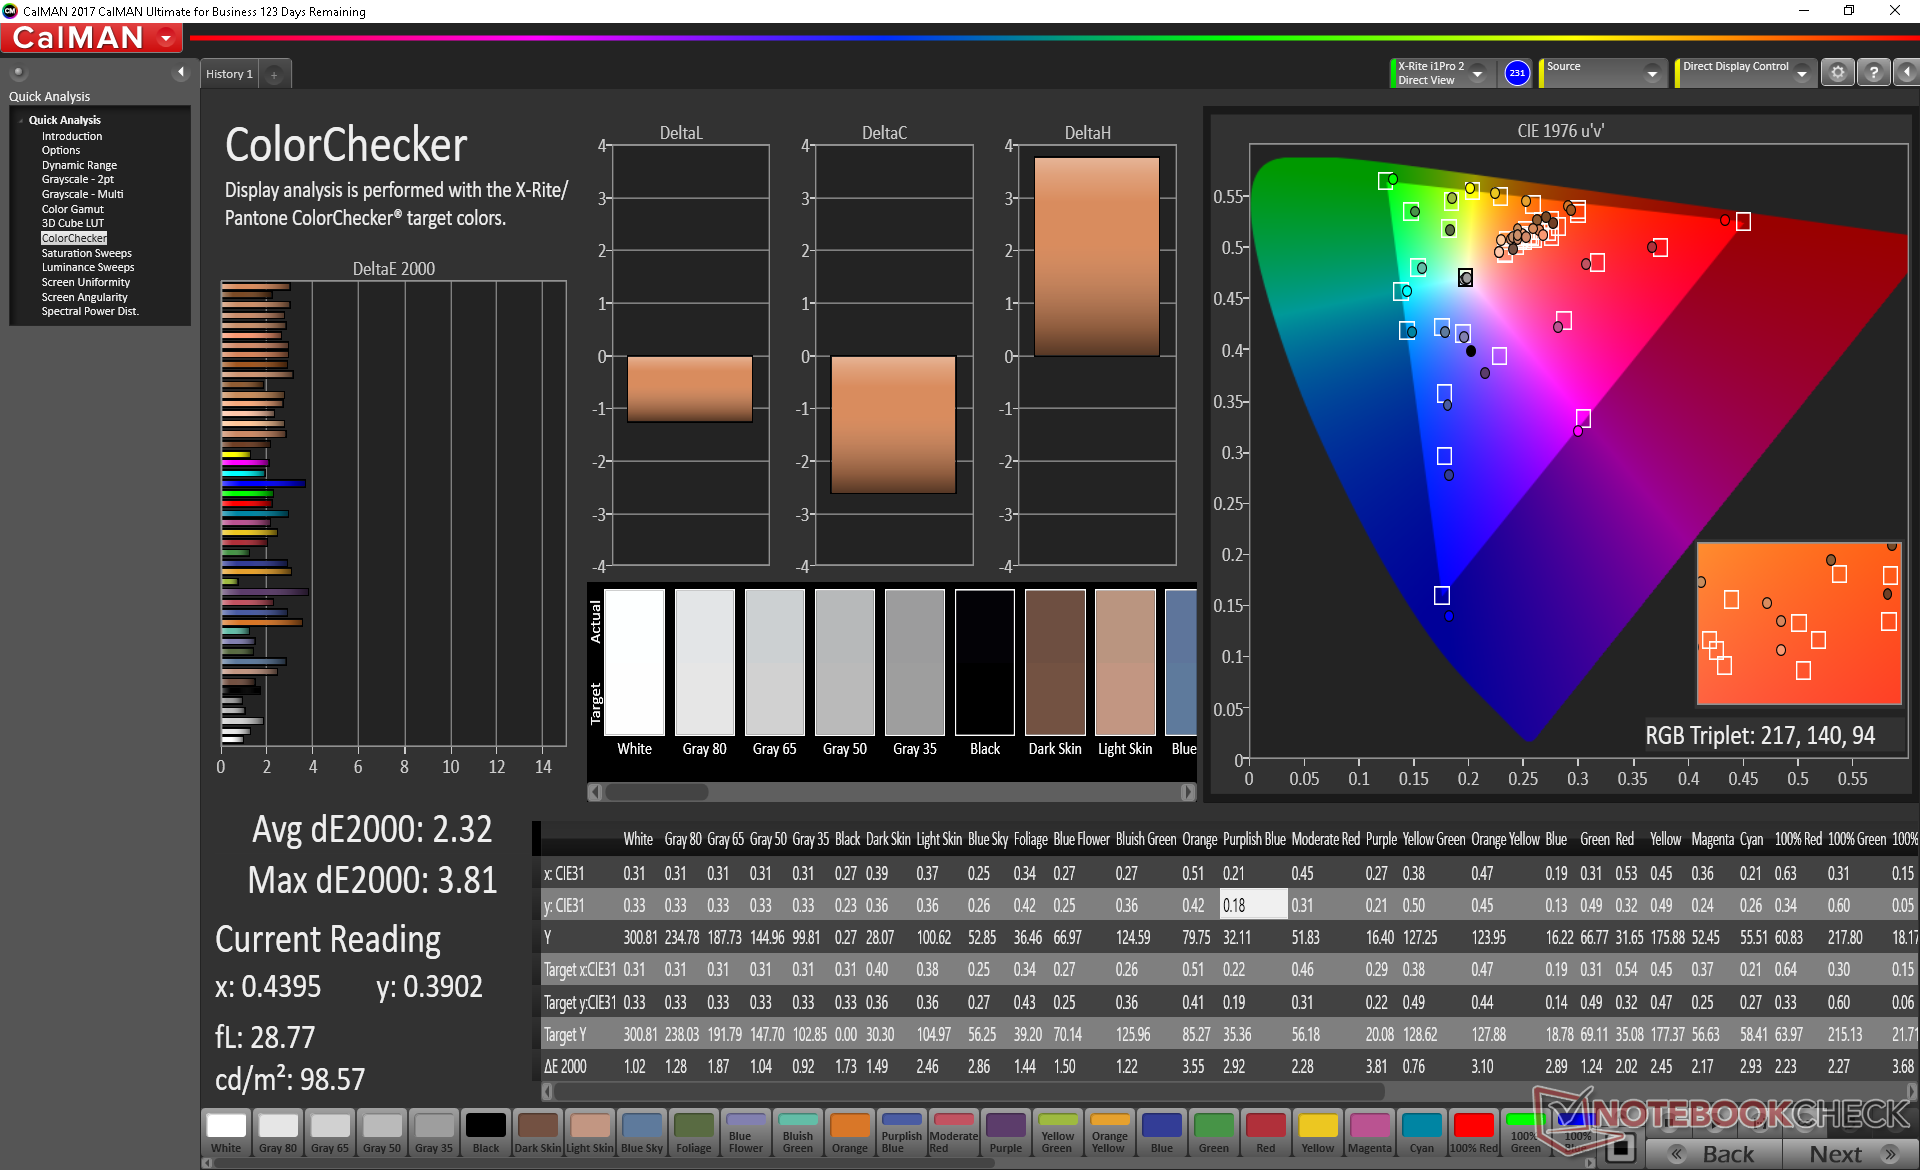
ΔE ColorChecker Calman: 2.32 | ∀{0.5-29.43 Ø4.73}
calibrated: 2.95
ΔE Greyscale Calman: 1.5 | ∀{0.09-98 Ø4.97}
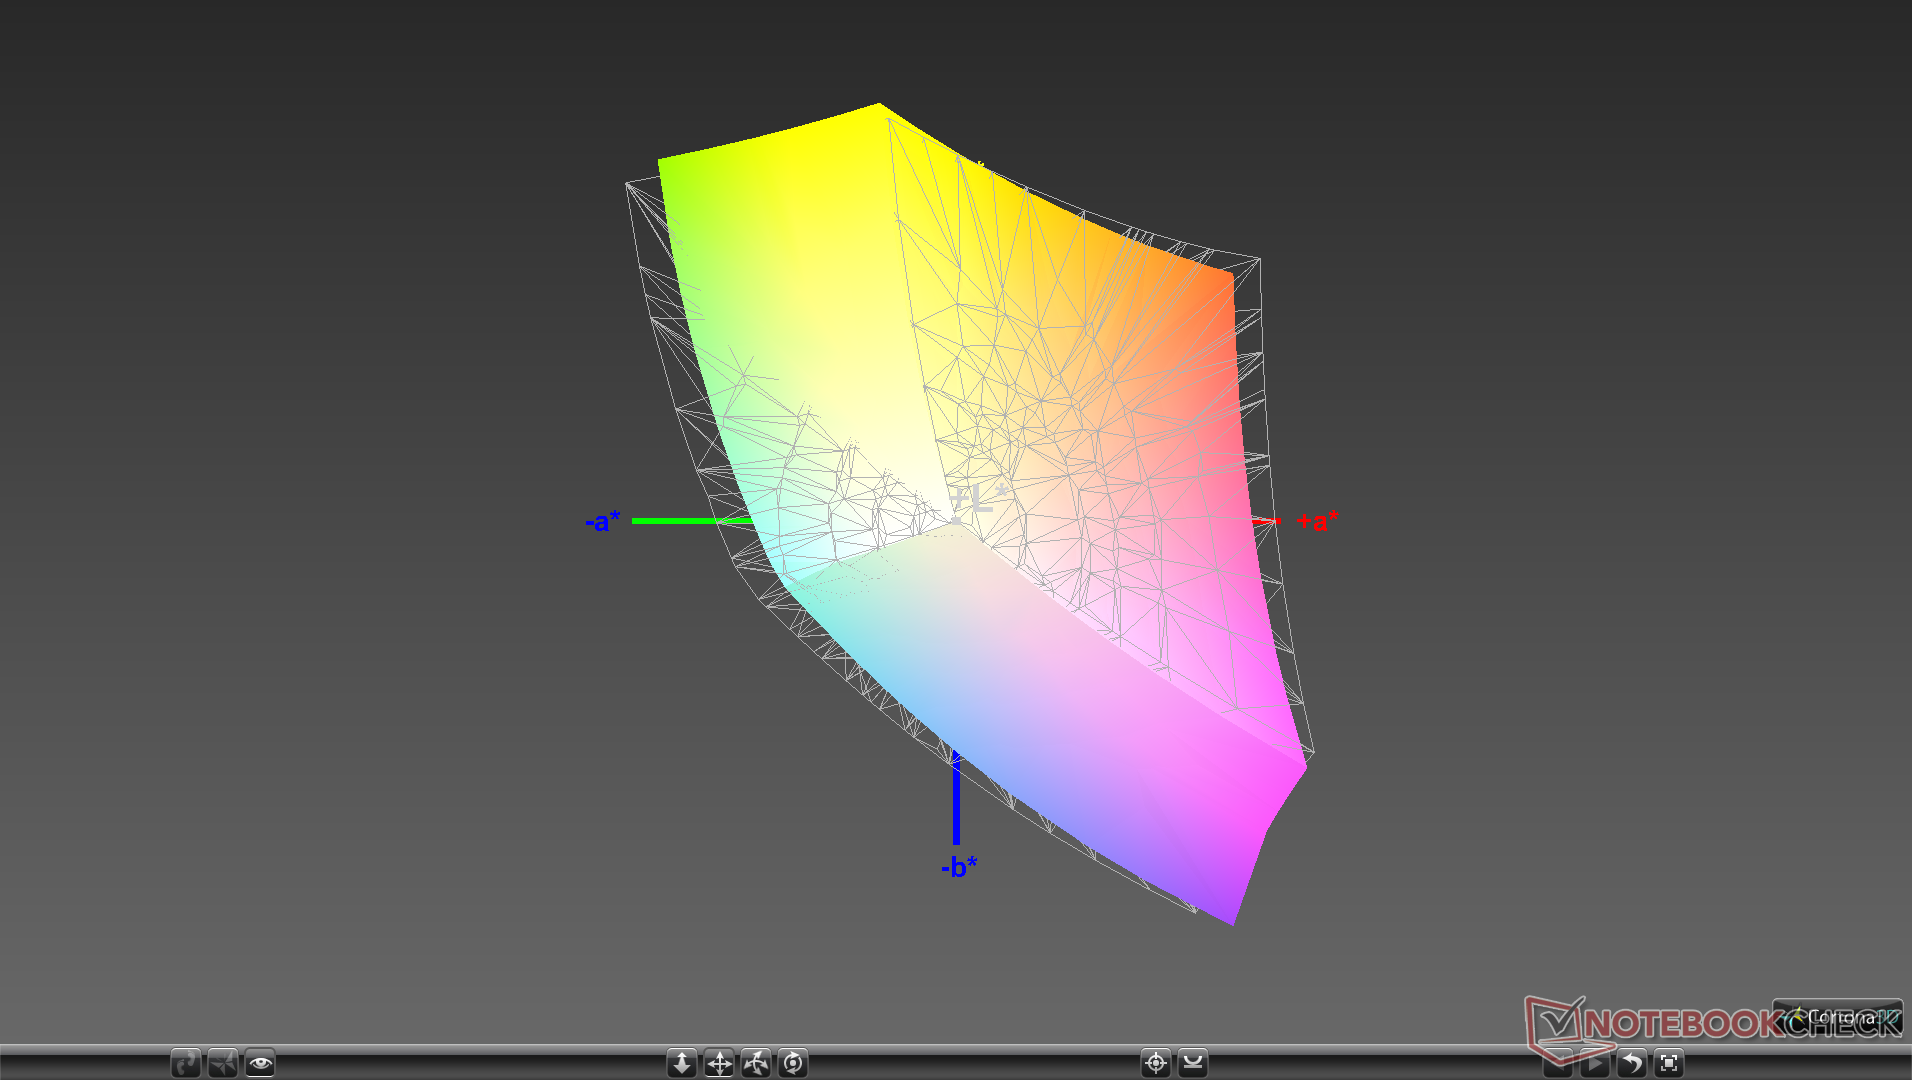
89% sRGB (Argyll 1.6.3 3D)
57.4% AdobeRGB 1998 (Argyll 1.6.3 3D)
62.5% AdobeRGB 1998 (Argyll 3D)
89.4% sRGB (Argyll 3D)
61.1% Display P3 (Argyll 3D)
Gamma: 2.3
CCT: 6764 K
| Razer Blade Pro 17 RTX 2060 AU Optronics B173HAN04.0, IPS, 17.3", 1920x1080 | Asus Zephyrus S GX701GX B173HAN04.0 (AUO409D), IPS, 17.3", 1920x1080 | MSI GS75 Stealth 9SG Chi Mei N173HCE-G33 (CMN175C), IPS, 17.3", 1920x1080 | Asus ASUS ROG Strix SCAR III G731GW-XB74 AU Optronics AUO409D, IPS, 17.3", 1920x1080 | Razer Blade Pro 2017 Sharp LQ173D1JW33 (SHP145A), IGZO, 17.3", 3840x2160 | Acer Predator Helios 500 PH517-51-93LS B173ZAN01.0, IPS LED, 17.3", 3840x2160 | |
|---|---|---|---|---|---|---|
| Display | 1% | 4% | -0% | 39% | 38% | |
| Display P3 Coverage (%) | 61.1 | 62.9 3% | 62.6 2% | 61.9 1% | 88.9 45% | 86.7 42% |
| sRGB Coverage (%) | 89.4 | 87.8 -2% | 93.5 5% | 86.3 -3% | 100 12% | 100 12% |
| AdobeRGB 1998 Coverage (%) | 62.5 | 63.9 2% | 64.7 4% | 62.9 1% | 99.7 60% | 99.4 59% |
| Response Times | -8% | -10% | -19% | -565% | -303% | |
| Response Time Grey 50% / Grey 80% * (ms) | 6.8 ? | 7.2 ? -6% | 7.2 ? -6% | 7.2 ? -6% | 60.8 ? -794% | 36 ? -429% |
| Response Time Black / White * (ms) | 8.8 ? | 9.6 ? -9% | 10 ? -14% | 11.6 ? -32% | 38.4 ? -336% | 24.4 ? -177% |
| PWM Frequency (Hz) | 25510 ? | 204.9 ? | ||||
| Screen | 7% | 17% | -34% | -45% | -15% | |
| Brightness middle (cd/m²) | 300.4 | 288 -4% | 366 22% | 297.4 -1% | 230 -23% | 366 22% |
| Brightness (cd/m²) | 289 | 287 -1% | 343 19% | 306 6% | 207 -28% | 349 21% |
| Brightness Distribution (%) | 93 | 91 -2% | 91 -2% | 80 -14% | 83 -11% | 86 -8% |
| Black Level * (cd/m²) | 0.32 | 0.2 37% | 0.29 9% | 0.31 3% | 0.2 37% | 0.46 -44% |
| Contrast (:1) | 939 | 1440 53% | 1262 34% | 959 2% | 1150 22% | 796 -15% |
| Colorchecker dE 2000 * | 2.32 | 2.33 -0% | 1.51 35% | 4.08 -76% | 5.62 -142% | 2.9 -25% |
| Colorchecker dE 2000 max. * | 3.81 | 5.34 -40% | 3.22 15% | 6.88 -81% | 10.24 -169% | 5.4 -42% |
| Colorchecker dE 2000 calibrated * | 2.95 | 2.47 16% | 0.71 76% | 4 -36% | 3.1 -5% | |
| Greyscale dE 2000 * | 1.5 | 1.19 21% | 1.93 -29% | 4 -167% | 4.54 -203% | 3.5 -133% |
| Gamma | 2.3 96% | 2.41 91% | 2.38 92% | 2.259 97% | 2.36 93% | 2.37 93% |
| CCT | 6764 96% | 6710 97% | 6881 94% | 7205 90% | 6625 98% | 6616 98% |
| Color Space (Percent of AdobeRGB 1998) (%) | 57.4 | 57 -1% | 60 5% | 56 -2% | 88 53% | 88.1 53% |
| Color Space (Percent of sRGB) (%) | 89 | 88 -1% | 94 6% | 86 -3% | 100 12% | 100 12% |
| Total Average (Program / Settings) | 0% /
4% | 4% /
11% | -18% /
-26% | -190% /
-98% | -93% /
-41% |
* ... smaller is better
Display Response Times
| ↔ Response Time Black to White | ||
|---|---|---|
| 8.8 ms ... rise ↗ and fall ↘ combined | ↗ 4.4 ms rise | 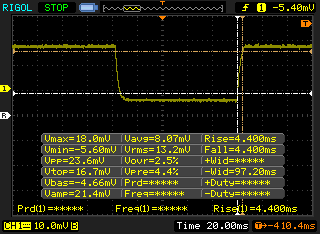 |
| ↘ 4.4 ms fall | ||
| The screen shows fast response rates in our tests and should be suited for gaming. In comparison, all tested devices range from 0.1 (minimum) to 240 (maximum) ms. » 24 % of all devices are better. This means that the measured response time is better than the average of all tested devices (19.9 ms). | ||
| ↔ Response Time 50% Grey to 80% Grey | ||
| 6.8 ms ... rise ↗ and fall ↘ combined | ↗ 3.6 ms rise | 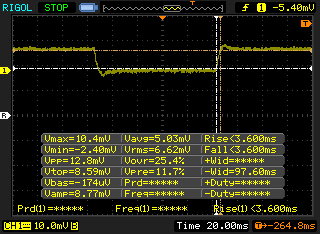 |
| ↘ 3.2 ms fall | ||
| The screen shows very fast response rates in our tests and should be very well suited for fast-paced gaming. In comparison, all tested devices range from 0.165 (minimum) to 636 (maximum) ms. » 19 % of all devices are better. This means that the measured response time is better than the average of all tested devices (31.1 ms). | ||
Screen Flickering / PWM (Pulse-Width Modulation)
| Screen flickering / PWM not detected | 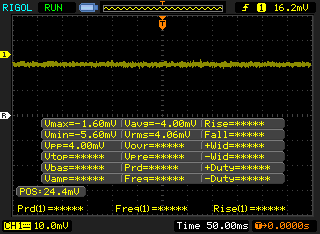 | ||
In comparison: 52 % of all tested devices do not use PWM to dim the display. If PWM was detected, an average of 7798 (minimum: 5 - maximum: 343500) Hz was measured. | |||

Performance
Razer doesn't like to offer "mid-range" gaming laptops as shown by the configuration options available for the Blade Pro 17. All Blade Pro 17 SKUs come with Core i7 CPUs and RTX graphics with a baseline 144 Hz panel as standard. The model utilizes Max-Q graphics where available as opposed to the full-power "Max-P" RTX 2070 or RTX 2080. This is definitely the right move since the last generation Blade Pro 2017 model had to underclock the full-power GTX 1080.
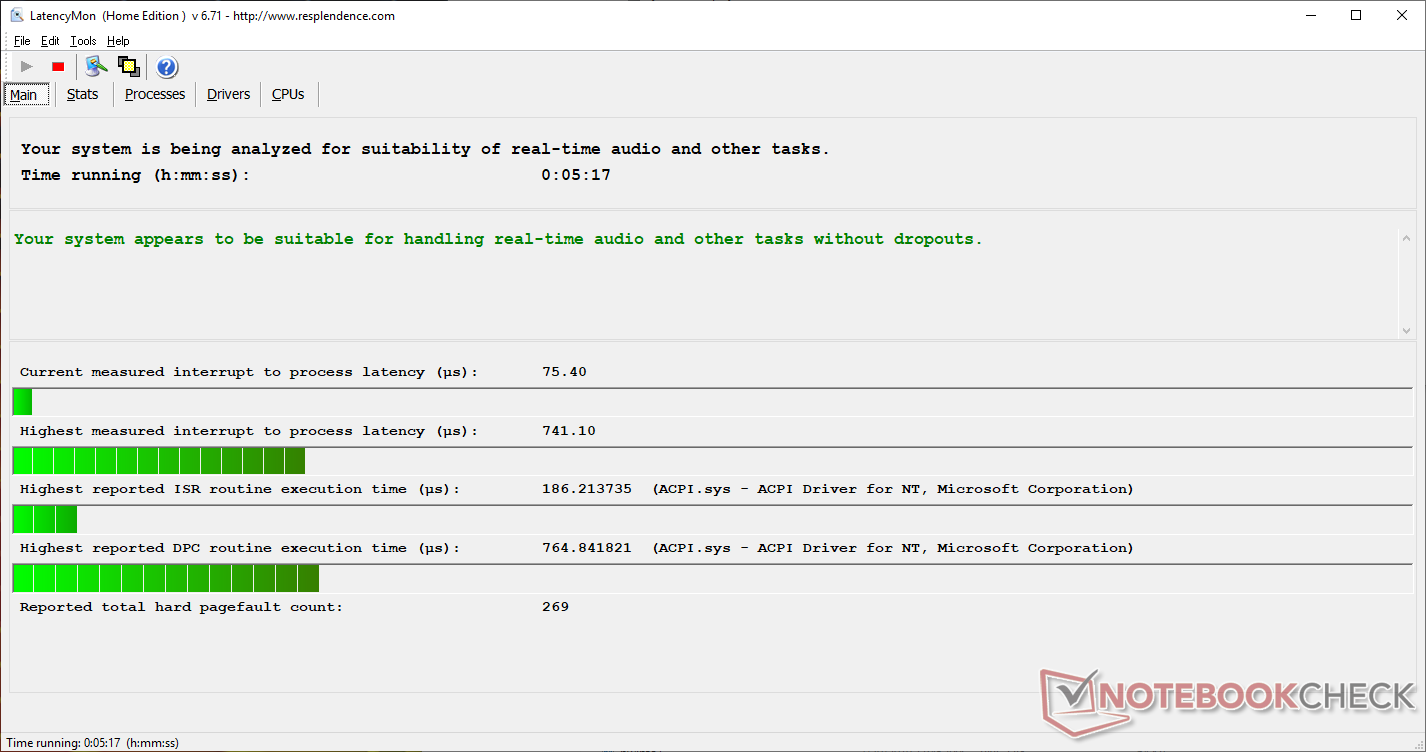
Nvidia Optimus comes standard meaning G-Sync is unavailable. LatencyMon shows no DPC issues with real-time audio recording even when wireless is enabled.
Processor
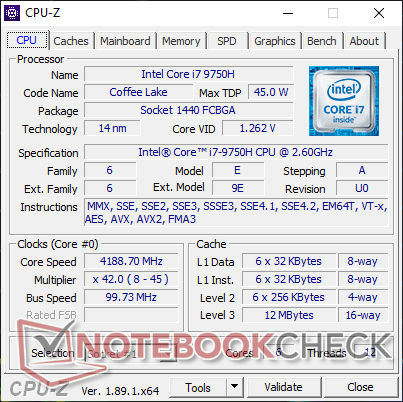
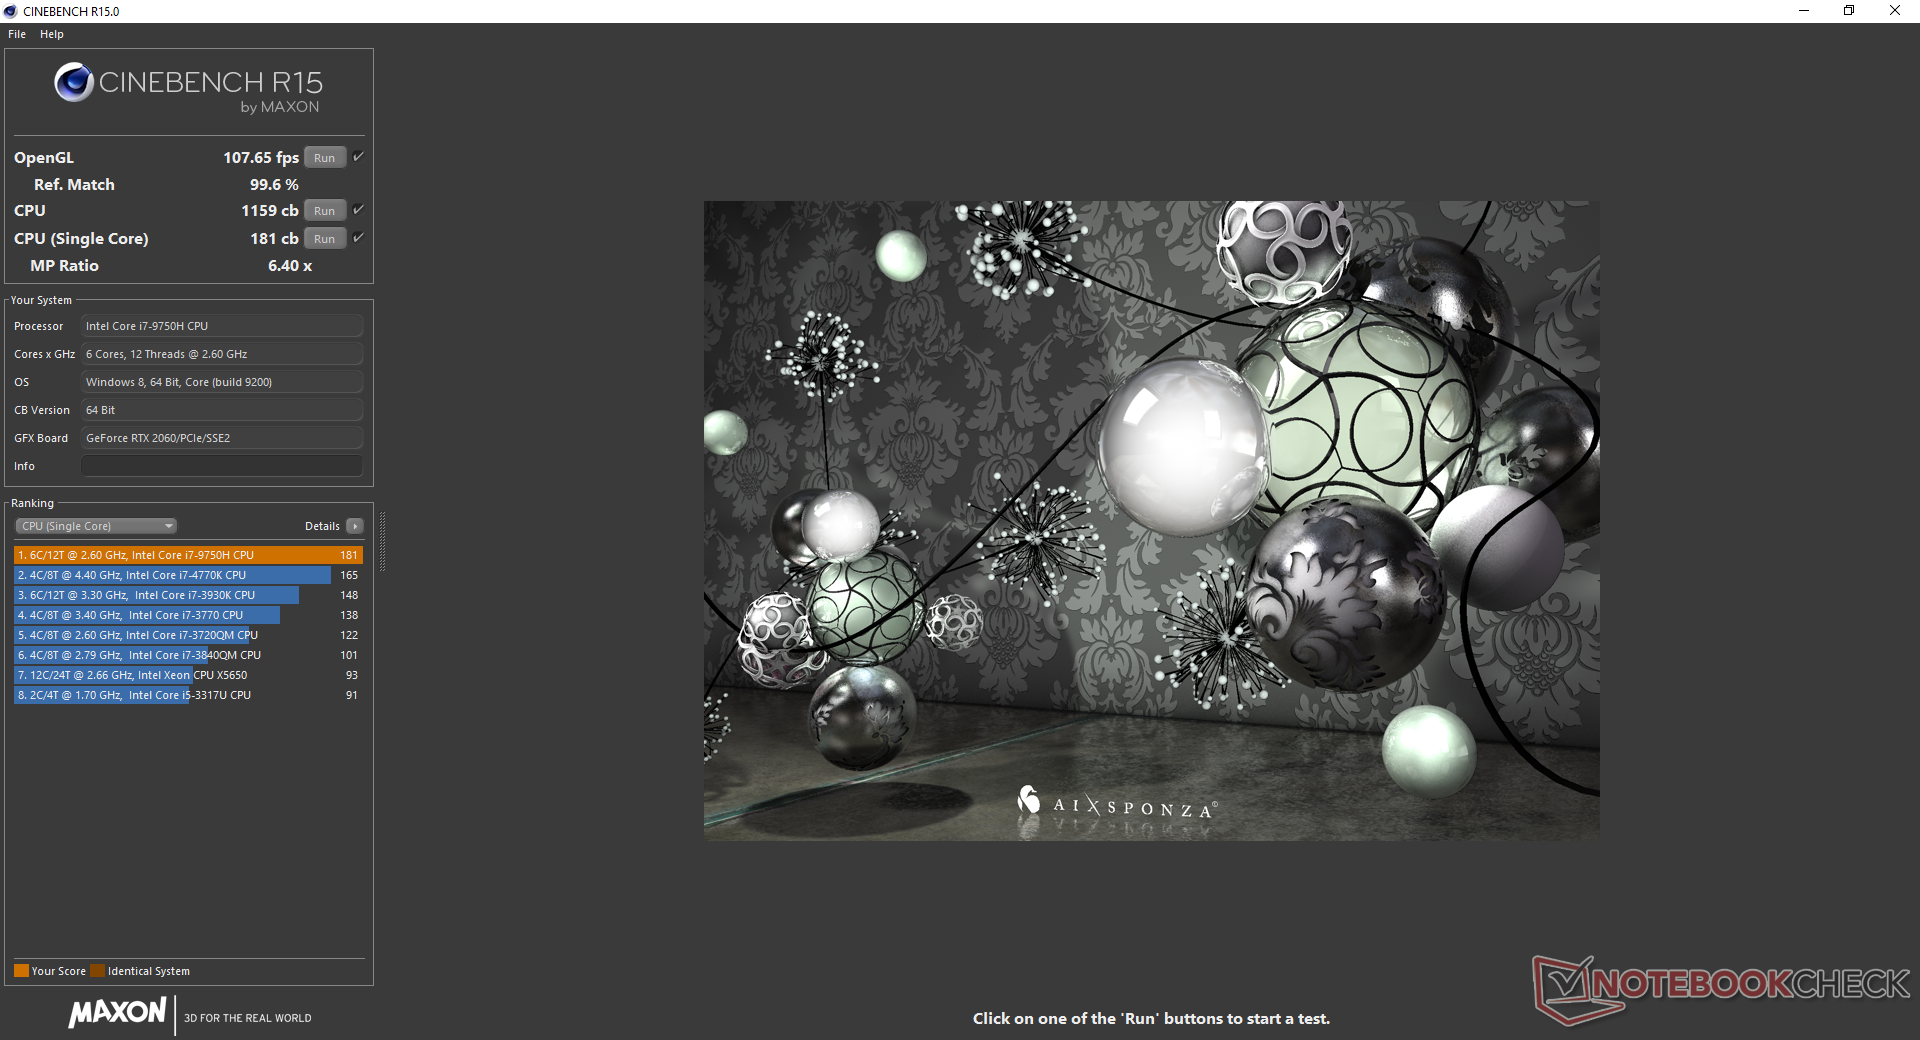
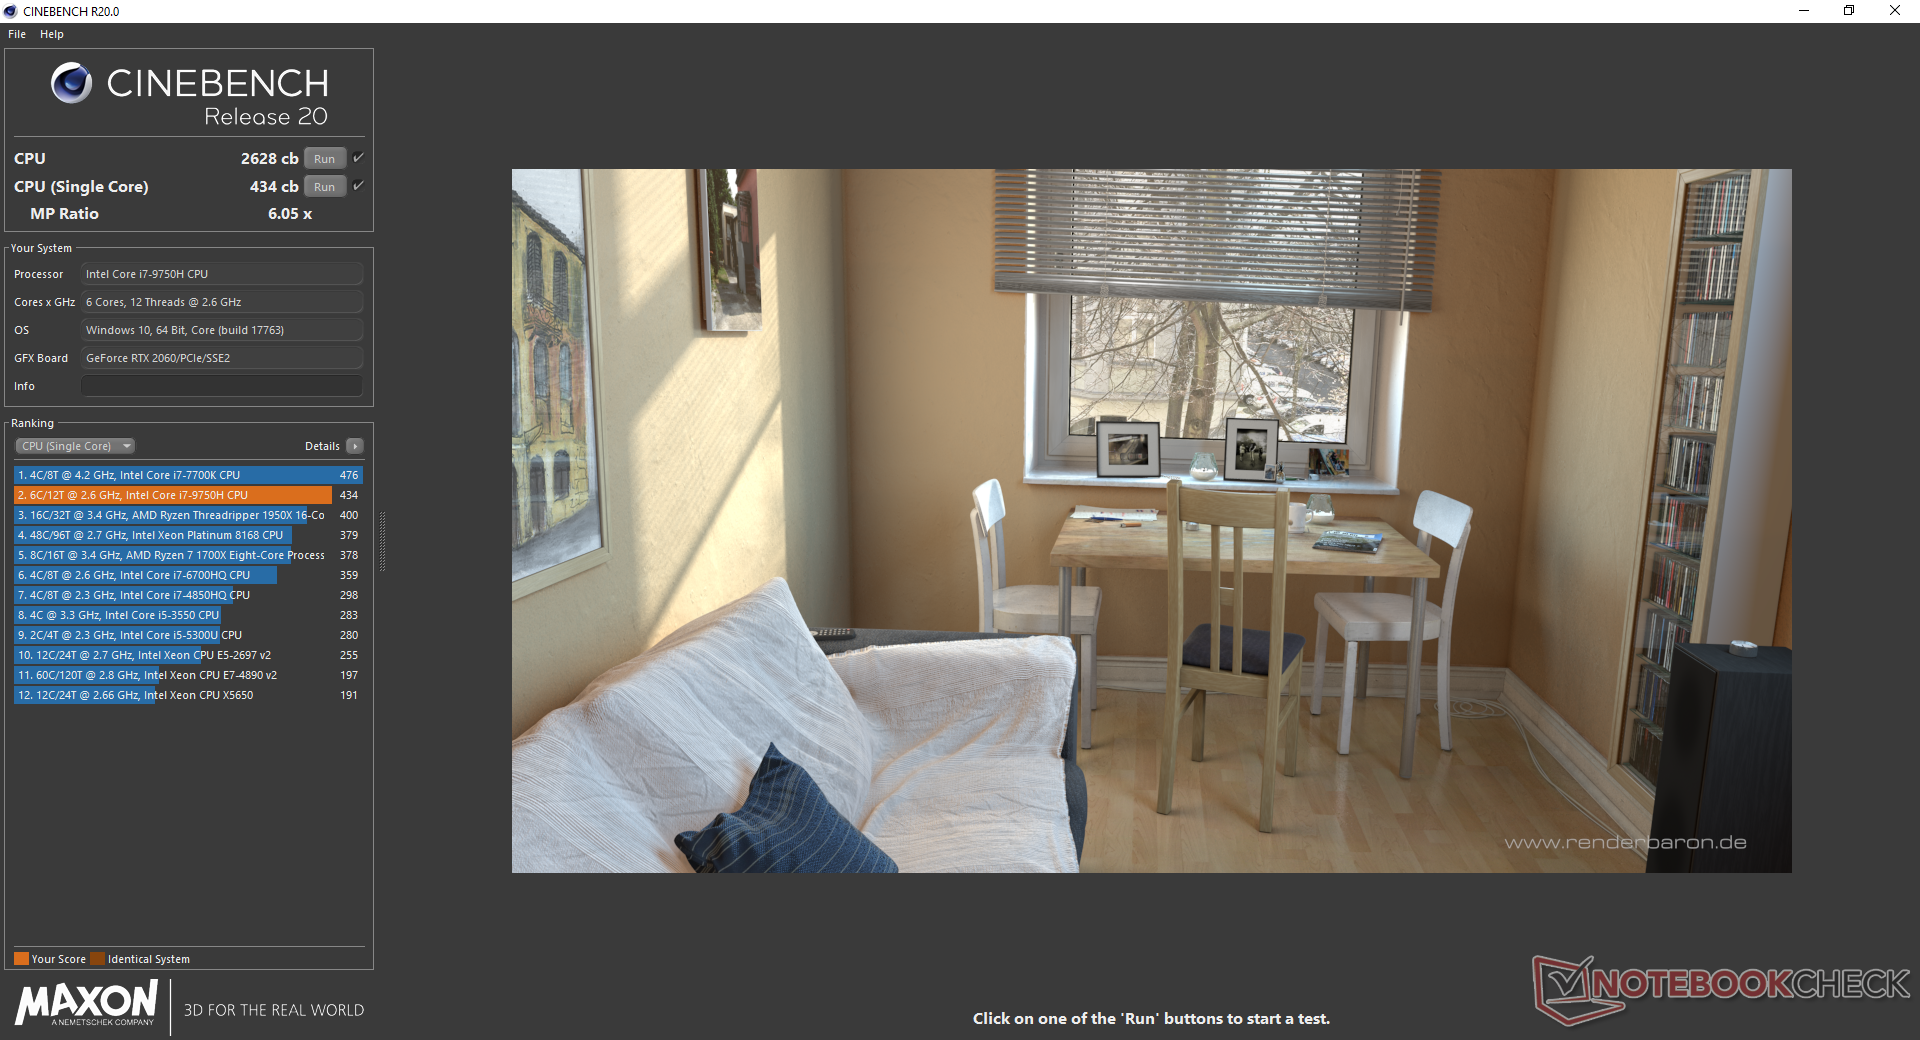
The Core i7-9750H CPU is a common find on gaming laptops and so we're already quite familiar with its performance. CineBench Multi-Thread benchmarks reveal it to be about 50 percent faster than the unlocked Core i7-7820HK on the last generation Blade Pro 2017. Results are essentially identical to the Blade Pro 17 RTX 2080 Max-Q even in terms of throttling behavior. CPU performance drops by about 10 percent when running CineBench R15 in a loop as maximum Turbo Boost is unsustainable as shown by our graph below.
See our dedicated page on the Core i7-9750H for more technical details and benchmark comparisons.
| Cinebench R10 | |
| Rendering Multiple CPUs 32Bit | |
| Schenker XMG Ultra 15 Turing | |
| MSI GE75 9SG | |
| Average Intel Core i7-9750H (28251 - 36304, n=13) | |
| Lenovo Legion Y540-17IRH | |
| Asus Strix GL703VM-DB74 | |
| Rendering Single 32Bit | |
| Schenker XMG Ultra 15 Turing | |
| MSI GE75 9SG | |
| Average Intel Core i7-9750H (6659 - 7214, n=13) | |
| Lenovo Legion Y540-17IRH | |
| Asus Strix GL703VM-DB74 | |
| wPrime 2.10 - 1024m | |
| Asus Strix GL703VM-DB74 | |
| Average Intel Core i7-9750H (n=1) | |
| MSI GE75 9SG | |
* ... smaller is better
System Performance
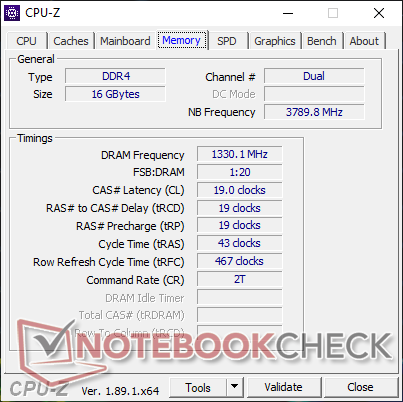
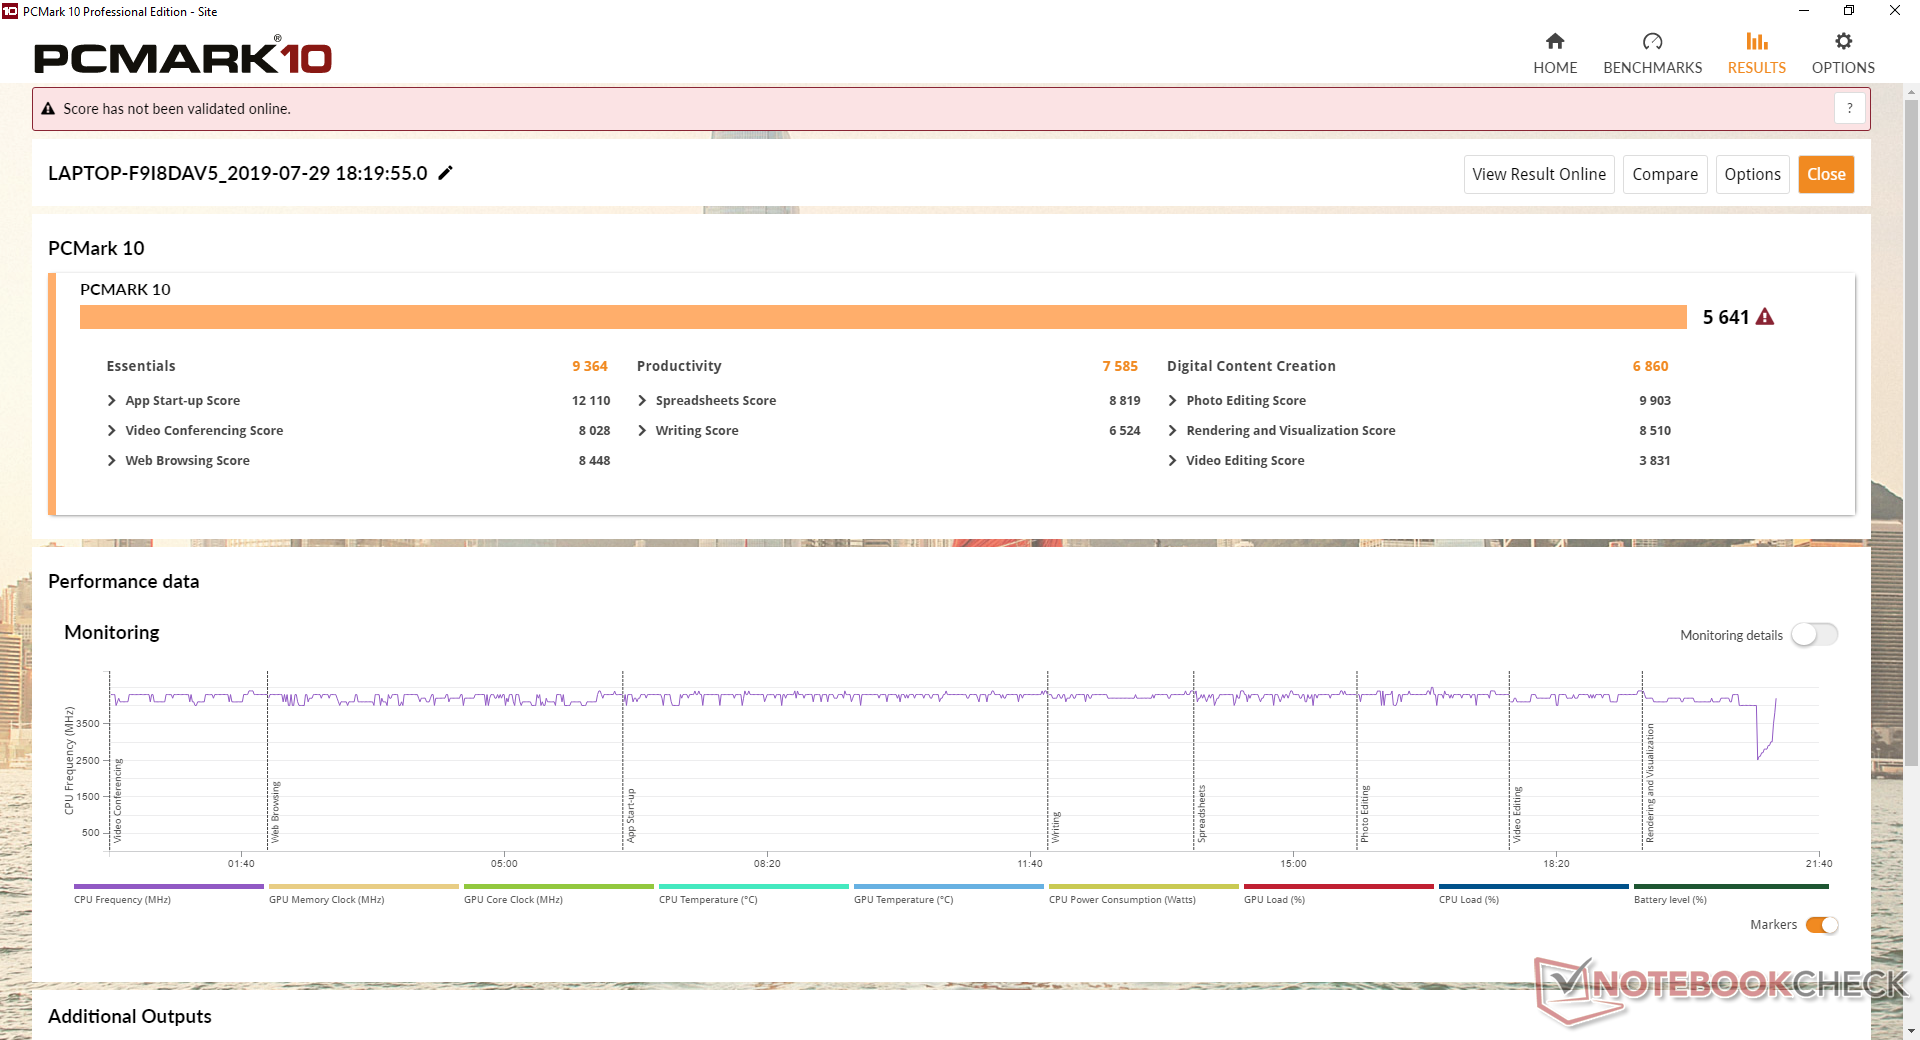
PCMark results are nearly identical to the Blade Pro 17 RTX 2080 Max-Q since both of our tested SKUs share the same Samsung SSD, RAM, and processor.
We experienced a strange CPU performance hiccup on our particular test unit. When waking from sleep, CPU Turbo Boost performance would sometimes be limited and not perform as fast as it should be even when set to High performance mode. Secondly, the Synapse software would have trouble loading at times when waking from sleep. A soft reboot fixes both issues.
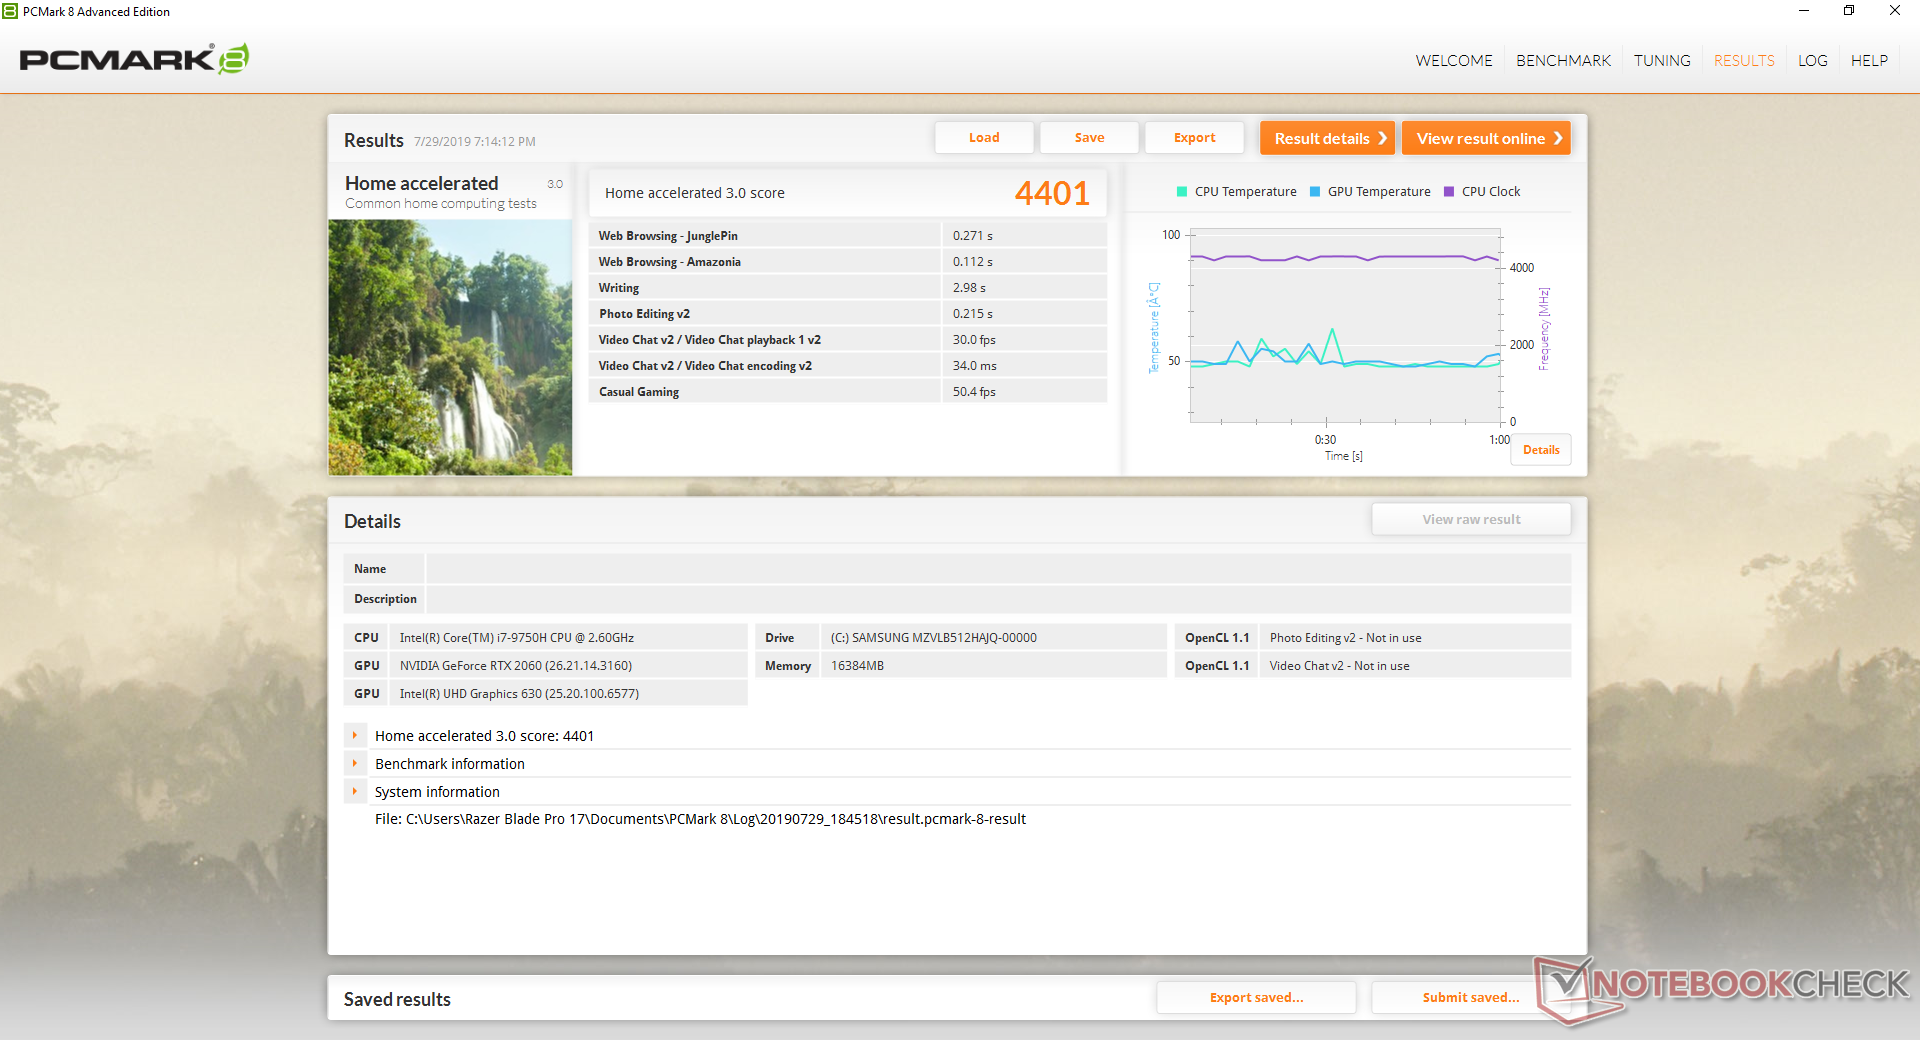
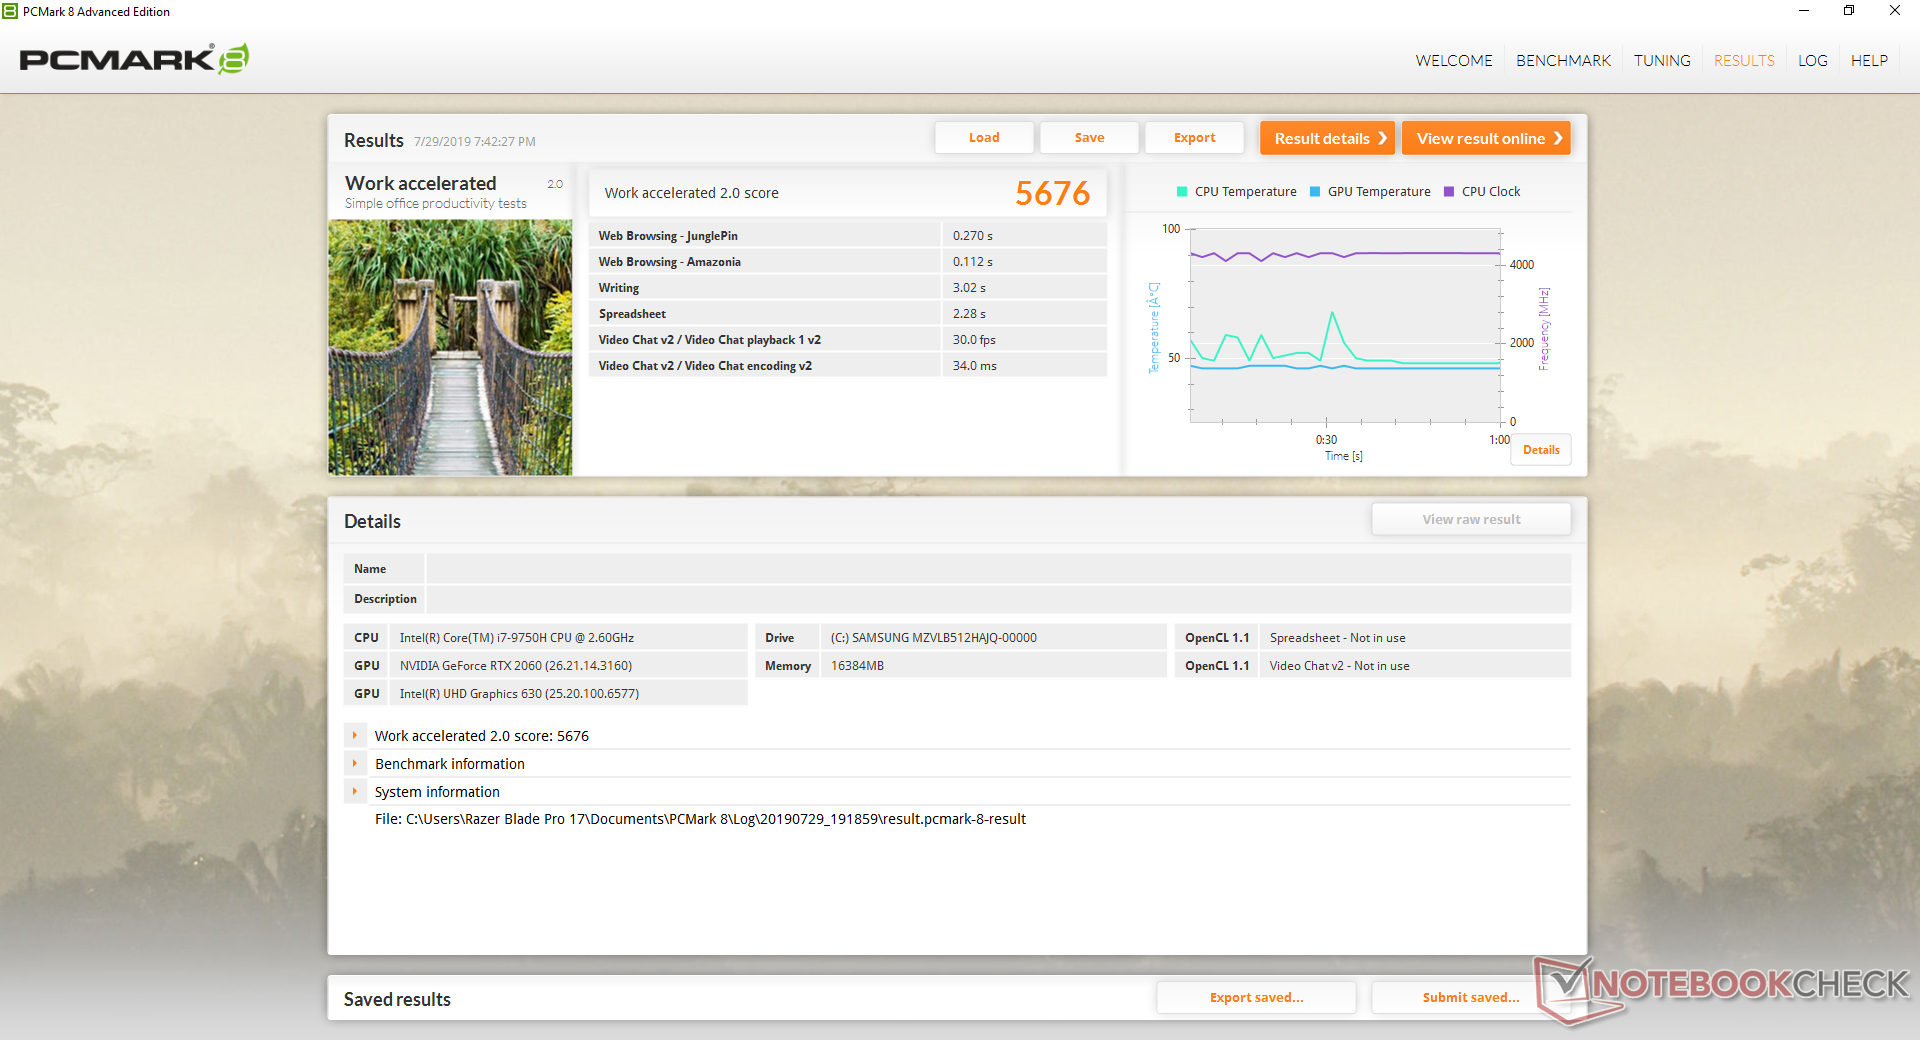
| PCMark 8 Home Score Accelerated v2 | 4401 points | |
| PCMark 8 Work Score Accelerated v2 | 5676 points | |
| PCMark 10 Score | 5641 points | |
Help | ||
Storage Devices
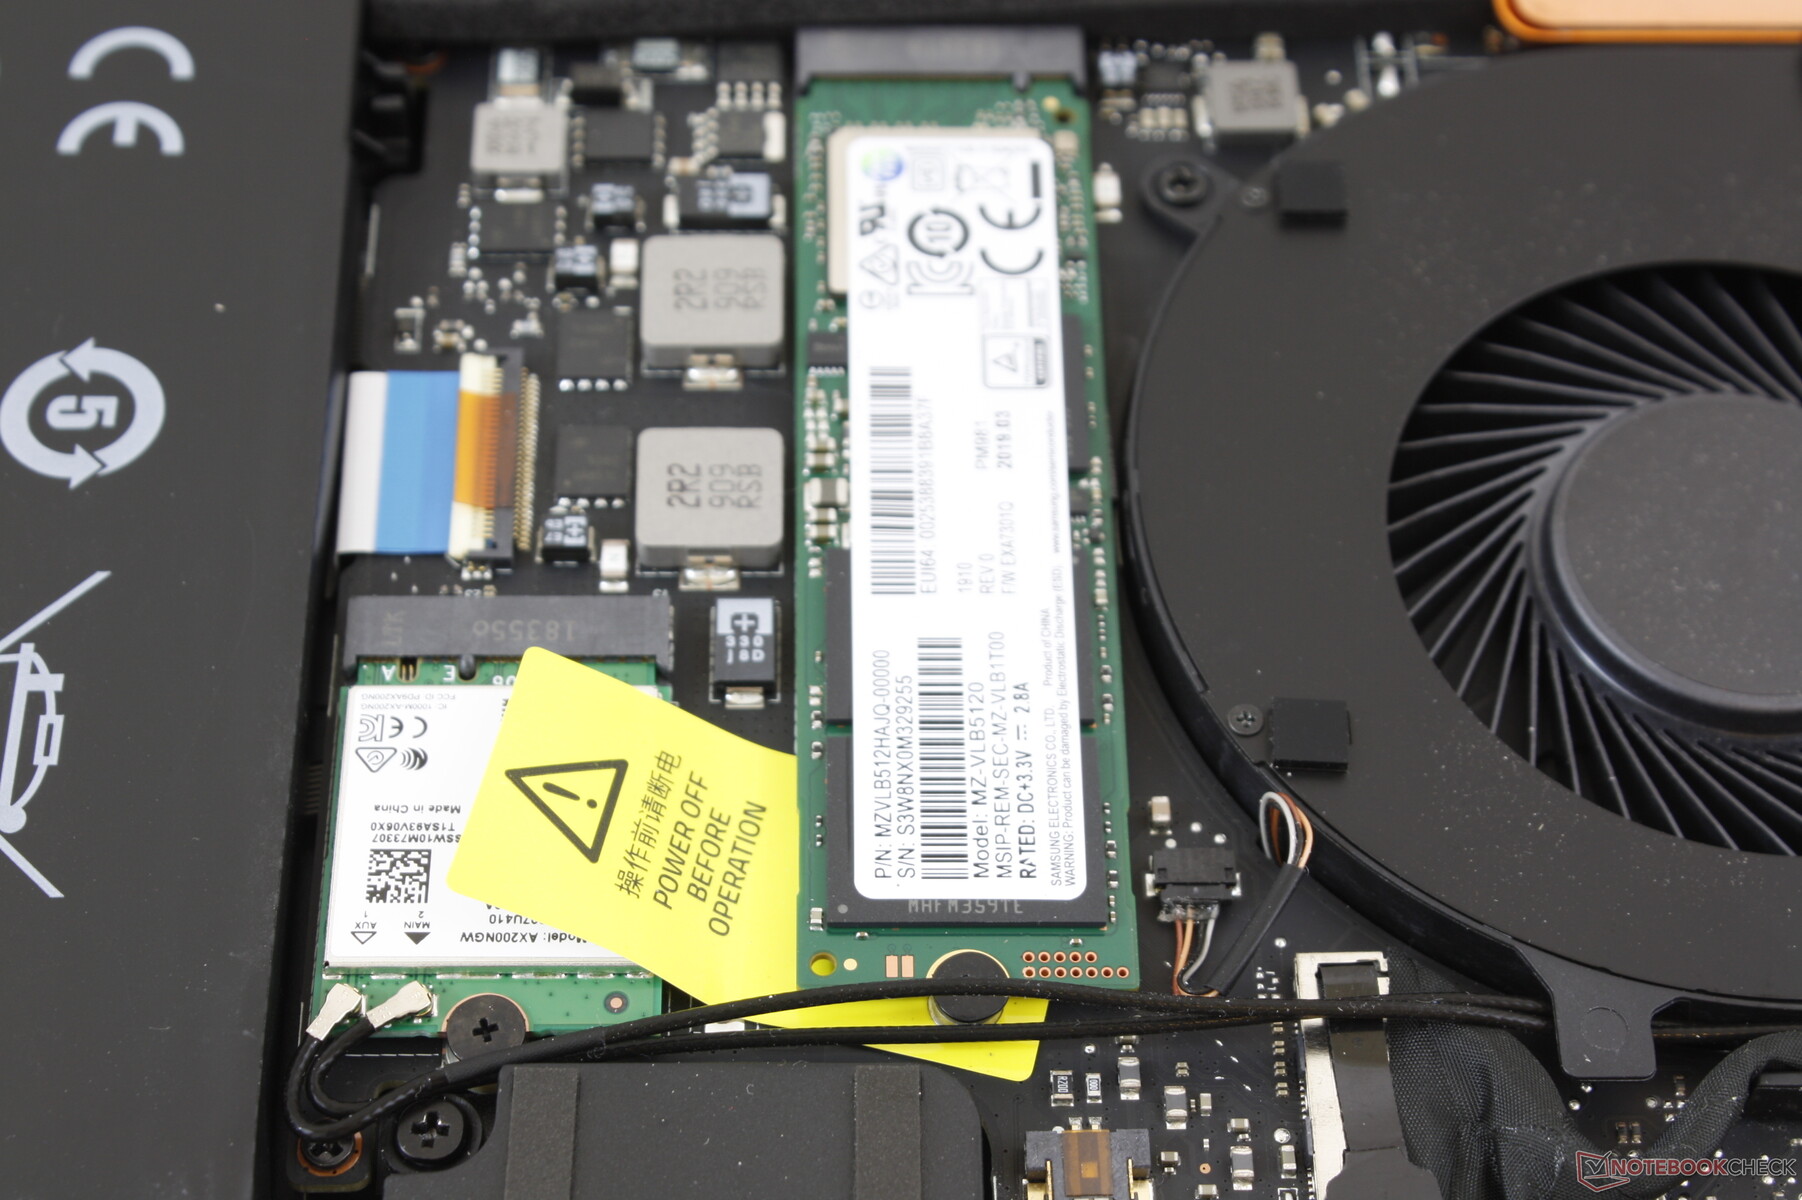
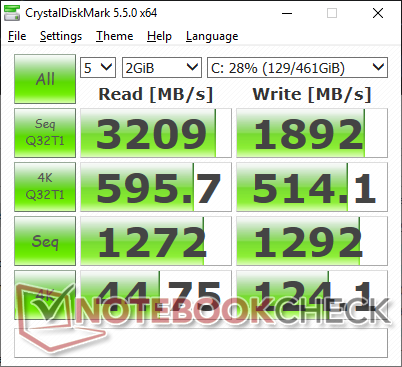
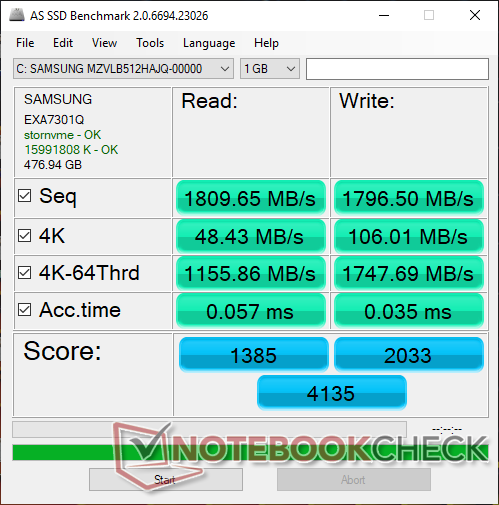
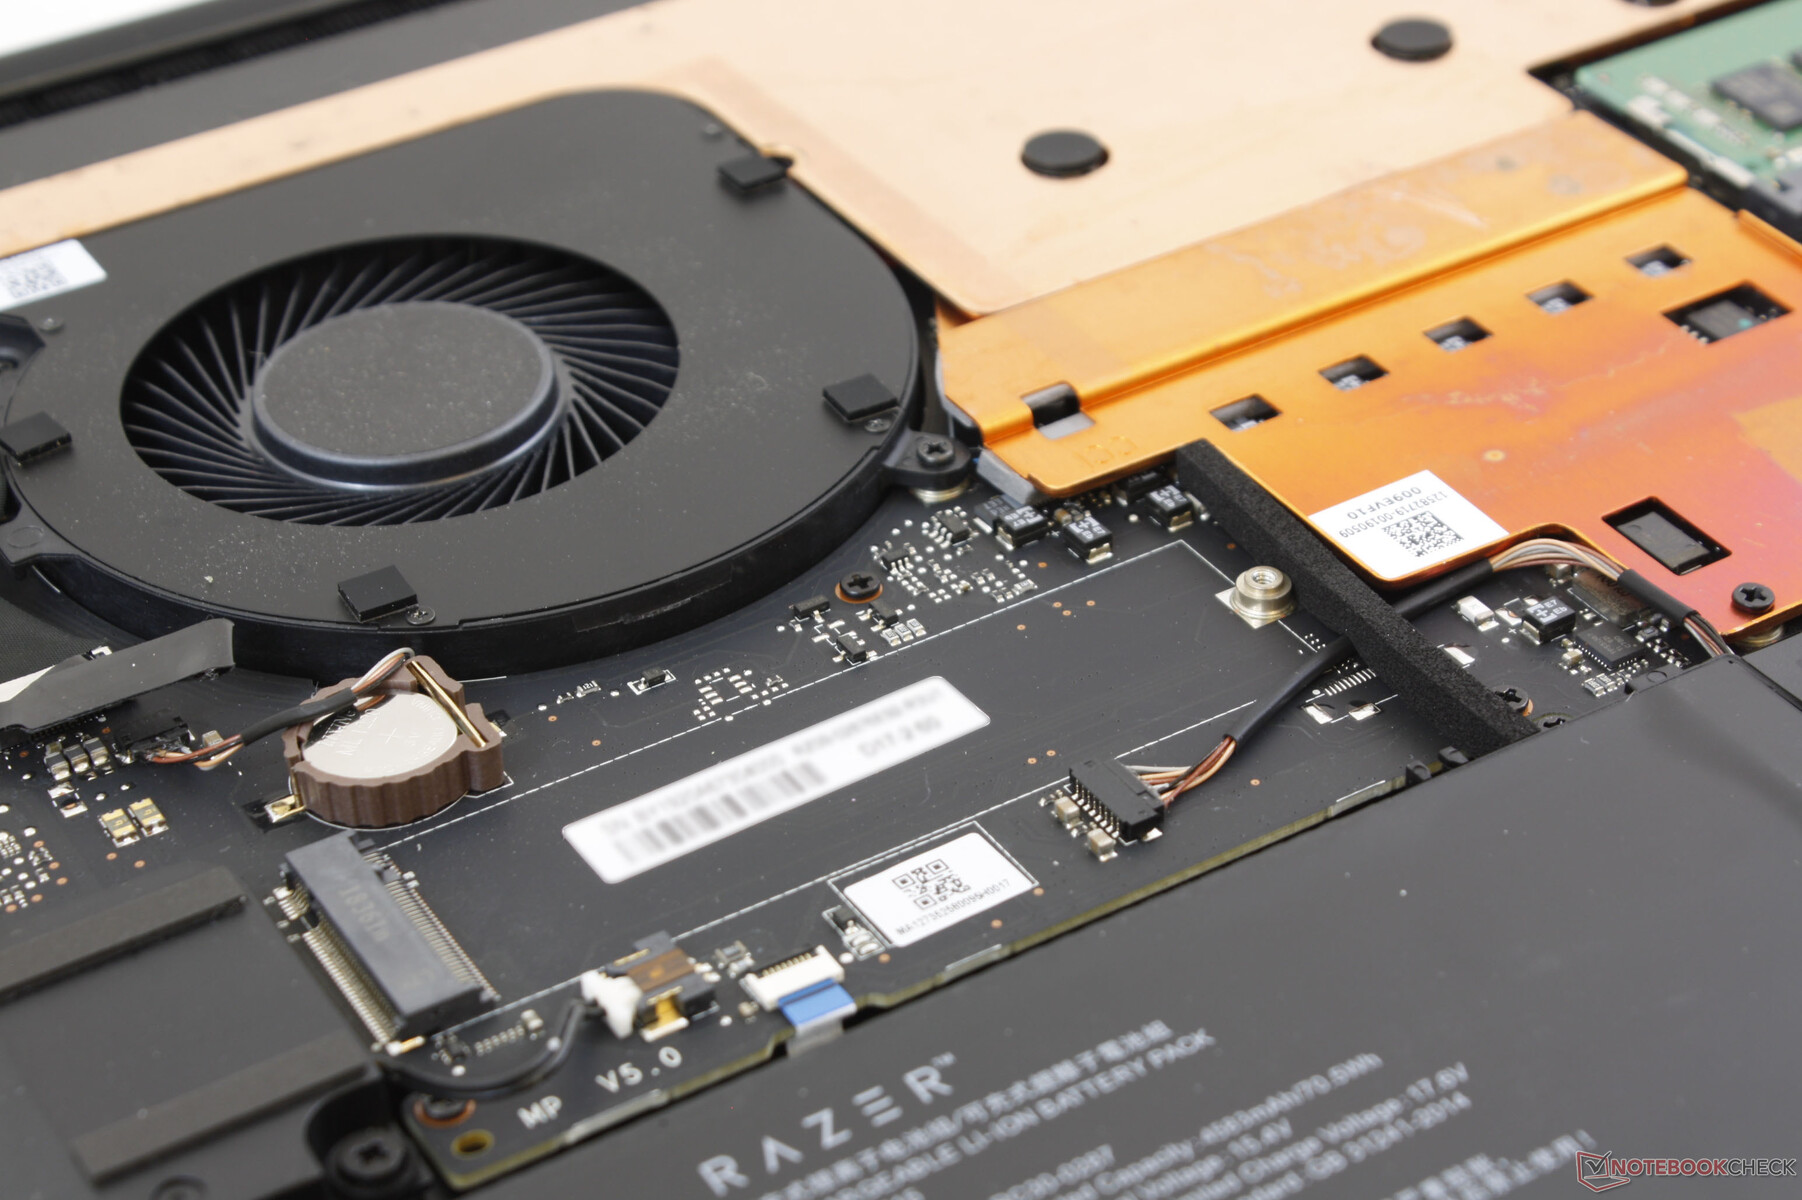
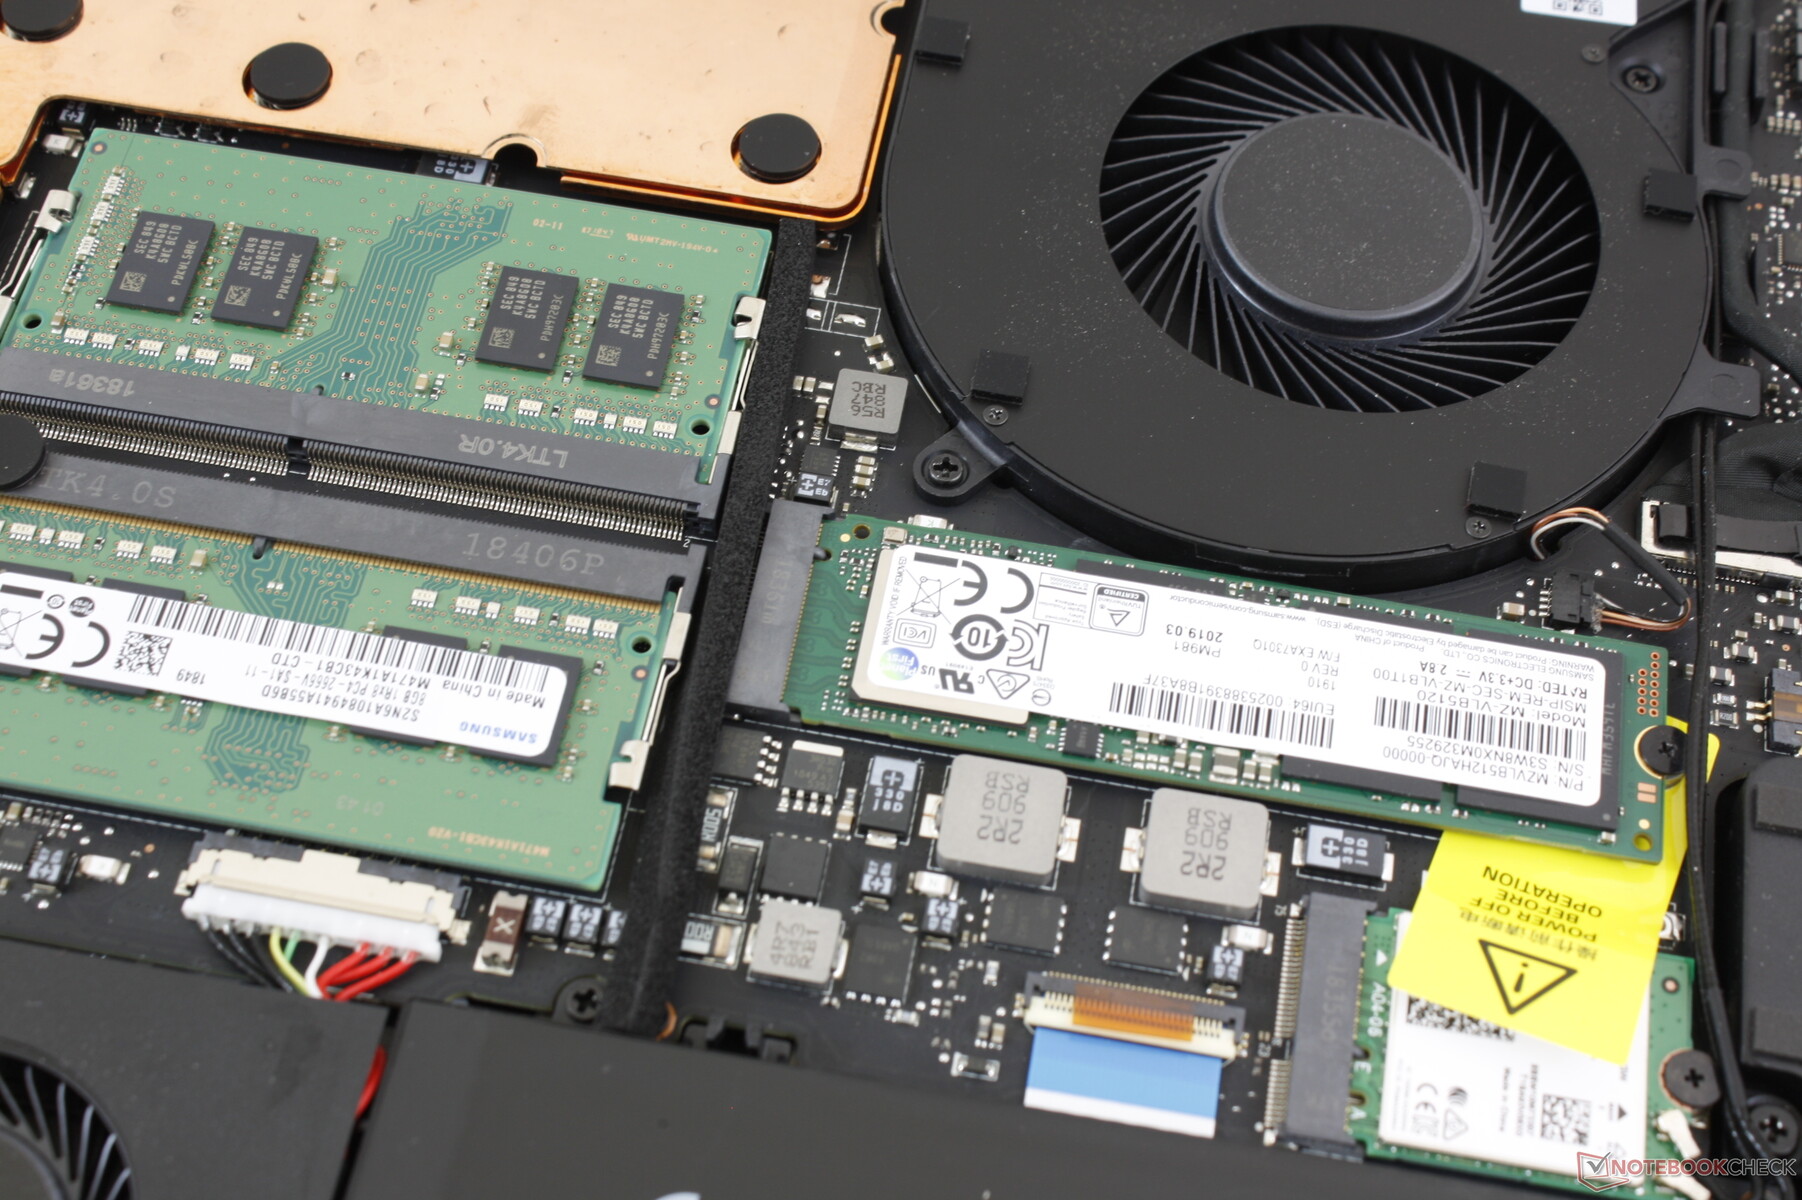
Razer ships high-end Samsung SSDs for all of its Blade 15 and Blade Pro 17 SKUs while some Blade Stealth SKUs may come with slower Lite-On drives instead. The Samsung PM981 is an upgrade over the Samsung PM951 on the last generation Blade Pro 2017 especially in terms of write rates. A second M.2 2280 PCIe slot is available for additional storage.
See our table of HDDs and SSDs for more benchmark comparisons.
| Razer Blade Pro 17 RTX 2060 Samsung SSD PM981 MZVLB512HAJQ | Asus Zephyrus S GX701GX Samsung SSD PM981 MZVLB1T0HALR | MSI GS75 Stealth 9SG 2x Samsung SSD PM981 MZVLB1T0HALR (RAID 0) | Asus ASUS ROG Strix SCAR III G731GW-XB74 Intel SSD 660p 1TB SSDPEKNW010T8 | Razer Blade Pro 2017 2x Samsung SSD PM951 MZVLV256HCHP (RAID 0) | |
|---|---|---|---|---|---|
| AS SSD | 5% | 6% | -34% | -19% | |
| Seq Read (MB/s) | 1810 | 911 -50% | 2855 58% | 1427 -21% | 2599 44% |
| Seq Write (MB/s) | 1797 | 2347 31% | 2687 50% | 1610 -10% | 588 -67% |
| 4K Read (MB/s) | 48.43 | 53 9% | 30.31 -37% | 25.63 -47% | 37.57 -22% |
| 4K Write (MB/s) | 106 | 122.5 16% | 96.3 -9% | 84.2 -21% | 104.4 -2% |
| 4K-64 Read (MB/s) | 1156 | 1577 36% | 1460 26% | 588 -49% | 1116 -3% |
| 4K-64 Write (MB/s) | 1748 | 1734 -1% | 1224 -30% | 732 -58% | 513 -71% |
| Access Time Read * (ms) | 0.057 | 0.08 -40% | 0.054 5% | 0.054 5% | 0.051 11% |
| Access Time Write * (ms) | 0.035 | 0.031 11% | 0.038 -9% | 0.071 -103% | 0.036 -3% |
| Score Read (Points) | 1385 | 1721 24% | 1776 28% | 756 -45% | 1414 2% |
| Score Write (Points) | 2033 | 2091 3% | 1589 -22% | 978 -52% | 676 -67% |
| Score Total (Points) | 4135 | 4771 15% | 4259 3% | 2134 -48% | 2715 -34% |
| Copy ISO MB/s (MB/s) | 1984 | 2226 12% | 1489 -25% | ||
| Copy Program MB/s (MB/s) | 588 | 426.4 -27% | 514 -13% | ||
| Copy Game MB/s (MB/s) | 835 | 1152 38% | 893 7% |
* ... smaller is better

GPU Performance
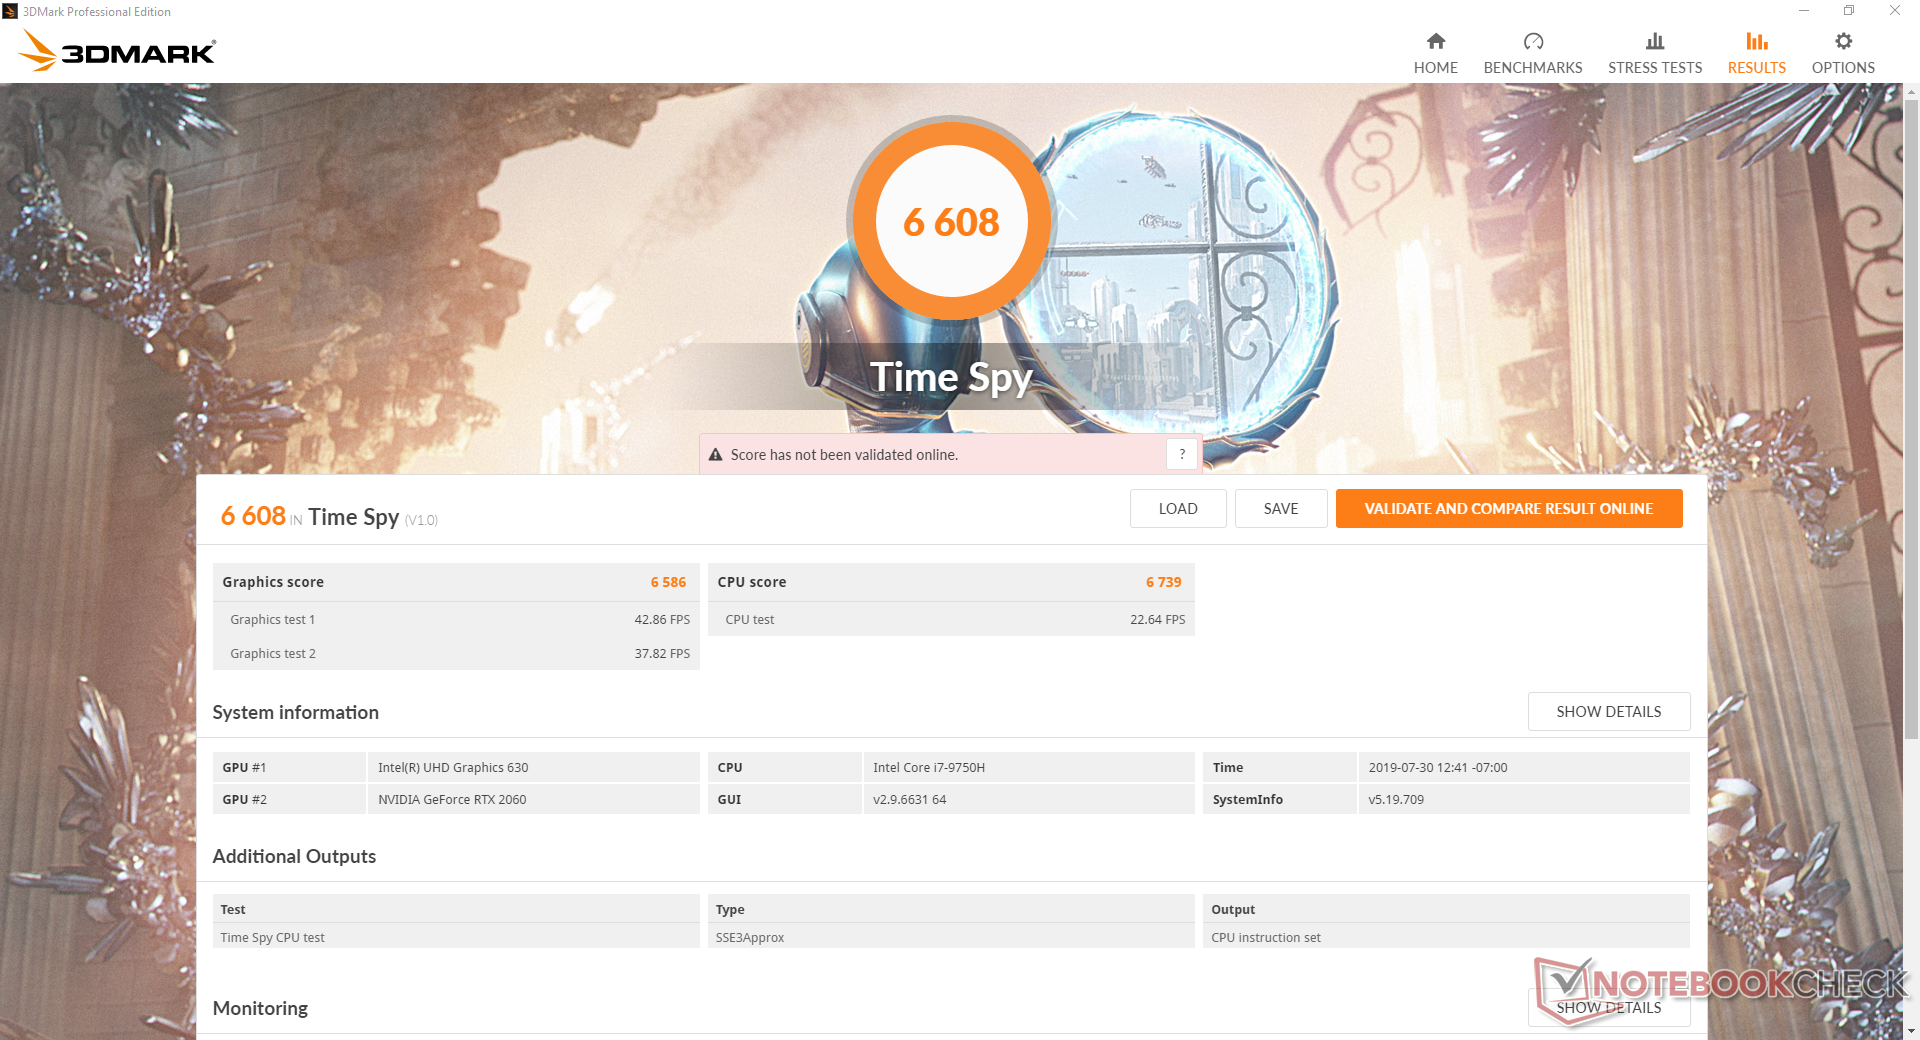
Of the seven different laptops we've tested with GeForce RTX 2060 graphics thus far, the Blade Pro 17 tops each of them in 3DMark tests to be one of the fastest laptops you can find with RTX 2060 graphics. Fire Strike and Time Spy results are about 6 percent and 9 percent above the average RTX 2060 in our database, respectively. Note that jumping from the RTX 2060 to the RTX 2070 Max-Q will bring only a minor boost in GPU performance by about 5 to 10 percent. Users considering the RTX 2080 Max-Q SKU over the RTX 2060 will see a much greater performance boost of about 35 percent.
A standard GeForce RTX 2060 desktop GPU will still outperform our mobile RTX 2060 by about 16 percent. GPU performance is surprisingly neck-to-neck with the less efficient Blade Pro 17 GTX 1080 when running DX12 titles.
Be sure to enable Turbo mode through Synapse or else you will not be getting the maximum performance of the GPU.
A "proper" desktop RTX 2060 is still faster than our mobile RTX 2060 by about 15 percent.
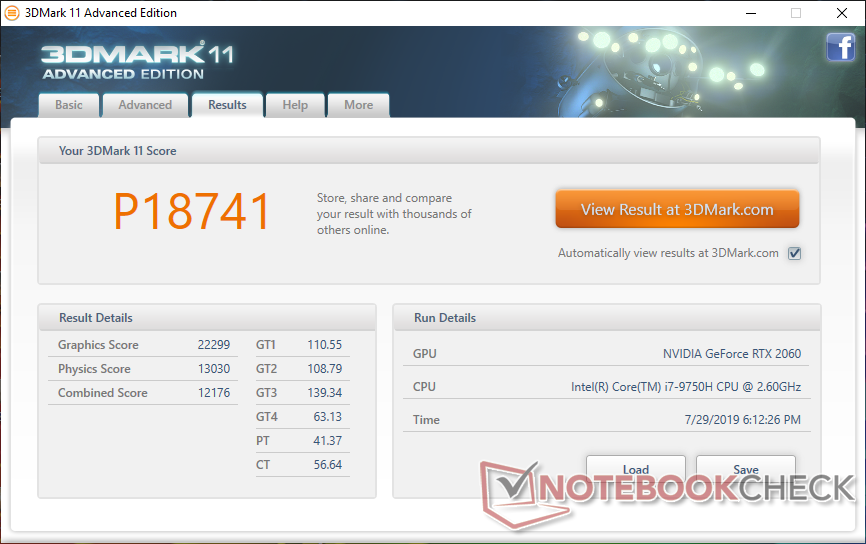
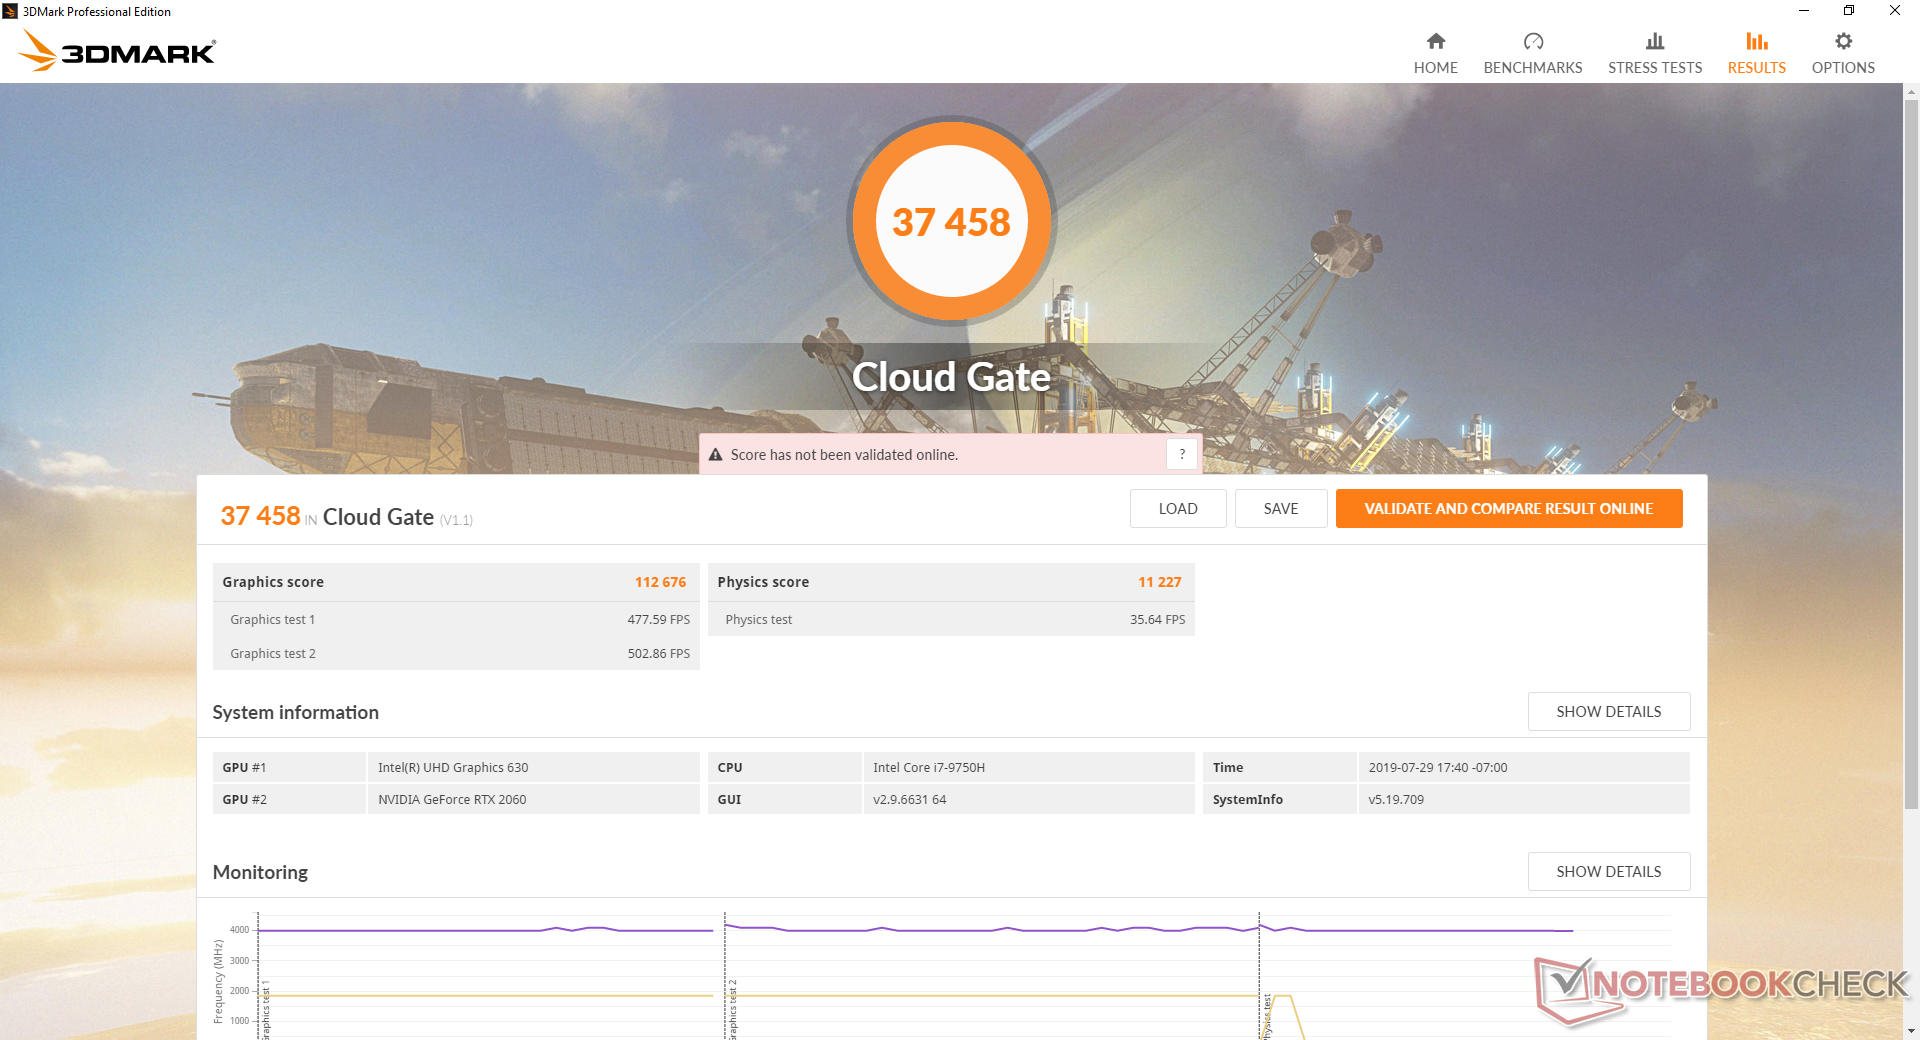
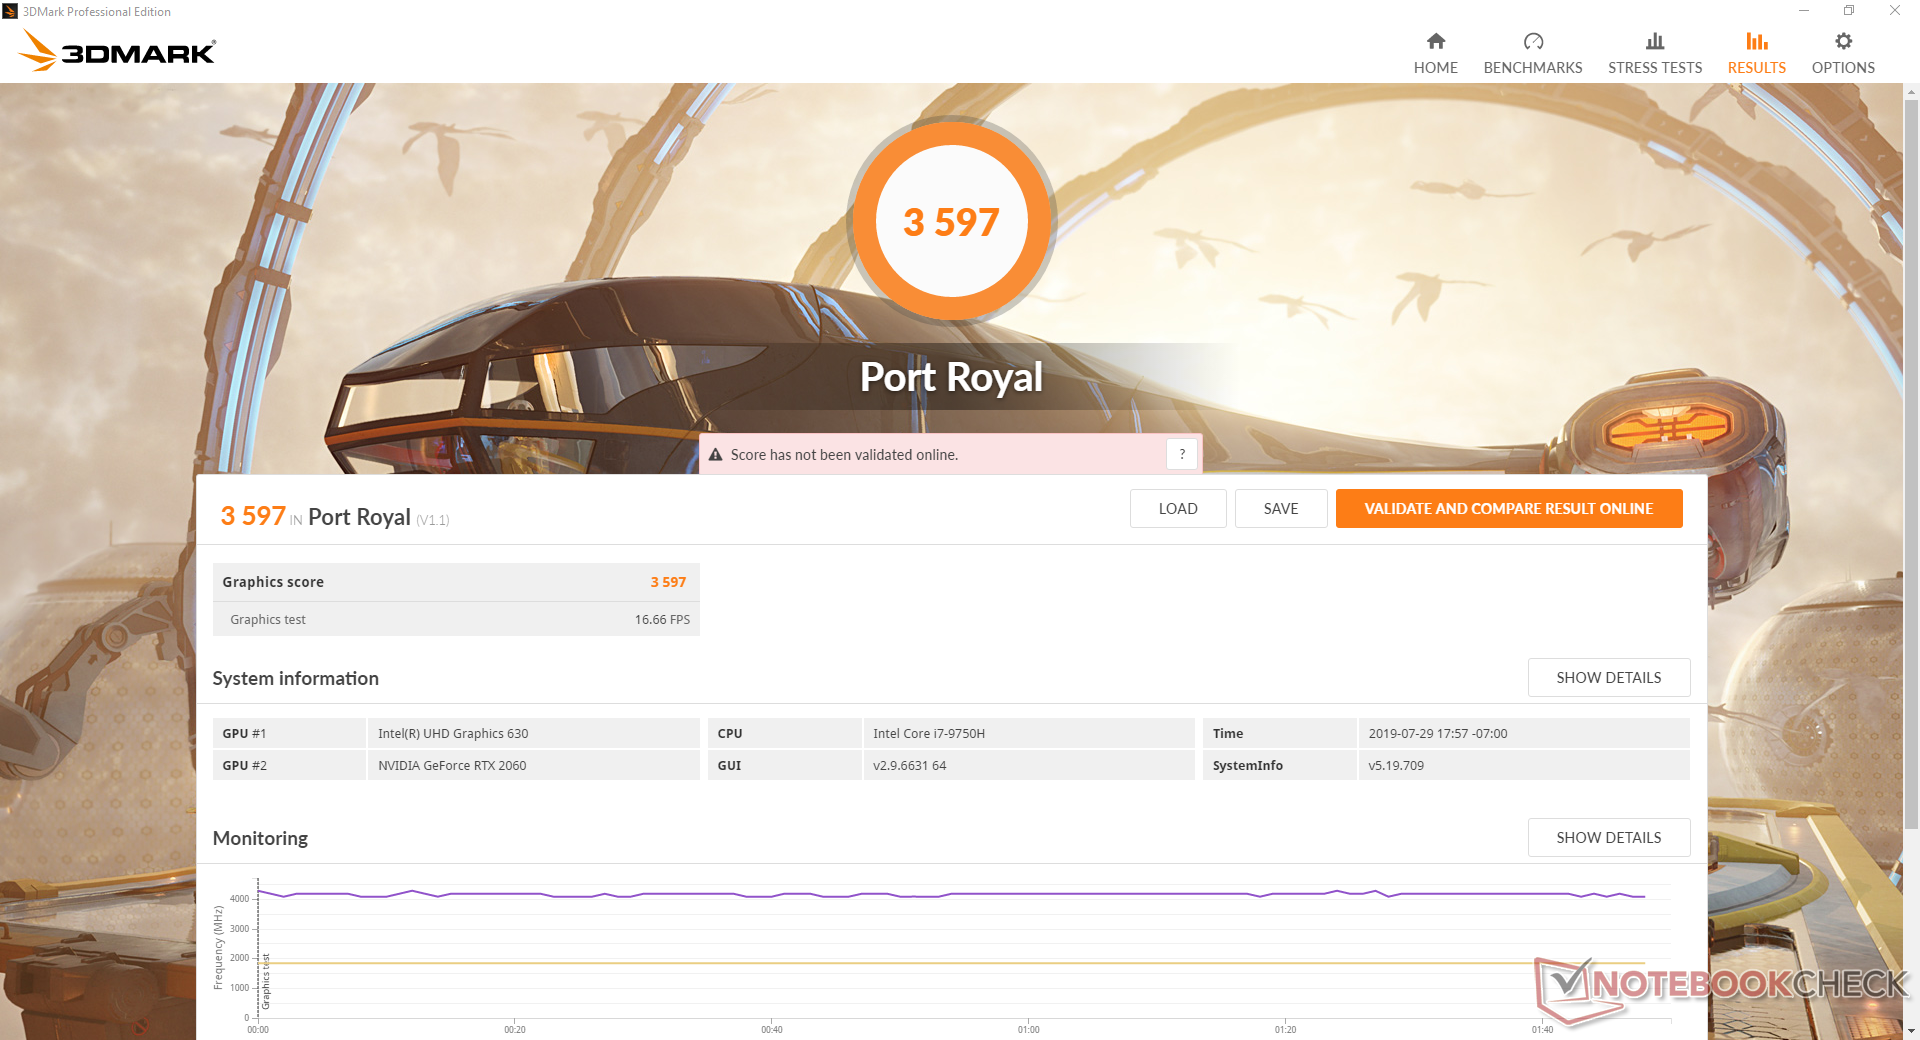

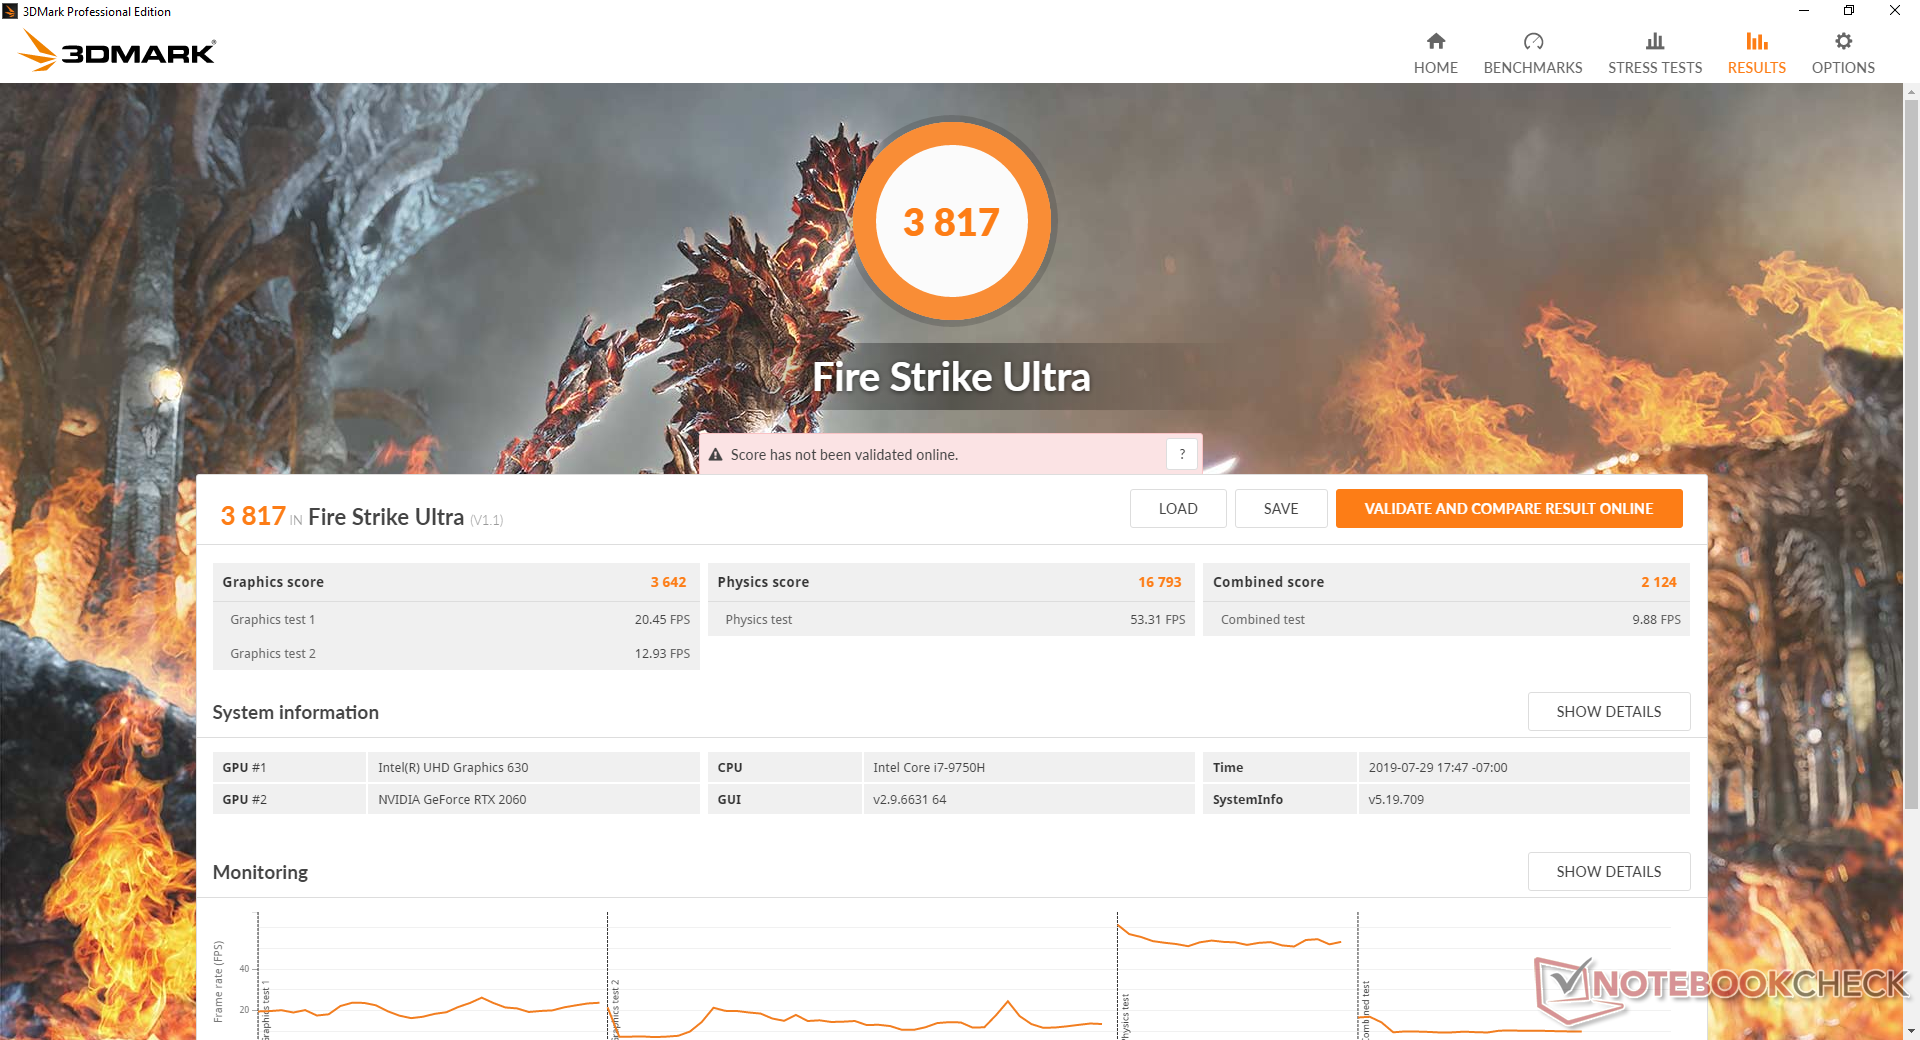
| 3DMark 11 Performance | 18741 points | |
| 3DMark Cloud Gate Standard Score | 37458 points | |
| 3DMark Fire Strike Score | 15132 points | |
| 3DMark Time Spy Score | 6608 points | |
Help | ||
Gaming Performance
The RTX 2060 is powerful enough to run the most demanding titles at 1080p on maximum or near maximum settings. In this case, the Blade Pro 17 RTX 2060 will perform slightly faster than other laptops with the same GPU as predicted by 3DMark. Reaching a stable 144 FPS will still be difficult on most titles outside of undemanding multiplayer ones like Rocket League, Overwatch, Fortnite, or LoL. If >60 FPS will be your goal, then consider the RTX 2080 Max-Q SKU instead.
G-Sync would have paired well with the RTX 2060, but it is not available here. Idling on Witcher 3 shows no recurring frame drops to suggest no interrupting background activity or major throttling behavior when gaming.
See our dedicated page on the mobile GeForce RTX 2060 for more gaming benchmarks and comparisons.
| Shadow of the Tomb Raider - 1920x1080 Highest Preset AA:T | |
| MSI GE75 9SG | |
| MSI RTX 2060 Gaming Z 6G | |
| Asus ASUS ROG Strix SCAR III G731GW-XB74 | |
| Alienware m15 P79F | |
| Razer Blade Pro 17 RTX 2060 | |
| Asus Zephyrus S GX701GX | |
| Average NVIDIA GeForce RTX 2060 Mobile (54 - 86, n=22) | |
| Asus ROG Strix G GL731GU-RB74 | |
| MSI GF75 Thin 9SC | |
| low | med. | high | ultra | |
|---|---|---|---|---|
| BioShock Infinite (2013) | 320.8 | 278 | 246.3 | 153.4 |
| The Witcher 3 (2015) | 279.4 | 196.4 | 118.5 | 65 |
| Shadow of the Tomb Raider (2018) | 130 | 97 | 92 | 81 |
Emissions
System Noise
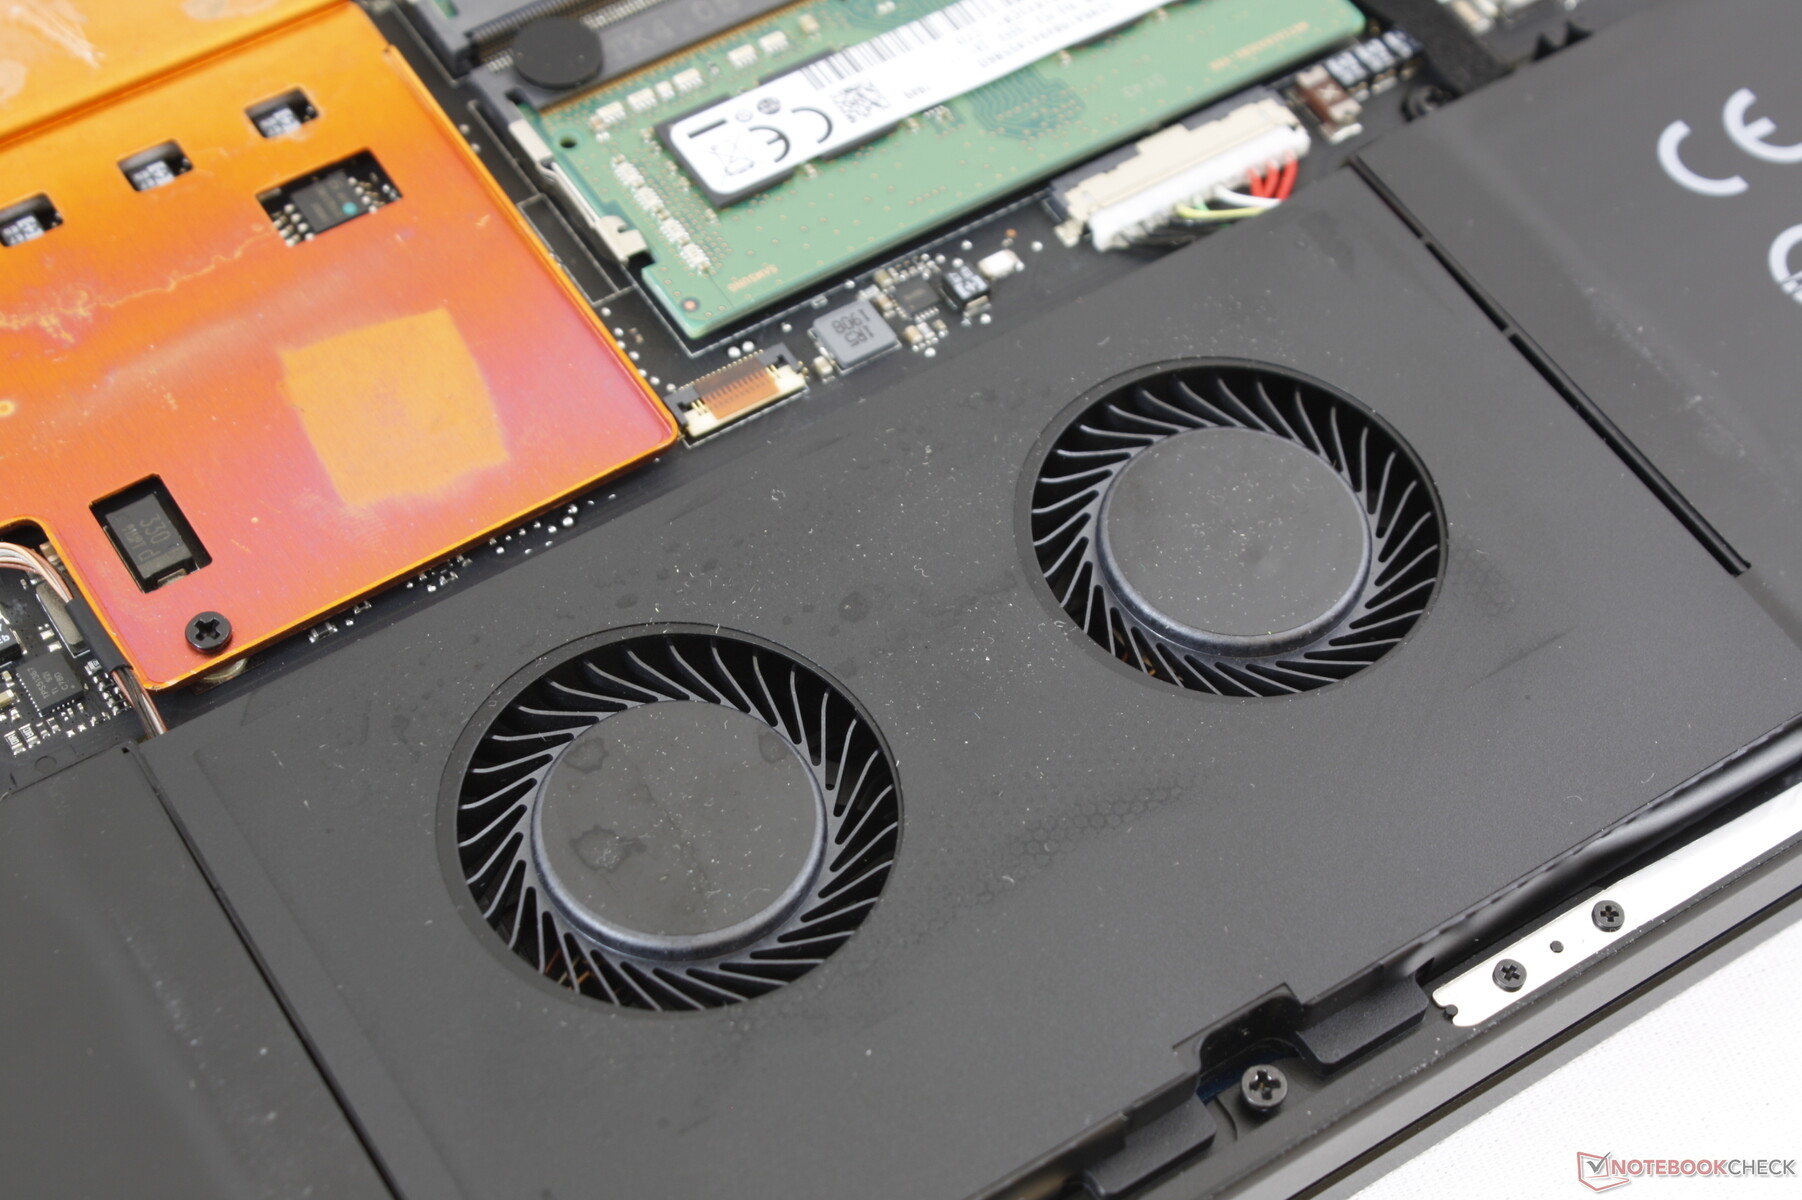
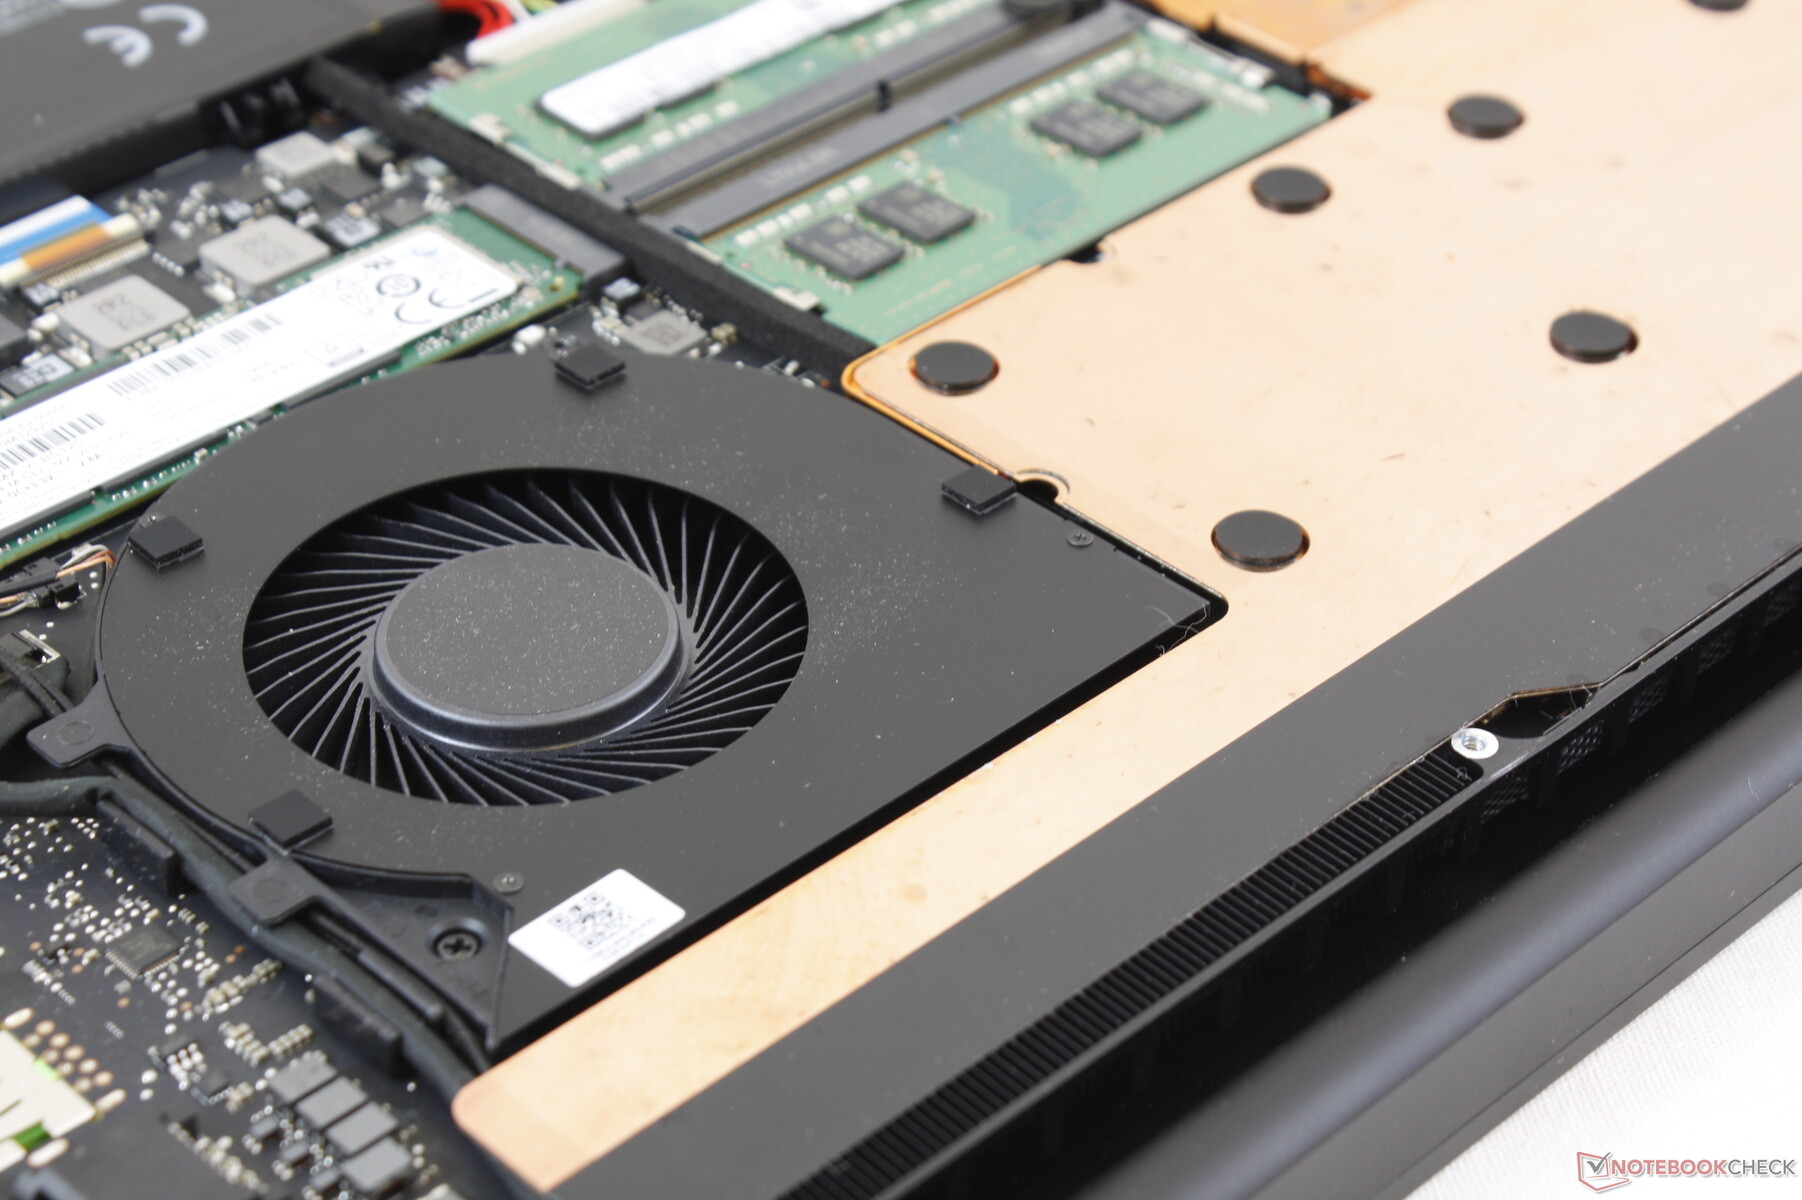
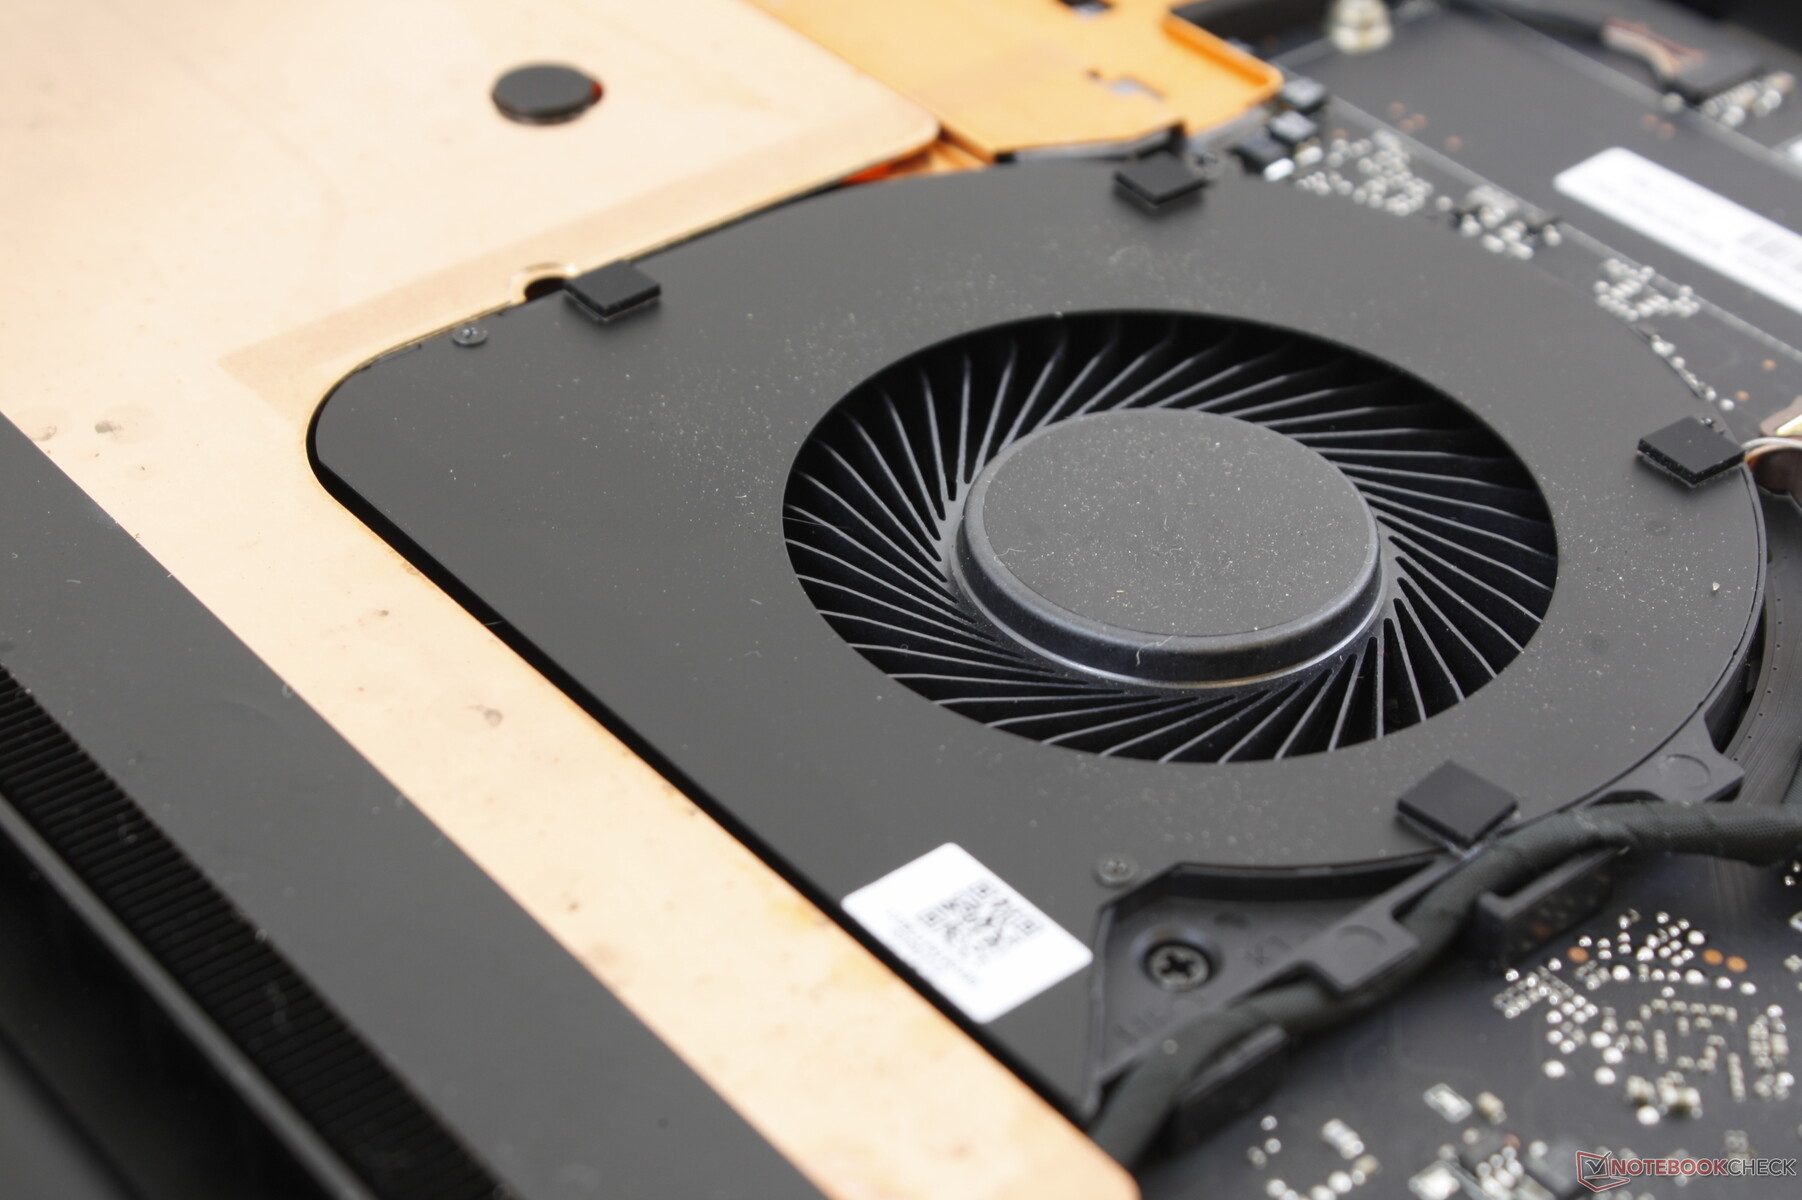
Other laptops with RTX 2060 graphics may employ a couple of fans and heat pipes and then call it a day. The Blade Pro 17 takes cooling to another level by utilizing a total of four fans and a vapor chamber cooler unlike most other laptops in the market. This approach is partially responsible for the heavier weight of the system when compared to something like the MSI GS75.
Fan noise when gaming is quieter than both the Blade Pro 2017 with GTX 1080 graphics and Blade Pro 17 with faster RTX 2080 Max-Q graphics at just under 49 dB(A). Nonetheless, this is still a loud gaming laptop no matter how you spin it. Fan noise will be slightly quieter if running on Balanced mode albeit at the cost of performance as detailed in our Blade Pro 17 RTX 2080 Max-Q review.
If simply web browsing or video streaming, the fans will idle or operate at 30 dB(A) at most for a near-silent experience. We're unable to notice any coil whine or electronic noise from our unit.
| Razer Blade Pro 17 RTX 2060 GeForce RTX 2060 Mobile, i7-9750H, Samsung SSD PM981 MZVLB512HAJQ | Asus Zephyrus S GX701GX GeForce RTX 2080 Max-Q, i7-8750H, Samsung SSD PM981 MZVLB1T0HALR | MSI GS75 Stealth 9SG GeForce RTX 2080 Max-Q, i7-9750H, 2x Samsung SSD PM981 MZVLB1T0HALR (RAID 0) | Asus ASUS ROG Strix SCAR III G731GW-XB74 GeForce RTX 2070 Mobile, i7-9750H, Intel SSD 660p 1TB SSDPEKNW010T8 | Razer Blade Pro 2017 GeForce GTX 1080 Mobile, i7-7820HK, 2x Samsung SSD PM951 MZVLV256HCHP (RAID 0) | Razer Blade Pro 17 RTX 2080 Max-Q GeForce RTX 2080 Max-Q, i7-9750H, Samsung SSD PM981 MZVLB512HAJQ | Acer Predator Helios 500 PH517-51-93LS GeForce GTX 1070 Mobile, i9-8950HK, Liteon CA1-8D512 | |
|---|---|---|---|---|---|---|---|
| Noise | -6% | -9% | -6% | -9% | -2% | 6% | |
| off / environment * (dB) | 28.2 | 29 -3% | 30 -6% | 28.2 -0% | 30 -6% | 28.2 -0% | 29.4 -4% |
| Idle Minimum * (dB) | 28.2 | 29 -3% | 31 -10% | 28.2 -0% | 30 -6% | 28.2 -0% | 29.4 -4% |
| Idle Average * (dB) | 28.2 | 32 -13% | 32 -13% | 28.5 -1% | 31 -10% | 28.2 -0% | 29.4 -4% |
| Idle Maximum * (dB) | 28.2 | 33 -17% | 38 -35% | 30 -6% | 33 -17% | 30.8 -9% | 30.1 -7% |
| Load Average * (dB) | 43 | 47 -9% | 47 -9% | 51.5 -20% | 43 -0% | 42 2% | 36 16% |
| Witcher 3 ultra * (dB) | 48.4 | 49 -1% | 48 1% | 55.3 -14% | 55 -14% | 51 -5% | 37.6 22% |
| Load Maximum * (dB) | 53.4 | 51 4% | 49 8% | 55.3 -4% | 58 -9% | 53 1% | 42.2 21% |
* ... smaller is better
Noise level
| Idle |
| 28.2 / 28.2 / 28.2 dB(A) |
| Load |
| 43 / 53.4 dB(A) |
 | ||
30 dB silent 40 dB(A) audible 50 dB(A) loud |
||
min: | ||
Temperature
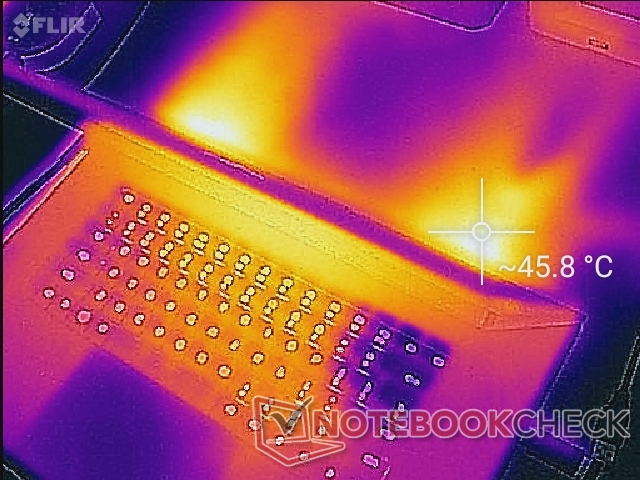
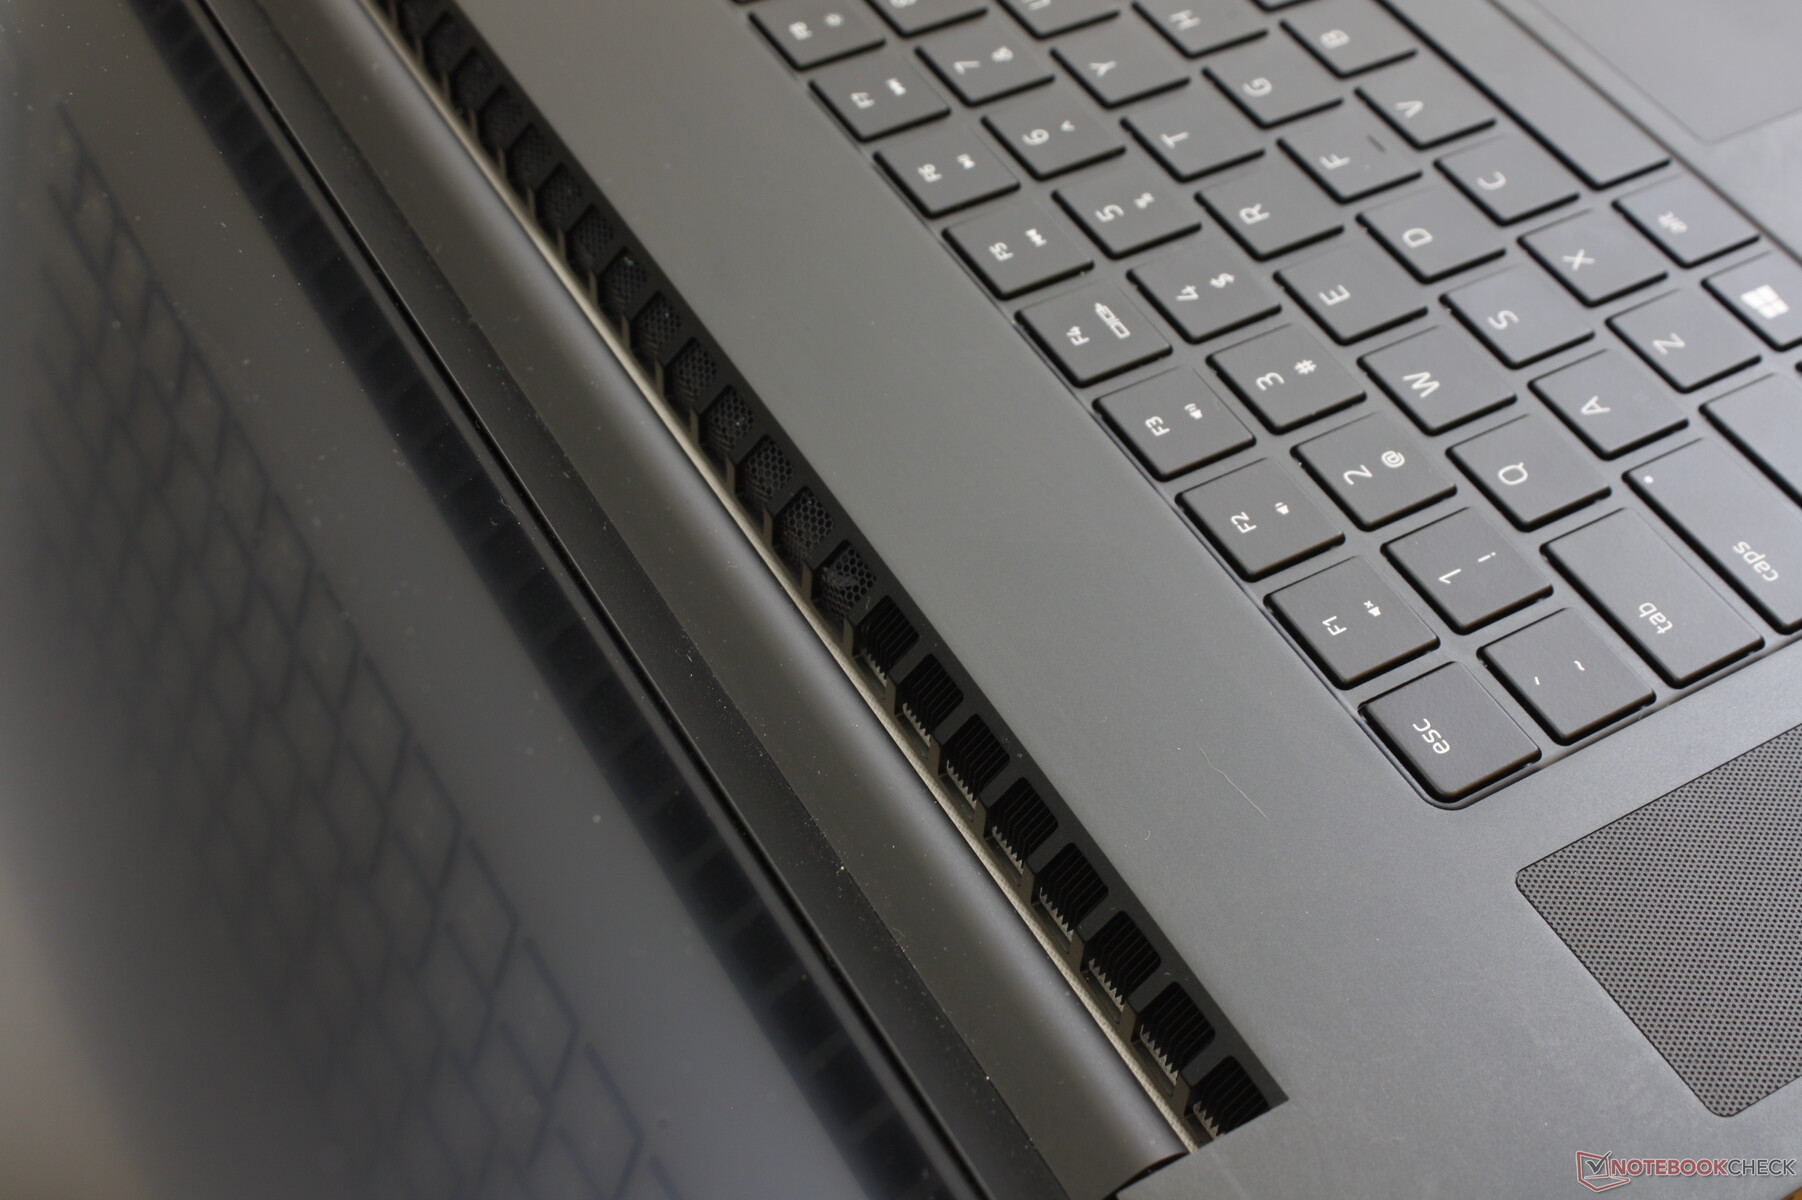
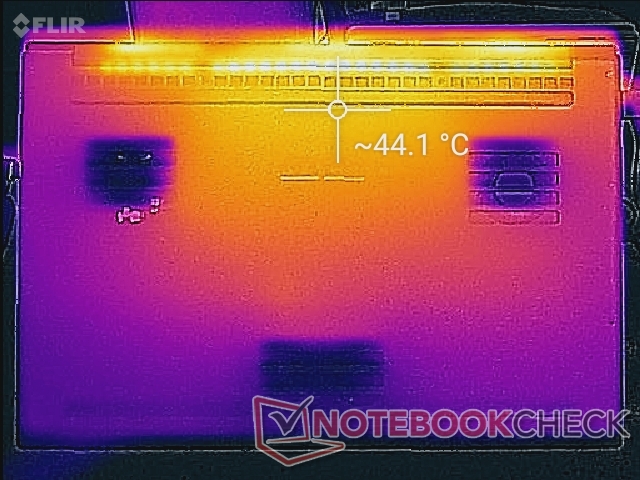
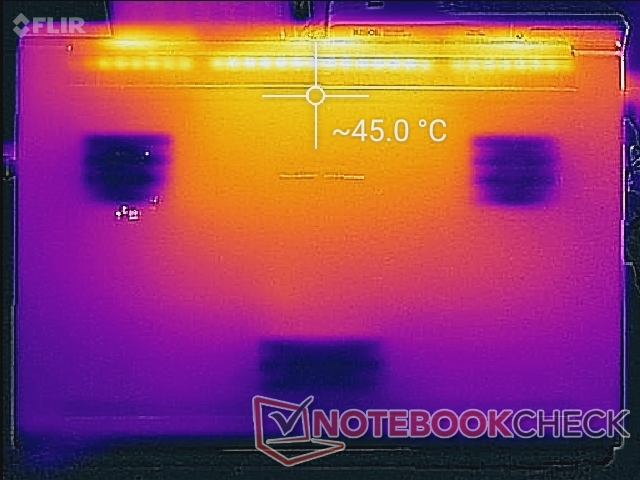
Hot spots when gaming are just a few degrees C cooler than on the Blade Pro 17 RTX 2080 Max-Q. These hot spots are towards the center of the keyboard and so the WASD keys and palm rests will be comparatively cooler in the low 30 C range. Overall surface temperatures are almost symmetric due to the symmetric cooling solution.
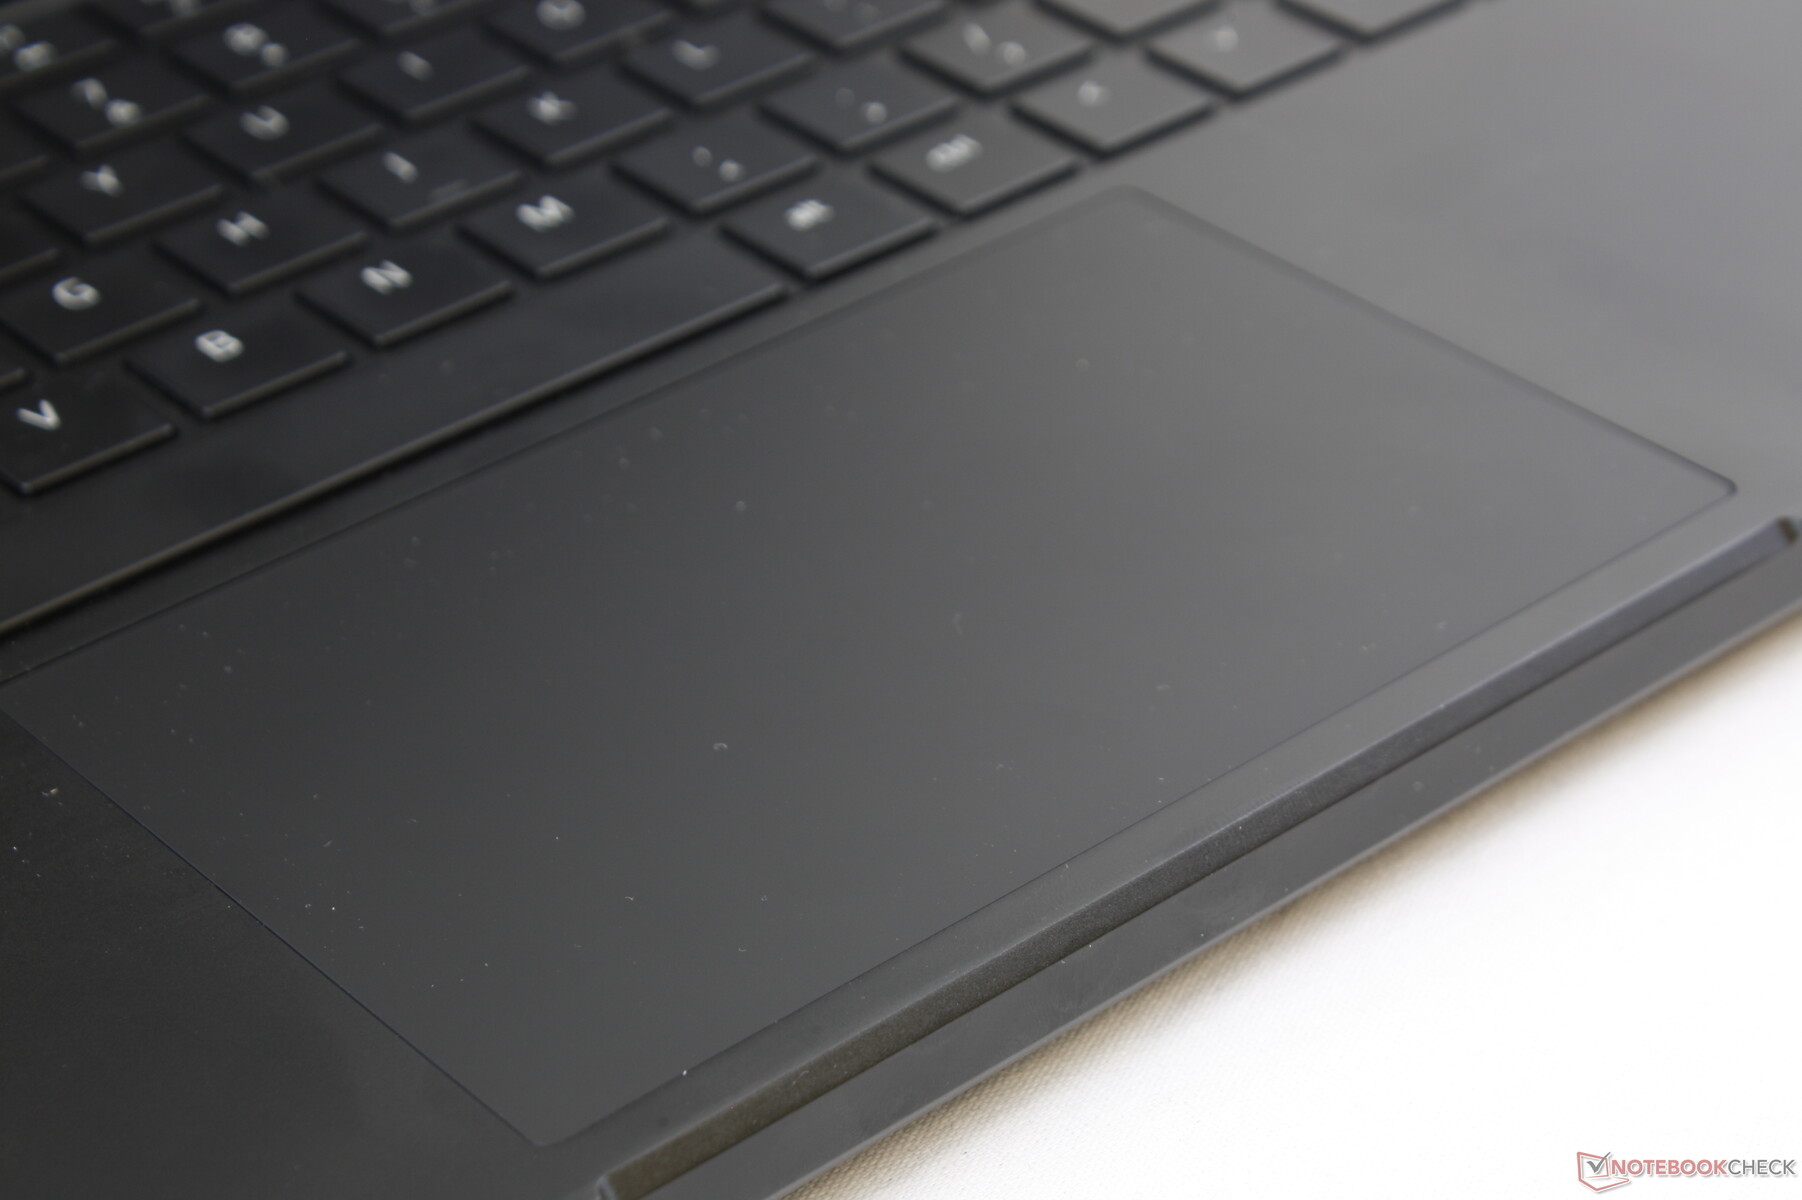
Unlike most laptops, the system draws additional cool air towards the front of the chassis via two small fans underneath the clickpad. It's recommended to game on a flat surface whenever possible to avoid impeding any of the ventilation grilles.
As noted before, the AC adapter will become warmer than most other AC adapters when gaming. Be sure to keep the adapter away from any sensitive surfaces or other cables.
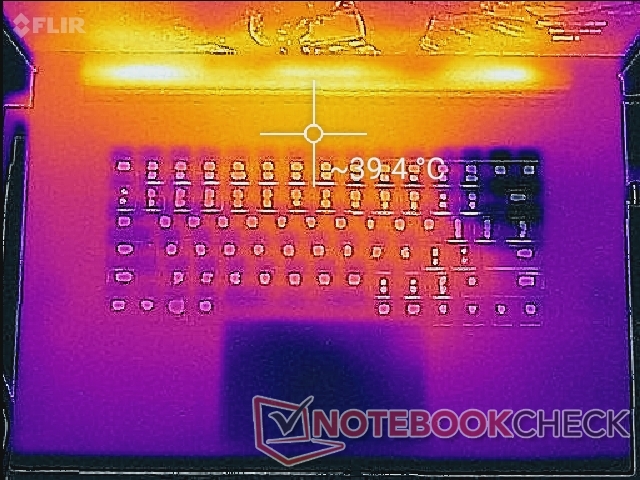
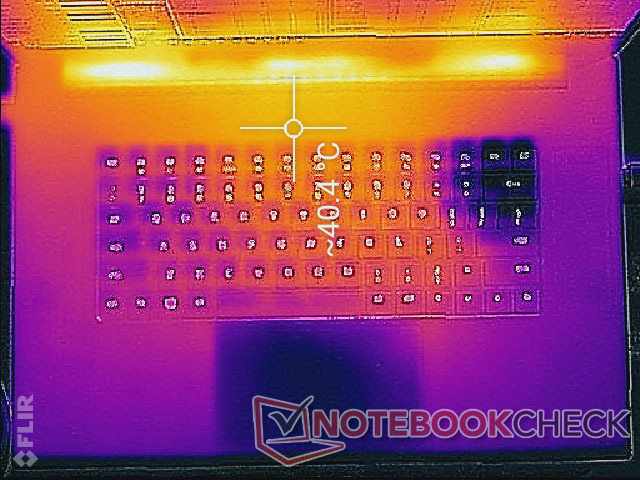
(±) The maximum temperature on the upper side is 40.6 °C / 105 F, compared to the average of 40.4 °C / 105 F, ranging from 21.2 to 68.8 °C for the class Gaming.
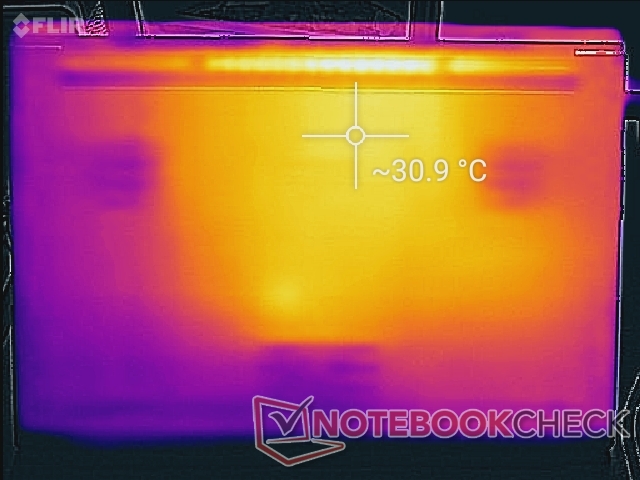
(-) The bottom heats up to a maximum of 45.4 °C / 114 F, compared to the average of 43.2 °C / 110 F
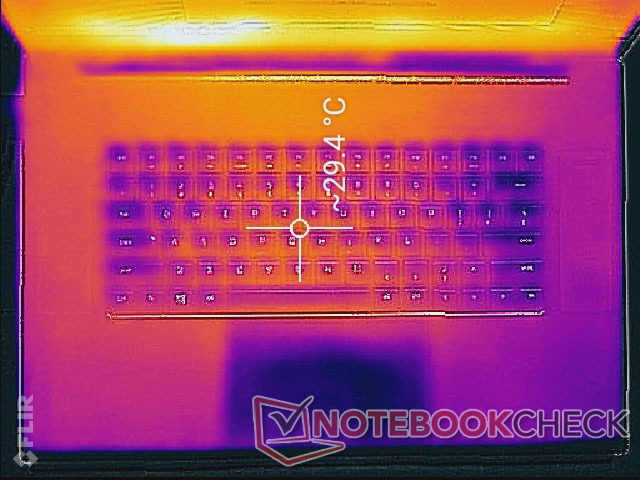
(+) In idle usage, the average temperature for the upper side is 28.6 °C / 83 F, compared to the device average of 33.9 °C / 93 F.
(±) Playing The Witcher 3, the average temperature for the upper side is 32.8 °C / 91 F, compared to the device average of 33.9 °C / 93 F.
(+) The palmrests and touchpad are cooler than skin temperature with a maximum of 30 °C / 86 F and are therefore cool to the touch.
(±) The average temperature of the palmrest area of similar devices was 28.8 °C / 83.8 F (-1.2 °C / -2.2 F).
Stress Test
We stress the system with synthetic loads in order to identify for any potential throttling or stability issues. Results are similar to what we discovered on the Blade Pro 17 2080 Max-Q other than the obvious differences in GPU clock rates. CPU and GPU temperatures when gaming on the Blade Pro 17 RTX 2060 run a few degrees cooler at about 73 C and 64 C, respectively, compared to 77 C and 67 C on the Blade Pro 17 RTX 2080 Max-Q. The Asus ROG Strix Hero III G731GW with full-power RTX 2070 graphics is even warmer in the mid 70 C range. Temperatures are cooler than expected on the Blade Pro 17 RTX 2060 considering the thin form factor.
Running on batteries will limit performance as is typical for gaming laptops. A 3DMark Fire Strike run on batteries returns Physics and Graphics scores of 10003 and 4548 points, respectively, compared to 16665 and 16647 points when on mains. Synapse Turbo mode becomes grayed out if on battery power.
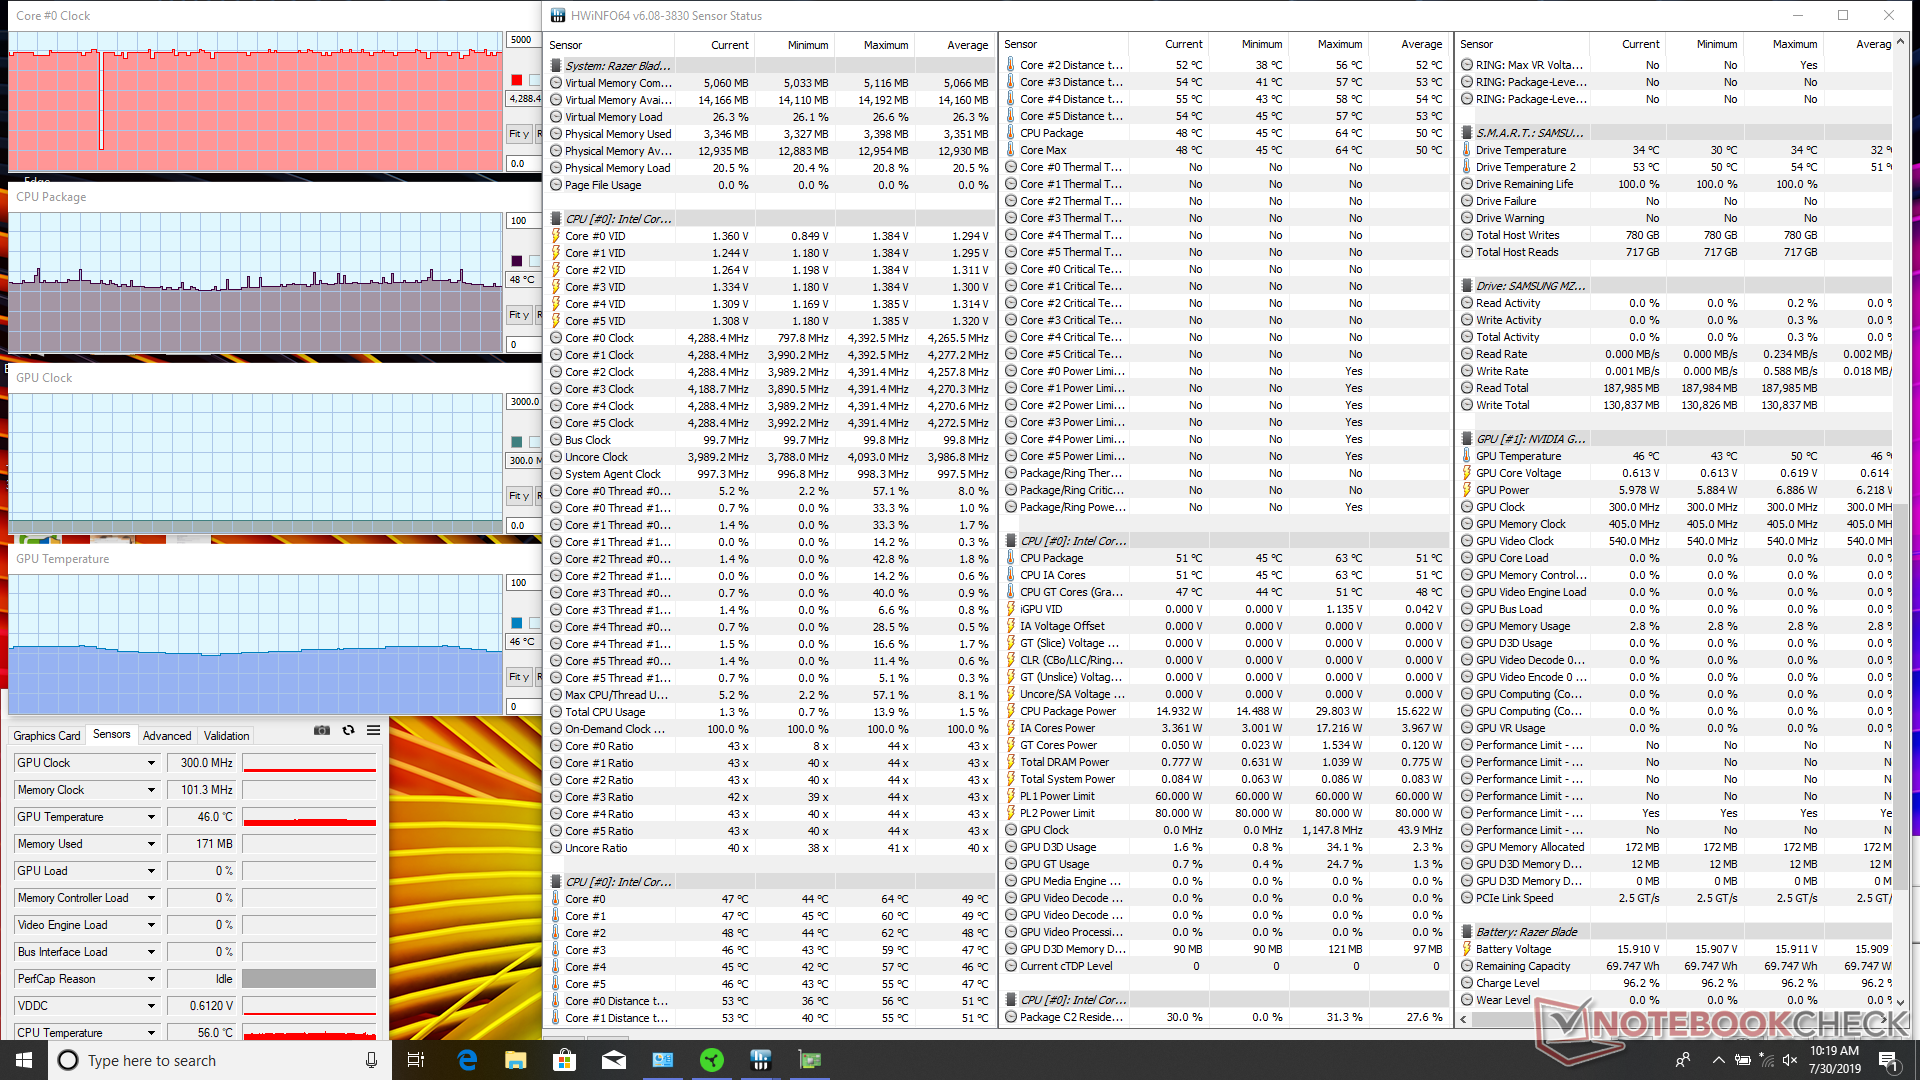
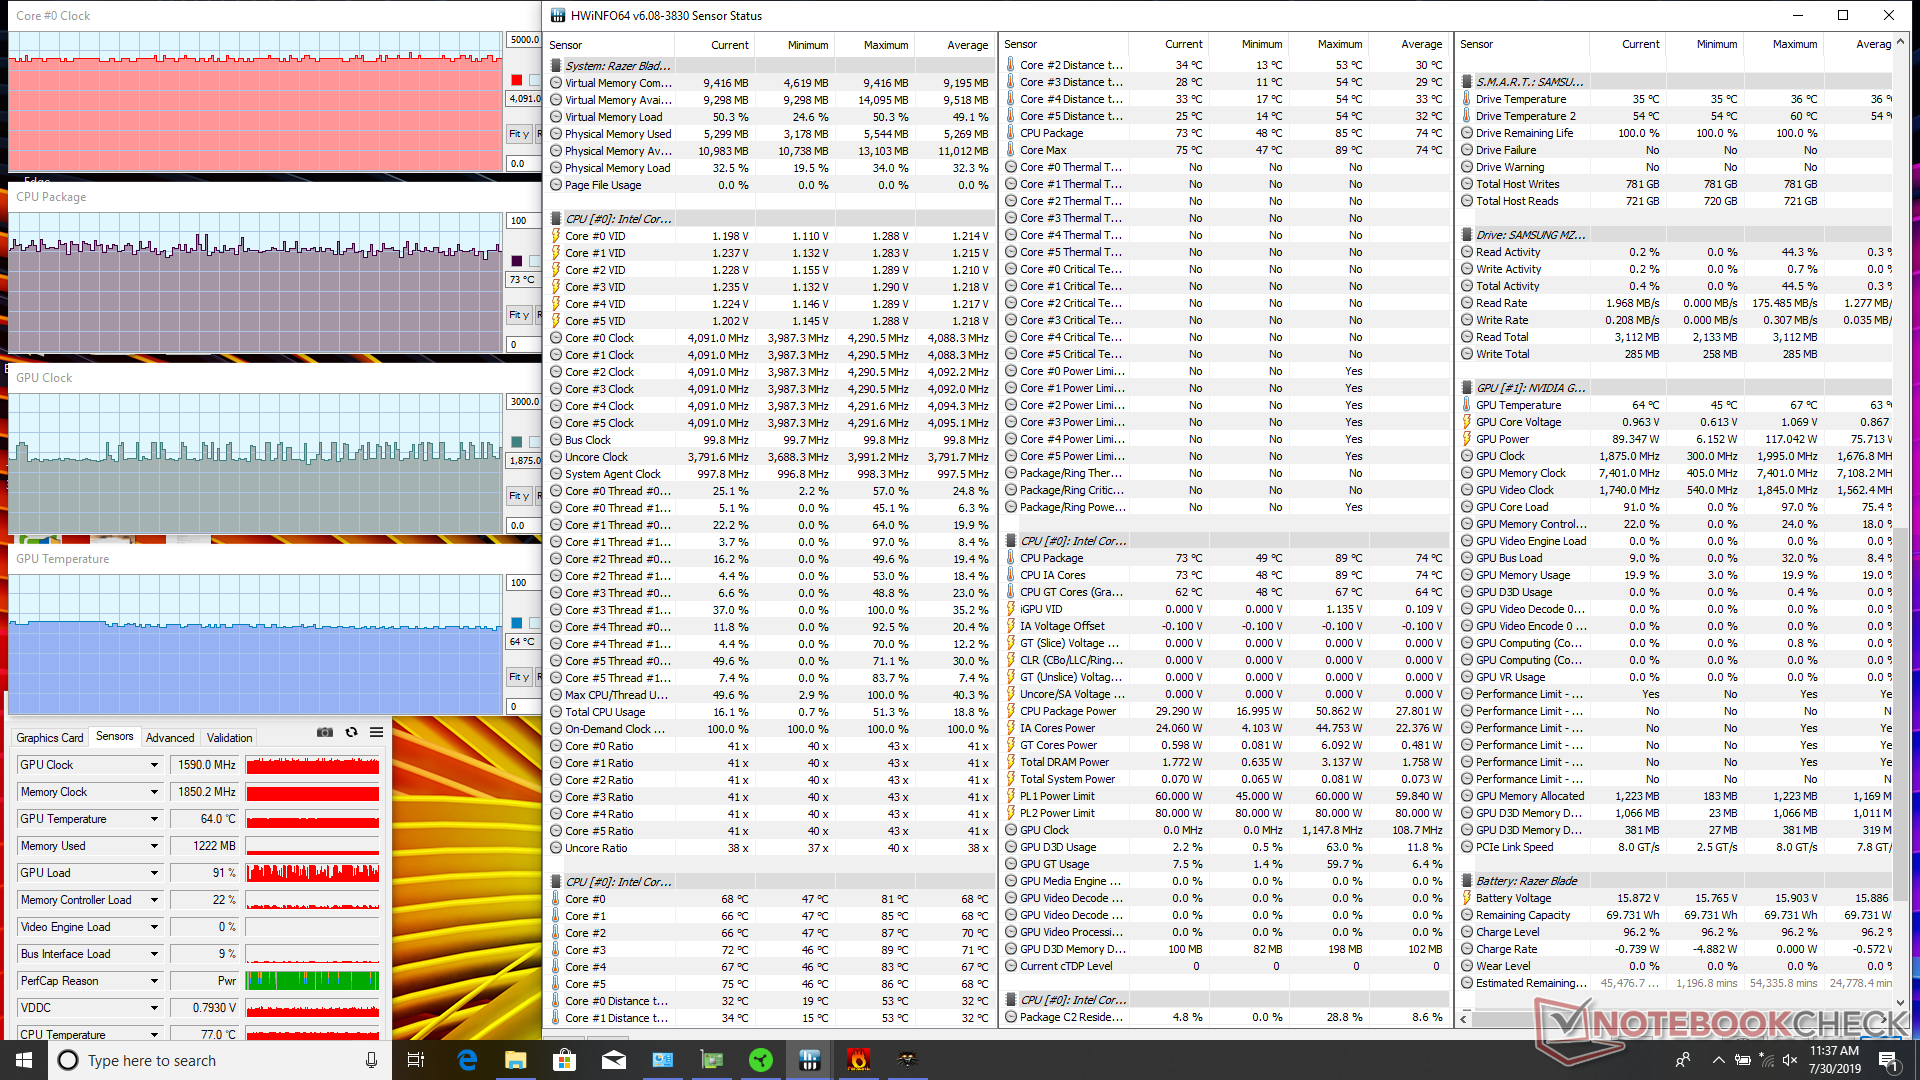
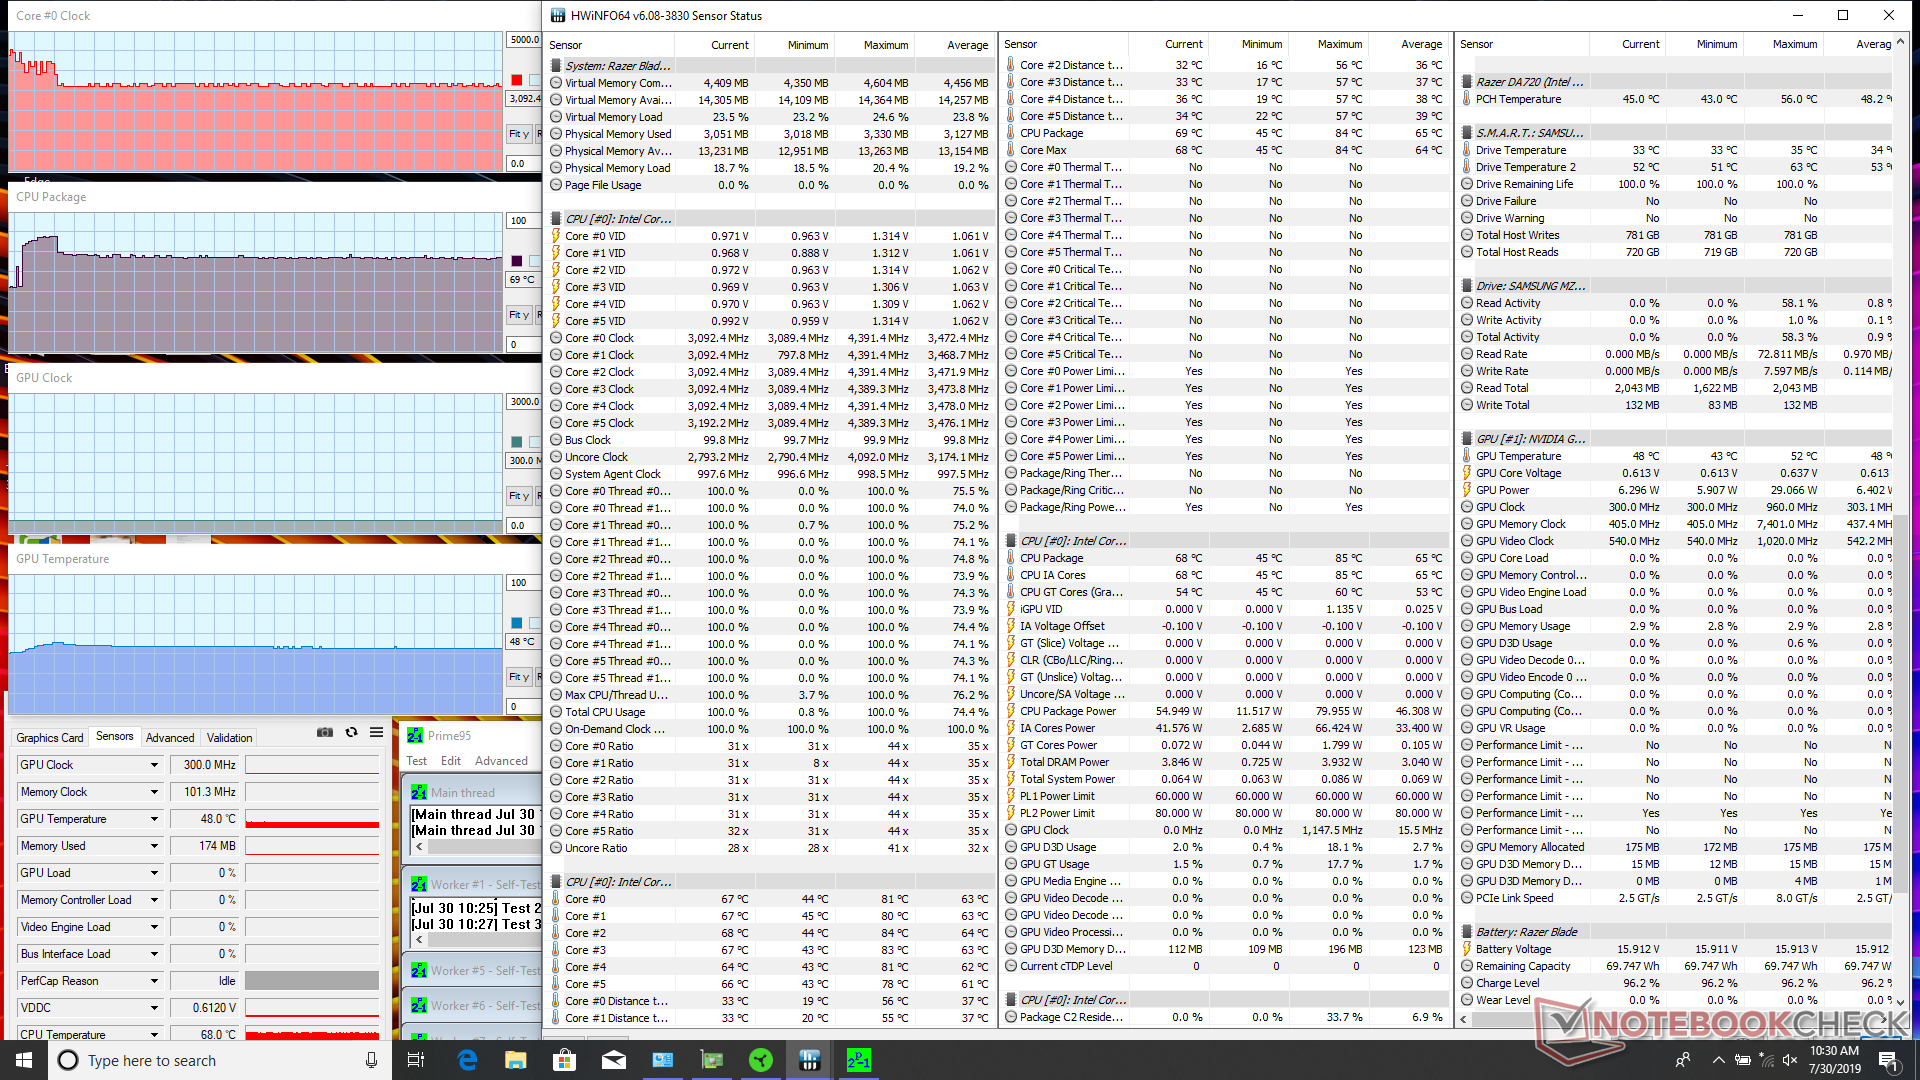
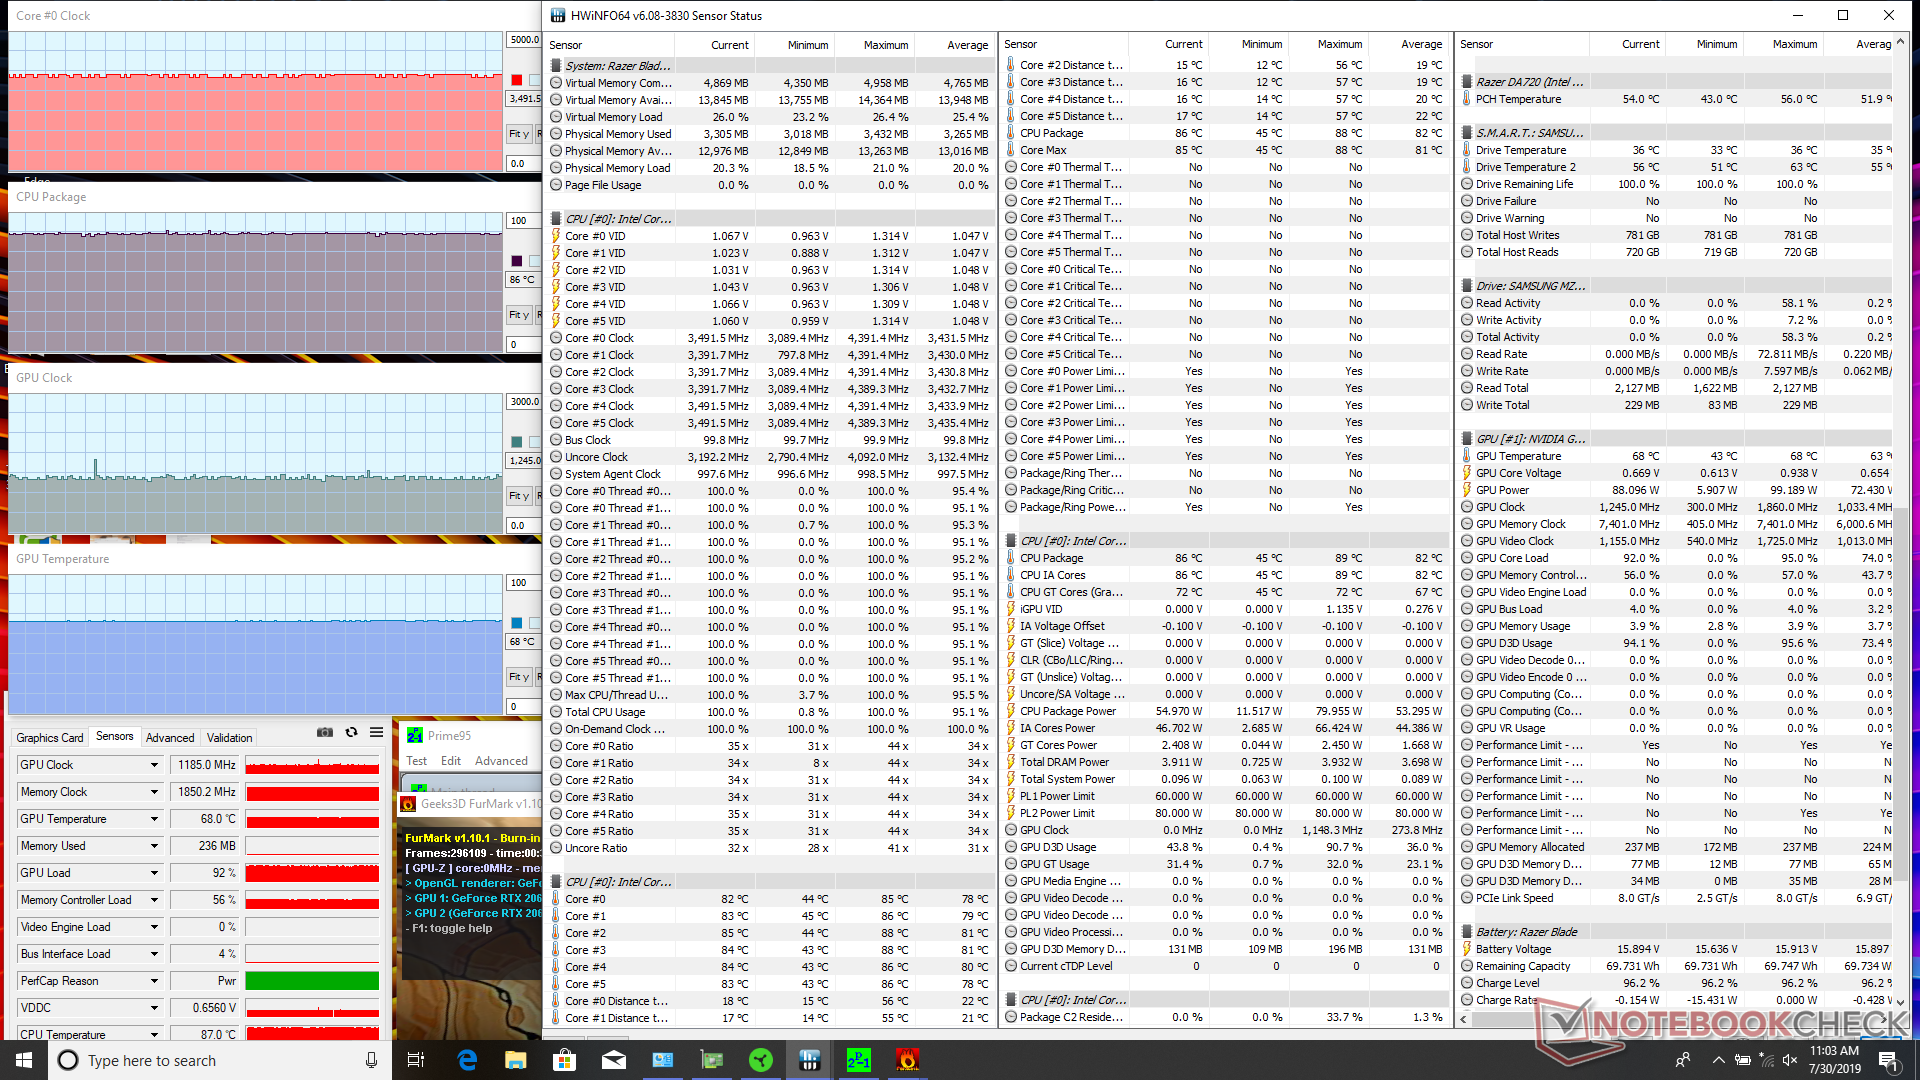
| CPU Clock (GHz) | GPU Clock (MHz) | Average CPU Temperature (°C) | Average GPU Temperature (°C) | |
| System Idle | -- | -- | 48 | 46 |
| Prime95 Stress | 3.1 - 3.2 | -- | 69 | 48 |
| Prime95 + FurMark Stress | 3.5 | 1185 - 1245 | 86 | 68 |
| Witcher 3 Stress | ~4.1 | 1590 - 1875 | ~73 | 64 |
Speakers


Razer Blade Pro 17 RTX 2060 audio analysis
(+) | speakers can play relatively loud (84.9 dB)
Bass 100 - 315 Hz
(±) | reduced bass - on average 9.6% lower than median
(±) | linearity of bass is average (14.4% delta to prev. frequency)
Mids 400 - 2000 Hz
(±) | higher mids - on average 6.7% higher than median
(+) | mids are linear (5.1% delta to prev. frequency)
Highs 2 - 16 kHz
(+) | balanced highs - only 2.4% away from median
(+) | highs are linear (4.4% delta to prev. frequency)
Overall 100 - 16.000 Hz
(±) | linearity of overall sound is average (18.1% difference to median)
Compared to same class
» 57% of all tested devices in this class were better, 8% similar, 35% worse
» The best had a delta of 6%, average was 18%, worst was 132%
Compared to all devices tested
» 38% of all tested devices were better, 8% similar, 54% worse
» The best had a delta of 4%, average was 24%, worst was 134%
Apple MacBook 12 (Early 2016) 1.1 GHz audio analysis
(+) | speakers can play relatively loud (83.6 dB)
Bass 100 - 315 Hz
(±) | reduced bass - on average 11.3% lower than median
(±) | linearity of bass is average (14.2% delta to prev. frequency)
Mids 400 - 2000 Hz
(+) | balanced mids - only 2.4% away from median
(+) | mids are linear (5.5% delta to prev. frequency)
Highs 2 - 16 kHz
(+) | balanced highs - only 2% away from median
(+) | highs are linear (4.5% delta to prev. frequency)
Overall 100 - 16.000 Hz
(+) | overall sound is linear (10.2% difference to median)
Compared to same class
» 7% of all tested devices in this class were better, 2% similar, 91% worse
» The best had a delta of 5%, average was 18%, worst was 53%
Compared to all devices tested
» 5% of all tested devices were better, 1% similar, 94% worse
» The best had a delta of 4%, average was 24%, worst was 134%
Energy Management
Power Consumption
Idling on desktop demands 16 W to 26 W depending on the brightness and power profile not unlike on the Blade Pro 17 RTX 2080 Max-Q. Idling on Turbo mode can draw up to 36 W.
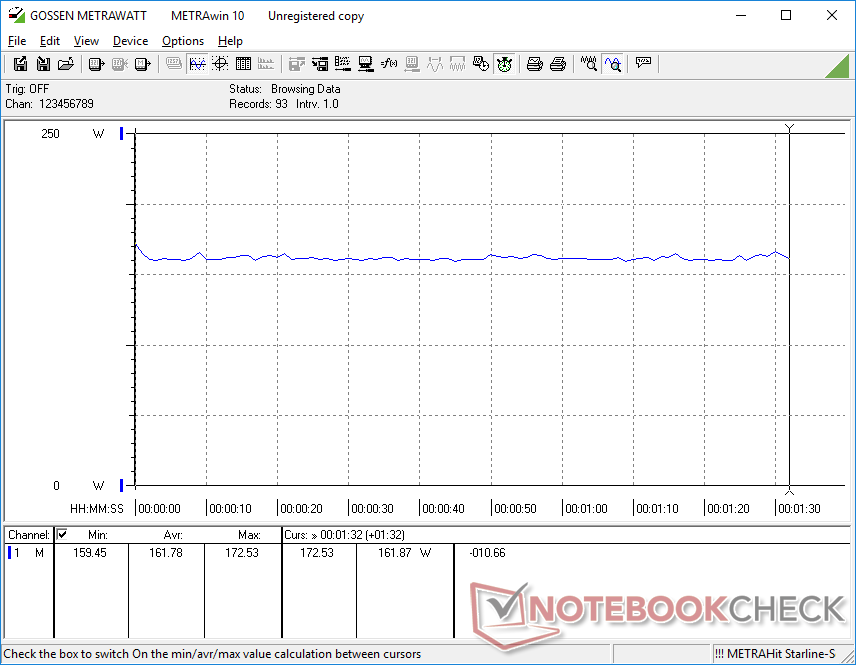
When gaming, the system consumes about 162 W compared to 183 W on the Blade Pro 17 2080 Max-Q meaning that users would be saving 11 percent on their power bill for a 26 percent decrease in graphics performance. Performance-per-Watt is actually higher on Razer's highest-end configuration even if performance-per-dollar may not be the best.
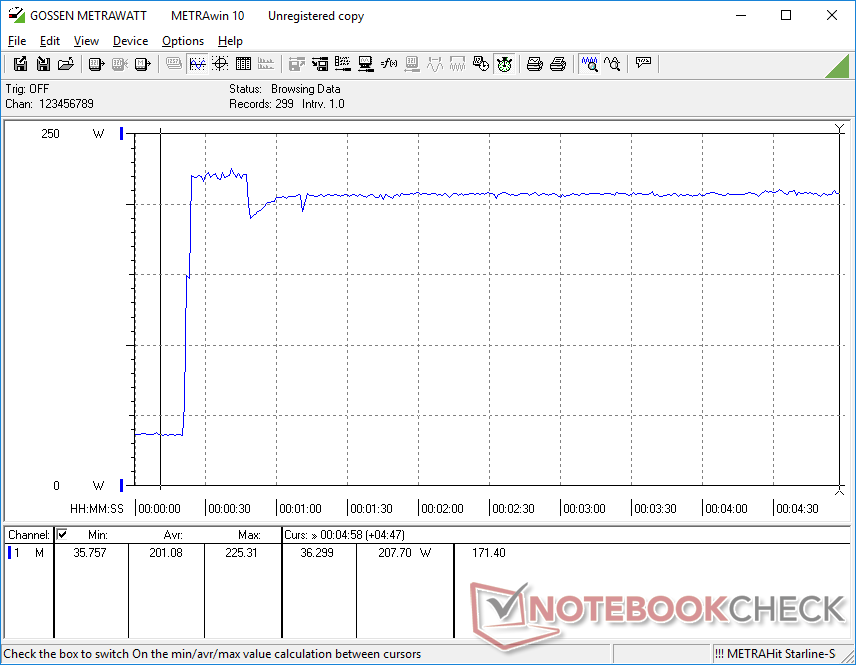
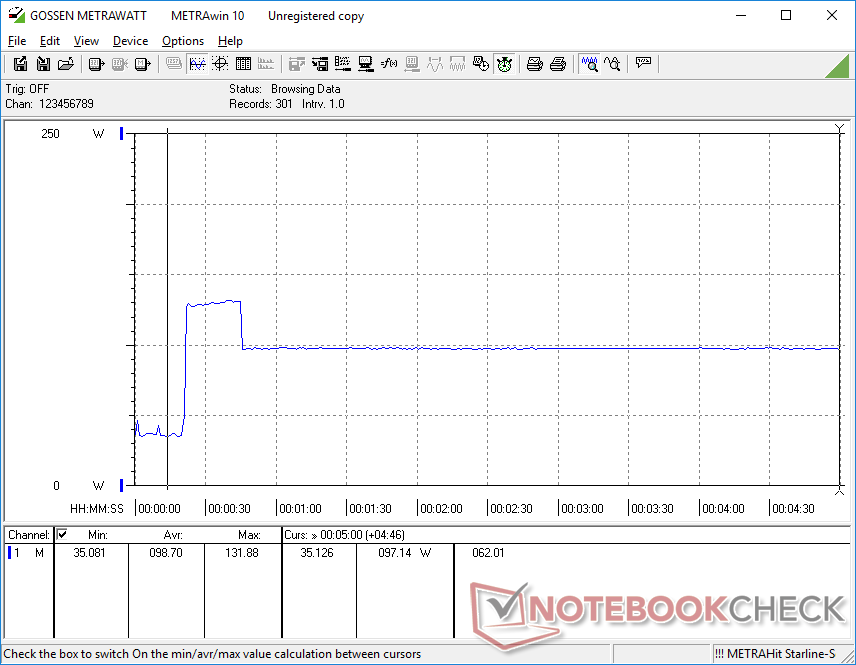
We're able to measure a peak consumption of 225 W from the small-medium (~17 x 7 x 2.5 cm) 230 W AC adapter when running both Prime95 and FurMark simultaneously. This high of a consumption is only temporary since the laptop is unable to sustain maximum Turbo Boost clock rates indefinitely. Likewise, running Prime95 produces a similar temporary spike in power consumption when clock rates are fastest before inevitably dropping.
| Off / Standby | |
| Idle | |
| Load |
|
Key:
min: | |
| Razer Blade Pro 17 RTX 2060 i7-9750H, GeForce RTX 2060 Mobile, Samsung SSD PM981 MZVLB512HAJQ, IPS, 1920x1080, 17.3" | Razer Blade Pro 17 RTX 2080 Max-Q i7-9750H, GeForce RTX 2080 Max-Q, Samsung SSD PM981 MZVLB512HAJQ, IPS, 1920x1080, 17.3" | Asus ASUS ROG Strix SCAR III G731GW-XB74 i7-9750H, GeForce RTX 2070 Mobile, Intel SSD 660p 1TB SSDPEKNW010T8, IPS, 1920x1080, 17.3" | Razer Blade Pro 2017 i7-7820HK, GeForce GTX 1080 Mobile, 2x Samsung SSD PM951 MZVLV256HCHP (RAID 0), IGZO, 3840x2160, 17.3" | Acer Predator Helios 500 PH517-51-93LS i9-8950HK, GeForce GTX 1070 Mobile, Liteon CA1-8D512, IPS LED, 3840x2160, 17.3" | Asus GL704GM-DH74 i7-8750H, GeForce GTX 1060 Mobile, WDC PC SN520 SDAPNUW-256G, IPS, 1920x1080, 17.3" | |
|---|---|---|---|---|---|---|
| Power Consumption | 1% | -16% | -46% | -31% | 8% | |
| Idle Minimum * (Watt) | 16 | 16.2 -1% | 18.2 -14% | 31 -94% | 24.6 -54% | 15.2 5% |
| Idle Average * (Watt) | 21.7 | 20.4 6% | 23 -6% | 36 -66% | 33.1 -53% | 20.4 6% |
| Idle Maximum * (Watt) | 26.1 | 26.1 -0% | 33.1 -27% | 44 -69% | 37.2 -43% | 27.3 -5% |
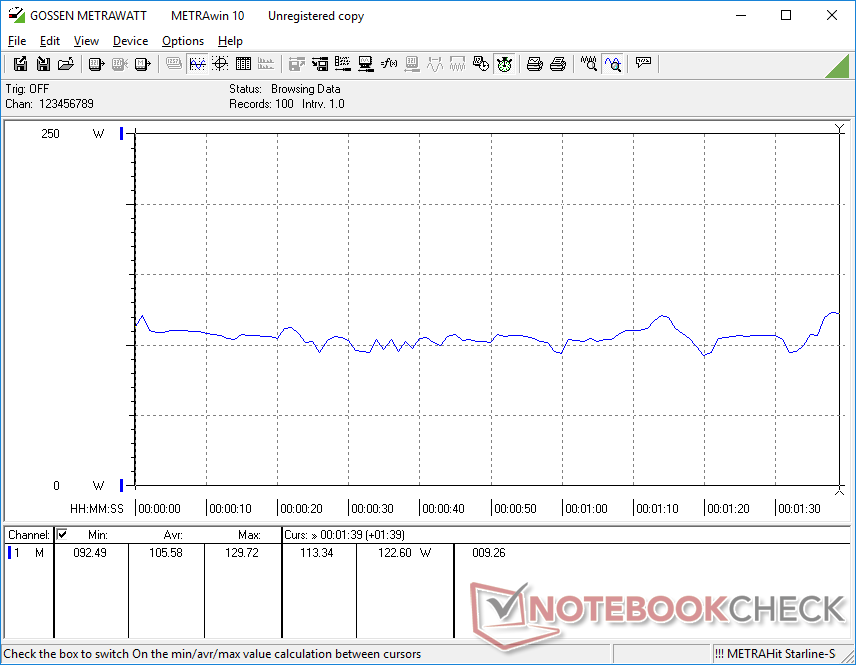
| Load Average * (Watt) | 105.6 | 96.5 9% | 124.8 -18% | 107 -1% | 124 -17% | 92.9 12% |
| Witcher 3 ultra * (Watt) | 161.8 | 182.9 -13% | 180.8 -12% | 212 -31% | 180 -11% | 143 12% |
| Load Maximum * (Watt) | 225.3 | 214.3 5% | 263 -17% | 258 -15% | 236.5 -5% | 190.6 15% |
* ... smaller is better
Battery Life
Battery capacity has dropped from 99 Wh to 70 Wh when compared to the last generation Blade Pro 2017. However, the improvements to power efficiency mean that runtimes can actually be longer. We're able to record a real-world WLAN runtime of 4.5 hours whereas the Blade Pro 2017 lasts for one hour shorter.
Runtimes are also nearly identical to the Blade Pro 17 RTX 2080 Max-Q SKU. Thus, don't expect battery life to be noticeably better or worse despite the performance differences between the RTX 2060 and RTX 2080 Max-Q. Recharging from empty to full capacity still takes about 1.5 hours.
| Razer Blade Pro 17 RTX 2060 i7-9750H, GeForce RTX 2060 Mobile, 70 Wh | Asus Zephyrus S GX701GX i7-8750H, GeForce RTX 2080 Max-Q, 76 Wh | MSI GS75 Stealth 9SG i7-9750H, GeForce RTX 2080 Max-Q, 80.25 Wh | Asus ASUS ROG Strix SCAR III G731GW-XB74 i7-9750H, GeForce RTX 2070 Mobile, 66 Wh | Razer Blade Pro 2017 i7-7820HK, GeForce GTX 1080 Mobile, 99 Wh | Acer Predator Helios 500 PH517-51-93LS i9-8950HK, GeForce GTX 1070 Mobile, 74 Wh | Razer Blade Pro 17 RTX 2080 Max-Q i7-9750H, GeForce RTX 2080 Max-Q, 70 Wh | |
|---|---|---|---|---|---|---|---|
| Battery runtime | -16% | 33% | -13% | -27% | -36% | 4% | |
| WiFi v1.3 (h) | 4.5 | 3.8 -16% | 6 33% | 3.9 -13% | 3.3 -27% | 2.9 -36% | 4.7 4% |
| Reader / Idle (h) | 5 | 7.7 | 4.2 | 4.2 | 4.9 | ||
| Load (h) | 0.9 | 1.2 | 1.4 | 1.4 | 1.4 |
Pros
Cons
Verdict
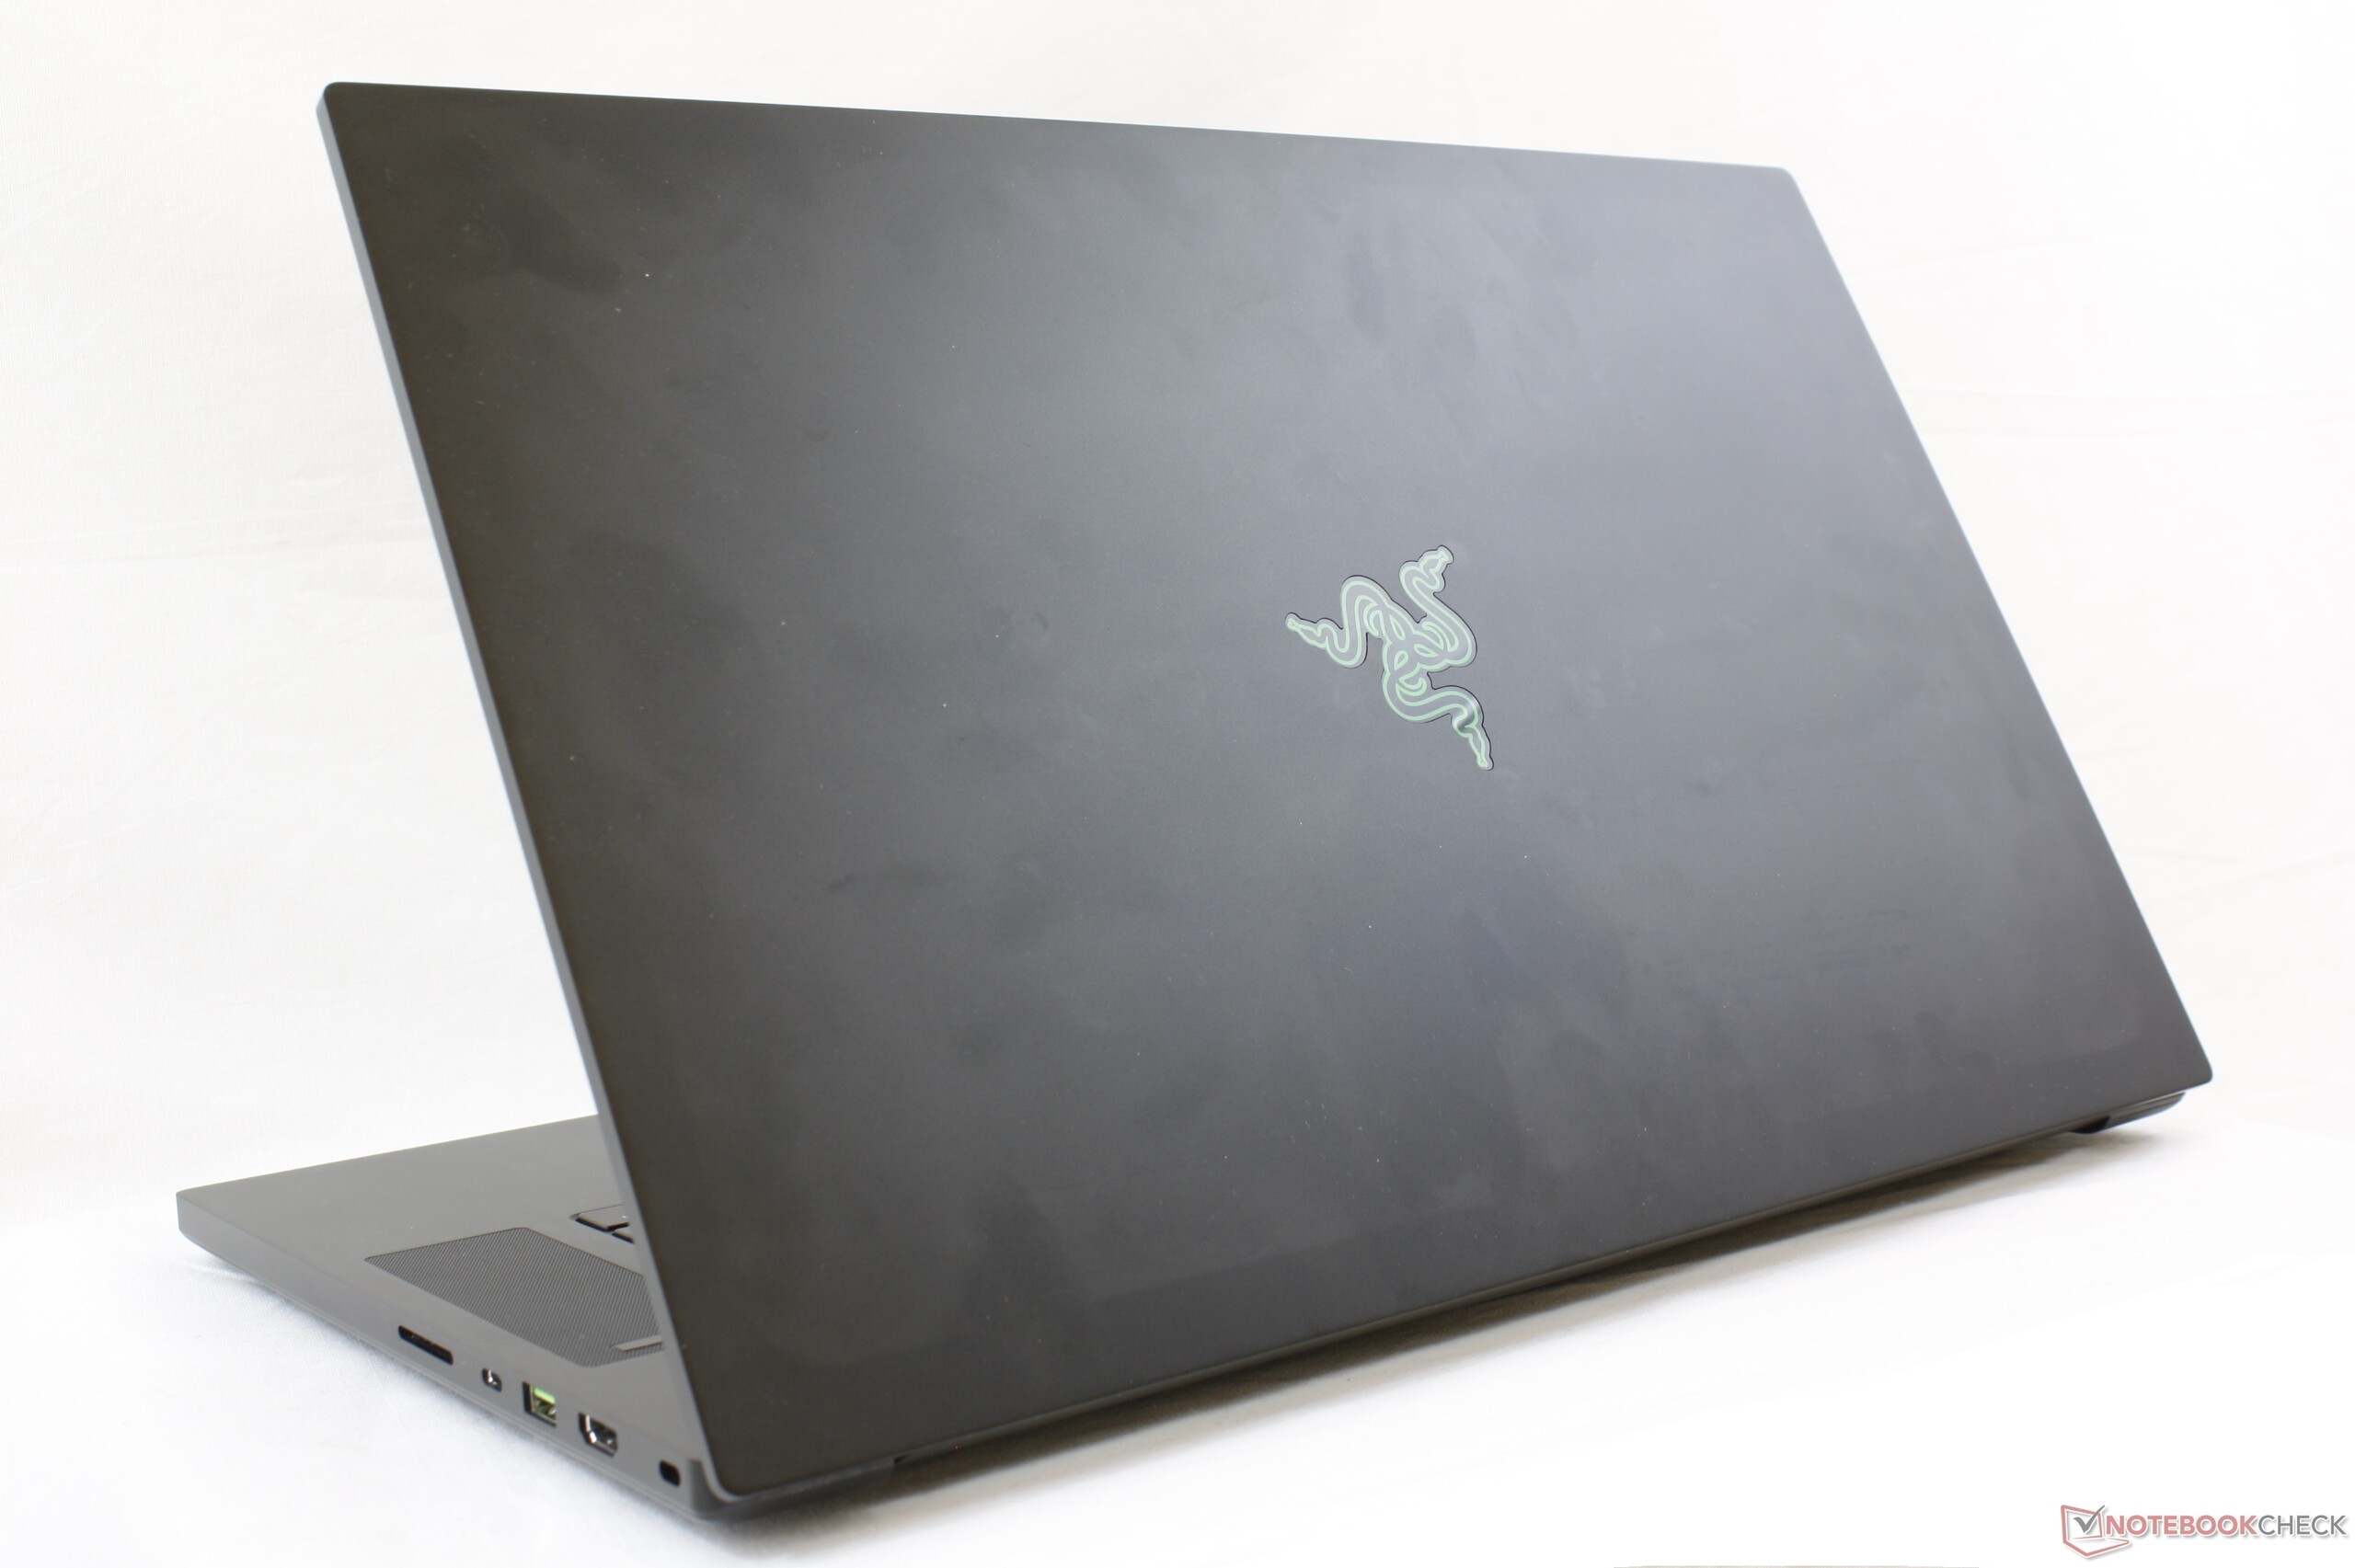
At $2500 USD, the Razer Blade Pro 17 RTX 2060 is more expensive than most alternatives like the Asus ROG Scar II GL704GV, Zephyrus S GX701GV, or MSI GS75 all configurable with the same GPU. The price premium goes towards not just the minimalist and stronger chassis design of the Razer, but also the vapor chamber cooler, UHS-III card reader, 2.5 Gbit RJ-45, and Wi-Fi 6 connectivity that are rare finds on competing RTX 2060 laptops. Paint the Blade Space Grey and passersby will likely mistaken it as a souped-up MacBook Pro for good reason.
A minor but notable advantage of the Blade Pro 17 is that its RTX 2060 GPU runs at faster clock rates than other laptops with the same GPU for slightly faster performance in games. The difference is wide enough that gaming performance comes close to the RTX 2070 Max-Q which actually makes the Blade Pro 17 RTX 2070 Max-Q SKU less of a bargain. When comparing the RTX 2060 SKU to the RTX 2080 Max-Q, the latter offers 35 percent faster performance for a 13 percent increase in power consumption. Other core aspects like battery life, fan noise, and temperatures are almost the same between the various Blade Pro 17 SKUs despite their differences in graphics performance.
The Blade Pro 17 shows off the GeForce RTX 2060 at its best. Auxiliary features like the quad fans, vapor chamber cooler, UHS-III card reader, 2.5 Gbit RJ-45, and Wi-Fi 6 connectivity can be found on no other gaming laptop with the same RTX 2060 GPU.
Razer Blade Pro 17 RTX 2060
- 08/05/2019 v6 (old)
Allen Ngo
