So much better than before: Razer Blade Pro 17 Laptop Review
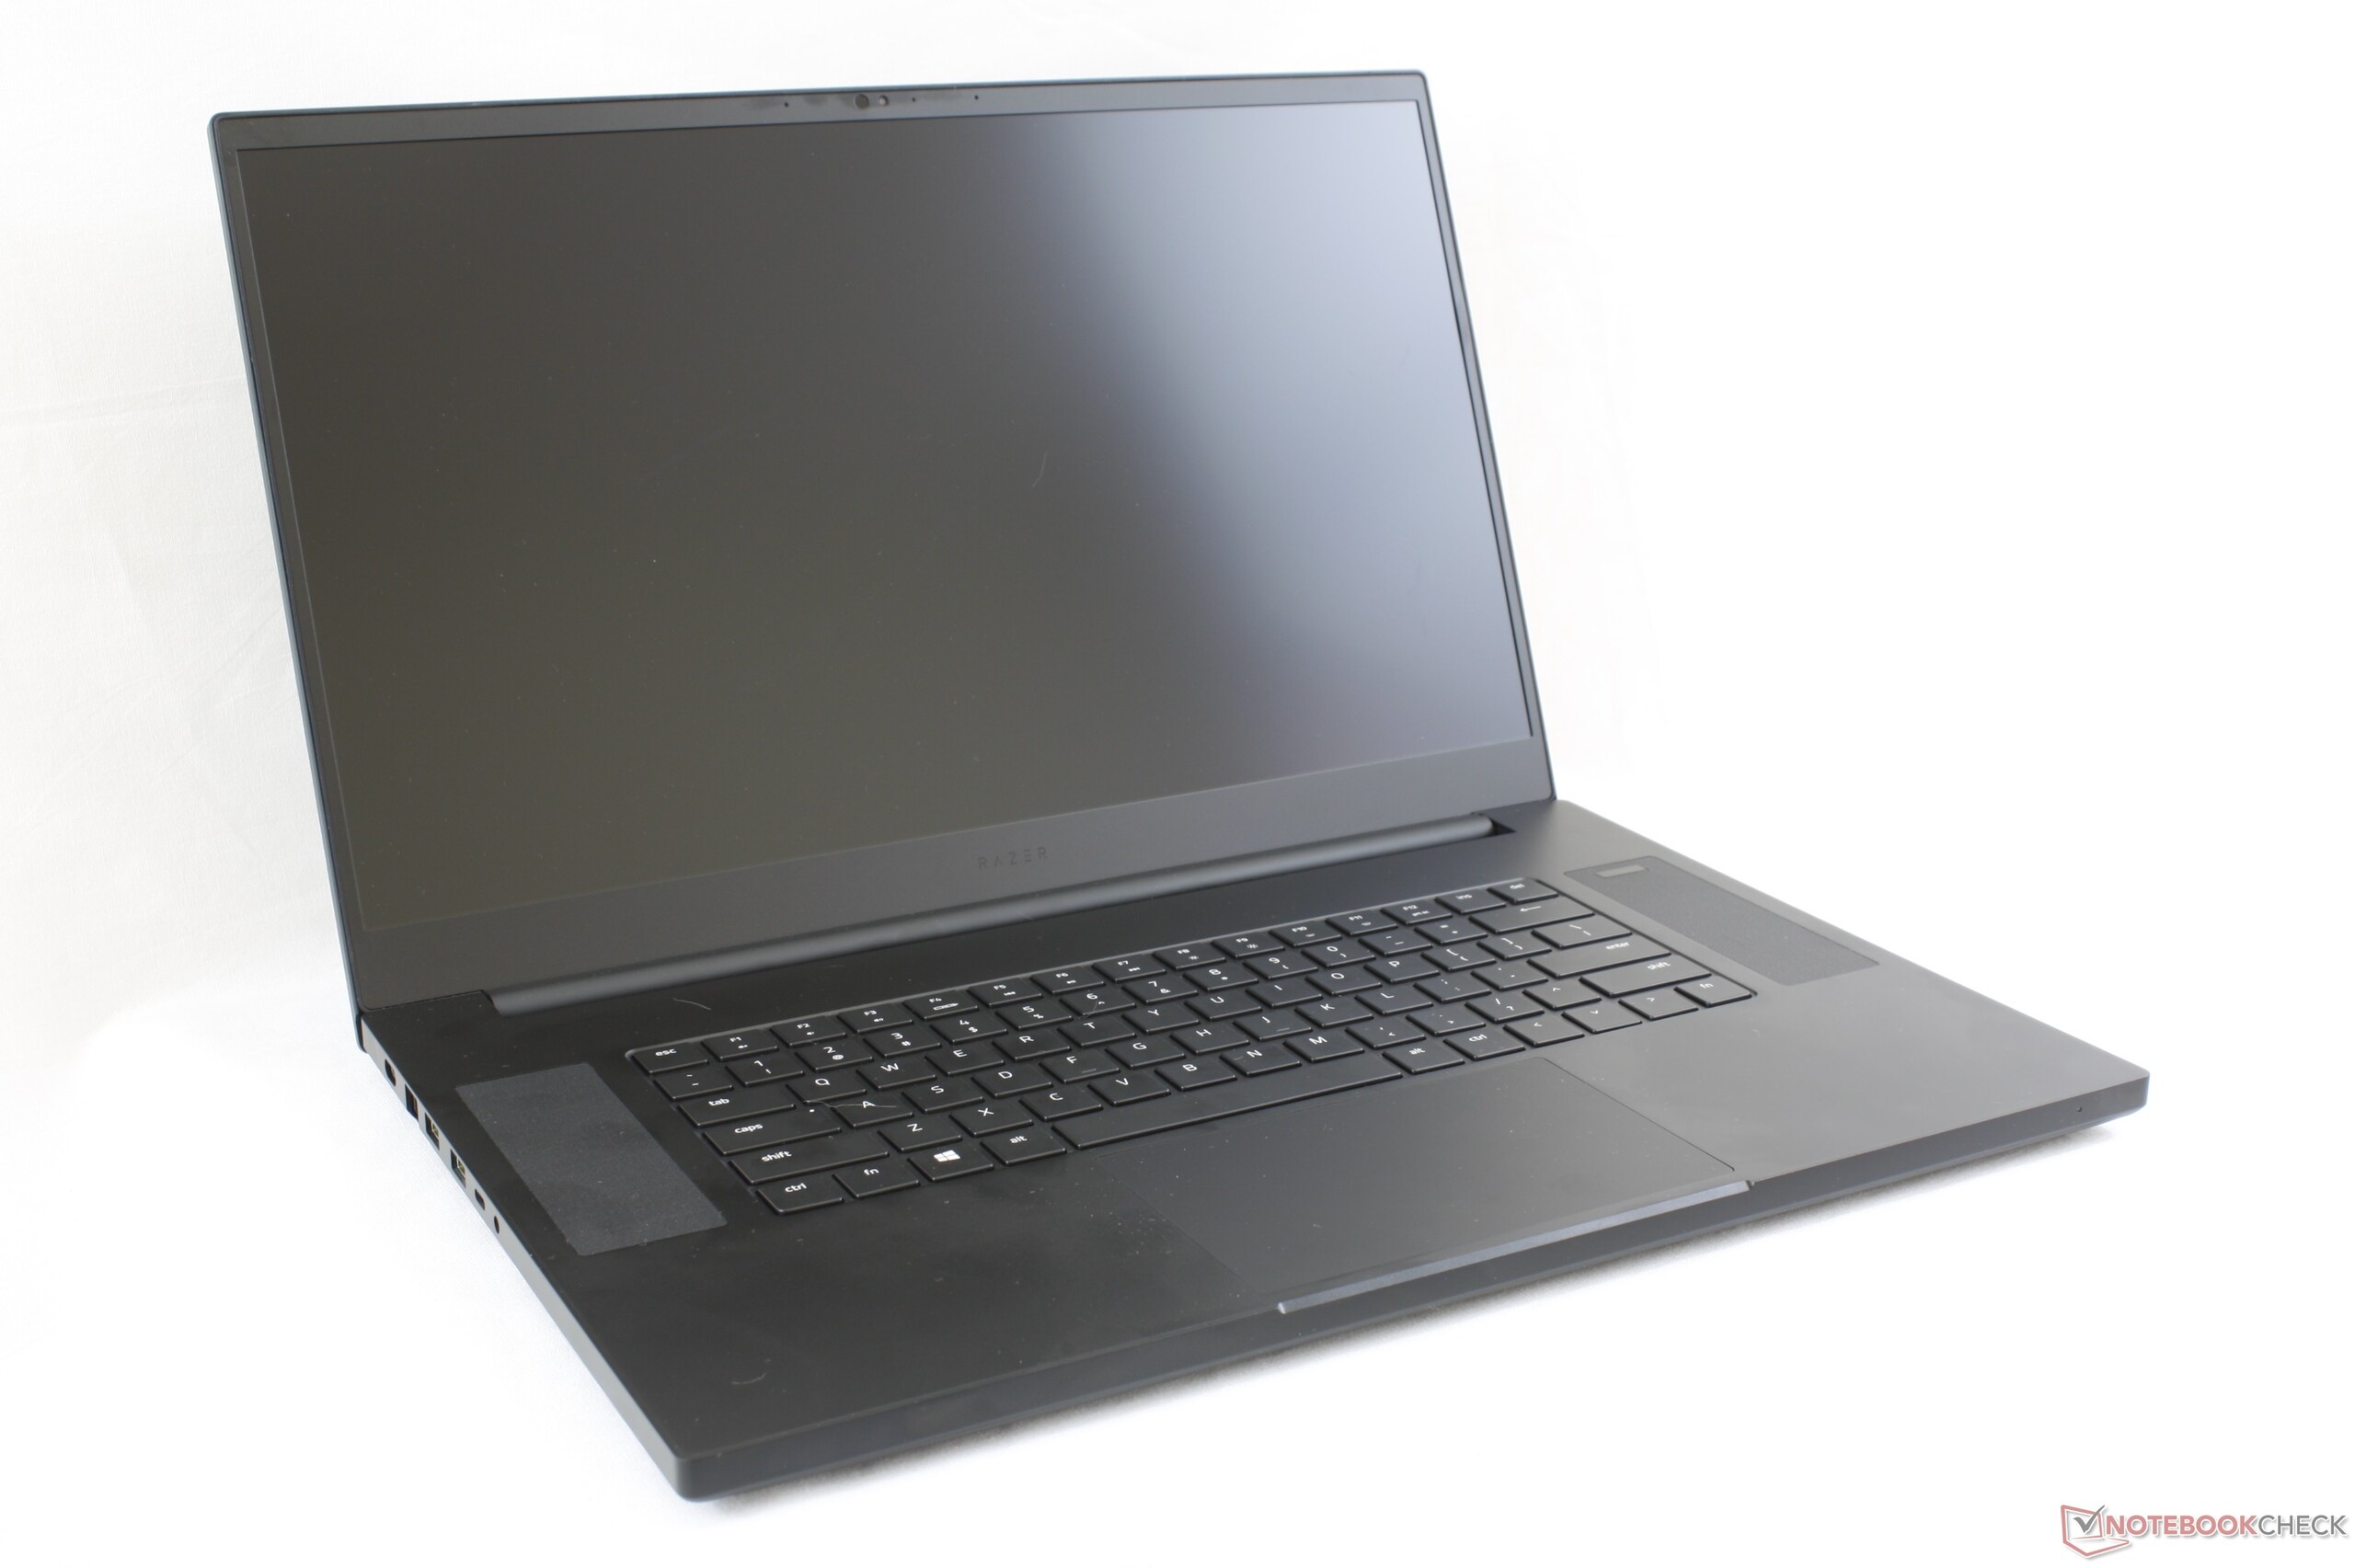
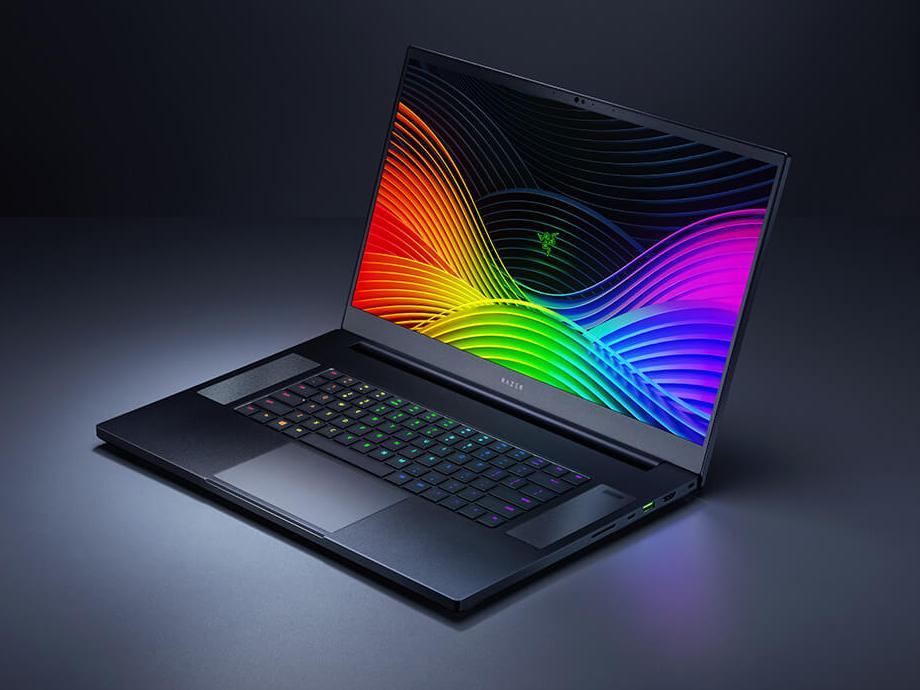
The 2019 Blade Pro 17 is the third generation model in Razer's lineup of 17.3-inch gaming laptops. It's a complete redesign of the Blade Pro 2016 and 2017 with many of the novelty features dropped in favor of a more streamlined experience. It also introduces narrow bezels to the Blade Pro series for the first time with many design elements lifted from the 15.6-inch Blade 15 series.
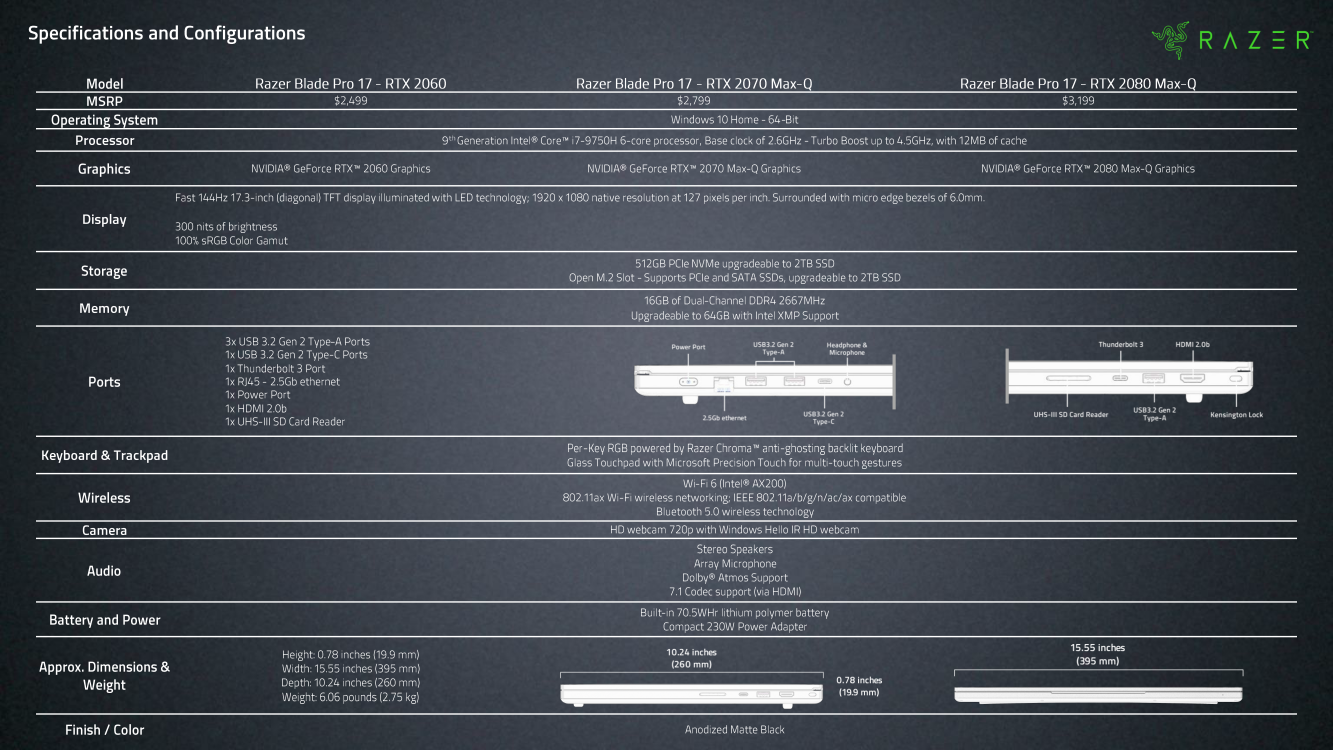
Current SKUs are more limited especially when compared to the wide range of Blade 15 options. There is just one display (1080p at 144 Hz), one CPU (Core i7-9750H), and three GPUs to choose from (RTX 2060. RTX 2070 Max-Q, RTX 2080 Max-Q) in contrast to the large variety of displays and processors available on competing alternatives. Our review below will show that this more focused approach by Razer works in their benefit to provide the best core gaming experience possible without the distracting auxiliary features users may not need.
Prices range from $2500 to $3200 USD depending on the GPU. Direct competitors include other ultra-thin enthusiast laptops like the 17.3-inch Alienware m17 R2, Lenovo Legion Y740, Asus Zephyrus S GX701, Asus ROG Scar III GL704, Acer Predator Triton 700, and the MSI GS75.
More Razer Blade reviews:
Case
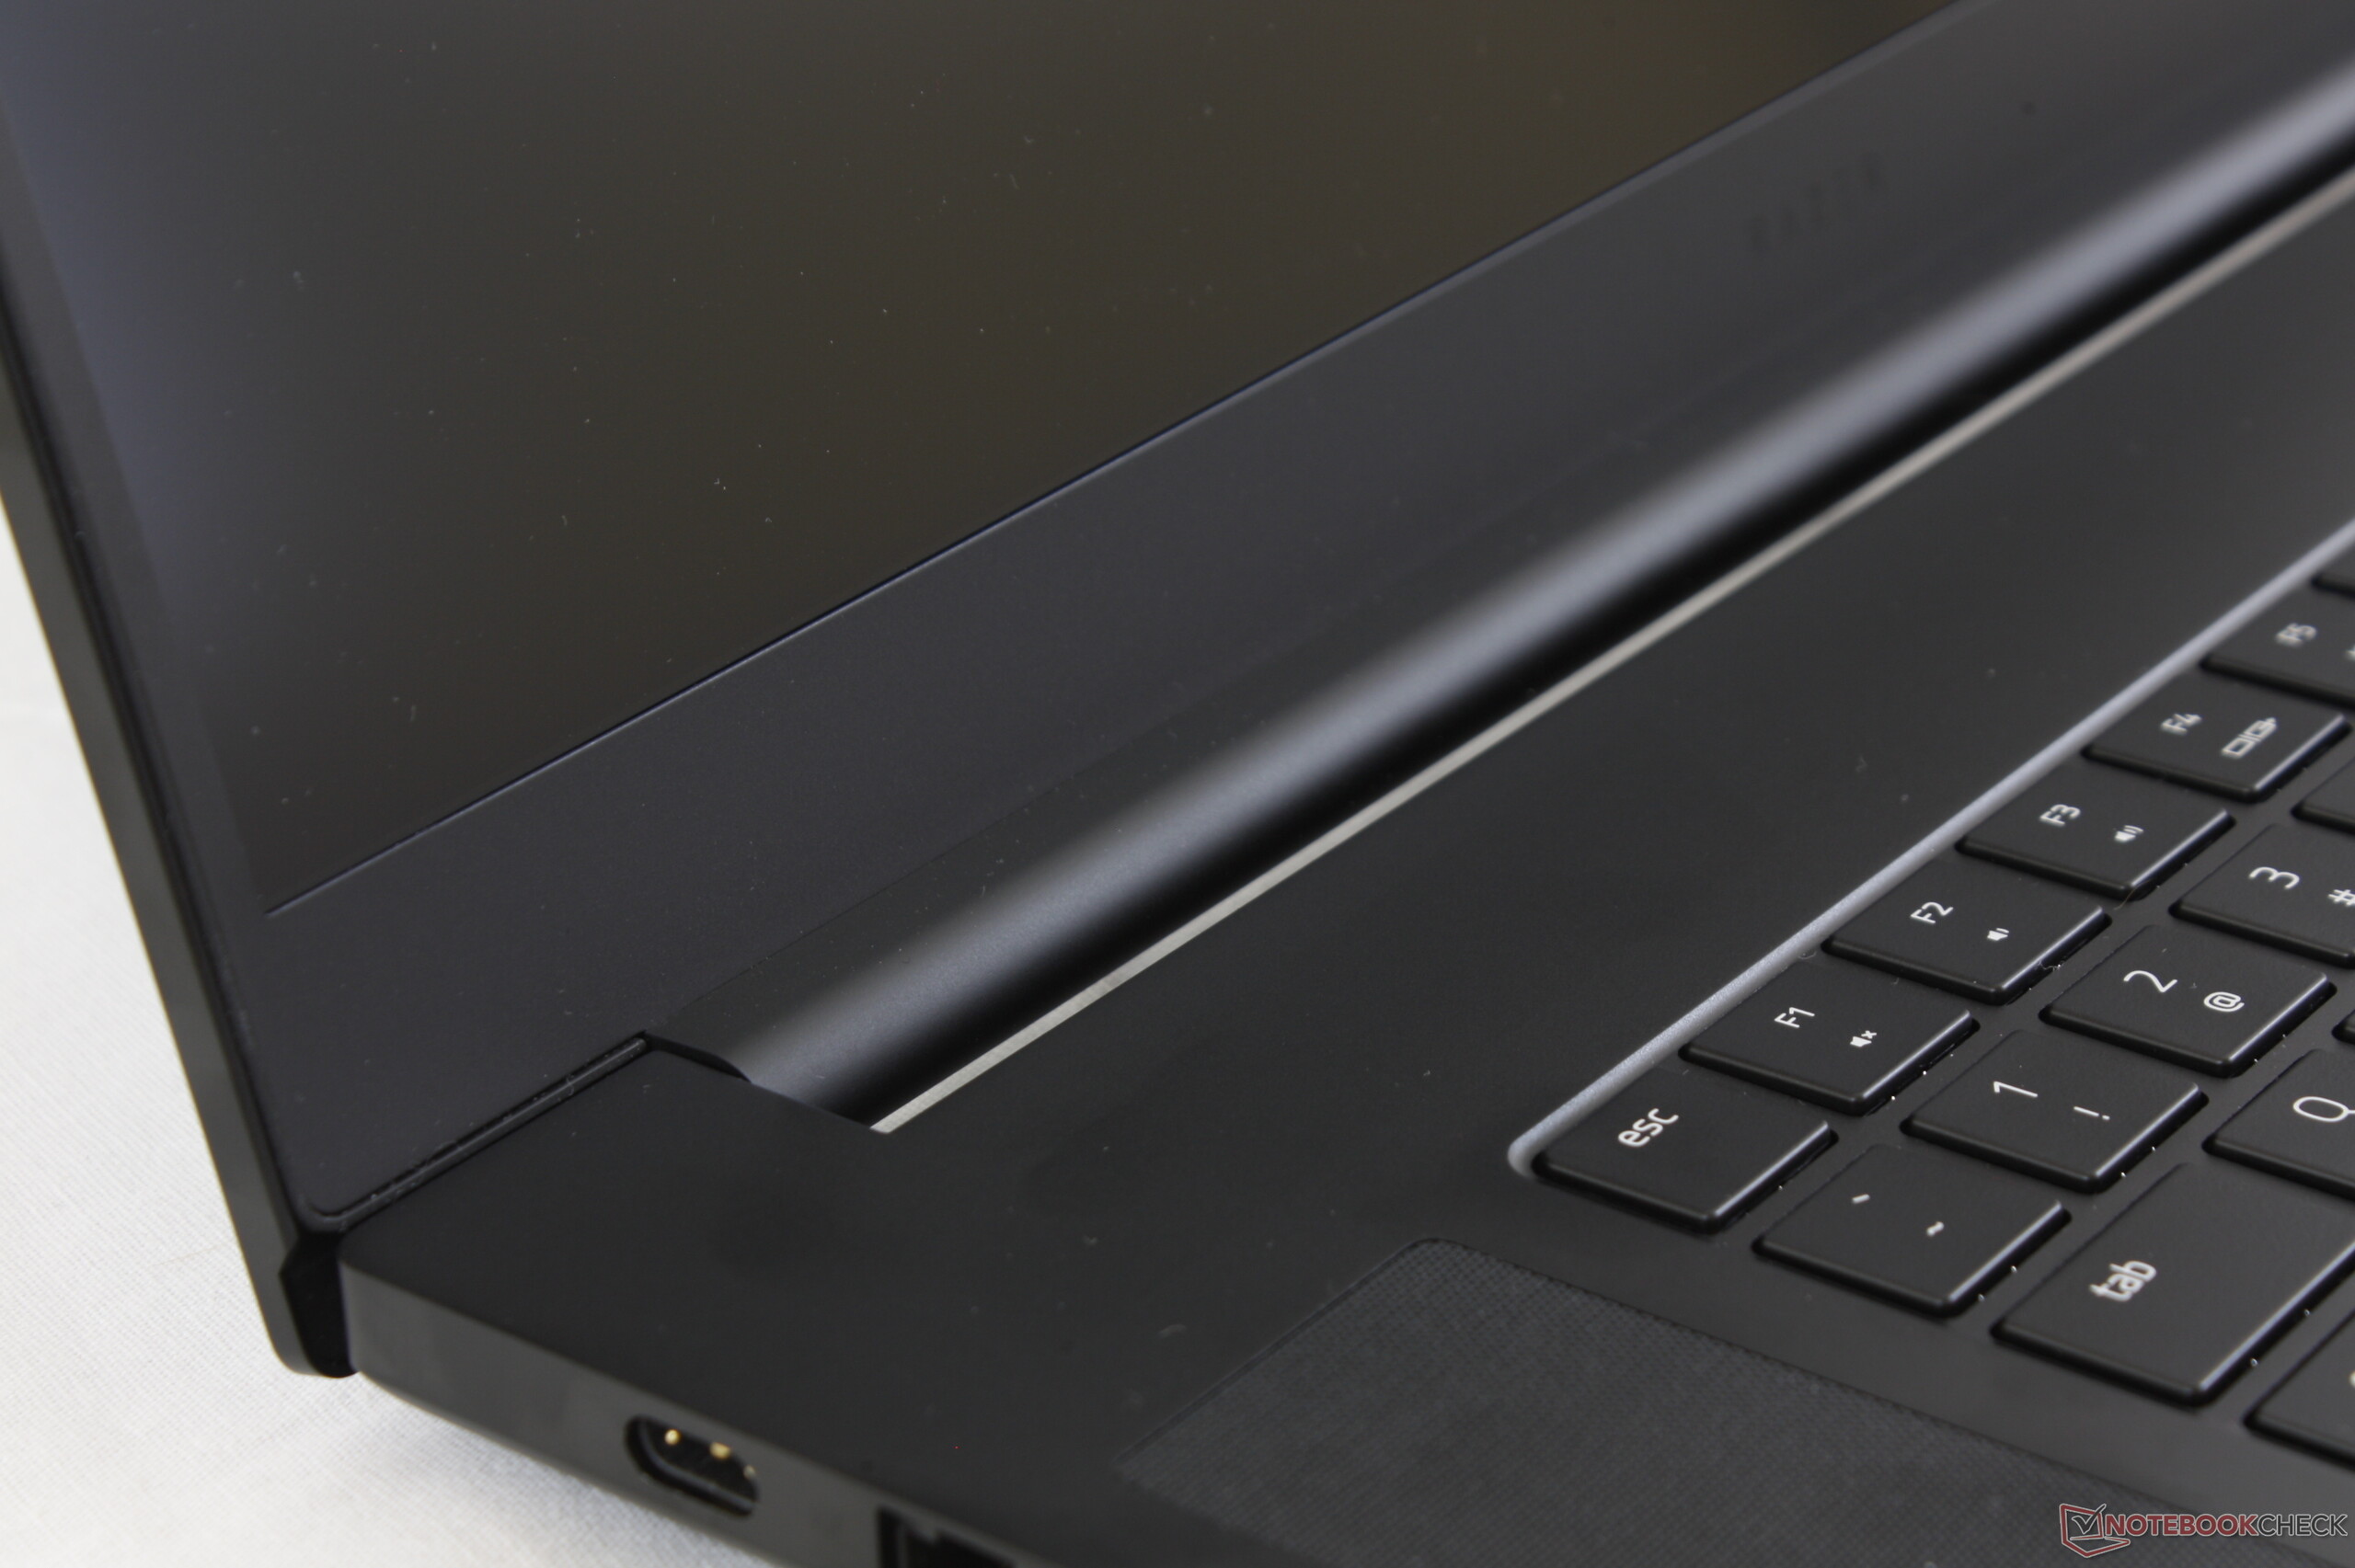
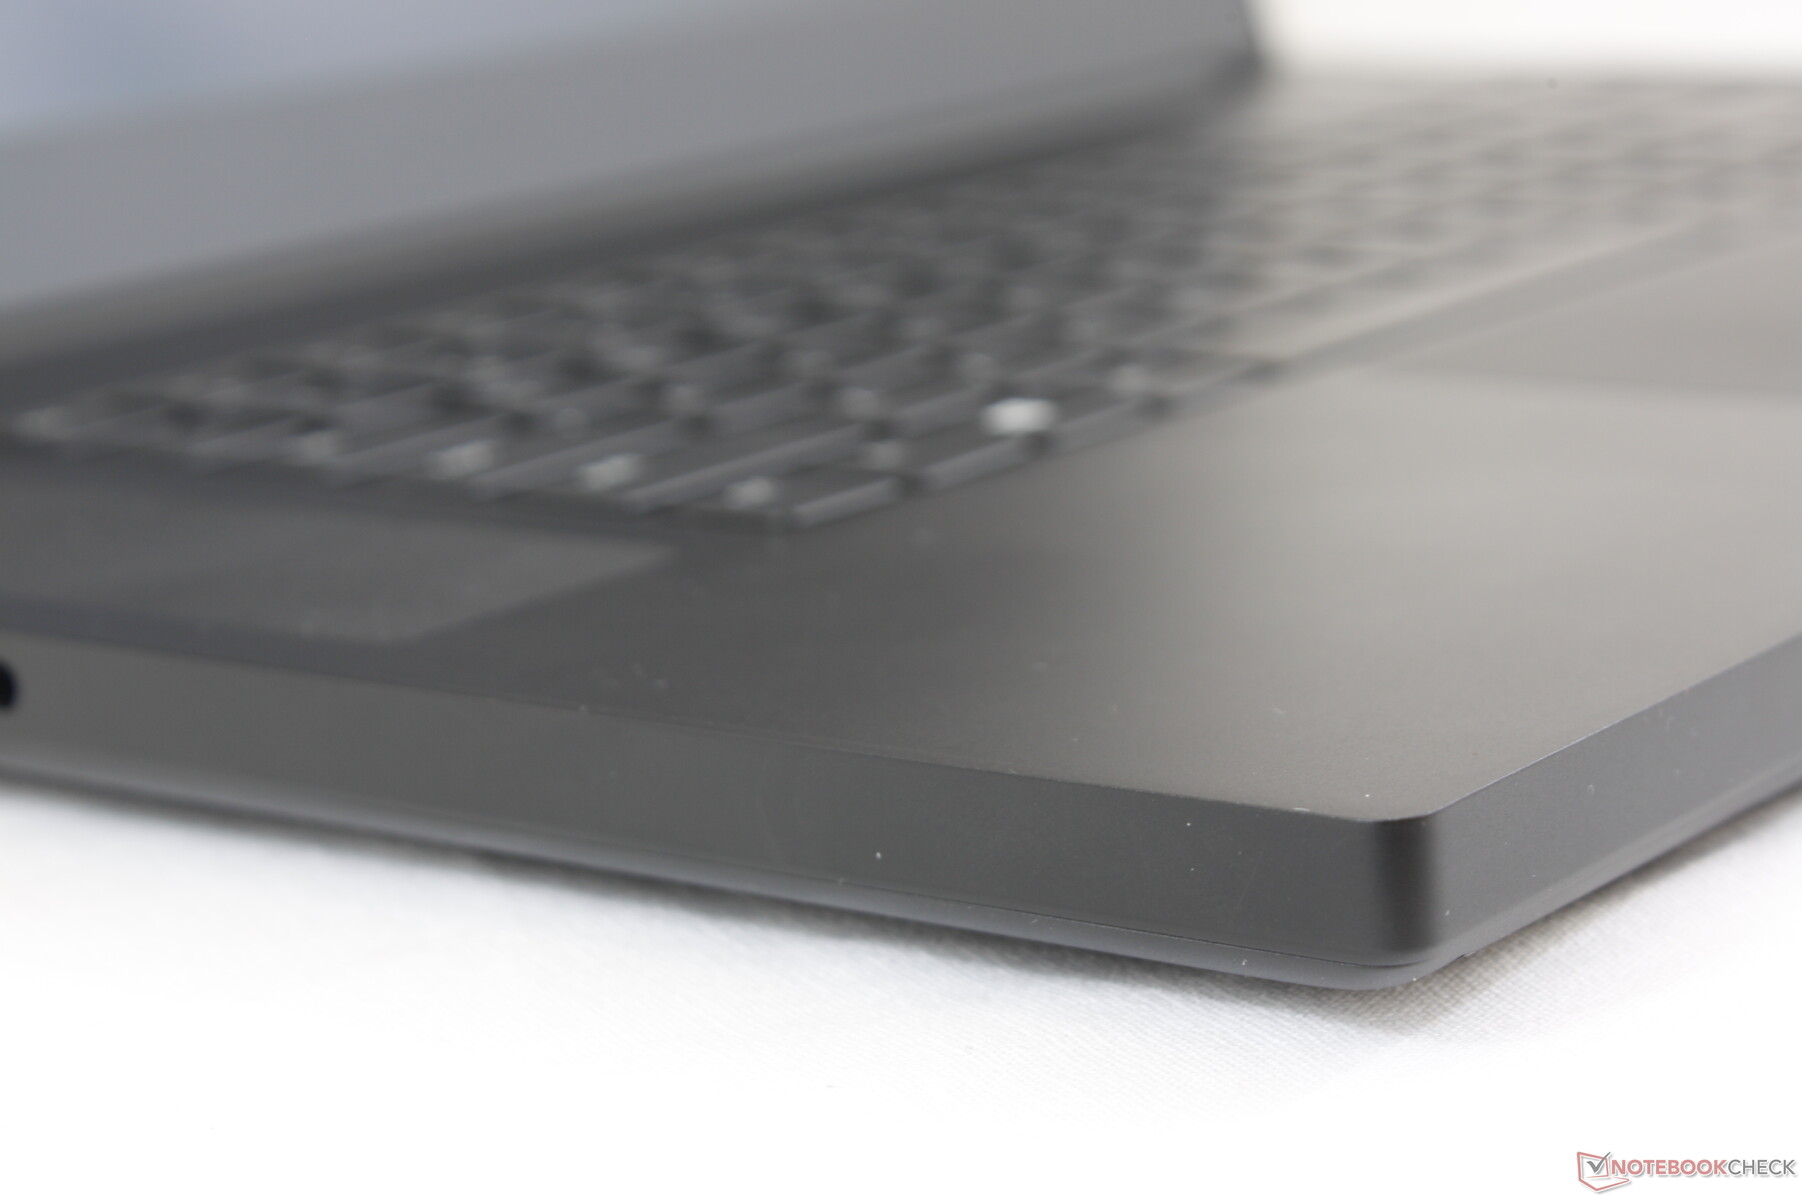
Take the 15.6-inch Blade 15 aluminum-magnesium chassis, enlarge it for a 17.3-inch form factor, and you essentially have the new Blade Pro 17. Razer has applied what they've learned from the Blade 15 series onto their third generation Blade Pro design and the results are impressive. Chassis rigidity in particular is excellent with essentially no flexing or creaking of the base when attempting to twist it or depress its keyboard center. Even the lid is stiffer than the lids of many other narrow-bezel 17.3-inch laptops including the Asus Zephyrus S GX701. It's amazing how Razer has translated its Blade 15 chassis so well for a larger screen size while maintaining the robust build almost 1:1. The 17.3-inch MSI GS75, for example, is also an enlarged version of its smaller 15.6-inch GS65 sibling and yet it feels comparatively weaker and more flexible.
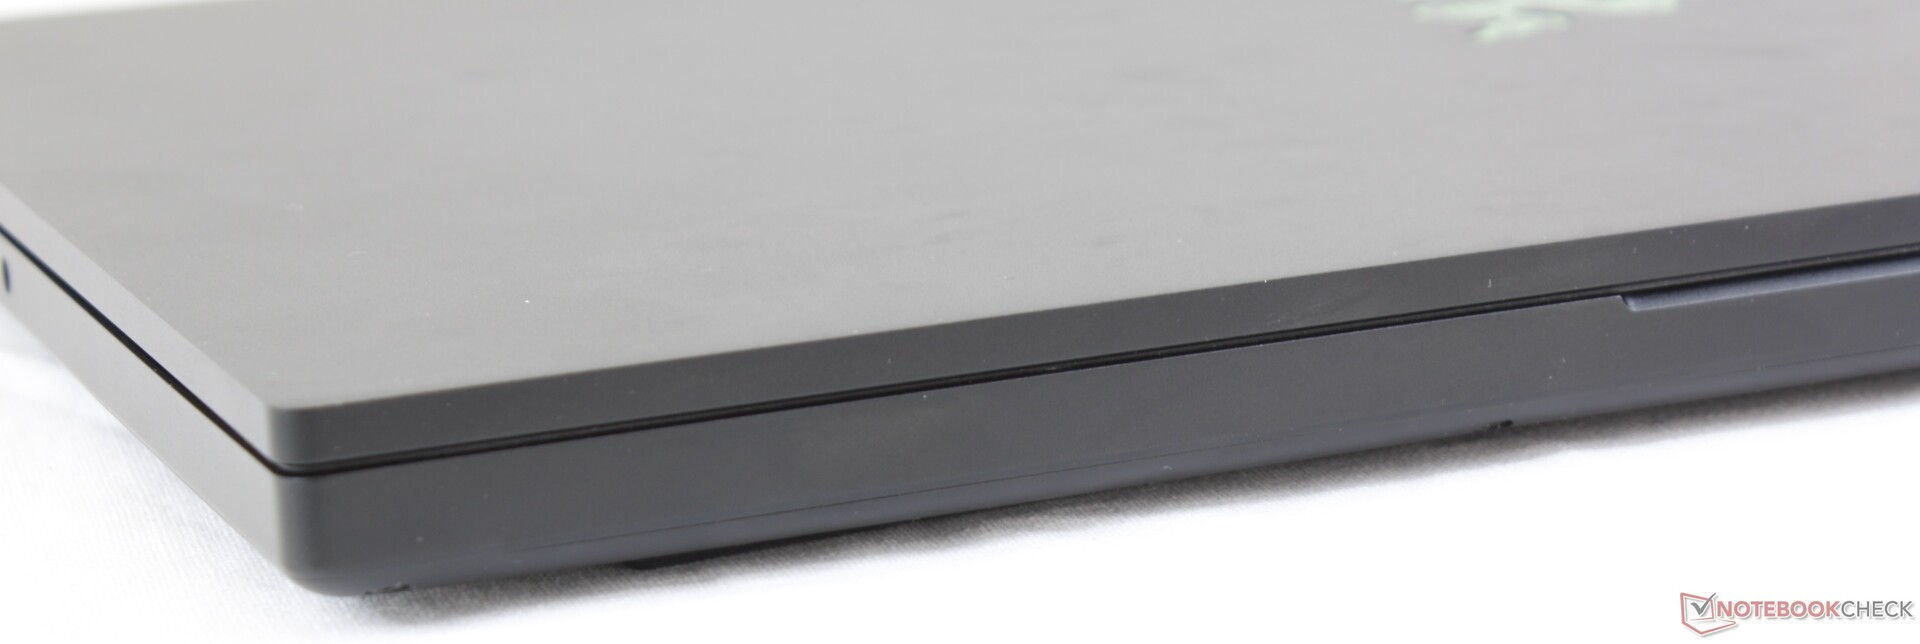
In short, you'll have a good idea of how the Blade Pro 17 looks and feels if you've ever handled a Blade 15. The flip side to this is that the notebook suffers from many of the same drawbacks as the current Blade 15 including the fingerprint-loving surfaces and limited hinge angle. The lids of the Lenovo Legion Y740 or Alienware m17 R1 can open almost the full 180 degrees in comparison.
Build quality is perfect on our test unit with no unintended gaps or defects between materials. It's a much more minimalist and unibody approach when compared to competing gaming laptops that ultimately jibes very well with Razer's current crop of Blade 15 and Blade Stealth offerings.
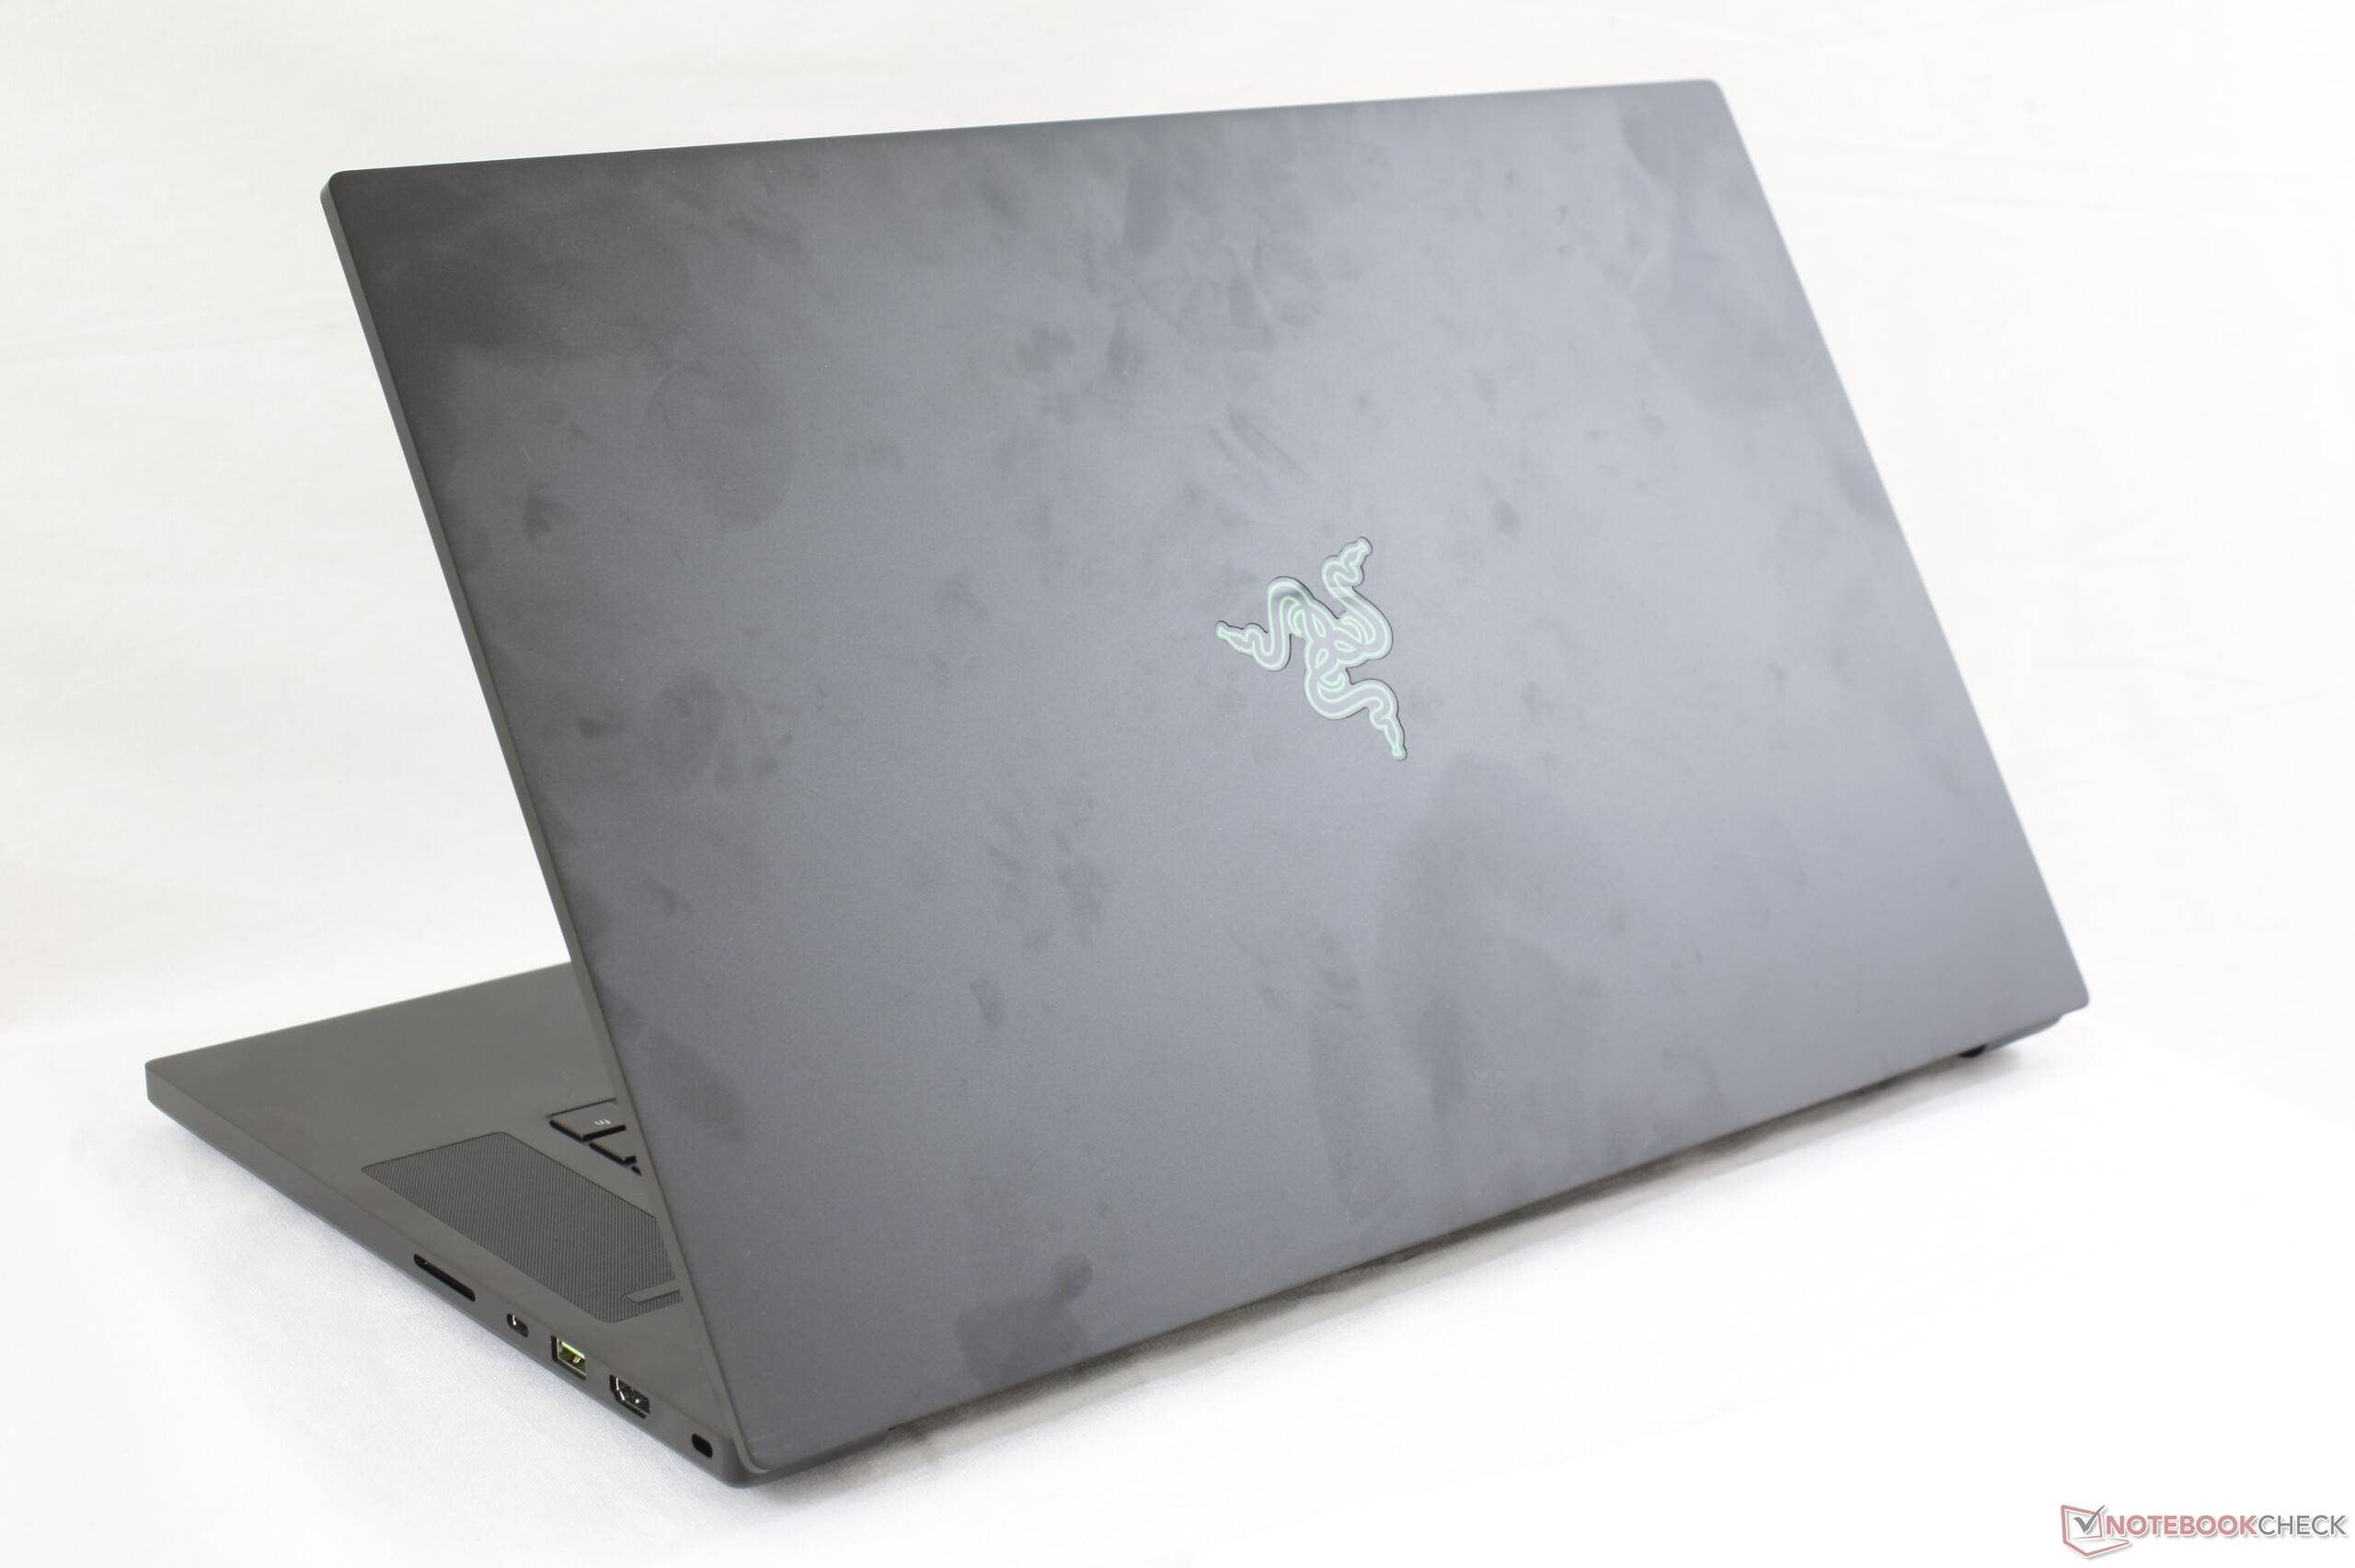
The Blade Pro 2017 was notoriously heavy at about 3.6 kg. The thinner bezels and significantly smaller dimensions of the new Blade Pro 17 have shaved off 800 grams (!) from the final weight to be more in line with other ultra-thin 17.3-inch gaming laptops including the Lenovo Legion Y740 and Asus ROG GL704GW. It's still about 500 g heavier than the MSI GS75, however, since Razer utilizes a stiffer skeleton with vapor chamber cooling.
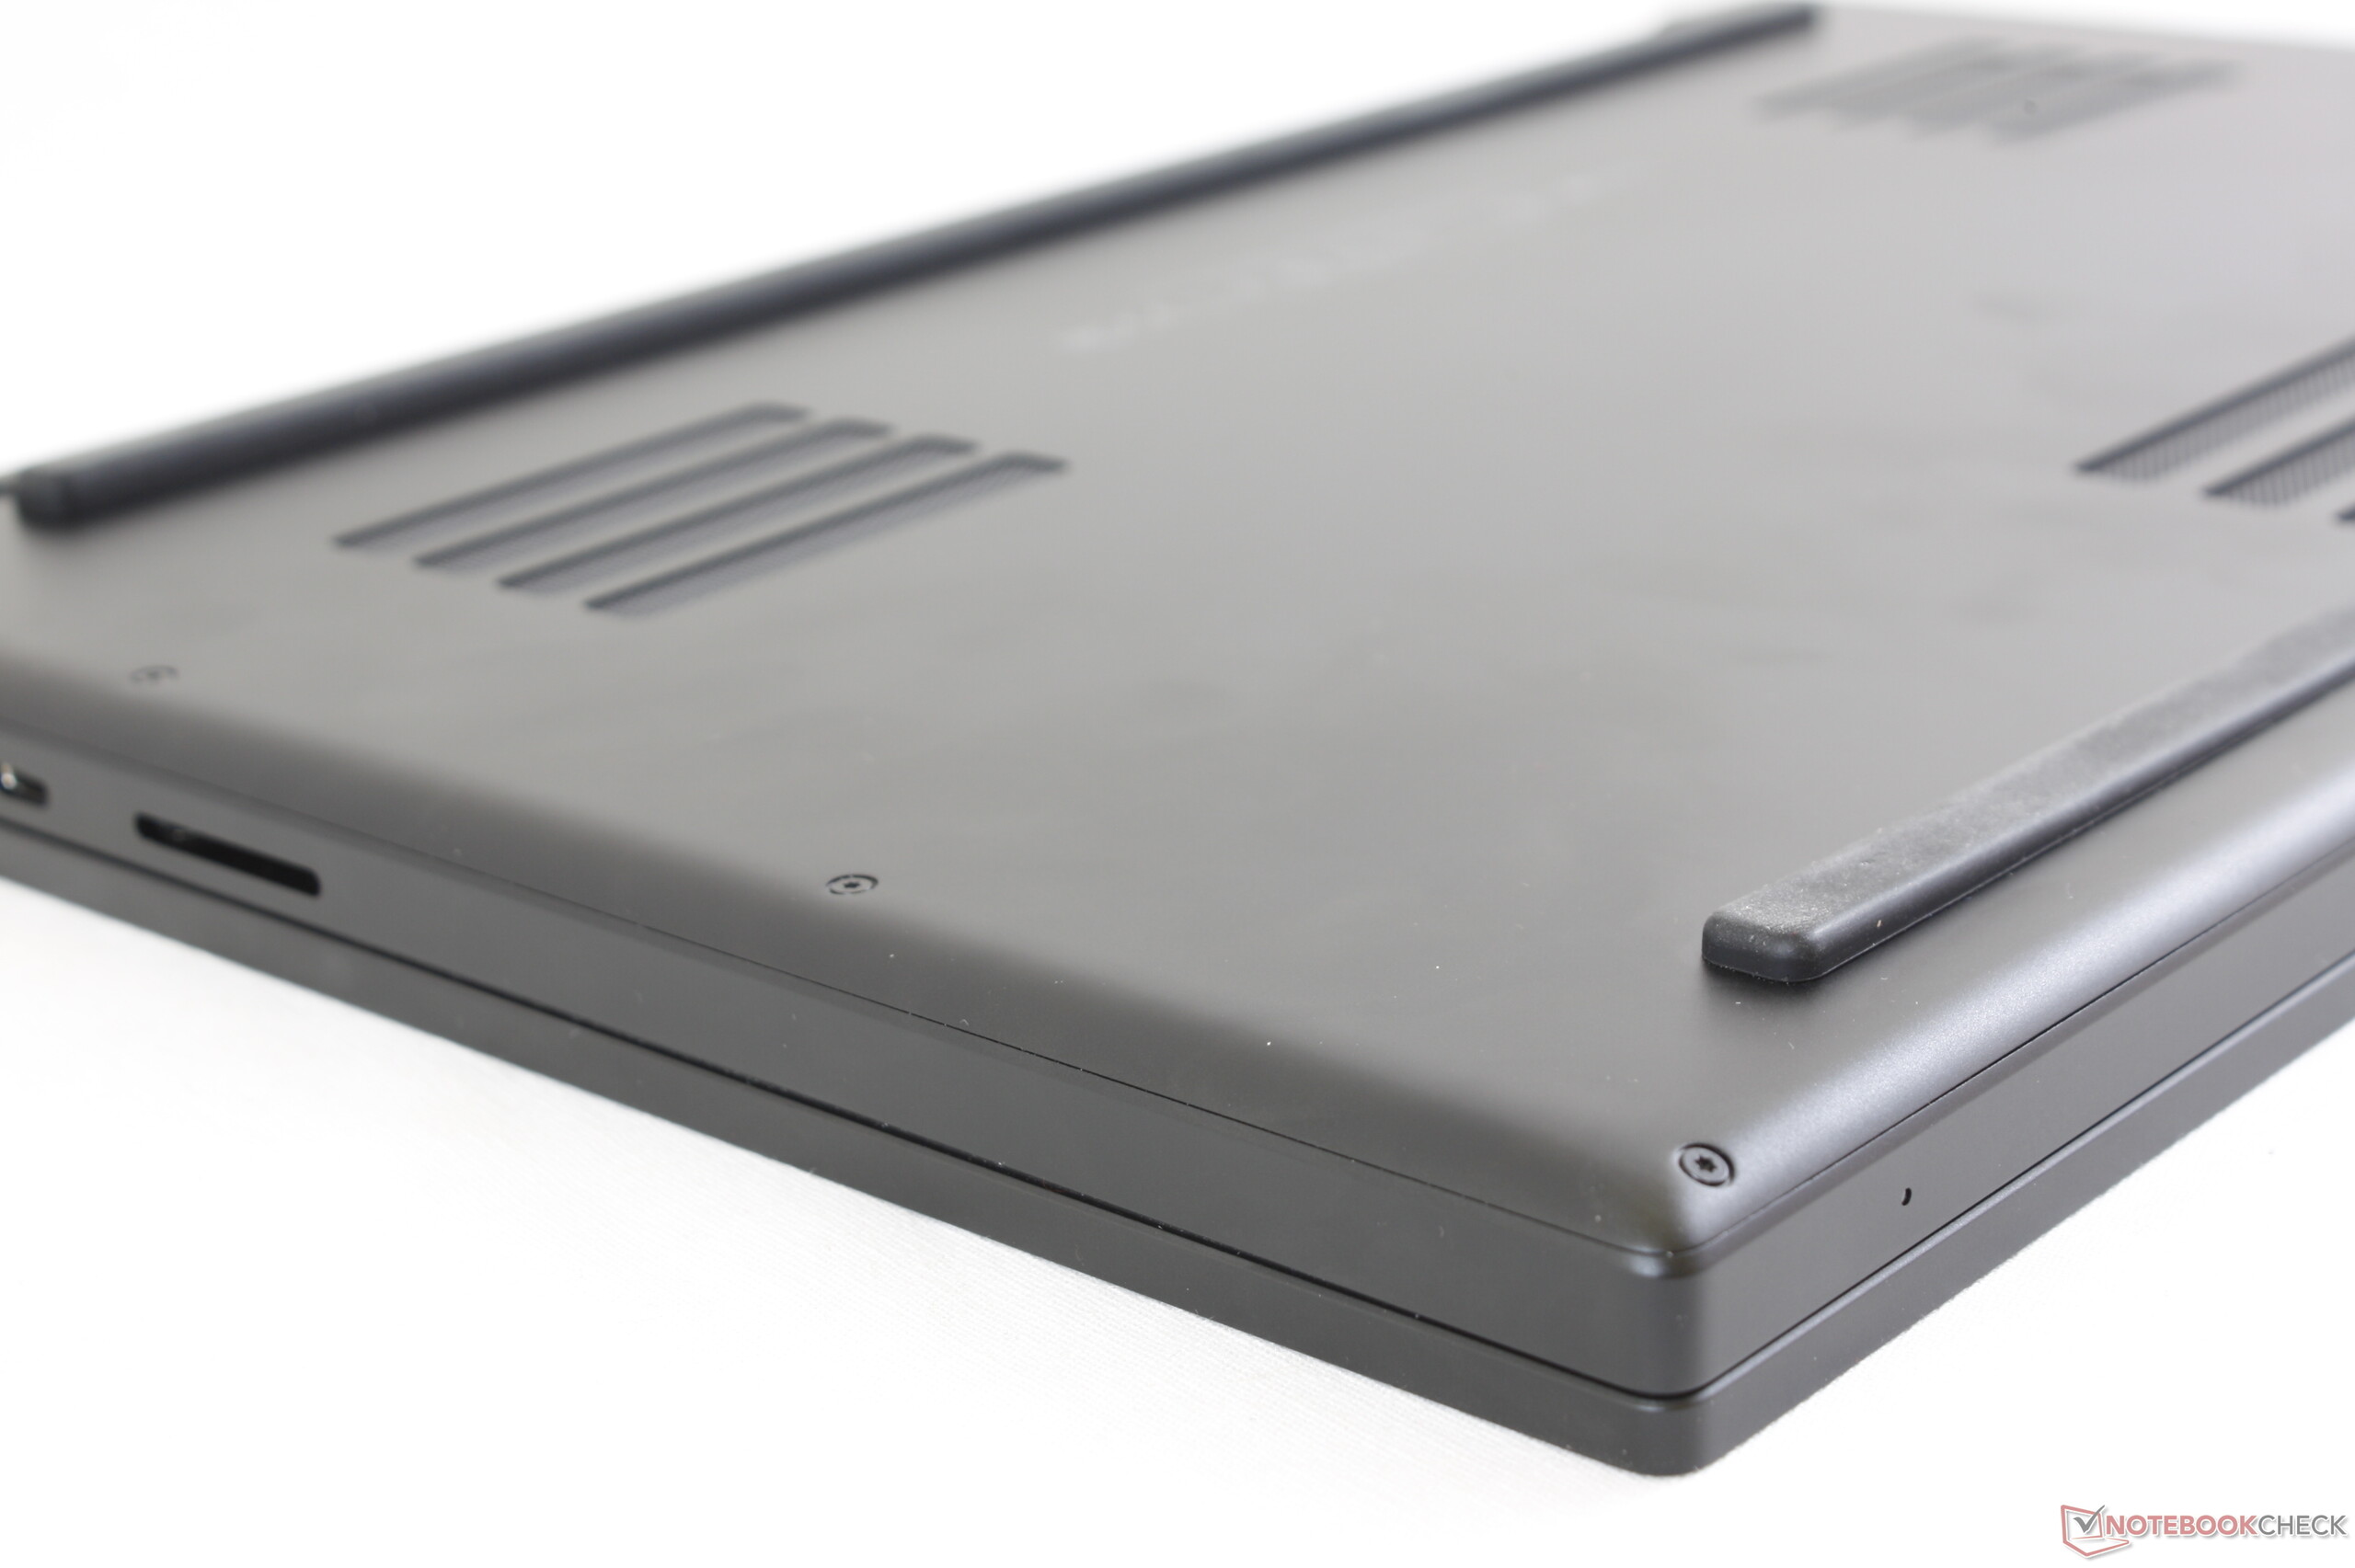
Footprint is small for its size category especially when compared to the Lenovo Legion Y740 or Alienware m17 since these alternatives have large "jet engine" rear ends dedicated for cooling.
Connectivity
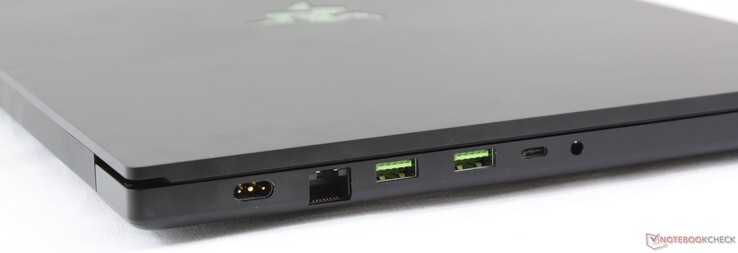
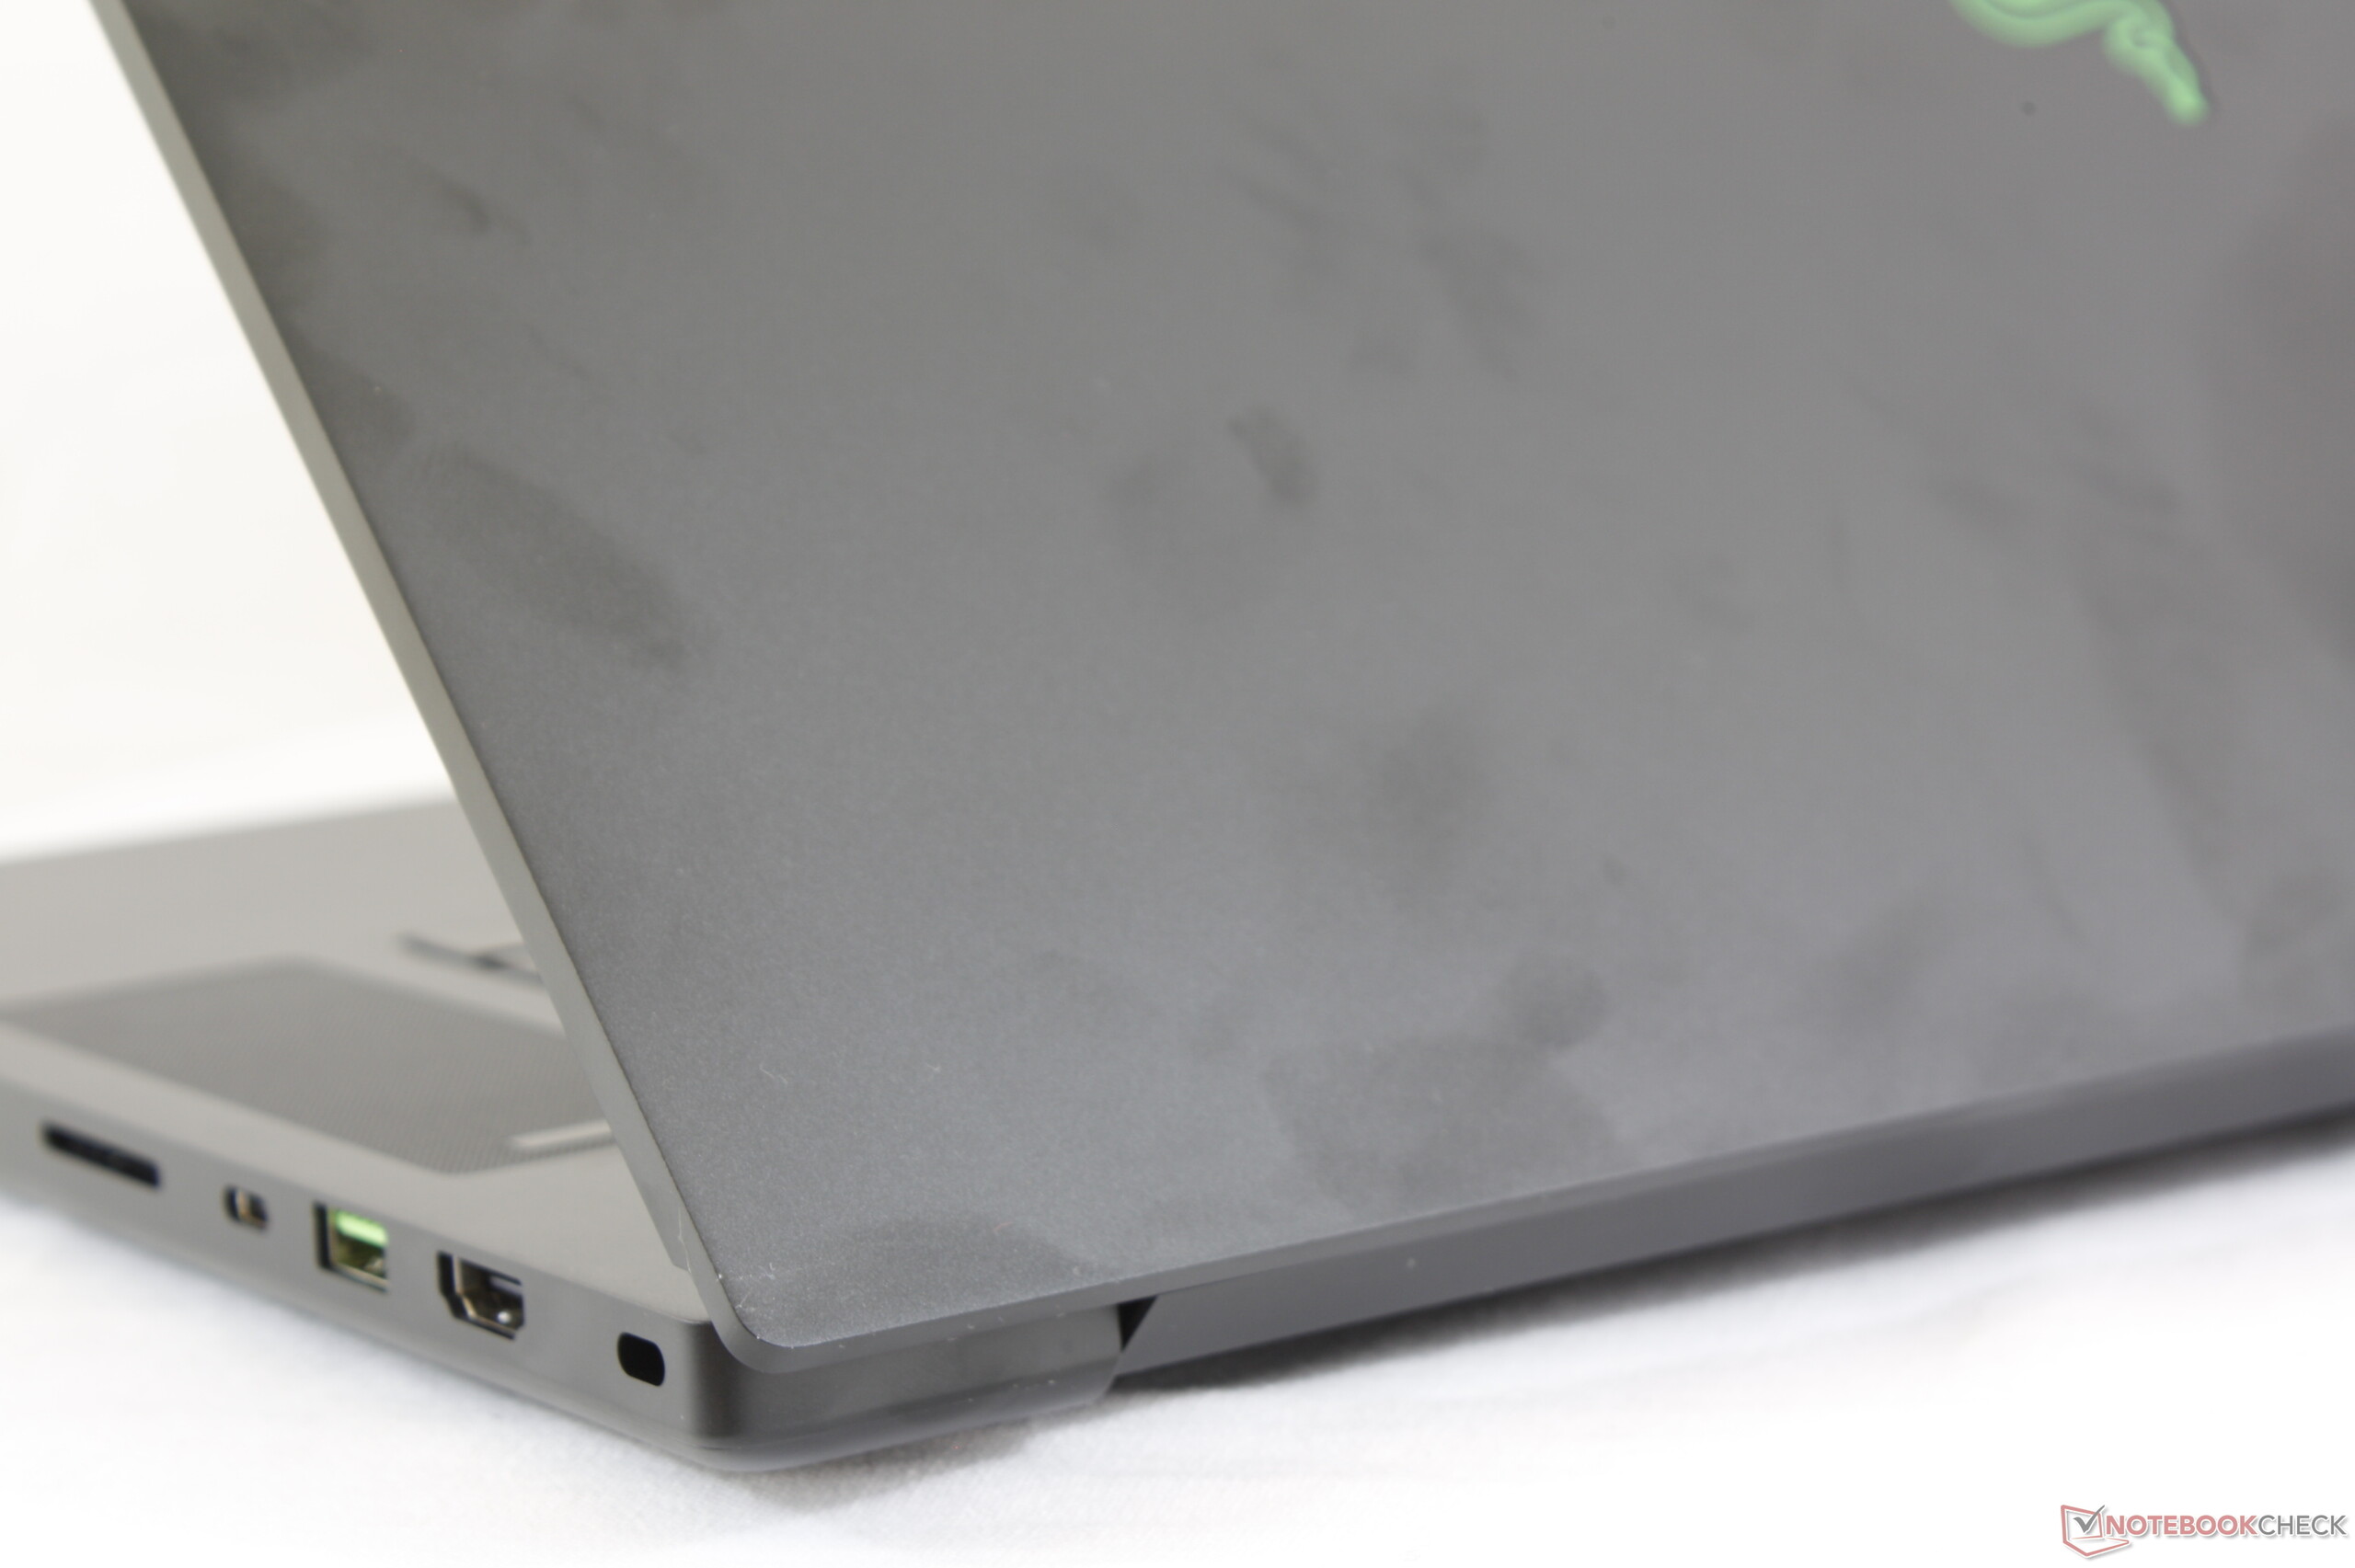
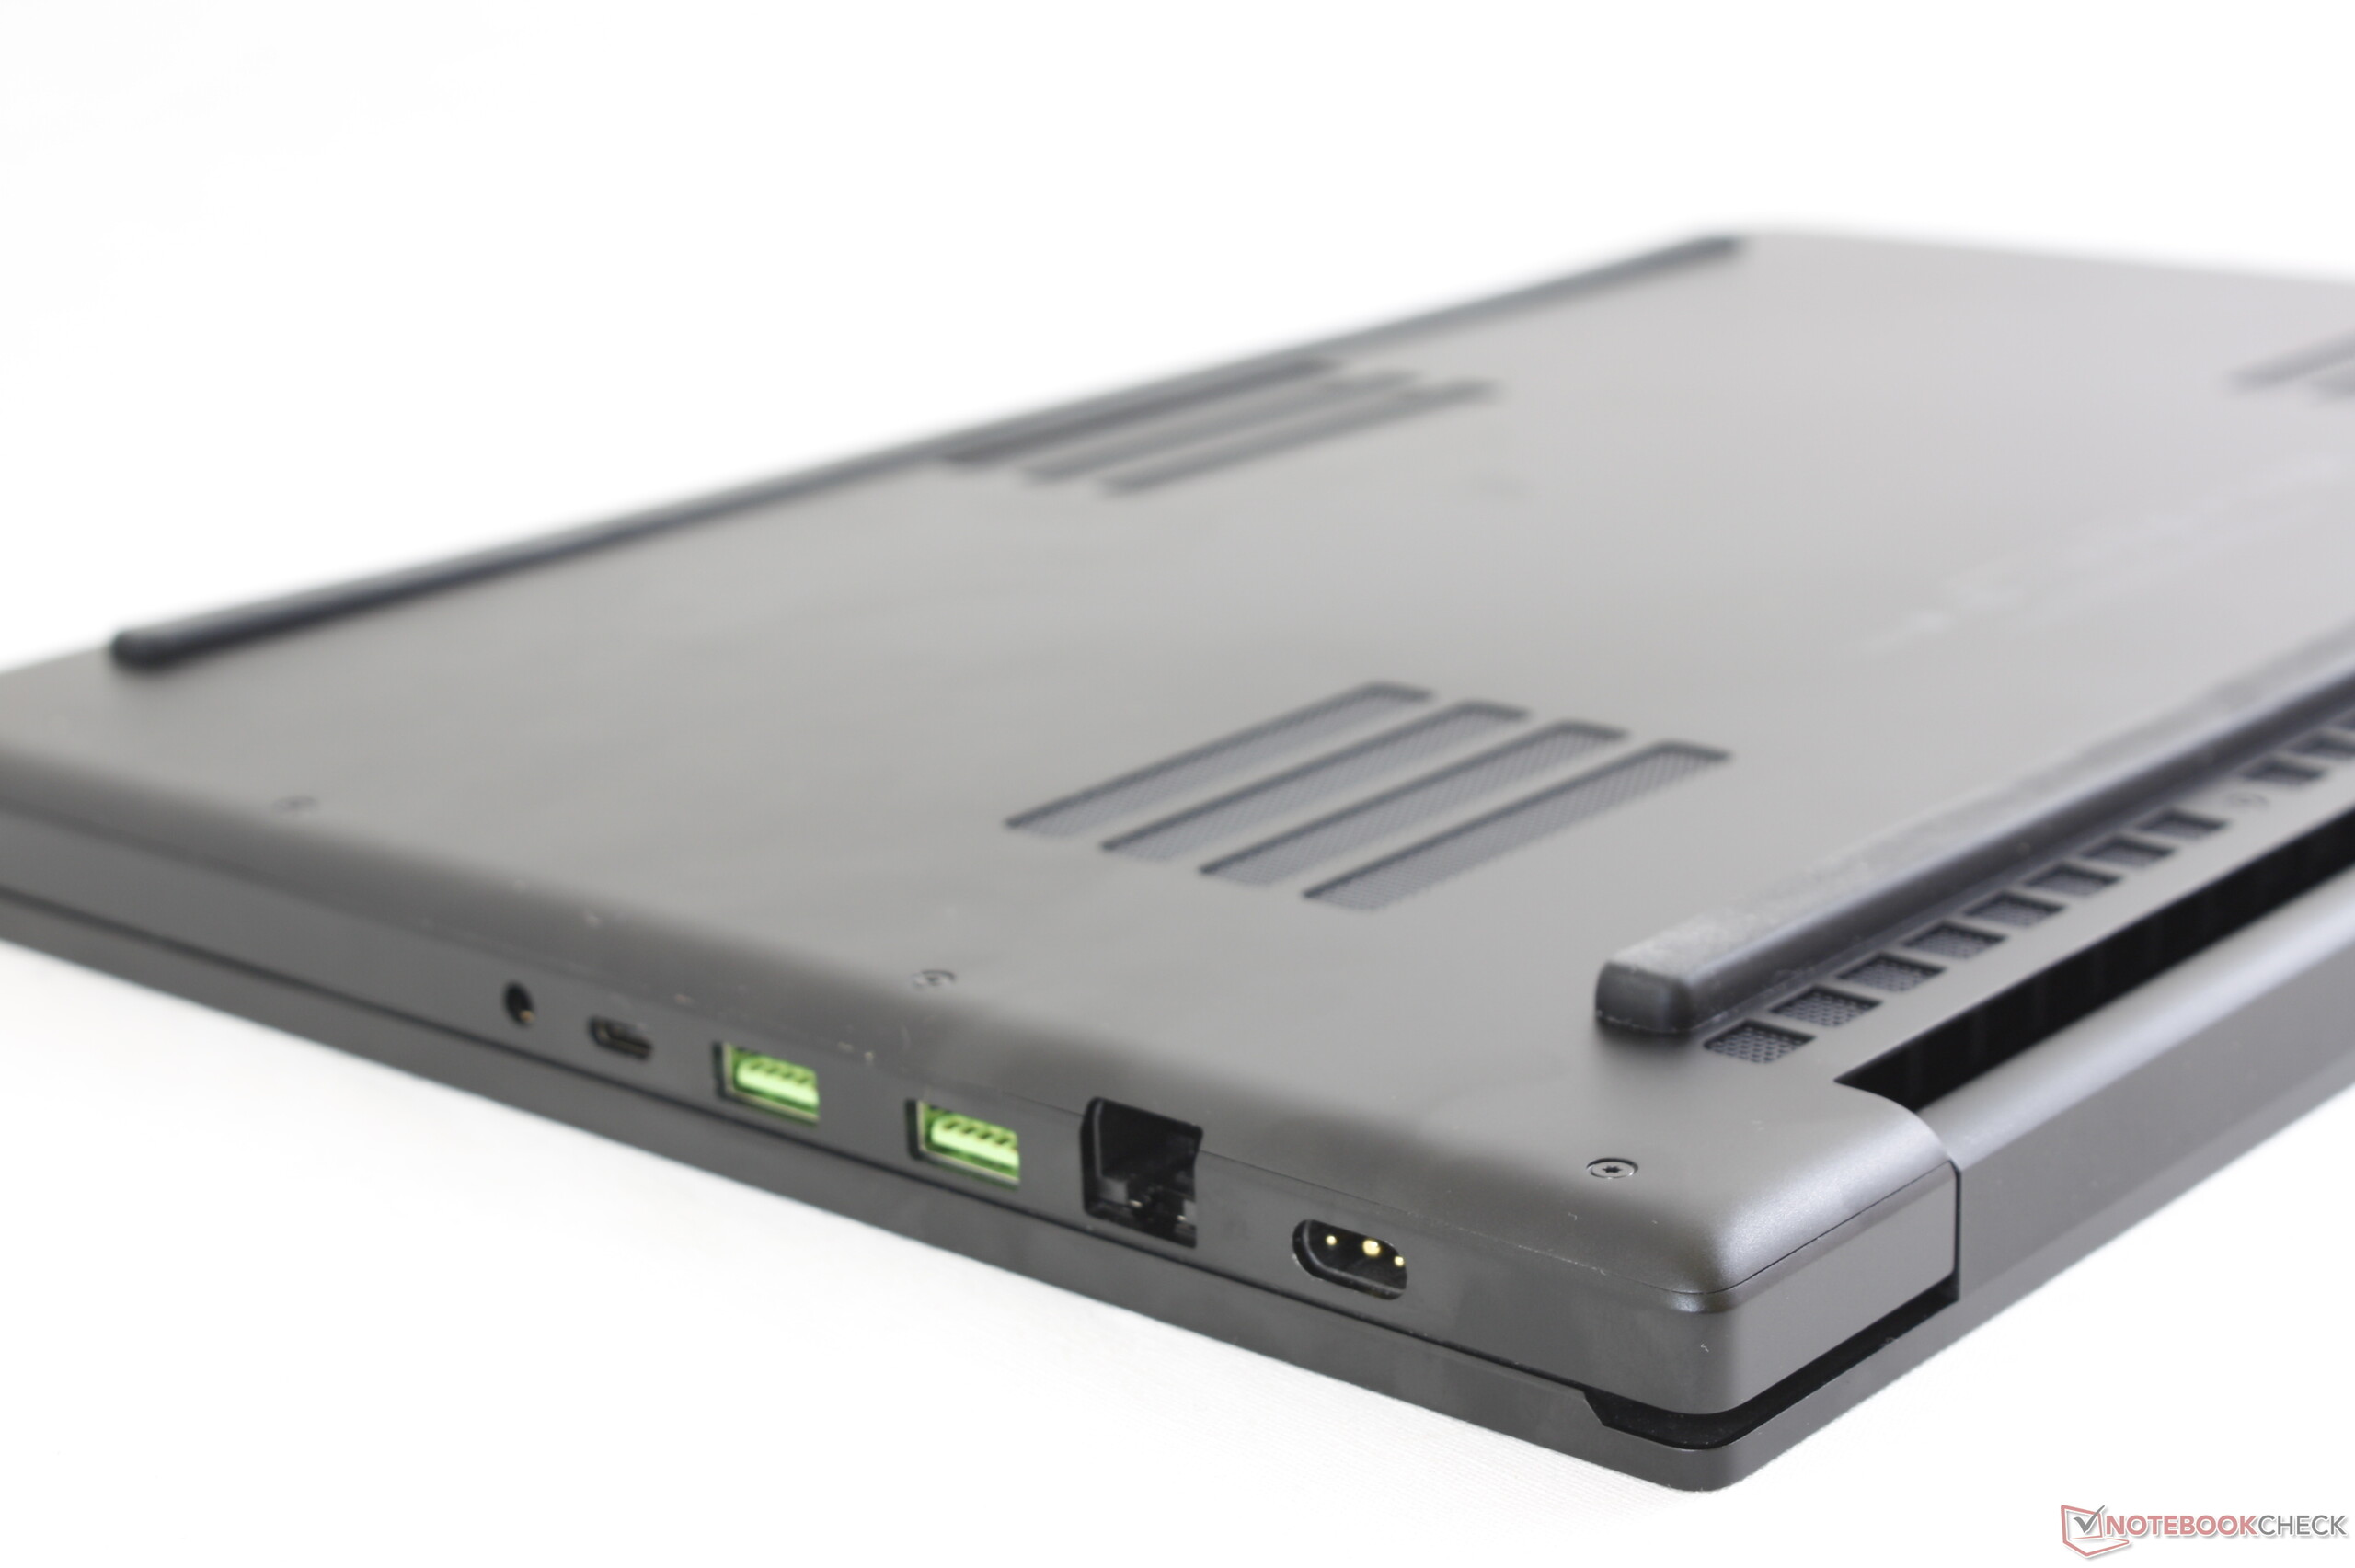
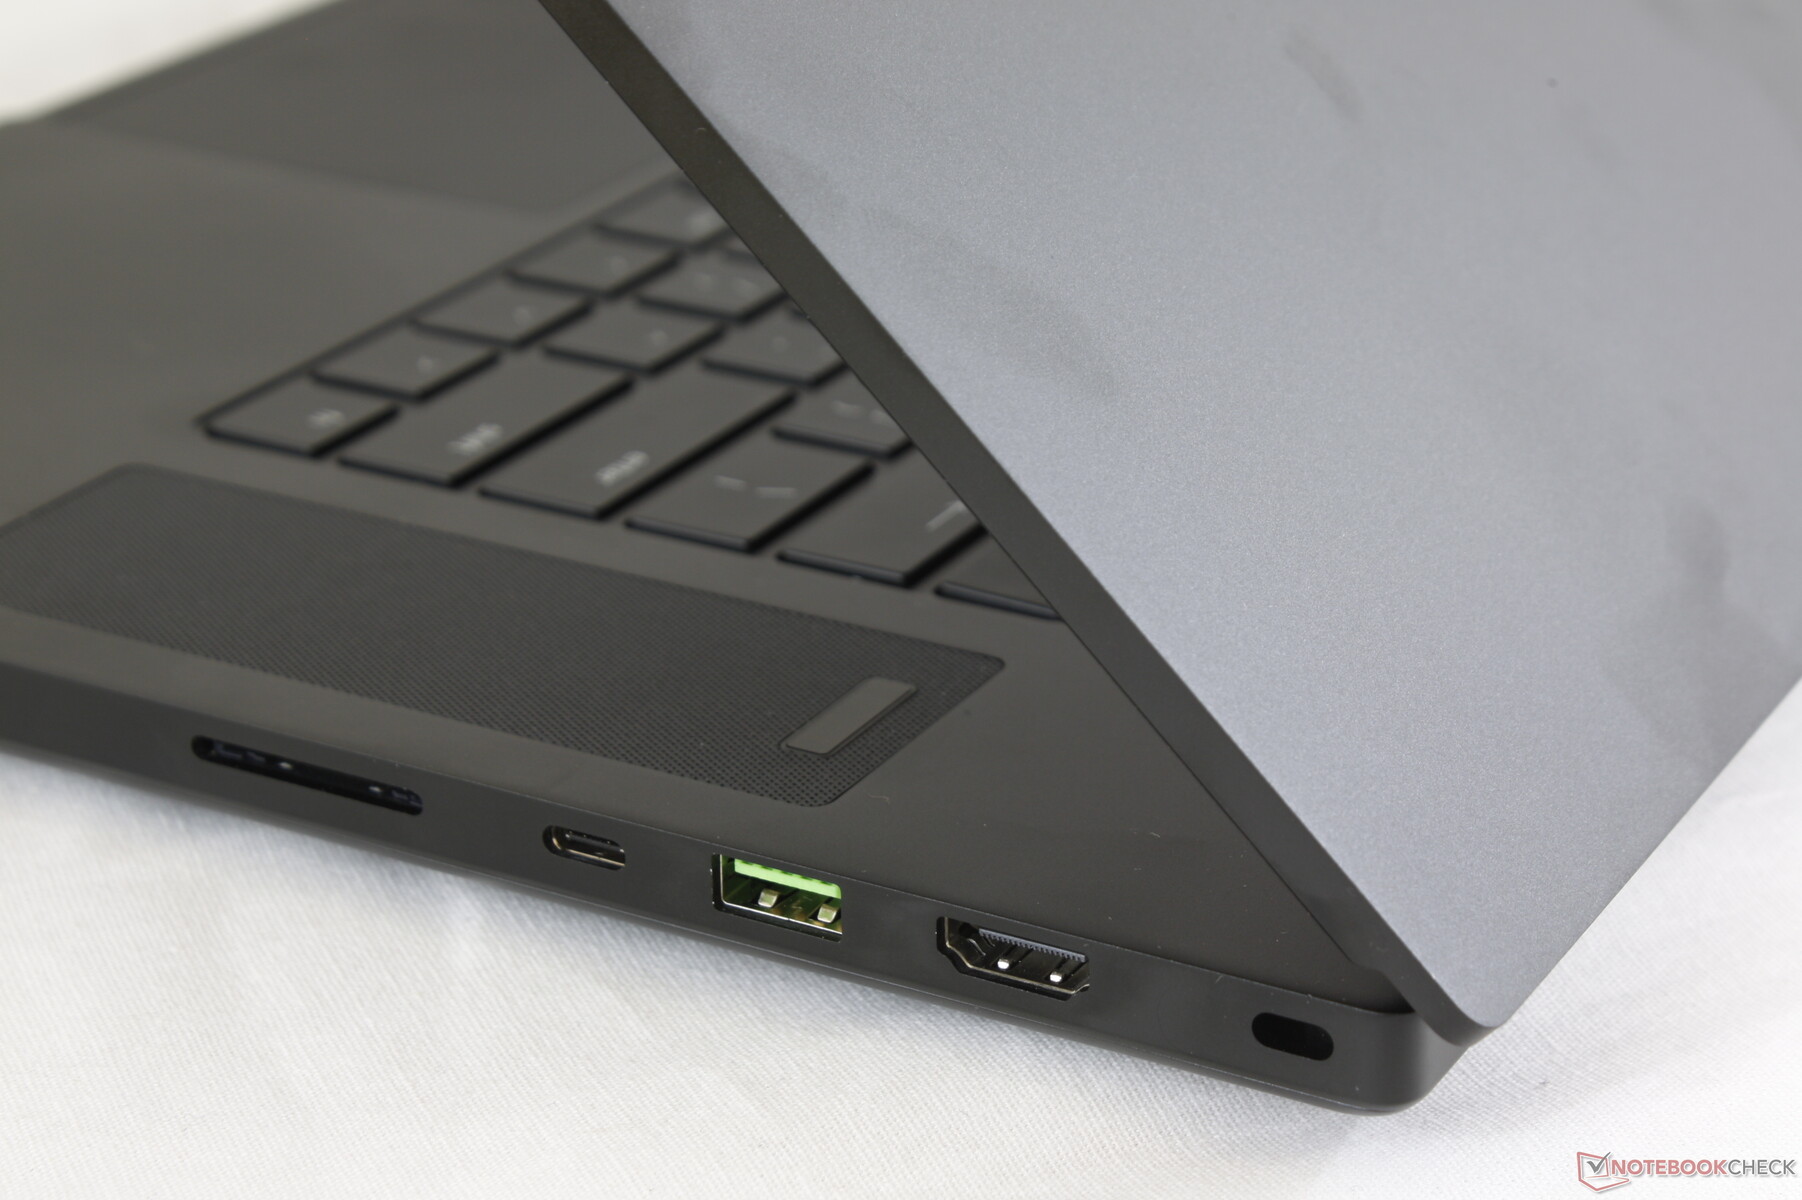
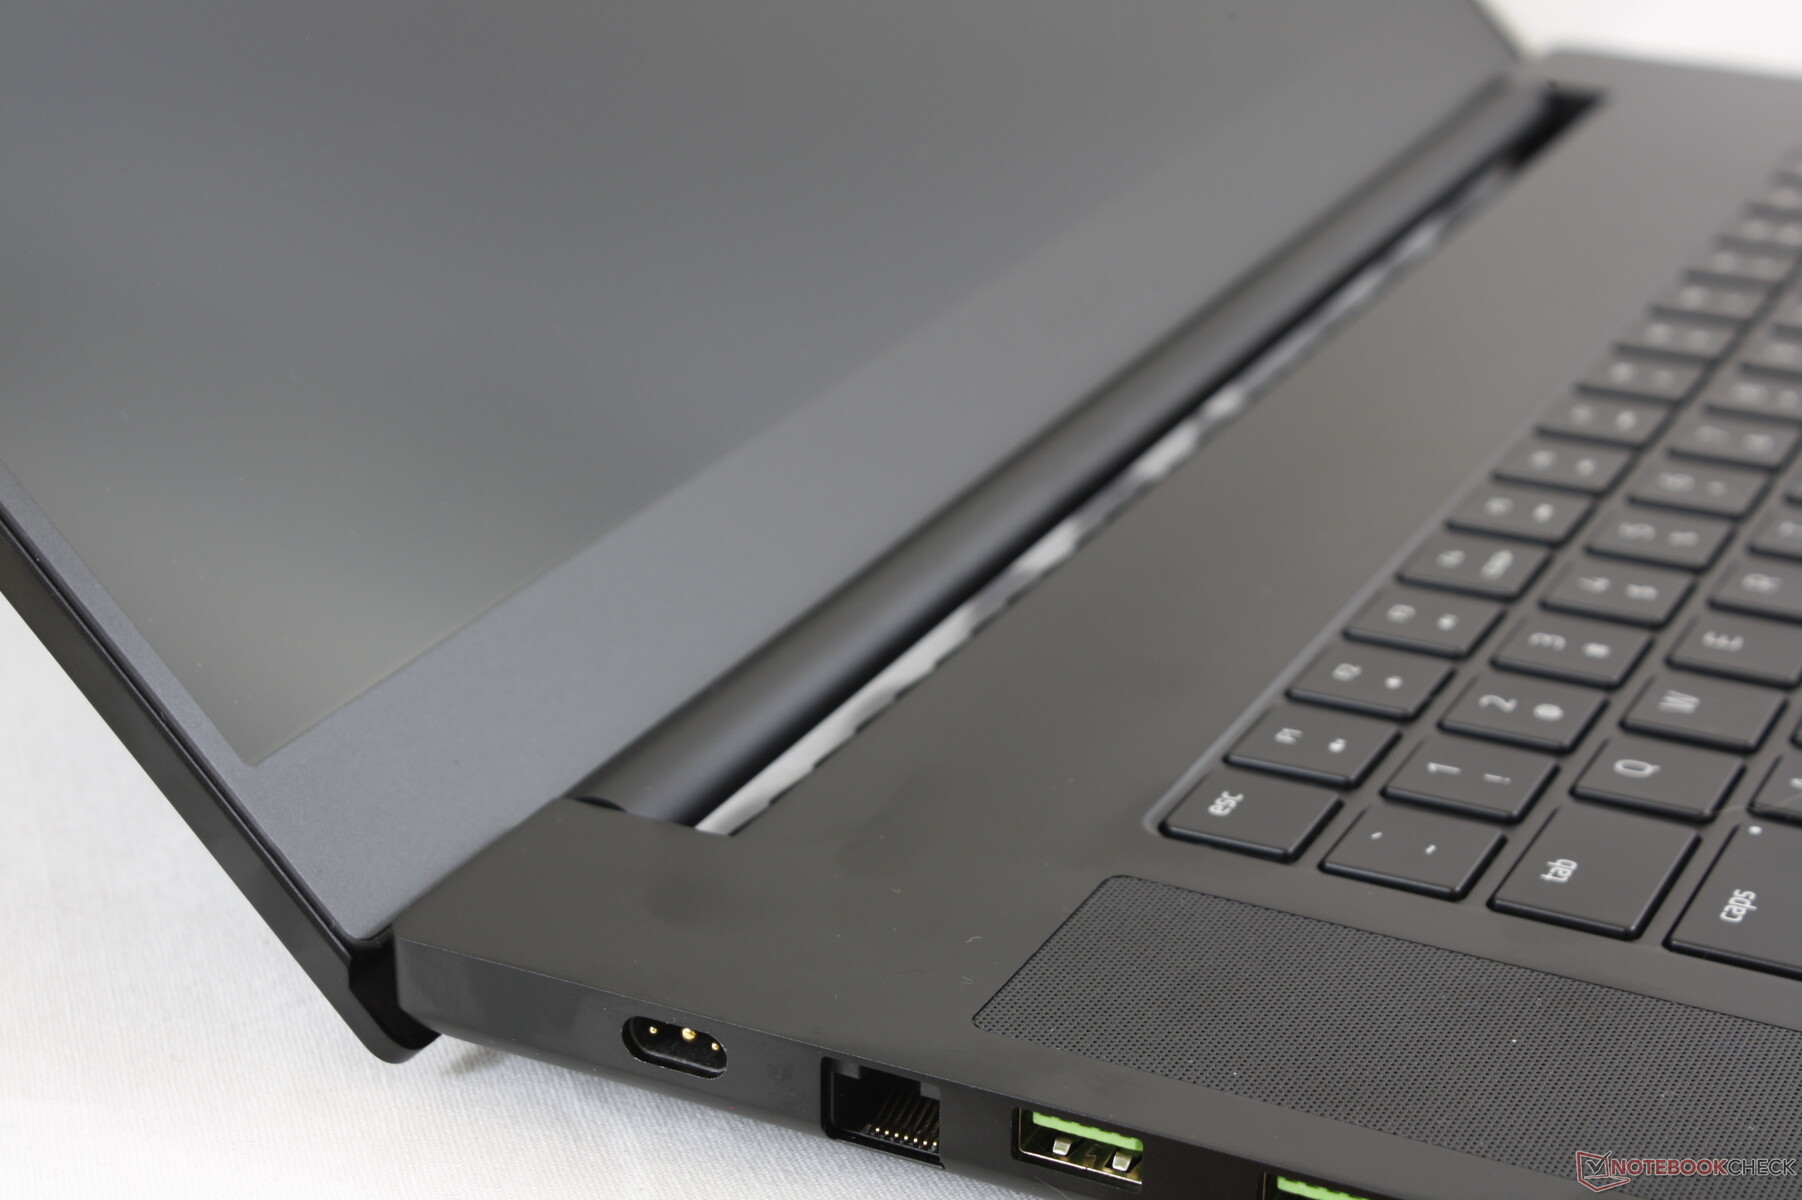
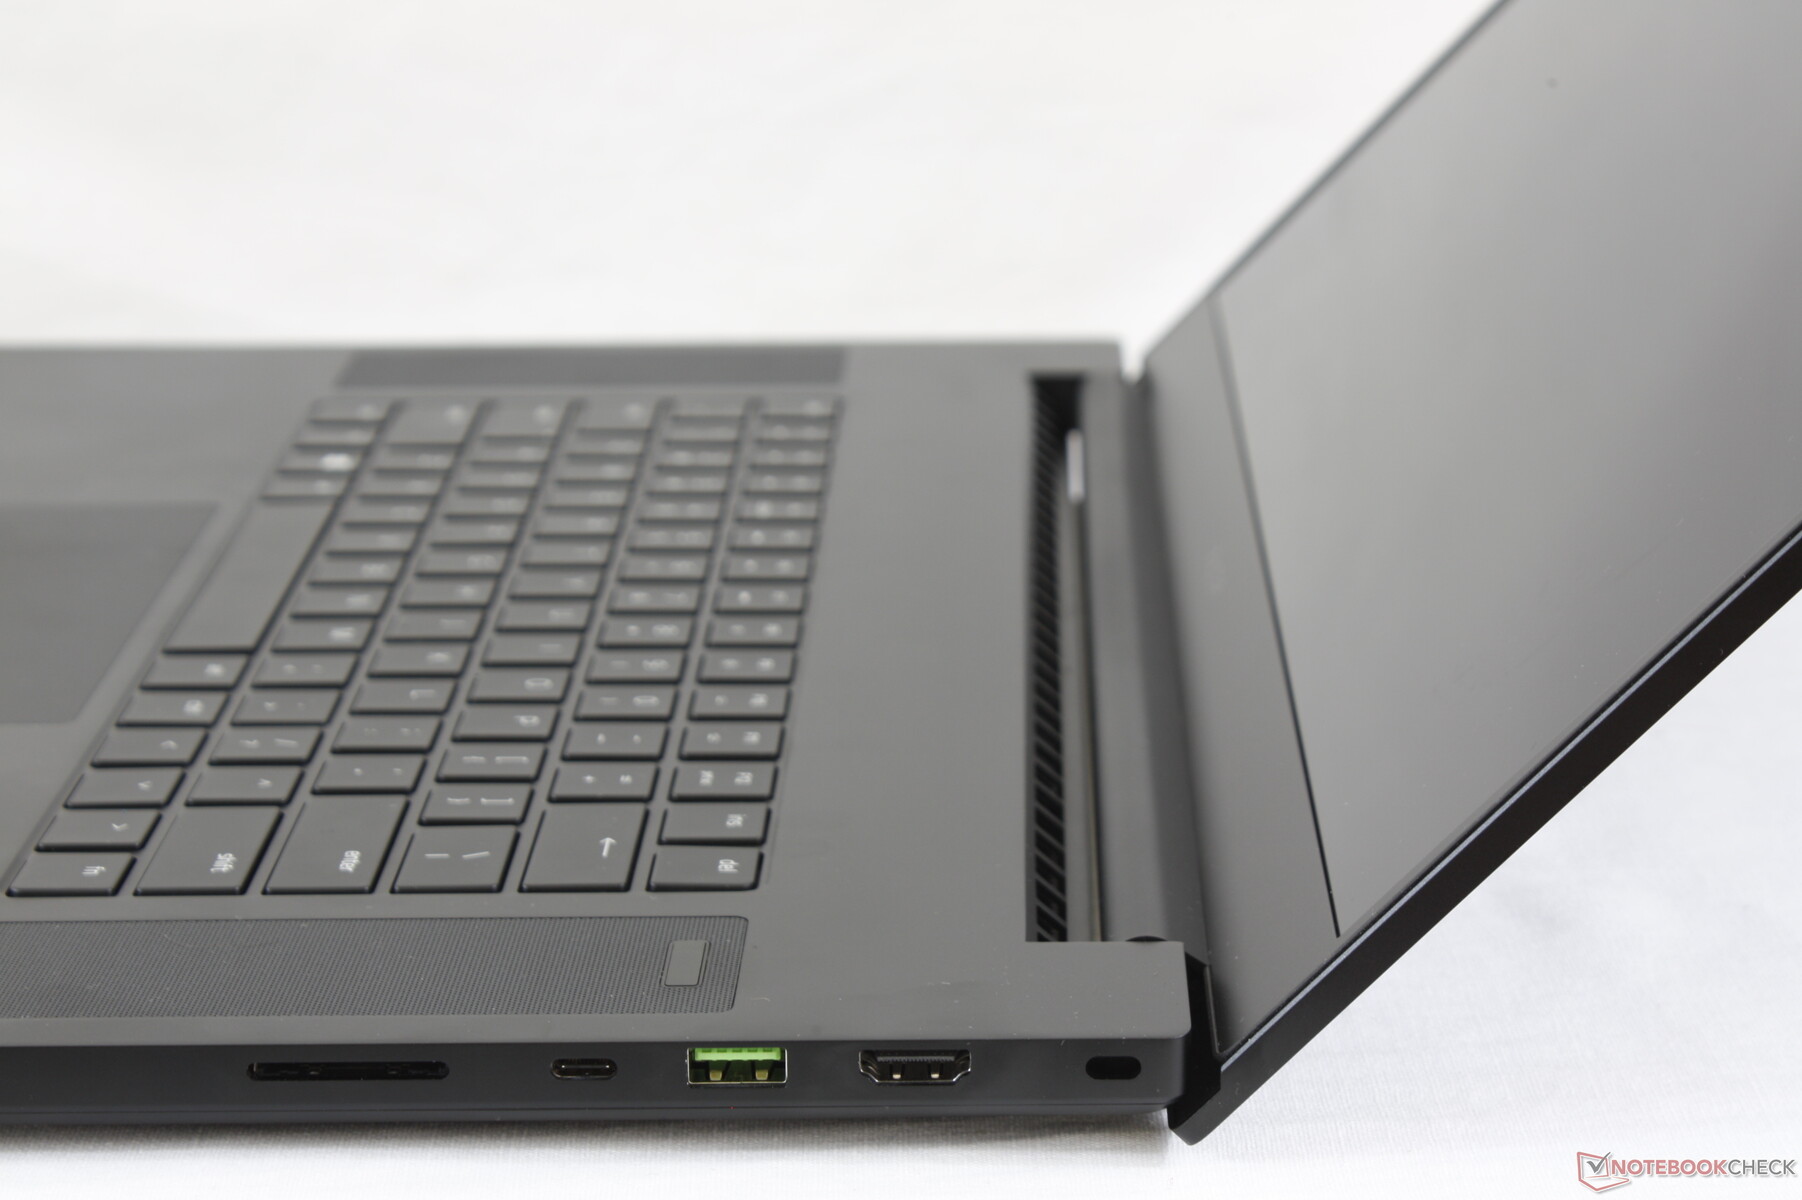
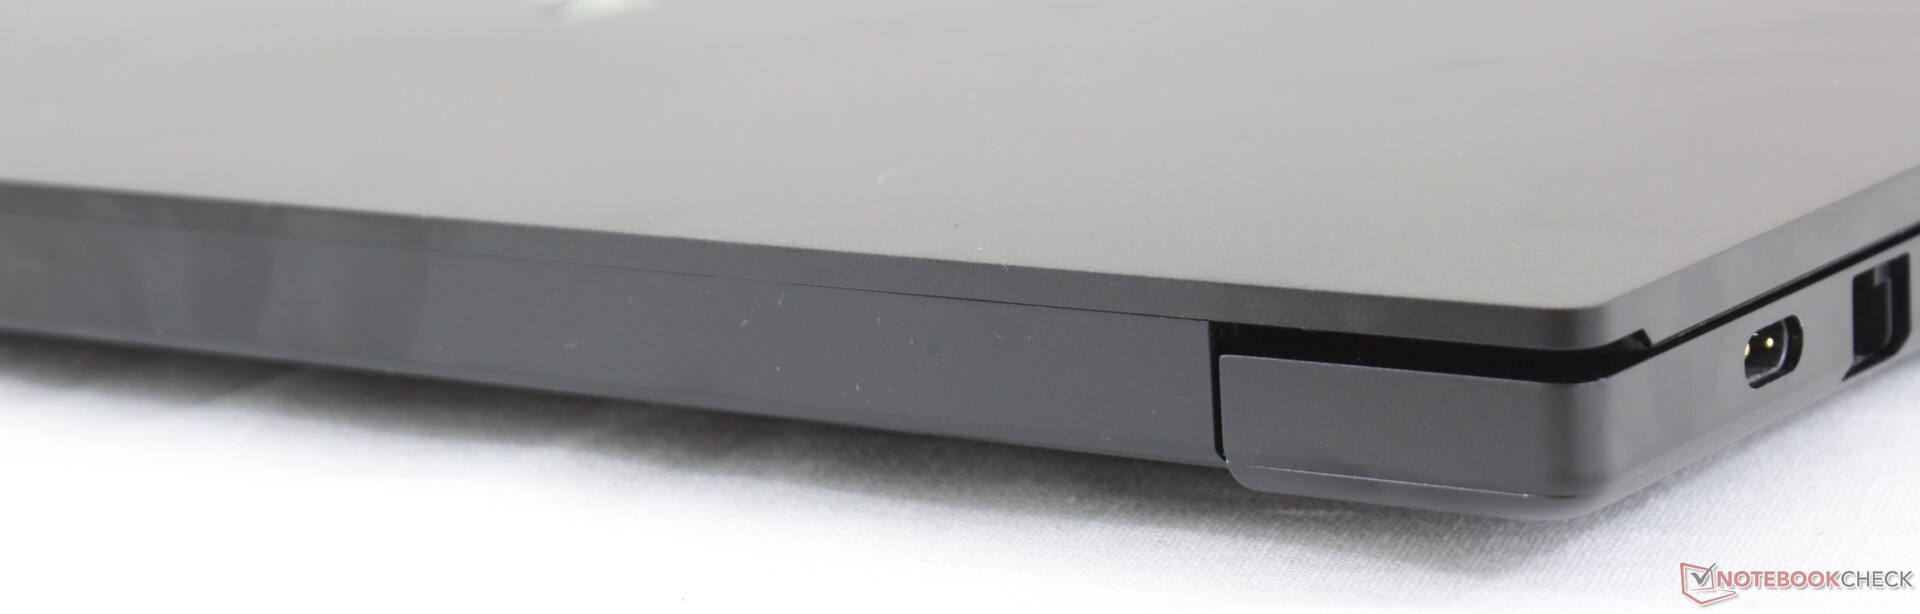
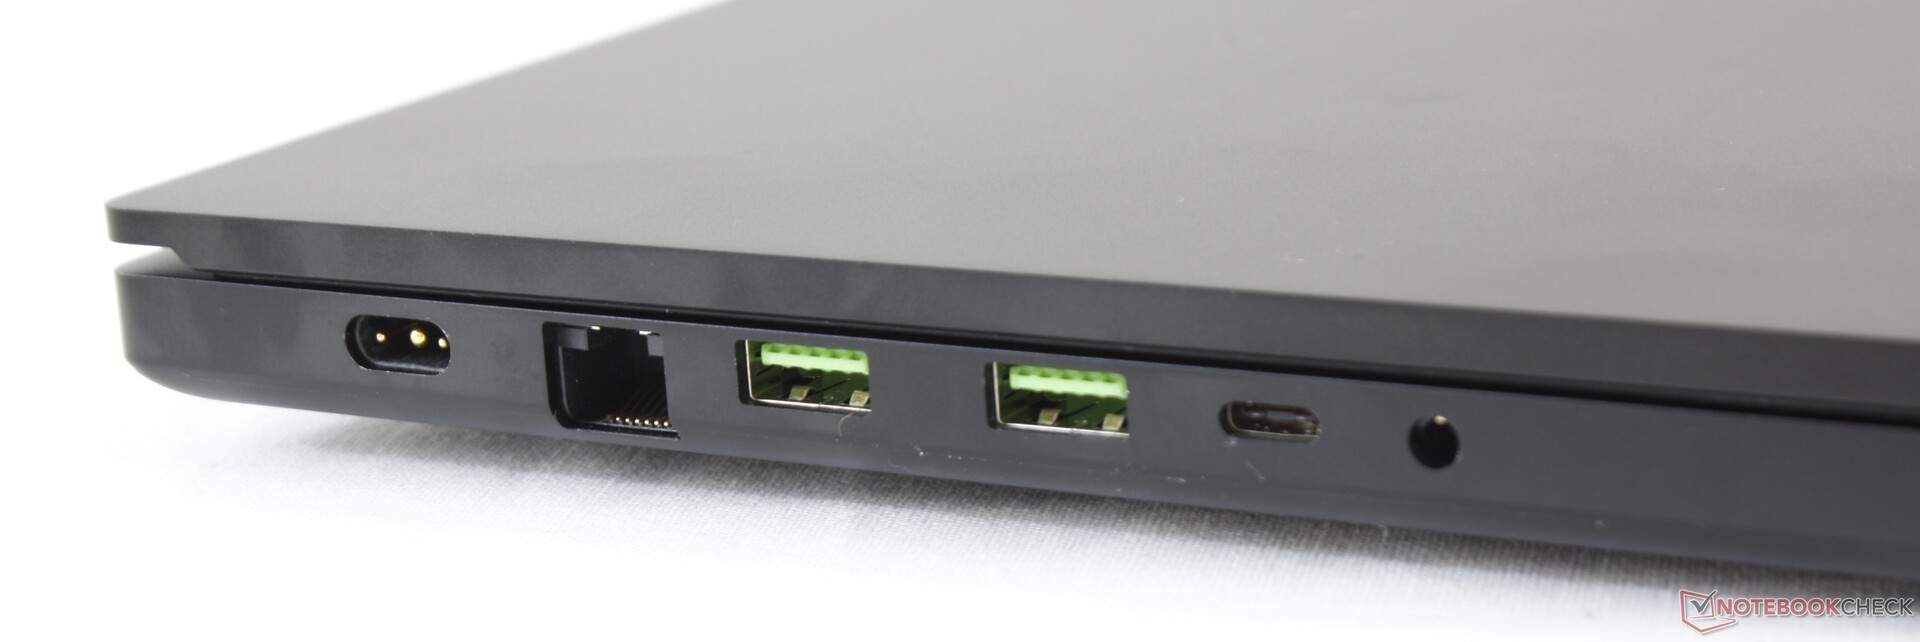
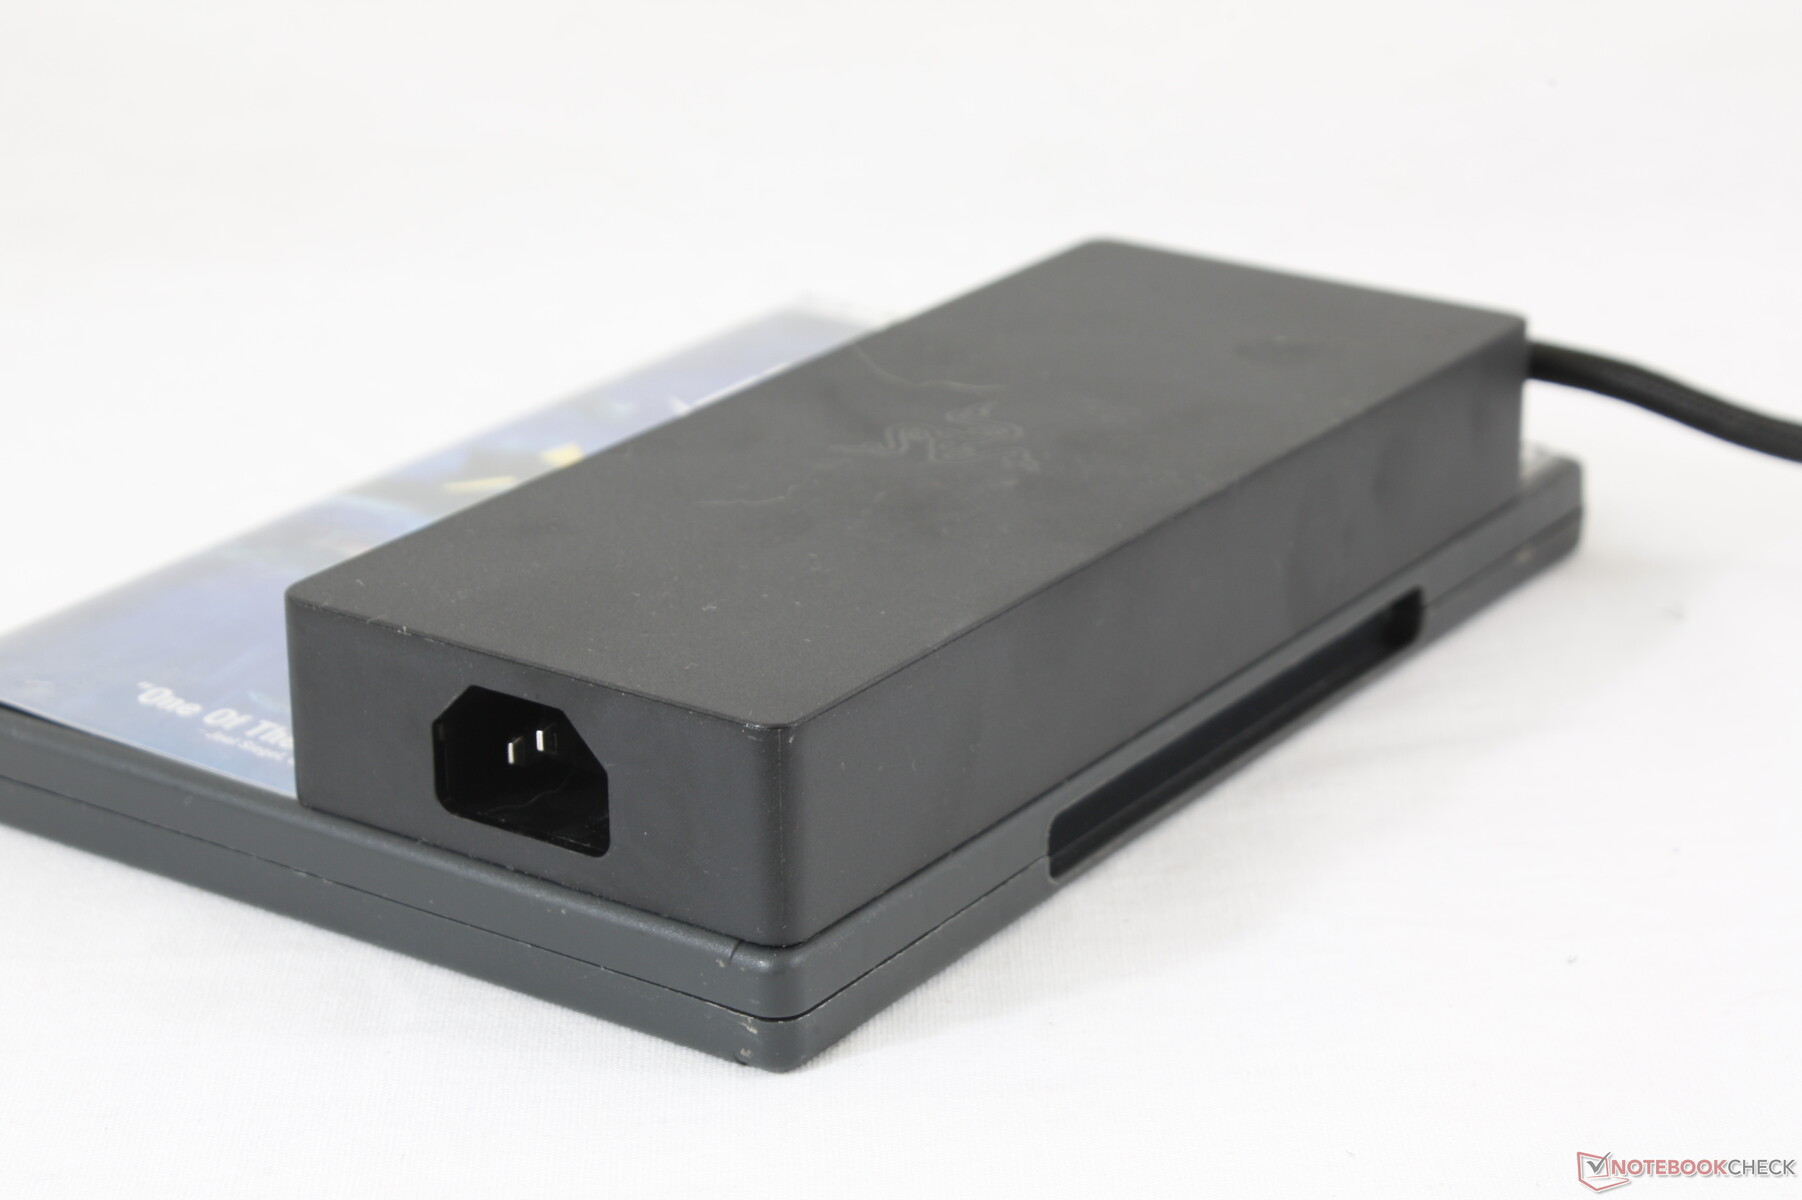
The Blade Pro 17 comes with all ports as found on the Blade Pro 2017 but with a second USB Type-C port thrown in for good measure. Many of the existing ports have also been upgraded for faster speeds including the USB ports (USB 3.0 to 3.2), Ethernet port (1 Gbps to 2.5 Gbps), and SD card reader (UHS-II to UHS-III). Ports are evenly distributed and evenly spaced toward the rear of the chassis where they are easy to access. Our main complaint is that the AC adapter cable can be thick and unwieldy to handle.
It's worth mentioning that the Blade Pro 17 AC adapter is incompatible with the last generation Blade Pro 2017. In contrast, the latest Blade 15 shares the same AC adapter port as the Blade Pro 17 for compatibility between screen sizes.
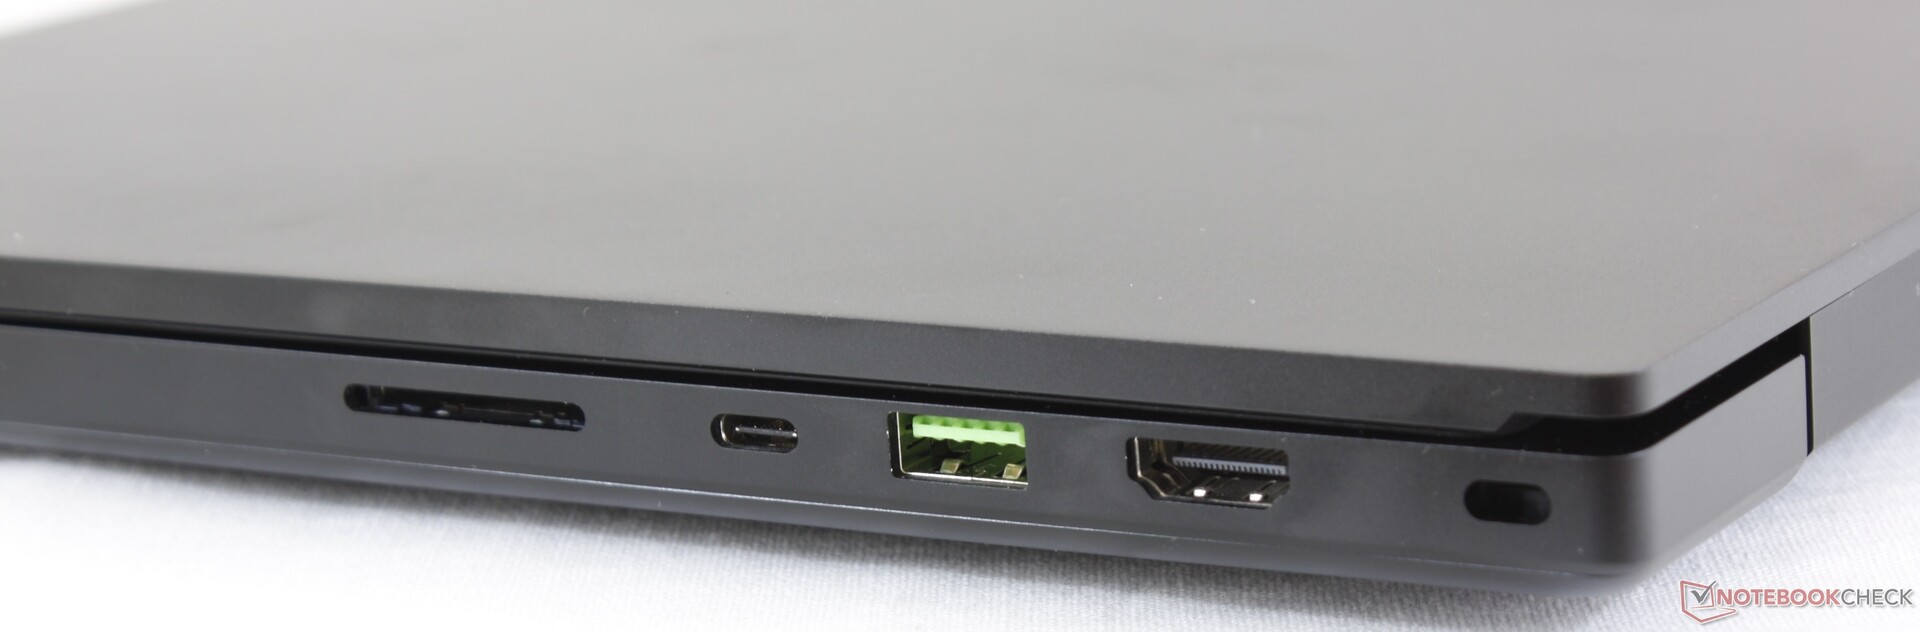
SD Card Reader
As one of the first laptops to ship with a UHS-III SD card reader, the Blade Pro 17 can support transfer rates of up to 624 MB/s with the appropriate SD card. We unfortunately have a Toshiba UHS-II SD card only and so we can't put this to the test, but the fact that the chassis integrates a card reader at all is more than what we can say for the Blade 15, Alienware m17, or Zephyrus S GX701.
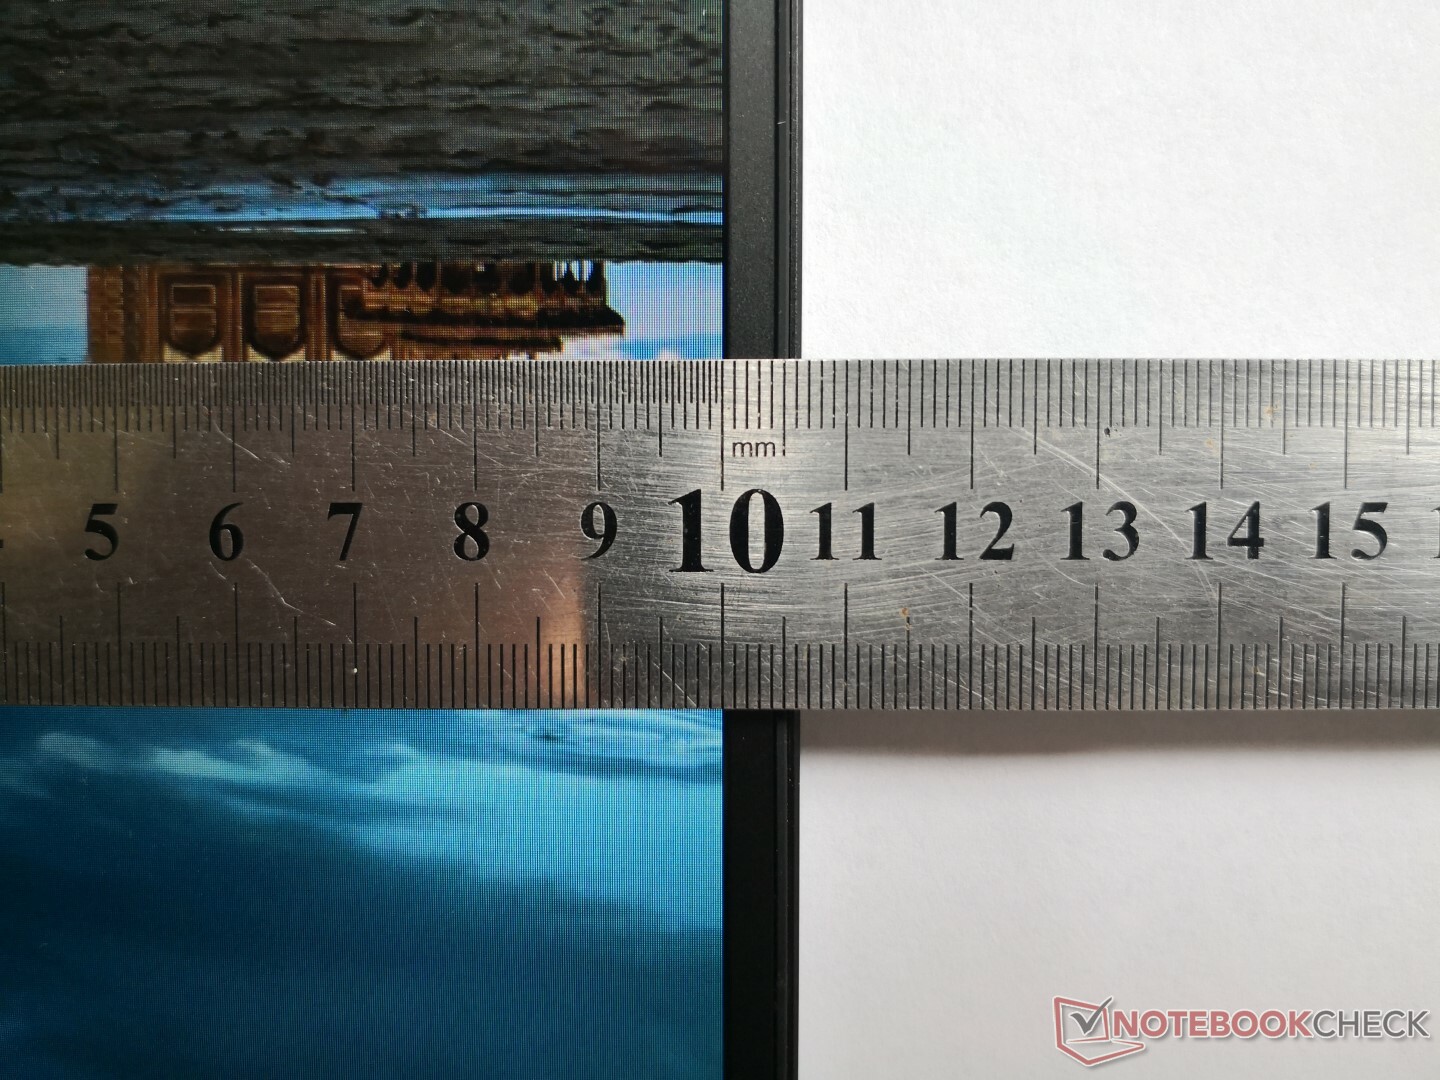
A fully inserted SD card will protrude by about 2 mm and so it doesn't sit completely flush against the edge.
| SD Card Reader | |
| average JPG Copy Test (av. of 3 runs) | |
| Dell XPS 15 9570 Core i9 UHD (Toshiba Exceria Pro SDXC 64 GB UHS-II) | |
| Razer Blade Pro 17 RTX 2080 Max-Q (Toshiba Exceria Pro SDXC 64 GB UHS-II) | |
| Asus ROG Strix Scar II GL704GW (Toshiba Exceria Pro SDXC 64 GB UHS-II) | |
| Razer Blade Pro 2017 (Toshiba Exceria Pro SDXC 64 GB UHS-II) | |
| maximum AS SSD Seq Read Test (1GB) | |
| Dell XPS 15 9570 Core i9 UHD (Toshiba Exceria Pro SDXC 64 GB UHS-II) | |
| Razer Blade Pro 17 RTX 2080 Max-Q (Toshiba Exceria Pro SDXC 64 GB UHS-II) | |
| Asus ROG Strix Scar II GL704GW (Toshiba Exceria Pro SDXC 64 GB UHS-II) | |
| Razer Blade Pro 2017 (Toshiba Exceria Pro SDXC 64 GB UHS-II) | |
Communication
The Blade 15 and Blade Pro 17 are some of the first laptops to ship with Intel AX200 wireless. This particular module offers Wi-Fi 6 or 802.11ax connectivity for transfer rates of up to 2.4 Gbps compared to 867 Mbps on the Blade Pro 2017 with the Killer 1535. Future Athena Ultrabooks are expected to come equipped with Intel AX200 modules as well. We experienced no connectivity issues during our time with the unit.
Note that our transfer rates recorded below are slower than the theoretical maximum of the AX200 since our server setup is limited by a 1 Gbps line. Wi-Fi 6 routers have yet to become ubiquitous or even affordable and so most users today will not be able to exploit its benefits. In other words, it's more of a future-proof feature for now.
Maintenance
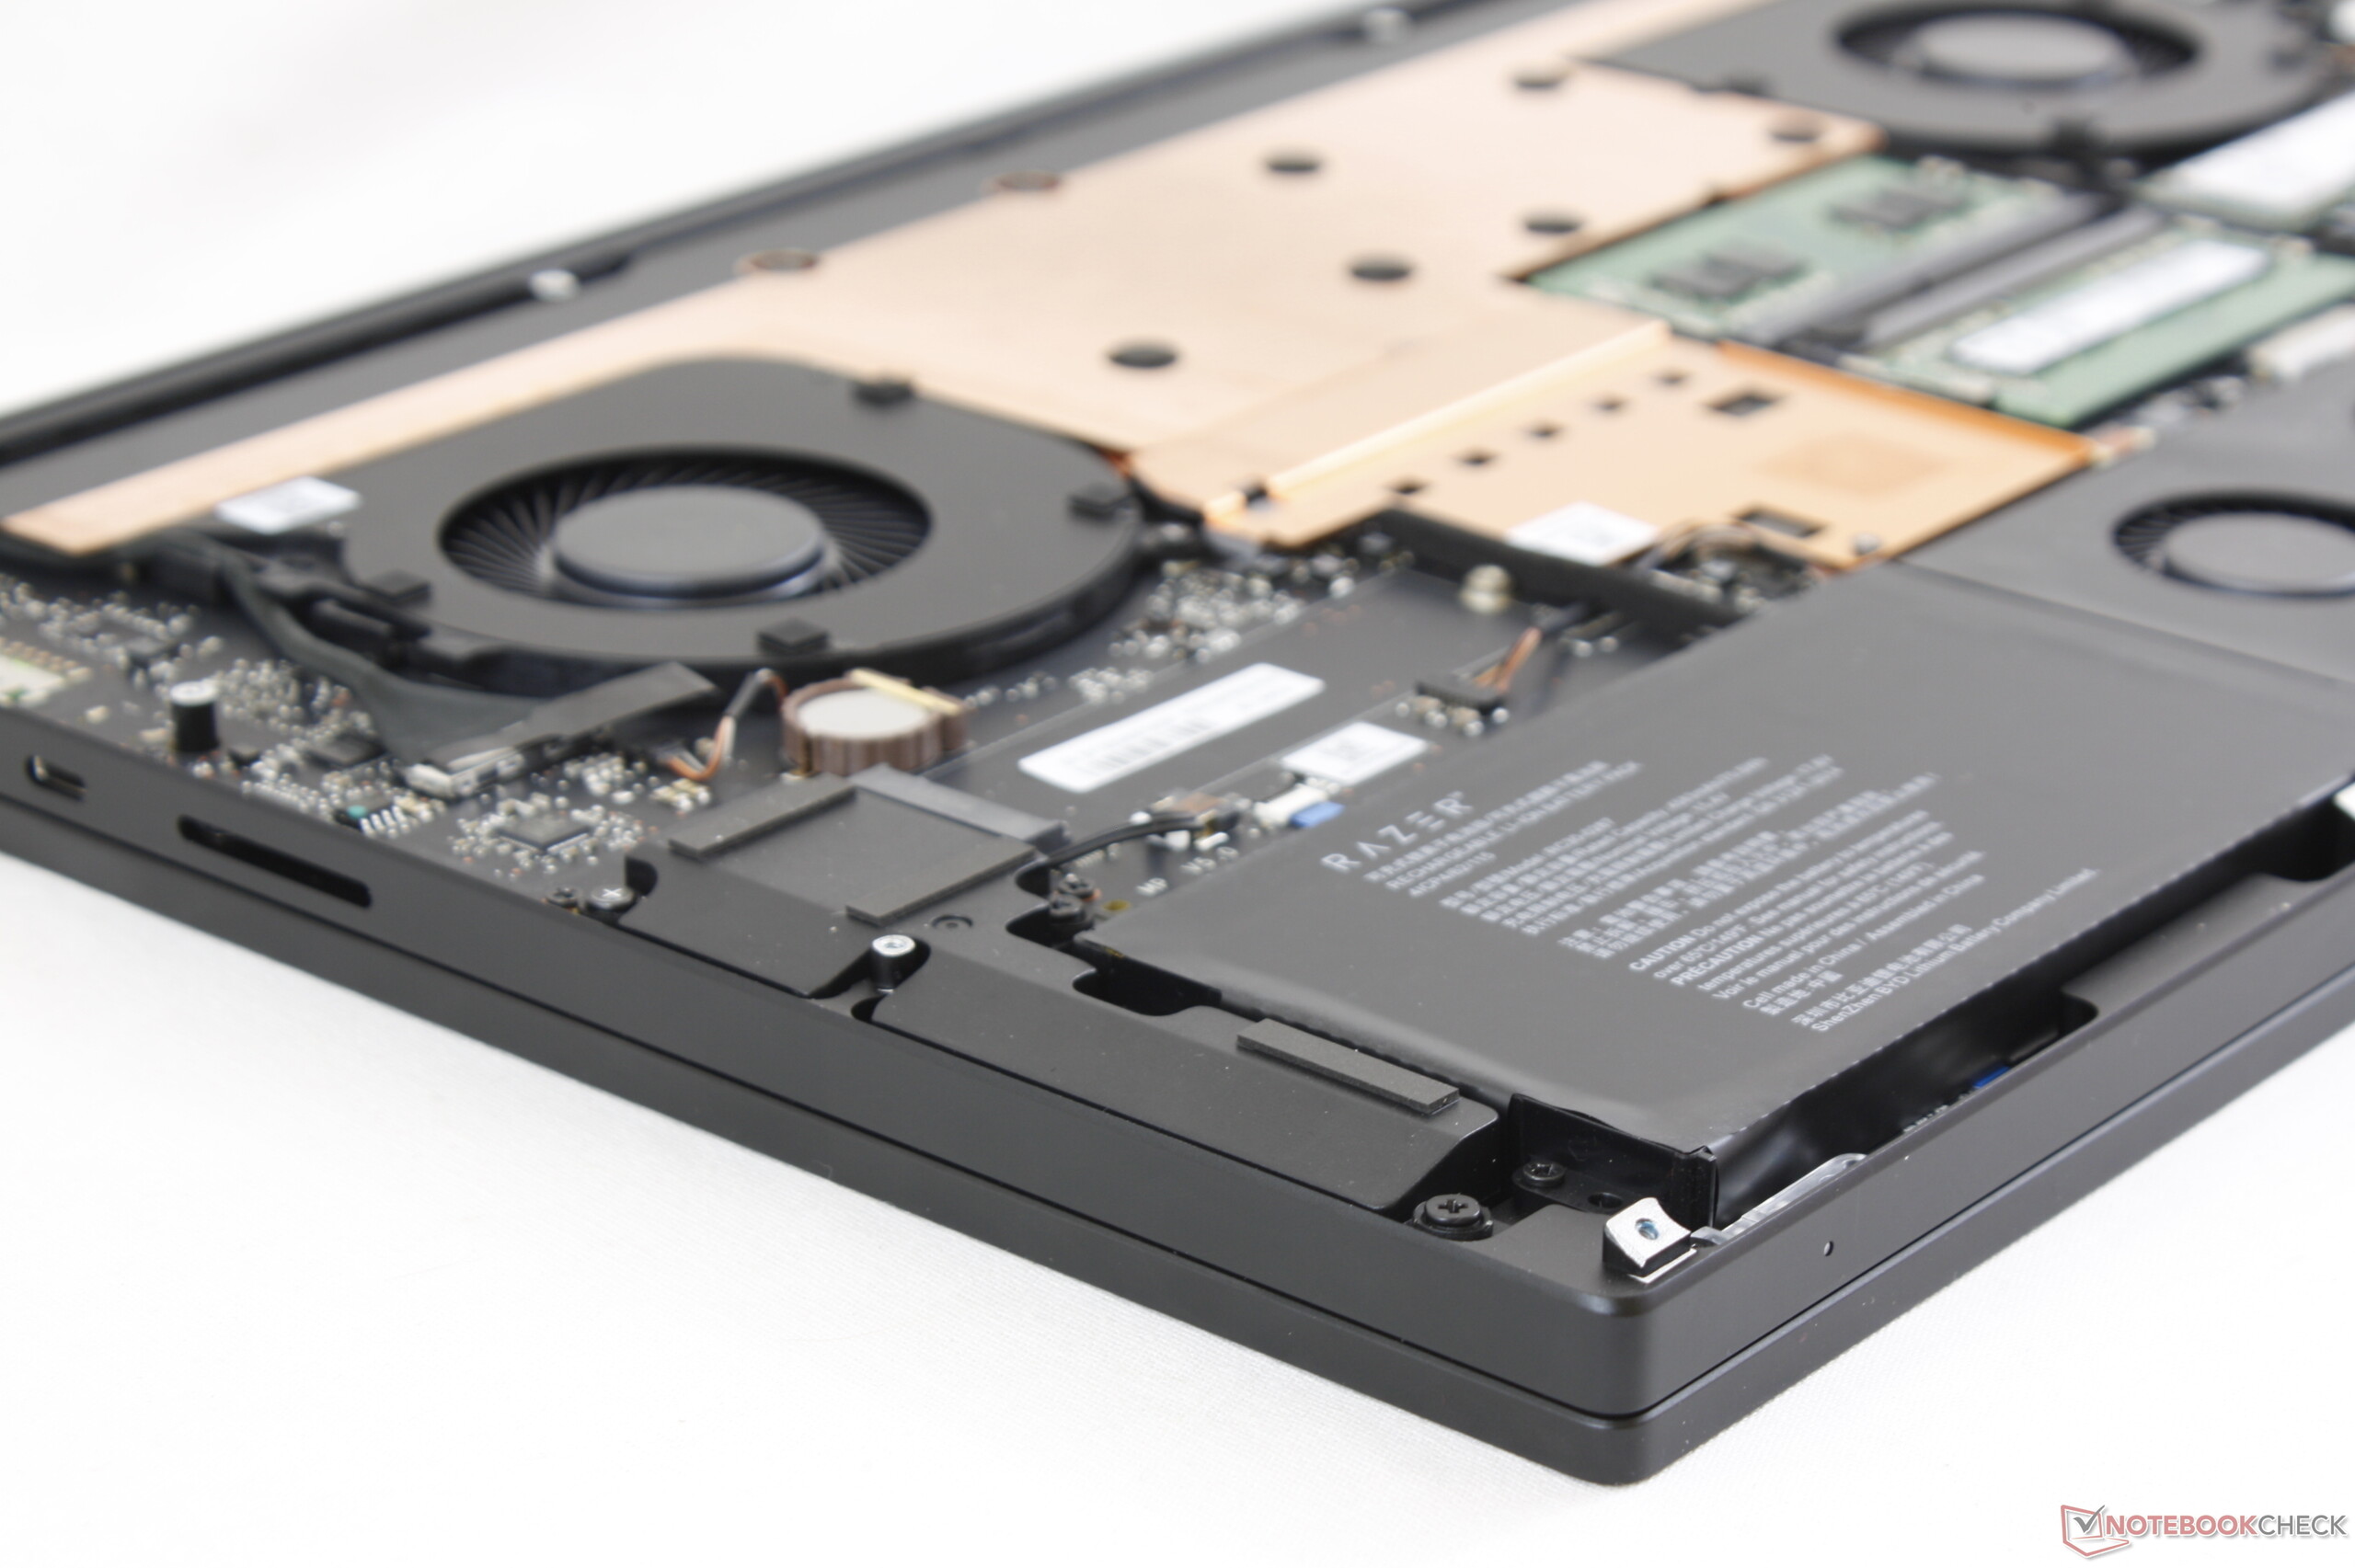
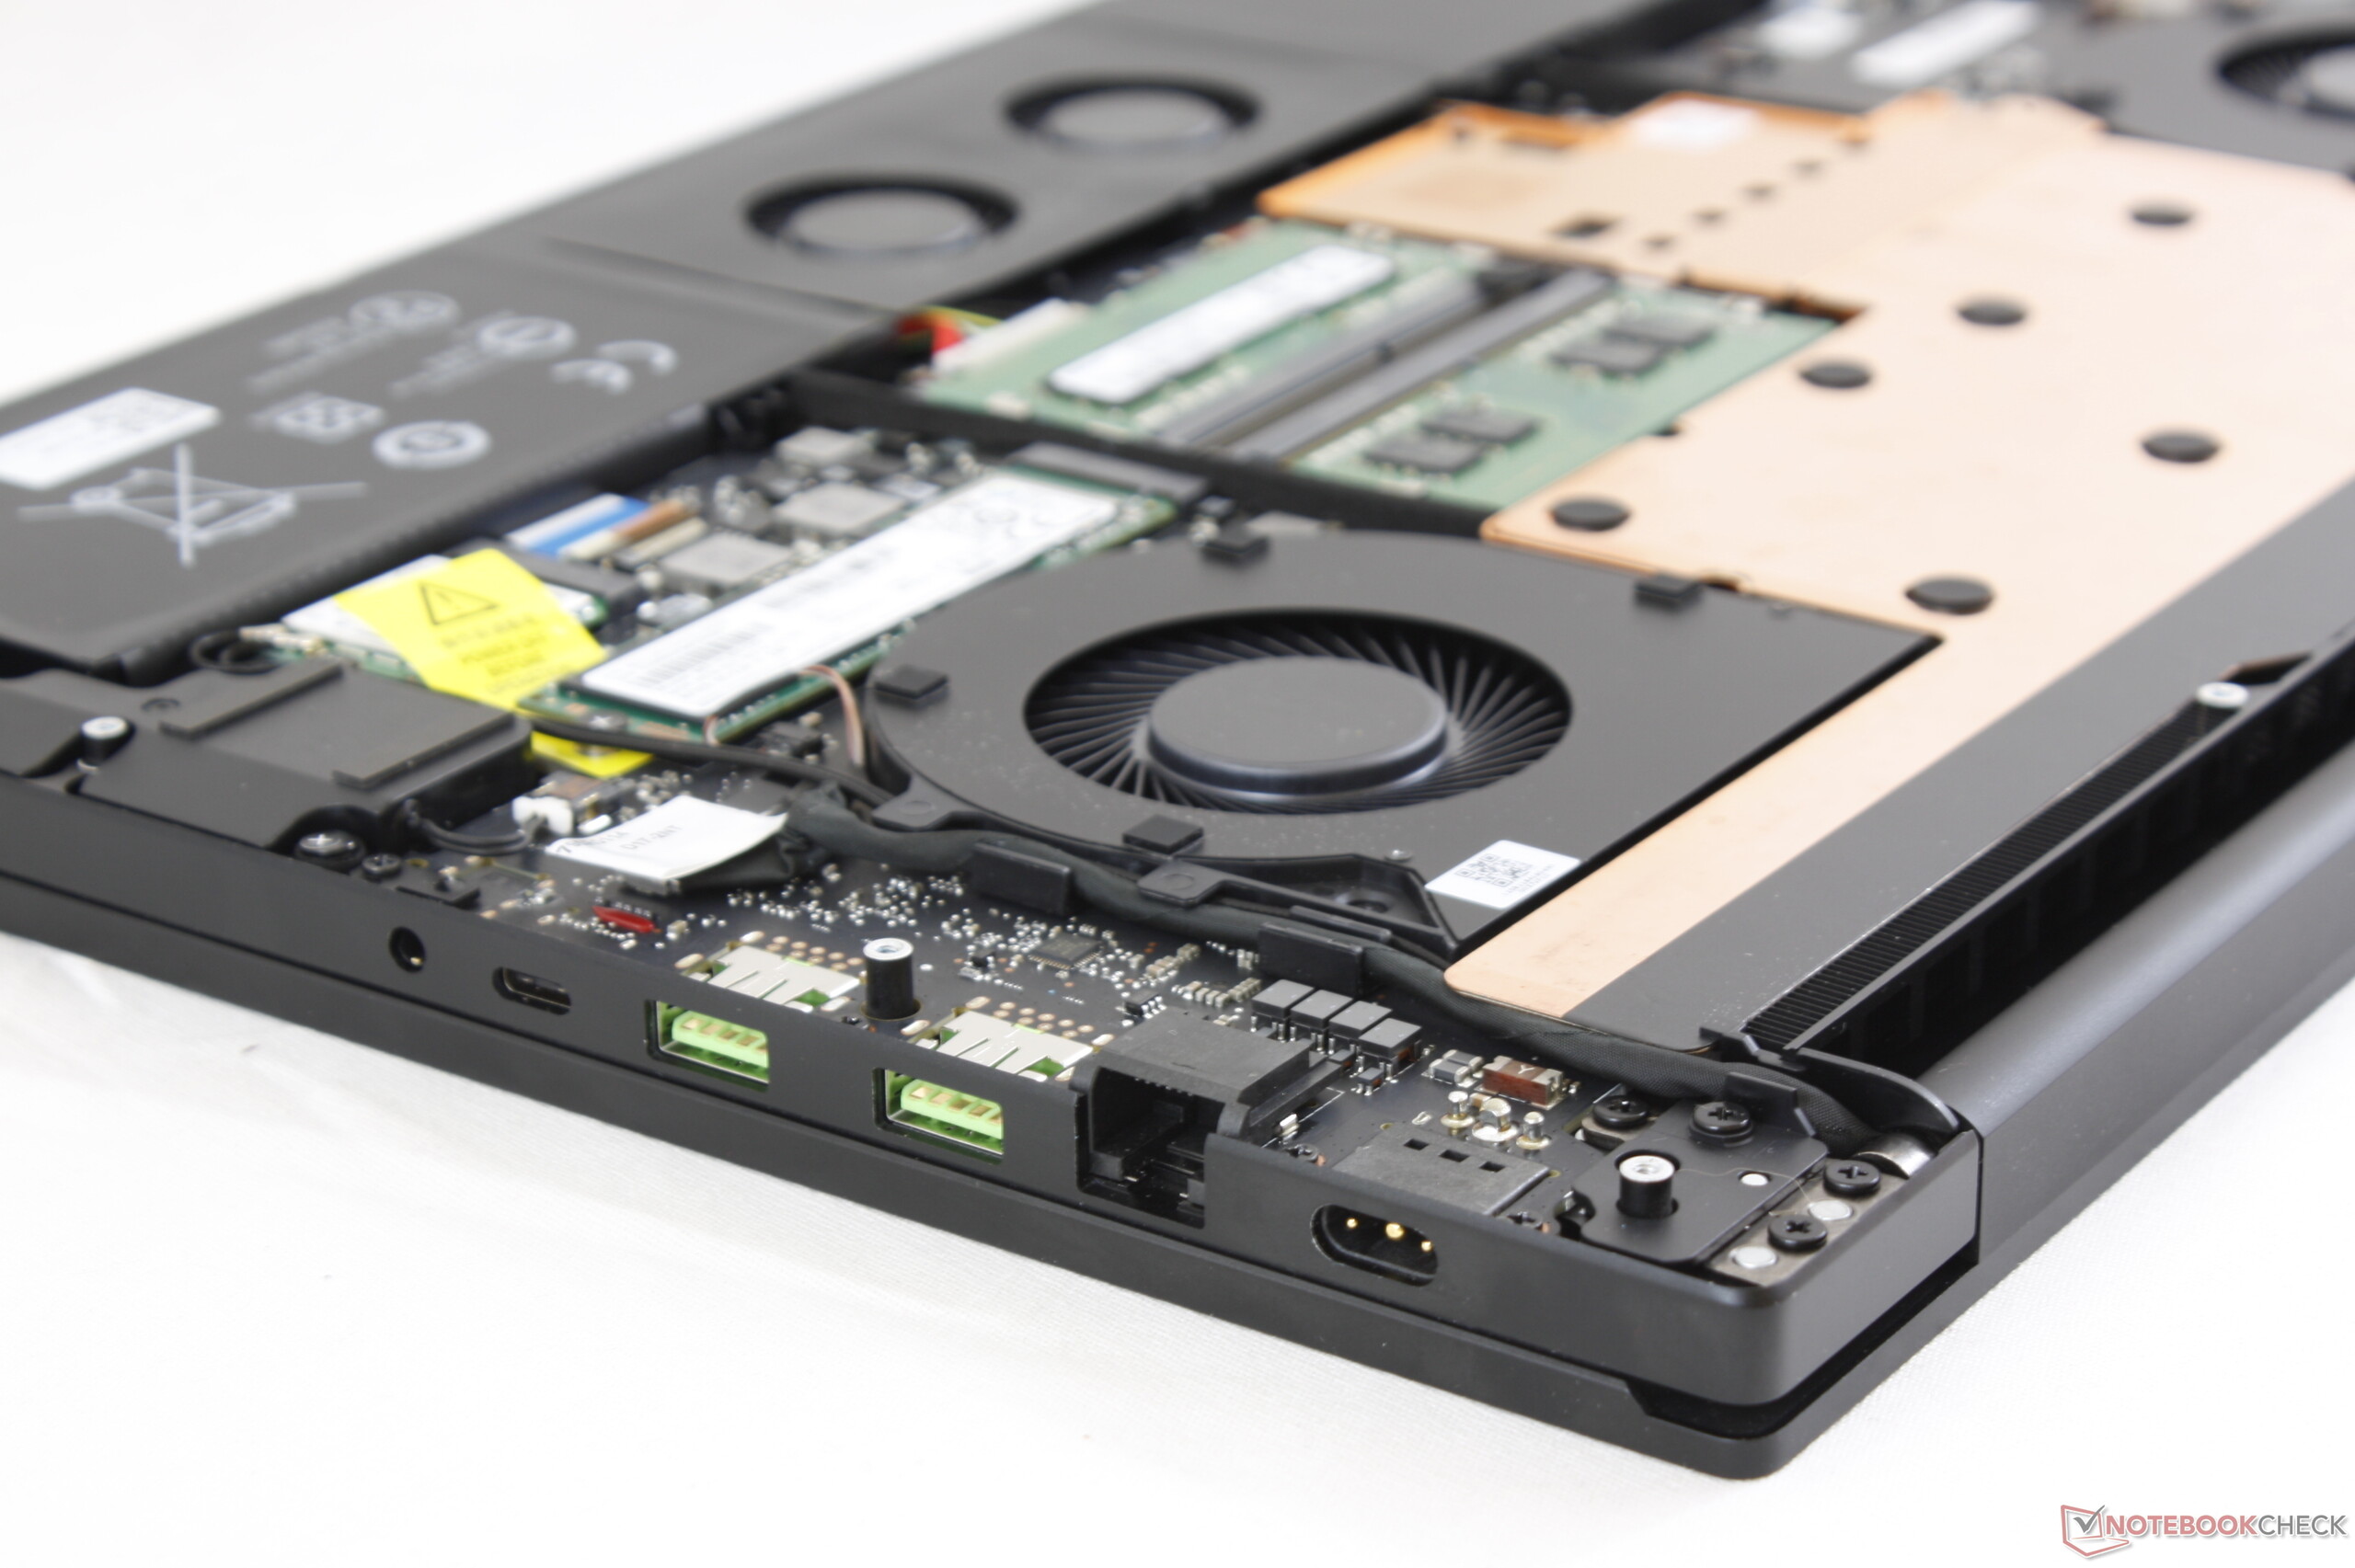
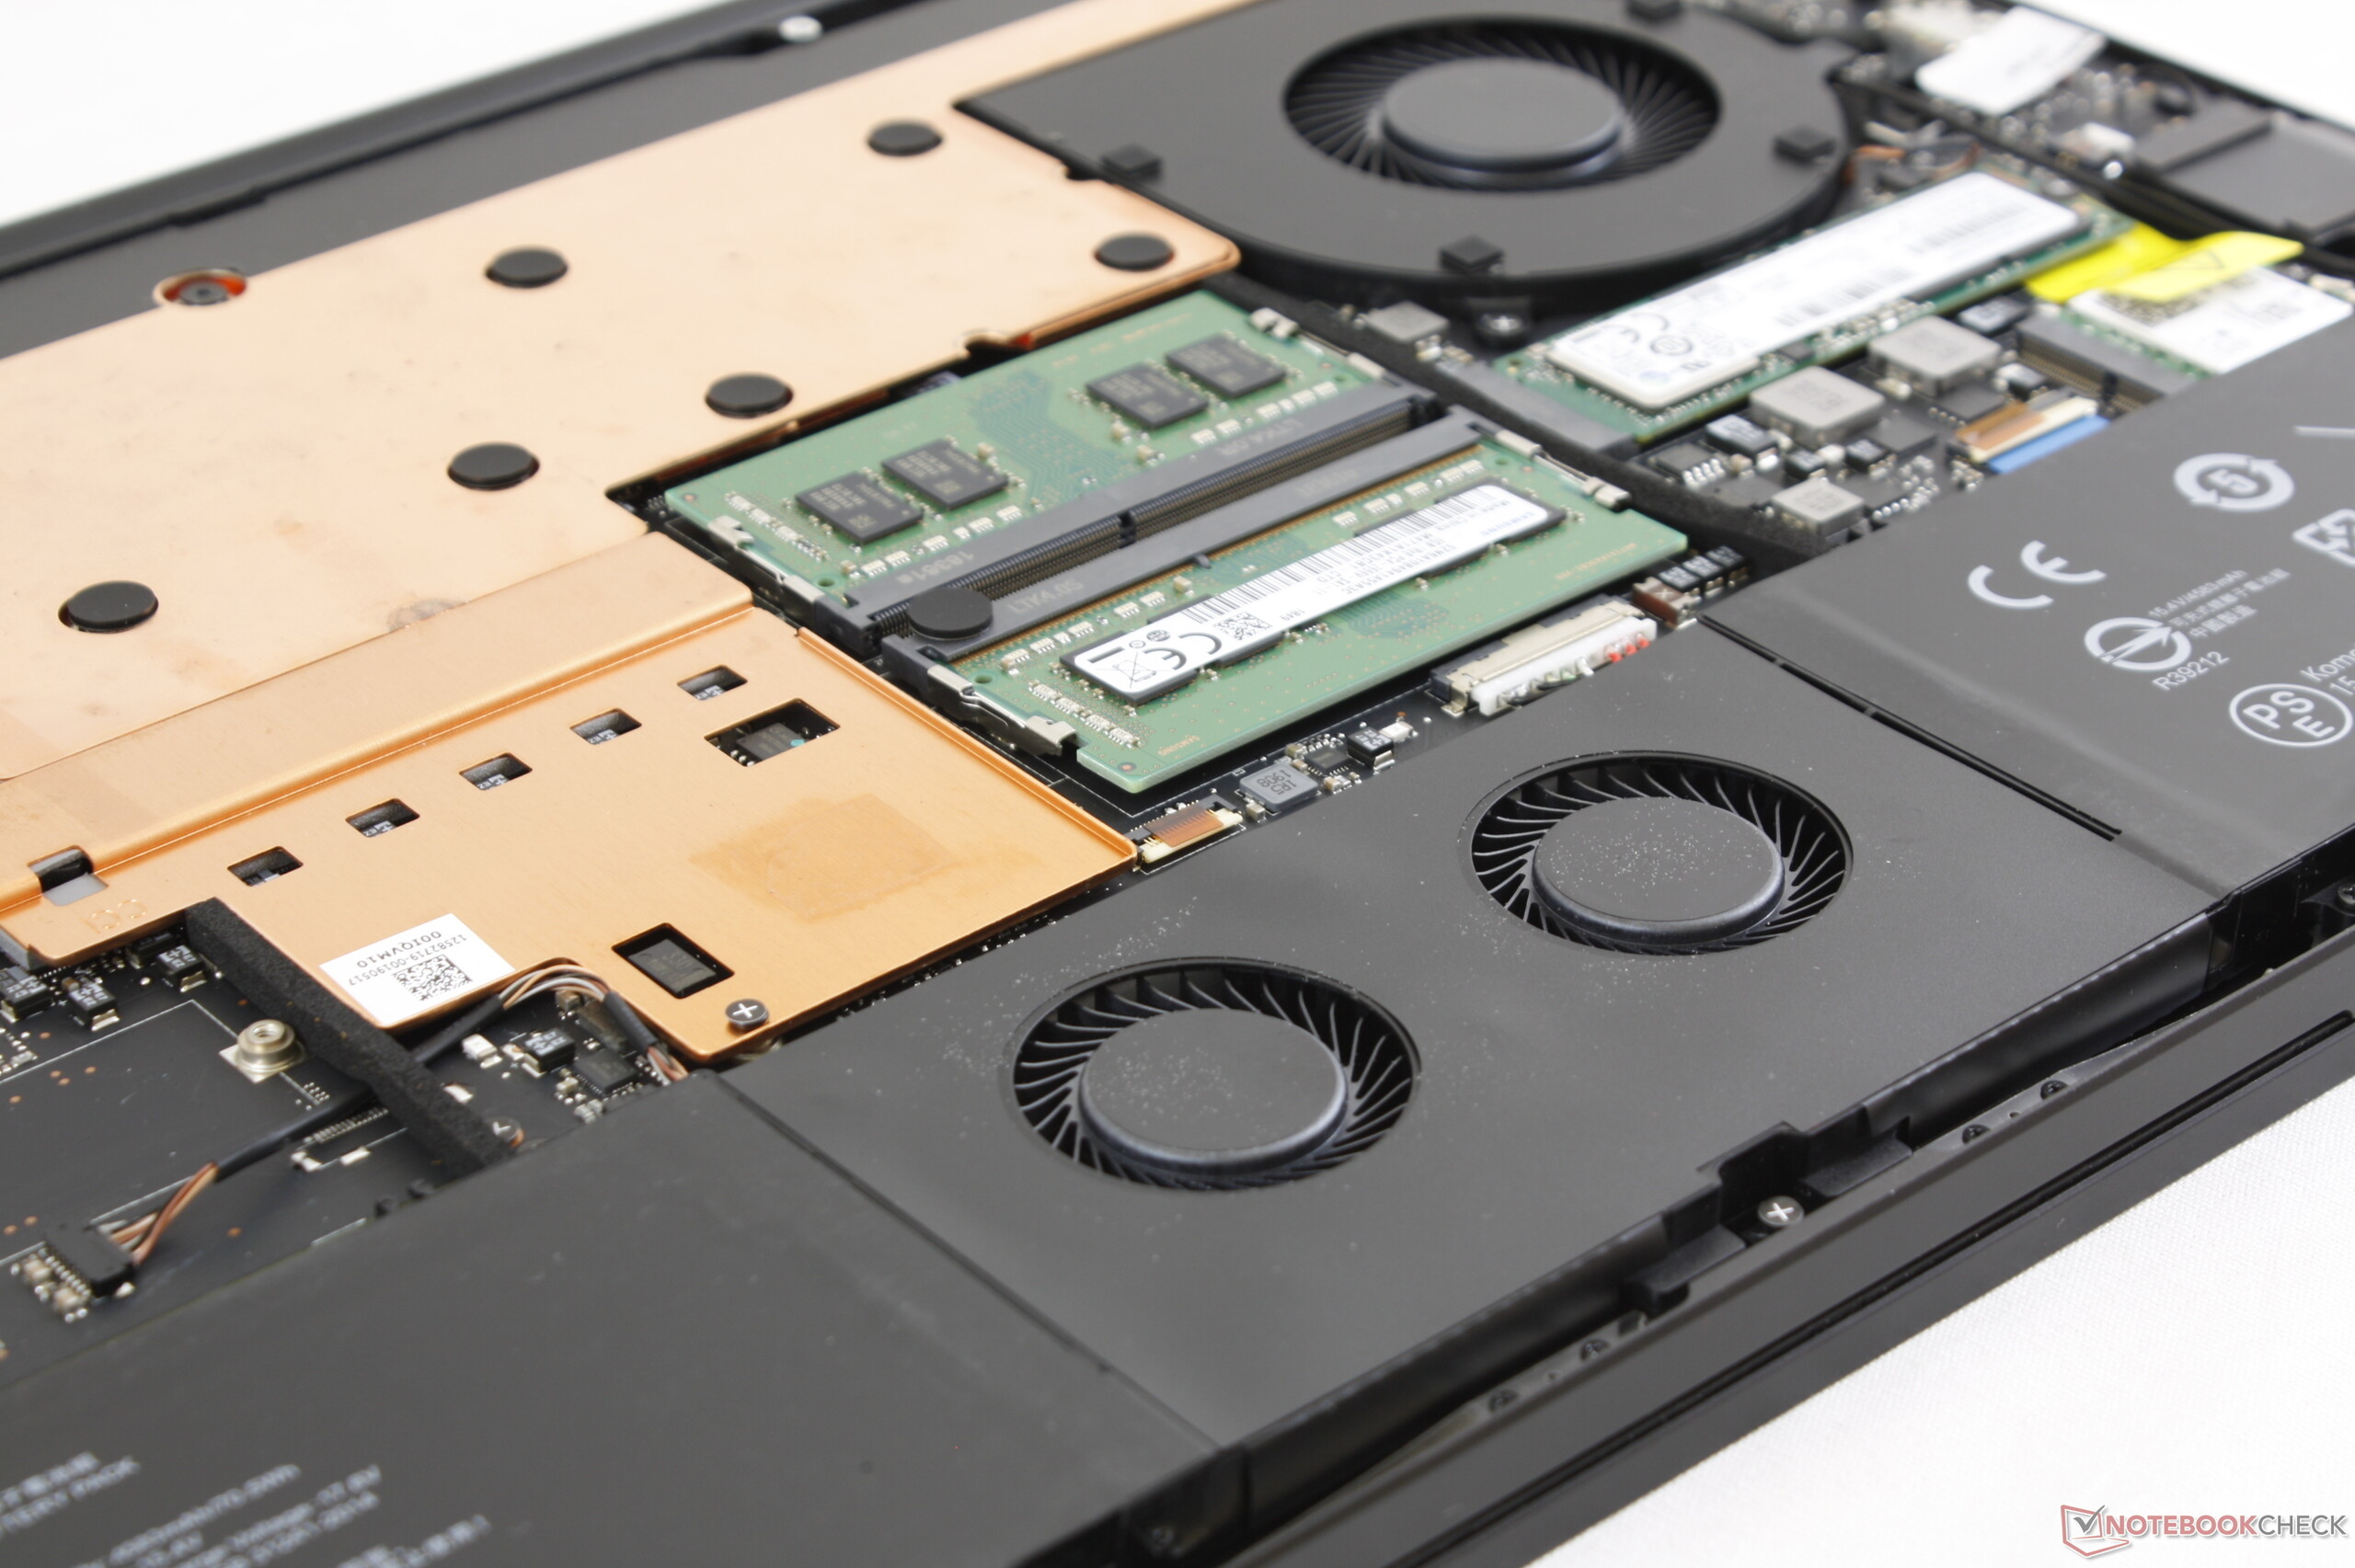
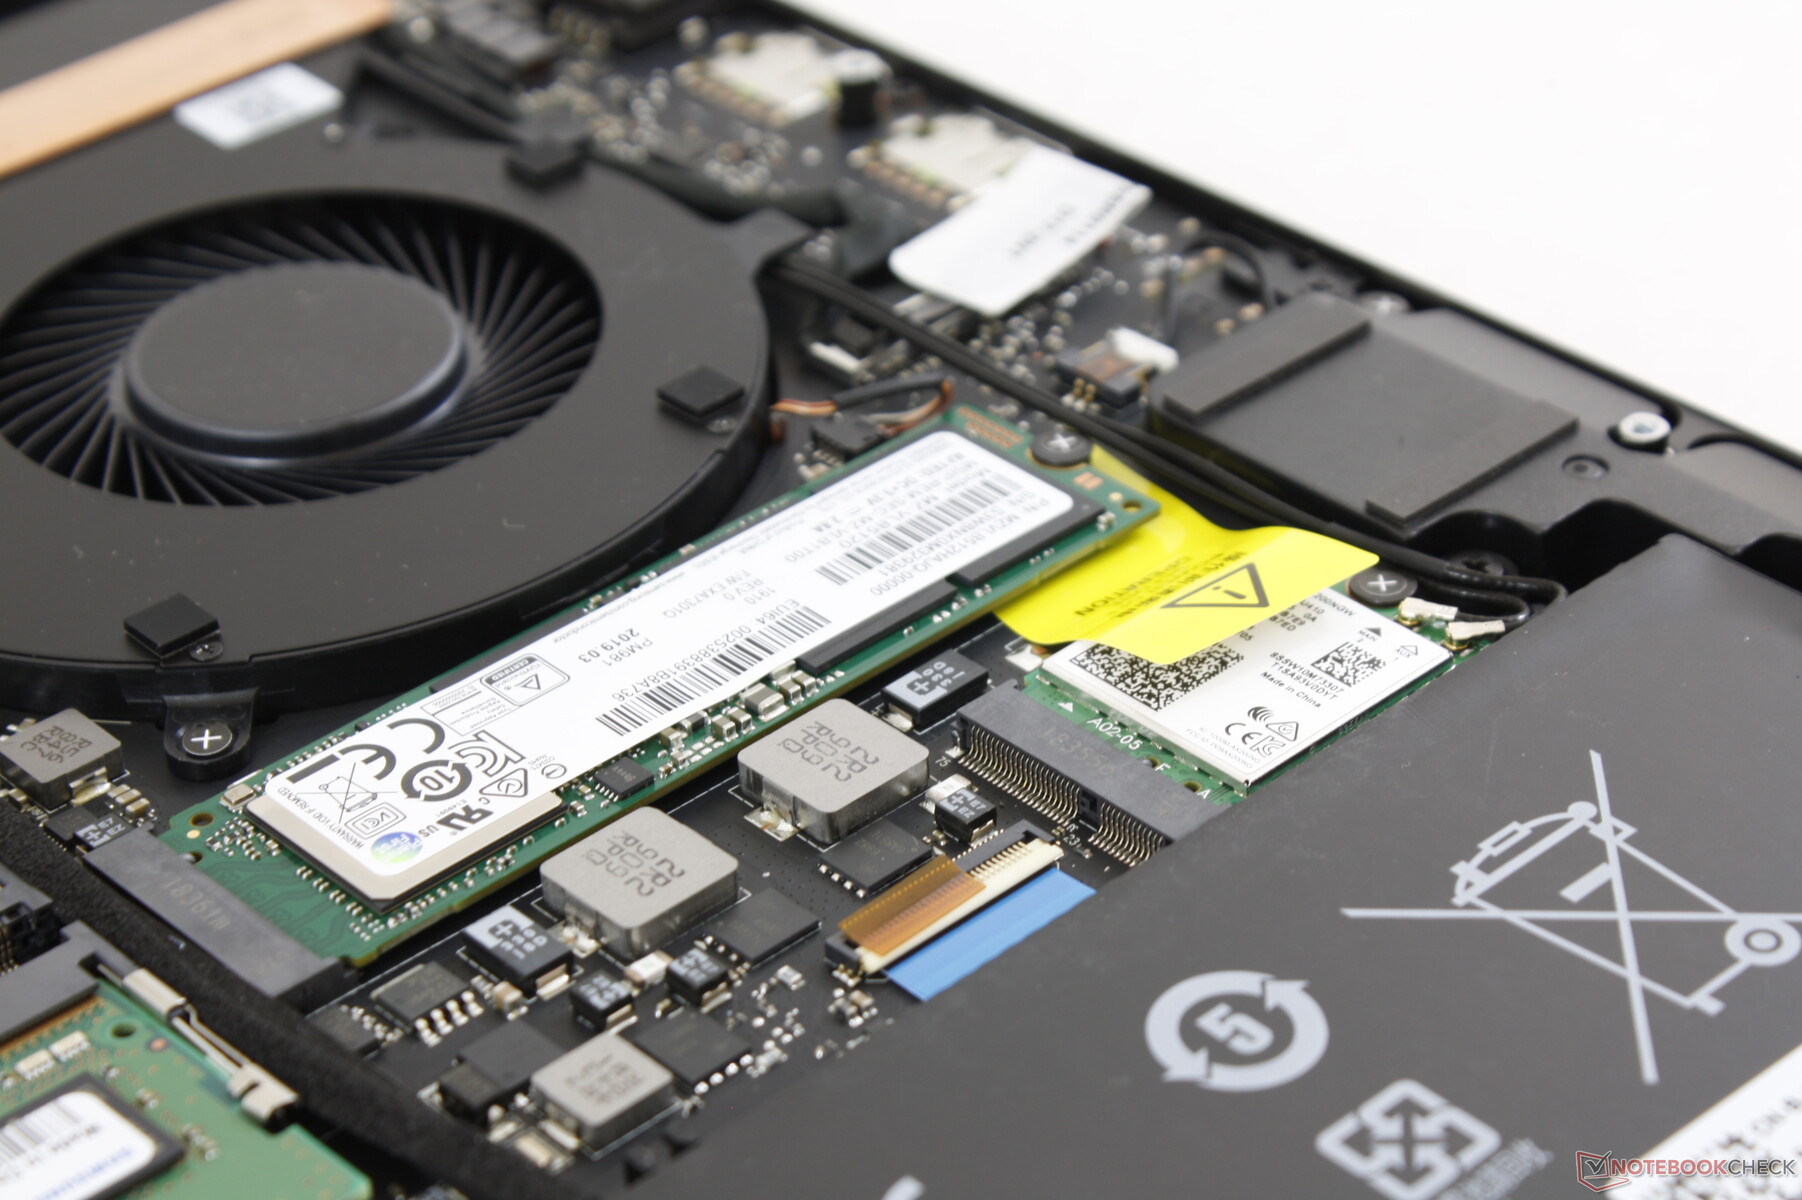
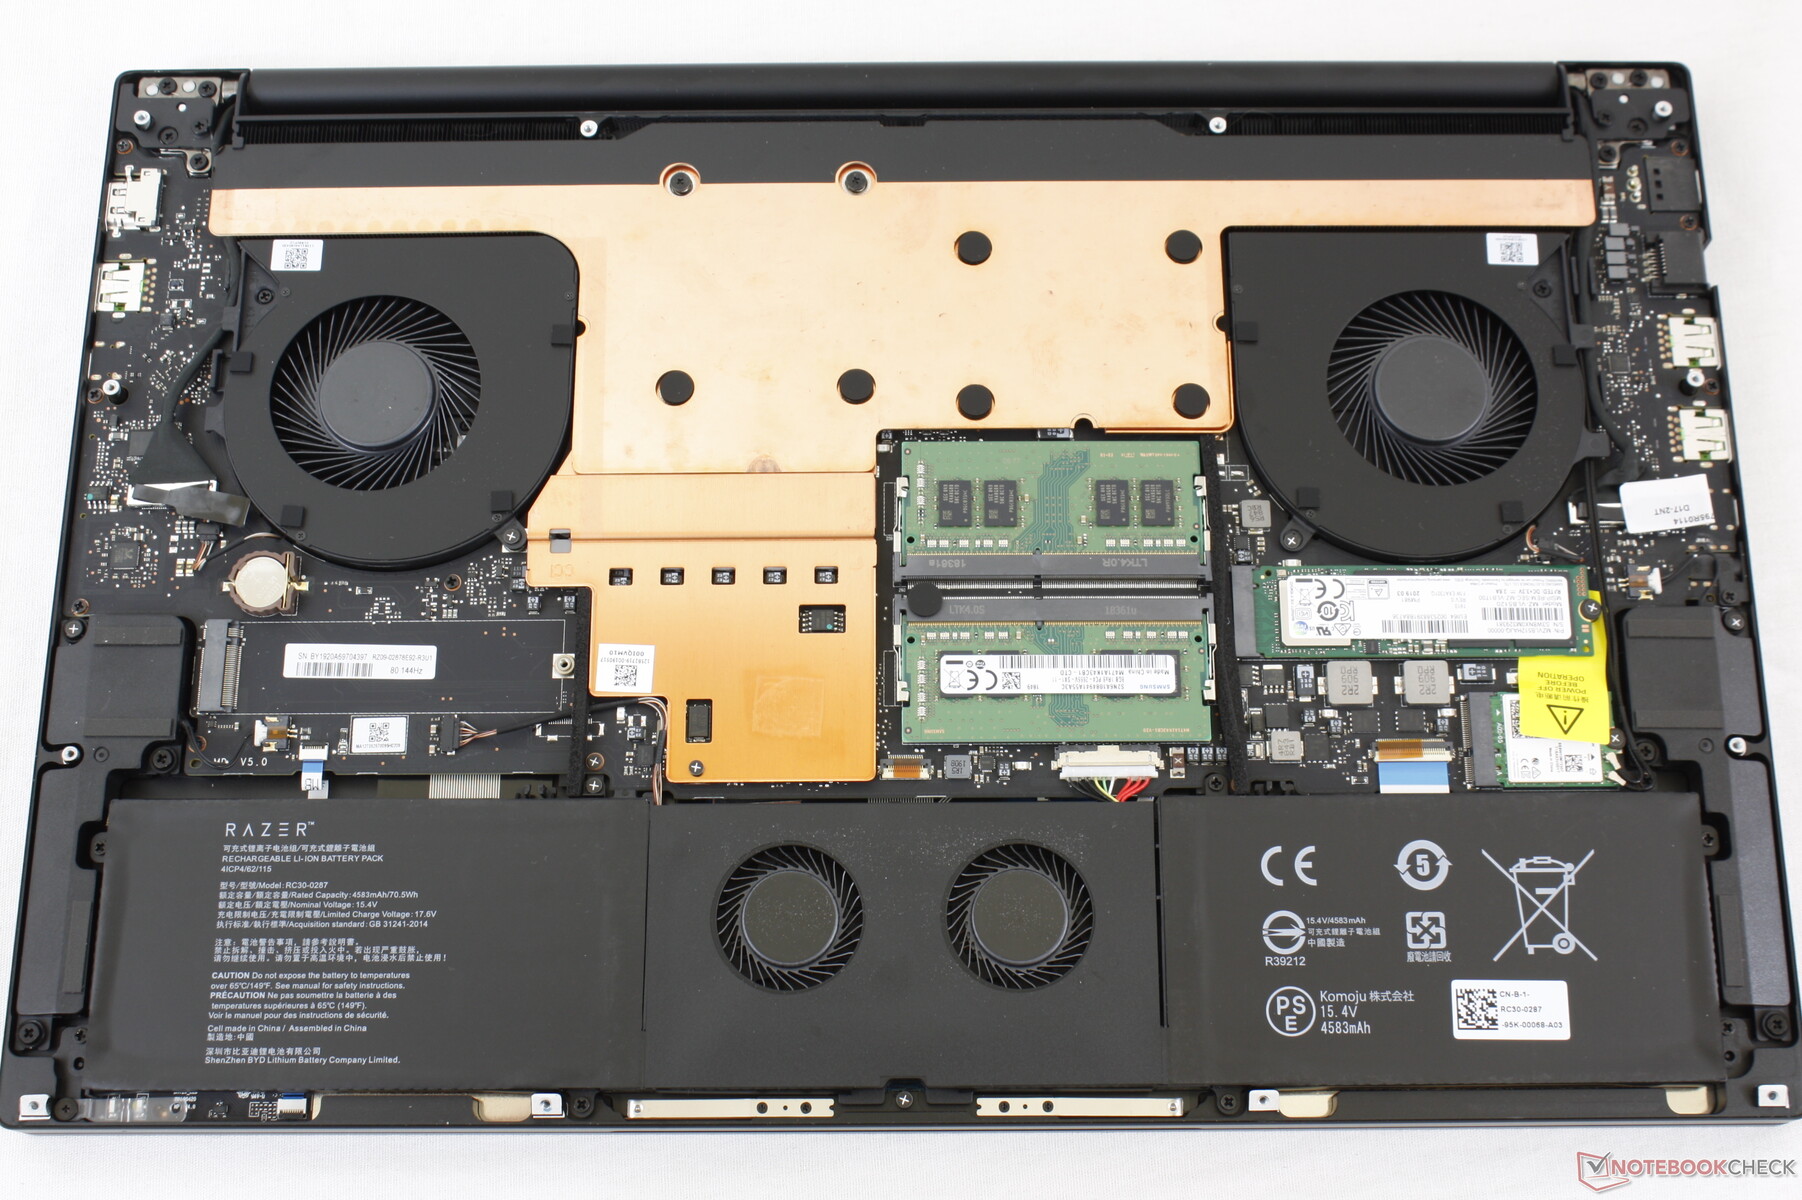
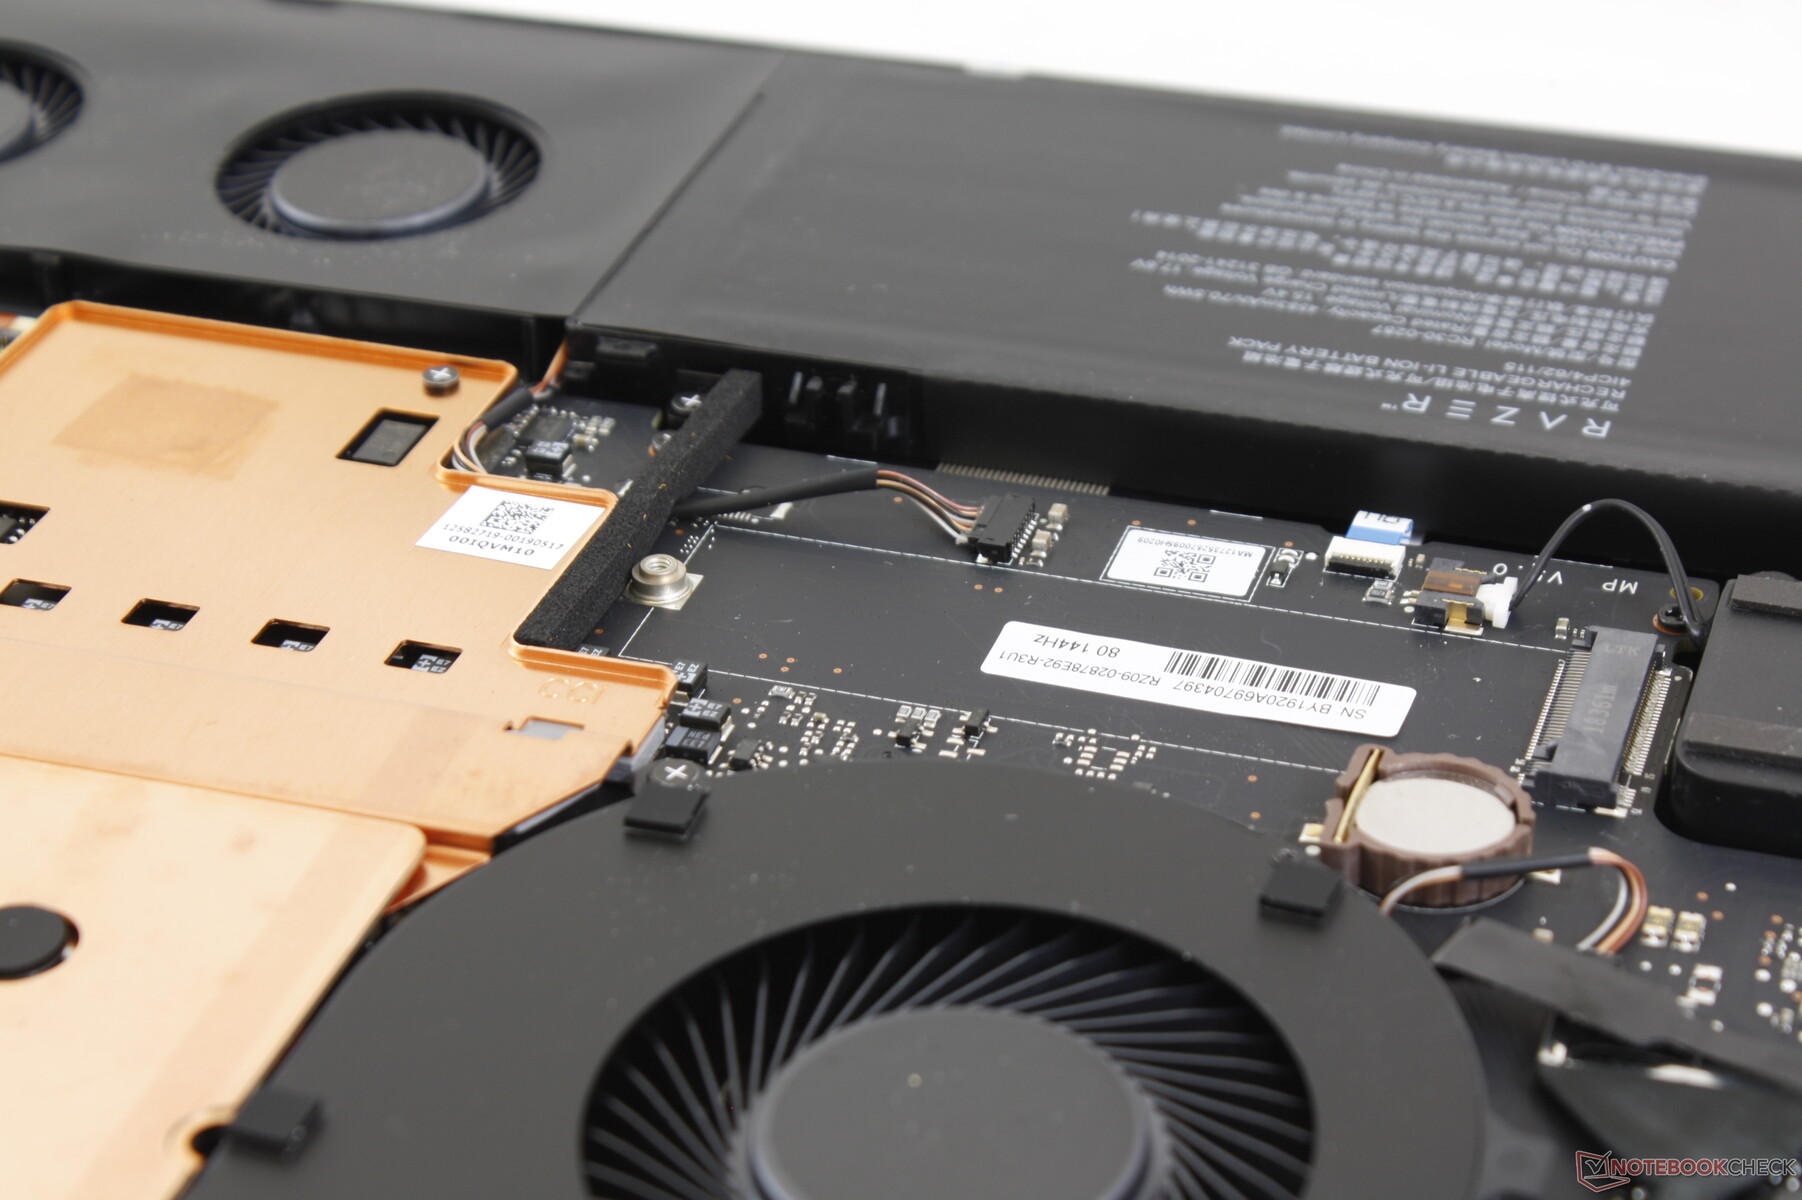
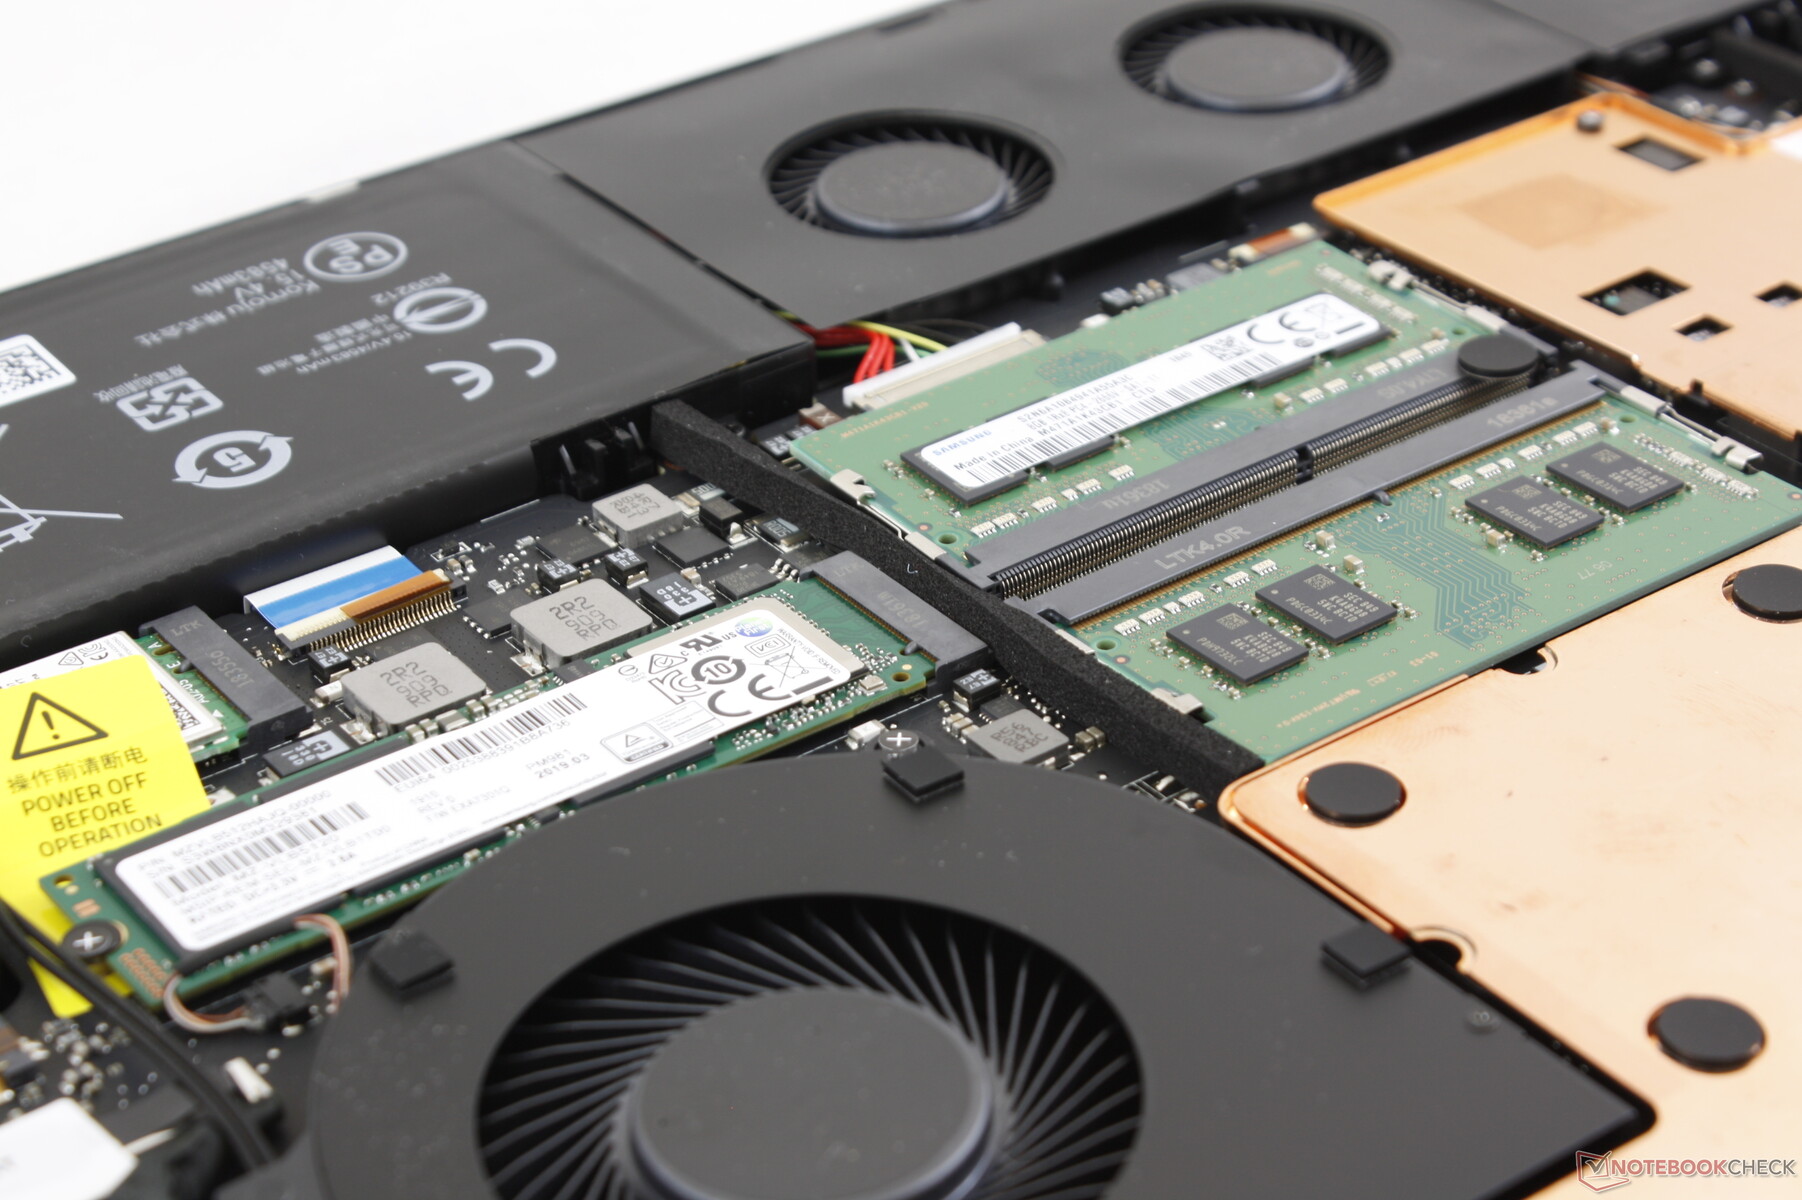
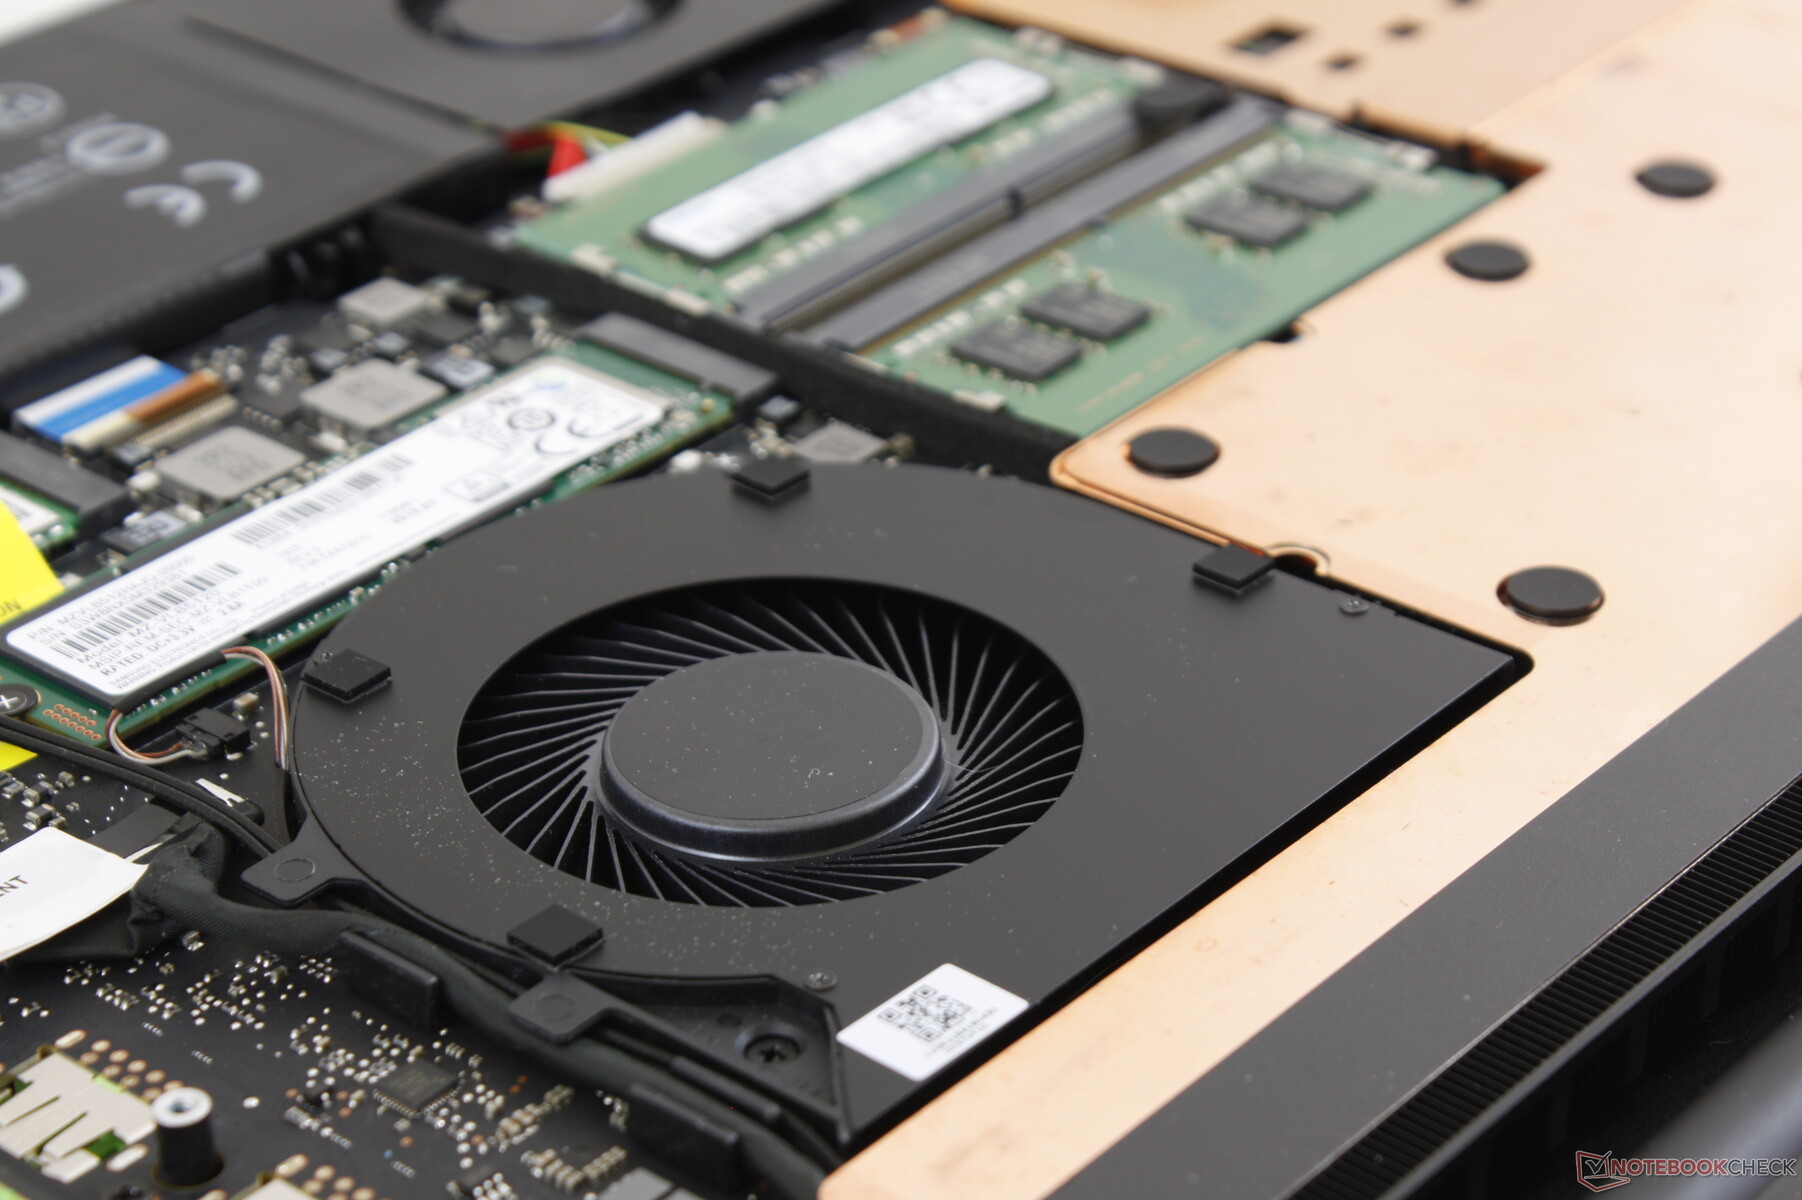
The bottom panel is secured by a dozen T5 Torx screws. Servicing is easy as the panel comes off without much effort and users have direct access to the SODIMM slots, storage bays, and WLAN slot. The motherboard has changed completely when compared to the Blade Pro 2017 GTX 1080 where RAM is soldered.
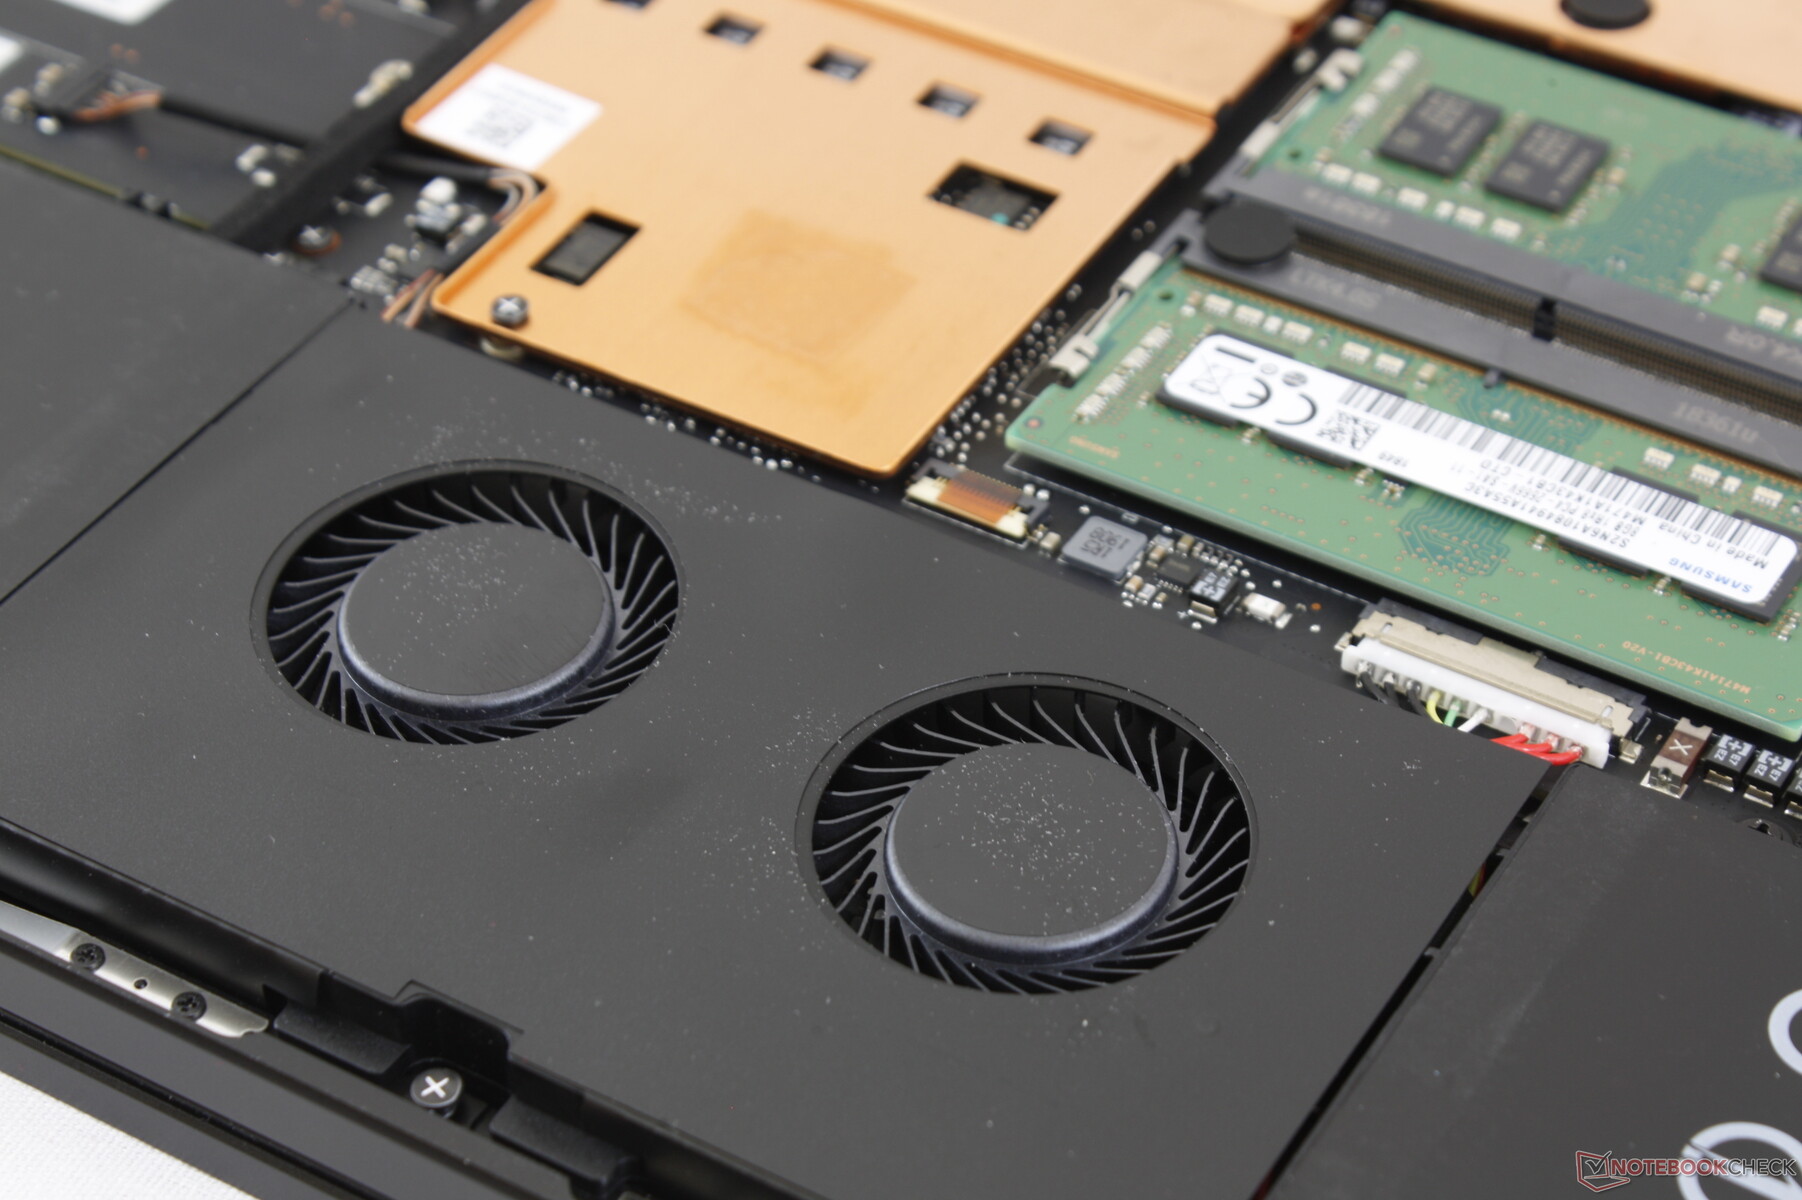
Note the two smaller fans that bisect the battery in order to provide additional air intake. No other gaming laptop comes equipped with fans this close to the trackpad. Razer says it may eventually drop the two fans from future iterations of the Blade Pro 17 depending on the CPU and GPU configuration.
Accessories and Warranty
Extras include a warranty card, Quick Start guide, a set of Razer logo stickers, and a small velvet cleaning cloth. We don't think it would be too much to ask for a free carrying sleeve much like how Asus includes one for its flagship ZenBook Ultrabooks.
The one-year limited manufacturer warranty applies with options to extend up to three years via RazerCare. The added protection is pricey at an additional $450 USD compared to ~$260 USD from Dell with the same three-year coverage and accidental damage protection.
Input Devices
Keyboard
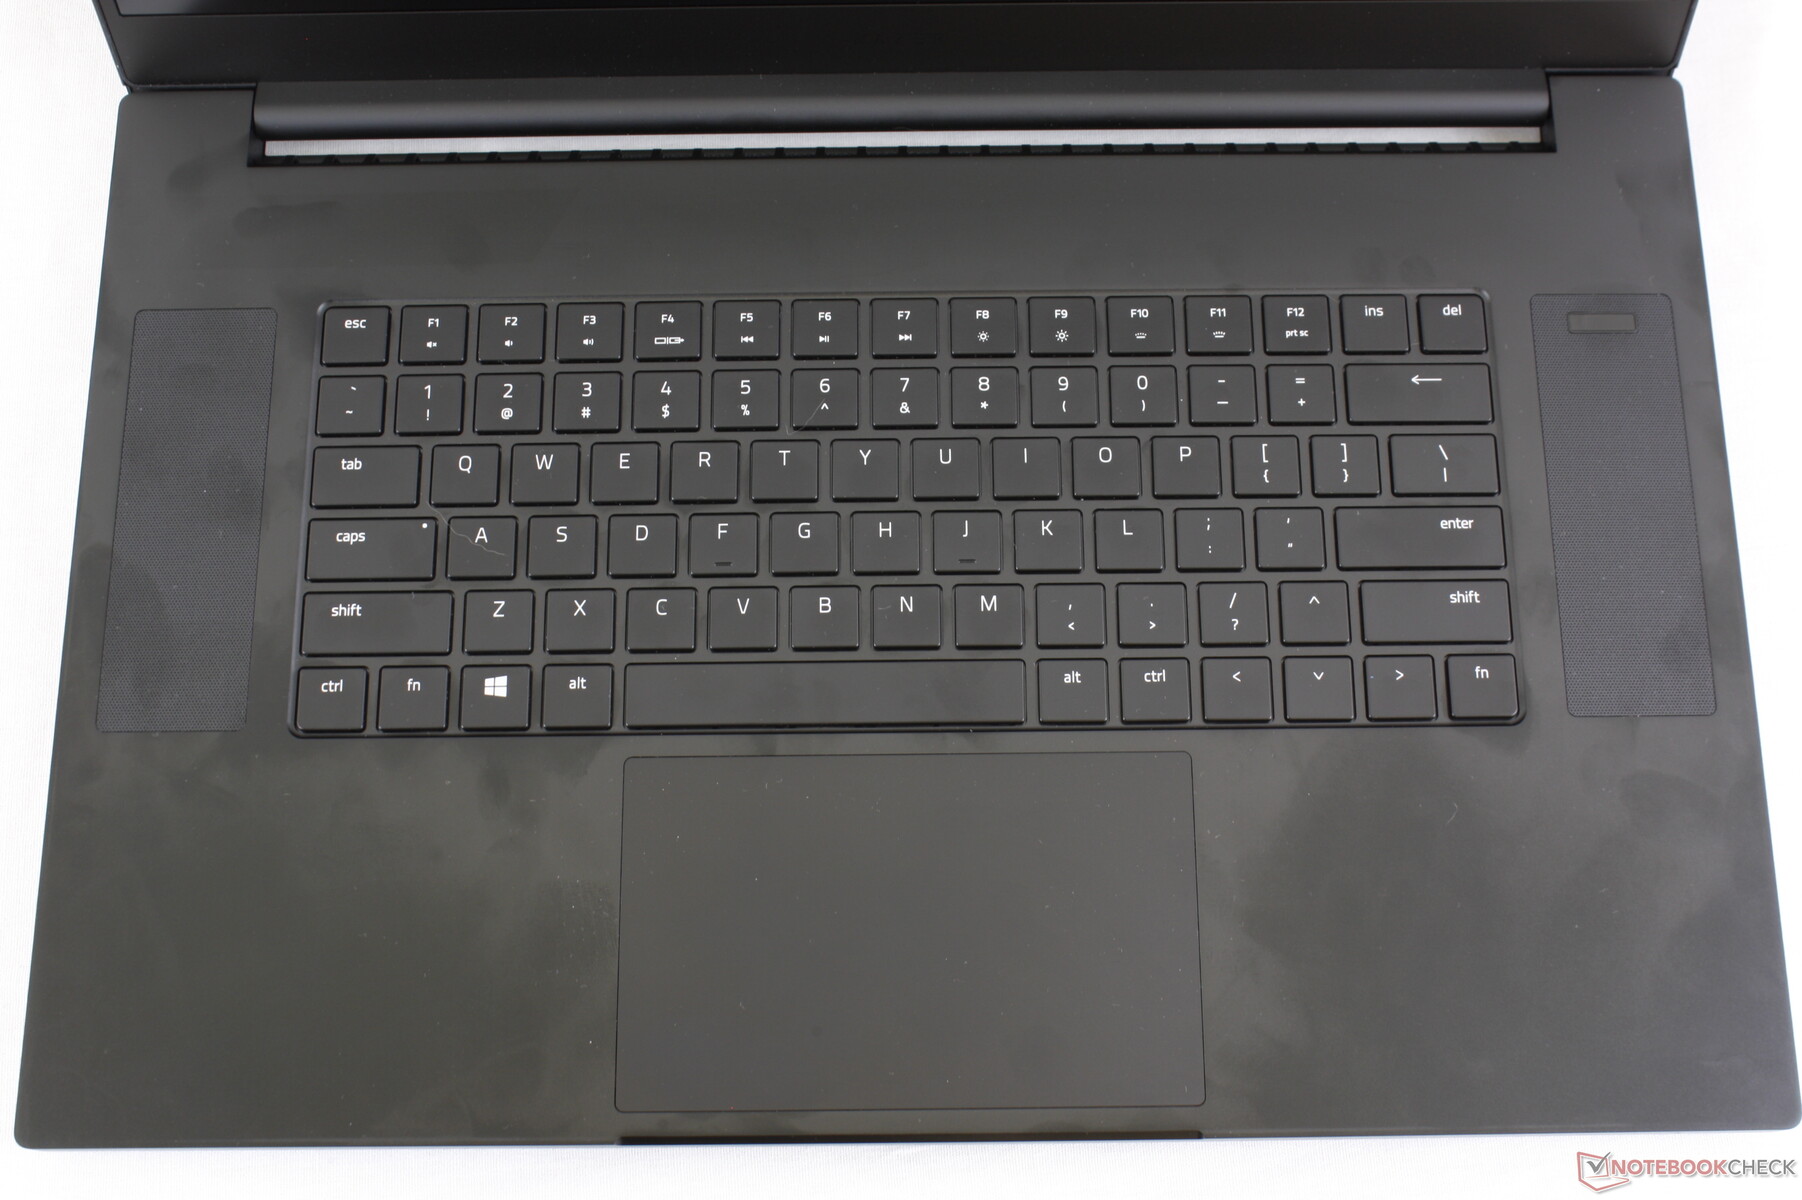
Razer has essentially lifted the Blade 15 keyboard and applied it here on the Blade Pro 17 to replace the mechanical switches on the Blade Pro 2017. Thus, our existing comments on the Blade 15 keyboard all apply here including the very shallow travel, light feedback, and generally quiet clatter. The keyboards on the competing MSI GS75 and Asus ROG GL704 feel deeper and firmer than what is offered here on the Blade Pro 17. While we prefer the stronger tactility on the aforementioned alternatives, we've also spoken to gamers who find the Razer Blade keyboard to be just fine. It's definitely something worth trying out in person before committing to a purchase.
We appreciate the fact that the F keys and Arrow keys are the same size as the main QWERTY keys for uniform feedback. These same keys tend to be smaller and therefore spongier on most other laptops. Still, we can't shake off the fact that the per-key RGB backlit keyboard feels very barebones on the Blade Pro 17. Previous Blade Pro models had volume wheels, RGB trackpad lights, and dedicated auxiliary keys for a more unique experience. Perhaps this minimalist approach is for the best.
Touchpad
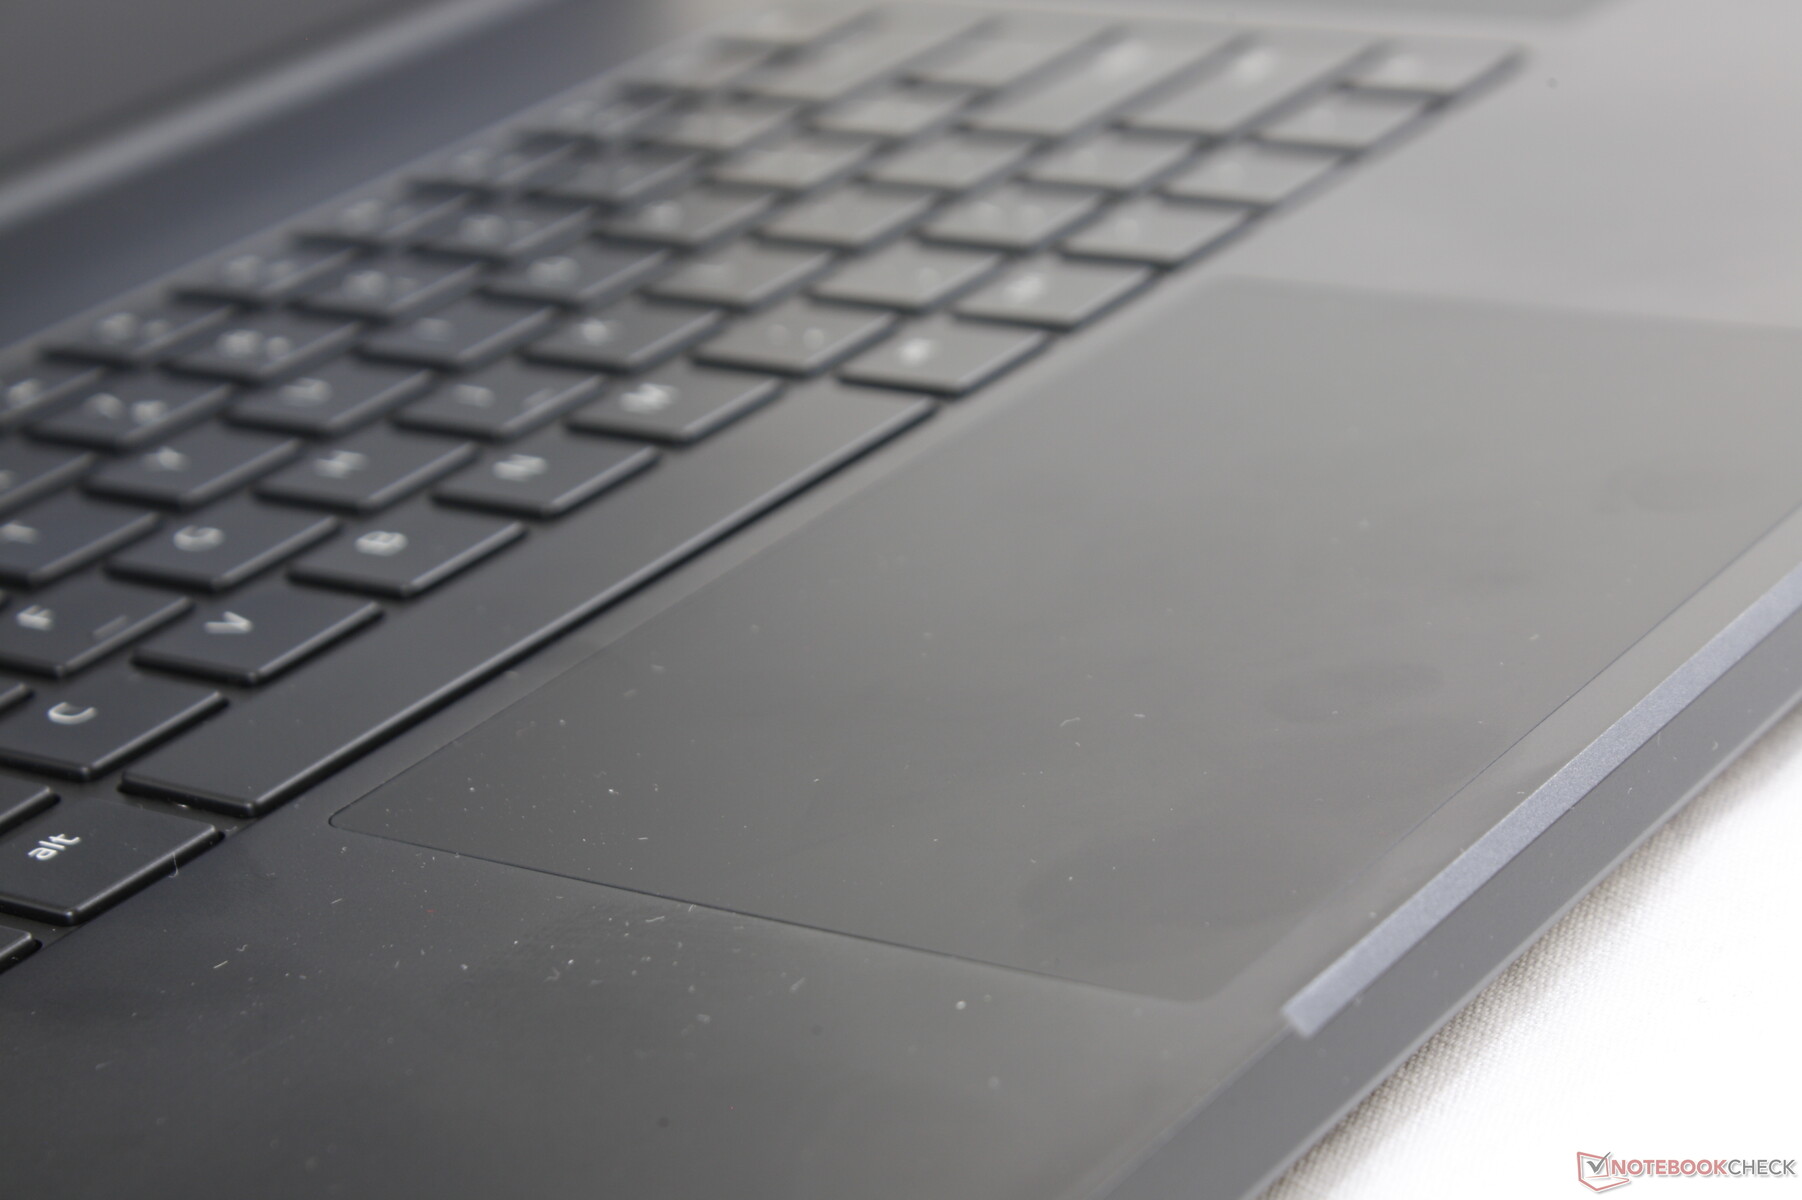
The large clickpad is exactly the same as on the Blade 15 down its texture, very quiet feedback, and even dimensions (13 x 8 cm). The glass surface is completely smooth for an even glide no matter the movement speed and the 144 Hz display refresh rate gives a more responsive feel overall. Our main complaint is that the integrated mouse keys continue to be soft with a spongy and unsatisfying click when pressed. Razer may as well just go all way and mimic the MacBook Pro clickpad for future iterations of the Blade series.

Display
As of this writing, the Blade Pro 17 ships with only one panel option: matte 1080p IPS at 144 Hz. Users who want 4K UHD, touchscreen, OLED, 240 Hz, or glossy are out of luck for now. A closer look at the display reveals it to be an AU Optronics B173HAN04.0 panel as found on a handful of other 17.3-inch gaming laptops including the Asus TUF FX705 and Zephyrus S GX701. All these laptops share similar qualities like color coverage, contrast, and response times as a result.
When compared to the 4K UHD IGZO panel on the Blade Pro 2017, this 1080p panel is an improvement in many ways. It offers a faster native refresh rate for smoother movement, significantly faster response times for less ghosting, and a much brighter backlight (300 nits vs. 230 nits) as shown by our comparison table below. These advantages come at the cost of resolution and gamut, but we find this to be a fair trade off from a gamer's perspective where fluidity and responsiveness are usually priority over color accuracy.
Onscreen content appears crisp with only a slight tinge of graininess as is common on most matte panels. Slight backlight bleeding is present on the top and bottom edges of our unit that only becomes noticeable when watching videos with black borders in a darkened environment.


| |||||||||||||||||||||||||
Brightness Distribution: 94 %
Center on Battery: 299.3 cd/m²
Contrast: 1032:1 (Black: 0.29 cd/m²)
ΔE ColorChecker Calman: 2.55 | ∀{0.5-29.43 Ø4.73}
calibrated: 2.9
ΔE Greyscale Calman: 3.5 | ∀{0.09-98 Ø4.97}
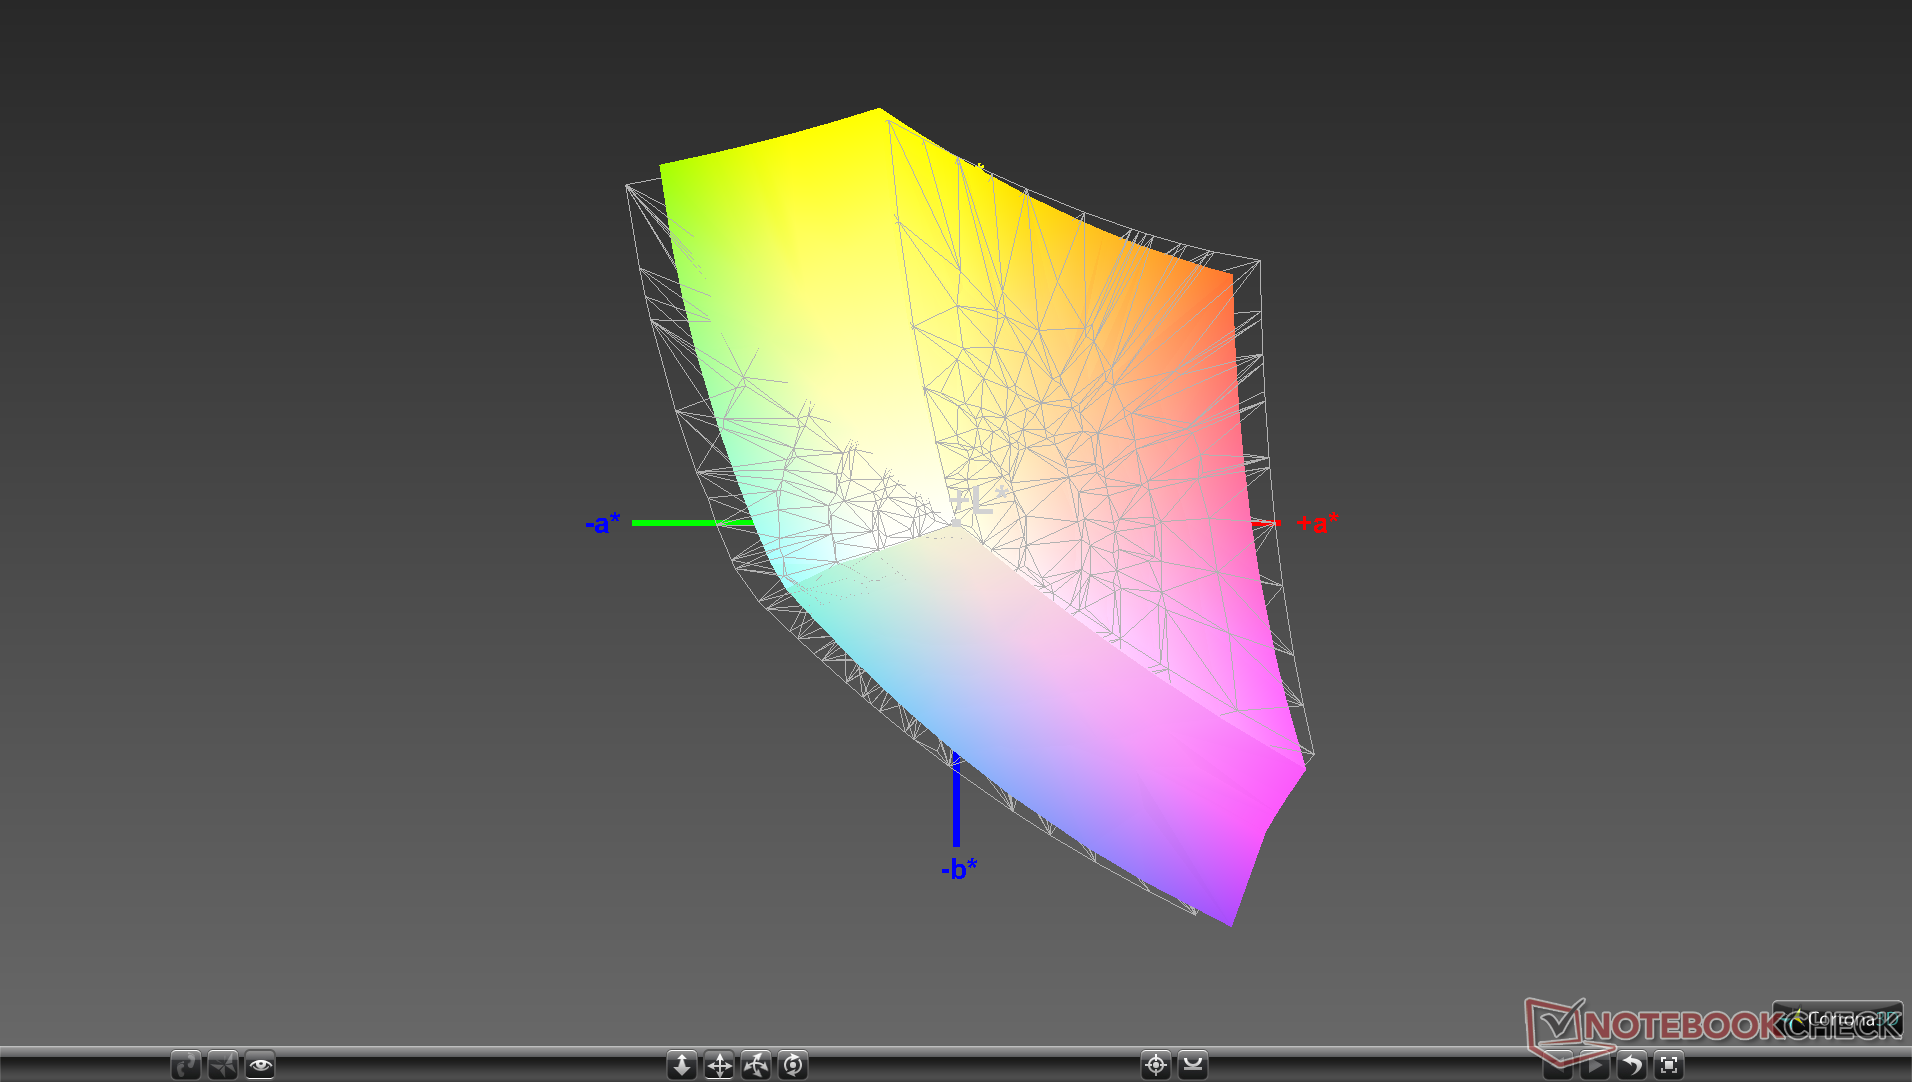
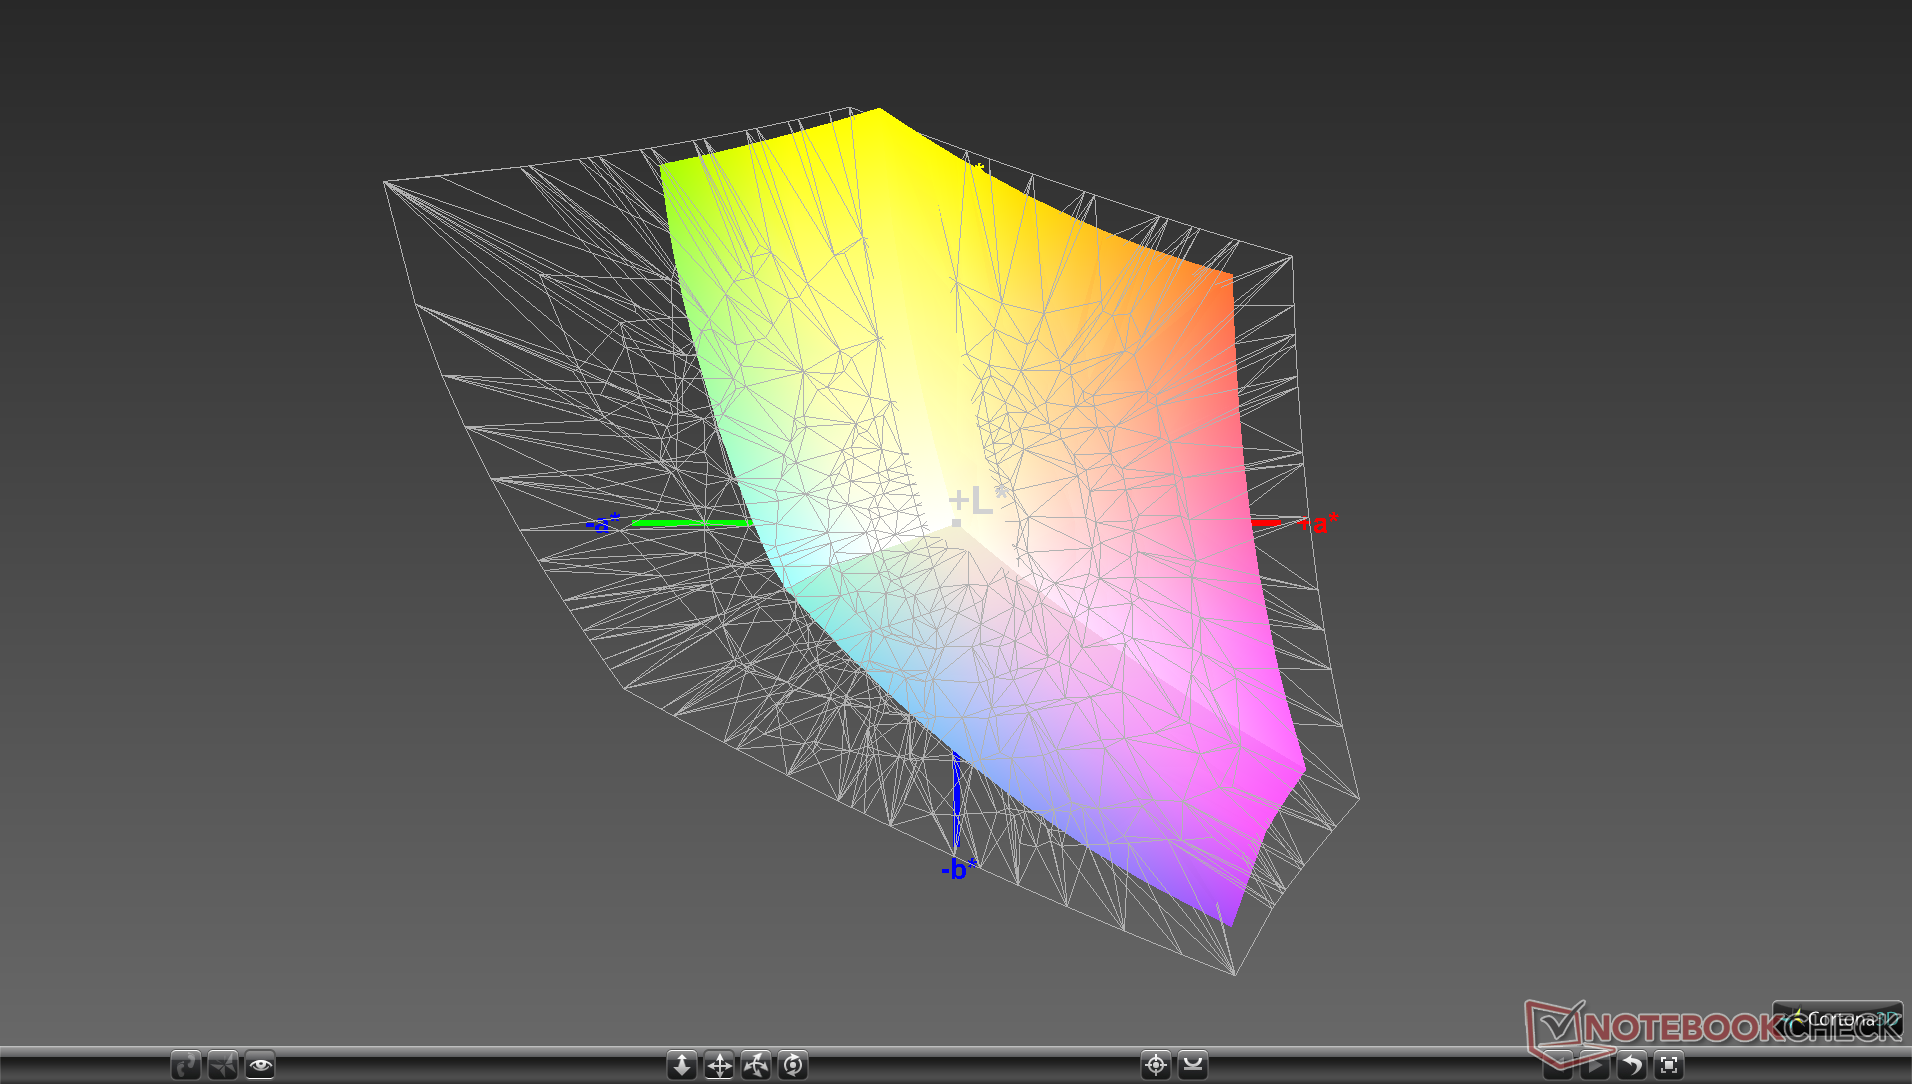
88.7% sRGB (Argyll 1.6.3 3D)
57% AdobeRGB 1998 (Argyll 1.6.3 3D)
62.1% AdobeRGB 1998 (Argyll 3D)
89% sRGB (Argyll 3D)
60.6% Display P3 (Argyll 3D)
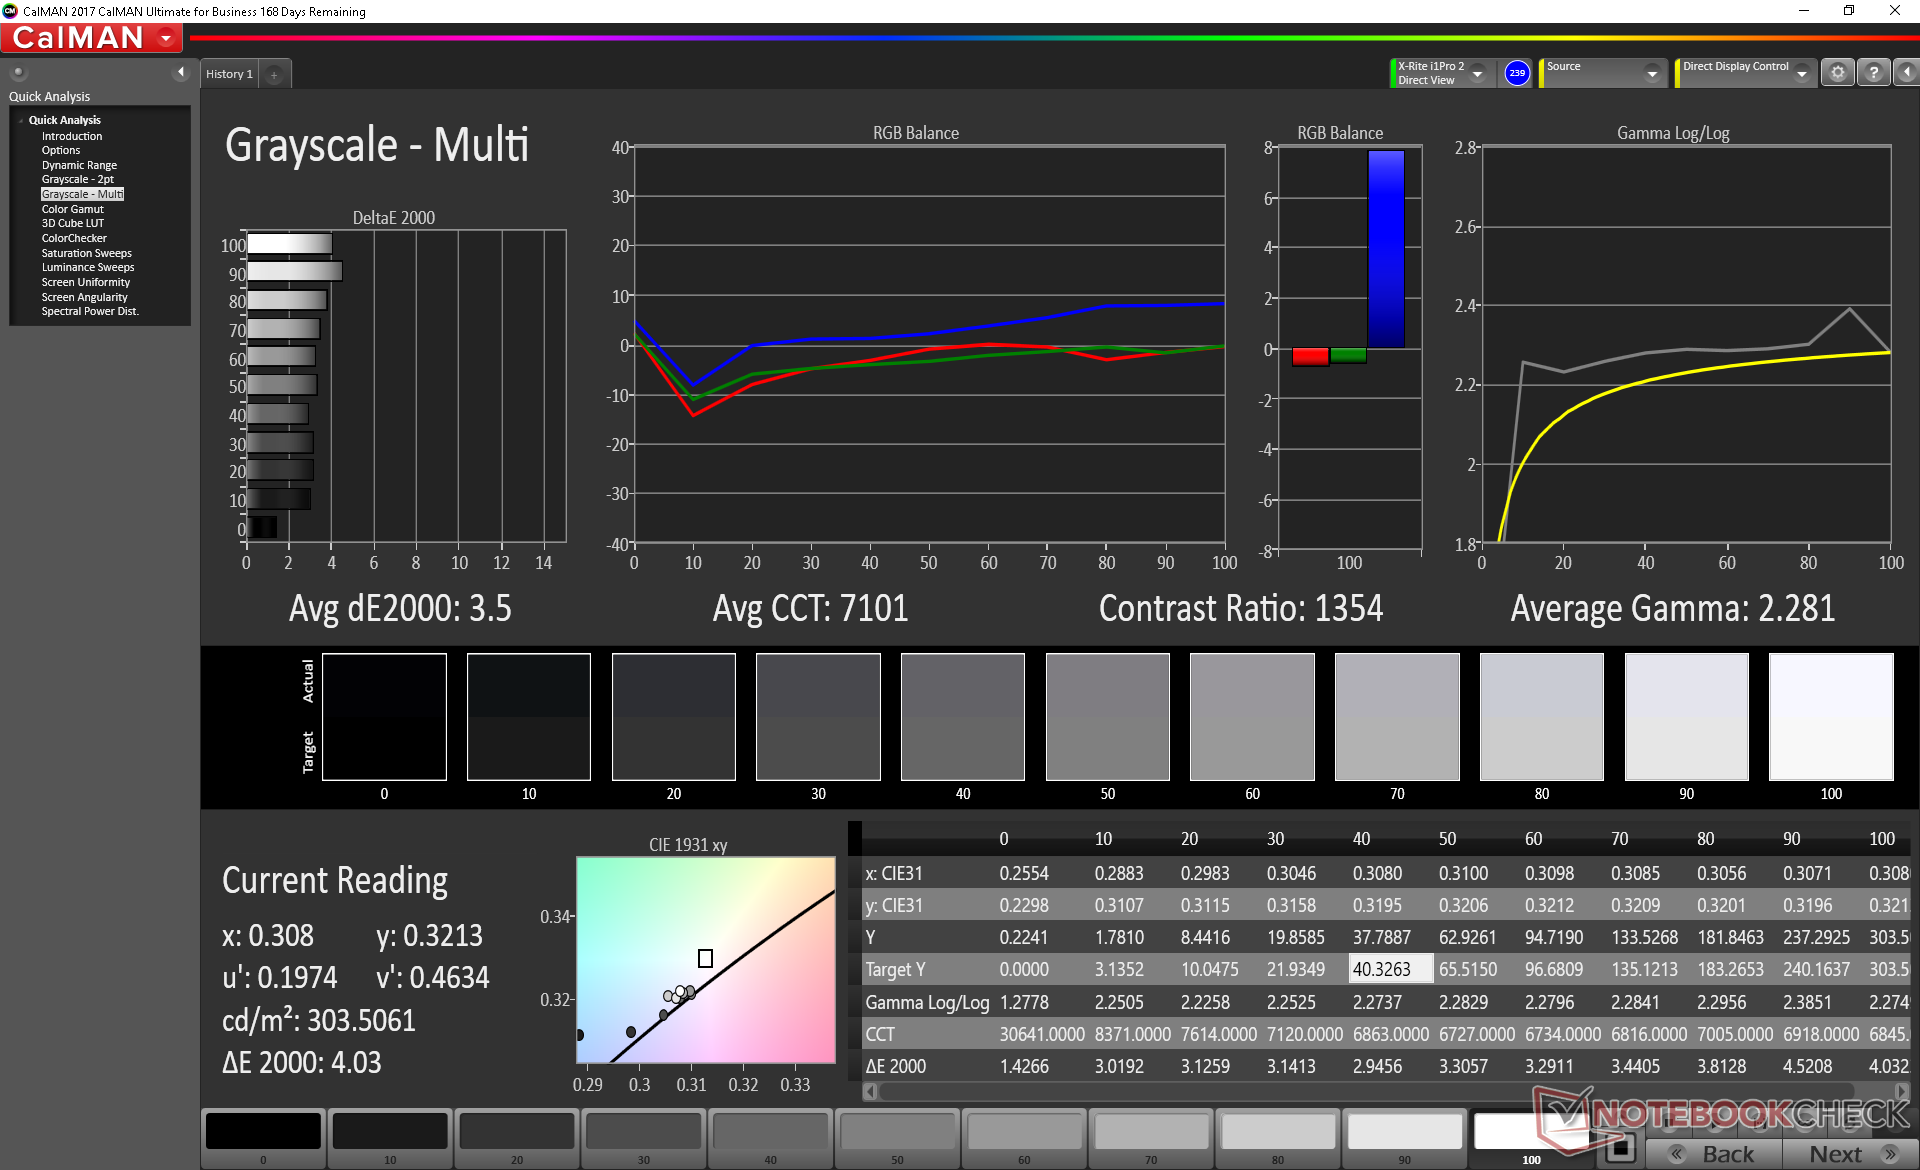
Gamma: 2.28
CCT: 7101 K
| Razer Blade Pro 17 RTX 2080 Max-Q AU Optronics B173HAN04.0, IPS, 17.3", 1920x1080 | Asus Zephyrus S GX701GX B173HAN04.0 (AUO409D), IPS, 17.3", 1920x1080 | Lenovo Legion Y740-17ICH AU Optronics B173HAN03.2, IPS, 17.3", 1920x1080 | Razer Blade Pro 2017 Sharp LQ173D1JW33 (SHP145A), IGZO, 17.3", 3840x2160 | MSI GS75 8SG Stealth N173HCE-G33 (CMN175C), IPS, 17.3", 1920x1080 | Alienware m17 P37E AU Optronics B173ZAN01.0, IPS, 17.3", 3840x2160 | |
|---|---|---|---|---|---|---|
| Display | 2% | 4% | 40% | 6% | 38% | |
| Display P3 Coverage (%) | 60.6 | 62.9 4% | 64 6% | 88.9 47% | 63.6 5% | 86.4 43% |
| sRGB Coverage (%) | 89 | 87.8 -1% | 90.4 2% | 100 12% | 95.4 7% | 99.9 12% |
| AdobeRGB 1998 Coverage (%) | 62.1 | 63.9 3% | 64.8 4% | 99.7 61% | 65.5 5% | 99.1 60% |
| Response Times | -3% | -81% | -547% | -6% | -308% | |
| Response Time Grey 50% / Grey 80% * (ms) | 6.8 ? | 7.2 ? -6% | 15.6 ? -129% | 60.8 ? -794% | 7.6 ? -12% | 35.6 ? -424% |
| Response Time Black / White * (ms) | 9.6 ? | 9.6 ? -0% | 12.8 ? -33% | 38.4 ? -300% | 9.6 ? -0% | 28 ? -192% |
| PWM Frequency (Hz) | 204.9 ? | 25510 ? | ||||
| Screen | 13% | -30% | -22% | 24% | -29% | |
| Brightness middle (cd/m²) | 299.3 | 288 -4% | 299.1 0% | 230 -23% | 355 19% | 357.9 20% |
| Brightness (cd/m²) | 294 | 287 -2% | 273 -7% | 207 -30% | 327 11% | 347 18% |
| Brightness Distribution (%) | 94 | 91 -3% | 81 -14% | 83 -12% | 85 -10% | 94 0% |
| Black Level * (cd/m²) | 0.29 | 0.2 31% | 0.27 7% | 0.2 31% | 0.26 10% | 0.33 -14% |
| Contrast (:1) | 1032 | 1440 40% | 1108 7% | 1150 11% | 1365 32% | 1085 5% |
| Colorchecker dE 2000 * | 2.55 | 2.33 9% | 5.07 -99% | 5.62 -120% | 1.54 40% | 6.57 -158% |
| Colorchecker dE 2000 max. * | 4.73 | 5.34 -13% | 10.55 -123% | 10.24 -116% | 3 37% | 9.86 -108% |
| Colorchecker dE 2000 calibrated * | 2.9 | 2.47 15% | 3.31 -14% | 0.77 73% | 6.74 -132% | |
| Greyscale dE 2000 * | 3.5 | 1.19 66% | 6.8 -94% | 4.54 -30% | 2.19 37% | 4.3 -23% |
| Gamma | 2.28 96% | 2.41 91% | 2.46 89% | 2.36 93% | 2.42 91% | 2.6 85% |
| CCT | 7101 92% | 6710 97% | 7805 83% | 6625 98% | 6893 94% | 6403 102% |
| Color Space (Percent of AdobeRGB 1998) (%) | 57 | 57 0% | 58.5 3% | 88 54% | 61 7% | 88.4 55% |
| Color Space (Percent of sRGB) (%) | 88.7 | 88 -1% | 89.9 1% | 100 13% | 95 7% | 100 13% |
| Total Average (Program / Settings) | 4% /
9% | -36% /
-30% | -176% /
-80% | 8% /
17% | -100% /
-52% |
* ... smaller is better
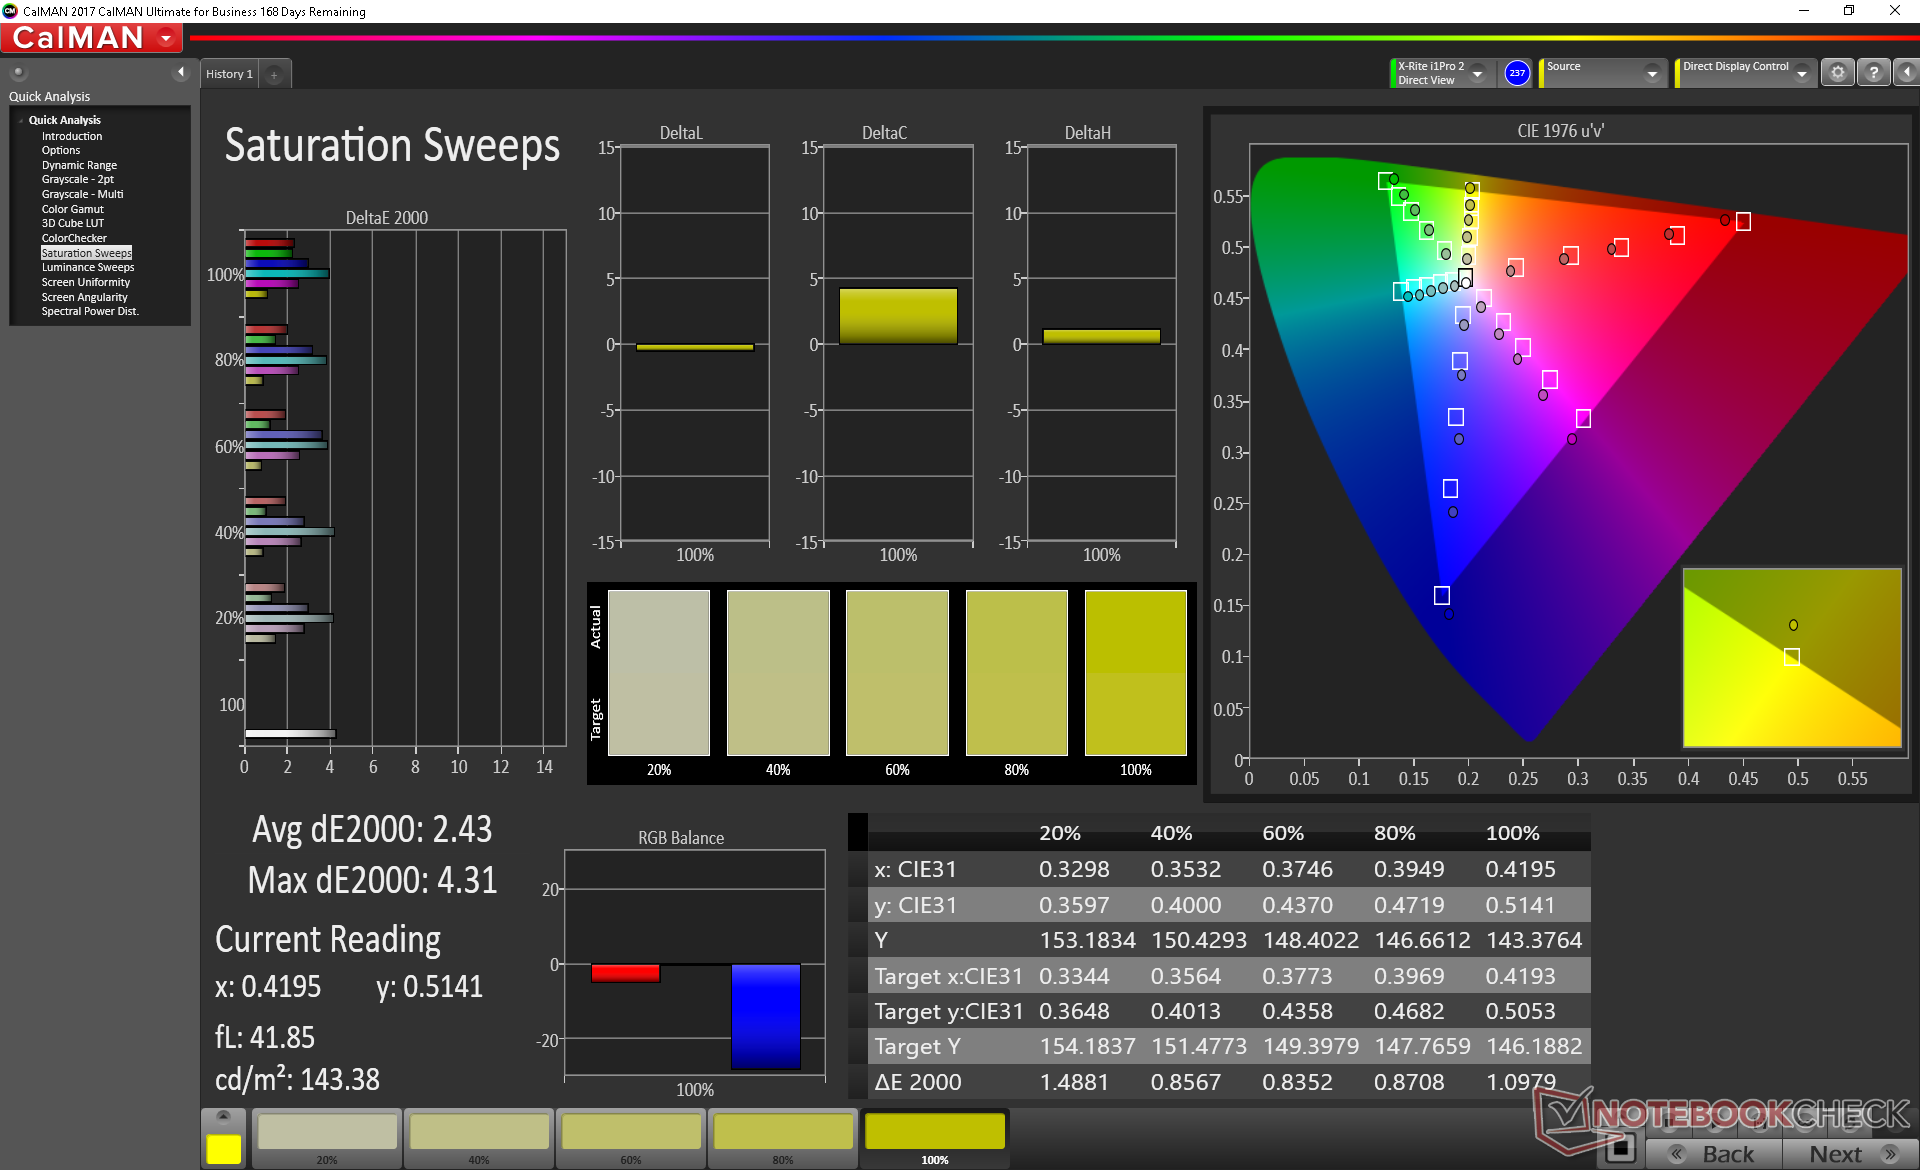
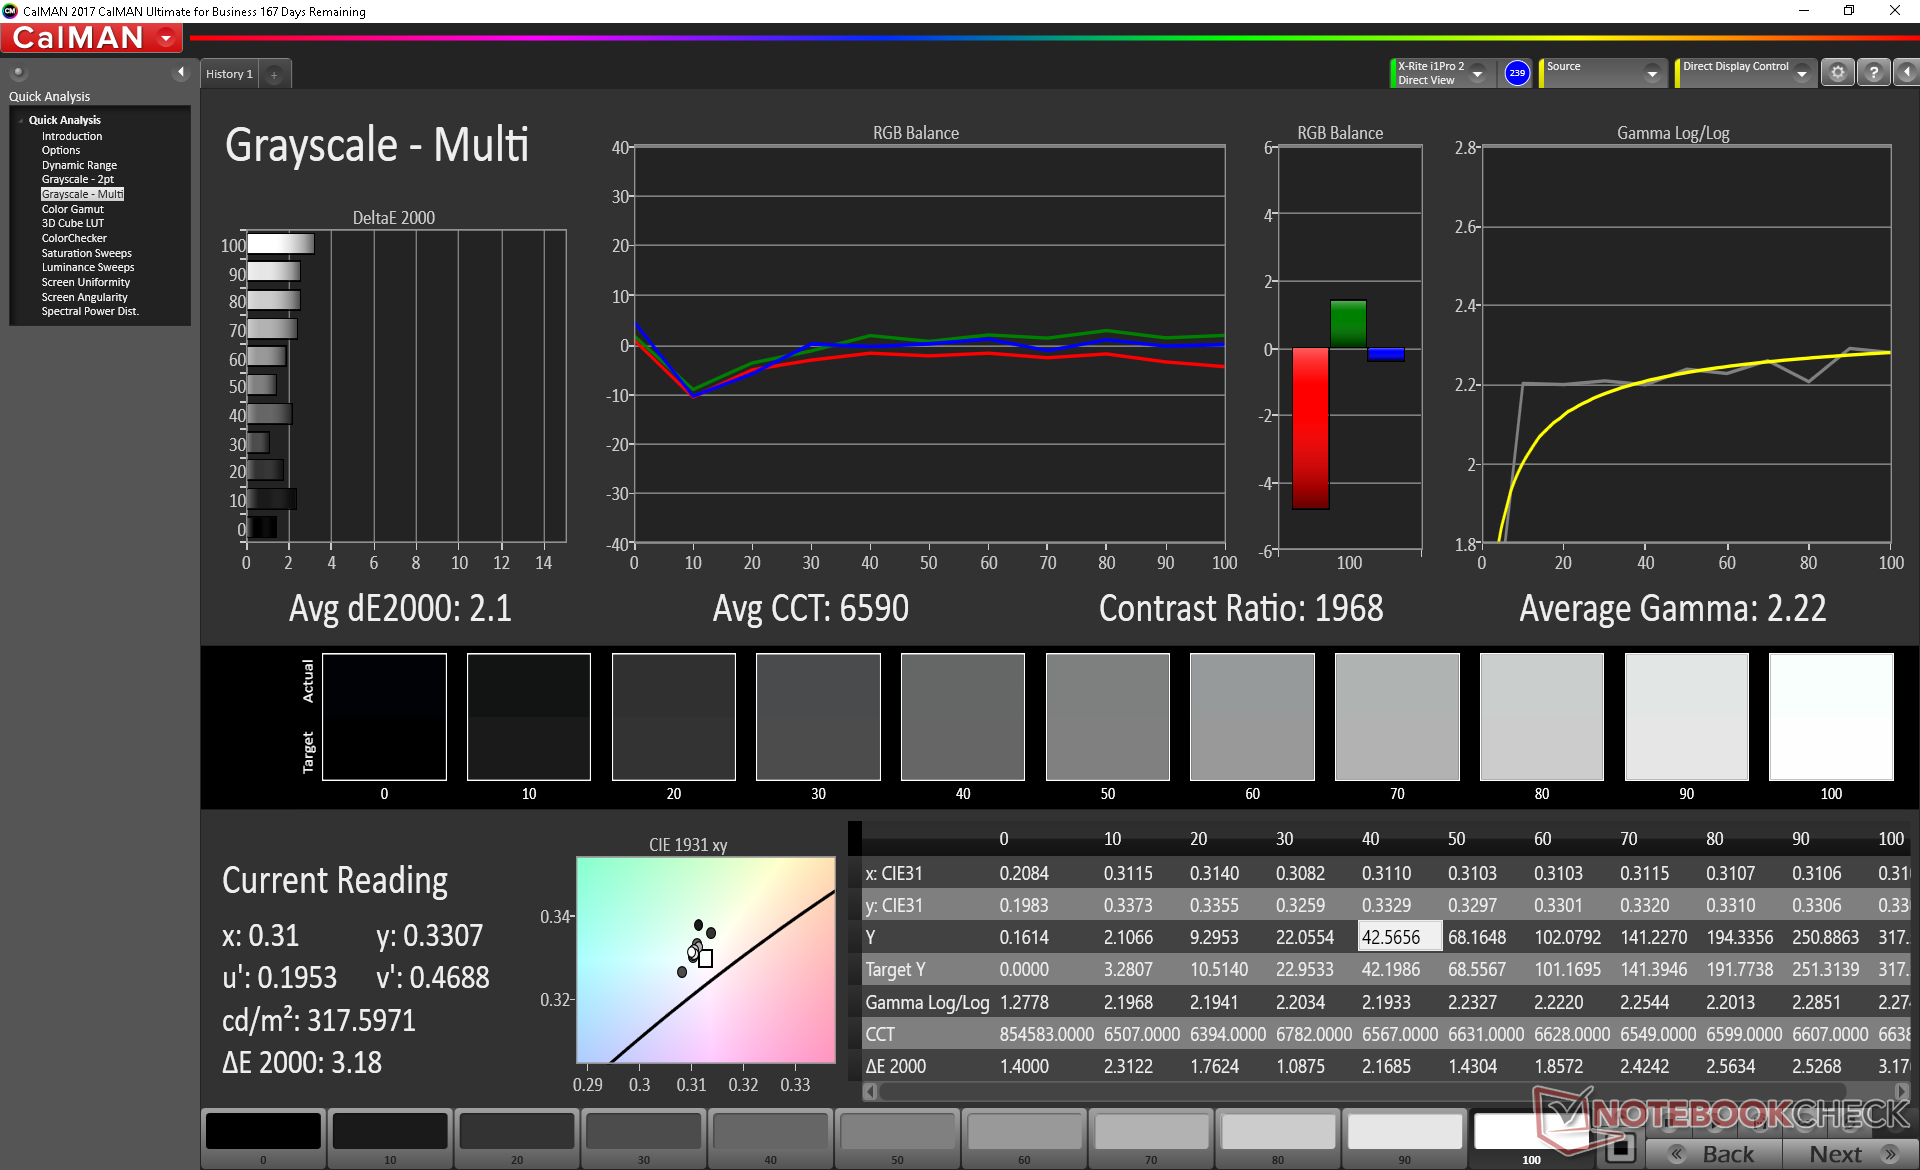
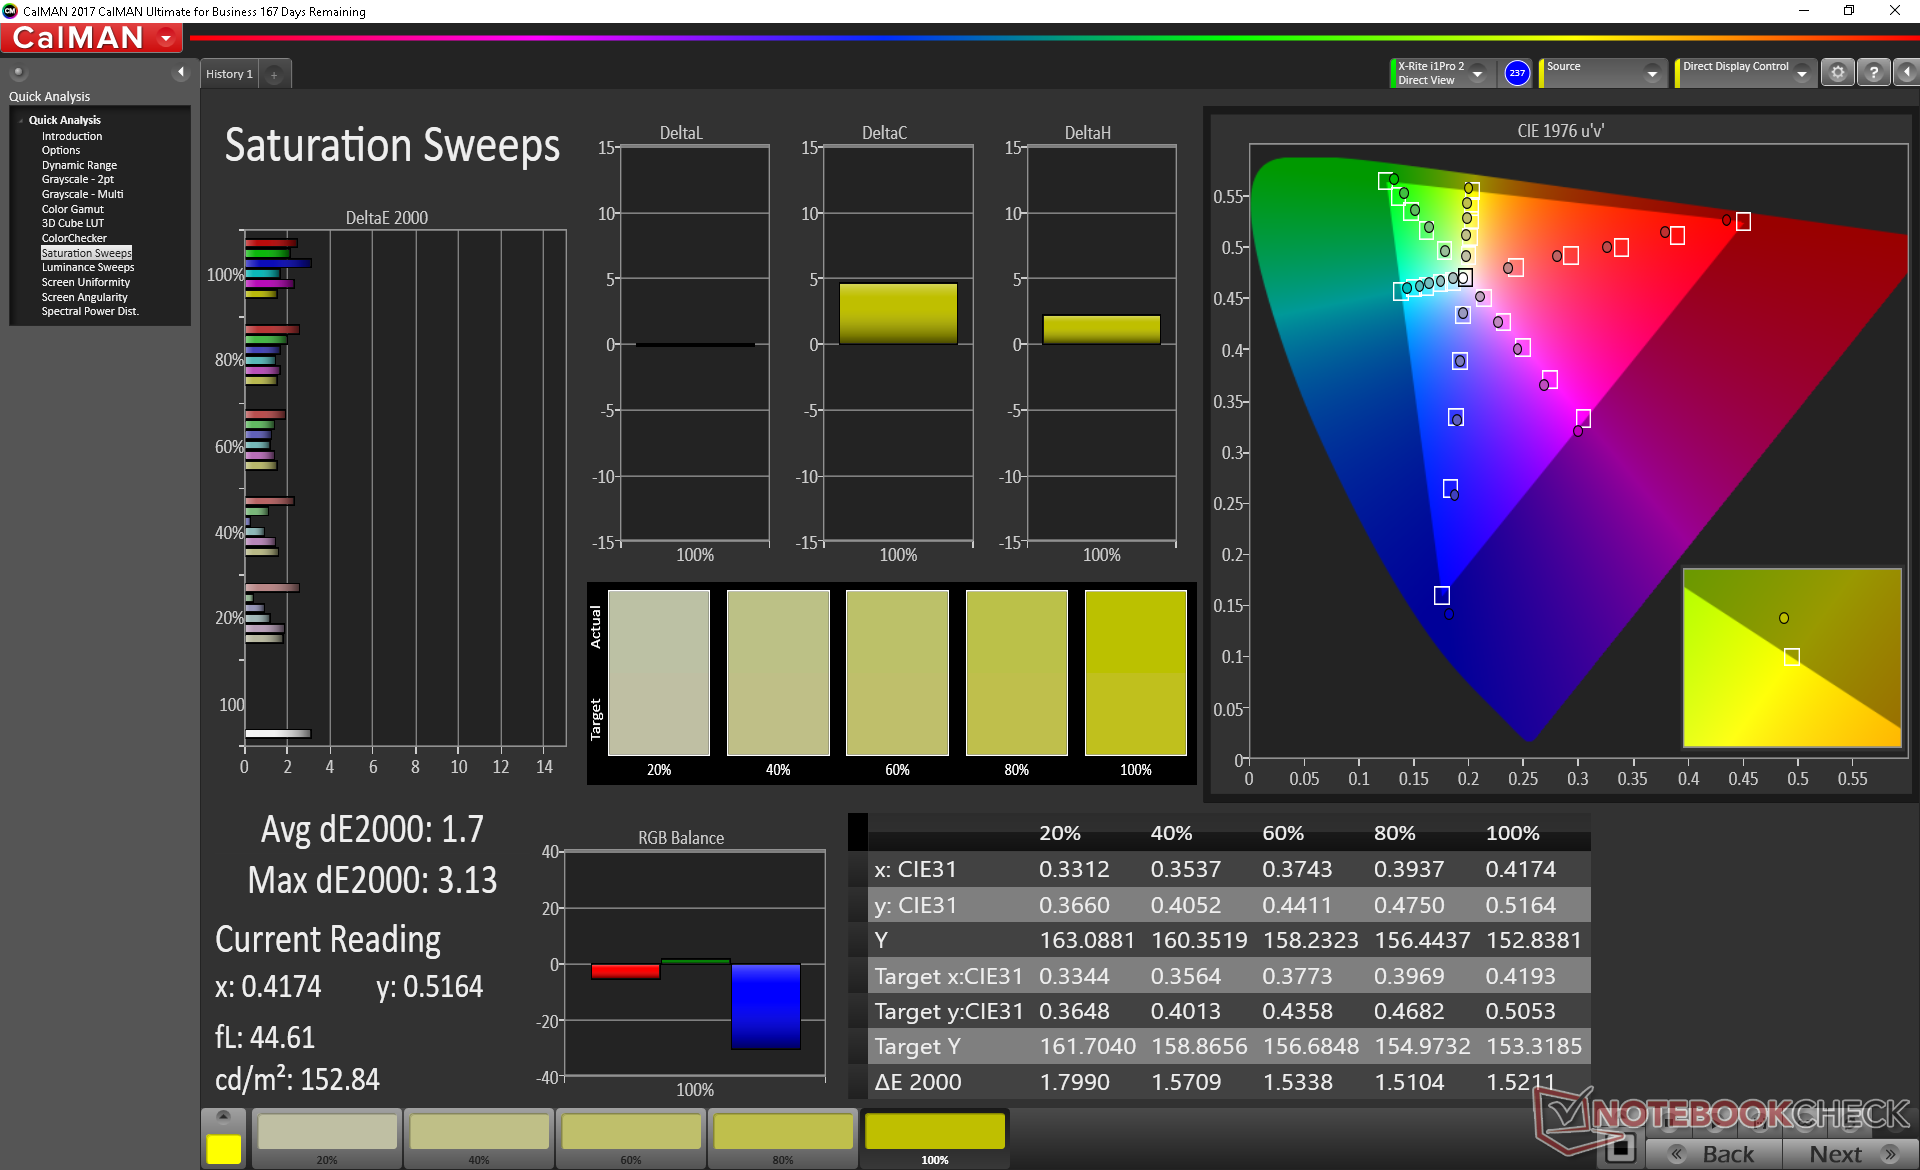
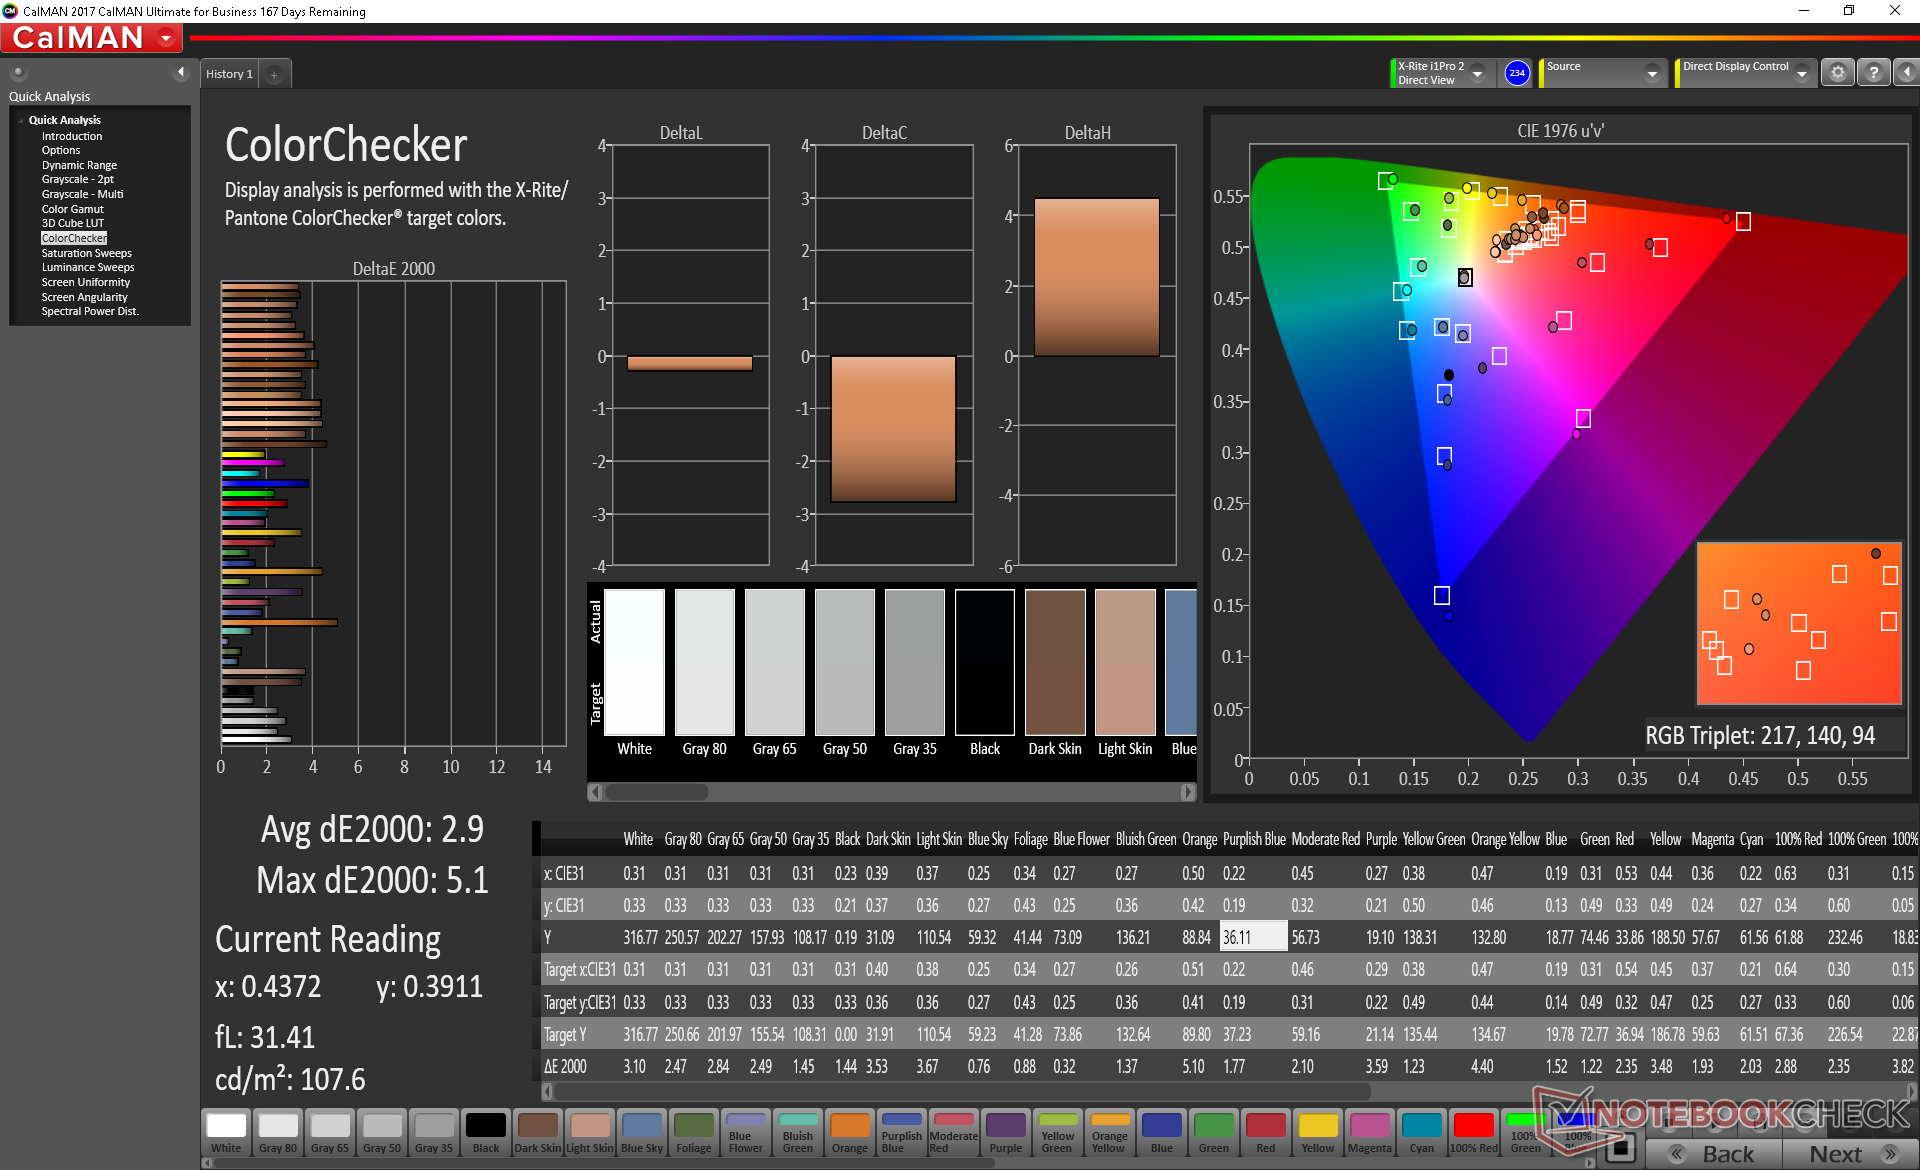
Razer advertises 100 percent sRGB coverage while our own independent measurements show this to be a little less at 89 percent. It's not an issue for gamers, but graphic designers hoping for full AdobeRGB coverage a la the Blade Pro 2017 will not find that option here.
Further measurements with an X-Rite colorimeter reveal good grayscale and colors albeit with a color temperature slightly on the cooler side. Our calibration addresses this for a warmer temperature (7101 vs. 6590) and a more accurate grayscale (average deltaE 3.5 vs. 2.1). In general, however, we don't find an end-user calibration imperative since the display is already quite accurate out of the box.

Display Response Times
| ↔ Response Time Black to White | ||
|---|---|---|
| 9.6 ms ... rise ↗ and fall ↘ combined | ↗ 5.2 ms rise | 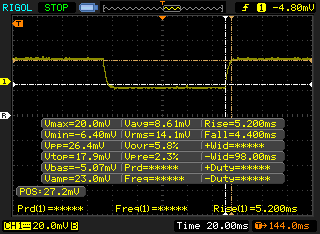 |
| ↘ 4.4 ms fall | ||
| The screen shows fast response rates in our tests and should be suited for gaming. In comparison, all tested devices range from 0.1 (minimum) to 240 (maximum) ms. » 26 % of all devices are better. This means that the measured response time is better than the average of all tested devices (19.9 ms). | ||
| ↔ Response Time 50% Grey to 80% Grey | ||
| 6.8 ms ... rise ↗ and fall ↘ combined | ↗ 3.4 ms rise | 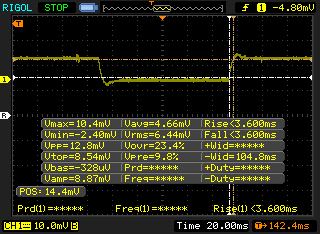 |
| ↘ 3.4 ms fall | ||
| The screen shows very fast response rates in our tests and should be very well suited for fast-paced gaming. In comparison, all tested devices range from 0.165 (minimum) to 636 (maximum) ms. » 19 % of all devices are better. This means that the measured response time is better than the average of all tested devices (31.1 ms). | ||
Screen Flickering / PWM (Pulse-Width Modulation)
| Screen flickering / PWM not detected | 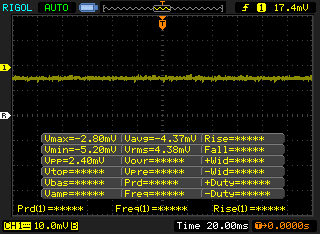 | ||
In comparison: 52 % of all tested devices do not use PWM to dim the display. If PWM was detected, an average of 7794 (minimum: 5 - maximum: 343500) Hz was measured. | |||
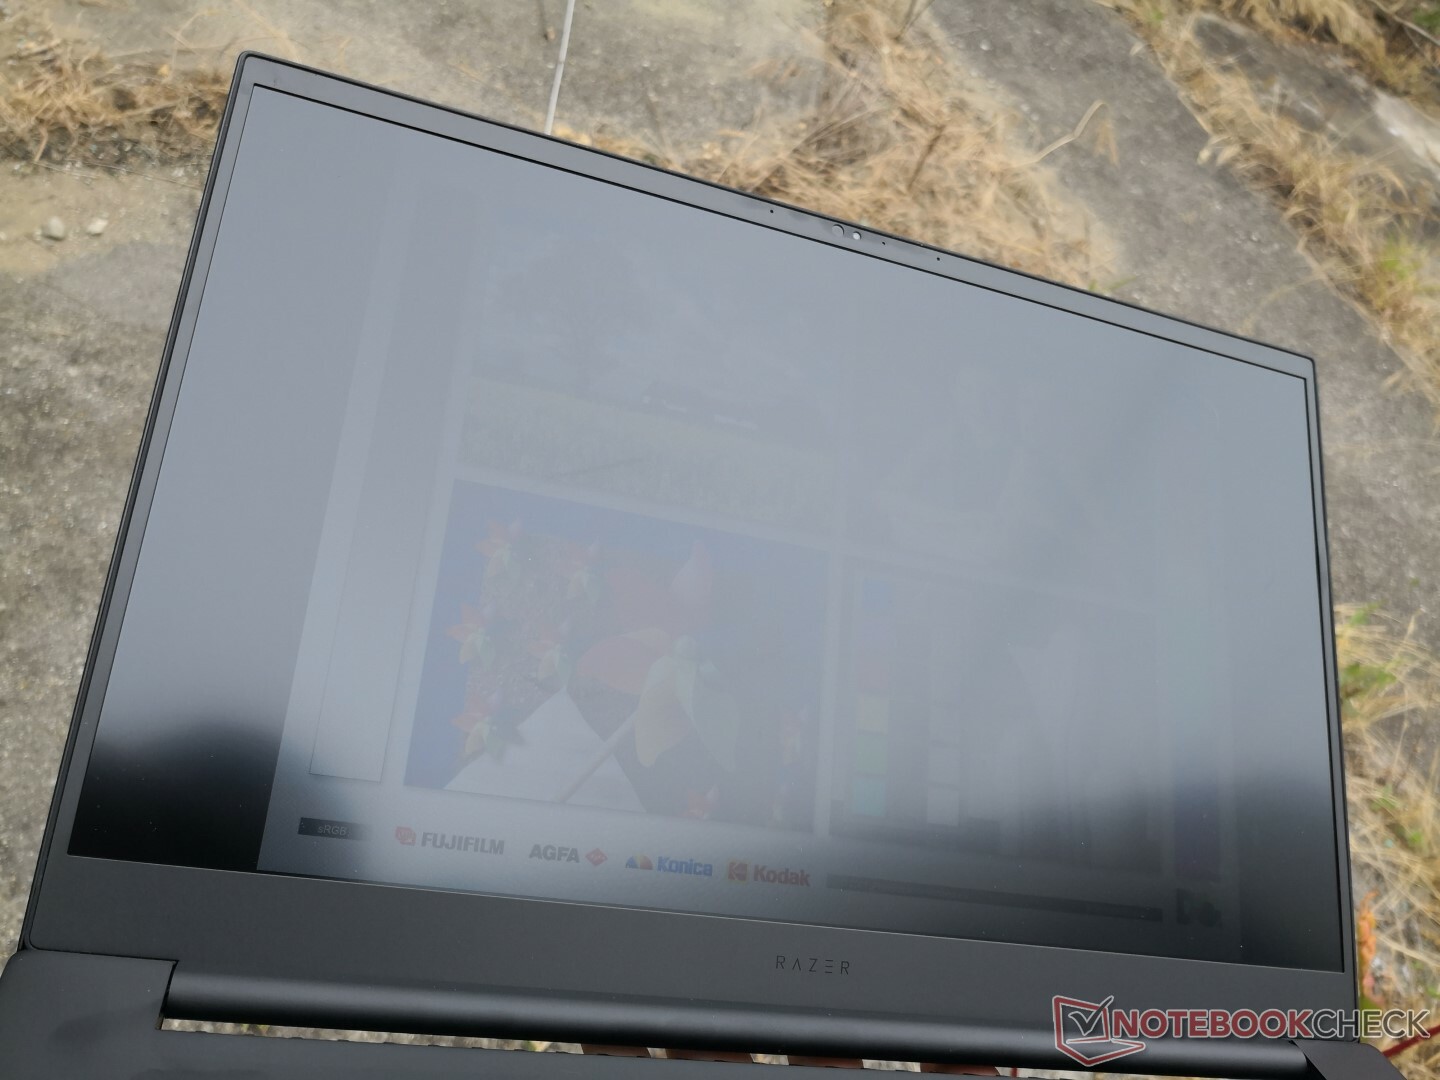
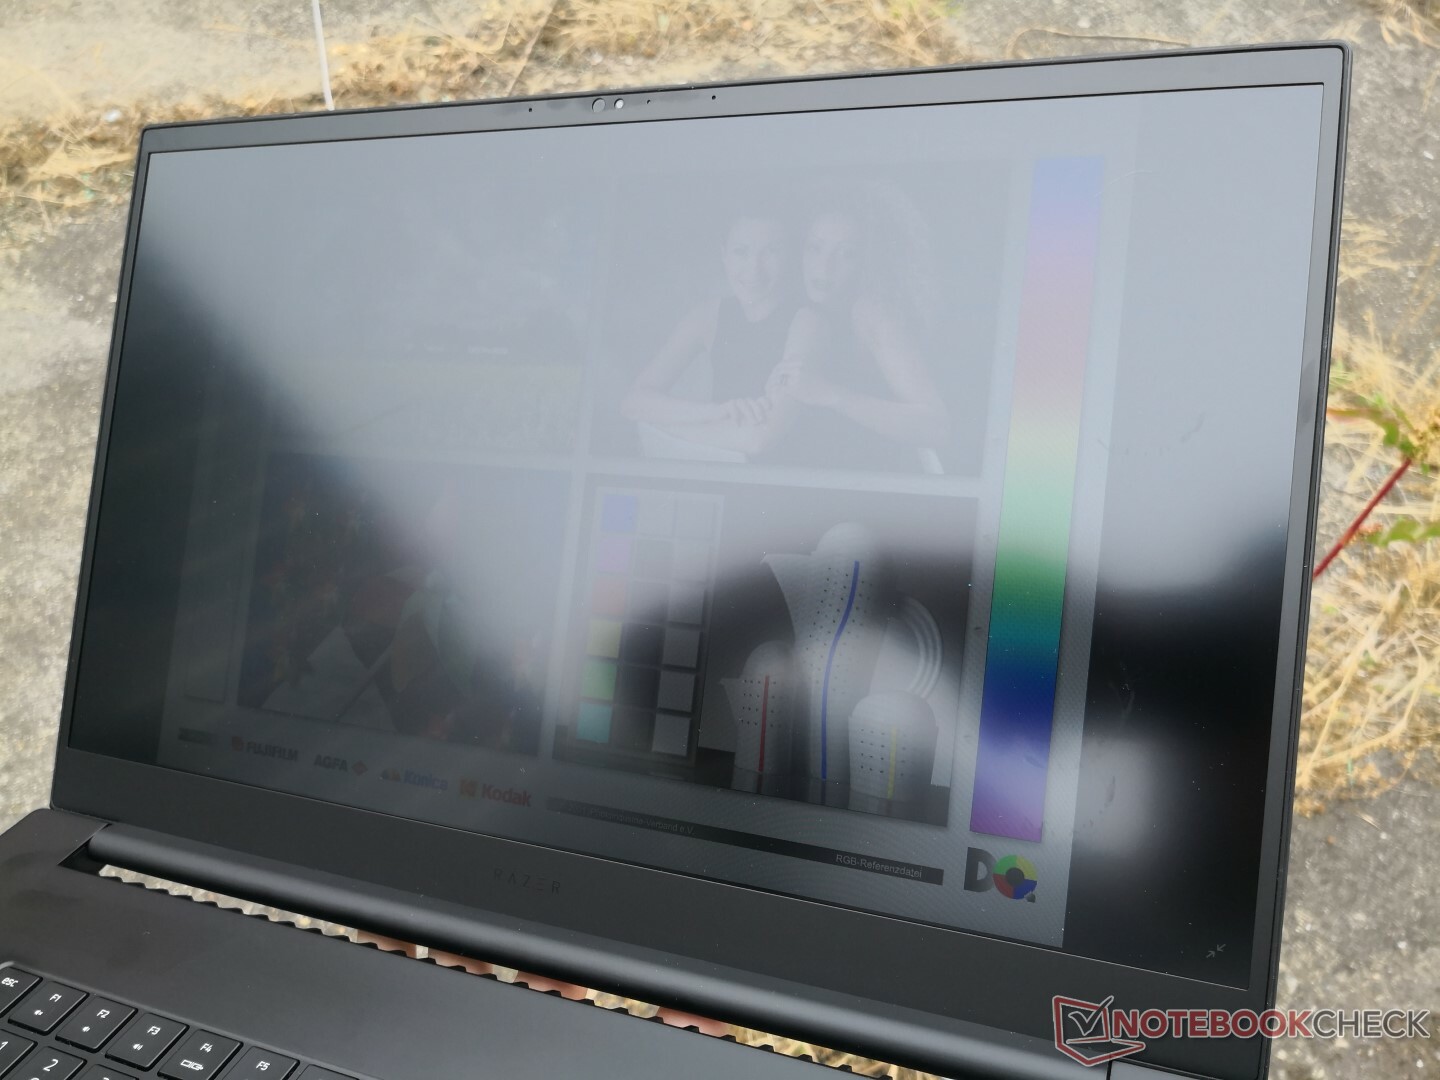
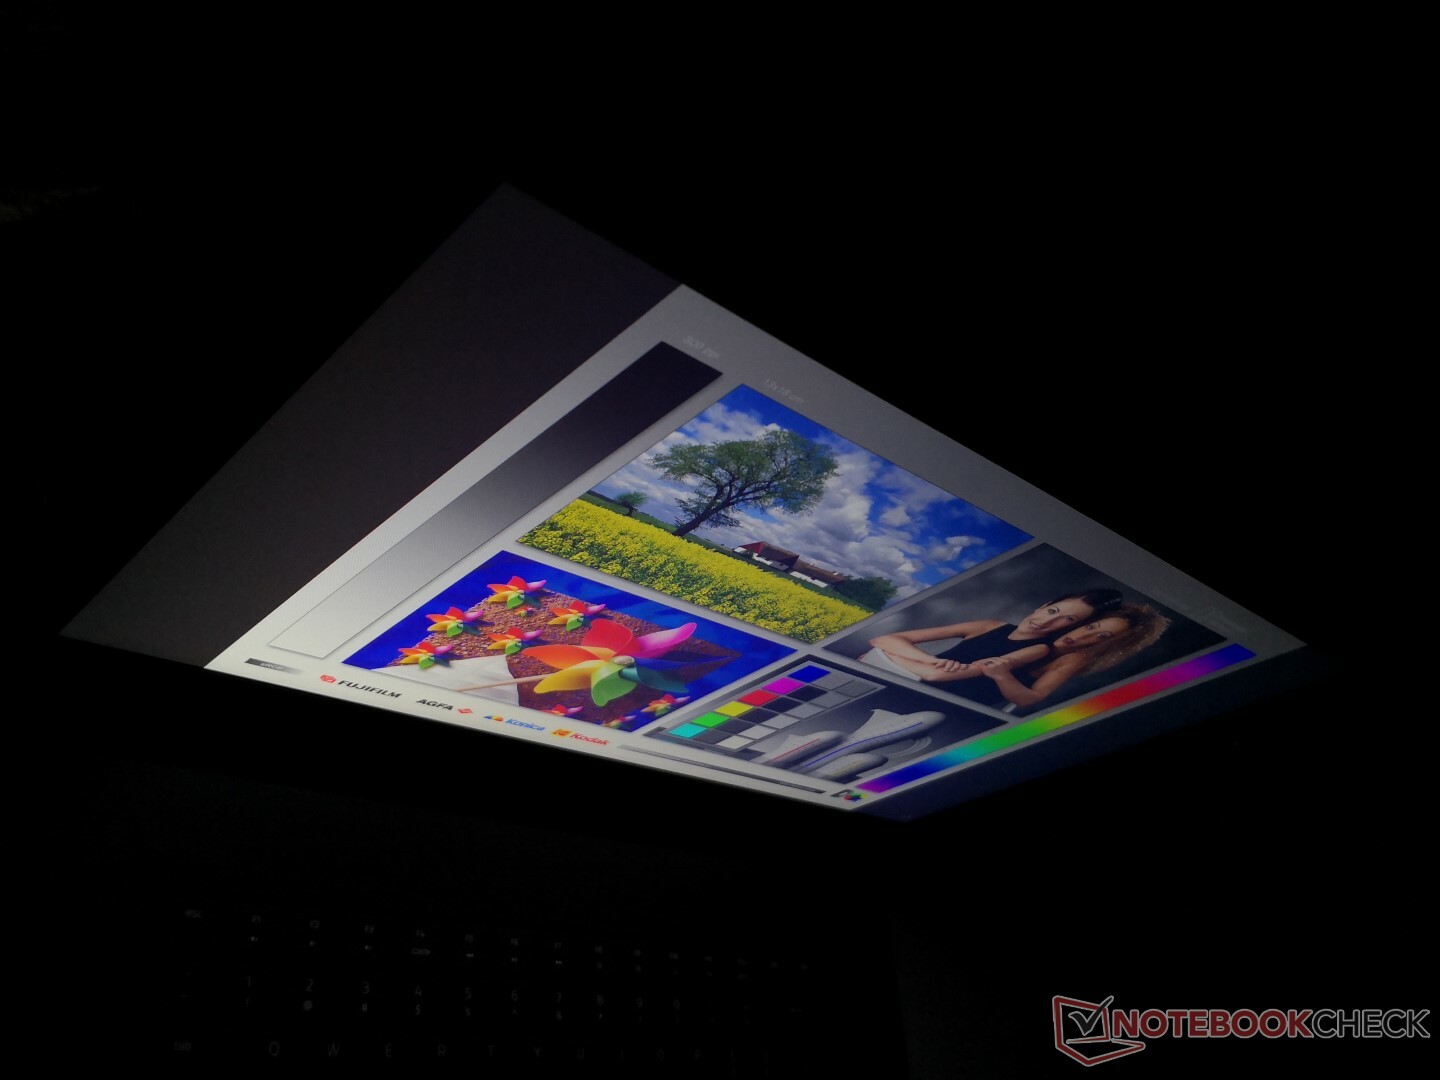
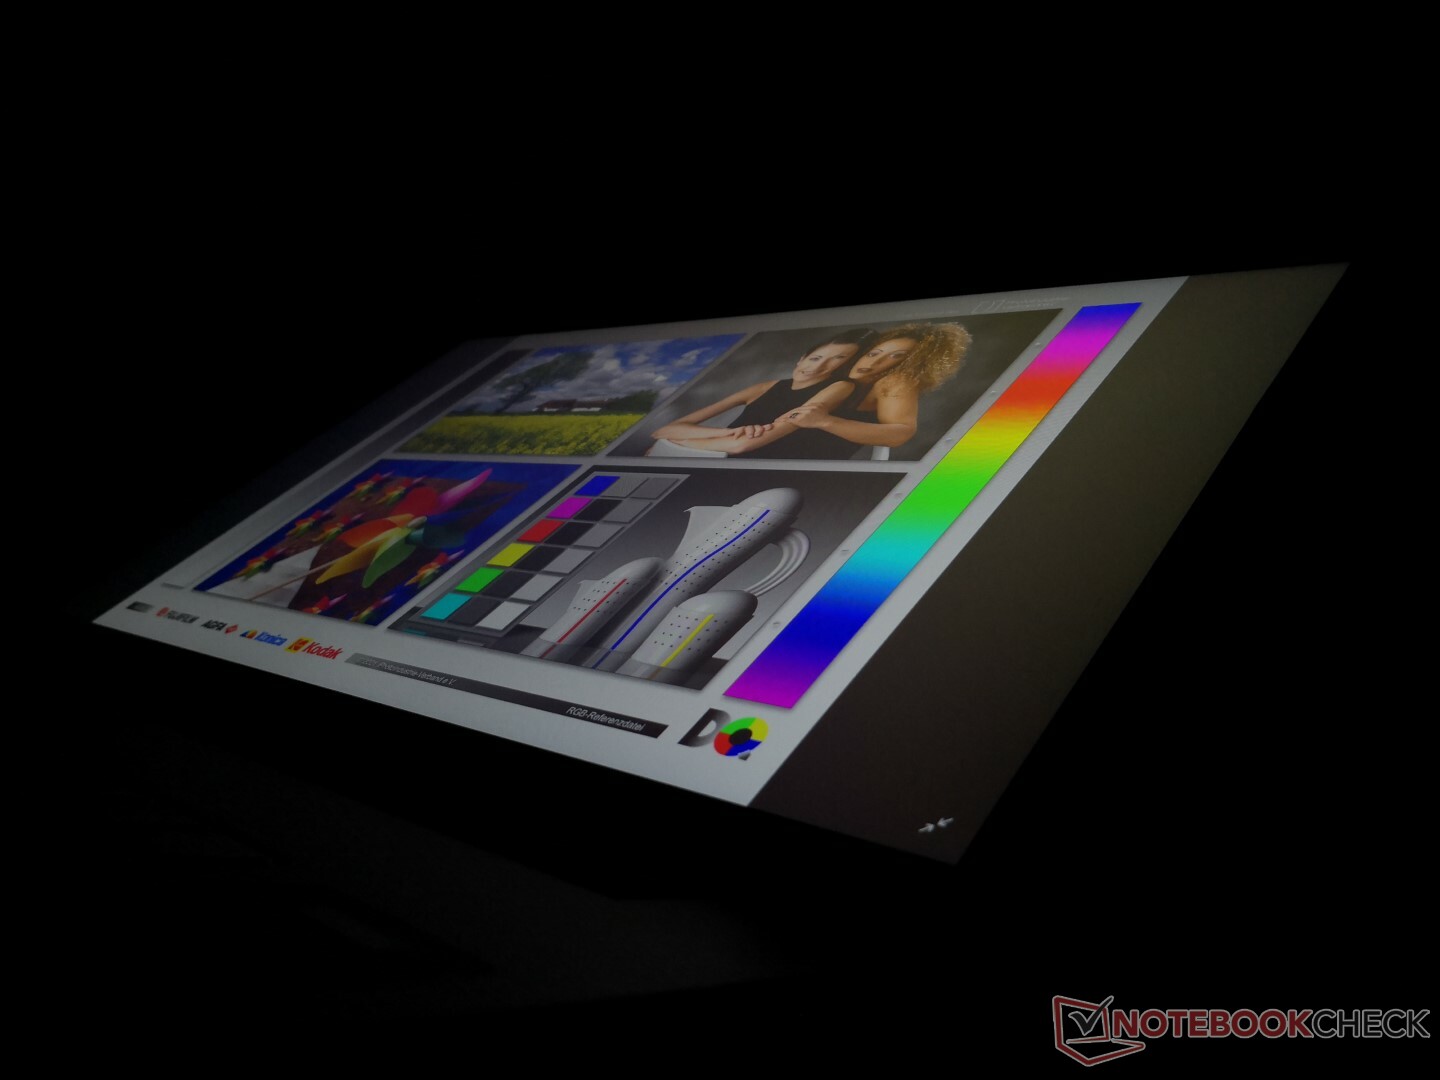
Outdoor visibility is better than the Blade Pro 2017 because of the brighter backlight and matte panel to reduce glare. Still, the Blade Pro 17 was not designed to be used outdoors frequently even though its sleek dimensions might suggest otherwise. Onscreen content will become washed out even on a cloudy day. Viewing angles are otherwise excellent with just slight changes to contrast, colors, and brightness if viewing from abnormally obtuse positions.


Performance
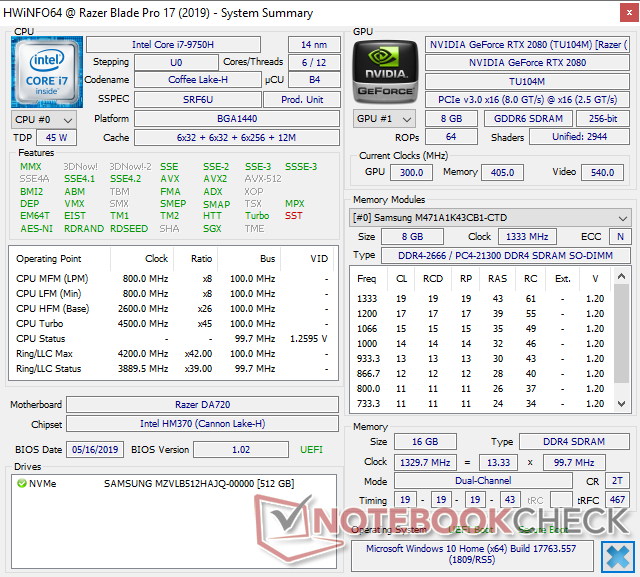
Whereas the Blade Pro 2017 had two 7th gen CPU options (i7-7700HQ and i7-7820HK) and two GPU options (GTX 1060 and GTX 1080), the current iteration of the Blade Pro 17 has just one 9th gen CPU option (Core i7-9750H) with three GPUs to choose from (RTX 2060, RTX 2070 Max-Q, RTX 2080 Max-Q). Razer has leapfrogged over an entire CPU generation and the benchmark results below will show just how much a performance boost users can expect.
Why is there no Core i9-9880H option? According to Razer, the Core i9 offers no significant benefits to gamers and so they have opted to focus on just the Core i7 for now. Nonetheless, we fully expect Razer to eventually introduce additional Blade Pro 17 SKUs in the future much like how the Blade 15 series has expanded into several different configurations.
Nvidia Optimus comes standard across all current SKUs which unfortunately omits G-Sync from the lineup.
Processor
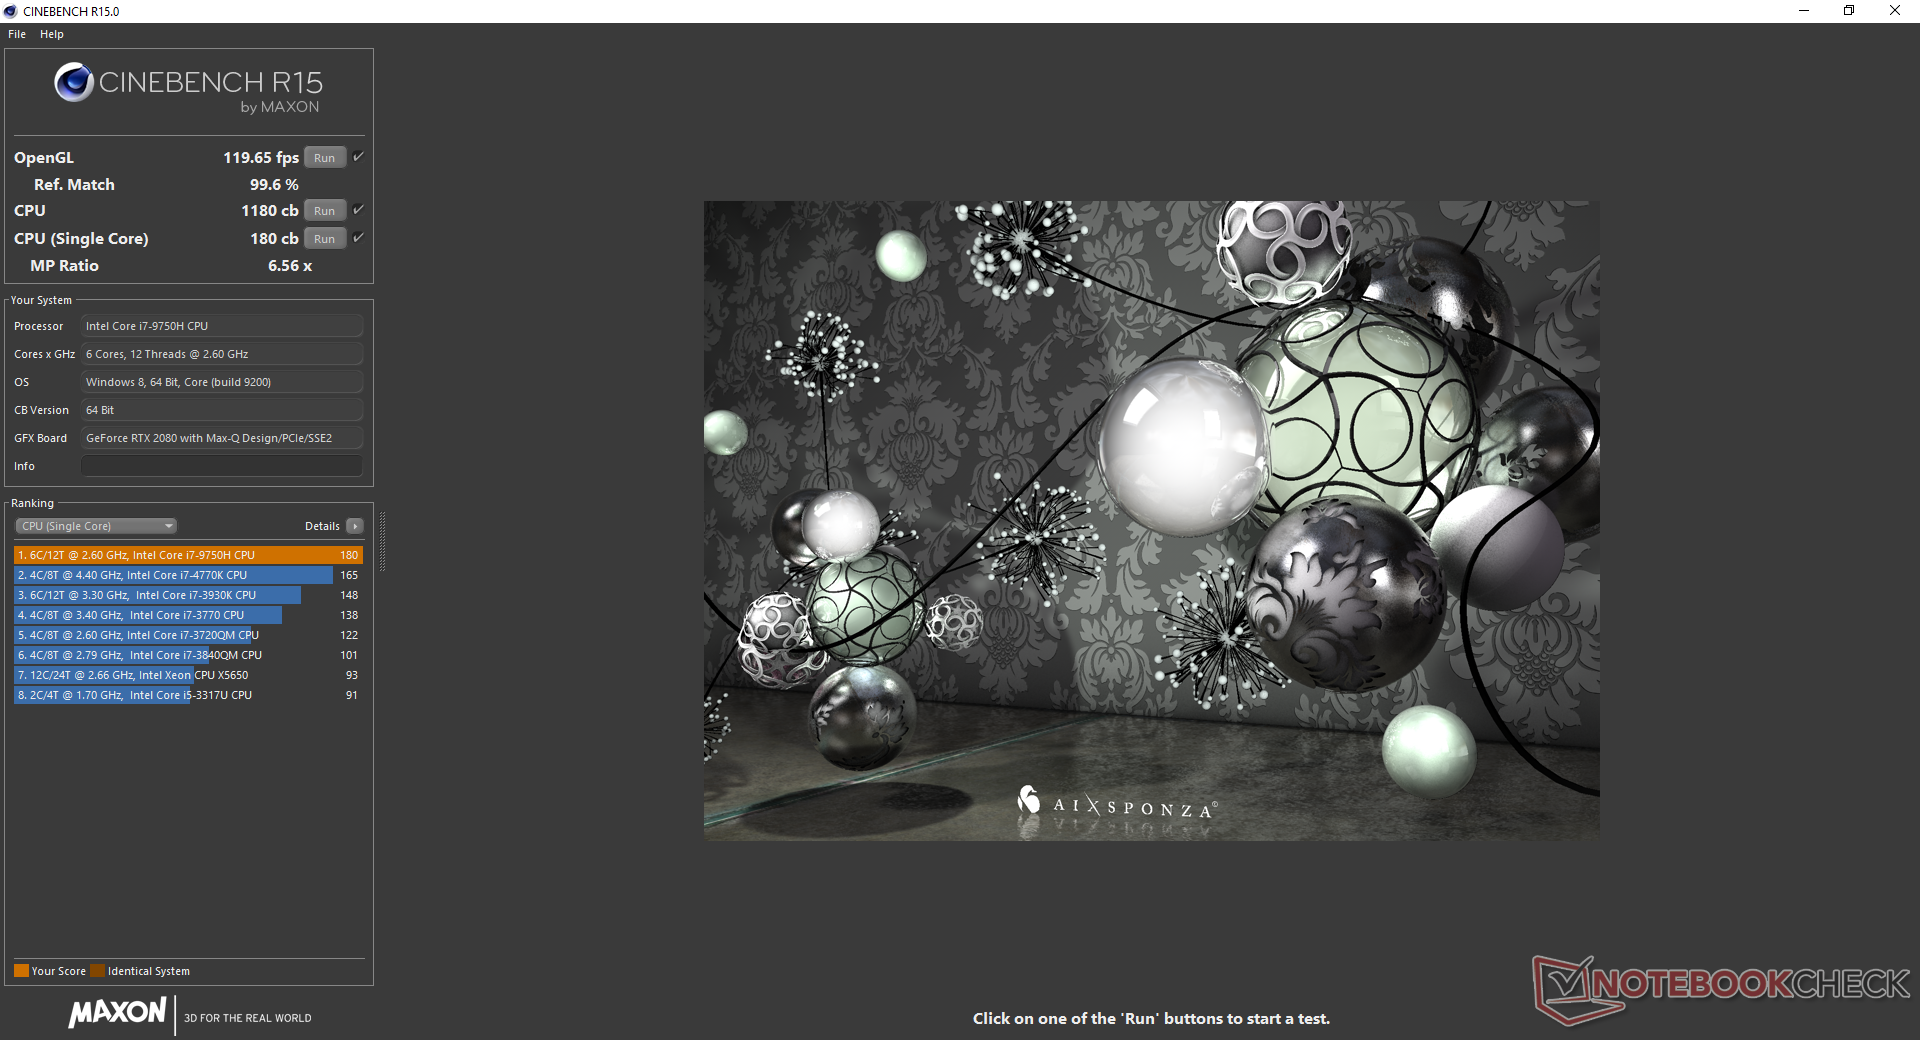
CPU performance is exactly where we expect it to be. CineBench results are within 1 percent of the average Core i7-9750H in our database taken from 13 other laptops. Users can expect about 44 to 53 percent faster multi-thread performance over the Core i5-8300H, Core i5-9300H, or older Core i7-7820HK as found on the Blade Pro 2017. In general, however, the Core i7-9750H offers just marginal benefits over the last generation Core i7-8750H at best. The octa-core Core i9-9880H as found on the MSI GE75 can offer almost 50 percent faster performance than the i7-9750H in our Razer.
Performance sustainability is average. By running CineBench R15 Multi-Thread in a loop, we are able to record a performance drop of almost 10 percent by the second loop as shown by our comparison graph below. Some laptops with the older Core i7-8750H like the Alienware m15 or Asus ROG Strix Scar II GL704GW are able to maintain faster clock rates for longer for better performance despite having a last generation processor.
See our dedicated page on the Core i7-9750H for more technical information and benchmark comparisons.
| Cinebench R11.5 | |
| CPU Single 64Bit | |
| MSI GE75 9SG | |
| Average Intel Core i7-9750H (1.96 - 2.19, n=10) | |
| Razer Blade Pro 2017 | |
| Asus ROG Zephyrus G15 GA502DU | |
| CPU Multi 64Bit | |
| MSI GE75 9SG | |
| Average Intel Core i7-9750H (11.3 - 14.1, n=10) | |
| Asus ROG Zephyrus G15 GA502DU | |
| Razer Blade Pro 2017 | |
| Cinebench R10 | |
| Rendering Multiple CPUs 32Bit | |
| MSI GE75 9SG | |
| Average Intel Core i7-9750H (28251 - 36304, n=13) | |
| Asus ROG Zephyrus G15 GA502DU | |
| Rendering Single 32Bit | |
| MSI GE75 9SG | |
| Average Intel Core i7-9750H (6659 - 7214, n=13) | |
| Asus ROG Zephyrus G15 GA502DU | |
| wPrime 2.10 - 1024m | |
| Asus ROG Zephyrus G15 GA502DU | |
| Average Intel Core i7-9750H (n=1) | |
| MSI GE75 9SG | |
* ... smaller is better
System Performance
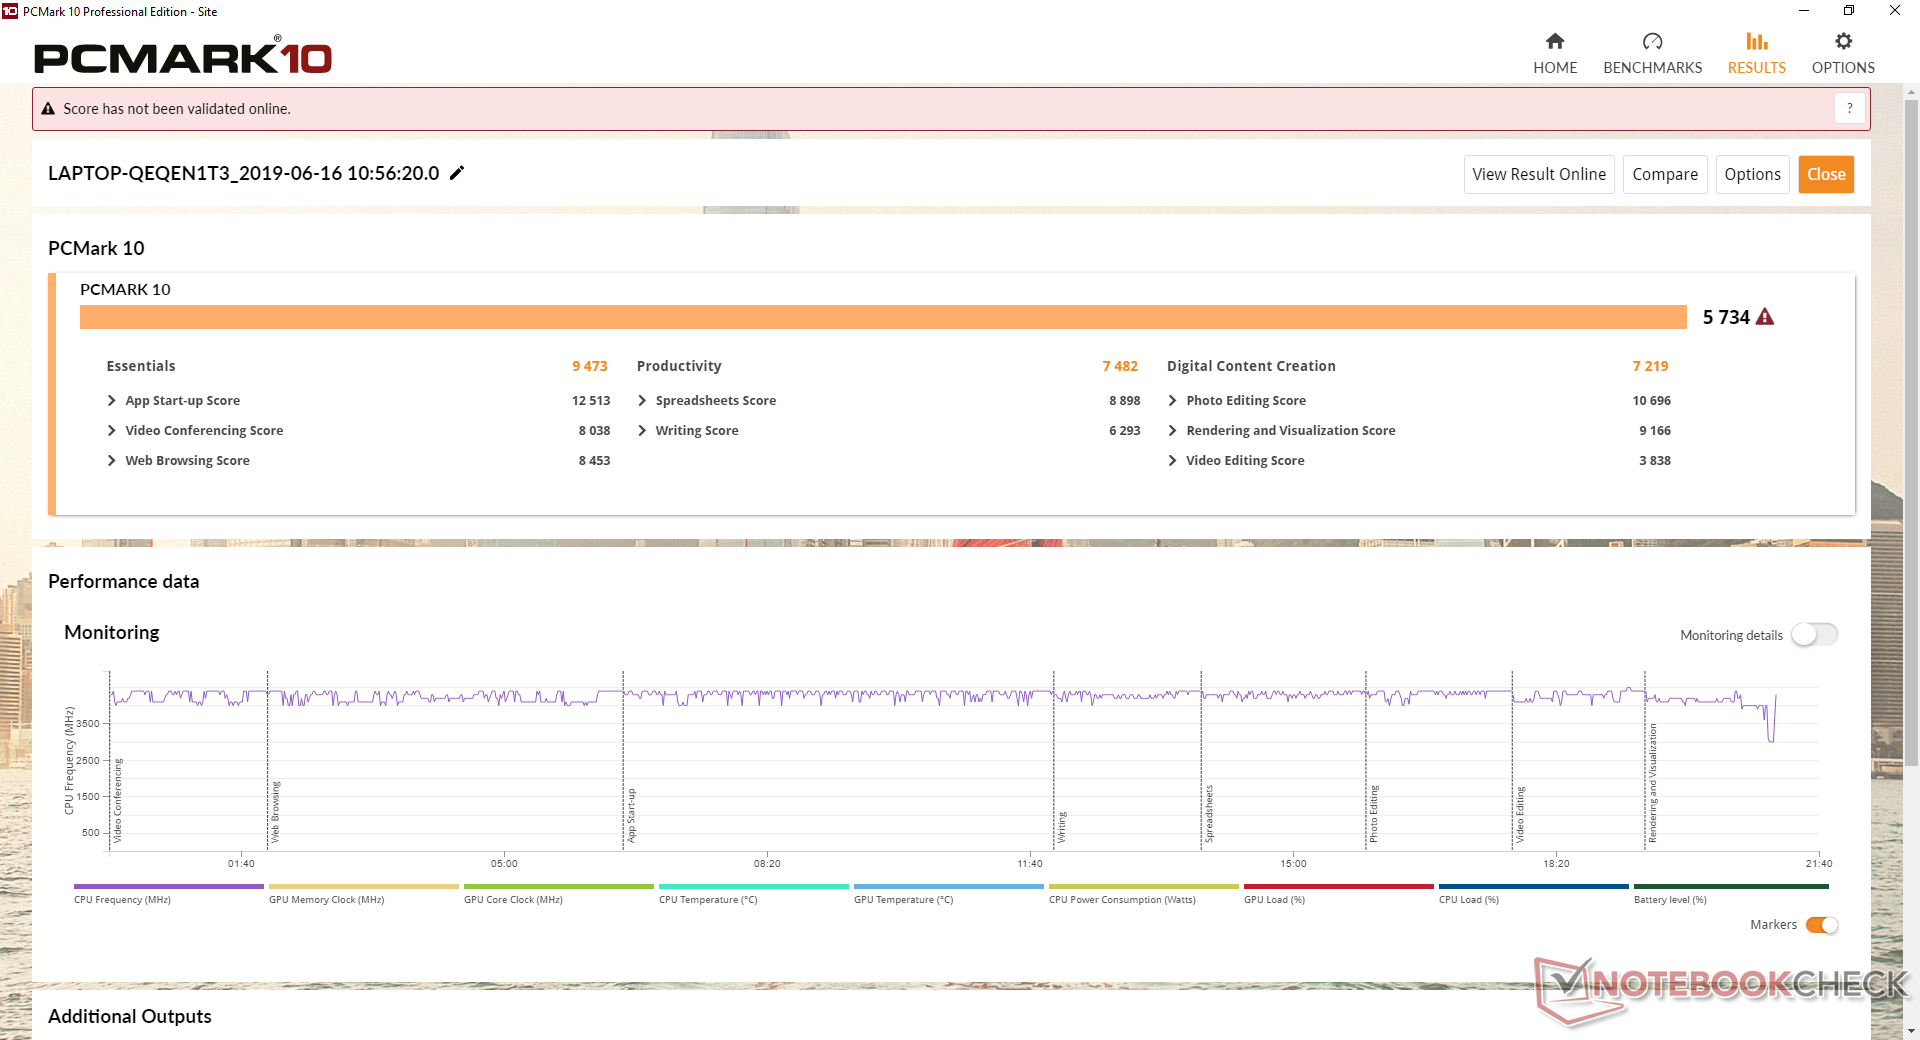
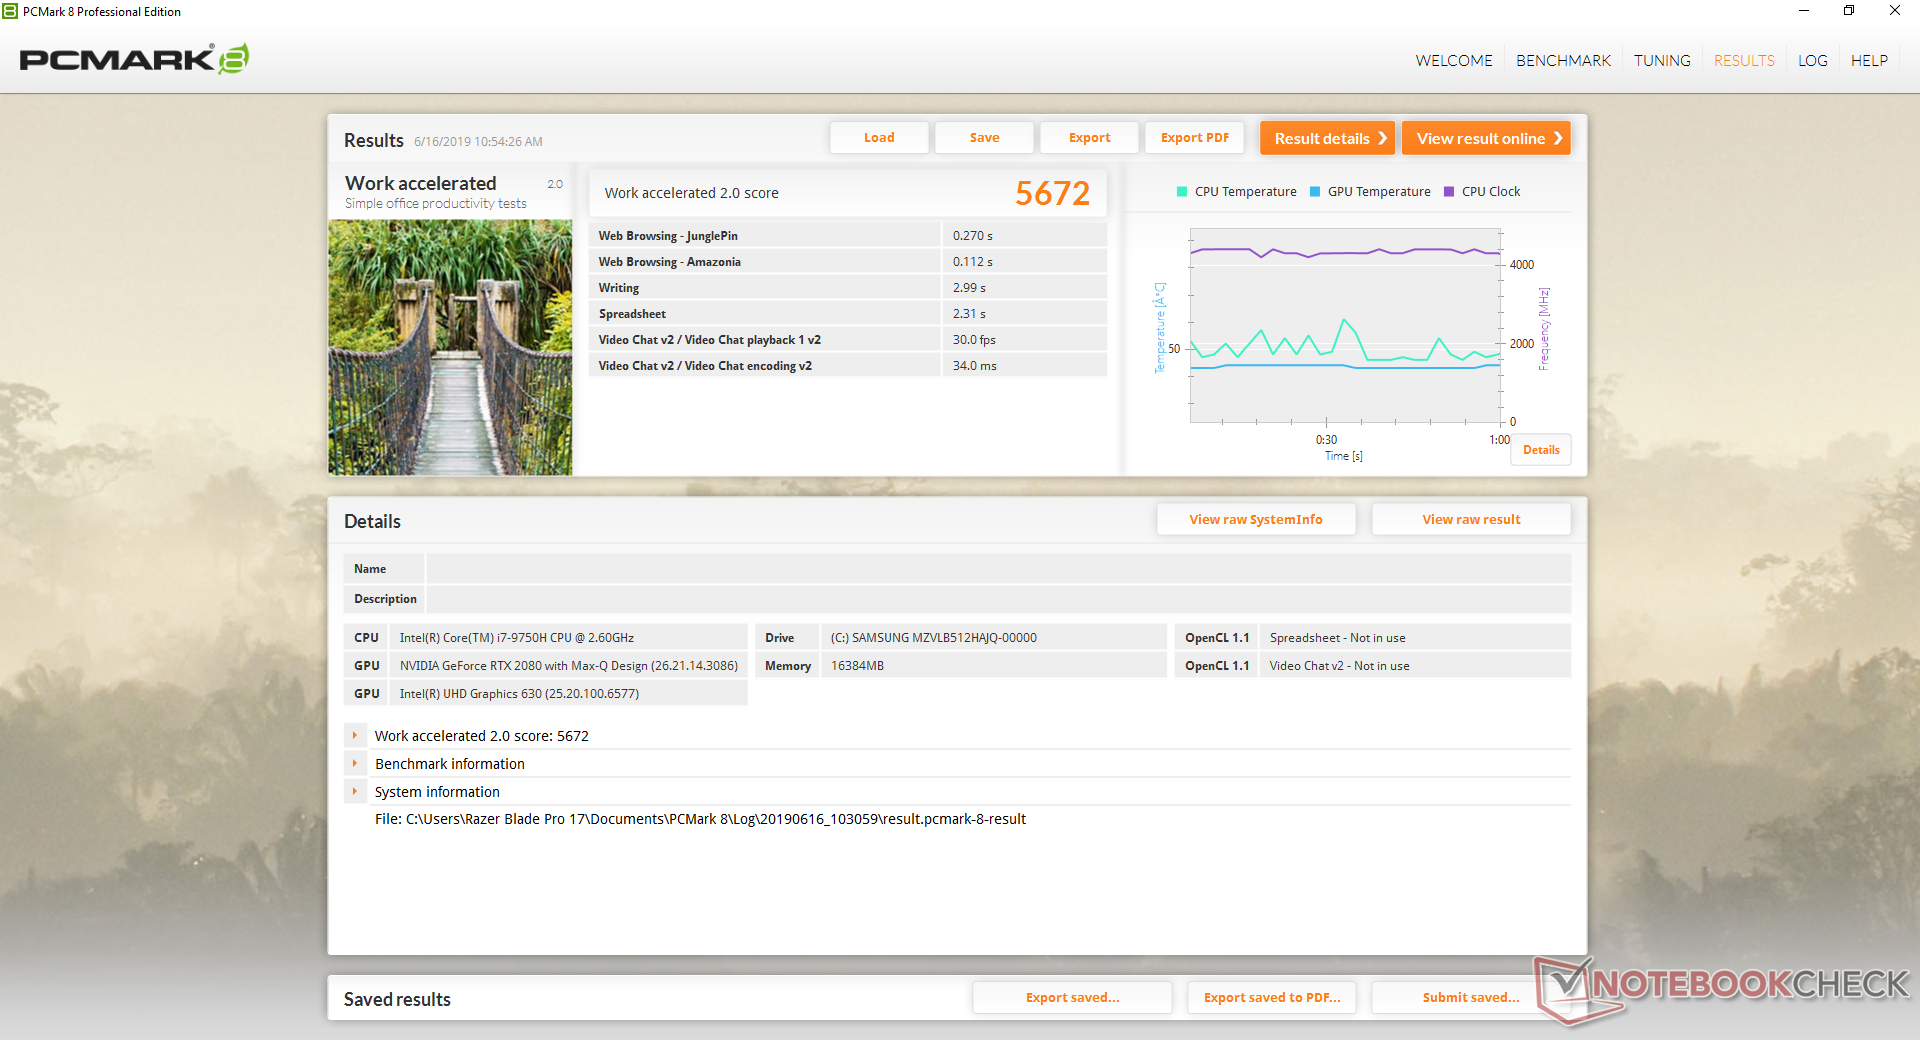
PCMark benchmarks rank the Blade Pro 17 in the same ballpark as other competing laptops with RTX graphics including the Asus ROG Strix Scar II GL704GW and Alienware m17. More notably, scores are significantly better than the last generation Blade Pro 2017 to show just how much of a performance boost the new model can bring to the table.
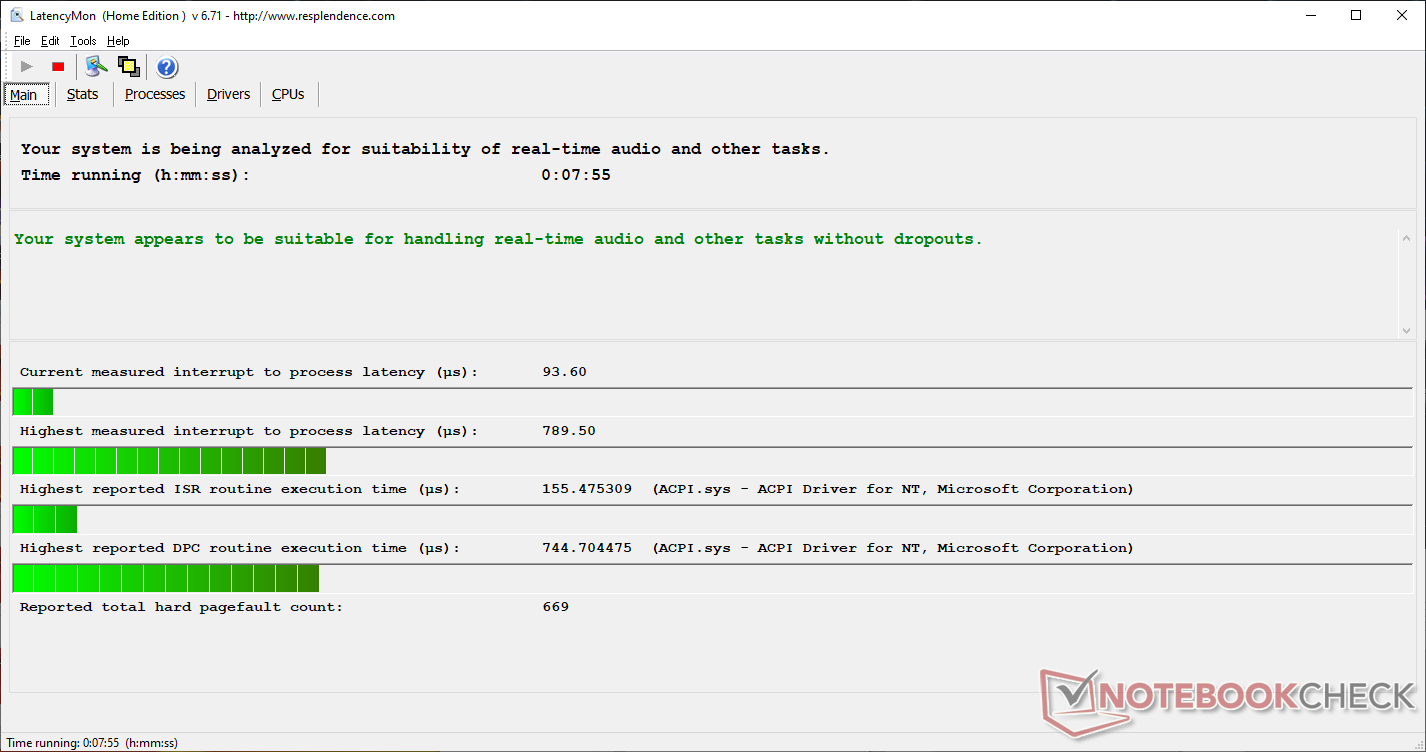
We didn't experience any software or hardware issues on our test unit save for two BSOD crashes early on in our testing. Both would occur whilst running Prime95 or Shadow of the Tomb Raider, but updating Windows and Synapse appears to have fixed the issue.
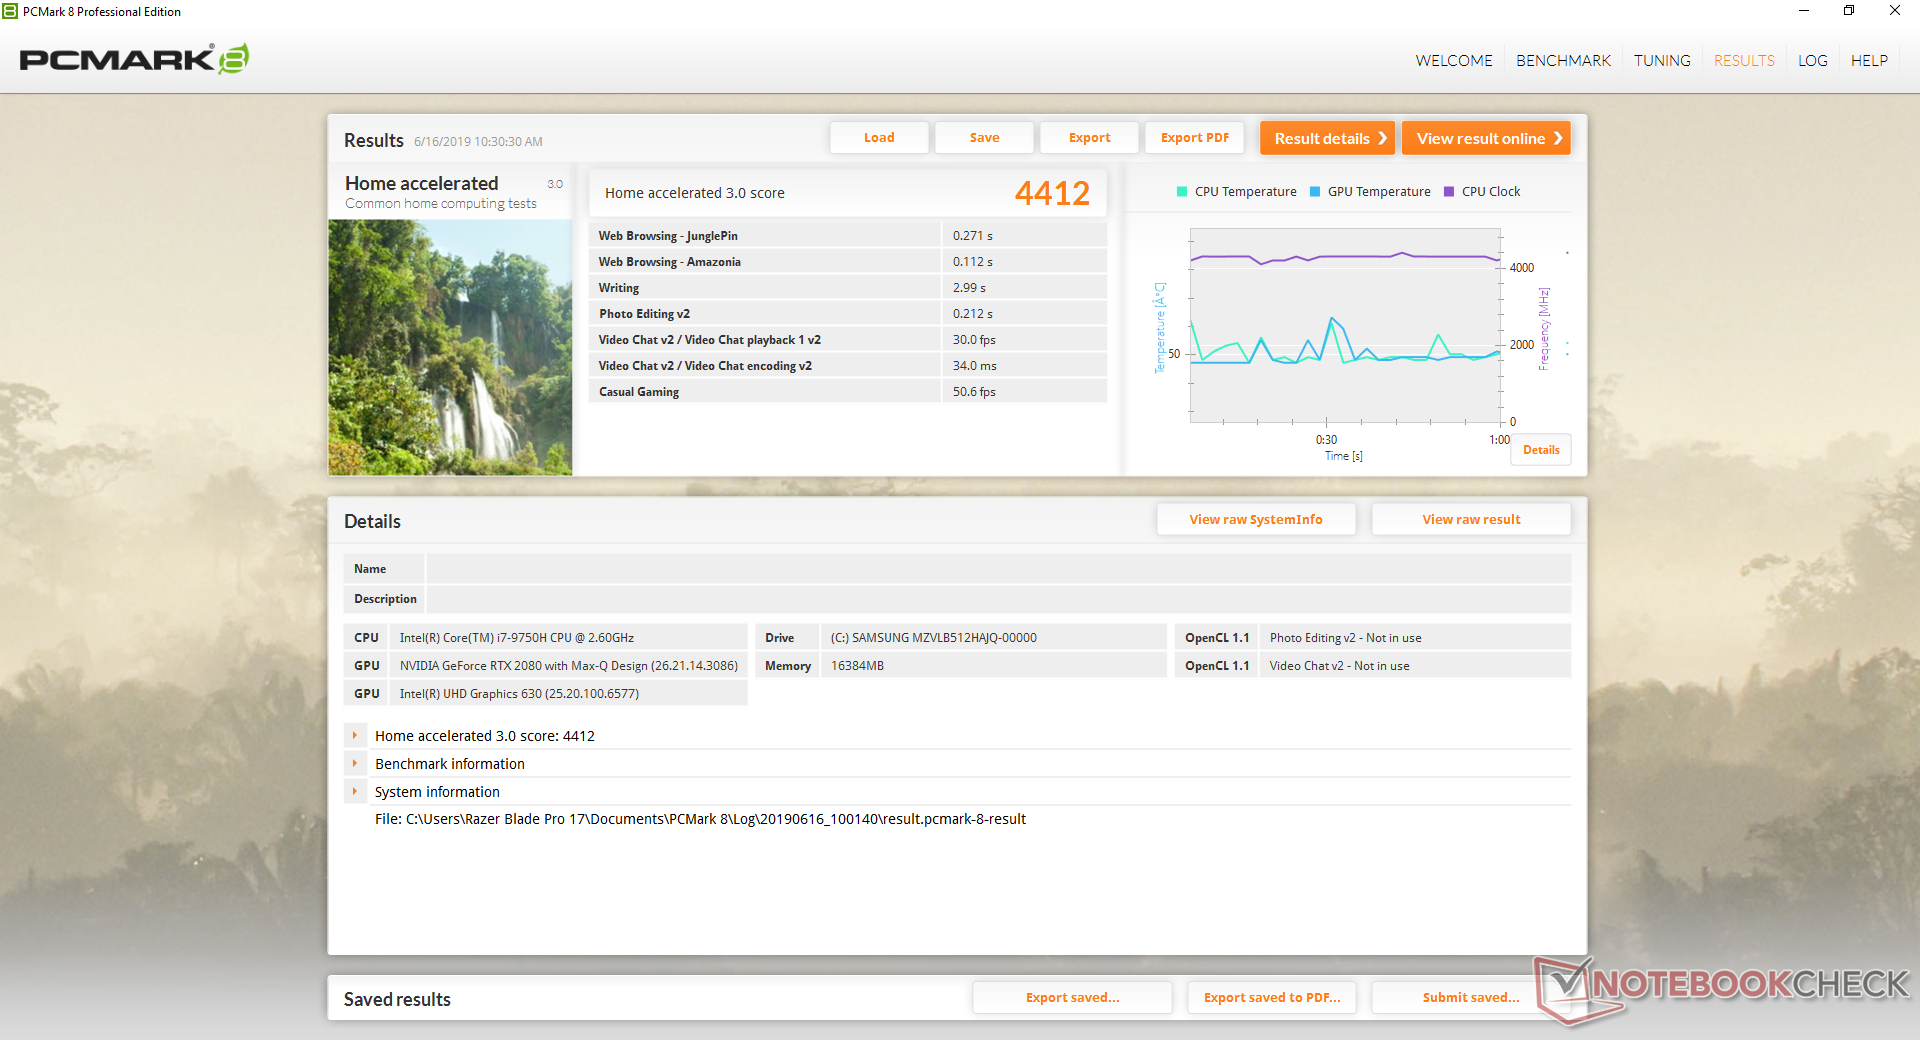
| PCMark 8 Home Score Accelerated v2 | 4412 points | |
| PCMark 8 Work Score Accelerated v2 | 5672 points | |
| PCMark 10 Score | 5734 points | |
Help | ||
Storage Devices
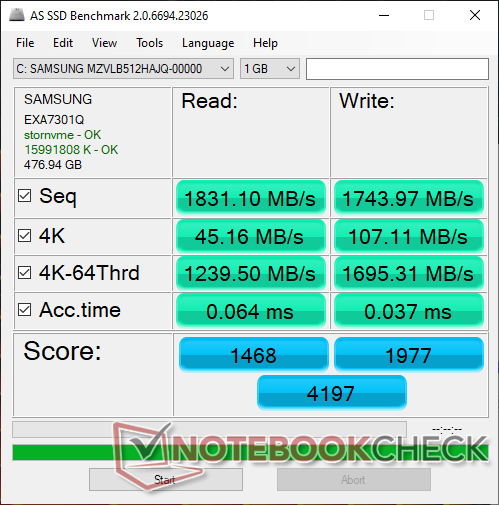
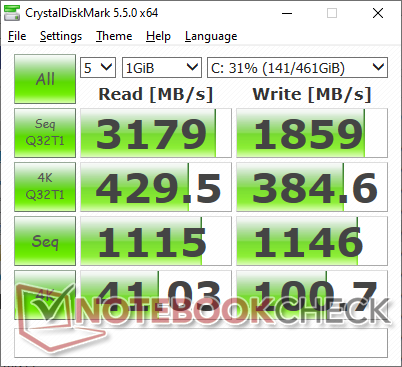
Two internal M.2 2280 PCIe x4 bays are available with optional RAID. Our specific test unit comes equipped with a high-end Samsung PM981 SSD in contrast to the older Samsung PM951 on our Blade Pro 2017. We commend Razer for sticking to Samsung SSDs across its entire Blade lineup as most other OEMs typically source from multiple manufacturers with an undesirably wide range of performance differences. When buying an Alienware or MSI, for example, it becomes a gamble as to whether or not you'll receive a Toshiba, Lite-On, or Samsung.
Transfer rates are where we expect them to be from a Samsung PM981. Sequential read and write rates are about 1800 MB/s each compared to almost half that from an Intel SSD 660p or even slower from the Toshiba BG3. Nonetheless, be prepared to spend more for storage as the Blade Pro 17 is one of the few 17-inch gaming laptops without a 2.5-inch SATA III bay.
See our table of HDDs and SSDs for more benchmark comparisons.
| Razer Blade Pro 17 RTX 2080 Max-Q Samsung SSD PM981 MZVLB512HAJQ | Asus ROG Strix Scar II GL704GW Intel SSD 660p SSDPEKNW512G8 | Alienware m17 P37E SK Hynix PC401 512GB M.2 (HFS512GD9TNG) | Lenovo Legion Y740-17ICH Samsung SSD PM981 MZVLB256HAHQ | Razer Blade Pro 2017 2x Samsung SSD PM951 MZVLV256HCHP (RAID 0) | MSI GS75 8SG Stealth 2x Samsung SSD PM981 MZVLB512HAJQ (RAID 0) | |
|---|---|---|---|---|---|---|
| AS SSD | -40% | -26% | -10% | -19% | 7% | |
| Seq Read (MB/s) | 1831 | 1315 -28% | 1835 0% | 1153 -37% | 2599 42% | 3005 64% |
| Seq Write (MB/s) | 1744 | 927 -47% | 1121 -36% | 1328 -24% | 588 -66% | 2668 53% |
| 4K Read (MB/s) | 45.16 | 52.4 16% | 23.98 -47% | 35.05 -22% | 37.57 -17% | 40.89 -9% |
| 4K Write (MB/s) | 107.1 | 122.8 15% | 100 -7% | 96 -10% | 104.4 -3% | 94.4 -12% |
| 4K-64 Read (MB/s) | 1240 | 326.5 -74% | 687 -45% | 727 -41% | 1116 -10% | 1366 10% |
| 4K-64 Write (MB/s) | 1695 | 727 -57% | 776 -54% | 1212 -28% | 513 -70% | 1197 -29% |
| Access Time Read * (ms) | 0.064 | 0.11 -72% | 0.047 27% | 0.063 2% | 0.051 20% | 0.055 14% |
| Access Time Write * (ms) | 0.037 | 0.045 -22% | 0.053 -43% | 0.04 -8% | 0.036 3% | 0.039 -5% |
| Score Read (Points) | 1468 | 510 -65% | 895 -39% | 878 -40% | 1414 -4% | 1708 16% |
| Score Write (Points) | 1977 | 942 -52% | 988 -50% | 1441 -27% | 676 -66% | 1558 -21% |
| Score Total (Points) | 4197 | 1715 -59% | 2306 -45% | 2784 -34% | 2715 -35% | 4123 -2% |
| Copy ISO MB/s (MB/s) | 2086 | 773 -63% | 1487 -29% | |||
| Copy Program MB/s (MB/s) | 425.5 | 493 16% | 608 43% | |||
| Copy Game MB/s (MB/s) | 555 | 647 17% | 1162 109% |
* ... smaller is better

GPU Performance
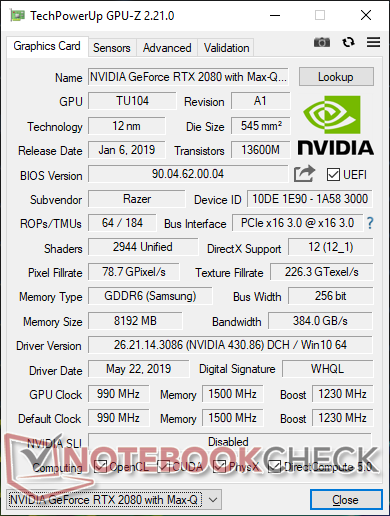
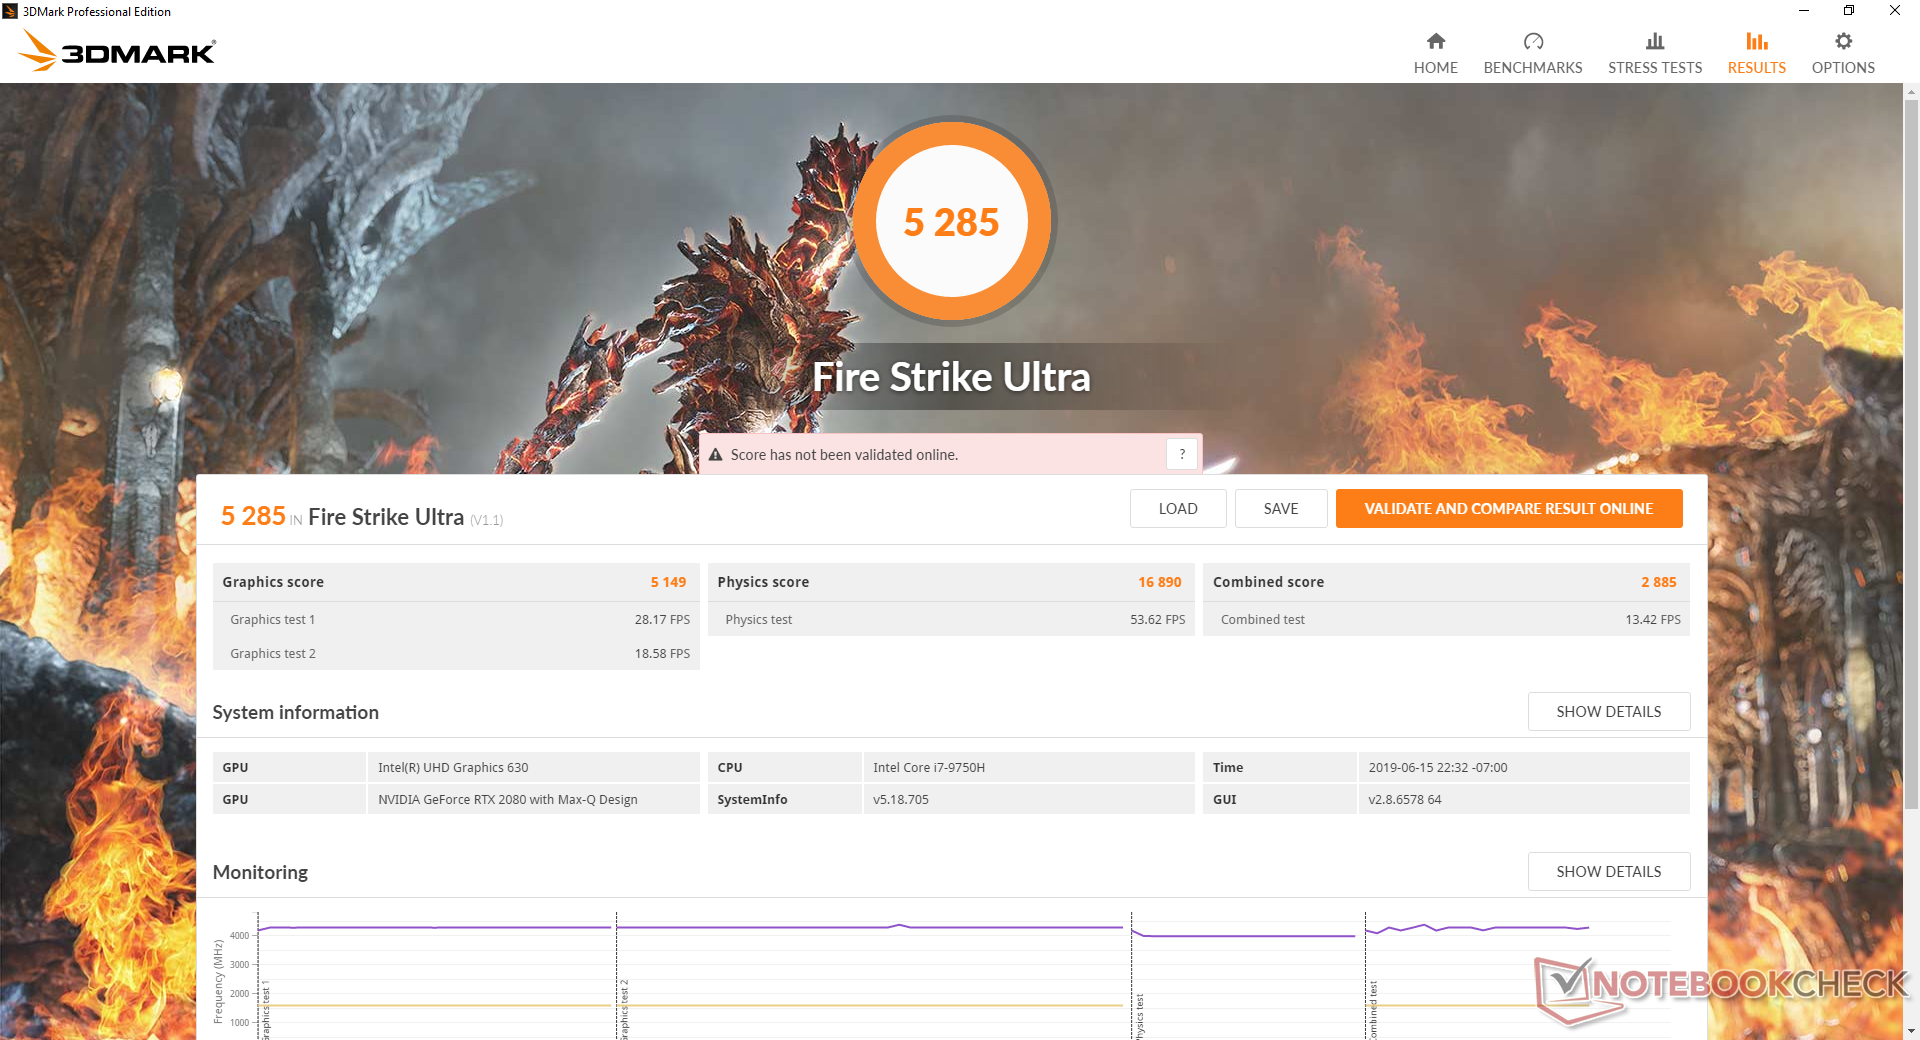
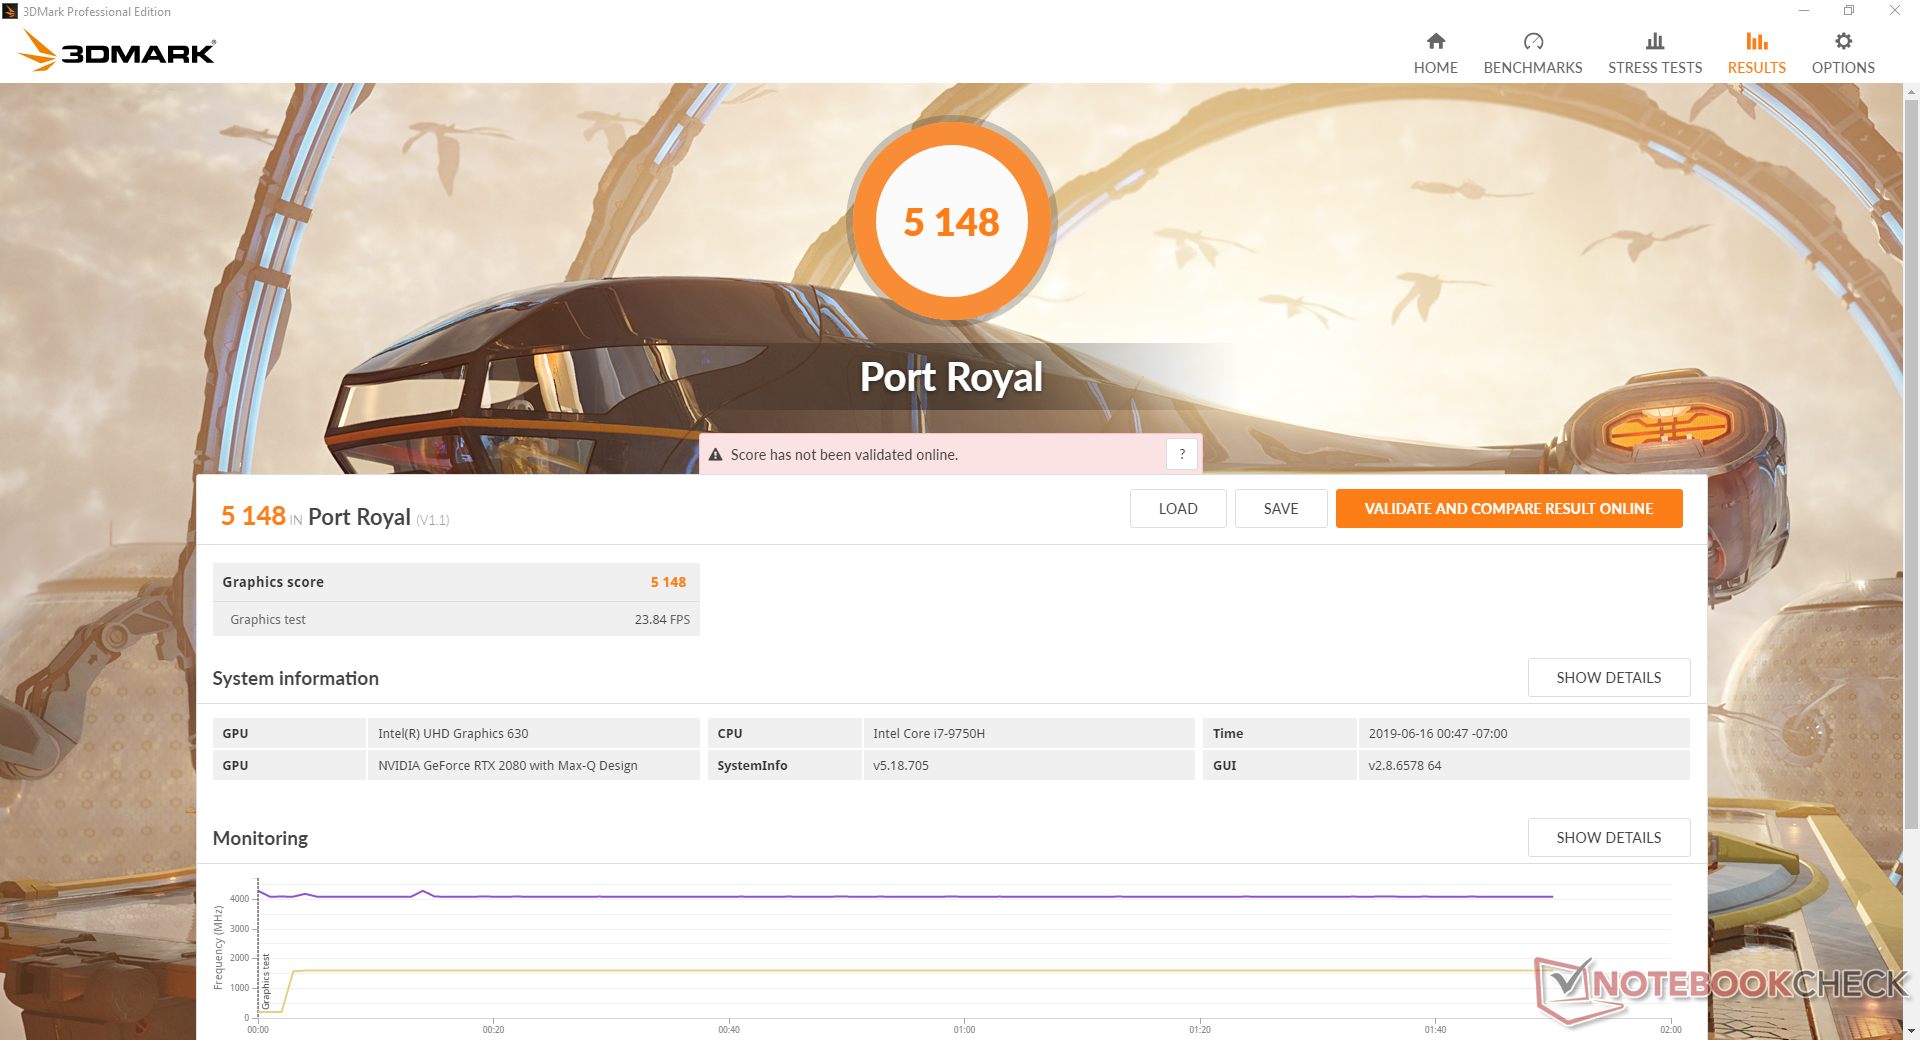
The Razer Blade series was practically designed to be an Nvidia Max-Q laptop. Even the Blade Pro 2017 had an underclocked GTX 1080 since Nvidia had not yet introduced its GeForce Max-Q series to the world. Impressively, the GeForce RTX 2080 Max-Q in our Blade Pro 17 is able to outperform the average RTX 2080 Max-Q in our database by 13 to 15 percent to be just 14 percent behind the standard RTX 2080 for laptops. Users upgrading from an older GTX 1080 laptop will see a raw performance boost of about 22 to 39 percent.
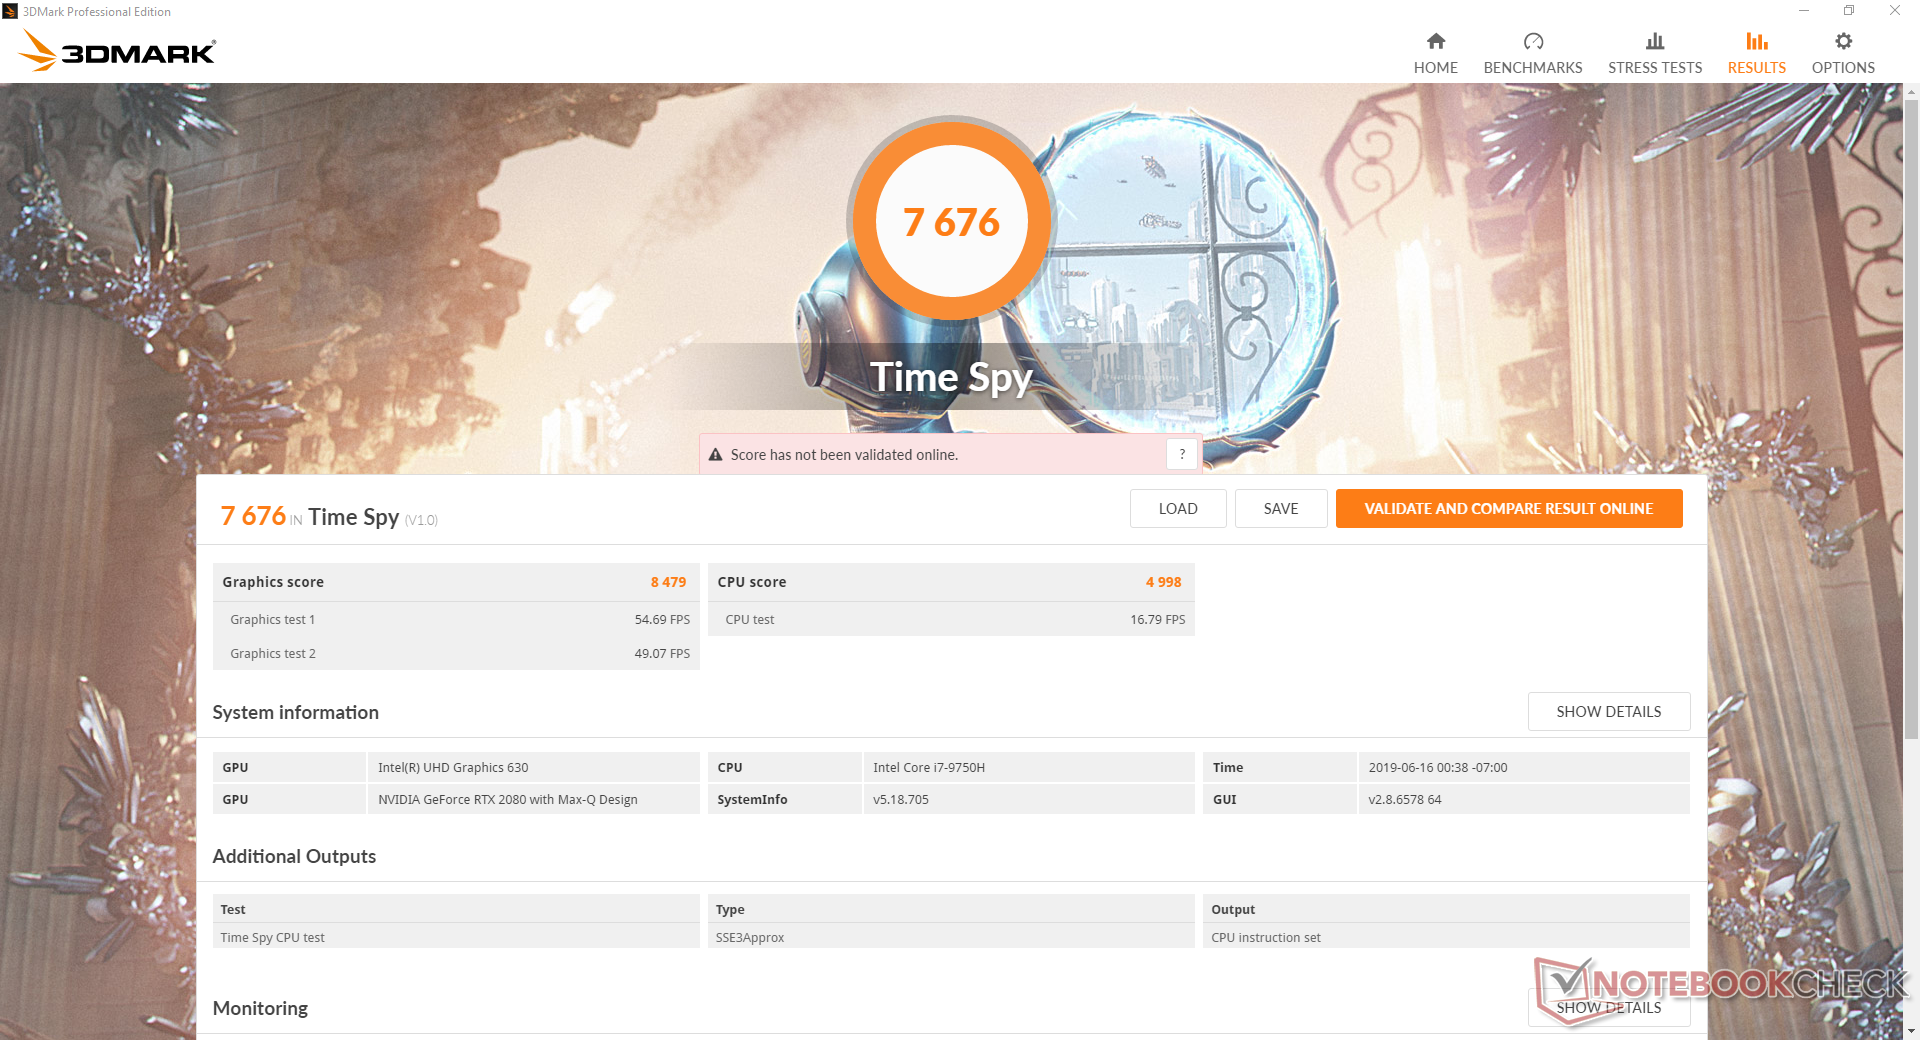
Much like what we discovered on the Blade 15, however, Nvidia Turing GPUs benefit much more from DX12 than DX11 and so users are recommended to run games in DX12 to get the most out of the RTX 2080 Max-Q. For example, the performance difference between a GTX 1080 Max-Q and RTX 2080 Max-Q is 24 percent when running the DX11-based Fire Strike benchmark compared to 45 percent when running the DX12-based Time Spy benchmark.
As explained here, be sure to set the system to High Performance in order to get the most out of the laptop. Running Time Spy on High Performance returns Physics and Graphics scores of 6791 and 8844 points, respectively, compared to 4998 and 8479 points when on Balanced mode.
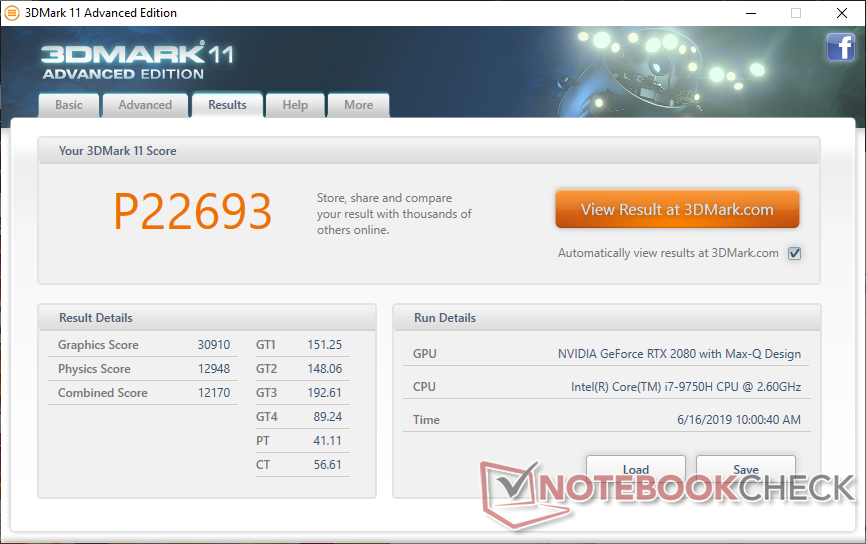
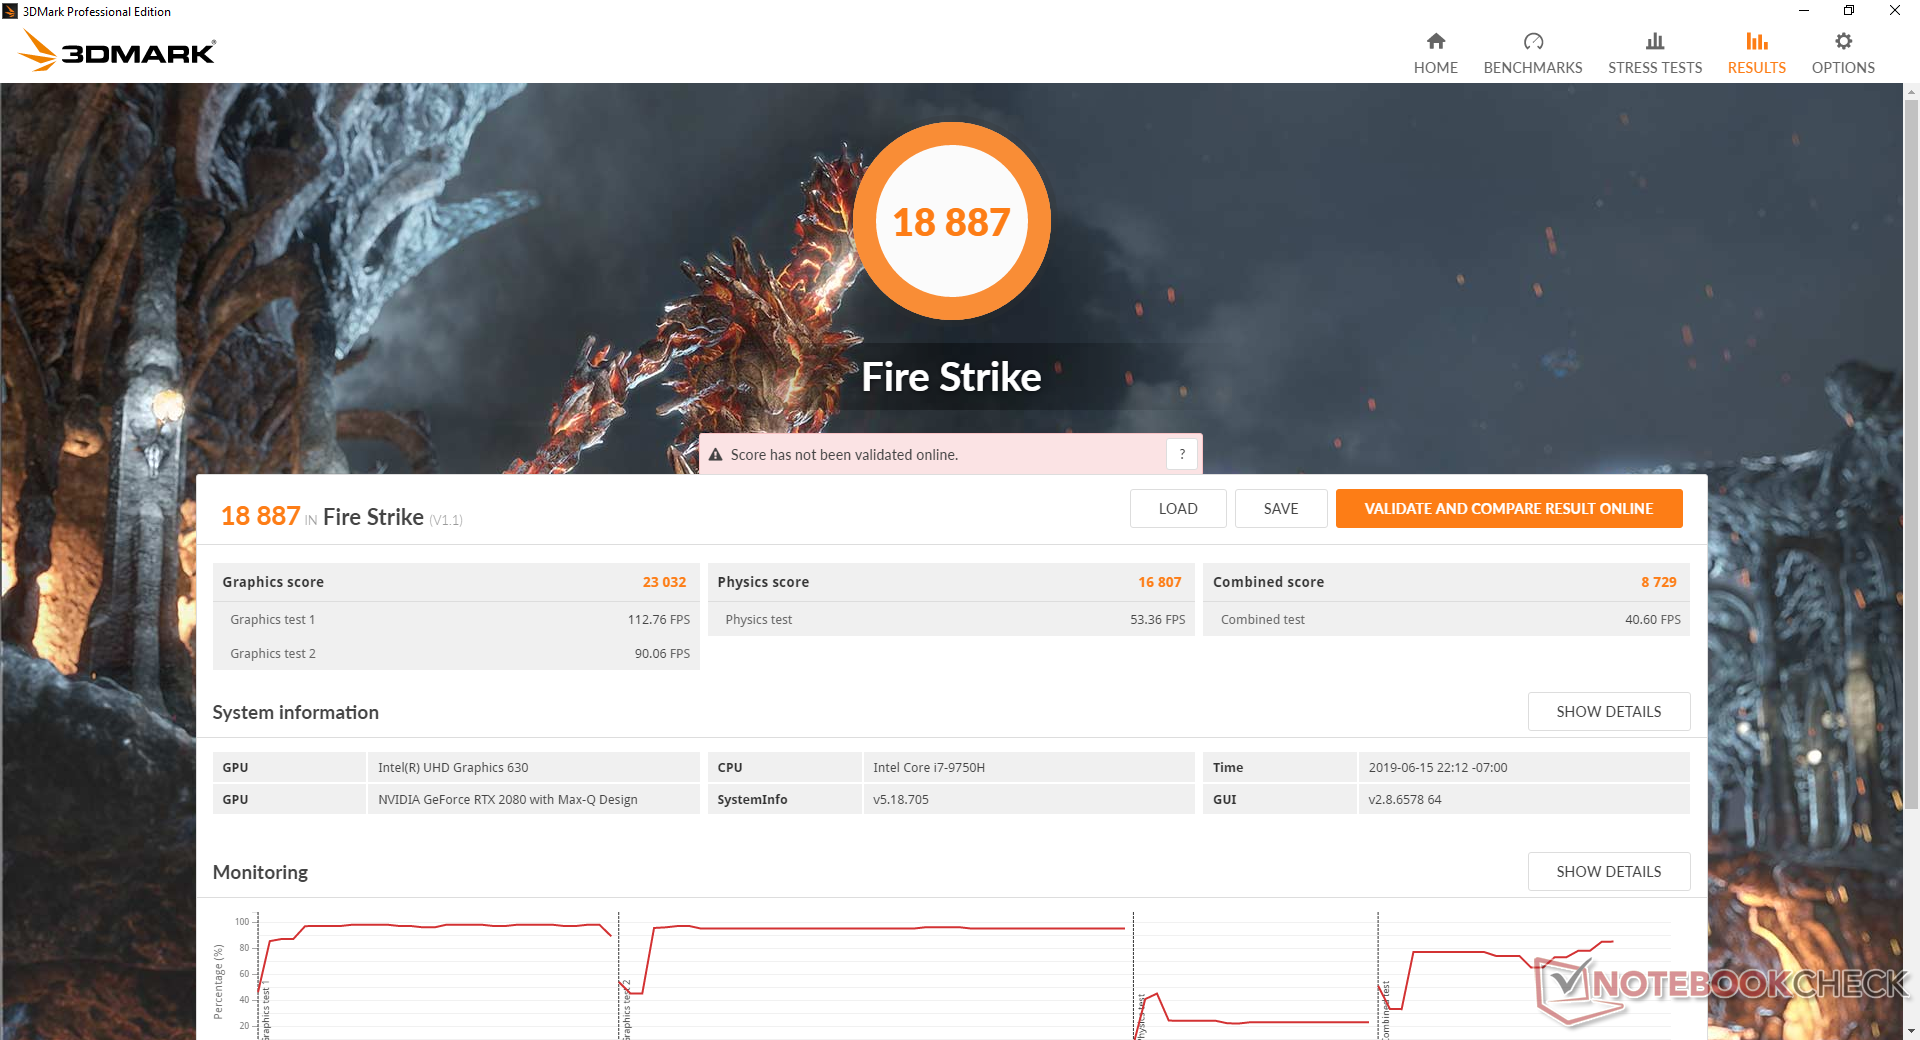

| 3DMark 11 Performance | 22693 points | |
| 3DMark Cloud Gate Standard Score | 38597 points | |
| 3DMark Fire Strike Score | 18887 points | |
| 3DMark Time Spy Score | 8460 points | |
Help | ||
Gaming Performance
Pretty much any title is playable on maximum settings and 60 FPS at the "low" native resolution of 1080p. Performance is only about 10 percent slower than a desktop powered by a GeForce RTX 2070. Reaching a steady 144 Hz, however, will still require a lot of fine tuning in the graphics menu save for popular undemanding multiplayer titles like Fortnite, Rocket League, or Overwatch. Consider engaging V-Sync if screen tearing is undesirable since there is no G-Sync.
Running Witcher 3 for a full hour reveals steady frame rates throughout to suggest no interrupting background activity. The only exception is towards the beginning of the test where frame rate dipped to 31 FPS momentarily before jumping back up to normal. We're unsure what happened here, but this anomaly never occurred a second time during the stress test.
See our dedicated page on the GeForce RTX 2080 Max-Q for more technical information and gaming benchmarks.
| low | med. | high | ultra | |
|---|---|---|---|---|
| BioShock Infinite (2013) | 307.6 | 282.2 | 252.3 | 177.7 |
| The Witcher 3 (2015) | 287.9 | 237.3 | 152.2 | 87.4 |
| Rocket League (2017) | 249 | 247.7 | 248.4 |
Emissions
System Noise
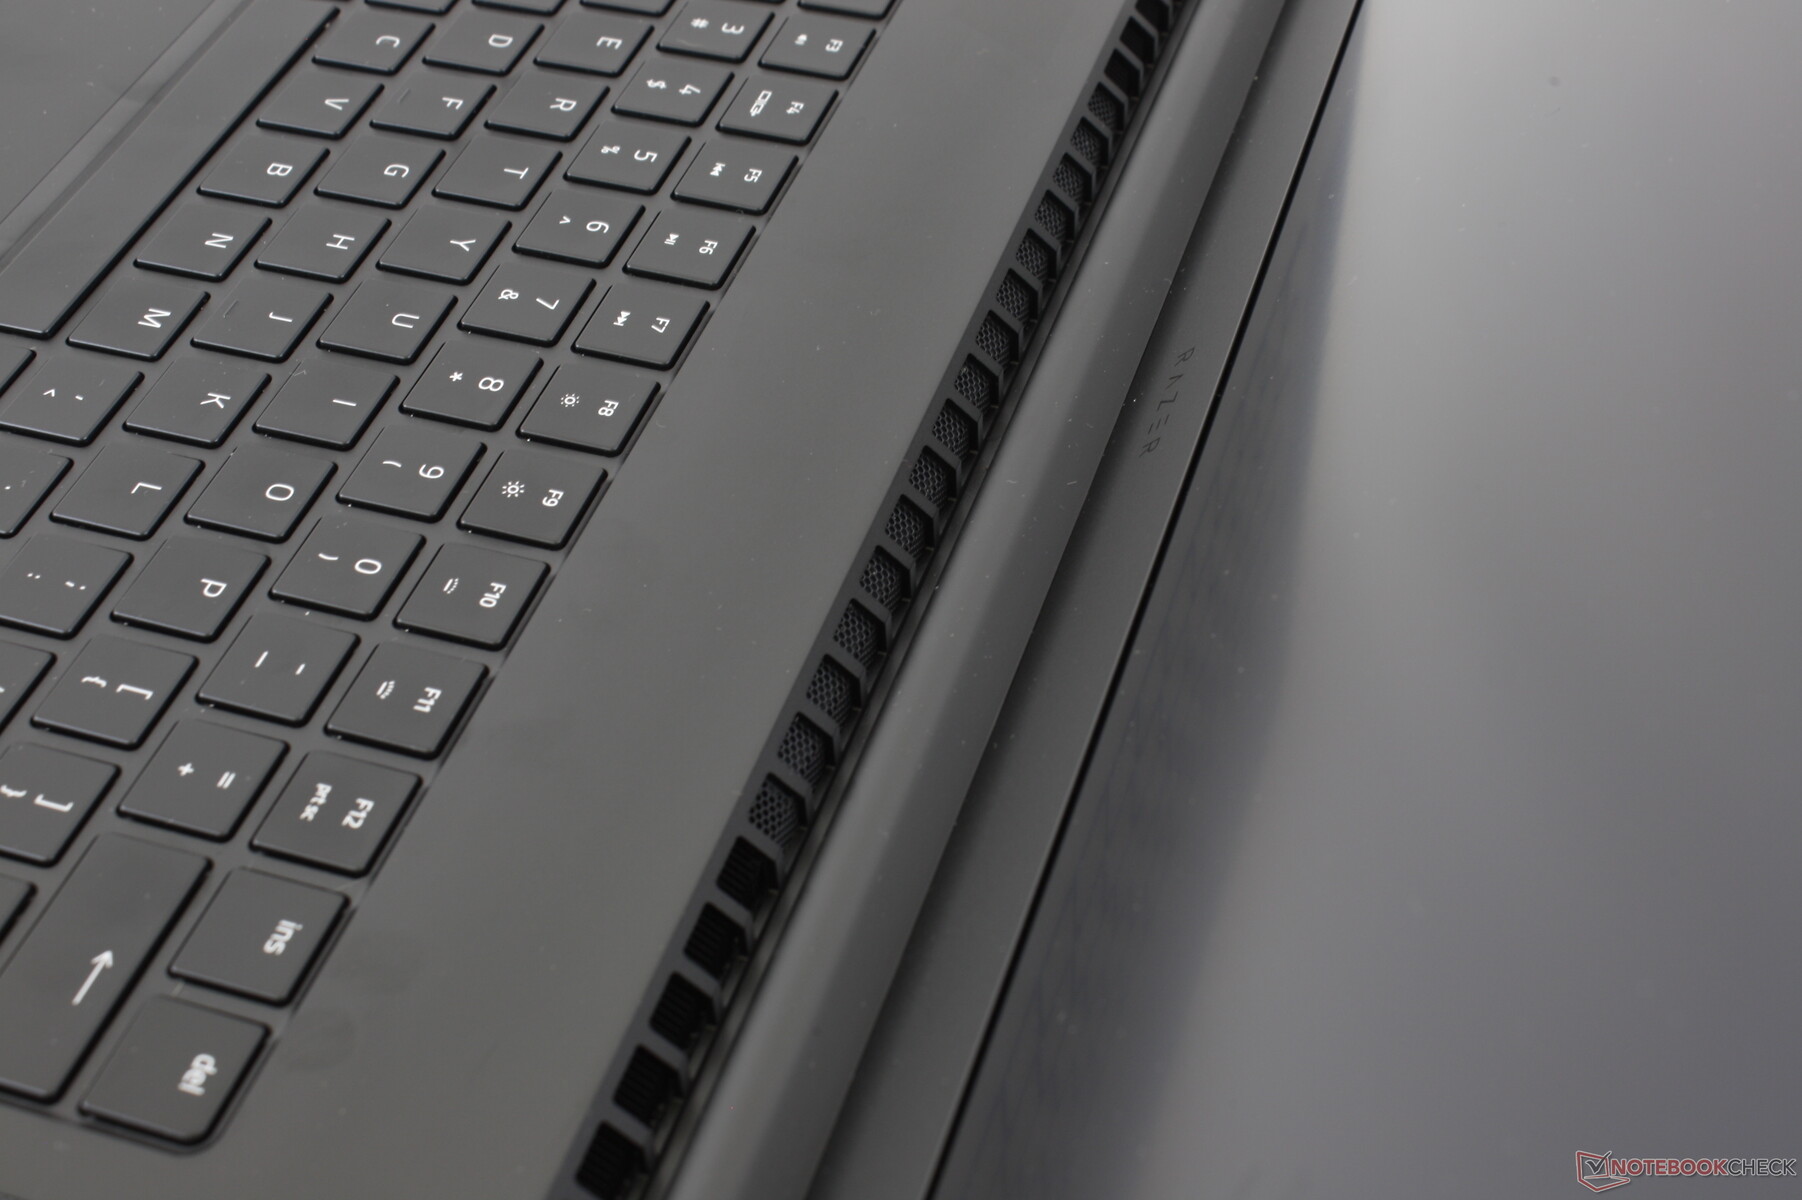
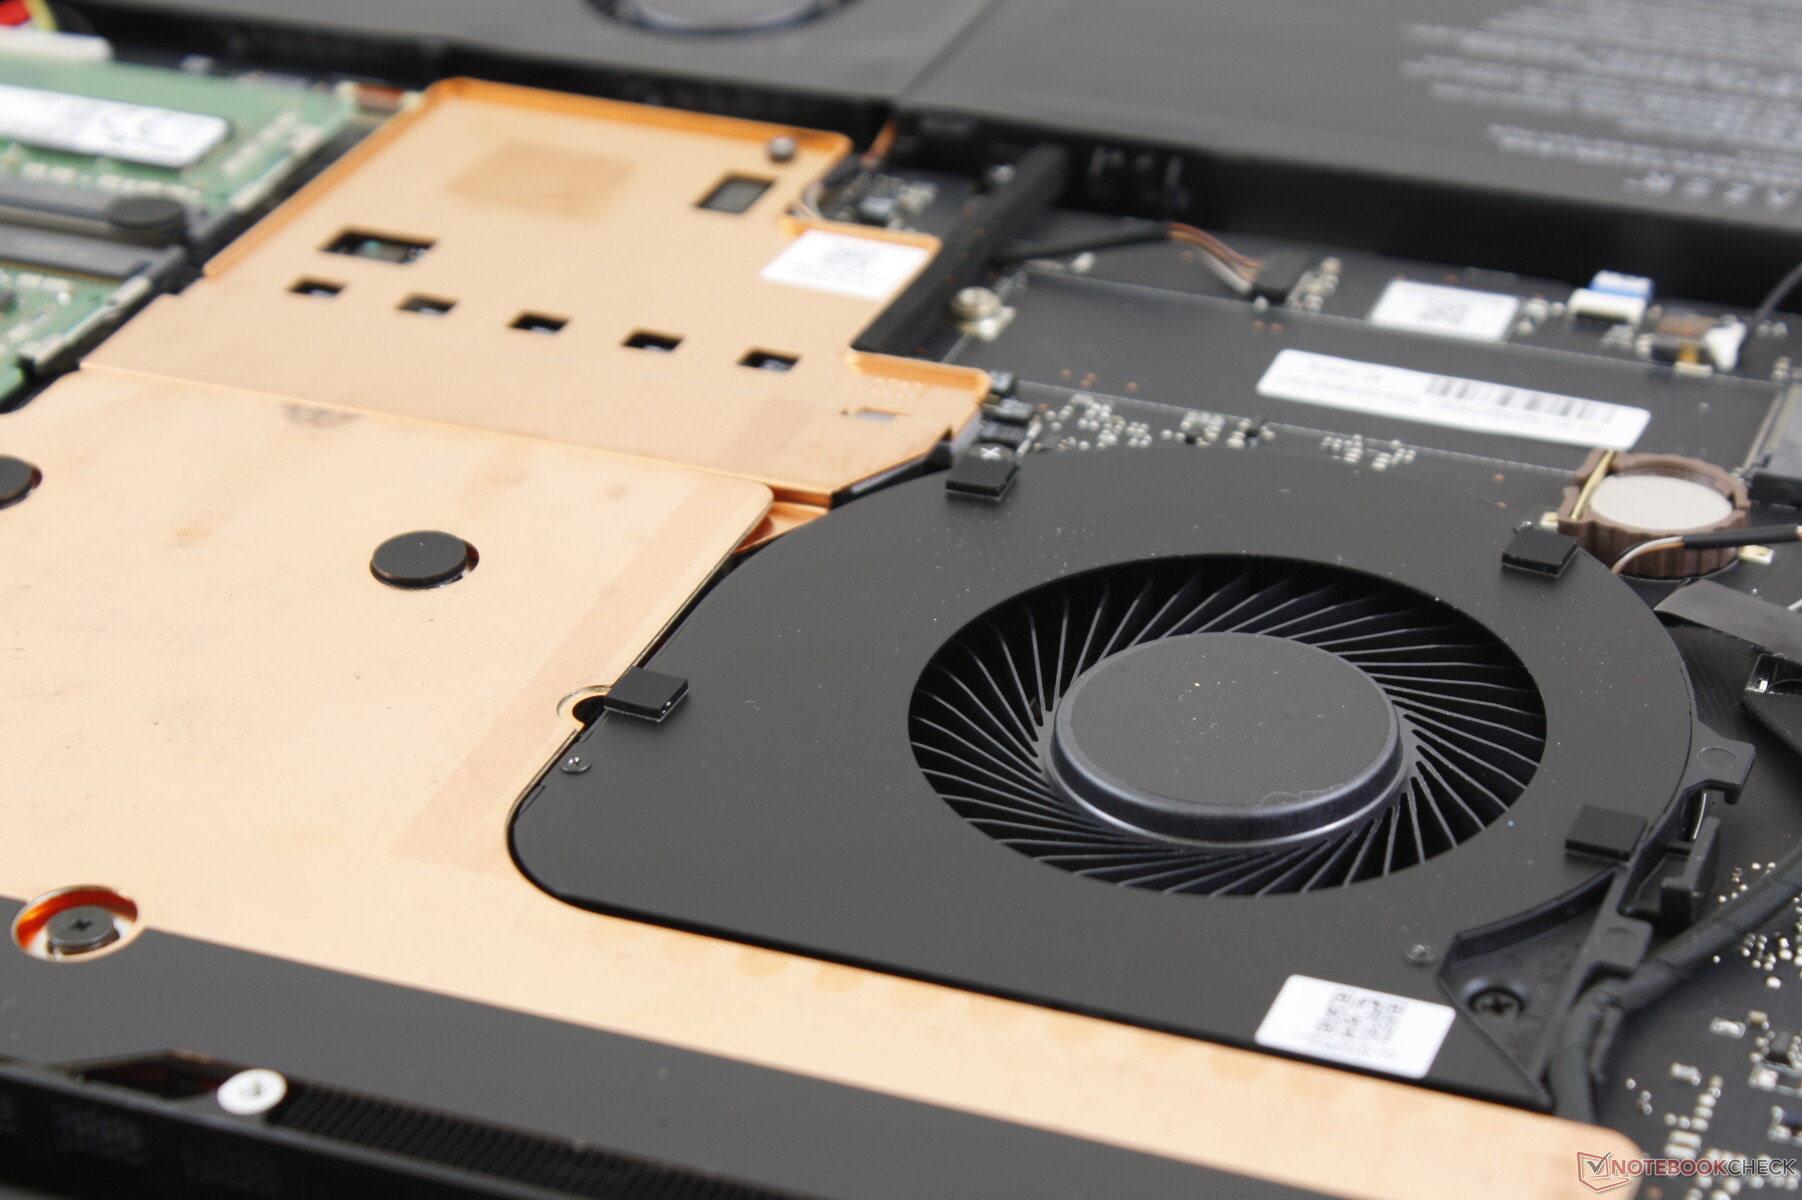
The cooling solution consists of two large ~55 mm fans, two small ~35 mm fans, and a vapor chamber cooler covering both processors and all VRAM modules. This is the first time we've seen four distinct fans on a 17-inch gaming laptop as most other OEMs are content with just two fans and traditional copper heat pipes instead. Does Razer's unique approach to cooling pay off?
While the Blade Pro 17 is quieter than the Blade Pro 2017 across the board, users must remember that fan noise and behavior depend highly on the power profile. High Performance mode will cause the fans to pulsate and respond to changes in processing load more frequently when compared to Balanced mode. If simply video streaming, word processing, or browsing when high performance is not required, we recommend staying on Balanced mode where fan noise is generally steady and quiet at 31.2 dB(A). Otherwise, fan noise can fluctuate anywhere between 30 dB(A) and 38 dB(A) when web browsing on High Performance.
Gaming on High Performance will induce a loud fan noise of 51 dB(A). This drops to just 44.6 dB(A) when gaming on the Balanced profile instead. The difference in noise is significant and so gaming on Balanced mode is a real option if you don't mind the slightly higher temperatures and slightly lower frame rates. If High Performance is more desirable, however, then the Blade Pro 17 is about as loud as the Asus GL704 or Alienware m17 despite the fancy vapor chamber cooler and extra fans. We find the 50 dB(A) range to be difficult to ignore when gaming without a good pair of headphones.
We're able to notice very minor coil whine or electronic noise on our test unit when in a completely quiet room. It's not bothersome or noticeable in more real-world conditions.
| Razer Blade Pro 17 RTX 2080 Max-Q GeForce RTX 2080 Max-Q, i7-9750H, Samsung SSD PM981 MZVLB512HAJQ | Asus ROG Strix Scar II GL704GW GeForce RTX 2070 Mobile, i7-8750H, Intel SSD 660p SSDPEKNW512G8 | Alienware m17 P37E GeForce RTX 2080 Max-Q, i9-8950HK, SK Hynix PC401 512GB M.2 (HFS512GD9TNG) | Lenovo Legion Y740-17ICH GeForce RTX 2080 Max-Q, i7-8750H, Samsung SSD PM981 MZVLB256HAHQ | Razer Blade Pro 2017 GeForce GTX 1080 Mobile, i7-7820HK, 2x Samsung SSD PM951 MZVLV256HCHP (RAID 0) | MSI GS75 8SG Stealth GeForce RTX 2080 Max-Q, i7-8750H, 2x Samsung SSD PM981 MZVLB512HAJQ (RAID 0) | |
|---|---|---|---|---|---|---|
| Noise | -8% | -3% | 4% | -7% | -8% | |
| off / environment * (dB) | 28.2 | 29 -3% | 28.2 -0% | 28.3 -0% | 30 -6% | 30 -6% |
| Idle Minimum * (dB) | 28.2 | 29 -3% | 28.2 -0% | 31.5 -12% | 30 -6% | 31 -10% |
| Idle Average * (dB) | 28.2 | 32 -13% | 28.2 -0% | 31.6 -12% | 31 -10% | 32 -13% |
| Idle Maximum * (dB) | 30.8 | 40 -30% | 31 -1% | 31.6 -3% | 33 -7% | 41 -33% |
| Load Average * (dB) | 42 | 46 -10% | 50.8 -21% | 32.3 23% | 43 -2% | 47 -12% |
| Witcher 3 ultra * (dB) | 51 | 51 -0% | 50.8 -0% | 43 16% | 55 -8% | 47 8% |
| Load Maximum * (dB) | 53 | 52 2% | 50.8 4% | 45.5 14% | 58 -9% | 48 9% |
* ... smaller is better
Noise level
| Idle |
| 28.2 / 28.2 / 30.8 dB(A) |
| Load |
| 42 / 53 dB(A) |
 | ||
30 dB silent 40 dB(A) audible 50 dB(A) loud |
||
min: | ||
Temperature
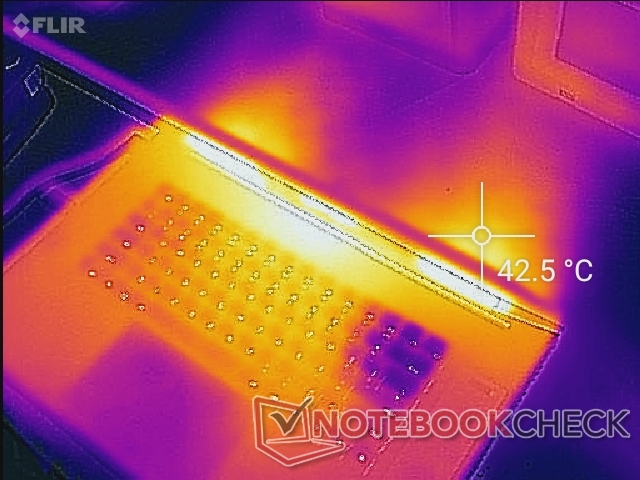
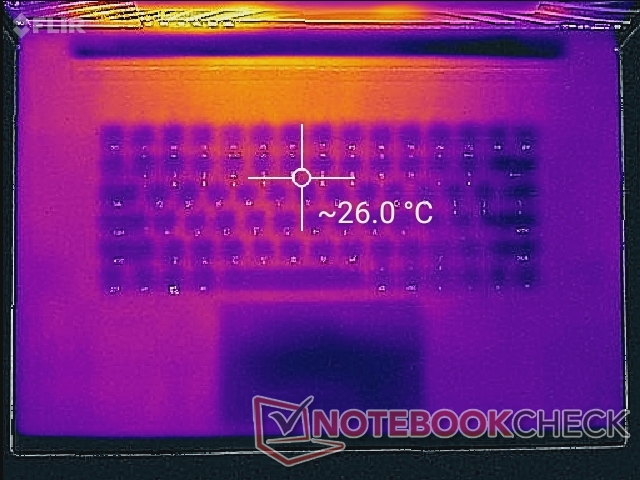
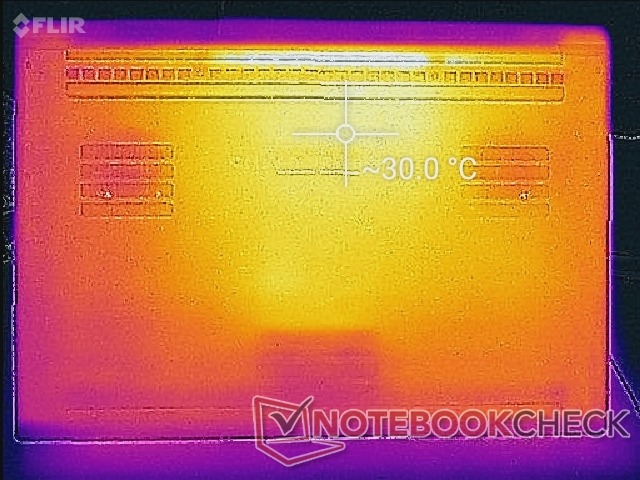
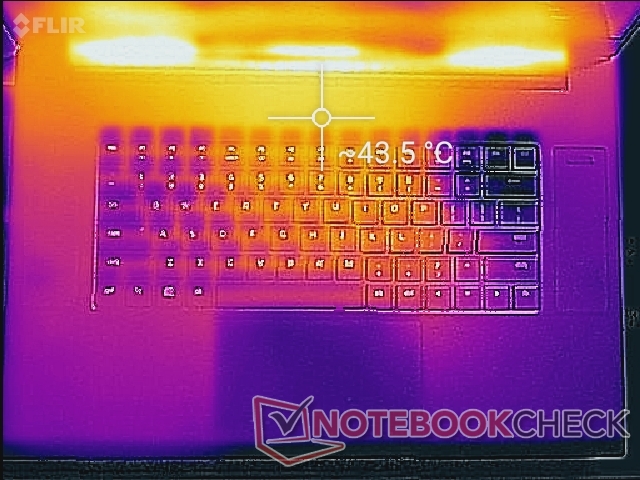
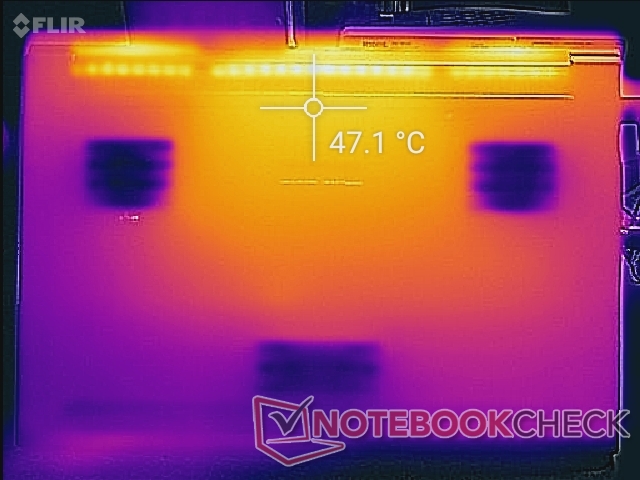
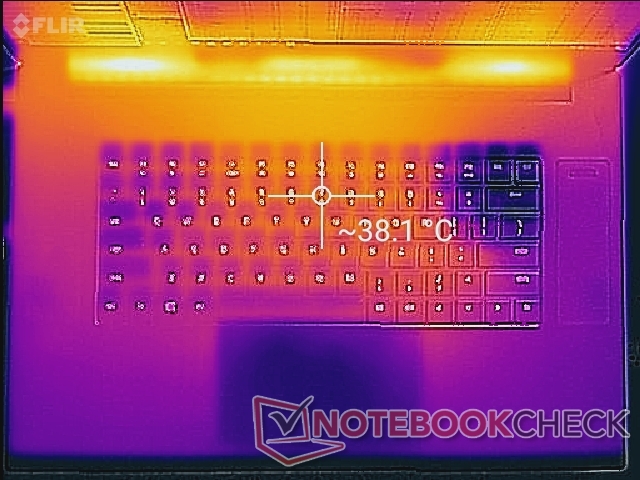
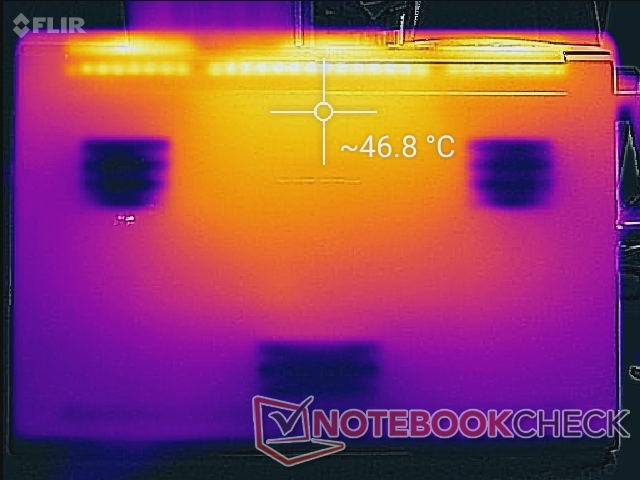
Surface temperatures when idling are flat on both sides of the laptop with the bottom being just slightly warmer overall. When gaming, surfaces can become as warm as 43 C to 47 C which is typical of most ultra-thin gaming laptops. These hot spots are generally toward the rear of the chassis away from the WASD keys and palm rests for more comfortable use as shown by our temperature maps below.
The temperature gradient is noticeably steeper on the Razer when compared to the MSI GS75 meaning that the average surface temperature is warmer on the MSI. The palm rests, for example, top out at 33 C when gaming on the Razer compared to 38 C on the competing GS75. While we prefer the palm rests to be cooler, we can't say we found them to be uncomfortably warm when gaming, either.
Stress Test
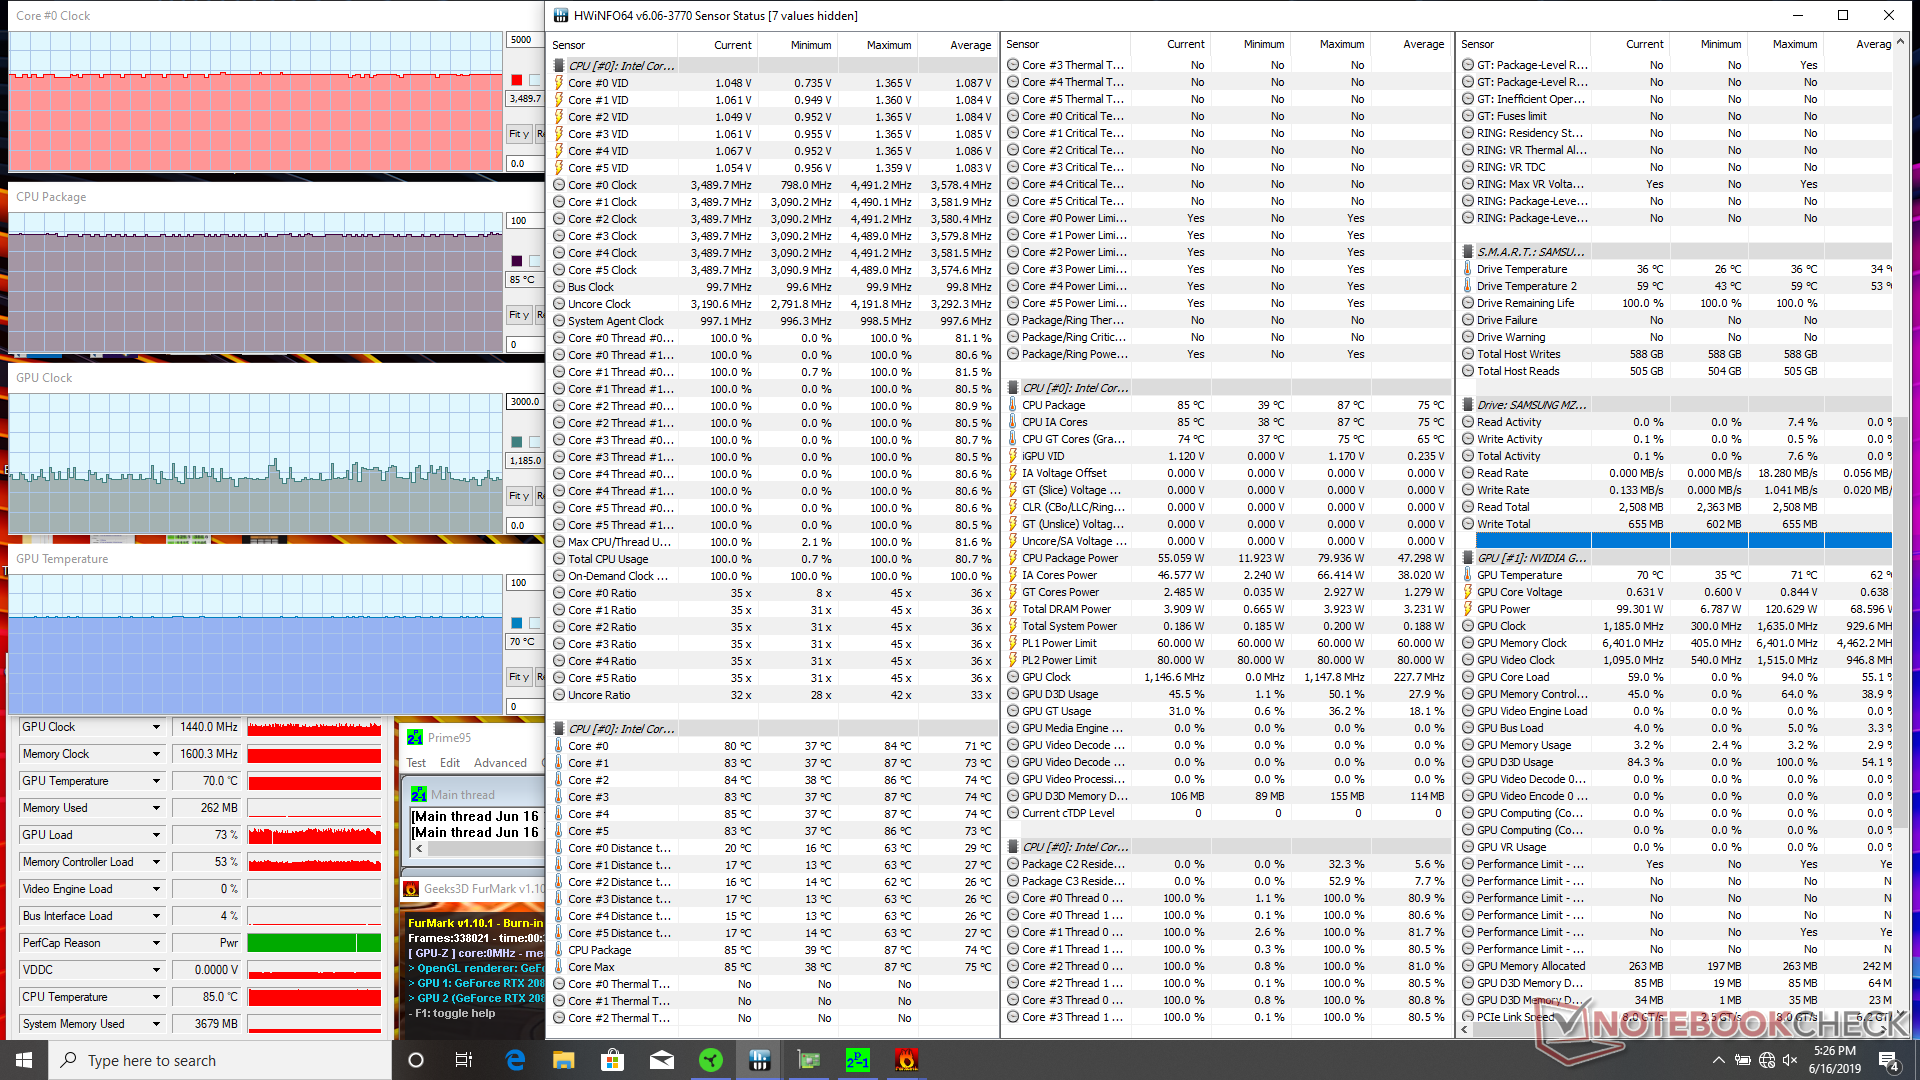
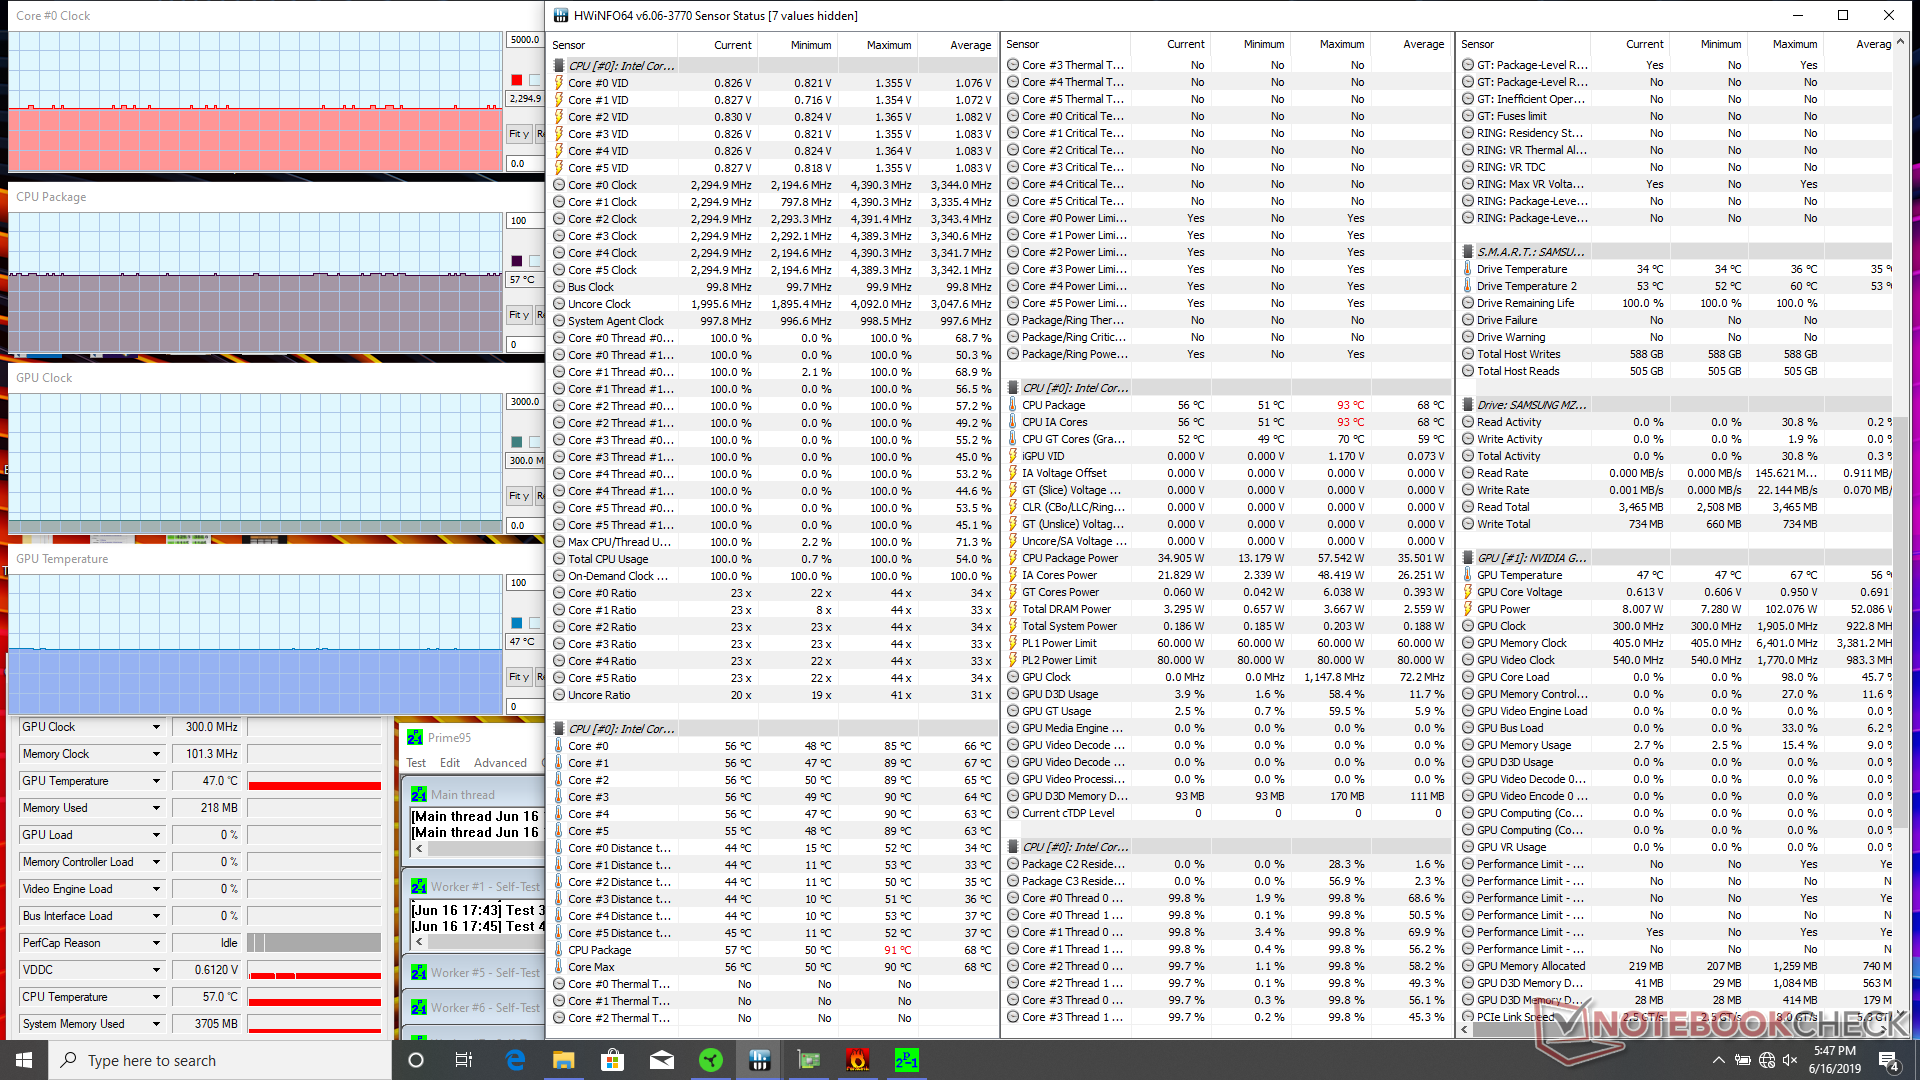
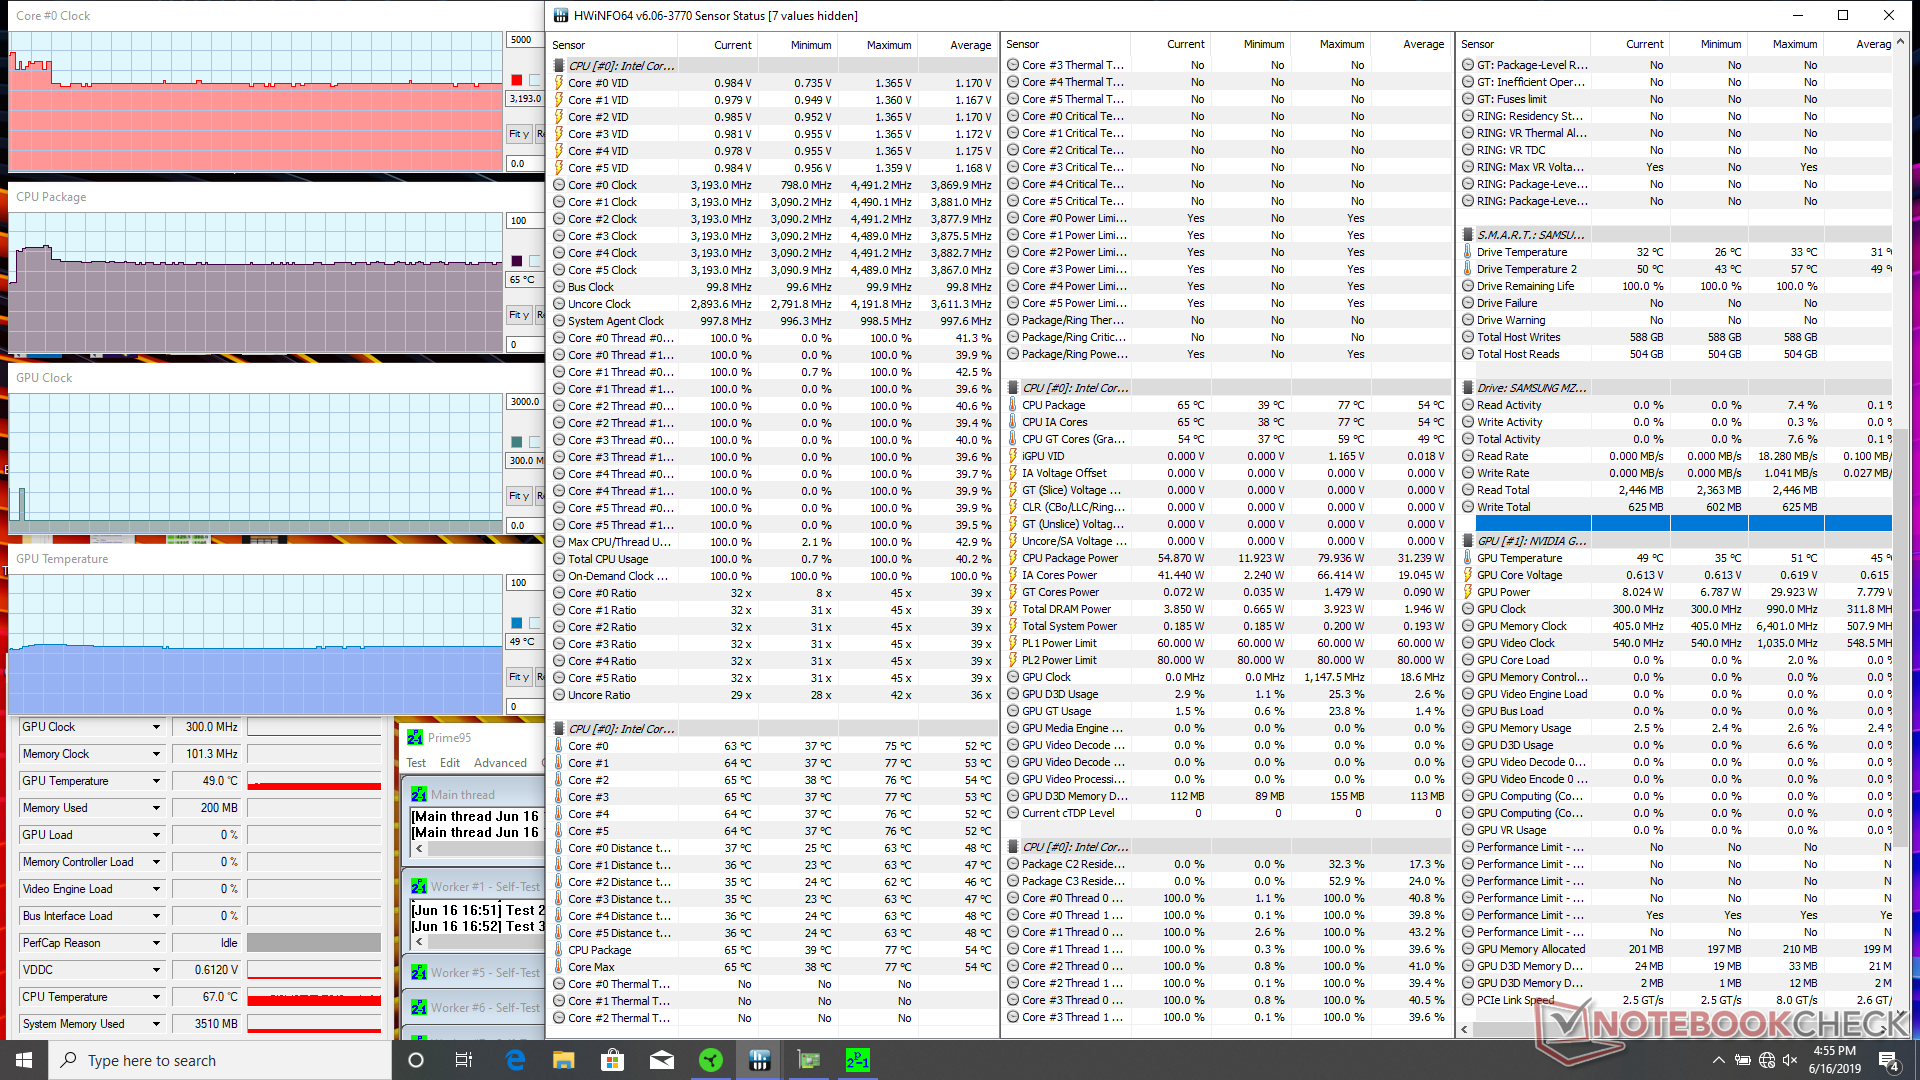
We stress the laptop with synthetic loads to identify for any potential throttling or stability issues. When running Prime95, the CPU can be observed reaching as high as 4 GHz for the first few seconds before hitting a core temperature of 77 C. Thereafter, clock rates drop to the 3.2 to 3.3 GHz range in order to maintain a cooler core temperature of 65 C. Running both Prime95 and FurMark simultaneously results in CPU and GPU temperatures of 85 C and 70 C, respectively. Overall, the Blade Pro 17 is cooler than the competing Alienware m17 where core temperatures can reach over 90 C when subjected to similar processing conditions.
Running Witcher 3 is more representative of real-world gaming loads. CPU and GPU temperatures stabilize at 77 C and 67 C, respectively, with the GPU clock rate in particular running stably at 1530 MHz compared to 1335 MHz on the aforementioned Alienware m17. The faster clock rate is likely at least partially responsible for the faster than expected performance from the synthetic 3DMark tests above.
Again, keep in mind that there is a small but measurable GPU performance difference between Balanced and High Performance modes. As shown by our table below, running on High Performance mode results in slightly faster GPU clock rates and even memory clock rates (1600 MHz vs. 1500 MHz). Core temperatures become cooler as well since the system fans run louder in this mode.
Running on battery will limit performance. A Time Spy run on batteries returns Physics and Graphics scores of only 1662 and 2441 points, respectively, compared to 6791 and 8844 points when on mains. The High Performance Synapse profile becomes grayed out when on battery power.
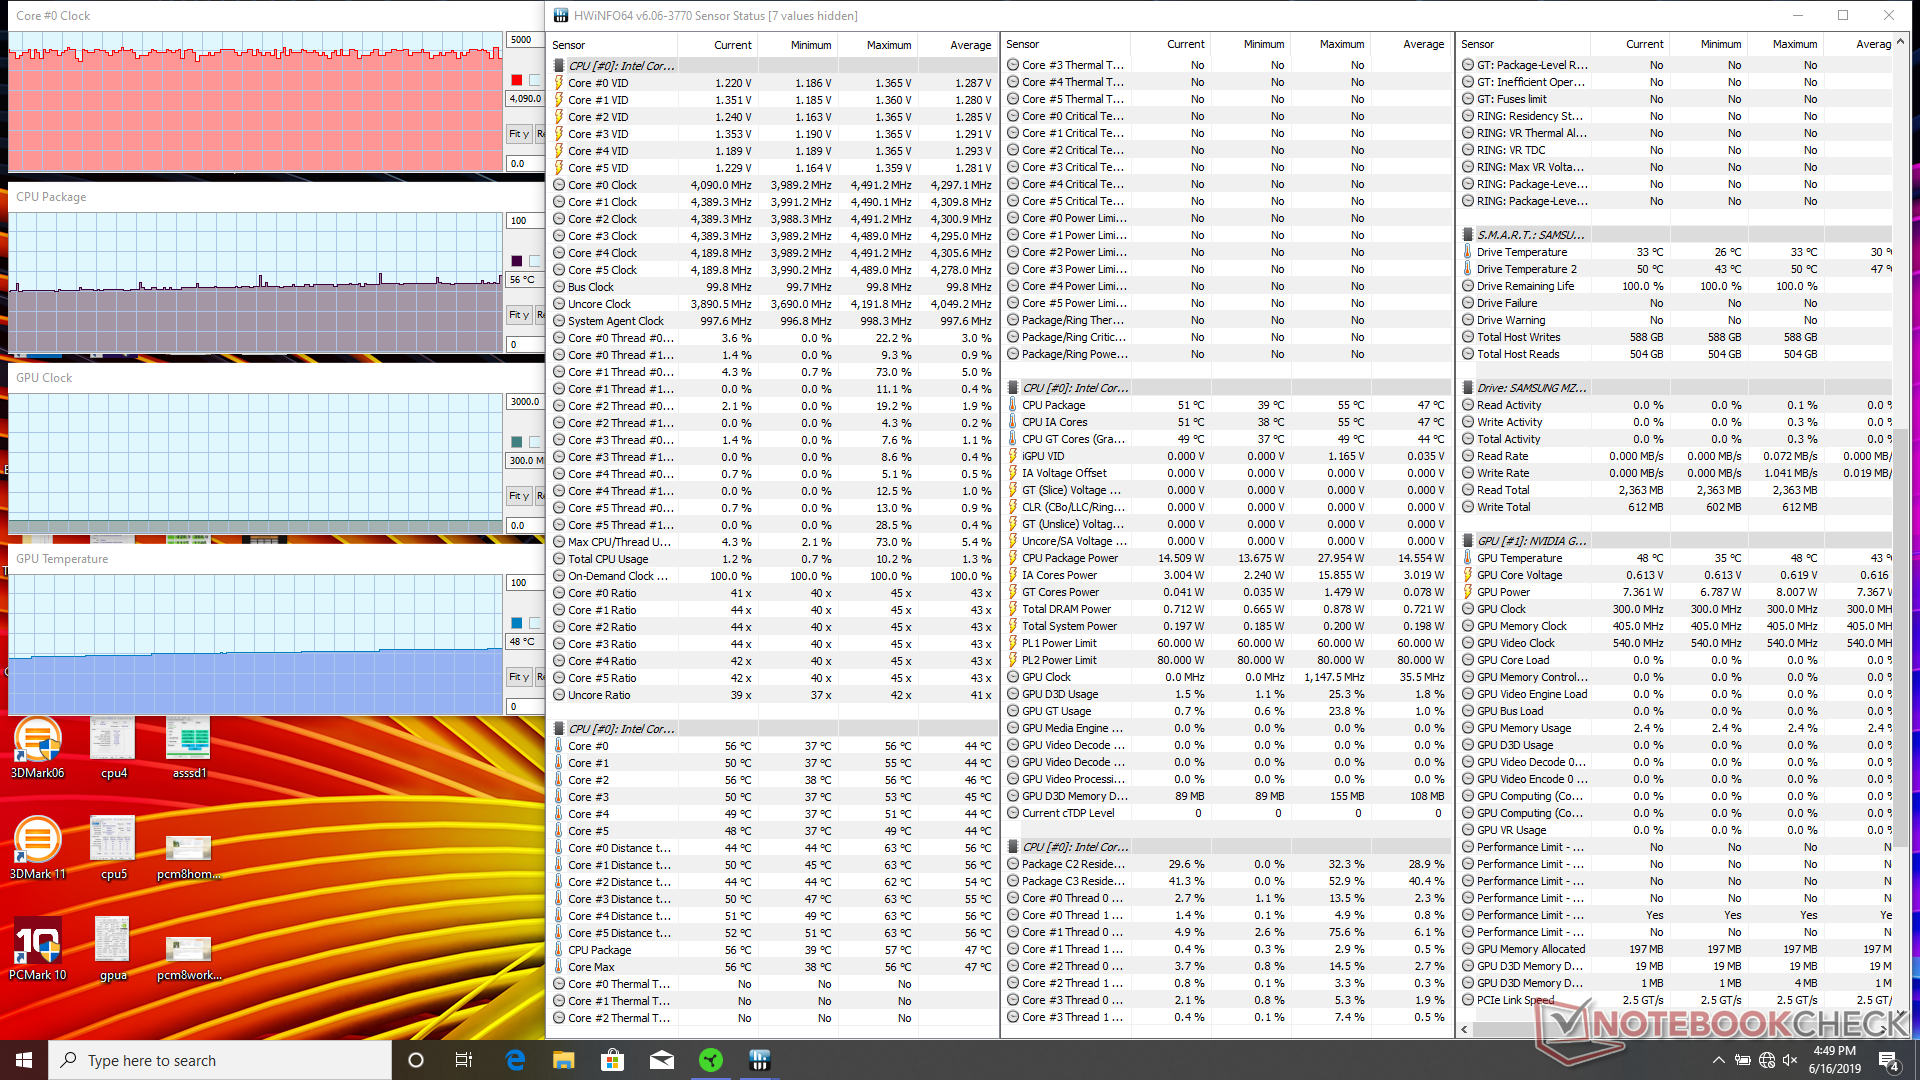
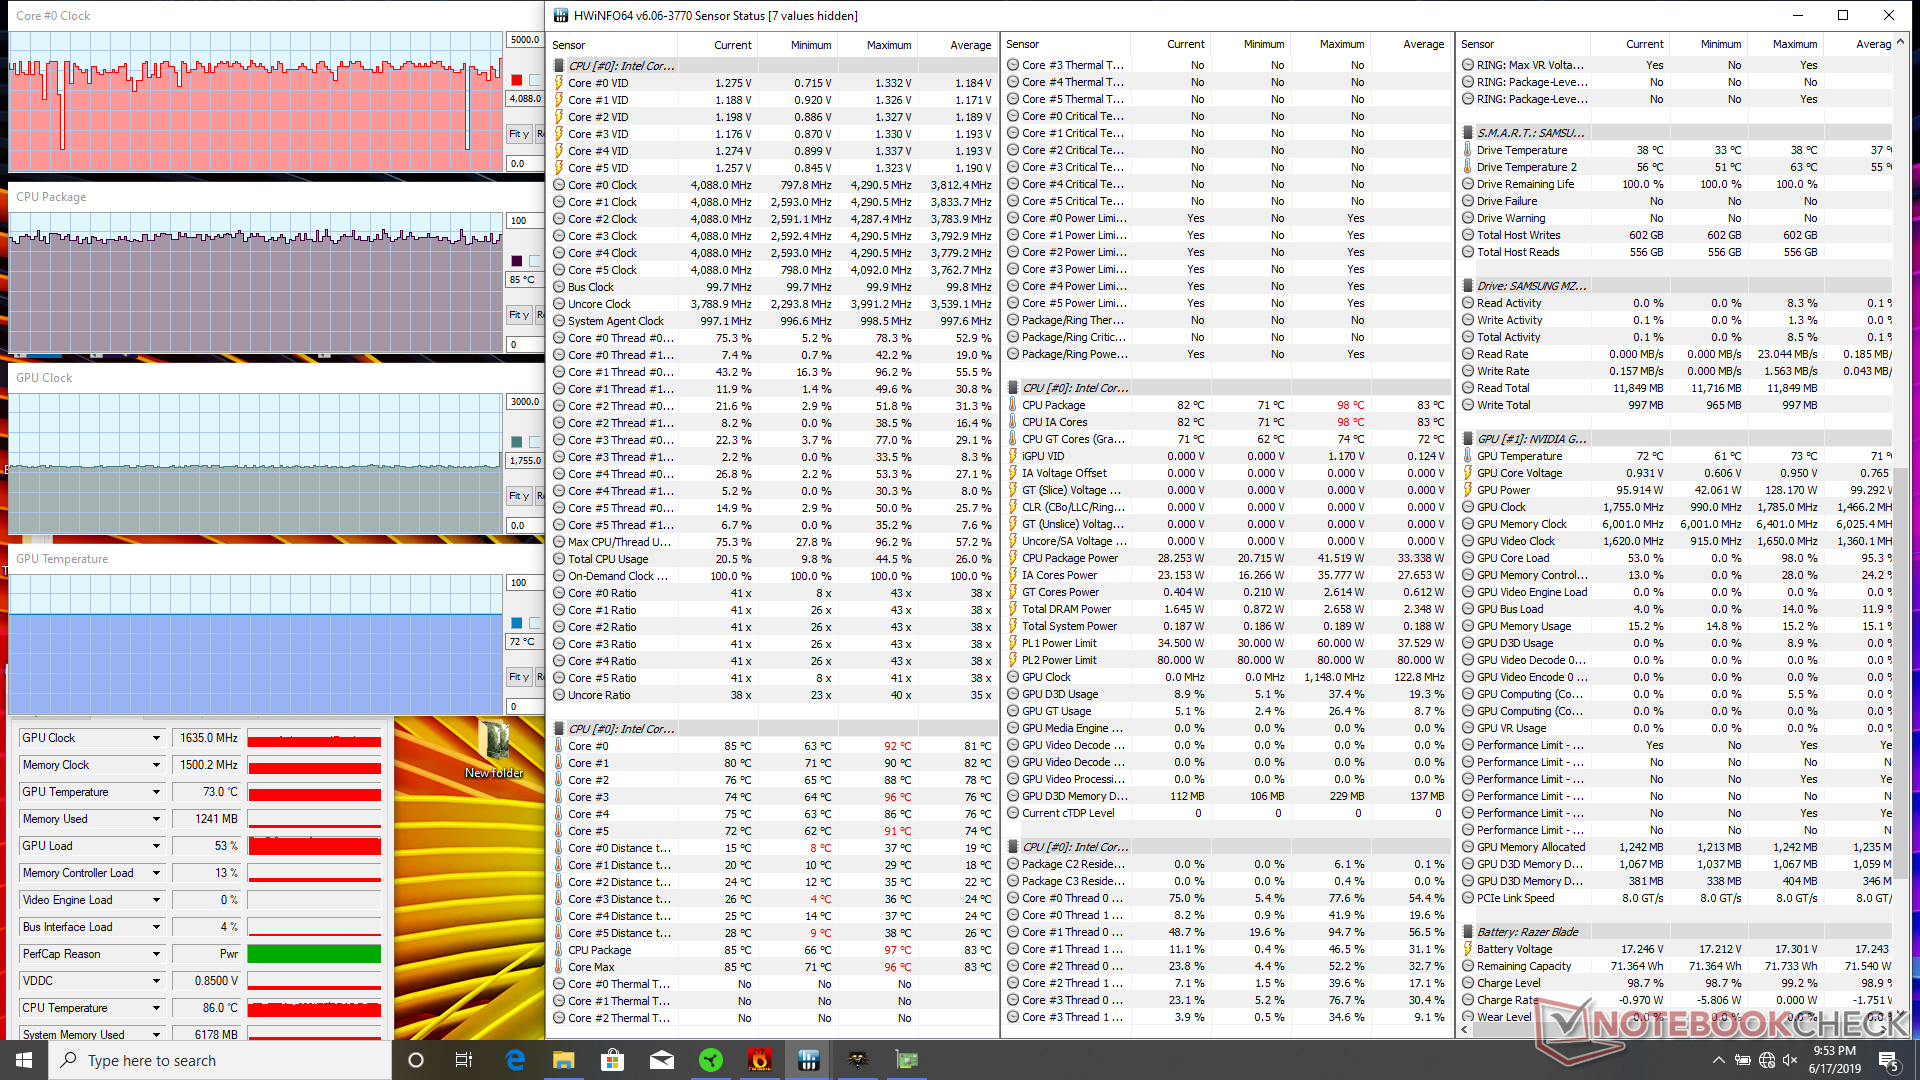
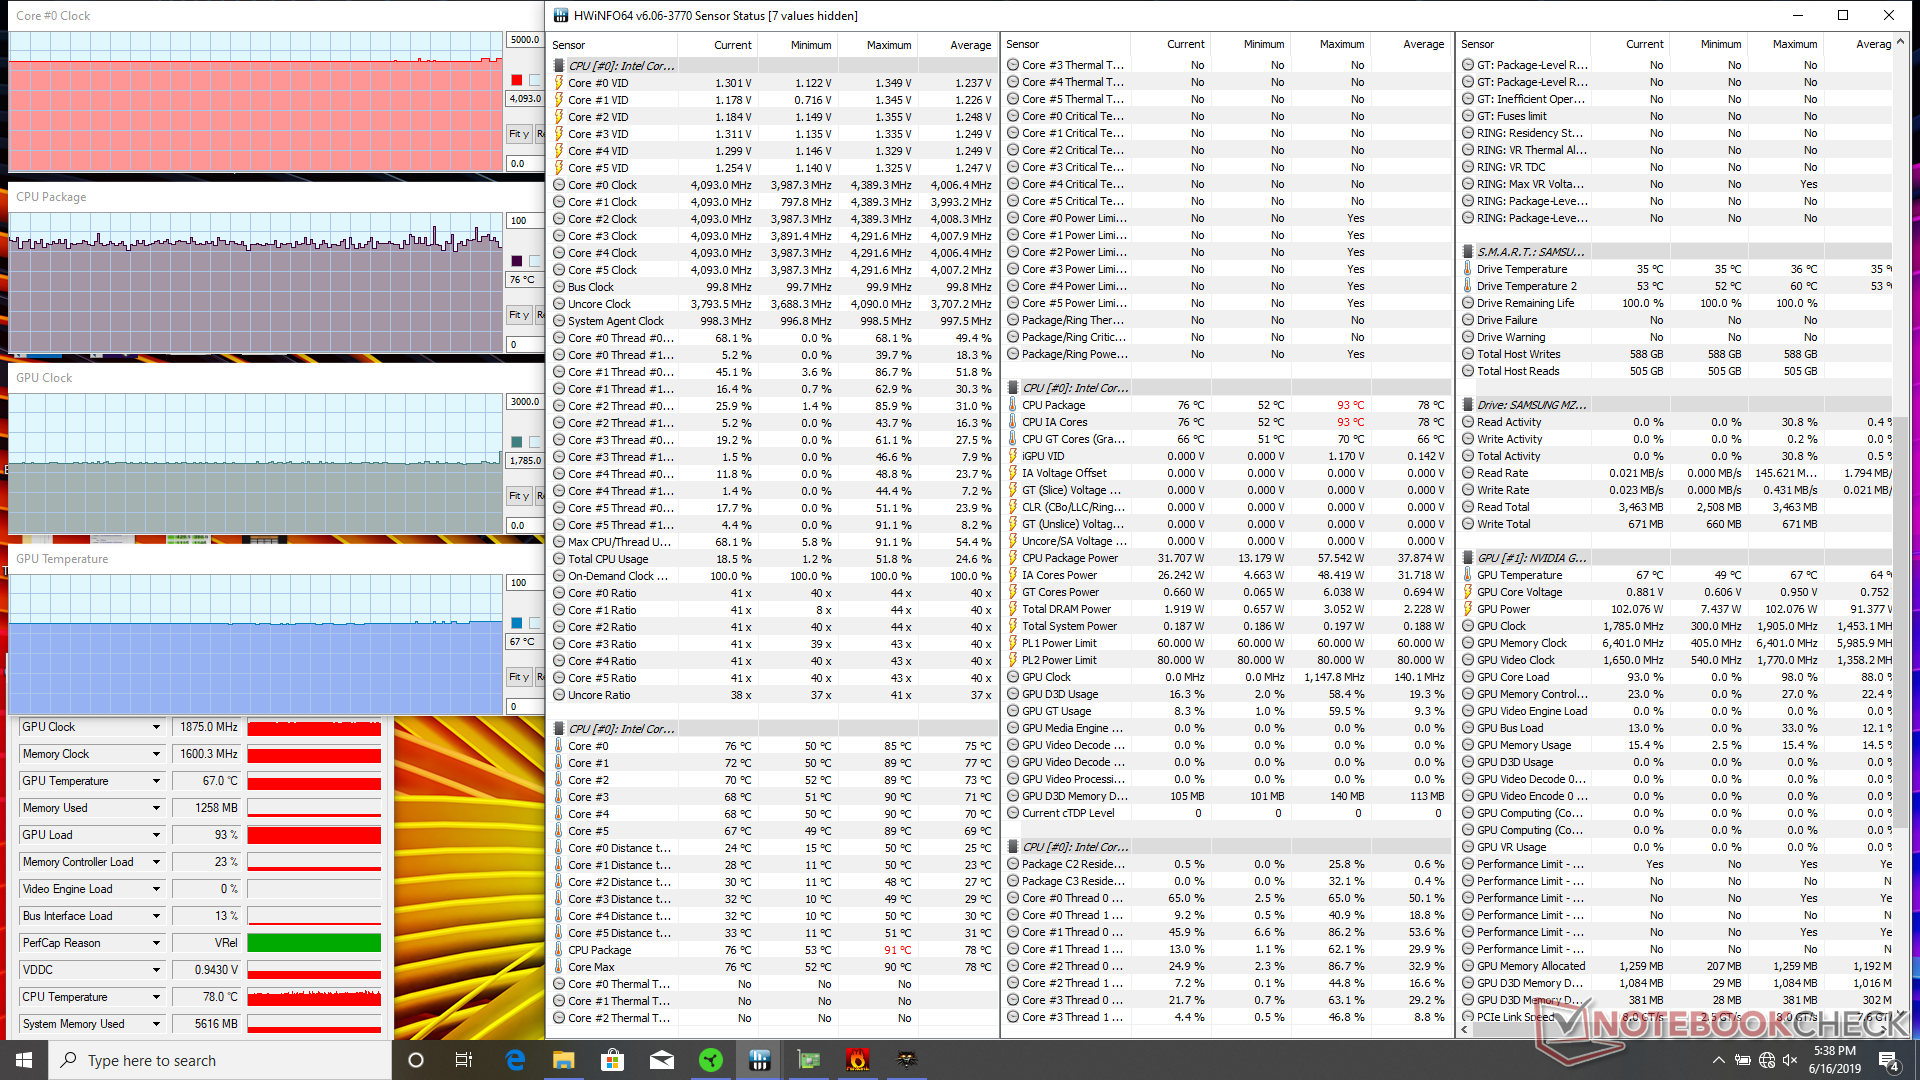
| CPU Clock (GHz) | GPU Clock (MHz) | Average CPU Temperature (°C) | Average GPU Temperature (°C) | |
| System Idle | -- | -- | 56 | 48 |
| Prime95 Stress (High Performance) | 3.2 | -- | 65 | 49 |
| Prime95 + FurMark Stress (High Performance) | 3.5 | 1440 | 85 | 70 |
| Witcher 3 Stress (High Performance) | 4.1 | 1530 | ~77 | 67 |
| Witcher 3 Stress (Balanced) | 3.7 - 4.1 | 1470 | ~85 | 72 |
(±) The maximum temperature on the upper side is 43 °C / 109 F, compared to the average of 40.4 °C / 105 F, ranging from 21.2 to 68.8 °C for the class Gaming.
(-) The bottom heats up to a maximum of 47.2 °C / 117 F, compared to the average of 43.2 °C / 110 F
(+) In idle usage, the average temperature for the upper side is 25.5 °C / 78 F, compared to the device average of 33.9 °C / 93 F.
(±) Playing The Witcher 3, the average temperature for the upper side is 34.8 °C / 95 F, compared to the device average of 33.9 °C / 93 F.
(+) The palmrests and touchpad are reaching skin temperature as a maximum (32.8 °C / 91 F) and are therefore not hot.
(-) The average temperature of the palmrest area of similar devices was 28.8 °C / 83.8 F (-4 °C / -7.2 F).
Speakers
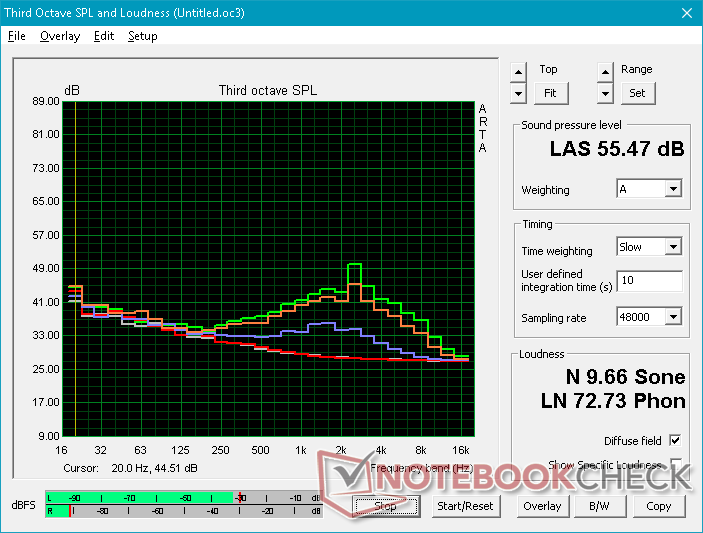
Razer has dropped the THX certification for the Blade Pro 17 and, to be honest, we don't even notice the difference in practice. Audio quality is still decent for a 17-inch form factor with a drop off at 250 Hz as is common on laptop speakers. The Alienware m17 has the advantage here with its louder volume and broader range. Perhaps a dedicated subwoofer would be the next step for the Blade Pro series for stronger bass should audio be a priority. Until then, the integrated speakers on the Blade Pro 17 can get the job done even if the oomph factor is missing.

Razer Blade Pro 17 RTX 2080 Max-Q audio analysis
(+) | speakers can play relatively loud (83.6 dB)
Bass 100 - 315 Hz
(±) | reduced bass - on average 10.5% lower than median
(±) | linearity of bass is average (14.4% delta to prev. frequency)
Mids 400 - 2000 Hz
(±) | higher mids - on average 5.3% higher than median
(+) | mids are linear (4.6% delta to prev. frequency)
Highs 2 - 16 kHz
(+) | balanced highs - only 3.5% away from median
(±) | linearity of highs is average (10% delta to prev. frequency)
Overall 100 - 16.000 Hz
(±) | linearity of overall sound is average (17.9% difference to median)
Compared to same class
» 54% of all tested devices in this class were better, 9% similar, 37% worse
» The best had a delta of 6%, average was 18%, worst was 132%
Compared to all devices tested
» 37% of all tested devices were better, 8% similar, 55% worse
» The best had a delta of 4%, average was 24%, worst was 134%
Apple MacBook 12 (Early 2016) 1.1 GHz audio analysis
(+) | speakers can play relatively loud (83.6 dB)
Bass 100 - 315 Hz
(±) | reduced bass - on average 11.3% lower than median
(±) | linearity of bass is average (14.2% delta to prev. frequency)
Mids 400 - 2000 Hz
(+) | balanced mids - only 2.4% away from median
(+) | mids are linear (5.5% delta to prev. frequency)
Highs 2 - 16 kHz
(+) | balanced highs - only 2% away from median
(+) | highs are linear (4.5% delta to prev. frequency)
Overall 100 - 16.000 Hz
(+) | overall sound is linear (10.2% difference to median)
Compared to same class
» 7% of all tested devices in this class were better, 2% similar, 91% worse
» The best had a delta of 5%, average was 18%, worst was 53%
Compared to all devices tested
» 5% of all tested devices were better, 1% similar, 94% worse
» The best had a delta of 4%, average was 24%, worst was 134%
Energy Management
Power Consumption
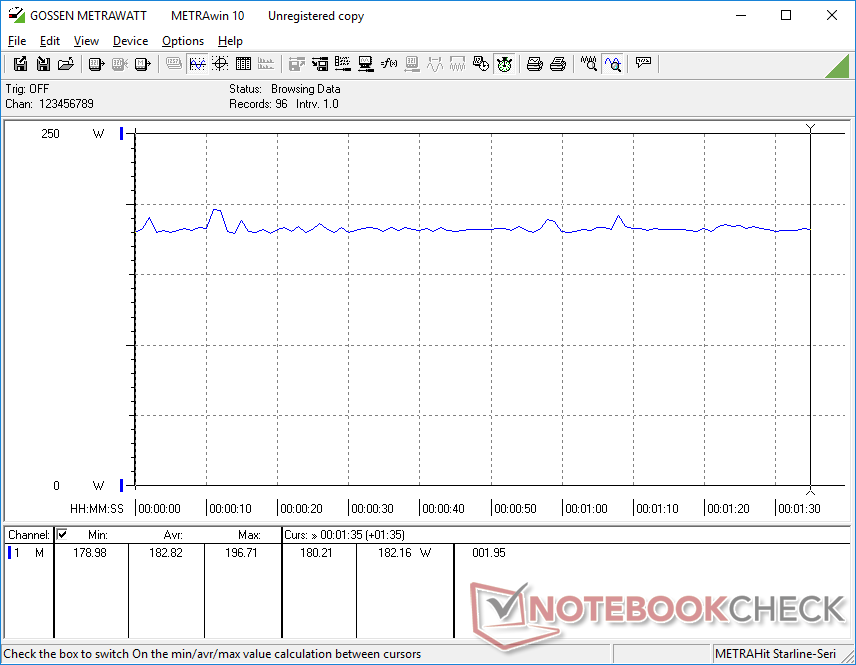
The Blade Pro 17 is indubitably more power efficient than the Blade Pro 2017 when given the same processing conditions. Idling on desktop draws 16 W to 26 W on the Blade Pro 17 versus 31 W to 44 W on the last generation model. When running Witcher 3, consumption is about 14 percent less which becomes even more impressive when you remember that GPU performance is actually up by 22 to 39 percent between the Blade Pro GTX 1080 and RTX 2080 Max-Q. The significantly improved performance-per-Watt has a direct impact on battery life as our next section will show.
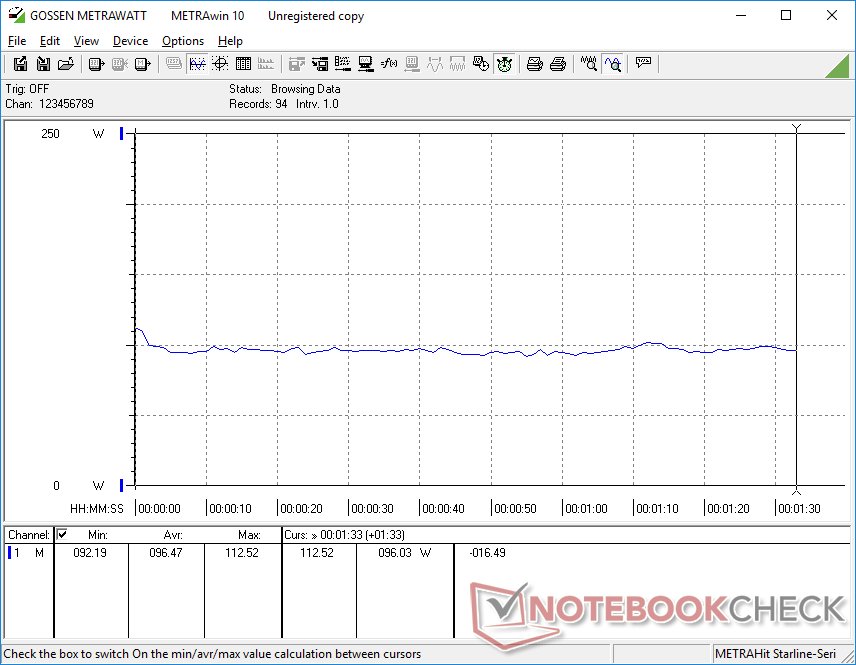
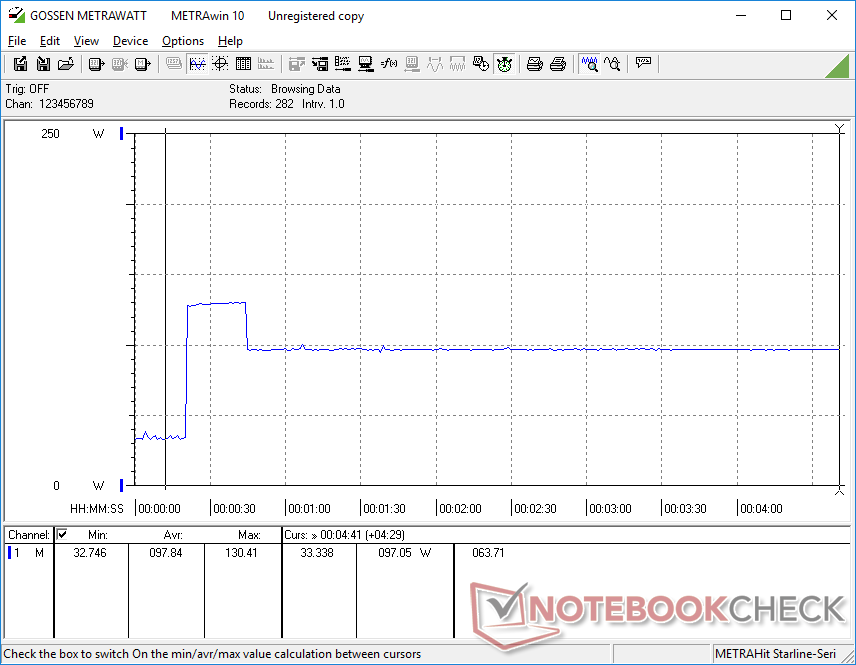
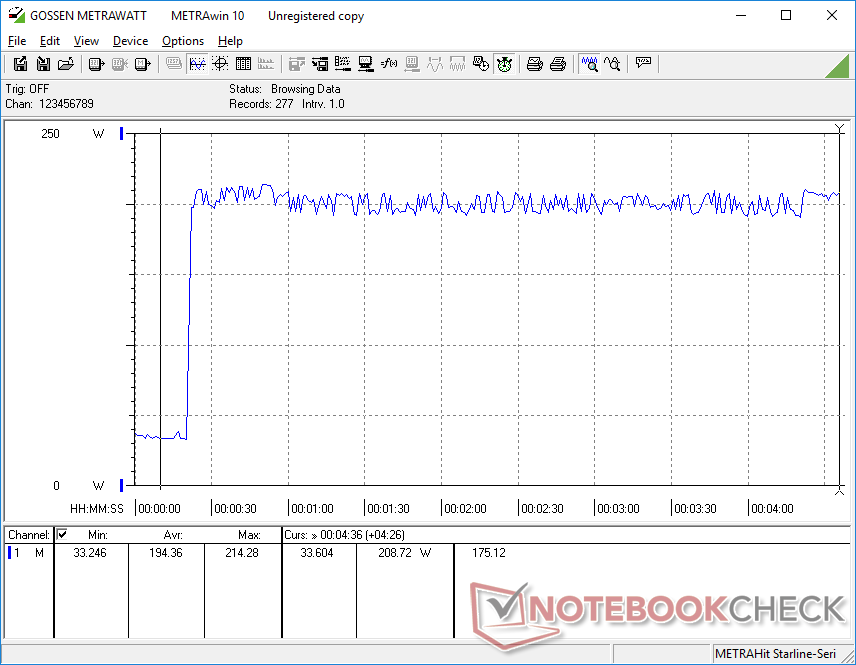
We're able to record a maximum consumption of 214 W from the relatively small (~17 x 7 x 2.5 cm) and lightweight 230 W AC adapter when running both Prime95 and FurMark simultaneously. If running only Prime95, consumption spikes to 130 W for the first few seconds when Turbo Boost is at its maximum before falling to 97 W. This behavior mirrors our CineBench loop test and stress test observations above.
| Off / Standby | |
| Idle | |
| Load |
|
Key:
min: | |
| Razer Blade Pro 17 RTX 2080 Max-Q i7-9750H, GeForce RTX 2080 Max-Q, Samsung SSD PM981 MZVLB512HAJQ, IPS, 1920x1080, 17.3" | Asus ROG Strix Scar II GL704GW i7-8750H, GeForce RTX 2070 Mobile, Intel SSD 660p SSDPEKNW512G8, AHVA, 1920x1080, 17.3" | Razer Blade Pro 2017 i7-7820HK, GeForce GTX 1080 Mobile, 2x Samsung SSD PM951 MZVLV256HCHP (RAID 0), IGZO, 3840x2160, 17.3" | MSI GS75 8SG Stealth i7-8750H, GeForce RTX 2080 Max-Q, 2x Samsung SSD PM981 MZVLB512HAJQ (RAID 0), IPS, 1920x1080, 17.3" | MSI GE75 9SG i9-9880H, GeForce RTX 2080 Mobile, Samsung SSD PM981 MZVLB1T0HALR, AHVA, 1920x1080, 17.3" | MSI GP75 Leopard 9SD i7-9750H, GeForce GTX 1660 Ti Mobile, Kingston RBUSNS8154P3256GJ1, IPS, 1920x1080, 17.3" | |
|---|---|---|---|---|---|---|
| Power Consumption | -9% | -47% | 13% | -8% | 17% | |
| Idle Minimum * (Watt) | 16.2 | 19 -17% | 31 -91% | 13 20% | 13.9 14% | 10 38% |
| Idle Average * (Watt) | 20.4 | 22 -8% | 36 -76% | 17 17% | 18.8 8% | 15 26% |
| Idle Maximum * (Watt) | 26.1 | 29 -11% | 44 -69% | 23 12% | 23.1 11% | 22 16% |
| Load Average * (Watt) | 96.5 | 102 -6% | 107 -11% | 90 7% | 112.3 -16% | 92 5% |
| Witcher 3 ultra * (Watt) | 182.9 | 190 -4% | 212 -16% | 147 20% | 231 -26% | 153 16% |
| Load Maximum * (Watt) | 214.3 | 231 -8% | 258 -20% | 215 -0% | 291.5 -36% | 216 -1% |
* ... smaller is better
Battery Life
Battery capacity has dropped from 99 Wh on the Blade Pro 2017 to 70 Wh on the Blade Pro 2019 because the extra pair of internal fans occupy battery space. Even so, runtimes are actually longer on the new Blade Pro despite the reduction in battery capacity. We're able to record 4.5 hours of real-world WLAN use compared to 3 hours on the 2017 model when set to the same Balanced profile and Optimus conditions.
Recharging from empty to full capacity takes 1.5 hours as is normal on most laptops.
| Razer Blade Pro 17 RTX 2080 Max-Q i7-9750H, GeForce RTX 2080 Max-Q, 70 Wh | Asus ROG Strix Scar II GL704GW i7-8750H, GeForce RTX 2070 Mobile, 66 Wh | Alienware m17 P37E i9-8950HK, GeForce RTX 2080 Max-Q, 90 Wh | Lenovo Legion Y740-17ICH i7-8750H, GeForce RTX 2080 Max-Q, 76 Wh | Razer Blade Pro 2017 i7-7820HK, GeForce GTX 1080 Mobile, 99 Wh | MSI GS75 8SG Stealth i7-8750H, GeForce RTX 2080 Max-Q, 80.25 Wh | MSI GE75 9SG i9-9880H, GeForce RTX 2080 Mobile, 65 Wh | |
|---|---|---|---|---|---|---|---|
| Battery runtime | -4% | 16% | -32% | -15% | 11% | 4% | |
| Reader / Idle (h) | 4.9 | 6.2 27% | 9.1 86% | 4.2 -14% | 7.7 57% | ||
| WiFi v1.3 (h) | 4.7 | 3.9 -17% | 4.9 4% | 3.2 -32% | 3.3 -30% | 5.3 13% | 4.9 4% |
| Load (h) | 1.4 | 1.1 -21% | 0.8 -43% | 1.4 0% | 0.9 -36% | ||
| Witcher 3 ultra (h) | 0.9 |
Pros
Cons
Verdict
Historically, Razer Blade Pro laptops have always had novel features to distinguish themselves from competitors. The Blade Pro 2015, for example, had a unique screenpad while the Blade Pro 2017 had mechanical keys, trackpad lights, THX certification, and a volume wheel. The 2019 Blade Pro 17 drops all these fancy features to focus on the basics and the outcome is the best Blade laptop to ever come out of Razer. The gen-to-gen improvements are actually tangible and not just marginal or superficial; it's 22 percent lighter, 24 percent smaller, 30 percent brighter, and 14 percent more power efficient when gaming all while offering up to 39 percent faster graphics performance than the last generation Blade Pro 2017 GTX 1080. Throw in the easily upgradeable RAM and storage and you have a gaming laptop that seemingly checks all the right boxes.
There are several aspects we think could make the Blade Pro 17 even better. Firmer, deeper keyboard keys a la the SteelSeries keys on MSI laptops would improve tactility while the spongy clickpad could certainly take some cues from the MacBook Pro. Fan noise on High Performance is quieter than on the Blade Pro 2017, but it's still loud at over 50 dB(A). Macro keys for toggling between Balanced and High Performance modes would make it much faster and easier than having to open and click through Synapse each time. Integrating a dedicated subwoofer could improve audio quality without ever needing THX certification in the first place. Meanwhile, the AC adapter cable is too taut and could be made thinner and more flexible for easier carrying. These drawbacks aren't enough to bring down what is otherwise an excellent gaming laptop for its screen size and ultrathin category.
Price will likely be a point of contention preventing gamers from taking the plunge. For $2500 USD, users can buy a Lenovo Legion Y740-17ICH with the same Core i7-9750H CPU and RTX 2080 Max-Q GPU as our $3200 Blade Pro 17 configuration. Whether or not the price premium is worth the objectively stronger and arguably more luxurious chassis design of the Razer is something only you can answer for yourself. For our money, however, it's definitely worth considering now more than ever before because of all the significant refinements over the Blade Pro 2017.
Razer has streamlined its Blade Pro series for a stronger gaming experience overall. If you're in the market for a thin 17-inch gaming laptop, skip the bloated Blade Pro 2017 and consider the leaner Blade Pro 17. It'll cost a bit more than some competitors, but it'll feel and play a little better as well.
Razer Blade Pro 17 RTX 2080 Max-Q
- 09/20/2019 v7 (old)
Allen Ngo
Price comparison
