Razer Blade 15 Base Model (i7-8750H, GTX 1060 Max-Q) Laptop Review
 vs. Blade 15 Base Model (right)")
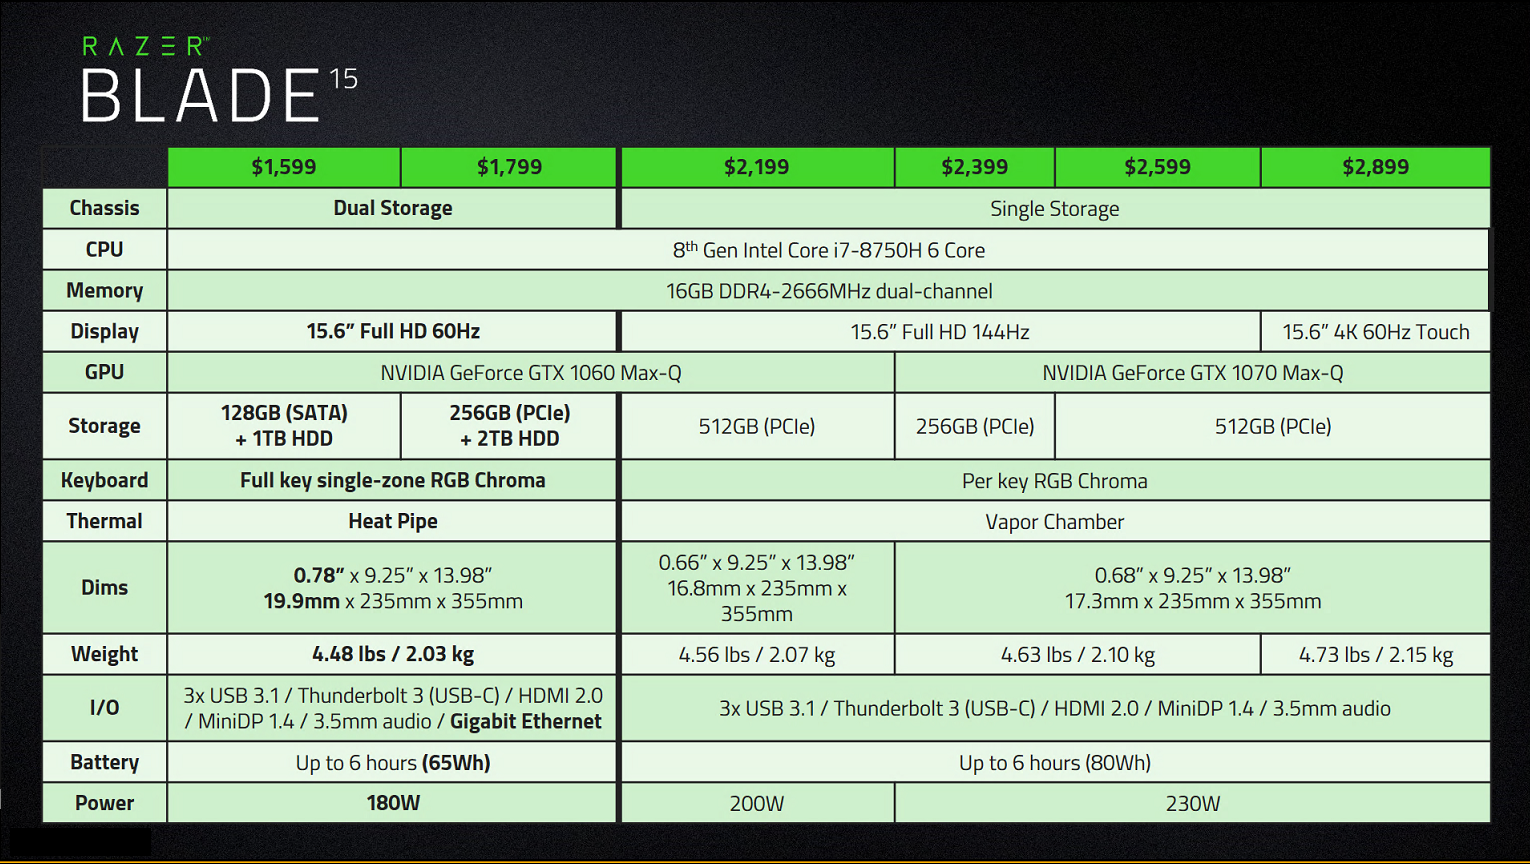
Unveiled just a couple of weeks ago as the Dual Storage Blade 15, the system was conceived as a new less expensive configuration for the existing Blade 15 series released earlier this year. Razer is now referring to the new model as the Blade 15 Base Model while retroactively renaming the two original Blade 15 SKUs as the Advanced Model to better contrast the configurations.
The Base Model omits a number of features while introducing a few new ones for a lower price of entry. Razer has done a pretty good job summarizing all the main differences between the Base Model and Advanced Model Blade 15 configurations through the table below and on the official product page. The most notable changes are the slight increase in thickness, lack of per-key RGB lighting, addition of a 2.5-inch SATA III bay, and more limited number of display and GPU options. The end result is a system that starts at just $1600 USD compared to the whopping $2200 USD for the original Blade 15 Advanced Model.
Aside from the differences above, the core specifications and visual design are identical between the Base Model and Advanced Model including the Core i7-8750H CPU, GTX 1060 Max-Q GPU, and dual-channel RAM. Our review here will dive deeper into their differences to uncover what users will be missing and gaining when considering the Blade 15 Base Model. We highly recommend checking out our existing reviews on the original Blade 15 GTX 1060 Max-Q and GTX 1070 Max-Q Advanced Models since the Base Model is nearly identical.
Direct competitors in the narrow-bezel 15.6-inch gaming space have only risen in number since the launch of the original Blade 15 Advanced Model. Alternatives to the Blade 15 include the HP Omen 15, HP Pavilion Gaming 15, MSI GS65, Gigabyte Aero 15X v8, Schenker XMG Neo, and the recently released Dell Alienware m15.
More Razer reviews:
Case
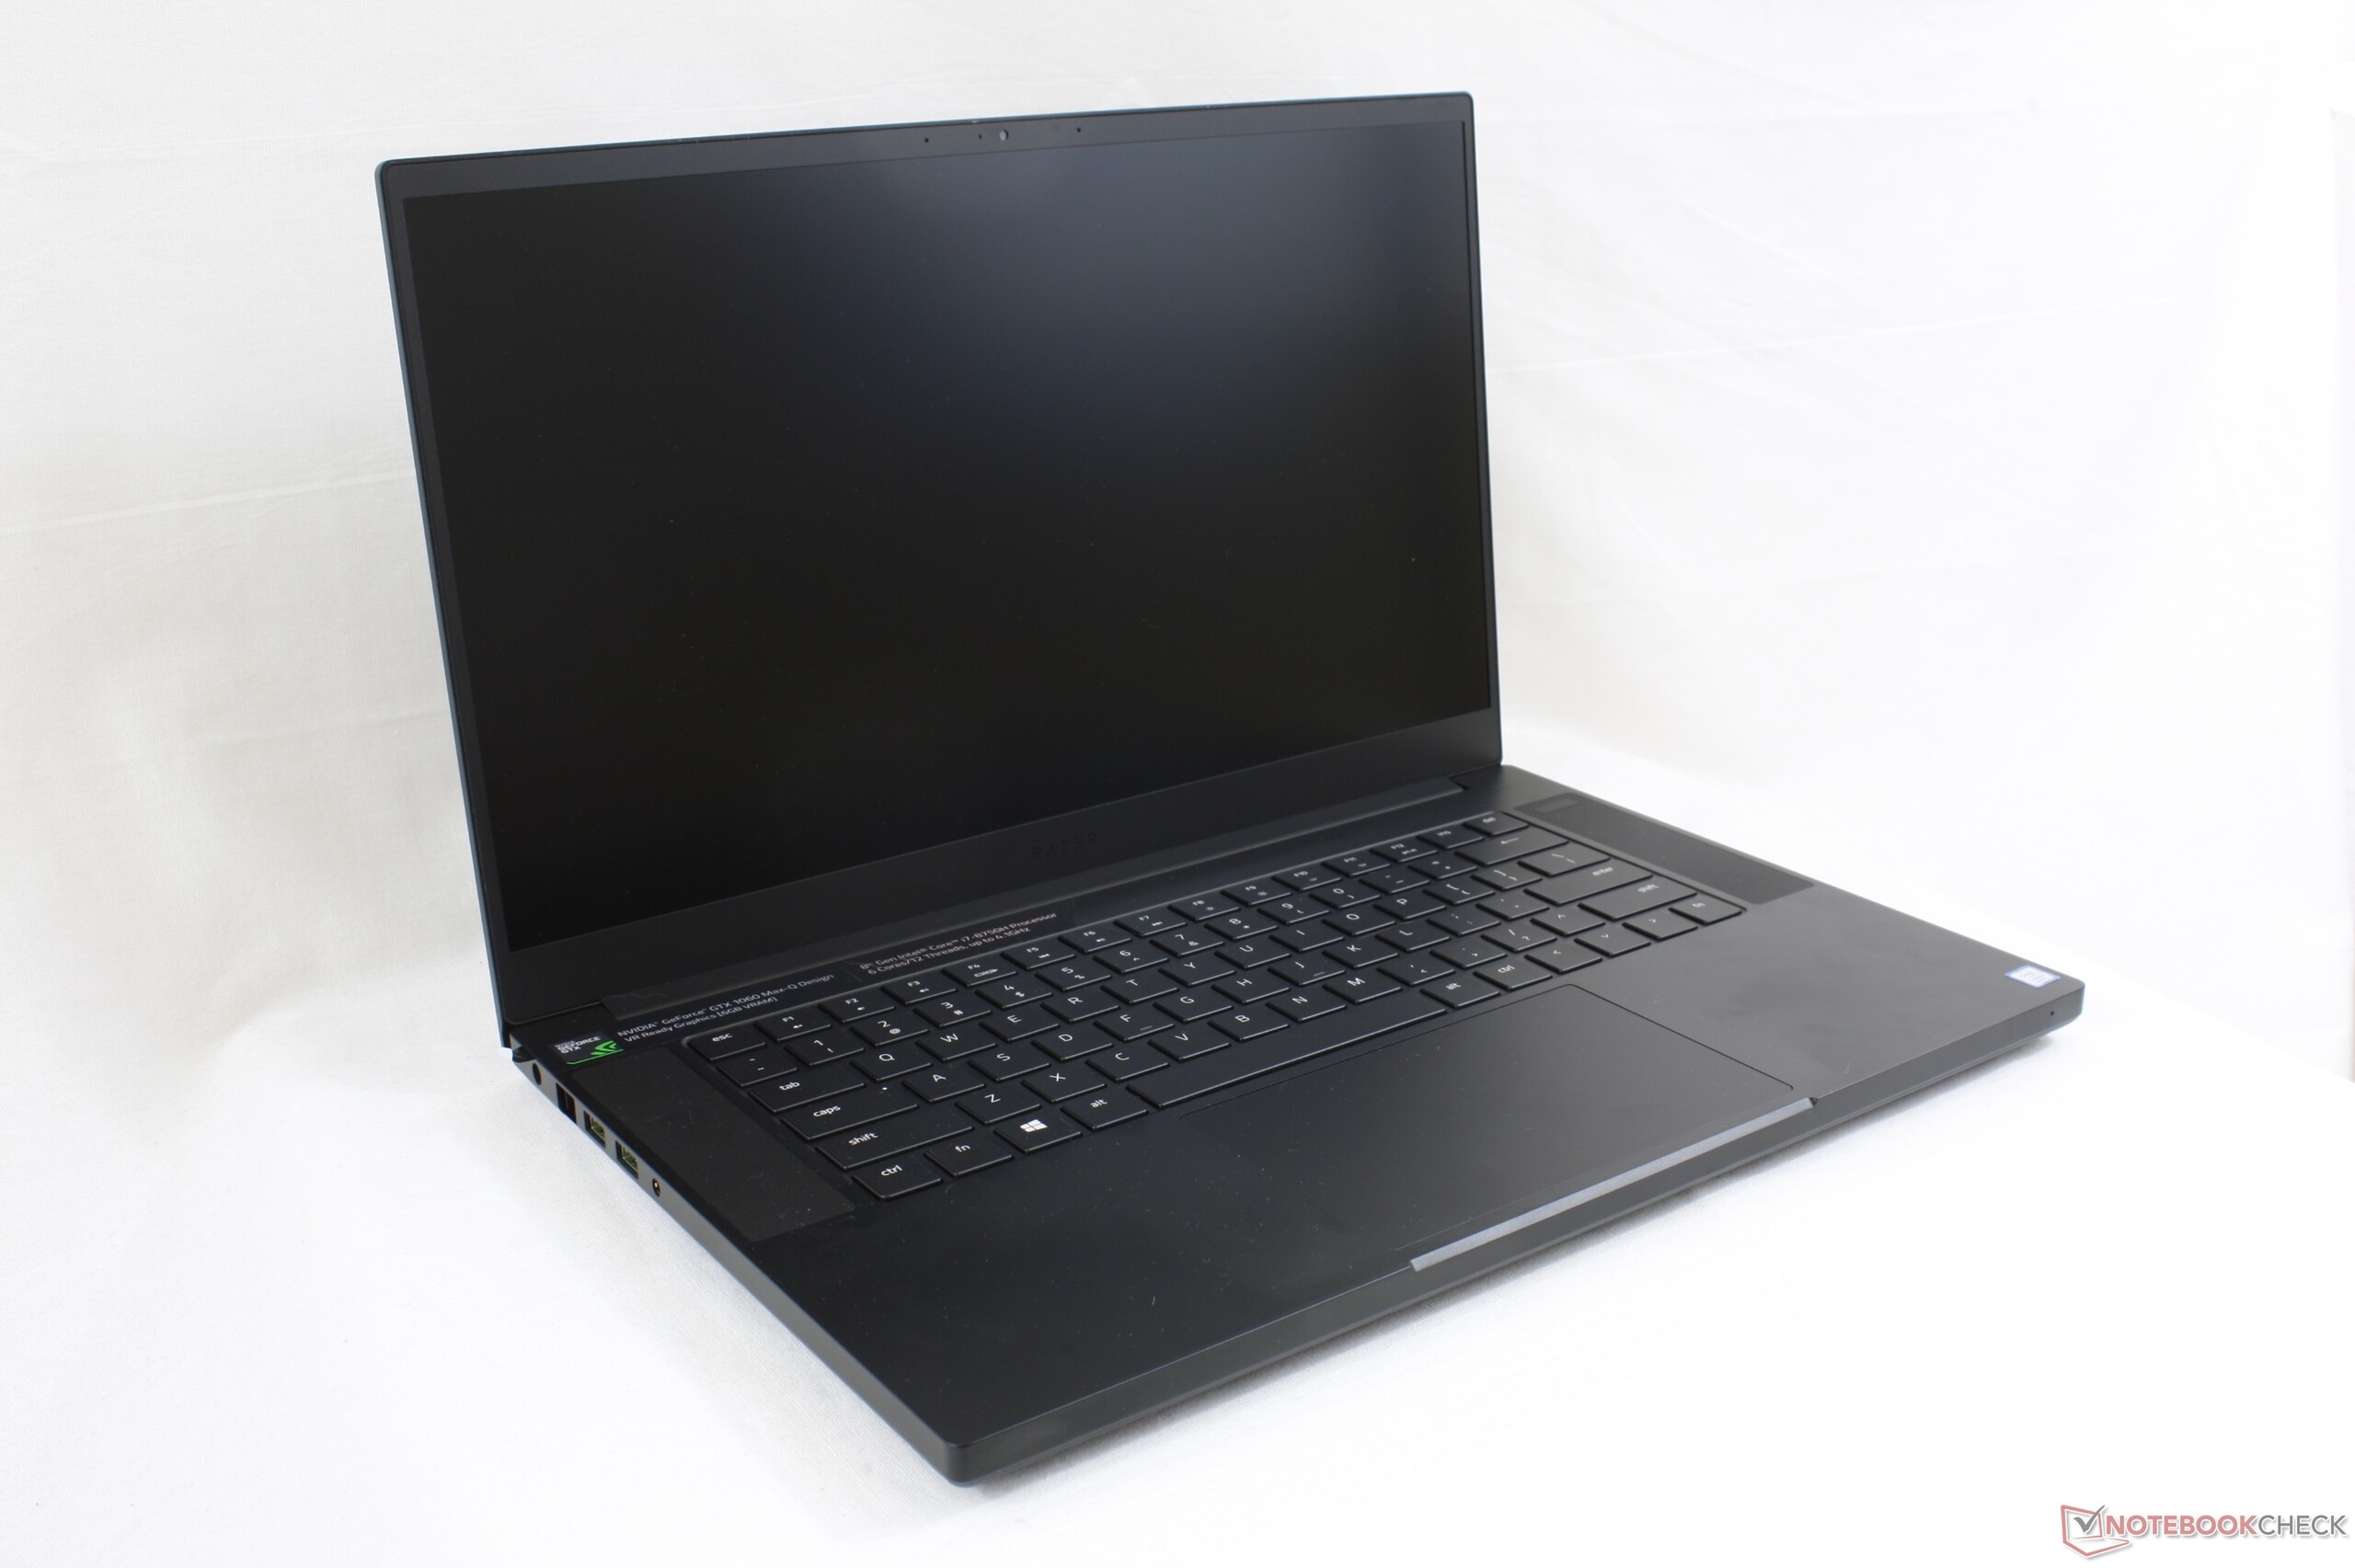
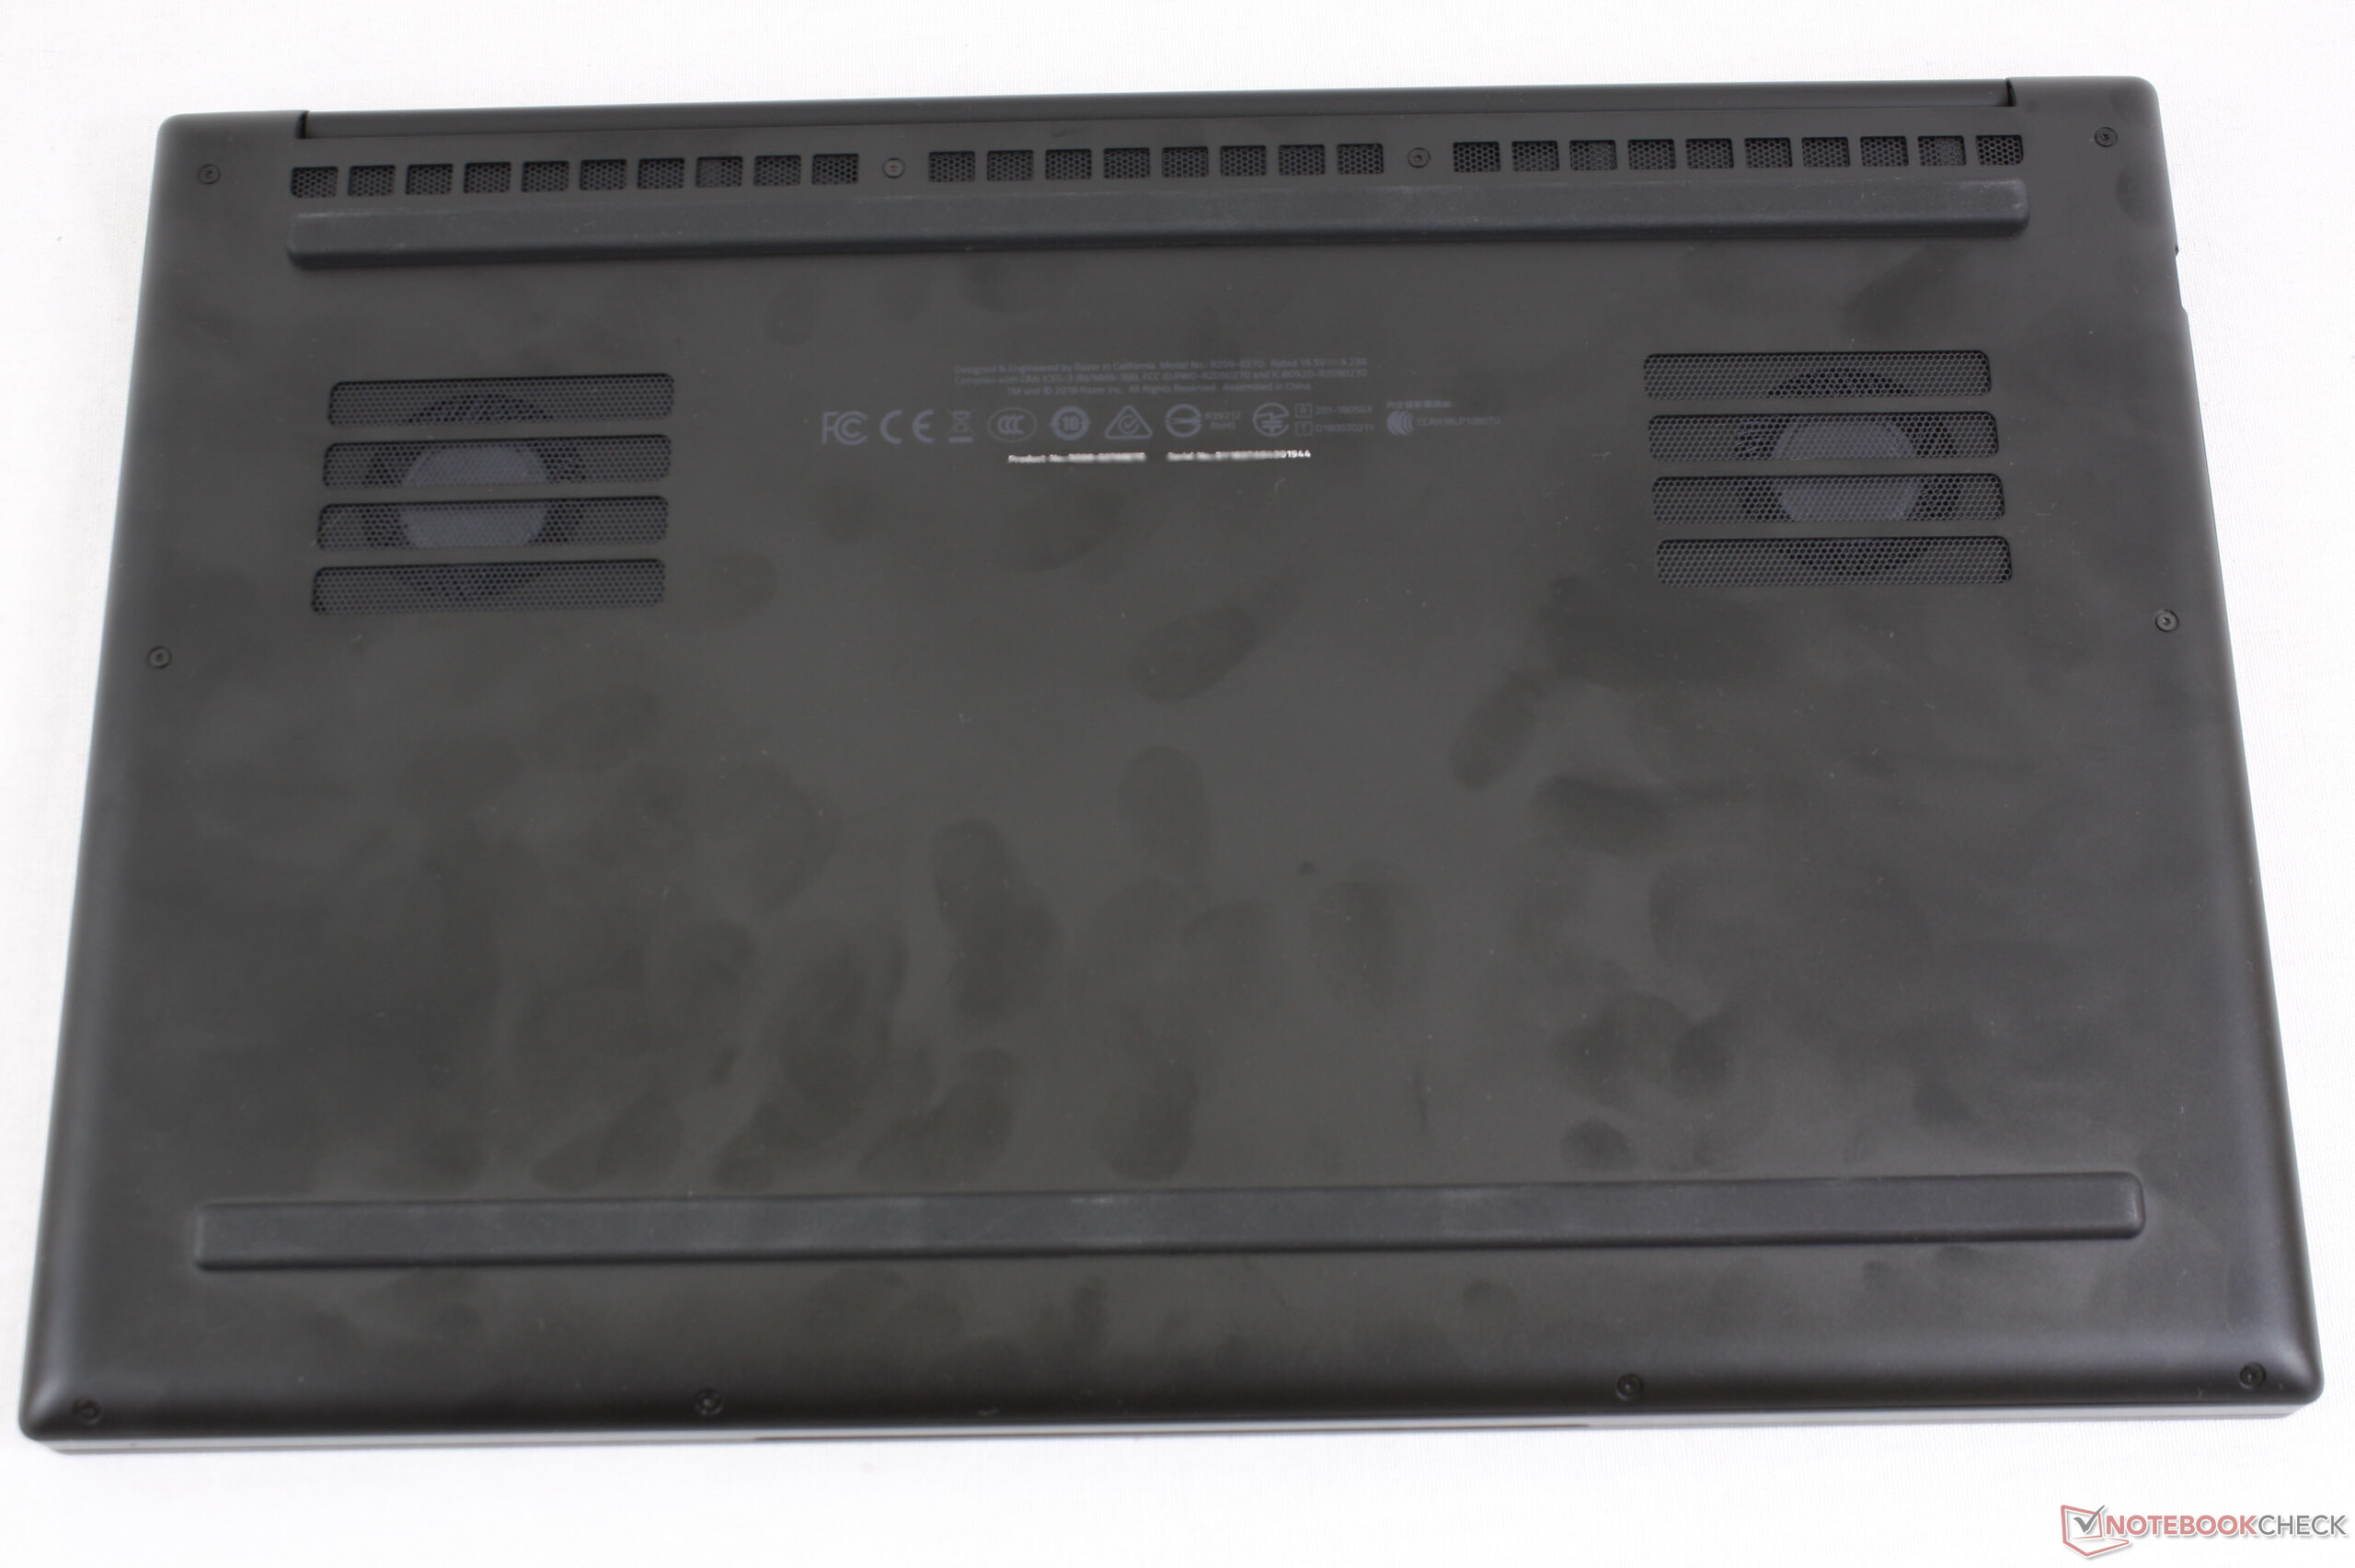
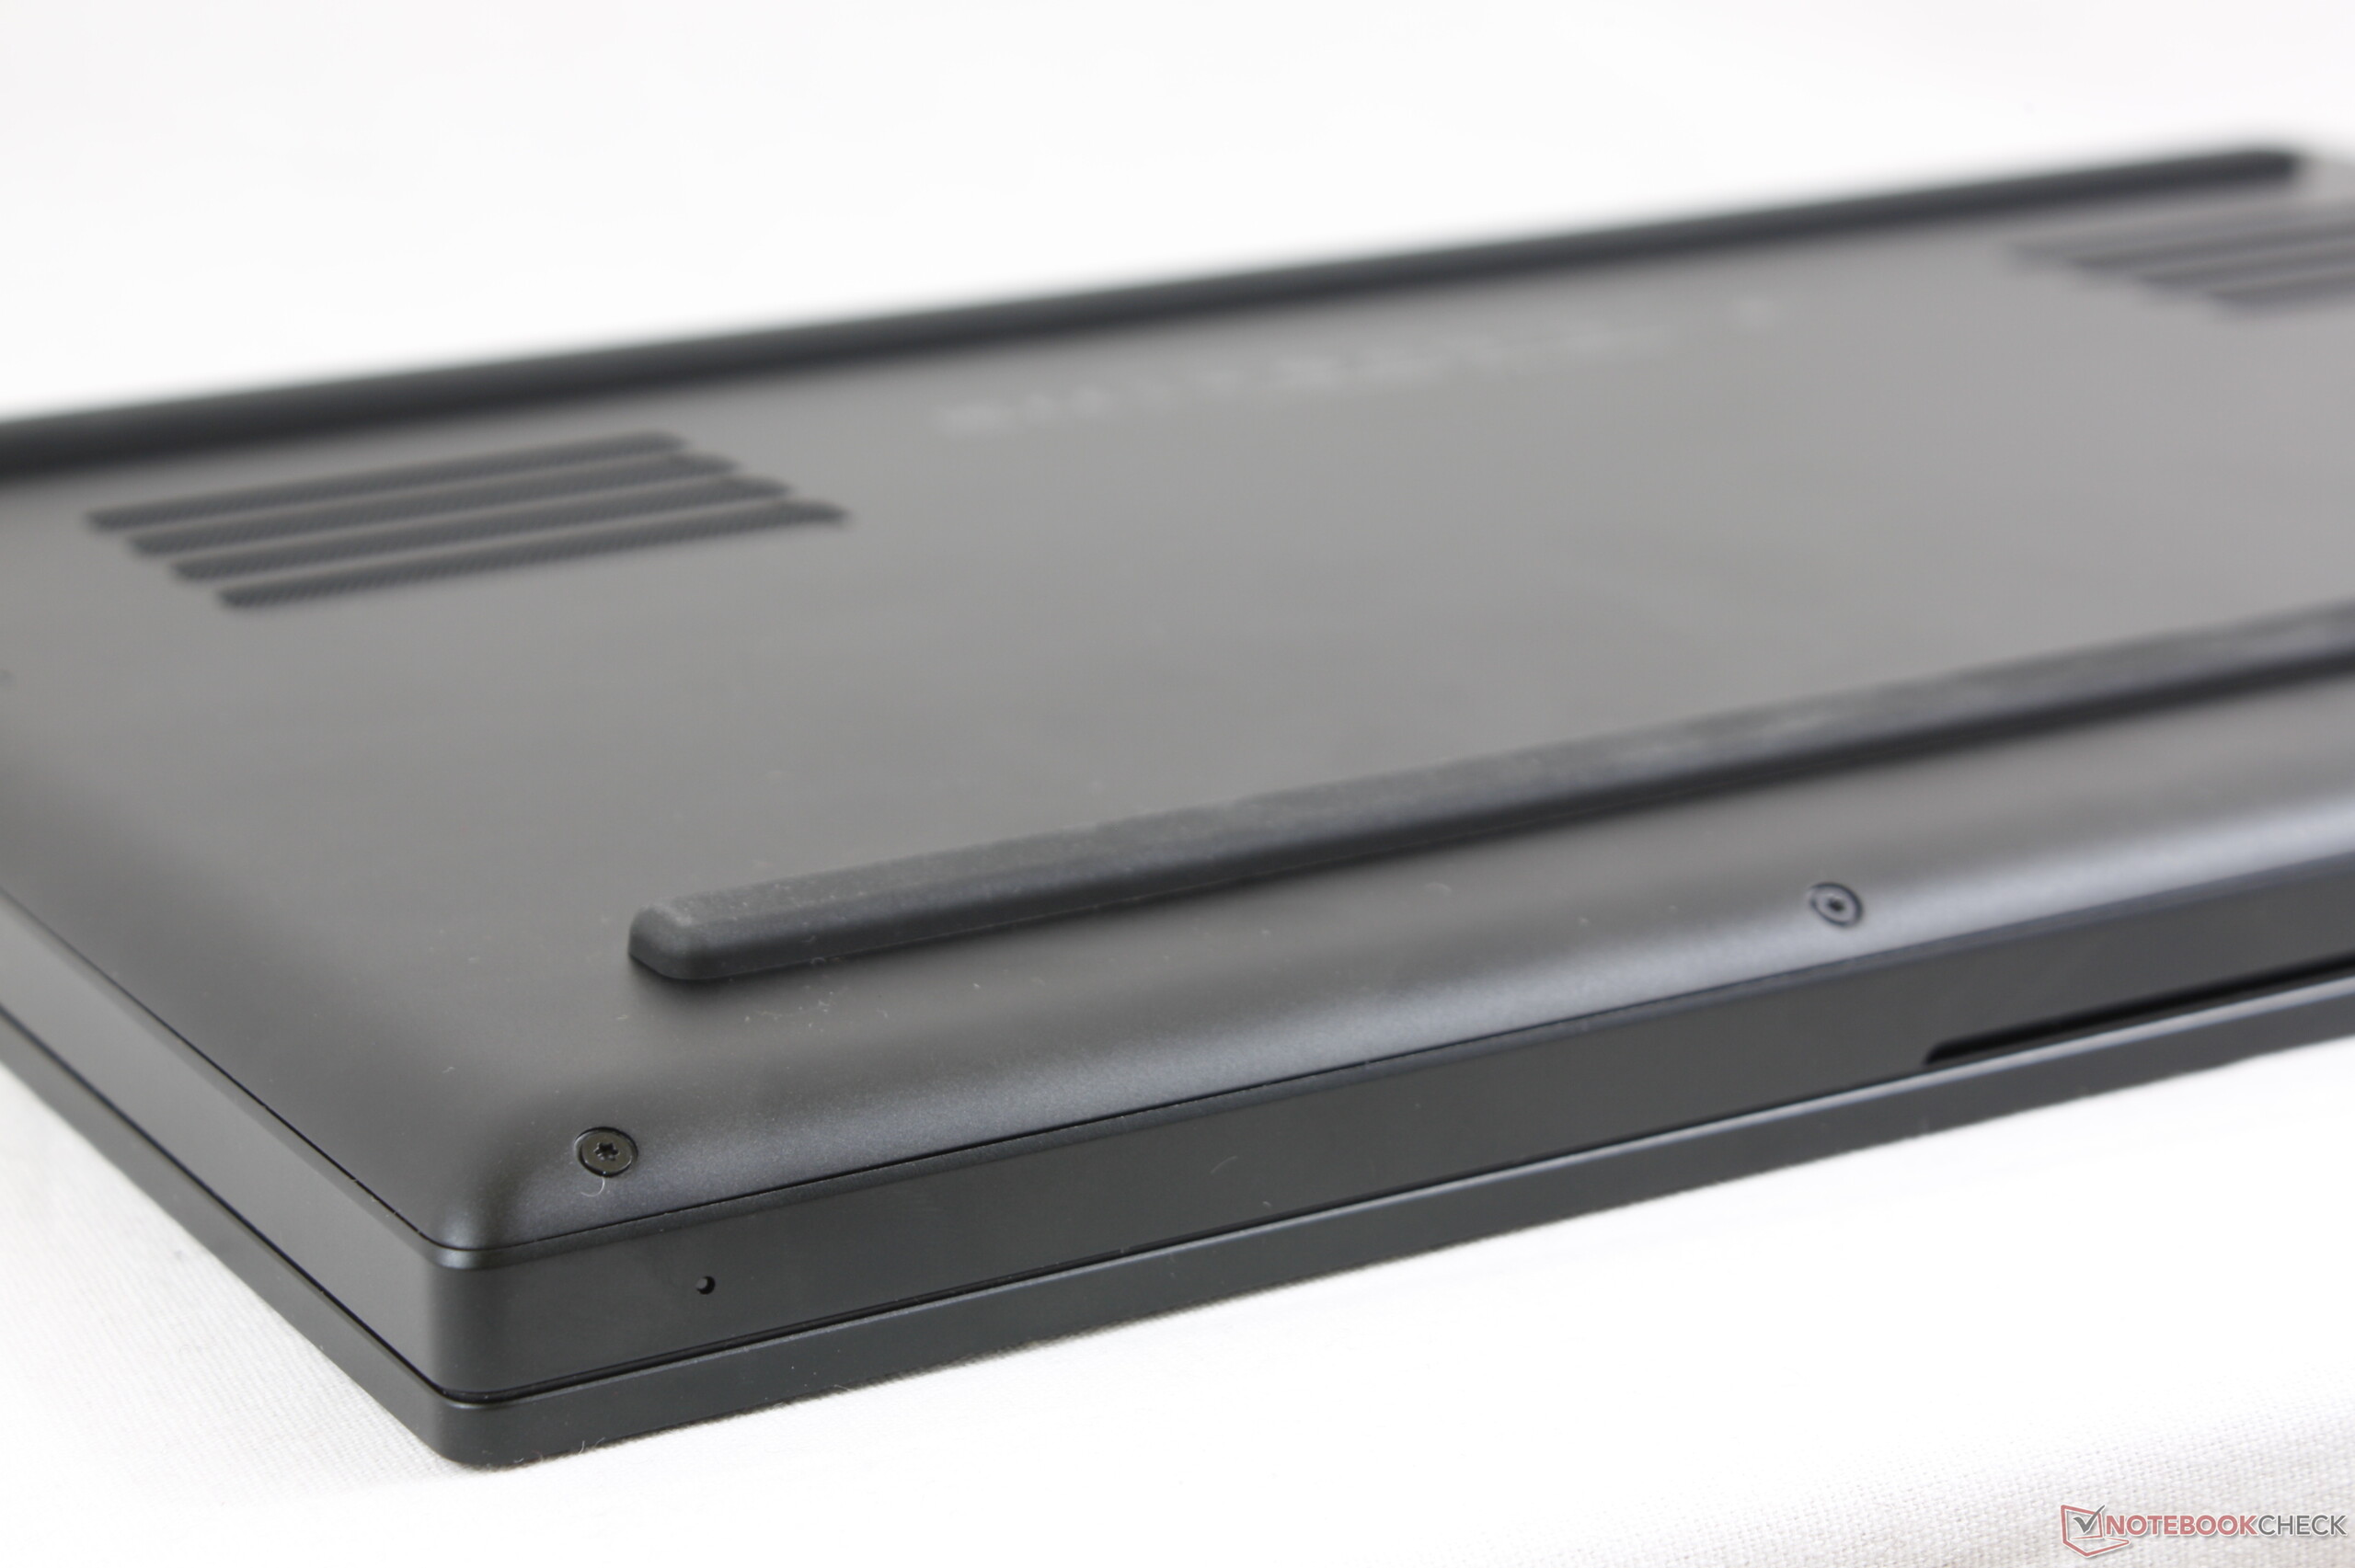
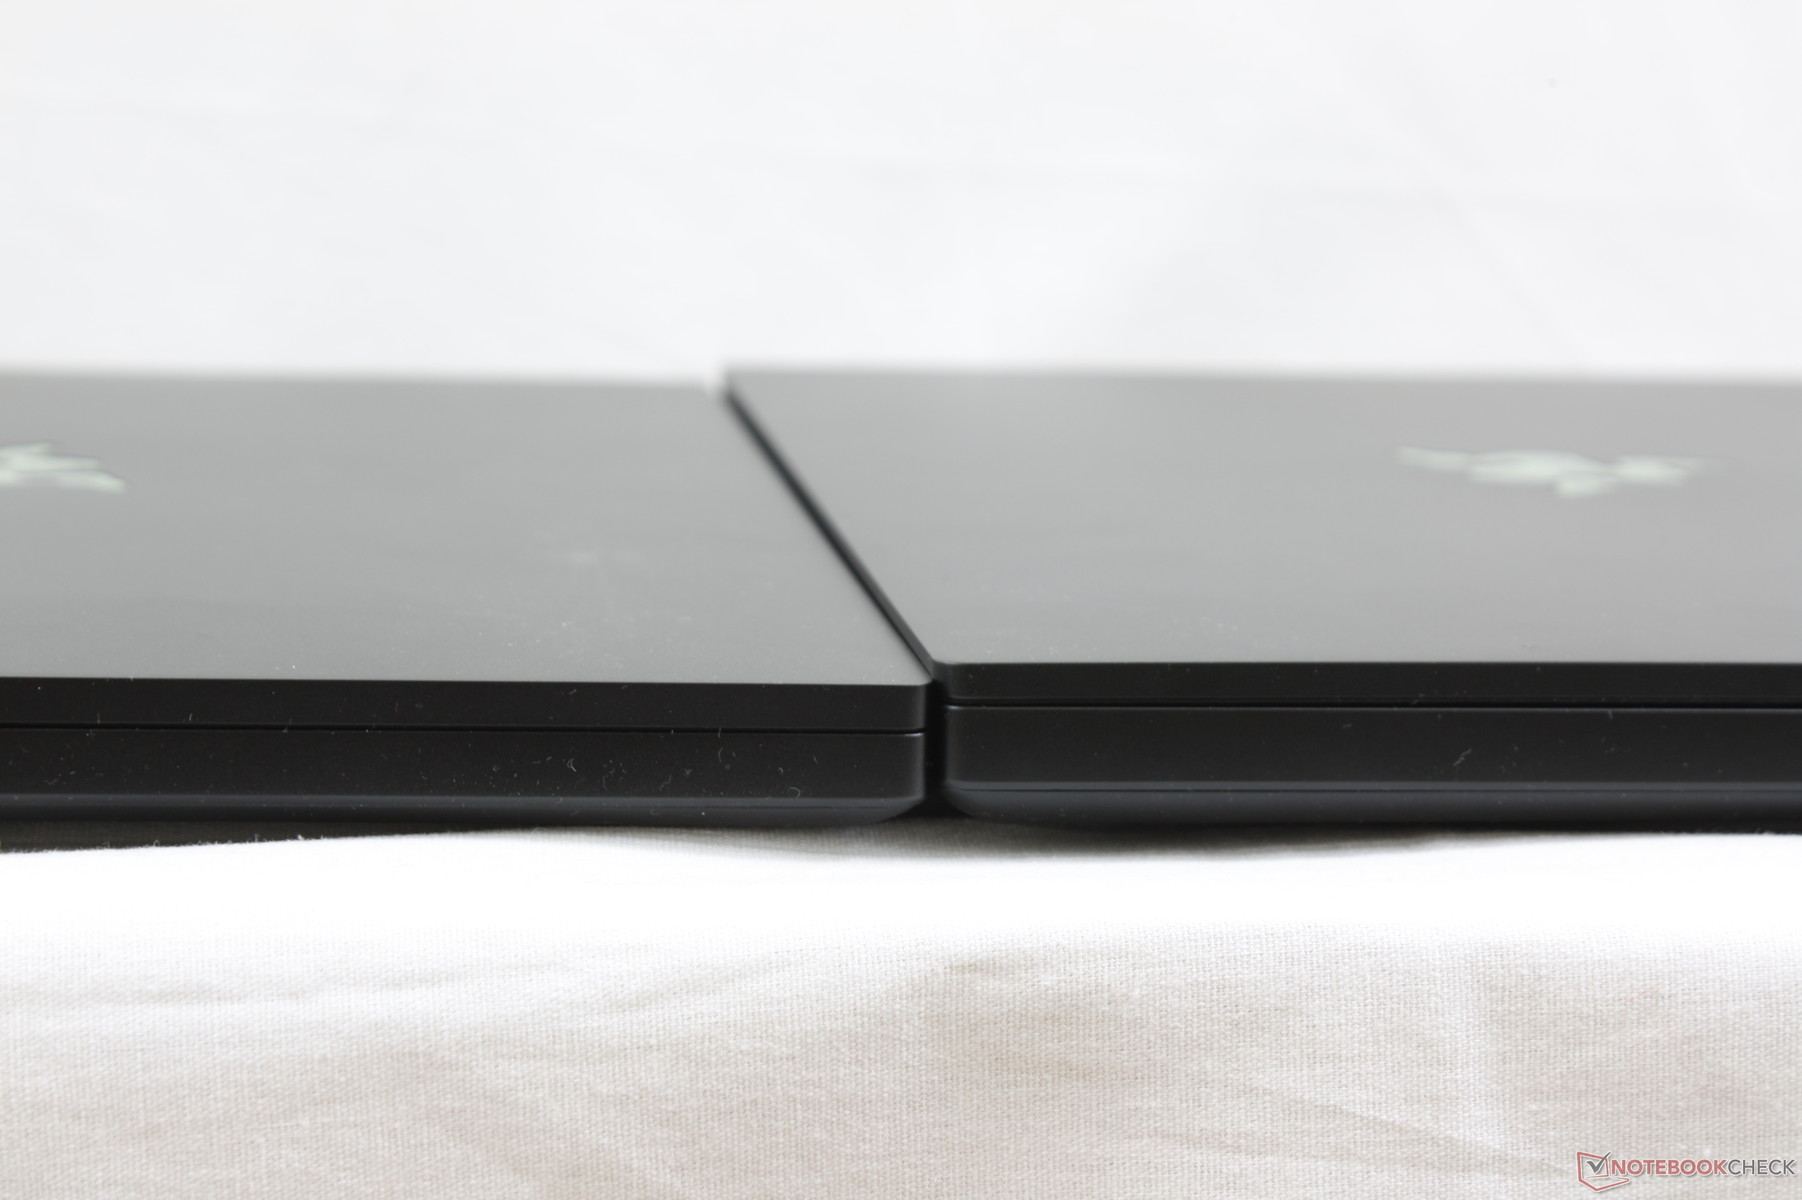
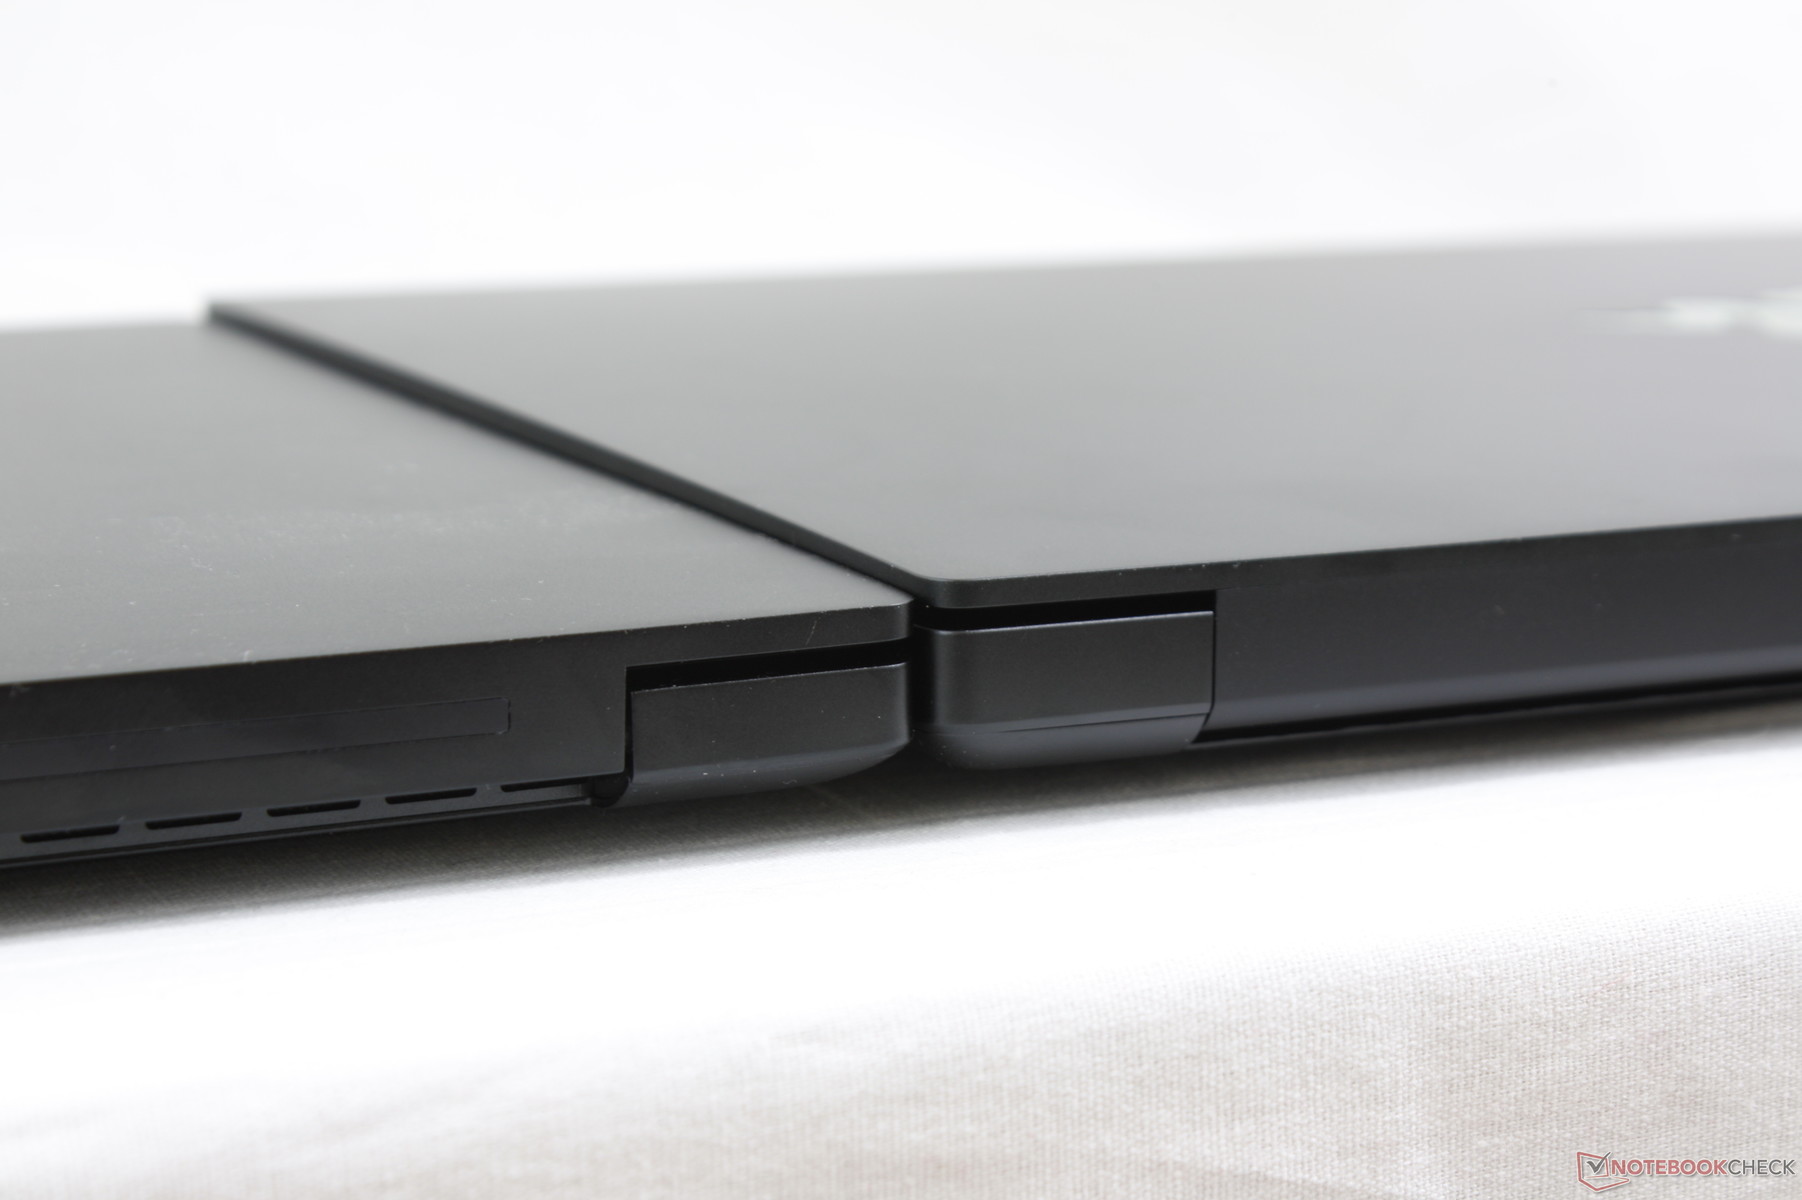
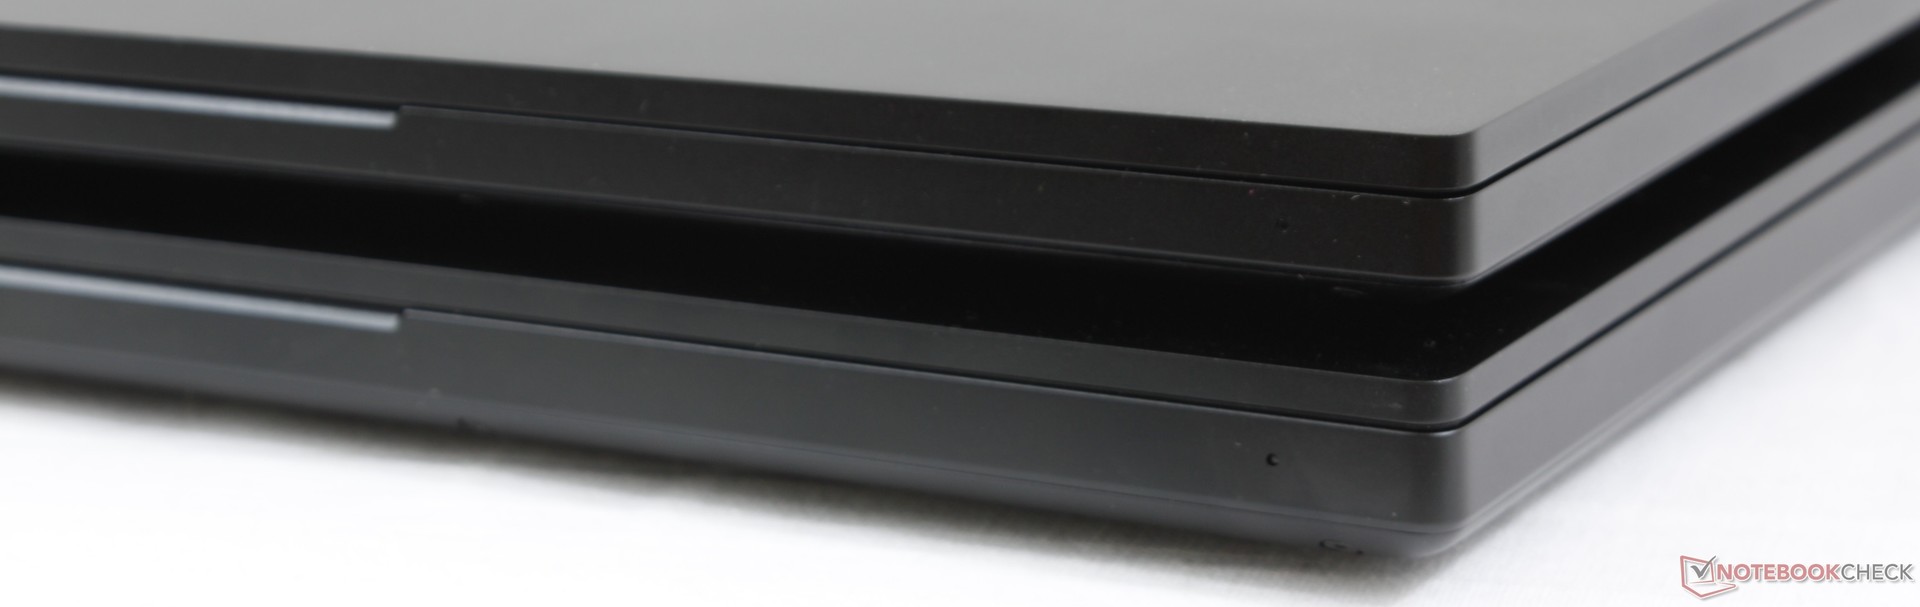
With both the Base Model and Advanced Model in hand, we can say with certainty that the Base Model feels just as strong and rigid as its Advanced Model counterpart and all of our original comments on case quality still apply here for the Base Model. In fact, it's quite difficult to even feel the minute differences in thickness between the two SKUs. The edges and corners of the bottom plate are rounder this time around, but this is still the same aluminum chassis that we're already familiar with. Users who want the Base Model instead of the Advanced Model can rest easy knowing that they are not getting the short end of the stick in terms of chassis quality.
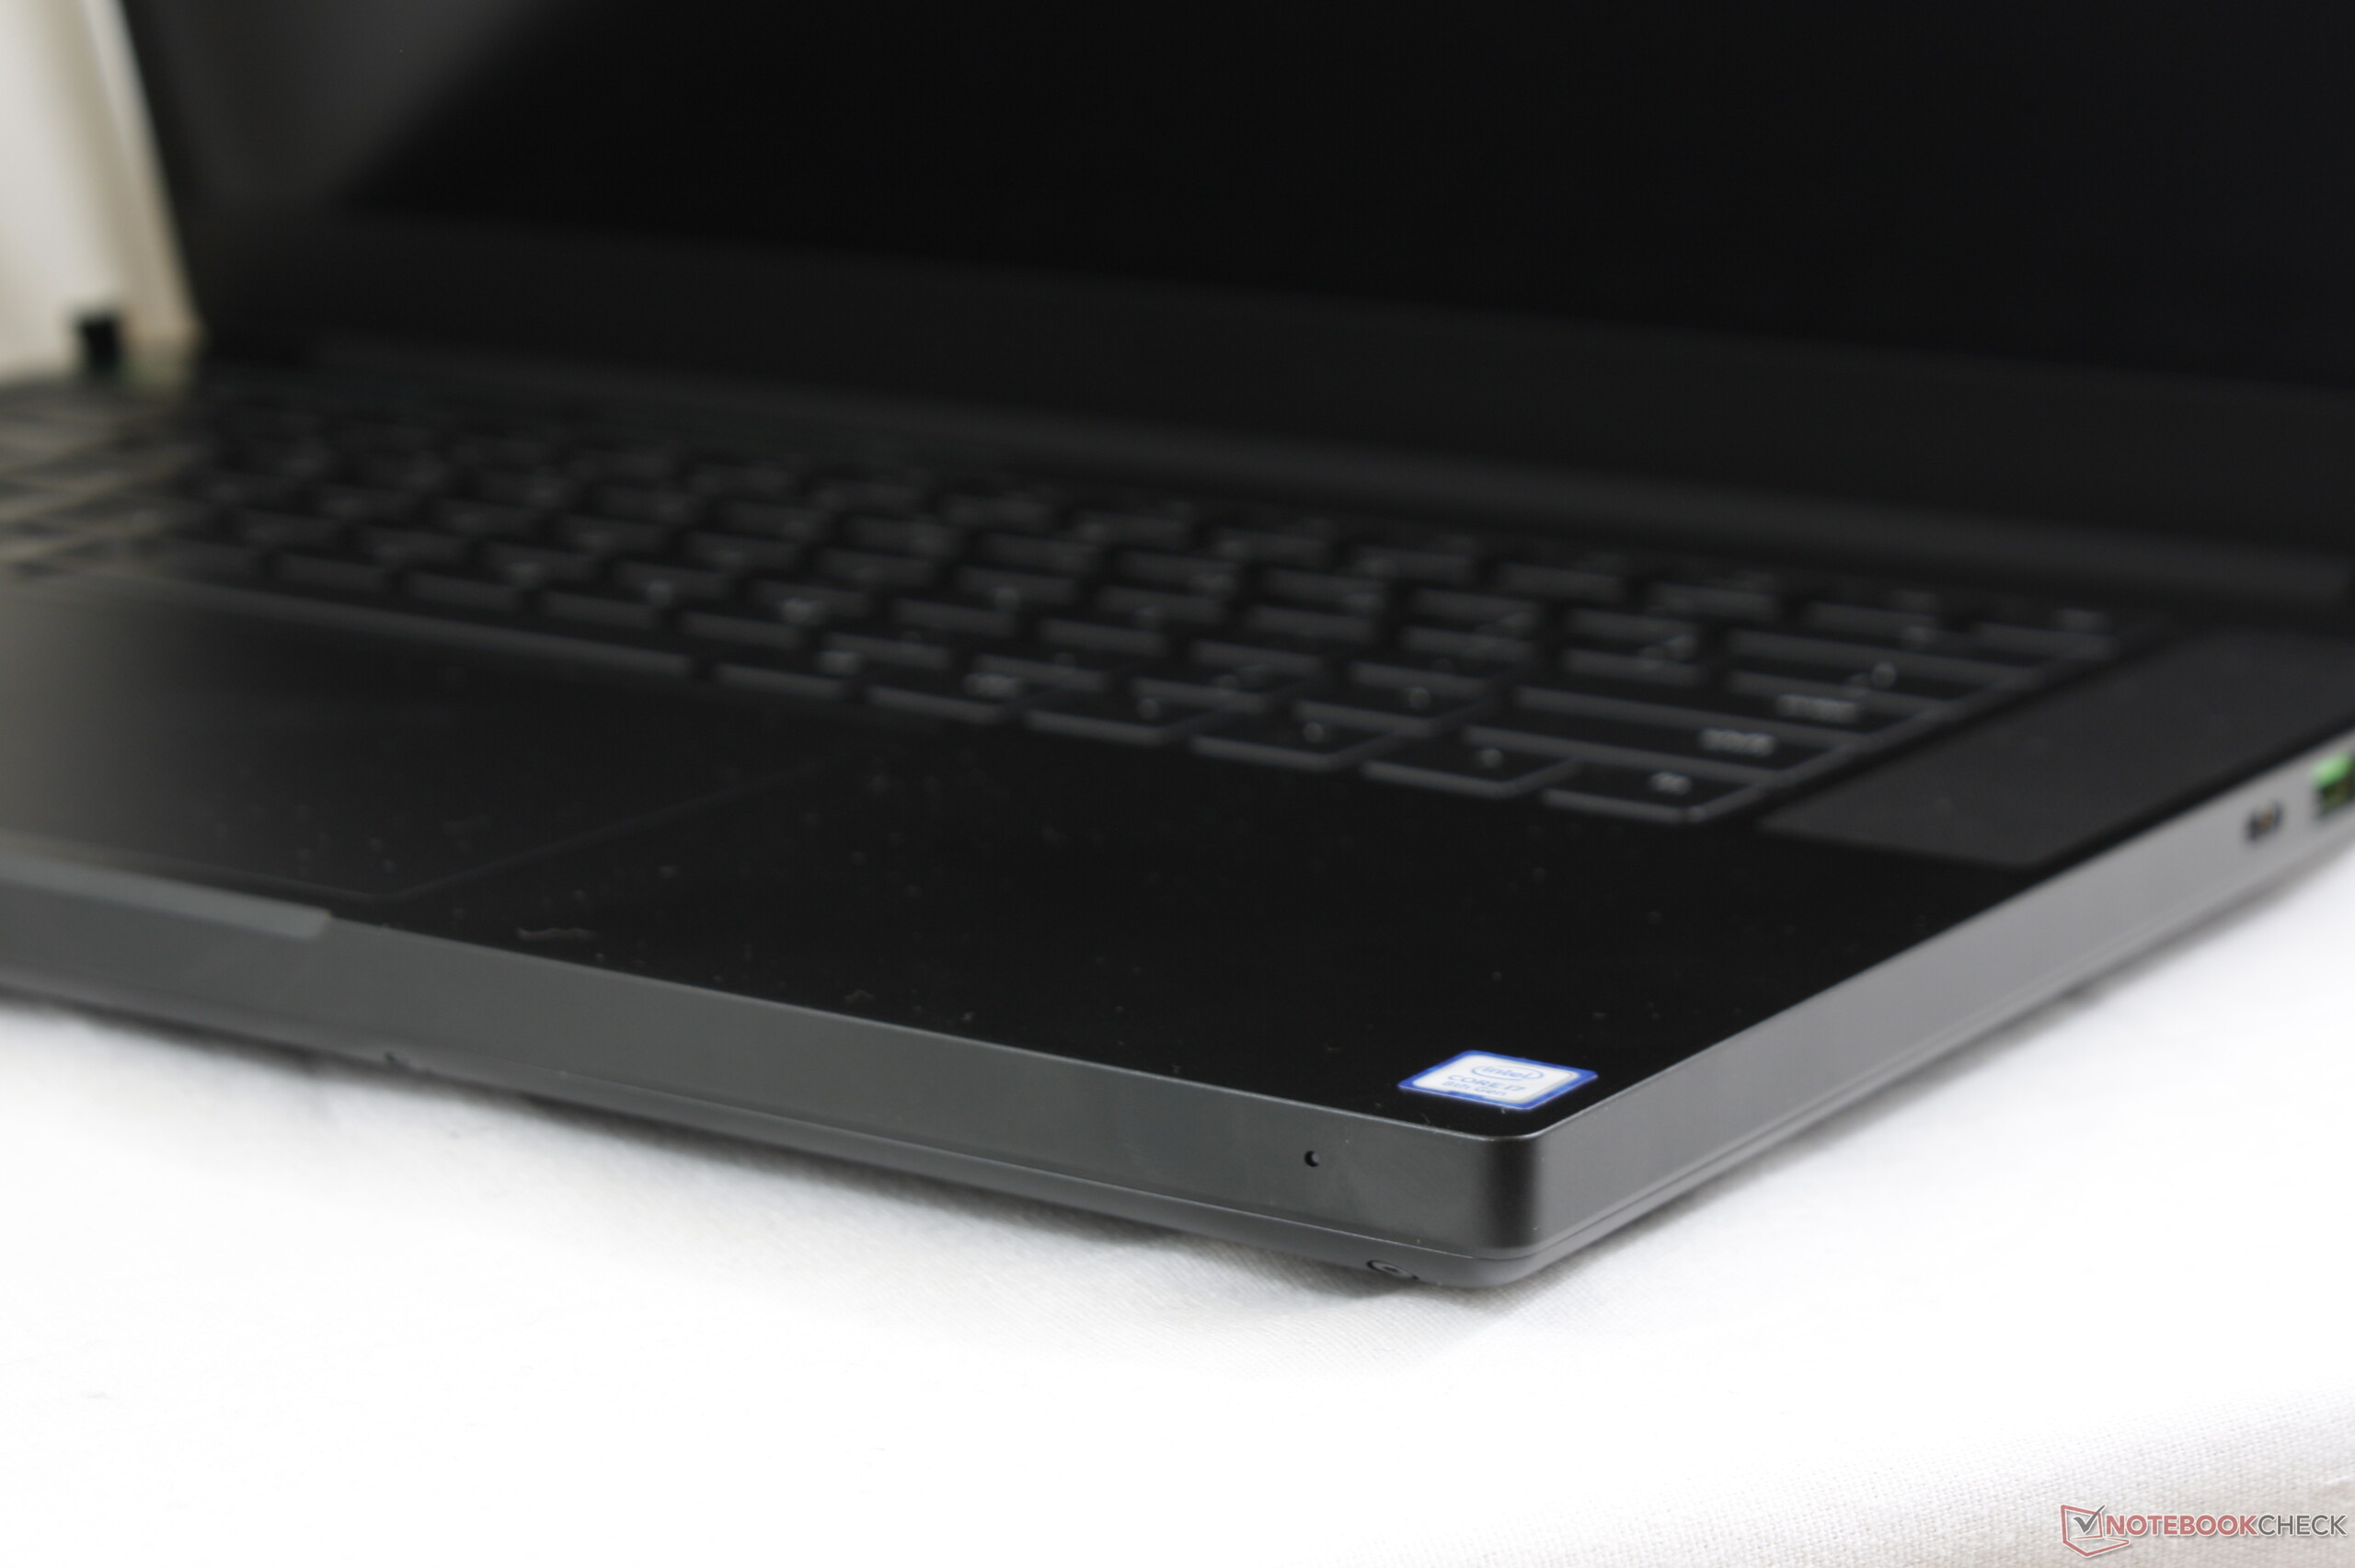
The Base Model is 2.6 mm and 3.1 mm thicker than the GTX 1070 Max-Q and GTX 1060 Max-Q Advanced Models, respectively, while length and width remain intact. The MSI GS65 is thinner by almost 2 mm, but it is still the larger system by volume.
The new Blade 15 is marginally lighter than its Advanced Model siblings despite its thicker profile because of the smaller battery and new cooling solution. Vapor chamber cooling in the Advanced Models is notorious for being very heavy when compared to traditional copper heat pipes.
Why make the Base Model thicker in the first place? Razer says the extra volume afforded allows for a 2.5-inch SATA bay that is missing in the Advanced Models.
Connectivity
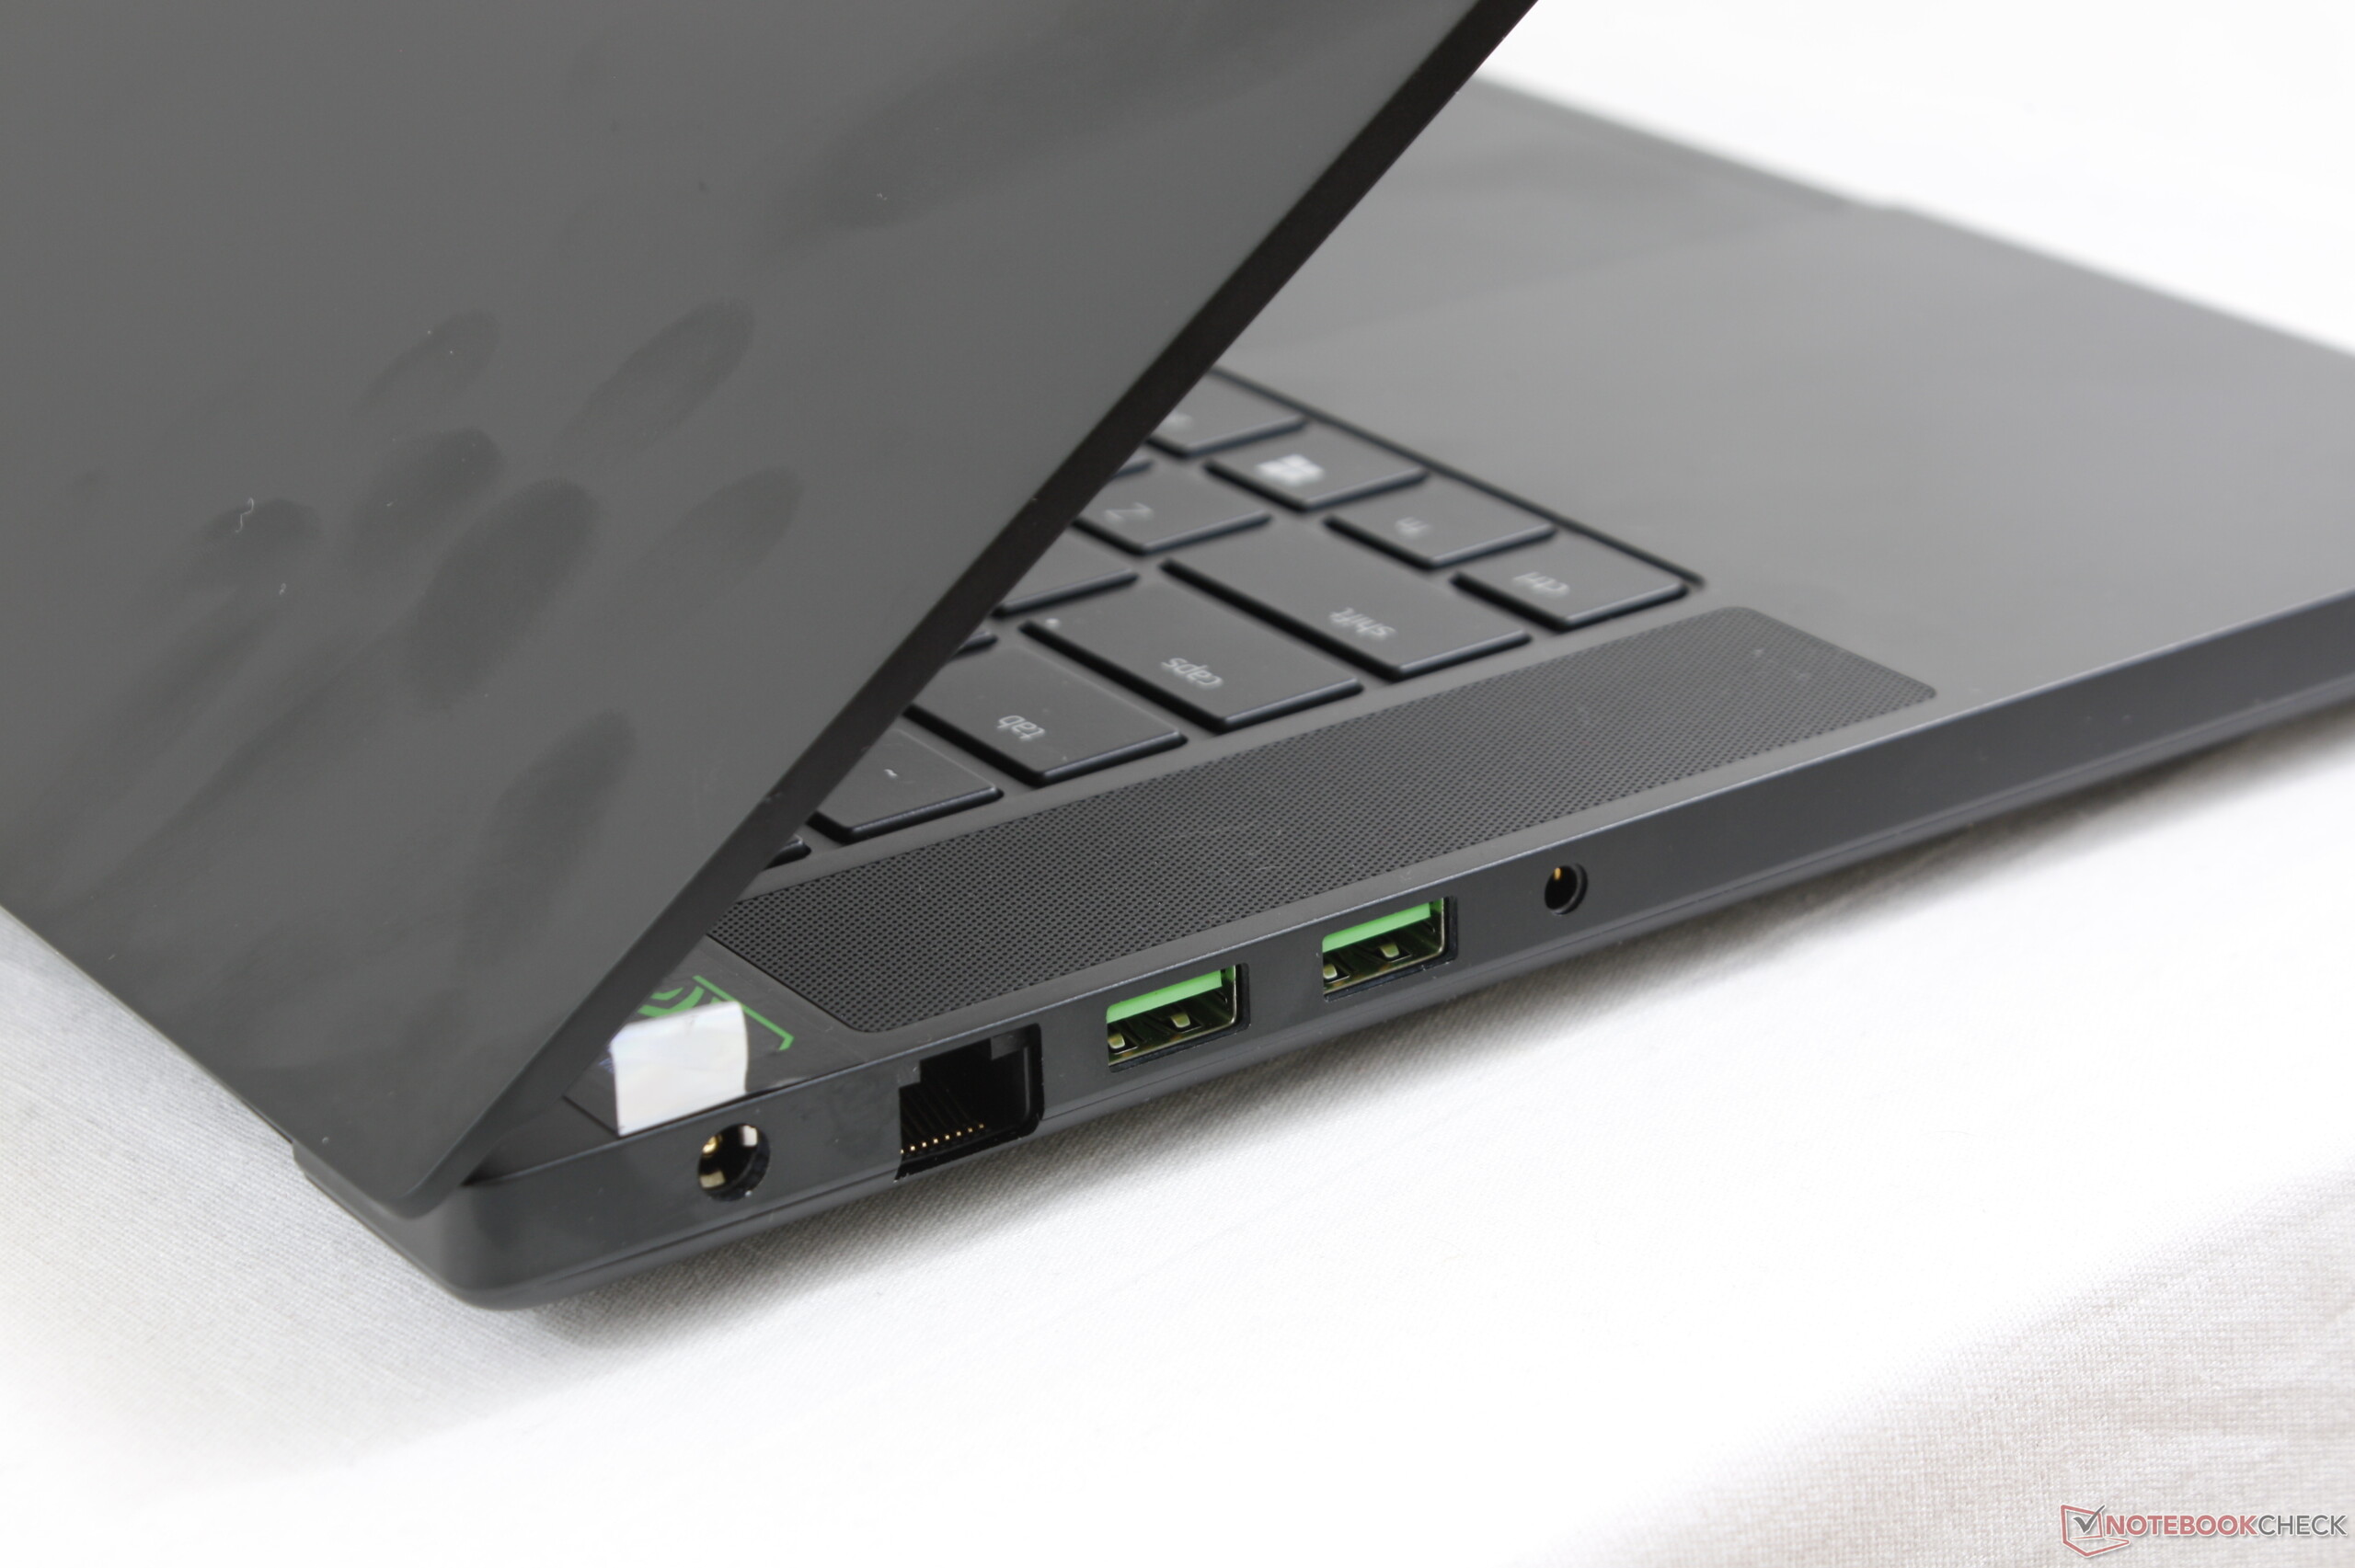
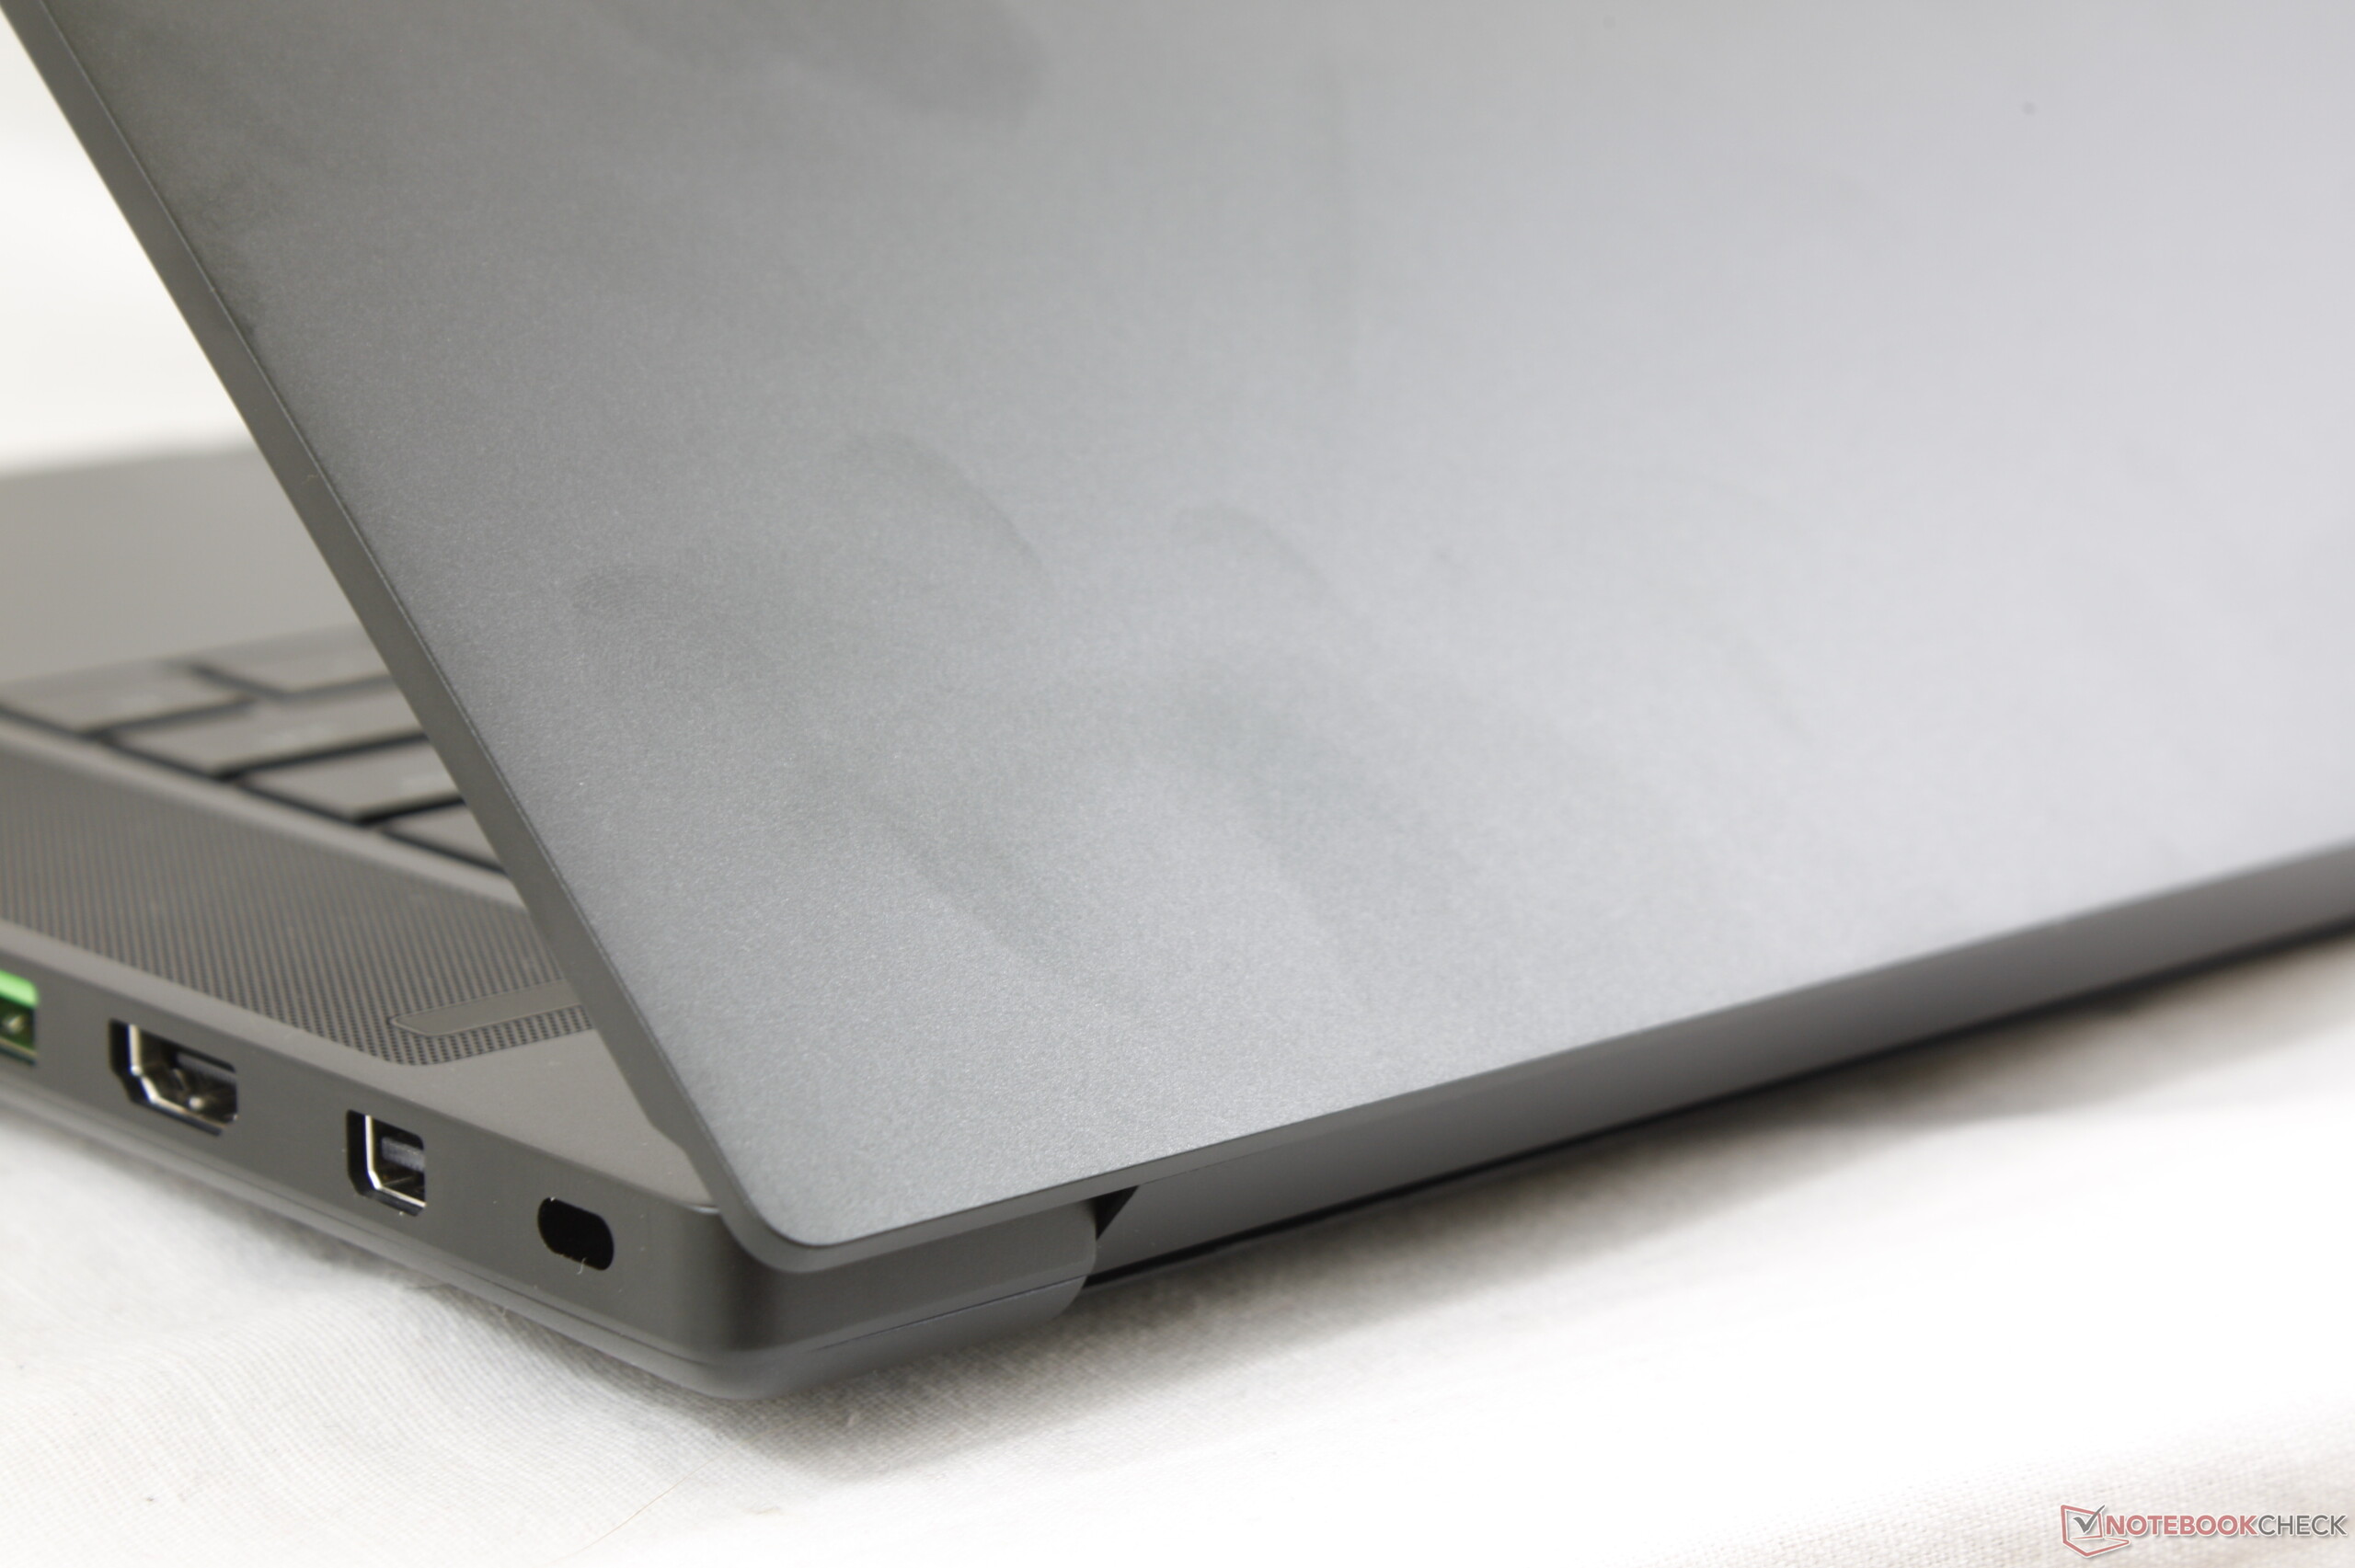
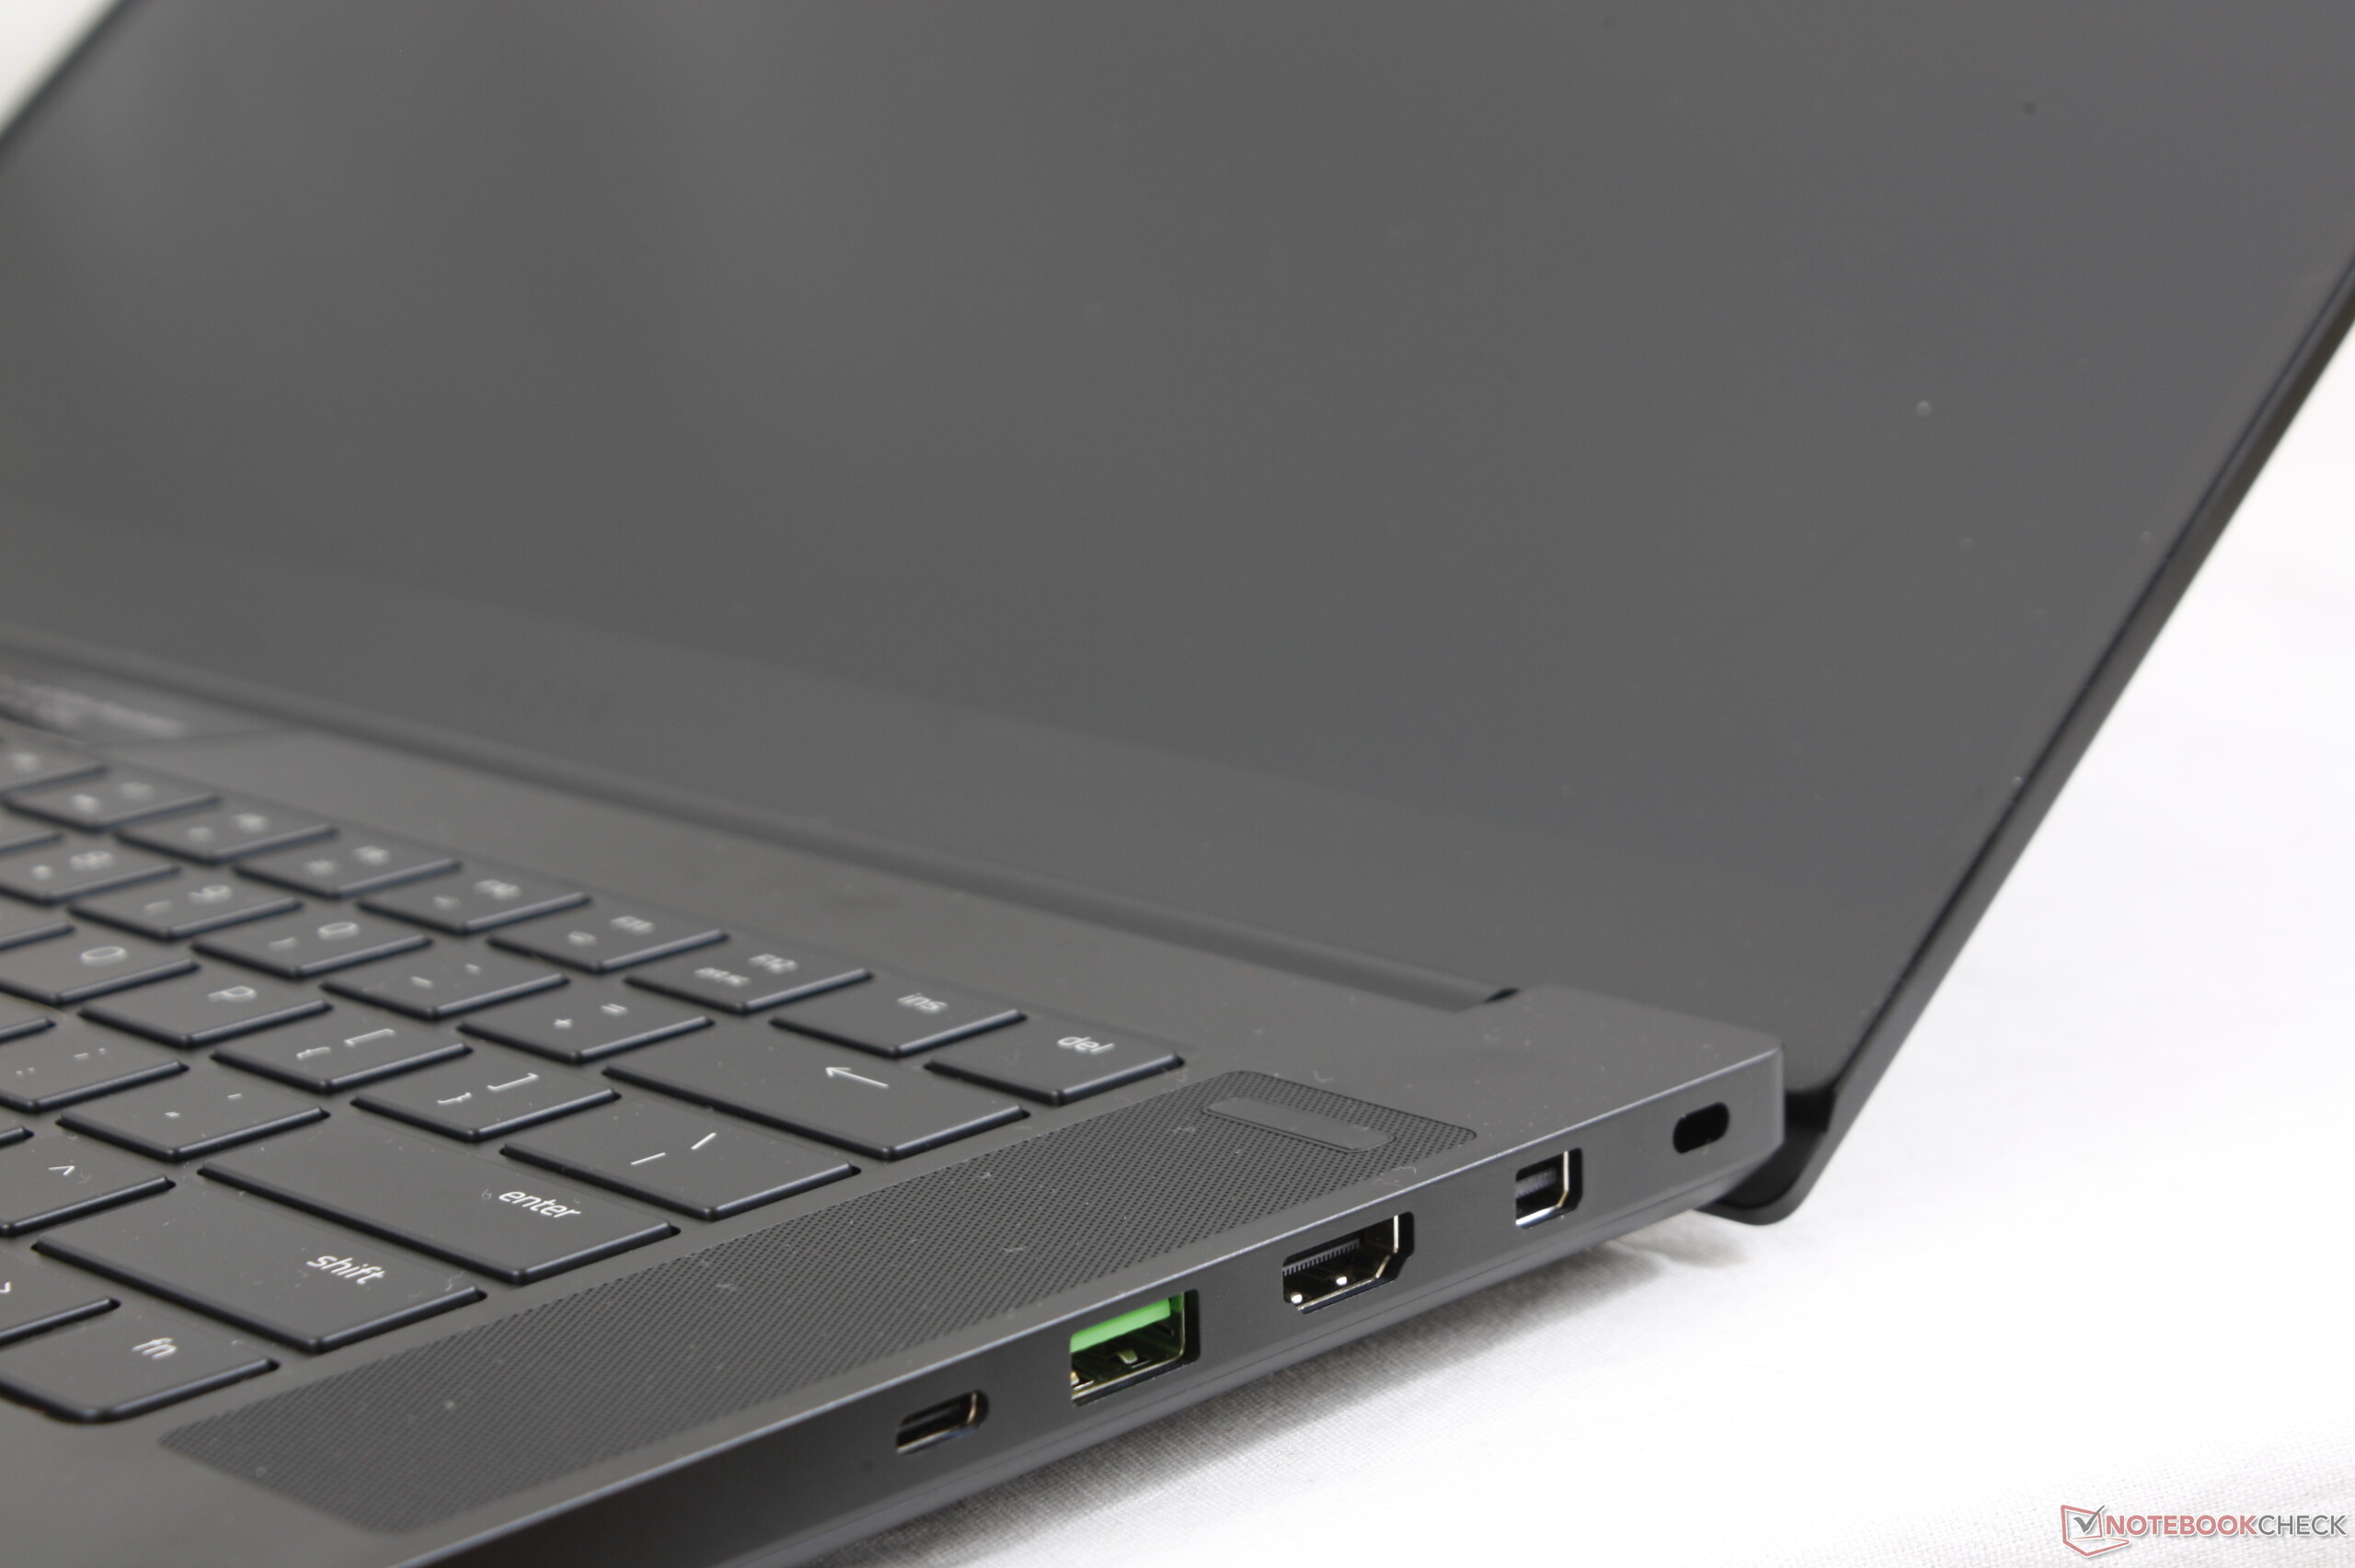
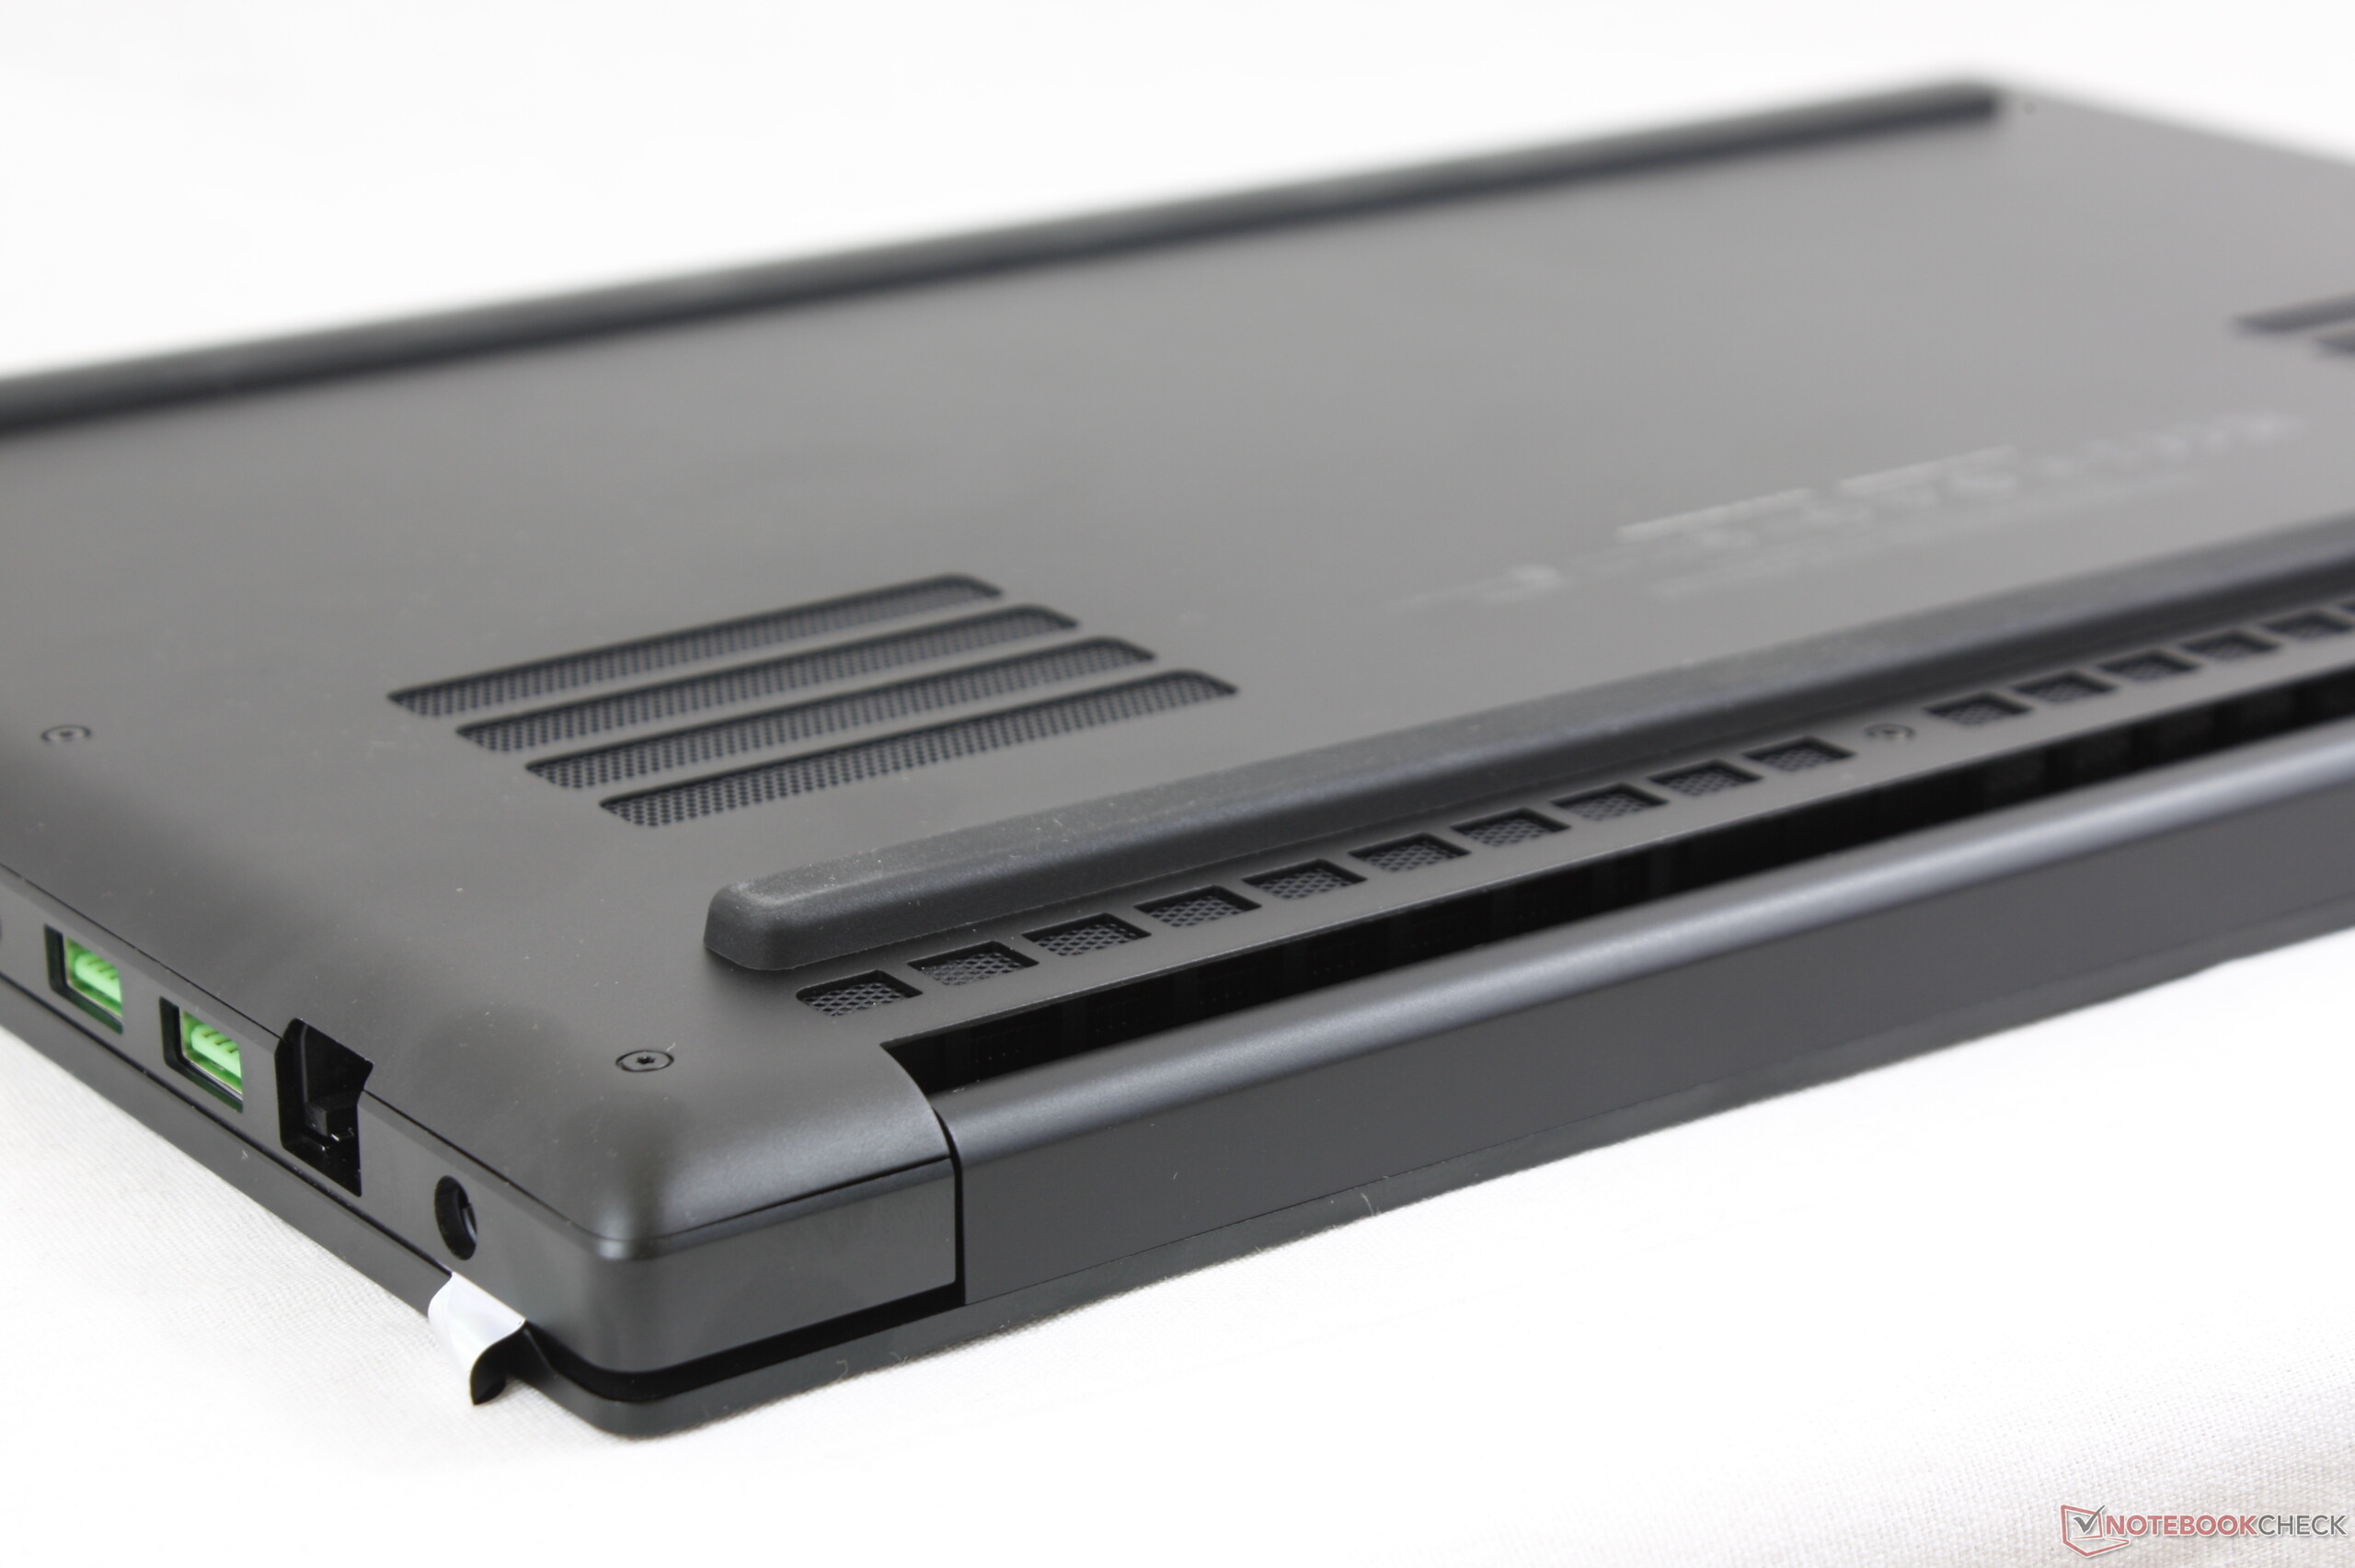
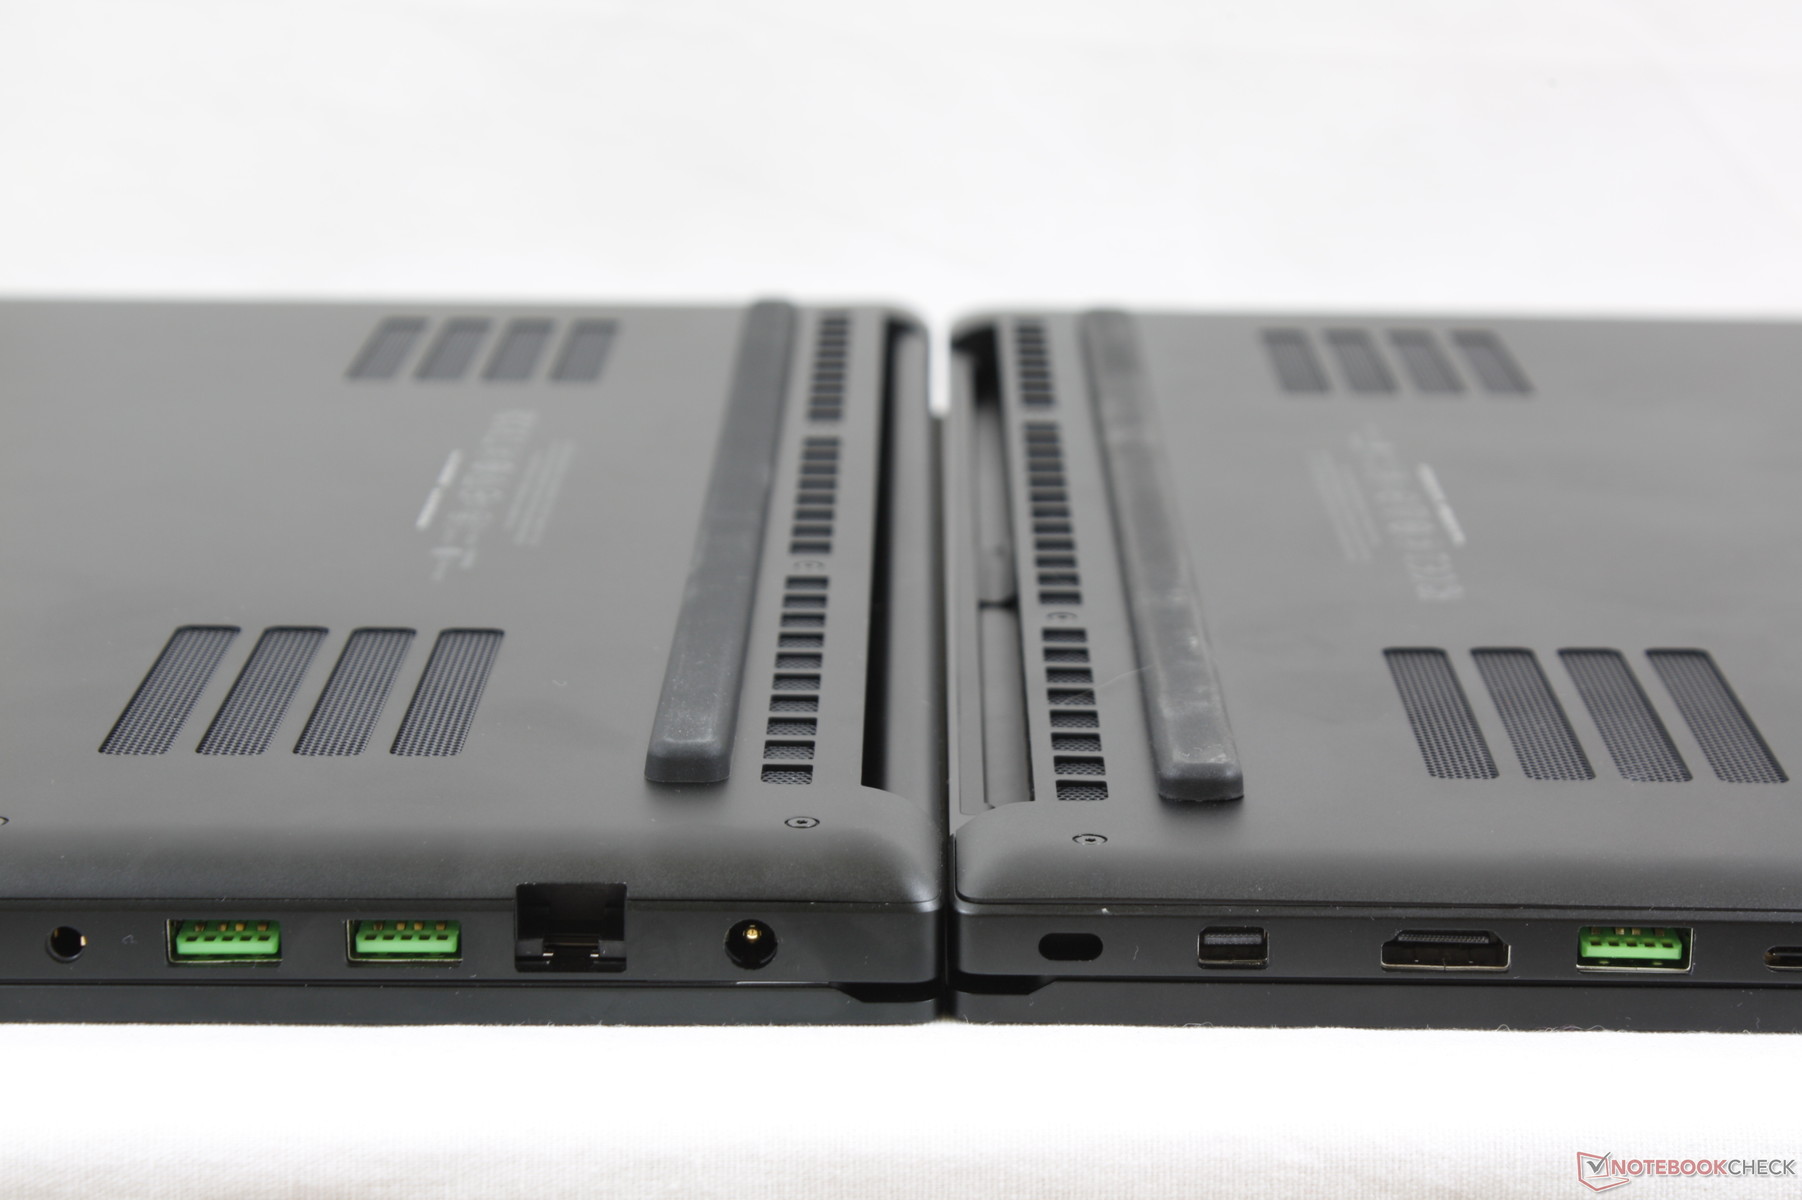
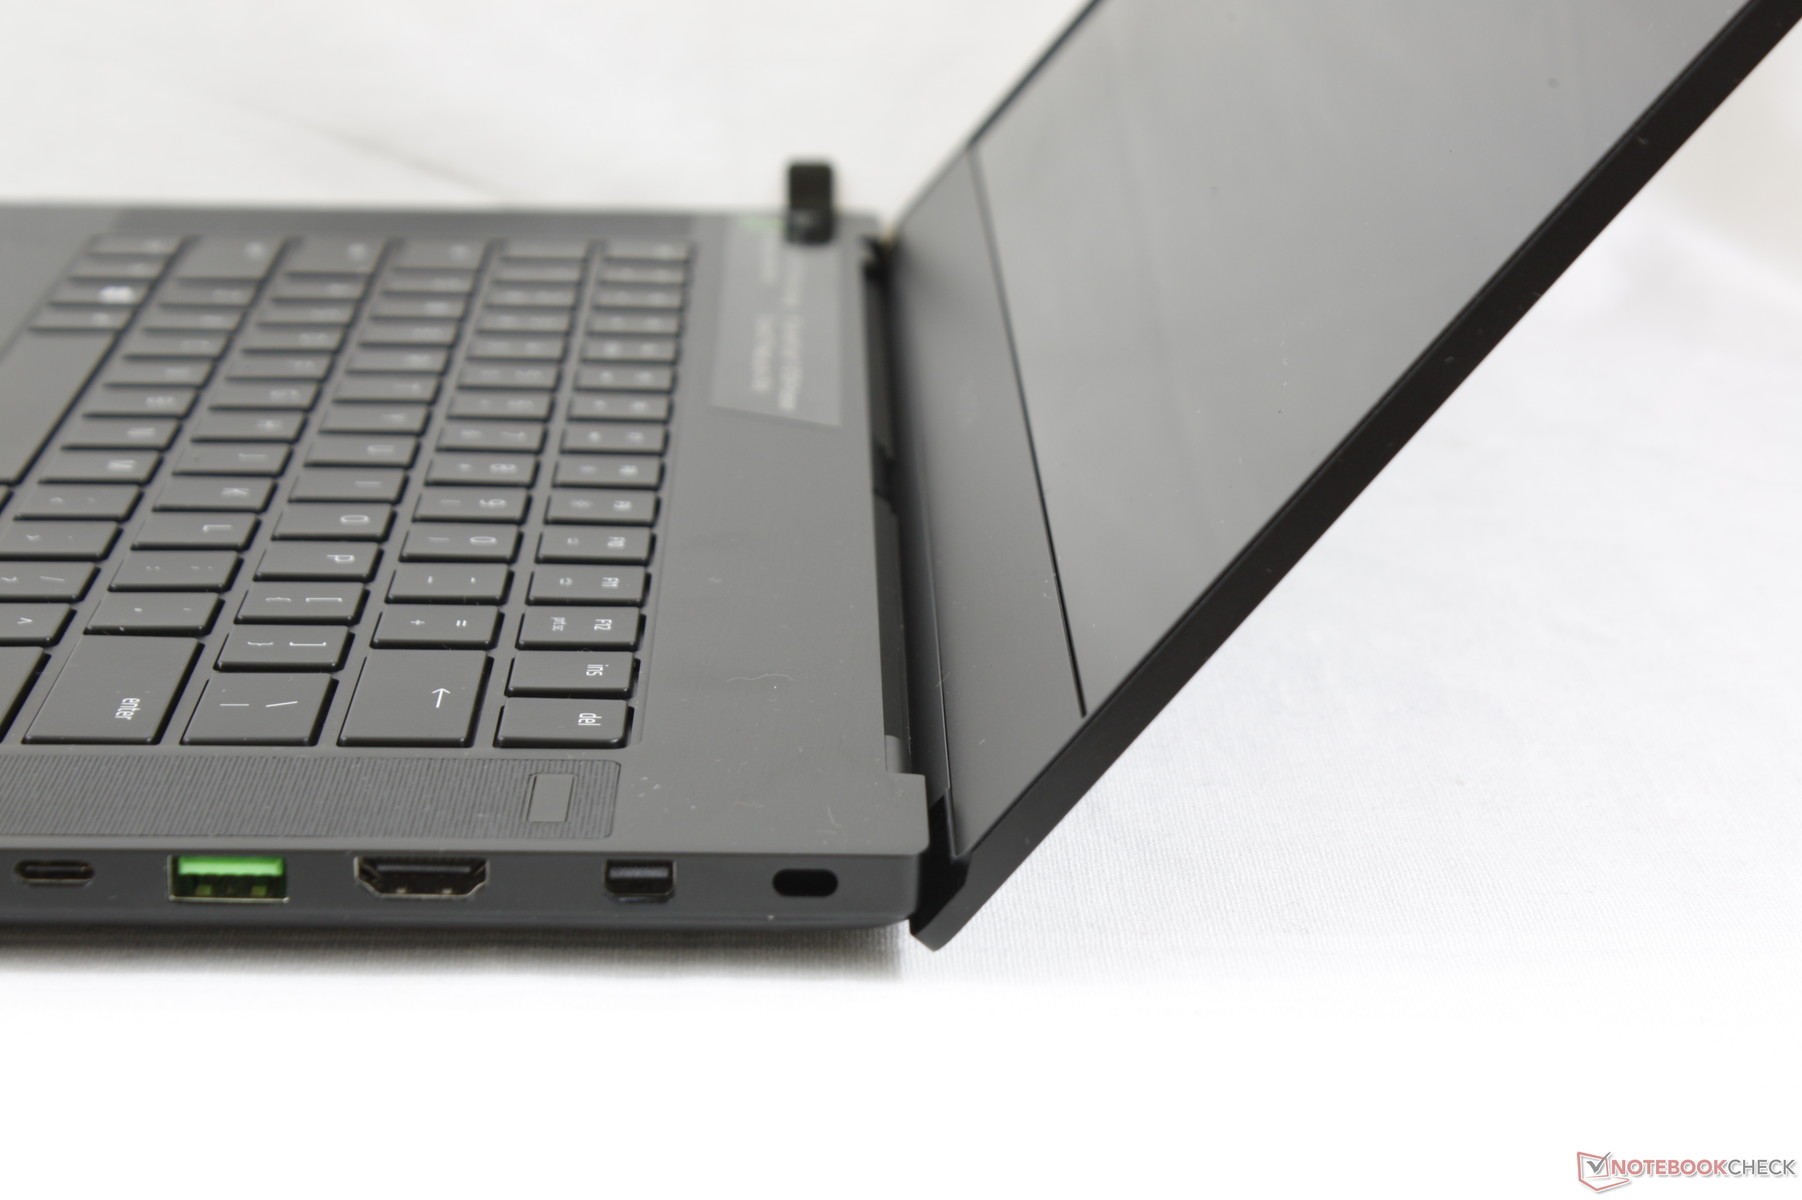
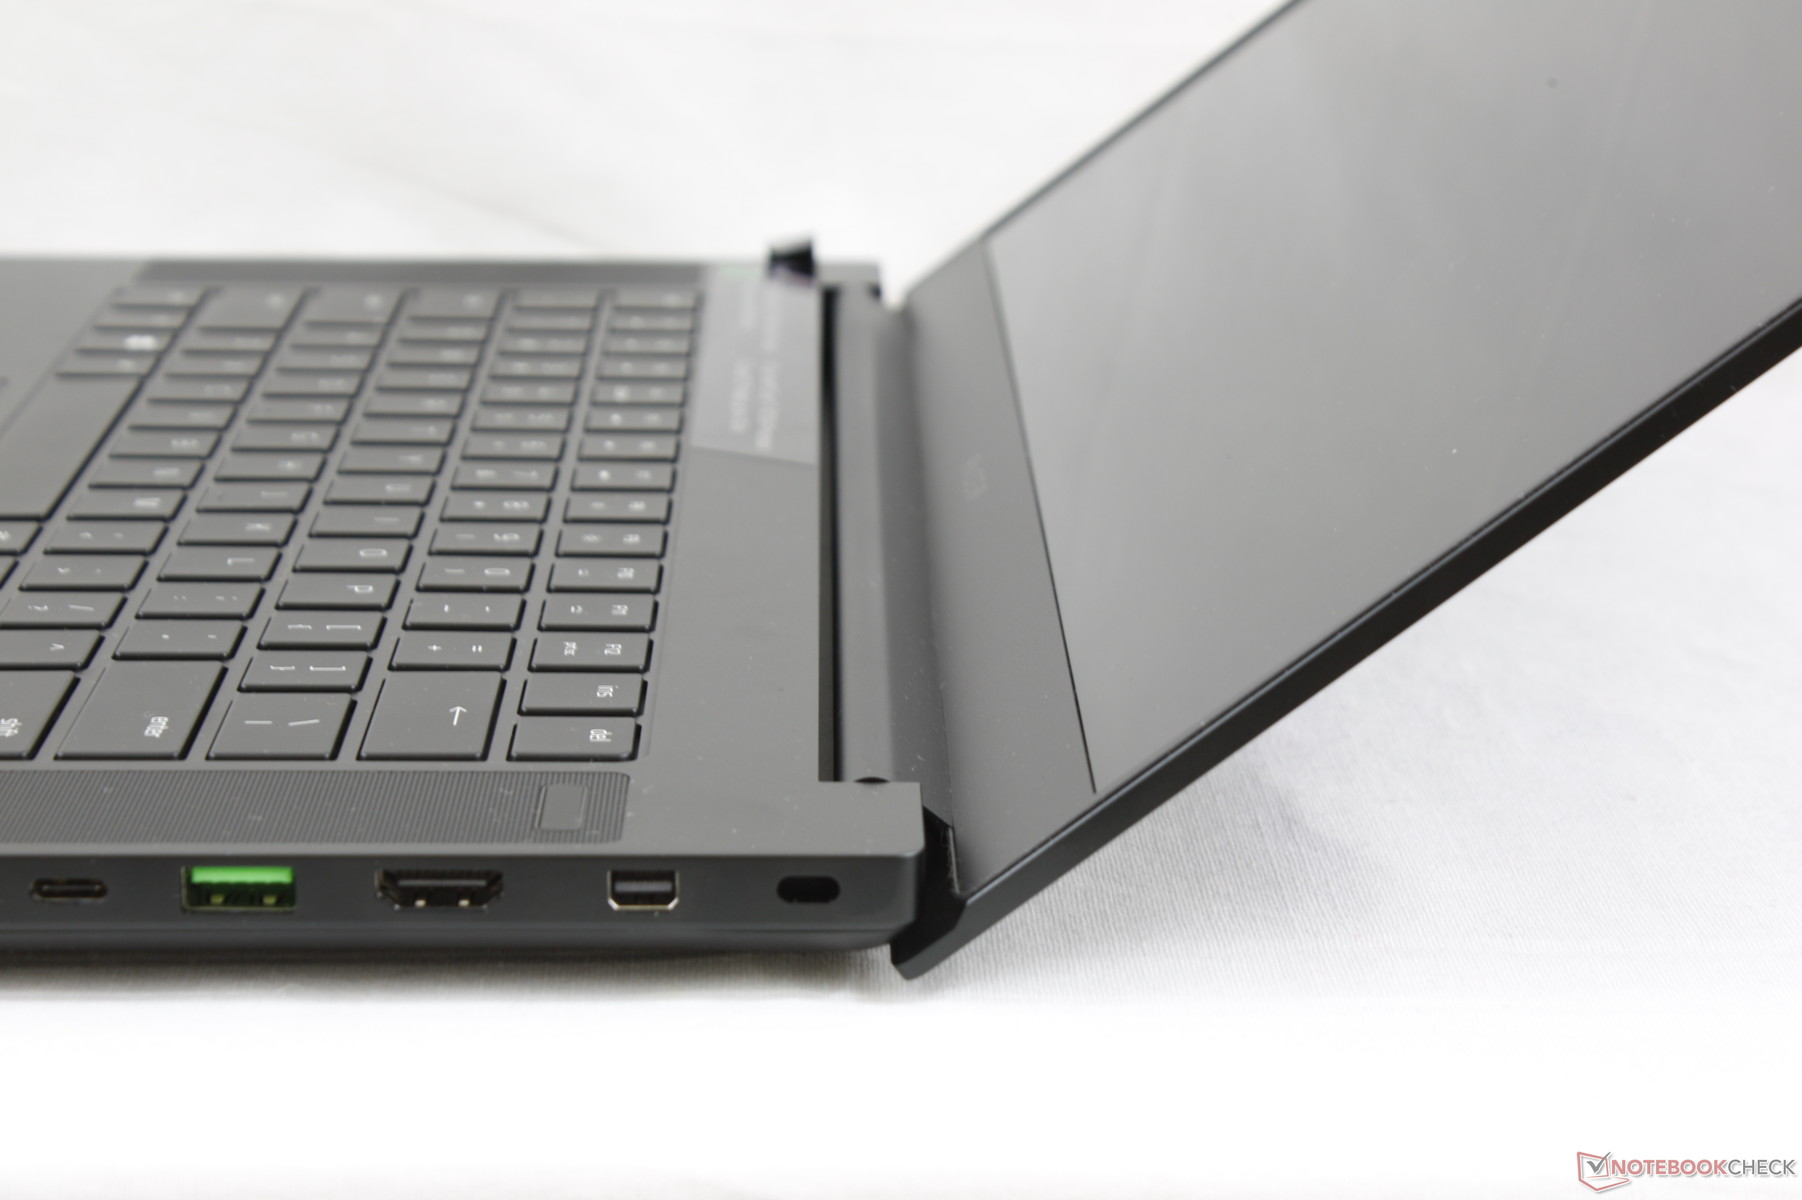
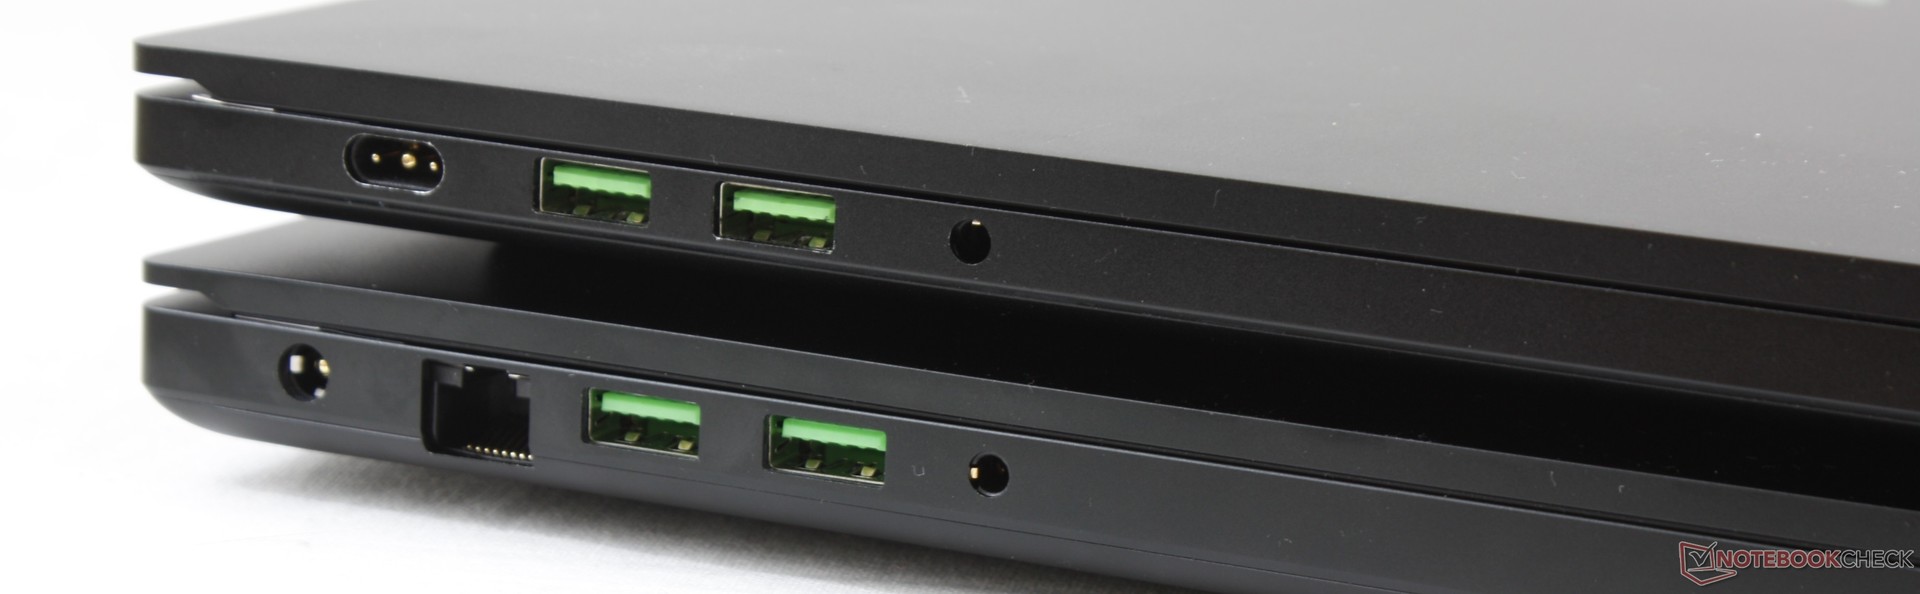
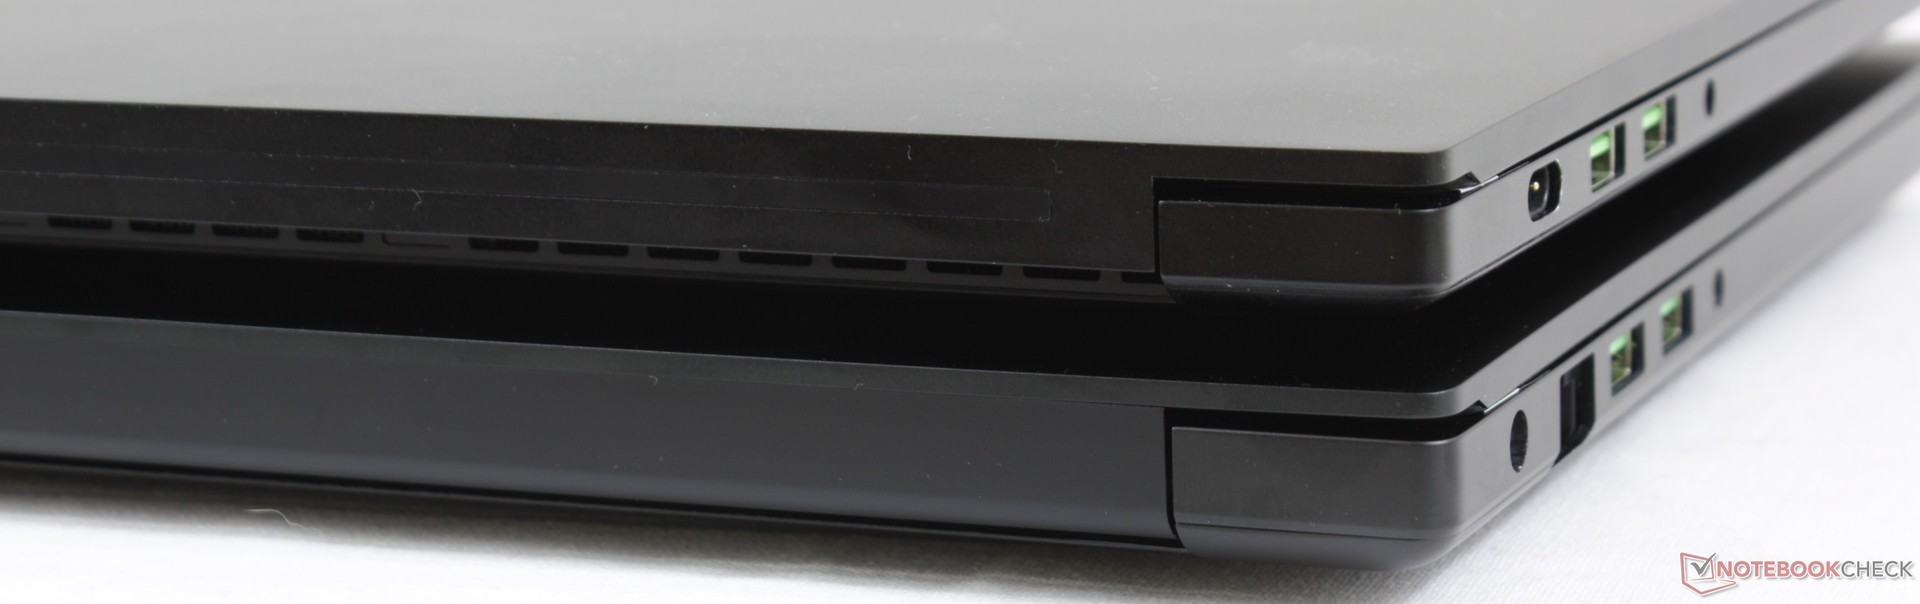
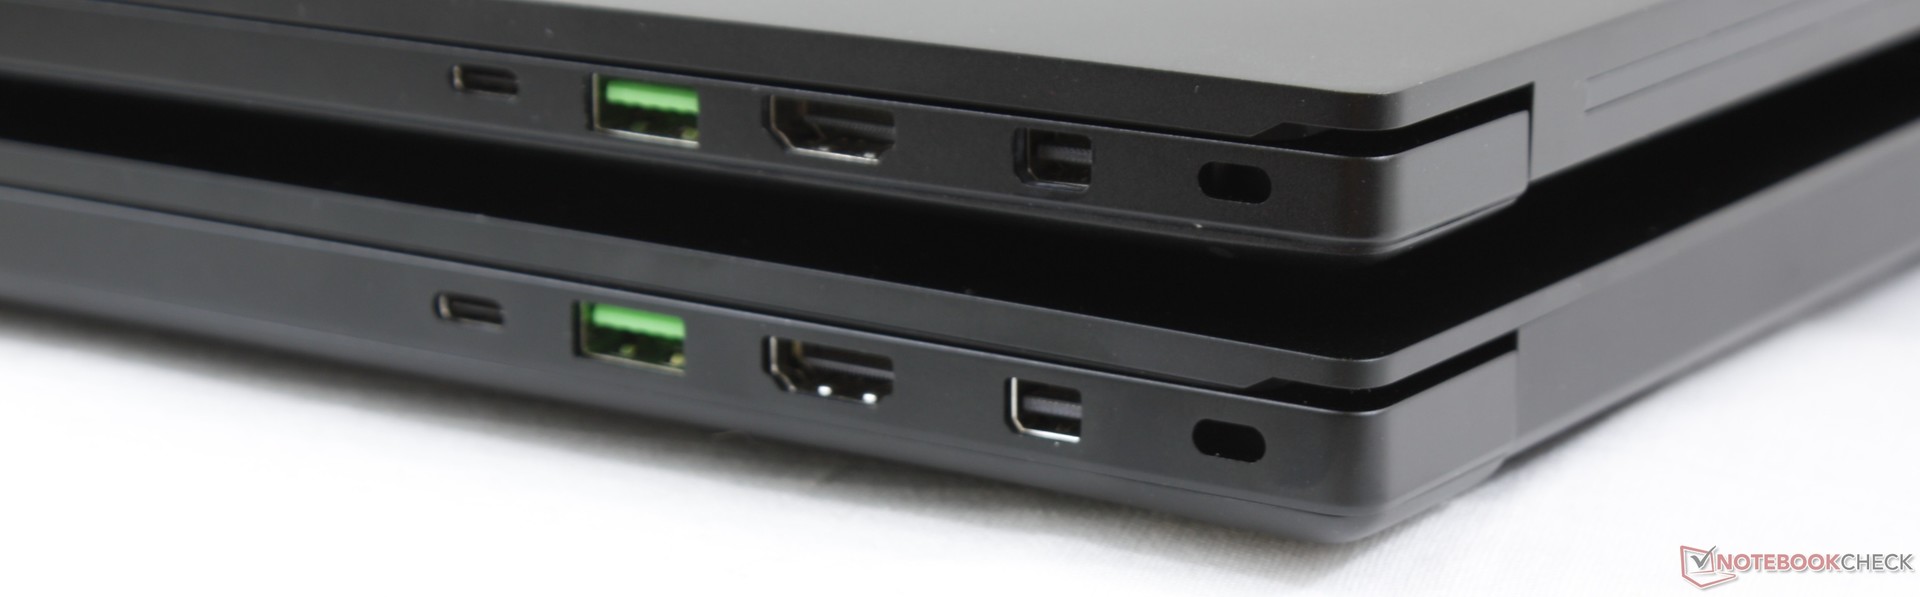
An easy way to distinguish the Blade 15 Base Model from the Advanced Model is to look at the available ports. Namely, the Base Model includes an Ethernet port whereas the Advanced Model does not. The AC port has also changed to signify that the AC adapters are not interchangeable between the models.
An option that continues to be missing across the Blade family is the SD card reader. Razer says it is aware that Blade laptops are beginning to appeal to content creators who are more likely to use the SD card slot when compared to core gamers. In other words, Razer will consider the SD card slot for future models, but users will have to make do without one for now. Users who want an integrated card reader should consider the Gigabyte Aero 15X v8 or Schenker XMG Neo 15.
Our images below show the Base Model on bottom and the Advanced Model on top for reference.
Communication
WLAN has not changed. Note that the Intel 9260 is capable of transfer rates of up to 1.73 Gbps even though our test results below are much slower because our server is limited by a 1 Gbps line. There are no Killer WiFi options as commonly found on the Dell and Alienware series.
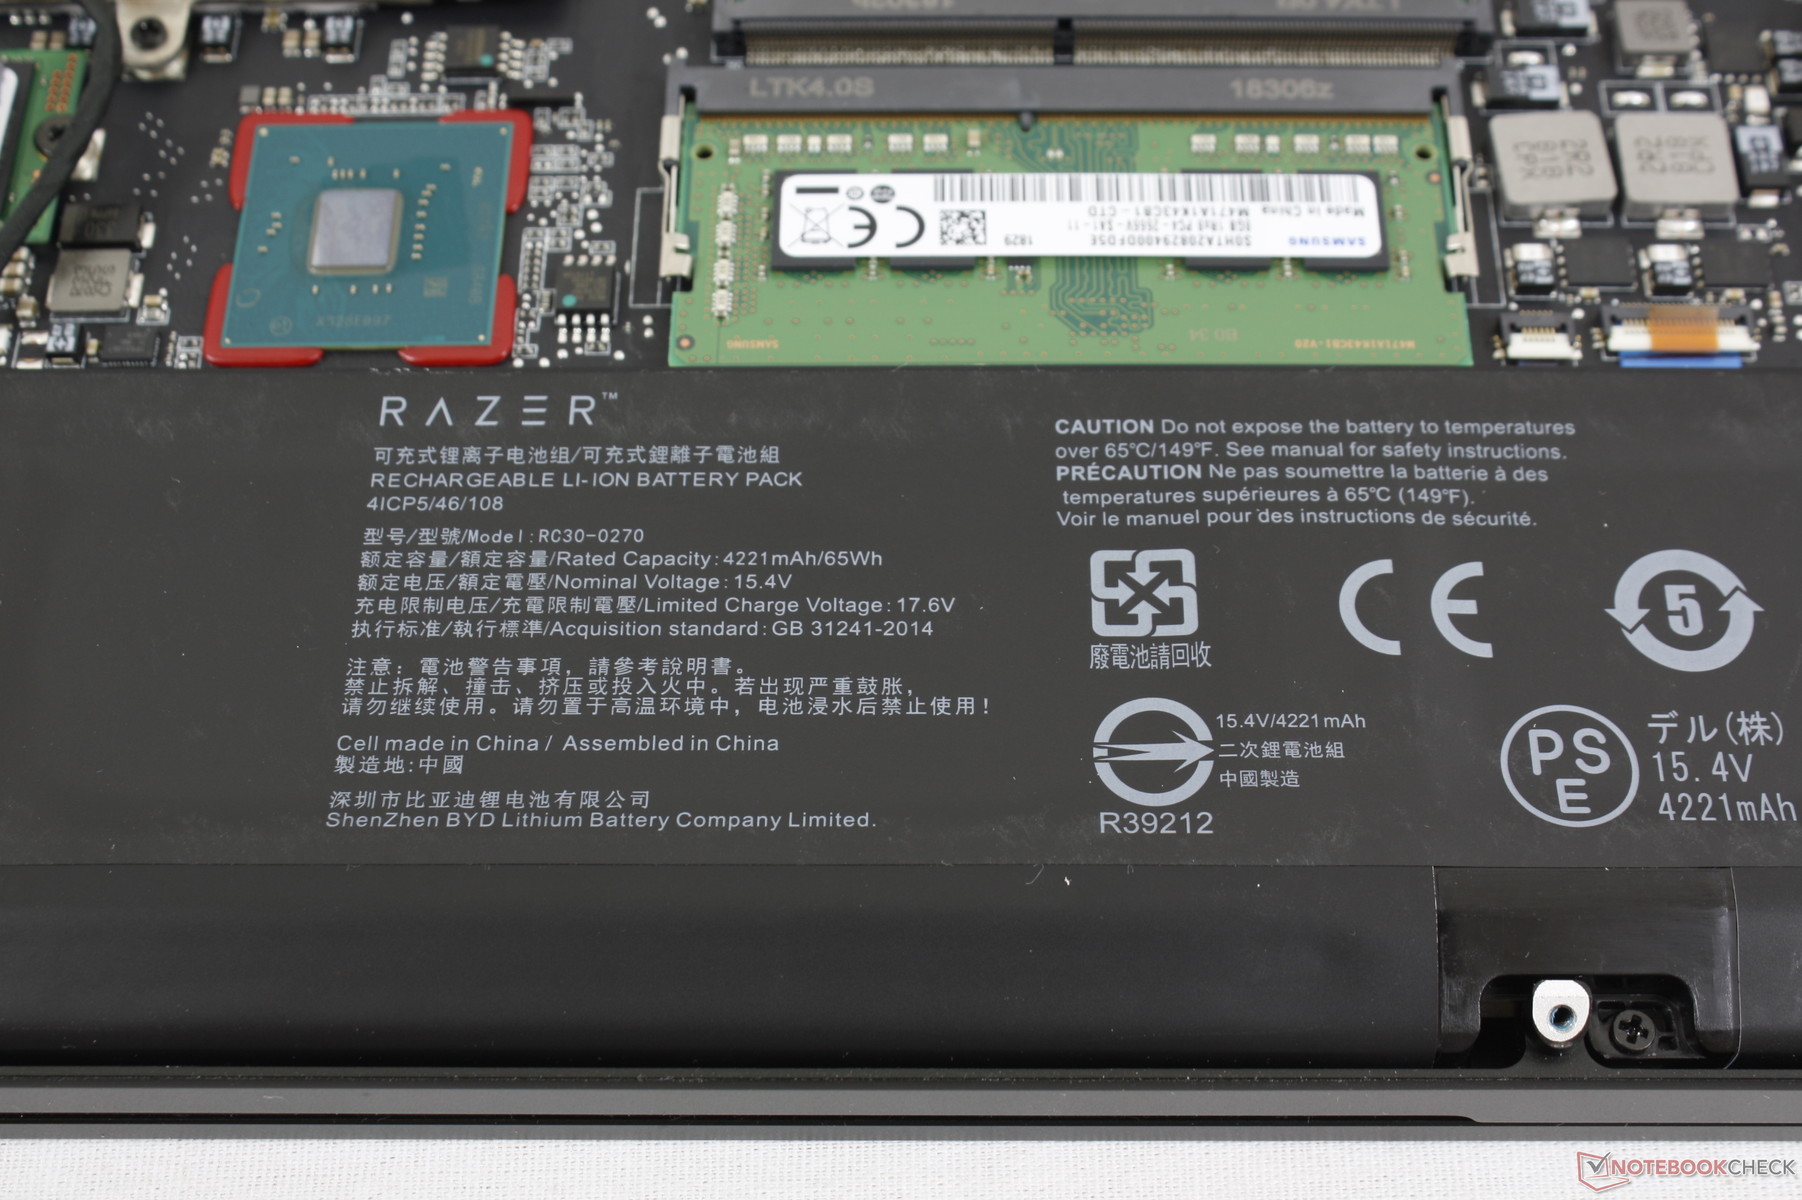
Maintenance
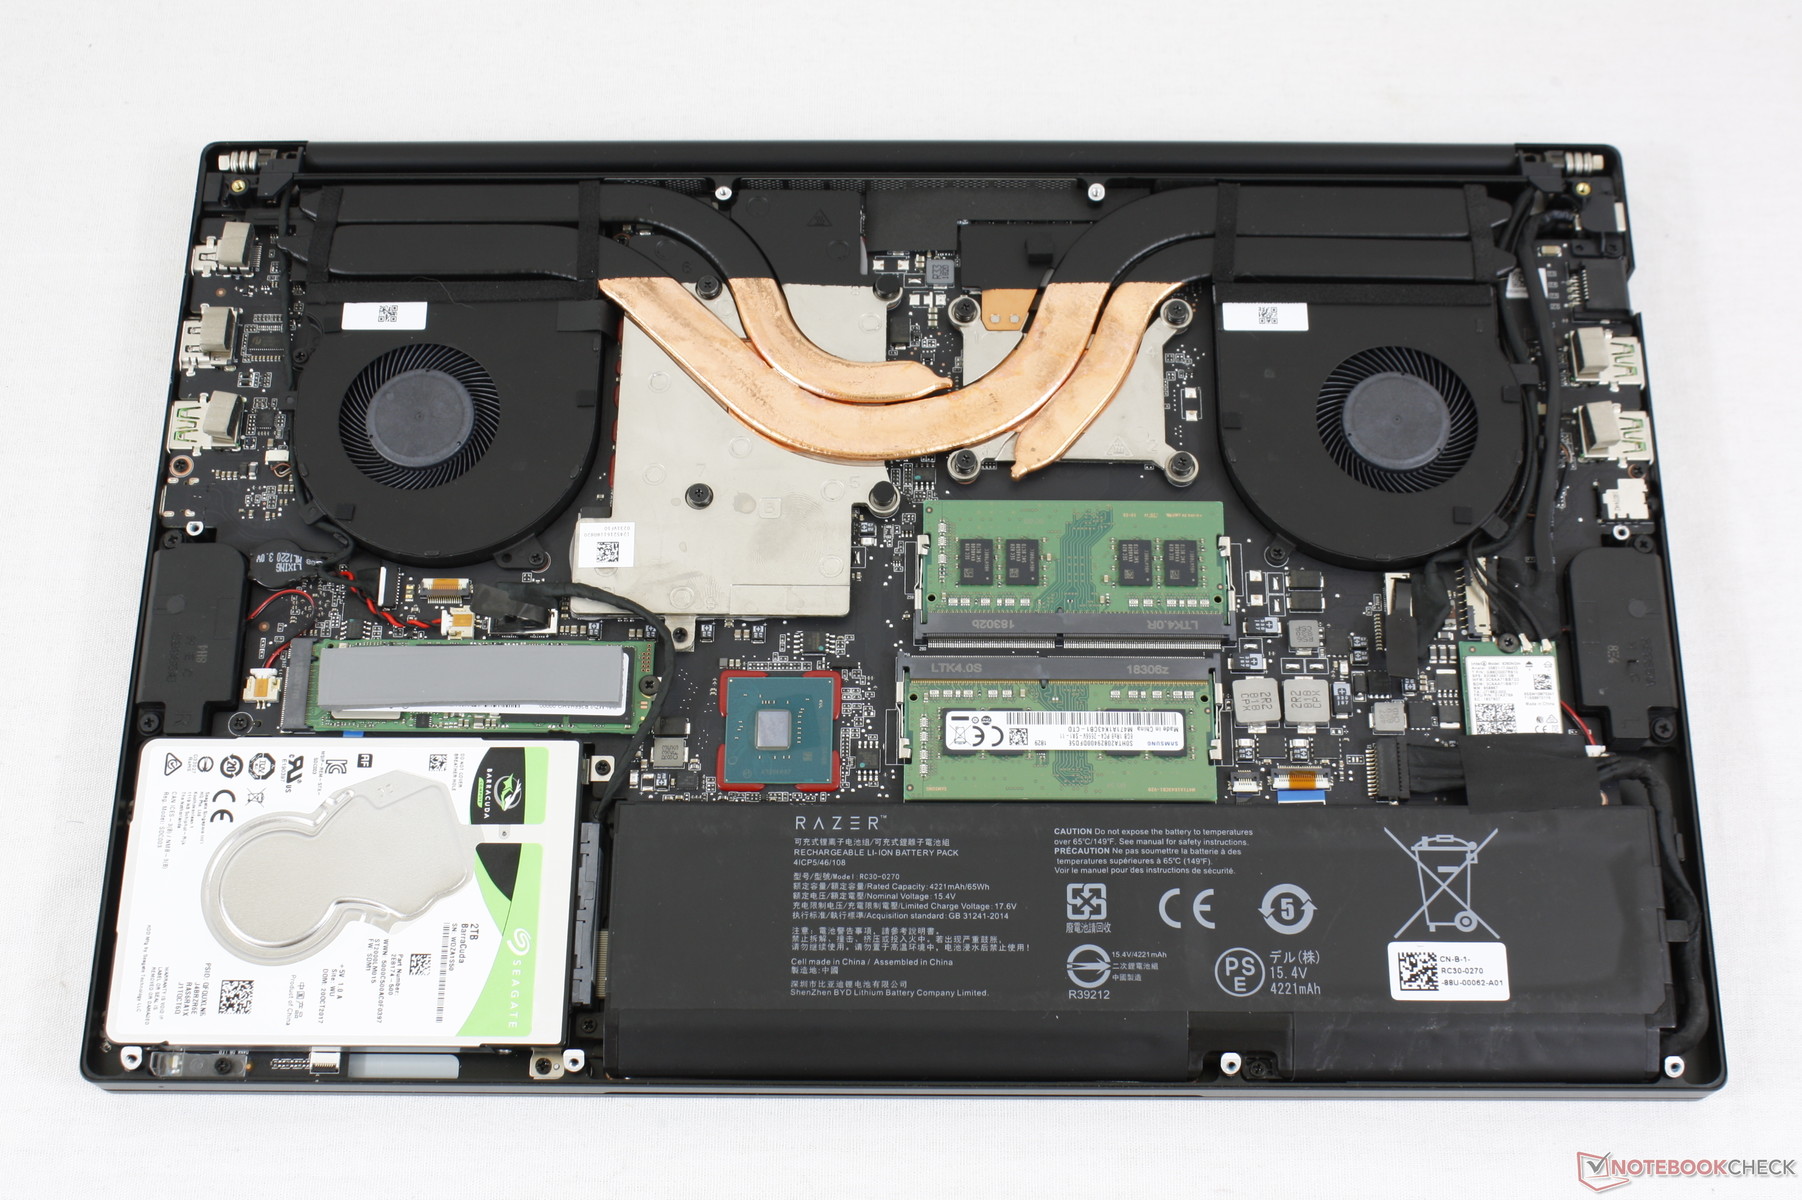
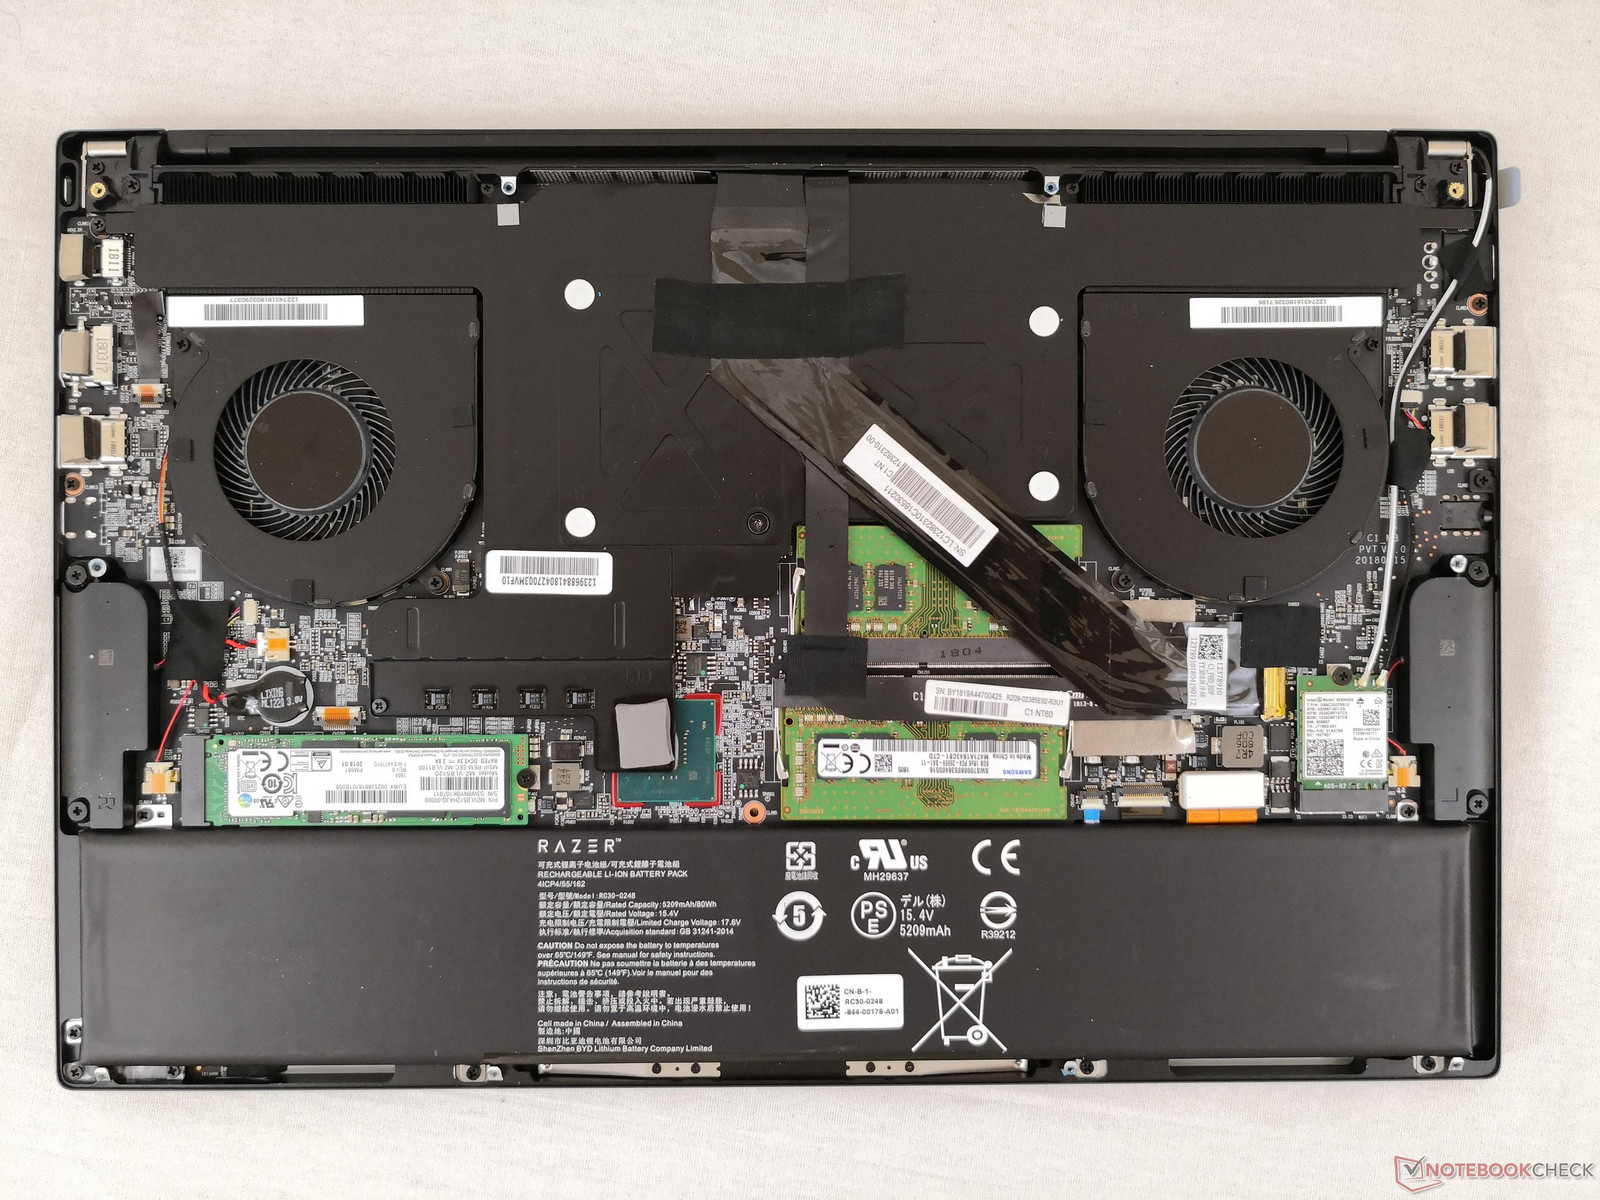
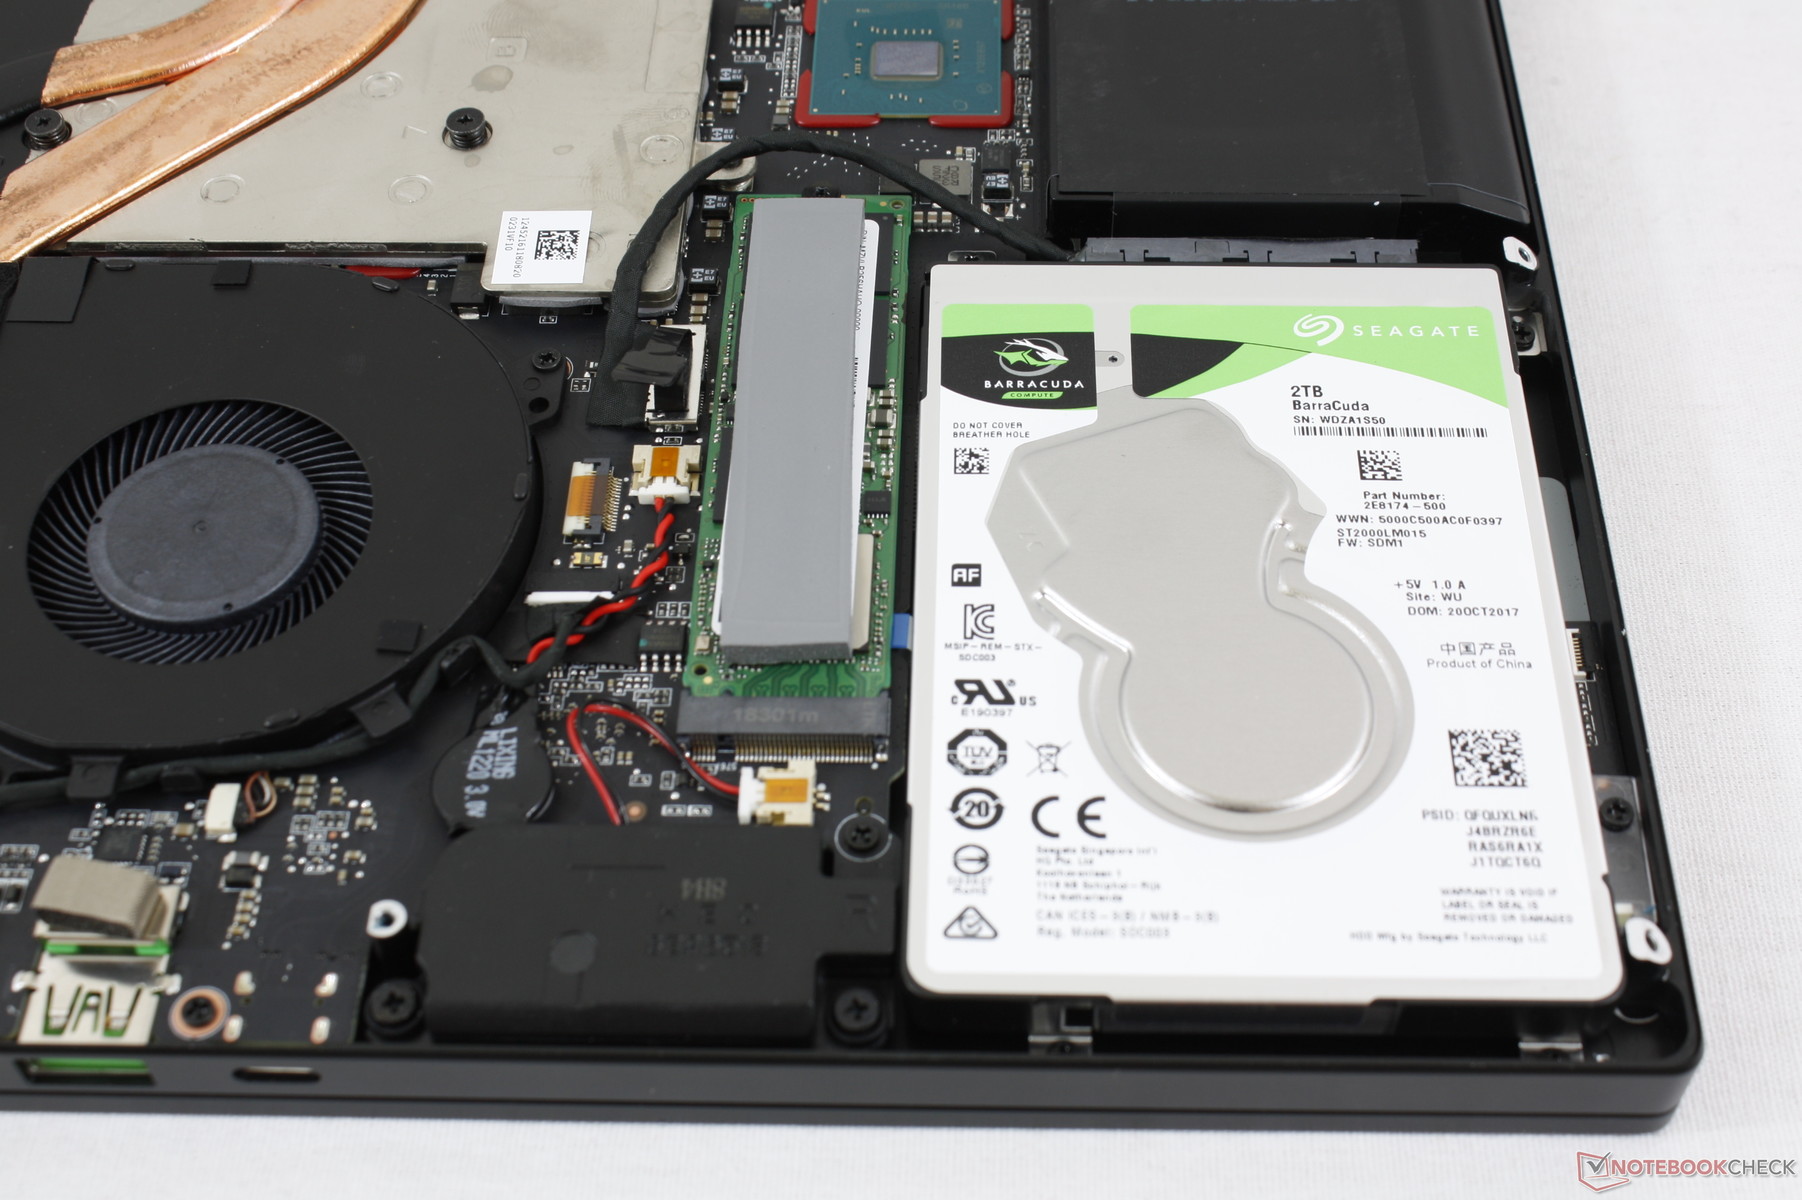
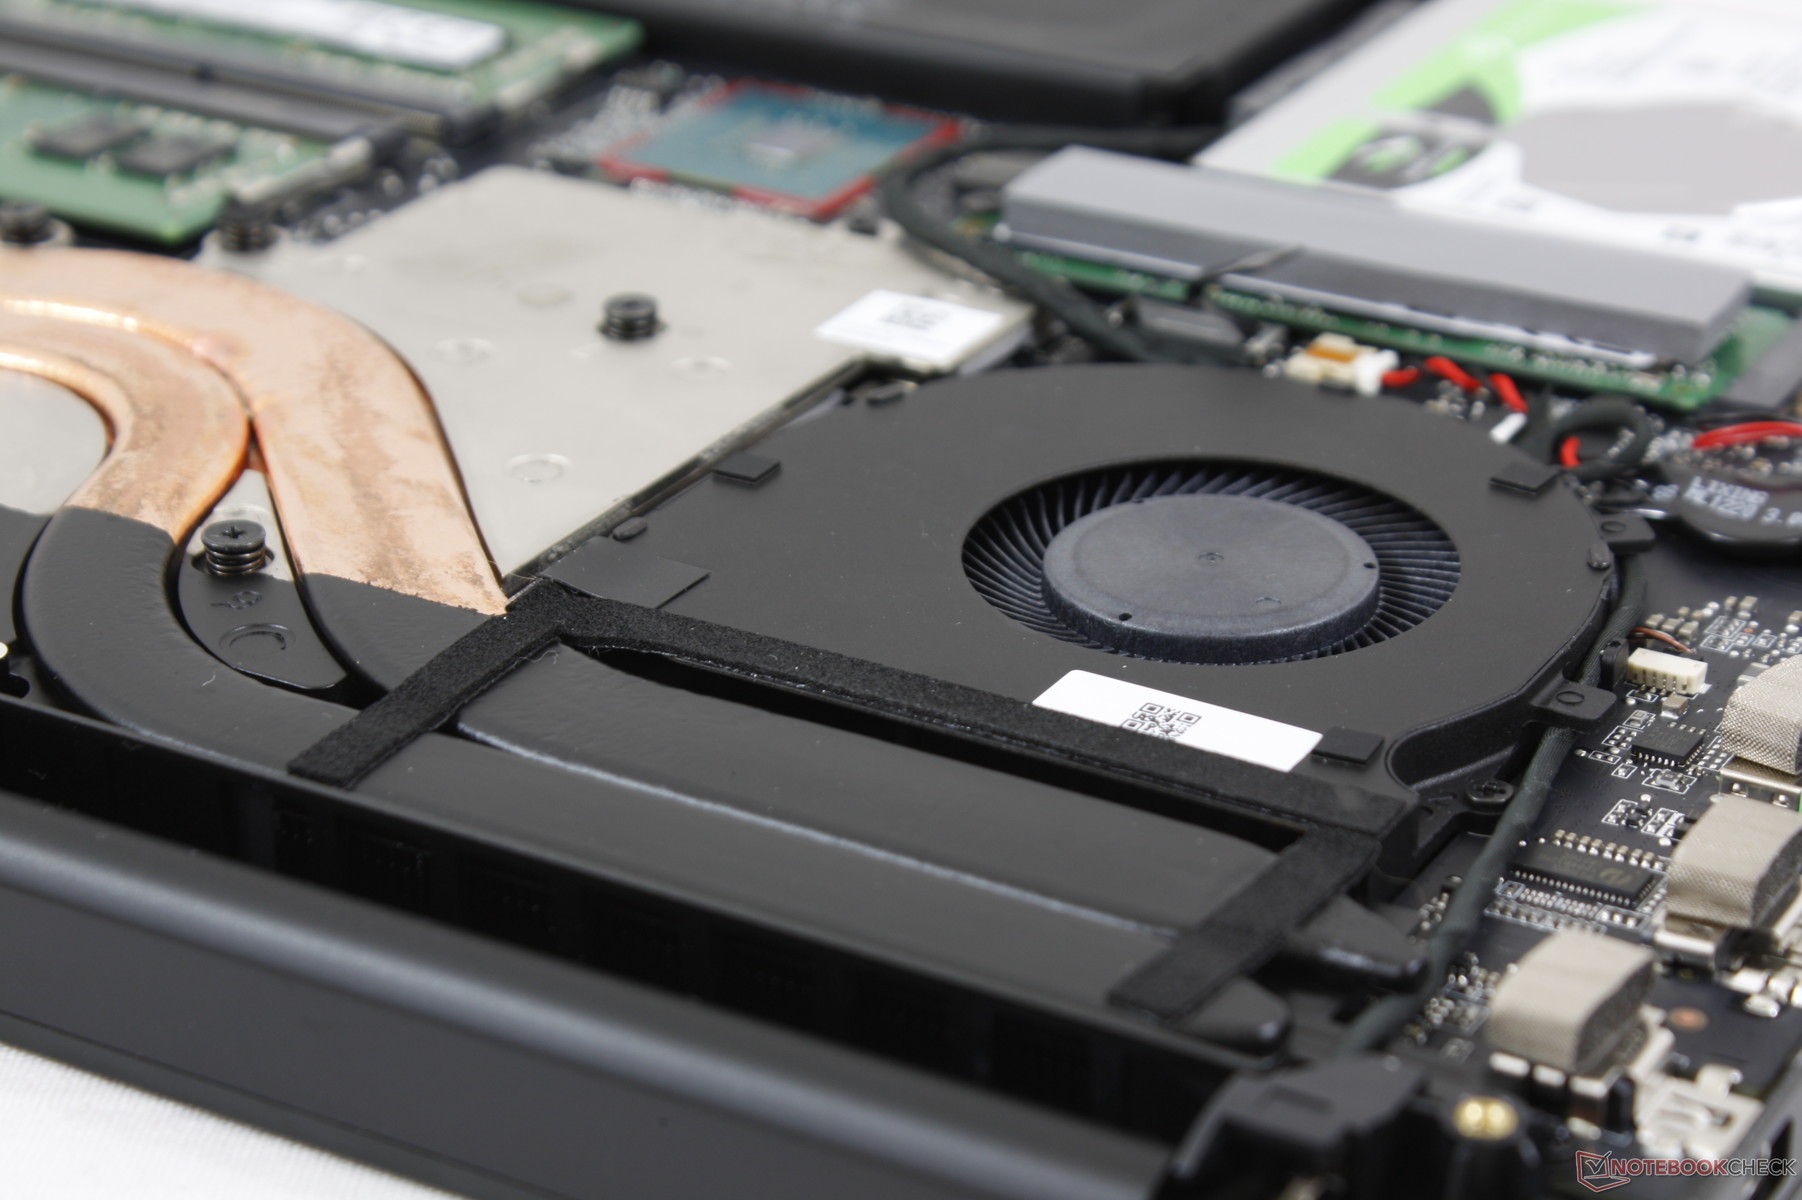
Serviceability is easy and requires only a T5 Torx wrench. Once inside, users have direct access to both storage bays, both DDR4 SODIMM slots, both system fans, M.2 WLAN module, and the battery.
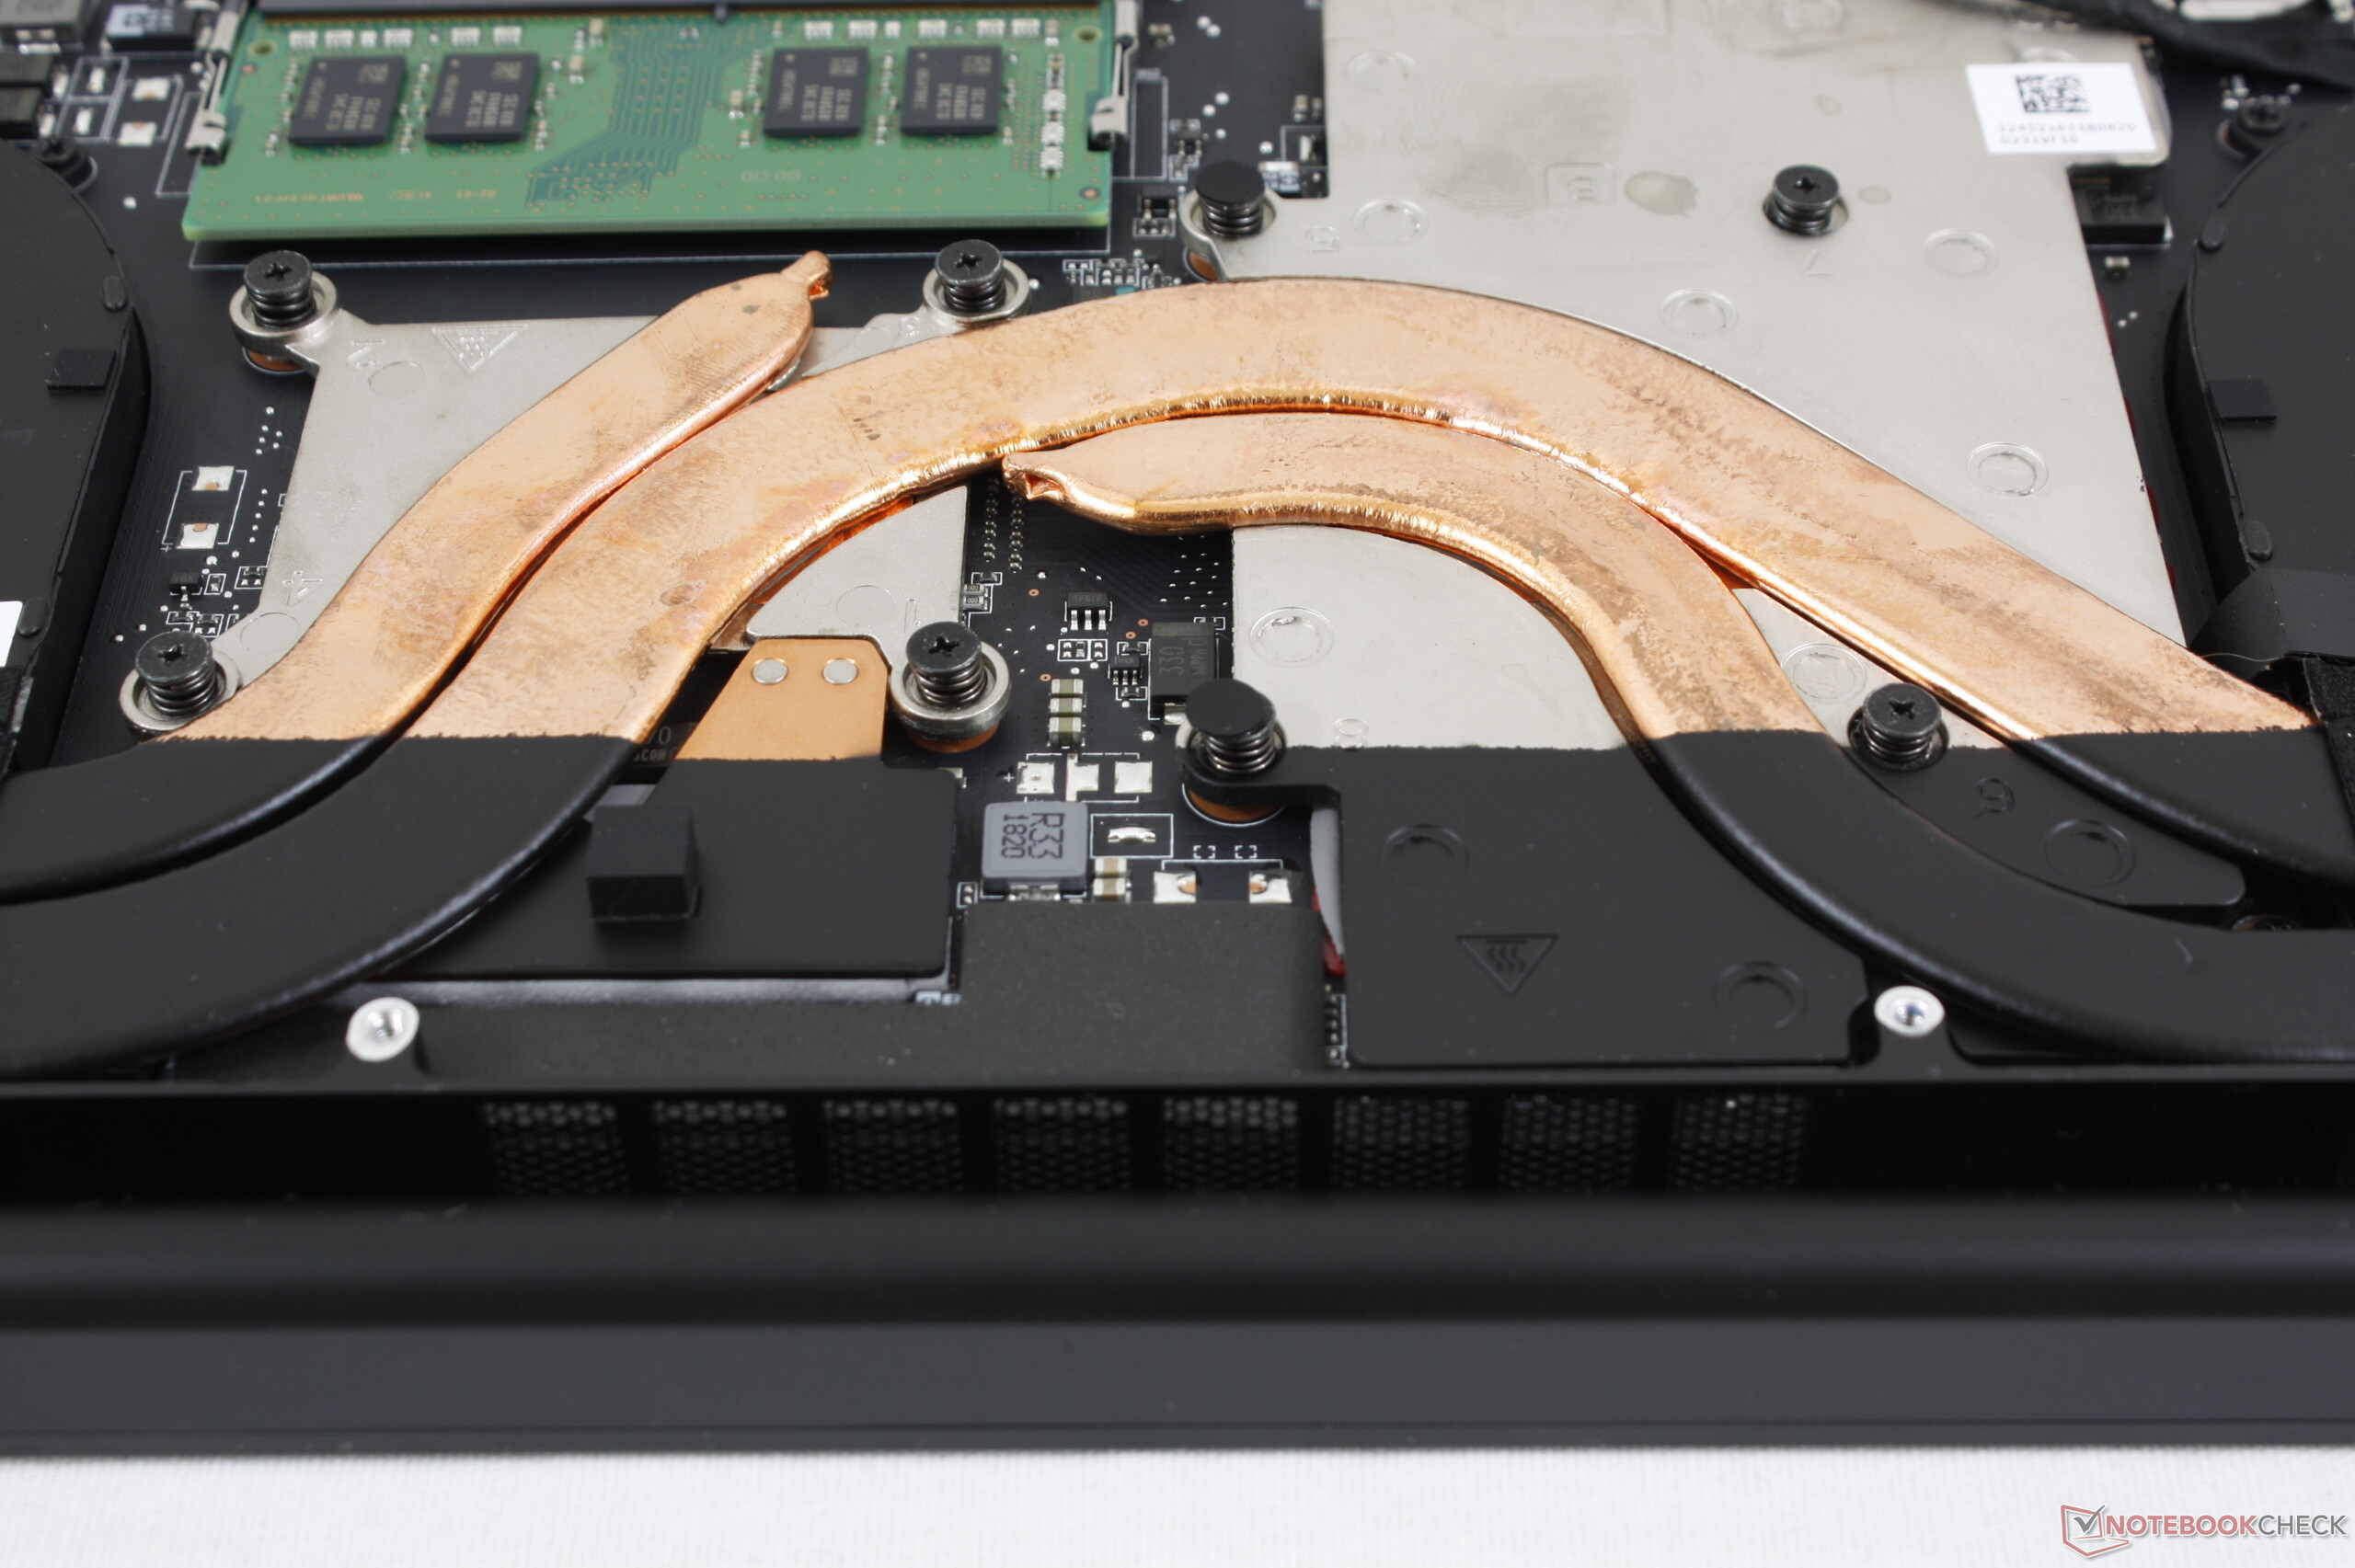
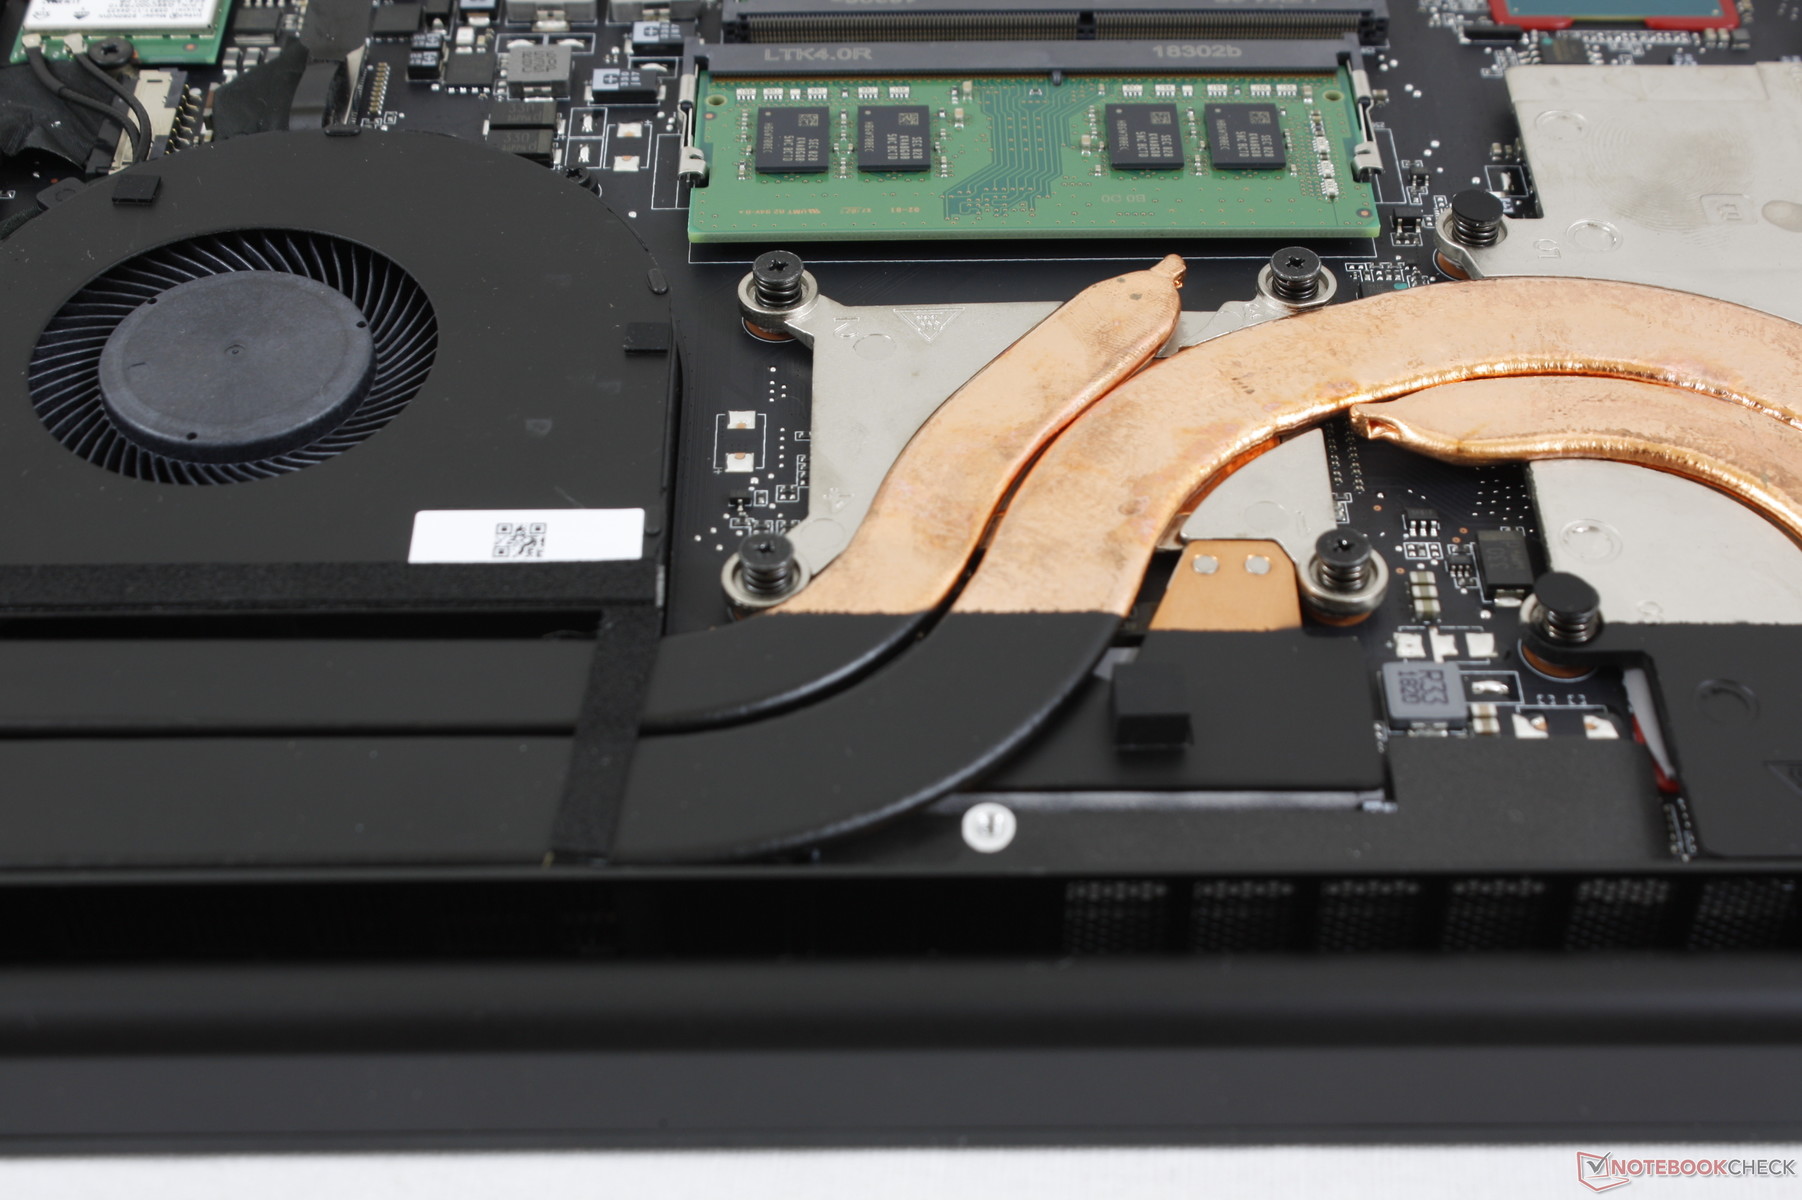
There are a couple of major internal differences between the Base Model and Advanced Model as shown by our comparison pictures below. Firstly, the battery has been truncated to make room for the 2.5-inch SATA III bay similar to the XPS 15 single storage and XPS 15 dual storage SKUs. Secondly, the cooling solution has been revamped from vapor chamber to traditional copper heat pipes. The motherboard layout between both configurations are otherwise very nearly the same.
Accessories and Warranty
Included extras are a small velvet cleaning cloth, Quick Start guide, Razer logo stickers, and a warranty card. We would've preferred a larger cleaning cloth like what MSI includes for its G series of gaming laptops.
Warranty is the usual one-year period. In contrast, the baseline warranty for Aorus laptops or the EVGA SC15 is two years each. Please see our Guarantees, Return policies and Warranties FAQ for country-specific information.
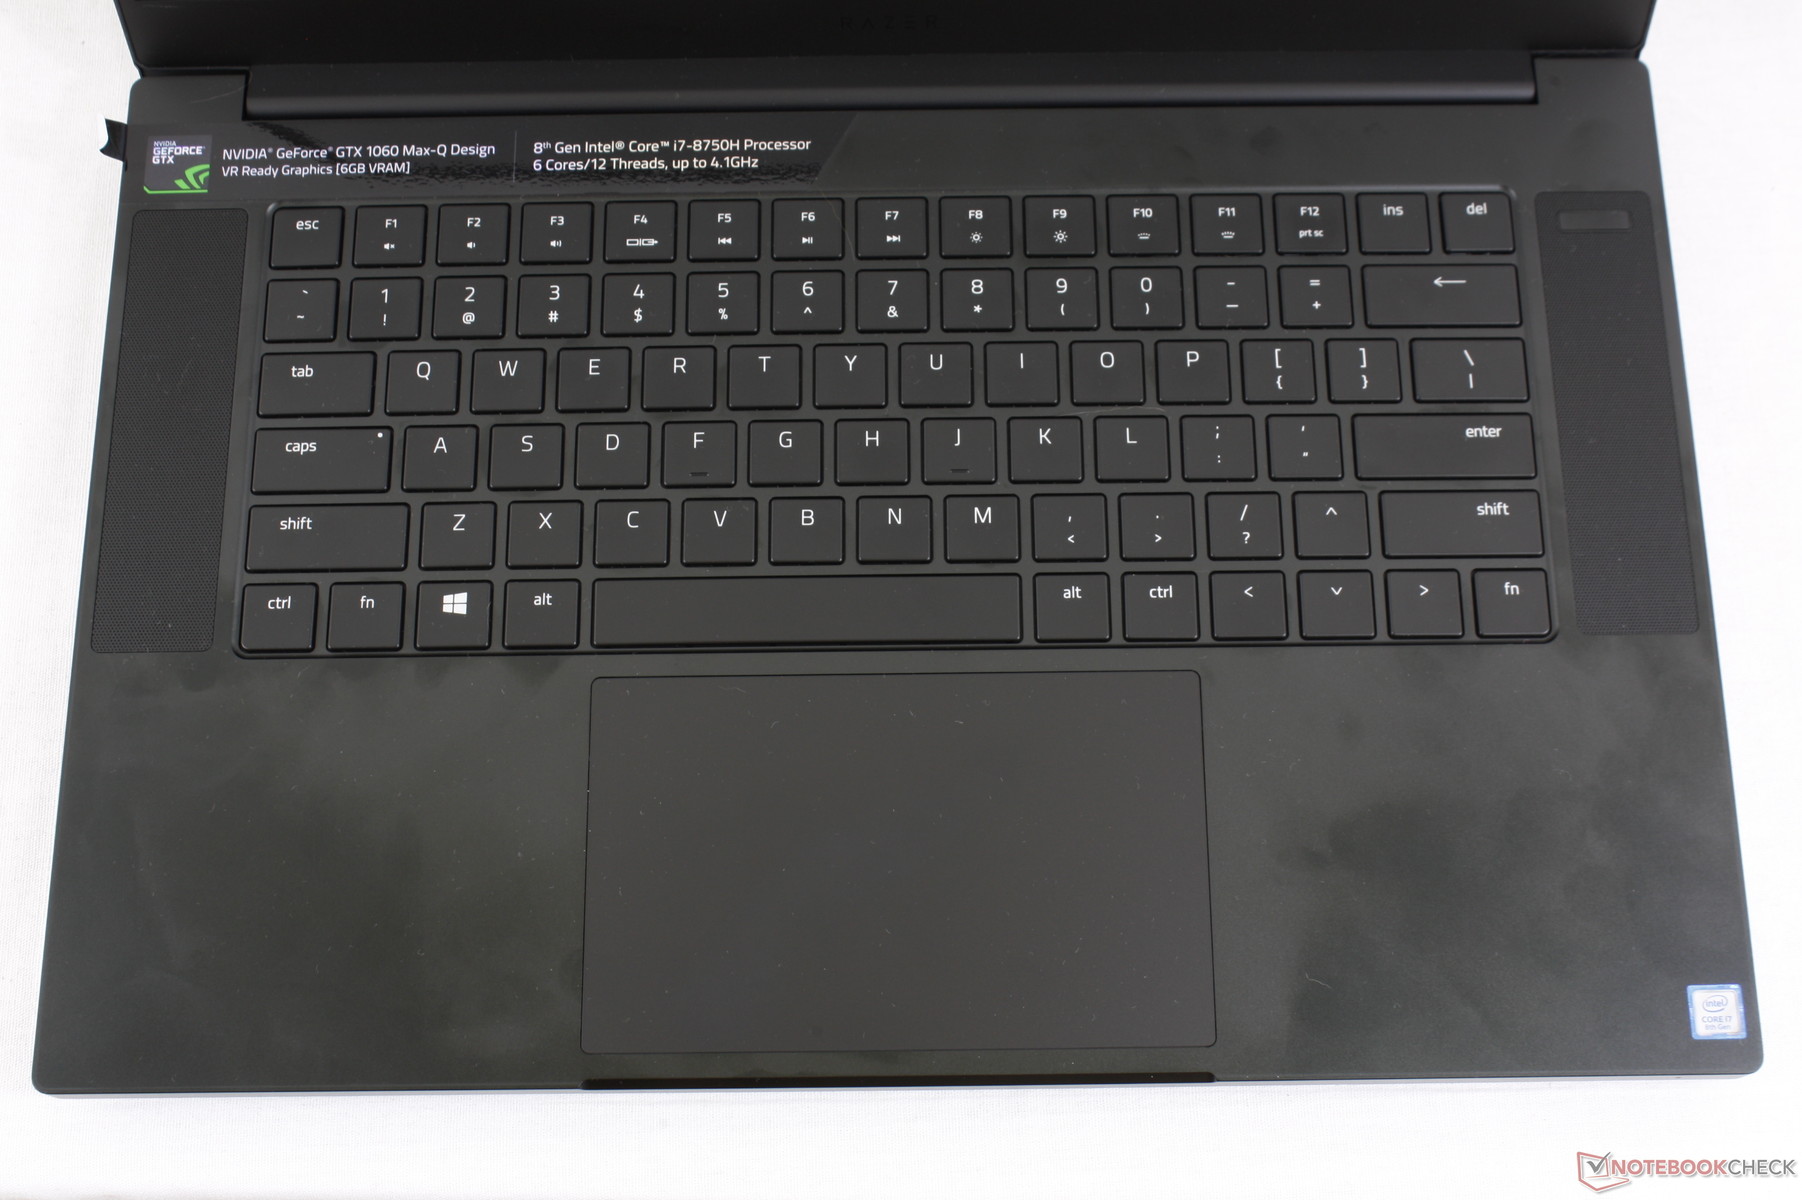
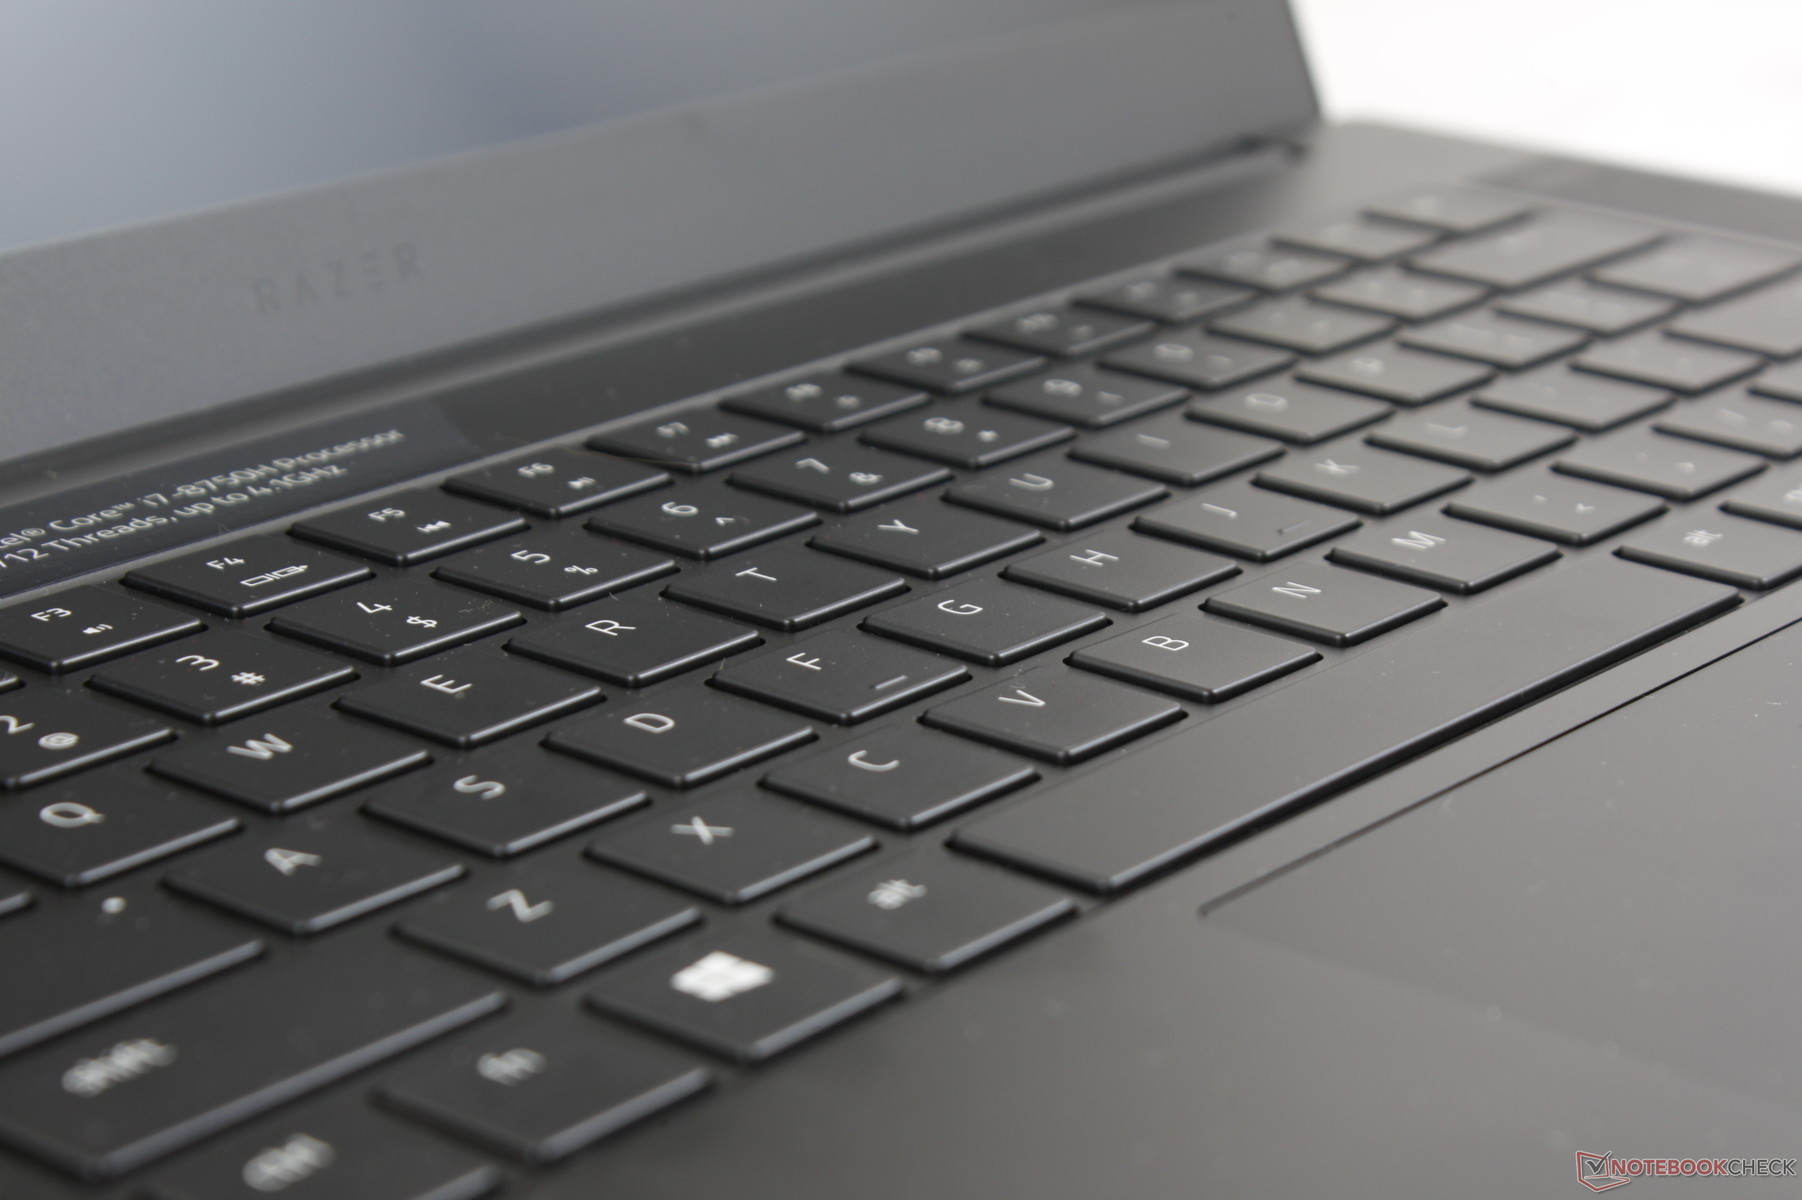
Input Devices
Keyboard and Touchpad
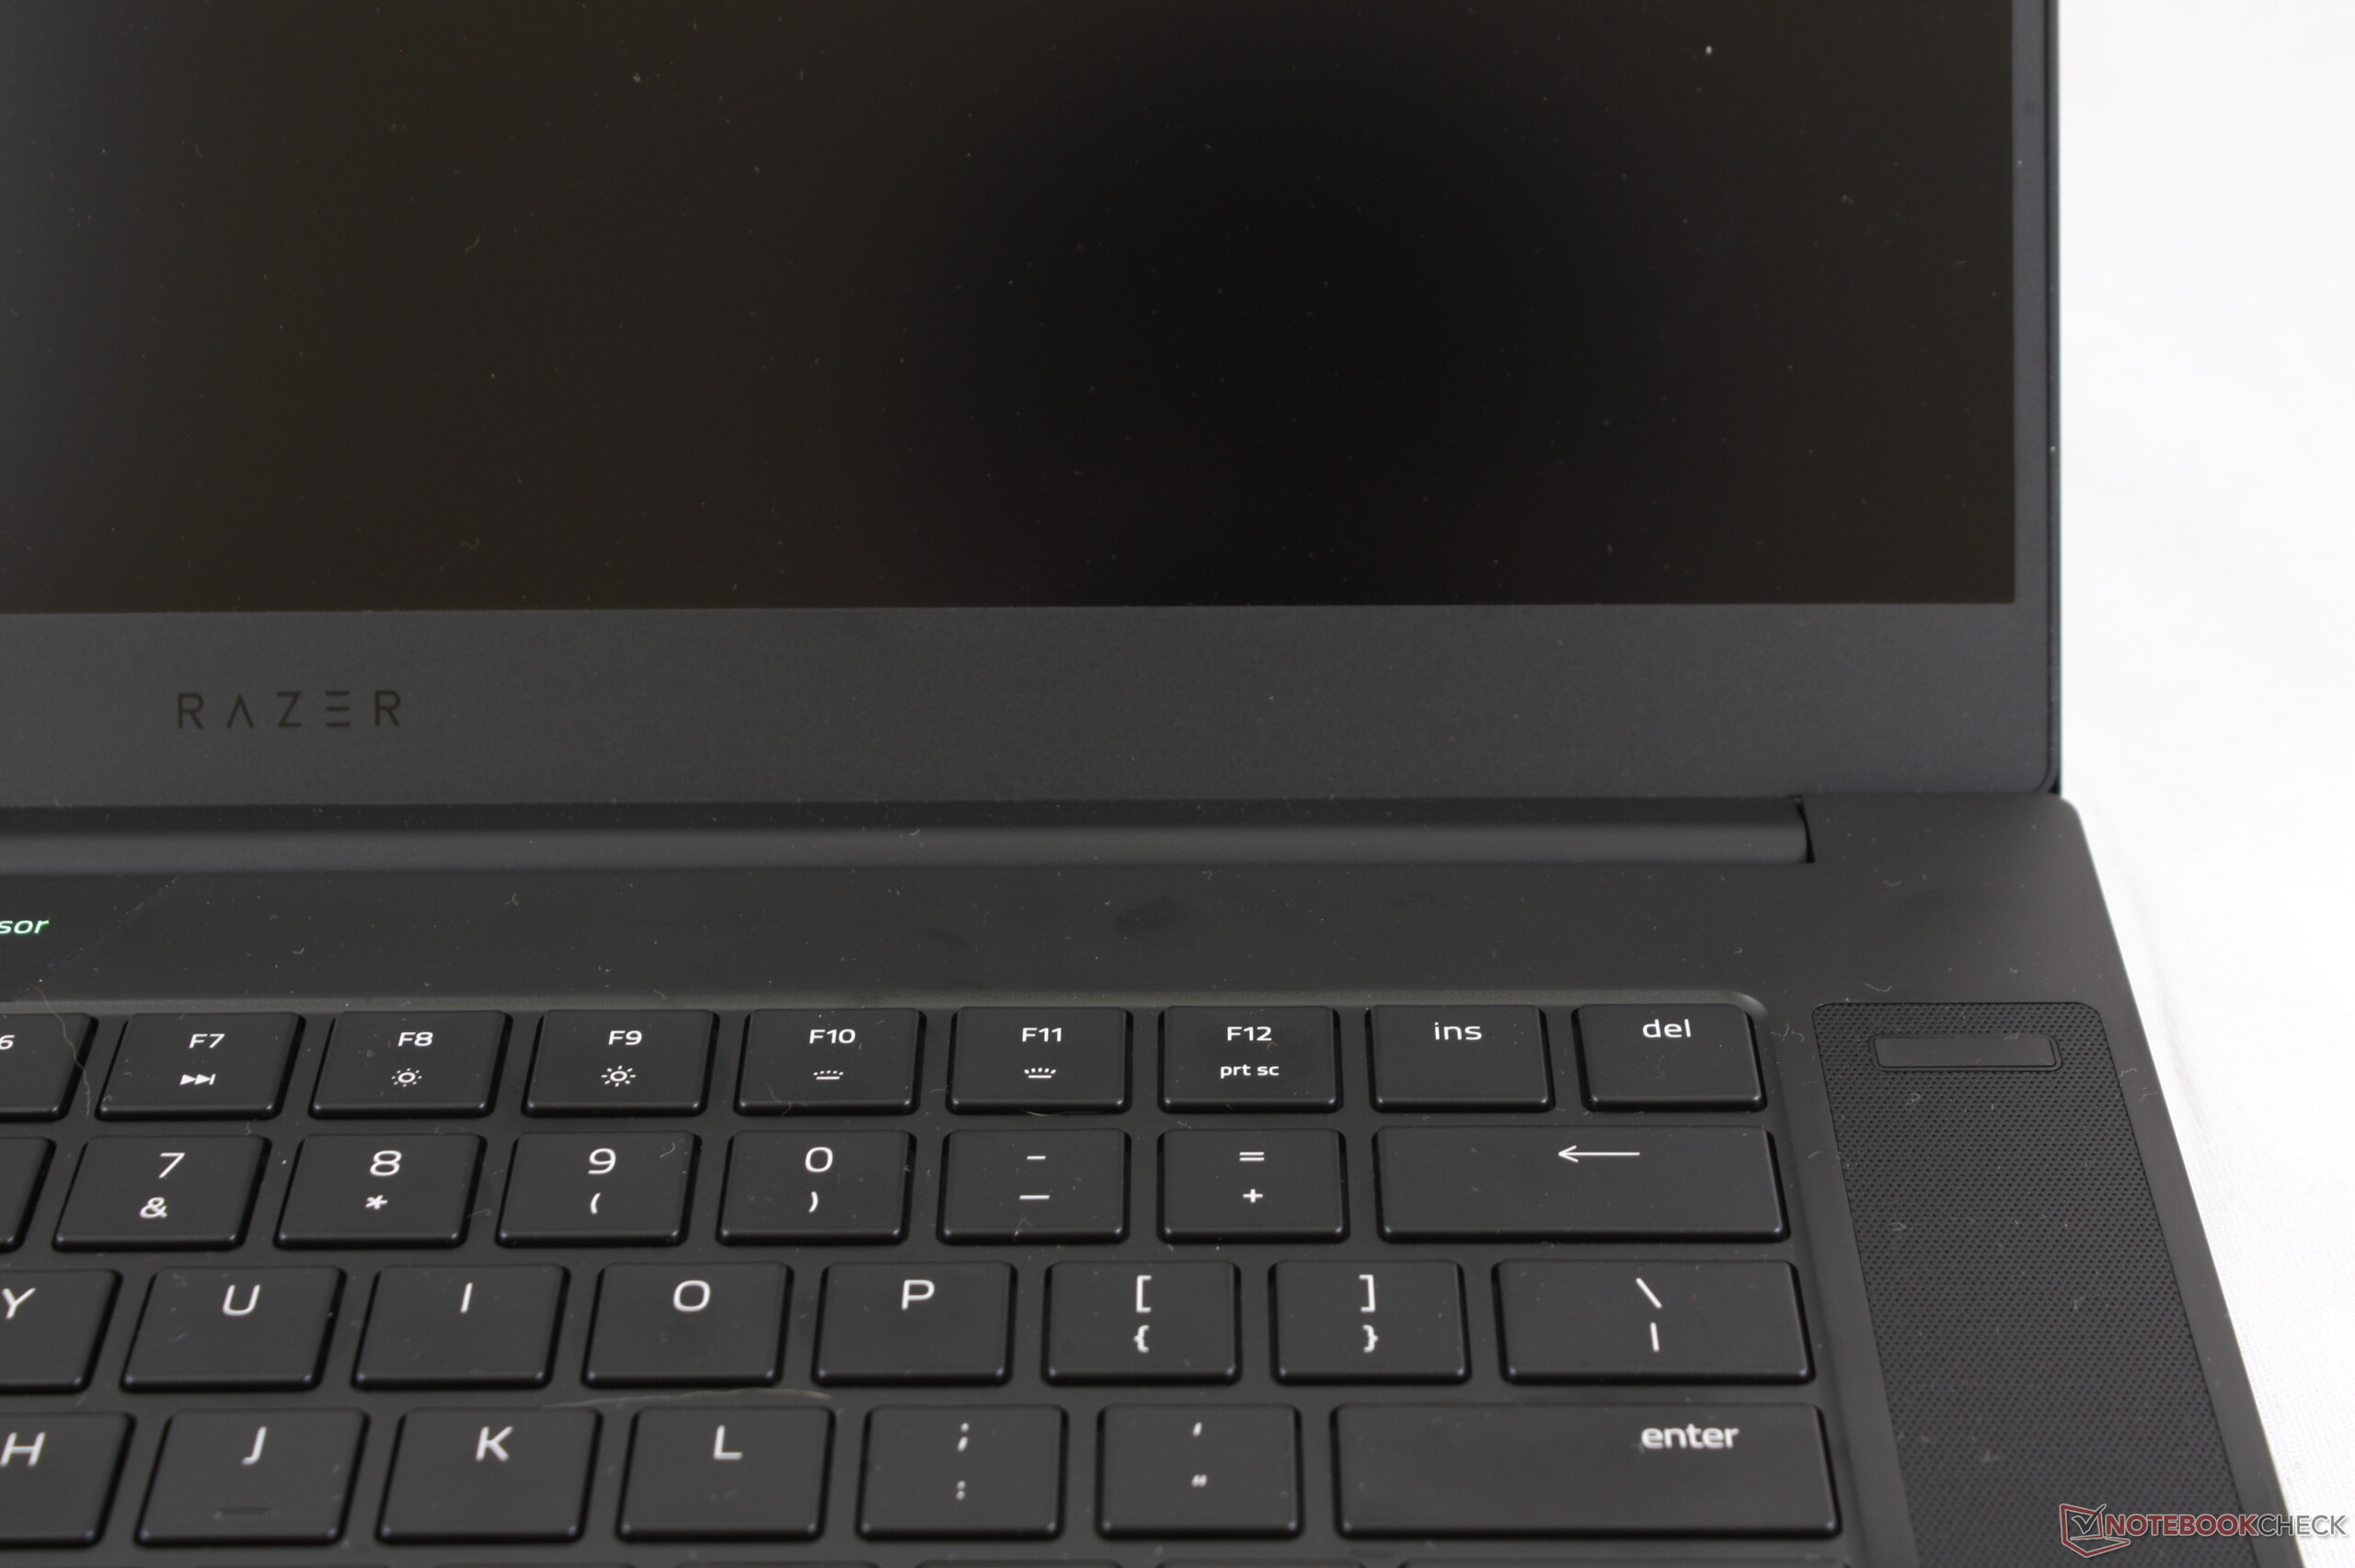
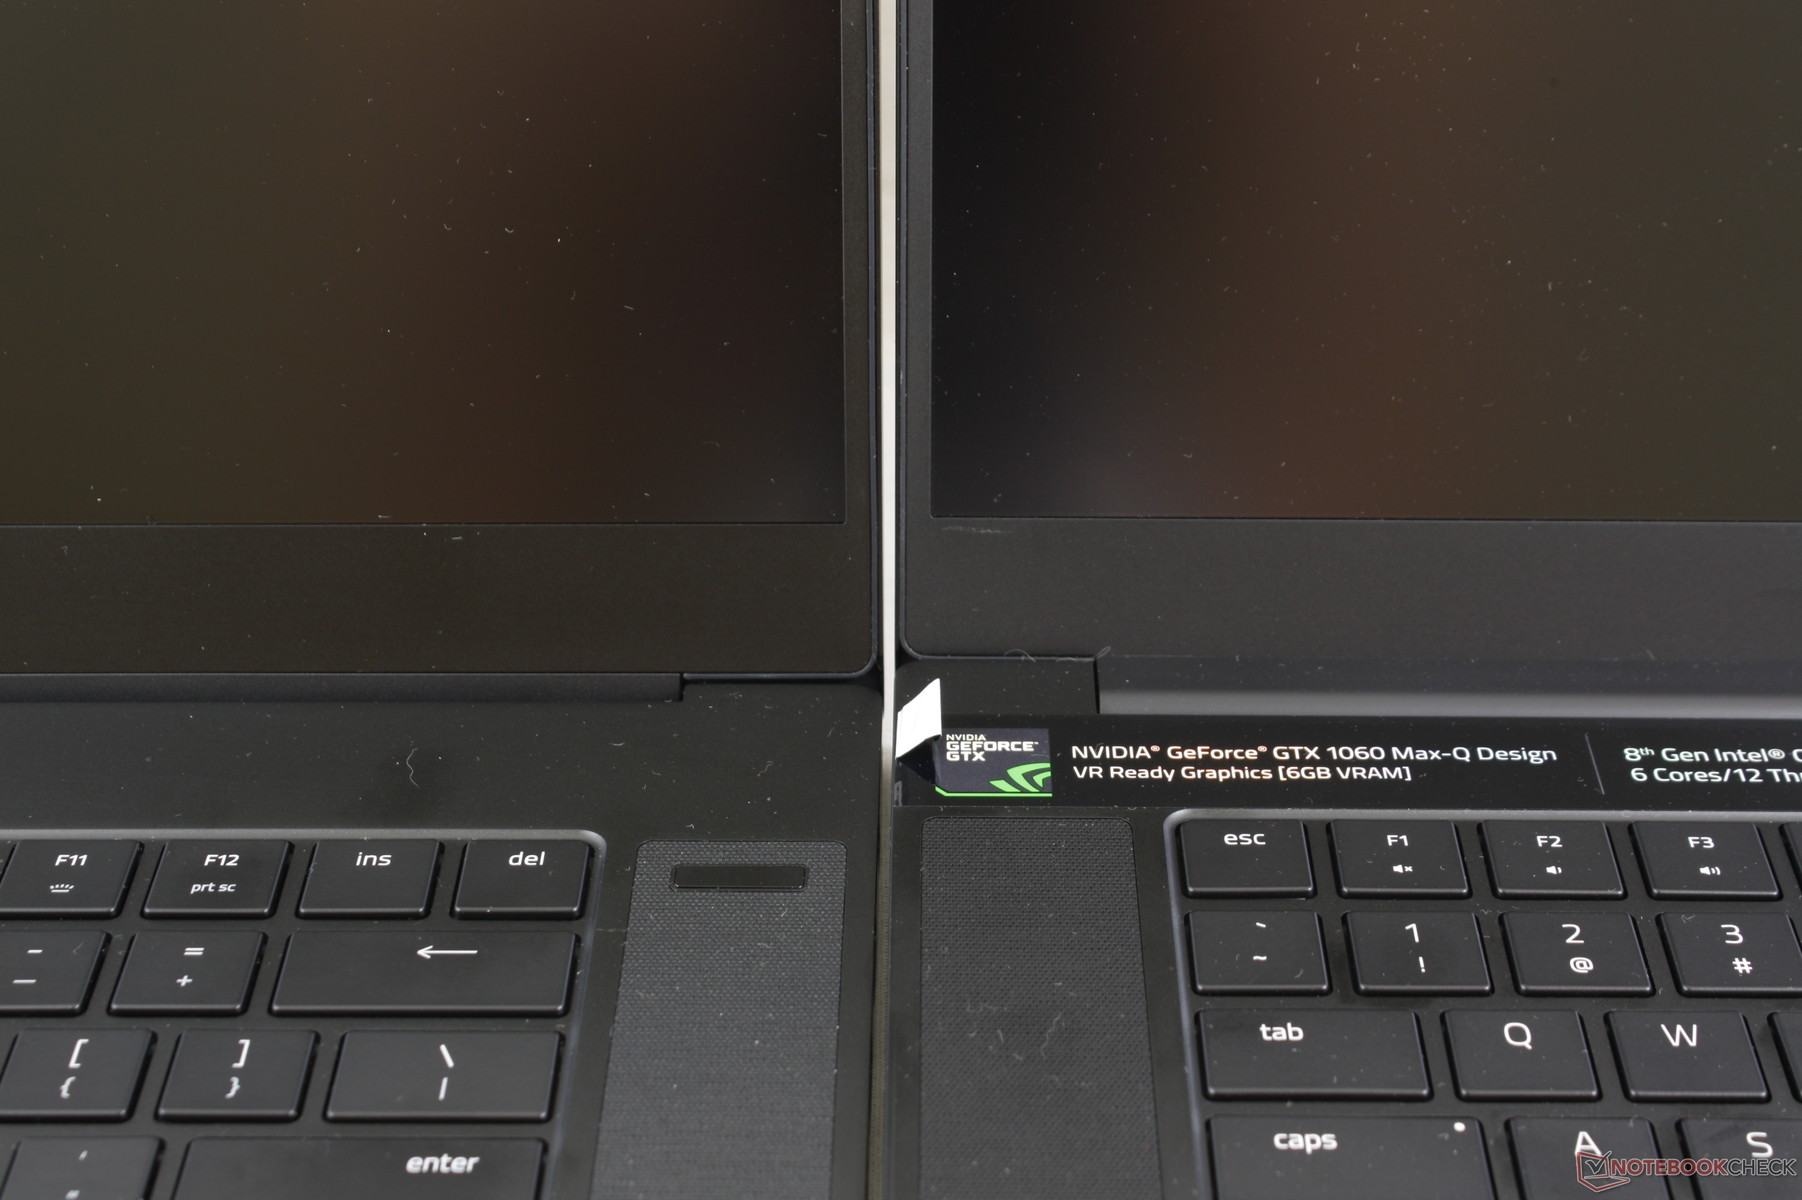
There have been no changes made to the keyboard or trackpad in terms of size, travel, and feedback. Per-key RGB lighting is gone in favor of single-zone RGB lighting, but this is completely superficial. We weren't huge fans of the keyboard feedback on the Advanced Model because the keys are shallow in travel and very light when compared to the GS65 or XPS 15, so we're a bit disappointed to not see any improvements in this regard. Ultrabook users will feel right at home while desktop gamers will take some time to get used to.
Display
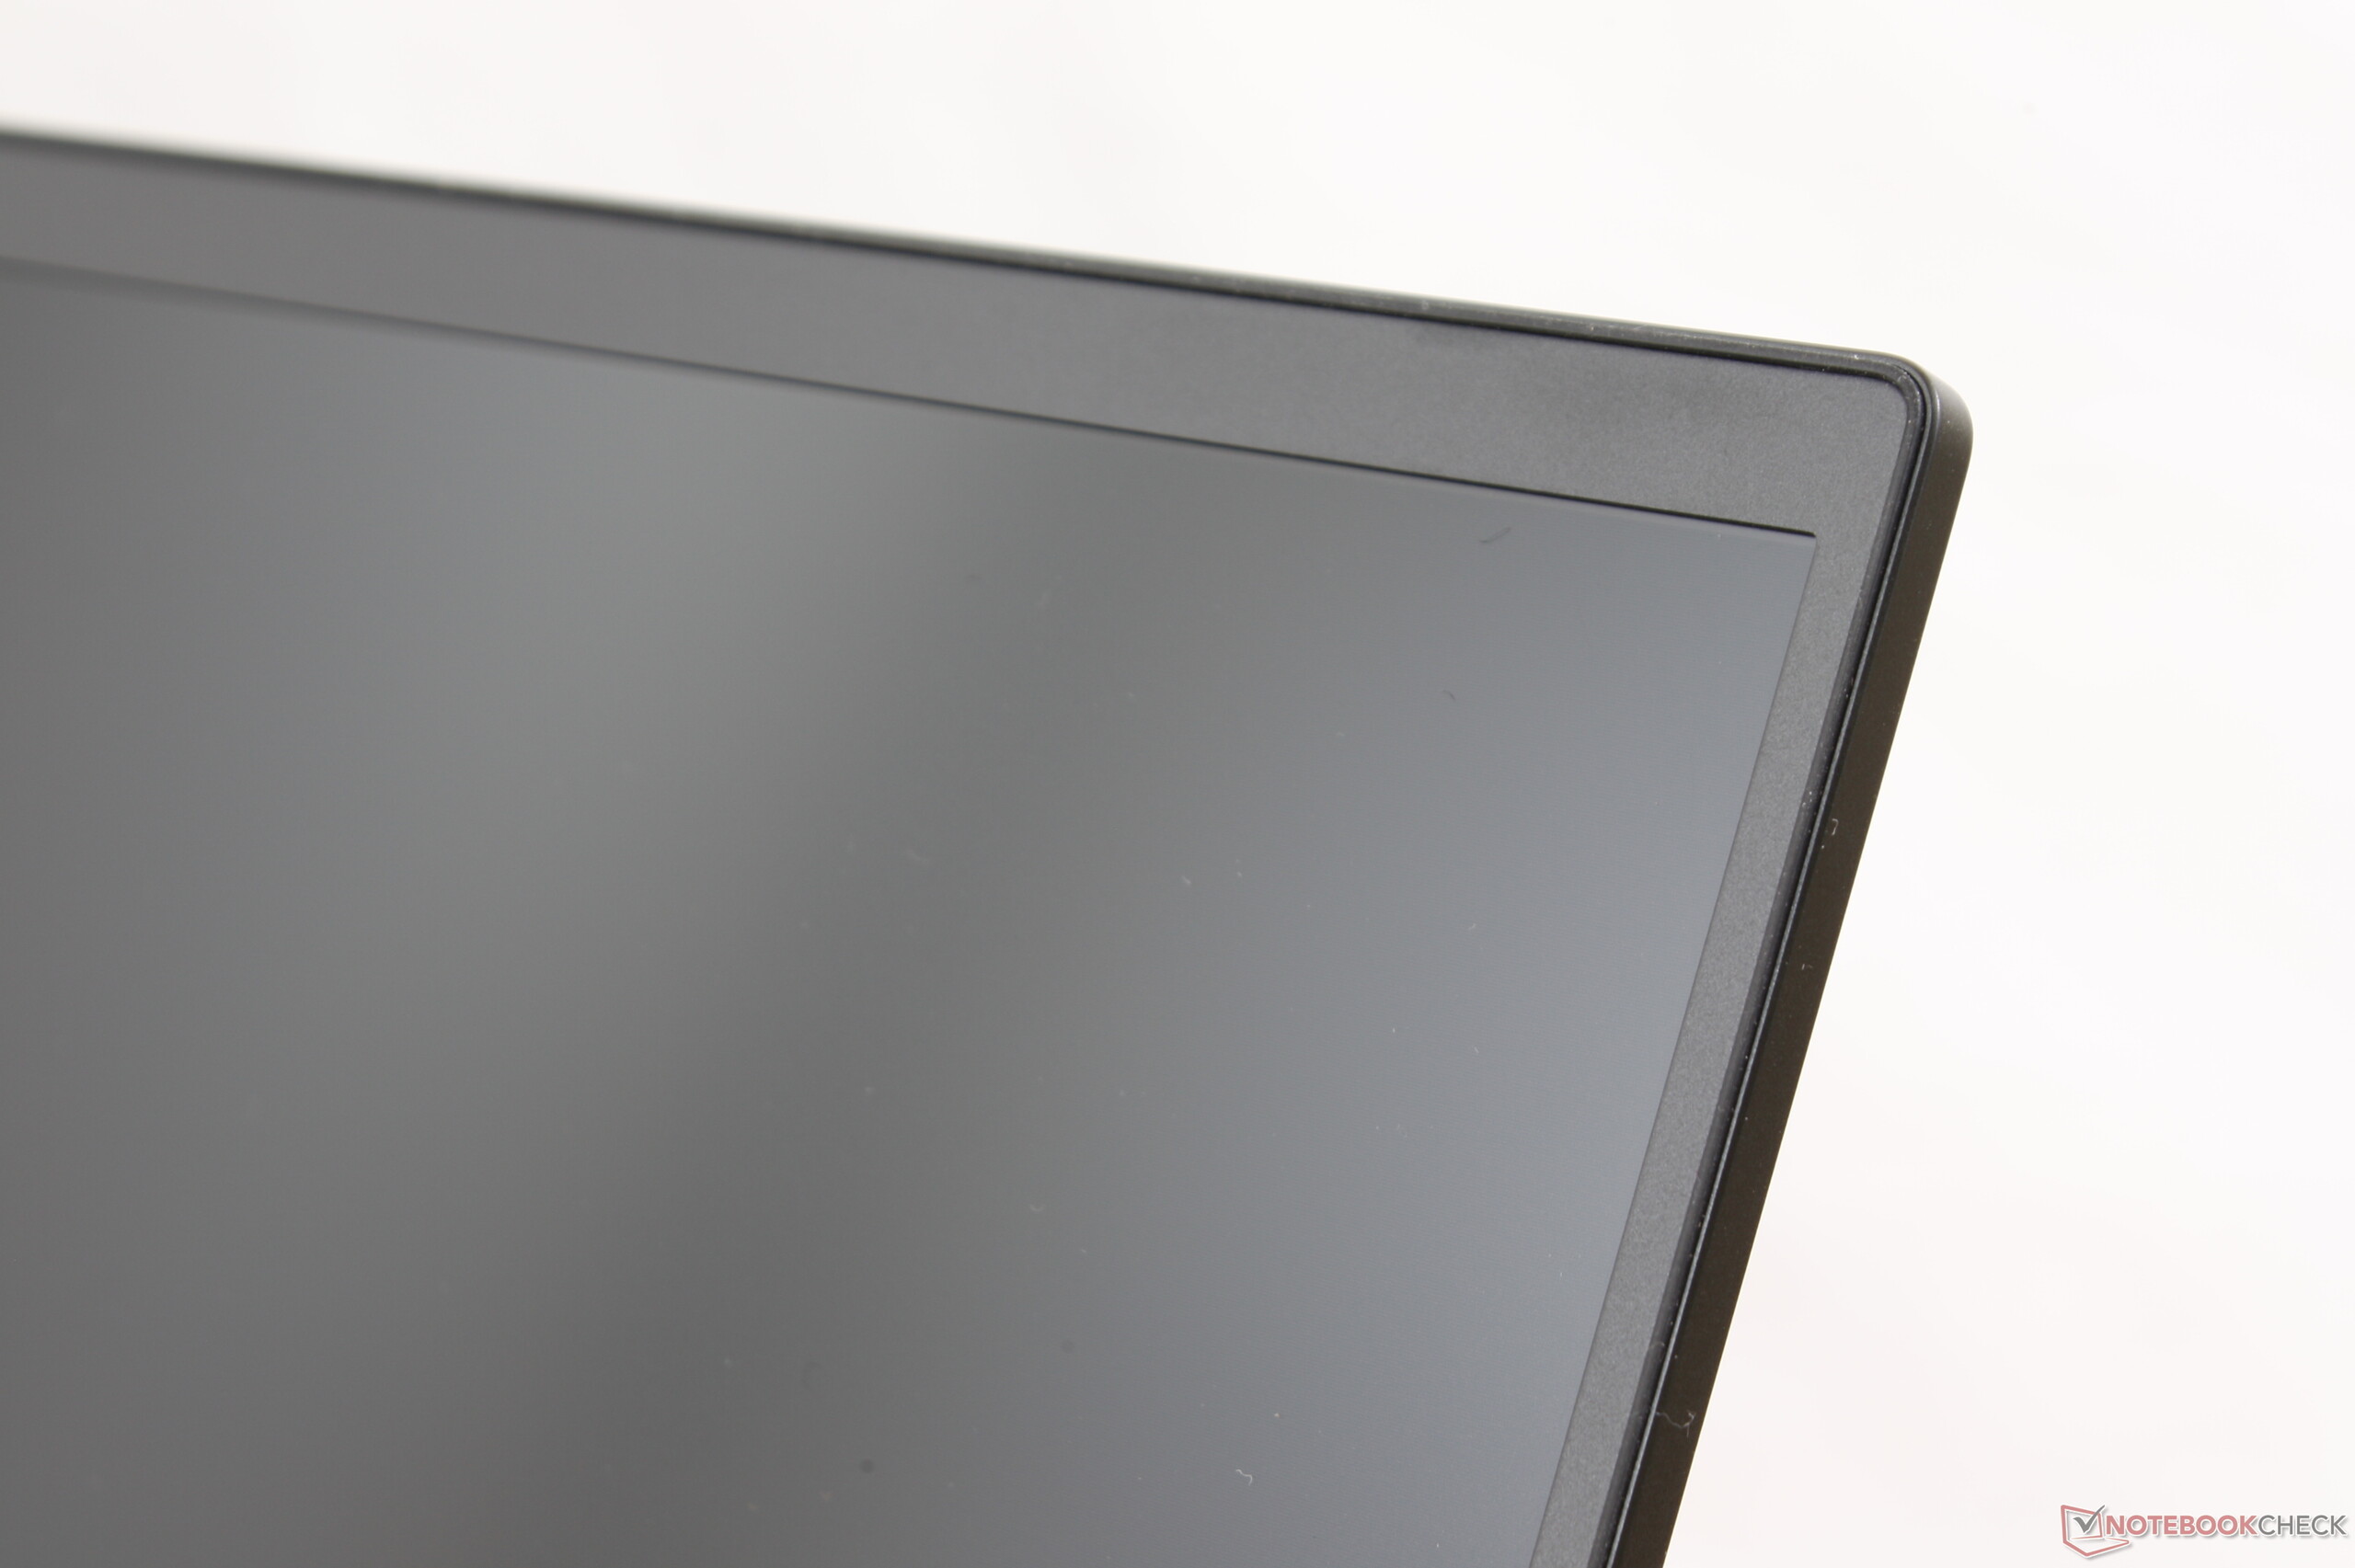
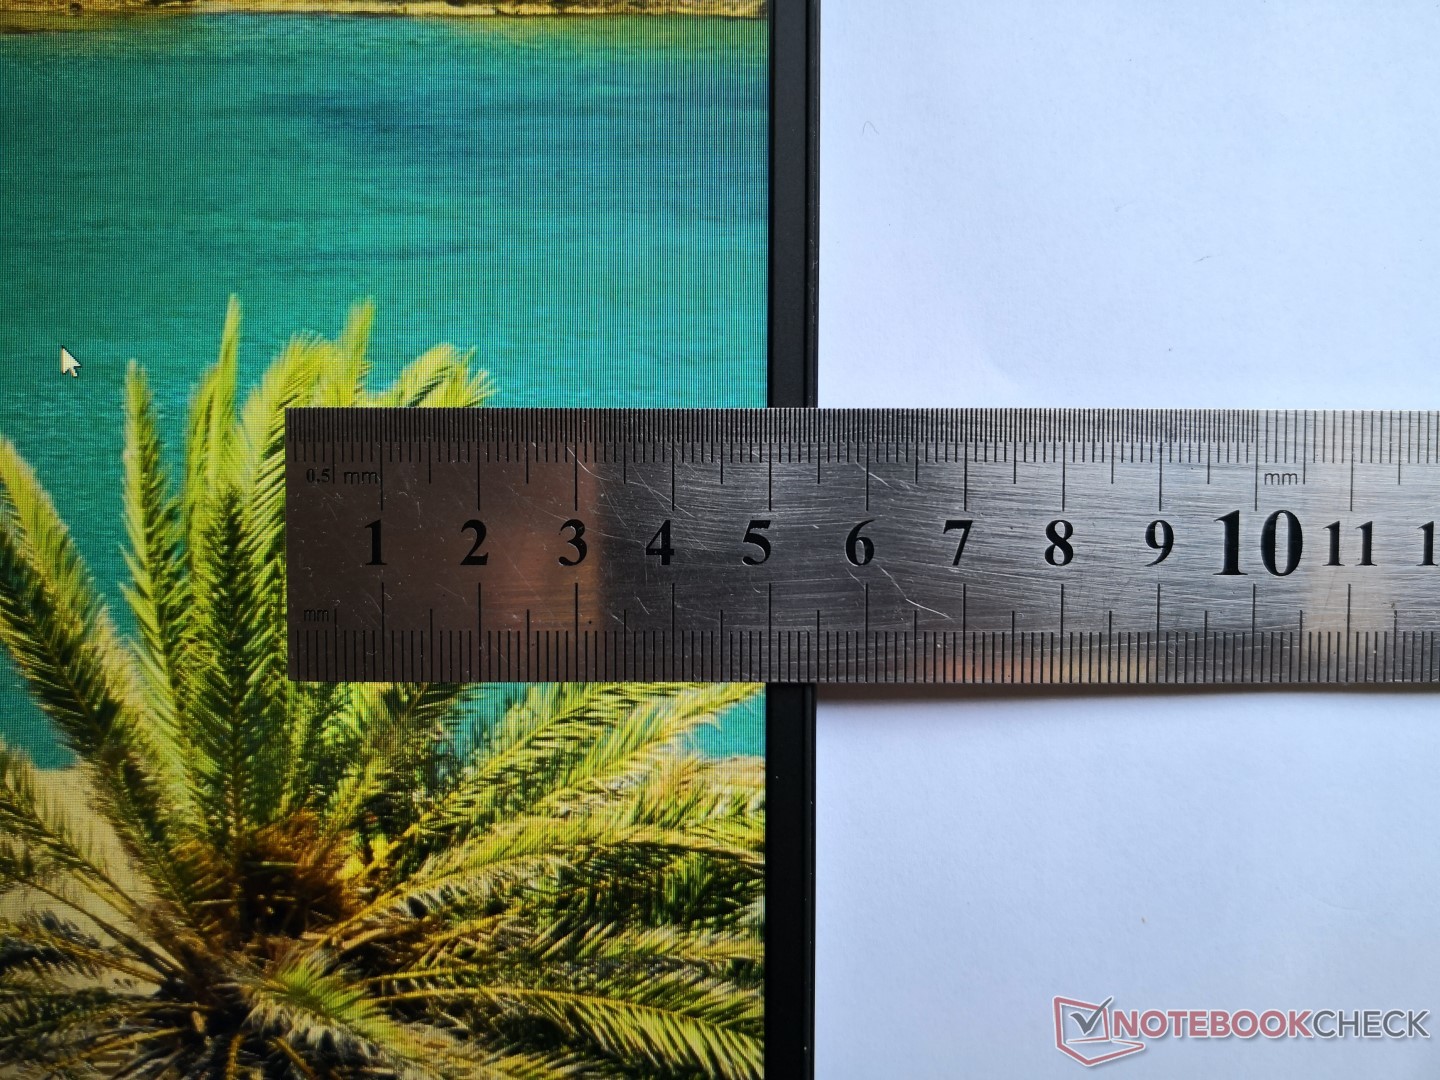
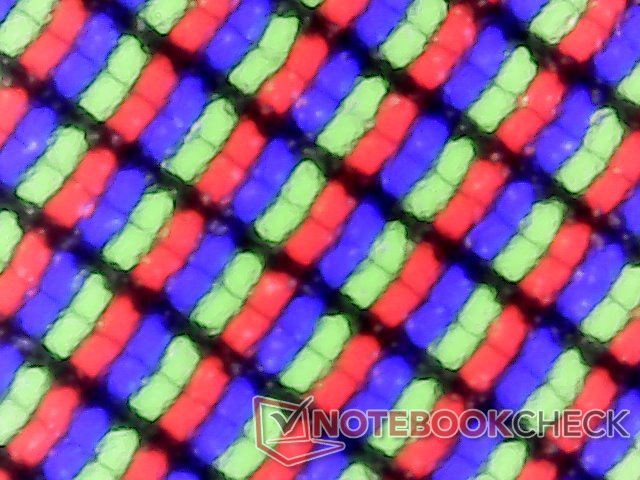
Razer has swapped out the 144 Hz LG panel on the Advanced Model for a 60 Hz AU Optronics panel on the Base Model. While pixel count, clarity, and even contrast remain the same, the reduction in refresh rate and slower black-white and gray-gray response times are noticeable when gaming. Users won't get that super-smooth and almost ghost-free experience that the Advanced Models have to offer. It's a sacrifice that Base Model owners will have to make.
It's worth noting that the same AU Optronics NV156FHM-N61 panel on the Razer Base Model can also be found on the Lenovo ThinkPad X1 Extreme and Xiaomi Mi Notebook Pro. Consequently, all three laptops share similar display properties and color profiles. This is still an excellent panel for gaming and by no means a budget display.
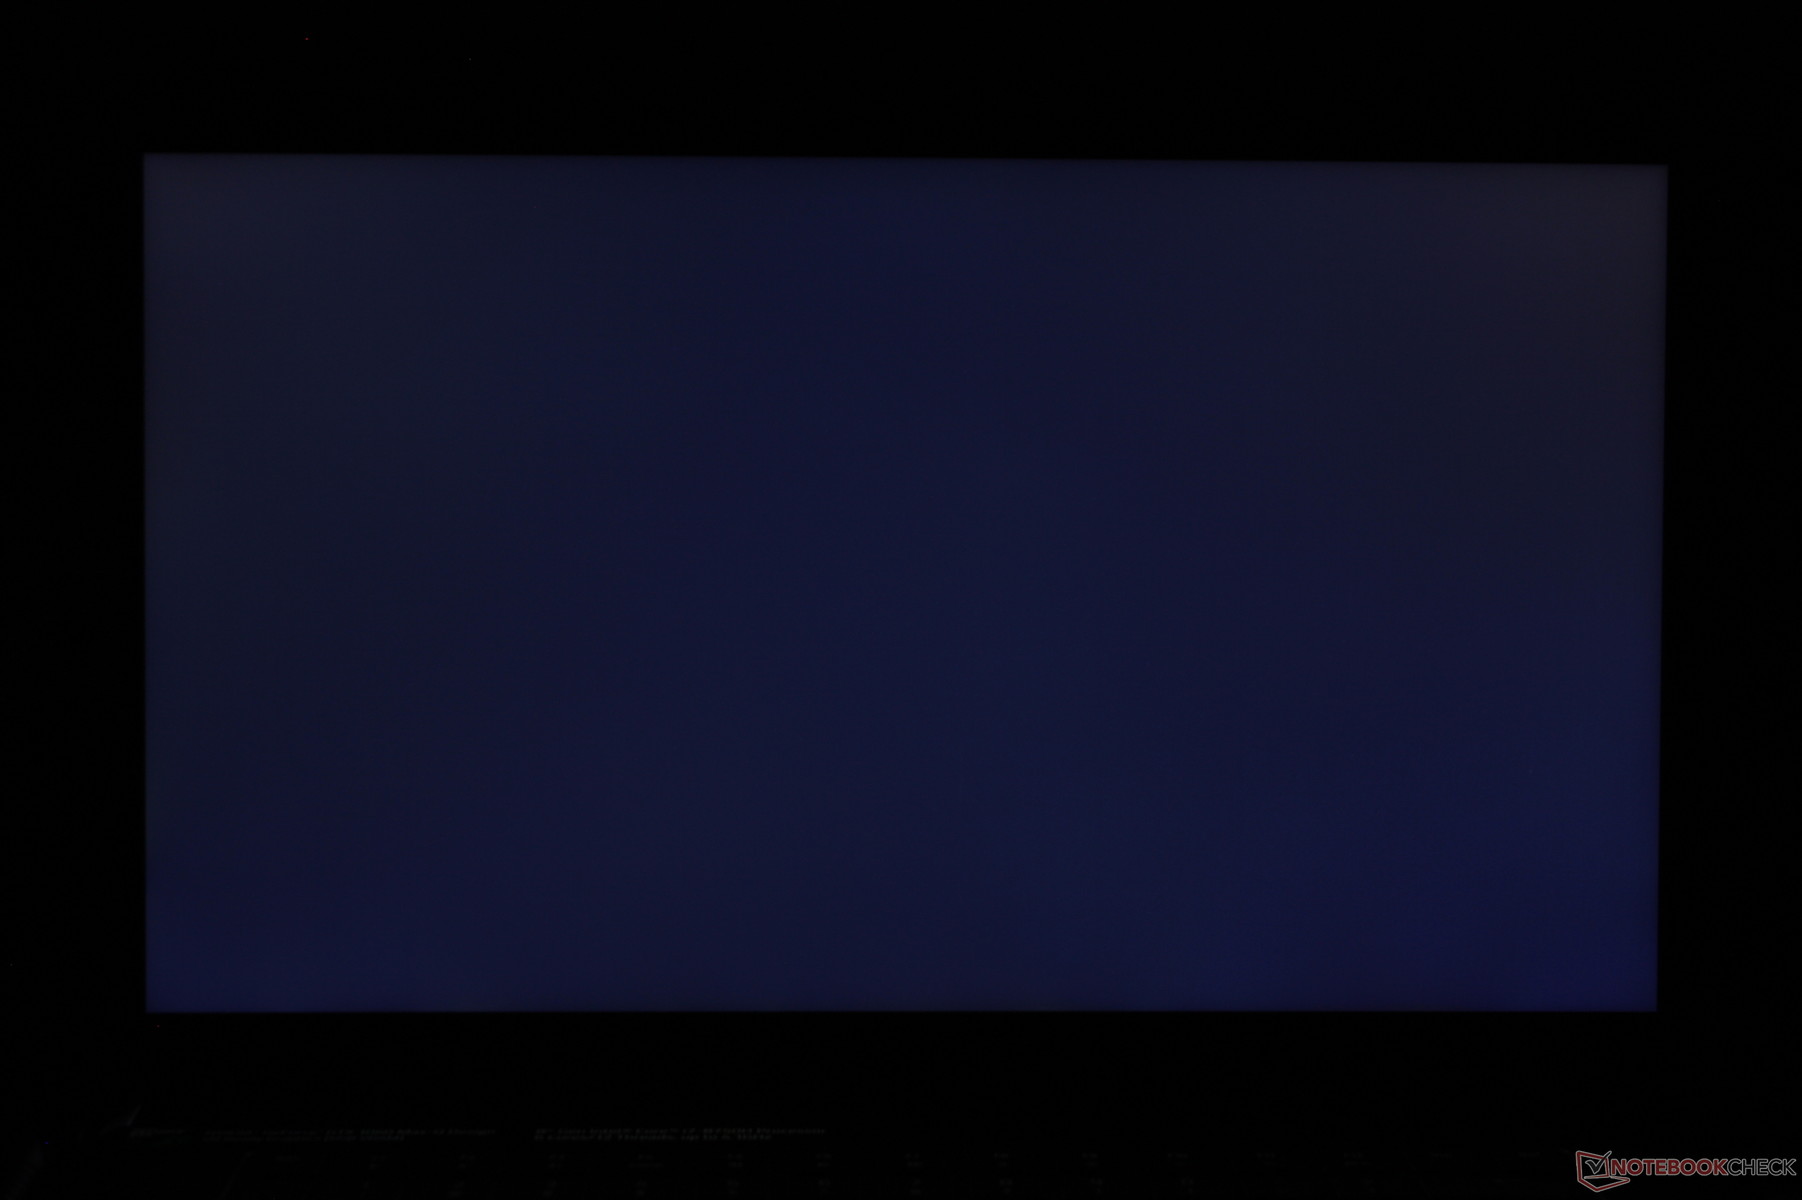
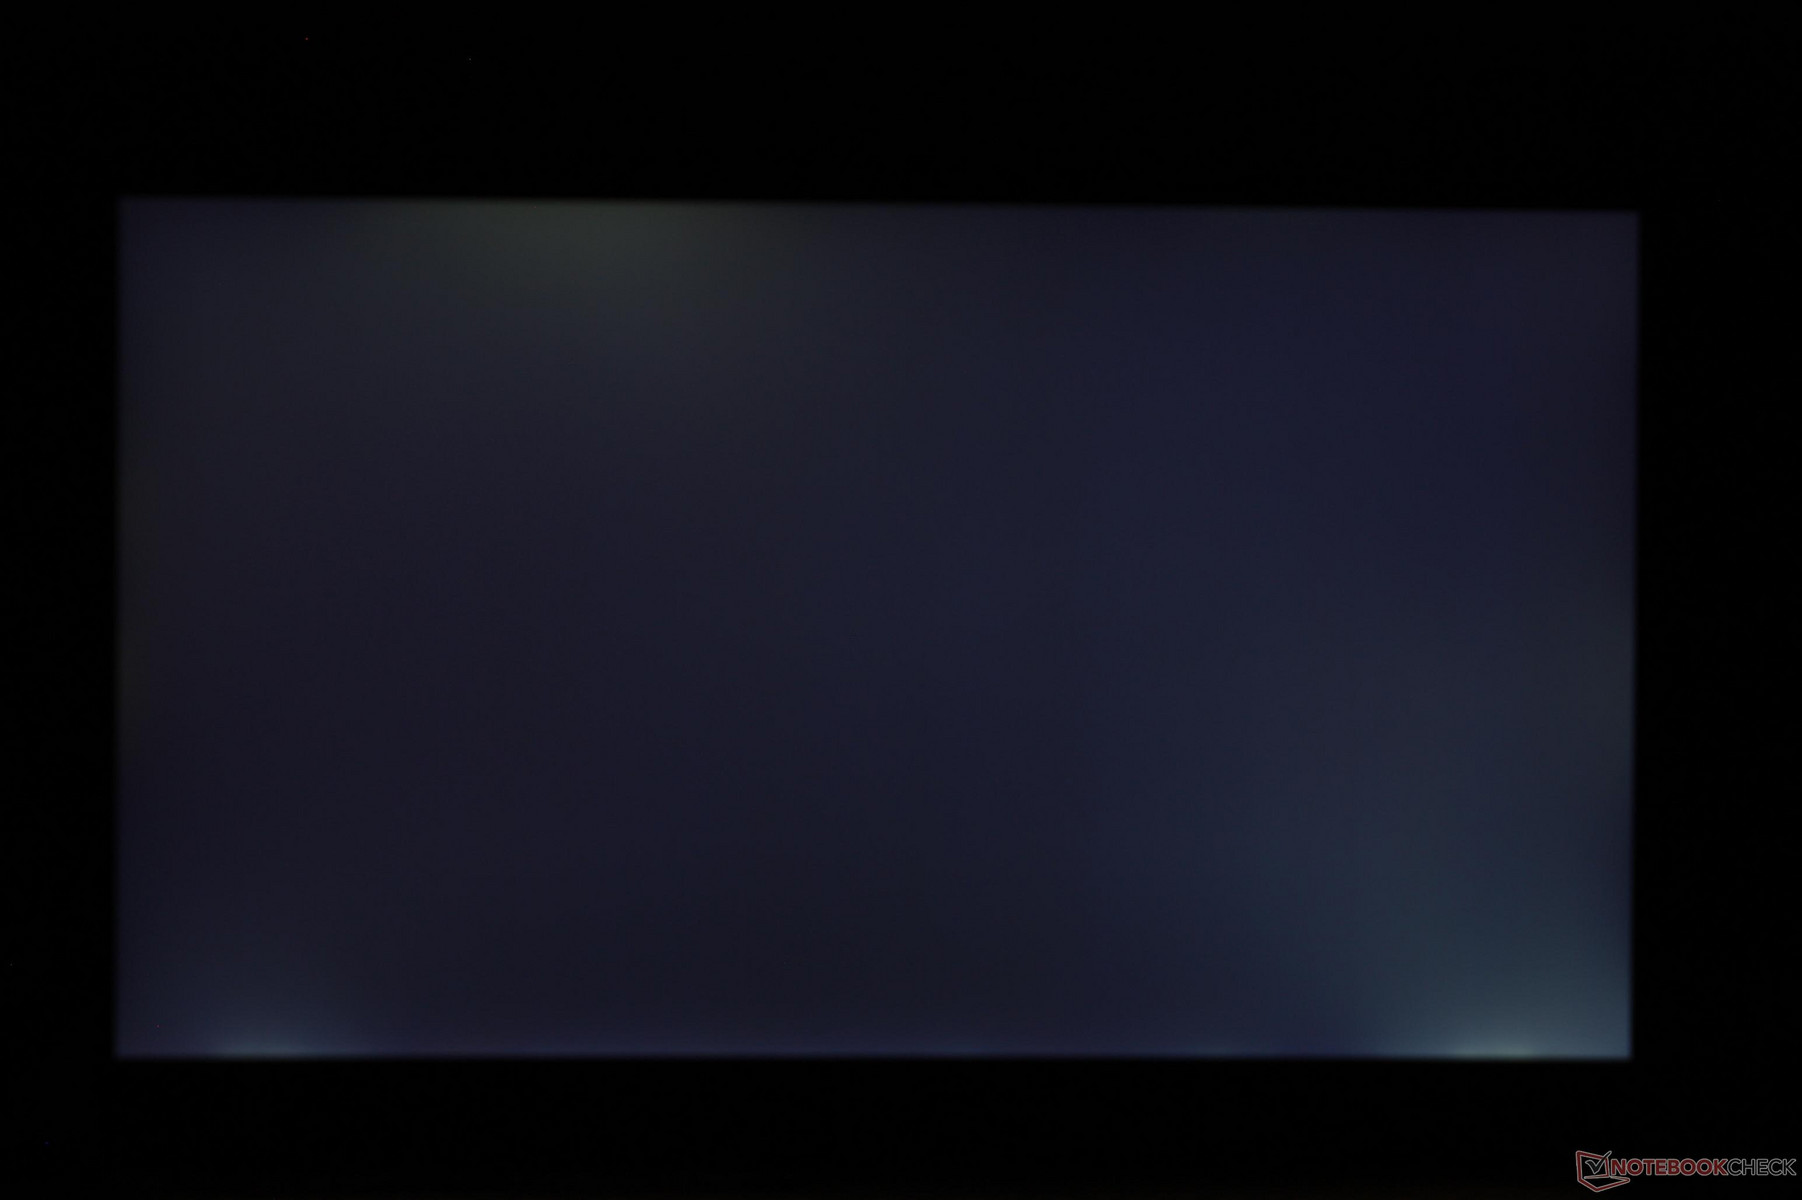
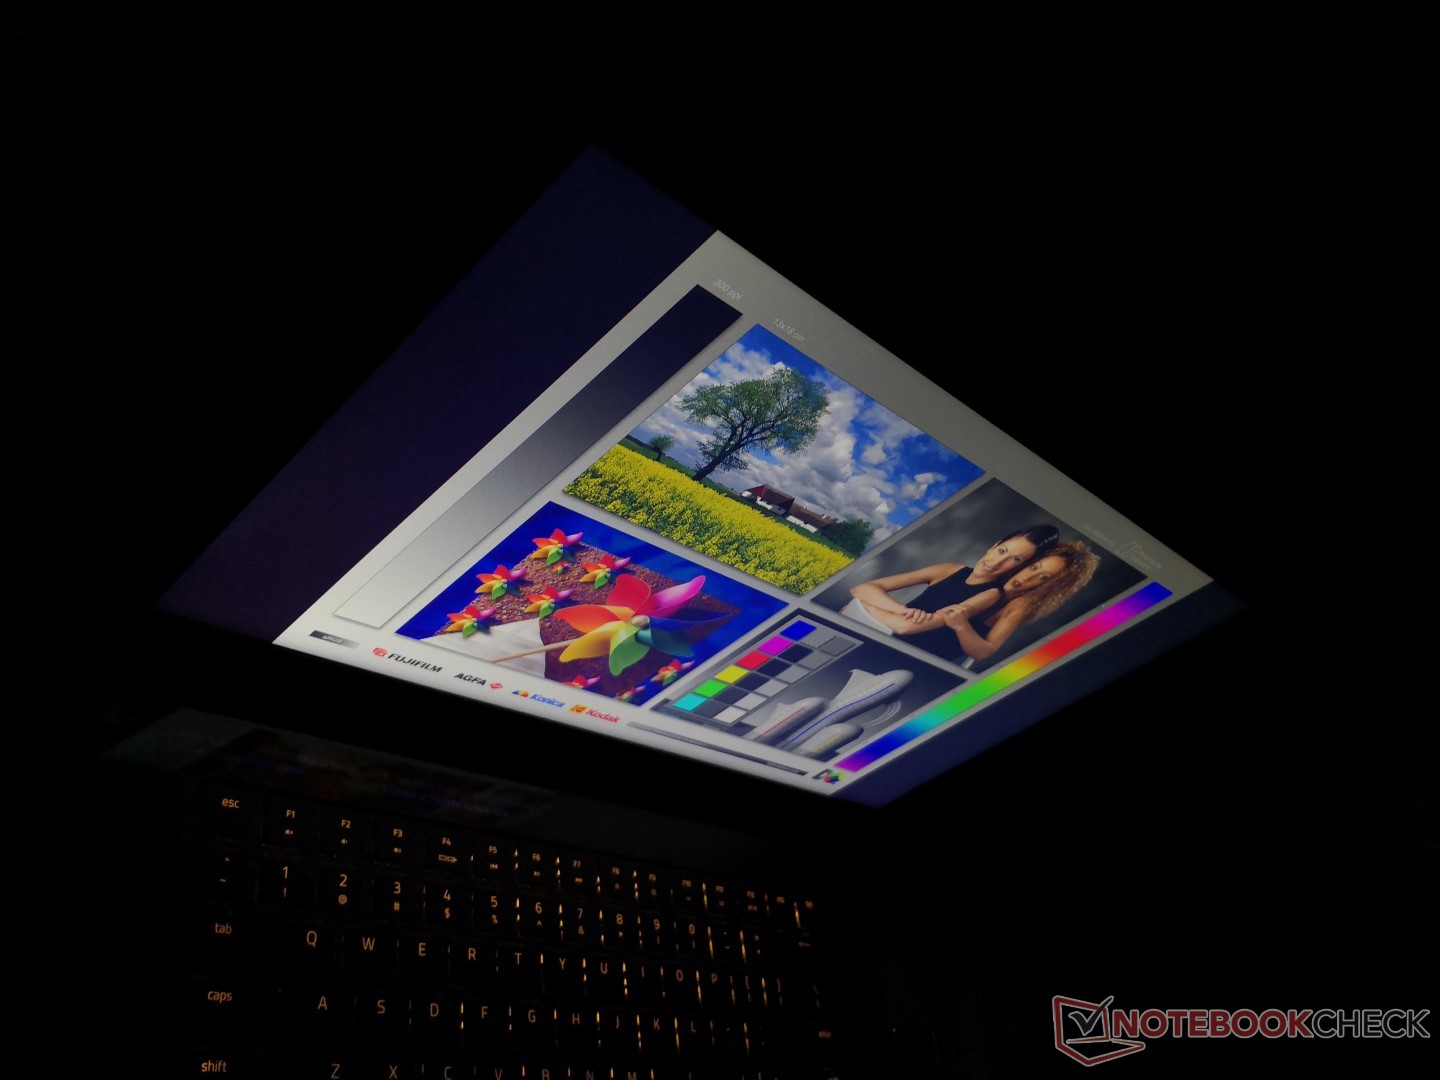
Backlight bleeding has improved over the our GTX 1060 Max-Q Advanced Model. Whereas our latter unit suffers from moderate bleeding along the bottom edge, the Base Model is very even throughout.
An interesting find is that the Base Model is slightly dimmer than the Advanced Model and that its backlight exhibits pulse-width modulation on almost all brightness levels. Most users will not likely notice the flickering, though it is present nonetheless unlike on the Advanced Model.
| |||||||||||||||||||||||||
Brightness Distribution: 86 %
Center on Battery: 273.6 cd/m²
Contrast: 912:1 (Black: 0.3 cd/m²)
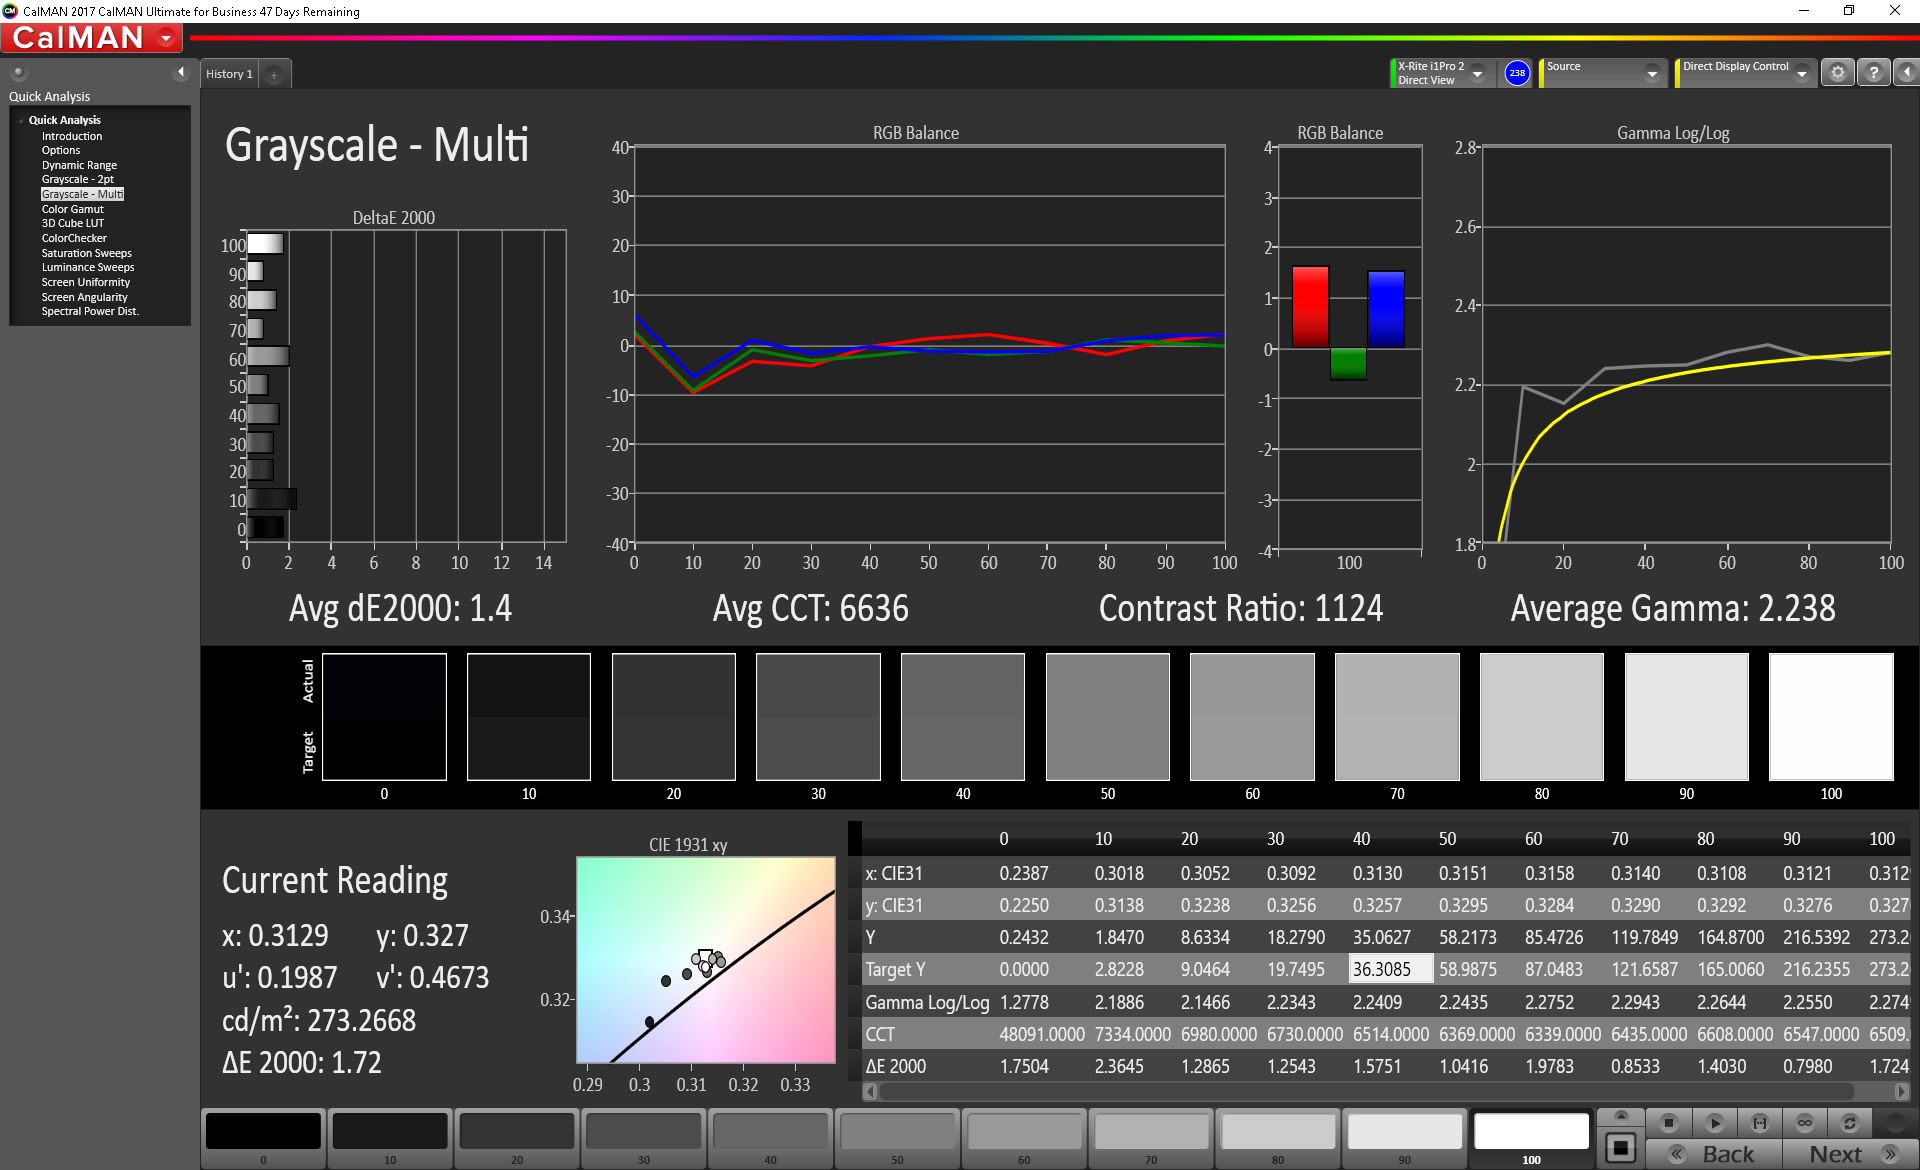
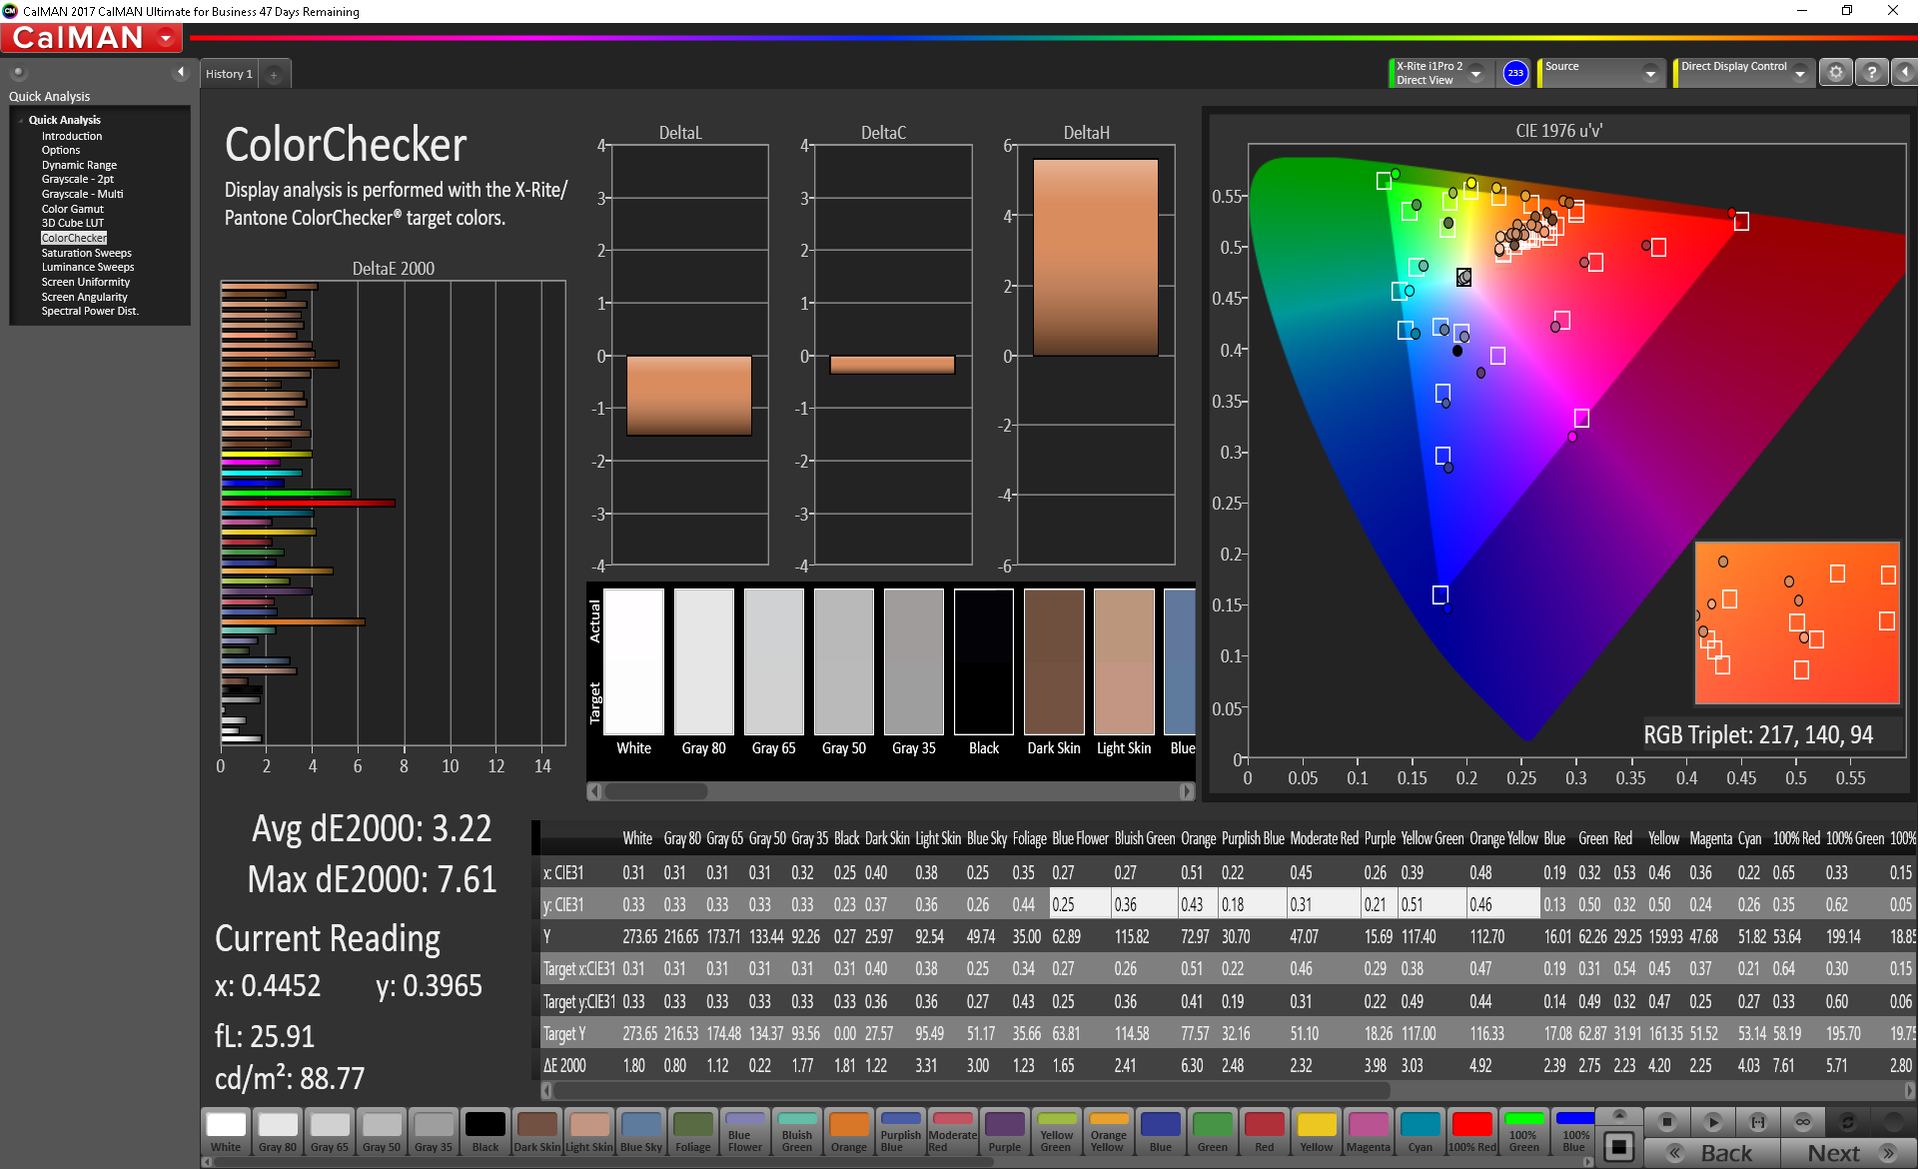
ΔE ColorChecker Calman: 3.22 | ∀{0.5-29.43 Ø4.71}
calibrated: 4.1
ΔE Greyscale Calman: 1.4 | ∀{0.09-98 Ø4.96}
86.2% sRGB (Argyll 1.6.3 3D)
56.4% AdobeRGB 1998 (Argyll 1.6.3 3D)
63.3% AdobeRGB 1998 (Argyll 3D)
86.6% sRGB (Argyll 3D)
66.3% Display P3 (Argyll 3D)
Gamma: 2.24
CCT: 6636 K
| Razer Blade 15 Base Model BOE NV156FHM-N61, IPS, 15.6", 1920x1080 | Razer Blade 15 GTX 1060 LGD05C0, IPS, 15.6", 1920x1080 | HP Pavilion Gaming 15t-cx0000 AU Optronics AUO82ED, IPS, 15.6", 1920x1080 | MSI GS65 Stealth Thin 8RE-051US AUO80ED, IPS, 15.6", 1920x1080 | Gigabyte Aero 15X v8 LGD05C0, IPS, 15.6", 1920x1080 | Apple MacBook Pro 15 2018 (2.6 GHz, 560X) APPA040, IPS, 15.4", 2880x1800 | |
|---|---|---|---|---|---|---|
| Display | 3% | 4% | 4% | 2% | 34% | |
| Display P3 Coverage (%) | 66.3 | 64.4 -3% | 66.5 0% | 65.8 -1% | 63.6 -4% | 98.7 49% |
| sRGB Coverage (%) | 86.6 | 93.4 8% | 91.7 6% | 92.1 6% | 93.8 8% | 99.9 15% |
| AdobeRGB 1998 Coverage (%) | 63.3 | 65.5 3% | 67.1 6% | 67 6% | 64.9 3% | 86.6 37% |
| Response Times | 66% | 62% | 58% | 63% | 1% | |
| Response Time Grey 50% / Grey 80% * (ms) | 39.2 ? | 13.6 ? 65% | 17.6 ? 55% | 20 ? 49% | 16.8 ? 57% | 43.2 ? -10% |
| Response Time Black / White * (ms) | 35.2 ? | 12 ? 66% | 11.2 ? 68% | 12 ? 66% | 11.2 ? 68% | 31.2 ? 11% |
| PWM Frequency (Hz) | 21190 ? | 117000 ? | ||||
| Screen | 11% | -8% | -12% | 21% | 42% | |
| Brightness middle (cd/m²) | 273.6 | 304.3 11% | 357.5 31% | 250.9 -8% | 313 14% | 520 90% |
| Brightness (cd/m²) | 262 | 293 12% | 351 34% | 257 -2% | 300 15% | 492 88% |
| Brightness Distribution (%) | 86 | 80 -7% | 85 -1% | 83 -3% | 78 -9% | 88 2% |
| Black Level * (cd/m²) | 0.3 | 0.38 -27% | 0.36 -20% | 0.32 -7% | 0.33 -10% | 0.39 -30% |
| Contrast (:1) | 912 | 801 -12% | 993 9% | 784 -14% | 948 4% | 1333 46% |
| Colorchecker dE 2000 * | 3.22 | 1.79 44% | 4.19 -30% | 2.77 14% | 1.29 60% | 1.2 63% |
| Colorchecker dE 2000 max. * | 7.61 | 3.69 52% | 6.97 8% | 5.89 23% | 2.04 73% | 2.3 70% |
| Colorchecker dE 2000 calibrated * | 4.1 | 3.2 22% | 2.5 39% | |||
| Greyscale dE 2000 * | 1.4 | 1.1 21% | 3.5 -150% | 4 -186% | 0.69 51% | 1.3 7% |
| Gamma | 2.24 98% | 2.27 97% | 2.324 95% | 2.27 97% | 2.43 91% | 2.18 101% |
| CCT | 6636 98% | 6665 98% | 7028 92% | 6901 94% | 6550 99% | 6738 96% |
| Color Space (Percent of AdobeRGB 1998) (%) | 56.4 | 59.8 6% | 60 6% | 60 6% | 60 6% | |
| Color Space (Percent of sRGB) (%) | 86.2 | 92.8 8% | 91 6% | 92 7% | 94 9% | |
| Total Average (Program / Settings) | 27% /
16% | 19% /
3% | 17% /
-0% | 29% /
23% | 26% /
34% |
* ... smaller is better
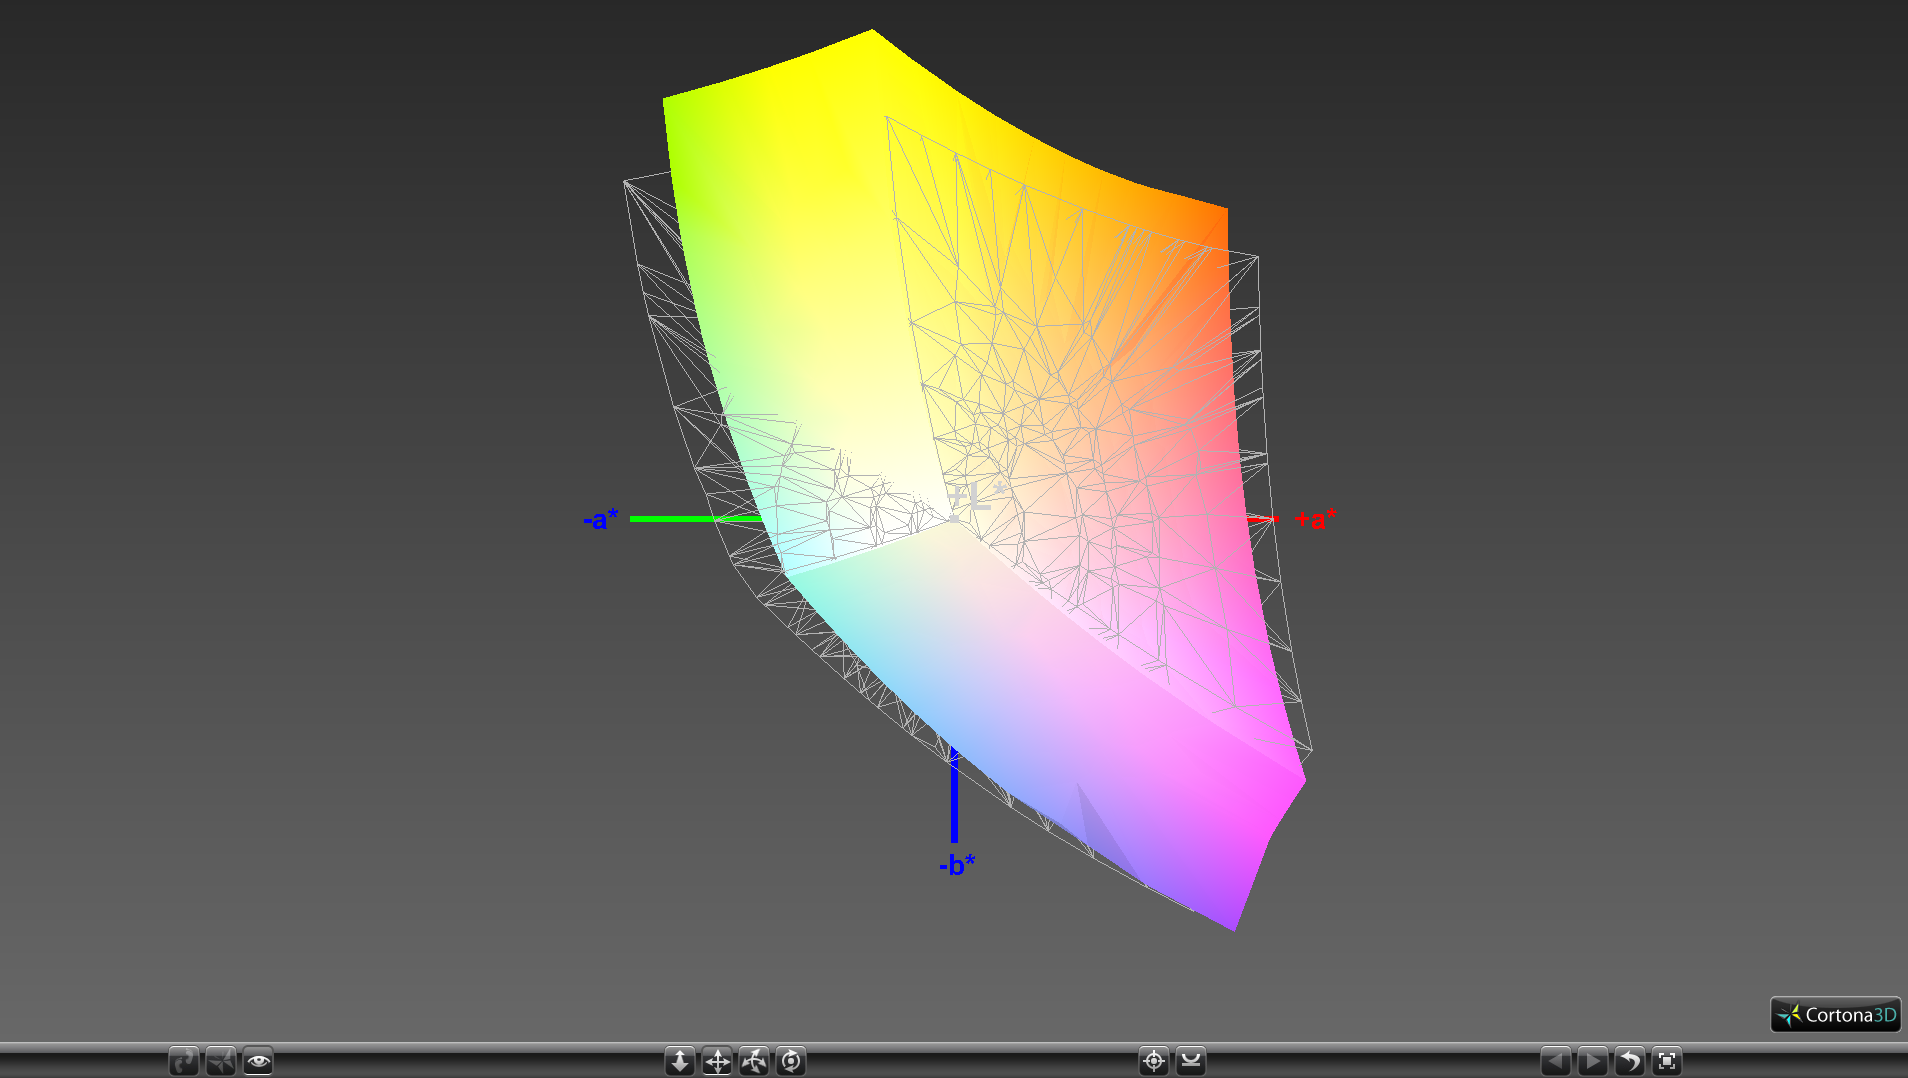
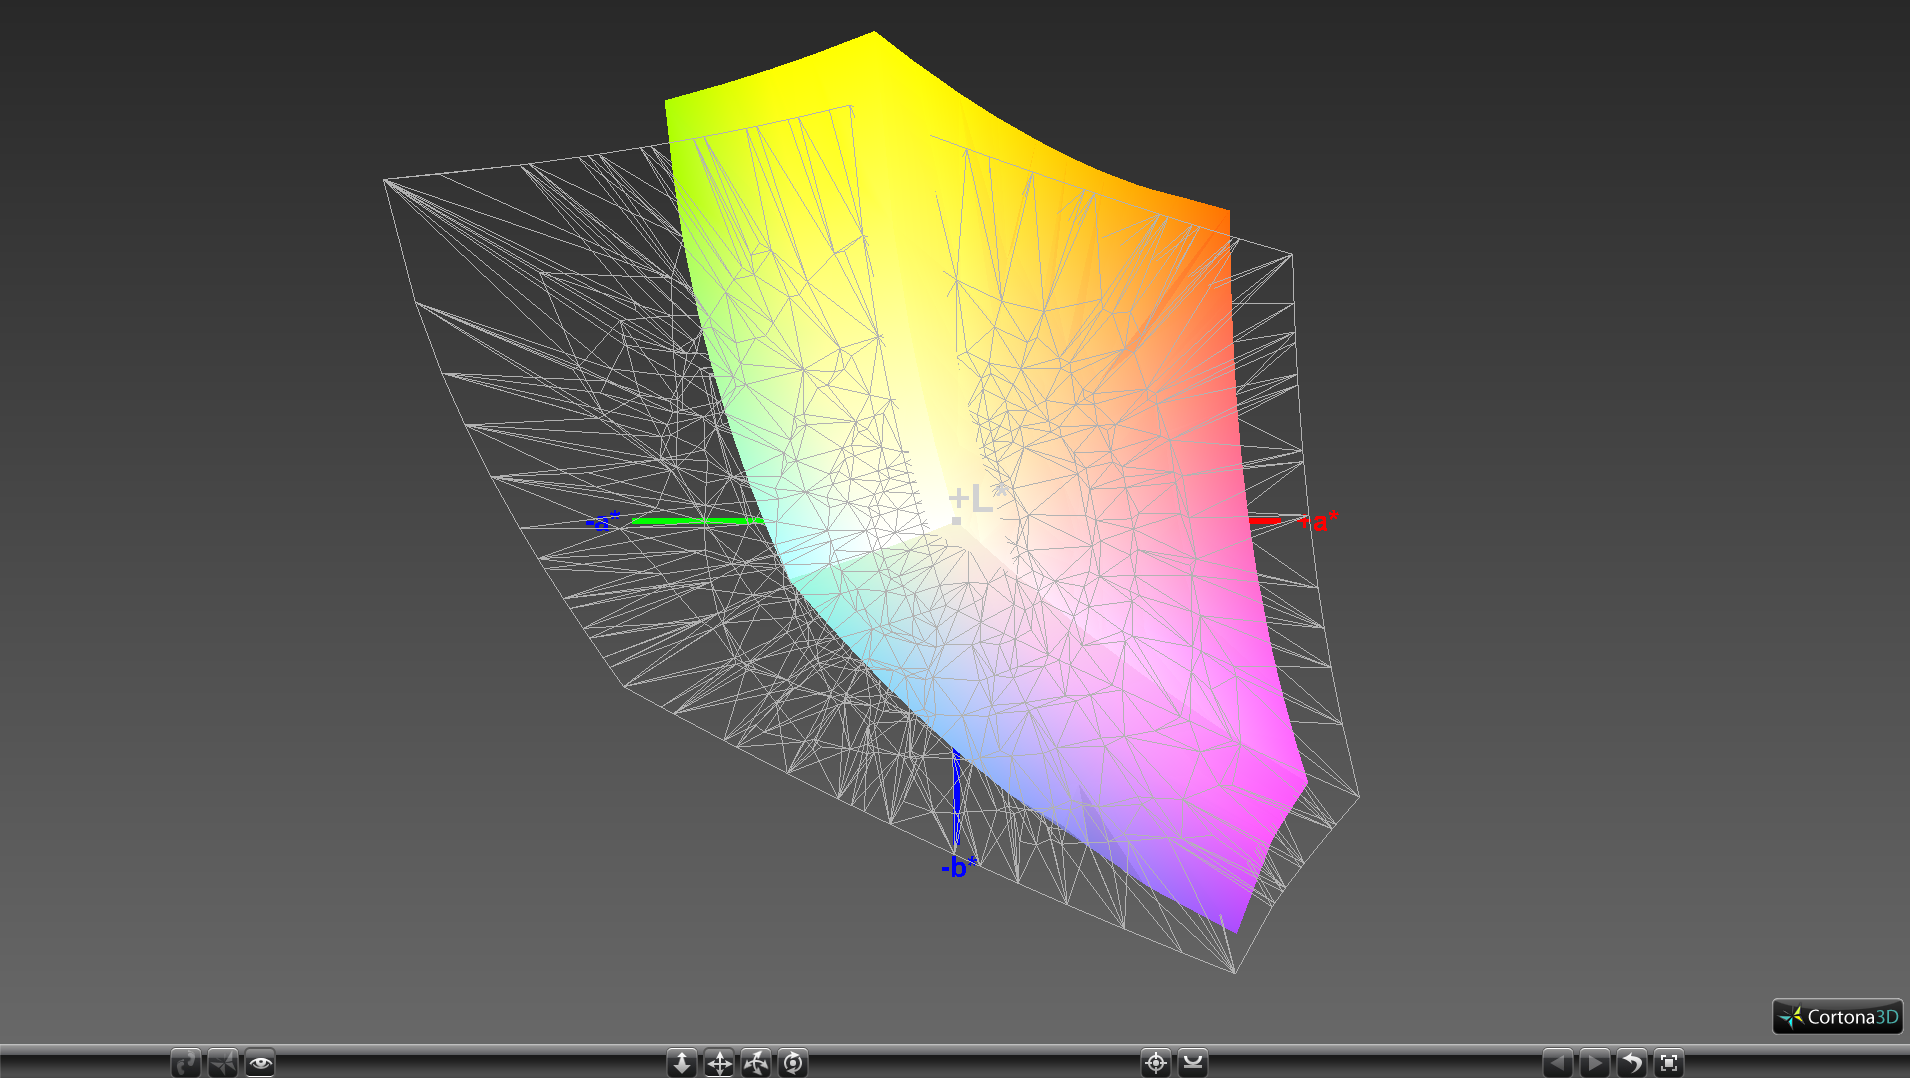
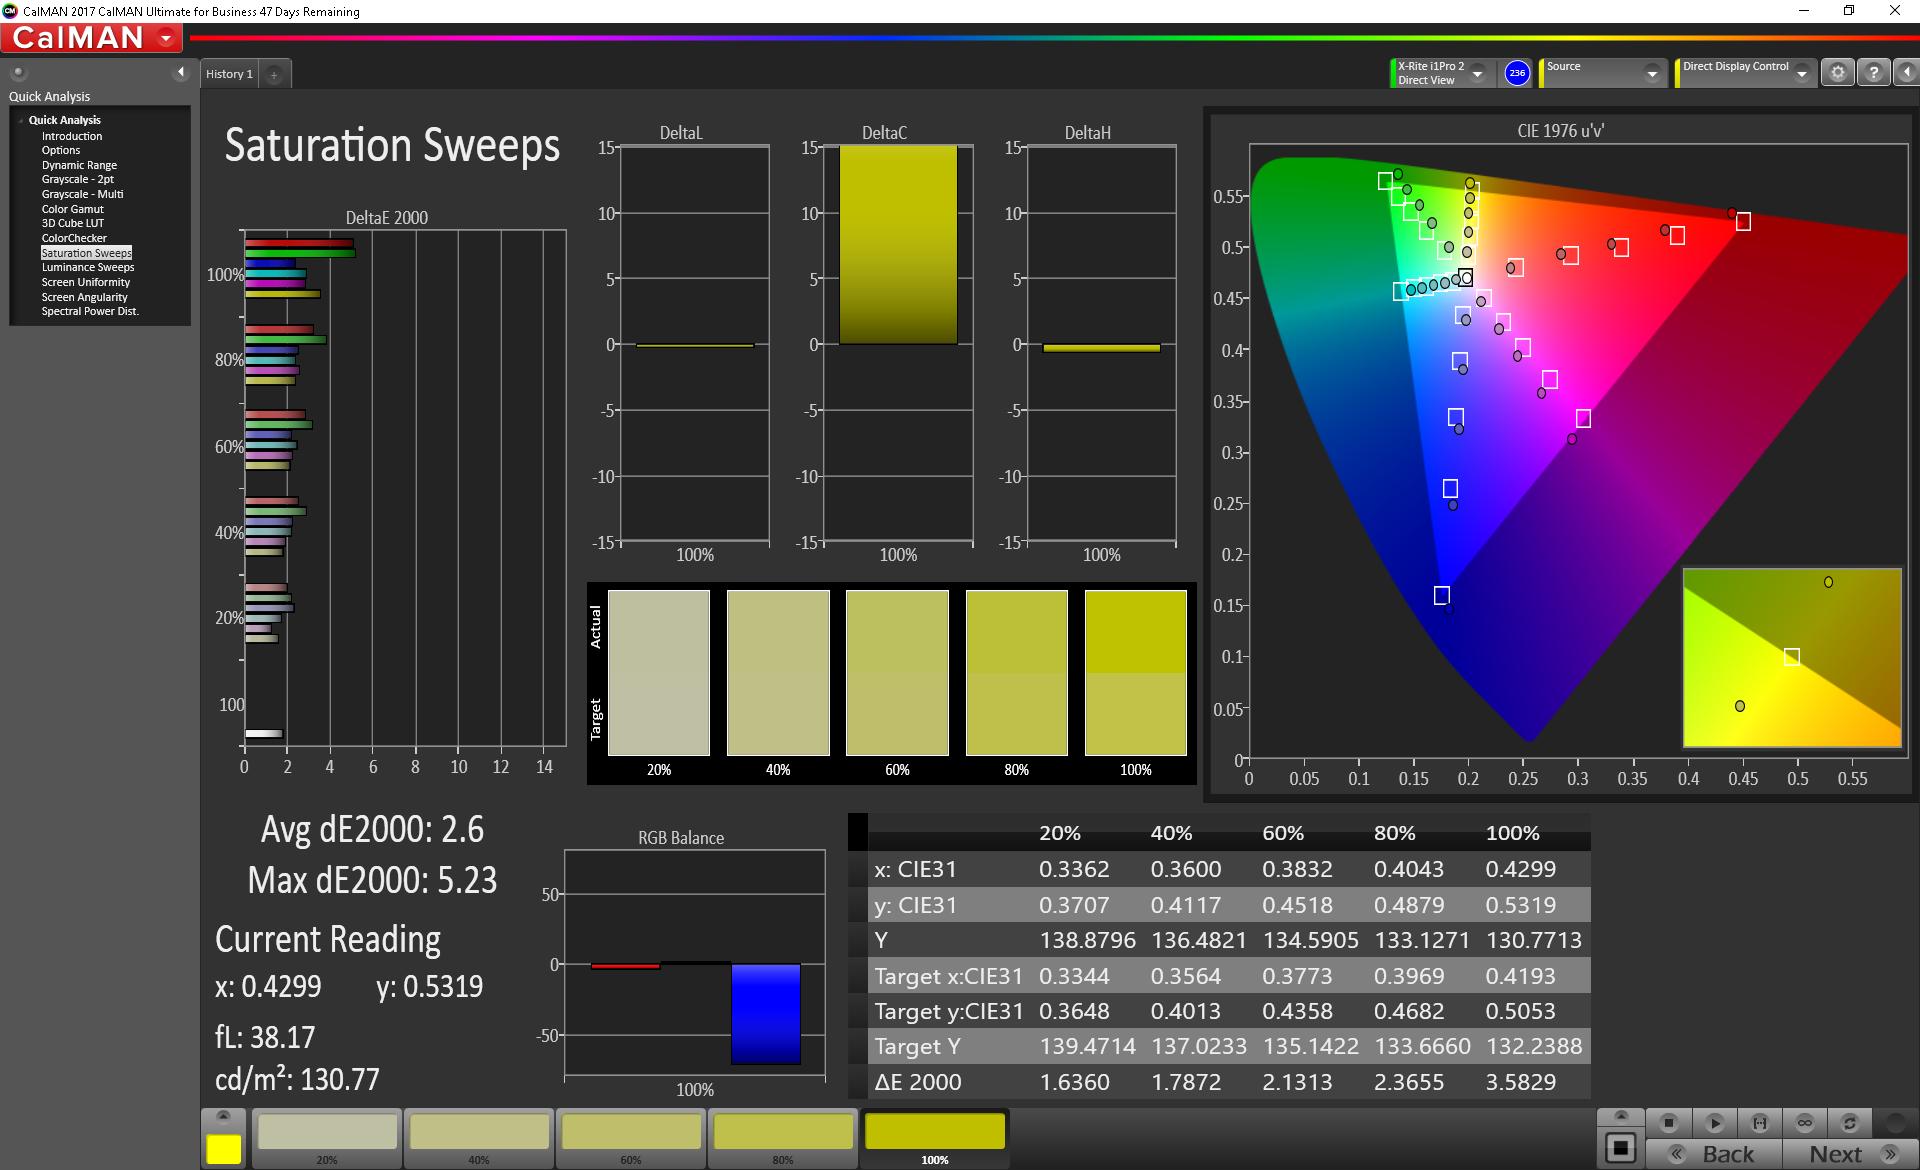
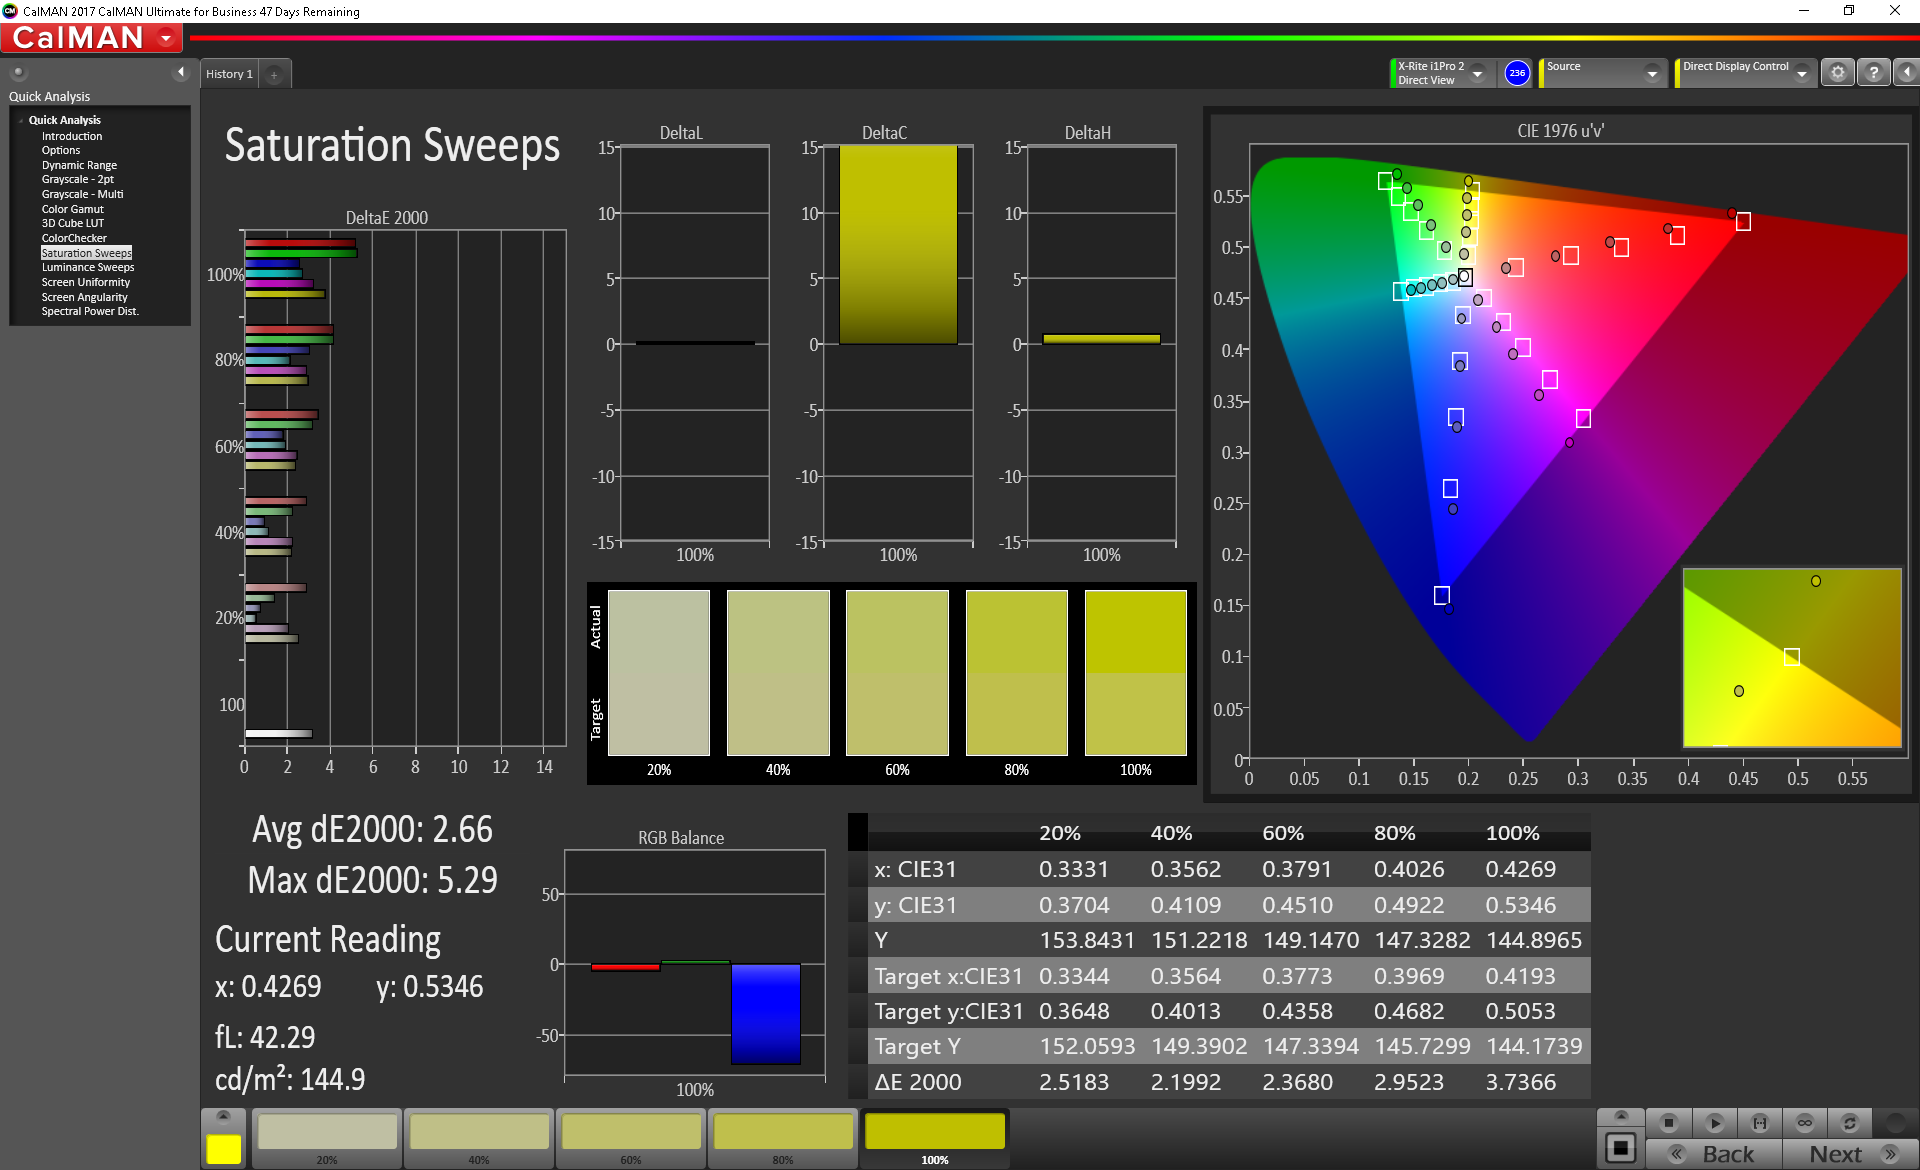
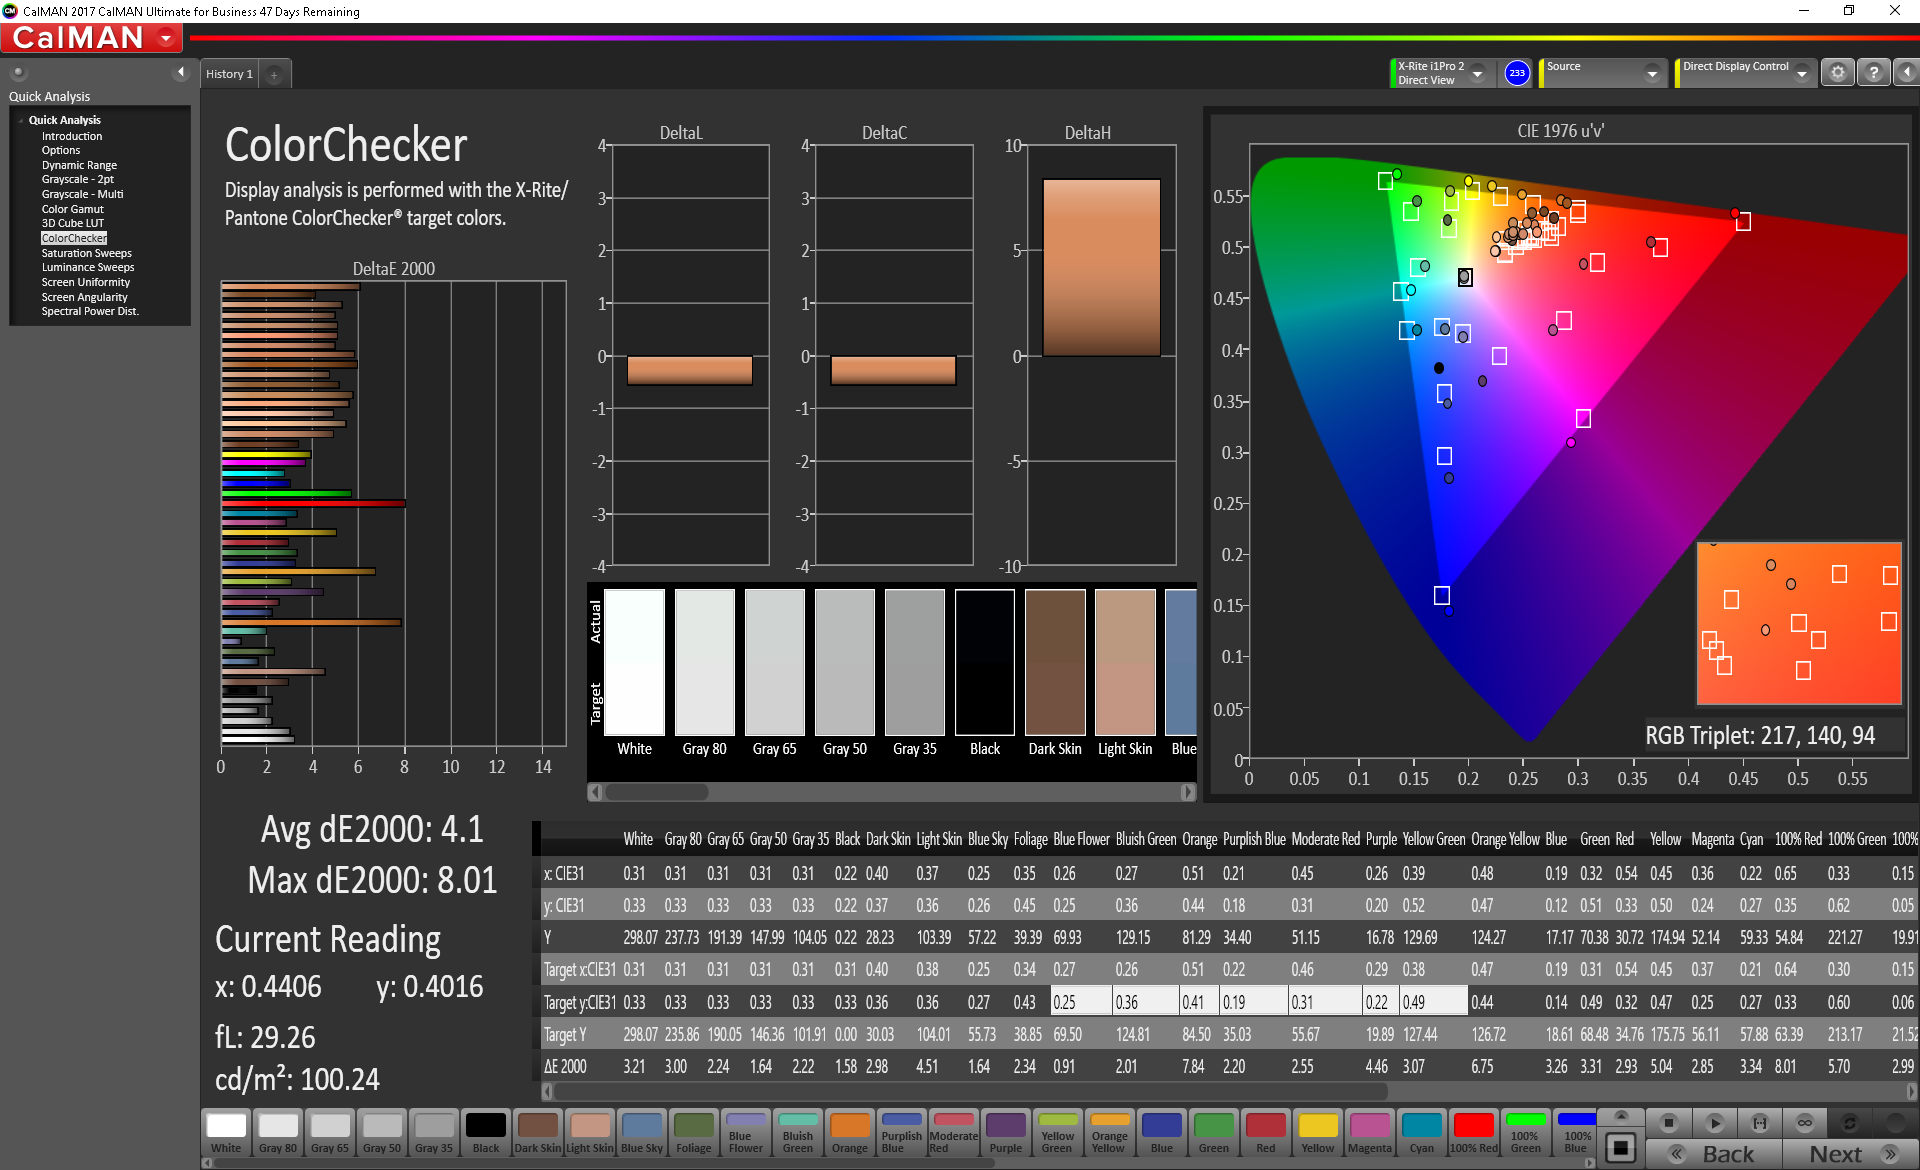
Color space is slightly narrower than the 144 Hz panels on the Advanced Model for a sRGB coverage of about 86 percent. For gaming purposes, however, this should be of no concern. Users who want full sRGB or AdobeRGB coverage should consider the larger Blade Pro where such options are available.
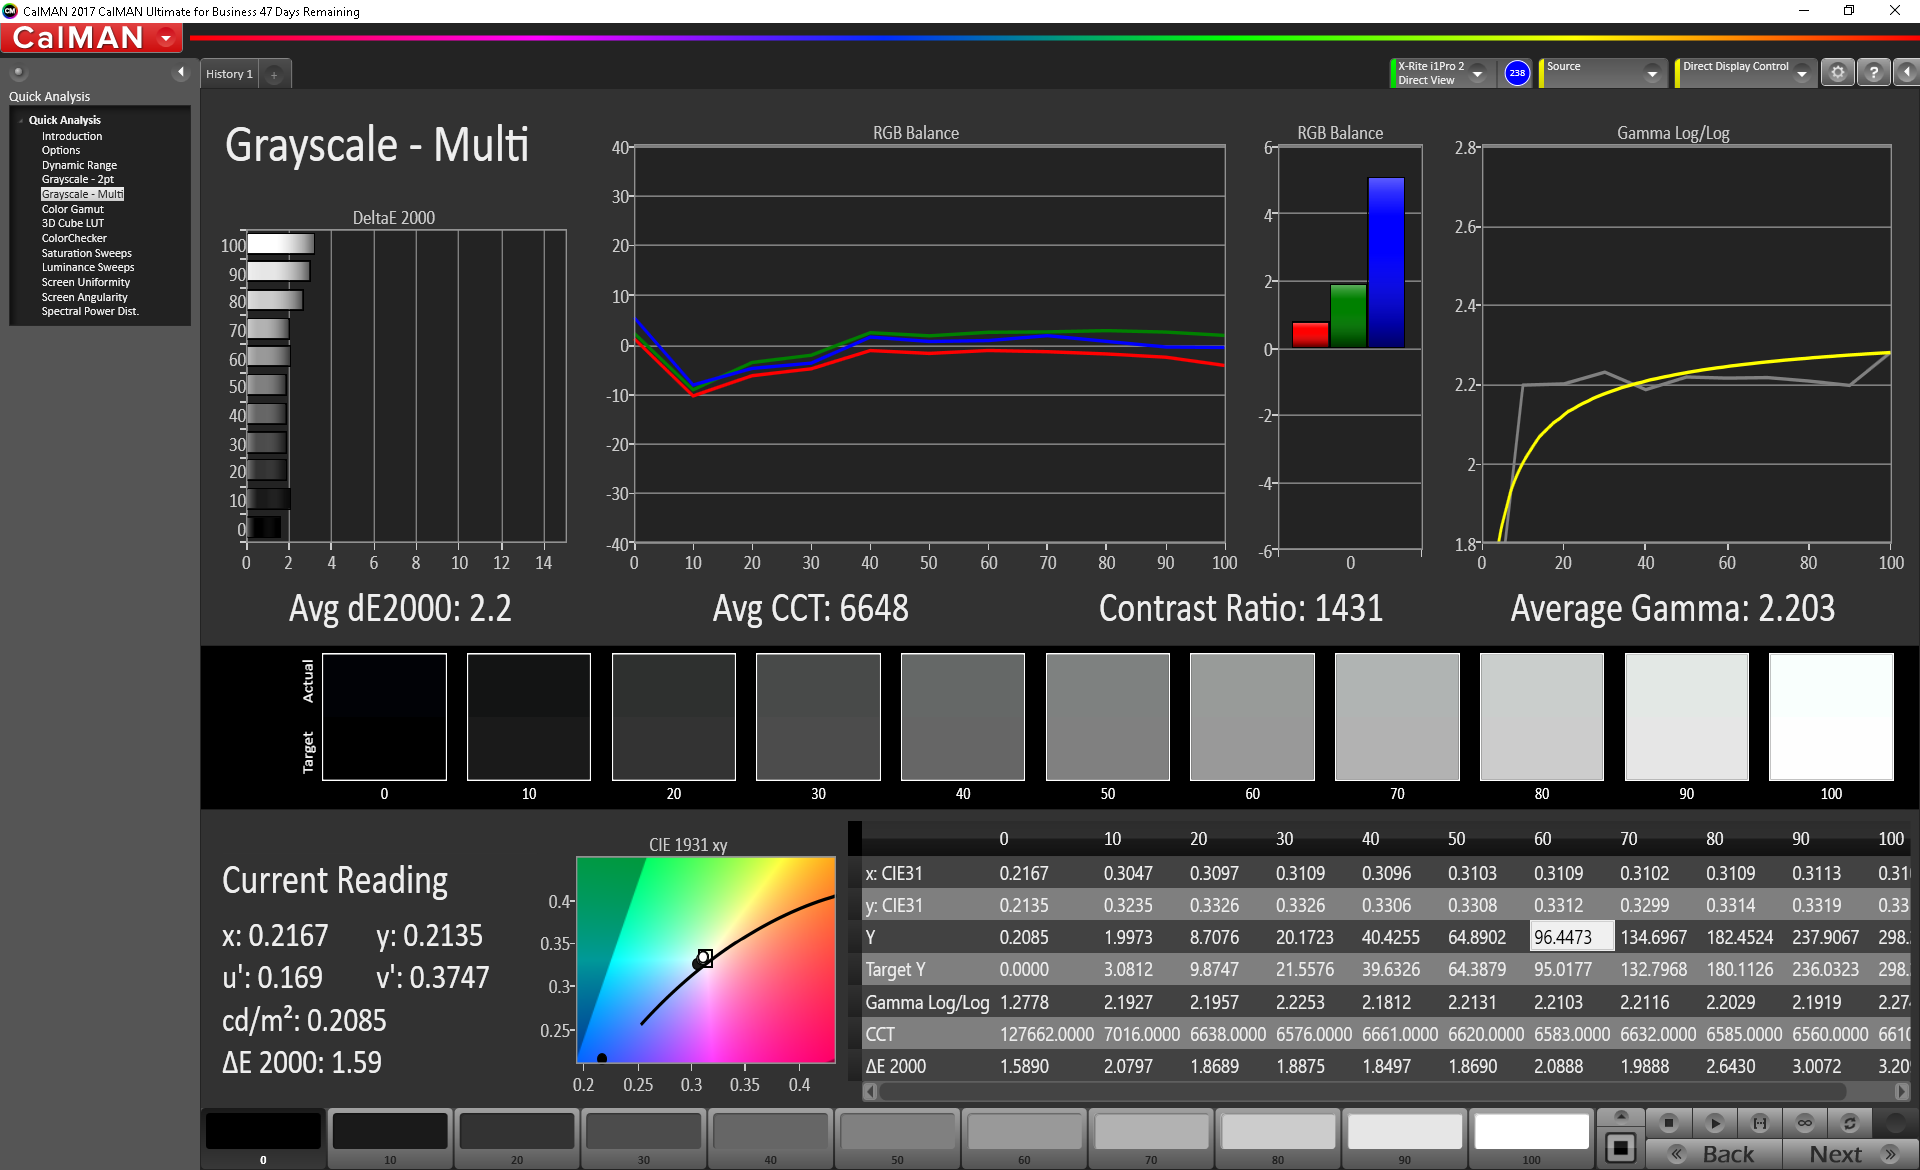
Further measurements with a X-Rite spectrophotometer reveal very accurate grayscale and colors out of the box. Our attempts to calibrate the display even further were futile as shown by our CalMAN results below. Note that pure colors are represented less accurately than colors of lower saturation since sRGB coverage is imperfect.
Display Response Times
| ↔ Response Time Black to White | ||
|---|---|---|
| 35.2 ms ... rise ↗ and fall ↘ combined | ↗ 20.4 ms rise | 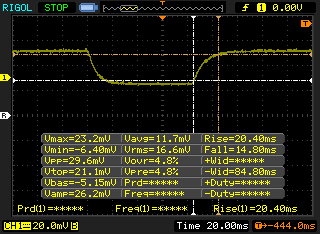 |
| ↘ 14.8 ms fall | ||
| The screen shows slow response rates in our tests and will be unsatisfactory for gamers. In comparison, all tested devices range from 0.1 (minimum) to 240 (maximum) ms. » 93 % of all devices are better. This means that the measured response time is worse than the average of all tested devices (19.8 ms). | ||
| ↔ Response Time 50% Grey to 80% Grey | ||
| 39.2 ms ... rise ↗ and fall ↘ combined | ↗ 19.6 ms rise | 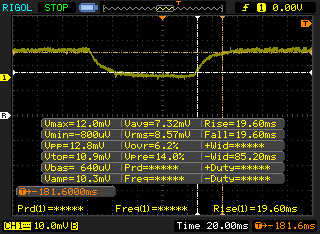 |
| ↘ 19.6 ms fall | ||
| The screen shows slow response rates in our tests and will be unsatisfactory for gamers. In comparison, all tested devices range from 0.165 (minimum) to 636 (maximum) ms. » 60 % of all devices are better. This means that the measured response time is worse than the average of all tested devices (31 ms). | ||
Screen Flickering / PWM (Pulse-Width Modulation)
| Screen flickering / PWM detected | 21190 Hz | ≤ 99 % brightness setting | 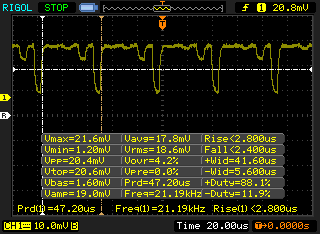 |
The display backlight flickers at 21190 Hz (worst case, e.g., utilizing PWM) Flickering detected at a brightness setting of 99 % and below. There should be no flickering or PWM above this brightness setting. The frequency of 21190 Hz is quite high, so most users sensitive to PWM should not notice any flickering. In comparison: 52 % of all tested devices do not use PWM to dim the display. If PWM was detected, an average of 7754 (minimum: 5 - maximum: 343500) Hz was measured. | |||
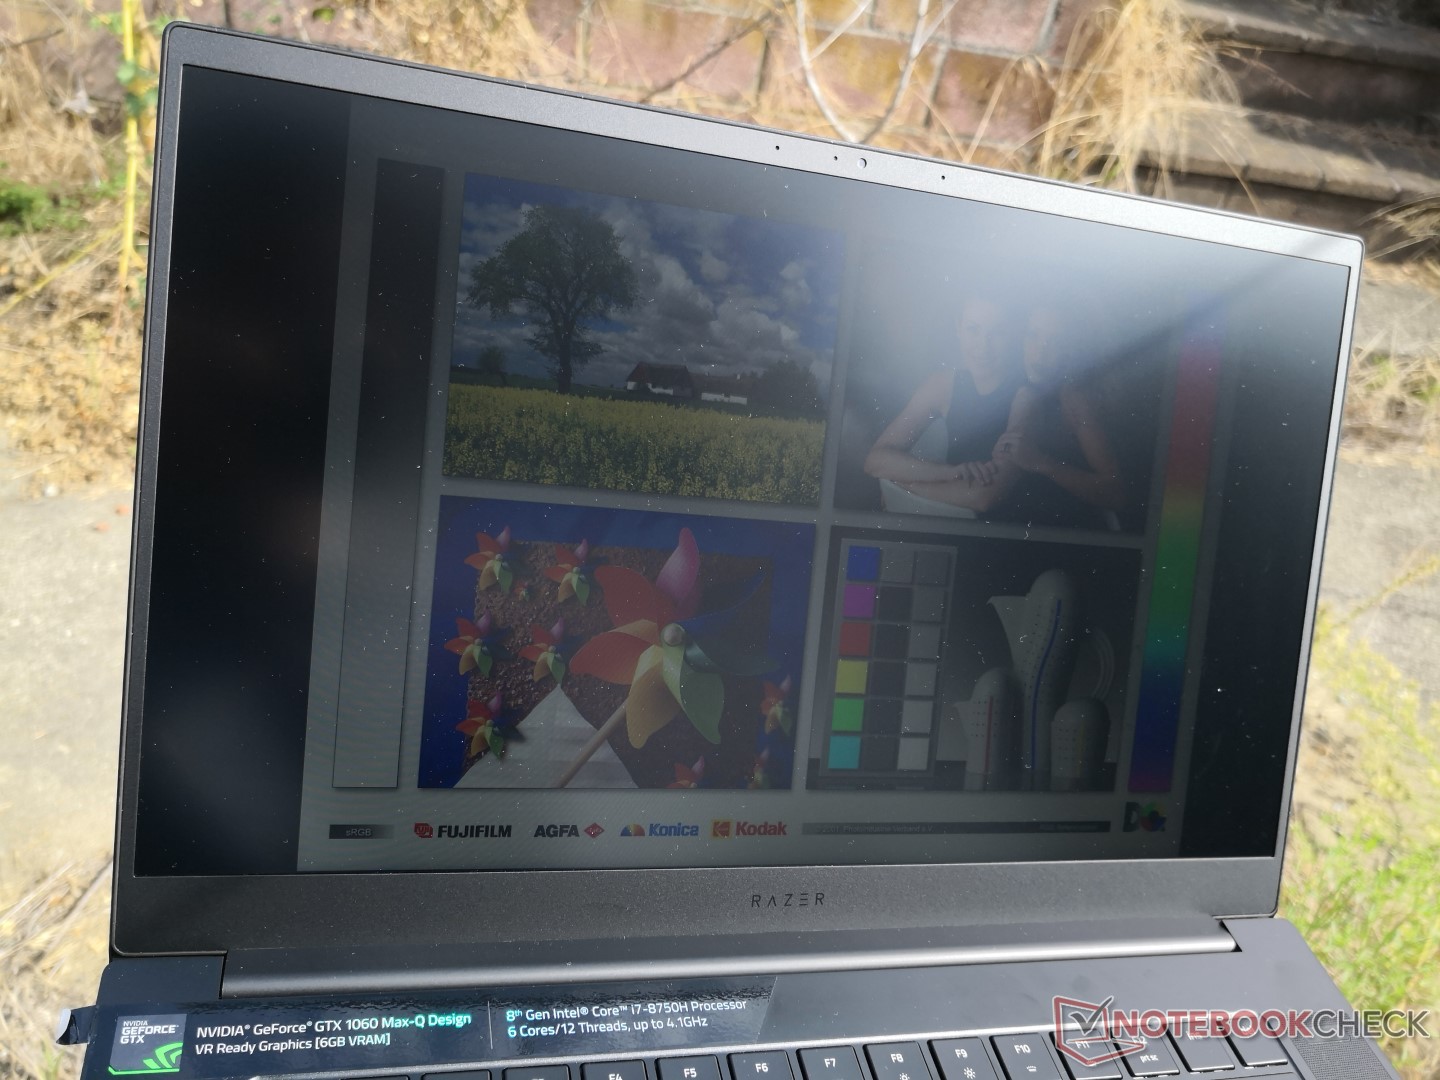
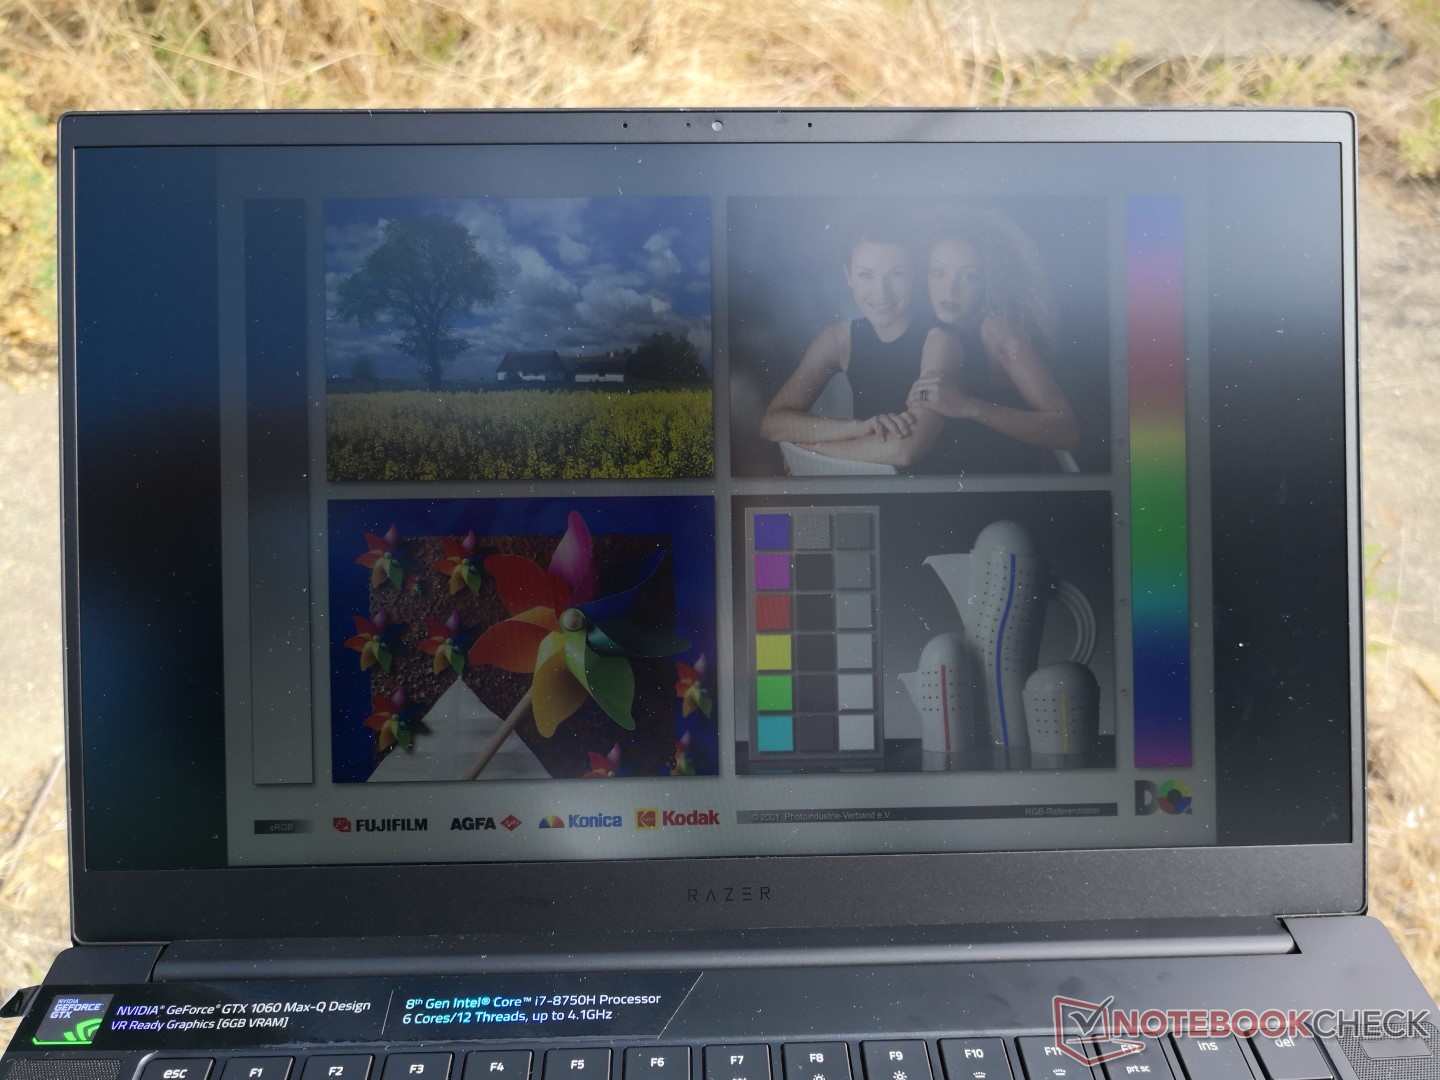
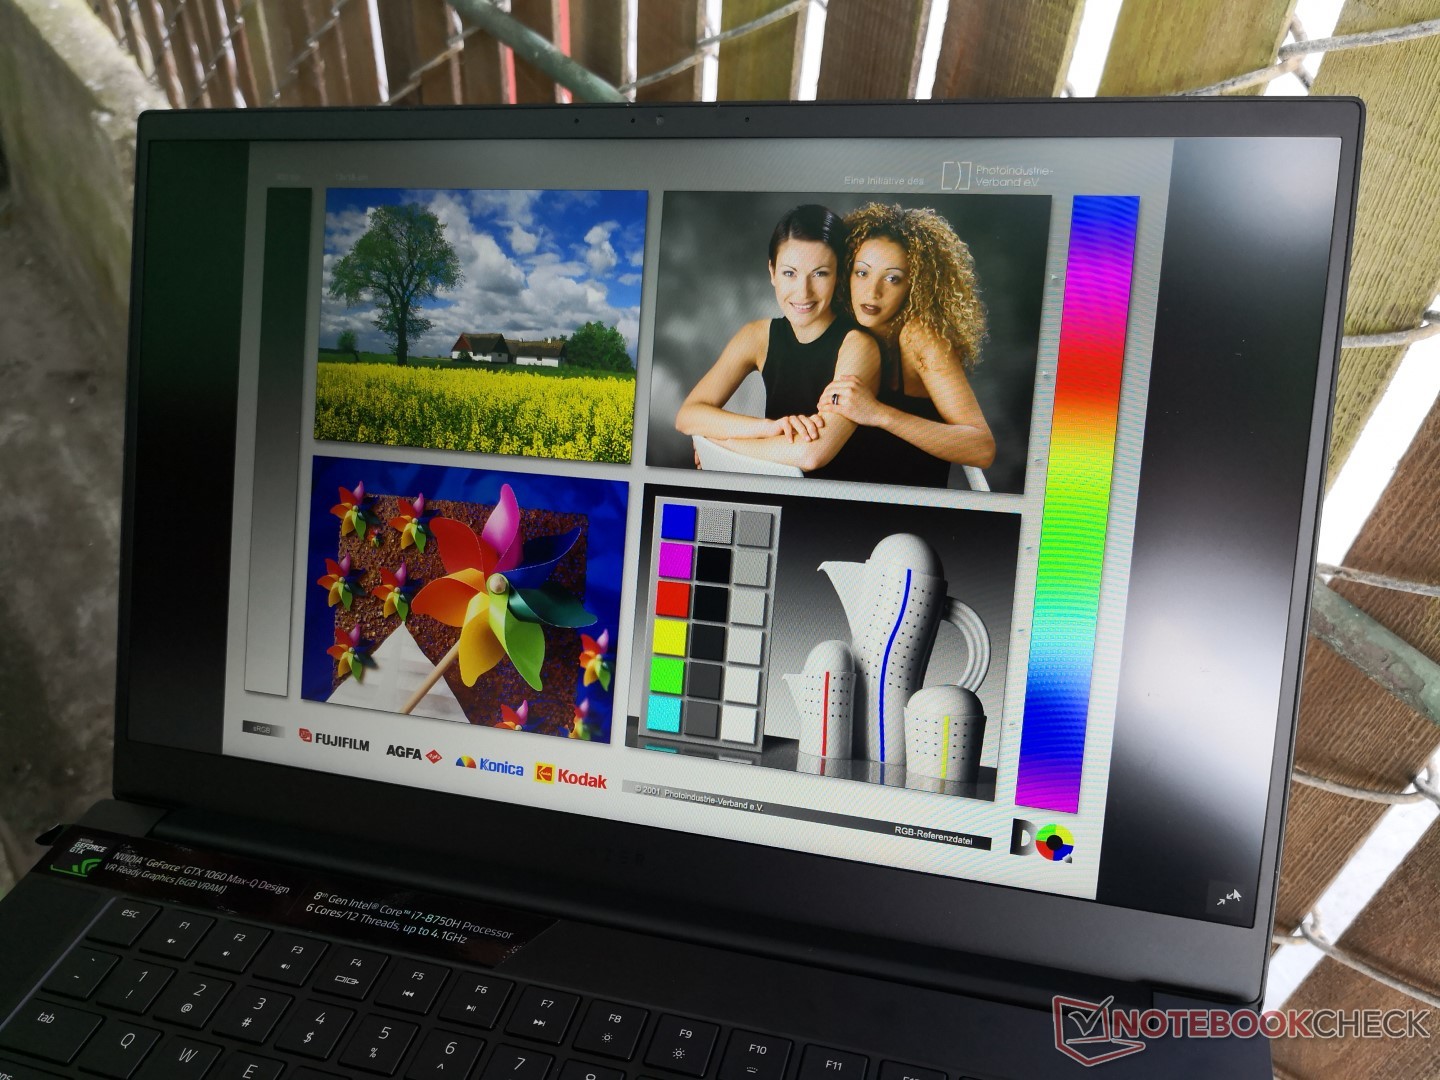
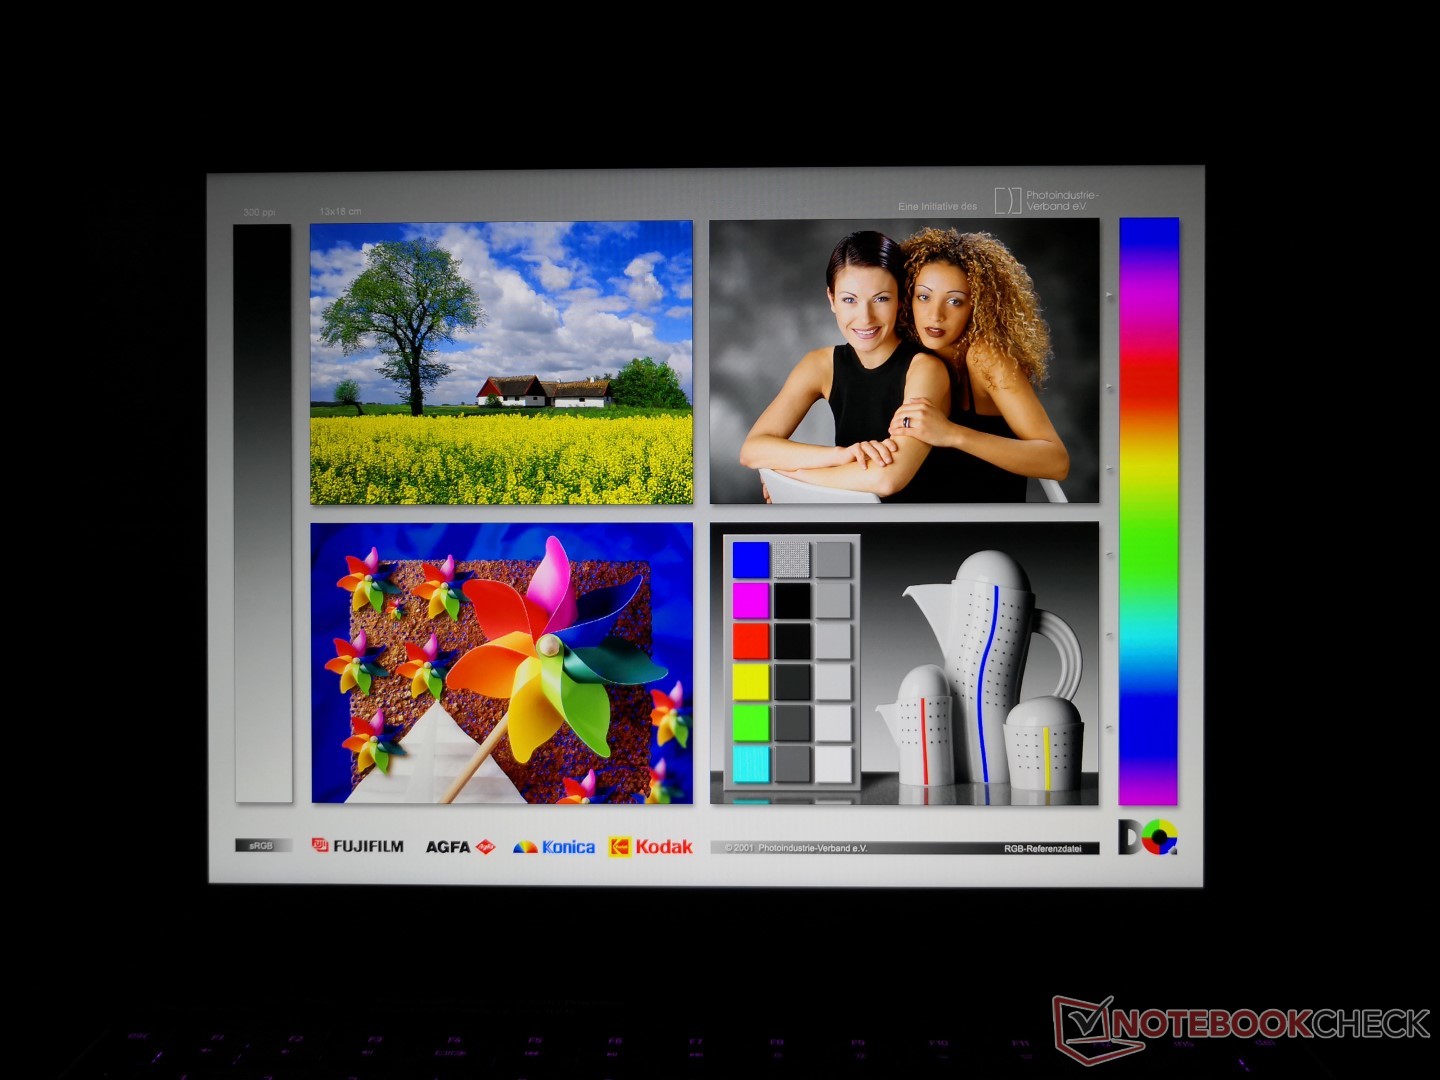
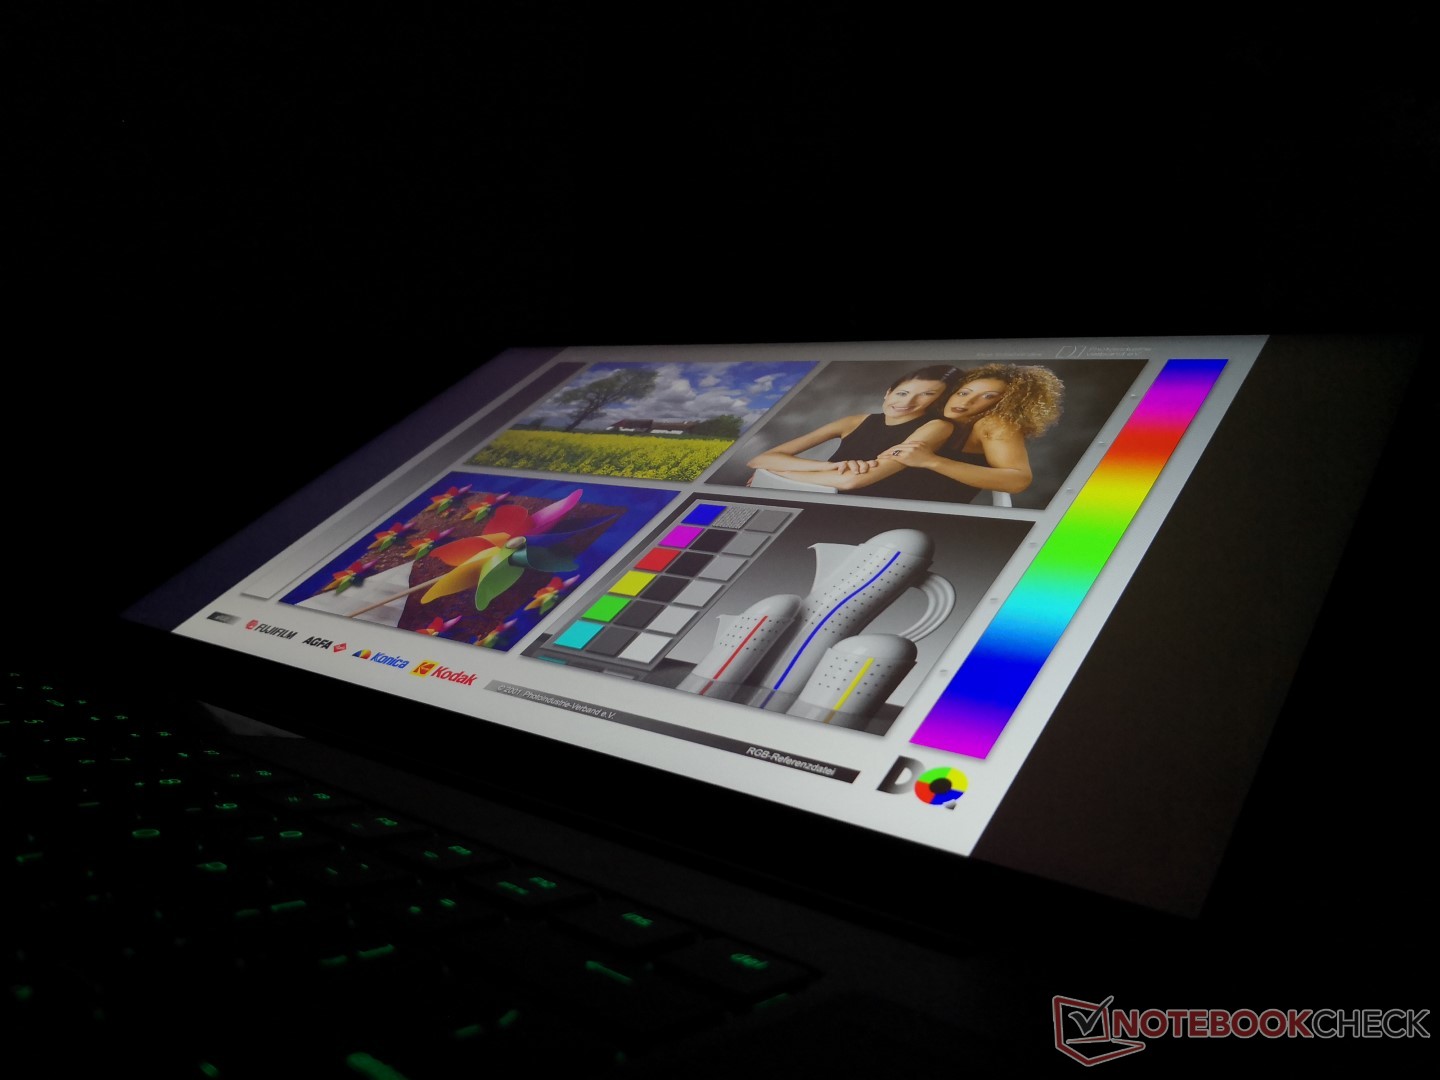
Outdoor visibility remains unchanged. While the matte panel helps in reducing glare, the backlight was not designed to overcome sunlight. Viewing angles are otherwise very wide with no major color shifts or contrast changes.
Performance
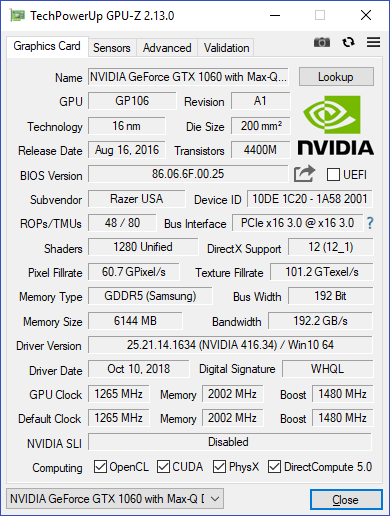
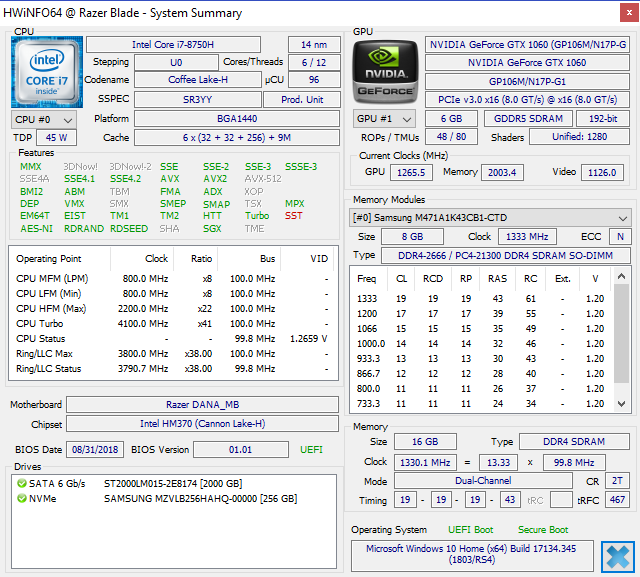
Advanced Model buyers have the option of a GeForce GTX 1060 Max-Q or GTX 1070 Max-Q GPU with a FHD or 4K UHD display. Base Model buyers are limited to the GTX 1060 Max-Q GPU and 60 Hz 1080p panel. The expandable DDR4 RAM and i7-8750H CPU are otherwise identical between all configurations.
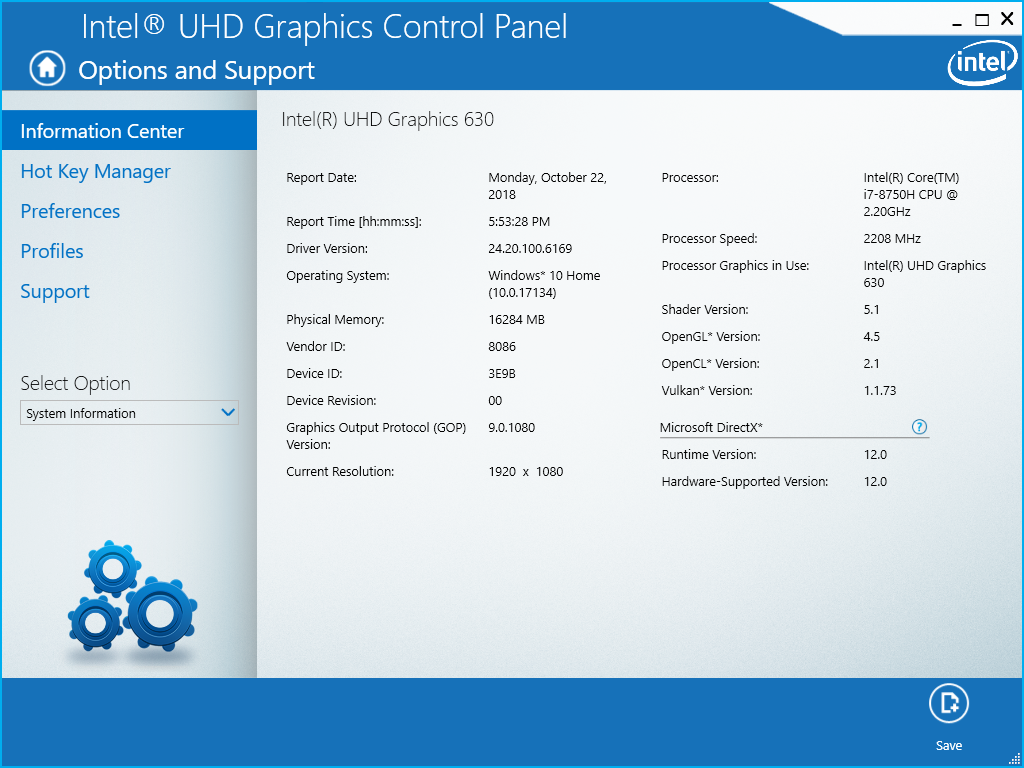
Nvidia Optimus is included for automatic switching to the UHD Graphics 630 GPU.
Processor
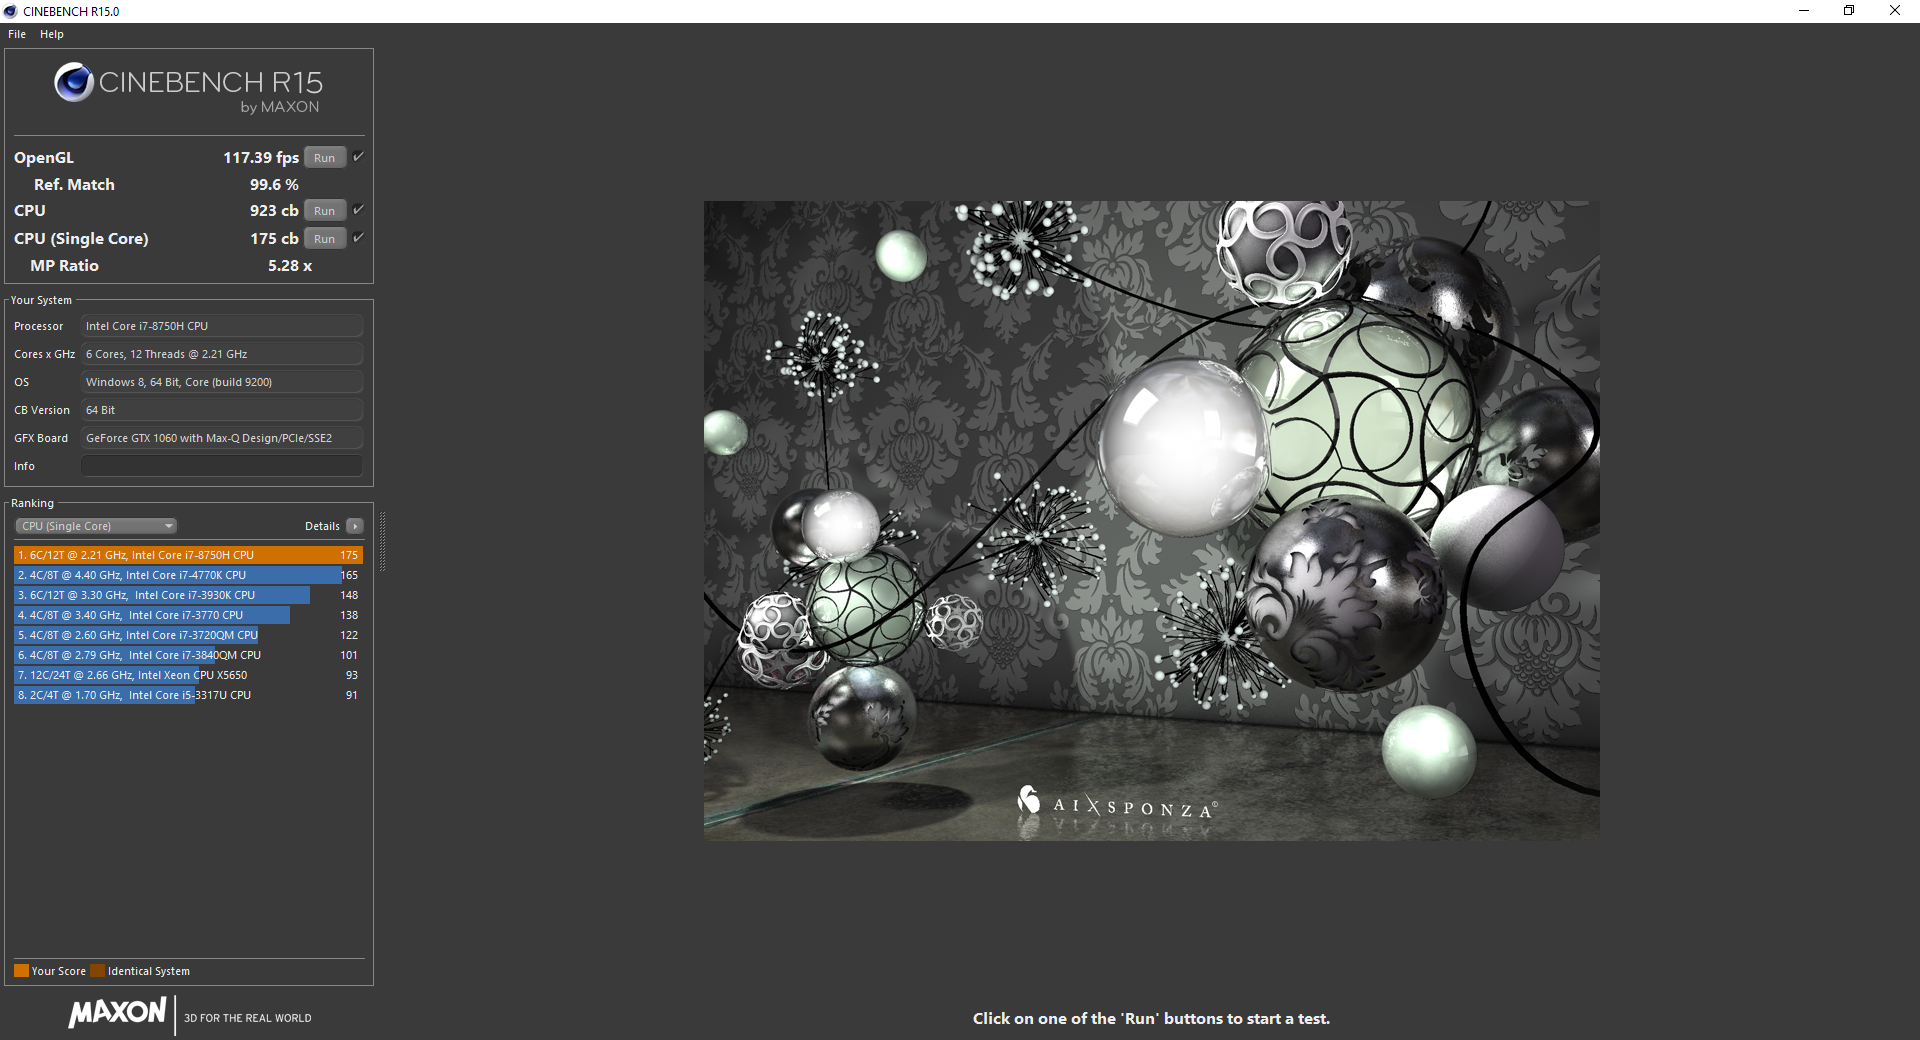
The Core i7-8750H in the Base Model performs almost identically to the same CPU in the Advanced Model. We say "almost" because it is actually slightly slower by a few percentage points according to CineBench R15. Nonetheless, the difference is so minimal that users are unlikely to notice in practice. Raw multi-thread performance is about 30 percent faster than the i7-7700HQ in last year's Razer Blade Pro and even 20 percent faster than the i7-7820HK.
Running CineBench R15 Multi-Thread in a loop is a good way to test performance sustainability. For the Base Model, its initial score of 927 points drops to 862 points by the second loop to represent a performance dip of only 7 percent. Similar drops can also be observed on the Advanced Model SKUs as shown by the comparison graph below.
See our dedicated page on the Core i7-8750H for more technical information and benchmarks.
System Performance
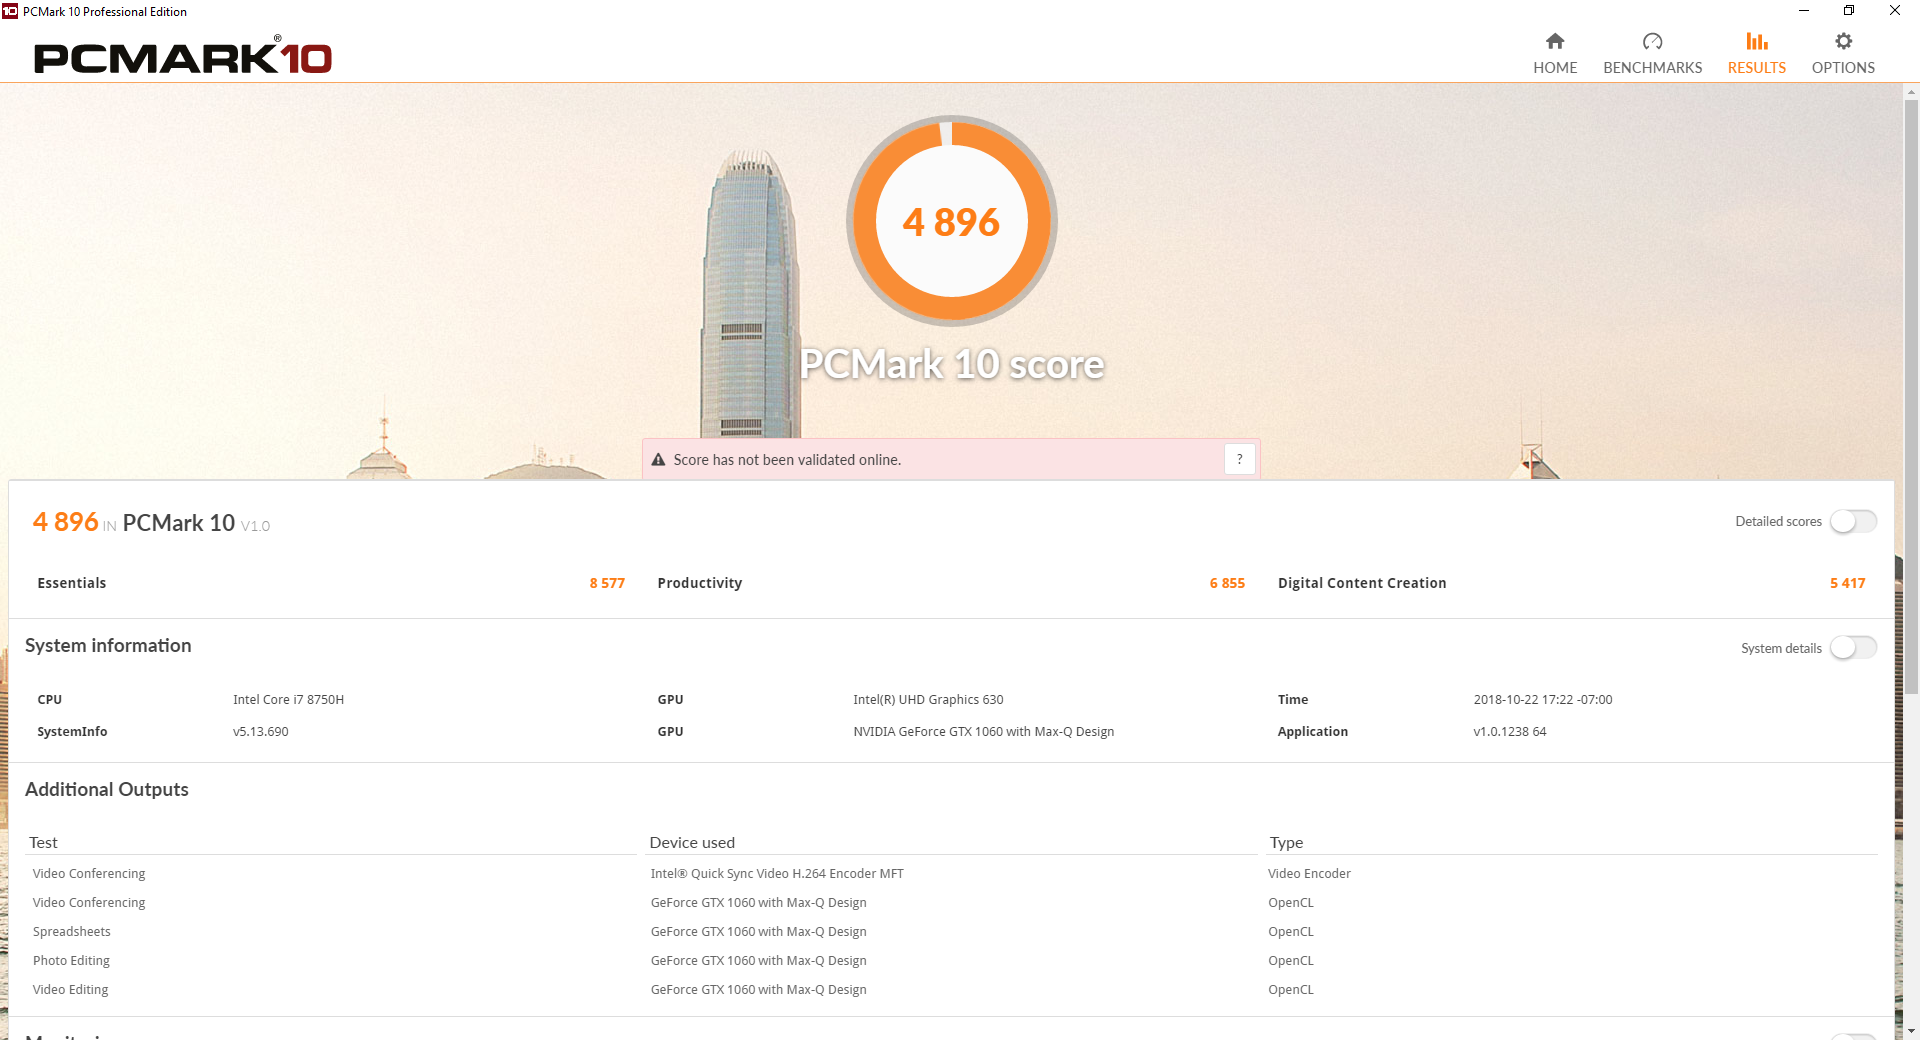
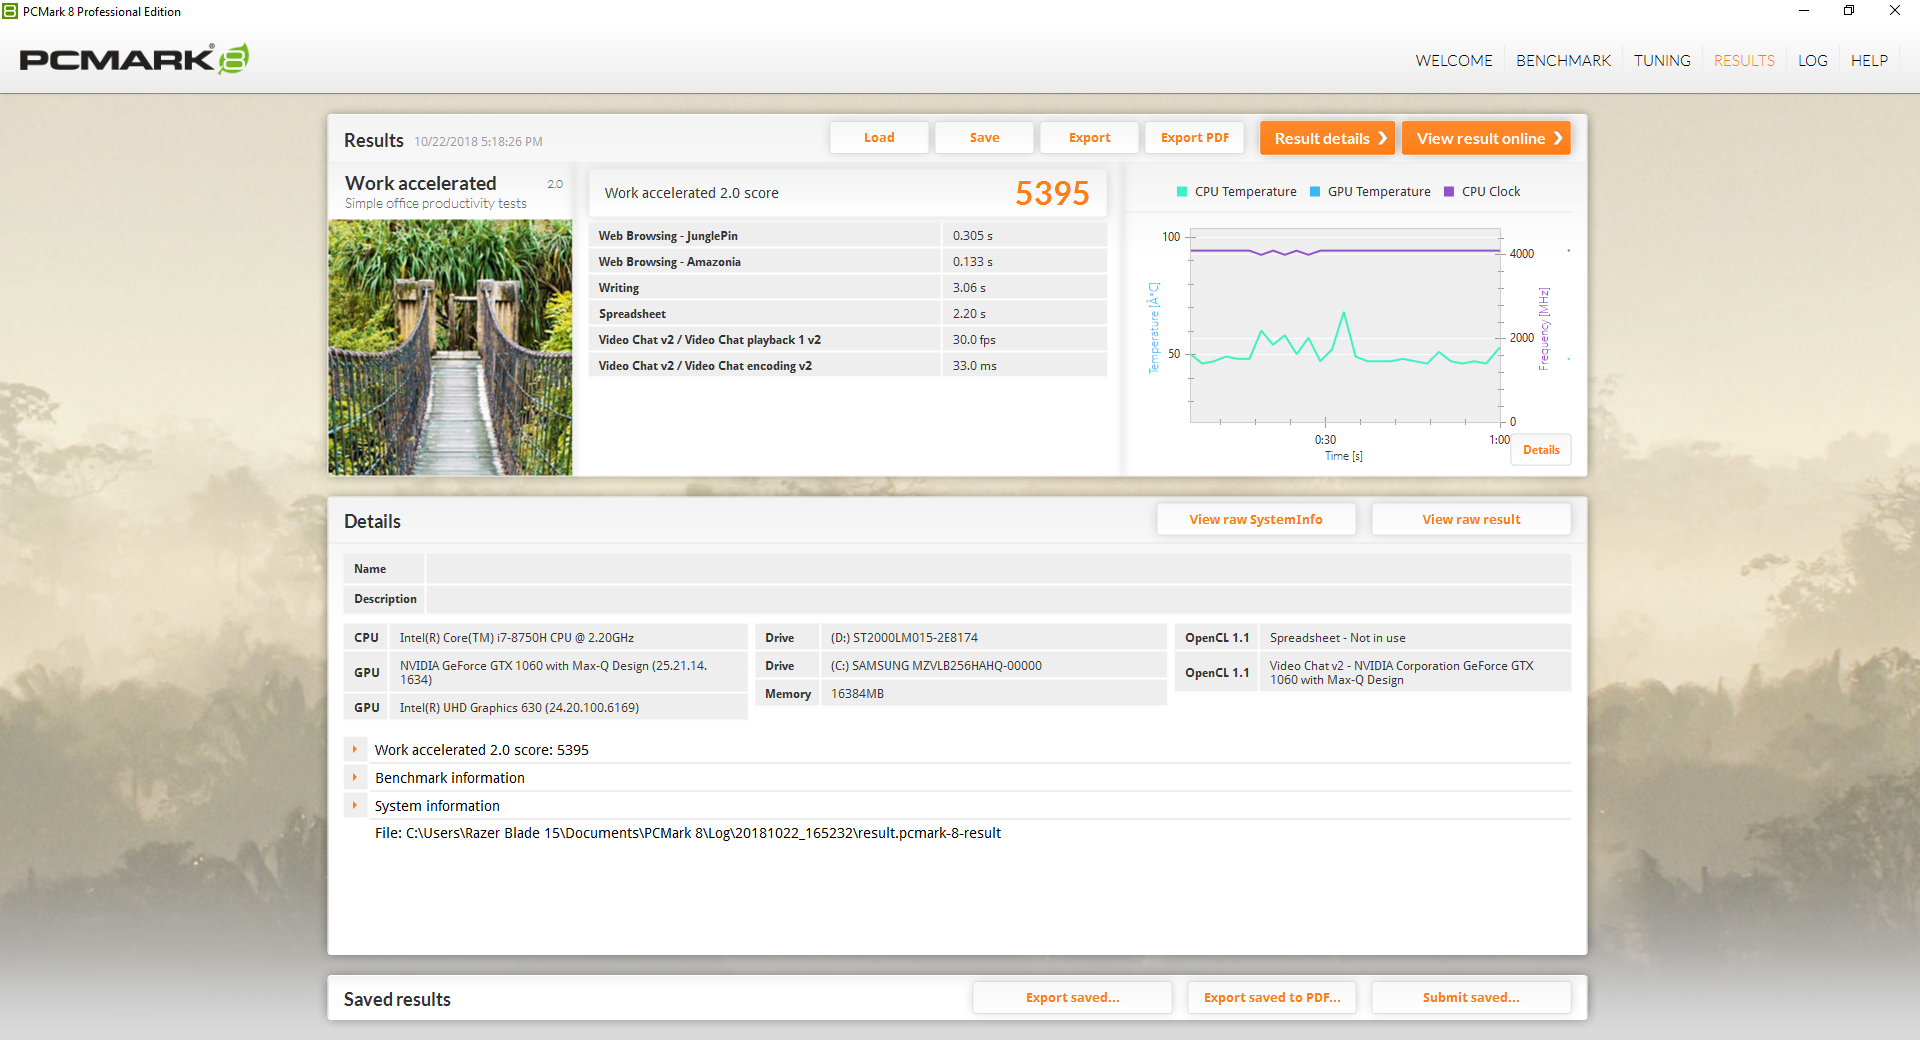
PCMark benchmarks rank our Blade 15 Base Model within single-digit percentage points from the Advanced Models. In other words, day-to-day performance for browsing, streaming, and office-type productivity work are not any slower on the Base Model. We experienced no software issues during our time with the test unit.
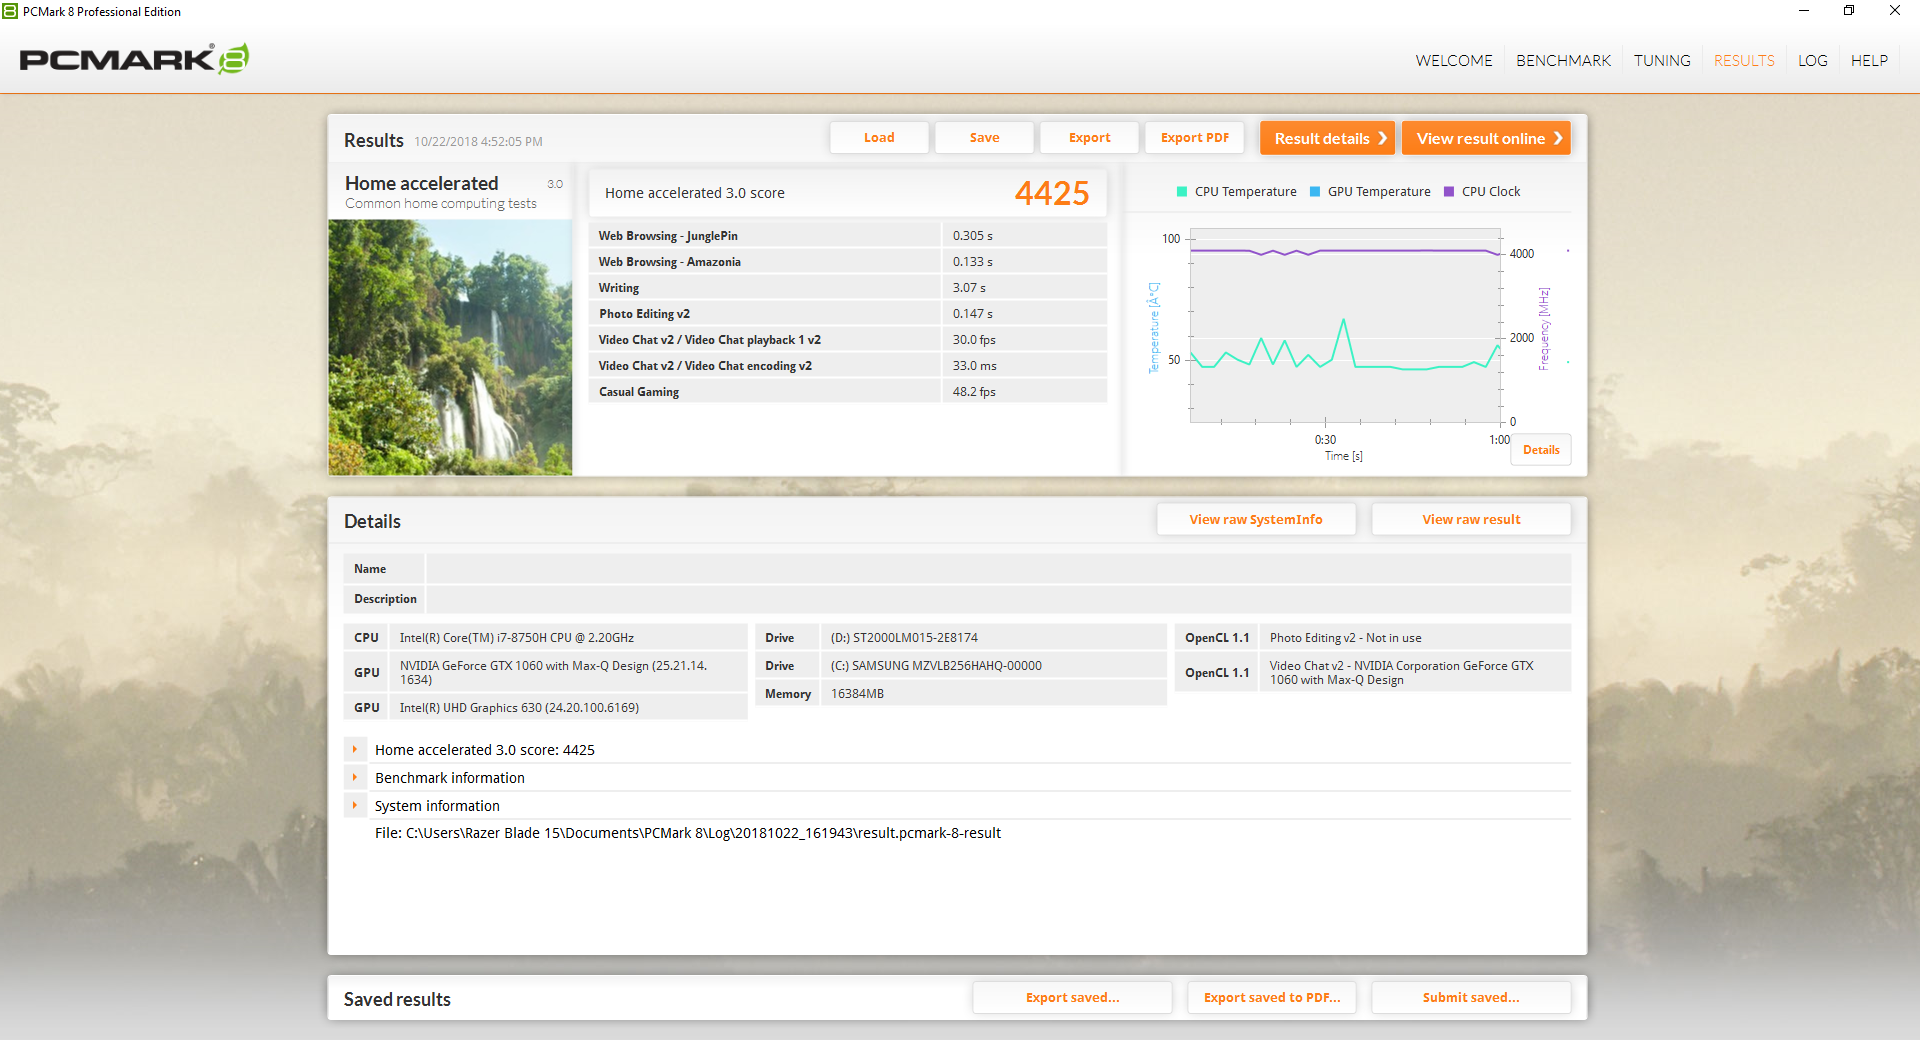
| PCMark 8 Home Score Accelerated v2 | 4425 points | |
| PCMark 8 Work Score Accelerated v2 | 5395 points | |
| PCMark 10 Score | 4896 points | |
Help | ||
Storage Devices
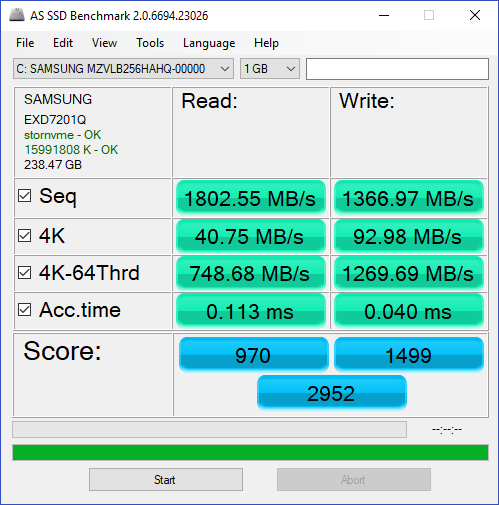
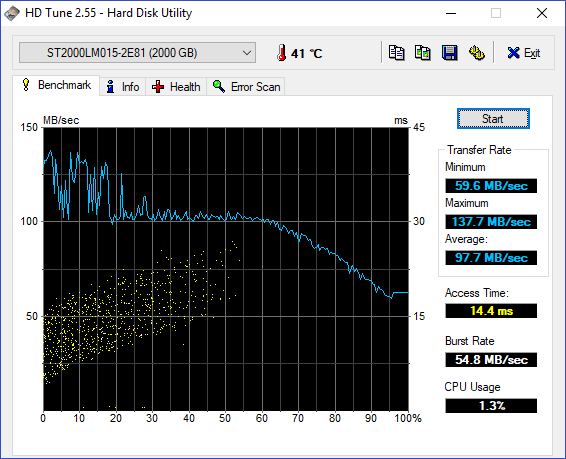
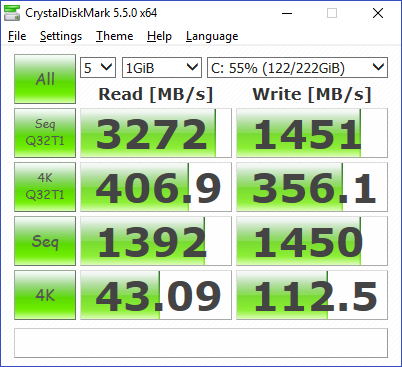
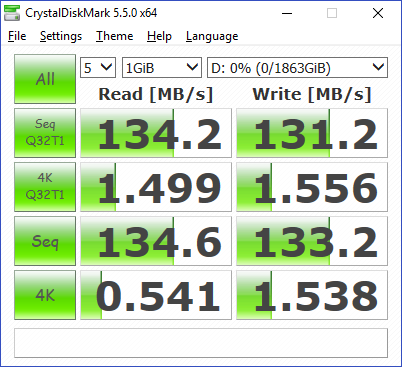
The Base Model gets a secondary 2.5-inch SATA III bay in addition to the M.2 2280 PCIe x4 slot of the Advanced Model for dual storage capabilities. Our specific test unit is equipped with a 256 GB Samsung PM981 M.2 NVMe SSD and a secondary 5400 RPM 2 TB Seagate HDD. Gamers with a large library of games can expand storage space much more cheaply on the Base Model when compared to the Advanced Model. Note that the 2.5-inch SATA bay is designed to accept 7 mm drives and not 9.5 mm.
The lowest-end SKU includes a 128 GB SATA III M.2 SSD that will likely top out at just 500 MB/s for sequential read and write. We're unsure if these will also be Samsung SSDs, but SATA III speeds are more than sufficient for mainstream gaming purposes.
See our table of HDDs and SSDs for more benchmark comparisons.
| Razer Blade 15 Base Model Samsung SSD PM981 MZVLB256HAHQ | Razer Blade 15 2018 Samsung PM961 NVMe MZVLW512HMJP | HP Pavilion Gaming 15t-cx0000 Samsung SSD PM981 MZVLB512HAJQ | MSI GS65 Stealth Thin 8RE-051US Samsung SSD PM981 MZVLB256HAHQ | Gigabyte Aero 15X v8 Toshiba NVMe THNSN5512GPU7 | Apple MacBook Pro 15 2018 (2.6 GHz, 560X) Apple SSD AP0512 | |
|---|---|---|---|---|---|---|
| AS SSD | 25% | 24% | -14% | -12% | -35% | |
| Copy Game MB/s (MB/s) | 1070 | |||||
| Copy Program MB/s (MB/s) | 495.5 | |||||
| Copy ISO MB/s (MB/s) | 1892 | |||||
| Score Total (Points) | 2952 | 3806 29% | 4113 39% | 2039 -31% | 2536 -14% | 2119 -28% |
| Score Write (Points) | 1499 | 1450 -3% | 2087 39% | 802 -46% | 939 -37% | 347 -77% |
| Score Read (Points) | 970 | 1584 63% | 1319 36% | 815 -16% | 1092 13% | 1199 24% |
| Access Time Write * (ms) | 0.04 | 0.038 5% | 0.038 5% | 0.045 -13% | 0.046 -15% | |
| Access Time Read * (ms) | 0.113 | 0.051 55% | 0.051 55% | 0.071 37% | 0.119 -5% | 0.225 -99% |
| 4K-64 Write (MB/s) | 1270 | 1204 -5% | 1808 42% | 570 -55% | 742 -42% | 163.5 -87% |
| 4K-64 Read (MB/s) | 749 | 1300 74% | 1160 55% | 611 -18% | 847 13% | 965 29% |
| 4K Write (MB/s) | 93 | 93.6 1% | 95.9 3% | 83.8 -10% | 80.4 -14% | 18.78 -80% |
| 4K Read (MB/s) | 40.75 | 46.45 14% | 35.03 -14% | 43.09 6% | 23.36 -43% | 9.46 -77% |
| Seq Write (MB/s) | 1367 | 1521 11% | 1829 34% | 1475 8% | 1163 -15% | 1644 20% |
| Seq Read (MB/s) | 1803 | 2376 32% | 1235 -32% | 1612 -11% | 2213 23% | 2239 24% |
* ... smaller is better

GPU Performance
Nvidia Max-Q is designed to be slightly slower than the standard non Max-Q counterpart as exemplified by the GTX 1070 Max-Q and GTX 1080 Max-Q when compared to the GTX 1070 and GTX 1080, respectively. Nonetheless, we've already proven that the GTX 1060 Max-Q is only within 10 percent of the performance of a base GTX 1060 for laptops. The Blade 15 Base Model is essentially just as powerful as the GTX 1060 Max-Q GPU in the Advanced Model and even the 2017 Blade Pro according to 3DMark benchmarks.
A "proper" desktop GTX 1060 6 GB is still about 15 percent faster while the GTX 1050 Ti is about 30 percent slower than our Base Model Razer. Users who want to upgrade to the GTX 1070 Max-Q Advanced Model will see a raw graphics boost of about 40 percent.
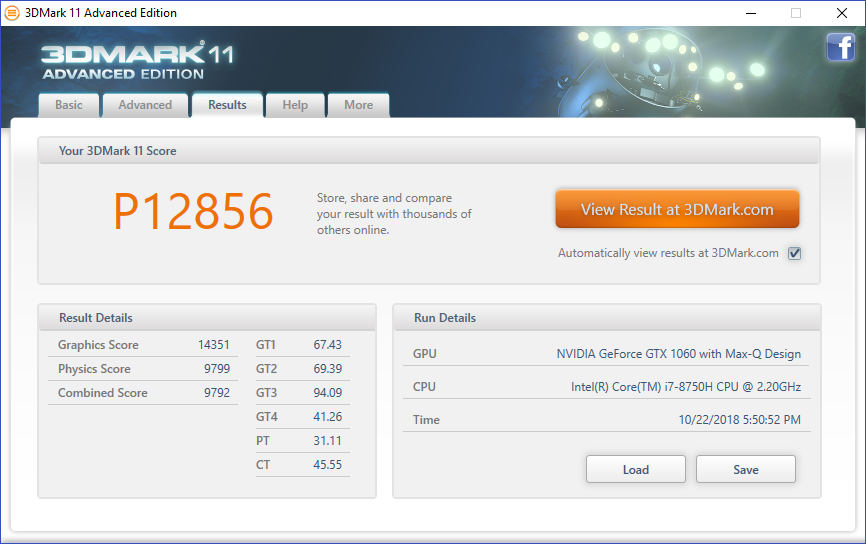
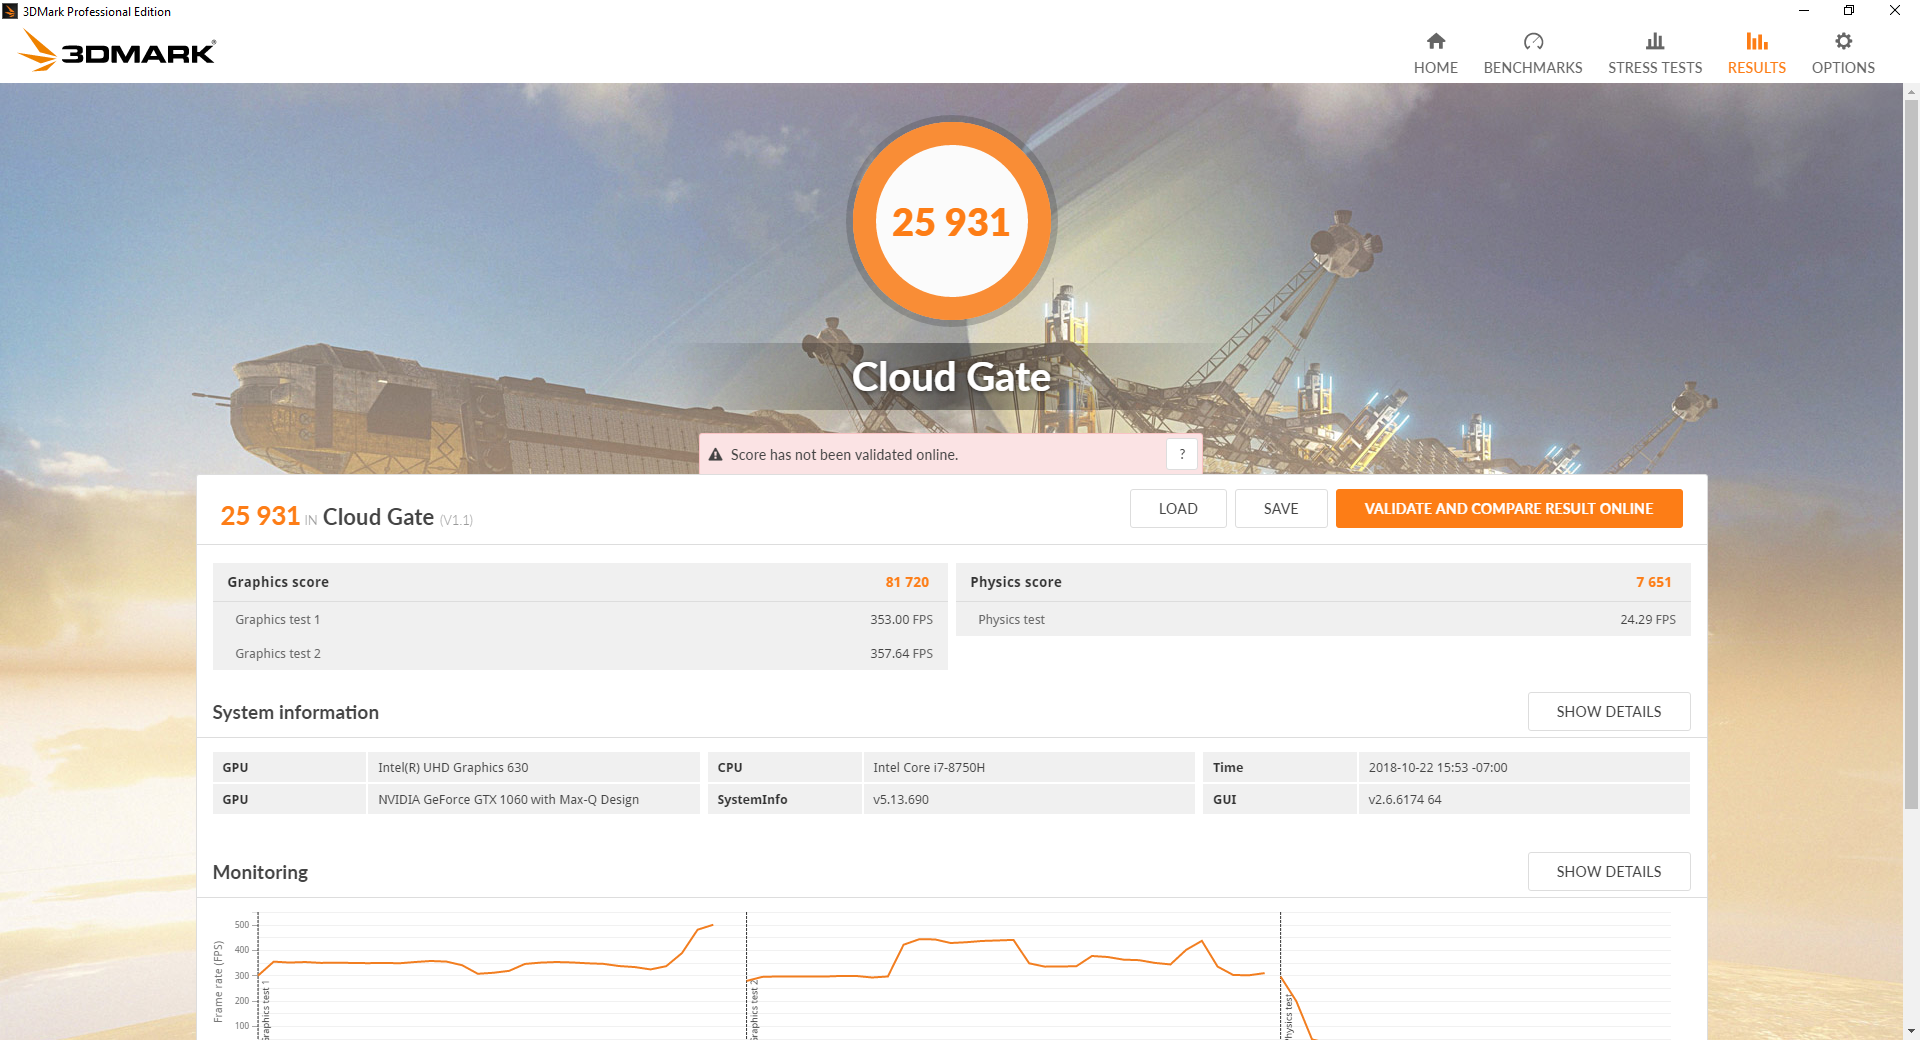
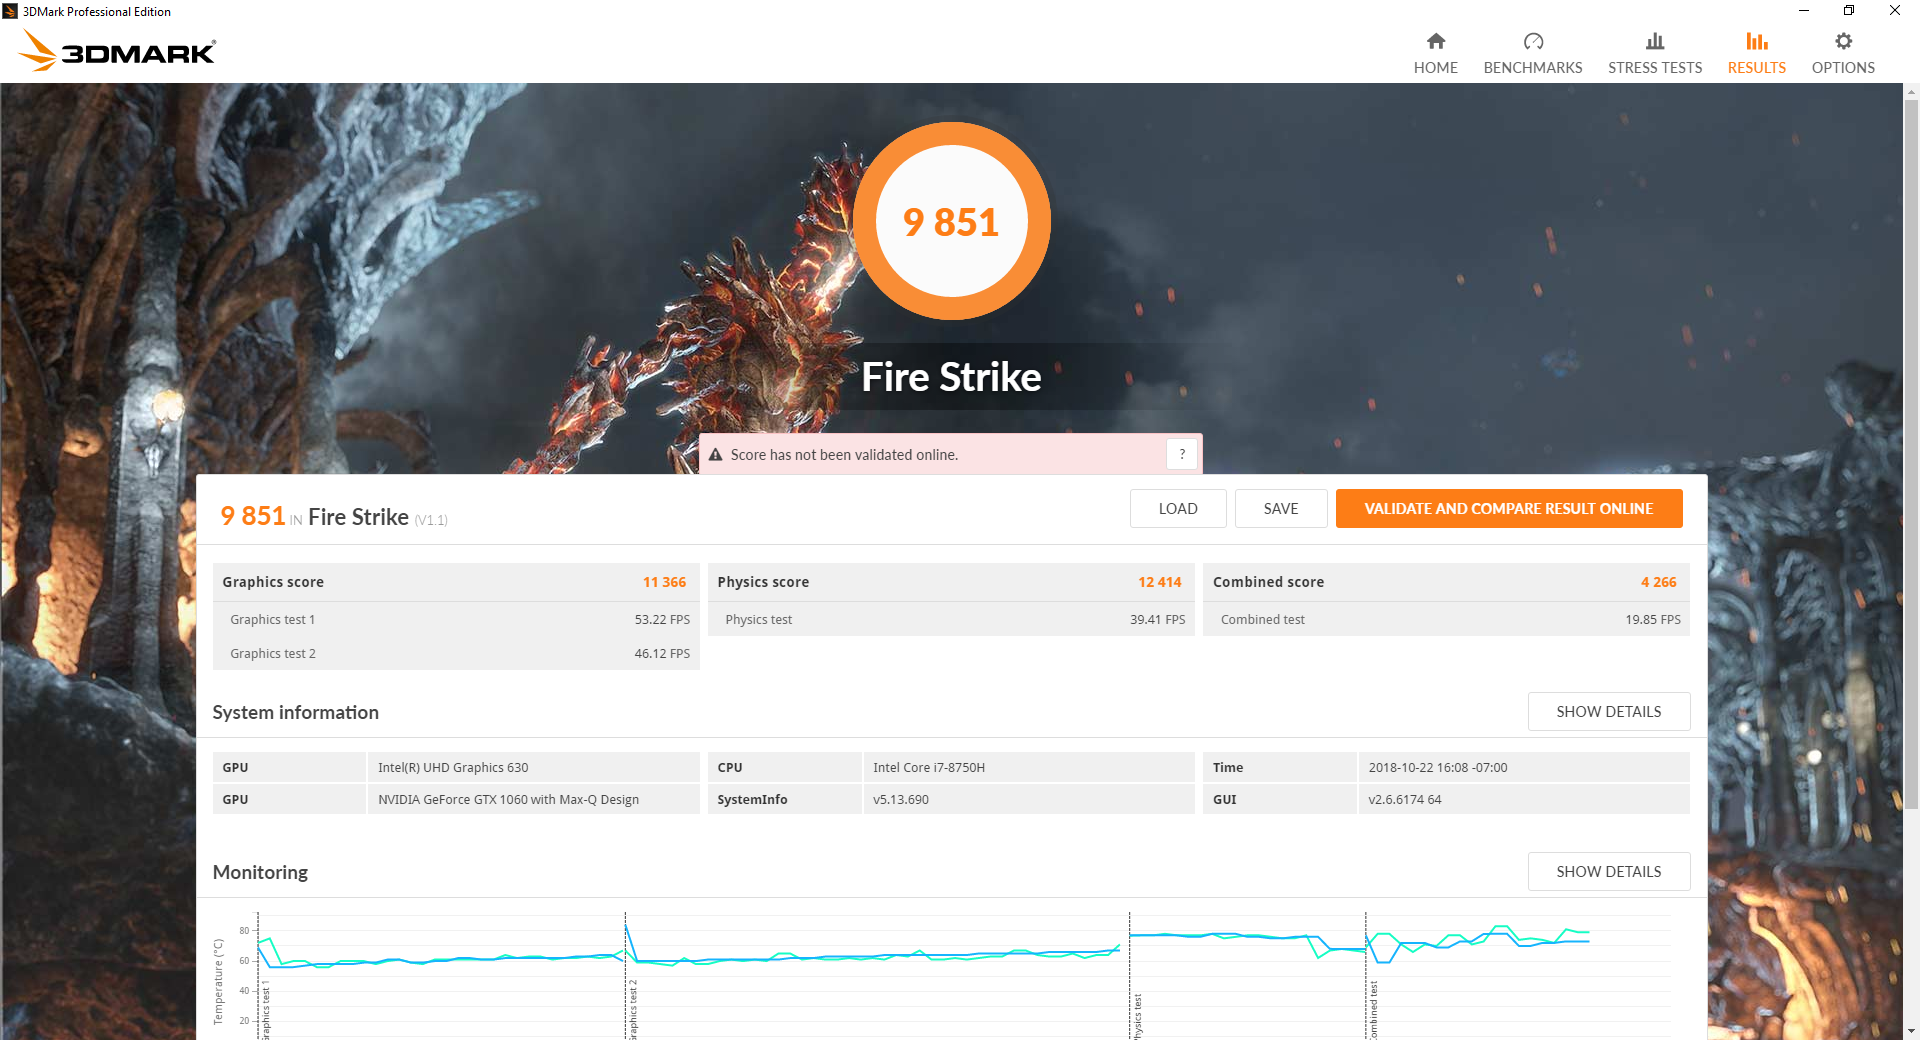
| 3DMark 11 Performance | 12856 points | |
| 3DMark Cloud Gate Standard Score | 25931 points | |
| 3DMark Fire Strike Score | 9851 points | |
Help | ||
Gaming Performance
Real-world gaming performance is nearly identical to the standard GTX 1060 for laptops minus up to 10 percent. All current titles should be able to run at 1080p and at frame rates above 30 FPS. More demanding titles like Witcher 3 or Monster Hunter World will require more settings to be tuned down for faster frame rates.
See our page on the GTX 1060 Max-Q for more technical information and benchmark comparisons.
| low | med. | high | ultra | |
|---|---|---|---|---|
| BioShock Infinite (2013) | 288 | 224 | 213.4 | 112 |
| The Witcher 3 (2015) | 204.9 | 134.7 | 71.4 | 38.5 |
| Rise of the Tomb Raider (2016) | 183.7 | 133.3 | 73.3 | 66.4 |
Stress Test
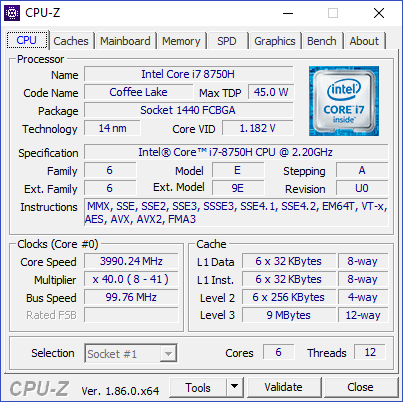
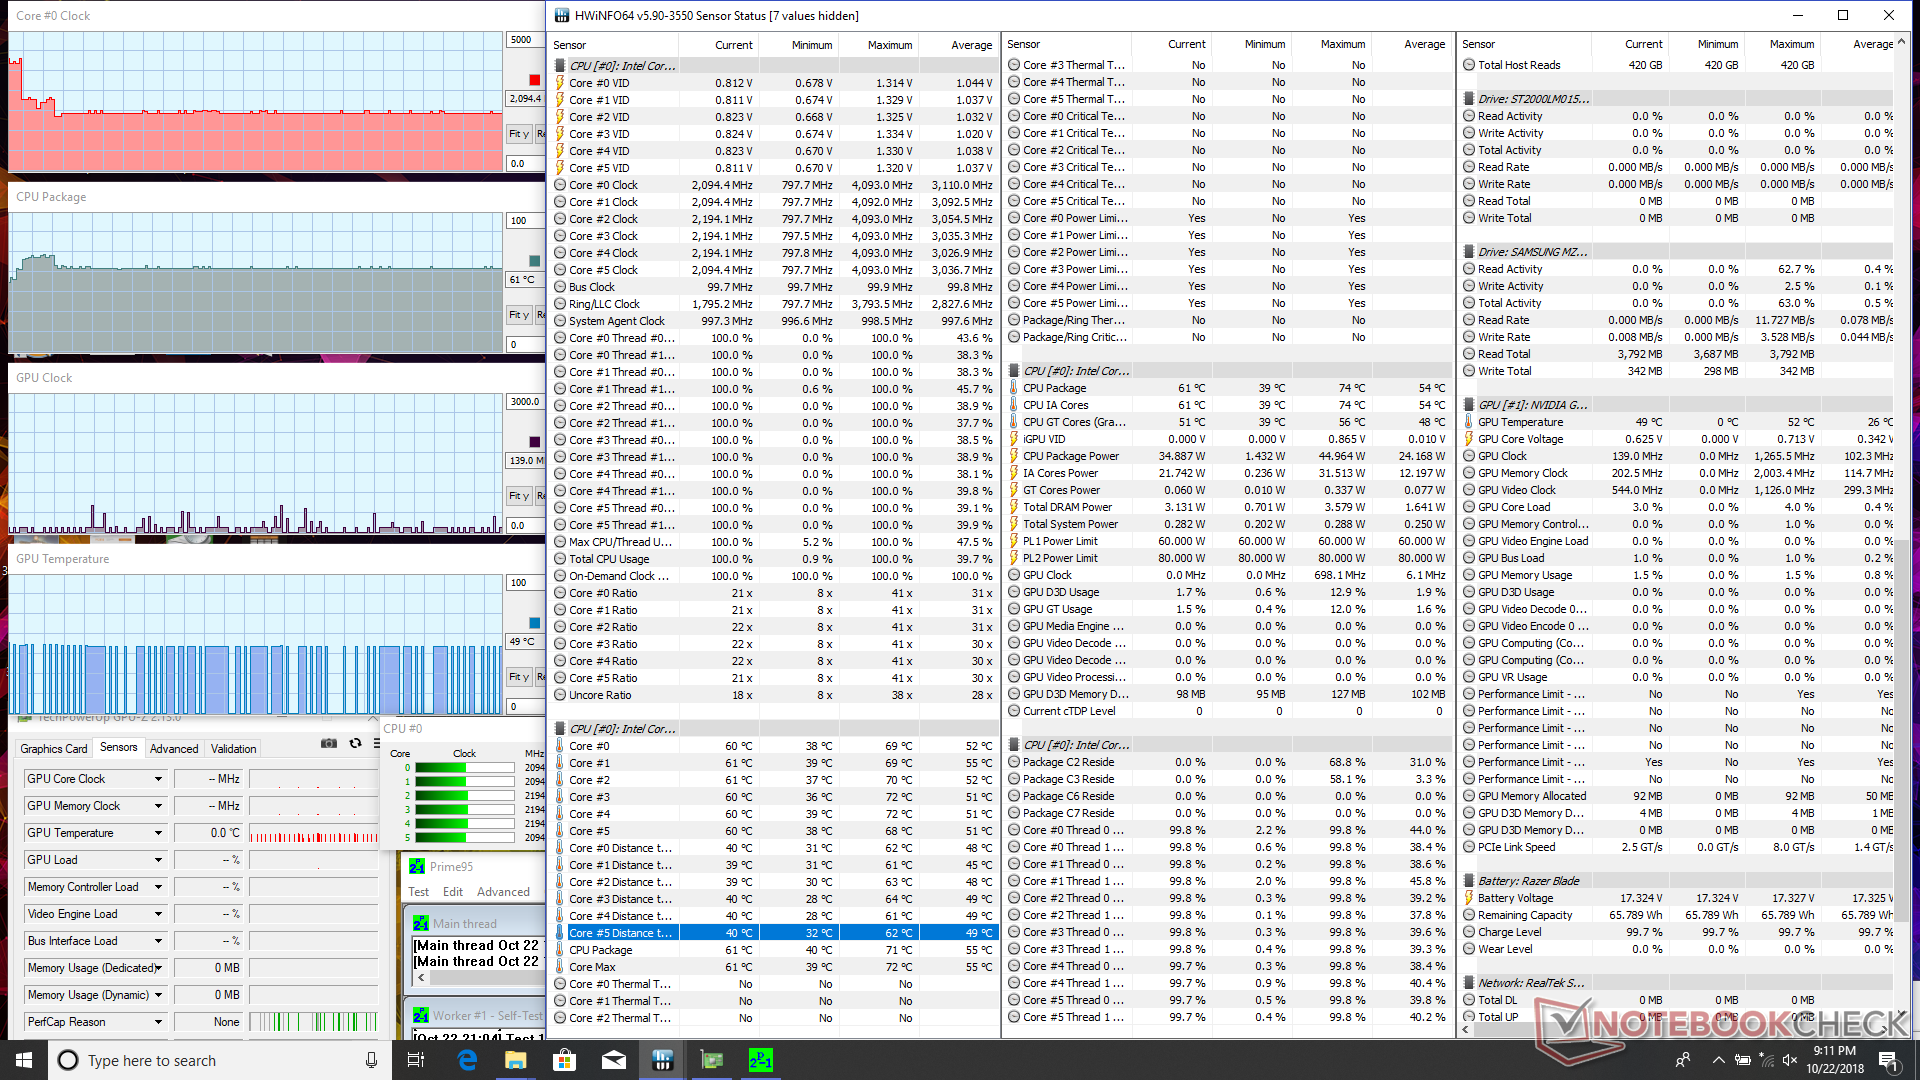
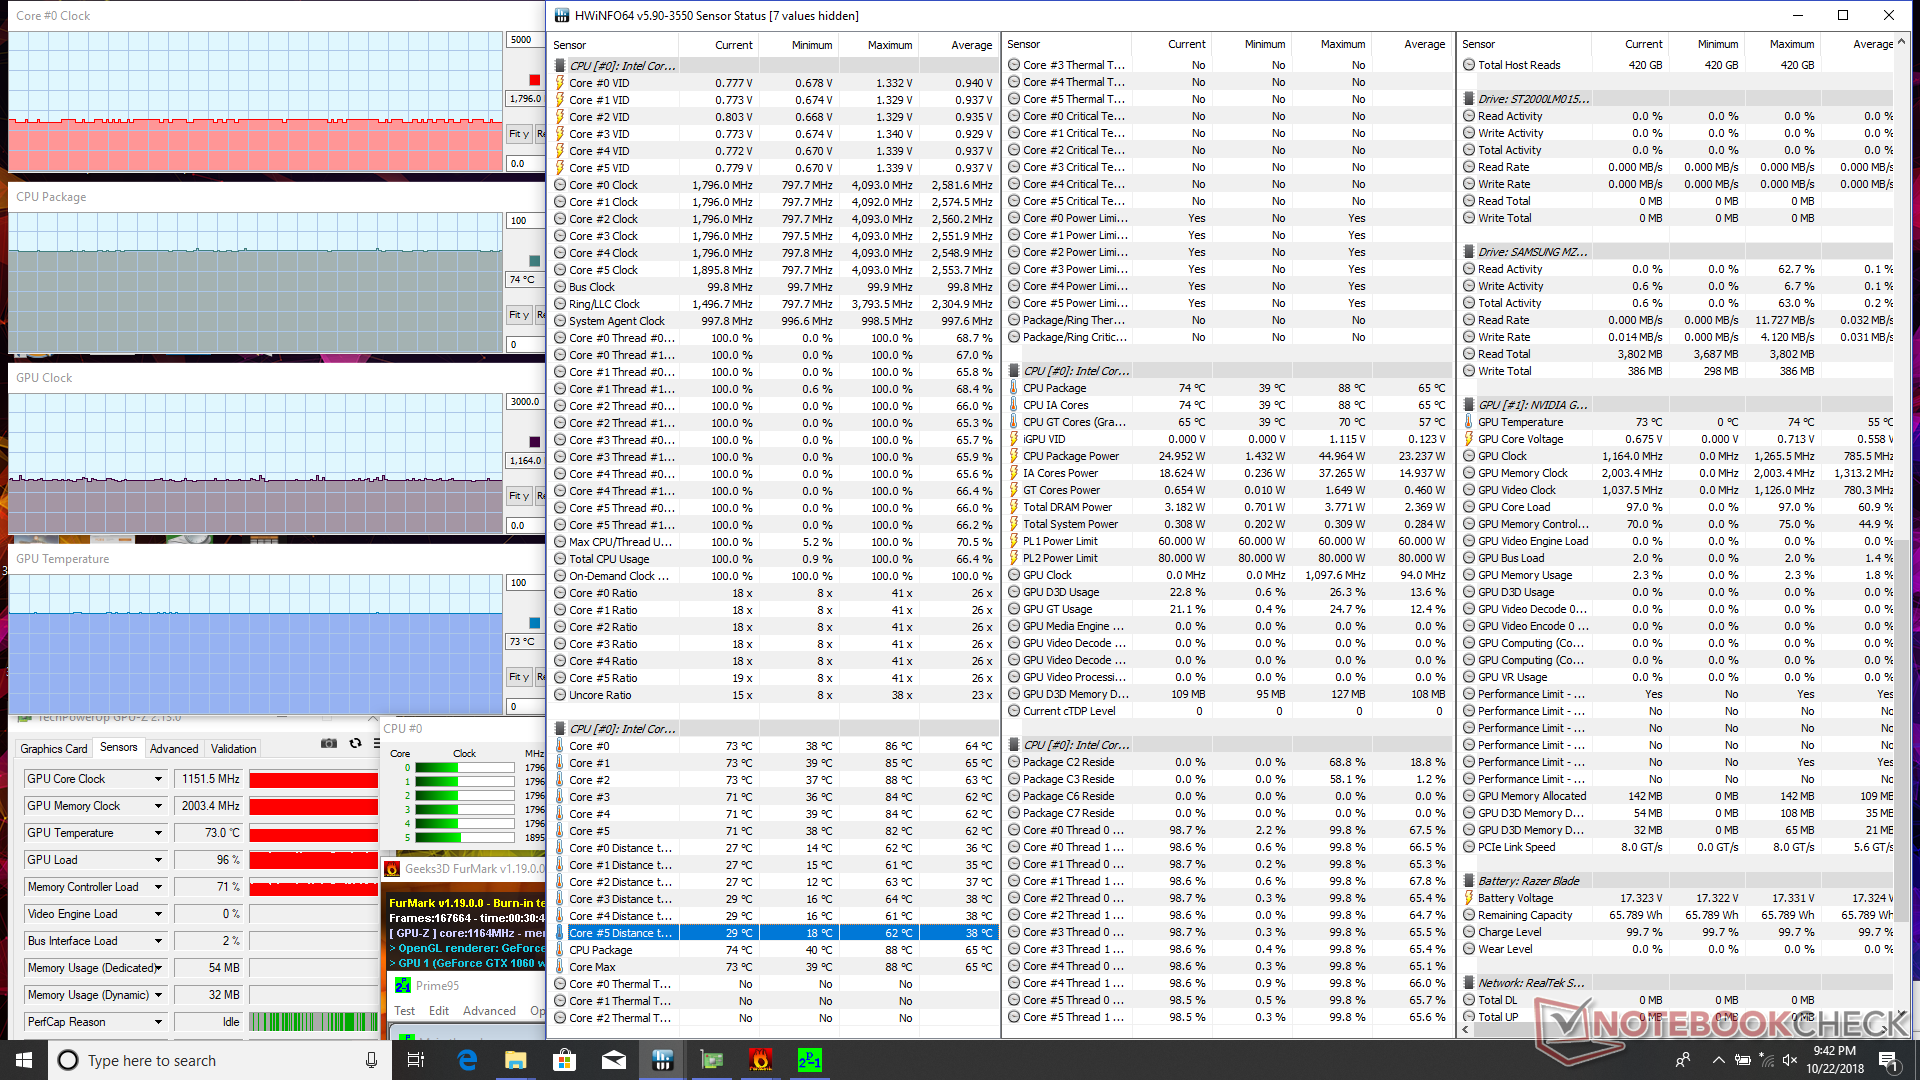
We stress the system with synthetic loads to identify for any potential throttling or stability issues. When subjected to Prime95 stress, we can observe the CPU operating at 2.6 GHz for the first few seconds before hitting 71 C. Once this threshold is reached, clock rates drops to 2.1 GHz to 2.2 GHz for a cooler core temperature of 61 C as shown by our screenshot below. The GTX 1060 Max-Q Advanced Model with the same i7-8750H CPU is able to run faster at up to 2.9 GHz to explain why its CineBench R15 scores are consistently higher than the Base Model. When under maximum stress (Prime95+FurMark), CPU and GPU temperatures stabilize in the low 70 C range each whereas the same processors in the GTX 1060 Max-Q Advanced Model become slightly warmer in the high 70 C range. Thus, the Base Model runs a bit cooler than its Advanced Model counterpart.
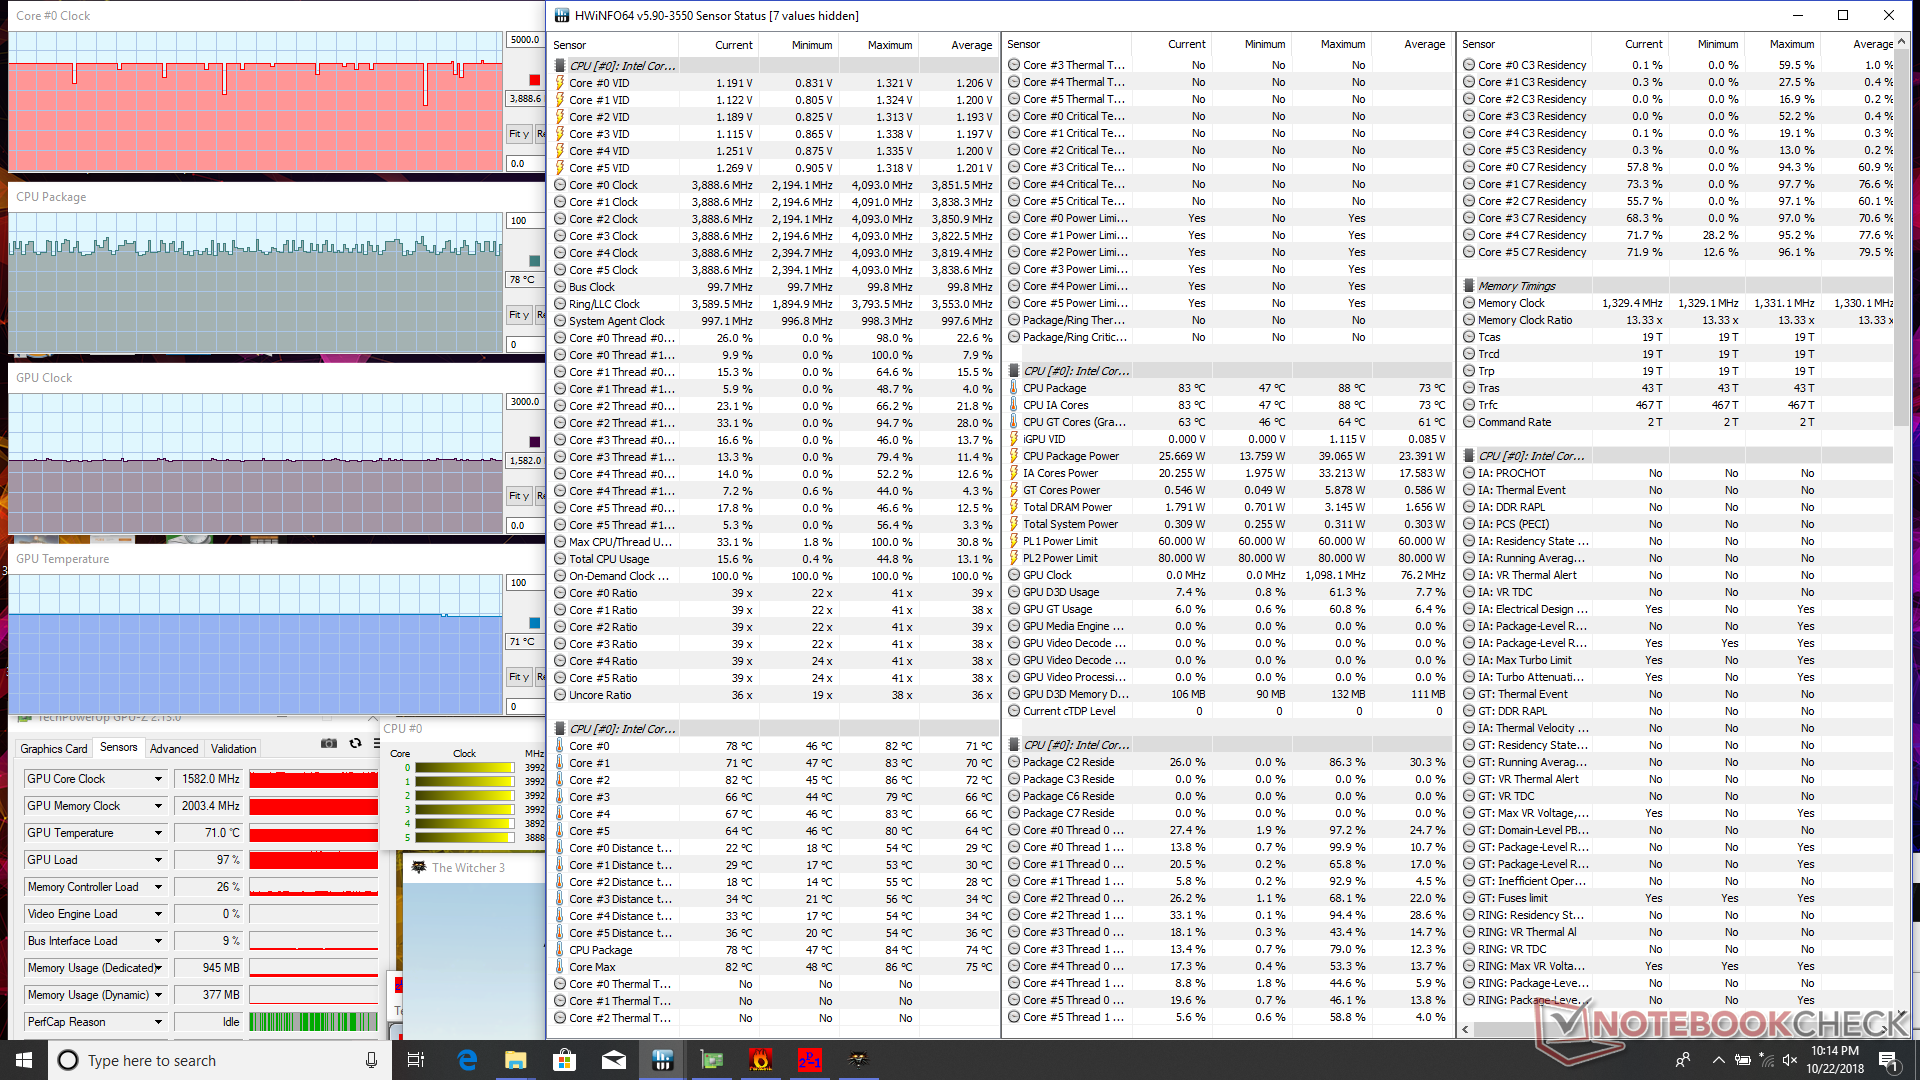
Running Witcher 3 is more representative of real-world gaming stress. The Base Model is again cooler with a stable GPU temperature of 71 C compared to 79 C on the equivalent Advanced Model. Performance is also steady with no degradation or recurring drops over time.
Running on battery power will limit FPS to 30 when gaming even after setting Windows to Maximum Performance and the GPU to 'Prefer maximum performance' with V-Sync disabled. Annoyingly, the simplest way to disable this is to download and login to GeForce Experience to toggle the 30 FPS limiter.
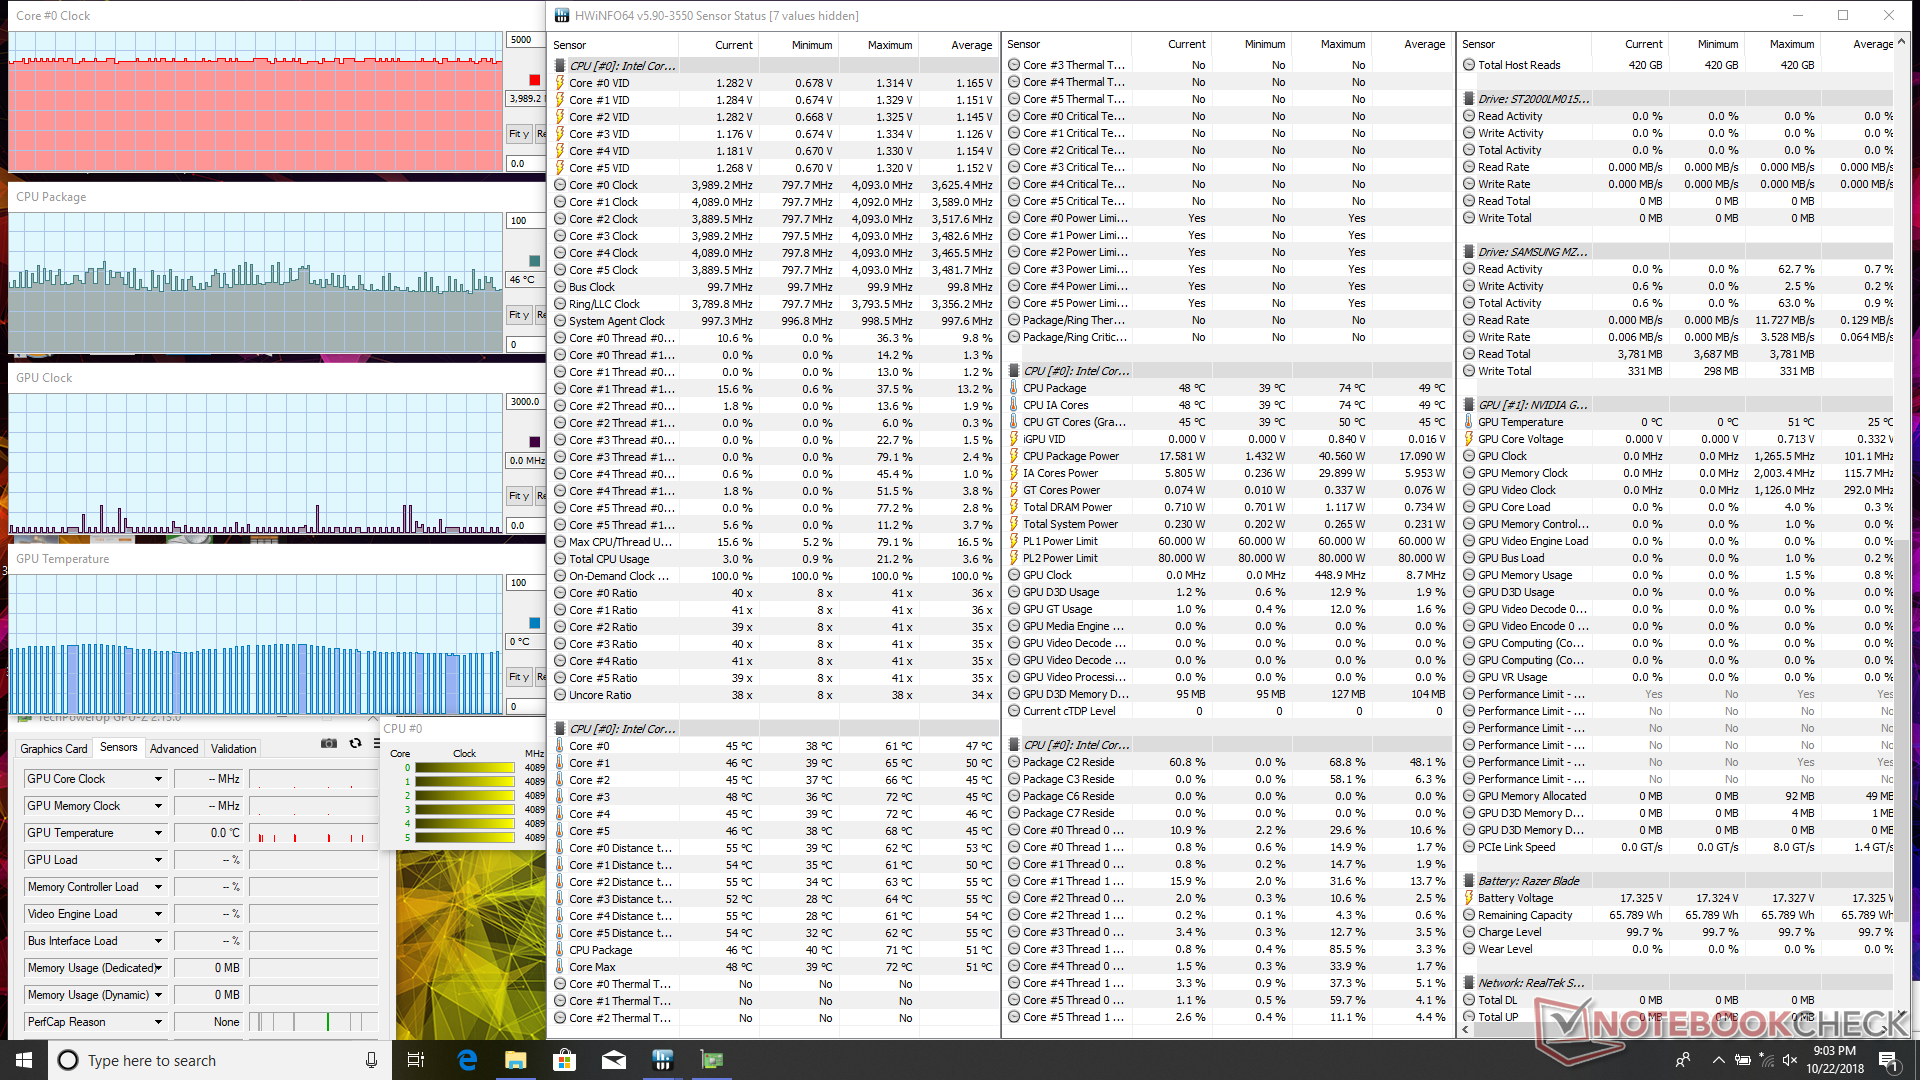
| CPU Clock (GHz) | GPU Clock (MHz) | Average CPU Temperature (°C) | Average GPU Temperature (°C) | |
| System Idle | -- | -- | 46 | 43 |
| Prime95 Stress | 2.1 | -- | 61 | -- |
| Prime95 + FurMark Stress | 1.8 | 1164 | 74 | 73 |
| Witcher 3 Stress | 3.9 | 1582 | ~78 | 71 |
Emissions
System Noise
The cooling solution consists of twin fans and three copper heat pipes between them in place of the vapor chamber cooler of the Advanced Model. We were initially told that the fans on the Base Model would be larger than on the Advanced Model, but they are still very similar in diameter at just under 50 mm upon closer inspection. One of the three heat pipes is quite thick at about 1.5 cm in width.
Fan noise on the Base Model is always present no matter the load because the system fans never idle. Light loads like browsing or video streaming will bump fan noise up by just a bit, but it is thankfully not enough to be distracting. We recommend working in Power Saver mode if the extra horsepower is not needed to reduce fan pulsing.
When under higher loads like gaming, the Base Model is unfortunately not all that much different from the Advanced model. In fact, it may even be louder when gaming at just over 51 dB(A) compared to the 45 dB(A) range of the Advanced Model and the GS65. The cooler core temperatures during the stress test above seemingly come at the cost of louder fans.
We can notice no electronic noise from our test unit.
Noise level
| Idle |
| 31 / 31.2 / 31.3 dB(A) |
| Load |
| 47.2 / 44.3 dB(A) |
 | ||
30 dB silent 40 dB(A) audible 50 dB(A) loud |
||
min: | ||
| Razer Blade 15 Base Model GeForce GTX 1060 Max-Q, i7-8750H, Samsung SSD PM981 MZVLB256HAHQ | Razer Blade 15 2018 GeForce GTX 1070 Max-Q, i7-8750H, Samsung PM961 NVMe MZVLW512HMJP | Razer Blade 15 GTX 1060 GeForce GTX 1060 Max-Q, i7-8750H, Samsung SSD PM981 MZVLB512HAJQ | HP Pavilion Gaming 15t-cx0000 GeForce GTX 1060 Max-Q, i7-8750H, Samsung SSD PM981 MZVLB512HAJQ | MSI GS65 Stealth Thin 8RE-051US GeForce GTX 1060 Mobile, i7-8750H, Samsung SSD PM981 MZVLB256HAHQ | Gigabyte Aero 15X v8 GeForce GTX 1070 Max-Q, i7-8750H, Toshiba NVMe THNSN5512GPU7 | Apple MacBook Pro 15 2018 (2.6 GHz, 560X) Radeon Pro 560X, i7-8850H, Apple SSD AP0512 | |
|---|---|---|---|---|---|---|---|
| Noise | -2% | 2% | 1% | 5% | -5% | 4% | |
| off / environment * (dB) | 27.8 | 29 -4% | 28.1 -1% | 28.3 -2% | 28.4 -2% | 29 -4% | 29.6 -6% |
| Idle Minimum * (dB) | 31 | 29 6% | 28.1 9% | 32.2 -4% | 28.4 8% | 30 3% | 30.1 3% |
| Idle Average * (dB) | 31.2 | 30 4% | 33 -6% | 32.4 -4% | 28.4 9% | 31 1% | 30.1 4% |
| Idle Maximum * (dB) | 31.3 | 38 -21% | 33.5 -7% | 32.4 -4% | 29.6 5% | 35 -12% | 30.1 4% |
| Load Average * (dB) | 47.2 | 46 3% | 42.2 11% | 40.2 15% | 43.5 8% | 49 -4% | 46.8 1% |
| Witcher 3 ultra * (dB) | 51.3 | 49 4% | 45.3 12% | 45 12% | 45.7 11% | 51 1% | 36 30% |
| Load Maximum * (dB) | 44.3 | 46 -4% | 45.7 -3% | 47.2 -7% | 45.7 -3% | 54 -22% | 46.8 -6% |
* ... smaller is better
Temperature
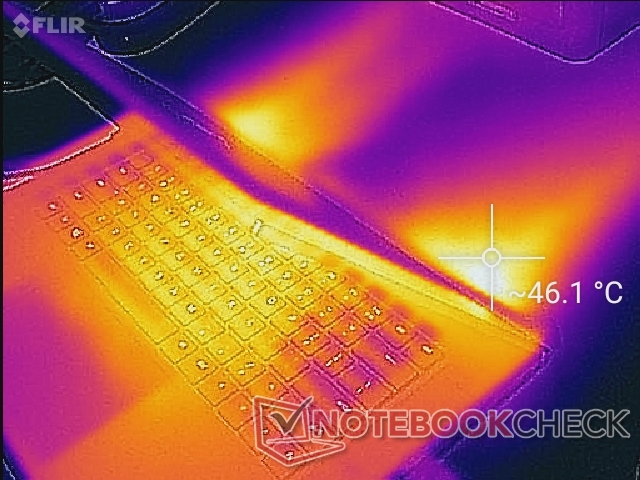
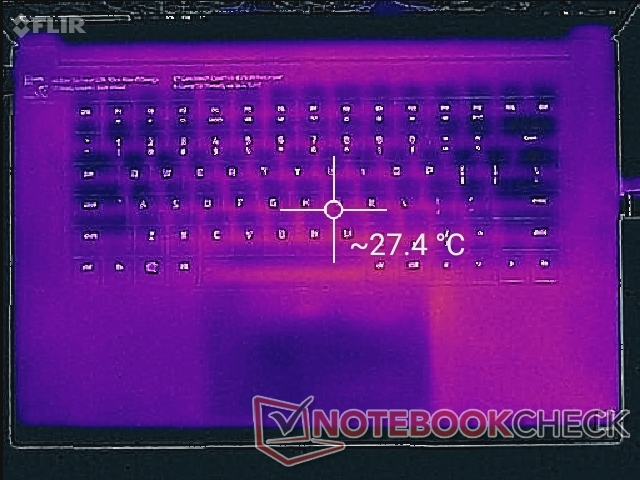
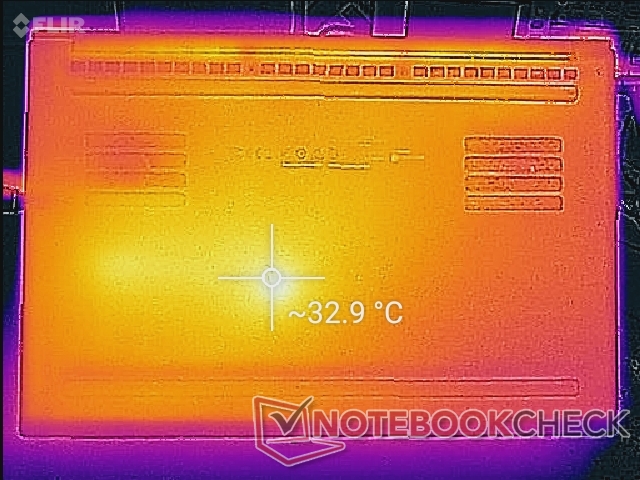
Are surface temperatures any cooler or warmer on the Base Model? When idling, the top of the notebook is flat at about 27 C on average while the bottom hot spot nearest the PCH can be about 33 C. When gaming, surface temperatures on both sides of the laptop will be in the low 40 C range as shown by our temperature maps below. This is significantly cooler than the GTX 1060 Max-Q Advanced Model where hot spots can reach over 50 C when subjected to similar gaming conditions. It's safe to say that the changes to the cooling solution and thickness for the Base Model design have had a tangible impact on the temperature development of the chassis.
The dual rear exhaust remains unchanged. The WASD keys and palm rests never become uncomfortably warm when gaming since the cooling solution is towards the rear of the system.
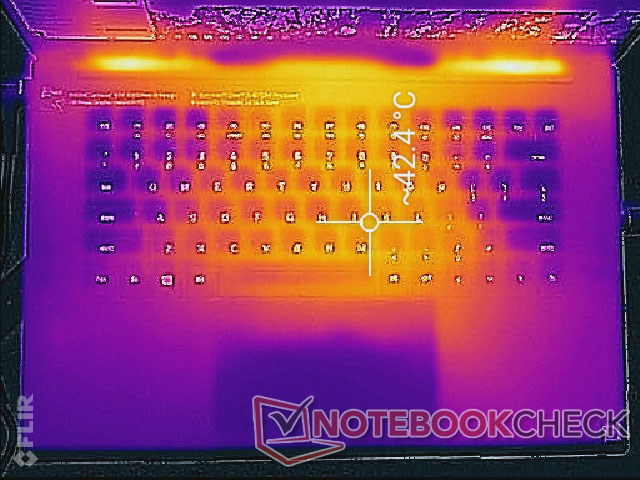
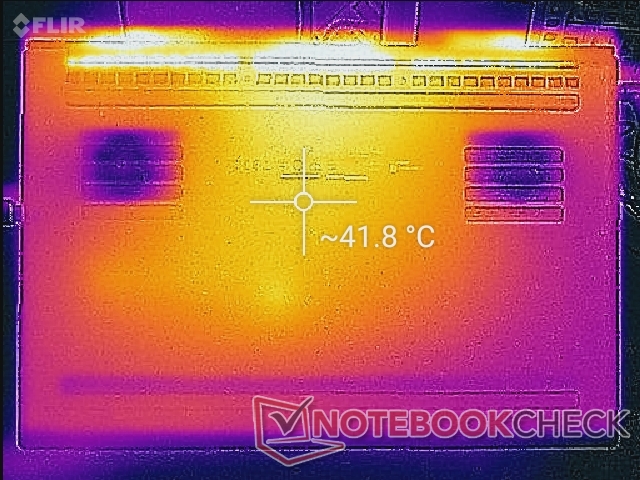
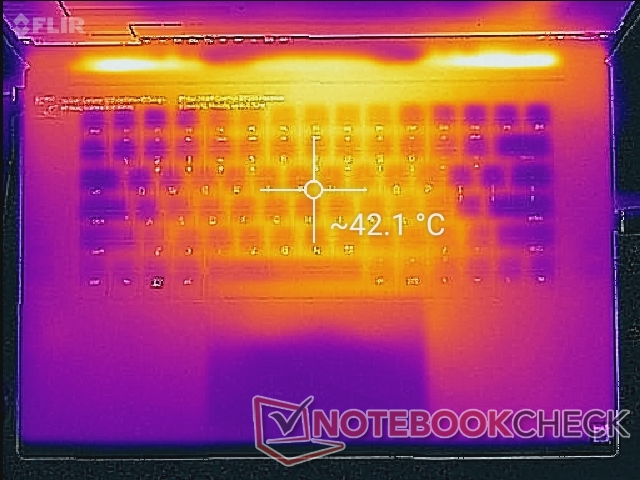
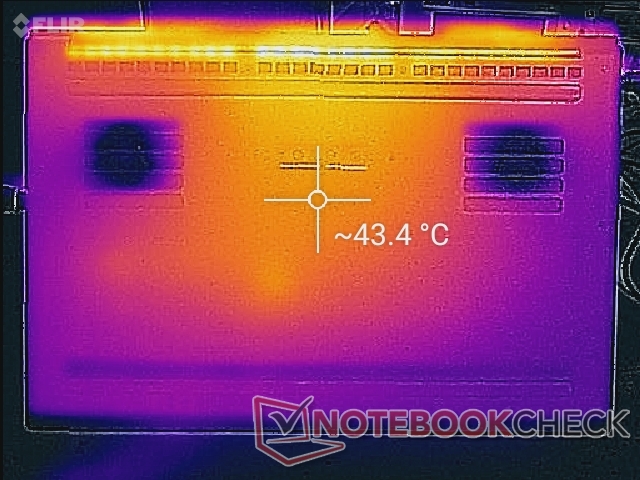
(-) The maximum temperature on the upper side is 45.2 °C / 113 F, compared to the average of 40.4 °C / 105 F, ranging from 21.2 to 68.8 °C for the class Gaming.
(-) The bottom heats up to a maximum of 46.4 °C / 116 F, compared to the average of 43.2 °C / 110 F
(+) In idle usage, the average temperature for the upper side is 26.6 °C / 80 F, compared to the device average of 33.9 °C / 93 F.
(±) Playing The Witcher 3, the average temperature for the upper side is 36.1 °C / 97 F, compared to the device average of 33.9 °C / 93 F.
(+) The palmrests and touchpad are reaching skin temperature as a maximum (33.8 °C / 92.8 F) and are therefore not hot.
(-) The average temperature of the palmrest area of similar devices was 28.8 °C / 83.8 F (-5 °C / -9 F).
Speakers

Audio quality has not changed from the Advanced Model meaning that bass continues to be weak. Maximum volume is still loud enough for gaming when headphones are not available and the palm rests will vibrate just slightly if on higher volume settings. We're hopeful for a dedicated subwoofer in the future for better media playback.
Energy Management
Power Consumption
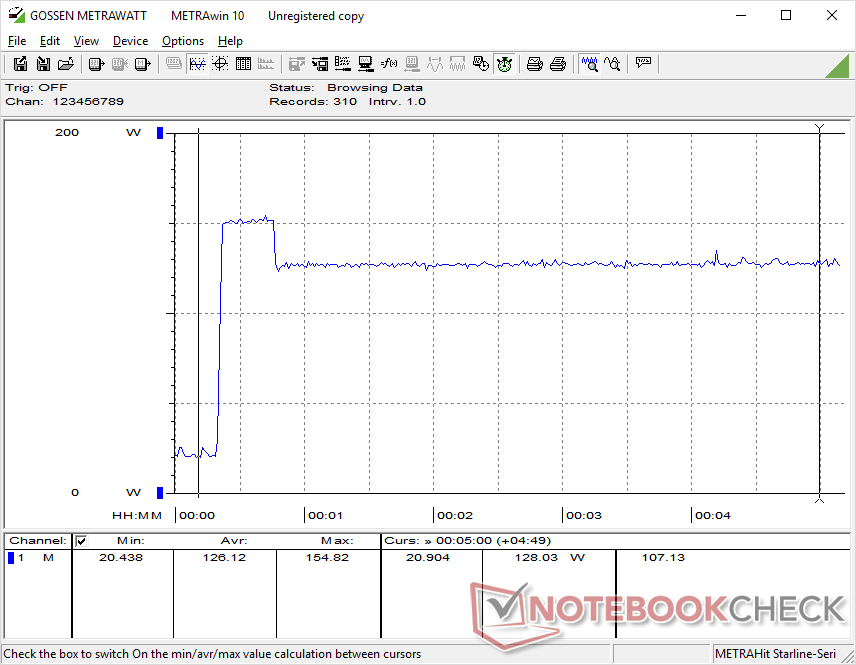
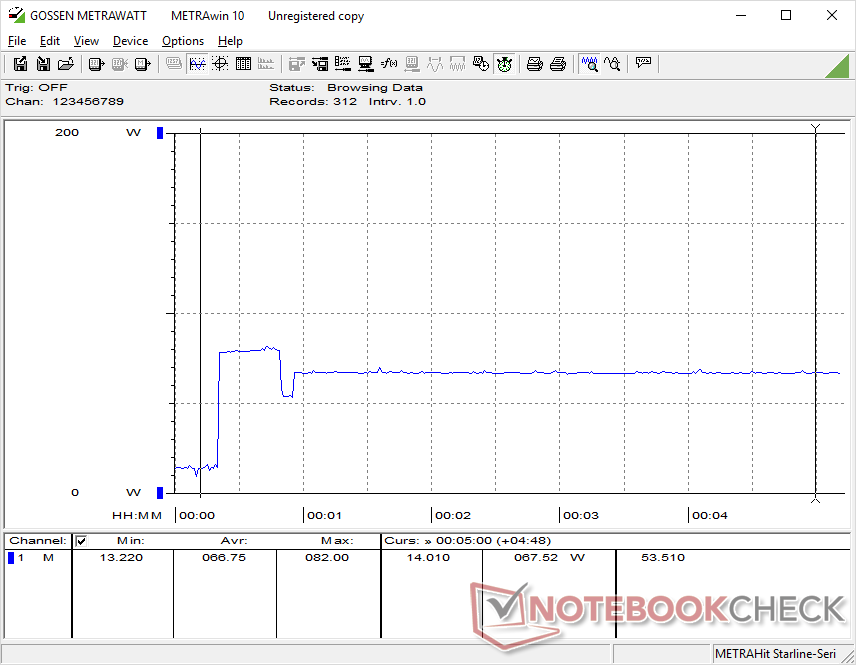
Power consumption when idling on desktop is lower when compared to the Blade 15 GTX 1060 Max-Q Advanced Model (10 W vs. 15 W) likely due in part to the more demanding 144 Hz display panel of the latter configuration. Otherwise, both systems are nearly identical when gaming. Expect a constant draw of about 114 W when running demanding games like Witcher 3. The more powerful GTX 1070 Max-Q Advanced Model will demand at least 30 W more when subjected to similar stressful loads.
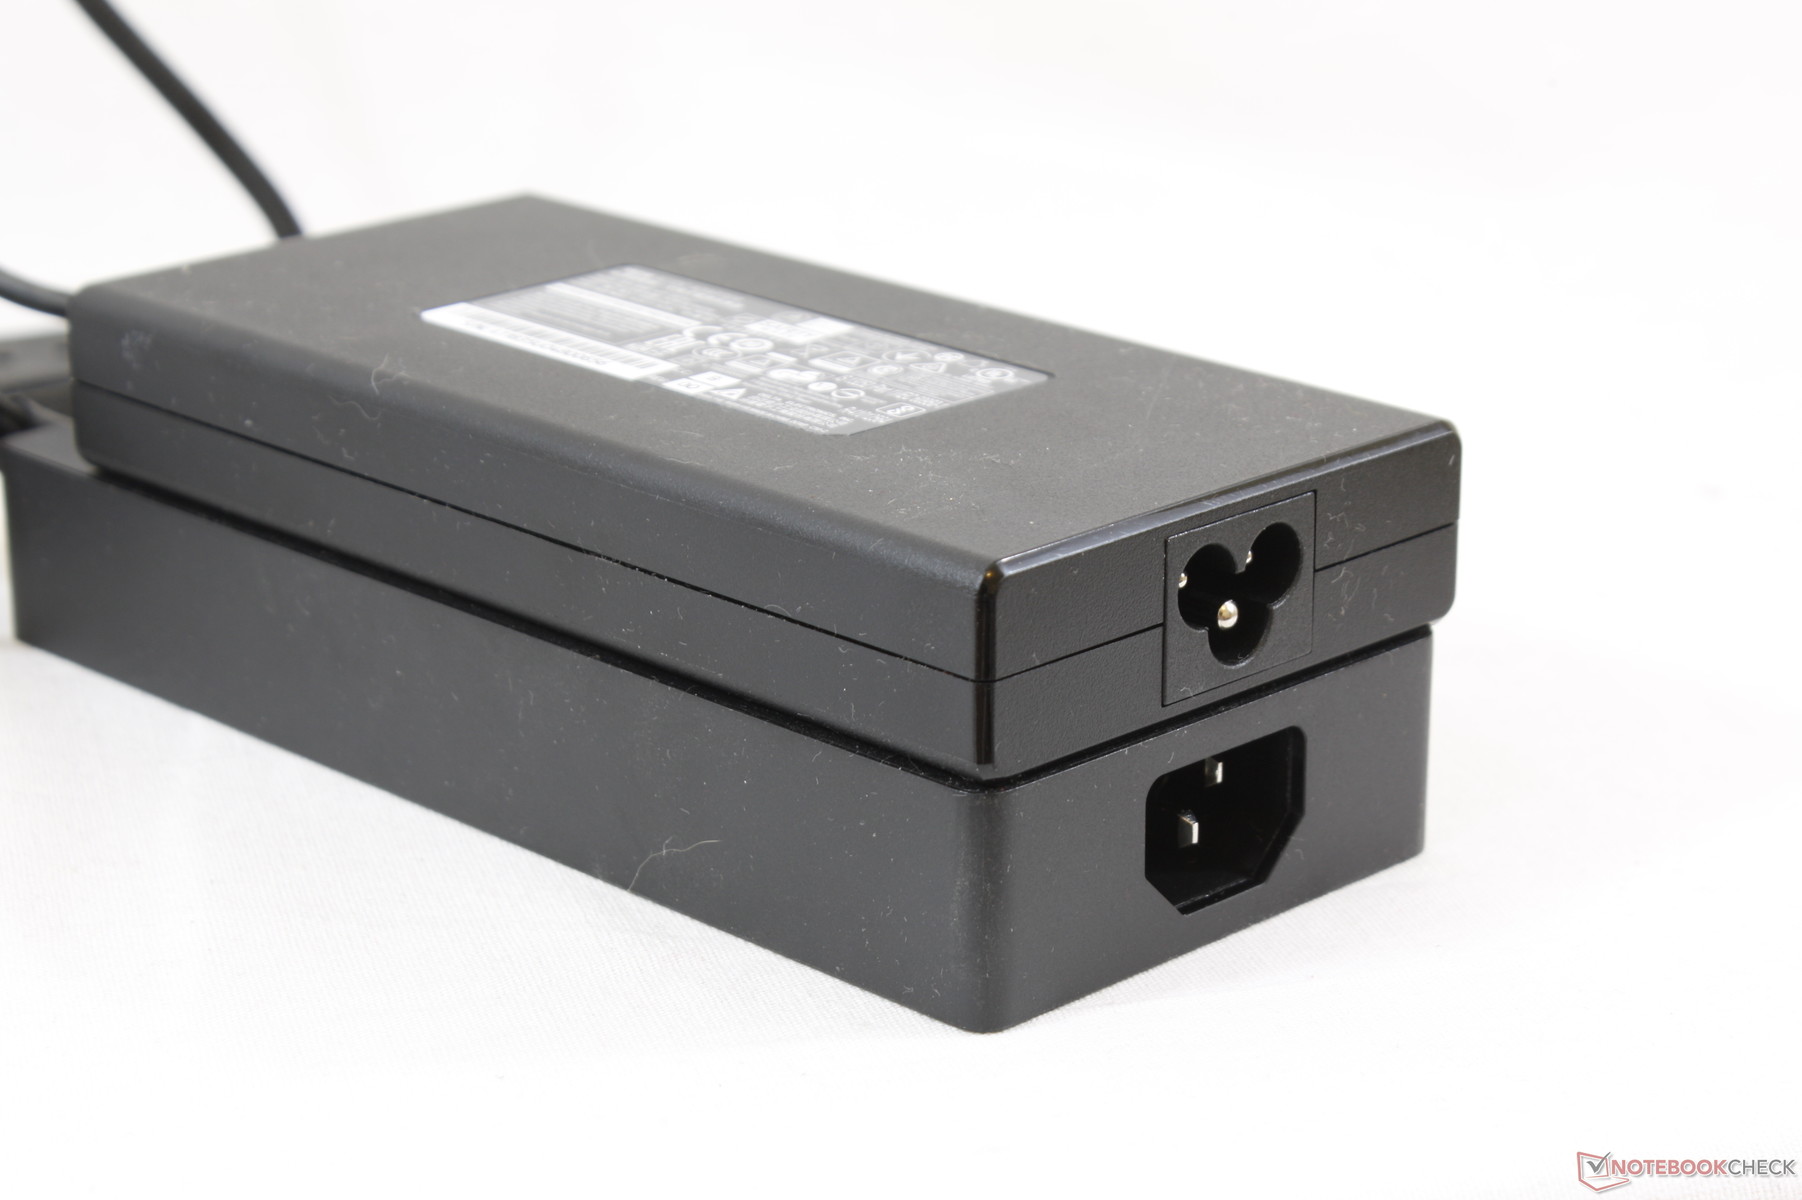
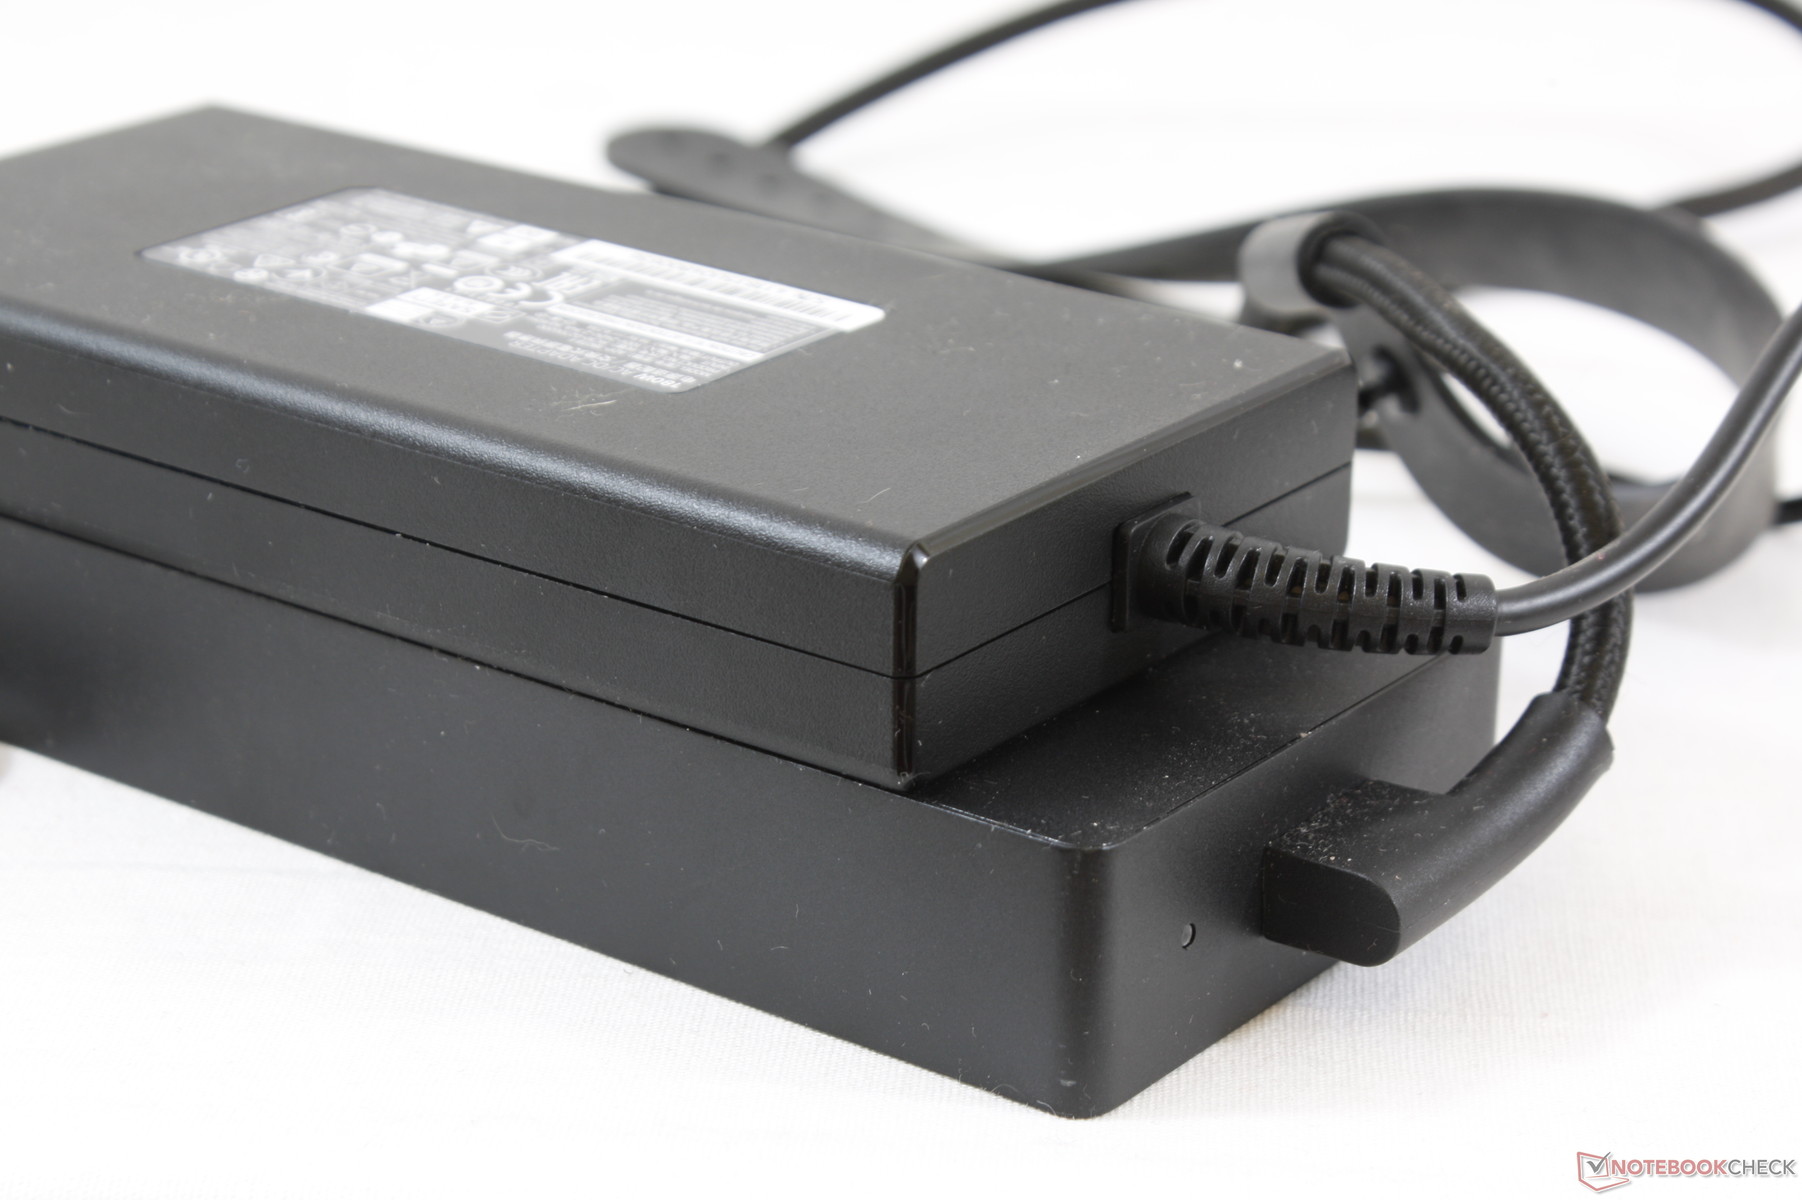
The medium-sized 180 W AC adapter (~15.2 x 7.2 x 2.3 cm) is shorter in length with less bulky wires than the 200 W and 230 W AC adapters of the Advanced Models. The highest consumption we are able to record from our Base Model is 155 W with both processors are at 100 percent utilization, so the new AC adapter has more than enough juice to power the system.
| Off / Standby | |
| Idle | |
| Load |
|
Key:
min: | |
| Razer Blade 15 Base Model i7-8750H, GeForce GTX 1060 Max-Q, Samsung SSD PM981 MZVLB256HAHQ, IPS, 1920x1080, 15.6" | Razer Blade 15 2018 i7-8750H, GeForce GTX 1070 Max-Q, Samsung PM961 NVMe MZVLW512HMJP, IPS, 1920x1080, 15.6" | HP Pavilion Gaming 15t-cx0000 i7-8750H, GeForce GTX 1060 Max-Q, Samsung SSD PM981 MZVLB512HAJQ, IPS, 1920x1080, 15.6" | MSI GS65 Stealth Thin 8RE-051US i7-8750H, GeForce GTX 1060 Mobile, Samsung SSD PM981 MZVLB256HAHQ, IPS, 1920x1080, 15.6" | Gigabyte Aero 15X v8 i7-8750H, GeForce GTX 1070 Max-Q, Toshiba NVMe THNSN5512GPU7, IPS, 1920x1080, 15.6" | Apple MacBook Pro 15 2018 (2.6 GHz, 560X) i7-8850H, Radeon Pro 560X, Apple SSD AP0512, IPS, 2880x1800, 15.4" | |
|---|---|---|---|---|---|---|
| Power Consumption | -23% | 17% | 0% | -24% | 30% | |
| Idle Minimum * (Watt) | 10.2 | 14 -37% | 6 41% | 8.7 15% | 14 -37% | 3.4 67% |
| Idle Average * (Watt) | 13.2 | 17 -29% | 11.2 15% | 13 2% | 18 -36% | 11 17% |
| Idle Maximum * (Watt) | 17.6 | 21 -19% | 13.3 24% | 14.3 19% | 22 -25% | 14.9 15% |
| Load Average * (Watt) | 99.5 | 95 5% | 89.2 10% | 107.4 -8% | 91 9% | 78.9 21% |
| Witcher 3 ultra * (Watt) | 113.6 | 141 -24% | 101.9 10% | 129 -14% | 142 -25% | |
| Load Maximum * (Watt) | 133.3 | 179 -34% | 134.5 -1% | 151.5 -14% | 173 -30% | 91.2 32% |
* ... smaller is better
Battery Life
The GTX 1060 Max-Q Advanced Model has a 22 percent larger battery than the Base Model and, perhaps not by coincidence, it also outlasts the Base Model by 22 percent. When we subject both systems to the same WLAN load and at the same 150-nit brightness setting, the Base Model clocks in at 5.5 hours or a little over one hour shorter than its higher-end equivalent. Overall runtimes are inferior to the GS65 and Aero 15X v8 but still longer than the GTX 1070 Max-Q Advanced Model.
Charging from near empty to full capacity is fast at just under 1.5 hours.
| Razer Blade 15 Base Model i7-8750H, GeForce GTX 1060 Max-Q, 65 Wh | Razer Blade 15 GTX 1060 i7-8750H, GeForce GTX 1060 Max-Q, 80 Wh | HP Pavilion Gaming 15t-cx0000 i7-8750H, GeForce GTX 1060 Max-Q, 70 Wh | MSI GS65 Stealth Thin 8RE-051US i7-8750H, GeForce GTX 1060 Mobile, 82 Wh | Gigabyte Aero 15X v8 i7-8750H, GeForce GTX 1070 Max-Q, 94.24 Wh | Apple MacBook Pro 15 2018 (2.6 GHz, 560X) i7-8850H, Radeon Pro 560X, 83 Wh | |
|---|---|---|---|---|---|---|
| Battery runtime | 22% | -3% | -4% | 46% | 85% | |
| Reader / Idle (h) | 11.5 | 8 -30% | 12.7 10% | |||
| WiFi v1.3 (h) | 5.5 | 6.7 22% | 6.3 15% | 6.2 13% | 8.6 56% | 10.2 85% |
| Load (h) | 1.5 | 1.6 7% | 1.2 -20% | 2.6 73% | ||
| Witcher 3 ultra (h) | 1.5 |
Pros
Cons
Verdict
When users see "Base Model", they may assume that it would be slower and have fewer features than the "Advanced Model". This couldn't be further from the truth because the Base Model is just as fast as the Advanced Model and with two features (2.5-inch SATA bay and RJ-45) not found on the latter. In fact, it's even lighter and runs cooler. Users are getting the same stylish chassis design and construction quality across all configurations.
Instead, what makes the Base Model so much more affordable than the Advanced Model is its lack of high-end features that mainstream gamers may not care too much about. The GTX 1070 Max-Q GPU, vapor chamber cooling, per-key RGB lighting, 144 Hz display, and super-fast response times are all options for the Advanced Model only. What matters most is actual gaming performance and it is here that the Base Model stands neck-to-beck with the GTX 1060 Max-Q Advanced Model while costing hundreds of dollars less.
The main drawbacks are similar to the Advanced Model including the loud fans when gaming and shallow keyboard keys. The smaller battery cuts runtime by an hour or so and falls short of the GS65 and Aero 15X. The slightly thicker chassis when compared to the Advanced Model is actually a non-issue since it's barely noticeable in practice. The core Razer design and experience remain intact from top to bottom.
The retail price of the Blade 15 Base Model is within $200 USD of its closest narrow-bezel competitors like the MSI GS65, HP Pavilion Gaming 15t, or Gigabyte Aero 15X v8. For the best construction quality and rigidity, we wouldn't hesitate to recommend the Razer Base Model over other ultrathins. For longer runtimes and a 144 Hz panel, consider the aforementioned examples or upgrading to the Blade 15 Advanced Model.
Razer Blade 15 Base Model
- 10/26/2018 v6 (old)
Allen Ngo
Price comparison
