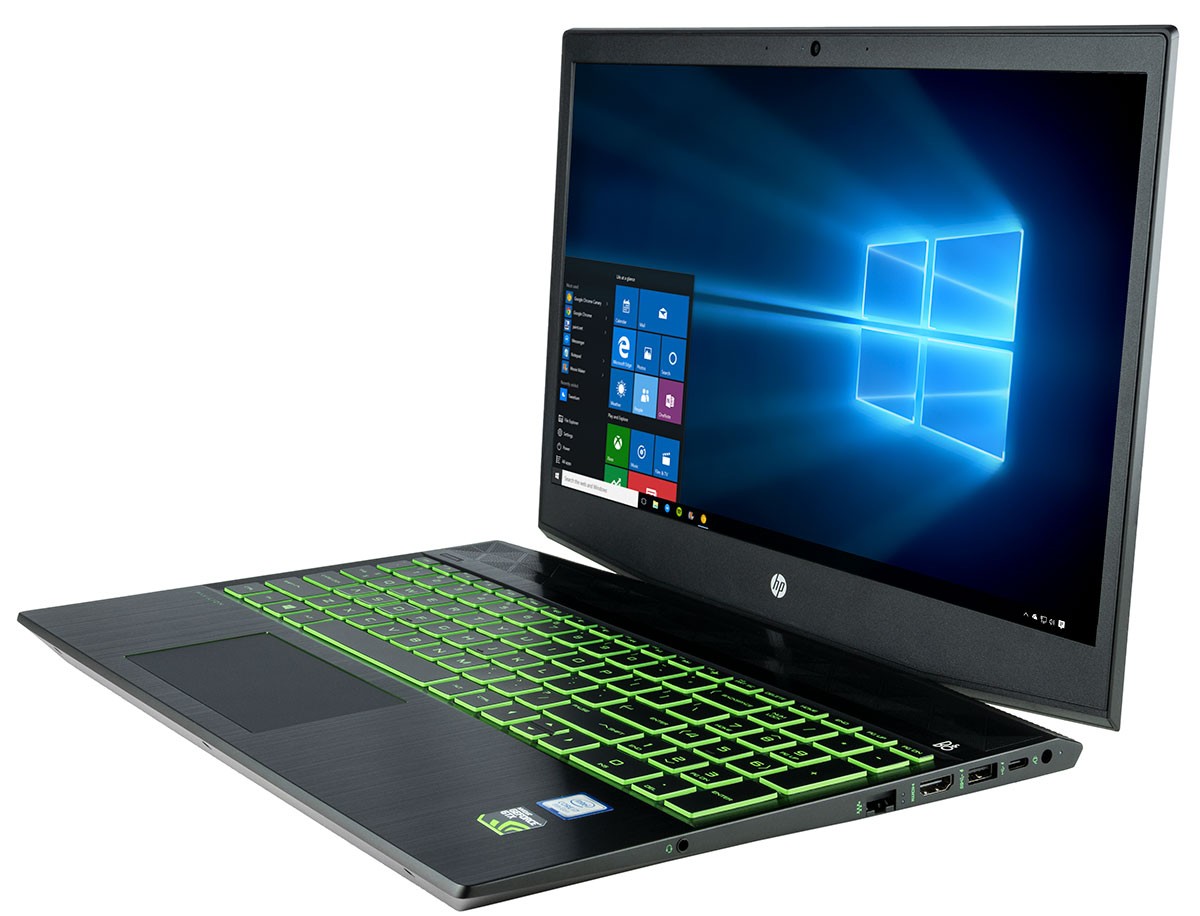
HP Pavilion Gaming 15t (i7-8750H, GTX 1060 3 GB) Laptop Review
Lower-cost gaming laptops keep getting better and better. Dell's G7 and Acer's Helios 300 are proof of this theory, and OEMs are being pushed to improve their entry-level gaming notebooks as a result. HP is looking to up the ante with its Pavilion Gaming 15t, the company's newest entry in the mid-tier gaming market and the direct successor to the Pavilion Power 15.
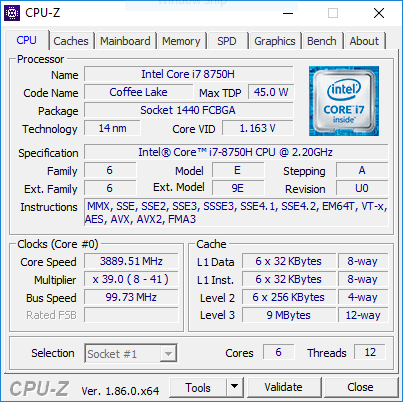
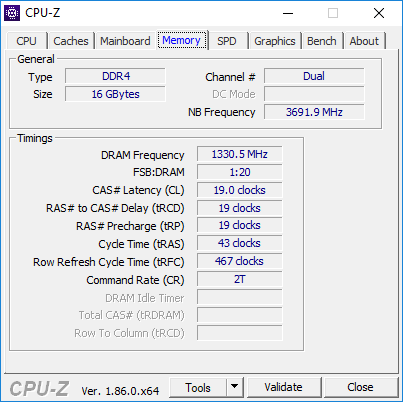
The Pavilion Gaming 15t takes some cues from HP's other lines. There are echoes of design language from both Omen and Pavilion laptops, and the result falls somewhere in the middle. The internals of the laptop are decidedly mid-range. Intel's Core i7-8750H pairs well with the Nvidia GeForce GTX 1060 Max-Q. These are small upgrades from the usual Core i5-8300H/GTX 1050 Ti combo typically seen in this price bracket, but HP is keeping costs at bay by opting for the 3 GB variant of the 1060 Max-Q. A 144 Hz display, 16 GB of RAM, an NVMe boot SSD and 1 TB HDD round off the specifications. These options are upgrades over what we're used to seeing in the USD $1200-1300 bracket. Will they be enough to edge out competitors? We shall see.
The mid-tier gaming market has never been more competitive. Dell's G7, the Acer Helios 300, the Asus FX503VM, Lenovo's Legion Y530, and the MSI GV62 are all strong contenders in this space. Each of these makes its own sacrifices to hit a lower price bracket. Will that be enough for the Pavilion Gaming 15t to rise above the rest? Let's dive in.
Case
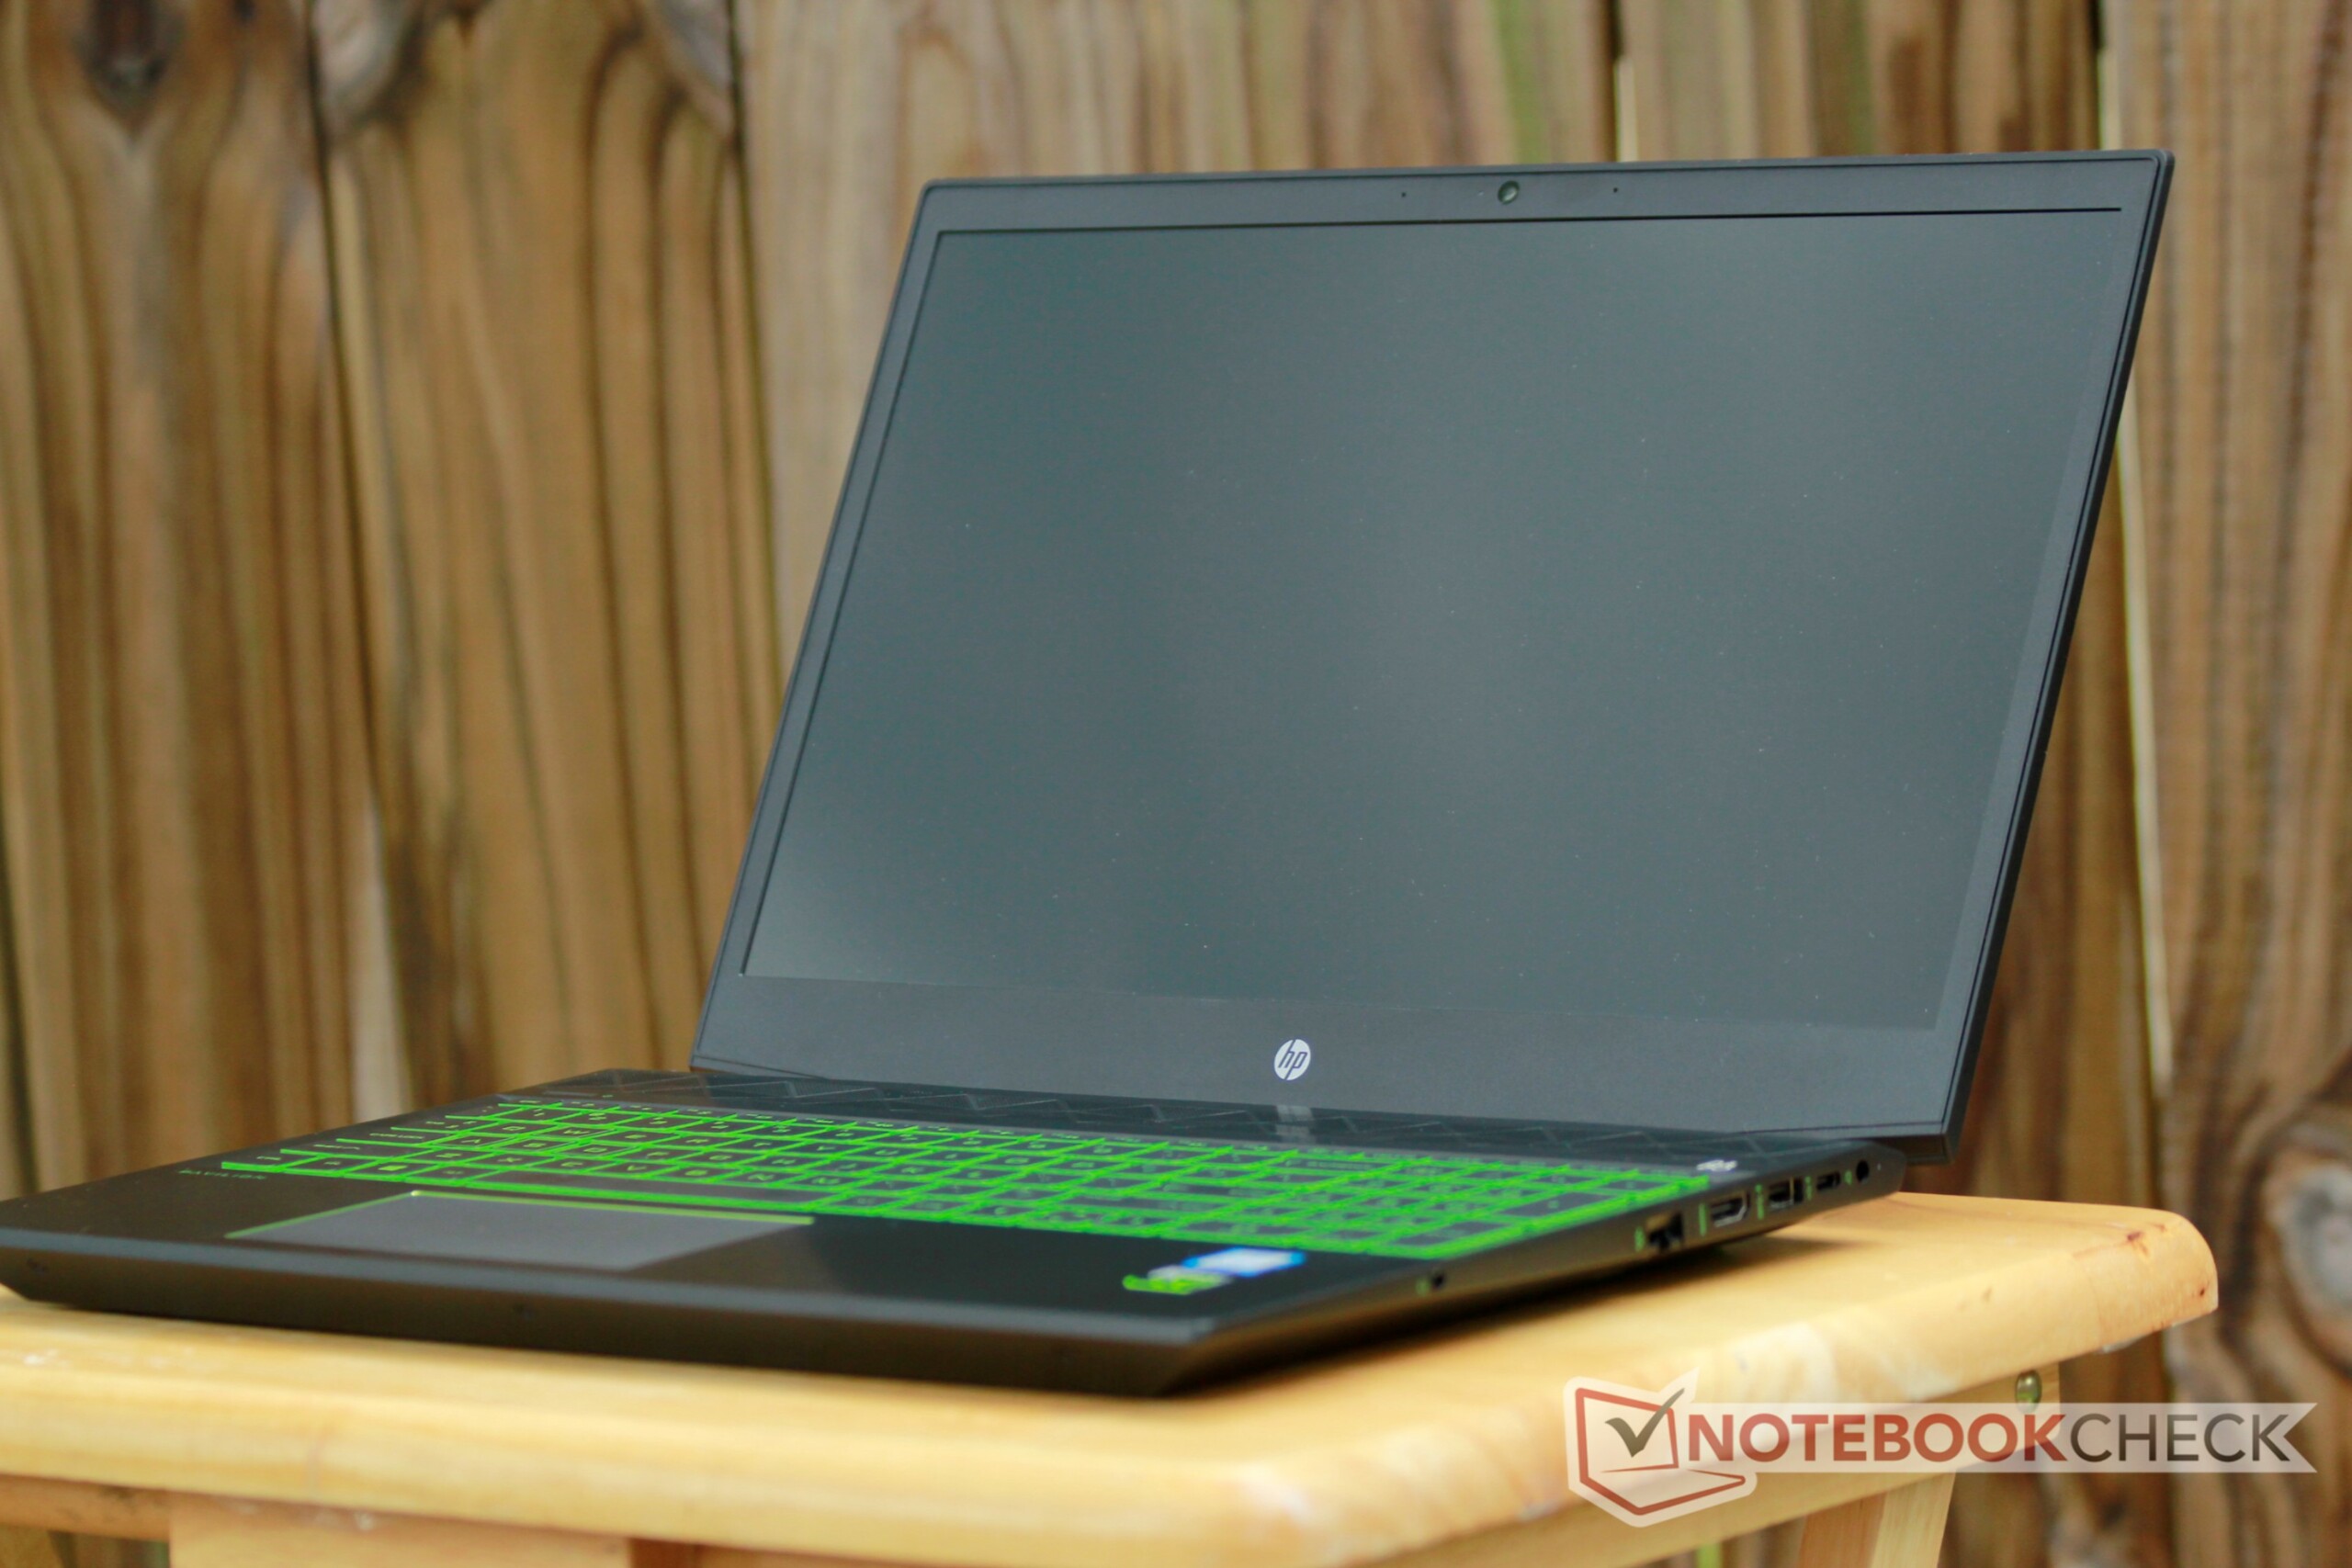
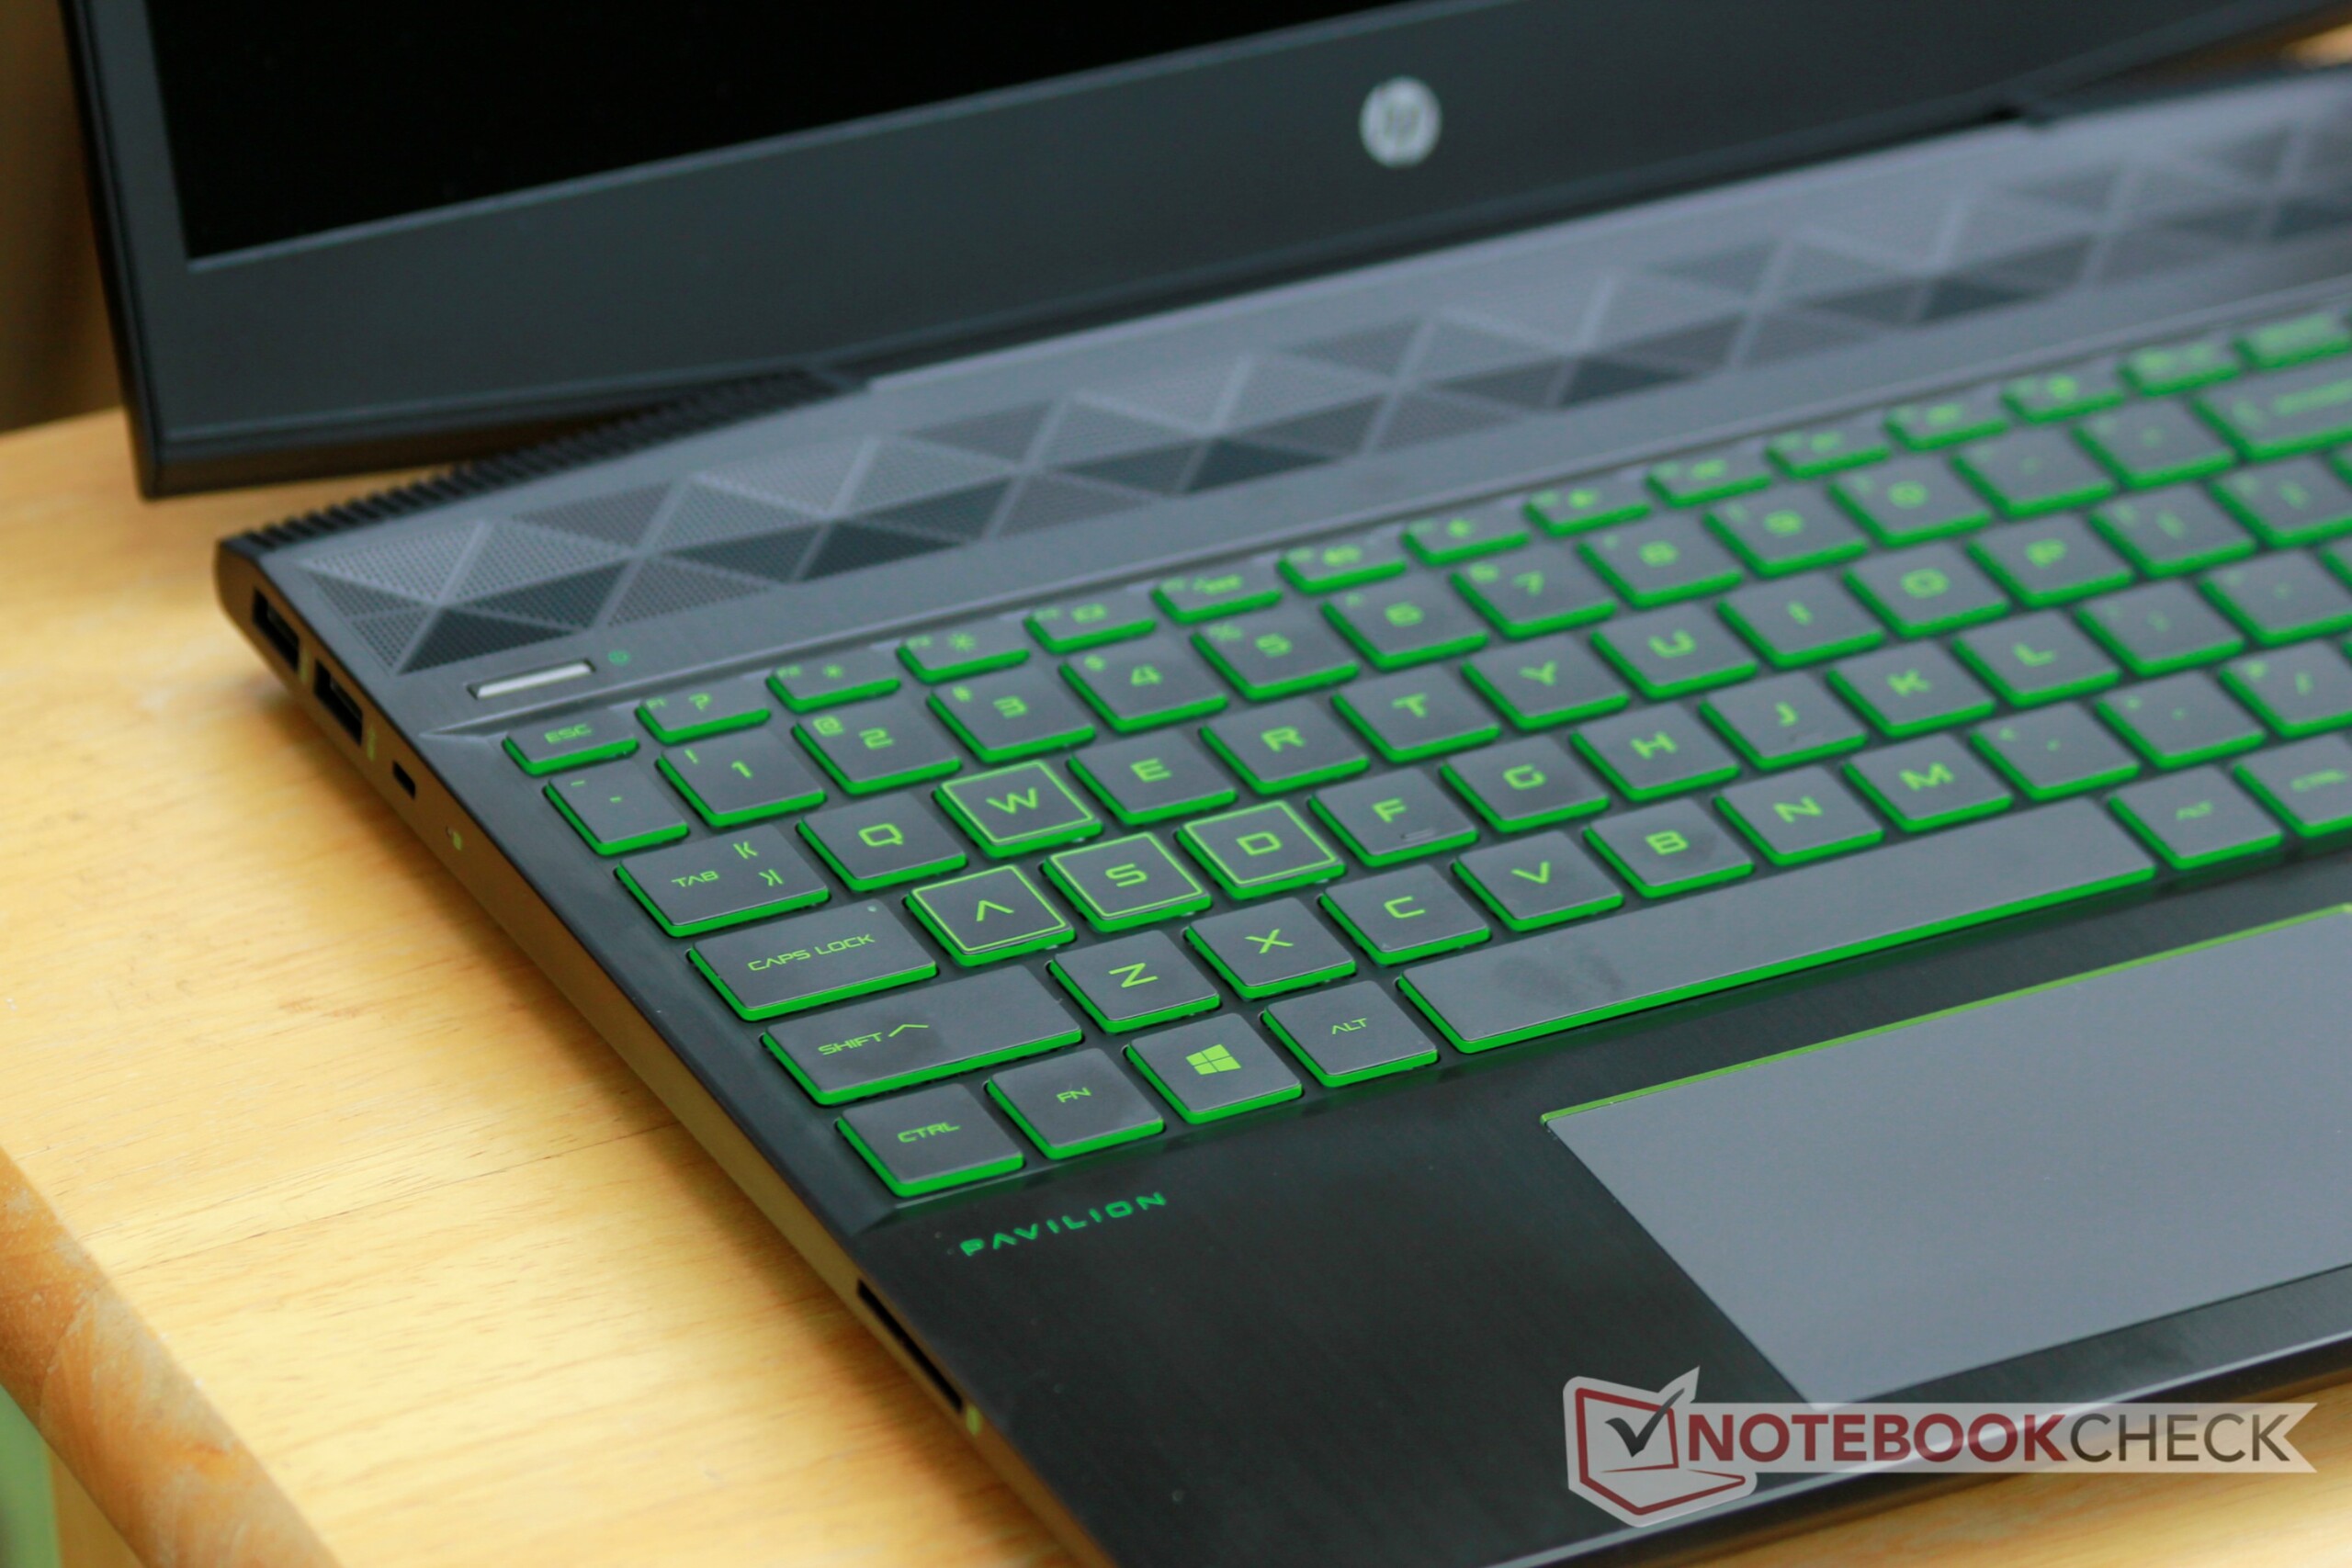
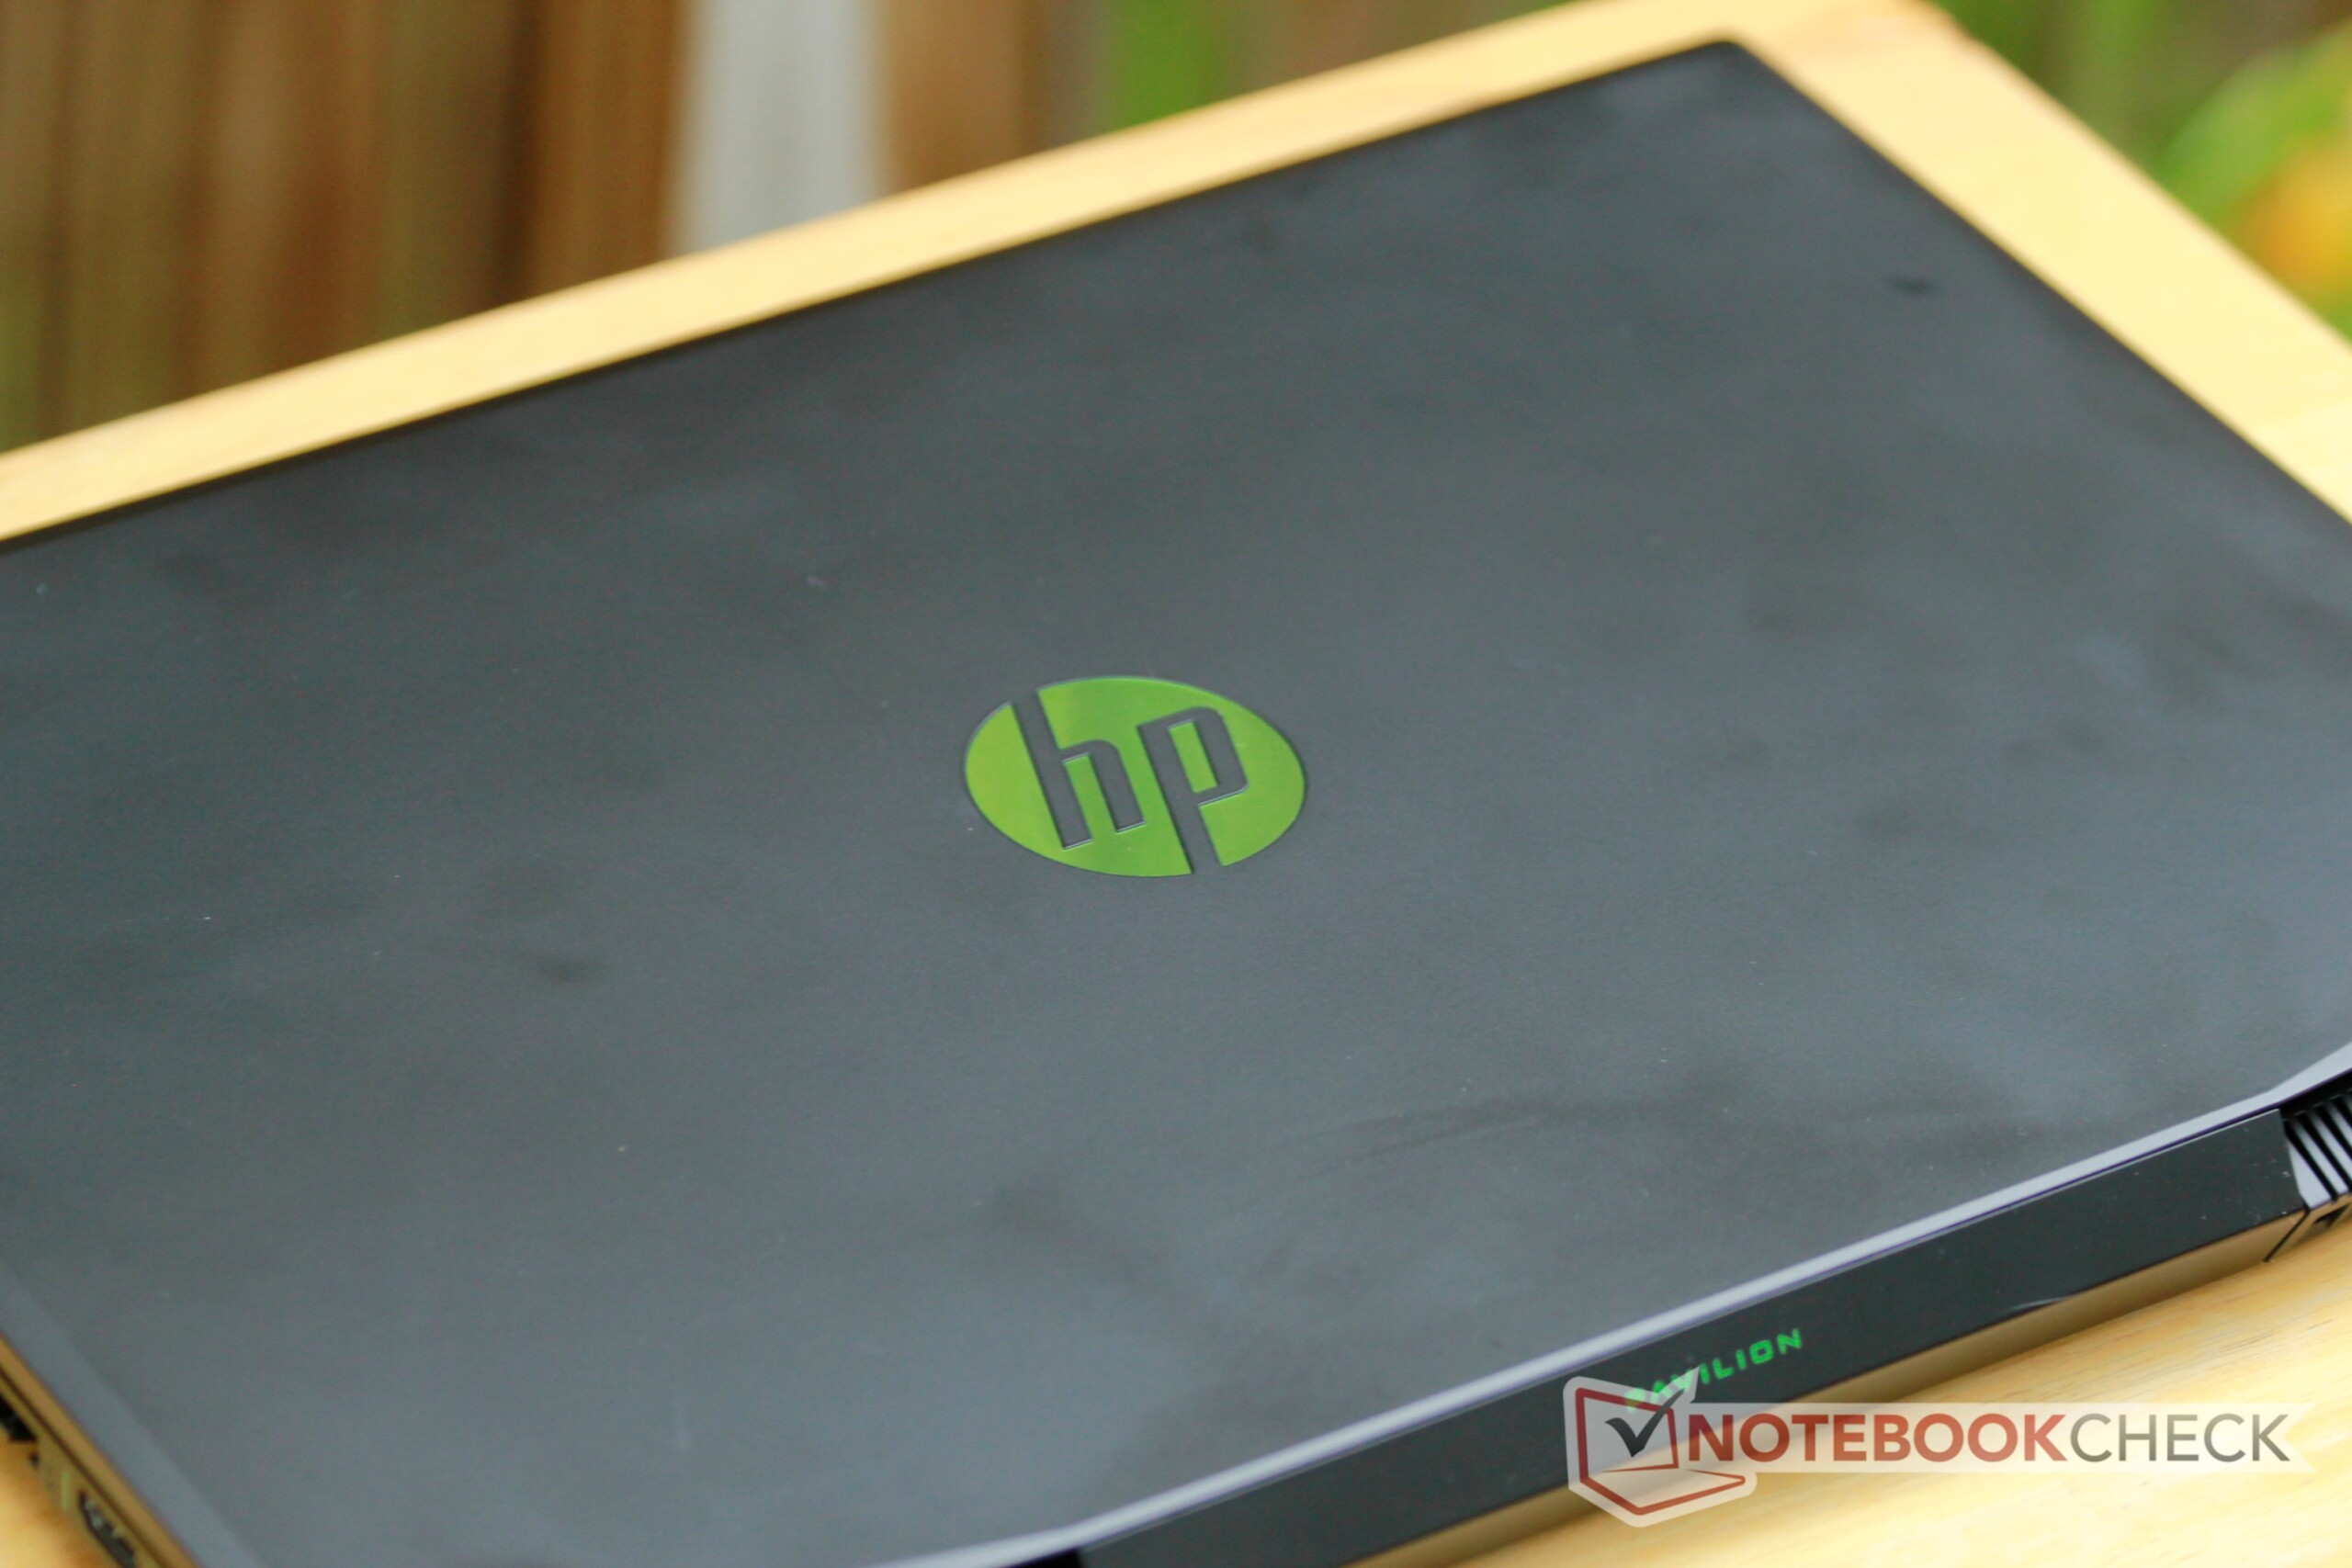
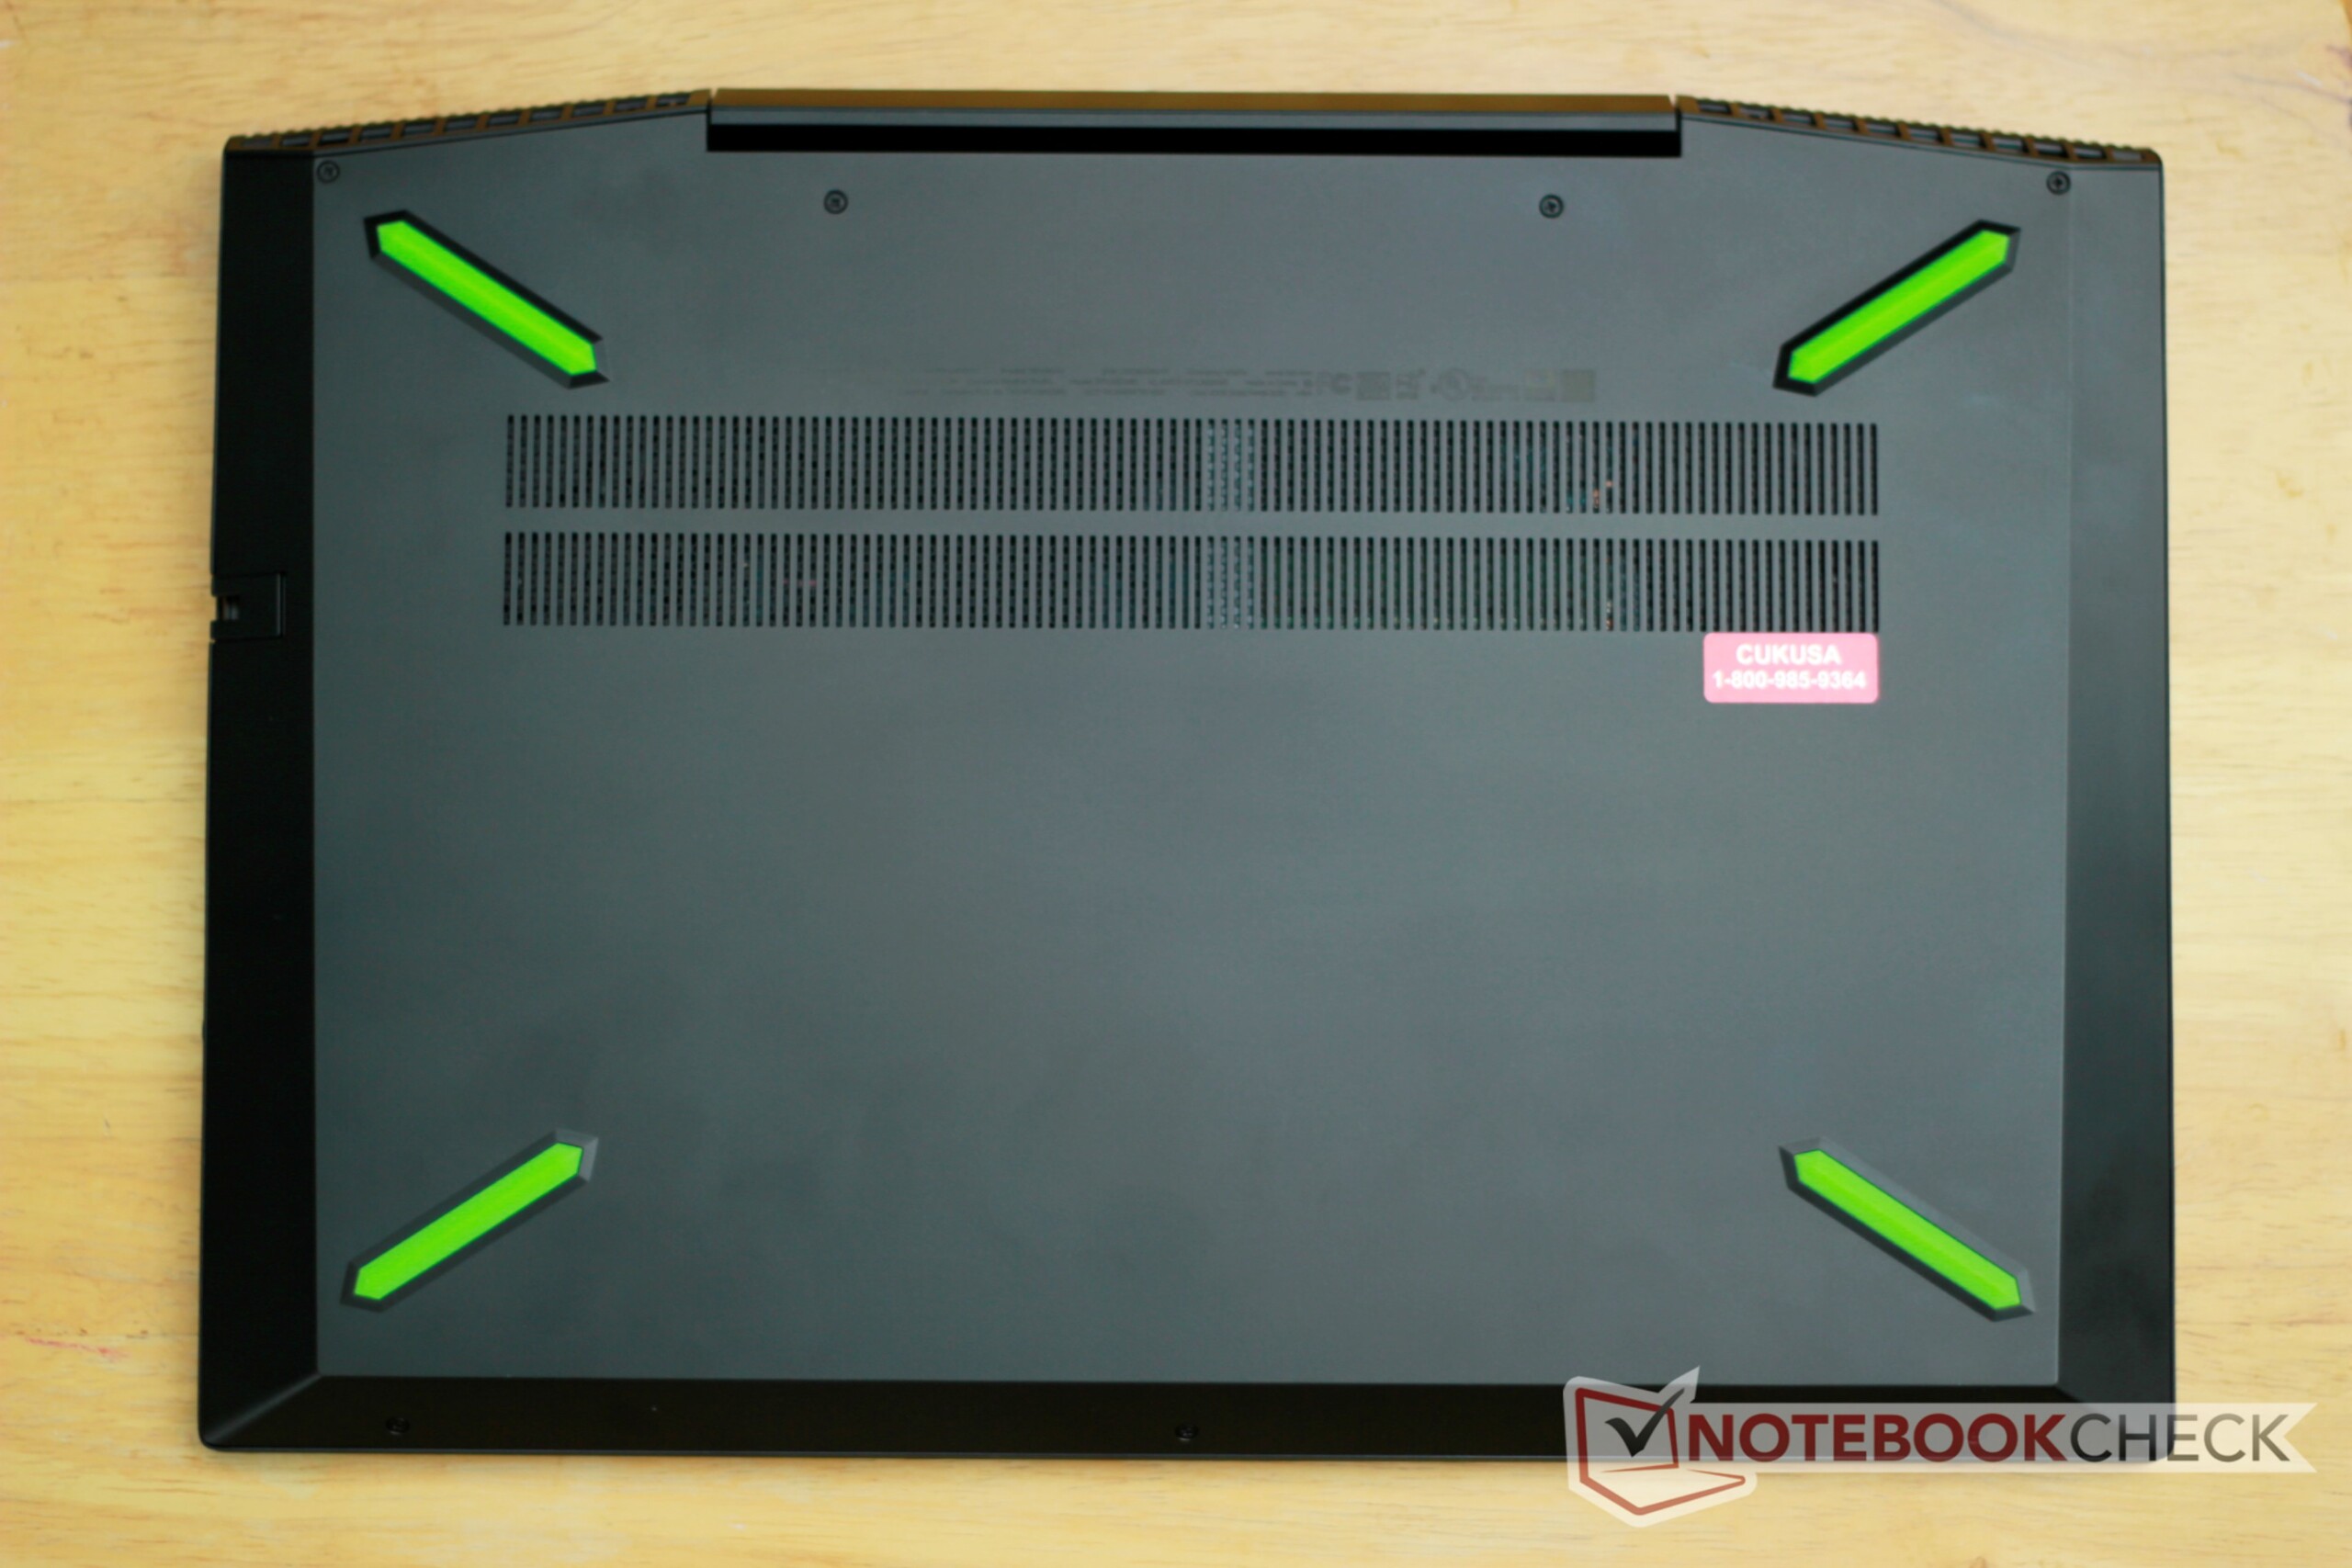
The Pavilion Gaming 15t's case is a blend of premium and budget materials. The keyboard deck is a single piece of brushed black aluminum that looks sleek but attracts fingerprints. This beauty is more than skin deep; the deck is very sturdy. Flex is minimal, even across the vents along the top edge. The rest of the device is plastic. The bottom panel is as firm as the top deck. There are no noticeable weak spots, and the bottom does not warp under direct pressure. Both the keyboard deck and bottom panel creak slightly when pressed.
The lid is the polar opposite of the main chassis. Made entirely from plastic, it is thin and feels flimsy. It easily twists under light torsion. Warping the back of the lid (such as near the HP logo) does not distort the LCD display, hinting at some shielding between the panel and its housing. The lid does not creak when twisted. The hinge is sturdy and strong. It is a bit too stiff for one-handed opening, but it holds the display in place and does not wobble under normal use (e.g., while typing). All said, build quality is good with the exception of the weak display housing.
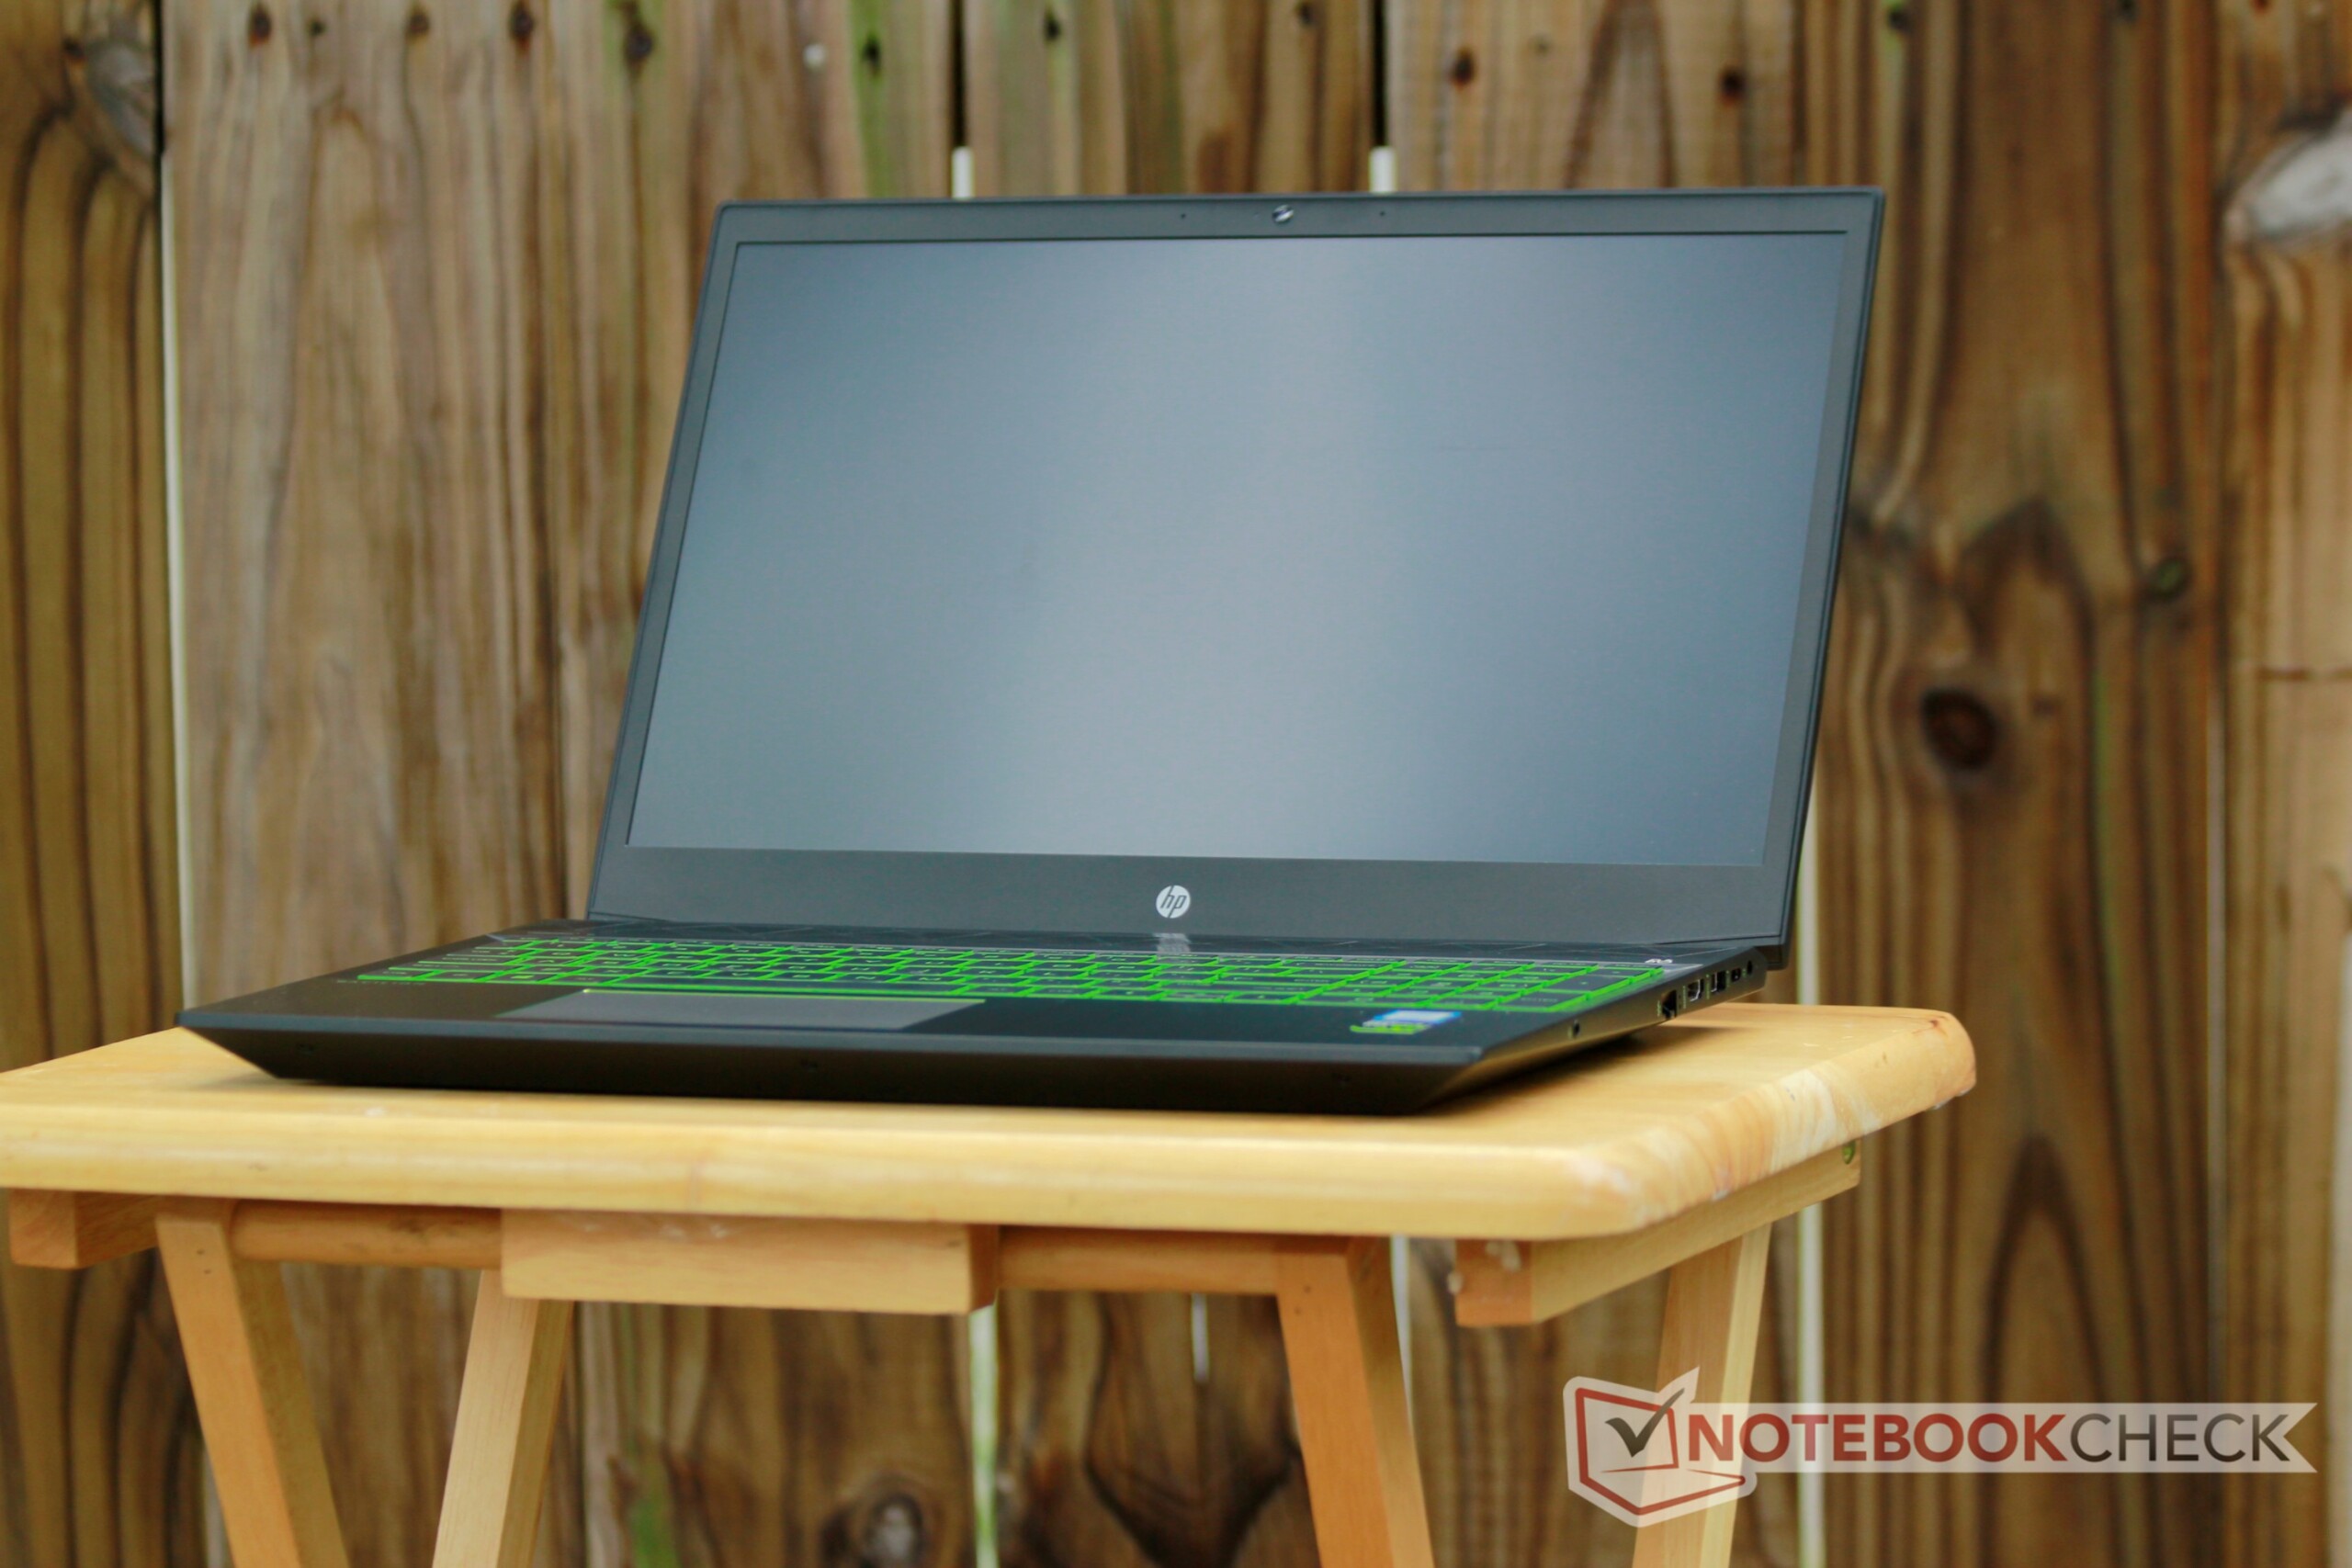
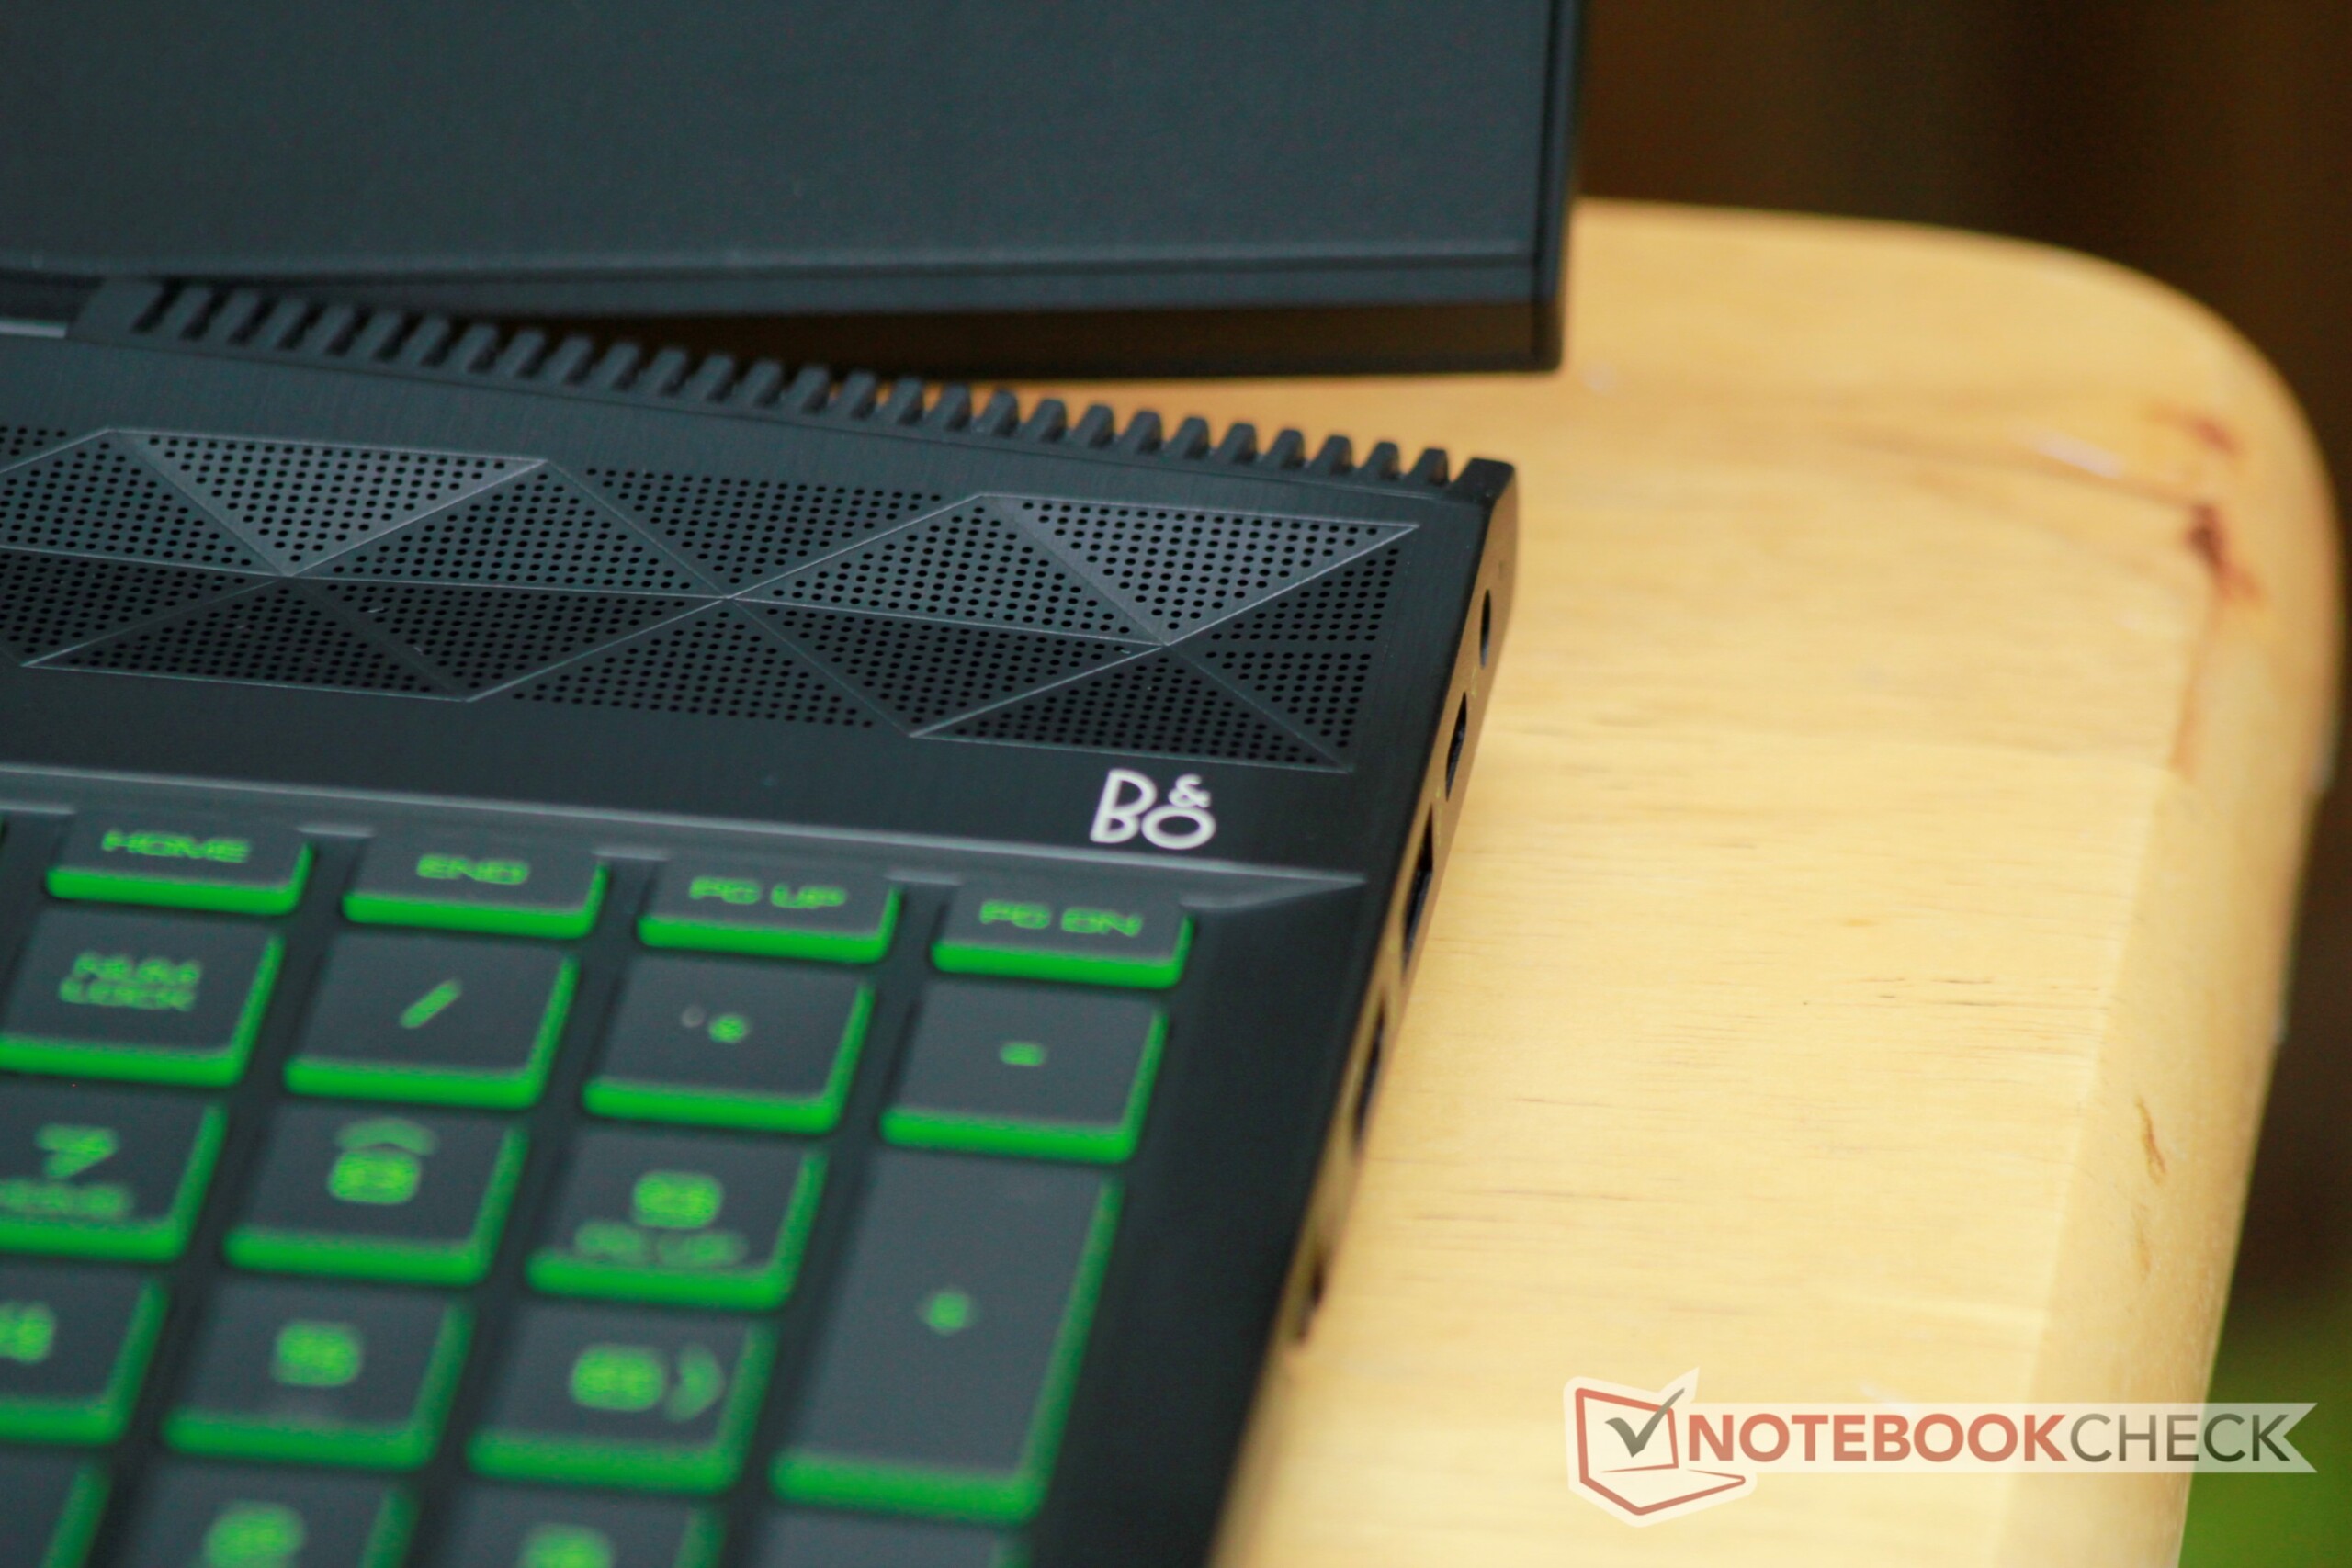
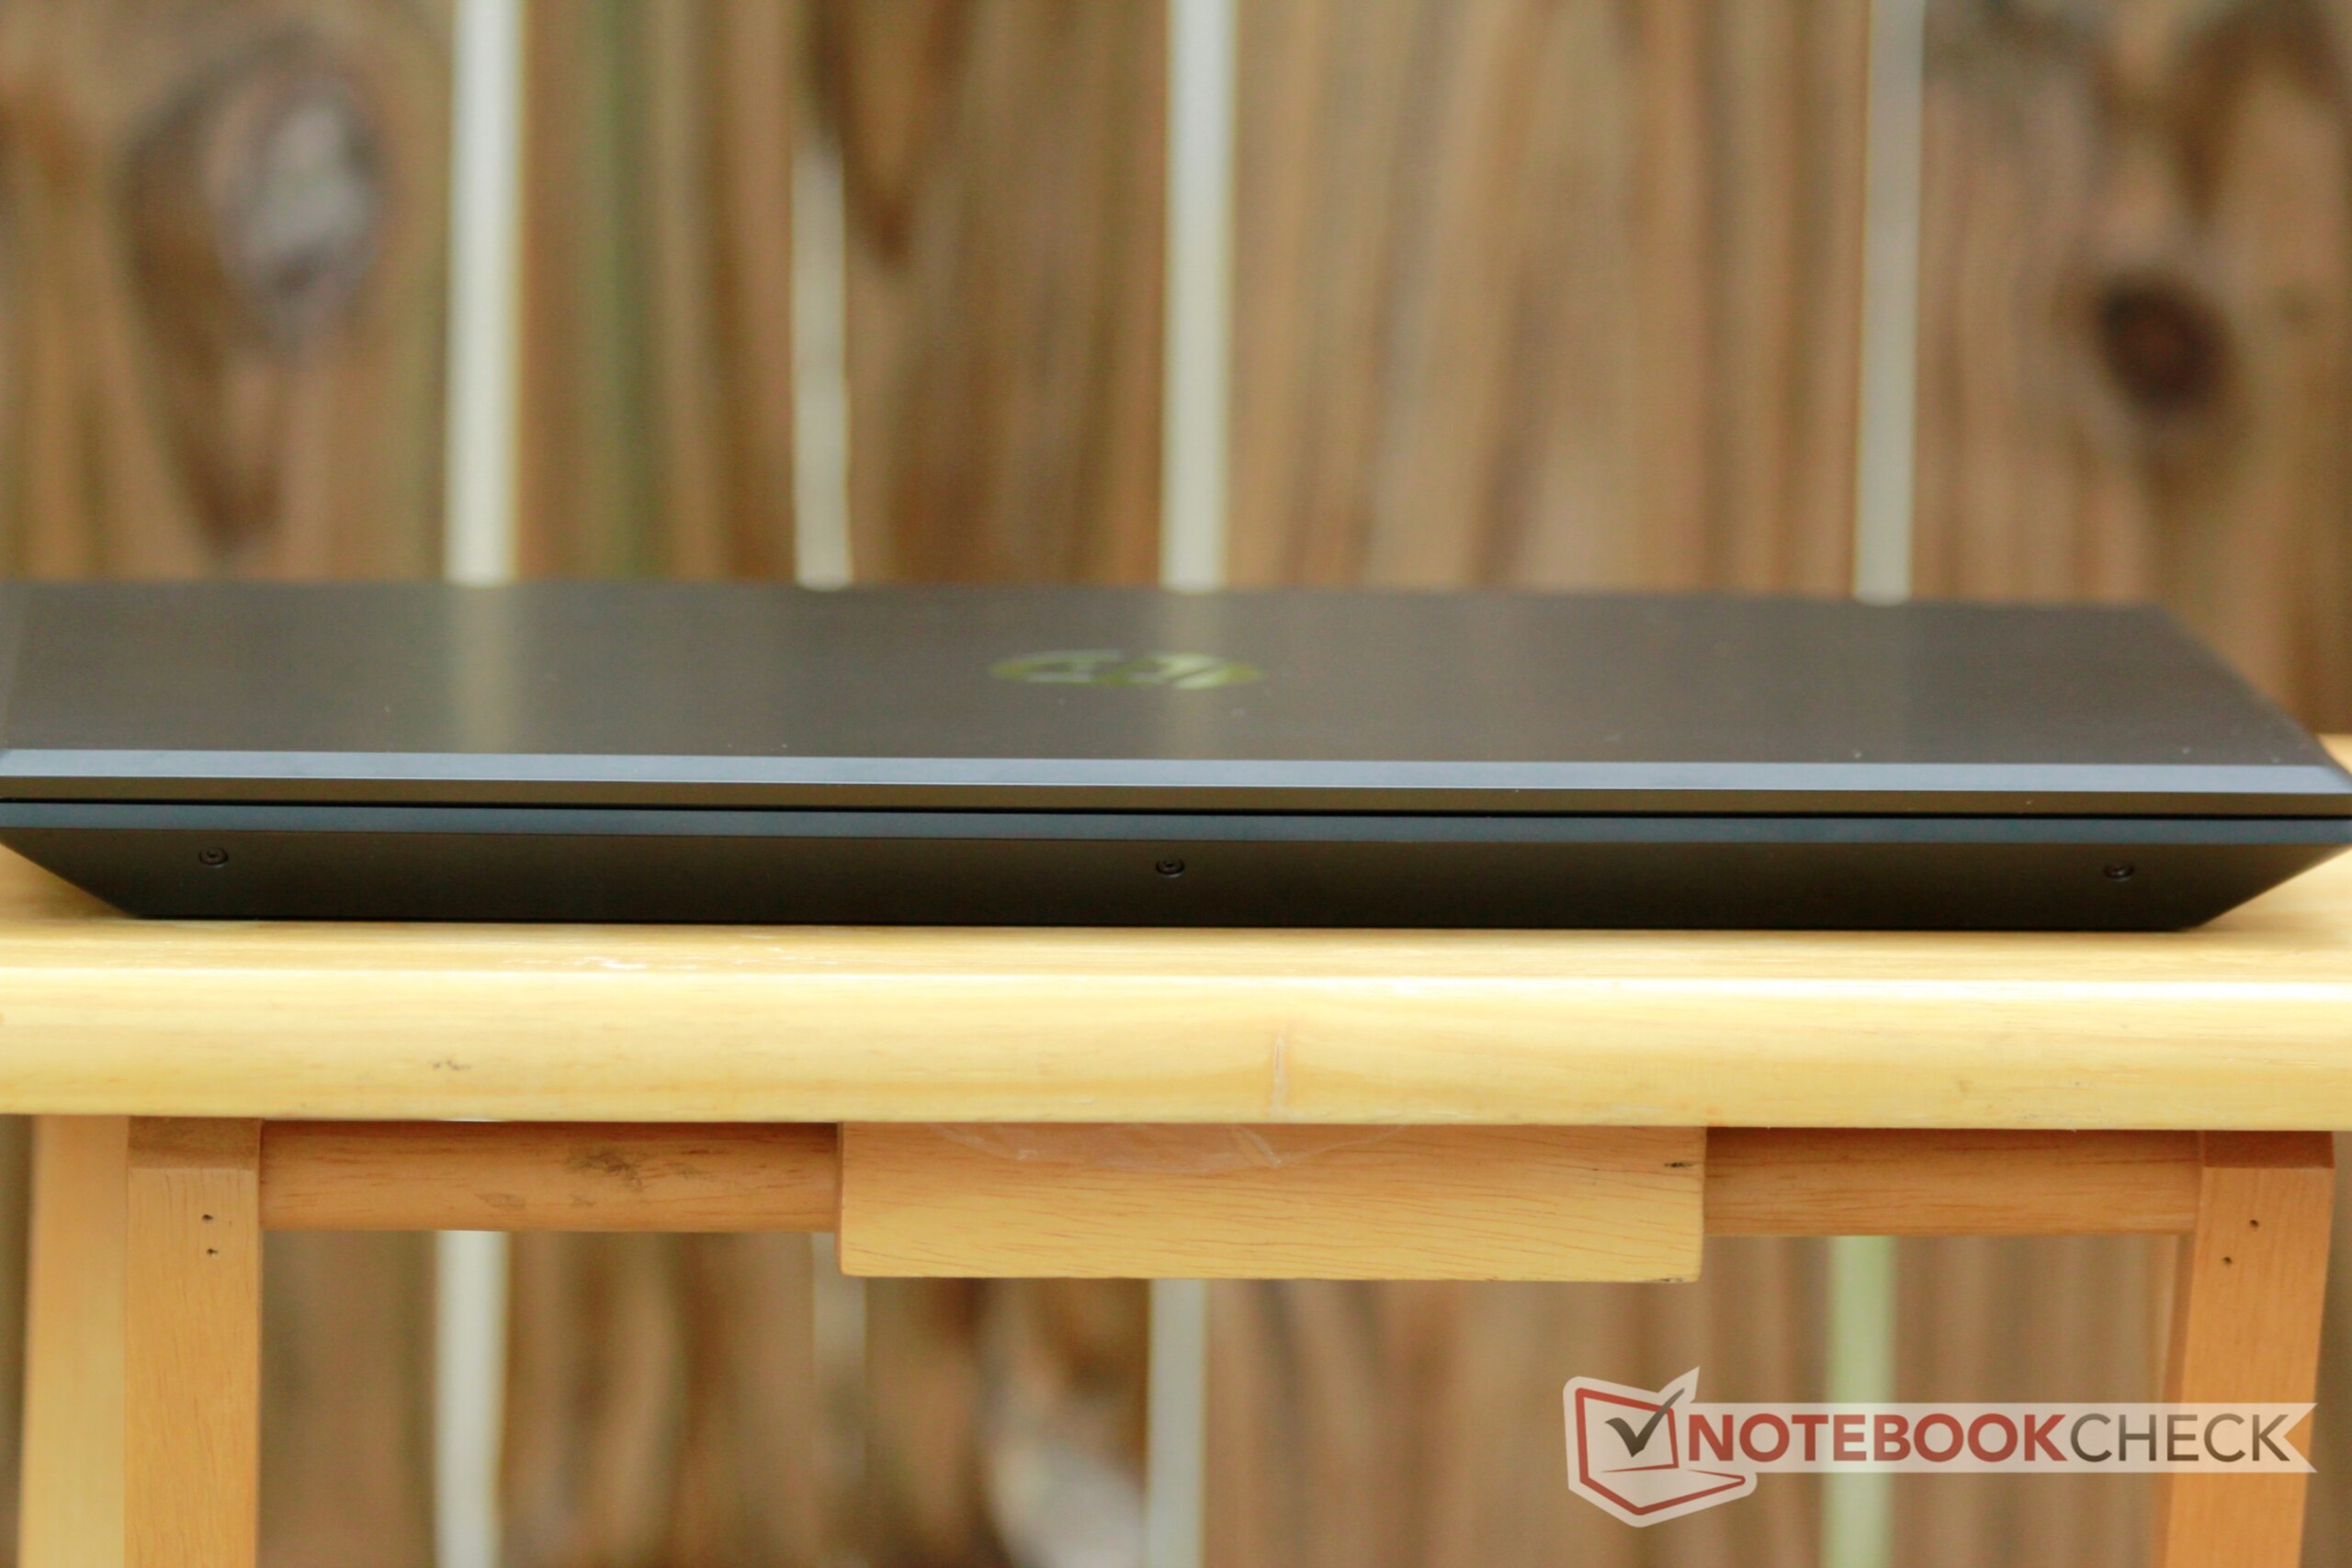
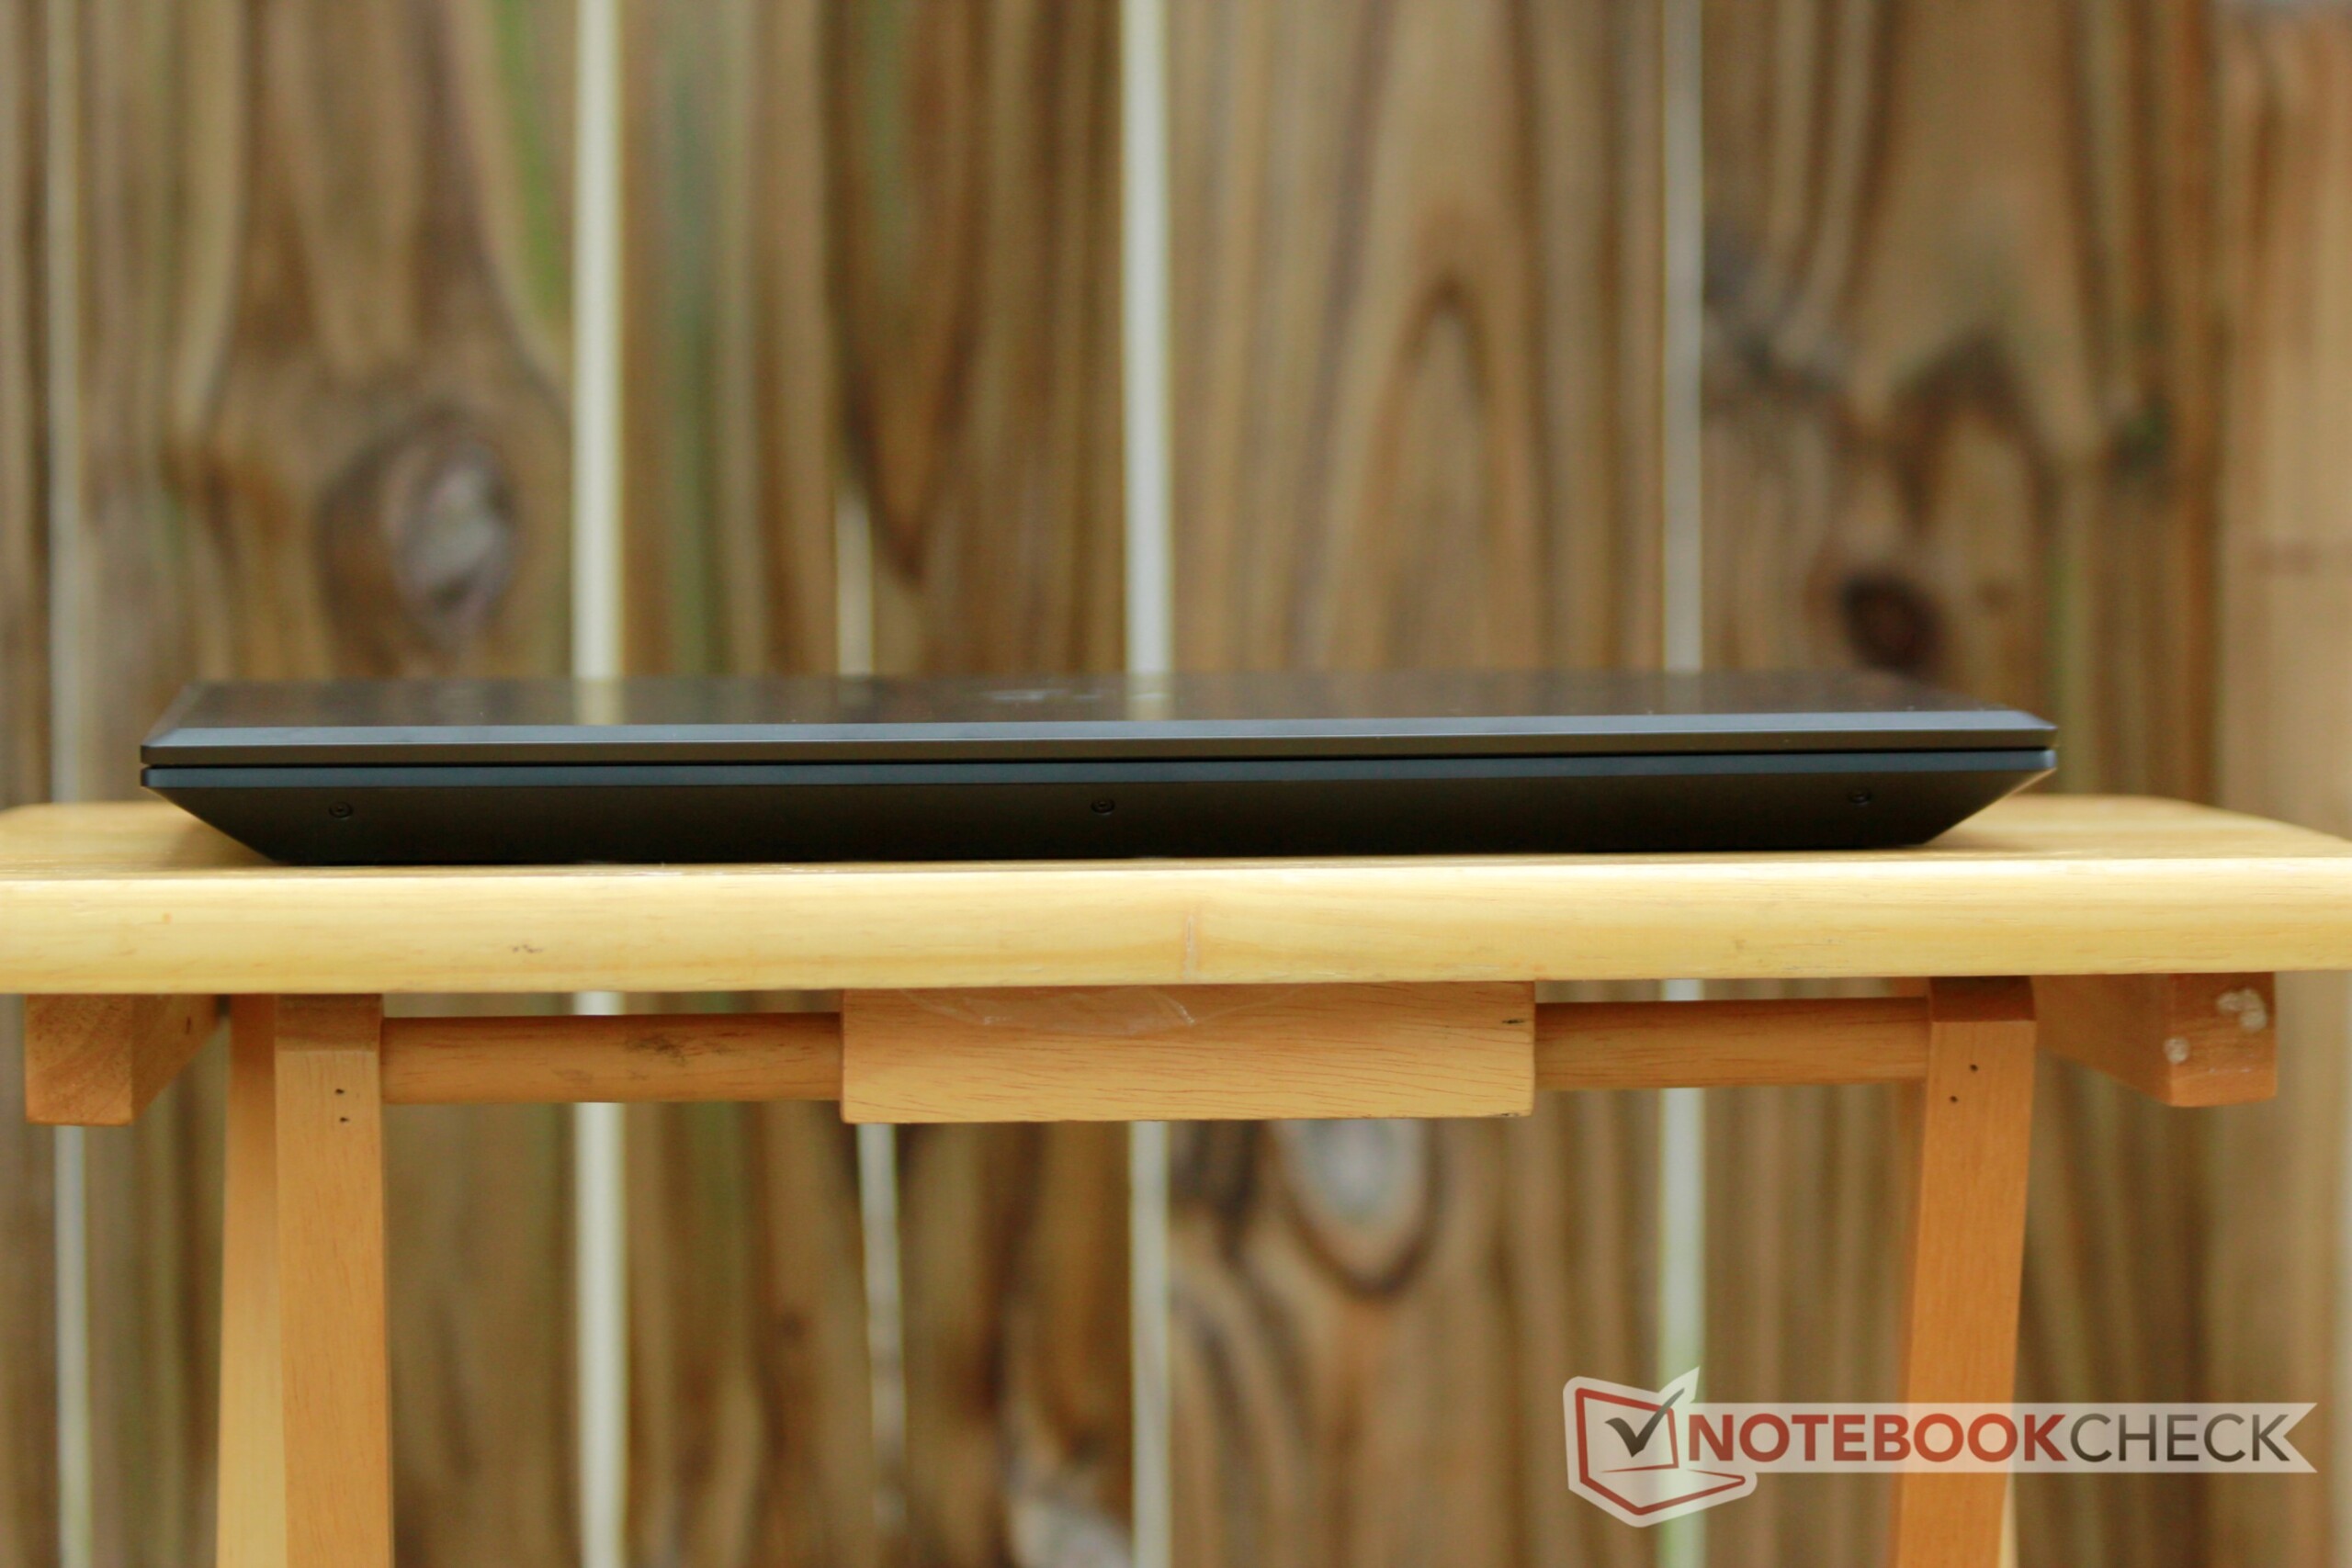
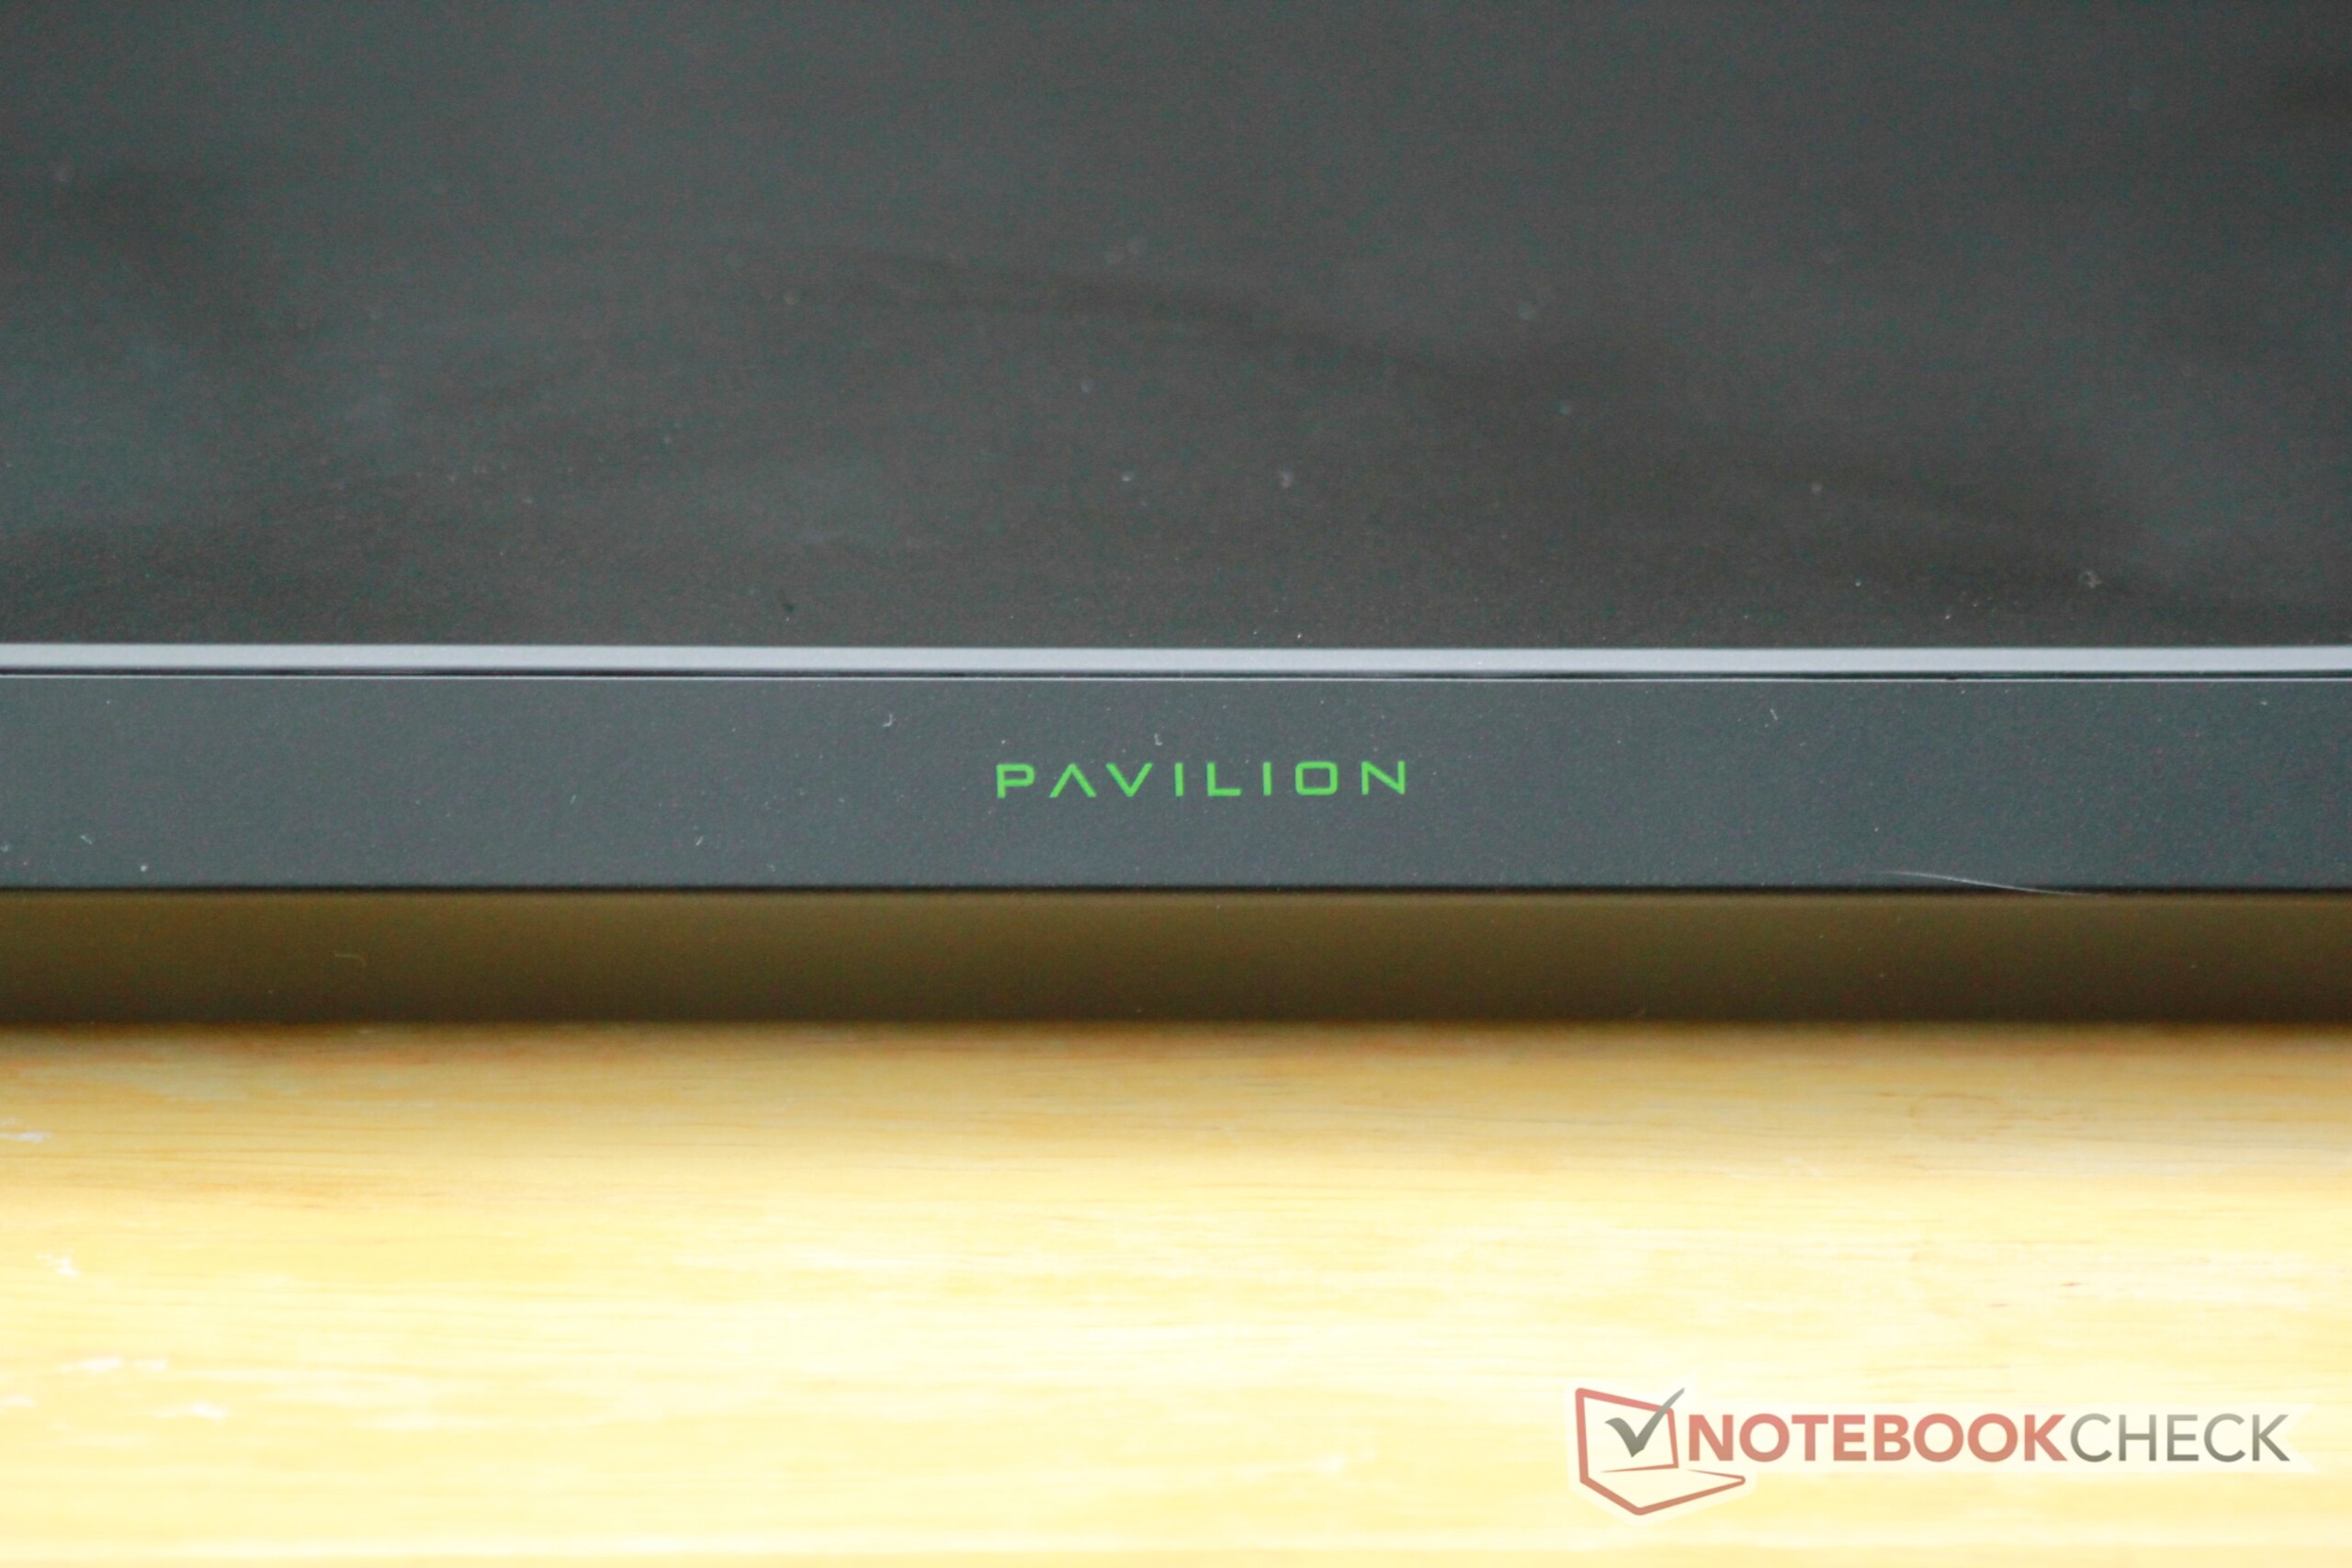
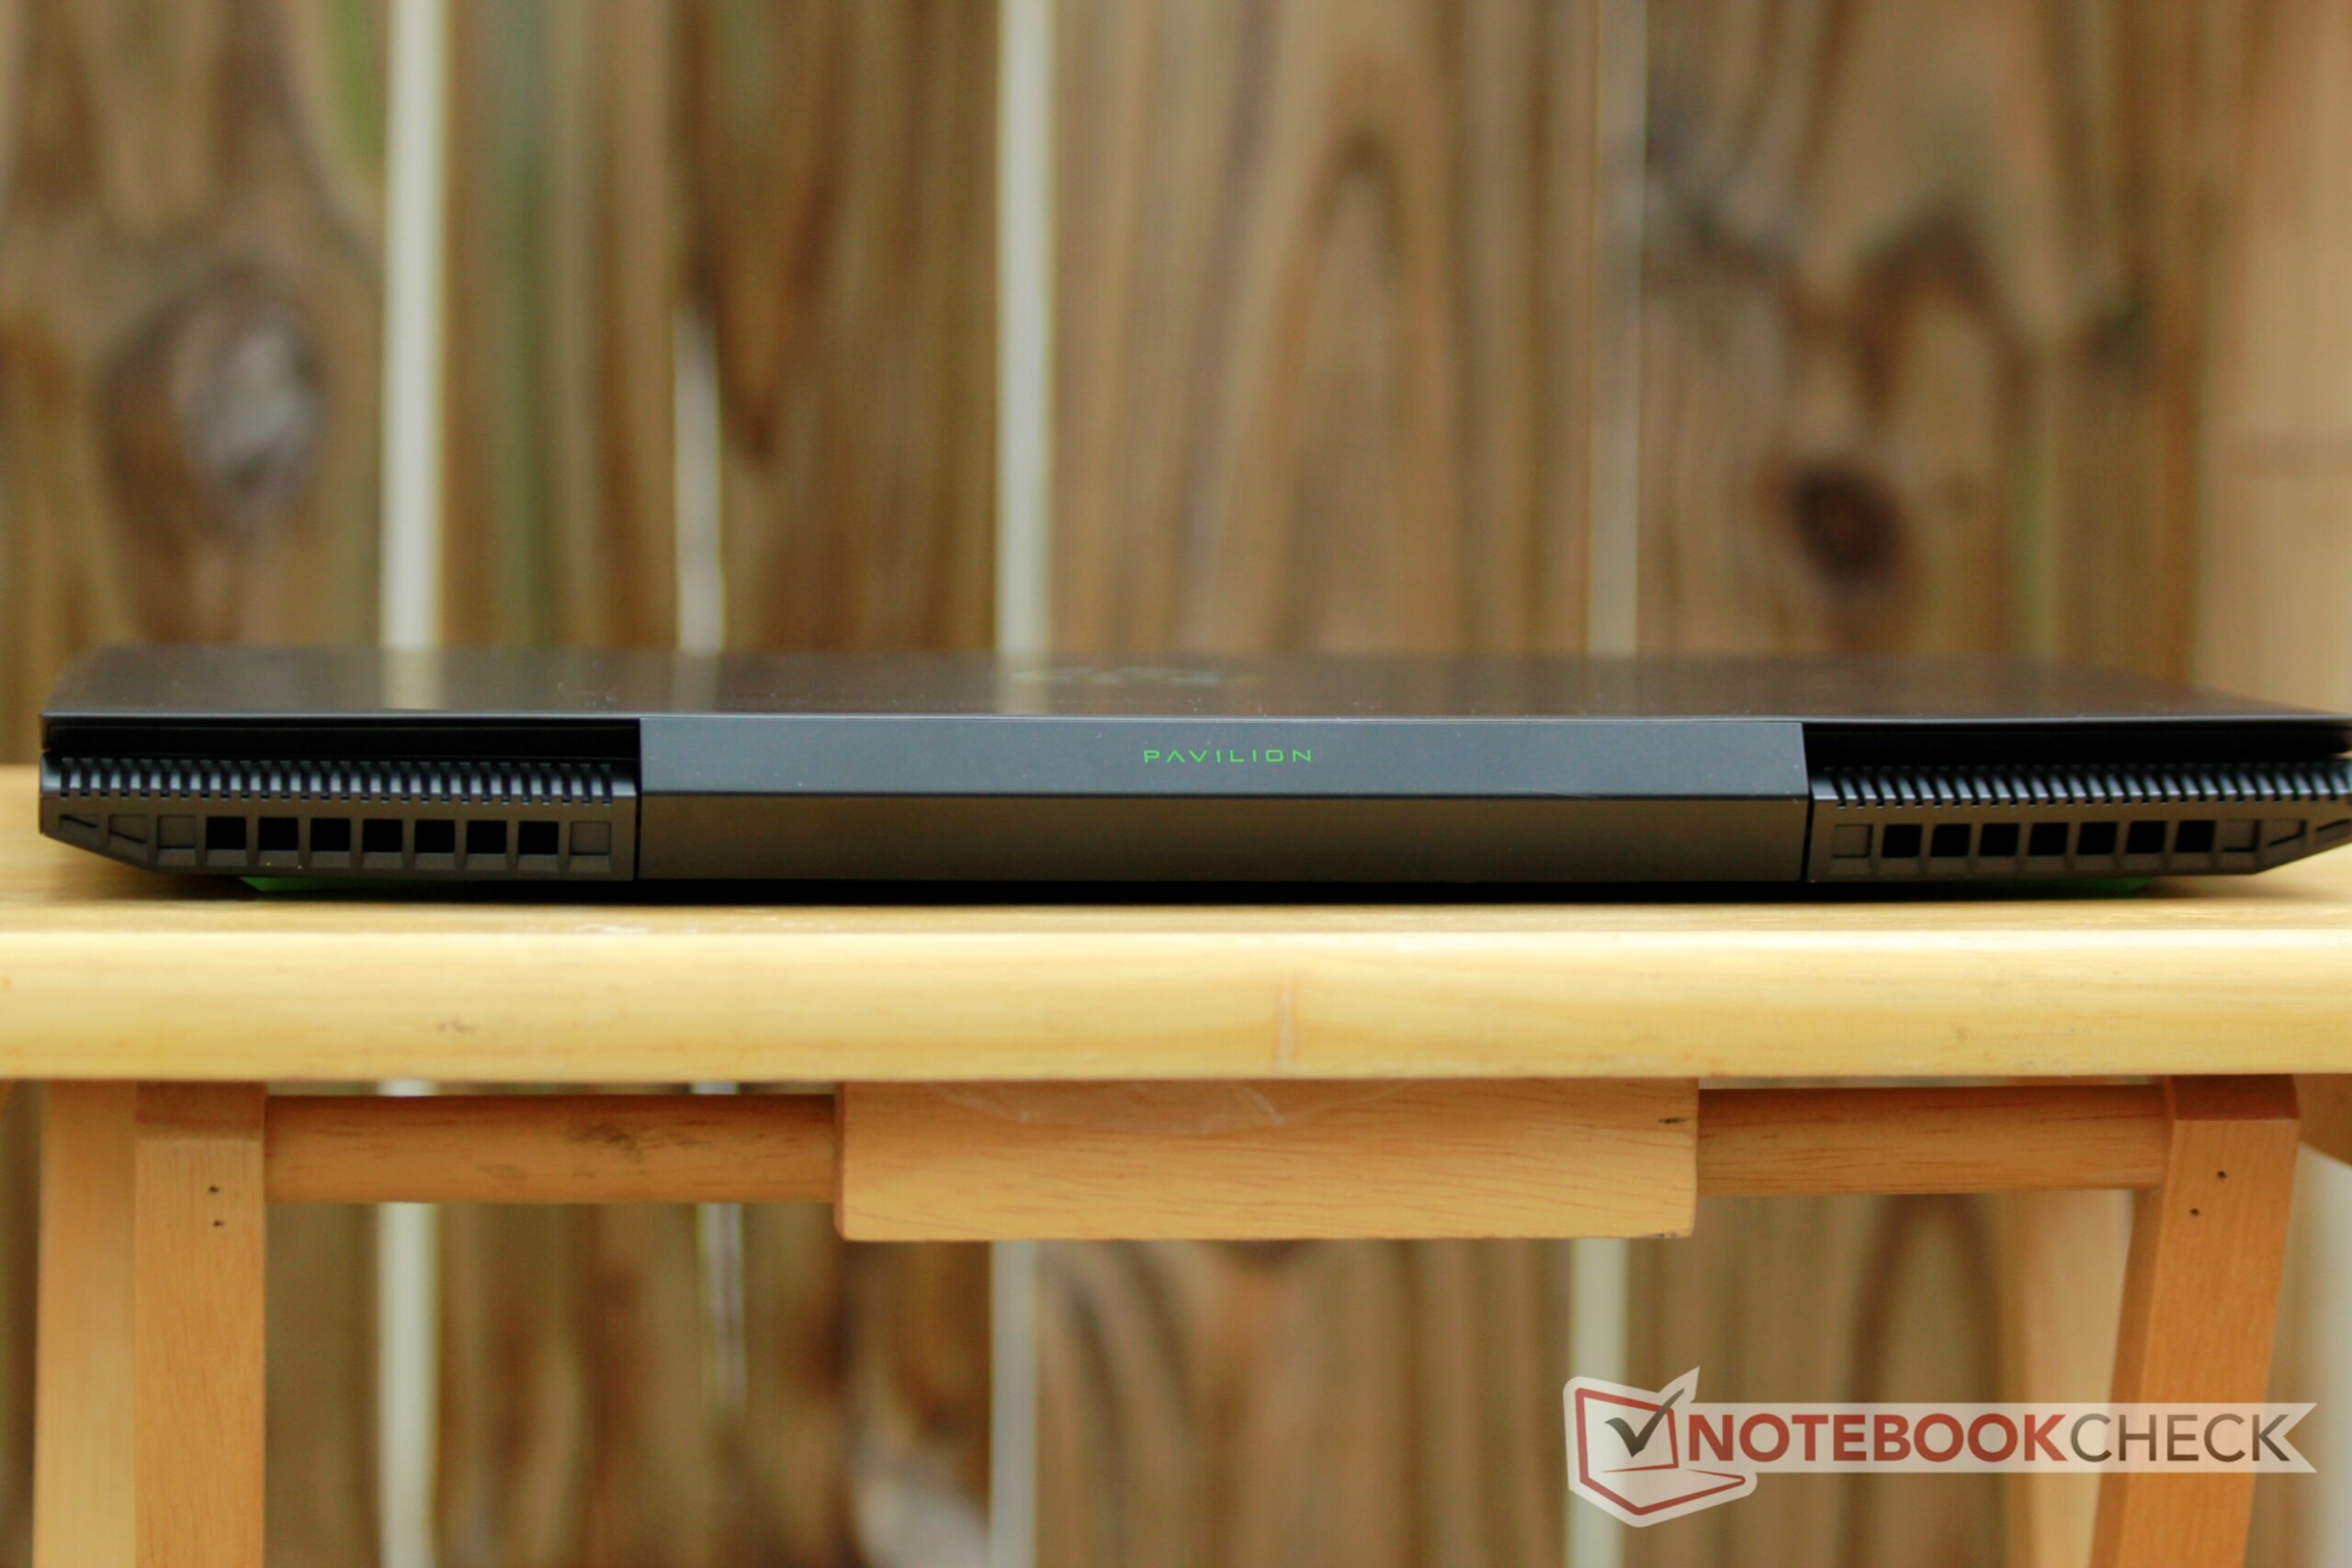
The Pavilion Gaming 15t has a smaller footprint than most other 15-inch gaming laptops. This is thanks in part to its small display bezels; while the Pavilion certainly doesn't qualify as a "bezel-less" laptop, the display housing has trimmed a few centimeters off the sides. The keyboard also extends up to the sides of the case, leaving about 1.5 cm of clearance. The angle of the bottom panel makes the laptop look thinner than it really is. At about 2.5 cm thick, it's depth is average for a mid-tier device.
Connectivity
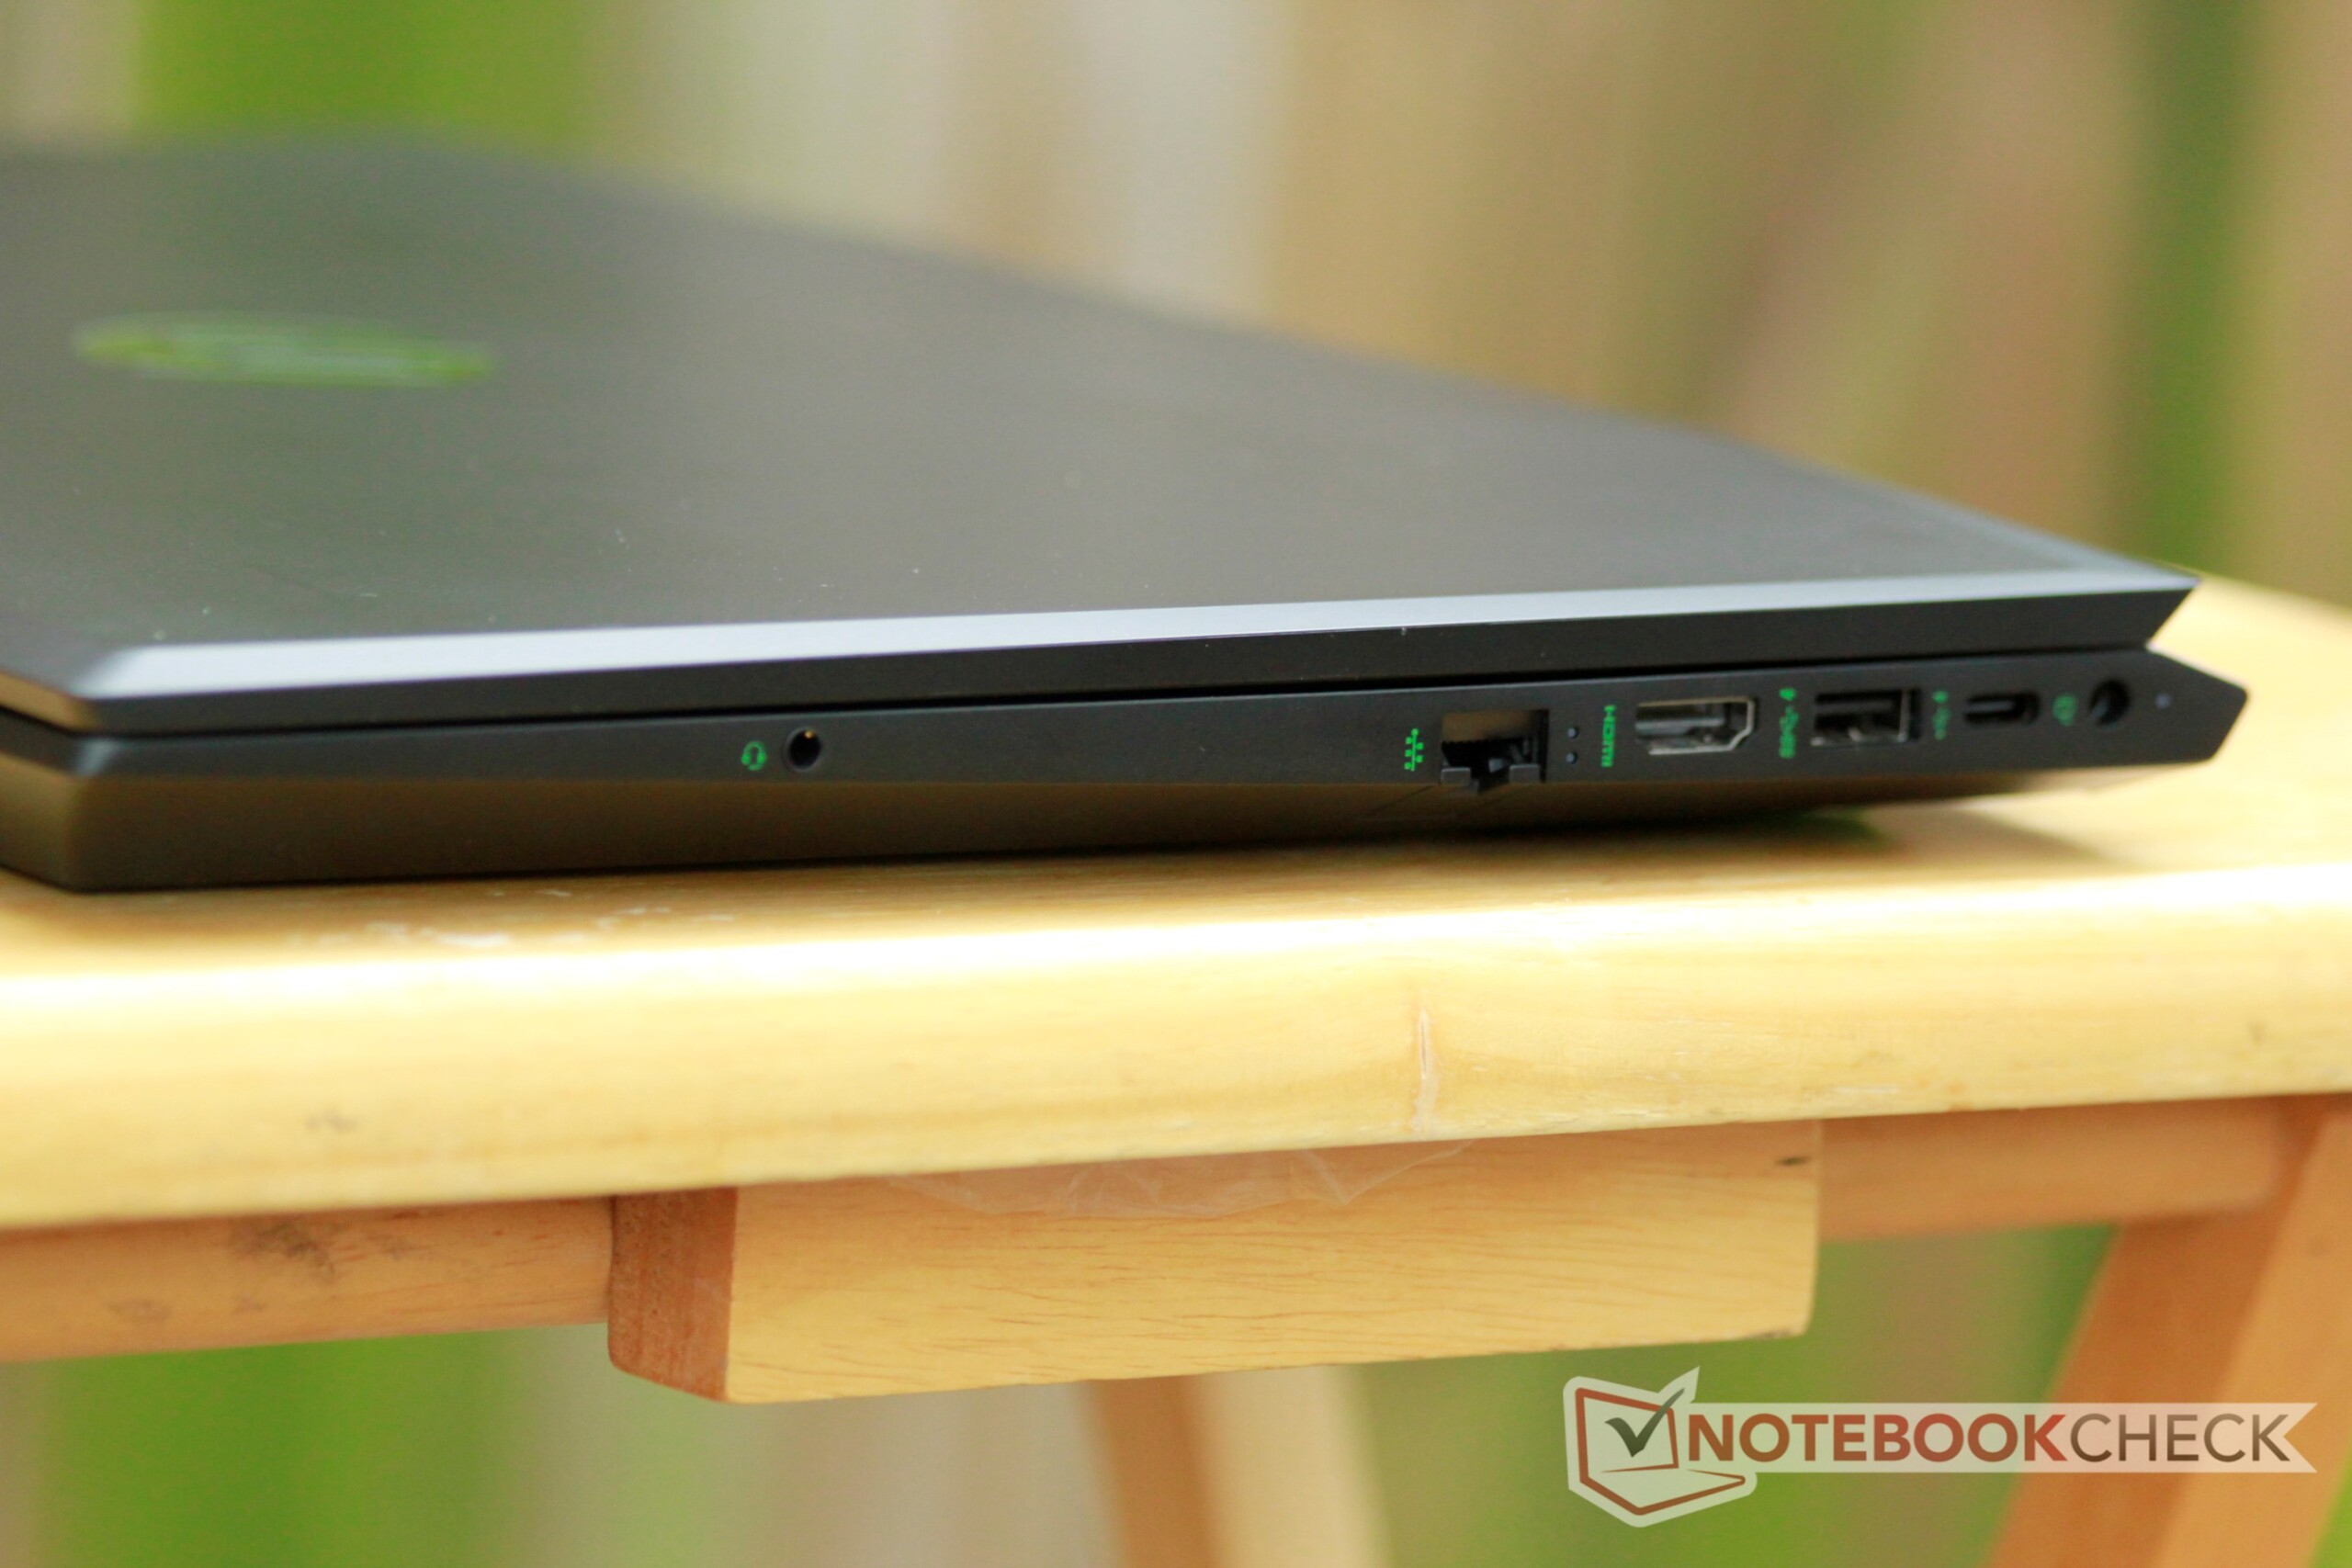
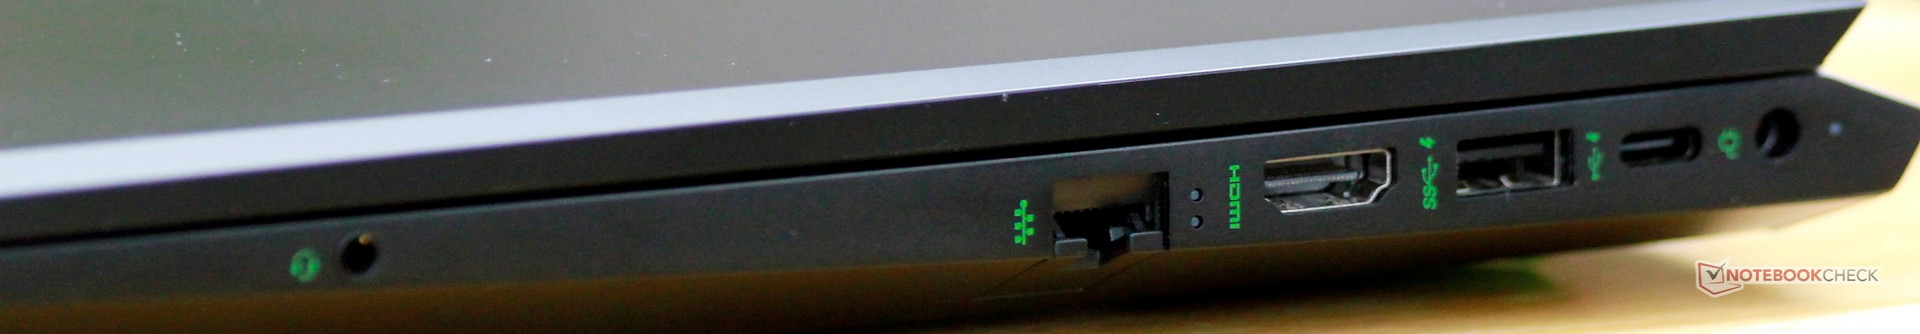
The Pavilion Gaming 15t has a good selection of ports, including a single USB Type-C port. Unfortunately, Thunderbolt 3 is missing. That limits peripheral options, especially for external displays; the HDMI 1.4 port is the sole monitor hookup. The ports are a bit too close together; large thumb drives or USB connectors may block other ports.
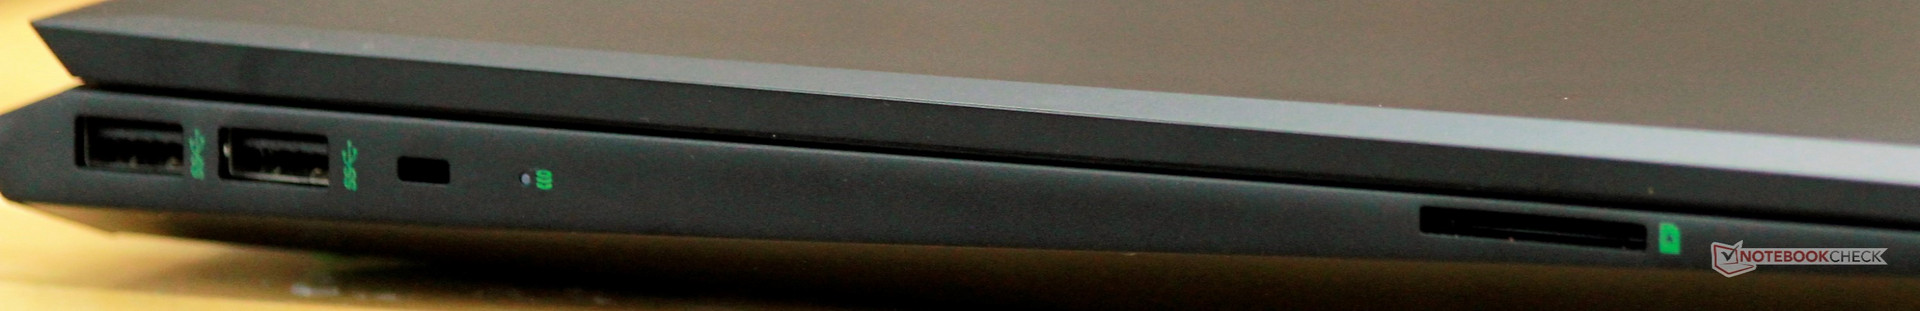
SD Card Reader
The full-sized SD card reader is about average for most gaming laptops, budget or not. Read and write speeds hover around 80 MB/s, which is fairly good. A few devices in this price bracket are a bit better, but users will need to shell out quite a bit more to get a significantly faster card reader.
| SD Card Reader | |
| average JPG Copy Test (av. of 3 runs) | |
| Average of class Gaming (20.9 - 210, n=54, last 2 years) | |
| HP Pavilion Gaming 15t-cx0000 (Toshiba Exceria Pro SDXC 64 GB UHS-II) | |
| HP Omen 15-dc0001ng (Toshiba Exceria Pro SDXC 64 GB UHS-II) | |
| Asus FX503VM-EH73 (Toshiba Exceria Pro SDXC 64 GB UHS-II) | |
| Acer Predator Helios 300 PH317-52-51M6 (Toshiba Exceria Pro SDXC 64 GB UHS-II) | |
| MSI GV62 8RE-016US (Toshiba Exceria Pro SDXC 64 GB UHS-II) | |
| Dell G7 15-7588 (Toshiba Exceria Pro SDXC 64 GB UHS-II) | |
| maximum AS SSD Seq Read Test (1GB) | |
| Average of class Gaming (25.5 - 261, n=51, last 2 years) | |
| HP Omen 15-dc0001ng (Toshiba Exceria Pro SDXC 64 GB UHS-II) | |
| Asus FX503VM-EH73 (Toshiba Exceria Pro SDXC 64 GB UHS-II) | |
| Acer Predator Helios 300 PH317-52-51M6 (Toshiba Exceria Pro SDXC 64 GB UHS-II) | |
| HP Pavilion Gaming 15t-cx0000 (Toshiba Exceria Pro SDXC 64 GB UHS-II) | |
| Dell G7 15-7588 (Toshiba Exceria Pro SDXC 64 GB UHS-II) | |
| MSI GV62 8RE-016US (Toshiba Exceria Pro SDXC 64 GB UHS-II) | |
Communication
Similar to the SD card reader, WiFi speeds are average for a gaming laptop. Send and receive speeds are good (630-680 MBit/s), and connections are reliable. Game and file downloads occurr quickly and with no hiccups. We experienced no drops during our review period.
Maintenance
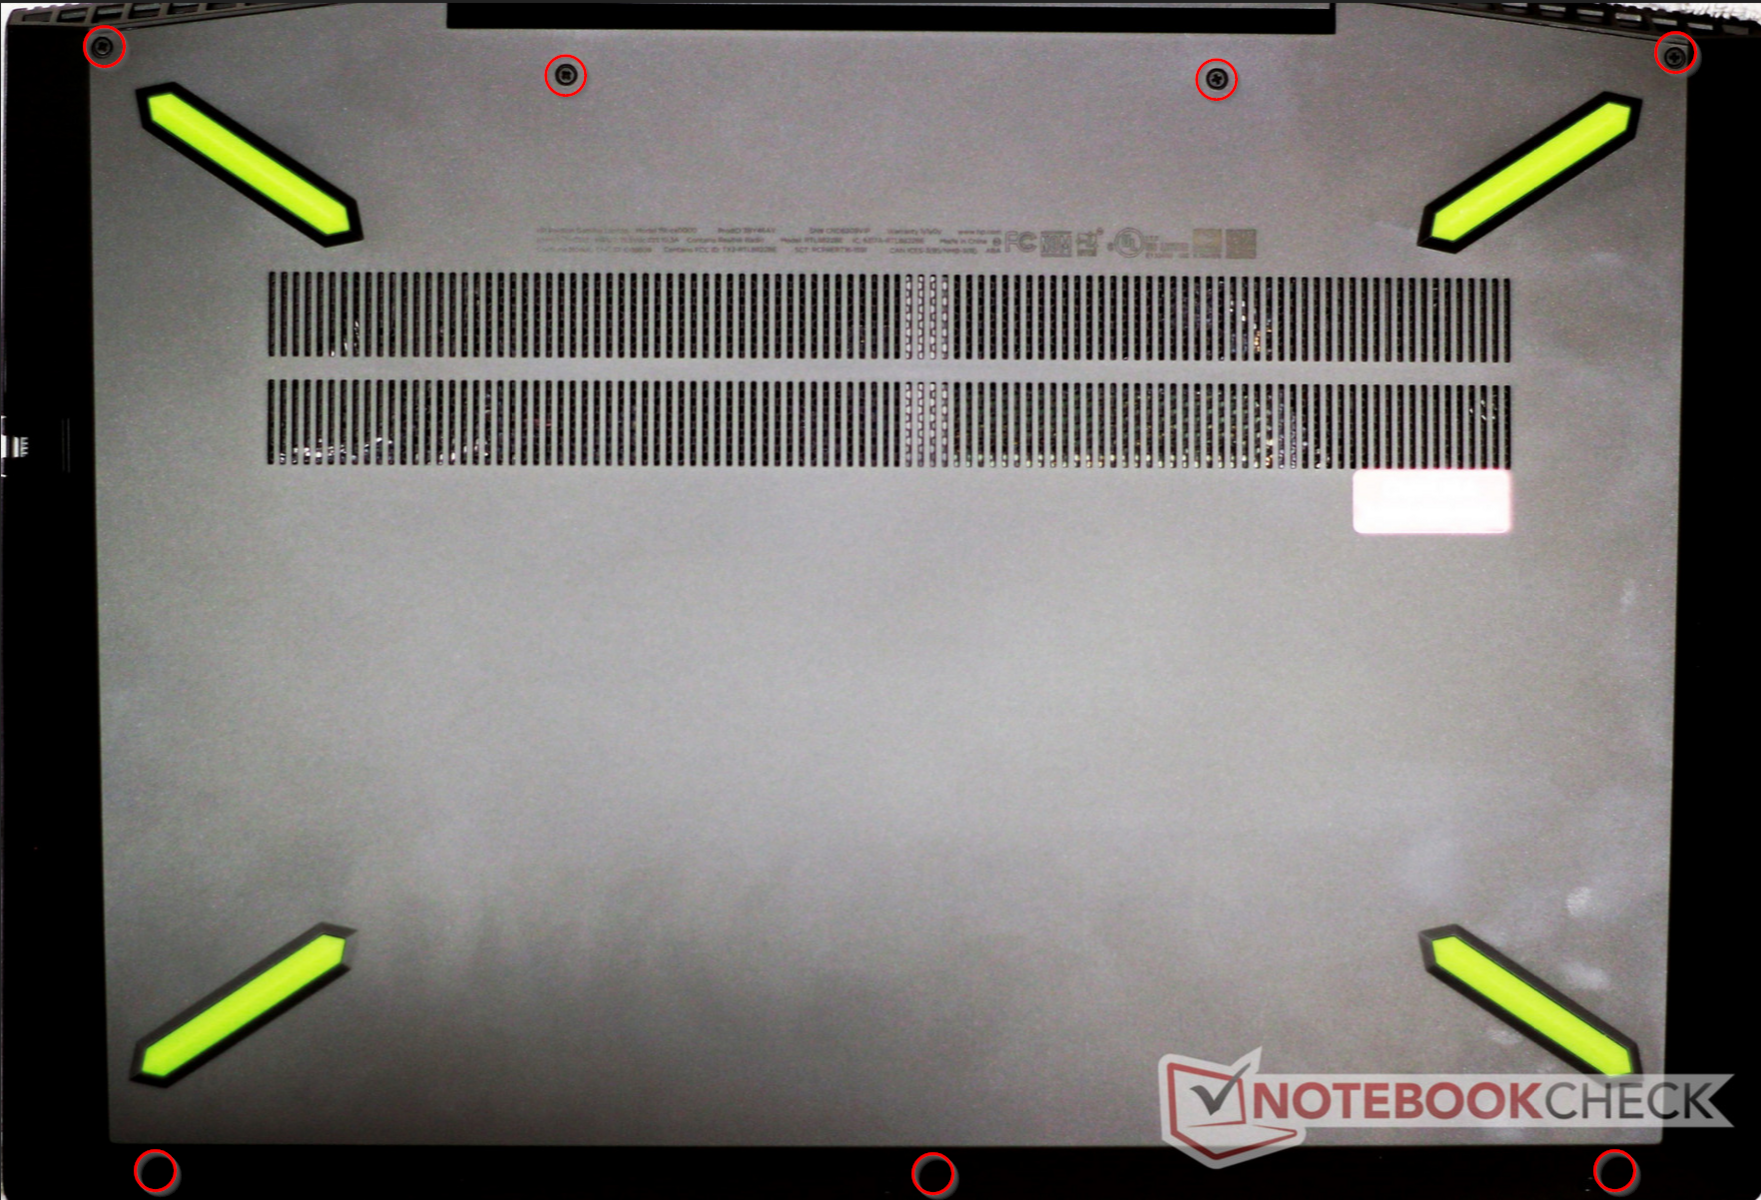
Maintenance is fairly easy. Seven Phillips Head #0 screws and several plastic clips hold the bottom panel on. Keep in mind that the four screws along the top of the bottom panel (adjacent to the display hinge) are longer than the three along the bottom edge. There is a small notch in the upper-right corner of the bottom panel (right above the pair of USB 3.0 ports) that can be used to pry the plastic clips and remove the bottom panel.
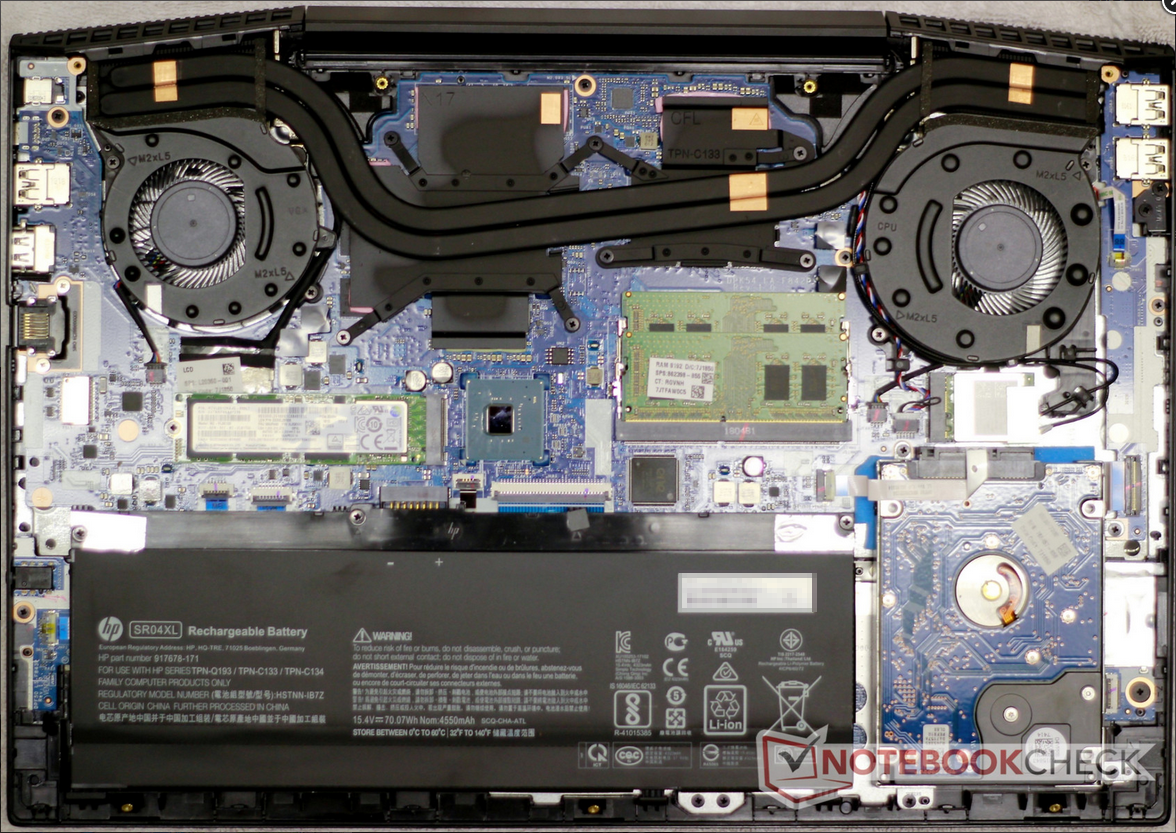
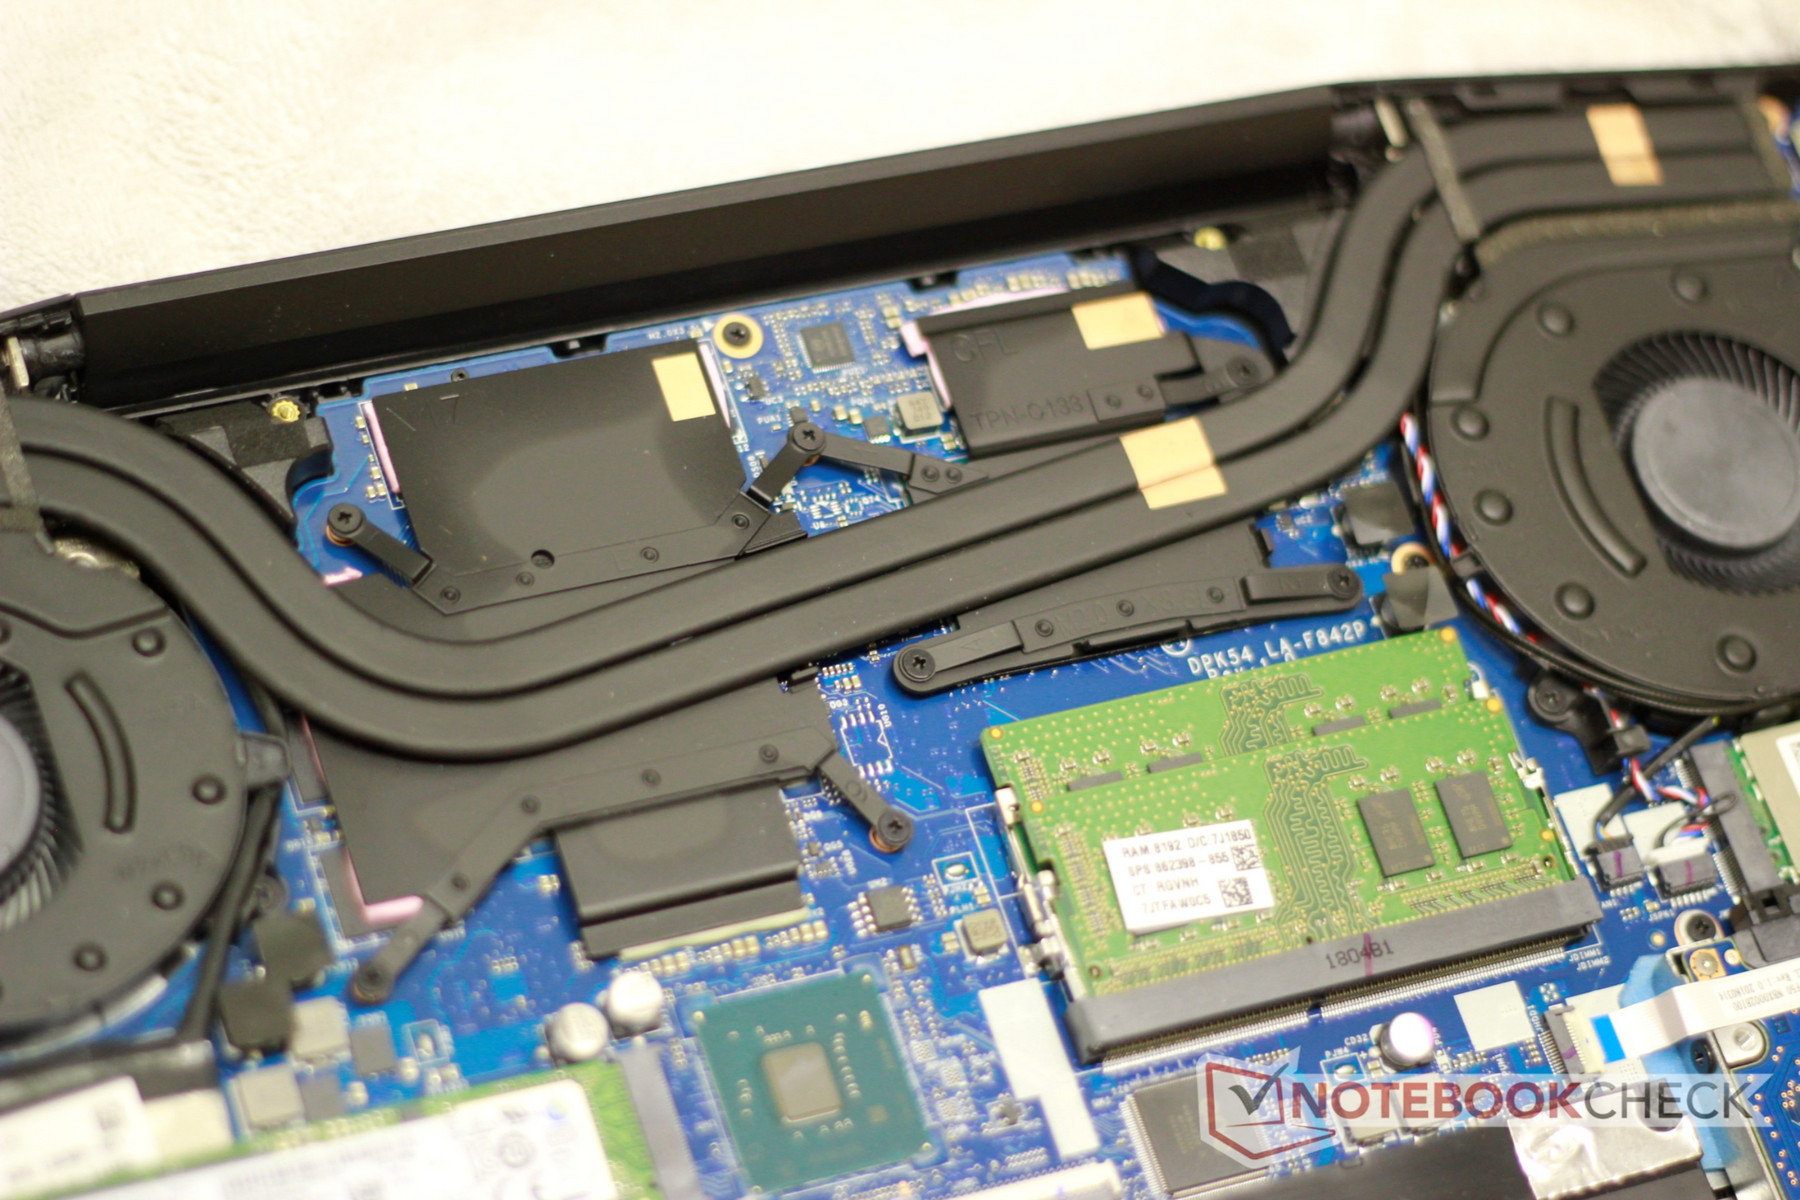
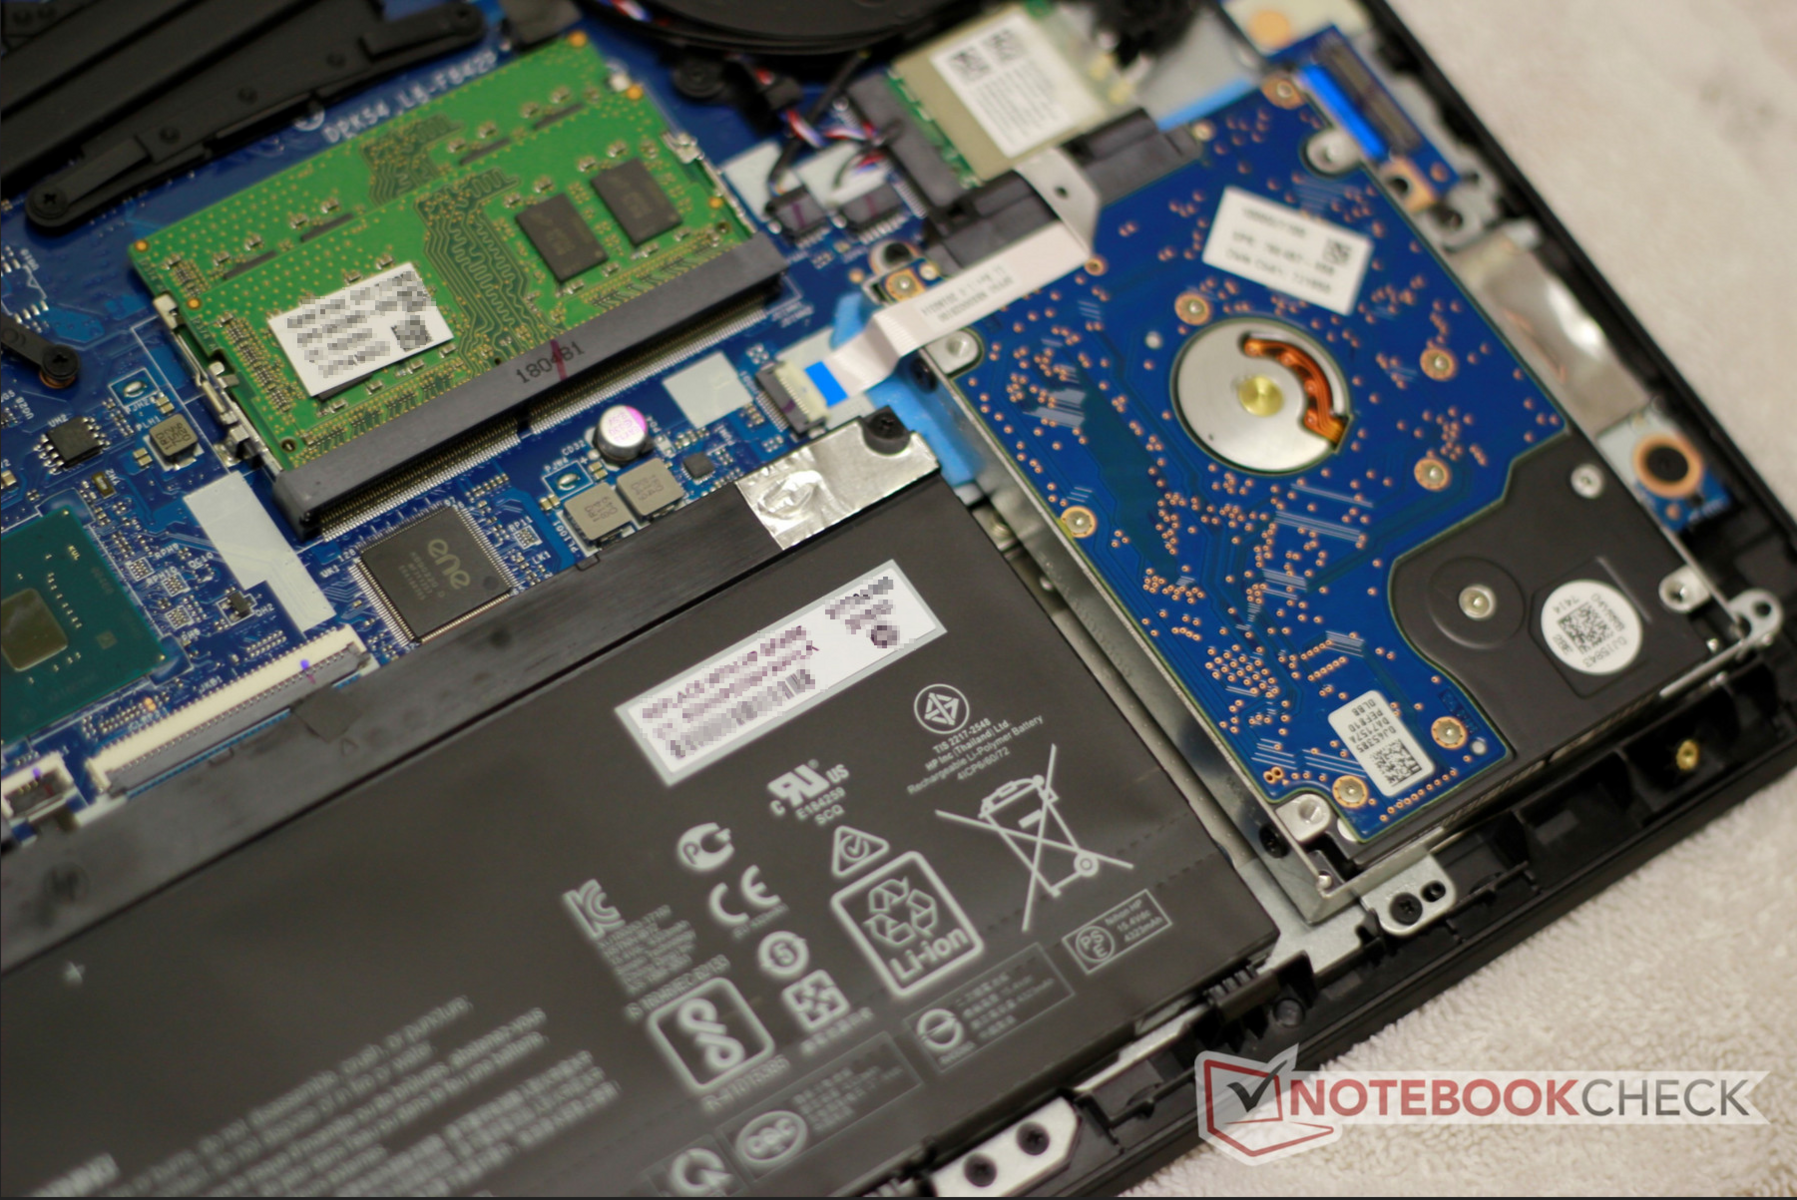
Once the case is opened, users will have ready access to every component inside the machine. The CPU and GPU are soldered to the motherboard, but the heat pipe array can be removed for re-applying thermal paste if desired. Both RAM modules, both storage drives, and the WiFi card are easy to replace. The battery can also be swapped out. All said, while maintenance isn't as easy as Dell's G7, upgrades and repairs are simple and straightforward.
The HP Pavilion Gaming 15t comes with a standard 12-month warranty. Please see our Guarantees, Return policies and Warranties FAQ for country-specific information.
Input Devices
Keyboard
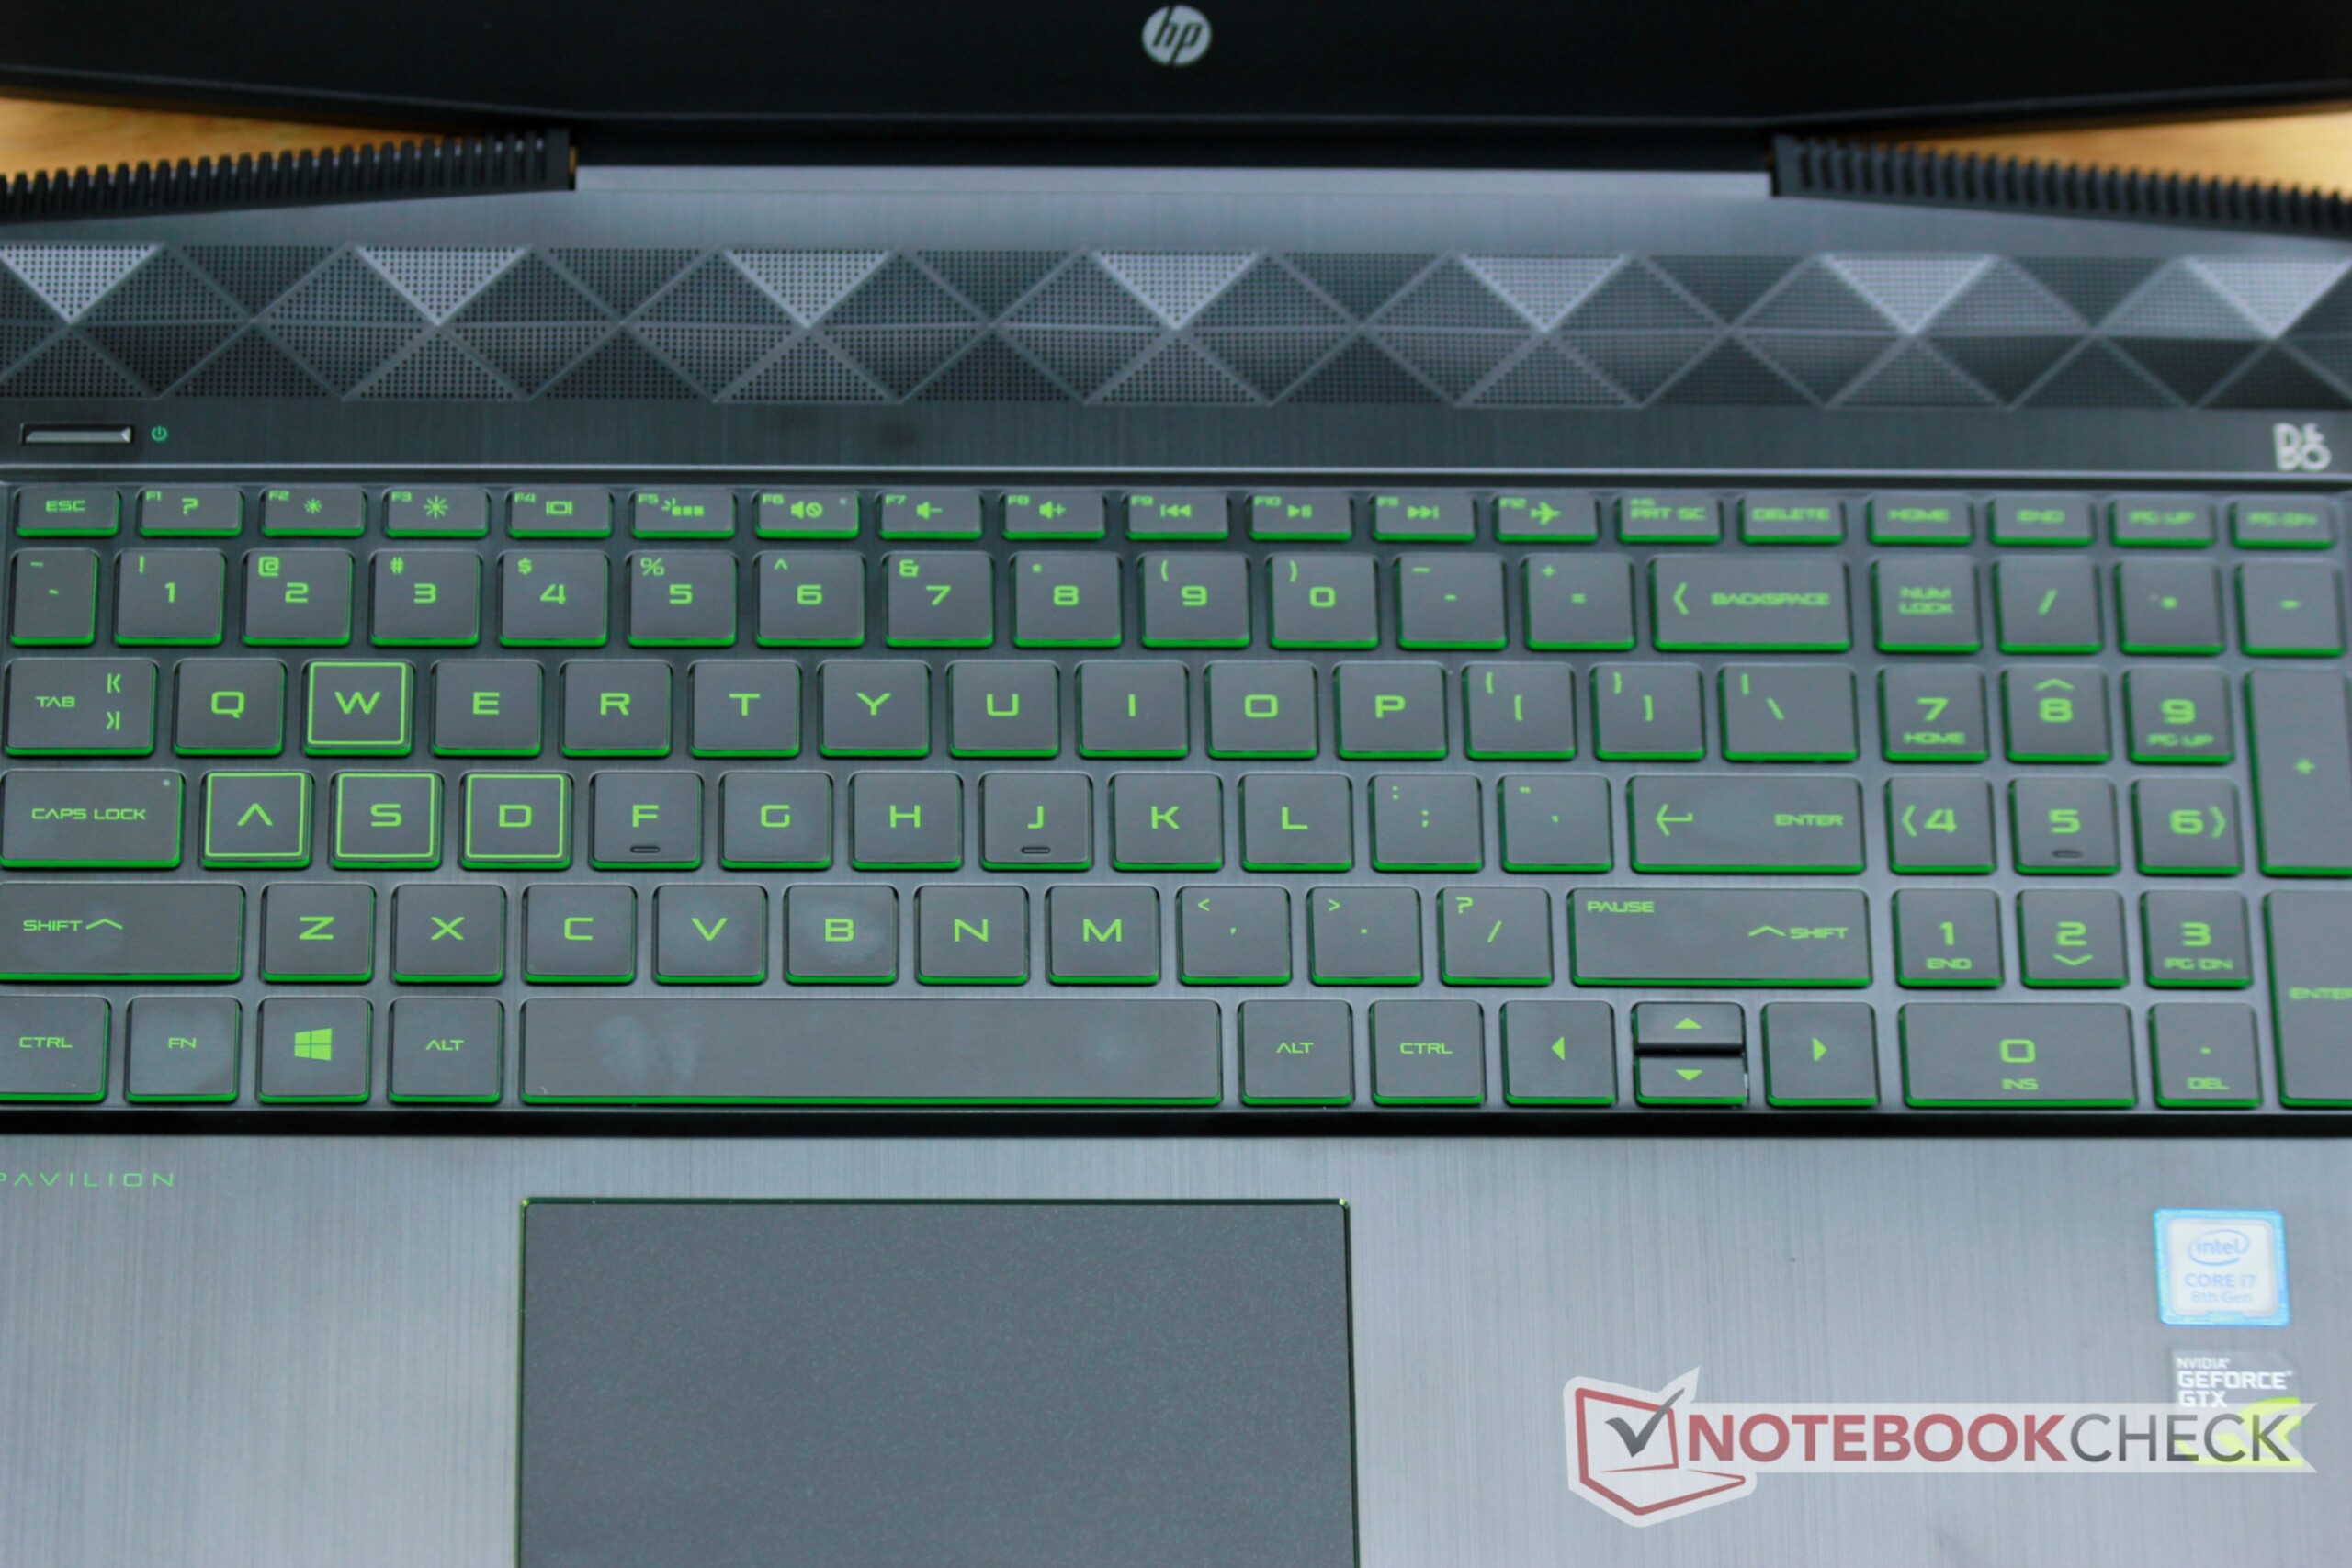
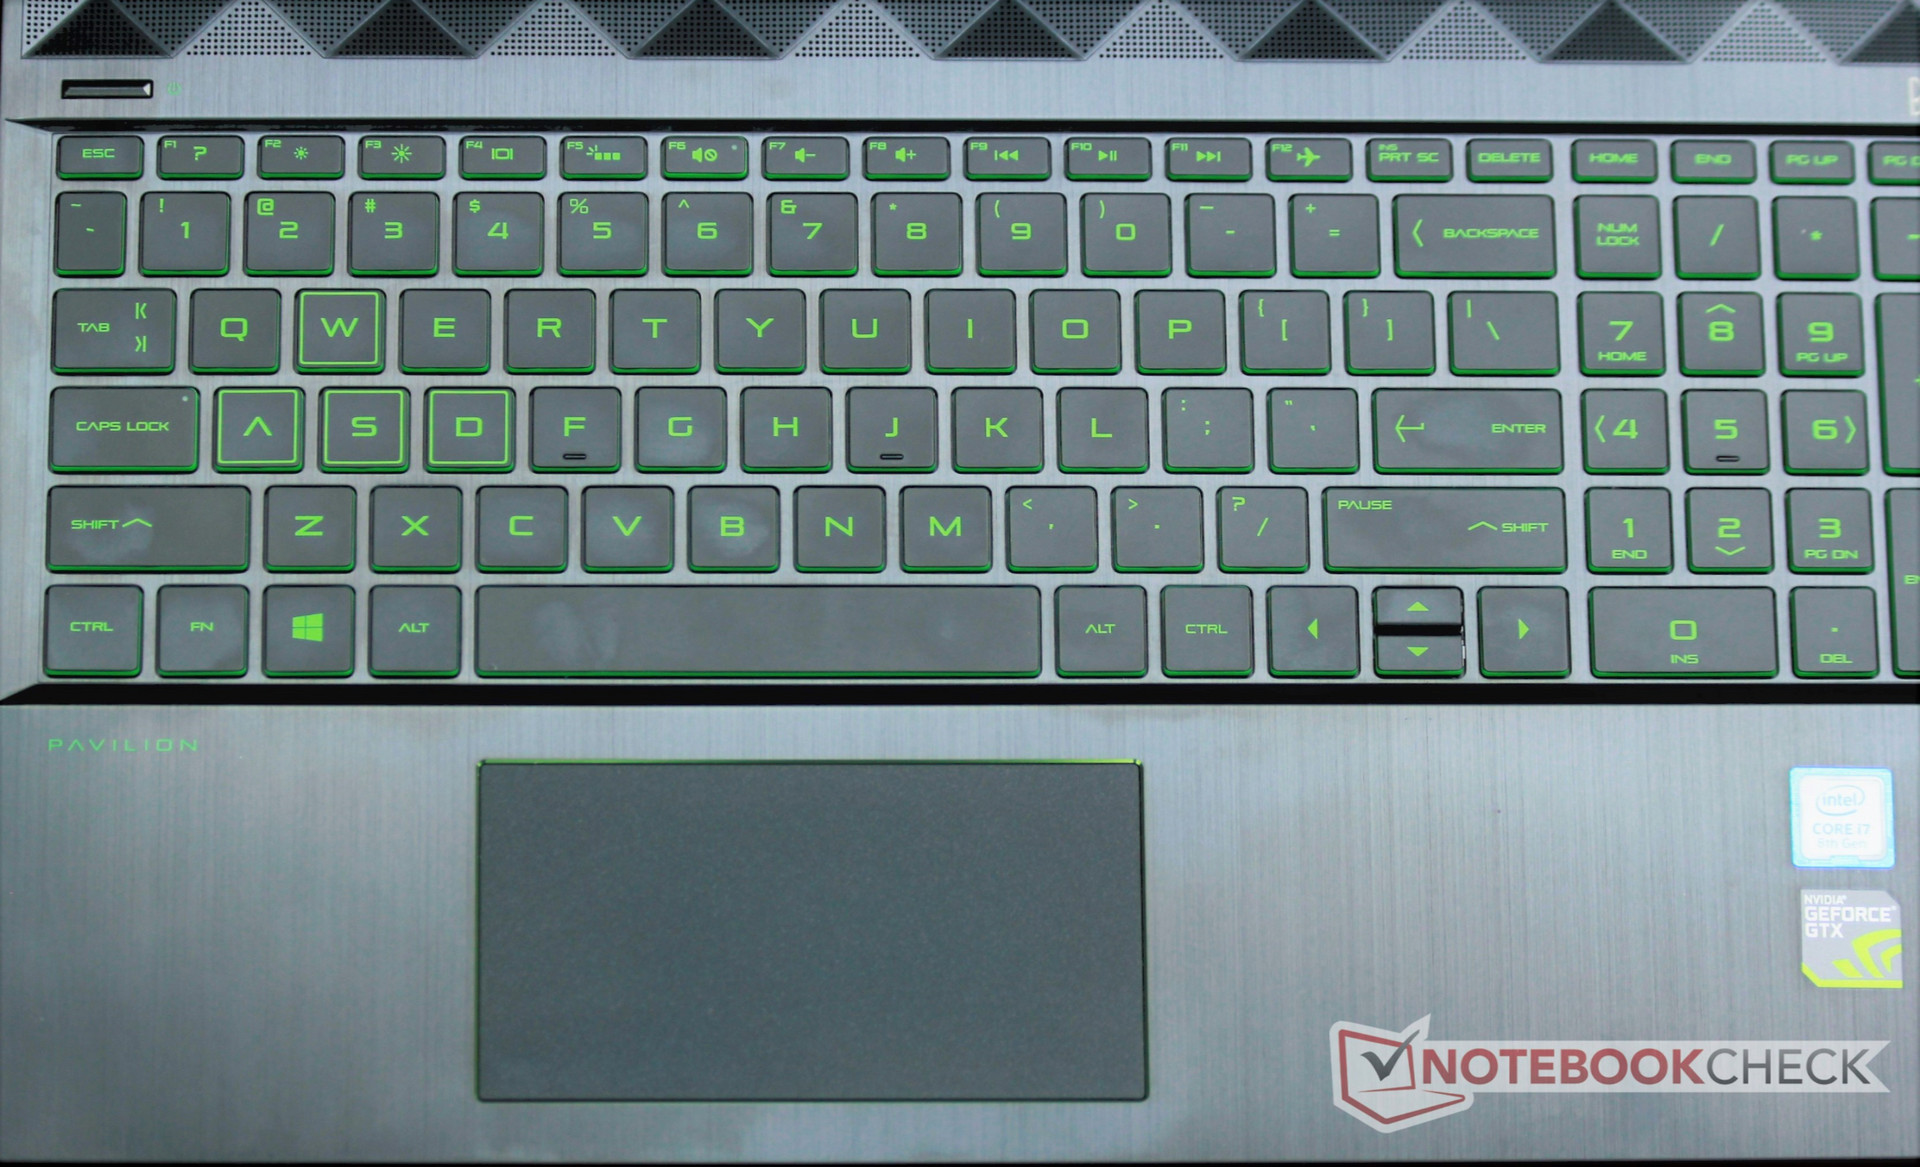
One of the biggest weaknesses of low- and mid-tiered gaming laptops typically lies in their input devices. Thankfully, the Pavilion Gaming 15t's keyboard is excellent. Feedback is firm and response is crisp. The keyboard extends across almost the entire deck, which gives plenty of space for the keycaps (16 mm x 16 mm). This makes typing a breeze. Compared to the Dell G7's small keys and mushy response, the Pavilion Gaming 15t's keyboard is far superior. Clatter is similar to the G7; while present, the noise isn't overly distracting.
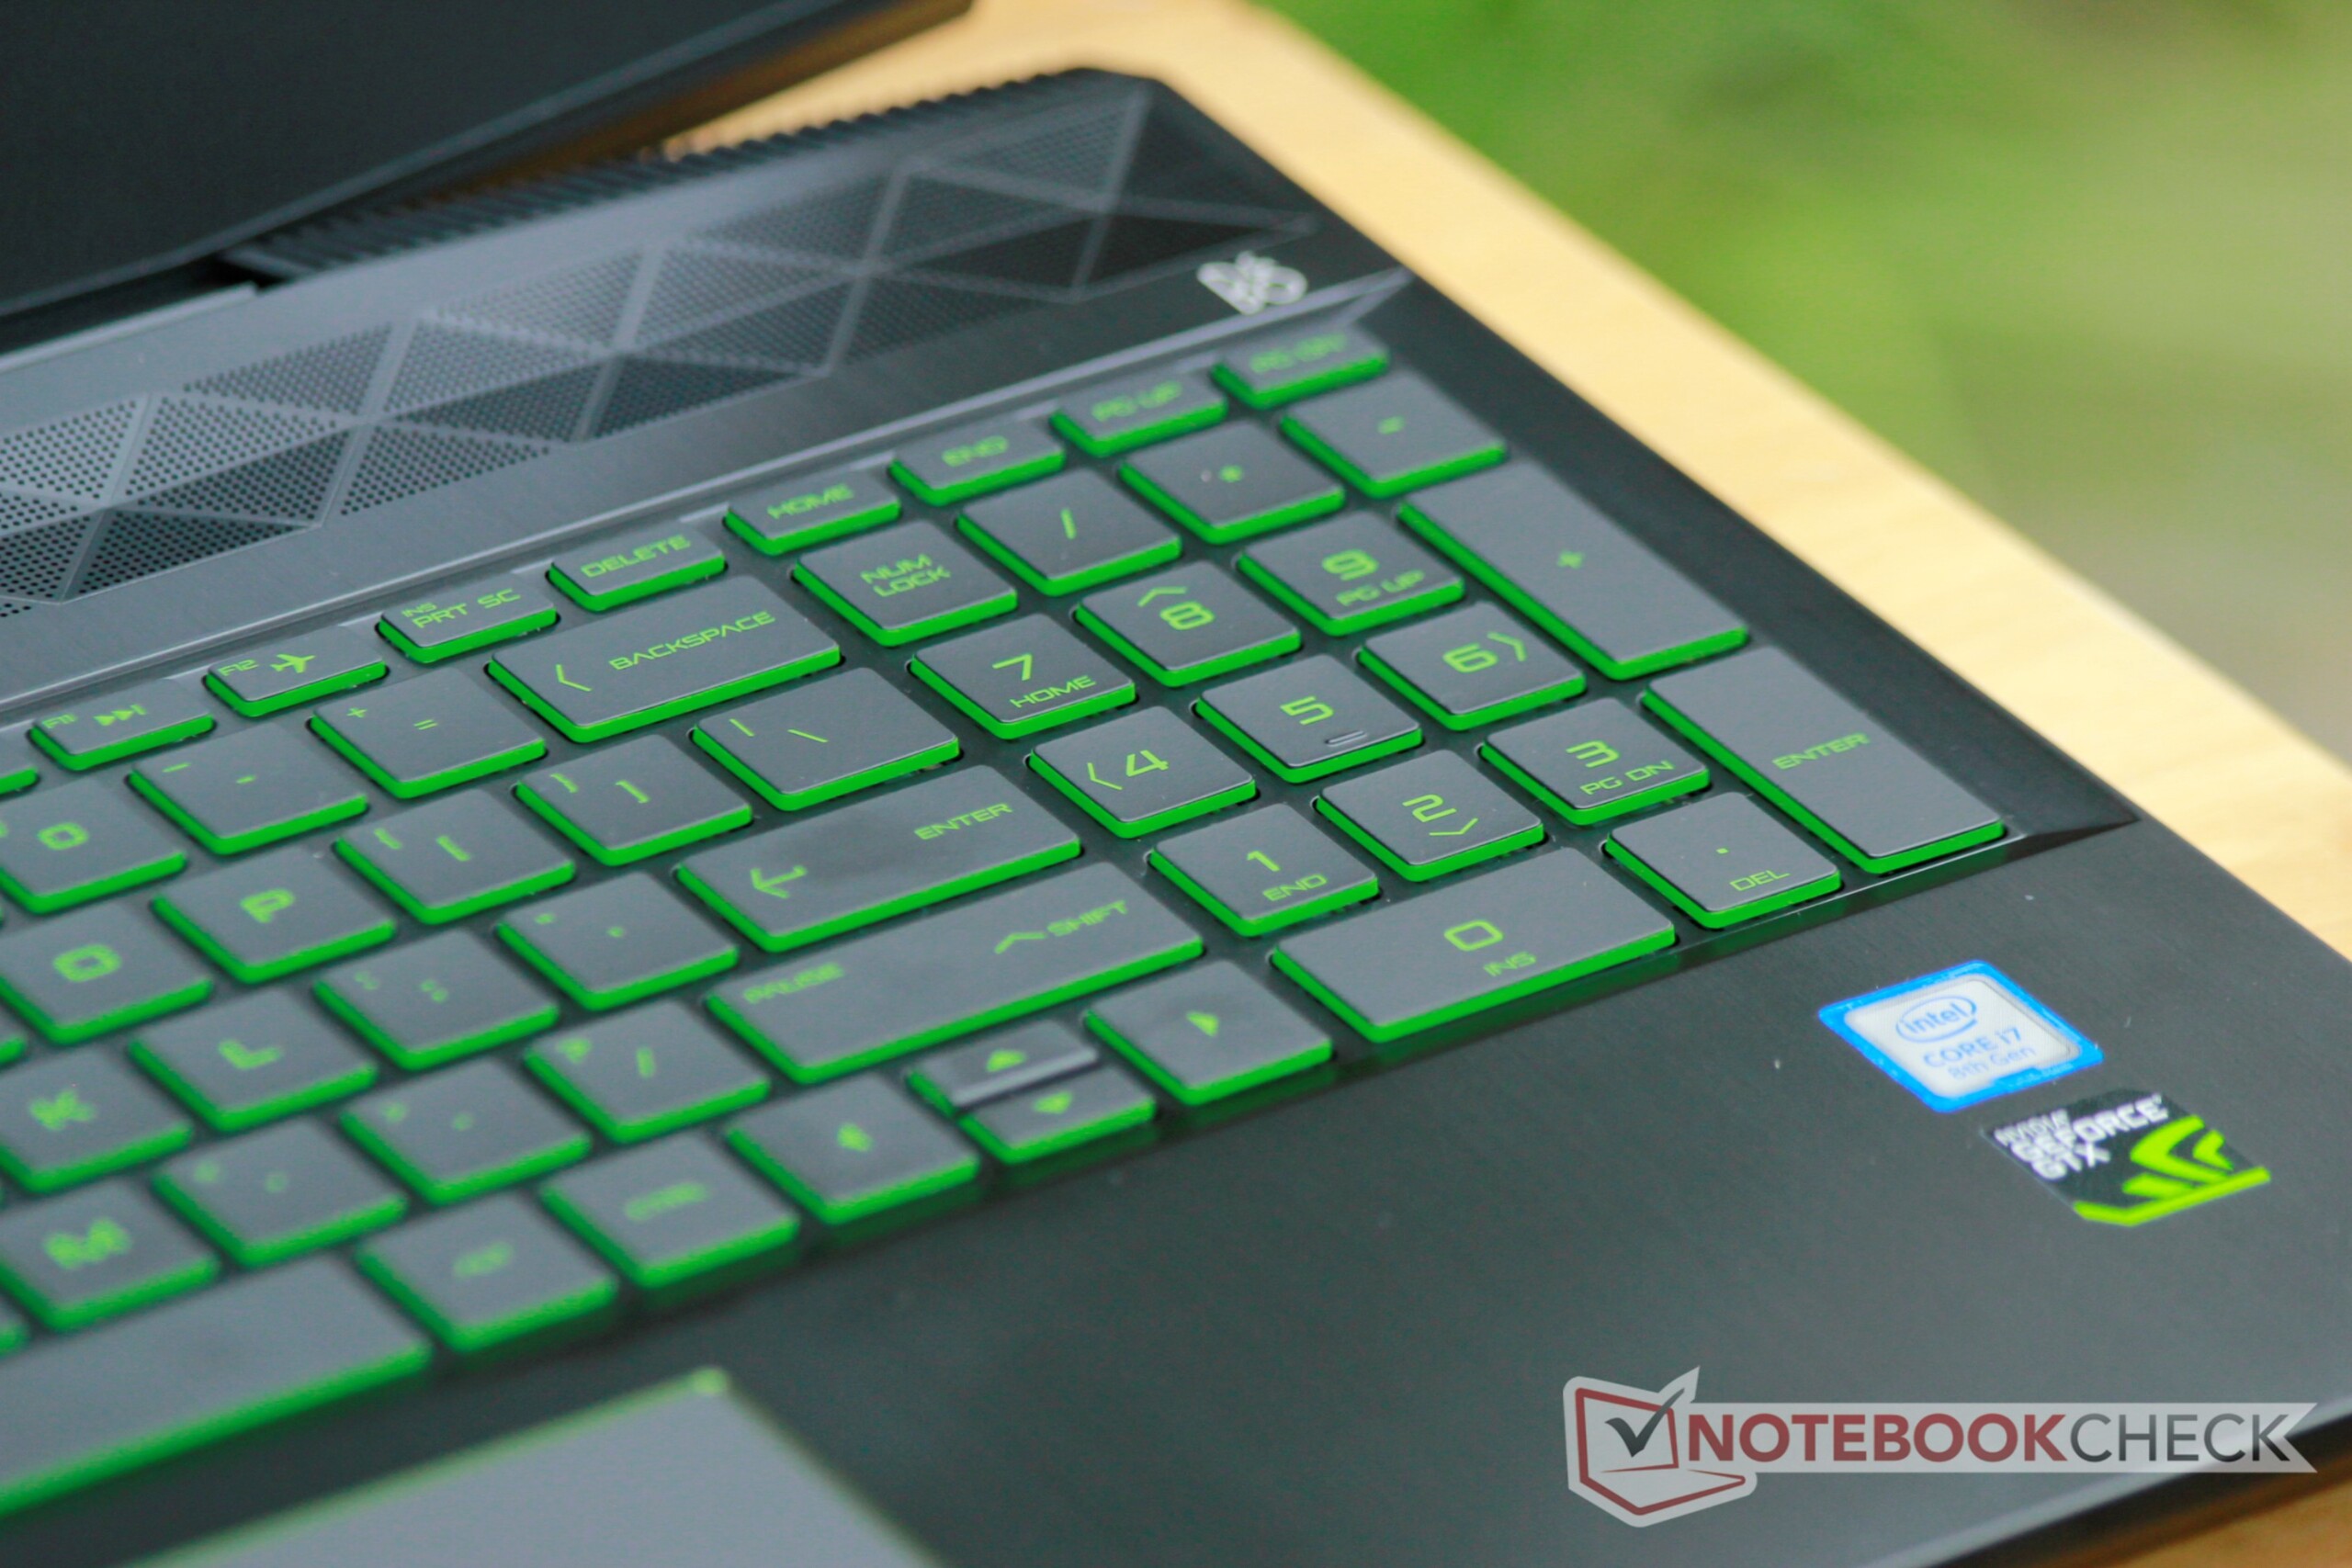
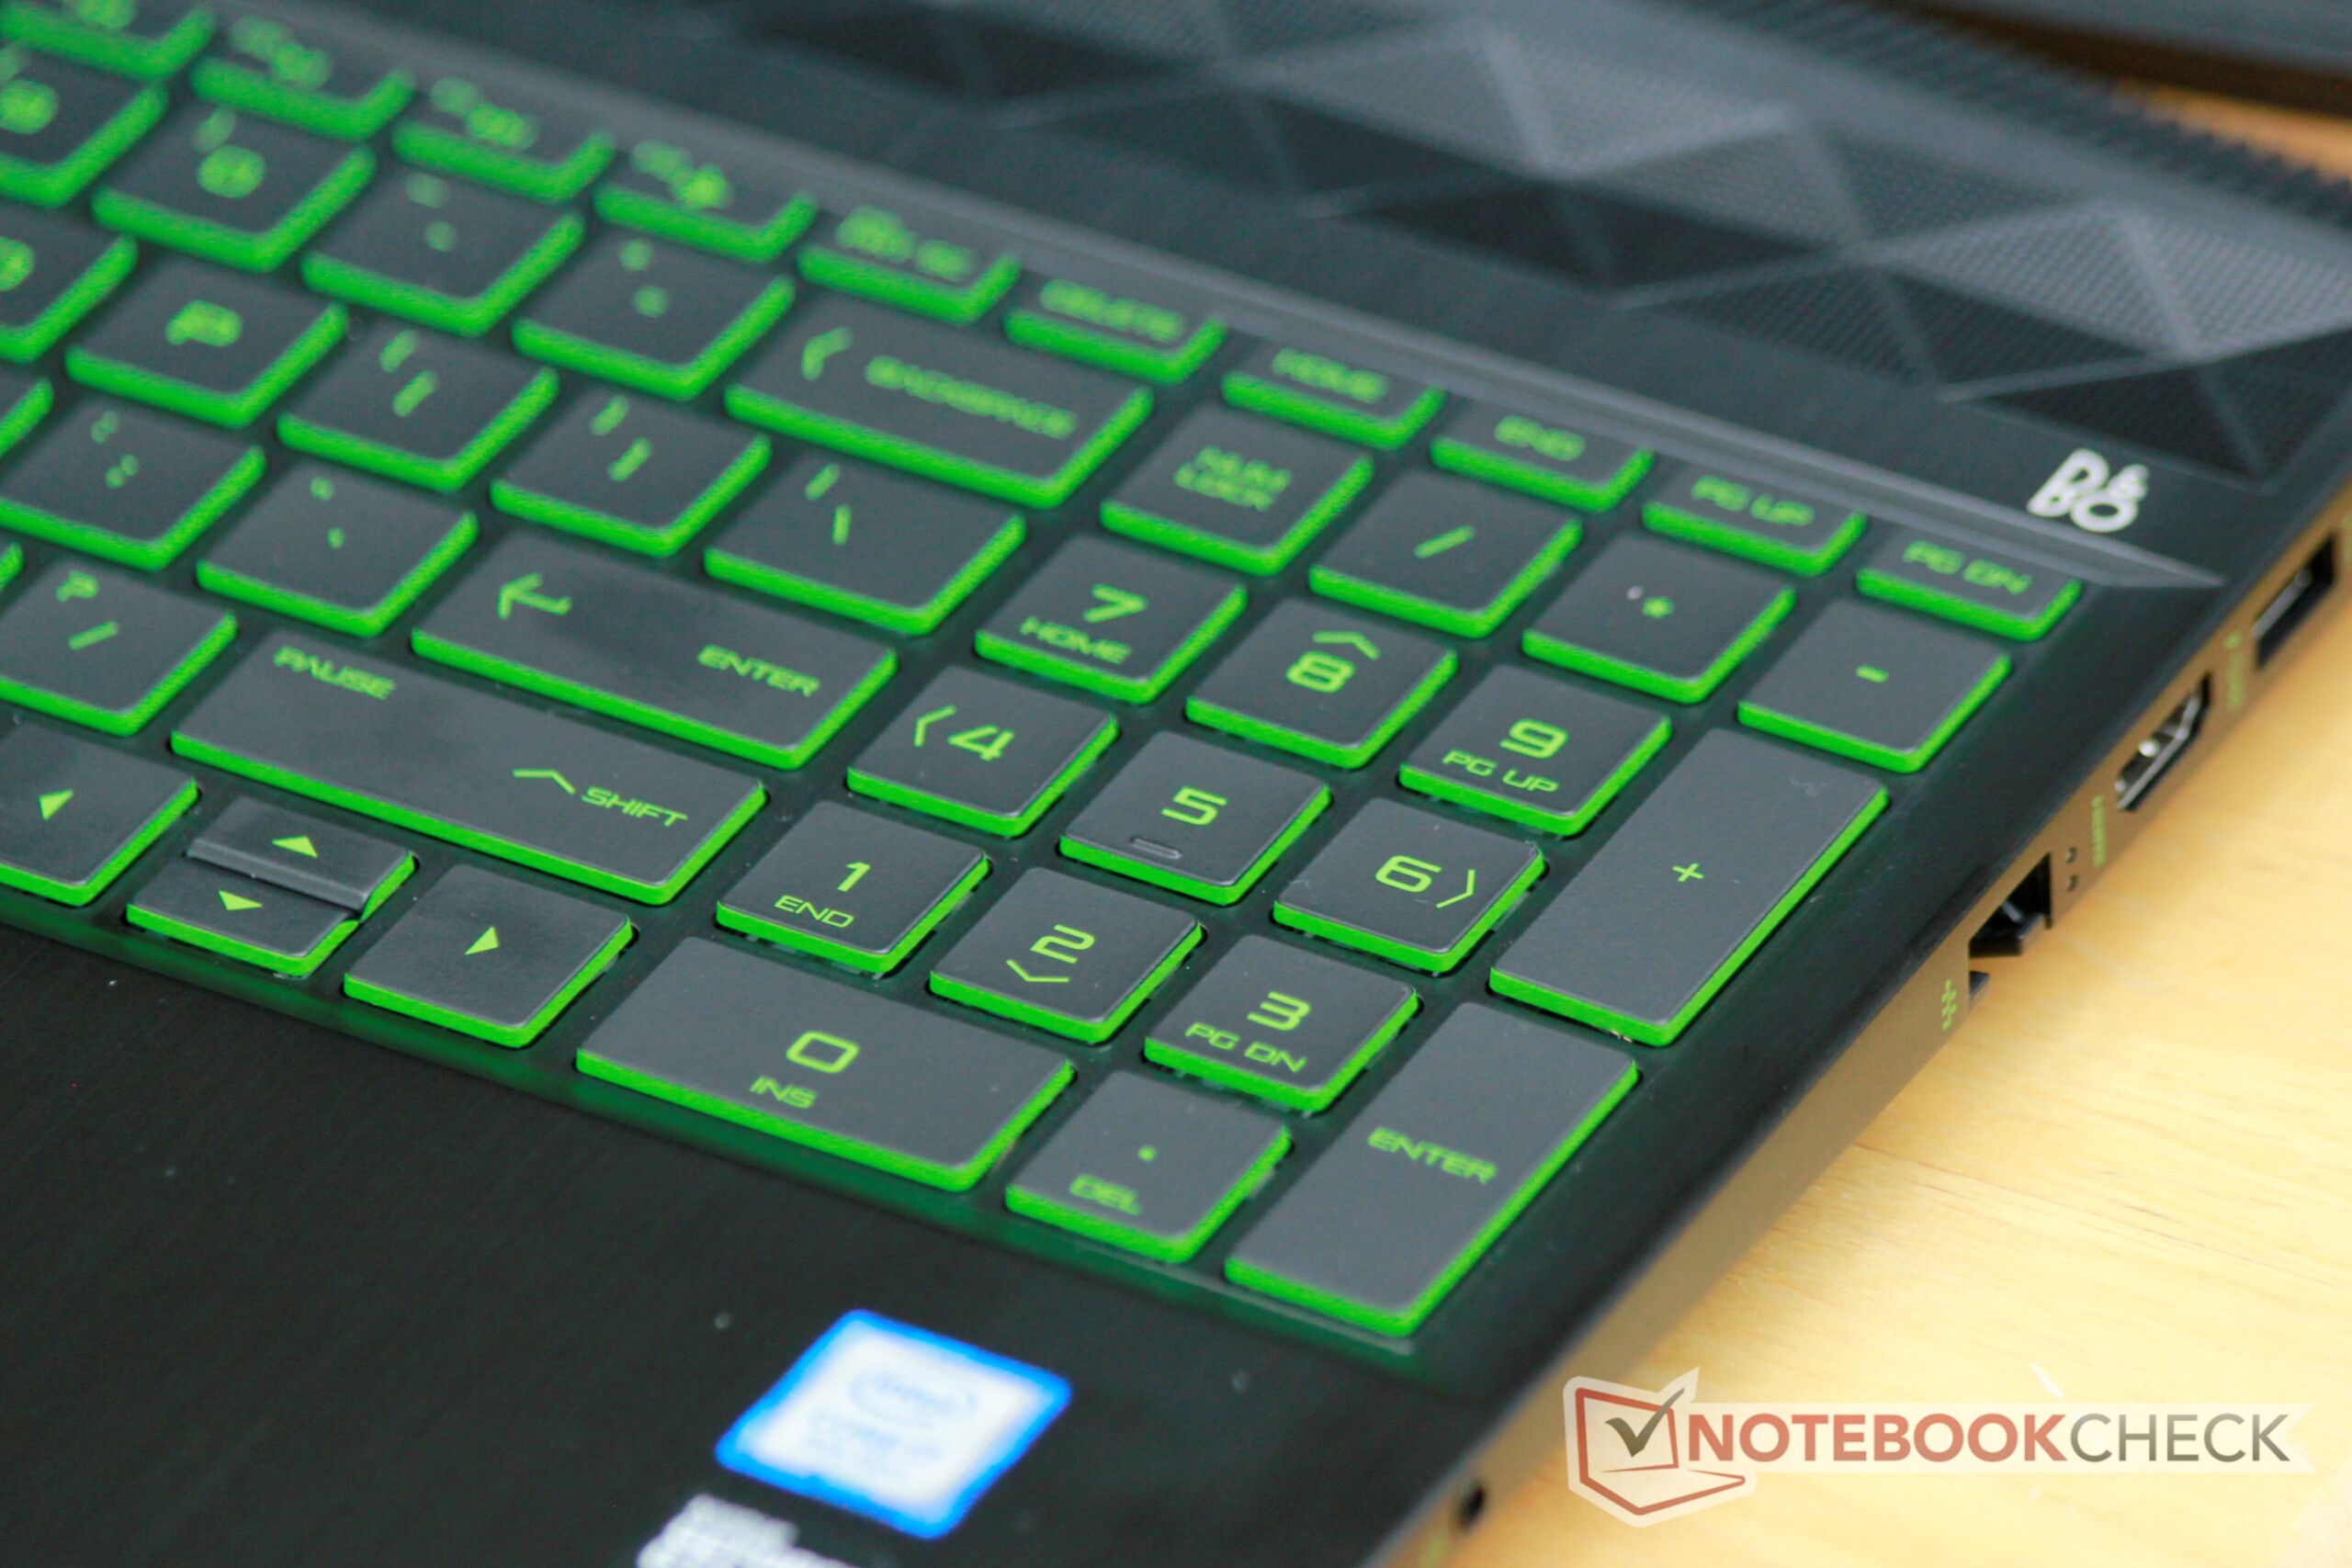
We do have a few complaints. The half-sized up and down arrow keys are annoying to use at times. The acid green coloring is garish, and the backlight (which is the same pungent shade of green) is piercing in dark environments. HP does offer a version of the Pavilion Gaming 15t with a white backlight and matching lettering. Travel is also a bit on the shallow side but should be acceptable for most writing and office work. None of these issues are deal breakers, and the keyboard is fantastic overall.
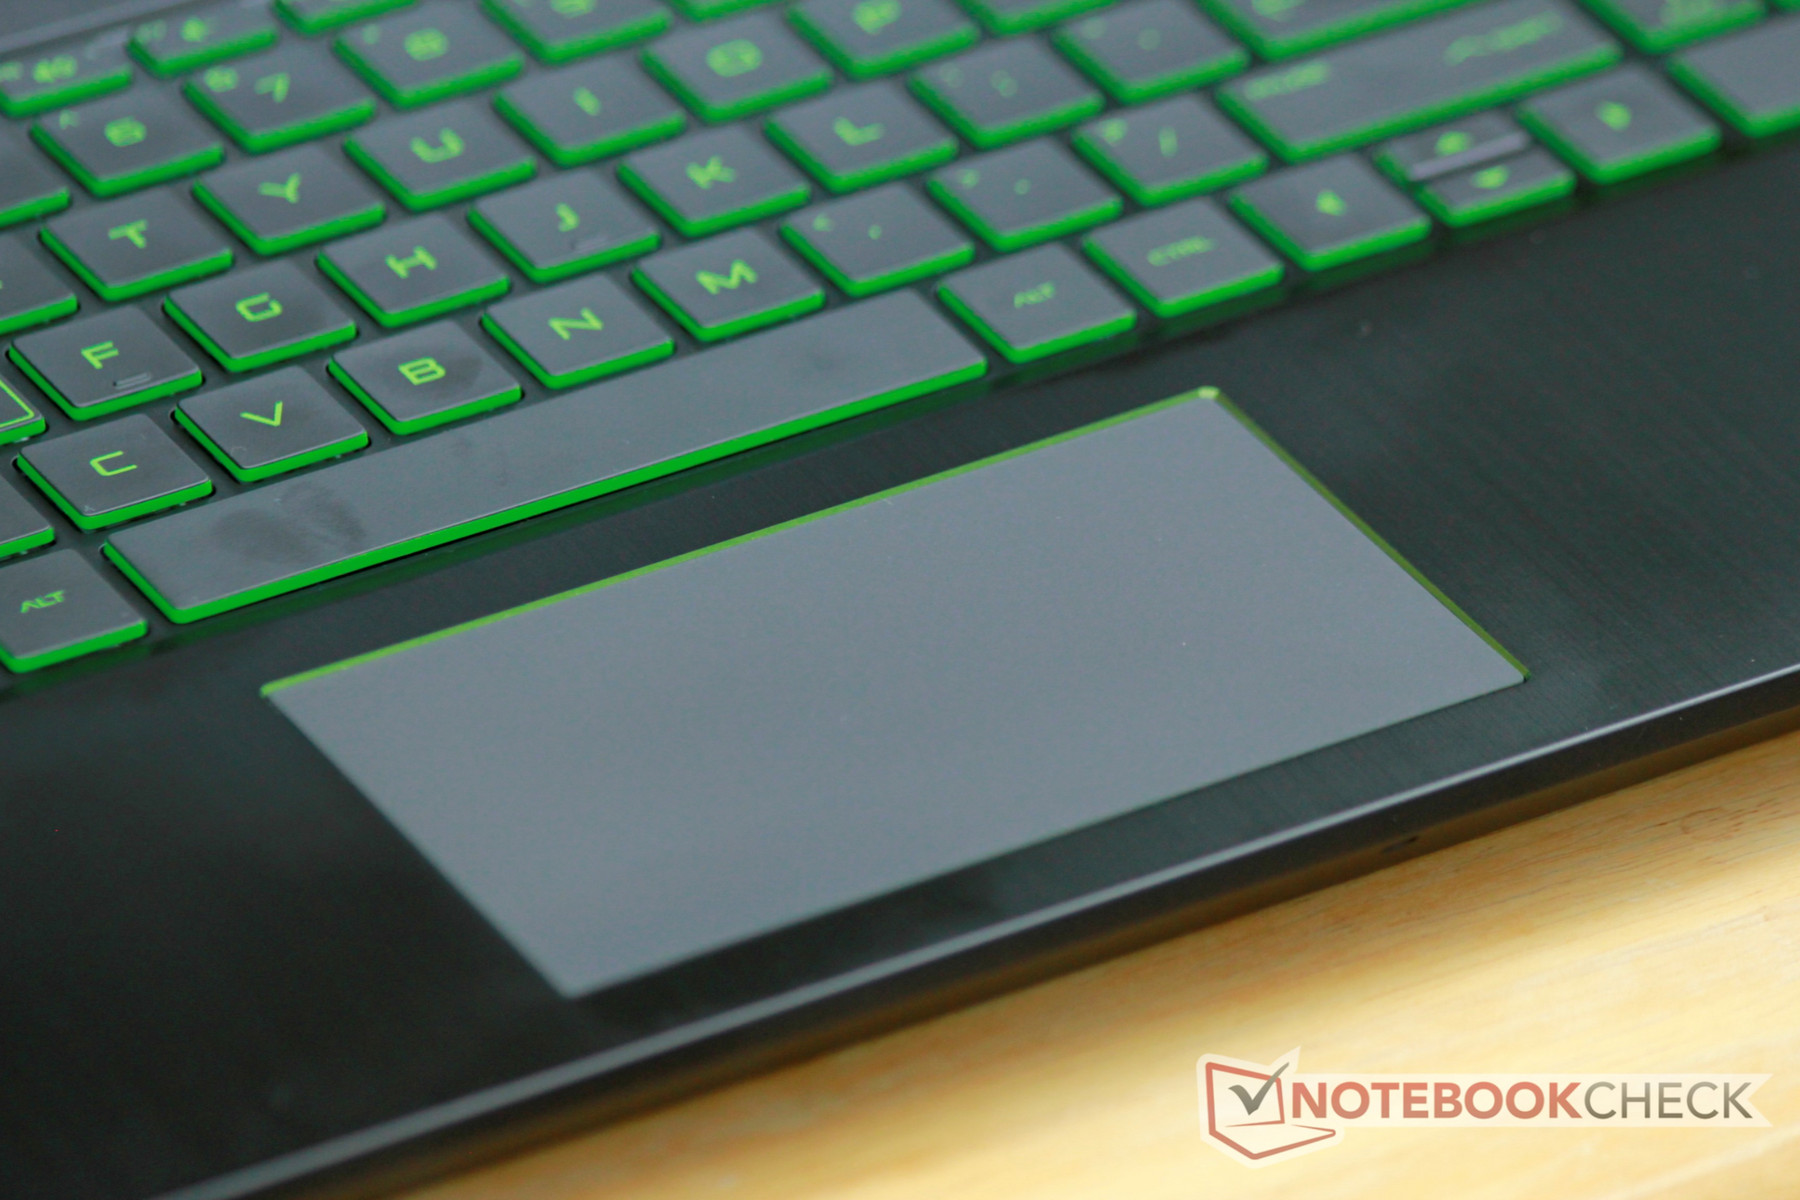
Touchpad
While the keyboard is much better than most laptops' in this price range, the touchpad is simply average. Its narrow dimensions (11.3 cm x 6 cm) take a bit of adjustment, but tracking is smooth across the matte plastic finish. Gestures are responsive, and there is no cursor skipping. The biggest flaw is the clicking mechanism, which feels hollow and cheap. Clicks register accurately, but the hinge feels more like an afterthought, which leaves a poor impression. The touchpad is usable, but most users will reach for a mouse.
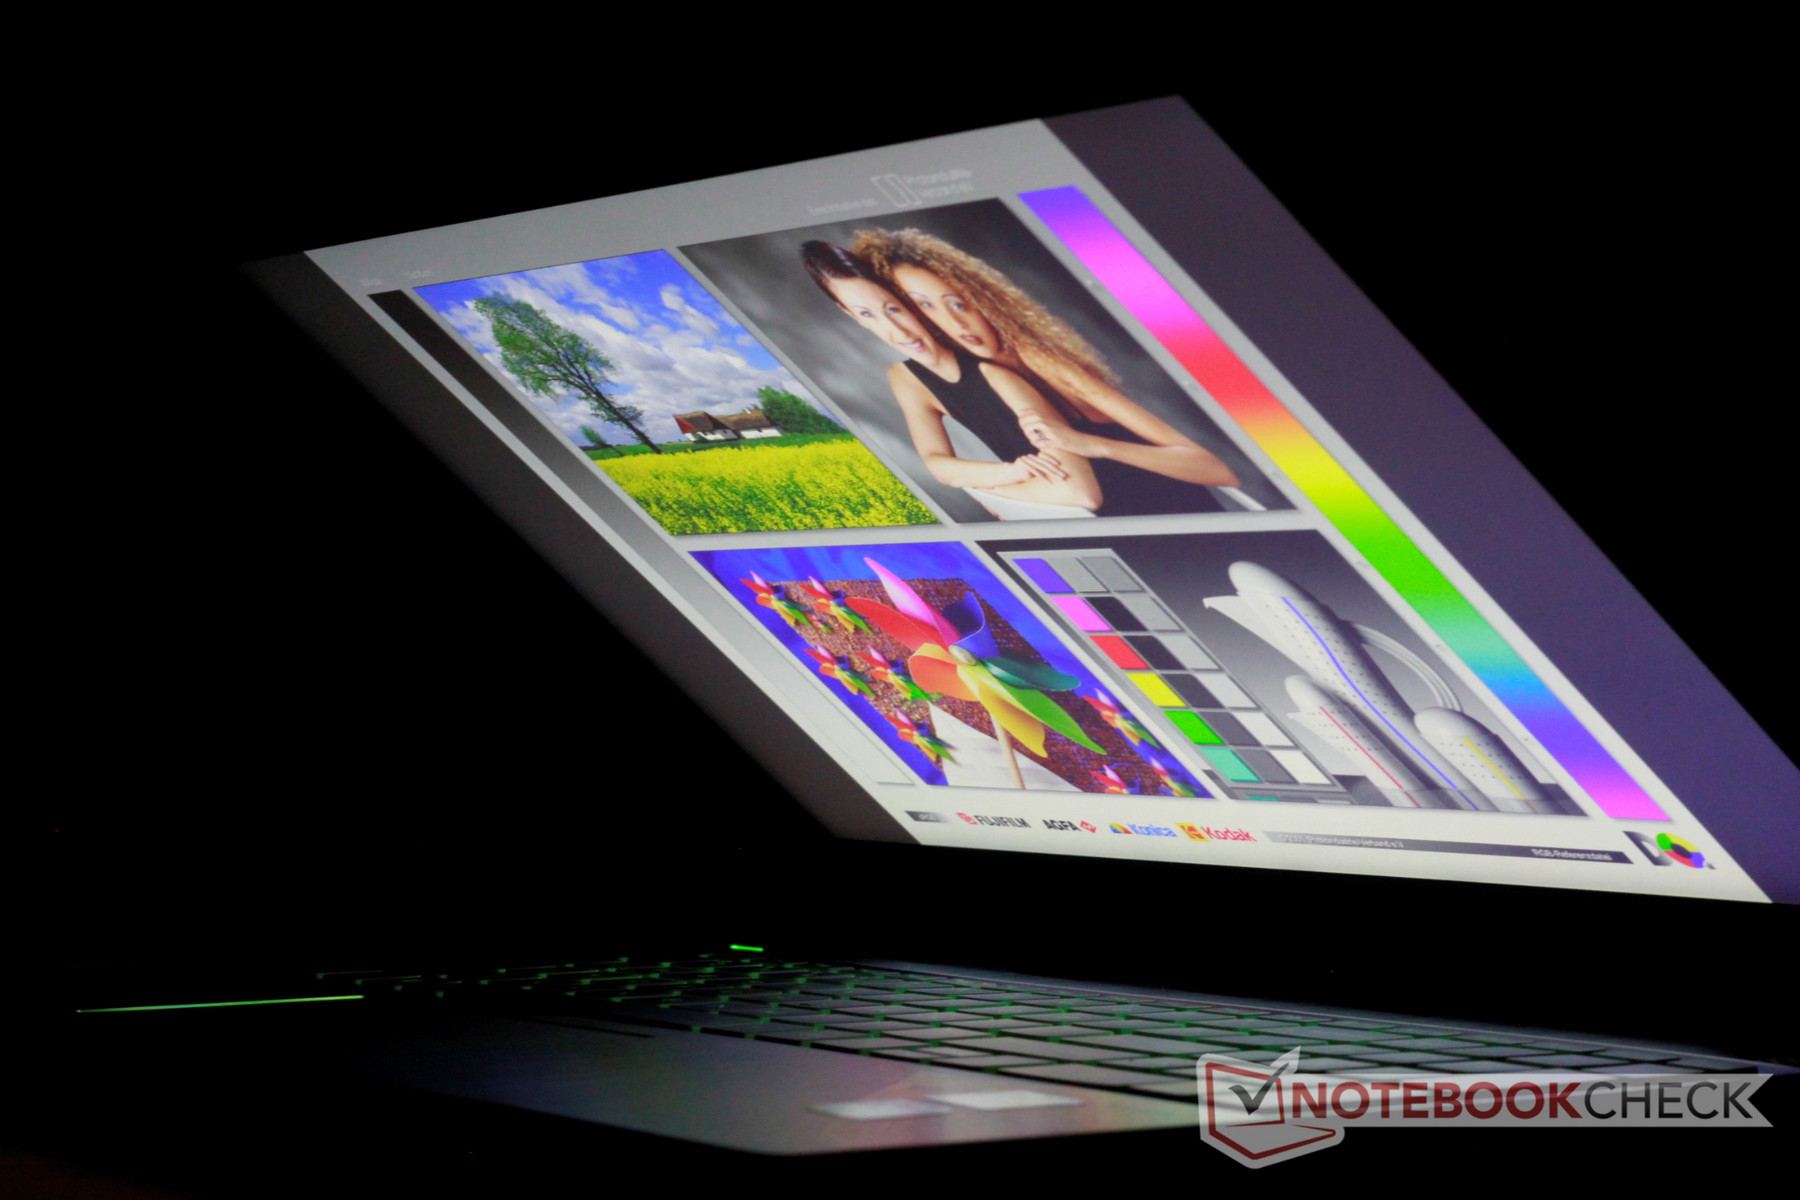
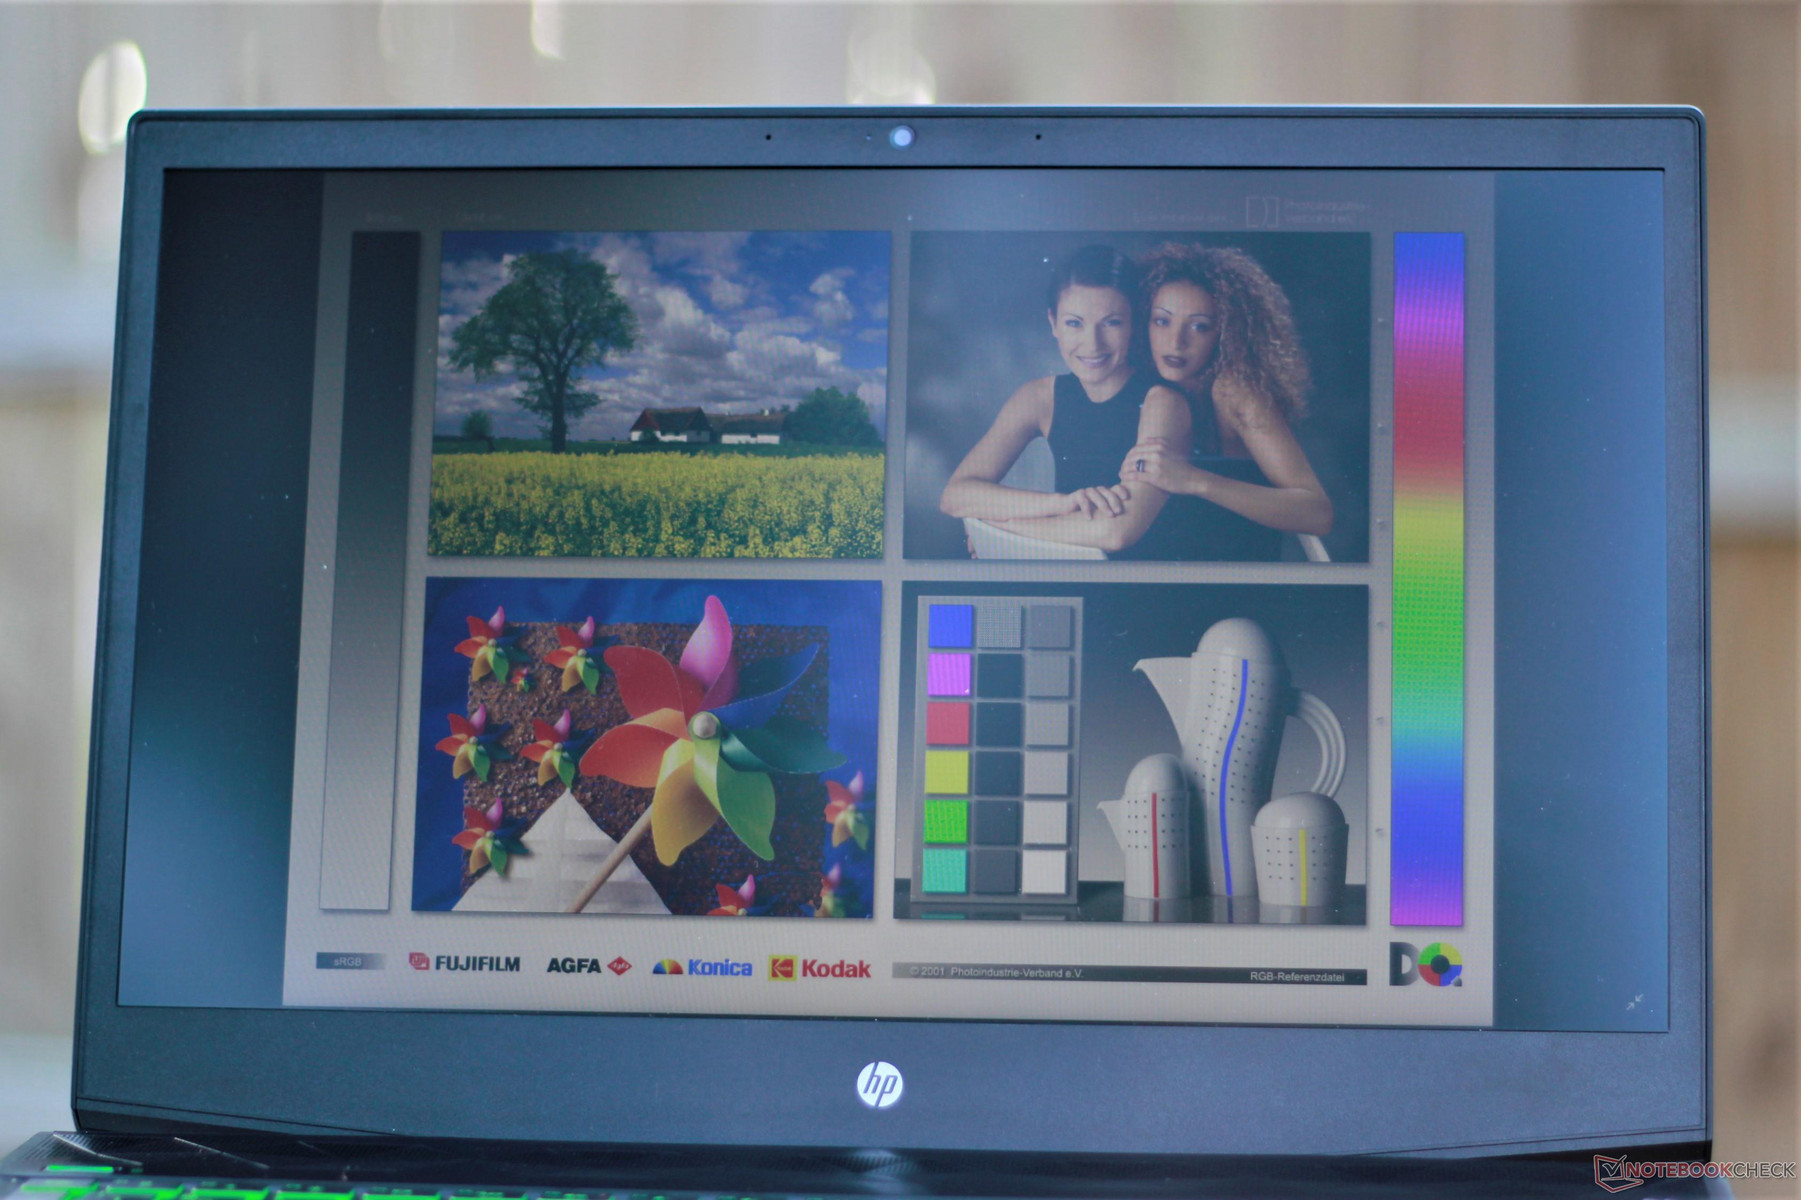
Display
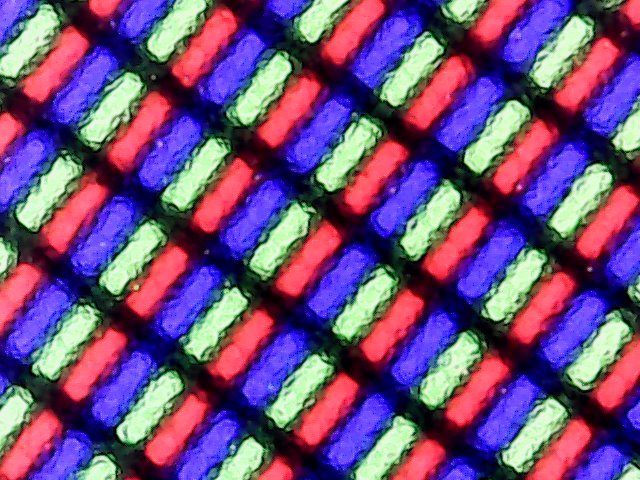
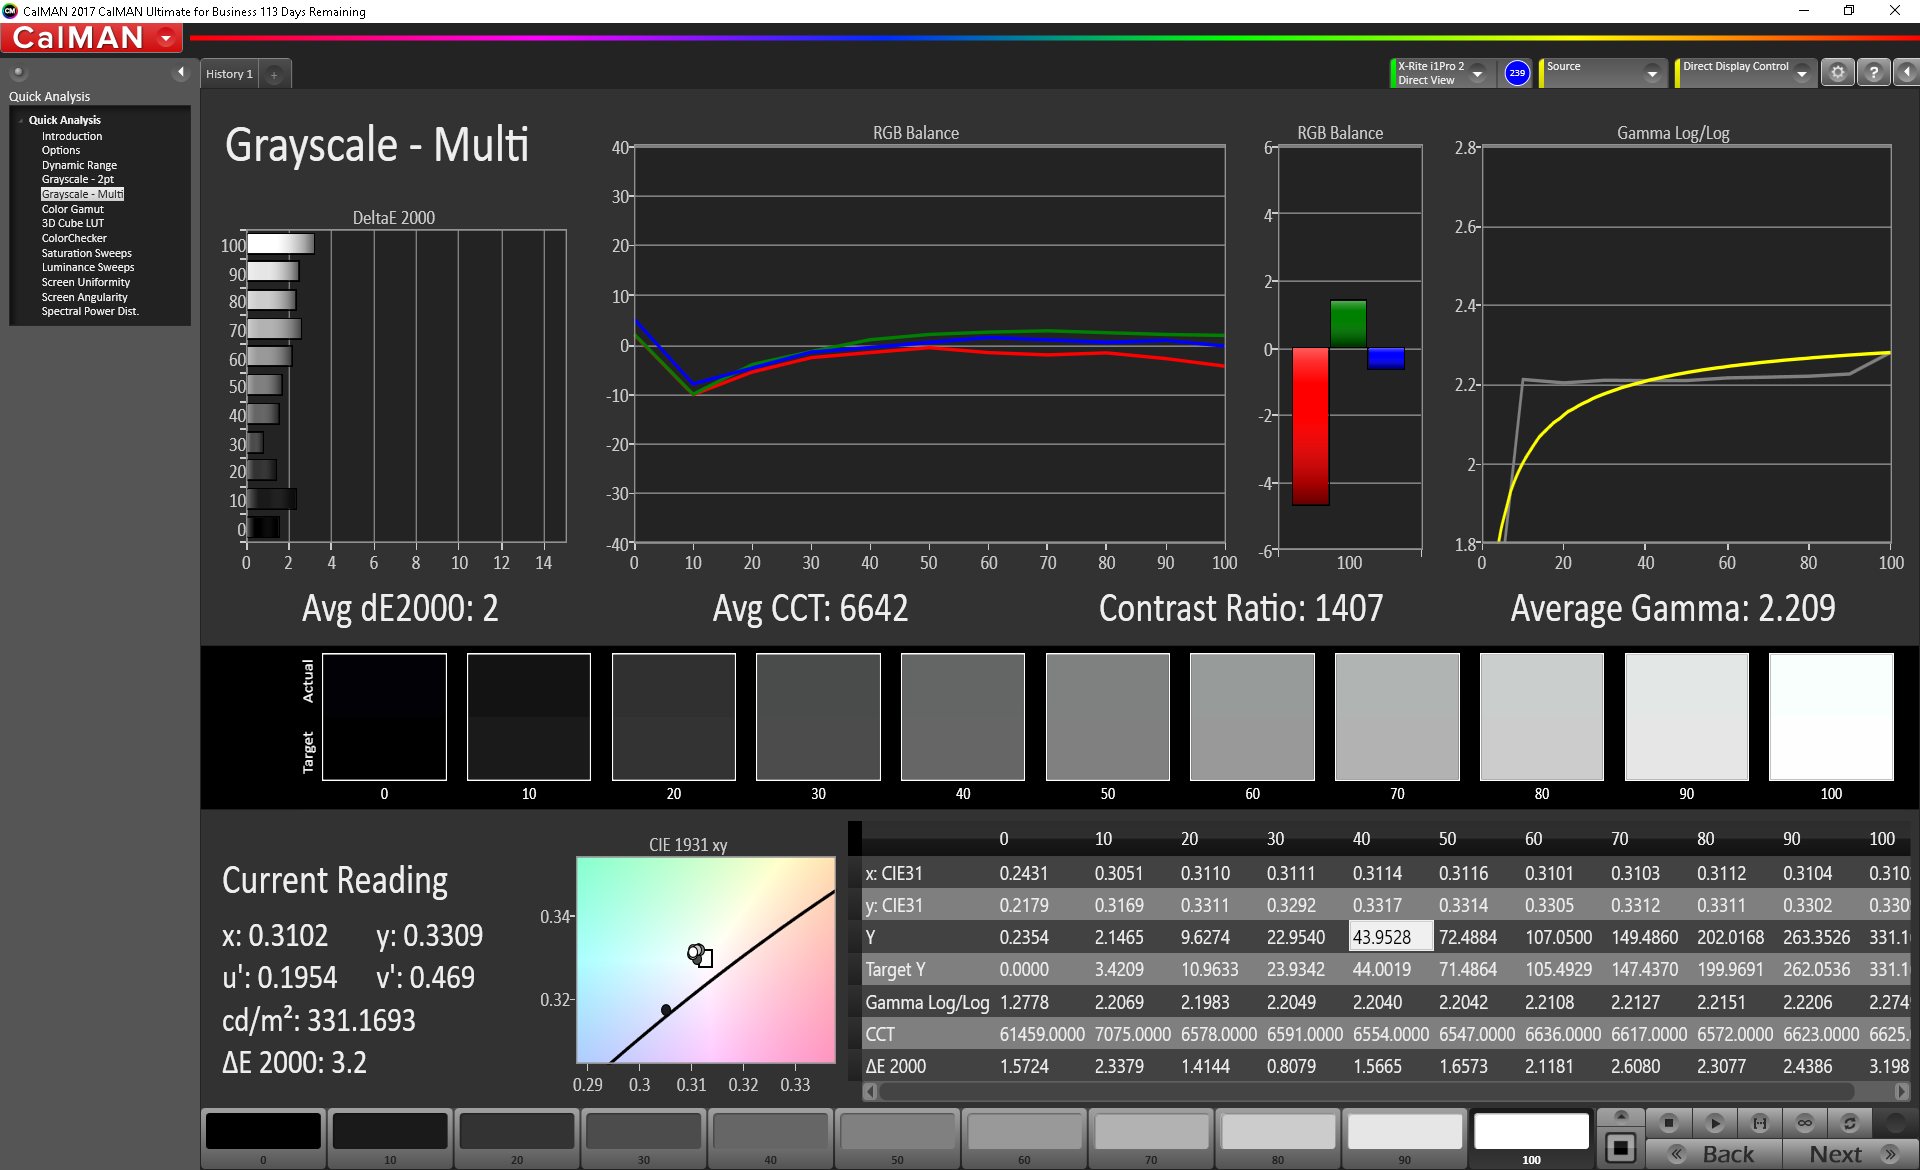
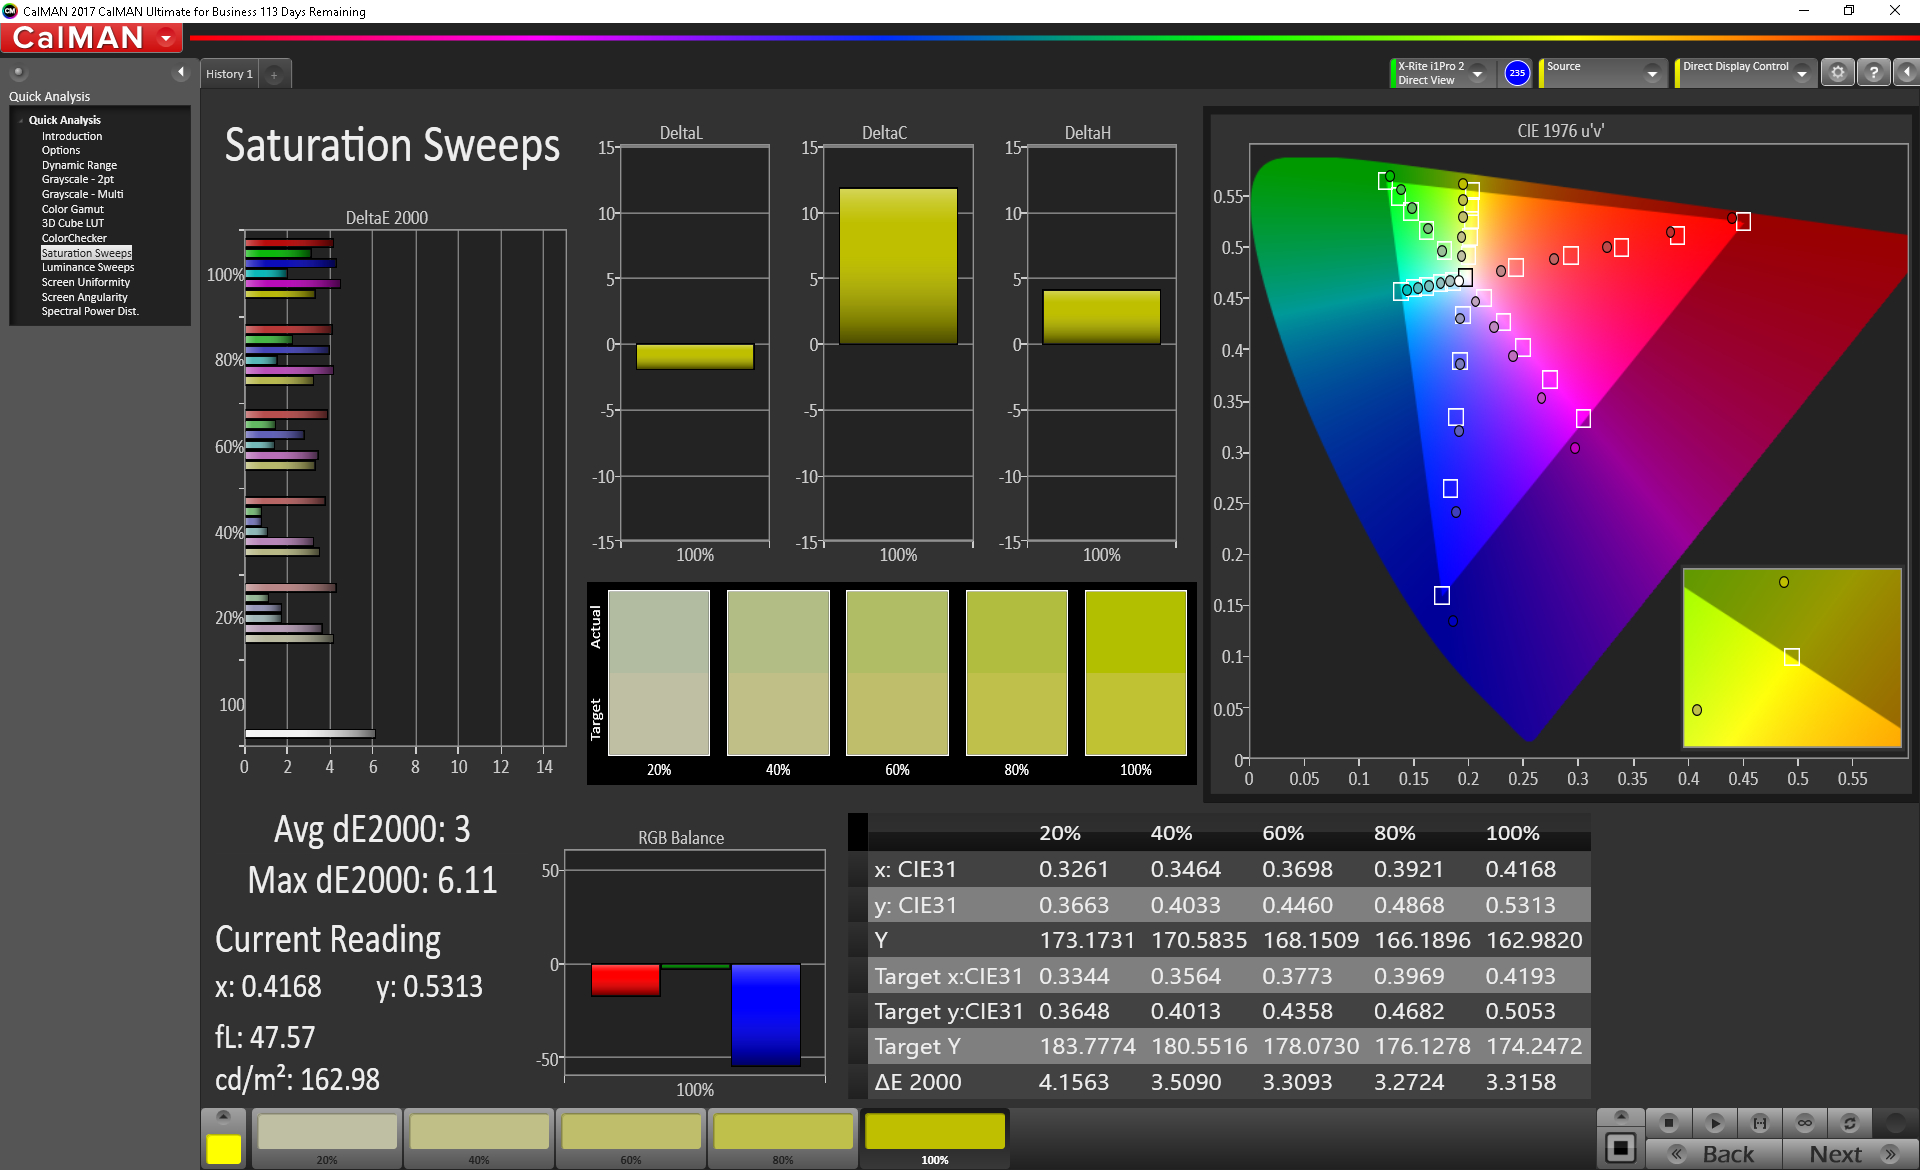
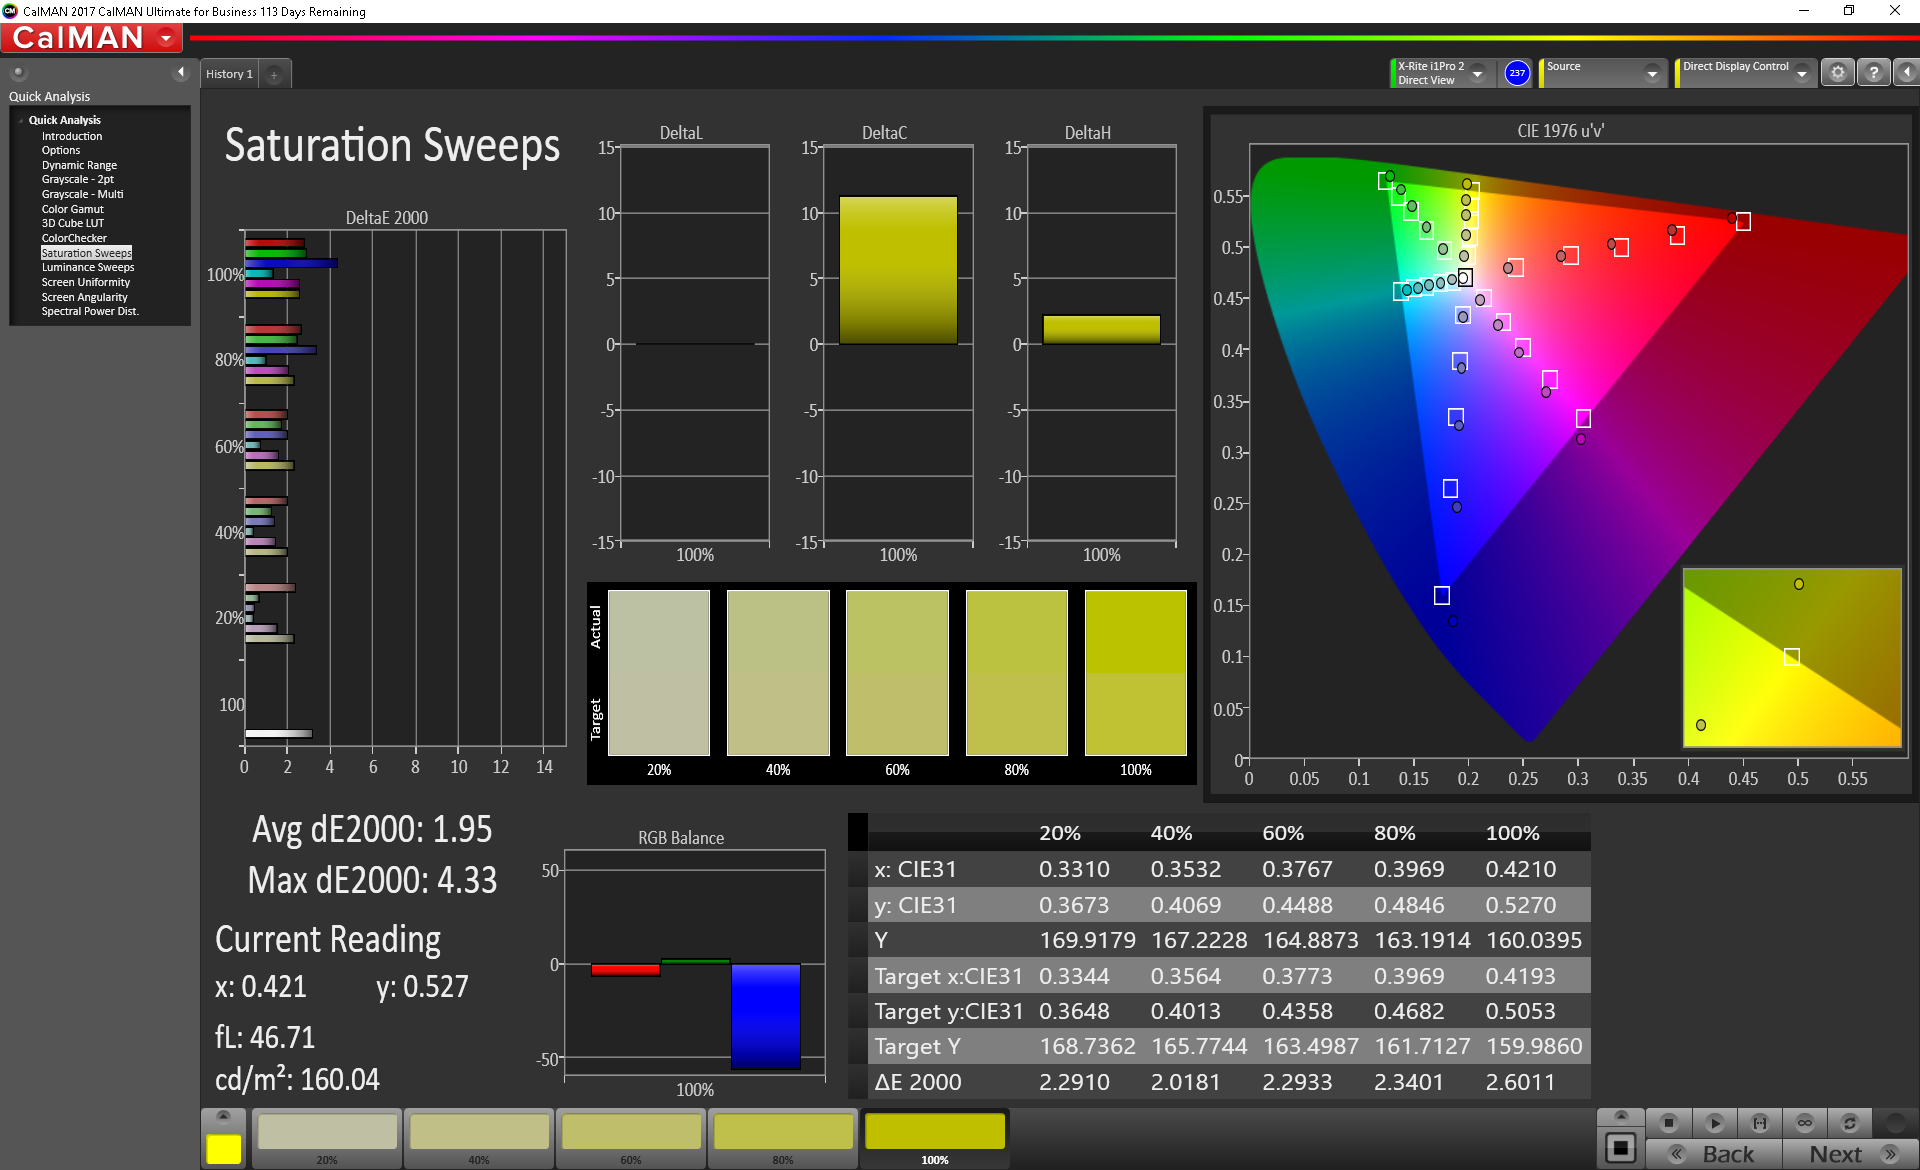
The Full HD display from AU Optronics sports a feature not commonly seen at this price point: a high refresh rate. The 144 Hz panel boasts quick response times and smooth motion, a definite upgrade from the more typical 60 Hz screens used in low- and mid-tier gaming laptops. The display does not support G-Sync. The high refresh rate isn't the only high point of the display, either. The backlight gets fairly bright at about 350 nits, and distribution is fairly even if a bit dim in the upper left corner. This isn't noticeable in normal use. The contrast ratio is good at 993:1. Blacks look deep and colors are well-defined. PWM is entirely absent. All of this coupled with the good color coverage and accuracy to make for one of the better displays in the mid-tier gaming market. HP also offers 60 Hz FHD (standard) and 60 Hz 4K display options.
| |||||||||||||||||||||||||
Brightness Distribution: 85 %
Center on Battery: 357.5 cd/m²
Contrast: 993:1 (Black: 0.36 cd/m²)
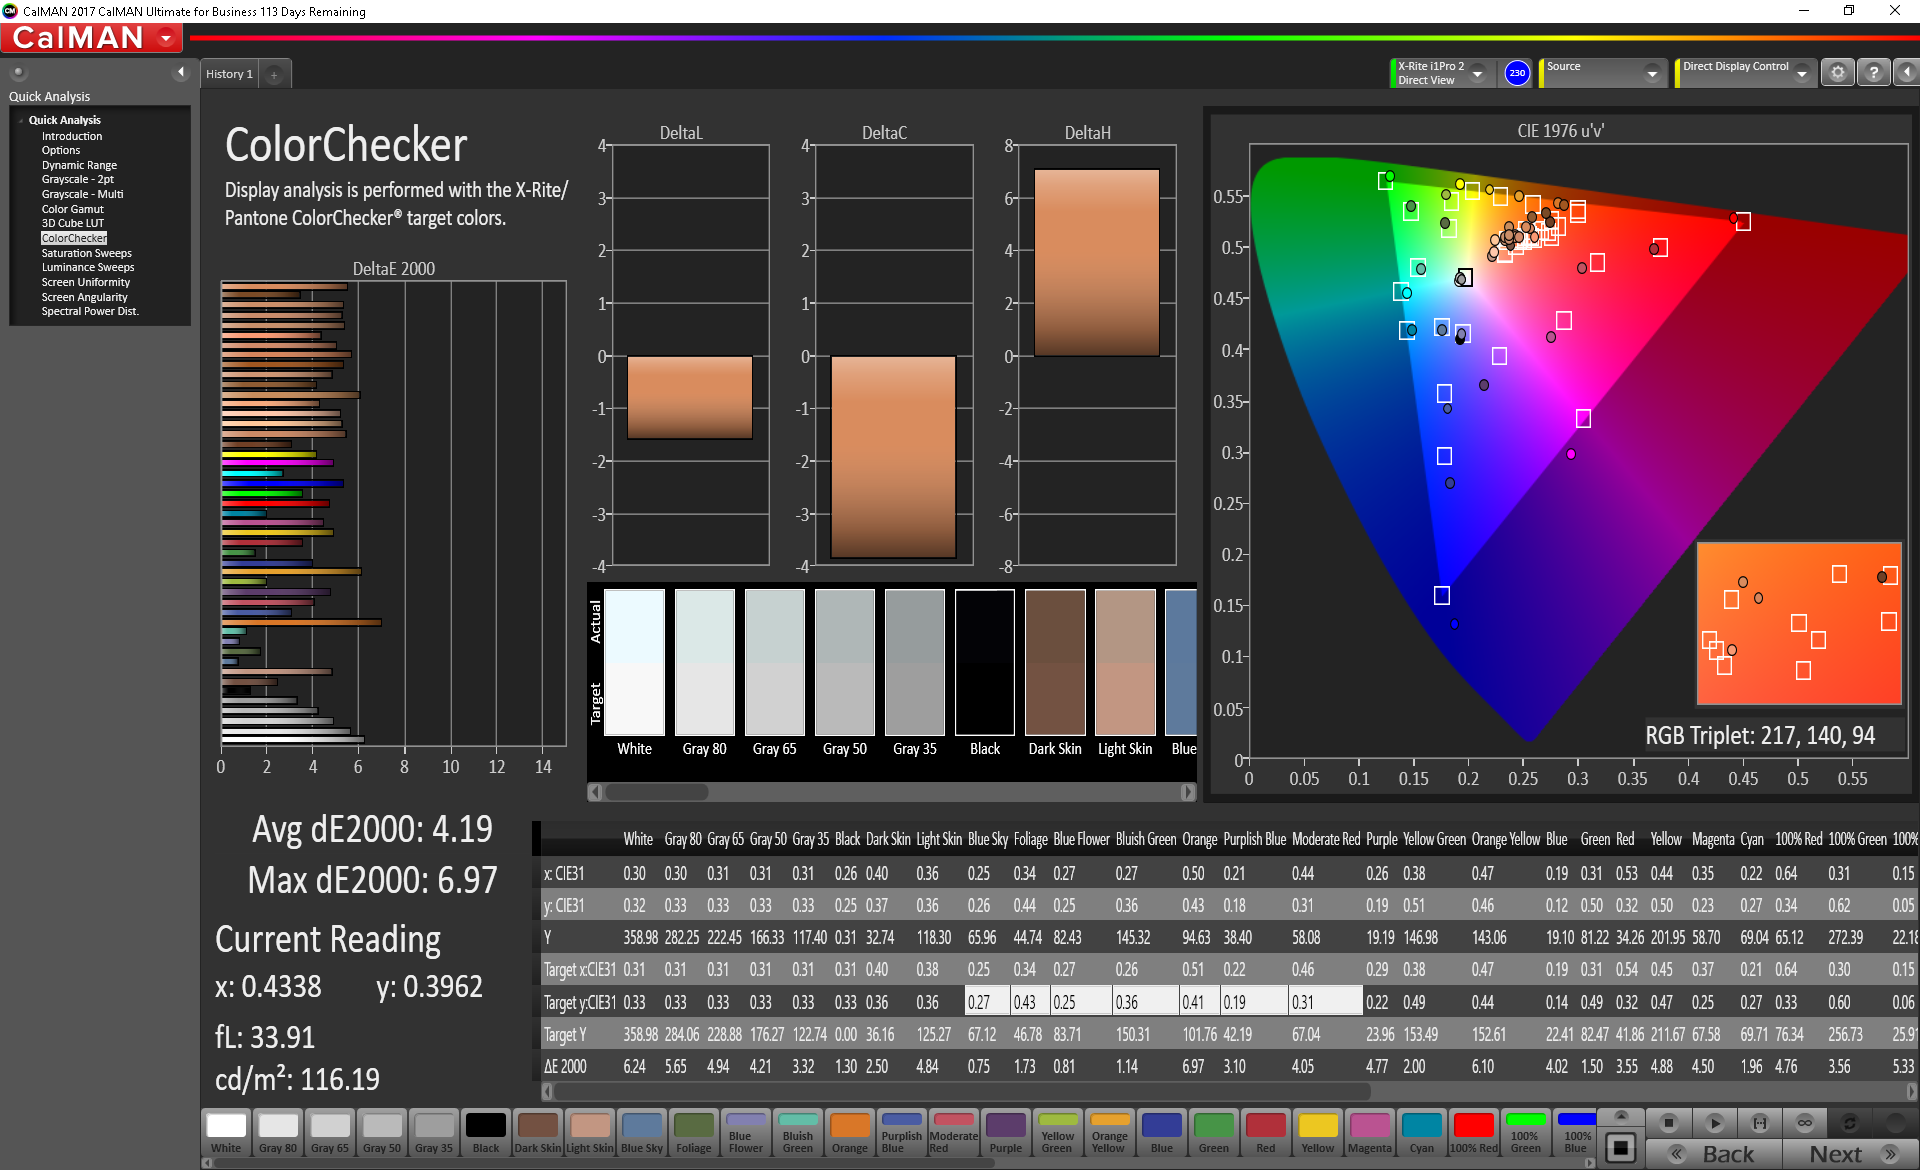
ΔE ColorChecker Calman: 4.19 | ∀{0.5-29.43 Ø4.73}
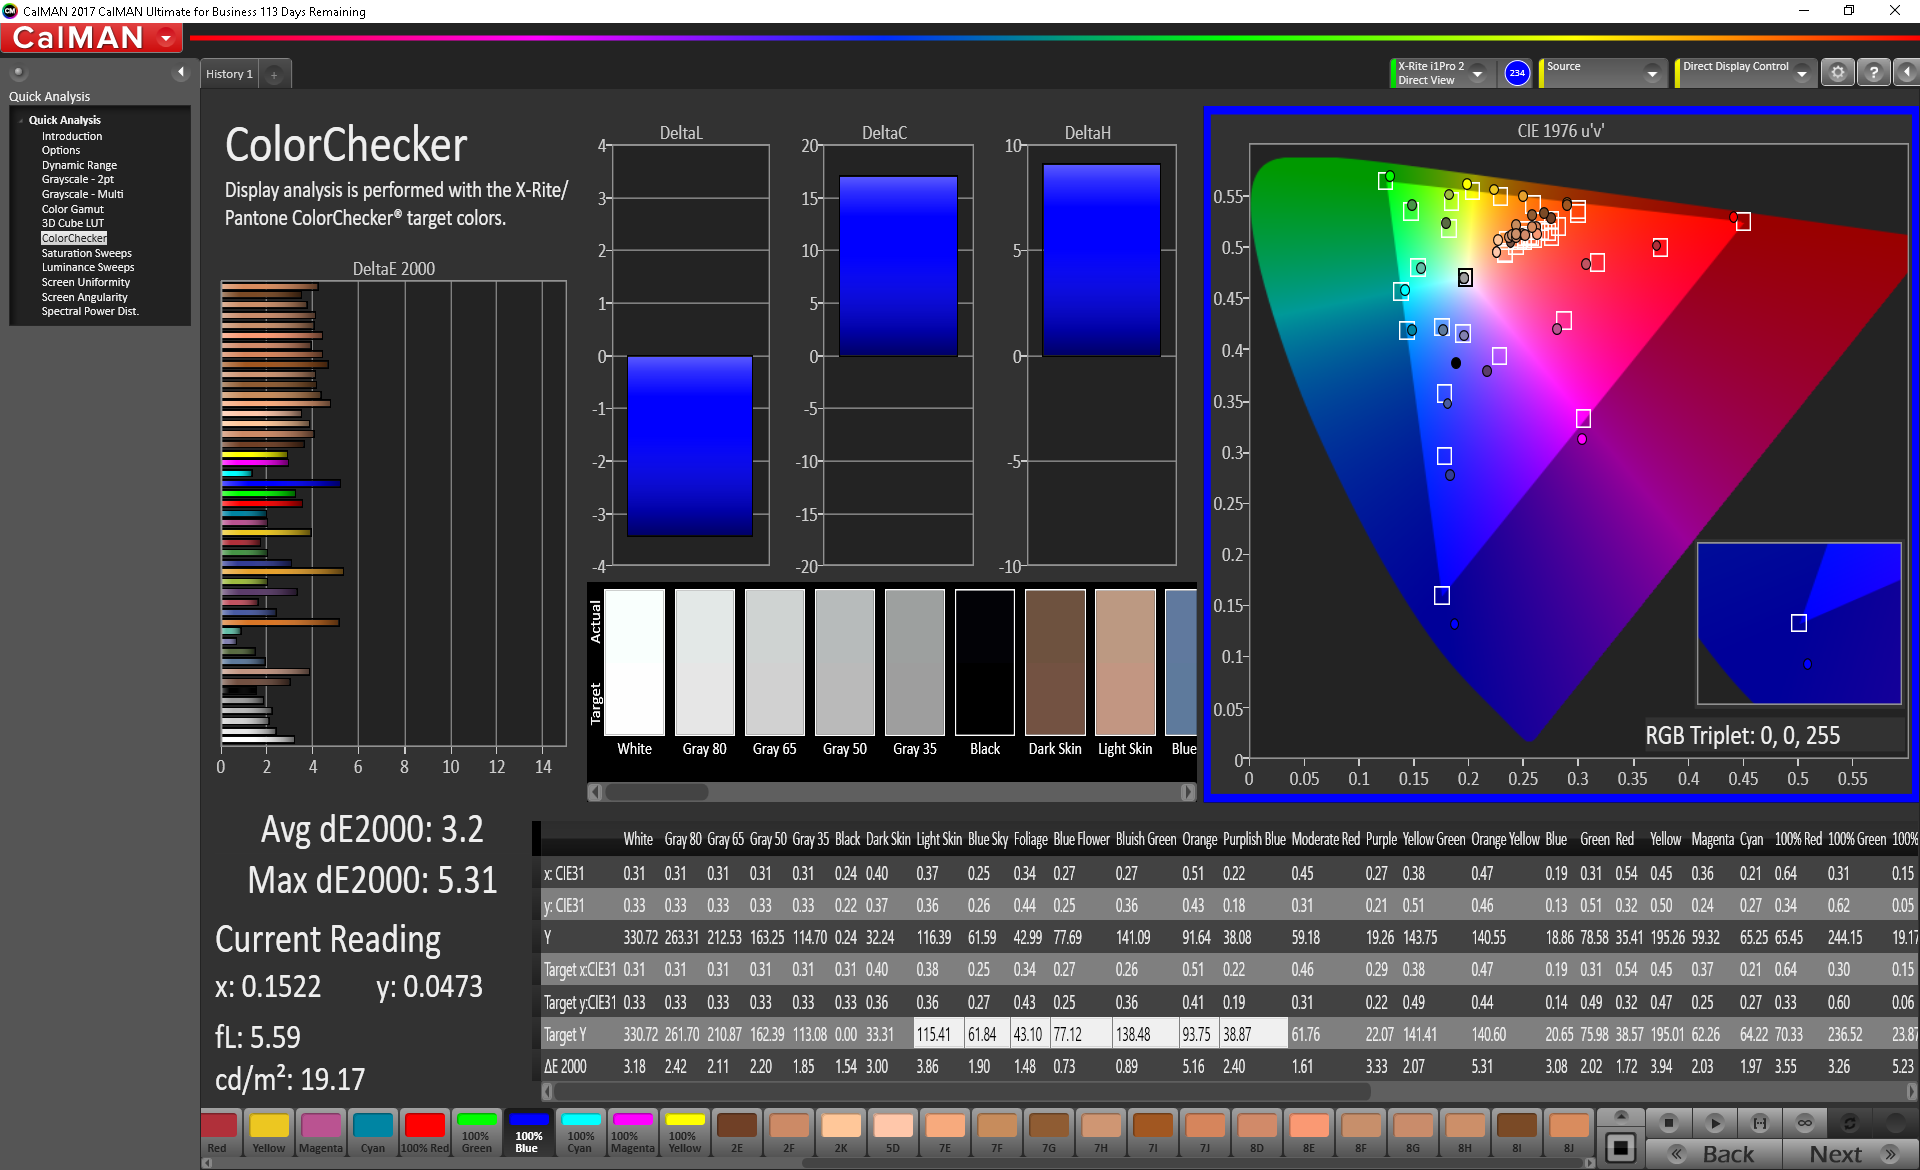
calibrated: 3.2
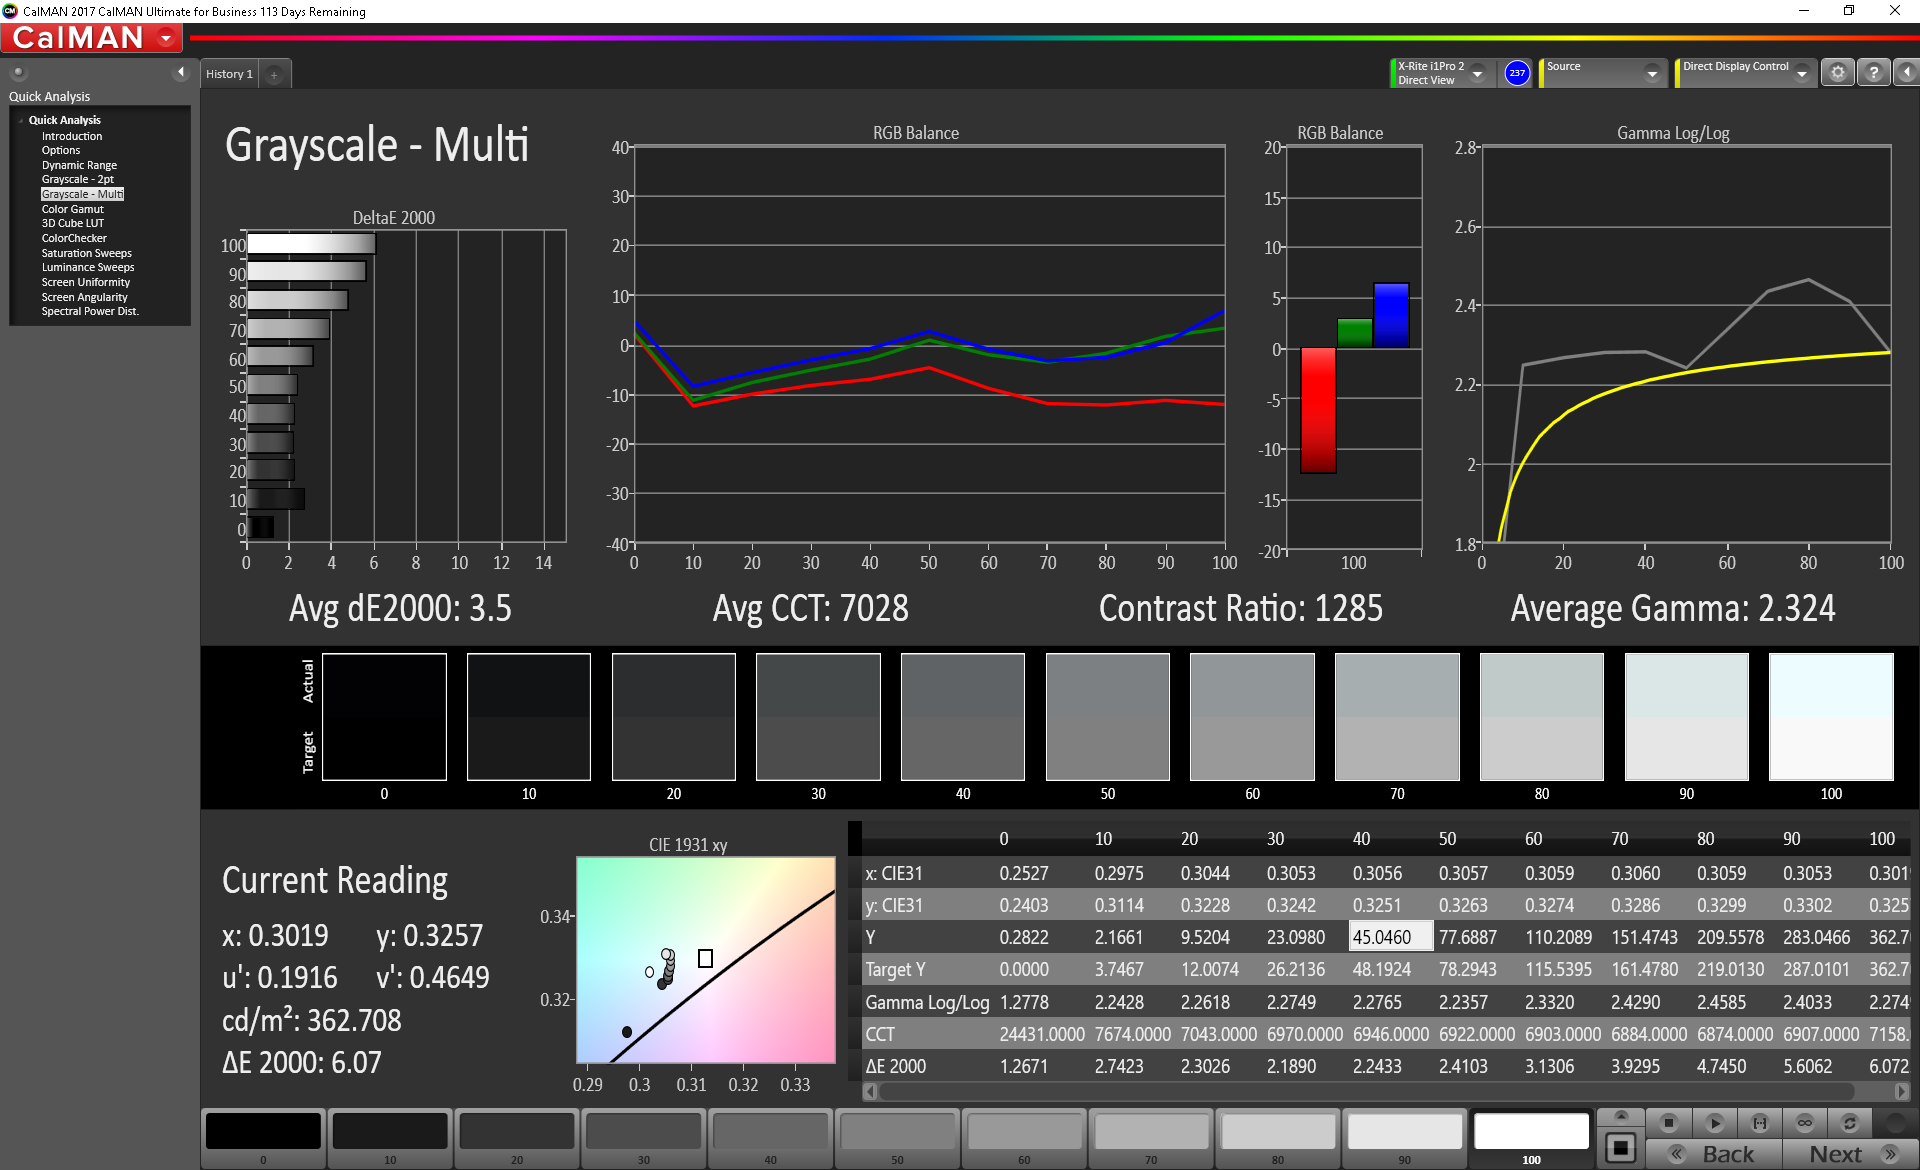
ΔE Greyscale Calman: 3.5 | ∀{0.09-98 Ø4.97}
91% sRGB (Argyll 1.6.3 3D)
60% AdobeRGB 1998 (Argyll 1.6.3 3D)
67.1% AdobeRGB 1998 (Argyll 3D)
91.7% sRGB (Argyll 3D)
66.5% Display P3 (Argyll 3D)
Gamma: 2.324
CCT: 7028 K
| HP Pavilion Gaming 15t-cx0000 AU Optronics AUO82ED, IPS, 15.6", 1920x1080 | Dell G7 15-7588 LG Philips LGD053F, IPS, 15.6", 1920x1080 | Acer Predator Helios 300 PH317-52-51M6 LG Philips LP173WF4-SPF5 (LGD056D), IPS, 17.3", 1920x1080 | Lenovo Legion Y530-15ICH B156HAN02.1, IPS, 15.6", 1920x1080 | Asus FX503VM-EH73 AU Optronics B156HAN06.1, IPS, 15.6", 1920x1080 | HP Omen 15-dc0001ng BOE07A1, IPS, 15.6", 1920x1080 | MSI GV62 8RE-016US LG Philips LGD0590, IPS, 15.6", 1920x1080 | |
|---|---|---|---|---|---|---|---|
| Display | -41% | -4% | -40% | -42% | -38% | -38% | |
| Display P3 Coverage (%) | 66.5 | 37.82 -43% | 67.1 1% | 38.31 -42% | 37.48 -44% | 39.64 -40% | 39.58 -40% |
| sRGB Coverage (%) | 91.7 | 56.2 -39% | 86.1 -6% | 57.3 -38% | 56.3 -39% | 59 -36% | 59.5 -35% |
| AdobeRGB 1998 Coverage (%) | 67.1 | 39.2 -42% | 63 -6% | 39.58 -41% | 38.72 -42% | 40.95 -39% | 40.91 -39% |
| Response Times | -130% | -101% | -169% | -146% | -179% | -104% | |
| Response Time Grey 50% / Grey 80% * (ms) | 17.6 ? | 38.8 ? -120% | 36 ? -105% | 43.6 ? -148% | 36.8 ? -109% | 47.2 ? -168% | 33.2 ? -89% |
| Response Time Black / White * (ms) | 11.2 ? | 26.8 ? -139% | 22 ? -96% | 32.4 ? -189% | 31.6 ? -182% | 32.4 ? -189% | 24.4 ? -118% |
| PWM Frequency (Hz) | 122000 ? | 200 ? | |||||
| Screen | -61% | -20% | -34% | -34% | -14% | -35% | |
| Brightness middle (cd/m²) | 357.5 | 250.9 -30% | 365 2% | 282.8 -21% | 235.9 -34% | 275 -23% | 268.7 -25% |
| Brightness (cd/m²) | 351 | 246 -30% | 341 -3% | 264 -25% | 235 -33% | 254 -28% | 246 -30% |
| Brightness Distribution (%) | 85 | 89 5% | 89 5% | 88 4% | 91 7% | 90 6% | 82 -4% |
| Black Level * (cd/m²) | 0.36 | 0.34 6% | 0.32 11% | 0.42 -17% | 0.27 25% | 0.27 25% | 0.42 -17% |
| Contrast (:1) | 993 | 738 -26% | 1141 15% | 673 -32% | 874 -12% | 1019 3% | 640 -36% |
| Colorchecker dE 2000 * | 4.19 | 7.34 -75% | 6.51 -55% | 4.93 -18% | 4.81 -15% | 4.62 -10% | 4.79 -14% |
| Colorchecker dE 2000 max. * | 6.97 | 28.66 -311% | 12.32 -77% | 17.65 -153% | 21.55 -209% | 8.05 -15% | 18.13 -160% |
| Colorchecker dE 2000 calibrated * | 3.2 | 4.42 -38% | 2.9 9% | 4.07 -27% | 3.59 -12% | 4.31 -35% | |
| Greyscale dE 2000 * | 3.5 | 6.8 -94% | 7.65 -119% | 3.8 -9% | 3.1 11% | 4.31 -23% | 3.1 11% |
| Gamma | 2.324 95% | 2.164 102% | 2.64 83% | 2.449 90% | 2.31 95% | 2.49 88% | 2.28 96% |
| CCT | 7028 92% | 6780 96% | 8066 81% | 6112 106% | 6984 93% | 7000 93% | 7049 92% |
| Color Space (Percent of AdobeRGB 1998) (%) | 60 | 36 -40% | 56 -7% | 36 -40% | 36 -40% | 38 -37% | 38 -37% |
| Color Space (Percent of sRGB) (%) | 91 | 56 -38% | 86 -5% | 57 -37% | 56 -38% | 59 -35% | 59 -35% |
| Total Average (Program / Settings) | -77% /
-66% | -42% /
-27% | -81% /
-52% | -74% /
-50% | -77% /
-39% | -59% /
-44% |
* ... smaller is better
Color coverage is very good for the price range. The panel covers 91% of the sRGB gamut and 60% of the AdobeRGB color space. While color professionals will want more, gamers will be more than happy with the bevy of available colors. The panel should also offer enough color coverage for amateur photo and video work. Considering most similarly-priced gaming machines only offer 50-60% of the sRGB gamut, the Pavilion Gaming 15t doesn't have much competition in this regard.
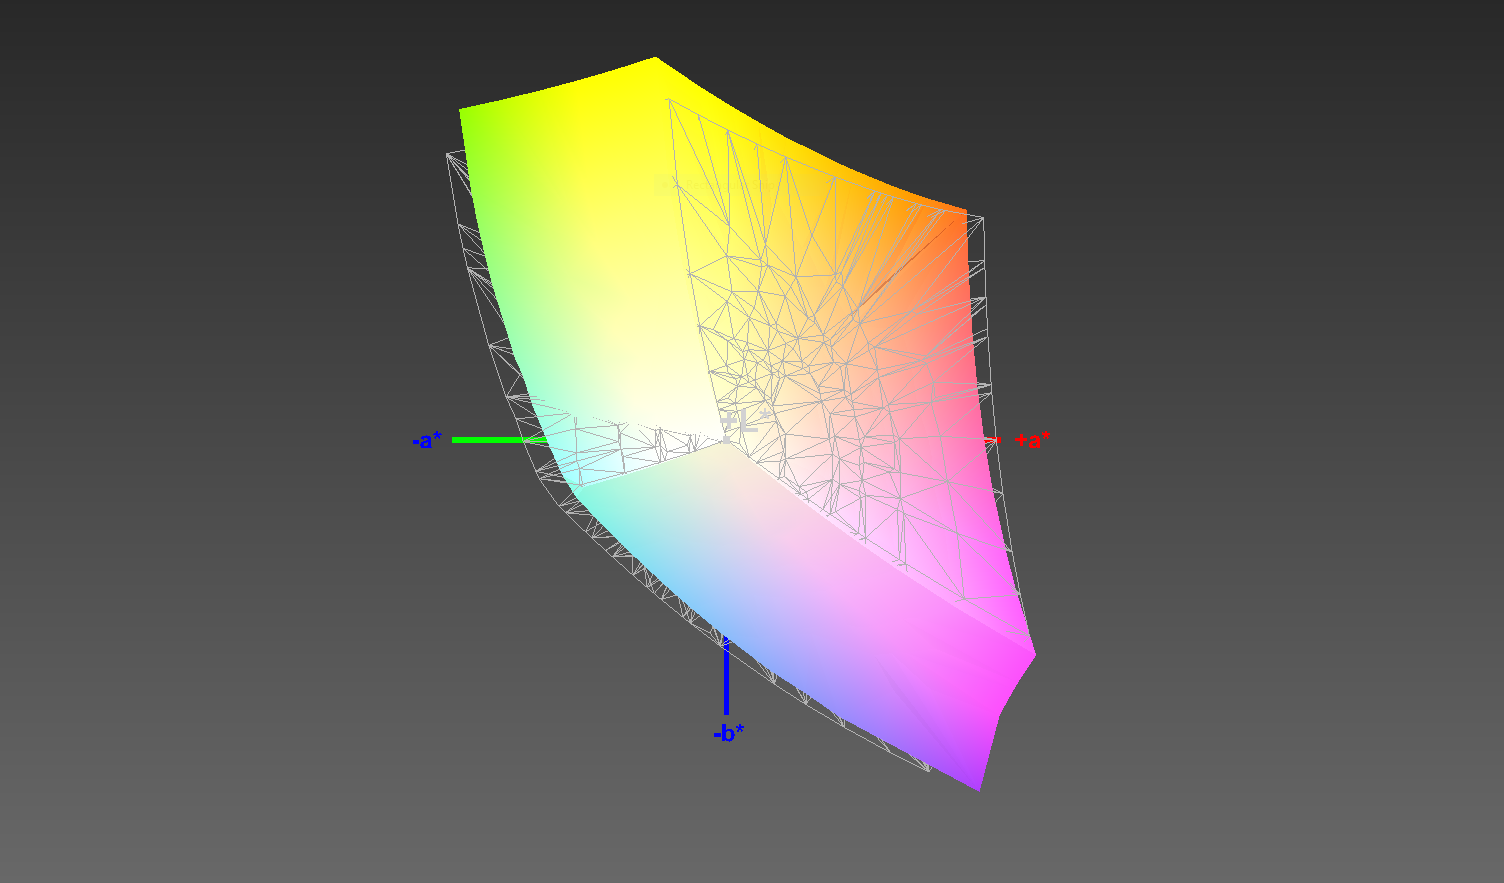
Just like color coverage, color accuracy is above average for this end of the market. Out of the box, the DeltaE2000 score for colors sits at 4.19. While not good enough for professional color work, this score is better than most competitors. Calibration improves this score a bit to 3.2. Grays are also fairly accurate with a DeltaE2000 of 3.5. Colors are a bit cool at 7028 K; whites subsequently have a subtle blue tint to them, though this isn't distracting.
Display Response Times
| ↔ Response Time Black to White | ||
|---|---|---|
| 11.2 ms ... rise ↗ and fall ↘ combined | ↗ 6 ms rise | 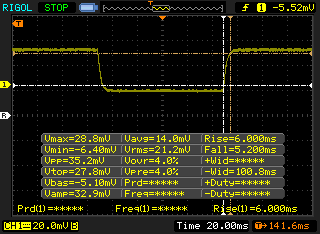 |
| ↘ 5.2 ms fall | ||
| The screen shows good response rates in our tests, but may be too slow for competitive gamers. In comparison, all tested devices range from 0.1 (minimum) to 240 (maximum) ms. » 30 % of all devices are better. This means that the measured response time is better than the average of all tested devices (19.9 ms). | ||
| ↔ Response Time 50% Grey to 80% Grey | ||
| 17.6 ms ... rise ↗ and fall ↘ combined | ↗ 9.2 ms rise | 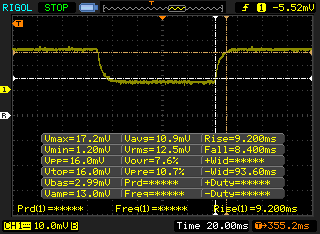 |
| ↘ 8.4 ms fall | ||
| The screen shows good response rates in our tests, but may be too slow for competitive gamers. In comparison, all tested devices range from 0.165 (minimum) to 636 (maximum) ms. » 31 % of all devices are better. This means that the measured response time is better than the average of all tested devices (31.1 ms). | ||
Screen Flickering / PWM (Pulse-Width Modulation)
| Screen flickering / PWM not detected | 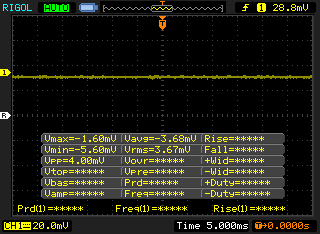 | ||
In comparison: 52 % of all tested devices do not use PWM to dim the display. If PWM was detected, an average of 7798 (minimum: 5 - maximum: 343500) Hz was measured. | |||
Due to its IPS panel, the display's viewing angles are good. Images and text remain vivid and clear at angles up to 85°, though the screen starts washing out on the vertical axis at about 40°. Backlight bleed is present, but not noticeable. There is a significant amount of clouding in the lower left corner of the screen, but this is hard to make out in all but the darkest rooms.
The matte finish and bright backlight make outdoor use possible. Direct sunlight obscures the display, but the screen is fully visible under shade or cloud cover.
Performance
Even in the budget sector, gaming laptops have become very competent machines. This is thanks in large part to Intel's six-core Core i7-8750H, which is making its way into more and more devices, especially those in lower price brackets. The CPU pairs nicely with mid- and high-tier GPUs, such as the Nvidia Geforce GTX 1060 and GTX 1070. The Pavilion Gaming 15t under review sports an Nvidia GeForce GTX 1060 Max-Q, though HP has opted for the 3 GB version rather than the more expensive 6 GB variant. On top of the reduction of VRAM, the GPU's clock speeds are also lower than the 6 GB GTX 1060. Does halving the VRAM make a significant difference in performance? Let's take a look.
Processor
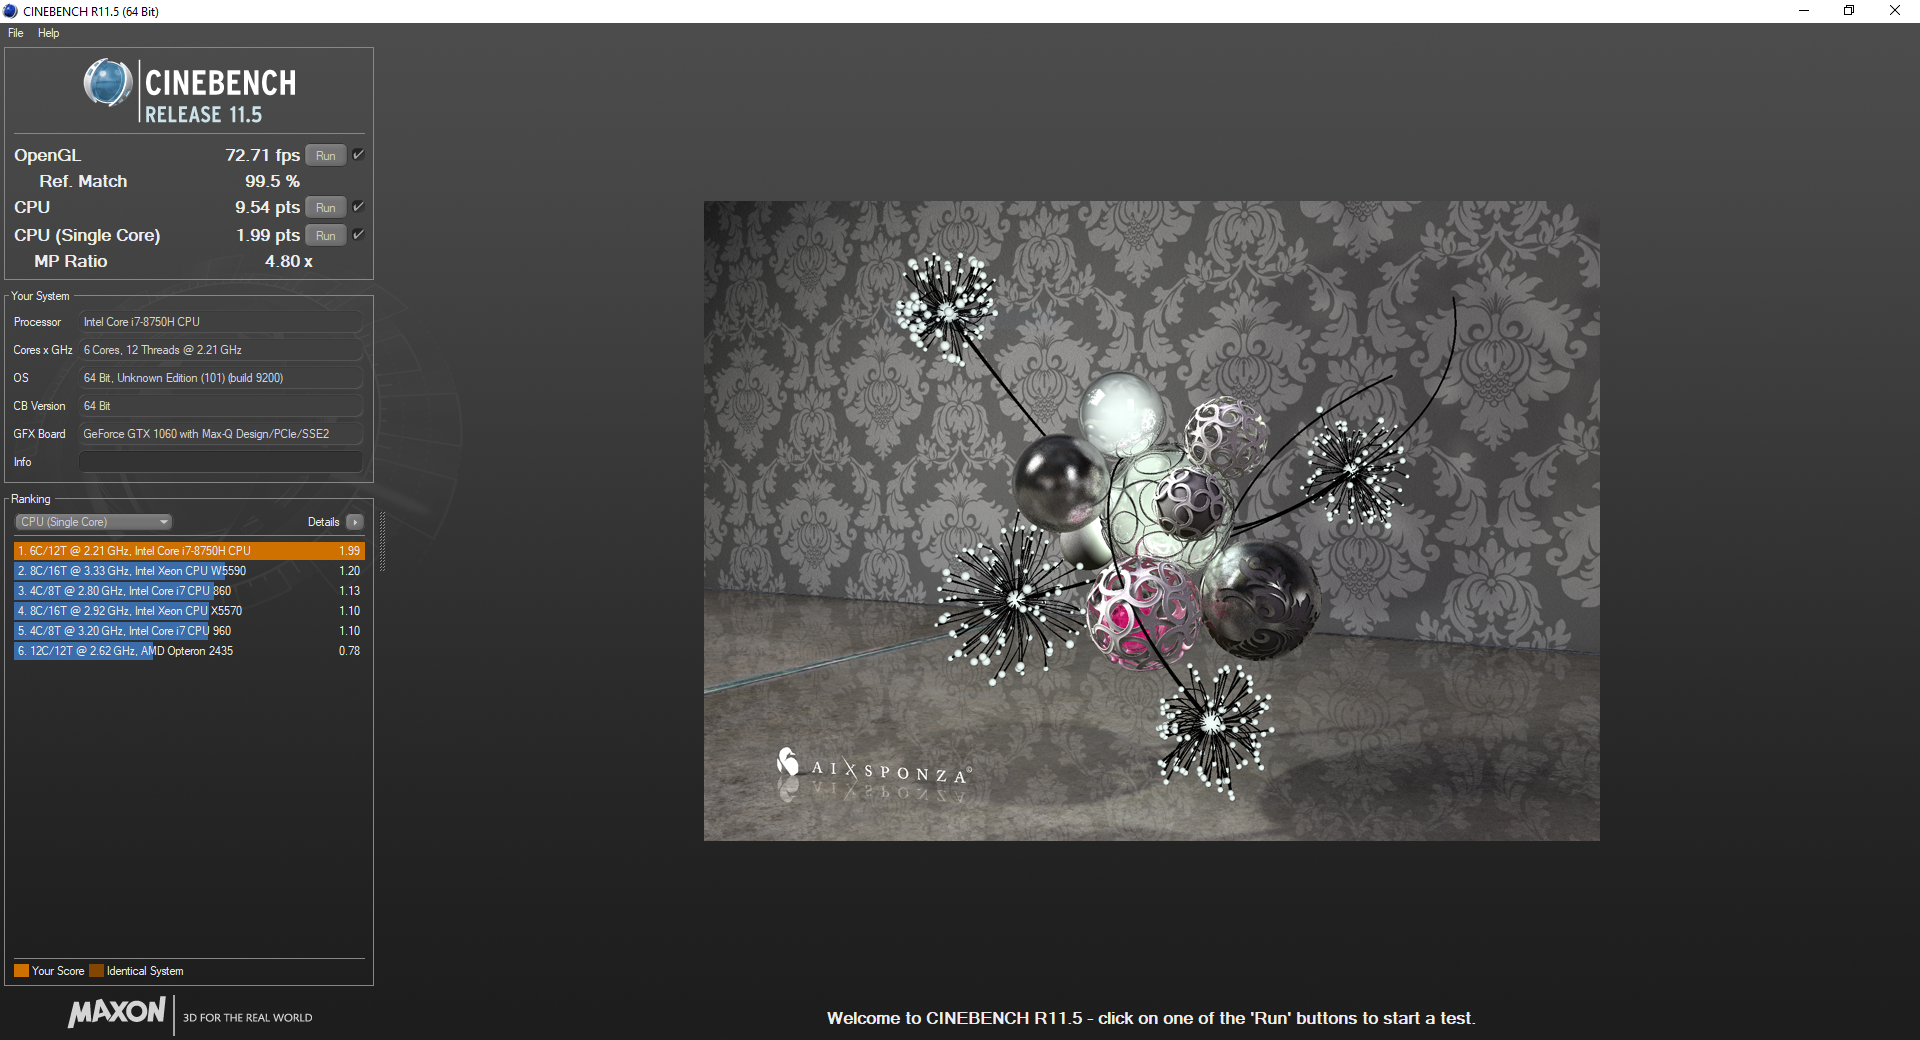
The Intel Core i7-8750H is the go-to CPU for most gaming laptops. The hexacore chip is a welcome replacement for last year's Core i7-7700HQ, which had only four cores. Typically, the 50% higher core count translates to about 50% performance in multi-threaded testing. Curiously, the Pavilion Gaming 15t doesn't come close to this average, beating the 7700HQ by a mere 18%. Heavy CPU throttling is the likely culprit, as multiple runs confirm these findings. While the CPU is stable over our Cinebench R15 loop, performance stays locked between 845 cb and 860 cb, well below the 1050+ cb the 8750H typically hits. In this regard, the HP Pavilion Gaming 15t's 8750H is more akin to the Core i5-8300H. Despite the extra cost of the Core i7, there seems to be no benefit.

| wPrime 2.10 - 1024m | |
| HP ProBook 645 G4 3UP62EA | |
| Asus FX503VM-EH73 | |
| HP Pavilion Gaming 15t-cx0000 | |
| Average Intel Core i7-8750H (125.5 - 180.5, n=6) | |
| Average of class Gaming (33 - 210, n=6, last 2 years) | |
* ... smaller is better
System Performance
Overall system benchmarks echo our CPU tests. The Pavilion Gaming 15t more closely matches Core i5-8300H devices rather than Core i7-8750H machines. Still, system performance is good. The Pavilion Gaming 15t feels responsive, due mainly to the Samsung PM981 NVMe SSD. The UI glides on the 144 Hz panel, and programs open quickly. Games loaded onto the SSD will benefit from reduced load times, and standard office tasks are handled with aplomb.


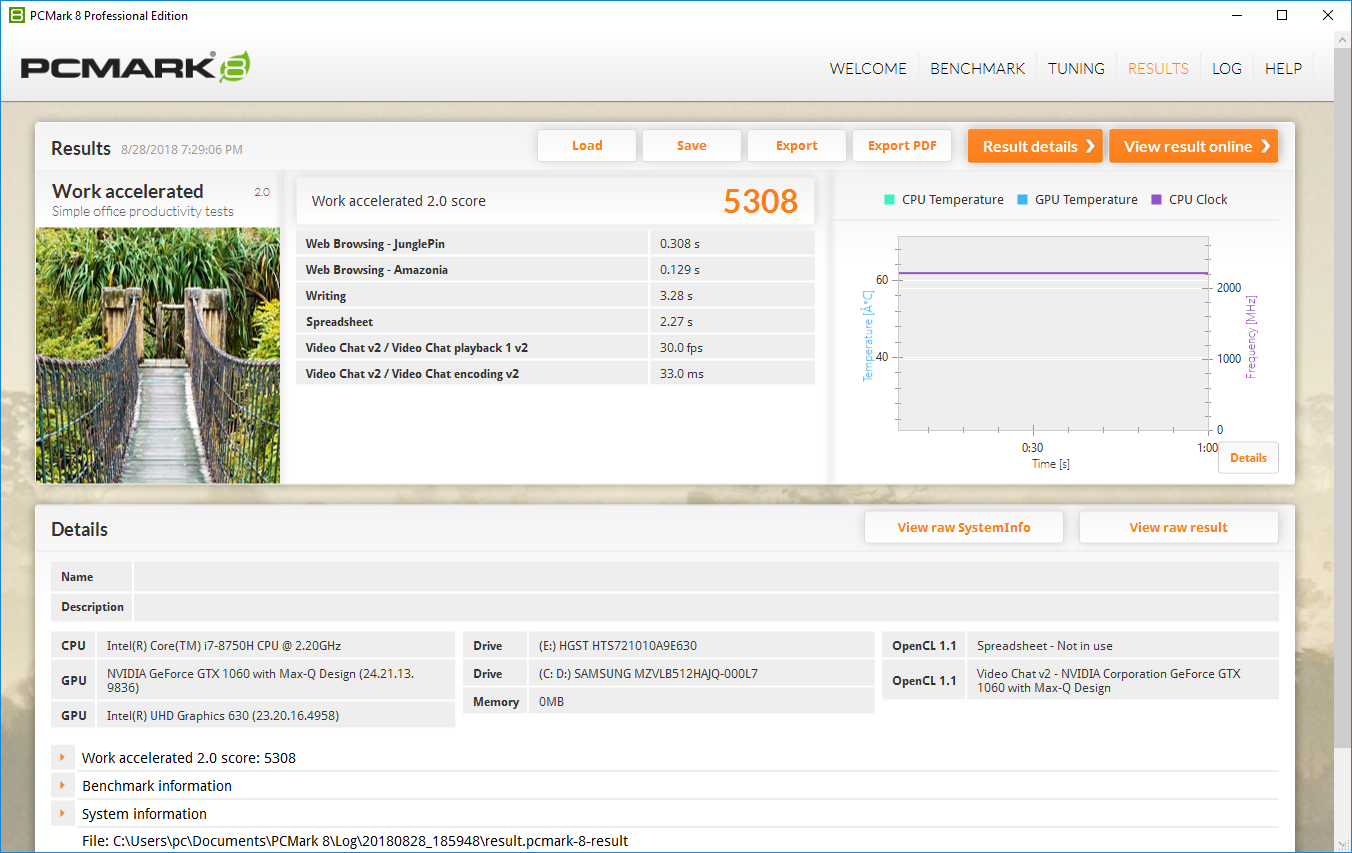
| PCMark 8 Home Score Accelerated v2 | 4606 points | |
| PCMark 8 Work Score Accelerated v2 | 5308 points | |
| PCMark 10 Score | 4724 points | |
Help | ||
Storage Devices
As we mentioned above, the PCIe NVMe SSD is quick. Our SKU uses Samsung's PM981, one of the quickest consumer drives on the market today. This drive is complemented by a 7200 RPM drive for mass storage. The mass storage drive is fairly quick for a mechanical drive, so file transfers between drives should occur reasonably fast. It should be noted that most other gaming laptops in this class typically use slower SATA III SSDs, so the NVMe boot drive is a very nice upgrade; read and write speeds are in a league of their own. HP also sells cheaper SKUs that use a SATA HDD with a 16 GB Intel Optane drive.
There is a marked discrepancy between sequential read times in AS SSD and CrystalDiskMark 5.2.1. This difference was seen in multiple passes through both benchmarks.


| HP Pavilion Gaming 15t-cx0000 Samsung SSD PM981 MZVLB512HAJQ | Dell G7 15-7588 SK hynix SC311 SATA | Acer Predator Helios 300 PH317-52-51M6 Hynix HFS128G39TND | Lenovo Legion Y530-15ICH Toshiba KBG30ZMT128G | Asus FX503VM-EH73 SanDisk SD8SN8U128G1002 | HP Omen 15-dc0001ng Toshiba KBG30ZMV128G | MSI GV62 8RE-016US Samsung PM871b MZNLN128HAHQ | Average Samsung SSD PM981 MZVLB512HAJQ | |
|---|---|---|---|---|---|---|---|---|
| AS SSD | -87% | -120% | -212% | -92% | -117% | -73% | -3% | |
| Copy Game MB/s (MB/s) | 223.2 | 122.6 | 1057 ? | |||||
| Copy Program MB/s (MB/s) | 126.9 | 69.2 | 454 ? | |||||
| Copy ISO MB/s (MB/s) | 460.8 | 170.5 | 1755 ? | |||||
| Score Total (Points) | 4113 | 528 -87% | 811 -80% | 838 -80% | 798 -81% | 670 -84% | 703 -83% | 3966 ? -4% |
| Score Write (Points) | 2087 | 181 -91% | 196 -91% | 128 -94% | 178 -91% | 195 -91% | 207 -90% | 1780 ? -15% |
| Score Read (Points) | 1319 | 233 -82% | 414 -69% | 497 -62% | 411 -69% | 343 -74% | 334 -75% | 1451 ? 10% |
| Access Time Write * (ms) | 0.038 | 0.068 -79% | 0.259 -582% | 0.287 -655% | 0.09 -137% | 0.227 -497% | 0.057 -50% | 0.08337 ? -119% |
| Access Time Read * (ms) | 0.051 | 0.161 -216% | 0.626 -1127% | 0.17 -233% | 0.177 -247% | 0.113 -122% | 0.05092 ? -0% | |
| 4K-64 Write (MB/s) | 1808 | 99.6 -94% | 120.1 -93% | 78.9 -96% | 95.5 -95% | 103.6 -94% | 129.4 -93% | 1504 ? -17% |
| 4K-64 Read (MB/s) | 1160 | 158.8 -86% | 336.6 -71% | 335.3 -71% | 343.4 -70% | 187.8 -84% | 257.7 -78% | 1203 ? 4% |
| 4K Write (MB/s) | 95.9 | 59.8 -38% | 62.7 -35% | 35.74 -63% | 46.48 -52% | 79.3 -17% | 63.5 -34% | 112 ? 17% |
| 4K Read (MB/s) | 35.03 | 23.66 -32% | 26.5 -24% | 38.71 11% | 20.44 -42% | 31.48 -10% | 26.23 -25% | 50.5 ? 44% |
| Seq Write (MB/s) | 1829 | 220.3 -88% | 128.2 -93% | 131.6 -93% | 328.4 -82% | 123.5 -93% | 138.1 -92% | 1637 ? -10% |
| Seq Read (MB/s) | 1235 | 506 -59% | 513 -58% | 1231 0% | 476.3 -61% | 1238 0% | 503 -59% | 1976 ? 60% |
* ... smaller is better

GPU Performance
Nvidia's GeForce GTX 1060 Max-Q is becoming a popular choice for mid-tier gaming laptops due to its solid "bang-for-the-buck" performance. HP has cut some costs by using the 3 GB variant of the GTX 1060 Max-Q. In addition to less VRAM, the GPU suffers from lower clock speeds than its 6 GB brother (1063 MHz vs. 1265 MHz base, 1342 MHz vs. 1480 MHz boost).
How much do these drawbacks affect real-world performance? For the most part, a small but noticeable amount. In 3DMark's various tests, the Pavilion Gaming 15t comes in 8-10% behind the Dell G7, which uses the 6 GB GTX 1060 Max-Q. Additionally, resolutions higher than 1920x1080 (Full HD) demand more VRAM, as do higher graphics settings in AAA games. The 3 GB GTX 1060 is held back from these settings by its limitations. The HP Pavilion Gaming 15t is well-suited to gaming at FHD and High settings; turning these dials up may result in low frame rates and stutters.

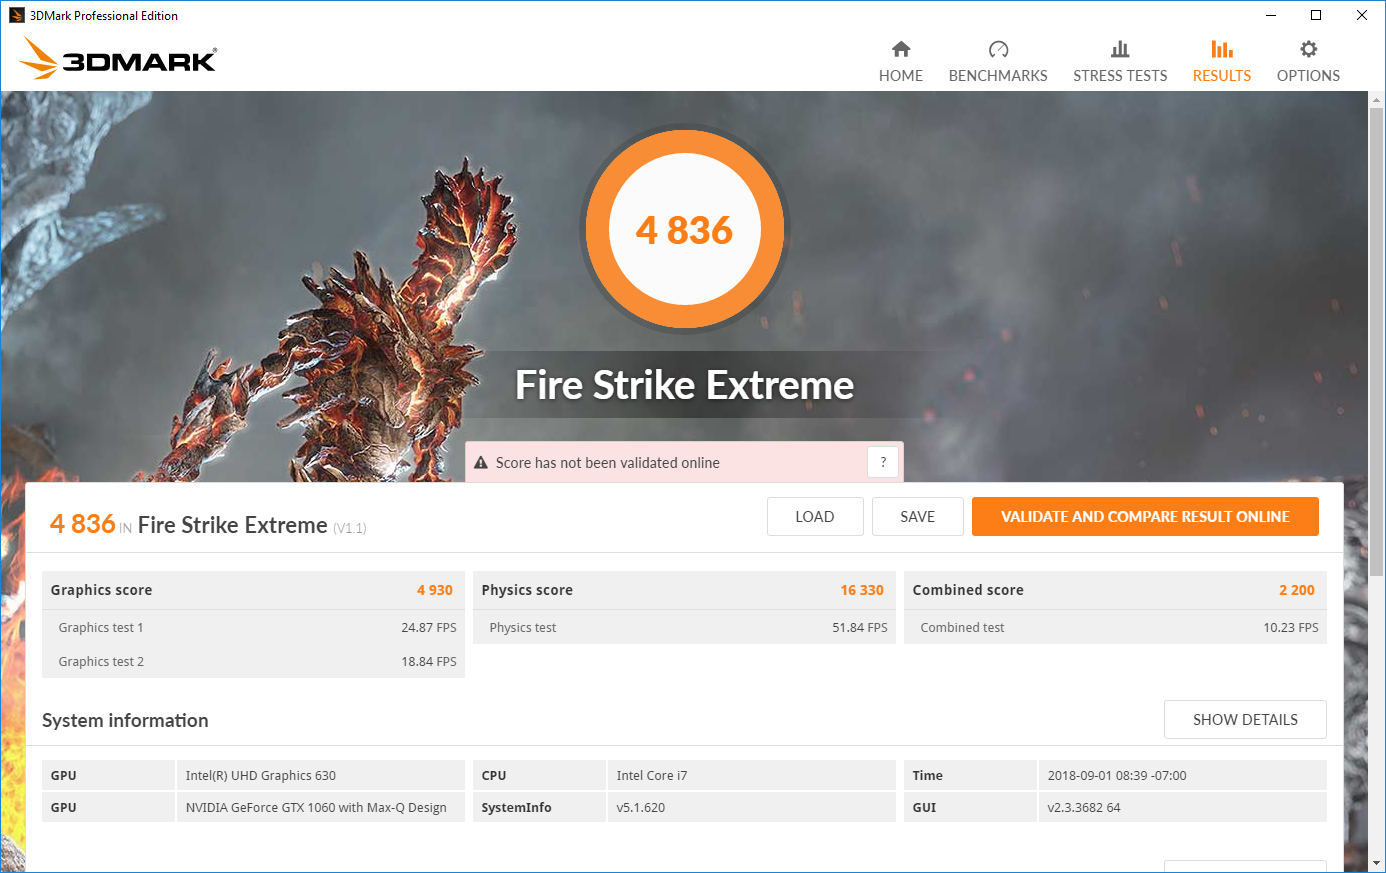
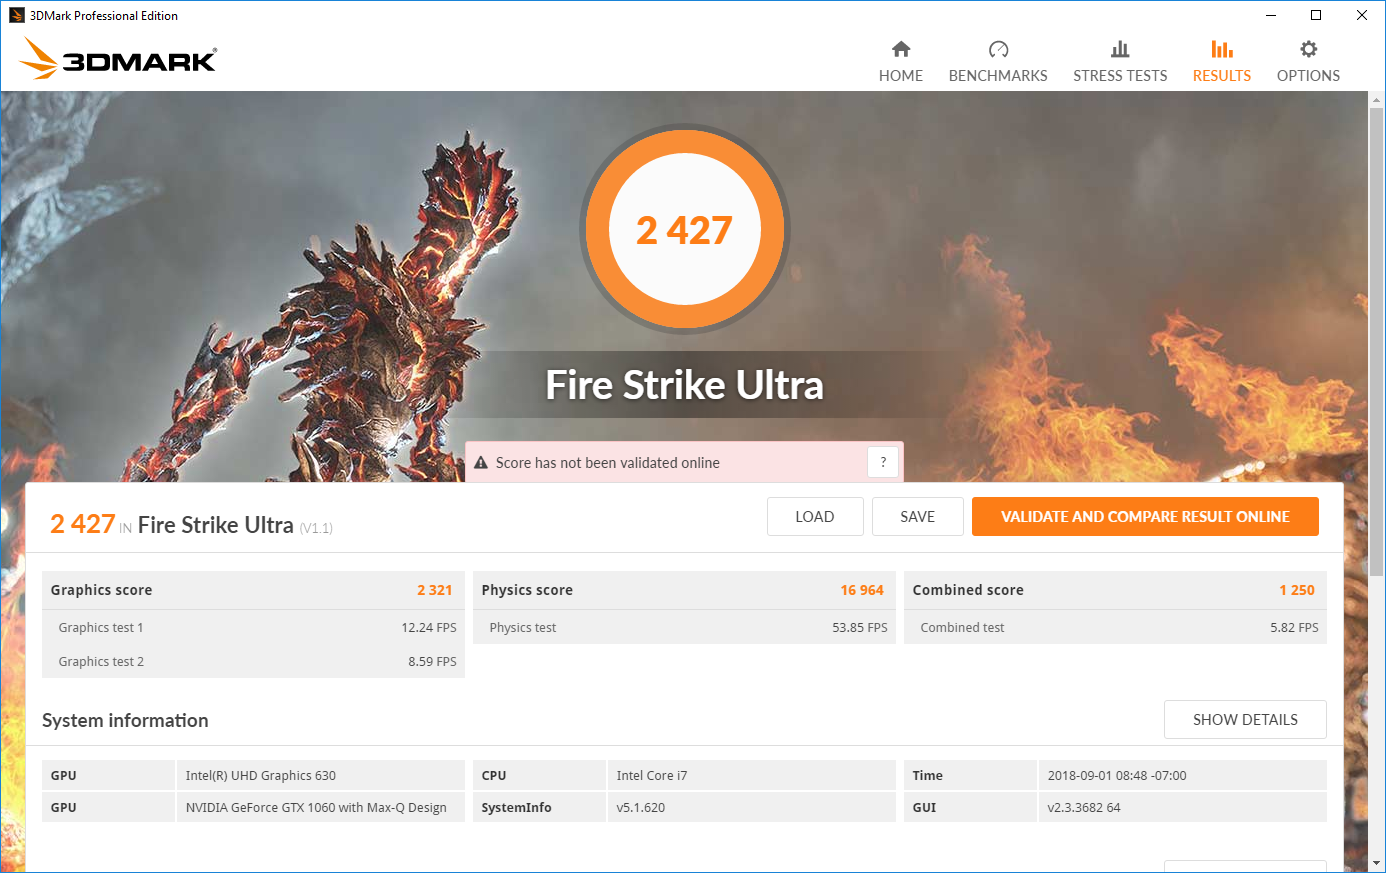

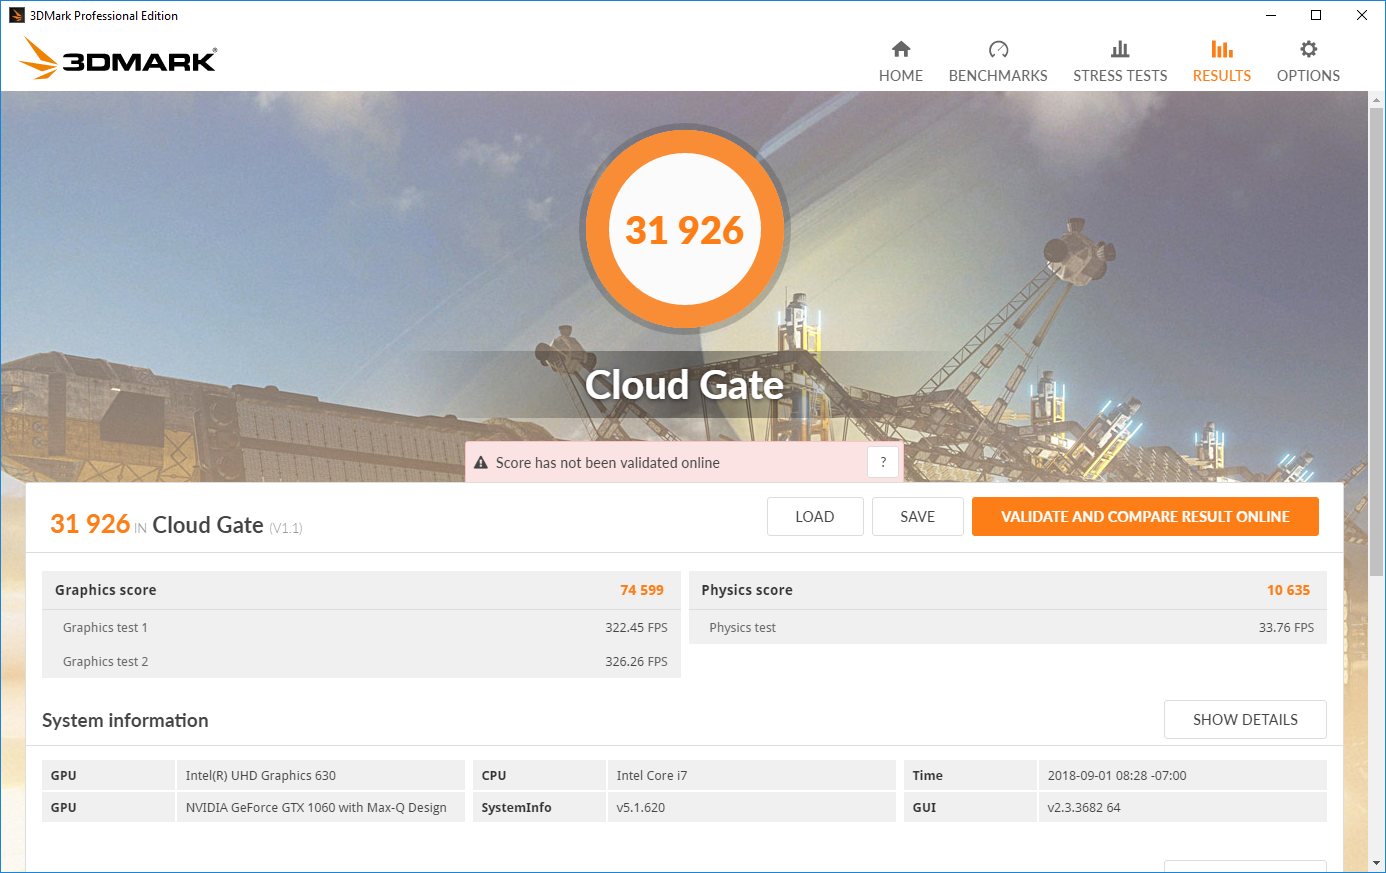
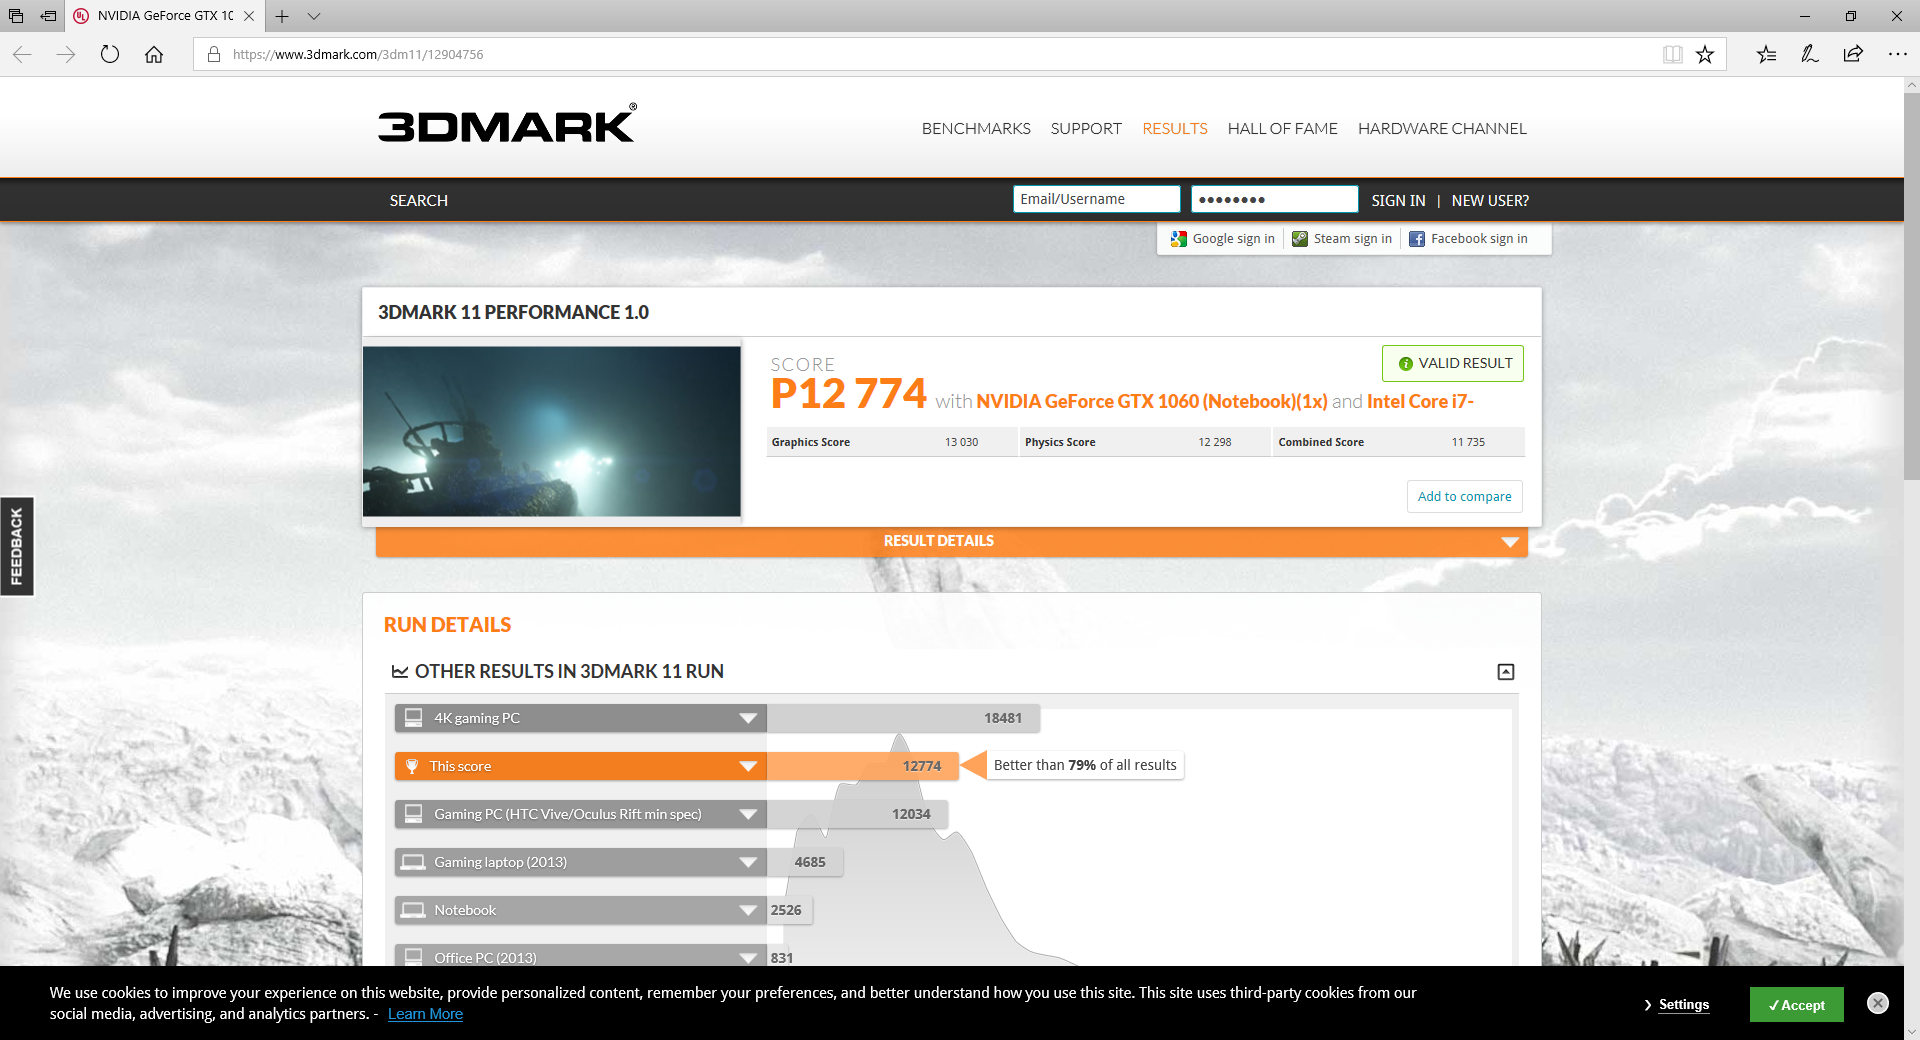
| 3DMark 06 Standard Score | 34189 points | |
| 3DMark 11 Performance | 12774 points | |
| 3DMark Cloud Gate Standard Score | 31926 points | |
| 3DMark Fire Strike Score | 9348 points | |
Help | ||
Gaming Performance
Most recent titles are entirely playable at Full HD and high settings, hitting around 50-60 fps. That said, the Pavilion Gaming 15t seems intentionally designed for more casual or competitive titles that are lighter on system resources. For example, Rocket League easily exceeds 144 fps, even at the highest settings. Thus, the game is able to fully take advantage of the high refresh rate display. Other titles like CS:GO and Team Fortress 2 should see similar results, although modern battle royale games (e.g., PUBG and Fortnite) may require that settings be dialed back.
Over long play sessions, the GPU is fairly consistent. Over an hour-long playthrough of The Witcher 3 (FHD/High), frame rates average between 46 and 50 fps with no noticeable drops. Most titles should remain consistent over long periods.
| low | med. | high | ultra | |
|---|---|---|---|---|
| BioShock Infinite (2013) | 327 | 231 | 215 | 102 |
| The Witcher 3 (2015) | 50 | |||
| Rise of the Tomb Raider (2016) | 168 | 111 | 63 | 54 |
| Rocket League (2017) | 250 | 216 | 155 |
Stress Test
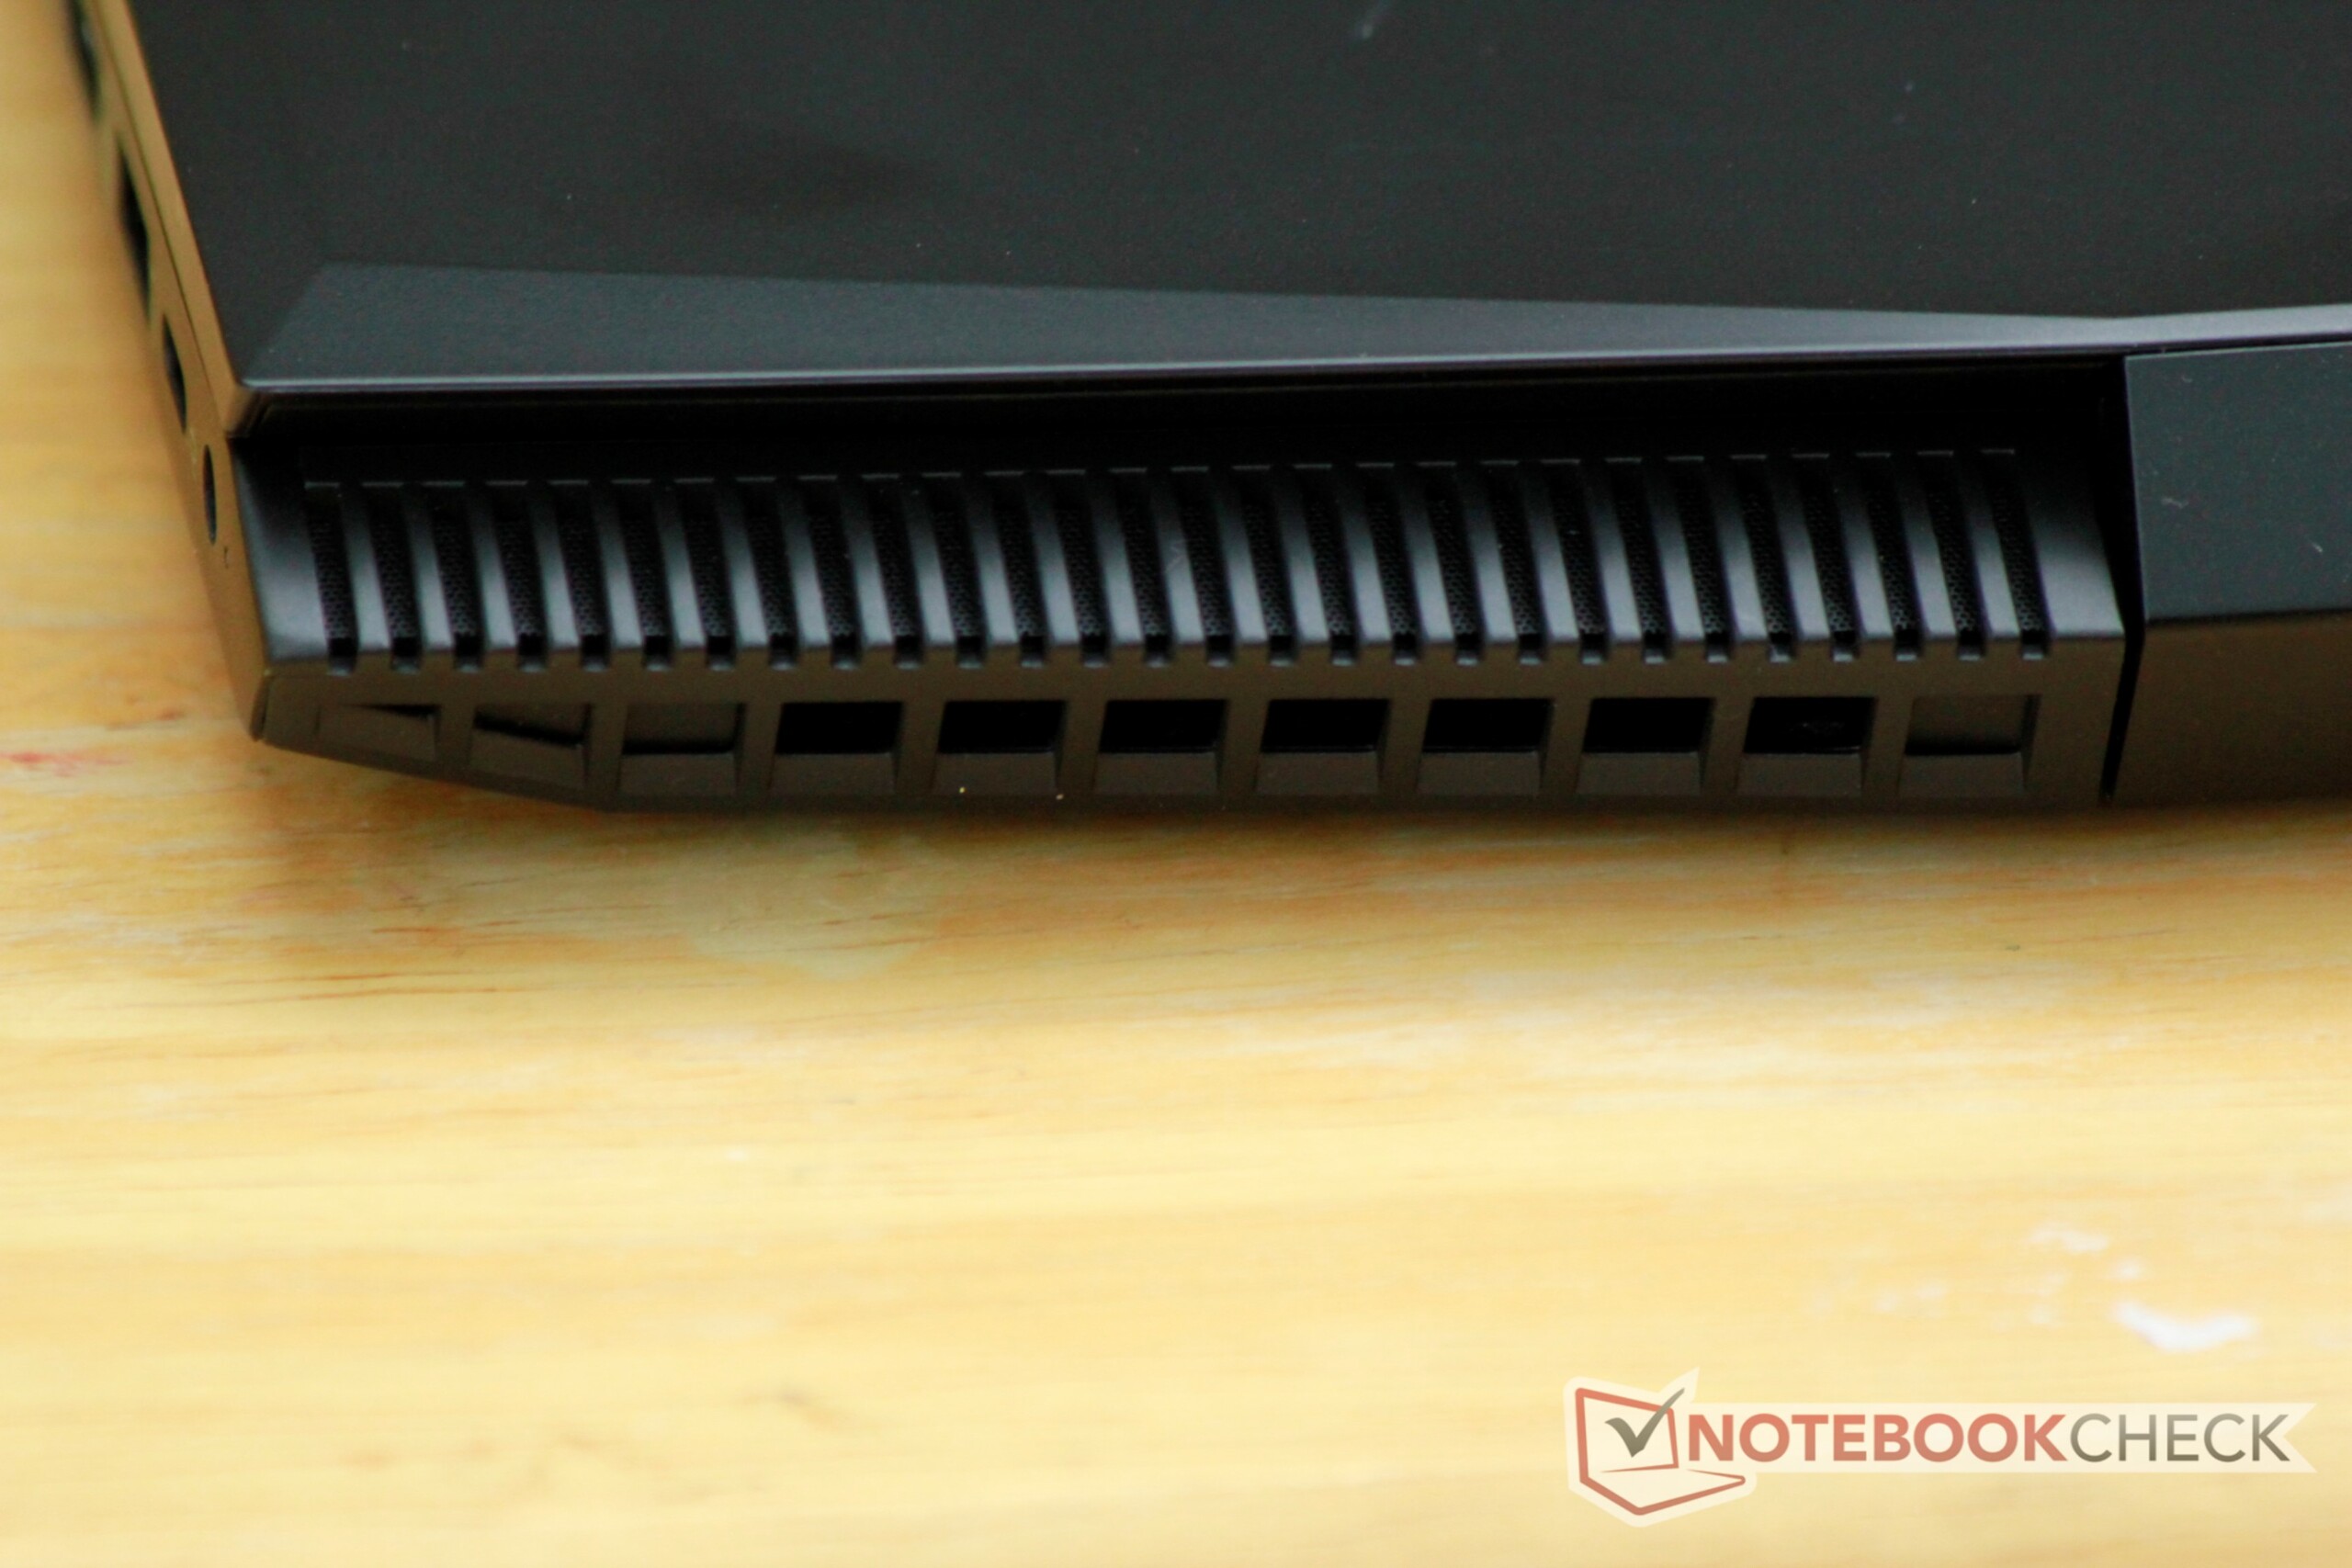
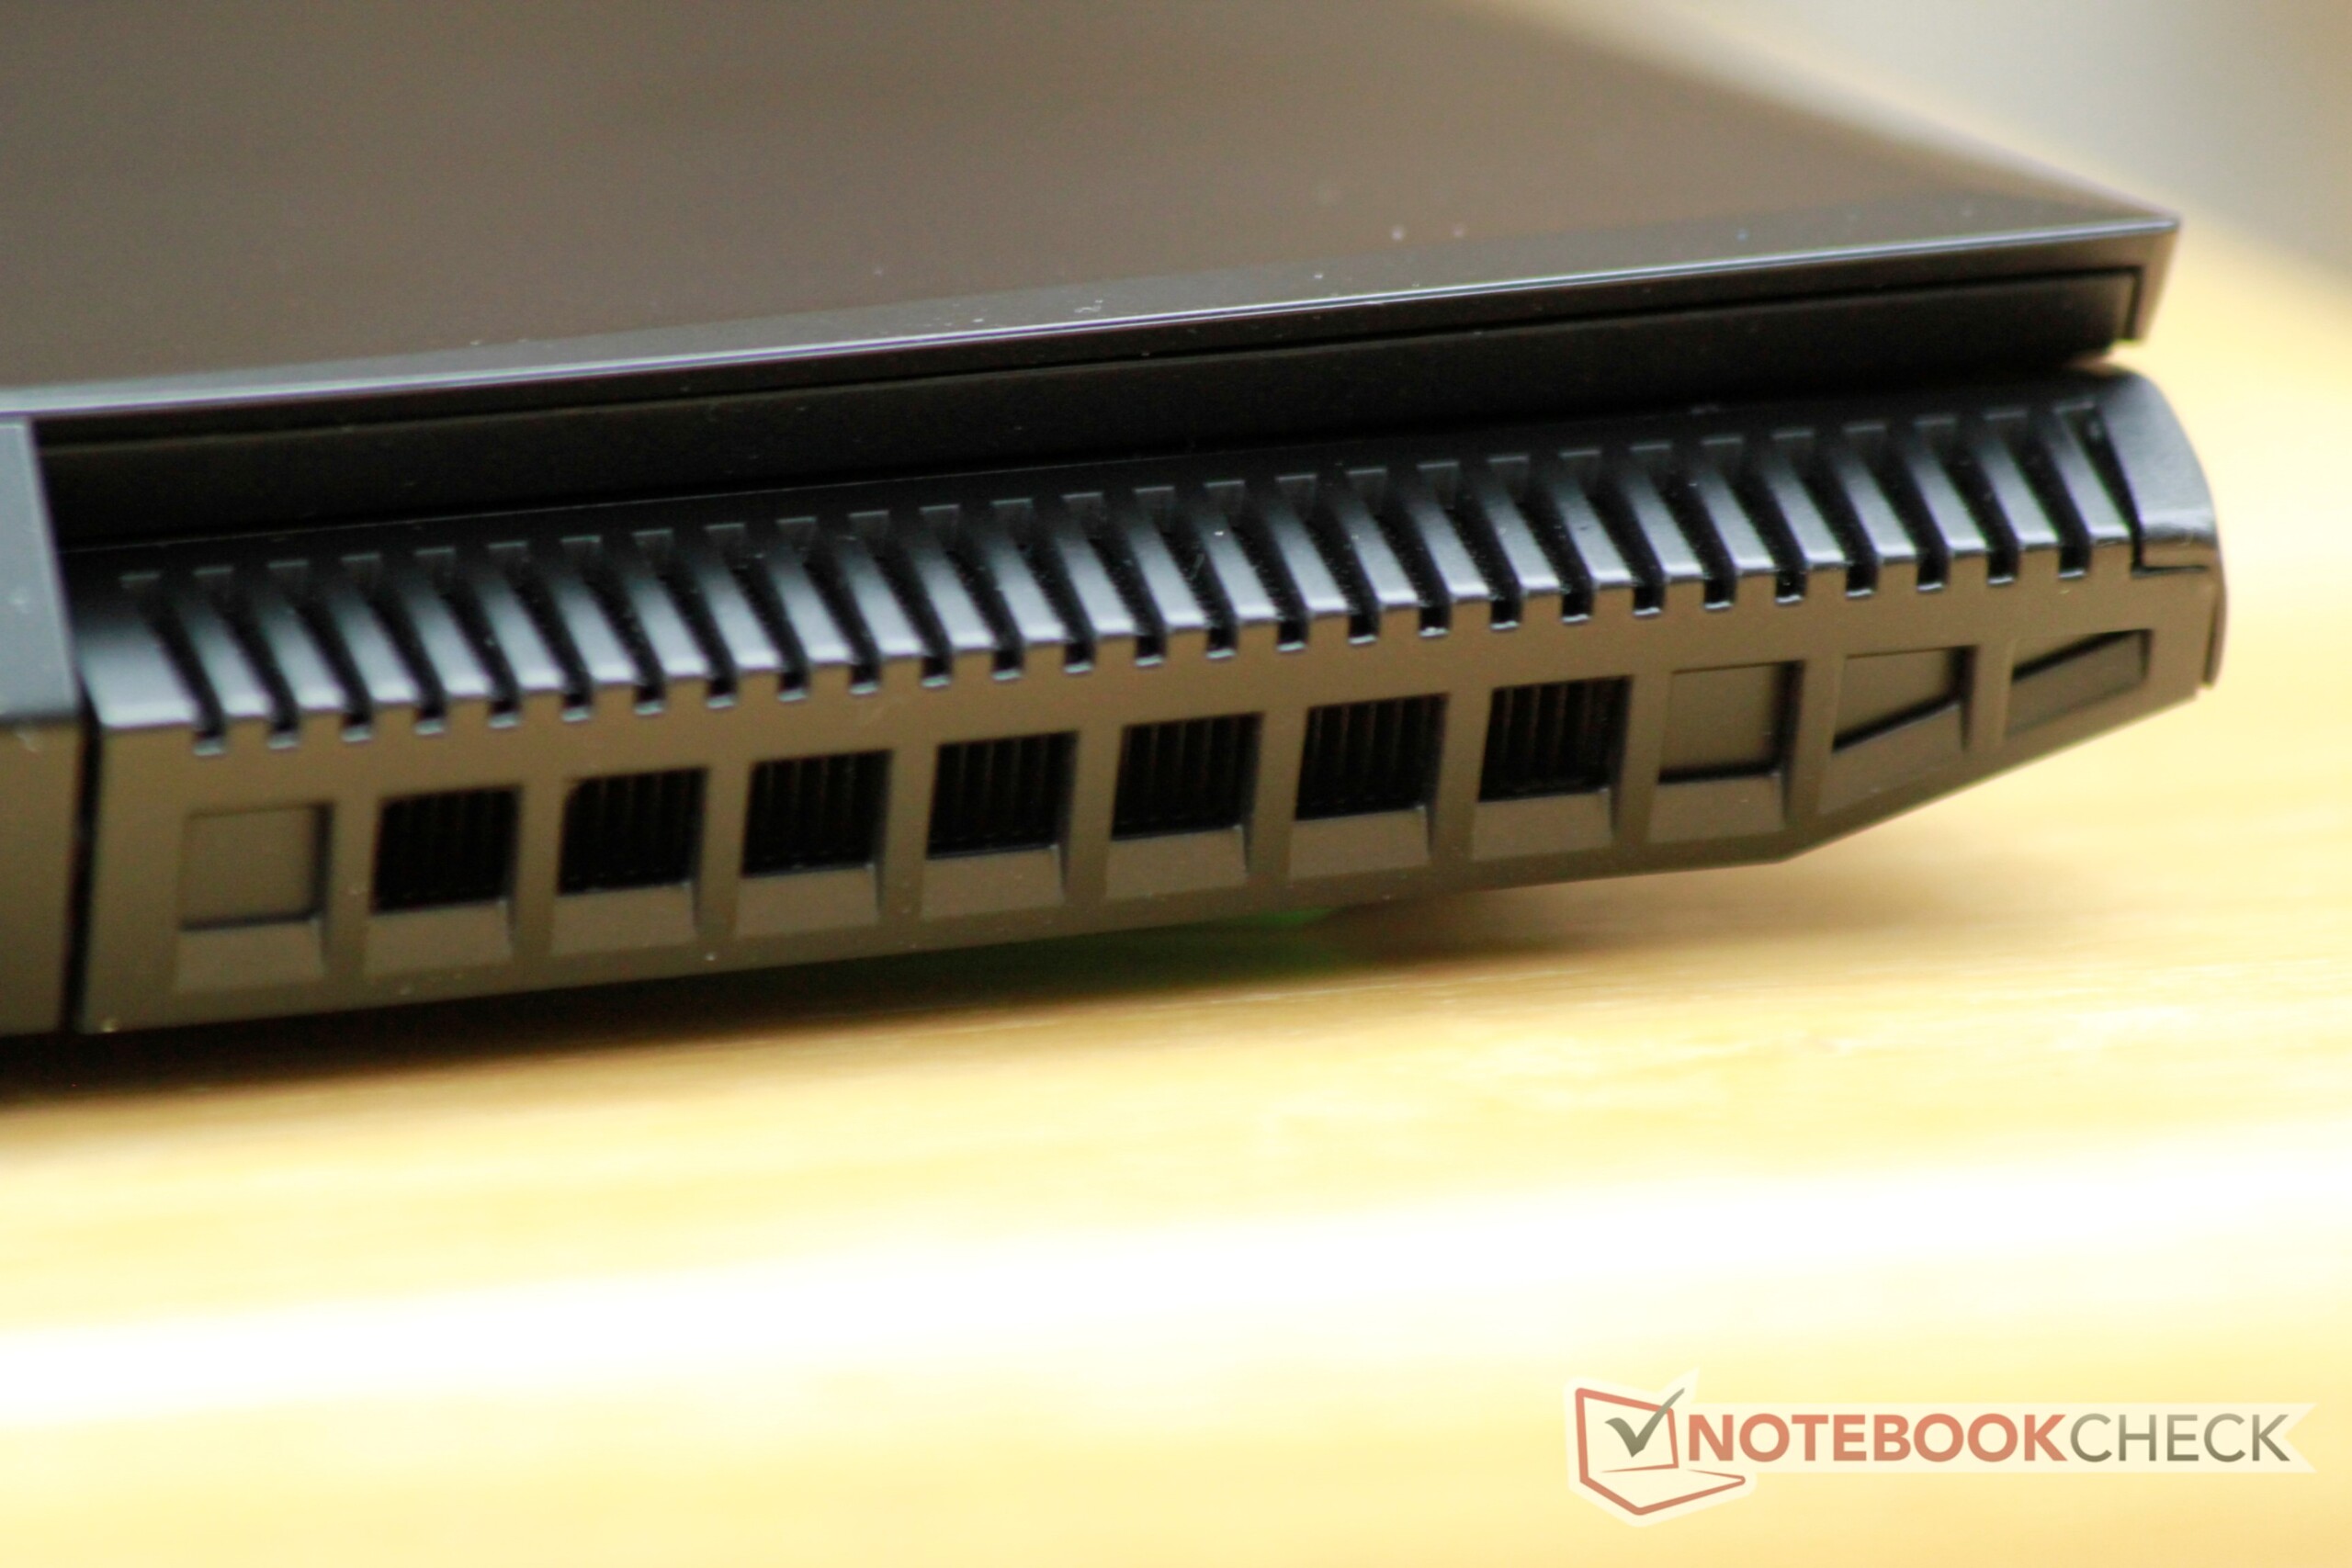
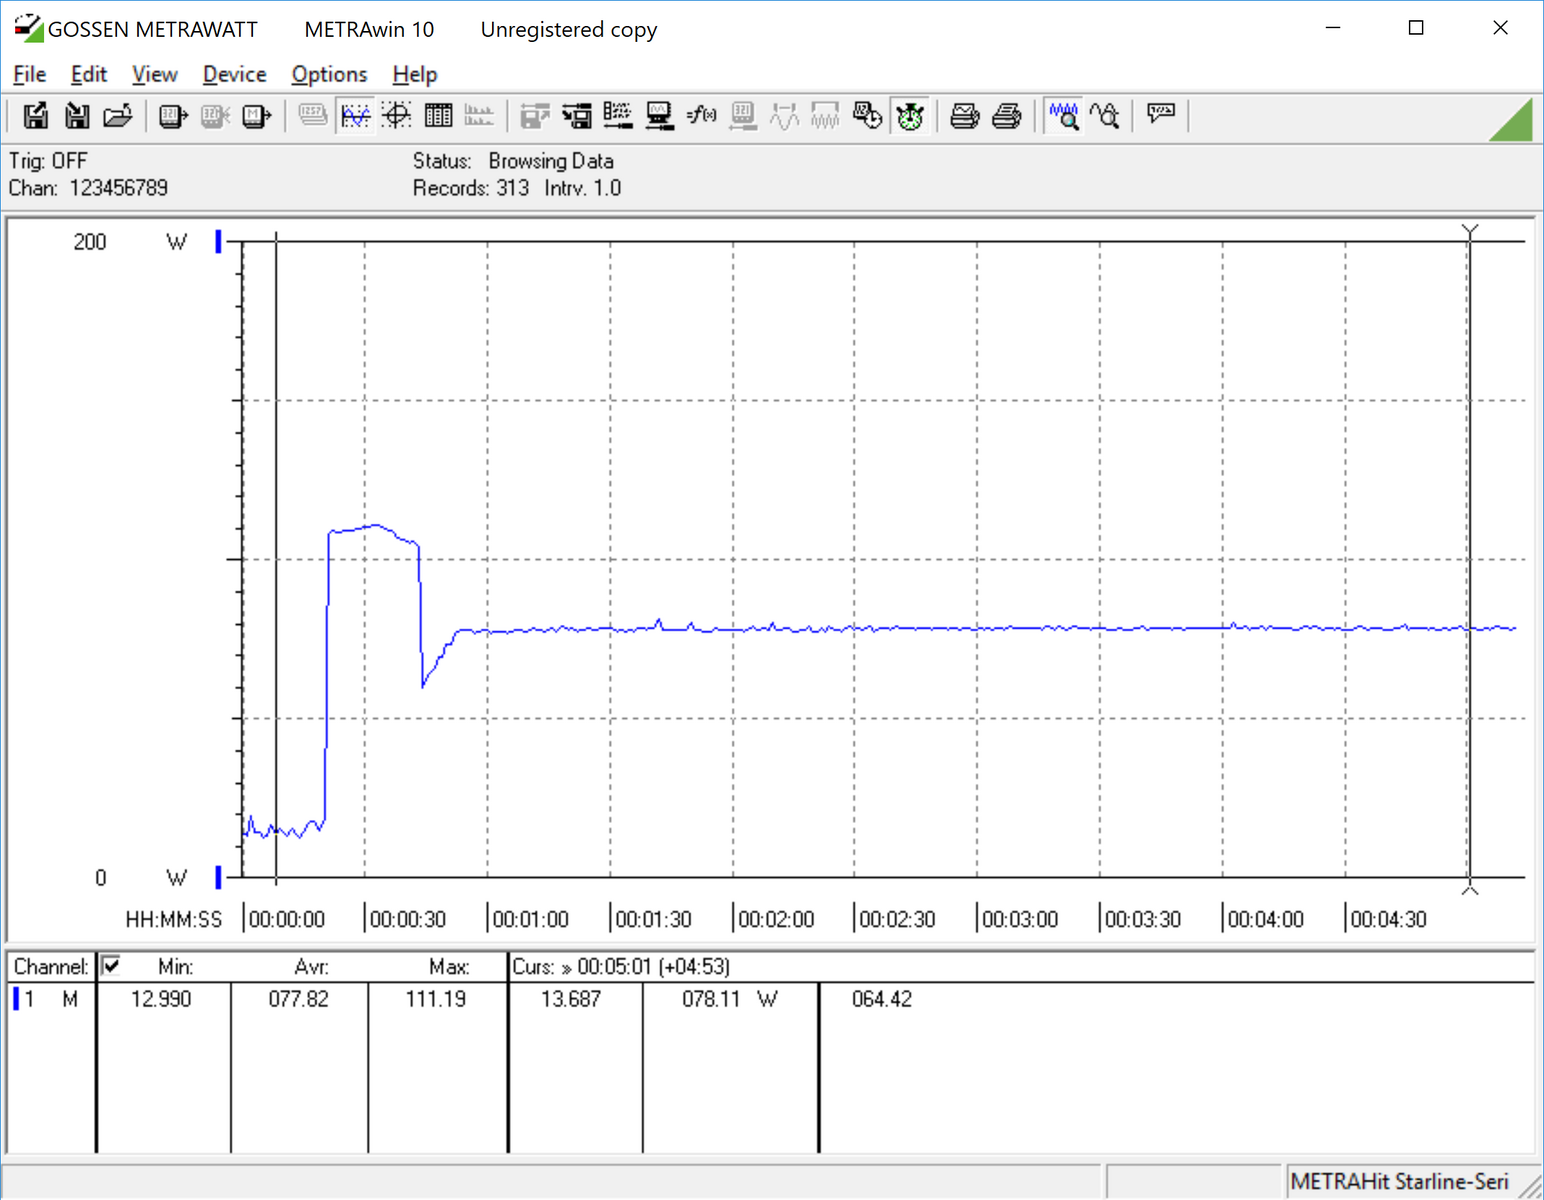
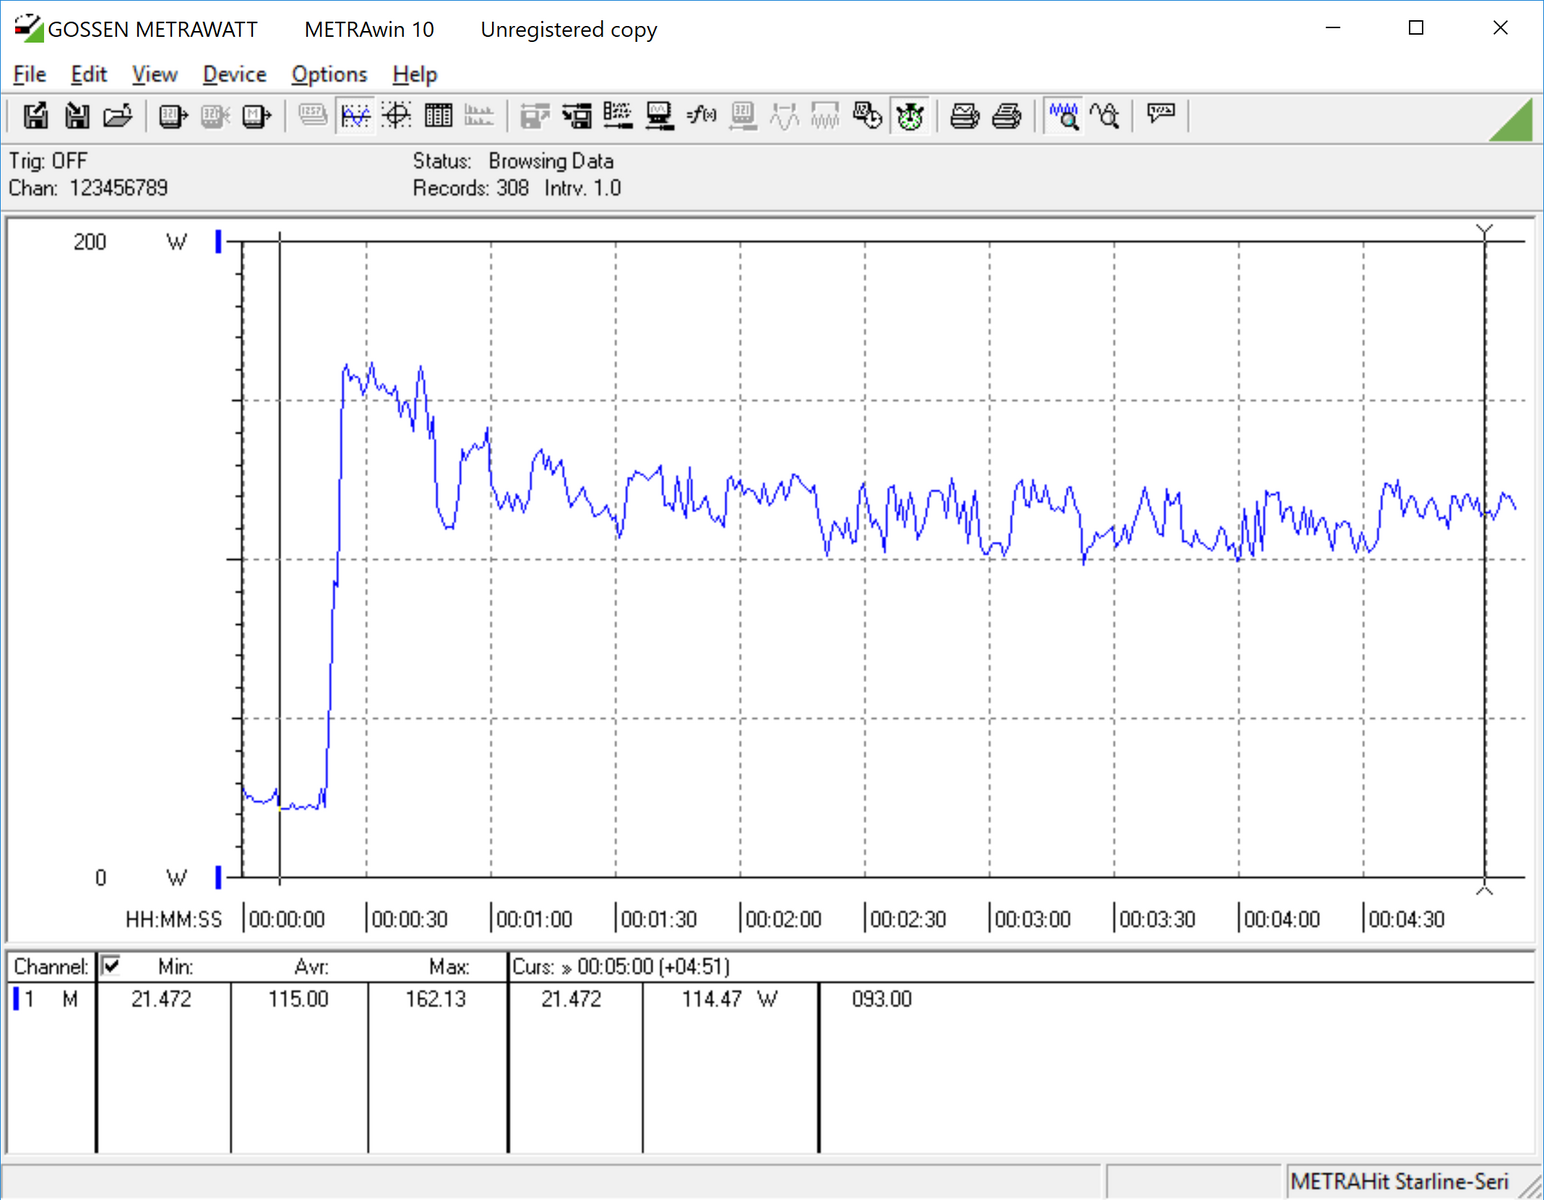
Stress testing confirms our initial suspicions of CPU throttling. Running Prime95 for an hour sees the CPU average 3.1 GHz, which is not atypical compared to other Core i7-8750H machines. Temperatures average 85° C across the package. Furmark sees similar results for the GPU; the GTX 1060 Max-Q runs at a lower but still reasonable clock speed (~1000 MHz), and temperatures remain controlled at 82° C. The trouble begins when both the CPU and GPU are under load. Running Prime95 and Furmark together causes both chips to pull back even further. Despite this throttling, temperatures average just shy of 95° C, which suggests that the system is struggling to keep heat under control and is forced to throttle its components.
In real-world use, the GPU and CPU perform well. After playing The Witcher 3 for an hour, the CPU hovers around 4.0 GHz and the GPU averages about 1450 MHz. Both are operating near their rated boosts, and temperatures settle in just under 90° C. While synthetic benchmarks cause the system to throttle, the Pavilion Gaming 15t should be able to handle more realistic loads. Still, there are machines in this price bracket (like Dell's G7) that perform better while staying cooler.
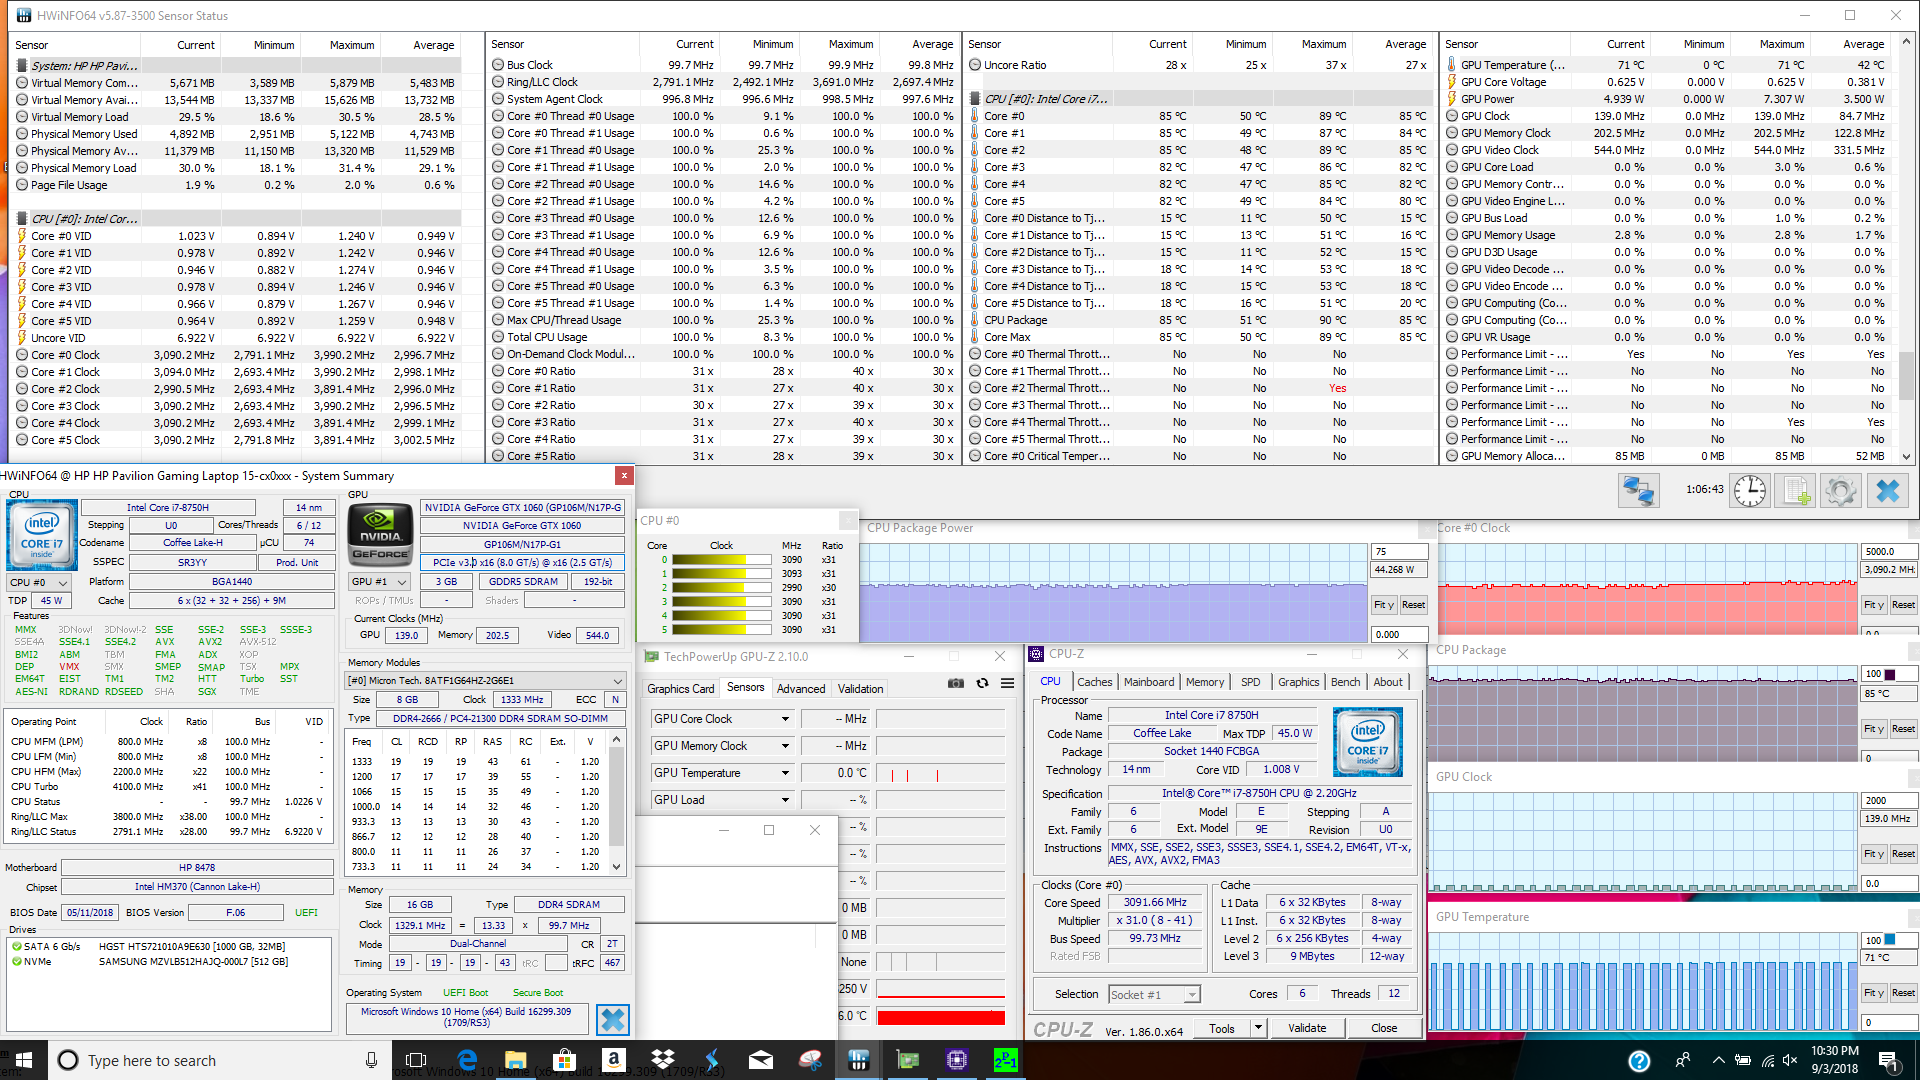
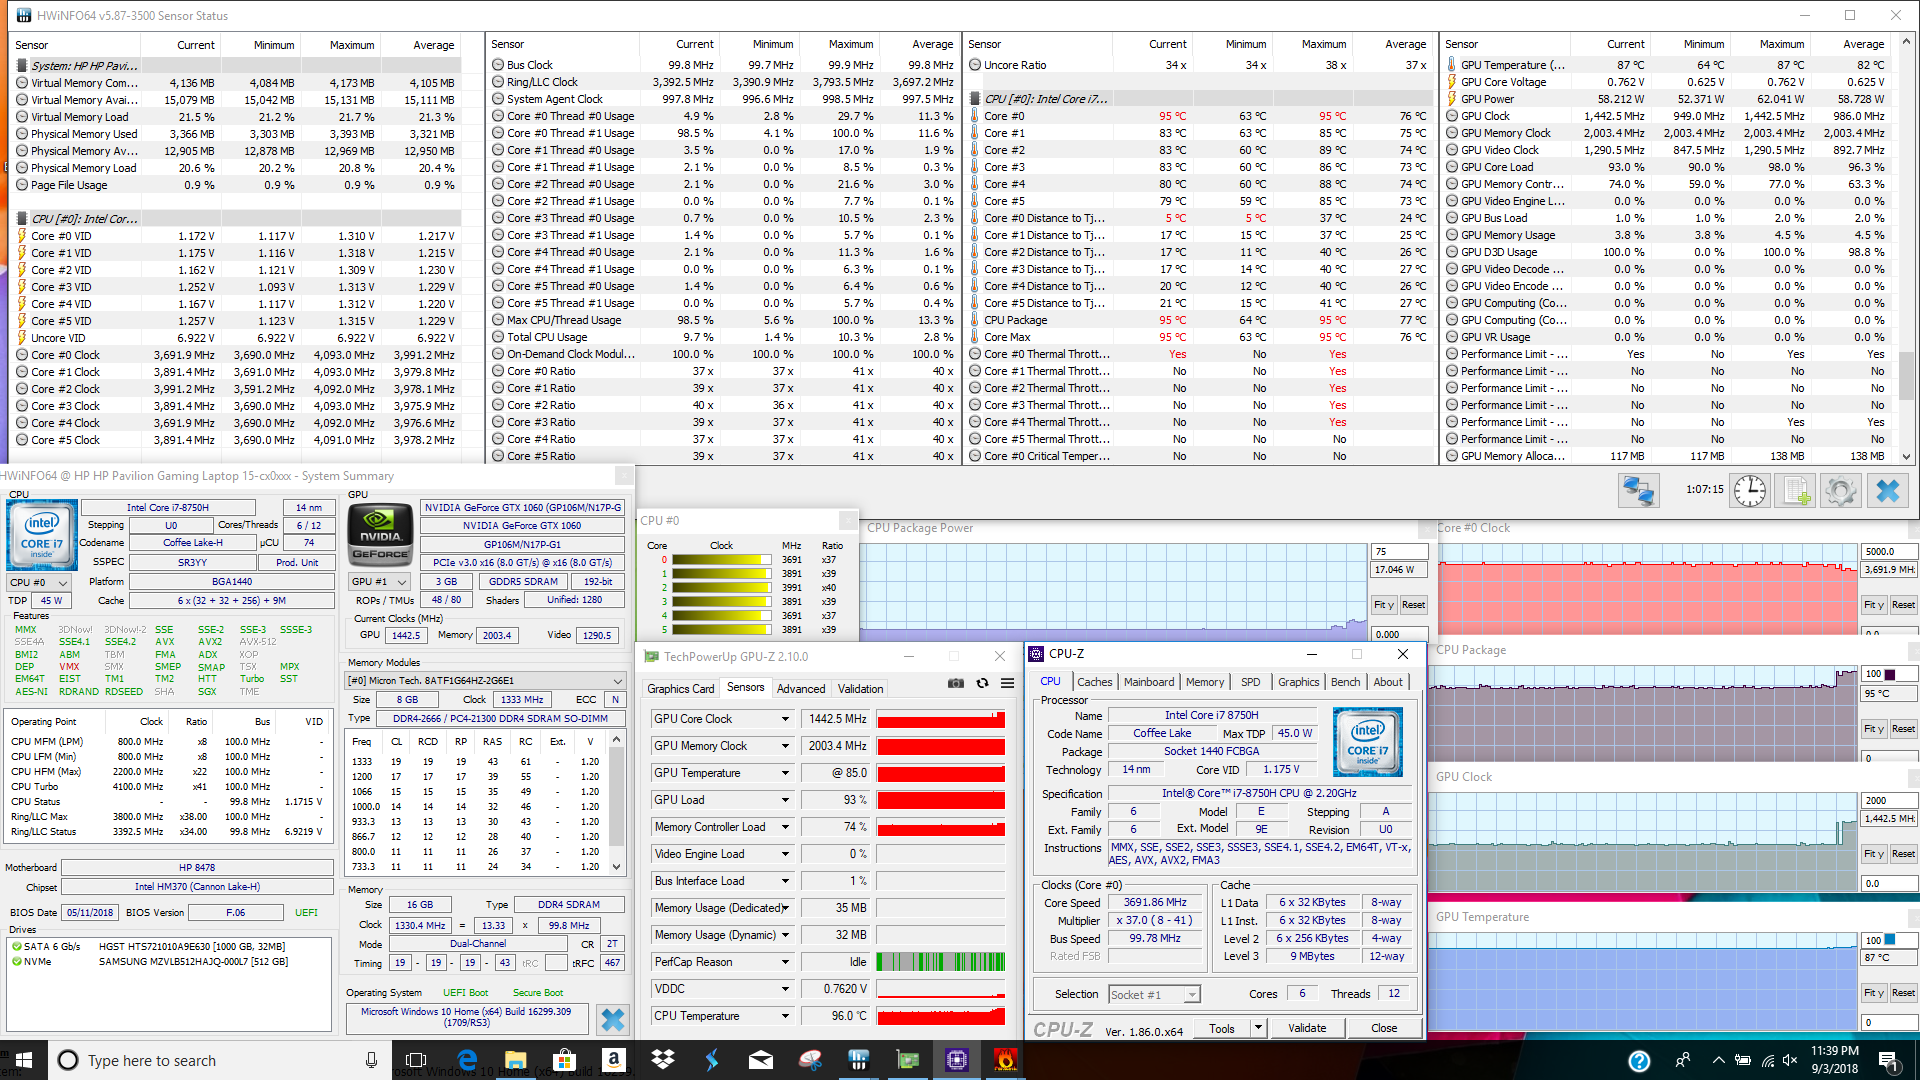
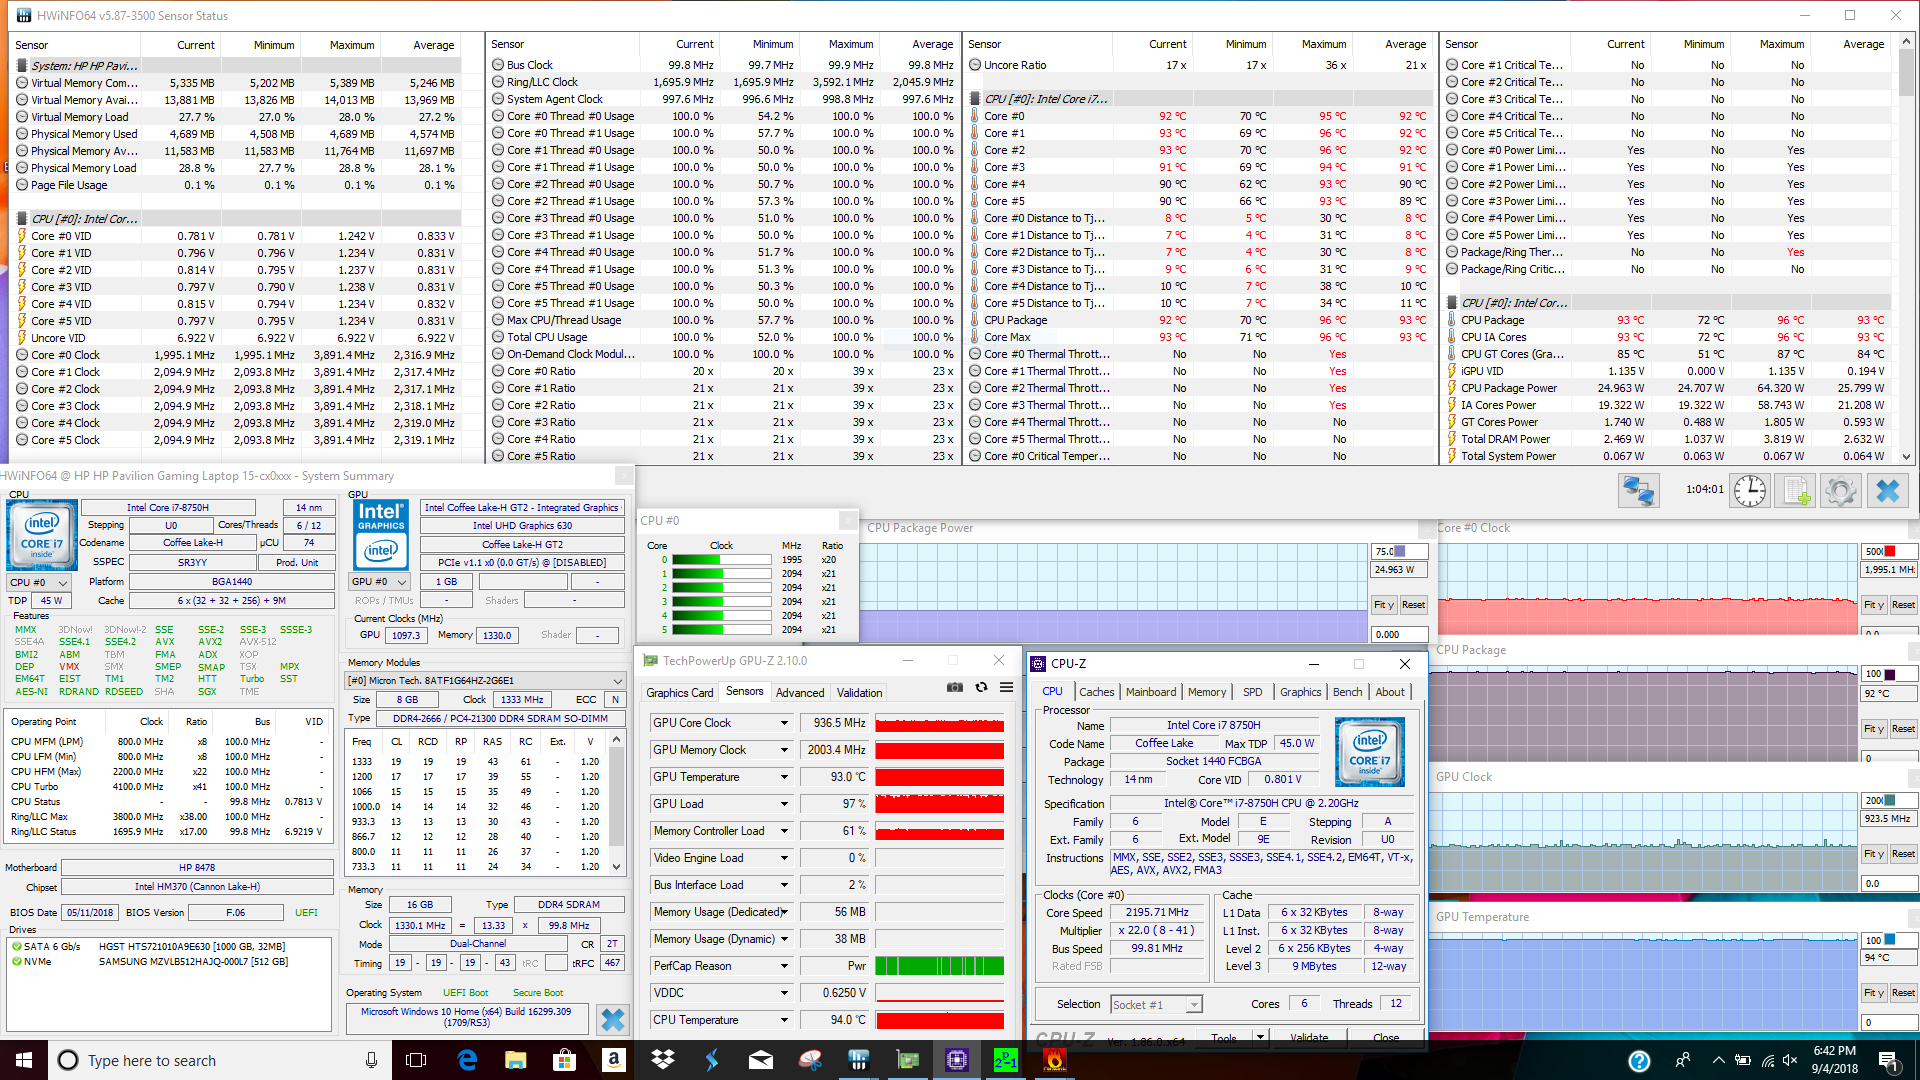
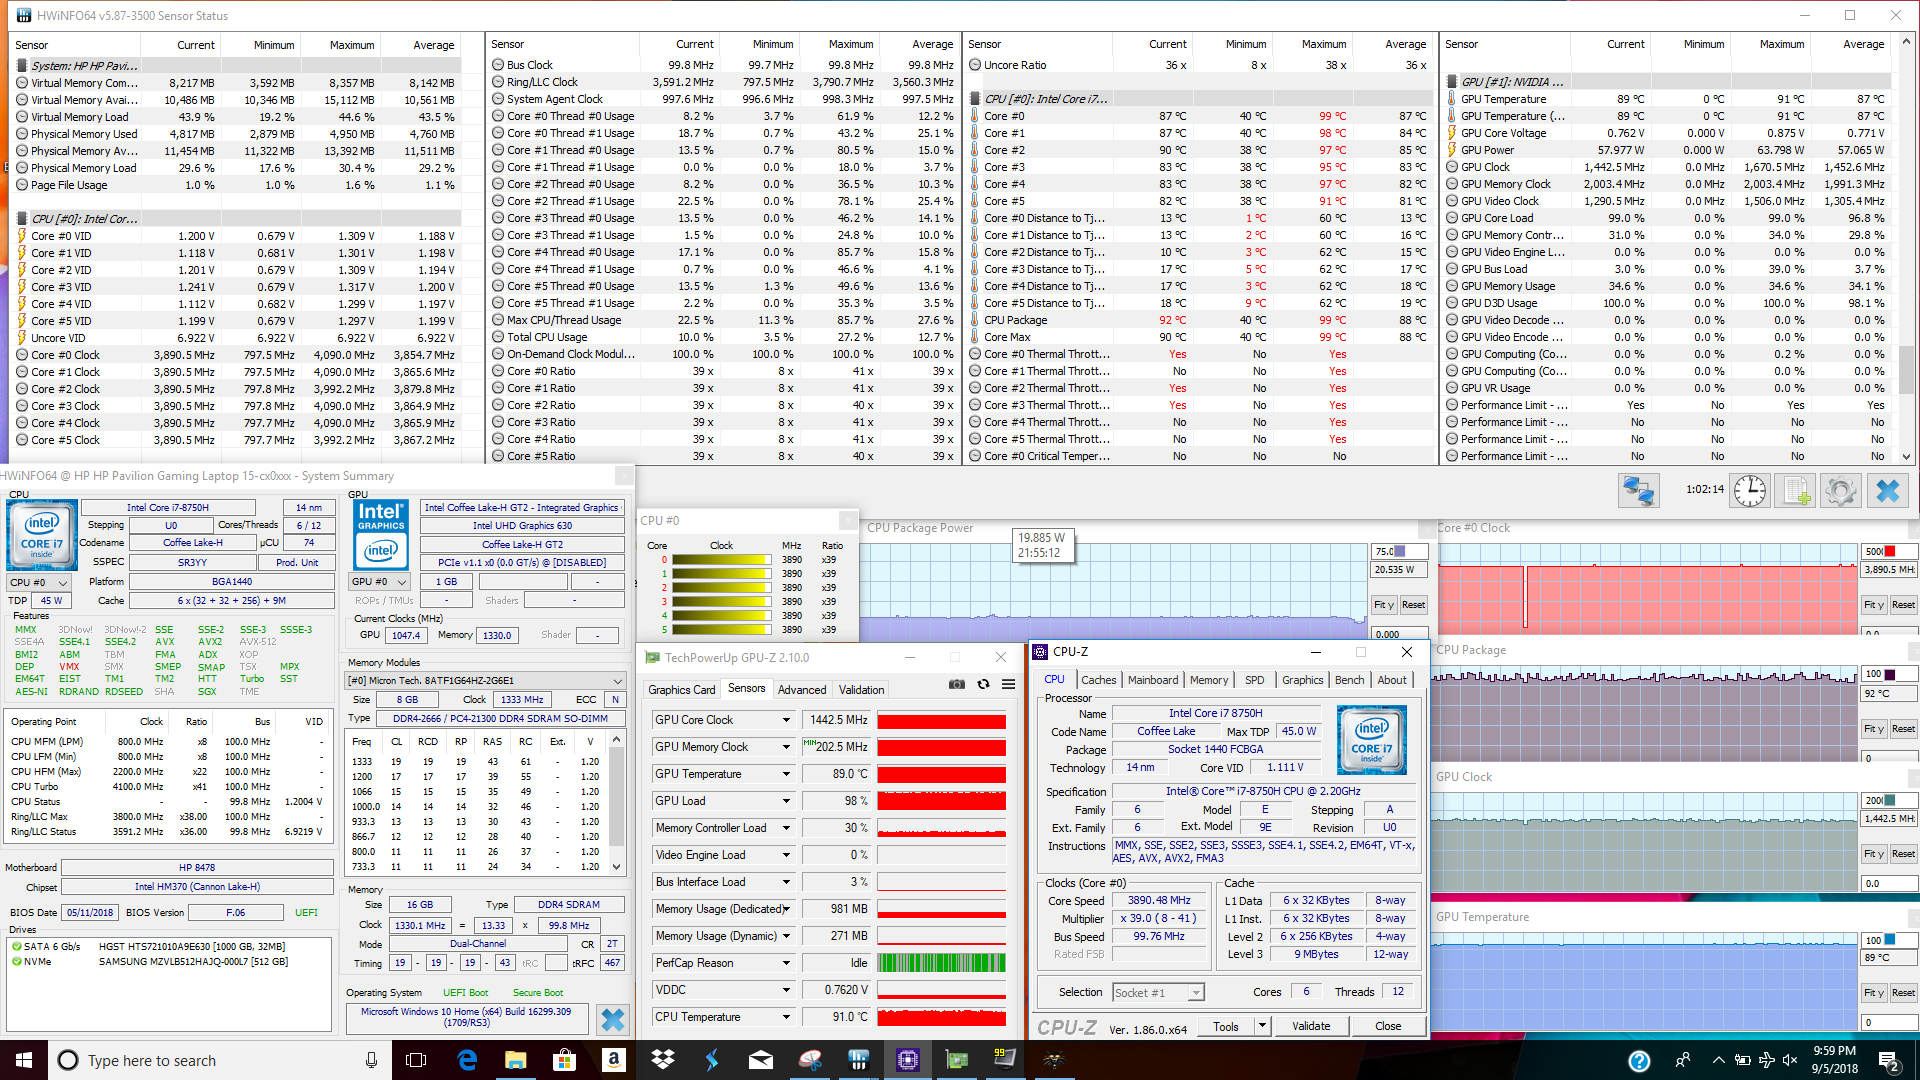
| CPU Clock (GHz) | GPU Clock (MHz) | Average CPU Temperature (°C) | Average GPU Temperature (°C) | |
| Prime95 Stress | 3.1 | - | 85 | - |
| FurMark Stress | 4.0 | 986 | 77 | 82 |
| Prime95 + FurMark Stress | 2.0 | 925 | 93 | 94 |
| Witcher 3 Stress | 3.9 | 1450 | 88 | 89 |
Emissions
System Noise
Fan noise is on the quieter side of average for mid-tier gaming laptops. The system is fairly quiet when idle, especially because there is no noticeable coil whine. Under load, the fans ramp up aggressively. When gaming, noise averages about 45 dB(A). To top it off, the fans are somewhat shrill and can be noticed from across an office. Still, the Pavilion Gaming 15t does not get as loud as some of its competitors.
Noise level
| Idle |
| 32.2 / 32.4 / 32.4 dB(A) |
| Load |
| 40.2 / 47.2 dB(A) |
 | ||
30 dB silent 40 dB(A) audible 50 dB(A) loud |
||
min: | ||
| HP Pavilion Gaming 15t-cx0000 GeForce GTX 1060 Max-Q, i7-8750H, Samsung SSD PM981 MZVLB512HAJQ | Dell G7 15-7588 GeForce GTX 1060 Max-Q, i7-8750H, SK hynix SC311 SATA | Acer Predator Helios 300 PH317-52-51M6 GeForce GTX 1050 Ti Mobile, i5-8300H, Hynix HFS128G39TND | Lenovo Legion Y530-15ICH GeForce GTX 1050 Ti Mobile, i5-8300H, Toshiba KBG30ZMT128G | Asus FX503VM-EH73 GeForce GTX 1060 Mobile, i7-7700HQ, SanDisk SD8SN8U128G1002 | HP Omen 15-dc0001ng GeForce GTX 1050 Ti Mobile, i5-8300H, Toshiba KBG30ZMV128G | MSI GV62 8RE-016US GeForce GTX 1060 Mobile, i5-8300H, Samsung PM871b MZNLN128HAHQ | |
|---|---|---|---|---|---|---|---|
| Noise | 2% | -1% | 8% | 1% | -5% | -6% | |
| off / environment * (dB) | 28.3 | 28.1 1% | 29 -2% | 28 1% | 27.8 2% | 29 -2% | 28.2 -0% |
| Idle Minimum * (dB) | 32.2 | 29 10% | 29 10% | 28 13% | 29.6 8% | 29 10% | 33.5 -4% |
| Idle Average * (dB) | 32.4 | 29 10% | 31 4% | 28 14% | 29.6 9% | 33 -2% | 33.5 -3% |
| Idle Maximum * (dB) | 32.4 | 29.2 10% | 33 -2% | 28.5 12% | 29.6 9% | 41 -27% | 33.7 -4% |
| Load Average * (dB) | 40.2 | 40.6 -1% | 45 -12% | 34.9 13% | 37.3 7% | 44 -9% | 41 -2% |
| Witcher 3 ultra * (dB) | 45 | 49.8 -11% | 45 -0% | 40 11% | 49.8 -11% | 47 -4% | 52.3 -16% |
| Load Maximum * (dB) | 47.2 | 49.8 -6% | 51 -8% | 49.6 -5% | 53.7 -14% | 49 -4% | 52.3 -11% |
* ... smaller is better
Temperature
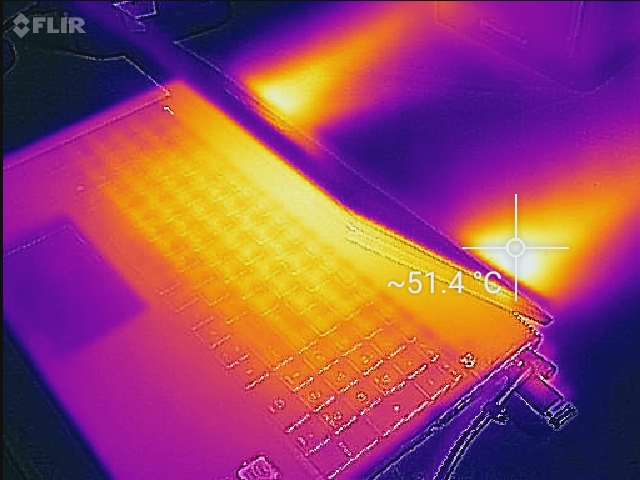
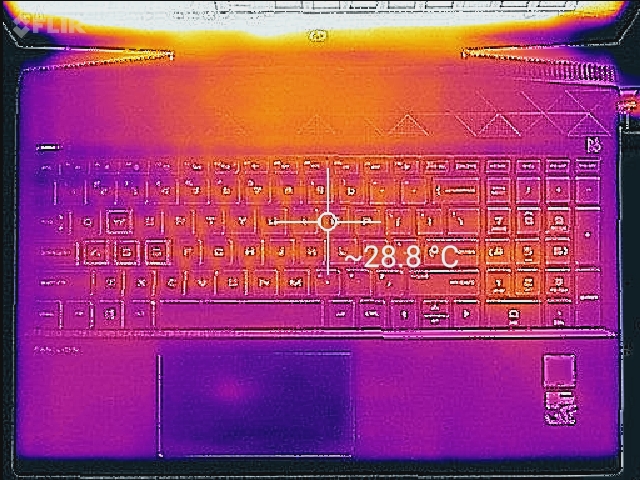
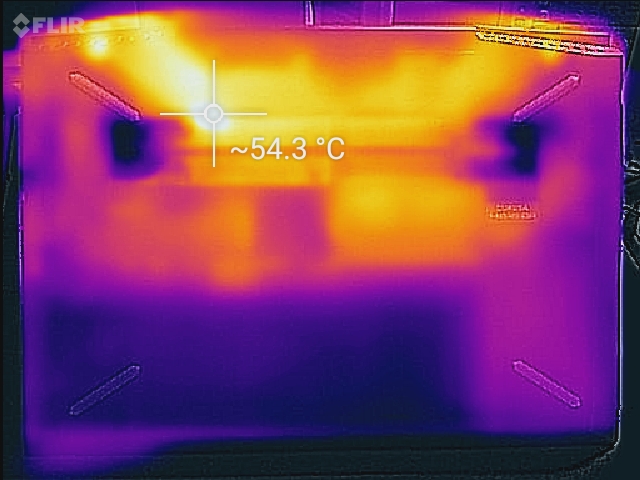
The Pavilion Gaming 15t struggles to control both internal and external temperatures under load. Heavy work and gaming cause the keyboard to climb between 44-46° C across most of its middle. After about 10 minutes, the keys start to feel warm; some users may find them uncomfortable. This is not uncommon for budget and mid-tier laptops; the Asus FX503 and MSI GV62 also suffer from hot keyboards. The bottom panel climbs past 50° C across the upper portion that covers the heat pipe array, making lap use uncomfortable at best and unusable at worst. Considering that heat is also exhausted out the back, we suggest using the Pavilion Gaming 15t on a flat surface when gaming.
(-) The maximum temperature on the upper side is 46 °C / 115 F, compared to the average of 40.4 °C / 105 F, ranging from 21.2 to 68.8 °C for the class Gaming.
(-) The bottom heats up to a maximum of 52 °C / 126 F, compared to the average of 43.2 °C / 110 F
(+) In idle usage, the average temperature for the upper side is 28.1 °C / 83 F, compared to the device average of 33.9 °C / 93 F.
(-) Playing The Witcher 3, the average temperature for the upper side is 38.1 °C / 101 F, compared to the device average of 33.9 °C / 93 F.
(+) The palmrests and touchpad are reaching skin temperature as a maximum (32.4 °C / 90.3 F) and are therefore not hot.
(-) The average temperature of the palmrest area of similar devices was 28.8 °C / 83.8 F (-3.6 °C / -6.5 F).
Speakers

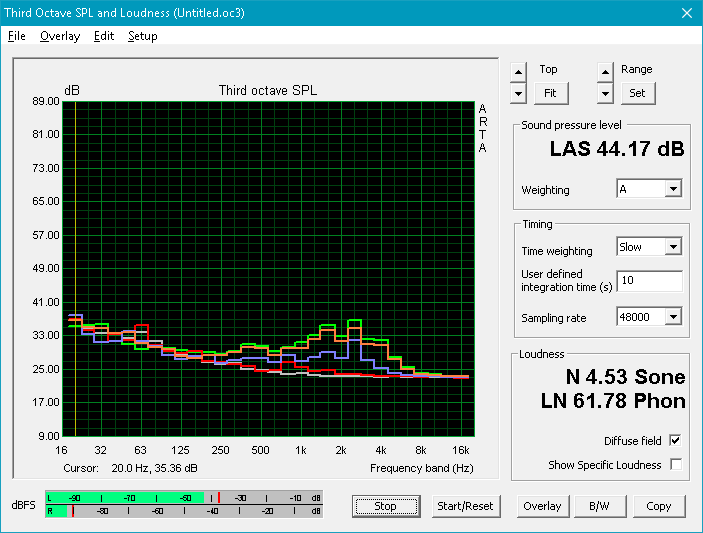
The speakers are unexceptional. They manage to get reasonably loud at about 70 dB, but bass is almost completely absent. As such, the overall sound profile is thin and feels hollow. Sounds remain clear at any volume level with no rattle or distortion. The speakers are remarkably similar to those used in Dell's G7 and are fairly typical for this price range.
HP Pavilion Gaming 15t-cx0000 audio analysis
(-) | not very loud speakers (69.7 dB)
Bass 100 - 315 Hz
(-) | nearly no bass - on average 17.8% lower than median
(±) | linearity of bass is average (14.1% delta to prev. frequency)
Mids 400 - 2000 Hz
(+) | balanced mids - only 3.3% away from median
(+) | mids are linear (6.4% delta to prev. frequency)
Highs 2 - 16 kHz
(+) | balanced highs - only 2.1% away from median
(+) | highs are linear (6% delta to prev. frequency)
Overall 100 - 16.000 Hz
(±) | linearity of overall sound is average (22% difference to median)
Compared to same class
» 79% of all tested devices in this class were better, 6% similar, 15% worse
» The best had a delta of 6%, average was 18%, worst was 132%
Compared to all devices tested
» 63% of all tested devices were better, 6% similar, 30% worse
» The best had a delta of 4%, average was 24%, worst was 134%
Dell G7 15-7588 audio analysis
(±) | speaker loudness is average but good (74.8 dB)
Bass 100 - 315 Hz
(-) | nearly no bass - on average 16.7% lower than median
(±) | linearity of bass is average (11.8% delta to prev. frequency)
Mids 400 - 2000 Hz
(+) | balanced mids - only 4.6% away from median
(±) | linearity of mids is average (7.1% delta to prev. frequency)
Highs 2 - 16 kHz
(+) | balanced highs - only 4.8% away from median
(±) | linearity of highs is average (10.7% delta to prev. frequency)
Overall 100 - 16.000 Hz
(±) | linearity of overall sound is average (21.1% difference to median)
Compared to same class
» 76% of all tested devices in this class were better, 4% similar, 20% worse
» The best had a delta of 6%, average was 18%, worst was 132%
Compared to all devices tested
» 58% of all tested devices were better, 7% similar, 35% worse
» The best had a delta of 4%, average was 24%, worst was 134%
Energy Management
Power Consumption
Power consumption is about average for a mid-tier gaming laptop. The Pavilion Gaming 15t pulls about 100 Watts under normal gaming loads, which is well below the power supply's 200 W rating. Under full load, the device draws 135 Watts. The Pavilion Gaming 15t draws about 15% less power than the similarly-specced Dell G7, likely because of the G7's higher clock speeds under load. This is especially interesting considering the Pavilion Gaming 15t has a brighter 144 Hz panel that should demand more power.
| Off / Standby | |
| Idle | |
| Load |
|
Key:
min: | |
| HP Pavilion Gaming 15t-cx0000 i7-8750H, GeForce GTX 1060 Max-Q, Samsung SSD PM981 MZVLB512HAJQ, IPS, 1920x1080, 15.6" | Dell G7 15-7588 i7-8750H, GeForce GTX 1060 Max-Q, SK hynix SC311 SATA, IPS, 1920x1080, 15.6" | Acer Predator Helios 300 PH317-52-51M6 i5-8300H, GeForce GTX 1050 Ti Mobile, Hynix HFS128G39TND, IPS, 1920x1080, 17.3" | Lenovo Legion Y530-15ICH i5-8300H, GeForce GTX 1050 Ti Mobile, Toshiba KBG30ZMT128G, IPS, 1920x1080, 15.6" | Asus FX503VM-EH73 i7-7700HQ, GeForce GTX 1060 Mobile, SanDisk SD8SN8U128G1002, IPS, 1920x1080, 15.6" | HP Omen 15-dc0001ng i5-8300H, GeForce GTX 1050 Ti Mobile, Toshiba KBG30ZMV128G, IPS, 1920x1080, 15.6" | MSI GV62 8RE-016US i5-8300H, GeForce GTX 1060 Mobile, Samsung PM871b MZNLN128HAHQ, IPS, 1920x1080, 15.6" | |
|---|---|---|---|---|---|---|---|
| Power Consumption | 6% | 3% | 5% | -28% | -28% | -32% | |
| Idle Minimum * (Watt) | 6 | 5.5 8% | 6 -0% | 4.5 25% | 12.8 -113% | 12 -100% | 9.38 -56% |
| Idle Average * (Watt) | 11.2 | 7.6 32% | 9 20% | 10 11% | 15.4 -38% | 14 -25% | 15.95 -42% |
| Idle Maximum * (Watt) | 13.3 | 9 32% | 13 2% | 13.8 -4% | 15.9 -20% | 18 -35% | 18.46 -39% |
| Load Average * (Watt) | 89.2 | 94 -5% | 95 -7% | 92.5 -4% | 78 13% | 92 -3% | 95.68 -7% |
| Witcher 3 ultra * (Watt) | 101.9 | 116.3 -14% | 102 -0% | 108.1 -6% | 107.3 -5% | 100 2% | 135.6 -33% |
| Load Maximum * (Watt) | 134.5 | 154.4 -15% | 134 -0% | 123.2 8% | 143.4 -7% | 142 -6% | 156.98 -17% |
* ... smaller is better
Battery Life
Battery life is a bit lower than expected given the 70 Wh battery. The Pavilion Gaming 15t died after 6 hours 15 minutes in our WiFi v1.3 battery test, which opens a new webpage every 30-40 seconds on the Balanced power profile. Nvidia's Optimus helps a bit with battery life, but the high refresh rate display needs more power than a standard 60 Hz panel and will thus drain the battery faster. The HP Omen 15, for instance, lasts two hours longer in the same test.
While users can likely get away with leaving the power supply at home for a short workday of word processing and web browsing, they will need the adapter if they plan to do any gaming; the Pavilion Gaming 15t lasted a mere hour and a half under load.
| HP Pavilion Gaming 15t-cx0000 i7-8750H, GeForce GTX 1060 Max-Q, 70 Wh | Dell G7 15-7588 i7-8750H, GeForce GTX 1060 Max-Q, 56 Wh | Acer Predator Helios 300 PH317-52-51M6 i5-8300H, GeForce GTX 1050 Ti Mobile, 48 Wh | Lenovo Legion Y530-15ICH i5-8300H, GeForce GTX 1050 Ti Mobile, 52.5 Wh | Asus FX503VM-EH73 i7-7700HQ, GeForce GTX 1060 Mobile, 64 Wh | HP Omen 15-dc0001ng i5-8300H, GeForce GTX 1050 Ti Mobile, 70 Wh | MSI GV62 8RE-016US i5-8300H, GeForce GTX 1060 Mobile, 41 Wh | |
|---|---|---|---|---|---|---|---|
| Battery runtime | 31% | 16% | -35% | -29% | 27% | -45% | |
| Reader / Idle (h) | 8 | 10.9 36% | 11.8 48% | 5.7 -29% | 10.4 30% | 5.3 -34% | |
| WiFi v1.3 (h) | 6.3 | 7.5 19% | 5.9 -6% | 4.1 -35% | 4.6 -27% | 8.6 37% | 3.5 -44% |
| Load (h) | 1.6 | 2.2 38% | 1.7 6% | 1.1 -31% | 1.8 13% | 0.7 -56% |
Pros
Cons
Verdict

The HP Pavilion Gaming 15t is a bit of a mixed bag. While it succeeds in bringing some nice features to the mid-range gaming laptop space, it falls short in other regards. For instance, 144 Hz display options are almost unheard of in this price range and give the Pavilion Gaming 15t a serious edge over its rivals. On the flip side, the weak CPU performance and thermal throttling work against the notebook.
The Pavilion Gaming 15t is essentially a budget version of the HP Omen 15. The Pavilion shares some features with the Omen line, like the 144 Hz display, and makes them available at a lower price point. The Omen 15t has better build quality and higher-grade components, but these come at a higher cost.
Outside of HP's own internal competitors, there are two main roadblocks for the Pavilion Gaming 15t: Dell and Lenovo. The Dell G7 and Lenovo's Legion Y530 are both excellent mid-range gaming laptops that offer similar performance at similar price points. The G7 has everything the Pavilion offers with the benefit of better build quality, longer battery life, and higher performance, and improved heat management. The major advantage of the Pavilion Gaming 15t is its high refresh rate screen. The Pavilion Gaming 15t is also more compact and lighter than the G7, which may be enticing to gamers on the go.
In sum, HP has created a competitive laptop that falls short in a few key areas but is overall a competent gaming machine. If you want to game on a budget, there are better options on the market. However, if a 144 Hz appeals to you, it may be worth the extra $100-200 to purchase the Pavilion Gaming 15t.
HP Pavilion Gaming 15t-cx0000
- 09/15/2018 v6 (old)
Sam Medley
Price comparison
