Dell G7 15 (i7-8750H, GTX 1060 Max-Q) Laptop Review
Since the release of the 2015 Inspiron 15 7000, Dell has had a strong presence in the budget gaming market. Every year since has seen the release of a new Inspiron 15, each slightly better than the last. However, mid-2018 has brought an important change; Dell has eschewed the Inspiron brand for its budget gaming offerings, rebranding them the "G" line. While the name has changed, Dell's goal remains the same. With the G7, the company aims to offer a powerful package at the absolute best price.
We recently reviewed Dell's other gaming offerings, the G3 and G5. Today, we have the top-of-the-line model: the G7. The 15-inch gaming laptop is the spiritual successor of Dell's Inspiron 15 7577. There are a few notable upgrades that set it apart. For one, the G7 now includes Intel's latest Coffee Lake CPUs (up to a Core i9). Nvidia's GTX 1060 Max-Q GPU makes the jump as well. However, the price tag is $100 cheaper than the Inspiron 15. Our model today sports an Intel Core i7-8750H and GTX 1060 Max-Q (as a well as a few other niceties) and retails for USD $1100.
The budget segment of the gaming laptop market has recently been flooded with exceptionally good hardware. As such, there is no shortage of competitors. We will look at how Dell's older Inspiron 15 7000 7577 compares to the G7. We will also look at Acer's Helios 300, Asus' FX503VM, the HP Omen 15t, and the Lenovo Lenovo Legion Y520 15IKBN (7700HQ, FHD, GTX 1050 Ti) Laptop ReviewLegion Y530. Let's see which laptop is most deserving of your hard-earned dollars.
Case
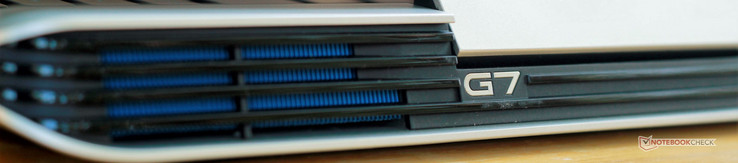
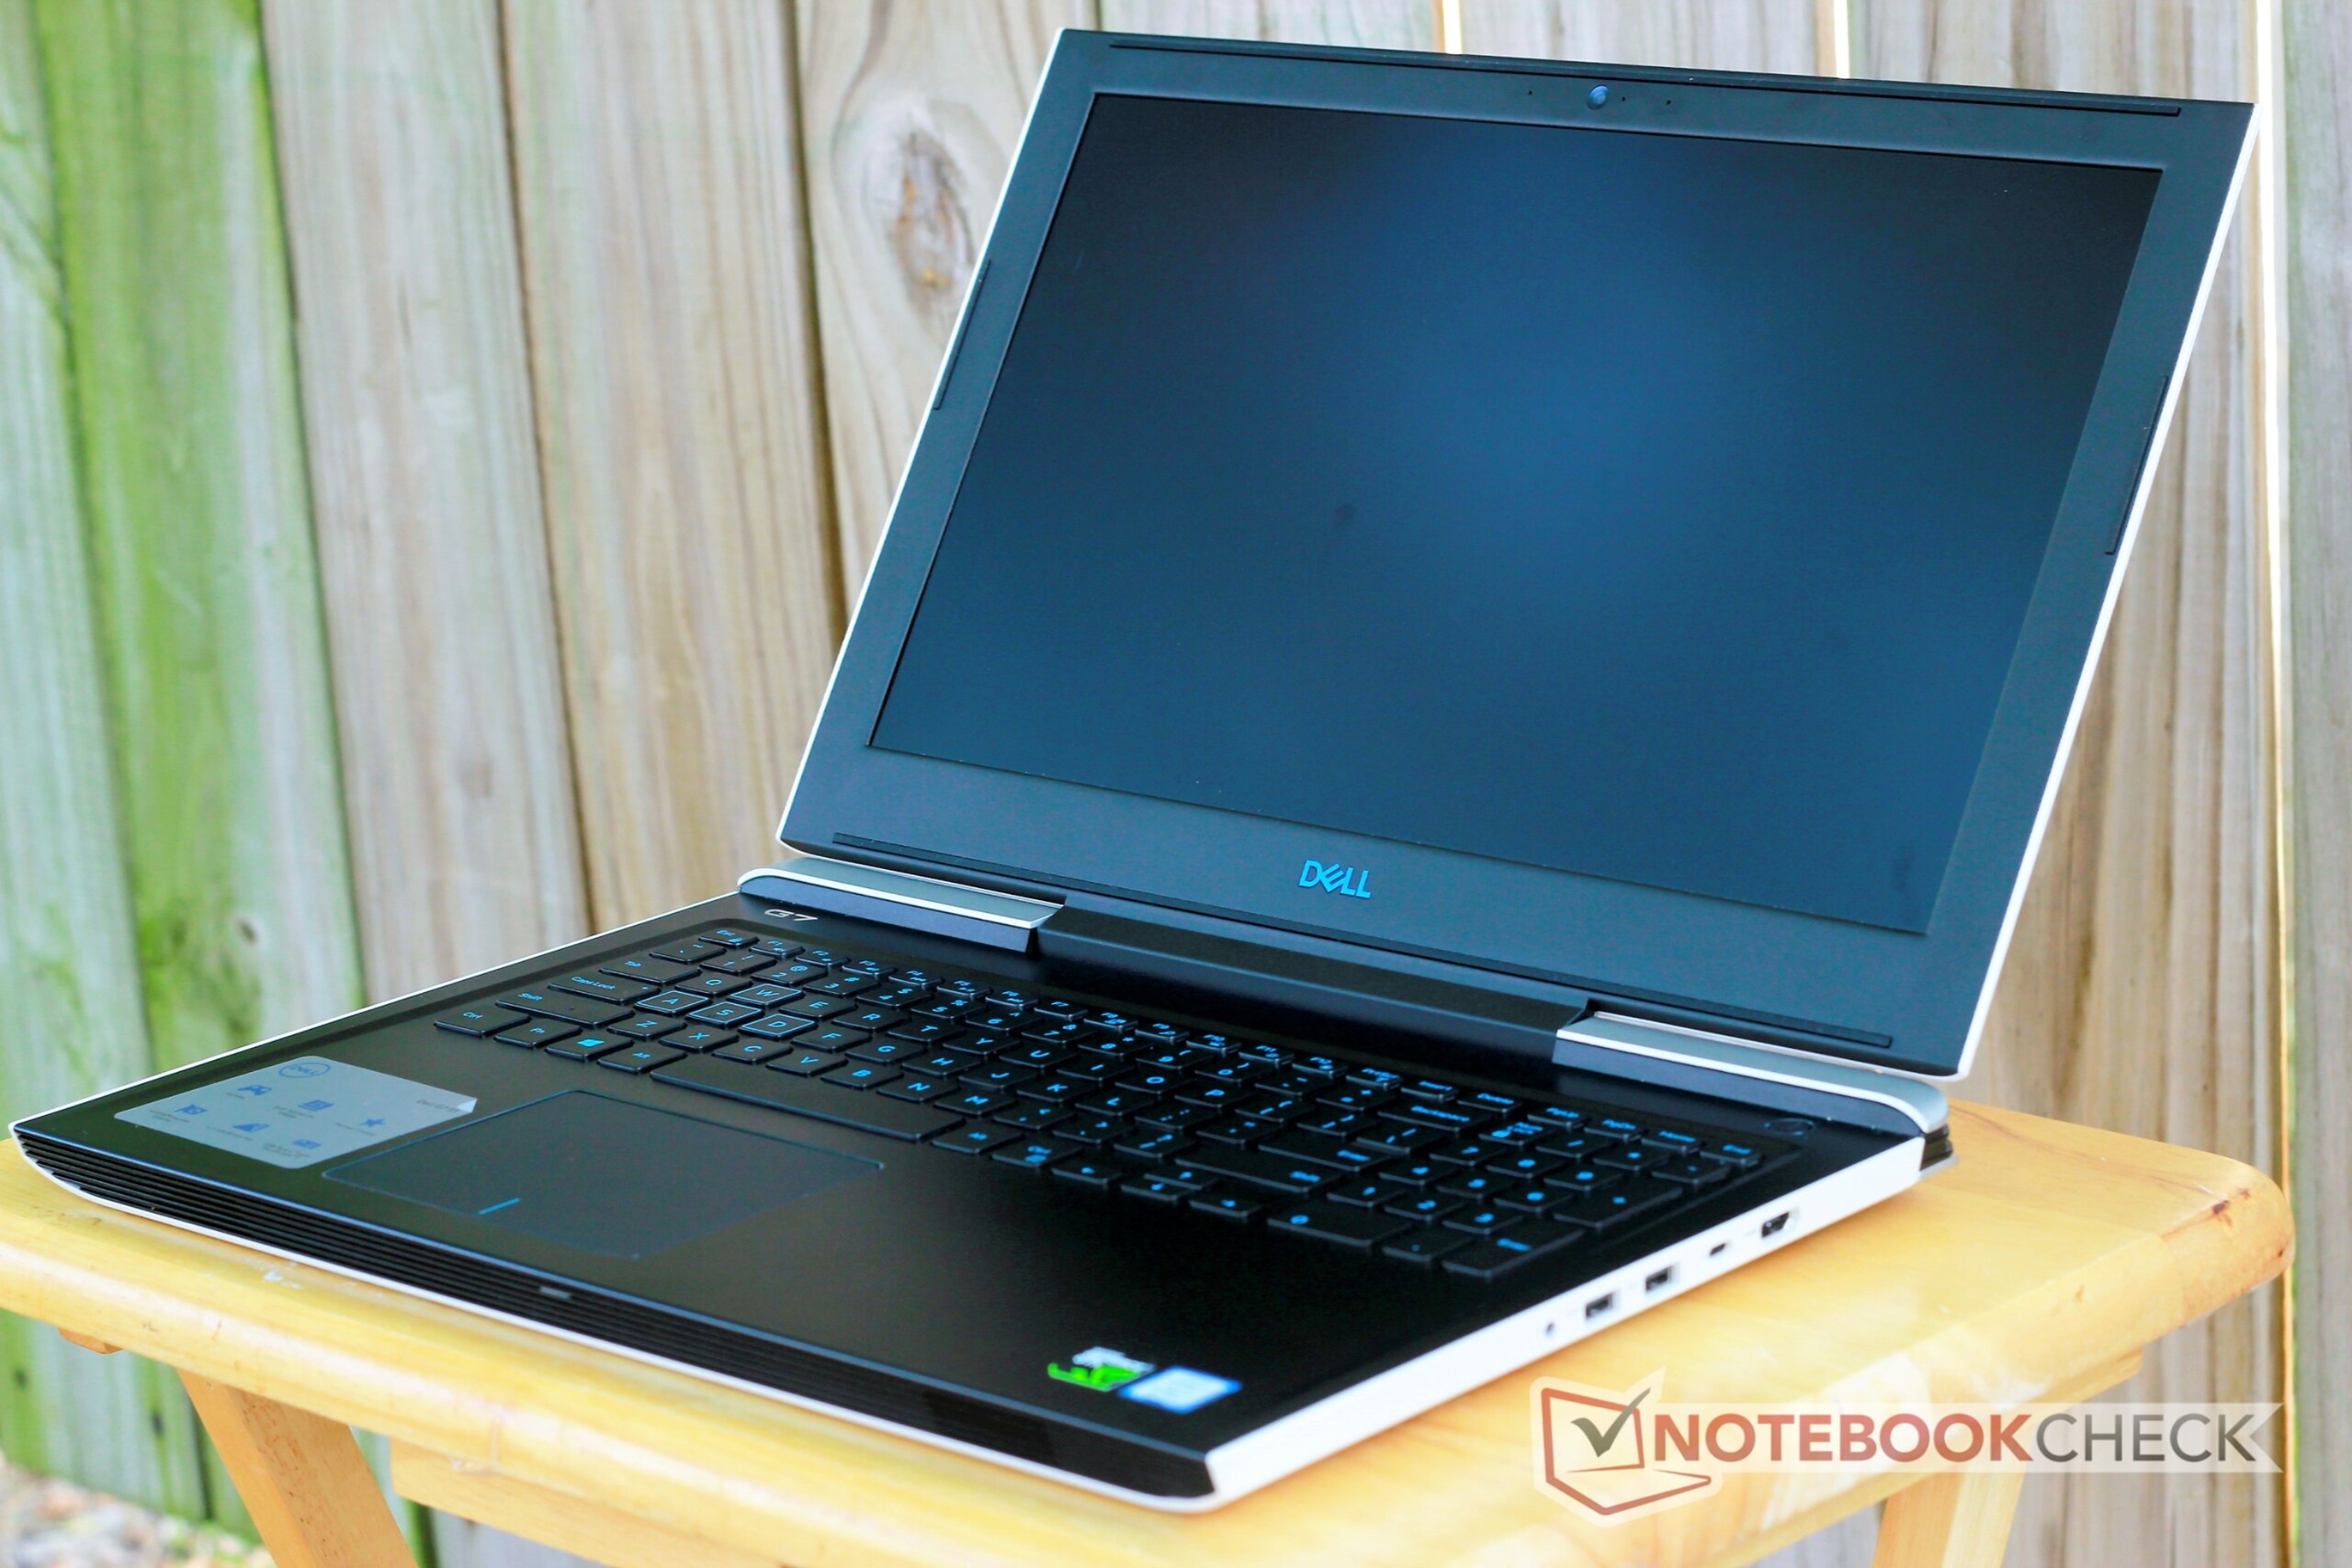
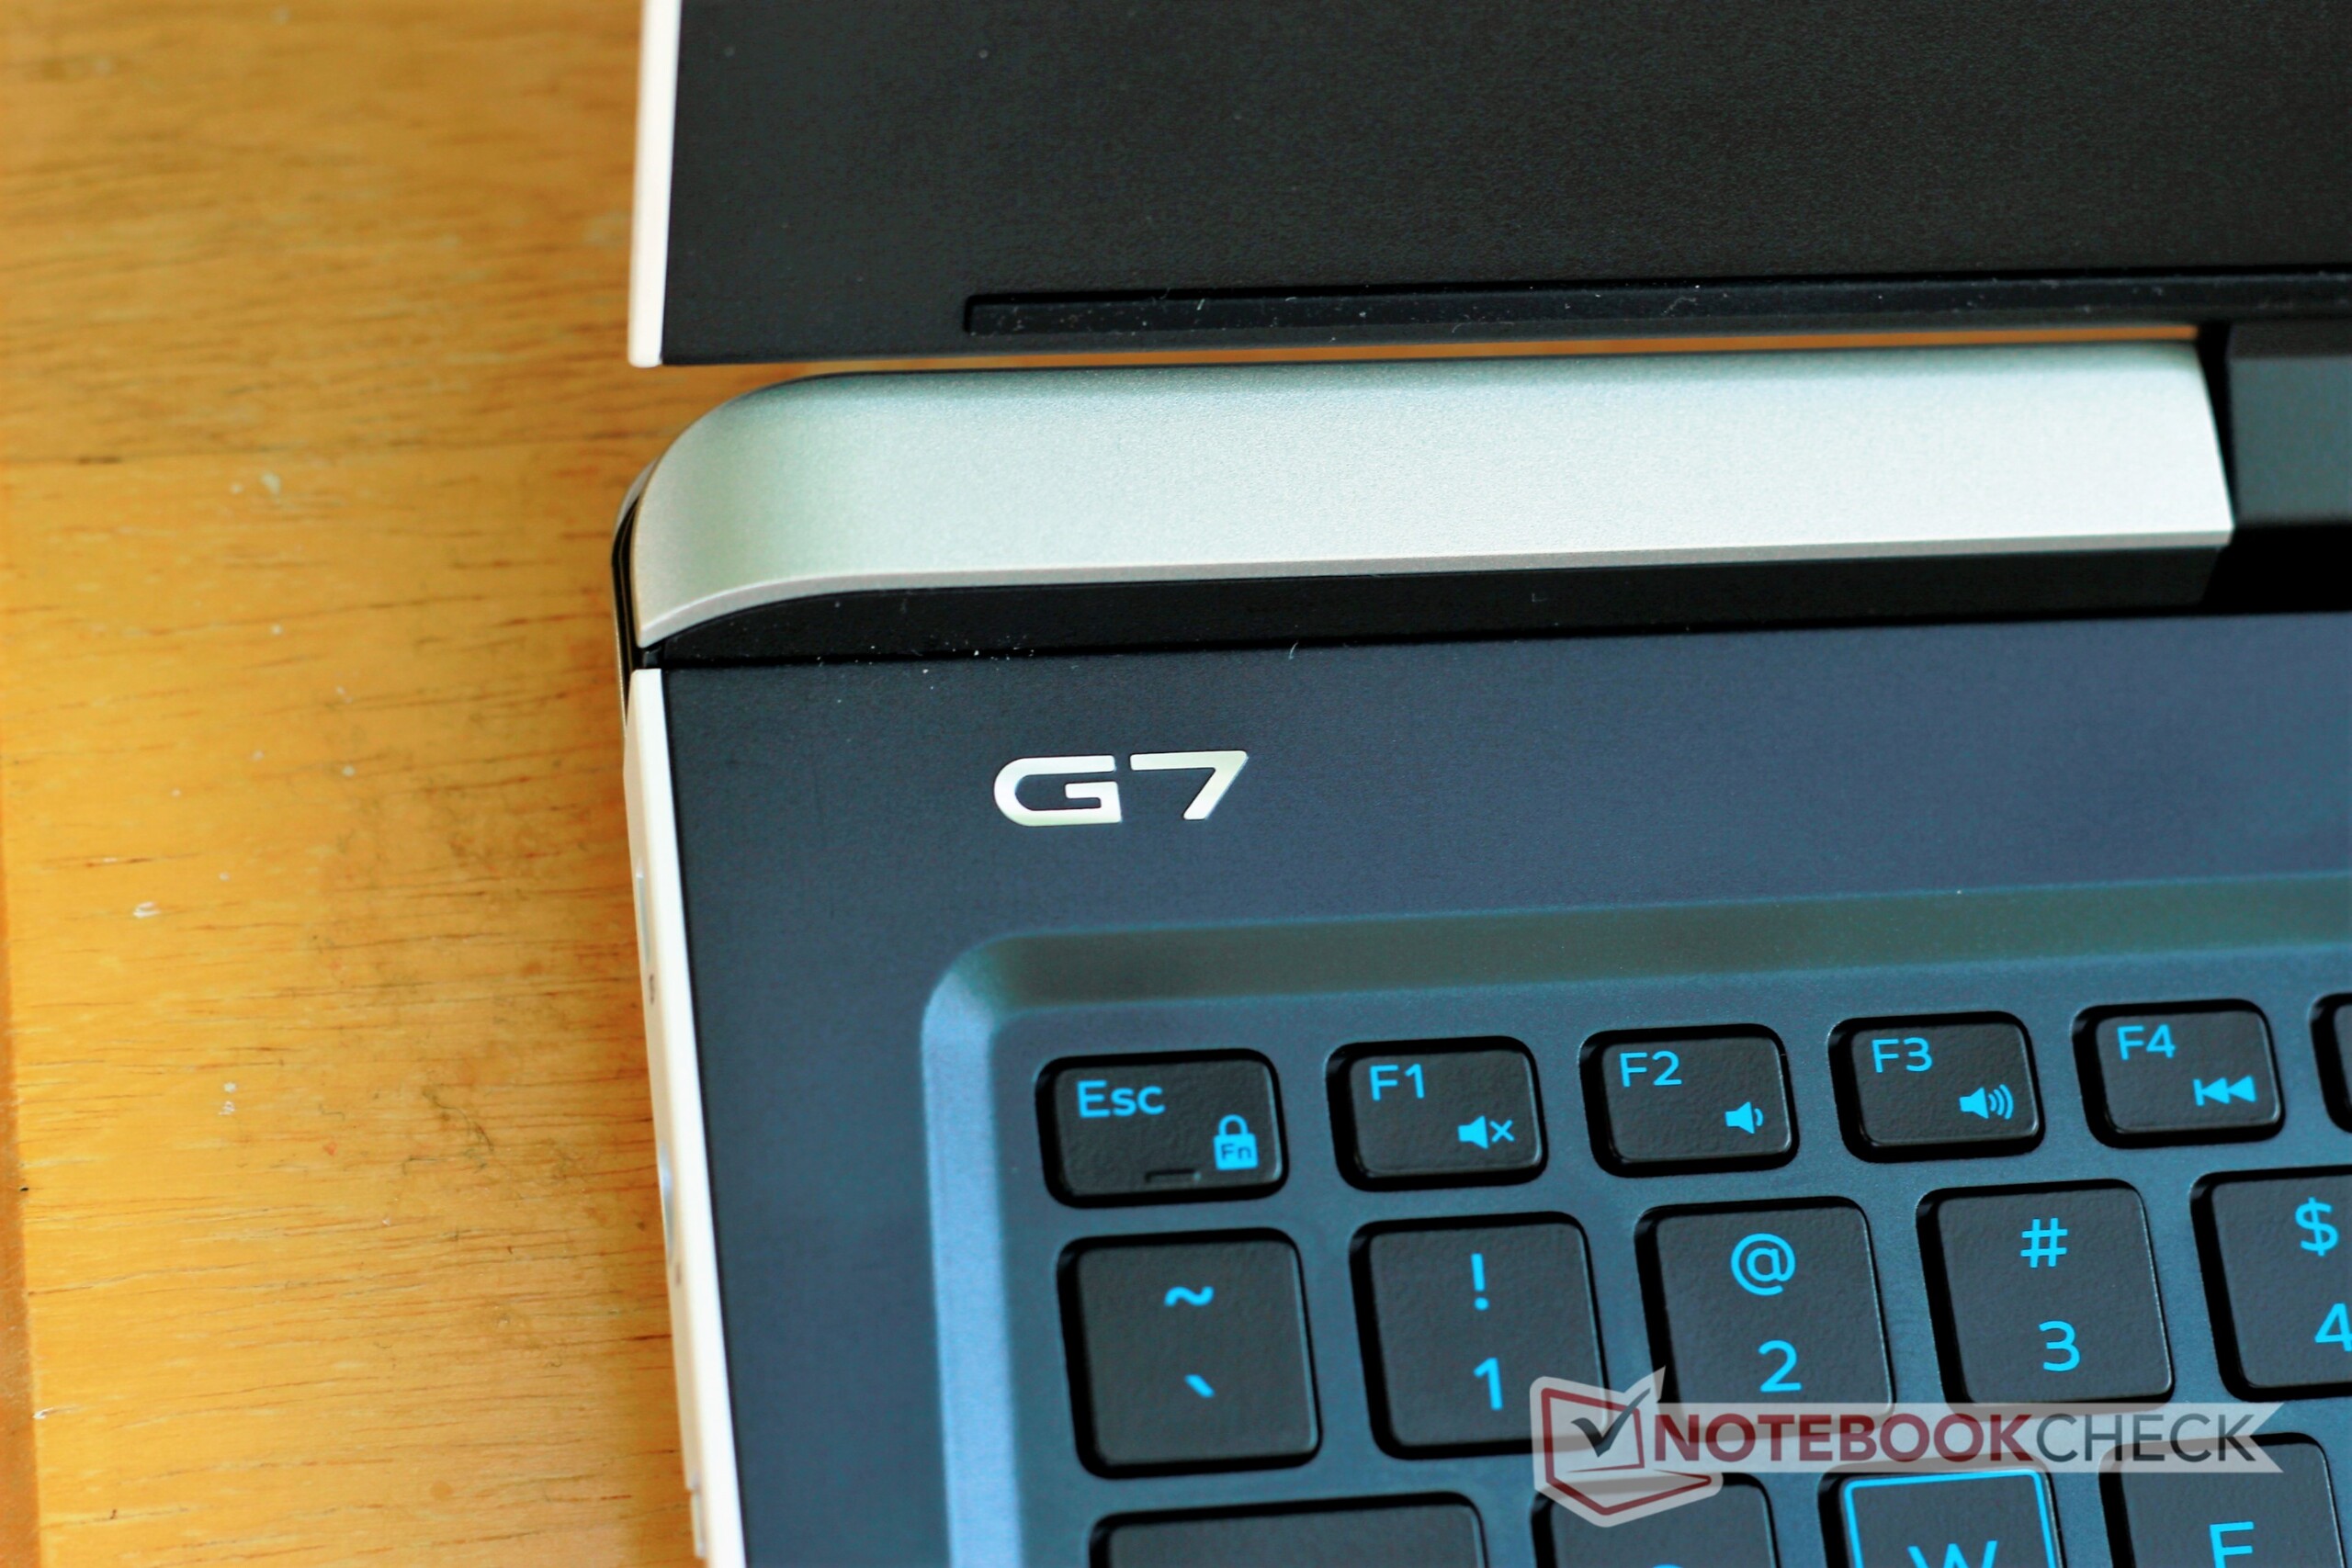
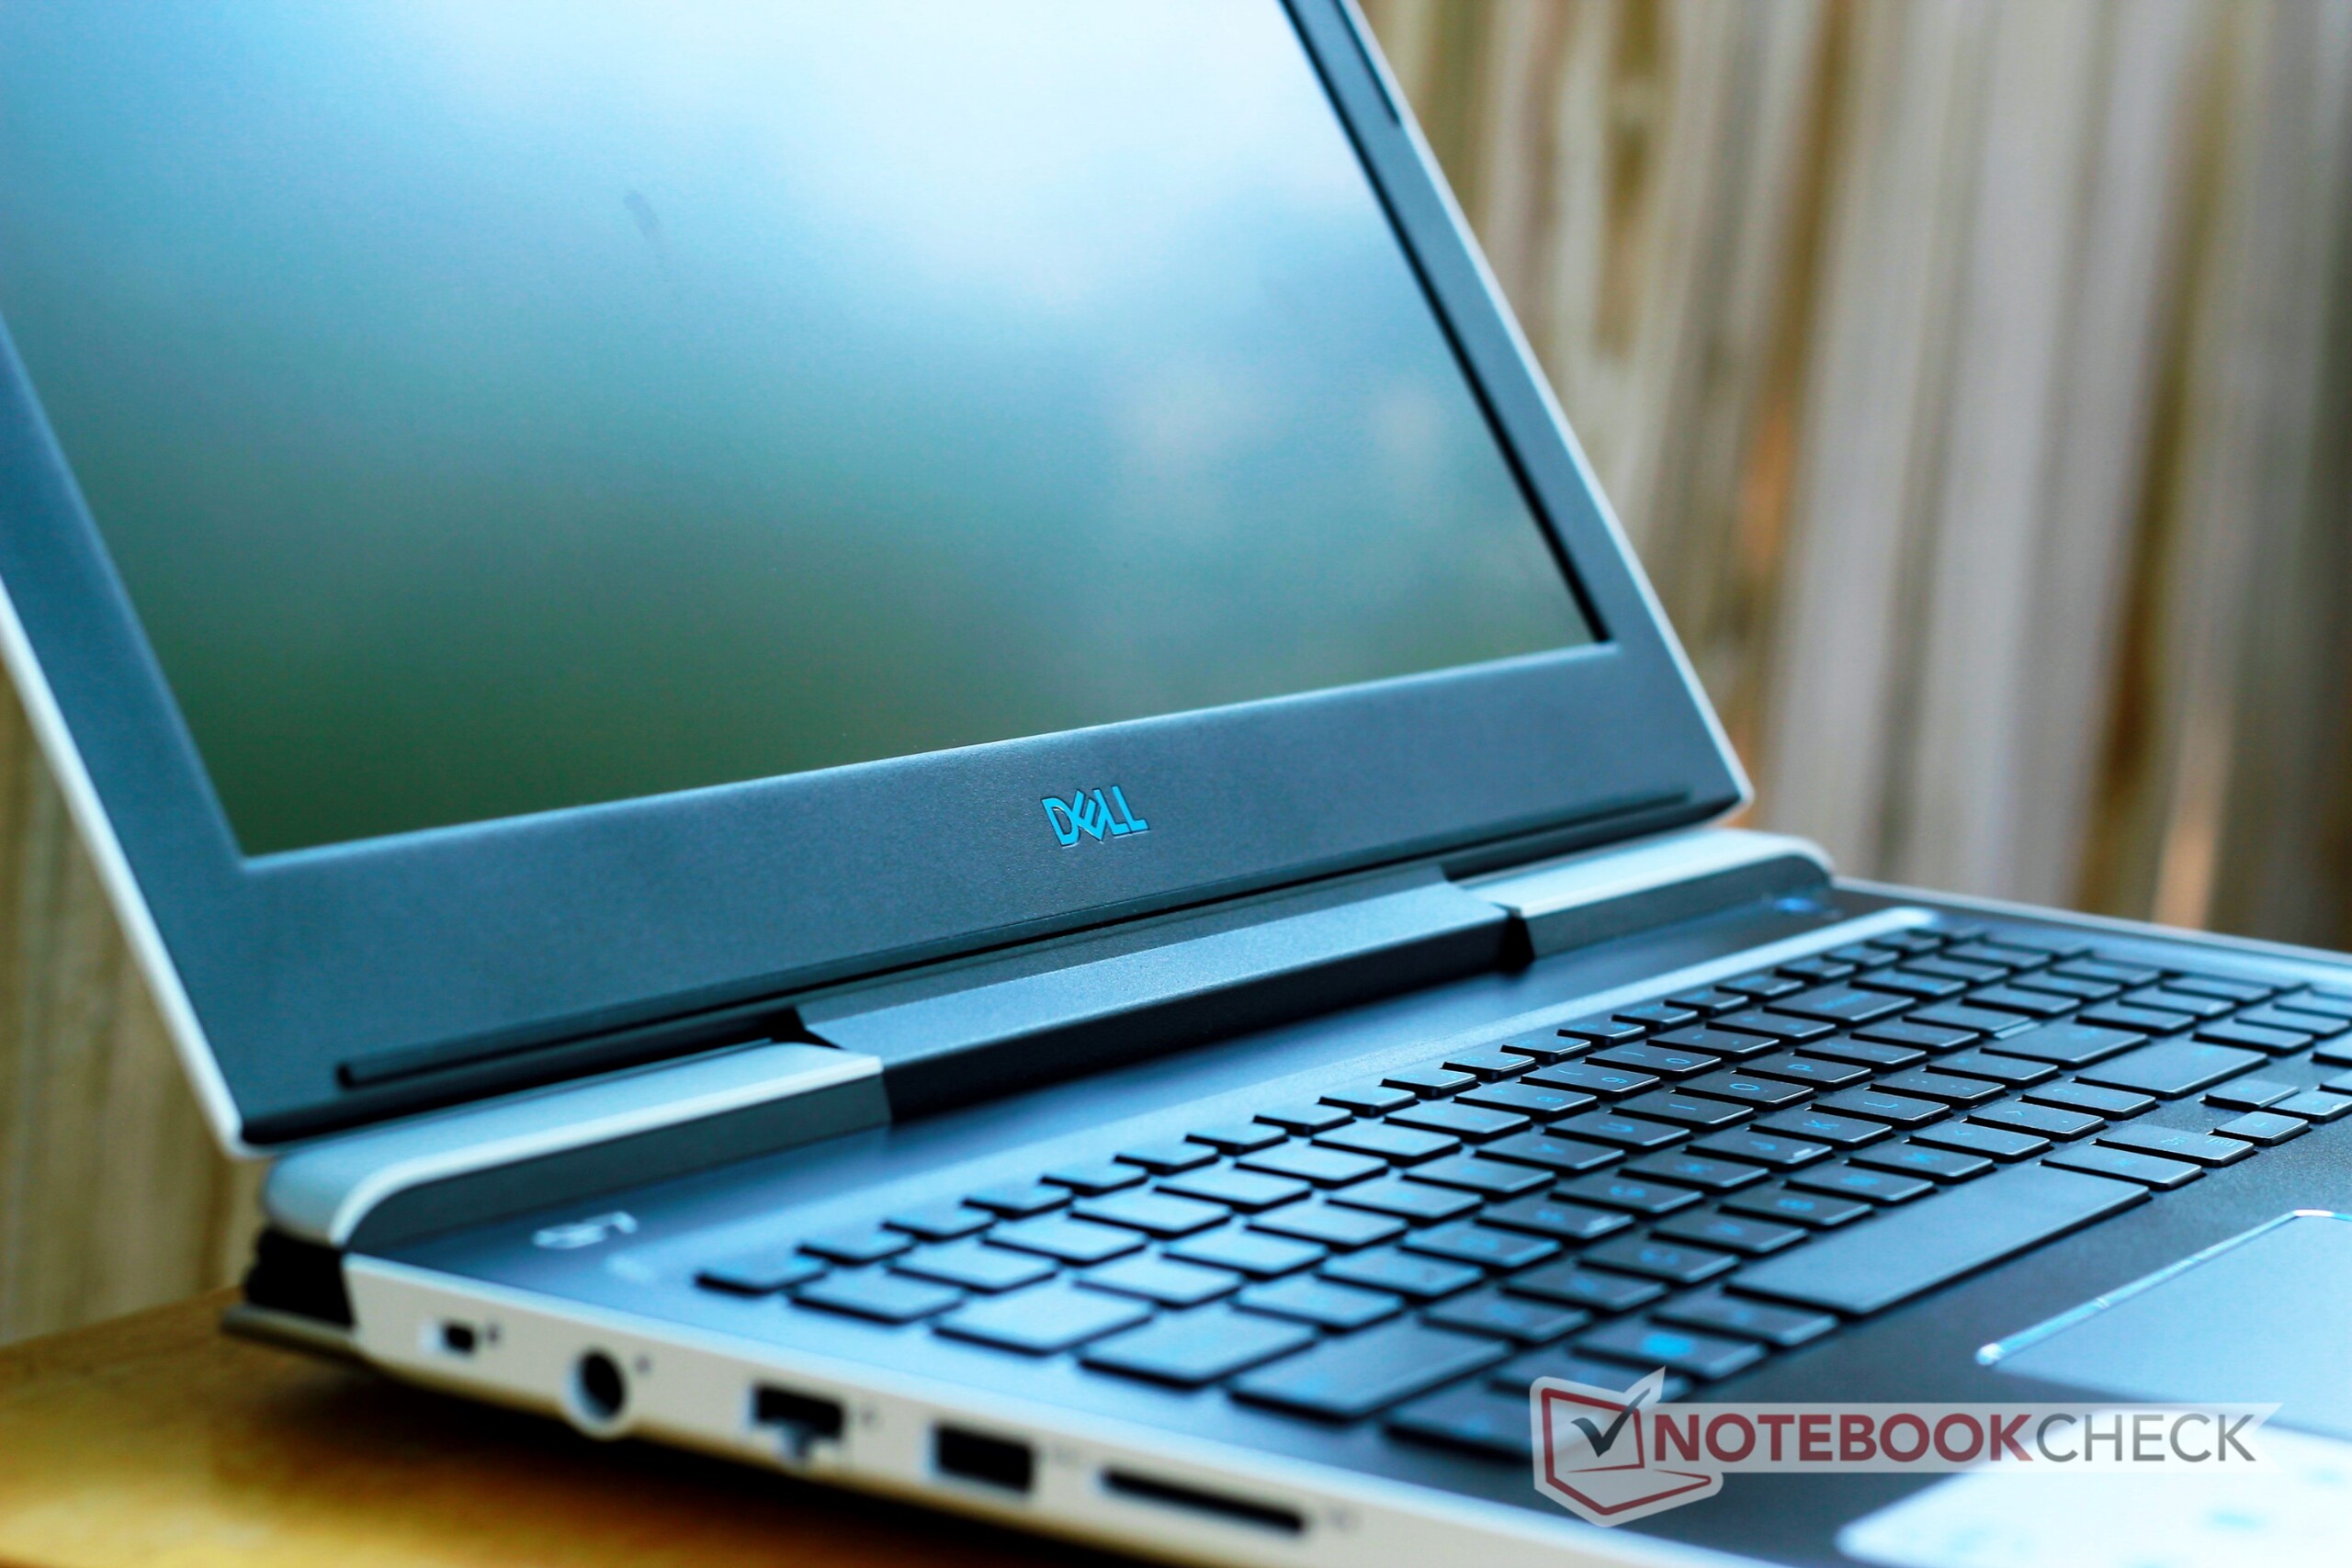
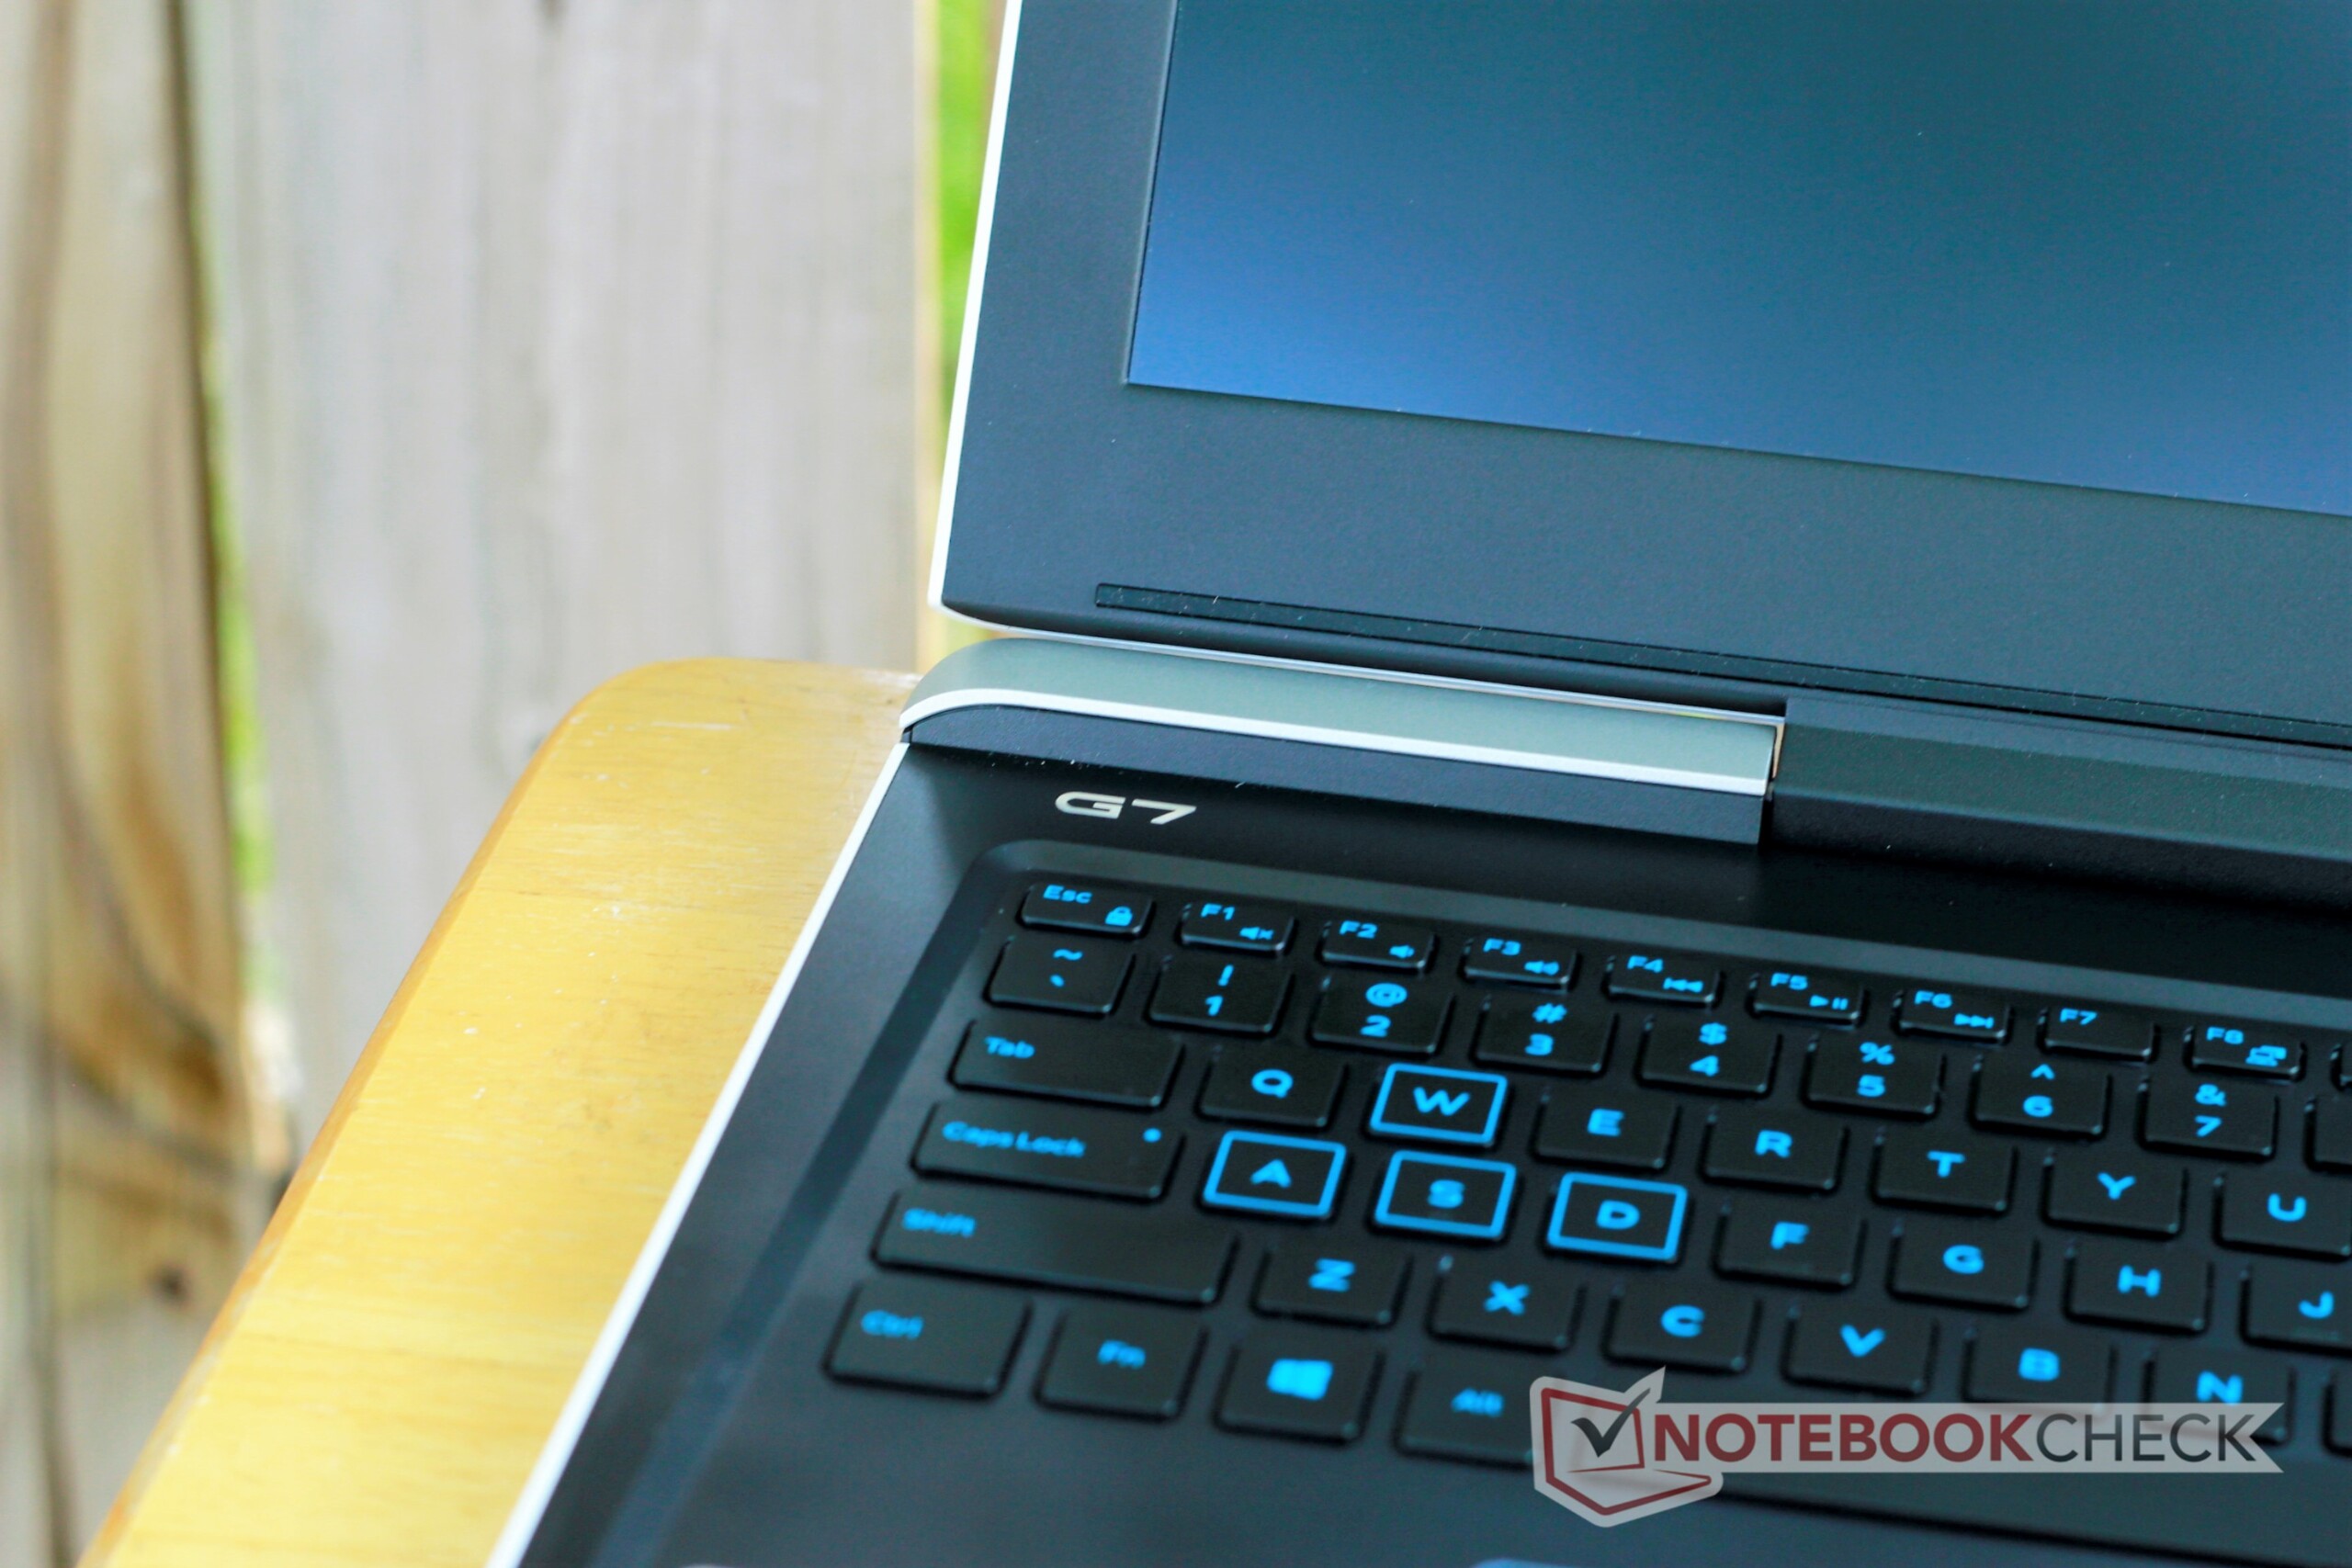
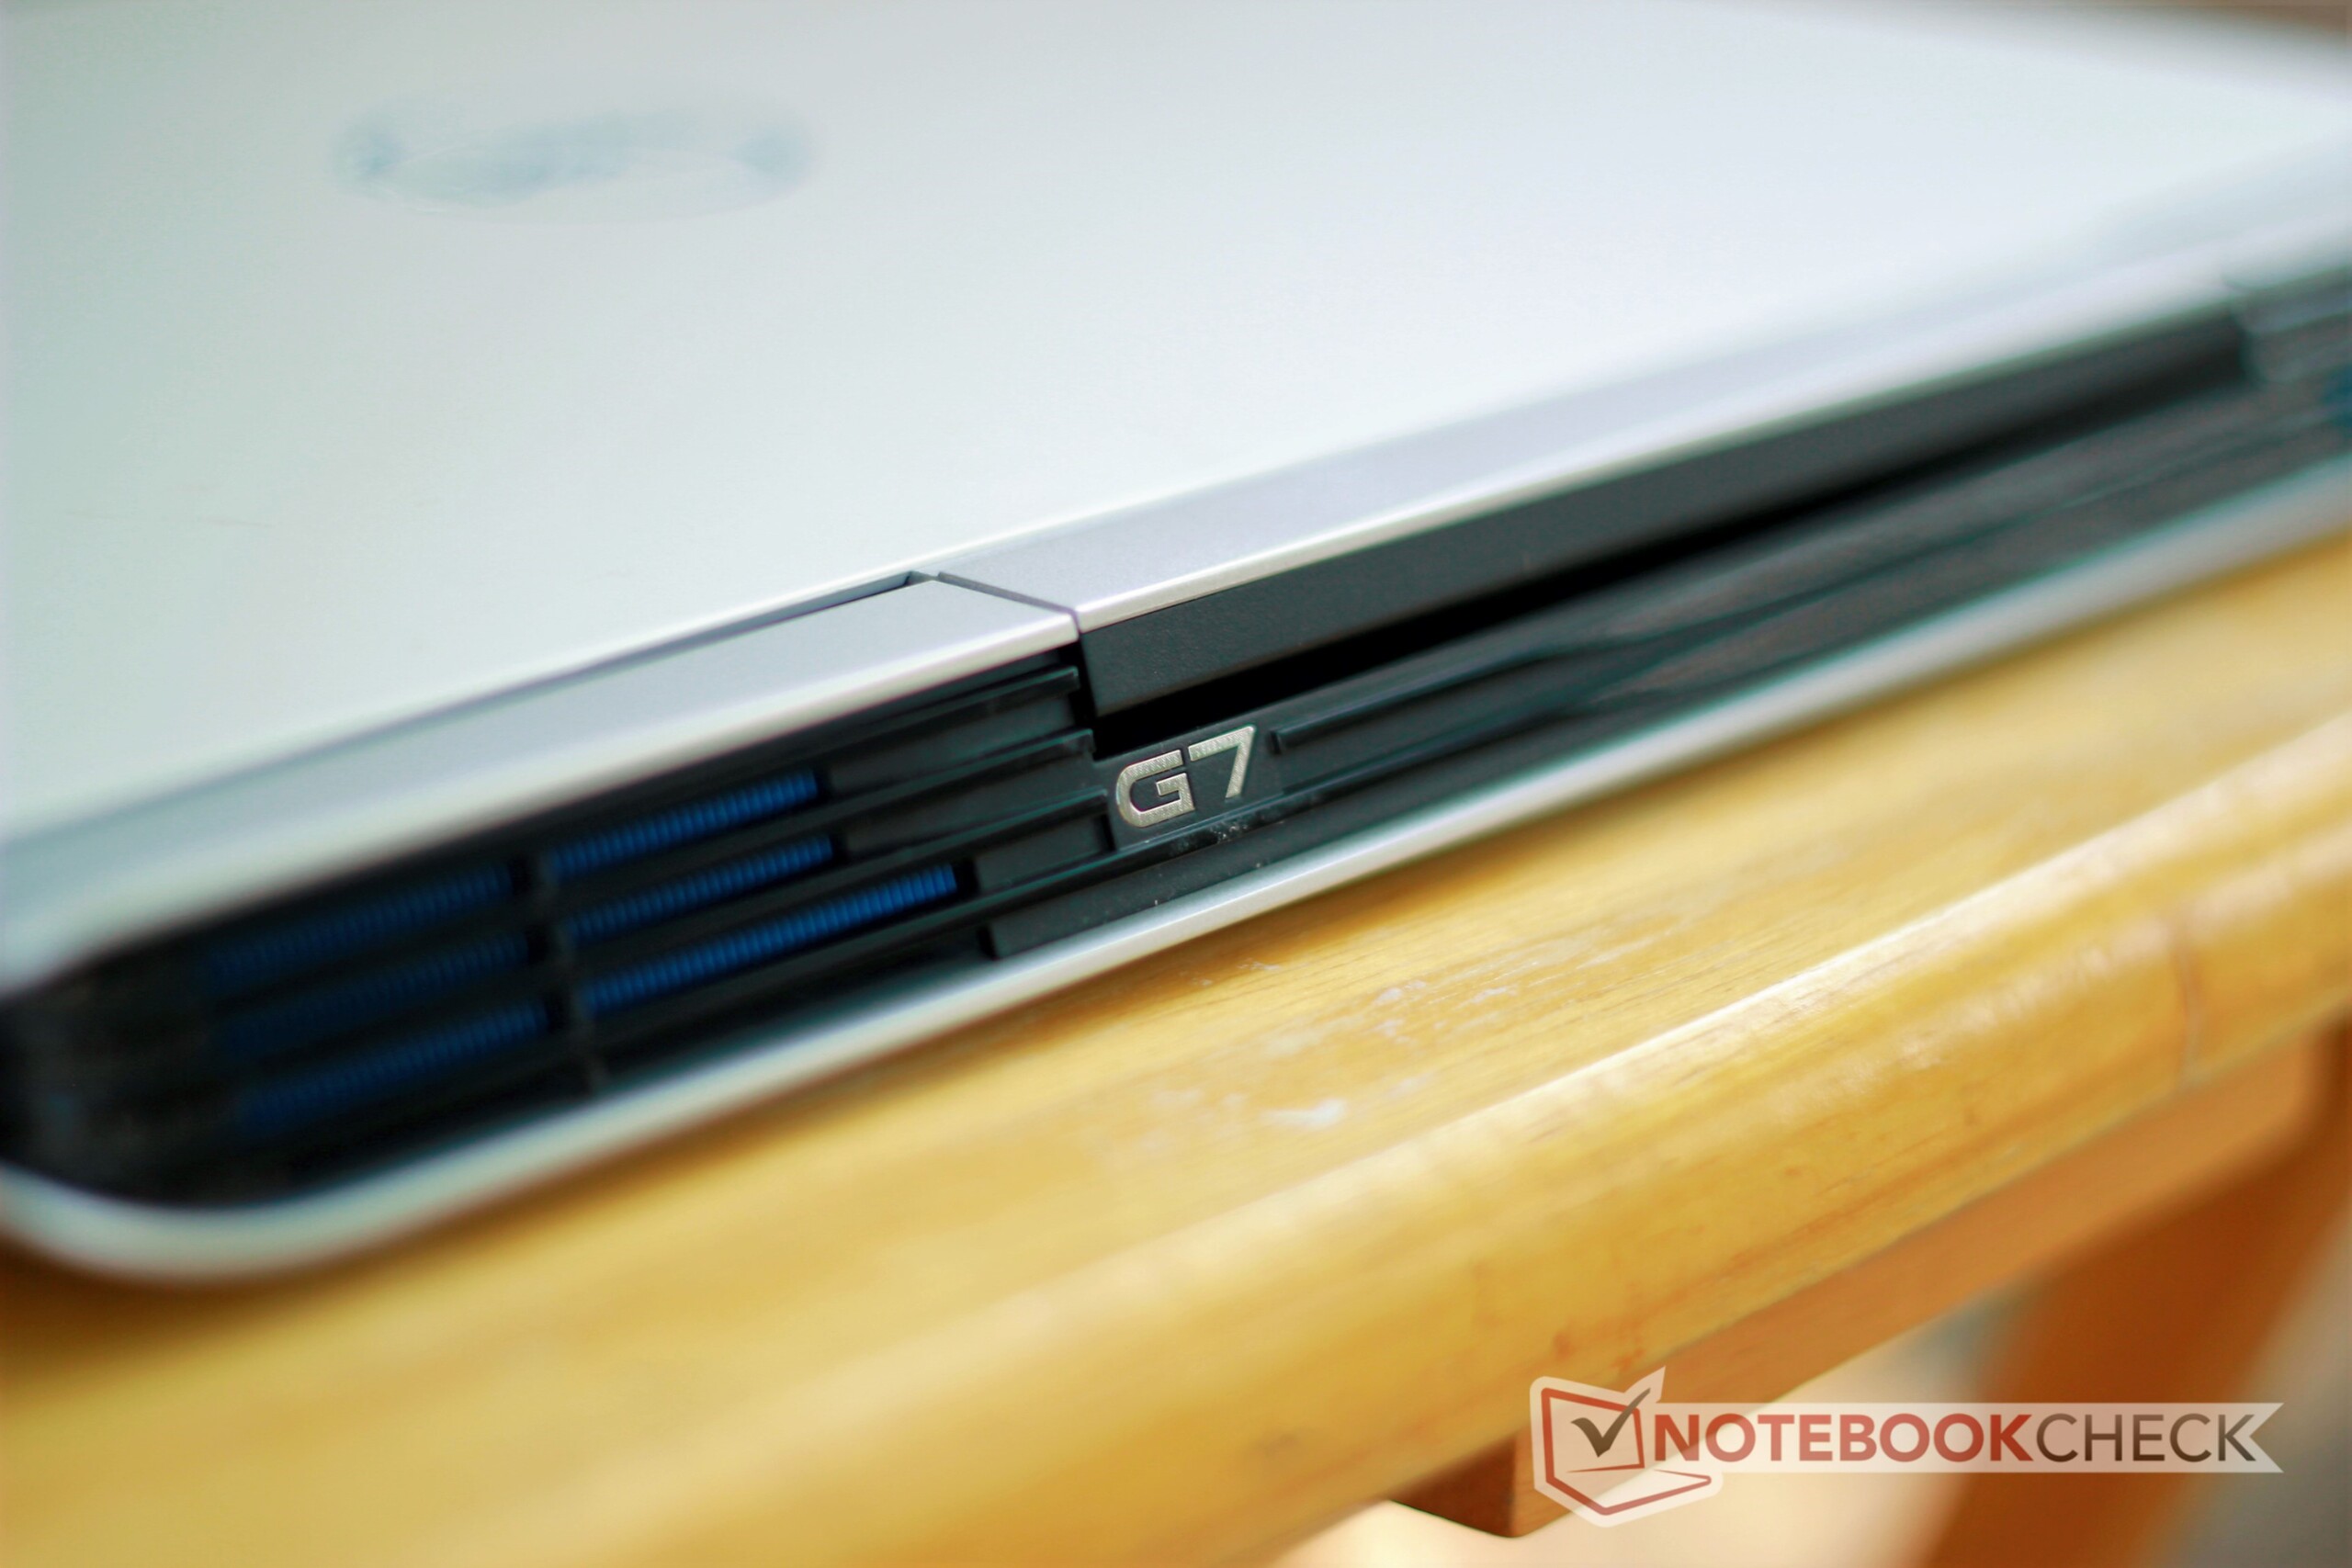
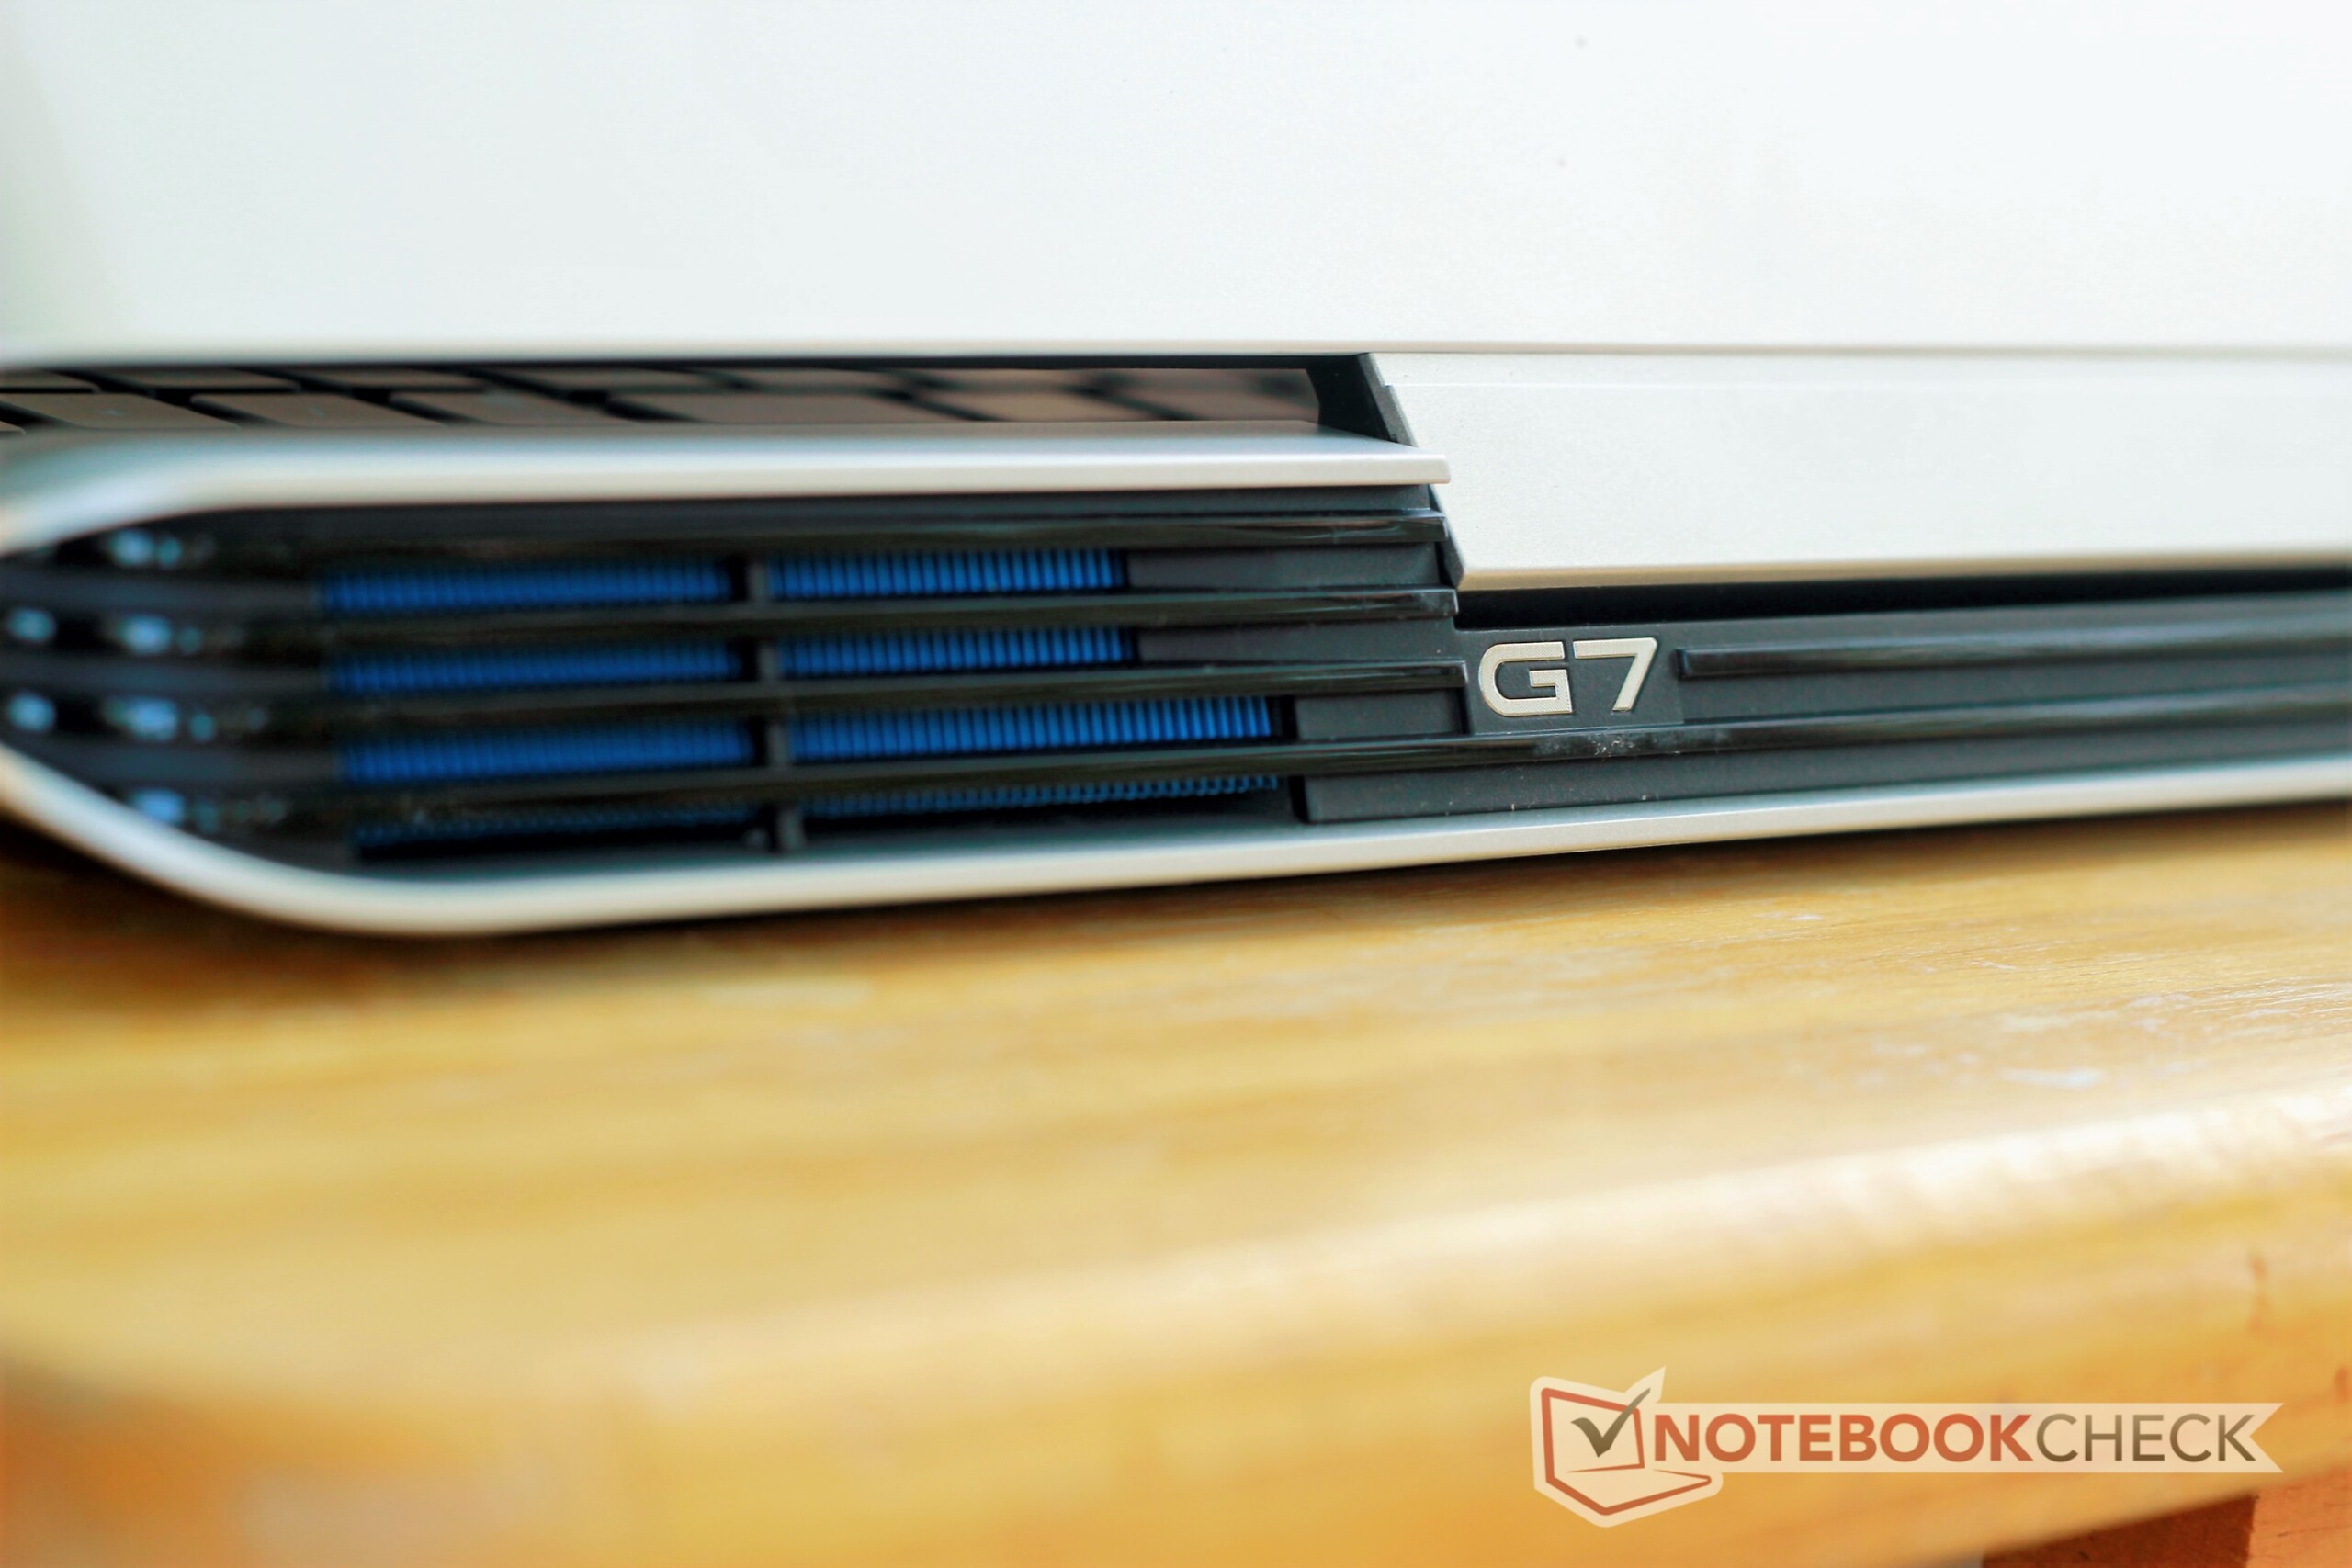
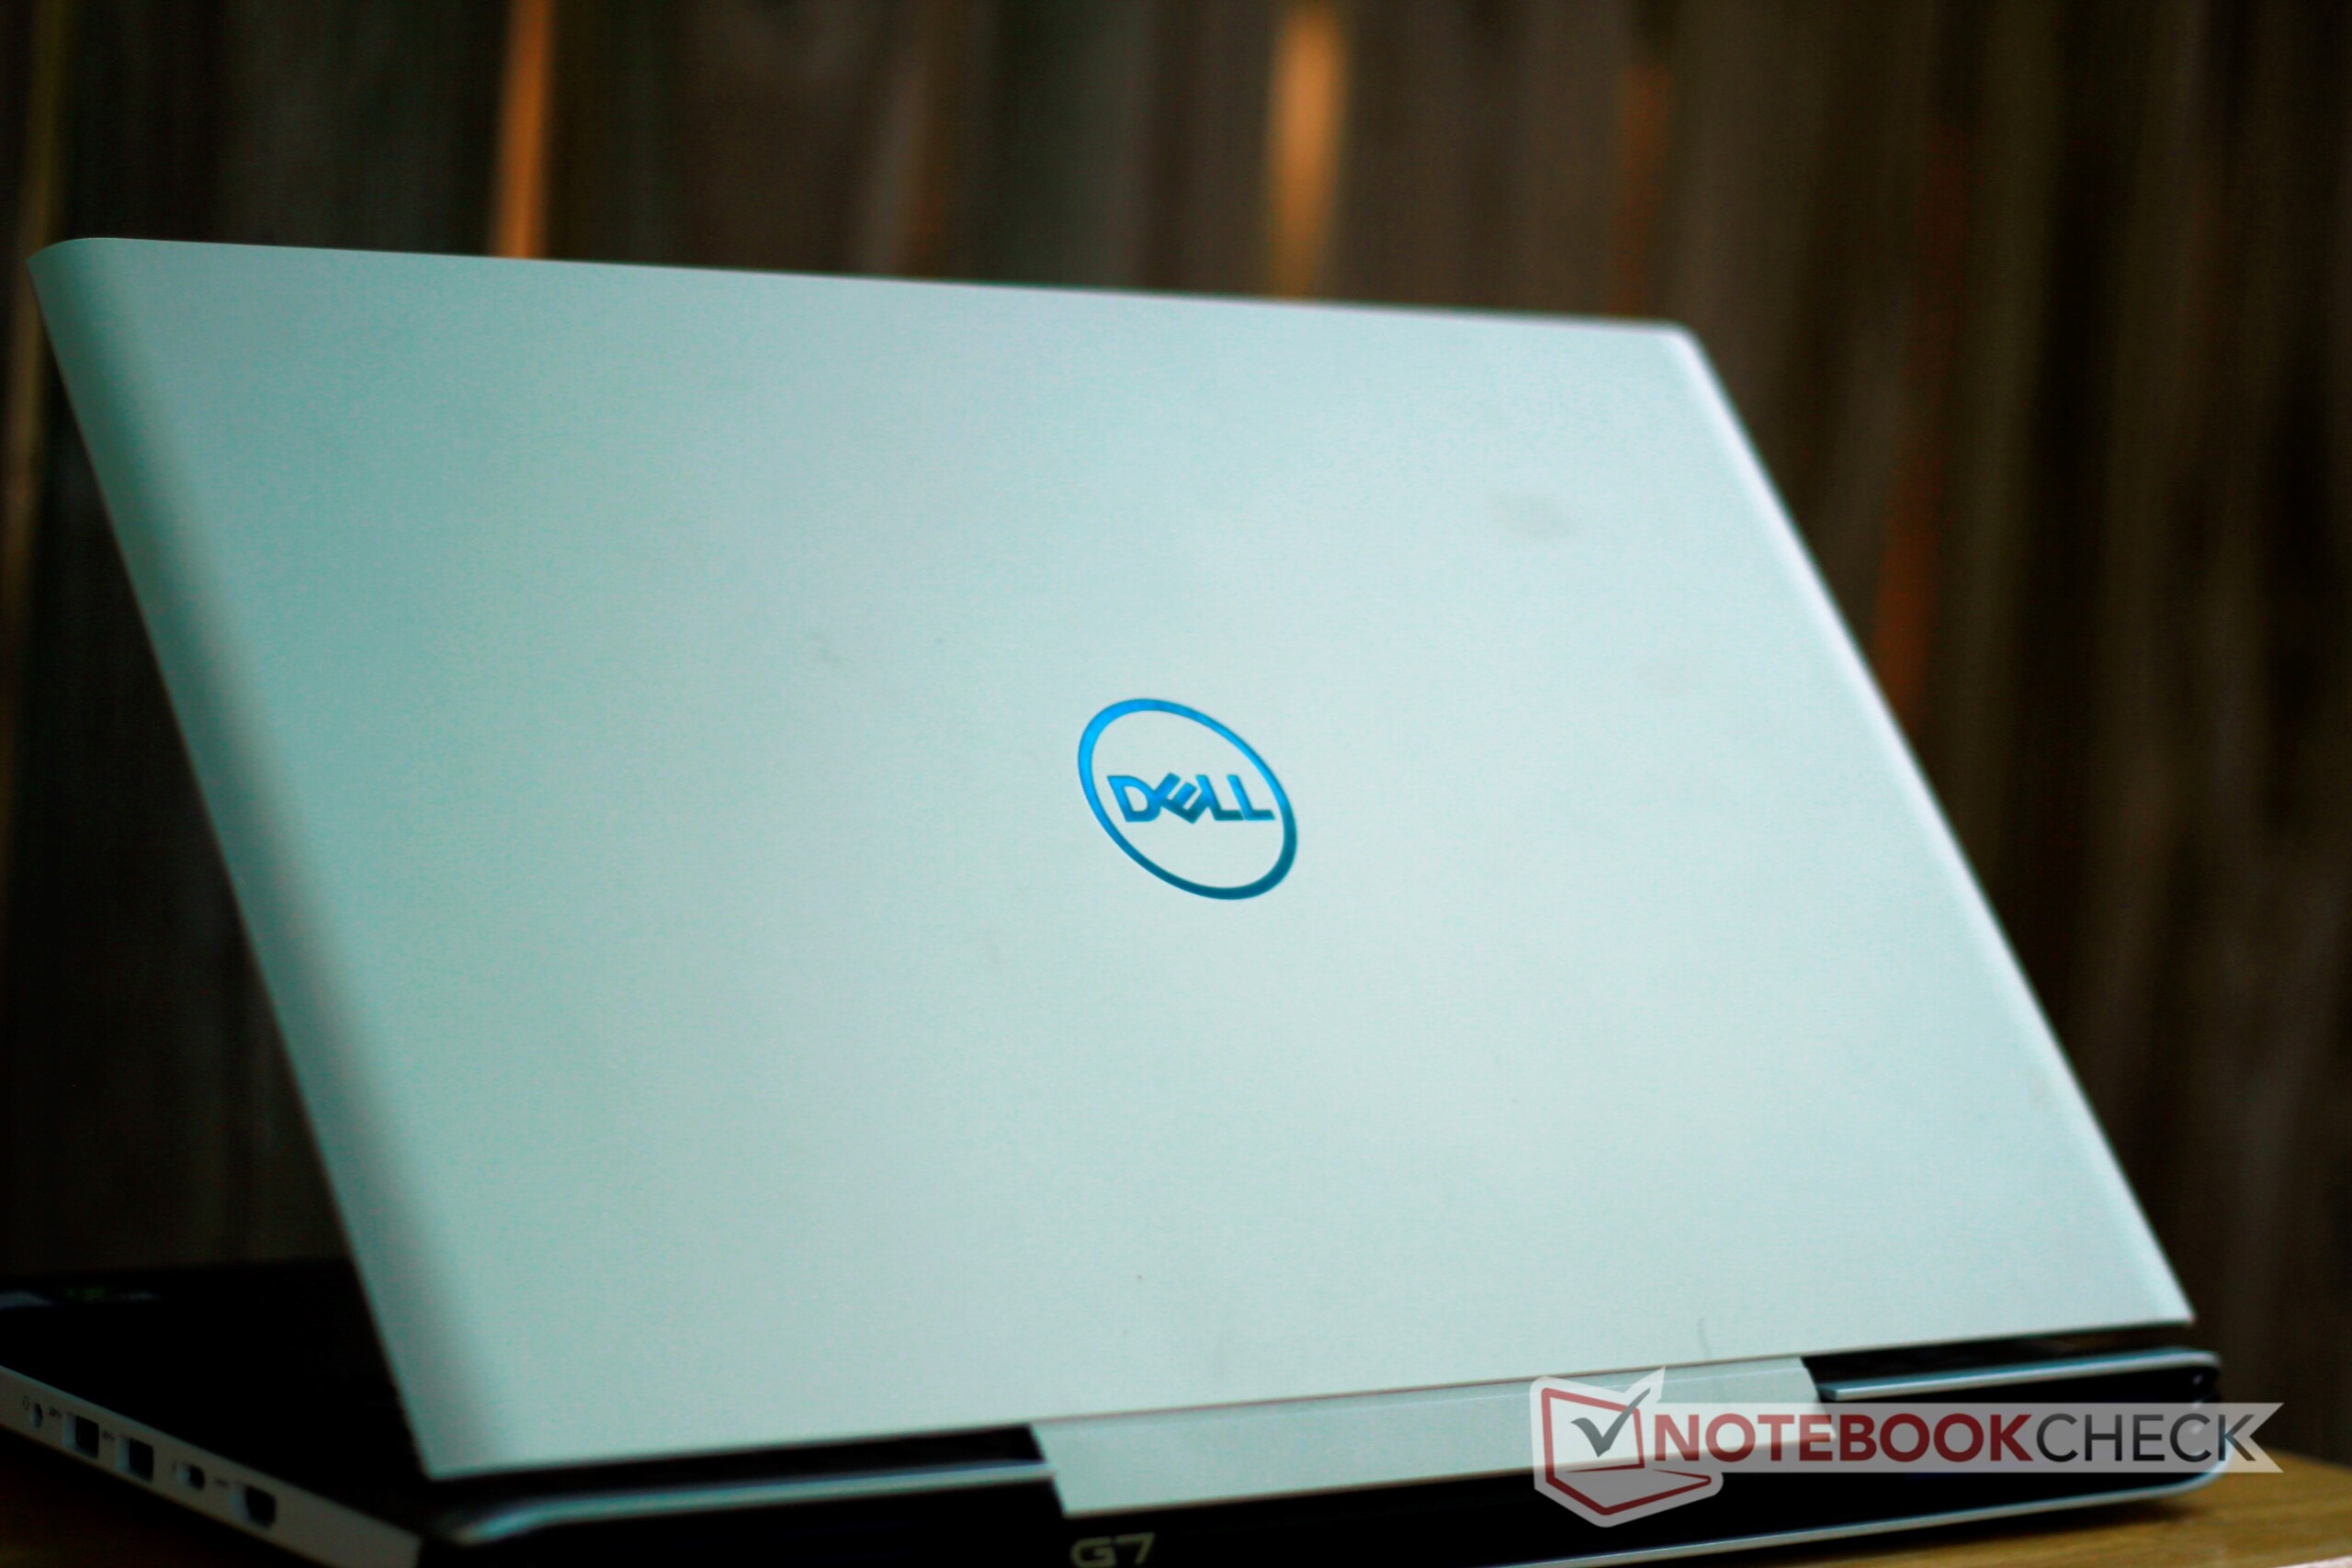
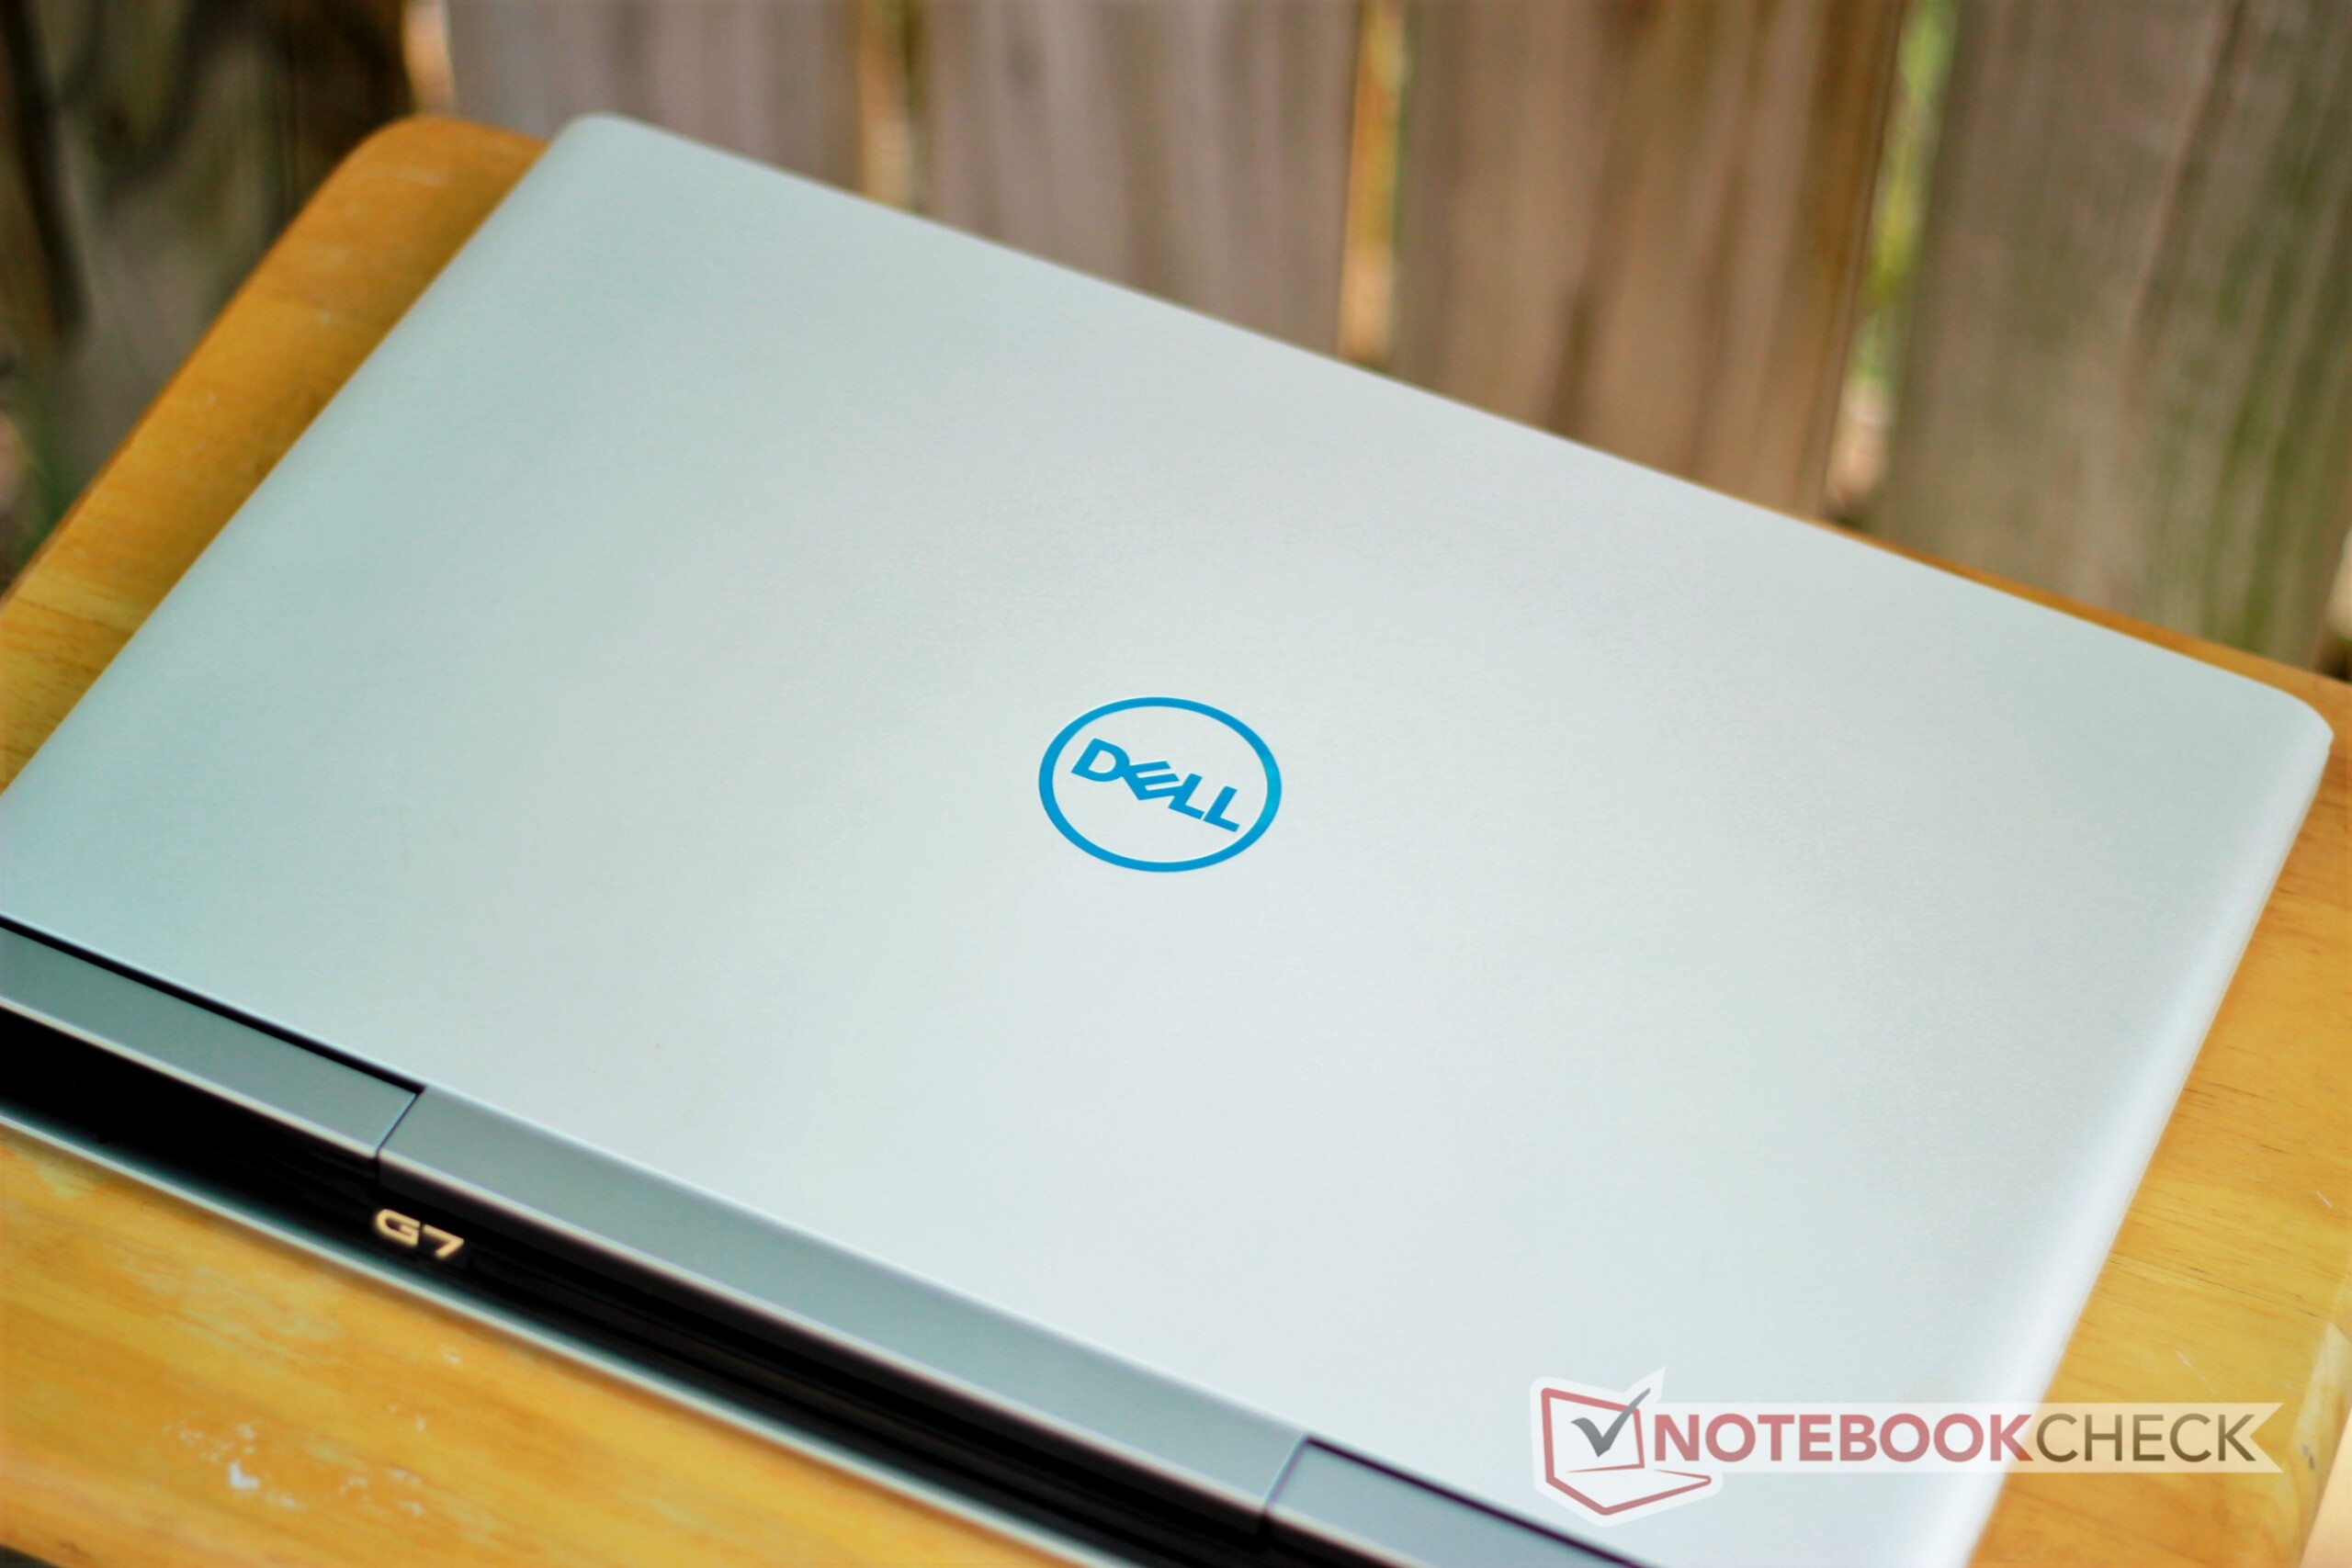
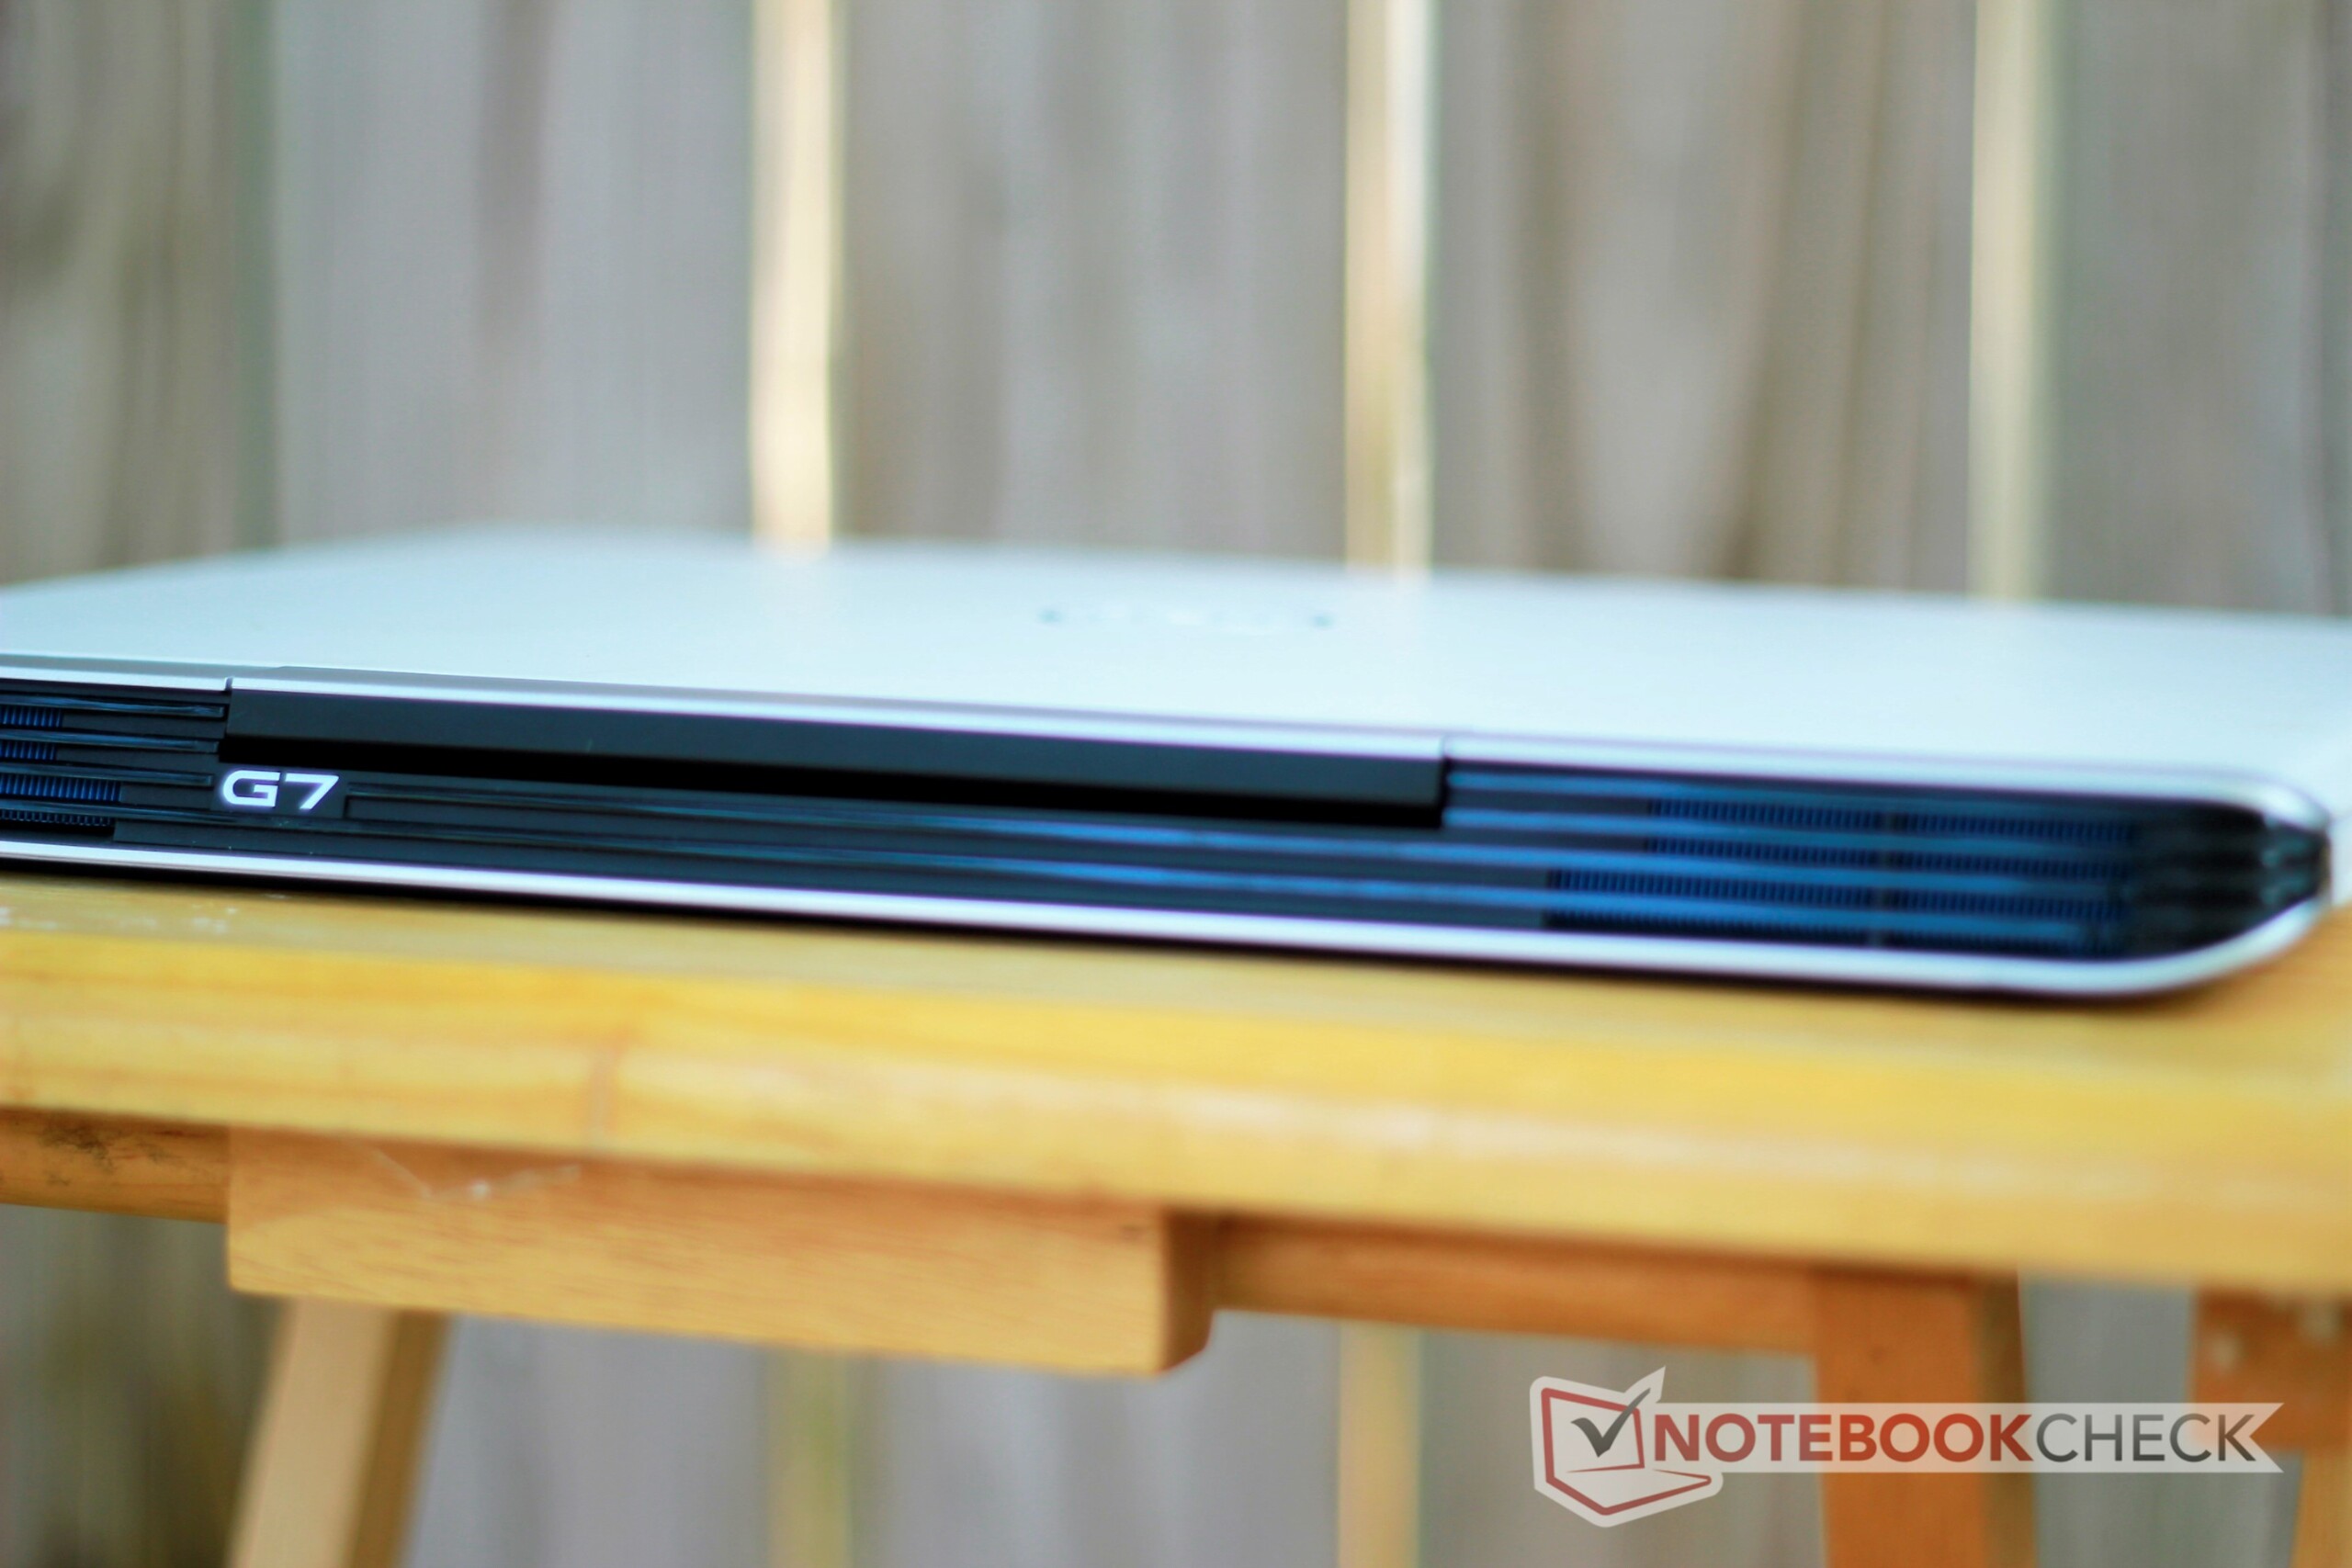
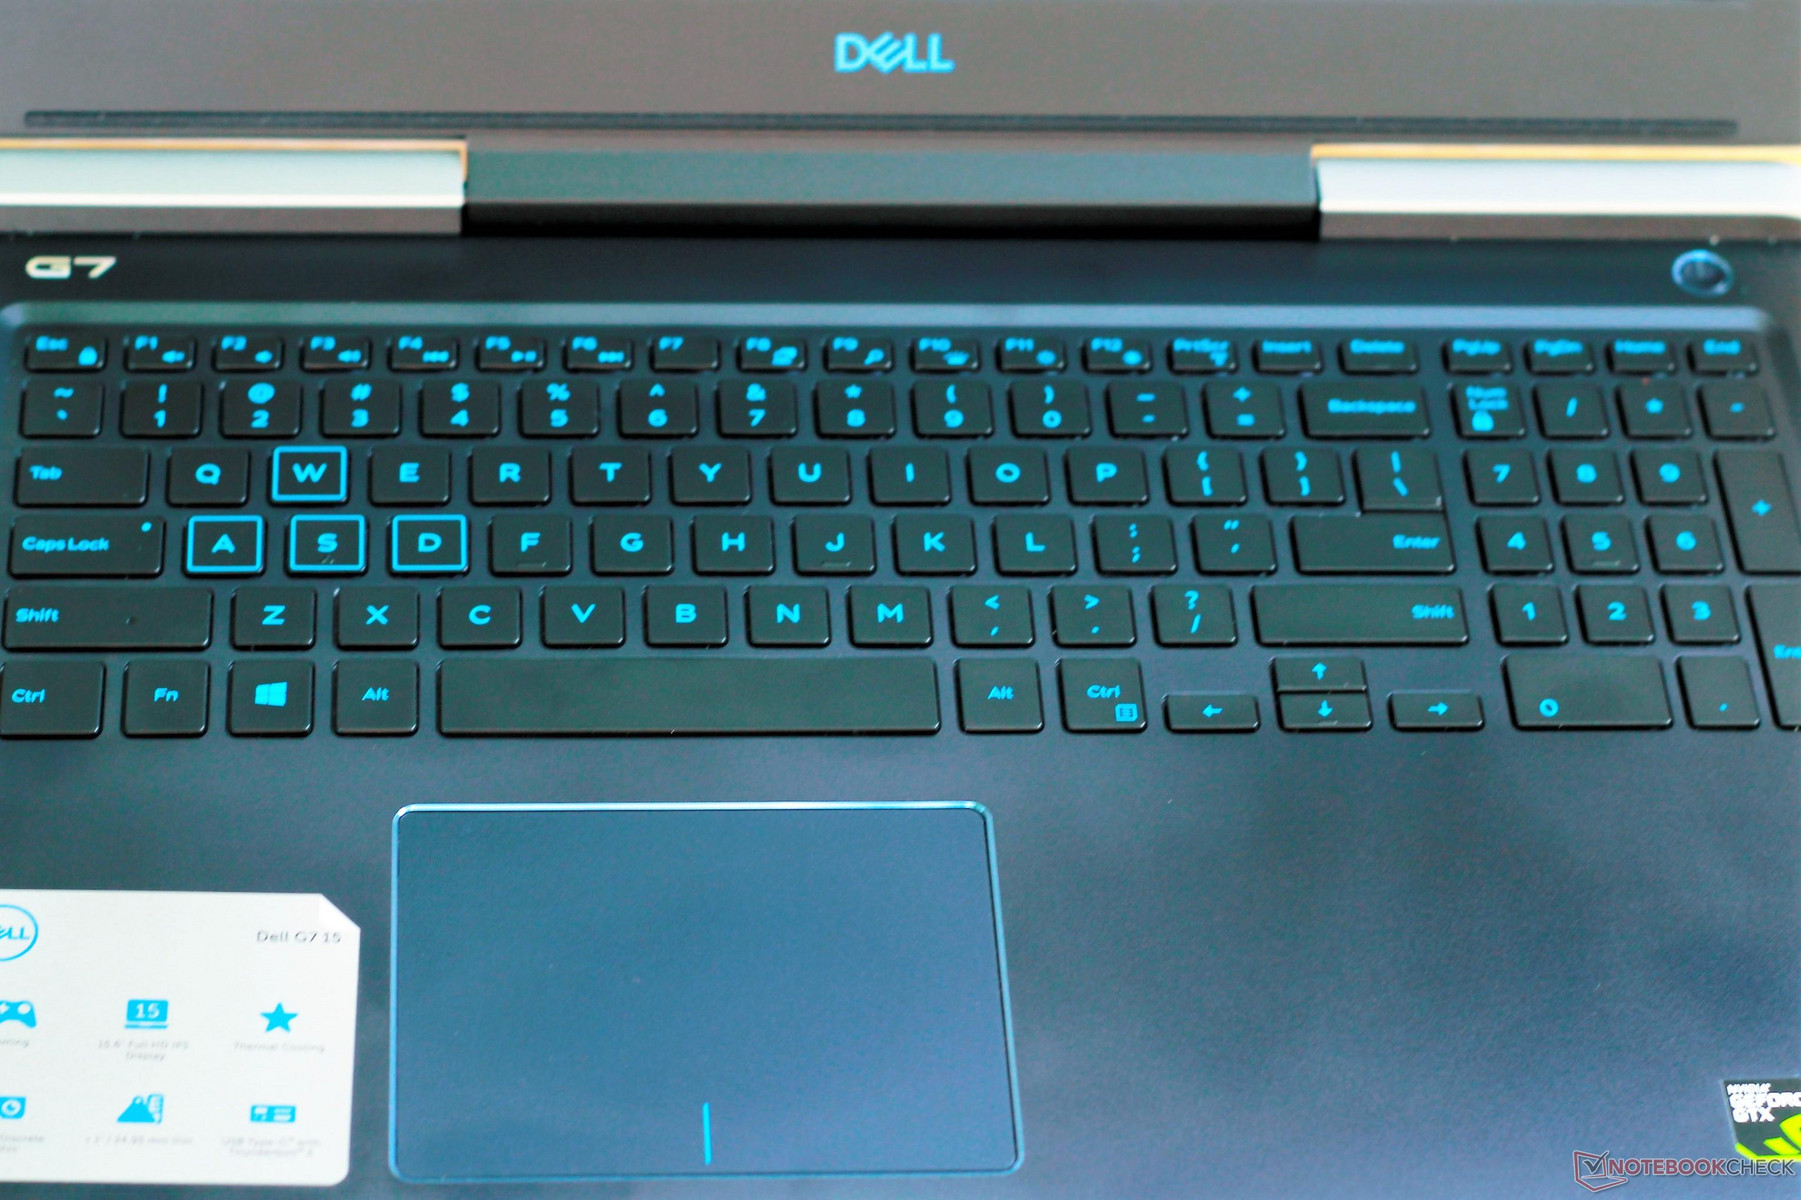
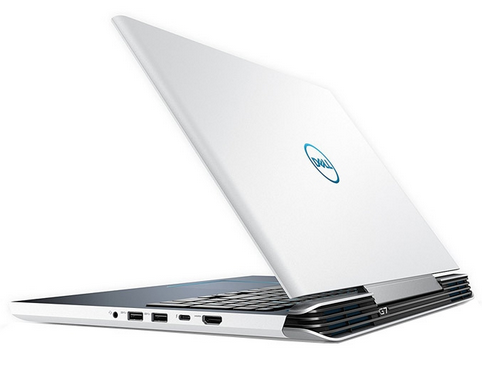
Like Dell's previous mid-range gaming laptops, the G7 is wrapped almost entirely in plastic. The G7 retains much of the design of the Inspiron 15 7000 7577, keeping the same tapered front and back with the rear-facing heat fins providing a subtle color accent. Dell offers a standard black and gray color scheme in addition to the blue and white model we have today. The combination of blue and white is, in our opinion, rather striking and makes the device stand out among other budget options. The satin finish gives the case a nice look and is highly resistant to fingerprints and smudges.
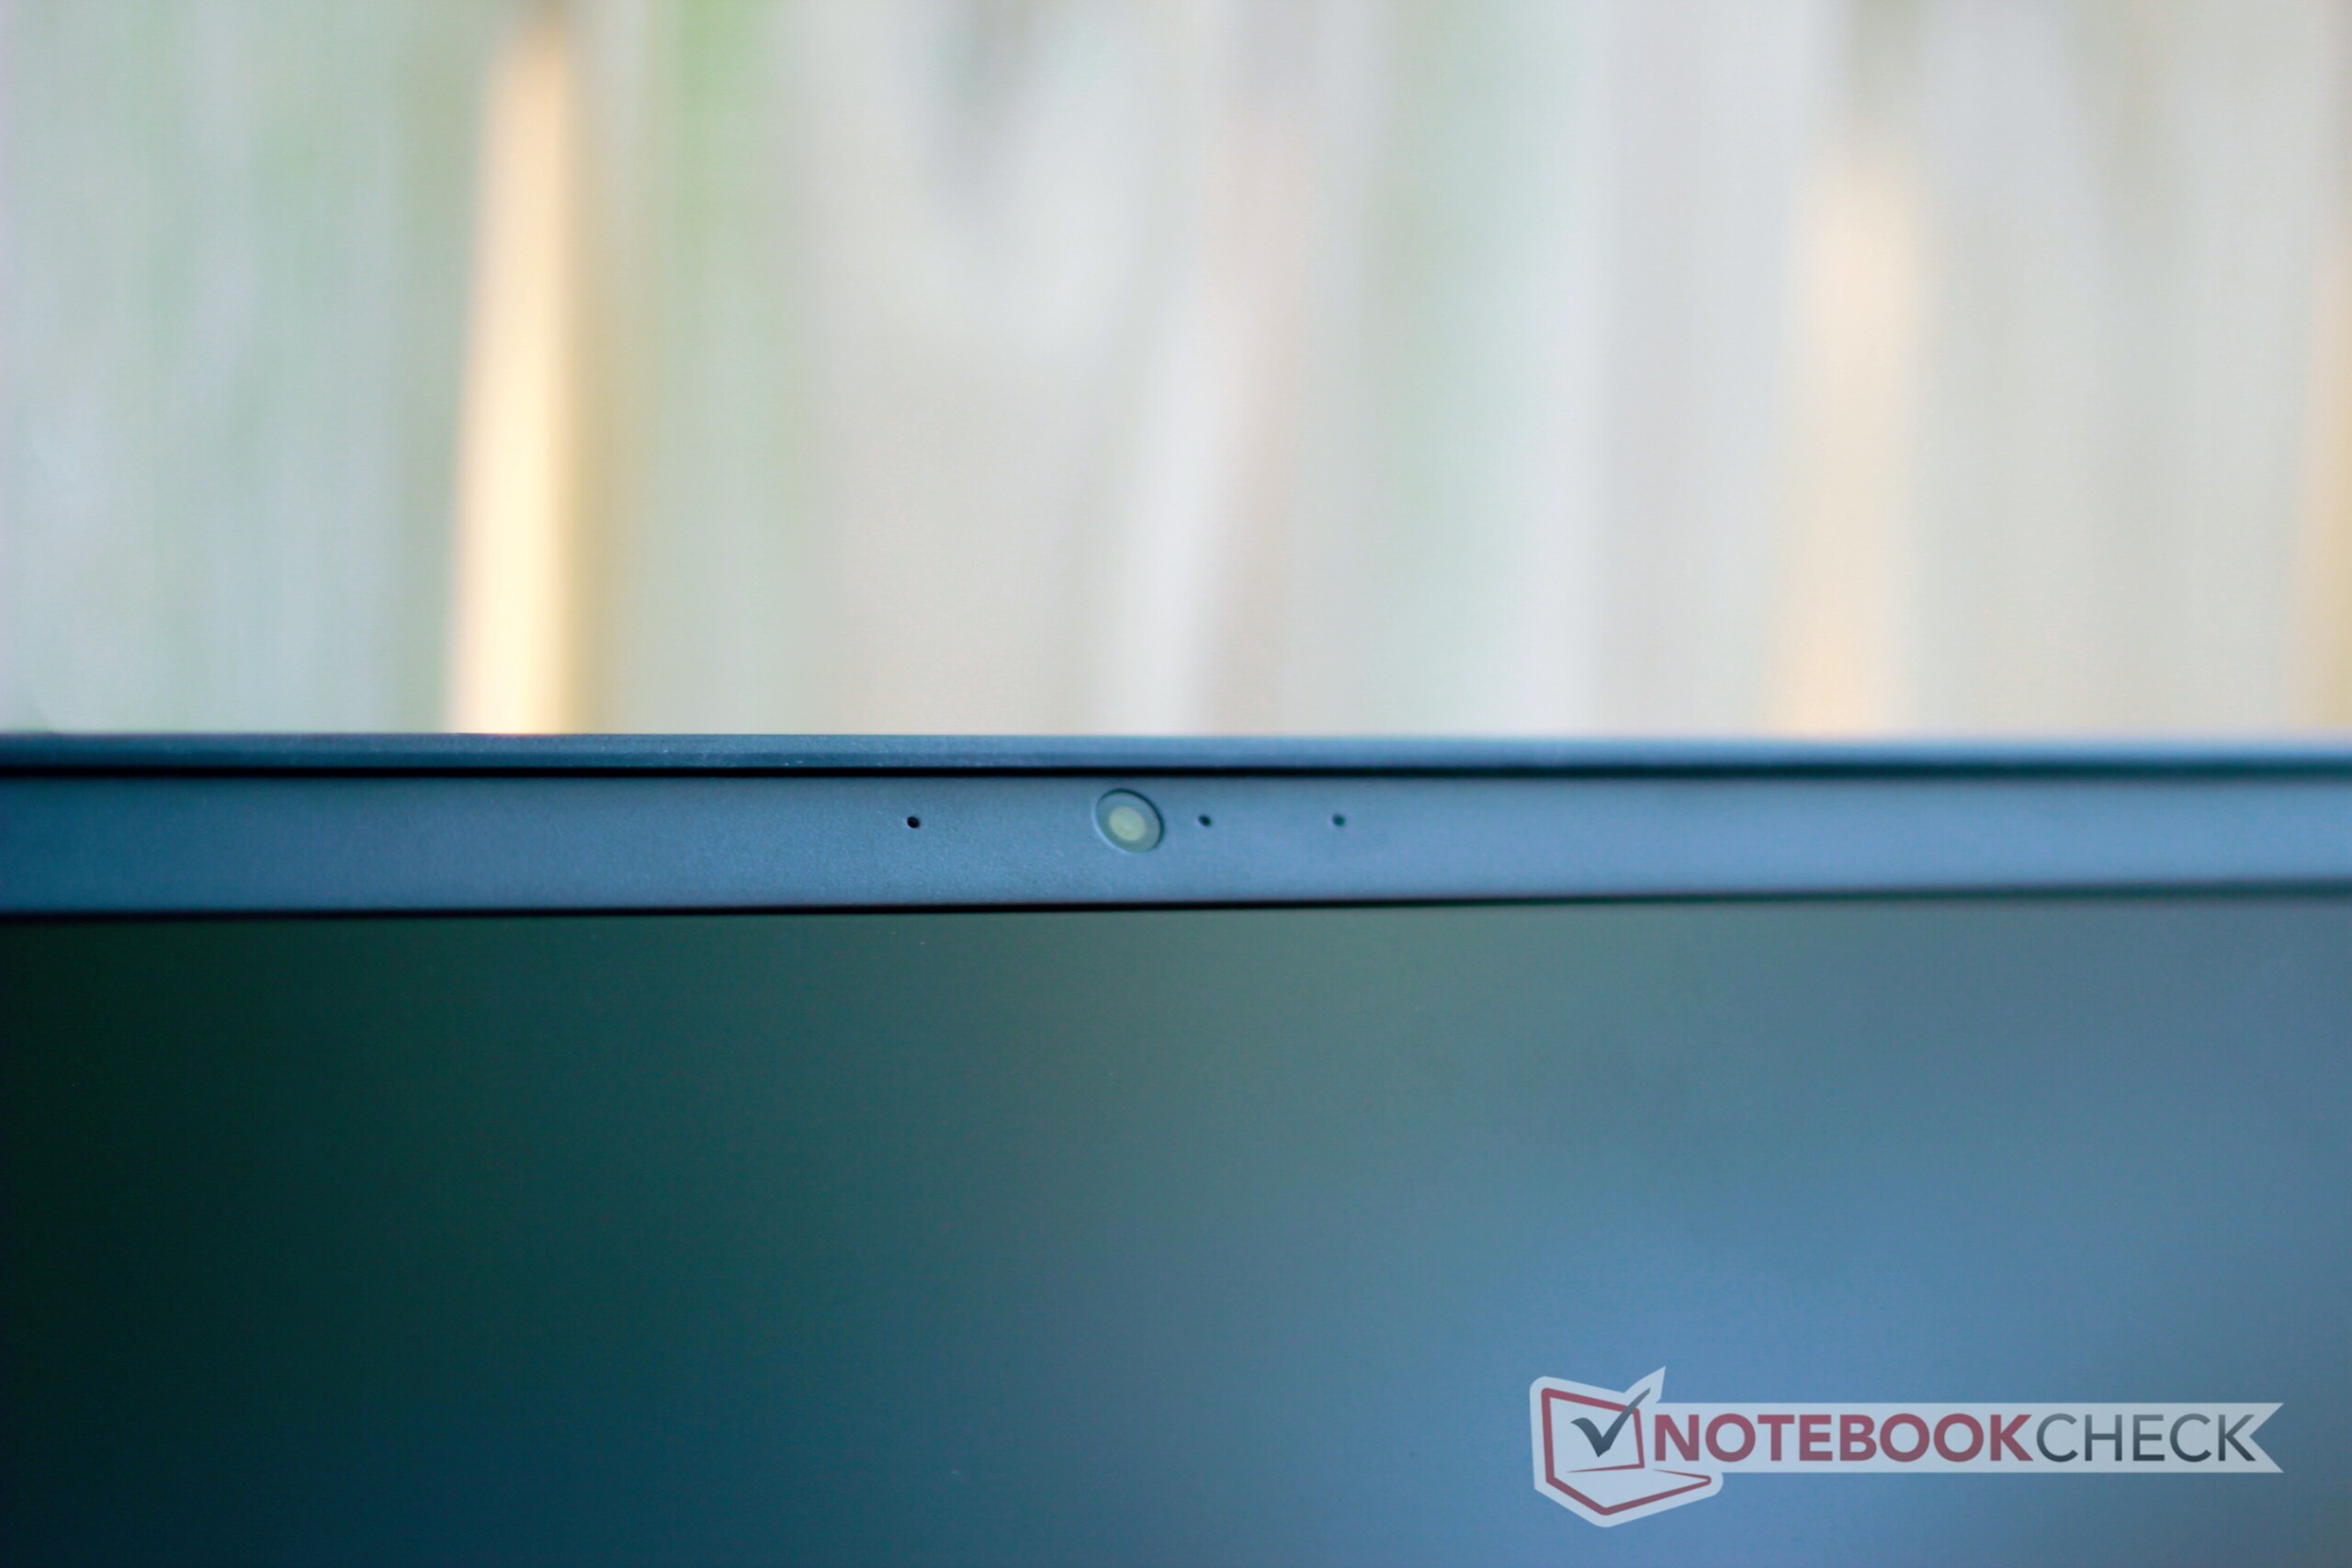
In spite of its plastic construction, the case is rigid and firm. Both the bottom panel and the magnesium keyboard deck exhibit almost no flex under direct pressure. Gaps and seams are even and tight. There is a slight bit of creak when the right edge of the machine is squeezed. The lid is the weakest point; it can be twisted and flexed inward without much effort. The display bezel sits flush with the panel, which was not the case with the older Inspiron 7577. The hinge is well-tuned and holds the screen steady while typing. One-handed opening is easy, and the screen can be opened to about 135 degrees. All said, the G7 is well-built, just like its older brother. Considering build quality is the first thing to go with other budget gaming laptops, the robust case is quite welcome.


The excellent build quality comes at the cost of weight and size. The G7 is about as large as other budget gaming devices, but the Lenovo Legion Y530, Asus FX503VM, and Dell G3 all have smaller footprints. While not the most portable, the G7 will fit into most backpacks. Users in search of a more compact notebook should look to Lenovo or Asus for better options.
Connectivity
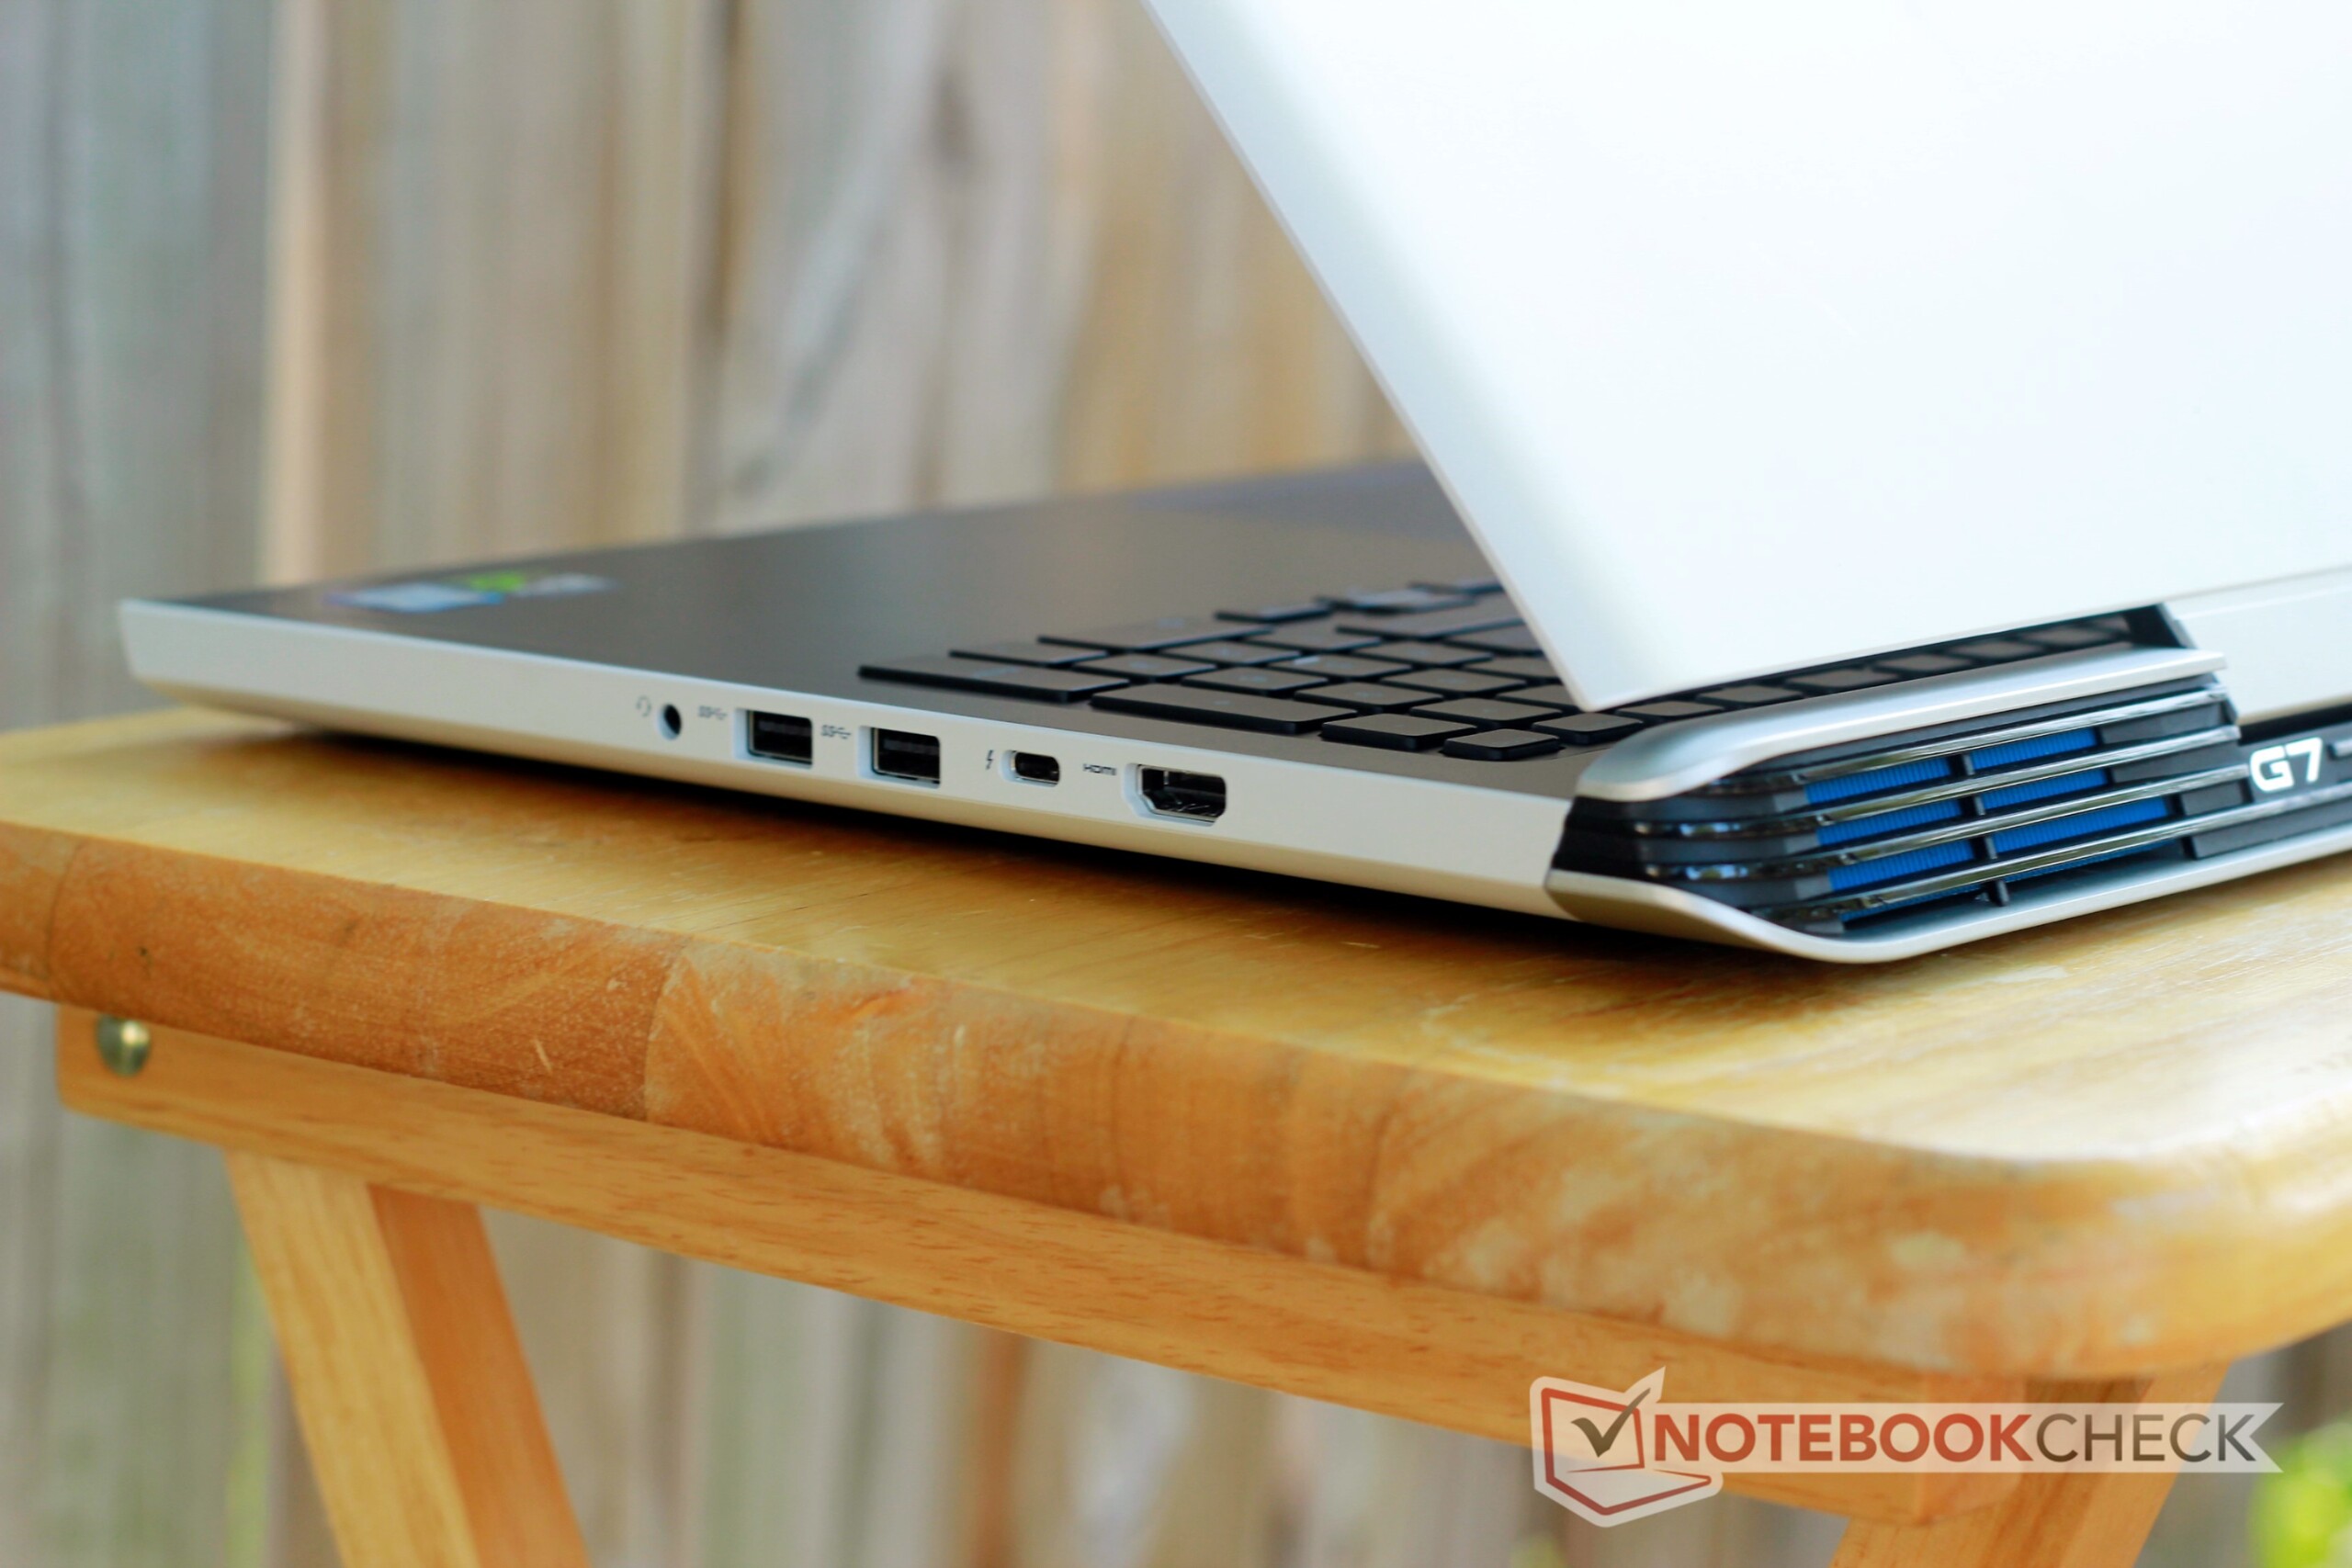
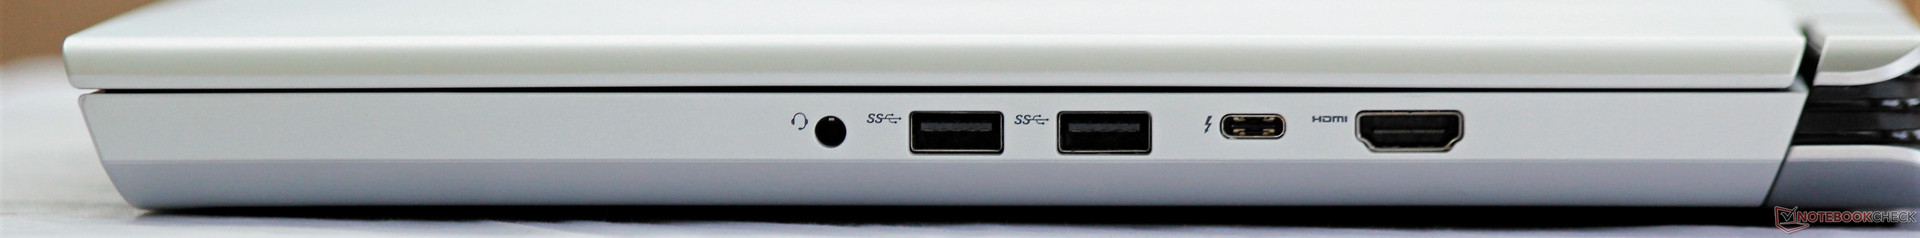
Port layout is a standout feature. The star of the show is the Thunderbolt 3-compatible USB Type-C port, something usually omitted at this price point. The remaining ports are well positioned and offer plenty of space, and the selection is varied. All the bases are covered: three USB ports, two display output (DisplayPort via Thunderbolt 3), and Ethernet are all available. There's not much more users could want.
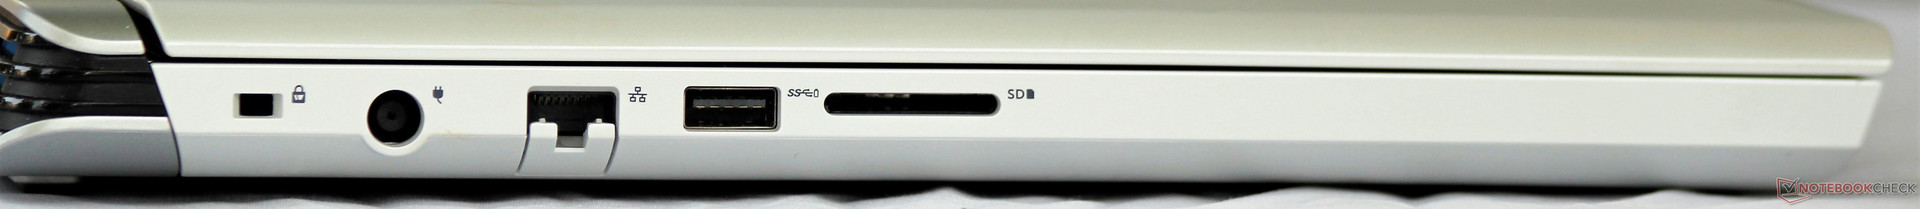
SD Card Reader
The card reader is disappointing. Transfer speeds are slow at about 20-30 MB/s. This isn't terribly surprising, as the Inspiron 15 7000 7577 had similar speeds, but the restricted speeds are still disheartening. To make matters worse, the reader is half-sized, which means half the card will stick out. Professionals that rely on SD cards will want to steer clear of the G7.
| SD Card Reader | |
| average JPG Copy Test (av. of 3 runs) | |
| Average of class Gaming (20.9 - 210, n=54, last 2 years) | |
| Asus FX503VM-EH73 (Toshiba Exceria Pro SDXC 64 GB UHS-II) | |
| Acer Predator Helios 300 PH317-52-51M6 (Toshiba Exceria Pro SDXC 64 GB UHS-II) | |
| HP Omen 15t-ce000 (Toshiba Exceria Pro SDXC 64 GB UHS-II) | |
| Dell Inspiron 15 7000 7577 (Toshiba Exceria Pro SDXC 64 GB UHS-II) | |
| Dell G7 15-7588 (Toshiba Exceria Pro SDXC 64 GB UHS-II) | |
| maximum AS SSD Seq Read Test (1GB) | |
| Average of class Gaming (25.5 - 261, n=51, last 2 years) | |
| HP Omen 15t-ce000 (Toshiba Exceria Pro SDXC 64 GB UHS-II) | |
| Asus FX503VM-EH73 (Toshiba Exceria Pro SDXC 64 GB UHS-II) | |
| Acer Predator Helios 300 PH317-52-51M6 (Toshiba Exceria Pro SDXC 64 GB UHS-II) | |
| Dell G7 15-7588 (Toshiba Exceria Pro SDXC 64 GB UHS-II) | |
| Dell Inspiron 15 7000 7577 (Toshiba Exceria Pro SDXC 64 GB UHS-II) | |
Communication
Wireless speeds are good. The Intel 9560 wireless card has become fairly common among Coffee Lake-based laptops and with good reason. Transmit and receive speeds hover around 650 MBit/s, and connections are reliable with no hiccups or drops.
Maintenance & Warranty
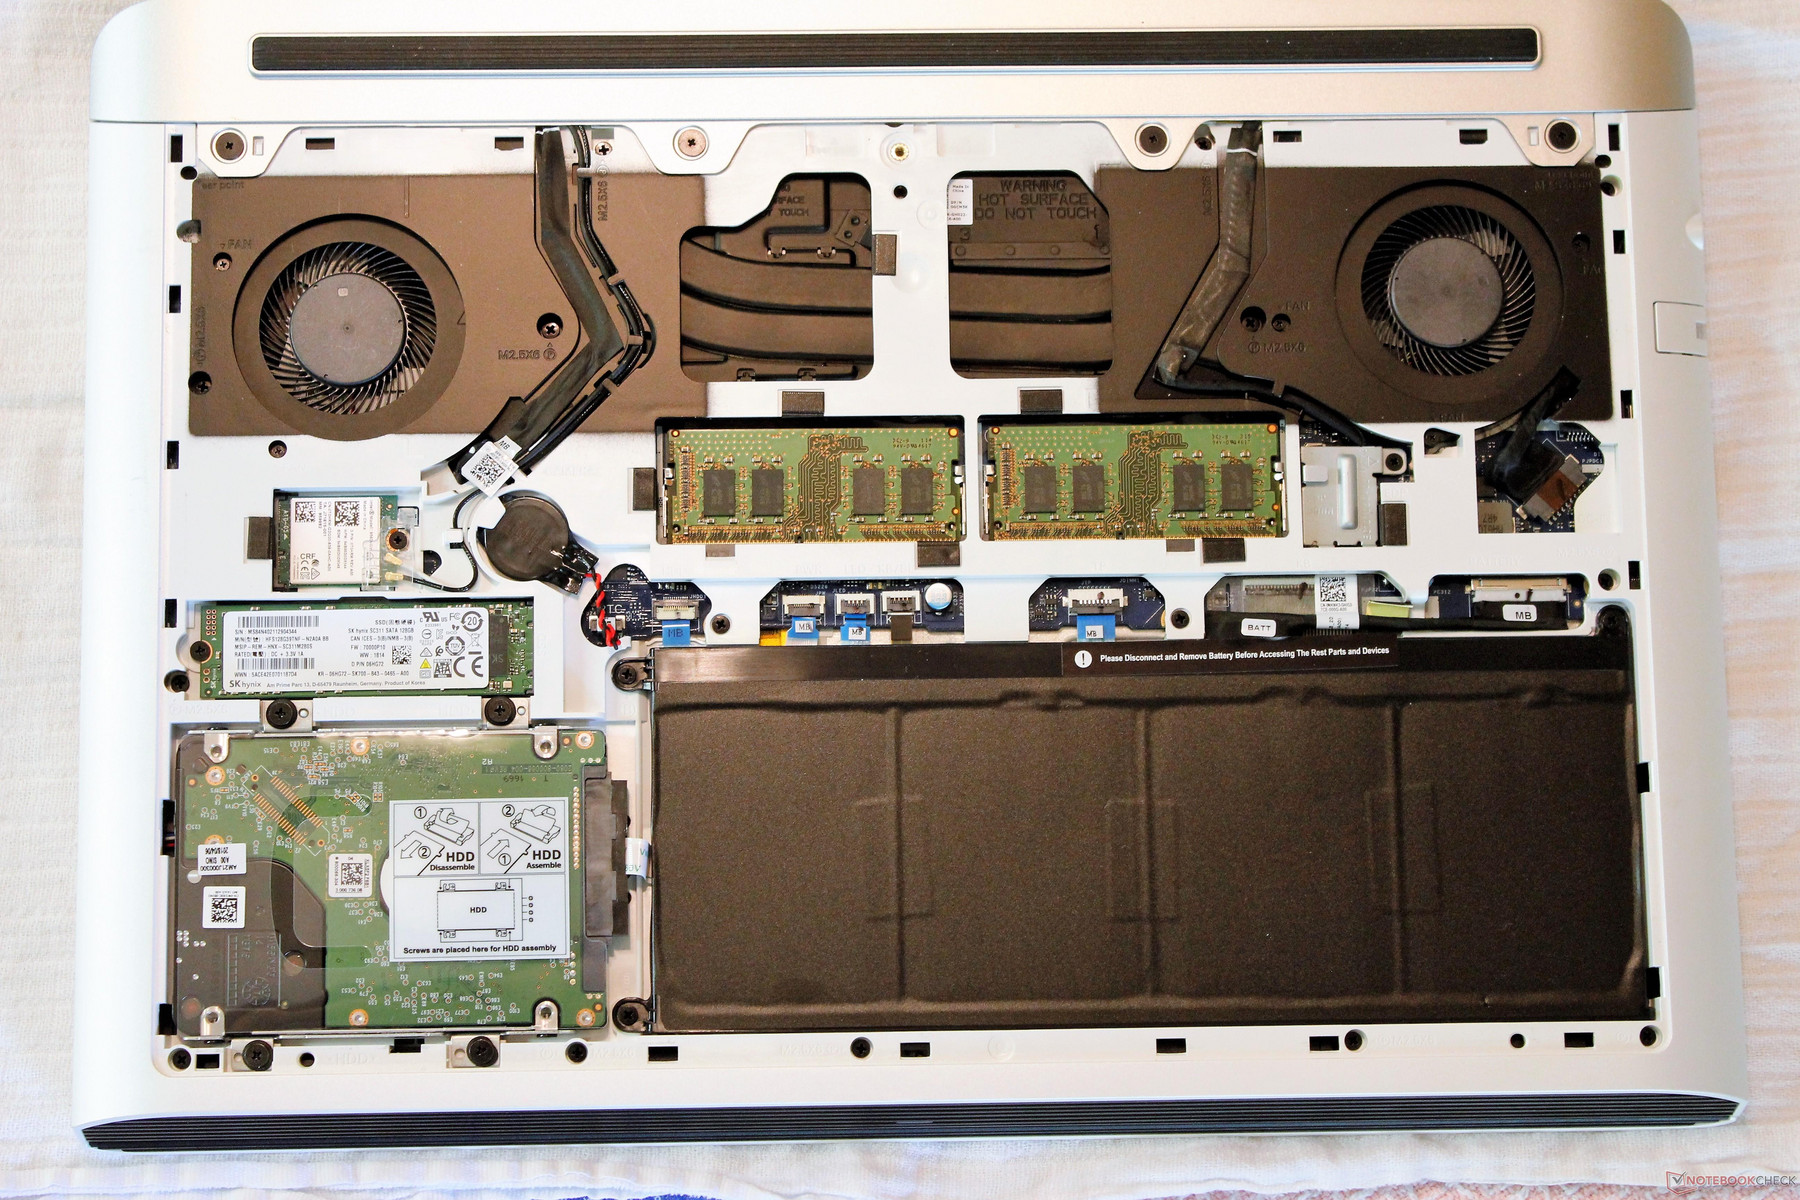
One of the highest points of Dell's Inspiron 15 7000 series was maintenance, and that story continues here. A single screw and several plastic clips are all that hold the bottom panel in place, and these are easily disengaged. Once inside, users will have access to almost everything; the fans, wireless card, both RAM DIMMs, and storage are all readily available. The only components that require further disassembly to access are the CPU and GPU, both of which are soldered. DIYers that want to repaste the silicon have their work cut out for them.
Dell offers a standard 12-month warranty with the G7.
Input Devices
Keyboard
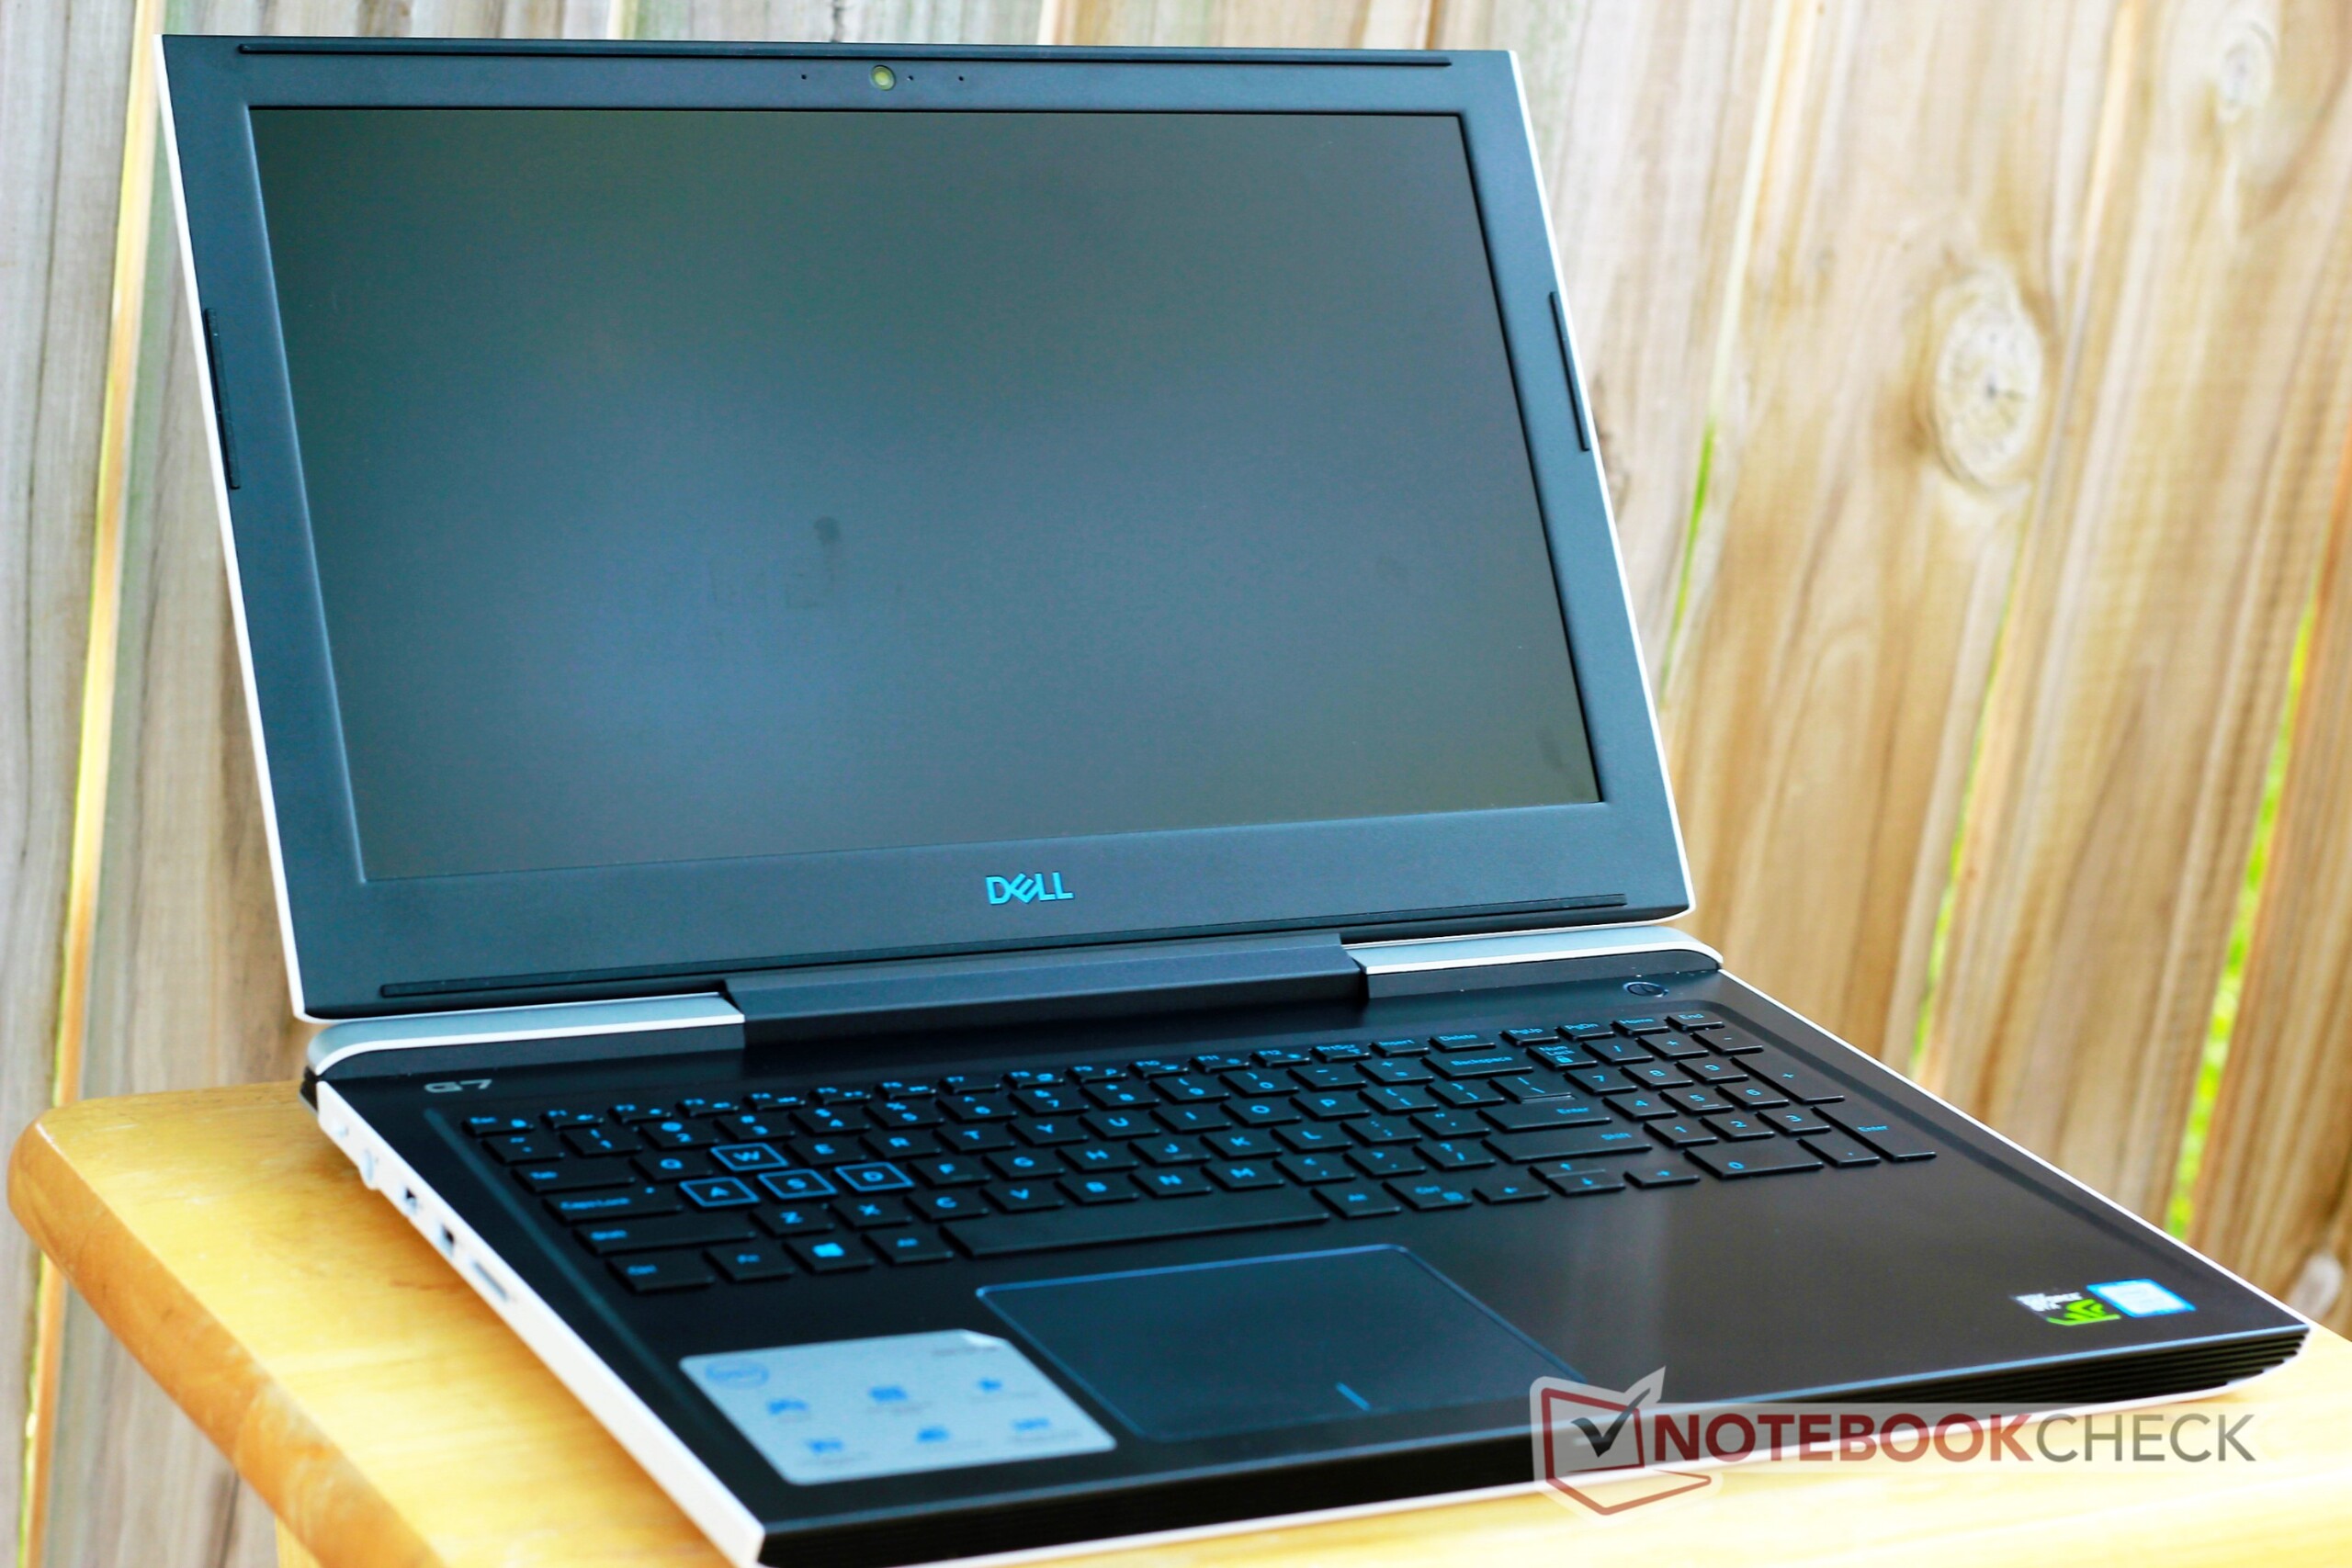
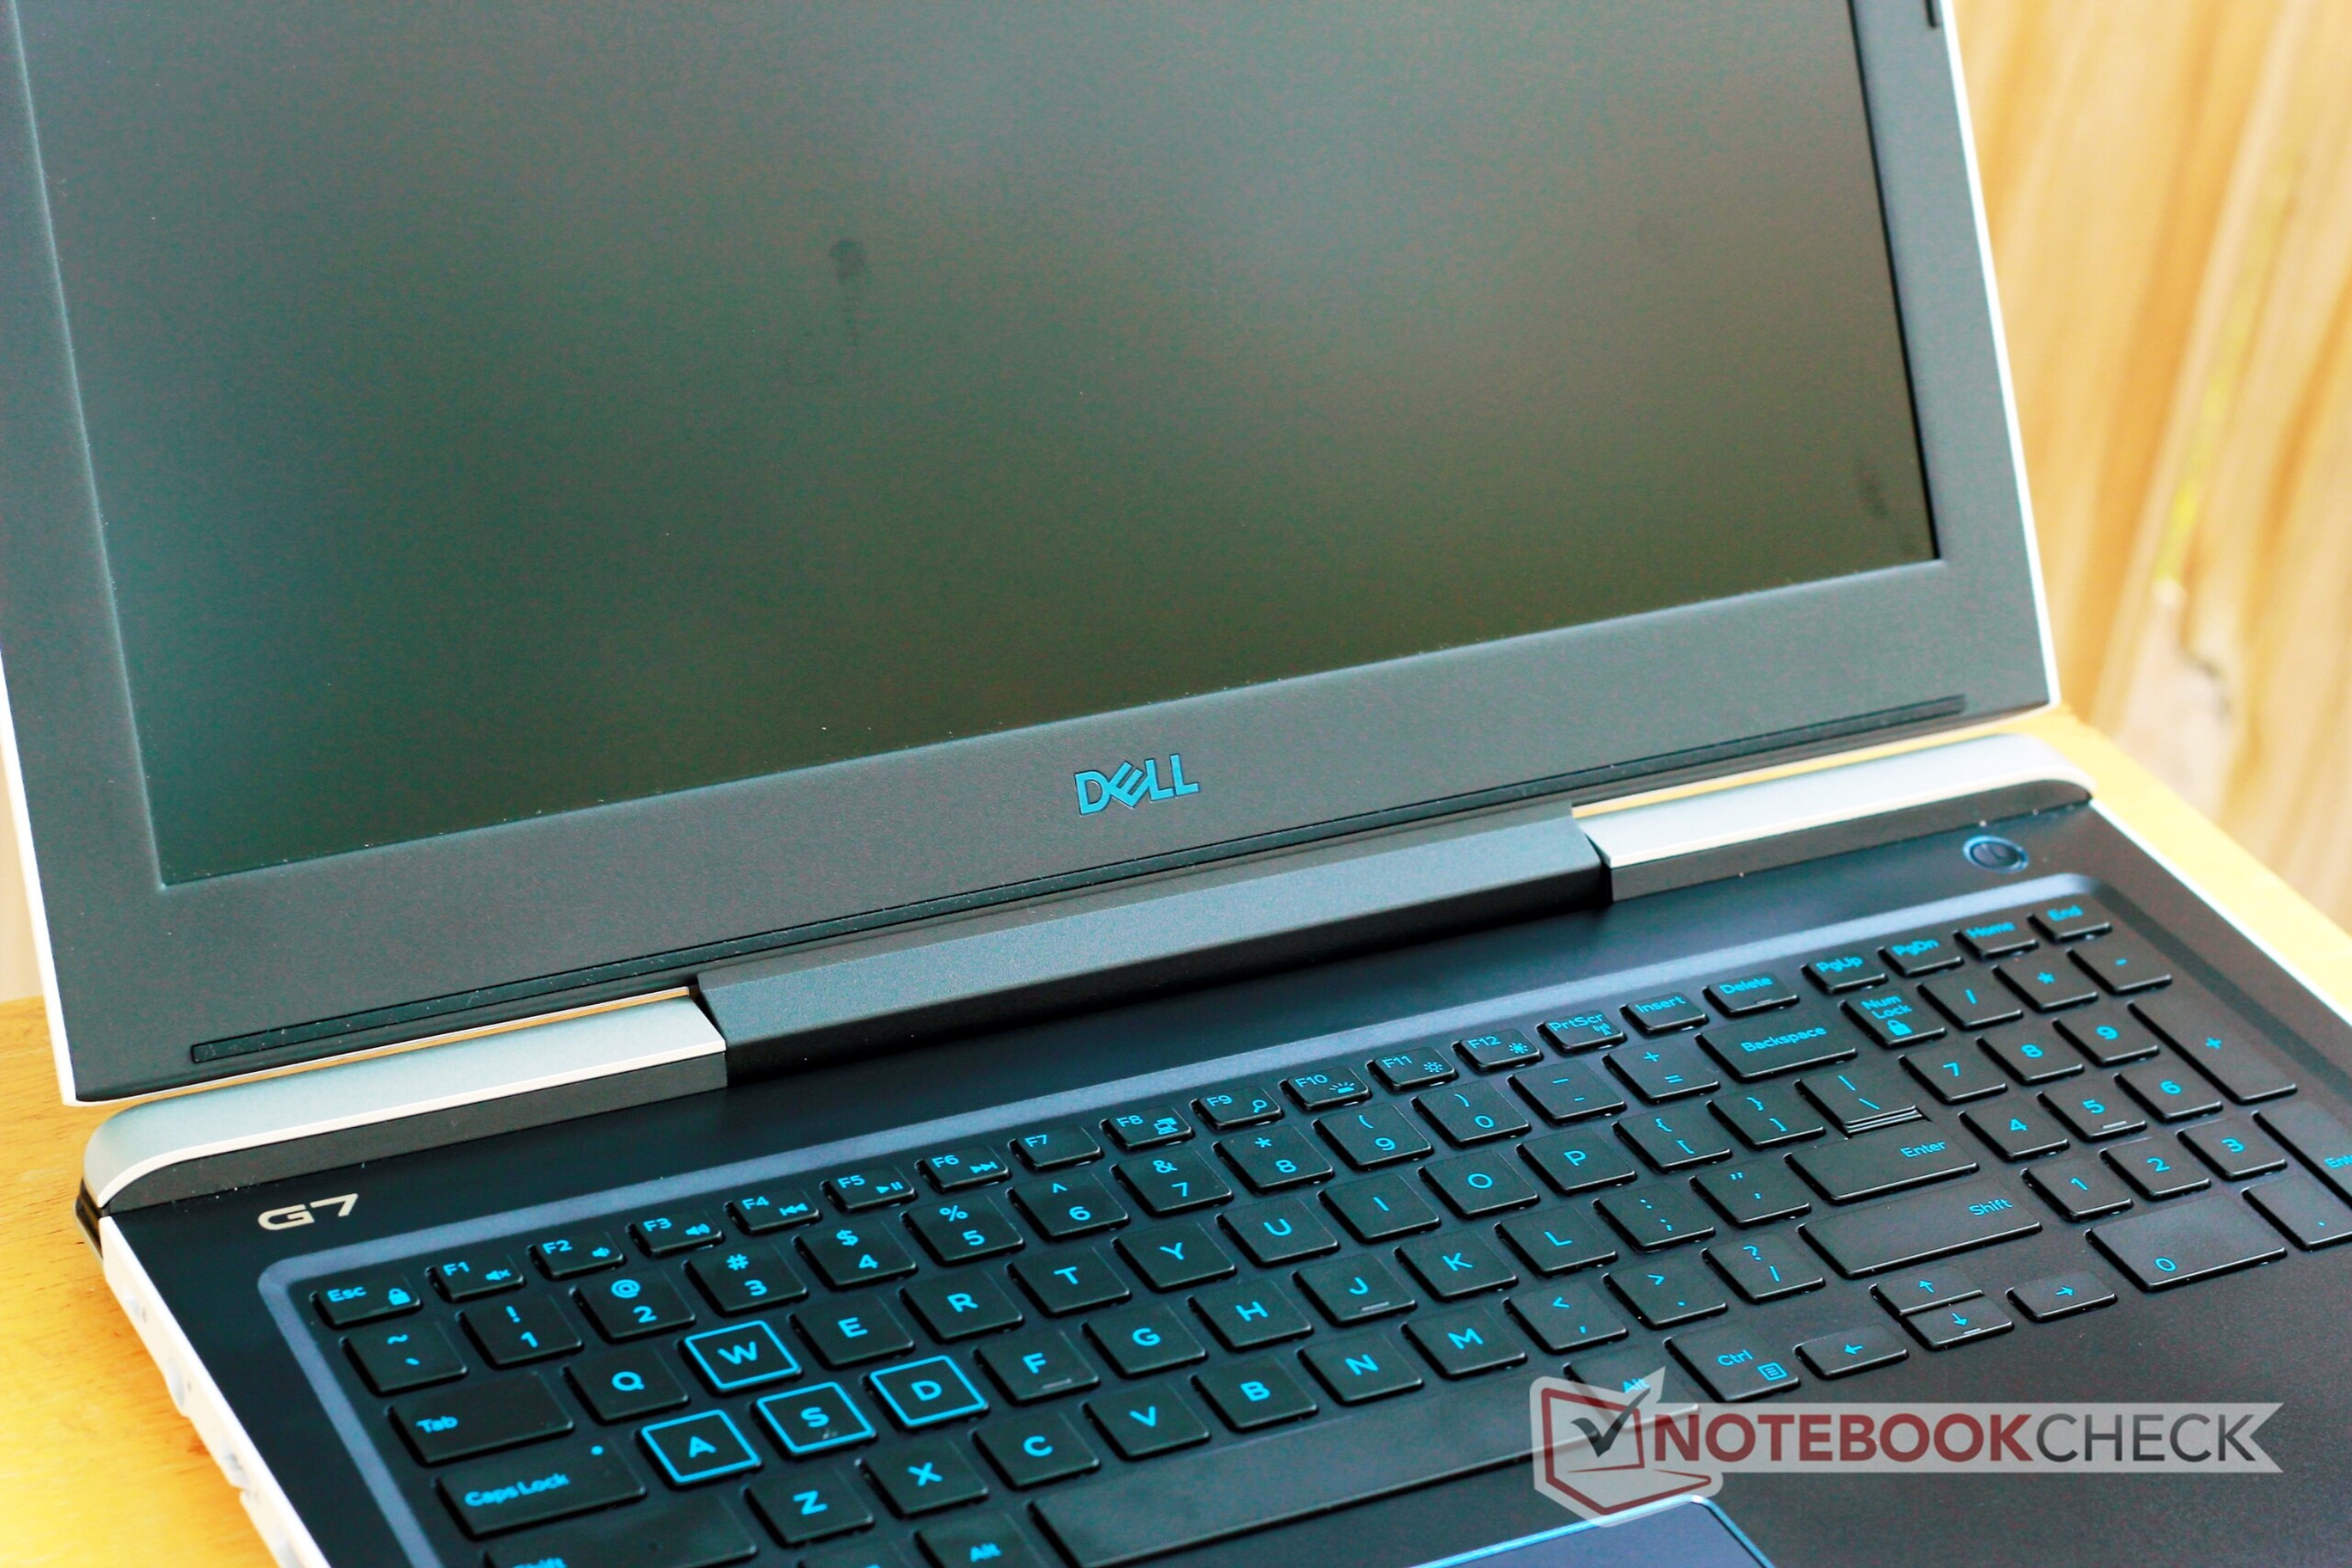
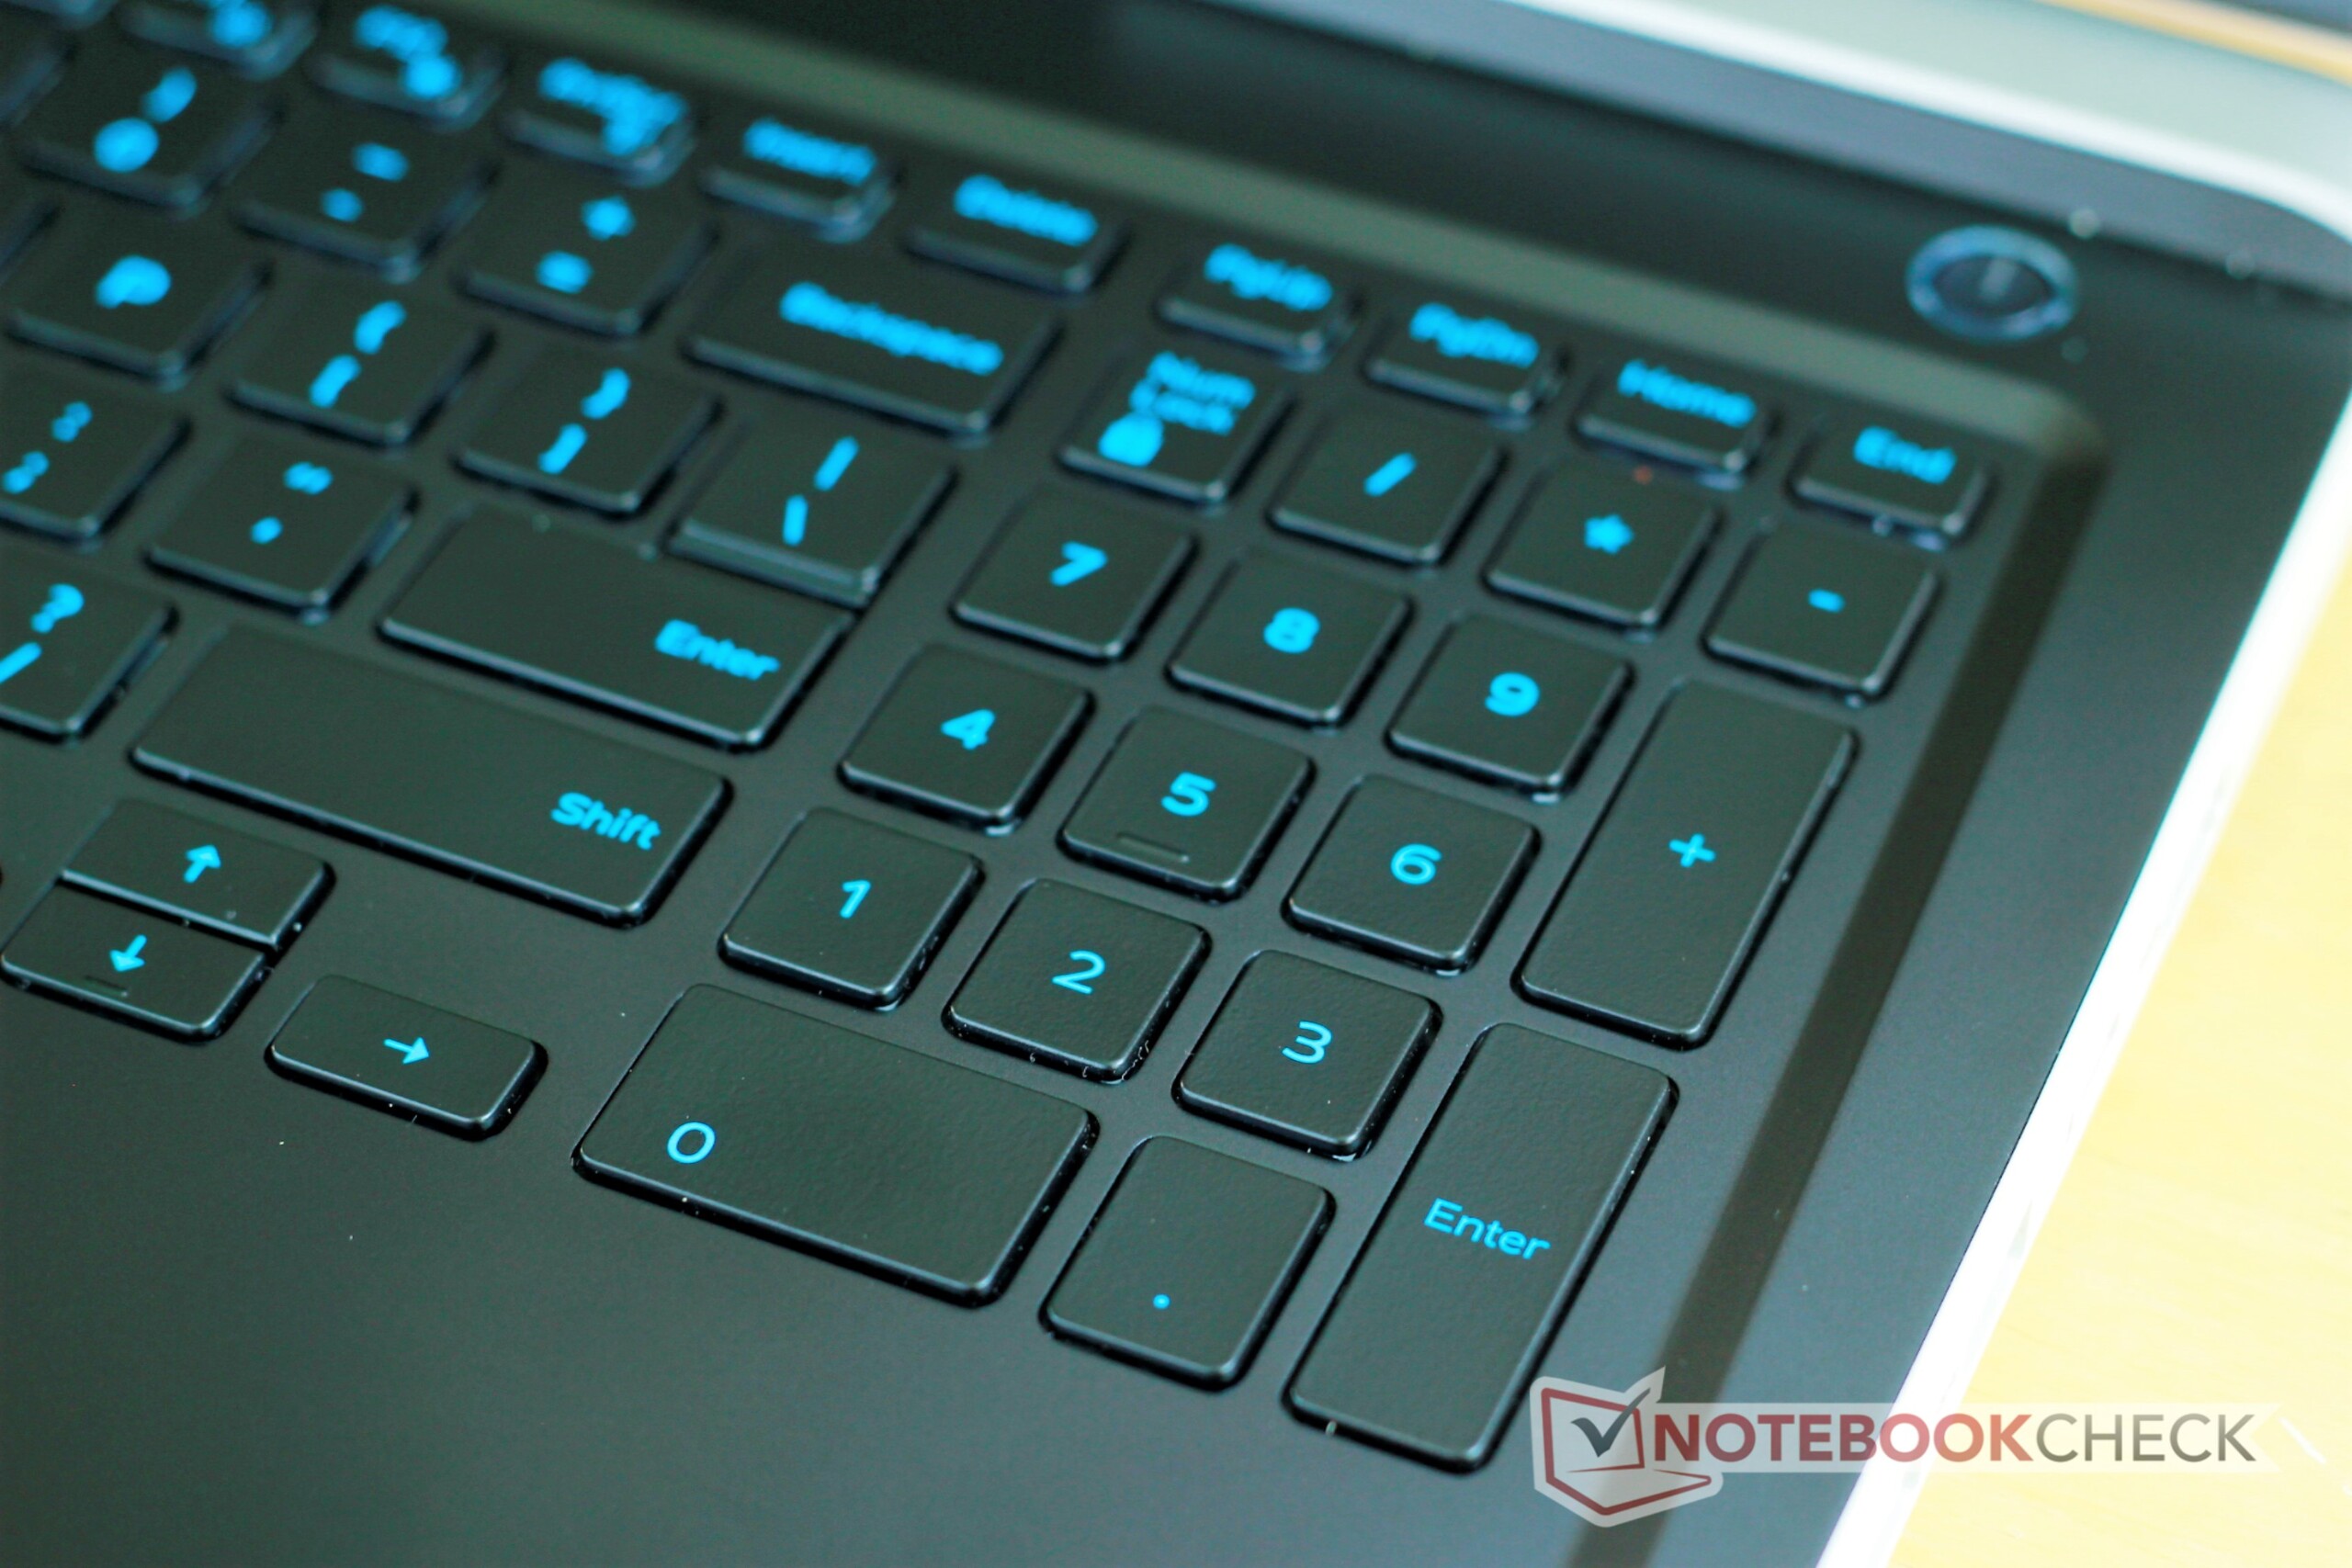
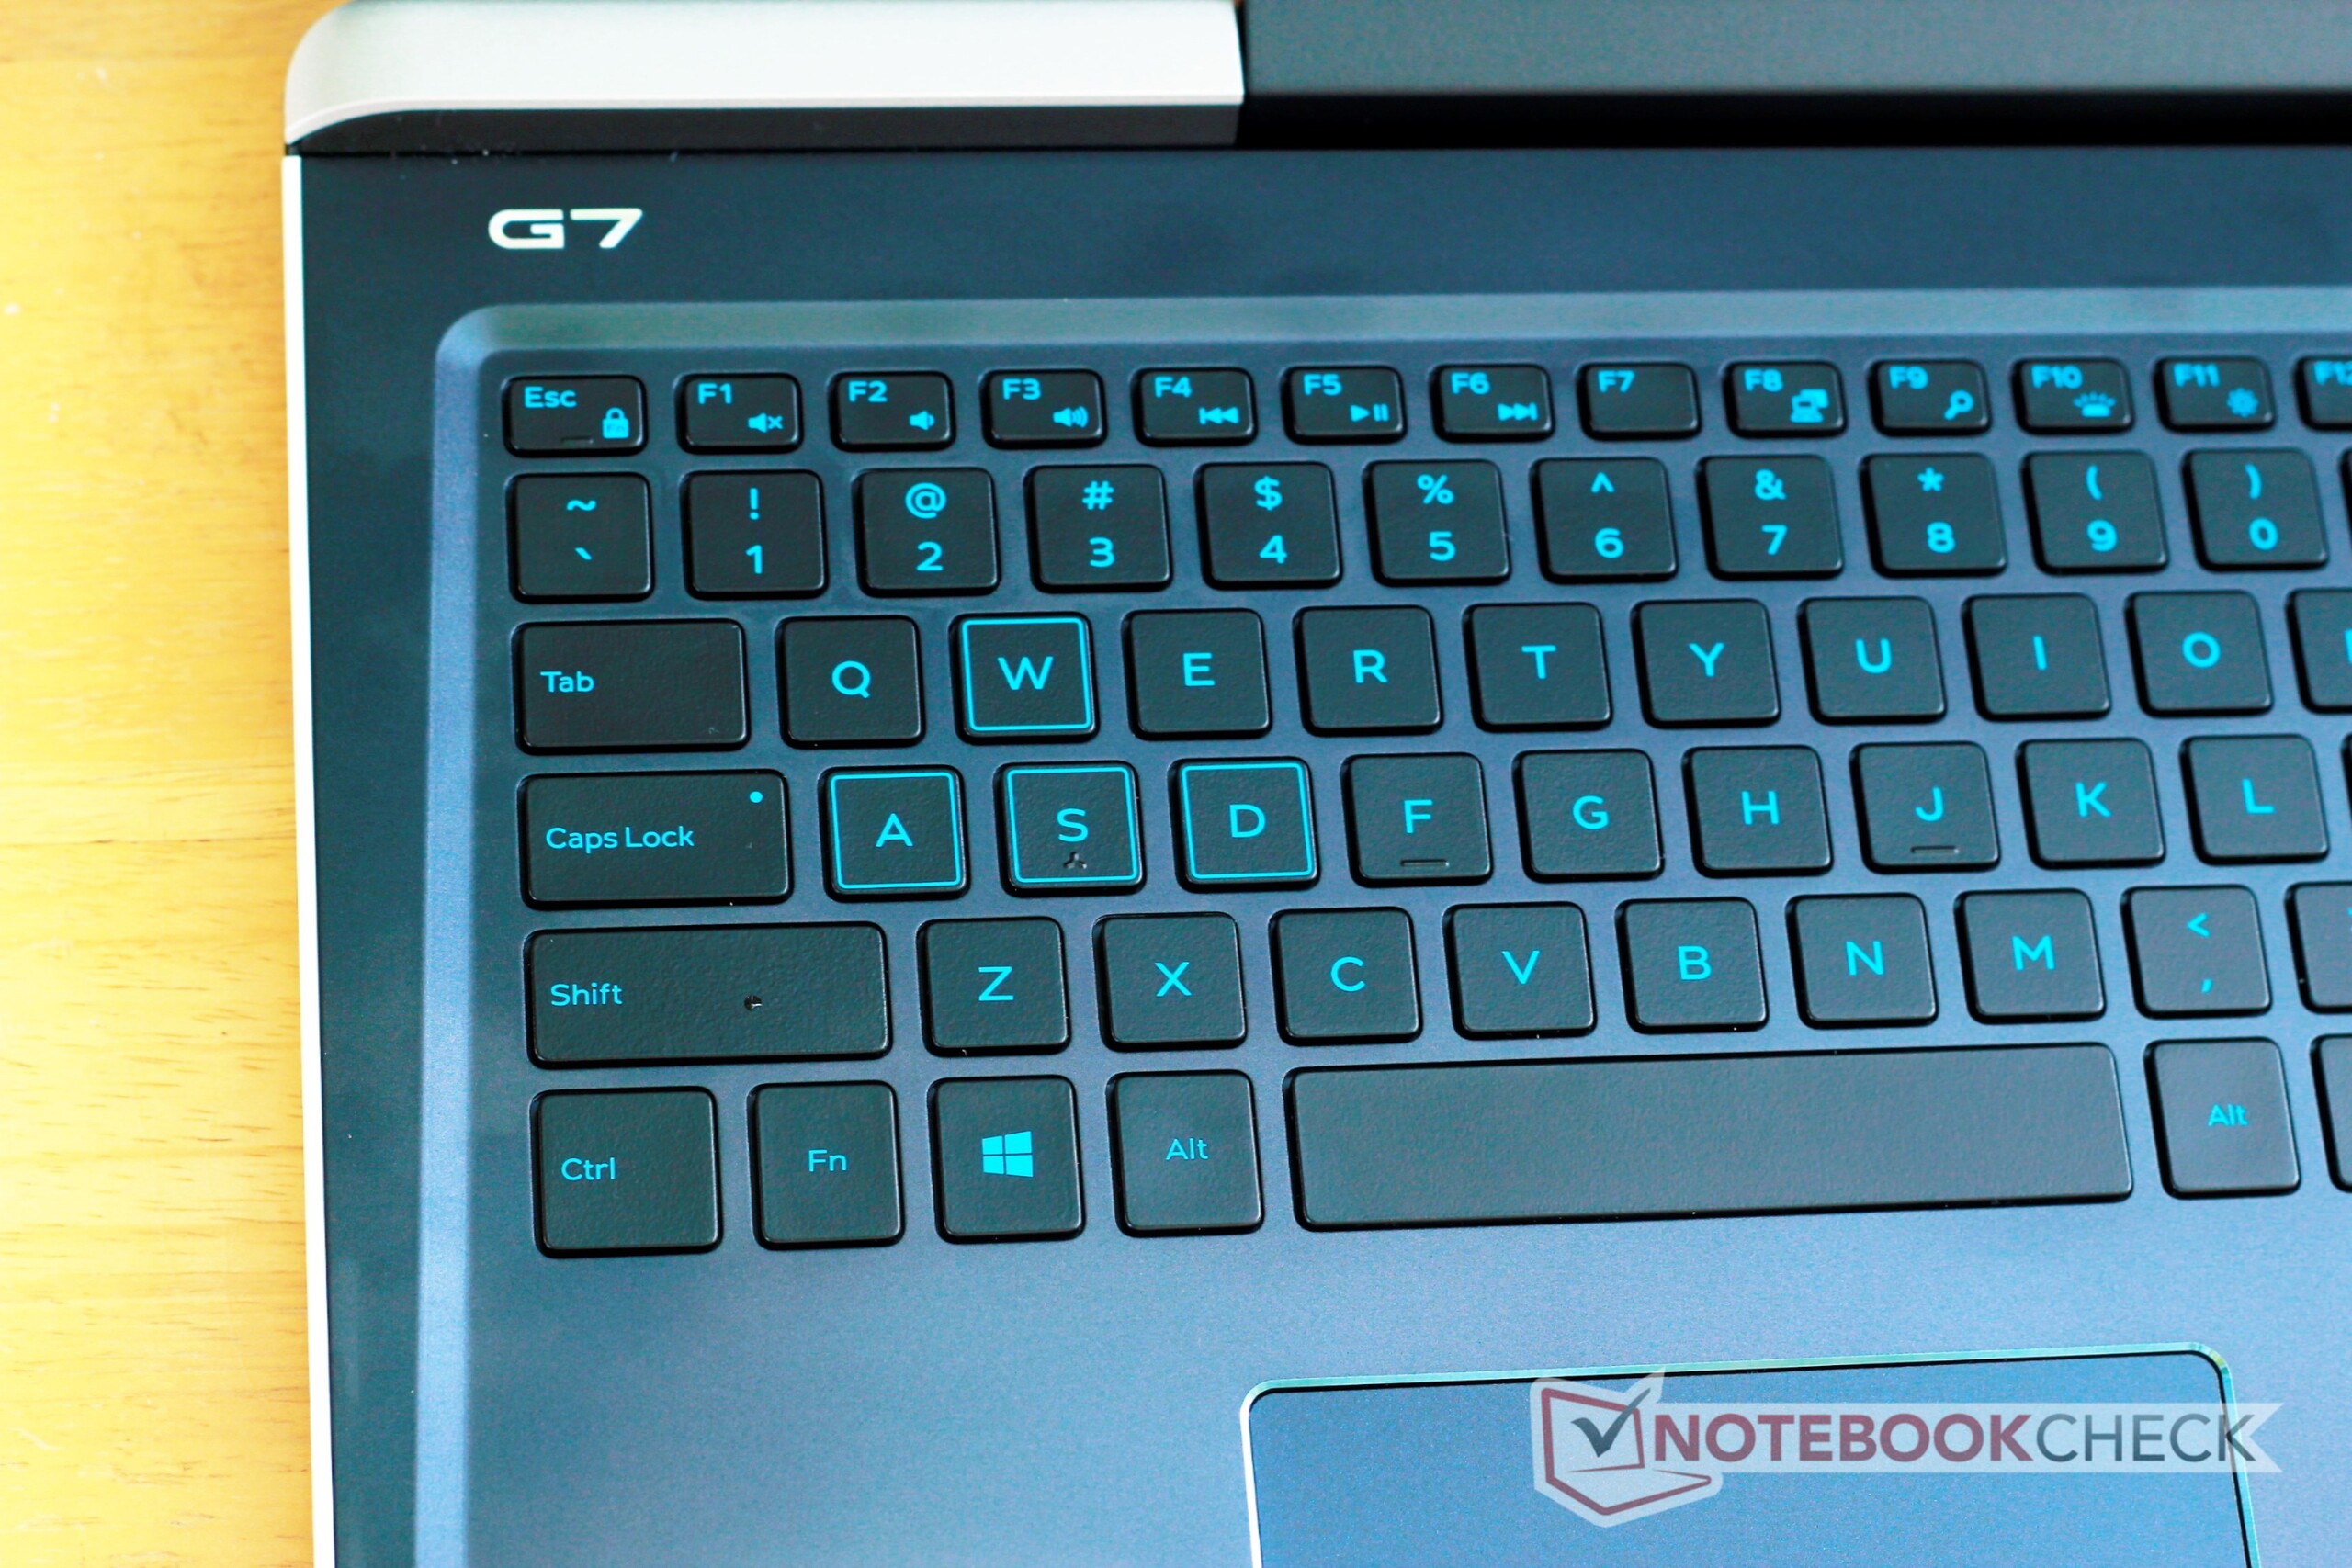
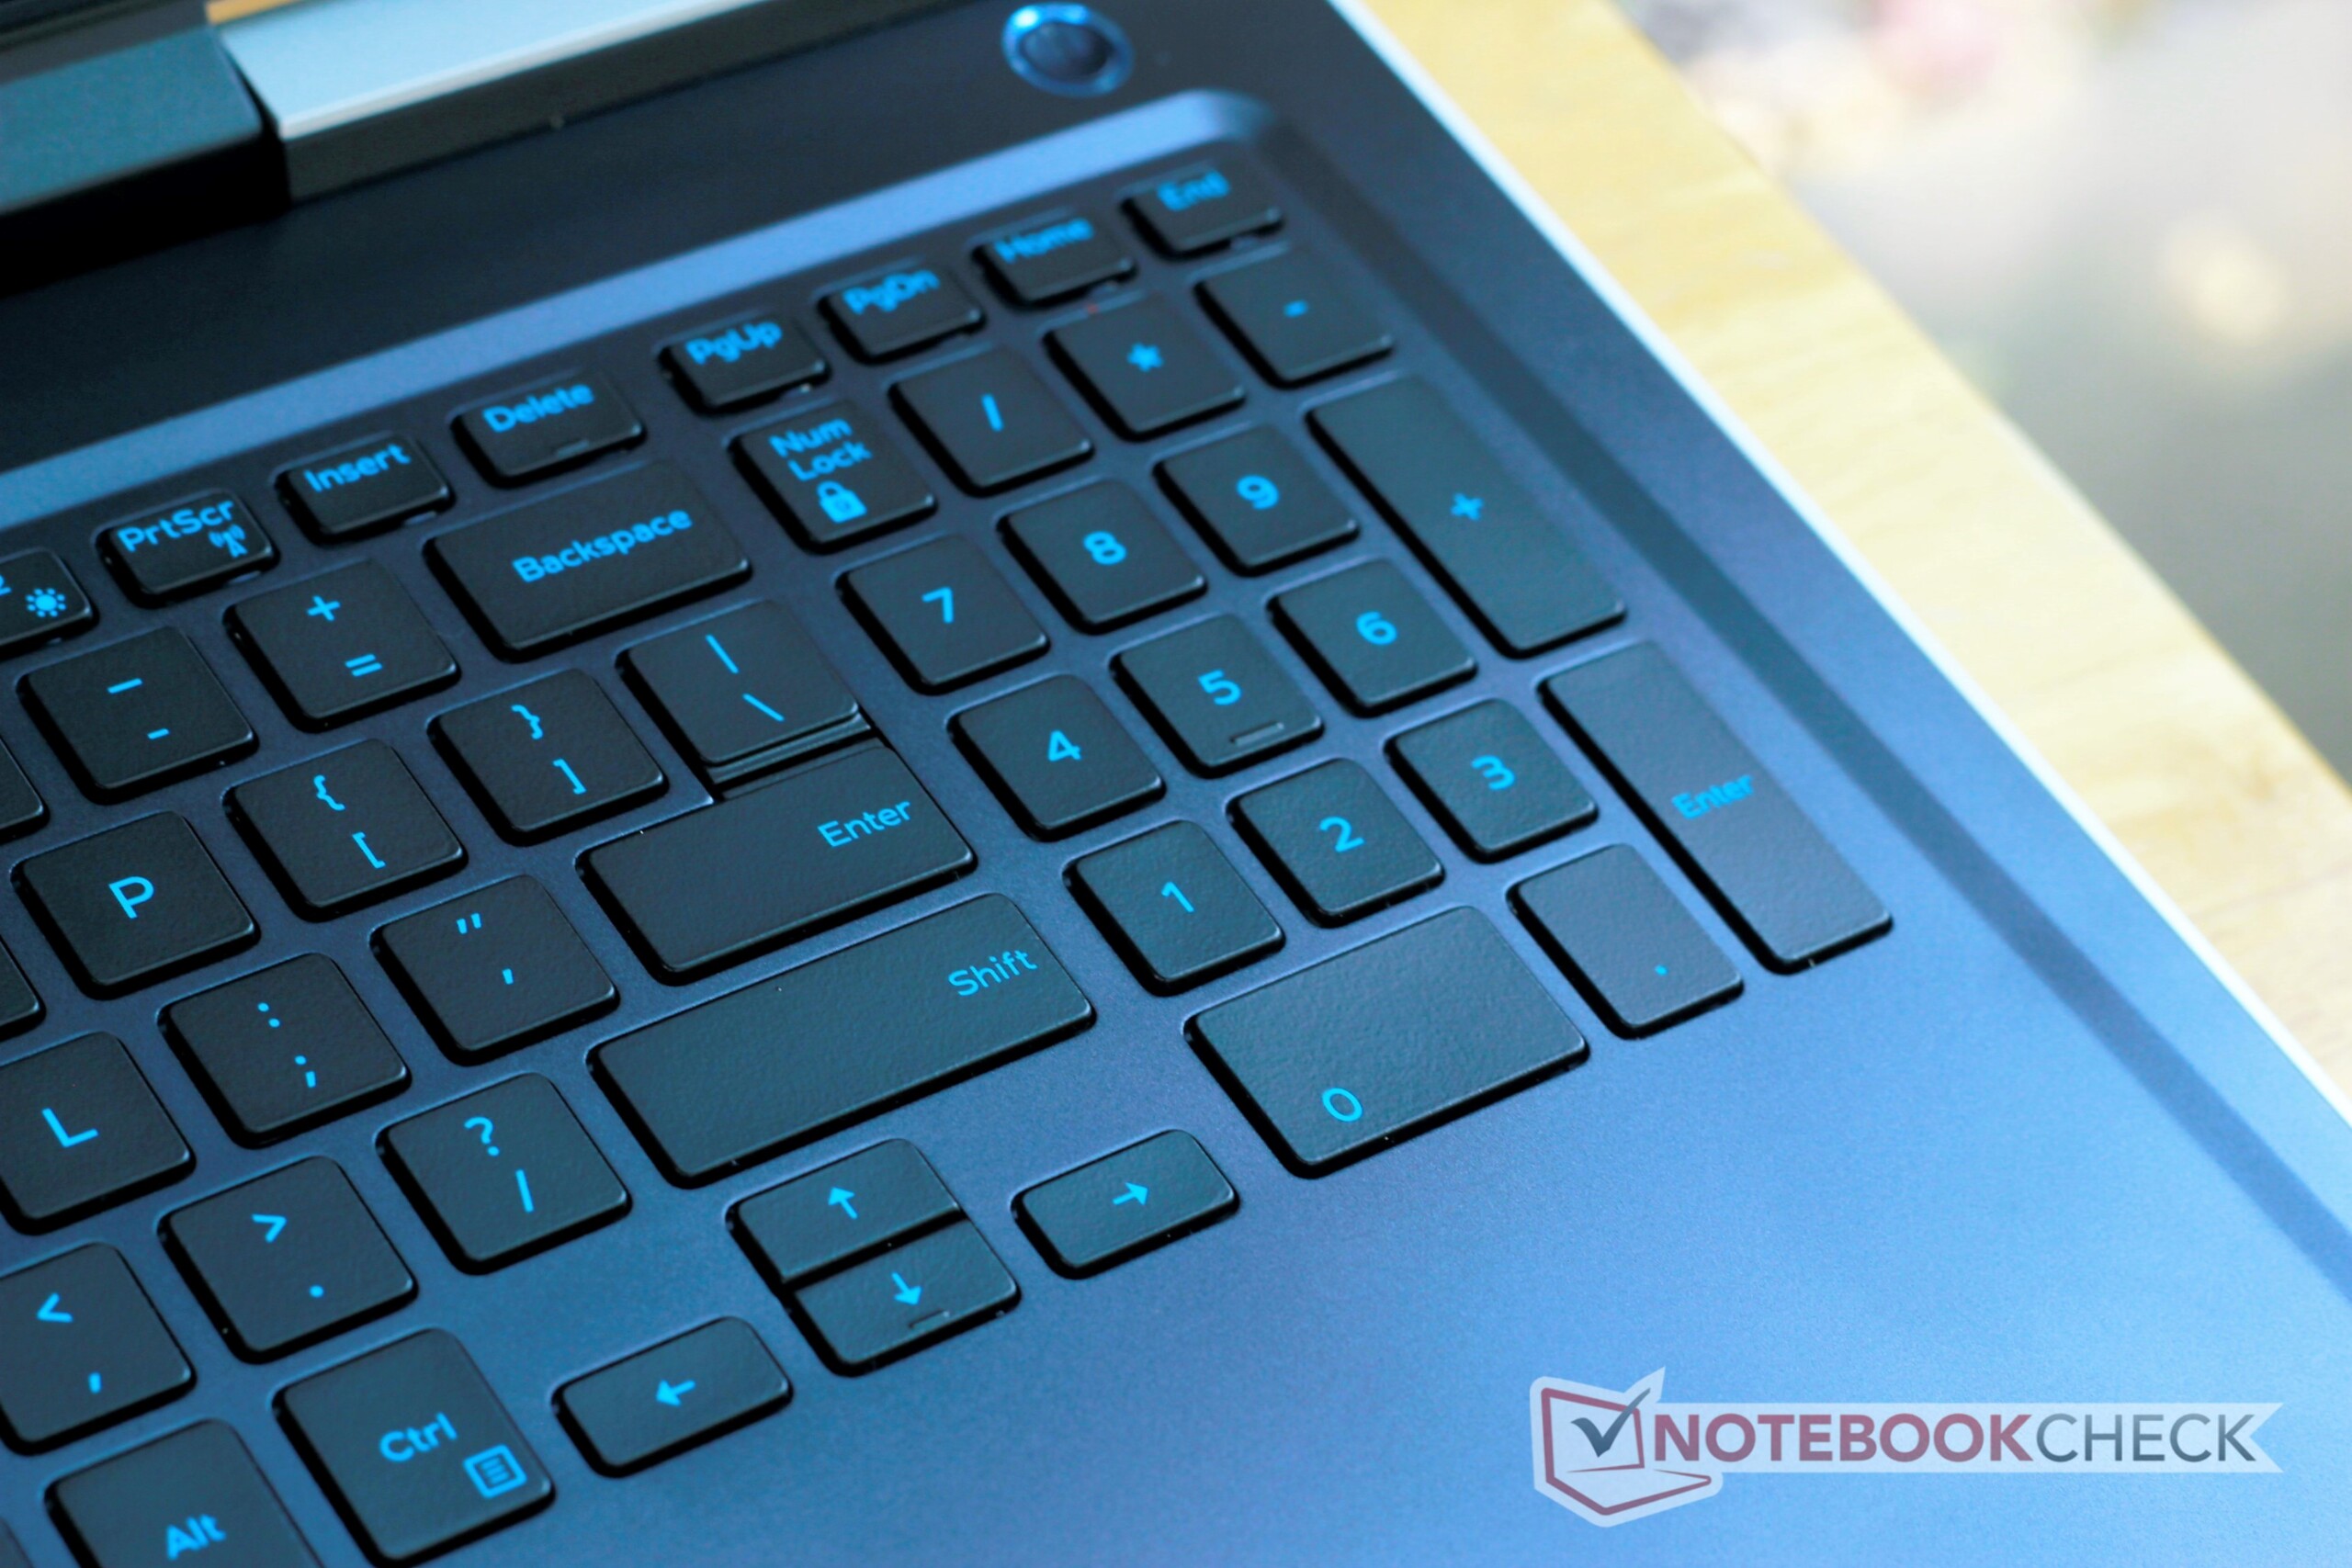
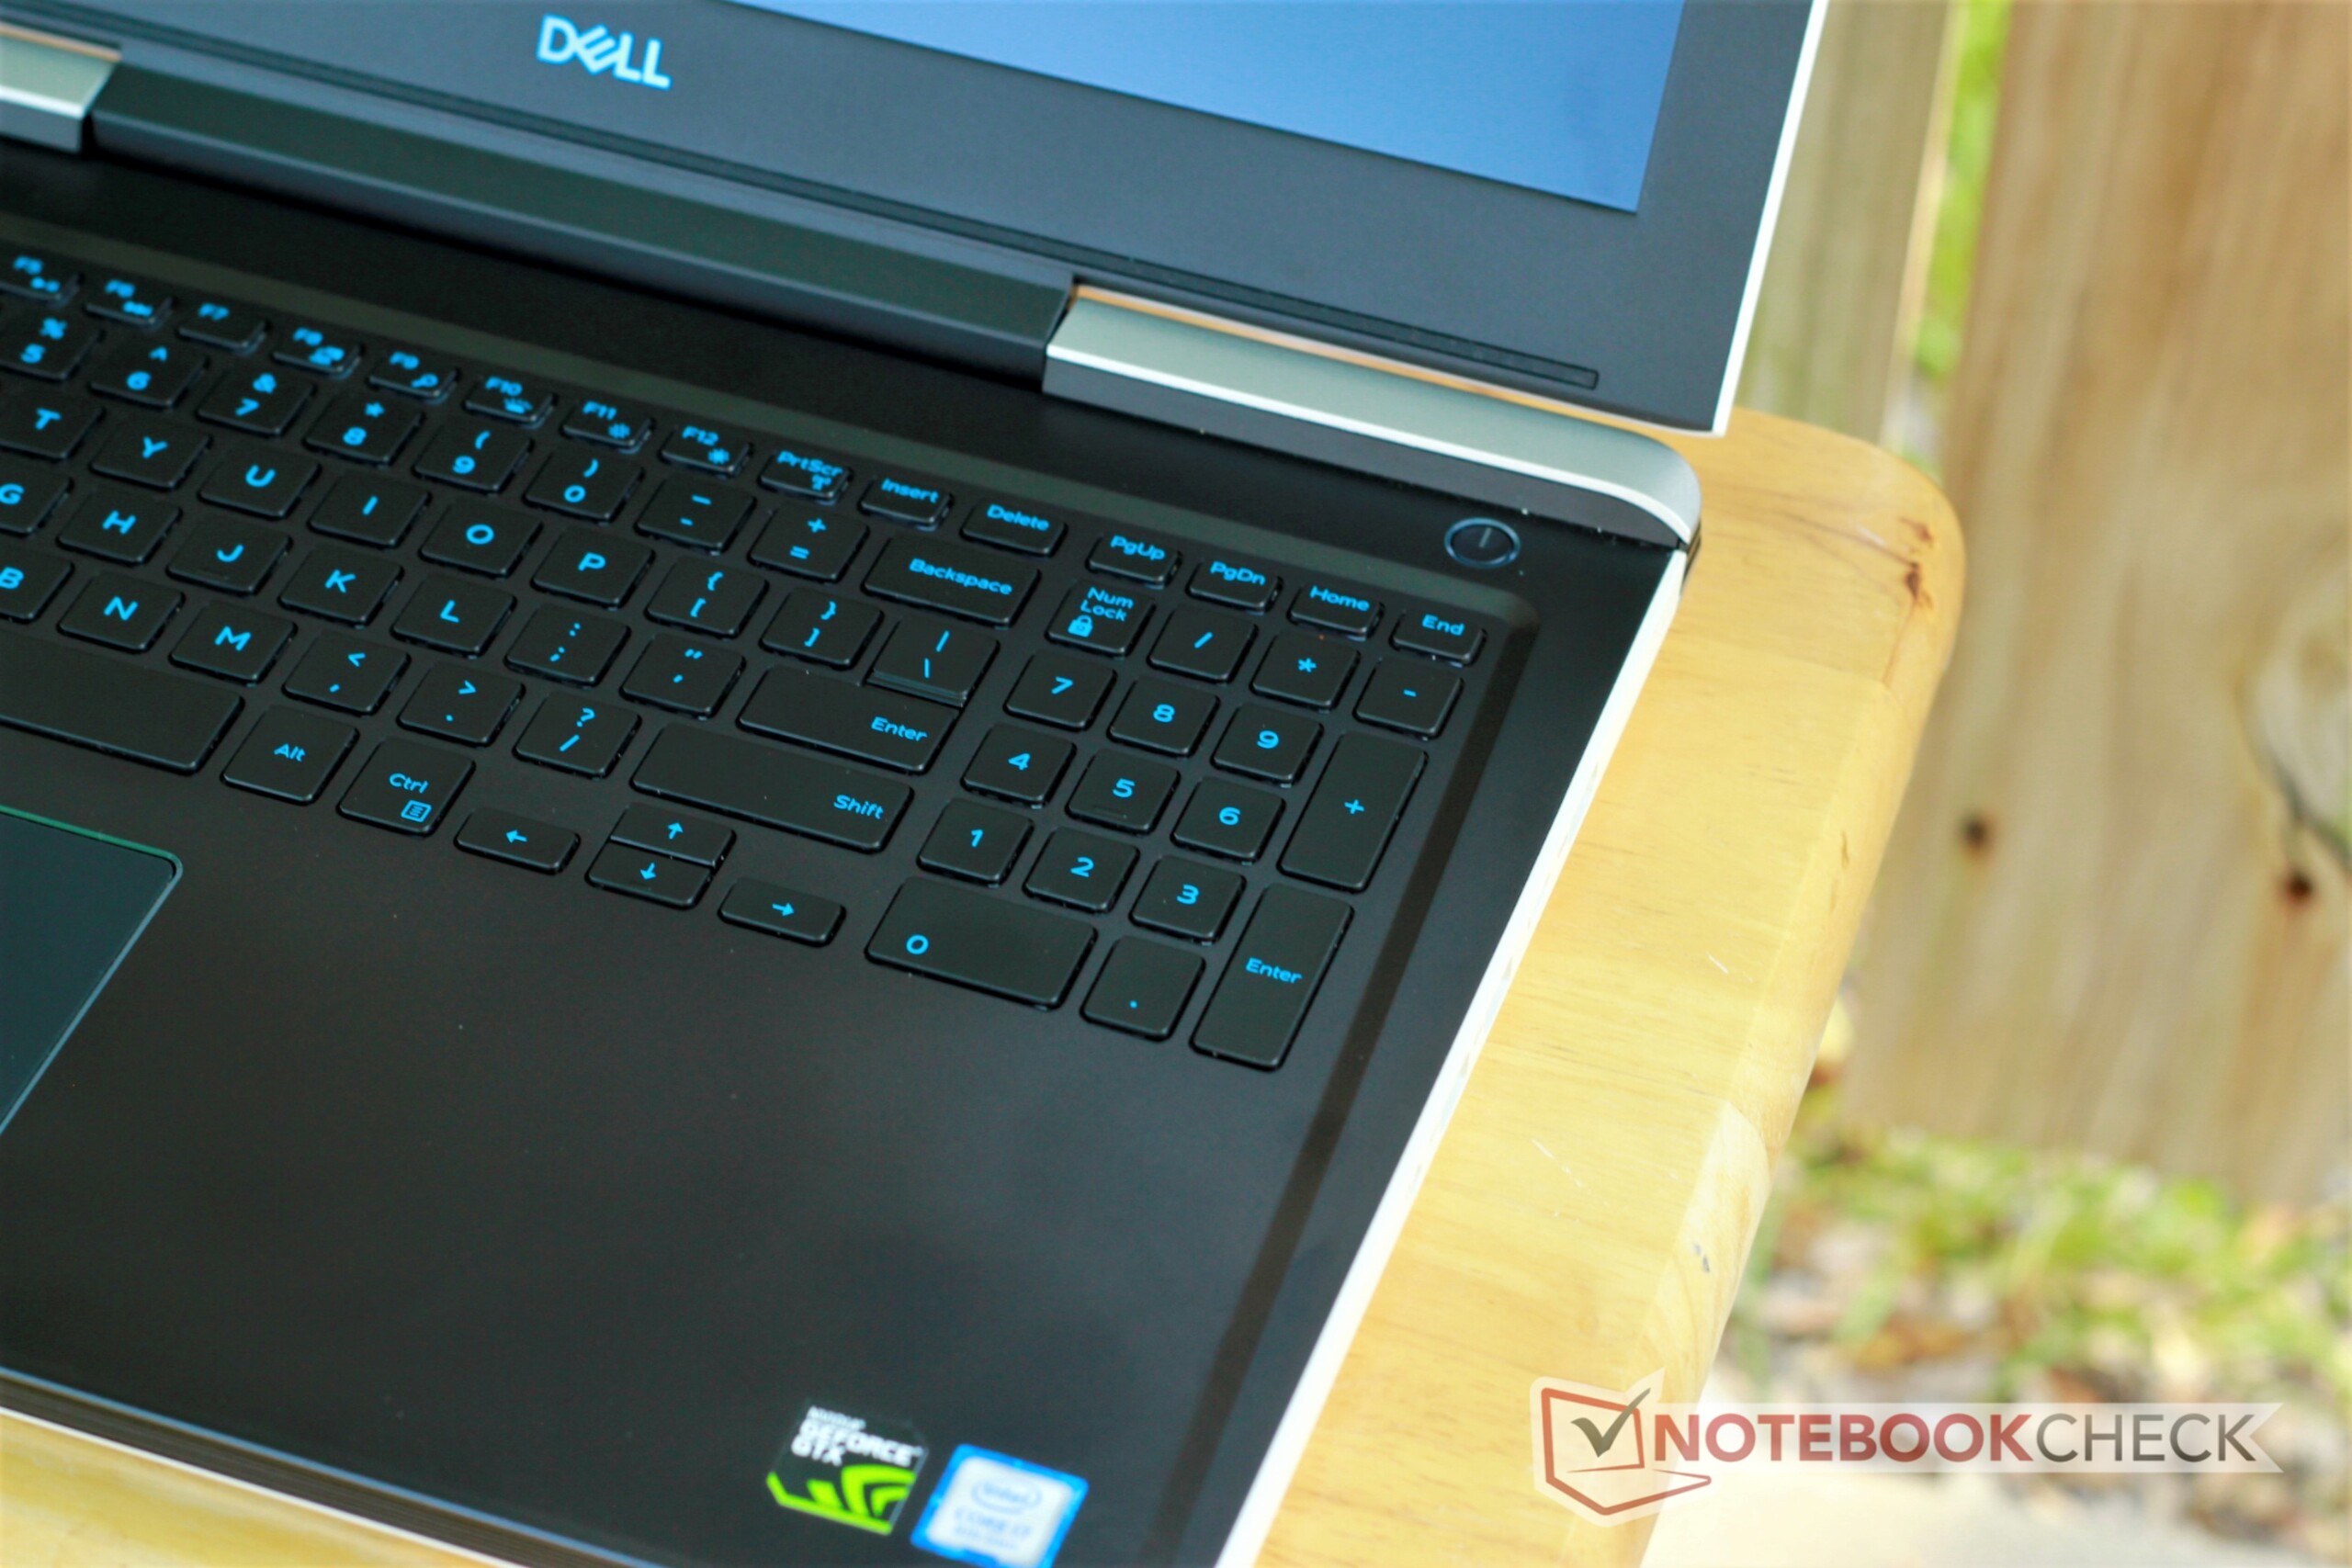
The keyboard is best described as passable. The keys are small (15 mm x 15 mm) and don't offer much in the way of travel (1.4 mm). Feedback feels spongy, and the plastic keycaps feel flat and cheap. Typing generates a small amount of noise. The space bar, in particular, is clacky. The half-sized arrow keys are small and, just as with the Inspiron 15 7000 7577, feel like an afterthought.
The two-stage backlight on our model glows blue underneath the keys, adding to the aesthetic. The backlight looks nice in most environments but is piercing in dark rooms. The blue lettering contrasts nicely with the black keycaps. The gray model uses a red backlight.
Touchpad
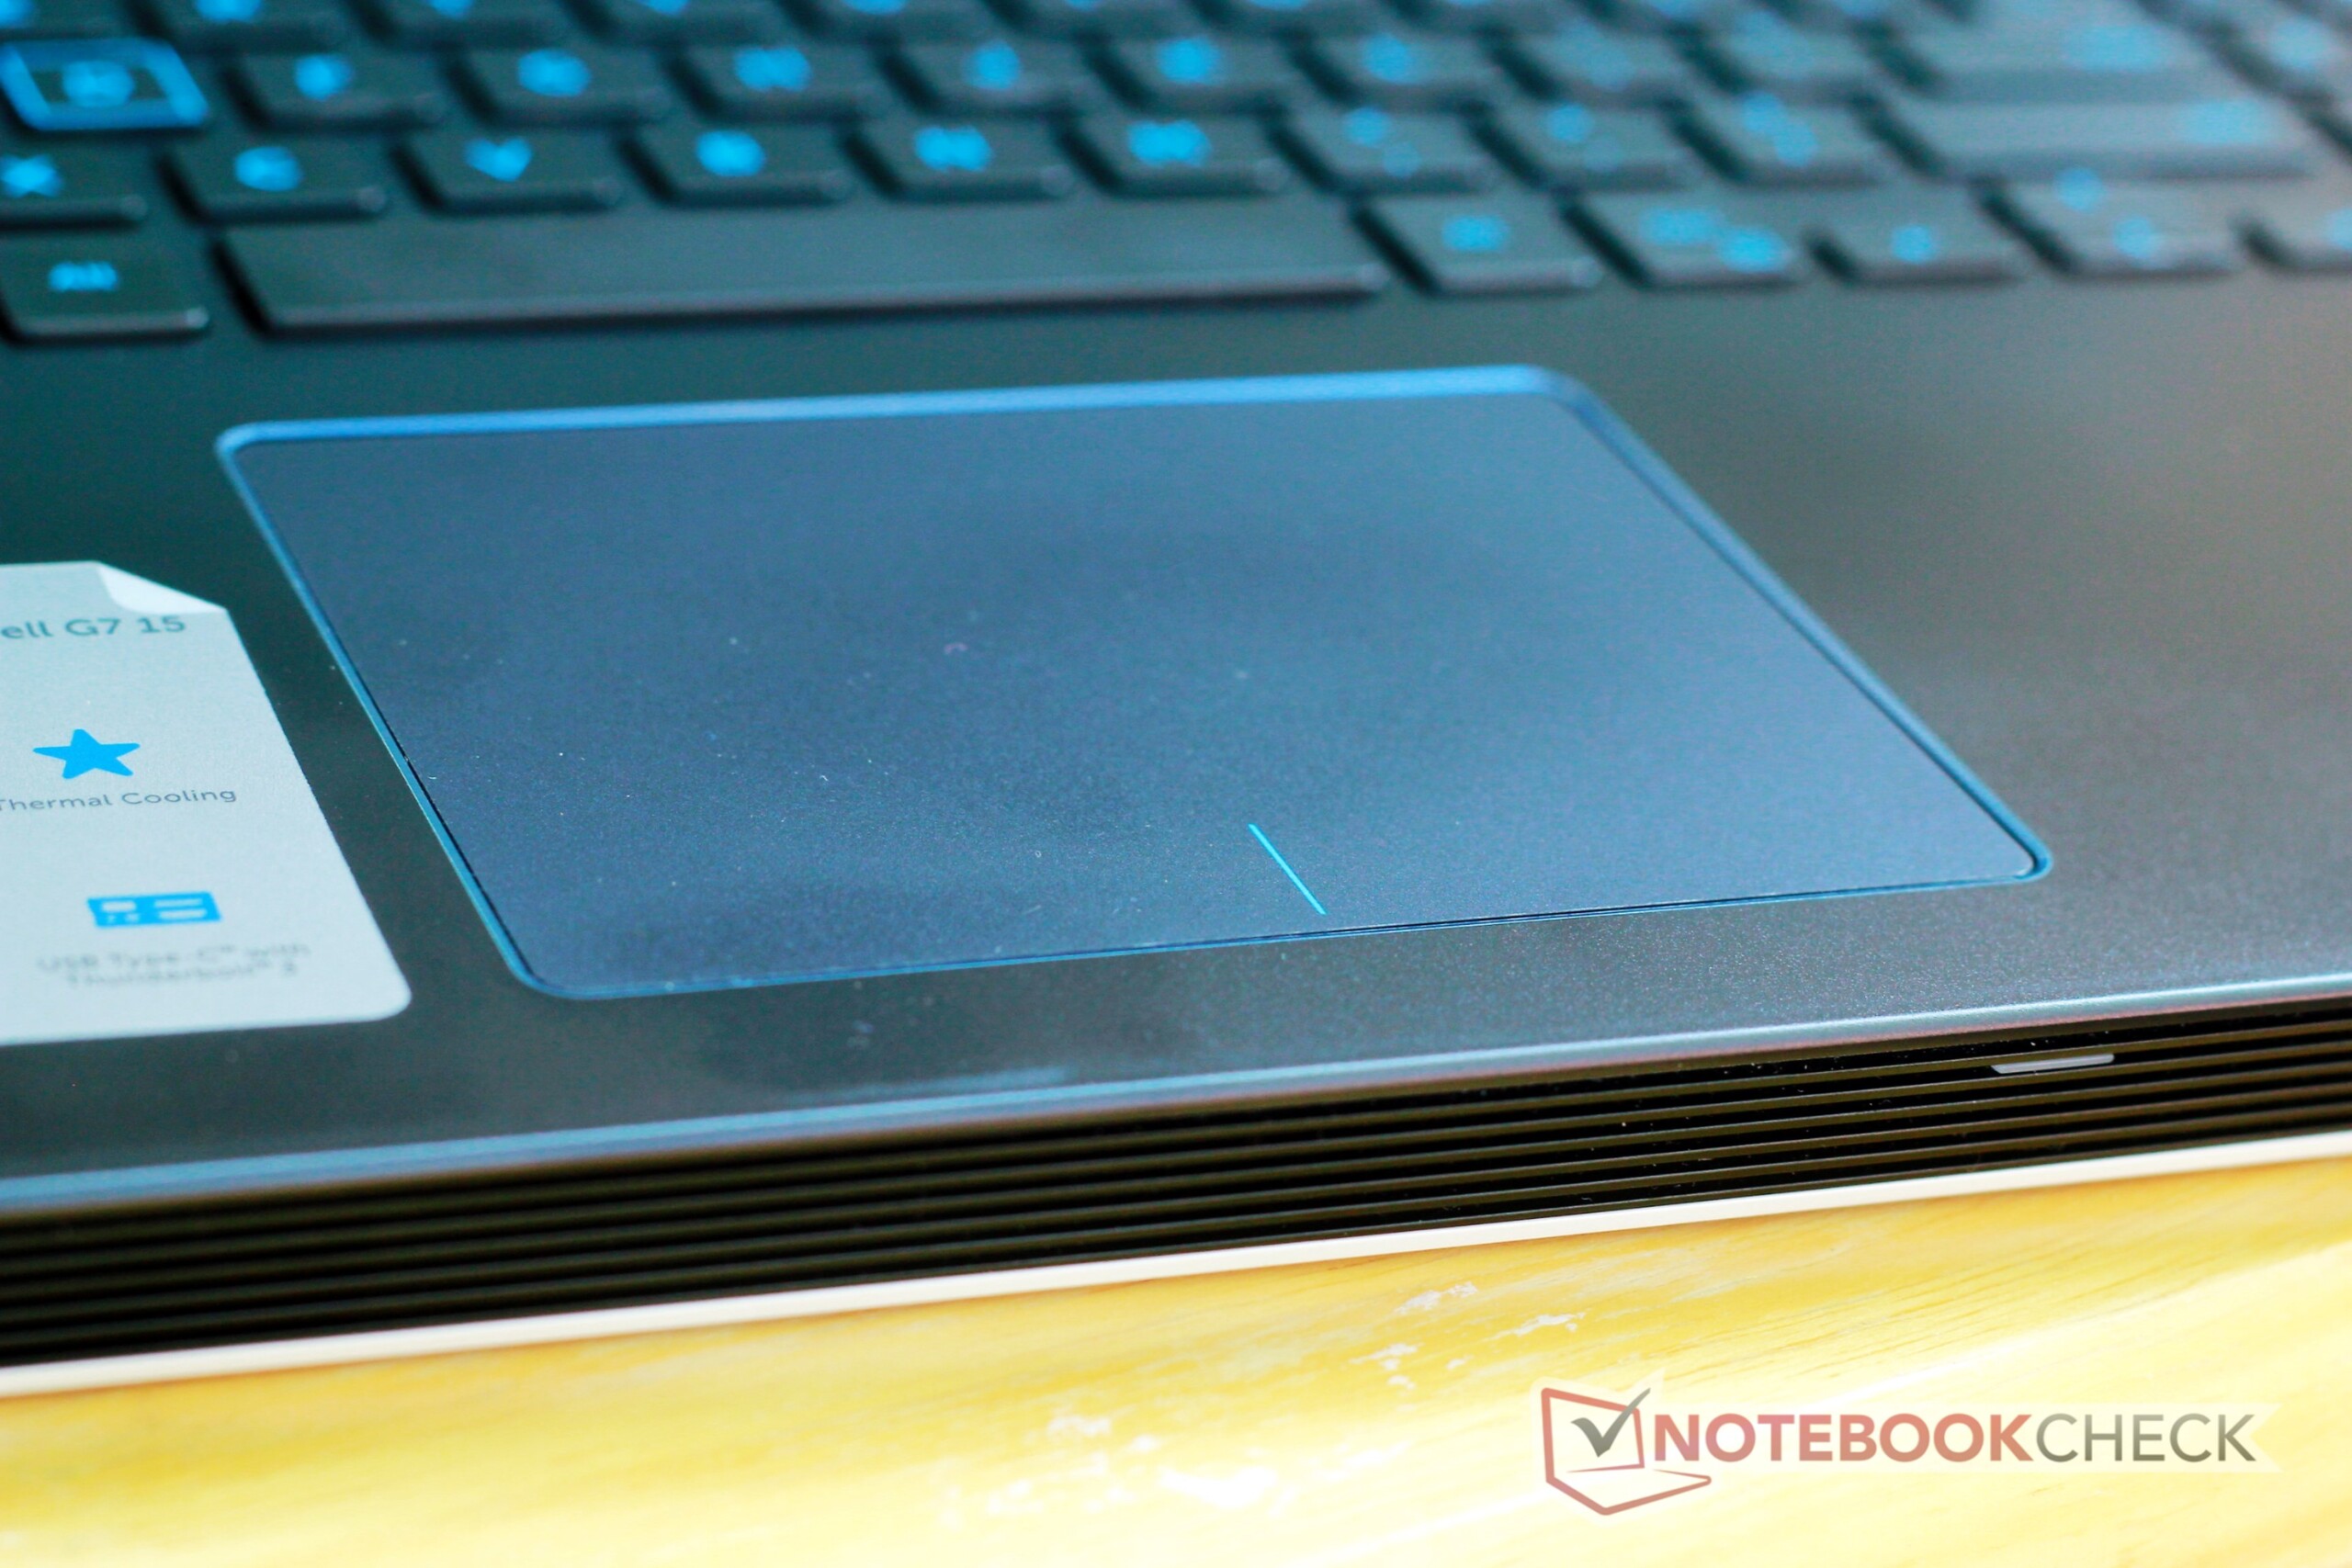
The touchpad is a direct copy from the Inspiron 15 7000 7577. The integrated mouse buttons feel hollow and have shallow travel. Feedback is decent and clicks register accurately. Tracking is good, and the textured finish feels premium underhand. Overall, the touchpad is average.

Display
The Full HD IPS display is good. Response times are in line with other budget gaming laptops. PWM is completely absent. The contrast ratio is decent, if a bit low, at 738:1. Anecdotally, contrast is fine; blacks look adequately deep and images look crisp without any gray clouding seen in lower quality displays.
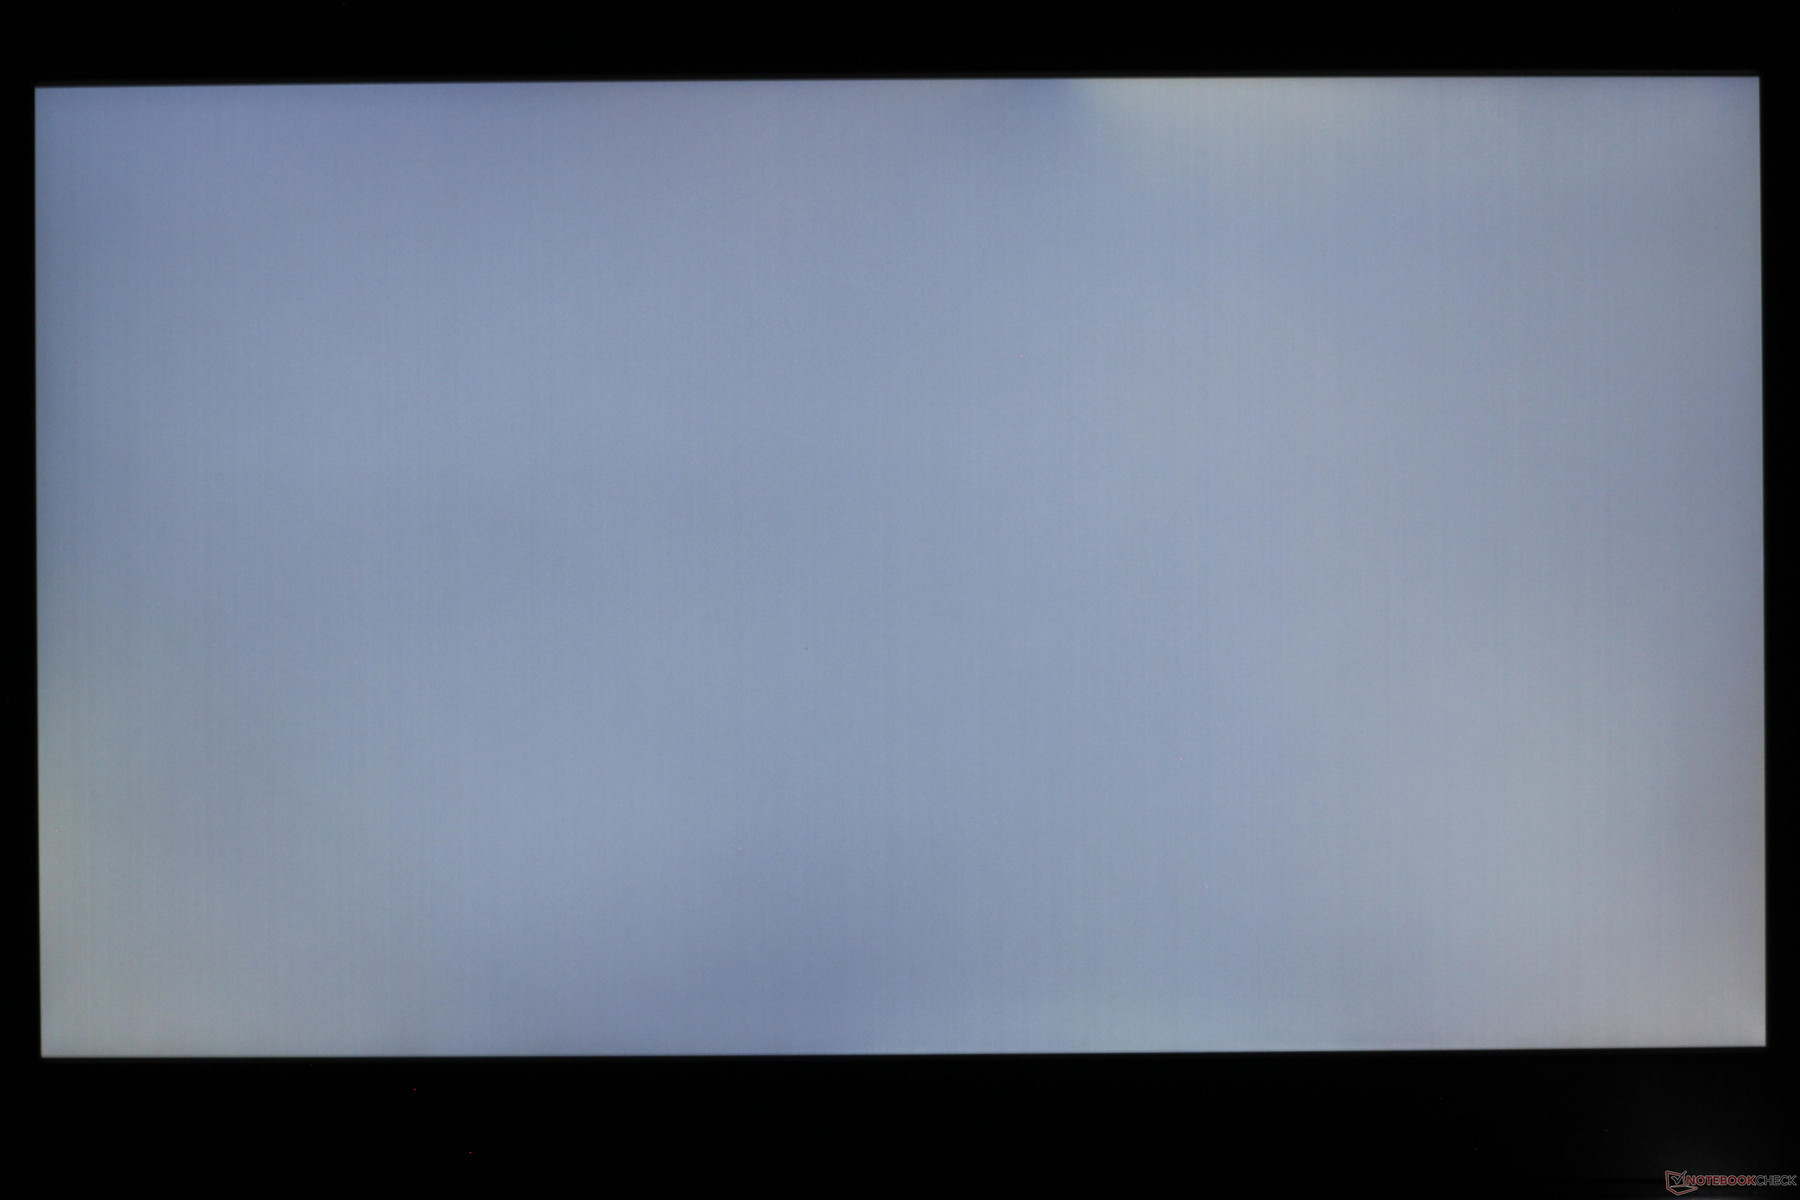
The primary weakness of the LG panel is its relatively low brightness. At just under 250 nits, the screen will appear dim in most environments, even at its maximum brightness. On the plus side, the backlight is fairly even (89% distribution) and there is virtually no bleed. However, compared to other devices (particularly the HP Omen 15t), the G7's screen falls short.
| |||||||||||||||||||||||||
Brightness Distribution: 89 %
Center on Battery: 250.9 cd/m²
Contrast: 738:1 (Black: 0.34 cd/m²)
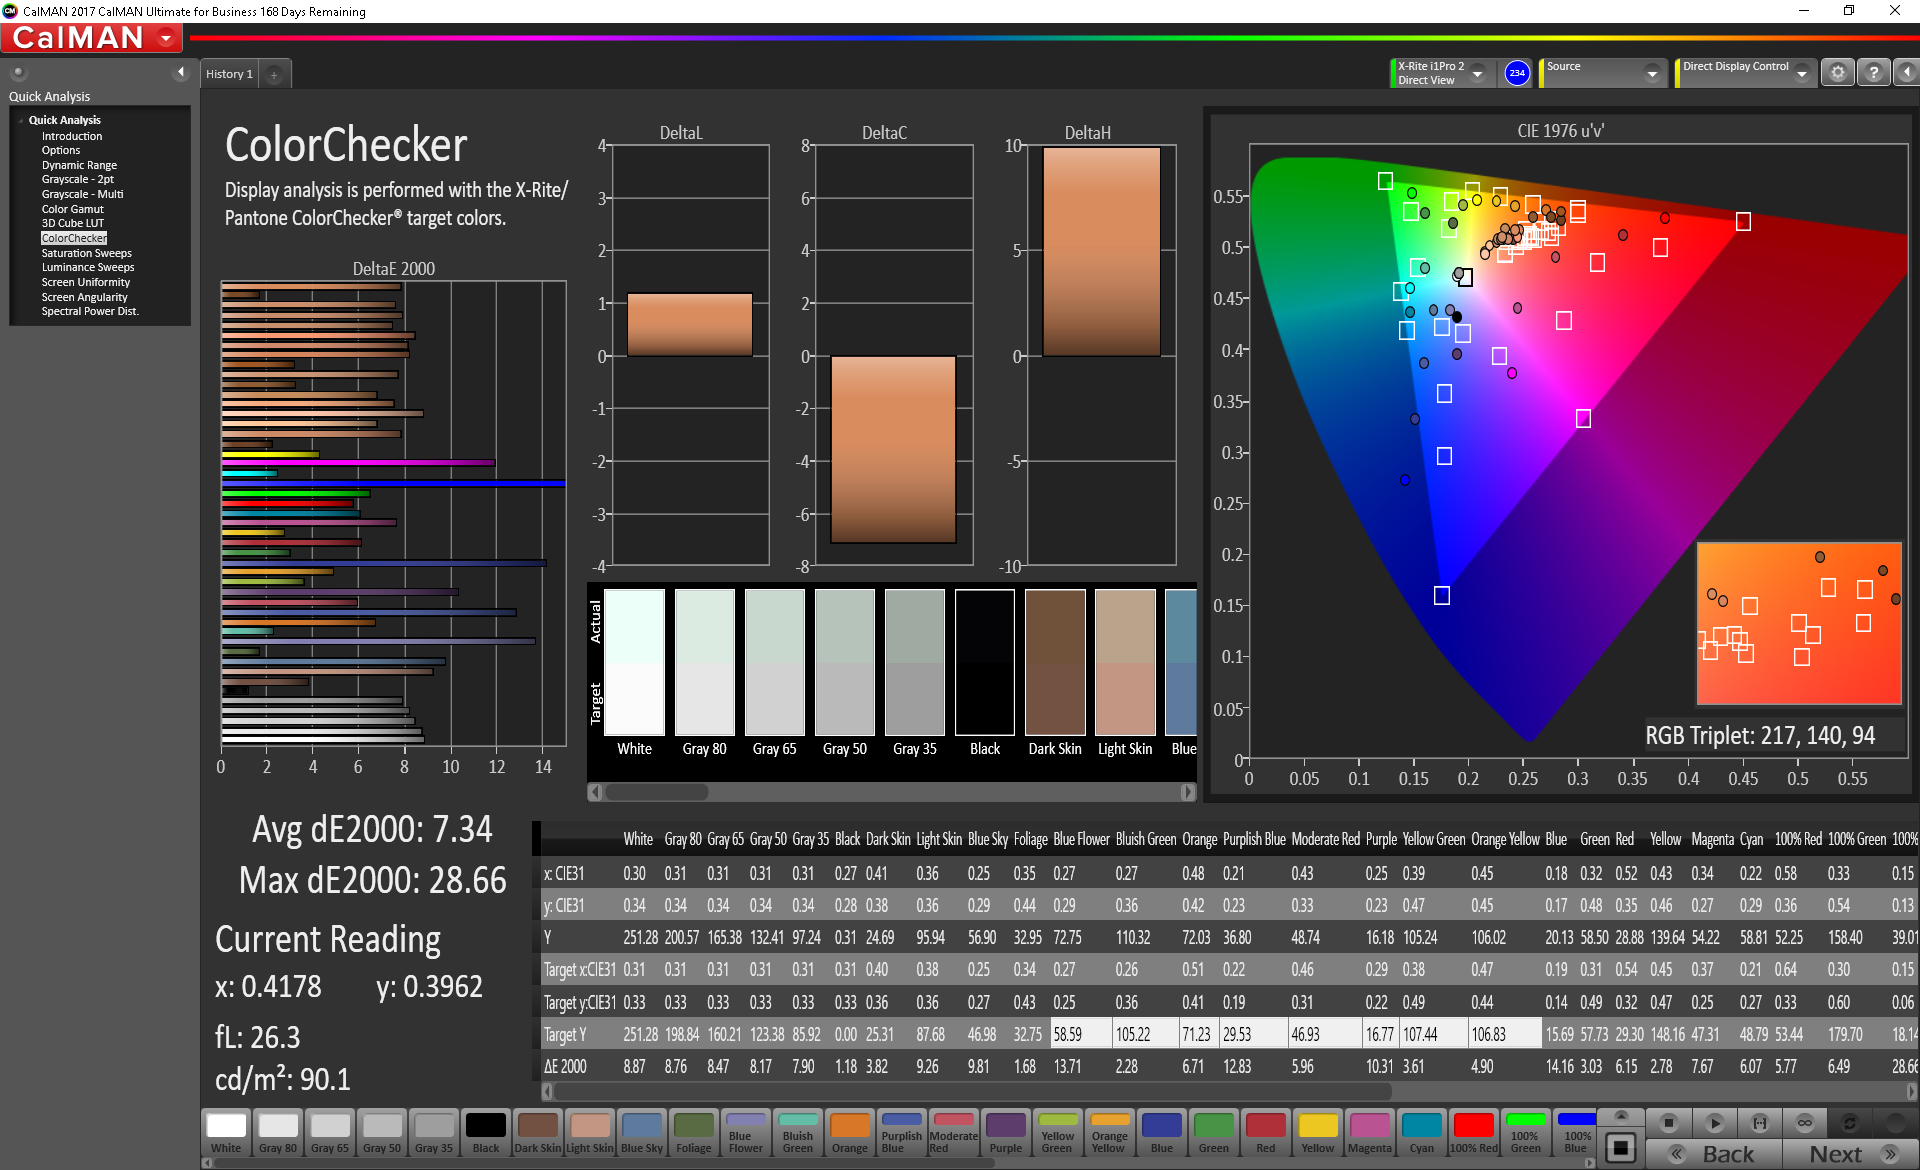
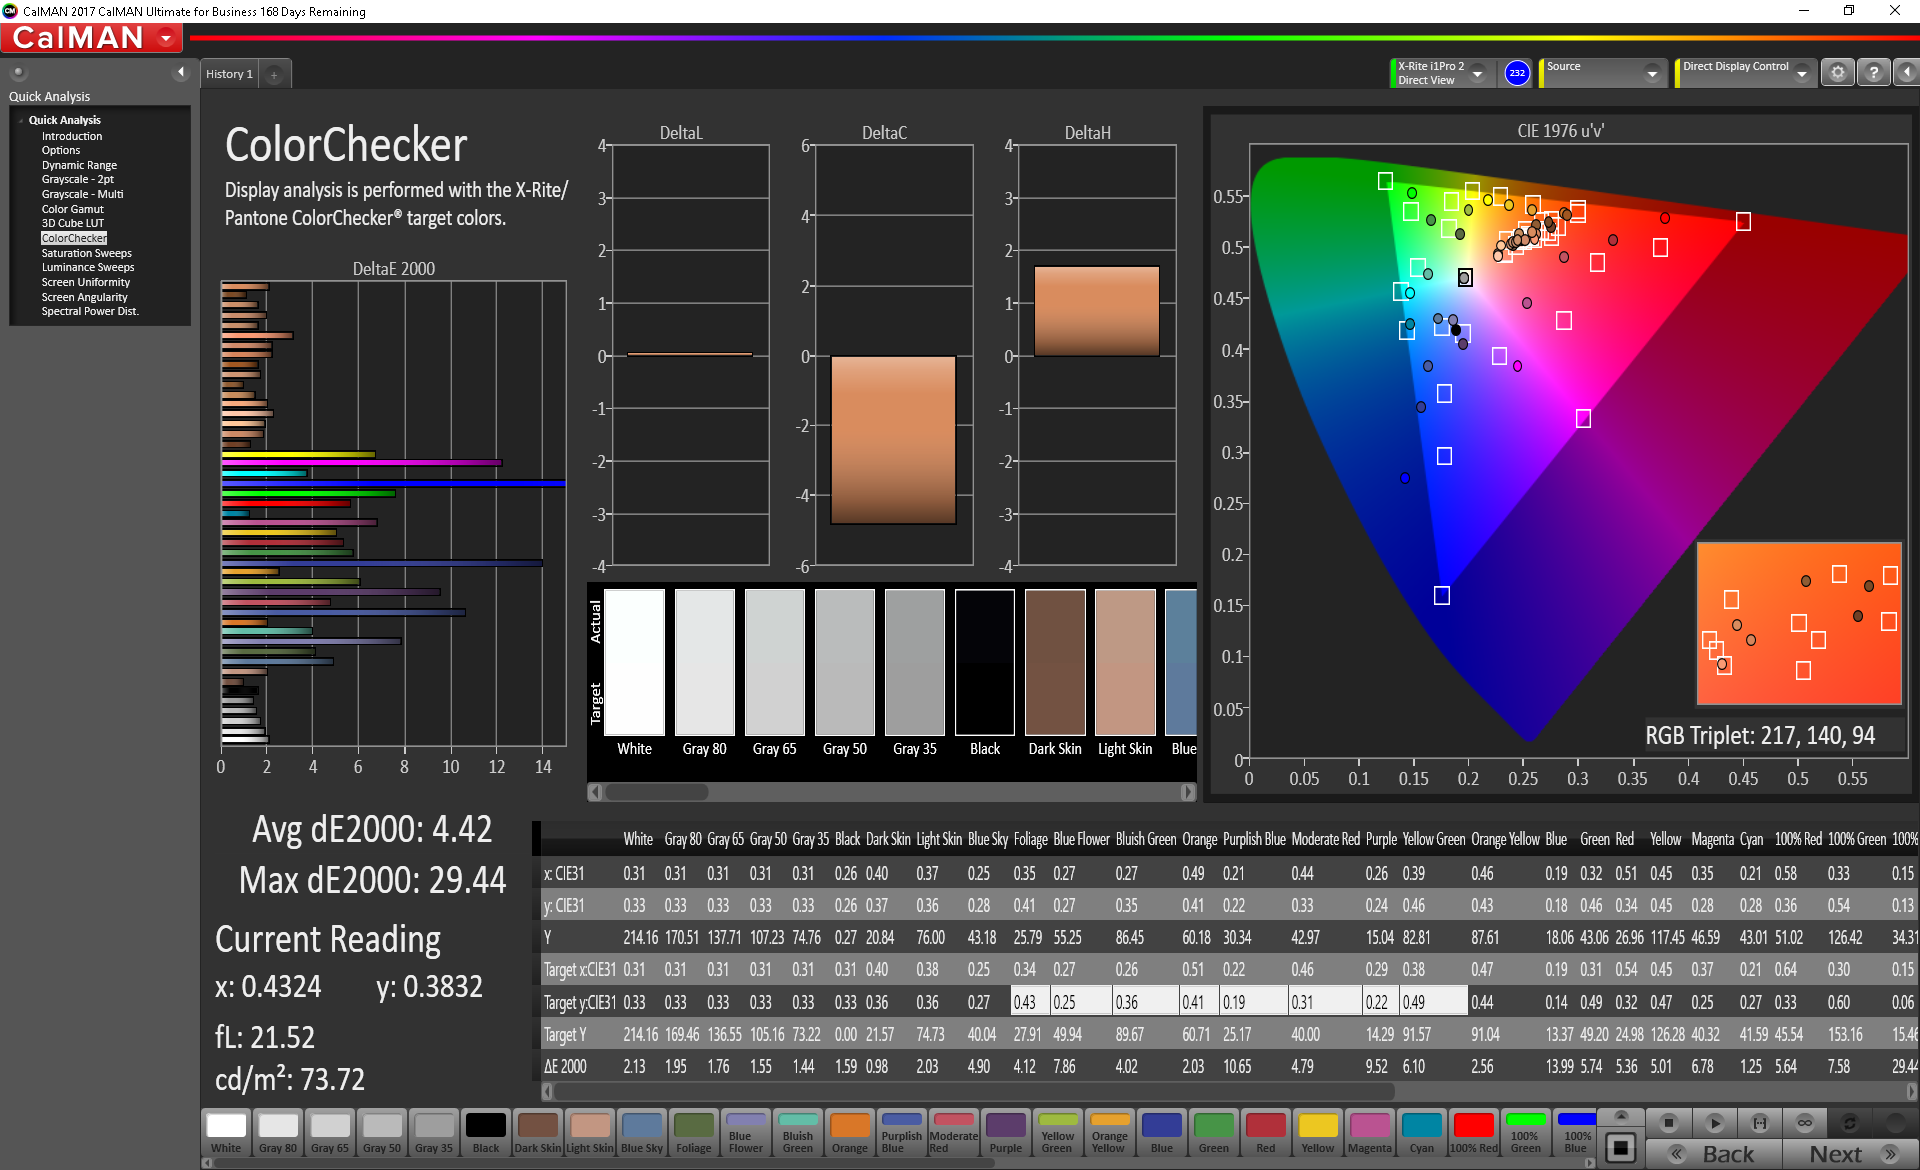
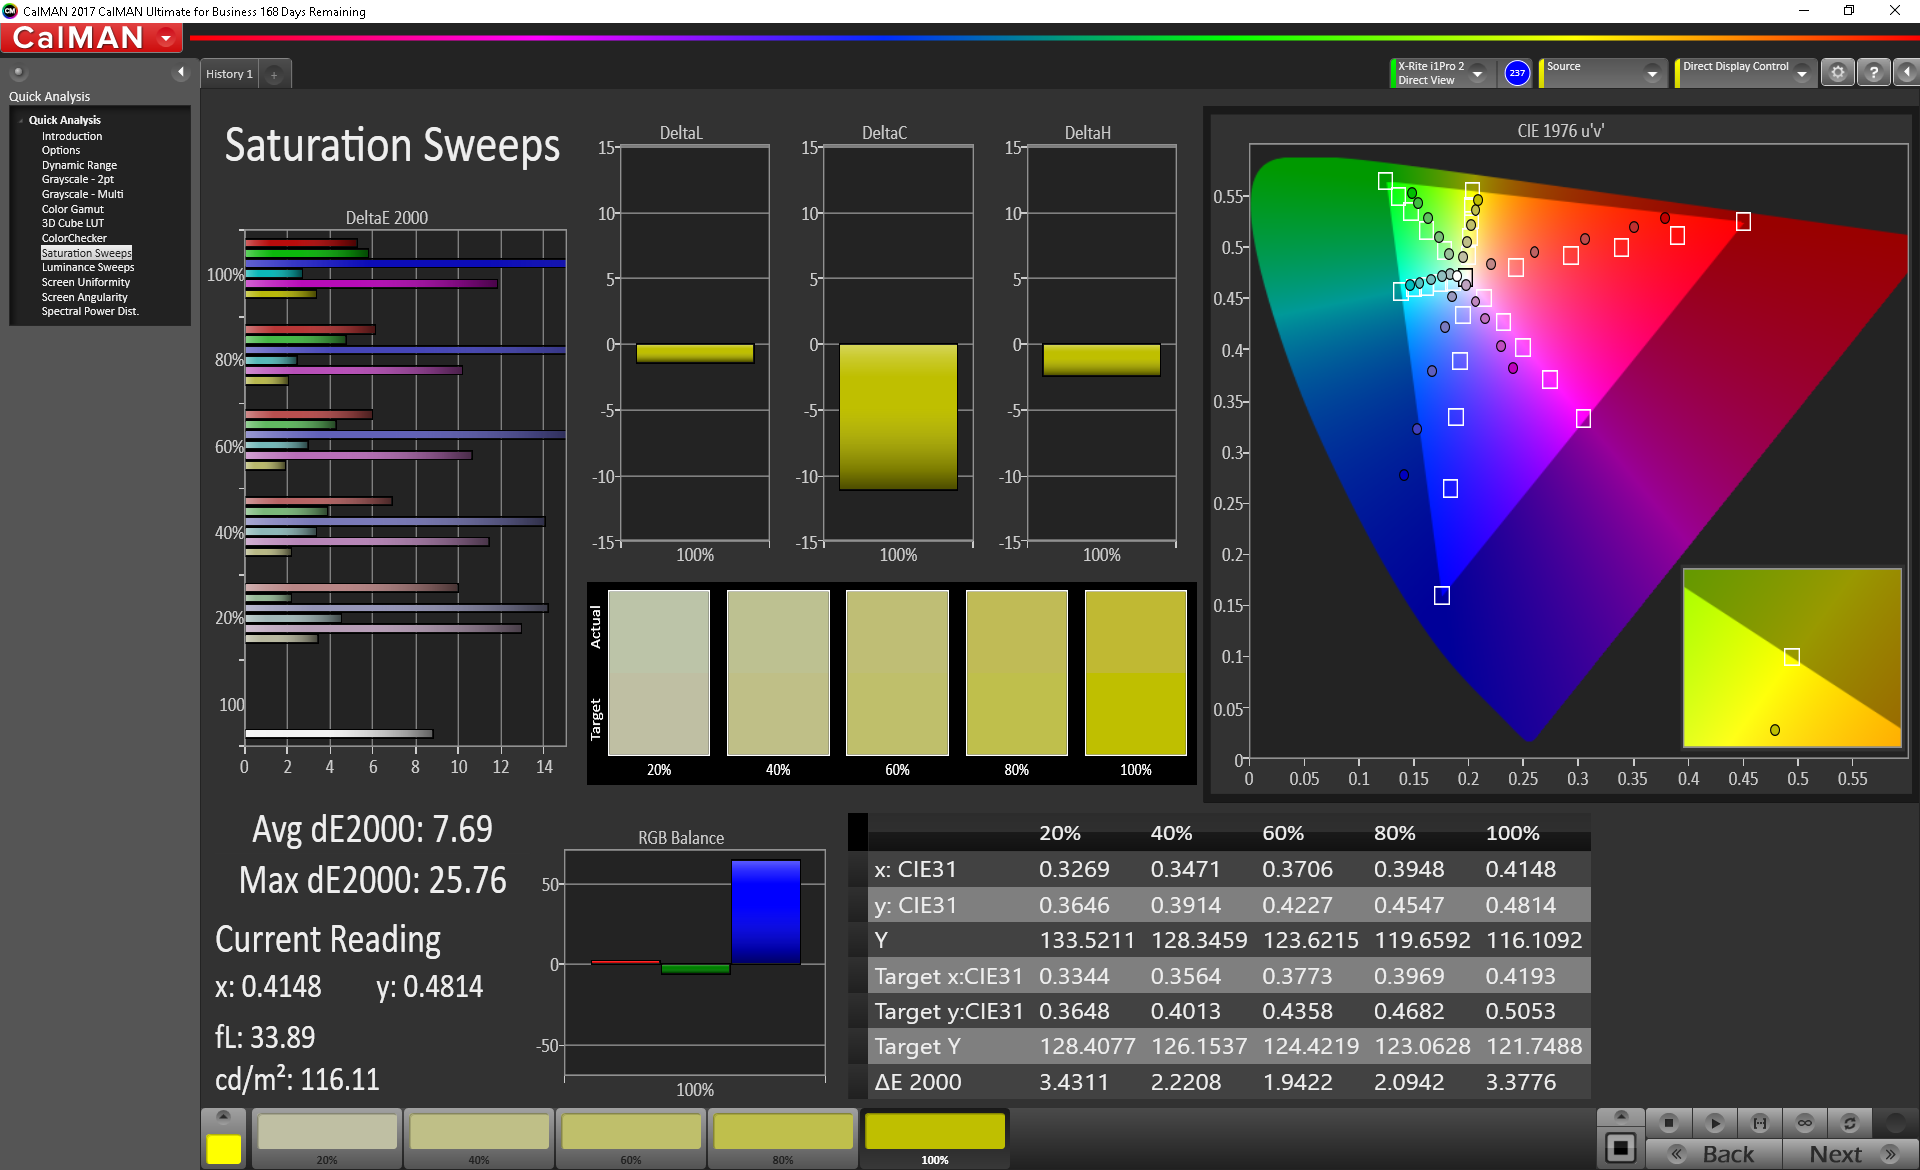
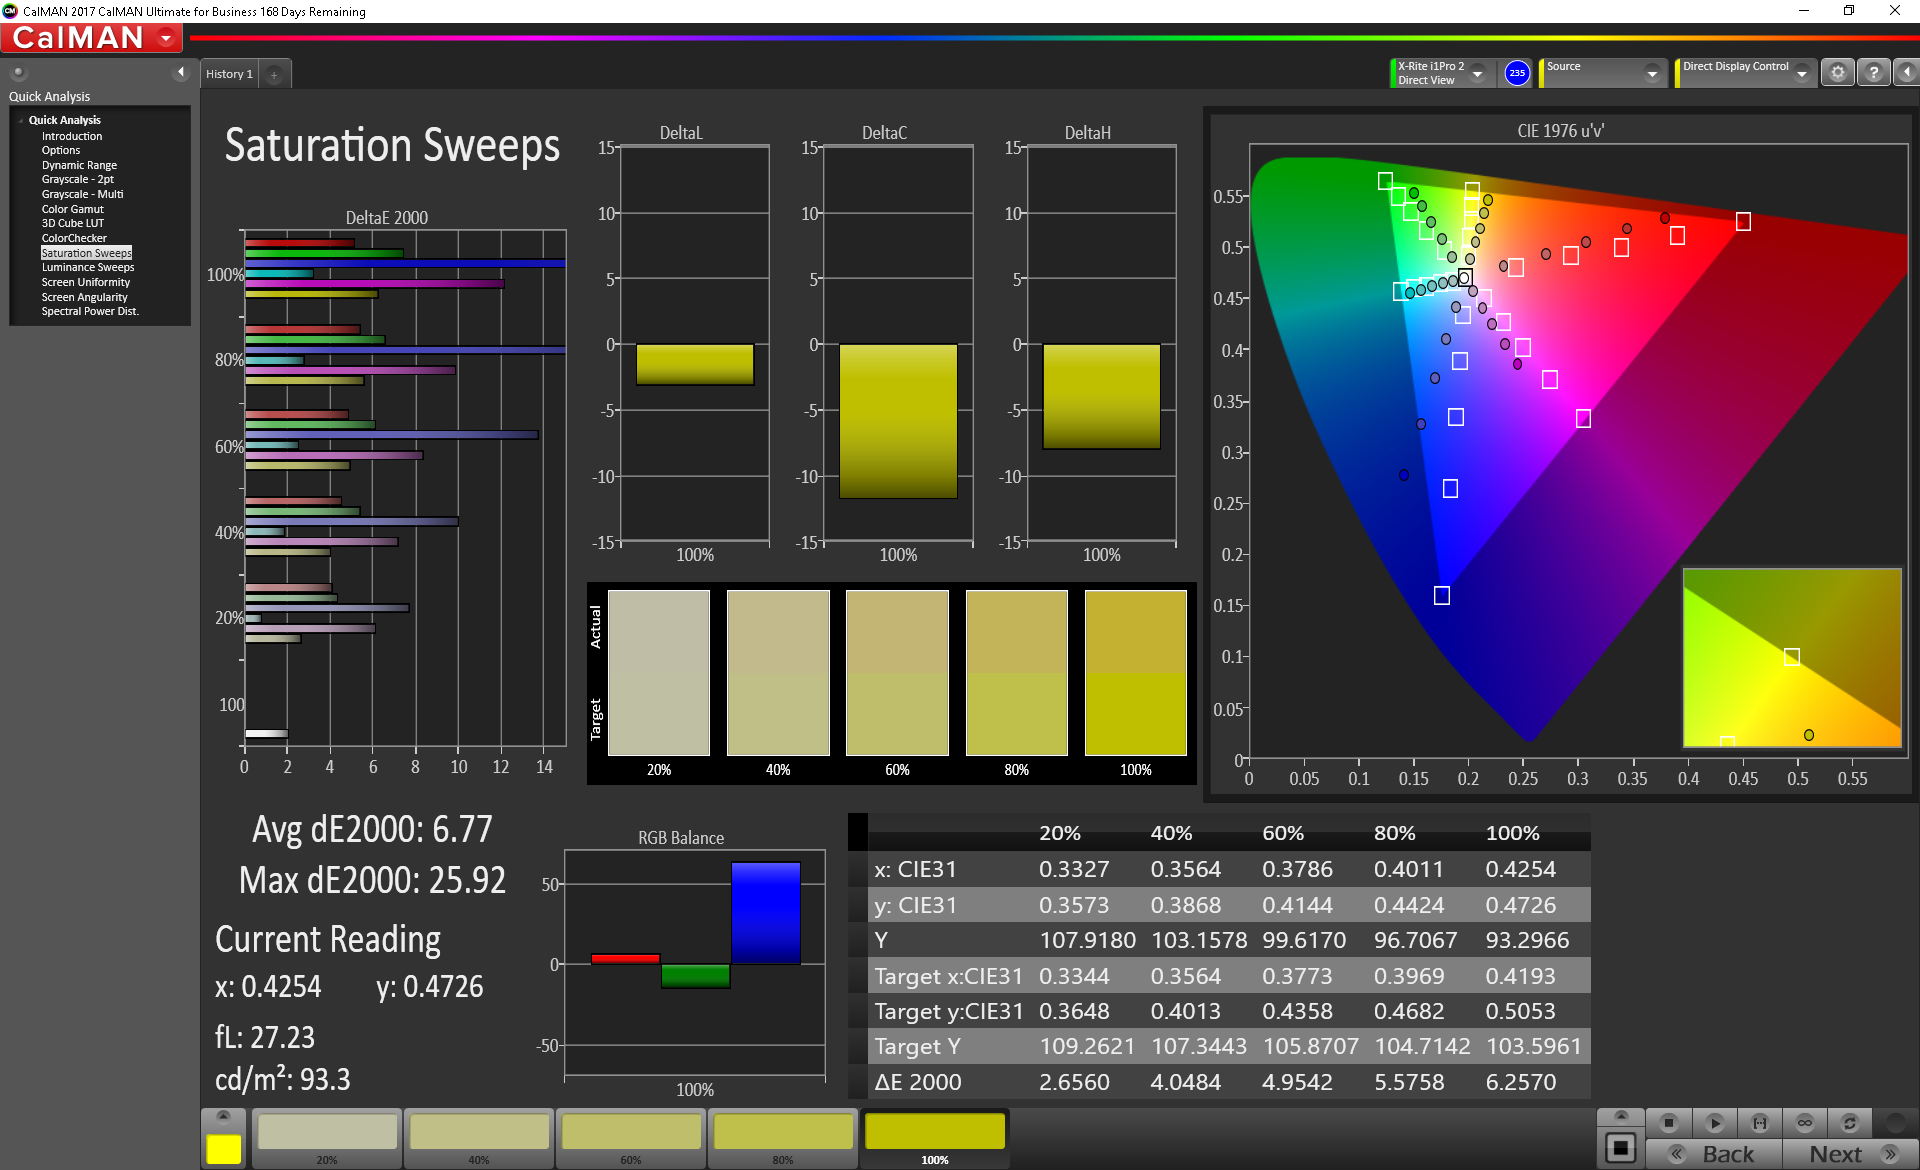
ΔE ColorChecker Calman: 7.34 | ∀{0.5-29.43 Ø4.73}
calibrated: 4.42
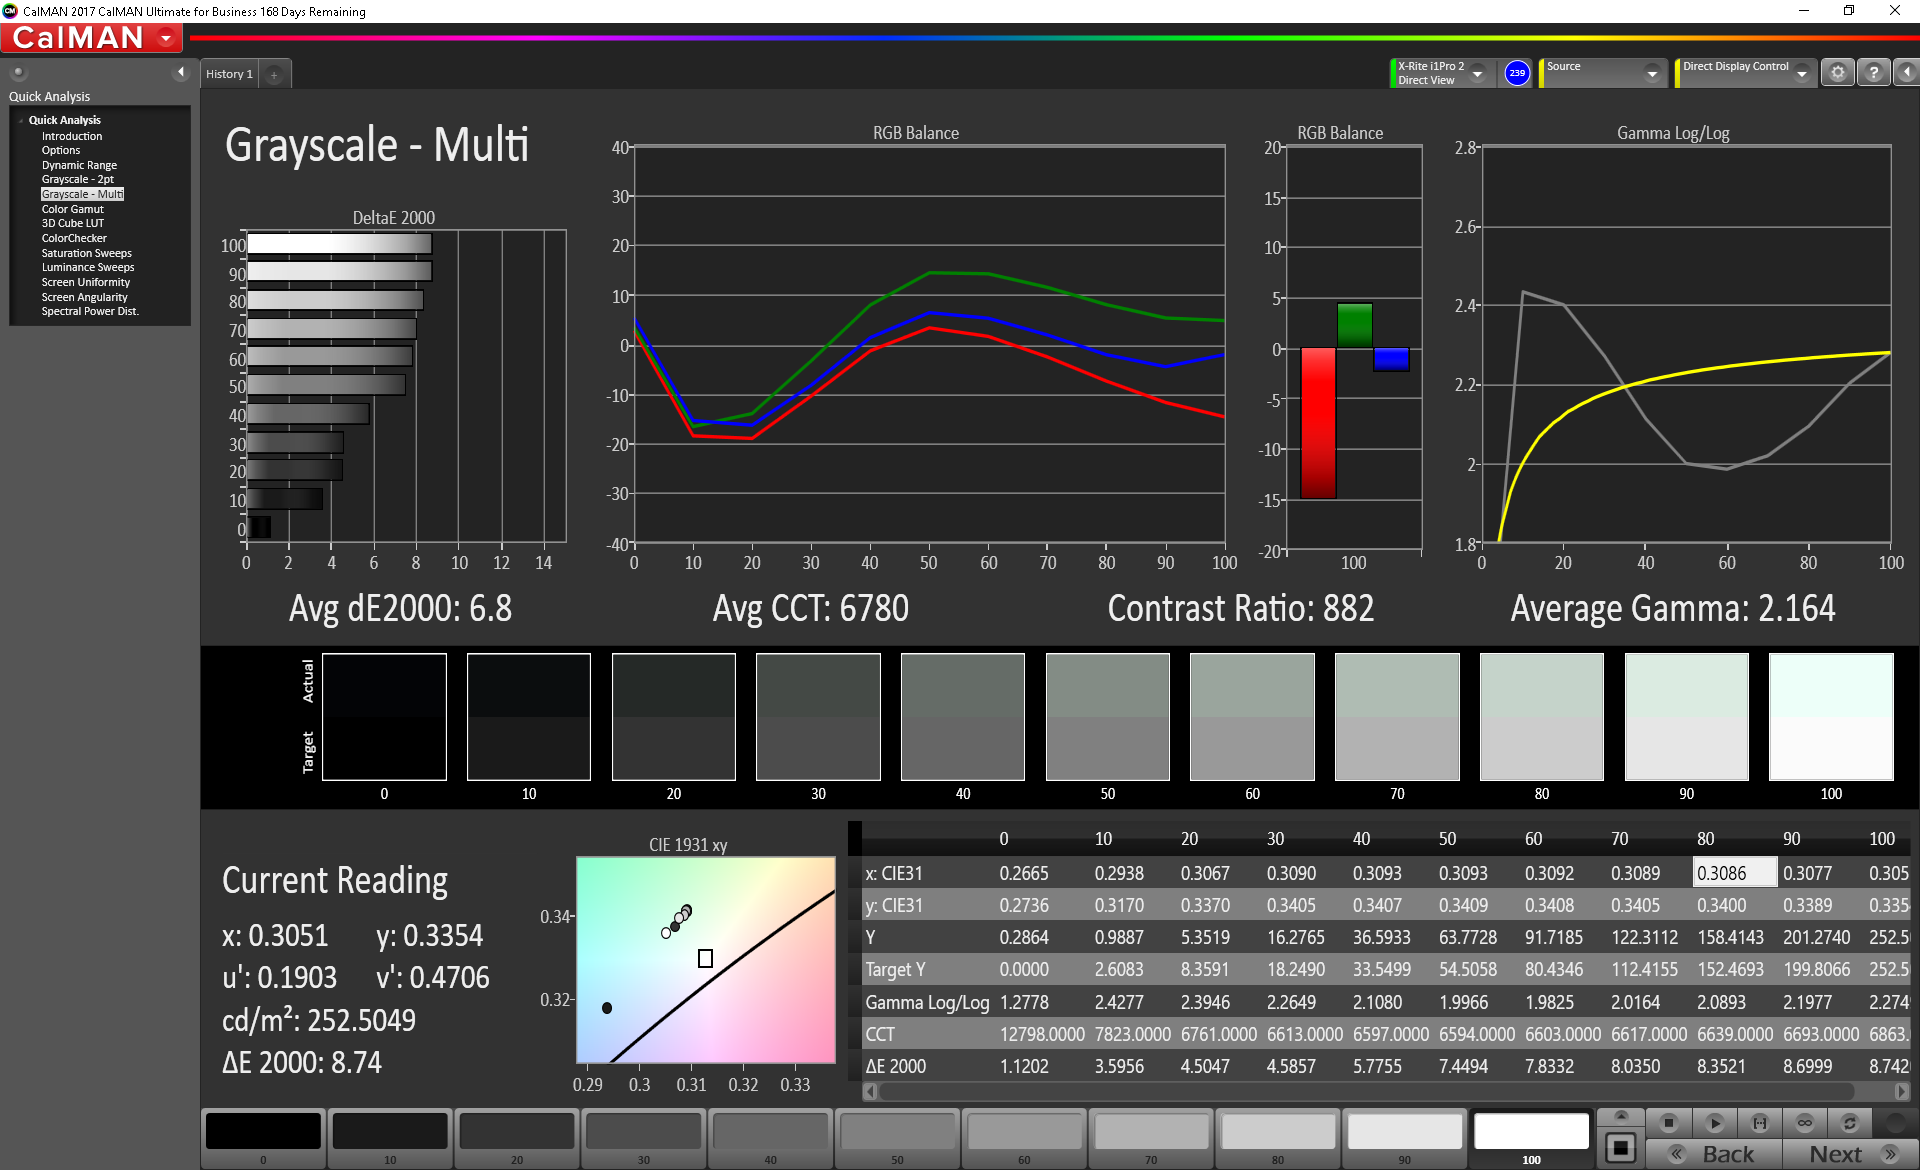
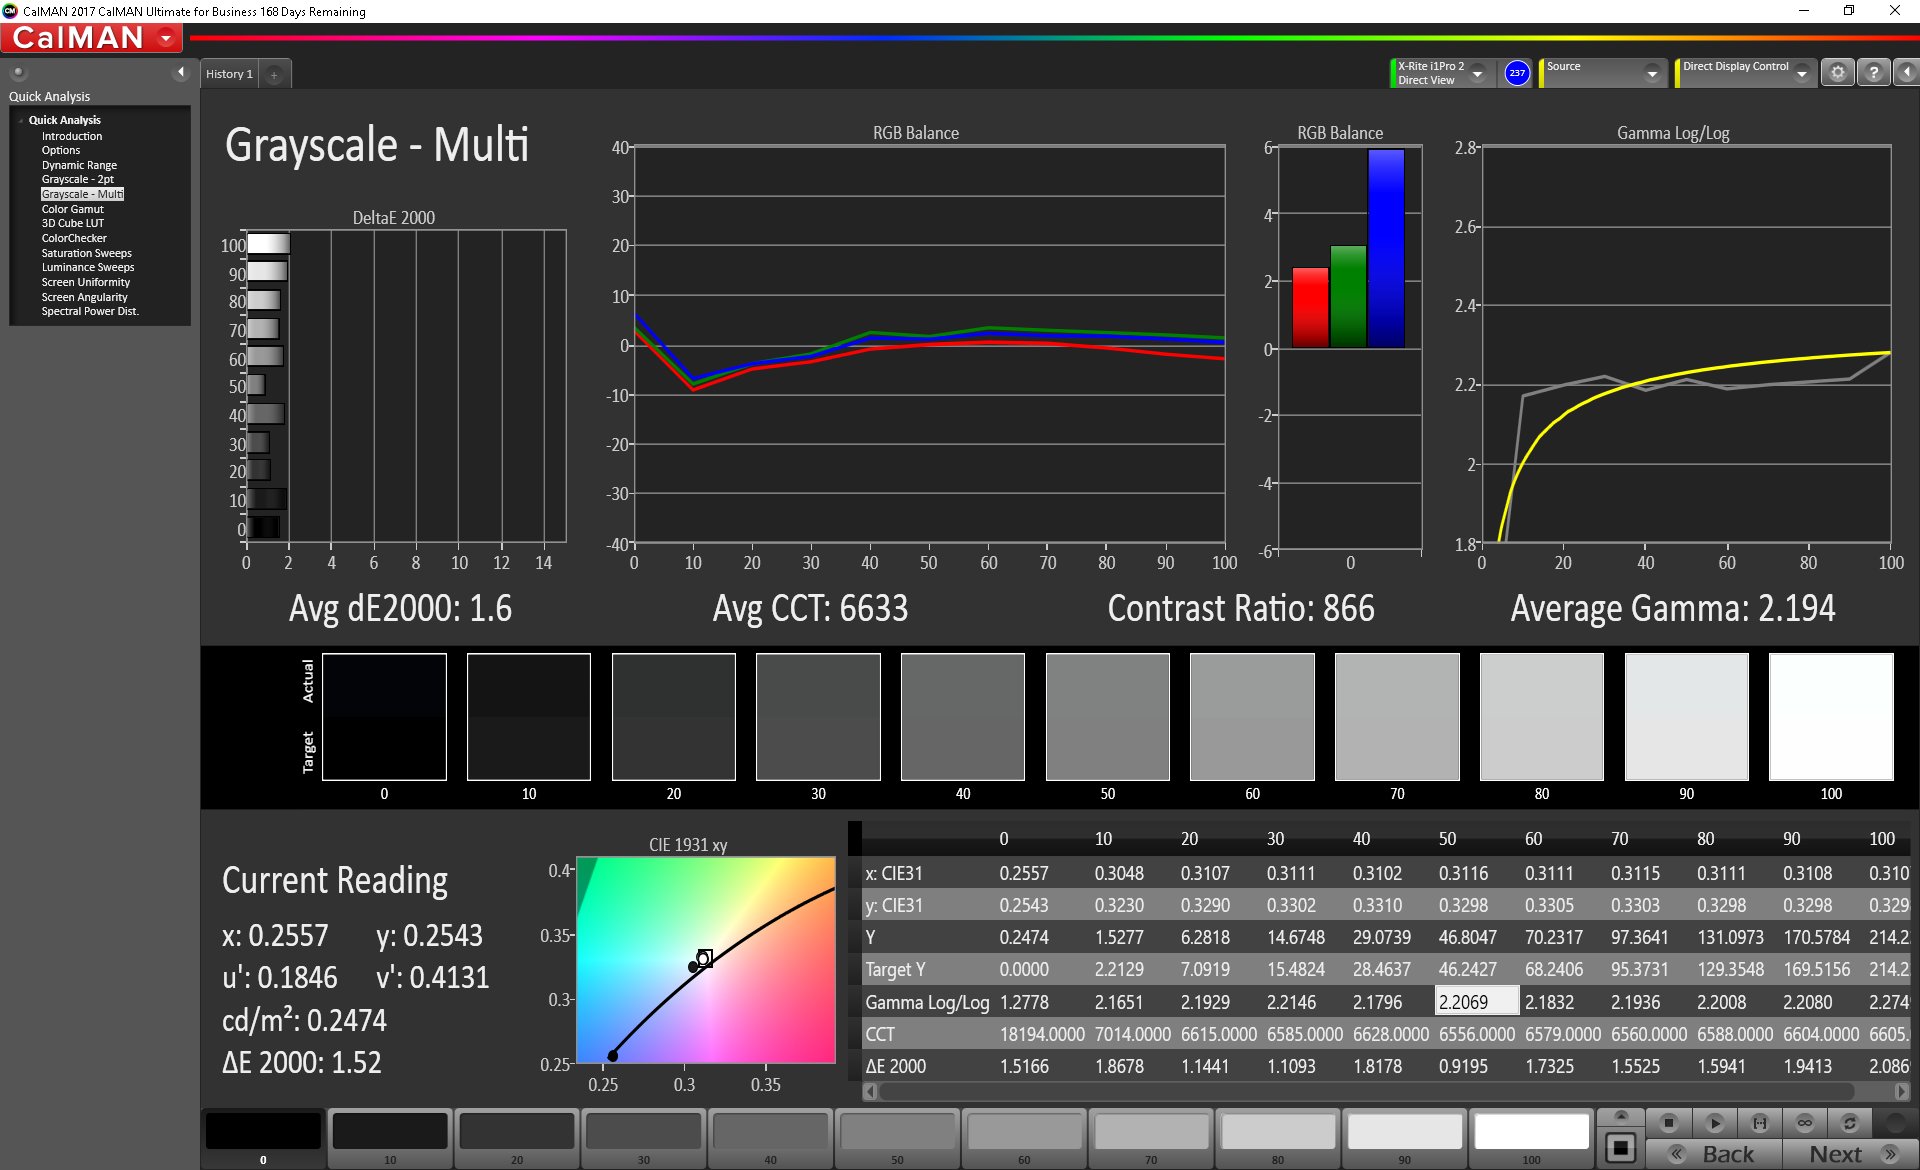
ΔE Greyscale Calman: 6.8 | ∀{0.09-98 Ø4.97}
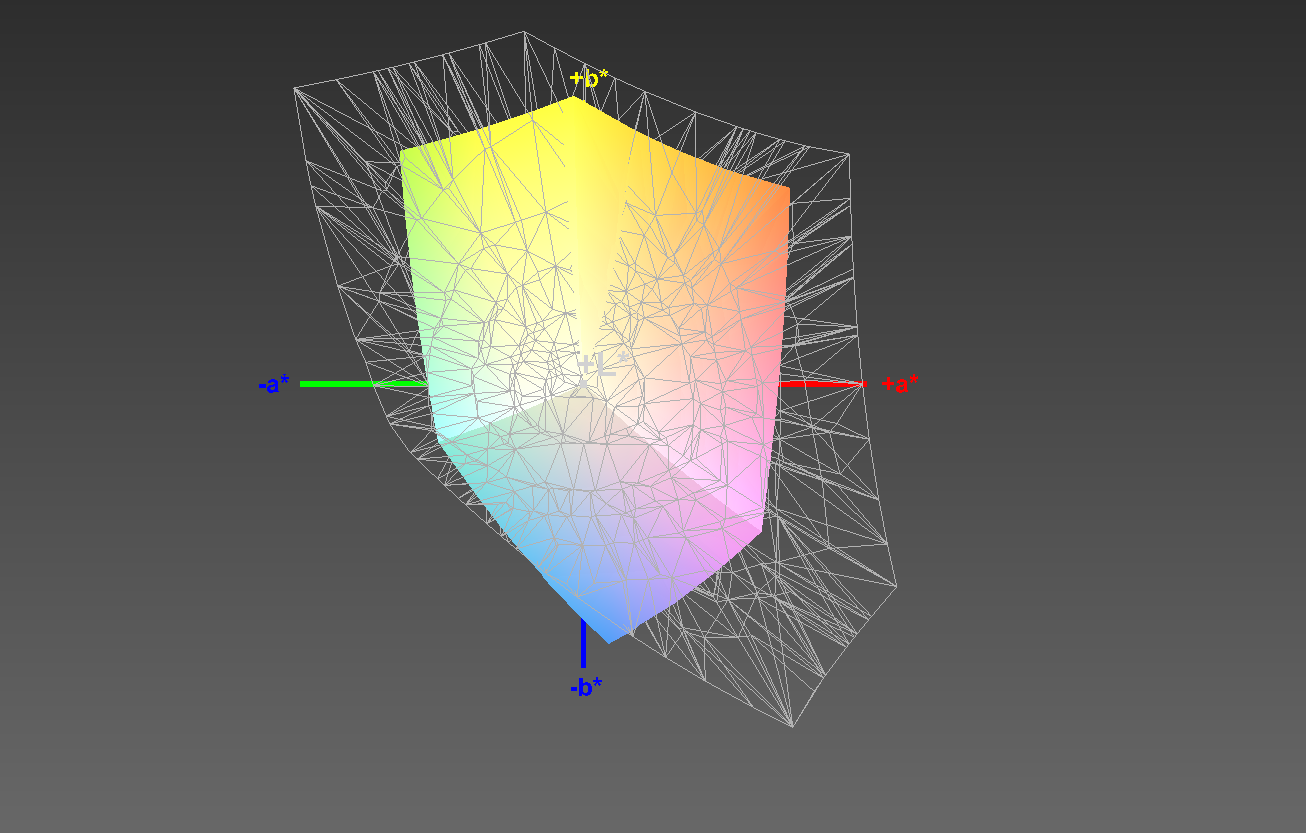
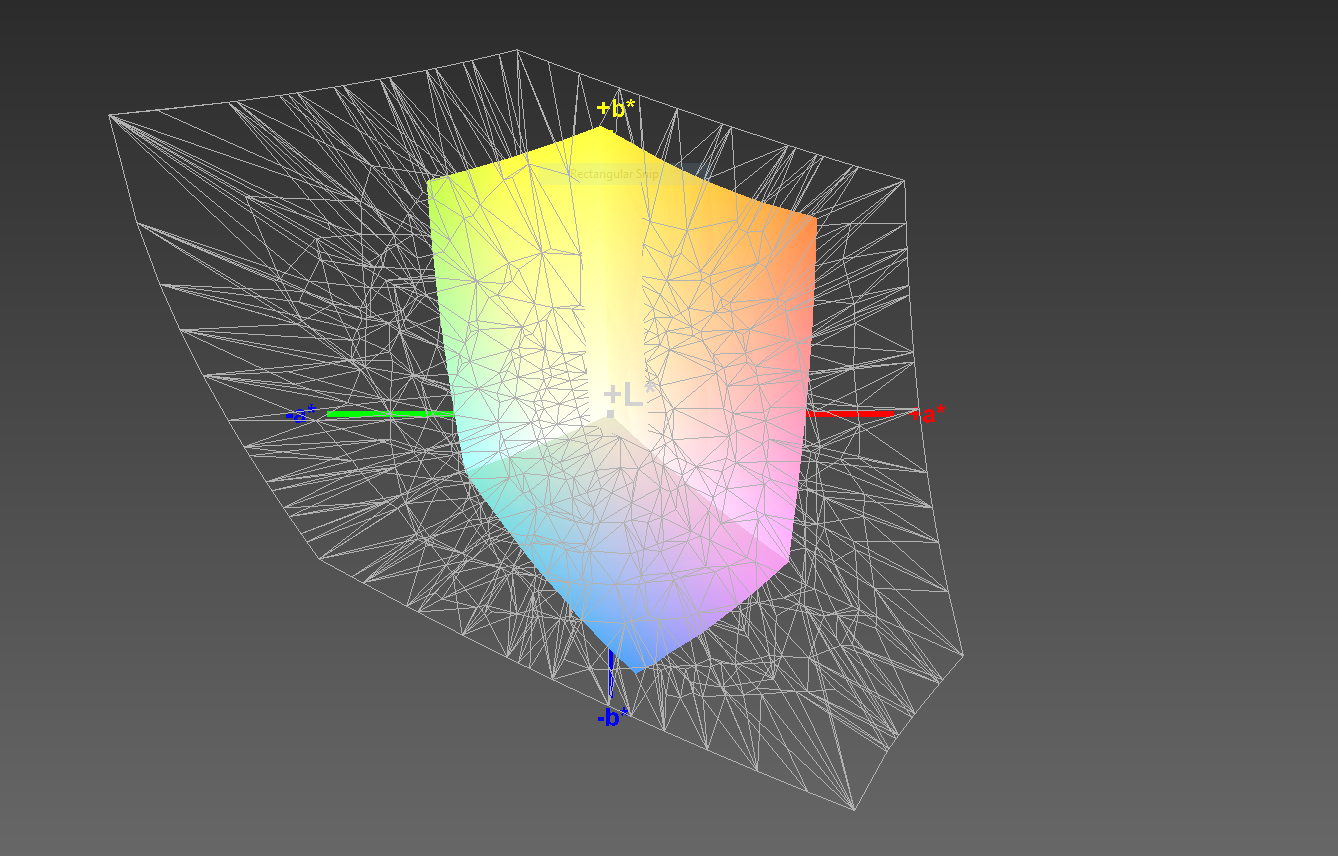
56% sRGB (Argyll 1.6.3 3D)
36% AdobeRGB 1998 (Argyll 1.6.3 3D)
39.2% AdobeRGB 1998 (Argyll 3D)
56.2% sRGB (Argyll 3D)
37.82% Display P3 (Argyll 3D)
Gamma: 2.164
CCT: 6780 K
| Dell G7 15-7588 LG Philips LGD053F, IPS, 15.6", 1920x1080 | Dell Inspiron 15 7000 7577 ID: LG Philips LGD053F, Name: 156WF6, Dell P/N: 4XK13, IPS, 15.6", 1920x1080 | Acer Predator Helios 300 PH317-52-51M6 LG Philips LP173WF4-SPF5 (LGD056D), IPS, 17.3", 1920x1080 | Asus FX503VM-EH73 AU Optronics B156HAN06.1, IPS, 15.6", 1920x1080 | HP Omen 15t-ce000 AU Optronics AUO23EB, IPS, 15.6", 3840x2160 | Lenovo Legion Y530-15ICH B156HAN02.1, IPS, 15.6", 1920x1080 | |
|---|---|---|---|---|---|---|
| Display | -2% | 64% | -1% | 70% | 1% | |
| Display P3 Coverage (%) | 37.82 | 37.07 -2% | 67.1 77% | 37.48 -1% | 66.1 75% | 38.31 1% |
| sRGB Coverage (%) | 56.2 | 55.6 -1% | 86.1 53% | 56.3 0% | 91.8 63% | 57.3 2% |
| AdobeRGB 1998 Coverage (%) | 39.2 | 38.32 -2% | 63 61% | 38.72 -1% | 66.9 71% | 39.58 1% |
| Response Times | 3% | 13% | -7% | 5% | -17% | |
| Response Time Grey 50% / Grey 80% * (ms) | 38.8 ? | 35.6 ? 8% | 36 ? 7% | 36.8 ? 5% | 37.6 ? 3% | 43.6 ? -12% |
| Response Time Black / White * (ms) | 26.8 ? | 27.6 ? -3% | 22 ? 18% | 31.6 ? -18% | 24.8 ? 7% | 32.4 ? -21% |
| PWM Frequency (Hz) | 122000 ? | |||||
| Screen | 12% | 31% | 14% | 38% | 10% | |
| Brightness middle (cd/m²) | 250.9 | 235.4 -6% | 365 45% | 235.9 -6% | 358.5 43% | 282.8 13% |
| Brightness (cd/m²) | 246 | 223 -9% | 341 39% | 235 -4% | 350 42% | 264 7% |
| Brightness Distribution (%) | 89 | 91 2% | 89 0% | 91 2% | 95 7% | 88 -1% |
| Black Level * (cd/m²) | 0.34 | 0.28 18% | 0.32 6% | 0.27 21% | 0.39 -15% | 0.42 -24% |
| Contrast (:1) | 738 | 841 14% | 1141 55% | 874 18% | 919 25% | 673 -9% |
| Colorchecker dE 2000 * | 7.34 | 5.6 24% | 6.51 11% | 4.81 34% | 4.6 37% | 4.93 33% |
| Colorchecker dE 2000 max. * | 28.66 | 20.3 29% | 12.32 57% | 21.55 25% | 8.5 70% | 17.65 38% |
| Colorchecker dE 2000 calibrated * | 4.42 | 2.9 34% | 4.07 8% | |||
| Greyscale dE 2000 * | 6.8 | 3.6 47% | 7.65 -13% | 3.1 54% | 5.2 24% | 3.8 44% |
| Gamma | 2.164 102% | 2.23 99% | 2.64 83% | 2.31 95% | 2.28 96% | 2.449 90% |
| CCT | 6780 96% | 7214 90% | 8066 81% | 6984 93% | 6410 101% | 6112 106% |
| Color Space (Percent of AdobeRGB 1998) (%) | 36 | 35.2 -2% | 56 56% | 36 0% | 66.9 86% | 36 0% |
| Color Space (Percent of sRGB) (%) | 56 | 55.4 -1% | 86 54% | 56 0% | 91.8 64% | 57 2% |
| Total Average (Program / Settings) | 4% /
8% | 36% /
35% | 2% /
9% | 38% /
40% | -2% /
5% |
* ... smaller is better
Color space coverage is in line with other budget gaming laptops. While not excellent (56% sRGB, 36% AdobeRGB), the display covers an adequate amount of colors for gaming and general use. Those in search of wider color availability should look at HP's Omen 15t, which covers 92% of the sRGB color gamut.
Color accuracy is somewhat poor. The DeltaE2000 scores for colors and grays sit at 7.34 and 6.8, respectively. These are a far cry from what is generally considered acceptable for professional use (DeltaE2000 of 3 or below) and worse than most competitors. The glaring weakness is the maximum DeltaE2000 of 28.66 present in blue wavelengths. This causes a wide variance in blues and purples. While this doesn't affect daily use and won't be noticed by most, it does prohibit the G7 from professional color work.
Display Response Times
| ↔ Response Time Black to White | ||
|---|---|---|
| 26.8 ms ... rise ↗ and fall ↘ combined | ↗ 14.4 ms rise | 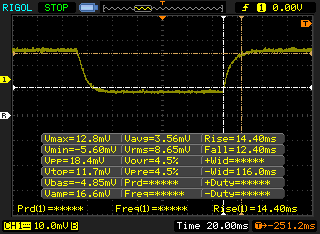 |
| ↘ 12.4 ms fall | ||
| The screen shows relatively slow response rates in our tests and may be too slow for gamers. In comparison, all tested devices range from 0.1 (minimum) to 240 (maximum) ms. » 67 % of all devices are better. This means that the measured response time is worse than the average of all tested devices (19.9 ms). | ||
| ↔ Response Time 50% Grey to 80% Grey | ||
| 38.8 ms ... rise ↗ and fall ↘ combined | ↗ 16 ms rise | 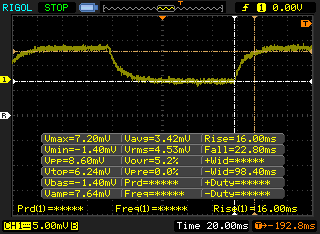 |
| ↘ 22.8 ms fall | ||
| The screen shows slow response rates in our tests and will be unsatisfactory for gamers. In comparison, all tested devices range from 0.165 (minimum) to 636 (maximum) ms. » 58 % of all devices are better. This means that the measured response time is worse than the average of all tested devices (31.1 ms). | ||
Screen Flickering / PWM (Pulse-Width Modulation)
| Screen flickering / PWM not detected |  | ||
In comparison: 52 % of all tested devices do not use PWM to dim the display. If PWM was detected, an average of 7794 (minimum: 5 - maximum: 343500) Hz was measured. | |||
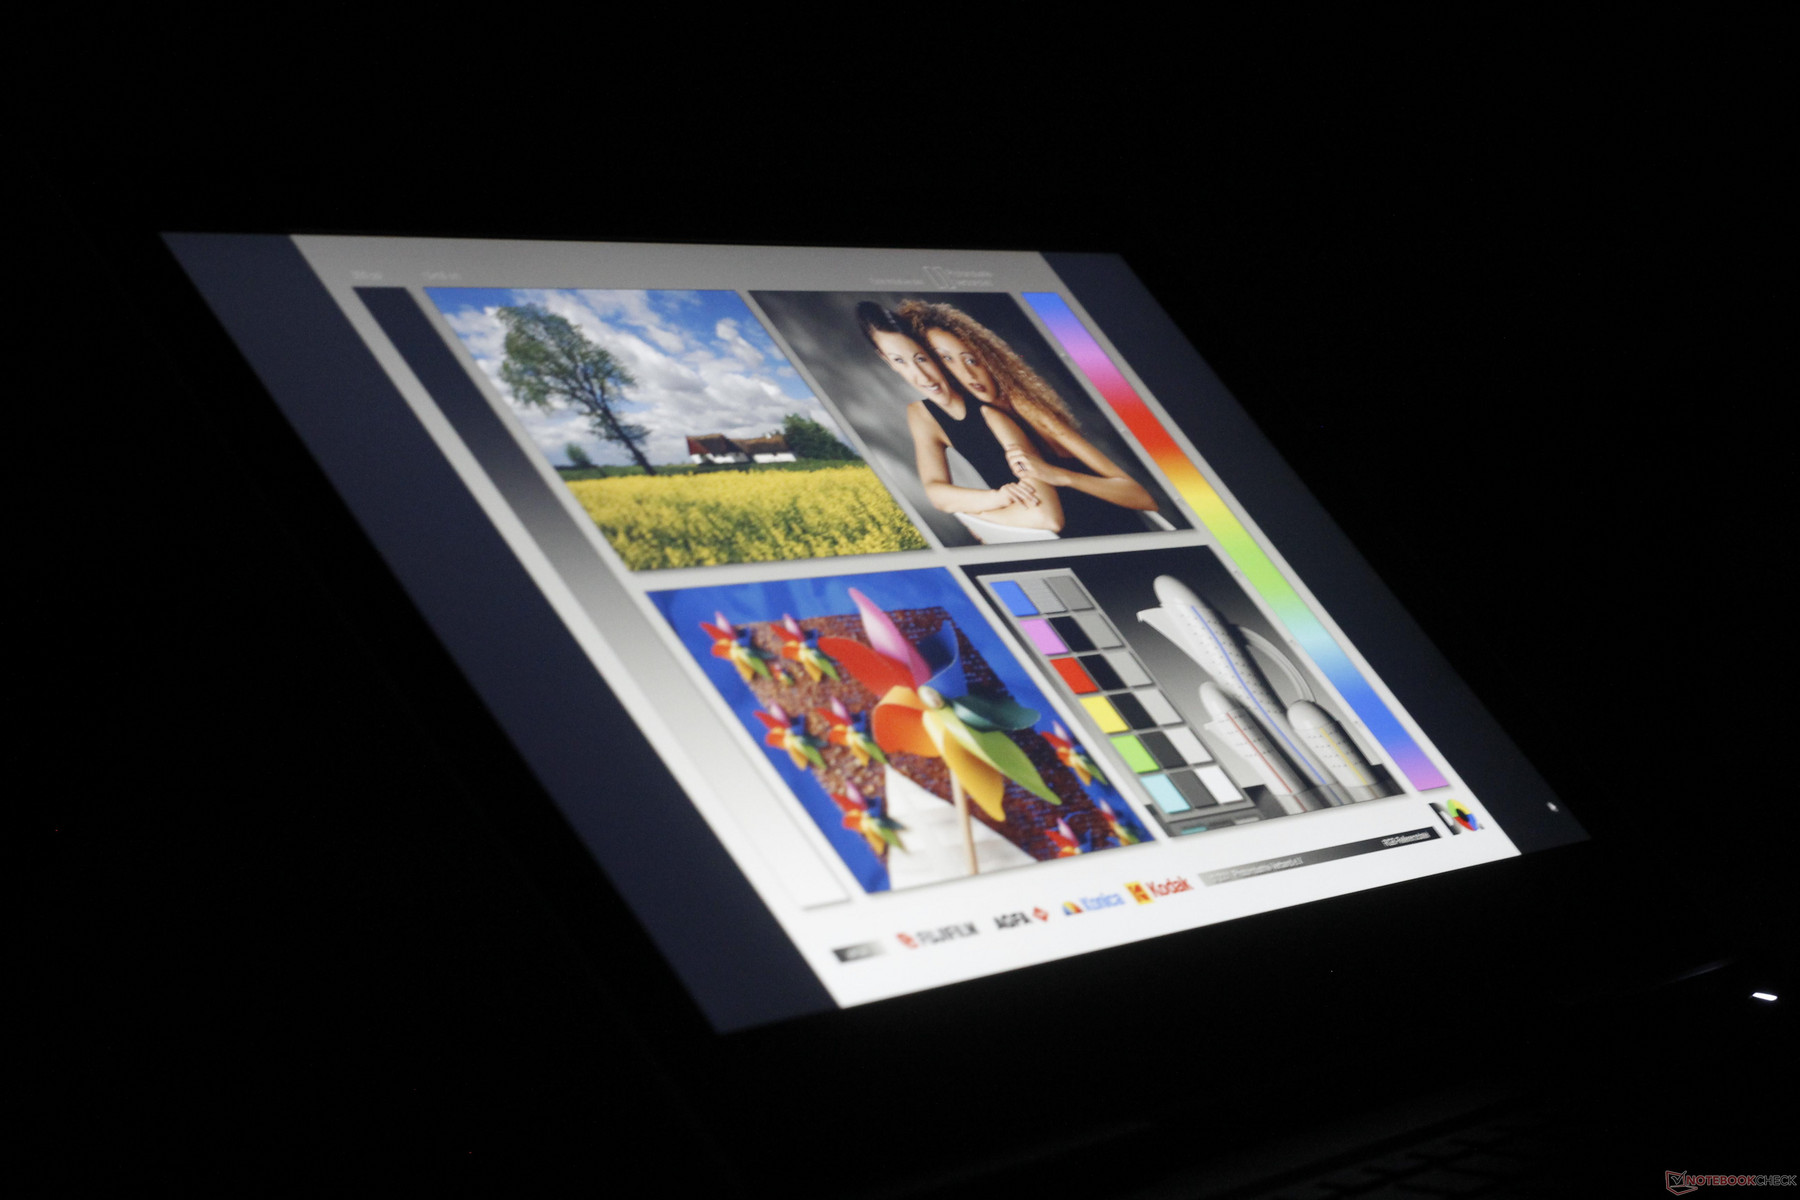
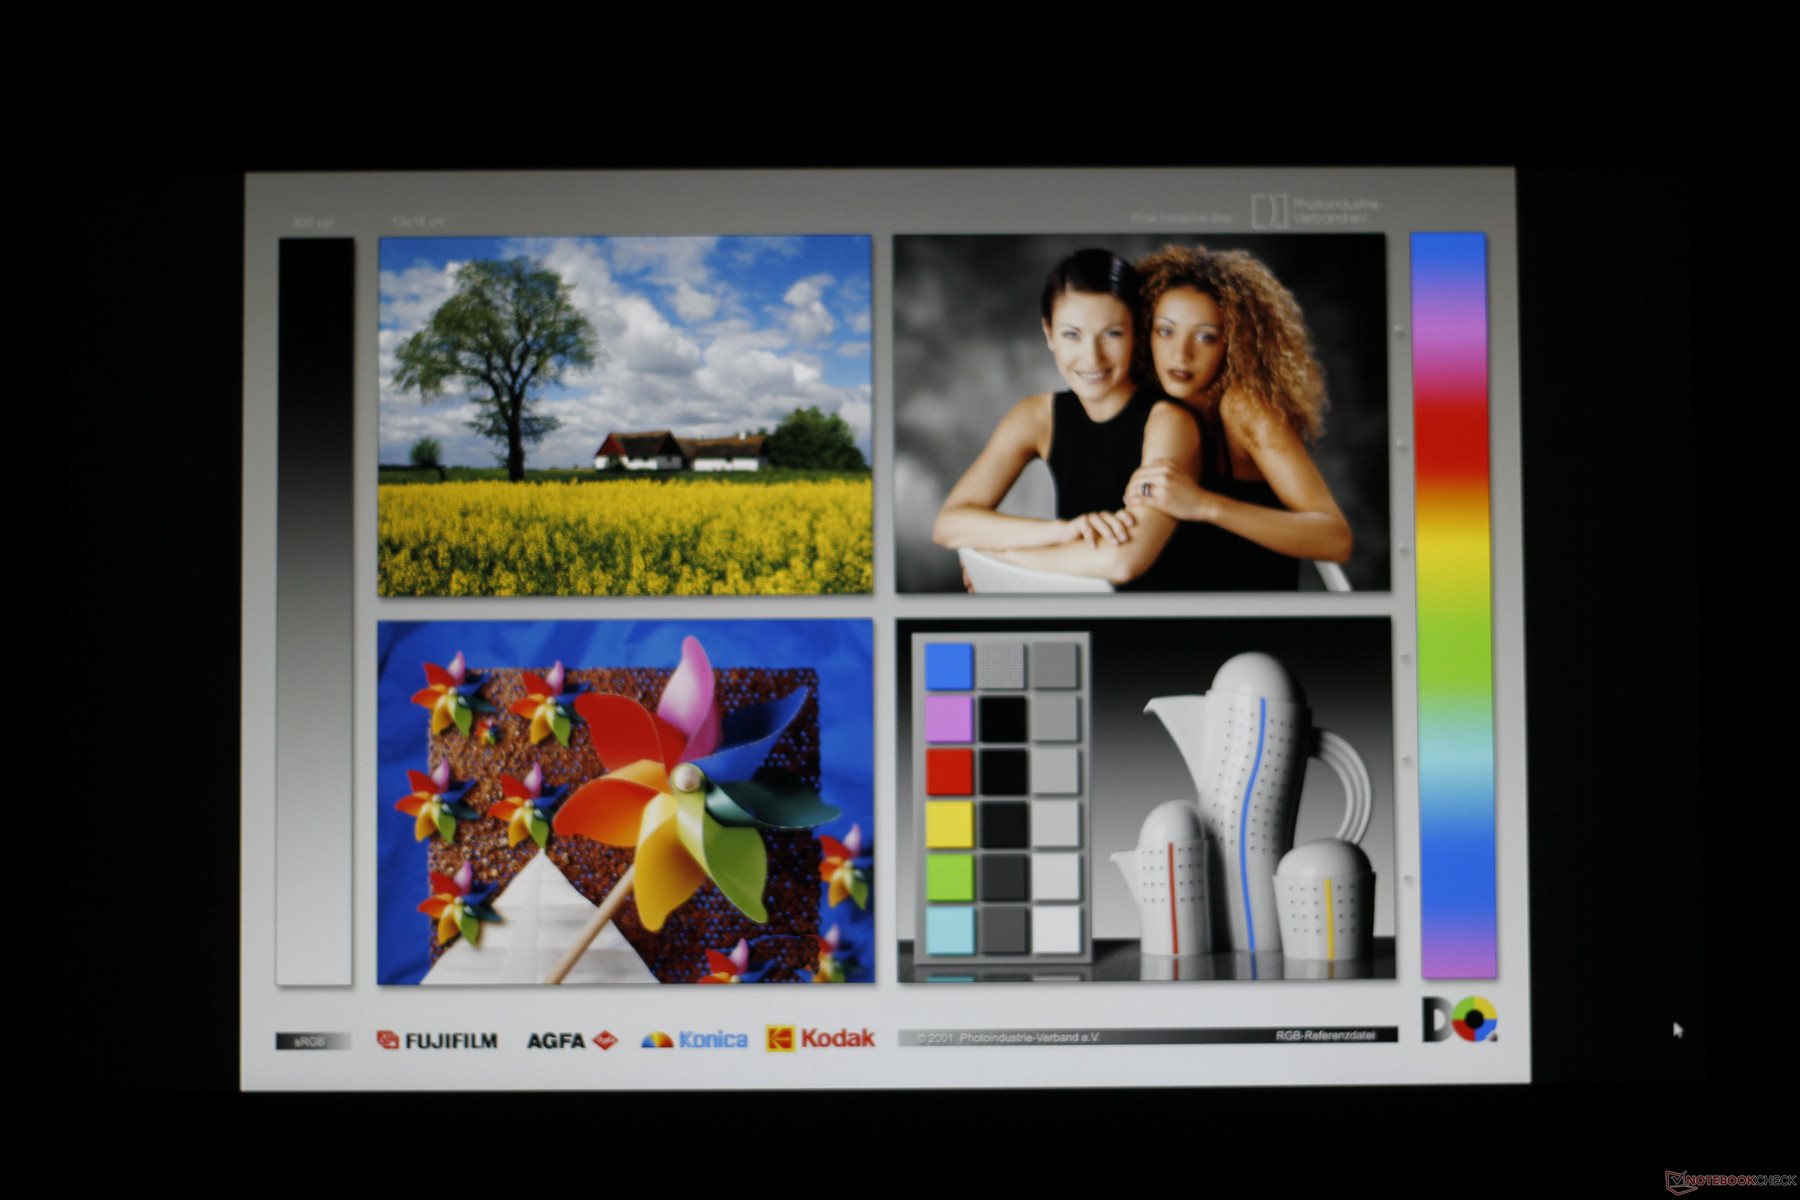
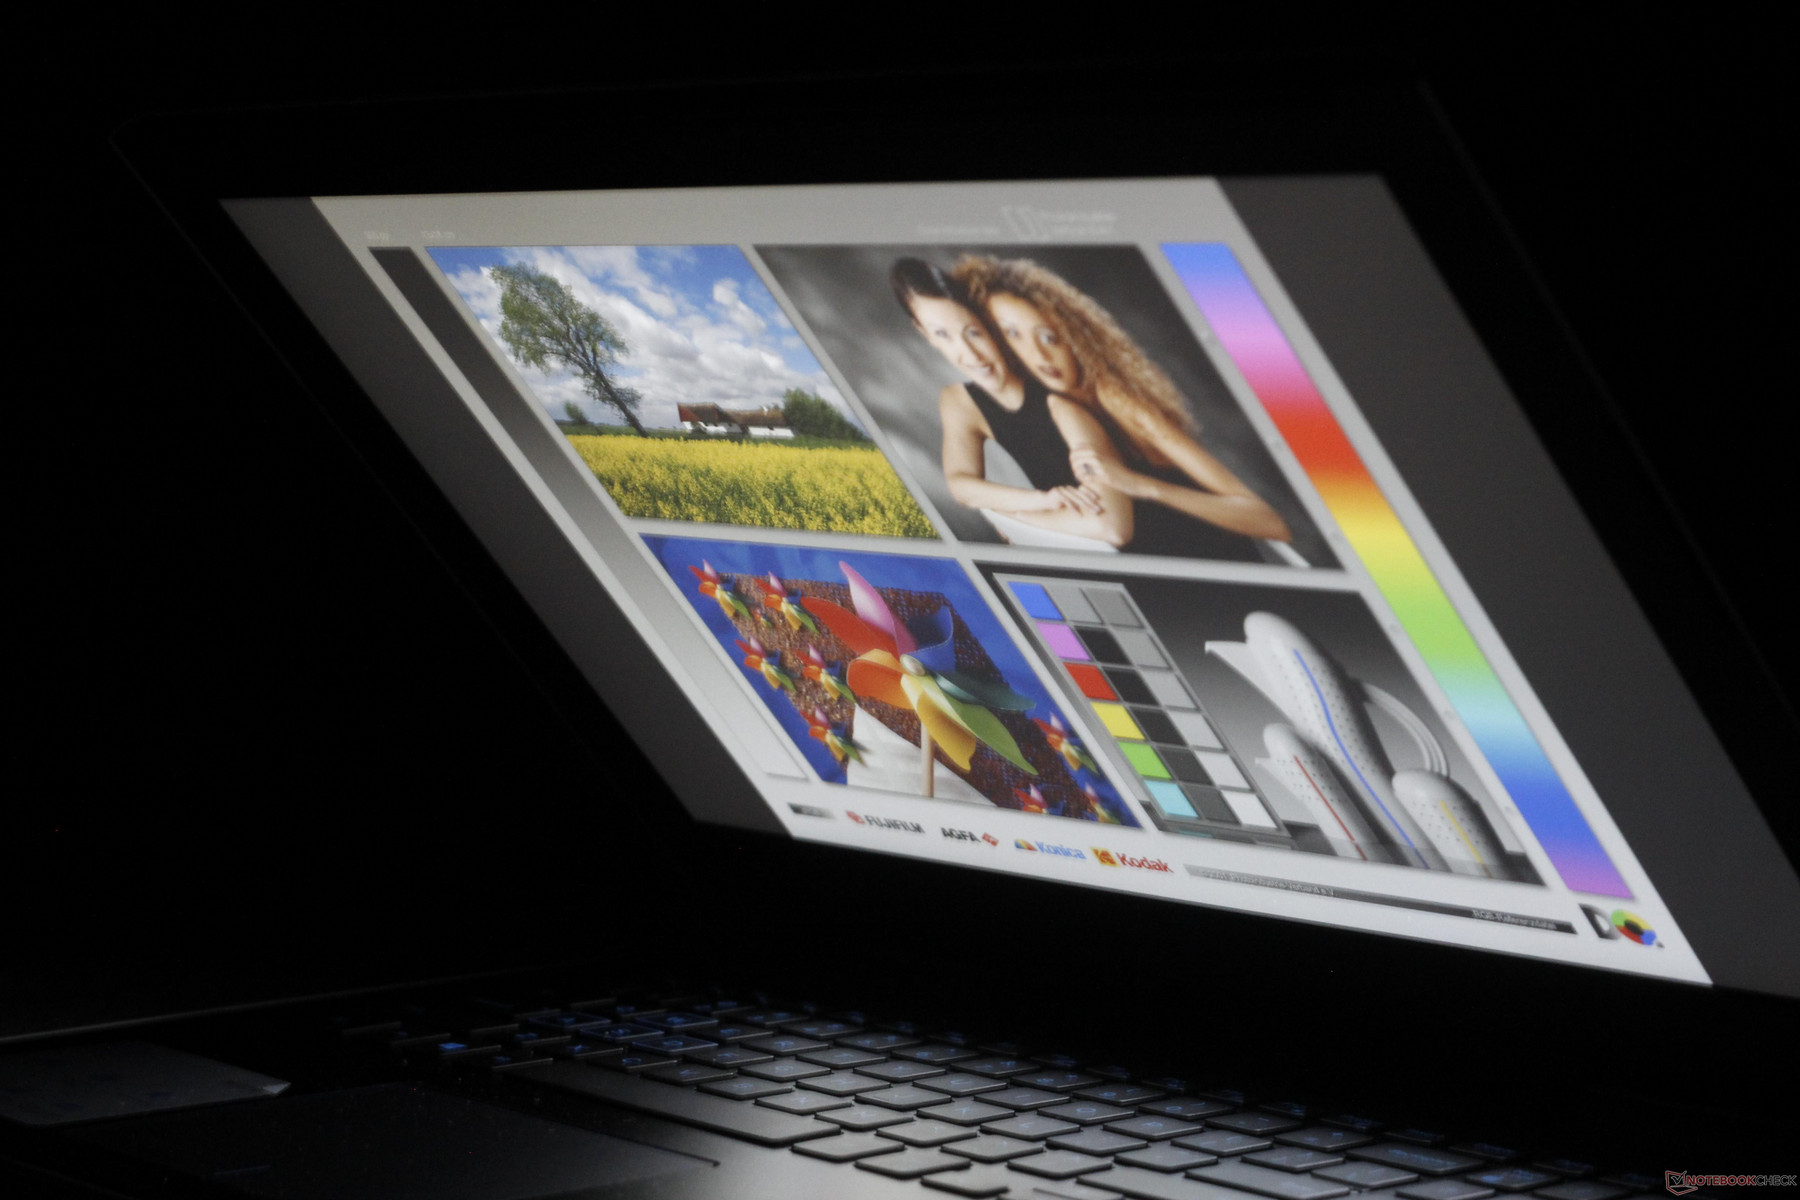
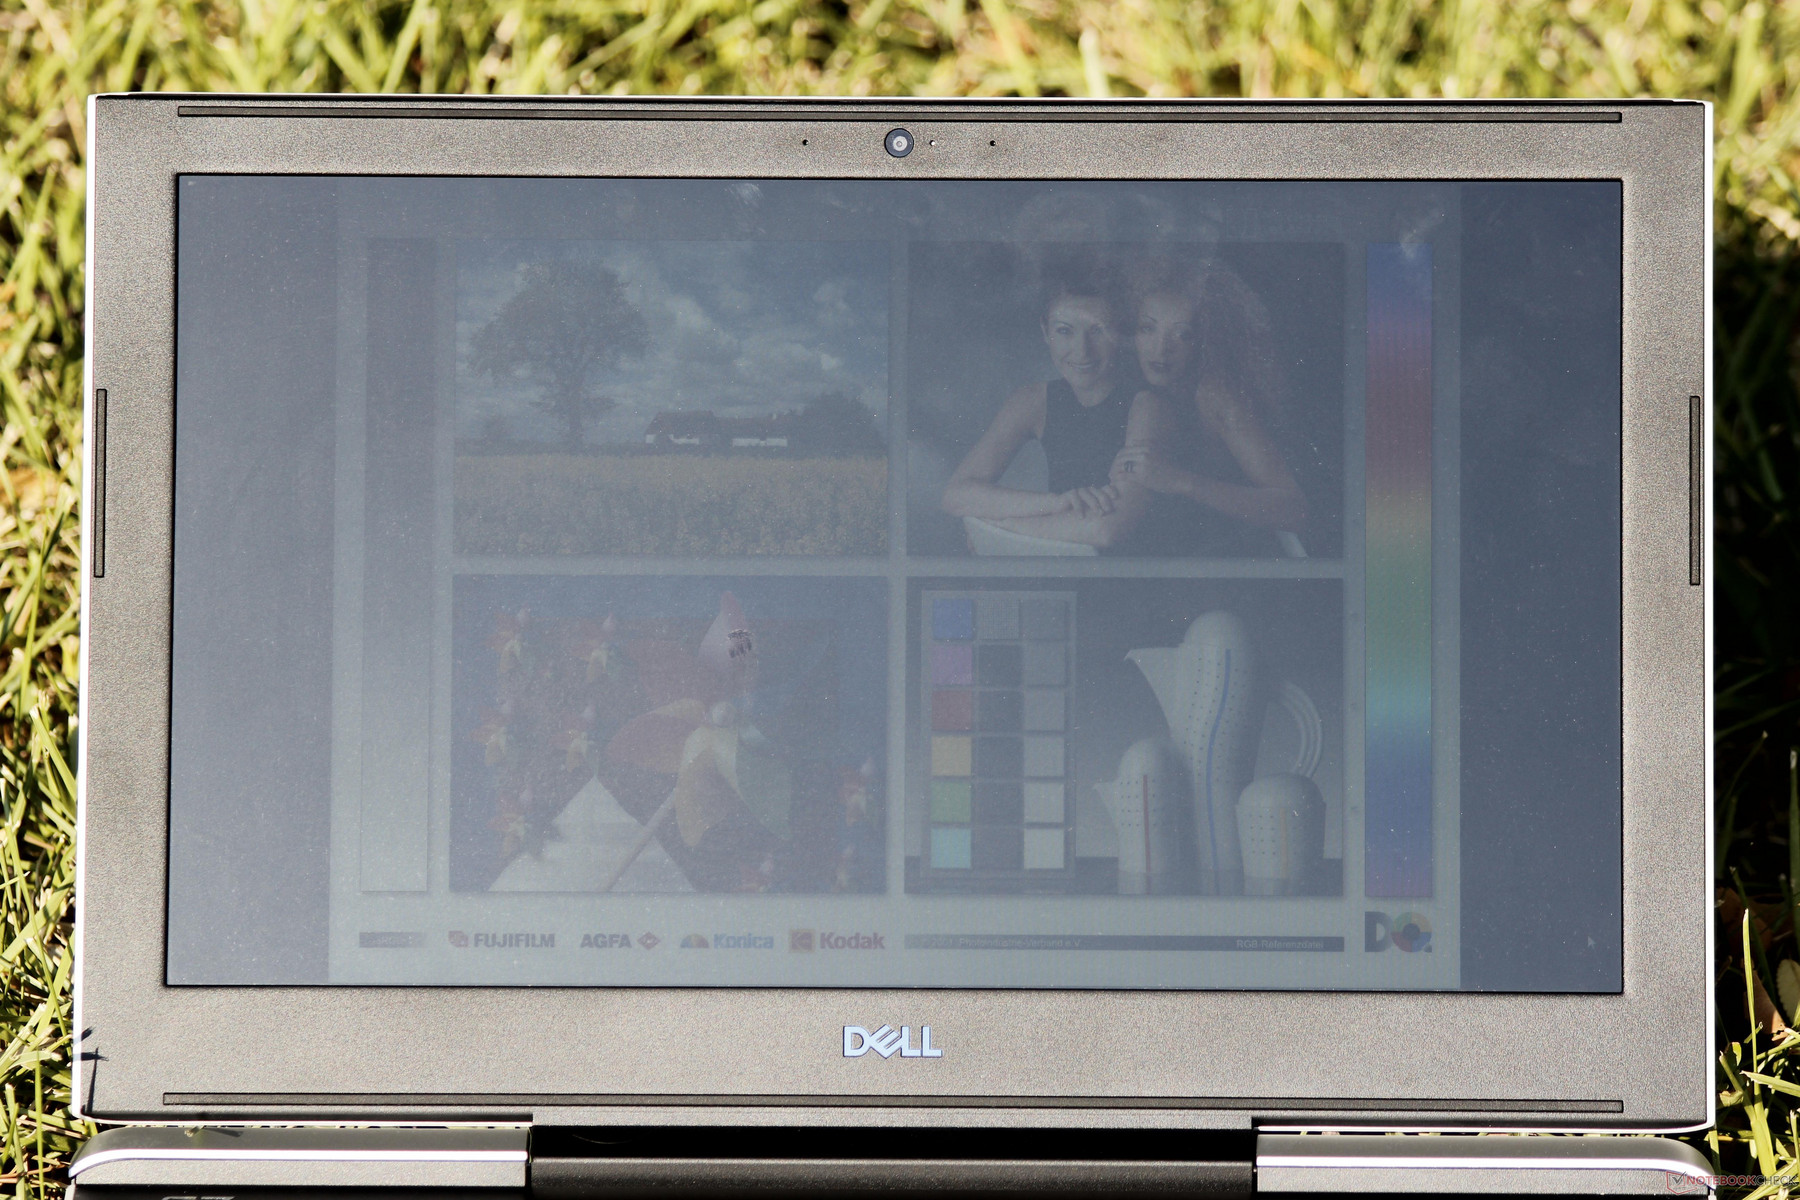
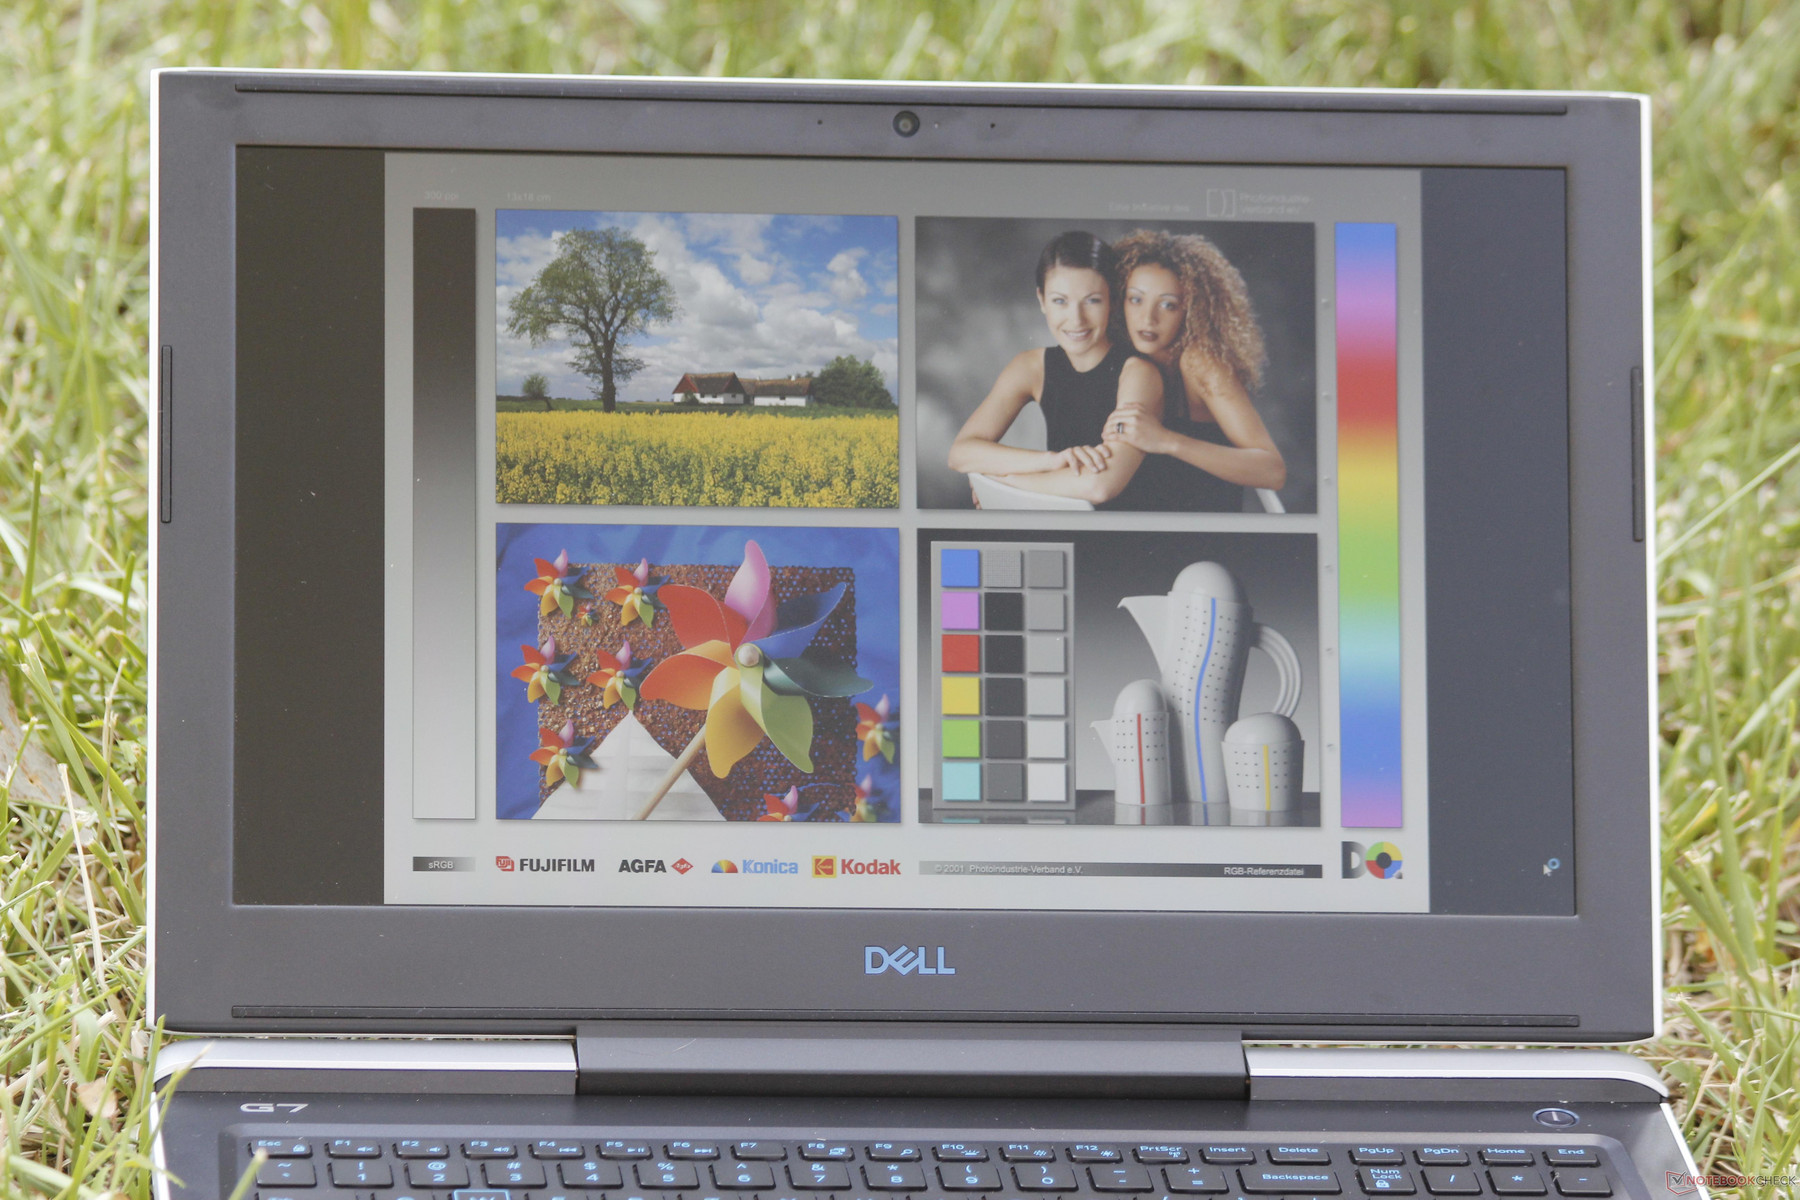
As with most IPS displays, viewing angles are good. Images remain clear and accurate when viewed off-angle but dim rapidly past 60°. The low overall brightness is partly to blame. In the same vein, the screen cannot be used outdoors or under bright direct lighting. In sunlight, the display cannot be seen, so shade is a requirement. Backlight bleed is almost non-existent, save for a small spot in the upper right of the screen. Still, this spot is not readily noticeable.
Performance
The Intel Core i7-8750H and Nvidia's GeForce GTX 1060 make for an excellent FHD gaming machine. The Max-Q design helps cut back on heat and noise output without sacrificing much in the way of performance. Additionally, stress is well-handled, making the G7 a heavyweight contender in the budget gaming market.
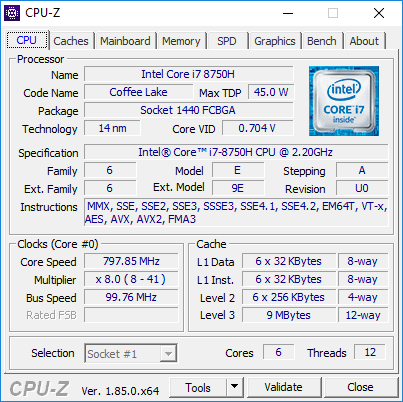
Processor
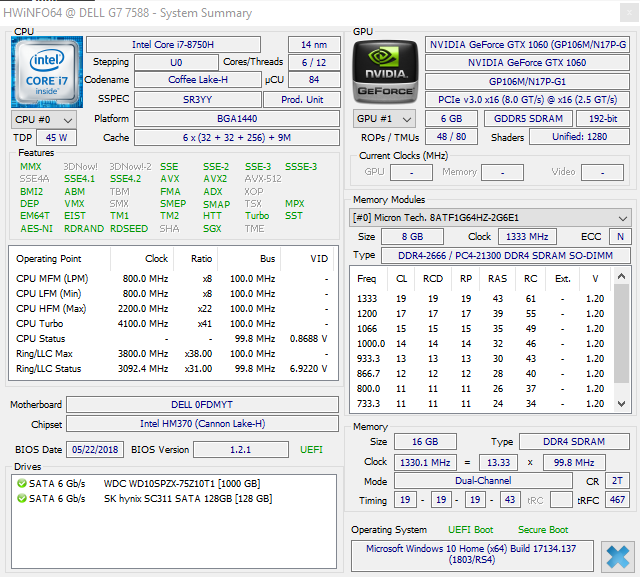
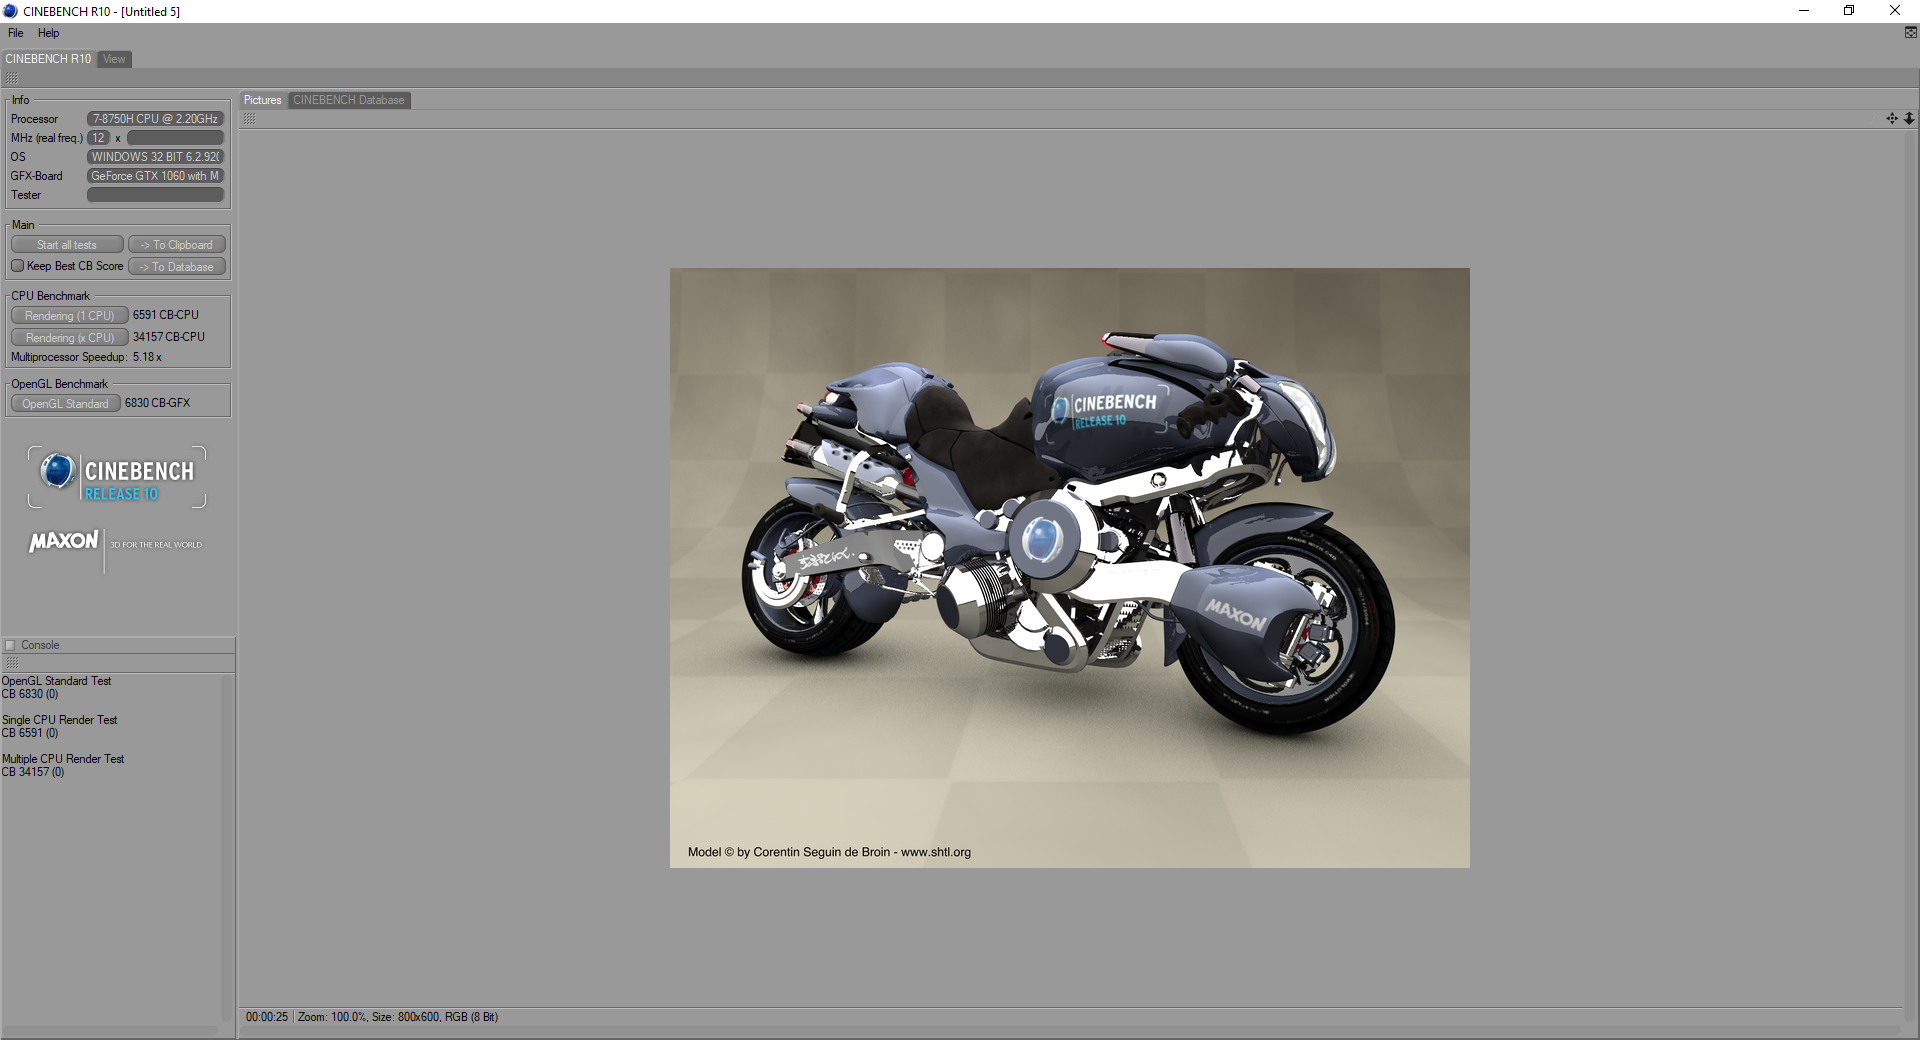
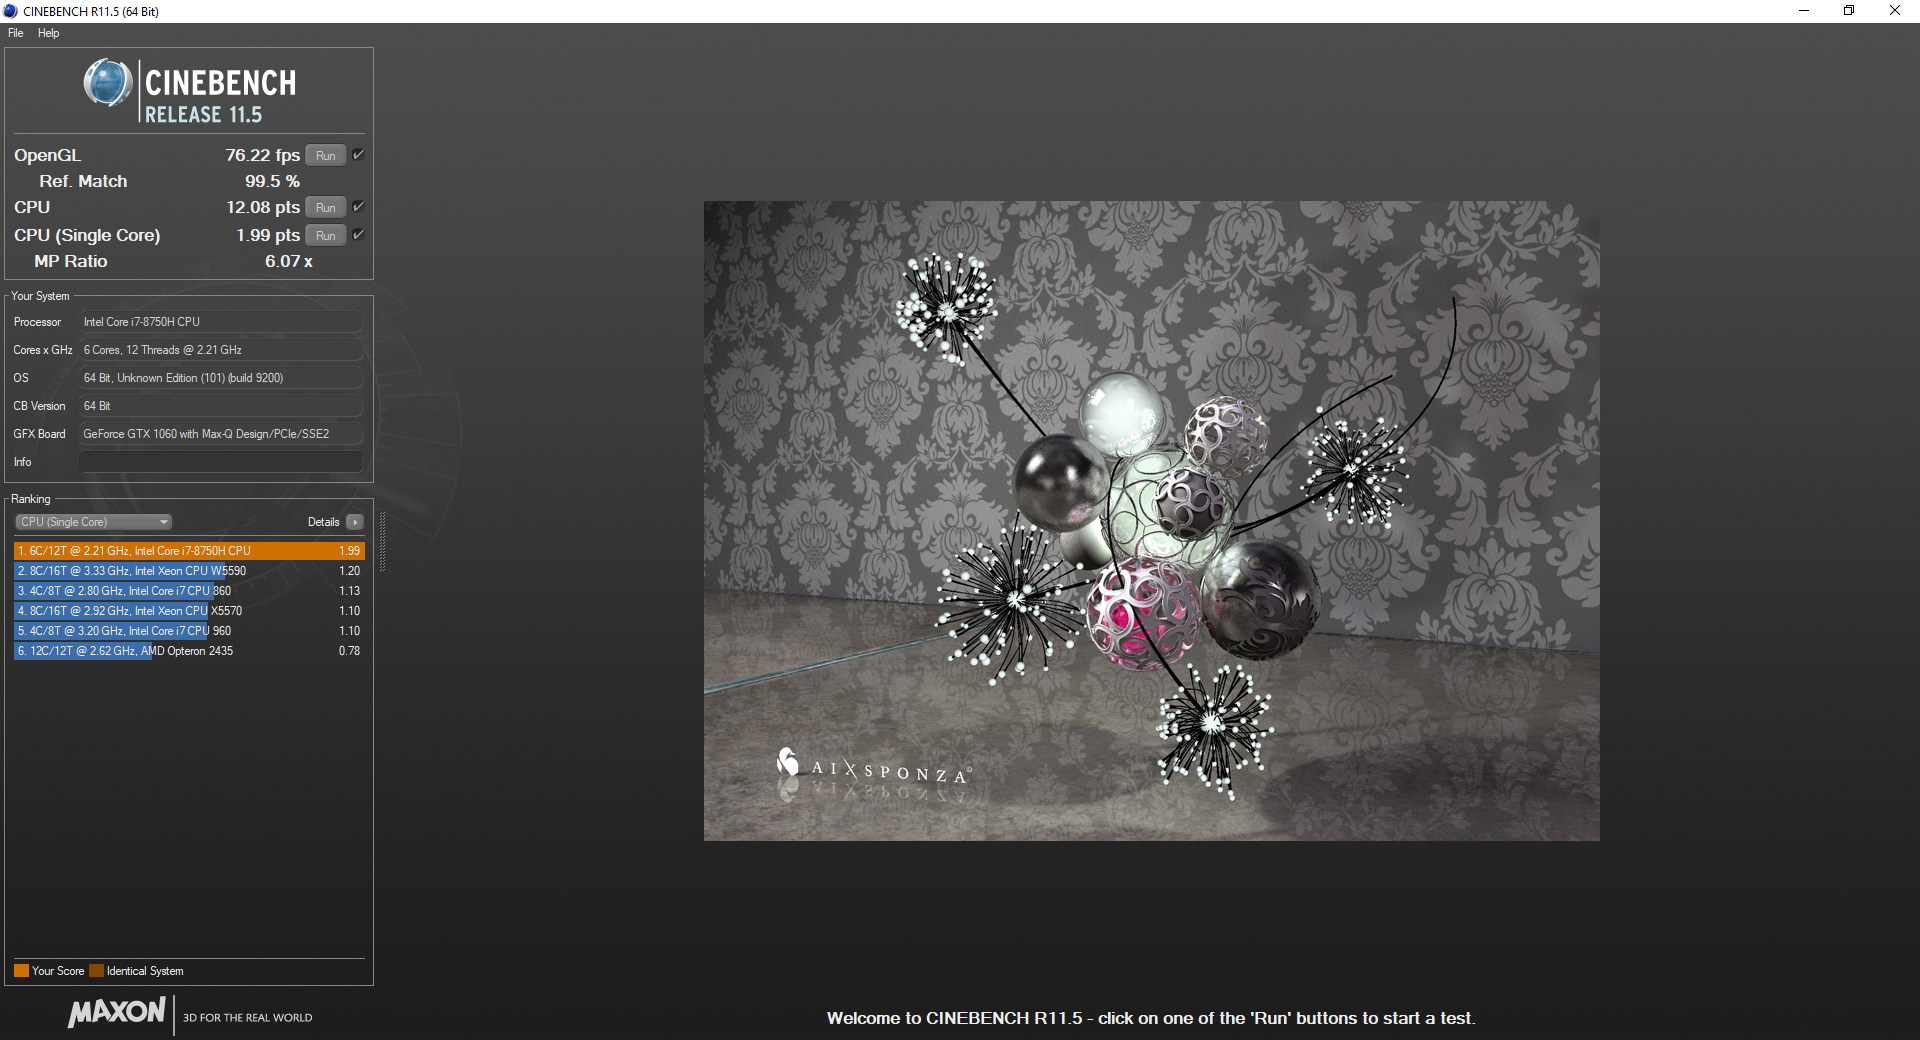
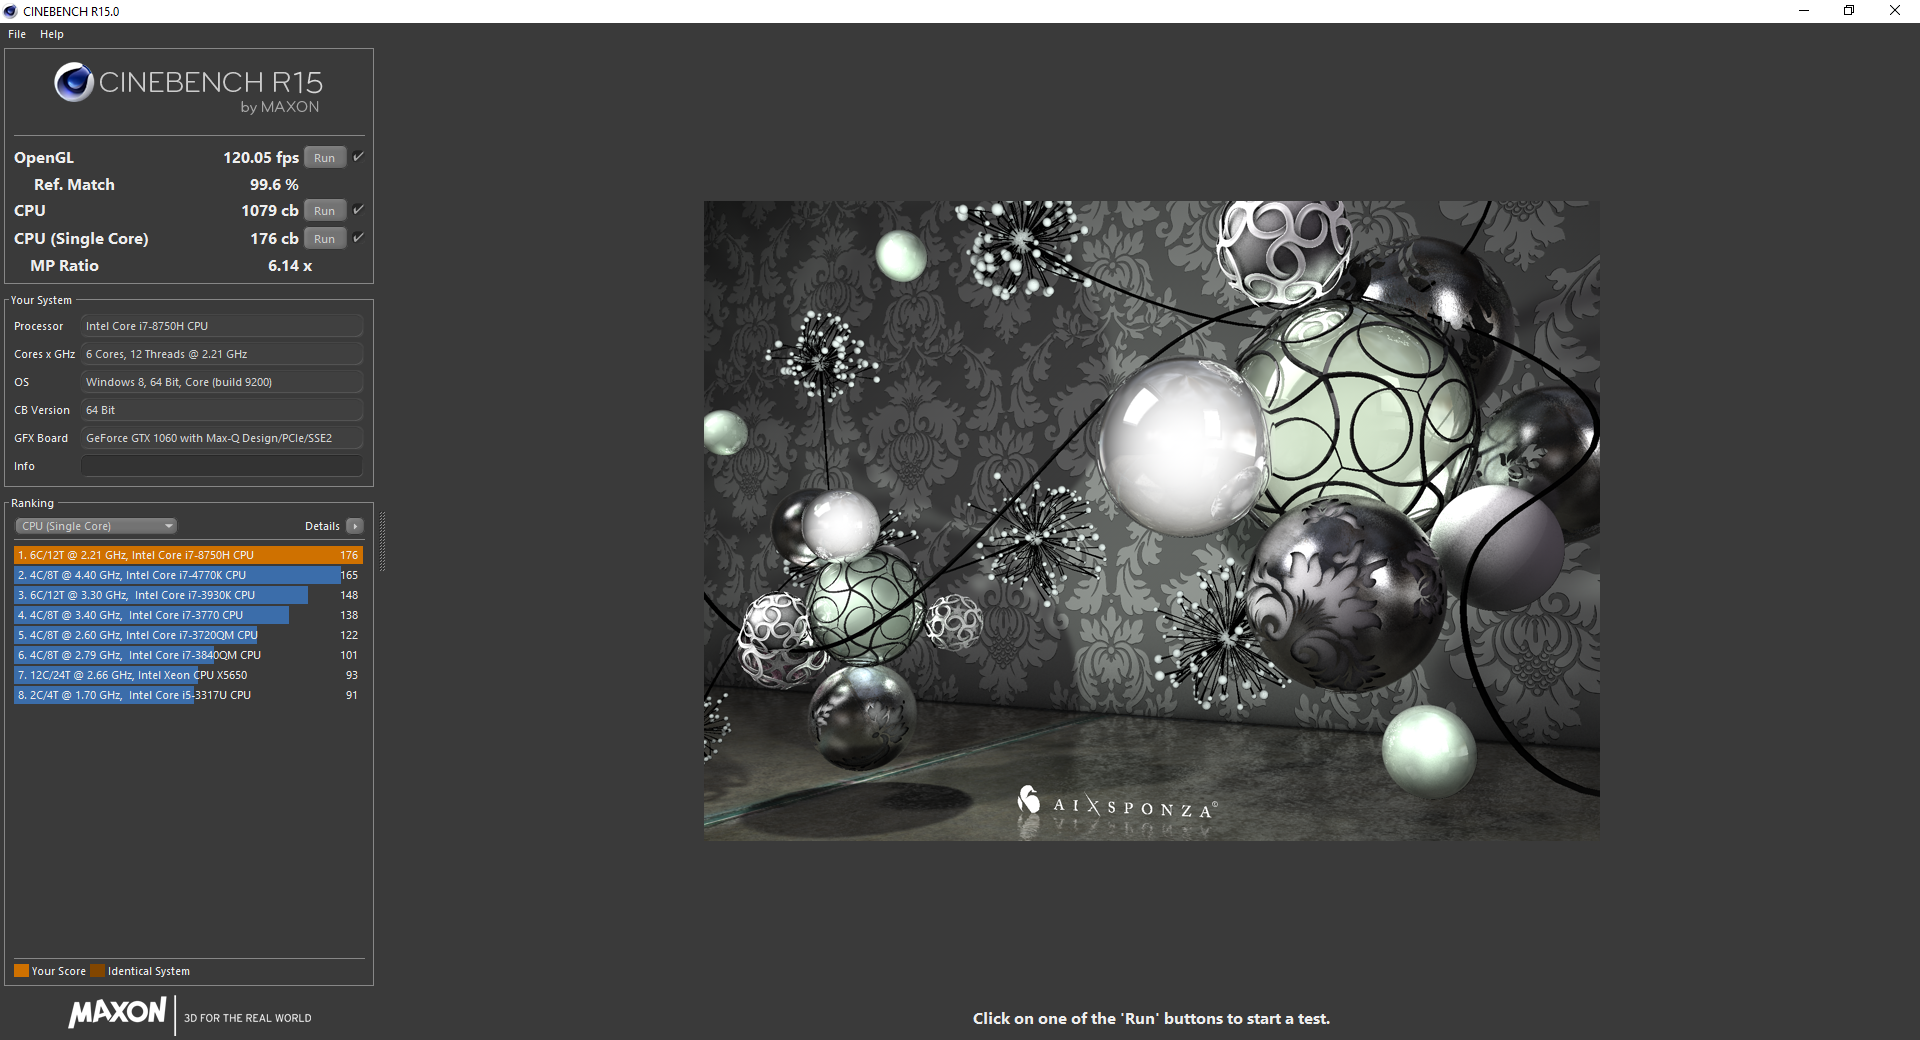
Intel's 8th gen Core i7-8750H has become the new gold standard for gaming laptops, supplanting the Core i7-7700HQ. The new six-core CPU brings a massive leap in performance over the older silicon, scoring about 50% higher in Cinebench R15's multicore test. The 8750H also keeps pace with the much more expensive Core i9-8950HK in the same benchmark. On battery, Cinebench scores hover around 1000, or about 93% of the machine's performance when plugged in.
Over longer workloads (as measured by our Cinebench R15 loop), the G7 sees a dip in performance after the first pass but levels off at about 91% of the original score. The G7 holds here throughout the rest of the loop without any noticeable throttling.
For more information on the Intel Core i7-8750H, please see our dedicated CPU page here.
* ... smaller is better
System Performance
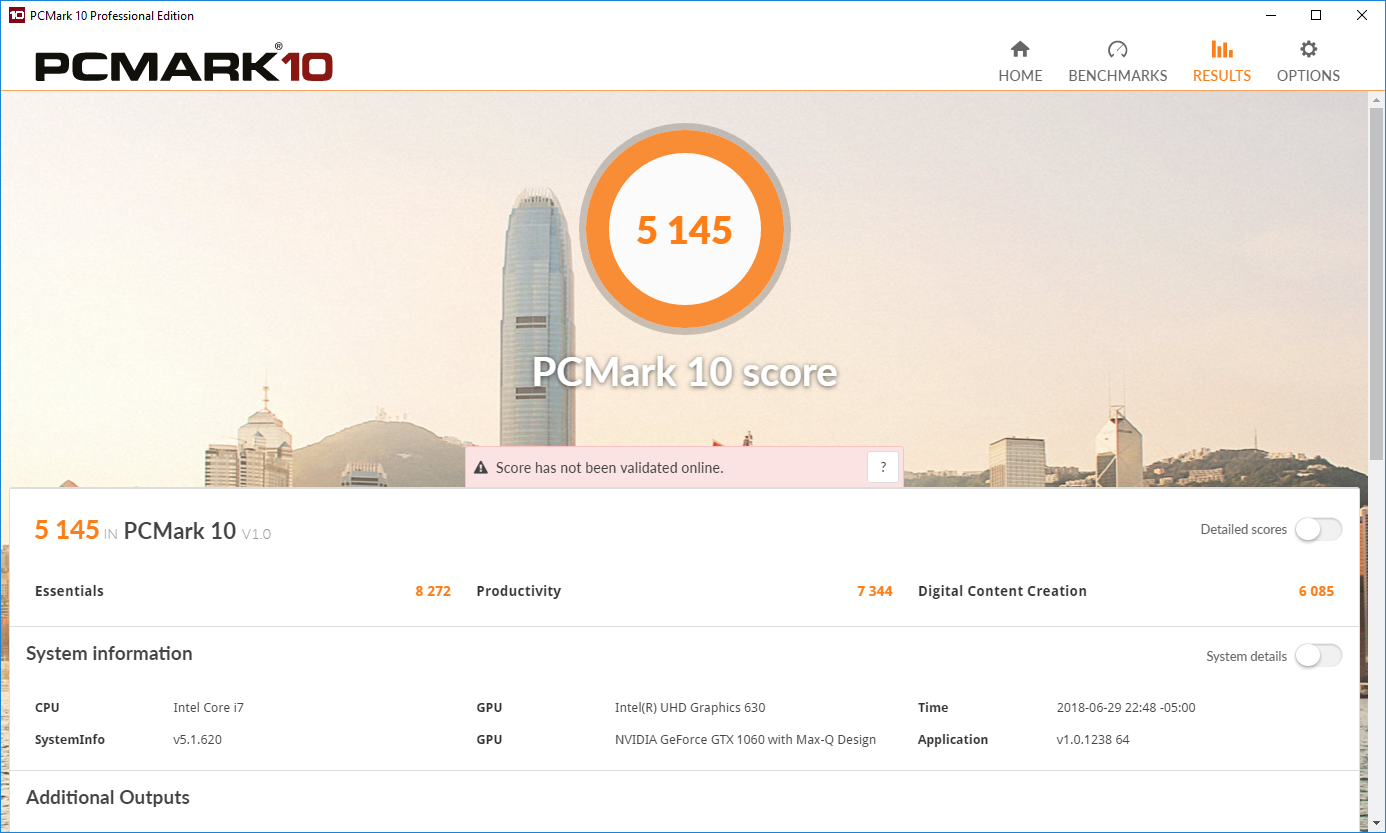
Overall system performance is excellent. The G7 benchmarks in line with other budget gaming laptops in PCMark 8 and PCMark 10. e have yet to experience any hiccups in normal use. Game load times feel slow, likely due to the SATA SSD. An NVMe drive should help lower these load times but likely won't improve overall use by a noticeable amount.
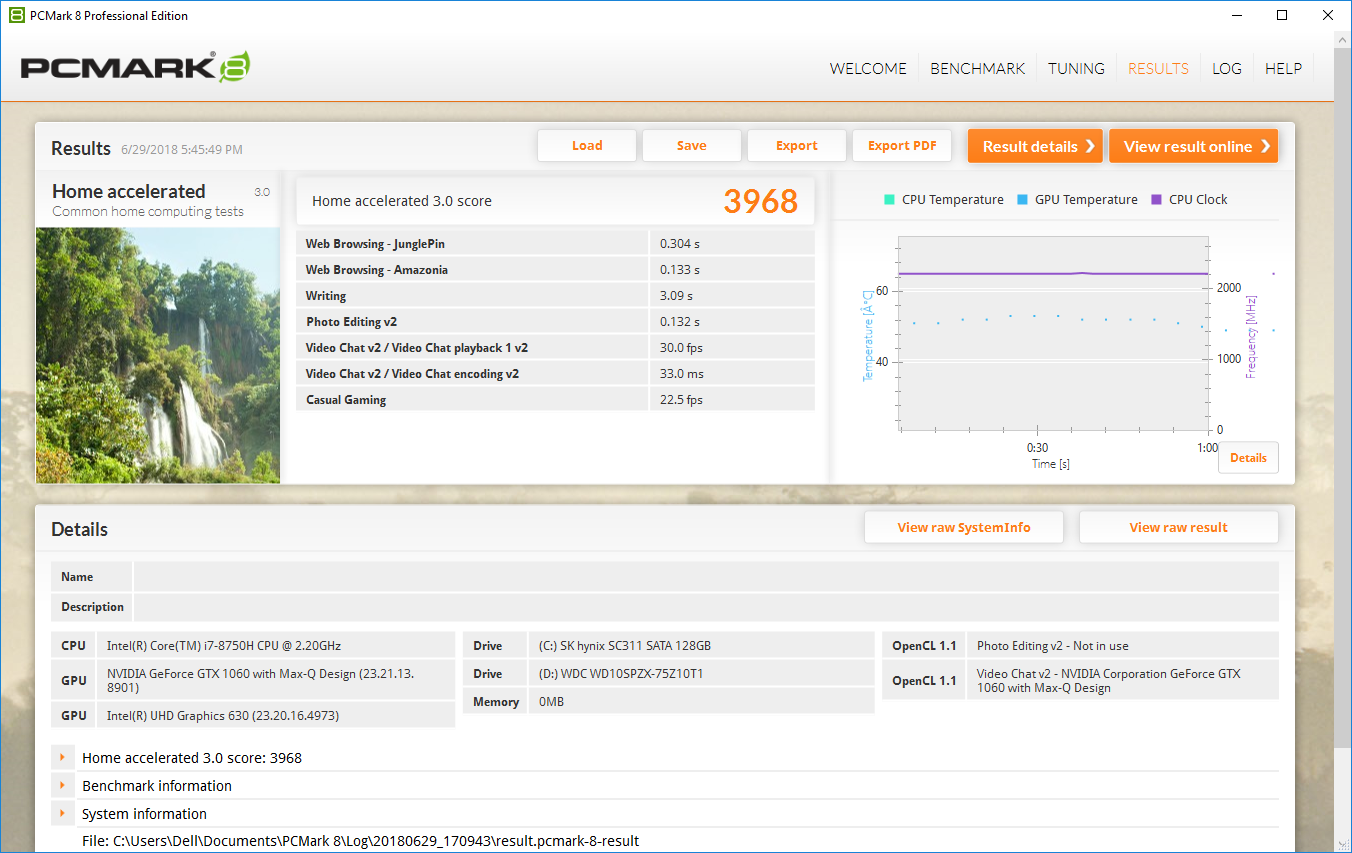

| PCMark 8 Home Score Accelerated v2 | 3968 points | |
| PCMark 8 Work Score Accelerated v2 | 5410 points | |
| PCMark 10 Score | 5285 points | |
Help | ||
Storage Devices
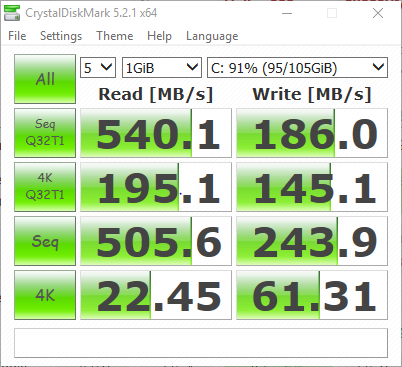
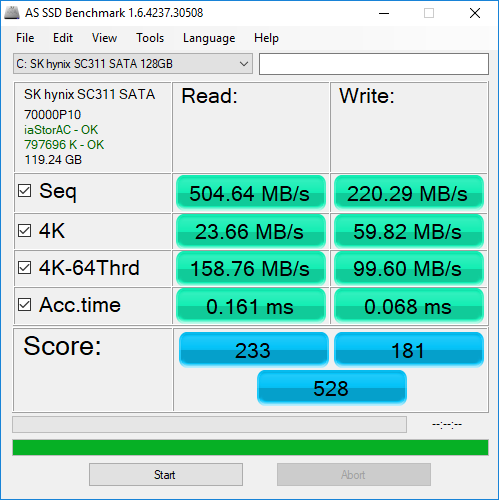
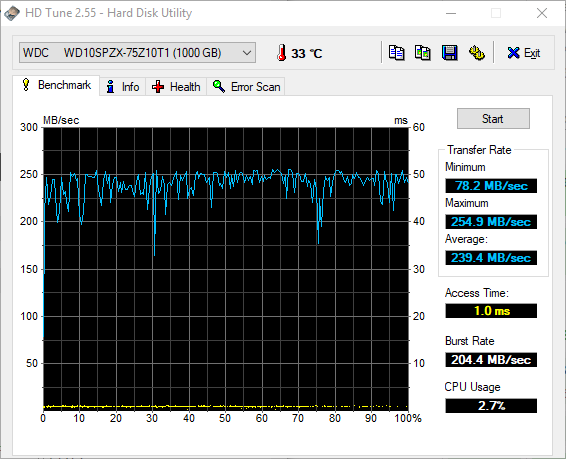
Dell offers a few options for storage. Our review unit ships with a 128 GB SATA SSD and a 1 TB mechanical hard drive. The boot SSD is relatively slow, even by SATA standards. That said, it is still plenty fast for everyday tasks. As mentioned above, game load times suffer a bit. The M.2 slot is compatible with NVMe drives, and the easy maintenance options should make swapping the SSD for a faster PCIe-based drive a snap. The HDD is fairly quick compared to other budget gaming machines, and the ample terabyte of storage is very welcome.

| Dell G7 15-7588 SK hynix SC311 SATA | Dell Inspiron 15 7000 7577 Samsung PM961 MZVLW256HEHP | Acer Predator Helios 300 PH317-52-51M6 Hynix HFS128G39TND | Asus FX503VM-EH73 SanDisk SD8SN8U128G1002 | HP Omen 15t-ce000 Samsung PM961 NVMe MZVLW128HEGR | Lenovo Legion Y530-15ICH Toshiba KBG30ZMT128G | |
|---|---|---|---|---|---|---|
| AS SSD | 227% | -3% | 19% | 146% | -23% | |
| Copy Game MB/s (MB/s) | 223.2 | 382.5 71% | 736 230% | |||
| Copy Program MB/s (MB/s) | 126.9 | 274.8 117% | 195.4 54% | |||
| Copy ISO MB/s (MB/s) | 460.8 | 814 77% | 1087 136% | |||
| Score Total (Points) | 528 | 2405 355% | 811 54% | 798 51% | 1515 187% | 838 59% |
| Score Write (Points) | 181 | 594 228% | 196 8% | 178 -2% | 361 99% | 128 -29% |
| Score Read (Points) | 233 | 1241 433% | 414 78% | 411 76% | 789 239% | 497 113% |
| Access Time Write * (ms) | 0.068 | 0.037 46% | 0.259 -281% | 0.09 -32% | 0.034 50% | 0.287 -322% |
| Access Time Read * (ms) | 0.161 | 0.058 64% | 0.17 -6% | 0.071 56% | 0.626 -289% | |
| 4K-64 Write (MB/s) | 99.6 | 375.8 277% | 120.1 21% | 95.5 -4% | 175.9 77% | 78.9 -21% |
| 4K-64 Read (MB/s) | 158.8 | 929 485% | 336.6 112% | 343.4 116% | 568 258% | 335.3 111% |
| 4K Write (MB/s) | 59.8 | 100.2 68% | 62.7 5% | 46.48 -22% | 111.2 86% | 35.74 -40% |
| 4K Read (MB/s) | 23.66 | 46.95 98% | 26.5 12% | 20.44 -14% | 43.09 82% | 38.71 64% |
| Seq Write (MB/s) | 220.3 | 1181 436% | 128.2 -42% | 328.4 49% | 743 237% | 131.6 -40% |
| Seq Read (MB/s) | 506 | 2652 424% | 513 1% | 476.3 -6% | 1774 251% | 1231 143% |
* ... smaller is better

GPU Performance
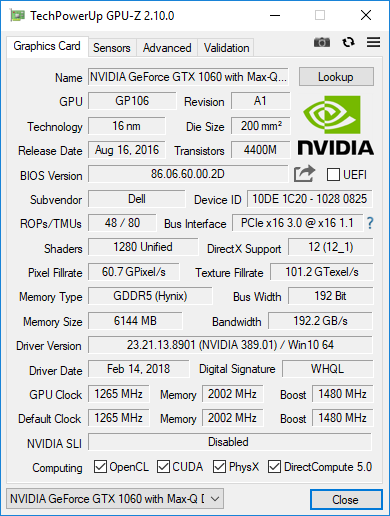
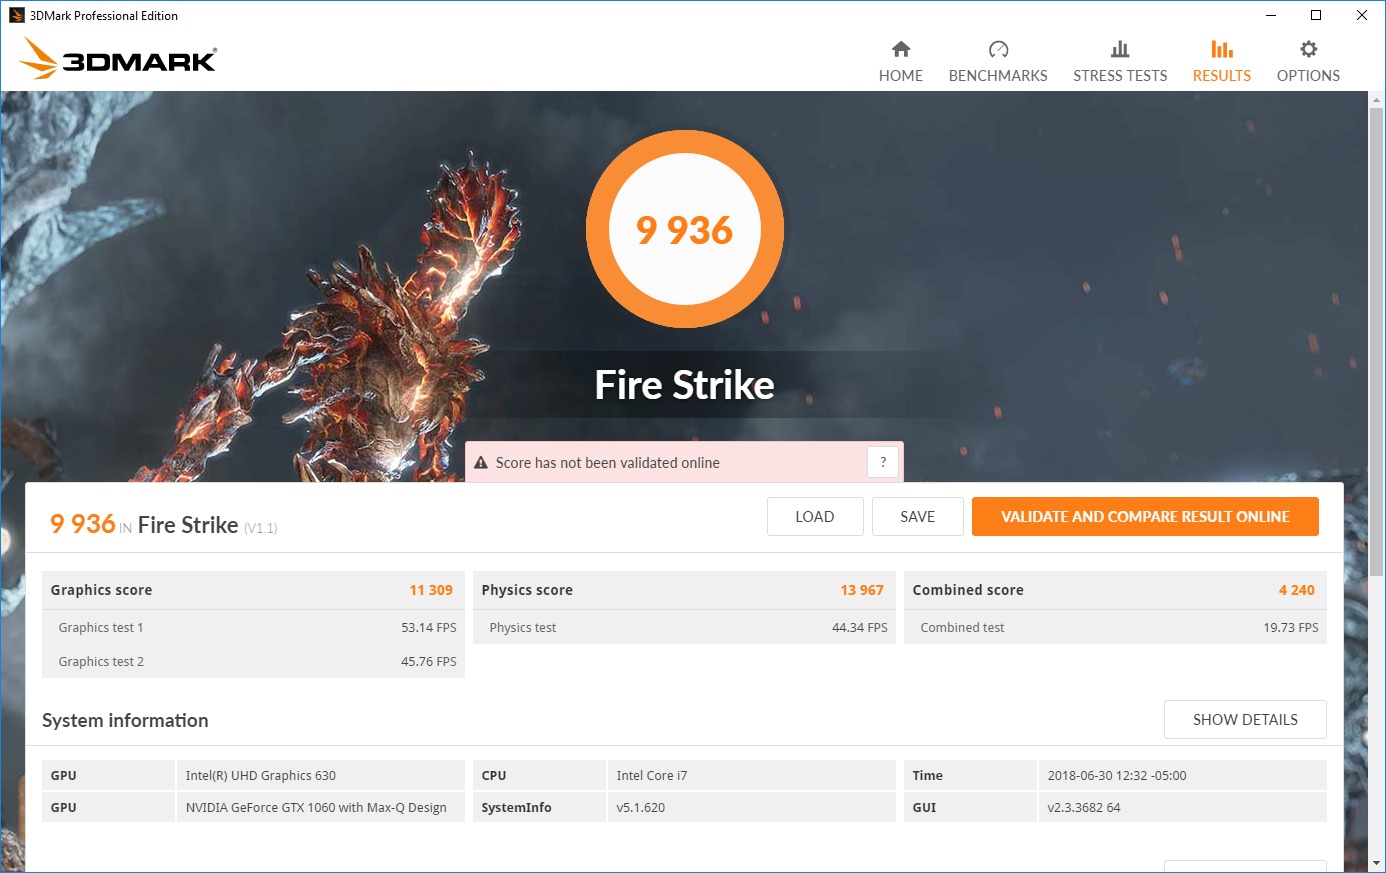
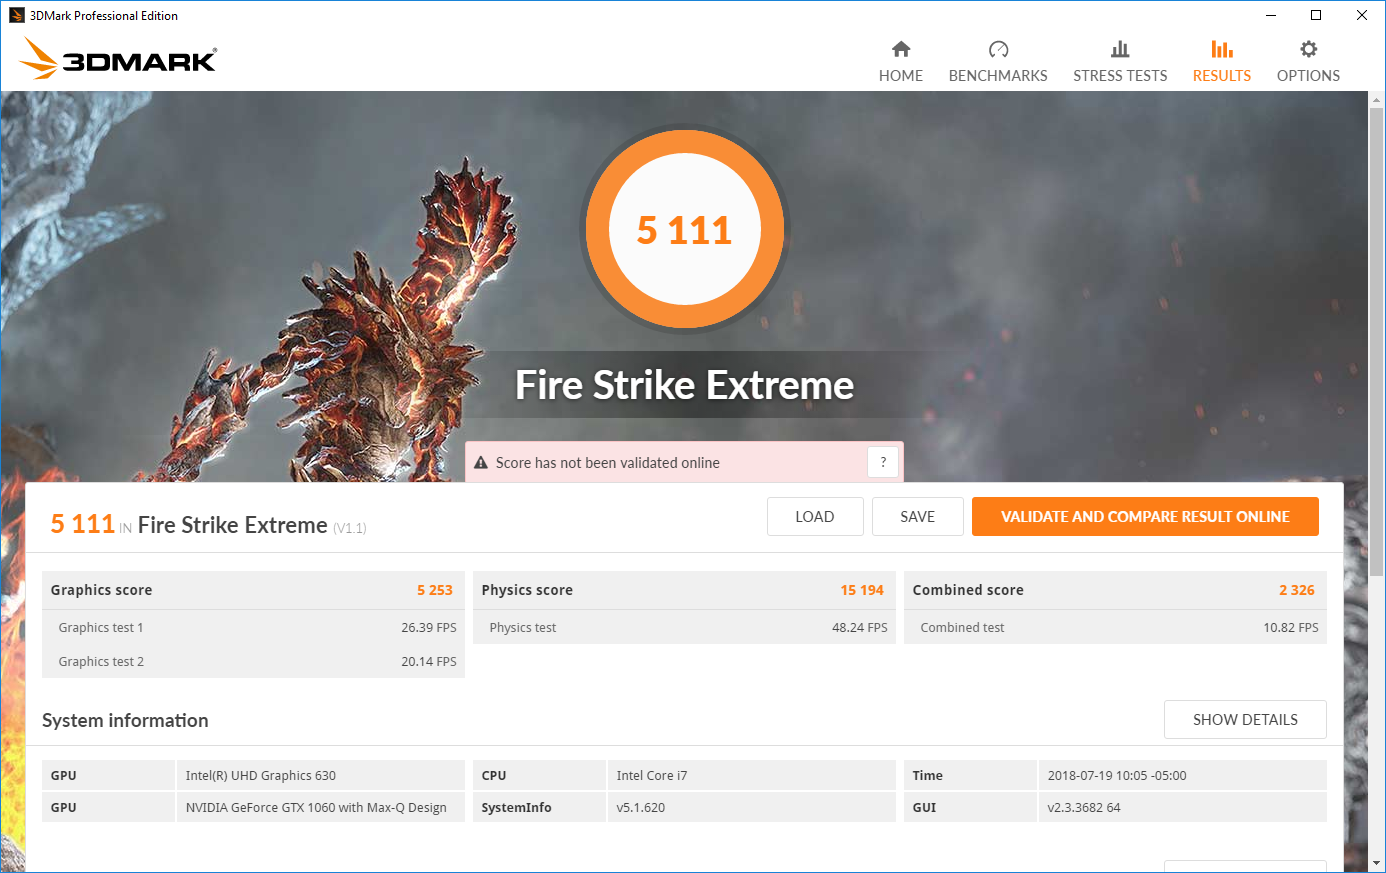
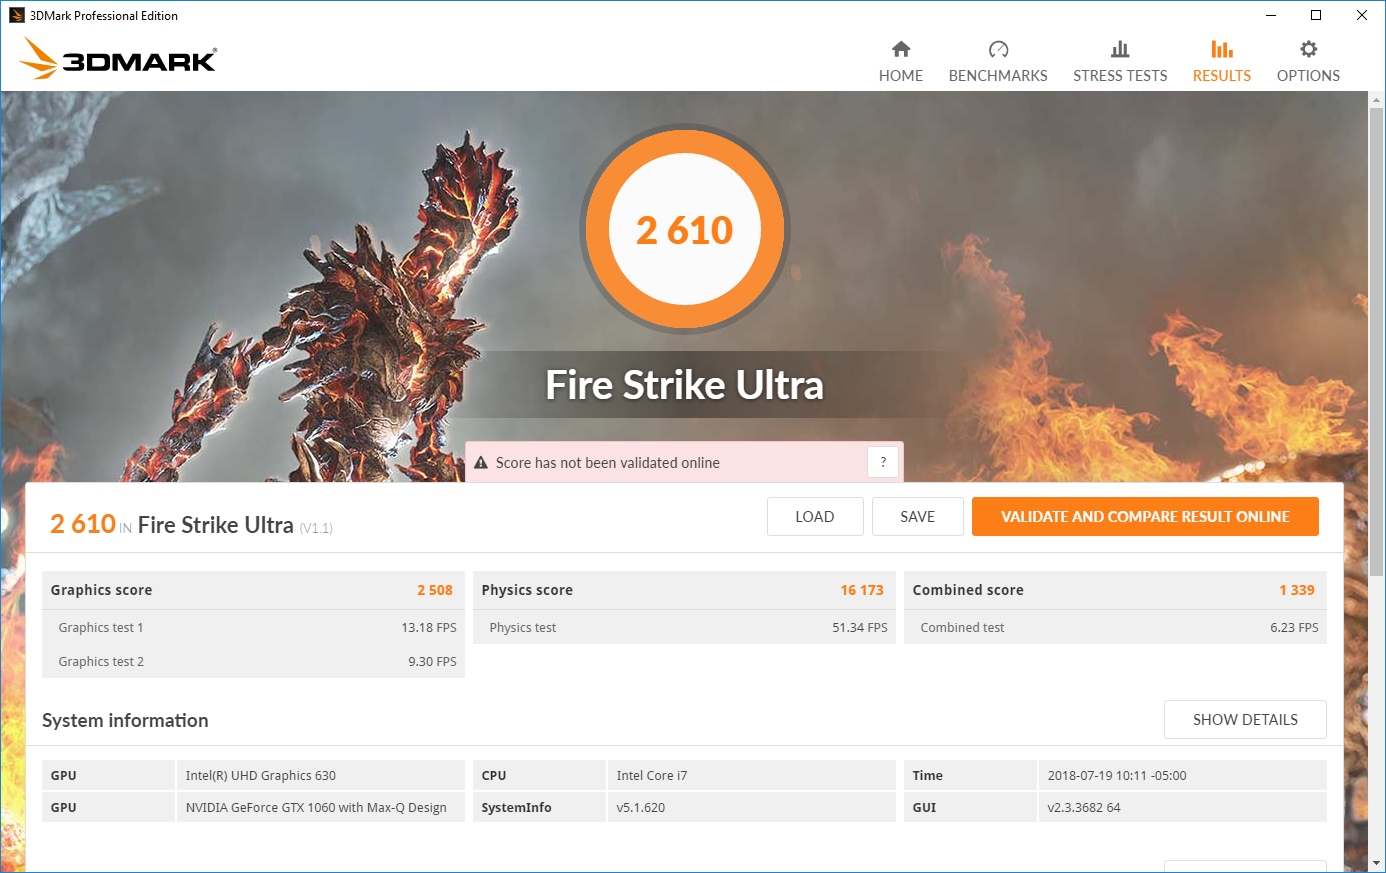
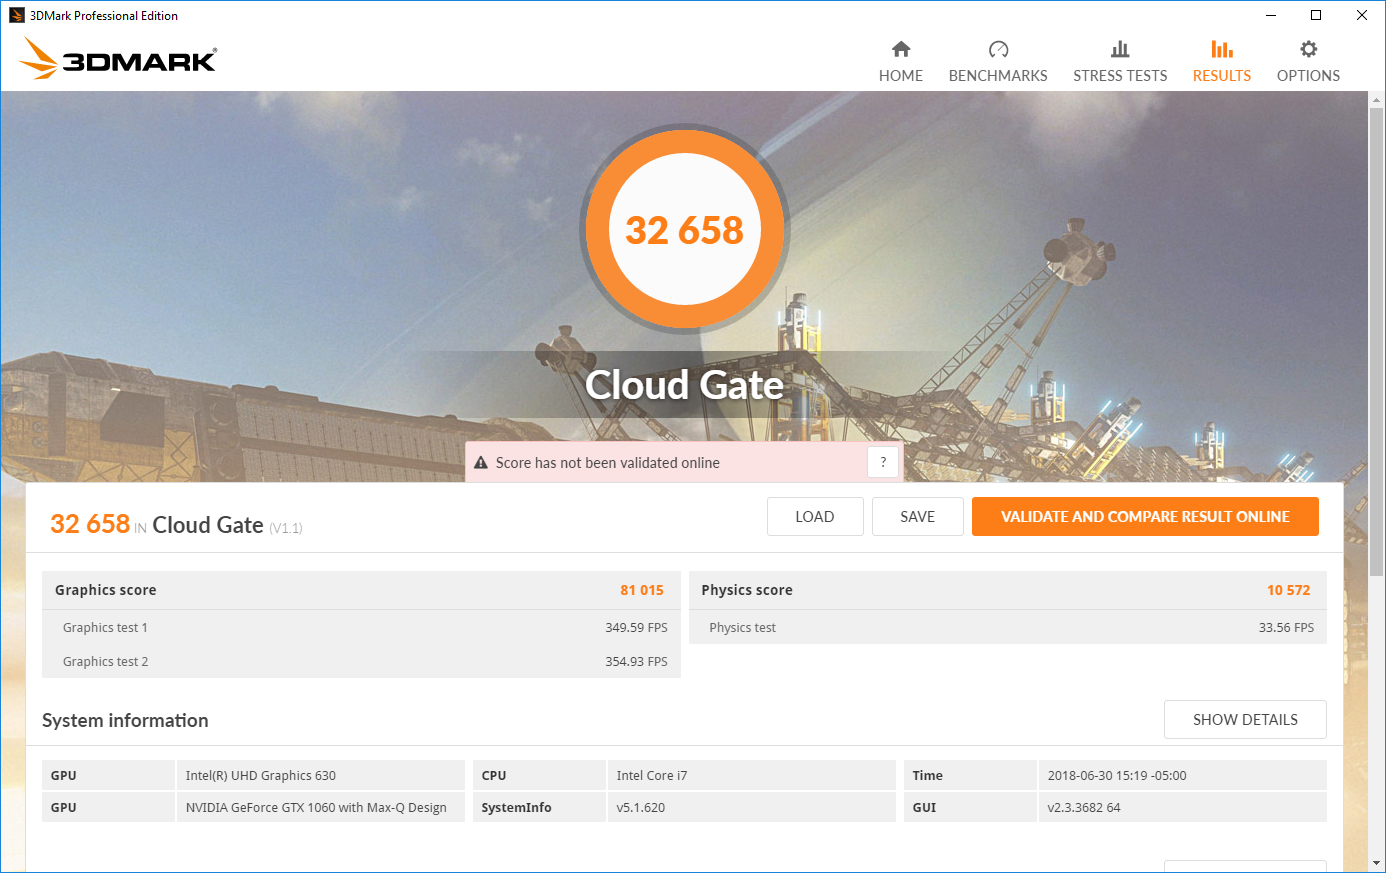
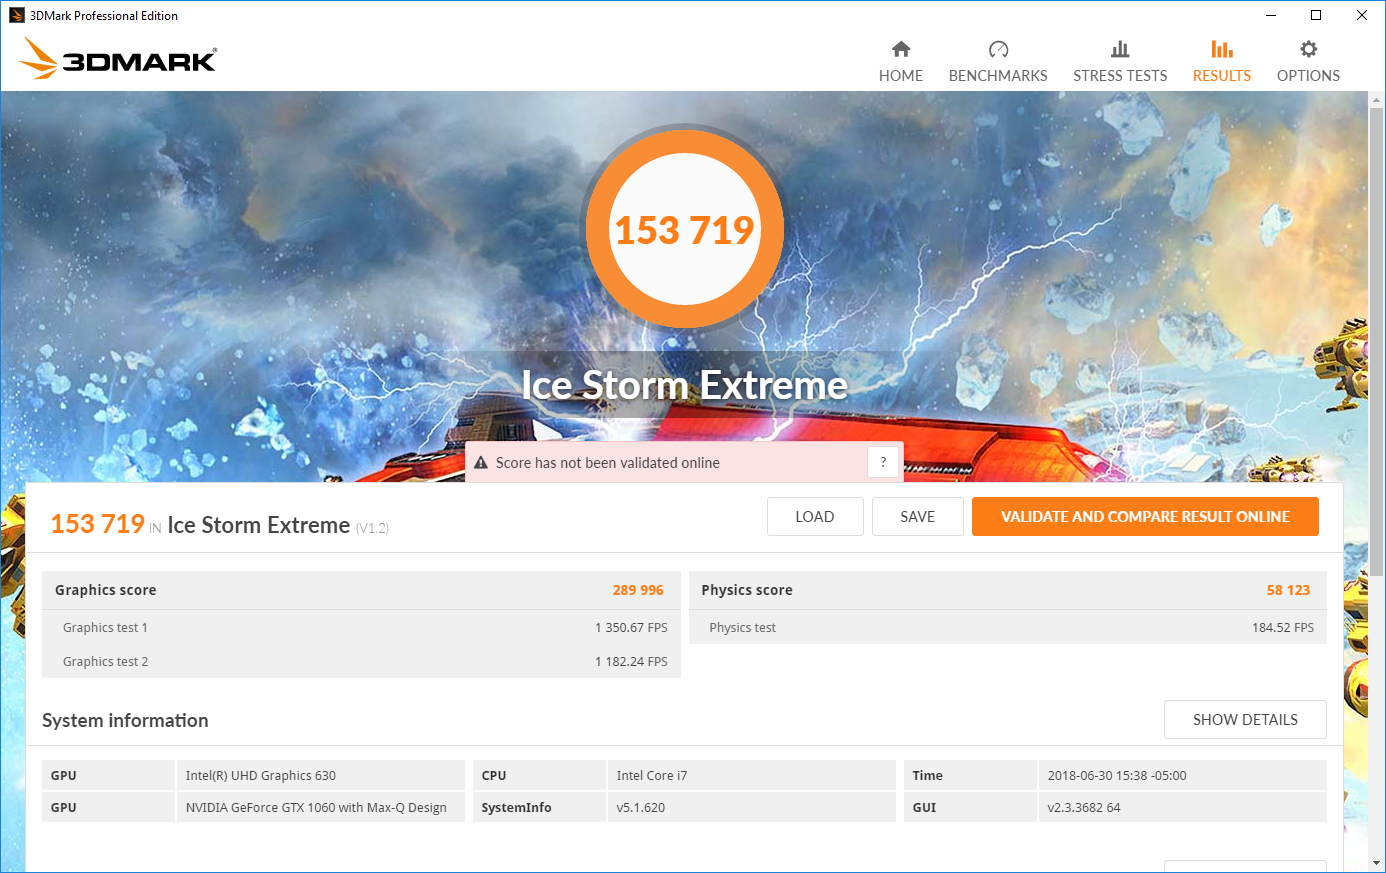
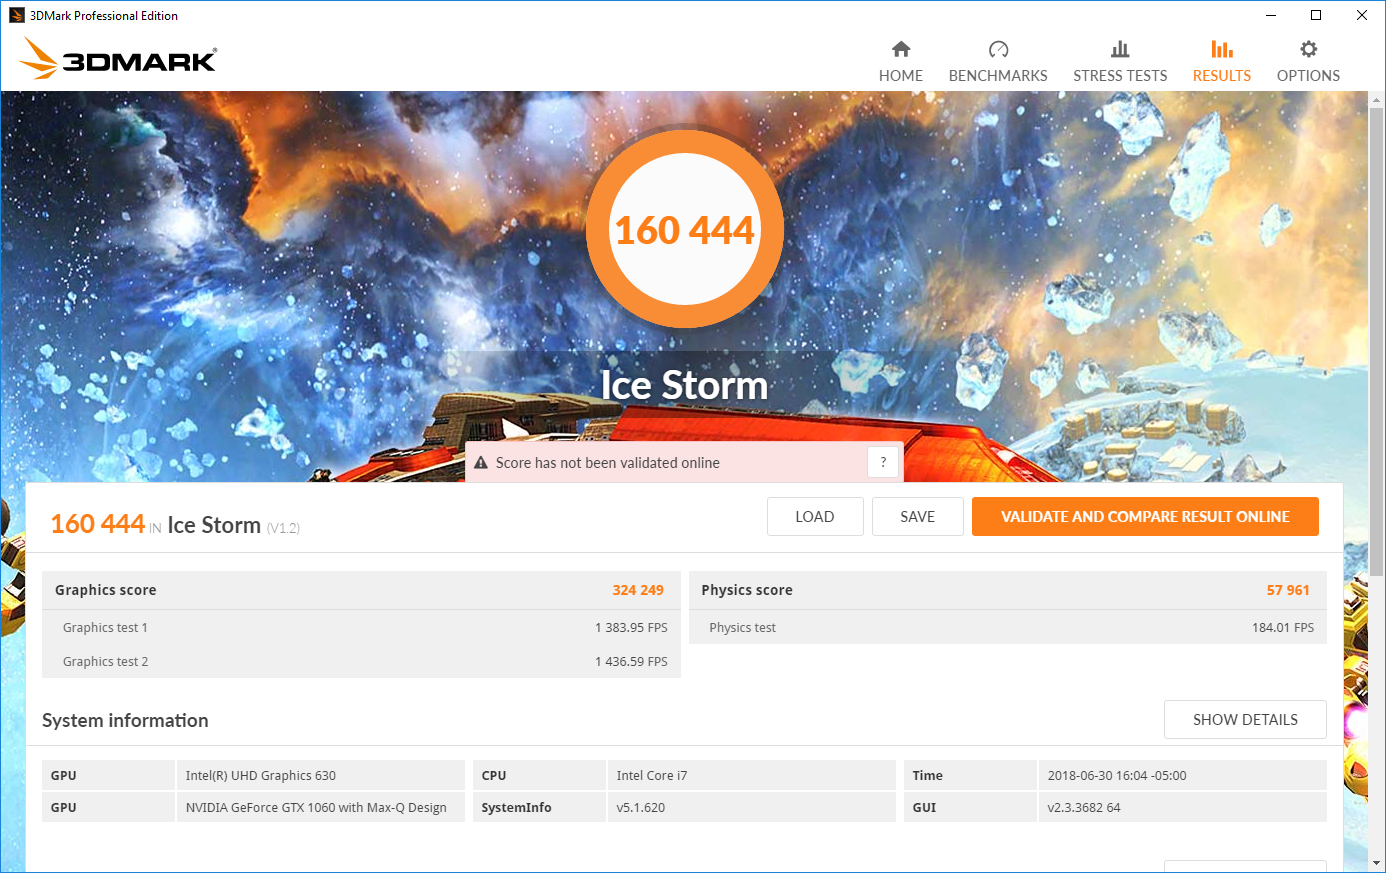
The GeForce GTX 1060 Max-Q is an excellent upgrade over the GTX 1050 Ti typically found in this price bracket. While the Max-Q design focuses on improved efficiency, it retains much of the performance of the full GTX 1060. The G7 scores about 50% better in 3DMark than machines with a 1050 Ti, making the upgrade a no-brainer. The GTX 1070 offers a further 50% boost in power. On battery, the G7 hits about 90-95% of its "plugged-in" graphical performance.
For more information on the Nvidia GeForce GTX 1060 Max-Q, check our dedicated GPU page here.
| 3DMark 11 Performance | 13296 points | |
| 3DMark Cloud Gate Standard Score | 32658 points | |
| 3DMark Fire Strike Score | 9936 points | |
Help | ||
Gaming Performance
It should be no surprise by now that the GTX 1060 Max-Q easily handles most games at FHD/High settings. What might be surprising is how well the G7's 1060 Max-Q keeps up with the full GTX 1060. While designed to mitigate some of the power draw and heat output of the full 1060 at the cost of some performance, the 1060 Max-Q matches the 1060 in most games. Again, the upgrade is practically a no-brainer. More demanding or poorly optimized titles will need to have settings pulled back to hit 60 FPS, but the G7 is well-poised to handle most modern titles.
| Rise of the Tomb Raider | |
| 1920x1080 Very High Preset AA:FX AF:16x (sort by value) | |
| Dell G7 15-7588 | |
| Asus FX503VM-EH73 | |
| Apple MacBook Pro 15 2018 (2.6 GHz, 560X) | |
| Acer Swift 3 SF315-41G-R6BR | |
| Dell G3 15 3579 | |
| Average NVIDIA GeForce GTX 1060 Max-Q (45.3 - 66.4, n=8) | |
| 1920x1080 High Preset AA:FX AF:4x (sort by value) | |
| Dell G7 15-7588 | |
| Apple MacBook Pro 15 2018 (2.6 GHz, 560X) | |
| Acer Swift 3 SF315-41G-R6BR | |
| Dell G3 15 3579 | |
| Average NVIDIA GeForce GTX 1060 Max-Q (63 - 73.3, n=7) | |
| 1366x768 Medium Preset AF:2x (sort by value) | |
| Dell G7 15-7588 | |
| Acer Swift 3 SF315-41G-R6BR | |
| Dell G3 15 3579 | |
| Average NVIDIA GeForce GTX 1060 Max-Q (111 - 133.3, n=6) | |
| 1024x768 Lowest Preset (sort by value) | |
| Dell G7 15-7588 | |
| Acer Swift 3 SF315-41G-R6BR | |
| Dell G3 15 3579 | |
| Average NVIDIA GeForce GTX 1060 Max-Q (148.1 - 203, n=5) | |
| low | med. | high | ultra | |
|---|---|---|---|---|
| The Witcher 3 (2015) | 189 | 125 | 62 | 37 |
| Rise of the Tomb Raider (2016) | 203 | 130 | 70 | 57 |
| Final Fantasy XV Benchmark (2018) | 109 | 59 | 43 | |
| Kingdom Come: Deliverance (2018) | 60 | 58 | 56 | 41 |
Stress Test
The G7 performs admirably under stress. Under synthetic load, the CPU hangs out at 2.6 GHz with intermittent boosts up to 4 GHz. Temperatures remain relatively cool at about 72° C, leaving plenty of headroom for the Intel chip. The CPU only sees trouble with Prime95 and FurMark run concurrently. Under this load, the CPU averages 2.9 GHz with boosts to 4 GHz, but temperatures rocket past 90° C about 5 minutes into the test. Core temperatures stay at this level for the rest of the hour-long benchmark. While within tolerance, the CPU doesn't boost after hitting 90° C.
The GPU handles both synthetic and real-world loads without breaking a sweat. While running FurMark, the GPU hangs near 1150 MHz. Consequently, temperatures stay solid at 62° C. During an hour-long play session of The Witcher 3, the CPU sits at 3.9 GHz while the GPU powers through at 1585 MHz. Despite running near their limits, temperatures are excellent; the CPU averages 76° C (with some spikes past 90° C) while the GPU settles in at 63° C and doesn't budge.
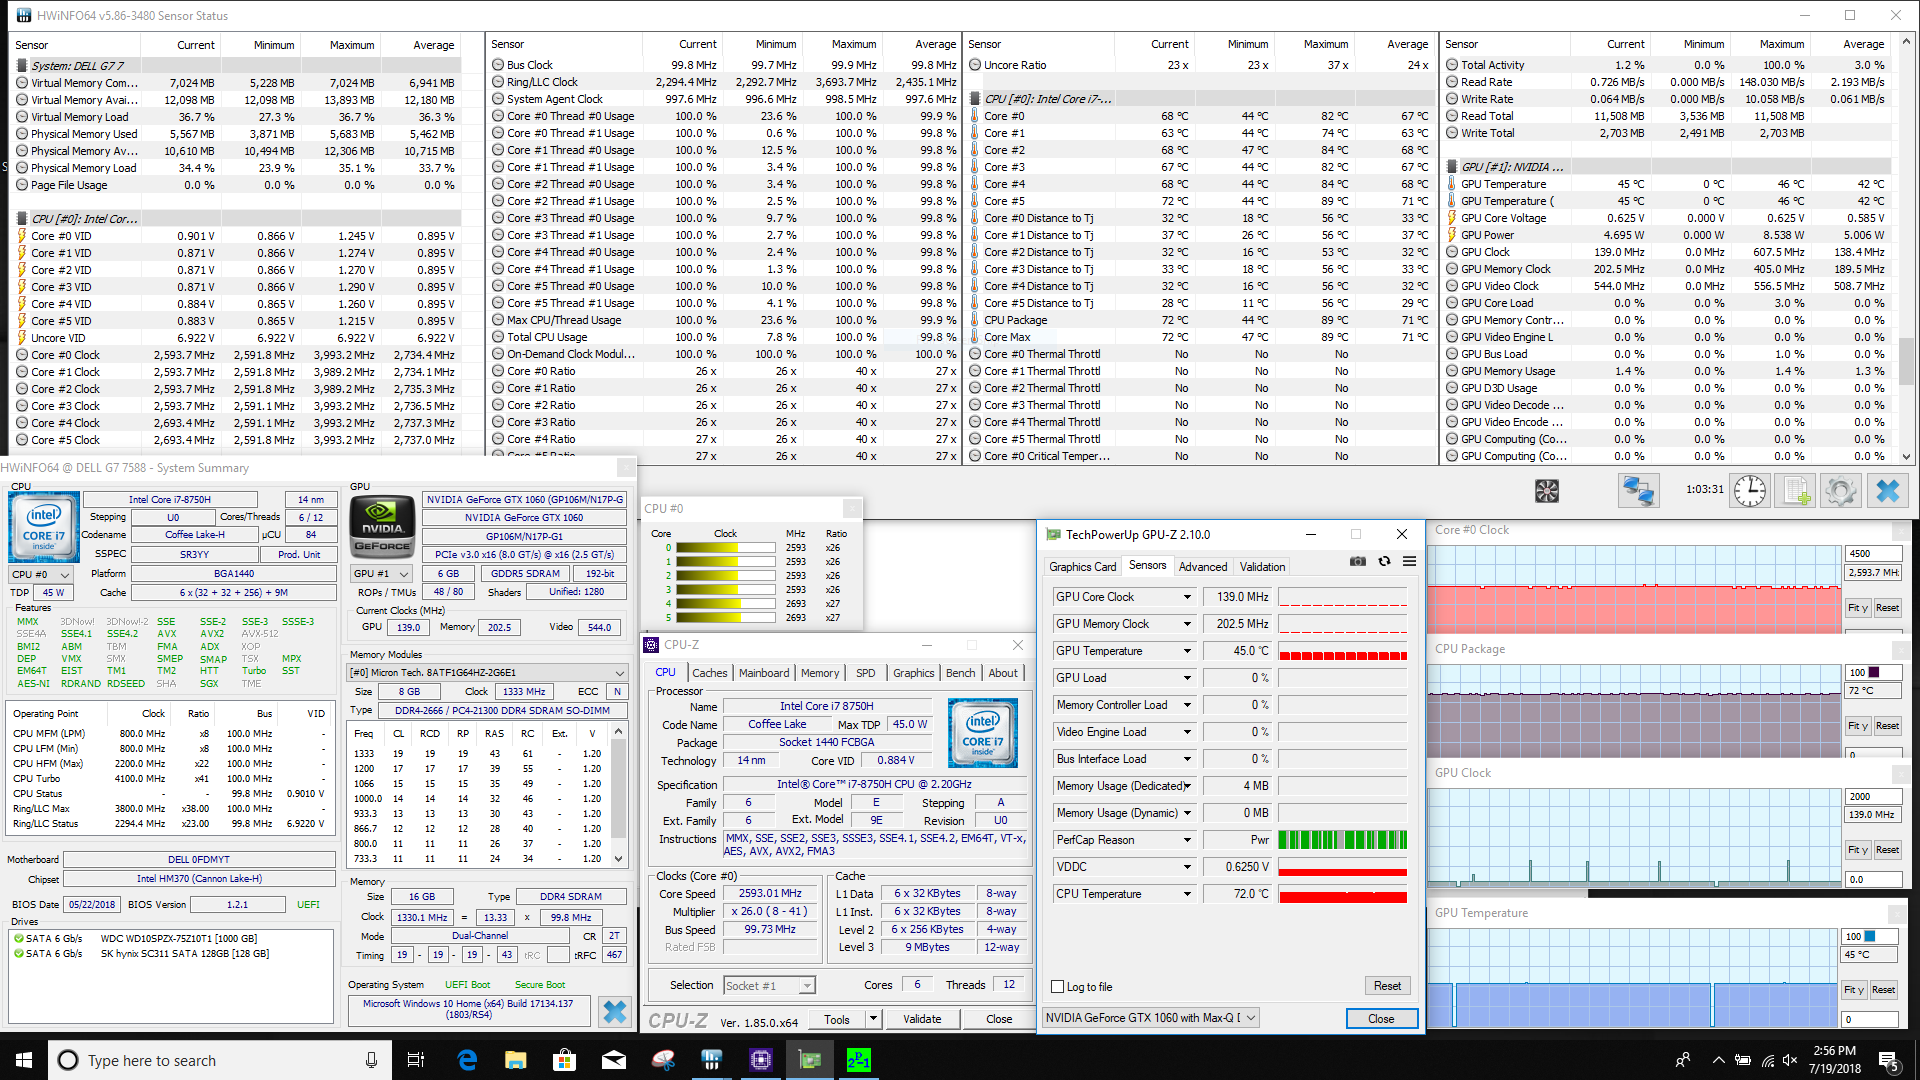
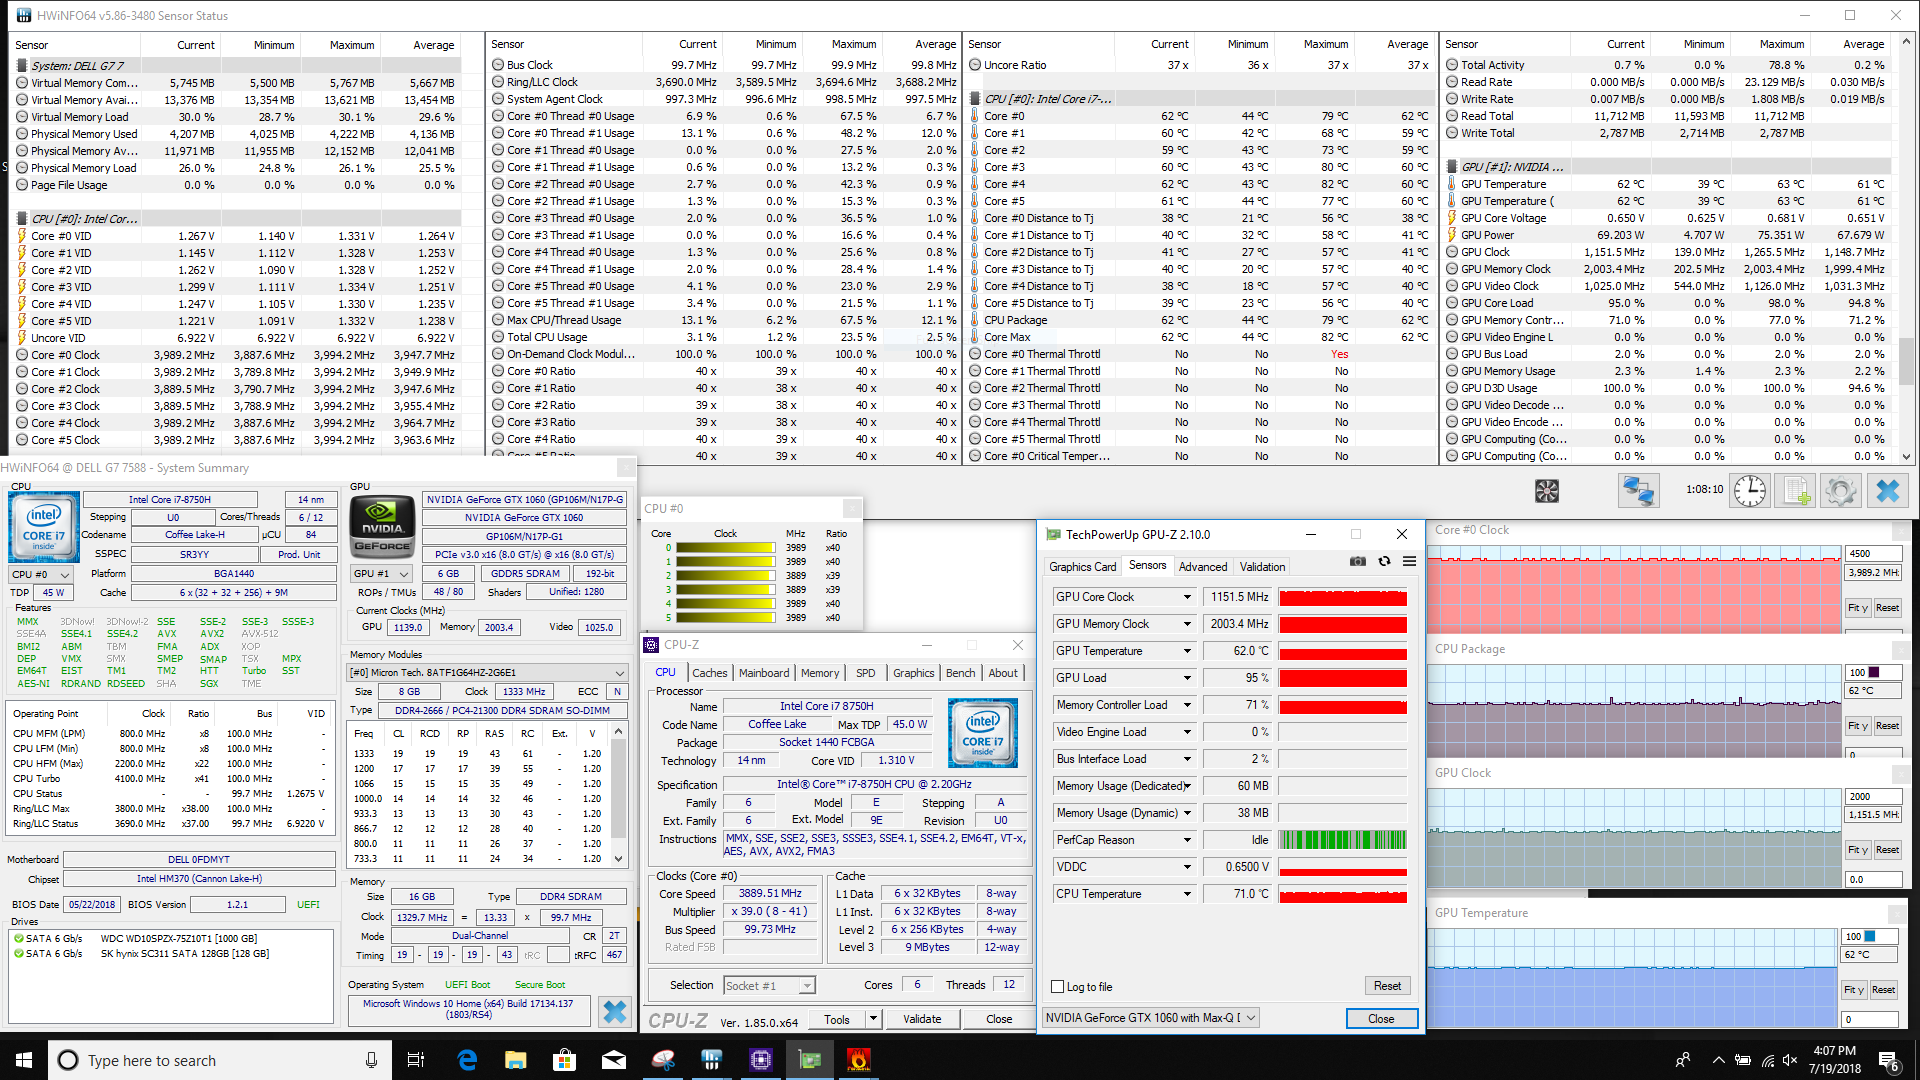
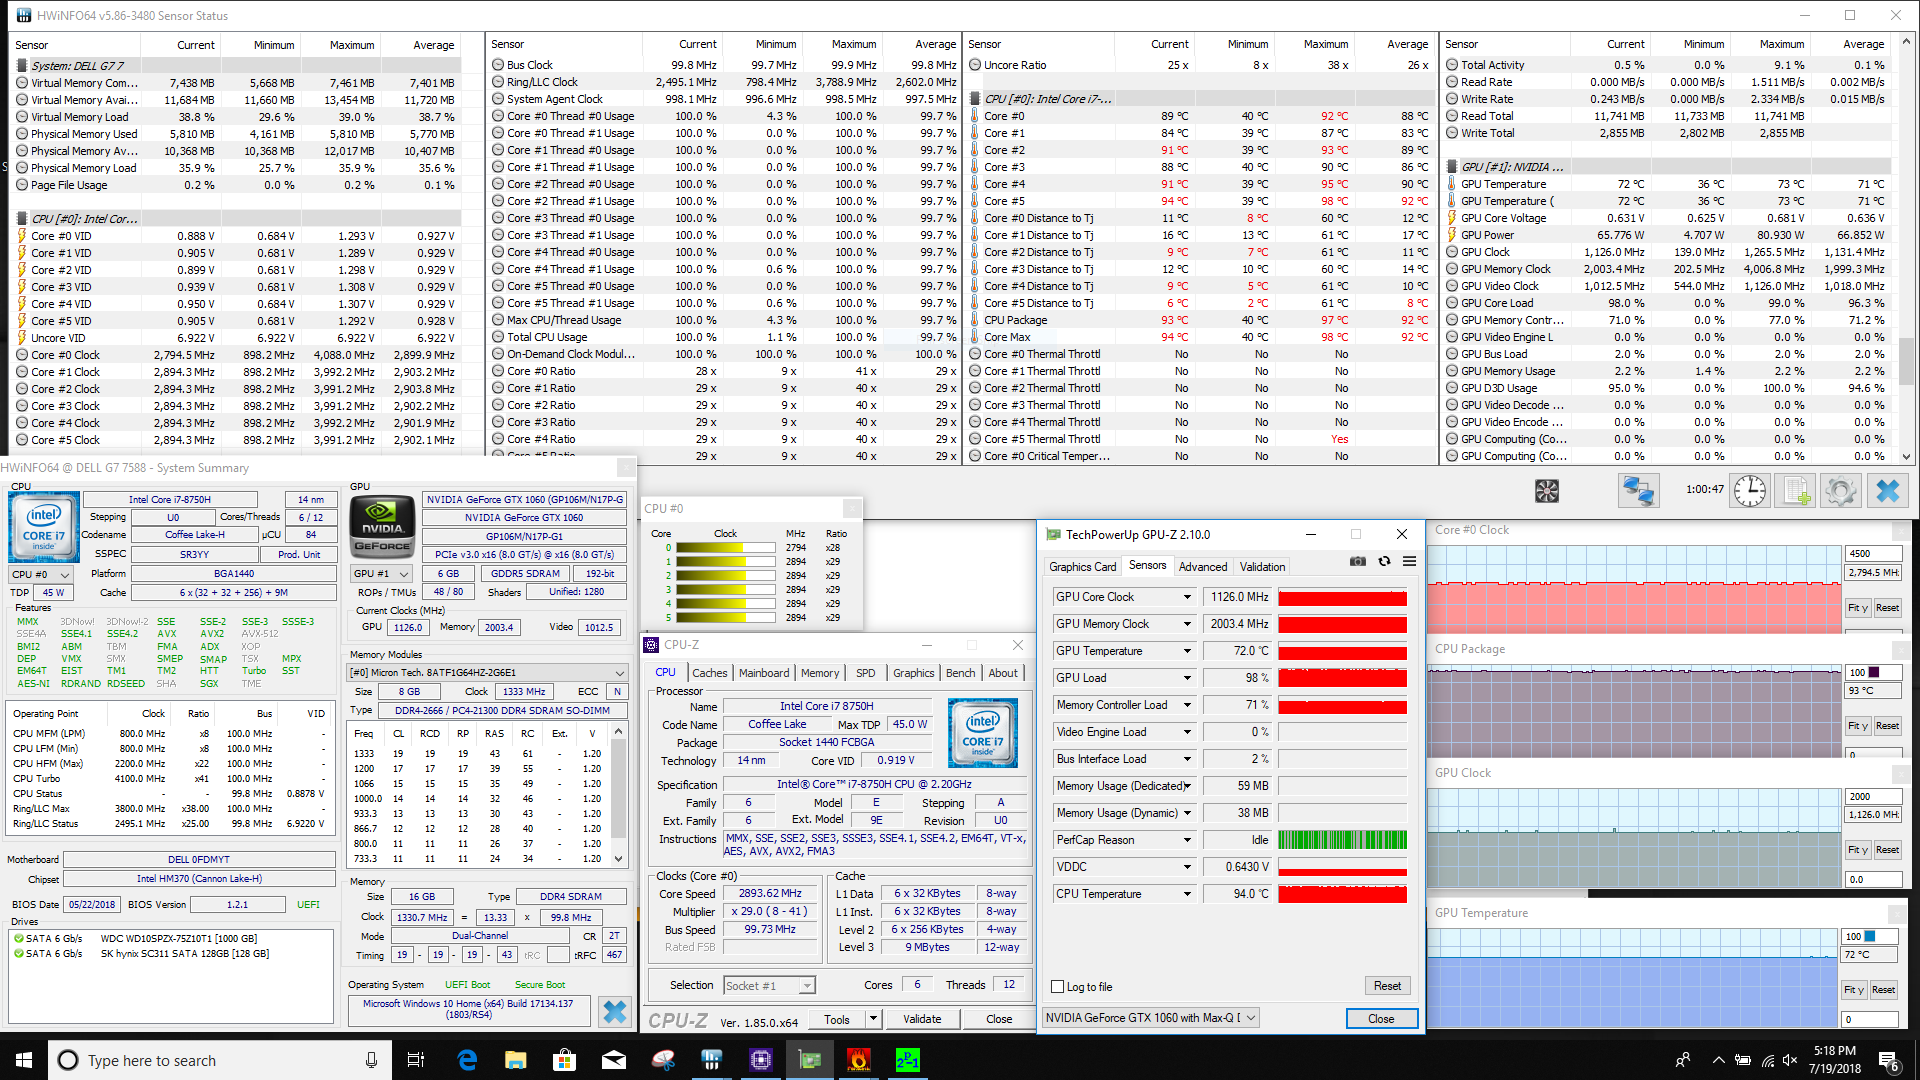
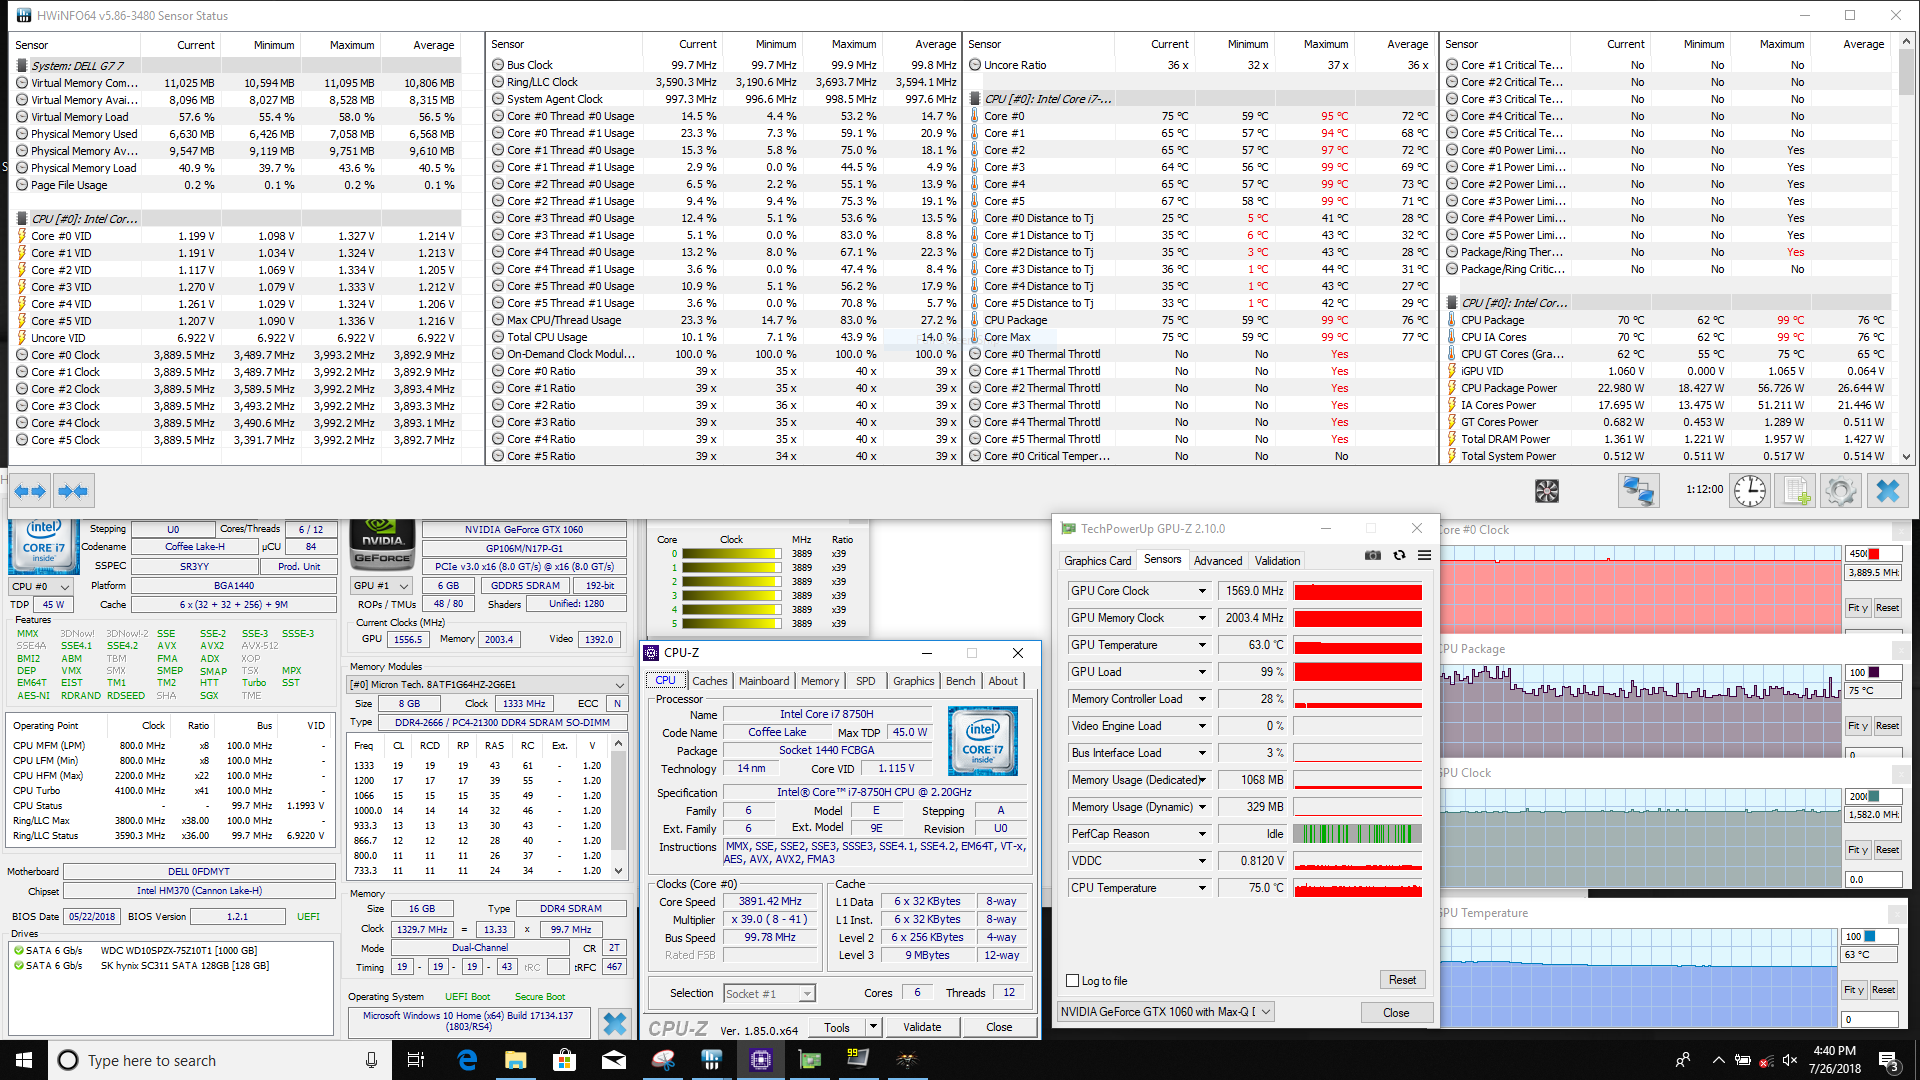
| CPU Clock (GHz) | GPU Clock (MHz) | Average CPU Temperature (°C) | Average GPU Temperature (°C) | |
| Prime95 Stress | 2.6 | - | 72 | - |
| FurMark Stress | 4.0 | 1150 | 62 | 62 |
| Prime95 + FurMark Stress | 2.9 | 1130 | 92 | 71 |
| Witcher 3 Stress | 3.9 | 1585 | 76 | 63 |
Emissions
System Noise
The downside of the G7's excellent stress management is the loud fan noise. The fans pulse between 46 and 50 dB(A) during gameplay and synthetic load, and the high pitch will cut through ambient noise like a knife. This isn't uncommon for budget gaming laptops (or gaming laptops in general) but is worth noting. Compared to other gaming notebooks, the G7's fan noise is about average. While idle, the machine is virtually silent, and there is no noticeable coil whine.
Noise level
| Idle |
| 29 / 29 / 29.2 dB(A) |
| Load |
| 40.6 / 49.8 dB(A) |
 | ||
30 dB silent 40 dB(A) audible 50 dB(A) loud |
||
min: | ||
| Dell G7 15-7588 GeForce GTX 1060 Max-Q, i7-8750H, SK hynix SC311 SATA | Dell Inspiron 15 7000 7577 GeForce GTX 1060 Max-Q, i5-7300HQ, Samsung PM961 MZVLW256HEHP | Acer Predator Helios 300 PH317-52-51M6 GeForce GTX 1050 Ti Mobile, i5-8300H, Hynix HFS128G39TND | Asus FX503VM-EH73 GeForce GTX 1060 Mobile, i7-7700HQ, SanDisk SD8SN8U128G1002 | HP Omen 15t-ce000 GeForce GTX 1060 Max-Q, i7-7700HQ, Samsung PM961 NVMe MZVLW128HEGR | Lenovo Legion Y530-15ICH GeForce GTX 1050 Ti Mobile, i5-8300H, Toshiba KBG30ZMT128G | |
|---|---|---|---|---|---|---|
| Noise | 9% | -4% | -1% | 2% | 6% | |
| off / environment * (dB) | 28.1 | 28 -0% | 29 -3% | 27.8 1% | 28.2 -0% | 28 -0% |
| Idle Minimum * (dB) | 29 | 28 3% | 29 -0% | 29.6 -2% | 30.4 -5% | 28 3% |
| Idle Average * (dB) | 29 | 28 3% | 31 -7% | 29.6 -2% | 30.4 -5% | 28 3% |
| Idle Maximum * (dB) | 29.2 | 28 4% | 33 -13% | 29.6 -1% | 30.5 -4% | 28.5 2% |
| Load Average * (dB) | 40.6 | 30.3 25% | 45 -11% | 37.3 8% | 38.5 5% | 34.9 14% |
| Witcher 3 ultra * (dB) | 49.8 | 39.5 21% | 45 10% | 49.8 -0% | 37.6 24% | 40 20% |
| Load Maximum * (dB) | 49.8 | 46.5 7% | 51 -2% | 53.7 -8% | 49 2% | 49.6 -0% |
* ... smaller is better
Temperature
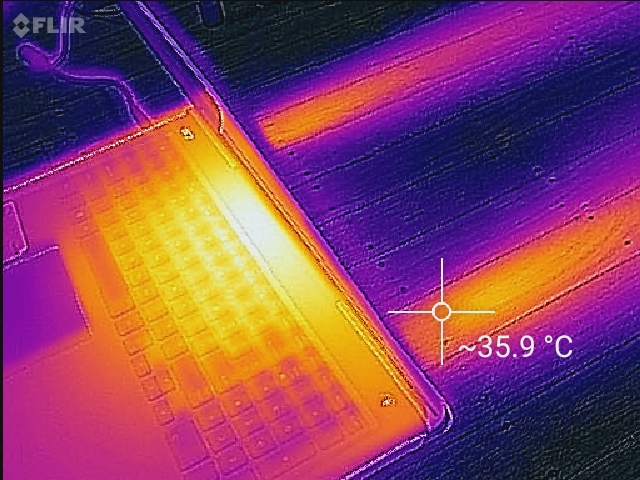
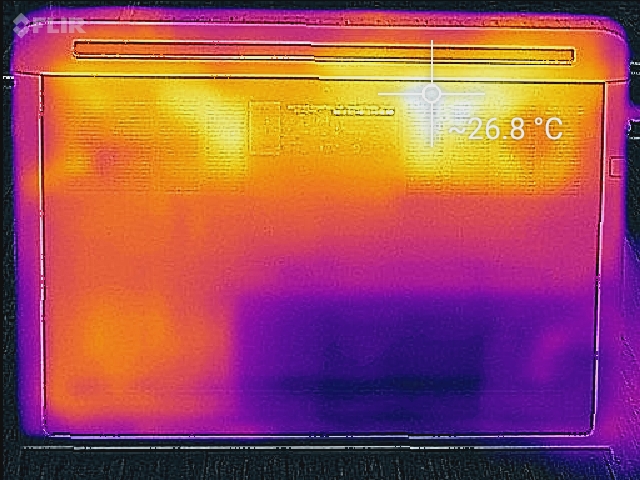
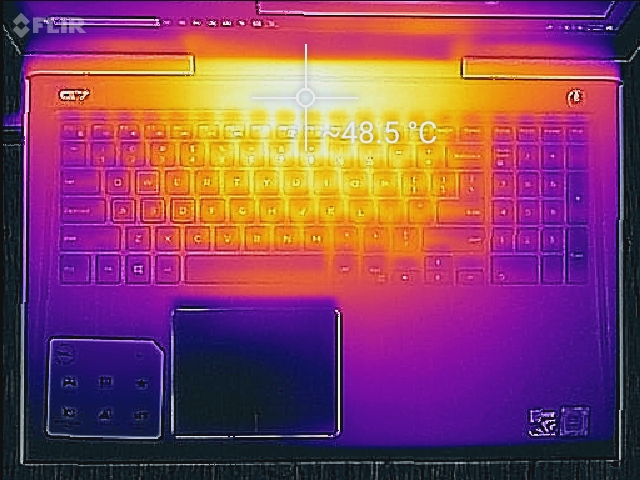
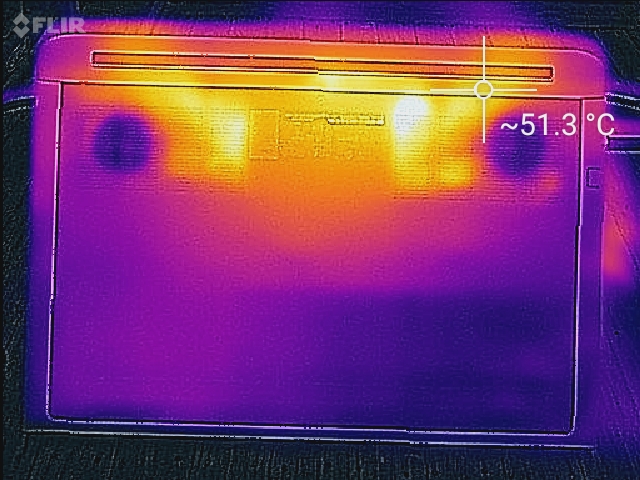
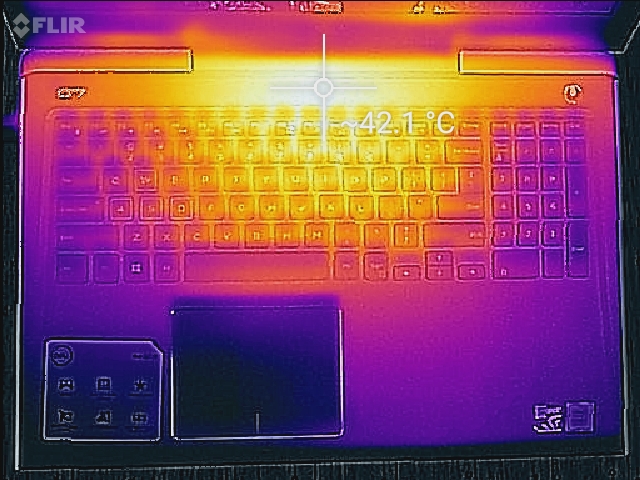
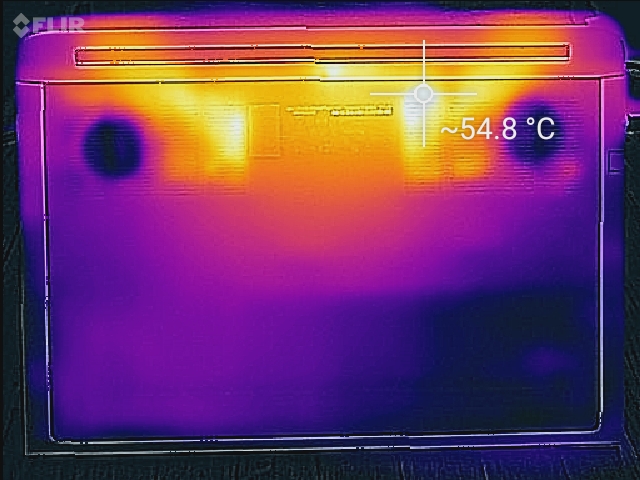
Our stress testing hinted at the G7's good heat management, and our thermal measurements confirm it. While the back vents get toasty at 50° C, the keyboard remains relatively cool under load. The upper center (specifically in between the Y, U, and 7 keys) feels warm to the touch under load, but the WASD keys, palm rest, and number pad stay relatively cool. While the bottom intake vents get hot, the majority of the bottom panel stays at or below 30° C. Despite this, lap gaming is not recommended as all heat is exhausted out the back right and back left of the device.
(-) The maximum temperature on the upper side is 48.6 °C / 119 F, compared to the average of 40.4 °C / 105 F, ranging from 21.2 to 68.8 °C for the class Gaming.
(-) The bottom heats up to a maximum of 51.4 °C / 125 F, compared to the average of 43.2 °C / 110 F
(+) In idle usage, the average temperature for the upper side is 22.7 °C / 73 F, compared to the device average of 33.9 °C / 93 F.
(+) Playing The Witcher 3, the average temperature for the upper side is 30.7 °C / 87 F, compared to the device average of 33.9 °C / 93 F.
(+) The palmrests and touchpad are cooler than skin temperature with a maximum of 29.4 °C / 84.9 F and are therefore cool to the touch.
(±) The average temperature of the palmrest area of similar devices was 28.8 °C / 83.8 F (-0.6 °C / -1.1 F).

Speakers

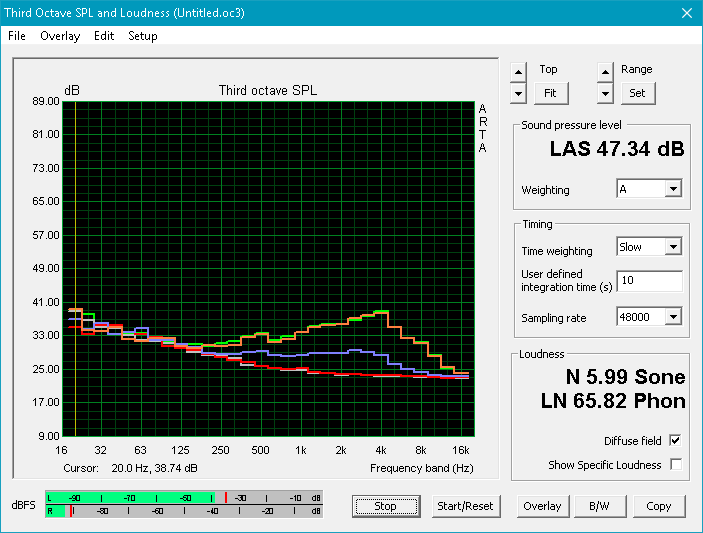
The speakers are average fair for the price. The lack of bass makes overall sound come off as thin, but the speakers do get reasonably loud at 75 dB. Sounds and music remain clear at maximum volume with no rattle or distortion. Still, the tinny profile will make users reach for headphones.
Dell G7 15-7588 audio analysis
(±) | speaker loudness is average but good (74.8 dB)
Bass 100 - 315 Hz
(-) | nearly no bass - on average 16.7% lower than median
(±) | linearity of bass is average (11.8% delta to prev. frequency)
Mids 400 - 2000 Hz
(+) | balanced mids - only 4.6% away from median
(±) | linearity of mids is average (7.1% delta to prev. frequency)
Highs 2 - 16 kHz
(+) | balanced highs - only 4.8% away from median
(±) | linearity of highs is average (10.7% delta to prev. frequency)
Overall 100 - 16.000 Hz
(±) | linearity of overall sound is average (21.1% difference to median)
Compared to same class
» 76% of all tested devices in this class were better, 4% similar, 20% worse
» The best had a delta of 6%, average was 18%, worst was 132%
Compared to all devices tested
» 58% of all tested devices were better, 7% similar, 35% worse
» The best had a delta of 4%, average was 24%, worst was 134%
Lenovo Legion Y530-15ICH audio analysis
(±) | speaker loudness is average but good (75.1 dB)
Bass 100 - 315 Hz
(±) | reduced bass - on average 14% lower than median
(±) | linearity of bass is average (14.1% delta to prev. frequency)
Mids 400 - 2000 Hz
(+) | balanced mids - only 1.5% away from median
(+) | mids are linear (6.7% delta to prev. frequency)
Highs 2 - 16 kHz
(+) | balanced highs - only 4.8% away from median
(±) | linearity of highs is average (10% delta to prev. frequency)
Overall 100 - 16.000 Hz
(±) | linearity of overall sound is average (18.9% difference to median)
Compared to same class
» 63% of all tested devices in this class were better, 8% similar, 29% worse
» The best had a delta of 6%, average was 18%, worst was 132%
Compared to all devices tested
» 44% of all tested devices were better, 8% similar, 48% worse
» The best had a delta of 4%, average was 24%, worst was 134%
Energy Management
Power Consumption
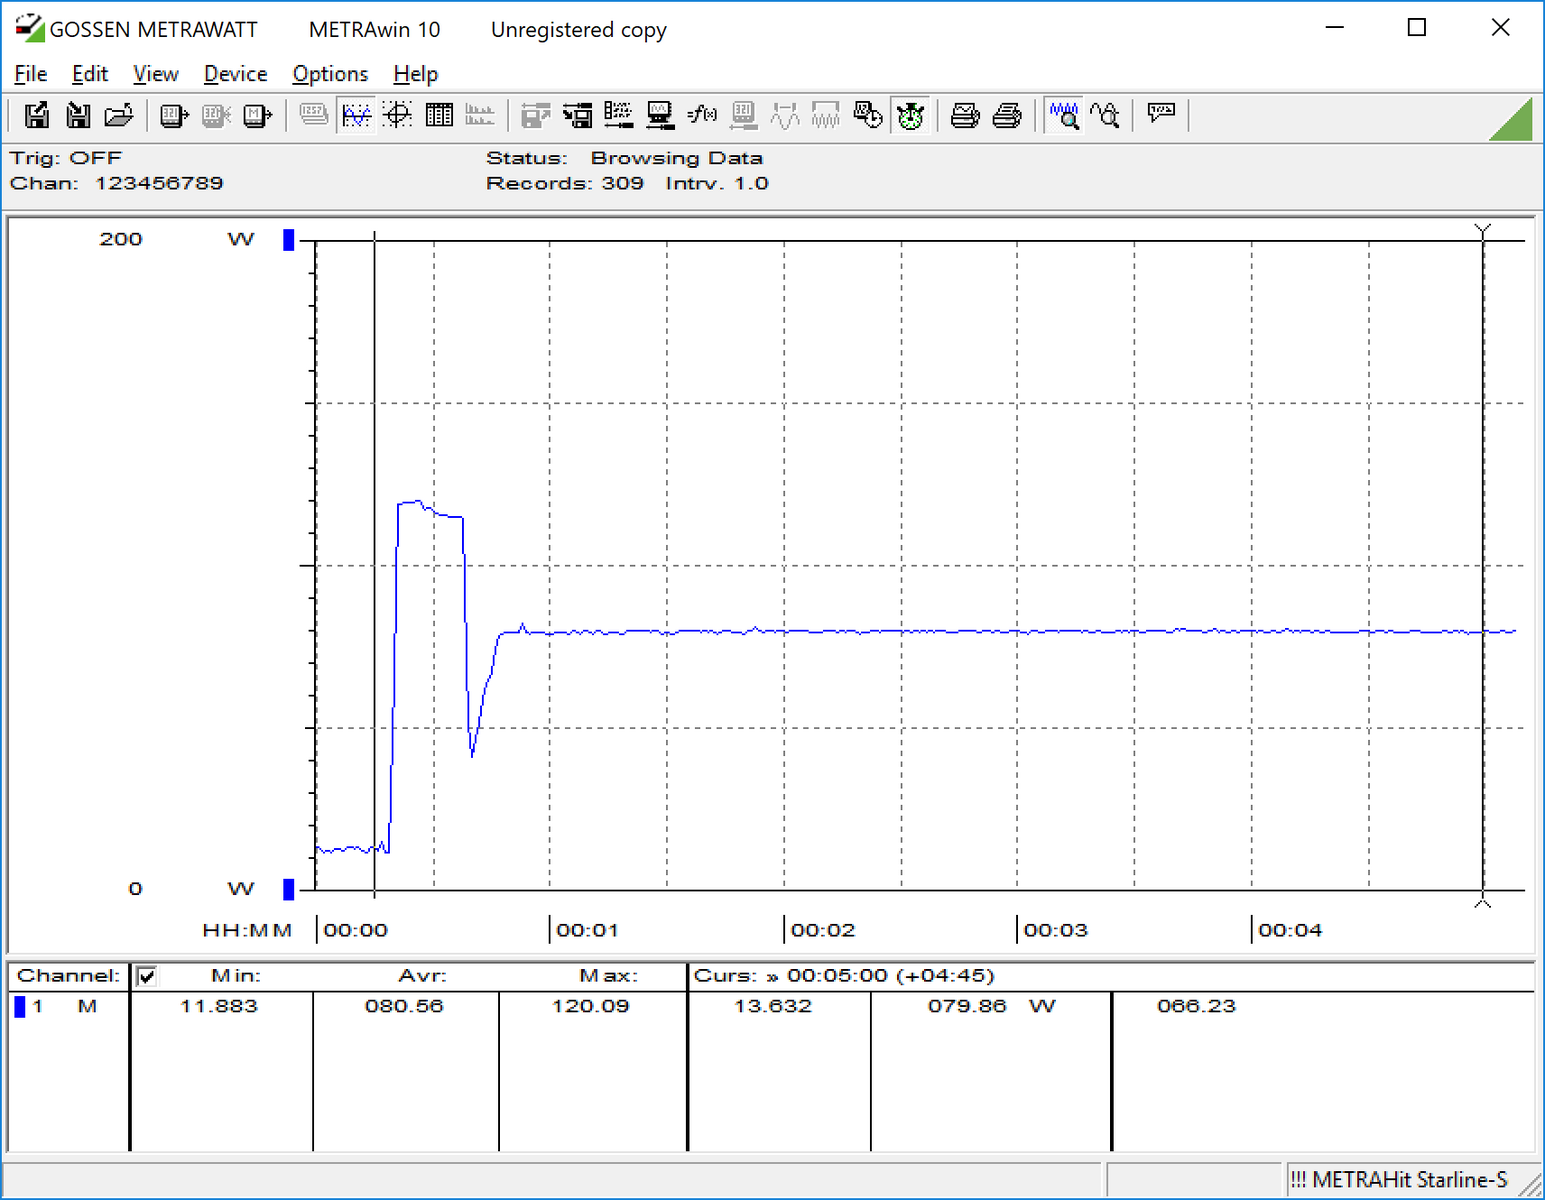
One benefit of Nvidia's GTX 1060 Max-Q is its more efficient power management. The G7 pulls only an average of 94 Watts, on average, when under load. While gaming, the G7 draws about 116 Watts, about 10% more than 1050 Ti-based laptops. The Core i7-8750H needs more power than the 7700HQ. As such, power-conscious users may want to opt for the HP Omen 15t, which pulls about 15% less power when stressed. The 180 Watt power supply supplies more than enough juice for the system.
| Off / Standby | |
| Idle | |
| Load |
|
Key:
min: | |
| Dell G7 15-7588 i7-8750H, GeForce GTX 1060 Max-Q, SK hynix SC311 SATA, IPS, 1920x1080, 15.6" | Schenker XMG Neo 15 i7-8750H, GeForce GTX 1060 Mobile, Samsung SSD 970 Pro 1TB, IPS, 1920x1080, 15.6" | Asus Strix GL703GM-DS74 i7-8750H, GeForce GTX 1060 Mobile, Samsung PM961 MZVLW256HEHP, TN LED, 1920x1080, 17.3" | Dell Inspiron 15 7000 7577 i5-7300HQ, GeForce GTX 1060 Max-Q, Samsung PM961 MZVLW256HEHP, IPS, 1920x1080, 15.6" | Acer Predator Helios 300 PH317-52-51M6 i5-8300H, GeForce GTX 1050 Ti Mobile, Hynix HFS128G39TND, IPS, 1920x1080, 17.3" | Asus FX503VM-EH73 i7-7700HQ, GeForce GTX 1060 Mobile, SanDisk SD8SN8U128G1002, IPS, 1920x1080, 15.6" | HP Omen 15t-ce000 i7-7700HQ, GeForce GTX 1060 Max-Q, Samsung PM961 NVMe MZVLW128HEGR, IPS, 3840x2160, 15.6" | Lenovo Legion Y530-15ICH i5-8300H, GeForce GTX 1050 Ti Mobile, Toshiba KBG30ZMT128G, IPS, 1920x1080, 15.6" | |
|---|---|---|---|---|---|---|---|---|
| Power Consumption | -45% | -127% | 10% | -8% | -47% | -80% | -6% | |
| Idle Minimum * (Watt) | 5.5 | 10 -82% | 18.88 -243% | 7.1 -29% | 6 -9% | 12.8 -133% | 15.4 -180% | 4.5 18% |
| Idle Average * (Watt) | 7.6 | 13 -71% | 24.36 -221% | 7.6 -0% | 9 -18% | 15.4 -103% | 22.4 -195% | 10 -32% |
| Idle Maximum * (Watt) | 9 | 18 -100% | 32.27 -259% | 8.6 4% | 13 -44% | 15.9 -77% | 22.4 -149% | 13.8 -53% |
| Load Average * (Watt) | 94 | 95 -1% | 107.74 -15% | 59.5 37% | 95 -1% | 78 17% | 78.1 17% | 92.5 2% |
| Witcher 3 ultra * (Watt) | 116.3 | 114 2% | 142 -22% | 89 23% | 102 12% | 107.3 8% | 97.5 16% | 108.1 7% |
| Load Maximum * (Watt) | 154.4 | 179 -16% | 160.28 -4% | 112.8 27% | 134 13% | 143.4 7% | 133.52 14% | 123.2 20% |
* ... smaller is better
Battery Life
When it comes to battery life, the G7 blows its competitors out of the water. In our Wifi v1.3 battery test, the G7 lasts 7.5 hours, which should almost get most users through a full workday. Most other budget gaming notebooks last only 4-5 hours. Even under full load, the G7 manages to pass the 2-hour mark, something not commonly seen with any gaming laptop. The charger can likely be left at home if office work is on the docket, but the G7 will need to be plugged in for gaming.
| Dell G7 15-7588 i7-8750H, GeForce GTX 1060 Max-Q, 56 Wh | Dell Inspiron 15 7000 7577 i5-7300HQ, GeForce GTX 1060 Max-Q, 56 Wh | Acer Predator Helios 300 PH317-52-51M6 i5-8300H, GeForce GTX 1050 Ti Mobile, 48 Wh | Asus FX503VM-EH73 i7-7700HQ, GeForce GTX 1060 Mobile, 64 Wh | HP Omen 15t-ce000 i7-7700HQ, GeForce GTX 1060 Max-Q, 70 Wh | Lenovo Legion Y530-15ICH i5-8300H, GeForce GTX 1050 Ti Mobile, 52.5 Wh | |
|---|---|---|---|---|---|---|
| Battery runtime | -11% | -12% | -46% | -48% | -45% | |
| Reader / Idle (h) | 10.9 | 11 1% | 11.8 8% | 5.7 -48% | 5 -54% | |
| WiFi v1.3 (h) | 7.5 | 6.9 -8% | 5.9 -21% | 4.6 -39% | 3.5 -53% | 4.1 -45% |
| Load (h) | 2.2 | 1.6 -27% | 1.7 -23% | 1.1 -50% | 1.4 -36% |
Pros
Cons
Verdict
Dell scored a major win with the original Inspiron 15 7000 gaming notebook several years ago and has kept the hits coming. Last year's Inspiron 15 7000 7577 was a popular budget gaming option, and this year's G7 sweetens the deal just a bit. In addition to the new name, the updated CPU offers a 40-50% performance bump in processor-heavy tasks, and the new color scheme makes for a unique and (subjectively) attractive case.
Otherwise, the G7 is simply a rebranded Inspiron 15 7000 7577. That's not a bad thing, but consumers that purchased the excellent 7577 last year have little reason to upgrade. However, others that are running older silicon or looking for a new entry-level gaming laptop should push the G7 to the top of their consideration list. Other notebooks at this end of the market come in with slightly lower price tags but make some heavy sacrifices in terms of heat management, fan noise, and build quality. The G7 boasts craftsmanship far outweighing its price bracket and offers stellar performance.
Taking powerful hardware typically seen in much more expensive devices and wrapping it in a beautiful and well-built case, the Dell G7 packs a lot of power per dollar. For budget-conscious gamers, it's hard to beat the Dell G7.
Dell G7 15-7588
- 07/31/2018 v6 (old)
Sam Medley
Price comparison
