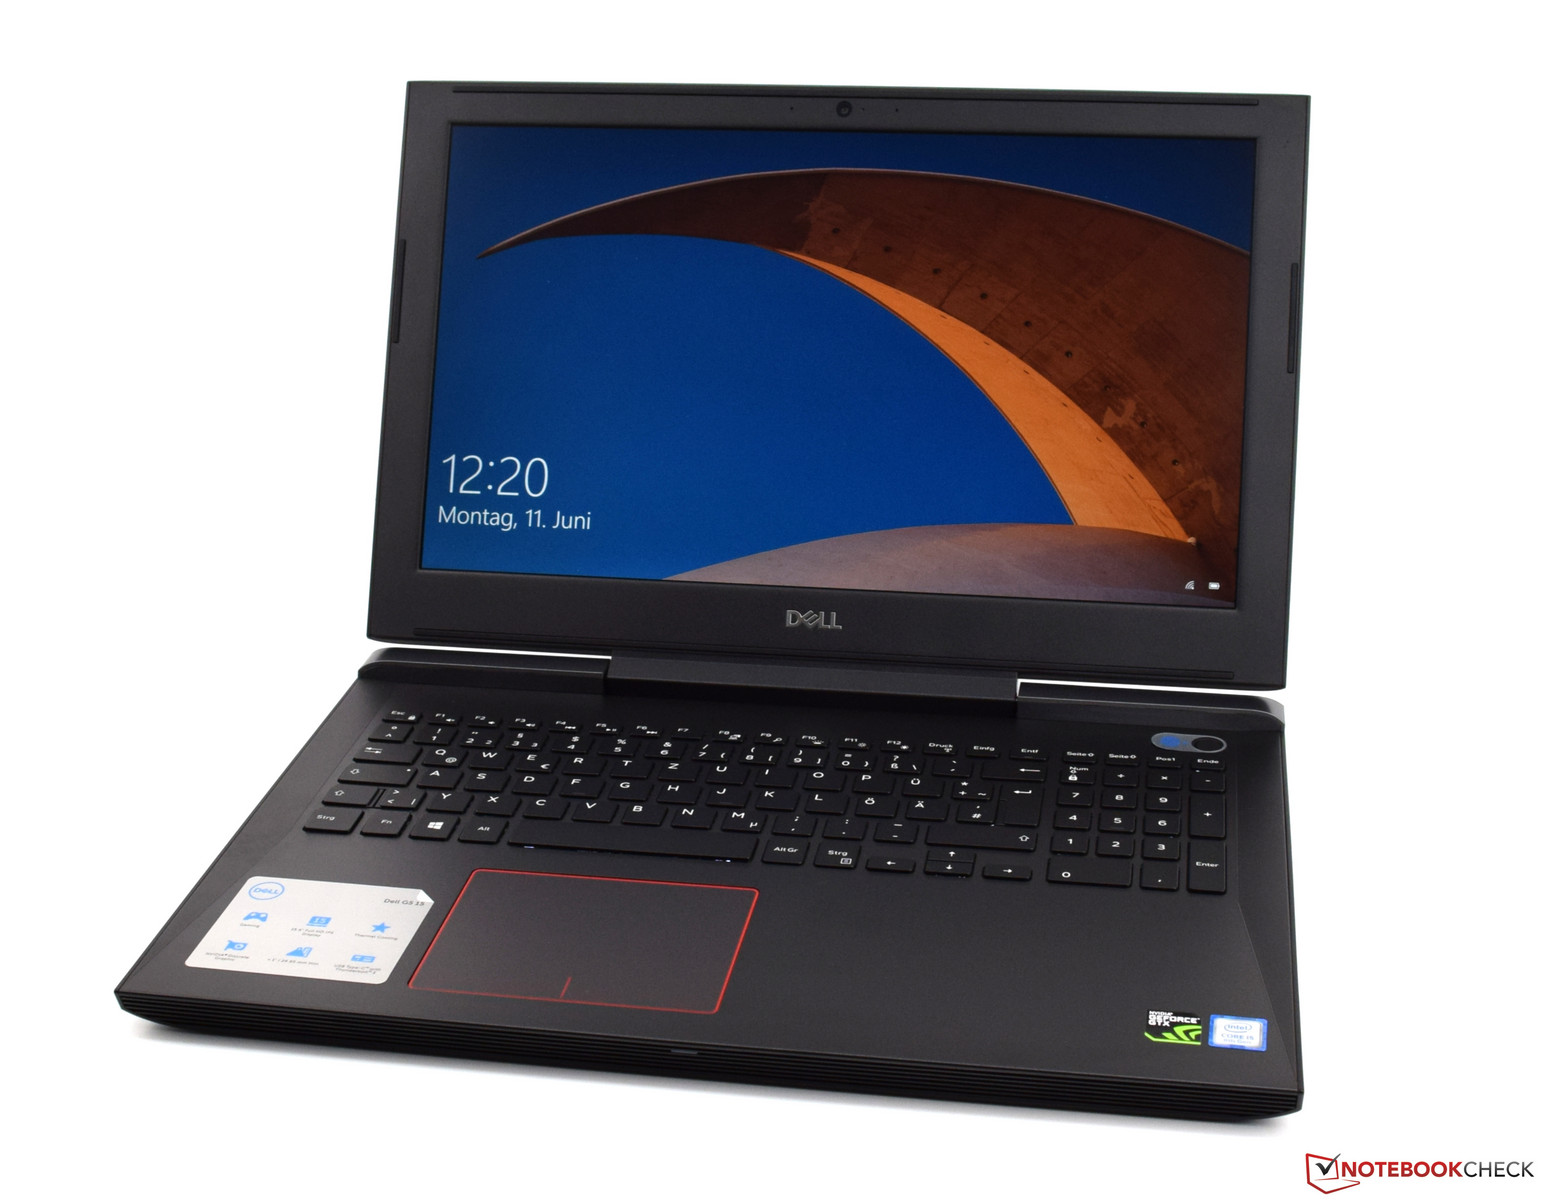
Dell G5 15 5587 (i5-8300H, GTX 1060 Max-Q, SSD, IPS) Laptop Review
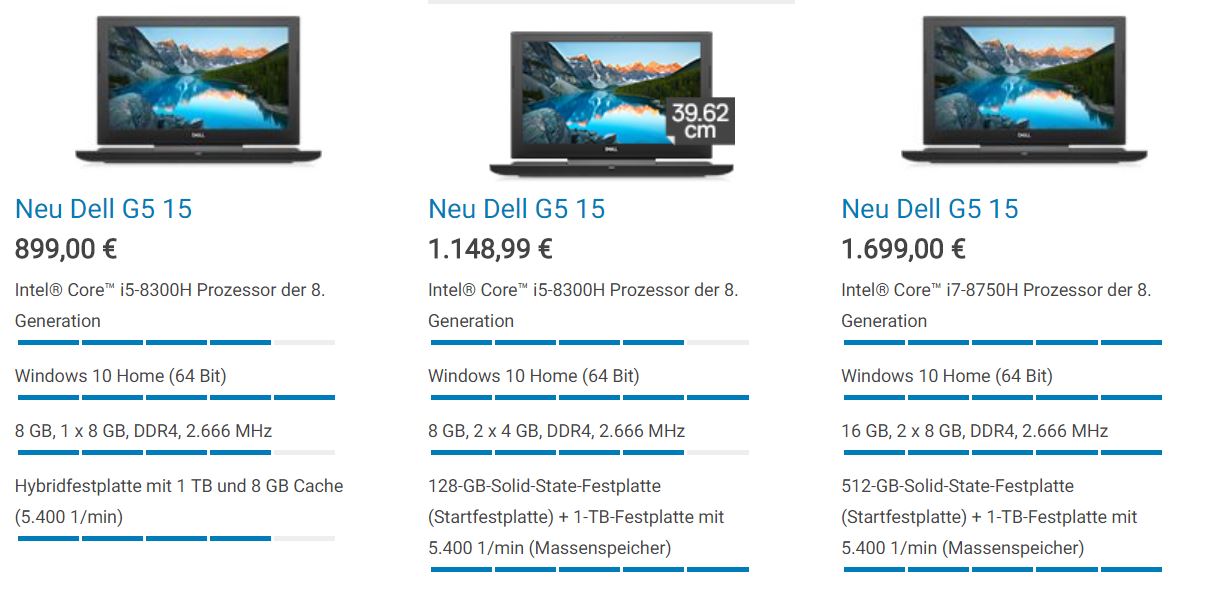
The Dell G5 15 is the successor of the Dell Inspiron 15 of the 7000 series, and at 899 Euros (~$1049; $799 in the US) it offers an affordable entry into the world of gaming laptops. For this, buyers receive a solid device with 8 GB of DDR4-RAM, a 1 TB hybrid hard drive, as well as an Nvidia GeForce GTX 1050 that is suitable for gaming. The basic configuration also includes the new Intel Core i5-8300H Coffee Lake CPU.
Dell offers many different variants of its new gaming racer. For the premium equipment, the manufacturer asks for 1699 Euros (~$1982; $1499 in the US), with the device offering a 4K panel and an Intel Core i7-8750H with 16 GB of RAM and a total of 1.5 TB of storage (512 GB SSD, 1 TB HDD). As the graphics accelerator, the top model has an Nvidia GeForce GTX 1060 Max-Q.
Our test unit offers a good medium option, even though the graphics card is not part of the mid-range equipment of the G5-15 series in this case, since with the GeForce GTX 1060 in the Max-Q design, our test unit offers a good basis to also play more-demanding games. On the other hand, we have to make do with some restrictions in the RAM and the SSD, although this is not too bad. All in all, the sales price of about 1150 Euros (~$1342) seems justified at first glance. Whether this is really the case, we will evaluate in detail in our test.
Potential comparison devices are primarily 15.6-inch gaming laptops with similar equipment. You can find an overview of the comparison devices in the table below.
| Dell Inspiron 15 7577 | Dell Inspiron 15 7577 | Acer Nitro 5 Spin | PC Specialist Proteus V | Asus FX503VM | Acer Predator Helios 300 | |
| CPU | Intel Core i5-7300HQ | Intel Core i5-7300HQ | Intel Core i7-8550U | Intel Core i7-7700HQ | Intel Core i7-7700HQ | Intel Core i5-8300H |
| GPU | Nvidia GeForce GTX 1060 Max-Q | Nvidia GeForce GTX 1050 | Nvidia GeForce GTX 1050 | Nvidia GeForce GTX 1060 | Nvidia GeForce GTX 1060 | Nvidia GeForce GTX 1050 Ti |
| Display | 15.6 in 1920x1080 (IPS) | 15.6 in 1920x1080 (IPS) | 15.6 in 1920x1080 (IPS) | 15.6 in 1920x1080 (IPS) | 15.6 in 1920x1080 (IPS) | 17.3 in 1920x1080 (IPS) |
| RAM | 8 GB DDR4 | 8 GB DDR4 | 8 GB DDR4 | 16 GB DDR4 | 16 GB DDR4 | 8 GB DDR4 |
| Storage | 256 GB SSD (NVMe) | 1 TB HDD | 256 GB SSD + 1 TB HDD | 256 GB SSD (NVMe) | 128 GB SSD + 1 TB HDD | 128 GB SSD + 1 TB HDD |
| Rating | 83% | 82% | 85% | 82% | 82% | 82% |
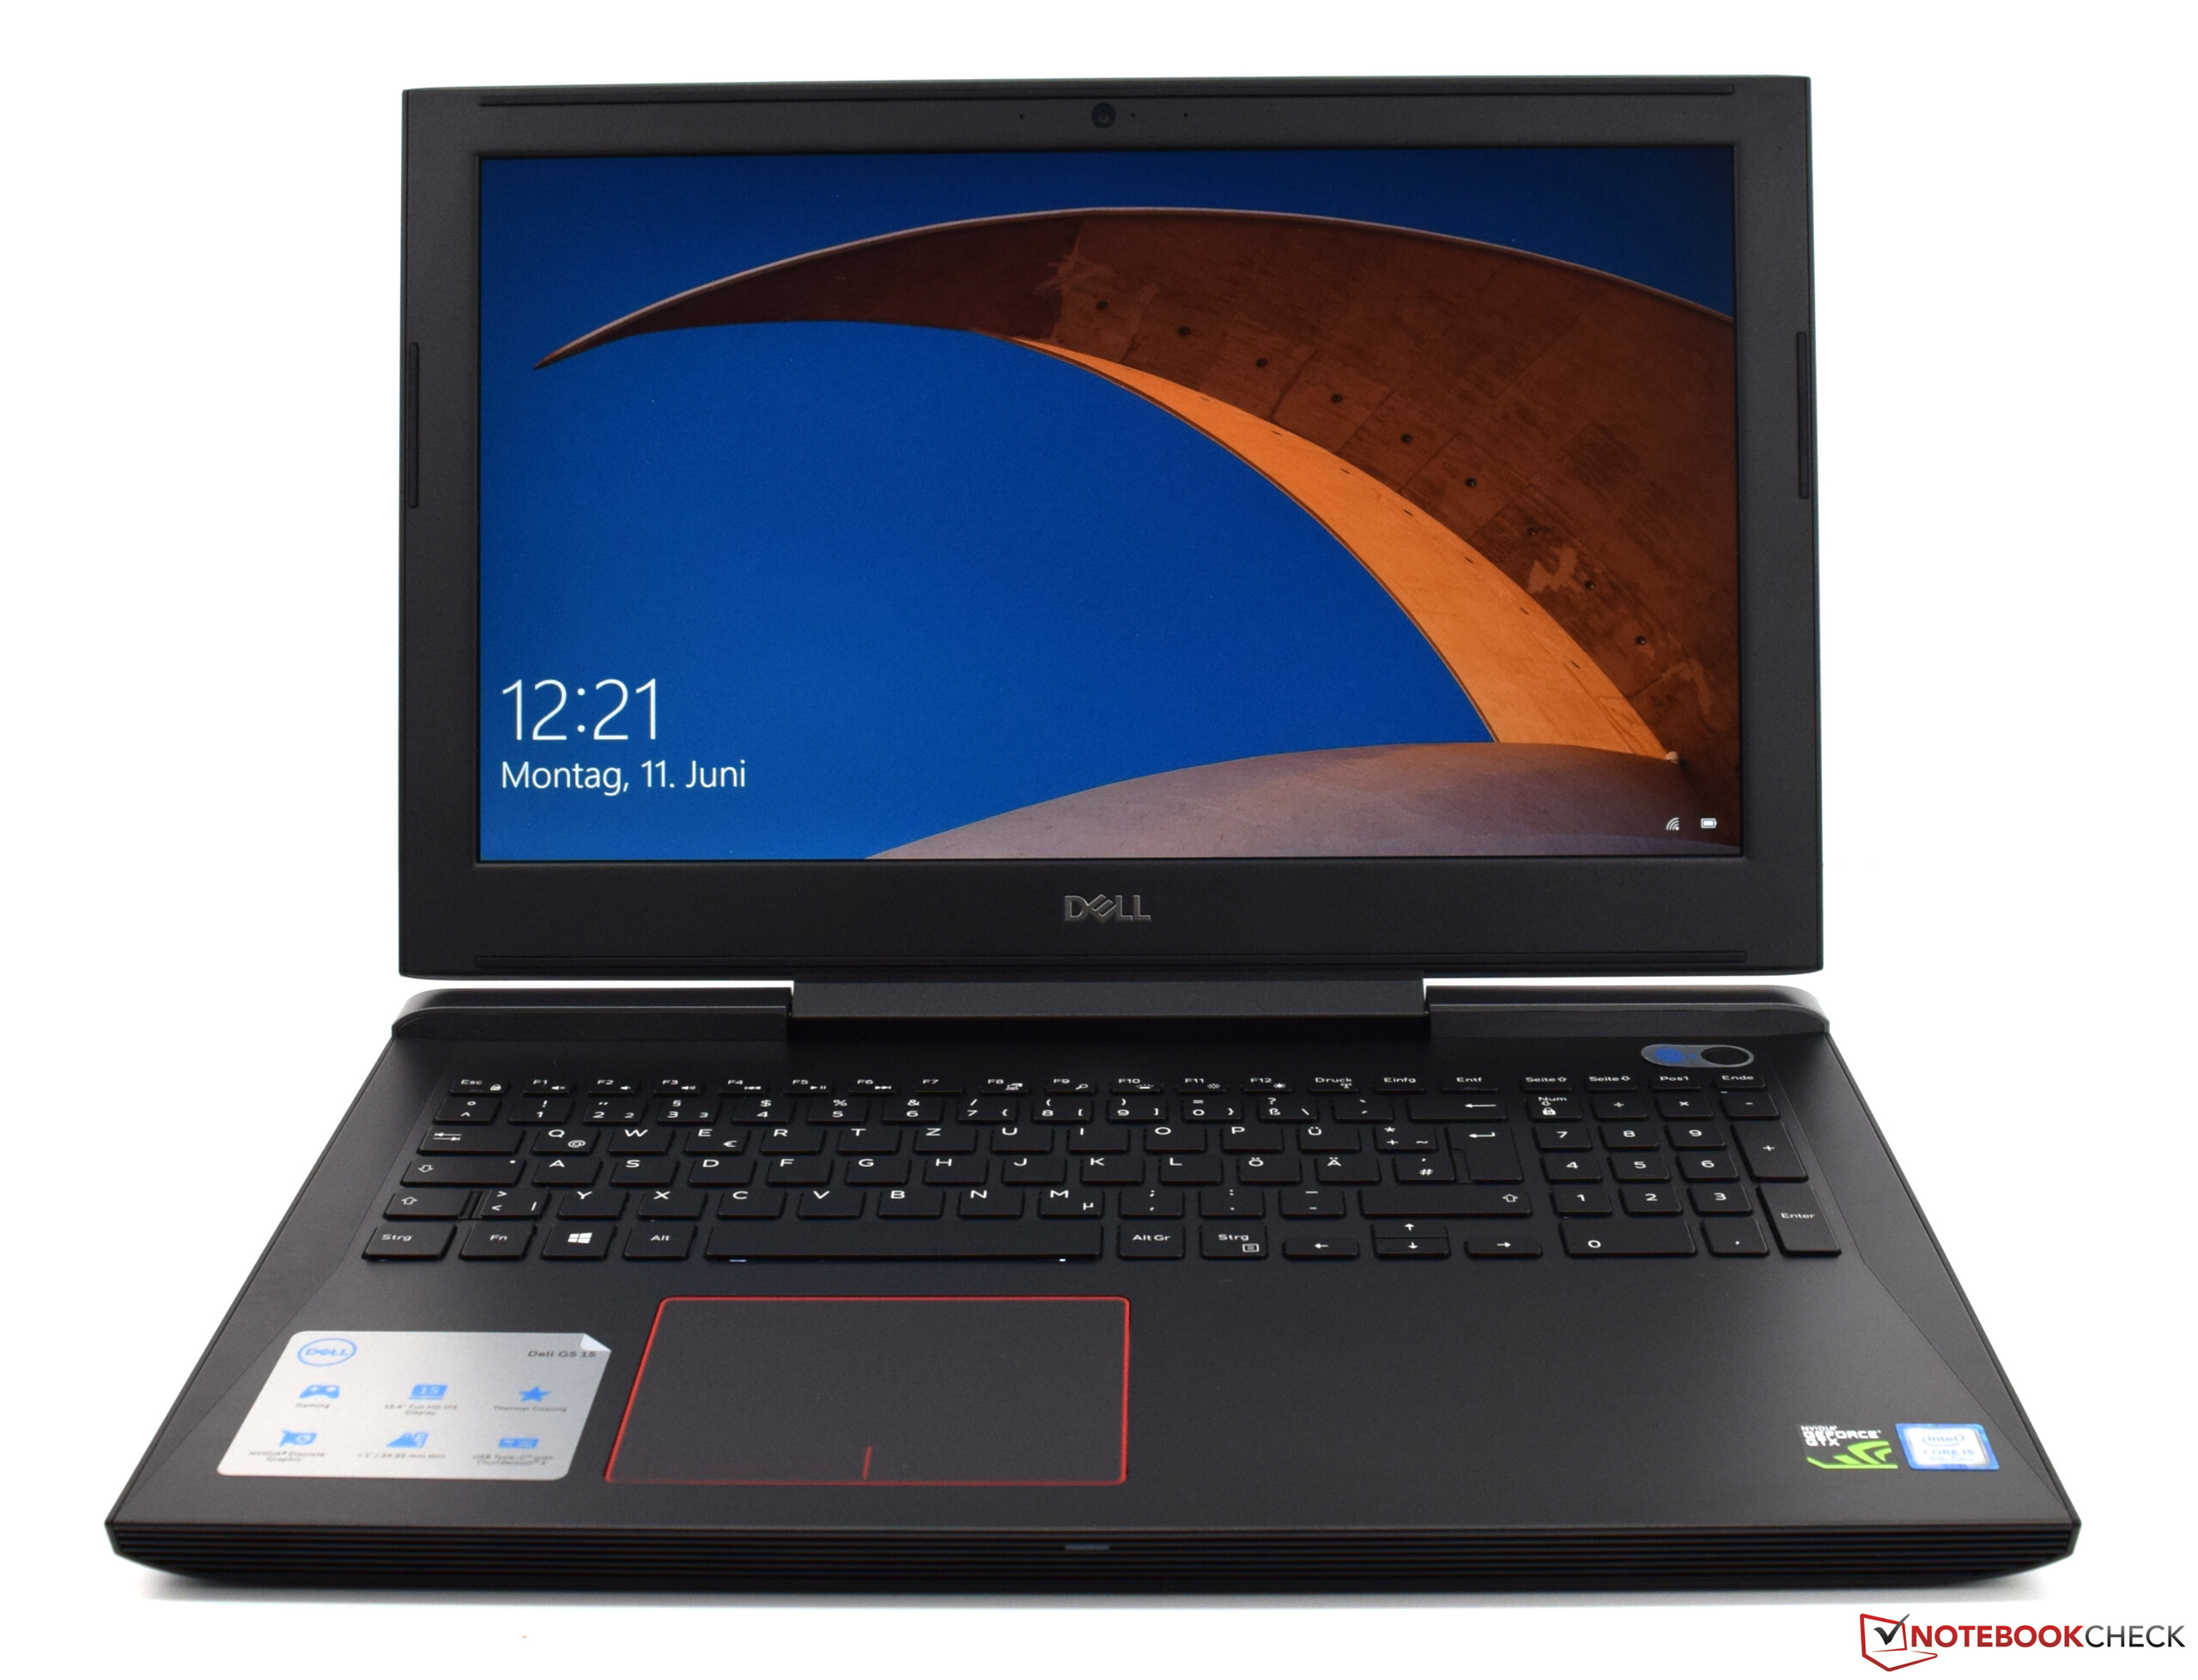
Case - A robust Dell gaming notebook
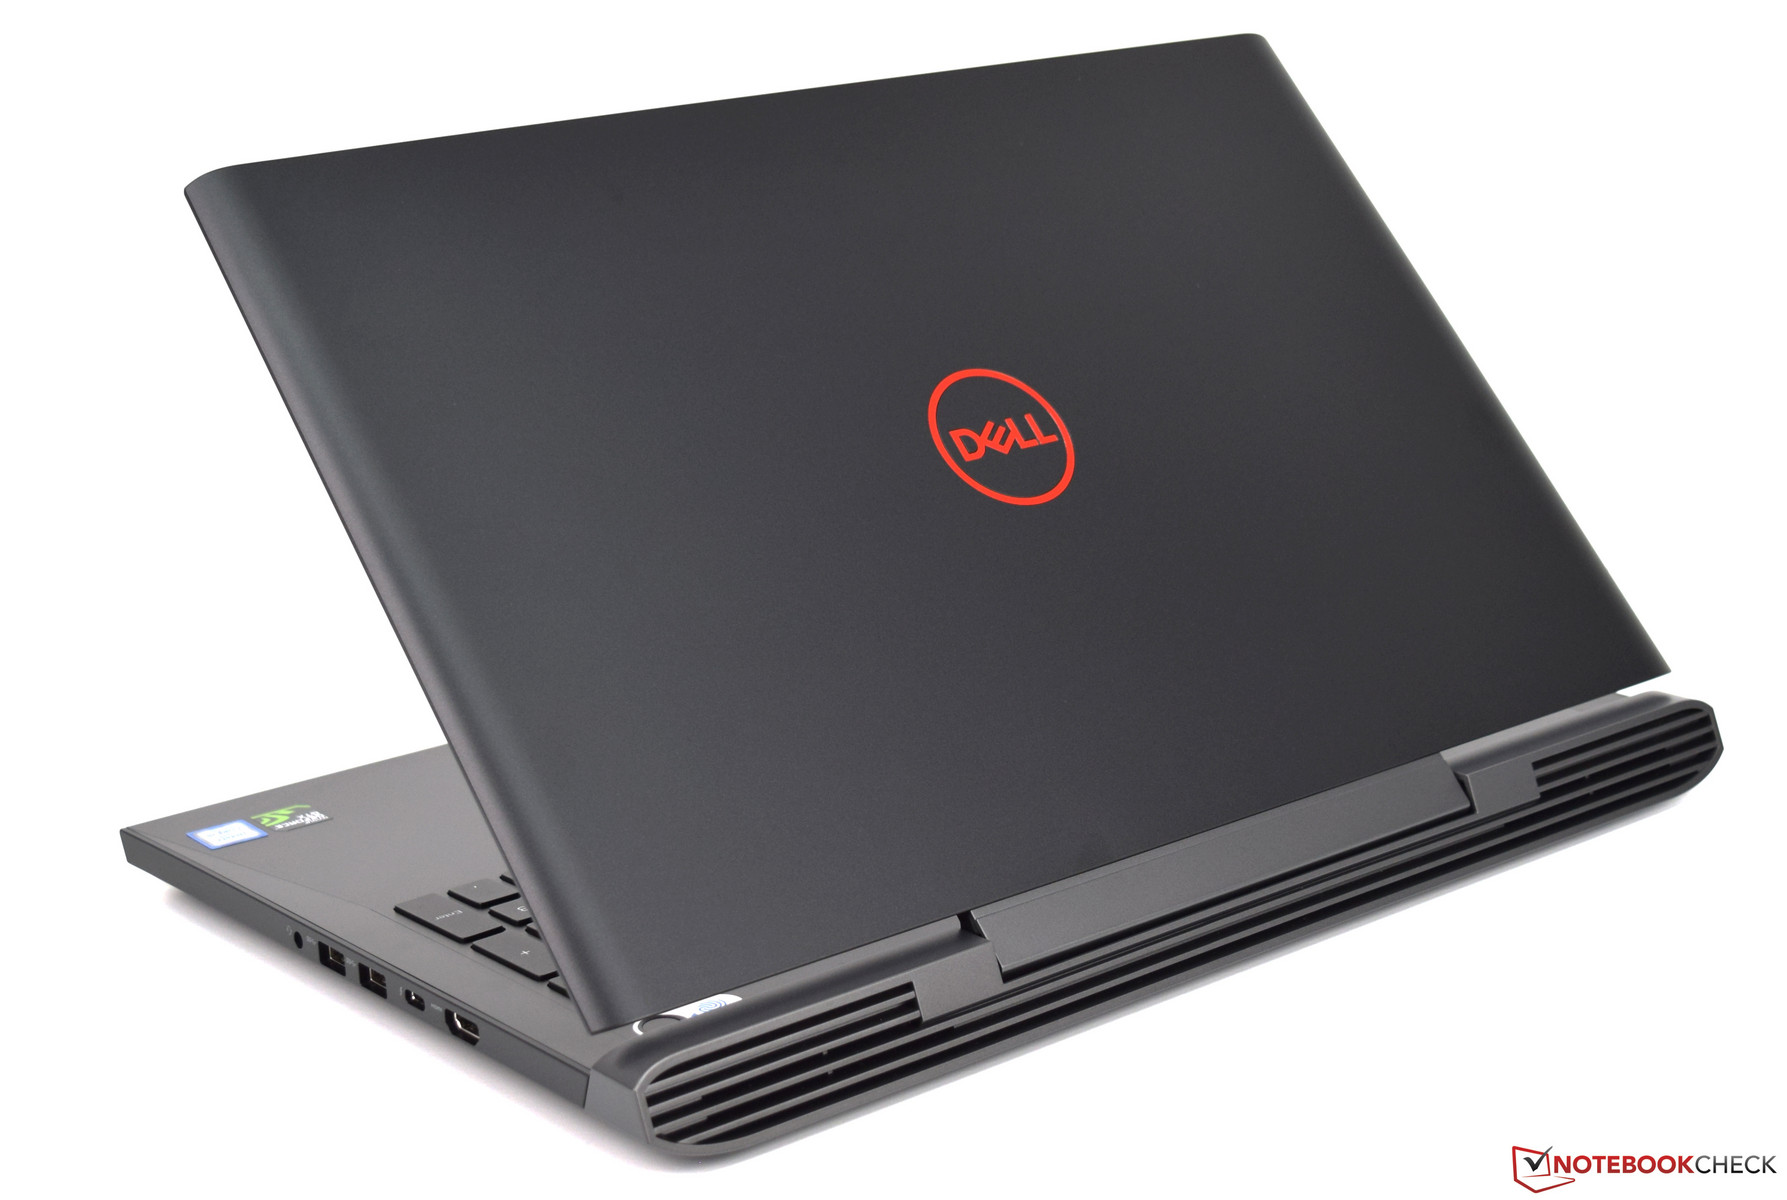
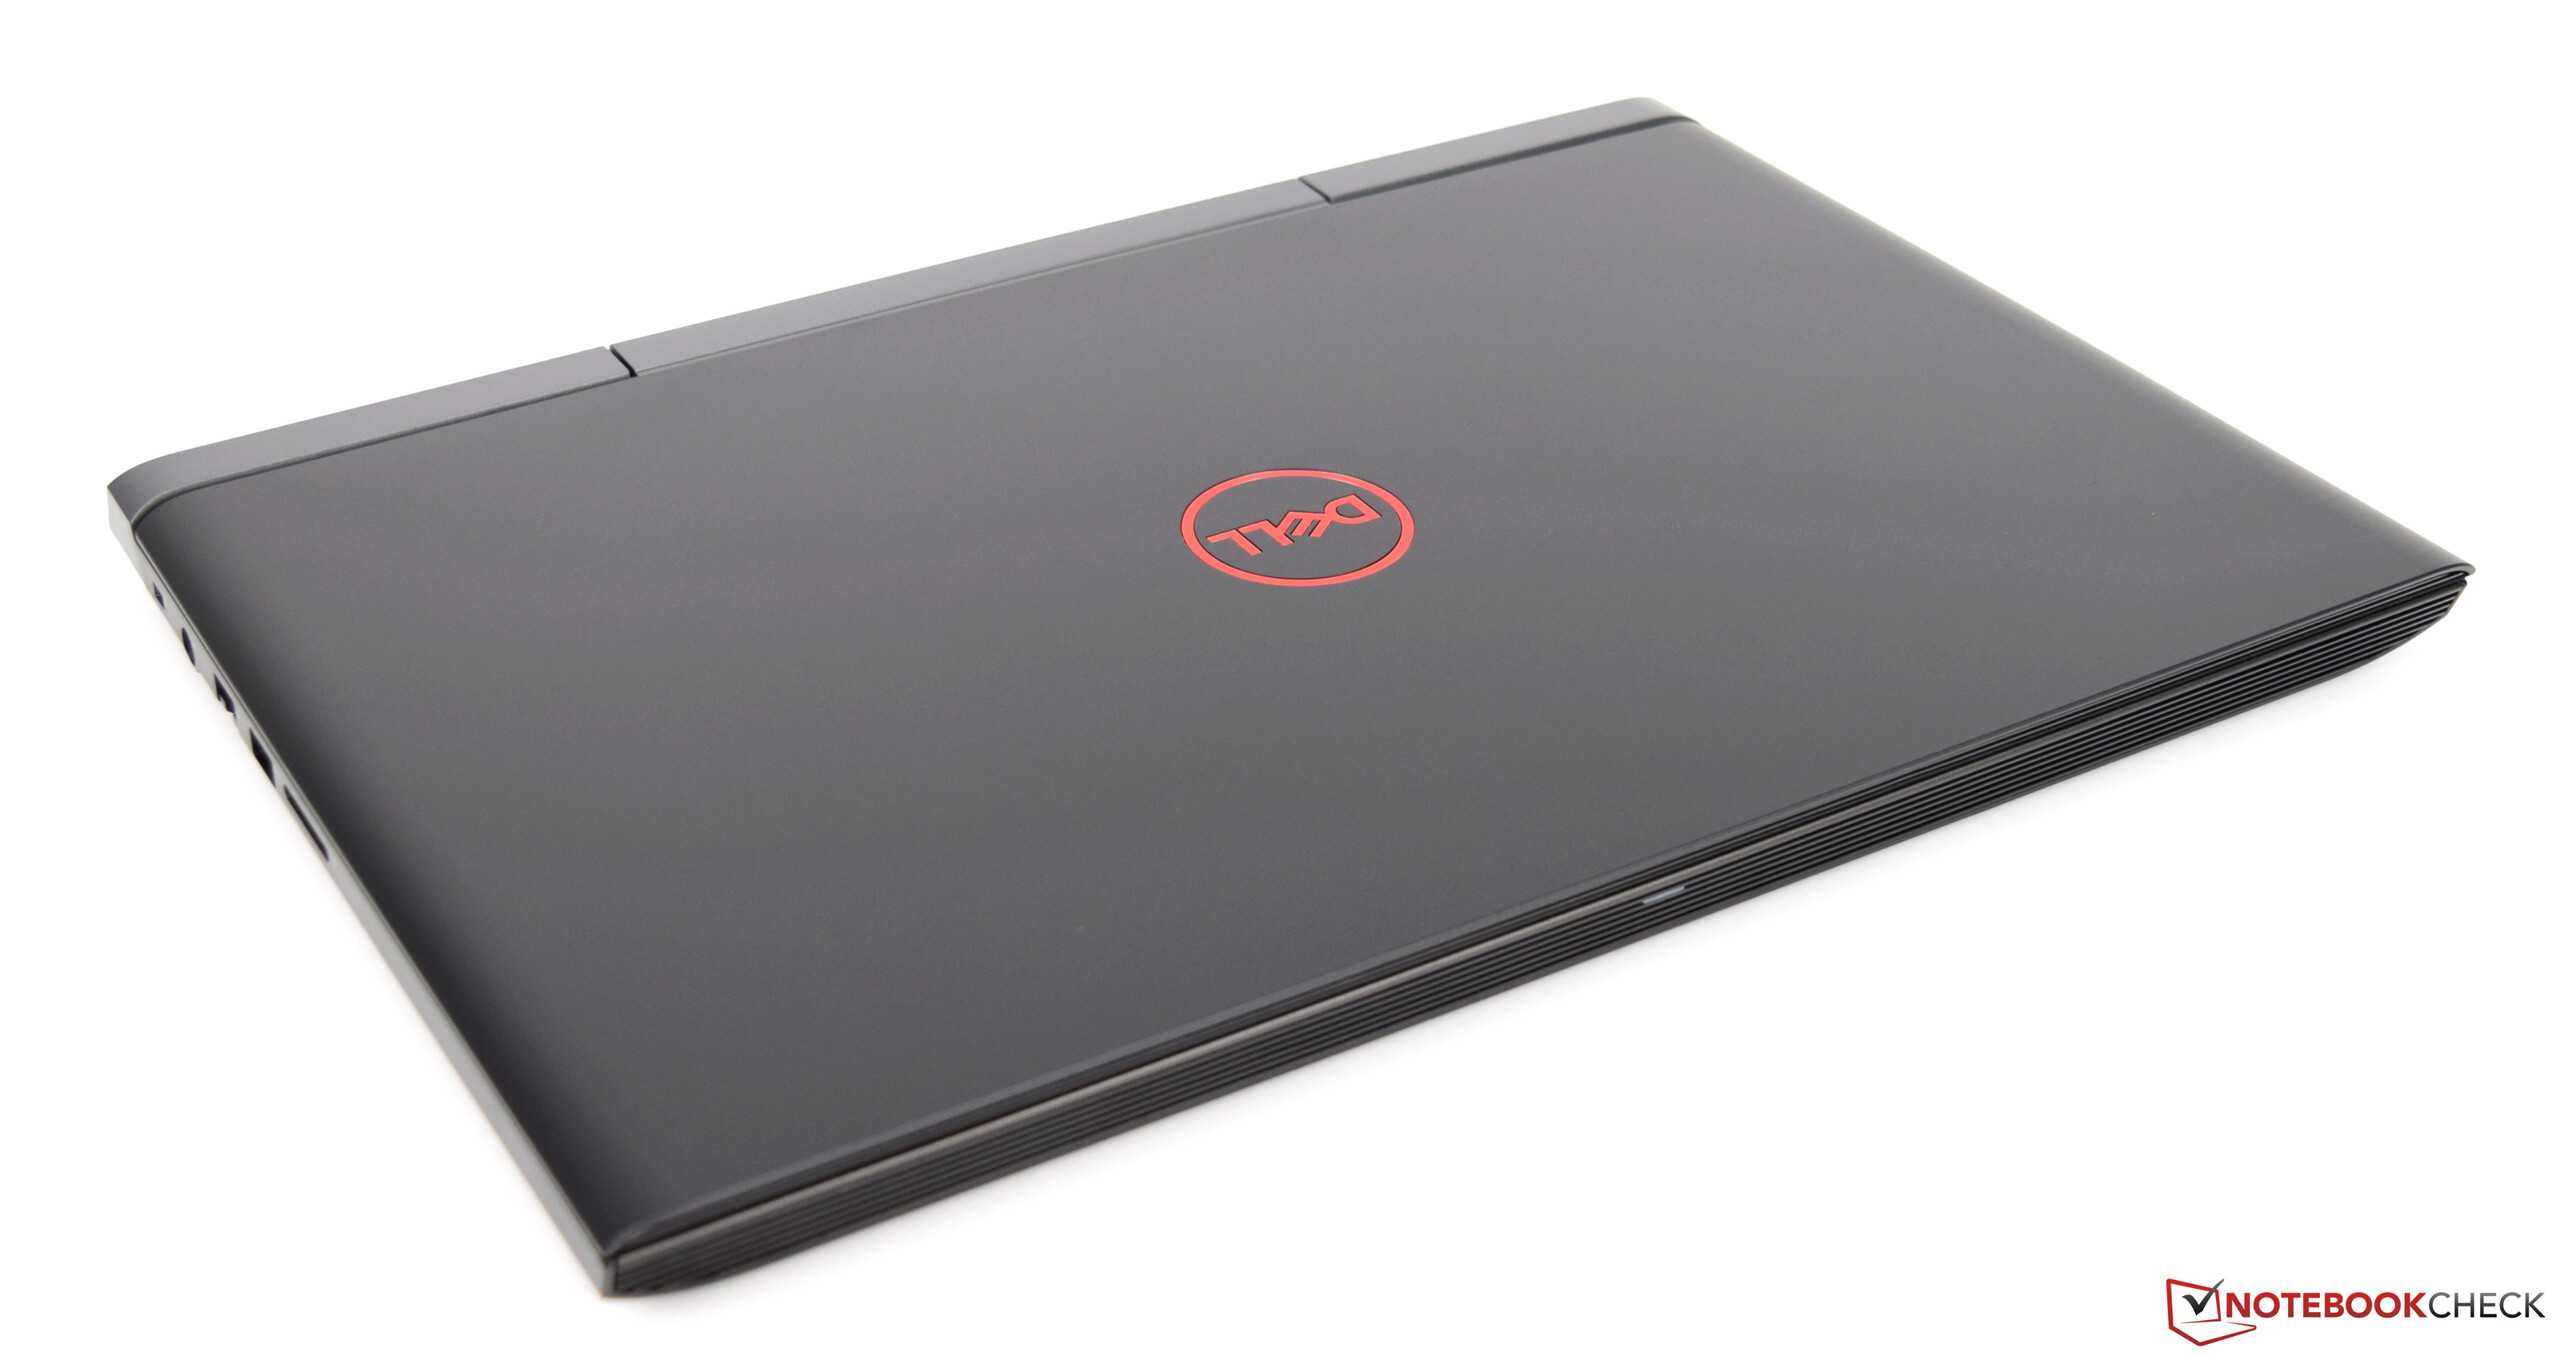
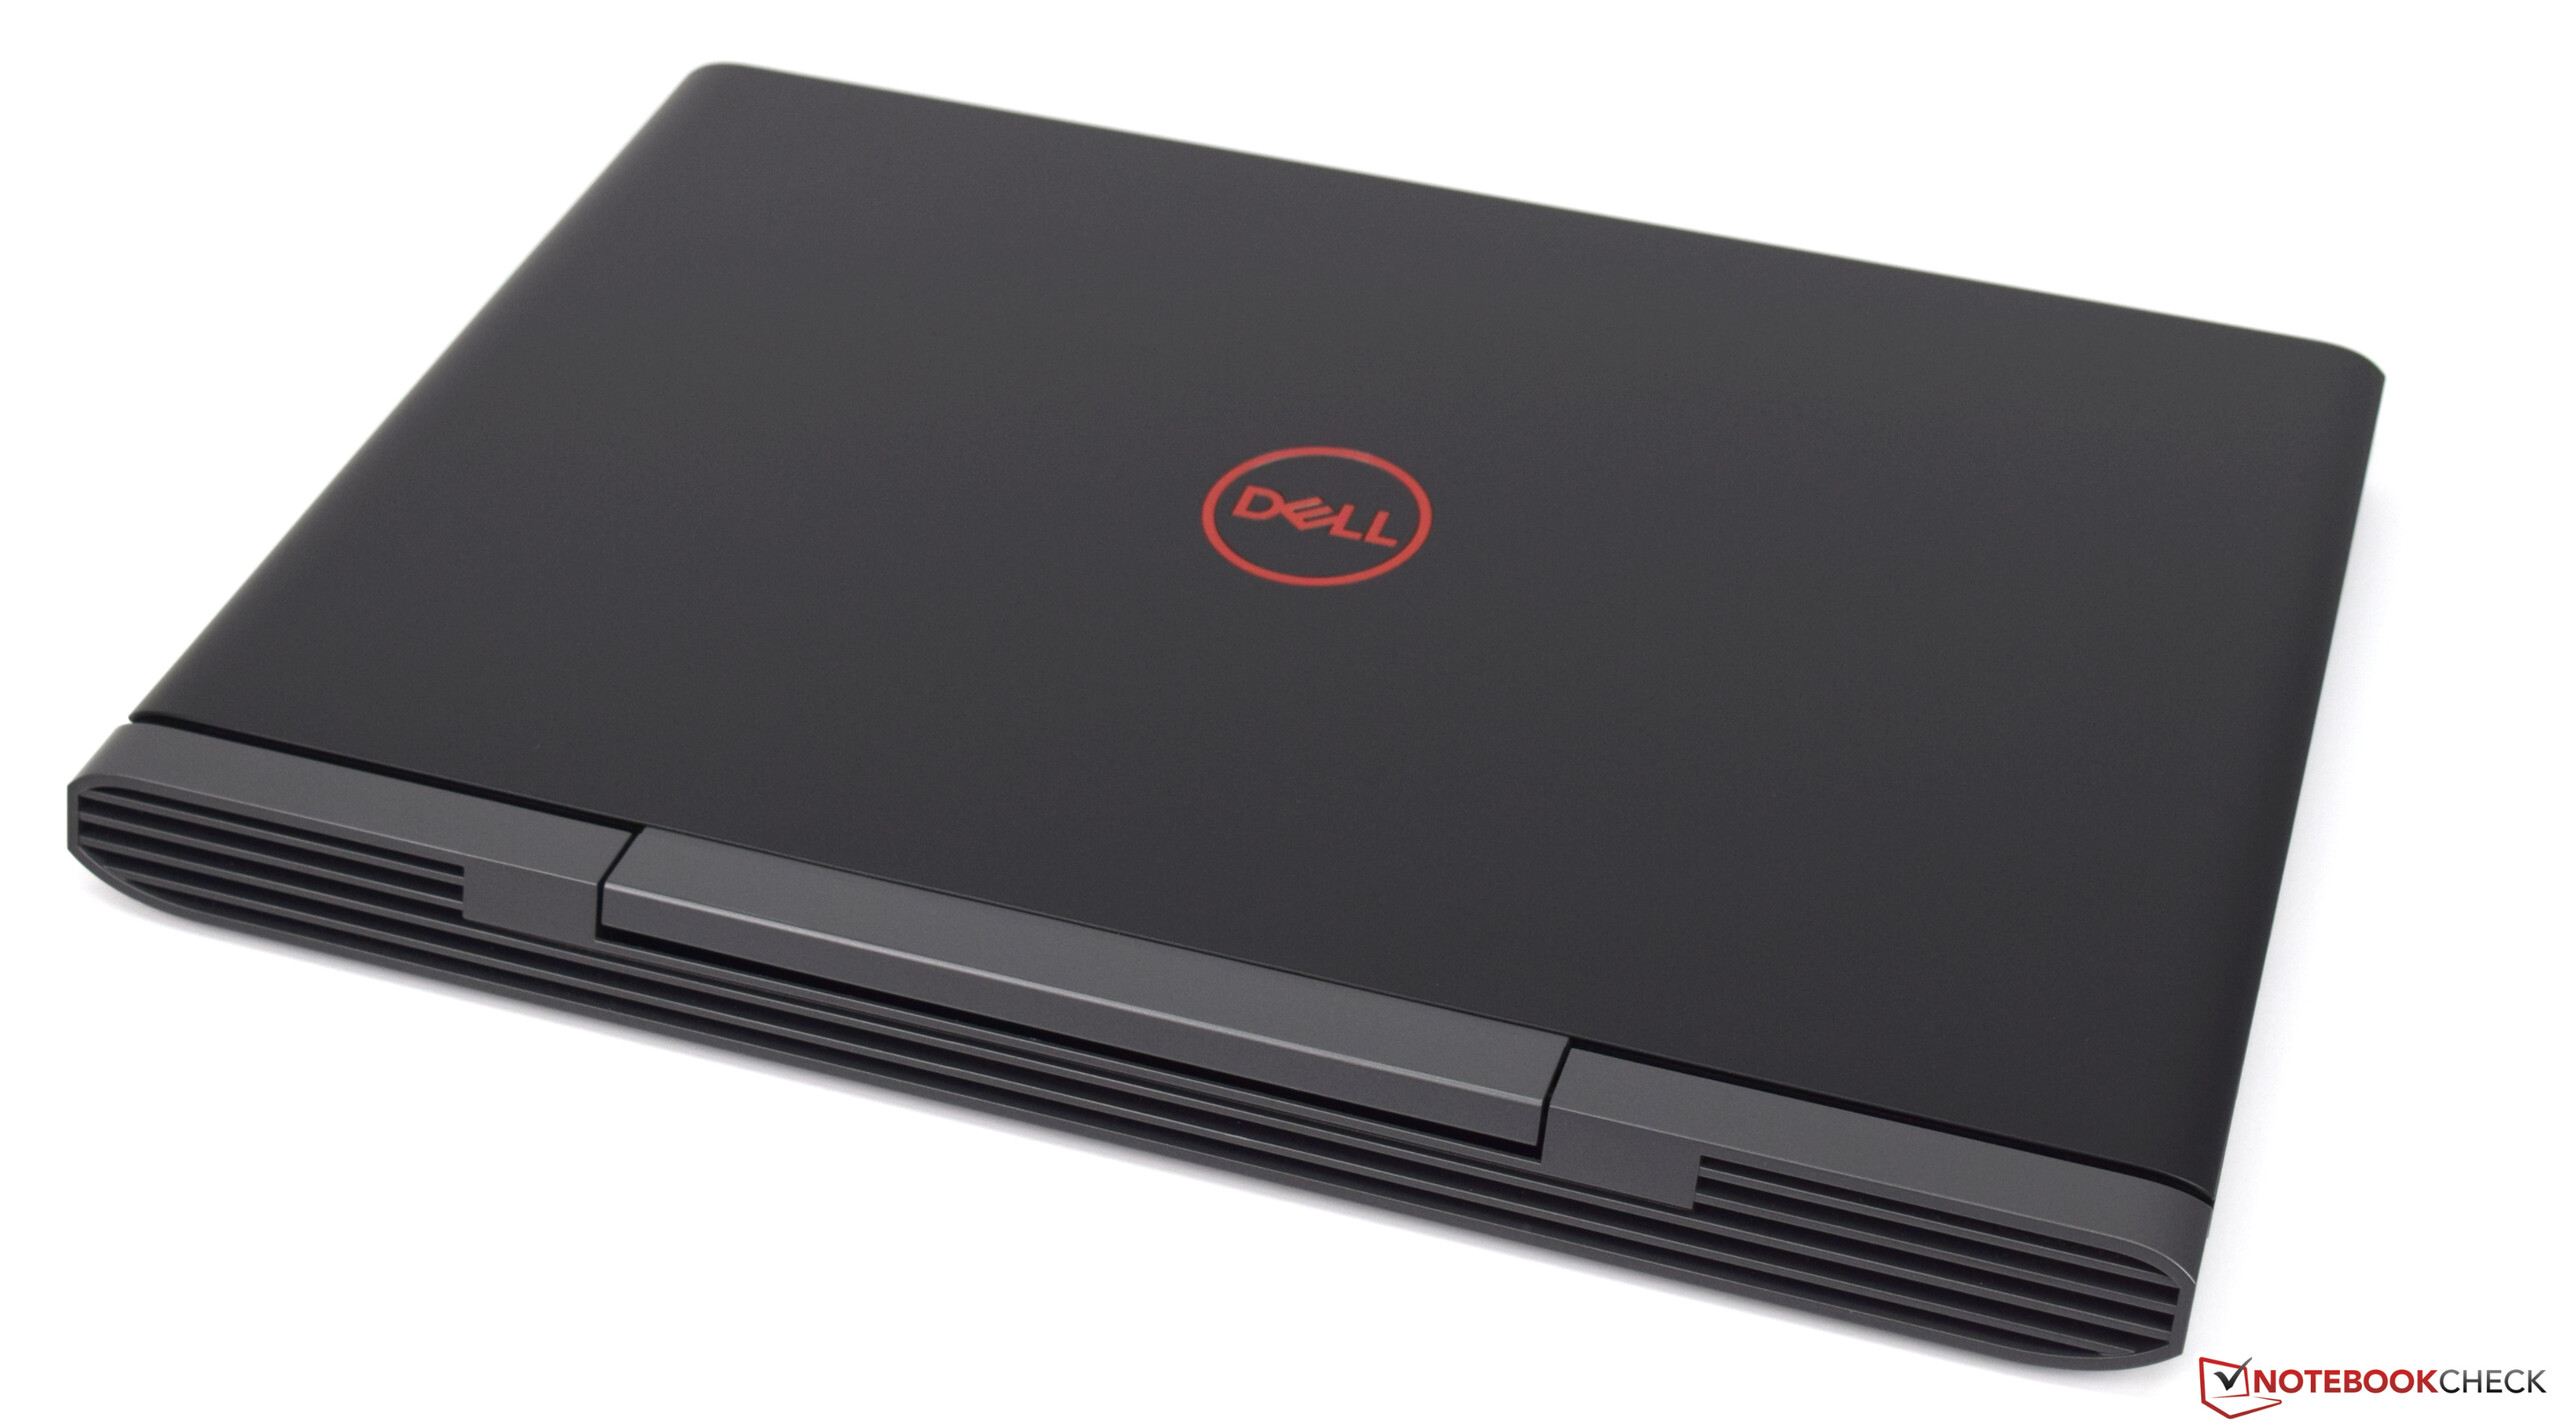
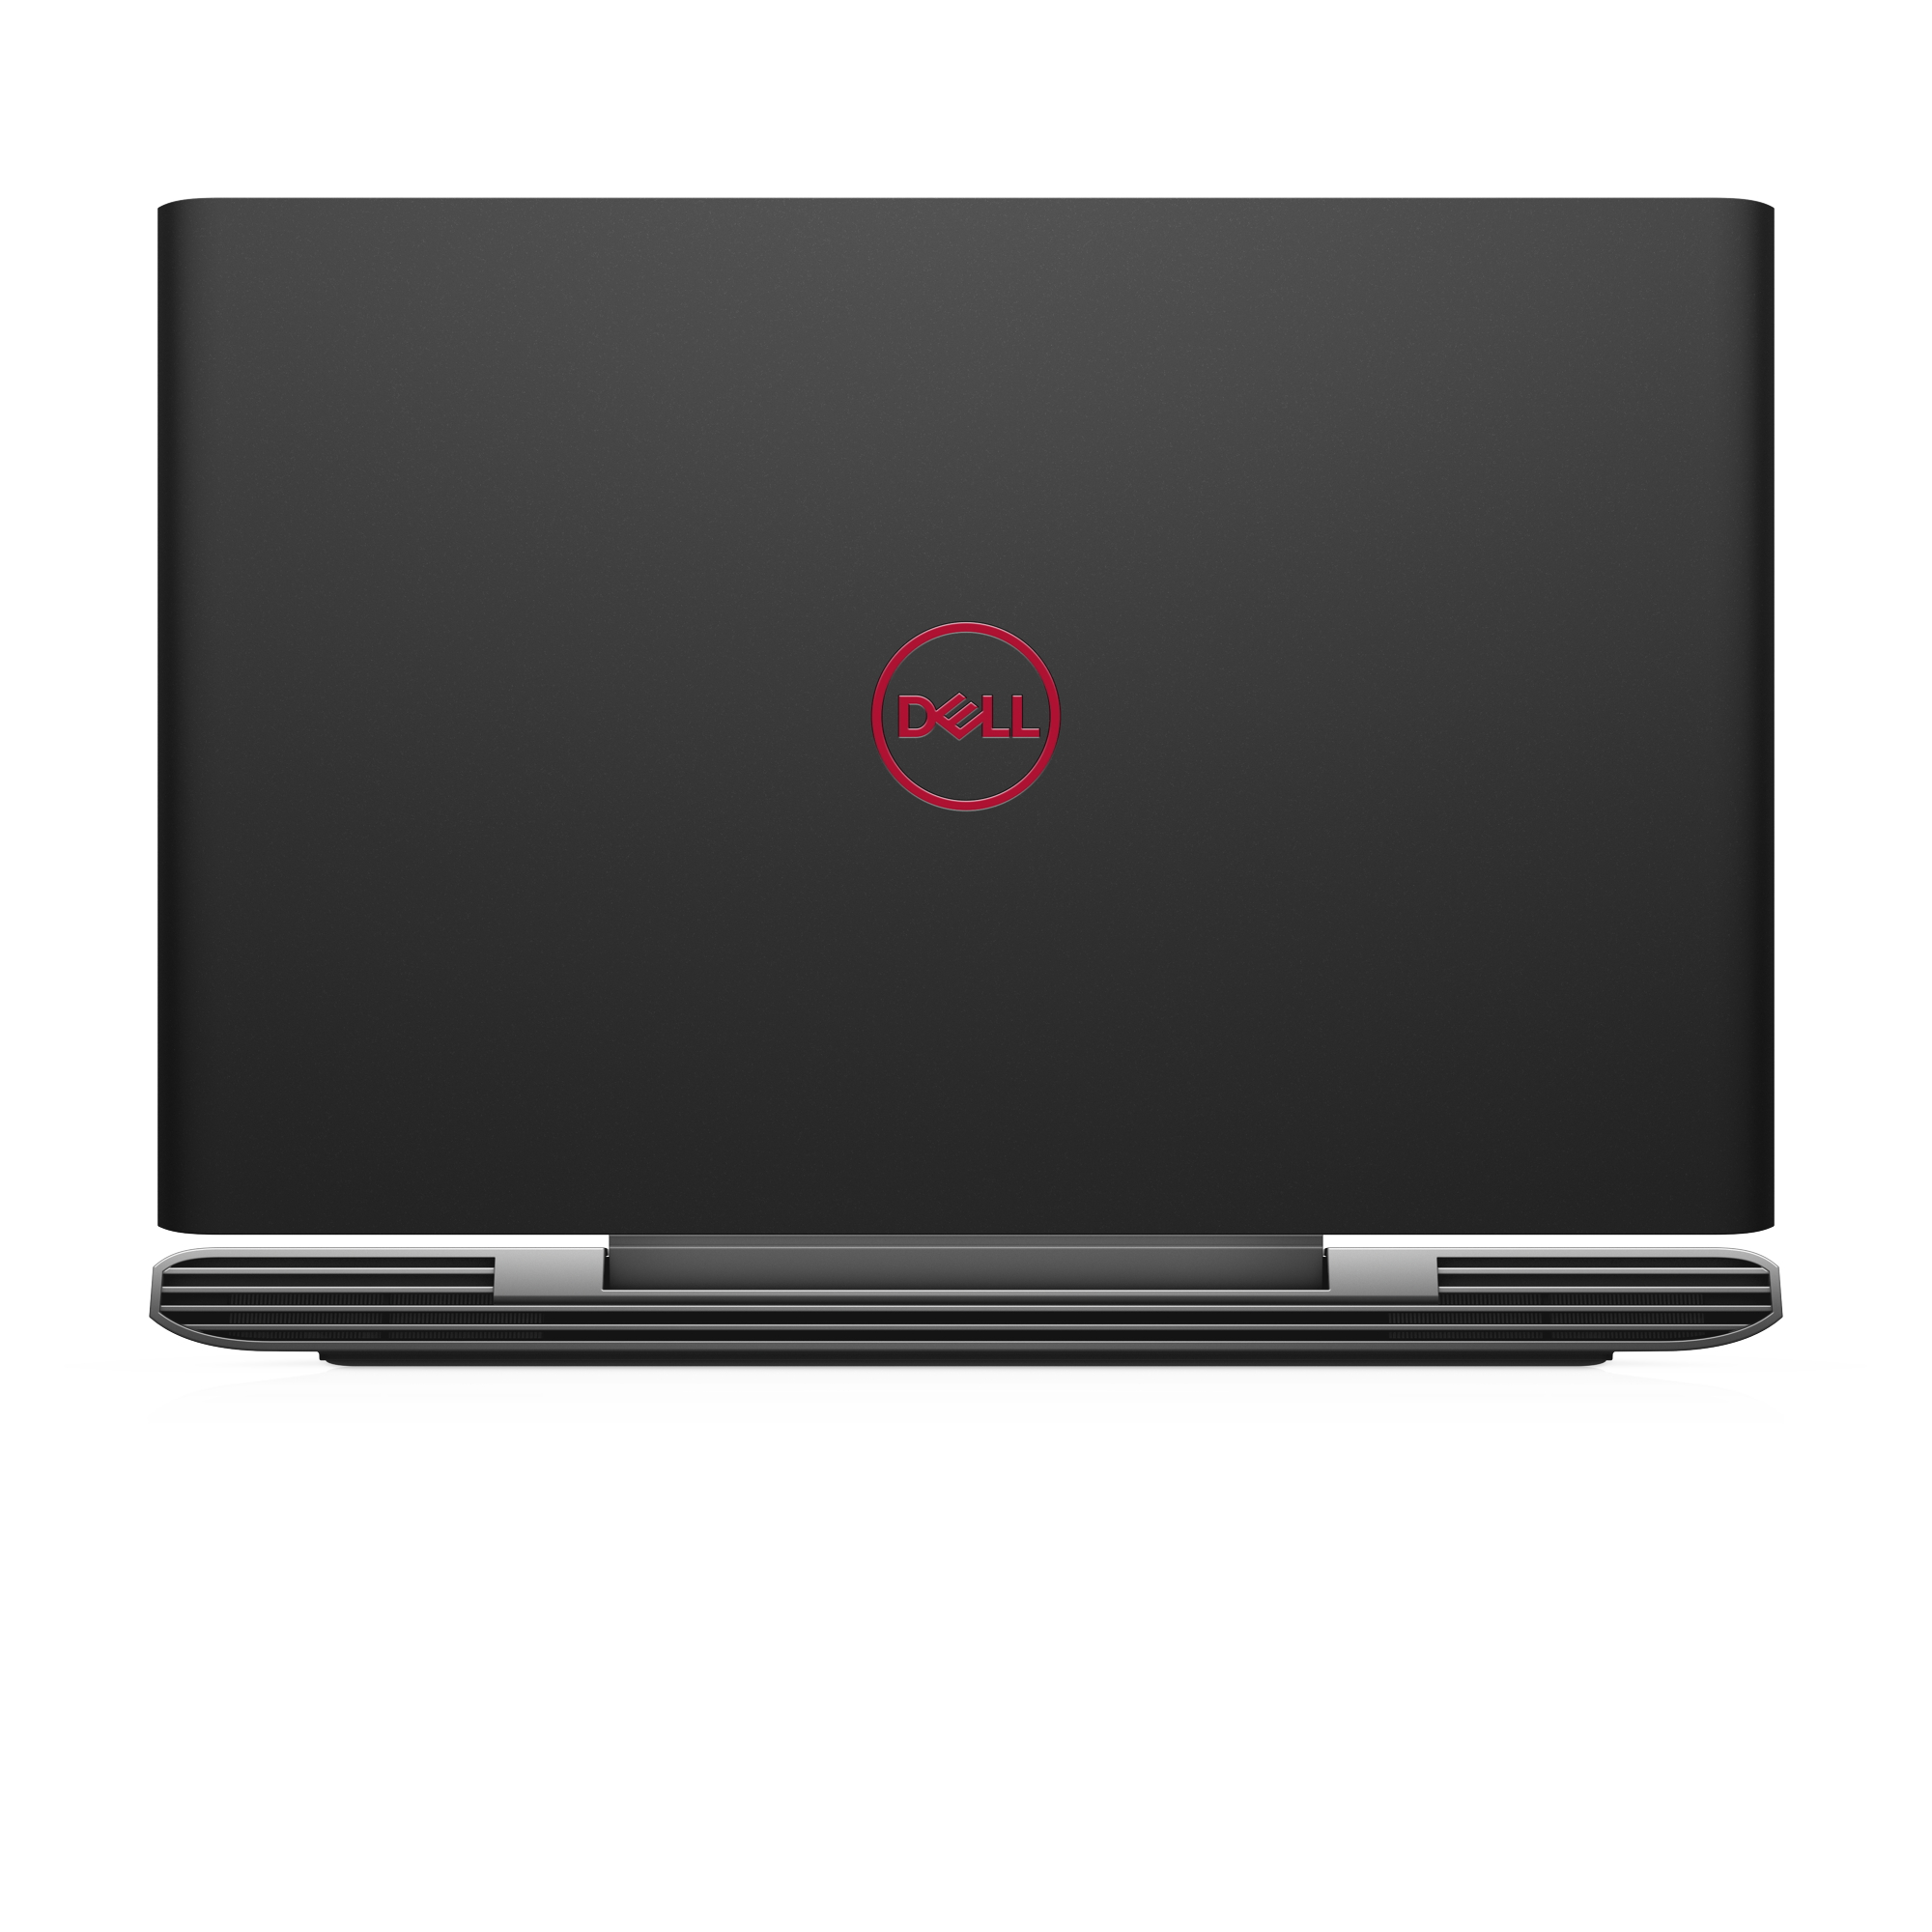
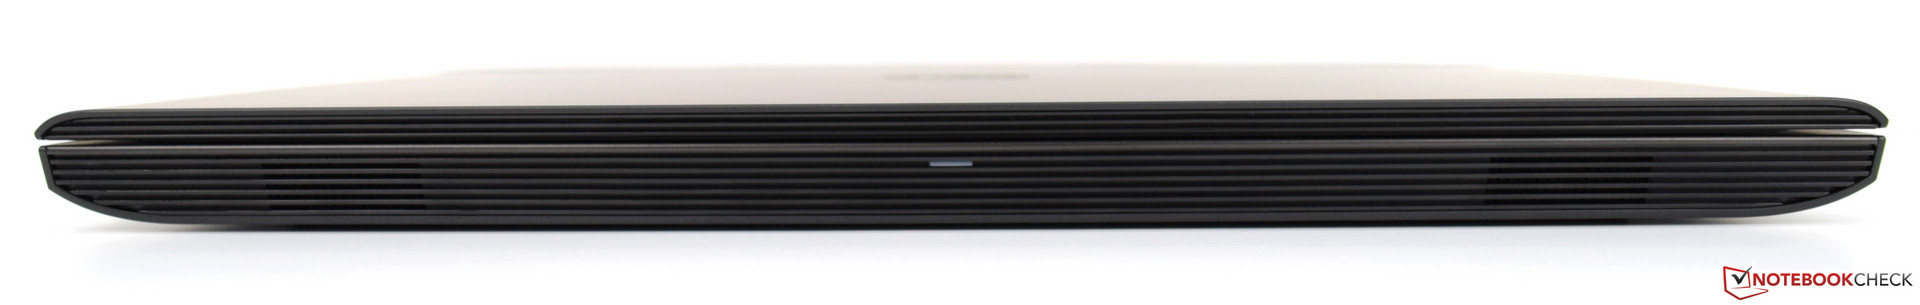
In terms of the case, Dell trusts what has been tried and tested, which means that the G5 15 corresponds exactly to the Inspiron 15 7000. This also includes all the well-known advantages and disadvantages, although the disadvantages are minimal and concern the visuals more. In brief: Fingerprints quickly become visible on the smooth surfaces and the front edges are quite sharp. But that is the full extent of our complaints.
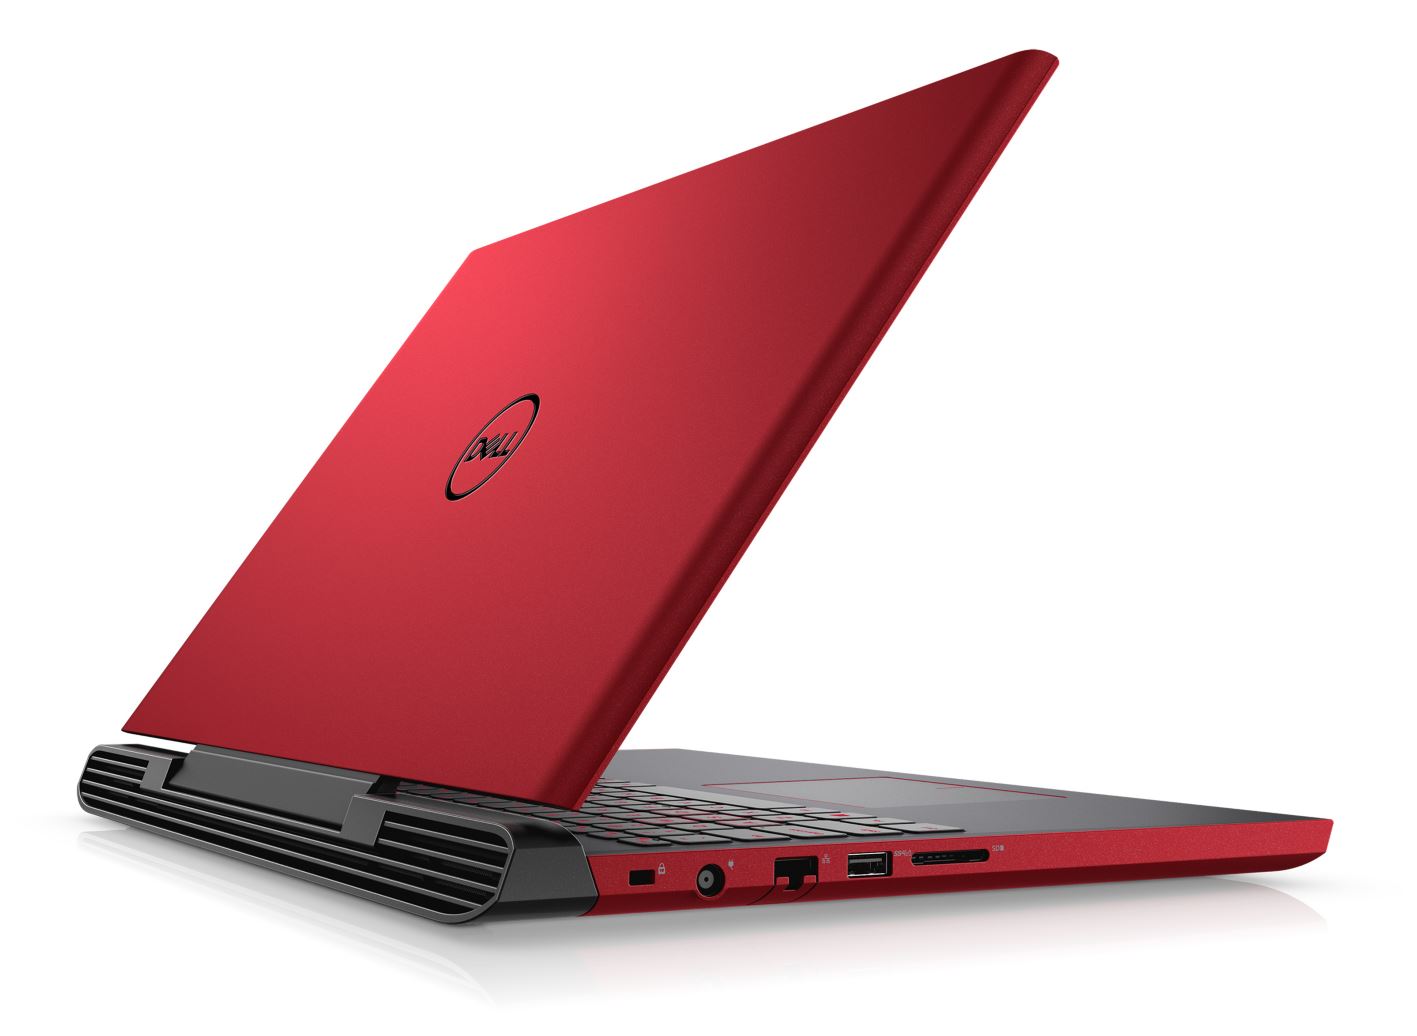
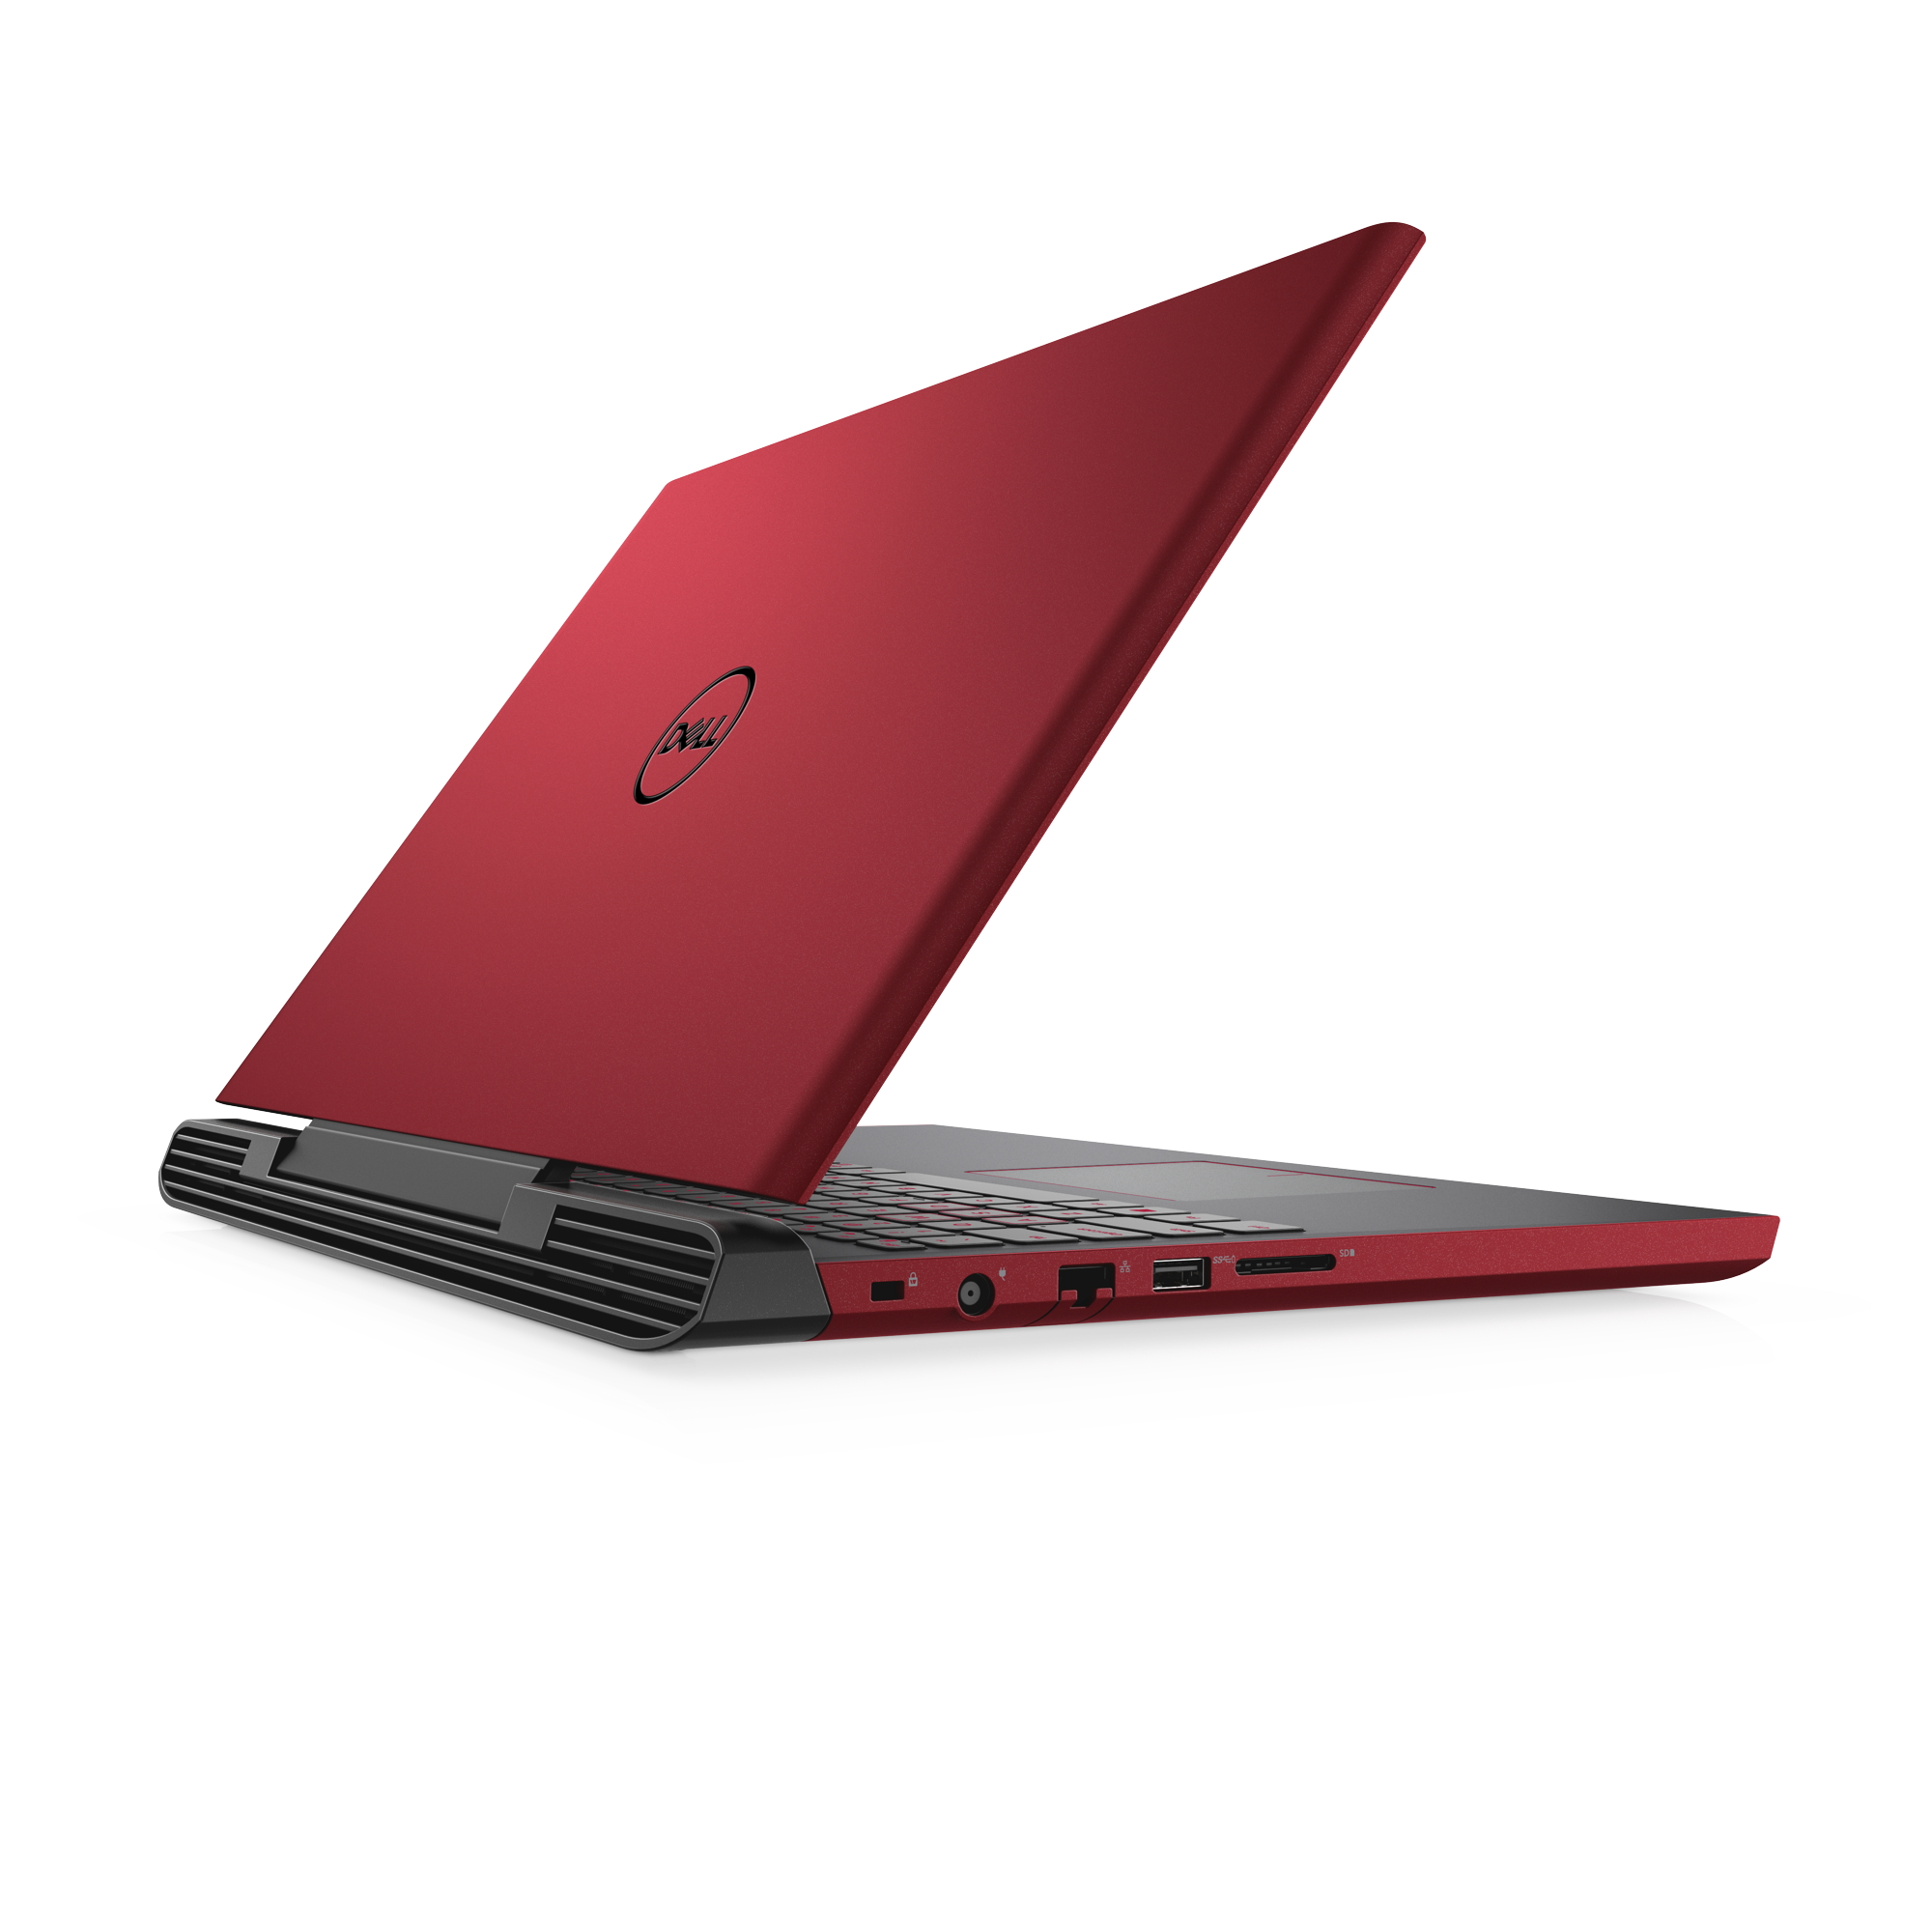
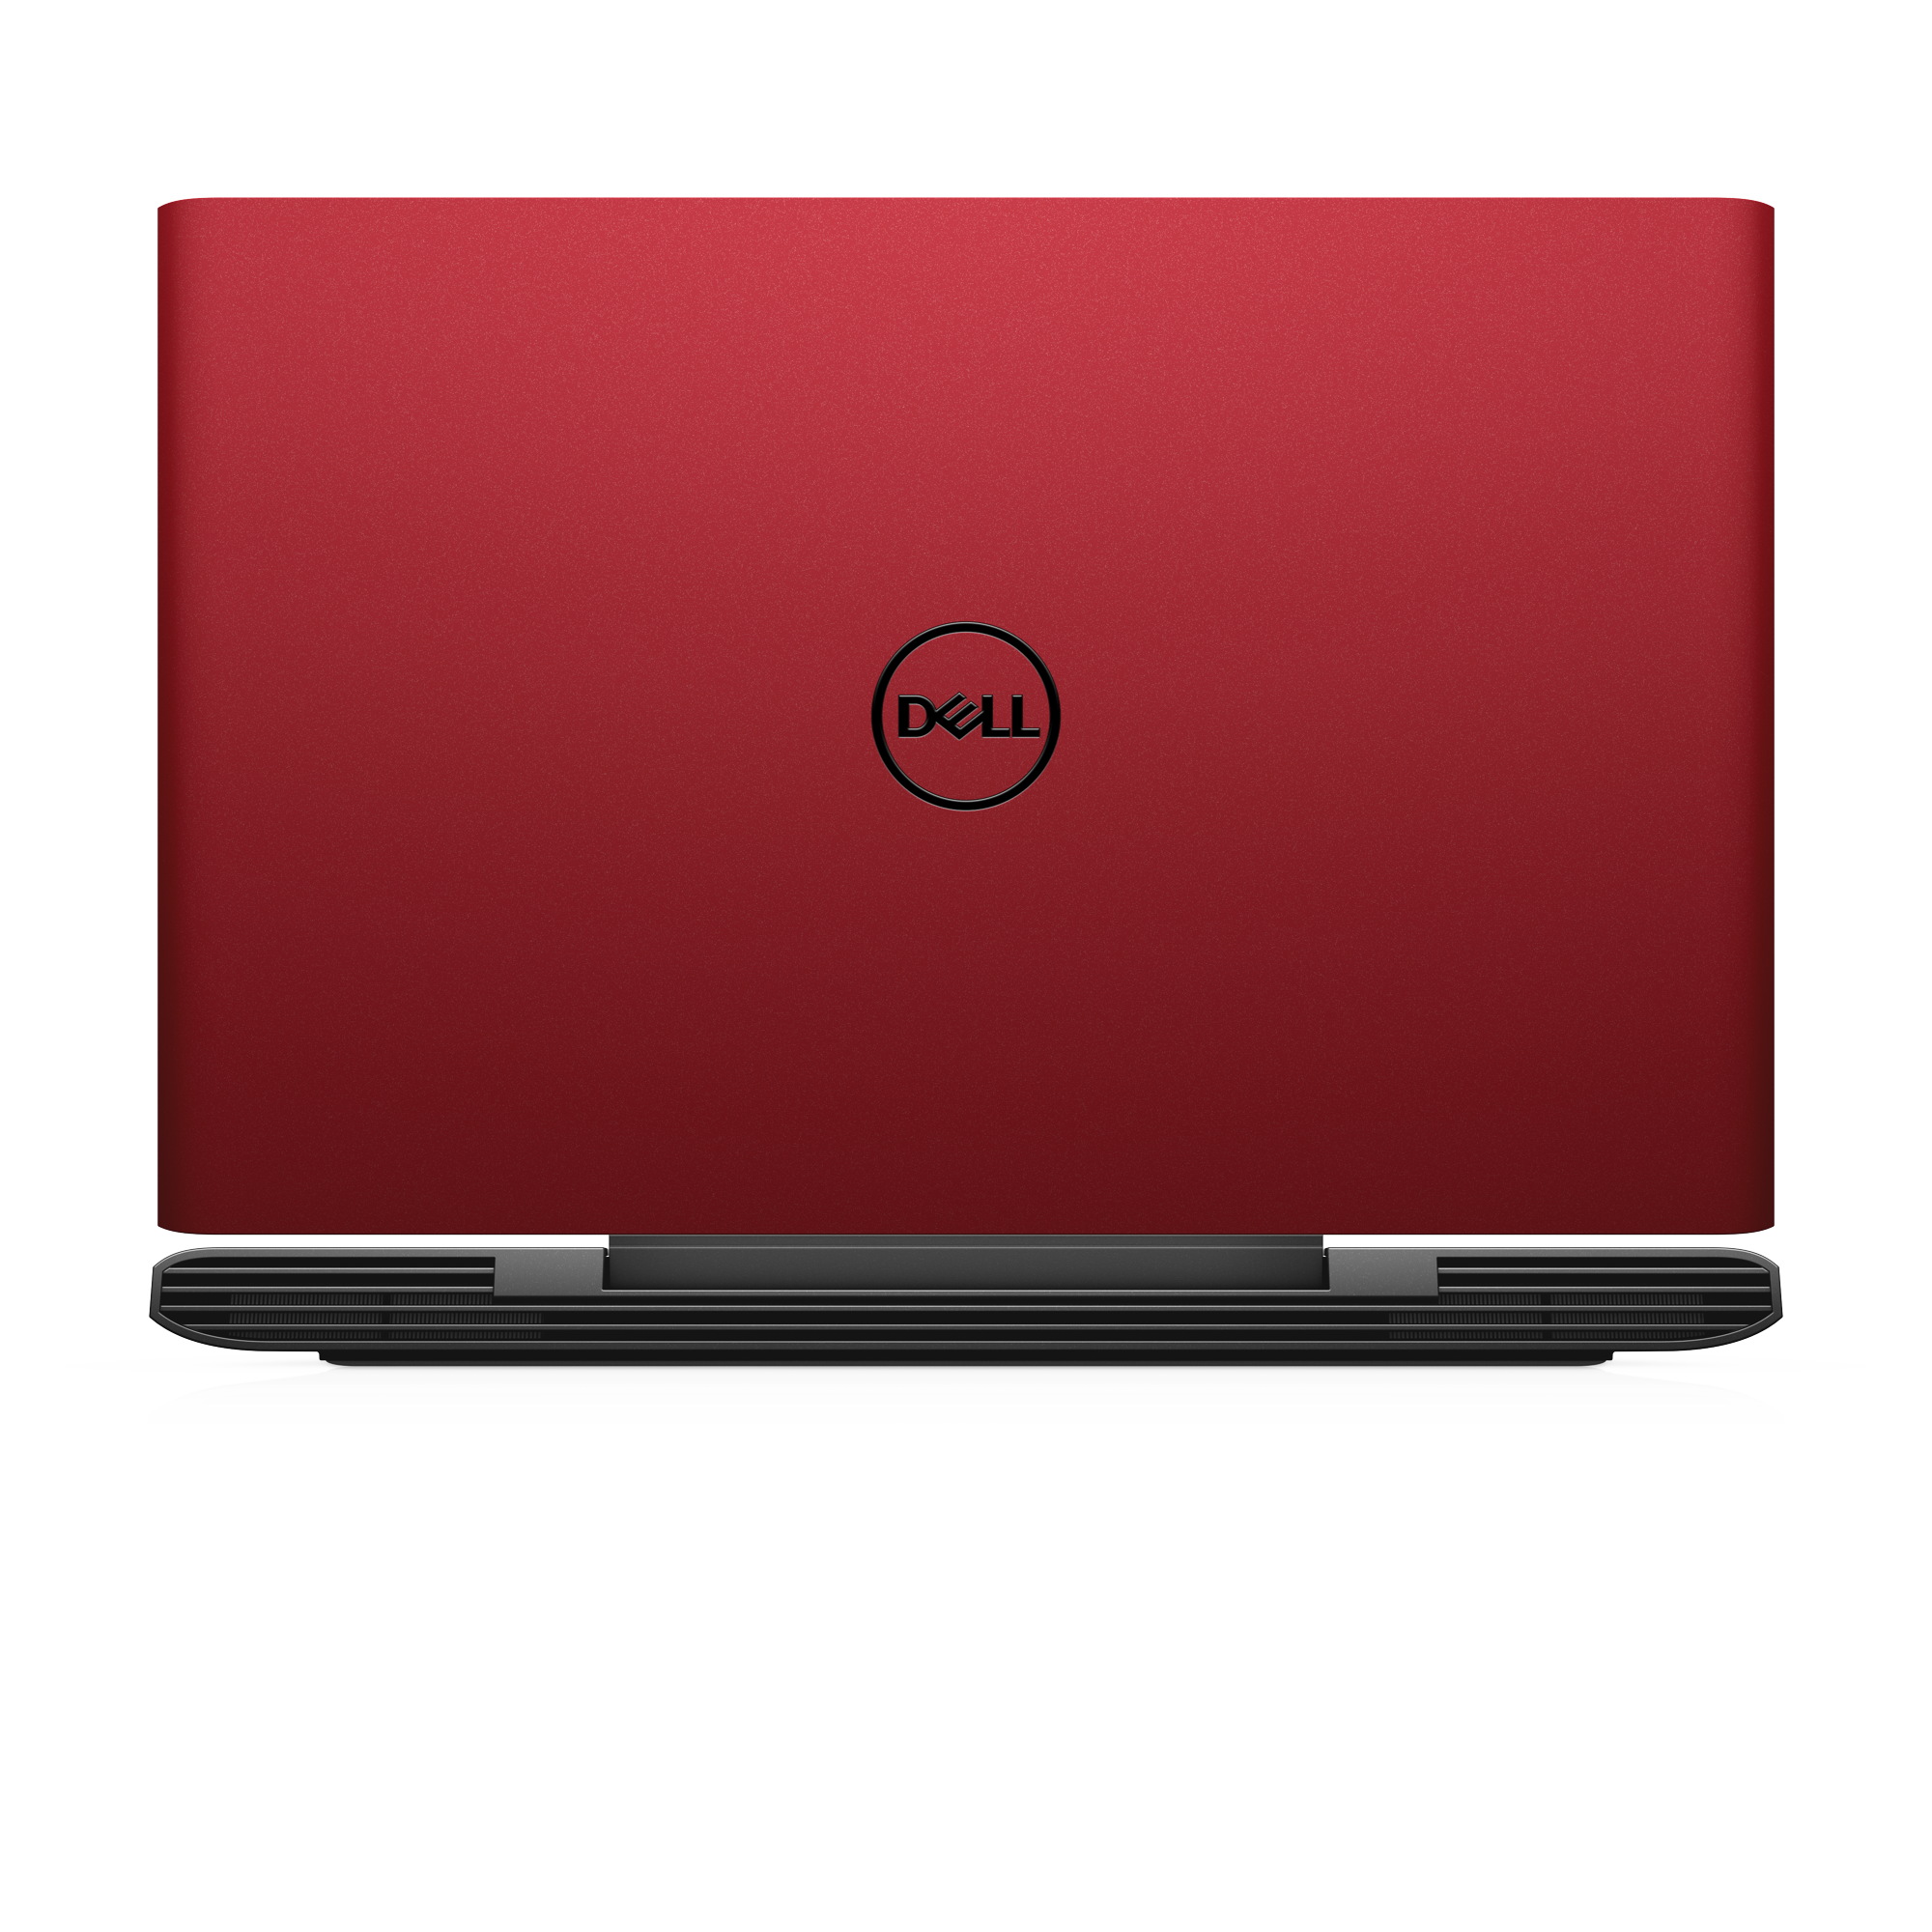
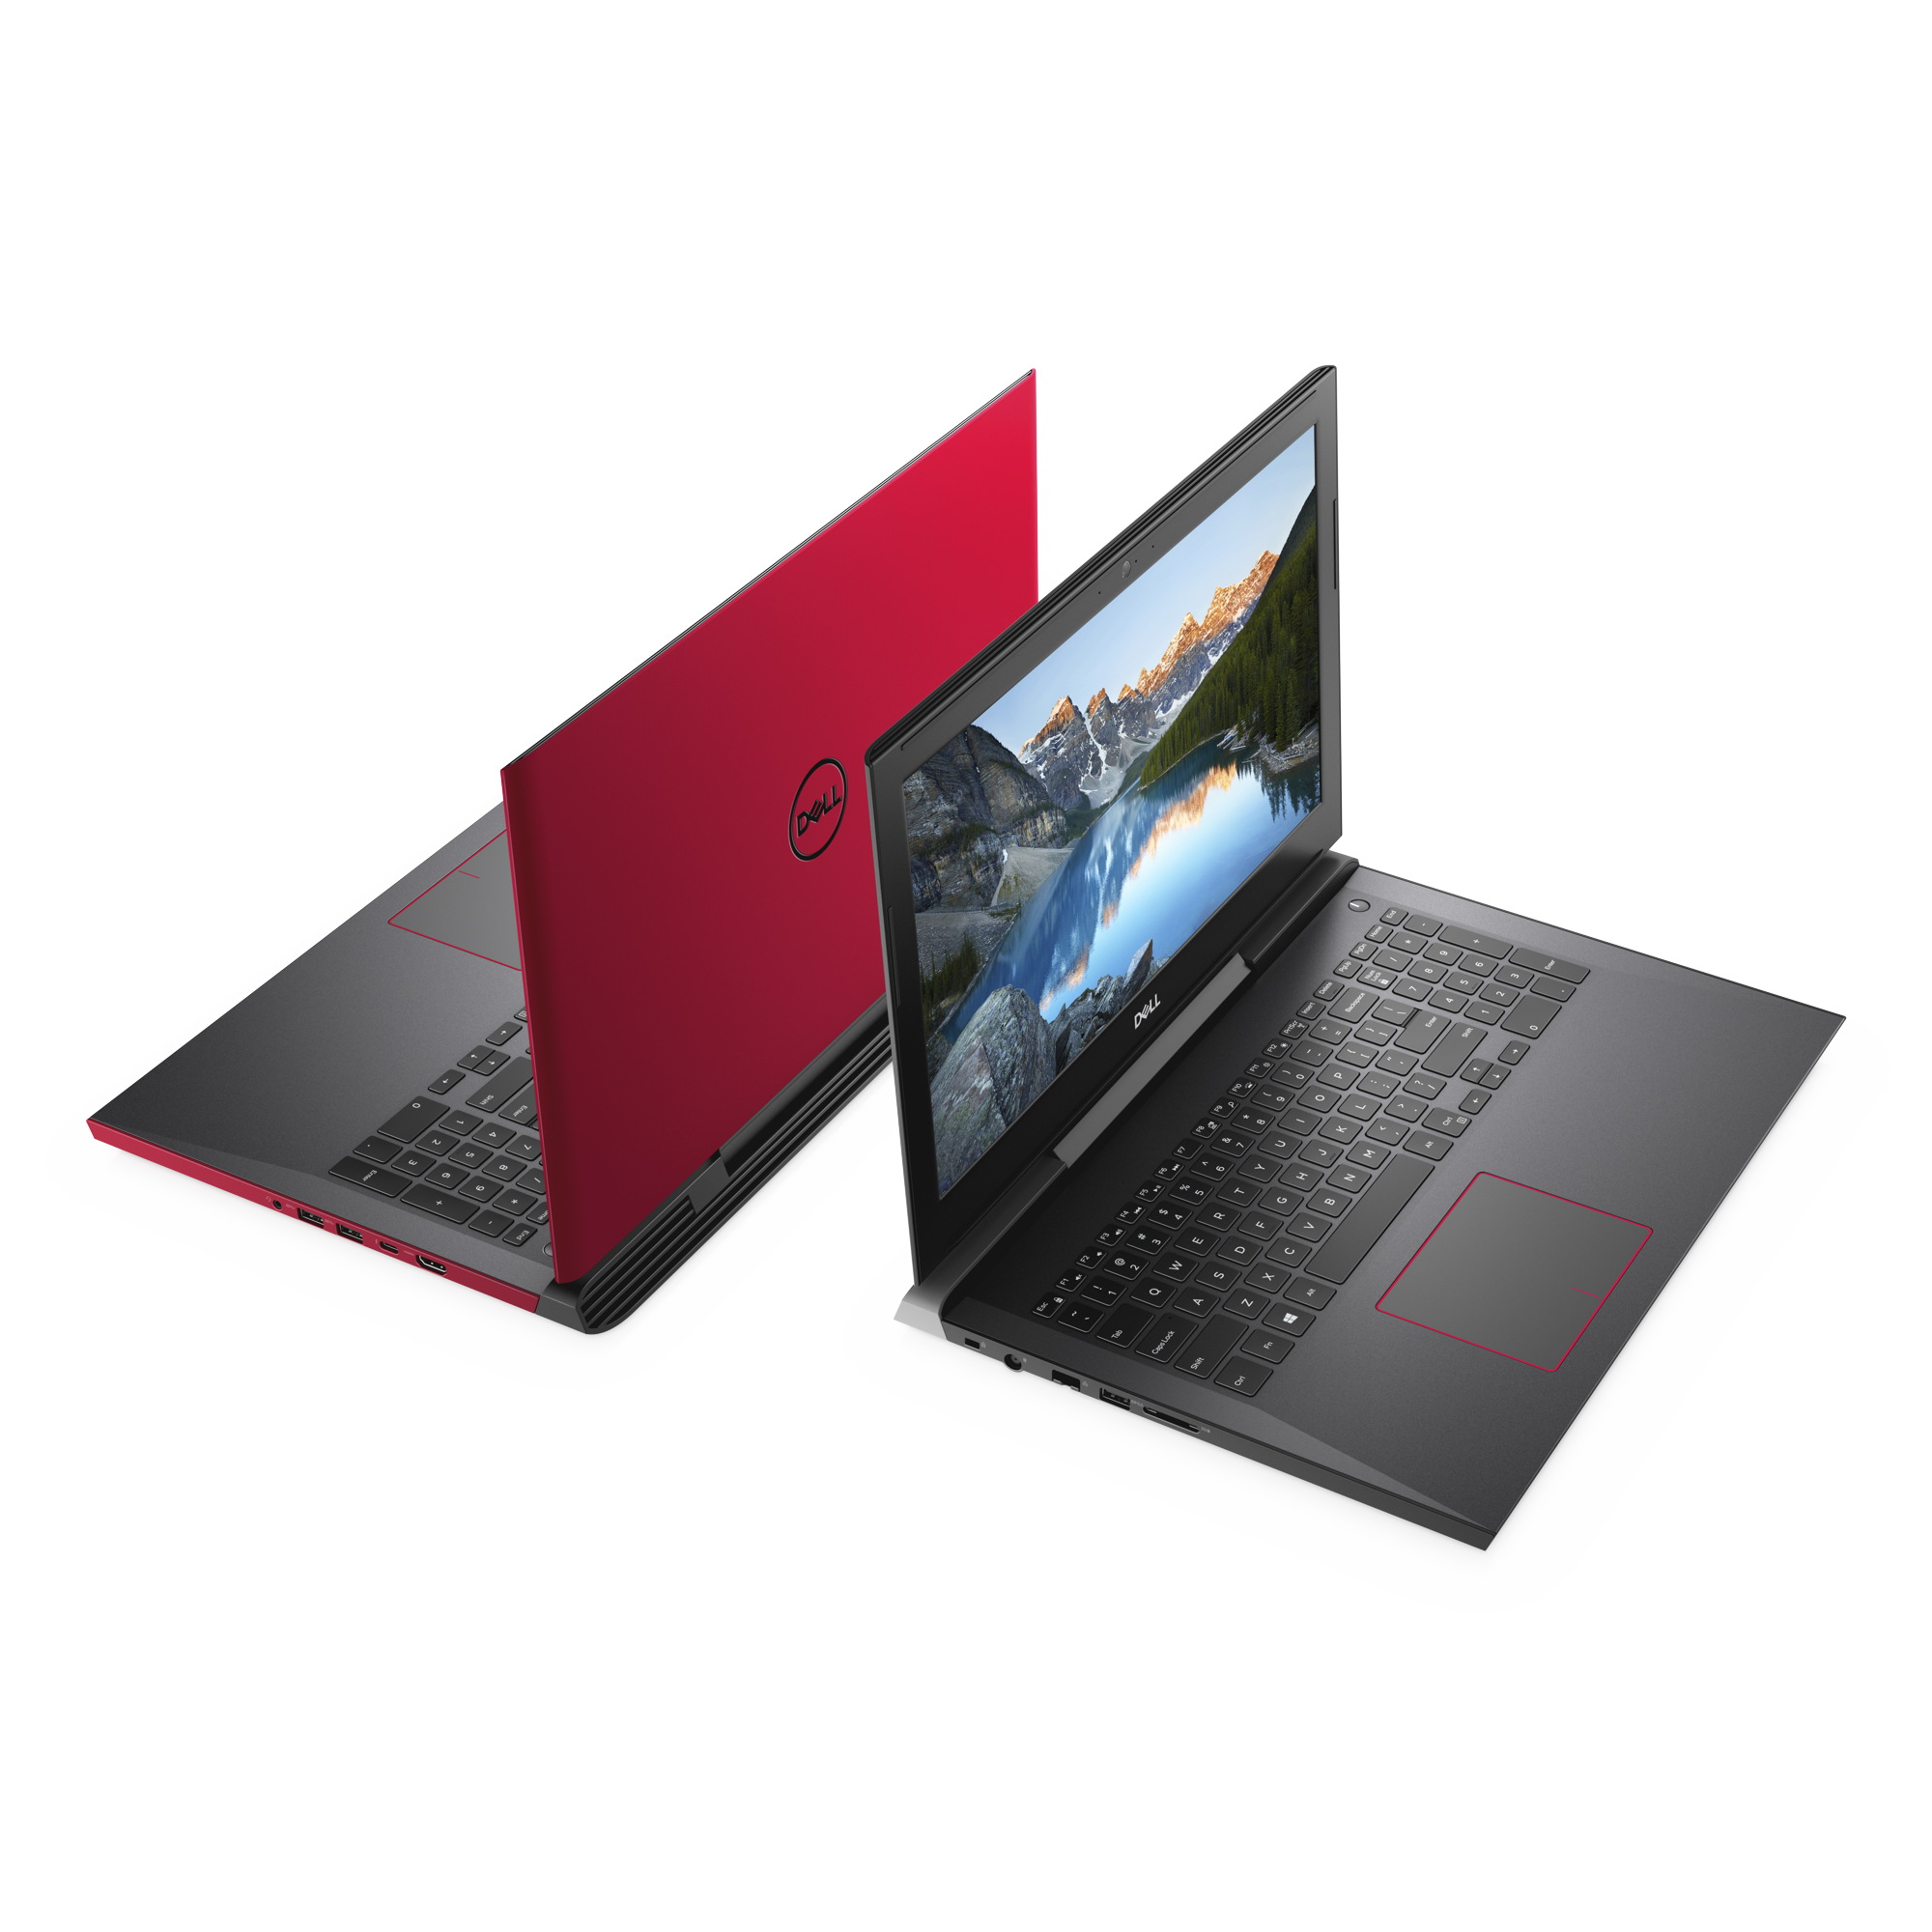
The design is of course a matter of taste and probably will not please everyone. On the other hand, it is also what makes the Dell G5 15 stand out from the masses of budget gaming notebooks. The device can be ordered in black or red (Beijing Red) color.
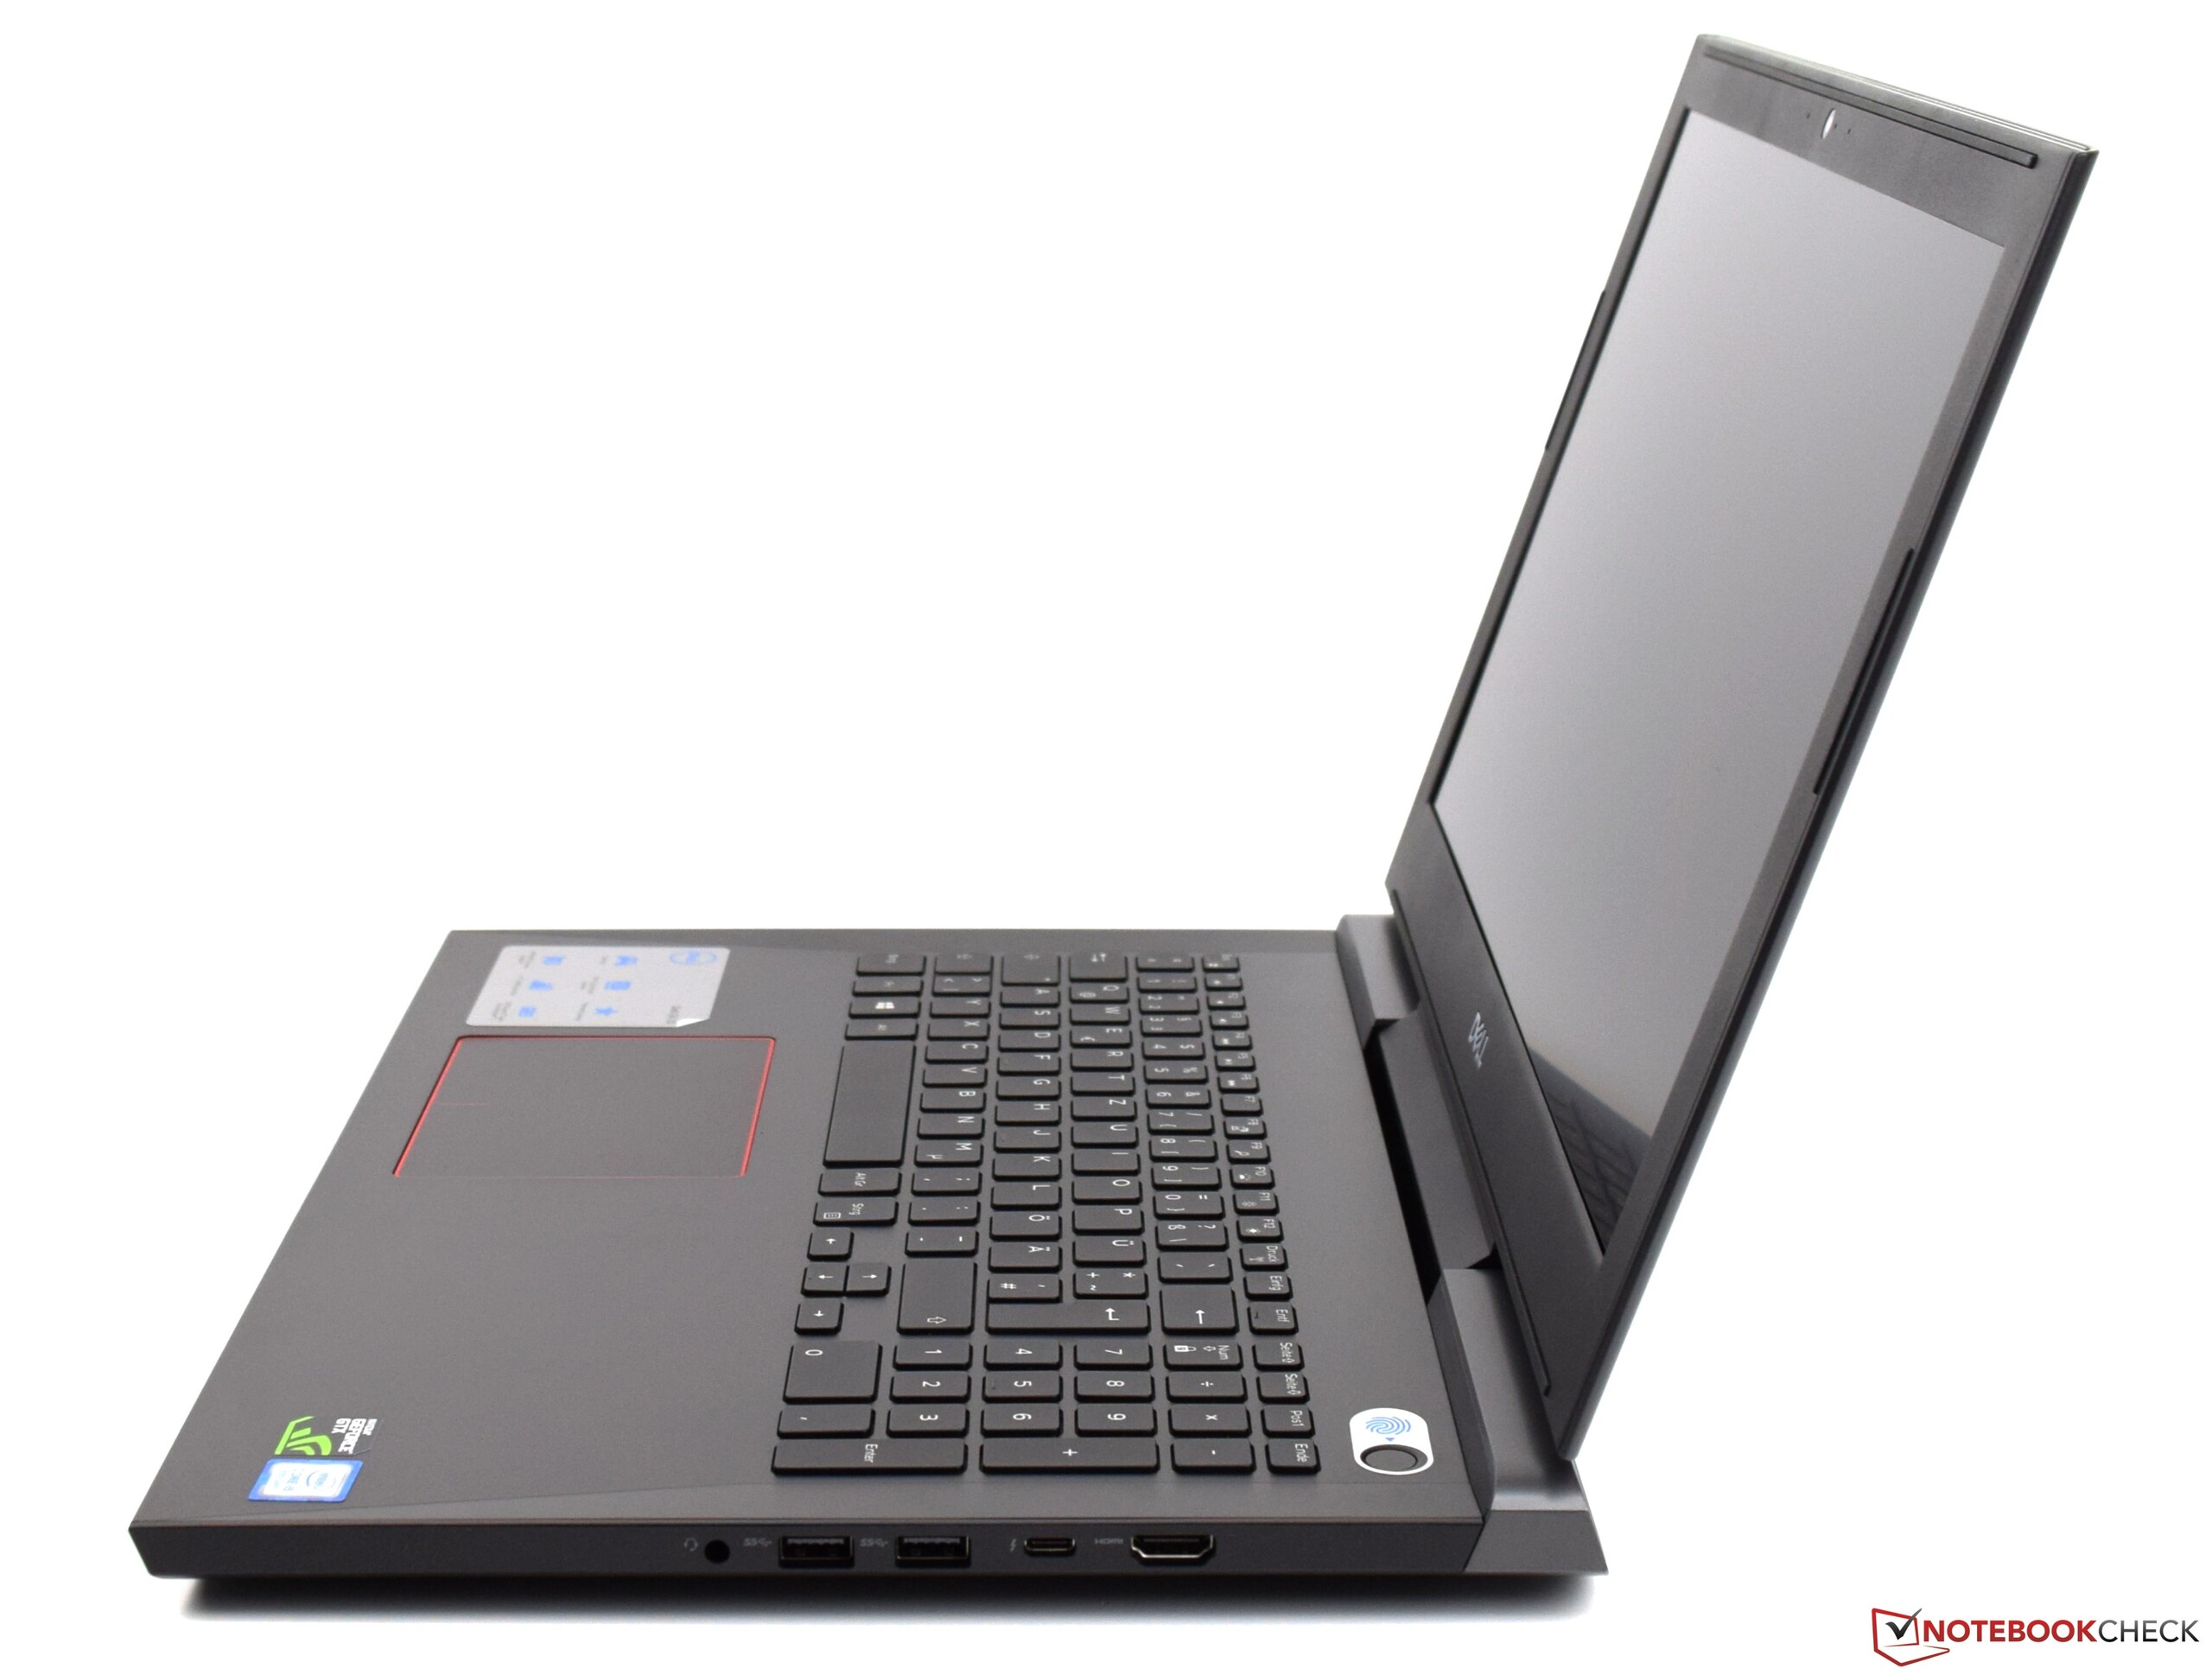
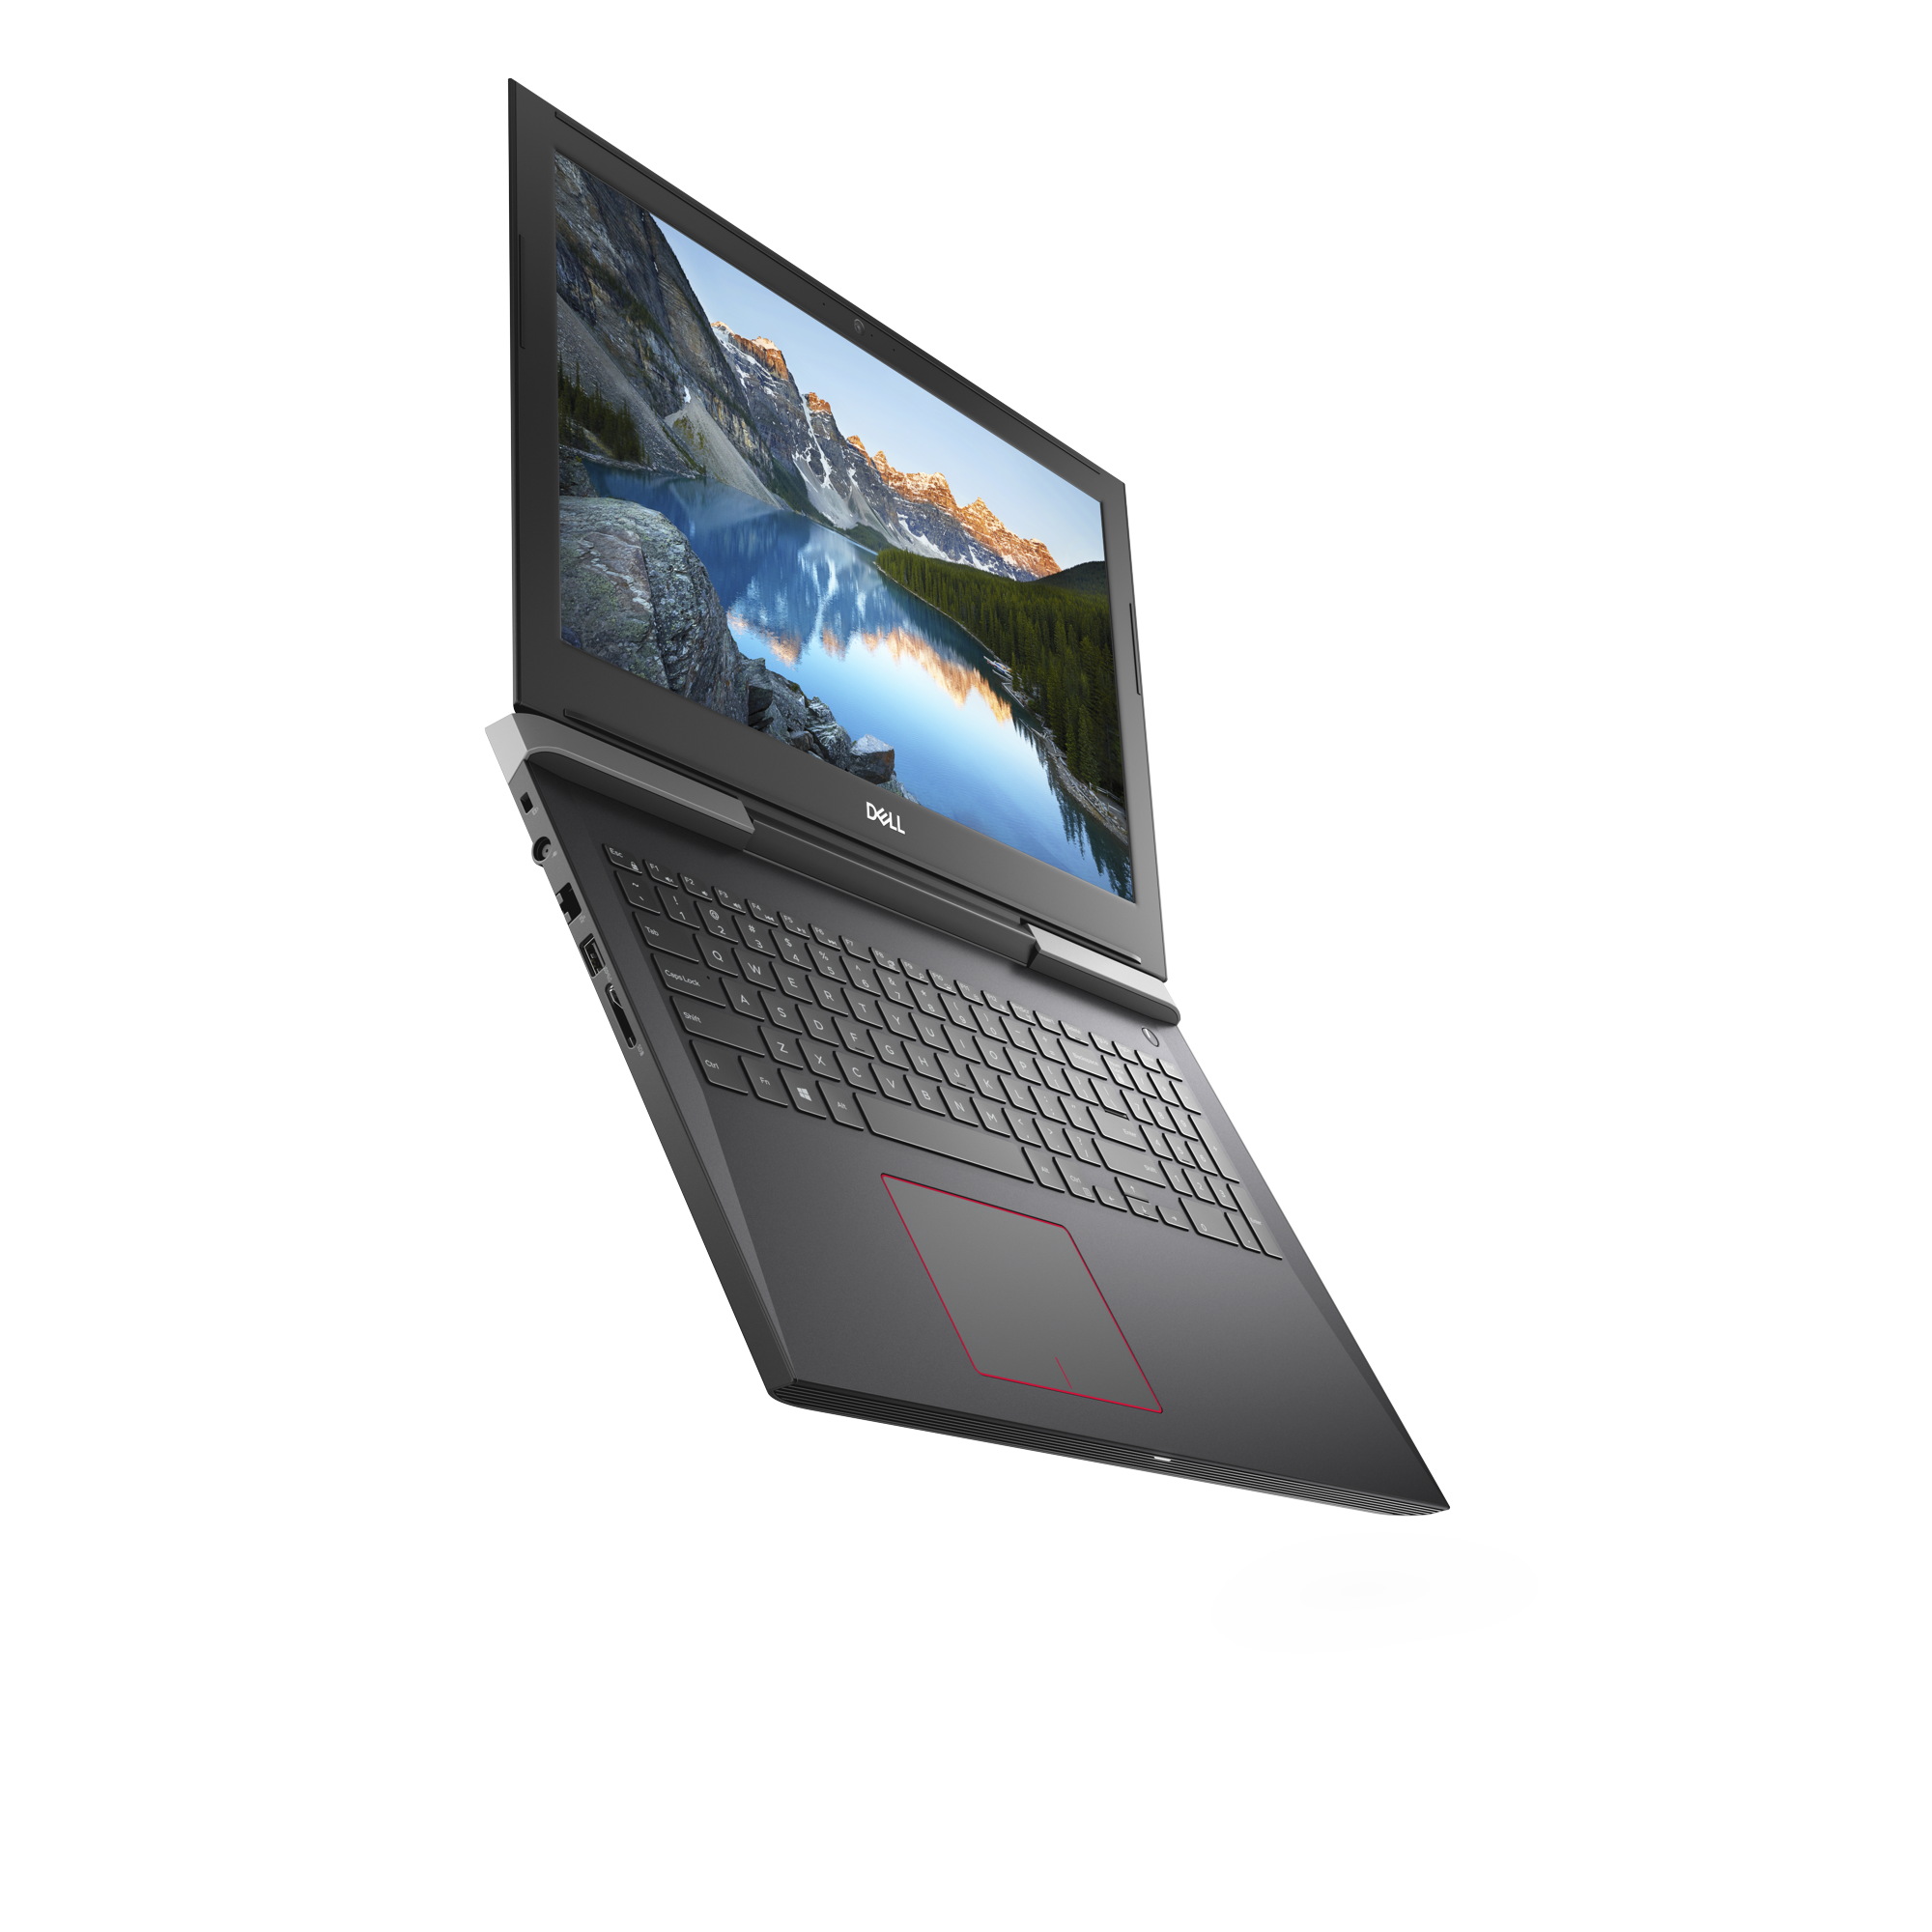
In terms of its stability, the Dell G5 15 leaves a very good impression. Due to the hinges positioned in the center, the display becomes very stable. You can open the display with one hand without any problems, and the maximum opening angle is sufficient at 140 degrees. The display is held in position very well, without there being any noticeable rebound after tapping it. The base also convinces with its stability and does not give in to pressure. We like the Dell G5 15 overall, and we also notice the excellent workmanship.

Size Comparison
Since the case of the Dell G5 15 is identical to that of its predecessor, it also has an identical footprint of 38.9 x 27.47 cm (15.3 x 10.8 in). This makes the case slightly larger than those of the other comparison devices. We should point out at this point that the Acer Nitro 5 Spin is the most compact. In terms of its weight, at 2.85 kg (~6.3 lb) the Dell is not one of the light-weights in our comparison, and another 699 grams (~1.5 lb) is added for the 180-watt power supply.
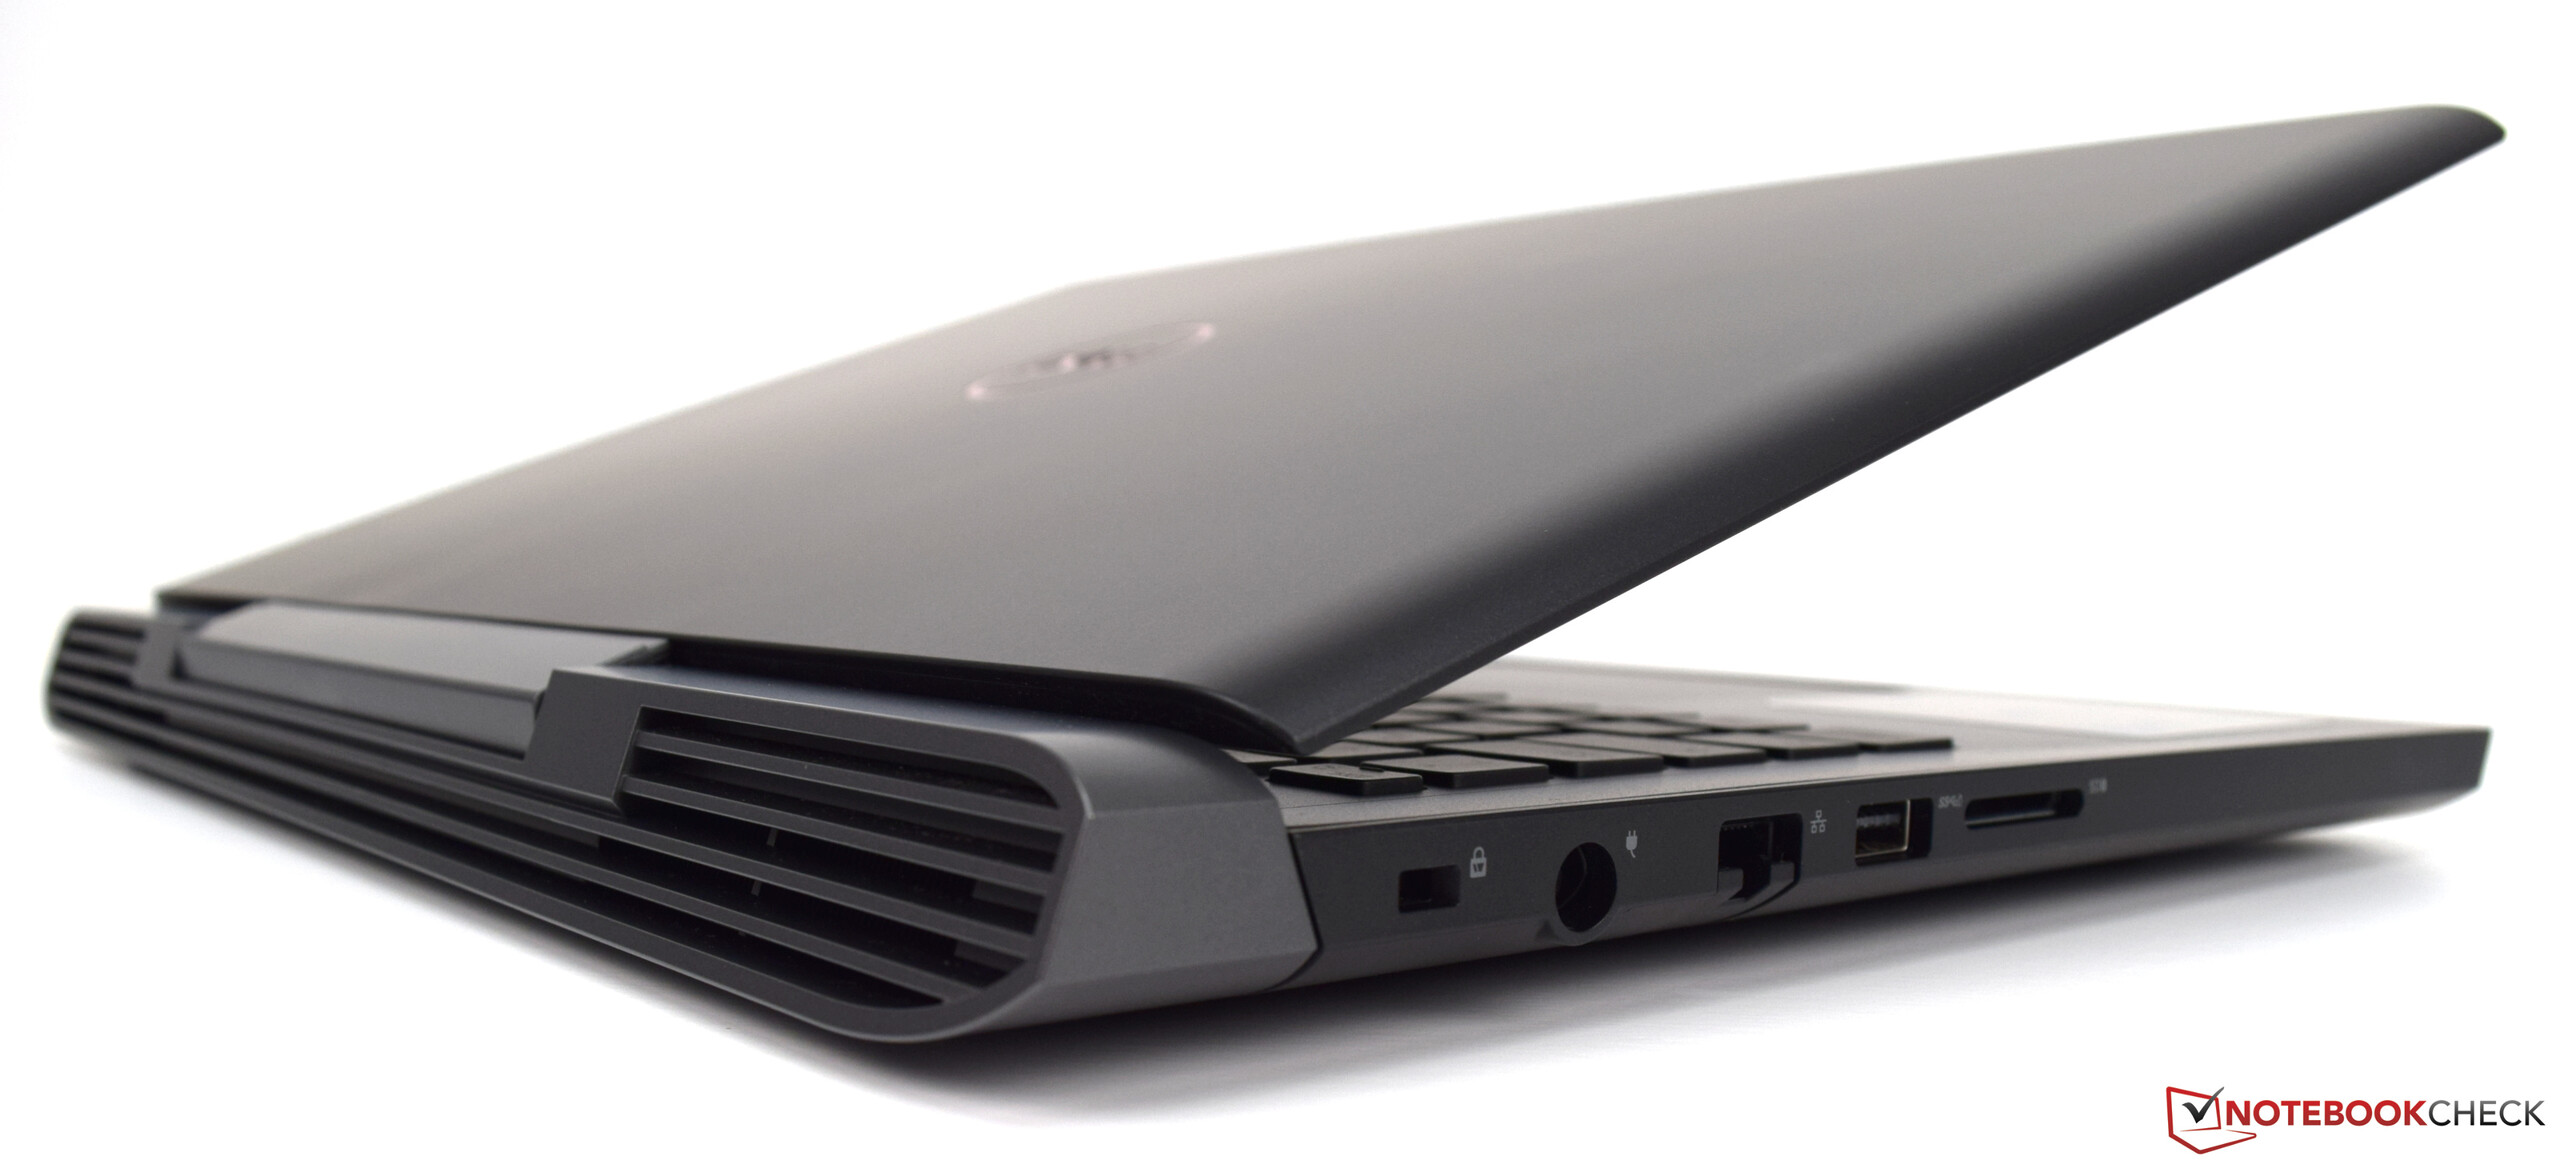
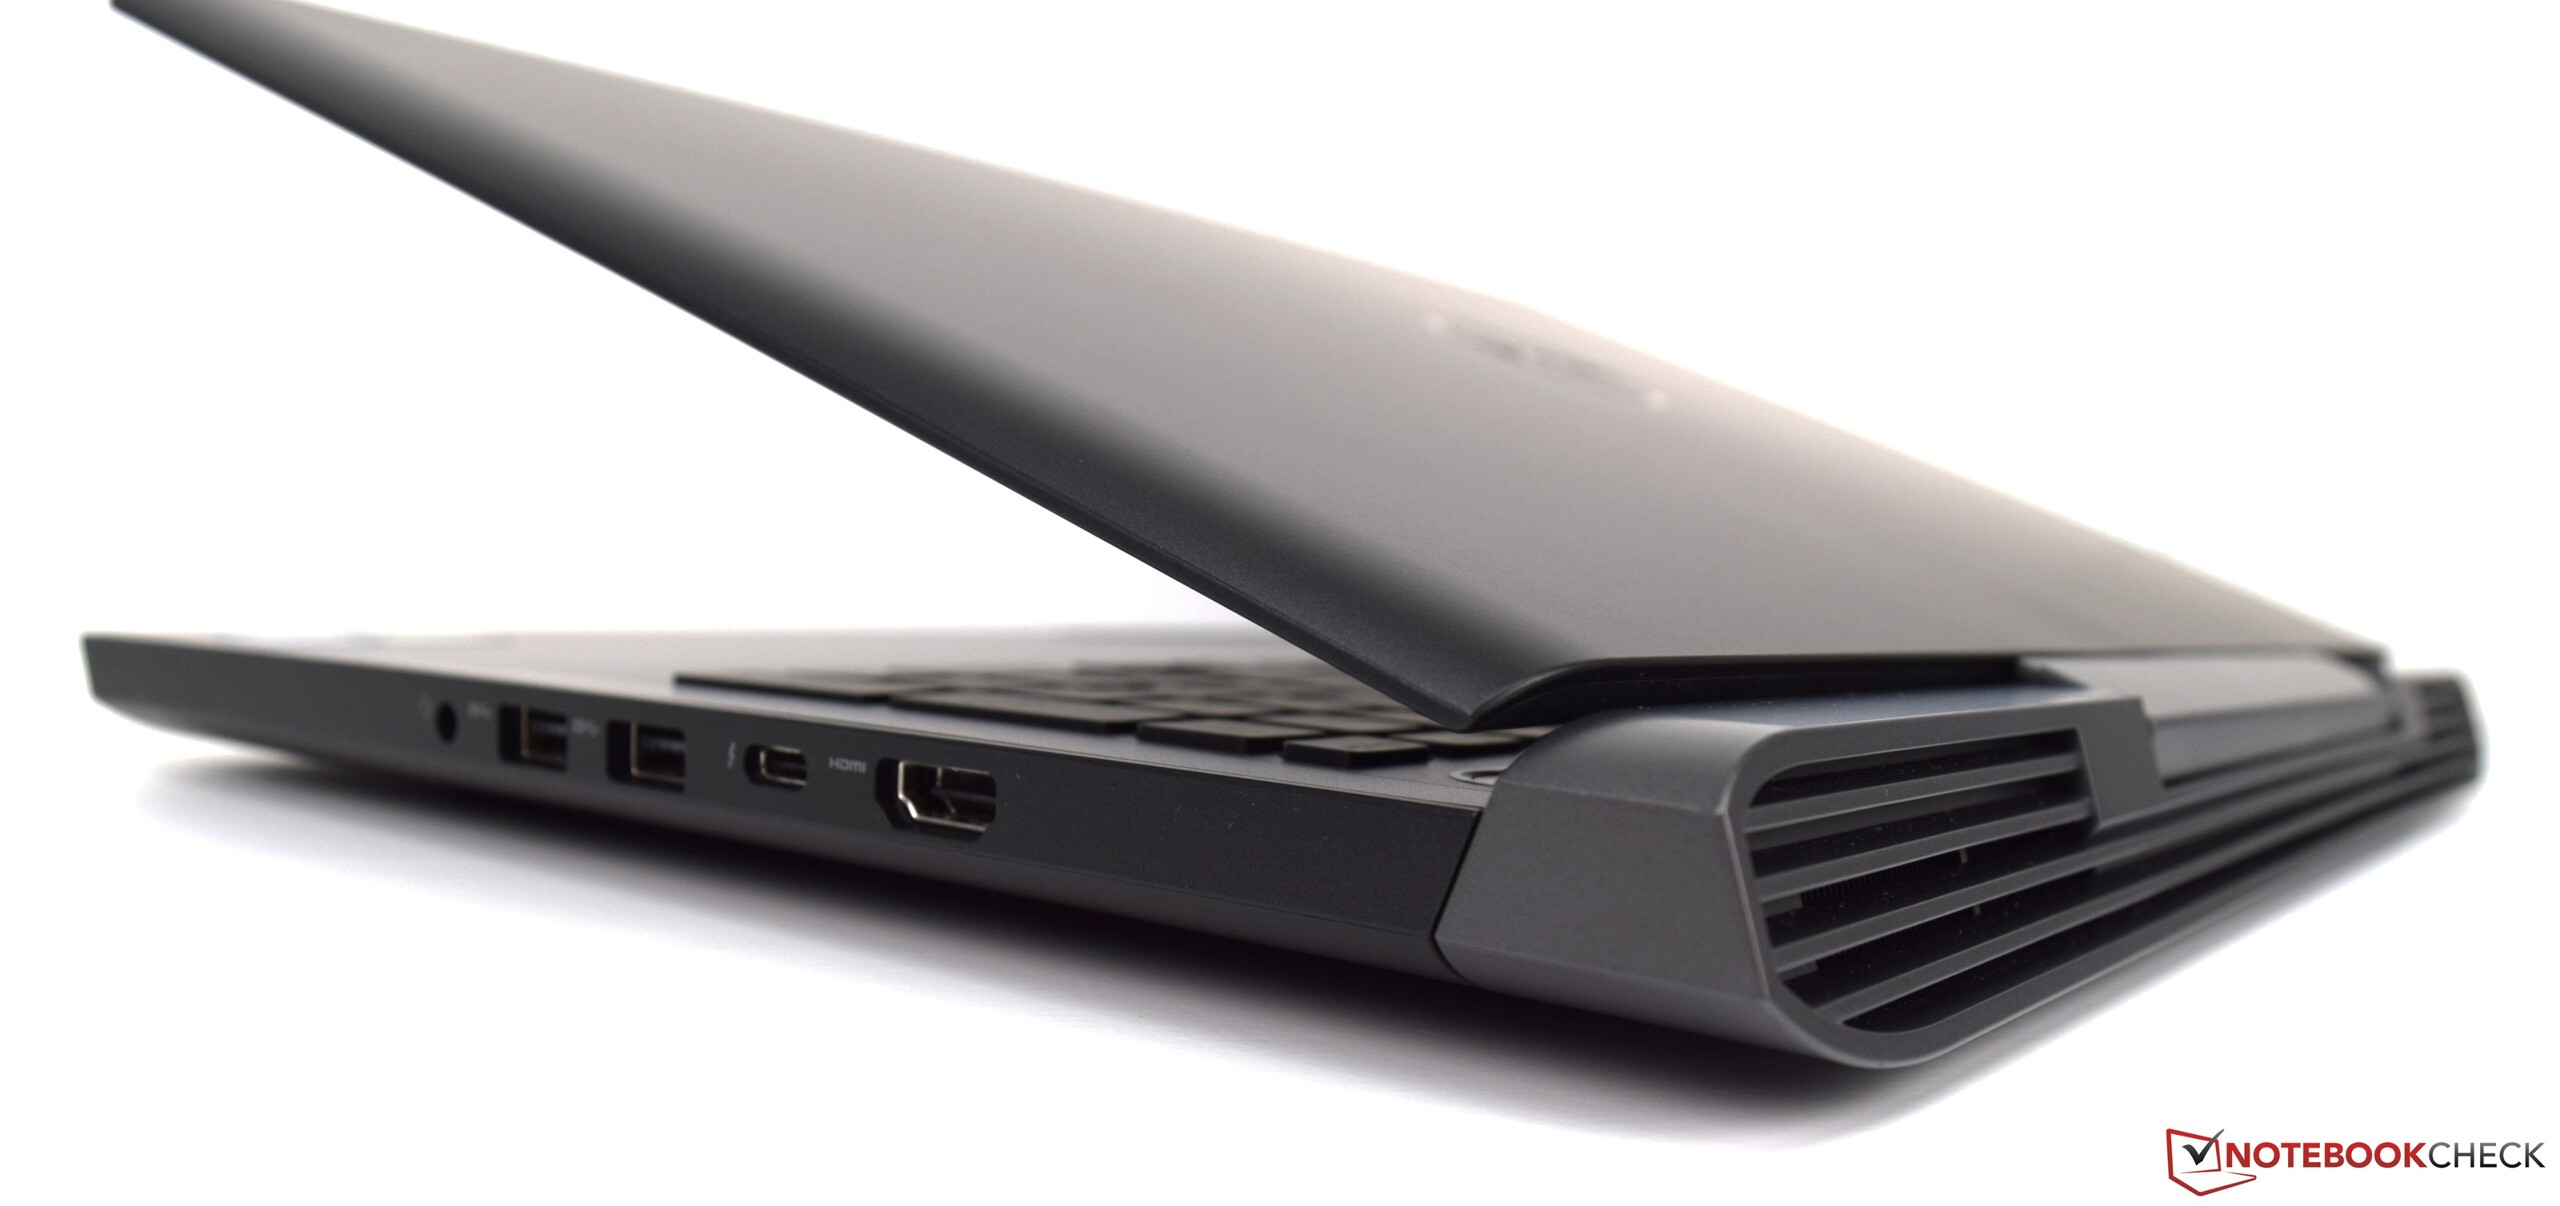
Equipment
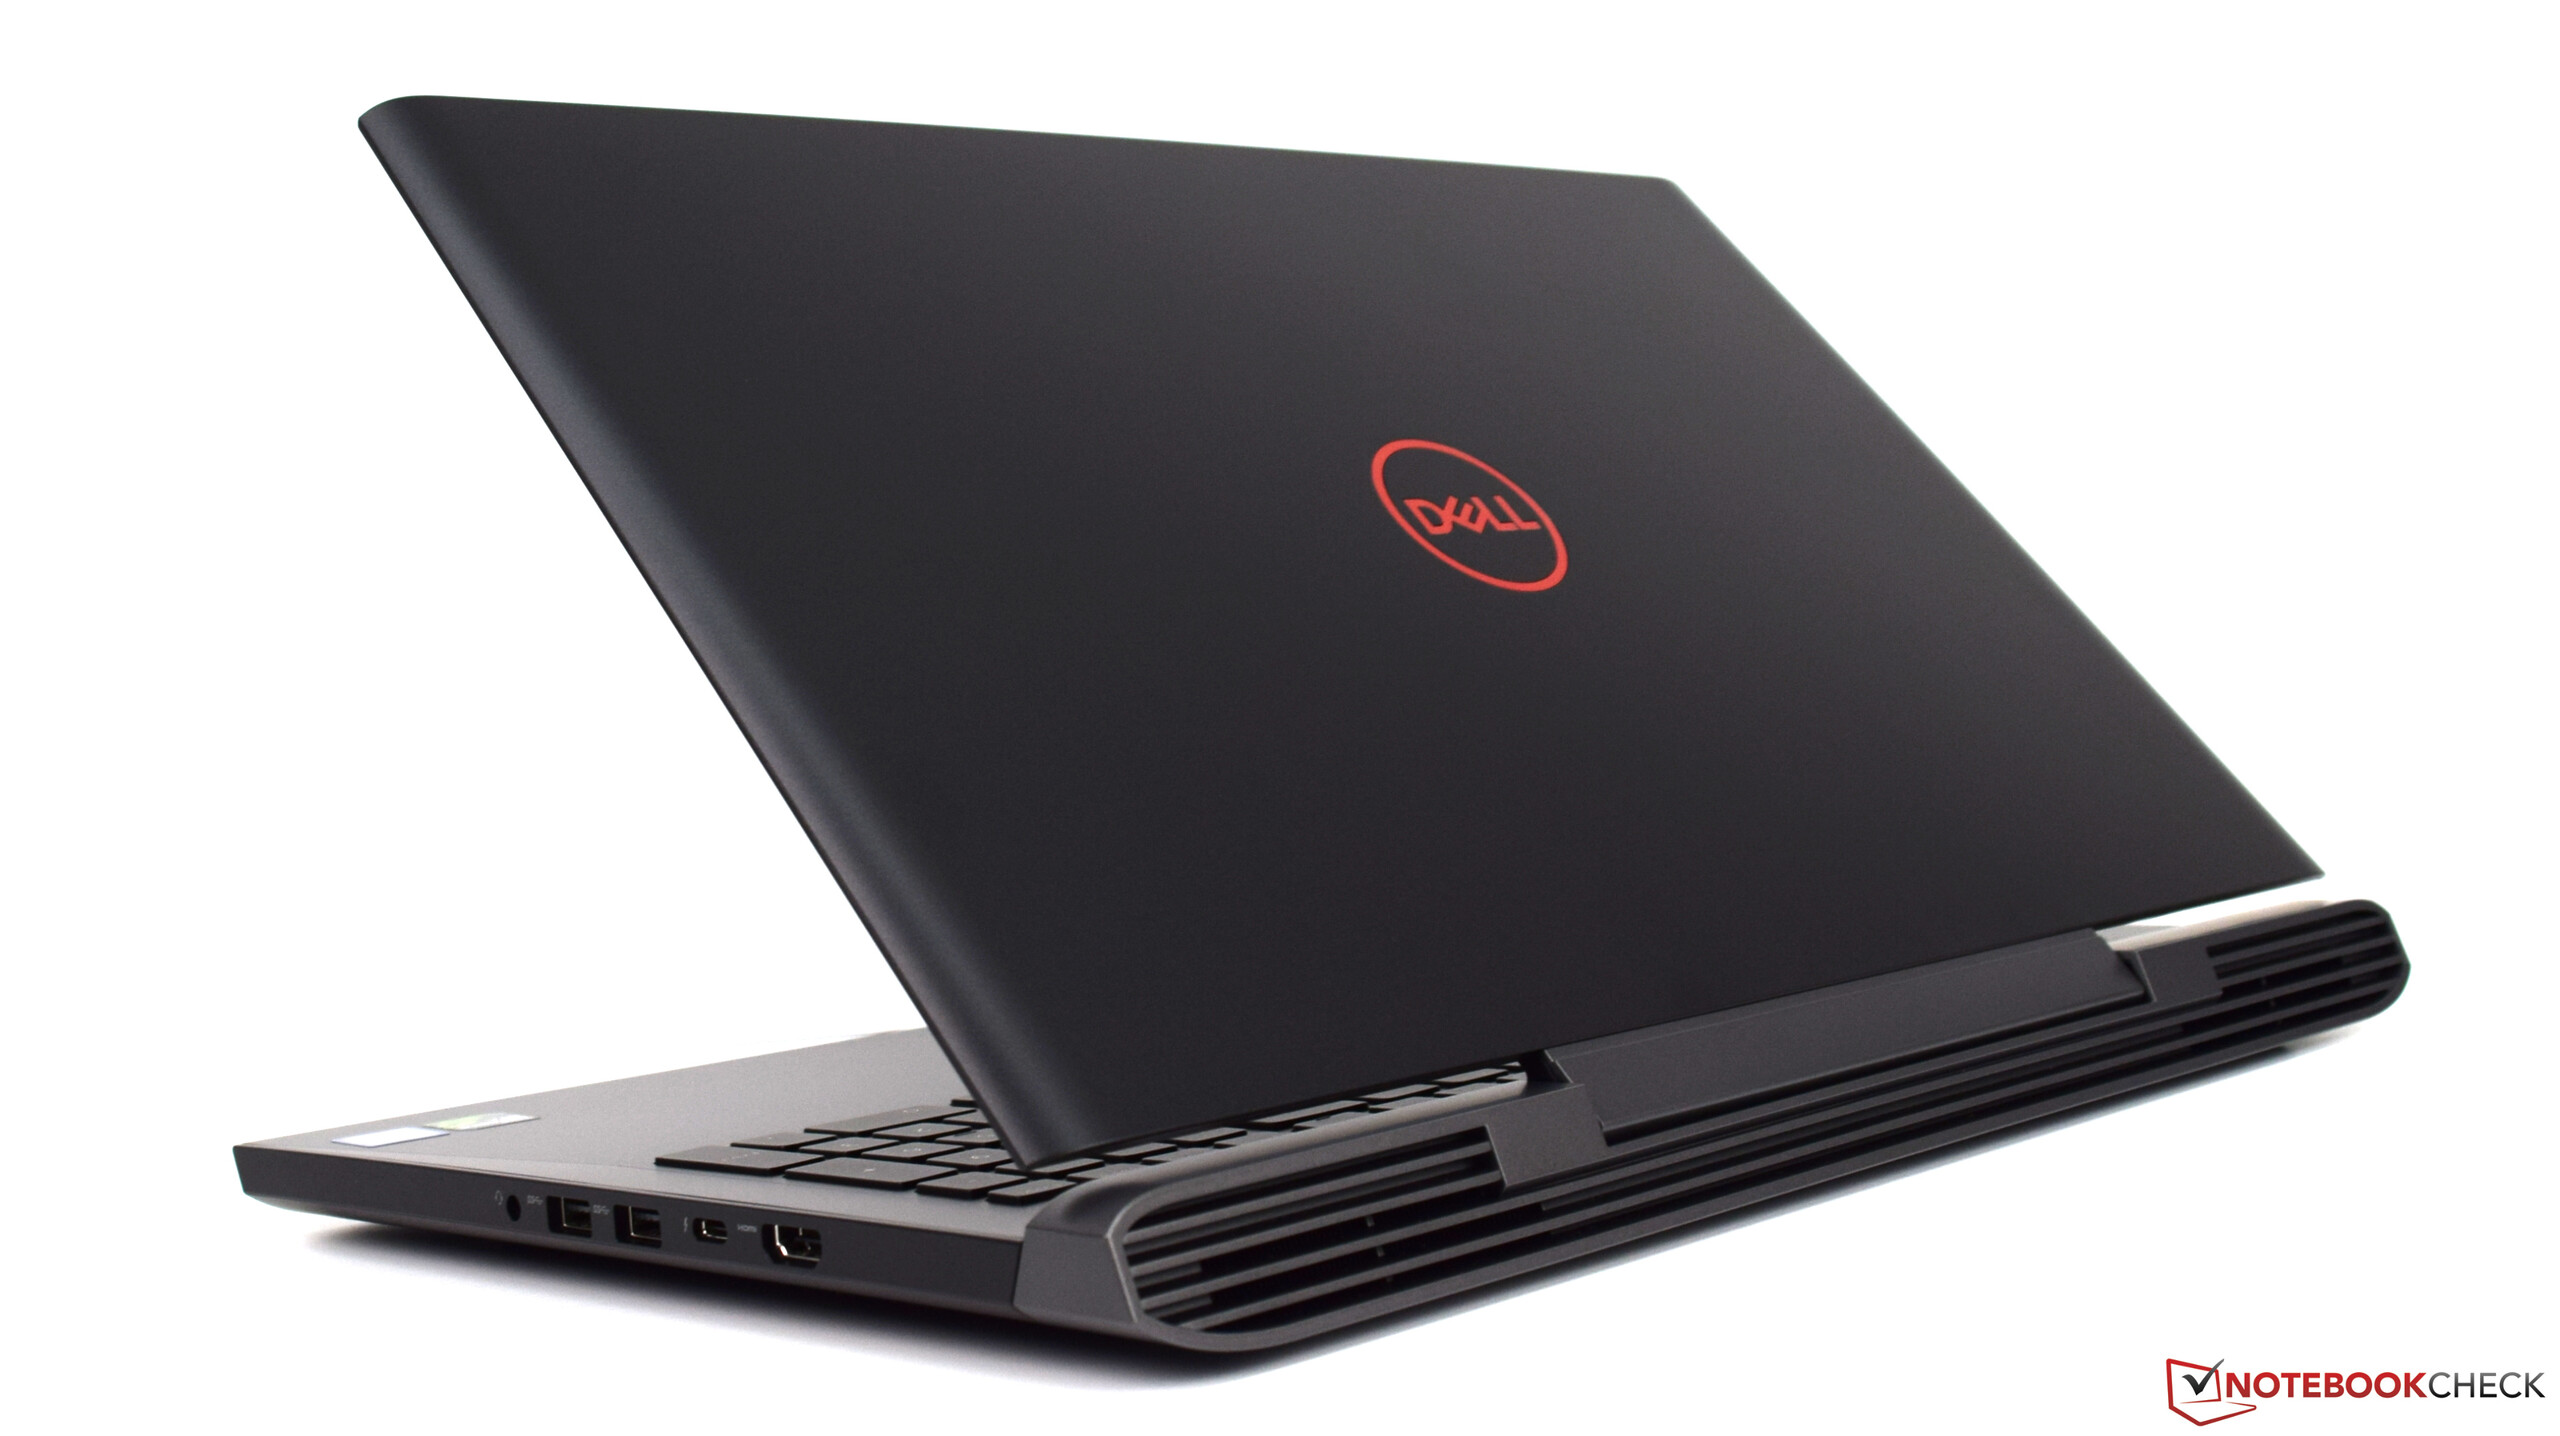
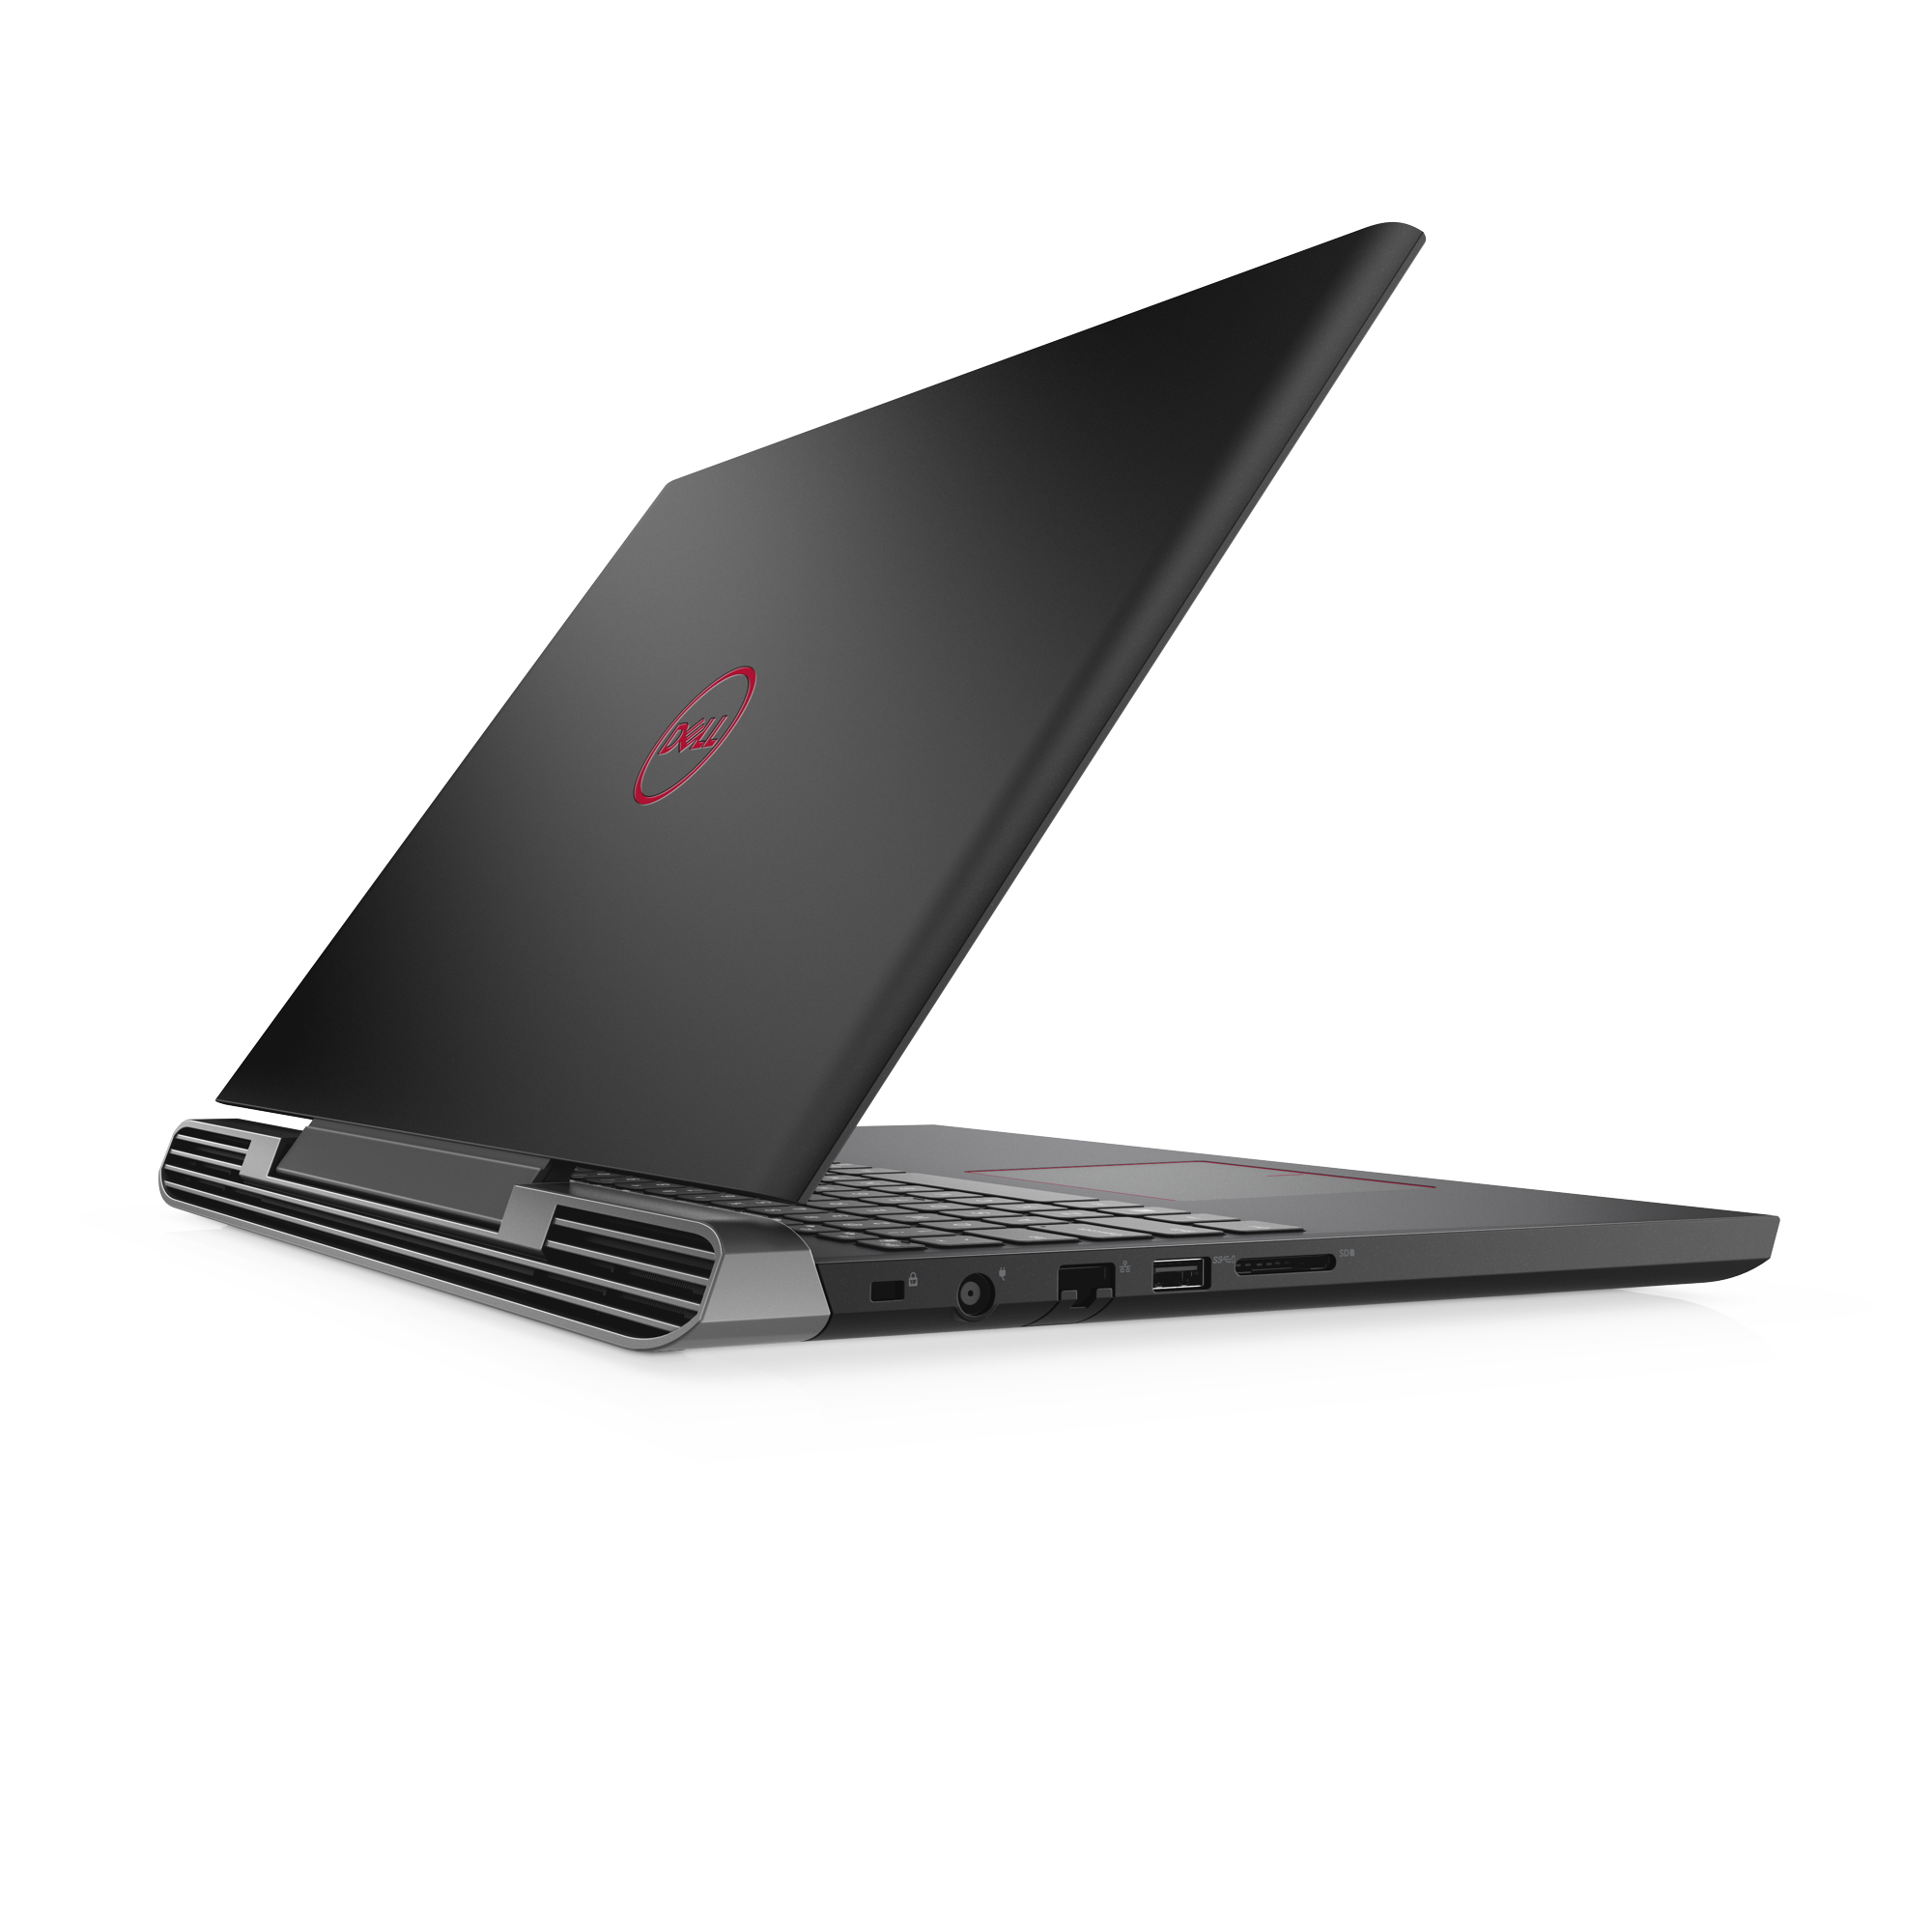
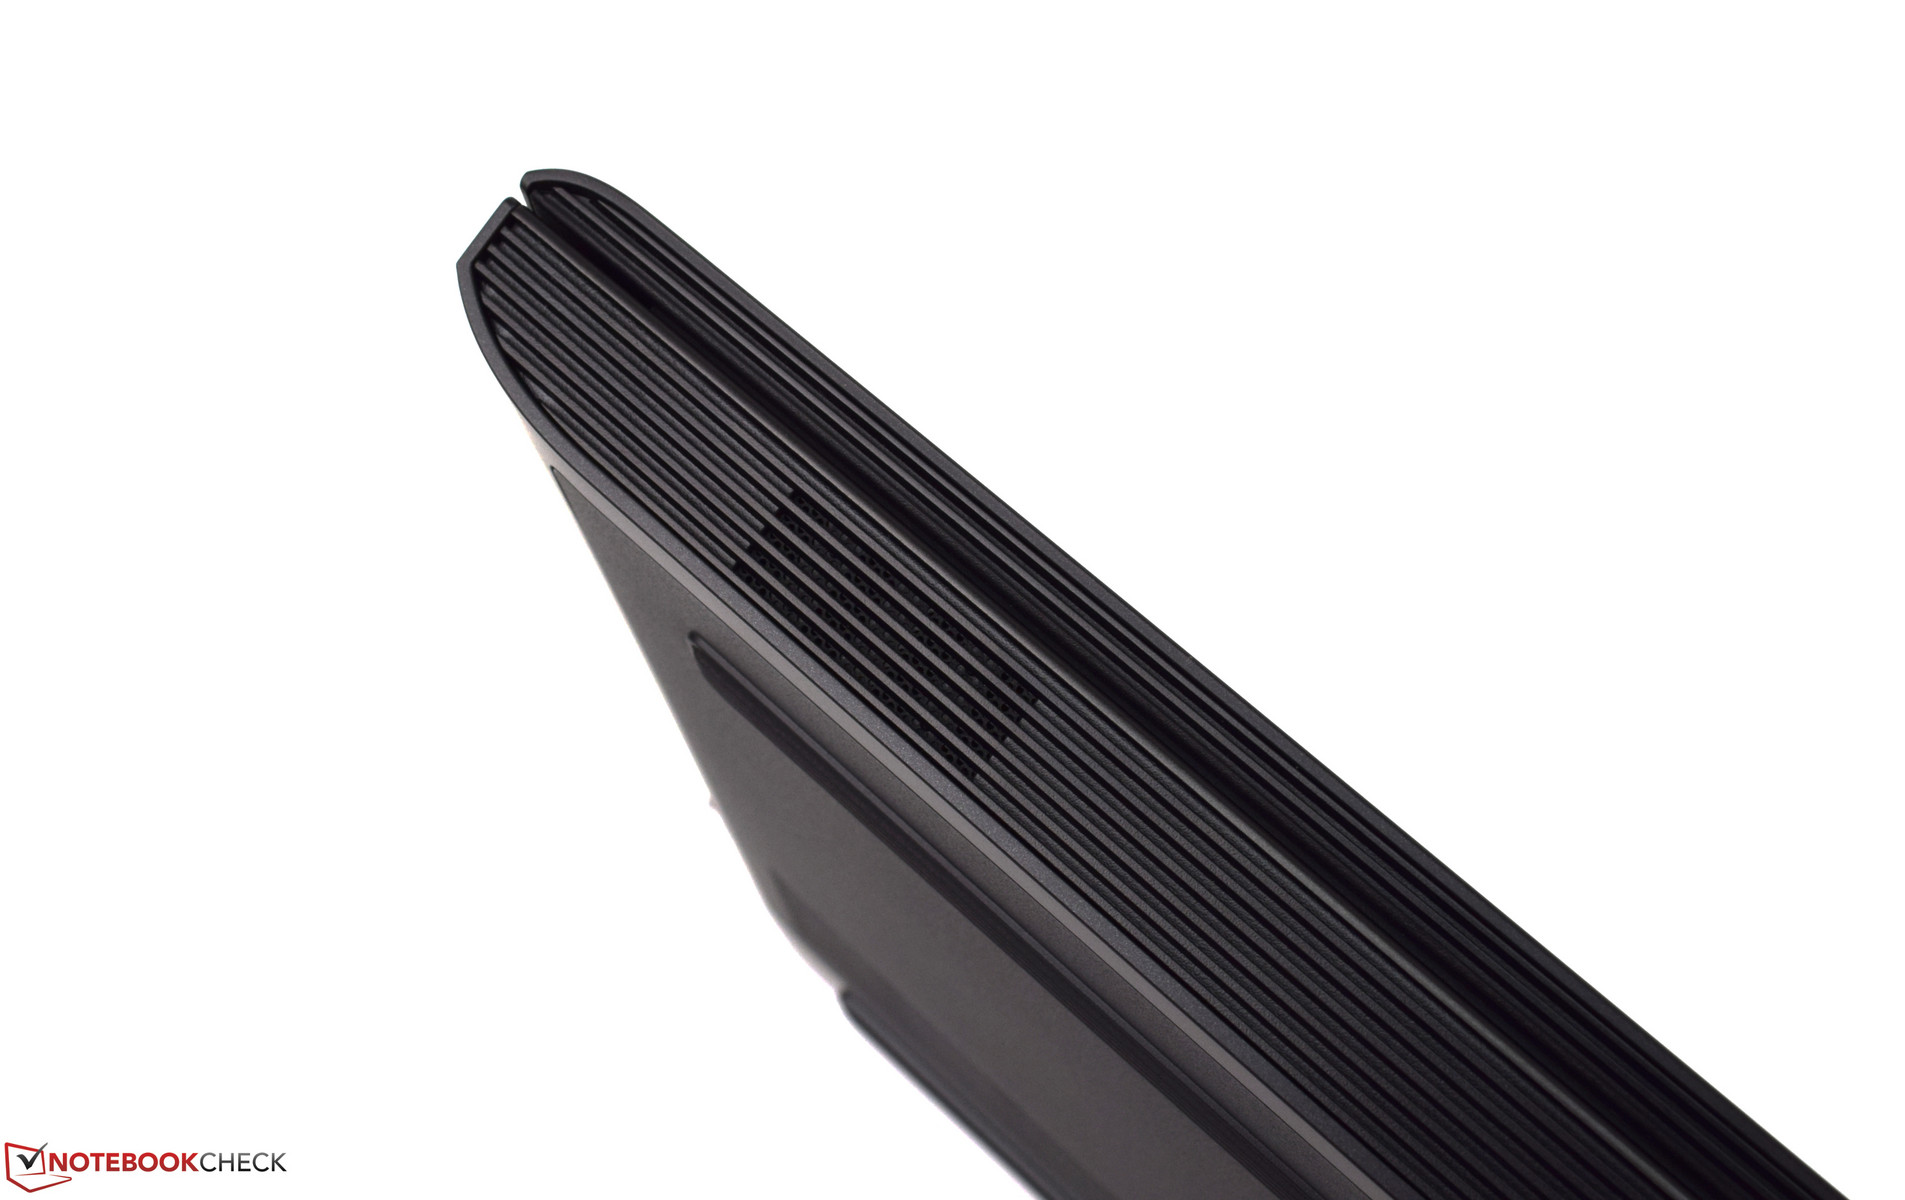
The Dell G5 15 5587 offers a good selection of equipment. We count a total of three USB-3.1 connections as well as a modern USB Type-C port, which can also handle Thunderbolt-3, allowing the device to be expanded with many adapters and also providing the display output via DisplayPort. Anyone wanting to connect an external display without having to use an adapter can also do this, since the Dell G5 15 also offers the current standard with an HDMI-2.0 connection. The positioning is solved well, with all the available connections in the back area on both sides. The notebook does not have any connection options in the front or back.
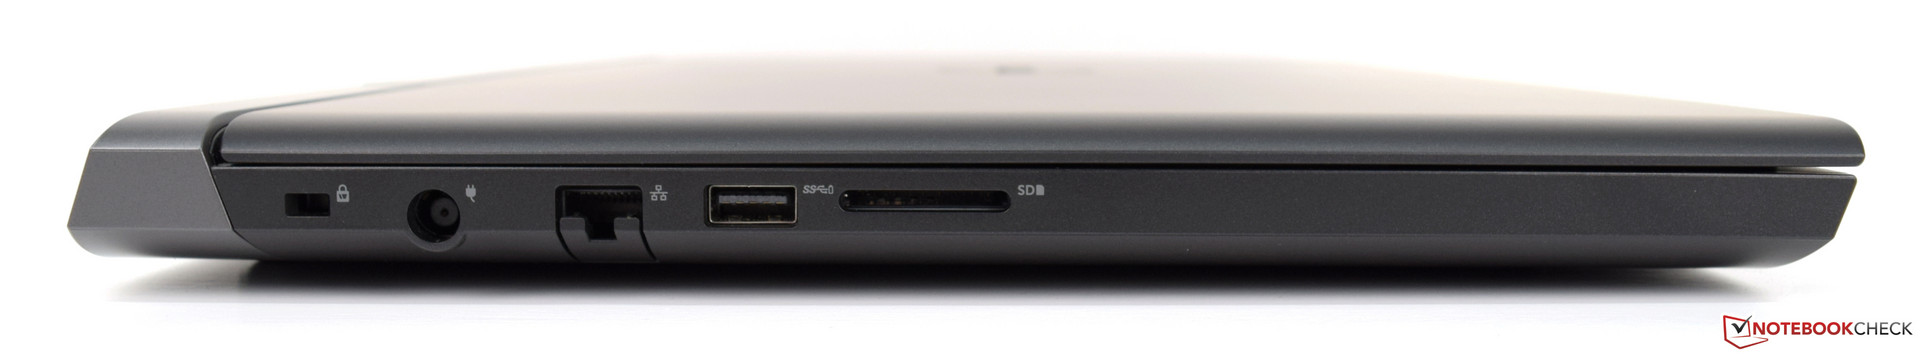

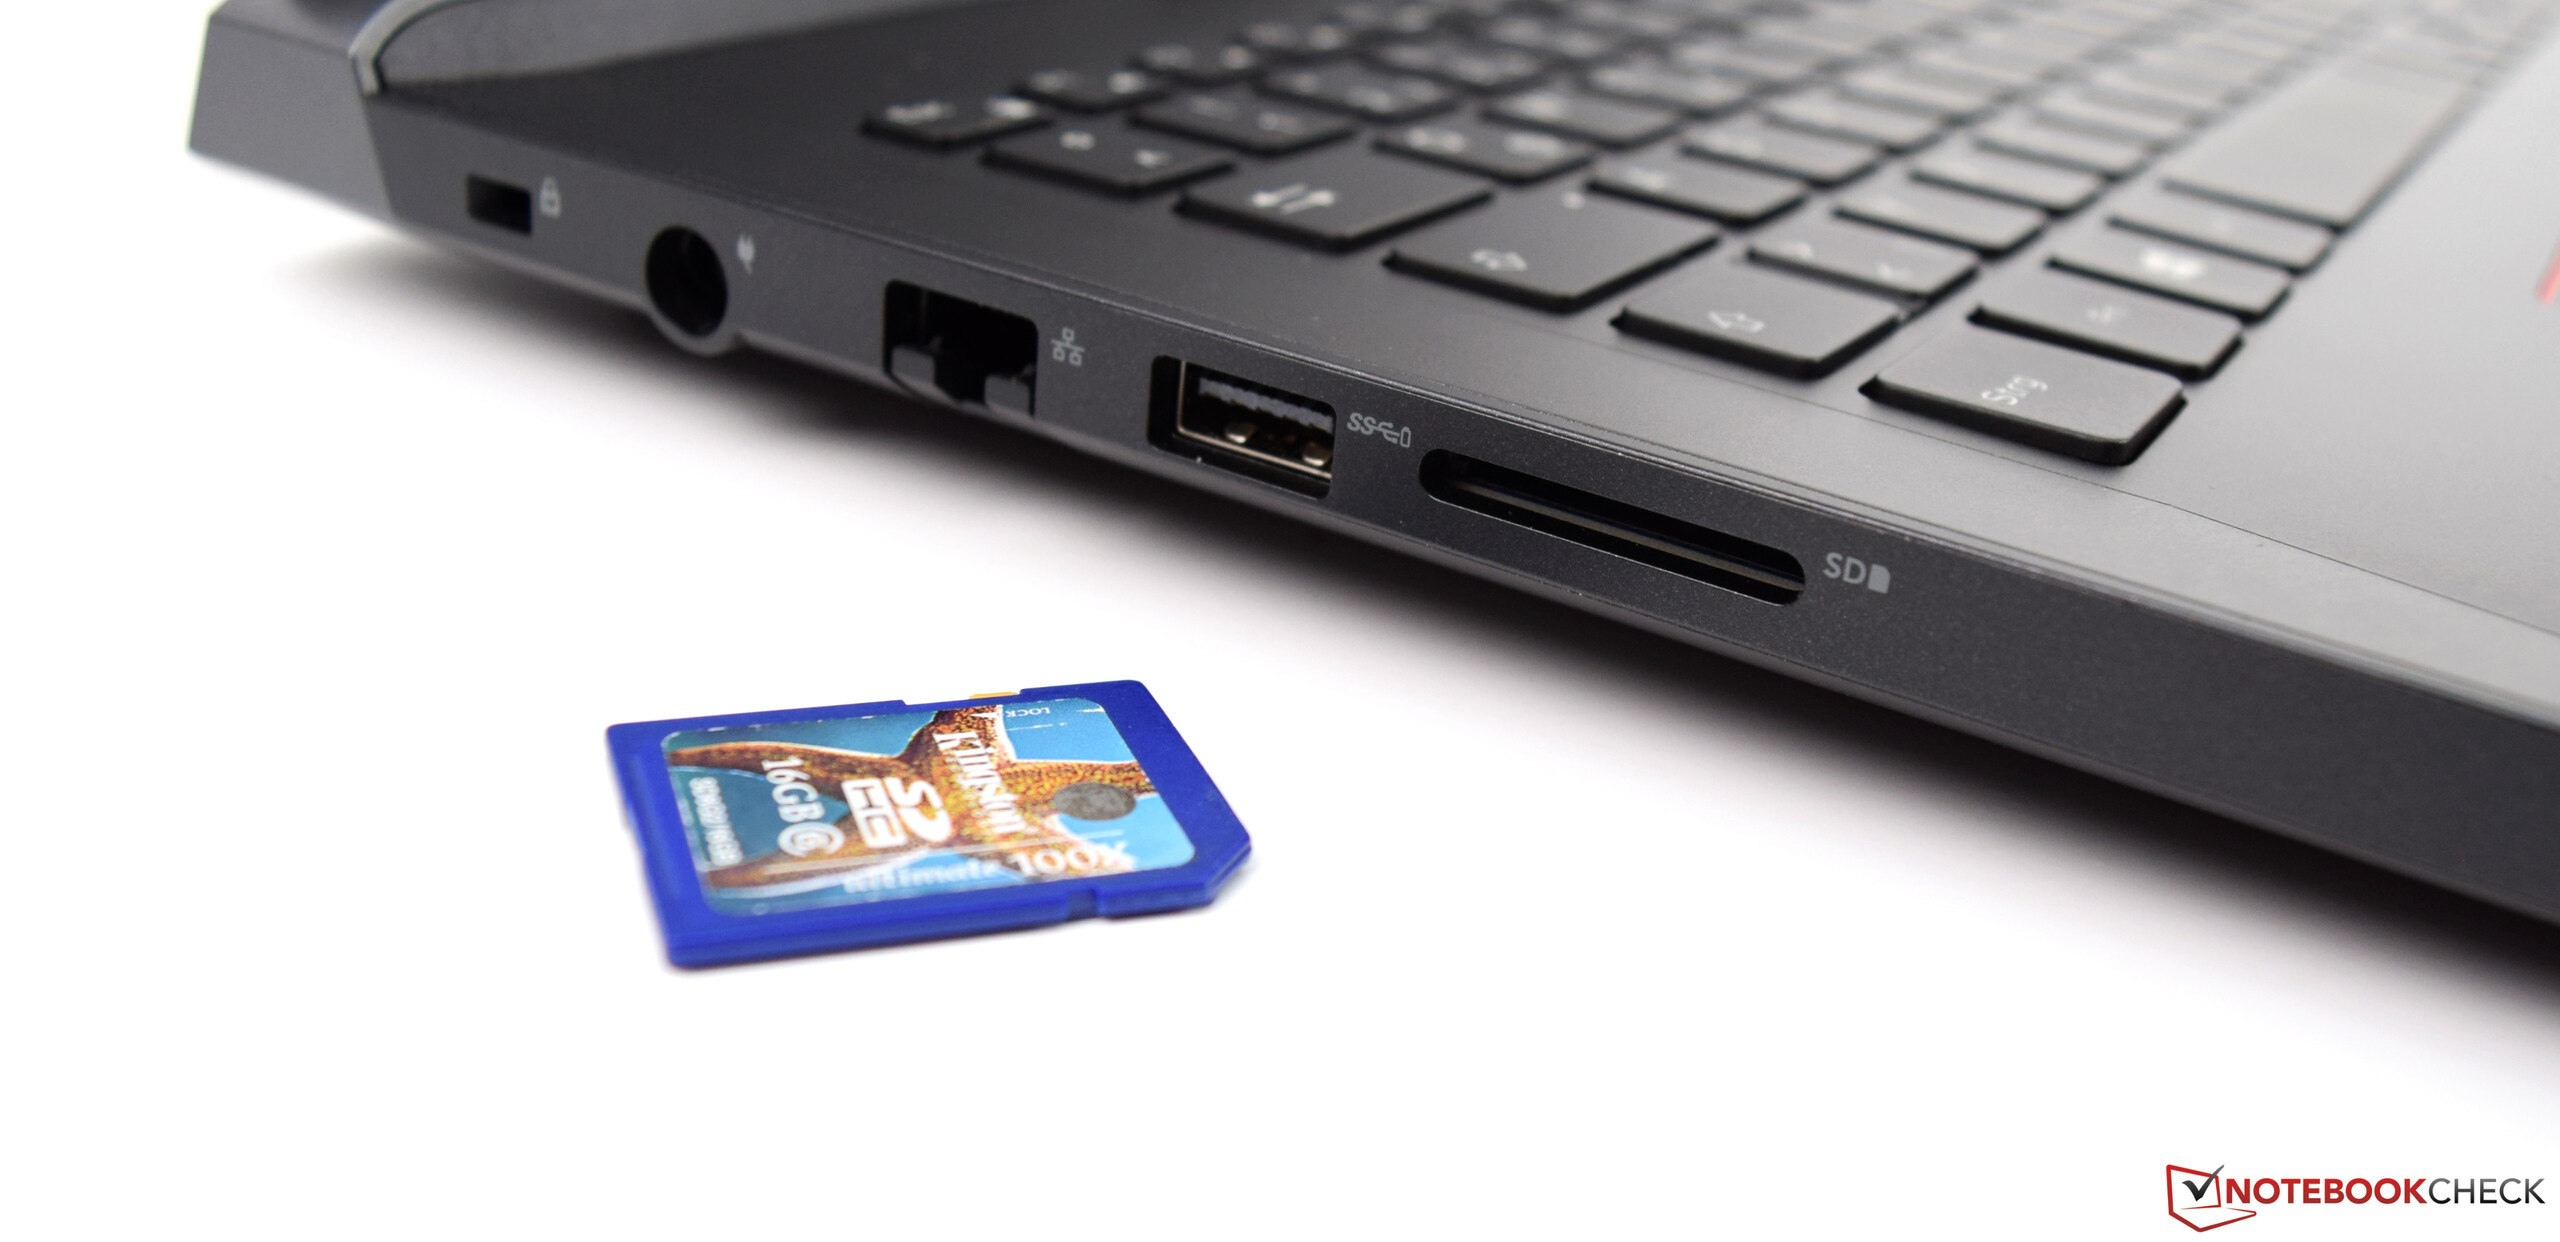
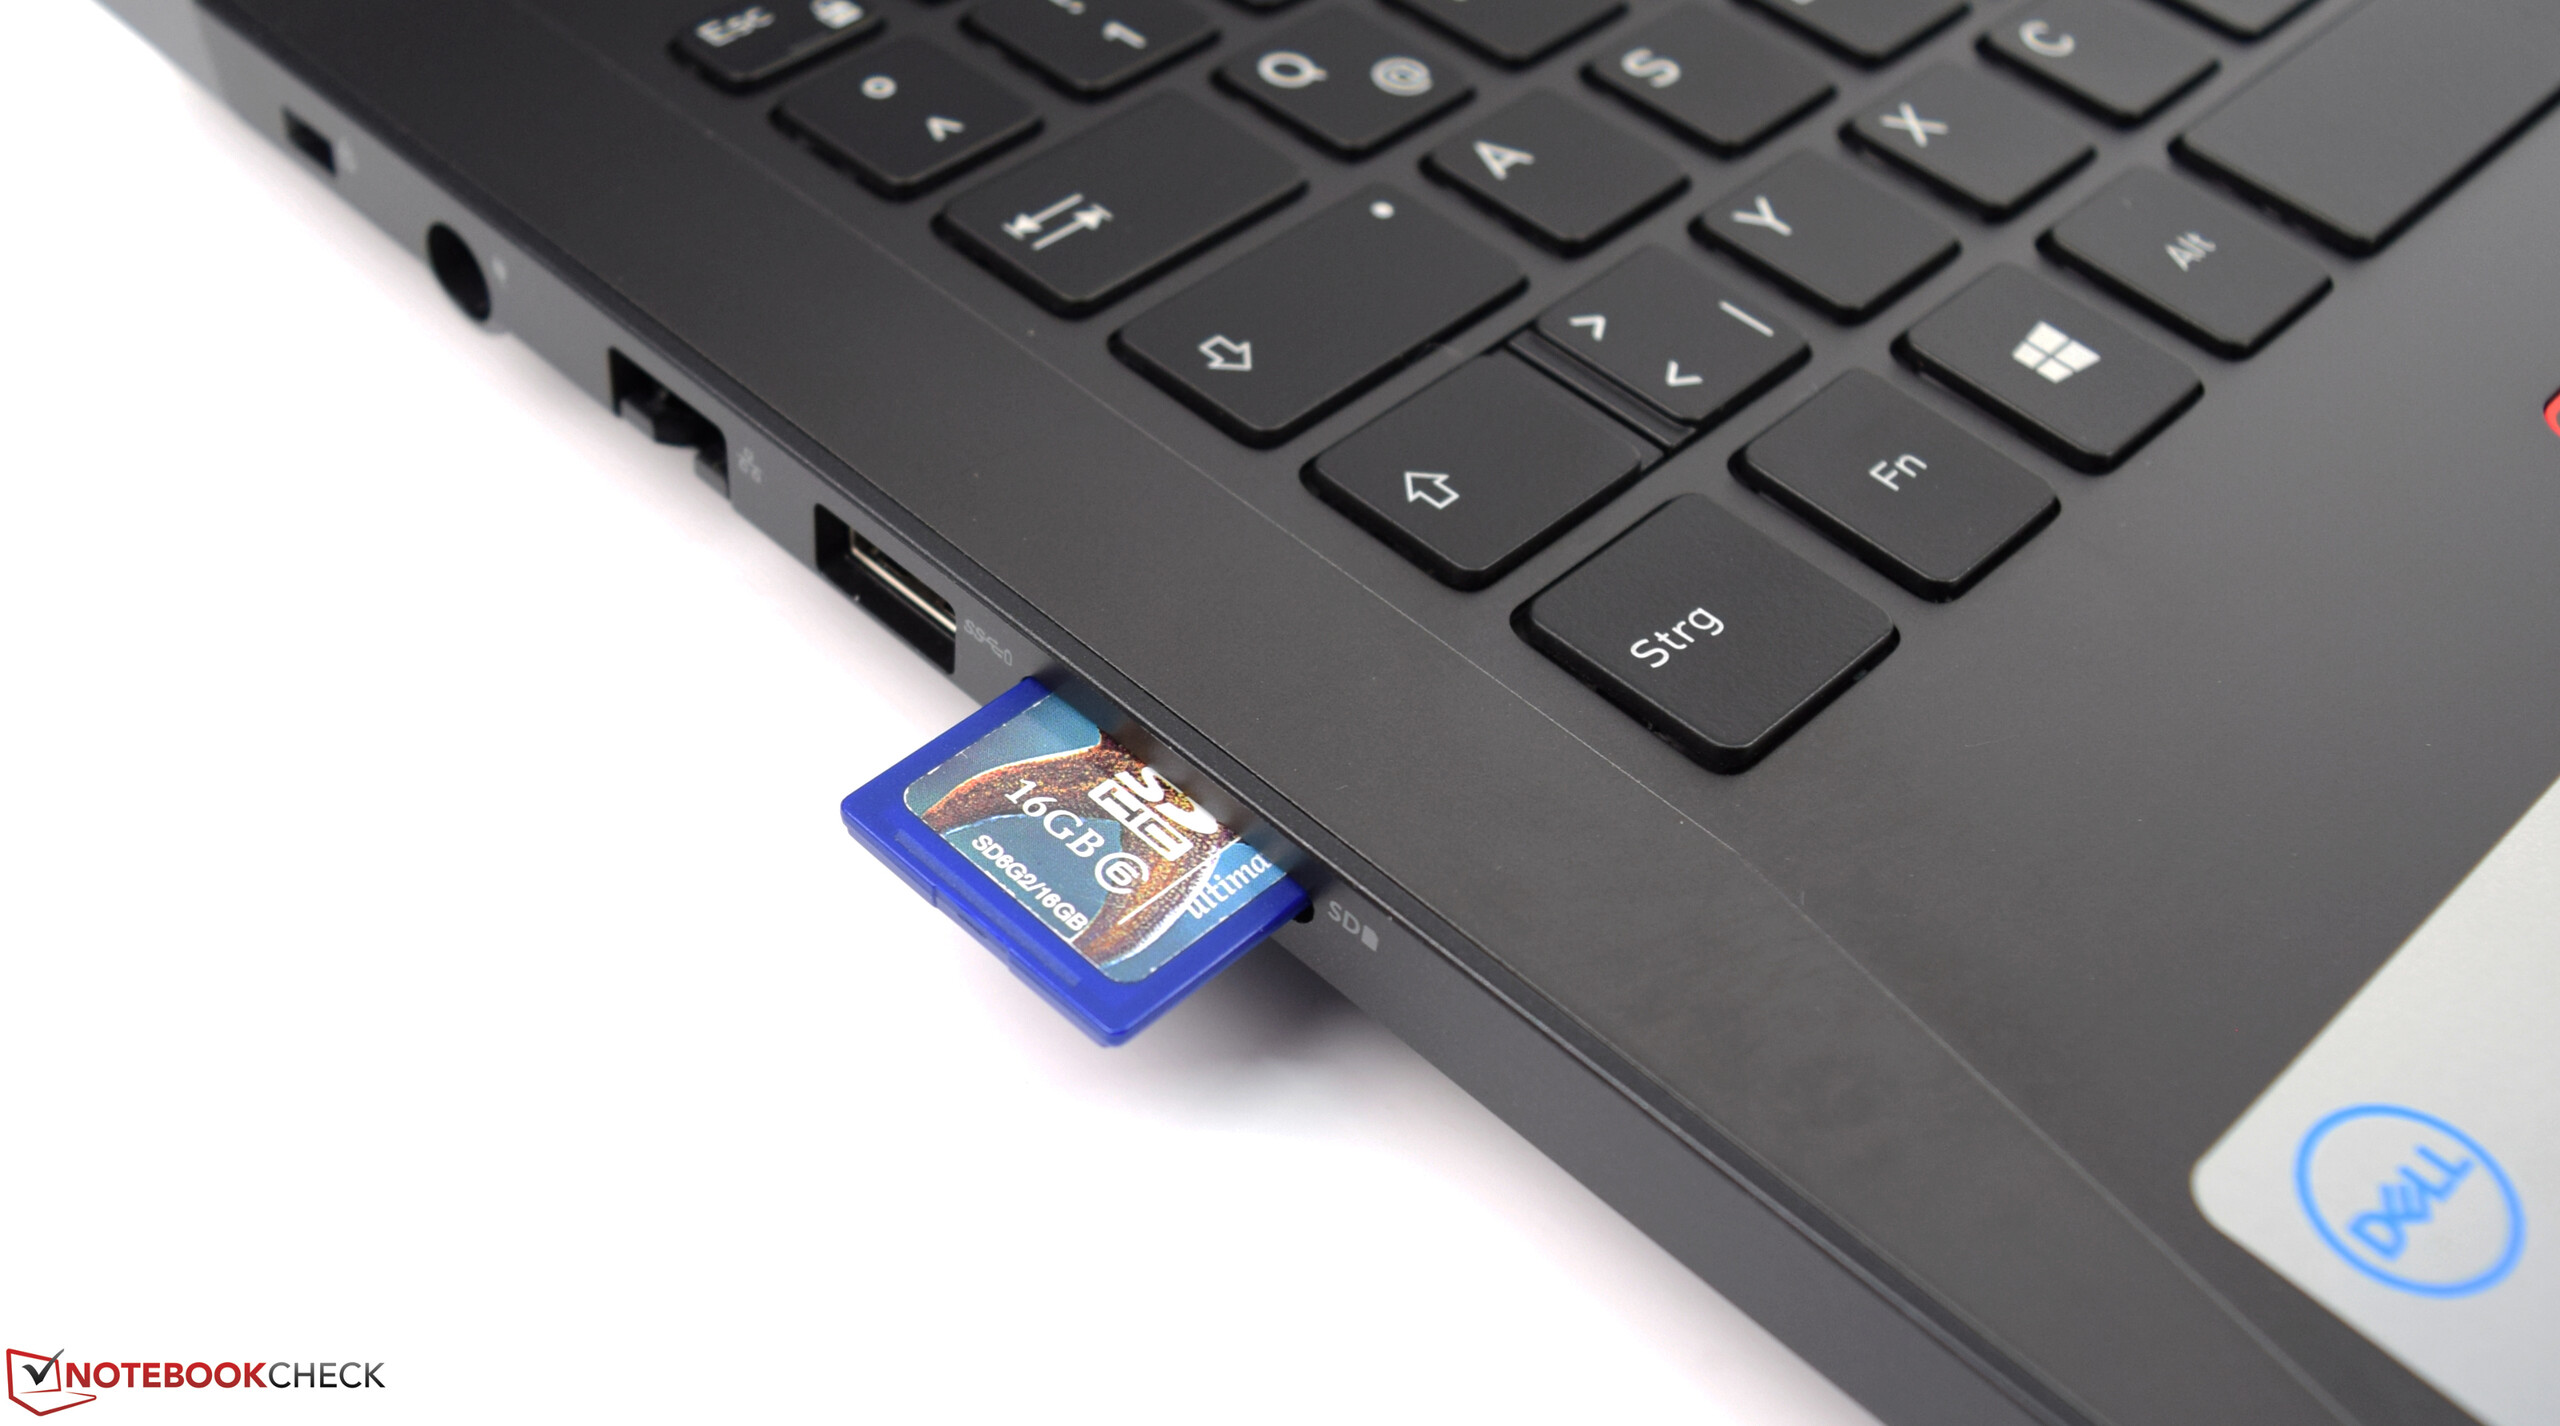
SD Card Reader
The Dell G5 15 5587 is furthermore equipped with an SD card reader that can handle all the usual storage cards. Unfortunately, the test shows that the card reader can only operate at USB-2.0 speeds. In contrast, the Asus FX503VM and the Proteus V offer SD card readers with USB-3.0 speed. We used our reference storage card from Toshiba (Exceria Pro SDXC 64 GB UHS-II) in the test.
| SD Card Reader | |
| average JPG Copy Test (av. of 3 runs) | |
| Average of class Gaming (20.9 - 210, n=54, last 2 years) | |
| PC Zentrum Proteus V (Toshiba Exceria Pro SDXC 64 GB UHS-II) | |
| Asus FX503VM-EH73 (Toshiba Exceria Pro SDXC 64 GB UHS-II) | |
| Acer Predator Helios 300 PH317-52-51M6 (Toshiba Exceria Pro SDXC 64 GB UHS-II) | |
| Dell Inspiron 15 7000 7577 (Toshiba Exceria Pro SDXC 64 GB UHS-II) | |
| Acer Nitro 5 Spin NP515-51-86CX (Toshiba Exceria Pro SDXC 64 GB UHS-II) | |
| Dell G5 15 5587 (Toshiba Exceria Pro SDXC 64 GB UHS-II) | |
| Dell Inspiron 15 7000 7577 (Toshiba Exceria Pro SDXC 64 GB UHS-II) | |
| maximum AS SSD Seq Read Test (1GB) | |
| Average of class Gaming (25.5 - 261, n=51, last 2 years) | |
| PC Zentrum Proteus V (Toshiba Exceria Pro SDXC 64 GB UHS-II) | |
| Asus FX503VM-EH73 (Toshiba Exceria Pro SDXC 64 GB UHS-II) | |
| Acer Predator Helios 300 PH317-52-51M6 (Toshiba Exceria Pro SDXC 64 GB UHS-II) | |
| Dell G5 15 5587 (Toshiba Exceria Pro SDXC 64 GB UHS-II) | |
| Dell Inspiron 15 7000 7577 (Toshiba Exceria Pro SDXC 64 GB UHS-II) | |
| Dell Inspiron 15 7000 7577 (Toshiba Exceria Pro SDXC 64 GB UHS-II) | |
| Acer Nitro 5 Spin NP515-51-86CX (Toshiba Exceria Pro SDXC 64 GB UHS-II) | |
Communication
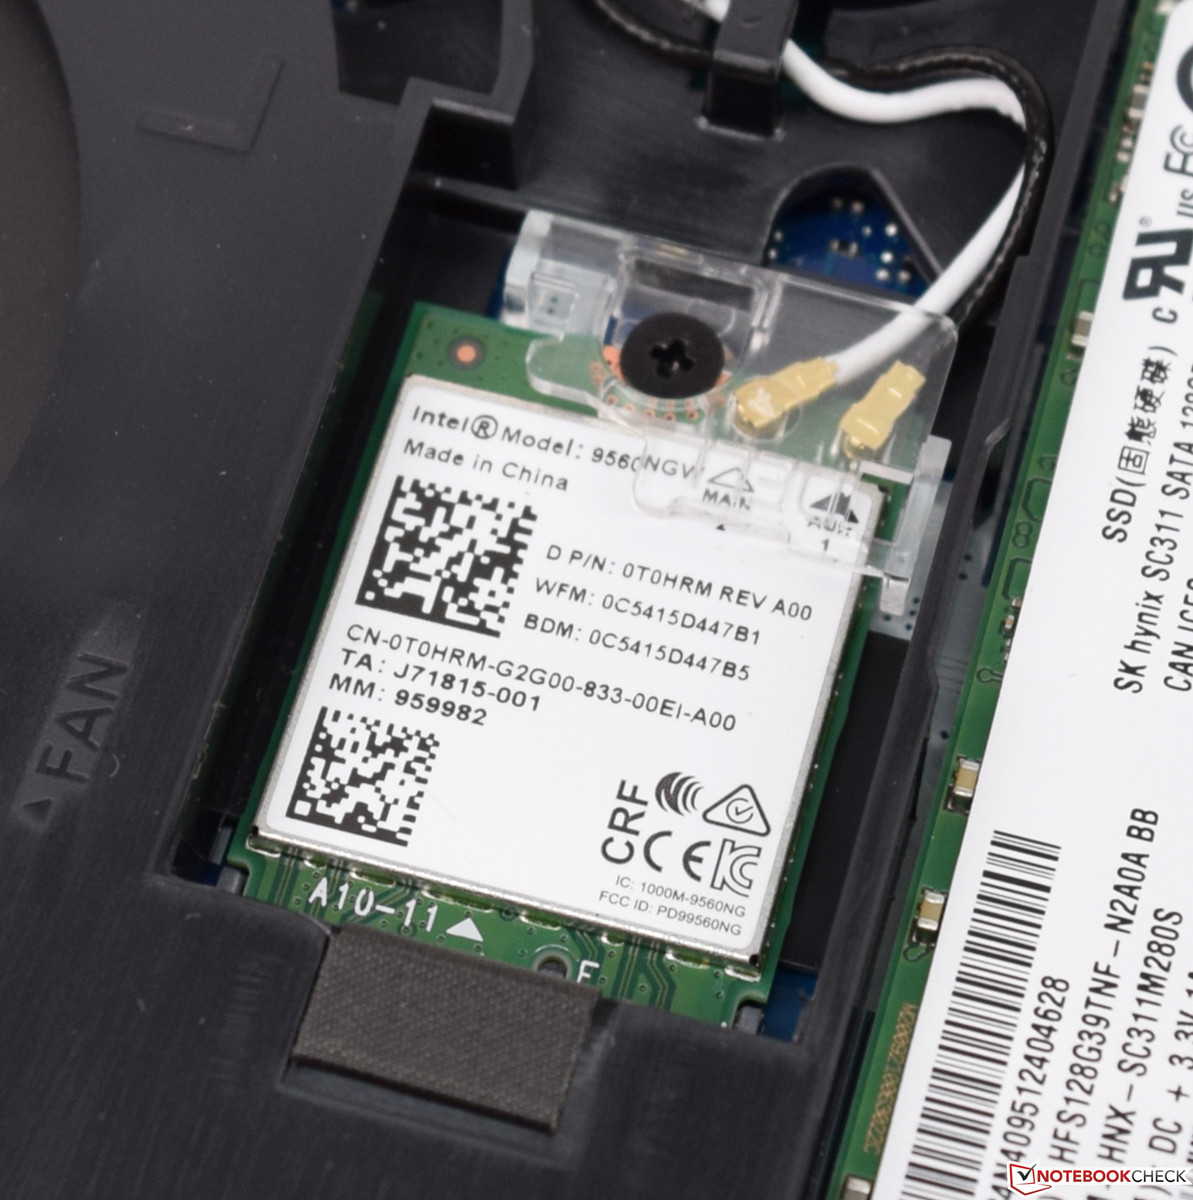
The wireless communication is handled by the Intel Wireless-AC 9560 WLAN module. This 2x2 dual-band module offers WLAN-AC and additionally Bluetooth 5.0. Unfortunately, the Dell G5 15 5587 only achieved a mixed result and performed below our expectations in the measurements where we setup an optimal scenario. Our test unit achieved an average transfer rate of 582 Mb/s while sending and still 485 Mb/s while receiving. While this is sufficient for all the usual applications, in our test the WLAN module significantly lags behind the maximum speed specified by the manufacturer (1.73 Gb/s).
The Dell G5 15 5587 offers another option to connect to the network in the form of an Ethernet port. The Killer-E2400 network card offers speeds up to 1 Gb/s and worked without any problems in the test.
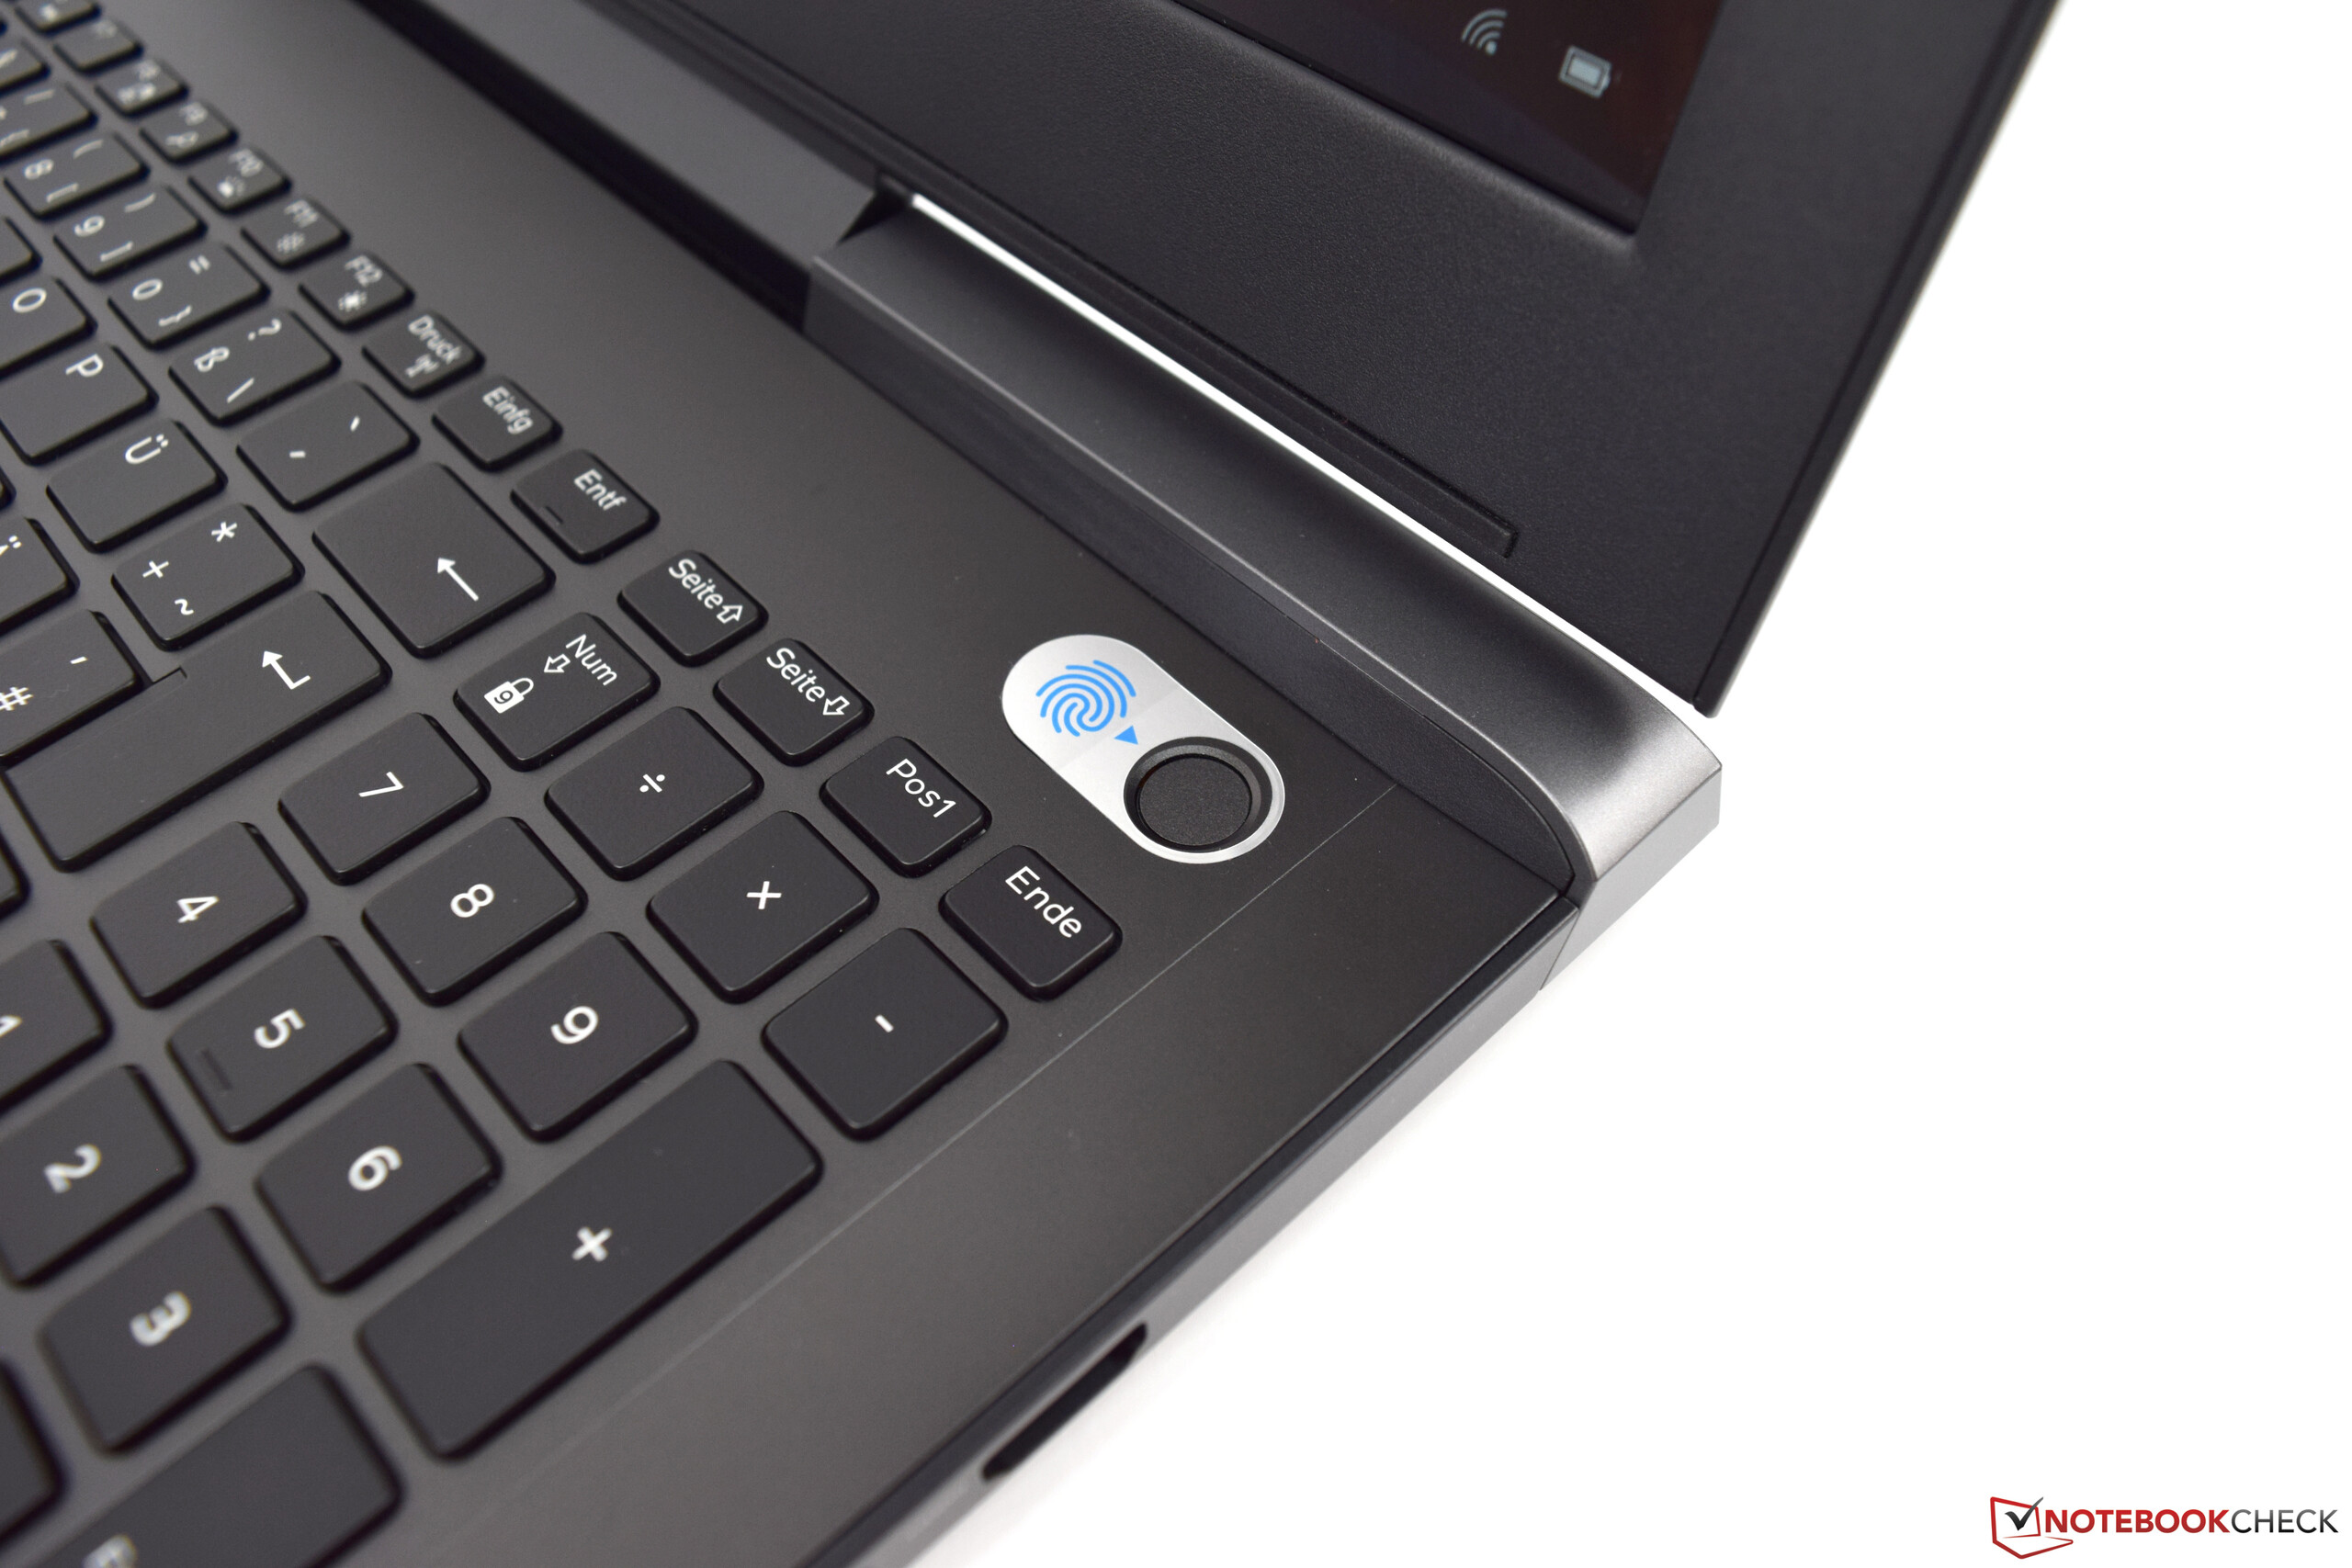
Security
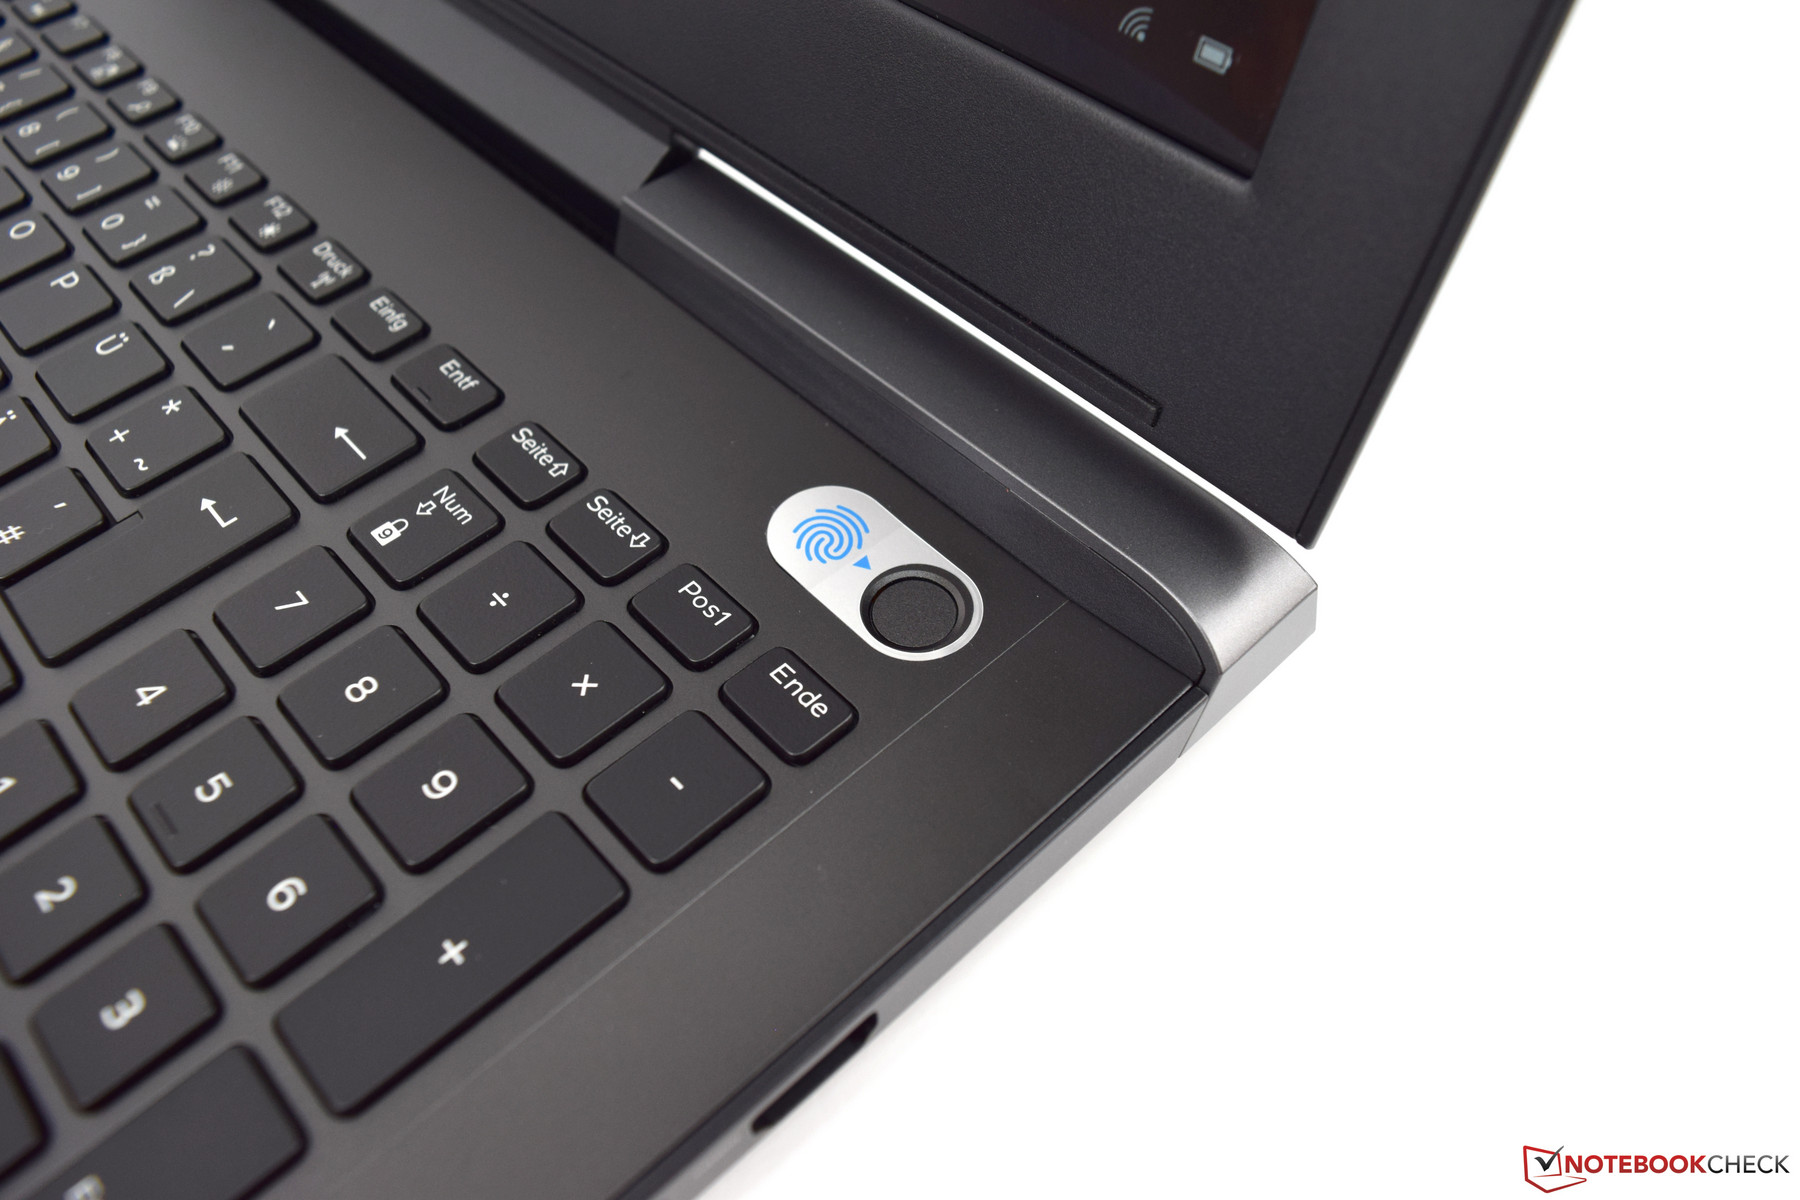
In terms of security, the Dell G5 15 5587 offers a TPM as well as a fingerprint sensor that is integrated into the power button. After a brief process of setting it up, the Windows logon can be performed comfortably with this biometric scanner. As software solution, McAfee LifeSafe is used, and a 12-month subscription is included in the purchase for private consumers. You can add this optional update into the cart during the ordering process.
Accessories
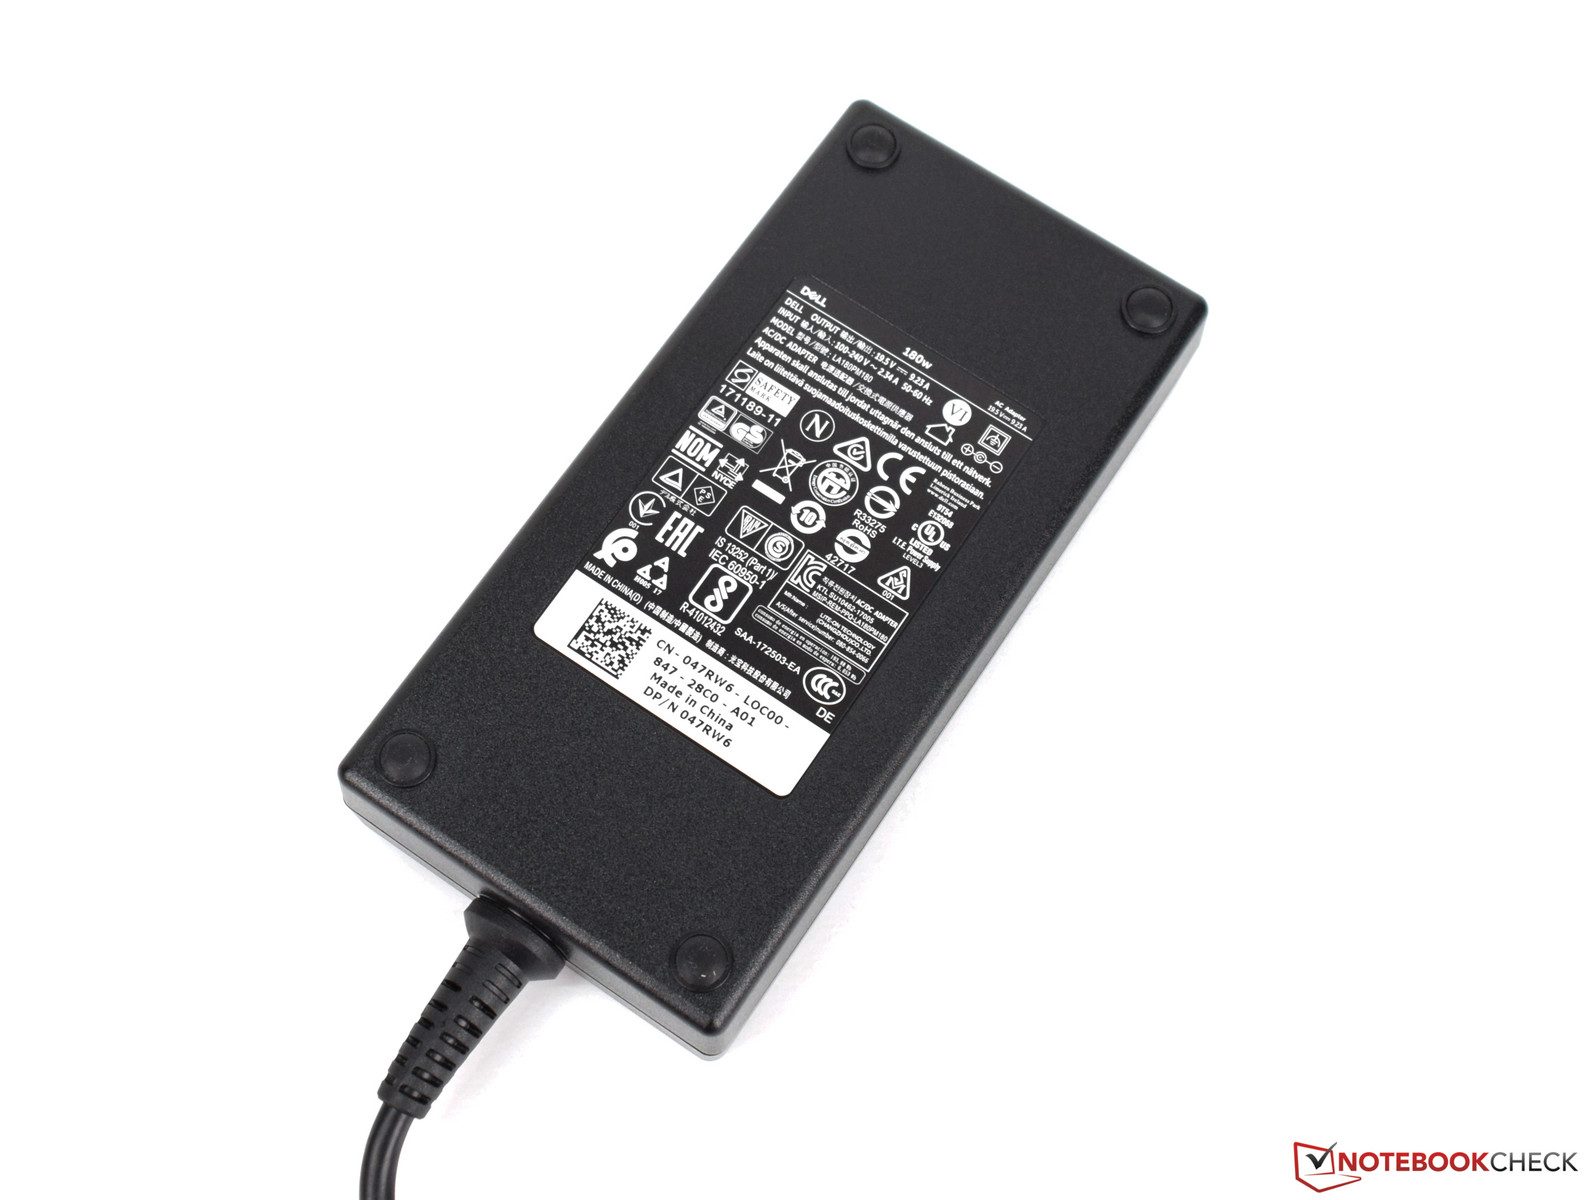
Apart from the device, the 180-watt power supply, various security guidelines, and warranty information are also included in the delivery. Of course, Dell also offers the corresponding accessories for its devices during the ordering process, such as a bag, an external mouse, or a headset. You can also find backpacks or docking solutions in the offered add-ons.
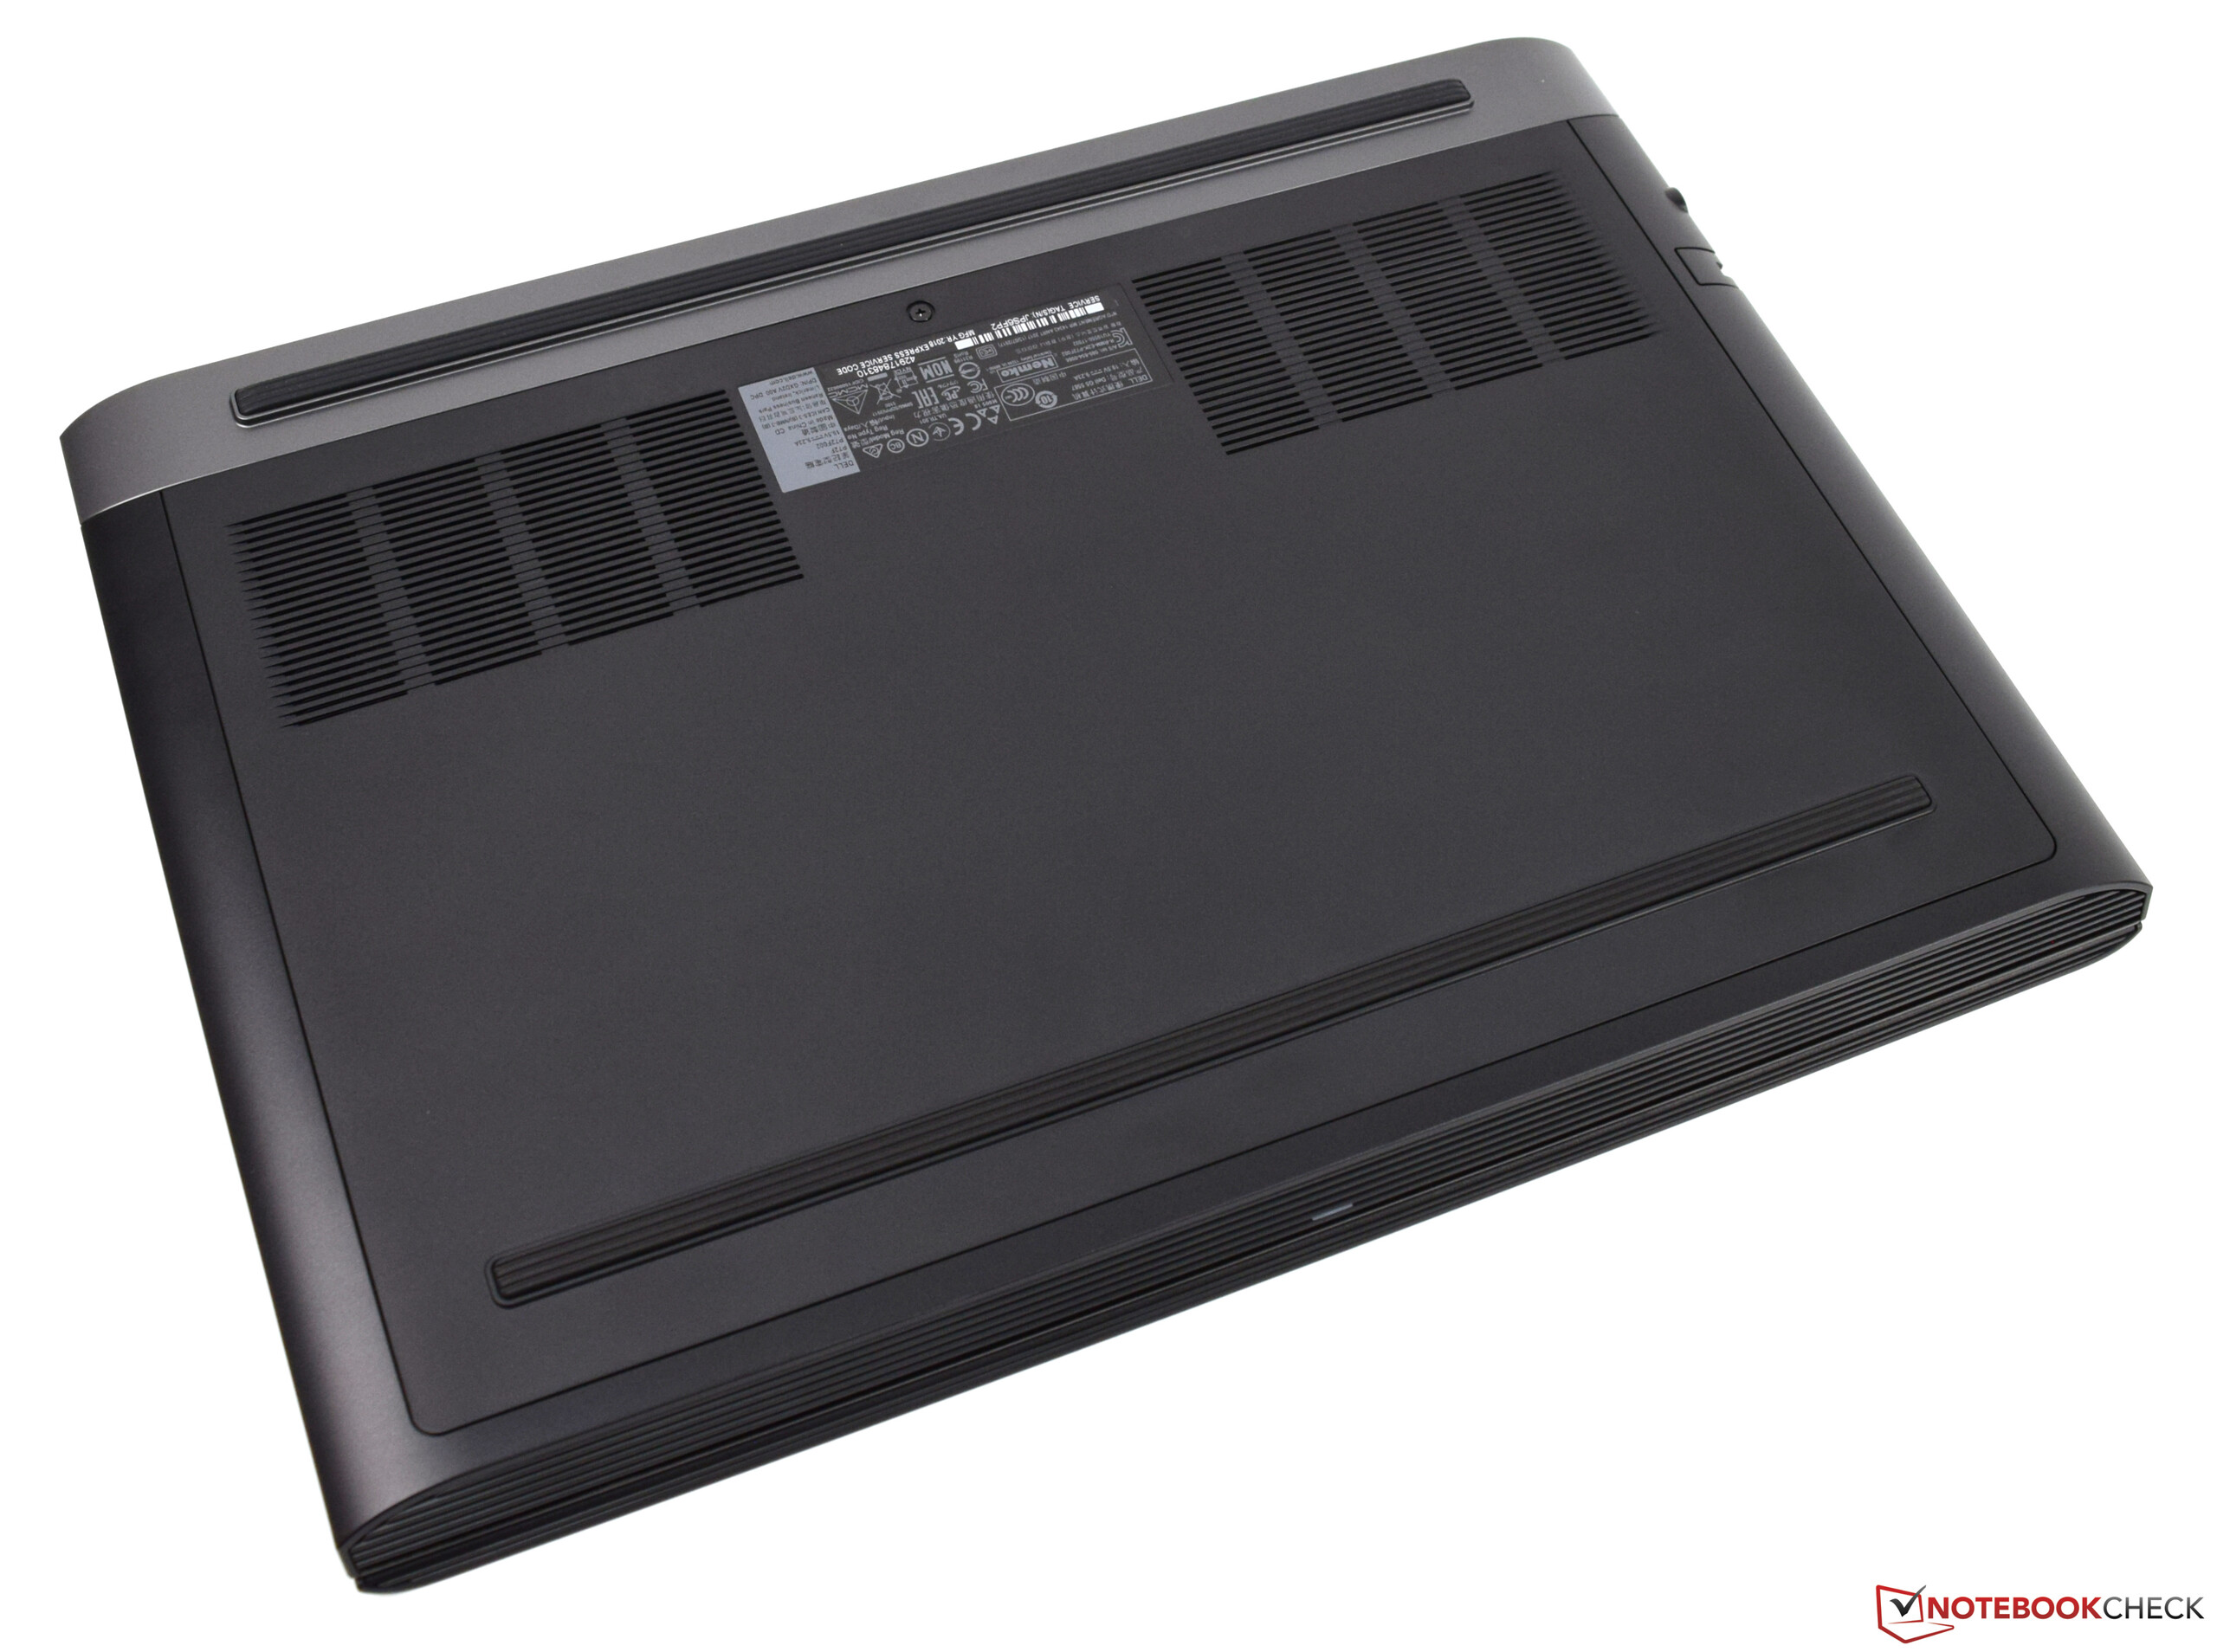
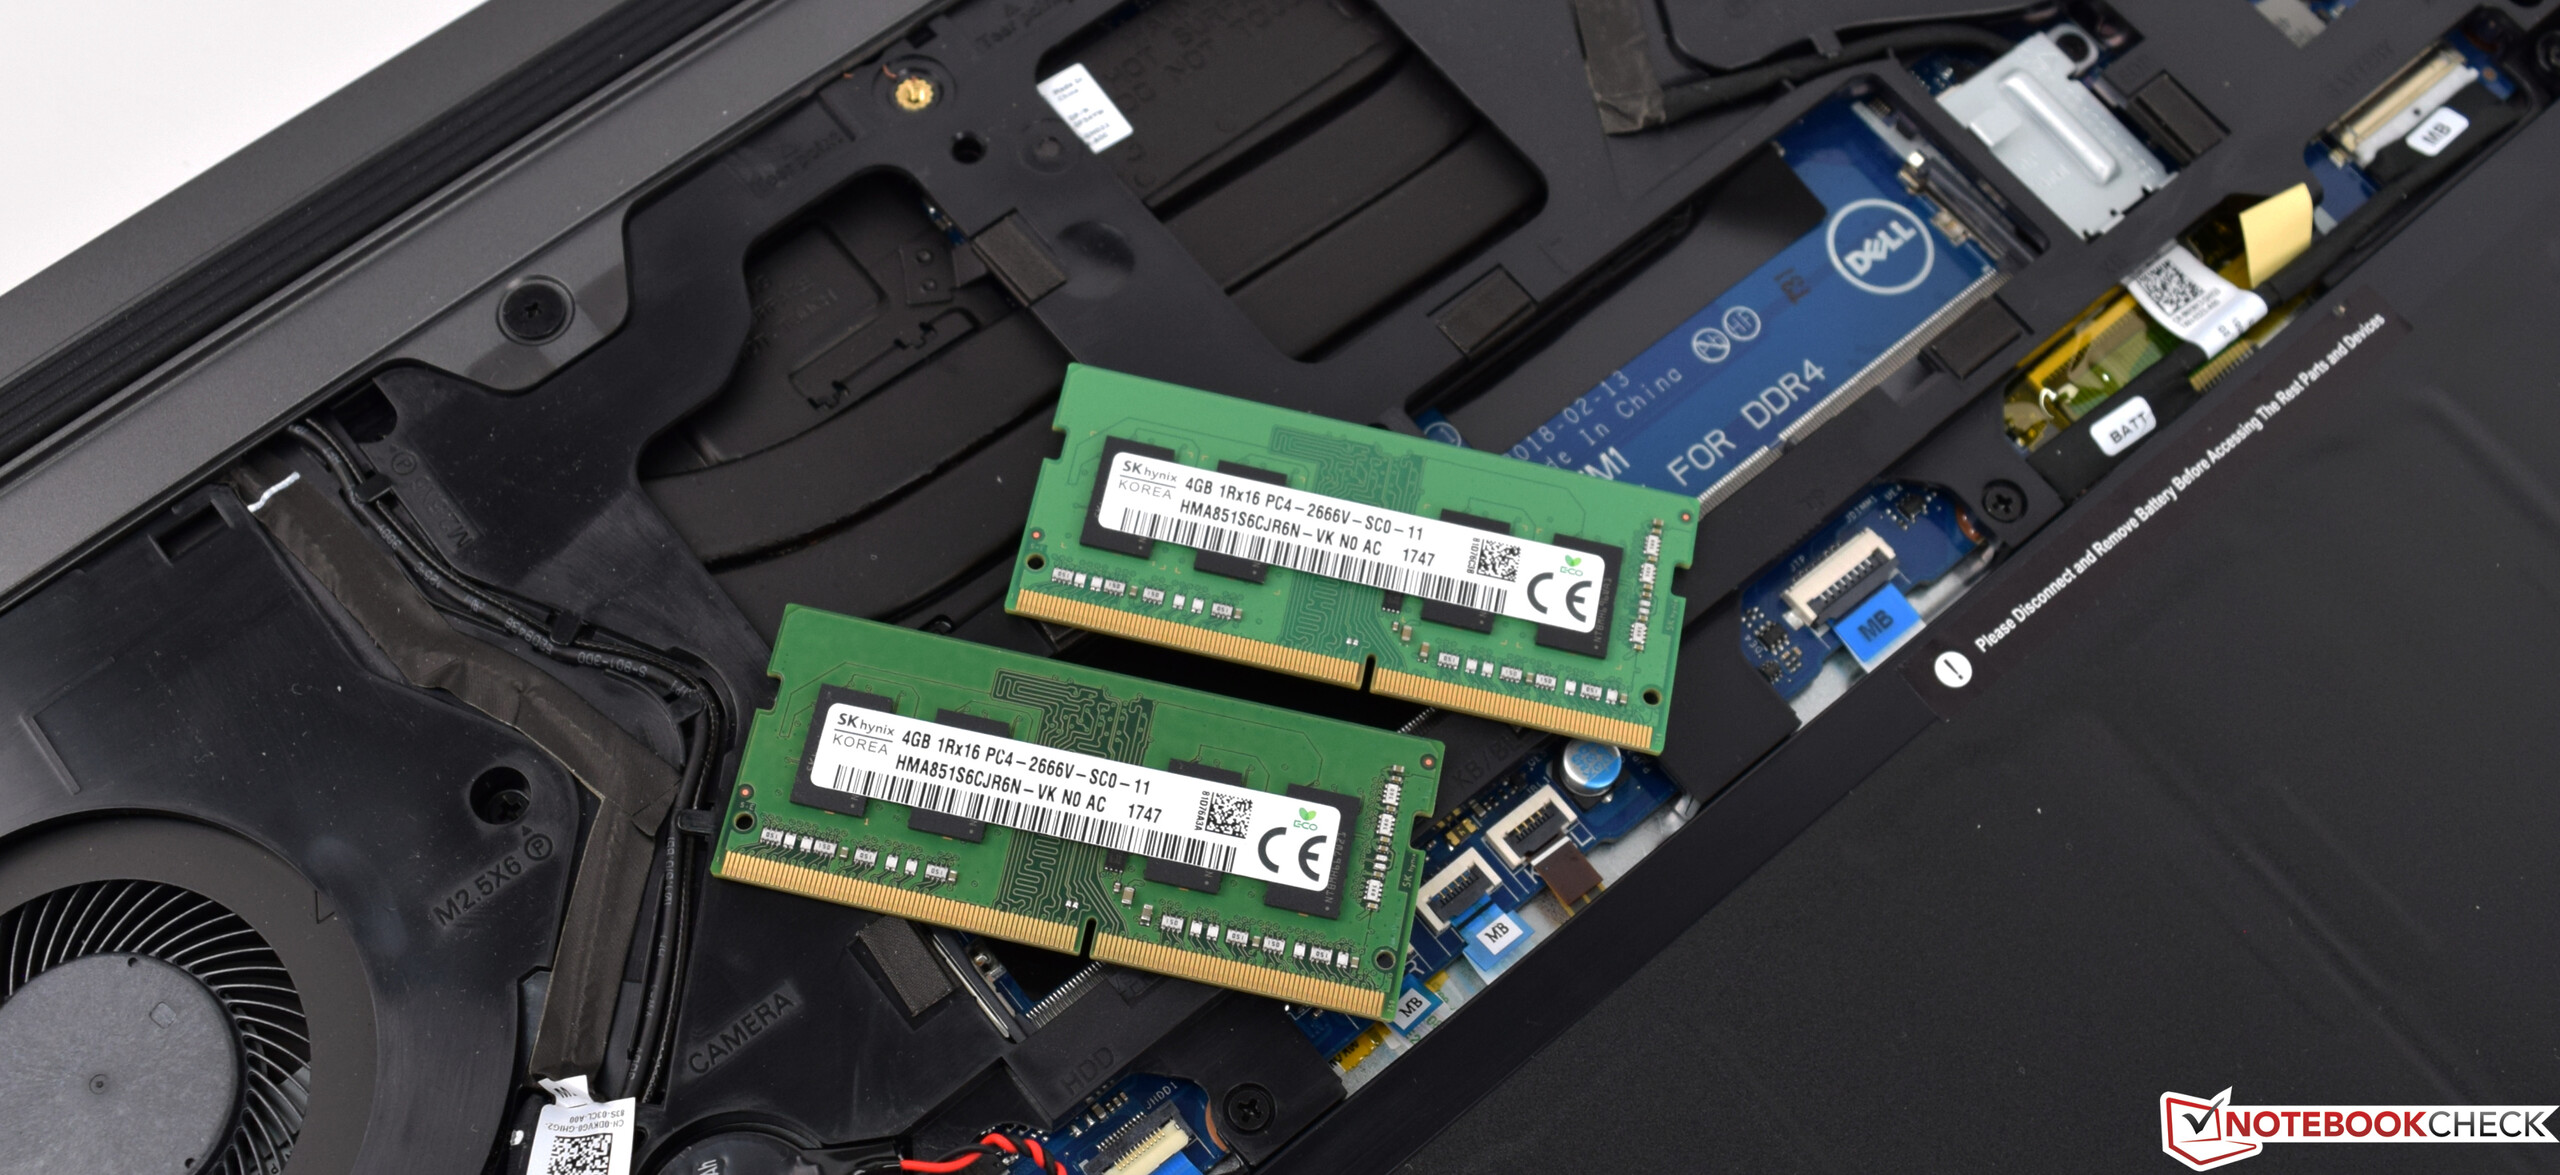
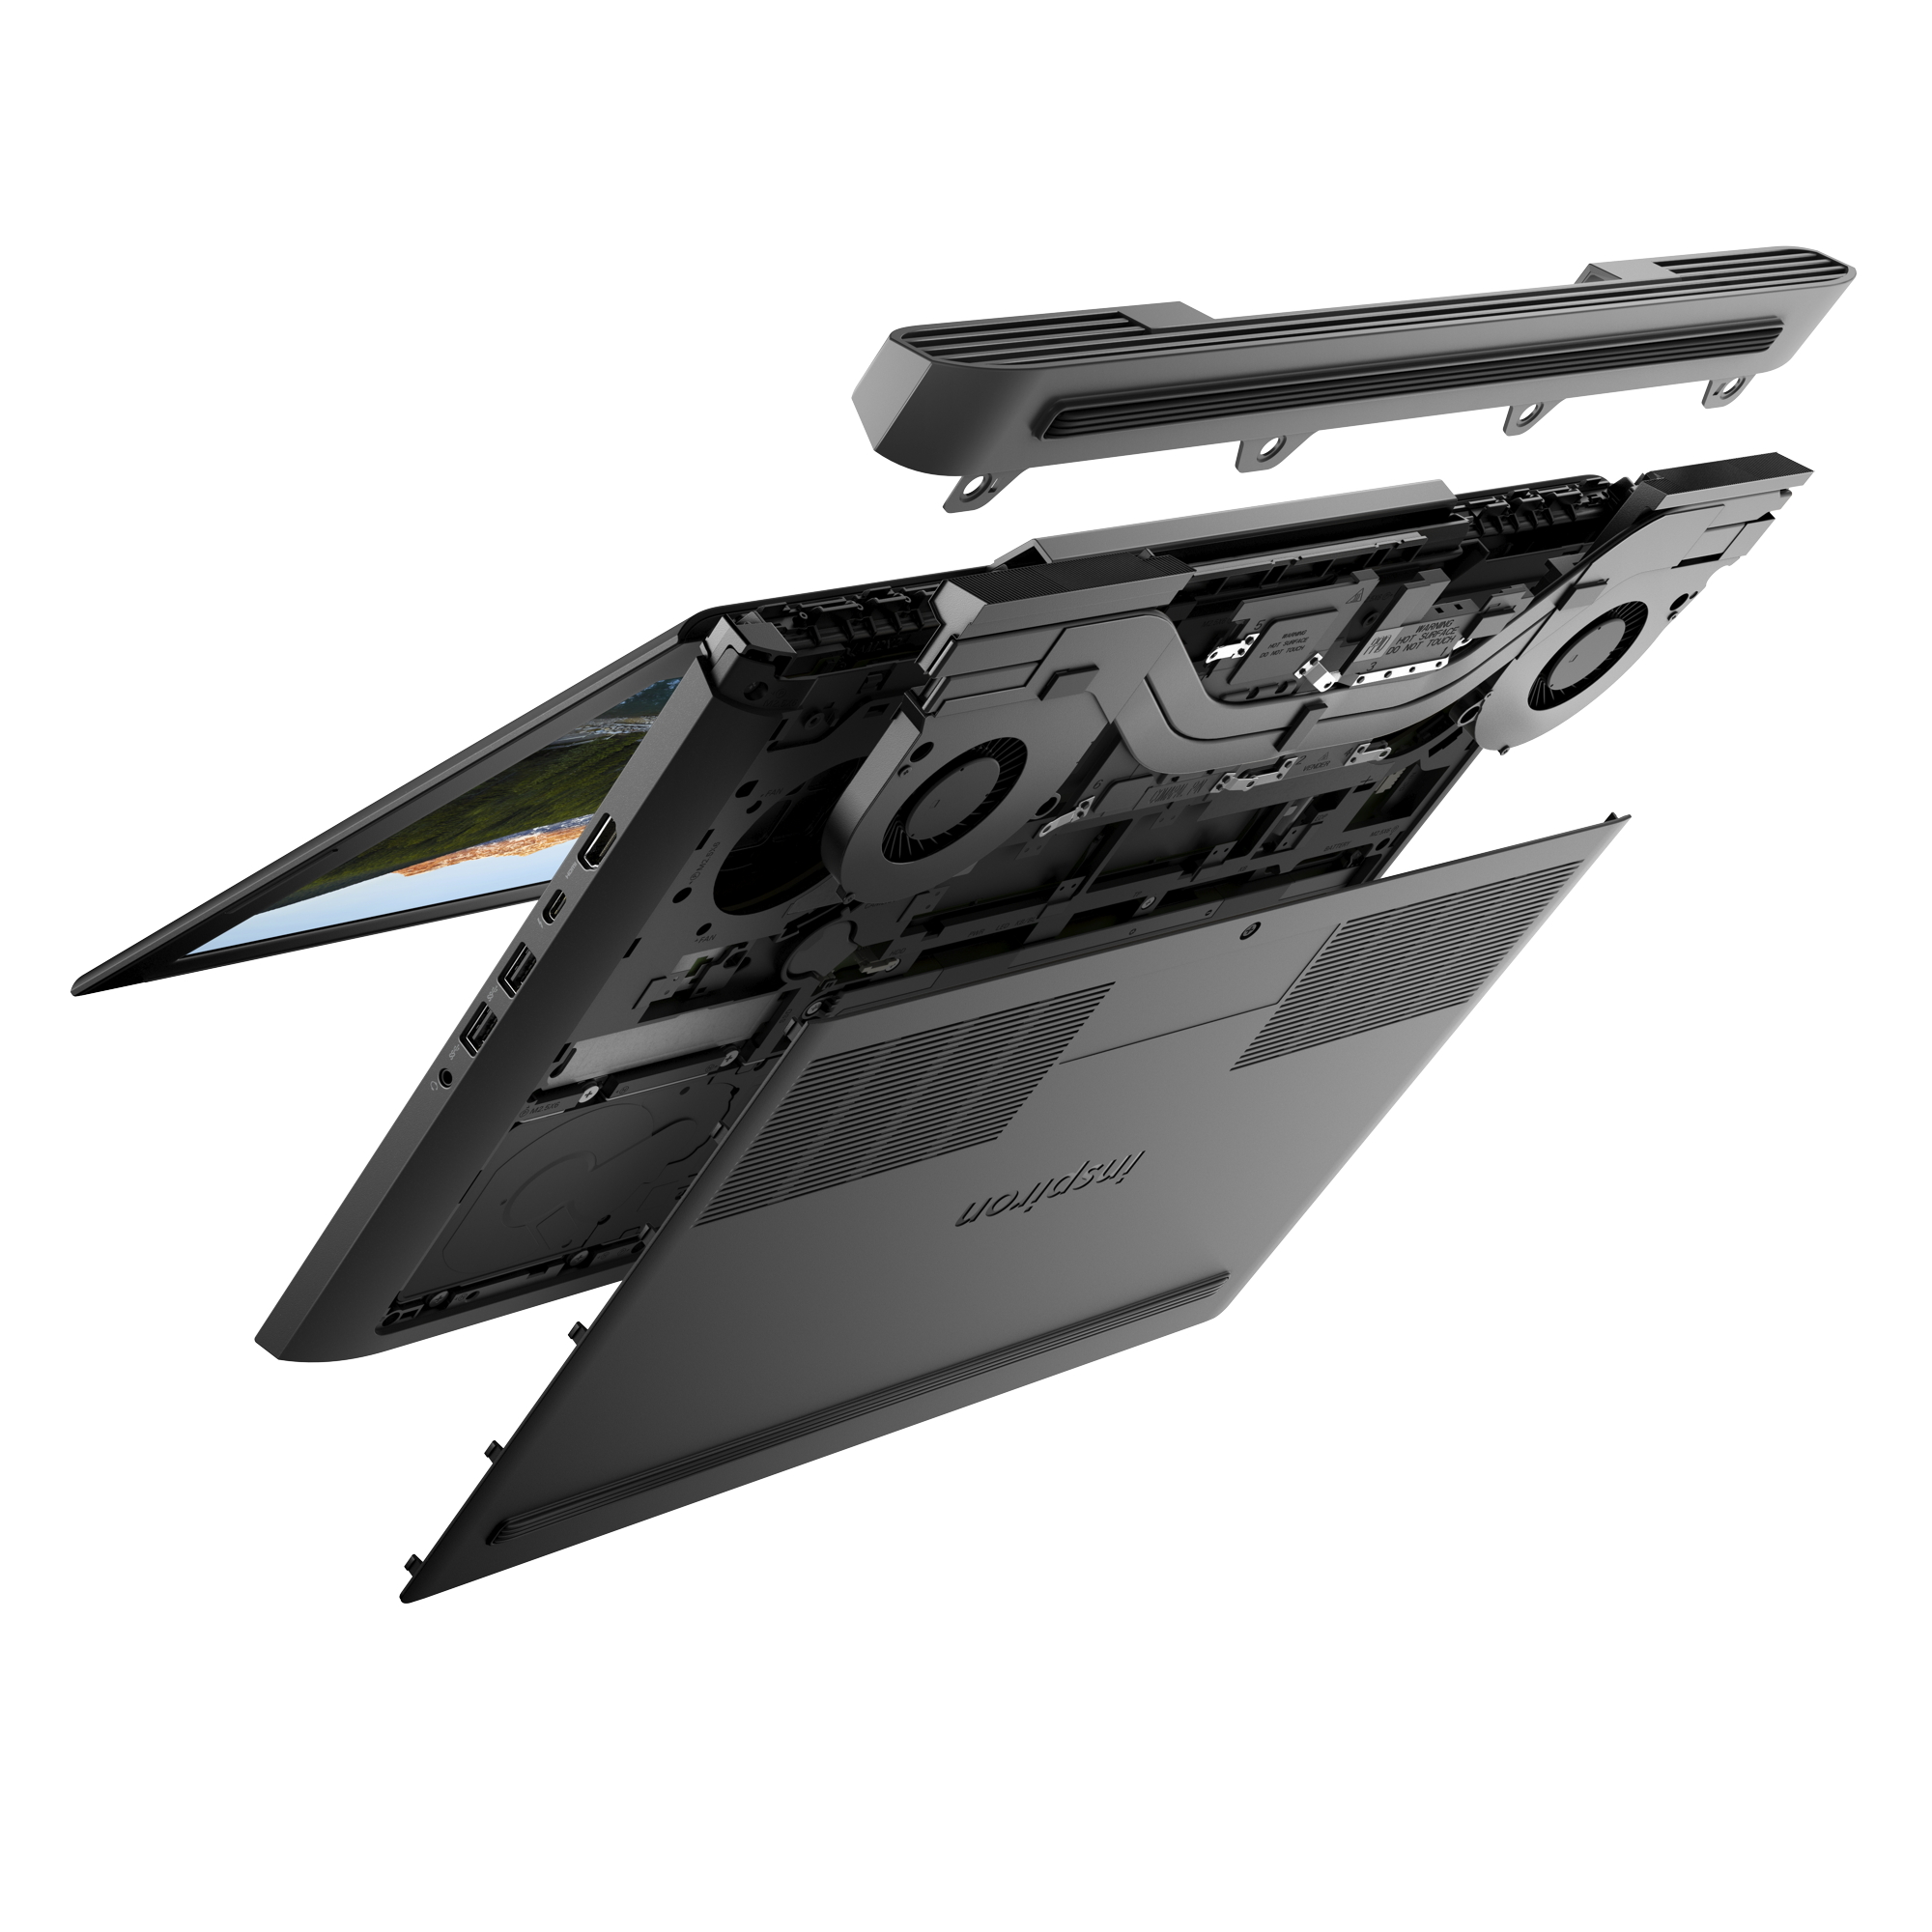
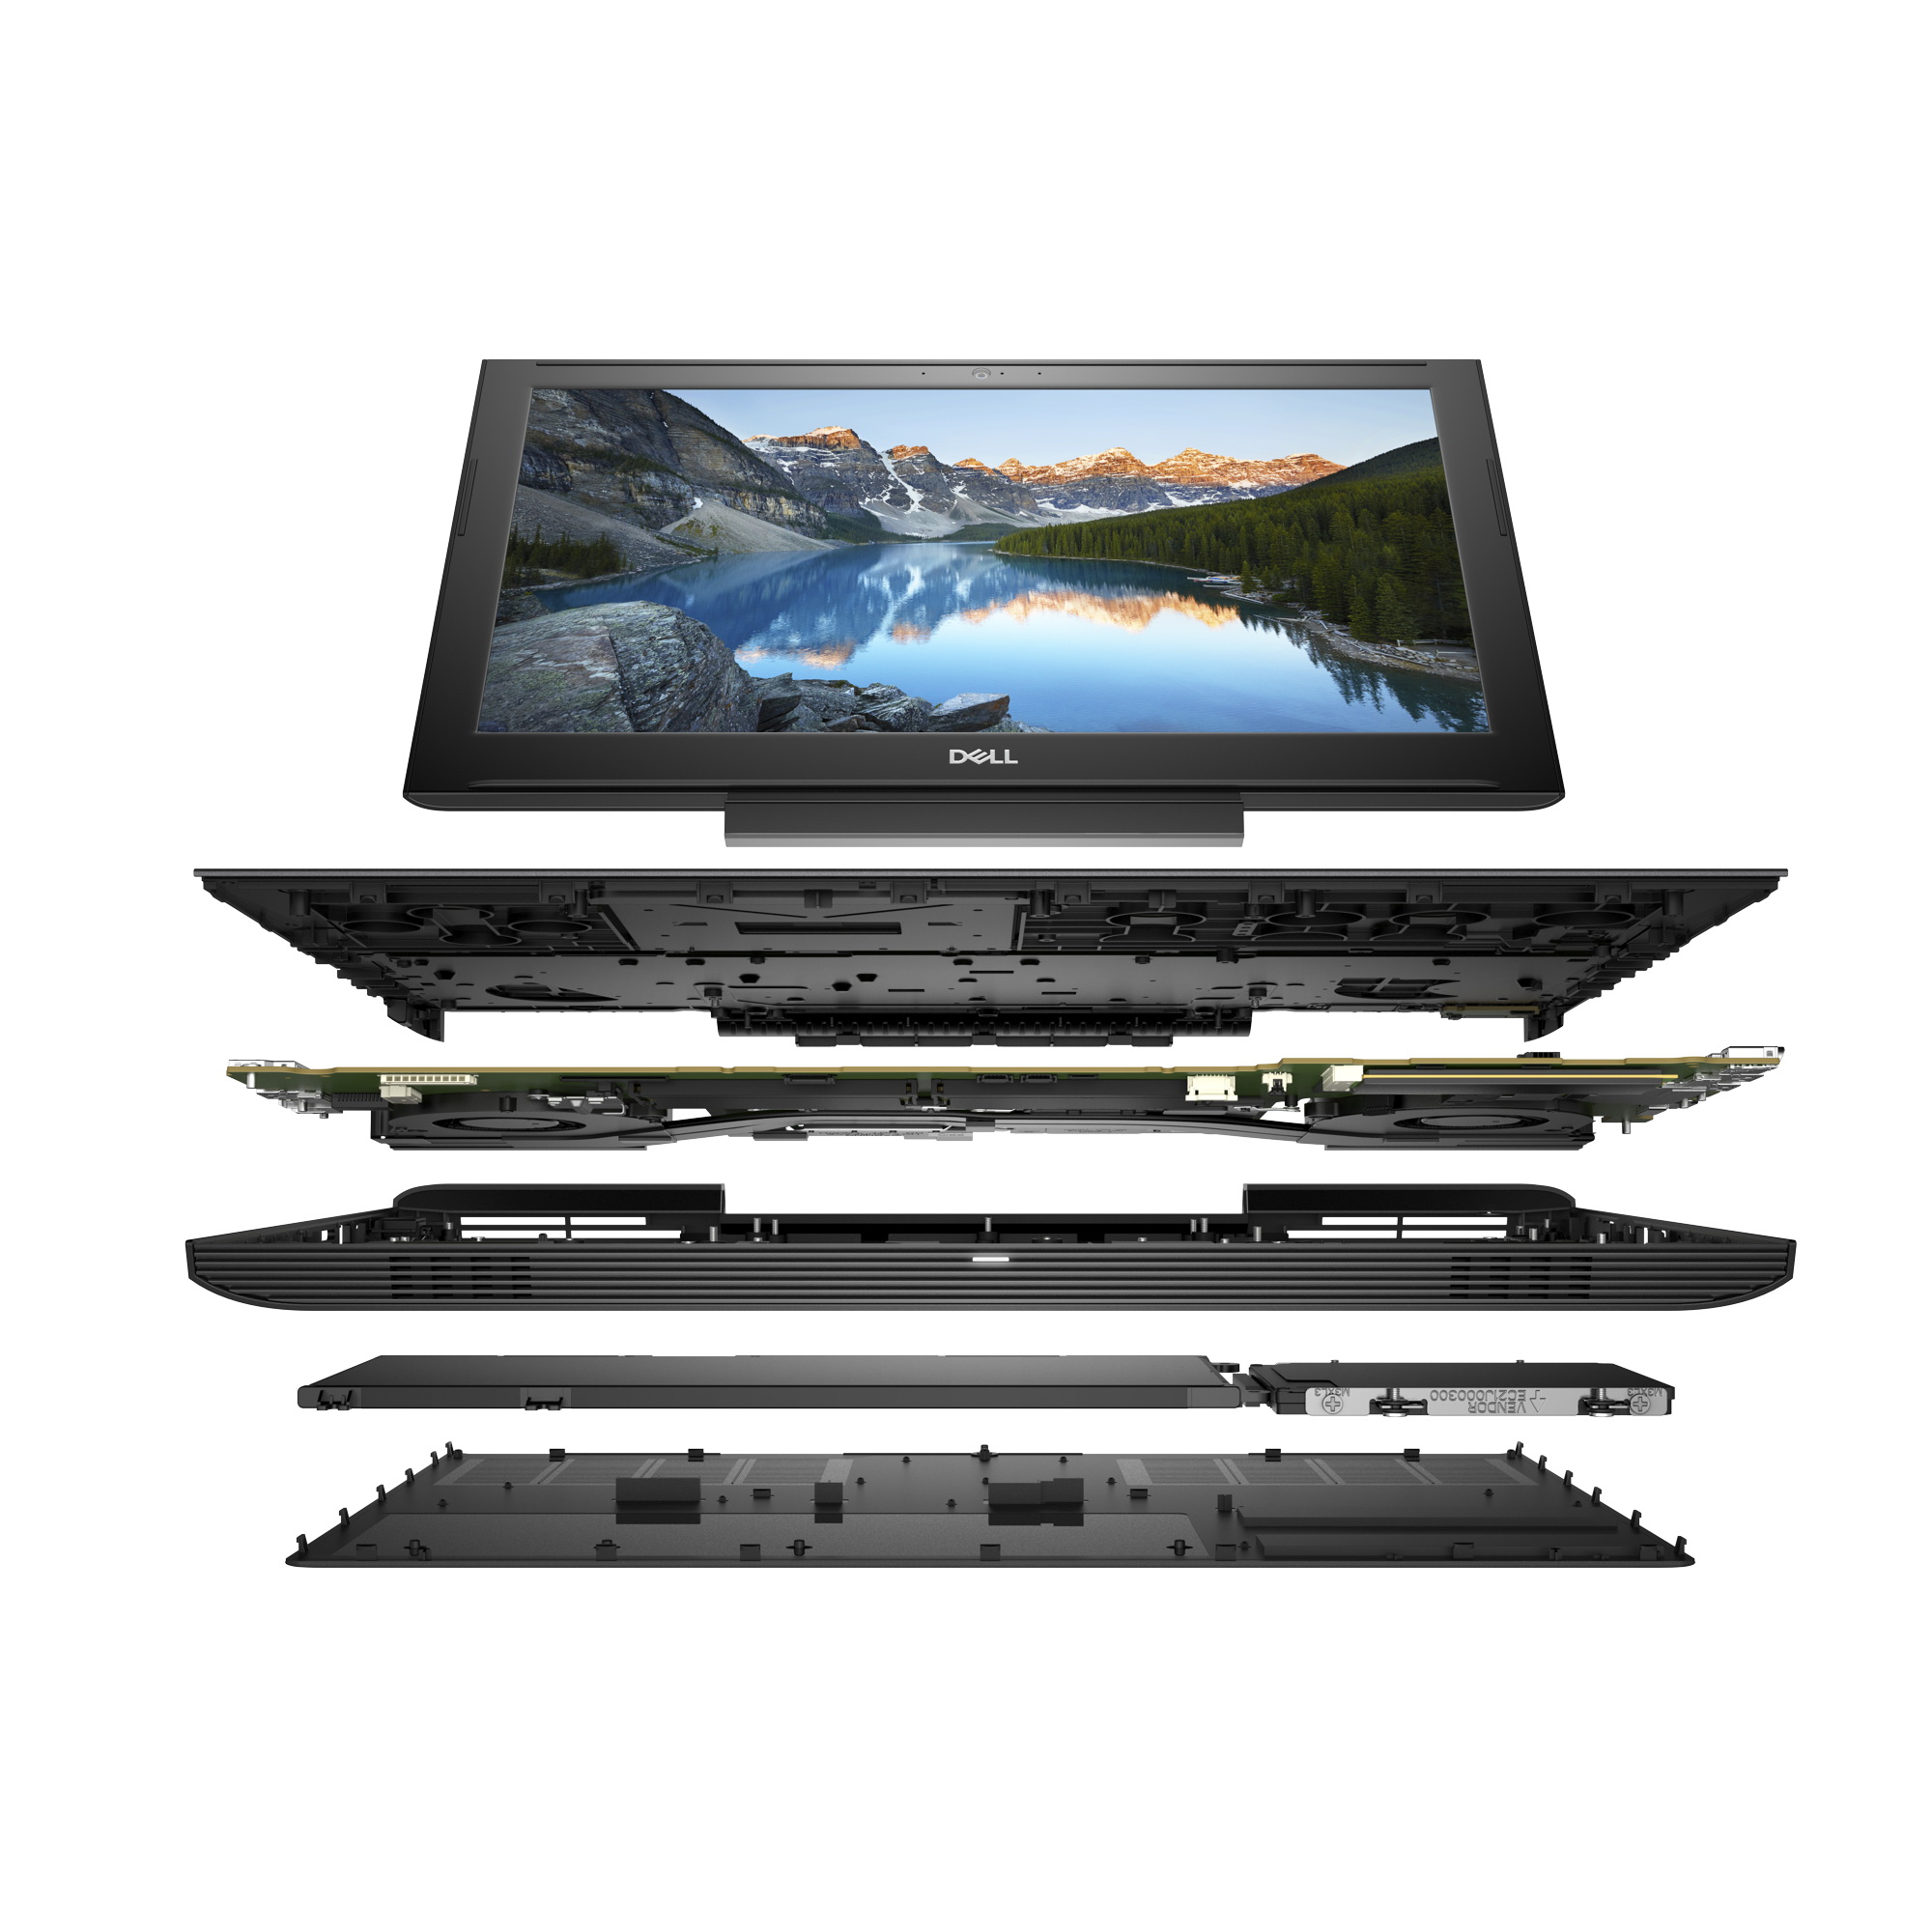
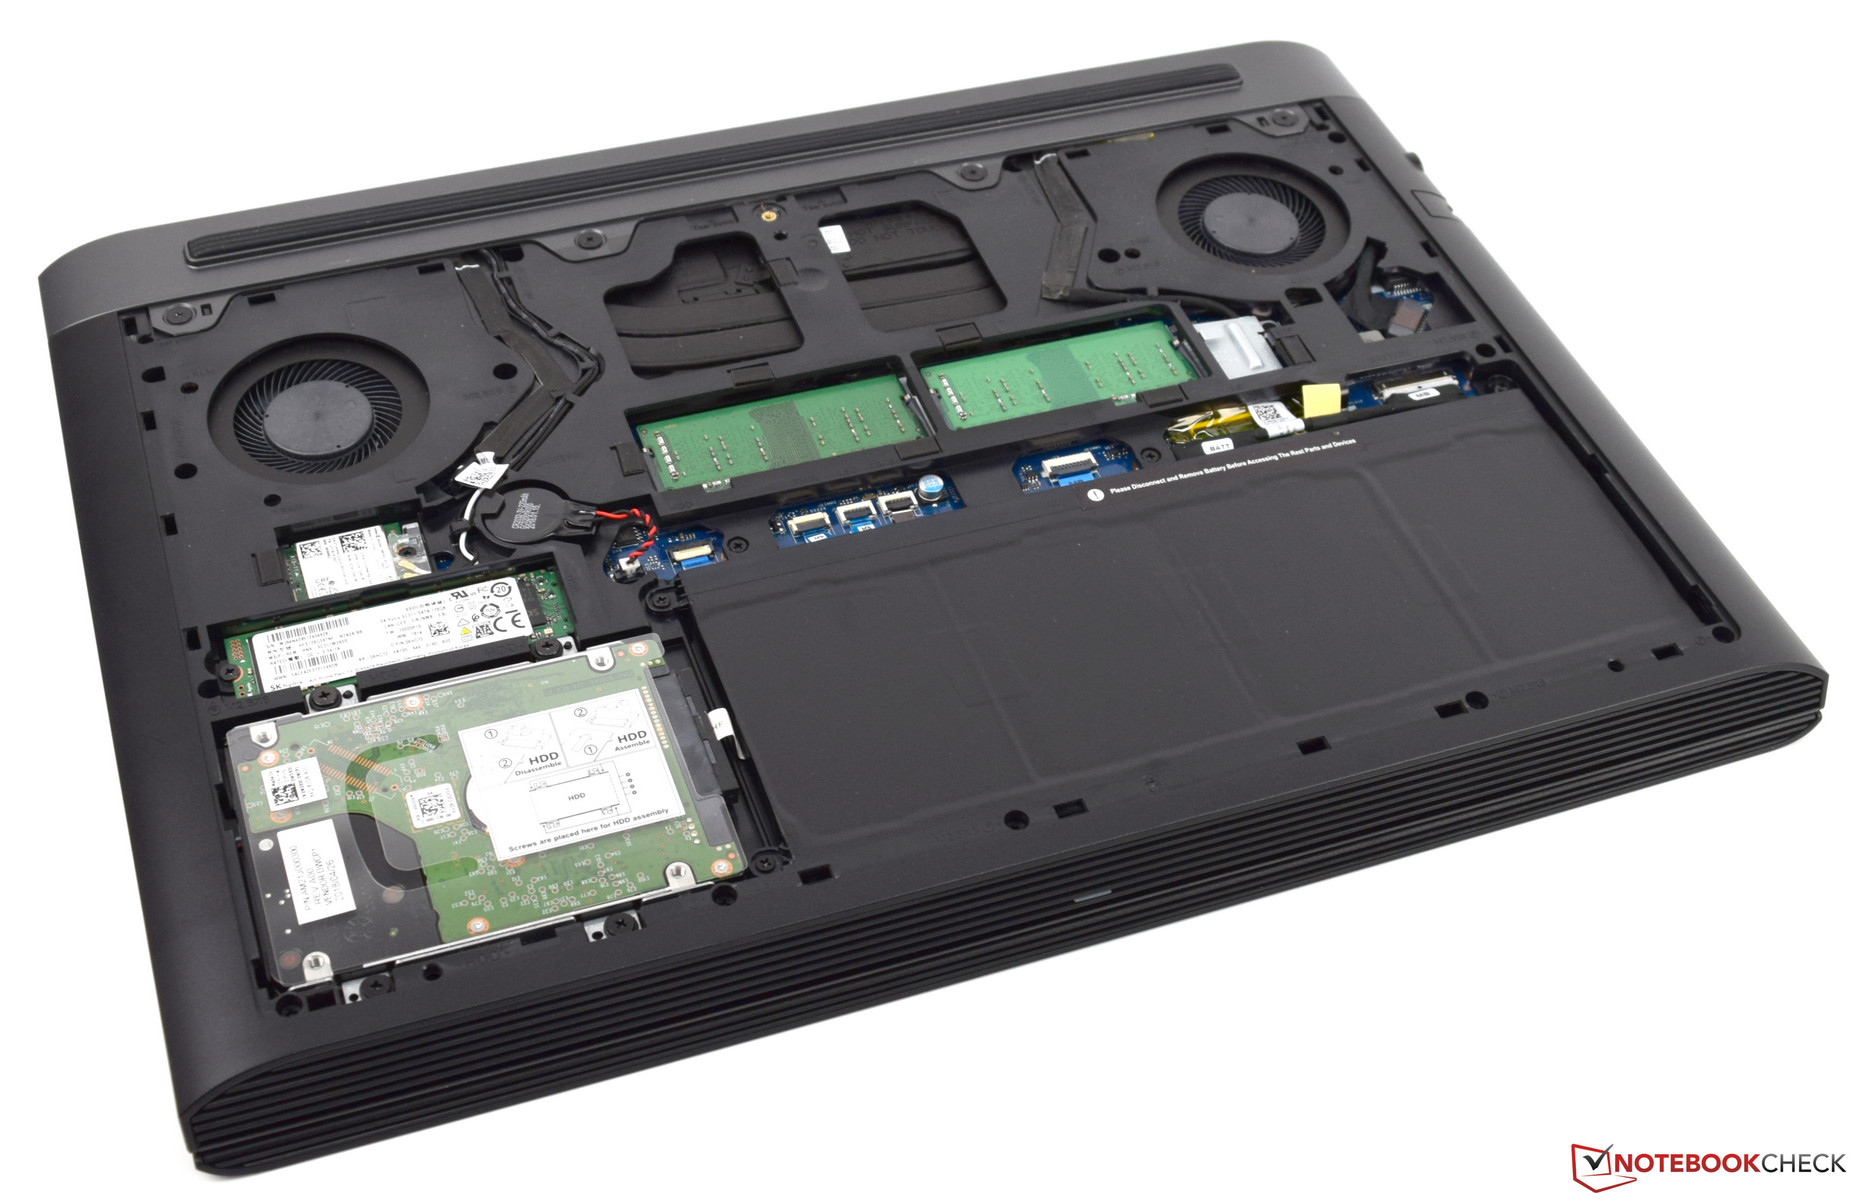
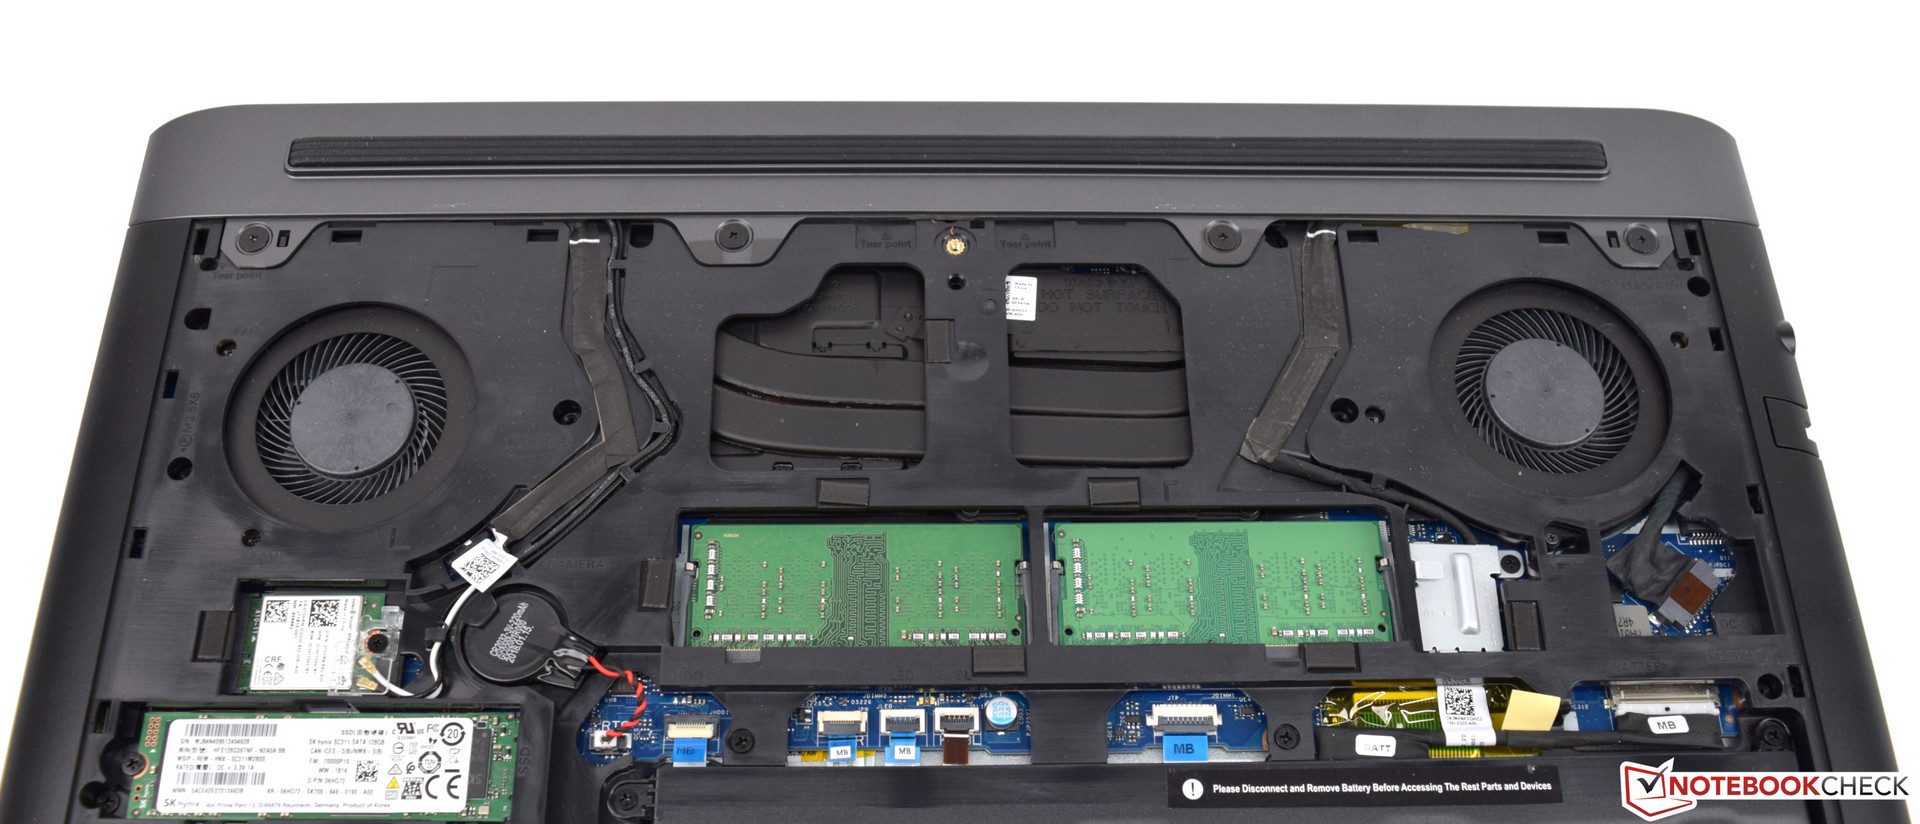
Maintenance
The Dell G5 15 5587 has a large maintenance cover, which covers almost the entire bottom of the base. While you only have to remove a single screw, you still need to proceed carefully, since the cover is held to the base with many clips. After its removal, you can easily access all the built-in components in order to replace them, if necessary. Our test unit does not offer any empty slots for quick upgrades. You can also clean the fans easily, in case they have become dirty.
Operating System
The Dell G5 15 5587 is offered with the 64-bit version of Microsoft Windows 10 Home. Ubuntu is also supported and can already be selected directly during the purchase. Compared to the Windows OS, the purchase price with the Linux operating system is slightly more affordable.
Warranty
With the purchase of the Dell G5 15 5587, customers receive one year of pick-up and repair hardware support. During the ordering process, Dell offers various extensions of the warranty. The "Premium Support Plus Onsite Service" lasting for four years requires a one-time payment of 387 Euros (~$451). Please see our Guarantees, Return policies and Warranties FAQ for country-specific information.
Input Devices
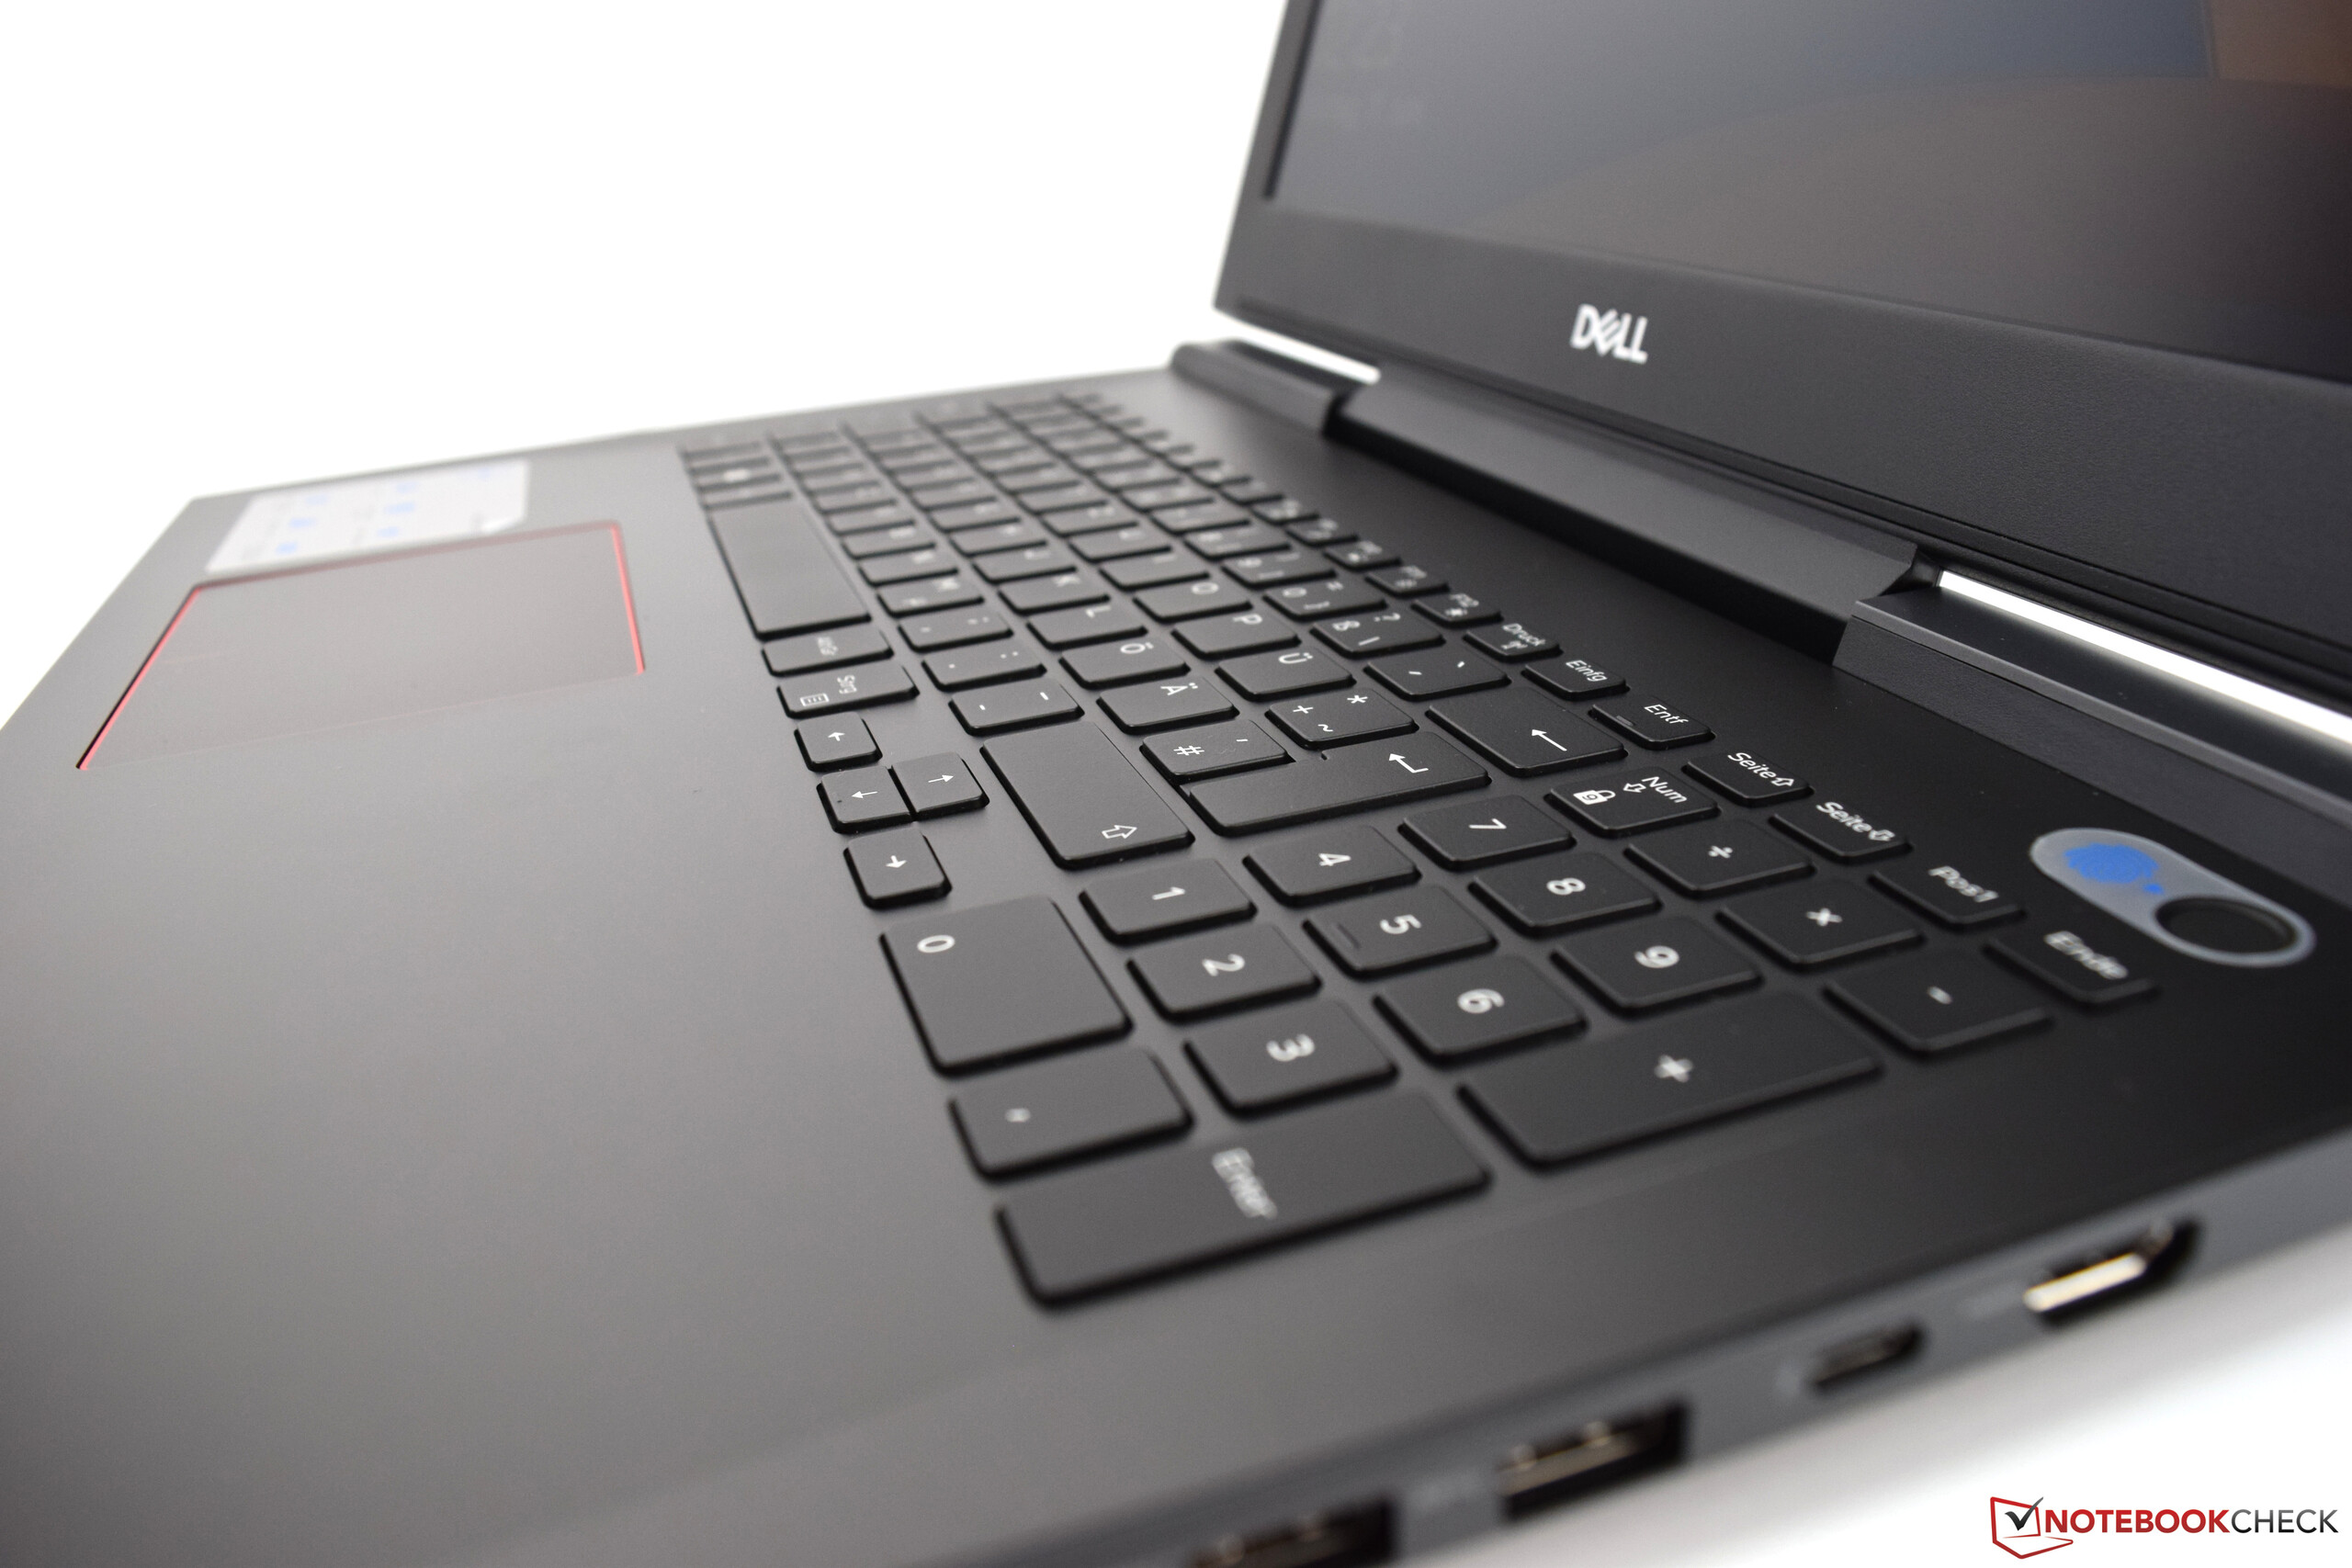
Keyboard
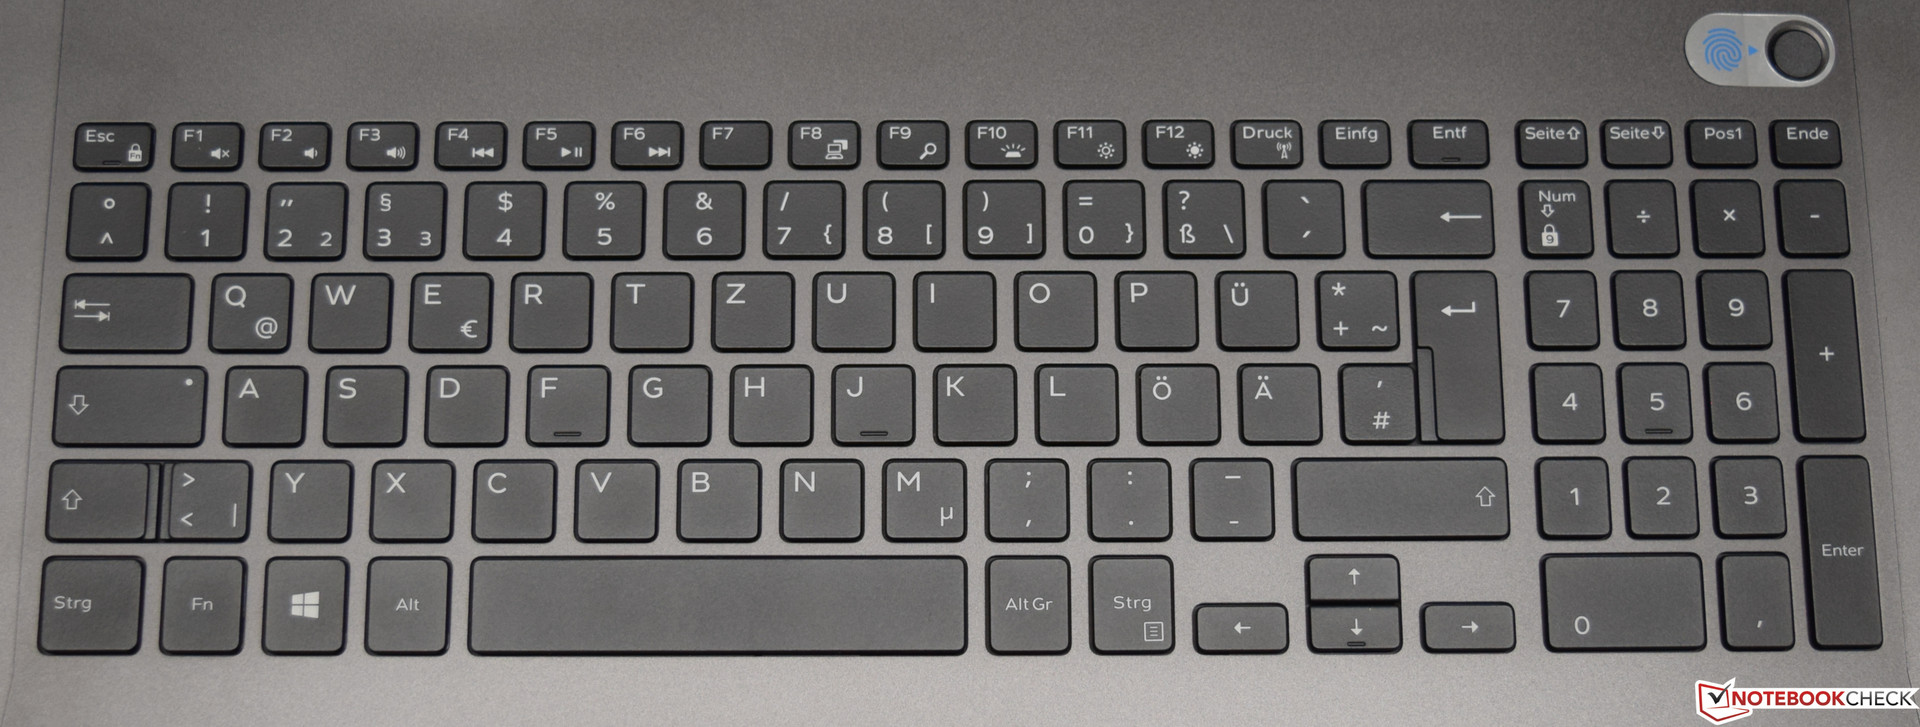
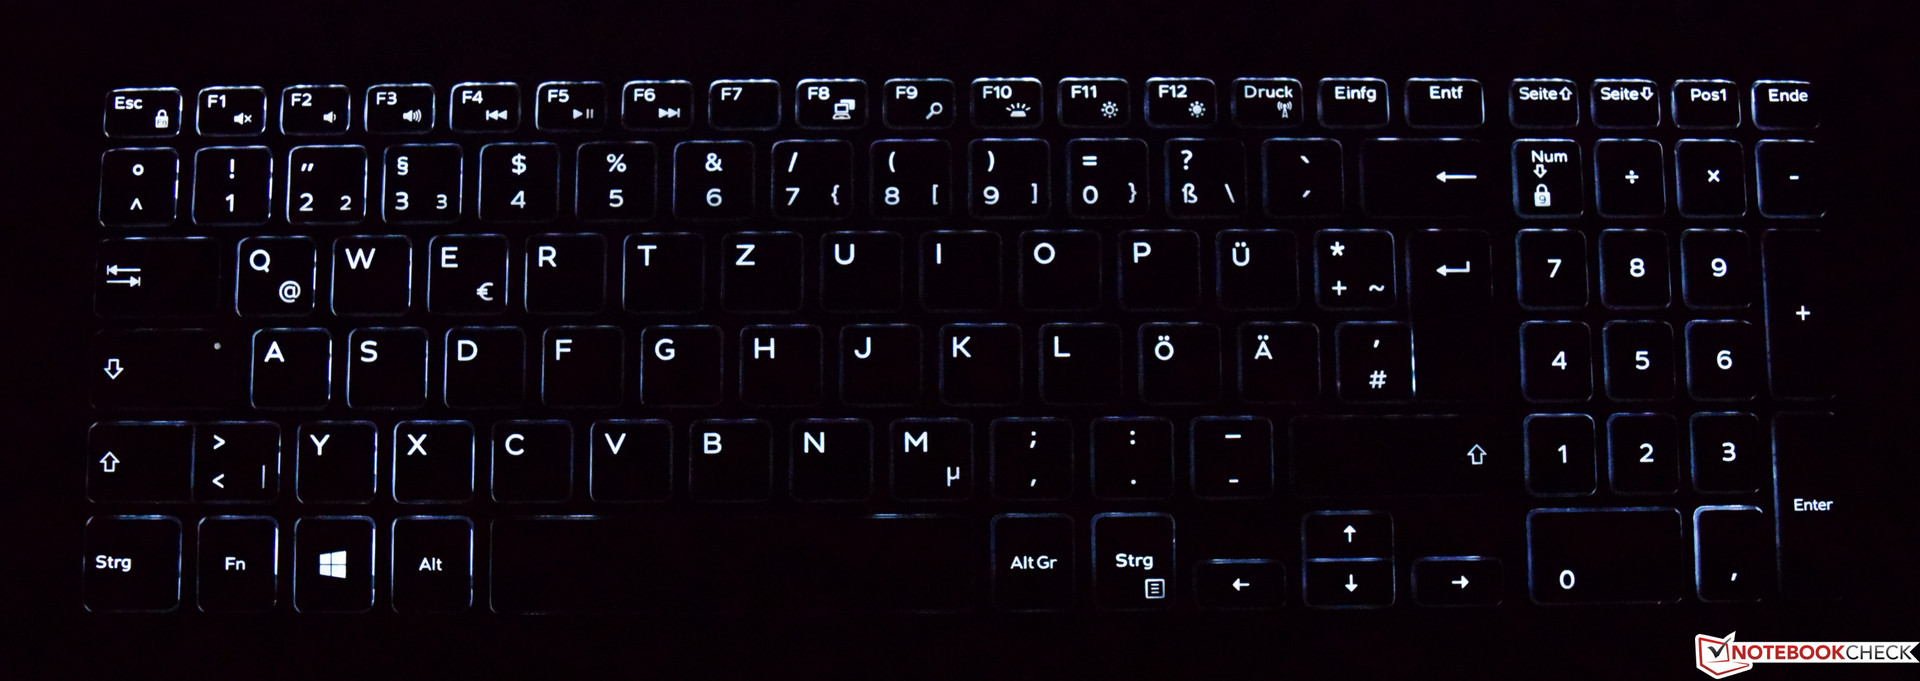
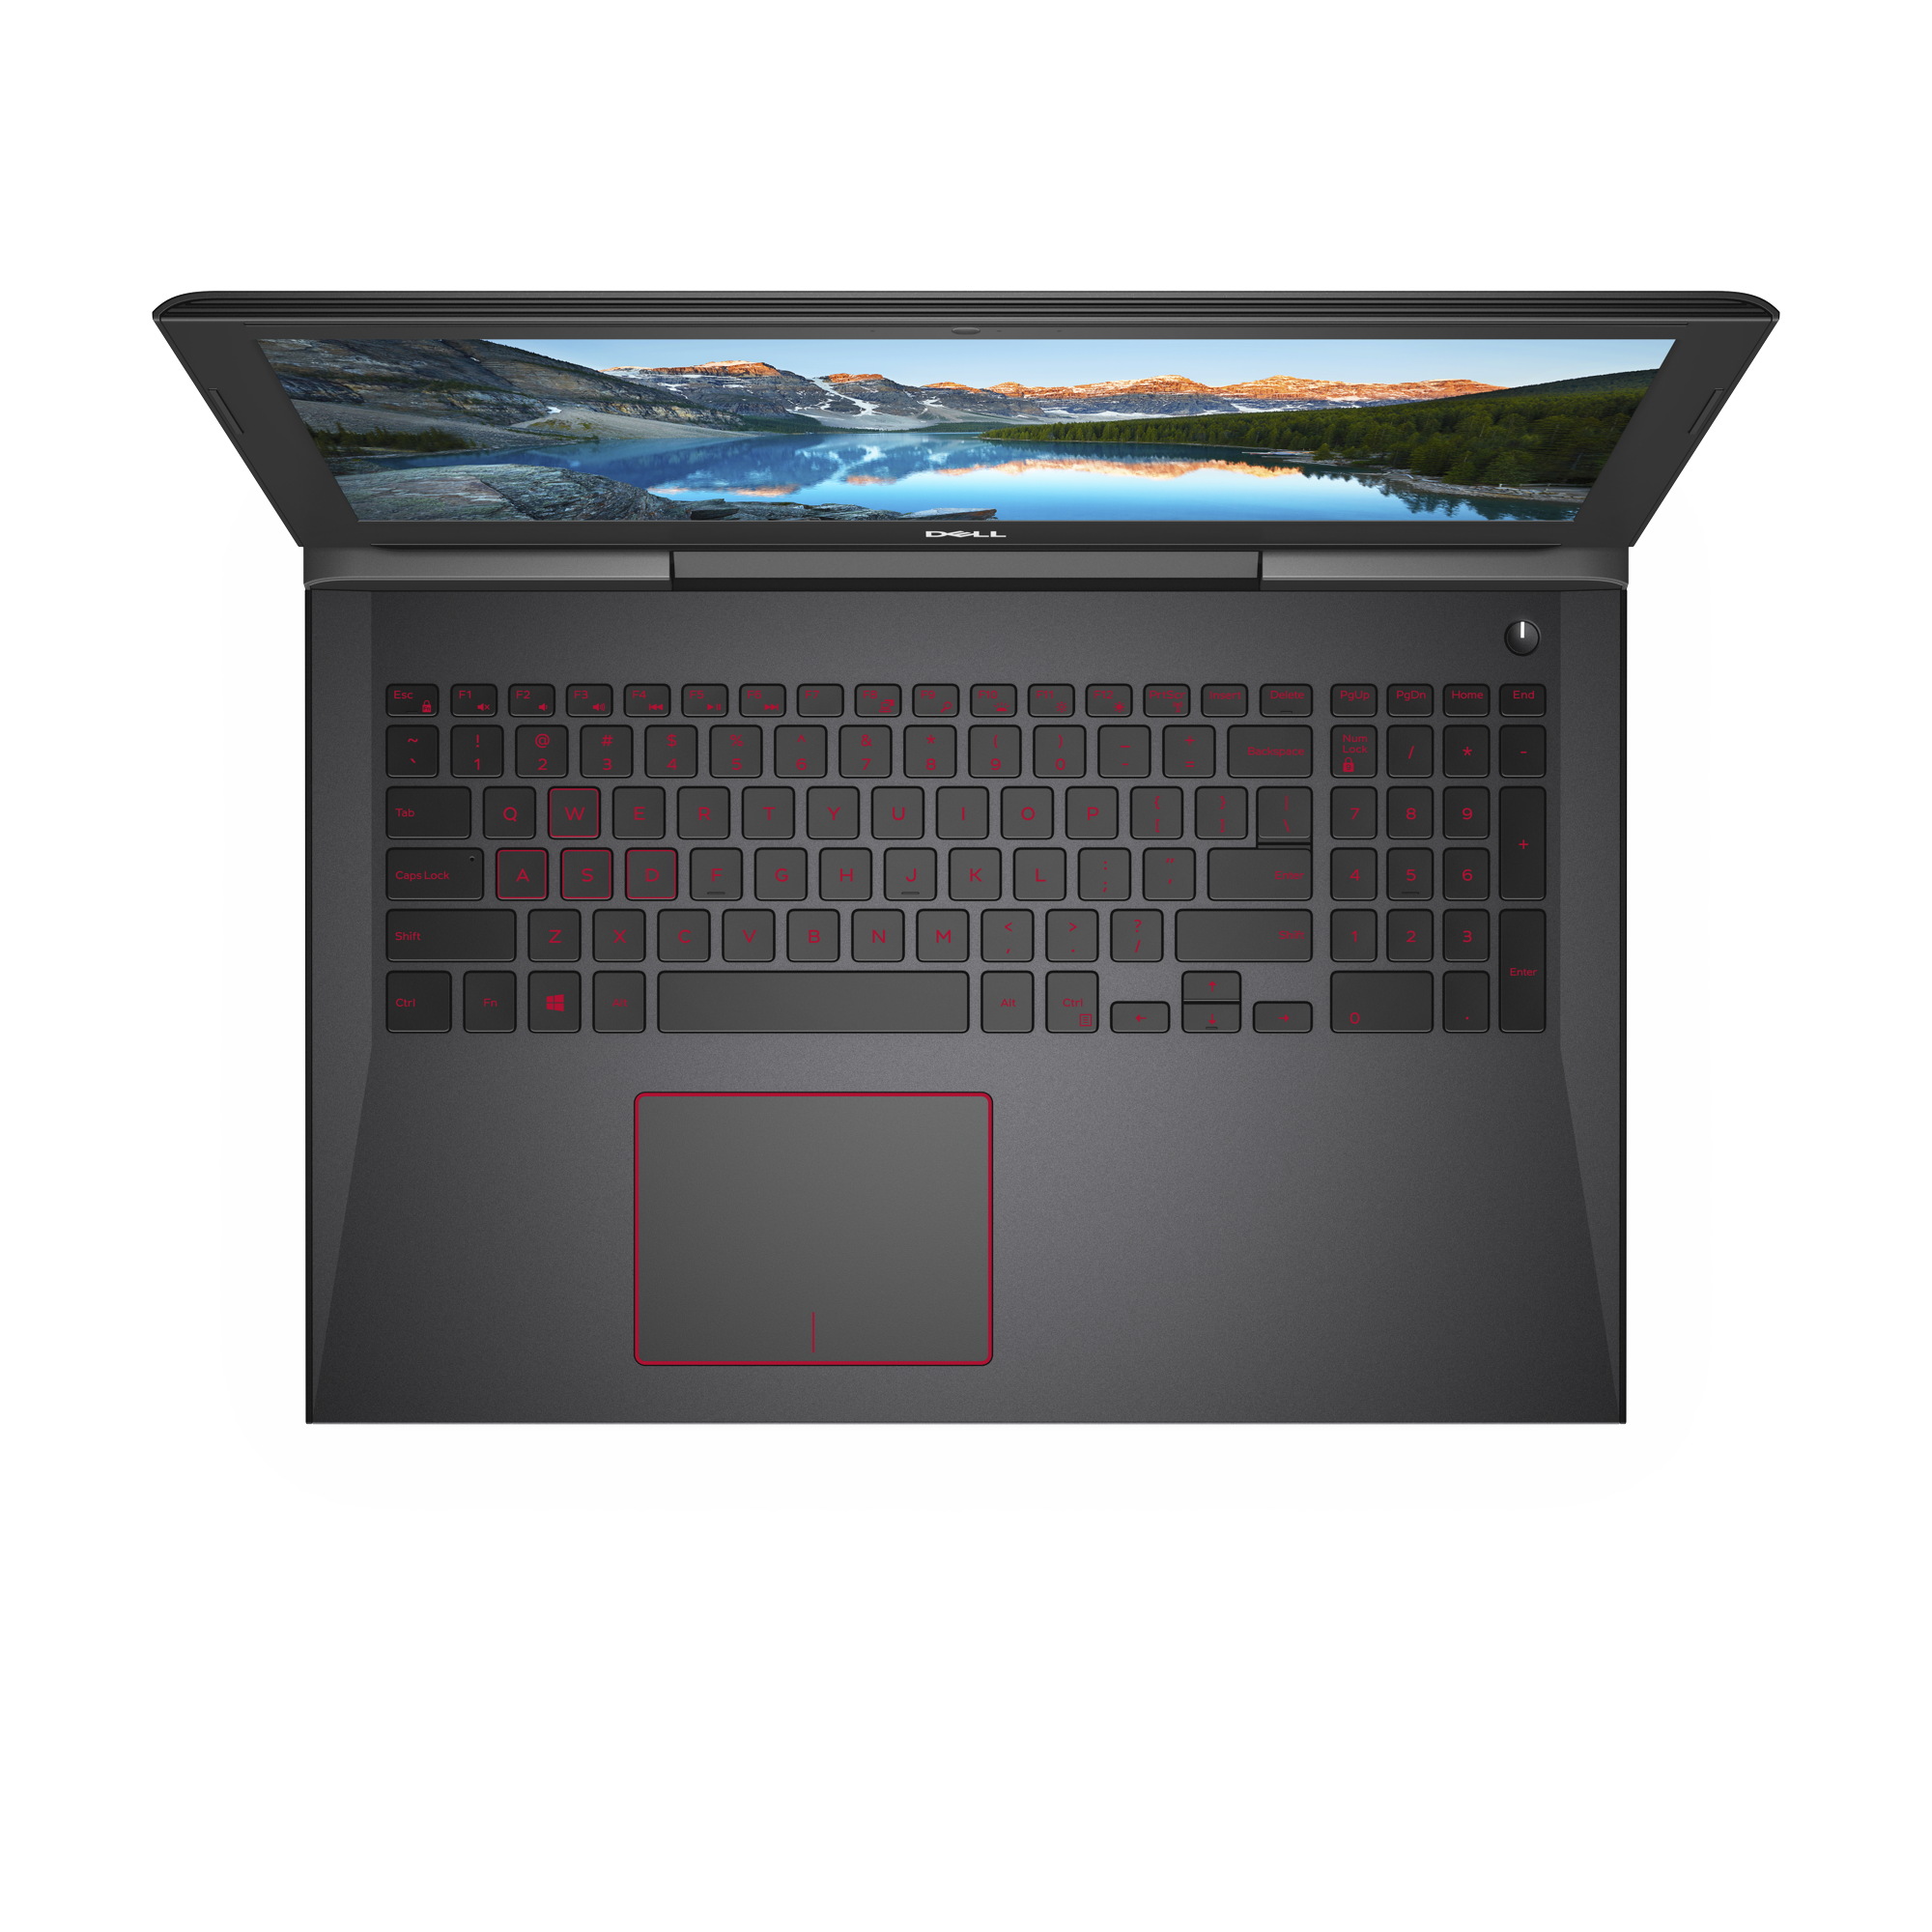
The six-row chiclet keyboard of the Dell G5 15 5587 looks clean and fits the overall impression well. While at 15 x 15 mm (0.6 x 0.6 in), the single keys are not overly large, this should still be sufficient for most users. The short stroke is accompanied by a crisp feedback. The typing noises are only barely audible, which we unfortunately cannot say about the Space key. It appears slightly wobbly and can also be clearly noticed acoustically. The white labeling is supported by a discreet, two-step backlight. Due to the layout, the cursor keys turned out to be slightly too small, which takes some getting used to. Unfortunately, their stroke is slightly softer, so it almost appears dampened.
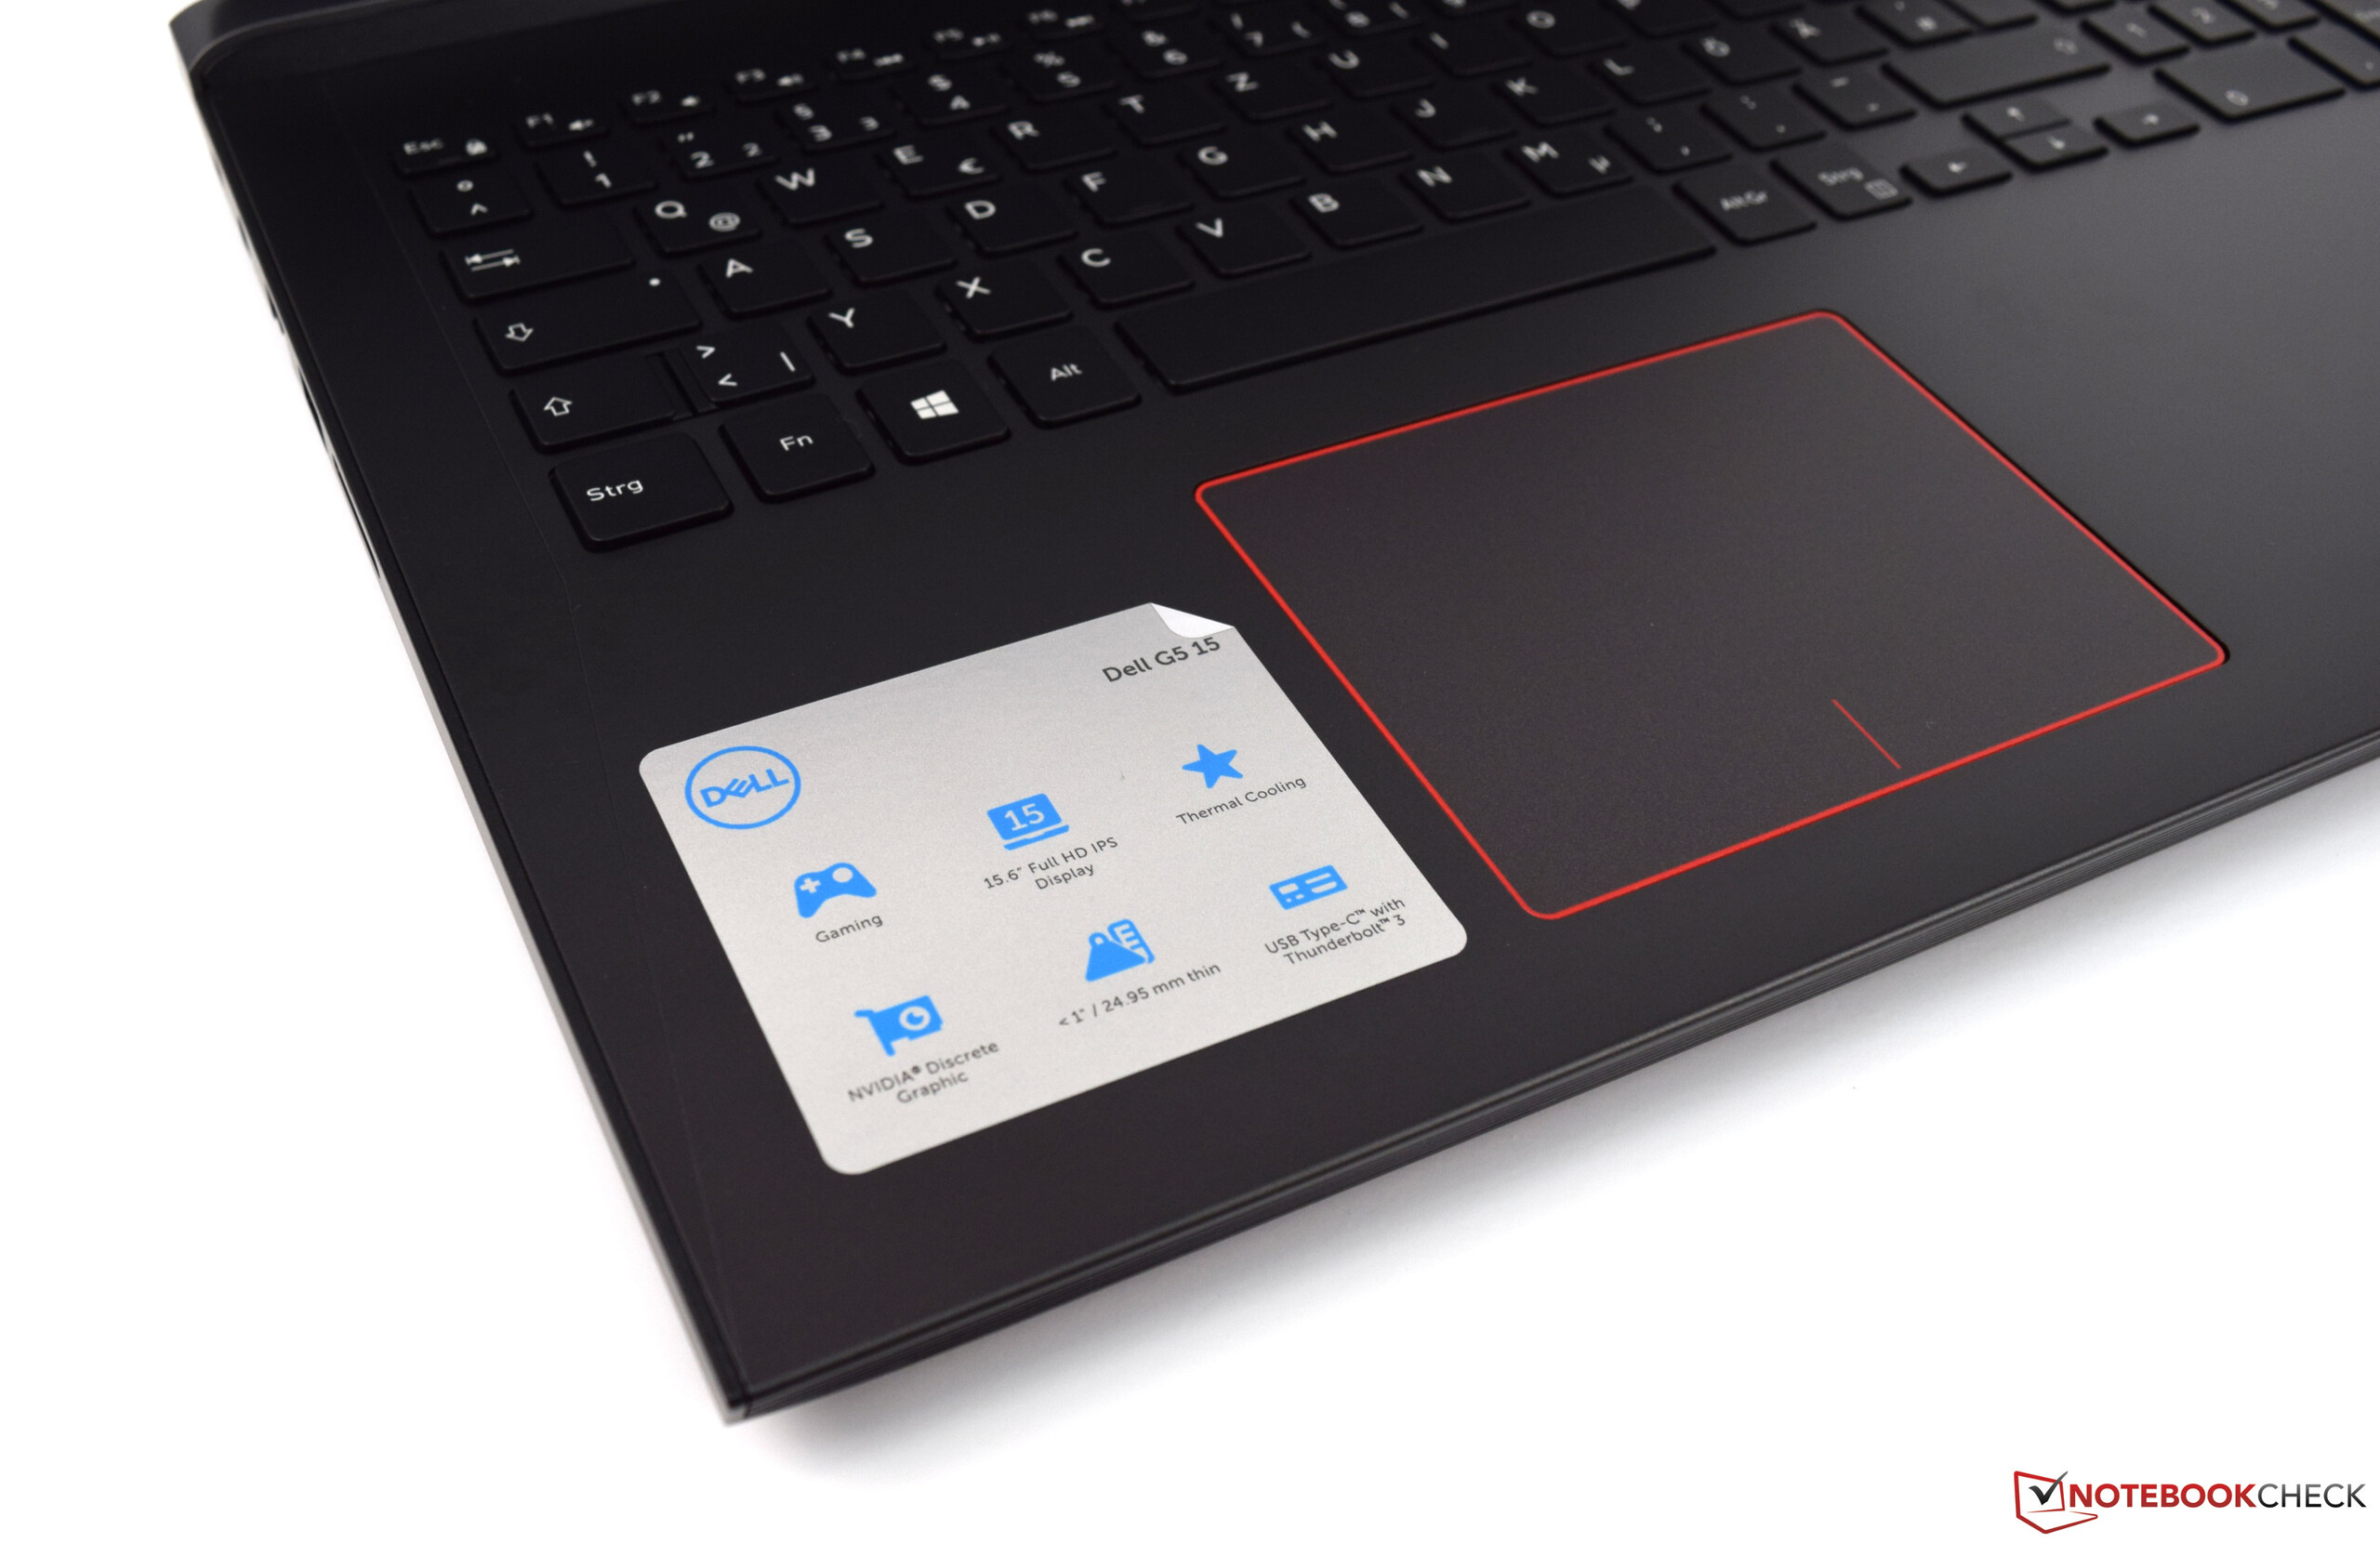
Touchpad

At 10.5 x 8.1 cm (4.1 x 3.2 in), the touchpad offers a comfortably large input area with a matte surface. The touchpad is visually highlighted by a red edge printed on the input area. We did not notice any inaccurate areas in our test unit.
The input keys positioned in the lower area have a short stroke and draw attention with a quiet clicking when pressed. We noticed that the left input key is quieter and softer than the right input key of the ClickPad. The two areas on the input surface are only visually separated by a red line. We like the ClickPad overall, and its large area is particularly advantageous for gesture controls with several fingers.
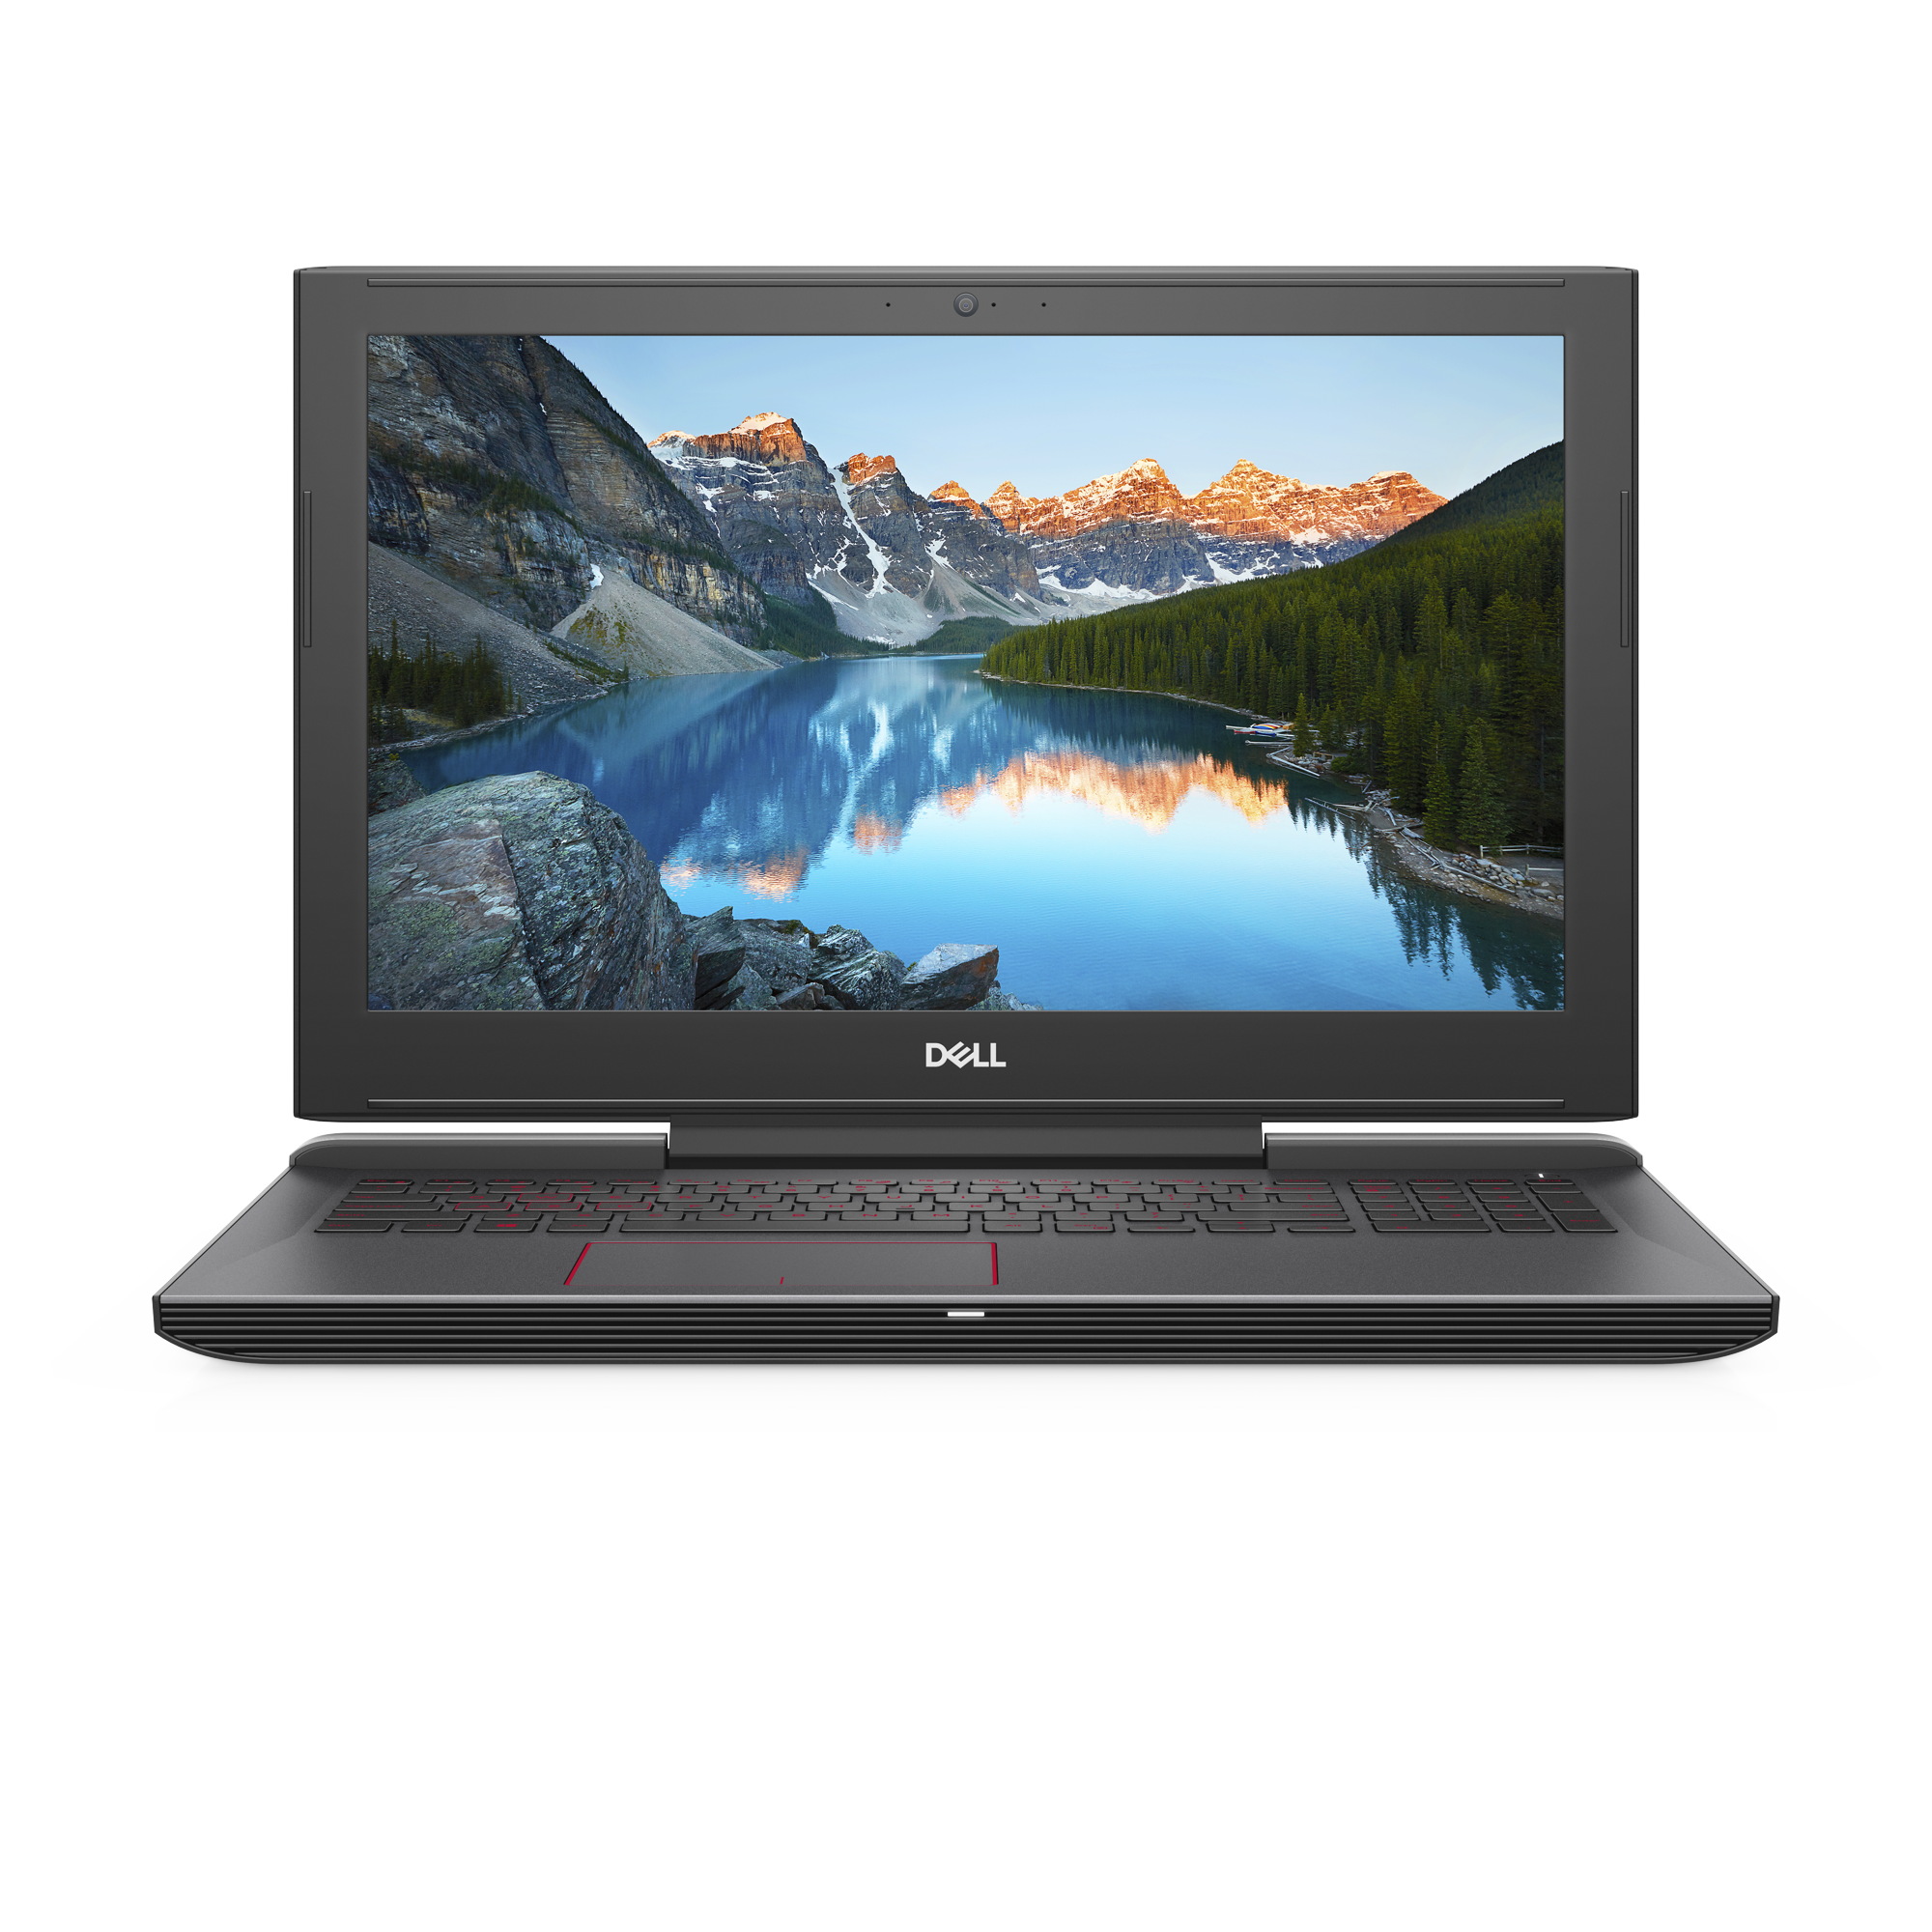
Display - The Dell G5 15 is also available with 4K
The LG display of our Dell G5 15 5587 is the same as that of the Dell Inspiron 15 7000. With a diagonal of 15.5 inch, the IPS panel offers 1920x1080 pixels, corresponding to a pixel density of 141 ppi. As an alternative to the Full HD panel, Dell also offers the G5 15 with a 4K display. Unfortunately, the display of our test unit only has a low display brightness of 224 cd/m². With an average of 332 cd/m², the Acer Nitro 5 Spin offers the brightest display by far in our comparison. The contrast ratio (818:1) suffers from the too-low brightness, since the black value is not particularly high at 0.28.
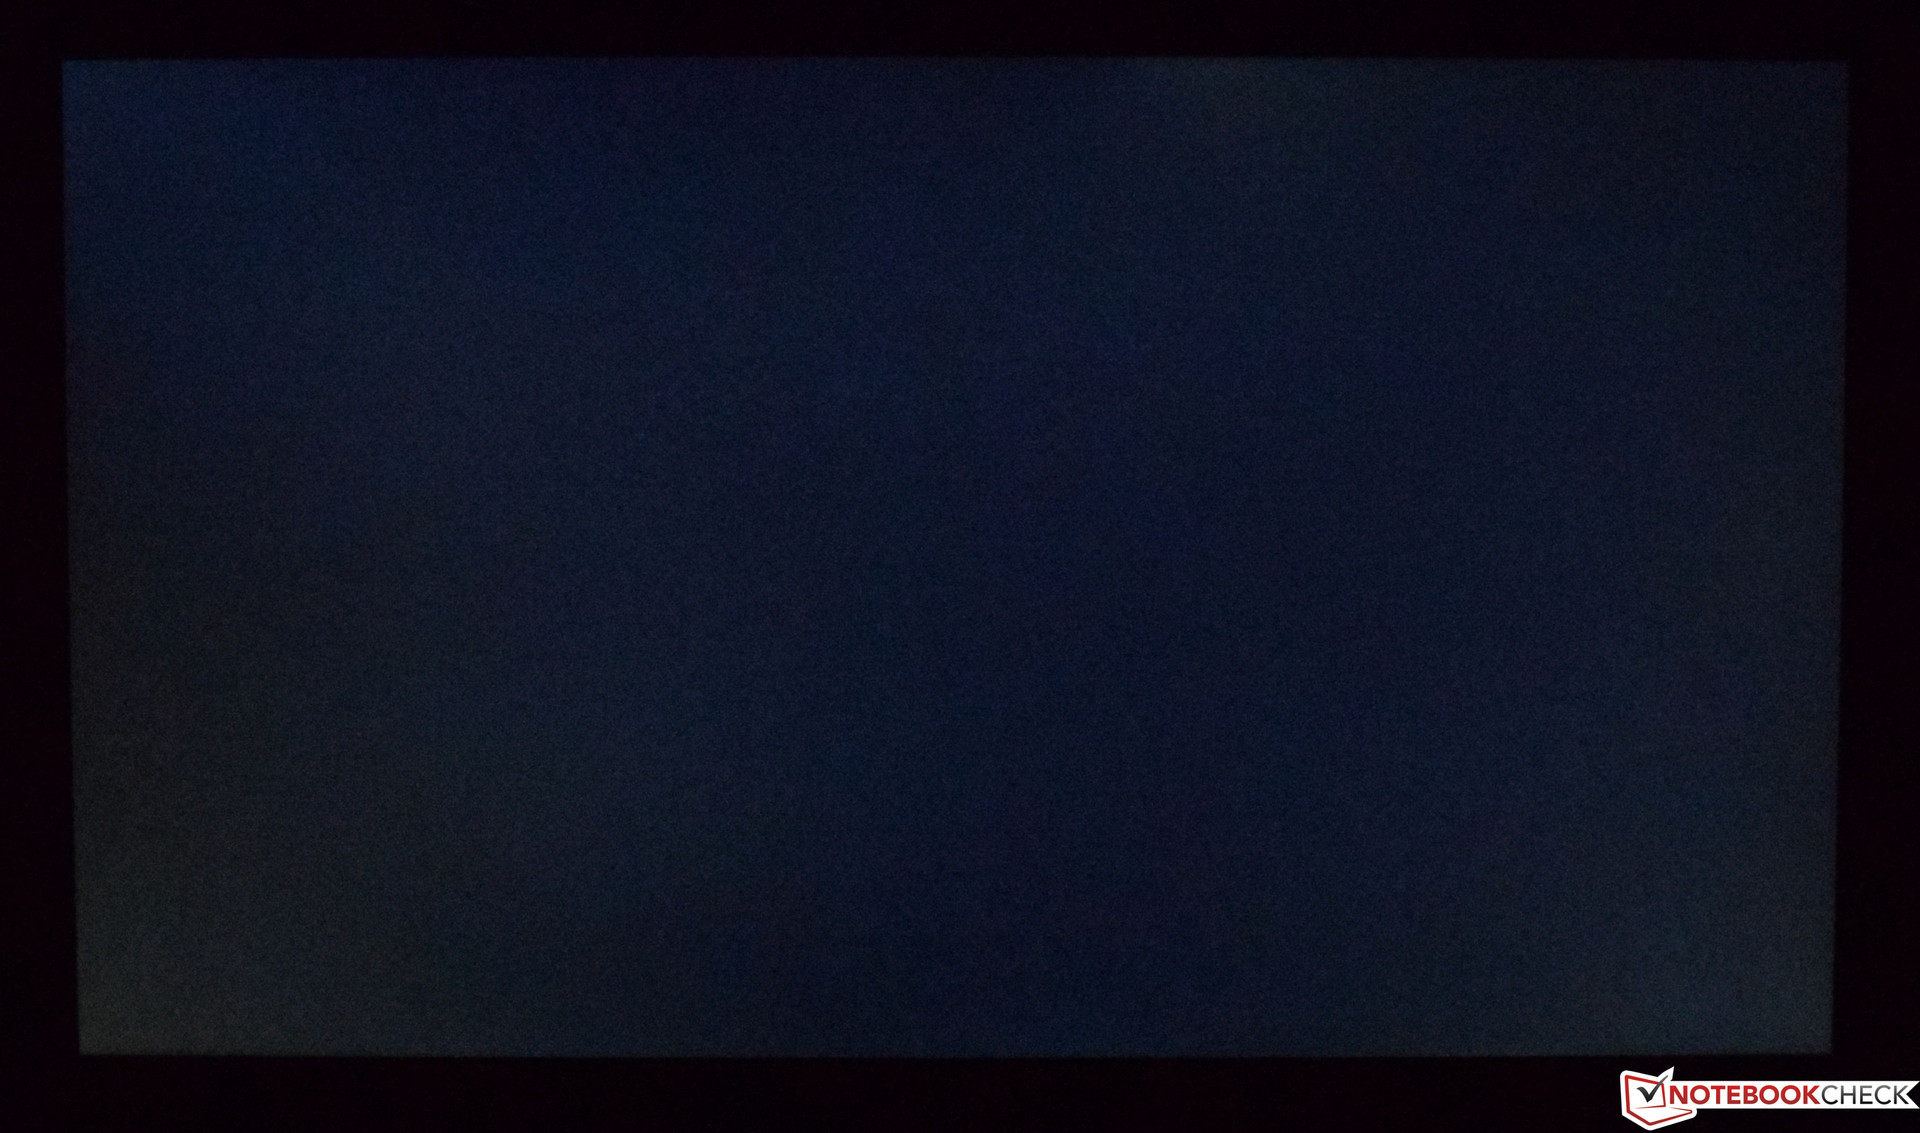
The brightness distribution is good in our test unit, and despite our measurement of 87%, we did not notice any shadings. However, the display does have some slight problems with a completely black image, where some clouding can be seen in the lower left corner. The panel deserves some praise for not using PWM to regulate the display brightness.
| |||||||||||||||||||||||||
Brightness Distribution: 87 %
Center on Battery: 229 cd/m²
Contrast: 818:1 (Black: 0.28 cd/m²)
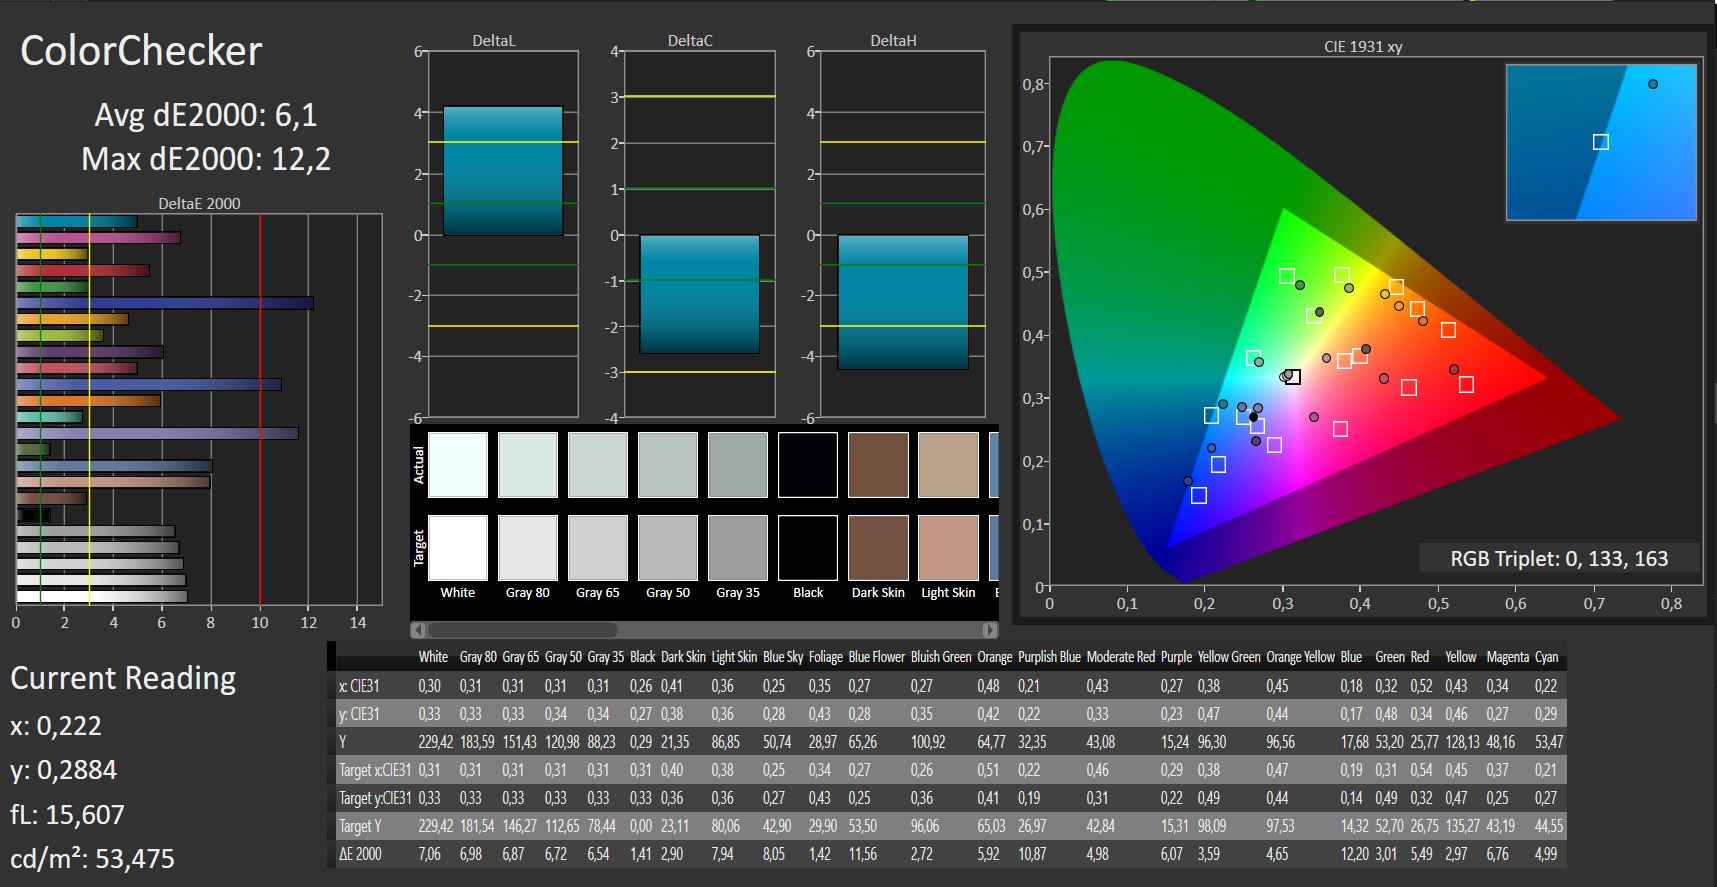
ΔE ColorChecker Calman: 6.1 | ∀{0.5-29.43 Ø4.73}
calibrated: 6.12
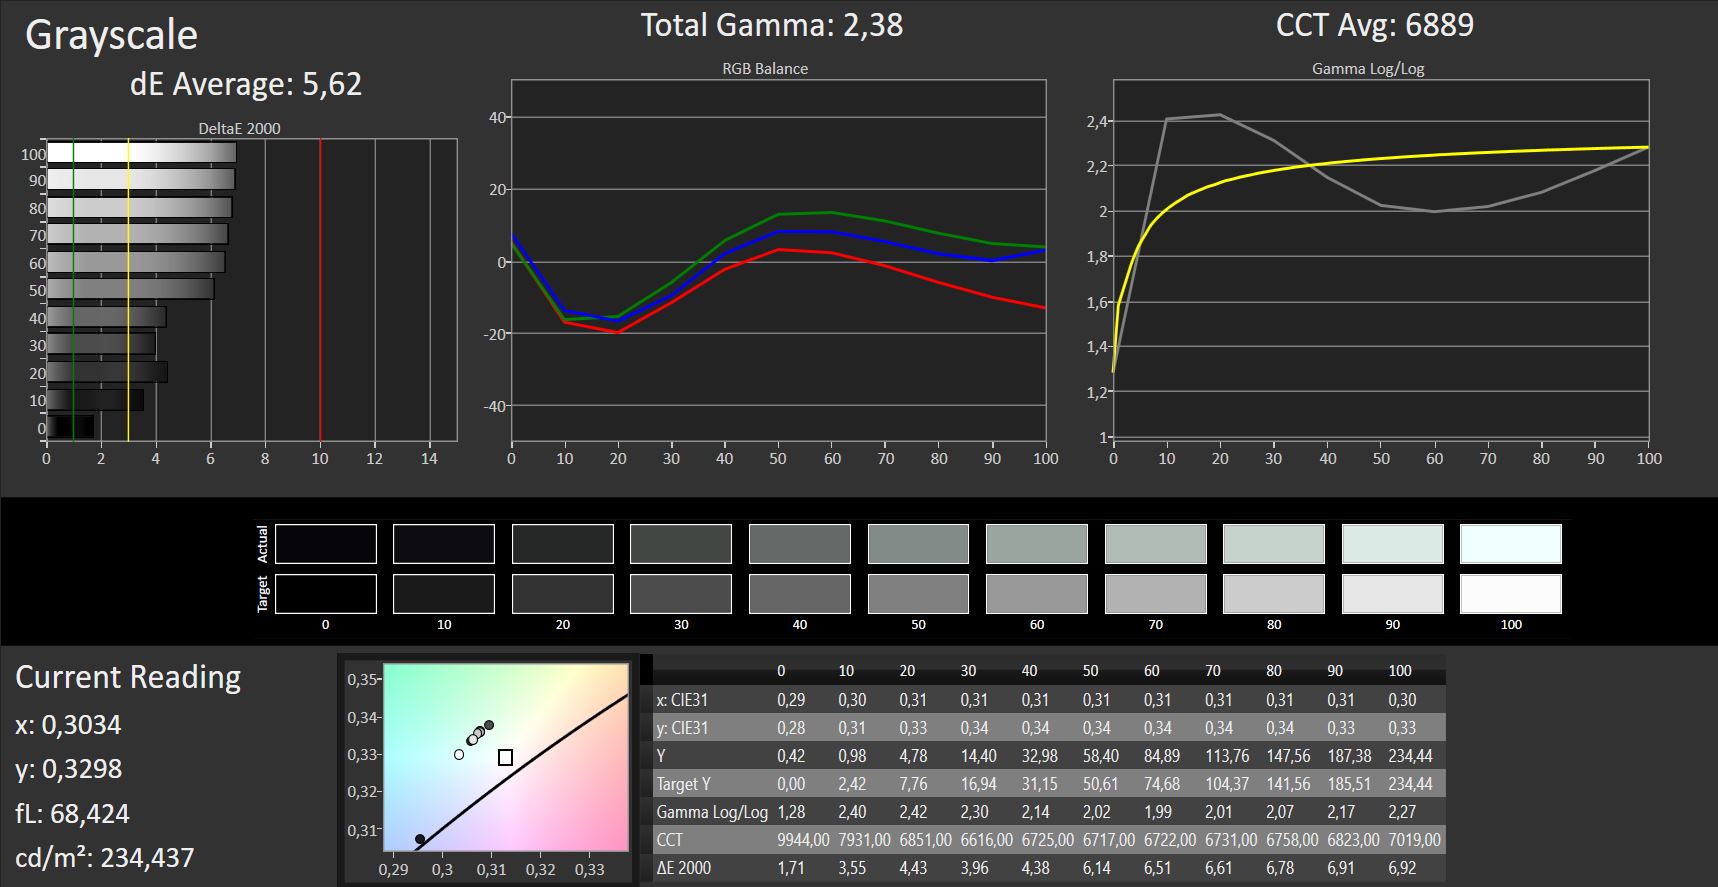
ΔE Greyscale Calman: 5.68 | ∀{0.09-98 Ø4.97}
57% sRGB (Argyll 1.6.3 3D)
36% AdobeRGB 1998 (Argyll 1.6.3 3D)
39.47% AdobeRGB 1998 (Argyll 3D)
56.8% sRGB (Argyll 3D)
38.13% Display P3 (Argyll 3D)
Gamma: 2.4
CCT: 6989 K
| Dell G5 15 5587 LGD053F, 156WF6, 1920x1080, 15.6" | Dell Inspiron 15 7000 7577 ID: LG Philips LGD053F, Name: 156WF6, Dell P/N: 4XK13, 1920x1080, 15.6" | Dell Inspiron 15 7000 7577 ID: LG Philips LGD053F, Name: 156WF6, Dell P/N: 4XK13, 1920x1080, 15.6" | PC Zentrum Proteus V BOEhydis NV156FHM-N42 (BOE06C6), 1920x1080, 15.6" | Asus FX503VM-EH73 AU Optronics B156HAN06.1, 1920x1080, 15.6" | Acer Nitro 5 Spin NP515-51-86CX Chi Mei CMN15D7, 1920x1080, 15.6" | Acer Predator Helios 300 PH317-52-51M6 LG Philips LP173WF4-SPF5 (LGD056D), 1920x1080, 17.3" | |
|---|---|---|---|---|---|---|---|
| Display | 6% | -3% | 2% | -2% | 67% | 63% | |
| Display P3 Coverage (%) | 38.13 | 40.4 6% | 37.07 -3% | 39.13 3% | 37.48 -2% | 64.9 70% | 67.1 76% |
| sRGB Coverage (%) | 56.8 | 60.5 7% | 55.6 -2% | 58 2% | 56.3 -1% | 92.6 63% | 86.1 52% |
| AdobeRGB 1998 Coverage (%) | 39.47 | 41.77 6% | 38.32 -3% | 40.42 2% | 38.72 -2% | 66.3 68% | 63 60% |
| Response Times | -21% | -12% | -63% | -22% | -9% | -1% | |
| Response Time Grey 50% / Grey 80% * (ms) | 33 ? | 41 ? -24% | 35.6 ? -8% | 52.8 ? -60% | 36.8 ? -12% | 36 ? -9% | 36 ? -9% |
| Response Time Black / White * (ms) | 24 ? | 28 ? -17% | 27.6 ? -15% | 39.6 ? -65% | 31.6 ? -32% | 26 ? -8% | 22 ? 8% |
| PWM Frequency (Hz) | 21930 ? | 122000 ? | |||||
| Screen | 19% | -2% | 21% | 1% | 25% | 23% | |
| Brightness middle (cd/m²) | 229 | 257 12% | 235.4 3% | 242 6% | 235.9 3% | 345 51% | 365 59% |
| Brightness (cd/m²) | 224 | 229 2% | 223 0% | 235 5% | 235 5% | 332 48% | 341 52% |
| Brightness Distribution (%) | 87 | 84 -3% | 91 5% | 85 -2% | 91 5% | 92 6% | 89 2% |
| Black Level * (cd/m²) | 0.28 | 0.17 39% | 0.28 -0% | 0.21 25% | 0.27 4% | 0.28 -0% | 0.32 -14% |
| Contrast (:1) | 818 | 1512 85% | 841 3% | 1152 41% | 874 7% | 1232 51% | 1141 39% |
| Colorchecker dE 2000 * | 6.1 | 5.34 12% | 5.6 8% | 4.27 30% | 4.81 21% | 5.85 4% | 6.51 -7% |
| Colorchecker dE 2000 max. * | 12.2 | 9.99 18% | 20.3 -66% | 7.09 42% | 21.55 -77% | 11.87 3% | 12.32 -1% |
| Colorchecker dE 2000 calibrated * | 6.12 | 2.9 53% | |||||
| Greyscale dE 2000 * | 5.68 | 4.82 15% | 3.6 37% | 2.17 62% | 3.1 45% | 8.11 -43% | 7.65 -35% |
| Gamma | 2.4 92% | 2.46 89% | 2.23 99% | 2.38 92% | 2.31 95% | 2.48 89% | 2.64 83% |
| CCT | 6989 93% | 6587 99% | 7214 90% | 6912 94% | 6984 93% | 6741 96% | 8066 81% |
| Color Space (Percent of AdobeRGB 1998) (%) | 36 | 38 6% | 35.2 -2% | 37 3% | 36 0% | 60 67% | 56 56% |
| Color Space (Percent of sRGB) (%) | 57 | 60 5% | 55.4 -3% | 58 2% | 56 -2% | 93 63% | 86 51% |
| Total Average (Program / Settings) | 1% /
11% | -6% /
-3% | -13% /
6% | -8% /
-3% | 28% /
29% | 28% /
28% |
* ... smaller is better
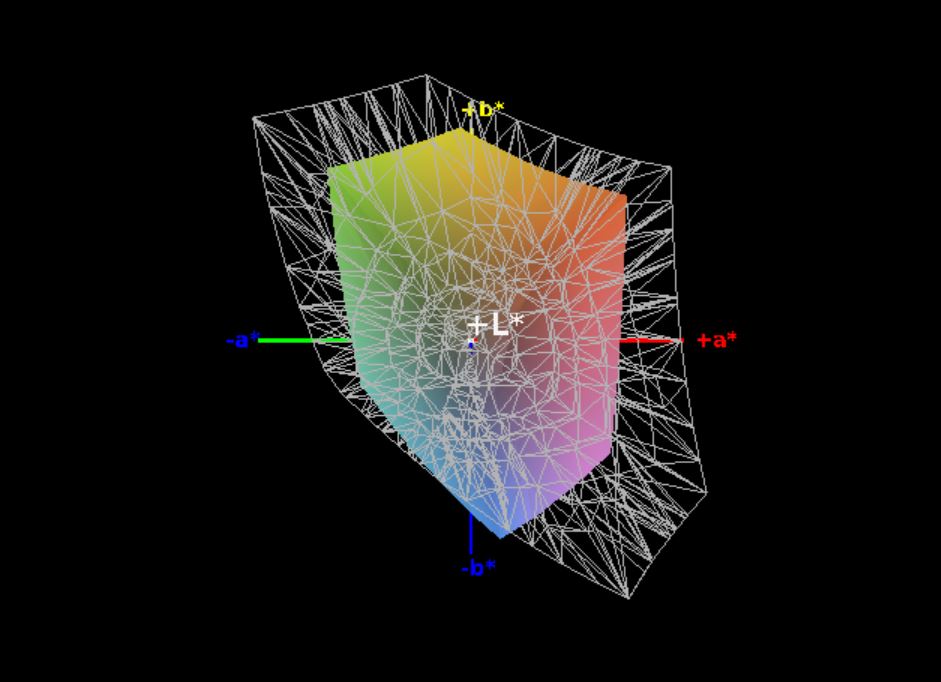
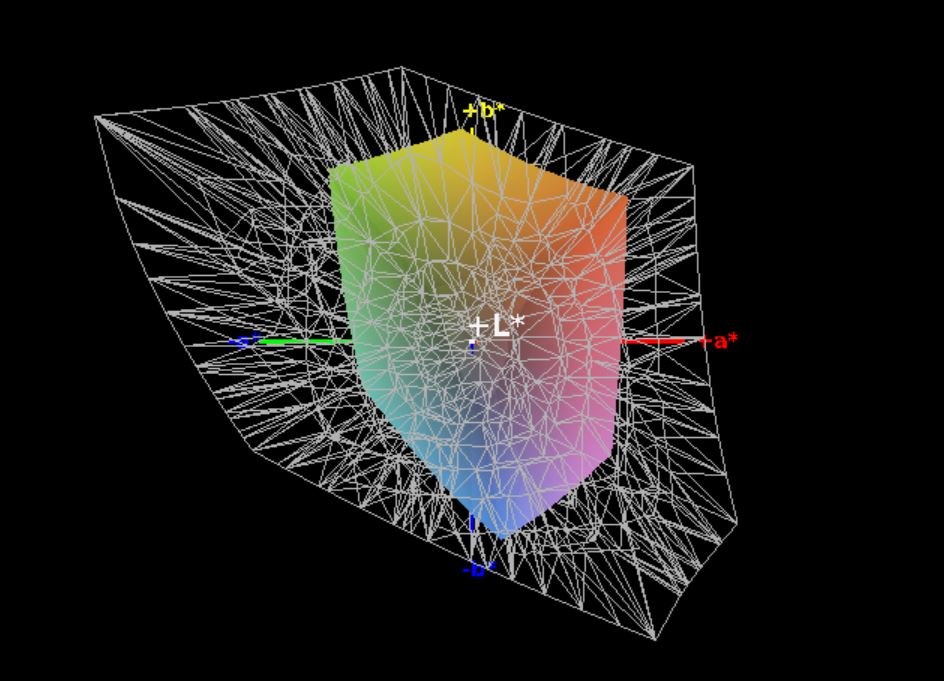
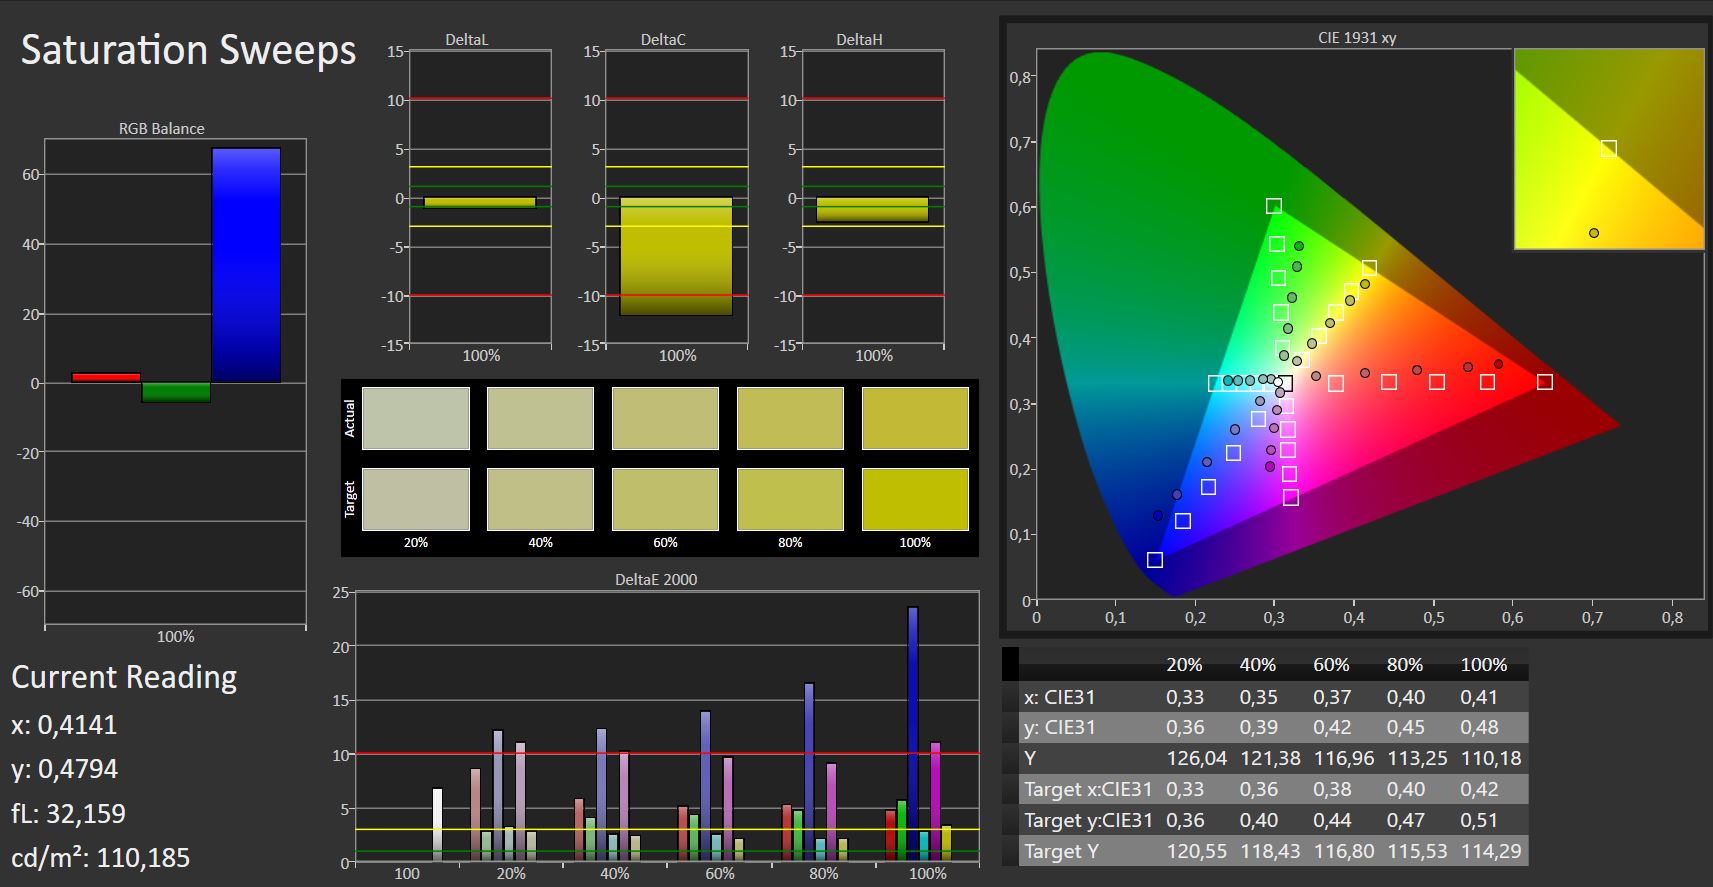
The offered image quality suffers from the low contrast. Colors appear slightly paler and black areas are covered by a visible gray veil. The measured DeltaE-2000 deviations are slightly too high in the state of delivery, and even calibration could only provide a marginal improvement. We have linked the corresponding ICC profile for download. However, compared to the other devices, the Dell G5 15 5587 does not need to hide, since they do not offer results that are much better. In color-space coverage (57% sRGB and 36% AdobeRGB), the Dell G5 15 5587 is also at the same level as the other devices in our comparison. Only the Acer Nitro 5 Spin is able to stand out here.


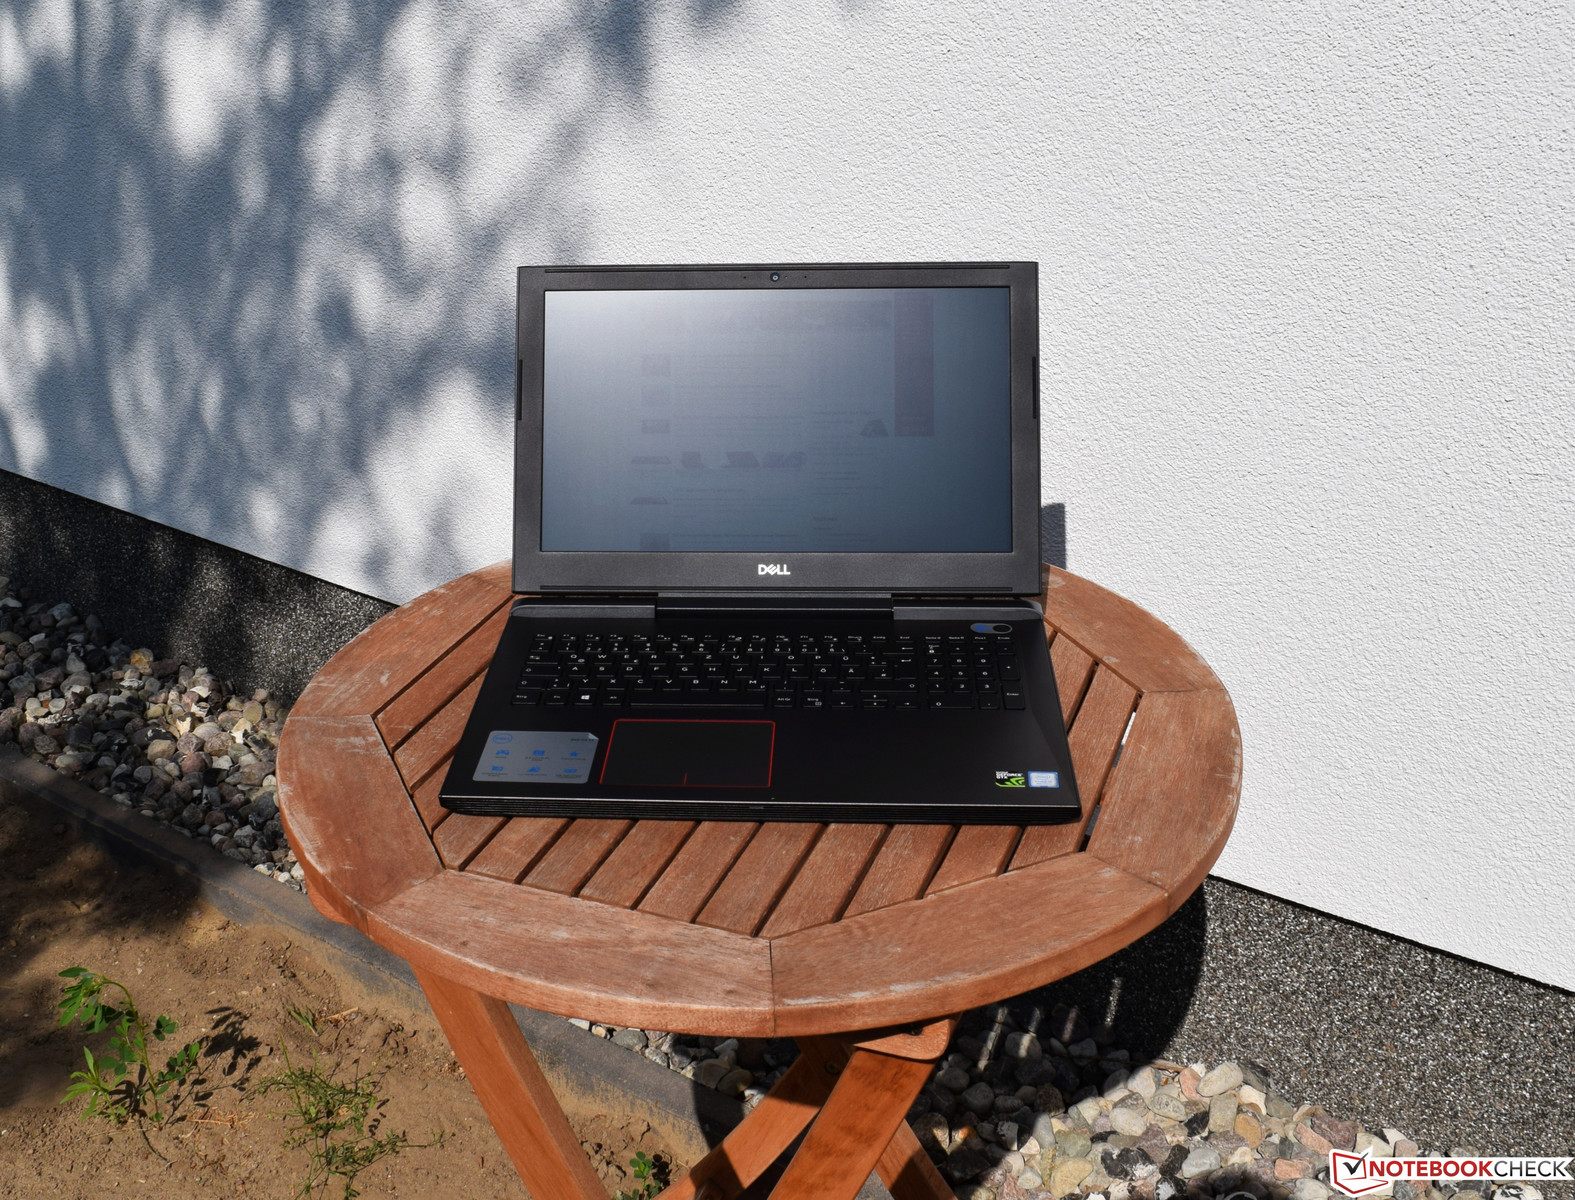
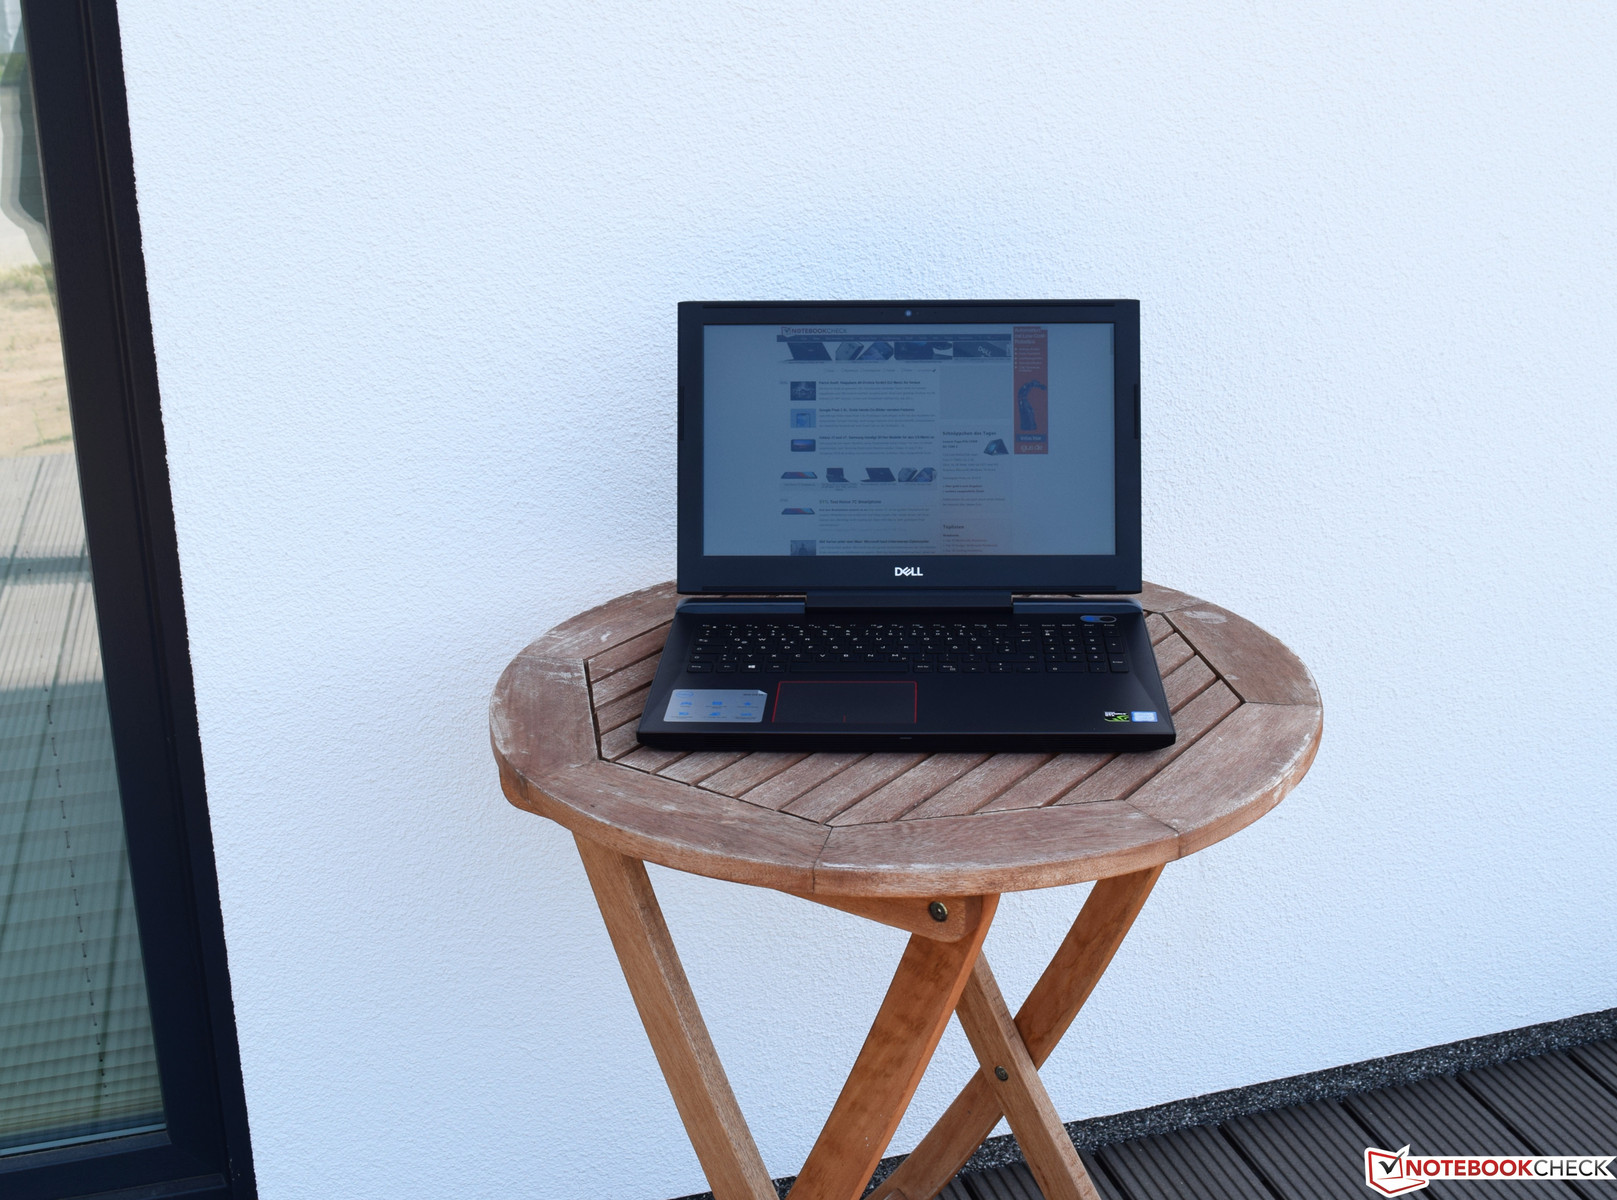
Despite the matte display surface, those who want to use the Dell G5 15 5587 outdoors should look for a shady place. In direct sunlight, the display brightness is insufficient to work unimpeded.
Display Response Times
| ↔ Response Time Black to White | ||
|---|---|---|
| 24 ms ... rise ↗ and fall ↘ combined | ↗ 14 ms rise | 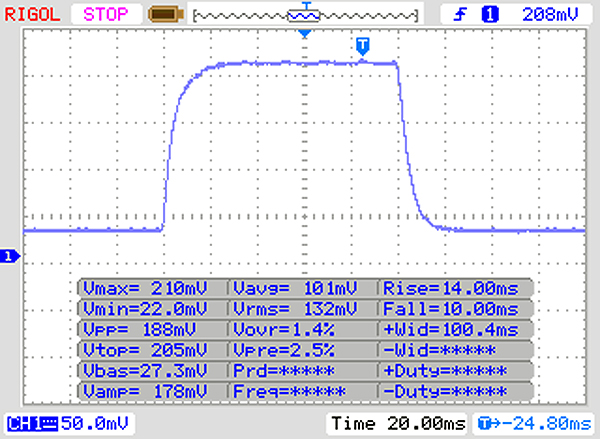 |
| ↘ 10 ms fall | ||
| The screen shows good response rates in our tests, but may be too slow for competitive gamers. In comparison, all tested devices range from 0.1 (minimum) to 240 (maximum) ms. » 54 % of all devices are better. This means that the measured response time is worse than the average of all tested devices (19.9 ms). | ||
| ↔ Response Time 50% Grey to 80% Grey | ||
| 33 ms ... rise ↗ and fall ↘ combined | ↗ 16 ms rise | 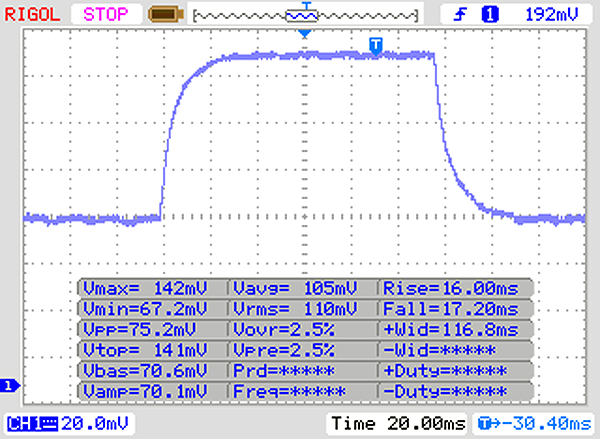 |
| ↘ 17 ms fall | ||
| The screen shows slow response rates in our tests and will be unsatisfactory for gamers. In comparison, all tested devices range from 0.165 (minimum) to 636 (maximum) ms. » 45 % of all devices are better. This means that the measured response time is similar to the average of all tested devices (31.1 ms). | ||
Screen Flickering / PWM (Pulse-Width Modulation)
| Screen flickering / PWM not detected |  | ||
In comparison: 52 % of all tested devices do not use PWM to dim the display. If PWM was detected, an average of 7794 (minimum: 5 - maximum: 343500) Hz was measured. | |||
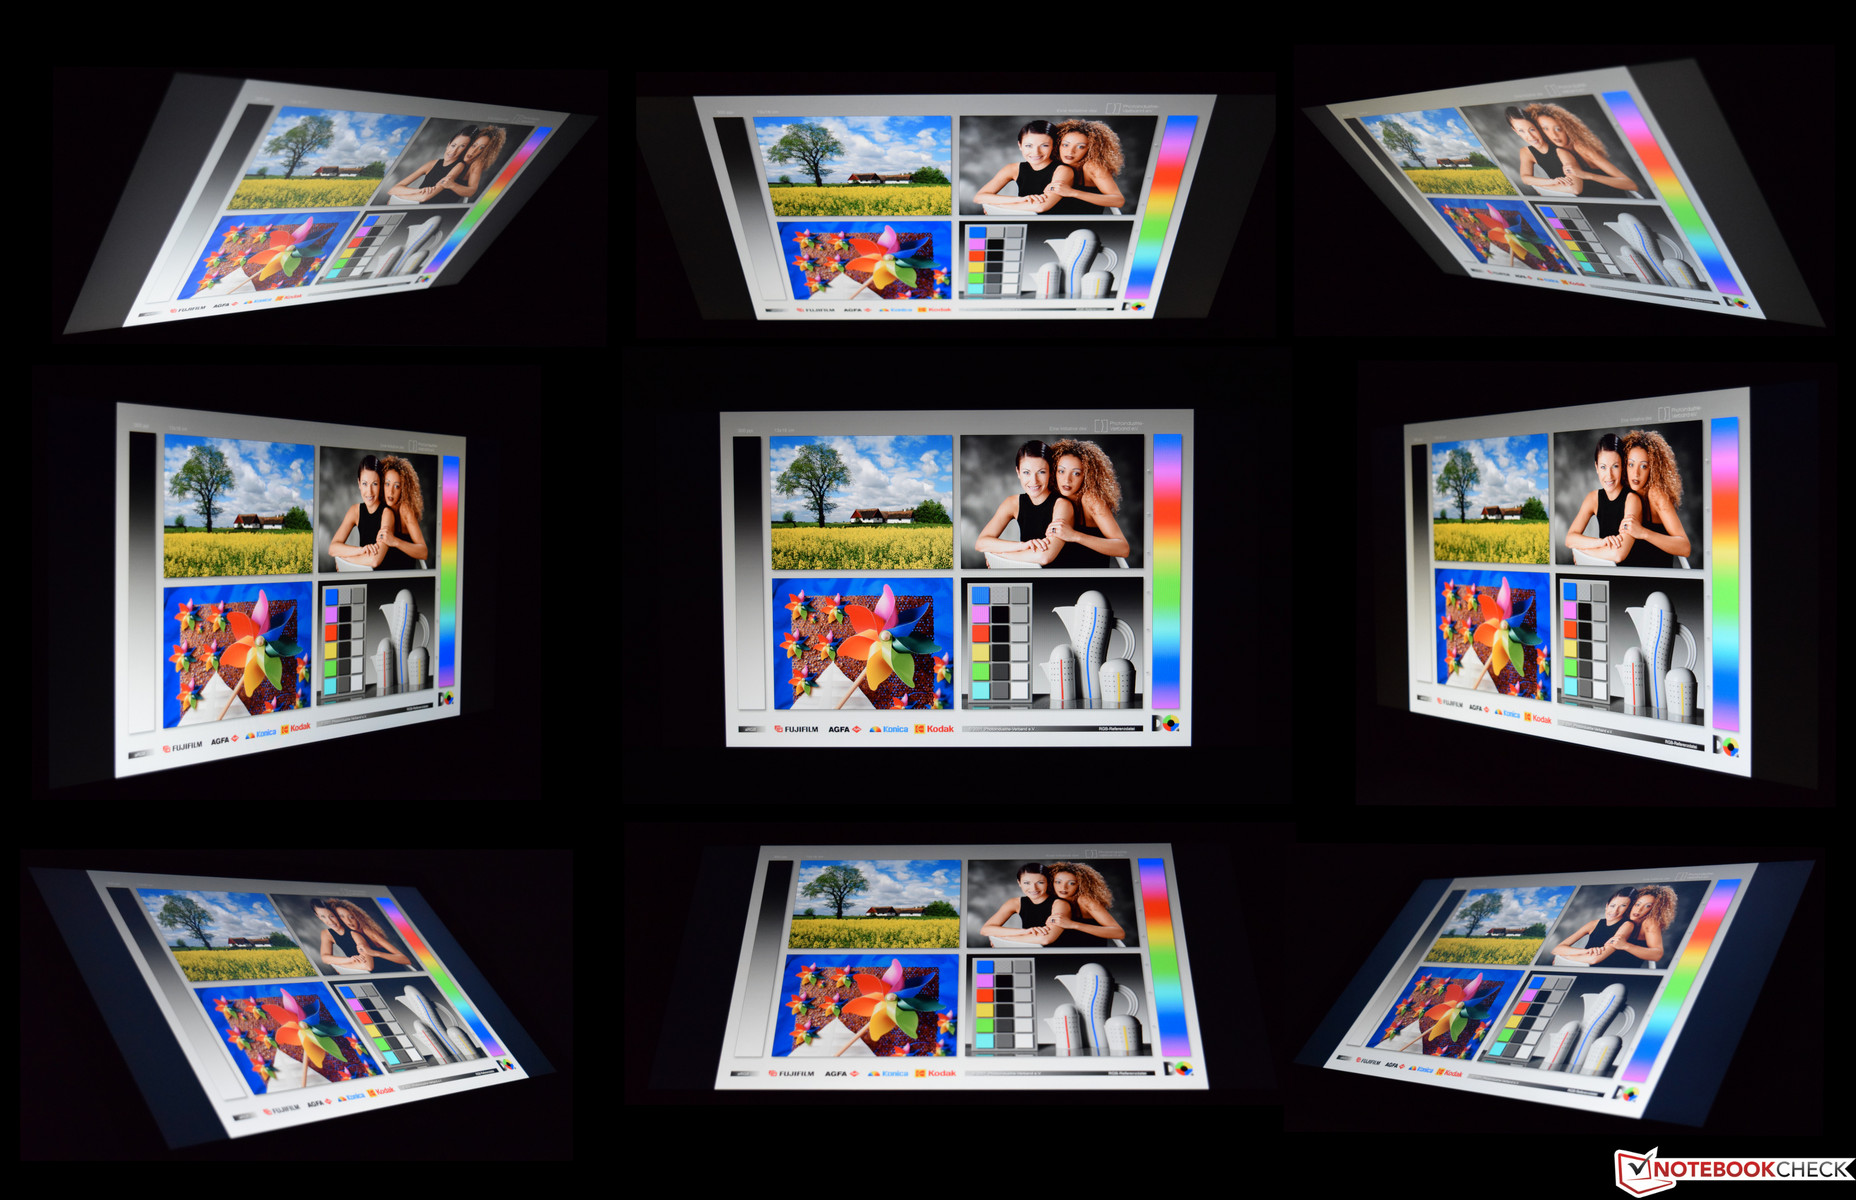
In the viewing-angle test, the IPS display is still able to collect some positive points with good stability. You can still see the test image without significant color changes from very steep viewing angles.
Performance - The Dell G5 15 with four or six cores
Basically, a gaming notebook can never be powerful enough. However, manufacturers must control the waste power of the components. With the Intel Core i5-8300H, Dell has equipped the G5 15 with a solid and fast quad-core CPU, which in combination with the Nvidia GeForce GTX 1060 Max-Q ensures good frame rates. Those who must have a six-core CPU can also get the gaming laptop with the Intel Core i7-8750H. There is no better GPU for this device.
While the significantly increased latencies ("LatencyMon") stand out in our test unit, these might be improved with driver updates in the future. We did not notice any limitations in this respect during our testing period.
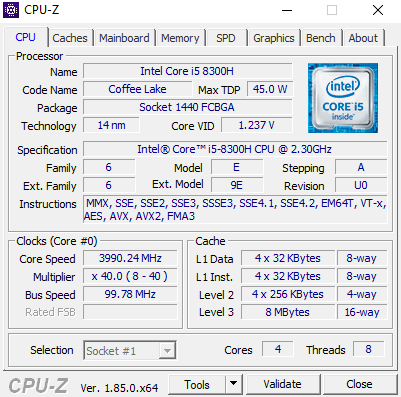
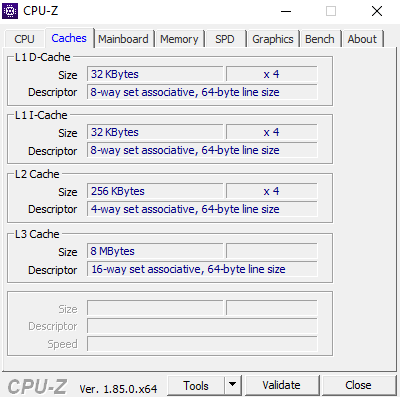
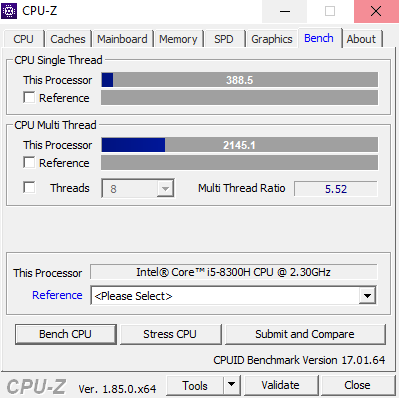


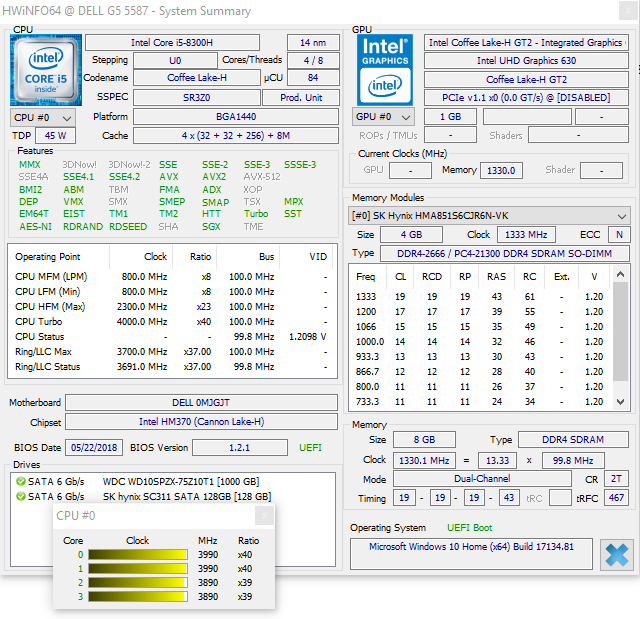
Processor
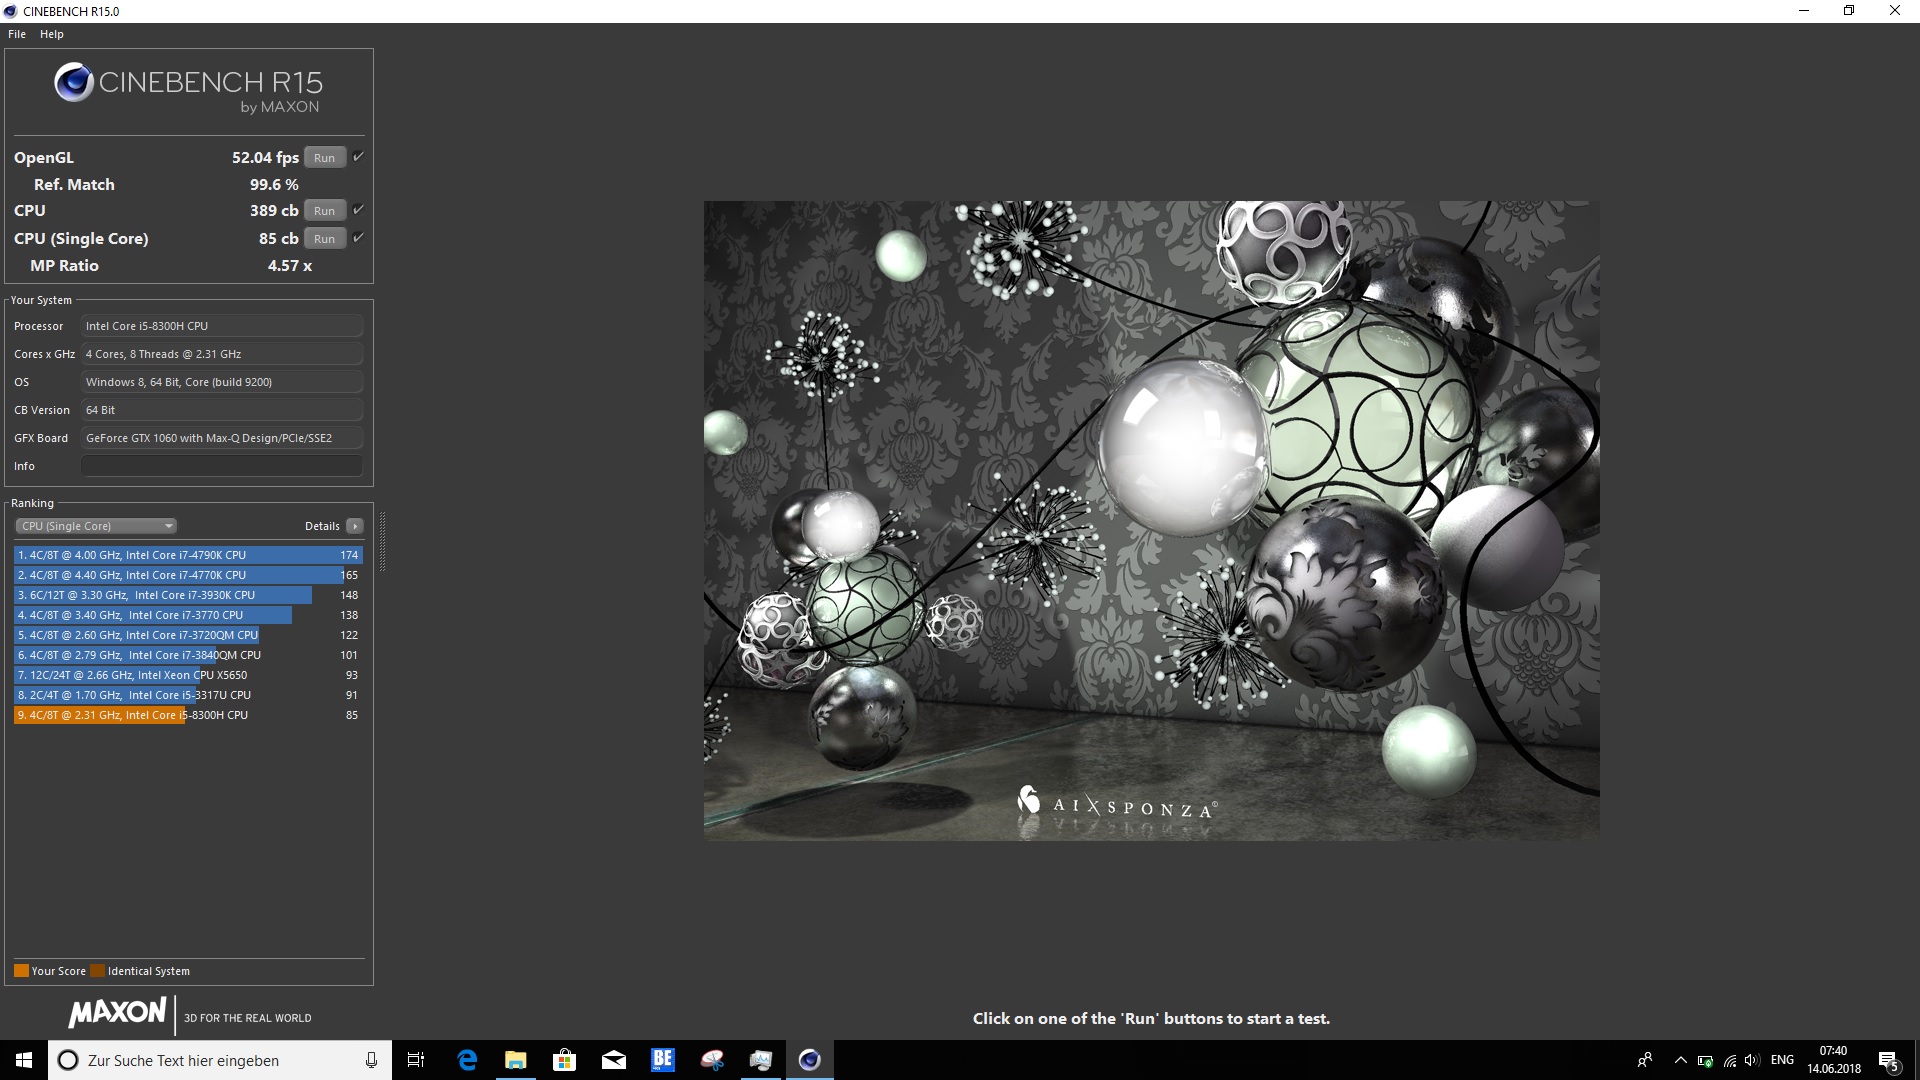
The processor is the brand-new Intel Core i5-8300H, which belongs to the current Coffee Lake series. The quad-core processor has a clock speed of 2.3 GHz – 4.0 GHz with a TDP of 45 watts. The SoC also offers Hyper-Threading, which means that the Intel Core i5-8300H can run eight threads simultaneously.
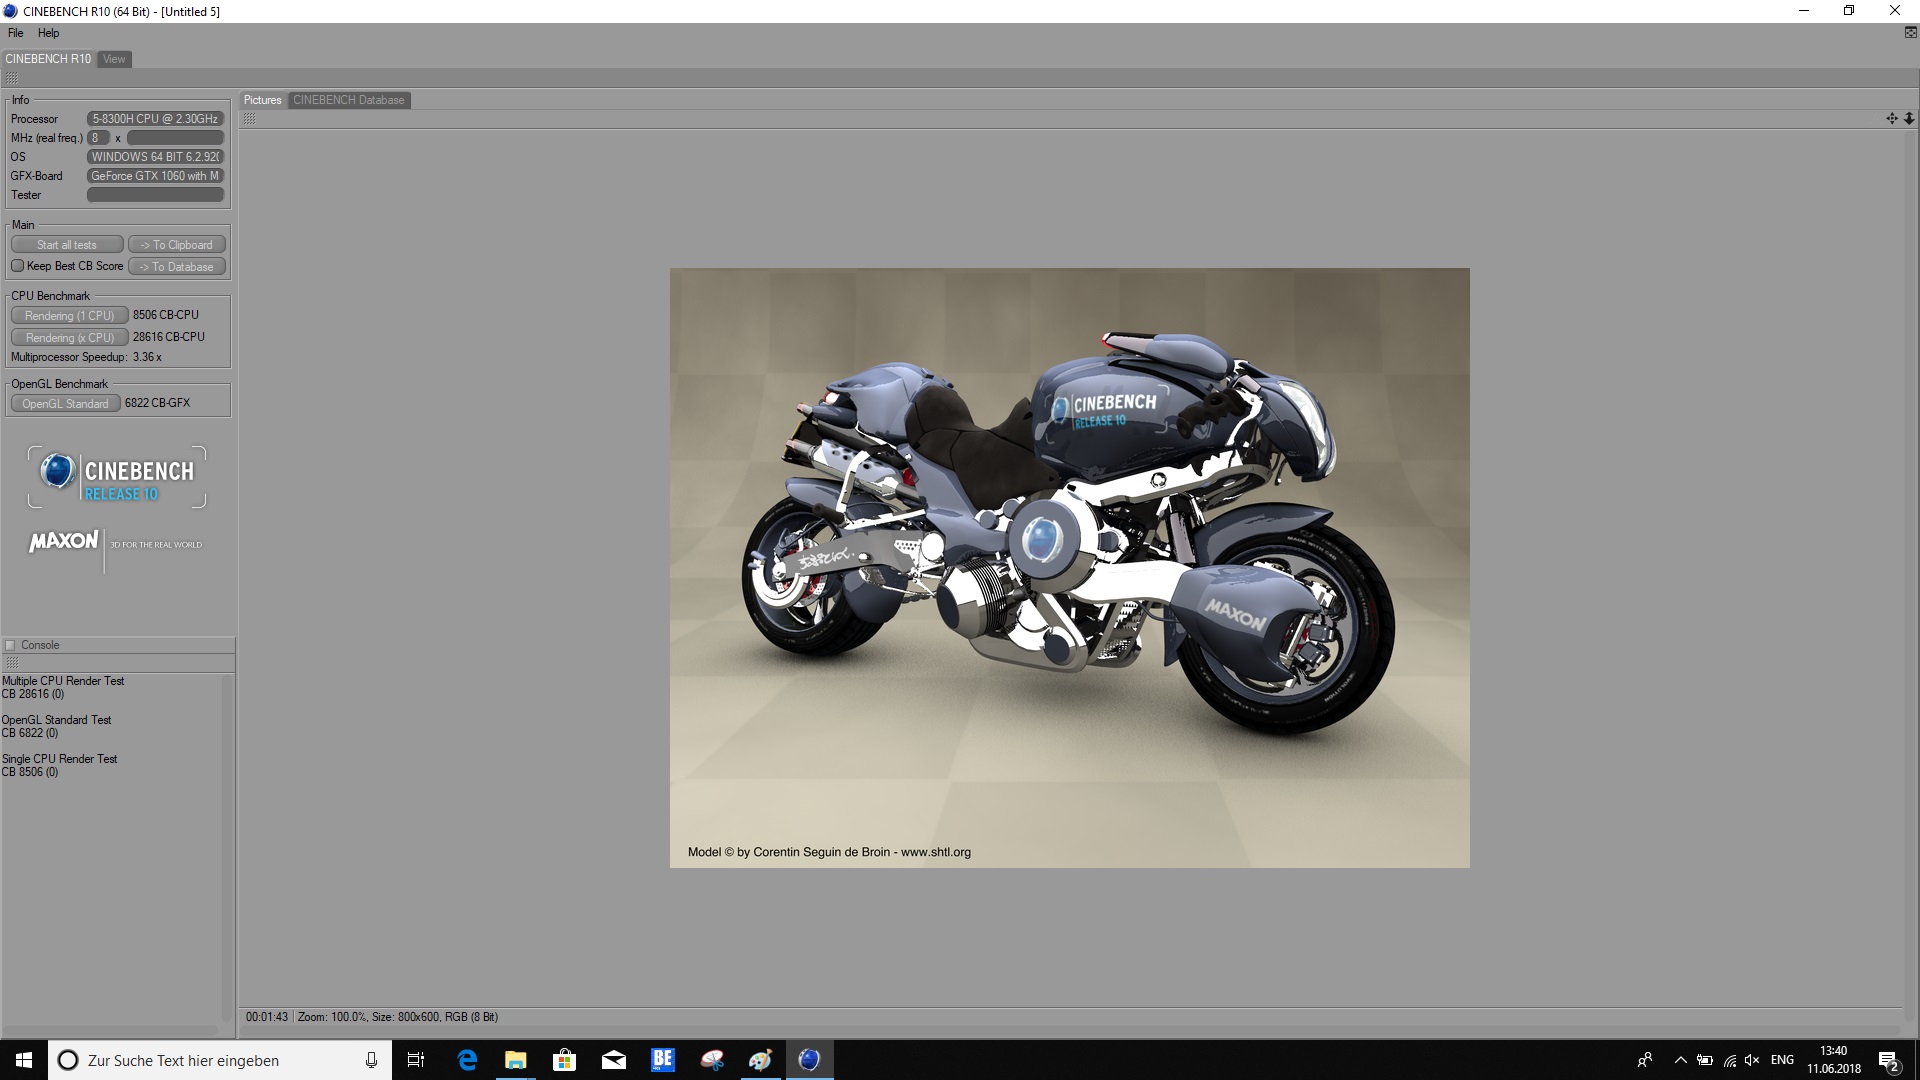
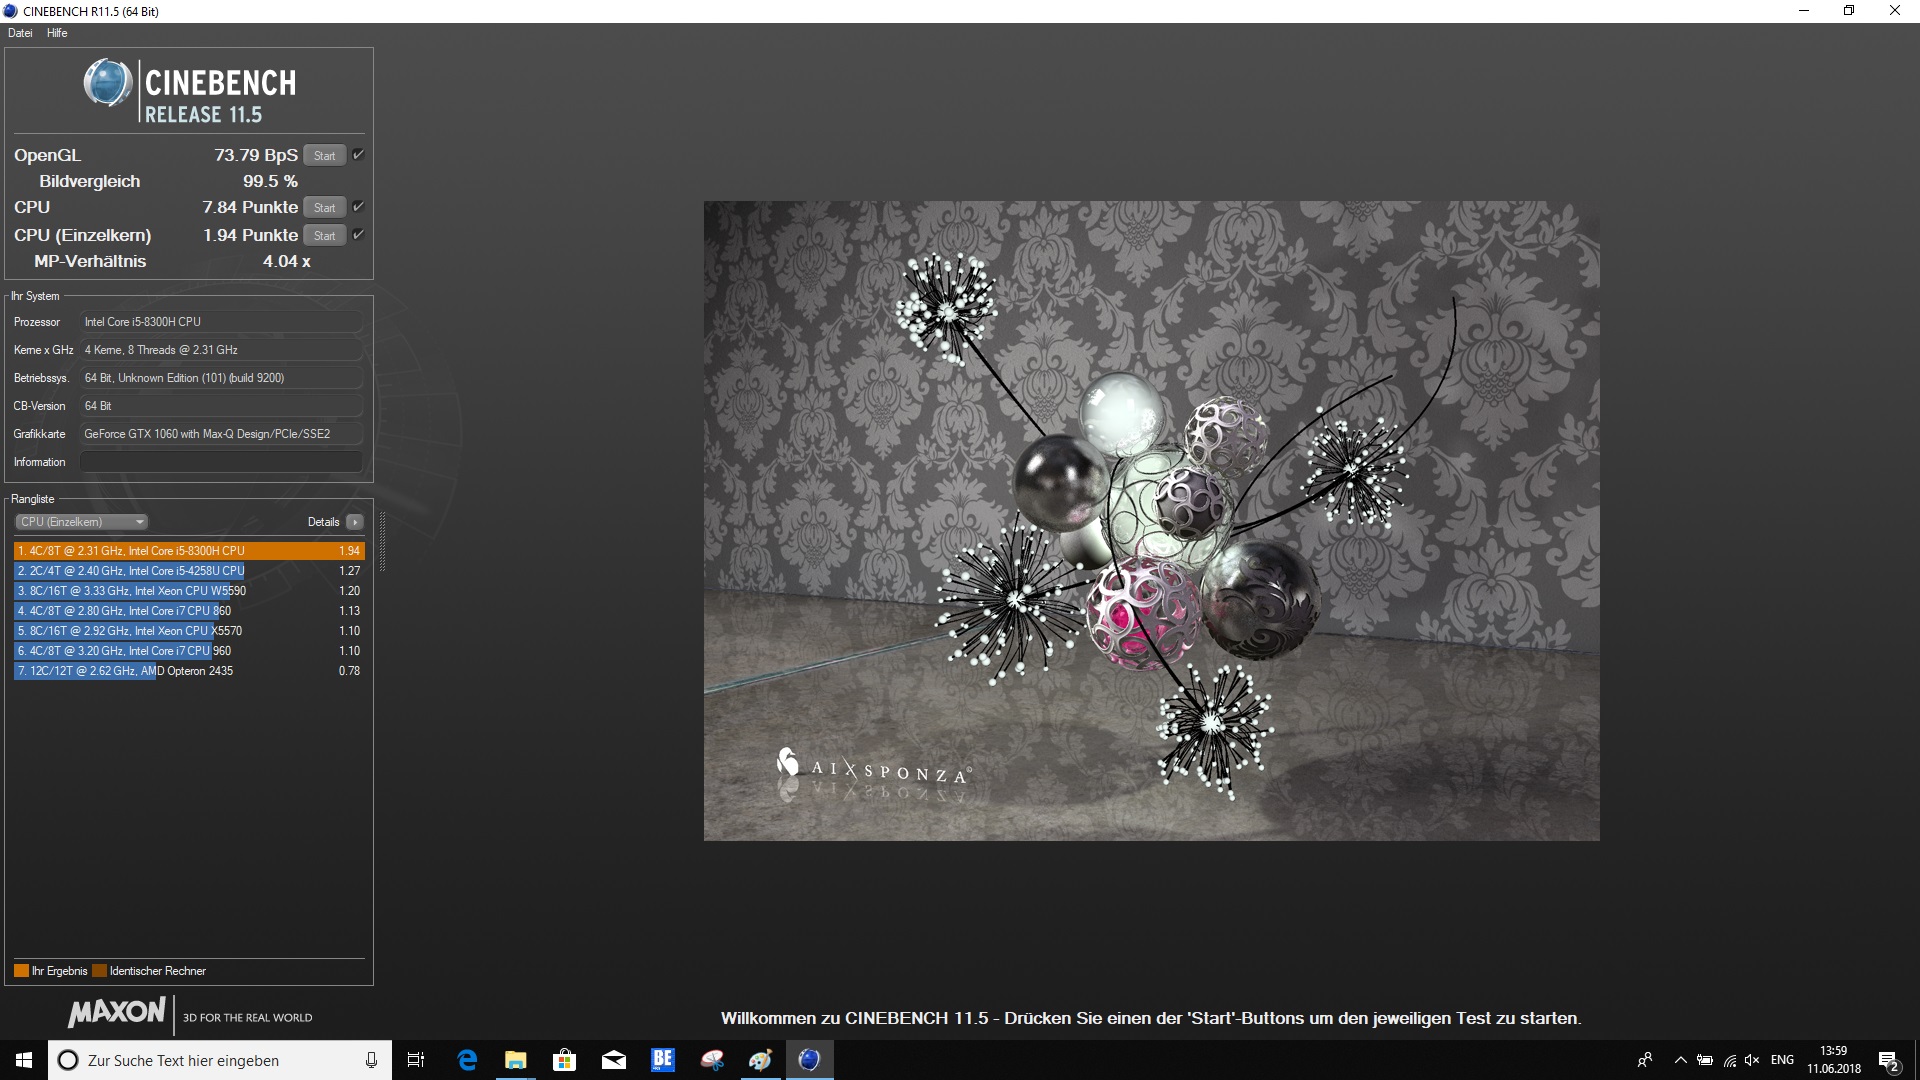
In the single-core test, the new processor runs very well, surpassing all the competitors. The multithread performance of the Intel Core i5-8300H looks only marginally worse than that of the Intel Core i7-7700HQ.
You can find additional benchmarks of the Intel Core i5-8300H here.
| Cinebench R10 | |
| Rendering Single CPUs 64Bit | |
| Average of class Gaming (17067 - 17085, n=2, last 2 years) | |
| Dell G5 15 5587 | |
| Average Intel Core i5-8300H (8277 - 8506, n=2) | |
| Dell Inspiron 15 7000 7577 | |
| Rendering Multiple CPUs 64Bit | |
| Average of class Gaming (14159 - 144628, n=2, last 2 years) | |
| Average Intel Core i5-8300H (28616 - 32021, n=2) | |
| Dell G5 15 5587 | |
| Dell Inspiron 15 7000 7577 | |
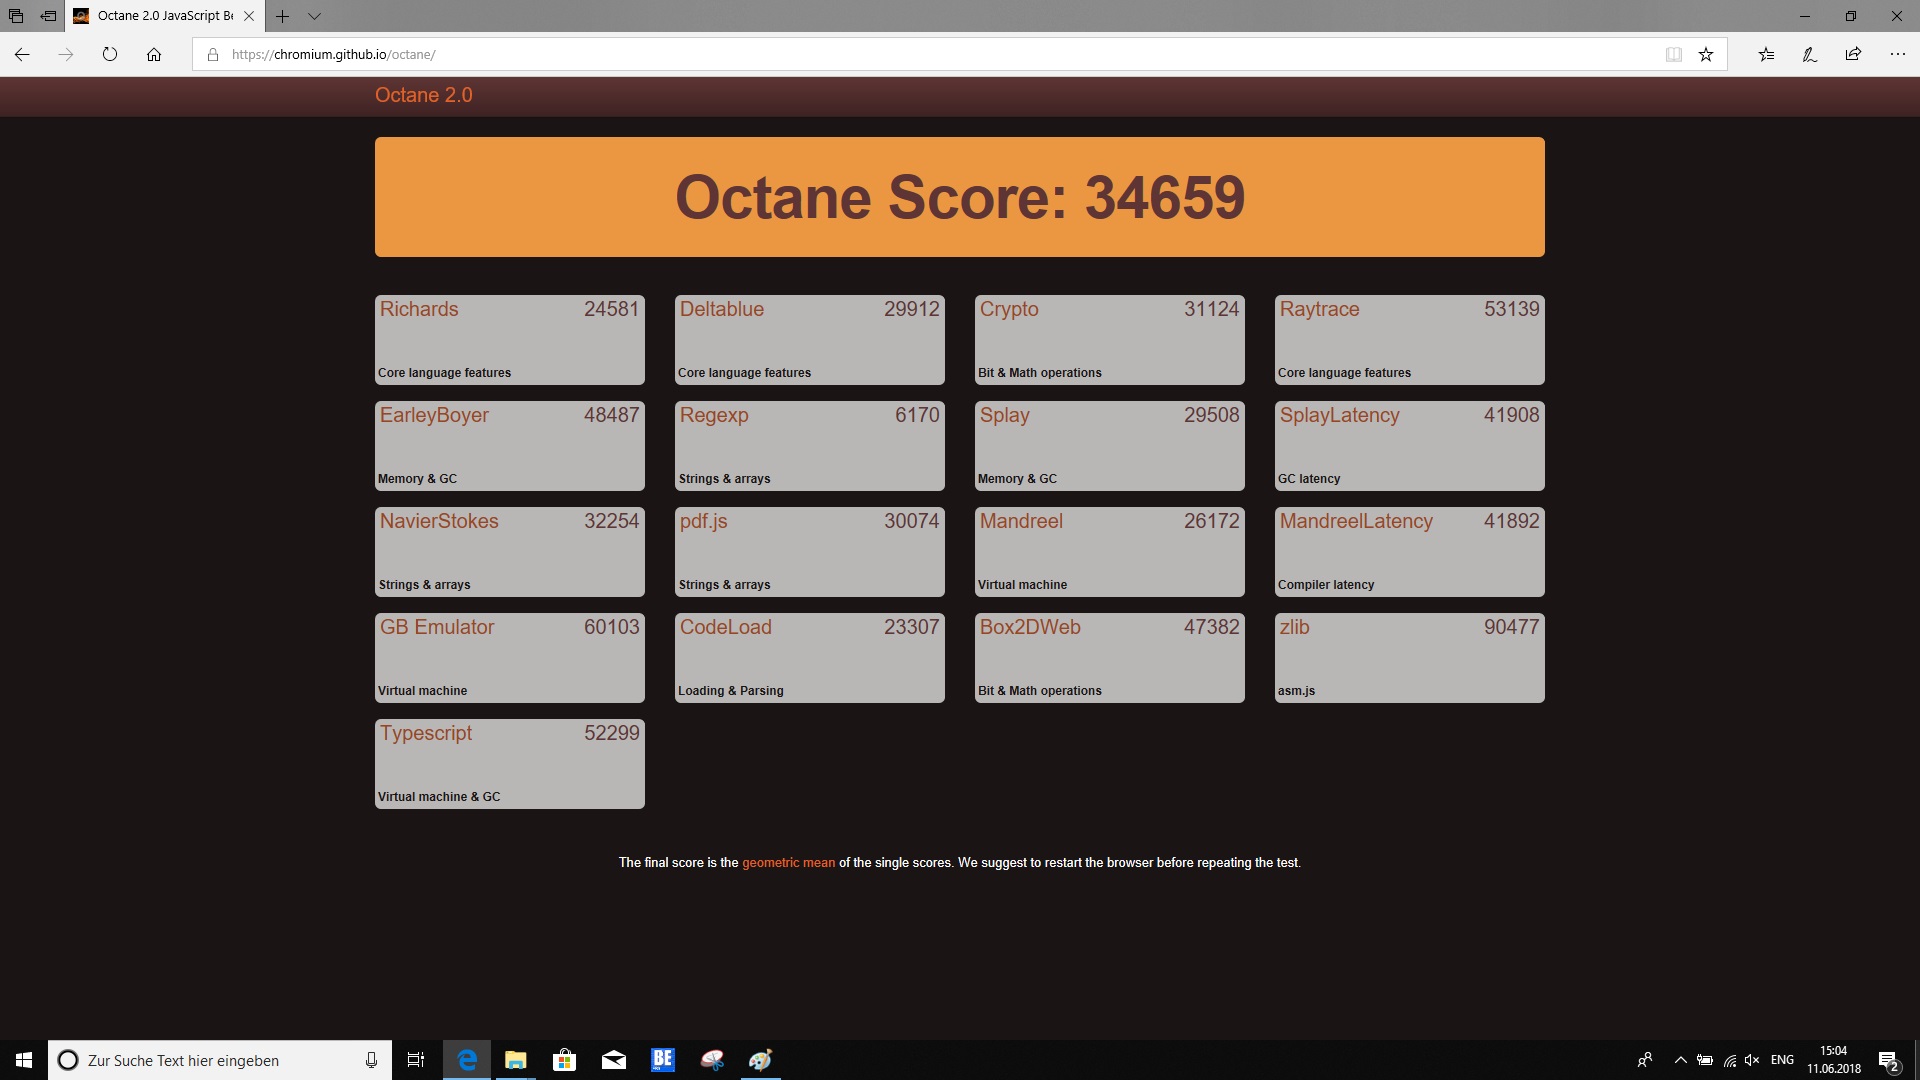
| Octane V2 - Total Score | |
| Average of class Gaming (87588 - 139447, n=30, last 2 years) | |
| Dell G5 15 5587 | |
| Average Intel Core i5-8300H (30806 - 34659, n=10) | |
| Dell Inspiron 15 7000 7577 | |
| Asus FX503VM-EH73 | |
* ... smaller is better
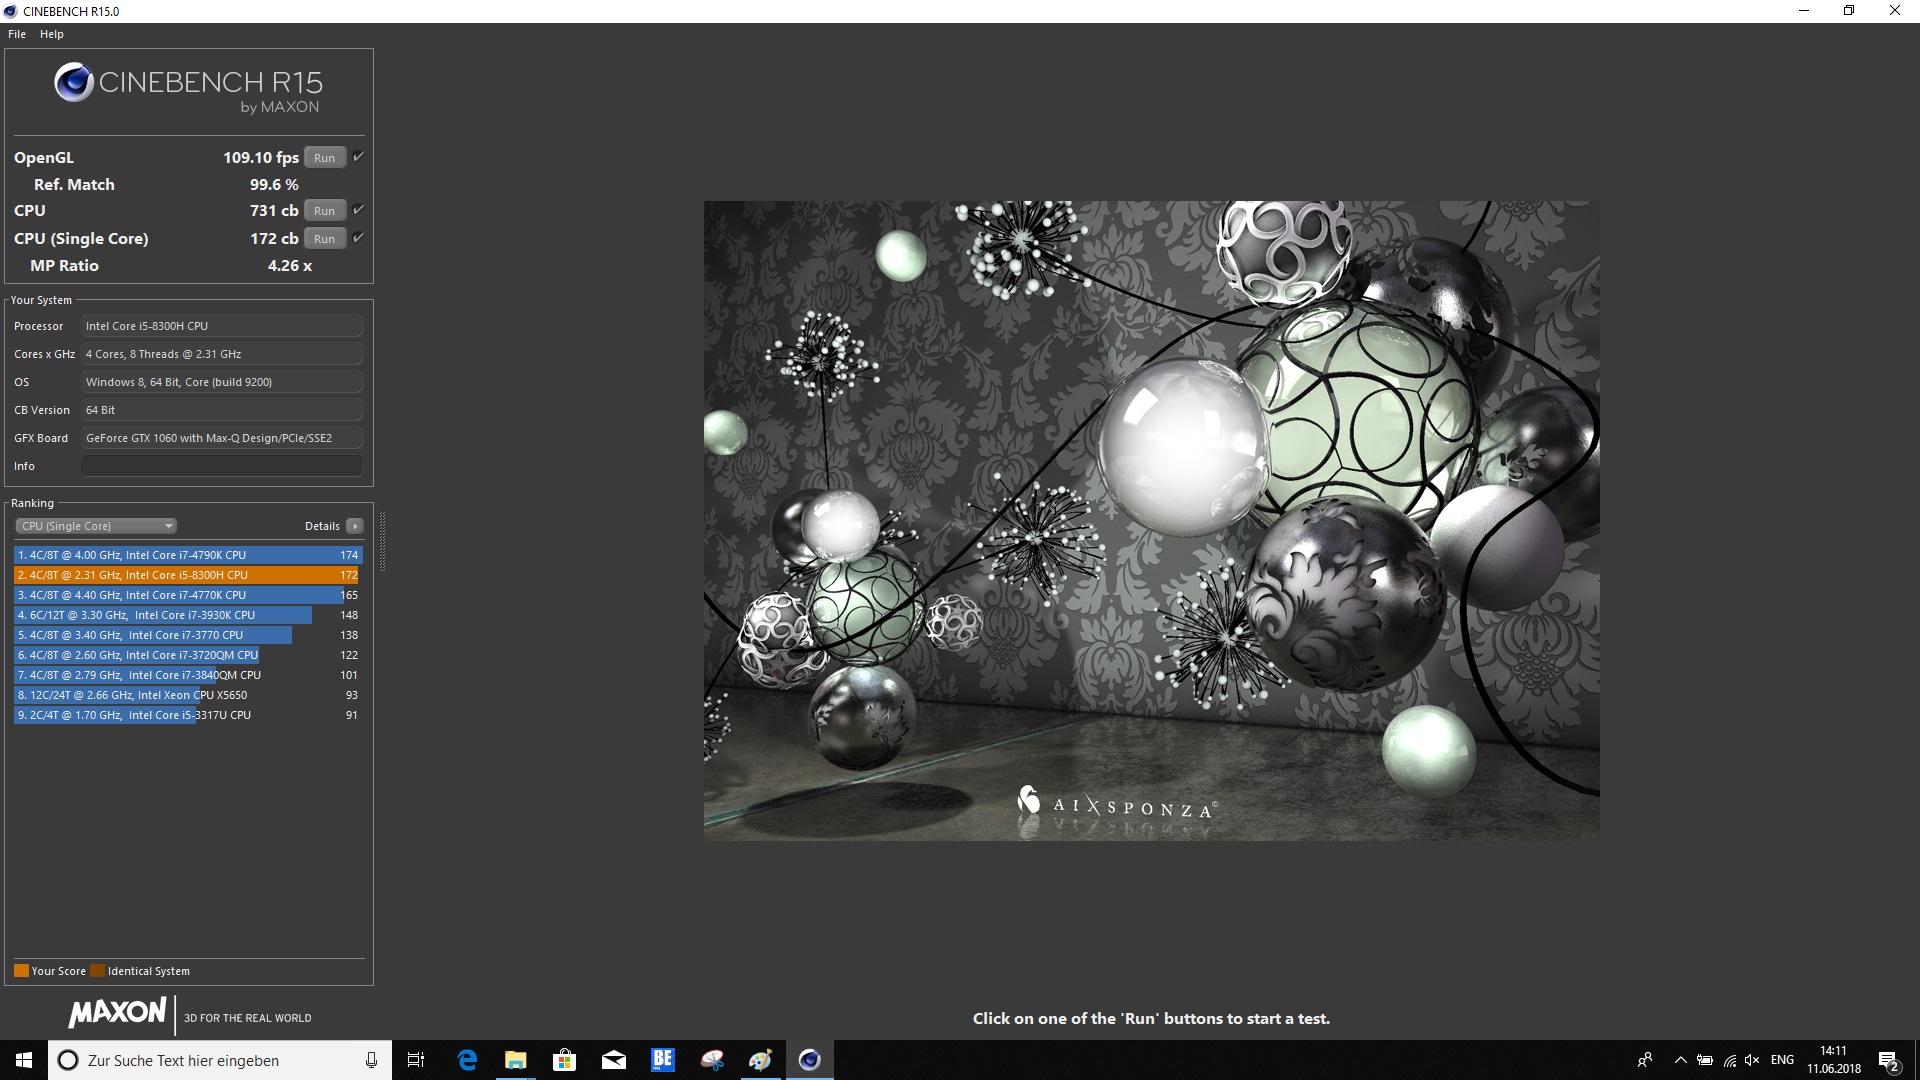

During the test with the Cinebench-R15 multi-loop, the Dell G5 15 5587 has to prove itself under constant load. We can see a slight performance drop after the first run, but it is only very small. Overall, the Intel Core i5-8300H handles the constant load quite well, with only a few exceptions. The result levels out at a good 720 points on average.
System Performance
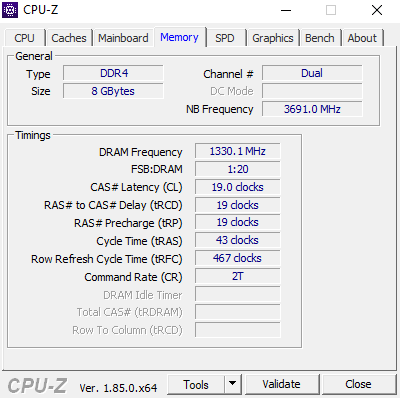
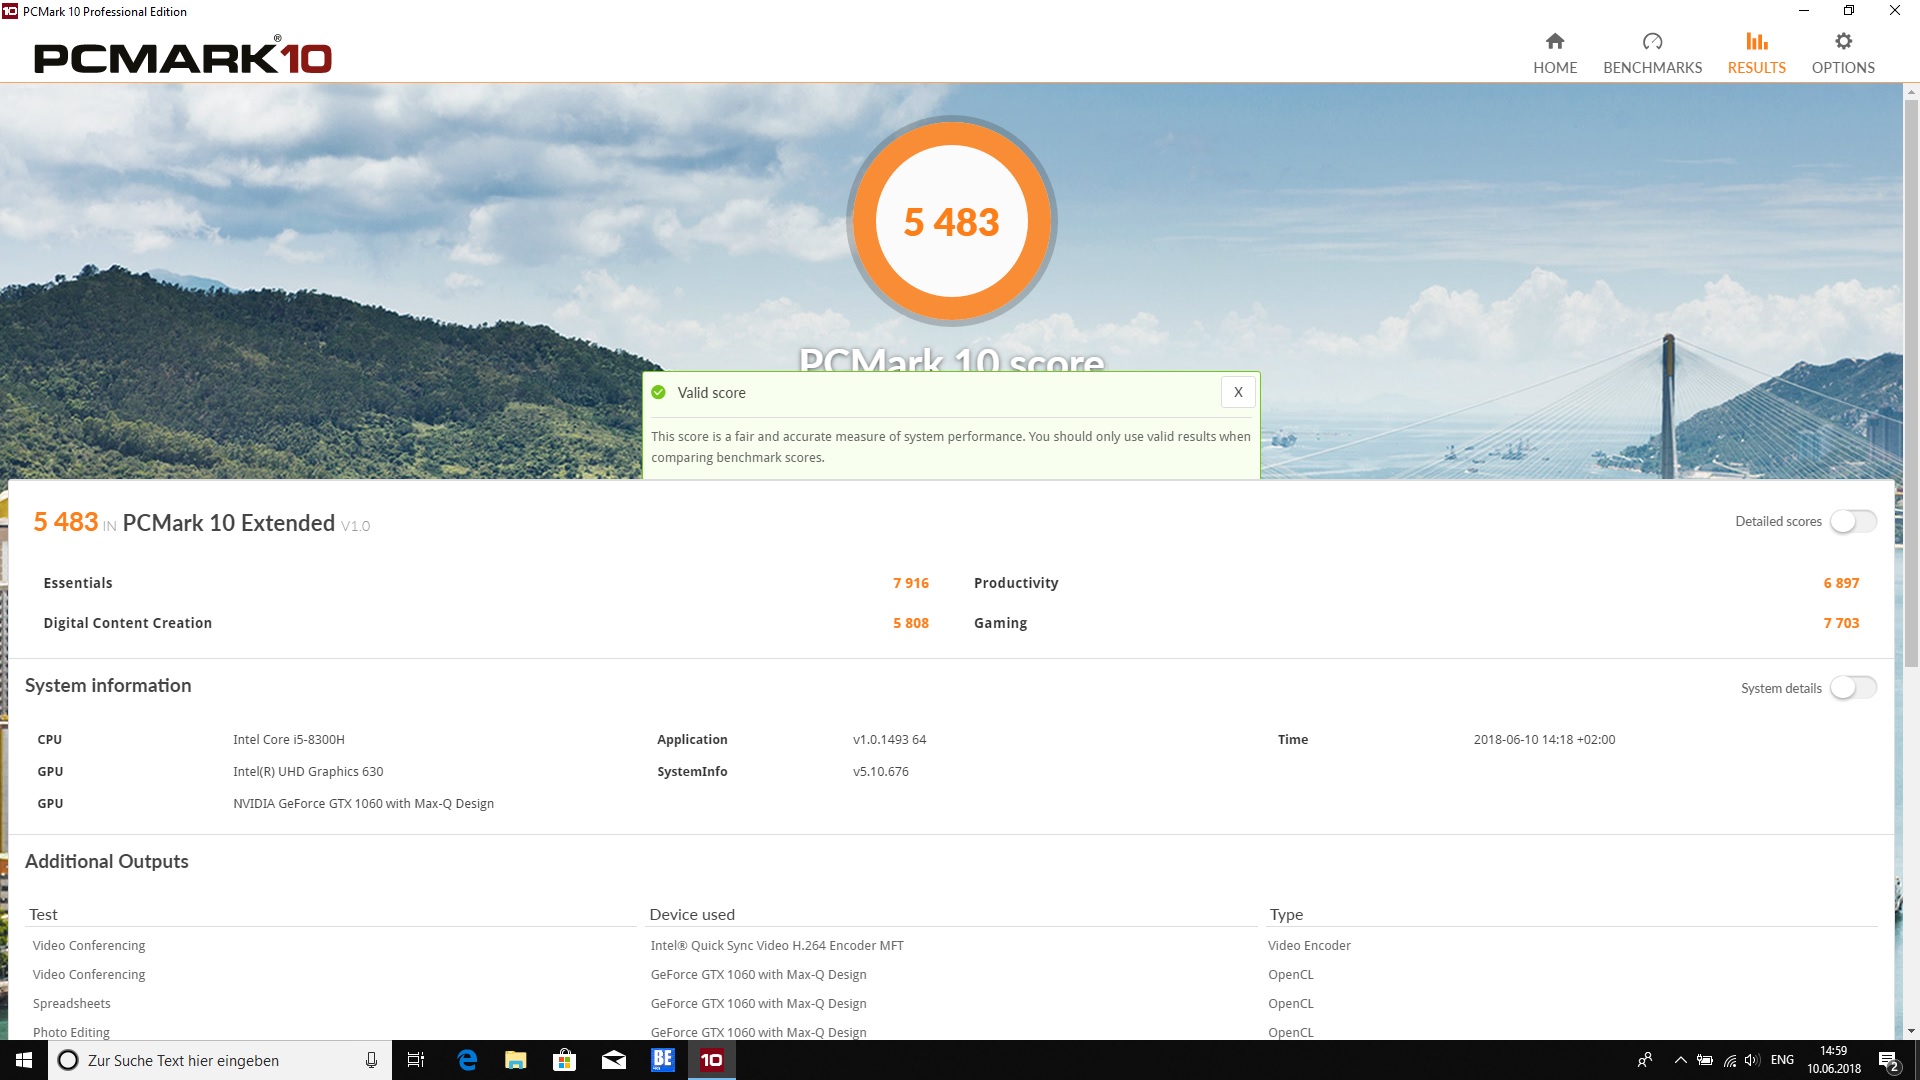
The system performance of the Dell G5 15 5587 is good to very good, which is also confirmed by the benchmarks we ran. Particularly the combination of the SSD and HDD ensures a smoothly running system. While there will surely be some complaints about the RAM, the test shows that the 8 GB DDR4-RAM is currently sufficient. During our test period, the notebook ran fast and without any stutters.
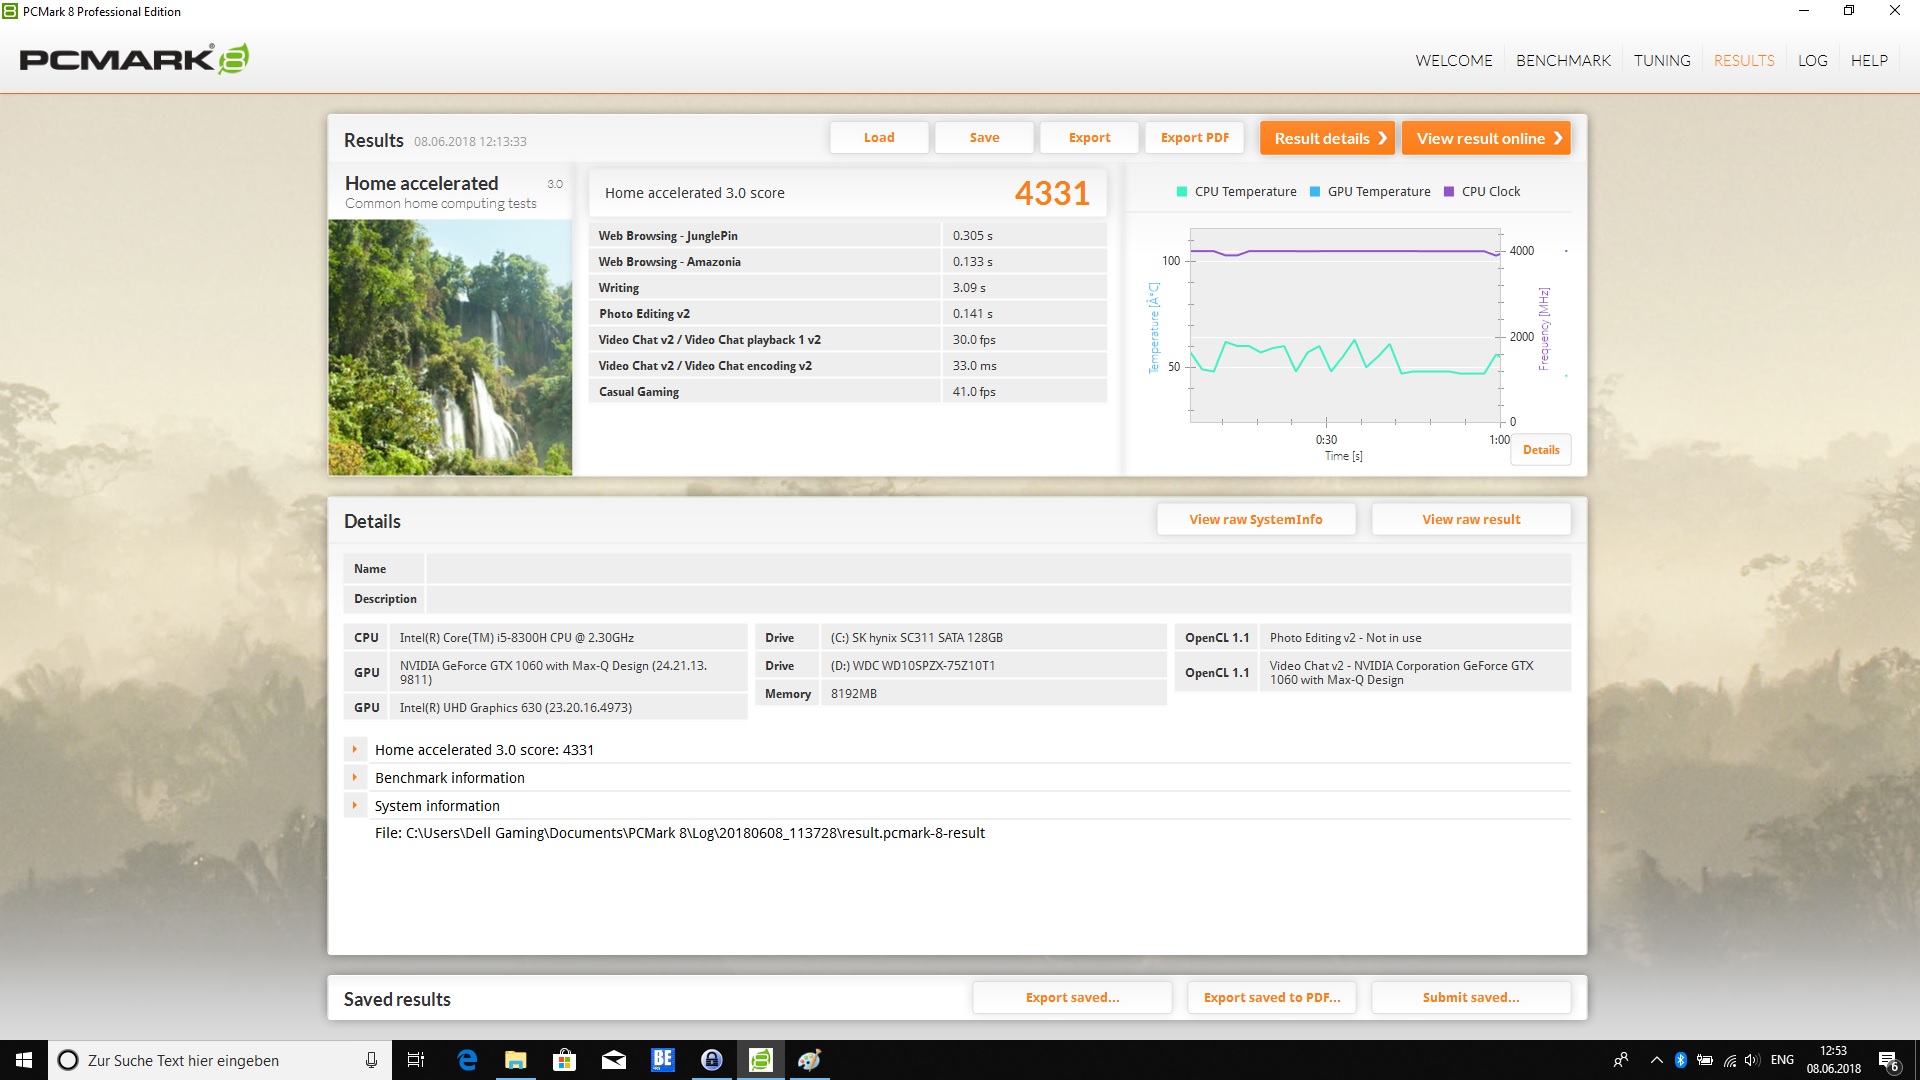
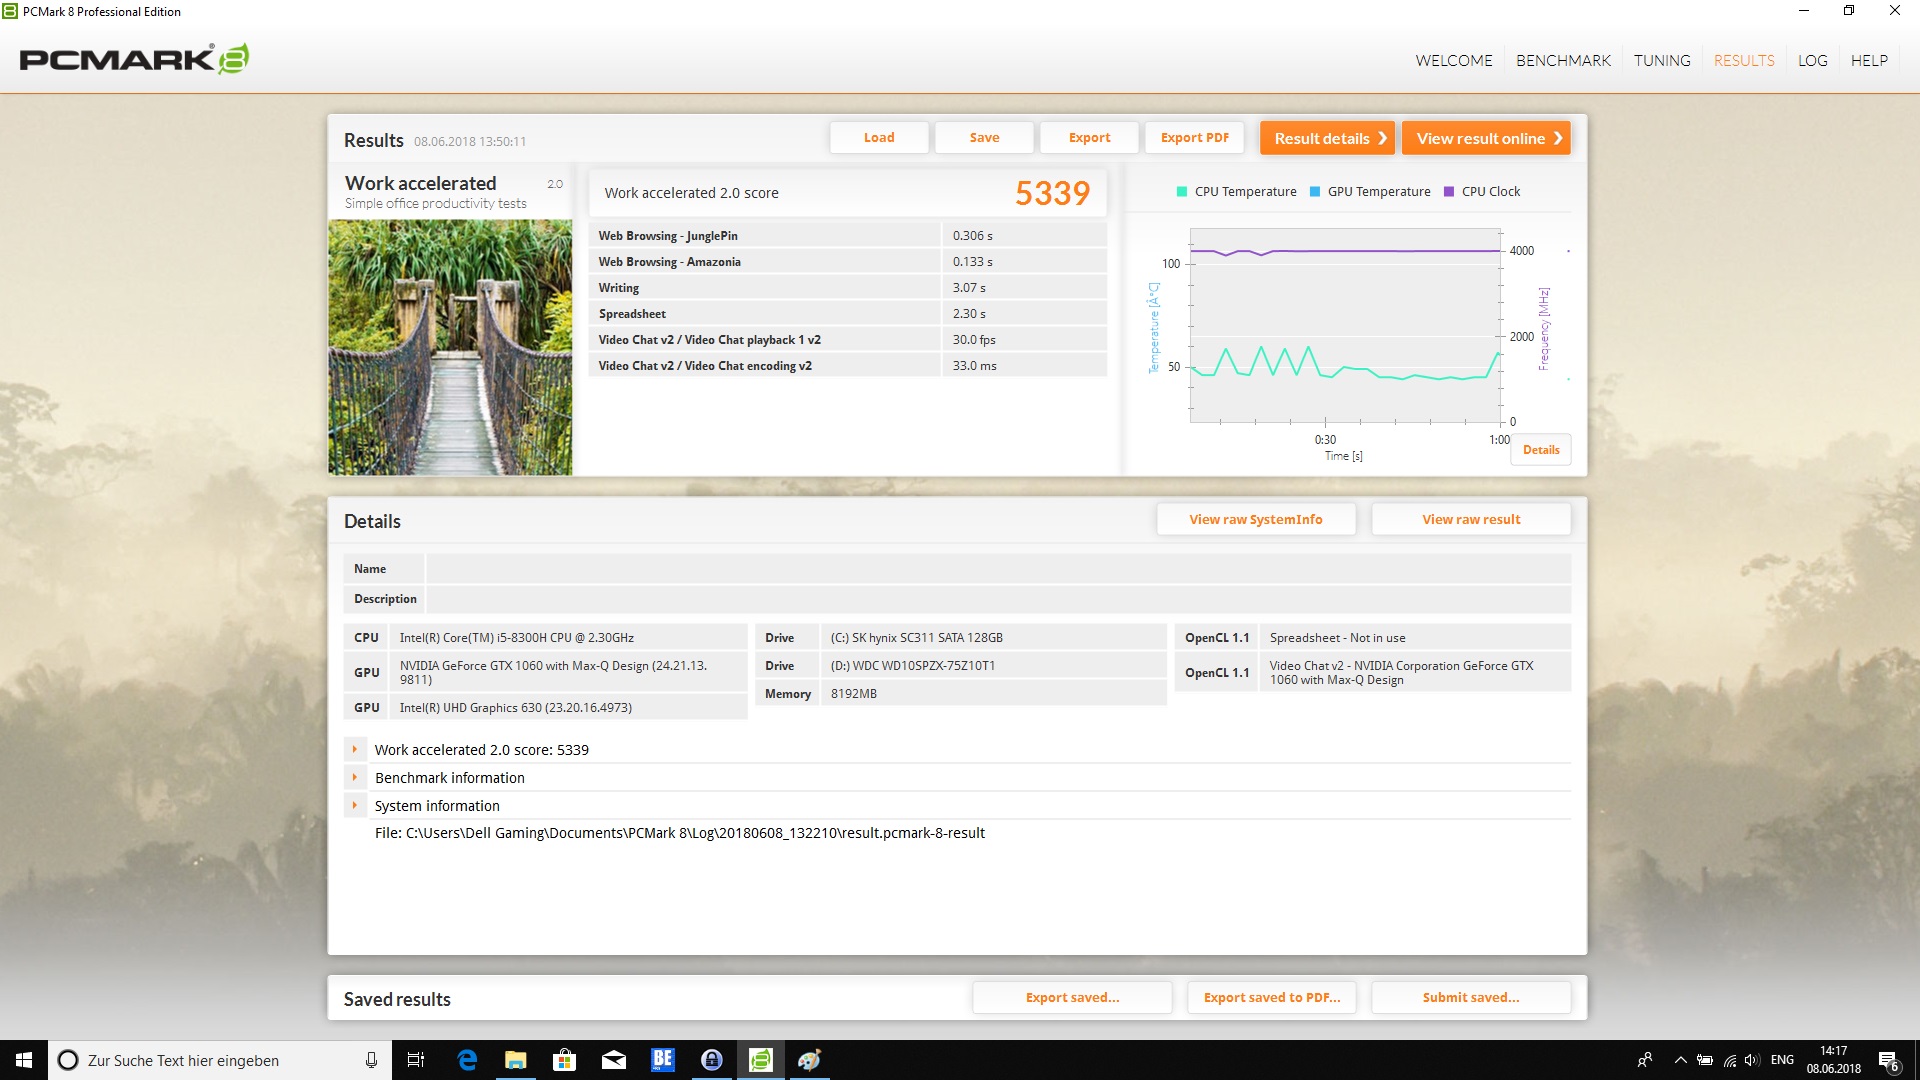

| PCMark 8 Home Score Accelerated v2 | 4331 points | |
| PCMark 8 Work Score Accelerated v2 | 5339 points | |
| PCMark 10 Score | 5483 points | |
Help | ||
Storage Solution
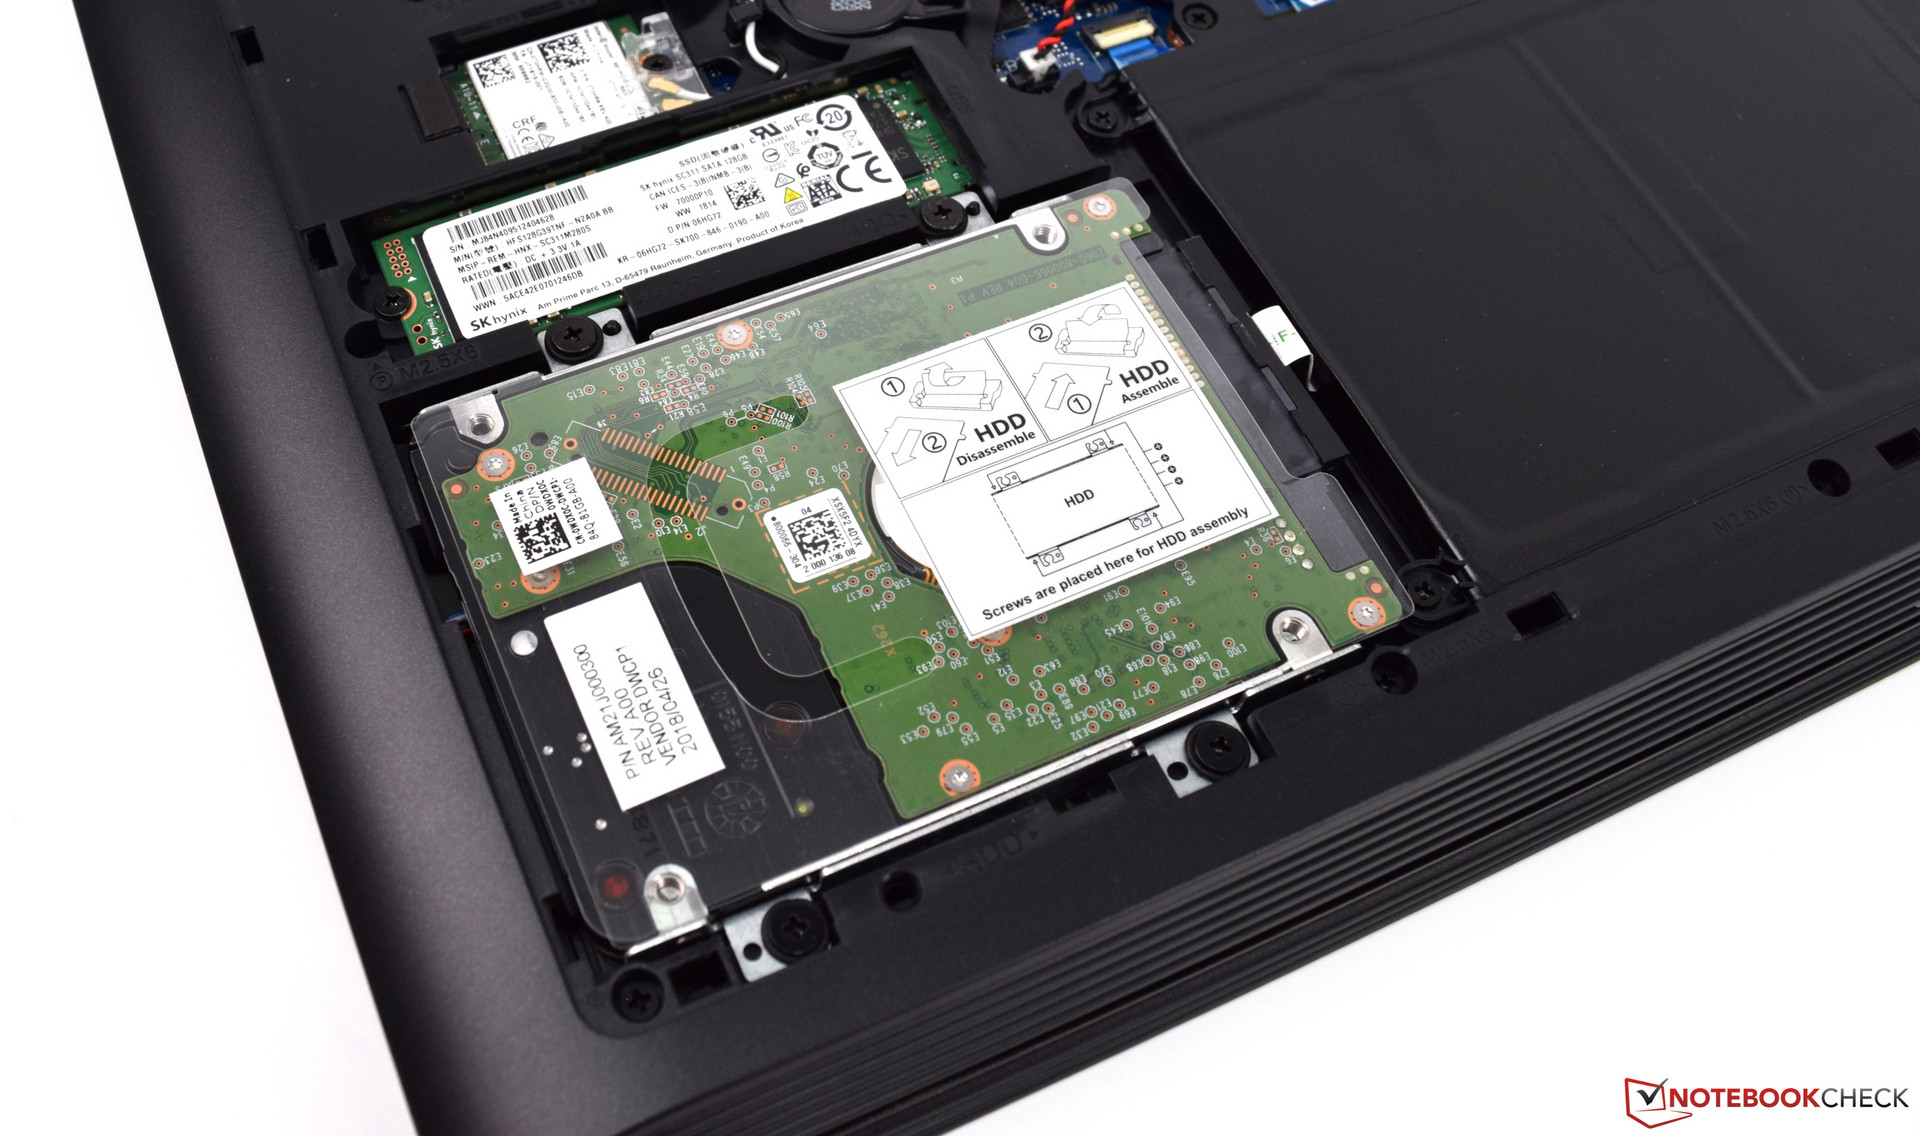
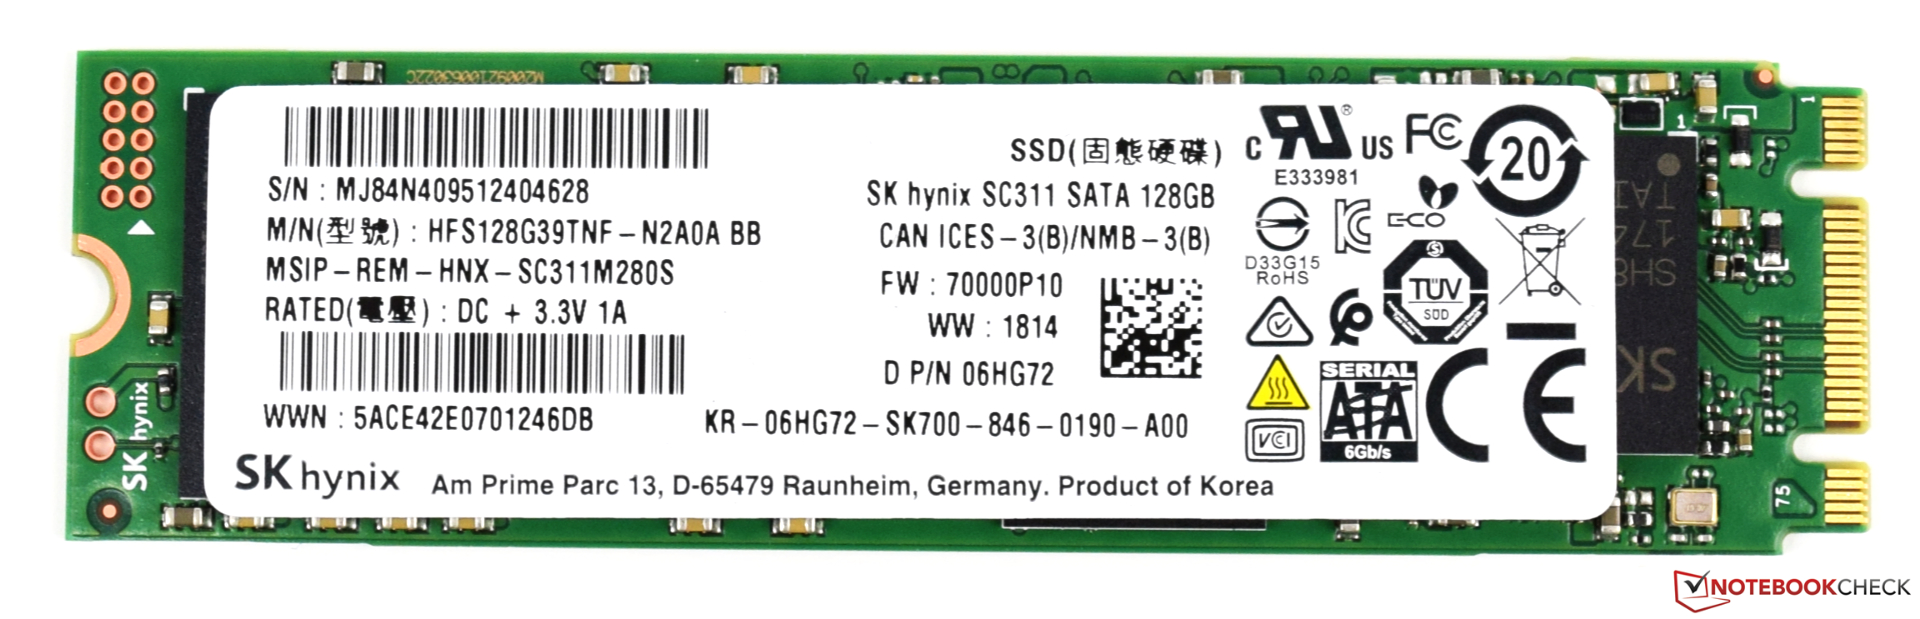
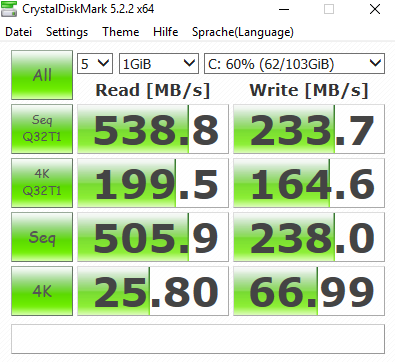
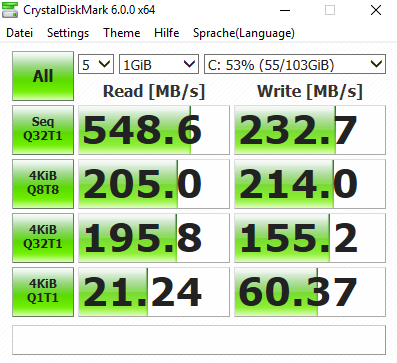
For storage, the Dell G5 15 5587 offers an SSD with 128 GB of space as well as a conventional hard drive with 1 TB of space. Unfortunately, the SSD from SK Hynix only runs at SATA speeds, which is a clear disadvantage compared to the devices that are equipped with fast PCIe SSDs. But we would rather have any SSD than only a hard drive, since there is still a clearly noticeable performance increase.
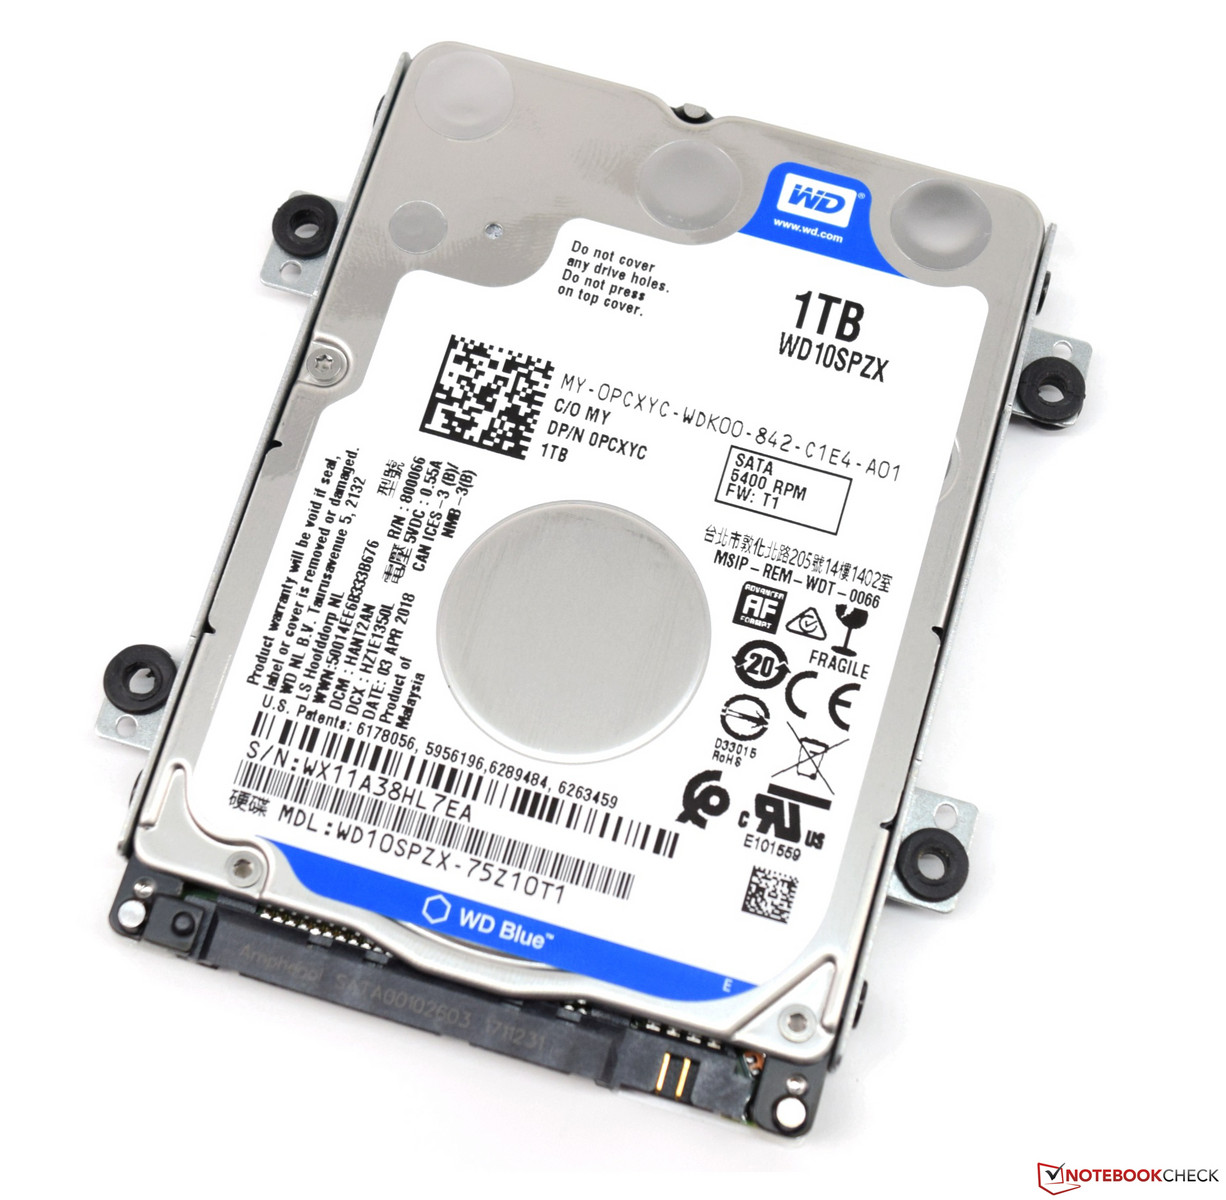
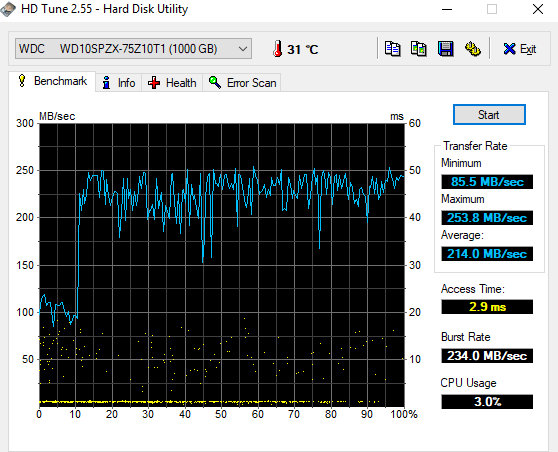
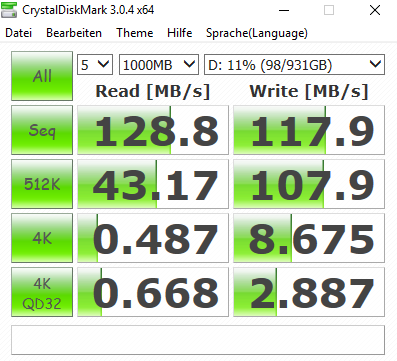
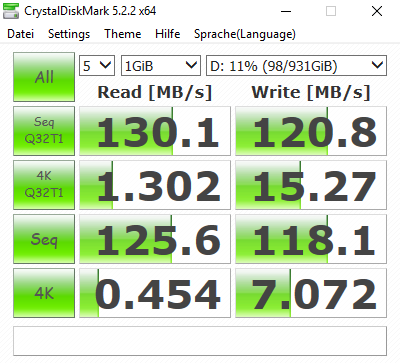
The 5400-rpm hard drive is a model of the Blue series from Western Digital. The measurement results are on the expected level. However, the HD Tune measurements should be taken with a grain of salt, since 214 MB/s on average is a bit much in our opinion. We repeated the test several times and always got the same result. So we would rather trust the CrystalDiskMark results here.
Those who order the Dell G5 15 5000 with a 512-GB SSD will receive a significantly faster flash storage with NVMe support.


| Dell G5 15 5587 SK hynix SC311 M.2 | Dell Inspiron 15 7000 7577 Samsung PM961 MZVLW256HEHP | PC Zentrum Proteus V Samsung PM961 MZVLW256HEHP | Asus FX503VM-EH73 SanDisk SD8SN8U128G1002 | Acer Nitro 5 Spin NP515-51-86CX Micron 1100 MTFDDAV256TBN | Acer Predator Helios 300 PH317-52-51M6 Hynix HFS128G39TND | |
|---|---|---|---|---|---|---|
| AS SSD | 198% | 220% | -6% | 22% | -47% | |
| Seq Read (MB/s) | 511 | 2652 419% | 2541 397% | 476.3 -7% | 490.1 -4% | 513 0% |
| Seq Write (MB/s) | 243.7 | 1181 385% | 1180 384% | 328.4 35% | 335.2 38% | 128.2 -47% |
| 4K Read (MB/s) | 24.44 | 46.95 92% | 51 109% | 20.44 -16% | 25.86 6% | 26.5 8% |
| 4K Write (MB/s) | 62.2 | 100.2 61% | 136.4 119% | 46.48 -25% | 78.1 26% | 62.7 1% |
| Access Time Read * (ms) | 0.128 | 0.058 55% | 0.045 65% | 0.17 -33% | 0.085 34% | |
| Access Time Write * (ms) | 0.066 | 0.037 44% | 0.028 58% | 0.09 -36% | 0.065 2% | 0.259 -292% |
| Score Total (Points) | 557 | 2405 332% | 2842 410% | 798 43% | 835 50% | 811 46% |
* ... smaller is better

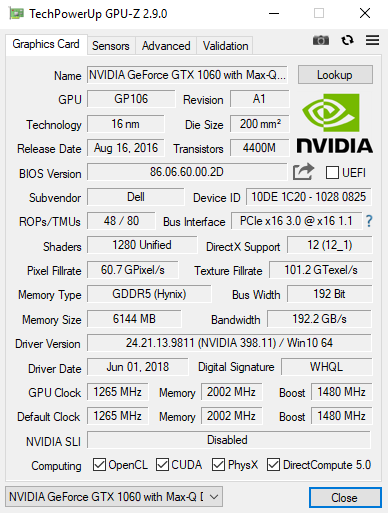
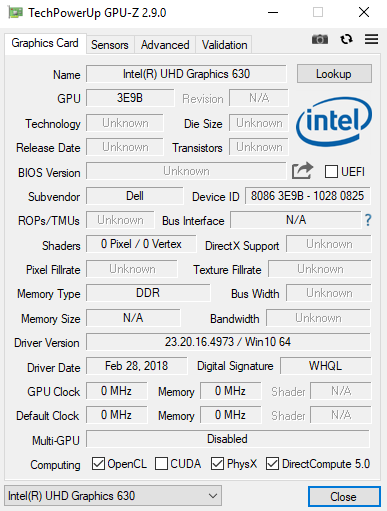
Graphics Card
In 2D operation, the Intel UHD Graphics 630 takes over the display output, supporting the processor thanks to the integrated hardware decoder for the reproduction of high-resolution videos.
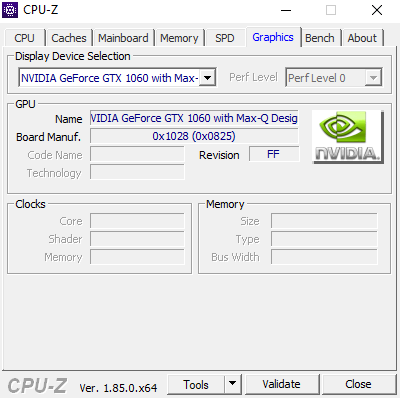
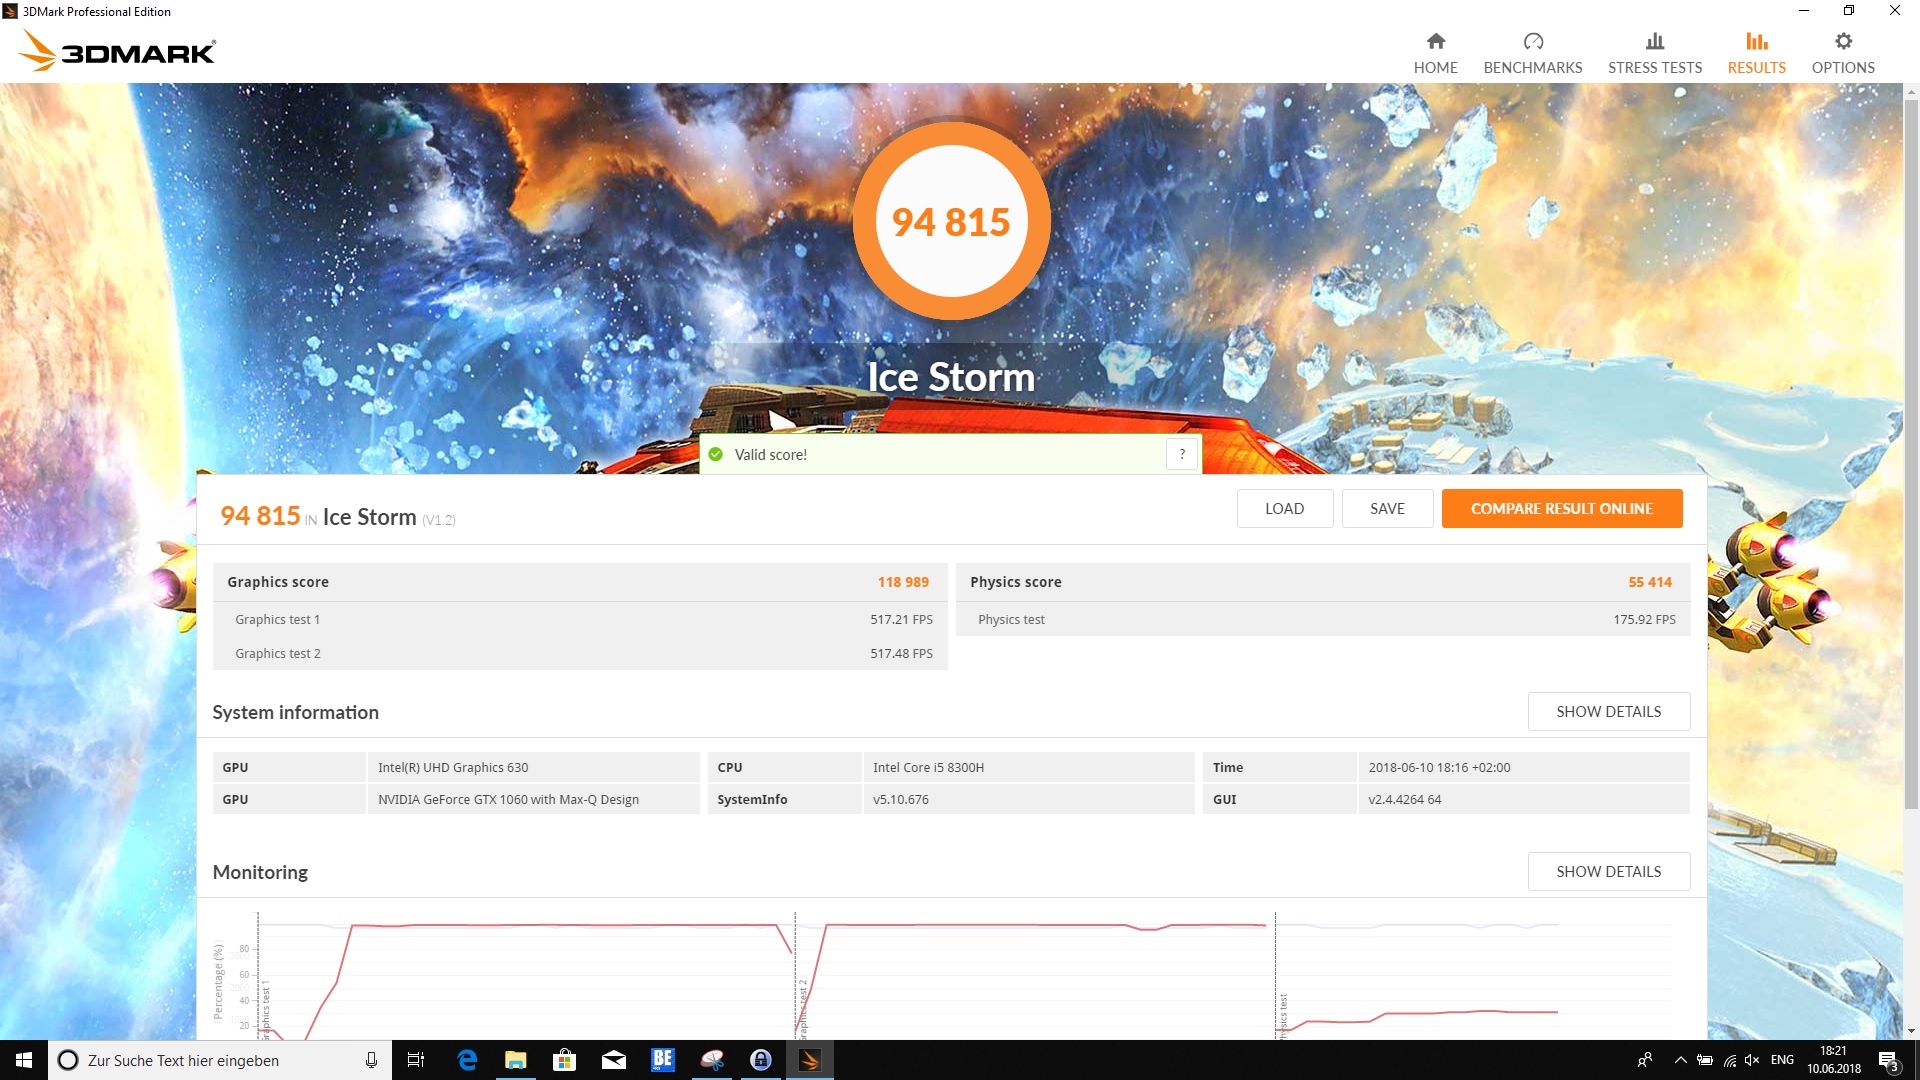
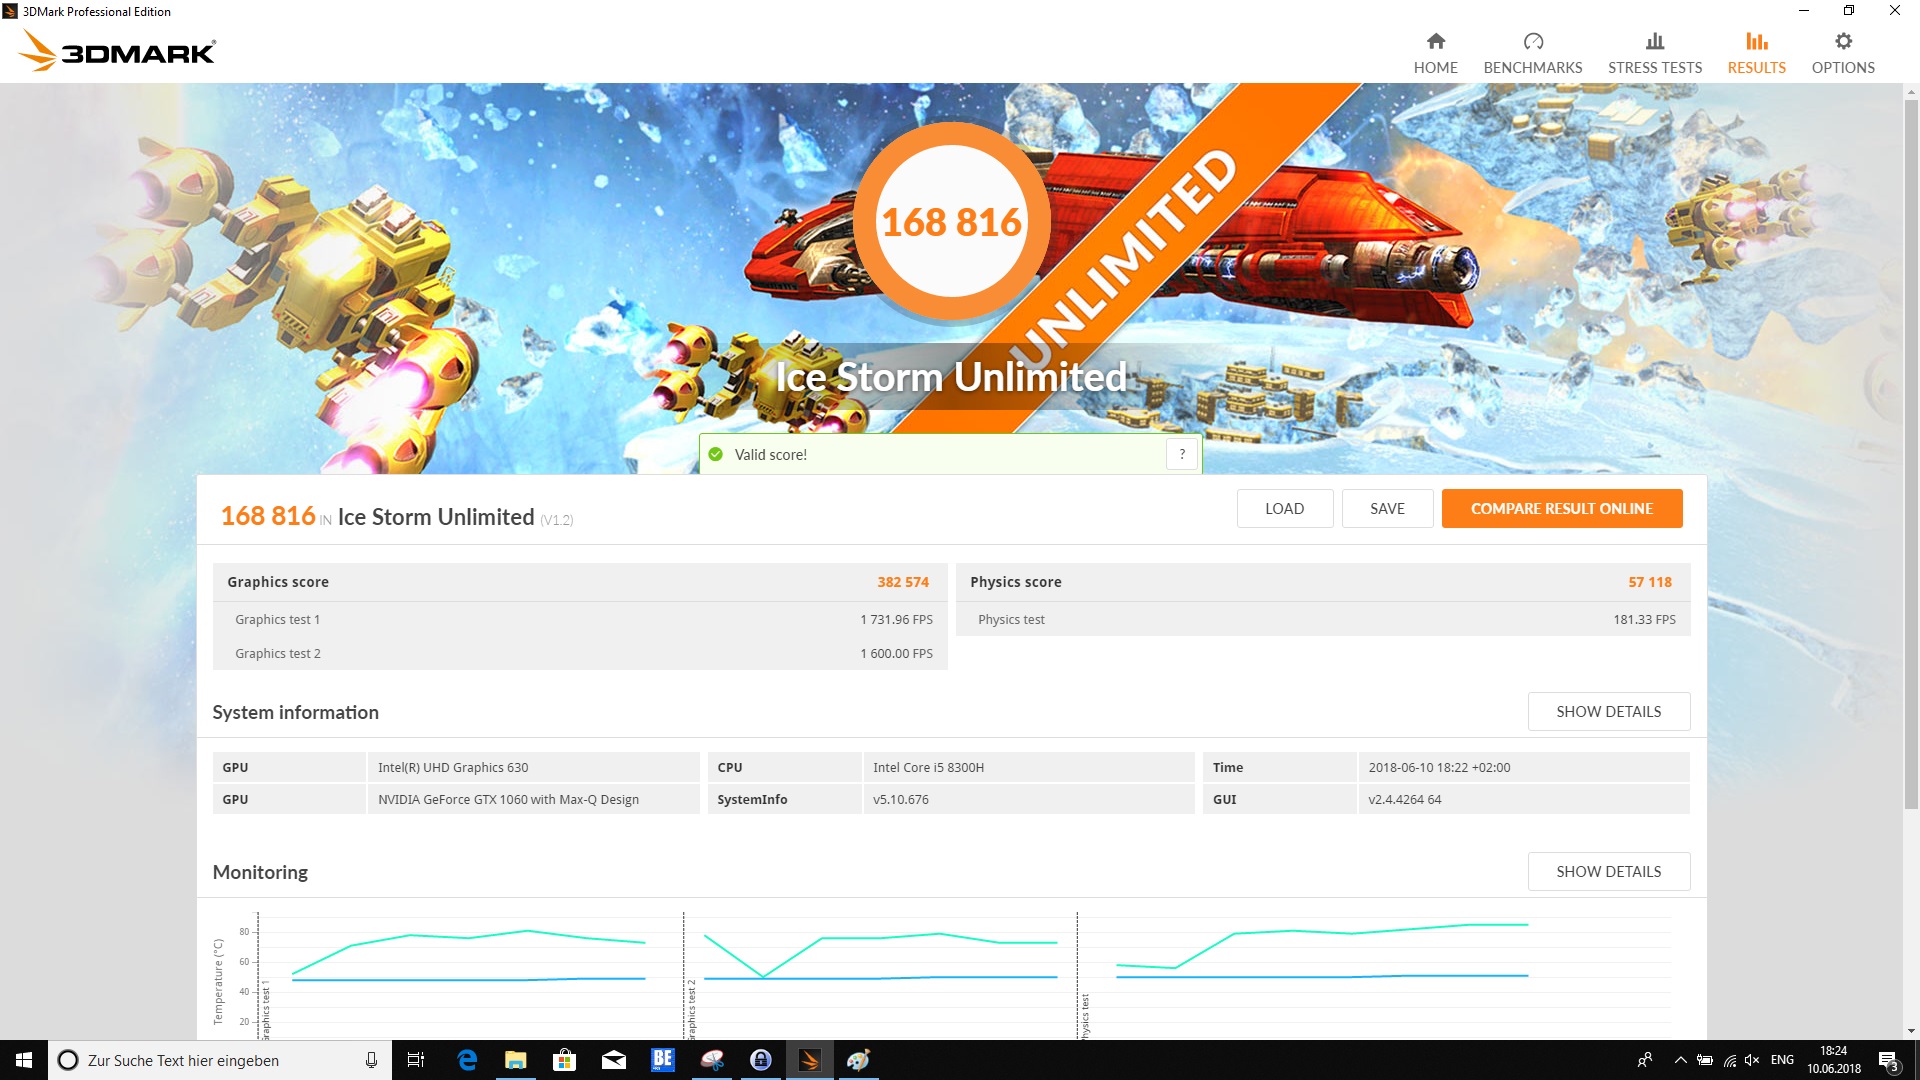
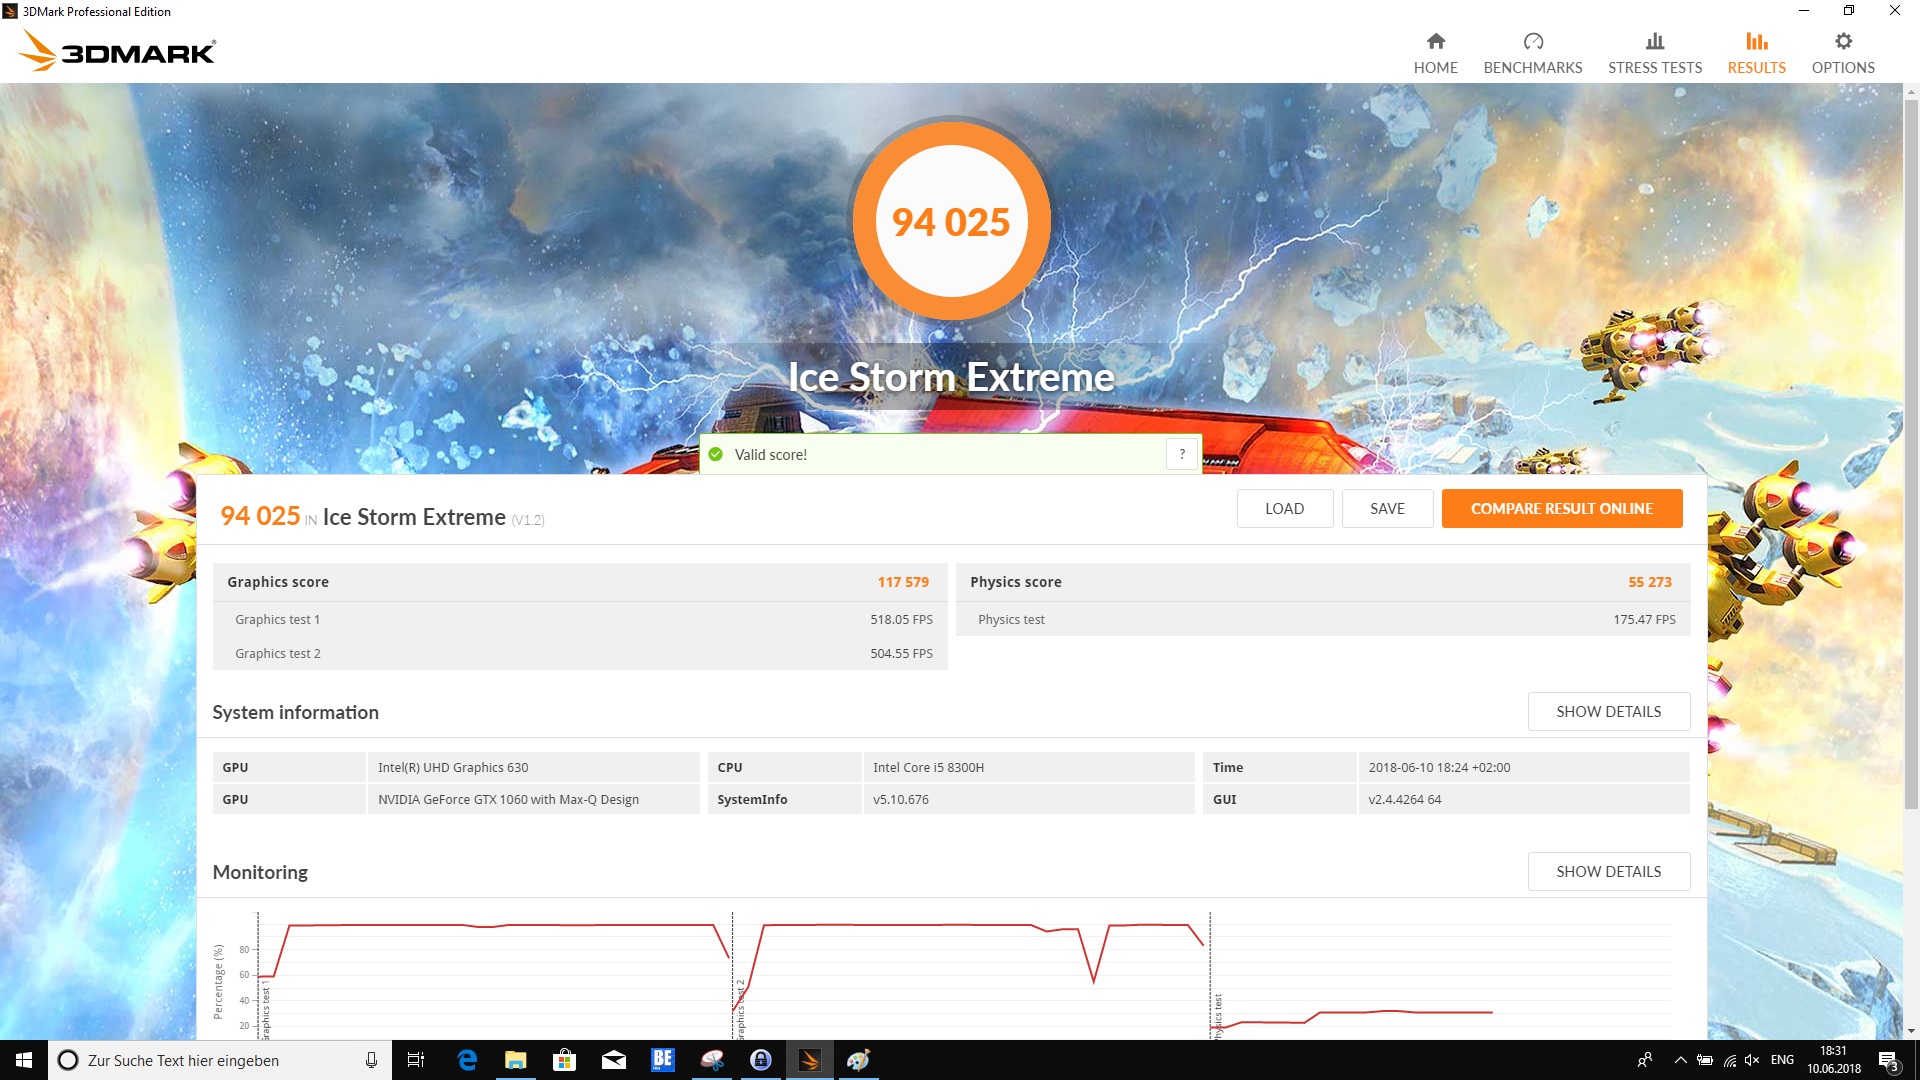
For gaming, the system switches to the dedicated graphics adapter via Nvidia Optimus. The Nvidia GeForce GTX 1060 Max-Q offers its own VRAM (6 GB GDDR5) and clocks at 1265 to 1480 MHz in Boost mode. Our test unit fares quite well in the synthetic benchmarks we ran. The Asus FX503VM as well as the Proteus V also offer a GeForce GTX 1060, but without the Max-Q design.
However, the direct comparison to the Dell Inspiron 15 7000 shows that you can get even slightly more performance out of the device with the new CPU. The two devices equipped with the GeForce GTX 1050 can only occupy the last places, leaving a little distance in between. This is an important comparison for those who want to purchase the Dell G5 15 with a GeForce GTX 1050 or 1050 Ti.
You can find additional benchmarks of the Intel UHD Graphics 630 and the Nvidia GeForce GTX 1060 Max-Q here.


| 3DMark 11 Performance | 12044 points | |
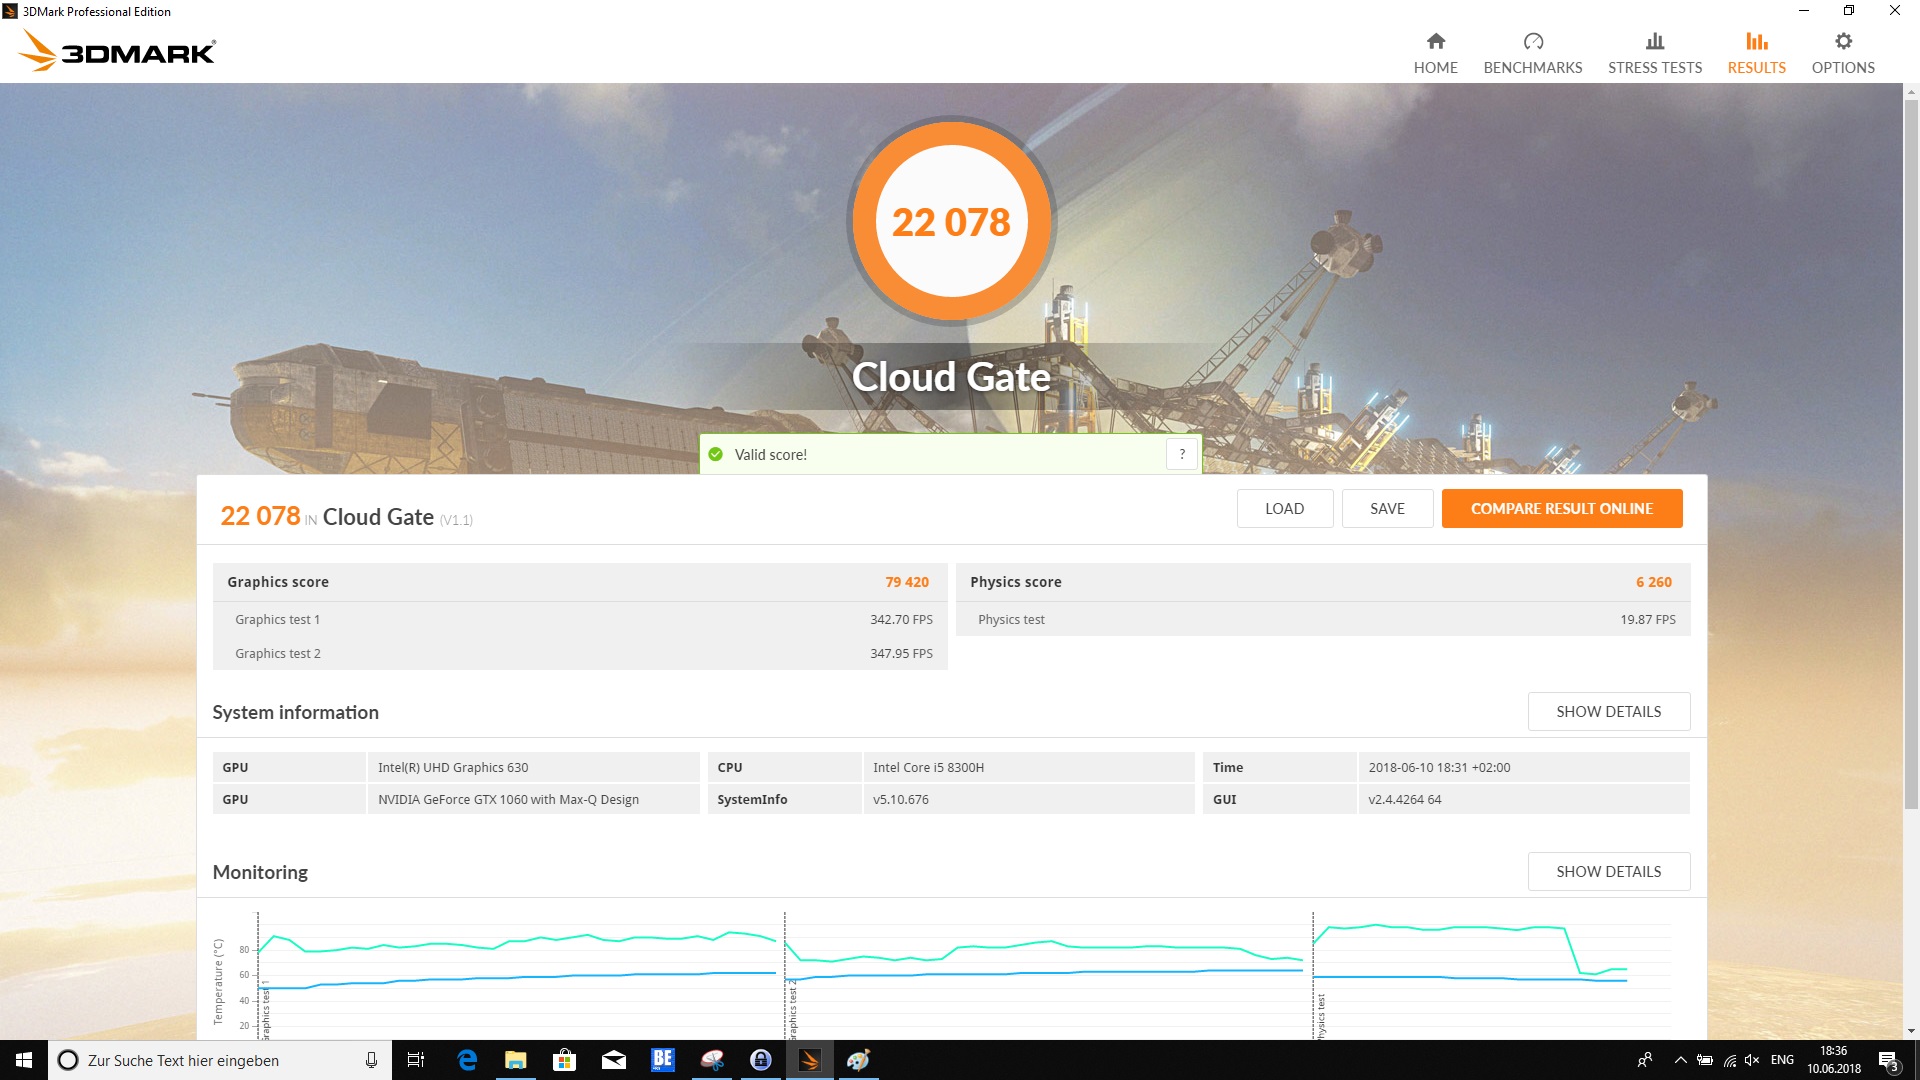
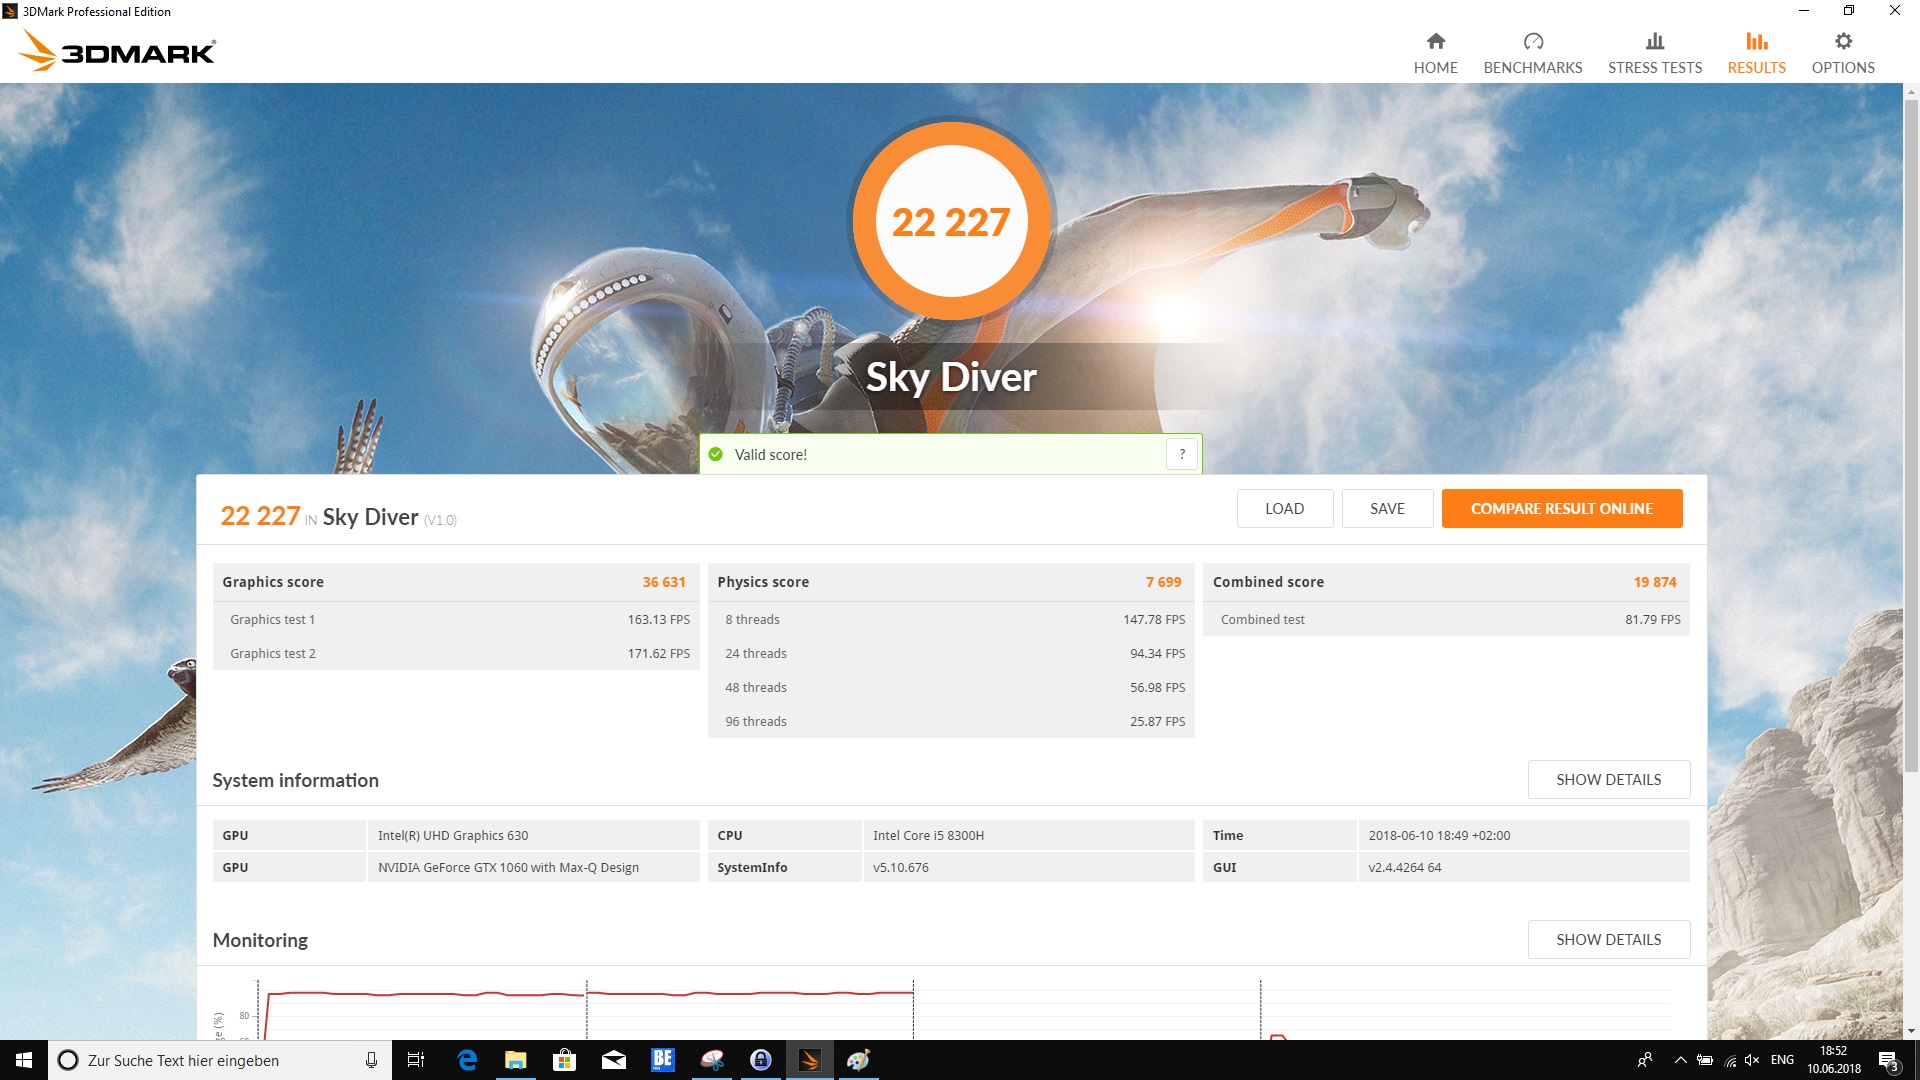
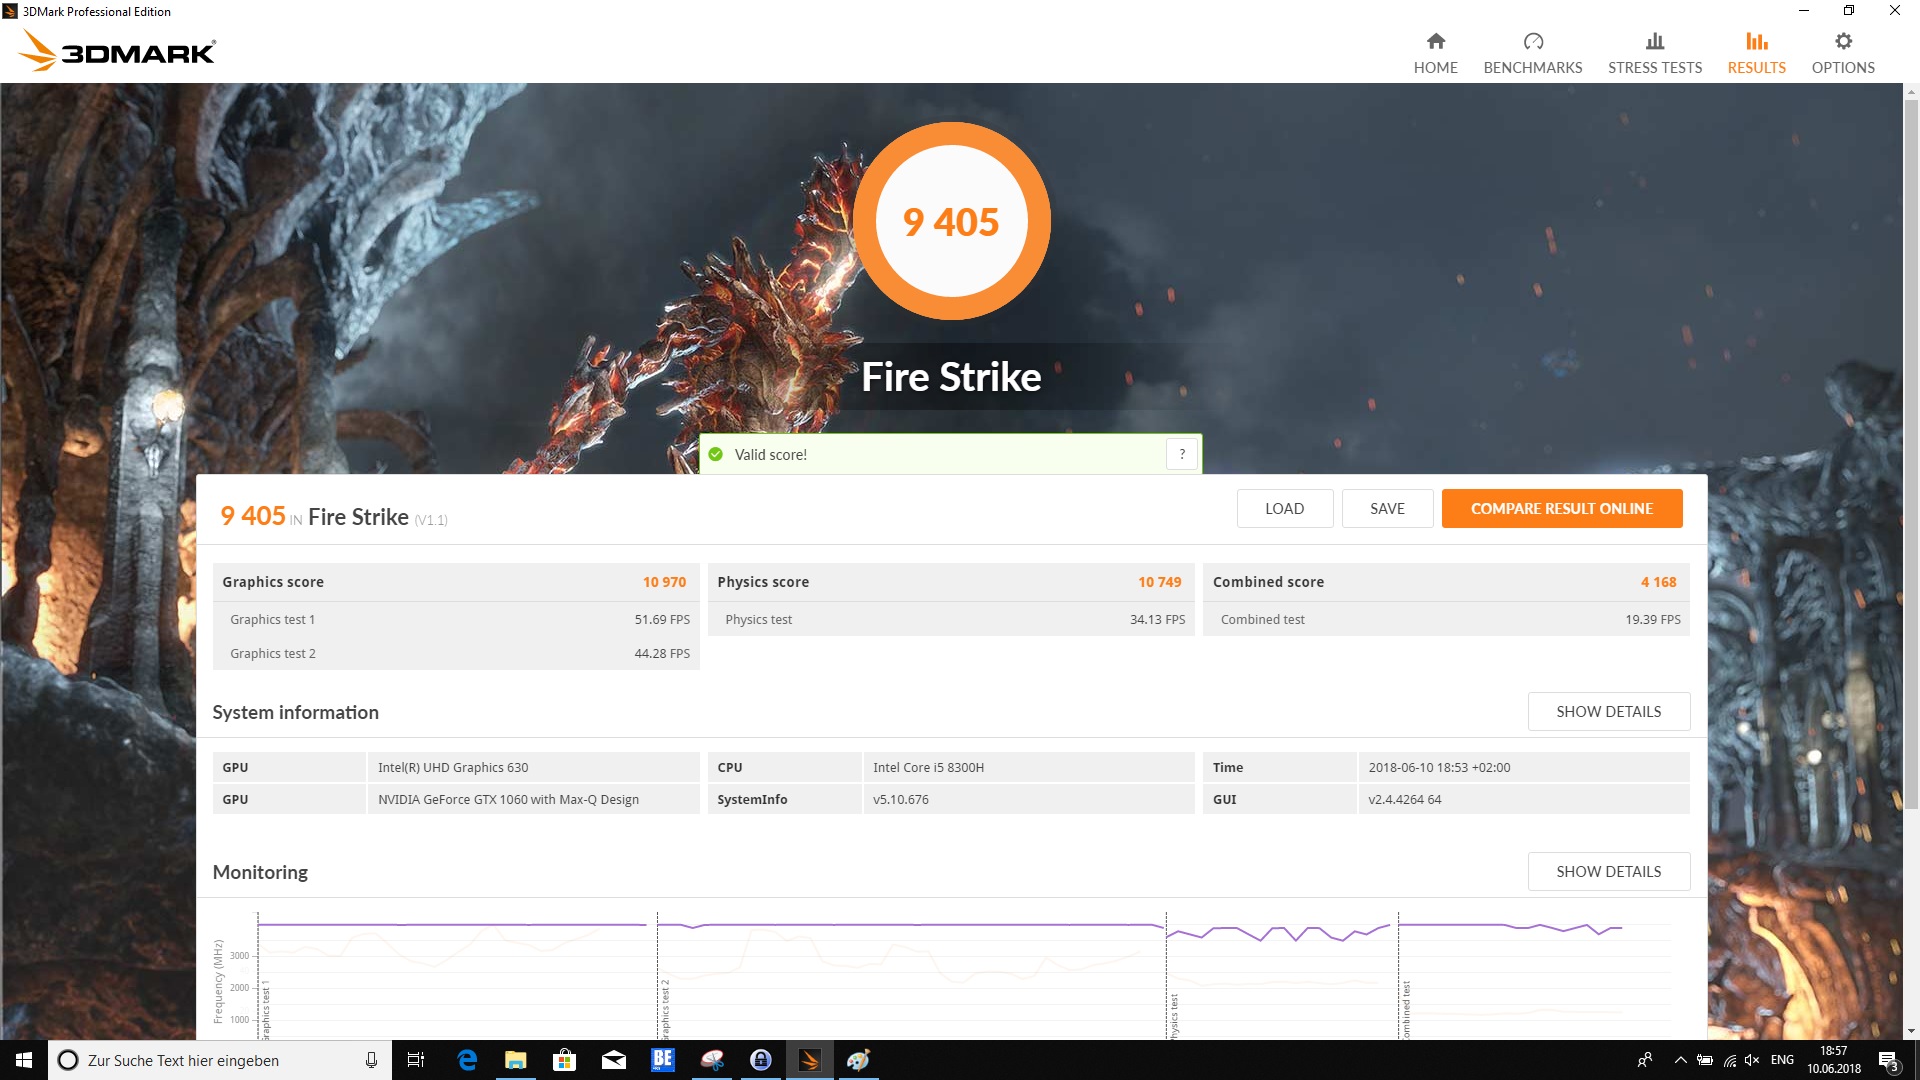
| 3DMark Ice Storm Standard Score | 94815 points | |
| 3DMark Cloud Gate Standard Score | 22078 points | |
| 3DMark Fire Strike Score | 9405 points | |
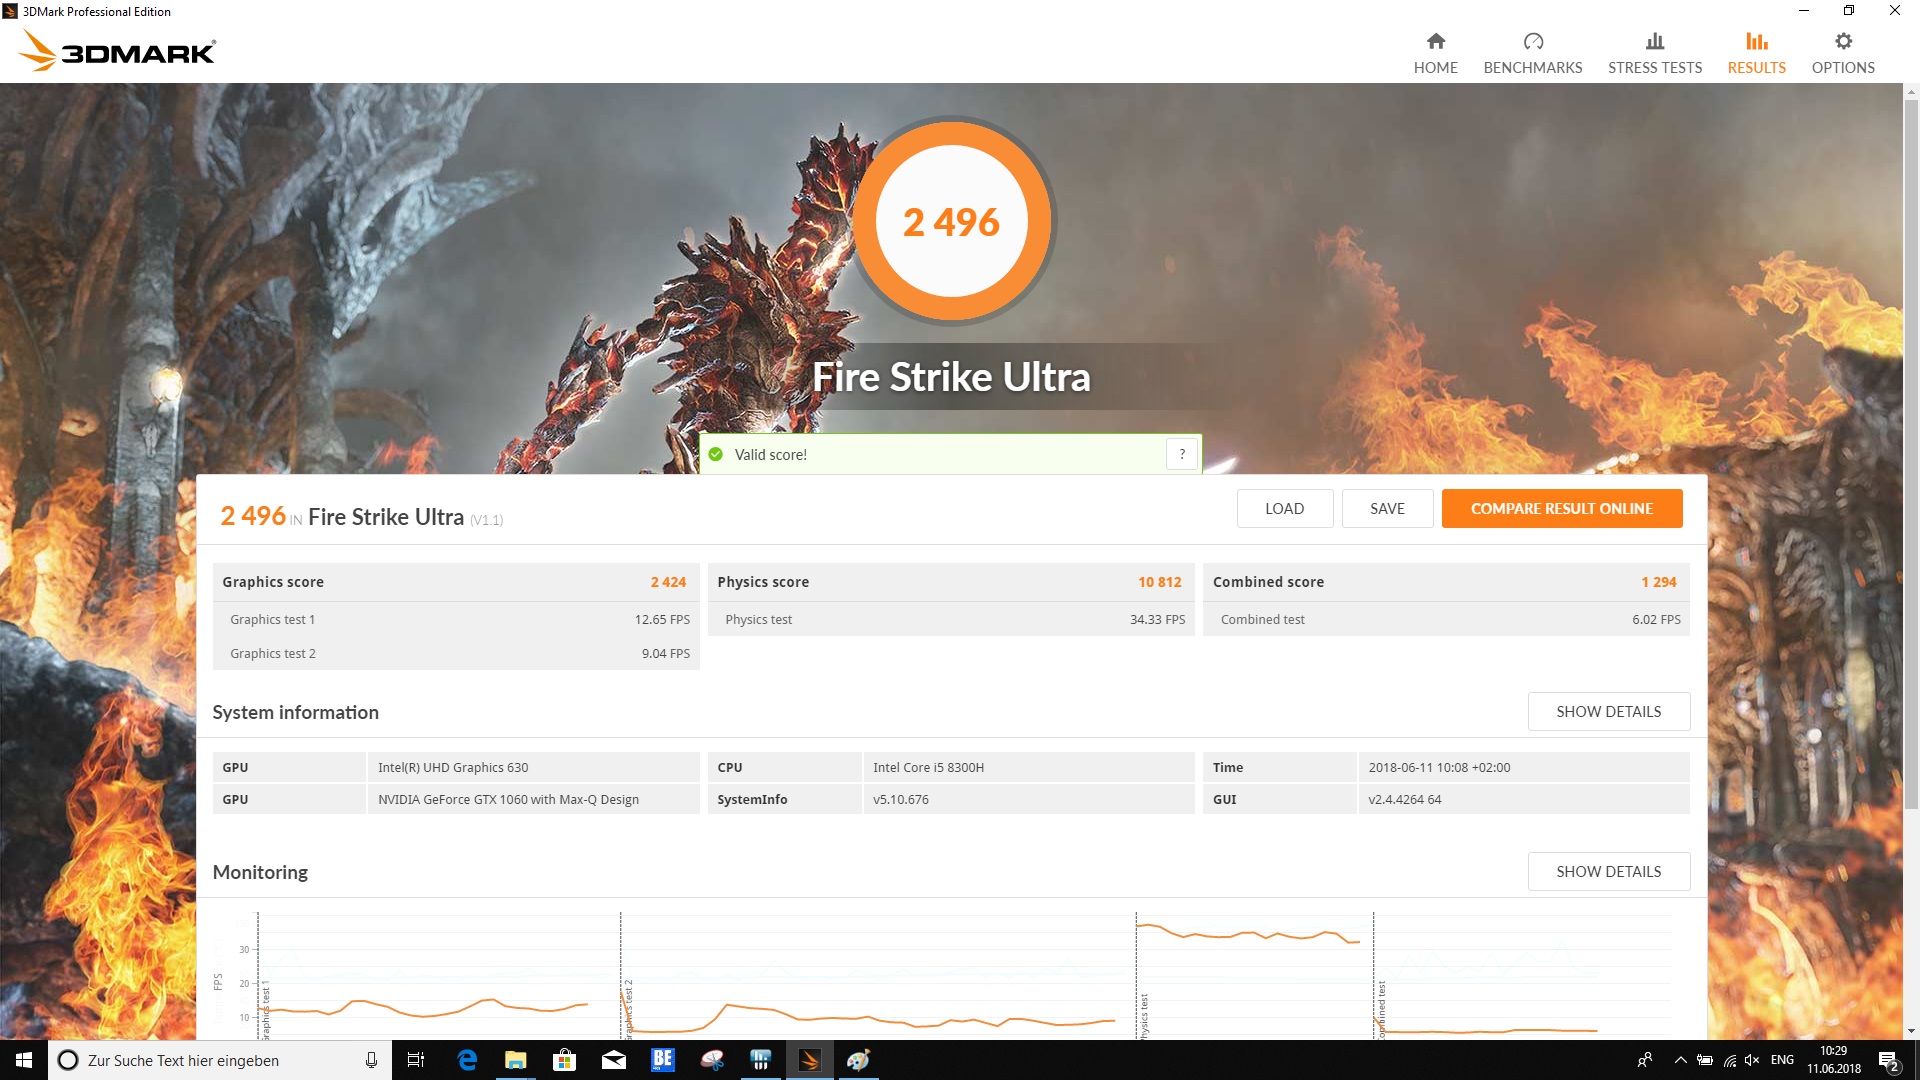
| 3DMark Fire Strike Extreme Score | 4886 points | |
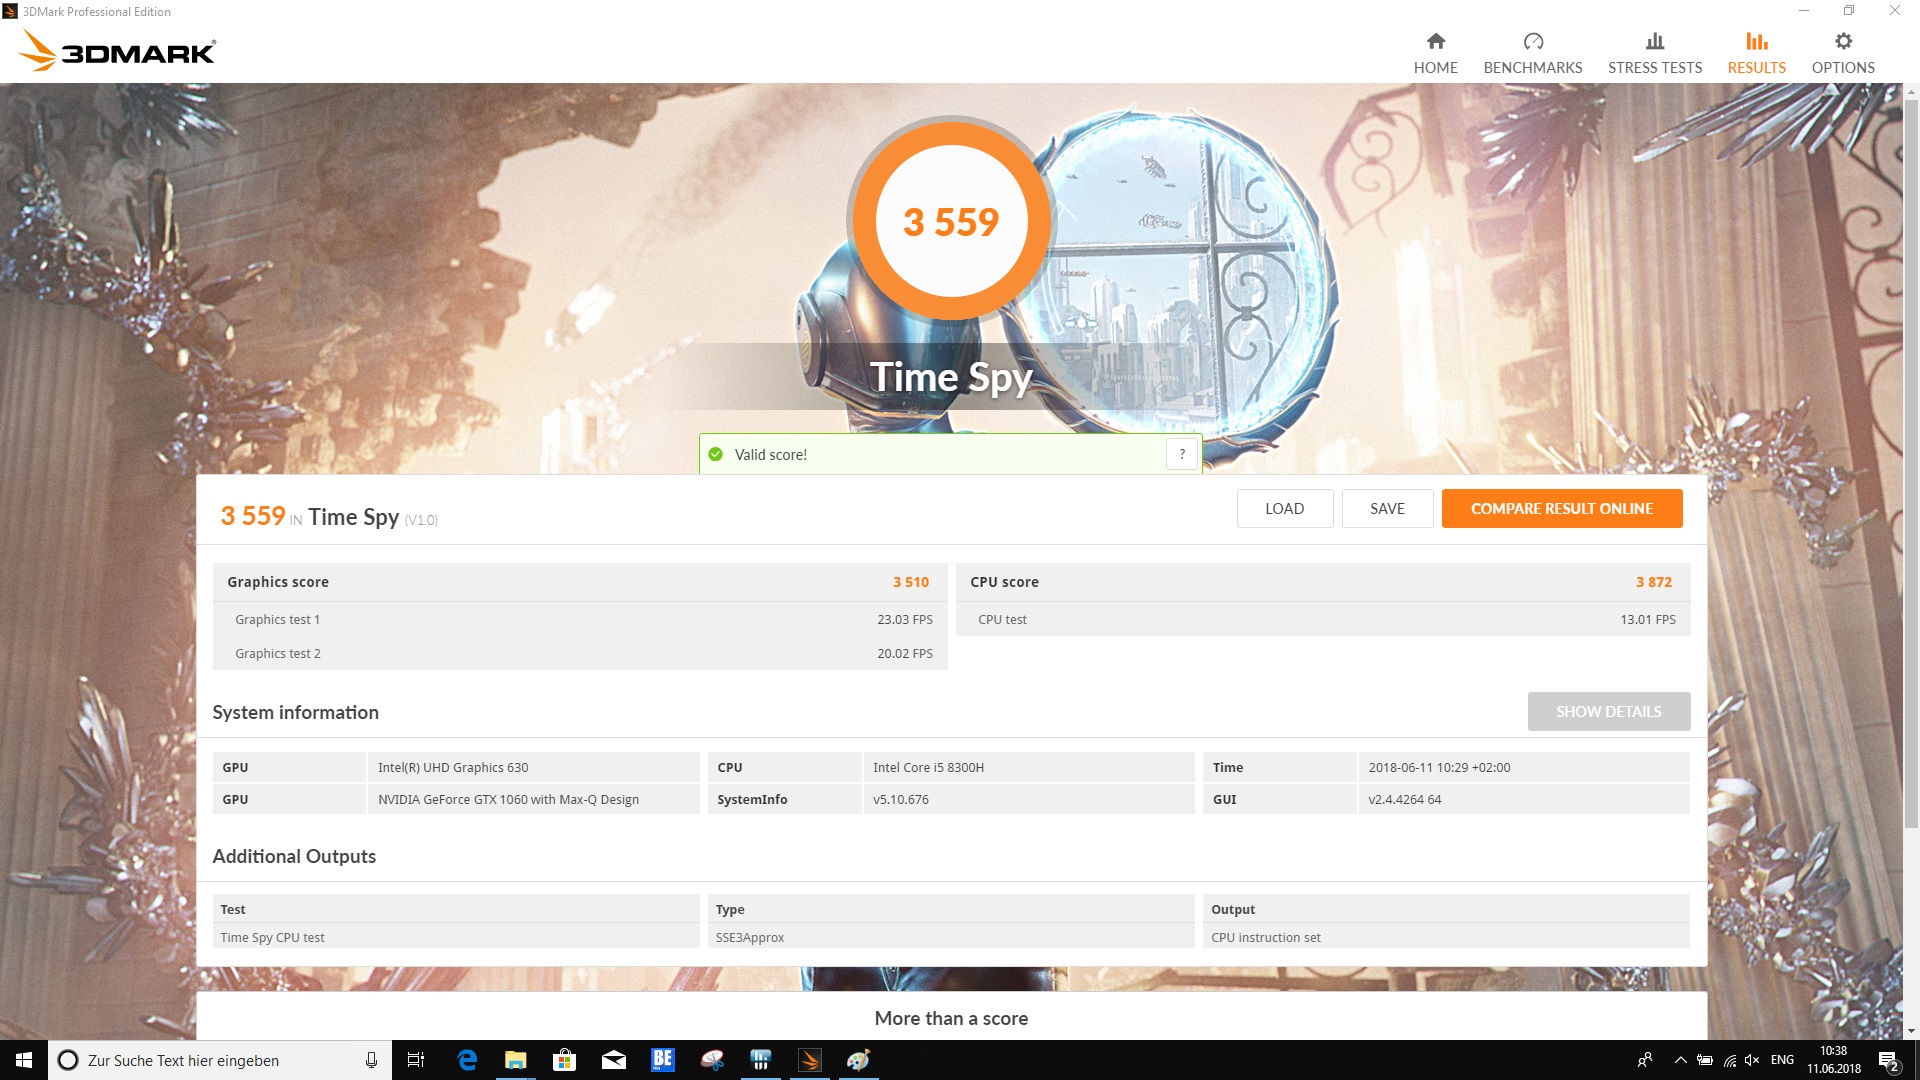
| 3DMark Time Spy Score | 3559 points | |
Help | ||
Gaming Performance
Thanks to the GeForce GTX 1060 Max-Q, the gaming performance of the Dell G5 15 5587 is sufficient. Not all games can be played in maximum detail in the native resolution without stutters, but this is not bad. The game The Witcher 3 clearly shows the limits of the device. On the other hand, in the also quite demanding Rise of the Tomb Raider, the game can even be played smoothly in maximum details. It is often different from case to case, so we cannot give a general determination of which preset is the best. However one thing is clear: The configuration with the Intel Core i5-8300H and GeForce GTX 1060 Max-Q is not suitable for 4K.
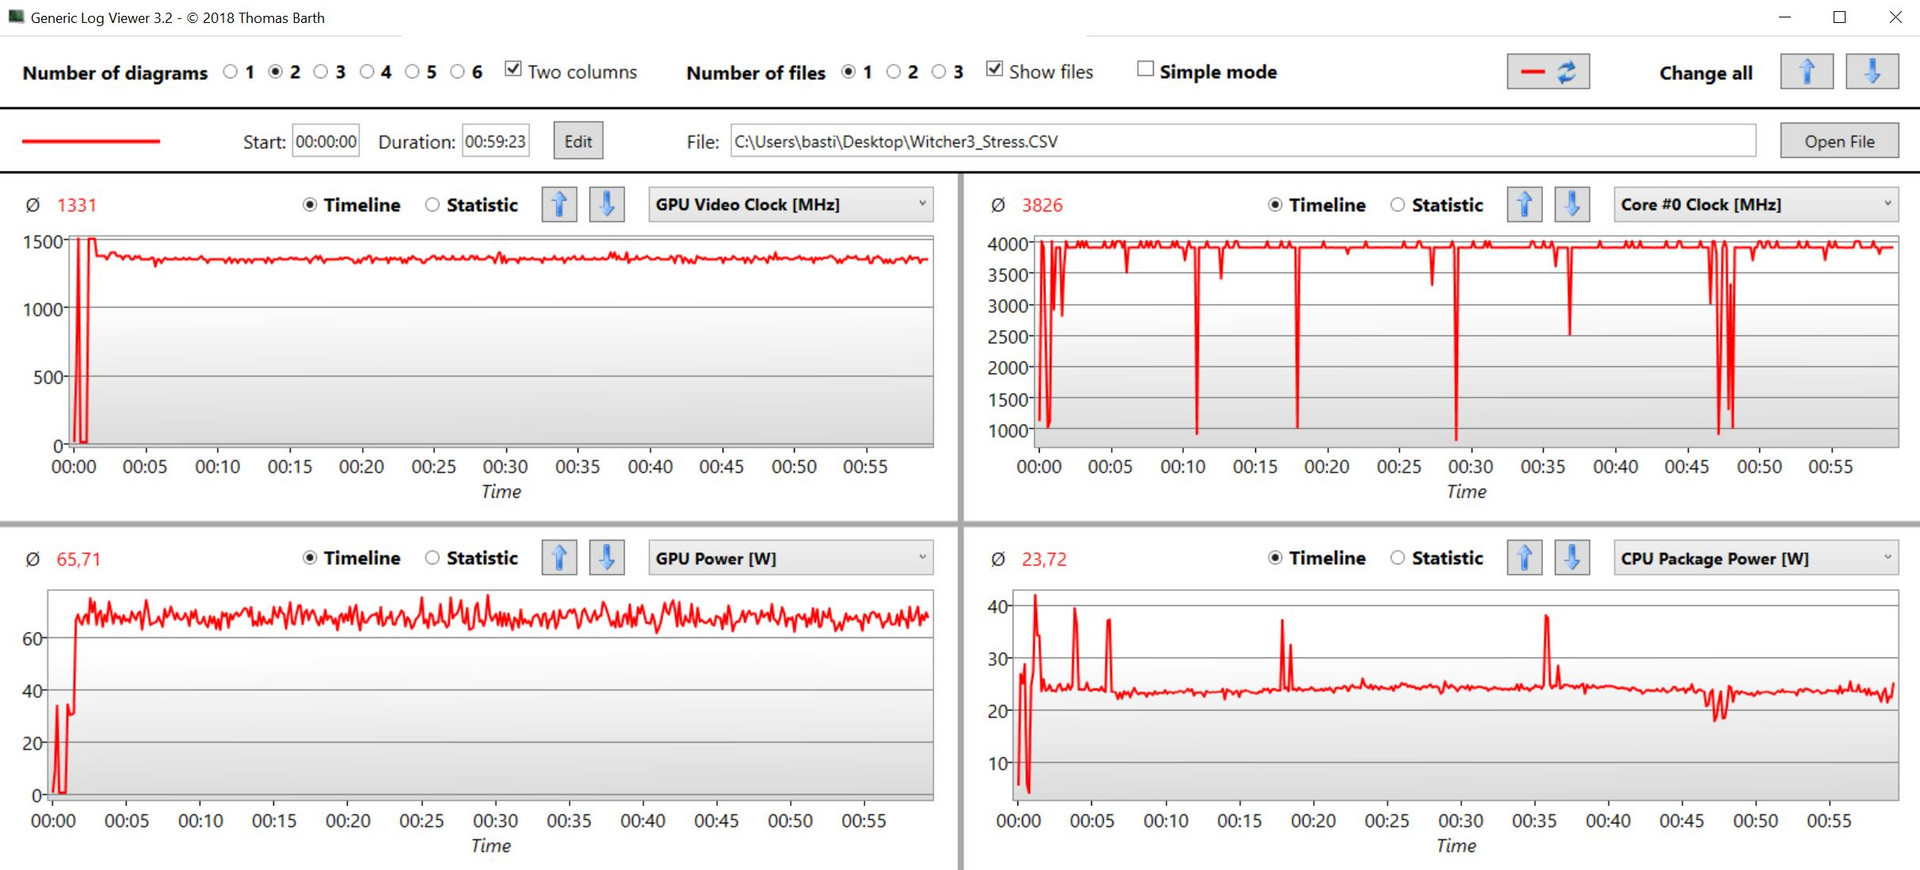
We ran an endurance test of the Dell G5 15 5587 using the game The Witcher 3 in order to determine how the frame rates behave over a longer period of time. Surprisingly, there are no frame drops worth mentioning that impact the game, even after longer periods of playing.
| BioShock Infinite - 1920x1080 Ultra Preset, DX11 (DDOF) | |
| Dell G5 15 5587 | |
| Average NVIDIA GeForce GTX 1060 Max-Q (87.2 - 112, n=8) | |
| Dell Inspiron 15 7000 7577 | |
| Dell Inspiron 15 7000 7577 | |
| Rise of the Tomb Raider - 1920x1080 Very High Preset AA:FX AF:16x | |
| Dell G5 15 5587 | |
| Asus FX503VM-EH73 | |
| Average NVIDIA GeForce GTX 1060 Max-Q (45.3 - 66.4, n=8) | |
| Dell Inspiron 15 7000 7577 | |
| Dell Inspiron 15 7000 7577 | |
| Acer Nitro 5 Spin NP515-51-86CX | |
| The Witcher 3 - 1920x1080 Ultra Graphics & Postprocessing (HBAO+) | |
| Average of class Gaming (95 - 240, n=8, last 2 years) | |
| PC Zentrum Proteus V | |
| Asus FX503VM-EH73 | |
| Average NVIDIA GeForce GTX 1060 Max-Q (34.6 - 38.5, n=9) | |
| Dell Inspiron 15 7000 7577 | |
| Dell G5 15 5587 | |
| Acer Predator Helios 300 PH317-52-51M6 | |
| Dell Inspiron 15 7000 7577 | |
| low | med. | high | ultra | 4K | |
|---|---|---|---|---|---|
| BioShock Infinite (2013) | 264 | 233.1 | 213.3 | 107.5 | |
| GTA V (2015) | 156.8 | 151.6 | 106.5 | 61.8 | 53.7 |
| The Witcher 3 (2015) | 172.2 | 122.3 | 58.3 | 34.9 | 23.3 |
| Rise of the Tomb Raider (2016) | 160.9 | 128.1 | 72.7 | 60.5 | 24.6 |
| Playerunknown's Battlegrounds (PUBG) (2017) | 141.9 | 92.5 | 85.6 | 63.3 | 12.9 |
| FIFA 18 (2017) | 290.6 | 277.9 | 252.3 | 245.7 | 130 |
| Assassin´s Creed Origins (2017) | 77 | 67 | 62 | 52 | 21 |
| Call of Duty WWII (2017) | 174.9 | 163.3 | 91.9 | 70.9 | 31.3 |
| Need for Speed Payback (2017) | 117.9 | 89.1 | 78.5 | 66.6 | 23.8 |
| Star Wars Battlefront 2 (2017) | 135.5 | 93.4 | 81.5 | 62.2 | |
| Fortnite (2018) | 178 | 132.6 | 115.7 | 72.8 | |
| Kingdom Come: Deliverance (2018) | 110 | 66.8 | 52.7 | 38 | 12 |
| Far Cry 5 (2018) | 110 | 70 | 65 | 48 | 20 |
Emissions
Noise Emissions
During idle after a cold start and also under low load, silent operation is not possible. While both fans also run during idle, at 31.1 – 34.2 dB(A), the measured volume is not loud. Thus there will always be a quiet whirring. Under load, the fans really rev up, and we measure the maximum value of the Dell G5 15 5587 at 44 dB(A). At 42.7 dB(A), the device is only marginally quieter during gaming.
We also noticed a quiet electronic chirping in our test unit when accessing the SSD storage.
Looking at it overall, the Dell G5 15 5587 leaves a good impression.
Noise level
| Idle |
| 31.1 / 31.1 / 34.2 dB(A) |
| Load |
| 34.9 / 44 dB(A) |
 | ||
30 dB silent 40 dB(A) audible 50 dB(A) loud |
||
min: | ||
| Dell G5 15 5587 GeForce GTX 1060 Max-Q, i5-8300H, SK hynix SC311 M.2 | Dell Inspiron 15 7000 7577 GeForce GTX 1050 Mobile, i5-7300HQ, Seagate Mobile HDD 1TB ST1000LX015-1U7172 | Dell Inspiron 15 7000 7577 GeForce GTX 1060 Max-Q, i5-7300HQ, Samsung PM961 MZVLW256HEHP | PC Zentrum Proteus V GeForce GTX 1060 Mobile, i7-7700HQ, Samsung PM961 MZVLW256HEHP | Asus FX503VM-EH73 GeForce GTX 1060 Mobile, i7-7700HQ, SanDisk SD8SN8U128G1002 | Acer Nitro 5 Spin NP515-51-86CX GeForce GTX 1050 Mobile, i5-8550U, Micron 1100 MTFDDAV256TBN | Acer Predator Helios 300 PH317-52-51M6 GeForce GTX 1050 Ti Mobile, i5-8300H, Hynix HFS128G39TND | |
|---|---|---|---|---|---|---|---|
| Noise | -2% | 9% | -16% | -2% | -2% | -5% | |
| off / environment * (dB) | 30.3 | 31 -2% | 28 8% | 31 -2% | 27.8 8% | 30.4 -0% | 29 4% |
| Idle Minimum * (dB) | 31.1 | 32.7 -5% | 28 10% | 37 -19% | 29.6 5% | 30.9 1% | 29 7% |
| Idle Average * (dB) | 31.1 | 32.7 -5% | 28 10% | 38 -22% | 29.6 5% | 30.9 1% | 31 -0% |
| Idle Maximum * (dB) | 34.2 | 32.7 4% | 28 18% | 39 -14% | 29.6 13% | 30.9 10% | 33 4% |
| Load Average * (dB) | 34.9 | 38.7 -11% | 30.3 13% | 47 -35% | 37.3 -7% | 42.6 -22% | 45 -29% |
| Witcher 3 ultra * (dB) | 42.7 | 39 9% | 39.5 7% | 43 -1% | 49.8 -17% | 45 -5% | |
| Load Maximum * (dB) | 44 | 44.6 -1% | 46.5 -6% | 52 -18% | 53.7 -22% | 45 -2% | 51 -16% |
* ... smaller is better
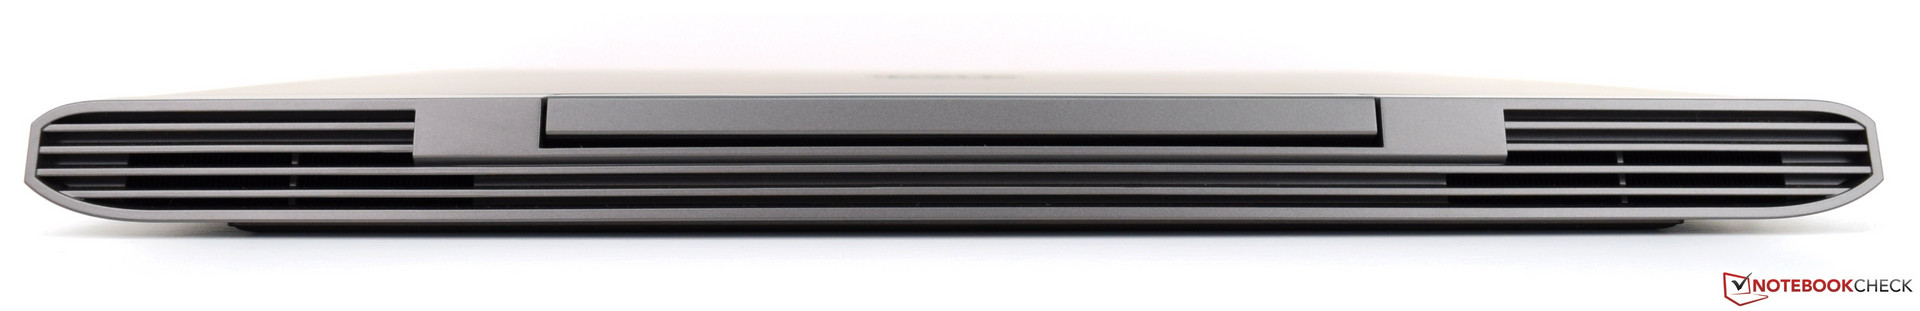
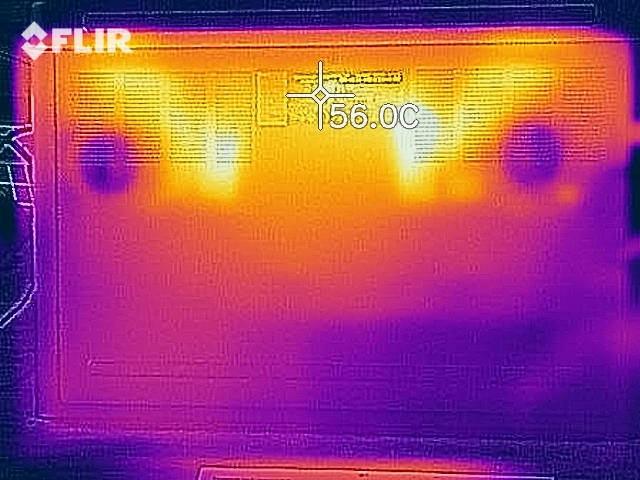
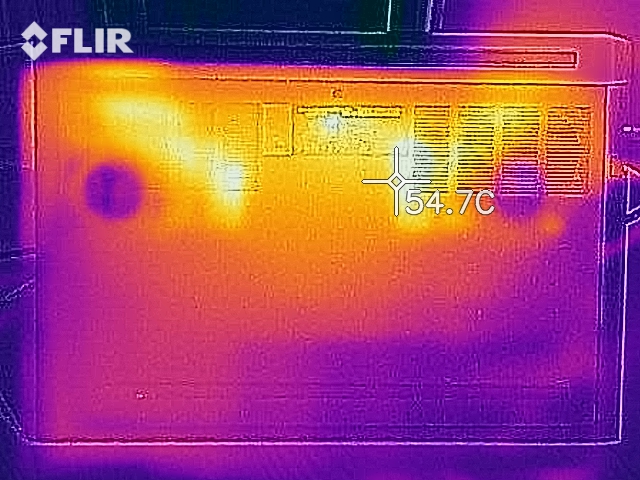
Temperature
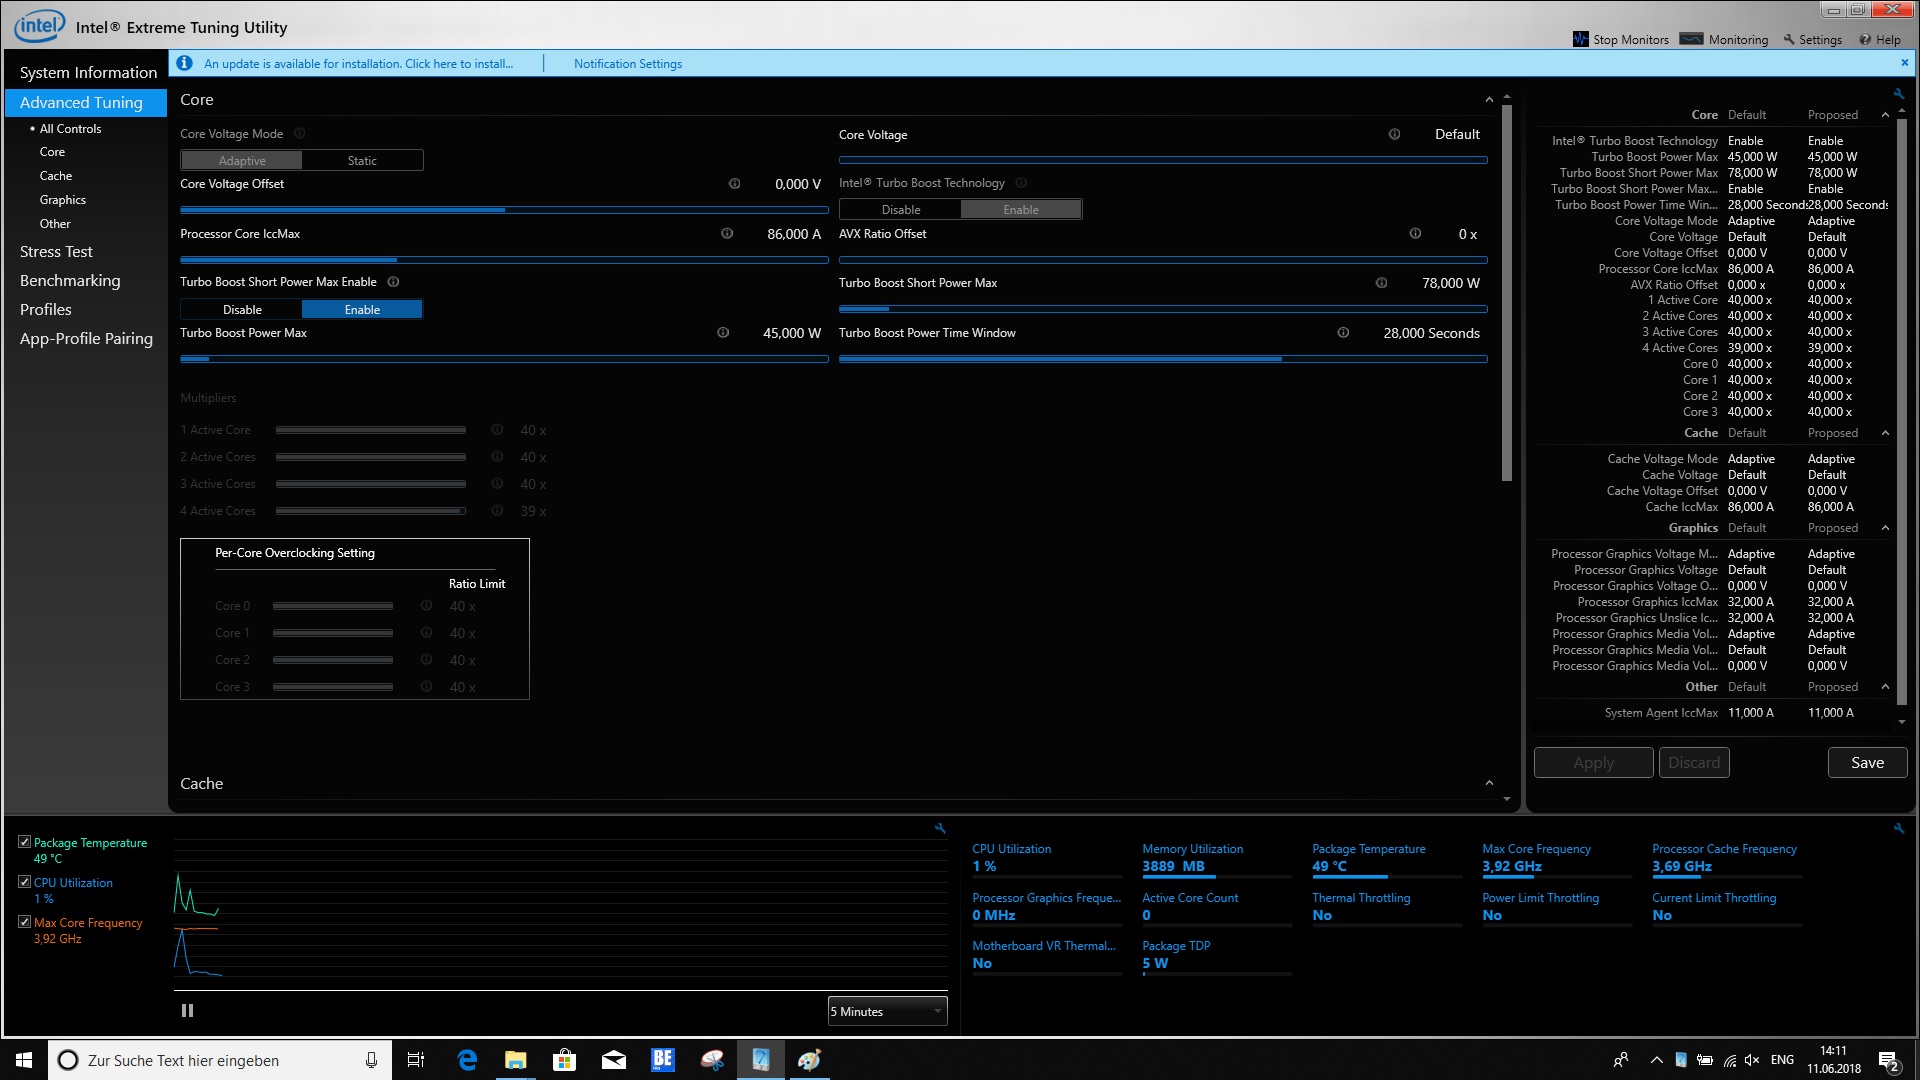
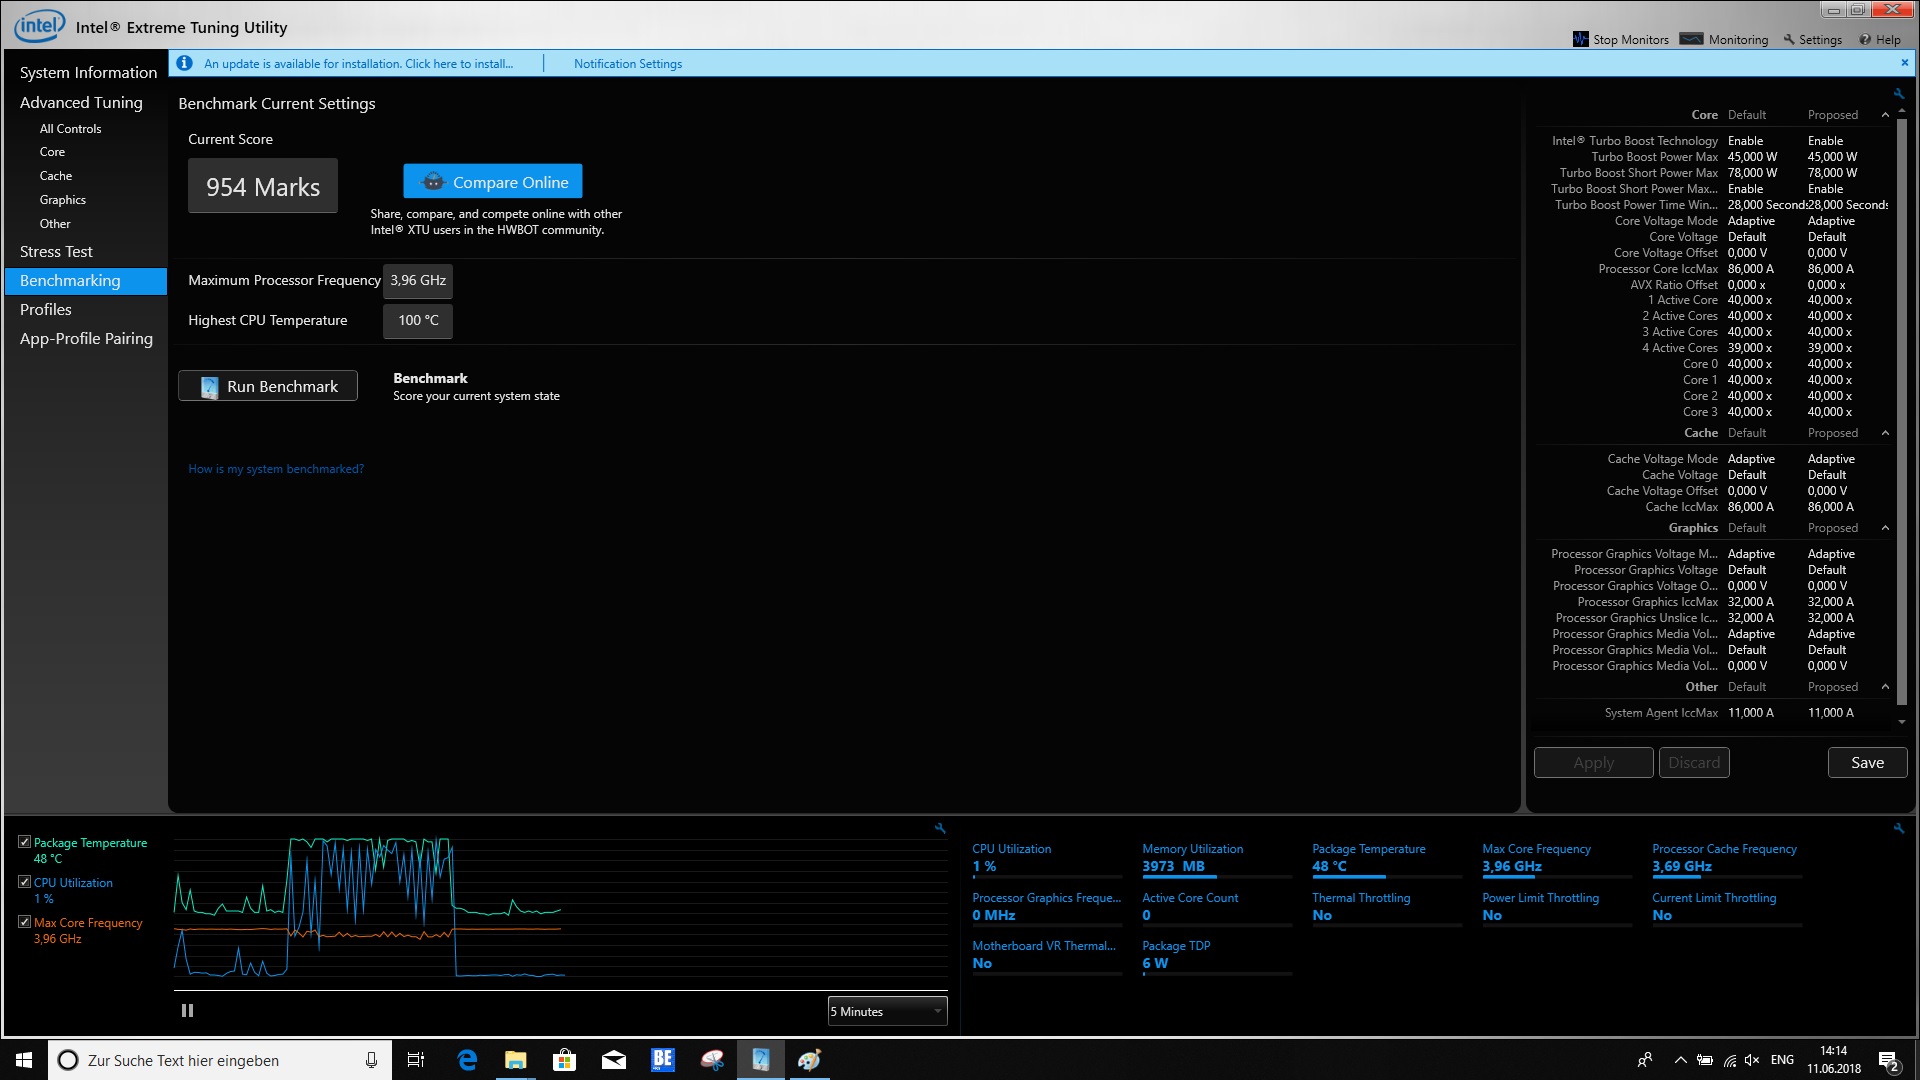
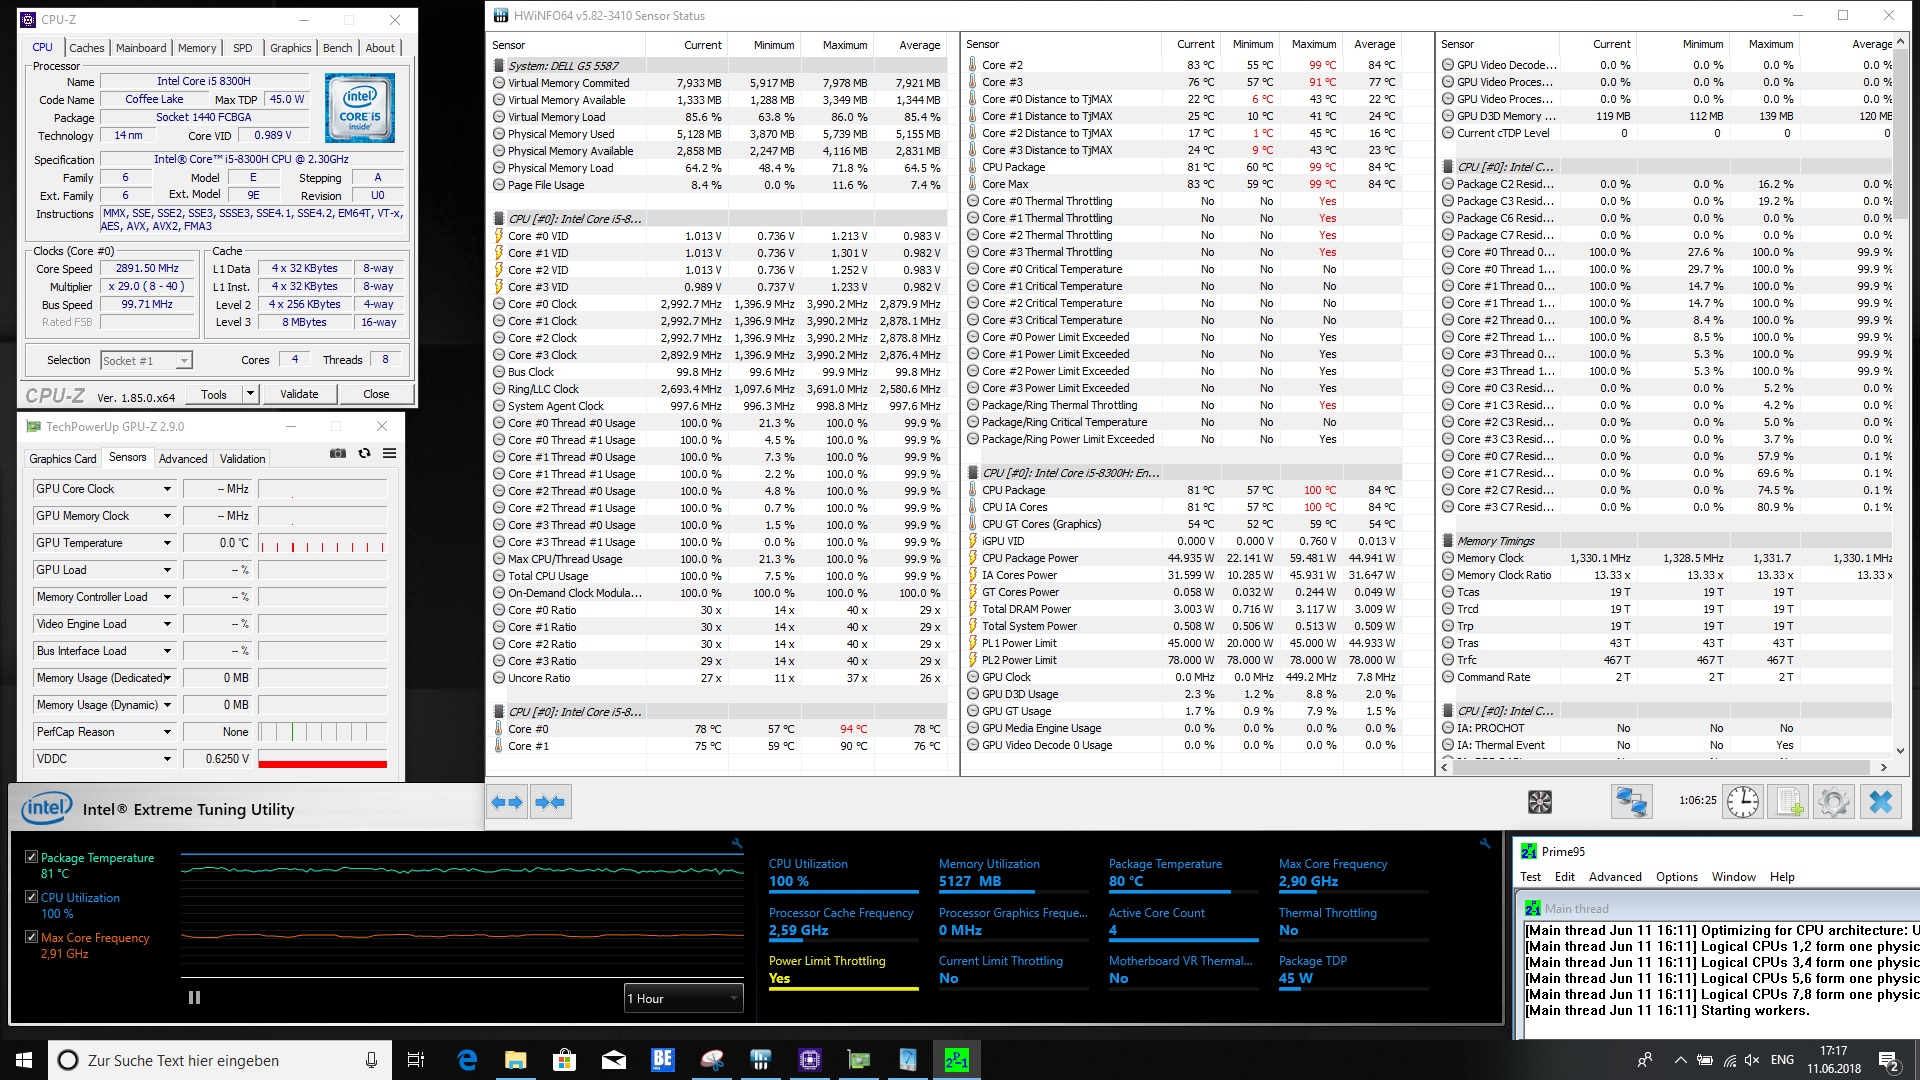
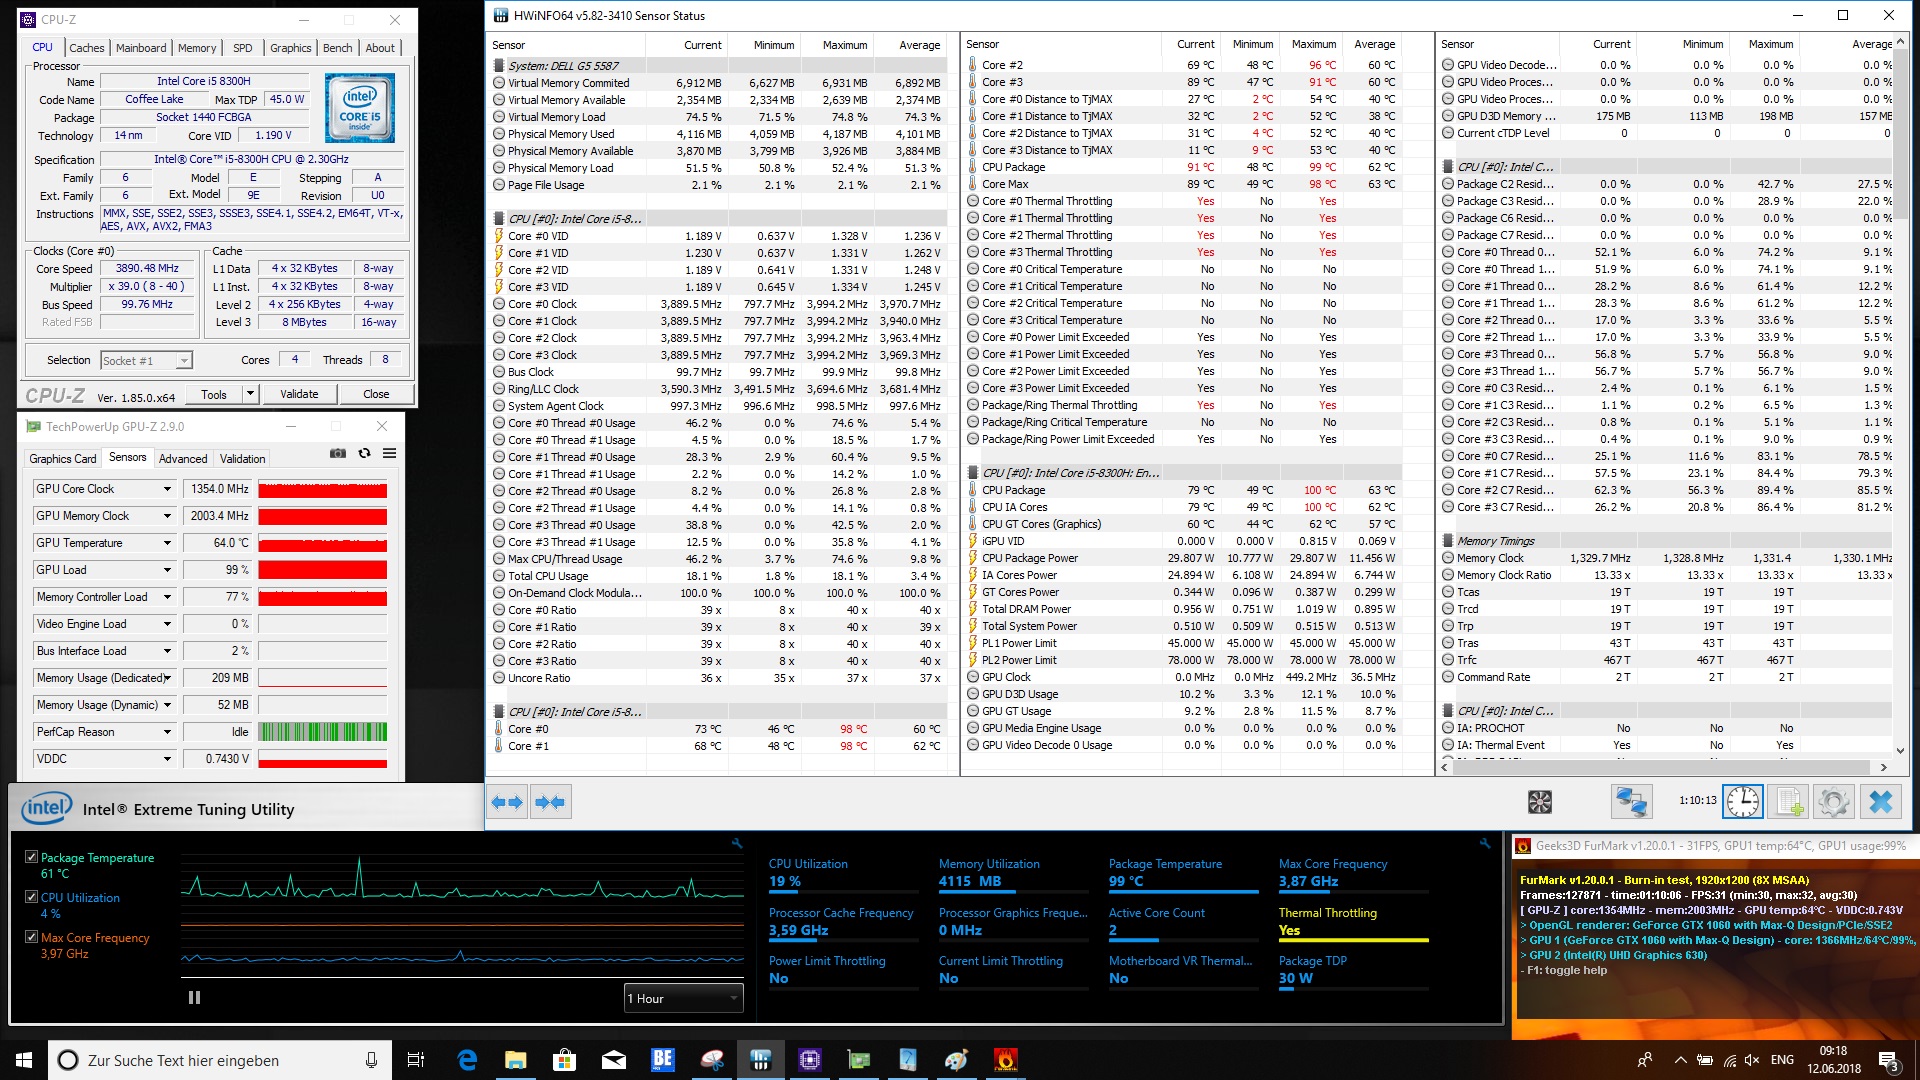
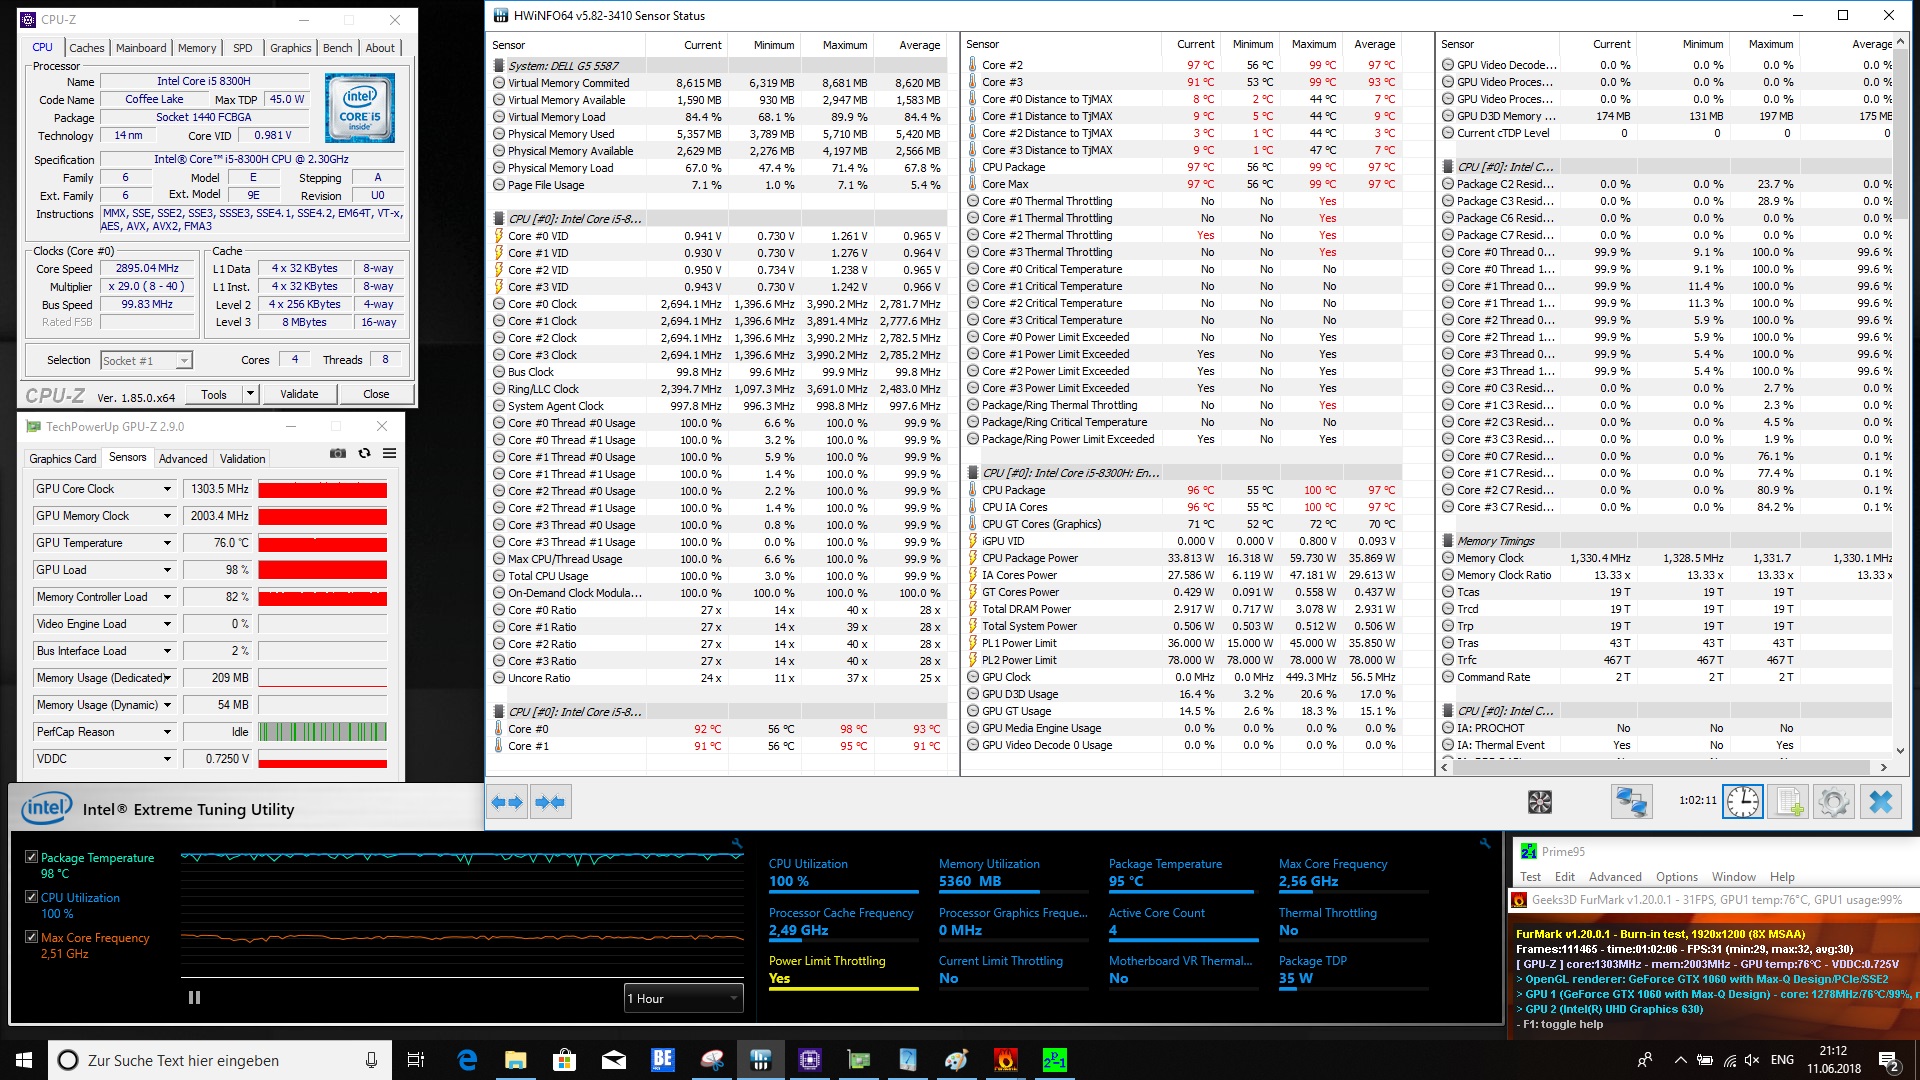
The benchmarks did not indicate that the Dell G5 15 5587 had a particular heat problem. However, when looking at the case temperatures, we notice that at 57 °C (135 °F) under load, they are simply too high. Only the Asus FX503VM can top this value with 59.6 °C (139 °F). Presumably the cooling unit is unable to dissipate the developing heat fast enough, causing a heat build-up. The stress test then shows that the Intel Core i5-8300H can easily reach its thermal limits, which means that it must be throttled. However, the SoC still runs through the Prime95 load test at 2.9 GHz on average. If only the GPU is put under load, at 64 °C (147 °F) we measure a normal temperature! During simultaneous load of the CPU and GPU, the GPU temperature rises to 76 °C (169 °F), which is still not a reason to throttle it.
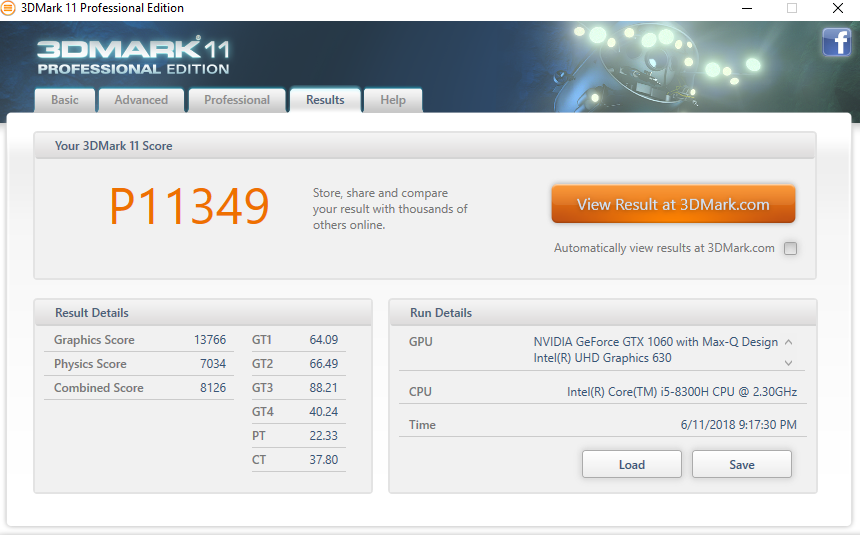
Due to the high temperatures, we test the 3D performance with 3DMark11 again afterwards. Fortunately, the result is not much worse compared to the cold start. At 700 points, the difference remains within acceptable limits.
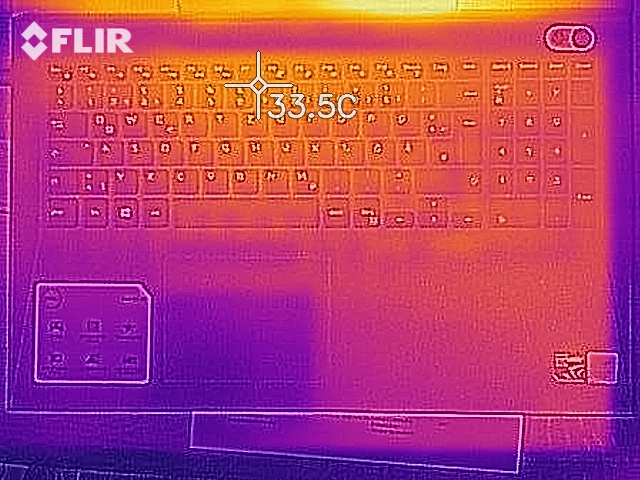
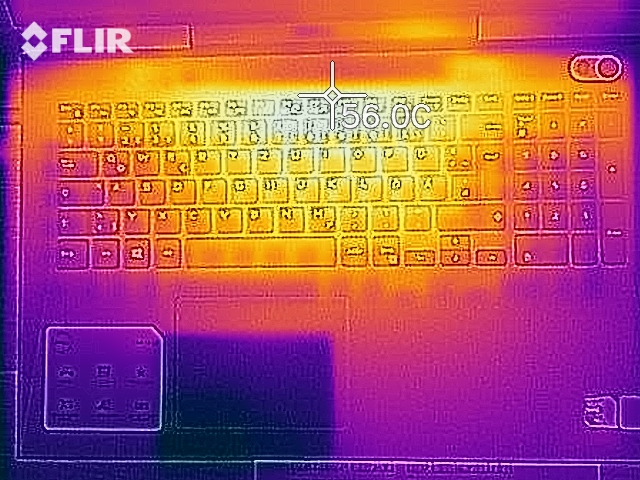
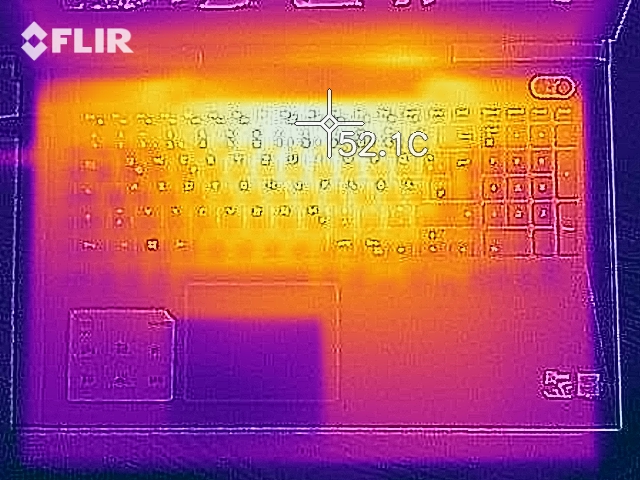
(-) The maximum temperature on the upper side is 50.2 °C / 122 F, compared to the average of 40.4 °C / 105 F, ranging from 21.2 to 68.8 °C for the class Gaming.
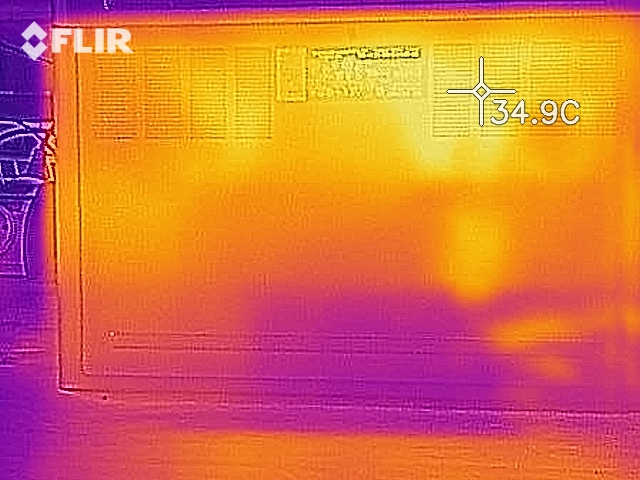
(-) The bottom heats up to a maximum of 57 °C / 135 F, compared to the average of 43.2 °C / 110 F
(+) In idle usage, the average temperature for the upper side is 27.3 °C / 81 F, compared to the device average of 33.9 °C / 93 F.
(-) Playing The Witcher 3, the average temperature for the upper side is 38.5 °C / 101 F, compared to the device average of 33.9 °C / 93 F.
(+) The palmrests and touchpad are reaching skin temperature as a maximum (33.7 °C / 92.7 F) and are therefore not hot.
(-) The average temperature of the palmrest area of similar devices was 28.8 °C / 83.8 F (-4.9 °C / -8.9 F).
| Dell G5 15 5587 GeForce GTX 1060 Max-Q, i5-8300H, SK hynix SC311 M.2 | Dell Inspiron 15 7000 7577 GeForce GTX 1050 Mobile, i5-7300HQ, Seagate Mobile HDD 1TB ST1000LX015-1U7172 | Dell Inspiron 15 7000 7577 GeForce GTX 1060 Max-Q, i5-7300HQ, Samsung PM961 MZVLW256HEHP | PC Zentrum Proteus V GeForce GTX 1060 Mobile, i7-7700HQ, Samsung PM961 MZVLW256HEHP | Asus FX503VM-EH73 GeForce GTX 1060 Mobile, i7-7700HQ, SanDisk SD8SN8U128G1002 | Acer Nitro 5 Spin NP515-51-86CX GeForce GTX 1050 Mobile, i5-8550U, Micron 1100 MTFDDAV256TBN | Acer Predator Helios 300 PH317-52-51M6 GeForce GTX 1050 Ti Mobile, i5-8300H, Hynix HFS128G39TND | |
|---|---|---|---|---|---|---|---|
| Heat | 13% | 12% | 5% | -20% | 10% | -3% | |
| Maximum Upper Side * (°C) | 50.2 | 35.9 28% | 44 12% | 44 12% | 59.6 -19% | 46 8% | 50 -0% |
| Maximum Bottom * (°C) | 57 | 41.6 27% | 43.8 23% | 53 7% | 56 2% | 47 18% | 52 9% |
| Idle Upper Side * (°C) | 28.6 | 27.9 2% | 26 9% | 29 -1% | 37 -29% | 29.6 -3% | 33 -15% |
| Idle Bottom * (°C) | 28.9 | 30.5 -6% | 28 3% | 29 -0% | 38.6 -34% | 24.6 15% | 30 -4% |
* ... smaller is better
Speakers
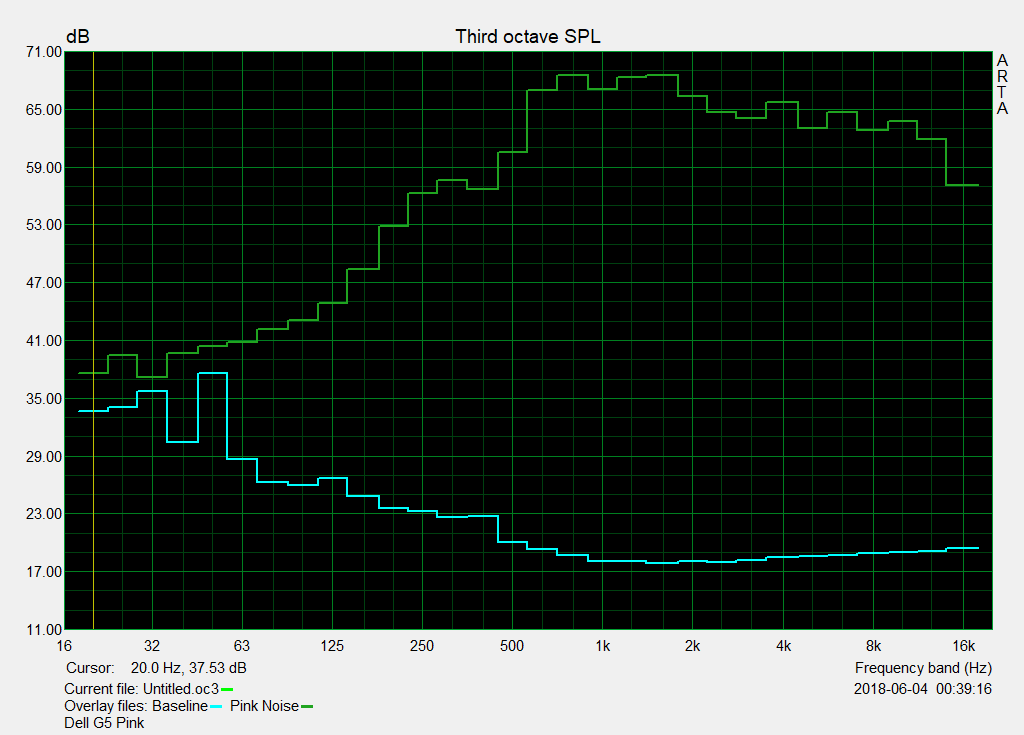
Dell has positioned the two speakers below the palm rest, which prevents a muffled sound on soft surfaces, since the speakers are pointed towards the user. We miss the use of a dedicated sub-woofer, causing a clear lack of bass and the mids and highs to dominate. At 68.5 dB(A), the maximum volume is not particularly high, yet it is sufficient. We did not notice any speaker noise in our test unit.
Using the Waves MaxxAudio Pro software, you can adjust the speakers a little more to your own needs. We liked the simple recording tool. However there was quite a lot of noise in the recording, which is a negative point for video recordings. The offered quality is sufficient for video-calling such as skyping. For external speakers, the Dell G5 15 5587 offers a 3.5-mm port (audio/microphone port) on the right side.
Dell G5 15 5587 audio analysis
(-) | not very loud speakers (68.5 dB)
Bass 100 - 315 Hz
(±) | reduced bass - on average 12.5% lower than median
(+) | bass is linear (5.9% delta to prev. frequency)
Mids 400 - 2000 Hz
(+) | balanced mids - only 4.6% away from median
(+) | mids are linear (5.1% delta to prev. frequency)
Highs 2 - 16 kHz
(+) | balanced highs - only 1.1% away from median
(+) | highs are linear (3.6% delta to prev. frequency)
Overall 100 - 16.000 Hz
(+) | overall sound is linear (14.9% difference to median)
Compared to same class
» 30% of all tested devices in this class were better, 7% similar, 63% worse
» The best had a delta of 6%, average was 18%, worst was 132%
Compared to all devices tested
» 20% of all tested devices were better, 4% similar, 76% worse
» The best had a delta of 4%, average was 24%, worst was 134%
Asus FX503VM-EH73 audio analysis
(-) | not very loud speakers (68.2 dB)
Bass 100 - 315 Hz
(±) | reduced bass - on average 11.5% lower than median
(±) | linearity of bass is average (14.8% delta to prev. frequency)
Mids 400 - 2000 Hz
(+) | balanced mids - only 1.9% away from median
(+) | mids are linear (6.7% delta to prev. frequency)
Highs 2 - 16 kHz
(+) | balanced highs - only 4.2% away from median
(±) | linearity of highs is average (7.6% delta to prev. frequency)
Overall 100 - 16.000 Hz
(±) | linearity of overall sound is average (19.4% difference to median)
Compared to same class
» 67% of all tested devices in this class were better, 7% similar, 26% worse
» The best had a delta of 6%, average was 18%, worst was 132%
Compared to all devices tested
» 48% of all tested devices were better, 7% similar, 45% worse
» The best had a delta of 4%, average was 24%, worst was 134%
Power Management - The Dell G5 is not suitable for gaming in battery mode
Power Consumption
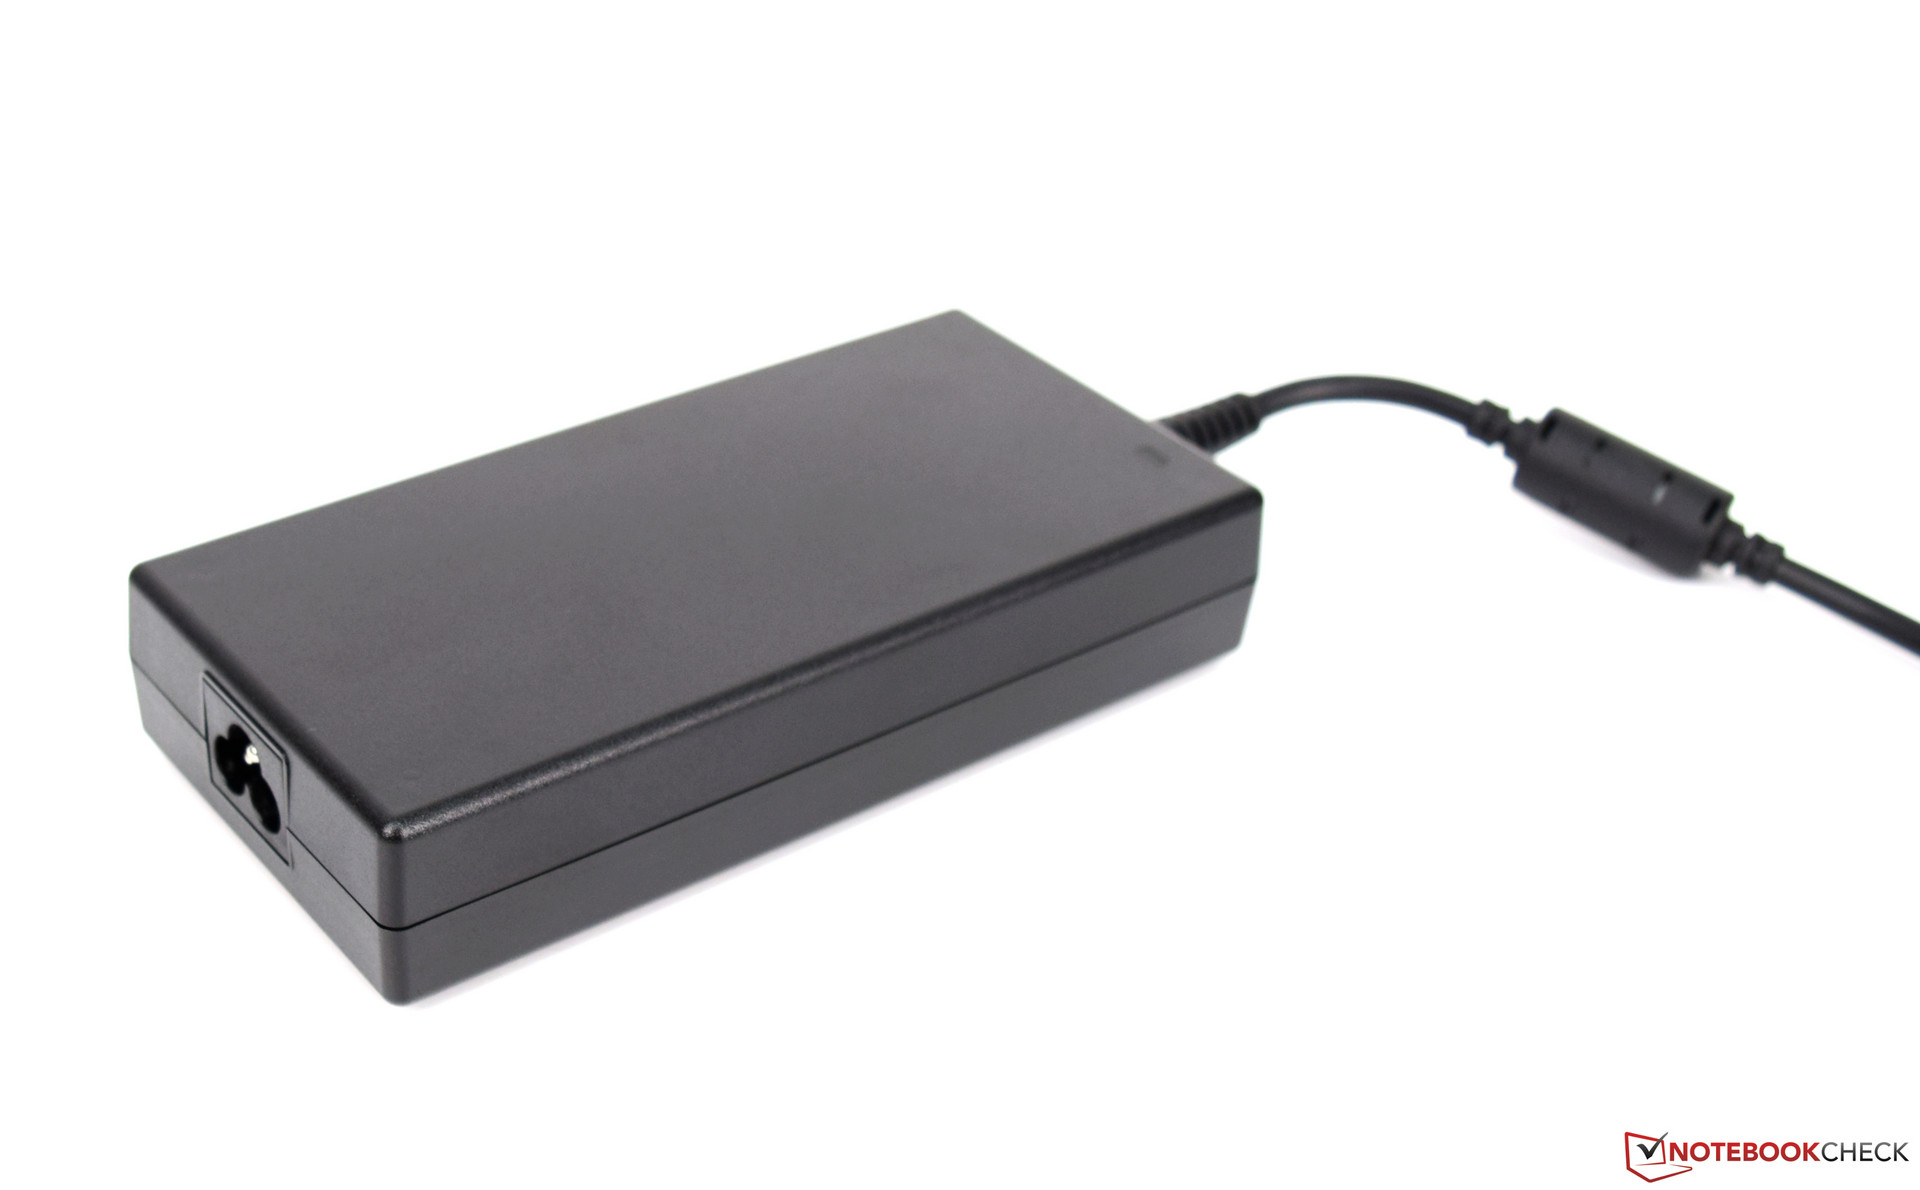
The power consumption is very good for a gaming laptop. Without load, the device can manage on 4.9 – 9.1 watts. During maximum load, the power supply has to offer 144 watts. Even though this is the second-highest value here, the offered performance puts this consumption into perspective. Our measurements show 90.8 watts during average load. At 110 watts, this becomes a little more during gaming, which is due to the graphics card.
In addition, the slightly higher power consumption is also due to the Intel Core i5-8300H which can draw up to 78 watts for short periods. The 180-watt power supply still does not hit its limits and is sized sufficiently.
Note:
Only the Dell G5 15 5000 with the GeForce GTX 1060 Max-Q is sold with a 180-watt power supply. The devices with other graphics adapters only offer a 130-watt power supply, which is sufficient due to the lower TDP.
| Off / Standby | |
| Idle | |
| Load |
|
Key:
min: | |
| Dell G5 15 5587 i5-8300H, GeForce GTX 1060 Max-Q, SK hynix SC311 M.2, IPS, 1920x1080, 15.6" | Dell Inspiron 15 7000 7577 i5-7300HQ, GeForce GTX 1050 Mobile, Seagate Mobile HDD 1TB ST1000LX015-1U7172, IPS, 1920x1080, 15.6" | Dell Inspiron 15 7000 7577 i5-7300HQ, GeForce GTX 1060 Max-Q, Samsung PM961 MZVLW256HEHP, IPS, 1920x1080, 15.6" | PC Zentrum Proteus V i7-7700HQ, GeForce GTX 1060 Mobile, Samsung PM961 MZVLW256HEHP, IPS, 1920x1080, 15.6" | Asus FX503VM-EH73 i7-7700HQ, GeForce GTX 1060 Mobile, SanDisk SD8SN8U128G1002, IPS, 1920x1080, 15.6" | Acer Nitro 5 Spin NP515-51-86CX i5-8550U, GeForce GTX 1050 Mobile, Micron 1100 MTFDDAV256TBN, IPS, 1920x1080, 15.6" | Acer Predator Helios 300 PH317-52-51M6 i5-8300H, GeForce GTX 1050 Ti Mobile, Hynix HFS128G39TND, IPS, 1920x1080, 17.3" | Average NVIDIA GeForce GTX 1060 Max-Q | Average of class Gaming | |
|---|---|---|---|---|---|---|---|---|---|
| Power Consumption | 3% | 8% | -181% | -50% | 20% | -10% | -40% | -111% | |
| Idle Minimum * (Watt) | 4.9 | 5.3 -8% | 7.1 -45% | 28 -471% | 12.8 -161% | 4.1 16% | 6 -22% | 9.14 ? -87% | 13.2 ? -169% |
| Idle Average * (Watt) | 8.5 | 8.8 -4% | 7.6 11% | 32 -276% | 15.4 -81% | 7.4 13% | 9 -6% | 13.2 ? -55% | 18.9 ? -122% |
| Idle Maximum * (Watt) | 9.1 | 9.7 -7% | 8.6 5% | 38 -318% | 15.9 -75% | 8.6 5% | 13 -43% | 15.1 ? -66% | 24.3 ? -167% |
| Load Average * (Watt) | 90.7 | 100 -10% | 59.5 34% | 91 -0% | 78 14% | 66 27% | 95 -5% | 88.3 ? 3% | 108 ? -19% |
| Witcher 3 ultra * (Watt) | 110 | 87 21% | 89 19% | 124 -13% | 107.3 2% | 102 7% | |||
| Load Maximum * (Watt) | 144 | 109 24% | 112.8 22% | 152 -6% | 143.4 -0% | 87 40% | 134 7% | 134.9 ? 6% | 254 ? -76% |
* ... smaller is better
Battery Life

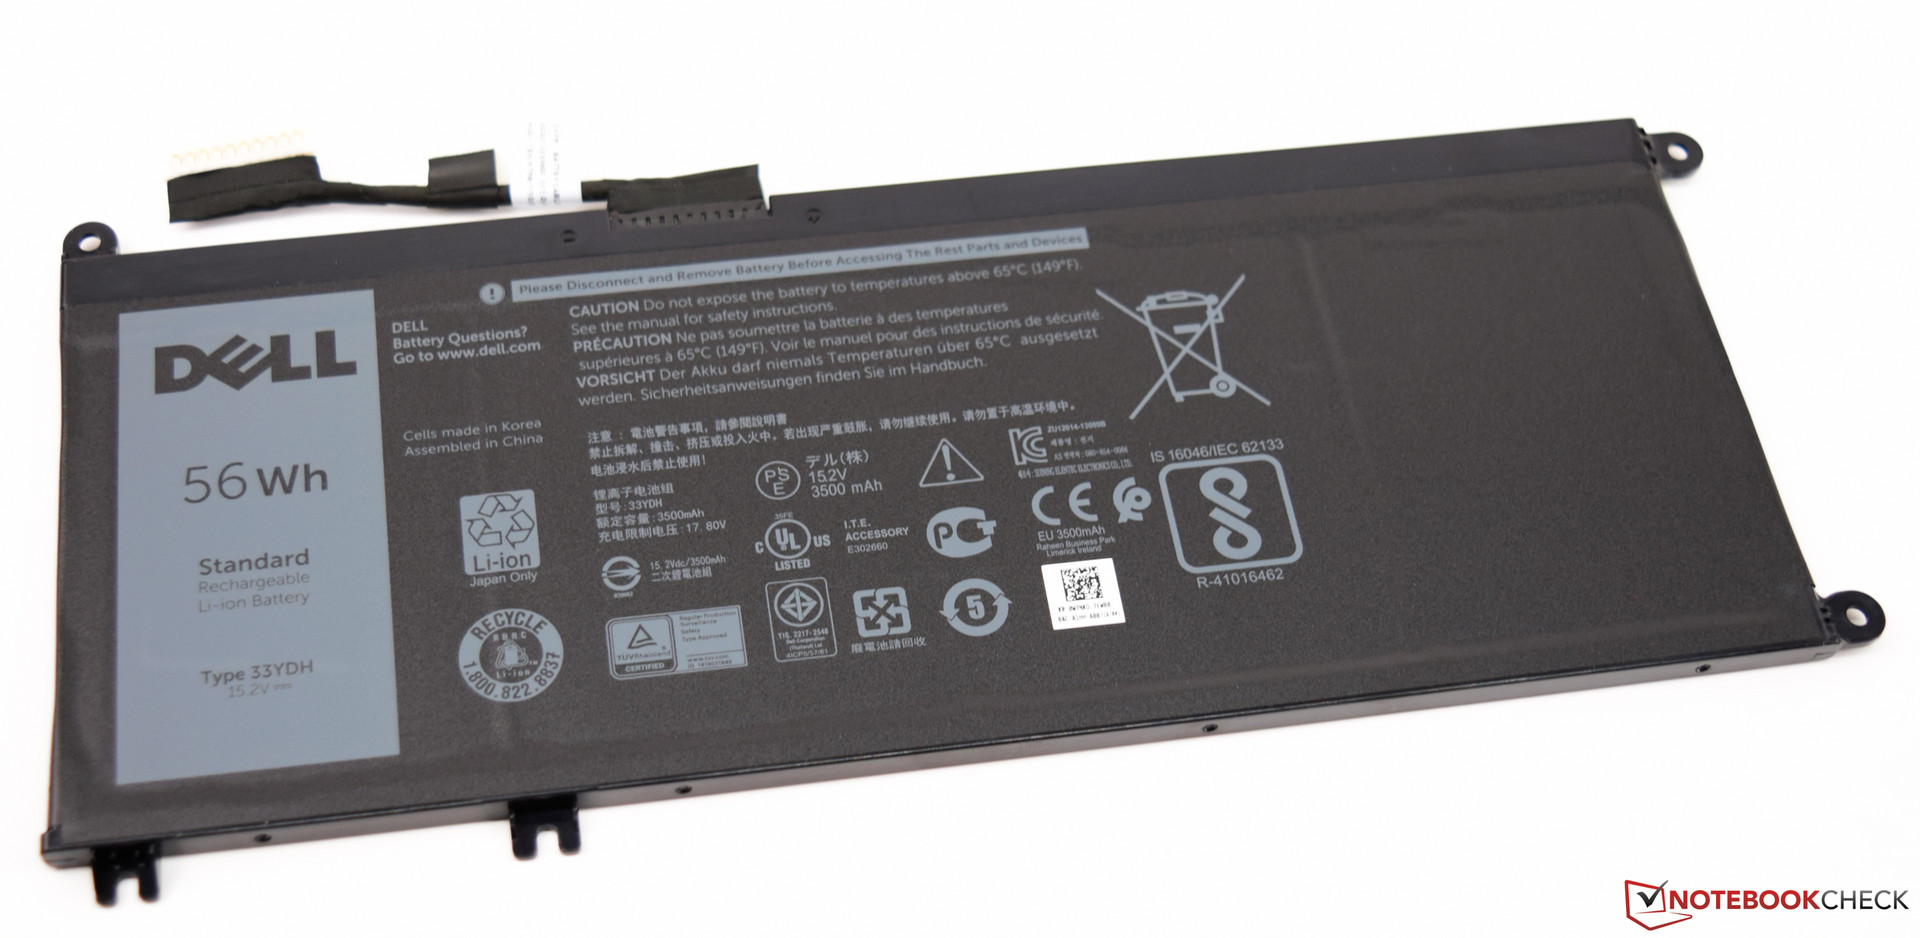
The moderate power consumption also ensures good results in the battery life. In idle operation, the 56-Wh battery lasts for almost 12 hours before the device has to be recharged. For the realistic WLAN test, the display brightness is adjusted to 150 cd/m², which corresponds to a reduction of the brightness by three steps in our test unit. With 6:31 hours, the Dell G5 15 5587 achieved a good result and was clearly above the average of the range of competitors.
However, the battery operation does have a large disadvantage. The CPU and GPU are throttled a lot in battery operation, which you can see in the example of 3DMark11, where a score of only 3789 points is a clear reduction compared to mains operation. The CPU clock speed is also throttled to 800 MHz in battery operation.
| Dell G5 15 5587 i5-8300H, GeForce GTX 1060 Max-Q, 56 Wh | Dell Inspiron 15 7000 7577 i5-7300HQ, GeForce GTX 1050 Mobile, 56 Wh | Dell Inspiron 15 7000 7577 i5-7300HQ, GeForce GTX 1060 Max-Q, 56 Wh | PC Zentrum Proteus V i7-7700HQ, GeForce GTX 1060 Mobile, Wh | Asus FX503VM-EH73 i7-7700HQ, GeForce GTX 1060 Mobile, 64 Wh | Acer Nitro 5 Spin NP515-51-86CX i5-8550U, GeForce GTX 1050 Mobile, 48 Wh | Acer Predator Helios 300 PH317-52-51M6 i5-8300H, GeForce GTX 1050 Ti Mobile, 48 Wh | Average of class Gaming | |
|---|---|---|---|---|---|---|---|---|
| Battery runtime | -6% | -9% | -47% | -44% | 2% | -11% | 1% | |
| Reader / Idle (h) | 11.8 | 11.1 -6% | 11 -7% | 3.7 -69% | 5.7 -52% | 12.5 6% | 11.8 0% | 8.71 ? -26% |
| H.264 (h) | 5.4 | 5.2 -4% | 3.3 -39% | 6.2 15% | 8.26 ? 53% | |||
| WiFi v1.3 (h) | 6.5 | 6.8 5% | 6.9 6% | 3.3 -49% | 4.6 -29% | 6.6 2% | 5.9 -9% | 7.02 ? 8% |
| Load (h) | 2.2 | 1.8 -18% | 1.6 -27% | 1.5 -32% | 1.1 -50% | 1.9 -14% | 1.7 -23% | 1.47 ? -33% |
Verdict
Pros
Cons
The Dell G5 15 5587 continues to be a good gaming notebook that appeals to buyers with its attractive price in particular. We were convinced by the very robust case with the hinges in the center, providing very good stiffness to the display lid. Thanks to the brand-new CPU, the device is now slightly faster than its predecessor model, which still had the added Inspiron label. Anyone for whom the CPU performance of the Intel Core i5-8300H is not sufficient can grab the Intel Core i7-8750H instead, which with its six cores increases the good multithread performance even more. However, the reasonable choice should be the smaller i5 sprout, which did well in our test.
If you look at the temperature development, our configuration really hits its limits in terms of the temperature dispersion. However, the CPU throttling remains within limits and does not negatively impact the ratings too much.
With the Nvidia GeForce GTX 1060 Max-Q, buyers receive the G5 15 5000 with the most powerful GPU Dell builds into this gaming laptop. The performance is good and sufficient enough to be able to play all the current games in their native resolution.
The Dell G5 15 5587 is a well-equipped gaming notebook with a modern CPU, a fast graphics card, and an attractive price.
The display was not able to convince us, although it did have some positive sides too. But having a matte surface and not using PWM is not always sufficient to be convincing. Our model simply lacks some contrast and brightness. In terms of the card reader, Dell should think about whether a USB-2.0 speed is still up-to-date. Fortunately, the Dell G5 15 also offers a storage card reader.
In terms of the sound, we would have expected a little more, since what the Dell G5 15 5587 delivers here is not suitable for a pure gaming device. A dedicated sub-woofer would have been desirable. Another point of complaint is the weight, which at almost 3 kg for a 15.6-inch device cannot easily be ignored.
While the storage might still be sufficient initially, we recommend a larger SSD solution in order to be able to make better use of the speed advantage.
Dell G5 15 5587
- 06/21/2018 v6 (old)
Sebastian Bade
Price comparison
