Dell G3 15 3579 (i5-8300H, GTX 1050, FHD) Laptop Review
Dell unveiled its G series of mainstream gaming laptops earlier this year as a spin-off and successor to the Inspiron Gaming series. According to Dell, divorcing gaming laptops from the Inspiron name will allow the OEM to expand its gaming lineup with more SKUs and sizes than ever before. We certainly don't disagree on that front as the G series spans 15.6-inch and 17.3-inch sizes under several G3, G5, or G7 model names for a very wide variety of options and configurations.
Our unit today is the 15.6-inch G3 15 3579 to represent the cheapest configuration (i5-8300H, GTX 1050, 1 TB HDD) that the G series currently has to offer. Core performance is similar to the Inspiron 15 7577 as they all carry the same GTX 1050 or GTX 1050 Ti, and GTX 1060 Max-Q options and even the same 56 Wh non-removable battery. The affordable G series is meant to complement the enthusiast Dell Alienware laptops that often retail for well over $1500 USD.
Direct competitors to our $850 USD G3 15 are numerous including the budget Gigabyte Sabre 15G, HP Pavilion Gaming, Asus Vivobook or FX/GL series, Lenovo Legion Y520, MSI GL/GP series, and the Acer Aspire series. We recommend checking out our review on the 17.3-inch G3 17 since Dell utilizes the same design language across the G3 lineup.
Case
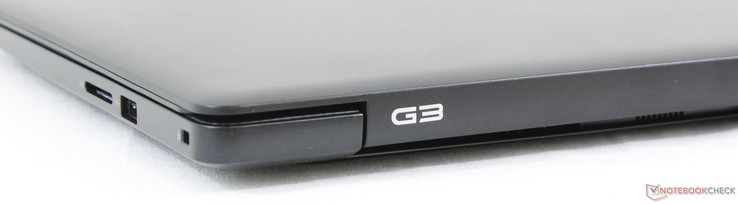
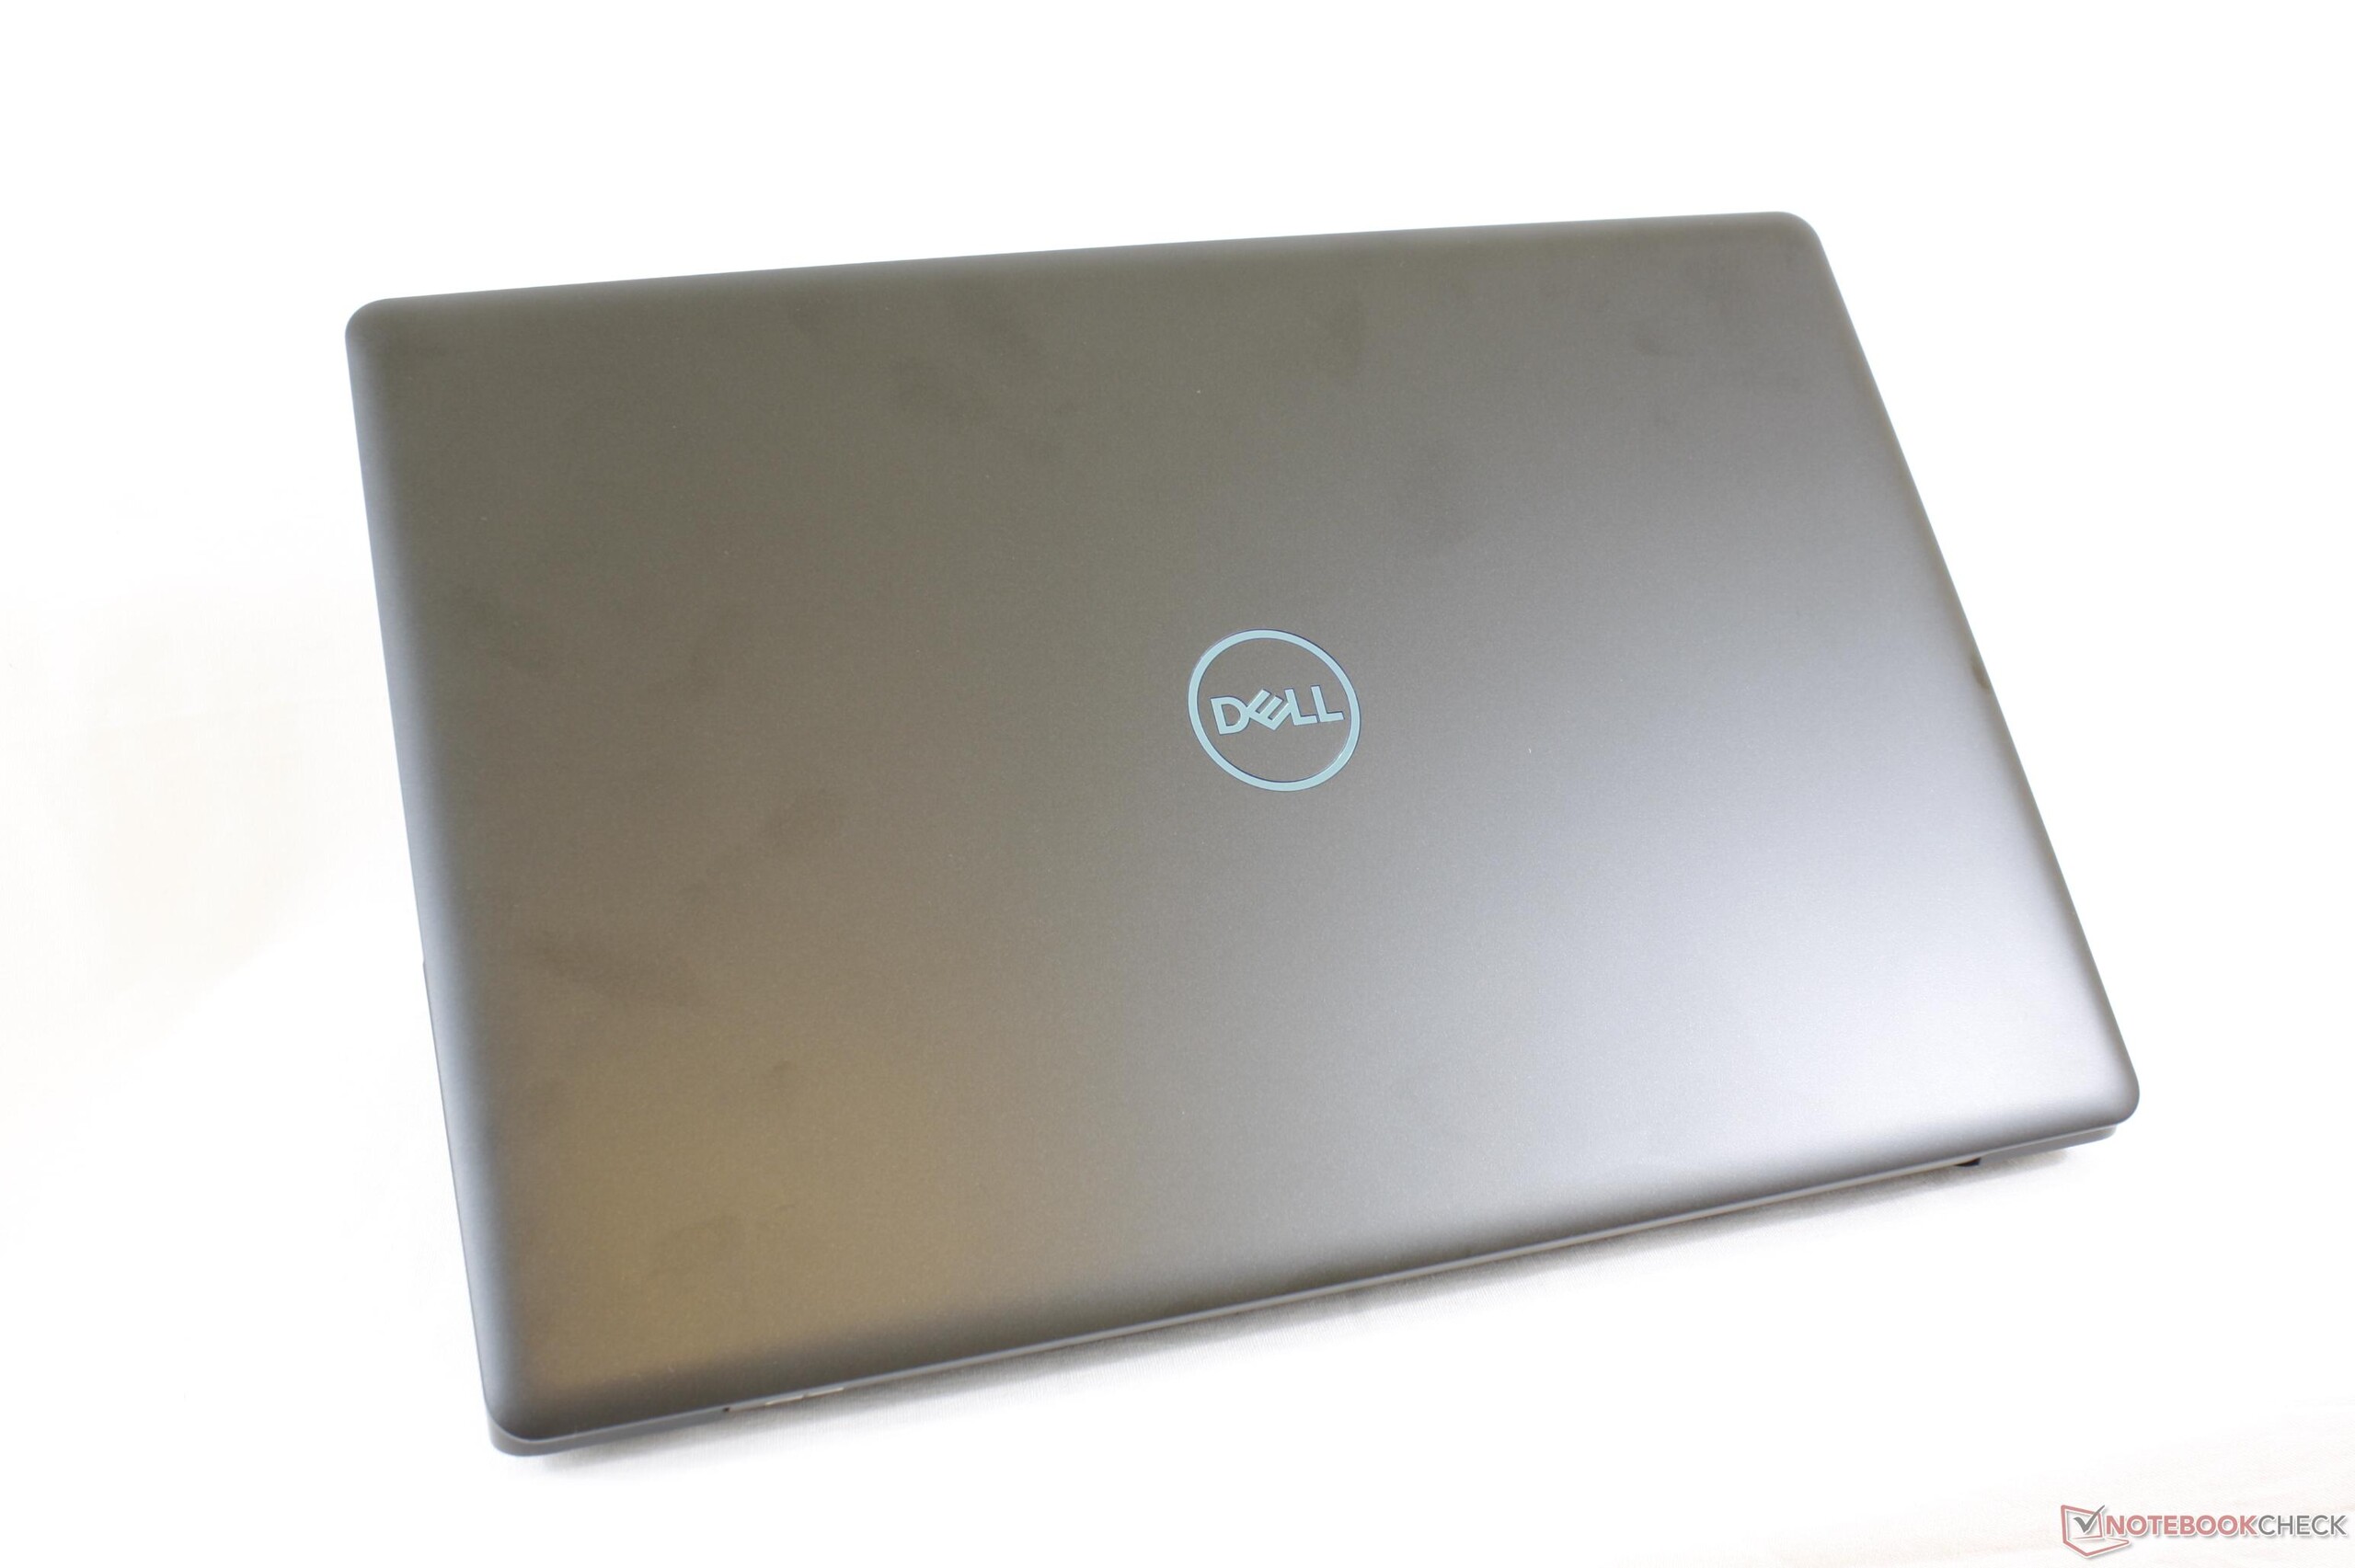
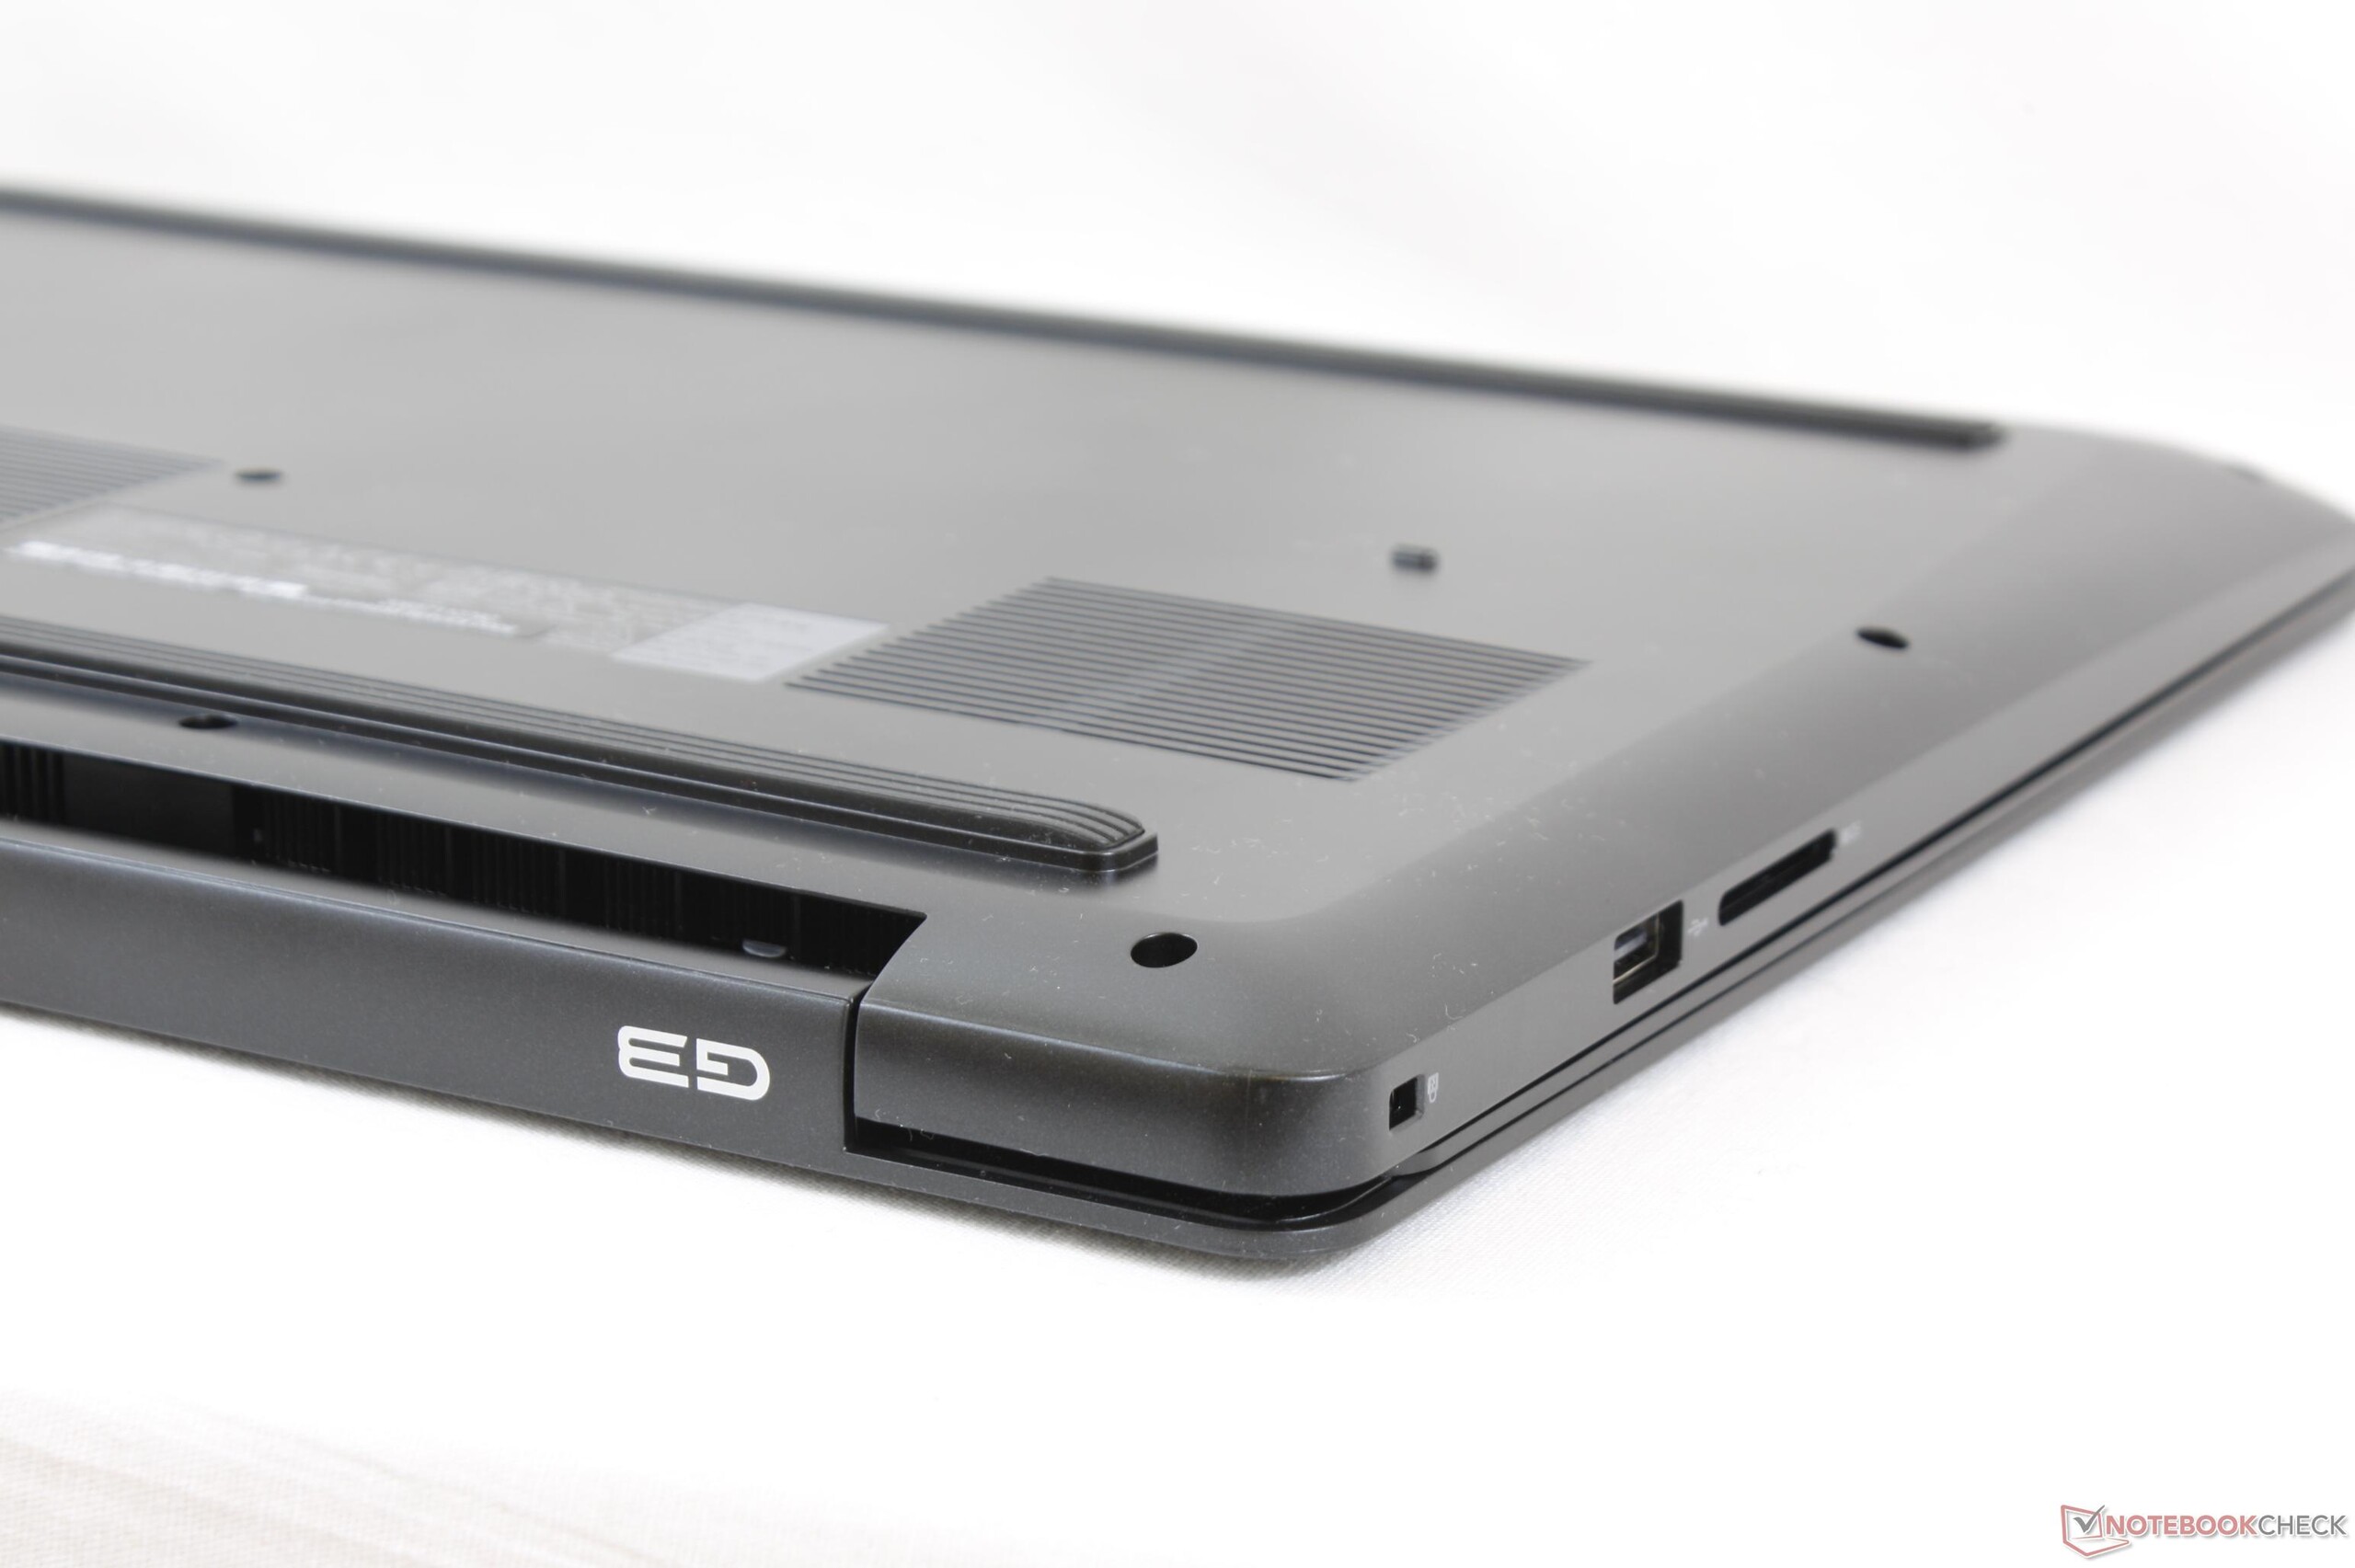
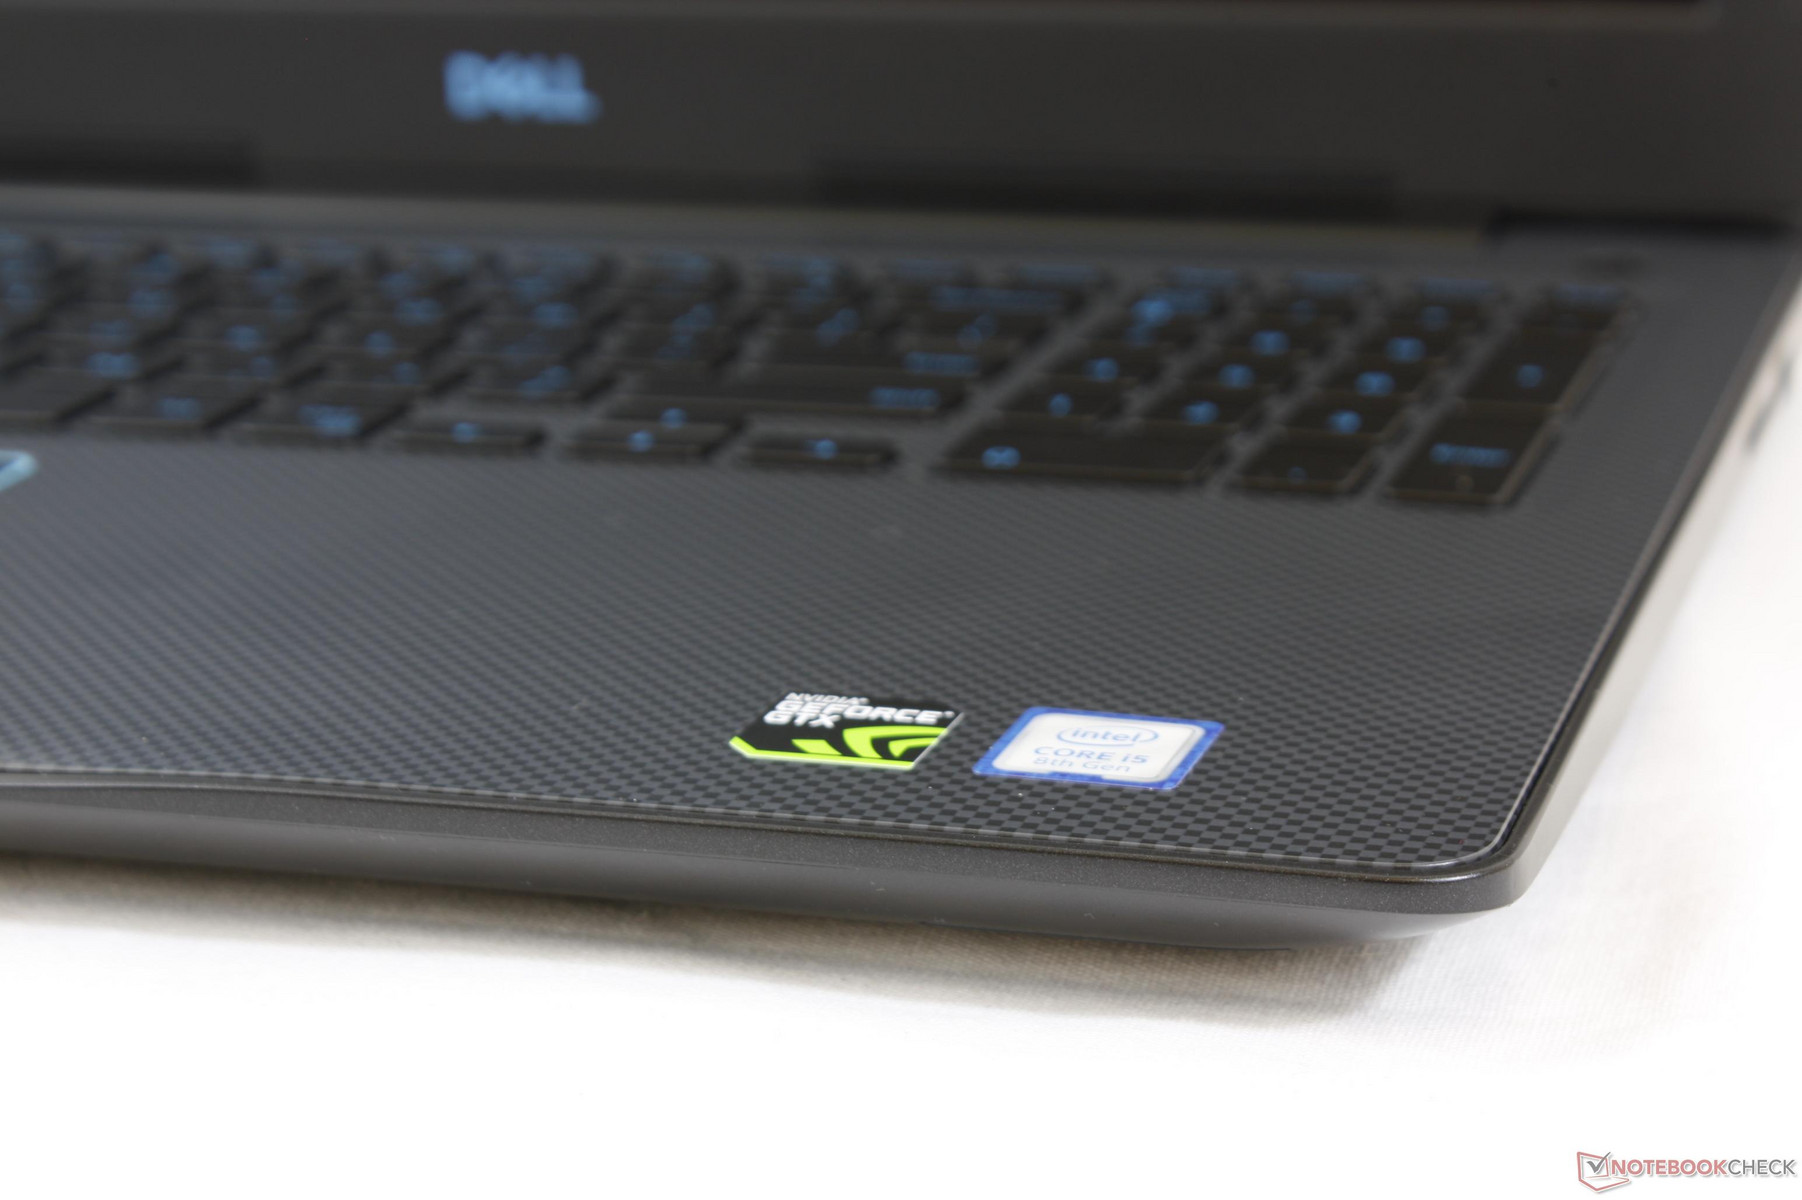
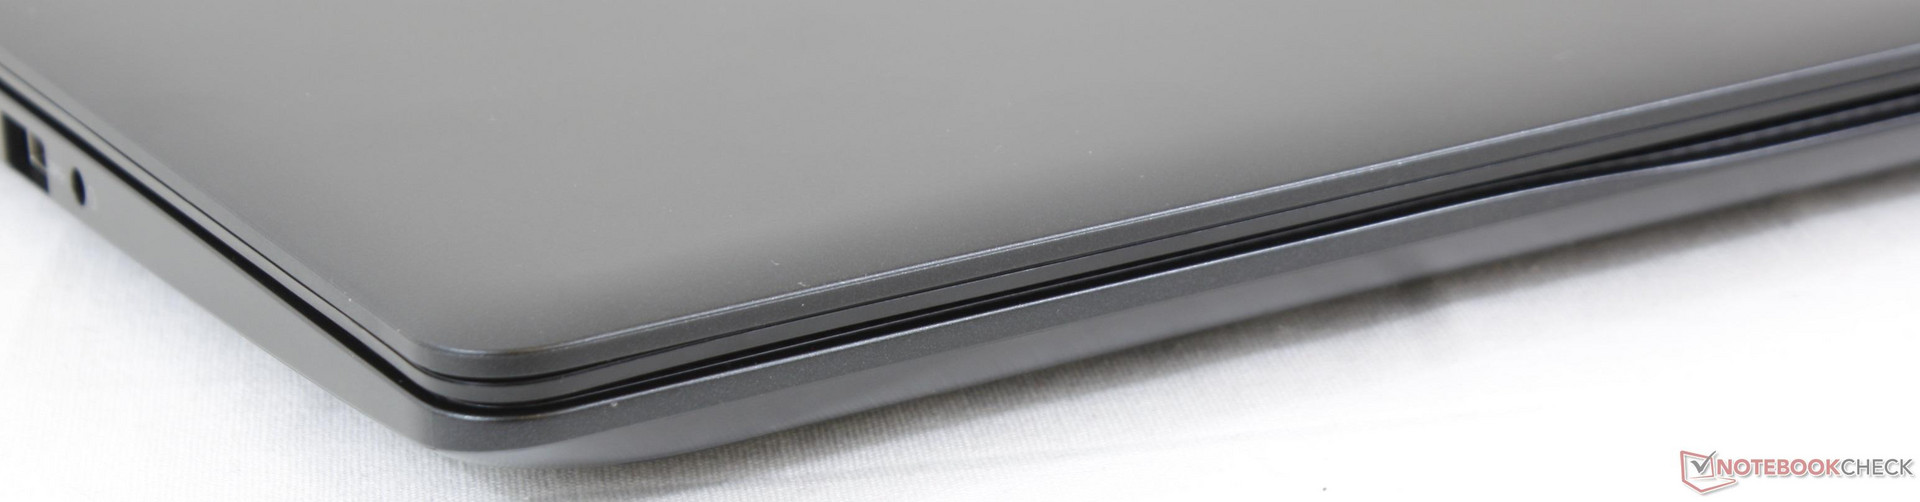
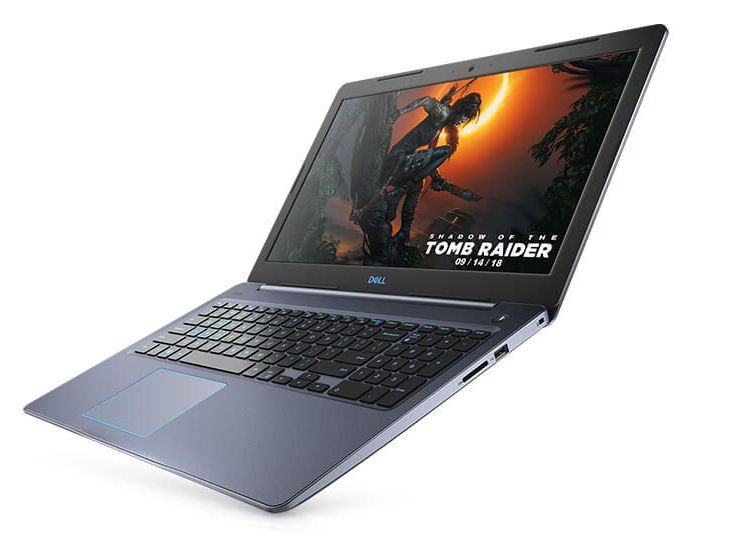
The G3 15 is designed to be one step below the Inspiron 15 7577. Gone are the "jet engine" style ventilation grilles in favor of a slimmer, sleeker, and more minimalist approach. Corners are rounder and smoother while the familiar Dell logo is now Teal in color instead of Red.
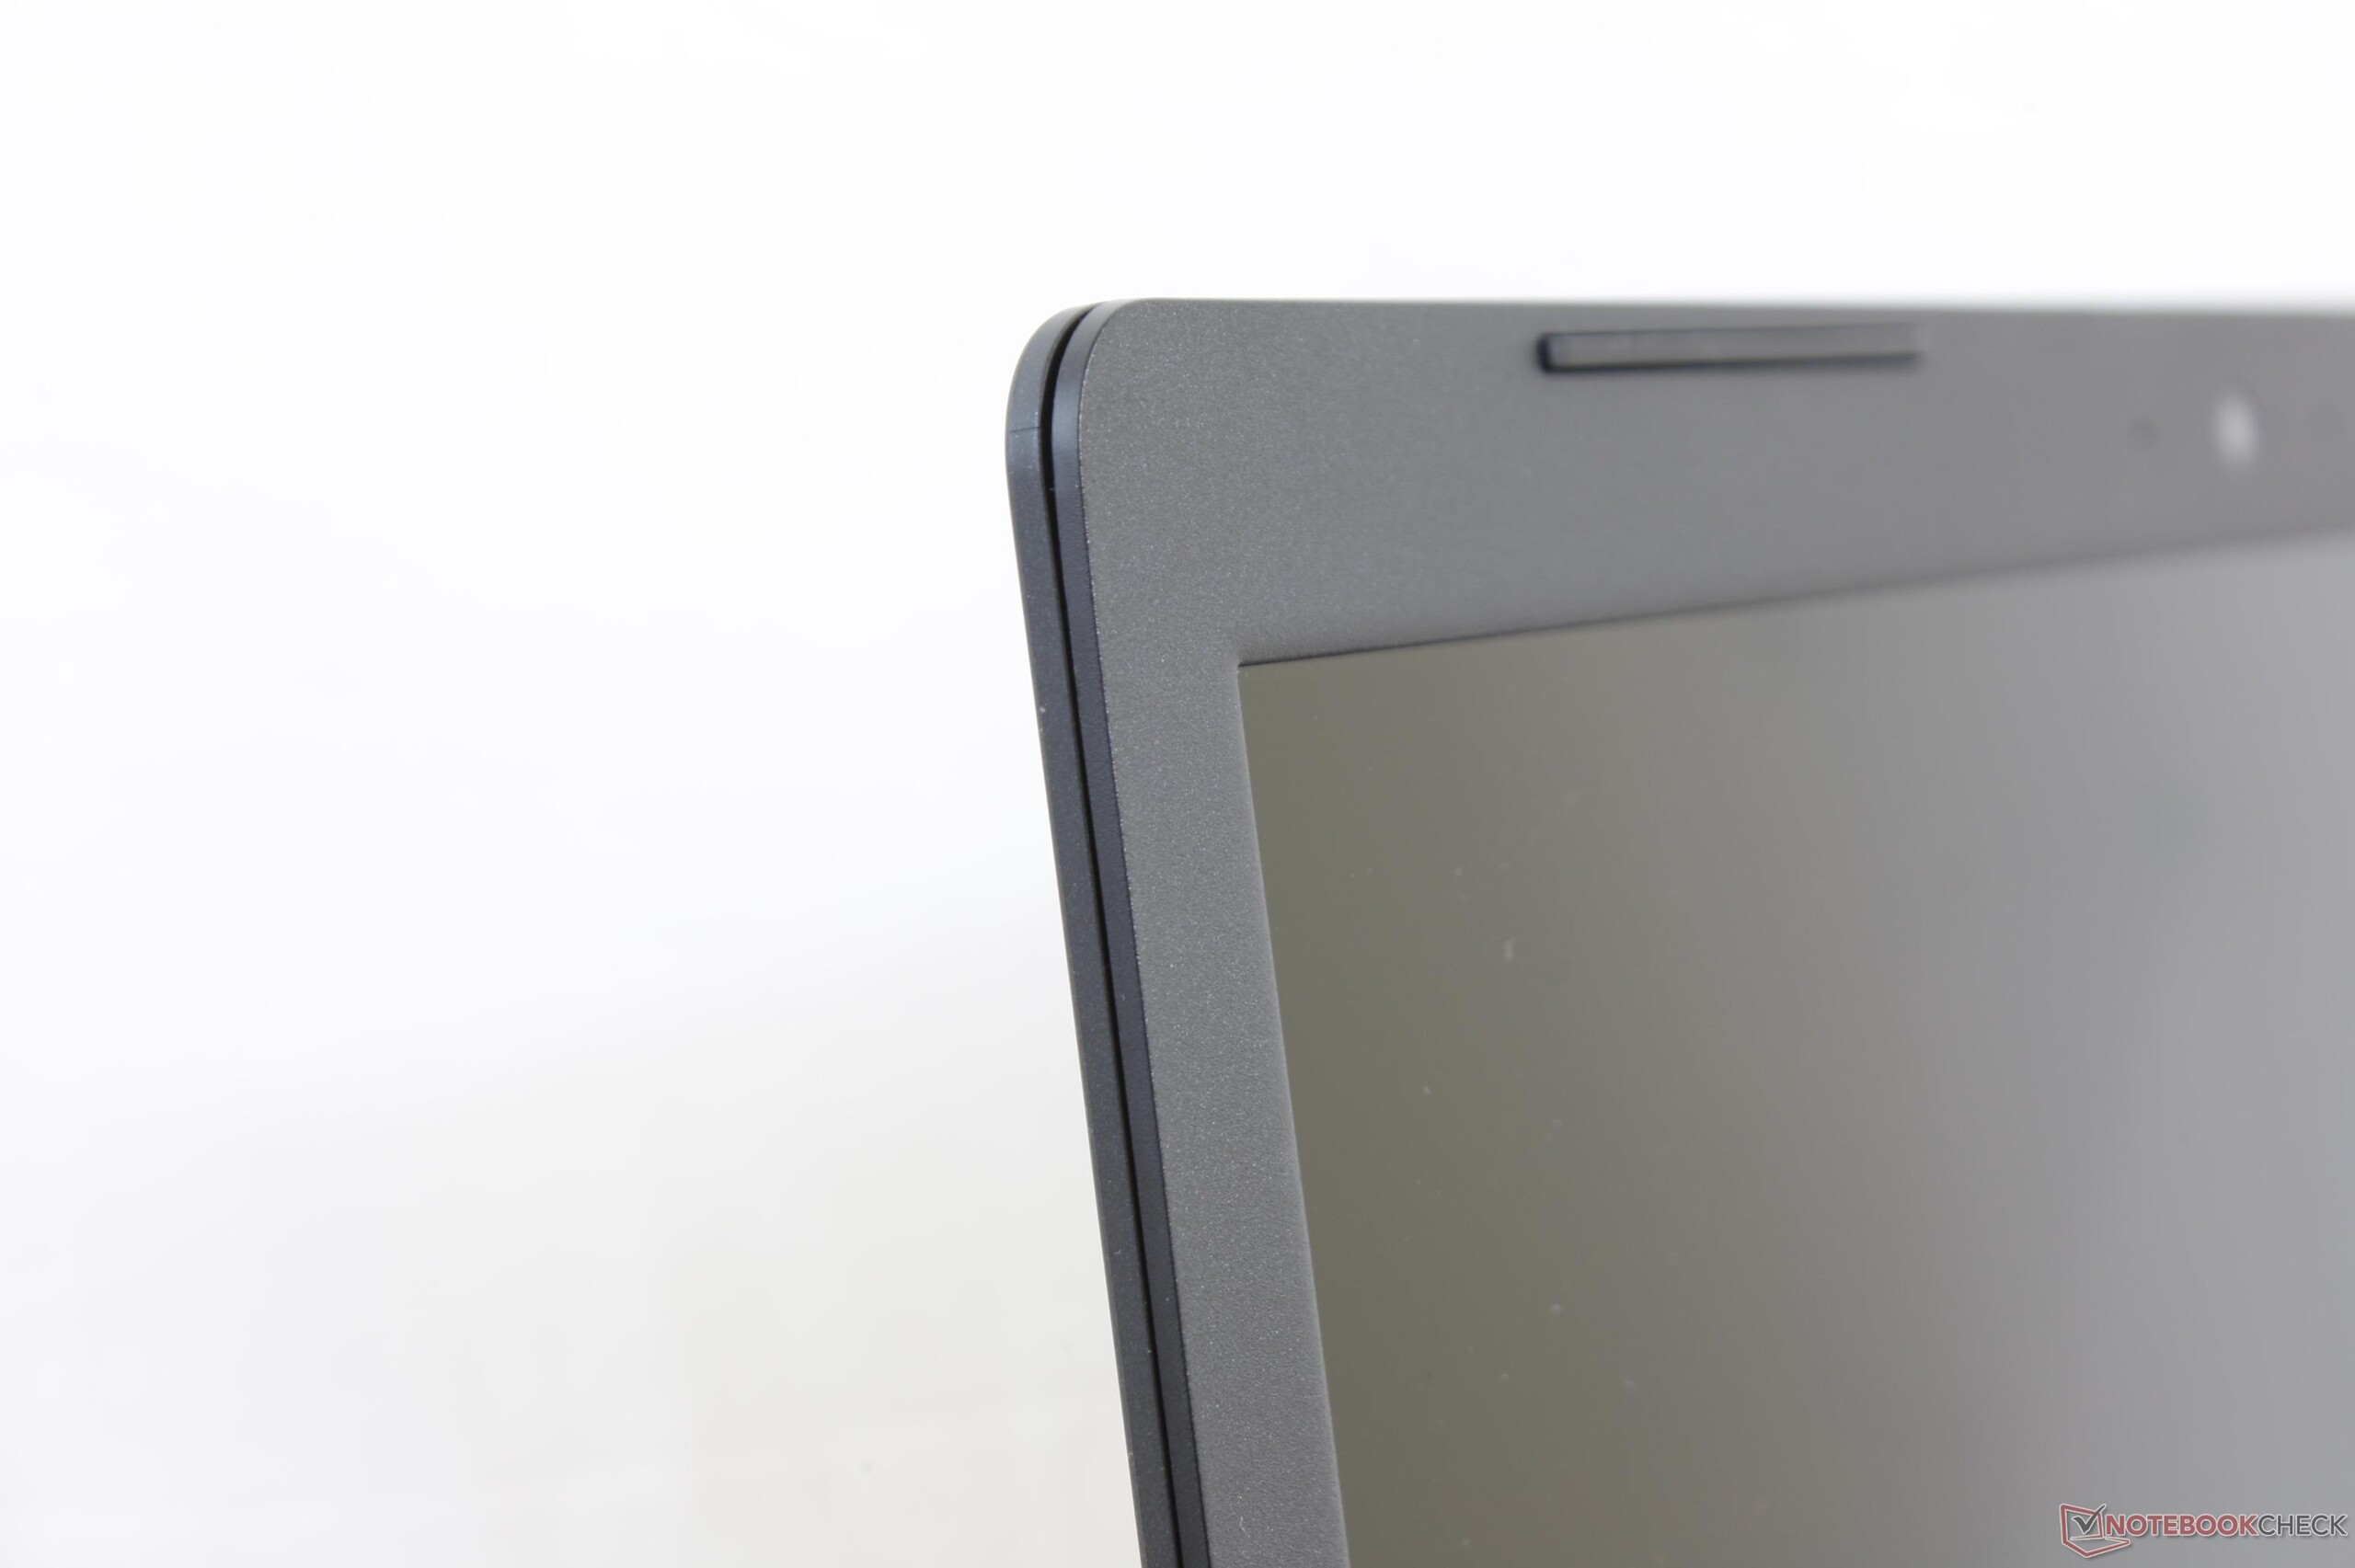
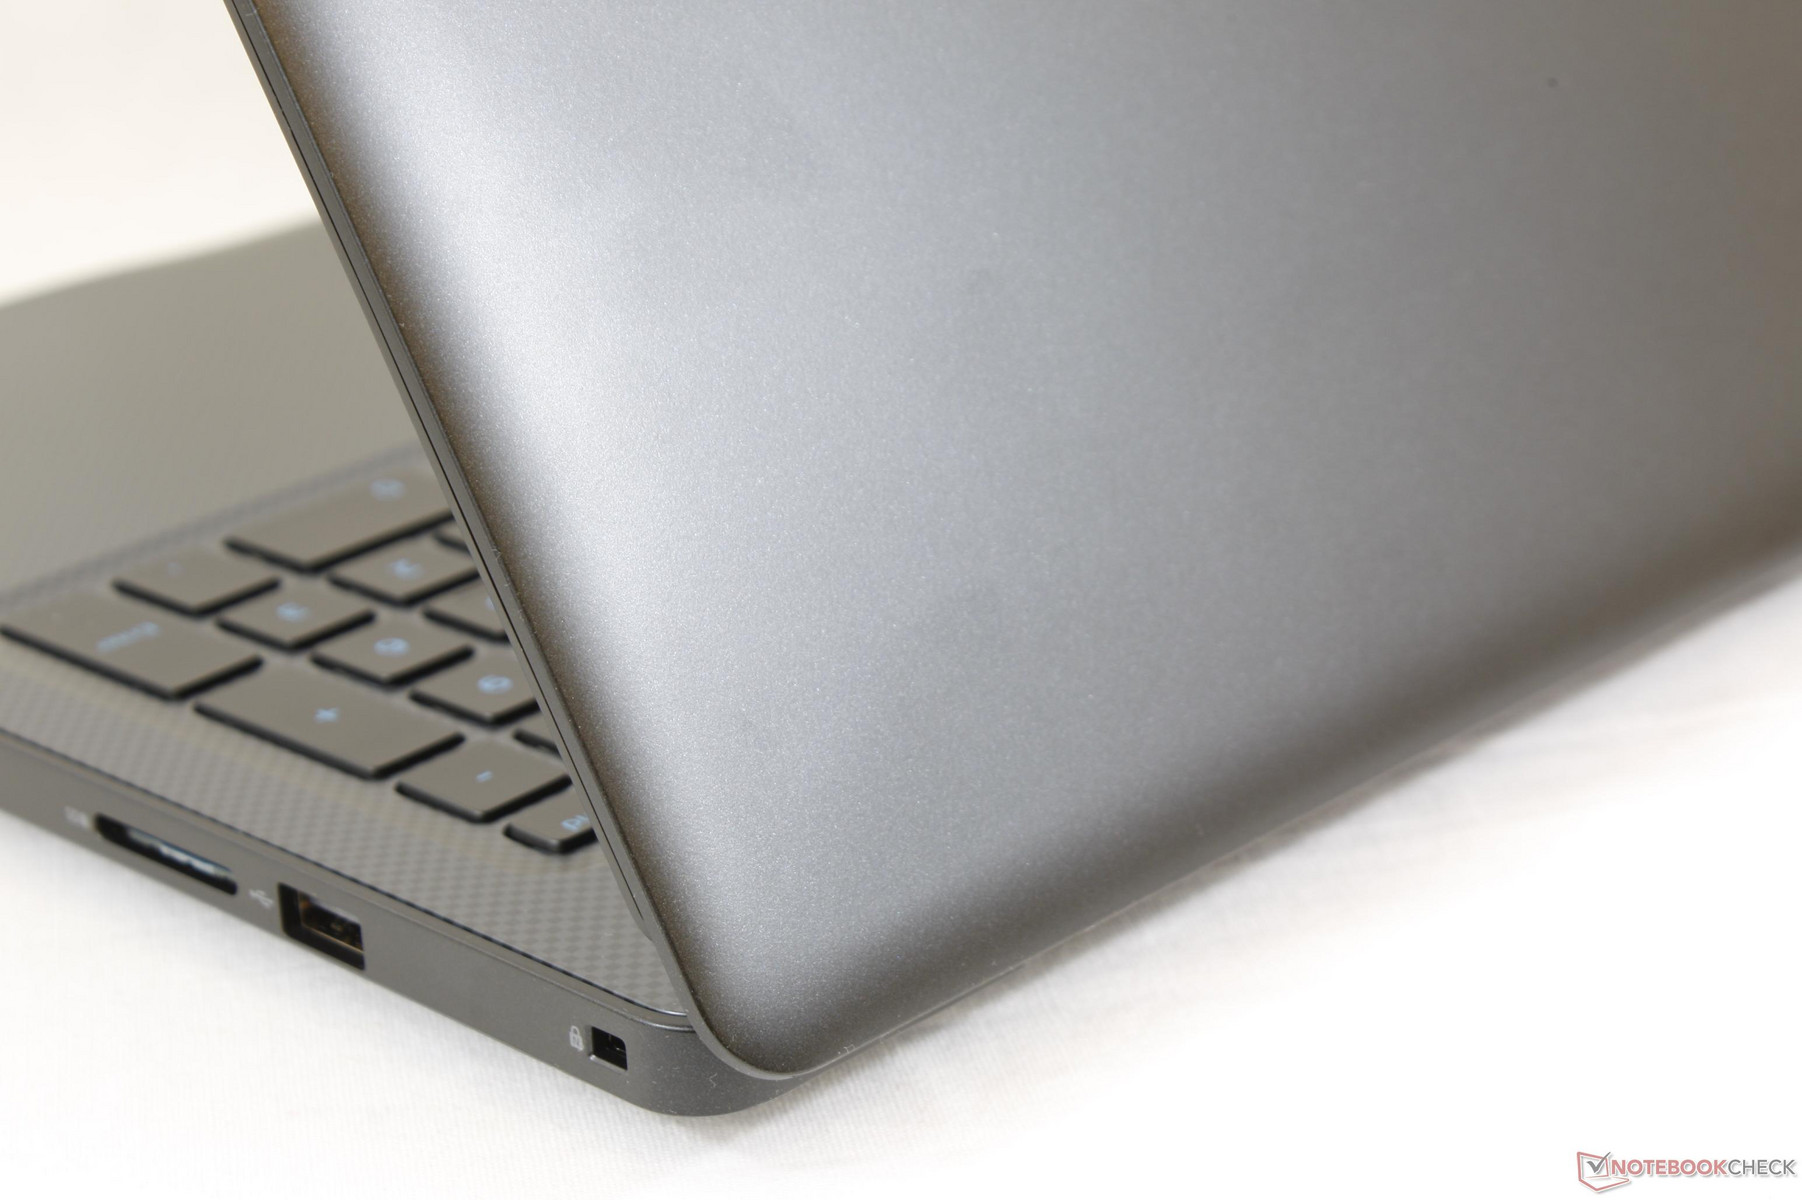
Unfortunately, the advantages over the Inspiron 15 7577 end here. The plastic surfaces of the G3 15 feel cheaper and more flexible for a poorer first impression. In fact, the cheap plastic palm rests remind us of the older HP Pavilion 15 or Omen 15. Our specific test unit also exhibits minor uneven gaps along the corner of the display. The new chassis is definitely a step backwards from the Inspiron 15 7577 when it comes to rigidity and quality.
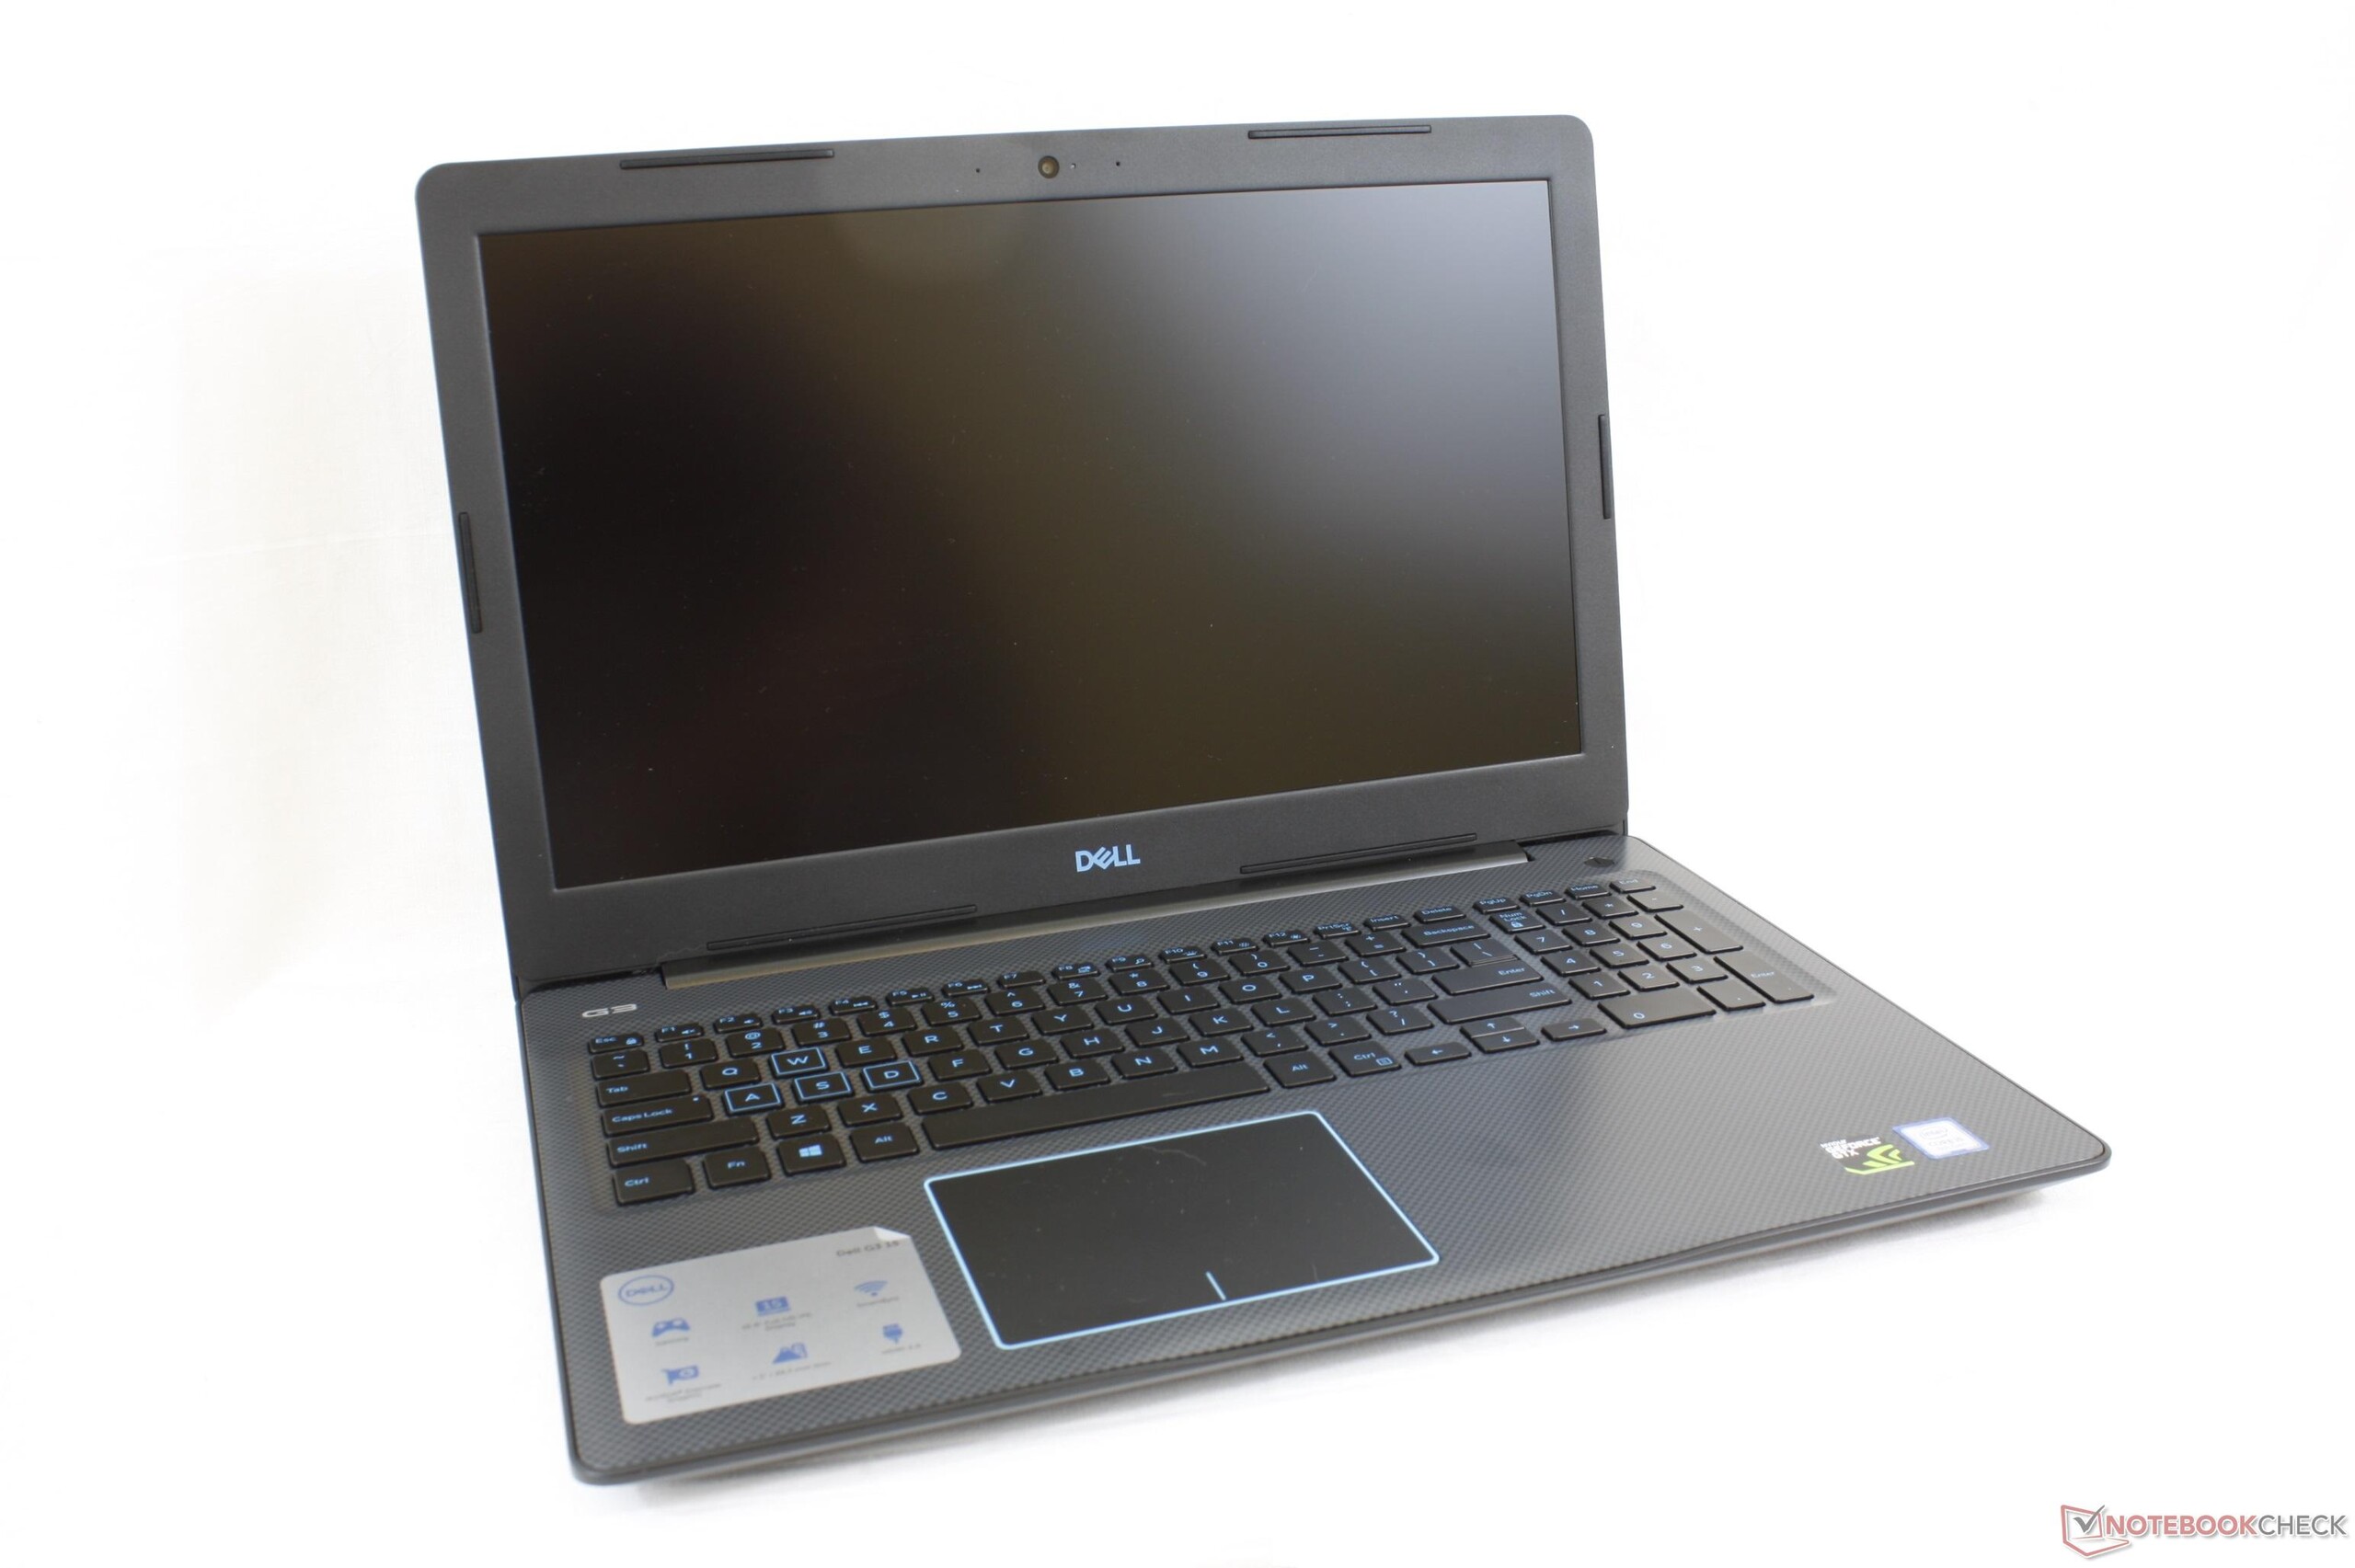
Common complaints about the Inspiron 15 7577 are its heavy weight and large size. The G3 15 addresses this by being smaller, thinner, and lighter as our comparison plugin below illustrates. The final dimensions are smaller than even the Gigabyte Sabre 15. For an entry-level gaming laptop, the G3 15 makes for a better portable option than its closest competitors.
Connectivity
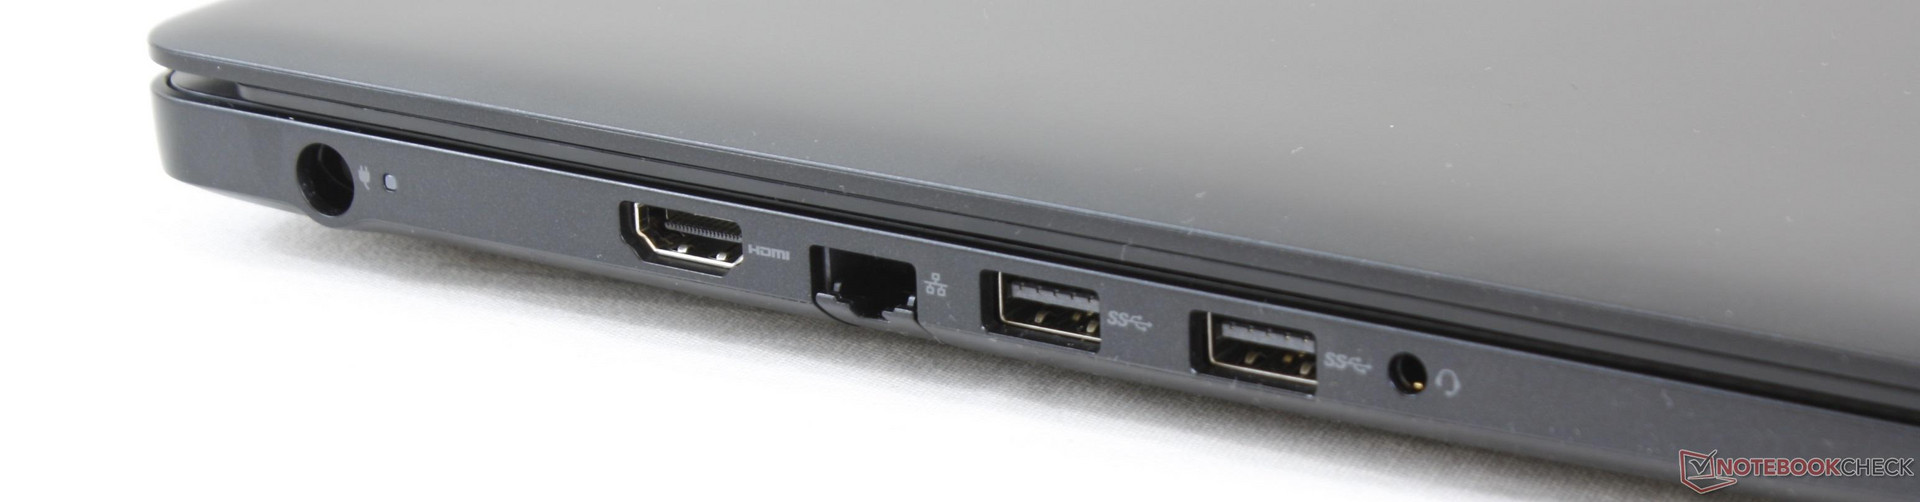
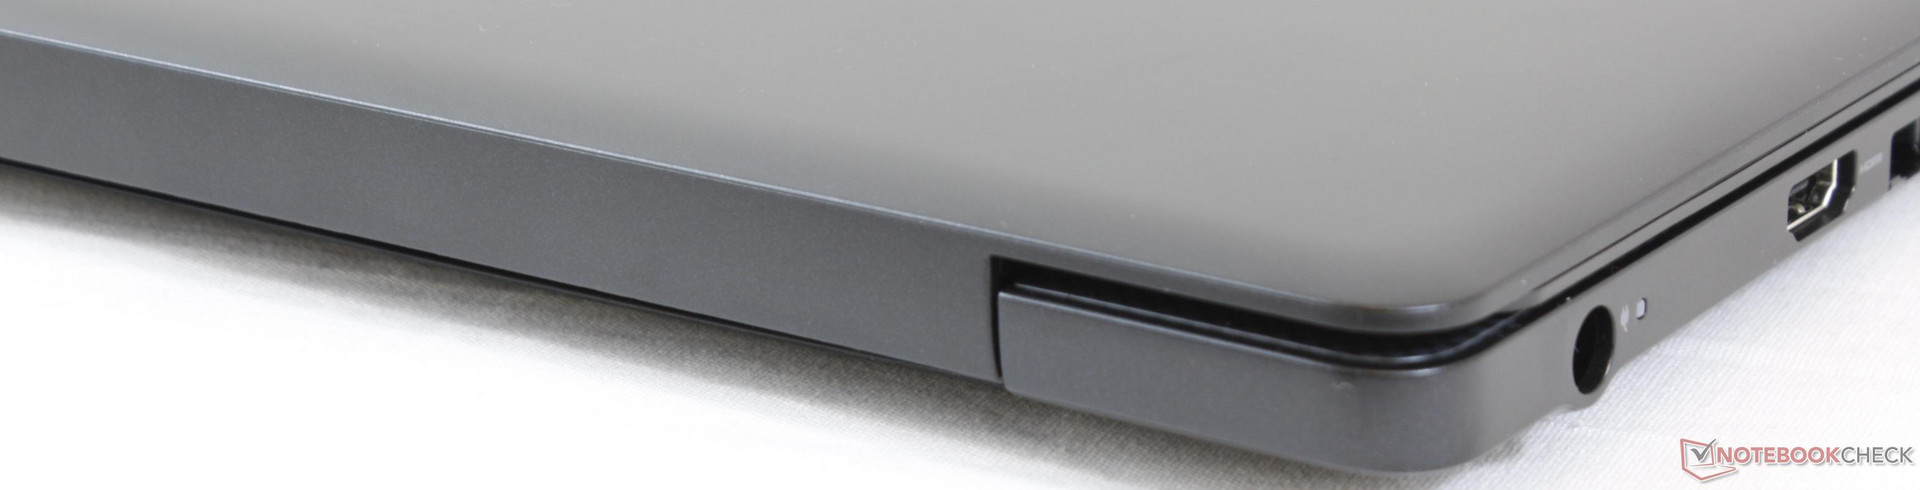
The G3 15 offers the exact same ports as on the 17.3-inch G3 17. Port positioning is excellent as all ports are easy to reach with none too close up front. The HDMI 2.0 port allows for 4k60 output to an external monitor.
Thunderbolt 3 is an optional port not included on our test unit. While we can understand the desire to not integrate Thunderbolt 3 across the entire lineup for cost reasons, we feel that the system should at least come with USB Type-C Gen. 1 as standard. A gaming laptop released in 2018 with no USB Type-C gives an outdated impression.
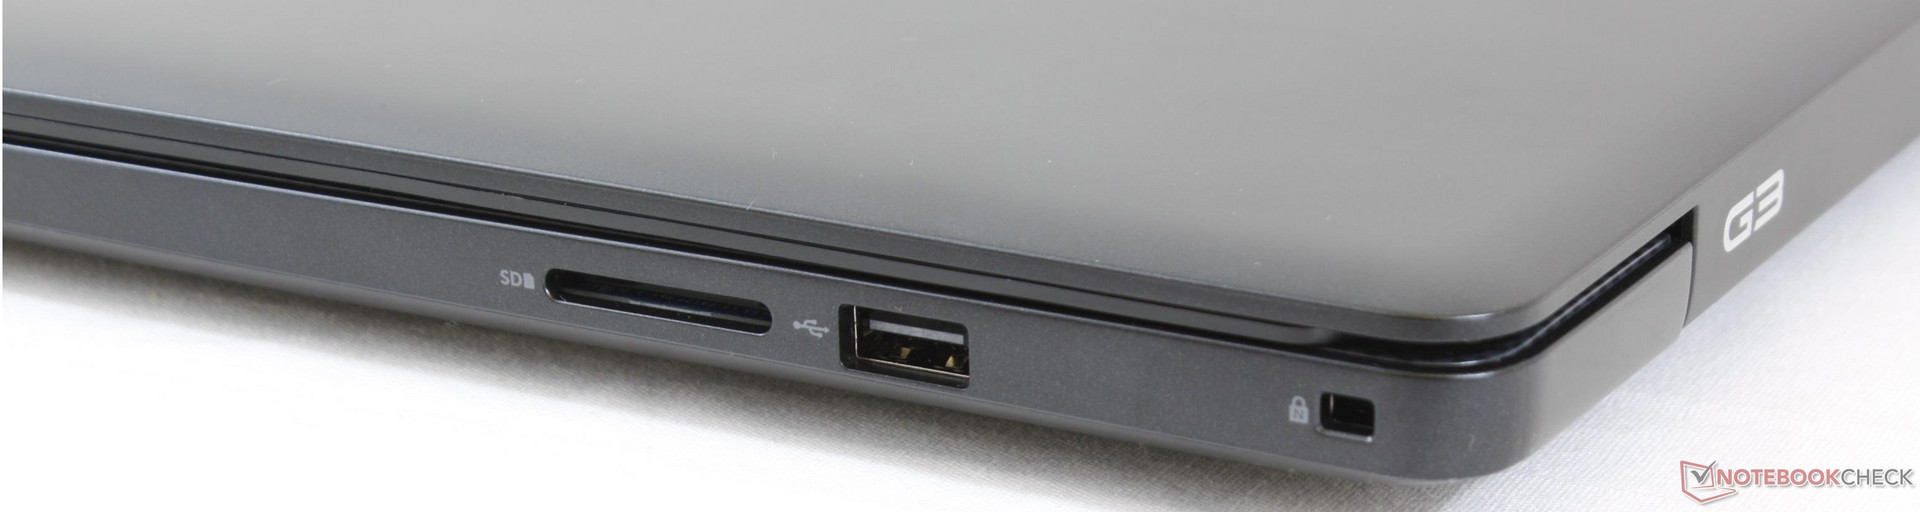
SD Card Reader
Transfer rates from the integrated card reader are extremely slow at just 24 MB/s. Moving 1 GB worth of images from our UHS-II test card to desktop takes about 40 seconds compared to just 6 to 8 seconds on the XPS 15.
Furthermore, the card reader is not spring-loaded. A fully inserted SD card will still protrude by almost half its length.
| SD Card Reader | |
| average JPG Copy Test (av. of 3 runs) | |
| MSI GS63VR 7RG-005 (Toshiba Exceria Pro SDXC 64 GB UHS-II) | |
| Dell Inspiron 15 7000 7577 4K (Toshiba Exceria Pro SDXC 64 GB UHS-II) | |
| Dell G3 15 3579 (Toshiba Exceria Pro SDXC 64 GB UHS-II) | |
| MSI GL63 8RC-069US (Toshiba Exceria Pro SDXC 64 GB UHS-II) | |
| maximum AS SSD Seq Read Test (1GB) | |
| MSI GS63VR 7RG-005 (Toshiba Exceria Pro SDXC 64 GB UHS-II) | |
| Dell Inspiron 15 7000 7577 4K (Toshiba Exceria Pro SDXC 64 GB UHS-II) | |
| Dell G3 15 3579 (Toshiba Exceria Pro SDXC 64 GB UHS-II) | |
| MSI GL63 8RC-069US (Toshiba Exceria Pro SDXC 64 GB UHS-II) | |
Communication
The unit ships with an Intel 9462 capable of transfer rates of up to 433 Mbps only. It's a budget cost-cutting module because the pricier Intel 8260 and newer 9260 are capable of up to 867 Mbps and 1.73 Gbps, respectively. For casual gaming and browsing, the slower speeds will have almost no impact on user experience. We can observe no connectivity issues on our test unit.
| Networking | |
| iperf3 transmit AX12 | |
| Lenovo Yoga 730-15IKB | |
| Dell Inspiron 15 7000 7577 4K | |
| Dell G3 15 3579 | |
| MSI GL63 8RC-069US | |
| iperf3 receive AX12 | |
| Dell Inspiron 15 7000 7577 4K | |
| Lenovo Yoga 730-15IKB | |
| MSI GL63 8RC-069US | |
| Dell G3 15 3579 | |
Accessories
There are no included extras outside of the AC adapter and Quick Start guide. A USB Type-A to Type-C adapter would have been a neat extra since the base configuration lacks USB Type-C.
Maintenance
The bottom panel is secured by a set of standard Philips screws. Unfortunately, the panel is also tightly attached to the rest of the notebook around the edges and corners. Dell has made servicing very difficult without special tools or risking damage. Users will find 2x SODIMM slots and dual storage bays inside not unlike on the G3 17.
Warranty
The standard one-year limited warranty applies with extensions of up to 4 years. Accidental damage and "Premium Plus" options are also available. Please see our Guarantees, Return policies and Warranties FAQ for country-specific information.
Input Devices
Keyboard
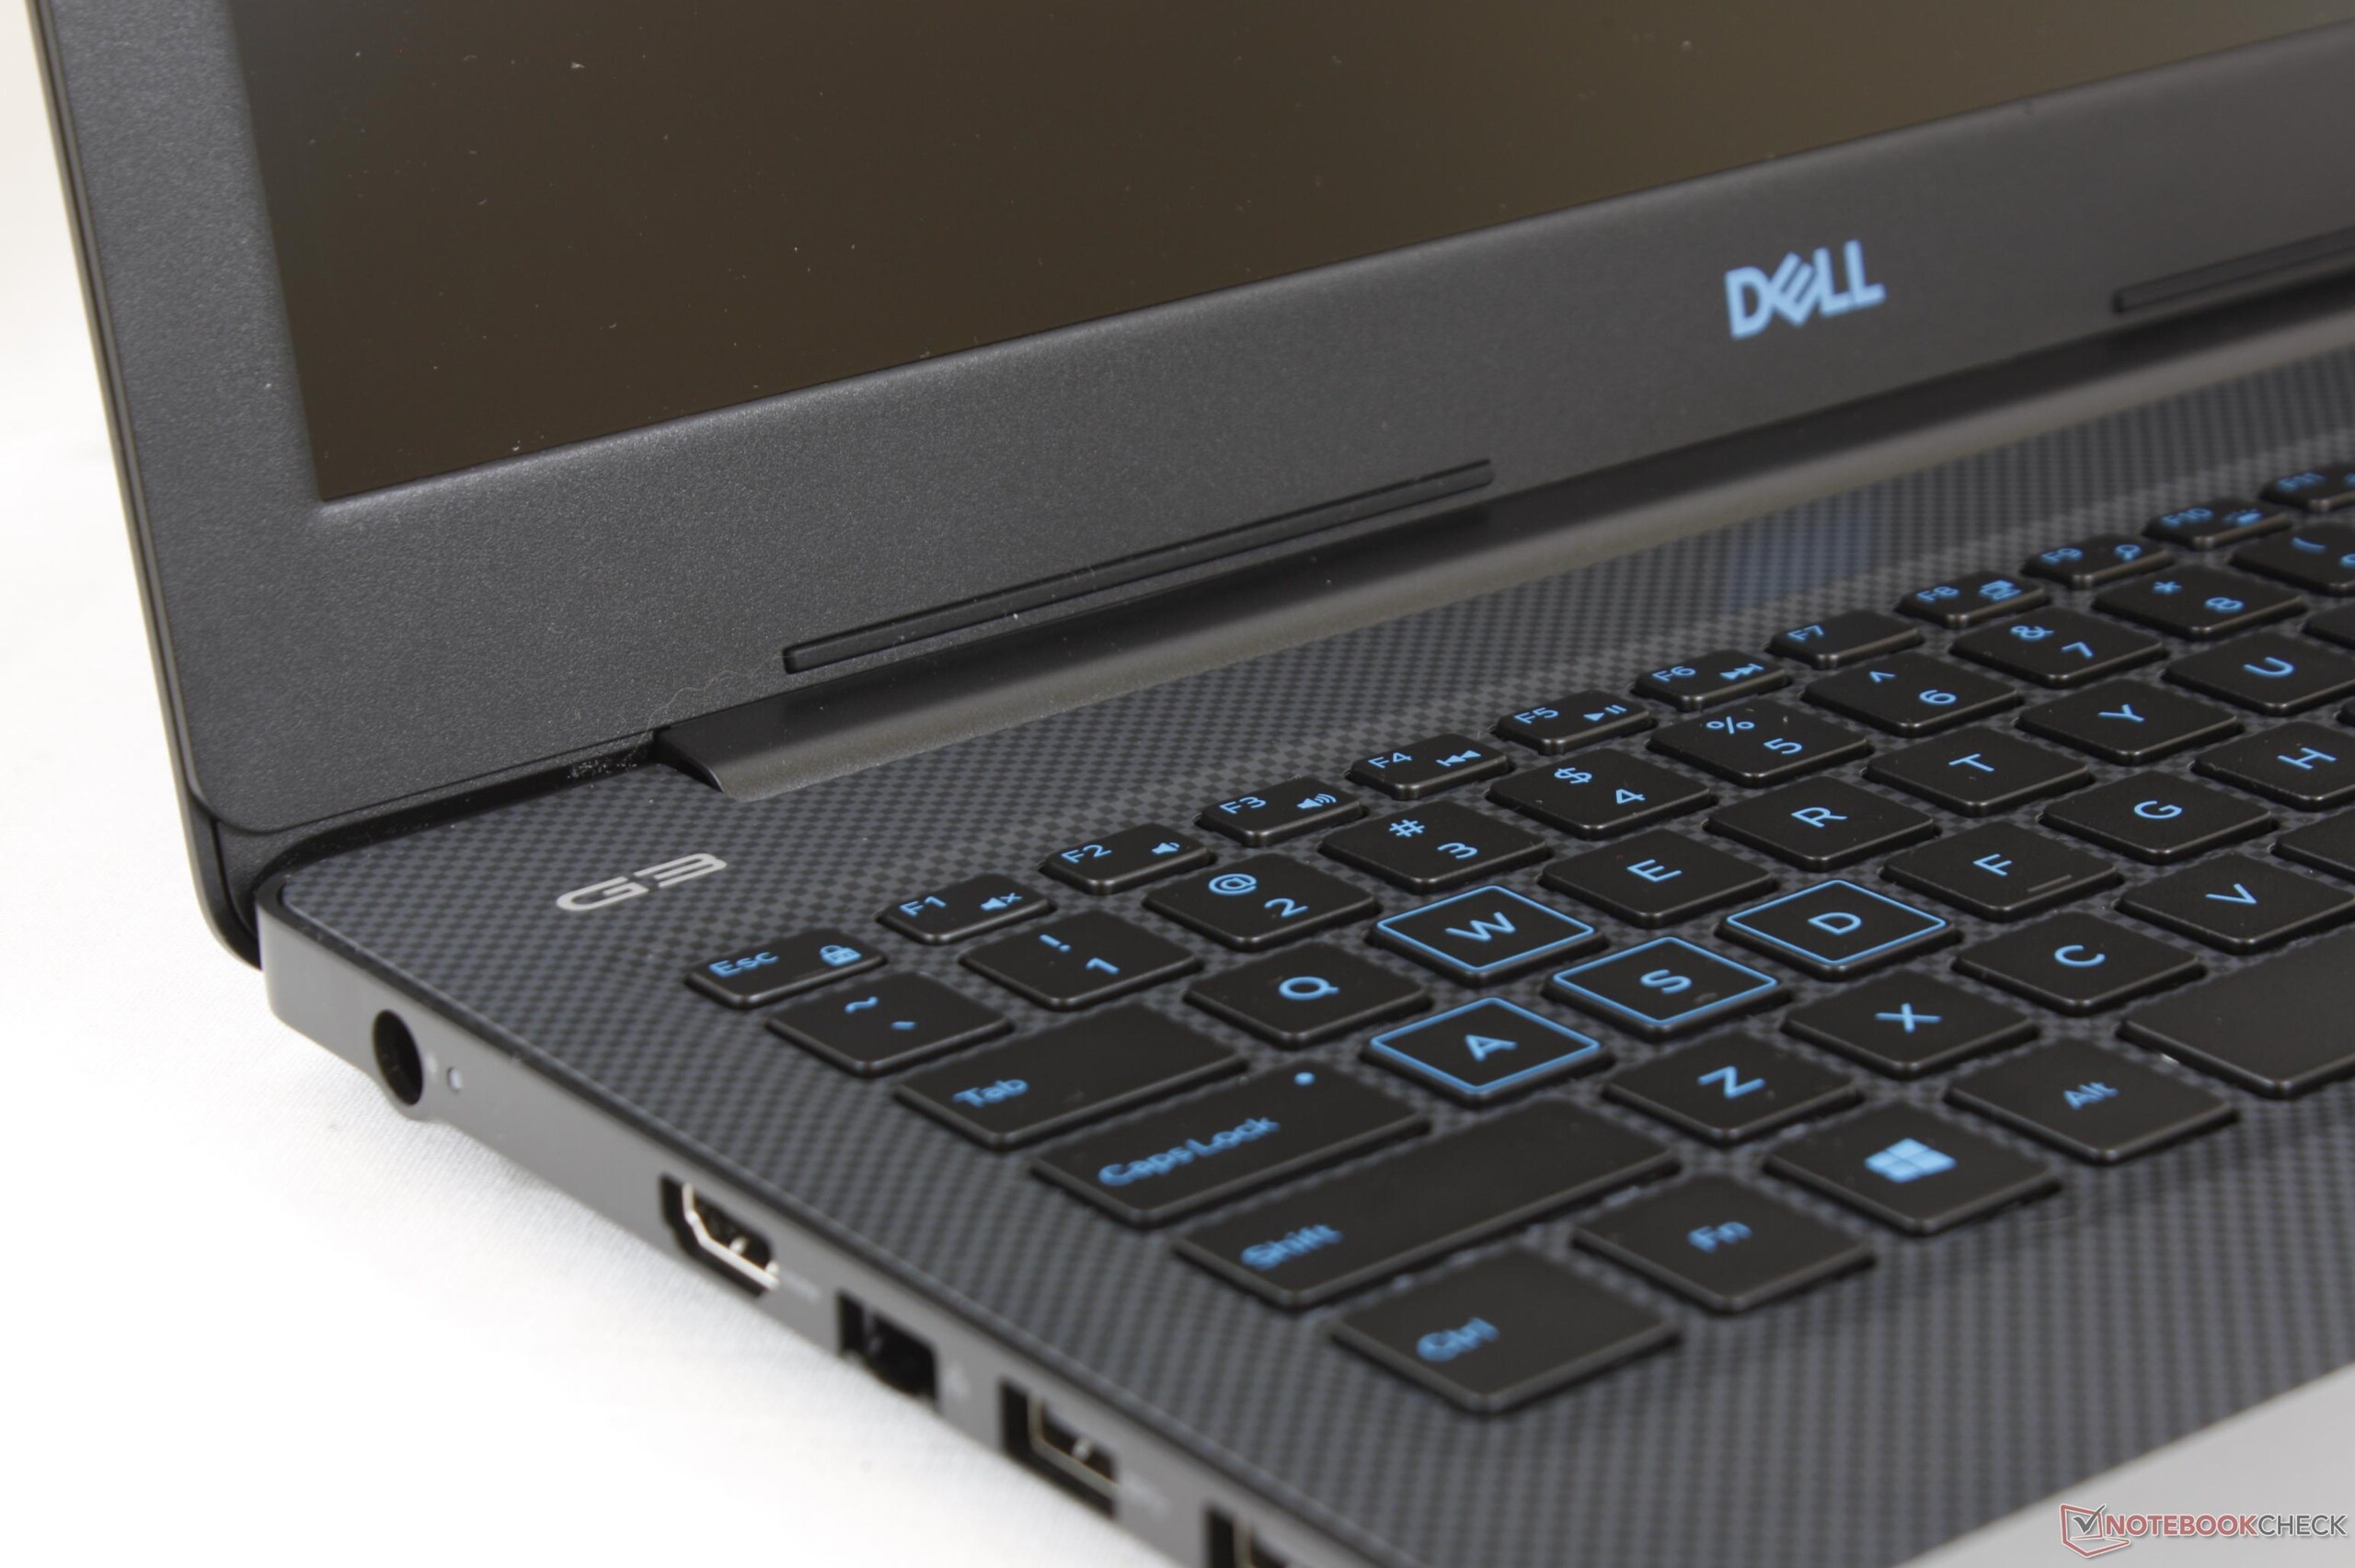
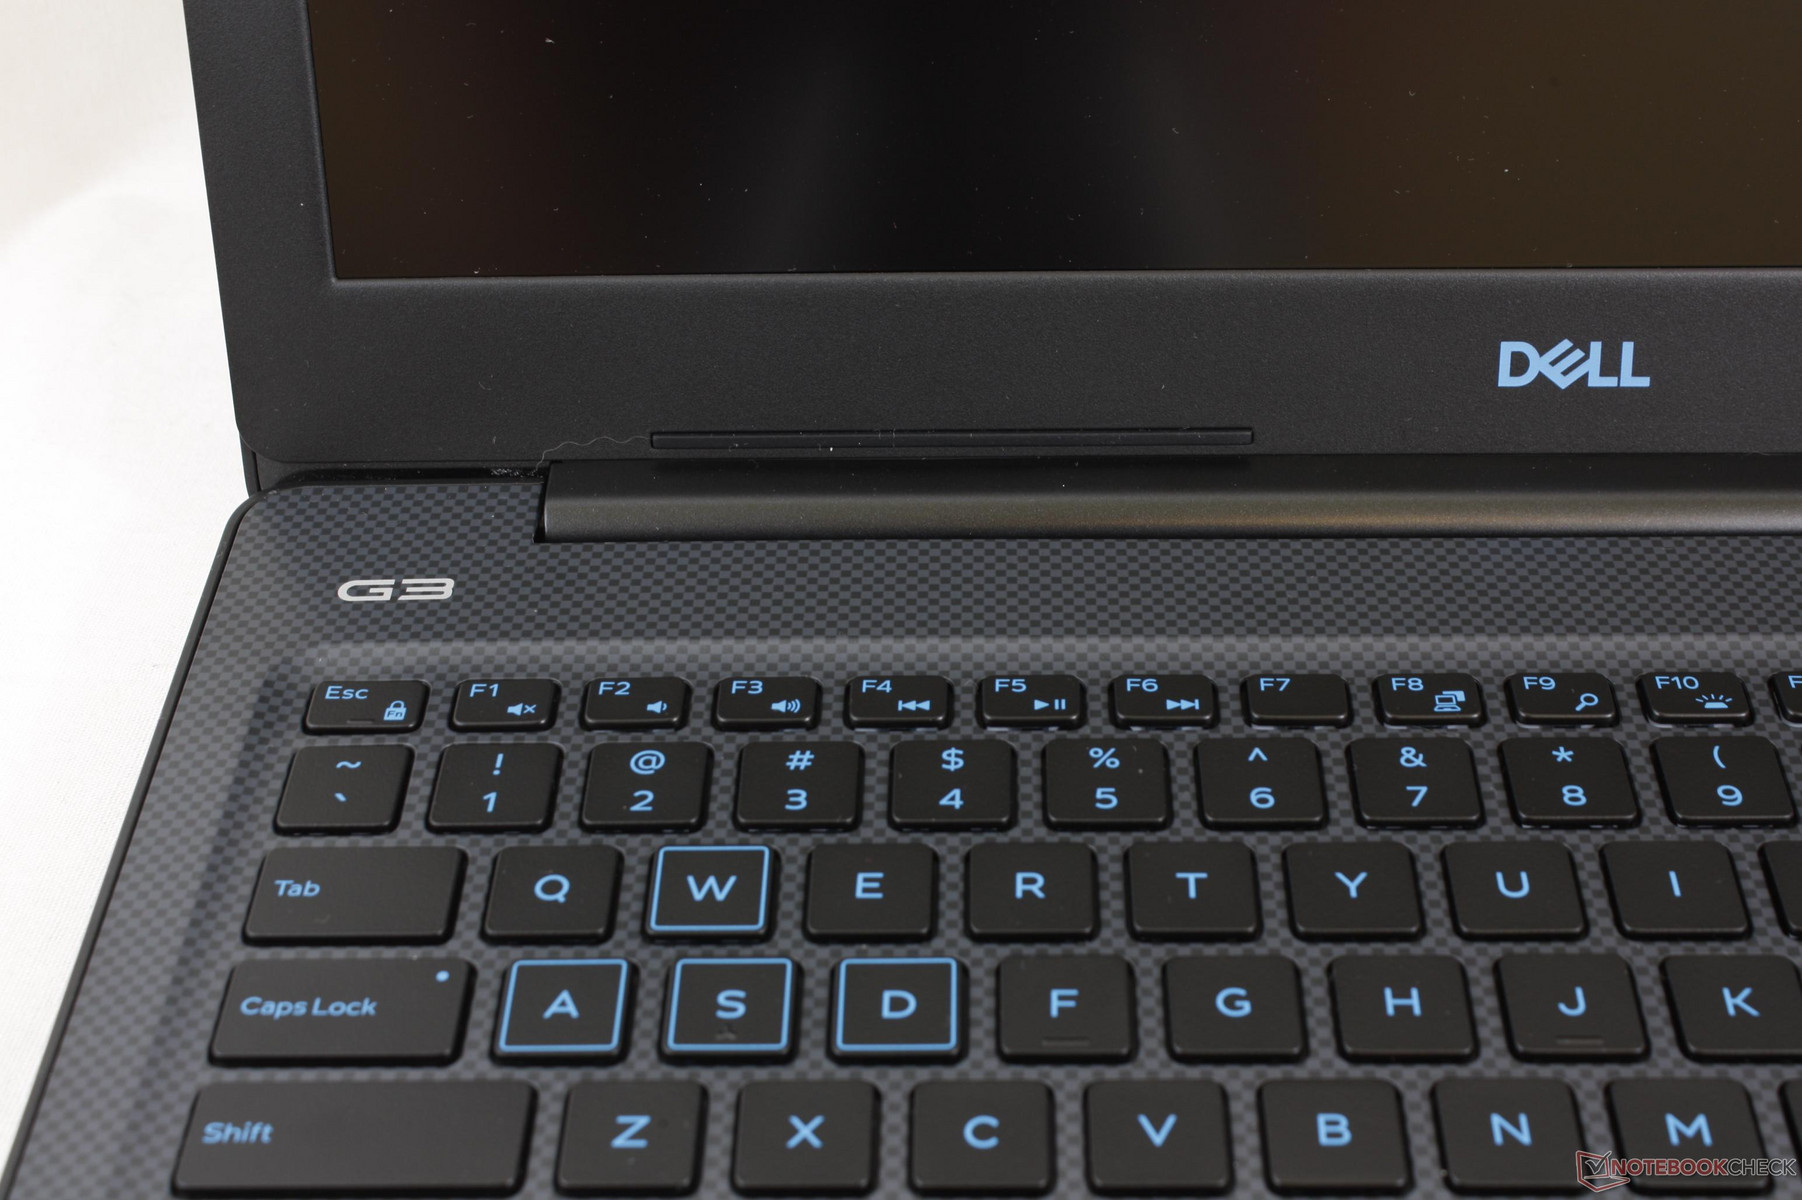
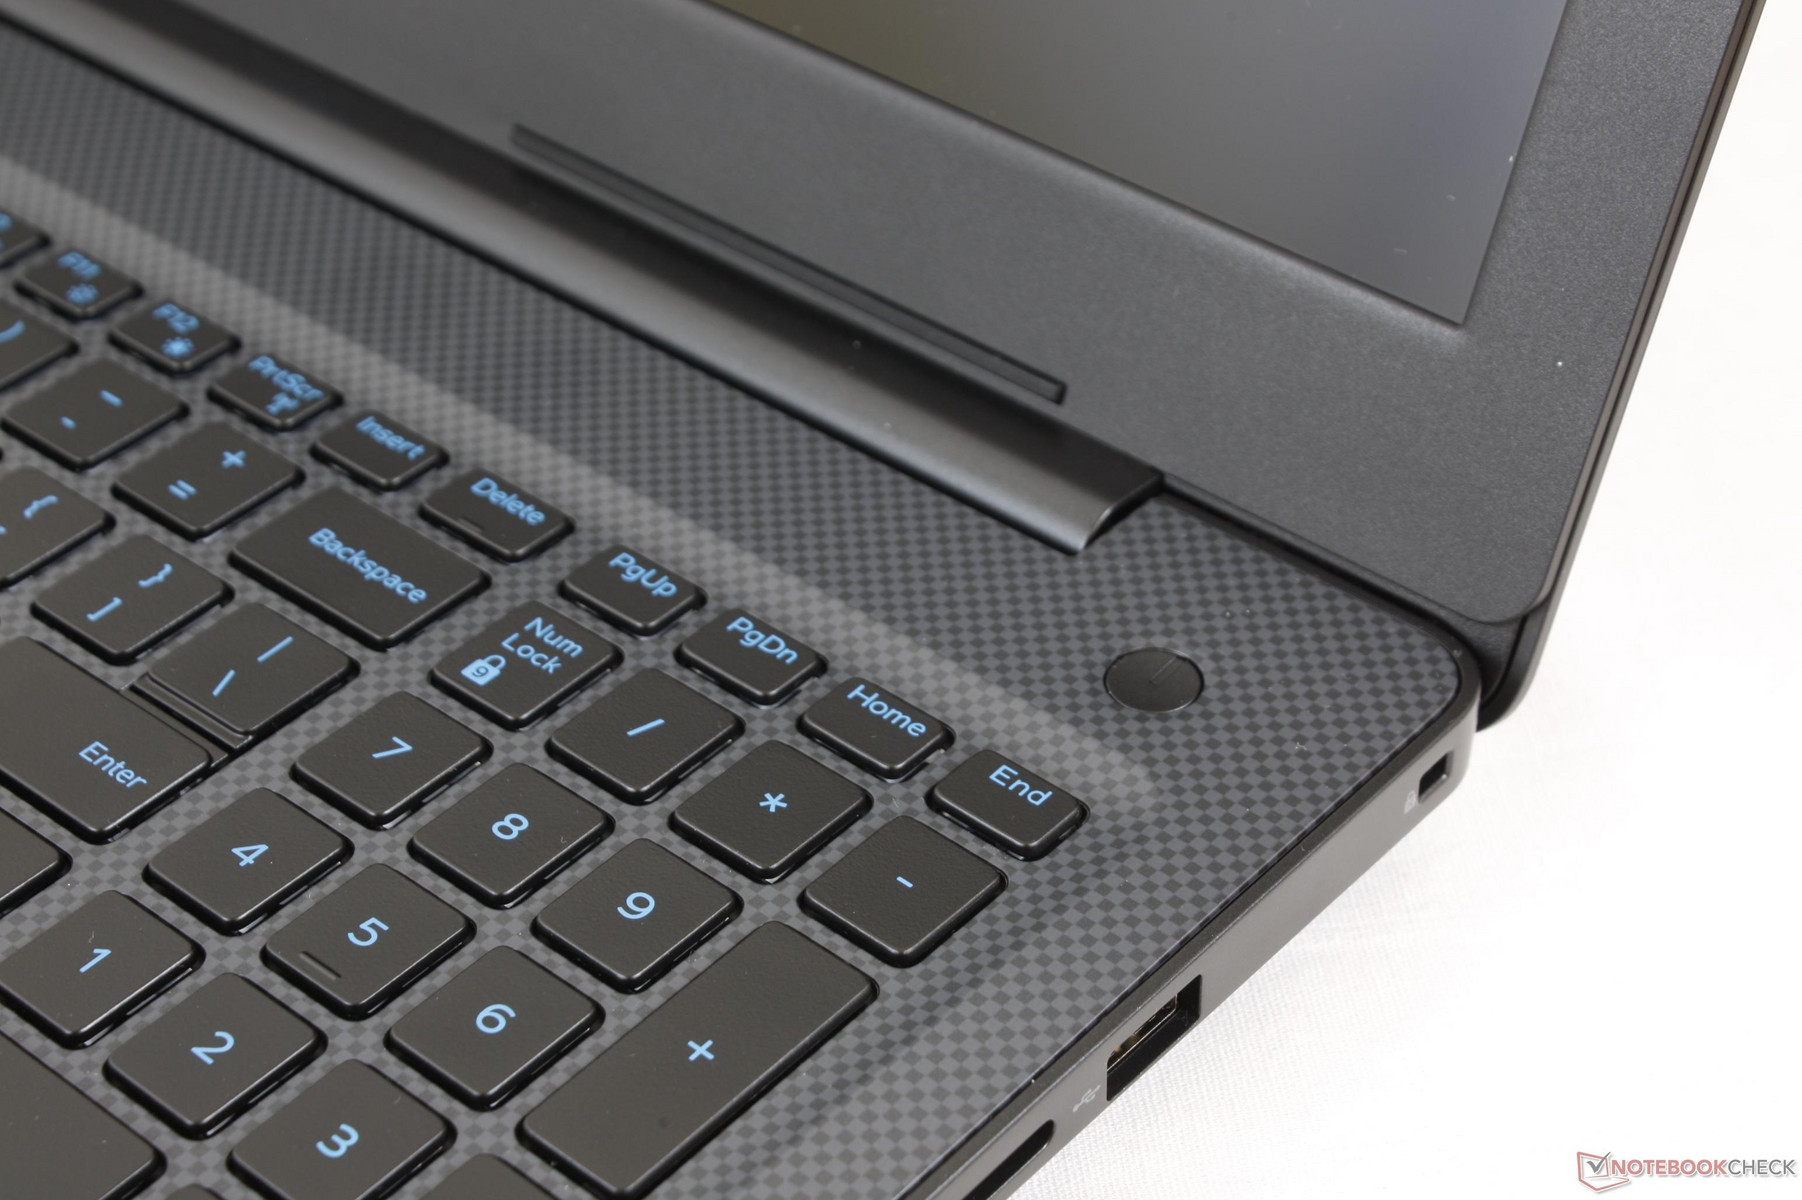
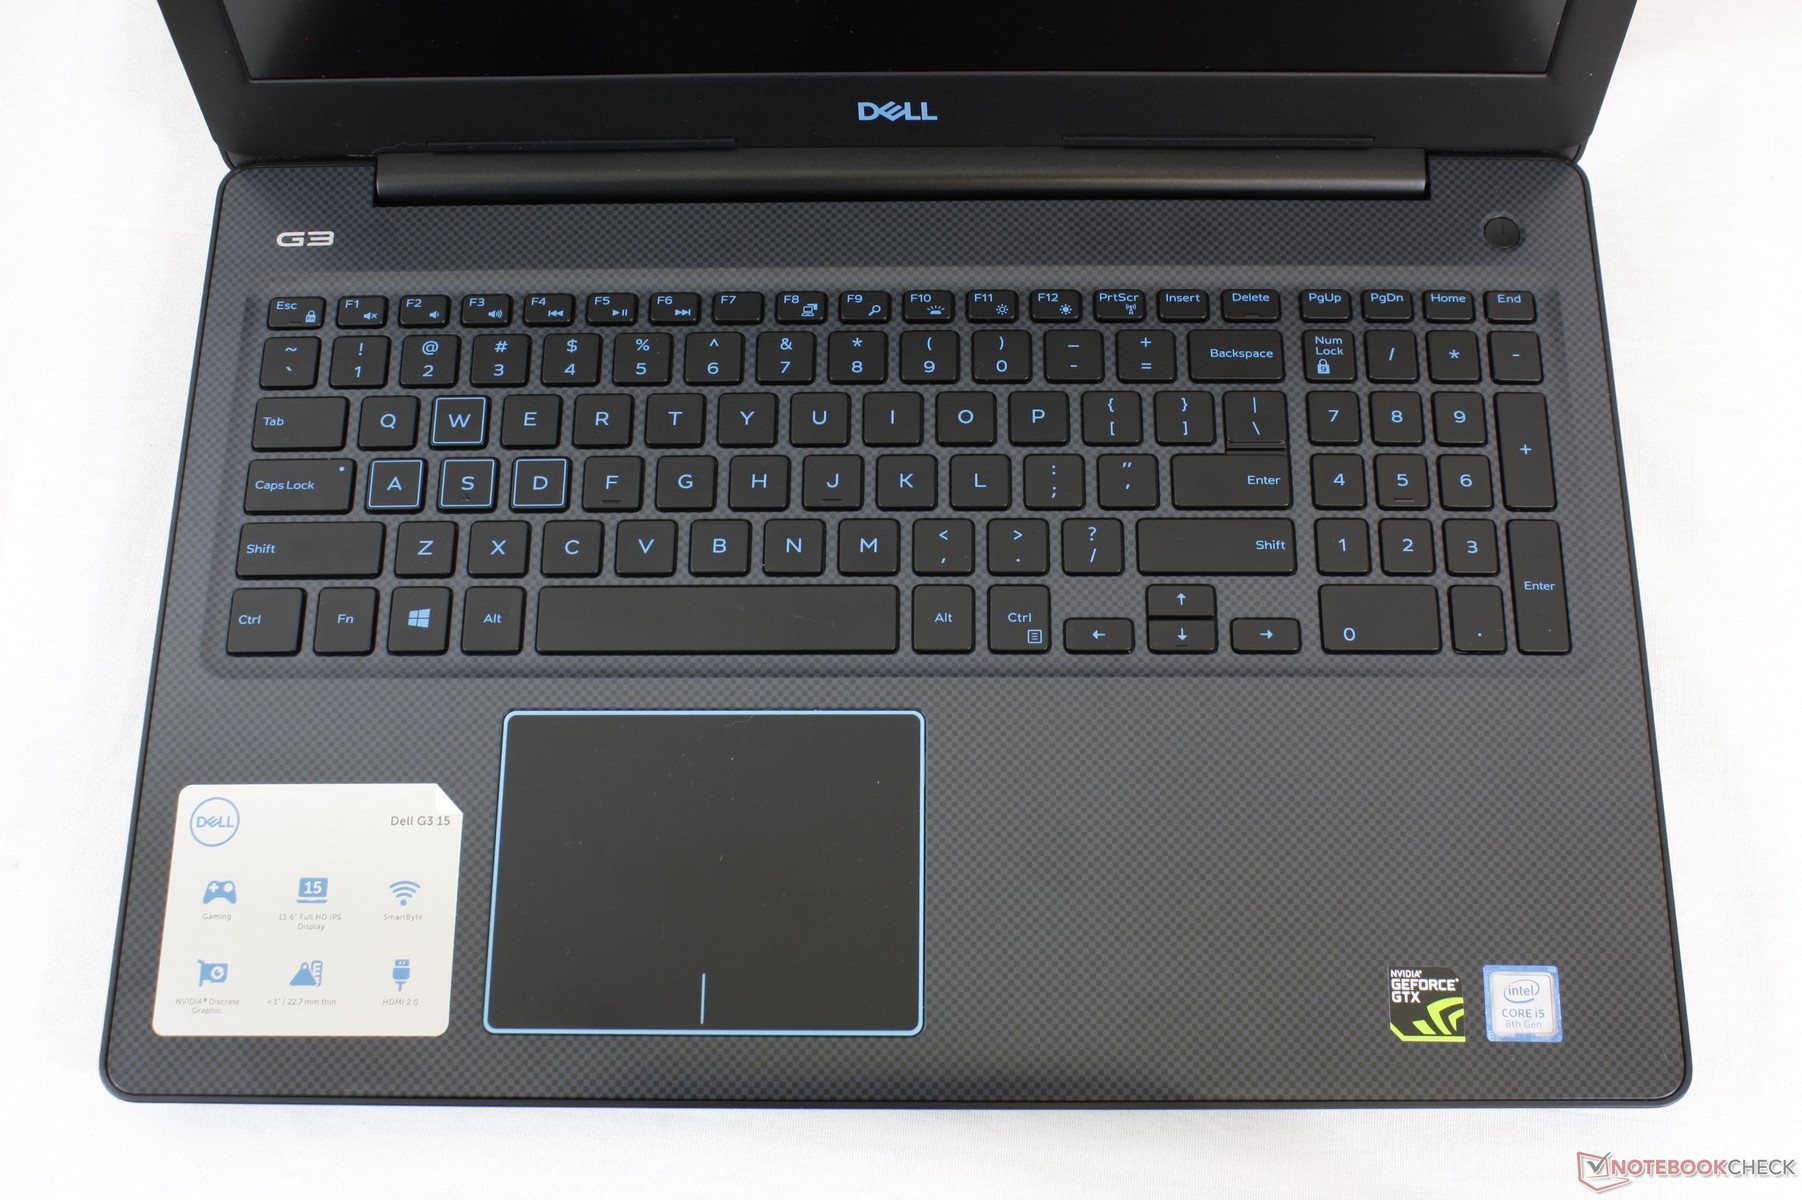
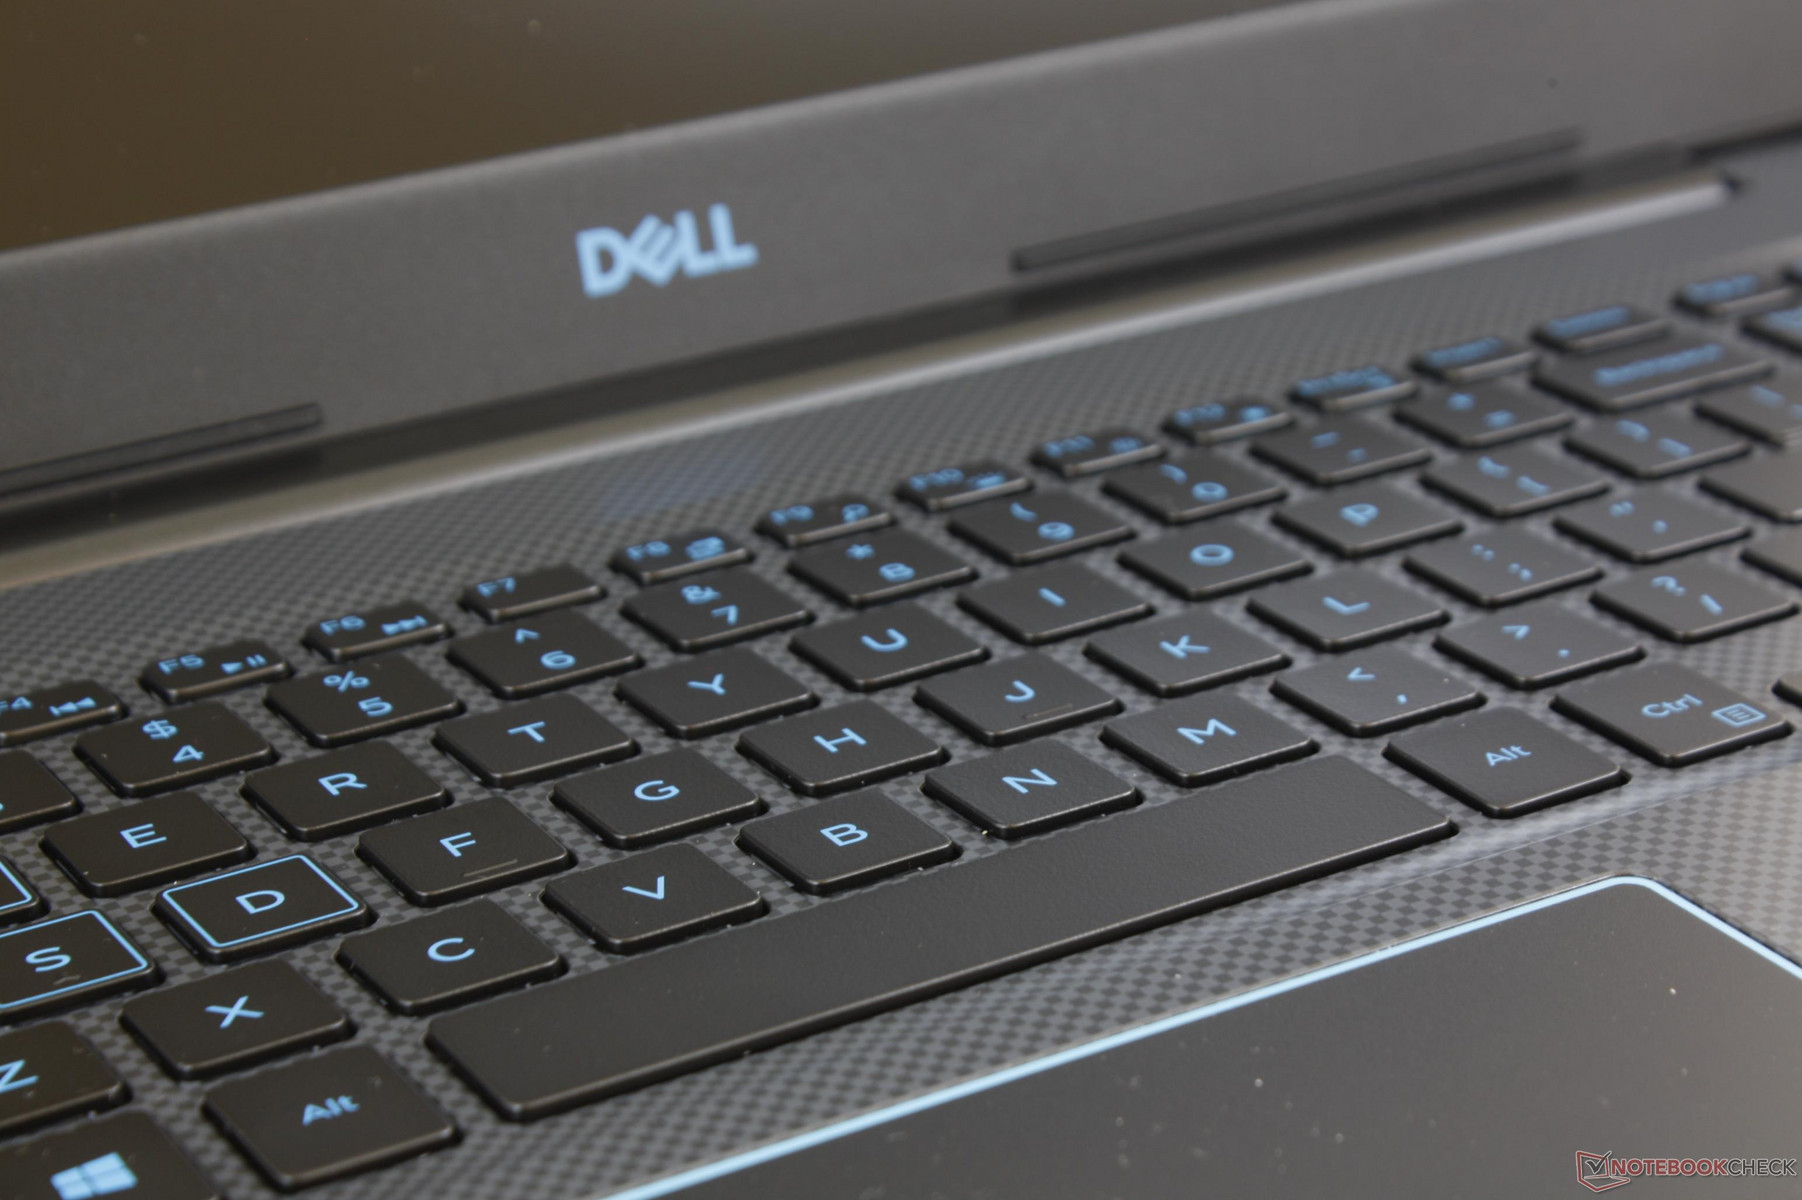
The "splash-resistant" chiclet keyboard (~34.5 x 10.3 cm) keys are soft in feedback and subsequently quiet with minimal clatter. Each key could have been firmer for a more satisfying typing experience closer to that of the XPS series. The NumPad and Arrow keys are even worse since they are smaller than the main QWERTY keys. Competing models like the Gigabyte Sabre 15 offer crisper keys that typists may like better.
The Blue backlight and Teal letters further distinguish the Dell G series from the Alienware series or older Inspiron Gaming series. It contrasts well with competing OEMs where Red is often the preferred color for gaming laptops.
Touchpad
The trackpad (~10.5 x 8 cm) is similar to the G3 17 and G5 15 in size and feel. It is slightly roughened in texture to avoid sticking when gliding across its surface. While cursor movements are reliable and smooth, the integrated mouse keys are very shallow in travel and on the spongy side. Firmer feedback would have made for a more agreeable experience should no external mouse be available.
Strangely, moving the cursor vertically along the right edge of the trackpad would sometimes cause the trackpad to not respond at all until we lift our finger. It's an annoying occurrence that we can find no toggle for in the settings menu.
Display
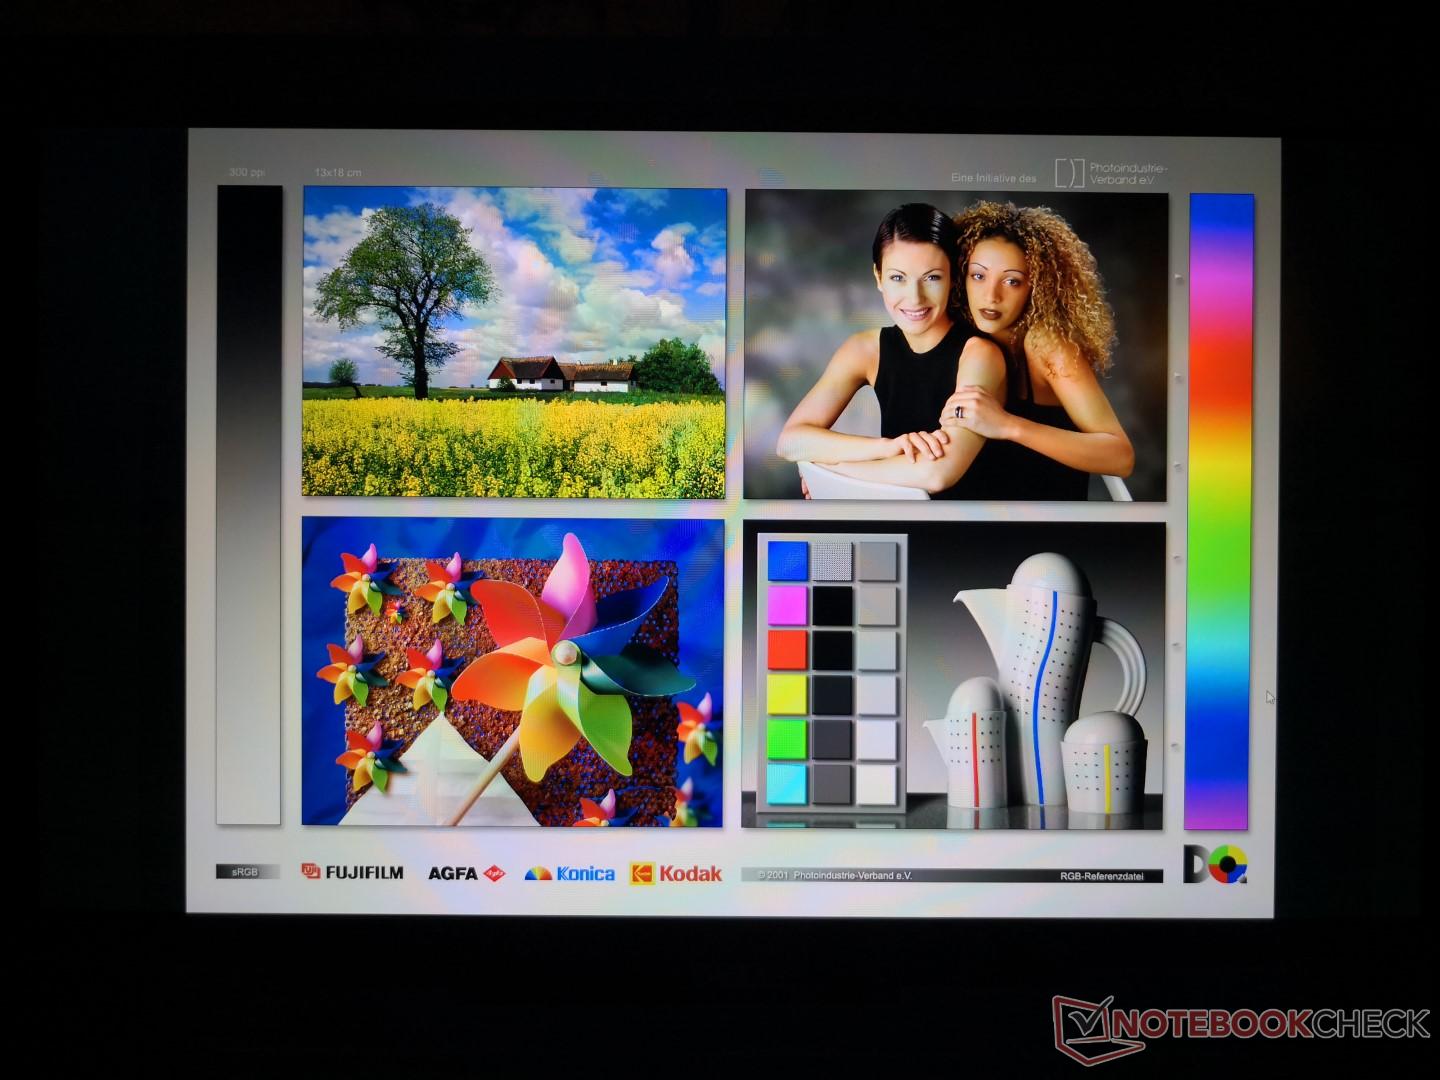
Perhaps unsurprisingly, the G3 15 utilizes the same LG Philips LP156WF6 IPS panel as on the Inspiron 15 7577. Even the Dell part number (4XK13) is exactly the same on both 1080p models. Display quality is nonetheless merely average. The backlight is weak at only about 200 nits maximum and contrast ratio is strangely lower than what we measured on the Inspiron 15 7577. These qualities are common for a budget gaming laptop as pricier models tend to offer 300 nit brightness levels with higher refresh rates, faster response times, and deeper contrast ratios. Users who want 4K UHD options will have to look at the G5 series.
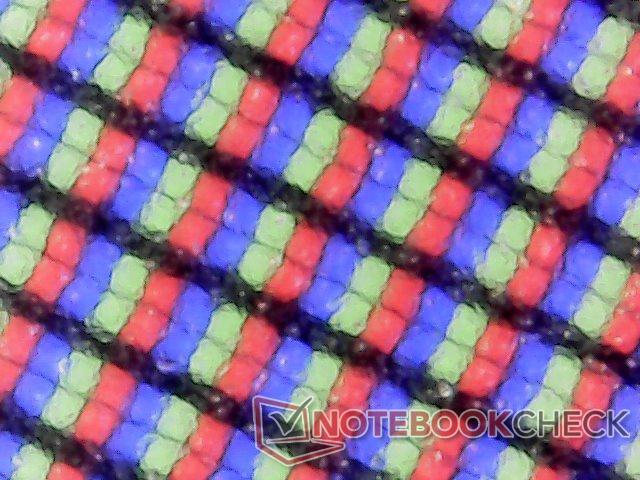
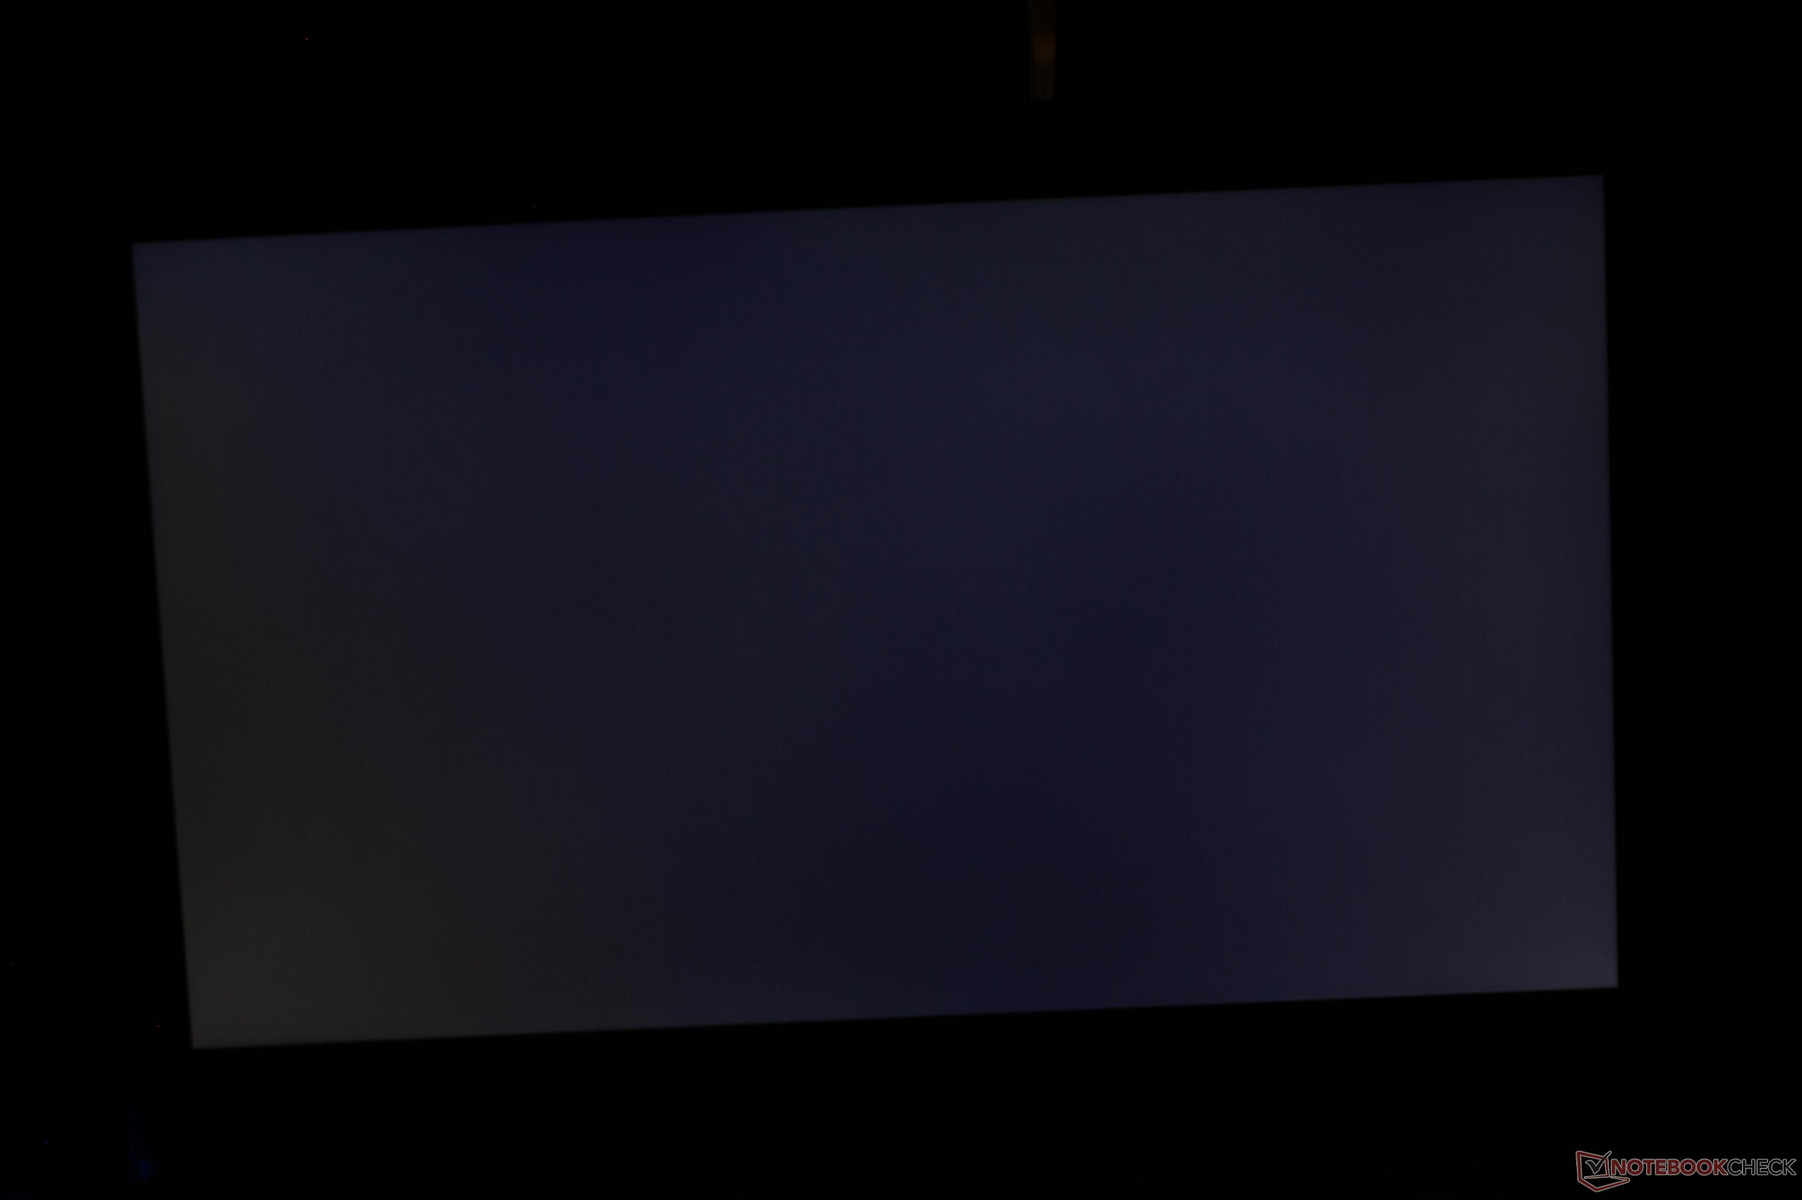
Subjectively, the matte panel appears clean with only minimal graininess. The slightly uneven backlight bleeding is hardly noticeable.
| |||||||||||||||||||||||||
Brightness Distribution: 81 %
Center on Battery: 208.2 cd/m²
Contrast: 612:1 (Black: 0.34 cd/m²)
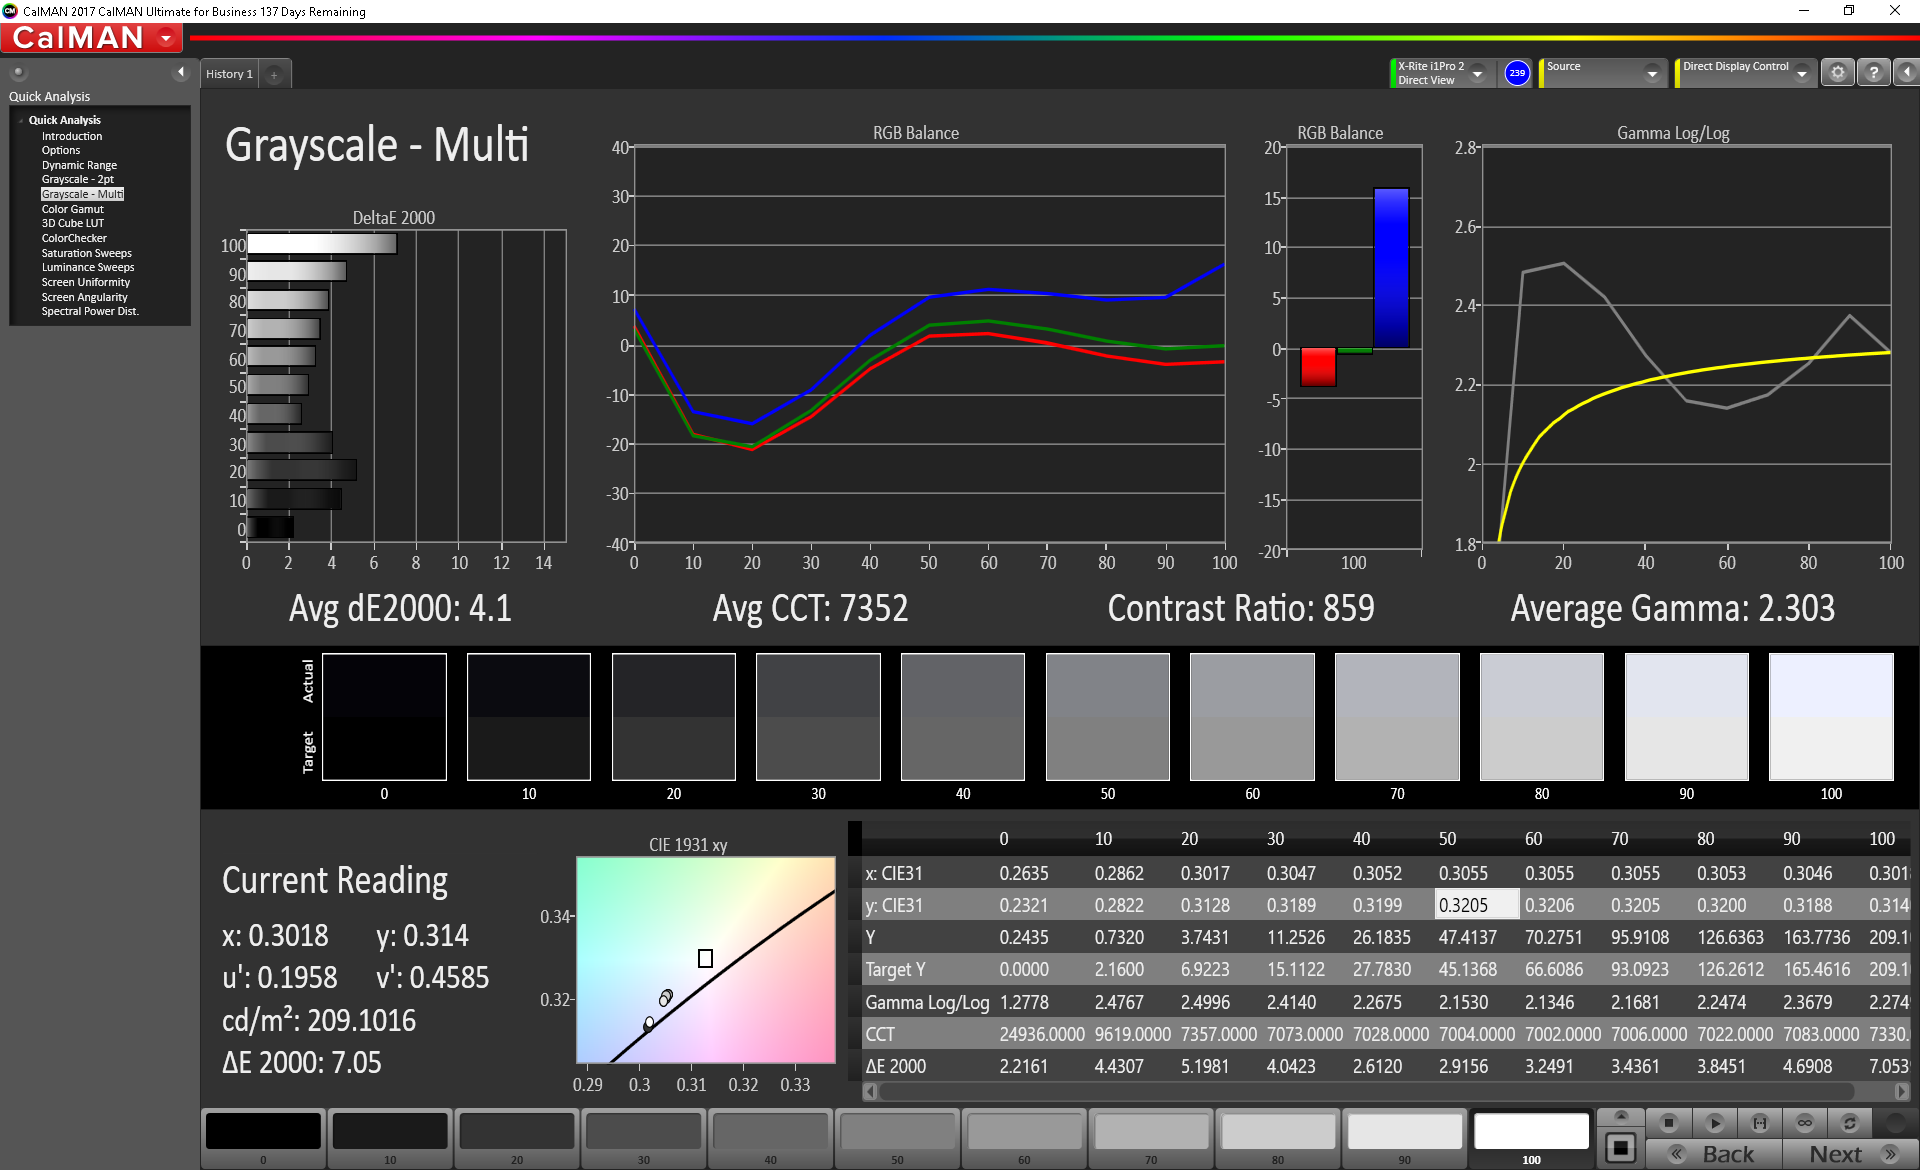
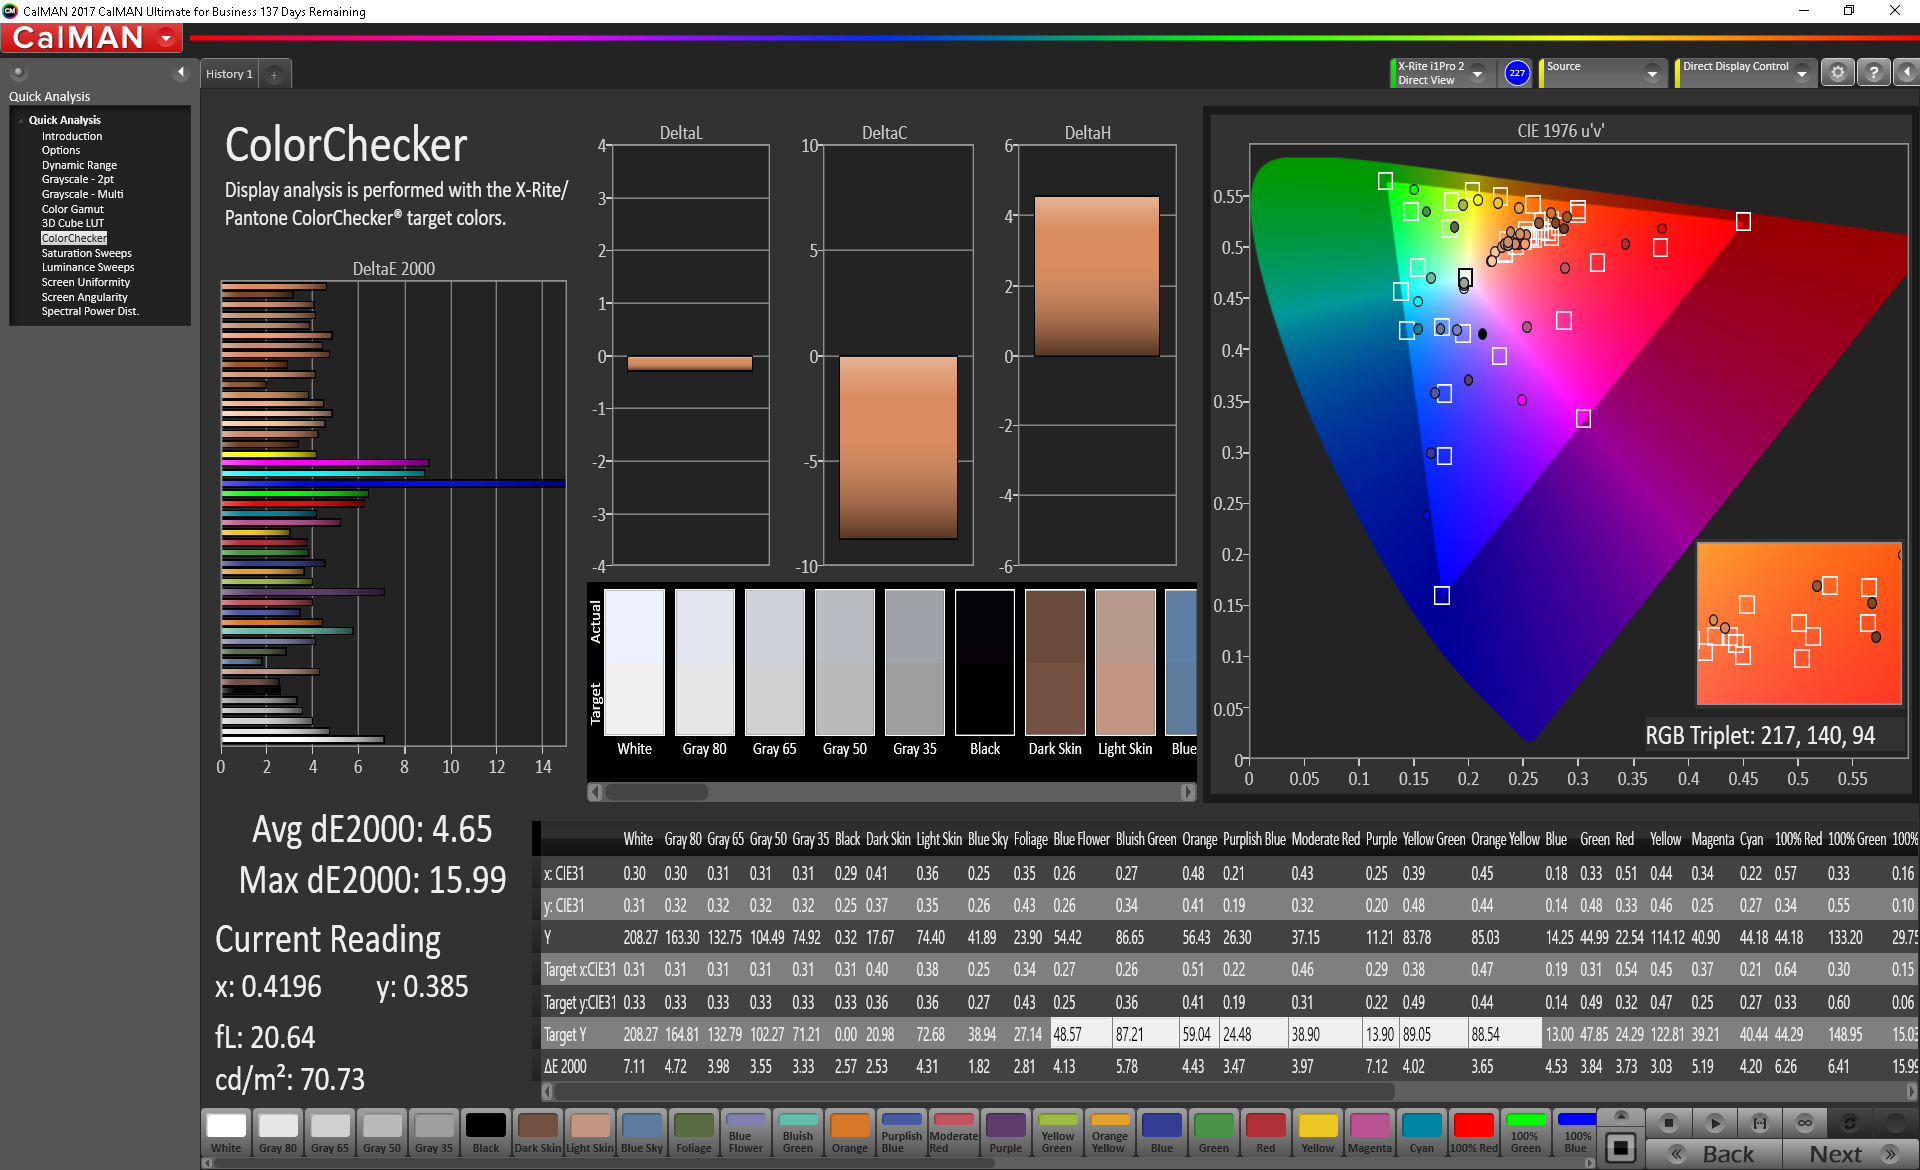
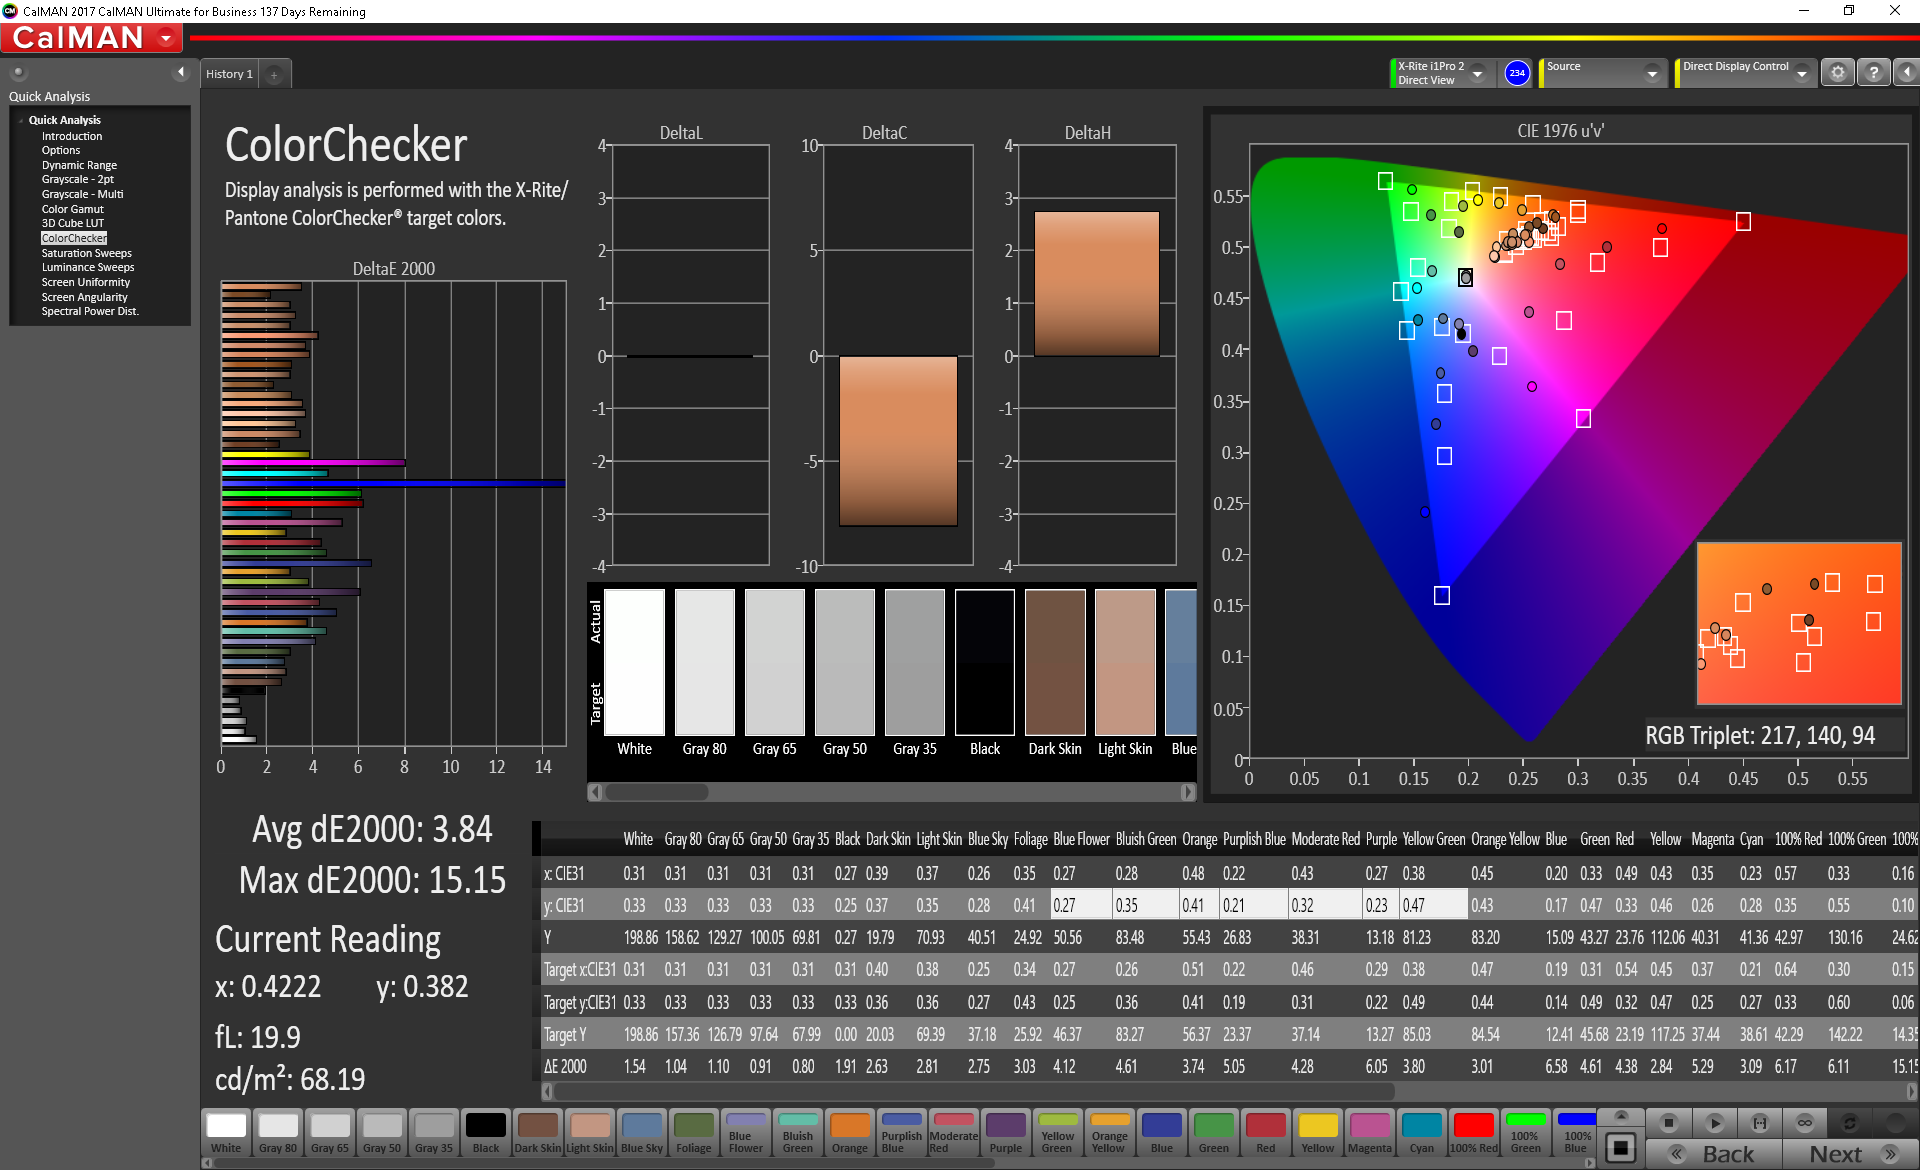
ΔE ColorChecker Calman: 4.65 | ∀{0.5-29.43 Ø4.71}
calibrated: 3.84
ΔE Greyscale Calman: 4.1 | ∀{0.09-98 Ø4.96}
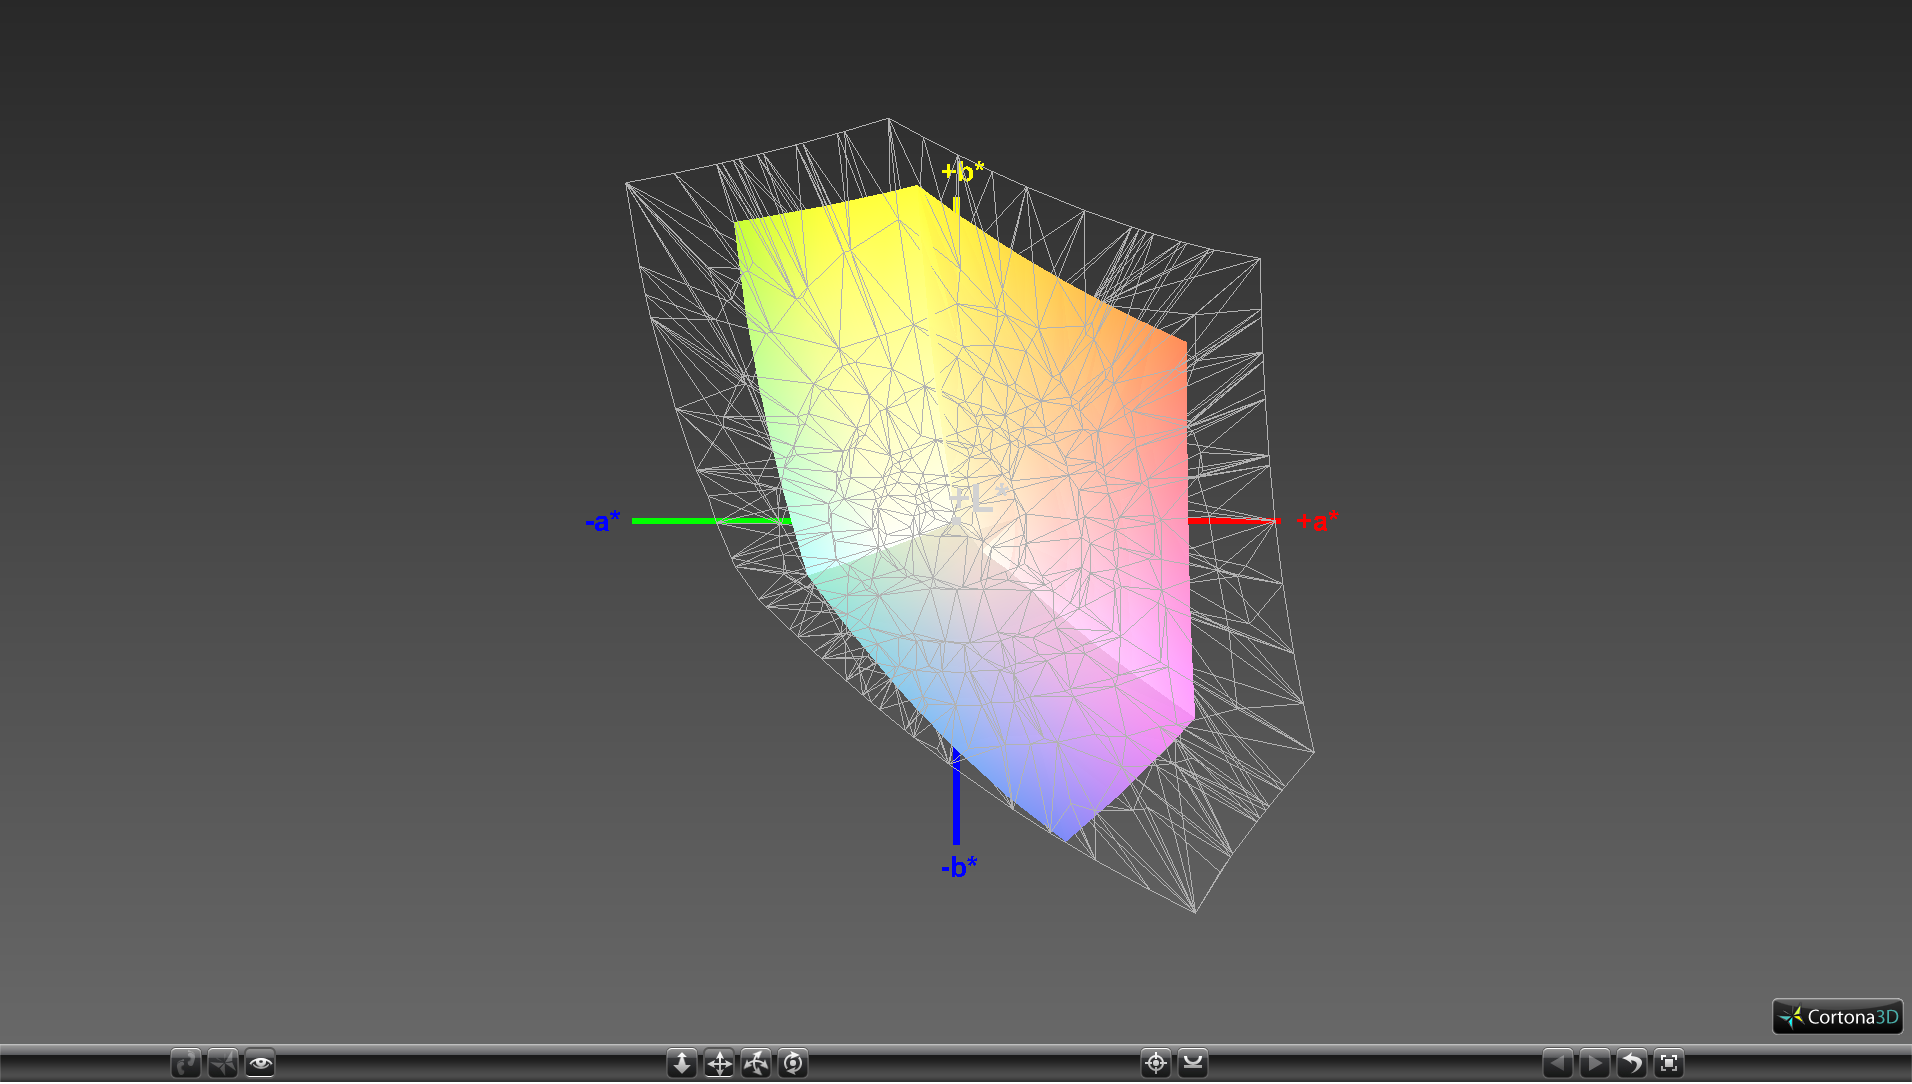
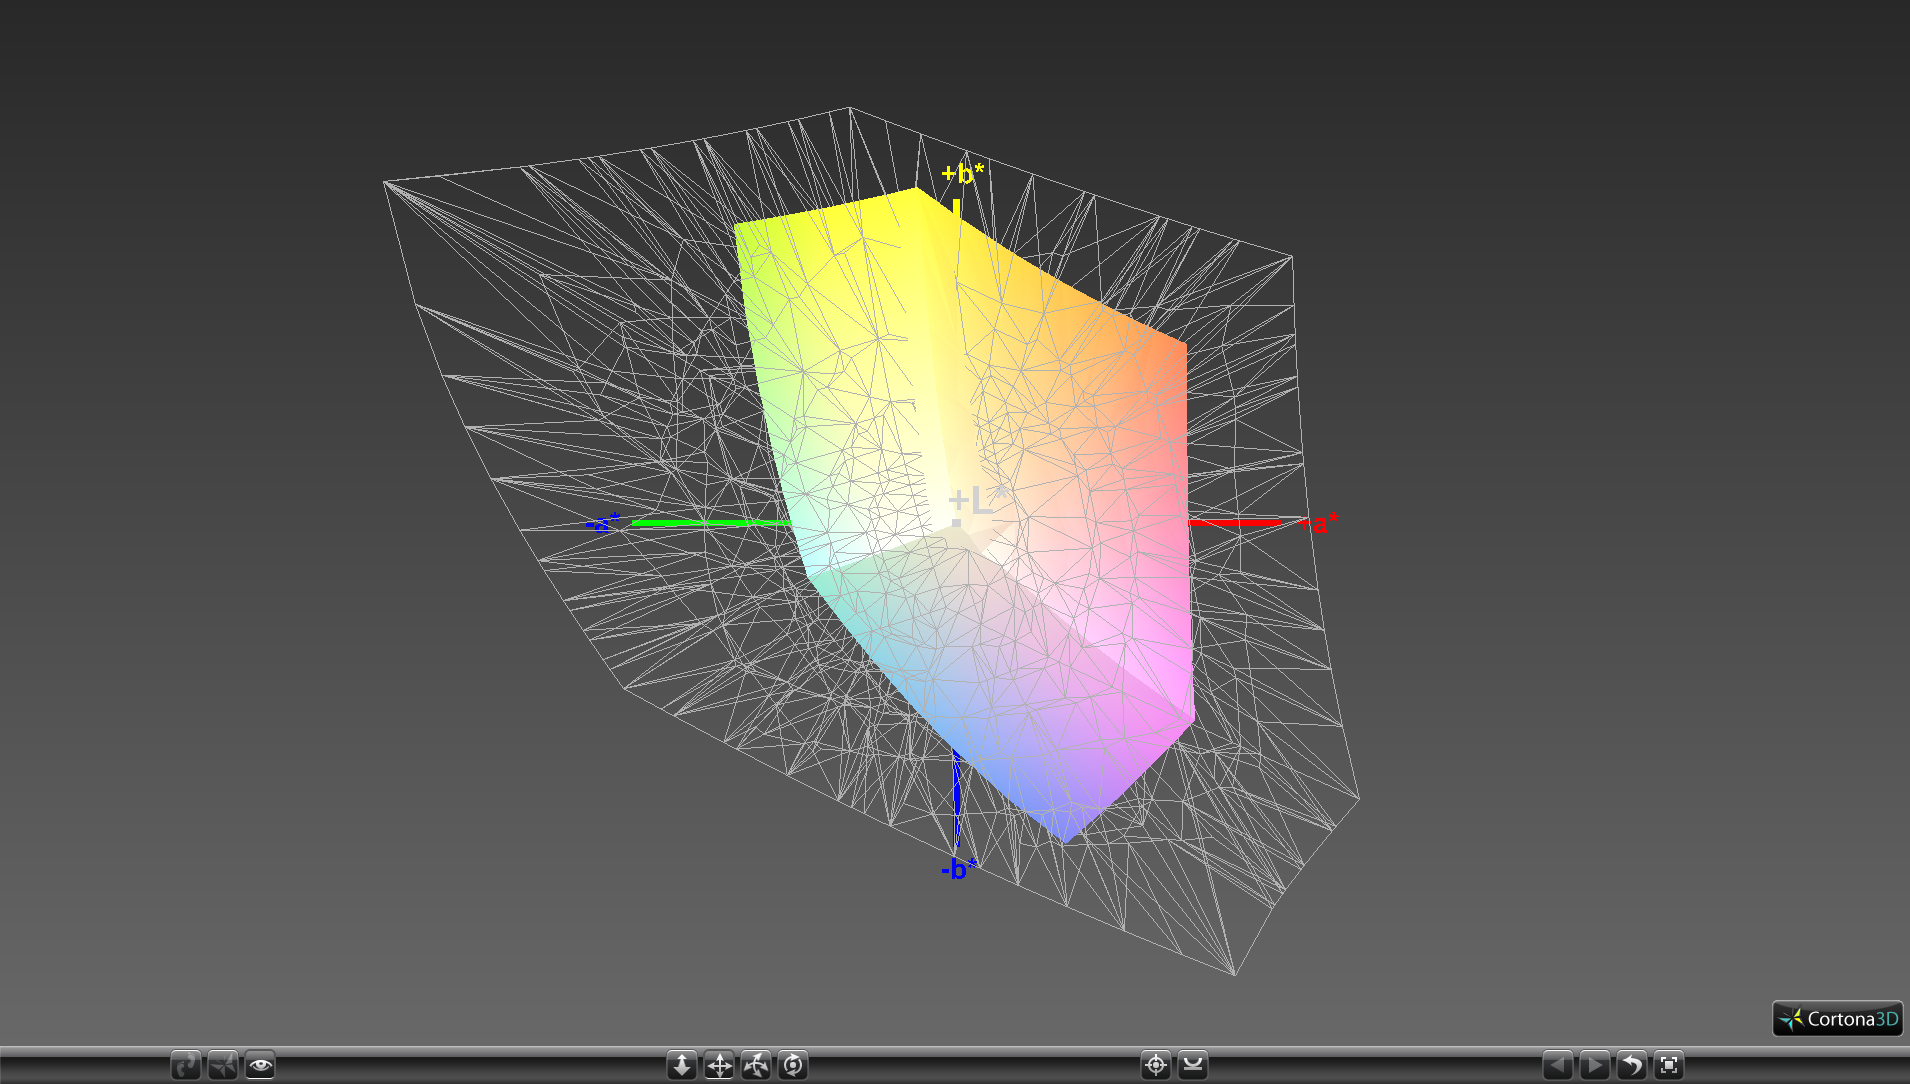
57.9% sRGB (Argyll 1.6.3 3D)
36.7% AdobeRGB 1998 (Argyll 1.6.3 3D)
39.75% AdobeRGB 1998 (Argyll 3D)
57.9% sRGB (Argyll 3D)
38.48% Display P3 (Argyll 3D)
Gamma: 2.3
CCT: 7352 K
| Dell G3 15 3579 LG Philips LP156WF6, IPS, 15.6", 1920x1080 | MSI GL63 8RC-069US LG Philips LP156WF6-SPK6, IPS, 15.6", 1920x1080 | Asus FX504GD AU Optronics B156HTN03.8, TN LED, 15.6", 1920x1080 | Dell Inspiron 15 7000 7577 4K Name: AU Optronics B156ZAN, IPS, 15.6", 3840x2160 | Dell Inspiron 15 7000 7577 ID: LG Philips LGD053F, Name: 156WF6, Dell P/N: 4XK13, IPS, 15.6", 1920x1080 | |
|---|---|---|---|---|---|
| Display | 2% | -4% | 74% | 5% | |
| Display P3 Coverage (%) | 38.48 | 39.4 2% | 37.09 -4% | 68.4 78% | 40.4 5% |
| sRGB Coverage (%) | 57.9 | 59.2 2% | 55.8 -4% | 97.1 68% | 60.5 4% |
| AdobeRGB 1998 Coverage (%) | 39.75 | 40.72 2% | 38.34 -4% | 69.6 75% | 41.77 5% |
| Response Times | -4% | 3% | -16% | -24% | |
| Response Time Grey 50% / Grey 80% * (ms) | 32.4 ? | 33.6 ? -4% | 41.6 ? -28% | 35.2 ? -9% | 41 ? -27% |
| Response Time Black / White * (ms) | 23.2 ? | 24 ? -3% | 15.2 ? 34% | 28.4 ? -22% | 28 ? -21% |
| PWM Frequency (Hz) | |||||
| Screen | 6% | -19% | 33% | 25% | |
| Brightness middle (cd/m²) | 208.2 | 286.5 38% | 260 25% | 322.9 55% | 257 23% |
| Brightness (cd/m²) | 203 | 258 27% | 241 19% | 309 52% | 229 13% |
| Brightness Distribution (%) | 81 | 82 1% | 85 5% | 90 11% | 84 4% |
| Black Level * (cd/m²) | 0.34 | 0.34 -0% | 0.55 -62% | 0.36 -6% | 0.17 50% |
| Contrast (:1) | 612 | 843 38% | 473 -23% | 897 47% | 1512 147% |
| Colorchecker dE 2000 * | 4.65 | 5.57 -20% | 7 -51% | 3.99 14% | 5.34 -15% |
| Colorchecker dE 2000 max. * | 15.99 | 16.8 -5% | 22.52 -41% | 8.97 44% | 9.99 38% |
| Colorchecker dE 2000 calibrated * | 3.84 | 4.16 -8% | 5.27 -37% | ||
| Greyscale dE 2000 * | 4.1 | 4.6 -12% | 6.1 -49% | 5.3 -29% | 4.82 -18% |
| Gamma | 2.3 96% | 2.15 102% | 1.97 112% | 2.041 108% | 2.46 89% |
| CCT | 7352 88% | 7564 86% | 7894 82% | 6941 94% | 6587 99% |
| Color Space (Percent of AdobeRGB 1998) (%) | 36.7 | 37.4 2% | 35.5 -3% | 62.9 71% | 38 4% |
| Color Space (Percent of sRGB) (%) | 57.9 | 58.9 2% | 61 5% | 96.8 67% | 60 4% |
| Total Average (Program / Settings) | 1% /
4% | -7% /
-14% | 30% /
34% | 2% /
14% |
* ... smaller is better
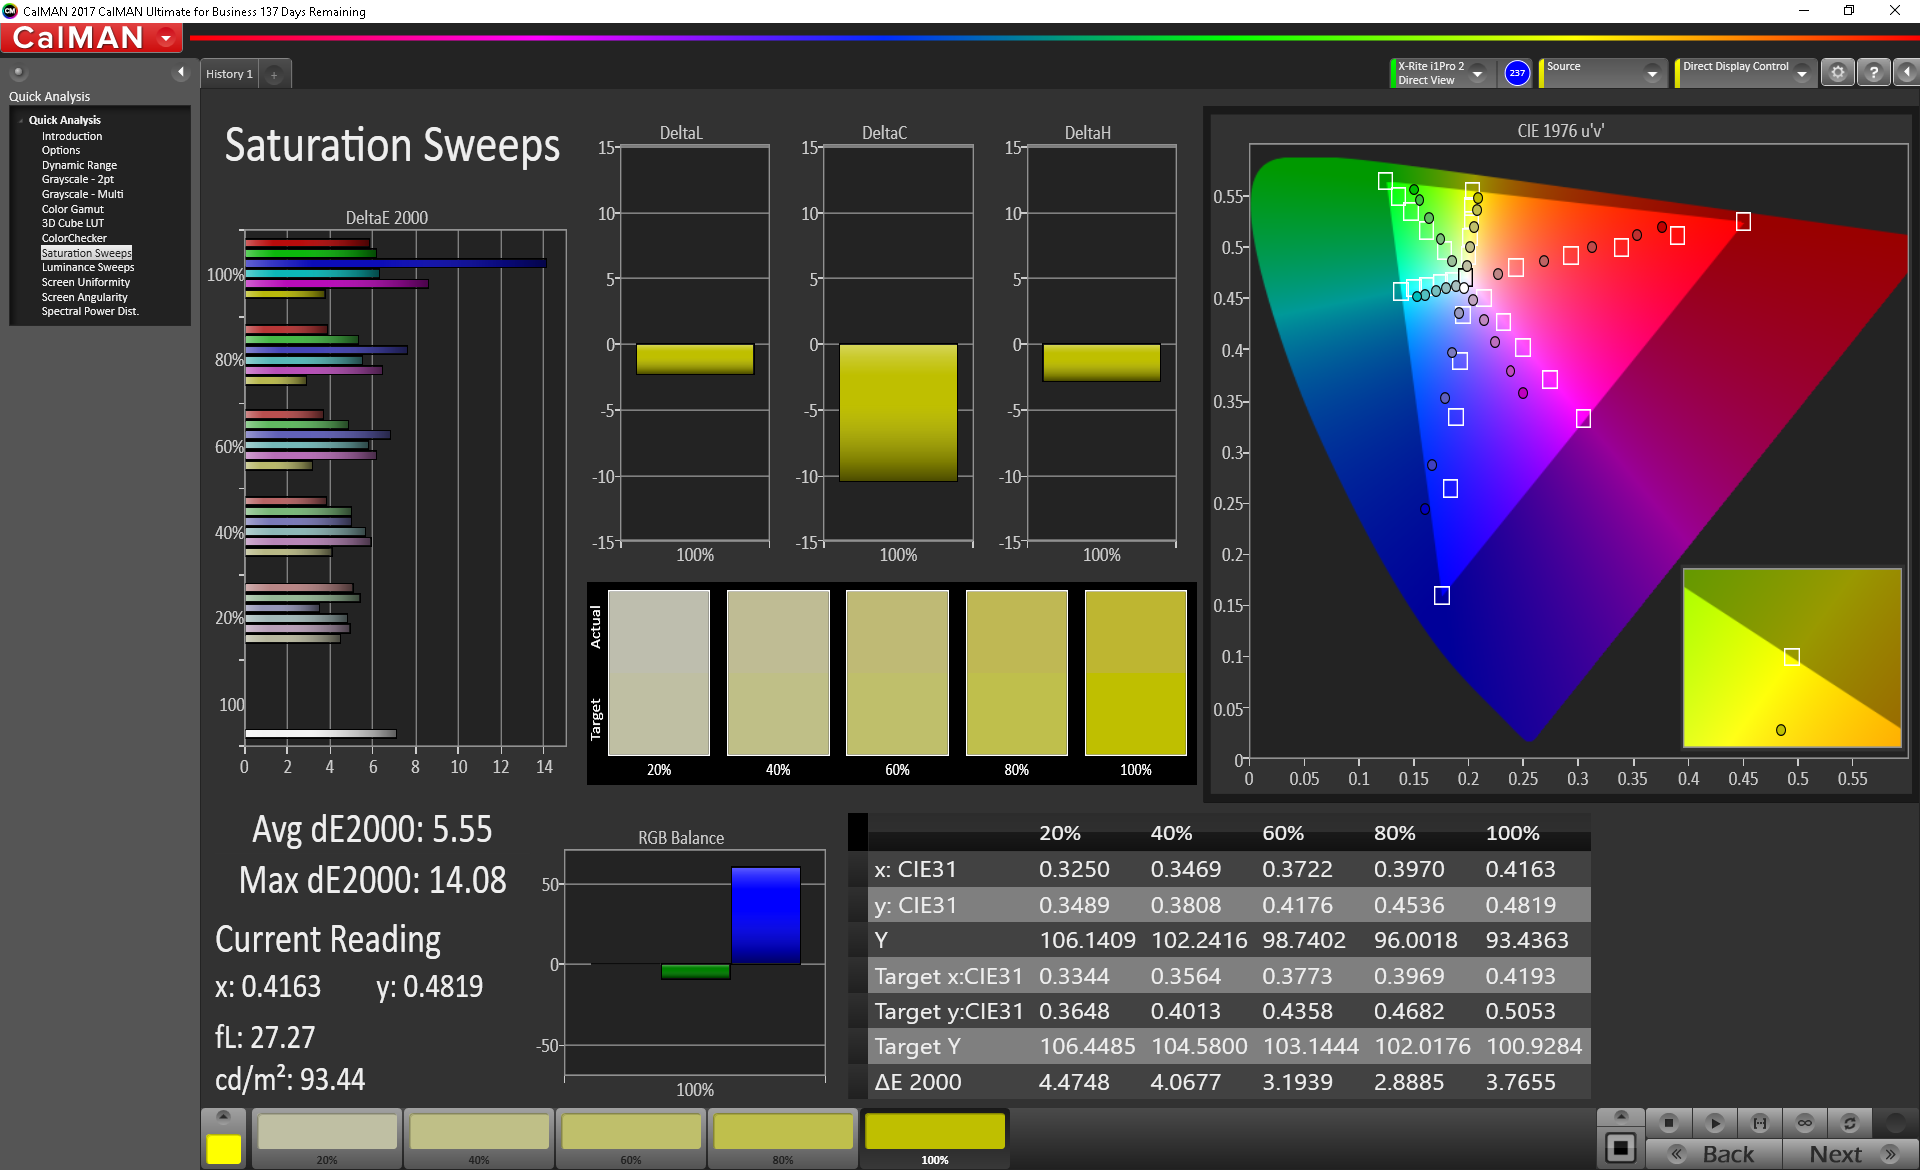
Color space is approximately 37 percent and 58 percent of the AdobeRGB and sRGB standards, respectively, to indicate a budget panel. In comparison, the color spaces of most flagship Ultrabooks tend to cover over 95 percent of sRGB for deeper and potentially more accurate colors. For gaming purposes, however, the narrow gamut here will not detract from the experience.
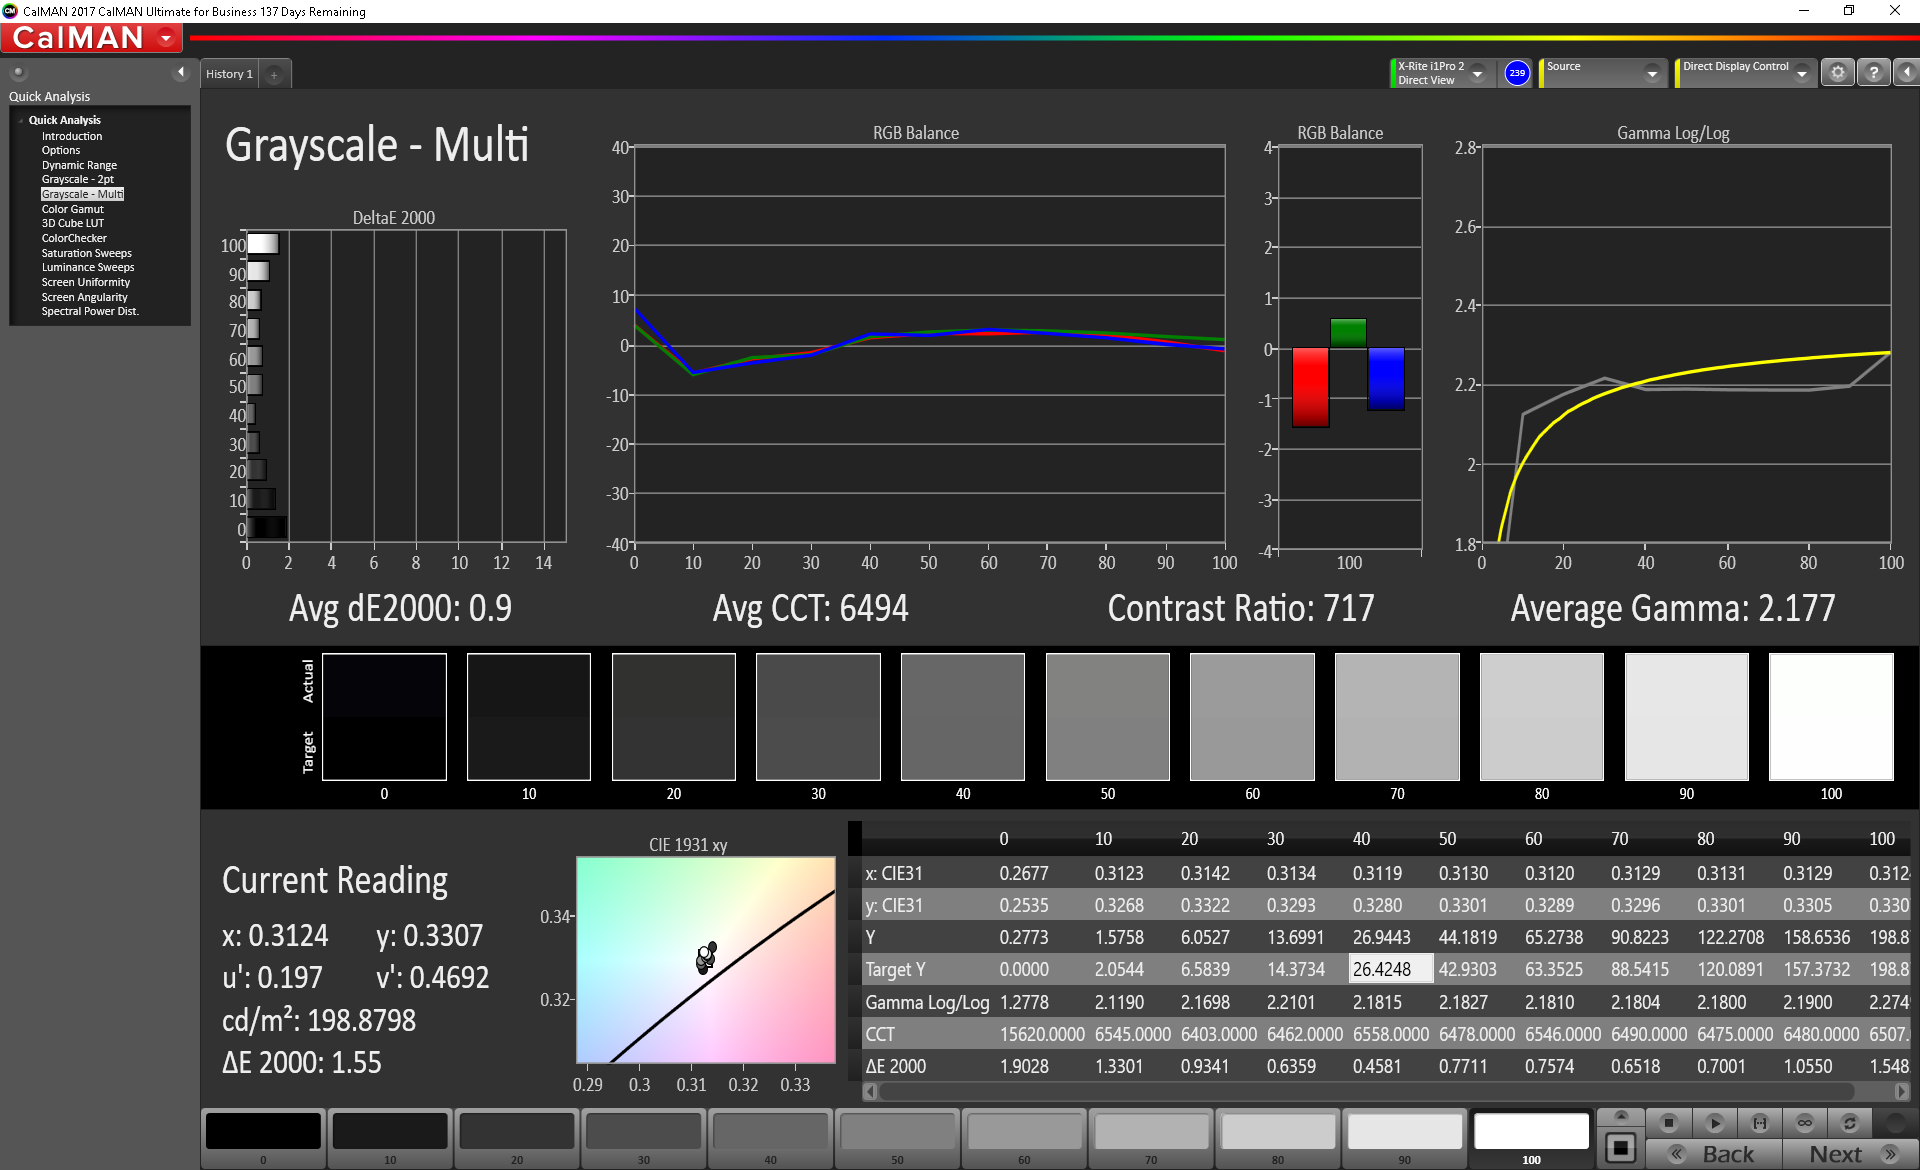
Further measurements with an X-Rite spectrophotometer reveal in imbalanced grayscale and an overly cool color temperature. Our calibration attempts improve both my noticeable margins. Colors, however, do not improve because of the narrow color gamut.

Display Response Times
| ↔ Response Time Black to White | ||
|---|---|---|
| 23.2 ms ... rise ↗ and fall ↘ combined | ↗ 13.2 ms rise | 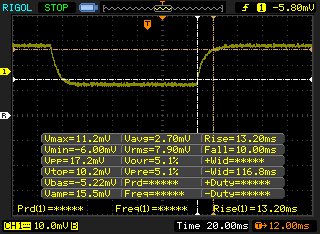 |
| ↘ 10 ms fall | ||
| The screen shows good response rates in our tests, but may be too slow for competitive gamers. In comparison, all tested devices range from 0.1 (minimum) to 240 (maximum) ms. » 53 % of all devices are better. This means that the measured response time is worse than the average of all tested devices (19.8 ms). | ||
| ↔ Response Time 50% Grey to 80% Grey | ||
| 32.4 ms ... rise ↗ and fall ↘ combined | ↗ 14.8 ms rise | 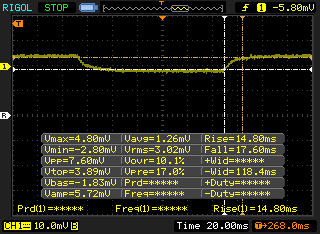 |
| ↘ 17.6 ms fall | ||
| The screen shows slow response rates in our tests and will be unsatisfactory for gamers. In comparison, all tested devices range from 0.165 (minimum) to 636 (maximum) ms. » 44 % of all devices are better. This means that the measured response time is similar to the average of all tested devices (30.9 ms). | ||
Screen Flickering / PWM (Pulse-Width Modulation)
| Screen flickering / PWM not detected | 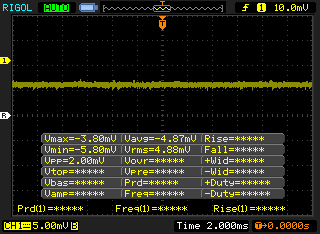 | ||
In comparison: 52 % of all tested devices do not use PWM to dim the display. If PWM was detected, an average of 7748 (minimum: 5 - maximum: 343500) Hz was measured. | |||
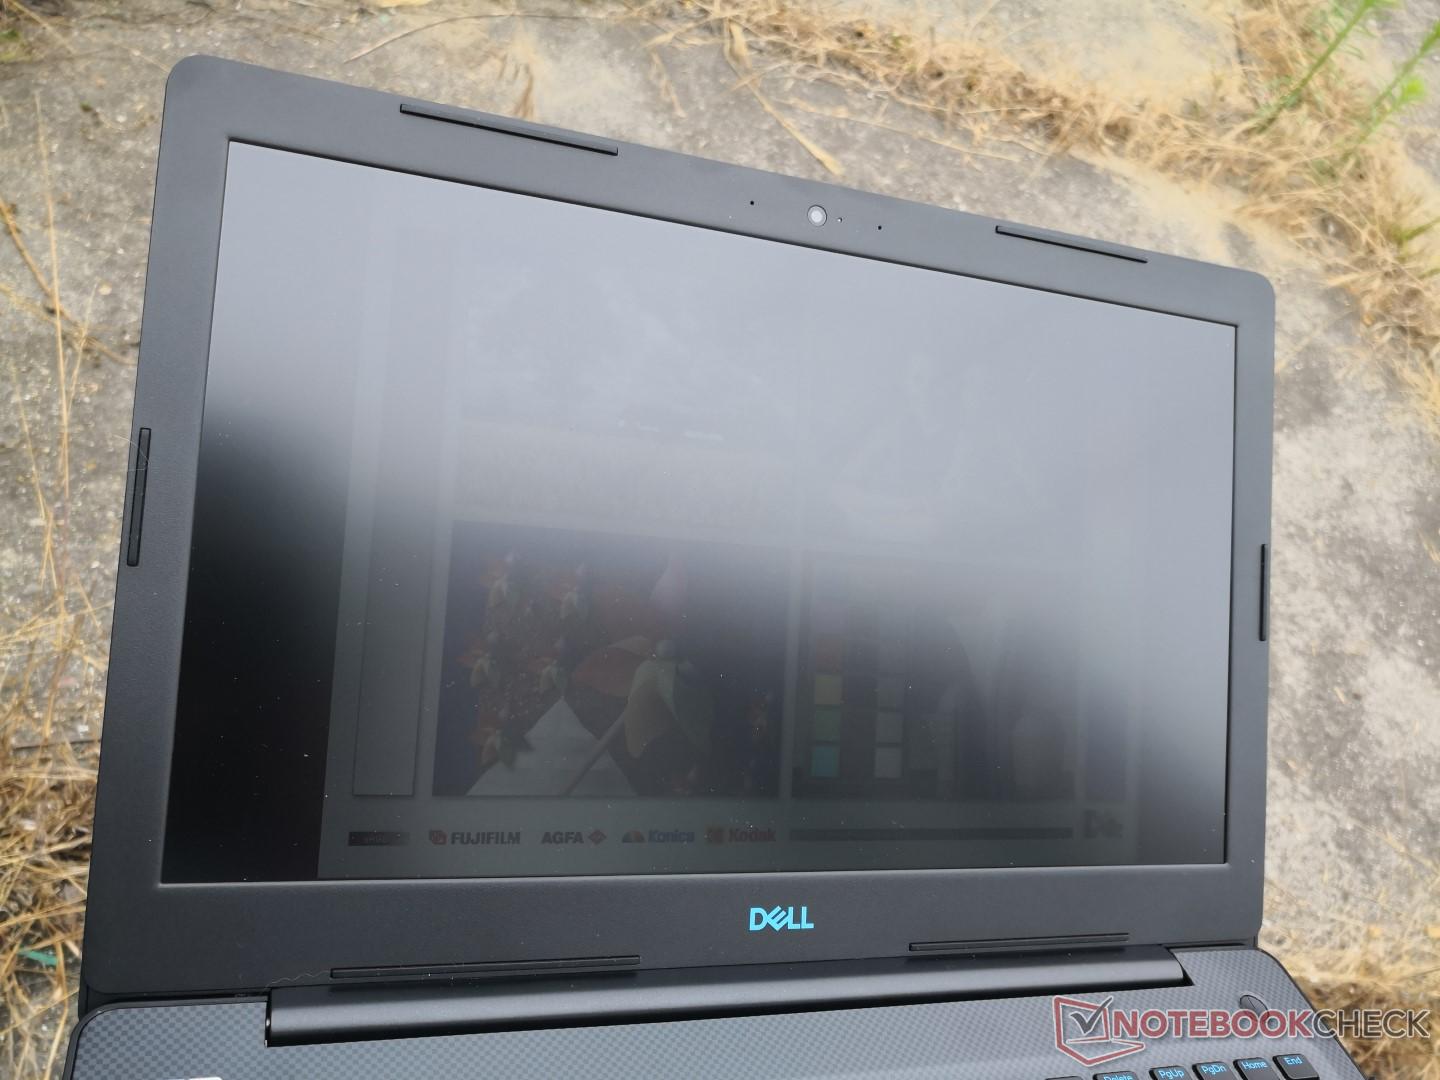
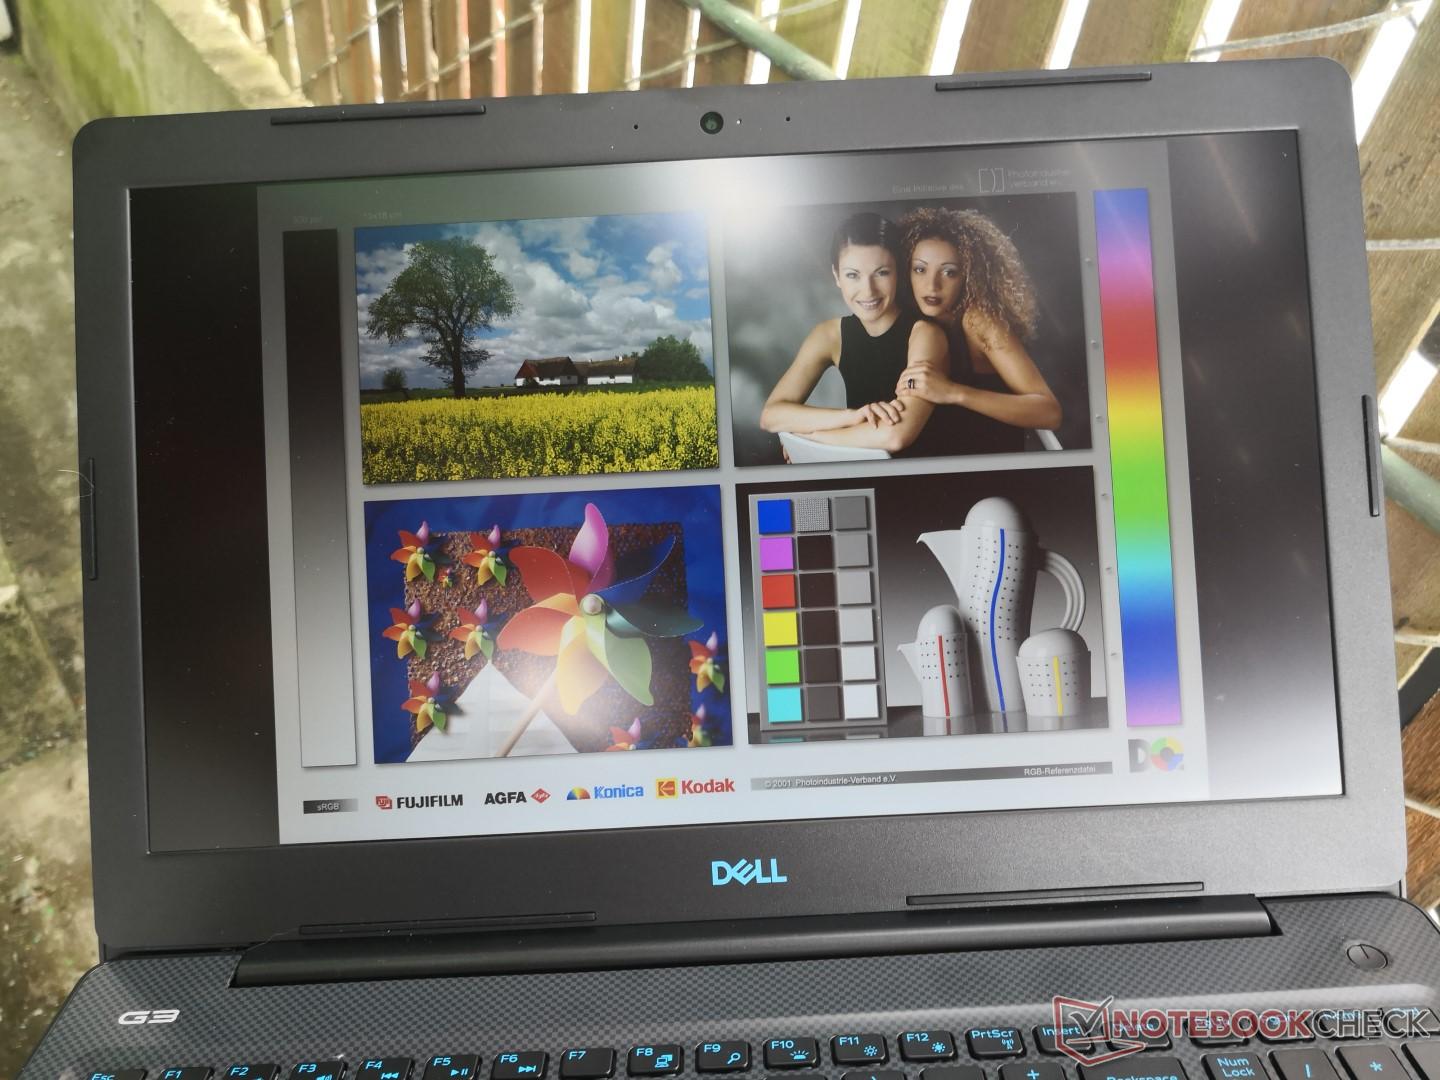
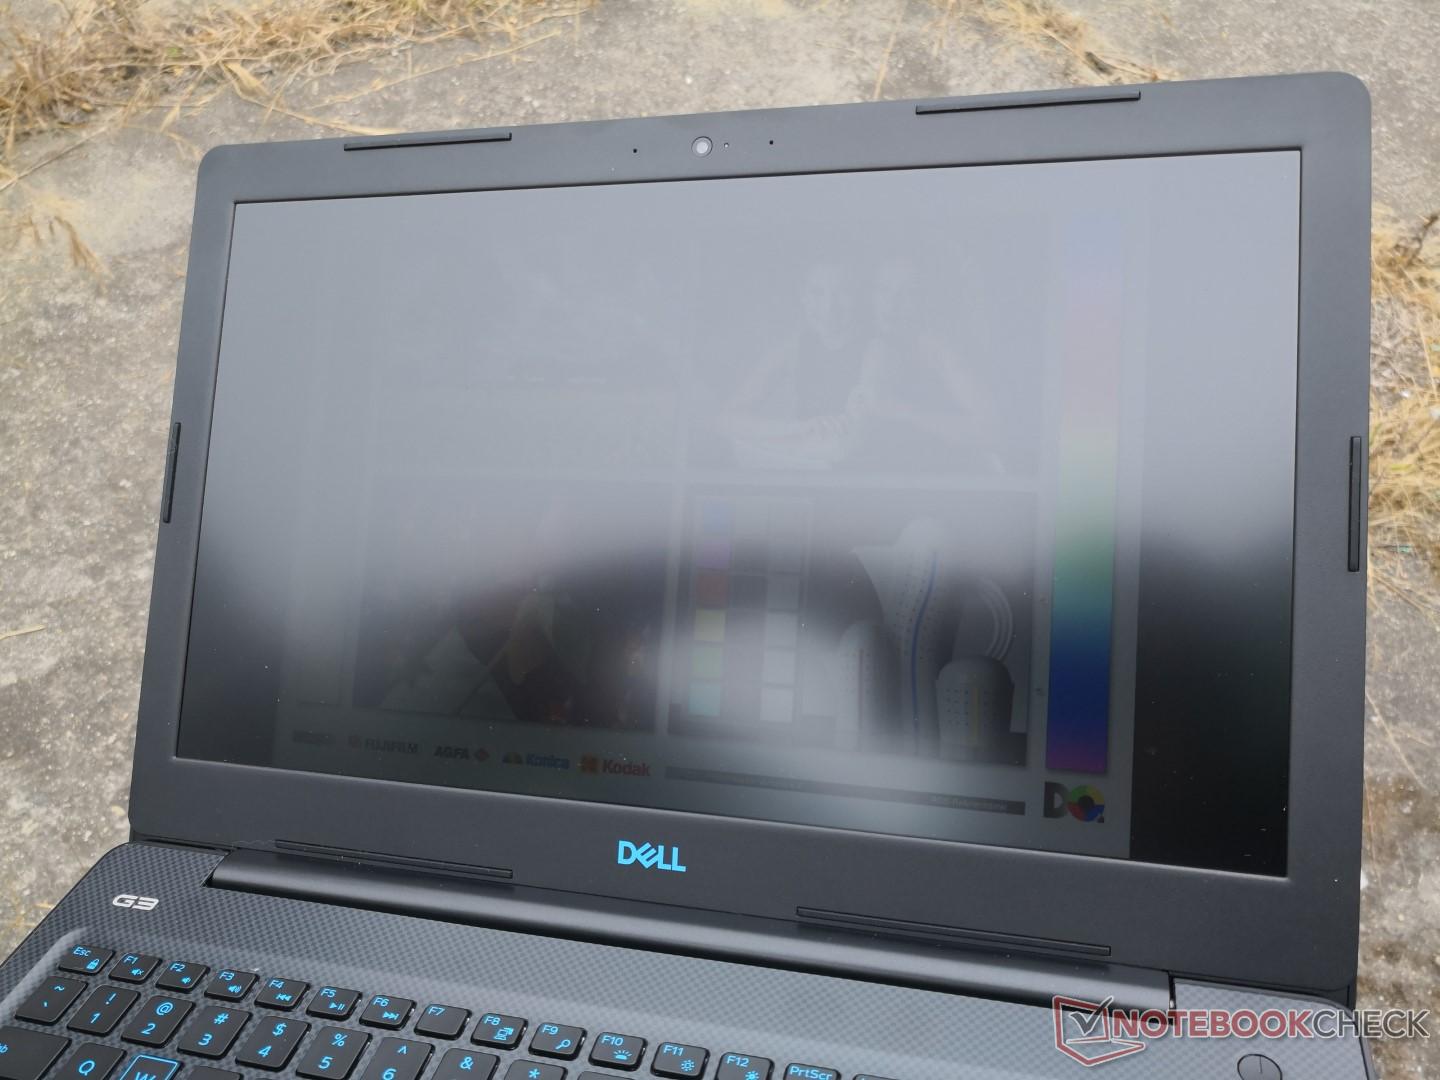
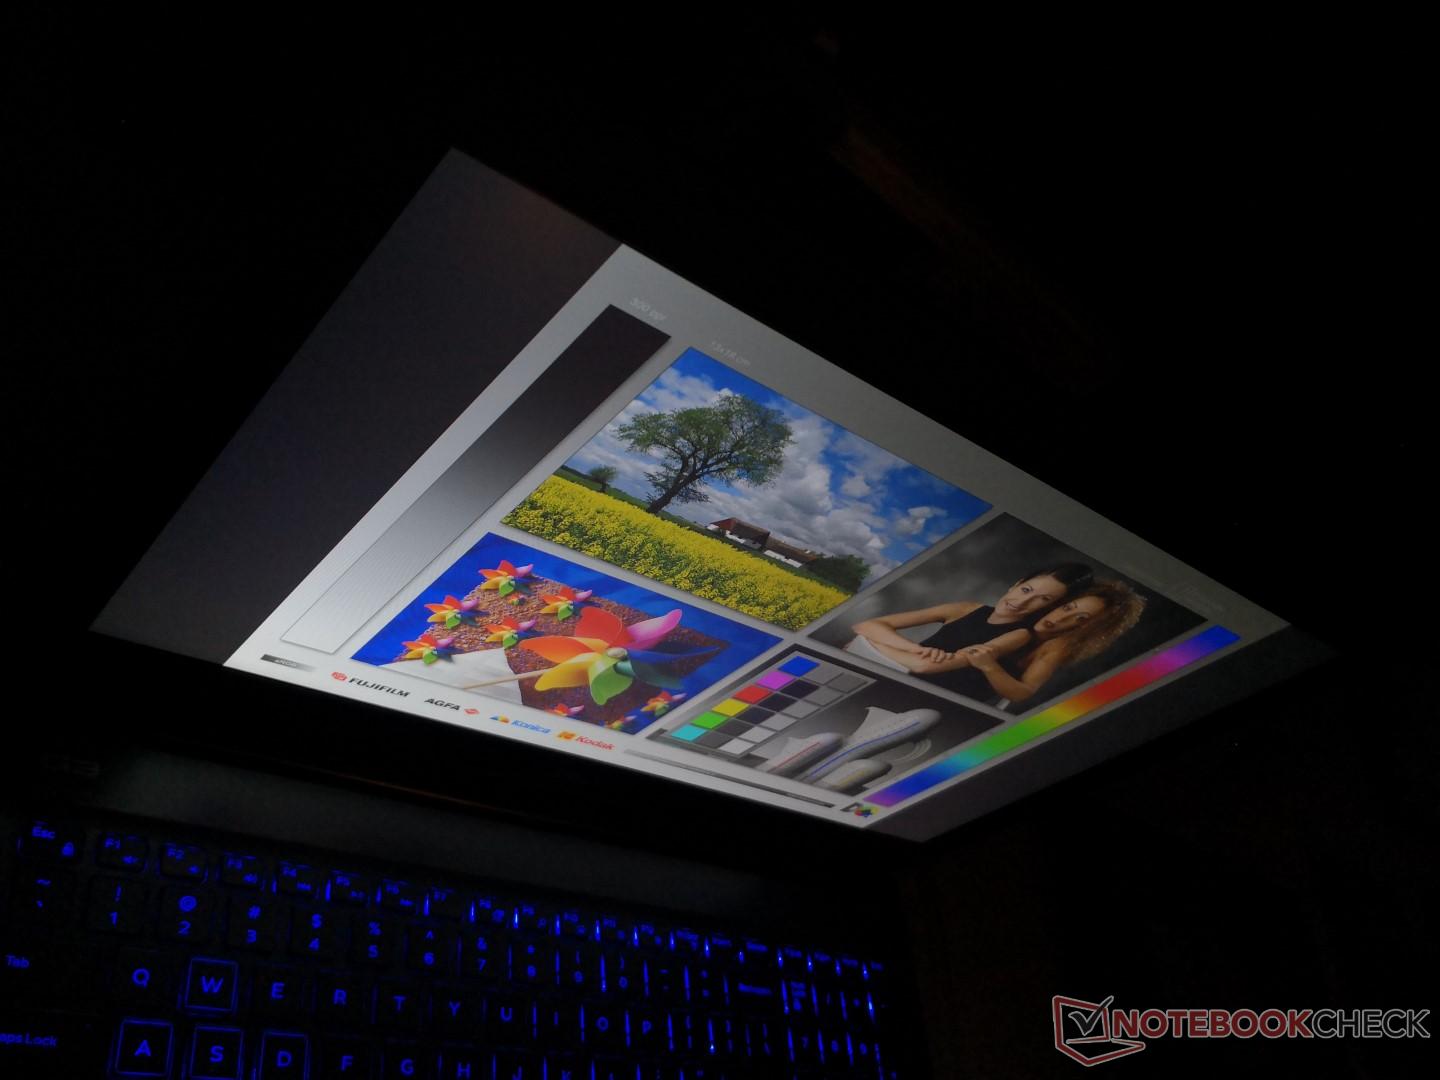
Outdoor visibility is poor due to the weak backlight. Glare is inevitable despite the matte overlay and onscreen content appears washed out as a result. Viewing angles are otherwise excellent with no major shifting in colors or contrast.

Performance
Core specifications are typical for an entry-level gaming laptop with CPU and GPU options ranging from the i5-8300H to the i7-8750H and GTX 1050 to the GTX 1060 Max-Q, respectively. The quad-core i5-8300H is a direct successor to the quad-core i5-7300HQ found on older budget gaming laptops. Users who want to go beyond the GTX 1060 Max-Q will have to look at Dell's higher-end Alienware series instead.
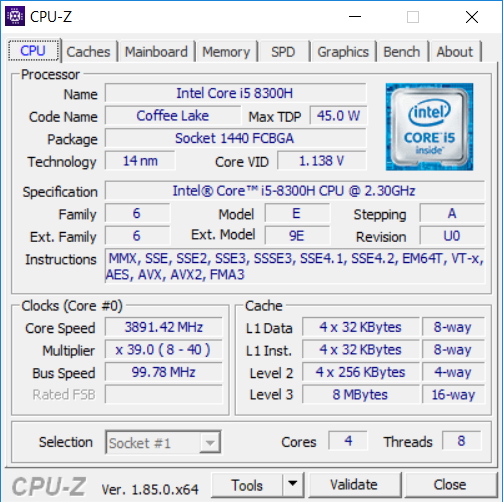
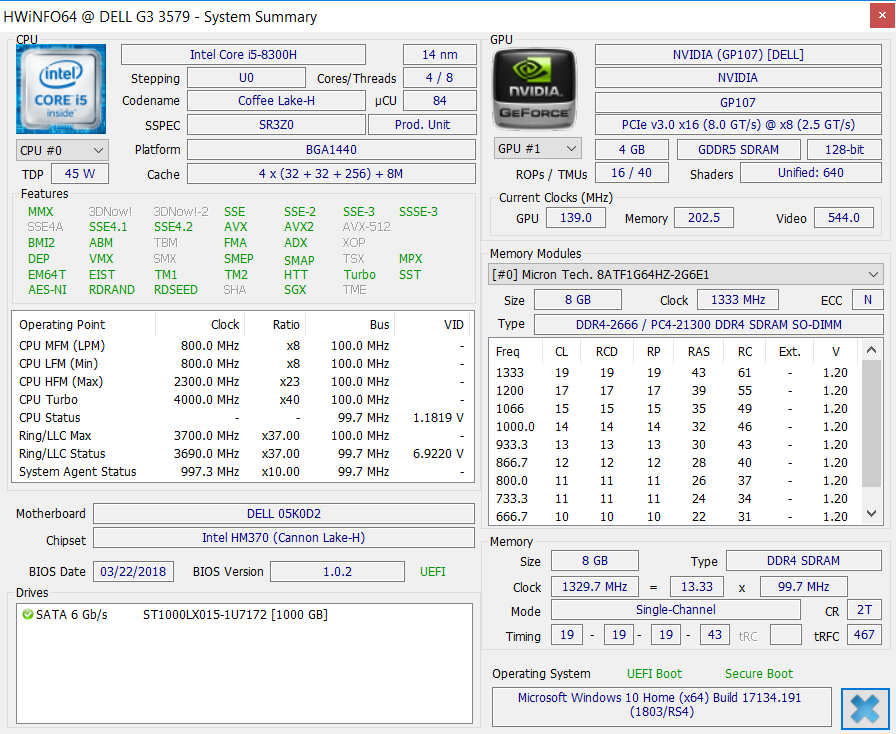
Processor
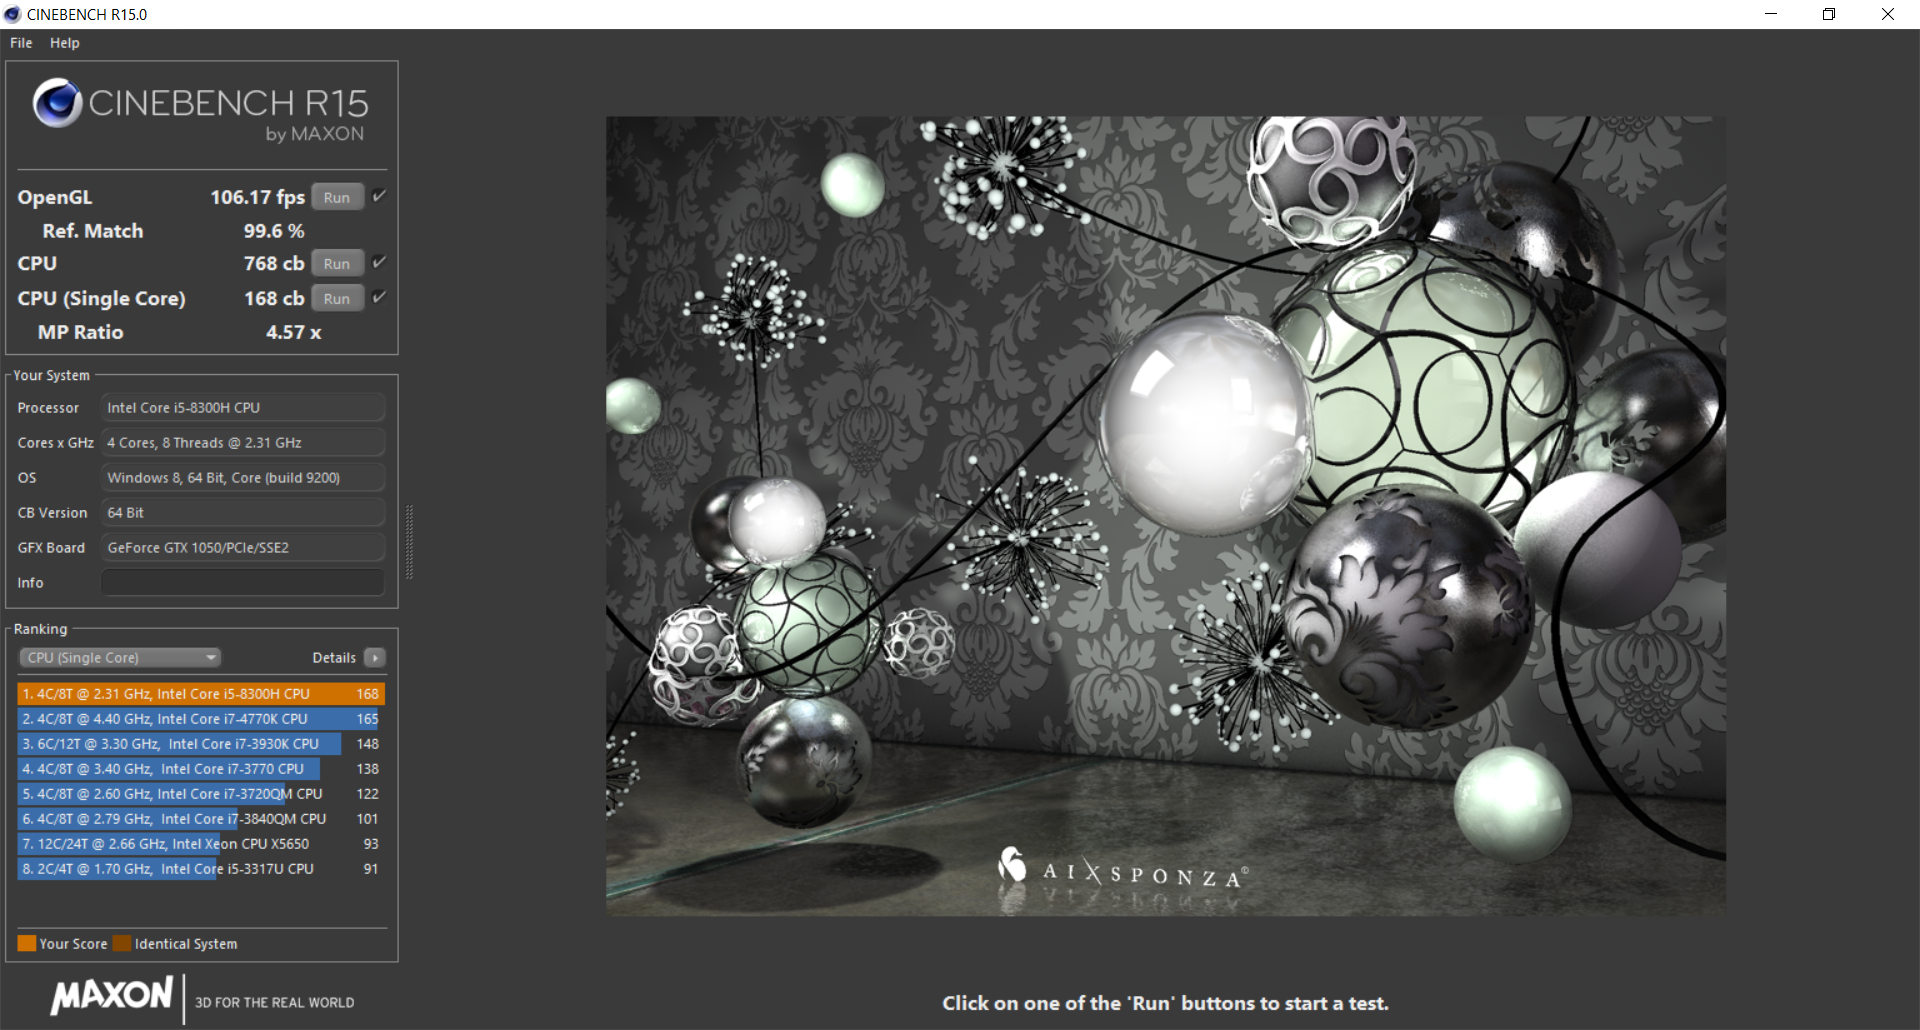
The Core i5-8300H in the Dell is performing where we expect it to be. Performance is on par with the last generation i7-7700HQ due to Hyper-Threading for 8 simultaneous threads versus just 4 on the i5-7300HQ. Jumping to the i7-8750H SKU will bring a 40 percent boost in CPU performance. For a budget gaming laptop, we find this higher-end Core i7 CPU to be a bit overkill.
Turbo Boost sustainability is good. Running CineBench R15 Multi-Thread in a loop results in a performance drop of just 3 percent over time.
See our dedicated page on the Core i5-8300H for more technical information and benchmarks.
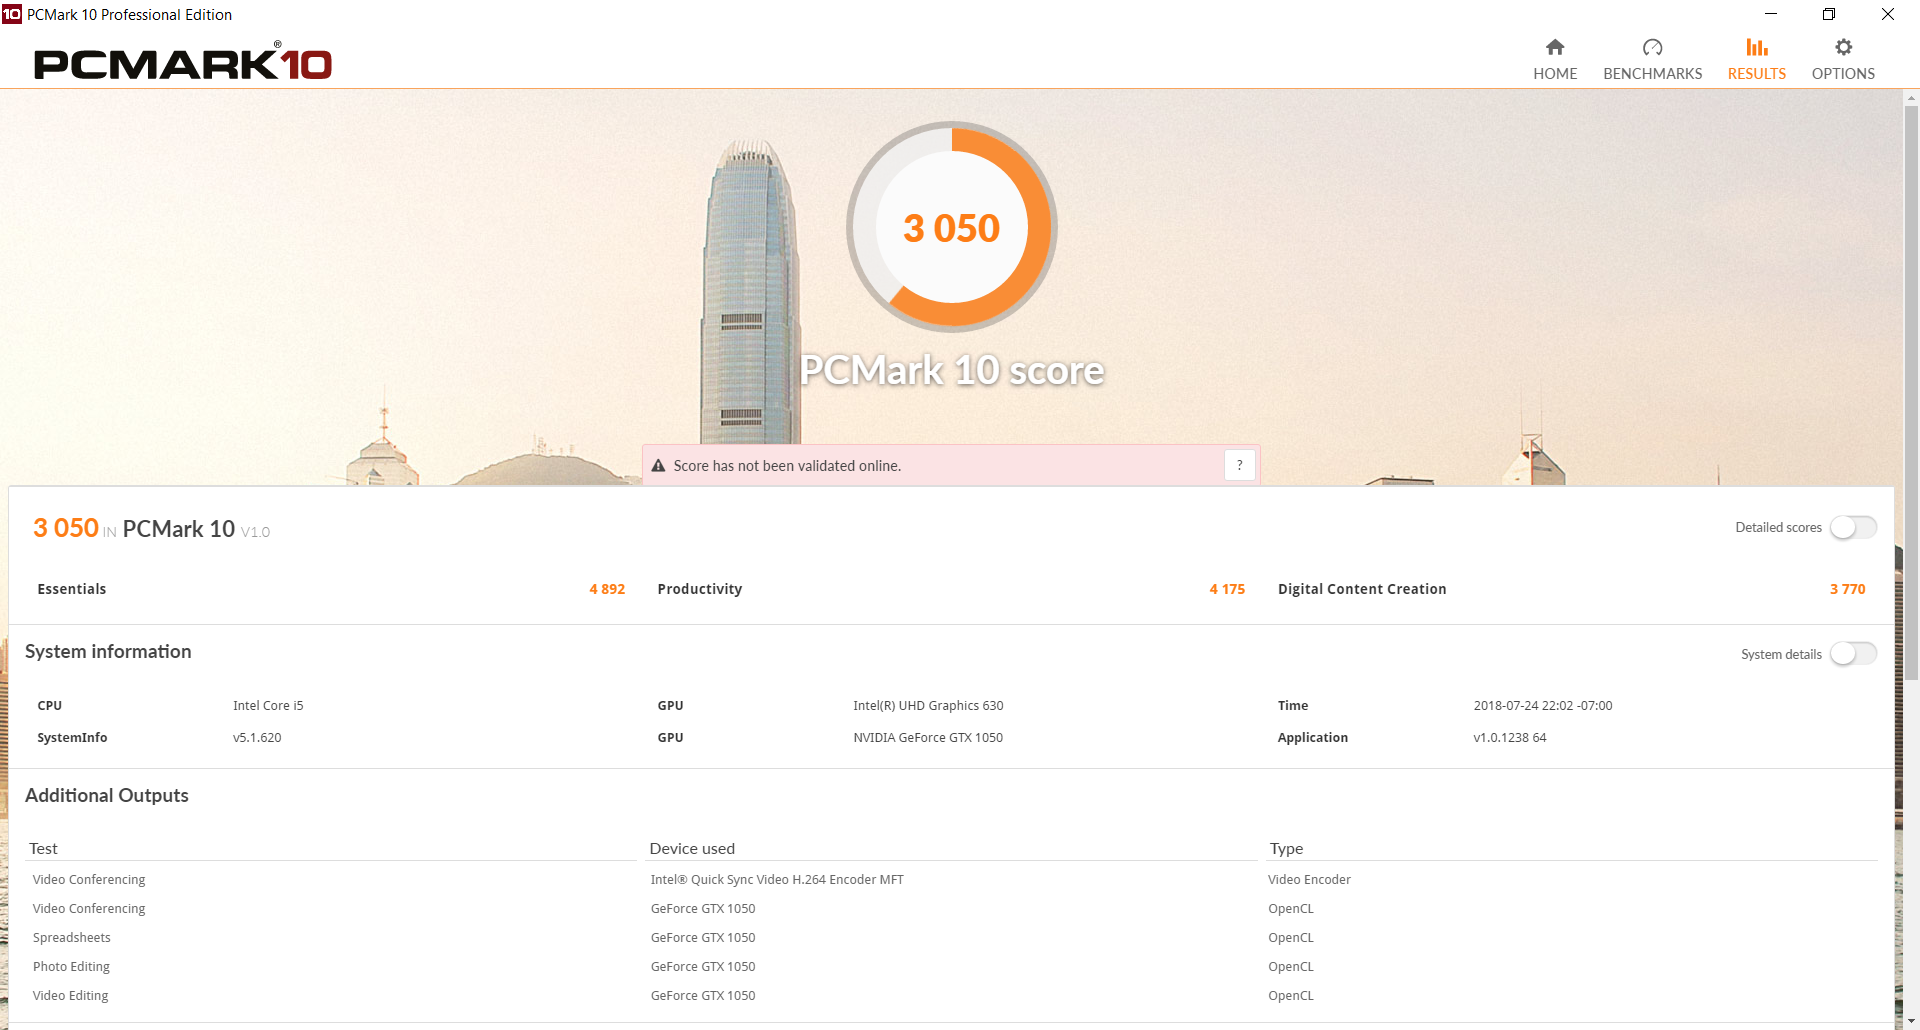
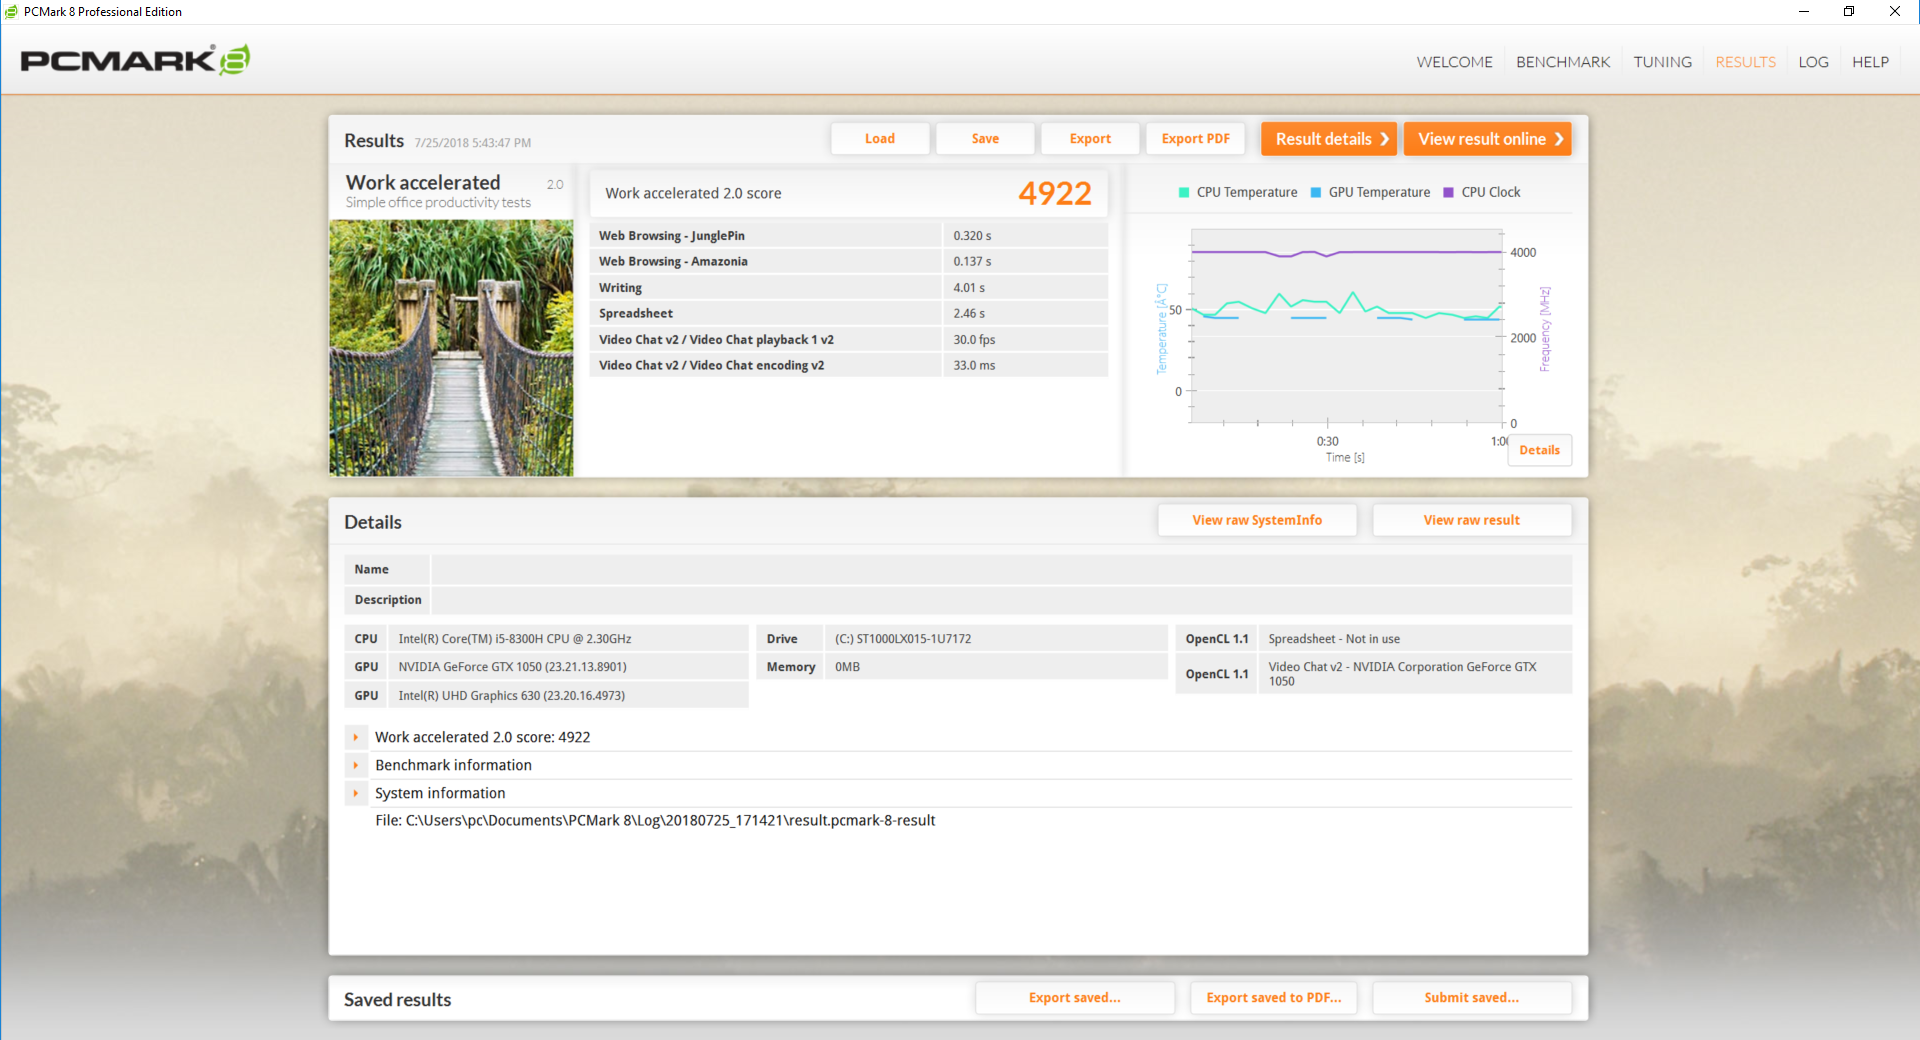
System Performance
PCMark 10 scores are about 20 percent slower than the MSI GL63 equipped with the same i5-8300H CPU and GTX 1050 GPU due to the very slow Seagate HDD in our Dell. Applications and windows open sluggishly and the HDD can be heard chugging along each time. We highly recommend avoiding the HDD configuration at all costs.
| PCMark 10 - Score | |
| Asus FX503VM-EH73 | |
| Lenovo Yoga 730-15IKB | |
| Dell Inspiron 15 7000 7577 4K | |
| MSI GL63 8RC-069US | |
| Average Intel Core i5-8300H, NVIDIA GeForce GTX 1050 Mobile (3050 - 4479, n=6) | |
| Dell G3 15 3579 | |
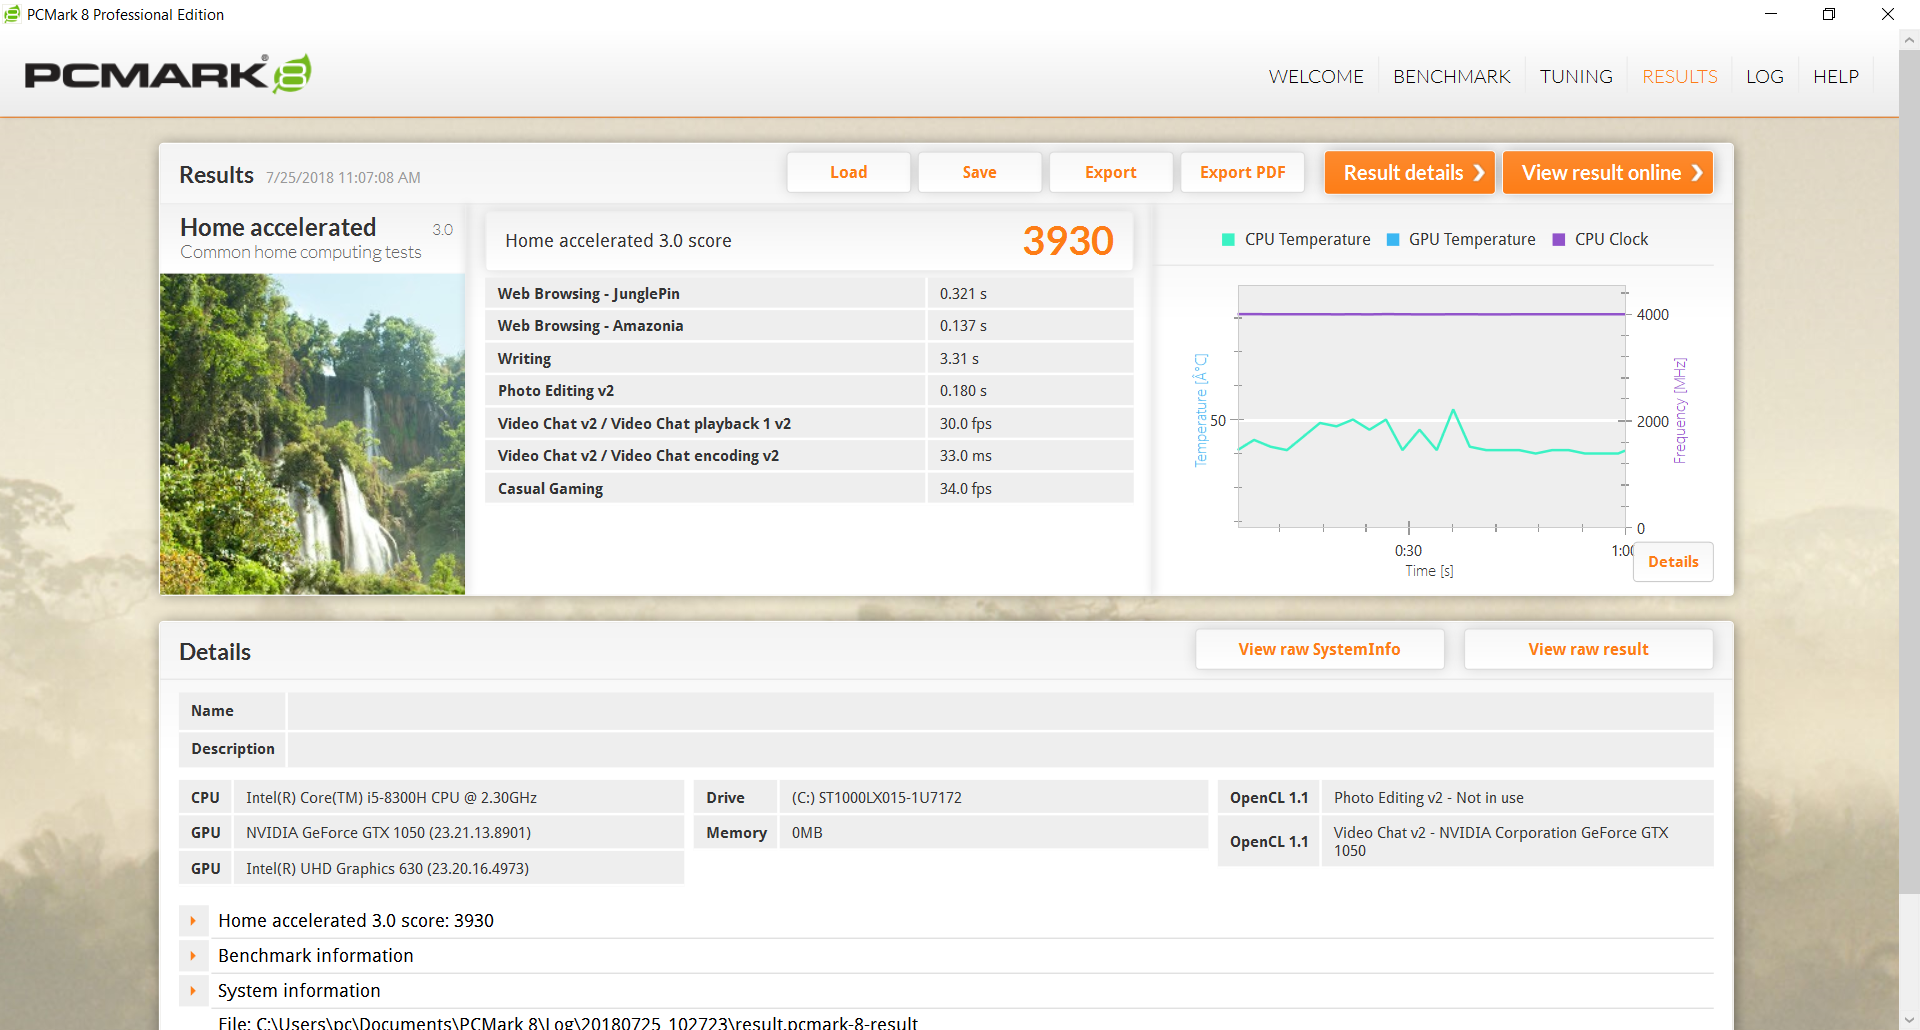
| PCMark 8 Home Score Accelerated v2 | 3930 points | |
| PCMark 8 Work Score Accelerated v2 | 4922 points | |
| PCMark 10 Score | 3050 points | |
Help | ||
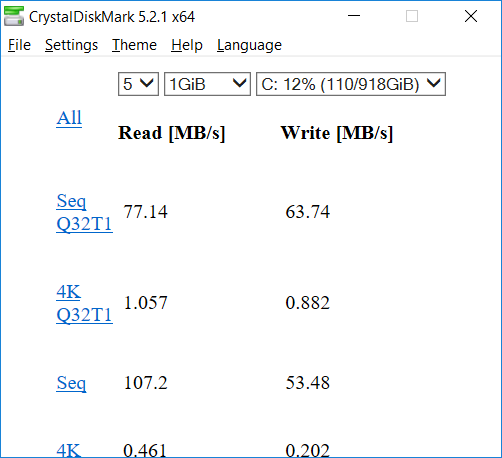
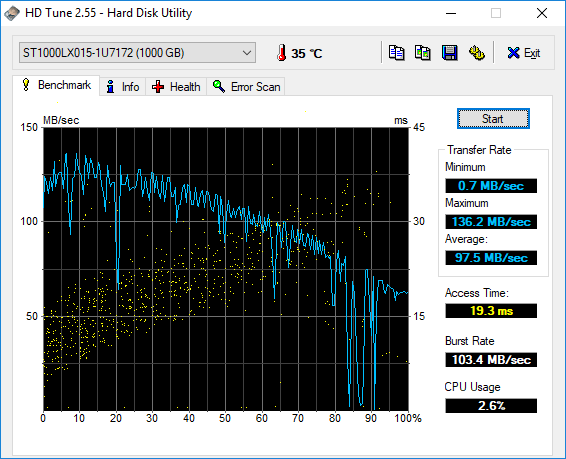
Storage Devices
Internal storage solutions include a 2.5-inch SATA III bay and a M.2 2280 slot compatible with NVMe drives. Our test unit comes with just a single 1 TB Seagate FireCuda ST1000LX015 HDD that can also be found on the Inspiron 15 7577. Unsurprisingly, HD Tune results are nearly identical between the two systems. Performance is unimpressive as even the slowest SATA III SSD will run laps around our Seagate HDD.
See our table of HDDs and SSDs for more benchmark comparisons.
| Dell G3 15 3579 Seagate Mobile HDD 1TB ST1000LX015-1U7172 | Asus VivoBook 15 F510UF-ES71 Seagate Mobile HDD 1TB ST1000LM035 | Asus FX504GD Seagate Mobile HDD 1TB ST1000LX015-1U7172 | Dell Latitude 7490 Toshiba KSG60ZMV256G | Dell Inspiron 15 7000 7577 Seagate Mobile HDD 1TB ST1000LX015-1U7172 | |
|---|---|---|---|---|---|
| CrystalDiskMark 5.2 / 6 | 117% | 18% | 10991% | 3% | |
| Write 4K (MB/s) | 0.202 | 1.283 535% | 0.27 34% | 79.4 39207% | 0.42 108% |
| Read 4K (MB/s) | 0.461 | 0.493 7% | 0.586 27% | 27.37 5837% | 0.41 -11% |
| Write Seq (MB/s) | 53.5 | 79.3 48% | 86.8 62% | 343.9 543% | 55.6 4% |
| Read Seq (MB/s) | 107.2 | 136.7 28% | 113.2 6% | 472.7 341% | 114.3 7% |
| Write 4K Q32T1 (MB/s) | 0.882 | 2.266 157% | 0.242 -73% | 206 23256% | 0.238 -73% |
| Read 4K Q32T1 (MB/s) | 1.057 | 1.068 1% | 0.963 -9% | 188.3 17715% | 0.942 -11% |
| Write Seq Q32T1 (MB/s) | 63.7 | 108.7 71% | 98.4 54% | 343.3 439% | 68.2 7% |
| Read Seq Q32T1 (MB/s) | 77.1 | 143.7 86% | 110.2 43% | 533 591% | 69.6 -10% |

GPU Performance
The GeForce GTX 1050 for laptops is only about 5 to 10 percent slower than the same GPU for desktops. Users can expect a rough 30 percent increase from the last generation GTX 960M commonly found on many older gaming notebooks. Opting for the costlier GTX 1050 Ti or GTX 1060 Max-Q configurations will boost graphics performance by 30 percent and 80 percent, respectively, over the GTX 1050.
Demanding titles like Witcher 3 are playable at native 1080p when most details are turned down to the low-medium range. See our GTX 1050 GPU page for more technical information and benchmark comparisons.
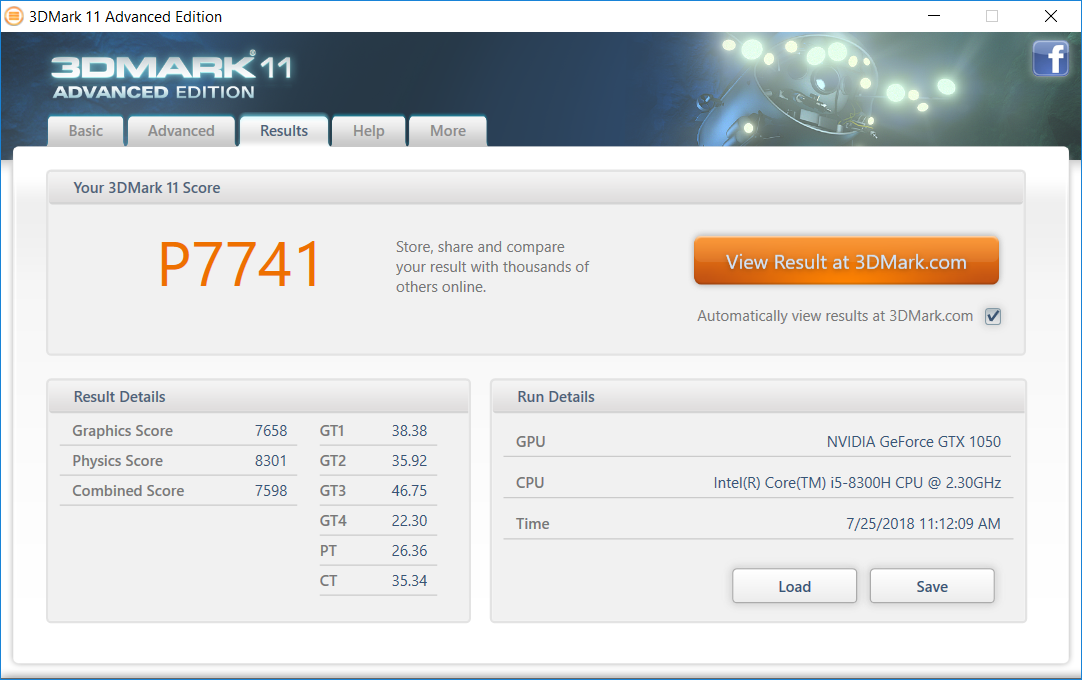
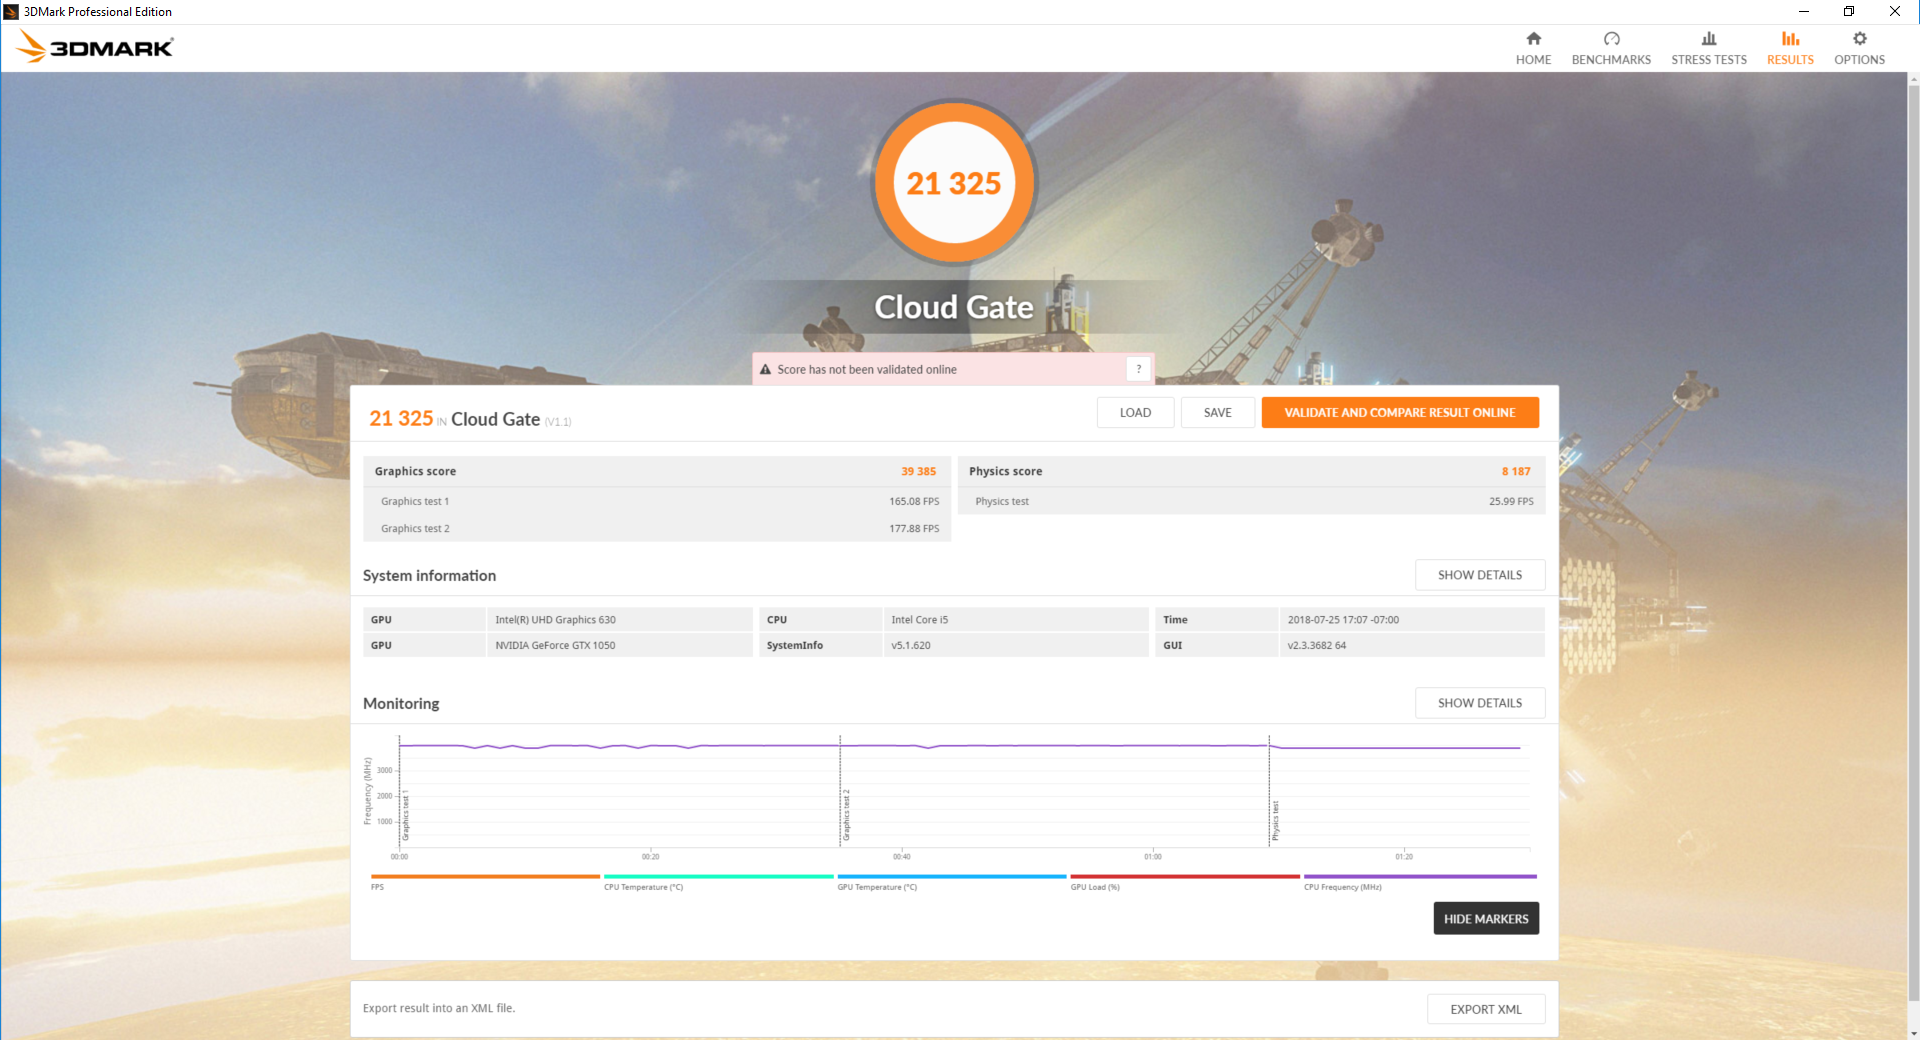
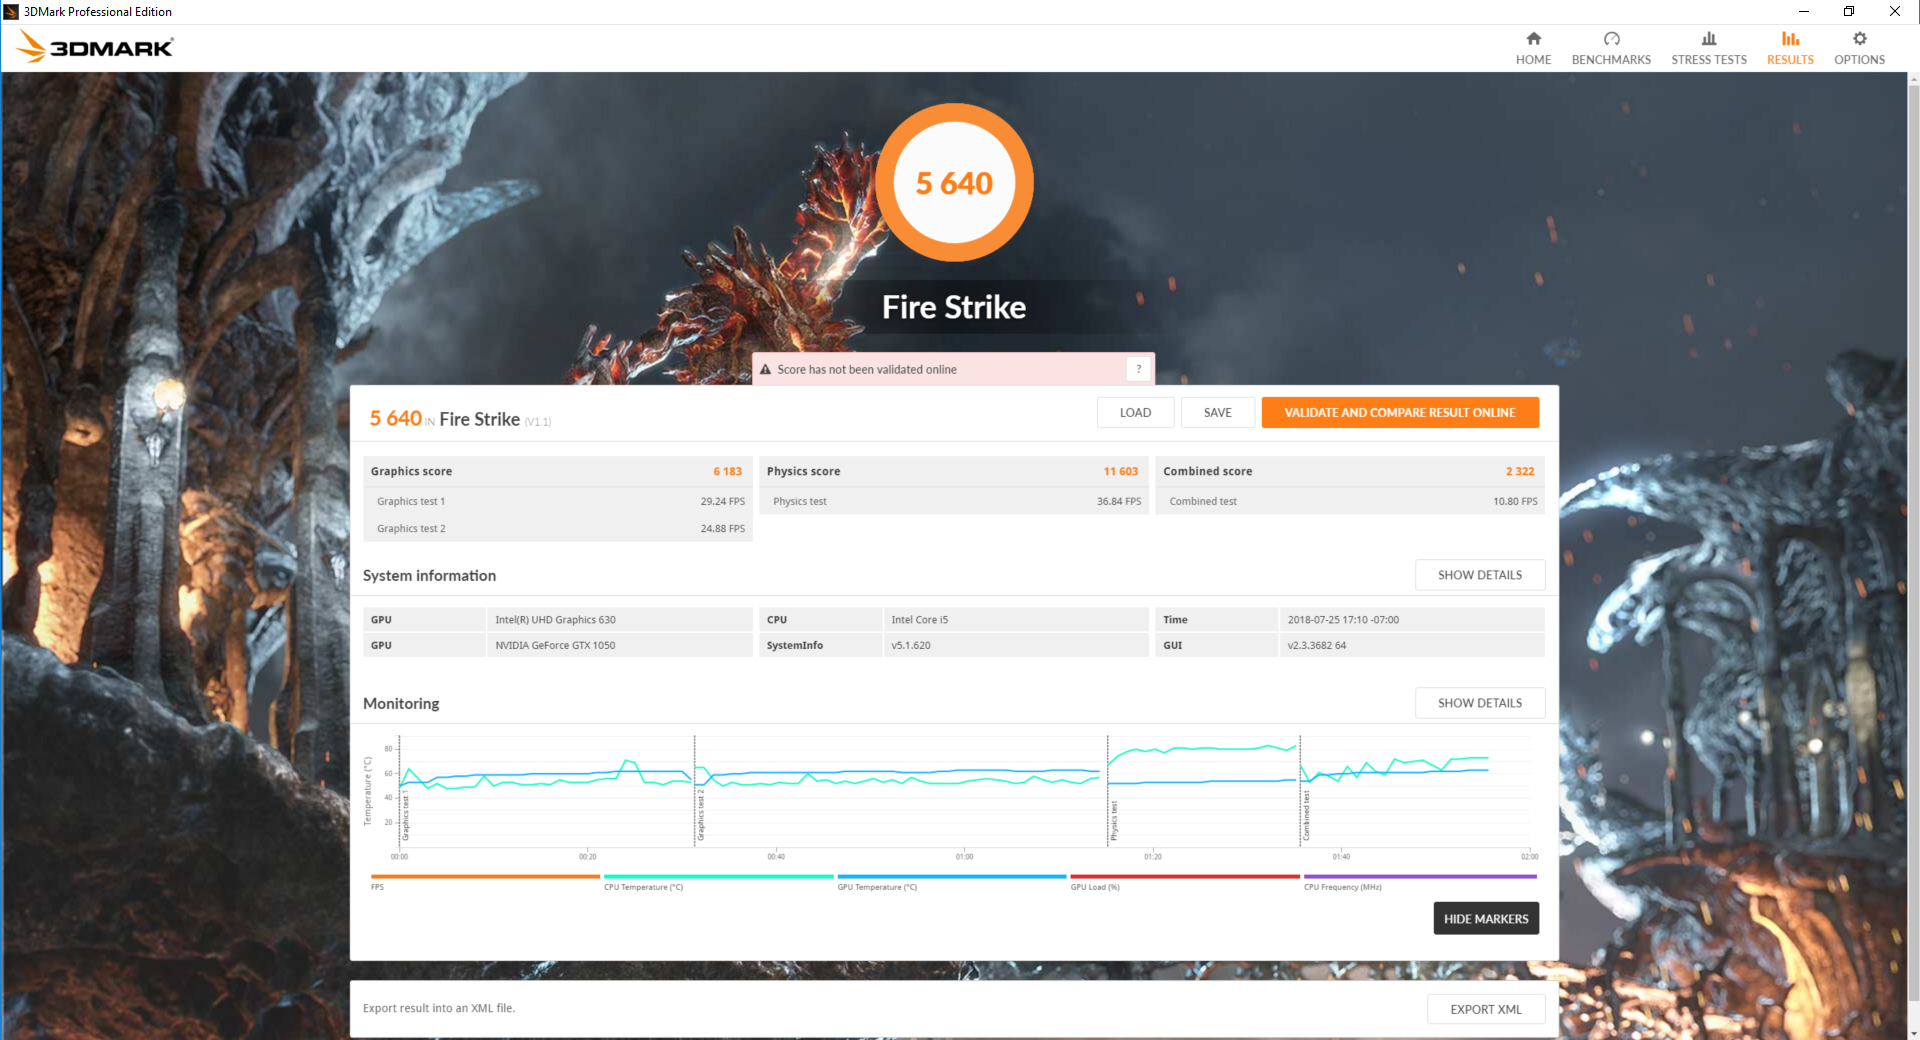
| 3DMark 11 Performance | 7741 points | |
| 3DMark Cloud Gate Standard Score | 21325 points | |
| 3DMark Fire Strike Score | 5640 points | |
Help | ||
| low | med. | high | ultra | |
|---|---|---|---|---|
| BioShock Infinite (2013) | 224 | 184 | 163 | 65.4 |
| The Witcher 3 (2015) | 113.9 | 68.9 | 39.4 | 22 |
| Rise of the Tomb Raider (2016) | 94.3 | 73.5 | 39.1 | 33 |
Stress Test
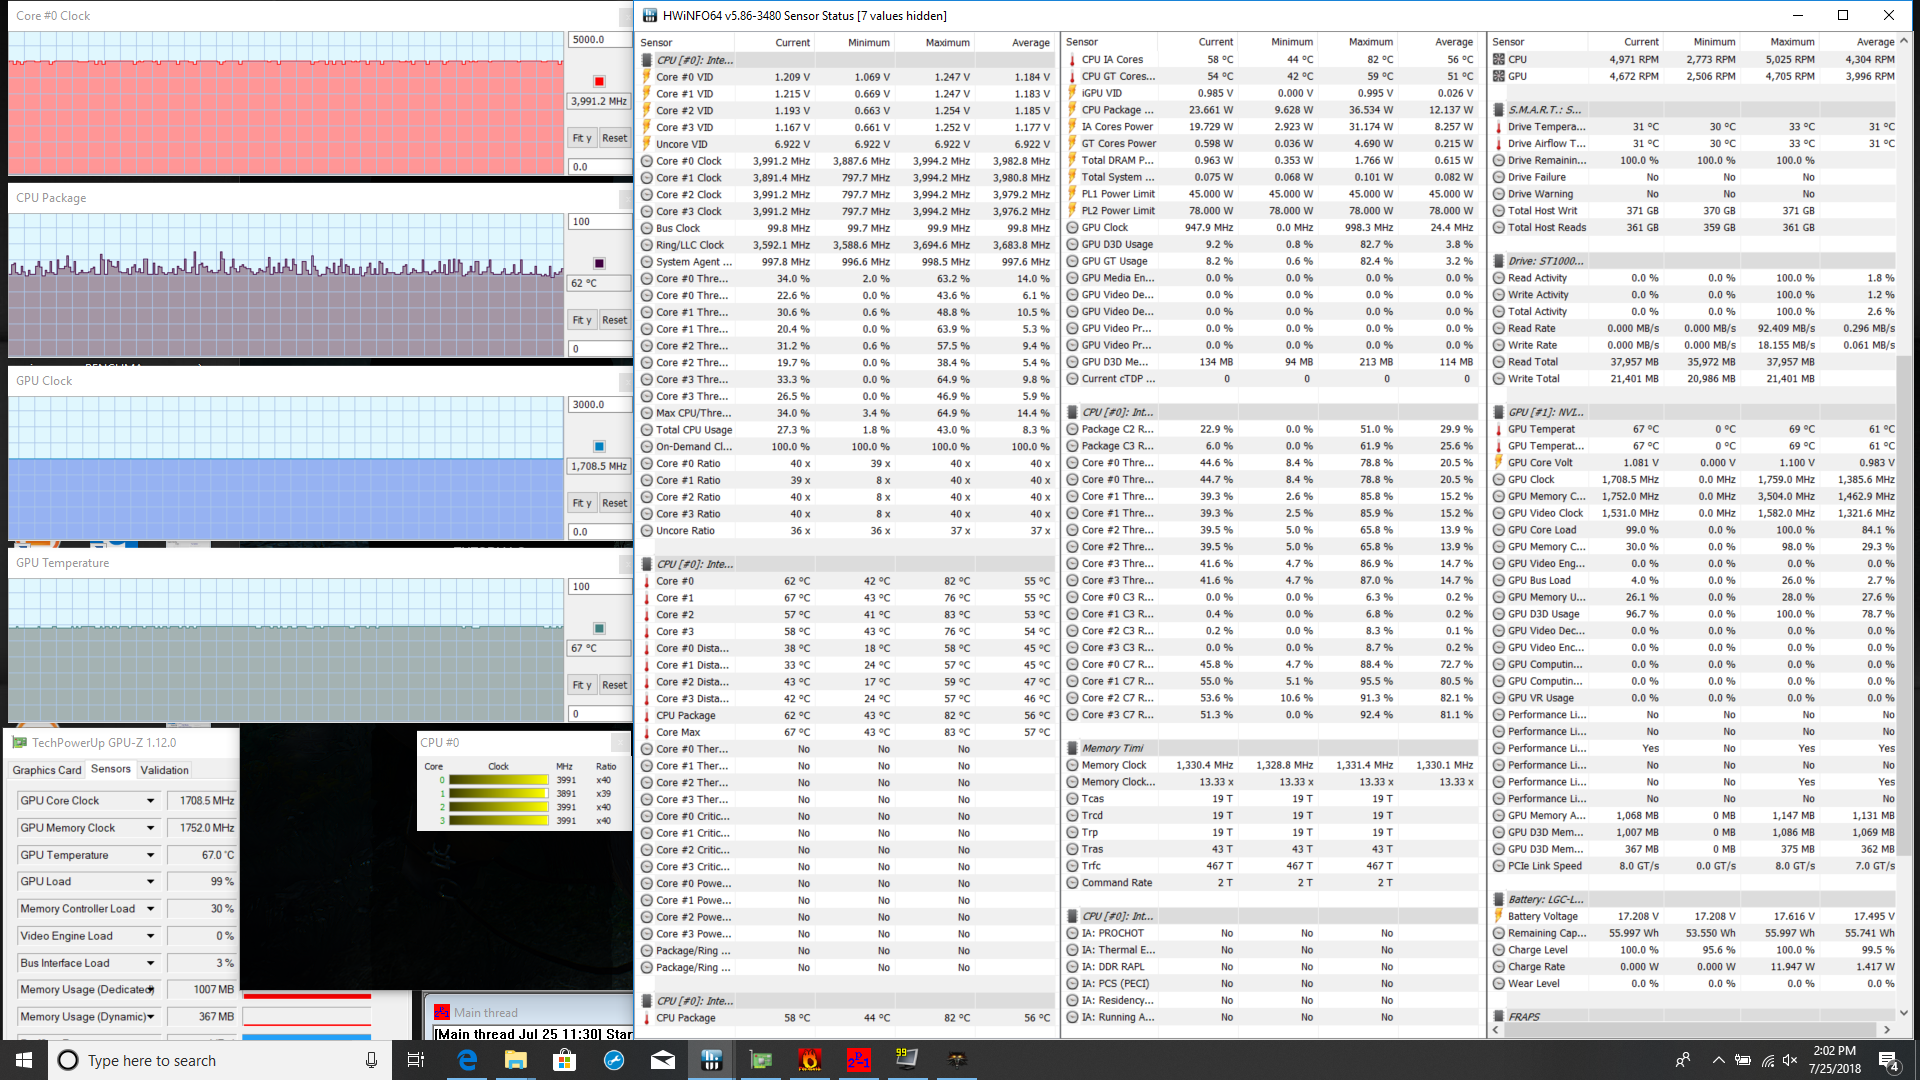
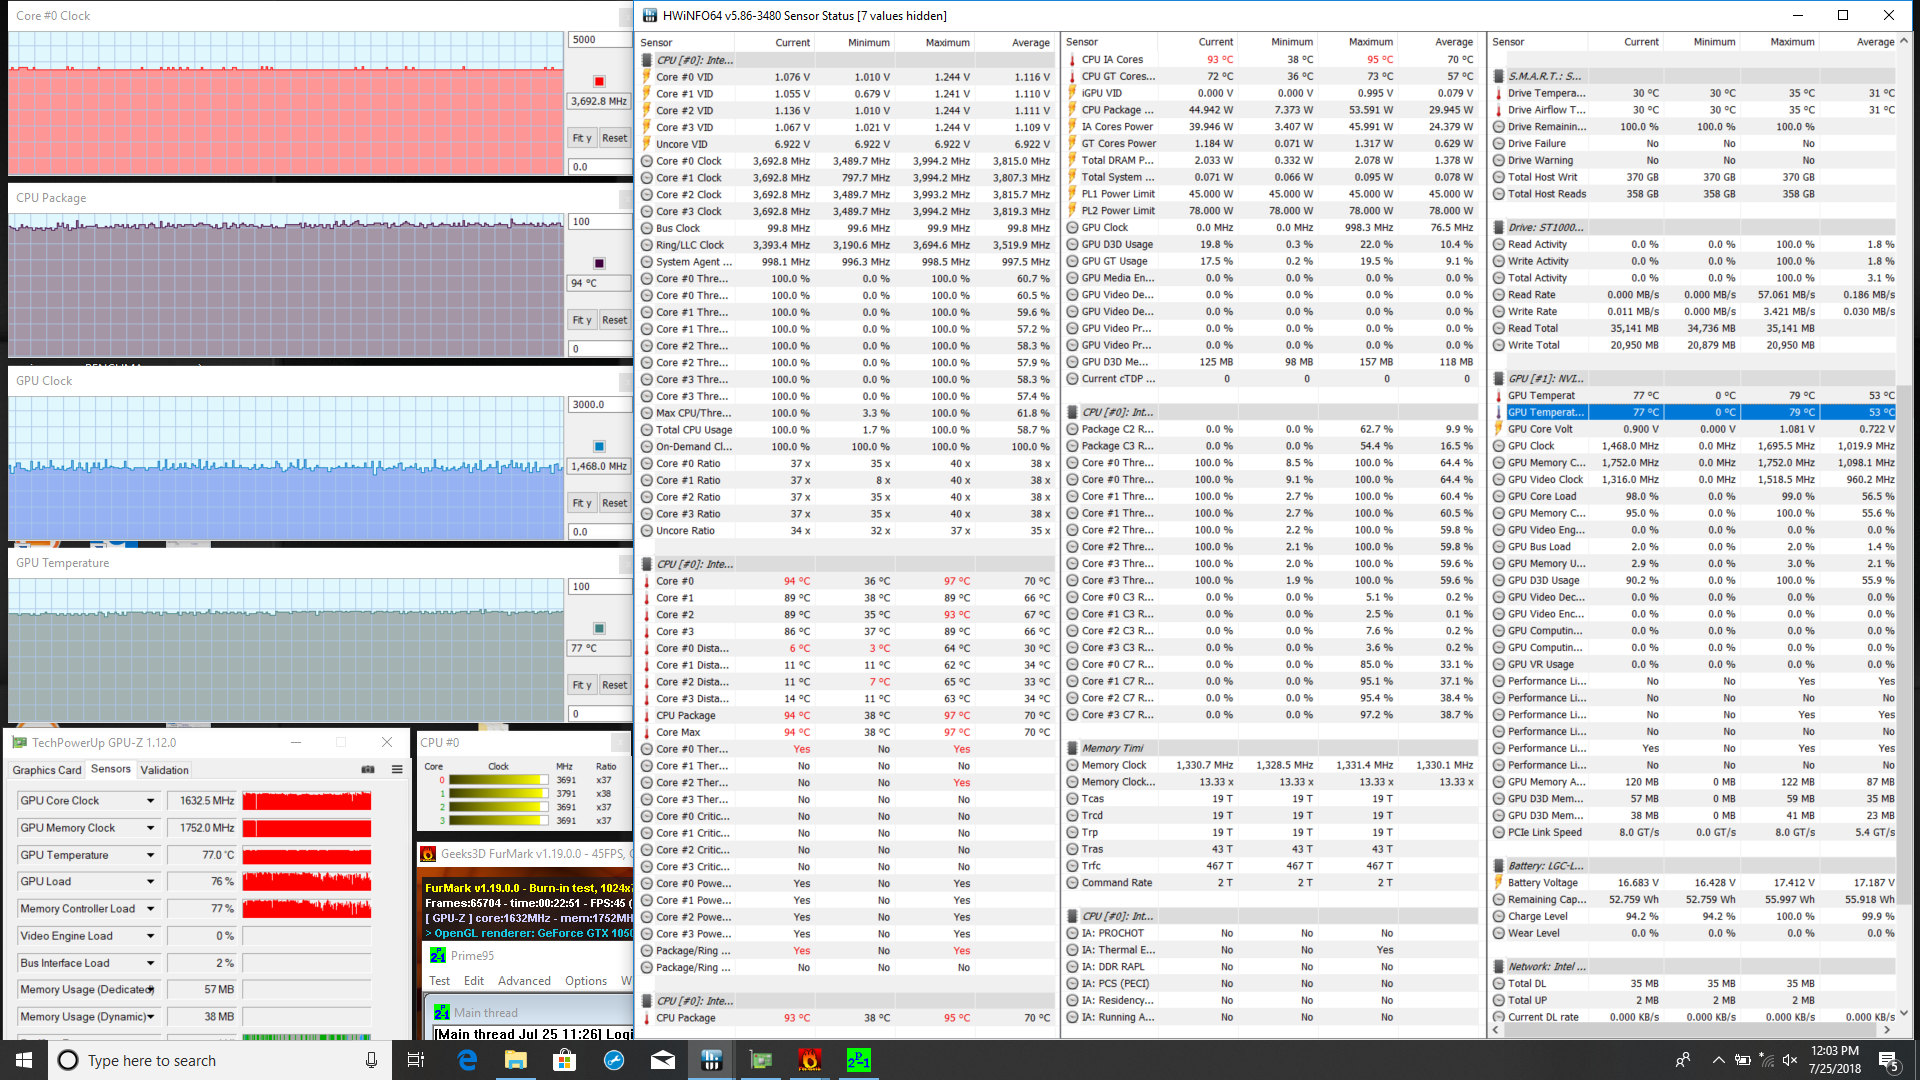
We stress the notebook with synthetic loads to test for potential throttling or stability issues. When subjected to Prime95 load, the CPU can be observed running at the maximum quad-core Turbo Boost clock rate of 3.9 GHz for the first few seconds before hitting 85 C. Once this temperature threshold is reached, clock rates drop to the 3.5 GHz to 3.7 GHz range in order to maintain a cooler core temperature of 75 C. Running both Prime95 and FurMark simultaneously will not throttle the CPU any further, but core temperature subsequently plateaus at a very high 94 C.
Running Witcher 3 is more representative of real-world gaming loads. When under such conditions, the CPU and GPU are both able to sustain Boost clock rates at reasonably cool core temperatures in the 60 C range each.
Running on batteries will limit CPU and GPU performance even when set to High Performance mode. A 3DMark 11 test run on batteries returns Physics and Graphics scores of just 5091 and 1751 points, respectively, compared to 8301 and 7658 points when on mains.
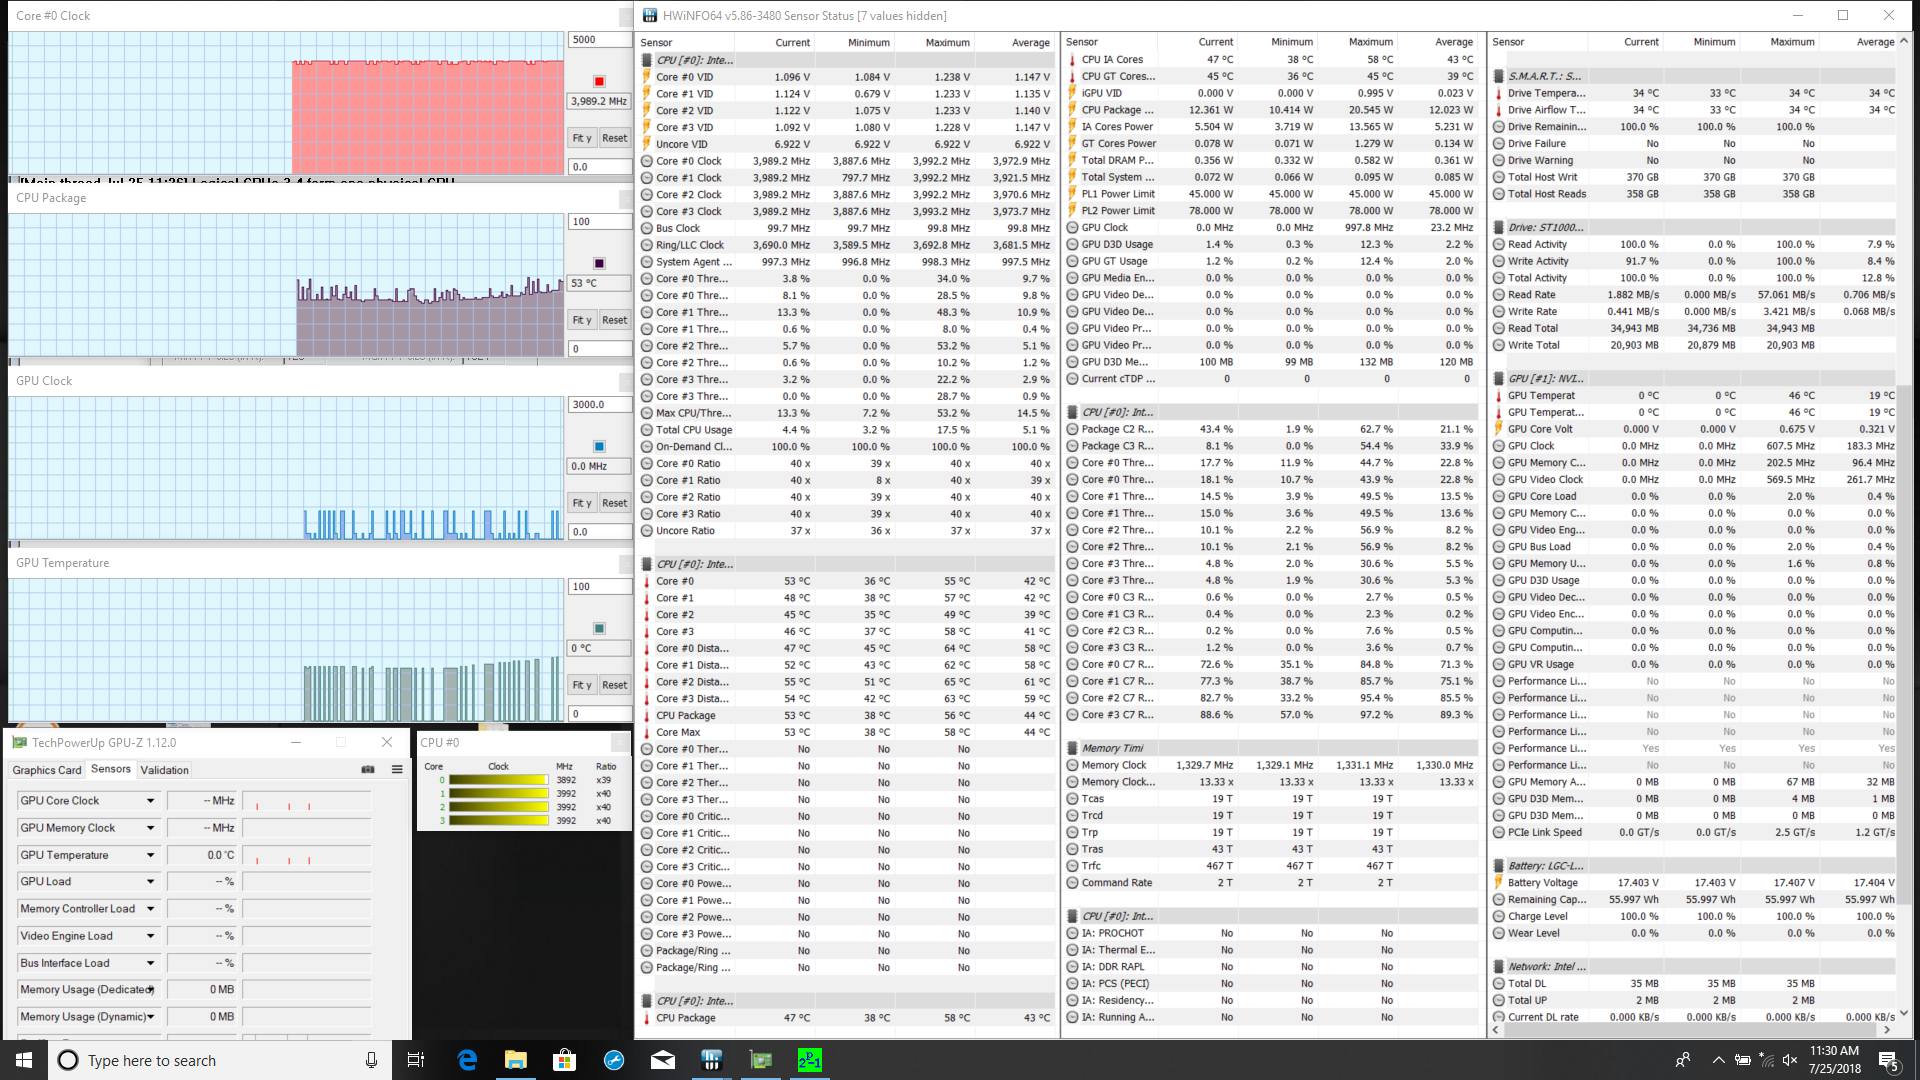
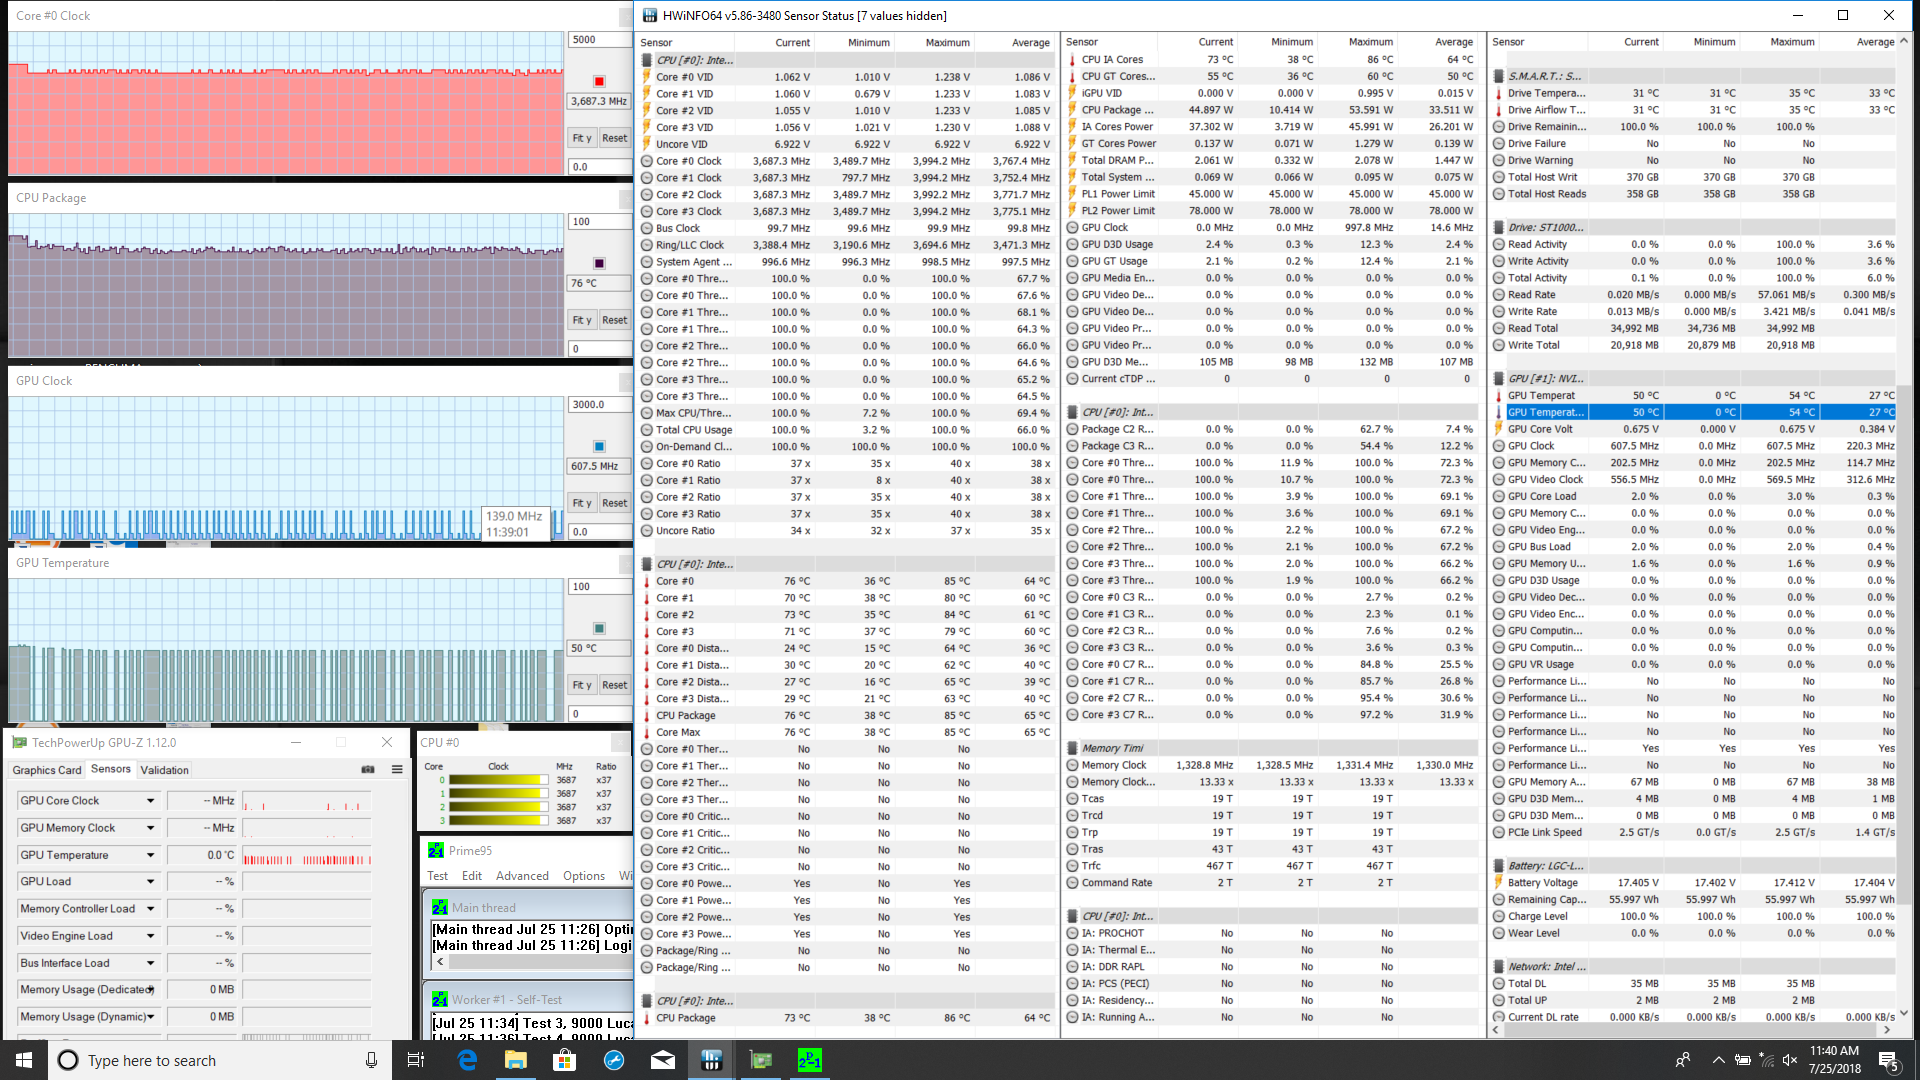
| CPU Clock (GHz) | GPU Clock (MHz) | Average CPU Temperature (°C) | Average GPU Temperature (°C) | |
| Prime95 Stress | 3.7 | -- | 76 | -- |
| FurMark Stress | -- | 1557 | -- | 54 |
| Prime95 + FurMark Stress | 3.7 | ~1468 | 94 | 77 |
| Witcher 3 Stress | 4.0 | 1709 | ~62 | 67 |
Emissions
System Noise
The cooling solution consists of dual fans and dual heat pipes not unlike on the G3 17. The system is silent when completely idle, but any sort of light activity like streaming or browsing will initiate the fans. Luckily, the fans are very quiet and almost unnoticeable during these low loads.
Higher loads like gaming will cause a steady fan noise of 47 dB(A) which is loud even for a gaming notebook. The MSI GL63, for example, tops out at 41 dB(A) when subjected to similar conditions. Even the older and more powerful Inspiron 15 7577 manages to run quieter than our G3 15 when gaming.
Based on our relatively cool core temperatures from above, the G3 15 can afford to run slightly warmer for quieter fan noise. Fan speed settings, however, are unavailable on this budget system.
Noise level
| Idle |
| 29.8 / 29.8 / 30 dB(A) |
| Load |
| 38.6 / 49.4 dB(A) |
 | ||
30 dB silent 40 dB(A) audible 50 dB(A) loud |
||
min: | ||
| Dell G3 15 3579 GeForce GTX 1050 Mobile, i5-8300H, Seagate Mobile HDD 1TB ST1000LX015-1U7172 | MSI GL63 8RC-069US GeForce GTX 1050 Mobile, i5-8300H, Toshiba HG6 THNSNJ256G8NY | Lenovo Yoga 730-15IKB GeForce GTX 1050 Mobile, i5-8550U, SK Hynix PC401 512GB M.2 (HFS512GD9TNG) | Dell Inspiron 15 7000 7577 4K GeForce GTX 1060 Max-Q, i7-7700HQ, SK hynix SC311 M.2 | Alienware 13 R3 (i5-7300HQ, GTX 1050 Ti) GeForce GTX 1050 Ti Mobile, i5-7300HQ, Samsung PM961 MZVLW256HEHP | |
|---|---|---|---|---|---|
| Noise | -2% | 2% | 3% | 4% | |
| off / environment * (dB) | 28 | 28.6 -2% | 30.5 -9% | 28.5 -2% | 29.7 -6% |
| Idle Minimum * (dB) | 29.8 | 28.6 4% | 30.5 -2% | 28.8 3% | 29.7 -0% |
| Idle Average * (dB) | 29.8 | 31.6 -6% | 30.5 -2% | 29.2 2% | 29.7 -0% |
| Idle Maximum * (dB) | 30 | 31.6 -5% | 30.5 -2% | 29.2 3% | 29.7 1% |
| Load Average * (dB) | 38.6 | 38.6 -0% | 37.5 3% | 34.6 10% | 32.7 15% |
| Witcher 3 ultra * (dB) | 46.9 | 40.6 13% | 44.1 6% | 36.4 22% | |
| Load Maximum * (dB) | 49.4 | 56.8 -15% | 37.5 24% | 49.3 -0% | 50 -1% |
* ... smaller is better
Temperature
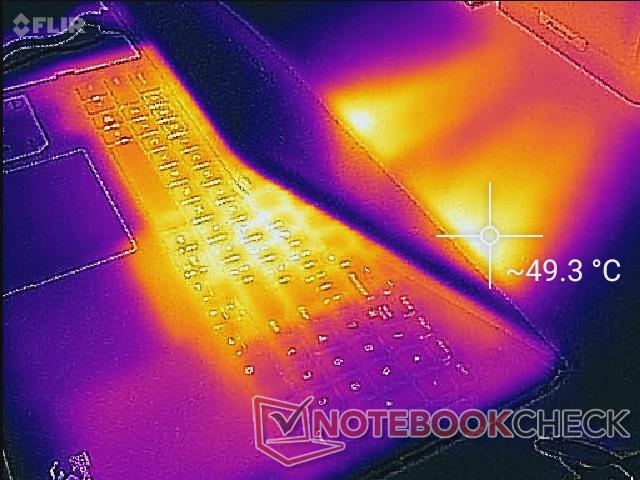
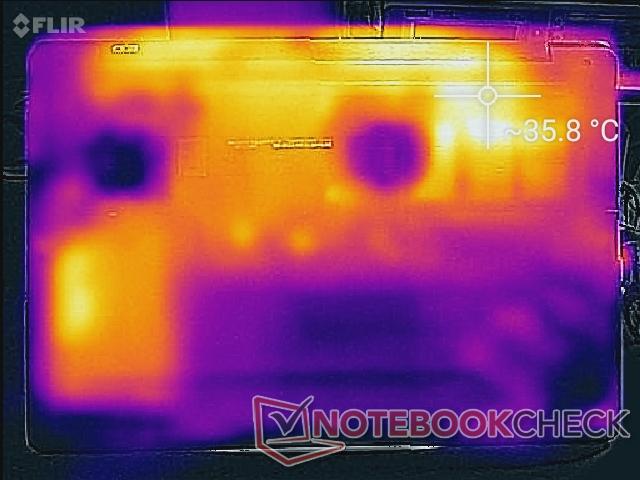
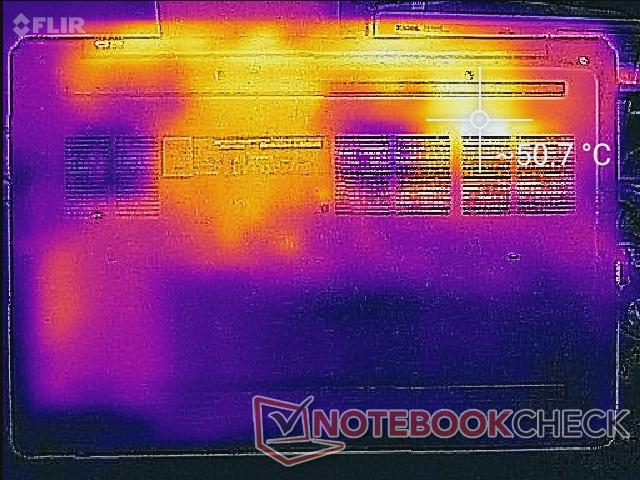
Surface temperatures when idling are warmest towards the center of the keyboard and on the right palm rest where the HDD lies underneath. Certain spots can become as warm as 40 C or 50 C when gaming as shown by our temperature maps below. The WASD keys, palm rests, and NumPad areas remain relatively cool for a comfortable gaming experience. Gaming is still not recommended without a flat desk because of the ventilation grilles and very warm temperatures along the bottom panel.
Hot spots on the G3 15 are definitely warmer than on the Inspiron 15 7577 when subjected to similar extreme loads even though our Inspiron configuration is significantly more powerful.
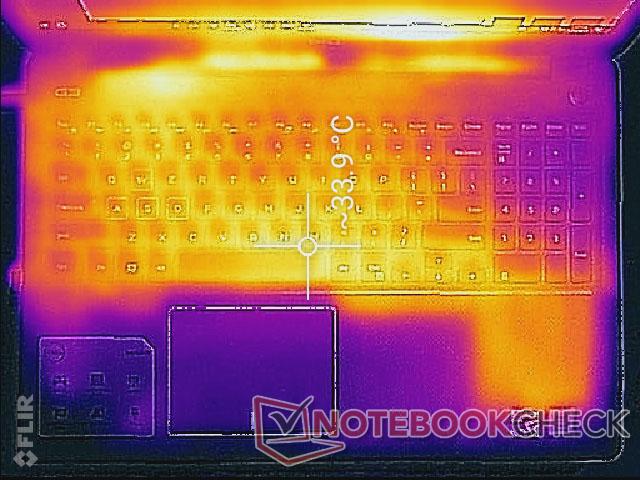
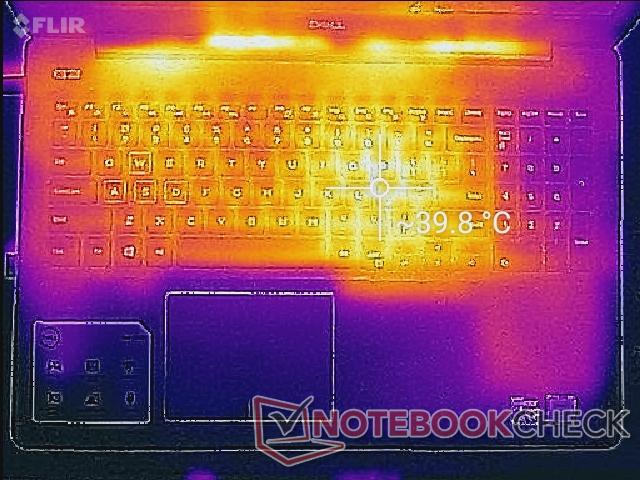
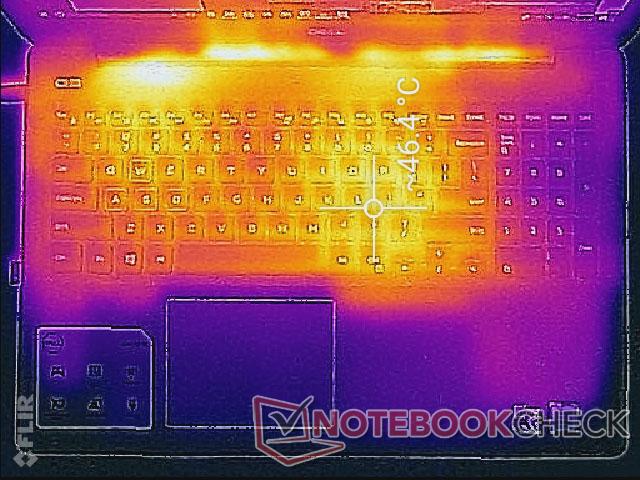
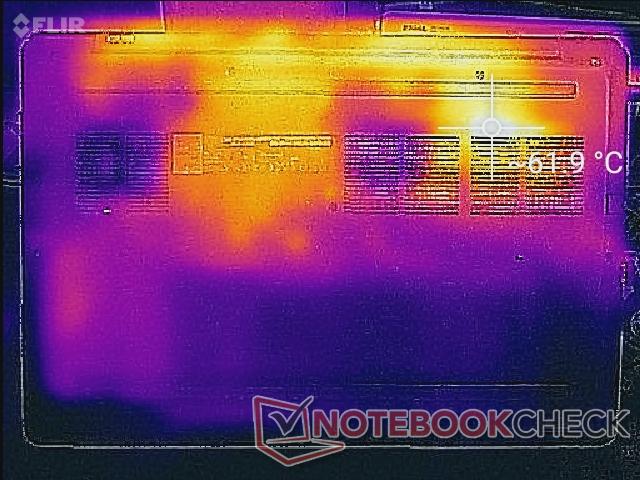
(-) The maximum temperature on the upper side is 47 °C / 117 F, compared to the average of 40.4 °C / 105 F, ranging from 21.2 to 68.8 °C for the class Gaming.
(-) The bottom heats up to a maximum of 61.2 °C / 142 F, compared to the average of 43.2 °C / 110 F
(+) In idle usage, the average temperature for the upper side is 30.3 °C / 87 F, compared to the device average of 33.9 °C / 93 F.
(+) Playing The Witcher 3, the average temperature for the upper side is 31.2 °C / 88 F, compared to the device average of 33.9 °C / 93 F.
(+) The palmrests and touchpad are cooler than skin temperature with a maximum of 31.6 °C / 88.9 F and are therefore cool to the touch.
(-) The average temperature of the palmrest area of similar devices was 28.8 °C / 83.8 F (-2.8 °C / -5.1 F).
Speakers
Sound quality from the stereo speakers is better than what we'd expect from a budget laptop. Audio is relatively balanced even when on high volume settings with no static or major reverberations. Bass, of course, is still lacking and average at best. The same Waves MaxxAudio software that shipped with the Inspiron 15 7577 can be found here on the G3 15.


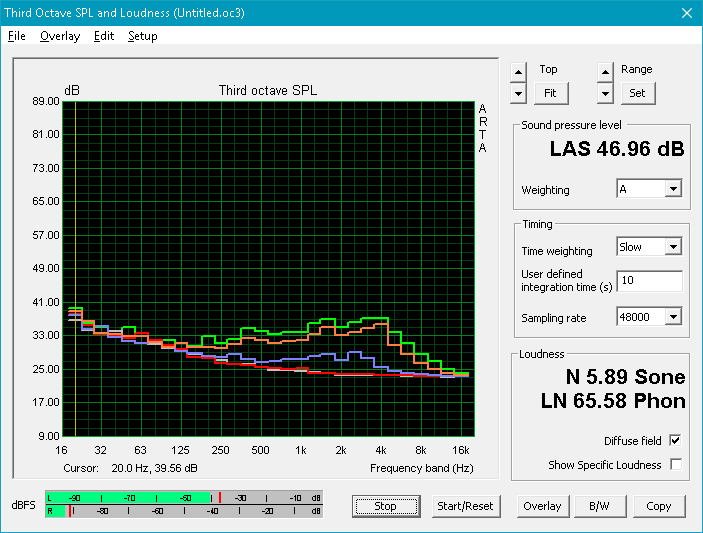
Dell G3 15 3579 audio analysis
(±) | speaker loudness is average but good (73.3 dB)
Bass 100 - 315 Hz
(-) | nearly no bass - on average 15.5% lower than median
(±) | linearity of bass is average (13.3% delta to prev. frequency)
Mids 400 - 2000 Hz
(+) | balanced mids - only 2.8% away from median
(±) | linearity of mids is average (7.3% delta to prev. frequency)
Highs 2 - 16 kHz
(+) | balanced highs - only 3.3% away from median
(±) | linearity of highs is average (9% delta to prev. frequency)
Overall 100 - 16.000 Hz
(±) | linearity of overall sound is average (18.1% difference to median)
Compared to same class
» 57% of all tested devices in this class were better, 8% similar, 35% worse
» The best had a delta of 6%, average was 18%, worst was 132%
Compared to all devices tested
» 39% of all tested devices were better, 8% similar, 54% worse
» The best had a delta of 4%, average was 23%, worst was 134%
Apple MacBook 12 (Early 2016) 1.1 GHz audio analysis
(+) | speakers can play relatively loud (83.6 dB)
Bass 100 - 315 Hz
(±) | reduced bass - on average 11.3% lower than median
(±) | linearity of bass is average (14.2% delta to prev. frequency)
Mids 400 - 2000 Hz
(+) | balanced mids - only 2.4% away from median
(+) | mids are linear (5.5% delta to prev. frequency)
Highs 2 - 16 kHz
(+) | balanced highs - only 2% away from median
(+) | highs are linear (4.5% delta to prev. frequency)
Overall 100 - 16.000 Hz
(+) | overall sound is linear (10.2% difference to median)
Compared to same class
» 7% of all tested devices in this class were better, 2% similar, 90% worse
» The best had a delta of 5%, average was 18%, worst was 53%
Compared to all devices tested
» 5% of all tested devices were better, 1% similar, 94% worse
» The best had a delta of 4%, average was 23%, worst was 134%
Energy Management
Power Consumption
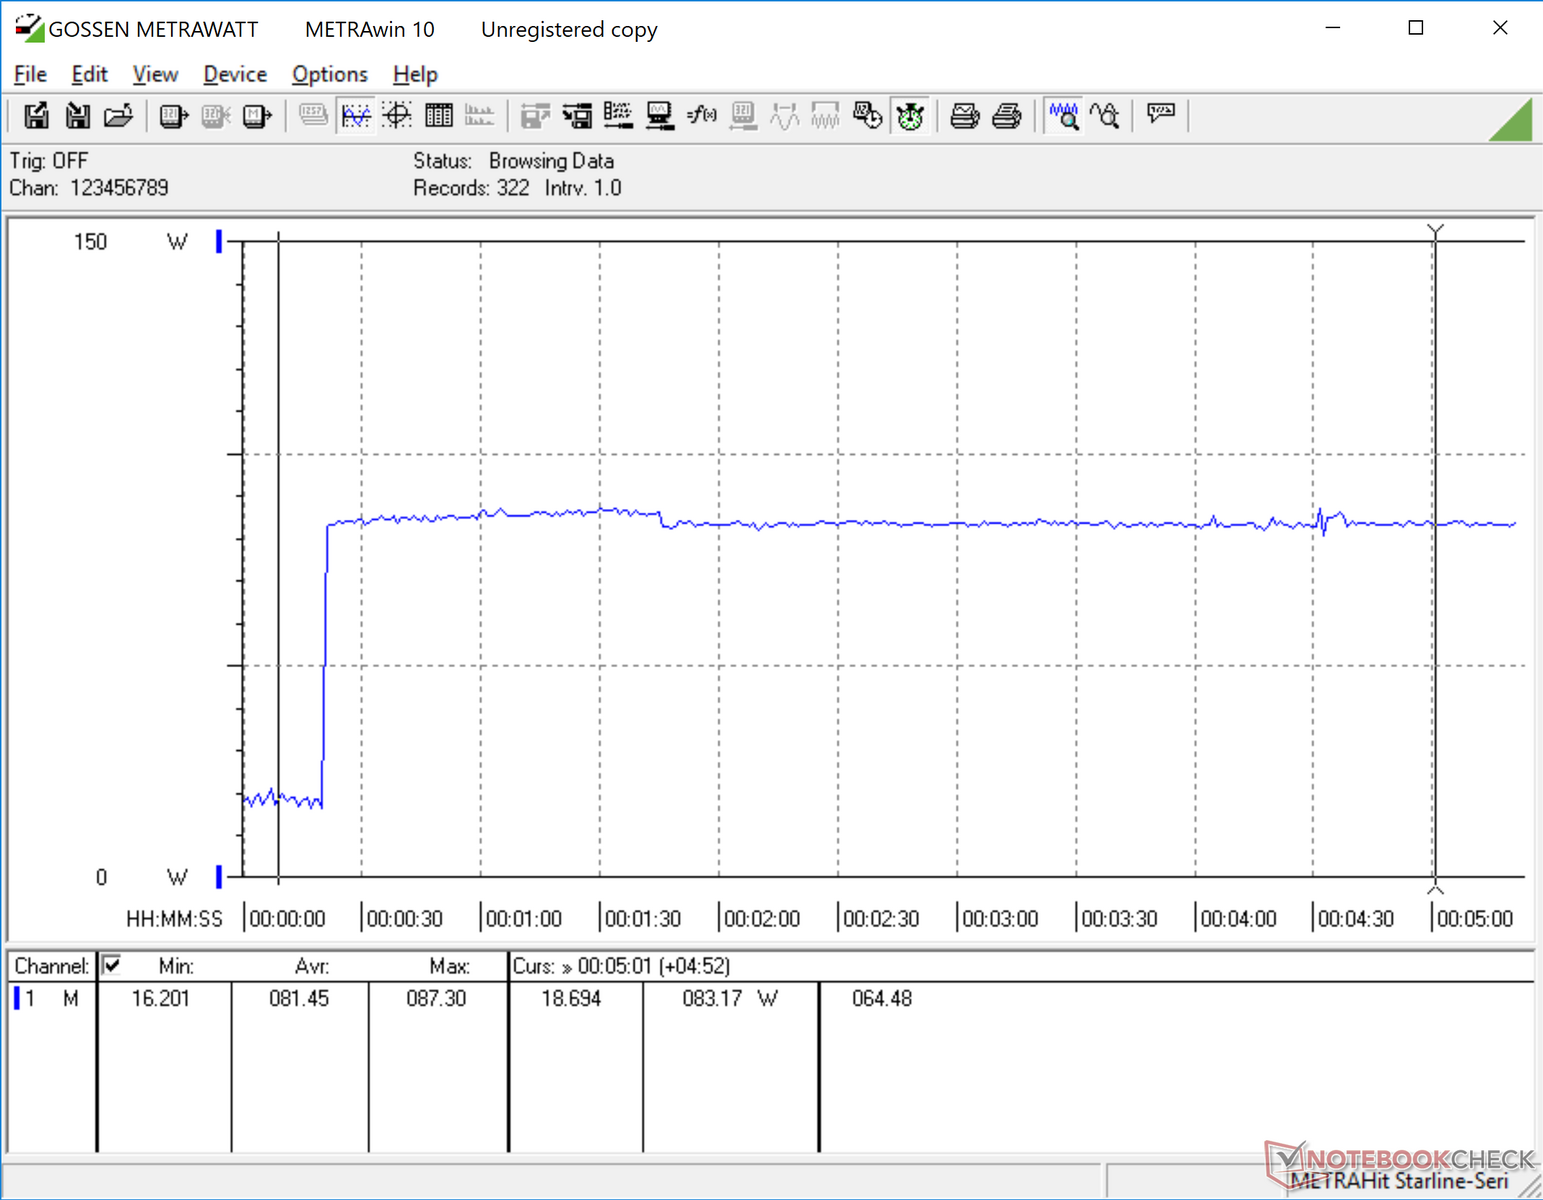
Idling on desktop draws about 8 W to 13 W depending on the profile and brightness setting. When gaming, consumption is very nearly the same as on the MSI GL63 and Asus FX504 each with the same i5-8300H CPU and GTX 1050 GPU. Interestingly, the G3 15 is slightly more demanding than the more powerful Inspiron 15 7577.
Maximum load will draw about 132 W from a medium-sized (~15 x 7.5 x 2.5 cm) 130 W adapter. A more capable 180 W adapter is included only with the GTX 1060 Max-Q configuration. We're very disappointed by this move because the G3 15 battery will continue to drain when running extreme loads even if connected to mains.
| Off / Standby | |
| Idle | |
| Load |
|
Key:
min: | |
| Dell G3 15 3579 i5-8300H, GeForce GTX 1050 Mobile, Seagate Mobile HDD 1TB ST1000LX015-1U7172, IPS, 1920x1080, 15.6" | MSI GL63 8RC-069US i5-8300H, GeForce GTX 1050 Mobile, Toshiba HG6 THNSNJ256G8NY, IPS, 1920x1080, 15.6" | Lenovo Yoga 730-15IKB i5-8550U, GeForce GTX 1050 Mobile, SK Hynix PC401 512GB M.2 (HFS512GD9TNG), IPS, 3840x2160, 15.6" | Asus FX504GD i5-8300H, GeForce GTX 1050 Mobile, Seagate Mobile HDD 1TB ST1000LX015-1U7172, TN LED, 1920x1080, 15.6" | Dell Inspiron 15 7000 7577 4K i7-7700HQ, GeForce GTX 1060 Max-Q, SK hynix SC311 M.2, IPS, 3840x2160, 15.6" | |
|---|---|---|---|---|---|
| Power Consumption | 7% | 27% | 8% | 11% | |
| Idle Minimum * (Watt) | 7.9 | 7.1 10% | 4.8 39% | 7.2 9% | 5.5 30% |
| Idle Average * (Watt) | 9.6 | 9.8 -2% | 10.1 -5% | 10.2 -6% | 10.5 -9% |
| Idle Maximum * (Watt) | 13 | 10.4 20% | 10.7 18% | 10.9 16% | 10.9 16% |
| Load Average * (Watt) | 93 | 88.8 5% | 44 53% | 93.3 -0% | 72 23% |
| Witcher 3 ultra * (Watt) | 100.6 | 93.3 7% | 95.8 5% | 97.4 3% | |
| Load Maximum * (Watt) | 132.7 | 132.5 -0% | 94.7 29% | 102.5 23% | 130.4 2% |
* ... smaller is better
Battery Life
Both the G3 15 and Inspiron 15 7577 use similar 56 W internal battery packs. Interestingly, battery life is longer than on the aforementioned Inspiron at about 6.5 hours of real-world WLAN use. The results are strange because the power consumption measurements above show the G3 15 to be the less efficient model overall. There are likely additional automatic power-saving measures on the G3 15 when running on batteries.
Charging from near empty to full capacity takes about 2 hours.
| Dell G3 15 3579 i5-8300H, GeForce GTX 1050 Mobile, 56 Wh | MSI GL63 8RC-069US i5-8300H, GeForce GTX 1050 Mobile, 41 Wh | Lenovo Yoga 730-15IKB i5-8550U, GeForce GTX 1050 Mobile, 51.5 Wh | Asus FX504GD i5-8300H, GeForce GTX 1050 Mobile, 48 Wh | Dell Inspiron 15 7000 7577 4K i7-7700HQ, GeForce GTX 1060 Max-Q, 56 Wh | Asus FX503VM-EH73 i7-7700HQ, GeForce GTX 1060 Mobile, 64 Wh | |
|---|---|---|---|---|---|---|
| Battery runtime | -51% | -35% | -51% | -25% | -40% | |
| Reader / Idle (h) | 7.3 | 11.6 | 7.5 | 10 | 5.7 | |
| WiFi v1.3 (h) | 6.5 | 4.3 -34% | 6.2 -5% | 3.7 -43% | 5.4 -17% | 4.6 -29% |
| Load (h) | 2.2 | 0.7 -68% | 0.8 -64% | 0.9 -59% | 1.5 -32% | 1.1 -50% |
Pros
Cons
Verdict
The Dell G3 is supposed to be an affordable gaming laptop positioned below the G5, G7, and Alienware series. It certainly gives the appropriate impression because it indubitably feels much cheaper and weaker than last year's Inspiron 15 7577. The plastic HP Pavilion-like palm rests, soft keyboard keys, soft trackpad, difficult serviceability, slow 1x1 WLAN, and dim display are all indicative of cut corners. Even USB Type-C is relegated to an option instead of a standard feature. It's hard to ignore all the cost-saving measures the G3 15 entails.
Fortunately, core performance is the highlight of the notebook. The system can sustain high Turbo Boost clock rates far better than expected and with cooler core temperatures when gaming. The new design is relatively lightweight and small for the price and we're glad to see that the abysmal TN panel option is finally gone. Fan noise could use some improvement because the system is louder than many of its competitors with the same GPU.
It's difficult to recommend the G3 15 even though it starts for under $900 USD. Users would be better off investing on the older Inspiron 15 7577 with the Core i7-7700HQ as it would give roughly the same performance as our G3 with the i5-8300H. The Inspiron is larger and heavier, but it makes up for its shortcomings with easier serviceability, quieter fans, Thunderbolt 3 port, and significantly better build quality from top to bottom.
The G3 15 is Dell's cheapest gaming laptop yet and it definitely doesn't hide it. Last year's Inspiron 15 7567 and 7577 are better in almost every way especially now that they can be found for about the same price.
Dell G3 15 3579
- 07/28/2018 v6 (old)
Allen Ngo
Price comparison
