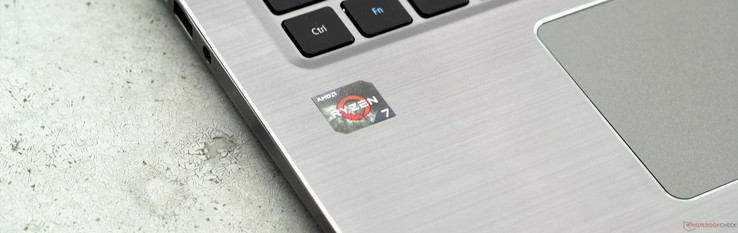
Acer Swift 3 (Ryzen 7 2700U, Radeon RX Vega 10) Laptop Review
Ryzen has been making waves in the desktop space since its introduction over a year ago, but Intel still dominates the laptop market. After a long wait, Ryzen CPUs are finally making their way into notebooks, but it's been a fairly slow trickle. Acer has been one of the manufacturers leading the Ryzen charge, and their Swift line has been among the first to debut AMD's new silicon.
Today's device is an update to the popular Swift 3 equipped with AMD's Ryzen 7 2700U and Radeon RX Vega 10 on-chip graphics. The new silicon is currently AMD's top-of-the-line accelerated processing unit (APU) for laptops. We'll see in this review whether or not the 2700U performs better than Intel's offerings and how much the Ryzen 7 APU bests the Ryzen 5 2500U.
As this is an update, we will forego discussion of the case, connections, input devices, and other external factors. For more details on those pieces of the Swift 3 experience, please check our prior review here. The Swift 3 has several competitors at this price point, most notably laptops powered by Intel's Core i5-8250U and Core i7-8550U. For this review, we will compare the Swift 3 to the Asus ZenBook 13 UX331UN, the Dell Inspiron 13-5379, the Lenovo ThinkPad L380, and the HP Pavilion 15. We will also look at other variants of the Swift 3, namely the Ryzen 5 2500U and Core i7-8550U models.
| SD Card Reader | |
| average JPG Copy Test (av. of 3 runs) | |
| Average of class Multimedia (23 - 531, n=43, last 2 years) | |
| HP Pavilion 15-cc107ng (Toshiba Exceria Pro SDXC 64 GB UHS-II) | |
| Lenovo ThinkPad L380-20M5000WGE (Toshiba Exceria Pro M501 microSDXC 64GB) | |
| Asus ZenBook 13 UX331UN (Toshiba Exceria Pro M501 microSDXC 64GB) | |
| Acer Swift 3 SF315-41-R6J9 (Toshiba Exceria Pro SDXC 64 GB UHS-II) | |
| Acer Swift 3 SF315-41-R4W1 | |
| Dell Inspiron 13-5379-9573 (Toshiba Exceria Pro SDXC 64 GB UHS-II) | |
| Acer Swift 3 SF314-52G-89SL (Toshiba Exceria Pro SDXC 64 GB UHS-II) | |
| maximum AS SSD Seq Read Test (1GB) | |
| Average of class Multimedia (27.9 - 1455, n=42, last 2 years) | |
| HP Pavilion 15-cc107ng (Toshiba Exceria Pro SDXC 64 GB UHS-II) | |
| Asus ZenBook 13 UX331UN (Toshiba Exceria Pro M501 microSDXC 64GB) | |
| Lenovo ThinkPad L380-20M5000WGE (Toshiba Exceria Pro M501 microSDXC 64GB) | |
| Acer Swift 3 SF315-41-R6J9 (Toshiba Exceria Pro SDXC 64 GB UHS-II) | |
| Acer Swift 3 SF315-41-R4W1 | |
| Dell Inspiron 13-5379-9573 (Toshiba Exceria Pro SDXC 64 GB UHS-II) | |
| Acer Swift 3 SF314-52G-89SL (Toshiba Exceria Pro SDXC 64 GB UHS-II) | |
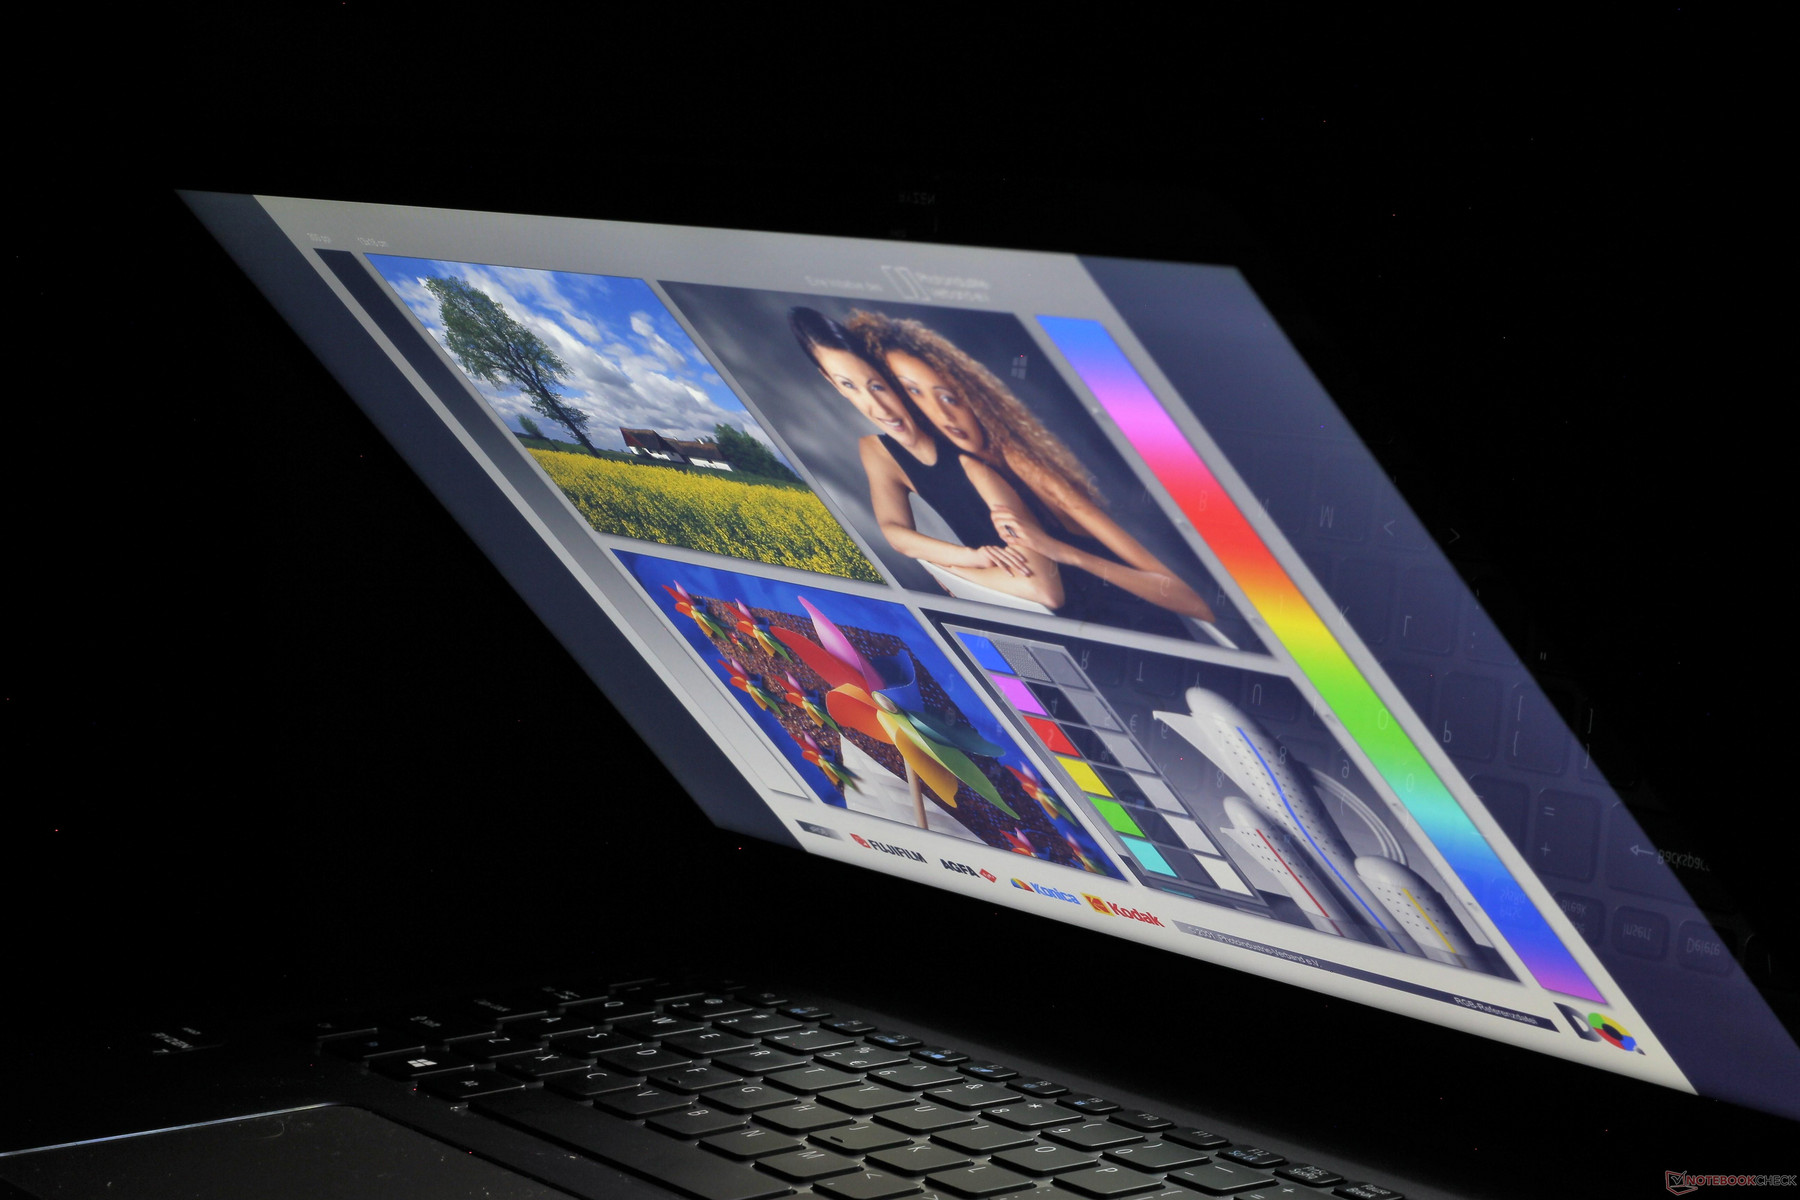
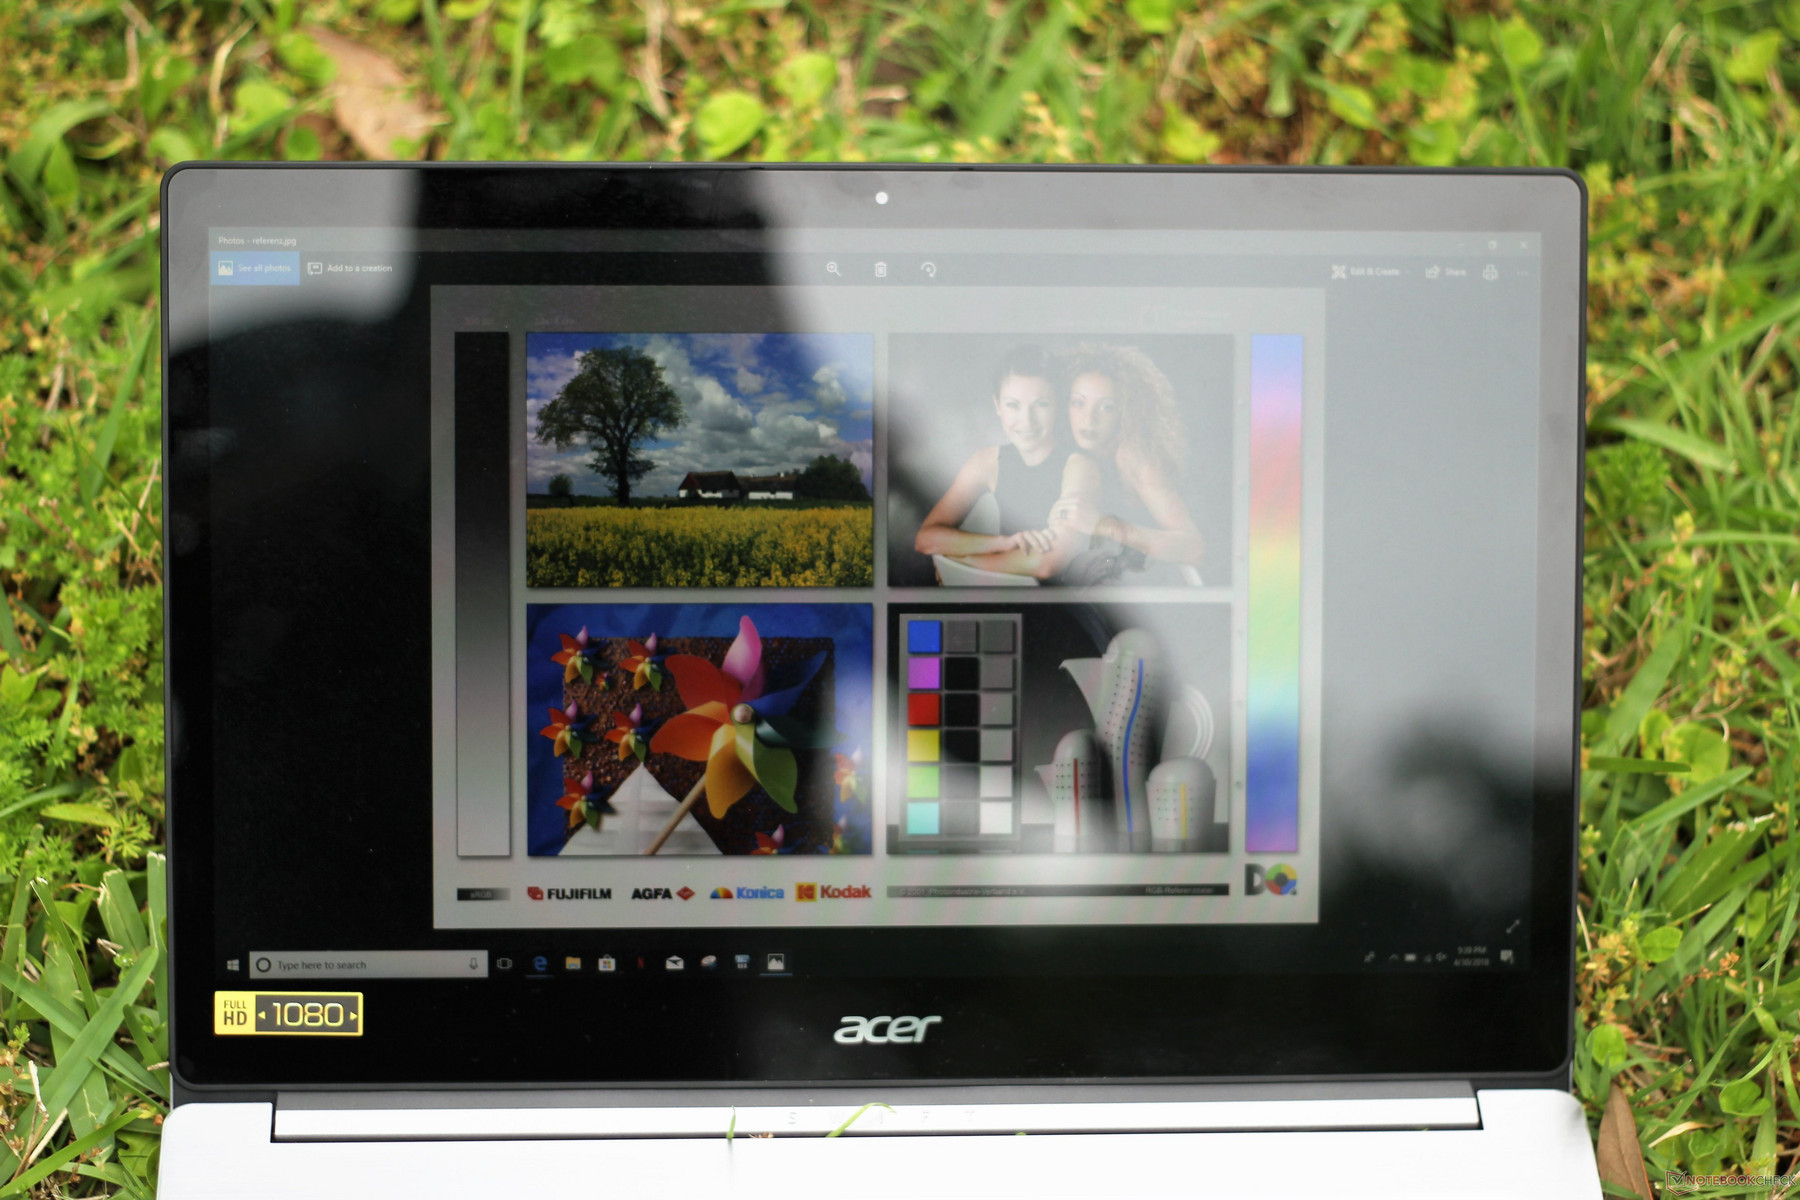
Display
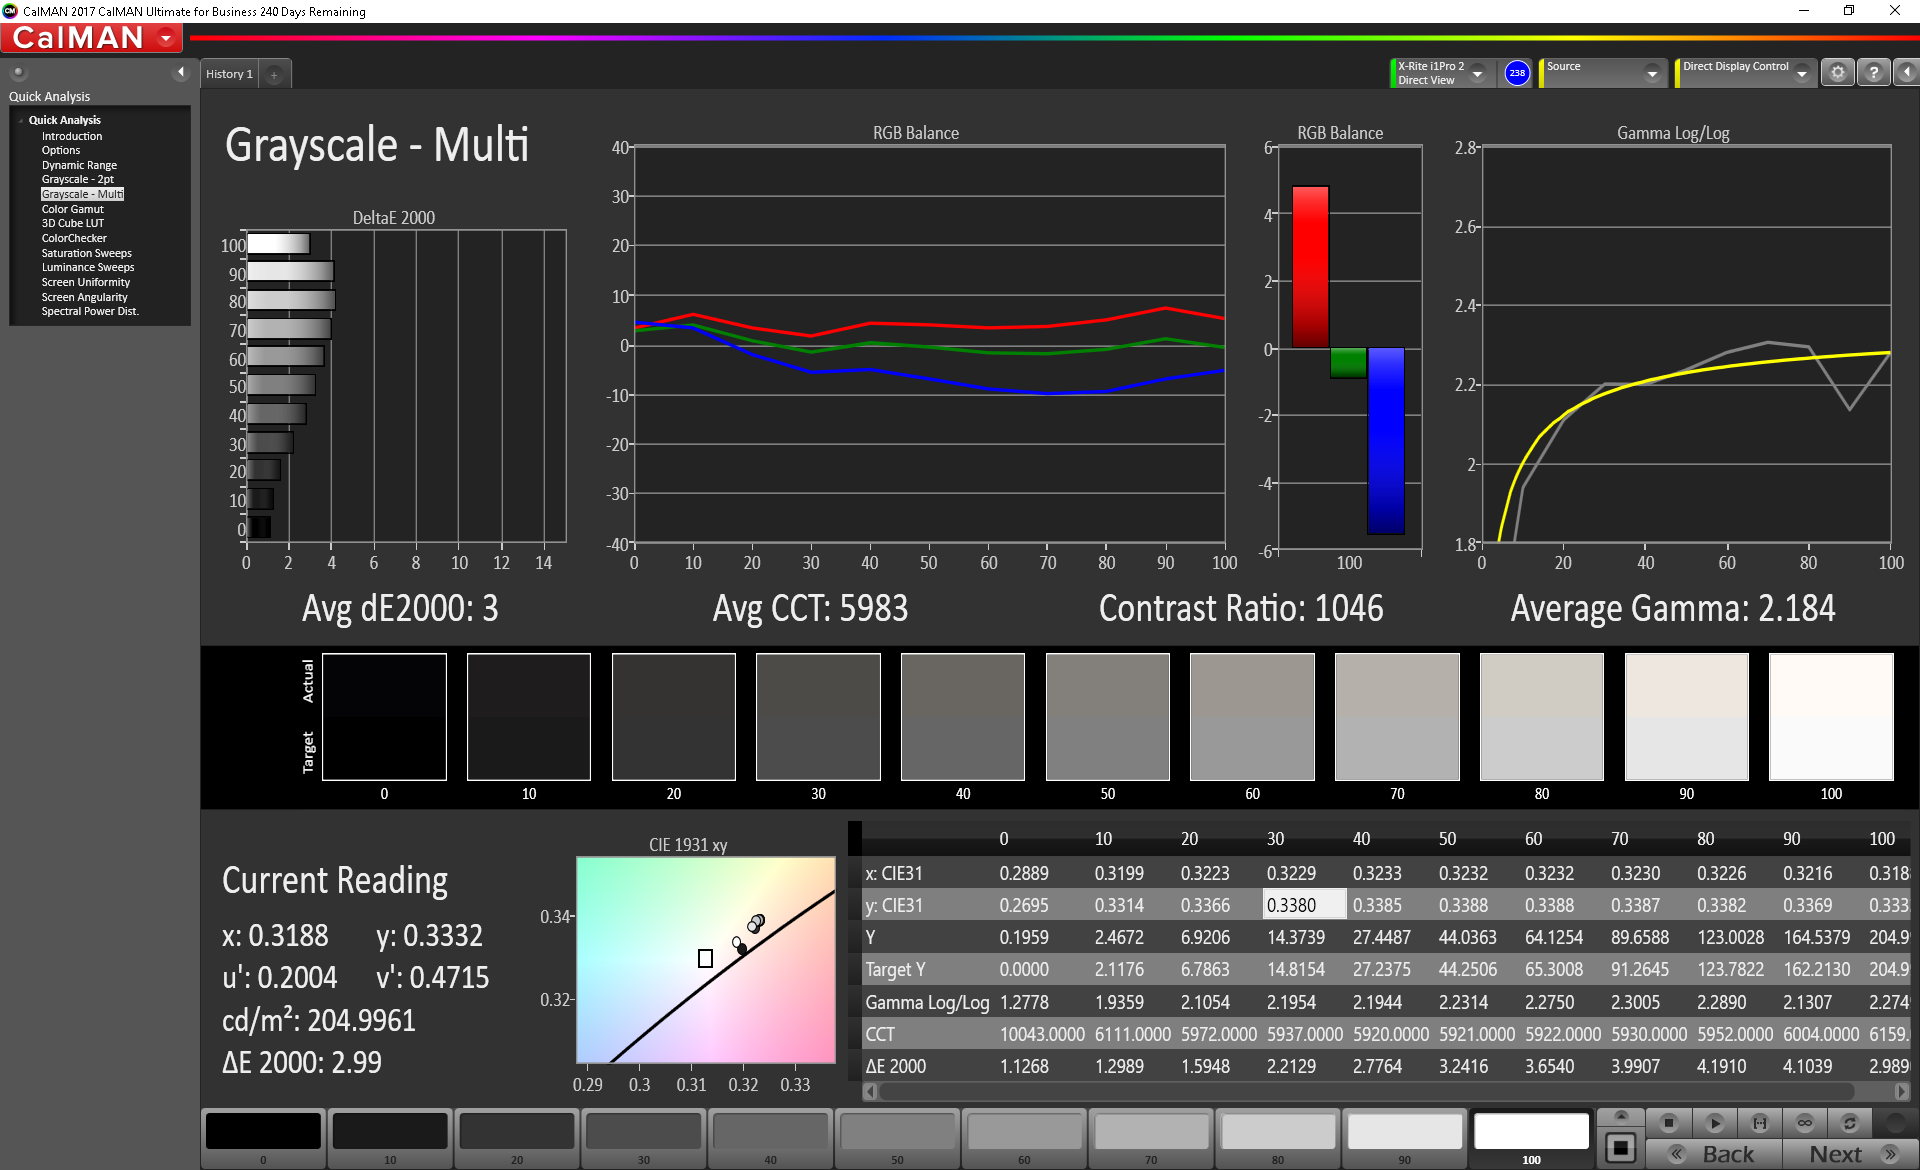
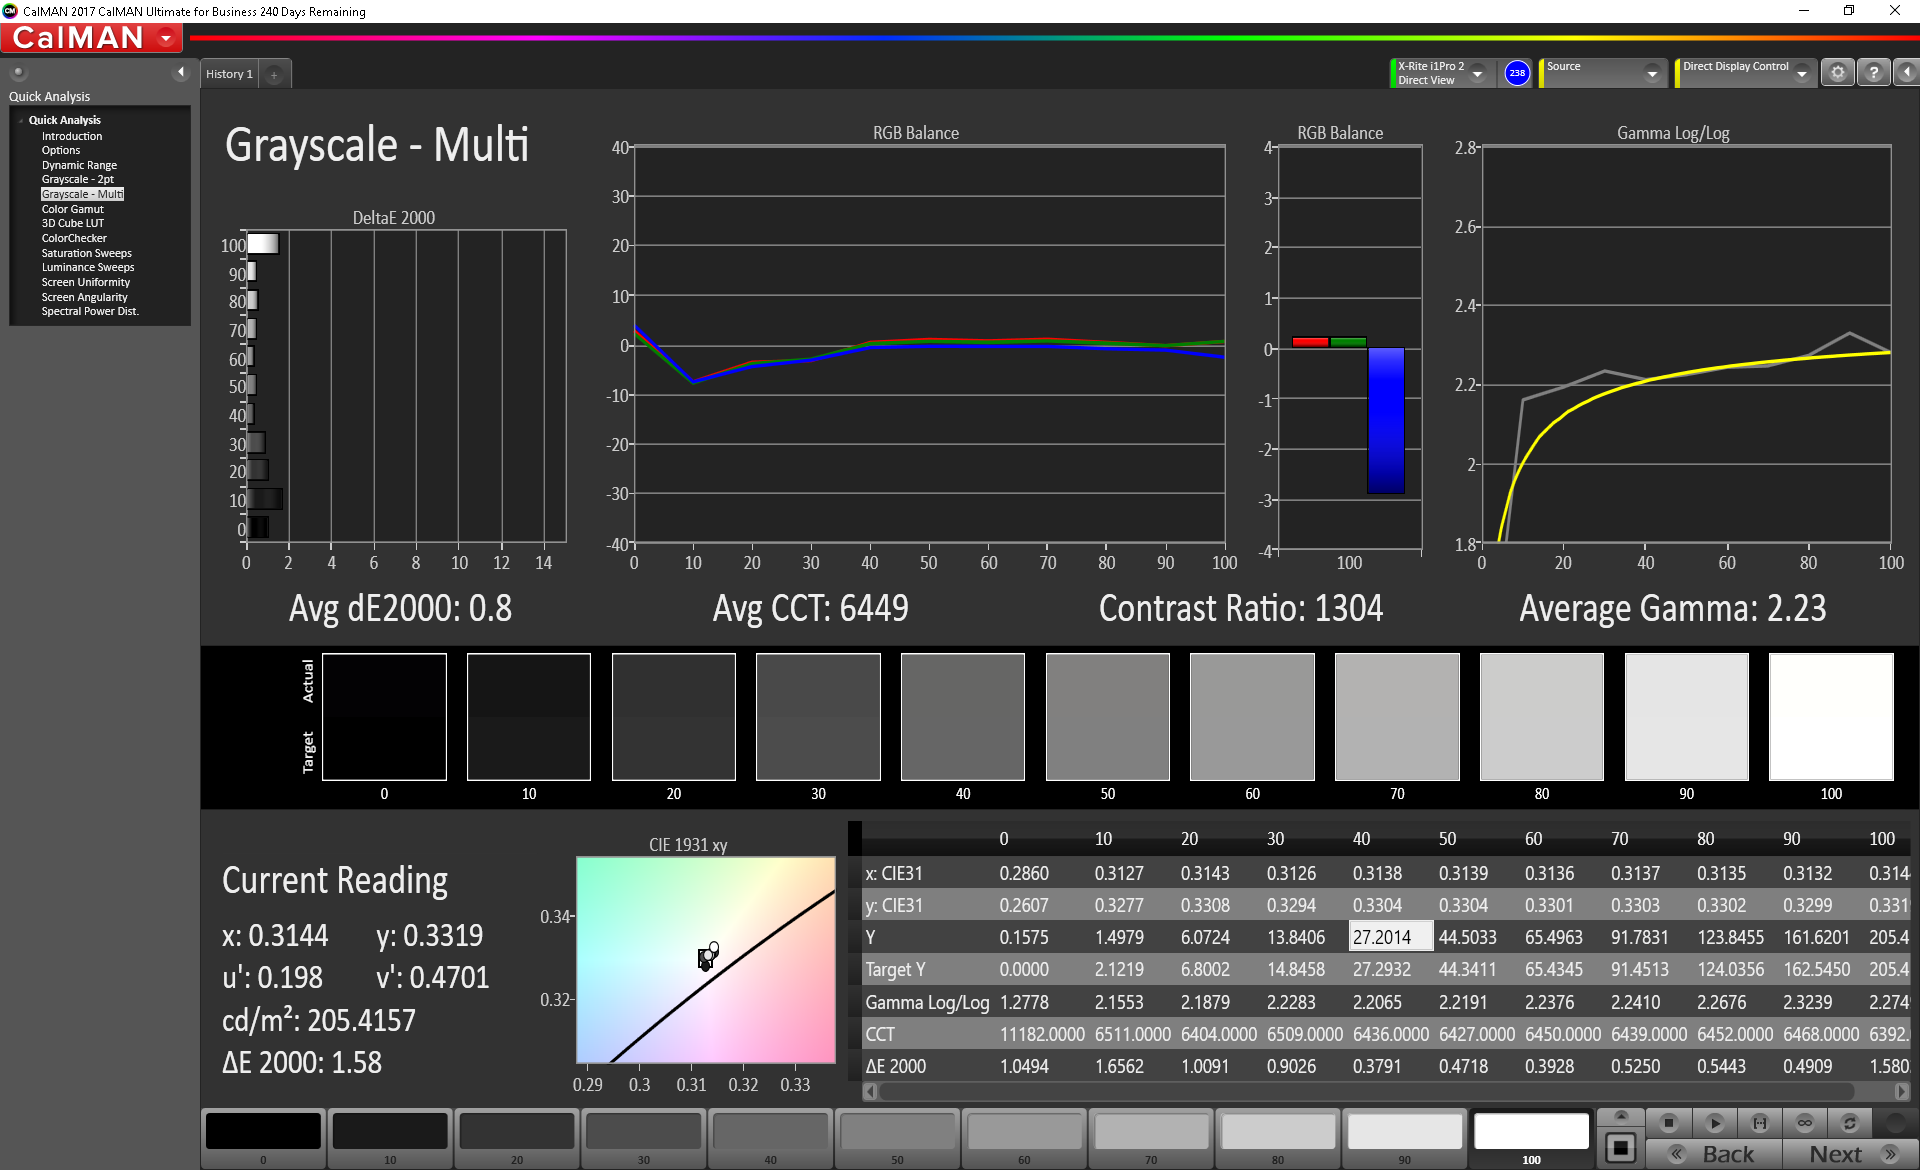
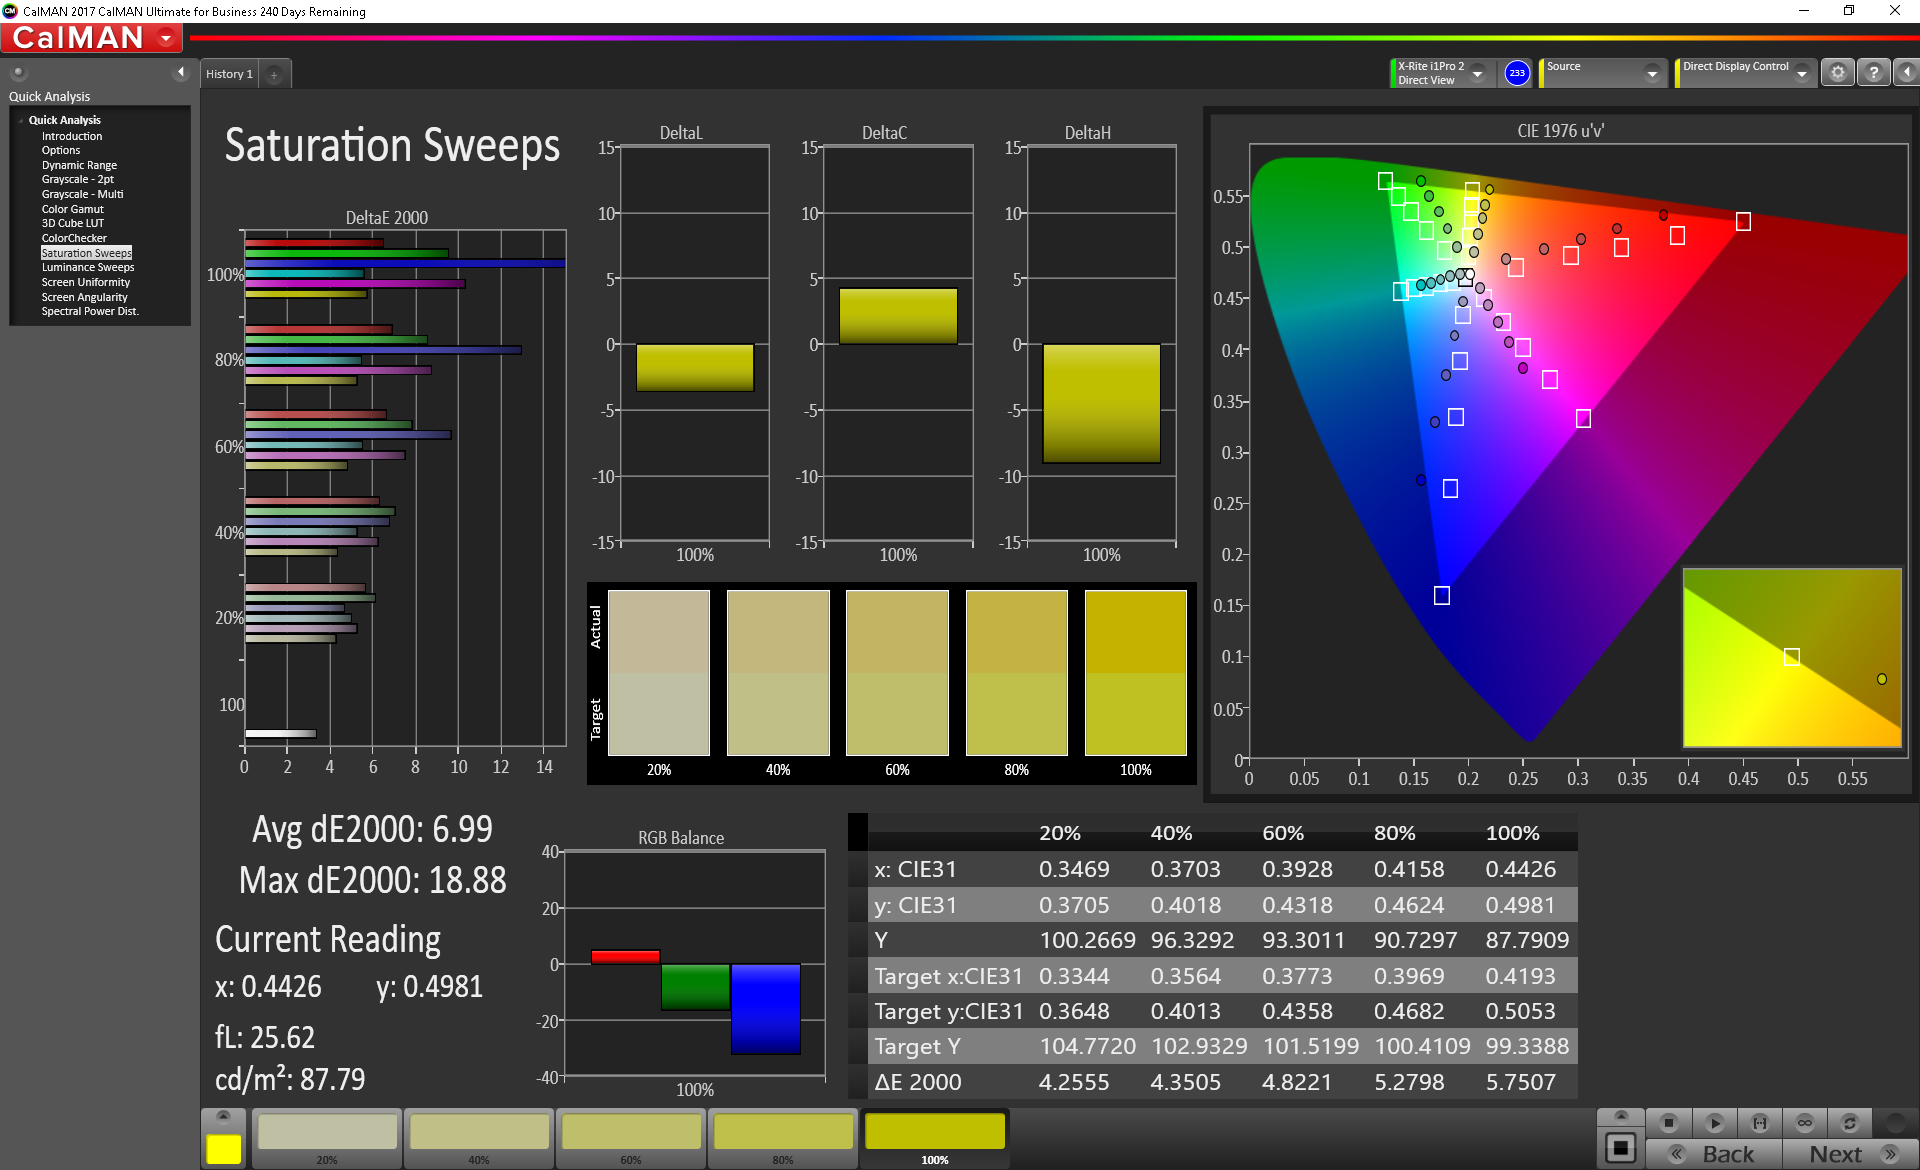
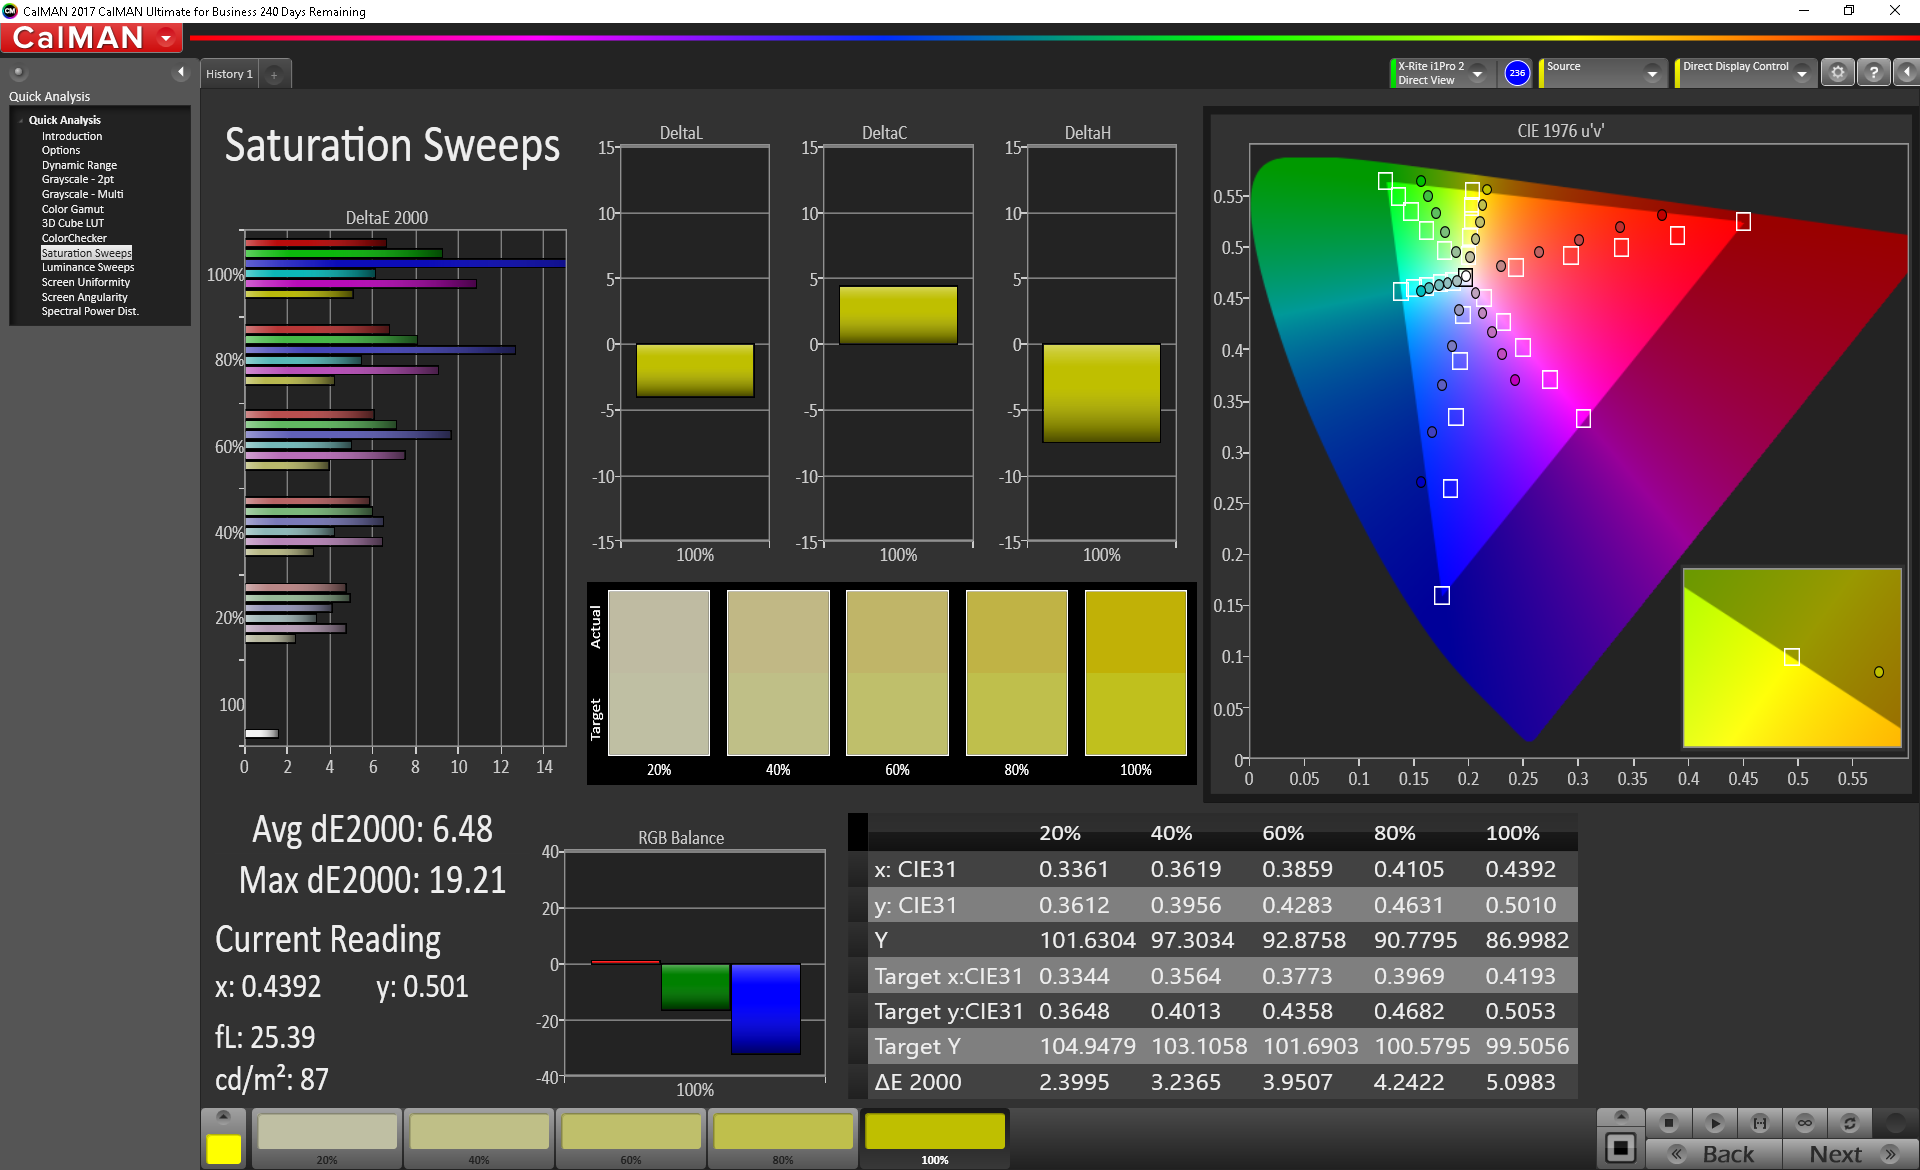
The BOE panel suffers from the same weaknesses that plague other variants of the Swift 3. The highly reflective finish and low backlight brightness make for a frustrating display. The average contrast (753:1) doesn't help much; most images look washed out. Despite the upgrade in internal hardware, the display is worse than that of the Ryzen 5-bsaed Swift 3 and much worse than other options on the market.
It should be noted that the Swift 3's default settings keep the display backlight at 150 nits when running on battery power. This limit can be removed by disabling VeriBright through the Radeon settings menu.
| |||||||||||||||||||||||||
Brightness Distribution: 71 %
Center on Battery: 203.4 cd/m²
Contrast: 753:1 (Black: 0.27 cd/m²)
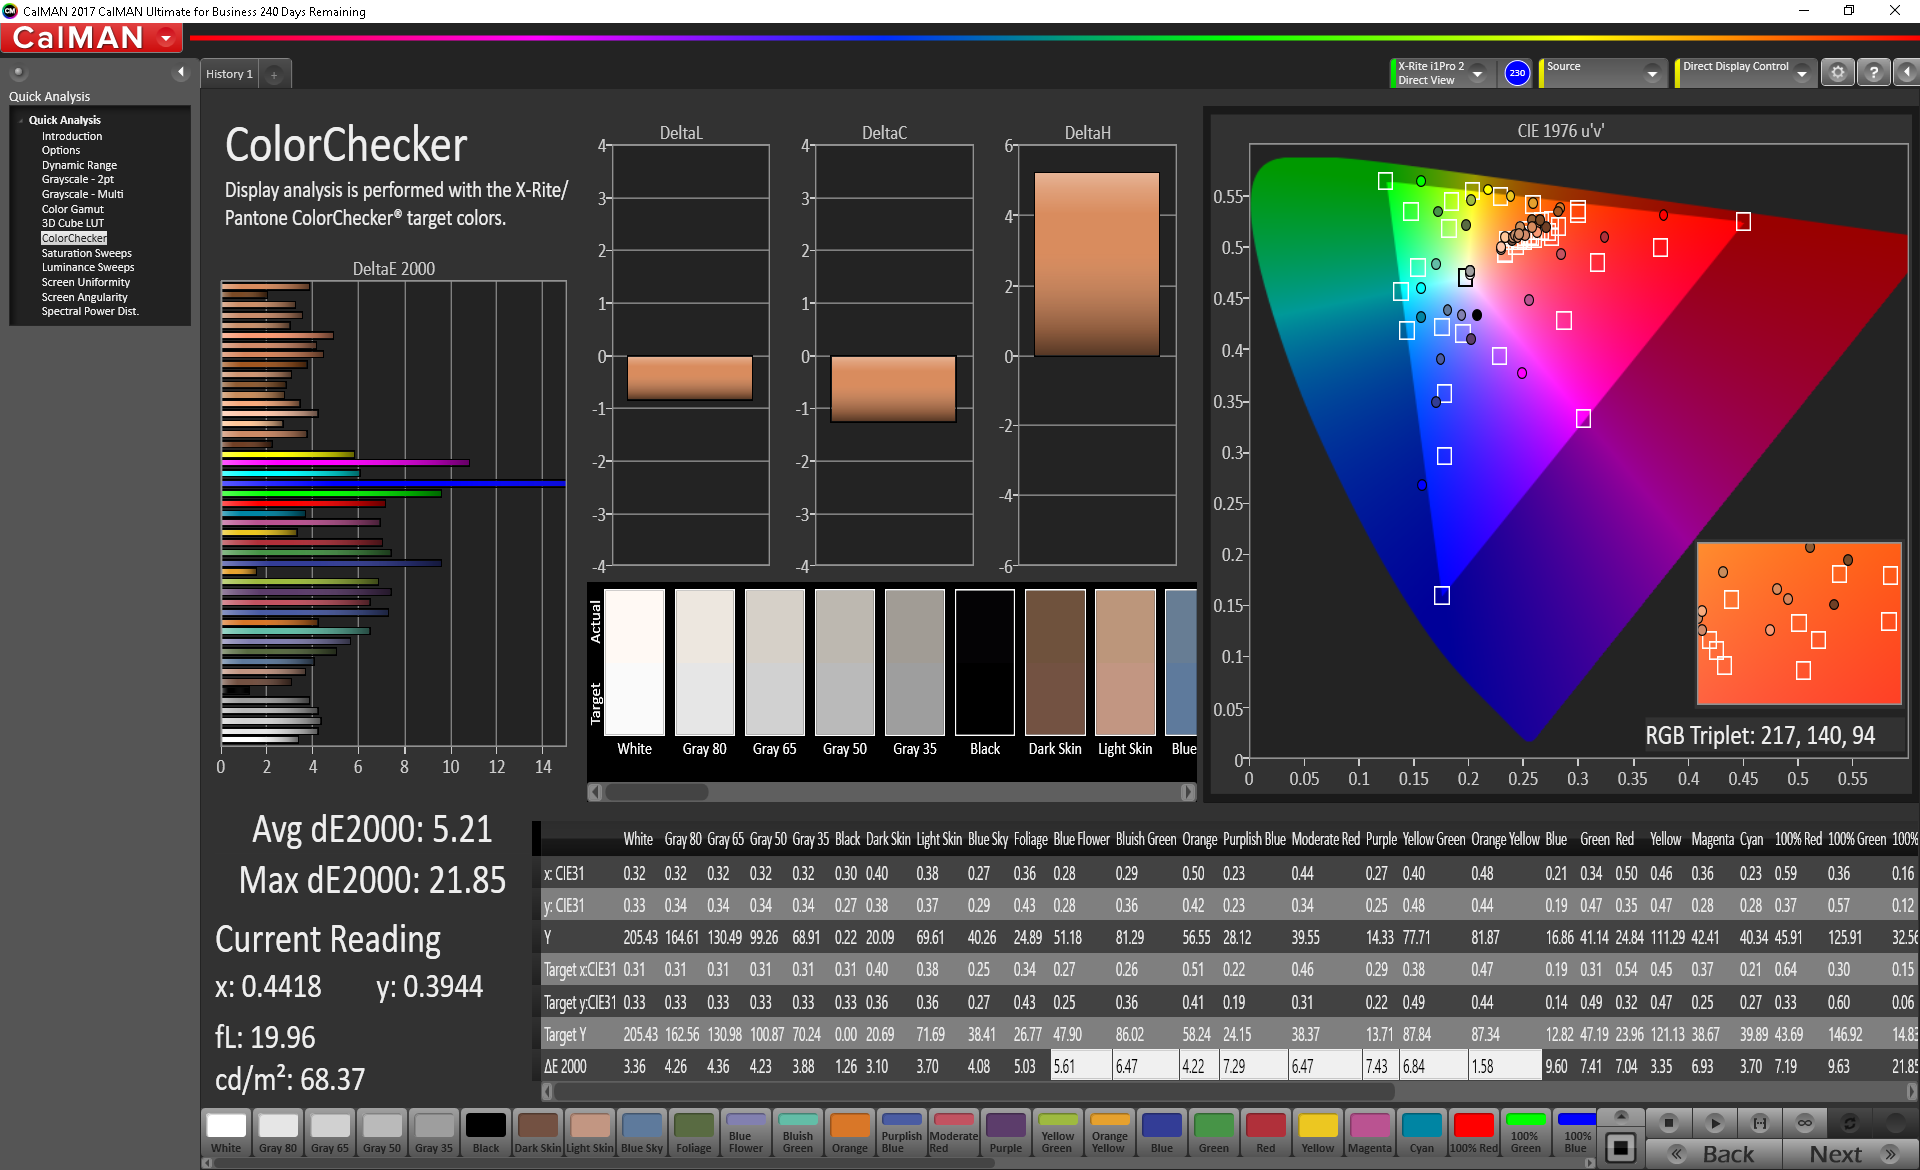
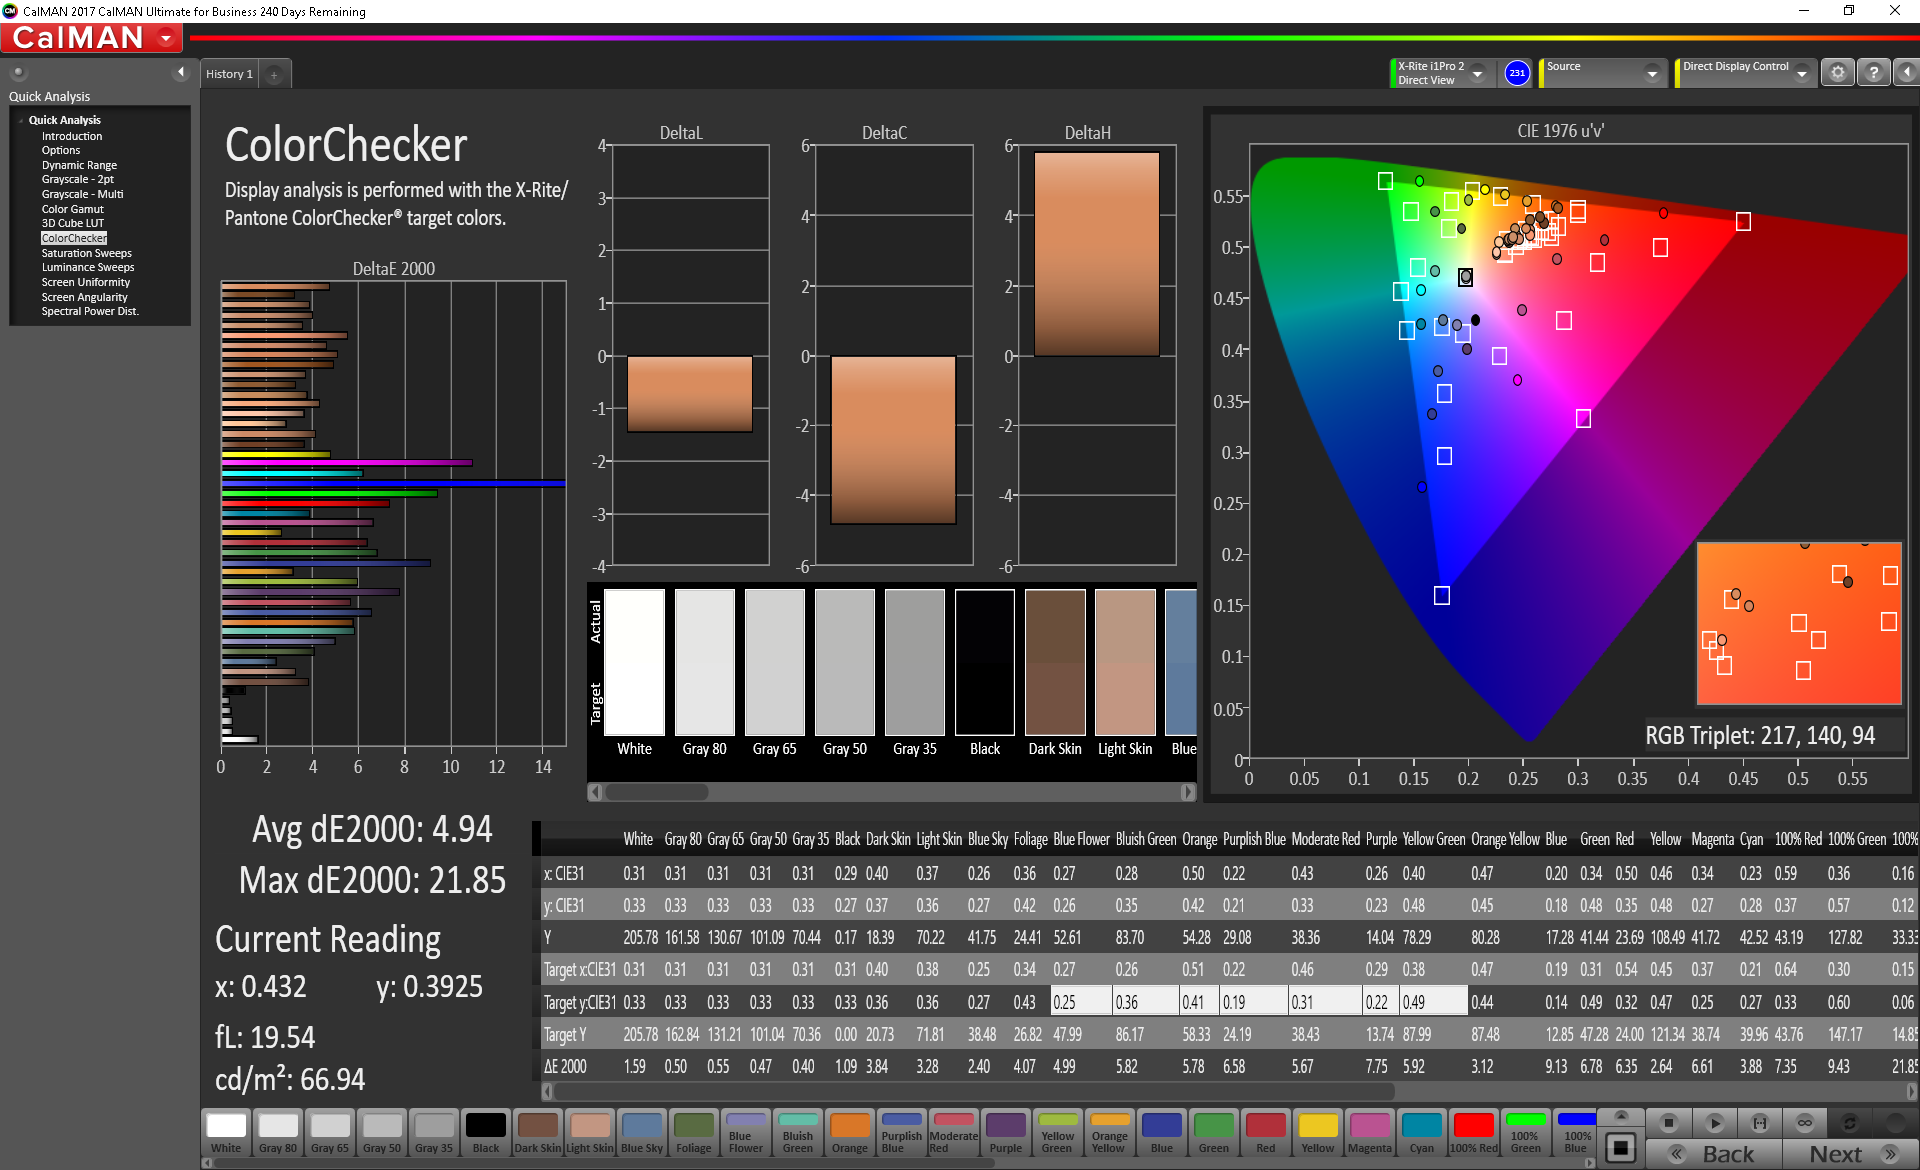
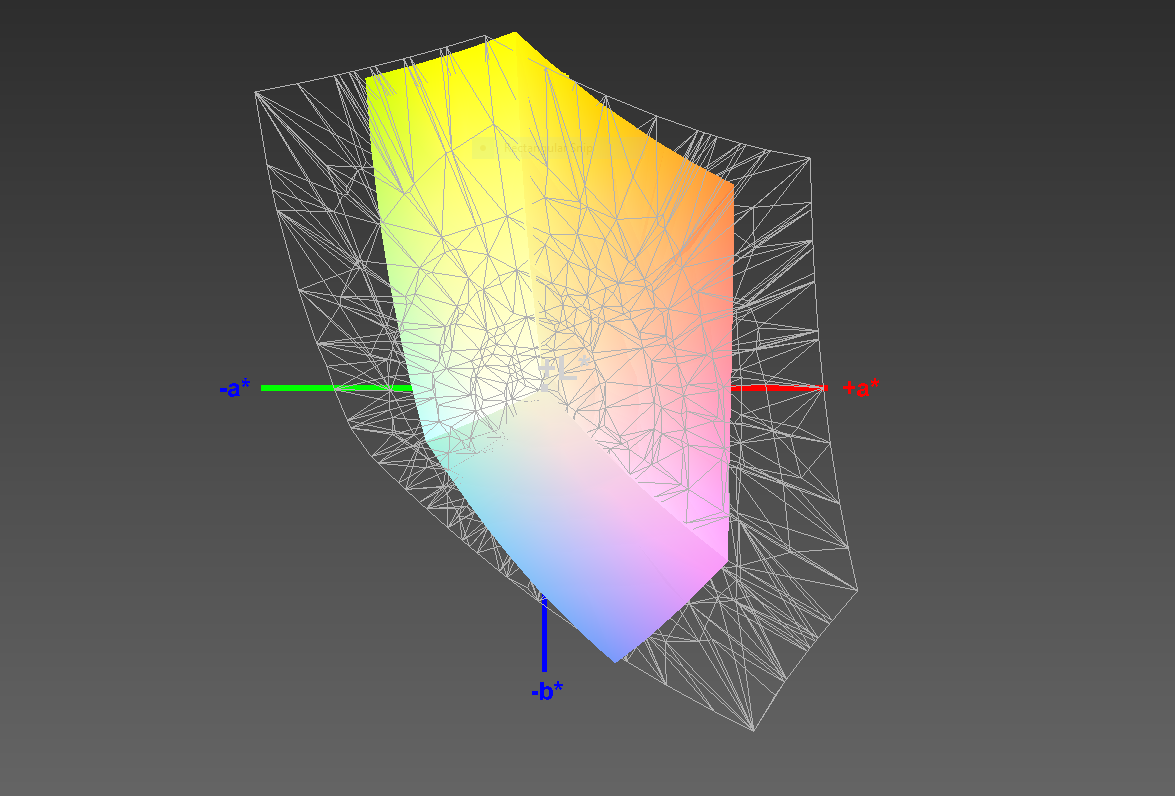
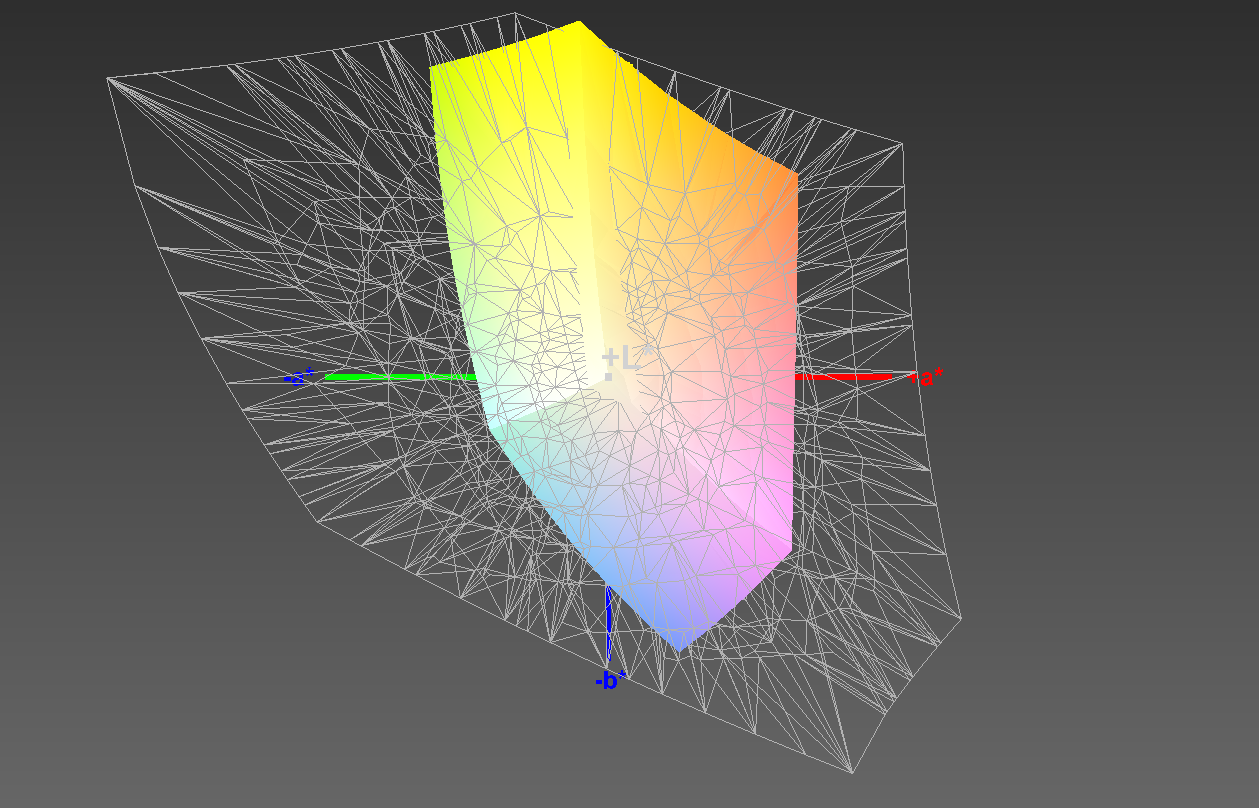
ΔE ColorChecker Calman: 5.21 | ∀{0.5-29.43 Ø4.73}
calibrated: 4.94
ΔE Greyscale Calman: 3 | ∀{0.09-98 Ø4.97}
58% sRGB (Argyll 1.6.3 3D)
37% AdobeRGB 1998 (Argyll 1.6.3 3D)
41.1% AdobeRGB 1998 (Argyll 3D)
58.1% sRGB (Argyll 3D)
39.79% Display P3 (Argyll 3D)
Gamma: 2.184
CCT: 5983 K
| Acer Swift 3 SF315-41-R6J9 BOE BOE0700, IPS, 15.6", 1920x1080 | Acer Swift 3 SF315-41-R4W1 BOE CQ NV156FHM-N48, IPS, 15.6", 1920x1080 | Acer Swift 3 SF314-52G-89SL AU Optronics B140HAN02.1, IPS, 14", 1920x1080 | Lenovo Ideapad 720S-13ARR LG Philips LGD04EF, IPS, 13.3", 1920x1080 | Lenovo ThinkPad L380-20M5000WGE Lenovo LEN4094, IPS, 13.3", 1920x1080 | Dell Inspiron 13-5379-9573 BOE BOE06A7, IPS, 13.3", 1920x1080 | Asus ZenBook 13 UX331UN AU Optronics B133HAN04.9, IPS, 13.3", 1920x1080 | HP Pavilion 15-cc107ng AU Optronics, TN LED, 15.6", 1920x1080 | |
|---|---|---|---|---|---|---|---|---|
| Display | 0% | -8% | 52% | 2% | 5% | 54% | -5% | |
| Display P3 Coverage (%) | 39.79 | 39.59 -1% | 36.09 -9% | 65.2 64% | 40.34 1% | 41.2 4% | 63.3 59% | 37.28 -6% |
| sRGB Coverage (%) | 58.1 | 58.5 1% | 54.2 -7% | 83.3 43% | 60.7 4% | 61.7 6% | 86.7 49% | 56.1 -3% |
| AdobeRGB 1998 Coverage (%) | 41.1 | 40.9 0% | 37.28 -9% | 60.9 48% | 41.69 1% | 42.6 4% | 63.4 54% | 38.51 -6% |
| Response Times | 2% | 21% | 26% | 16% | 7% | 19% | 32% | |
| Response Time Grey 50% / Grey 80% * (ms) | 43.2 ? | 46 ? -6% | 41 ? 5% | 36 ? 17% | 44 ? -2% | 45 ? -4% | 44 ? -2% | 45 ? -4% |
| Response Time Black / White * (ms) | 39.6 ? | 36 ? 9% | 25 ? 37% | 26 ? 34% | 26 ? 34% | 33 ? 17% | 24 ? 39% | 13 ? 67% |
| PWM Frequency (Hz) | 21370 | 21000 ? | 128000 ? | 192 ? | ||||
| Screen | 20% | 3% | 36% | 4% | 8% | 38% | -49% | |
| Brightness middle (cd/m²) | 203.4 | 237 17% | 233 15% | 299 47% | 271 33% | 274 35% | 329 62% | 234 15% |
| Brightness (cd/m²) | 188 | 229 22% | 217 15% | 306 63% | 253 35% | 272 45% | 306 63% | 230 22% |
| Brightness Distribution (%) | 71 | 88 24% | 88 24% | 90 27% | 89 25% | 81 14% | 86 21% | 76 7% |
| Black Level * (cd/m²) | 0.27 | 0.19 30% | 0.27 -0% | 0.27 -0% | 0.17 37% | 0.32 -19% | 0.3 -11% | 0.34 -26% |
| Contrast (:1) | 753 | 1247 66% | 863 15% | 1107 47% | 1594 112% | 856 14% | 1097 46% | 688 -9% |
| Colorchecker dE 2000 * | 5.21 | 4.85 7% | 5.85 -12% | 4.46 14% | 14.89 -186% | 5.57 -7% | 4.07 22% | 12.19 -134% |
| Colorchecker dE 2000 max. * | 21.85 | 8.34 62% | 11.51 47% | 10.51 52% | 31.08 -42% | 13.48 38% | 7.05 68% | 20.81 5% |
| Colorchecker dE 2000 calibrated * | 4.94 | 4.43 10% | ||||||
| Greyscale dE 2000 * | 3 | 3.84 -28% | 4.87 -62% | 2.41 20% | 2.51 16% | 4.66 -55% | 2.76 8% | 13.99 -366% |
| Gamma | 2.184 101% | 2.42 91% | 2.47 89% | 2.29 96% | 2.14 103% | 2.53 87% | 2.56 86% | 2.32 95% |
| CCT | 5983 109% | 6790 96% | 6908 94% | 6757 96% | 6455 101% | 7010 93% | 6915 94% | 15863 41% |
| Color Space (Percent of AdobeRGB 1998) (%) | 37 | 37 0% | 34 -8% | 55 49% | 38 3% | 39 5% | 56 51% | 36 -3% |
| Color Space (Percent of sRGB) (%) | 58 | 58 0% | 54 -7% | 83 43% | 60 3% | 61 5% | 86 48% | 56 -3% |
| Total Average (Program / Settings) | 7% /
14% | 5% /
3% | 38% /
38% | 7% /
5% | 7% /
7% | 37% /
38% | -7% /
-30% |
* ... smaller is better
Out of the box, the DeltaE2000 sits at 5.21 for color and 3 for grays. Calibration improves these numbers (4.94 for color, 0.8 for grays). While not optimal, these measurements match or beat most other mid-tier multimedia laptops. However, we should note the high maximum DeltaE2000 for colors. At 21.85, this translates to a wide color variance based on the specific wavelength. Blues and purples, in particular, seem to be the most inaccurate hues.
Display Response Times
| ↔ Response Time Black to White | ||
|---|---|---|
| 39.6 ms ... rise ↗ and fall ↘ combined | ↗ 22.8 ms rise | 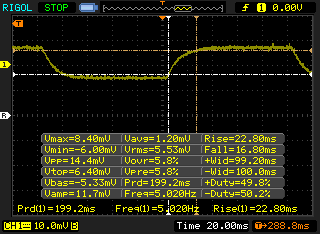 |
| ↘ 16.8 ms fall | ||
| The screen shows slow response rates in our tests and will be unsatisfactory for gamers. In comparison, all tested devices range from 0.1 (minimum) to 240 (maximum) ms. » 97 % of all devices are better. This means that the measured response time is worse than the average of all tested devices (19.9 ms). | ||
| ↔ Response Time 50% Grey to 80% Grey | ||
| 43.2 ms ... rise ↗ and fall ↘ combined | ↗ 22.8 ms rise | 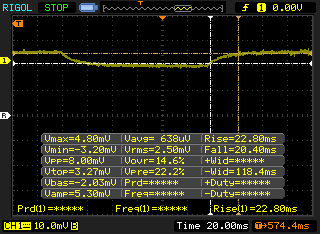 |
| ↘ 20.4 ms fall | ||
| The screen shows slow response rates in our tests and will be unsatisfactory for gamers. In comparison, all tested devices range from 0.165 (minimum) to 636 (maximum) ms. » 72 % of all devices are better. This means that the measured response time is worse than the average of all tested devices (31.1 ms). | ||
Screen Flickering / PWM (Pulse-Width Modulation)
| Screen flickering / PWM detected | 21370 Hz | 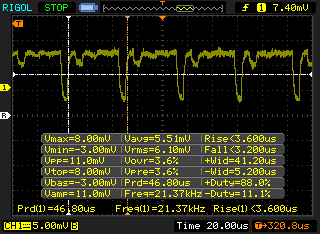 | |
The display backlight flickers at 21370 Hz (worst case, e.g., utilizing PWM) . The frequency of 21370 Hz is quite high, so most users sensitive to PWM should not notice any flickering. In comparison: 52 % of all tested devices do not use PWM to dim the display. If PWM was detected, an average of 7791 (minimum: 5 - maximum: 343500) Hz was measured. | |||
Viewing angles are good, but the dim screen makes images hard to discern at an angle. Colors remain accurate and text remains legible. The glossy screen is not favorable for use outdoors or under moderately bright fluorescent lights. Reflections are distracting, and the screen cannot get bright enough to cut past them. Overall, the screen is passable but very disappointing considering the price point.
Performance
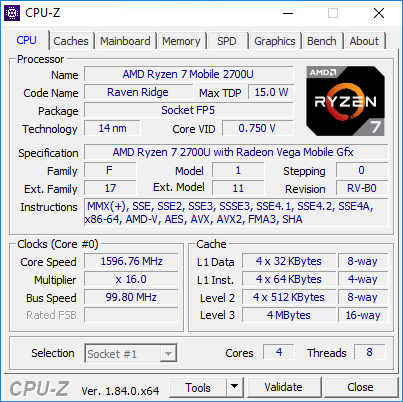
The Ryzen 7 2700U is AMD's top-of-the-line APU for notebooks and promises to compete with Intel's 8th generation U-series CPUs. With four cores (eight threads) clocked at 2.2 GHz (3.8 GHz boost on a single core), the 15 W 2700U stacks up well against Intel's Core i5-8250U and Core i7-8550U, at least on paper. The added benefit of a powerful Radeon RX Vega 10 iGPU gives Ryzen a shot at running circles around Intel. However, our system seems to have trouble with hitting its promised potential, as we'll explore below.
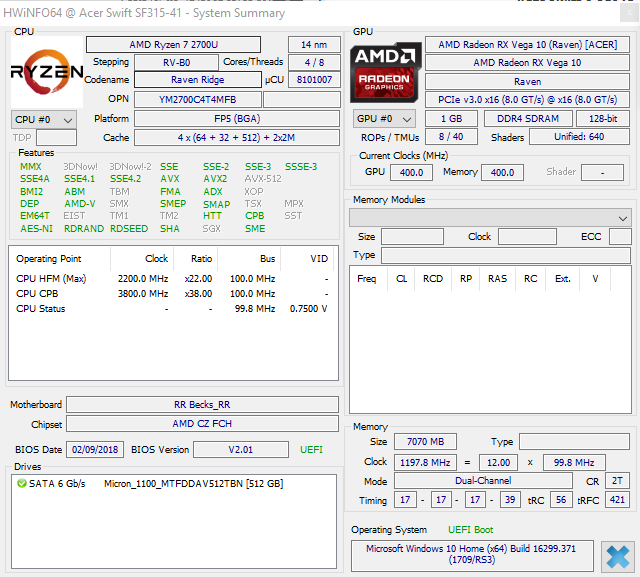
Processor
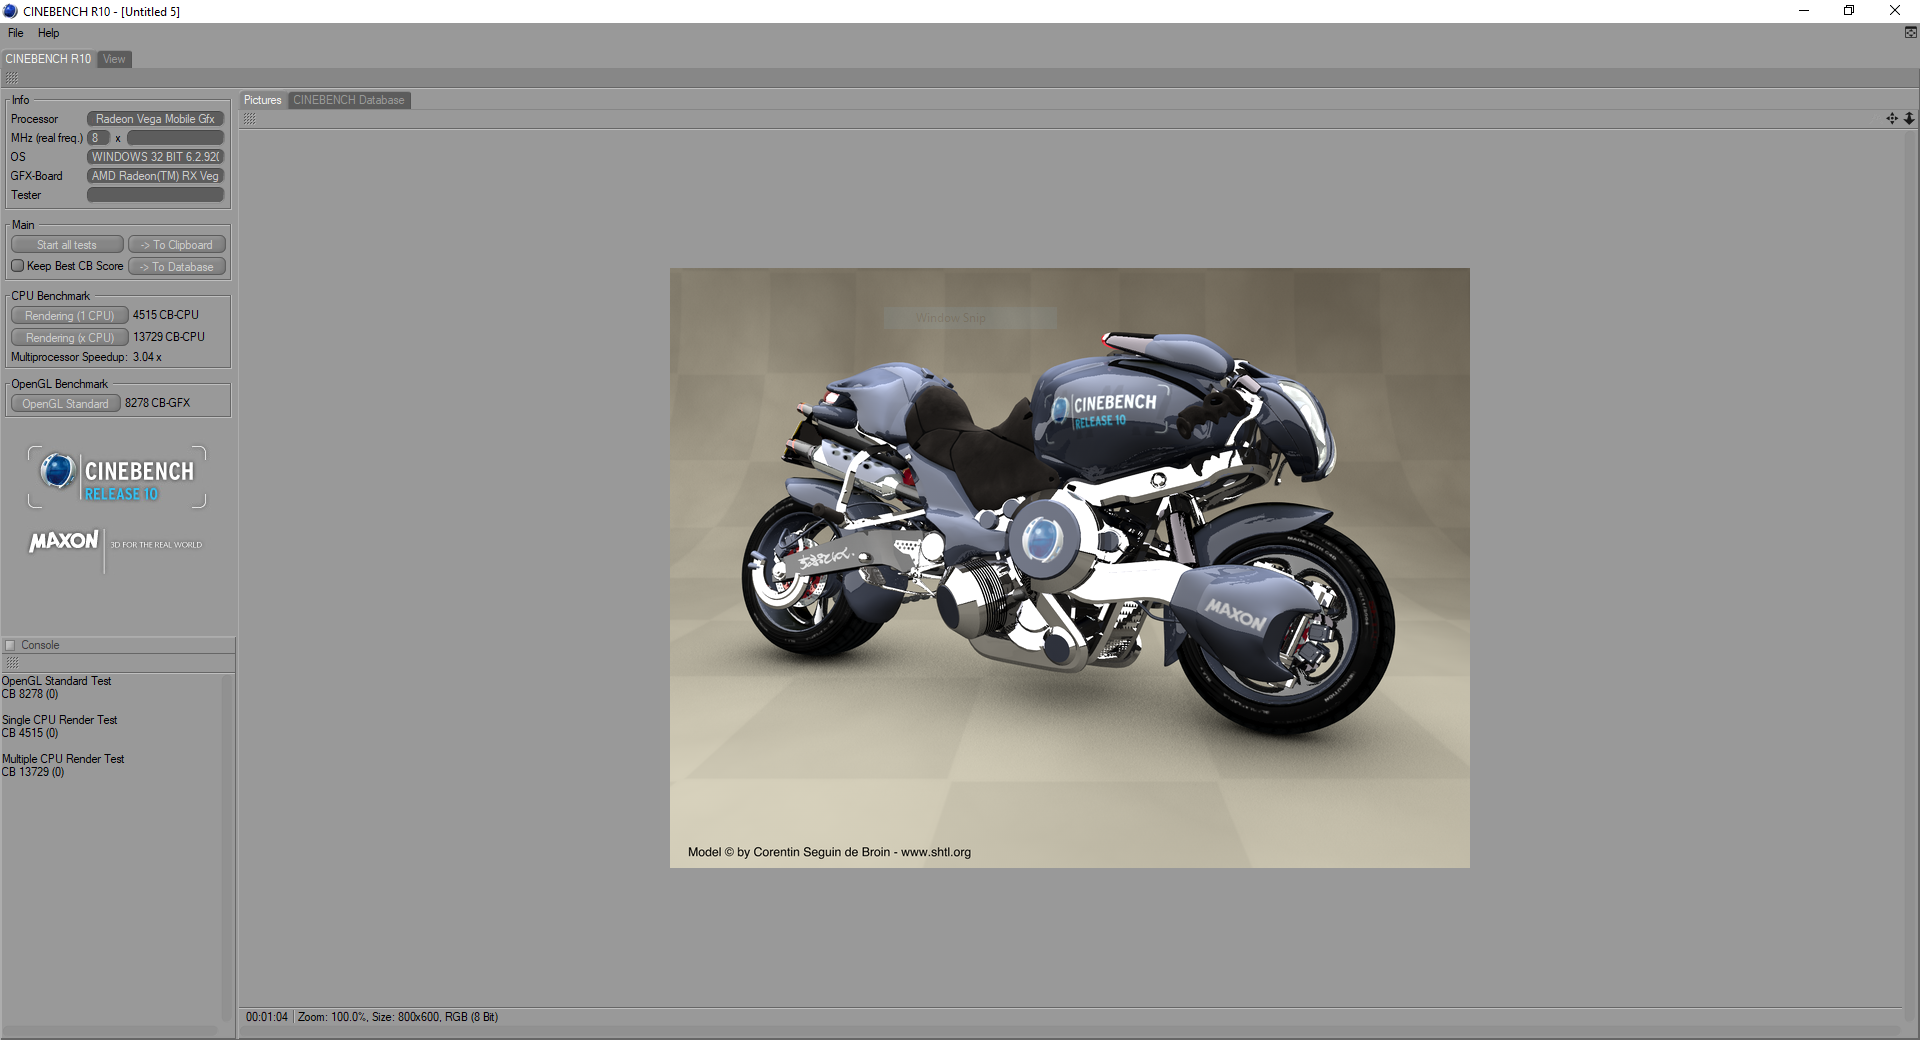
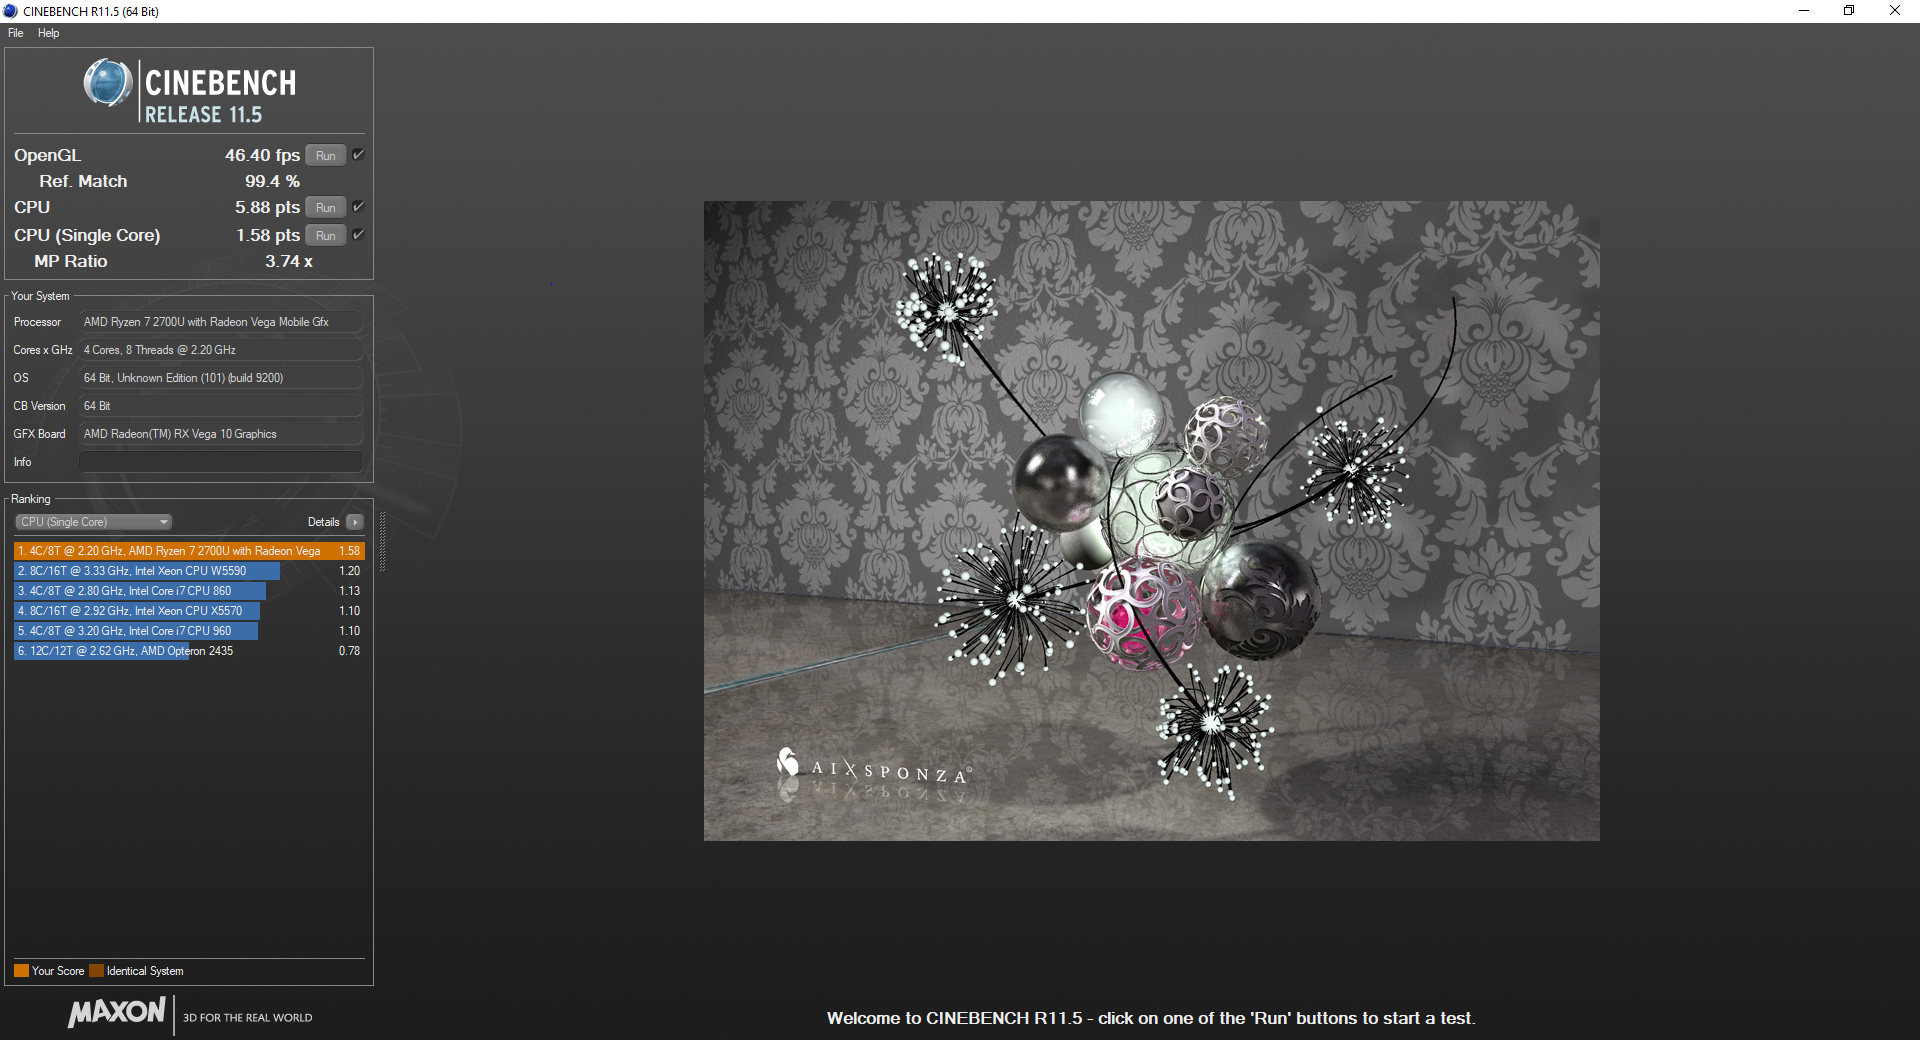
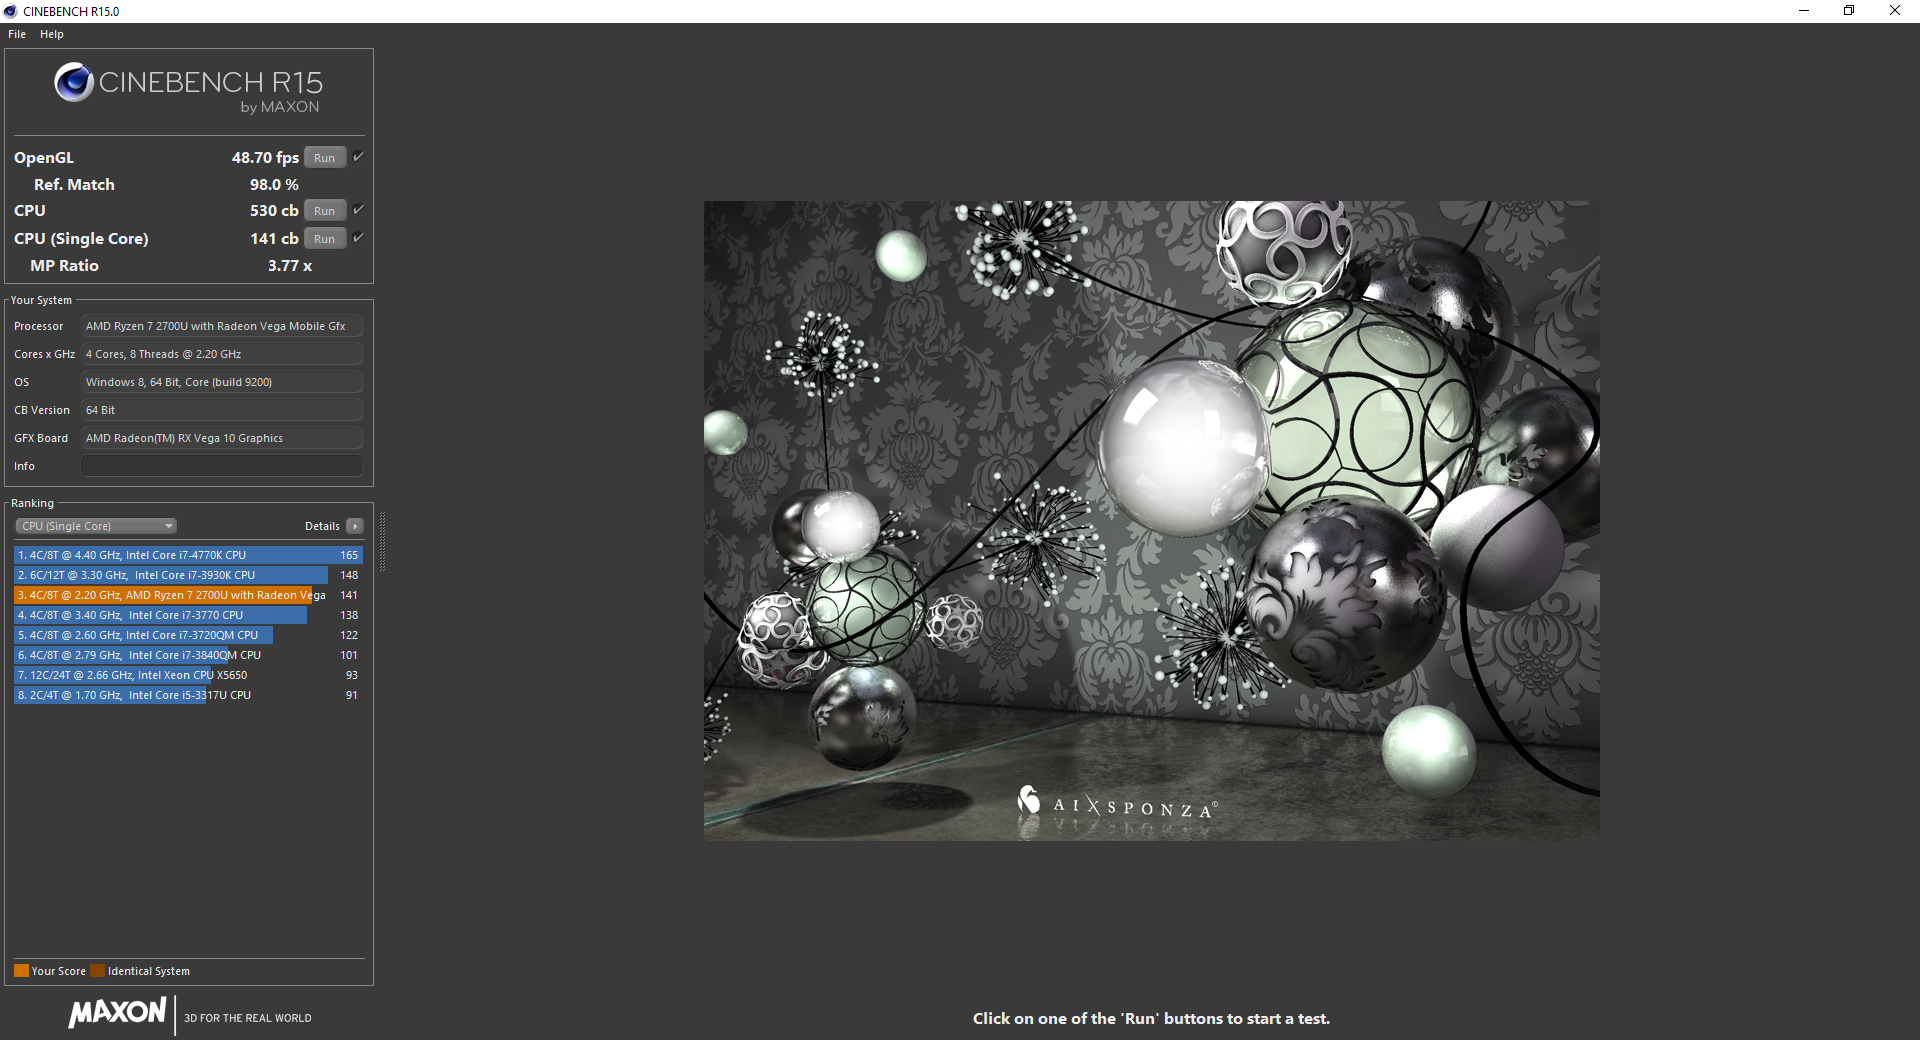
On paper, the Ryzen 7 2700U should compete with or beat out Intel's 8th gen Core i7 U-series CPUs, and we have indeed seen this play out in prior systems. It's this past performance that makes the Swift 3 particularly disappointing. In Cinebench R15's, the Swift 3 lags 5-20% behind devices equipped with Intel's Core i7-8550U (depending on the compared system). Even the lower-clocked Core i5-8250U (used in the Dell Inspiron 13 5379) scores better in single- and multi-threaded tests. It should also be noted that the Ryzen 7 version of the Swift 3 performed worse than the Ryzen 5 variant, which may indicate intentional throttling in our particular unit.
Long-term performance (tested by running Cinebench R15 several times in a row) is stable. The Swift 3 exhibits behavior commonly seen in this test; the systems has a strong initial run with a subsequent drop in performance that remains stable over the remaining passes.
To learn more about the Ryzen 7 2700U APU, please visit our dedicated CPU page here.
| wPrime 2.10 - 1024m | |
| Average of class Multimedia (227 - 340, n=6, last 2 years) | |
| Average AMD Ryzen 7 2700U (268 - 270, n=2) | |
| Acer Swift 3 SF315-41-R6J9 | |
| Asus FX503VM-EH73 | |
* ... smaller is better
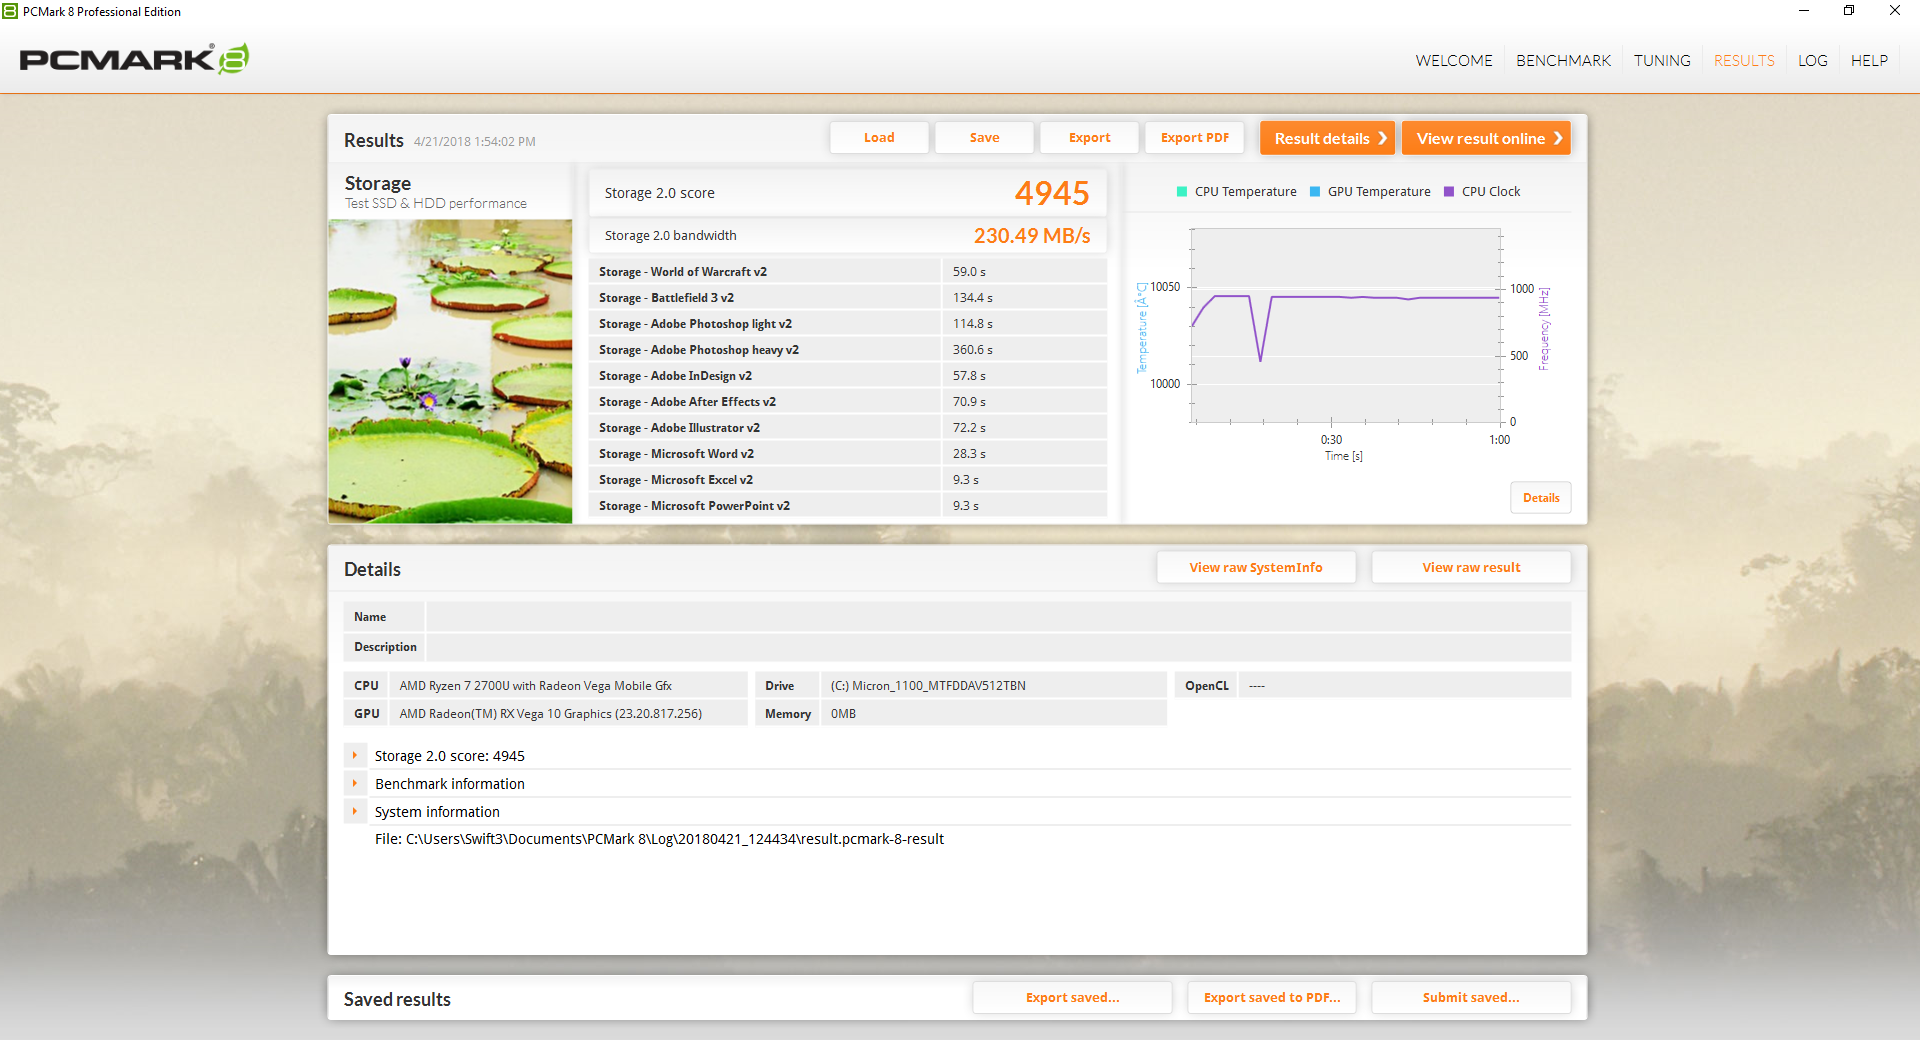
System Performance
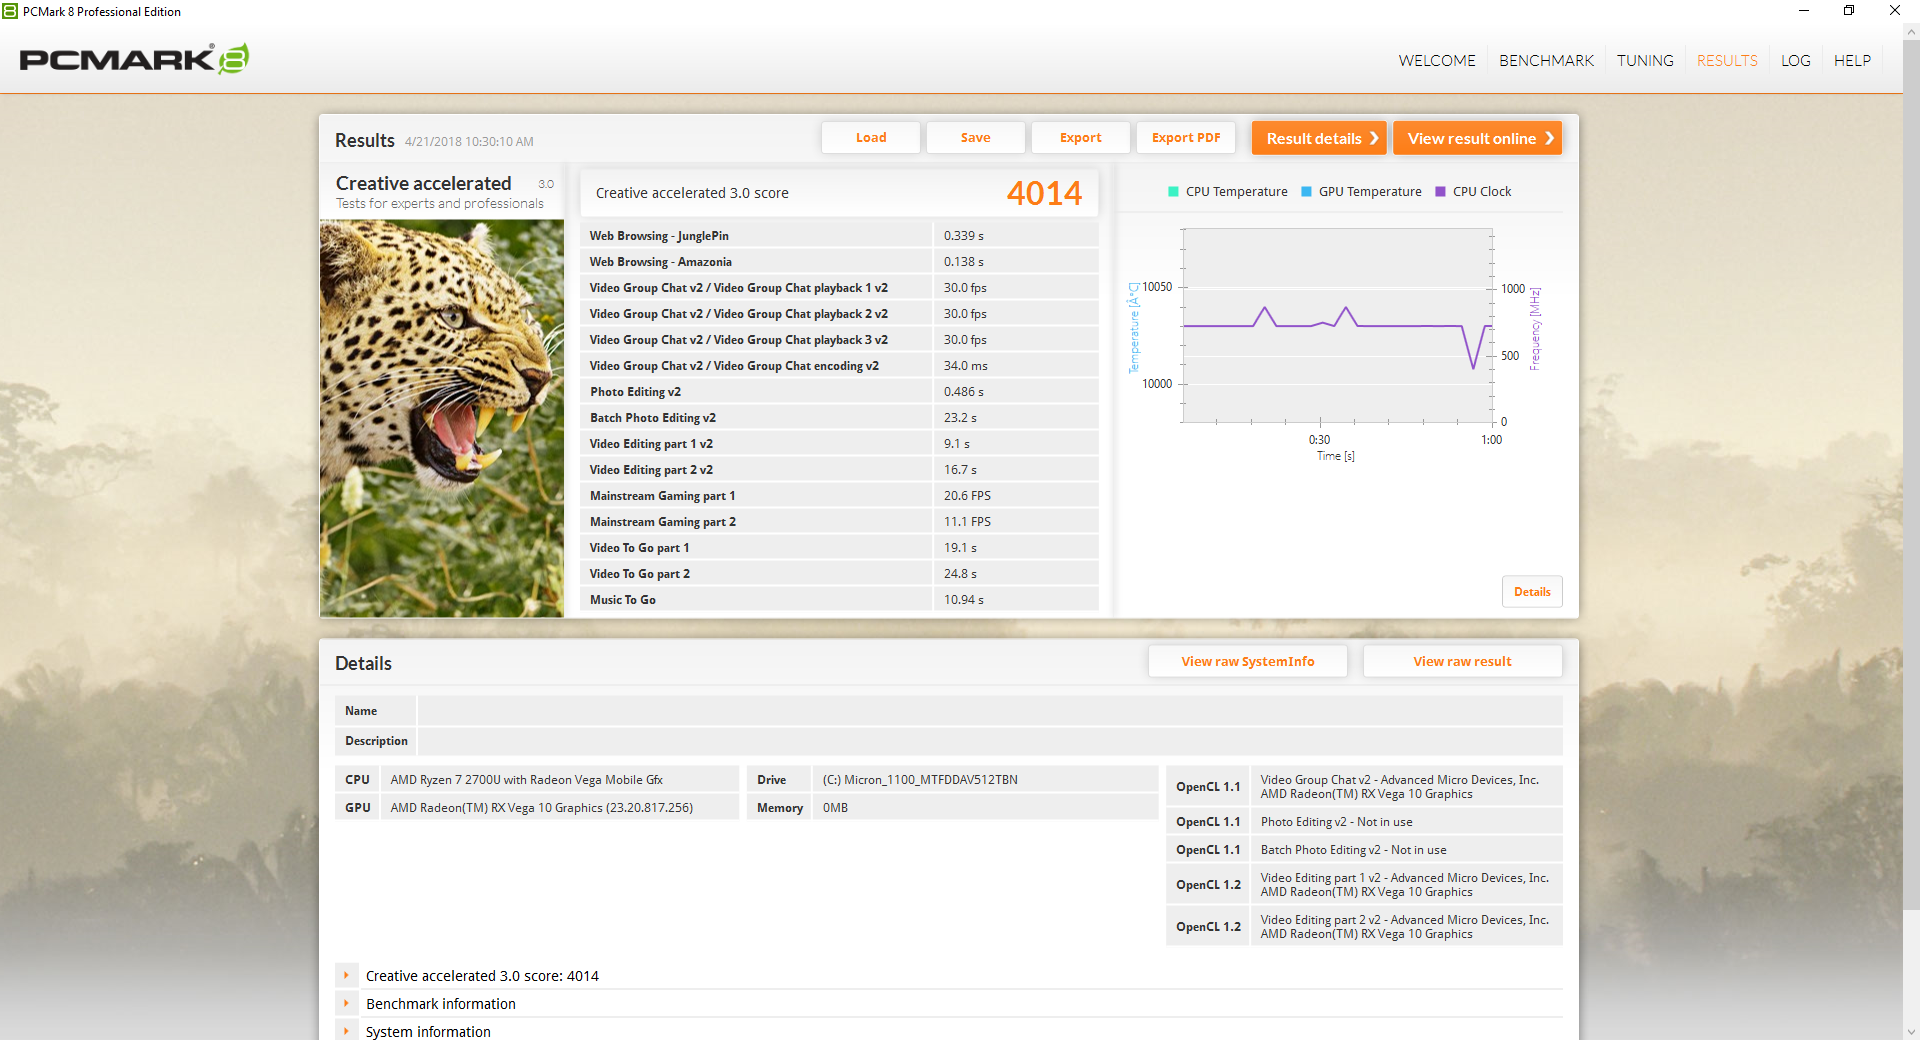
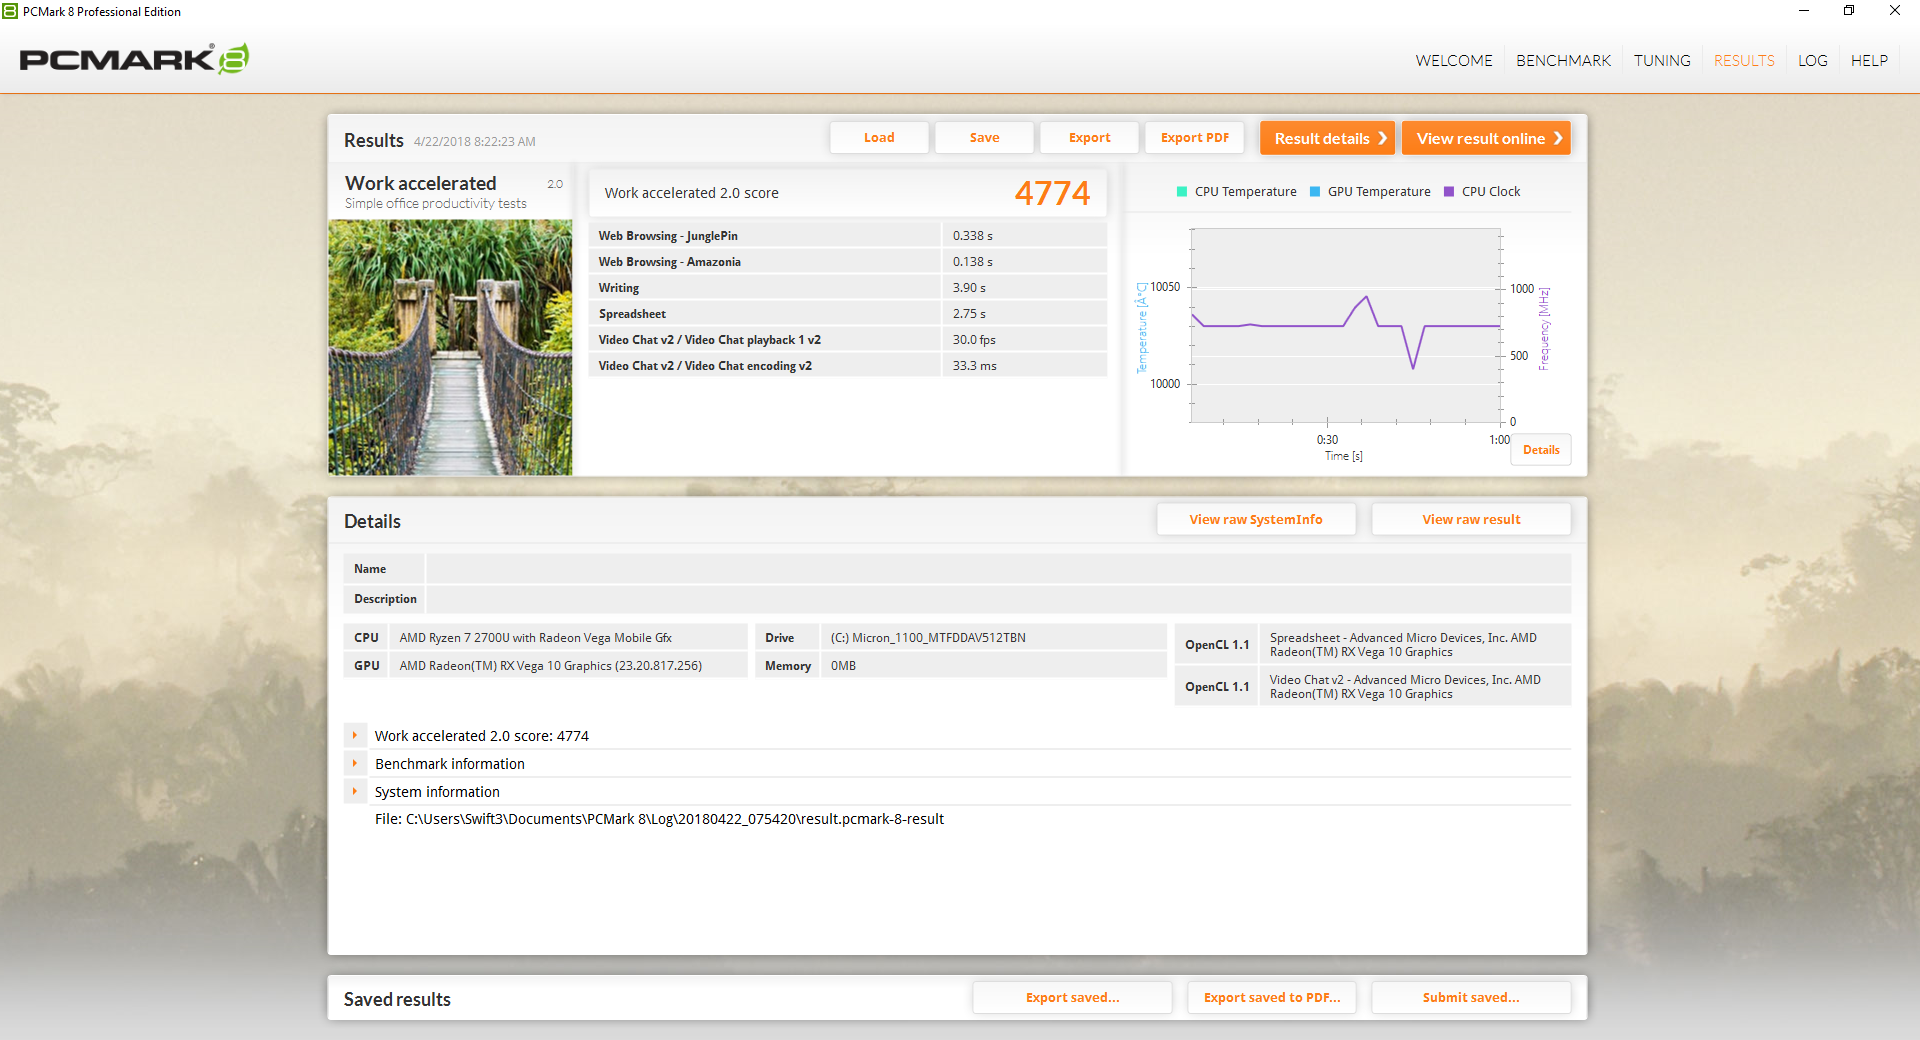
System performance is frustratingly slow. Opening the start menu or programs takes a tick too long and feels as though the device is playing catch-up. Once things get going, however, performance is smooth and responsive. The biggest hurdle lies in the SSD (discussed below). The Swift 3 scores well in PCMark 8's Creative benchmark, in particular, and beats out other devices with iGPUs. Notebooks with dedicated GPUs understandably trump the Ryzen SoC.
It should be noted that during our testing period, we experienced a handful of system crashes that resulted in either a BSOD or an unwarranted reboot. One occurred during our load battery test and two others occurred while browsing the web. The crashes cannot be intentionally repeated and seem to be random.
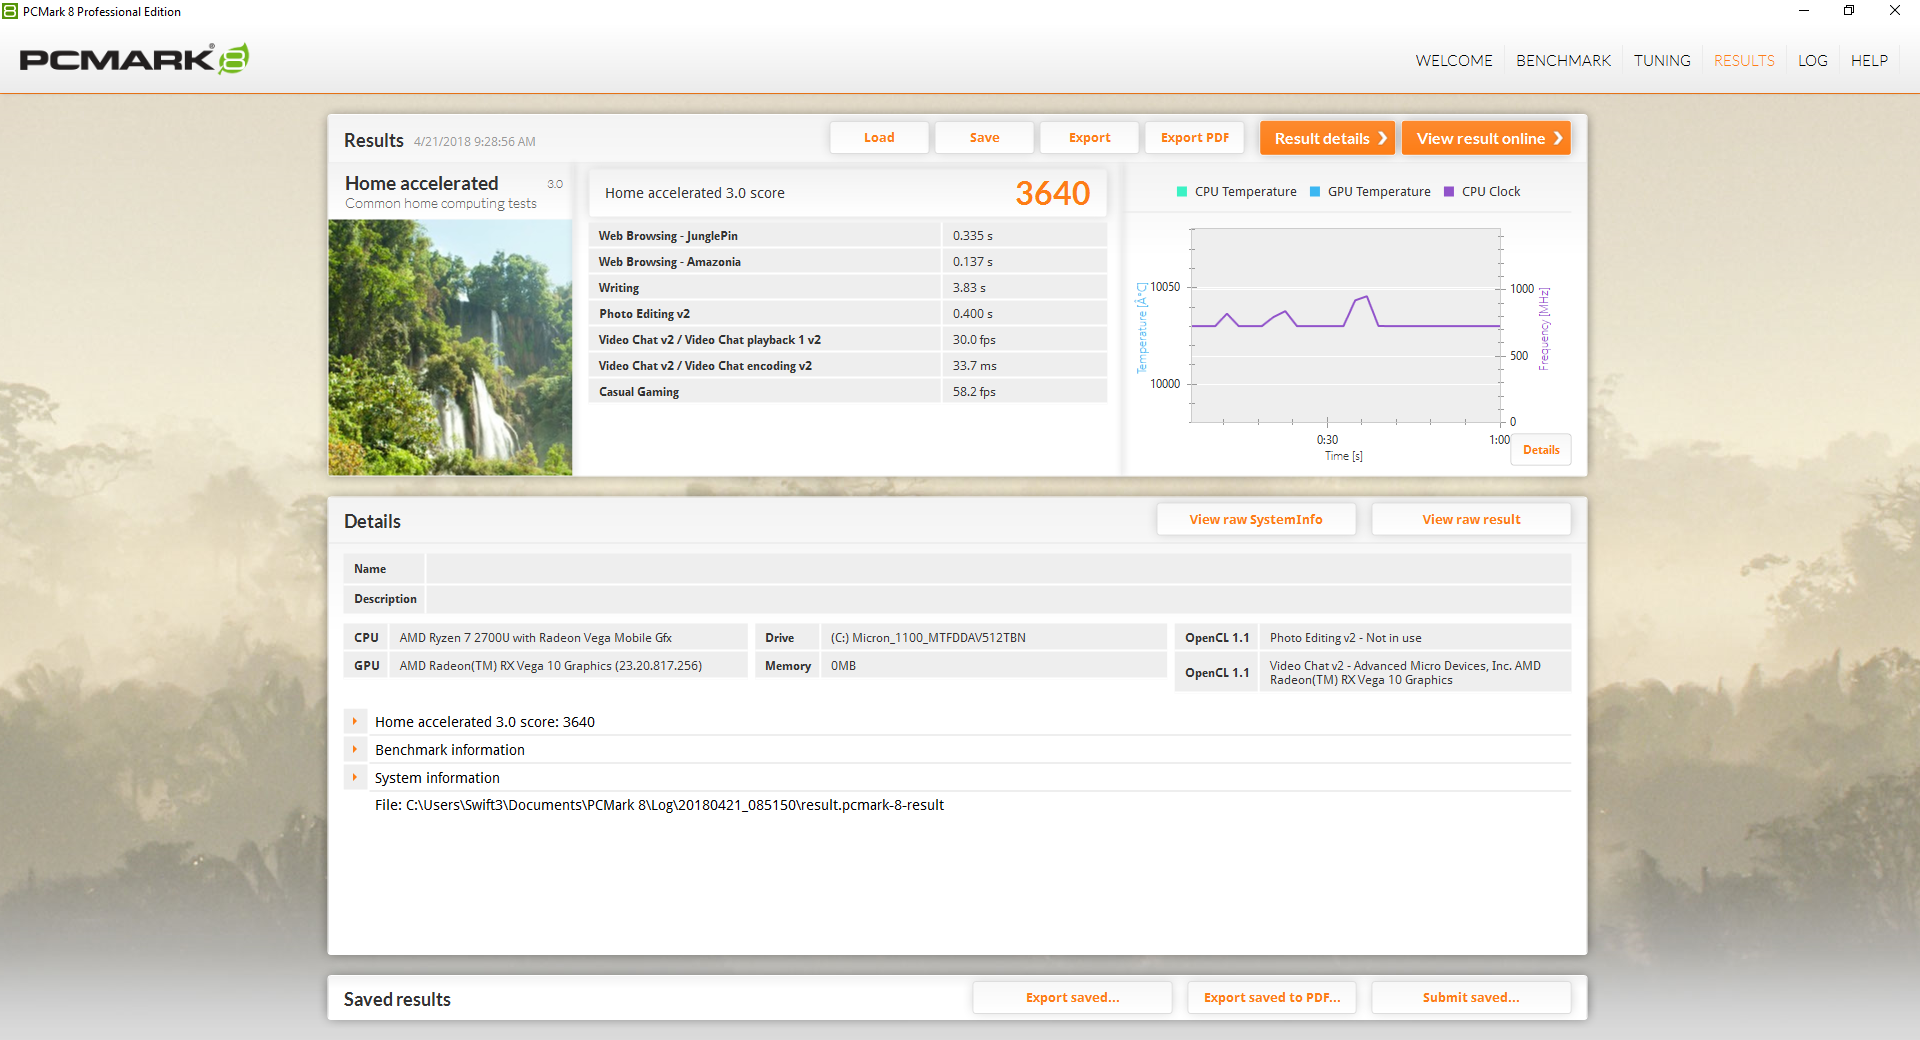
| PCMark 8 Home Score Accelerated v2 | 3640 points | |
| PCMark 8 Creative Score Accelerated v2 | 4014 points | |
| PCMark 8 Work Score Accelerated v2 | 4774 points | |
| PCMark 10 Score | 3303 points | |
Help | ||
Storage Devices
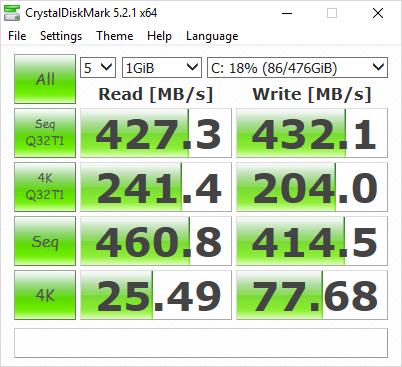
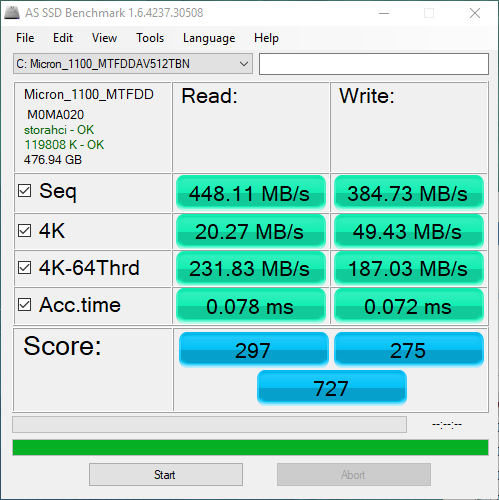
The Micron SSD is slow and disappointing. Despite its PCIe connection, the SSD used in this variant of the Swift 3 runs on the SATA protocol rather than the faster NVMe standard. As such, drive performance suffers. Speeds are slow, even for a SATA-based SSD, and fall well behind other options. It's odd that Acer chose a Micron SSD rather than the Intel SSD 600p used in other Swift 3 models. The Intel SSD 600p is much quicker, particular in read operations. Consumers should be aware of the options that Acer uses and choose their hard drive accordingly.
| Acer Swift 3 SF315-41-R6J9 Micron SSD 1100 SED 512GB, M.2 (MTFDDAV512TBN) | Acer Swift 3 SF315-41-R4W1 Intel SSD 600p SSDPEKKW256G7 | Acer Swift 3 SF314-52G-89SL Intel SSD 600p SSDPEKKW512G7 | Dell Inspiron 13-5379-9573 Micron 1100 MTFDDAV256TBN | Asus ZenBook 13 UX331UN SK Hynix HFS256G39TND-N210A | HP Pavilion 15-cc107ng SanDisk SD8SN8U256G1006 | Lenovo ThinkPad L380-20M5000WGE Samsung PM961 MZVLW256HEHP | Average Micron SSD 1100 SED 512GB, M.2 (MTFDDAV512TBN) | |
|---|---|---|---|---|---|---|---|---|
| AS SSD | 34% | 112% | 5% | -6% | 3% | -168% | 20% | |
| Copy Game MB/s (MB/s) | 221.7 | 421.5 90% | 154.1 -30% | 183.7 -17% | 222 ? 0% | |||
| Copy Program MB/s (MB/s) | 174.4 | 290.2 66% | 129.7 -26% | 142.3 -18% | 174.4 ? 0% | |||
| Copy ISO MB/s (MB/s) | 262.5 | 620 136% | 192.4 -27% | 333.5 27% | 263 ? 0% | |||
| Score Total (Points) | 727 | 1170 61% | 1703 134% | 812 12% | 991 36% | 890 22% | 1516 109% | 956 ? 31% |
| Score Write (Points) | 275 | 563 105% | 695 153% | 350 27% | 323 17% | 250 -9% | 143 -48% | 371 ? 35% |
| Score Read (Points) | 297 | 425 43% | 697 135% | 303 2% | 445 50% | 419 41% | 947 219% | 384 ? 29% |
| Access Time Write * (ms) | 0.072 | 0.204 -183% | 0.031 57% | 0.074 -3% | 0.23 -219% | 0.091 -26% | 1.995 -2671% | 0.056 ? 22% |
| Access Time Read * (ms) | 0.078 | 0.098 -26% | 0.07 10% | 0.13 -67% | 0.09 -15% | 0.133 -71% | 0.058 26% | 0.071 ? 9% |
| 4K-64 Write (MB/s) | 187 | 458.2 145% | 521 179% | 245.1 31% | 233.1 25% | 155.5 -17% | 114.2 -39% | 254 ? 36% |
| 4K-64 Read (MB/s) | 231.8 | 279.4 21% | 506 118% | 232.2 0% | 368.4 59% | 343.9 48% | 736 218% | 314 ? 35% |
| 4K Write (MB/s) | 49.43 | 48.36 -2% | 117.5 138% | 68.2 38% | 68.9 39% | 49.33 0% | 1.21 -98% | 73.7 ? 49% |
| 4K Read (MB/s) | 20.27 | 14.84 -27% | 29.55 46% | 24.71 22% | 27.98 38% | 25.92 28% | 44.53 120% | 22.8 ? 12% |
| Seq Write (MB/s) | 384.7 | 561 46% | 567 47% | 365.7 -5% | 213.7 -44% | 452 17% | 275 -29% | 436 ? 13% |
| Seq Read (MB/s) | 448.1 | 1304 191% | 1609 259% | 462.8 3% | 483.7 8% | 491.7 10% | 1971 340% | 467 ? 4% |
* ... smaller is better

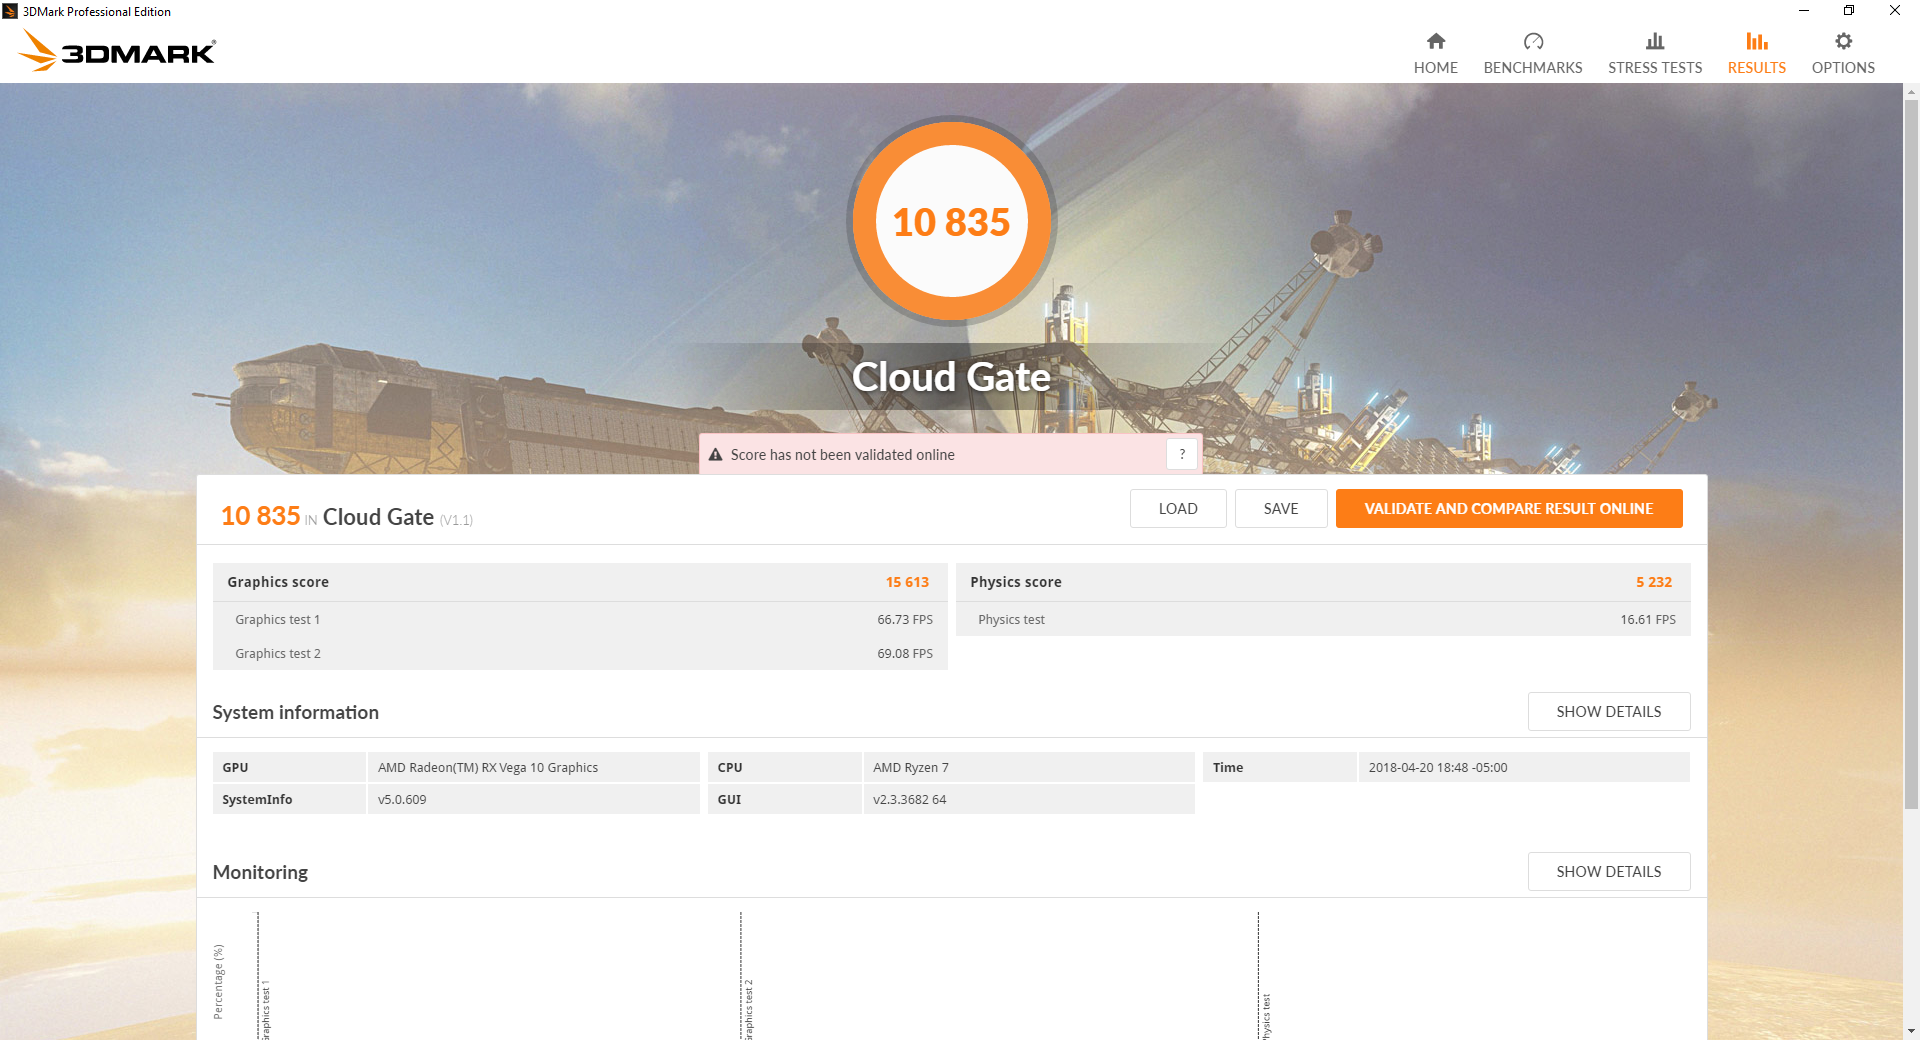
GPU Performance
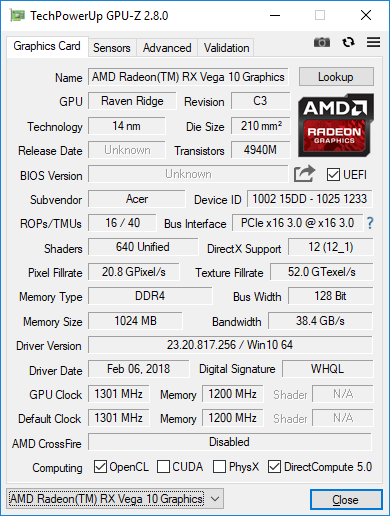
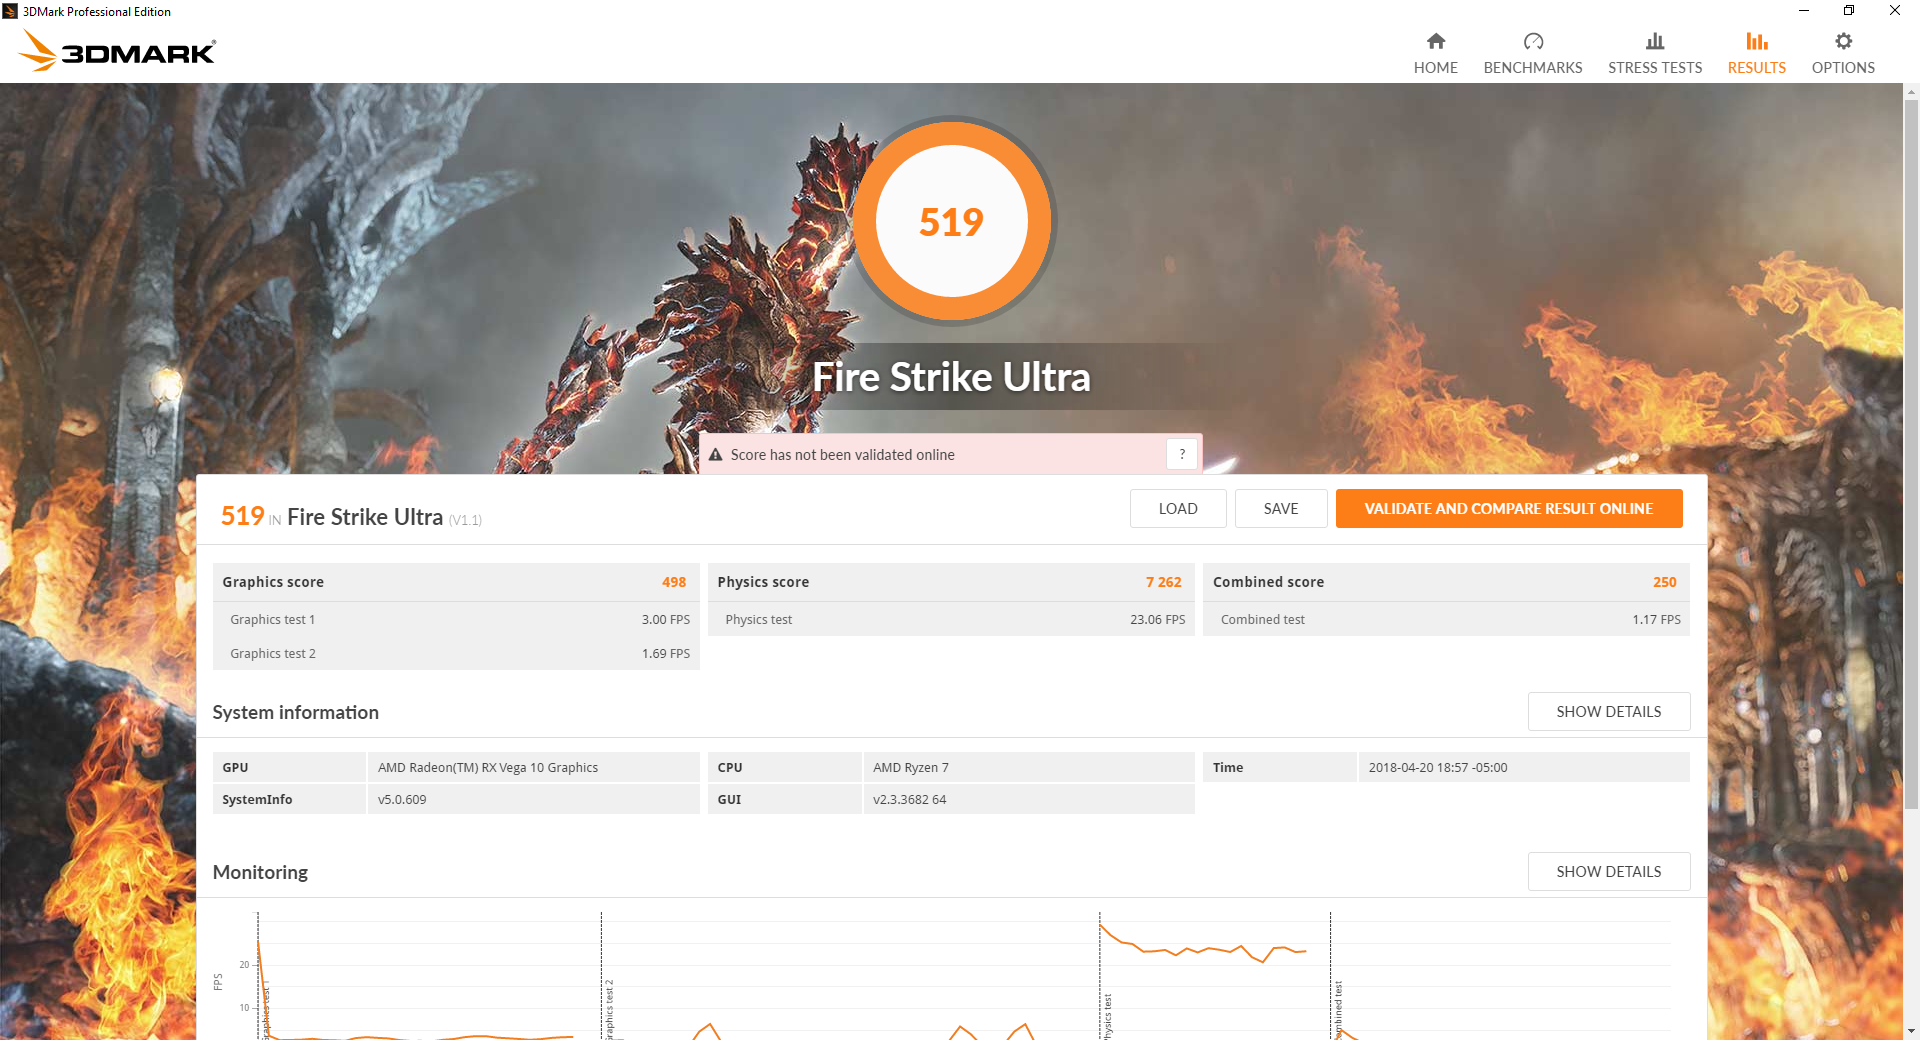
The purpose of an APU is to pair a competent CPU with a powerful integrated GPU, and here the combination of the Ryzen 7 2700U CPU and Radeon RX Vega 10 iGPU succeeds. The Swift 3's graphical prowess falls in between Nvidia's GeForce 940MX and GeForce MX150 GPUs. More pertinent to AMD's goal, the Radeon RX Vega 10 iGPU sits well above Intel's integrated solutions and more than doubles the performance of Intel's UHD Graphics 620's in Fire Strike. Intel's Iris Plus Graphics 640 are also left in the dust. Unsurprisingly, the RX Vega 10 falls far behind mid-tier graphics solutions like the GTX 1050 and GTX 1050 Ti. As far as on-chip GPUs are concerned, the RX Vega 10 is the current king.
For more information about the Radeon RX Vega 10 GPU, visit our dedicated GPU page here.
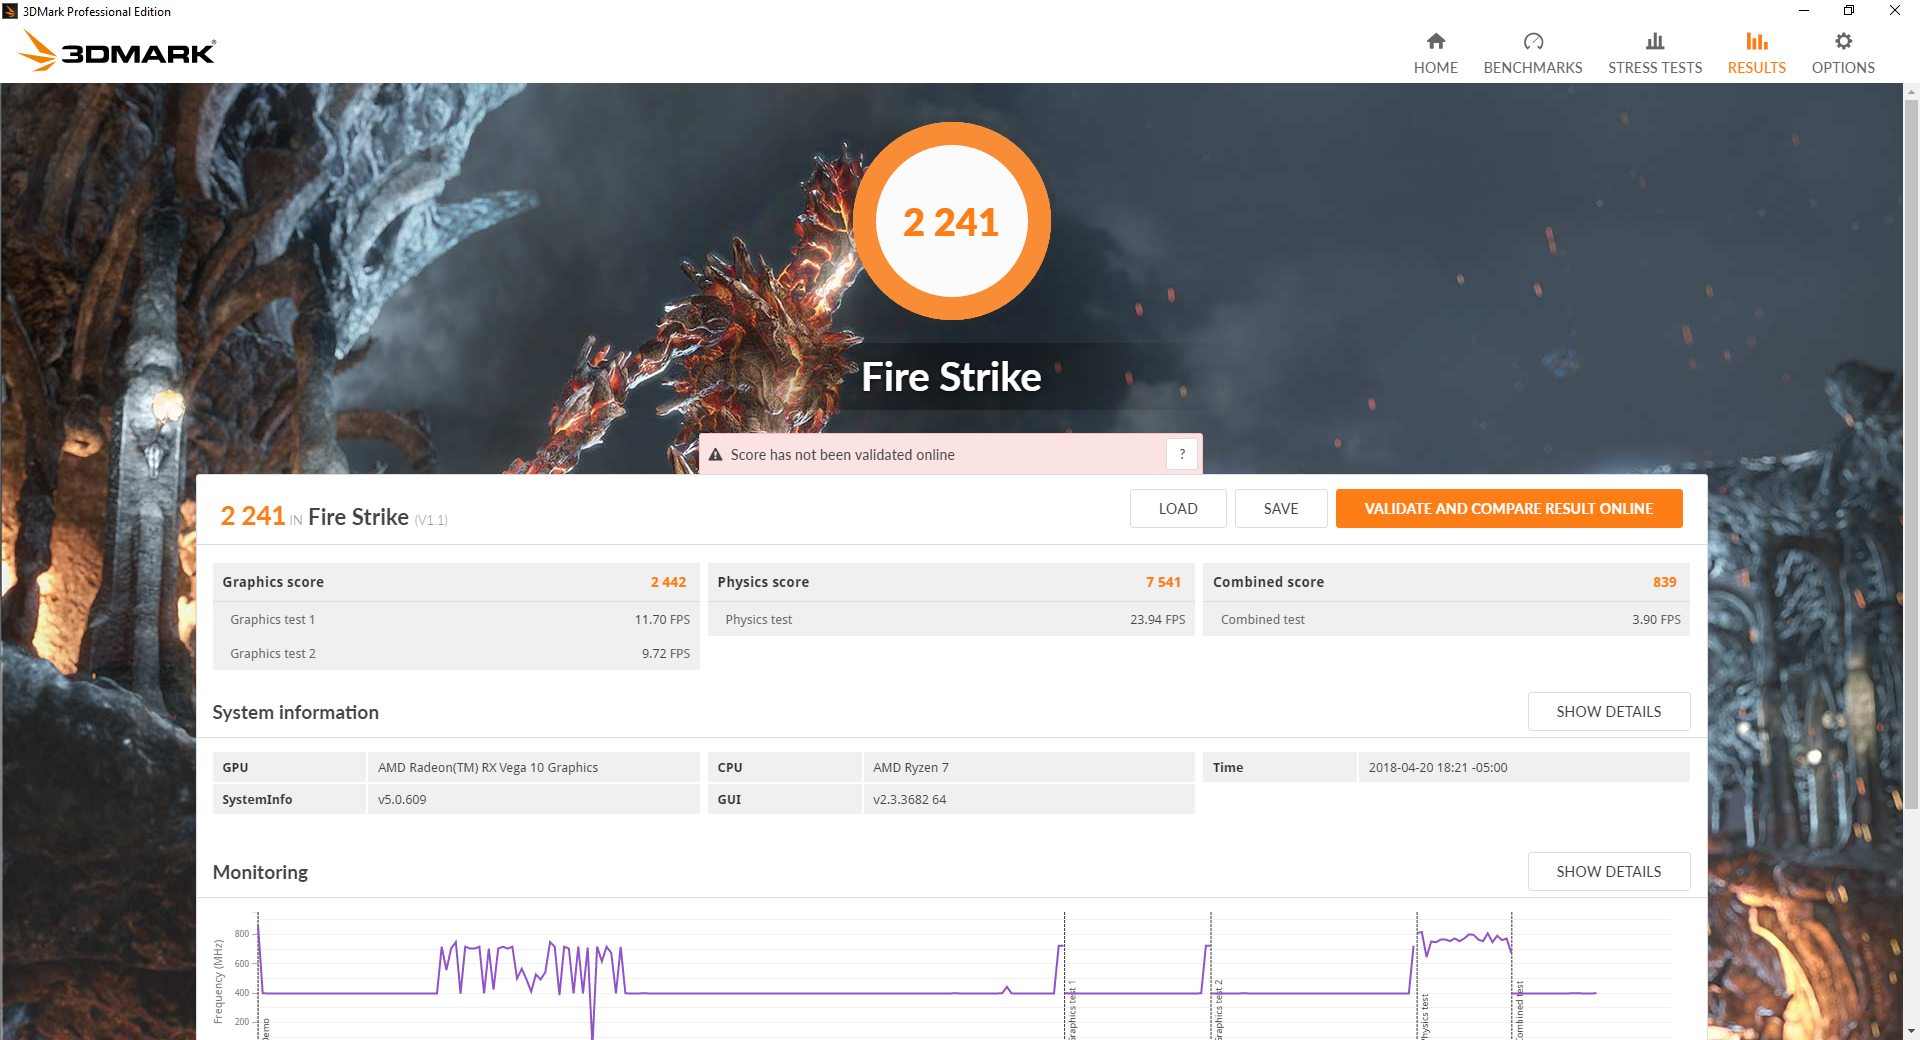
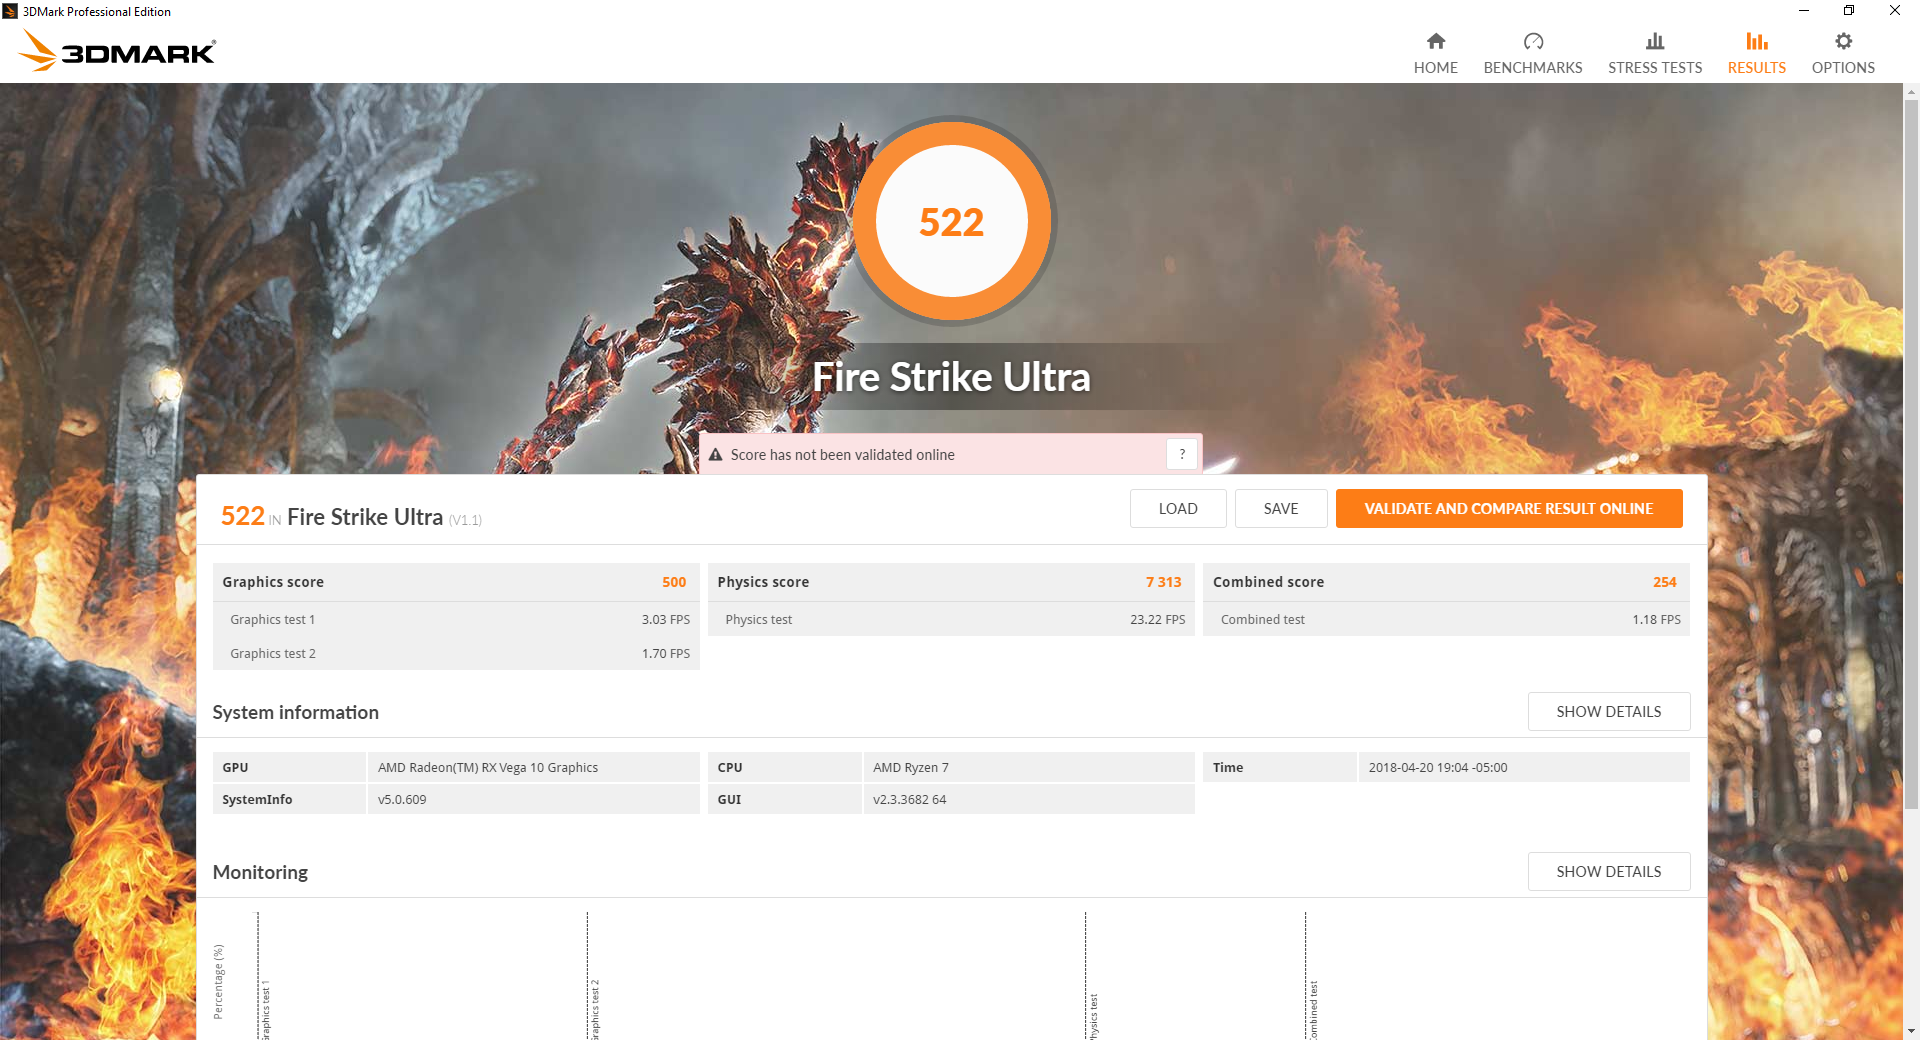
| 3DMark 06 Standard Score | 15372 points | |
| 3DMark 11 Performance | 3753 points | |
| 3DMark Cloud Gate Standard Score | 10835 points | |
| 3DMark Fire Strike Score | 2241 points | |
Help | ||
Gaming Performance
The RX Vega 10 GPU is powerful enough to hit Medium settings at 1366x768 in most games. Lighter titles like Rocket League are able to reach 30 fps at FHD (1920x1080) with High settings, but gamers may want to turn the resolution and/or graphics settings down to get higher framerates. More popular titles like DOTA 2 and CS: GO should also be fluid and enjoyable at Full HD at medium-high settings. All said, the Ryzen 2700U benefits greatly from the on-chip Vega 10 GPU, which blows Intel's iGPUs out of the water. Vega 10 is a reasonable solution for most multiplayer games. Gamers that play more demanding titles (like The Witcher 3) should look at notebooks with a dedicated GPU; even Nvidia's low-end MX150 offers better performance.
| Rocket League - 1920x1080 High Quality AA:High FX (sort by value) | |
| Acer Swift 3 SF315-41-R6J9 | |
| Average AMD Radeon RX Vega 10 (33 - 38.9, n=3) | |
| Dirt 4 - 1920x1080 Medium Preset AF:4x (sort by value) | |
| Acer Swift 3 SF315-41-R6J9 | |
| Average AMD Radeon RX Vega 10 (14.2 - 53, n=2) | |
| Rise of the Tomb Raider - 1366x768 Medium Preset AF:2x (sort by value) | |
| Acer Swift 3 SF315-41-R6J9 | |
| Average AMD Radeon RX Vega 10 (n=1) | |
| low | med. | high | ultra | |
|---|---|---|---|---|
| The Witcher 3 (2015) | 9.3 | |||
| Rise of the Tomb Raider (2016) | 30 | |||
| Civilization 6 (2016) | 29 | |||
| Rocket League (2017) | 33 | |||
| Dirt 4 (2017) | 53 | 21 |
Stress Test
Stressing the system via synthetic workloads reveals a possible reason behind the disappointing CPU performance we witnessed above. The Ryzen 2700U seems to be tuned very conservatively; in Prime95, the CPU boost intermittently to 3.2 GHz but generally holds back at just under 2.0 GHz. Temperatures on the CPU die are relatively low for a stress test, averaging about 74° C. GPU performance is similar; the Vega 10 GPU never manages to reach its boost clock of 1300 MHz under synthetic stress (via Furmark) or gaming load (during an hour-long session of The Witcher 3). There's plenty of headroom for increased performance, so the restrained clocks are a bit confusing. It could be that Acer has tuned the SoC down in order to keep both interior and exterior temperatures cooler. It could also be that the drivers are too new and these programs cannot fully utilize the hardware. The CPU and GPU can be pushed further; perhaps an update or improved drivers can mitigate this in the future.
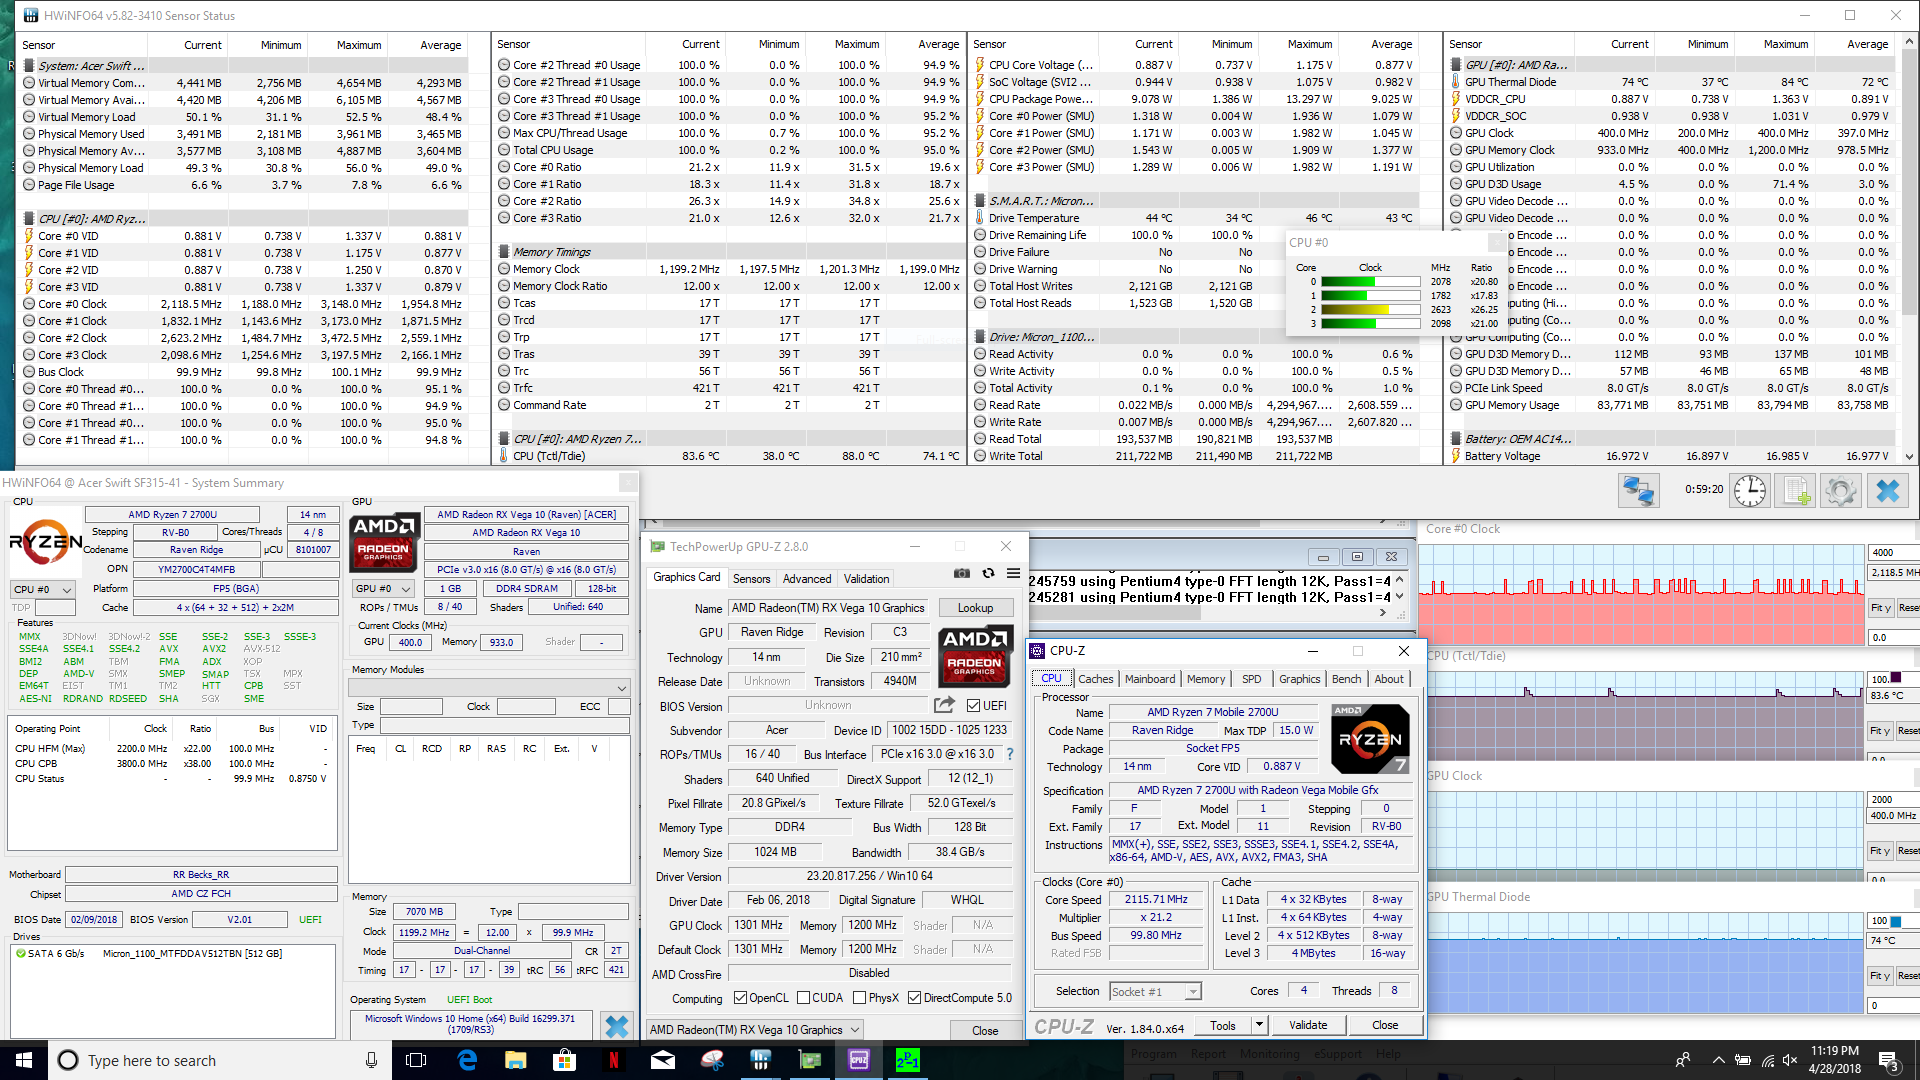
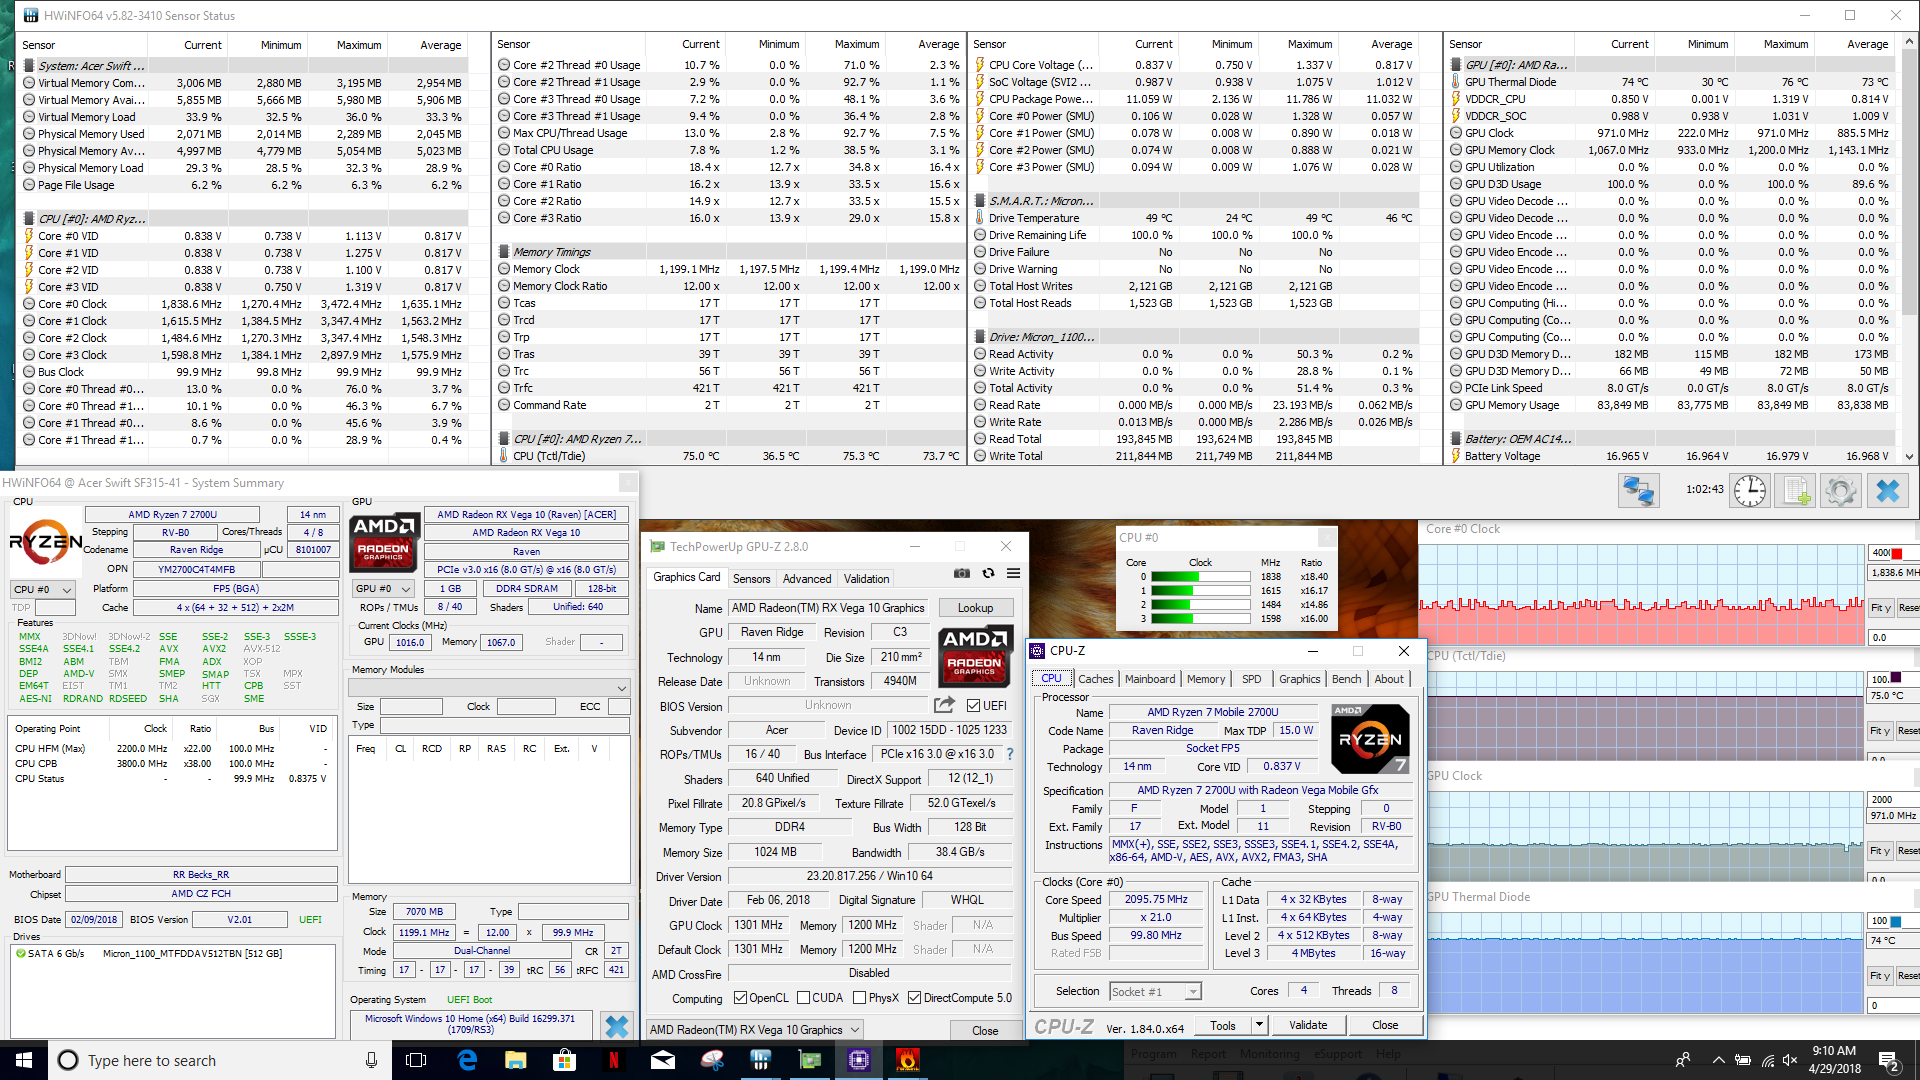
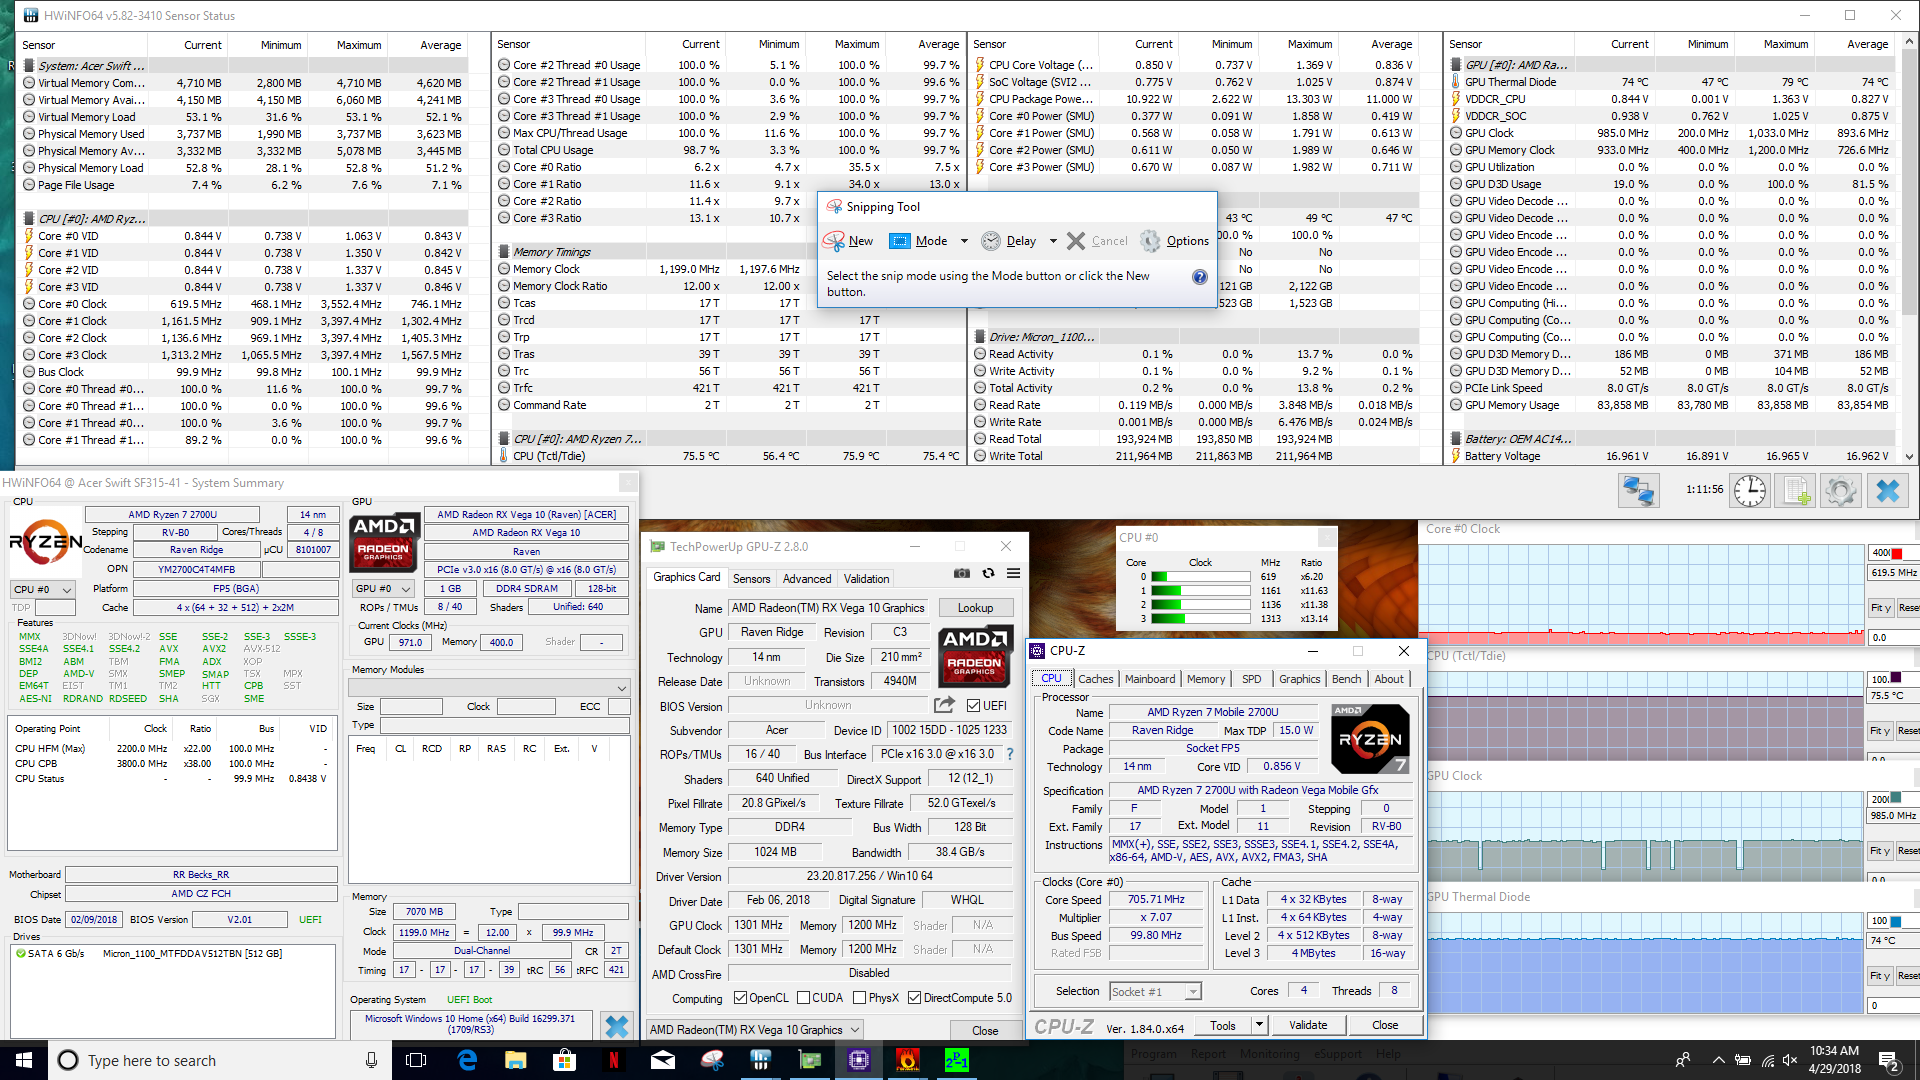
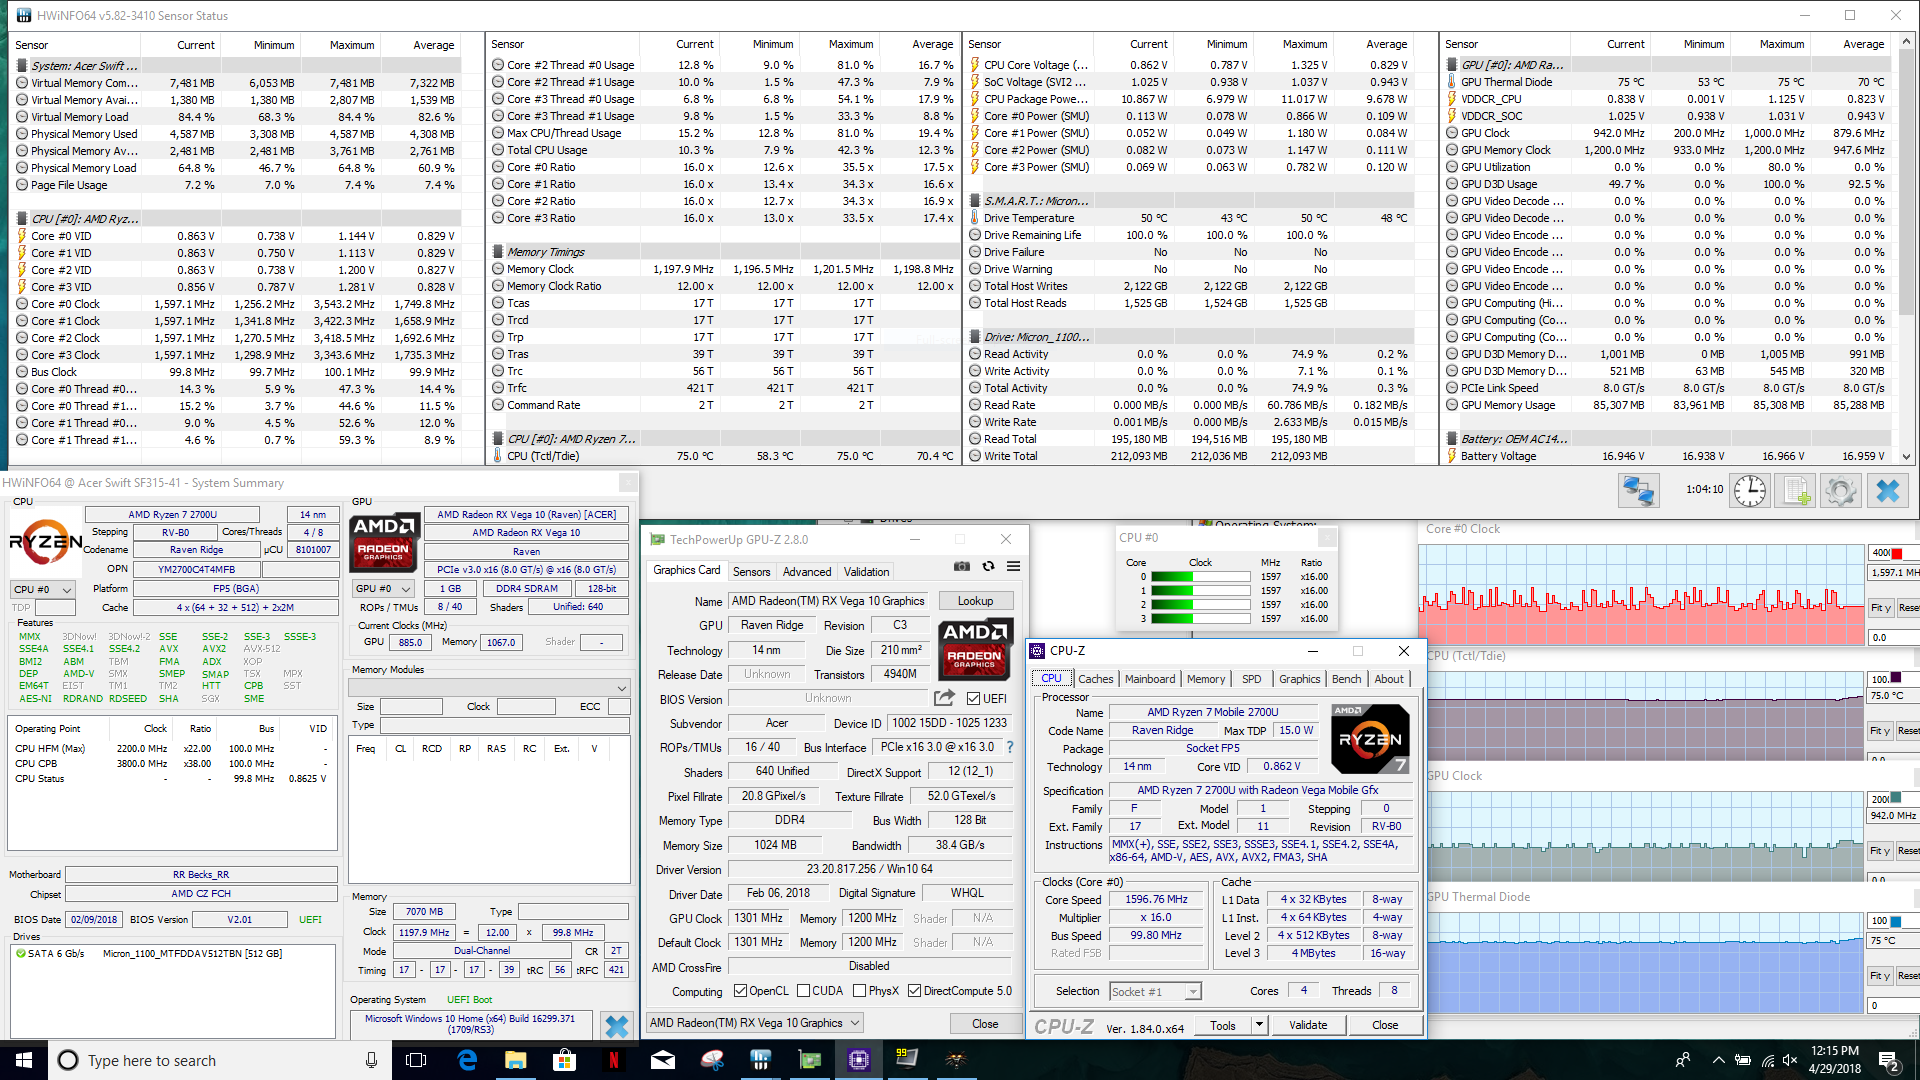
| CPU Clock (GHz) | GPU Clock (MHz) | Average CPU Temperature (°C) | Average GPU Temperature (°C) | |
| Prime95 Stress | 1.95 | 397 | 74 | 72 |
| FurMark Stress | 1.6 | 1150 | 74 | 73 |
| Prime95 + FurMark Stress | 1.4 | 900 | 75 | 74 |
| Witcher 3 Stress | 1.7 | 880 | 70 | 70 |
Emissions
System Noise
One of the high points of the Swift 3 is its external thermal management. The single fan is relatively quiet and only spins up when the device falls under moderate load. Even then, the low pitch blends into room noise remarkably well, and the overall fan volume rarely exceeds 35 dB(A). System noise is on the better side of average compared to other mid-tier devices and quieter than most thin-and-light notebooks (which tend to have shrill, high-pitched fans). There is coil whine, but it is only noticeable within 6 inches of the bottom panel.
Noise level
| Idle |
| 28.1 / 28.1 / 29.3 dB(A) |
| Load |
| 32.6 / 35.7 dB(A) |
 | ||
30 dB silent 40 dB(A) audible 50 dB(A) loud |
||
min: | ||
| Acer Swift 3 SF315-41-R6J9 Vega 10, R7 2700U, Micron SSD 1100 SED 512GB, M.2 (MTFDDAV512TBN) | Acer Swift 3 SF315-41-R4W1 Vega 8, R5 2500U, Intel SSD 600p SSDPEKKW256G7 | Acer Swift 3 SF314-52G-89SL GeForce MX150, i5-8550U, Intel SSD 600p SSDPEKKW512G7 | Dell Inspiron 13-5379-9573 UHD Graphics 620, i5-8250U, Micron 1100 MTFDDAV256TBN | Asus ZenBook 13 UX331UN GeForce MX150, i5-8550U, SK Hynix HFS256G39TND-N210A | Lenovo ThinkPad L380-20M5000WGE UHD Graphics 620, i5-8250U, Samsung PM961 MZVLW256HEHP | Lenovo Ideapad 720S-13ARR Vega 8, R5 2500U, Samsung PM961 NVMe MZVLW128HEGR | |
|---|---|---|---|---|---|---|---|
| Noise | -8% | -7% | -4% | -10% | -3% | -3% | |
| off / environment * (dB) | 28.1 | 31.8 -13% | 30.5 -9% | 30.1 -7% | 30.13 -7% | 30 -7% | 30.4 -8% |
| Idle Minimum * (dB) | 28.1 | 31.8 -13% | 30.5 -9% | 30.1 -7% | 30.13 -7% | 30 -7% | 30.4 -8% |
| Idle Average * (dB) | 28.1 | 32.1 -14% | 30.5 -9% | 30.1 -7% | 30.3 -8% | 30 -7% | 30.4 -8% |
| Idle Maximum * (dB) | 29.3 | 32.1 -10% | 30.9 -5% | 30.1 -3% | 30.3 -3% | 30 -2% | 30.4 -4% |
| Load Average * (dB) | 32.6 | 33 -1% | 35.6 -9% | 33 -1% | 39.2 -20% | 33.1 -2% | 32.3 1% |
| Witcher 3 ultra * (dB) | 33.3 | 35.1 -5% | |||||
| Load Maximum * (dB) | 35.7 | 34.8 3% | 35.6 -0% | 35 2% | 41 -15% | 32.6 9% | 31.4 12% |
* ... smaller is better
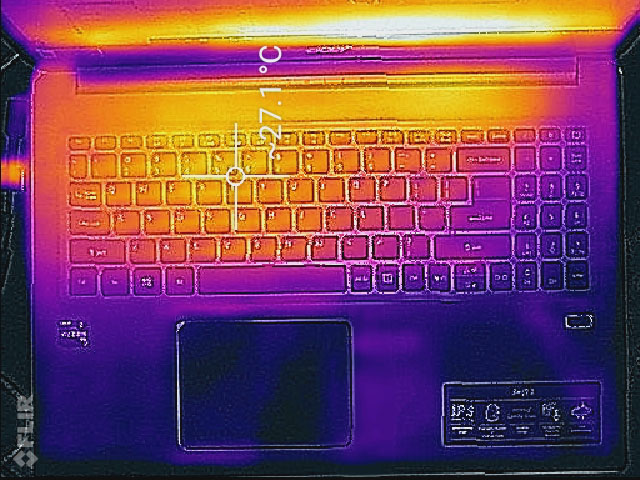
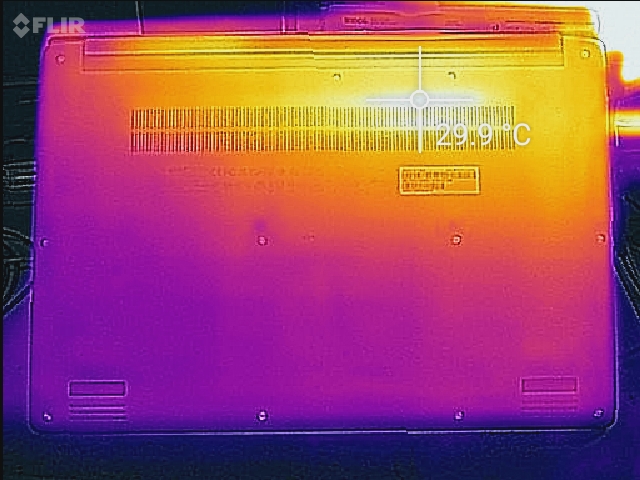
Temperature
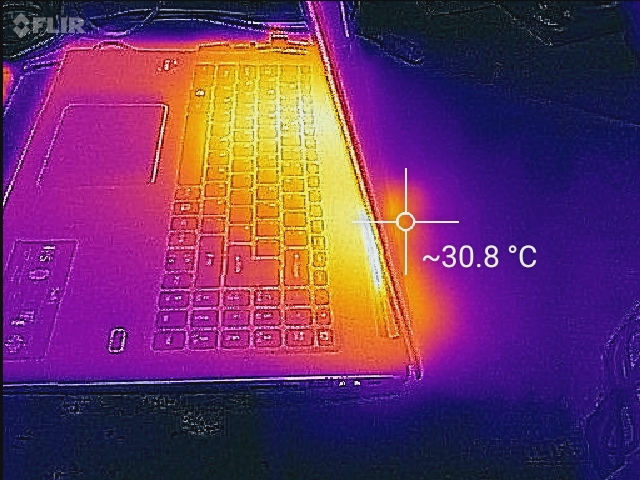
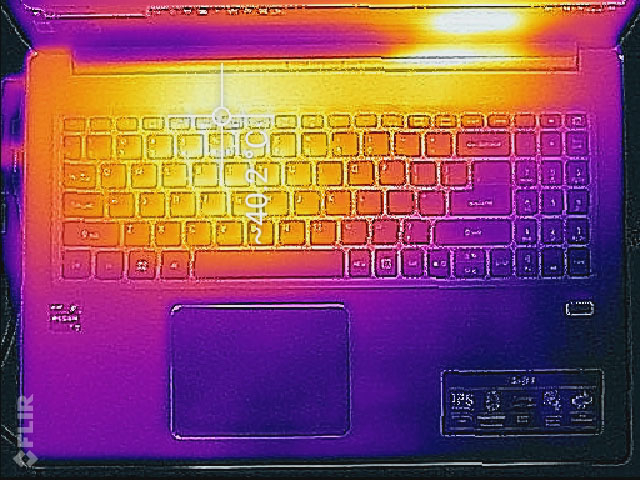
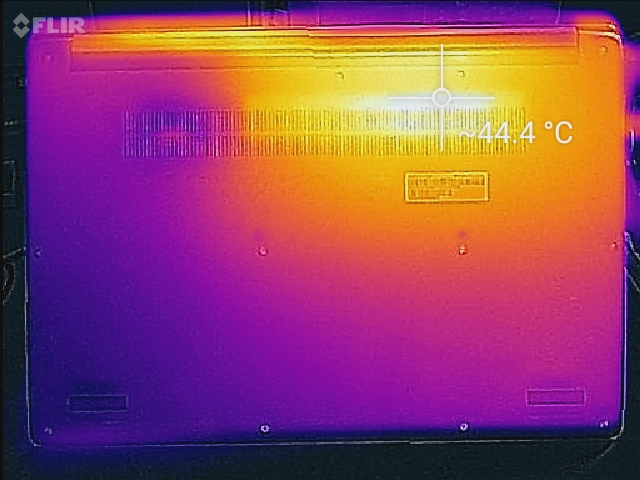
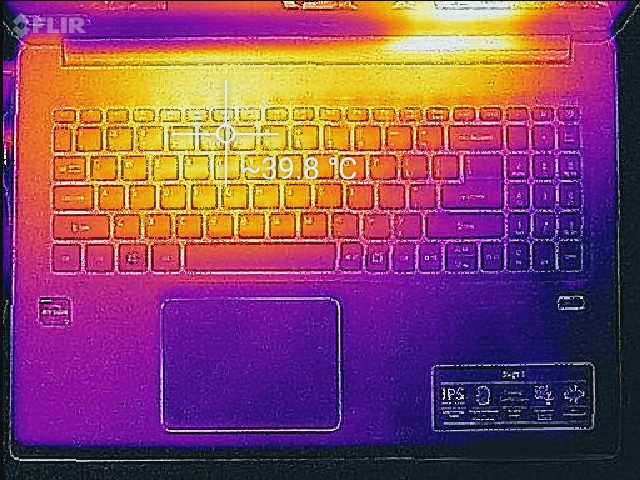
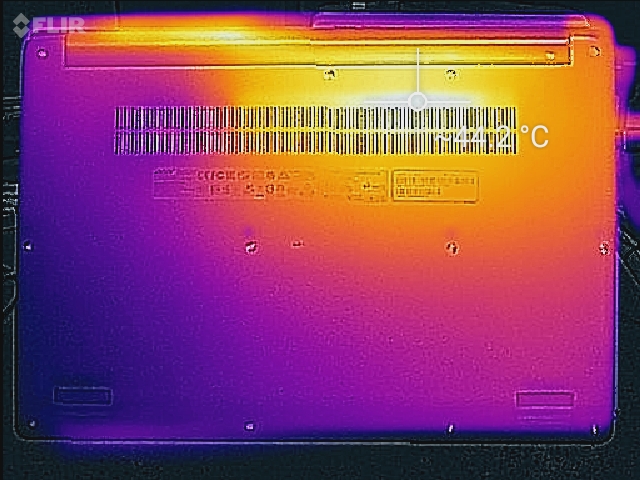
The Swift 3 has the best of both worlds: quiet fan noise and low external temperatures. Under full load, the hottest point on the chassis lies at the bottom left vent along the backside. Even this point only gets somewhat warm and never feels painful to the touch. The keyboard feels neither warm nor cool during long gaming sessions. While we bemoaned the lackluster performance (see the Stress Testing section), the resultant cooler temperatures are a pleasant consequence of the restrained hardware.
(±) The maximum temperature on the upper side is 40.2 °C / 104 F, compared to the average of 36.8 °C / 98 F, ranging from 21 to 71 °C for the class Multimedia.
(±) The bottom heats up to a maximum of 44.2 °C / 112 F, compared to the average of 39.1 °C / 102 F
(+) In idle usage, the average temperature for the upper side is 25.8 °C / 78 F, compared to the device average of 31.3 °C / 88 F.
(+) Playing The Witcher 3, the average temperature for the upper side is 31 °C / 88 F, compared to the device average of 31.3 °C / 88 F.
(+) The palmrests and touchpad are cooler than skin temperature with a maximum of 27.2 °C / 81 F and are therefore cool to the touch.
(±) The average temperature of the palmrest area of similar devices was 28.7 °C / 83.7 F (+1.5 °C / 2.7 F).
Speakers
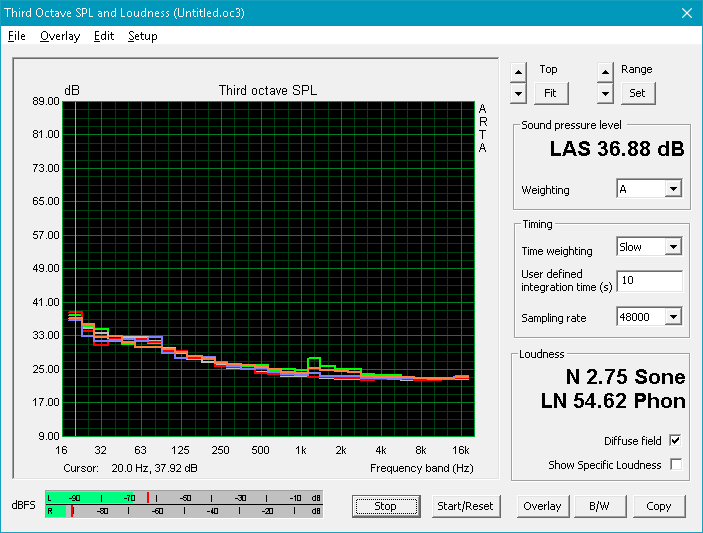
Most devices in this price range aren't known for their sound quality, and the Swift 3 is no exception. The speakers are underwhelming. Bass is almost entirely absent, and highs are thin and tinny. There is also a noticeable rattle in the chassis at higher volumes. The overall listening experience is none too pleasant. Headphones are highly recommended.
Acer Swift 3 SF315-41-R6J9 audio analysis
(-) | not very loud speakers (70.9 dB)
Bass 100 - 315 Hz
(-) | nearly no bass - on average 22.1% lower than median
(±) | linearity of bass is average (11.4% delta to prev. frequency)
Mids 400 - 2000 Hz
(±) | higher mids - on average 5.1% higher than median
(±) | linearity of mids is average (9.4% delta to prev. frequency)
Highs 2 - 16 kHz
(+) | balanced highs - only 3.7% away from median
(+) | highs are linear (4.8% delta to prev. frequency)
Overall 100 - 16.000 Hz
(±) | linearity of overall sound is average (23.9% difference to median)
Compared to same class
» 84% of all tested devices in this class were better, 6% similar, 10% worse
» The best had a delta of 5%, average was 17%, worst was 45%
Compared to all devices tested
» 72% of all tested devices were better, 6% similar, 22% worse
» The best had a delta of 4%, average was 24%, worst was 134%
Dell Inspiron 13-5379-9573 audio analysis
(-) | not very loud speakers (64.1 dB)
Bass 100 - 315 Hz
(±) | reduced bass - on average 10.2% lower than median
(±) | linearity of bass is average (7.6% delta to prev. frequency)
Mids 400 - 2000 Hz
(±) | higher mids - on average 5.3% higher than median
(±) | linearity of mids is average (7.7% delta to prev. frequency)
Highs 2 - 16 kHz
(±) | higher highs - on average 5.1% higher than median
(+) | highs are linear (6% delta to prev. frequency)
Overall 100 - 16.000 Hz
(±) | linearity of overall sound is average (21.3% difference to median)
Compared to same class
» 56% of all tested devices in this class were better, 12% similar, 32% worse
» The best had a delta of 6%, average was 20%, worst was 57%
Compared to all devices tested
» 59% of all tested devices were better, 7% similar, 33% worse
» The best had a delta of 4%, average was 24%, worst was 134%
Energy Management
Power Consumption
AMD CPUs are not renowned for their power management, but Ryzen may bring a change. When idle, the Ryzen 7 2700U system pulls more power than most of its Intel-based competitors. Under load, however, the Swift 3 draws about 33 Watts, which is similar to other devices with Kaby Lake R CPUs. As expected, the Swift 3 uses more power under full load (e.g., when gaming) than Intel systems without a dedicated GPU. The RX Vega 10 GPU needs about 30-40% more power than Intel's UHD Graphics 620, but the performance gain is certainly worth the trade. Conversely, systems with Nvidia's MX150 GPU pull another 10 or so Watts when gaming, a bump of about 25%.
| Off / Standby | |
| Idle | |
| Load |
|
Key:
min: | |
| Acer Swift 3 SF315-41-R6J9 R7 2700U, Vega 10, Micron SSD 1100 SED 512GB, M.2 (MTFDDAV512TBN), IPS, 1920x1080, 15.6" | Acer Swift 3 SF315-41-R4W1 R5 2500U, Vega 8, Intel SSD 600p SSDPEKKW256G7, IPS, 1920x1080, 15.6" | Acer Swift 3 SF314-52G-89SL i5-8550U, GeForce MX150, Intel SSD 600p SSDPEKKW512G7, IPS, 1920x1080, 14" | Dell Inspiron 13-5379-9573 i5-8250U, UHD Graphics 620, Micron 1100 MTFDDAV256TBN, IPS, 1920x1080, 13.3" | Asus ZenBook 13 UX331UN i5-8550U, GeForce MX150, SK Hynix HFS256G39TND-N210A, IPS, 1920x1080, 13.3" | Lenovo ThinkPad L380-20M5000WGE i5-8250U, UHD Graphics 620, Samsung PM961 MZVLW256HEHP, IPS, 1920x1080, 13.3" | Lenovo Ideapad 720S-13ARR R5 2500U, Vega 8, Samsung PM961 NVMe MZVLW128HEGR, IPS, 1920x1080, 13.3" | |
|---|---|---|---|---|---|---|---|
| Power Consumption | -22% | -12% | 16% | 18% | 24% | -4% | |
| Idle Minimum * (Watt) | 5.9 | 7.3 -24% | 4.4 25% | 3.2 46% | 2.2 63% | 2.7 54% | 5.3 10% |
| Idle Average * (Watt) | 8.6 | 9.7 -13% | 6.6 23% | 5.9 31% | 5 42% | 5.6 35% | 9 -5% |
| Idle Maximum * (Watt) | 8.7 | 13 -49% | 9.2 -6% | 8.8 -1% | 8 8% | 9.2 -6% | 12.6 -45% |
| Load Average * (Watt) | 32.8 | 40.4 -23% | 61 -86% | 31.2 5% | 33 -1% | 30 9% | 37.1 -13% |
| Witcher 3 ultra * (Watt) | 38.2 | 40 -5% | |||||
| Load Maximum * (Watt) | 40.9 | 42.2 -3% | 50 -22% | 42.2 -3% | 49.4 -21% | 30.4 26% | 26.5 35% |
* ... smaller is better
Battery Life
Sadly, battery life is still an issue with AMD systems. At 5 hours 17 minutes in our WiFi v1.3 battery test, the Swift 3 comes in far behind Intel-based systems. For instance, the Asus ZenBook 13 (Core i7-8550U) manages a 3.5-hour longer runtime in the same test even though it has a similarly-sized battery. Users will be able to get some work done away from the outlet, but the power adapter will need to be packed for even a modest day out. Thankfully, the power brick is small and very portable.
| Acer Swift 3 SF315-41-R6J9 R7 2700U, Vega 10, 49 Wh | Acer Swift 3 SF315-41-R4W1 R5 2500U, Vega 8, 48 Wh | Acer Swift 3 SF314-52G-89SL i5-8550U, GeForce MX150, 48 Wh | Dell Inspiron 13-5379-9573 i5-8250U, UHD Graphics 620, 42 Wh | Asus ZenBook 13 UX331UN i5-8550U, GeForce MX150, 50 Wh | Lenovo ThinkPad L380-20M5000WGE i5-8250U, UHD Graphics 620, 45 Wh | Lenovo Ideapad 720S-13ARR R5 2500U, Vega 8, 48 Wh | |
|---|---|---|---|---|---|---|---|
| Battery runtime | -1% | 47% | 13% | 55% | 71% | 6% | |
| Reader / Idle (h) | 13.3 | 12.2 -8% | 15.3 15% | 20.7 56% | 18.8 41% | 11.4 -14% | |
| WiFi v1.3 (h) | 5.3 | 5.2 -2% | 7.8 47% | 5.4 2% | 9 70% | 11.6 119% | 3.4 -36% |
| Load (h) | 1.3 | 1.4 8% | 1.6 23% | 1.8 38% | 2 54% | 2.2 69% |
Pros
Cons
Verdict
Ryzen 7 is here, but not in full force. Acer's Swift 3 is one of the first machines to use AMD's new APU, but it may not be the best picture of what the chip can do. While performance is slightly improved from the Ryzen 5 2500U in most cases, it still lags behind Intel's offerings in spite of the promises enumerated in AMD's marketing. Mixed with lackluster battery life and a disappointing screen, the Ryzen 7 variant of the Swift 3 has a lot working against it.
The machine hits some high points, though. The chassis looks nice and is fairly light and portable. The keyboard and touchpad are good, and gaming performance is superior to other on-chip GPUs. Ultimately, the restrained performance leaves a disheartening taste in our mouth. There's plenty of headroom to push the silicon further, which elicits some hope for the future. However, this speculation is fully reliant on AMD providing improved drivers and Acer pushing out updates in a timely fashion.
There is a silver lining: price. At $950, the Ryzen 7 variant of the Swift 3 is positioned well for consumers that want to indulge in some lighter gaming from time to time. Intel's Core i7-8550U handily beats the 2700U but is priced at about $200-300 more. The 10-15% drop in CPU performance may be worth the Swift 3's lower cost; the bump in GPU power is icing on a reasonably-priced cake. There are better options available, but they come with a higher tag.
In sum, the Ryzen 7 2700U promises a lot but fails to deliver, at least in the Acer Swift 3. There is plenty of room for improvement, but it's up to AMD and Acer to push the APU further. Still, the Swift 3 is well-priced for what it offers. Intel may need to start looking over their shoulder.
Acer Swift 3 SF315-41-R6J9
- 04/29/2018 v6 (old)
Sam Medley
Price comparison
