Acer Swift 3 SF314-55 (i3-8145U, SSD, FHD) Laptop Review
Acer’s Swift 3 SF315-55 is a complete redesign and has little to nothing in common with its predecessors bearing the same name (Swift 3 SF314-52G and Swift 3). The new model is smaller and thinner, and it is based on Intel’s Whiskey Lake platform. Its competitors are the Asus VivoBook S14 S406UA-BV023T and the Lenovo Ideapad 720S-13ARR.
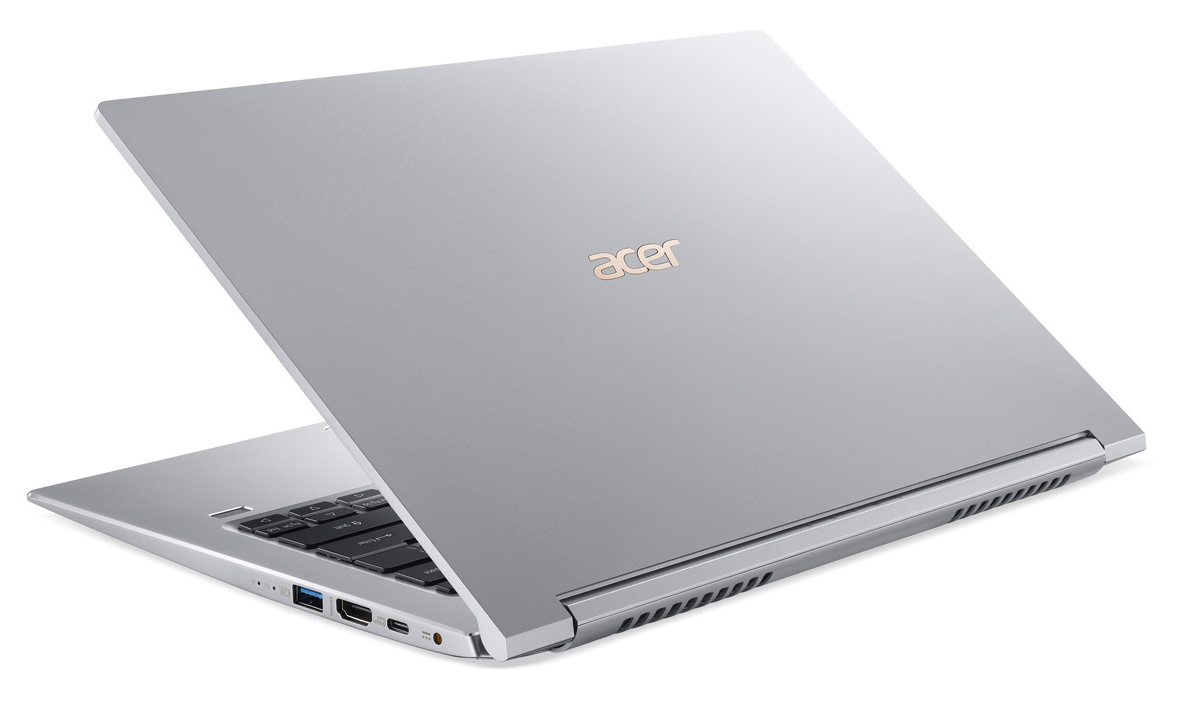
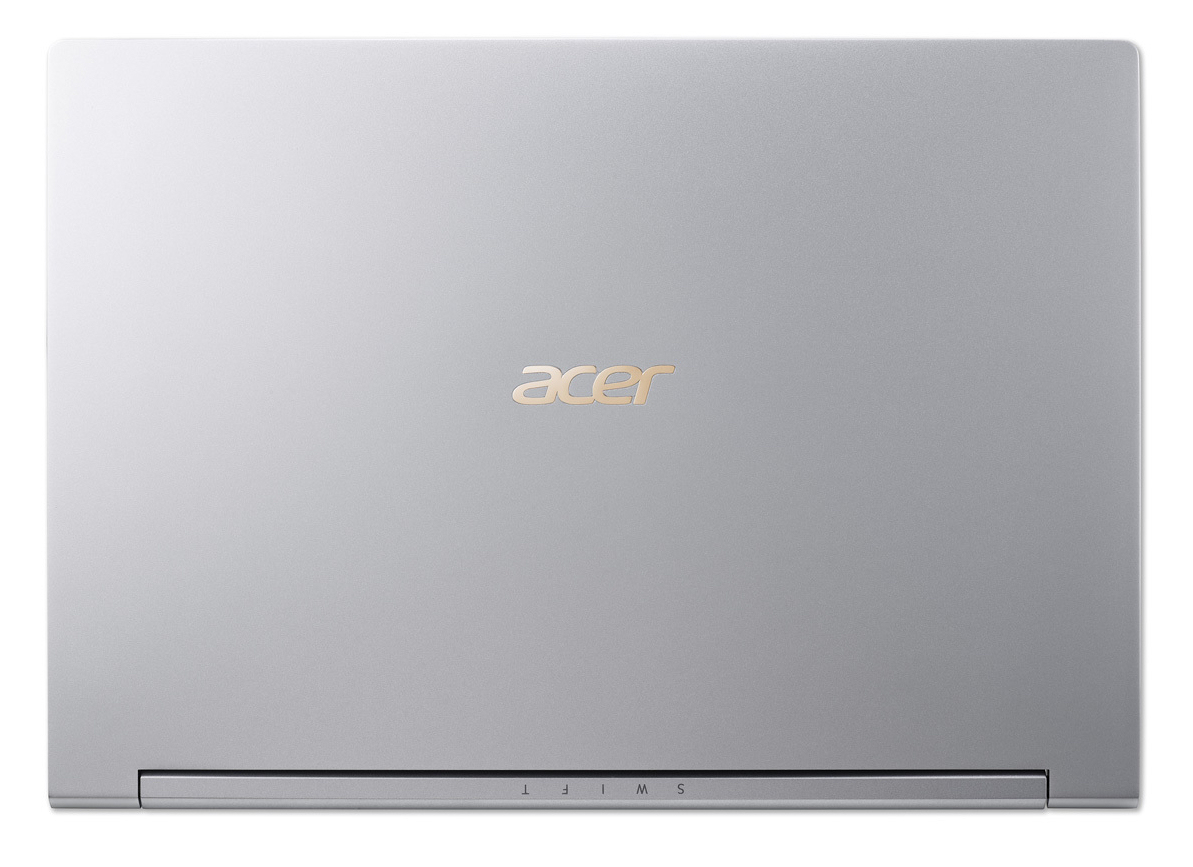
Case
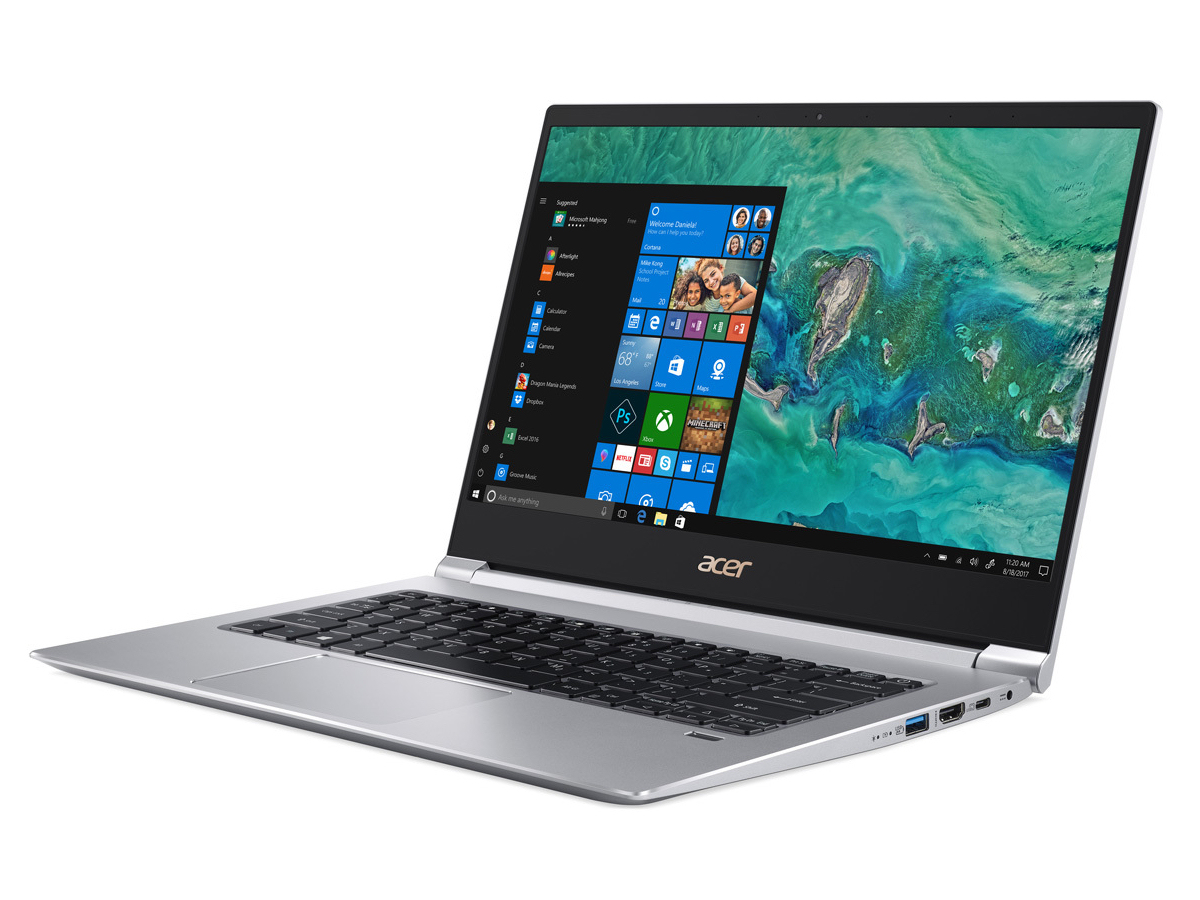
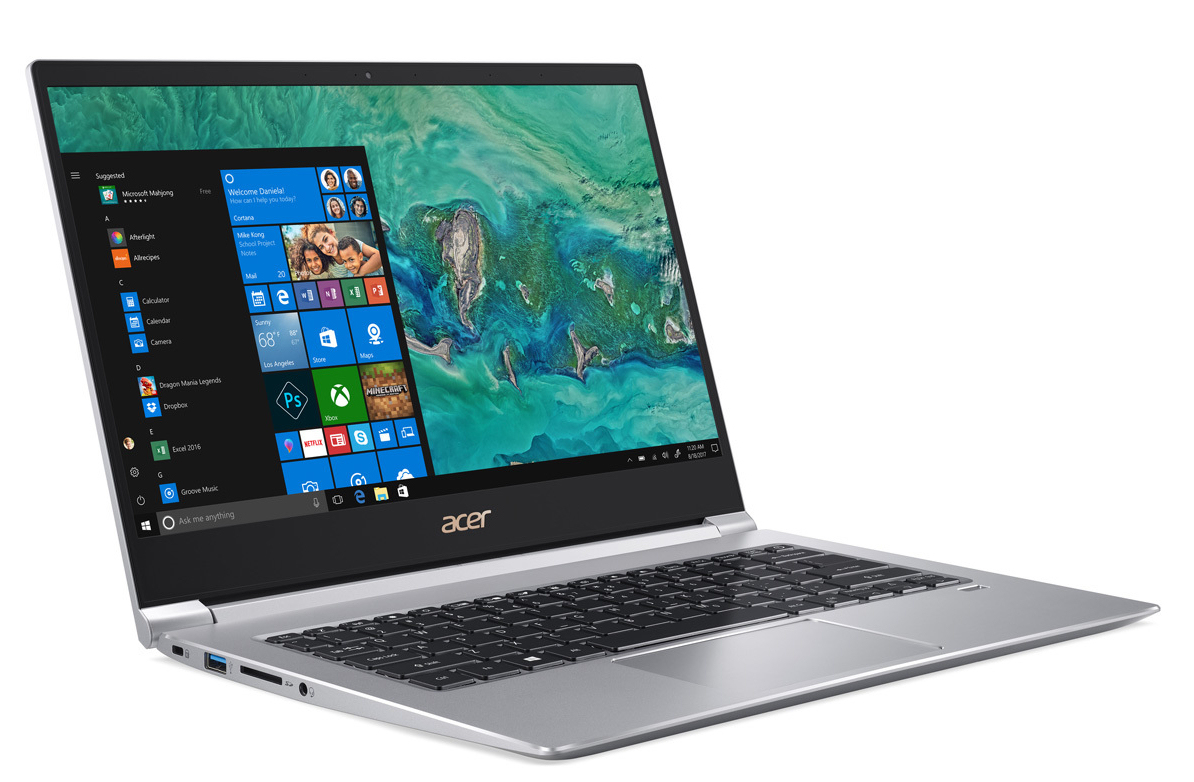
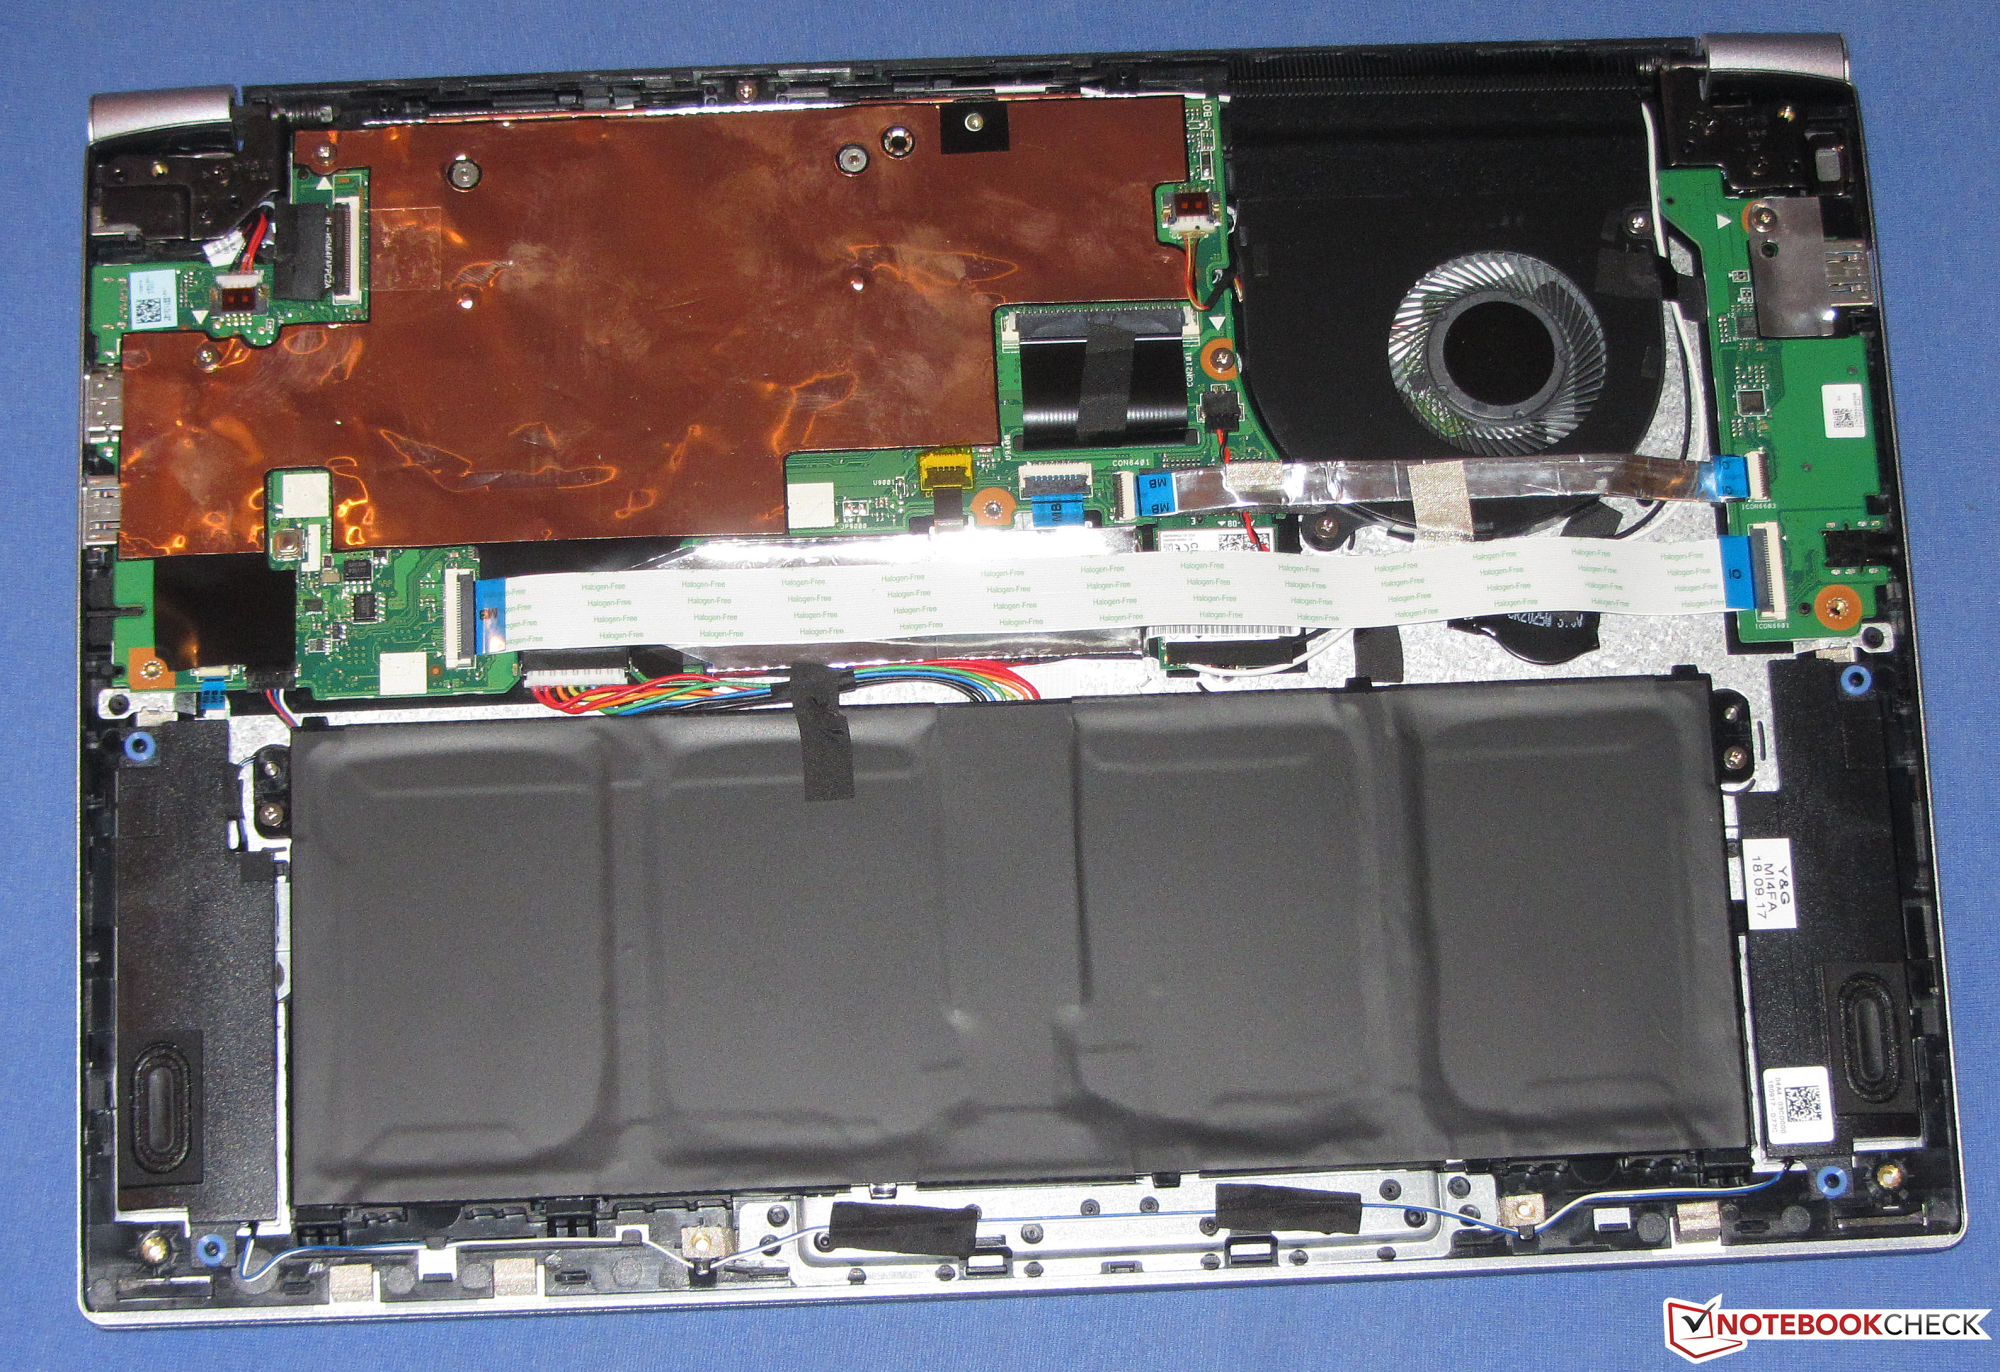
The SF314-55’s case is a brand-new design. It is thinner, smaller, and lighter than its predecessors’ but is still made of the exact same material: aluminum. Build quality is superb - the gaps are even and we found no overhanging lips anywhere on the device. All things considered, the Swift 3 is a fairly robust device, however we would have preferred if the base would have been a little bit sturdier than it already is. The battery is not user-replaceable, and the device lacks a maintenance opening.
In order to get to the internal hardware, the entire bottom cover must be removed. This requires removing all the screws at the bottom and prying the case open carefully with a spudger tool or a small spatula. Given that the case is fairly susceptible to scratches, you have to be very careful.
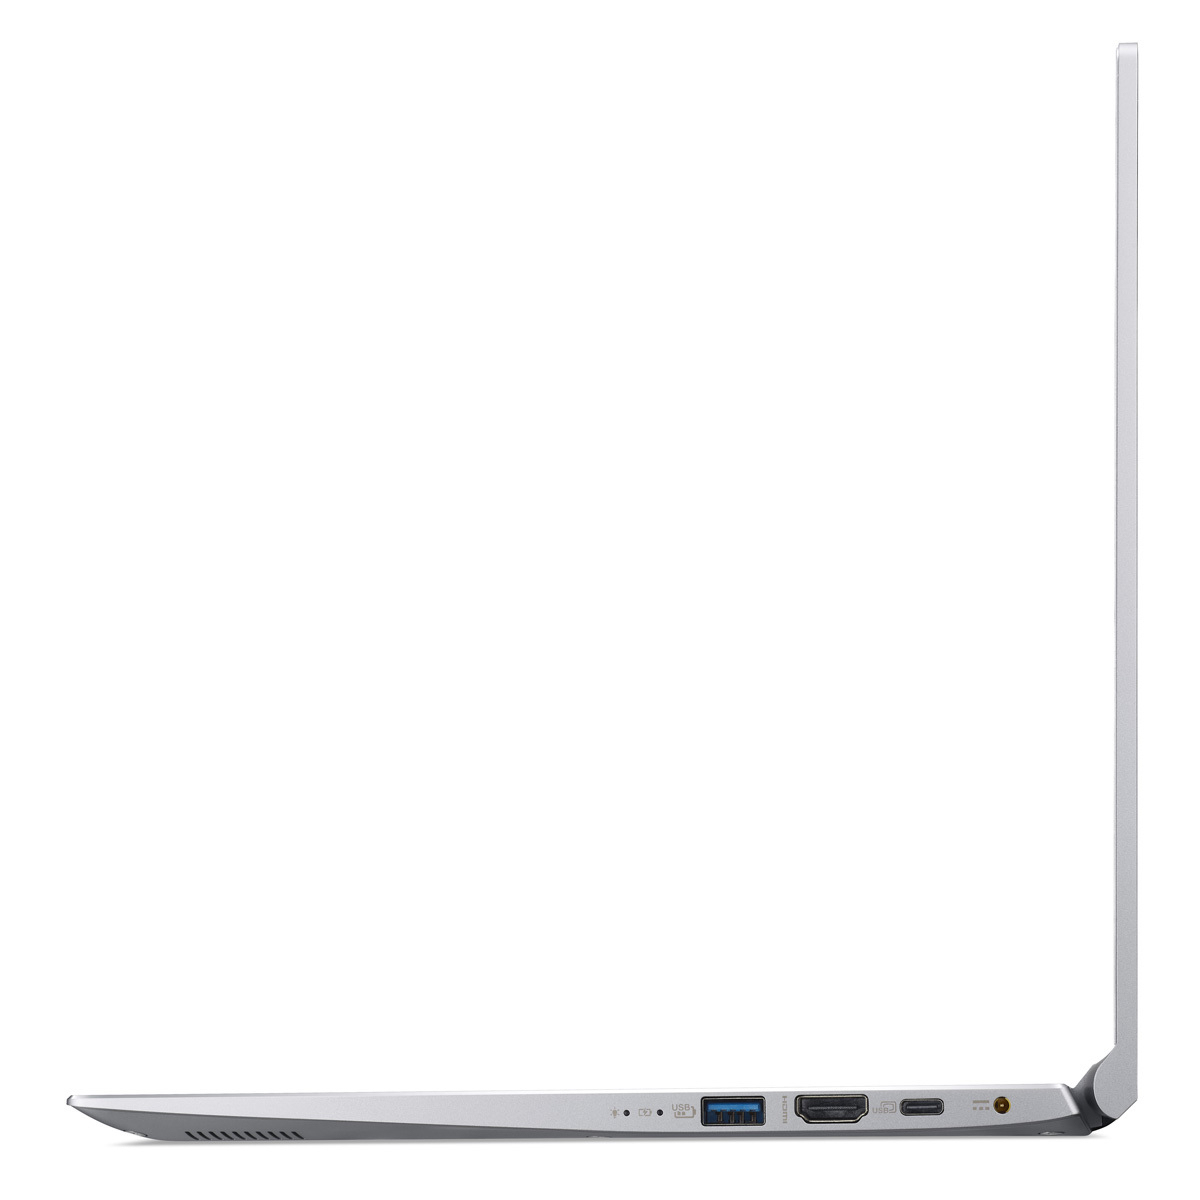
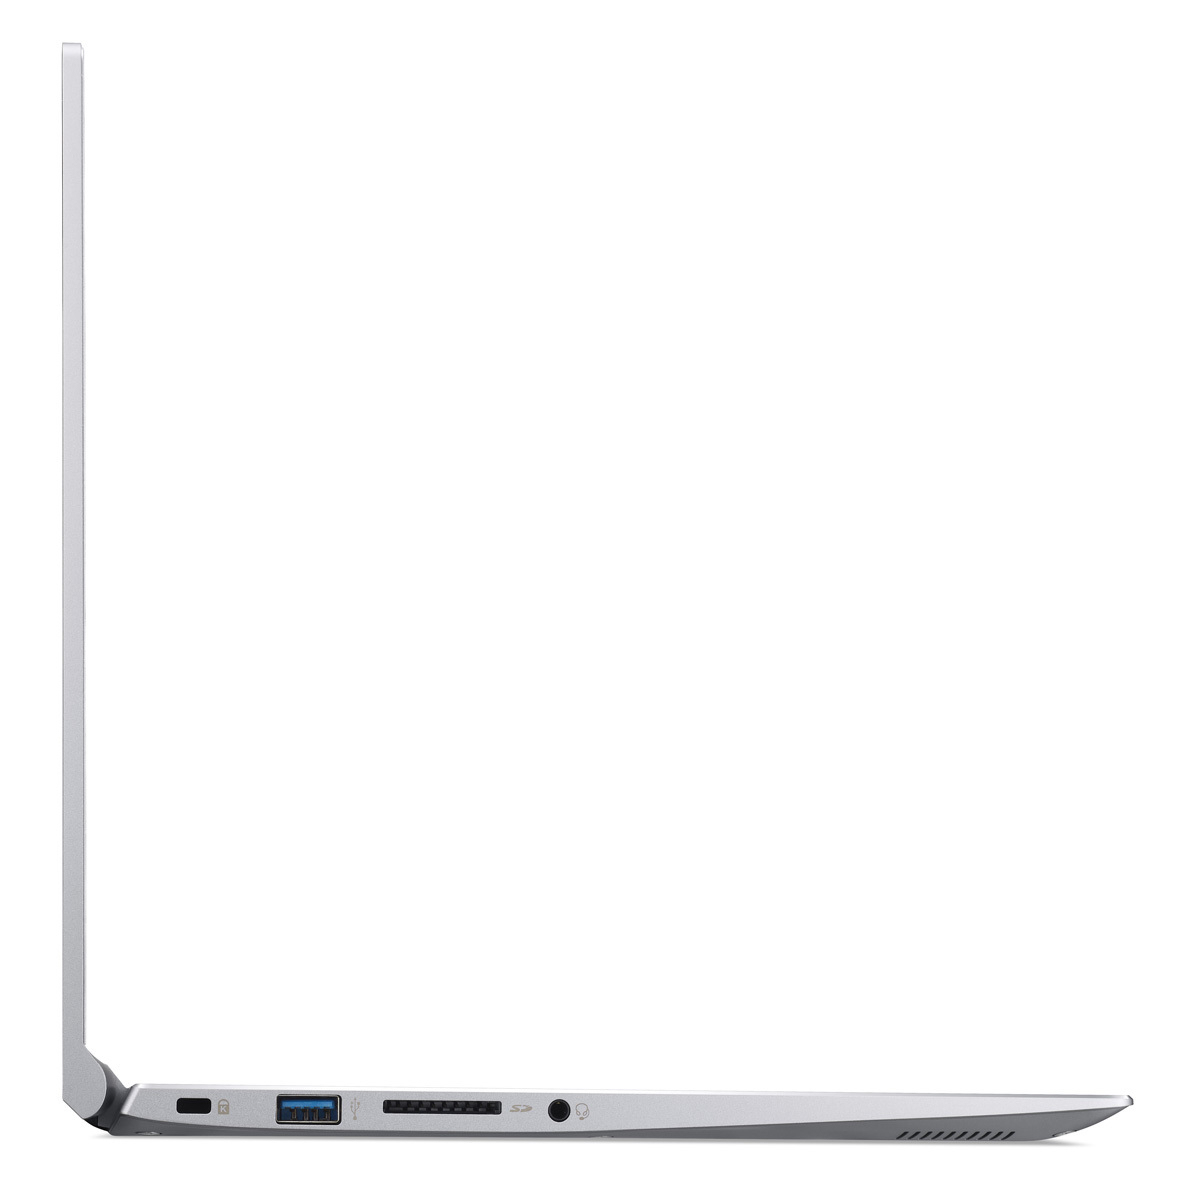
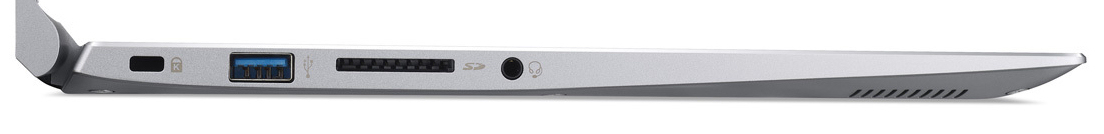
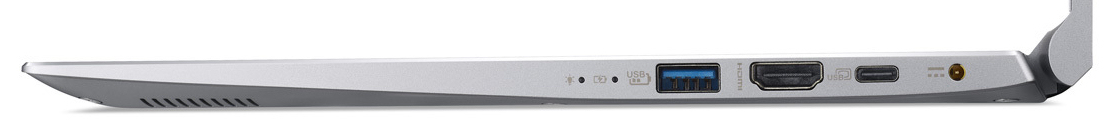
There are a total of three USB 3.1 Gen 1 ports on the unit, two USB Type-A and one USB Type-C. The latter includes support for Power Delivery and can be used as charging port. It also carries a DisplayPort signal, although this requires an extra adapter since Acer does not include any with the device. We tested both features, and both worked as expected. The Swift thus comes with two charging ports and two video-outputs.
The card reader is fairly lethargic. Copying large blocks of data results in transfer rates of no more than 29.5 MB/s. Copying 250 JPEG files of around 5 MB each topped out at 26.7 MB/s. Both tests were performed using our 64 GB Toshiba Exceria Pro SDXC UHS-II reference card. Once inserted, the SD card protruded from the case (around 15 mm, or 0.6 inches).
Wi-Fi communications are handled by Intel’s Wireless-AC 9560 modem with support for 802.11 a/b/g/n/ac. Data rates were decent under ideal conditions (no other Wi-Fi devices nearby, low distance between notebook and server).
Connectivity
| SD Card Reader | |
| average JPG Copy Test (av. of 3 runs) | |
| Average of class Subnotebook (23.7 - 188, n=9, last 2 years) | |
| Asus VivoBook S14 S406UA-BV023T (Toshiba Exceria Pro M501 microSDXC 64GB) | |
| Acer Swift 3 SF314-55-31N8 (Toshiba Exceria Pro SDXC 64 GB UHS-II) | |
| Acer Swift 3 (i5-7200U, HD 620) (Toshiba Exceria Pro SDXC 64 GB UHS-II) | |
| Acer Swift 3 SF314-52G-89SL (Toshiba Exceria Pro SDXC 64 GB UHS-II) | |
| maximum AS SSD Seq Read Test (1GB) | |
| Average of class Subnotebook (24.9 - 195, n=8, last 2 years) | |
| Asus VivoBook S14 S406UA-BV023T (Toshiba Exceria Pro M501 microSDXC 64GB) | |
| Acer Swift 3 SF314-55-31N8 (Toshiba Exceria Pro SDXC 64 GB UHS-II) | |
| Acer Swift 3 (i5-7200U, HD 620) (Toshiba Exceria Pro SDXC 64 GB UHS-II) | |
| Acer Swift 3 SF314-52G-89SL (Toshiba Exceria Pro SDXC 64 GB UHS-II) | |
Input Devices
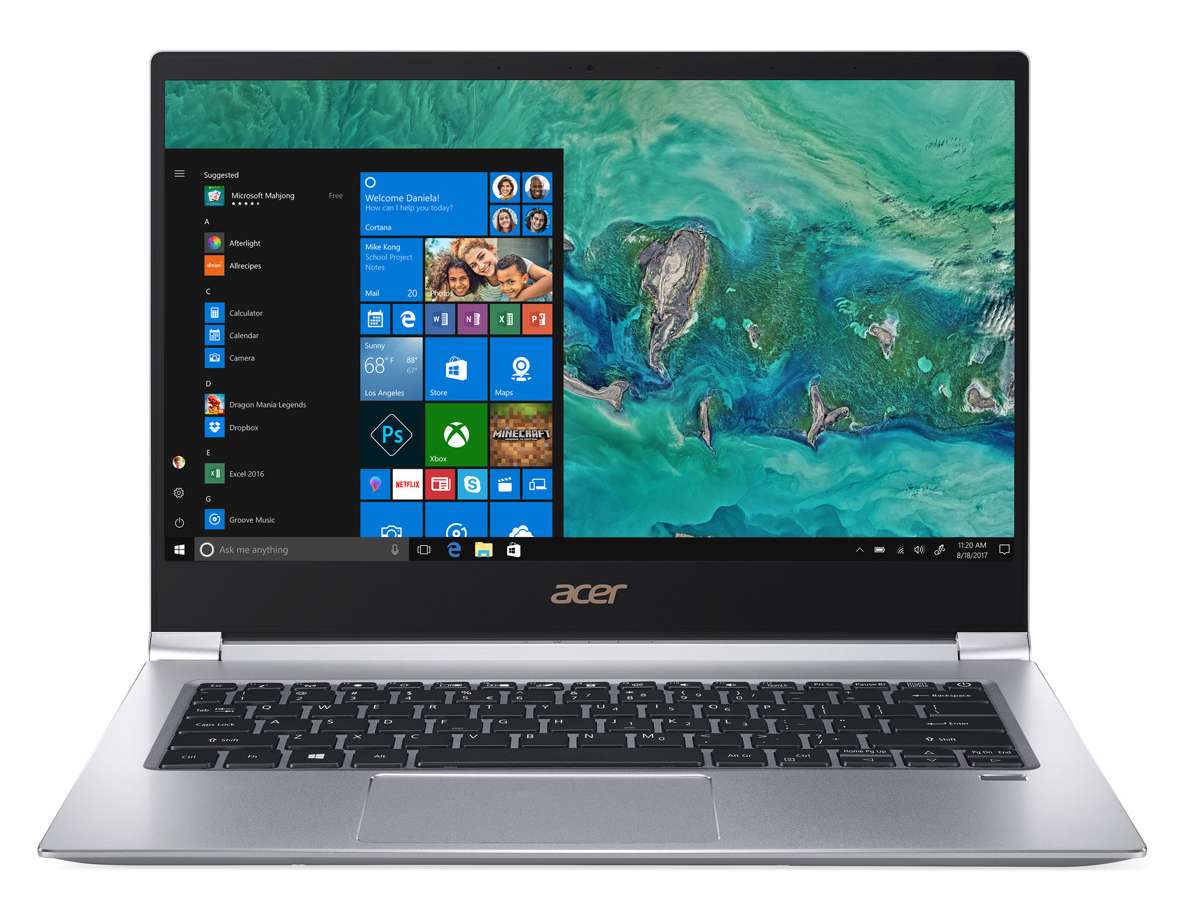
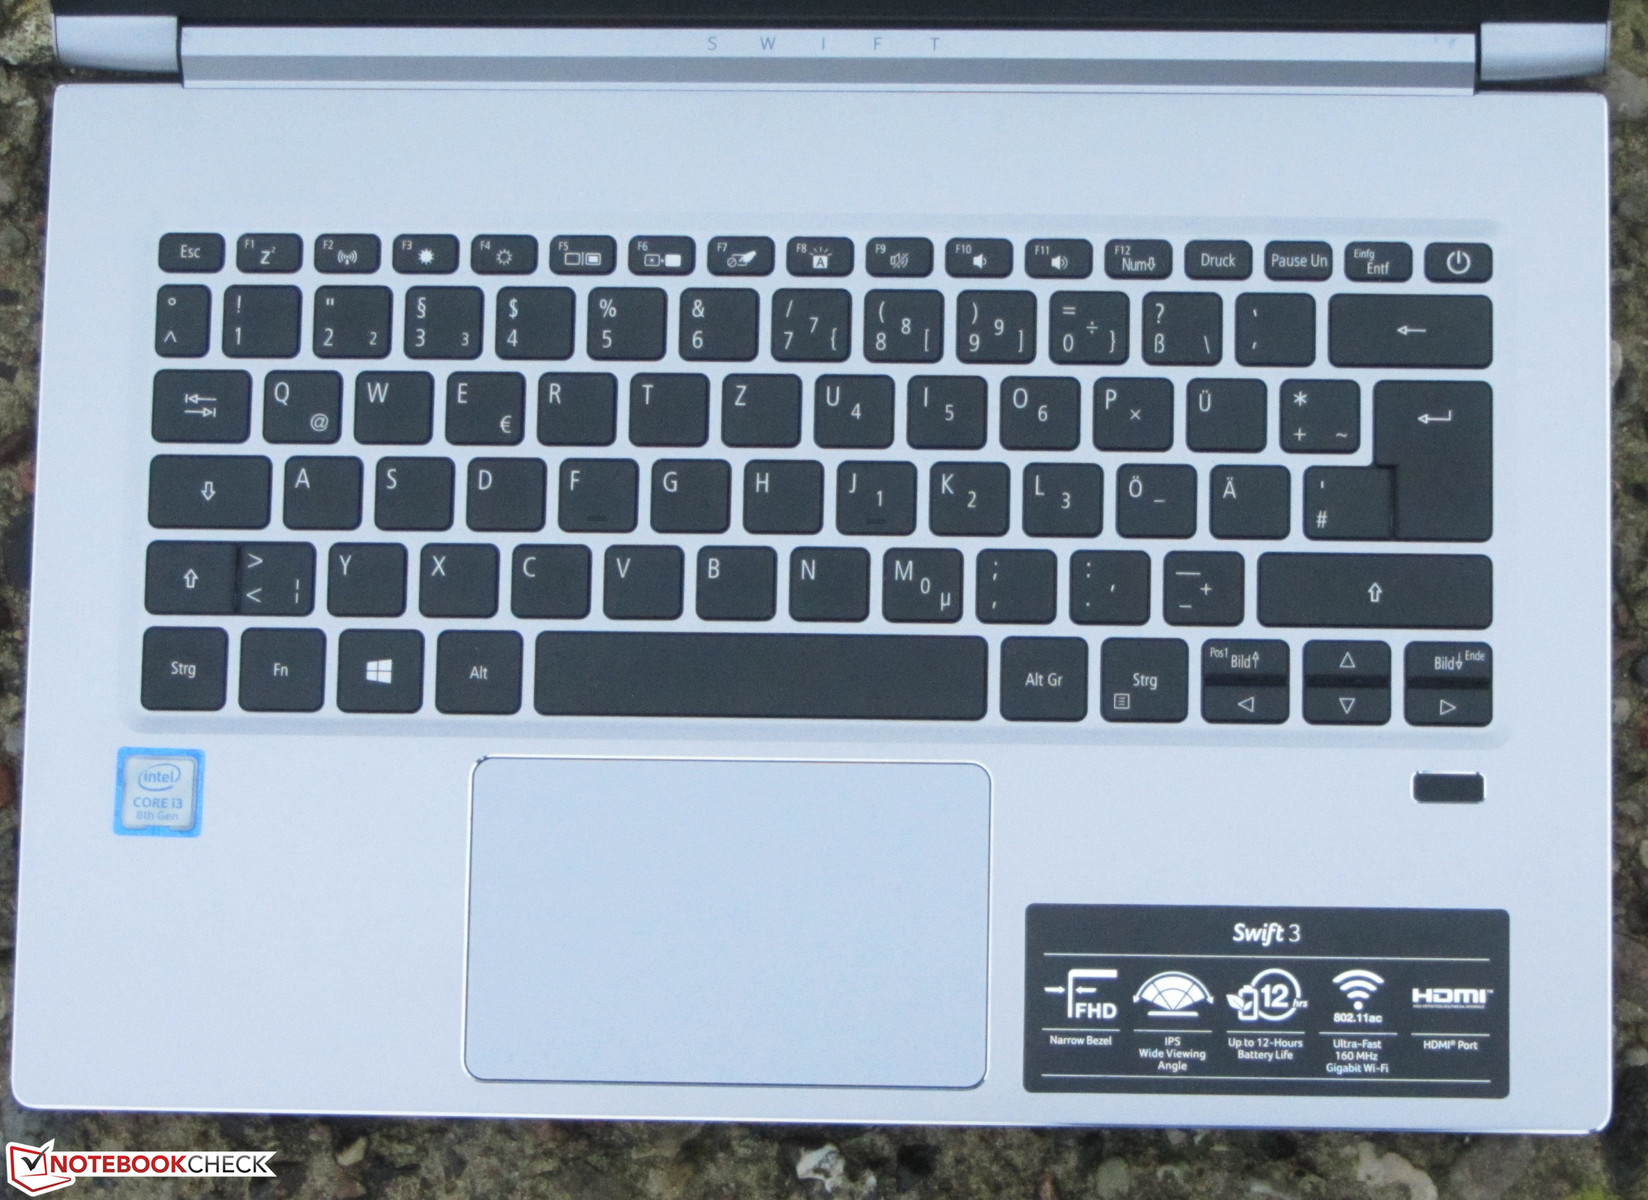
The Swift 3 features a backlit chiclet-style keyboard with even and smooth keys with short key travel and a well-defined pressure point. The keyboard flexed ever so slightly while typing, but not enough to become annoying. The backlight is operated via a function key and can only be turned on or off. All things considered, the keyboard is very usable and well suited even for sustained typing sessions.
The multitouch-capable ClickPad measures 10.5 x 6.5 cm (4.13 x 2.56 inches) in size and is thus large enough for comfortable gesture input. Its smooth surface was very pleasant, and it detected input up to its very edges and corners. The integrated buttons feature short key travel and a well-defined actuation point.
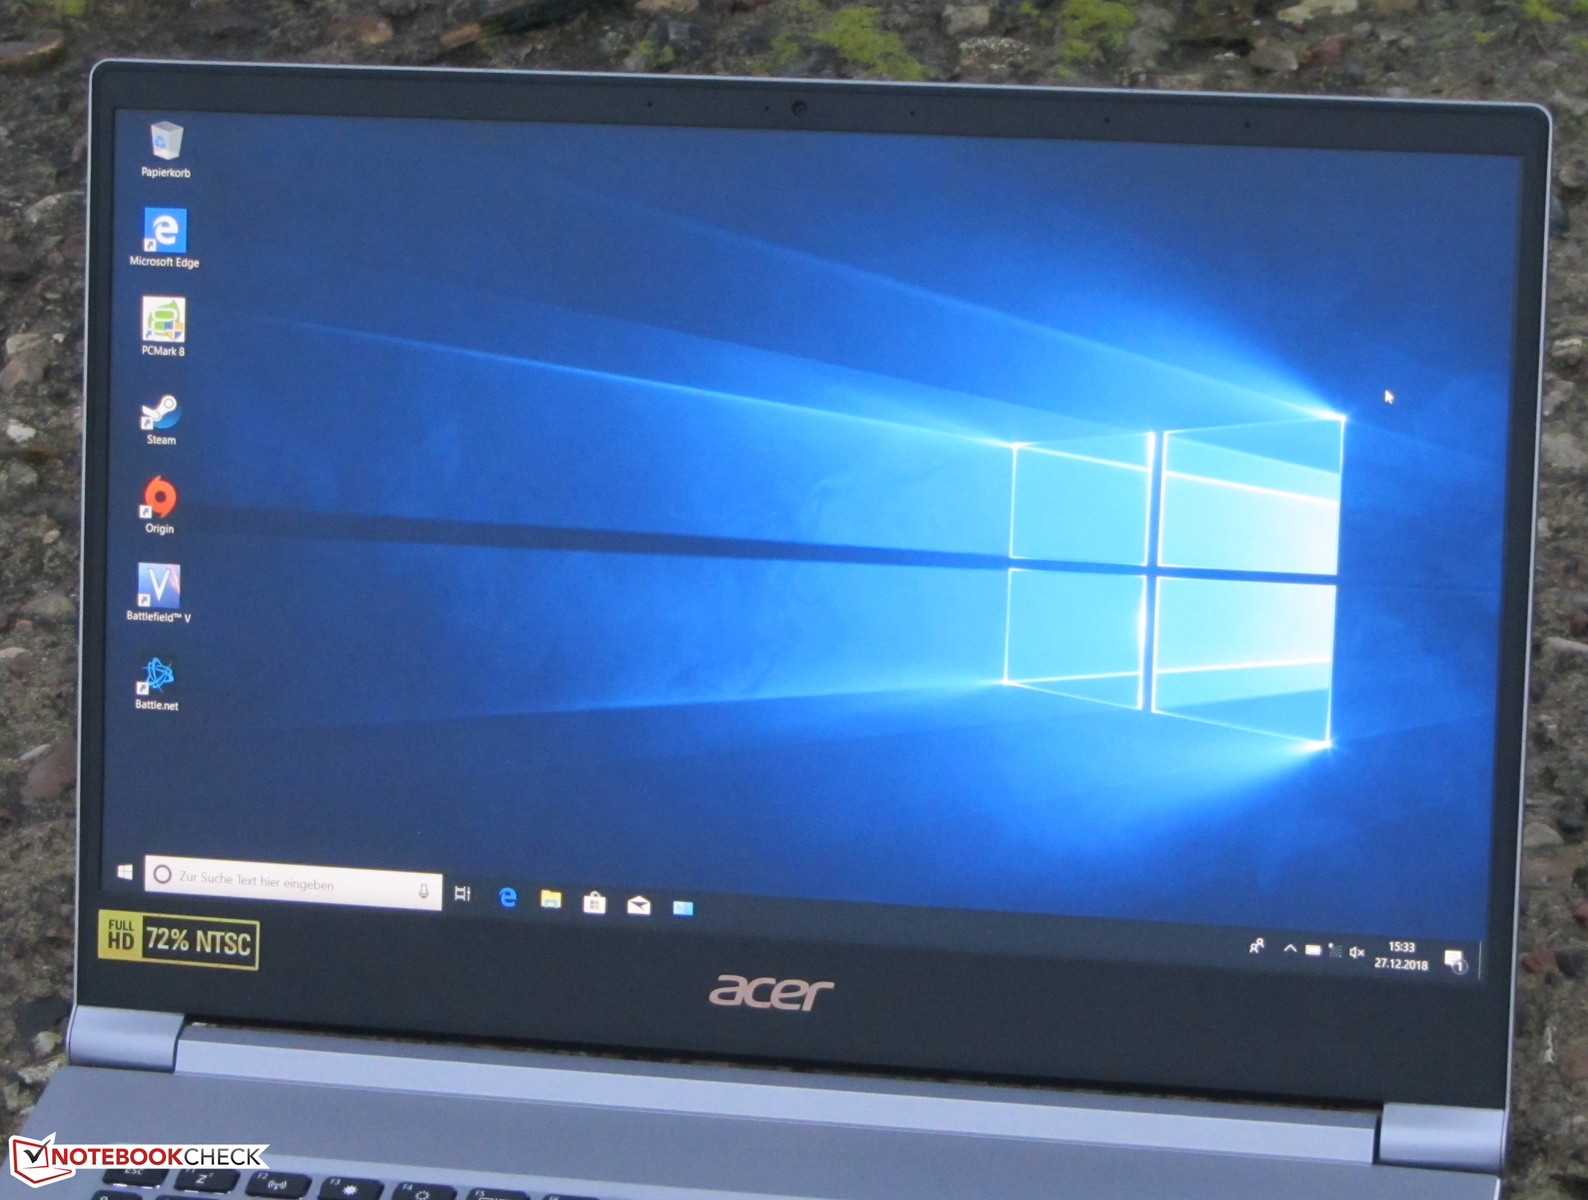
Display
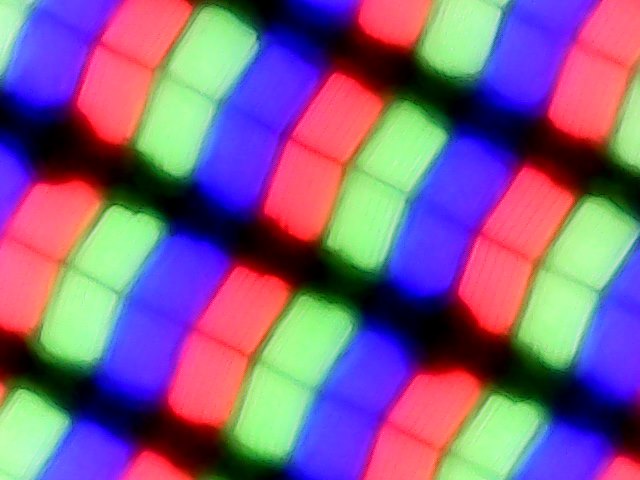
The matte 14-inch display features a native resolution of 1920x1080 and a decent contrast ratio of 1,078:1. Unfortunately, brightness was somewhat low and maxed out at just 275.6 nits. Considering the notebook’s price we would have expected more. Nevertheless, the Swift 3’s display is still brighter than both its predecessors’. In order to be considered good enough by us, contrast ratio and brightness have to exceed 1,000:1 and 300 nits, respectively.
We noticed PWM flickering at brightness levels of 20% and below at a very high frequency of 25 kHz, which should not cause any headaches or eye strain even in sensitive users.
| |||||||||||||||||||||||||
Brightness Distribution: 90 %
Center on Battery: 291 cd/m²
Contrast: 1078:1 (Black: 0.27 cd/m²)
ΔE ColorChecker Calman: 3.86 | ∀{0.5-29.43 Ø4.71}
ΔE Greyscale Calman: 5.33 | ∀{0.09-98 Ø4.96}
98% sRGB (Argyll 1.6.3 3D)
62% AdobeRGB 1998 (Argyll 1.6.3 3D)
67.8% AdobeRGB 1998 (Argyll 3D)
98.3% sRGB (Argyll 3D)
66.2% Display P3 (Argyll 3D)
Gamma: 2.25
CCT: 7426 K
| Acer Swift 3 SF314-55-31N8 IPS, 1920x1080, 14" | Acer Swift 3 SF314-52G-89SL IPS, 1920x1080, 14" | Acer Swift 3 (i5-7200U, HD 620) IPS, 1920x1080, 14" | Lenovo Ideapad 720S-13ARR IPS, 1920x1080, 13.3" | Asus VivoBook S14 S406UA-BV023T TN LED, 1366x768, 14" | Lenovo Ideapad 720S-13ARR IPS, 1920x1080, 13.3" | |
|---|---|---|---|---|---|---|
| Display | -45% | -38% | -9% | -41% | -9% | |
| Display P3 Coverage (%) | 66.2 | 36.09 -45% | 40.96 -38% | 65.2 -2% | 38.82 -41% | 65.1 -2% |
| sRGB Coverage (%) | 98.3 | 54.2 -45% | 61.4 -38% | 83.3 -15% | 58.2 -41% | 83.1 -15% |
| AdobeRGB 1998 Coverage (%) | 67.8 | 37.28 -45% | 42.34 -38% | 60.9 -10% | 40.11 -41% | 60.8 -10% |
| Response Times | 9% | 1% | 13% | 28% | 29% | |
| Response Time Grey 50% / Grey 80% * (ms) | 41 ? | 41 ? -0% | 43 ? -5% | 36 ? 12% | 42 ? -2% | 31 ? 24% |
| Response Time Black / White * (ms) | 30 ? | 25 ? 17% | 28 ? 7% | 26 ? 13% | 13 ? 57% | 20 ? 33% |
| PWM Frequency (Hz) | 25000 ? | 200 ? | 128000 ? | 200 ? | 65000 ? | |
| Screen | -24% | -19% | 0% | -57% | -9% | |
| Brightness middle (cd/m²) | 291 | 233 -20% | 281 -3% | 299 3% | 215 -26% | 324 11% |
| Brightness (cd/m²) | 276 | 217 -21% | 259 -6% | 306 11% | 208 -25% | 293 6% |
| Brightness Distribution (%) | 90 | 88 -2% | 81 -10% | 90 0% | 81 -10% | 78 -13% |
| Black Level * (cd/m²) | 0.27 | 0.27 -0% | 0.45 -67% | 0.27 -0% | 0.4 -48% | 0.32 -19% |
| Contrast (:1) | 1078 | 863 -20% | 624 -42% | 1107 3% | 538 -50% | 1013 -6% |
| Colorchecker dE 2000 * | 3.86 | 5.85 -52% | 4.19 -9% | 4.46 -16% | 9.37 -143% | 5.52 -43% |
| Colorchecker dE 2000 max. * | 8.26 | 11.51 -39% | 10.64 -29% | 10.51 -27% | 15.84 -92% | 10.91 -32% |
| Greyscale dE 2000 * | 5.33 | 4.87 9% | 2.55 52% | 2.41 55% | 10.52 -97% | 3.36 37% |
| Gamma | 2.25 98% | 2.47 89% | 2.24 98% | 2.29 96% | 2.45 90% | 2.23 99% |
| CCT | 7426 88% | 6908 94% | 6555 99% | 6757 96% | 11214 58% | 6687 97% |
| Color Space (Percent of AdobeRGB 1998) (%) | 62 | 34 -45% | 39 -37% | 55 -11% | 37 -40% | 55 -11% |
| Color Space (Percent of sRGB) (%) | 98 | 54 -45% | 61 -38% | 83 -15% | 58 -41% | 83 -15% |
| Total Average (Program / Settings) | -20% /
-24% | -19% /
-20% | 1% /
0% | -23% /
-43% | 4% /
-4% |
* ... smaller is better
Screen Flickering / PWM (Pulse-Width Modulation)
| Screen flickering / PWM detected | 25000 Hz | ≤ 20 % brightness setting | 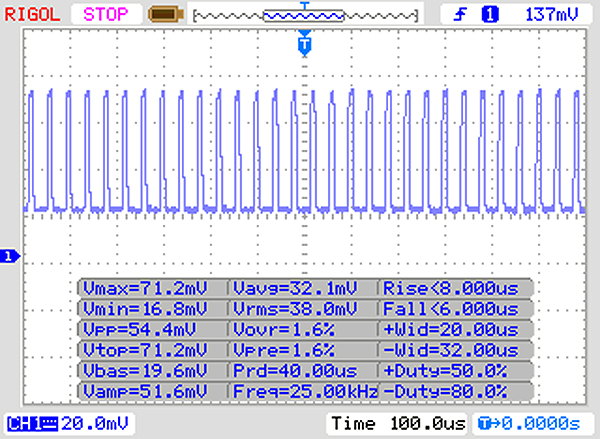 |
The display backlight flickers at 25000 Hz (worst case, e.g., utilizing PWM) Flickering detected at a brightness setting of 20 % and below. There should be no flickering or PWM above this brightness setting. The frequency of 25000 Hz is quite high, so most users sensitive to PWM should not notice any flickering. In comparison: 52 % of all tested devices do not use PWM to dim the display. If PWM was detected, an average of 7754 (minimum: 5 - maximum: 343500) Hz was measured. | |||
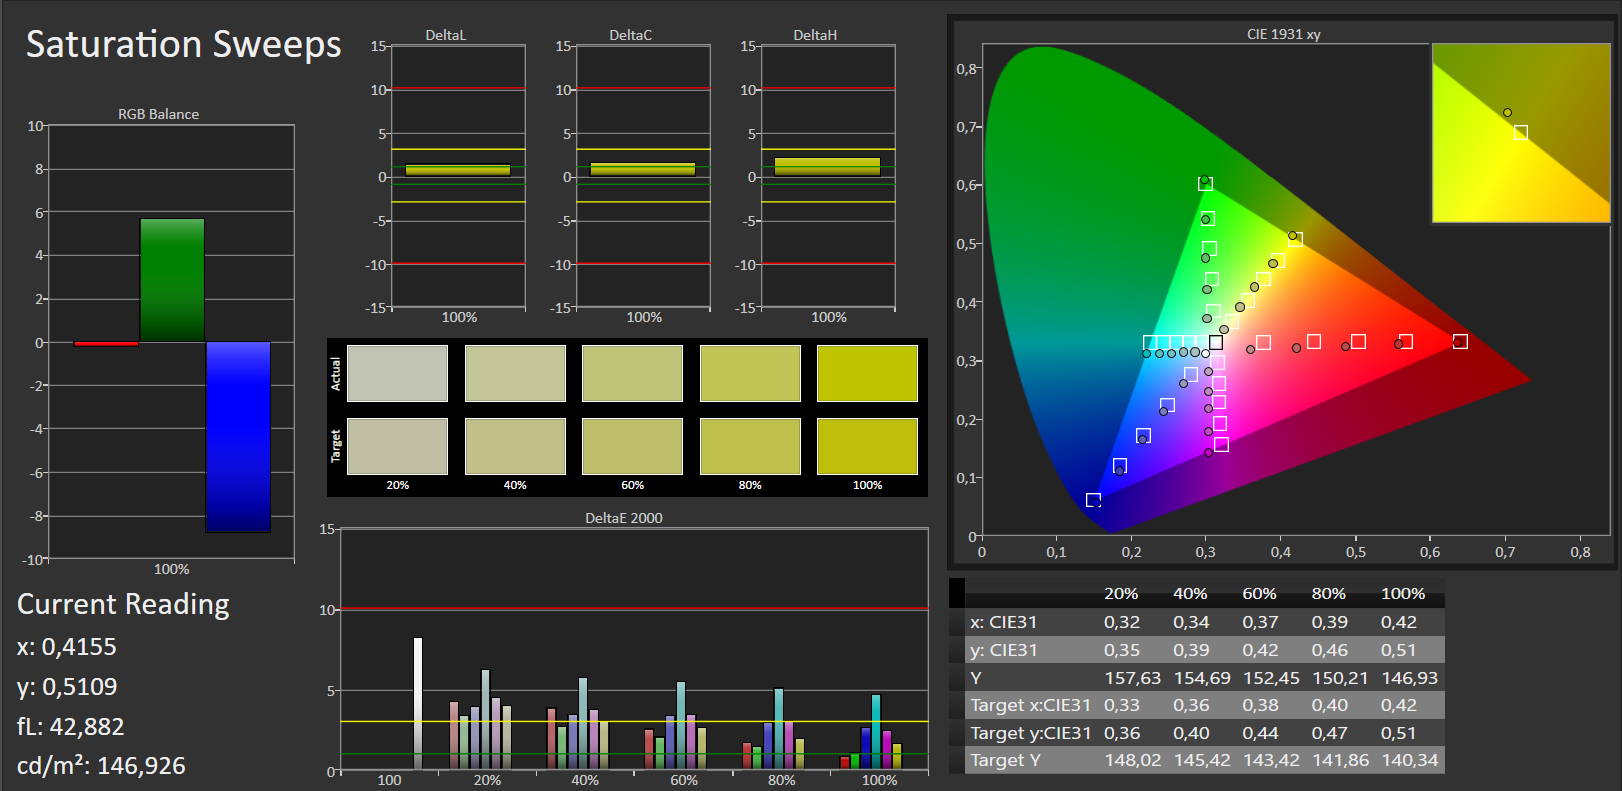
Color representation was very decent out of the box already, and the DeltaE 2000 deviation for colors was just 3.86. Ideally, you want this to be less than 3. We noticed no blue tint, and sRGB color-space coverage was a very decent 98%.
The ICC profile resulting from our calibration attempts can be found for download in the box above. Before using it you need to make sure that your display is the exact same model as ours (manufacturer and model number) as it is not uncommon for a manufacturer to source its display panels from various suppliers. Applying the ICC profile to a different panel will most likely result in less accurate colors.


Display Response Times
| ↔ Response Time Black to White | ||
|---|---|---|
| 30 ms ... rise ↗ and fall ↘ combined | ↗ 18 ms rise | 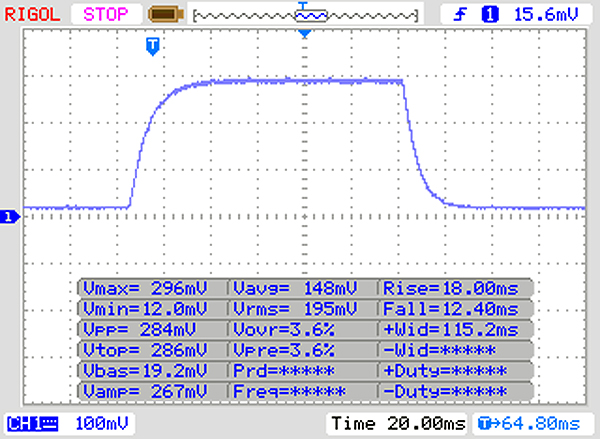 |
| ↘ 12 ms fall | ||
| The screen shows slow response rates in our tests and will be unsatisfactory for gamers. In comparison, all tested devices range from 0.1 (minimum) to 240 (maximum) ms. » 80 % of all devices are better. This means that the measured response time is worse than the average of all tested devices (19.8 ms). | ||
| ↔ Response Time 50% Grey to 80% Grey | ||
| 41 ms ... rise ↗ and fall ↘ combined | ↗ 21 ms rise | 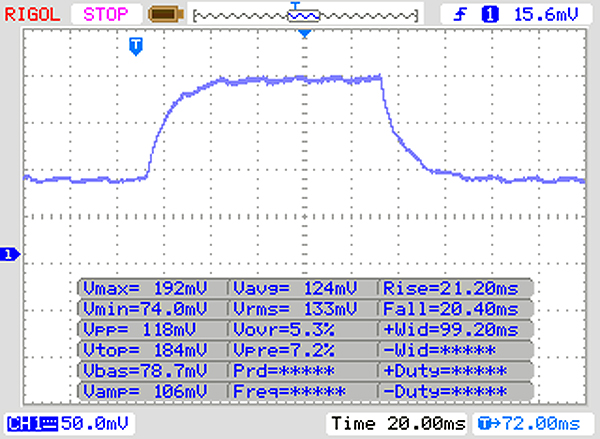 |
| ↘ 20 ms fall | ||
| The screen shows slow response rates in our tests and will be unsatisfactory for gamers. In comparison, all tested devices range from 0.165 (minimum) to 636 (maximum) ms. » 65 % of all devices are better. This means that the measured response time is worse than the average of all tested devices (31 ms). | ||
The display is based on IPS technology and can thus be read from any position and angle. Display brightness was only high enough for indoor use, outdoors the device is best kept in the shade or used only on overcast days.
Performance
Acer’s Swift 3 SF314-55 is an elegant and small 14-inch notebook. It offers more than enough performance for office tasks and Internet workflows. At the time of writing, it sold for around $700 and was the series’ entry-level SKU. Better-equipped SKUs are also available.
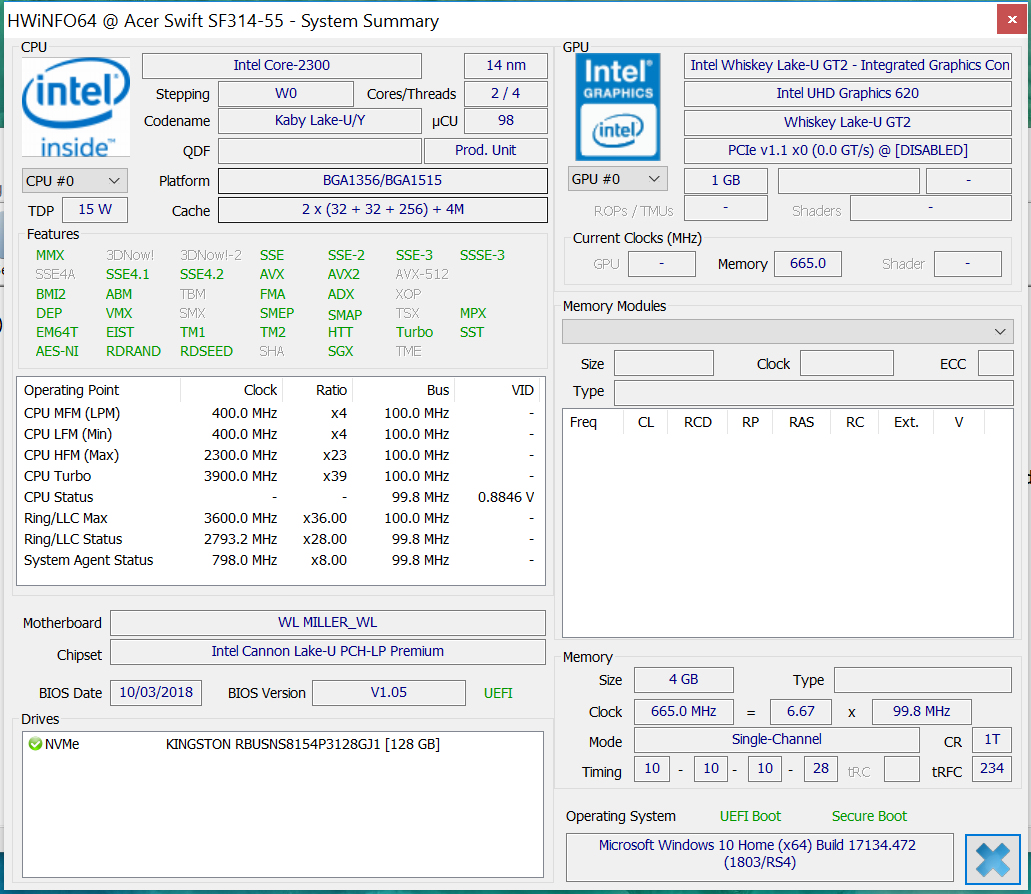
Processor
The Swift 3 is powered by an Intel Core i3-8145U dual-core CPU. The ULV model with a TDP of 15 W is based on Intel’s Whiskey Lake architecture and was fast enough for the most common range of applications. Its base clock speed of 2.1 GHz can turbo boost up to 3.7 on two cores and 3.9 GHz on one. It also supports Hyper-Threading, meaning it can run two threads per core simultaneously.
During our Cinebench multithread test the CPU ran at 3.7 GHz for a few seconds and subsequently reduced its clock speed to 3.4-3.5 GHz. In the single-thread test it clocked between 3.7 and 3.9 GHz. At least on mains, that is. On battery, CPU clock speeds were reduced to just 1.9-2.1 GHz and only occasionally clocked higher than that for very short periods of time. Consequently, the Cinebench R15 scores on battery were just 60 (single-thread) and 156 (multithread).
We found no way in our review unit’s BIOS setup to change this behavior and enable turbo boost on battery. After we had finished our tests, Acer released a new BIOS update, version 1.05, but that also did not have any impact at all.
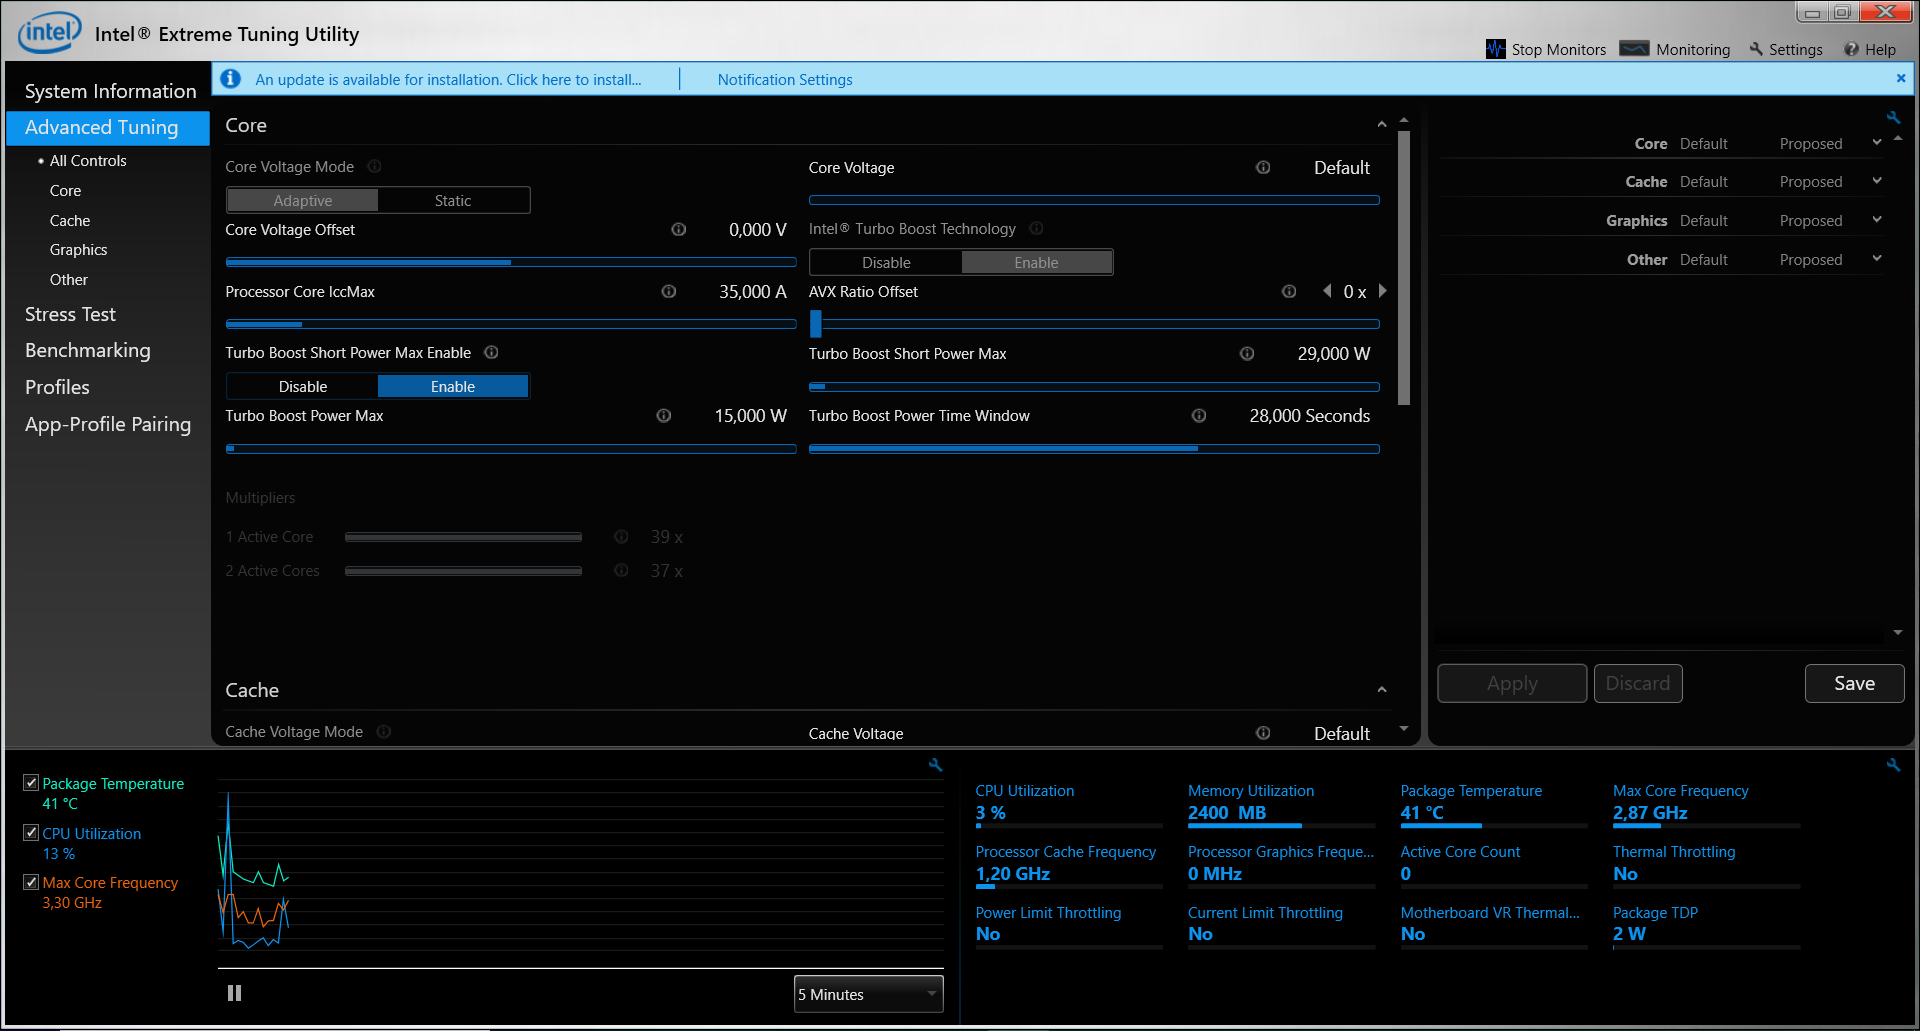
We verify whether or not turbo boost is applied over long periods of time by running Cinebench R15’s multithread test in a loop for at least 30 minutes. Our review unit’s score dropped between the first and second run of the test but remained steady and consistent afterwards. Therefore, performance does not decrease over time, and turbo boost is applied throughout the entire test at around 3.4-3.5 GHz.
We ran the same test on battery as well, and the device scored a very consistent 152 points over and over again.
There are no architectural differences between Whiskey Lake and Kaby Lake. In other words: The per-MHz-performance is identical between the two. However, Whiskey Lake’s optimized manufacturing process allows for higher clock speeds. Accordingly, the 8145U is only faster in our tests thanks to its higher turbo boost speeds compared to its Core i3-8130U Kaby Lake predecessor.
| JetStream 1.1 - 1.1 Total | |
| Acer Swift 3 SF314-52G-89SL (Edge 40) | |
| Asus VivoBook S14 S406UA-BV023T (Edge 41) | |
| Average Intel Core i3-8145U (205 - 227, n=3) | |
| Acer Swift 3 SF314-55-31N8 (Edge 42) | |
| Average of class Subnotebook (n=1last 2 years) | |
| Acer Aspire 3 A315-51-30YA (Edge 41) | |
| Lenovo Ideapad 720S-13ARR (Edge 42) | |
| Lenovo Ideapad 720S-13ARR | |
| Acer Swift 3 (i5-7200U, HD 620) | |
System Performance
Thanks to the combination of a Core i3 CPU and an NVMe SSD the system was very smooth and responsive at all times, and we have not encountered any issues. The Swift 3 was more than powerful enough for the most common office and Internet applications, which is further corroborated by its good PCMark benchmark scores. However, Acer could have improved performance somewhat by making use of the memory controller’s dual-channel mode, but the RAM soldered onto the motherboard only runs in single-channel mode. Activating dual-channel mode retroactively is not possible.
| PCMark 7 Score | 5393 points | |
| PCMark 8 Home Score Accelerated v2 | 3281 points | |
| PCMark 8 Creative Score Accelerated v2 | 4161 points | |
| PCMark 8 Work Score Accelerated v2 | 4556 points | |
| PCMark 10 Score | 3179 points | |
Help | ||
Storage Devices
The 128 GB M.2-2280 NVMe SSD is made by Kingston, and around 92 GB of the storage space is user-accessible out of the box. The rest is taken up by the Windows installation and the recovery partition. Traditionally, NVMe SSDs tend to be much faster than SATA III SSDs due to the fact that they are connected to the much faster PCIe 3.0 x4 bus instead of the SATA interface. While this particular Kingston SSD performed quite well, it was certainly not the fastest SSD available.

| Acer Swift 3 SF314-55-31N8 Kingston RBUSNS8154P3128GJ | Acer Swift 3 SF314-52G-89SL Intel SSD 600p SSDPEKKW512G7 | Acer Swift 3 (i5-7200U, HD 620) Intel SSD 600p SSDPEKKW256G7 | Lenovo Ideapad 720S-13ARR Samsung PM961 NVMe MZVLW128HEGR | Asus VivoBook S14 S406UA-BV023T SanDisk SD8SN8U256G1002 | Lenovo Ideapad 720S-13ARR Samsung PM961 MZVLW256HEHP | Average Kingston RBUSNS8154P3128GJ | Average of class Subnotebook | |
|---|---|---|---|---|---|---|---|---|
| AS SSD | 55% | 5% | -796% | -28% | 30% | 3% | 331% | |
| Seq Read (MB/s) | 1201 | 1609 34% | 1371 14% | 599 -50% | 490.6 -59% | 1977 65% | 973 ? -19% | 4504 ? 275% |
| Seq Write (MB/s) | 434.5 | 567 30% | 590 36% | 103.6 -76% | 297.6 -32% | 1321 204% | 404 ? -7% | 2934 ? 575% |
| 4K Read (MB/s) | 40.9 | 29.55 -28% | 32.12 -21% | 35.82 -12% | 26.05 -36% | 20.72 -49% | 28.2 ? -31% | 59 ? 44% |
| 4K Write (MB/s) | 90 | 117.5 31% | 94.1 5% | 0.96 -99% | 49.92 -45% | 33.62 -63% | 65.5 ? -27% | 164.4 ? 83% |
| 4K-64 Read (MB/s) | 425.5 | 506 19% | 279.6 -34% | 462.8 9% | 368.1 -13% | 933 119% | 317 ? -25% | 861 ? 102% |
| 4K-64 Write (MB/s) | 390.9 | 521 33% | 431.5 10% | 47.85 -88% | 151 -61% | 302.7 -23% | 259 ? -34% | 1695 ? 334% |
| Access Time Read * (ms) | 0.184 | 0.07 62% | 0.08 57% | 0.086 53% | 0.118 36% | 0.149 19% | 0.2317 ? -26% | 0.06711 ? 64% |
| Access Time Write * (ms) | 0.048 | 0.031 35% | 0.042 12% | 4.061 -8360% | 0.085 -77% | 0.109 -127% | 0.06829 ? -42% | 0.05138 ? -7% |
| Score Read (Points) | 586 | 697 19% | 449 -23% | 559 -5% | 443 -24% | 1152 97% | 443 ? -24% | 1369 ? 134% |
| Score Write (Points) | 524 | 695 33% | 585 12% | 59 -89% | 231 -56% | 468 -11% | 365 ? -30% | 2153 ? 311% |
| Score Total (Points) | 1386 | 1703 23% | 1235 -11% | 890 -36% | 899 -35% | 2174 57% | 1014 ? -27% | 4158 ? 200% |
| Copy ISO MB/s (MB/s) | 310.1 | 620 100% | 332.5 7% | 640 106% | 549 ? 77% | 2569 ? 728% | ||
| Copy Program MB/s (MB/s) | 88.4 | 290.2 228% | 109.4 24% | 75 -15% | 209 ? 136% | 813 ? 820% | ||
| Copy Game MB/s (MB/s) | 166.4 | 421.5 153% | 139.4 -16% | 225.1 35% | 369 ? 122% | 1781 ? 970% |
* ... smaller is better
GPU Performance
Video output is handled by Intel's UHD Graphics 620 GPU. It supports DirectX 12 and runs at clock speeds between 300 and 1,000 MHz. 3DMark benchmark results were at a level expected of this GPU.
| 3DMark 06 Standard Score | 7653 points | |
| 3DMark 11 Performance | 1511 points | |
| 3DMark Cloud Gate Standard Score | 6130 points | |
| 3DMark Fire Strike Score | 778 points | |
Help | ||
Gaming Performance
The Swift 3’s combination of CPU and GPU is capable of running some games smoothly. However, these are limited to games with very modest hardware requirements and will only run smoothly with reduced resolutions and details. More-demanding games, like Battlefield V, are not going to be playable at all.
| low | med. | high | ultra | |
|---|---|---|---|---|
| BioShock Infinite (2013) | 40.2 | 23.3 | 19.1 | 6 |
| Hitman 2 (2018) | 4.9 | |||
| Fallout 76 (2018) | 12 | |||
| Battlefield V (2018) | 9.2 | |||
| Farming Simulator 19 (2018) | 46.8 | 17.4 | ||
| Darksiders III (2018) | 16.5 | |||
| Just Cause 4 (2018) | 11.7 |
Emissions & Energy
System Noise
Acer’s 14-inch notebook remained quiet regardless of load. When idle, the fan was usually off and the device was thus completely silent. Under load the fan only revved up slightly, and the maximum sound pressure level determined during our stress test was a low 31.4 dB(A).
Noise level
| Idle |
| 30.3 / 30.3 / 30.3 dB(A) |
| Load |
| 31 / 31.4 dB(A) |
 | ||
30 dB silent 40 dB(A) audible 50 dB(A) loud |
||
min: | ||
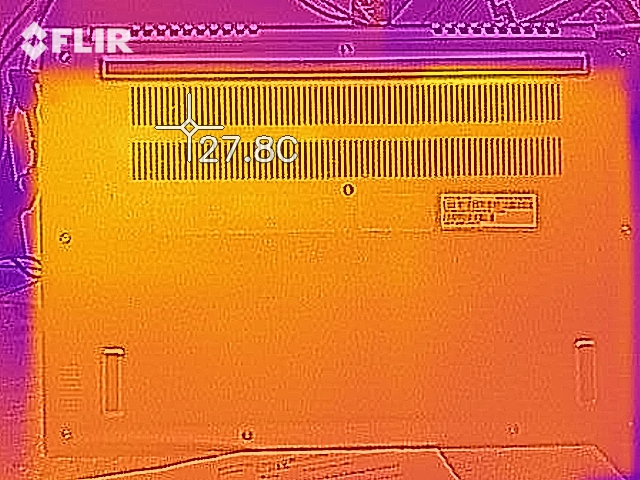
Temperature
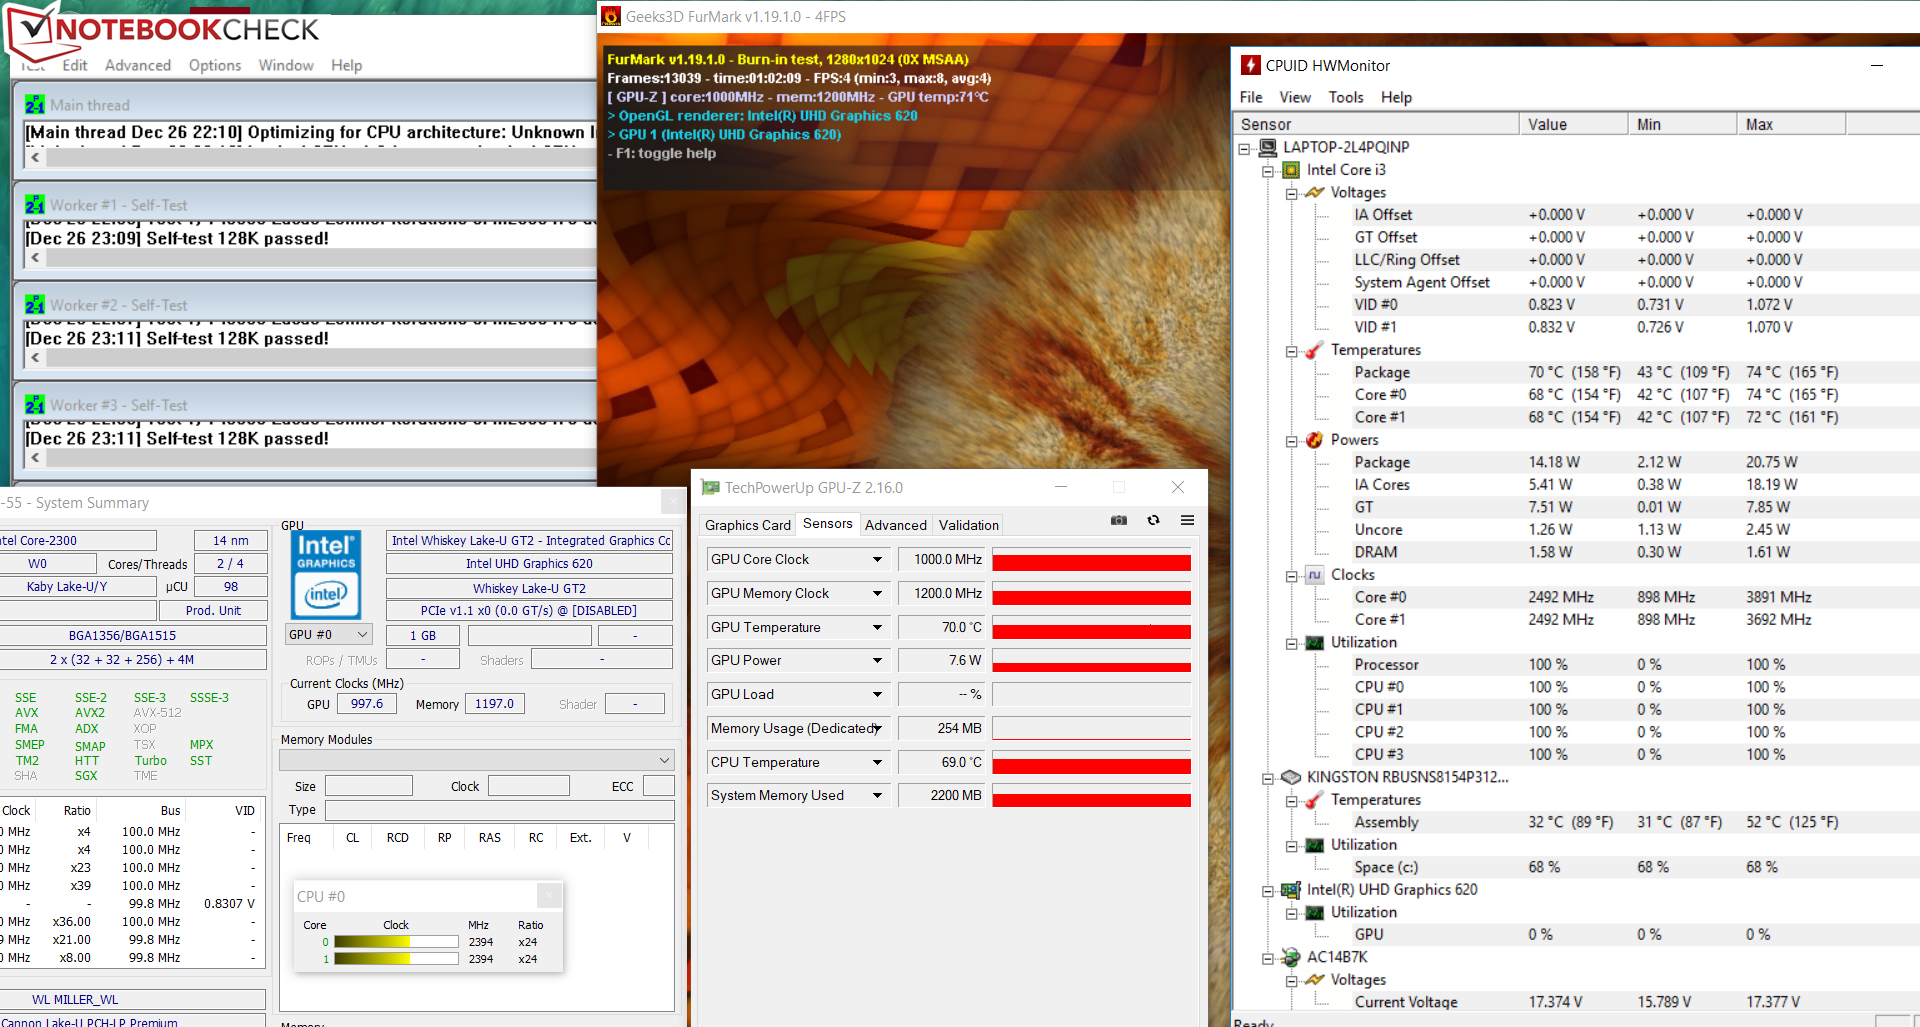
Our stress test (Prime95 and FurMark running simultaneously for at least one full hour) was performed differently on mains and on battery. The CPU ran at between 2.2 and 2.5 GHz on mains and between 1.8 and 2.1 GHz on battery. The GPU ran at its full speed regardless of power source.
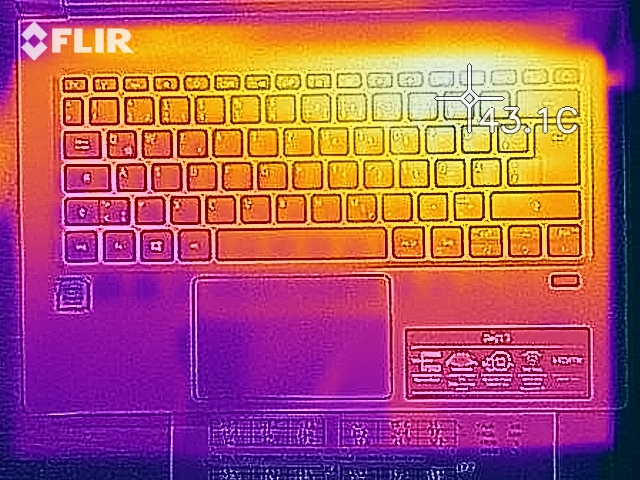
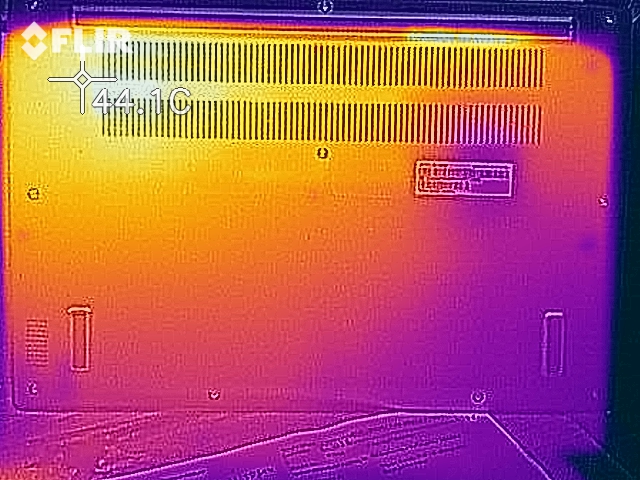
The Swift 3 remained fairly cool overall. We found two hot spots of more than 40 °C while running our stress test, but the device was much cooler during everyday use. Keep in mind that our stress test is an extreme load scenario that is rarely ever encountered in the real world. We use this test to determine any bottlenecks and potential stability issues.
(±) The maximum temperature on the upper side is 40.2 °C / 104 F, compared to the average of 35.9 °C / 97 F, ranging from 21.4 to 59 °C for the class Subnotebook.
(±) The bottom heats up to a maximum of 40 °C / 104 F, compared to the average of 39.2 °C / 103 F
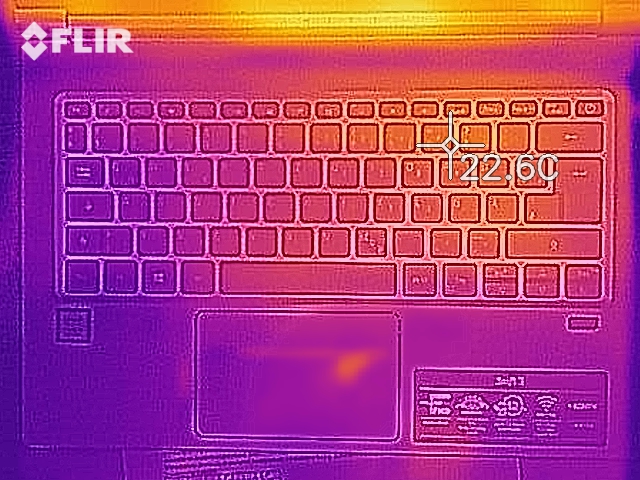
(+) In idle usage, the average temperature for the upper side is 23.5 °C / 74 F, compared to the device average of 30.8 °C / 87 F.
(+) The palmrests and touchpad are cooler than skin temperature with a maximum of 27.7 °C / 81.9 F and are therefore cool to the touch.
(±) The average temperature of the palmrest area of similar devices was 28.2 °C / 82.8 F (+0.5 °C / 0.9 F).
Speakers
The stereo speakers are located at the bottom of the device. Their soundscape is pleasant but lacks bass. As is often the case we suggest using headphones or external speakers for an improved audio experience.
Acer Swift 3 SF314-55-31N8 audio analysis
(-) | not very loud speakers (64.7 dB)
Bass 100 - 315 Hz
(-) | nearly no bass - on average 17.1% lower than median
(+) | bass is linear (5.3% delta to prev. frequency)
Mids 400 - 2000 Hz
(+) | balanced mids - only 3.1% away from median
(+) | mids are linear (6.8% delta to prev. frequency)
Highs 2 - 16 kHz
(+) | balanced highs - only 1.8% away from median
(+) | highs are linear (3.8% delta to prev. frequency)
Overall 100 - 16.000 Hz
(±) | linearity of overall sound is average (19.4% difference to median)
Compared to same class
» 60% of all tested devices in this class were better, 7% similar, 33% worse
» The best had a delta of 5%, average was 18%, worst was 53%
Compared to all devices tested
» 48% of all tested devices were better, 7% similar, 45% worse
» The best had a delta of 4%, average was 23%, worst was 134%
Apple MacBook 12 (Early 2016) 1.1 GHz audio analysis
(+) | speakers can play relatively loud (83.6 dB)
Bass 100 - 315 Hz
(±) | reduced bass - on average 11.3% lower than median
(±) | linearity of bass is average (14.2% delta to prev. frequency)
Mids 400 - 2000 Hz
(+) | balanced mids - only 2.4% away from median
(+) | mids are linear (5.5% delta to prev. frequency)
Highs 2 - 16 kHz
(+) | balanced highs - only 2% away from median
(+) | highs are linear (4.5% delta to prev. frequency)
Overall 100 - 16.000 Hz
(+) | overall sound is linear (10.2% difference to median)
Compared to same class
» 7% of all tested devices in this class were better, 2% similar, 90% worse
» The best had a delta of 5%, average was 18%, worst was 53%
Compared to all devices tested
» 5% of all tested devices were better, 1% similar, 94% worse
» The best had a delta of 4%, average was 23%, worst was 134%
Power Consumption
Acer’s SF314-55 was comparatively economic and efficient. Maximum power consumption when idle was just 6.1 W, which increased to 35.3 W while running our stress test (Prime95 and FurMark simultaneously for at least one full hour). With just Prime95 running, power consumption was even higher and peaked at 38.4 W. The power supply is rated at 45 W.
| Off / Standby | |
| Idle | |
| Load |
|
Key:
min: | |
Battery Life
In our real-life Wi-Fi test, in which we simulate conditions typical for browsing the web, the Swift 3 lasted for 10:14 hours. During this test, the energy plan is set to “Balanced”, display brightness is normalized to 150 nits, and all power-saving features are disabled.
Pros
Cons
Verdict
Acer’s Swift 3 SF314-55 is a 14-inch notebook with an elegant and compact metal case. It offers plenty of performance for everyday office and Internet tasks thanks to its Core i3 CPU, which manages to outperform its Kaby Lake competitors like the Core i5-7200U due to its higher turbo boost speeds. Despite this, the device remained very quiet and cool in all load scenarios.
An NVMe SSD makes for a buttery smooth and responsive system, and the SSD can be upgraded. Unfortunately, this requires removing the bottom cover and opening the case. The IPS panel offers great viewing angles and a good contrast ratio but its maximum brightness is nothing to write home about. Considering the laptop’s price we would have expected a brighter display. It is only bright enough for indoor use. The backlit keyboard left a good impression and was certainly well usable. Battery life was pretty decent; however, it comes at a price: CPU turbo boost is practically not applied on battery at all.
Our biggest criticism is the device’s meager RAM configuration. 4 GB is not enough considering the notebook’s price of around $700.
In addition, the RAM is soldered onto the motherboard and there are no free RAM slots available, which means it is impossible to add more memory. This is most certainly going to be a deal-breaker for many potential customers. For $100 more you can get the SF314-55-34T6 SKU with not only 8 GB of RAM but also a more spacious 256 GB SSD.
Acer Swift 3 SF314-55-31N8
- 12/29/2018 v6 (old)
Sascha Mölck
Price comparison

