

Asus VivoBook S14 S406UA (i5-8250U, SSD, HD) Laptop Review
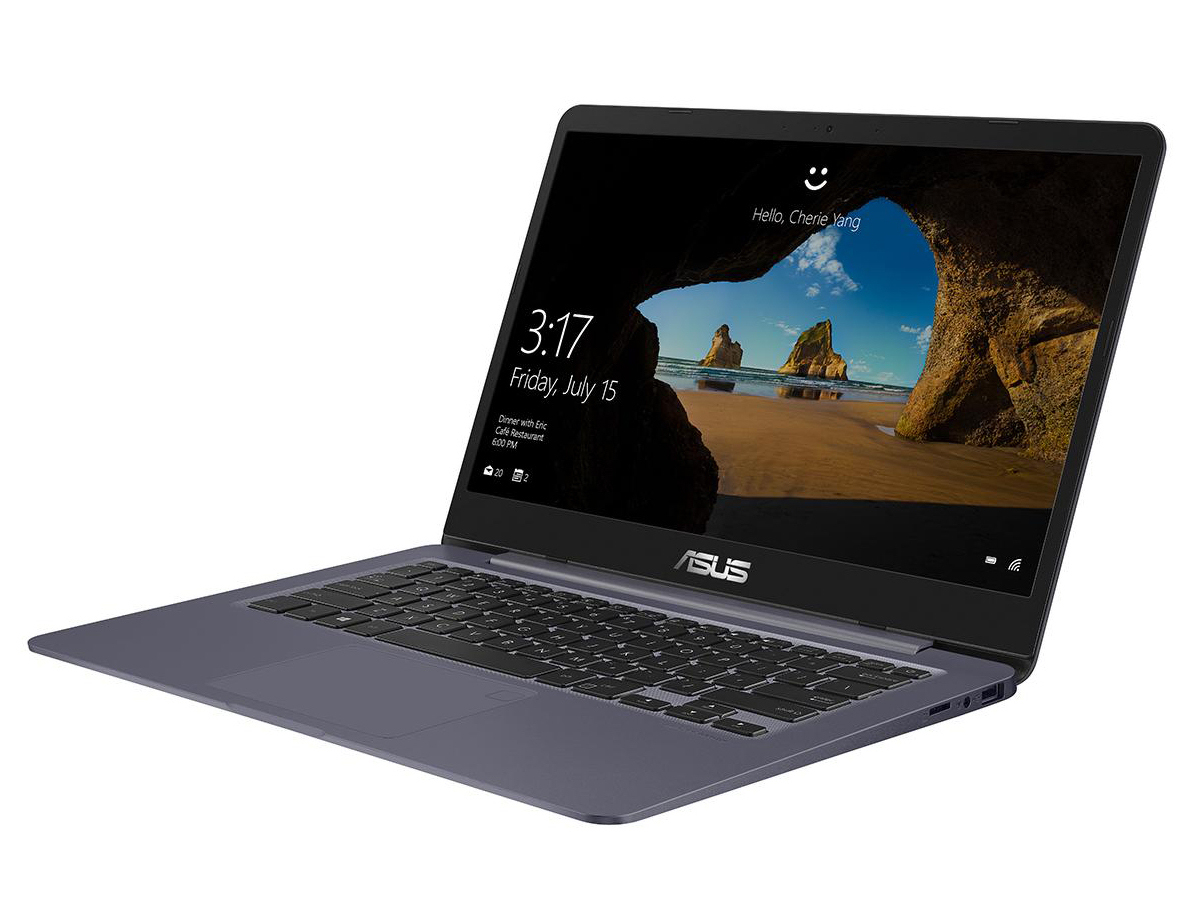
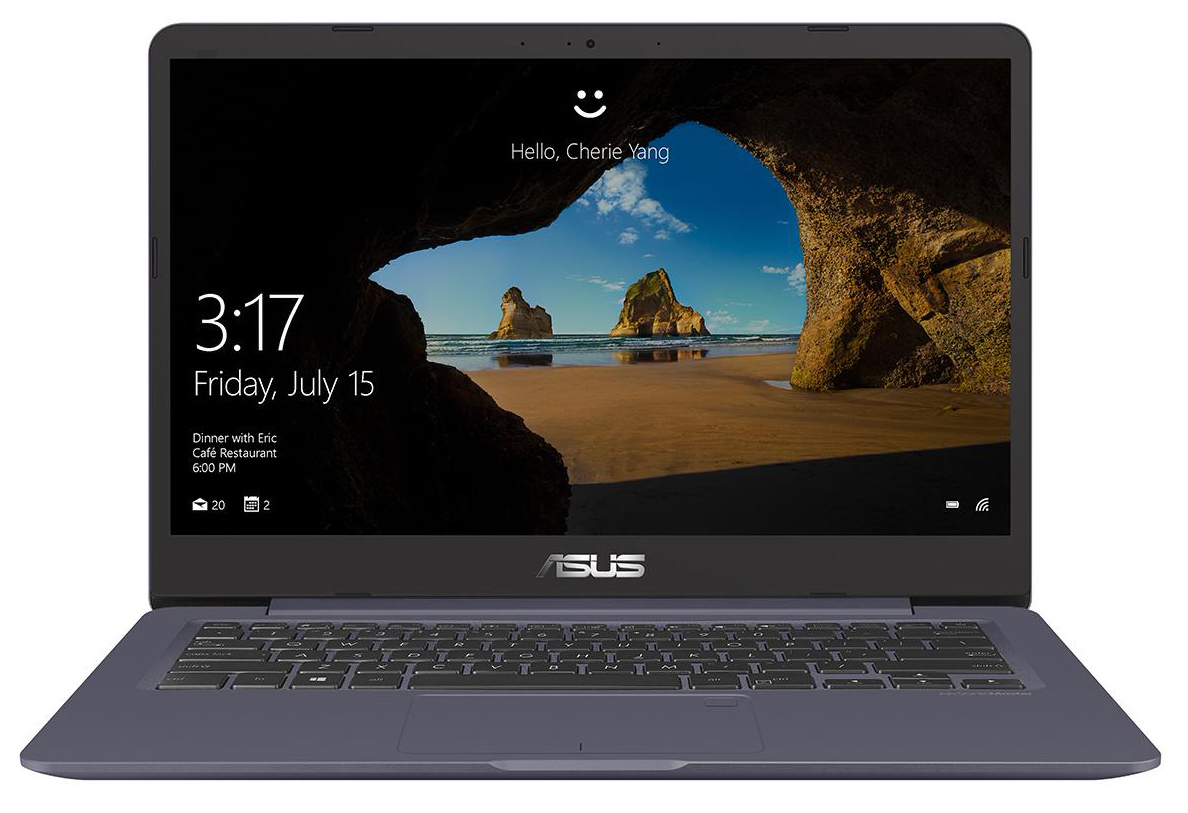
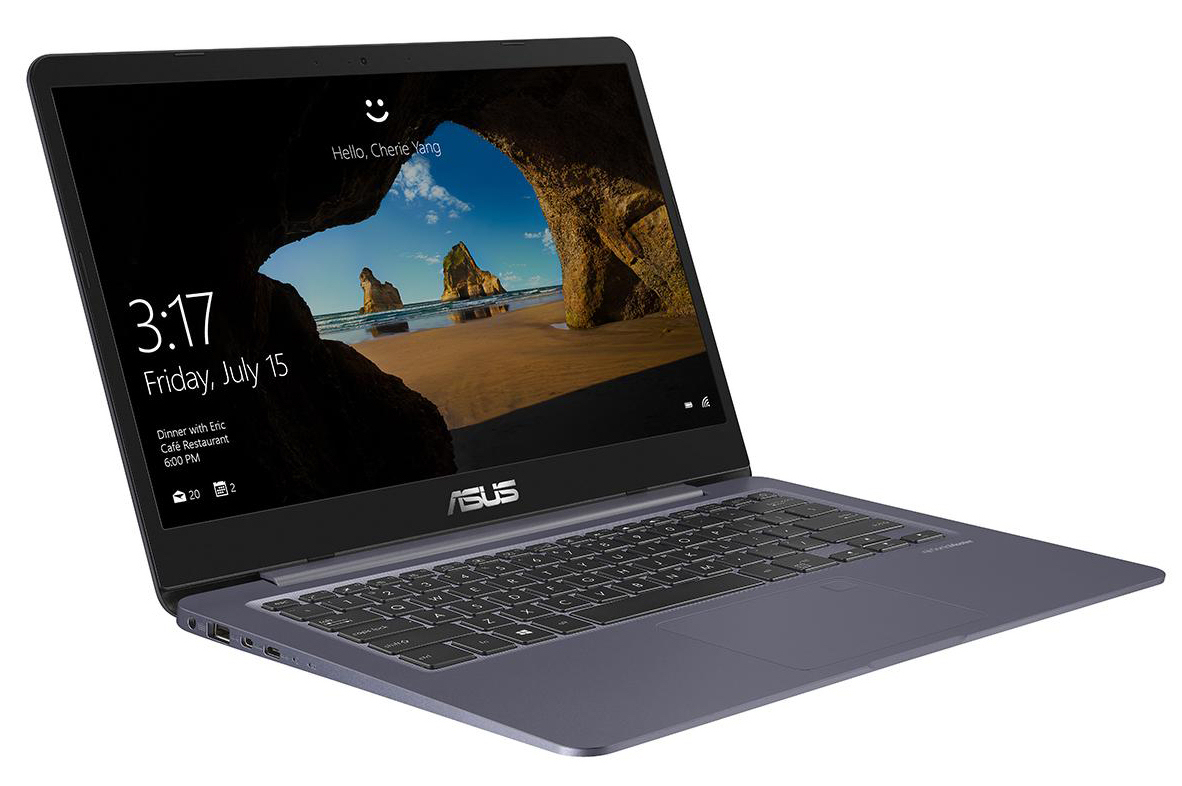
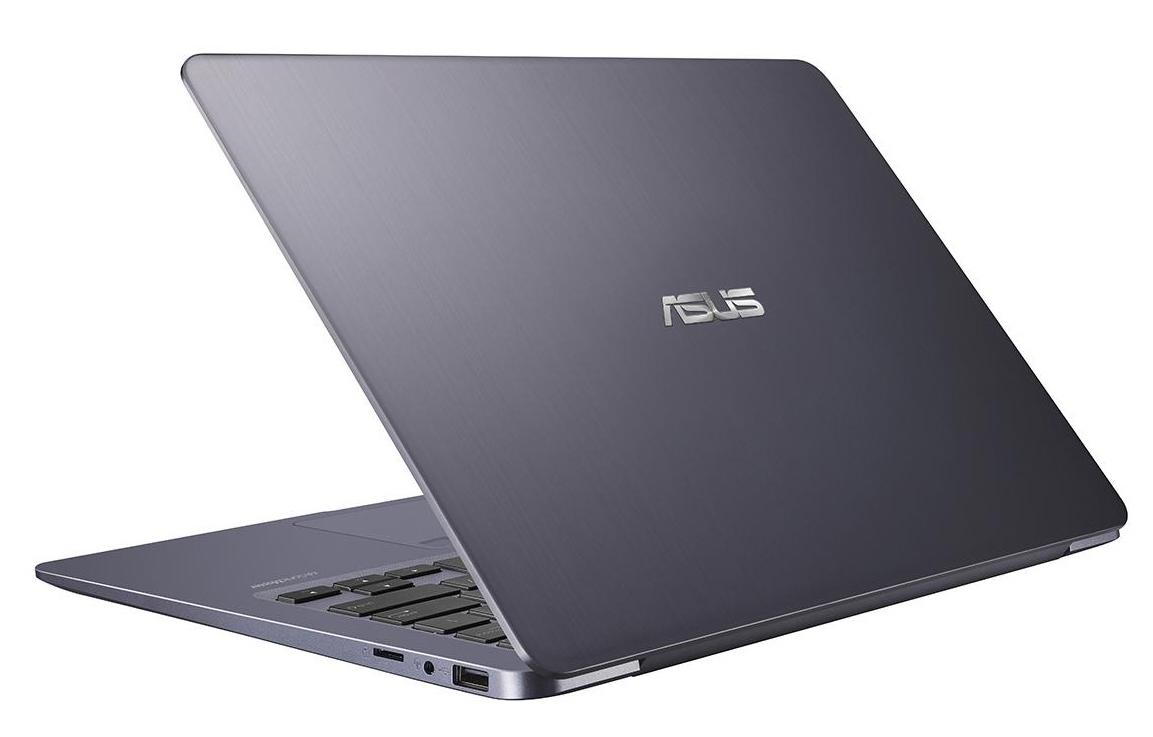
The VivoBook S14 S406UA from Asus represents a slim, compact 14-inch notebook with the dimensions of a 13.3-inch device. The laptop is powered by a ULV quad-core processor. The competitors of the device include: the Acer Swift 3 SF314-52, the HP Envy 13-ad065nr, the Dell Inspiron 13 7370 and the Apple MacBook Air 13.
Case & Connectivity
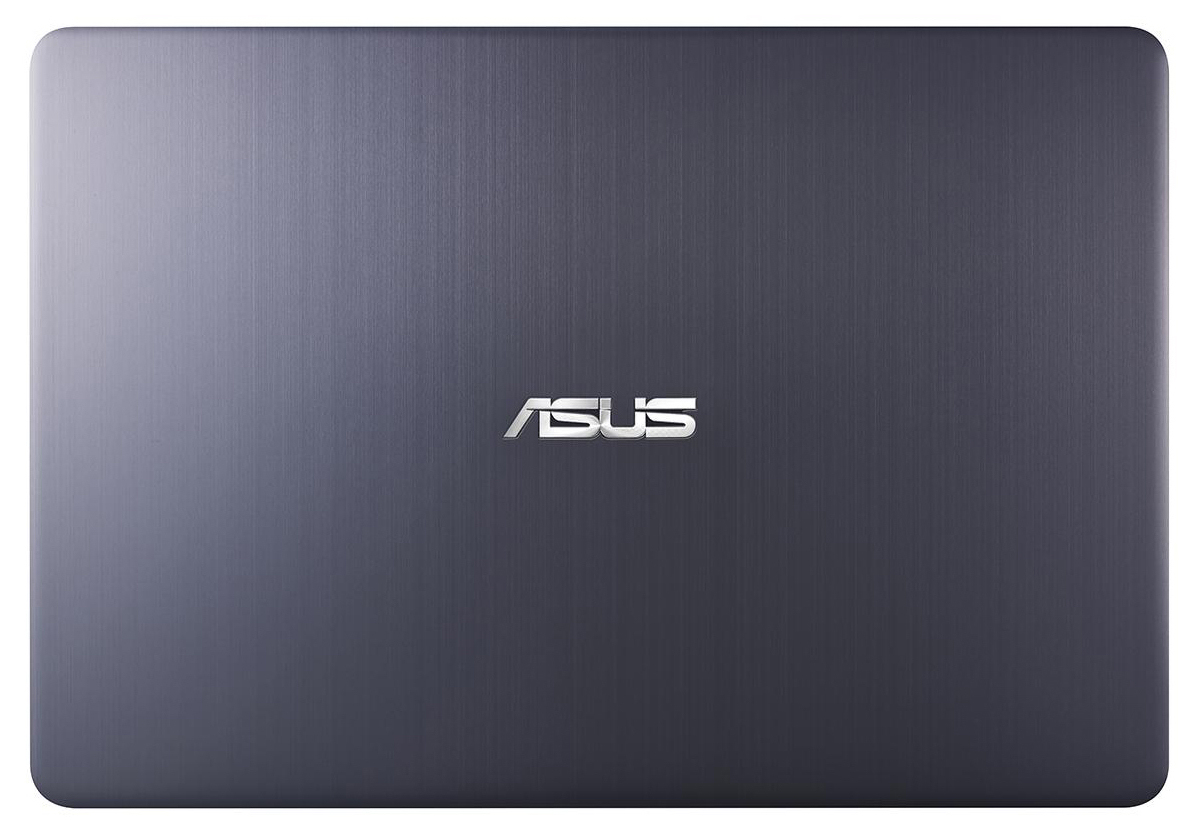
Asus packs the internals of the VivoBook in a case with the dimensions of a 13.3-inch device and outfits the whole thing with a 14-inch screen. Therefore, what we have here is a slim, compact notebook. The case of the VivoBook resembles very much that of the Asus ZenBook UX3410UA. Whereas the ZenBook’s case is made entirely of metal, only the back of the display lid of the VivoBook consists of this material. The chassis is made of plastic - not a very good decision. The chassis lacks both firmness and rigidity. It can be bent or twisted with little effort. These are the kind of things that should not crop up with a device intended for mobile use.
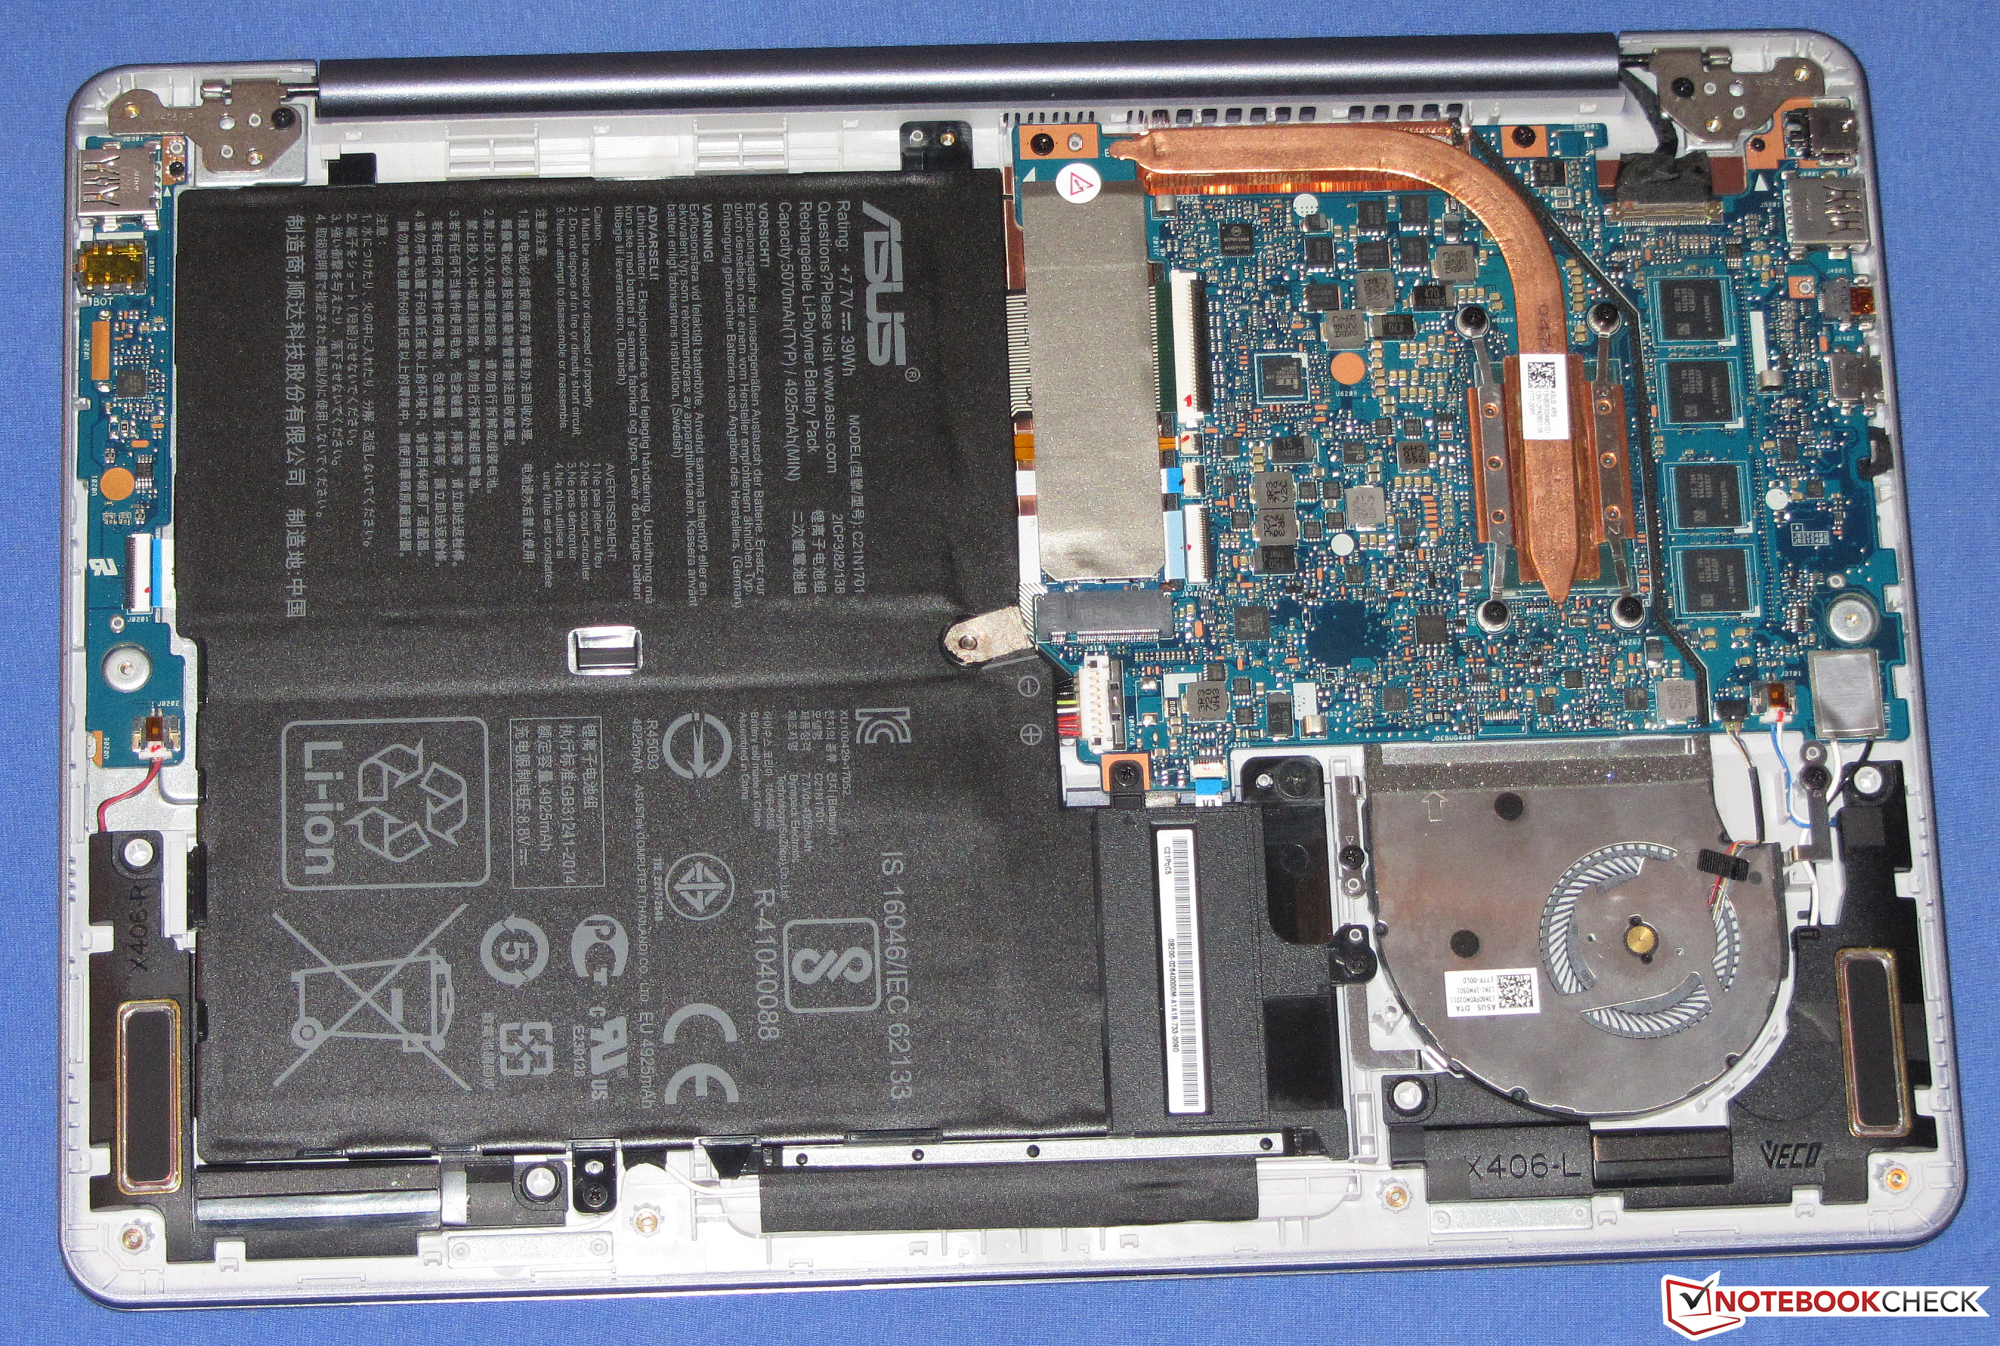
The notebook does not offer a maintenance hatch. In order to get to the internals, you will have to remove the bottom cover. For this, you will just have to undo the screws on the underside of the device. Attention: There are additional screws underneath both rubber feet. Subsequently, the bottom cover can be removed with the help of a silicone trowel. It is not attached particularly firmly.
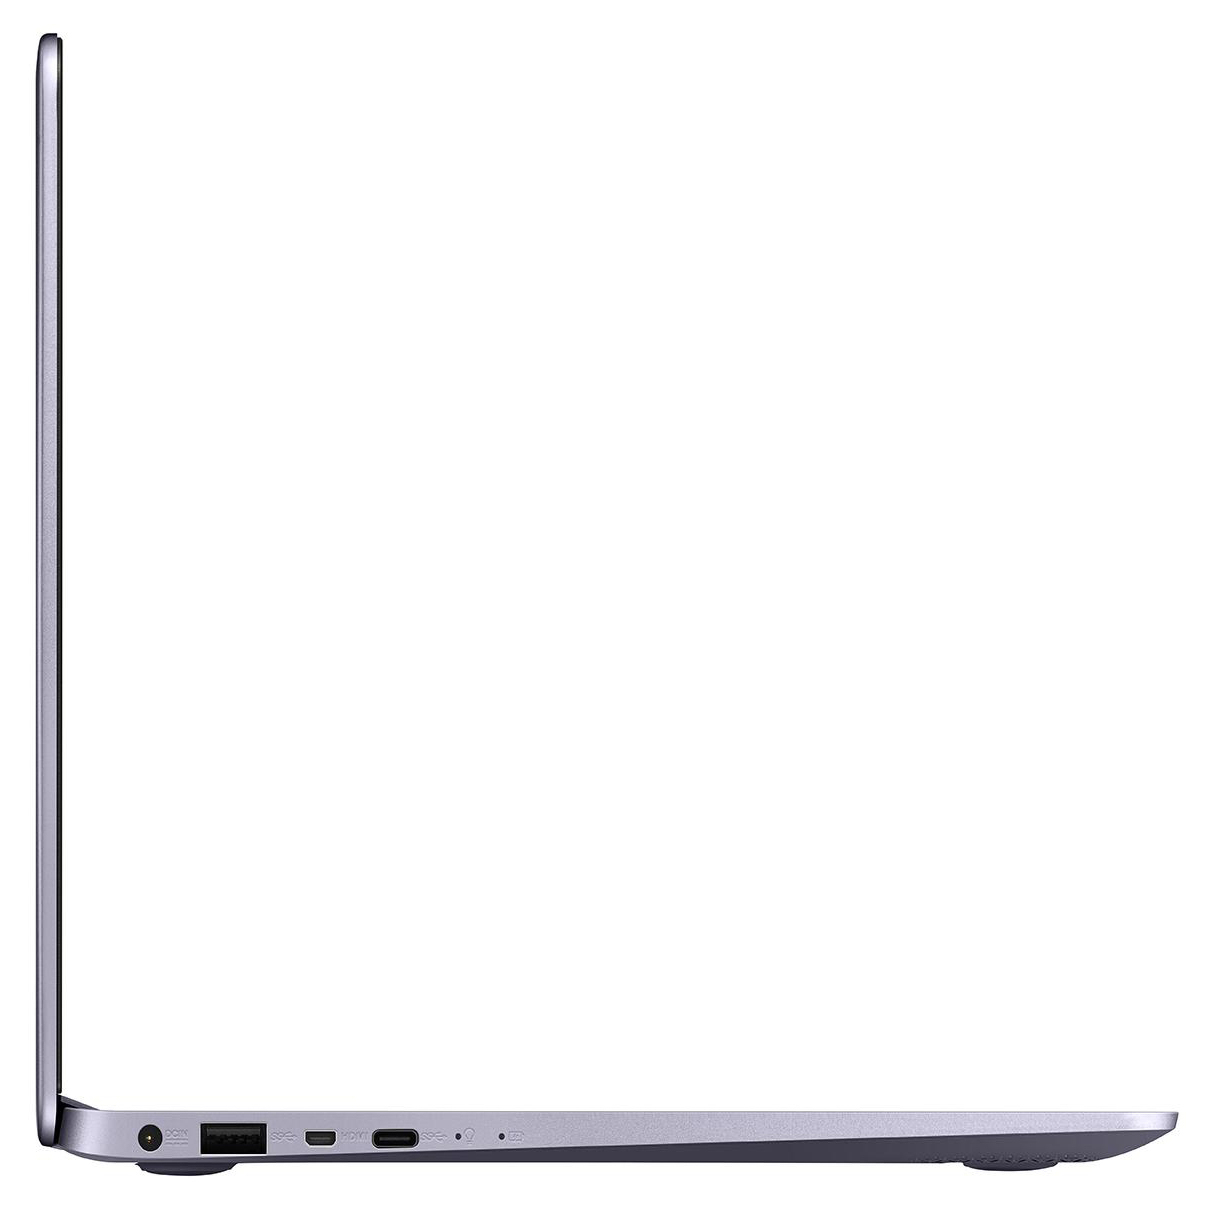
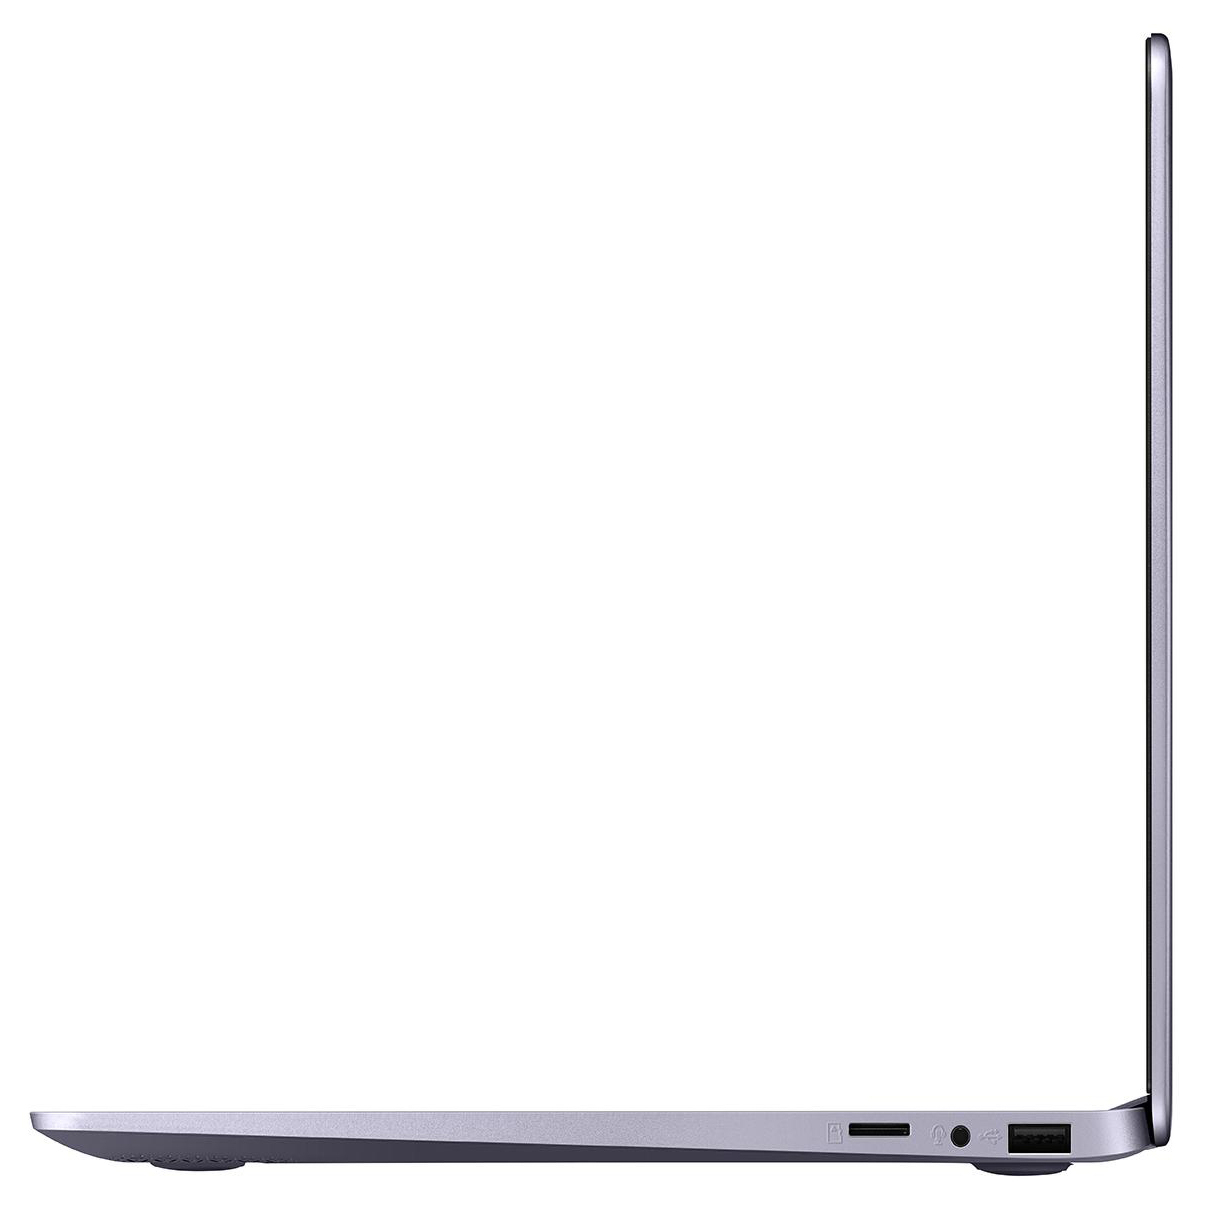
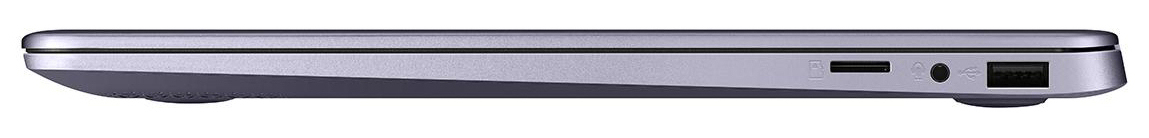
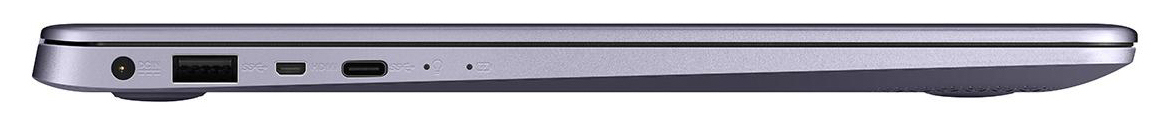
With the VivoBook, there are no surprises in terms of ports. The laptop comes with two USB Type-A ports (1x USB 2.0, 1x USB 3.1 Gen 1) and one Type-C port (USB 3.1 Gen 1). A port for video output (MicroHDMI) is also provided. The Type-C port can only be used for data transfers. With a device like the VivoBook, battery charging should also be an option with this port. Fundamentally, here Asus should have provided a Thunderbolt 3 port - a usual feature for a 900-Euro (~$1115) notebook.
The built-in SD card reader operates with an average speed. When copying large chunks of data, a maximum transfer speed of 37.8 MB/s was achieved. The transfer of 250 JPG image files was completed with a transfer rate of 38.7 MB/s. We test the SD card reader by means of a reference SD card (Toshiba Exceria Pro SDXC 64 GB UHS-II).
The Wi-Fi module (QCA9377) comes from Qualcomm. Besides the Wi-Fi standards 802.11a/b/g/n, it also supports the fast Wireless-AC standard. The data transfer rates that we have measured under the optimal conditions (no other Wi-Fi-enabled devices in close proximity, a short distance between the notebook and the server PC) are quite average, because the chip is based on 1x1 MIMO technology.
Ports
| SD Card Reader | |
| average JPG Copy Test (av. of 3 runs) | |
| Apple MacBook Air 13.3" 1.8 GHz (2017) (Toshiba Exceria Pro SDXC 64 GB UHS-II) | |
| Lenovo IdeaPad 320s-14IKB (Toshiba Exceria Pro SDXC 64 GB UHS-II) | |
| Schenker Slim 14 L17 (Toshiba Exceria Pro SDXC 64 GB UHS-II) | |
| HP Envy 13-ad065nr (Toshiba THN-M401S0640E2) | |
| Asus VivoBook S14 S406UA-BV023T (Toshiba Exceria Pro M501 microSDXC 64GB) | |
| Asus Zenbook UX3410UA (Toshiba Exceria Pro M401) | |
| Dell Inspiron 13 7370 (Toshiba Exceria Pro SDXC 64 GB UHS-II) | |
| Acer Swift 3 (i5-7200U, HD 620) (Toshiba Exceria Pro SDXC 64 GB UHS-II) | |
| maximum AS SSD Seq Read Test (1GB) | |
| Apple MacBook Air 13.3" 1.8 GHz (2017) (Toshiba Exceria Pro SDXC 64 GB UHS-II) | |
| Lenovo IdeaPad 320s-14IKB | |
| Schenker Slim 14 L17 (Toshiba Exceria Pro SDXC 64 GB UHS-II) | |
| HP Envy 13-ad065nr (Toshiba THN-M401S0640E2) | |
| Asus Zenbook UX3410UA (Toshiba Exceria Pro M401) | |
| Asus VivoBook S14 S406UA-BV023T (Toshiba Exceria Pro M501 microSDXC 64GB) | |
| Dell Inspiron 13 7370 (Toshiba Exceria Pro SDXC 64 GB UHS-II) | |
| Acer Swift 3 (i5-7200U, HD 620) (Toshiba Exceria Pro SDXC 64 GB UHS-II) | |
Input Devices
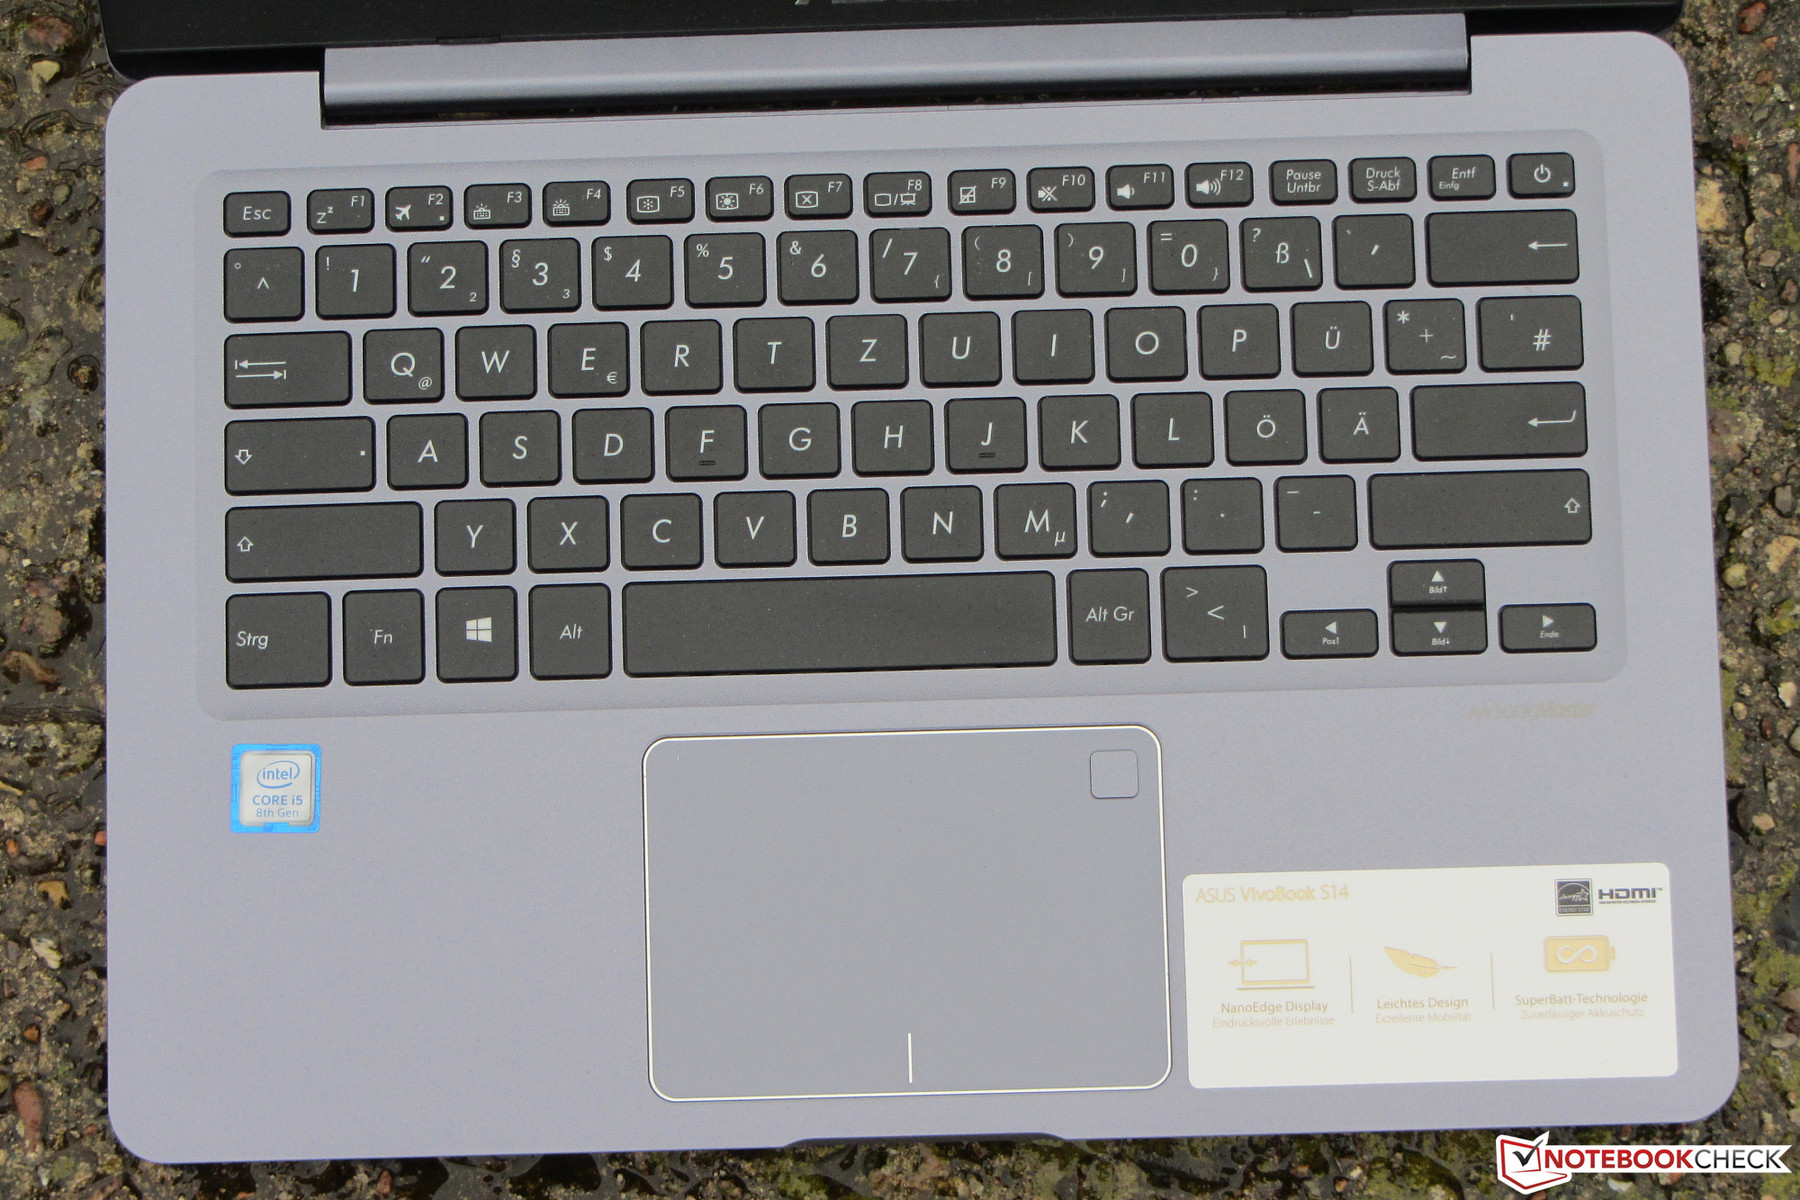
Asus has equipped the VivoBook with a backlit chiclet-style keyboard. The smooth keys have a short travel distance and a clear actuation point. However, they are too mushy for our taste. During typing, the keyboard exhibits some flex - particularly in the middle. All in all, here Asus delivers an “okay” keyboard that is fit for regular typing sessions. However, it is not a top-of-the-line model, by any means.
The multi-touch-enabled ClickPad takes up an area of some 10.5 x 7.3 cm (4.1 x 2.9 in). Therefore, there is enough space for the use of gesture controls. The smooth surface of the pad makes finger gliding easy. The ClickPad has a short travel distance and a clear actuation point. The fingerprint reader is located in the right upper corner of the ClickPad.
Display
The matte 14-inch display of the VivoBook operates with a native resolution of 1366x768. The brightness (208.1 cd/m2) and the contrast ratio (538:1) are too low. Here, devices with a similar price tag offer values that are well above 300 cd/m2 and 1000:1.
Unfortunately, at 90% brightness and below, the screen exhibits PWM flickering with a frequency of 200 Hz. Due to a relatively low frequency, susceptible individuals may experience headaches and eyestrain.
| |||||||||||||||||||||||||
Brightness Distribution: 81 %
Center on Battery: 215 cd/m²
Contrast: 538:1 (Black: 0.4 cd/m²)
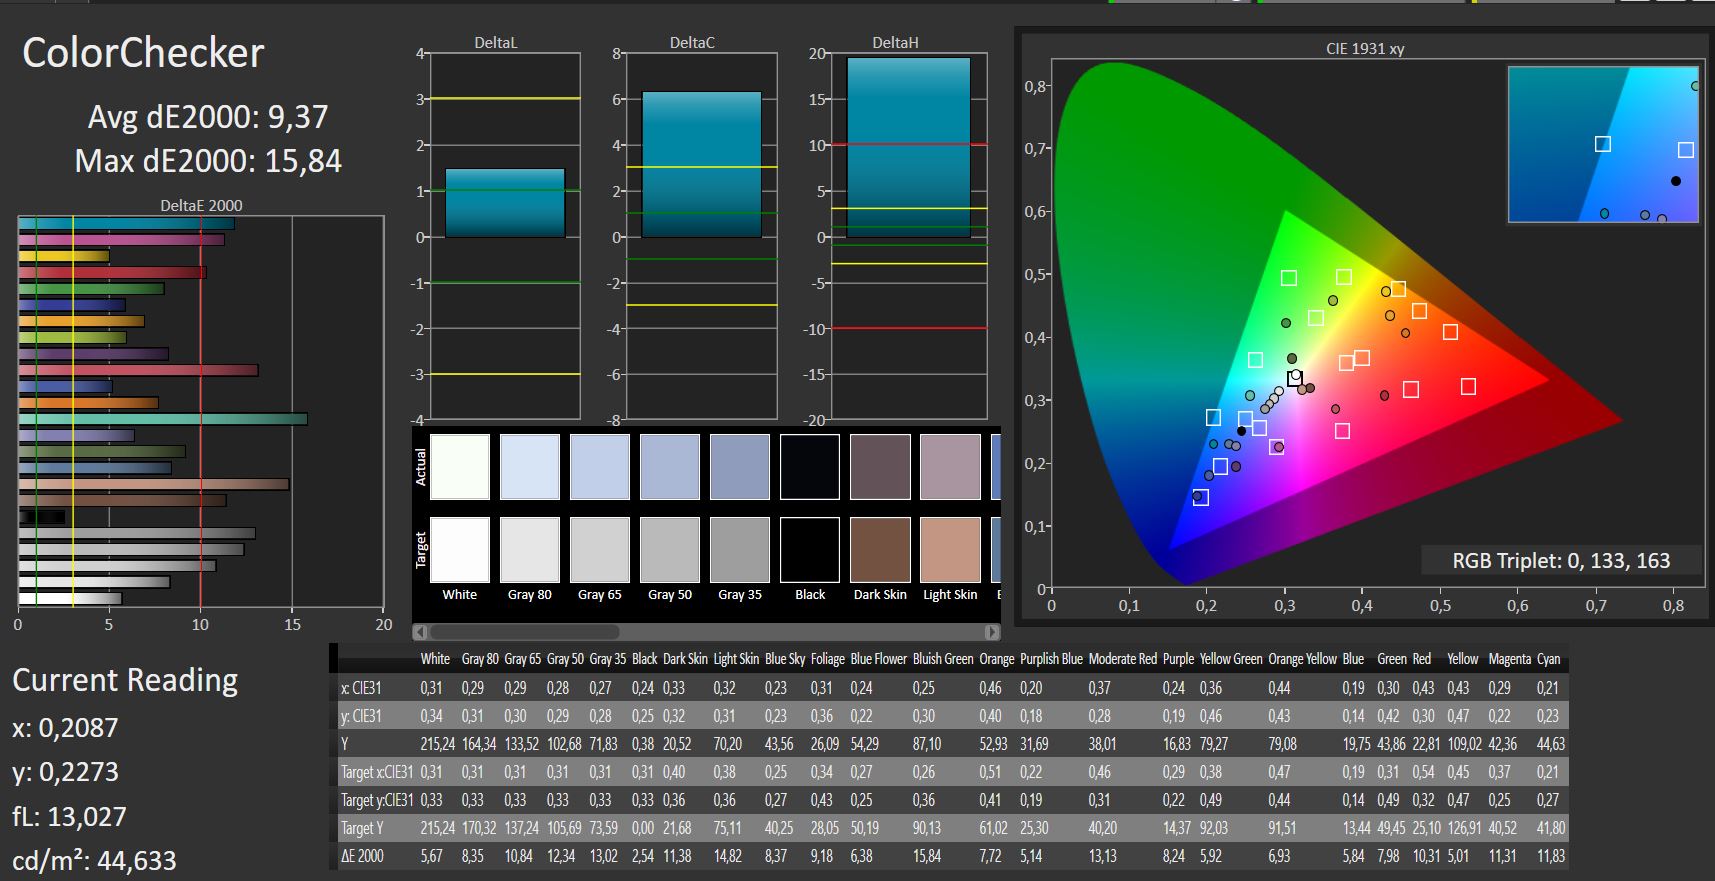
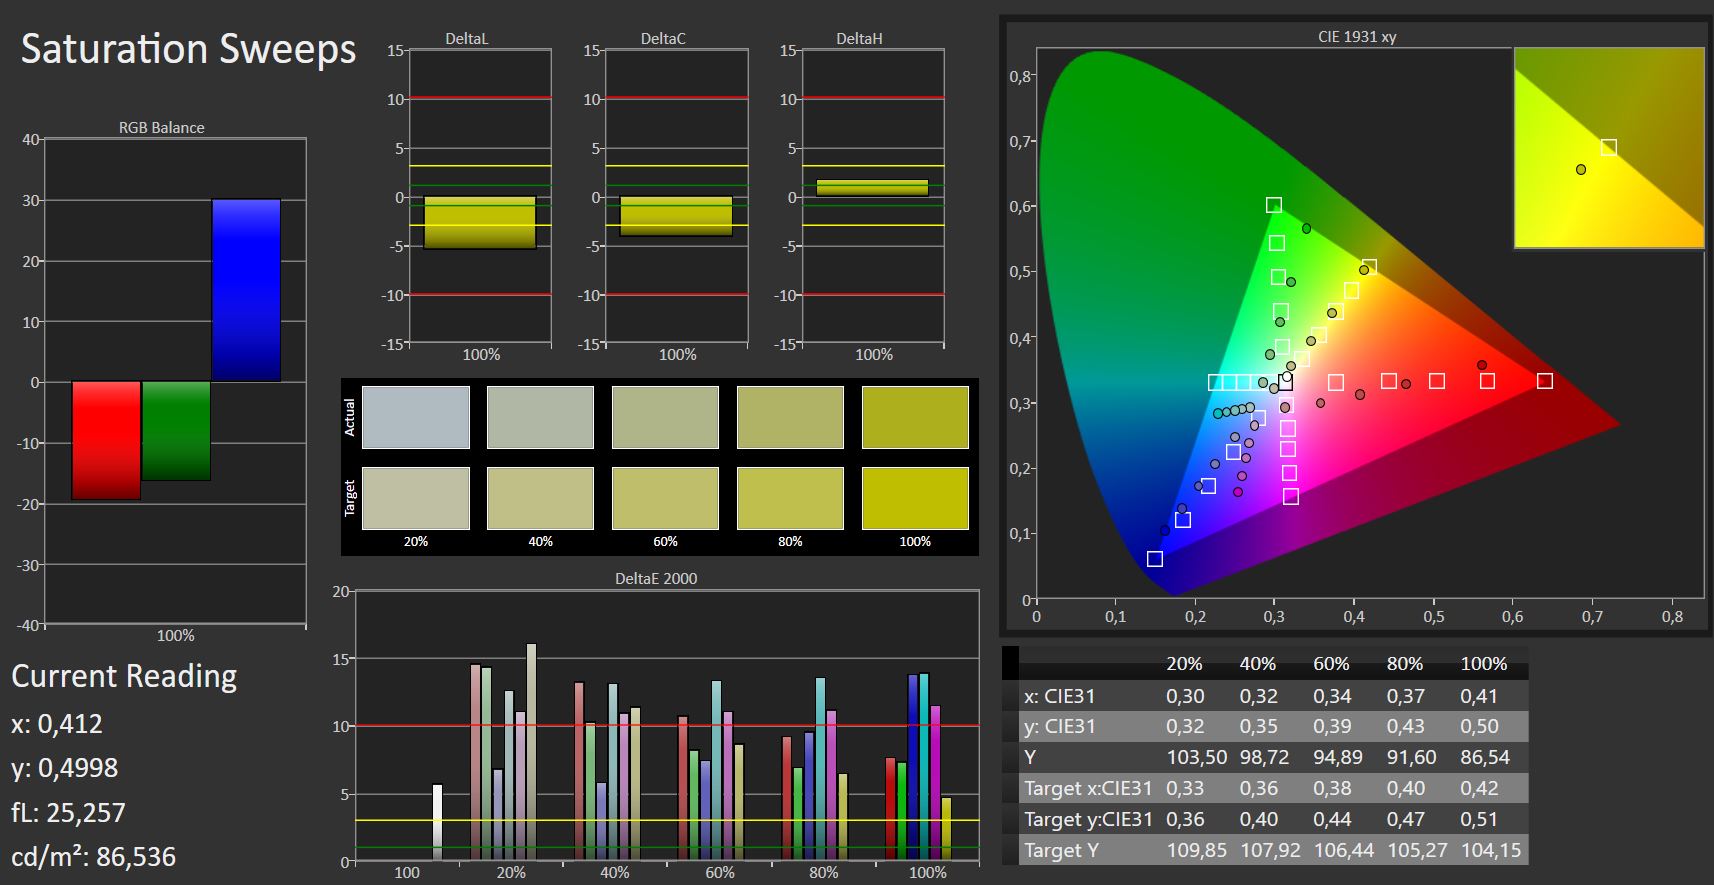
ΔE ColorChecker Calman: 9.37 | ∀{0.5-29.43 Ø4.79}
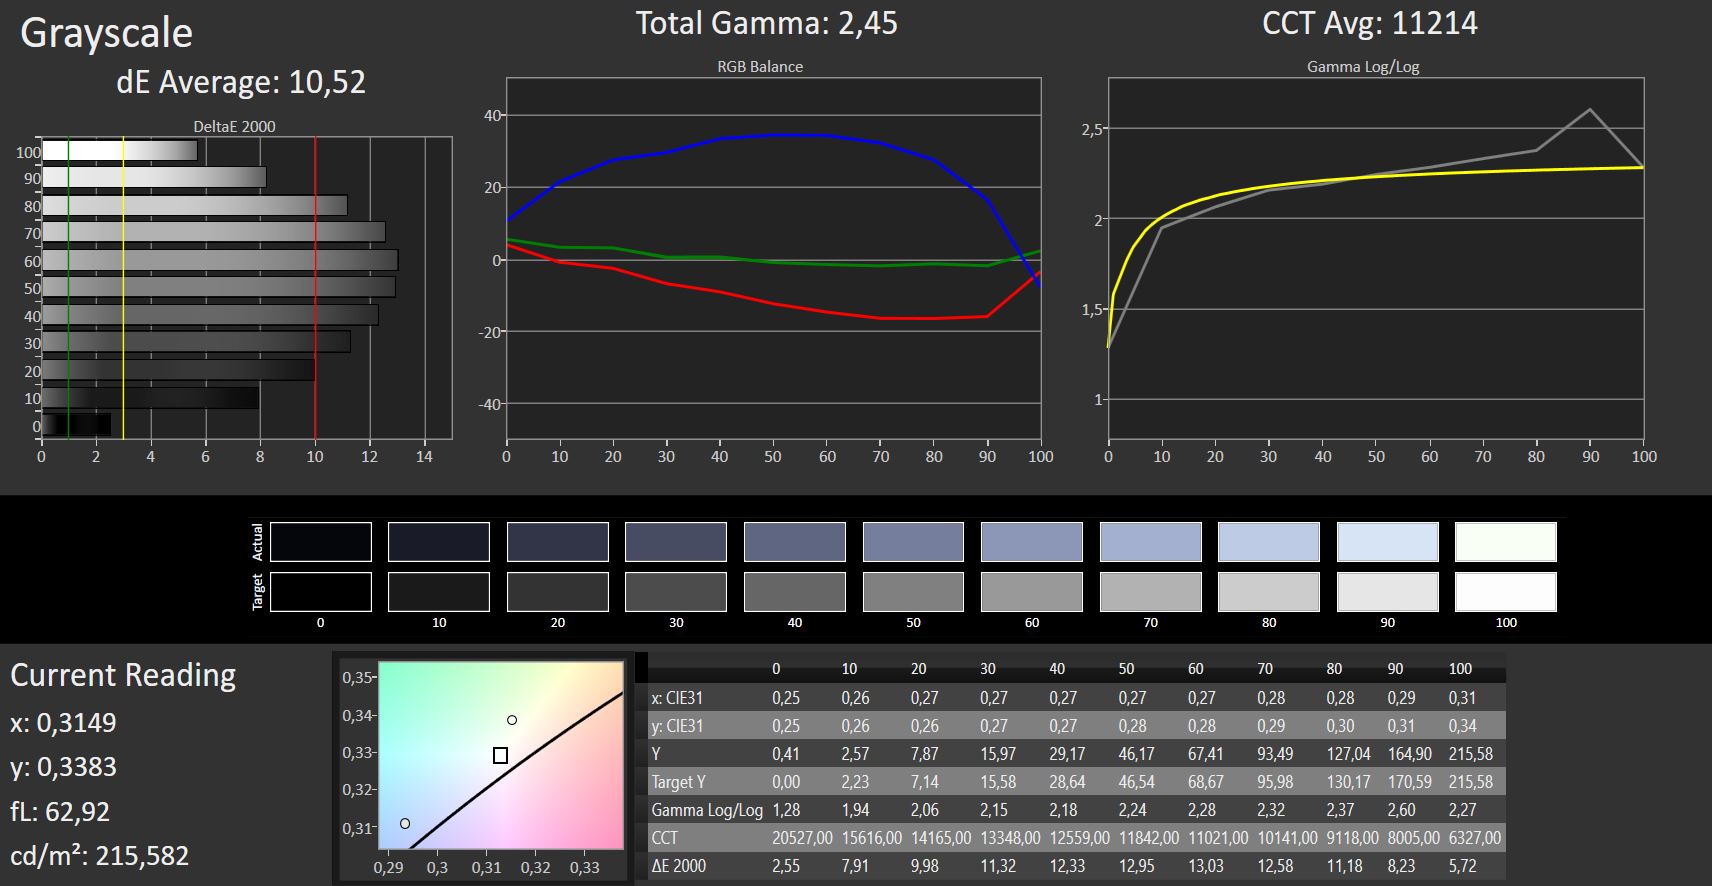
ΔE Greyscale Calman: 10.52 | ∀{0.09-98 Ø5}
58% sRGB (Argyll 1.6.3 3D)
37% AdobeRGB 1998 (Argyll 1.6.3 3D)
40.11% AdobeRGB 1998 (Argyll 3D)
58.2% sRGB (Argyll 3D)
38.82% Display P3 (Argyll 3D)
Gamma: 2.45
CCT: 11214 K
| Asus VivoBook S14 S406UA-BV023T TN LED, 1366x768, 14" | Asus Zenbook UX3410UA IPS, 1920x1080, 14" | Acer Swift 3 (i5-7200U, HD 620) IPS, 1920x1080, 14" | HP Envy 13-ad065nr IPS, 1920x1080, 13.3" | Dell Inspiron 13 7370 IPS, 1920x1080, 13.3" | Apple MacBook Air 13.3" 1.8 GHz (2017) TN LED, 1440x900, 13.3" | Lenovo IdeaPad 320s-14IKB IPS, 1920x1080, 14" | |
|---|---|---|---|---|---|---|---|
| Display | 72% | 6% | 55% | 59% | 7% | ||
| Display P3 Coverage (%) | 38.82 | 67.7 74% | 40.96 6% | 65.5 69% | 66.7 72% | 41.65 7% | |
| sRGB Coverage (%) | 58.2 | 99.1 70% | 61.4 5% | 83.8 44% | 86.2 48% | 61.8 6% | |
| AdobeRGB 1998 Coverage (%) | 40.11 | 69.4 73% | 42.34 6% | 61.3 53% | 63 57% | 43.03 7% | |
| Response Times | -71% | -59% | -20% | -82% | -72% | -69% | |
| Response Time Grey 50% / Grey 80% * (ms) | 42 ? | 33 ? 21% | 43 ? -2% | 28 ? 33% | 46 ? -10% | 52.4 ? -25% | 42 ? -0% |
| Response Time Black / White * (ms) | 13 ? | 34 ? -162% | 28 ? -115% | 22.4 ? -72% | 33 ? -154% | 28.4 ? -118% | 31 ? -138% |
| PWM Frequency (Hz) | 200 ? | 200 ? | 10200 ? | 201 ? | 58000 | 352 ? | |
| Screen | 61% | 23% | 39% | 41% | 29% | ||
| Brightness middle (cd/m²) | 215 | 376 75% | 281 31% | 290 35% | 301 40% | 274 27% | |
| Brightness (cd/m²) | 208 | 355 71% | 259 25% | 270 30% | 291 40% | 253 22% | |
| Brightness Distribution (%) | 81 | 87 7% | 81 0% | 78 -4% | 87 7% | 85 5% | |
| Black Level * (cd/m²) | 0.4 | 0.32 20% | 0.45 -13% | 0.32 20% | 0.33 17% | 0.31 22% | |
| Contrast (:1) | 538 | 1175 118% | 624 16% | 906 68% | 912 70% | 884 64% | |
| Colorchecker dE 2000 * | 9.37 | 3.2 66% | 4.19 55% | 4.8 49% | 5.39 42% | 5.74 39% | |
| Colorchecker dE 2000 max. * | 15.84 | 7.1 55% | 10.64 33% | 11.2 29% | 8.56 46% | 8.26 48% | |
| Greyscale dE 2000 * | 10.52 | 4.4 58% | 2.55 76% | 2.8 73% | 5.93 44% | 4.61 56% | |
| Gamma | 2.45 90% | 2.12 104% | 2.24 98% | 2.19 100% | 2.6 85% | 2.14 103% | |
| CCT | 11214 58% | 7440 87% | 6555 99% | 6382 102% | 6358 102% | 7281 89% | |
| Color Space (Percent of AdobeRGB 1998) (%) | 37 | 63.78 72% | 39 5% | 54.9 48% | 56 51% | 39 5% | |
| Color Space (Percent of sRGB) (%) | 58 | 98.98 71% | 61 5% | 83.5 44% | 86 48% | 61 5% | |
| Total Average (Program / Settings) | 21% /
46% | -10% /
9% | 25% /
35% | 6% /
28% | -72% /
-72% | -11% /
12% |
* ... smaller is better
Screen Flickering / PWM (Pulse-Width Modulation)
| Screen flickering / PWM detected | 200 Hz | ≤ 90 % brightness setting | 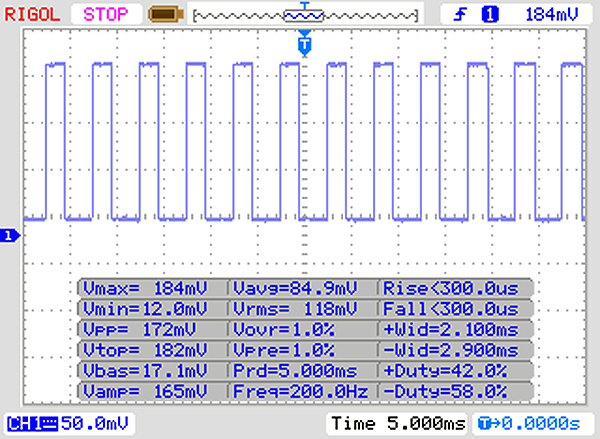 |
The display backlight flickers at 200 Hz (worst case, e.g., utilizing PWM) Flickering detected at a brightness setting of 90 % and below. There should be no flickering or PWM above this brightness setting. The frequency of 200 Hz is relatively low, so sensitive users will likely notice flickering and experience eyestrain at the stated brightness setting and below. In comparison: 53 % of all tested devices do not use PWM to dim the display. If PWM was detected, an average of 8152 (minimum: 5 - maximum: 343500) Hz was measured. | |||
The color reproduction fails to impress as well. Straight out of the box, the screen exhibits a DeltaE-2000 color deviation of 9.37. The DeltaE less than 3 is the optimal value. Moreover, the display suffers from a blue cast.
Display Response Times
| ↔ Response Time Black to White | ||
|---|---|---|
| 13 ms ... rise ↗ and fall ↘ combined | ↗ 7 ms rise | 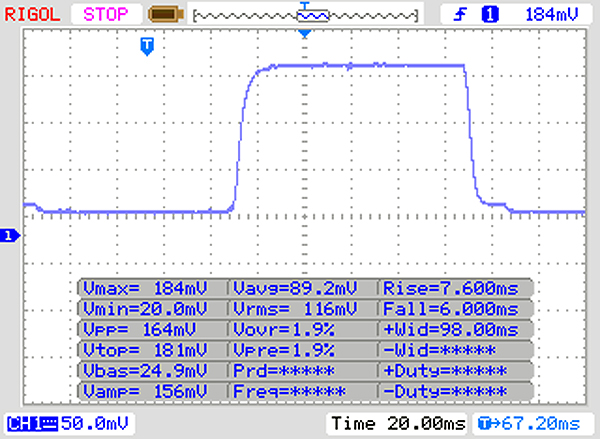 |
| ↘ 6 ms fall | ||
| The screen shows good response rates in our tests, but may be too slow for competitive gamers. In comparison, all tested devices range from 0.1 (minimum) to 240 (maximum) ms. » 32 % of all devices are better. This means that the measured response time is better than the average of all tested devices (20.3 ms). | ||
| ↔ Response Time 50% Grey to 80% Grey | ||
| 42 ms ... rise ↗ and fall ↘ combined | ↗ 22 ms rise | 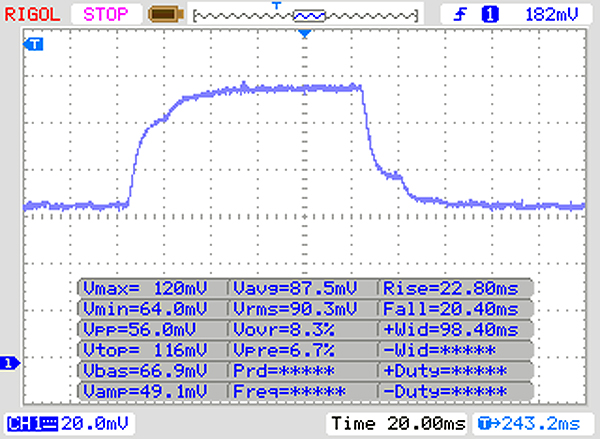 |
| ↘ 20 ms fall | ||
| The screen shows slow response rates in our tests and will be unsatisfactory for gamers. In comparison, all tested devices range from 0.165 (minimum) to 636 (maximum) ms. » 66 % of all devices are better. This means that the measured response time is worse than the average of all tested devices (31.7 ms). | ||
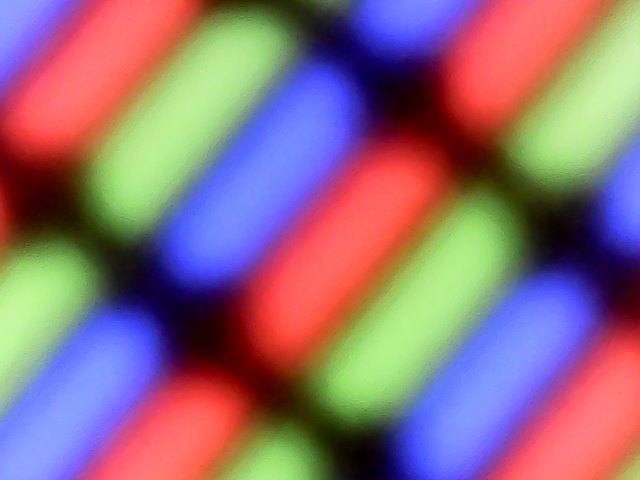
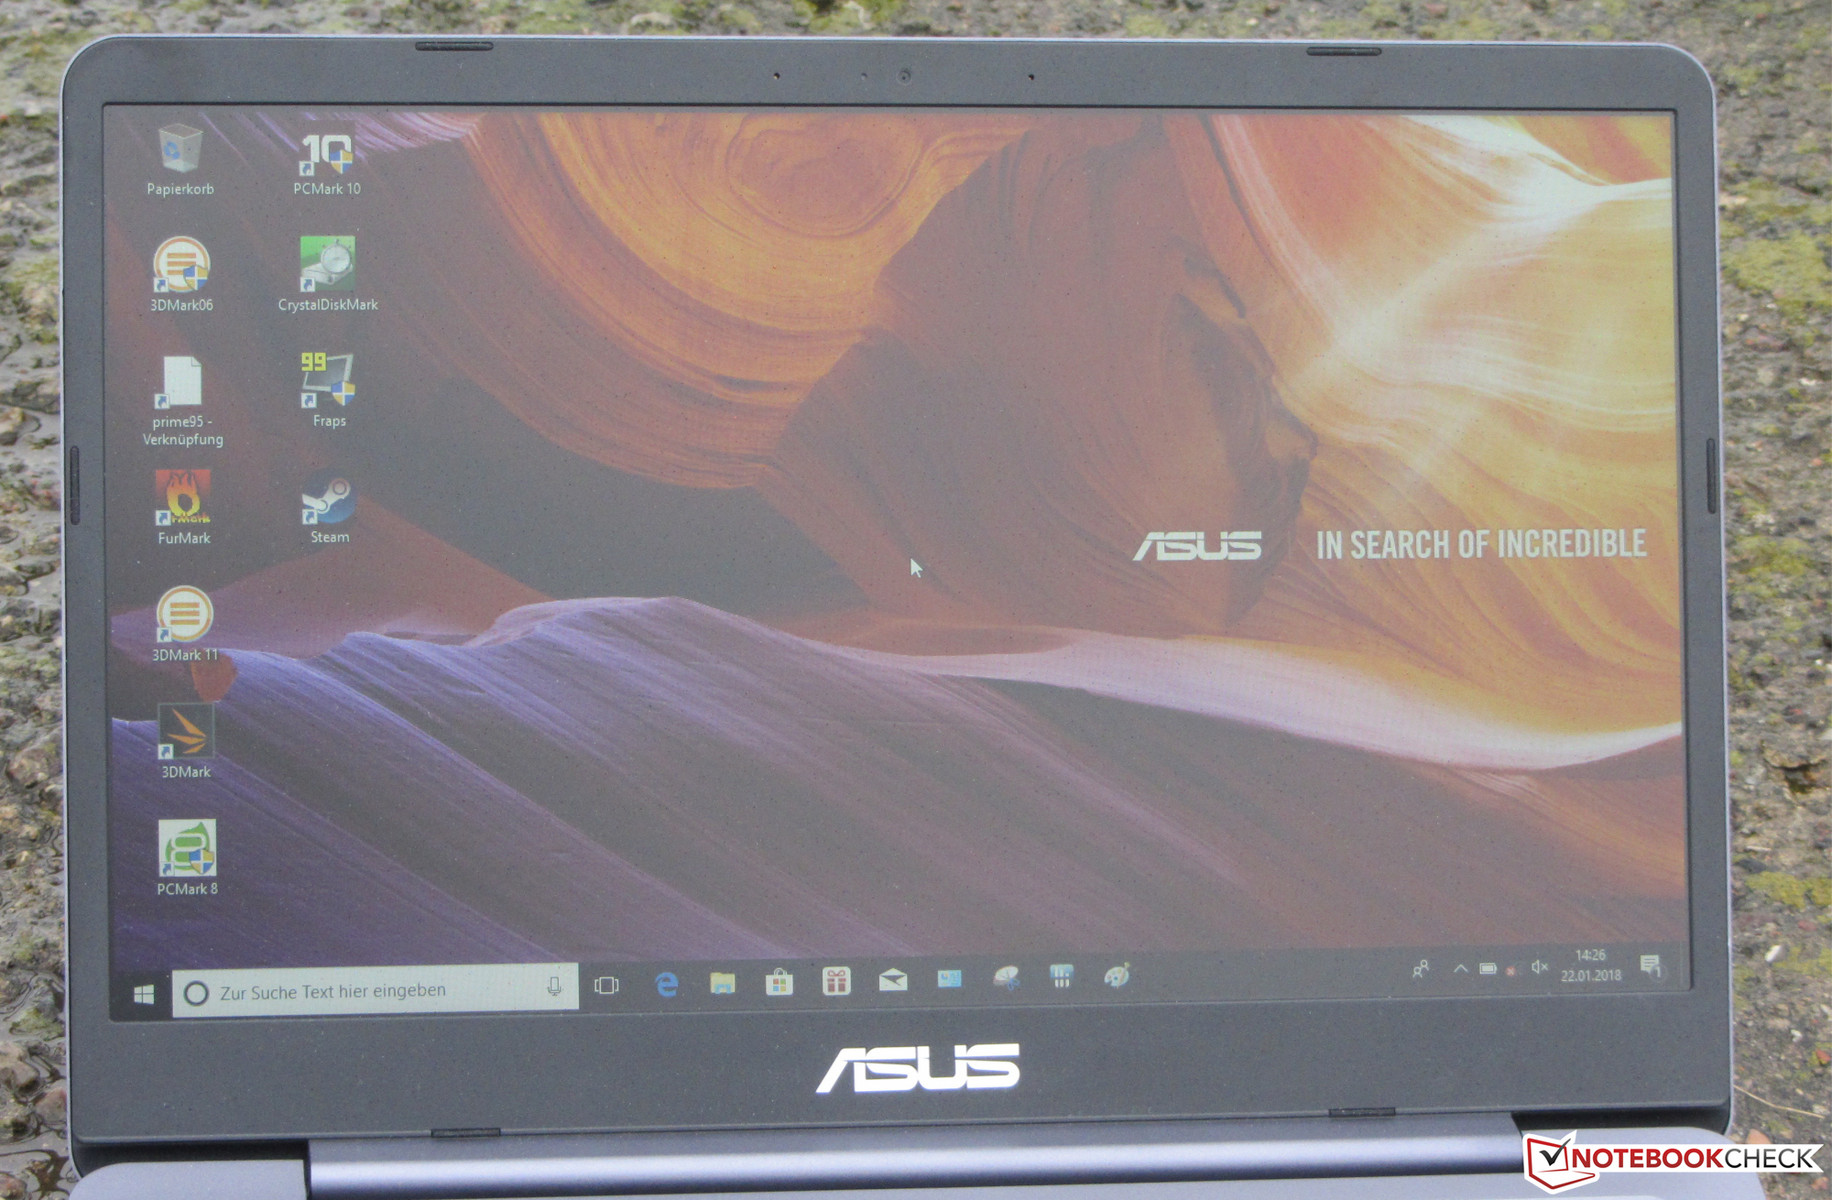
Asus has equipped the VivoBook with a TN panel with poor viewing angles. Consequently, the display is not legible from every angle. Outdoors, the device can only be used when the sun does not shine too brightly.
Performance
With the VivoBook S14, Asus has a slim 14-inch office notebook in its product range. It offers more than enough performance for such usage scenarios as office work and Internet browsing. Our review device can be had for 900 Euros ($1115). Other color and hardware configurations are also available.
Review Conditions
In the Windows system settings, only the “balanced” power plan is available to the user. The two other power plans, known as “high performance” and “power saver”, are not provided and therefore cannot be activated, even retroactively. There are no options in the laptop’s UEFI menu to influence the energy management. Therefore, all of our benchmarks and tests have been conducted using the “balanced” power plan.
Processor
The VivoBook is equipped with an Intel Core i5-8250U (Kaby Lake Refresh) quad-core processor, which is a ULV model. The processor comes with a base clock of 1.6 GHz. By means of Intel’s Turbo Boost Technology, the clock rate can be increased up to 3.4 GHz.
How well Intel’s Turbo Boost Technology works depends on the implementation. In our single-core Cinebench benchmarks, the CPU operates at full power. In the multi-core benchmarks, the clock rate fluctuates between 2.6 GHz and 3.4 GHz. However, this is only the case when the laptop is plugged in. When running on battery power, Intel’s Turbo Boost Technology is not used. Here the CPU runs at 1.8 GHz in the multi-core benchmarks and at 1.4 GHz in the single-core benchmarks. In the GeekBench benchmarks, Intel’s Turbo Boost Technology is used to the full, when plugged in. When running on battery power, the clock speed fluctuates between 800 to 900 MHz and 2.8 to 3.4 GHz.
We check if the Turbo boost can be used continually by running the Cinebench R15 multi-core benchmark in a continuous loop for 30 minutes. After the first benchmark run, the results decline significantly. After that, they do not remain on a consistent level. Intel’s Turbo Boost Technology is used, but not with a constant speed.
The results of the CPU benchmarks are on the normal level for this kind of processor.
| Cinebench R10 | |
| Rendering Multiple CPUs 32Bit | |
| Asus VivoBook S14 S406UA-BV023T | |
| HP Envy 13-ad065nr | |
| Rendering Single 32Bit | |
| Asus VivoBook S14 S406UA-BV023T | |
| HP Envy 13-ad065nr | |
| Geekbench 3 | |
| 32 Bit Multi-Core Score | |
| Asus VivoBook S14 S406UA-BV023T | |
| 32 Bit Single-Core Score | |
| Asus VivoBook S14 S406UA-BV023T | |
| Geekbench 4.0 | |
| 64 Bit Multi-Core Score | |
| Asus VivoBook S14 S406UA-BV023T | |
| 64 Bit Single-Core Score | |
| Asus VivoBook S14 S406UA-BV023T | |
| Geekbench 4.4 | |
| 64 Bit Multi-Core Score | |
| Asus VivoBook S14 S406UA-BV023T | |
| 64 Bit Single-Core Score | |
| Asus VivoBook S14 S406UA-BV023T | |
| JetStream 1.1 - Total Score | |
| Asus VivoBook S14 S406UA-BV023T (Edge 41) | |
| Asus Zenbook UX3410UA (Edge 38.14393.0.0) | |
| Acer Swift 3 (i5-7200U, HD 620) | |
| Lenovo IdeaPad 320s-14IKB | |
System Performance
Asus has put together a powerful quad-core processor with a fast SSD and dual-channel-enabled RAM. This combination creates a responsive system, which offers more than enough performance for such usage scenarios as office work and internet browsing. The very good results in the PCMark benchmarks confirm this. An increase in overall performance is not possible. Asus has already exhausted all the possibilities.
| PCMark 8 Home Score Accelerated v2 | 3937 points | |
| PCMark 8 Creative Score Accelerated v2 | 4871 points | |
| PCMark 8 Work Score Accelerated v2 | 5106 points | |
| PCMark 10 Score | 3612 points | |
Help | ||
Storage Devices
A SATA III SSD in the M.2-2280 form factor serves as the system drive. The SSD comes from SanDisk and has a total capacity of 256 GB. Right out of the box, only 205 GB is available to the user. The rest of the storage space is occupied by the Windows installation files and the Recovery Partition. The transfer rates are good.

| Asus VivoBook S14 S406UA-BV023T SanDisk SD8SN8U256G1002 | Asus Zenbook UX3410UA SanDisk SD8SN8U512G1002 | Acer Swift 3 (i5-7200U, HD 620) Intel SSD 600p SSDPEKKW256G7 | Dell Inspiron 13 7370 Micron 1100 MTFDDAV256TBN | Apple MacBook Air 13.3" 1.8 GHz (2017) Apple SSD SM0128G | Lenovo IdeaPad 320s-14IKB Samsung PM961 NVMe MZVLW128HEGR | |
|---|---|---|---|---|---|---|
| CrystalDiskMark 3.0 | 16% | 76% | -3% | 73% | 30% | |
| Read Seq (MB/s) | 480.1 | 494.5 3% | 1137 137% | 476.8 -1% | 1390 190% | 991 106% |
| Write Seq (MB/s) | 440.3 | 461.7 5% | 606 38% | 458.3 4% | 731 66% | 792 80% |
| Read 512 (MB/s) | 277.5 | 328 18% | 800 188% | 351 26% | 899 224% | 482.2 74% |
| Write 512 (MB/s) | 300.6 | 419.7 40% | 564 88% | 298.2 -1% | 715 138% | 138.5 -54% |
| Read 4k (MB/s) | 28.18 | 27.53 -2% | 31.6 12% | 20.79 -26% | 16.29 -42% | 28.11 0% |
| Write 4k (MB/s) | 52.6 | 56.5 7% | 108.3 106% | 65.8 25% | 27.17 -48% | 79 50% |
| Read 4k QD32 (MB/s) | 273.4 | 351 28% | 290.1 6% | 172.8 -37% | 300.9 10% | 320.9 17% |
| Write 4k QD32 (MB/s) | 192.4 | 249.3 30% | 251 30% | 160.3 -17% | 273.7 42% | 124.8 -35% |
Graphics Card
Intel’s UHD Graphics 620 is responsible for image rendering. The GPU supports DirectX 12 and operates with a core clock of 300 to 1100 MHz. The results in the 3DMark benchmarks are on the normal level for this kind of GPU. It benefits from the dual-channel-enabled RAM. As a result of this, the graphics chip can be better utilized, which leads to an increase in performance.
| 3DMark 11 Performance | 1953 points | |
| 3DMark Cloud Gate Standard Score | 8909 points | |
| 3DMark Fire Strike Score | 1086 points | |
Help | ||
Gaming Performance
The GPU-CPU combination of the laptop can run some games smoothly. This applies, above all, to the titles that have low system requirements. However, even such titles can only achieve playable frame rates with the low graphics settings and at low resolutions. The dual-channel-enabled RAM makes itself known while gaming: The frame rates of the VivoBook are higher than those of comparable devices whose RAM runs in single-channel mode.
| low | med. | high | ultra | |
|---|---|---|---|---|
| BioShock Infinite (2013) | 65.7 | 34.4 | 29.2 | 8.8 |
Emissions & Energy Management
System Noise
When idle, the fan often stands still, which leads to silent operation. However, it starts to spin even under light loads. For example, opening a website causes the fan to spin for a short while. Under these conditions, the fan operates with a low speed. Under light loads, the fan noise needs to be tolerated only for a short time; over a prolonged period, the fan noise can become annoying. Under medium and full loads, the fan spins harder. During the stress test, we measured a sound pressure level of 40.4 dB(A).
Noise level
| Idle |
| 30.2 / 30.2 / 31.3 dB(A) |
| Load |
| 40.1 / 40.4 dB(A) |
 | ||
30 dB silent 40 dB(A) audible 50 dB(A) loud |
||
min: | ||
Temperature
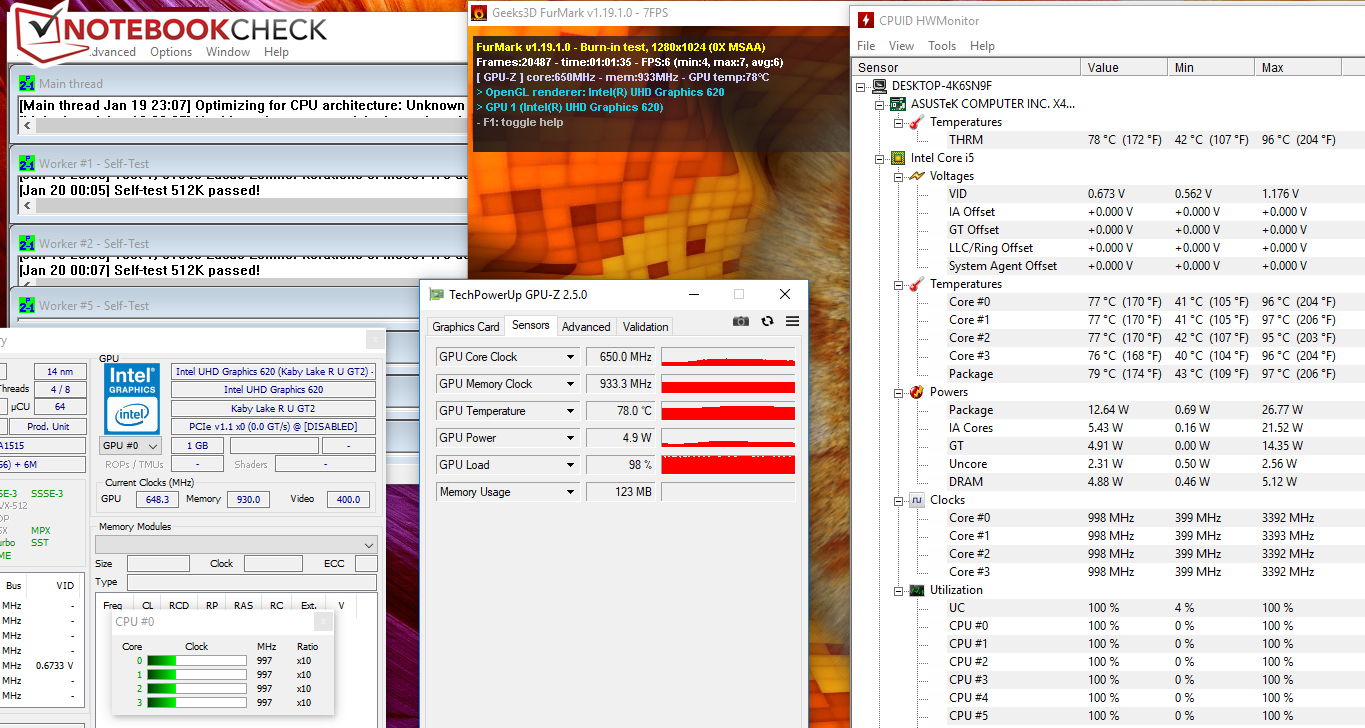
In our stress test (Prime95 and FurMark running for at least one hour), the VivoBook performs differently, when it is plugged in and when it is running on battery power. When plugged in, the CPU throttles from an initial 2.2 GHz down to around 1000 MHz (800 to 1300 MHz). The graphics chip starts the test with 950 MHz and then throttles down in the subsequent benchmark run. When running on battery power, the processor runs at 400 to 800 MHz. The core clock of the GPU fluctuates between 300 MHz and 1.1 GHz.
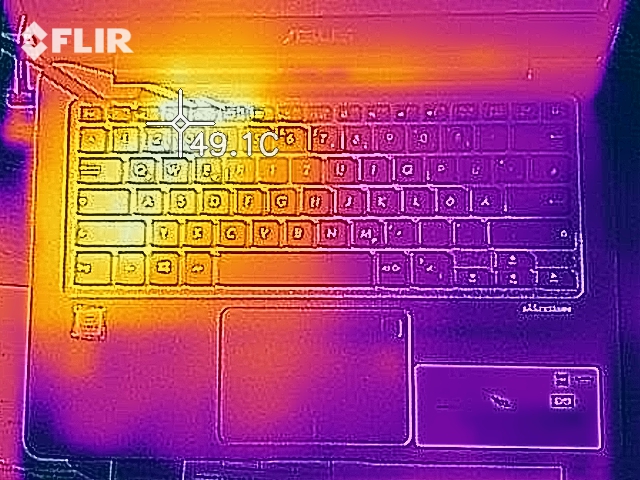
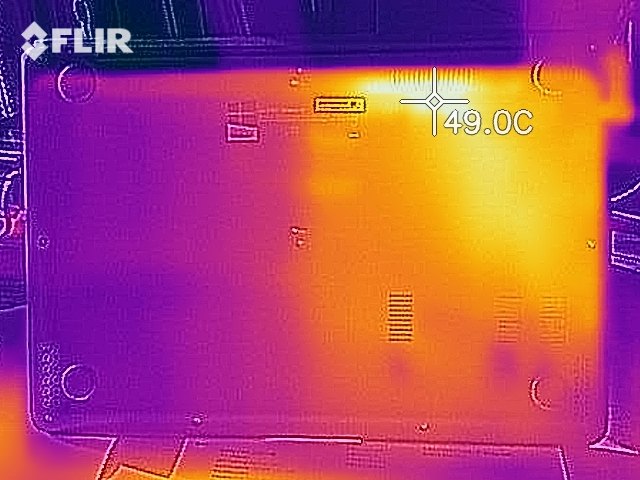
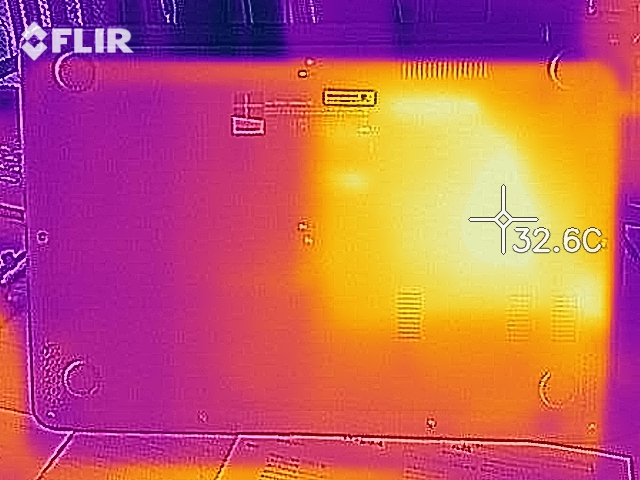
The notebook does not get excessively hot. During the stress test, the 40-degree (104 °F) Celsius mark is exceeded only at one measurement point.
(±) The maximum temperature on the upper side is 42.2 °C / 108 F, compared to the average of 34.3 °C / 94 F, ranging from 21.2 to 62.5 °C for the class Office.
(+) The bottom heats up to a maximum of 39.4 °C / 103 F, compared to the average of 36.8 °C / 98 F
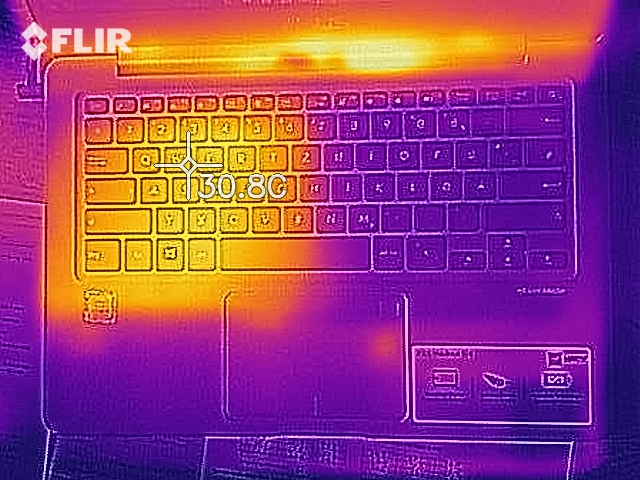
(+) In idle usage, the average temperature for the upper side is 25.9 °C / 79 F, compared to the device average of 29.5 °C / 85 F.
(+) The palmrests and touchpad are cooler than skin temperature with a maximum of 27.8 °C / 82 F and are therefore cool to the touch.
(±) The average temperature of the palmrest area of similar devices was 27.6 °C / 81.7 F (-0.2 °C / -0.3 F).
Speakers
The stereo speakers of the VivoBook are located on the underside of the device. They produce a pleasant, surprisingly voluminous sound, which we did not expect to hear, however, the maximum volume could have been somewhat higher.
Asus VivoBook S14 S406UA-BV023T audio analysis
(-) | not very loud speakers (57.6 dB)
Bass 100 - 315 Hz
(±) | reduced bass - on average 11.5% lower than median
(+) | bass is linear (6% delta to prev. frequency)
Mids 400 - 2000 Hz
(+) | balanced mids - only 2.8% away from median
(±) | linearity of mids is average (7% delta to prev. frequency)
Highs 2 - 16 kHz
(+) | balanced highs - only 1.8% away from median
(±) | linearity of highs is average (7.9% delta to prev. frequency)
Overall 100 - 16.000 Hz
(±) | linearity of overall sound is average (18.8% difference to median)
Compared to same class
» 33% of all tested devices in this class were better, 7% similar, 60% worse
» The best had a delta of 7%, average was 21%, worst was 53%
Compared to all devices tested
» 42% of all tested devices were better, 8% similar, 50% worse
» The best had a delta of 4%, average was 24%, worst was 134%
Apple MacBook 12 (Early 2016) 1.1 GHz audio analysis
(+) | speakers can play relatively loud (83.6 dB)
Bass 100 - 315 Hz
(±) | reduced bass - on average 11.3% lower than median
(±) | linearity of bass is average (14.2% delta to prev. frequency)
Mids 400 - 2000 Hz
(+) | balanced mids - only 2.4% away from median
(+) | mids are linear (5.5% delta to prev. frequency)
Highs 2 - 16 kHz
(+) | balanced highs - only 2% away from median
(+) | highs are linear (4.5% delta to prev. frequency)
Overall 100 - 16.000 Hz
(+) | overall sound is linear (10.2% difference to median)
Compared to same class
» 7% of all tested devices in this class were better, 2% similar, 91% worse
» The best had a delta of 5%, average was 18%, worst was 53%
Compared to all devices tested
» 4% of all tested devices were better, 1% similar, 94% worse
» The best had a delta of 4%, average was 24%, worst was 134%
Frequency diagram in comparison (checkboxes can be checked and unchecked!)
Energy Consumption
There are no abnormalities in terms of energy consumption to report. When idle, we have measured a maximum power draw of 7.6 watts. During the stress test, the power draw rose to 44 watts. After a minute or so, the power consumption fell to 33 watts, because the CPU and the GPU were throttled down. The nominal power draw of the AC adapter amounts to 45 watts.
| Off / Standby | |
| Idle | |
| Load |
|
Key:
min: | |
Battery Life
Our practically oriented Wi-Fi test simulates loads that are consistent with surfing the web. The “balanced” power plan is selected, the energy saving functions turned off and the display brightness set to some 150 cd/m². The VivoBook achieves a battery runtime of 7 hours and 56 minutes.
Pros
Cons
Verdict
With the VivoBook S14, Asus has an office notebook in its product range that comes with a 14-inch display, but has the dimensions of a 13.3-inch notebook. Therefore, the device looks quite slim and compact. The case proves to be the weak spot of the device: The plastic chassis exhibits a lot of flex and can easily be bent and twisted - an inacceptable flaw for a device that is expressly intended for mobile use.
The laptop is powered by a ULV quad-core processor, which offers more than enough performance for such usage scenarios as office work and Internet browsing. Whether or not a quad-core processor is really needed in a device like the VivoBook, every user must decide for themselves. However, for many users, a significantly cheaper VivoBook model, which comes with an Intel Core i3-7100U, should provide enough power.
The VivoBook S14 S406UA has only a few flaws, but these prove to be grave - for a device with such a price tag.
The screen represents the weak point of the device. Here, Asus opted for an HD panel with poor brightness, contrast and viewing angles. This display is inappropriate for a 900-Euro (~$1115) notebook. A bright, high contrast IPS screen is a must for a device with such a price tag.
The other flaw lies with the ports. Here, Asus should have implemented a Thunderbolt 3 port instead of a USB 3.1 (Gen 1) Type-C port, which would have increased the attractiveness of the device. Moreover, such a port can be expected in a device with this price tag.
A fast SSD makes for a very responsive system. The keyboard has left an “okay” impression and is suitable for regular typing. A positive: It comes with a backlight. The battery life is also very good. Those who can overlook the above-mentioned flaws will get a compact laptop suitable for typing and surfing the web, which will still cost quite a lot of money.
Asus VivoBook S14 S406UA-BV023T
- 01/23/2018 v6 (old)
Sascha Mölck
More articles related to this device
Asus VivoBook S14 S406UA-BV023T (VivoBook S14 Series)Related Articles

Price comparison
