Acer Swift 3 SF314 in review: No flight of fancy for the AMD laptop

The Swift 3 is Acer's bread-and-butter laptop — an inexpensive model whose entry-level variant is available for 530 Euros (~$530). Accordingly, we have tested many Swift models in the past, especially Intel variants and high-end solutions like the Swift X with GTX 1650 Mobile and the Swift 3X with an Intel Iris Xe MAX dGPU.
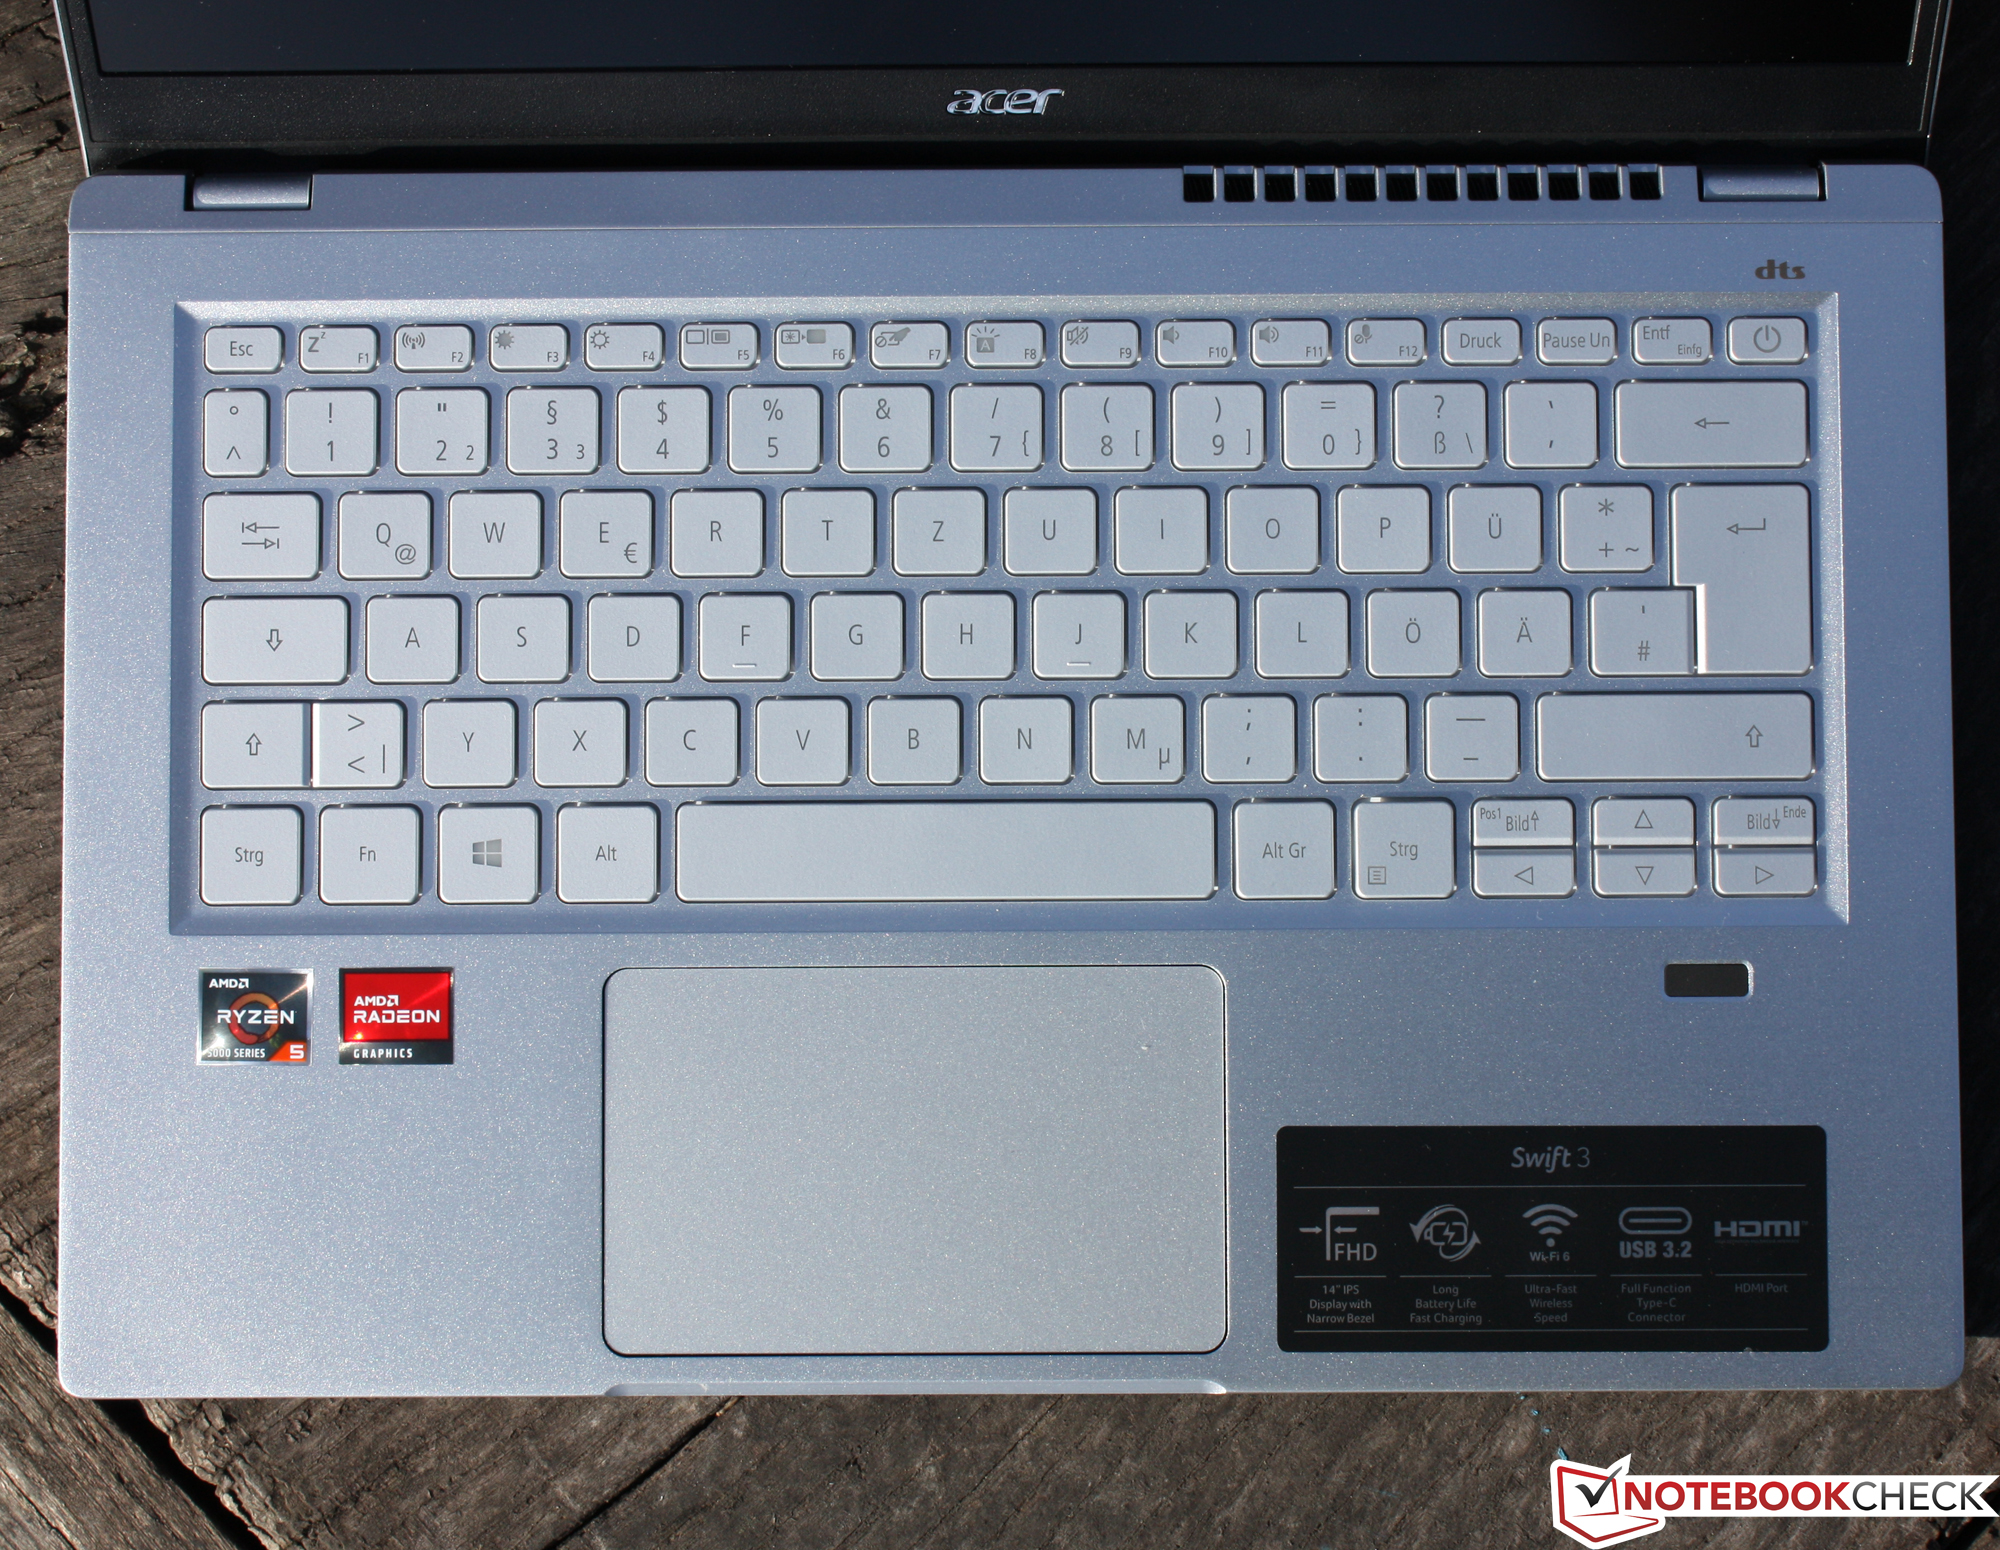
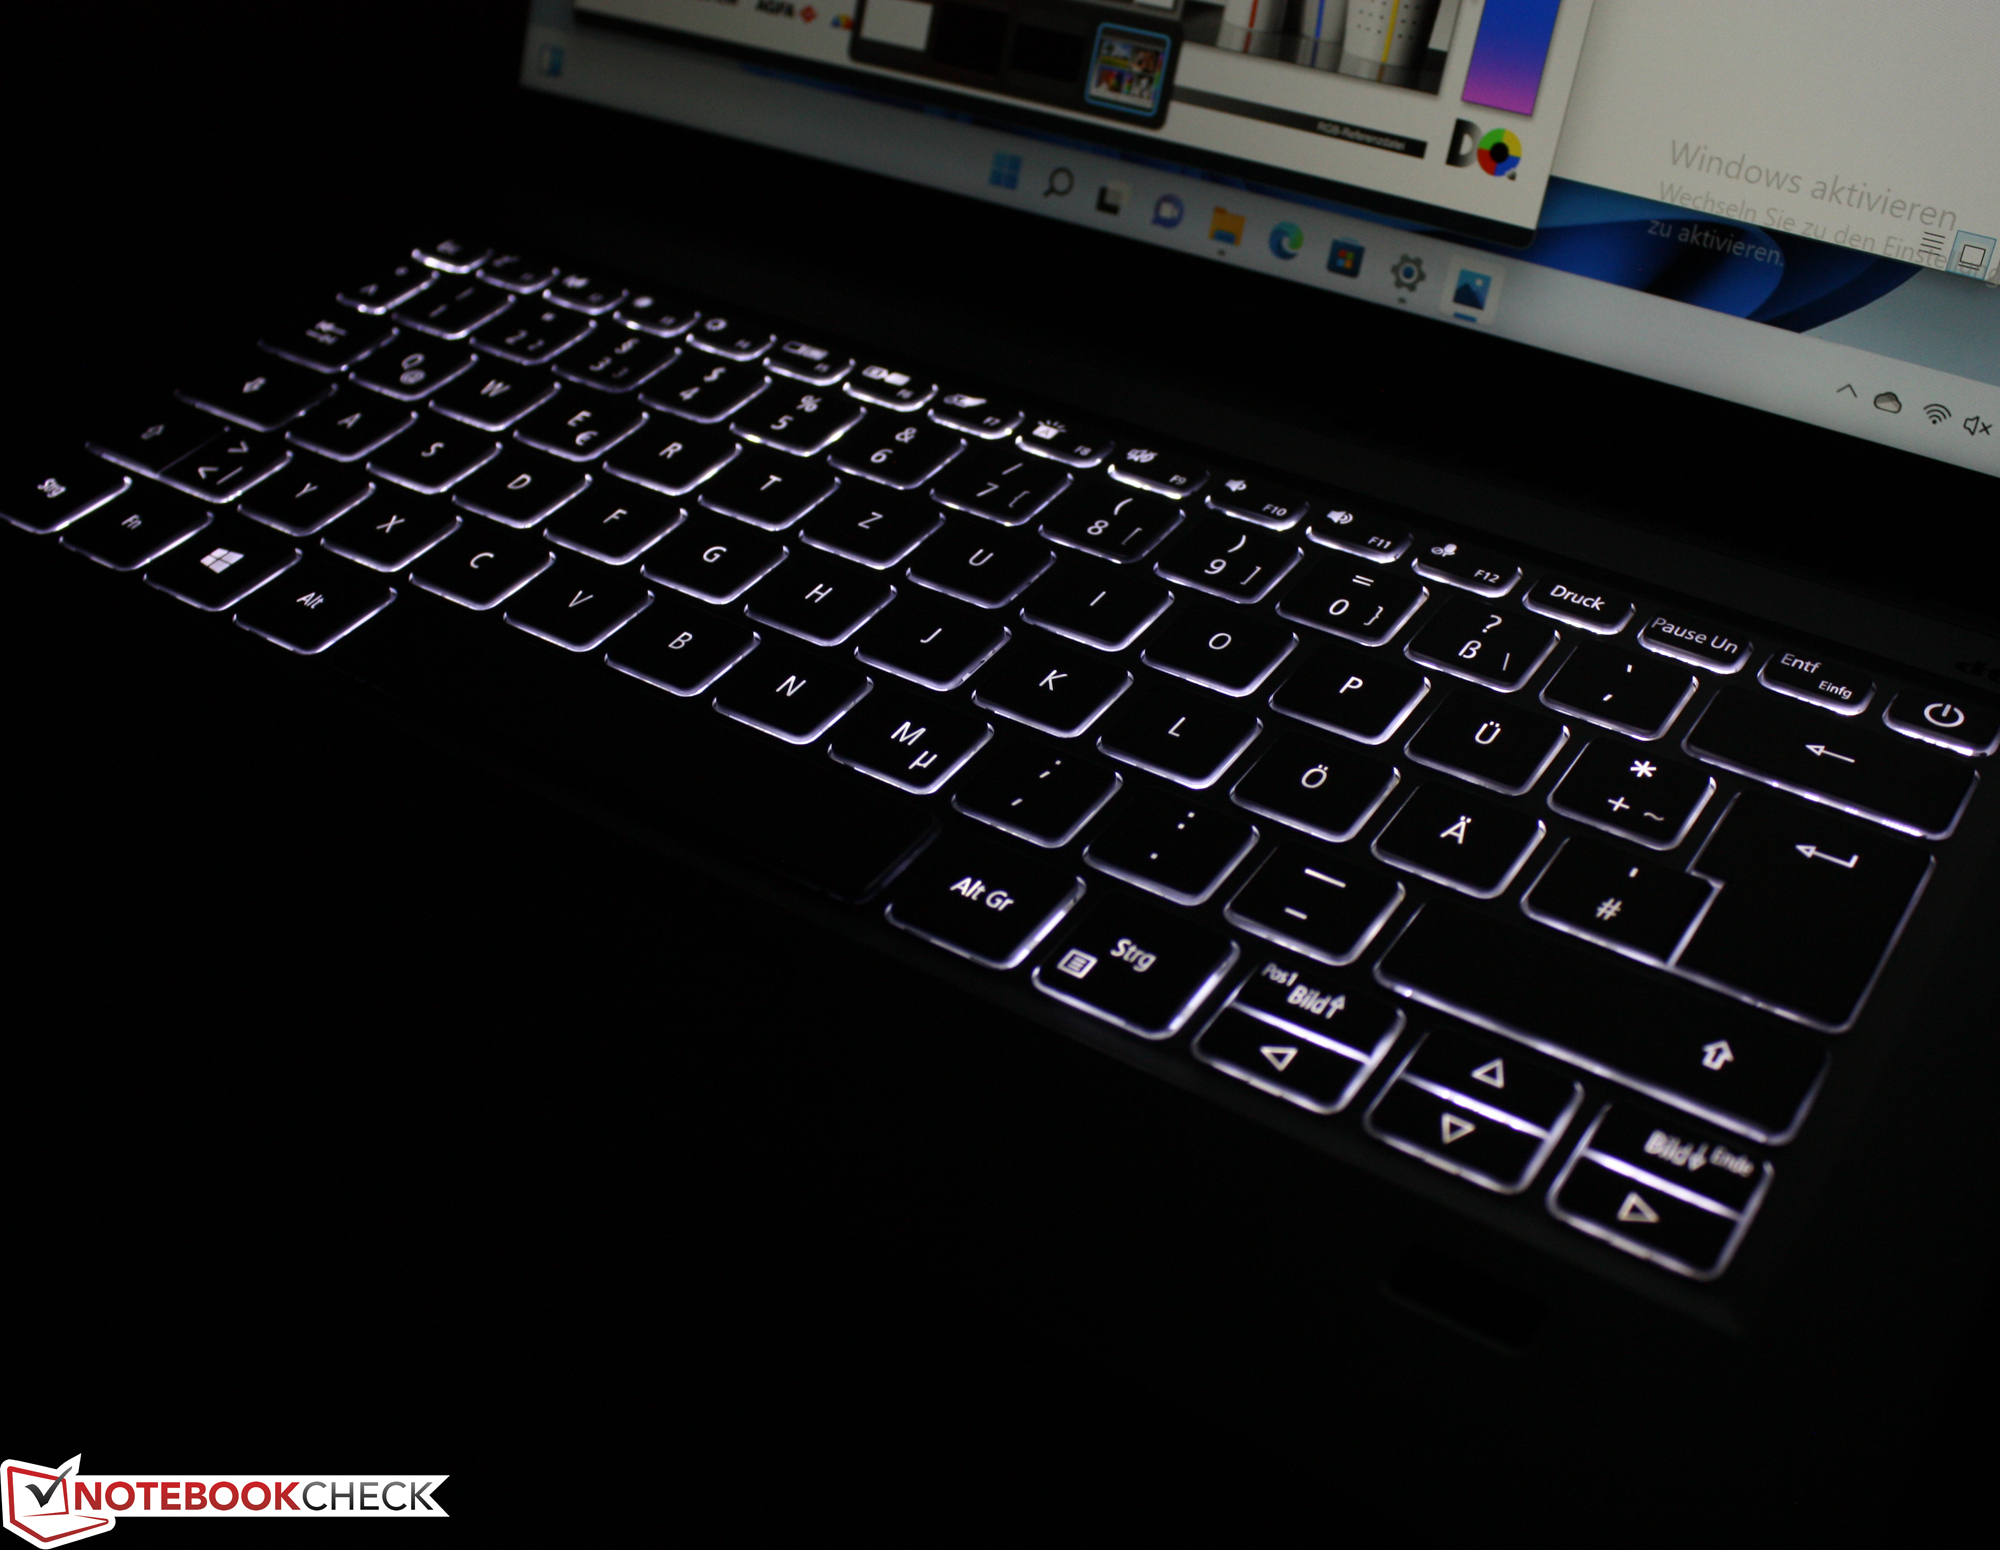
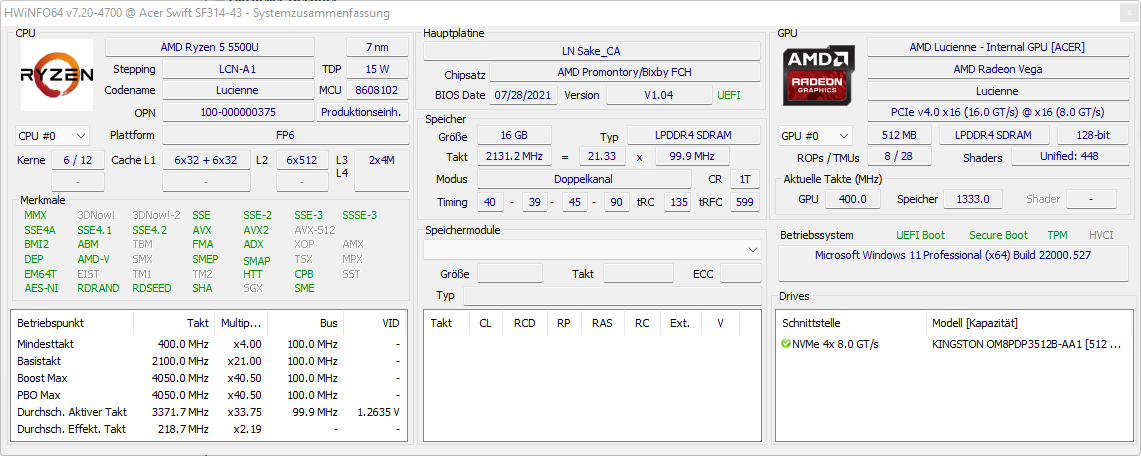
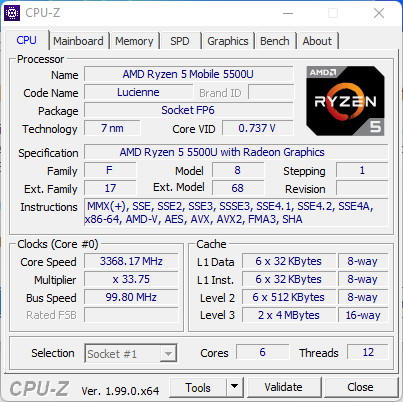
Today's update is about one of the smallest notebooks in the Swift lineup, the 1.3 kg-light SF314-43 with a Ryzen 5 5500U, 16 GB RAM, and a 512 GB SSD. To achieve the lowest possible price, retailers ship the model with Linux (eShell). We installed Windows 11 for which a small partition also had the necessary drivers.
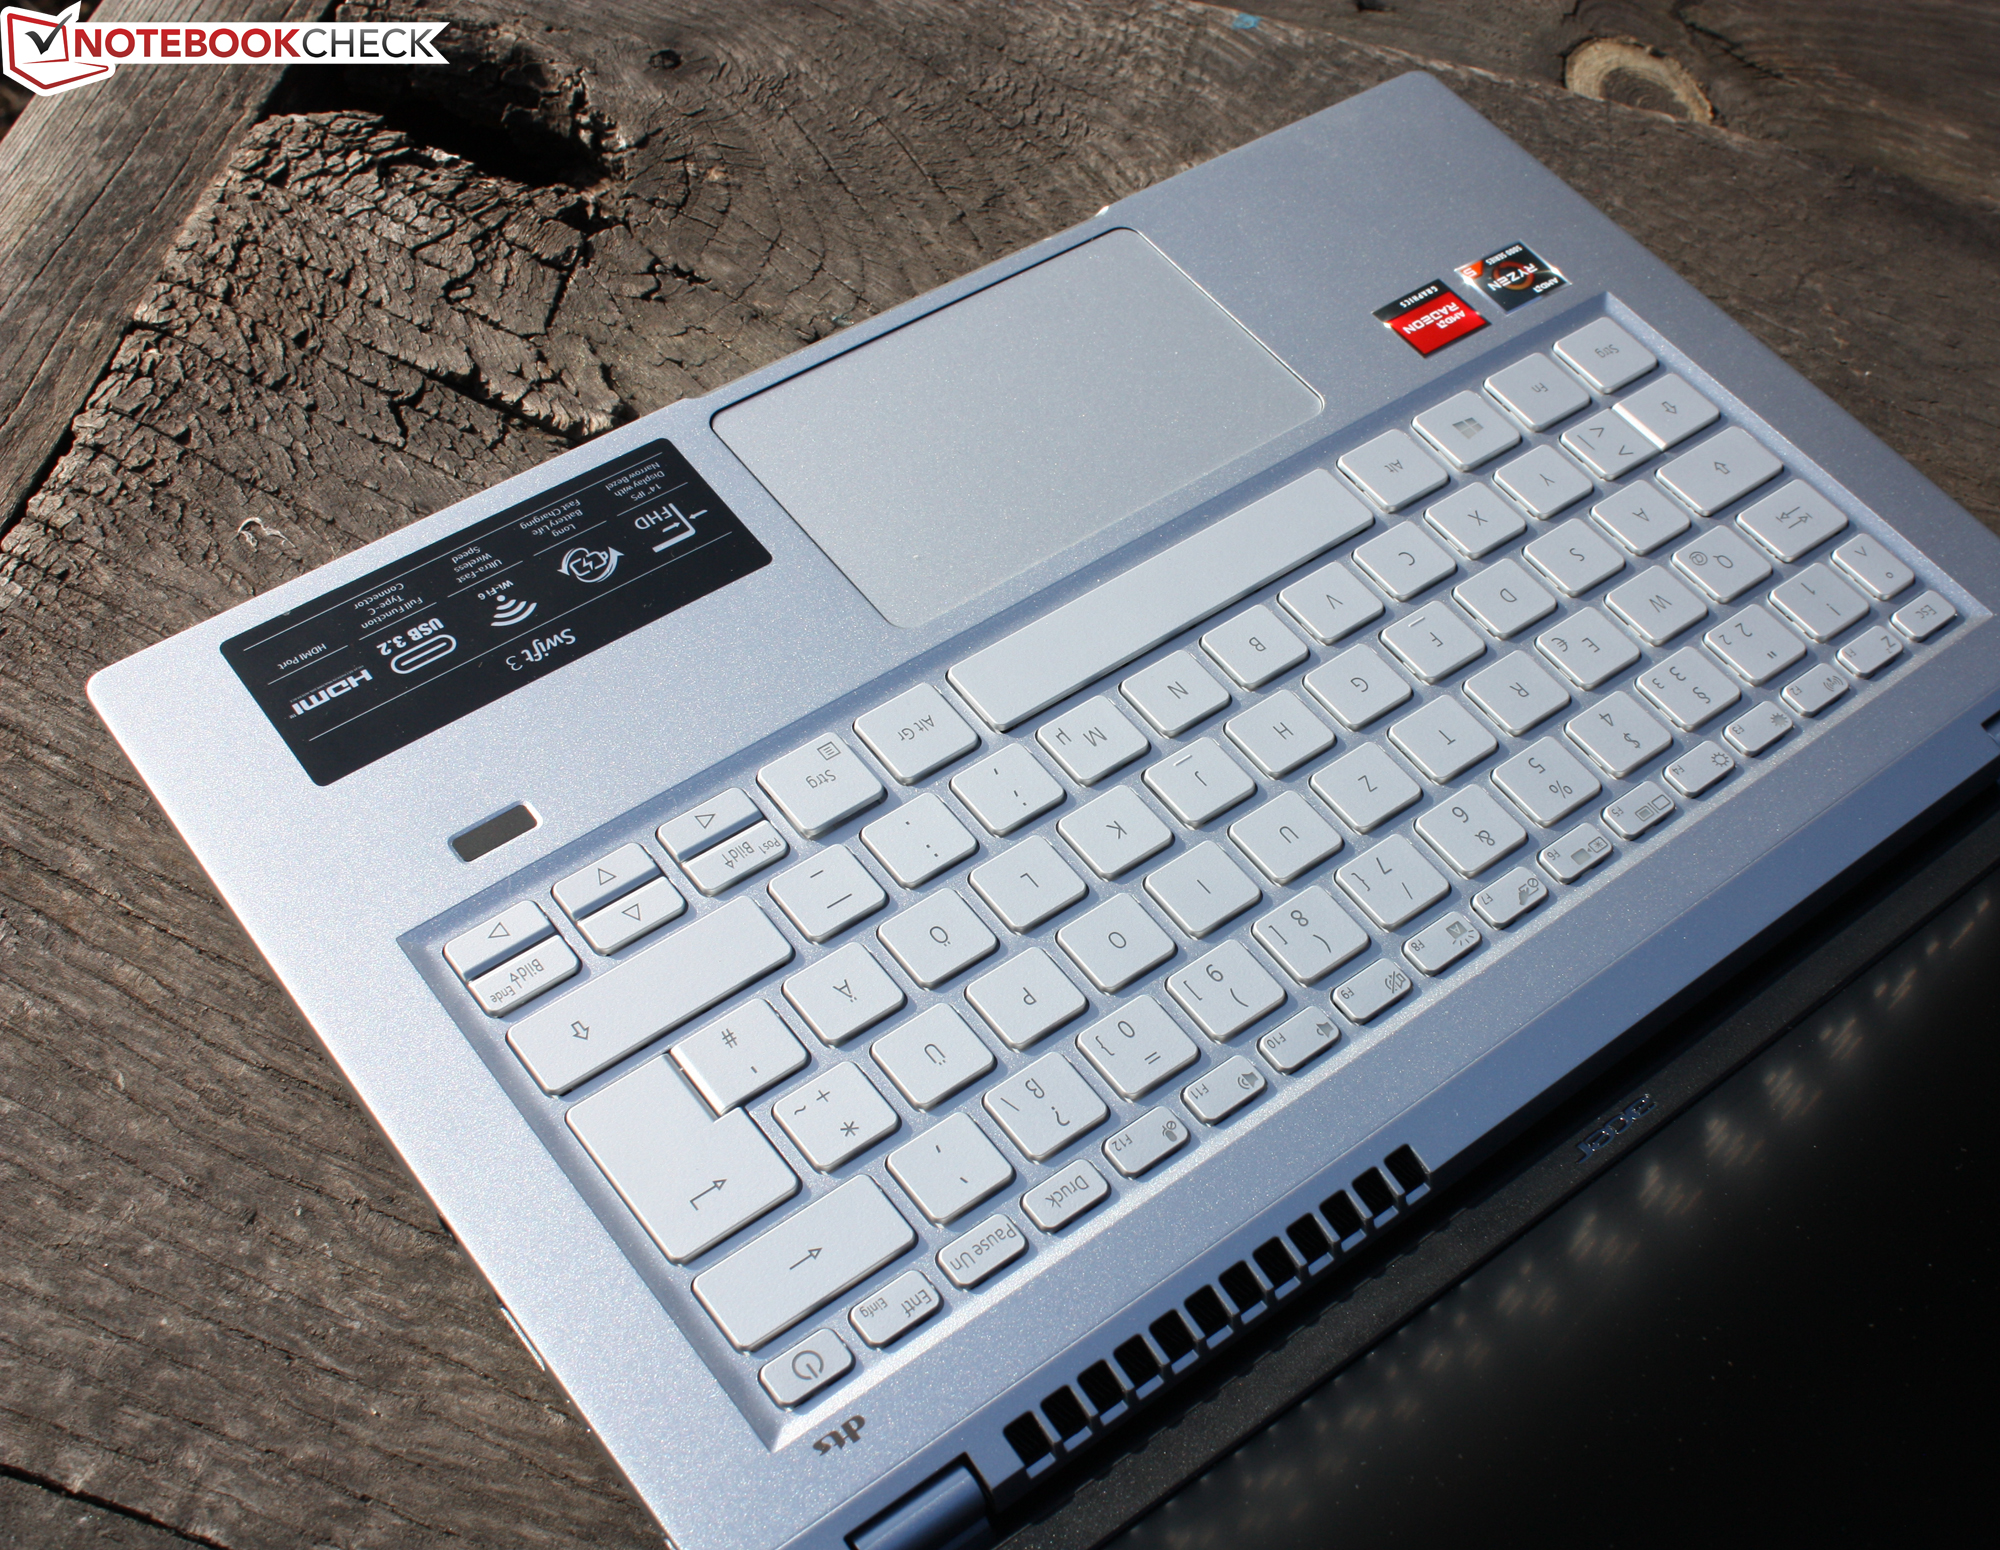
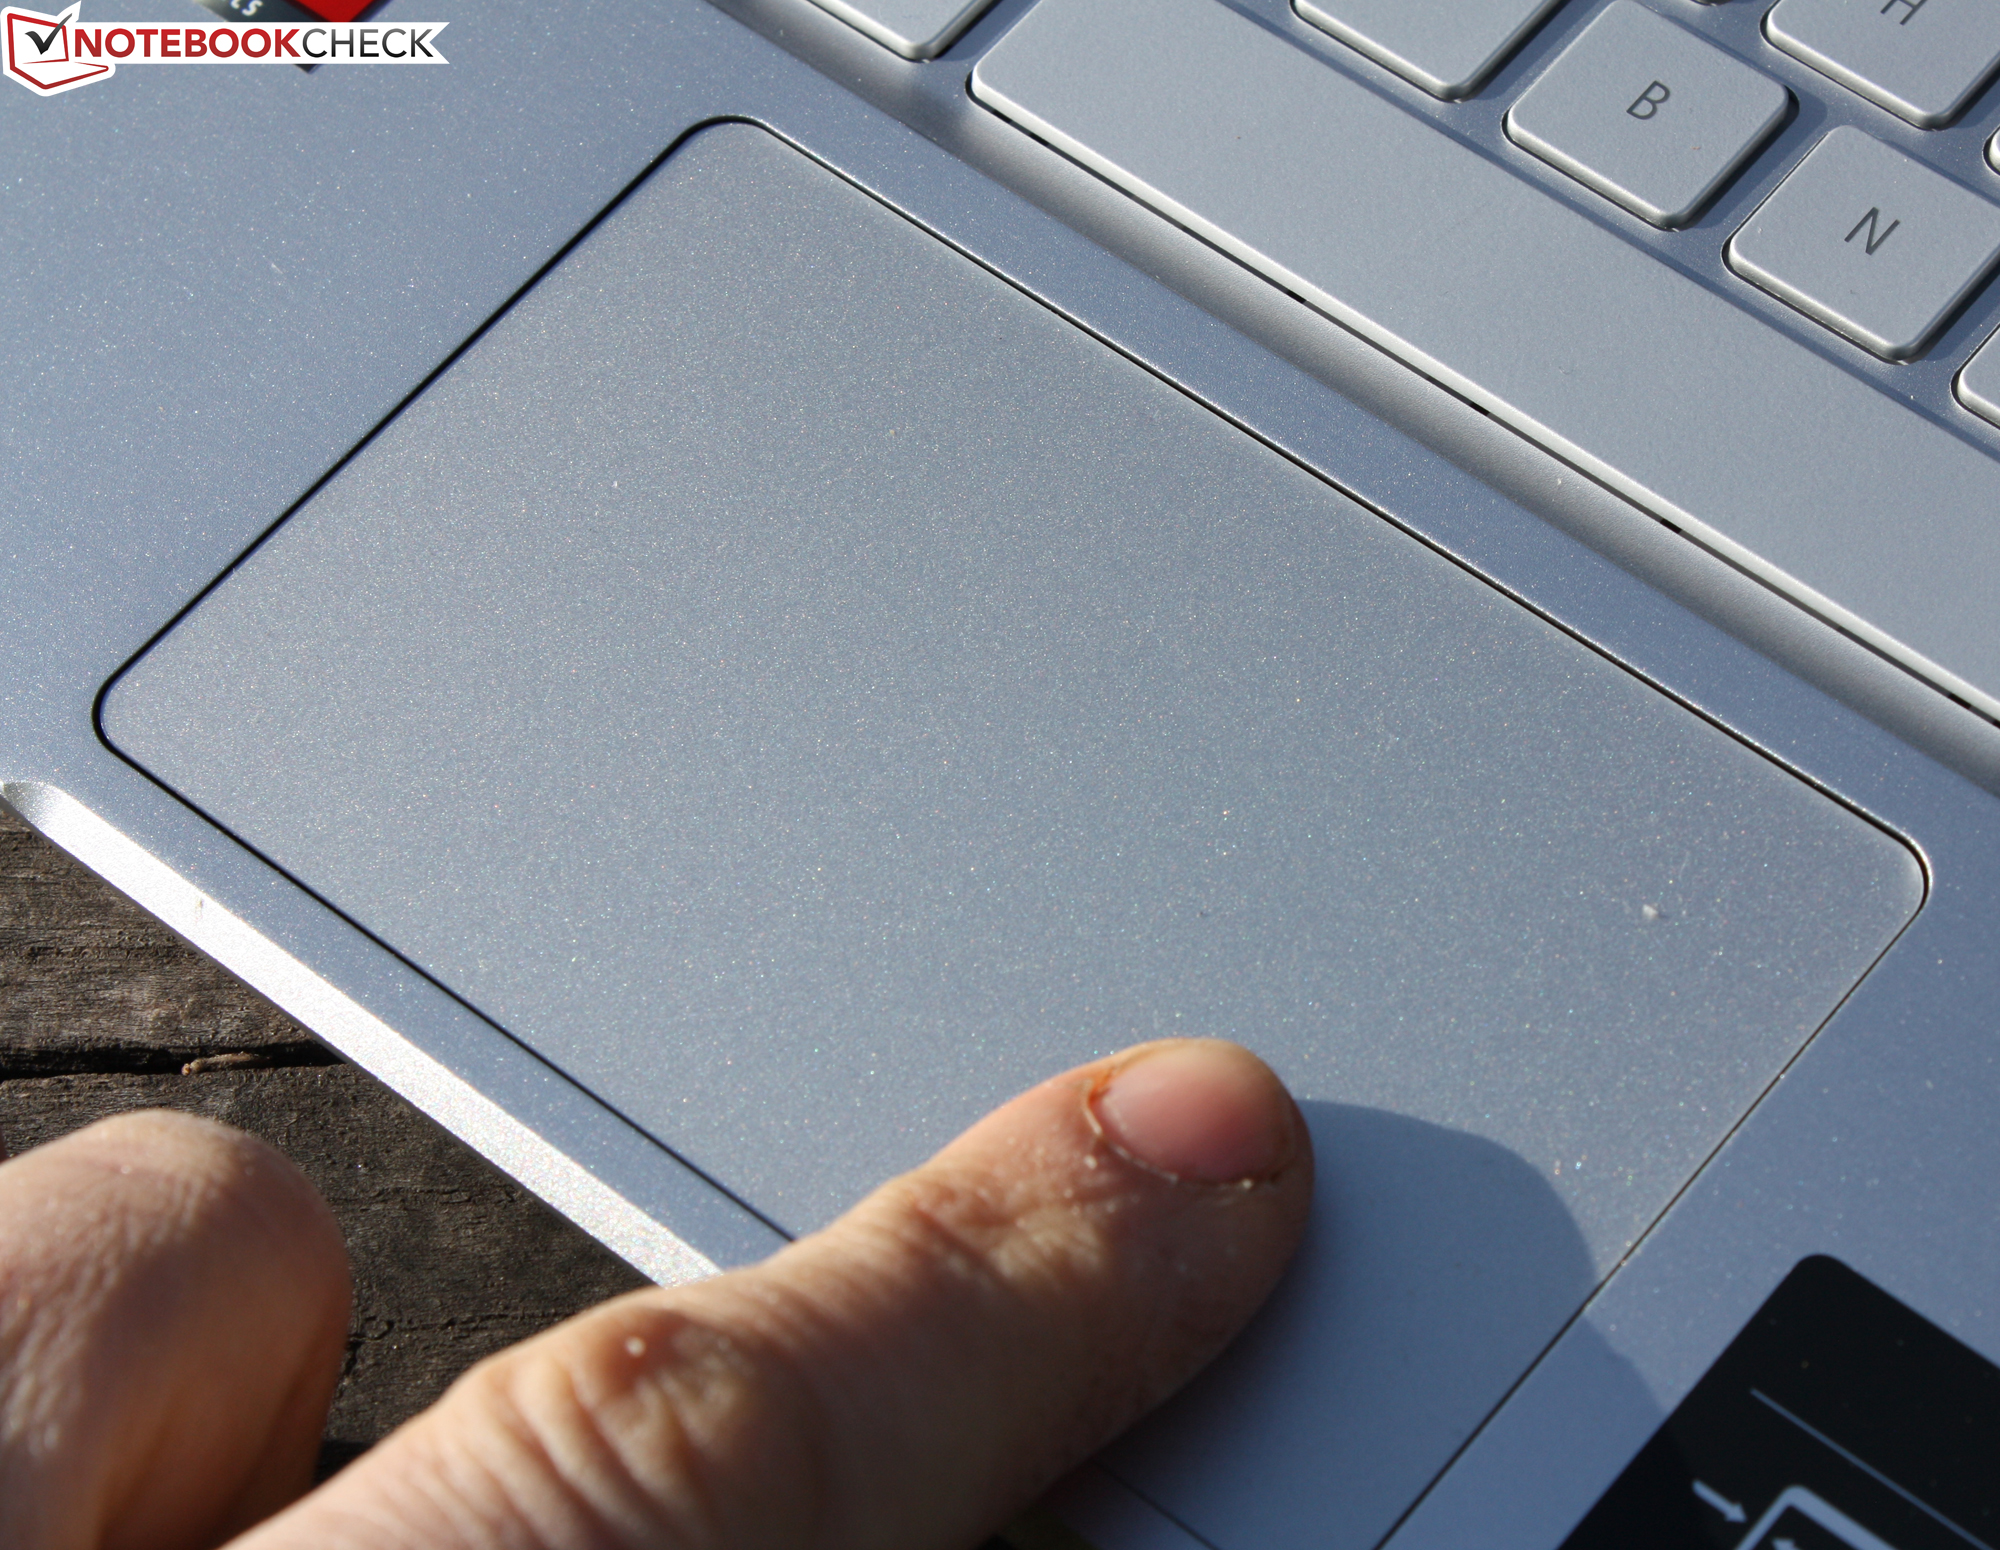
Due to the platform strategy, where one chassis is used for technically different variants, it is such that we already have the case, the input devices, and the ports from the Swift X SFX14 (GTX 1650) and from the Intel counterpart Swift 3 SF314-511. We will, therefore, skip these chapters and refer you to the corresponding reviews.
Other Acer Swift 14-inch devices in review:
- Acer Swift X SFX14-41G-R7F3 (Ryzen 5 5500U, GTX 1650 Mobile)
- Acer Swift 3 SF314-511(i5-1135G7, Iris Xe Graphics G7 80EUs)
- Acer Swift 3X SF314-510G(i7-1165G7, IntelIris Xe MAX)
- Acer Swift 3 SF314-42(Ryzen 7 4700U, Radeon RX) - 6/2020
Possible competitors in comparison
Rating | Date | Model | Weight | Height | Size | Resolution | Price |
|---|---|---|---|---|---|---|---|
| 86 % v7 (old) | 03 / 2022 | Acer Swift 3 SF314-43-R8BP R5 5500U, Vega 7 | 1.3 kg | 16.5 mm | 14.00" | 1920x1080 | |
| 88.2 % v7 (old) | 02 / 2022 | Acer Swift 3 SF314-511-54ZK i5-1135G7, Iris Xe G7 80EUs | 1.2 kg | 16.55 mm | 14.00" | 1920x1080 | |
| 86.7 % v7 (old) | 07 / 2021 | Lenovo ThinkPad E14 G3-20Y7003SGE R5 5500U, Vega 7 | 1.6 kg | 17.9 mm | 14.00" | 1920x1080 | |
| 84.8 % v7 (old) | 01 / 2022 | HP Pavilion 14-dv0357ng i5-1135G7, Iris Xe G7 80EUs | 1.4 kg | 19 mm | 14.00" | 1920x1080 | |
| 84.8 % v7 (old) | 01 / 2022 | Dell Latitude 14 5420-D2G5W i5-1135G7, Iris Xe G7 80EUs | 1.5 kg | 20.9 mm | 14.00" | 1920x1080 | |
| 83.6 % v7 (old) | Lenovo ThinkBook 14 G2 ITL 20VDS02G00 i3-1115G4, UHD Graphics Xe G4 48EUs | 1.5 kg | 17.9 mm | 14.00" | 1920x1080 |
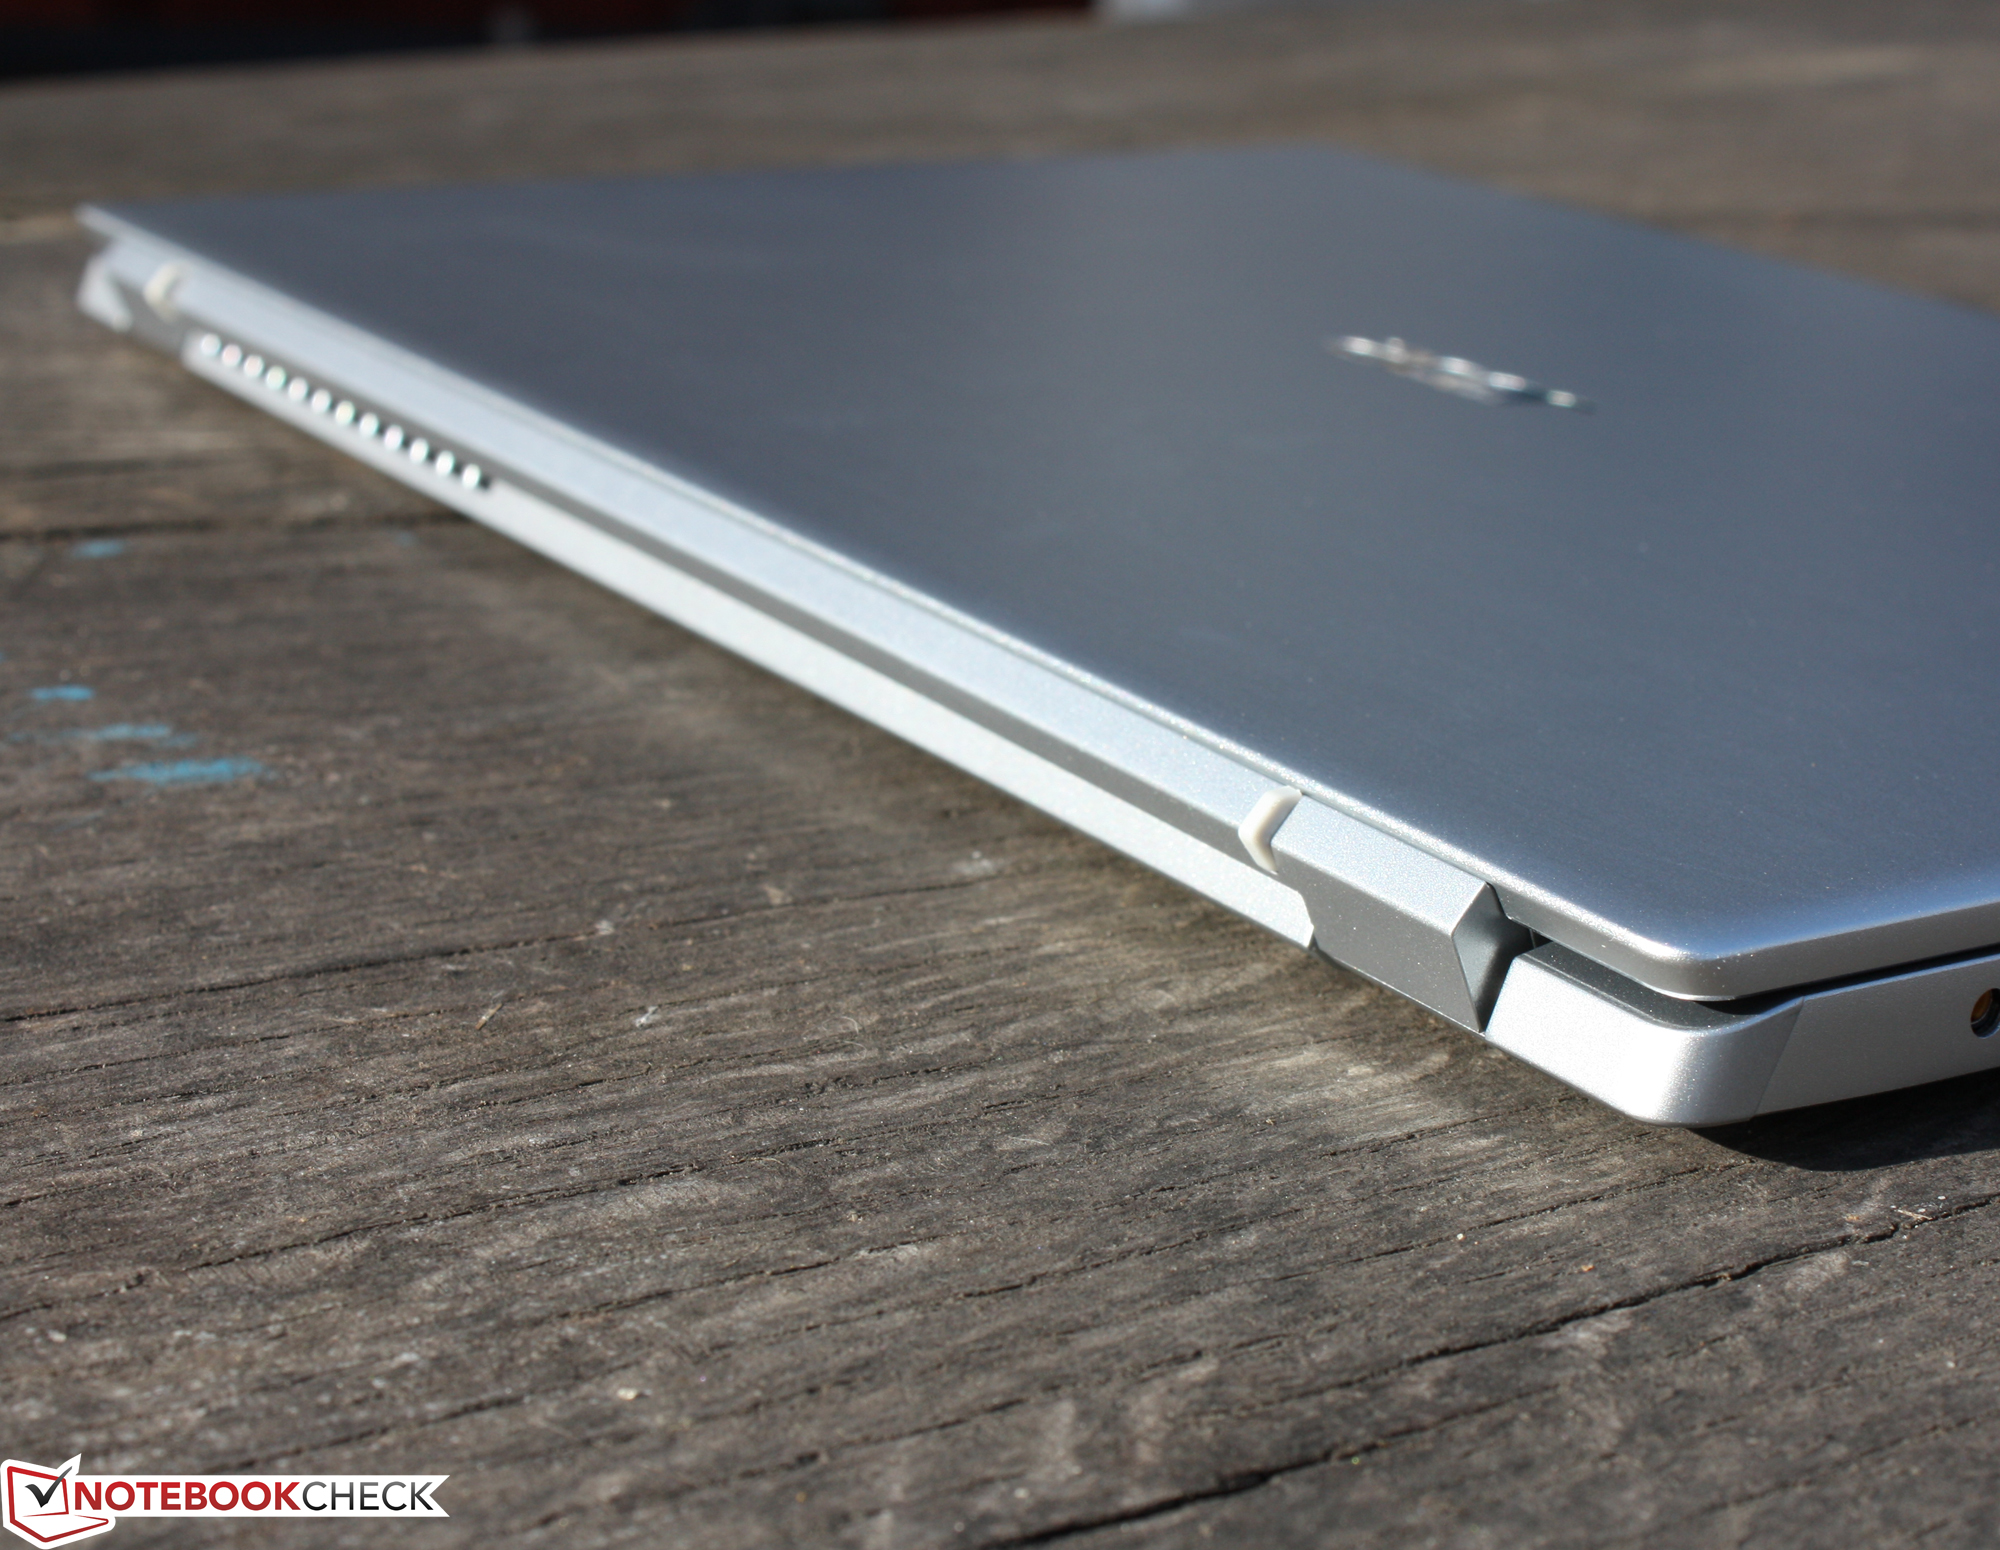
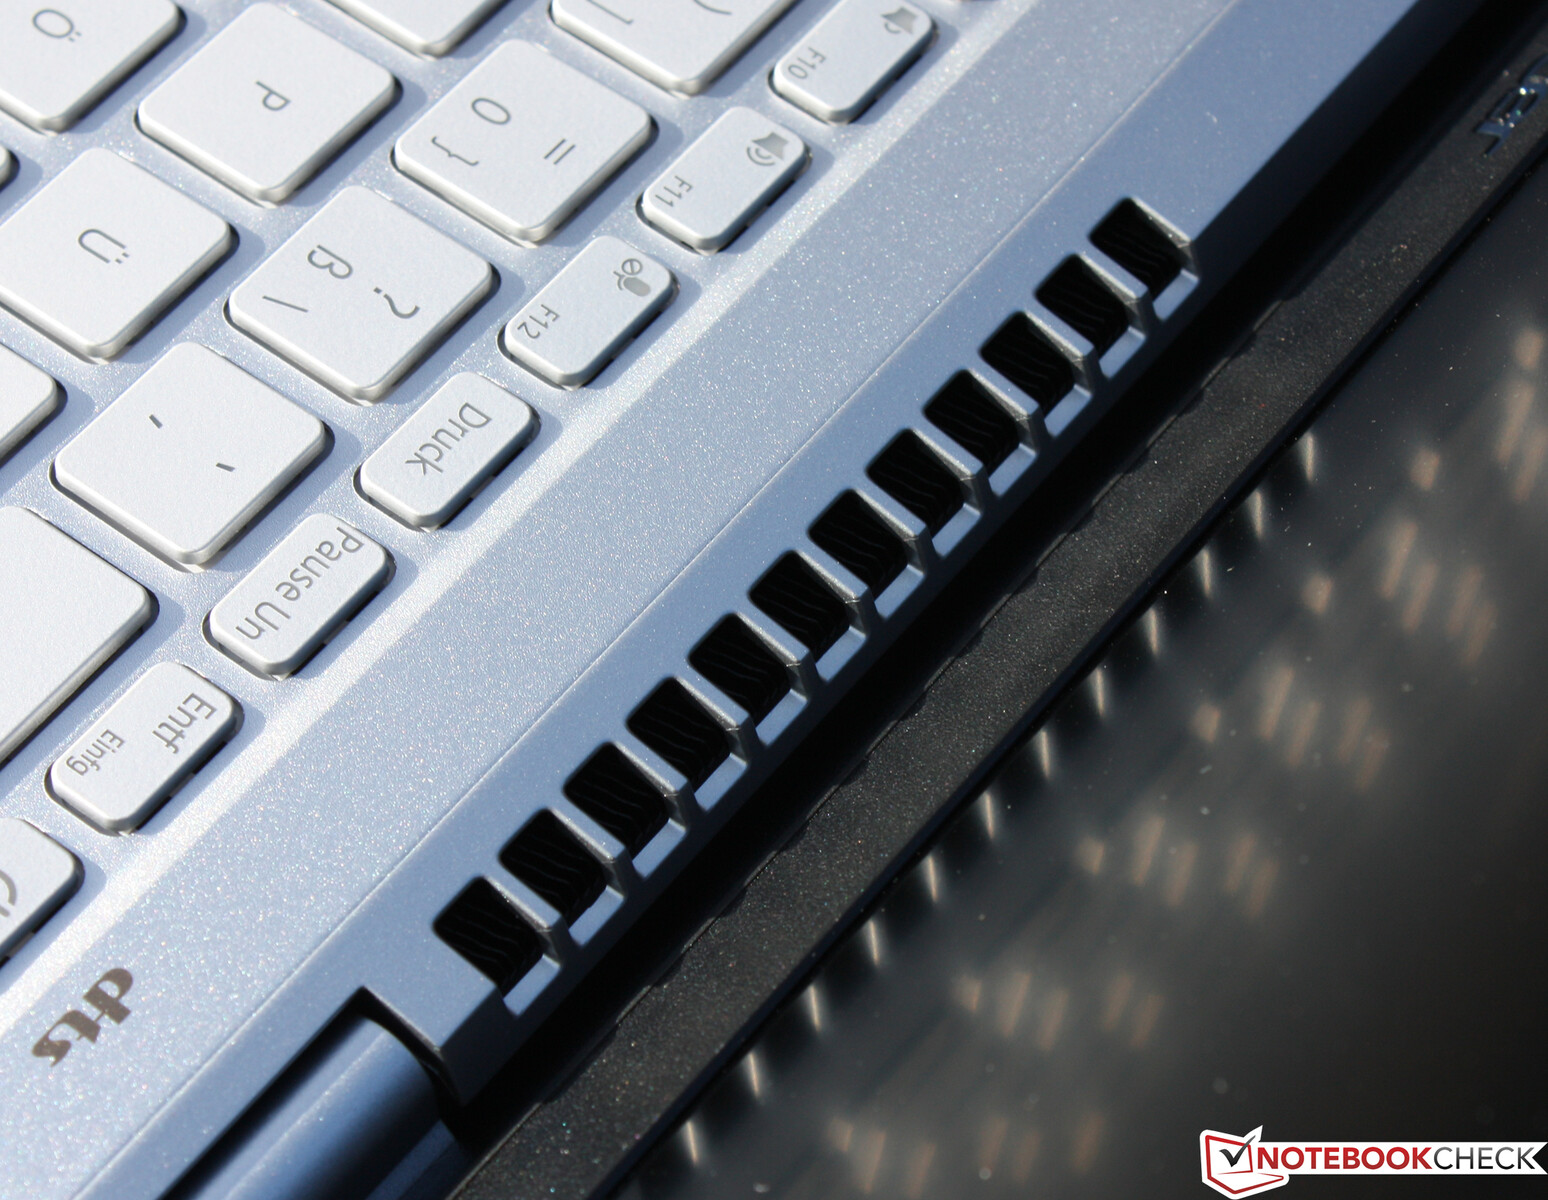
Case: Stable Swift 3
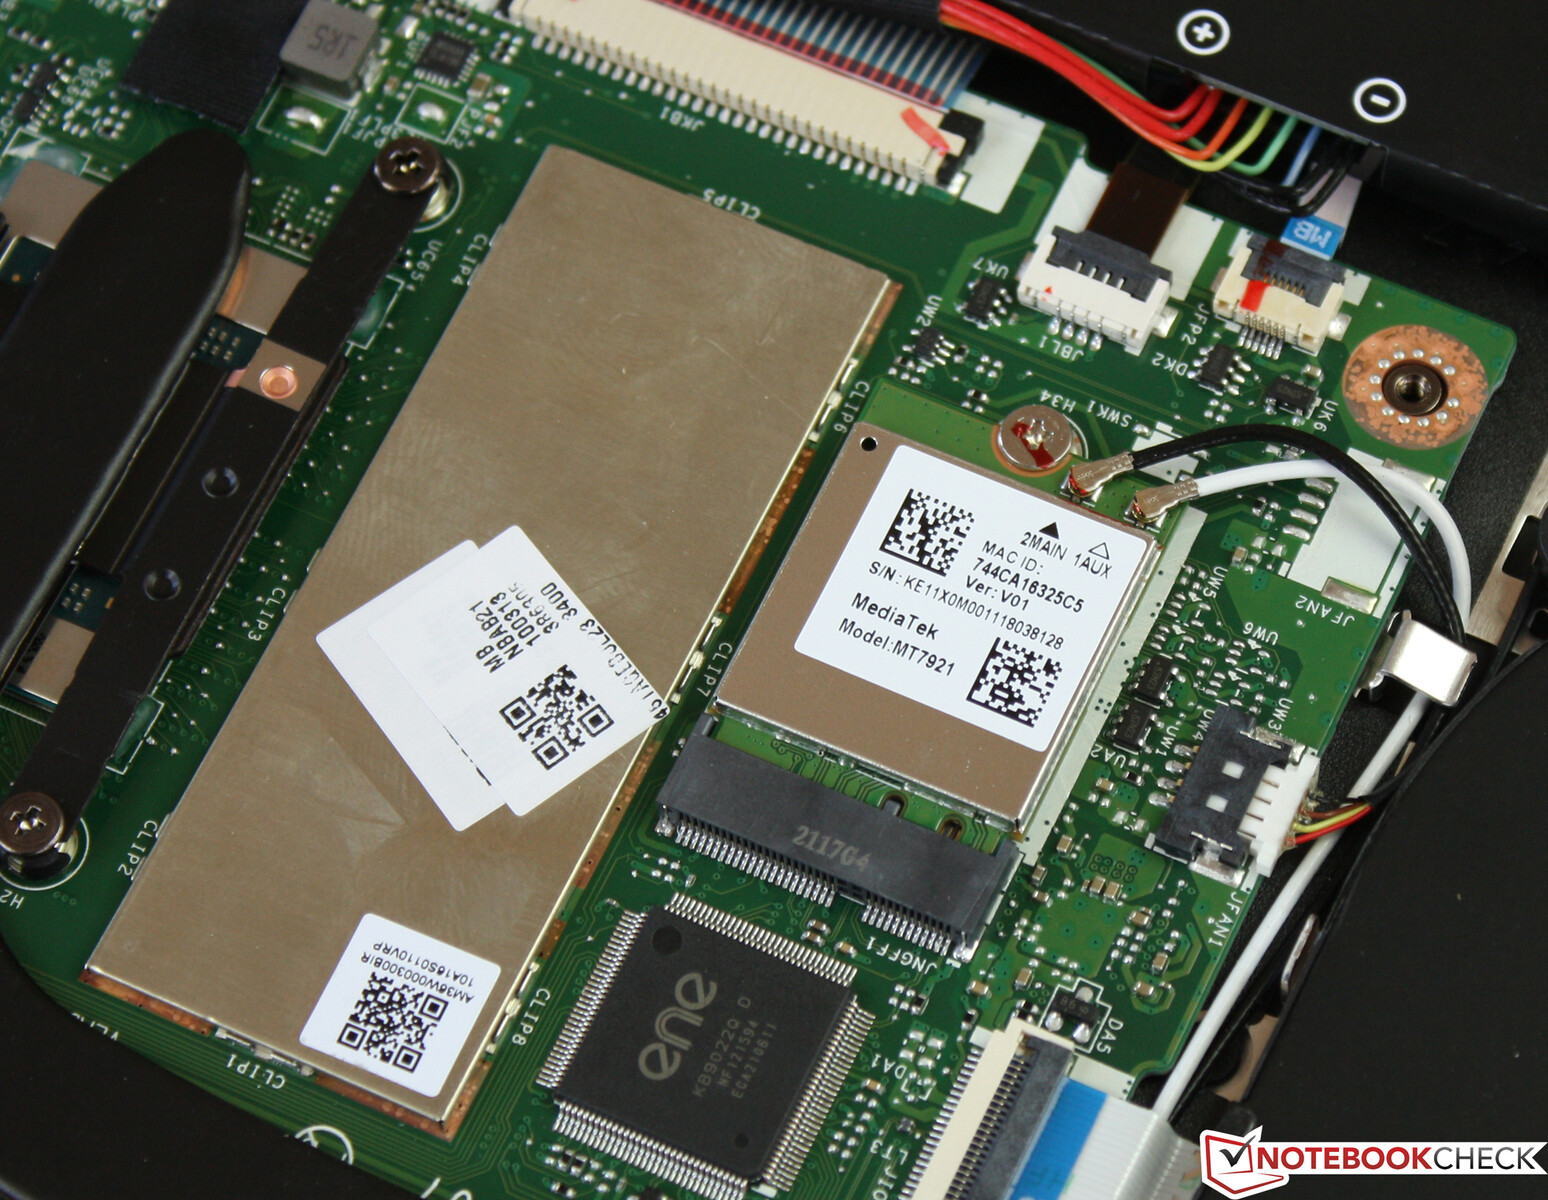
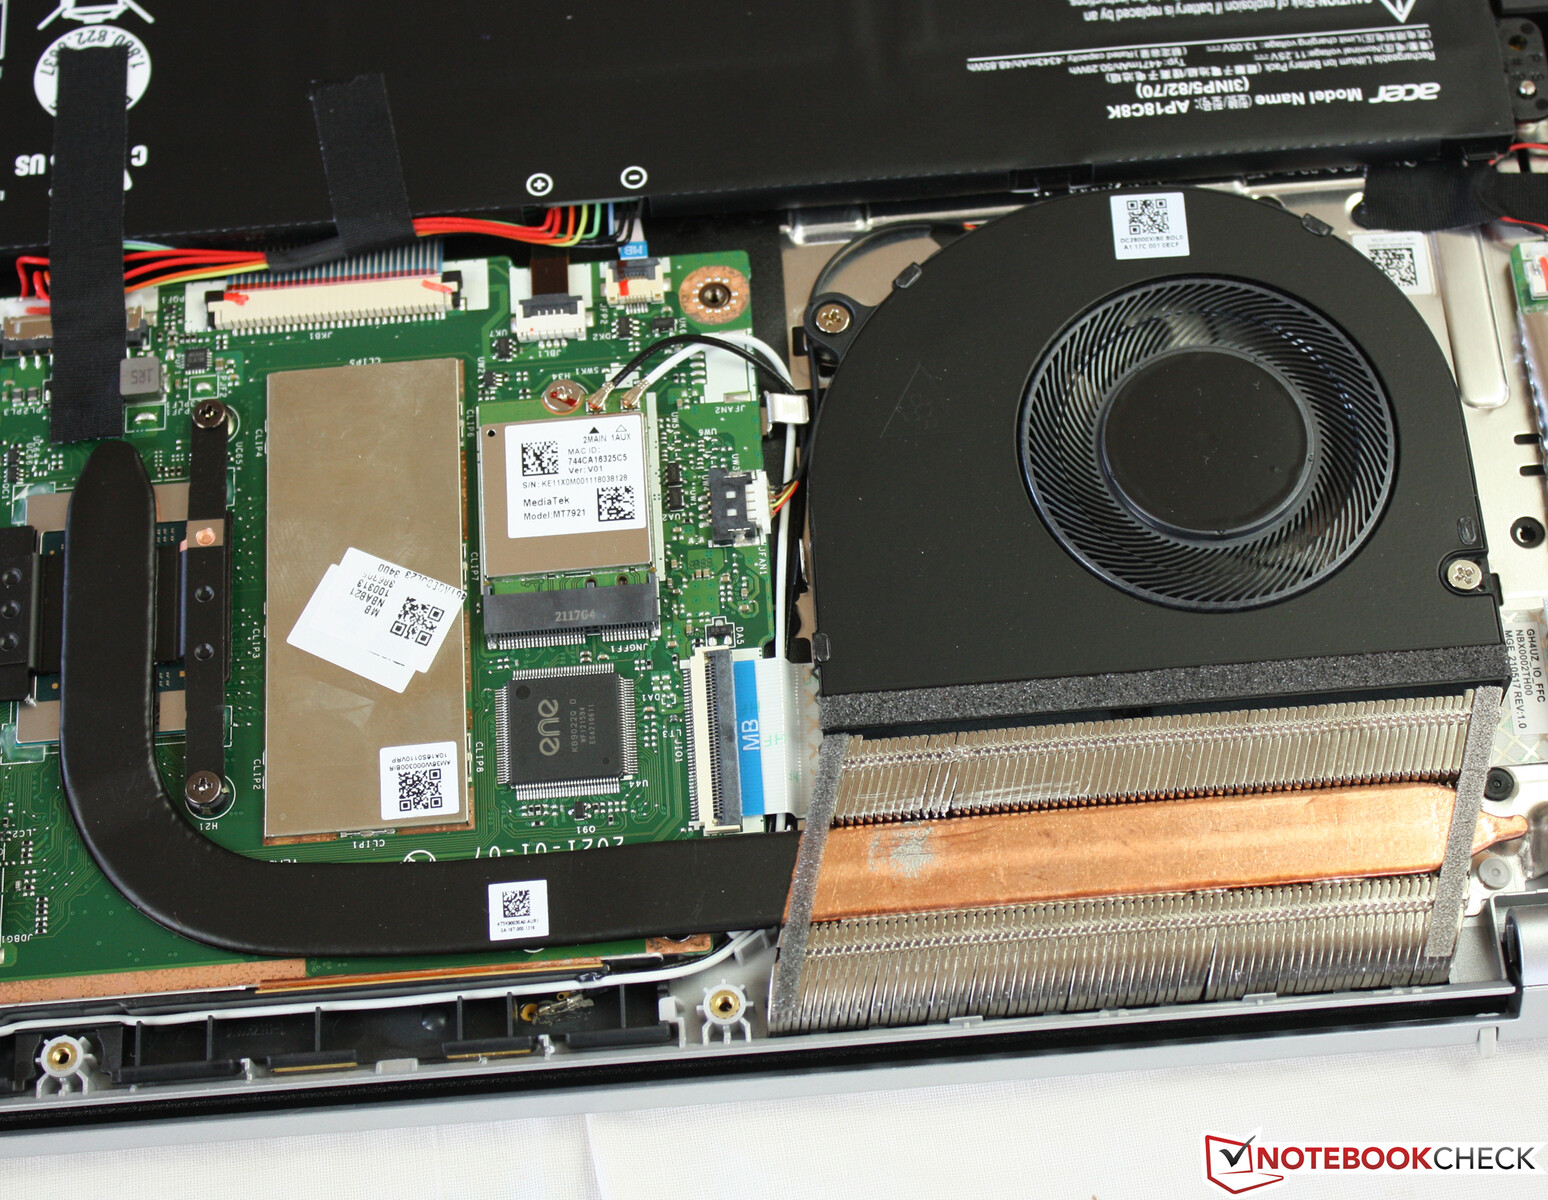
Equipment: MediaTek Wi-Fi is too slow
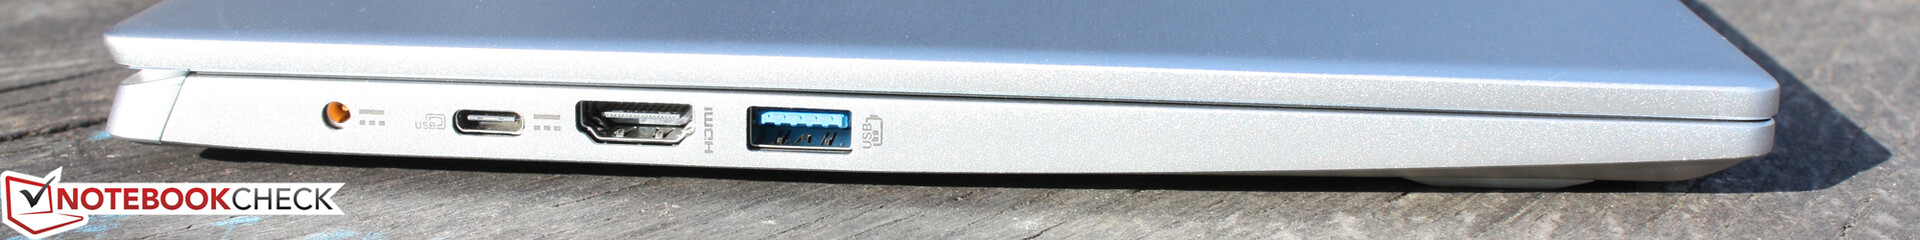
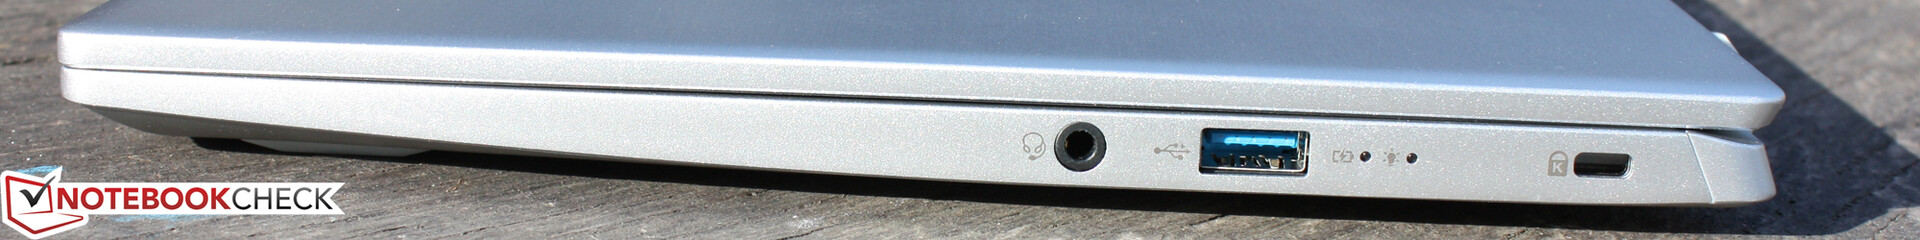
The ports are identical to those of the Swift X. Unfortunately, the bad Wi-Fi performance is also identical to that of the Swift X. The download speed seems like a disaster, which was the same issue with the Swift X as well. The transfer speeds determined under optimal conditions (no other WLAN devices in the near vicinity, one meter distance between the laptop and server PC) turn out to be very abysmal with just around 182 MBit/s (several random samples).
When transmitting, however, the MediaTek Wi-Fi chip is much faster at around 871 MBit/s. This is a good result although not really exhilarating. The discrepancy between sending and receiving speeds indicates a driver problem, which we assume can be remedied with a driver update in the future.
However, the question does arise as to where the antennas are installed in the all-around closed aluminum lid? That being said, this cannot be the reason for the poor scores as otherwise the uploads would also be identically low.
| Networking | |
| iperf3 transmit AX12 | |
| Acer Swift 3 SF314-511-54ZK | |
| Acer Swift 3 SF314-43-R8BP | |
| Lenovo ThinkPad E14 G3-20Y7003SGE | |
| Dell Latitude 14 5420-D2G5W | |
| Average MediaTek MT7921 (548 - 985, n=16) | |
| Lenovo ThinkBook 14 G2 ITL 20VDS02G00 | |
| Lenovo ThinkBook 14 G2 ITL 20VDS02G00 | |
| HP Pavilion 14-dv0357ng | |
| iperf3 receive AX12 | |
| Dell Latitude 14 5420-D2G5W | |
| Acer Swift 3 SF314-511-54ZK | |
| Lenovo ThinkPad E14 G3-20Y7003SGE | |
| Lenovo ThinkBook 14 G2 ITL 20VDS02G00 | |
| Lenovo ThinkBook 14 G2 ITL 20VDS02G00 | |
| Average MediaTek MT7921 (90 - 972, n=16) | |
| HP Pavilion 14-dv0357ng | |
| Acer Swift 3 SF314-43-R8BP | |
Webcam


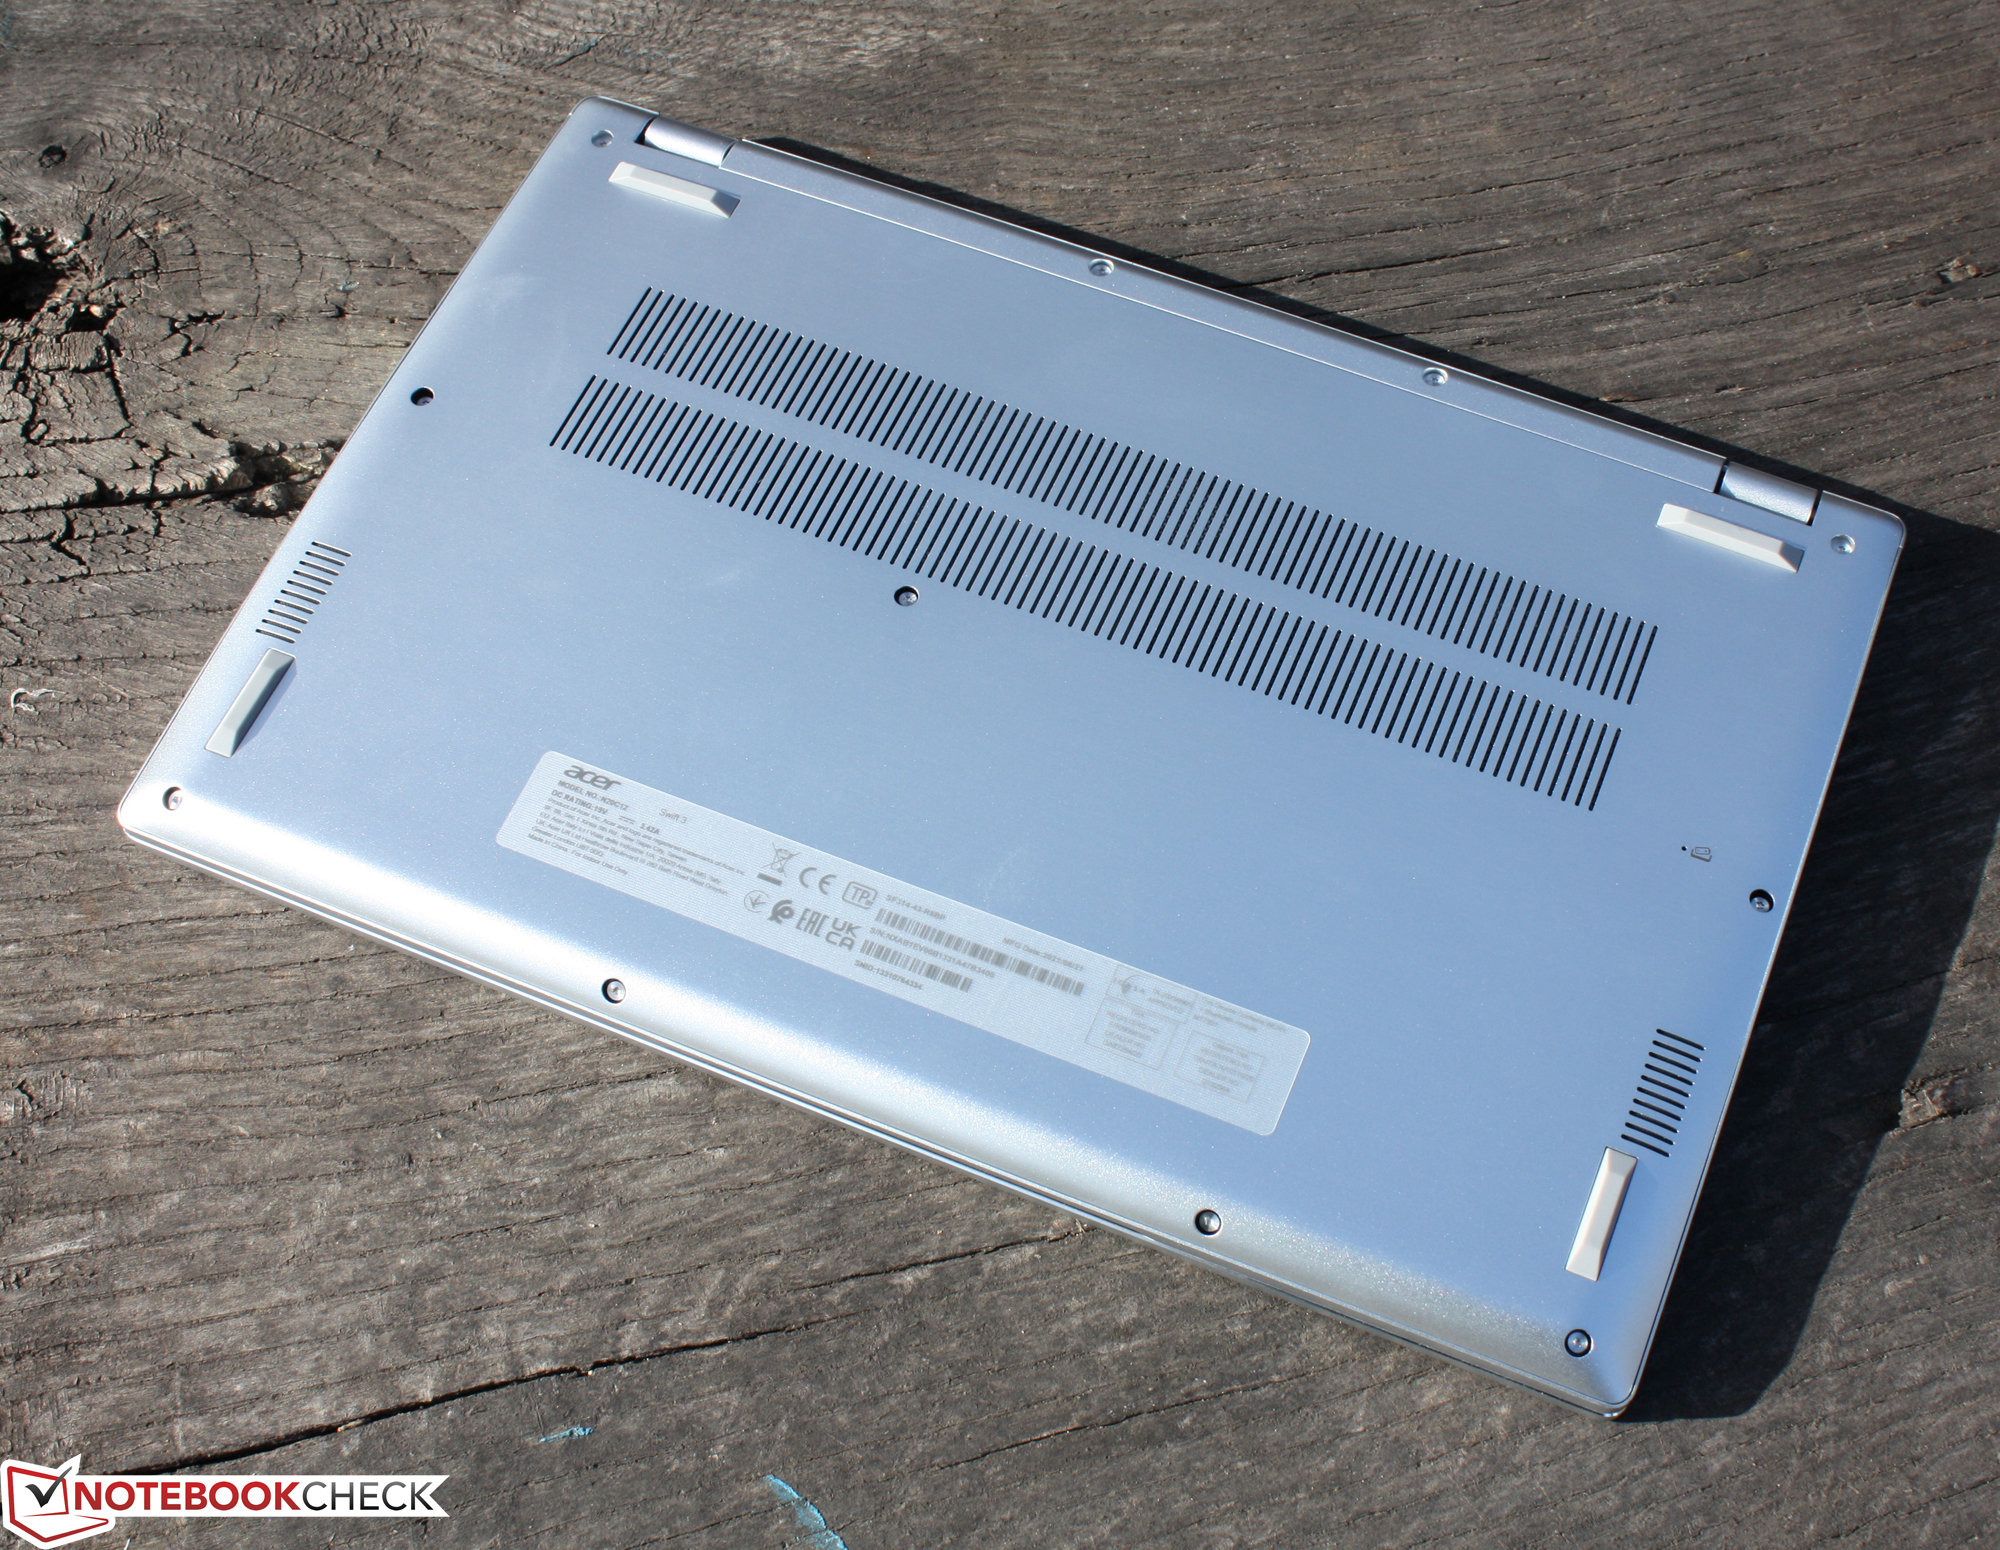
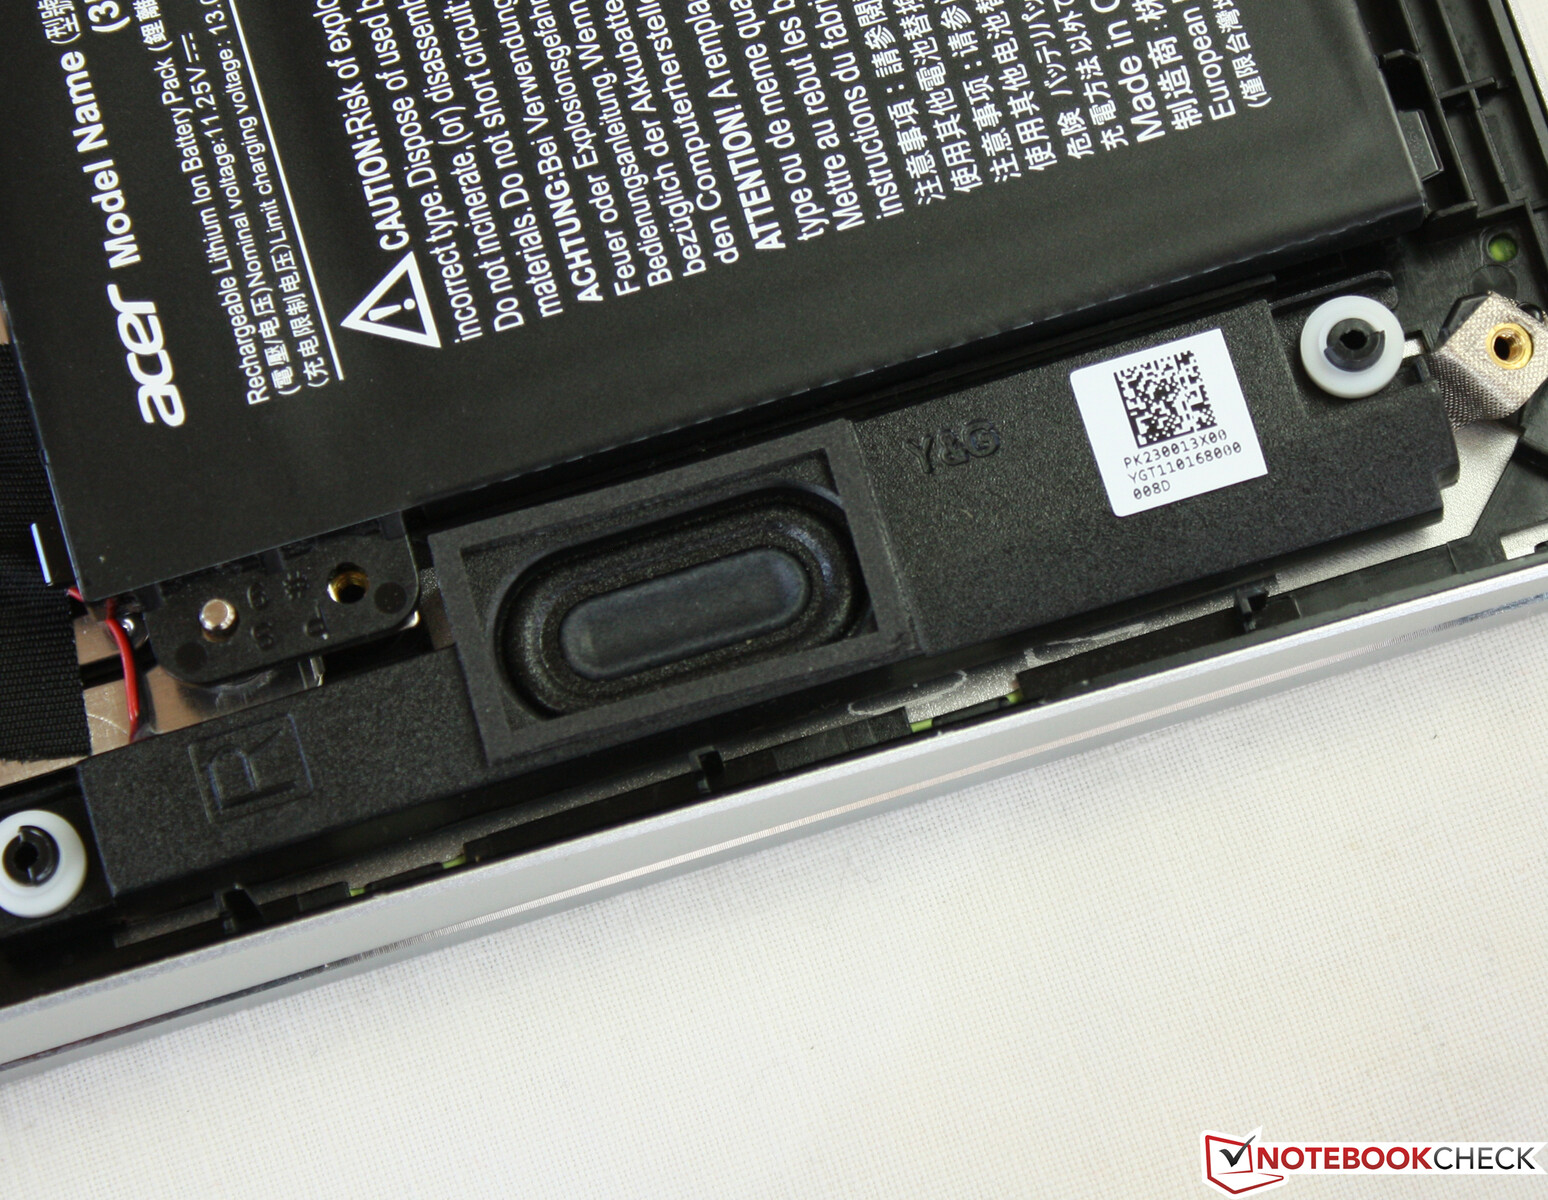
Maintenance
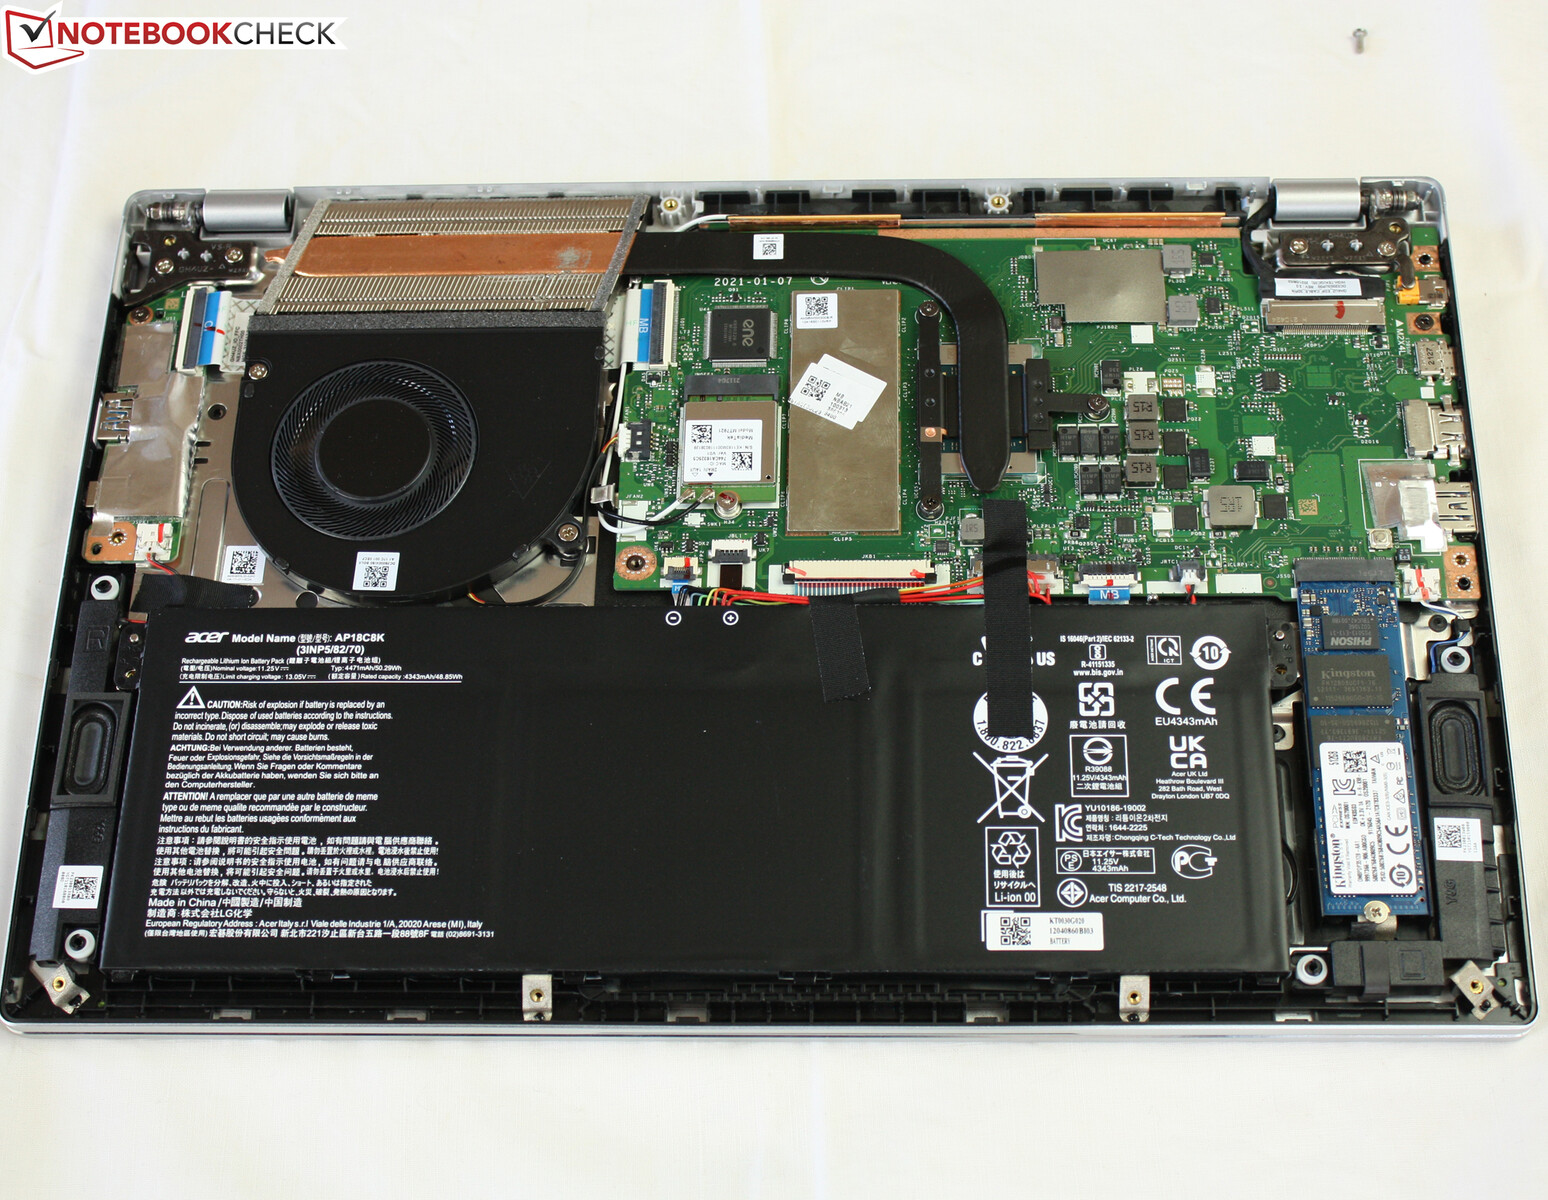
The Swift 3's WLAN card can be upgraded. The SSD can also be swapped for a larger model later. There is no second M.2 slot like in the Swift X. The working memory is soldered.
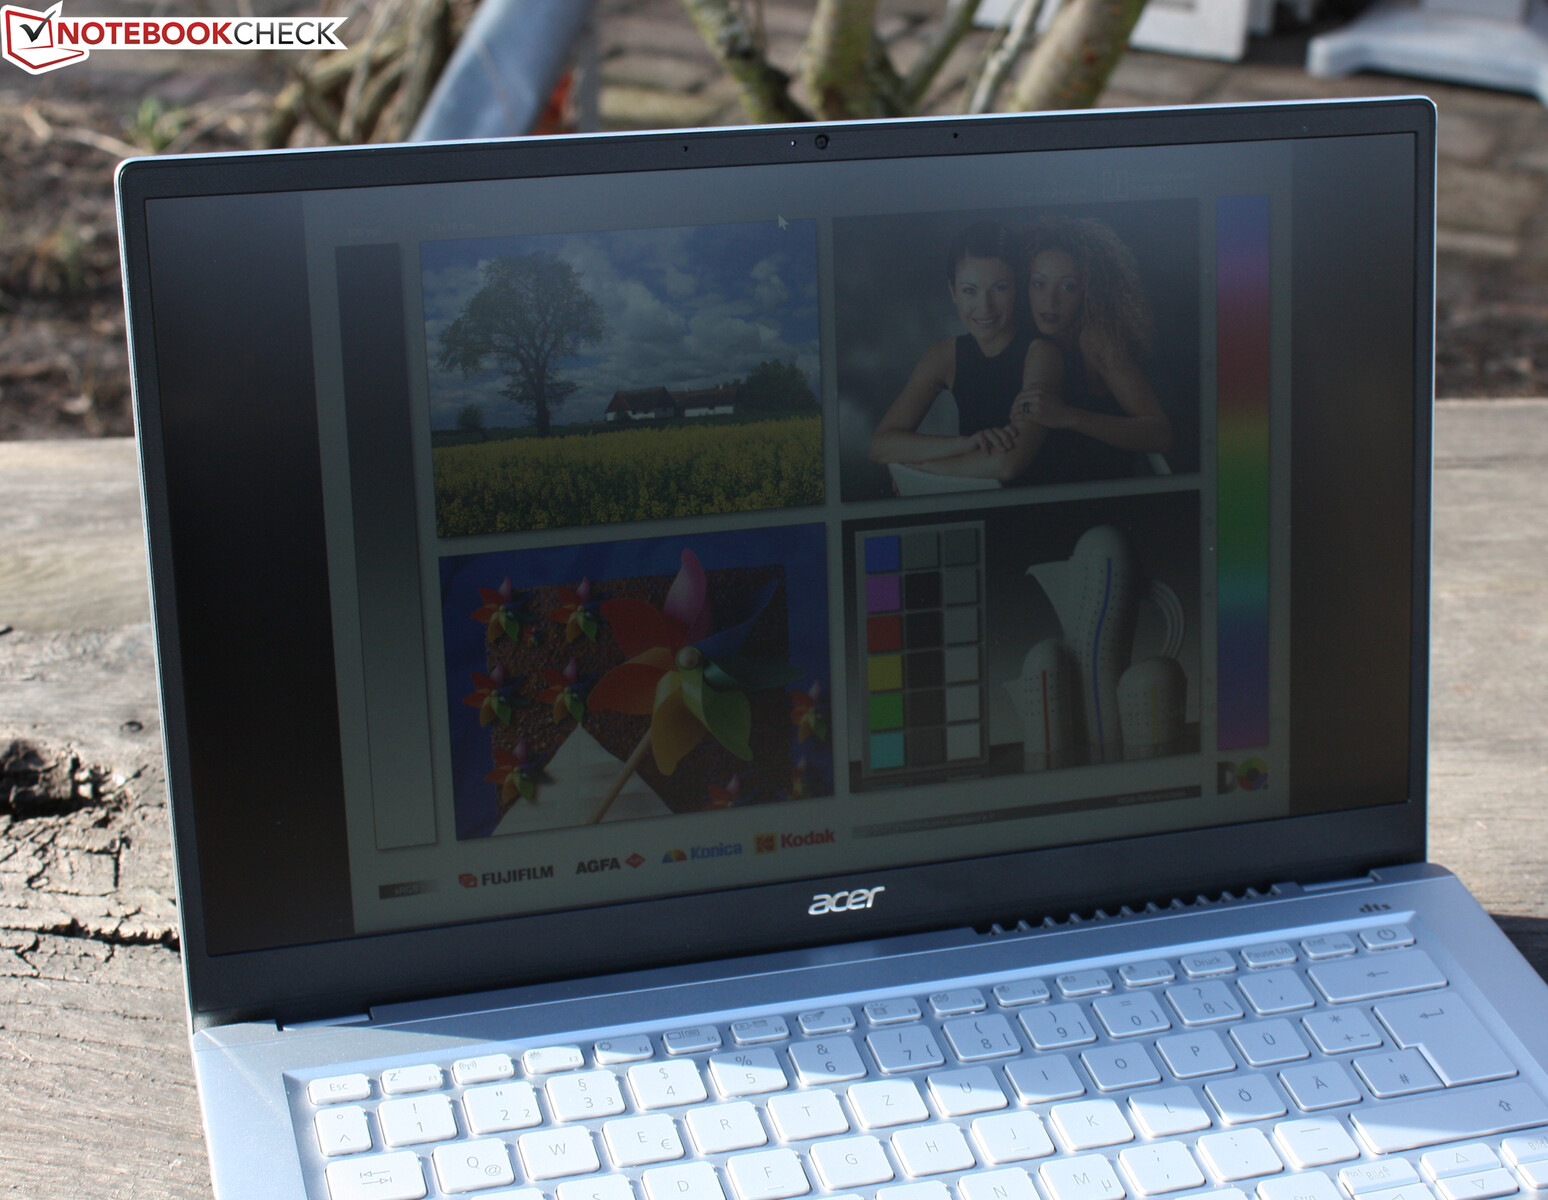
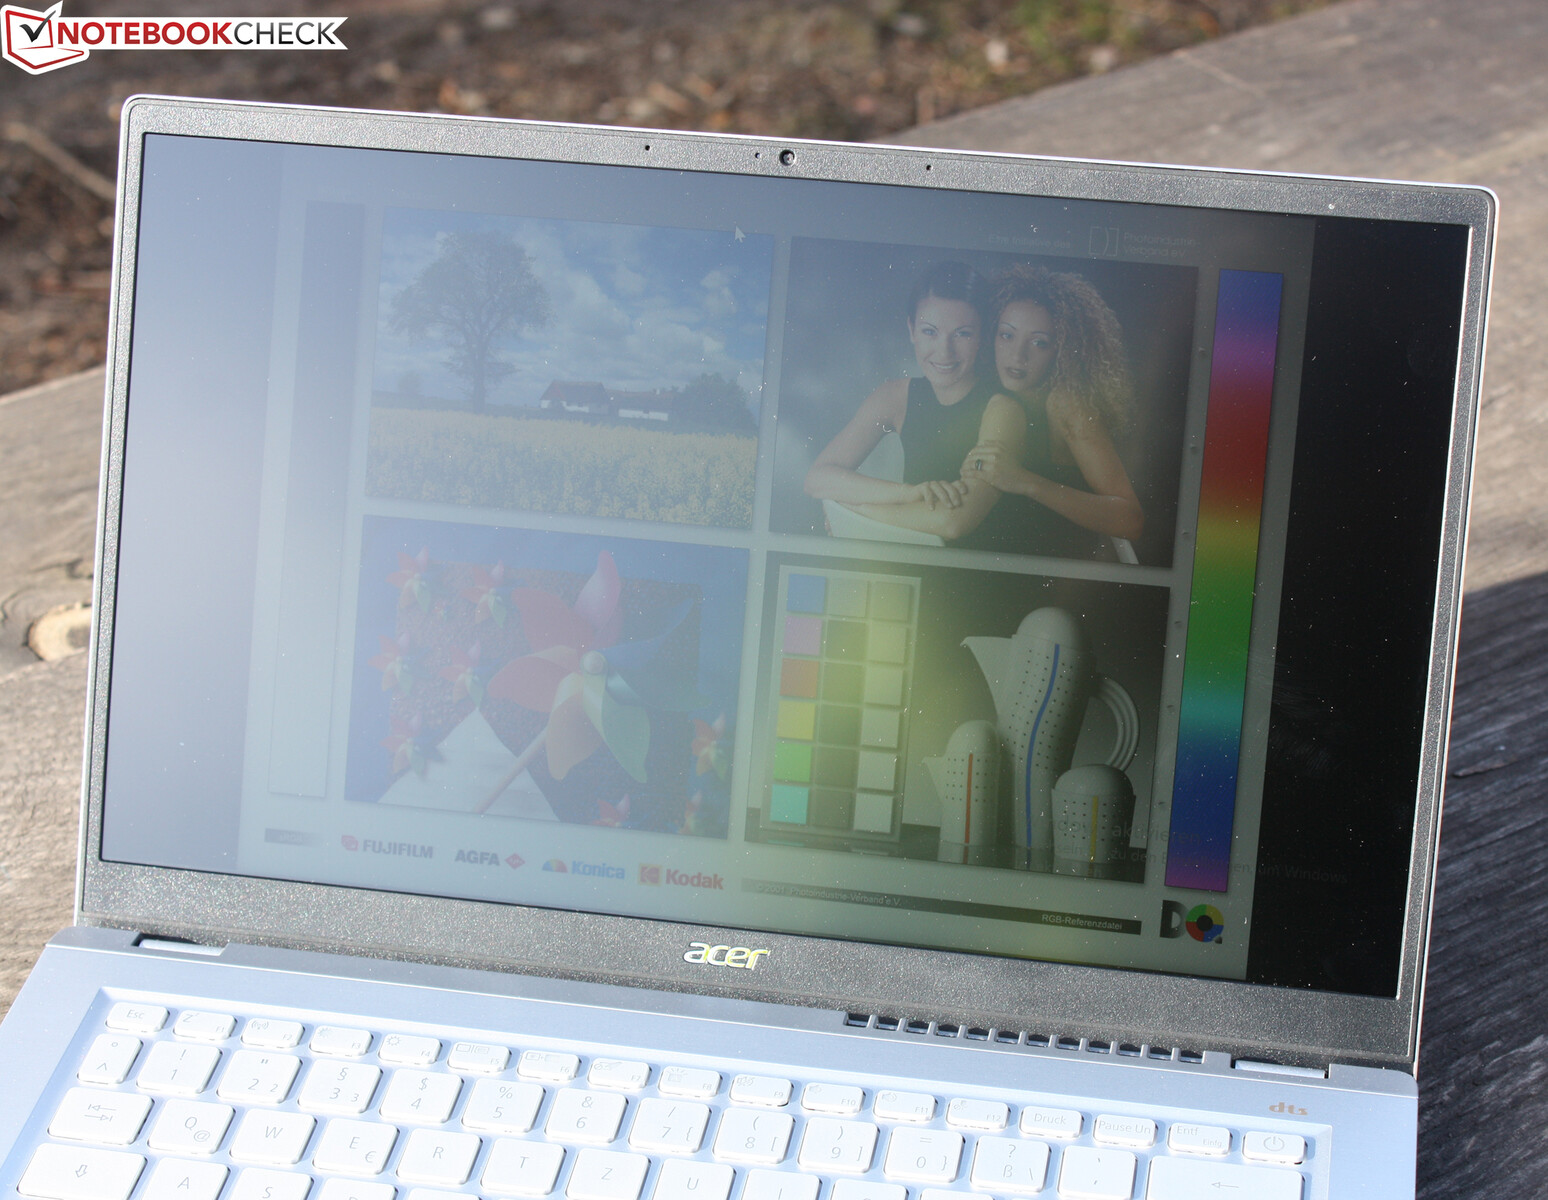
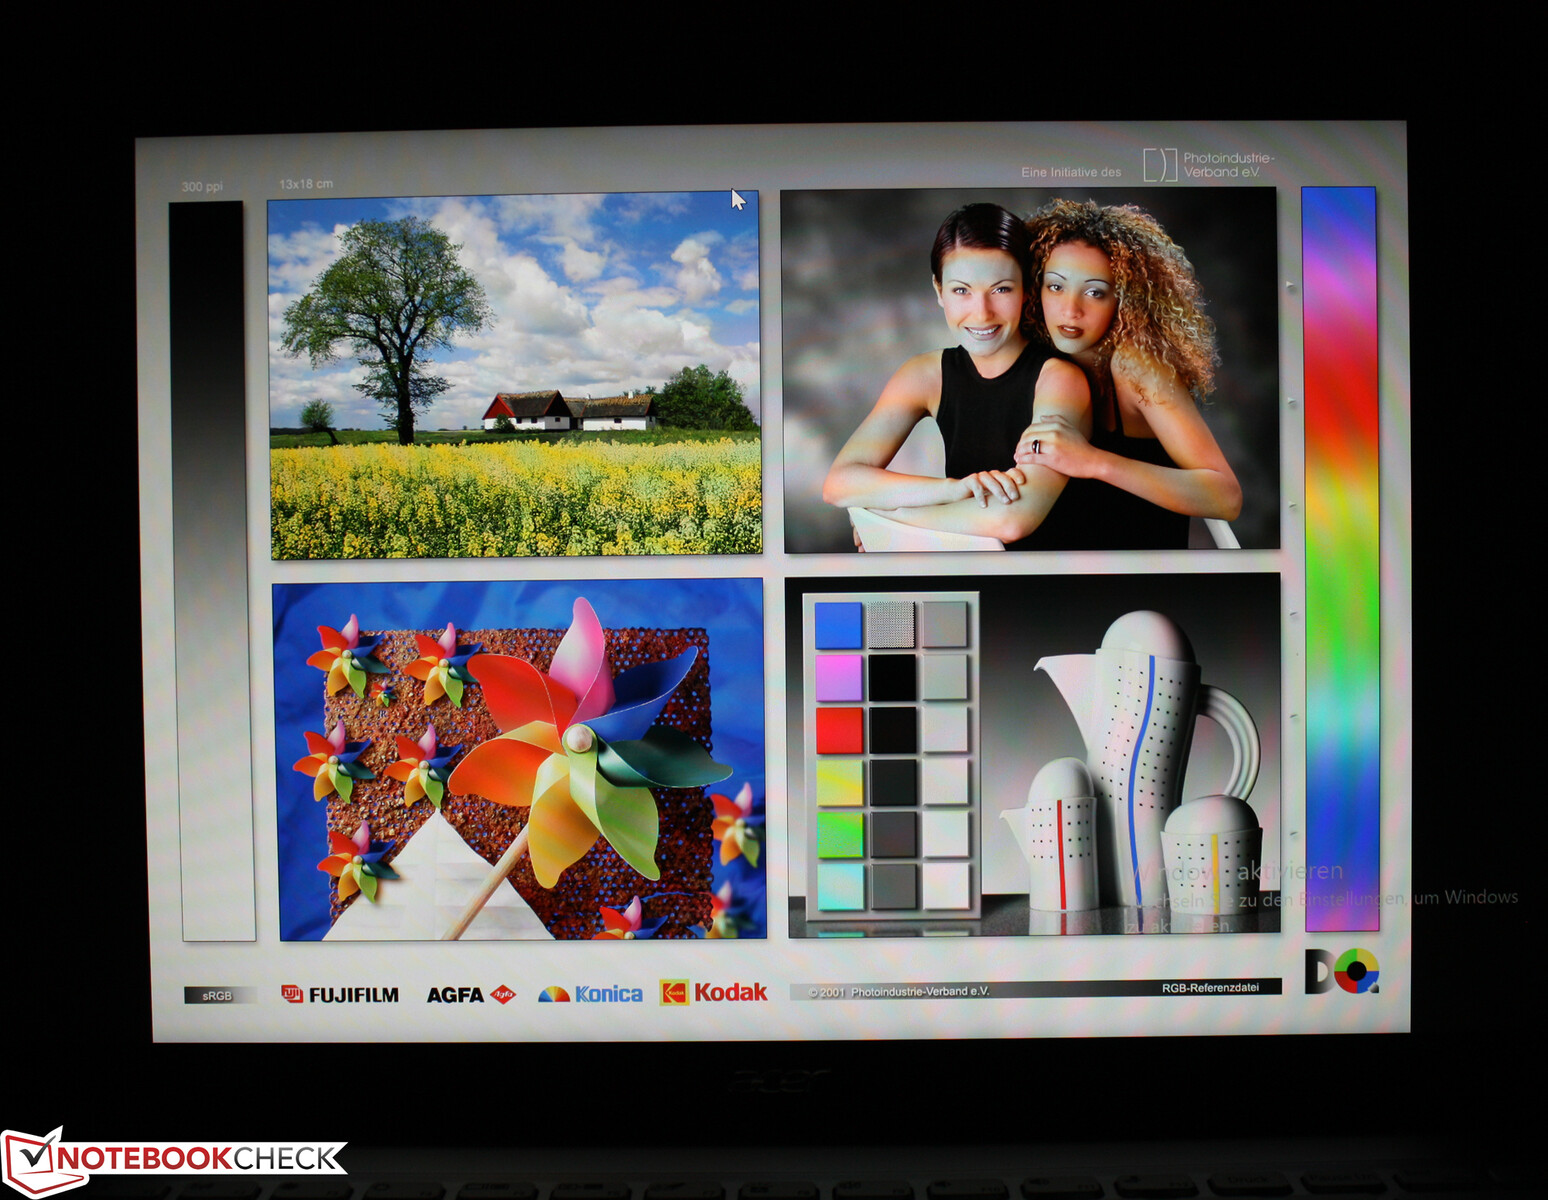
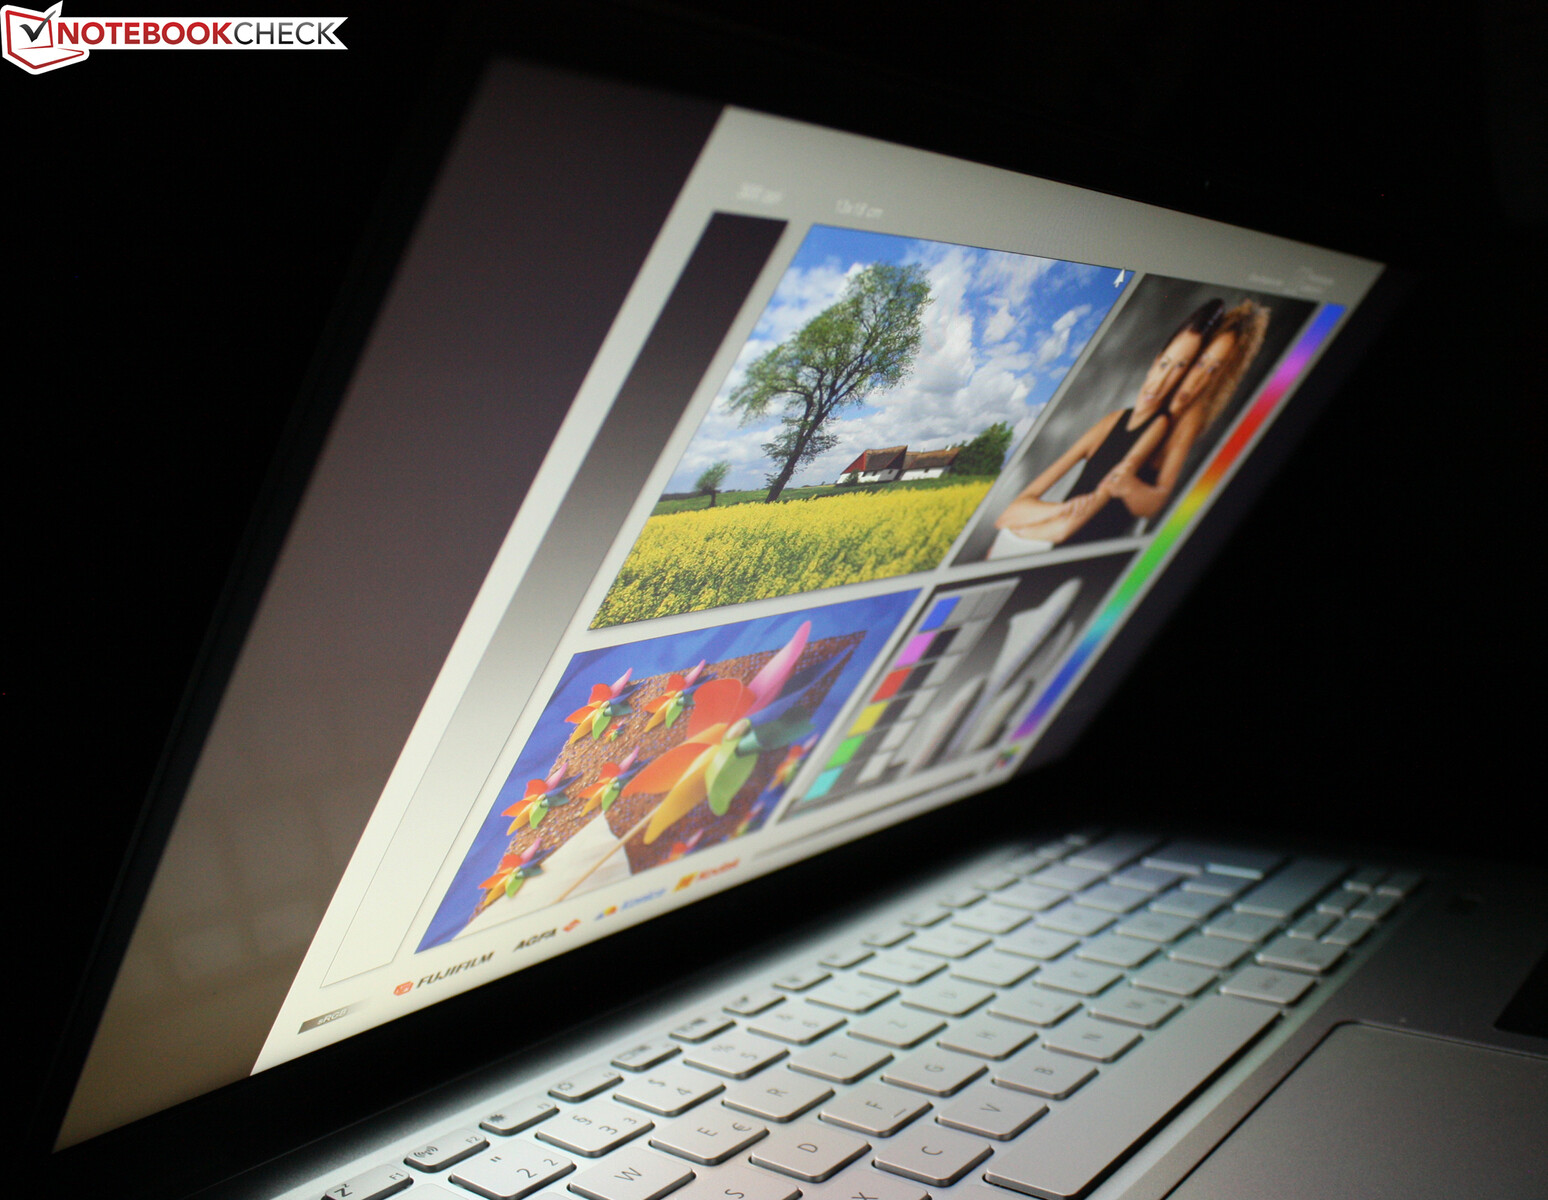
Display: Acer screen glows too weakly
While the Swift X SFX14-41G and Swift 3 SF314-511 are equipped with AUO panels (B140HAN06) that deliver excellent performance in our tests, our present model relies on a Chi-Mei screen (N140HCA EAC CMN). This seems to be a worse choice because the sRGB space is no longer fully covered and the brightness is also lower. However, the differences in contrast are negligible.
The brightness perceivably increases towards the center of the screen, but there's no visible backlight bleeding. The luminance in battery mode remains unchanged as long as AMD Vari Bright is disabled in the Radeon settings.
One negative aspect here is that the display uses PWM to reduce the brightness when the brightness is 20% and low. That being said, the high frequency of 25,000 Hz should not strain the eyes. Moreover, most users would find it difficult to work on the screen at such low brightness, because 20% is simply too dark even indoors.
| |||||||||||||||||||||||||
Brightness Distribution: 78 %
Center on Battery: 259 cd/m²
Contrast: 1079:1 (Black: 0.24 cd/m²)
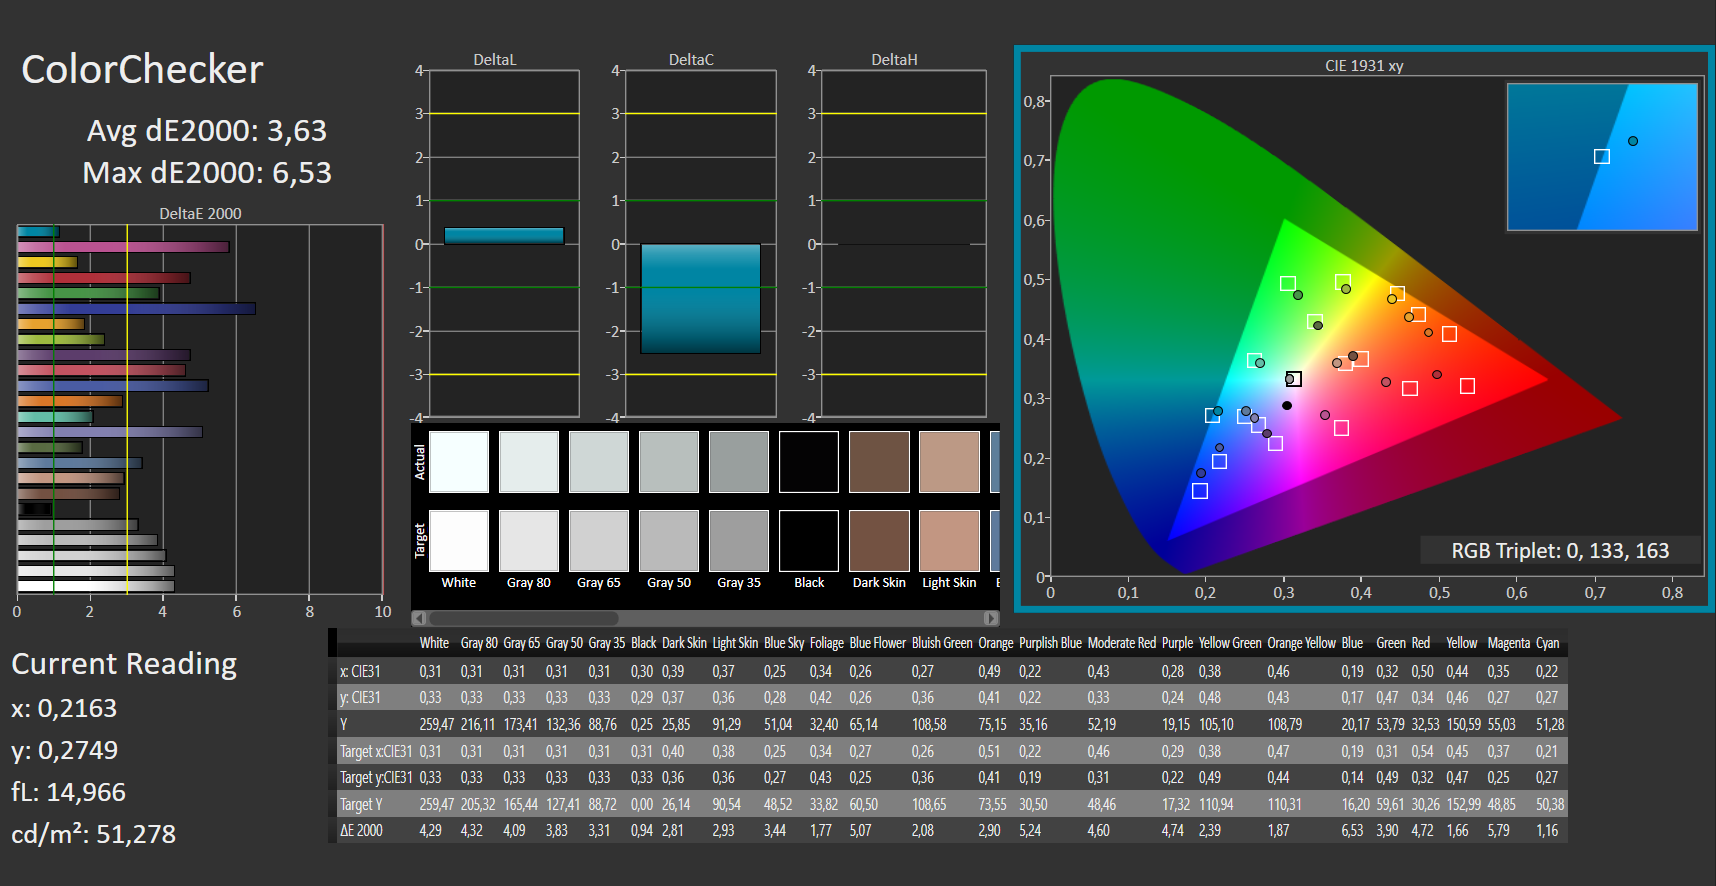
ΔE ColorChecker Calman: 3.63 | ∀{0.5-29.43 Ø4.72}
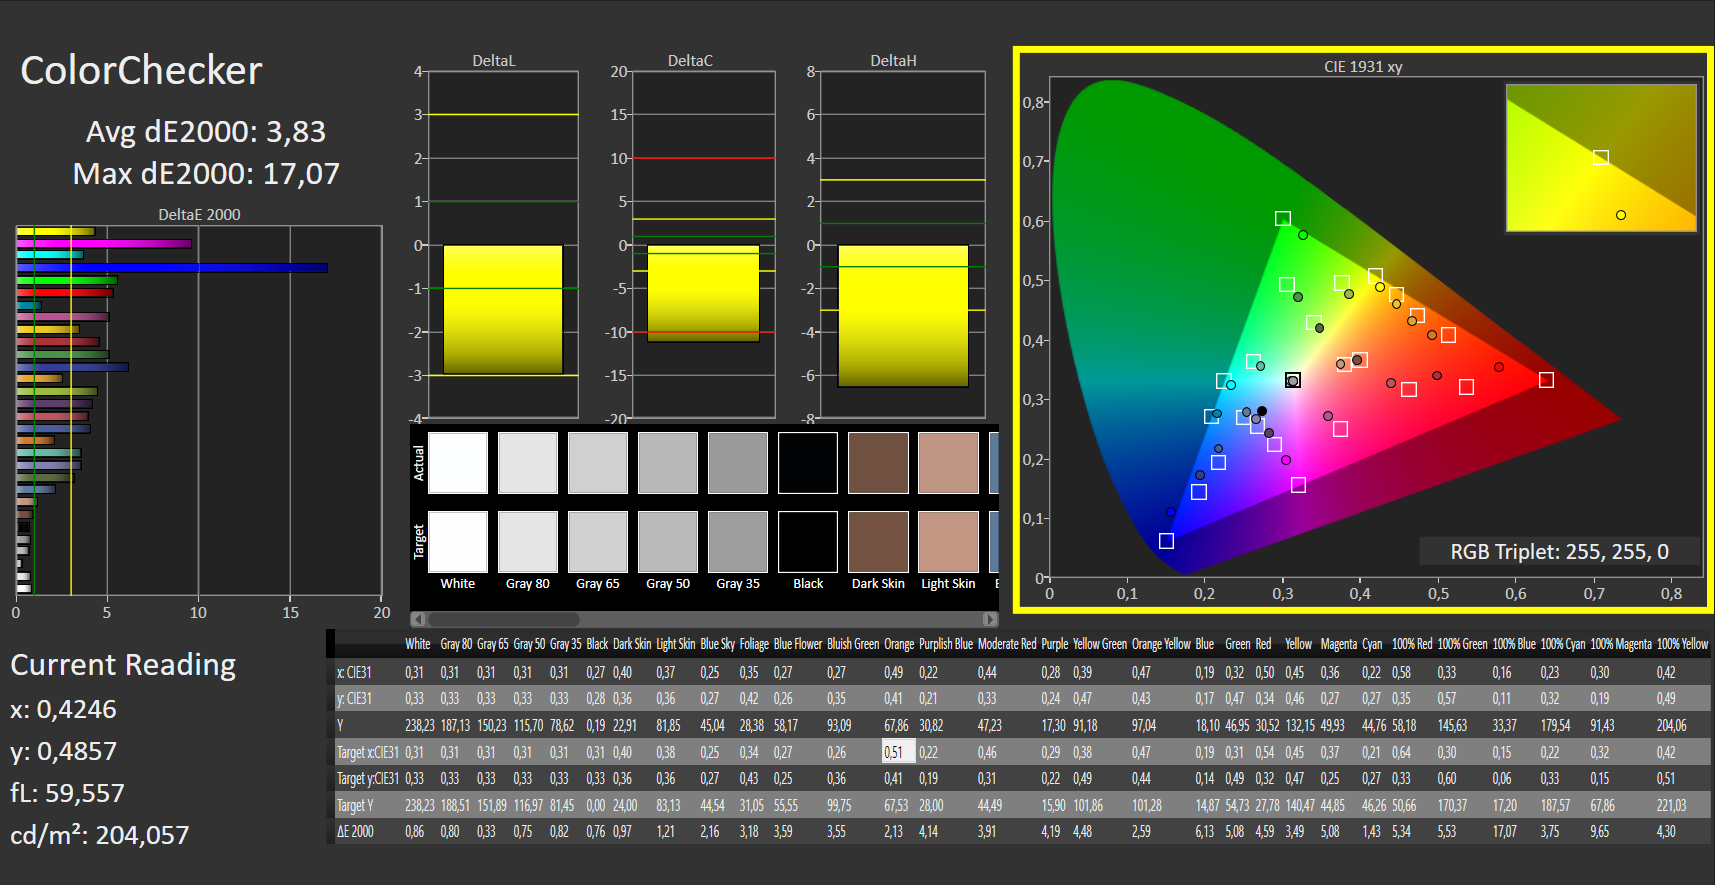
calibrated: 3.83
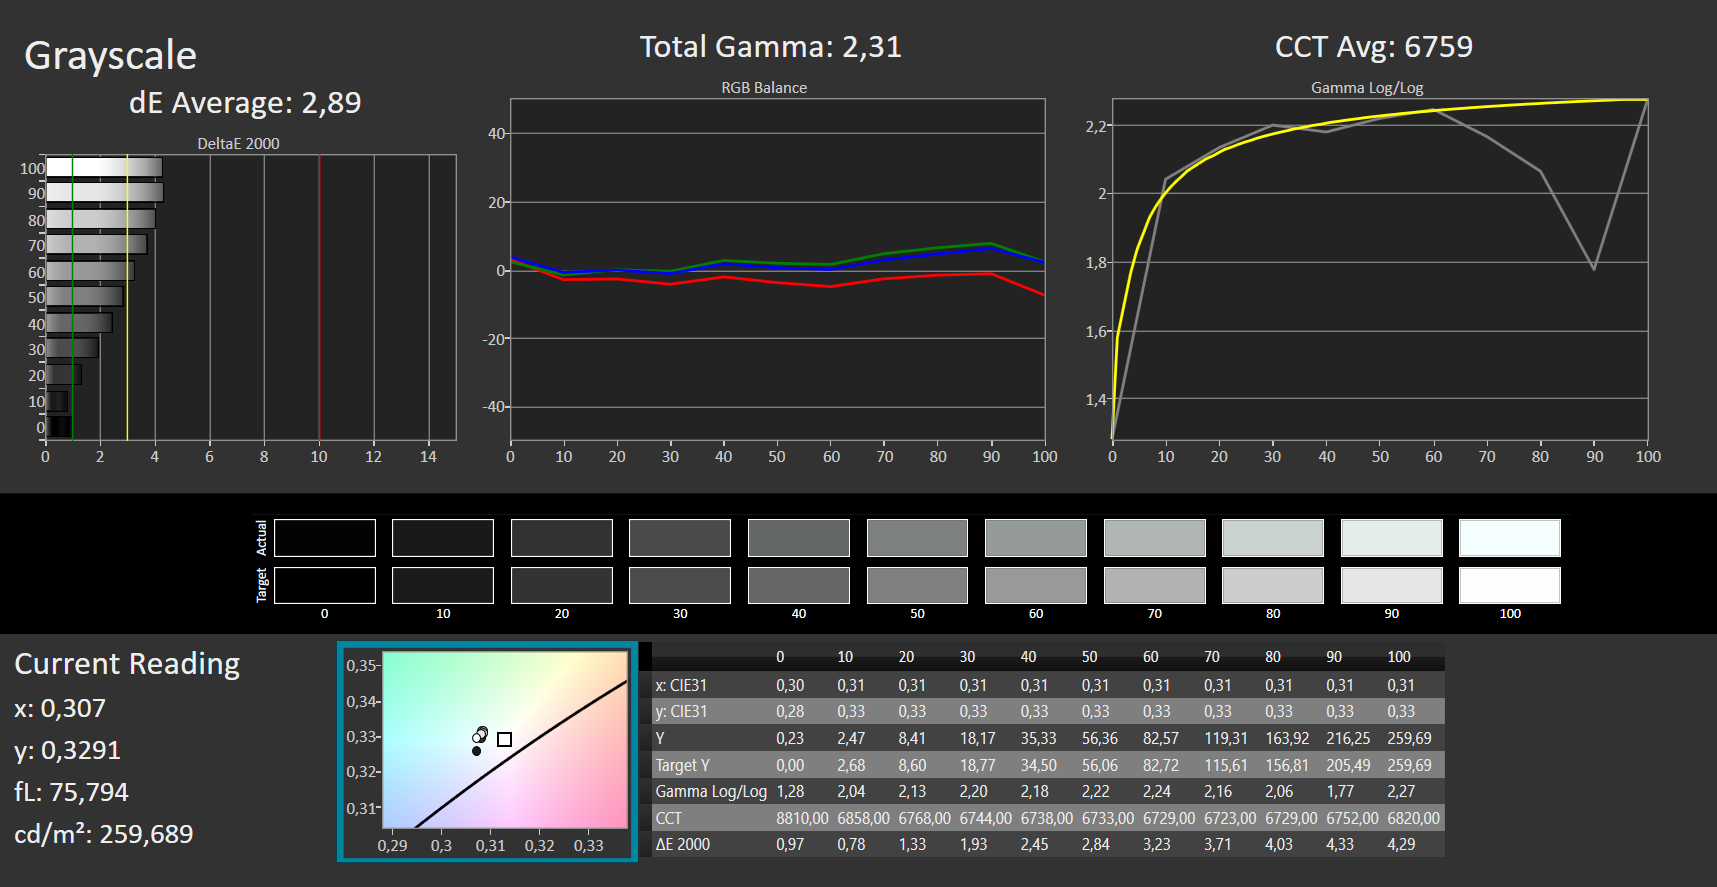
ΔE Greyscale Calman: 2.89 | ∀{0.09-98 Ø4.97}
45% AdobeRGB 1998 (Argyll 3D)
65% sRGB (Argyll 3D)
43% Display P3 (Argyll 3D)
Gamma: 2.31
CCT: 6759 K
| Acer Swift 3 SF314-43-R8BP Chi Mei N140HCA EAC CMN, IPS, 1920x1080, 14" | Acer Swift 3 SF314-511-54ZK AUO B140HAN06, IPS, 1920x1080, 14" | Lenovo ThinkPad E14 G3-20Y7003SGE NVM140FHM-N4V, IPS, 1920x1080, 14" | HP Pavilion 14-dv0357ng LGD0619, IPS, 1920x1080, 14" | Dell Latitude 14 5420-D2G5W AUO5491 / B140HAN, IPS, 1920x1080, 14" | Lenovo ThinkBook 14 G2 ITL 20VDS02G00 AU Optronics B140HAN04.E, a-Si IPS LED, 1920x1080, 14" | |
|---|---|---|---|---|---|---|
| Display | 53% | -7% | 42% | -17% | -14% | |
| Display P3 Coverage (%) | 43 | 67 56% | 40.3 -6% | 62 44% | 36 -16% | 37.2 -13% |
| sRGB Coverage (%) | 65 | 98 51% | 59.5 -8% | 92 42% | 54 -17% | 55.5 -15% |
| AdobeRGB 1998 Coverage (%) | 45 | 69 53% | 41.7 -7% | 63 40% | 37 -18% | 38.4 -15% |
| Response Times | -27% | 11% | 18% | -6% | -18% | |
| Response Time Grey 50% / Grey 80% * (ms) | 37 ? | 52 ? -41% | 35.2 ? 5% | 37 ? -0% | 41 ? -11% | 45.9 ? -24% |
| Response Time Black / White * (ms) | 26 ? | 29 ? -12% | 21.6 ? 17% | 17 ? 35% | 26 ? -0% | 29 ? -12% |
| PWM Frequency (Hz) | 25000 ? | |||||
| Screen | 28% | -10% | -10% | -3% | -27% | |
| Brightness middle (cd/m²) | 259 | 320 24% | 341 32% | 387 49% | 290 12% | 386 49% |
| Brightness (cd/m²) | 229 | 309 35% | 327 43% | 359 57% | 282 23% | 348 52% |
| Brightness Distribution (%) | 78 | 84 8% | 90 15% | 84 8% | 81 4% | 83 6% |
| Black Level * (cd/m²) | 0.24 | 0.25 -4% | 0.26 -8% | 0.55 -129% | 0.26 -8% | 0.29 -21% |
| Contrast (:1) | 1079 | 1280 19% | 1312 22% | 704 -35% | 1115 3% | 1331 23% |
| Colorchecker dE 2000 * | 3.63 | 2.57 29% | 5.1 -40% | 4.04 -11% | 4.65 -28% | 6.3 -74% |
| Colorchecker dE 2000 max. * | 6.53 | 3.5 46% | 17.6 -170% | 8.28 -27% | 7.5 -15% | 18.3 -180% |
| Colorchecker dE 2000 calibrated * | 3.83 | 0.76 80% | 4.4 -15% | 1 74% | 3.98 -4% | 4.1 -7% |
| Greyscale dE 2000 * | 2.89 | 2.46 15% | 2.1 27% | 5 -73% | 3.22 -11% | 5.4 -87% |
| Gamma | 2.31 95% | 2.23 99% | 2.11 104% | 2.62 84% | 2.54 87% | 2.55 86% |
| CCT | 6759 96% | 6311 103% | 6755 96% | 7123 91% | 6169 105% | 5894 110% |
| Total Average (Program / Settings) | 18% /
26% | -2% /
-7% | 17% /
5% | -9% /
-6% | -20% /
-23% |
* ... smaller is better
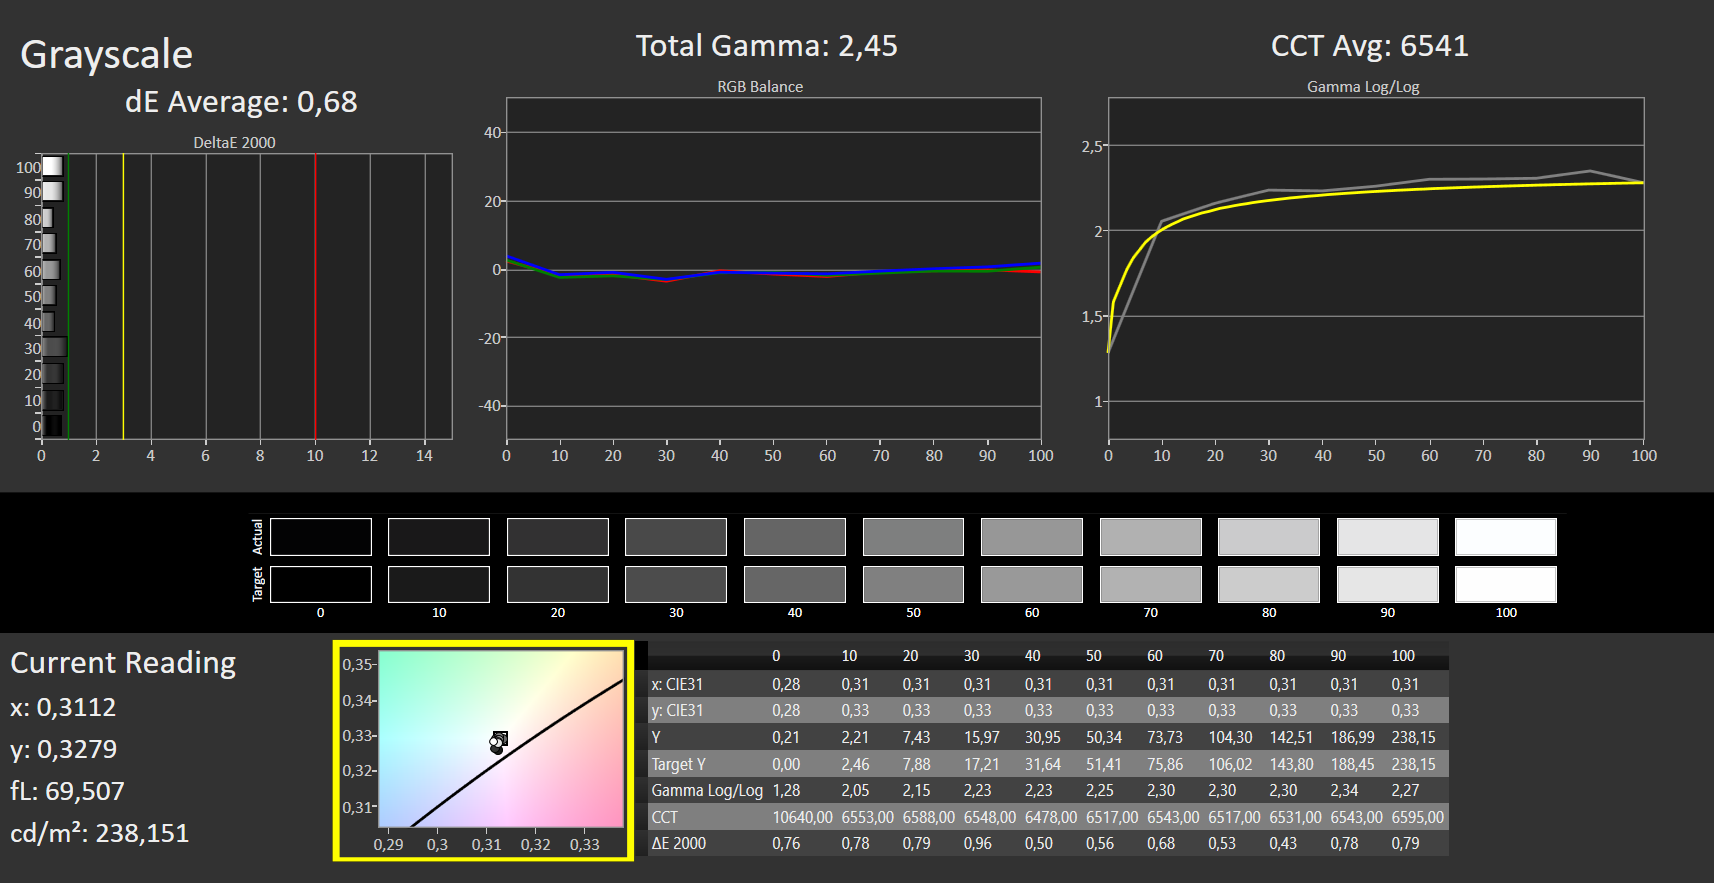
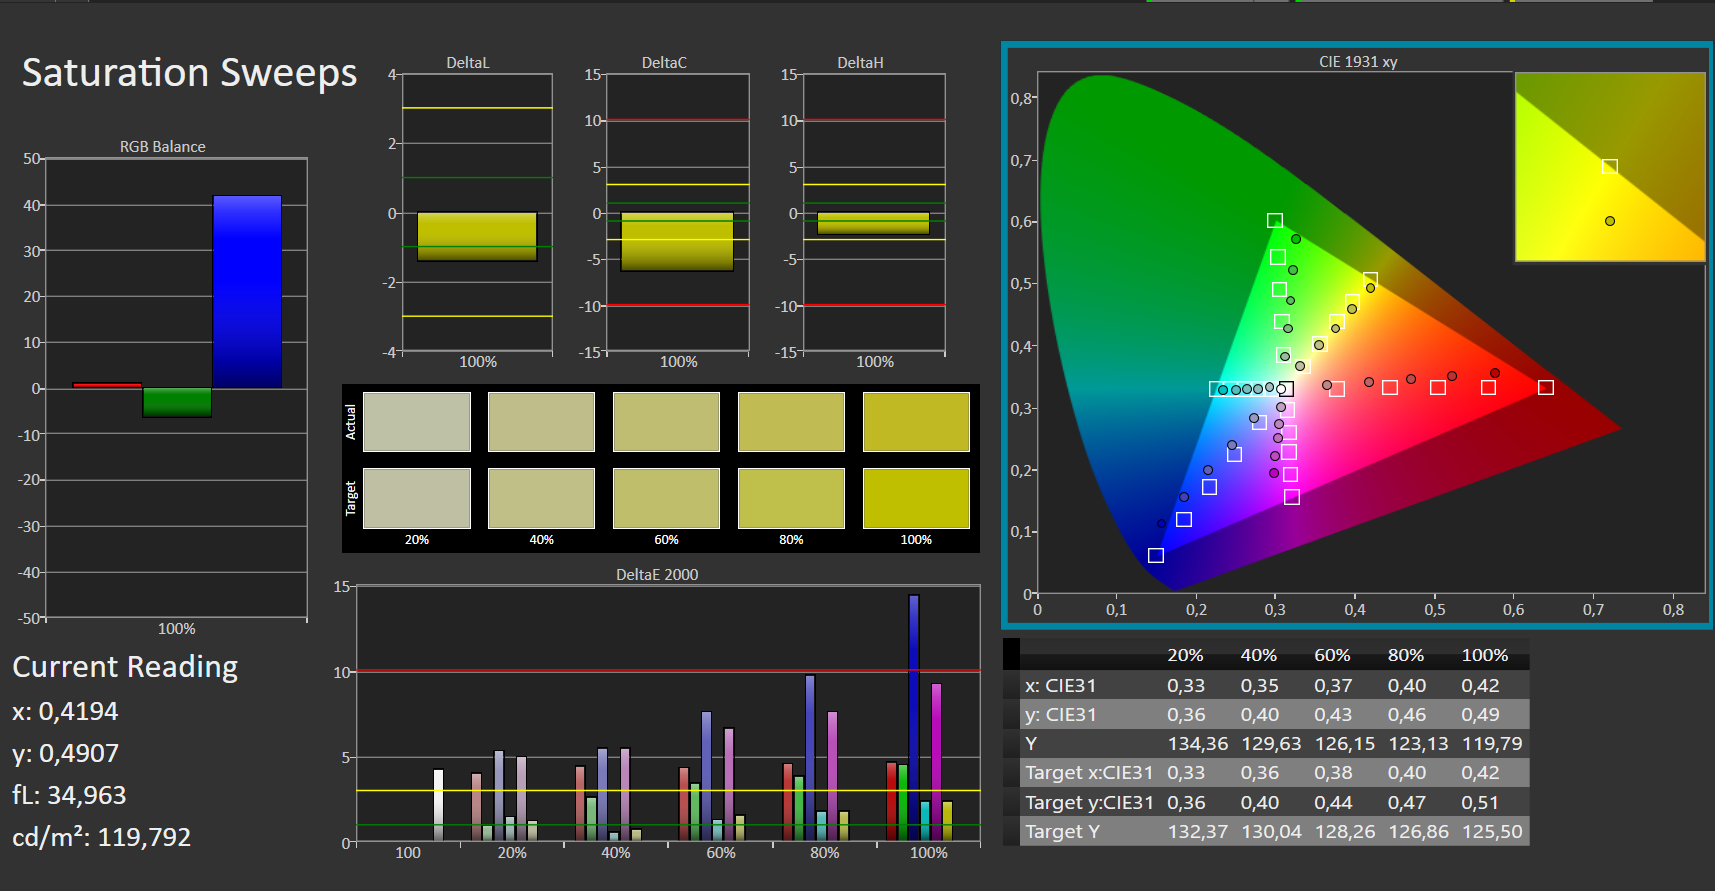
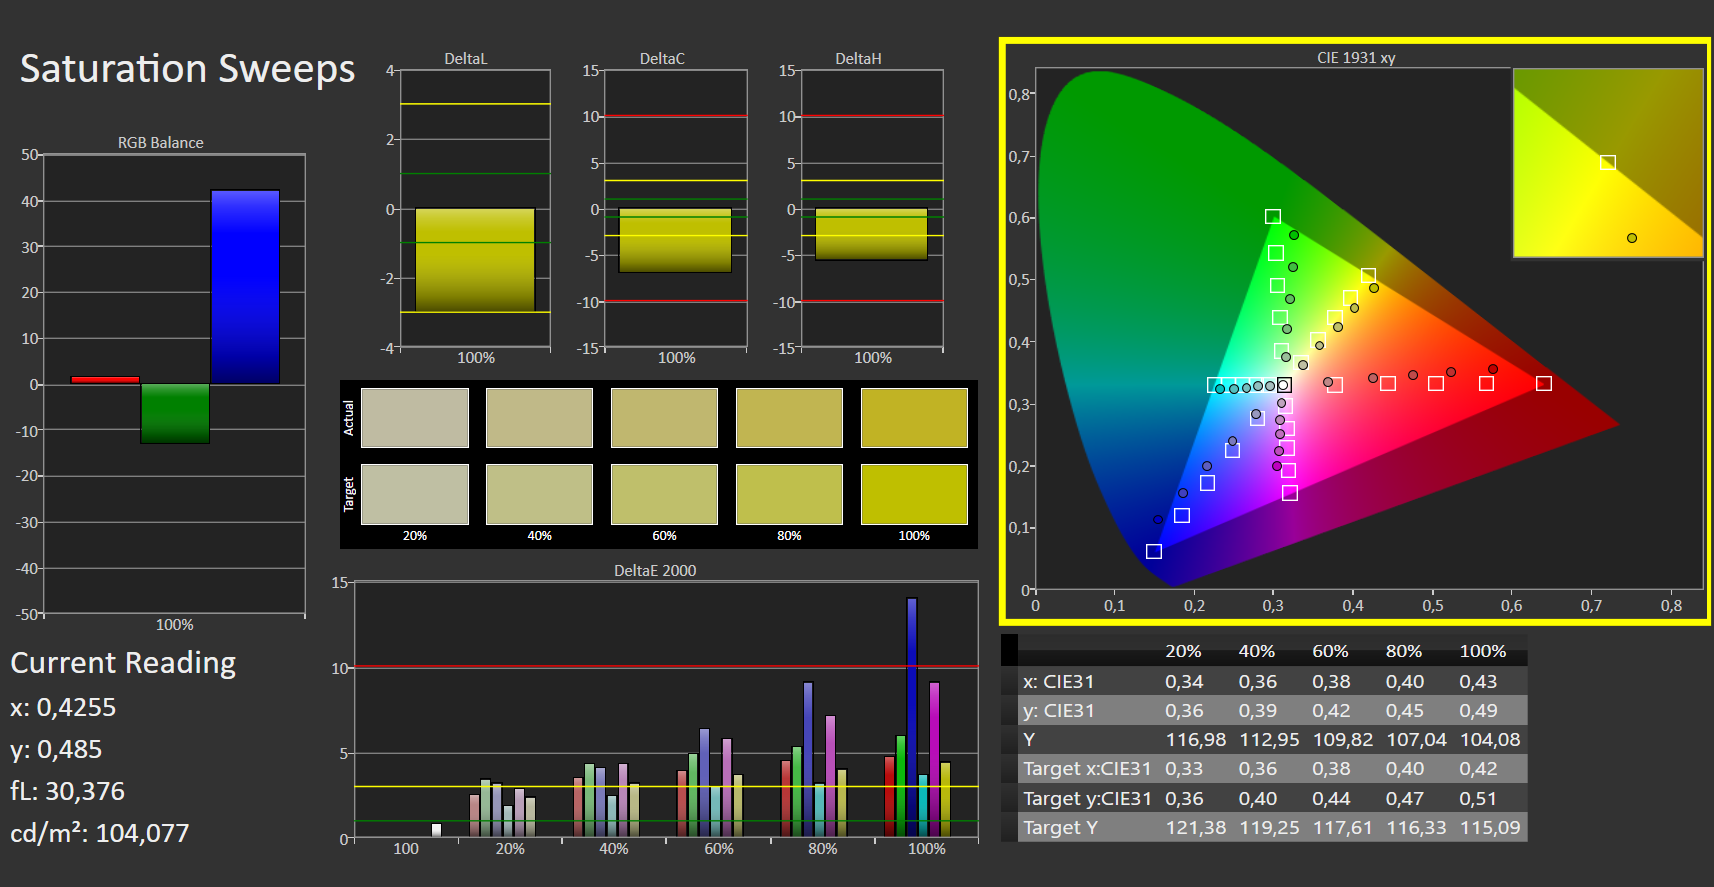
The AdobeRGB (45%) and sRGB (65%) color spaces are not completely reproduced.
The screen shows quite a decent color reproduction in its state of delivery. However, with a Delta E 2000 color deviation of 3.6, the target (Delta E less than 3) is just missed. The display does not suffer from a blue cast. The grayscale Delta E is 2.9. A calibration did not bring about an improvement — the Chi-Mei panel is apparently difficult to calibrate. The AUO panels of the Swift X (AMD) or Swift 3 SF314-511 (Intel) could improve their color reproduction through calibration.
Display Response Times
| ↔ Response Time Black to White | ||
|---|---|---|
| 26 ms ... rise ↗ and fall ↘ combined | ↗ 12 ms rise |  |
| ↘ 14 ms fall | ||
| The screen shows relatively slow response rates in our tests and may be too slow for gamers. In comparison, all tested devices range from 0.1 (minimum) to 240 (maximum) ms. » 62 % of all devices are better. This means that the measured response time is worse than the average of all tested devices (19.8 ms). | ||
| ↔ Response Time 50% Grey to 80% Grey | ||
| 37 ms ... rise ↗ and fall ↘ combined | ↗ 18 ms rise |  |
| ↘ 19 ms fall | ||
| The screen shows slow response rates in our tests and will be unsatisfactory for gamers. In comparison, all tested devices range from 0.165 (minimum) to 636 (maximum) ms. » 53 % of all devices are better. This means that the measured response time is worse than the average of all tested devices (31 ms). | ||
Screen Flickering / PWM (Pulse-Width Modulation)
| Screen flickering / PWM detected | 25000 Hz | ≤ 20 % brightness setting |  |
The display backlight flickers at 25000 Hz (worst case, e.g., utilizing PWM) Flickering detected at a brightness setting of 20 % and below. There should be no flickering or PWM above this brightness setting. The frequency of 25000 Hz is quite high, so most users sensitive to PWM should not notice any flickering. In comparison: 52 % of all tested devices do not use PWM to dim the display. If PWM was detected, an average of 7763 (minimum: 5 - maximum: 343500) Hz was measured. | |||
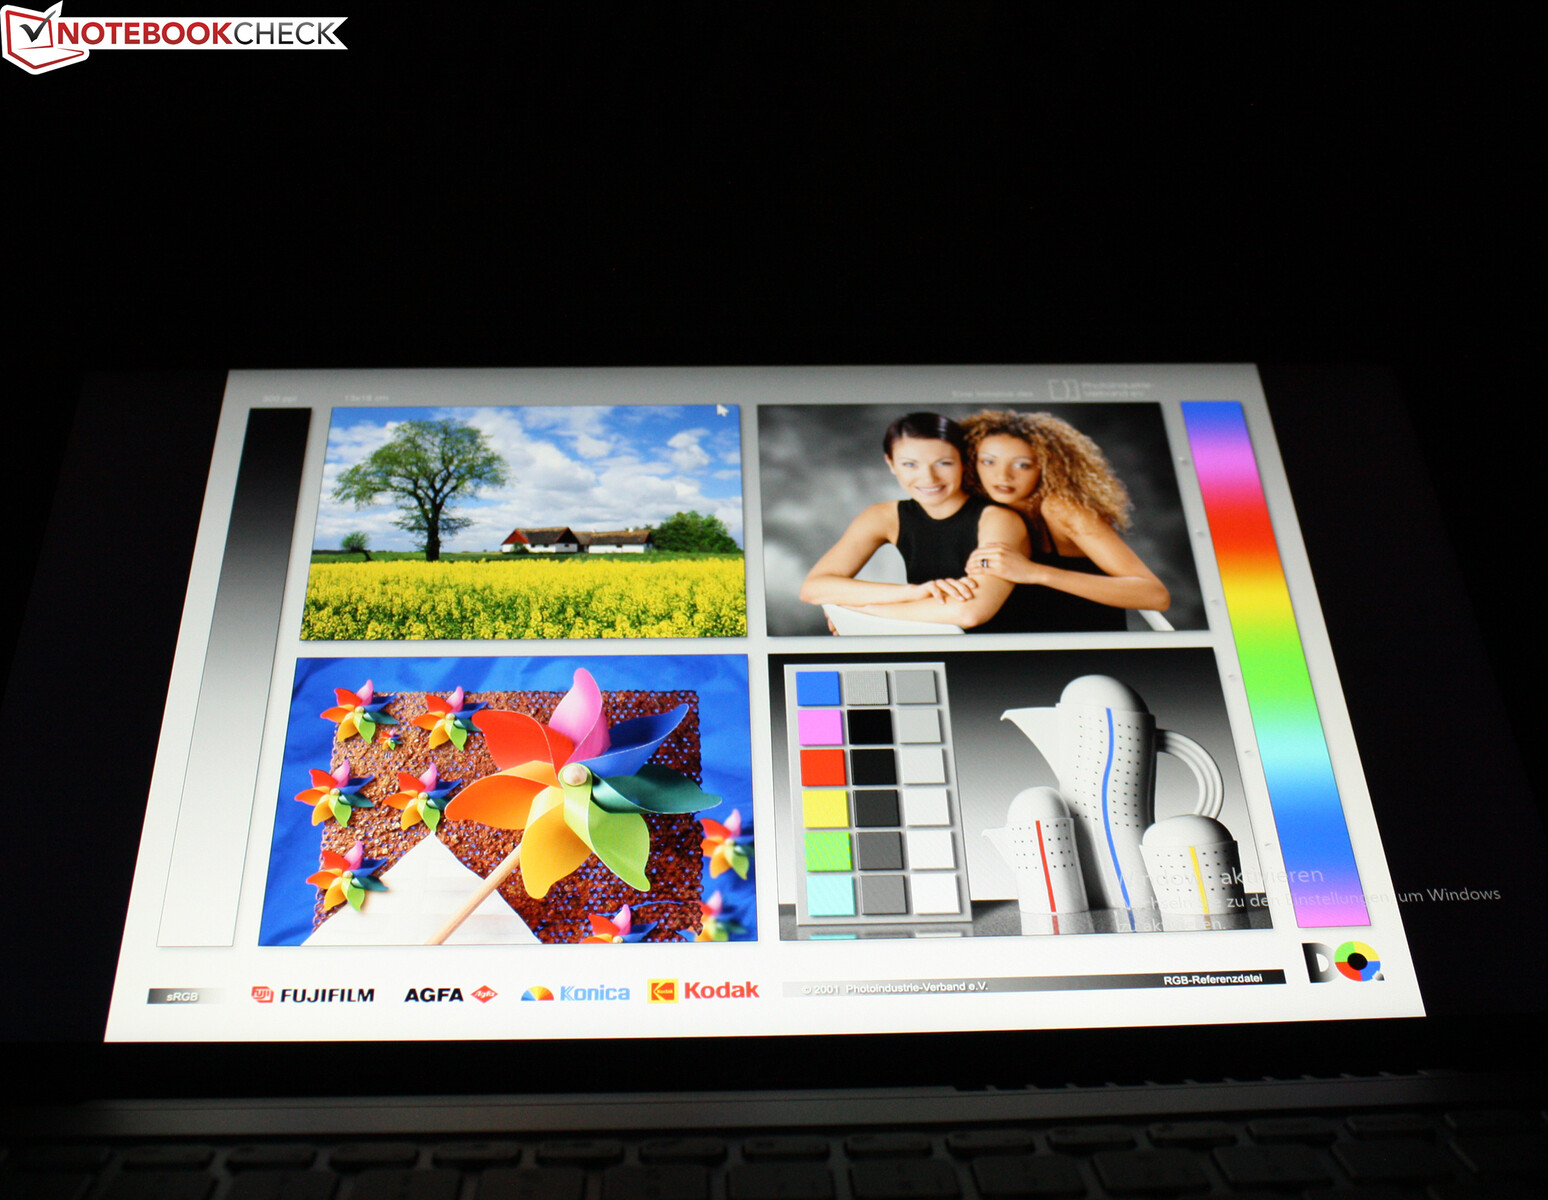
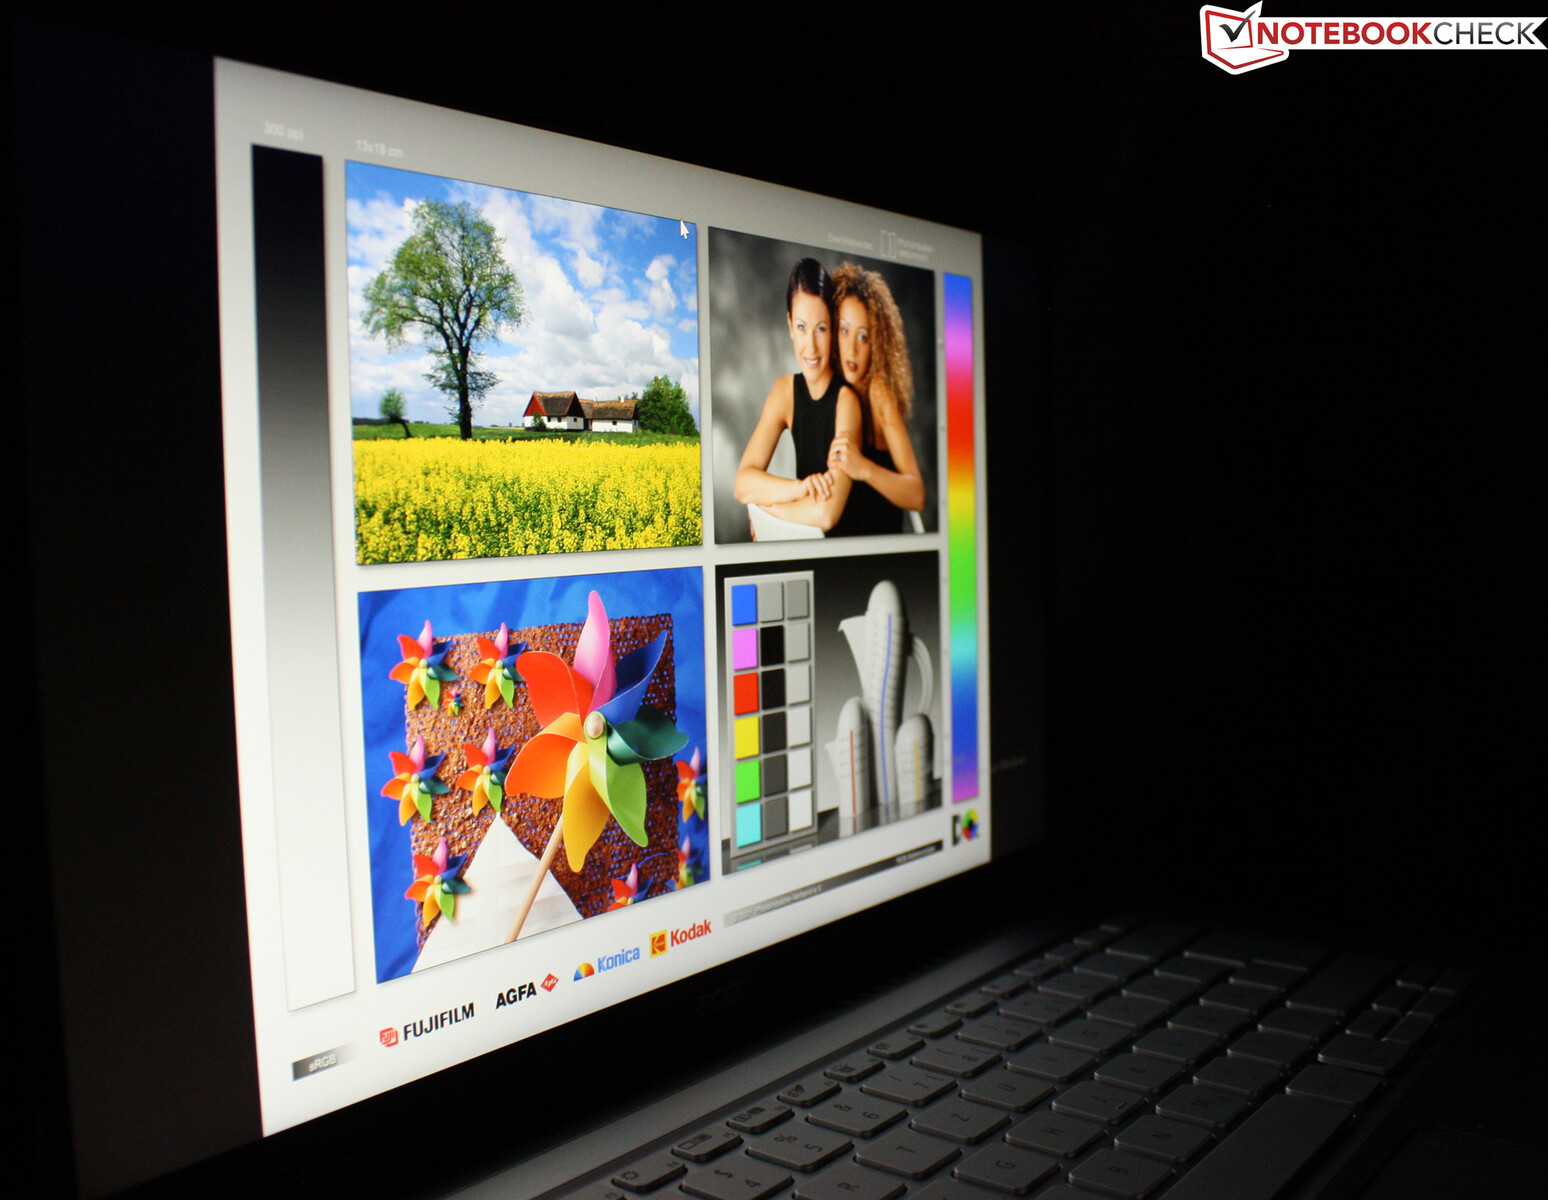
The Swift 3 comes with an IPS panel with stable viewing angles. Thus, the screen can be read from every position. The screen's low maximum brightness largely prevents reading in the sun. If you don't deactivate Vari Bright, you'll lose a good amount of luminance. This 14-incher is primarily made for indoor use. At least, the matte surface ensures minimal reflections.
Performance: No AMD high-flyer this time
Available AMD configurations for the Swift 3 include ones based on the Ryzen 5 5500U, 5700U and 5300U. The AMD models are offered with 8 or 16 GB of RAM. The choice should be considered carefully because the working memory cannot be changed or upgraded as it is soldered. The same applies to the SSD, which is offered from 256 GB to 1 TB. The hard drive is plugged in, but a second M.2 socket — like on the Swift X — is not available.
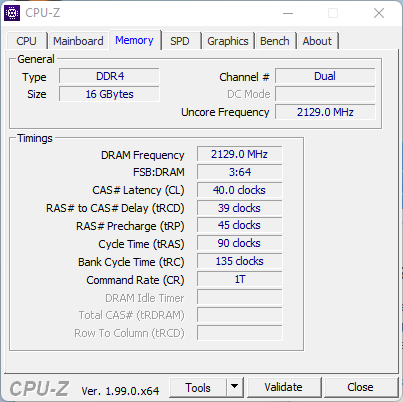
The RAM works as dual channel, which tickles out a bit more performance when gaming. We feel that our test variant with the Ryzen 5 5500U, 512 GB SSD, and 16 GB RAM offers the best price-performance ratio.
Test conditions
We installed Windows after removing Linux eShell. Thus, only the power management of Windows was available. This was set to "Best performance" for the performance tests and to "Best energy savings" during the endurance tests.
Processor
The Ryzen 5 5500U clocks up to 3.9 GHz in the Swift 3. This six-core from the beginning of 2021 has good computing performance but has to admit defeat to Intel's 11th generation processors in single-core. The Ryzen always beats Intel rivals from the Core i5 to Core i7 in multi-core. However, the Ryzen 5 5500U of the review sample is just below its own average from the database in many benchmarks although the difference of -1% is marginal.
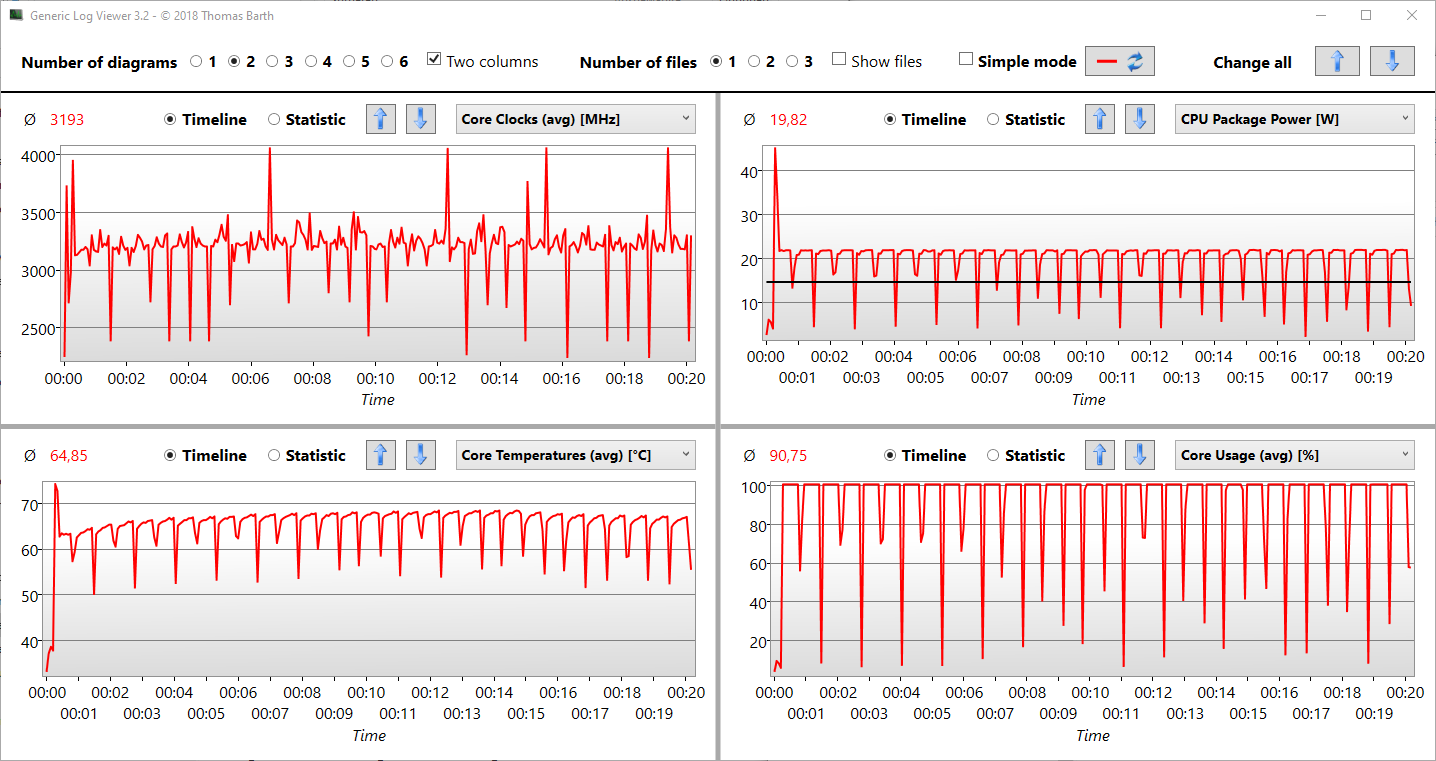
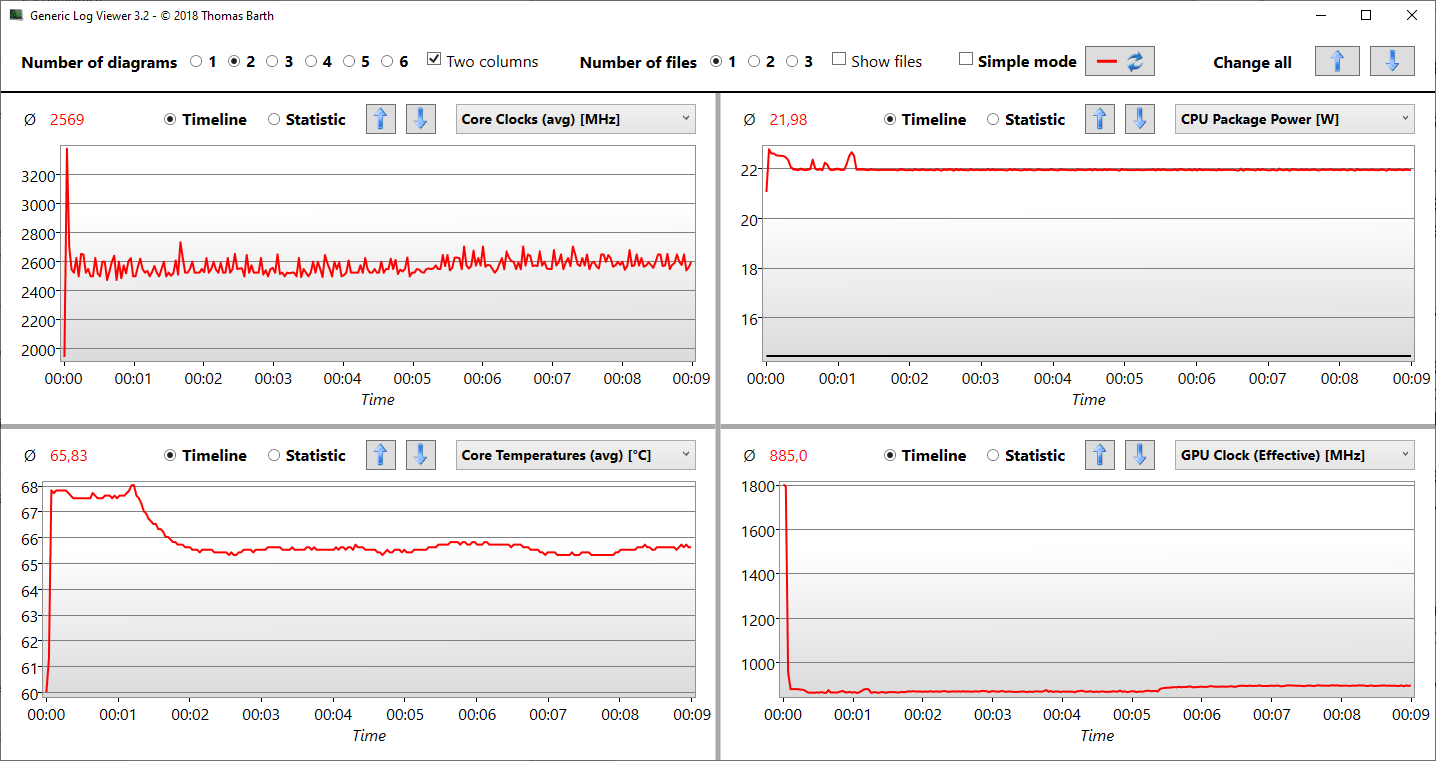
The CPU performance depends on the set TDP and the cooling. We see a maximum of 45 W as CPU package power during the Cinebench measurements, which should correspond to the PL2/Short Burst. However, this can only be maintained for a few seconds after which it continues at 22 W (3.2 instead of 3.9 GHz). This level is then maintained from the first to the last loop, apart from a few clock peaks during the course of the test. The performance does not decrease in battery mode as evident in the last 5 minutes of the R15 loop run in battery power.
Due to the extremely short PL2 usage and the drastic limitation to just 22 W, the results of the R15 loop almost look like a straight line without deviations. Here, Acer has opted for a very conservative TDP approach in favor of waste heat and low noise, which does not extract the last ounce of performance from the APU unlike what we've seen with the Lenovo ThinkPad E14 G3. How the Swift 3 would perform with a dual heatpipe setup is shown by its sister Swift X SFX14 (R5 5500U), which can maintain high performance (PL2) for 4 to 5 runs and is therefore 12% faster in the first run.
Cinebench R15 Multi Dauertest
Cinebench R23: Multi Core | Single Core
Cinebench R20: CPU (Multi Core) | CPU (Single Core)
Cinebench R15: CPU Multi 64Bit | CPU Single 64Bit
Blender: v2.79 BMW27 CPU
7-Zip 18.03: 7z b 4 | 7z b 4 -mmt1
Geekbench 5.5: Multi-Core | Single-Core
HWBOT x265 Benchmark v2.2: 4k Preset
LibreOffice : 20 Documents To PDF
R Benchmark 2.5: Overall mean
| CPU Performance rating | |
| Average of class Subnotebook | |
| Lenovo ThinkPad E14 G3-20Y7003SGE | |
| Average AMD Ryzen 5 5500U | |
| Acer Swift 3 SF314-43-R8BP | |
| Acer Swift 3 SF314-511-54ZK | |
| Dell Latitude 14 5420-D2G5W | |
| HP Pavilion 14-dv0357ng -6! | |
| Lenovo ThinkBook 14 G2 ITL 20VDS02G00 | |
| Cinebench R23 / Multi Core | |
| Average of class Subnotebook (1555 - 21812, n=60, last 2 years) | |
| Lenovo ThinkPad E14 G3-20Y7003SGE | |
| Average AMD Ryzen 5 5500U (6030 - 8565, n=19) | |
| Acer Swift 3 SF314-43-R8BP | |
| Acer Swift 3 SF314-511-54ZK | |
| Dell Latitude 14 5420-D2G5W | |
| HP Pavilion 14-dv0357ng | |
| Lenovo ThinkBook 14 G2 ITL 20VDS02G00 | |
| Cinebench R23 / Single Core | |
| Average of class Subnotebook (358 - 2213, n=61, last 2 years) | |
| Dell Latitude 14 5420-D2G5W | |
| Lenovo ThinkBook 14 G2 ITL 20VDS02G00 | |
| HP Pavilion 14-dv0357ng | |
| Acer Swift 3 SF314-511-54ZK | |
| Lenovo ThinkPad E14 G3-20Y7003SGE | |
| Average AMD Ryzen 5 5500U (1149 - 1183, n=18) | |
| Acer Swift 3 SF314-43-R8BP | |
| Cinebench R20 / CPU (Multi Core) | |
| Average of class Subnotebook (579 - 8541, n=57, last 2 years) | |
| Lenovo ThinkPad E14 G3-20Y7003SGE | |
| Average AMD Ryzen 5 5500U (2223 - 3316, n=20) | |
| Acer Swift 3 SF314-43-R8BP | |
| Dell Latitude 14 5420-D2G5W | |
| Acer Swift 3 SF314-511-54ZK | |
| HP Pavilion 14-dv0357ng | |
| Lenovo ThinkBook 14 G2 ITL 20VDS02G00 | |
| Cinebench R20 / CPU (Single Core) | |
| Average of class Subnotebook (128 - 832, n=57, last 2 years) | |
| Acer Swift 3 SF314-511-54ZK | |
| Dell Latitude 14 5420-D2G5W | |
| Lenovo ThinkBook 14 G2 ITL 20VDS02G00 | |
| Lenovo ThinkPad E14 G3-20Y7003SGE | |
| Acer Swift 3 SF314-43-R8BP | |
| Average AMD Ryzen 5 5500U (449 - 461, n=19) | |
| HP Pavilion 14-dv0357ng | |
| Cinebench R15 / CPU Multi 64Bit | |
| Average of class Subnotebook (327 - 3345, n=57, last 2 years) | |
| Lenovo ThinkPad E14 G3-20Y7003SGE | |
| Average AMD Ryzen 5 5500U (995 - 1412, n=20) | |
| Acer Swift 3 SF314-43-R8BP | |
| Acer Swift 3 SF314-511-54ZK | |
| Dell Latitude 14 5420-D2G5W | |
| HP Pavilion 14-dv0357ng | |
| Lenovo ThinkBook 14 G2 ITL 20VDS02G00 | |
| Cinebench R15 / CPU Single 64Bit | |
| Average of class Subnotebook (72.4 - 322, n=57, last 2 years) | |
| Dell Latitude 14 5420-D2G5W | |
| Acer Swift 3 SF314-511-54ZK | |
| Lenovo ThinkPad E14 G3-20Y7003SGE | |
| Average AMD Ryzen 5 5500U (170 - 179, n=18) | |
| Acer Swift 3 SF314-43-R8BP | |
| Lenovo ThinkBook 14 G2 ITL 20VDS02G00 | |
| Blender / v2.79 BMW27 CPU | |
| Lenovo ThinkBook 14 G2 ITL 20VDS02G00 | |
| HP Pavilion 14-dv0357ng | |
| Acer Swift 3 SF314-511-54ZK | |
| Dell Latitude 14 5420-D2G5W | |
| Average AMD Ryzen 5 5500U (358 - 490, n=18) | |
| Acer Swift 3 SF314-43-R8BP | |
| Lenovo ThinkPad E14 G3-20Y7003SGE | |
| Average of class Subnotebook (159 - 2271, n=58, last 2 years) | |
| 7-Zip 18.03 / 7z b 4 | |
| Average of class Subnotebook (11668 - 77867, n=57, last 2 years) | |
| Lenovo ThinkPad E14 G3-20Y7003SGE | |
| Average AMD Ryzen 5 5500U (29585 - 36896, n=18) | |
| Acer Swift 3 SF314-43-R8BP | |
| Acer Swift 3 SF314-511-54ZK | |
| Dell Latitude 14 5420-D2G5W | |
| HP Pavilion 14-dv0357ng | |
| Lenovo ThinkBook 14 G2 ITL 20VDS02G00 | |
| 7-Zip 18.03 / 7z b 4 -mmt1 | |
| Average of class Subnotebook (2643 - 6699, n=59, last 2 years) | |
| HP Pavilion 14-dv0357ng | |
| Dell Latitude 14 5420-D2G5W | |
| Lenovo ThinkBook 14 G2 ITL 20VDS02G00 | |
| Acer Swift 3 SF314-511-54ZK | |
| Average AMD Ryzen 5 5500U (4174 - 4378, n=19) | |
| Lenovo ThinkPad E14 G3-20Y7003SGE | |
| Acer Swift 3 SF314-43-R8BP | |
| Geekbench 5.5 / Multi-Core | |
| Average of class Subnotebook (2557 - 17218, n=48, last 2 years) | |
| Acer Swift 3 SF314-43-R8BP | |
| Lenovo ThinkPad E14 G3-20Y7003SGE | |
| Average AMD Ryzen 5 5500U (4063 - 5917, n=20) | |
| Acer Swift 3 SF314-511-54ZK | |
| Dell Latitude 14 5420-D2G5W | |
| Lenovo ThinkBook 14 G2 ITL 20VDS02G00 | |
| Geekbench 5.5 / Single-Core | |
| Average of class Subnotebook (726 - 2224, n=48, last 2 years) | |
| Acer Swift 3 SF314-511-54ZK | |
| Lenovo ThinkBook 14 G2 ITL 20VDS02G00 | |
| Dell Latitude 14 5420-D2G5W | |
| Lenovo ThinkPad E14 G3-20Y7003SGE | |
| Acer Swift 3 SF314-43-R8BP | |
| Average AMD Ryzen 5 5500U (1070 - 1126, n=20) | |
| HWBOT x265 Benchmark v2.2 / 4k Preset | |
| Average of class Subnotebook (0.97 - 25.1, n=57, last 2 years) | |
| Acer Swift 3 SF314-43-R8BP | |
| Lenovo ThinkPad E14 G3-20Y7003SGE | |
| Average AMD Ryzen 5 5500U (6.7 - 9.74, n=20) | |
| Acer Swift 3 SF314-511-54ZK | |
| Dell Latitude 14 5420-D2G5W | |
| Lenovo ThinkBook 14 G2 ITL 20VDS02G00 | |
| LibreOffice / 20 Documents To PDF | |
| Acer Swift 3 SF314-43-R8BP | |
| Average AMD Ryzen 5 5500U (60 - 80.7, n=17) | |
| Lenovo ThinkPad E14 G3-20Y7003SGE | |
| Average of class Subnotebook (39.9 - 220, n=56, last 2 years) | |
| Dell Latitude 14 5420-D2G5W | |
| Acer Swift 3 SF314-511-54ZK | |
| Lenovo ThinkBook 14 G2 ITL 20VDS02G00 | |
| R Benchmark 2.5 / Overall mean | |
| Lenovo ThinkBook 14 G2 ITL 20VDS02G00 | |
| Dell Latitude 14 5420-D2G5W | |
| Acer Swift 3 SF314-511-54ZK | |
| Average AMD Ryzen 5 5500U (0.607 - 0.67, n=19) | |
| Acer Swift 3 SF314-43-R8BP | |
| Lenovo ThinkPad E14 G3-20Y7003SGE | |
| Average of class Subnotebook (0.4024 - 1.456, n=58, last 2 years) | |
* ... smaller is better
AIDA64: FP32 Ray-Trace | FPU Julia | CPU SHA3 | CPU Queen | FPU SinJulia | FPU Mandel | CPU AES | CPU ZLib | FP64 Ray-Trace | CPU PhotoWorxx
| Performance rating | |
| Average of class Subnotebook | |
| Lenovo ThinkPad E14 G3-20Y7003SGE | |
| Average AMD Ryzen 5 5500U | |
| Acer Swift 3 SF314-43-R8BP | |
| Dell Latitude 14 5420-D2G5W | |
| Acer Swift 3 SF314-511-54ZK | |
| Lenovo ThinkBook 14 G2 ITL 20VDS02G00 | |
| AIDA64 / FP32 Ray-Trace | |
| Average of class Subnotebook (1135 - 32888, n=58, last 2 years) | |
| Lenovo ThinkPad E14 G3-20Y7003SGE | |
| Average AMD Ryzen 5 5500U (7222 - 10680, n=18) | |
| Acer Swift 3 SF314-43-R8BP | |
| Dell Latitude 14 5420-D2G5W | |
| Acer Swift 3 SF314-511-54ZK | |
| Lenovo ThinkBook 14 G2 ITL 20VDS02G00 | |
| AIDA64 / FPU Julia | |
| Average of class Subnotebook (5218 - 123315, n=58, last 2 years) | |
| Lenovo ThinkPad E14 G3-20Y7003SGE | |
| Average AMD Ryzen 5 5500U (41815 - 58107, n=18) | |
| Acer Swift 3 SF314-43-R8BP | |
| Dell Latitude 14 5420-D2G5W | |
| Acer Swift 3 SF314-511-54ZK | |
| Lenovo ThinkBook 14 G2 ITL 20VDS02G00 | |
| AIDA64 / CPU SHA3 | |
| Average of class Subnotebook (444 - 5287, n=58, last 2 years) | |
| Dell Latitude 14 5420-D2G5W | |
| Acer Swift 3 SF314-511-54ZK | |
| Lenovo ThinkPad E14 G3-20Y7003SGE | |
| Average AMD Ryzen 5 5500U (1354 - 1907, n=18) | |
| Acer Swift 3 SF314-43-R8BP | |
| Lenovo ThinkBook 14 G2 ITL 20VDS02G00 | |
| AIDA64 / CPU Queen | |
| Acer Swift 3 SF314-43-R8BP | |
| Average AMD Ryzen 5 5500U (68235 - 74033, n=18) | |
| Lenovo ThinkPad E14 G3-20Y7003SGE | |
| Average of class Subnotebook (10579 - 95002, n=50, last 2 years) | |
| Dell Latitude 14 5420-D2G5W | |
| Acer Swift 3 SF314-511-54ZK | |
| Lenovo ThinkBook 14 G2 ITL 20VDS02G00 | |
| AIDA64 / FPU SinJulia | |
| Lenovo ThinkPad E14 G3-20Y7003SGE | |
| Average AMD Ryzen 5 5500U (9007 - 10446, n=18) | |
| Acer Swift 3 SF314-43-R8BP | |
| Average of class Subnotebook (744 - 18418, n=58, last 2 years) | |
| Dell Latitude 14 5420-D2G5W | |
| Acer Swift 3 SF314-511-54ZK | |
| Lenovo ThinkBook 14 G2 ITL 20VDS02G00 | |
| AIDA64 / FPU Mandel | |
| Average of class Subnotebook (3341 - 65433, n=58, last 2 years) | |
| Lenovo ThinkPad E14 G3-20Y7003SGE | |
| Average AMD Ryzen 5 5500U (21894 - 30659, n=18) | |
| Acer Swift 3 SF314-43-R8BP | |
| Dell Latitude 14 5420-D2G5W | |
| Acer Swift 3 SF314-511-54ZK | |
| Lenovo ThinkBook 14 G2 ITL 20VDS02G00 | |
| AIDA64 / CPU AES | |
| Dell Latitude 14 5420-D2G5W | |
| Average of class Subnotebook (638 - 96917, n=58, last 2 years) | |
| Lenovo ThinkPad E14 G3-20Y7003SGE | |
| Average AMD Ryzen 5 5500U (31792 - 54455, n=18) | |
| Acer Swift 3 SF314-43-R8BP | |
| Acer Swift 3 SF314-511-54ZK | |
| Lenovo ThinkBook 14 G2 ITL 20VDS02G00 | |
| AIDA64 / CPU ZLib | |
| Average of class Subnotebook (164.9 - 1379, n=58, last 2 years) | |
| Lenovo ThinkPad E14 G3-20Y7003SGE | |
| Average AMD Ryzen 5 5500U (234 - 614, n=18) | |
| Acer Swift 3 SF314-43-R8BP | |
| Dell Latitude 14 5420-D2G5W | |
| Acer Swift 3 SF314-511-54ZK | |
| Lenovo ThinkBook 14 G2 ITL 20VDS02G00 | |
| AIDA64 / FP64 Ray-Trace | |
| Average of class Subnotebook (610 - 17495, n=58, last 2 years) | |
| Lenovo ThinkPad E14 G3-20Y7003SGE | |
| Average AMD Ryzen 5 5500U (3943 - 5717, n=18) | |
| Acer Swift 3 SF314-43-R8BP | |
| Dell Latitude 14 5420-D2G5W | |
| Acer Swift 3 SF314-511-54ZK | |
| Lenovo ThinkBook 14 G2 ITL 20VDS02G00 | |
| AIDA64 / CPU PhotoWorxx | |
| Average of class Subnotebook (6569 - 85600, n=58, last 2 years) | |
| Acer Swift 3 SF314-511-54ZK | |
| Acer Swift 3 SF314-43-R8BP | |
| Lenovo ThinkPad E14 G3-20Y7003SGE | |
| Average AMD Ryzen 5 5500U (7765 - 22932, n=18) | |
| Dell Latitude 14 5420-D2G5W | |
| Lenovo ThinkBook 14 G2 ITL 20VDS02G00 | |
System performance
The application performance is, therefore, a bit worse than a Lenovo ThinkPad E14 G3, for example, which is able to extract more performance out of the R5 5500U. Productivity and Essentials tests in PCMark 10 suffer especially. In contrast, the test device is quite ahead in Digital Content Creation, which could be due to the fast dual-channel working memory (see AIDA64 tests) and the low latency. The Kingston SSD does not have a positive effect here; it is only moderately fast.
CrossMark: Overall | Productivity | Creativity | Responsiveness
| PCMark 10 / Score | |
| Average of class Subnotebook (4920 - 9939, n=44, last 2 years) | |
| Lenovo ThinkPad E14 G3-20Y7003SGE | |
| Average AMD Ryzen 5 5500U, AMD Radeon RX Vega 7 (4626 - 5301, n=13) | |
| Acer Swift 3 SF314-511-54ZK | |
| Acer Swift 3 SF314-43-R8BP | |
| HP Pavilion 14-dv0357ng | |
| Dell Latitude 14 5420-D2G5W | |
| Lenovo ThinkBook 14 G2 ITL 20VDS02G00 | |
| PCMark 10 / Essentials | |
| Average of class Subnotebook (8552 - 11646, n=44, last 2 years) | |
| HP Pavilion 14-dv0357ng | |
| Acer Swift 3 SF314-511-54ZK | |
| Lenovo ThinkPad E14 G3-20Y7003SGE | |
| Average AMD Ryzen 5 5500U, AMD Radeon RX Vega 7 (8390 - 9789, n=13) | |
| Lenovo ThinkBook 14 G2 ITL 20VDS02G00 | |
| Dell Latitude 14 5420-D2G5W | |
| Acer Swift 3 SF314-43-R8BP | |
| PCMark 10 / Productivity | |
| Average of class Subnotebook (5435 - 16606, n=44, last 2 years) | |
| Lenovo ThinkPad E14 G3-20Y7003SGE | |
| Average AMD Ryzen 5 5500U, AMD Radeon RX Vega 7 (6262 - 7958, n=13) | |
| HP Pavilion 14-dv0357ng | |
| Lenovo ThinkBook 14 G2 ITL 20VDS02G00 | |
| Acer Swift 3 SF314-511-54ZK | |
| Acer Swift 3 SF314-43-R8BP | |
| Dell Latitude 14 5420-D2G5W | |
| PCMark 10 / Digital Content Creation | |
| Average of class Subnotebook (5722 - 13779, n=44, last 2 years) | |
| Acer Swift 3 SF314-43-R8BP | |
| Acer Swift 3 SF314-511-54ZK | |
| Average AMD Ryzen 5 5500U, AMD Radeon RX Vega 7 (4513 - 5540, n=13) | |
| Lenovo ThinkPad E14 G3-20Y7003SGE | |
| Dell Latitude 14 5420-D2G5W | |
| HP Pavilion 14-dv0357ng | |
| Lenovo ThinkBook 14 G2 ITL 20VDS02G00 | |
| CrossMark / Overall | |
| Average of class Subnotebook (365 - 2356, n=59, last 2 years) | |
| Acer Swift 3 SF314-511-54ZK | |
| Dell Latitude 14 5420-D2G5W | |
| Acer Swift 3 SF314-43-R8BP | |
| Average AMD Ryzen 5 5500U, AMD Radeon RX Vega 7 (958 - 1103, n=6) | |
| Lenovo ThinkBook 14 G2 ITL 20VDS02G00 | |
| CrossMark / Productivity | |
| Average of class Subnotebook (364 - 2277, n=59, last 2 years) | |
| Acer Swift 3 SF314-511-54ZK | |
| Dell Latitude 14 5420-D2G5W | |
| Lenovo ThinkBook 14 G2 ITL 20VDS02G00 | |
| Average AMD Ryzen 5 5500U, AMD Radeon RX Vega 7 (1039 - 1153, n=6) | |
| Acer Swift 3 SF314-43-R8BP | |
| CrossMark / Creativity | |
| Average of class Subnotebook (372 - 2743, n=59, last 2 years) | |
| Acer Swift 3 SF314-511-54ZK | |
| Acer Swift 3 SF314-43-R8BP | |
| Average AMD Ryzen 5 5500U, AMD Radeon RX Vega 7 (895 - 1054, n=6) | |
| Dell Latitude 14 5420-D2G5W | |
| Lenovo ThinkBook 14 G2 ITL 20VDS02G00 | |
| CrossMark / Responsiveness | |
| Average of class Subnotebook (312 - 1854, n=59, last 2 years) | |
| Acer Swift 3 SF314-511-54ZK | |
| Lenovo ThinkBook 14 G2 ITL 20VDS02G00 | |
| Average AMD Ryzen 5 5500U, AMD Radeon RX Vega 7 (918 - 1112, n=6) | |
| Dell Latitude 14 5420-D2G5W | |
| Acer Swift 3 SF314-43-R8BP | |
| PCMark 10 Score | 4787 points | |
Help | ||
| AIDA64 / Memory Copy | |
| Average of class Subnotebook (14554 - 131023, n=58, last 2 years) | |
| Acer Swift 3 SF314-43-R8BP | |
| Average AMD Ryzen 5 5500U (19083 - 40547, n=18) | |
| AIDA64 / Memory Read | |
| Average of class Subnotebook (15948 - 127174, n=58, last 2 years) | |
| Acer Swift 3 SF314-43-R8BP | |
| Average AMD Ryzen 5 5500U (23005 - 47024, n=18) | |
| AIDA64 / Memory Write | |
| Average of class Subnotebook (15709 - 135141, n=58, last 2 years) | |
| Acer Swift 3 SF314-43-R8BP | |
| Average AMD Ryzen 5 5500U (20150 - 42337, n=18) | |
| AIDA64 / Memory Latency | |
| Acer Swift 3 SF314-43-R8BP | |
| Average AMD Ryzen 5 5500U (87.3 - 119, n=18) | |
| Average of class Subnotebook (6.1 - 159.9, n=56, last 2 years) | |
* ... smaller is better
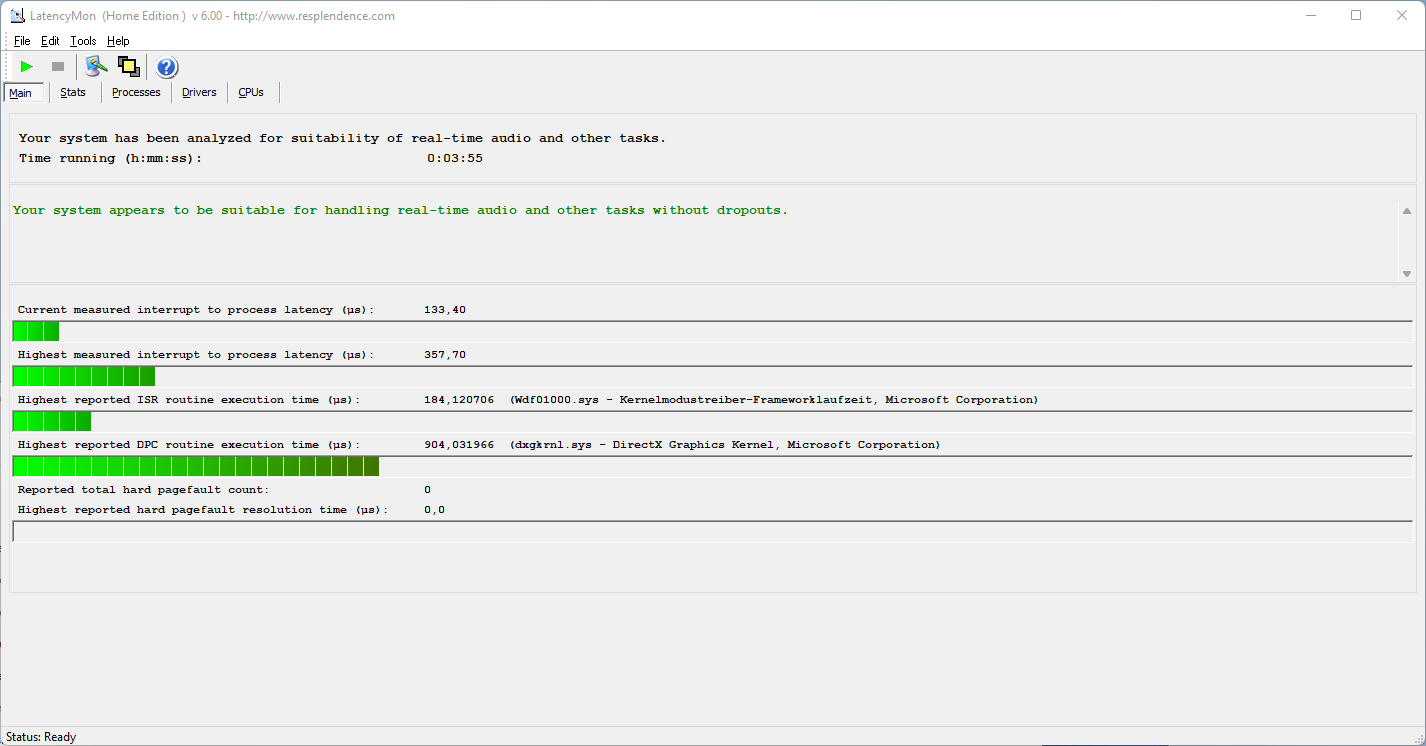
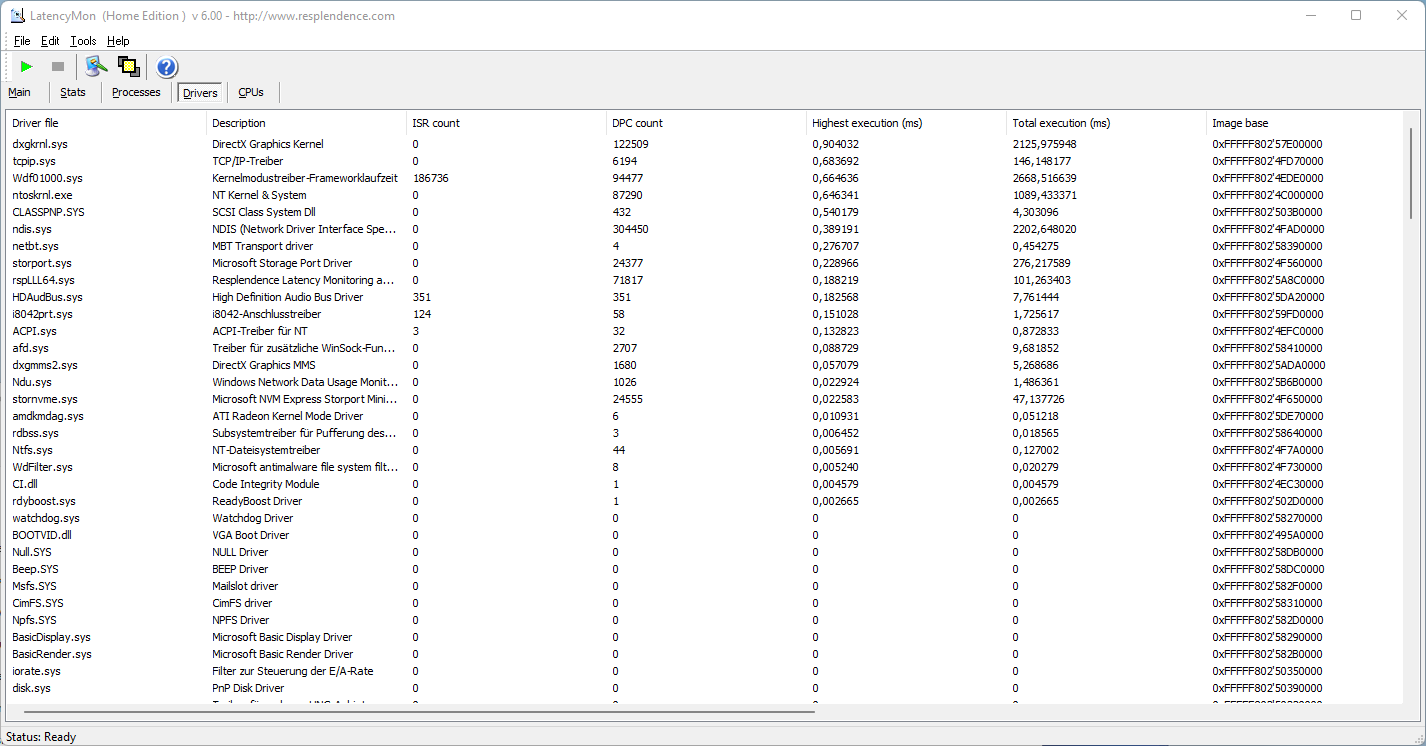
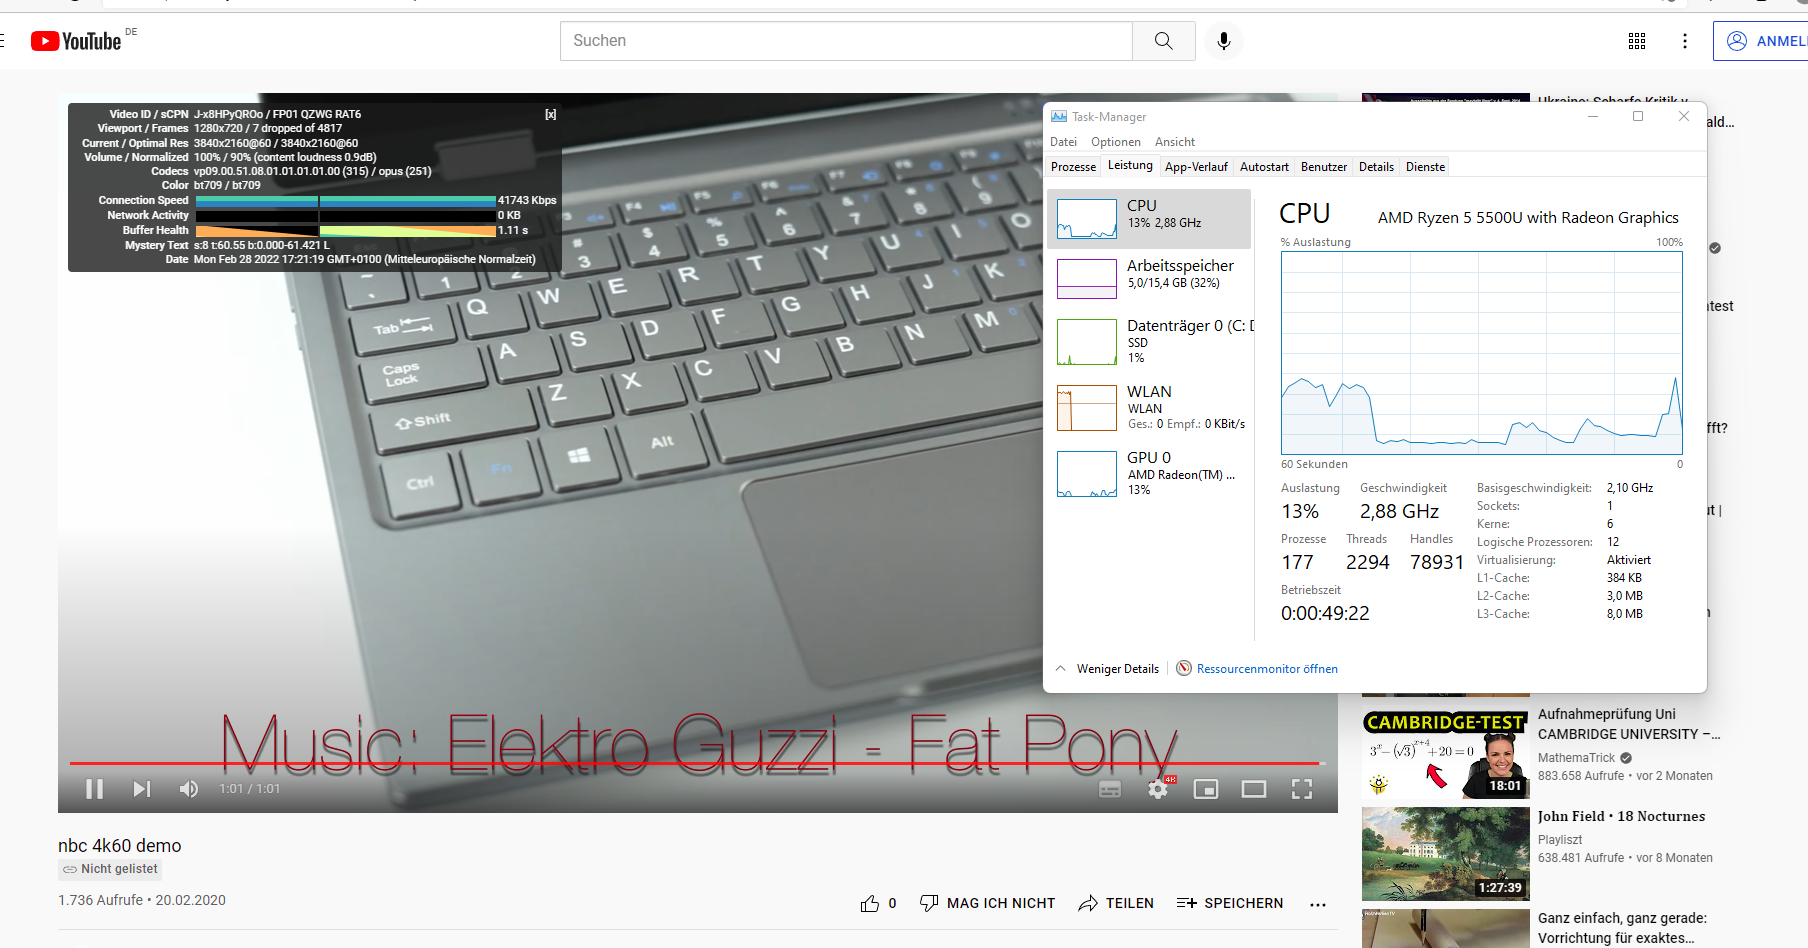
DPC latency
In the test with LatencyMon, the Swift 3 hardly shows any increased latency. Thus, the 14-incher is quite suitable for real-time applications and the like. The measurement is based on the present driver configuration.
| DPC Latencies / LatencyMon - interrupt to process latency (max), Web, Youtube, Prime95 | |
| Dell Latitude 14 5420-D2G5W | |
| Lenovo ThinkBook 14 G2 ITL 20VDS02G00 | |
| HP Pavilion 14-dv0357ng | |
| Acer Swift 3 SF314-511-54ZK | |
| Lenovo ThinkPad E14 G3-20Y7003SGE | |
| Acer Swift 3 SF314-43-R8BP | |
* ... smaller is better
Mass storage
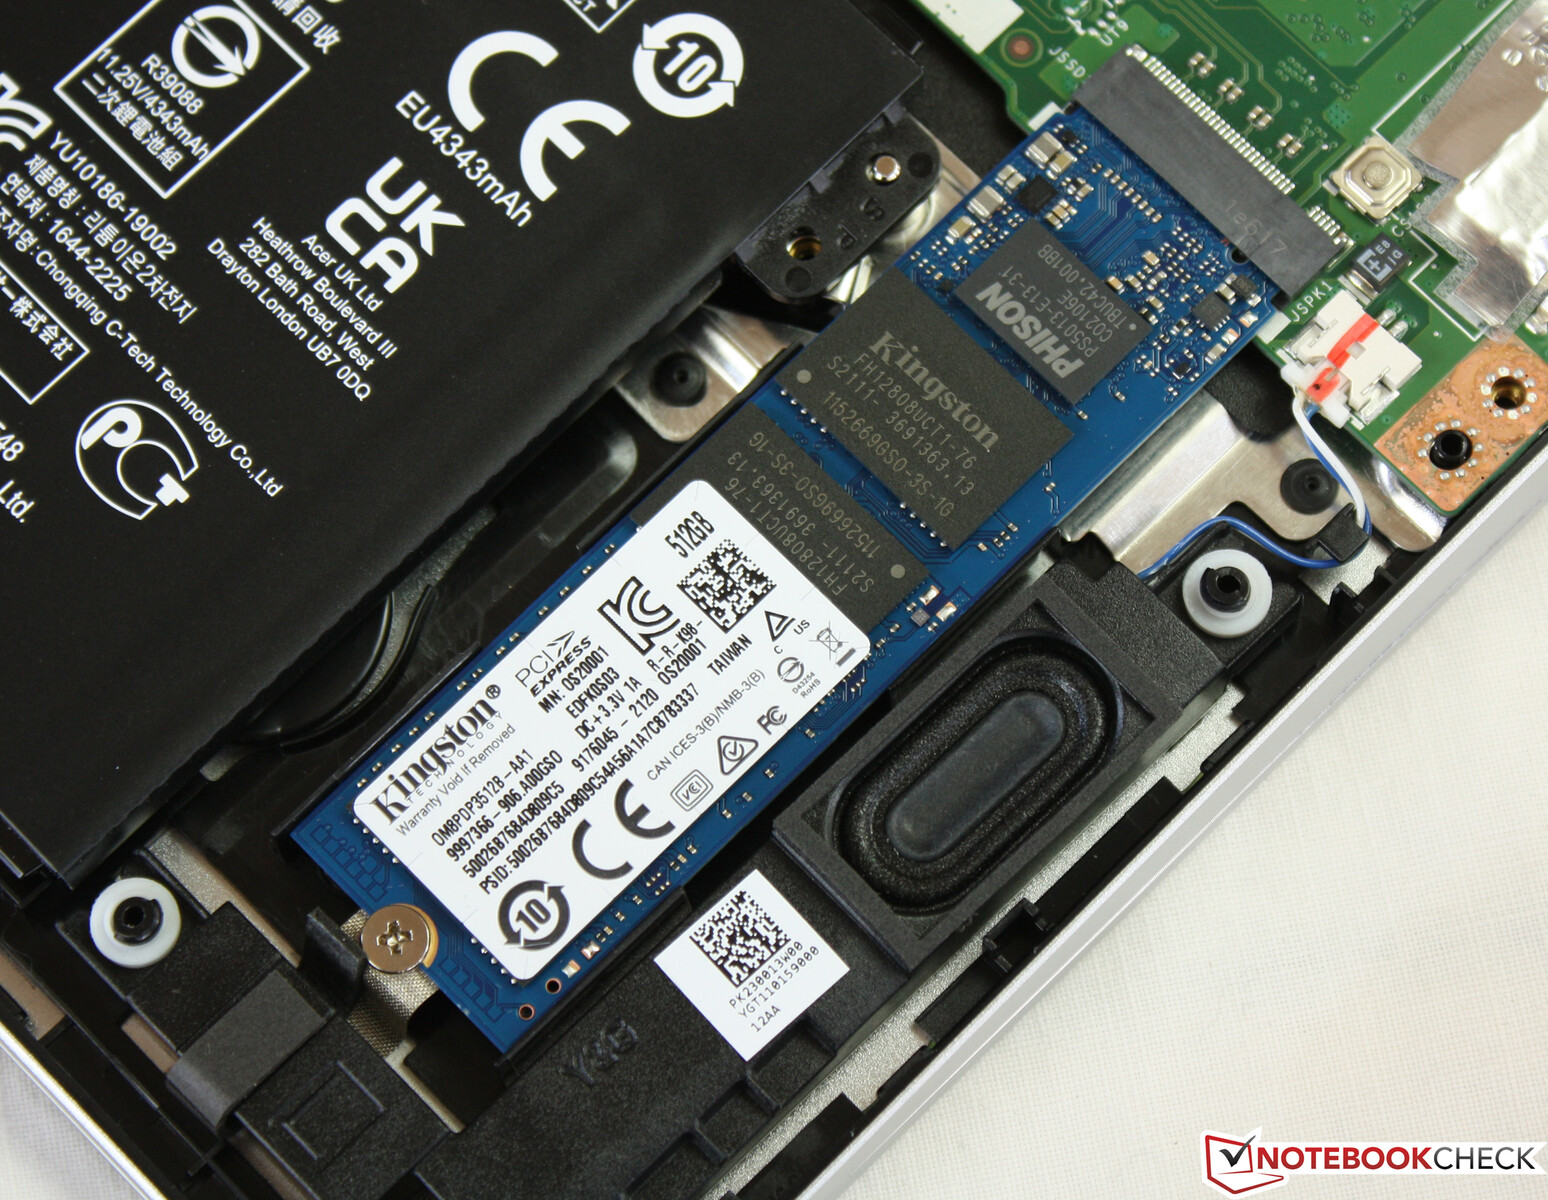
The Kingston solid-state storage with a gross capacity of 512 GB is the middle one among Acer's configurations. There is no second M.2 slot for expansion. The Kingston drive struggles in the midfield. We find the Samsung PM9A1 SSD in the Swift 3 SF314-511 (Intel, iGPU) to be very fast. Note: Manufacturers can equip devices of the same type with different SSDs; there is no guarantee that you will get a WDC, a Micron, a Kingston or a Samsung.
Performance of other mass storage devices in our tests can be seen in our HDD/SSD benchmark tables.

| Drive Performance rating - Percent | |
| Acer Swift 3 SF314-511-54ZK -1! | |
| Average of class Subnotebook | |
| Lenovo ThinkPad E14 G3-20Y7003SGE | |
| Lenovo ThinkBook 14 G2 ITL 20VDS02G00 | |
| Acer Swift 3 SF314-43-R8BP | |
| Average Kingston OM8PDP3512B-AI1 | |
| Dell Latitude 14 5420-D2G5W | |
| HP Pavilion 14-dv0357ng -8! | |
* ... smaller is better
Continuous power read: DiskSpd Read Loop, Queue Depth 8
Graphics card
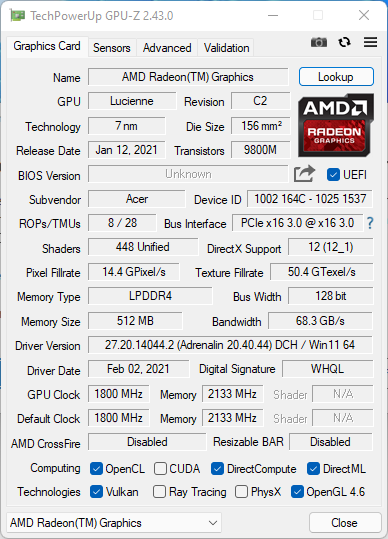
With the integrated Radeon RX Vega 7 SoC graphics, the Swift 3 is not designed for gaming, which is immediately evident in our games table: Even old titles are able to run smoothly only at minimum settings. If you are seriously thinking about current games, you should definitely look for an alternative. Within the iGPU laptops, the Radeon RX is on about the same level as the Intel Iris Xe Graphics G7 80EUs.
Performance comparison with other GPUs can be found in our GPU benchmark list.
| 3DMark Performance rating - Percent | |
| Average of class Subnotebook | |
| Acer Swift 3 SF314-511-54ZK | |
| HP Pavilion 14-dv0357ng | |
| Acer Swift 3 SF314-43-R8BP | |
| Lenovo ThinkPad E14 G3-20Y7003SGE | |
| Average AMD Radeon RX Vega 7 | |
| Dell Latitude 14 5420-D2G5W | |
| Lenovo ThinkBook 14 G2 ITL 20VDS02G00 | |
| 3DMark 11 - 1280x720 Performance GPU | |
| Average of class Subnotebook (995 - 18489, n=55, last 2 years) | |
| Acer Swift 3 SF314-511-54ZK | |
| Acer Swift 3 SF314-43-R8BP | |
| HP Pavilion 14-dv0357ng | |
| Lenovo ThinkPad E14 G3-20Y7003SGE | |
| Average AMD Radeon RX Vega 7 (3353 - 6249, n=62) | |
| Dell Latitude 14 5420-D2G5W | |
| Lenovo ThinkBook 14 G2 ITL 20VDS02G00 | |
| 3DMark | |
| 1920x1080 Fire Strike Graphics | |
| Average of class Subnotebook (832 - 16347, n=56, last 2 years) | |
| Acer Swift 3 SF314-511-54ZK | |
| HP Pavilion 14-dv0357ng | |
| Acer Swift 3 SF314-43-R8BP | |
| Lenovo ThinkPad E14 G3-20Y7003SGE | |
| Average AMD Radeon RX Vega 7 (1772 - 4037, n=66) | |
| Dell Latitude 14 5420-D2G5W | |
| Lenovo ThinkBook 14 G2 ITL 20VDS02G00 | |
| 2560x1440 Time Spy Graphics | |
| Average of class Subnotebook (804 - 6288, n=55, last 2 years) | |
| Acer Swift 3 SF314-511-54ZK | |
| HP Pavilion 14-dv0357ng | |
| Acer Swift 3 SF314-43-R8BP | |
| Lenovo ThinkPad E14 G3-20Y7003SGE | |
| Average AMD Radeon RX Vega 7 (496 - 1249, n=61) | |
| Dell Latitude 14 5420-D2G5W | |
| Lenovo ThinkBook 14 G2 ITL 20VDS02G00 | |
| 3DMark 11 Performance | 5686 points | |
| 3DMark Fire Strike Score | 3437 points | |
| 3DMark Time Spy Score | 1305 points | |
Help | ||
Gaming performance
| The Witcher 3 | |
| 1366x768 Medium Graphics & Postprocessing | |
| Average of class Subnotebook (71 - 115, n=8, last 2 years) | |
| Acer Swift 3 SF314-511-54ZK | |
| HP Pavilion 14-dv0357ng | |
| Acer Swift 3 SF314-43-R8BP | |
| Average AMD Radeon RX Vega 7 (9.74 - 81.3, n=39) | |
| Dell Latitude 14 5420-D2G5W | |
| 1920x1080 High Graphics & Postprocessing (Nvidia HairWorks Off) | |
| Average of class Subnotebook (25.6 - 64, n=13, last 2 years) | |
| HP Pavilion 14-dv0357ng | |
| Acer Swift 3 SF314-511-54ZK | |
| Lenovo ThinkPad E14 G3-20Y7003SGE | |
| Average AMD Radeon RX Vega 7 (8.96 - 26.2, n=52) | |
| Acer Swift 3 SF314-43-R8BP | |
| Dell Latitude 14 5420-D2G5W | |
| Dota 2 Reborn - 1920x1080 ultra (3/3) best looking | |
| Average of class Subnotebook (13 - 97, n=61, last 2 years) | |
| Acer Swift 3 SF314-511-54ZK | |
| Acer Swift 3 SF314-43-R8BP | |
| Lenovo ThinkPad E14 G3-20Y7003SGE | |
| Average AMD Radeon RX Vega 7 (23.3 - 58.2, n=62) | |
| HP Pavilion 14-dv0357ng | |
| Lenovo ThinkBook 14 G2 ITL 20VDS02G00 | |
| Final Fantasy XV Benchmark | |
| 1920x1080 Standard Quality | |
| Average of class Subnotebook (15.1 - 75.2, n=54, last 2 years) | |
| Acer Swift 3 SF314-511-54ZK | |
| Acer Swift 3 SF314-43-R8BP | |
| HP Pavilion 14-dv0357ng | |
| Lenovo ThinkPad E14 G3-20Y7003SGE | |
| Average AMD Radeon RX Vega 7 (8.9 - 20.3, n=44) | |
| Dell Latitude 14 5420-D2G5W | |
| 1280x720 Lite Quality | |
| Average of class Subnotebook (21.4 - 129.8, n=55, last 2 years) | |
| Acer Swift 3 SF314-511-54ZK | |
| Acer Swift 3 SF314-43-R8BP | |
| Lenovo ThinkPad E14 G3-20Y7003SGE | |
| HP Pavilion 14-dv0357ng | |
| Average AMD Radeon RX Vega 7 (17.1 - 41.1, n=44) | |
| Dell Latitude 14 5420-D2G5W | |
| Lenovo ThinkBook 14 G2 ITL 20VDS02G00 | |
| Strange Brigade | |
| 1280x720 lowest AF:1 | |
| Average of class Subnotebook (78.8 - 335, n=49, last 2 years) | |
| Acer Swift 3 SF314-511-54ZK | |
| Acer Swift 3 SF314-43-R8BP | |
| HP Pavilion 14-dv0357ng | |
| Lenovo ThinkPad E14 G3-20Y7003SGE | |
| Average AMD Radeon RX Vega 7 (19.4 - 95.3, n=43) | |
| Dell Latitude 14 5420-D2G5W | |
| Lenovo ThinkBook 14 G2 ITL 20VDS02G00 | |
| 1920x1080 medium AA:medium AF:4 | |
| Average of class Subnotebook (29.8 - 137.5, n=49, last 2 years) | |
| Acer Swift 3 SF314-511-54ZK | |
| Acer Swift 3 SF314-43-R8BP | |
| HP Pavilion 14-dv0357ng | |
| Lenovo ThinkPad E14 G3-20Y7003SGE | |
| Average AMD Radeon RX Vega 7 (13.4 - 36.1, n=43) | |
| Dell Latitude 14 5420-D2G5W | |
| Lenovo ThinkBook 14 G2 ITL 20VDS02G00 | |
| F1 2021 | |
| 1280x720 Ultra Low Preset | |
| Average AMD Radeon RX Vega 7 (71 - 107.9, n=13) | |
| Acer Swift 3 SF314-43-R8BP | |
| 1920x1080 Medium Preset AA:T AF:16x | |
| Average AMD Radeon RX Vega 7 (29 - 45.8, n=12) | |
| Acer Swift 3 SF314-43-R8BP | |
| 1920x1080 Ultra Low Preset | |
| Lenovo ThinkBook 14 G2 ITL 20VDS02G00 | |
Witcher 3 FPS-Diagramm
| low | med. | high | ultra | |
|---|---|---|---|---|
| The Witcher 3 (2015) | 34.7 | 17.4 | 13 | |
| Dota 2 Reborn (2015) | 100 | 82.8 | 54 | 50.2 |
| Final Fantasy XV Benchmark (2018) | 35.4 | 18.1 | 12.4 | |
| Far Cry 5 (2018) | 44 | 20 | 19 | |
| Strange Brigade (2018) | 81.4 | 32.1 | 27 | 22.9 |
| F1 2021 (2021) | 71 | 29 |
Emissions: Quiet 14-incher from Acer
Noise emissions
The Swift 3 does not produce much noise over the entire load range. When idling, the fan stands still and silence reigns. Under load, the fan barely revs up. Thus, we measured sound pressure levels of 38 dB(A) in the stress test and 34 dB(A) under medium load. These emissions are quite low, which should be the case for a mobile subnotebook. Nobody wants to take a fan heater to the library.
Noise level
| Idle |
| 26 / 26 / 27.5 dB(A) |
| Load |
| 34 / 38.2 dB(A) |
 | ||
30 dB silent 40 dB(A) audible 50 dB(A) loud |
||
min: | ||
| Acer Swift 3 SF314-43-R8BP Vega 7, R5 5500U, Kingston OM8PDP3512B-AI1 | Acer Swift 3 SF314-511-54ZK Iris Xe G7 80EUs, i5-1135G7, Samsung PM9A1 MZVL2512HCJQ | Lenovo ThinkPad E14 G3-20Y7003SGE Vega 7, R5 5500U, SK Hynix BC711 HFM512GD3HX015N | HP Pavilion 14-dv0357ng Iris Xe G7 80EUs, i5-1135G7, Intel Optane Memory H10 with Solid State Storage 32GB + 1TB HBRPEKNX0203AH(L/H) | Dell Latitude 14 5420-D2G5W Iris Xe G7 80EUs, i5-1135G7, WDC PC SN530 SDBPTPZ-256G | Lenovo ThinkBook 14 G2 ITL 20VDS02G00 UHD Graphics Xe G4 48EUs, i3-1115G4, Samsung PM991A MZALQ256HBJD | |
|---|---|---|---|---|---|---|
| Noise | 1% | 8% | 3% | -4% | -1% | |
| off / environment * (dB) | 26 | 25 4% | 23.8 8% | 25.4 2% | 25 4% | 24.6 5% |
| Idle Minimum * (dB) | 26 | 25 4% | 23.8 8% | 25.4 2% | 25 4% | 24.6 5% |
| Idle Average * (dB) | 26 | 25 4% | 23.8 8% | 25.4 2% | 25 4% | 24.6 5% |
| Idle Maximum * (dB) | 27.5 | 27.5 -0% | 25 9% | 25.4 8% | 25 9% | 26.7 3% |
| Load Average * (dB) | 34 | 32.9 3% | 32 6% | 35.4 -4% | 36.5 -7% | 38.9 -14% |
| Load Maximum * (dB) | 38.2 | 42 -10% | 34.5 10% | 35.5 7% | 52.4 -37% | 42.8 -12% |
| Witcher 3 ultra * (dB) | 32 |
* ... smaller is better
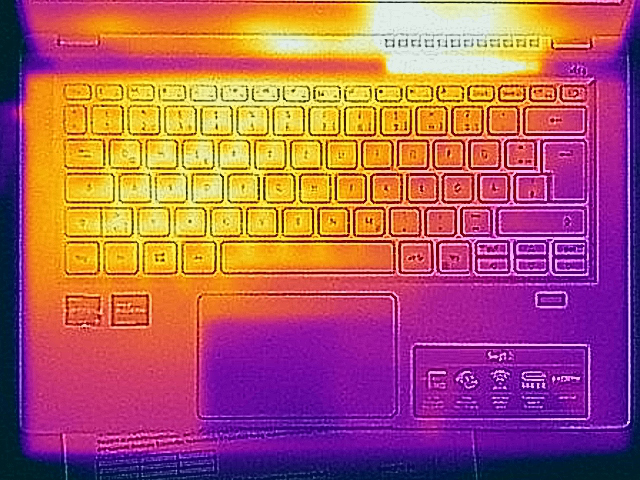
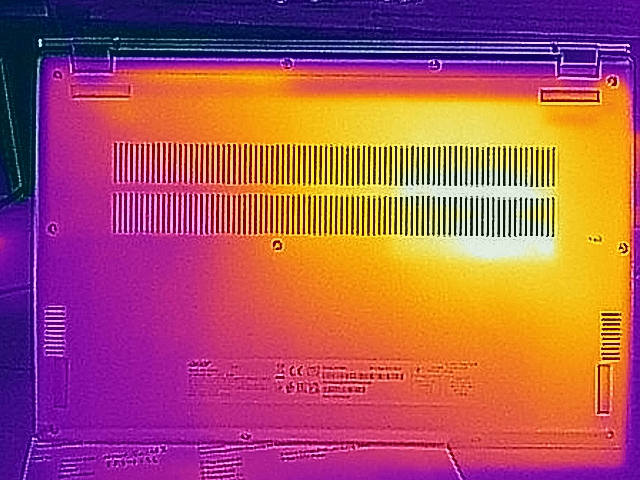
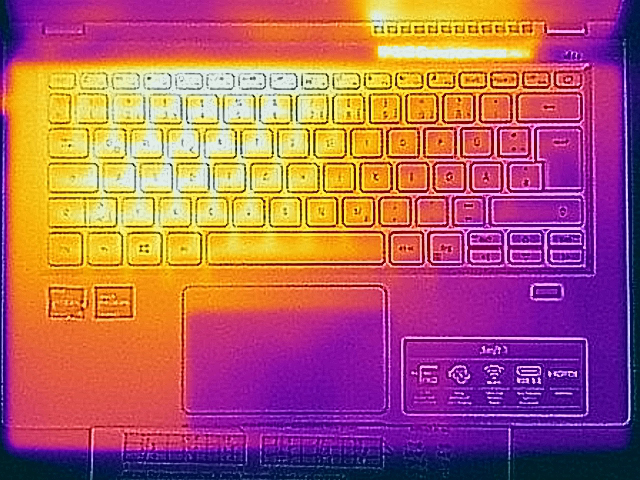
Temperature
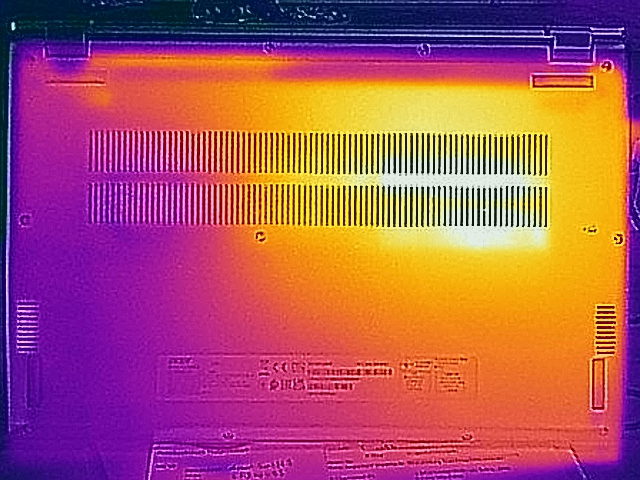
The performance is trimmed to low temperatures and ensures moderate heat emissions of 36 or 38 degrees at most. The heat dissipation chart shows the results after our stress test, and the case stays relatively cool during gaming.
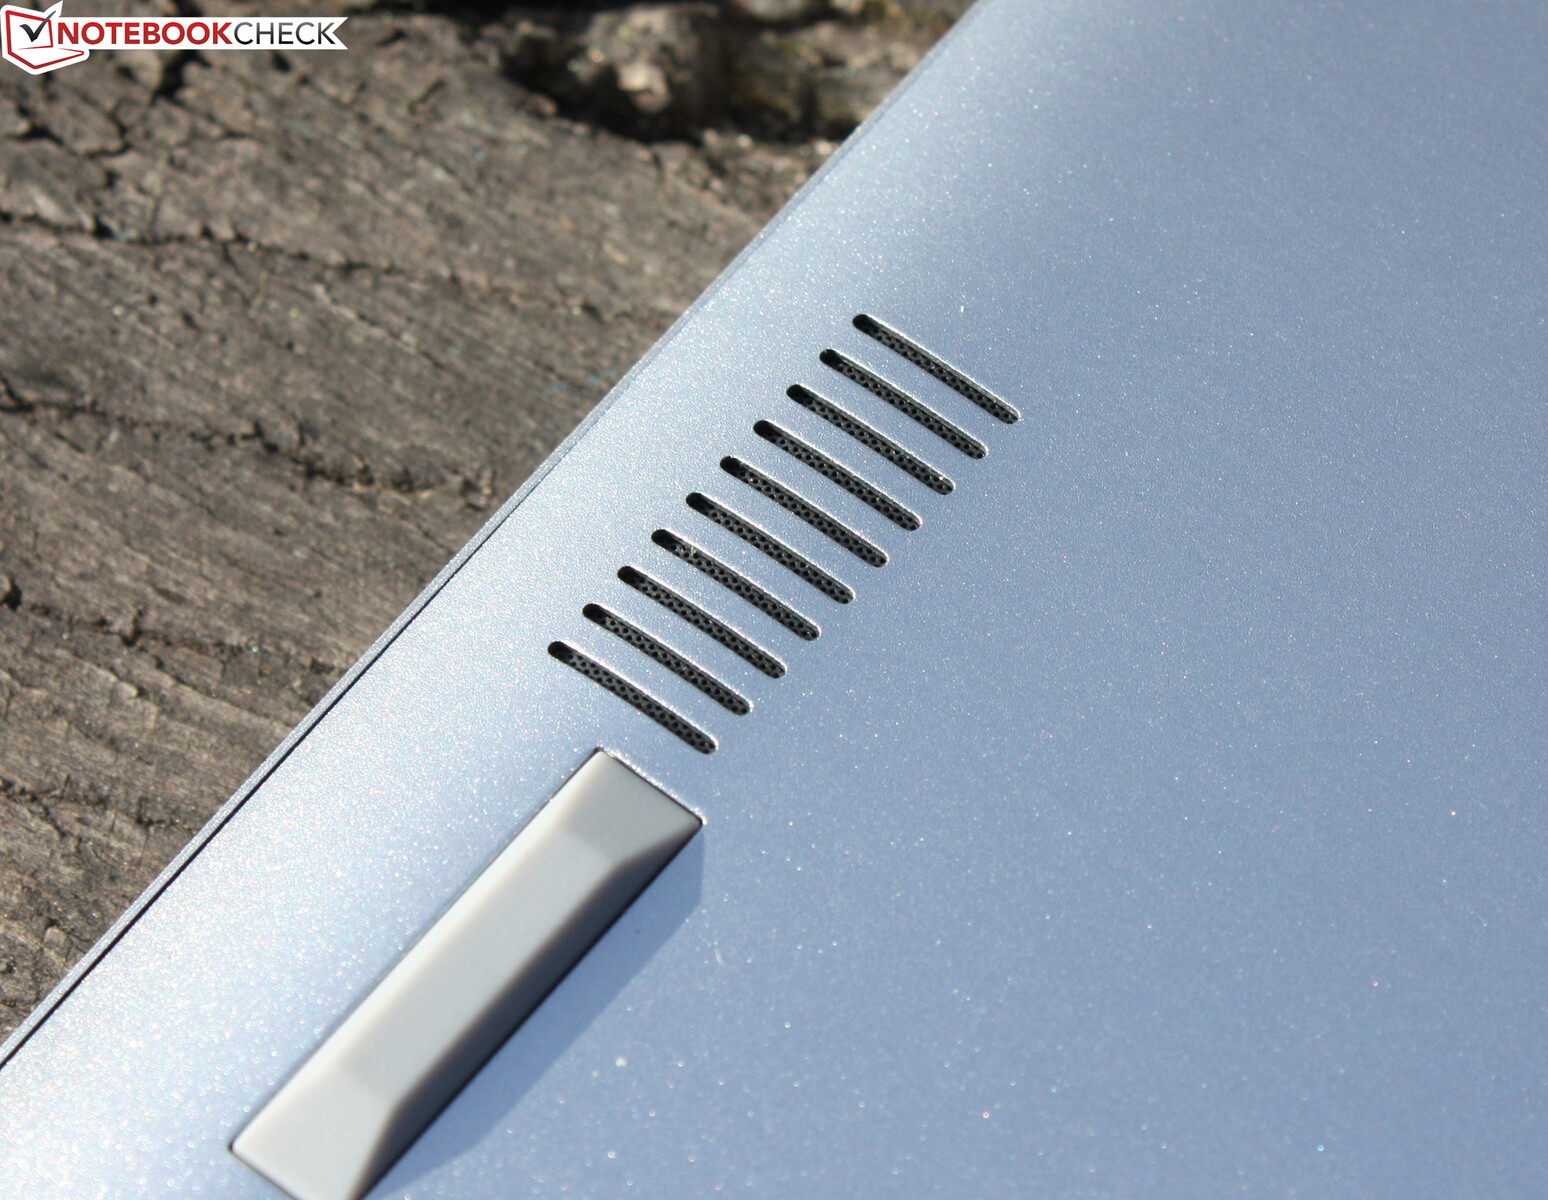
The case only feels warm during sustained load and never gets too hot to place on the thighs, for instance. However, you should not place this 14-incher on a blanket or carpet as that would block the air intakes on the underside. The display, when opened, deliberately raises the base to allow a better air supply.
The average idle temperature is just 23 degrees, and the metal case feels lukewarm.
(+) The maximum temperature on the upper side is 36 °C / 97 F, compared to the average of 35.9 °C / 97 F, ranging from 21.4 to 59 °C for the class Subnotebook.
(+) The bottom heats up to a maximum of 38 °C / 100 F, compared to the average of 39.2 °C / 103 F
(+) In idle usage, the average temperature for the upper side is 23 °C / 73 F, compared to the device average of 30.8 °C / 87 F.
(+) The palmrests and touchpad are cooler than skin temperature with a maximum of 28.9 °C / 84 F and are therefore cool to the touch.
(±) The average temperature of the palmrest area of similar devices was 28.2 °C / 82.8 F (-0.7 °C / -1.2 F).
| Acer Swift 3 SF314-43-R8BP AMD Ryzen 5 5500U, AMD Radeon RX Vega 7 | Acer Swift 3 SF314-511-54ZK Intel Core i5-1135G7, Intel Iris Xe Graphics G7 80EUs | Lenovo ThinkPad E14 G3-20Y7003SGE AMD Ryzen 5 5500U, AMD Radeon RX Vega 7 | HP Pavilion 14-dv0357ng Intel Core i5-1135G7, Intel Iris Xe Graphics G7 80EUs | Dell Latitude 14 5420-D2G5W Intel Core i5-1135G7, Intel Iris Xe Graphics G7 80EUs | Lenovo ThinkBook 14 G2 ITL 20VDS02G00 Intel Core i3-1115G4, Intel UHD Graphics Xe G4 48EUs | |
|---|---|---|---|---|---|---|
| Heat | -8% | -14% | -17% | -13% | -8% | |
| Maximum Upper Side * (°C) | 36 | 39.6 -10% | 45.1 -25% | 40.5 -13% | 41.7 -16% | 35 3% |
| Maximum Bottom * (°C) | 38 | 43.2 -14% | 49.3 -30% | 39.9 -5% | 35.6 6% | 38 -0% |
| Idle Upper Side * (°C) | 24.1 | 25 -4% | 24.7 -2% | 31.3 -30% | 29.9 -24% | 28 -16% |
| Idle Bottom * (°C) | 25.7 | 26.2 -2% | 25.6 -0% | 31.1 -21% | 29.7 -16% | 30 -17% |
* ... smaller is better
Stress test
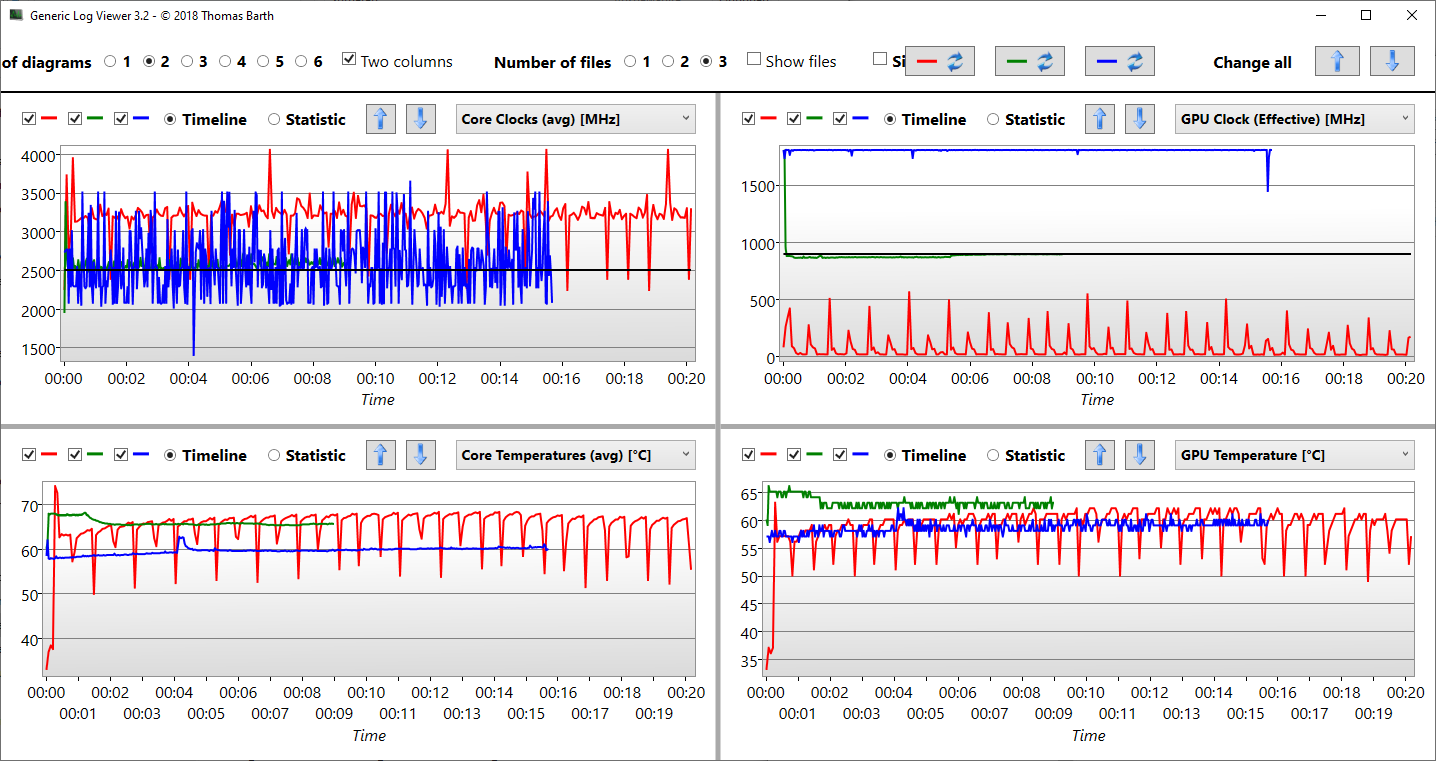
The Acer Swift 3 runs through our stress tests (Prime95 and Furmark for one hour) in a similar manner in both mains and battery mode. The processor runs at 3.4 GHz for a few seconds after which the clock drops to 2.5 GHz. The graphics core's clock drops from an initial 1,800 MHz to about 800 MHz. We can see the behavior from the earlier Cinebench R15 test here as well — PL2 can only be held for a very short time (just seconds) after which significant throttling occurs. Throttling is typical for AMD and Intel processors, but we rarely see such a massive drop, especially since it also occurs in the R15 loop - i.e. under sole CPU load.
It must be noted here that the stress test is an extreme scenario that does not occur in everyday use. We use this test to check whether the system also runs stably under full load.
The slim notebook does not heat up excessively. We recorded temperatures of around 35 degrees Celsius at three measuring points during the stress test. The values are within the green zone in everyday use. The mostly silent device does not even get warm to the touch.
Loudspeaker
Acer Swift 3 SF314-43-R8BP audio analysis
(-) | not very loud speakers (71.8 dB)
Bass 100 - 315 Hz
(-) | nearly no bass - on average 28.3% lower than median
(±) | linearity of bass is average (12.3% delta to prev. frequency)
Mids 400 - 2000 Hz
(±) | higher mids - on average 5.9% higher than median
(±) | linearity of mids is average (8.9% delta to prev. frequency)
Highs 2 - 16 kHz
(+) | balanced highs - only 4.2% away from median
(+) | highs are linear (4.8% delta to prev. frequency)
Overall 100 - 16.000 Hz
(±) | linearity of overall sound is average (26% difference to median)
Compared to same class
» 87% of all tested devices in this class were better, 2% similar, 11% worse
» The best had a delta of 5%, average was 18%, worst was 53%
Compared to all devices tested
» 80% of all tested devices were better, 4% similar, 16% worse
» The best had a delta of 4%, average was 24%, worst was 134%
Lenovo ThinkPad E14 G3-20Y7003SGE audio analysis
(±) | speaker loudness is average but good (77.5 dB)
Bass 100 - 315 Hz
(±) | reduced bass - on average 13.7% lower than median
(±) | linearity of bass is average (13% delta to prev. frequency)
Mids 400 - 2000 Hz
(±) | higher mids - on average 7% higher than median
(+) | mids are linear (3.7% delta to prev. frequency)
Highs 2 - 16 kHz
(+) | balanced highs - only 3.7% away from median
(+) | highs are linear (4.7% delta to prev. frequency)
Overall 100 - 16.000 Hz
(±) | linearity of overall sound is average (19.3% difference to median)
Compared to same class
» 38% of all tested devices in this class were better, 7% similar, 54% worse
» The best had a delta of 7%, average was 21%, worst was 53%
Compared to all devices tested
» 47% of all tested devices were better, 8% similar, 46% worse
» The best had a delta of 4%, average was 24%, worst was 134%
Power management
Energy consumption
The Swift 3 does not reveal any conspicuities in terms of energy consumption. We register a maximum power consumption of 7.7 W in idle. During the stress test (Prime95 and Furmark run for at least one hour), the value increases up to 63 W but only in the first few seconds! After that, the throttled Swift plods along with just under 40 W.
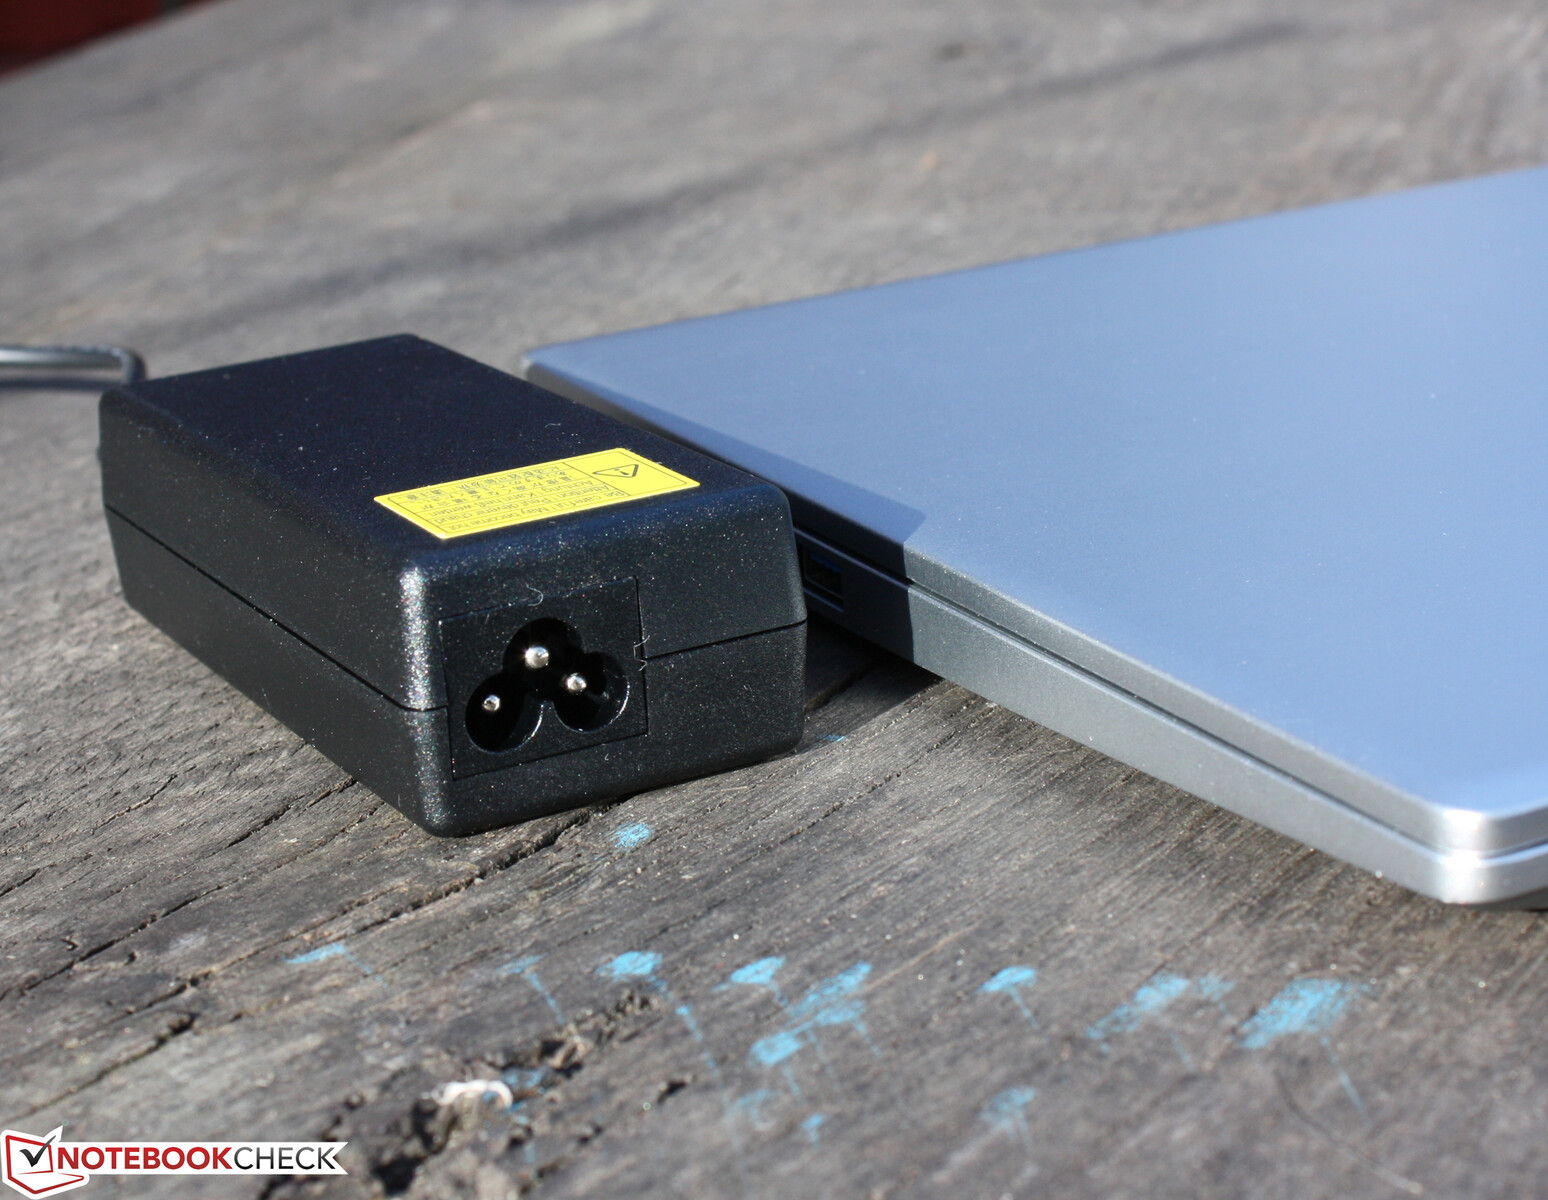
More energy — about 44 W — is drawn when we run The Witcher 3 test but even this is only in the first 30 seconds. After that, a clock throttling of the iGPU ensures a constant reduction to 41 W. The power supply's nominal power is 65 W.
| Off / Standby | |
| Idle | |
| Load |
|
Key:
min: | |
| Acer Swift 3 SF314-43-R8BP R5 5500U, Vega 7, Kingston OM8PDP3512B-AI1, IPS, 1920x1080, 14" | Acer Swift 3 SF314-511-54ZK i5-1135G7, Iris Xe G7 80EUs, Samsung PM9A1 MZVL2512HCJQ, IPS, 1920x1080, 14" | Lenovo ThinkPad E14 G3-20Y7003SGE R5 5500U, Vega 7, SK Hynix BC711 HFM512GD3HX015N, IPS, 1920x1080, 14" | HP Pavilion 14-dv0357ng i5-1135G7, Iris Xe G7 80EUs, Intel Optane Memory H10 with Solid State Storage 32GB + 1TB HBRPEKNX0203AH(L/H), IPS, 1920x1080, 14" | Dell Latitude 14 5420-D2G5W i5-1135G7, Iris Xe G7 80EUs, WDC PC SN530 SDBPTPZ-256G, IPS, 1920x1080, 14" | Lenovo ThinkBook 14 G2 ITL 20VDS02G00 i3-1115G4, UHD Graphics Xe G4 48EUs, Samsung PM991A MZALQ256HBJD, a-Si IPS LED, 1920x1080, 14" | Average AMD Radeon RX Vega 7 | Average of class Subnotebook | |
|---|---|---|---|---|---|---|---|---|
| Power Consumption | -1% | -4% | -13% | 1% | -28% | -9% | -4% | |
| Idle Minimum * (Watt) | 4.1 | 4.3 -5% | 3.5 15% | 4.8 -17% | 3.4 17% | 6.3 -54% | 4.79 ? -17% | 3.86 ? 6% |
| Idle Average * (Watt) | 5.4 | 6.8 -26% | 7.5 -39% | 8.5 -57% | 7.1 -31% | 9.5 -76% | 7.72 ? -43% | 6.61 ? -22% |
| Idle Maximum * (Watt) | 7.7 | 9 -17% | 8.7 -13% | 12.4 -61% | 8.4 -9% | 10.4 -35% | 9.12 ? -18% | 8 ? -4% |
| Load Average * (Watt) | 44 | 33.3 24% | 43.6 1% | 37.7 14% | 35.3 20% | 32.7 26% | 38.4 ? 13% | 42.2 ? 4% |
| Witcher 3 ultra * (Watt) | 41.8 | 33.3 20% | 42.2 -1% | 35.4 15% | 35.4 15% | |||
| Load Maximum * (Watt) | 63 | 65 -3% | 55 13% | 45.3 28% | 67 -6% | 63.3 -0% | 51.7 ? 18% | 64.5 ? -2% |
* ... smaller is better
Energieaufnahme Witcher 3 / Stresstest
Energieaufnahme mit externem Monitor
Battery life
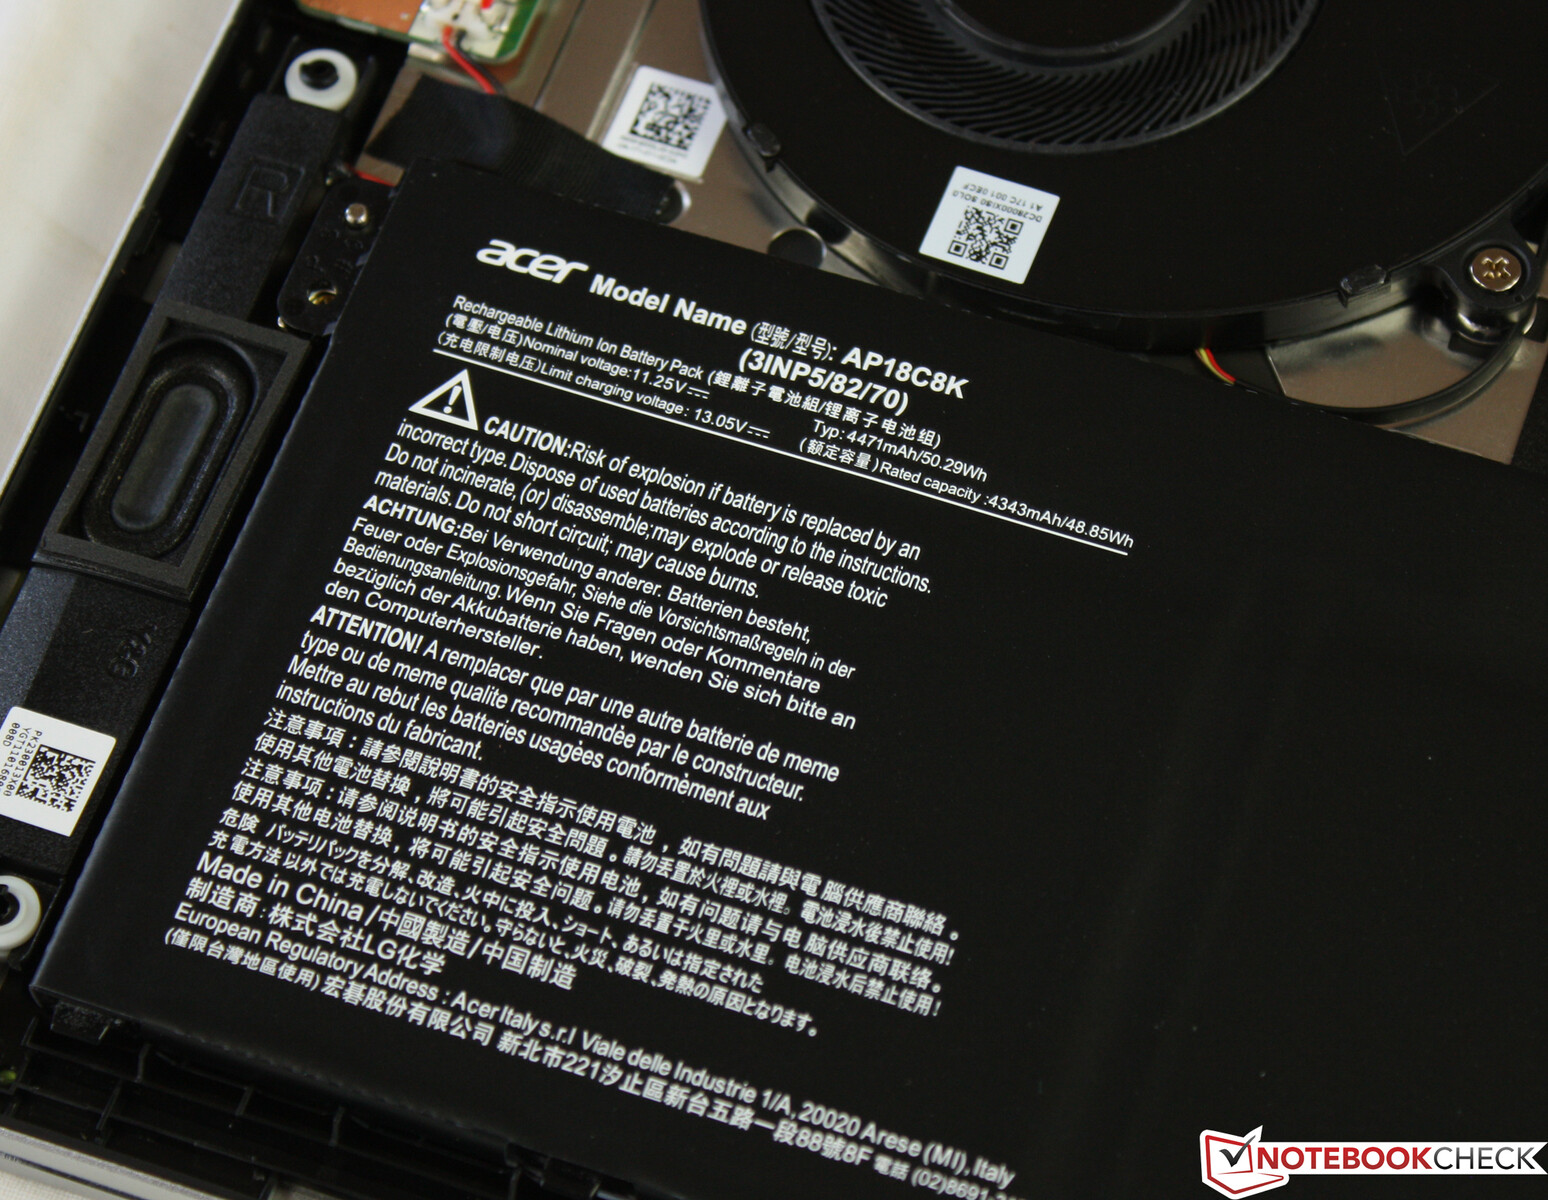
The Acer Swift 3 notebook achieves a runtime of 8:25 h in our practical WLAN test. We use a script to simulate the load when accessing websites. The display brightness is set to about 150 cd/m². That is less runtime than most competitors, but our Swift 3 unit only has a 48 Wh battery unlike the 56 Wh cell in the Swift 3 SF314-511 (Intel).
| Acer Swift 3 SF314-43-R8BP R5 5500U, Vega 7, 48 Wh | Acer Swift 3 SF314-511-54ZK i5-1135G7, Iris Xe G7 80EUs, 56 Wh | Lenovo ThinkPad E14 G3-20Y7003SGE R5 5500U, Vega 7, 57 Wh | HP Pavilion 14-dv0357ng i5-1135G7, Iris Xe G7 80EUs, 43 Wh | Dell Latitude 14 5420-D2G5W i5-1135G7, Iris Xe G7 80EUs, 63 Wh | Lenovo ThinkBook 14 G2 ITL 20VDS02G00 i3-1115G4, UHD Graphics Xe G4 48EUs, 58 Wh | Average of class Subnotebook | |
|---|---|---|---|---|---|---|---|
| Battery runtime | 43% | 3% | -29% | 37% | -8% | 44% | |
| Reader / Idle (h) | 19.3 | 33.6 74% | 22.9 19% | 13.2 -32% | 28.6 ? 48% | ||
| WiFi v1.3 (h) | 8.4 | 12.1 44% | 11.3 35% | 6 -29% | 12.8 52% | 7.6 -10% | 14 ? 67% |
| Load (h) | 1.7 | 1.9 12% | 1.2 -29% | 2.4 41% | 2 18% | 1.969 ? 16% | |
| H.264 (h) | 13.8 | 5.9 | 8.8 | 15.4 ? | |||
| Witcher 3 ultra (h) | 2 |
Pros
Cons
Verdict: Acer's Swift 3 is not the swiftest


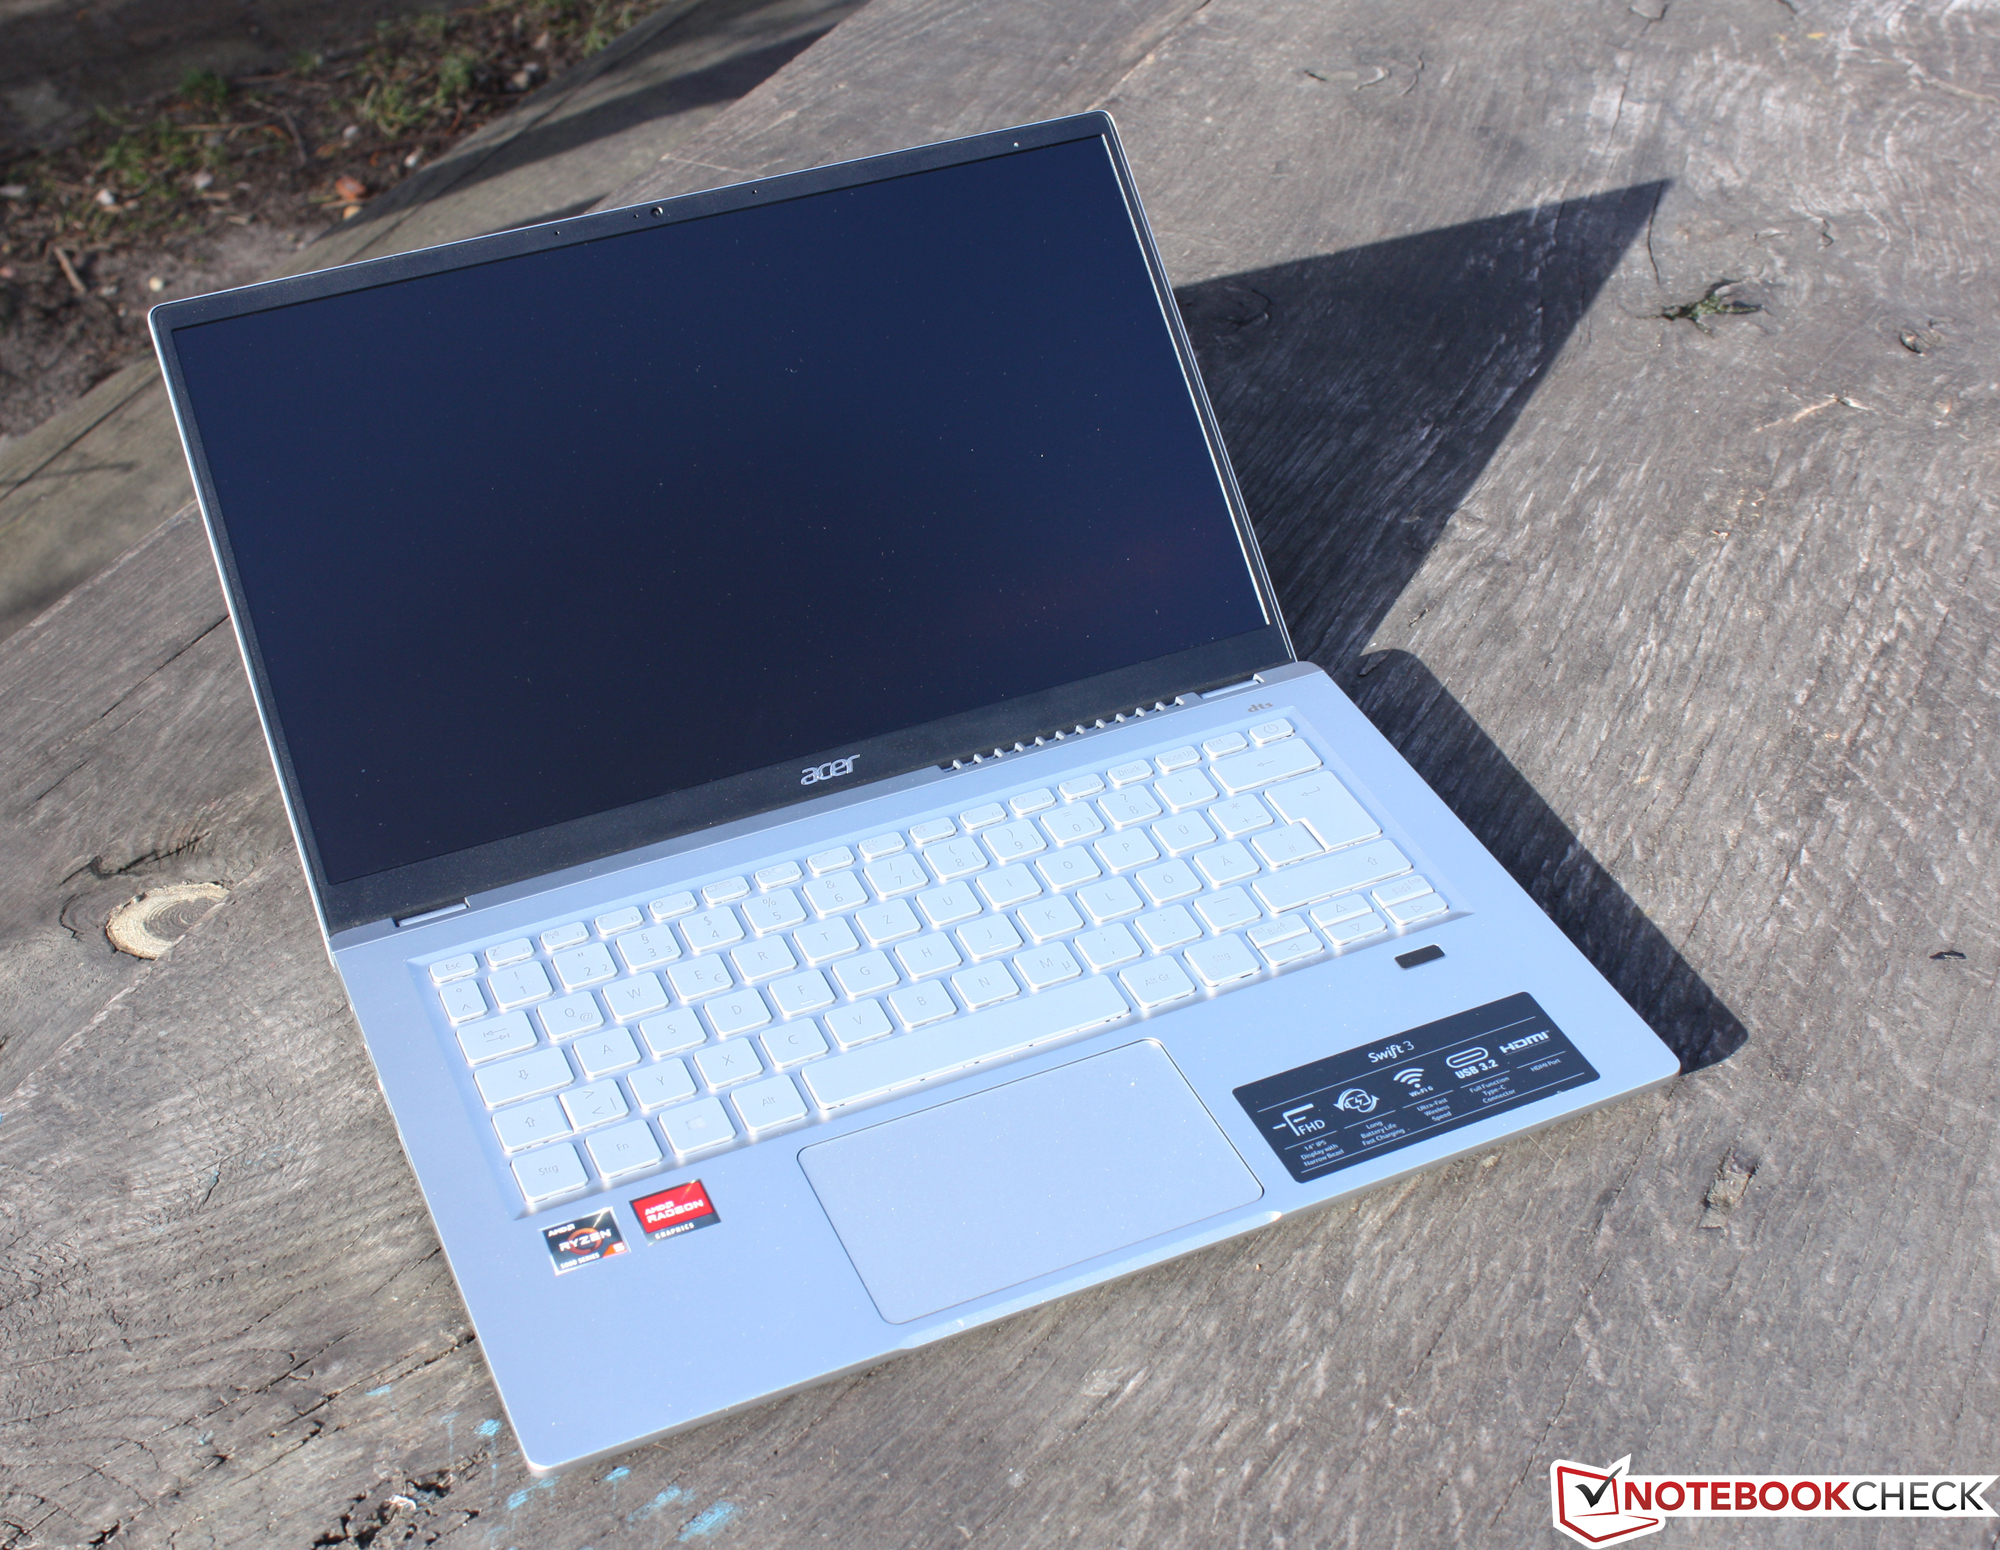
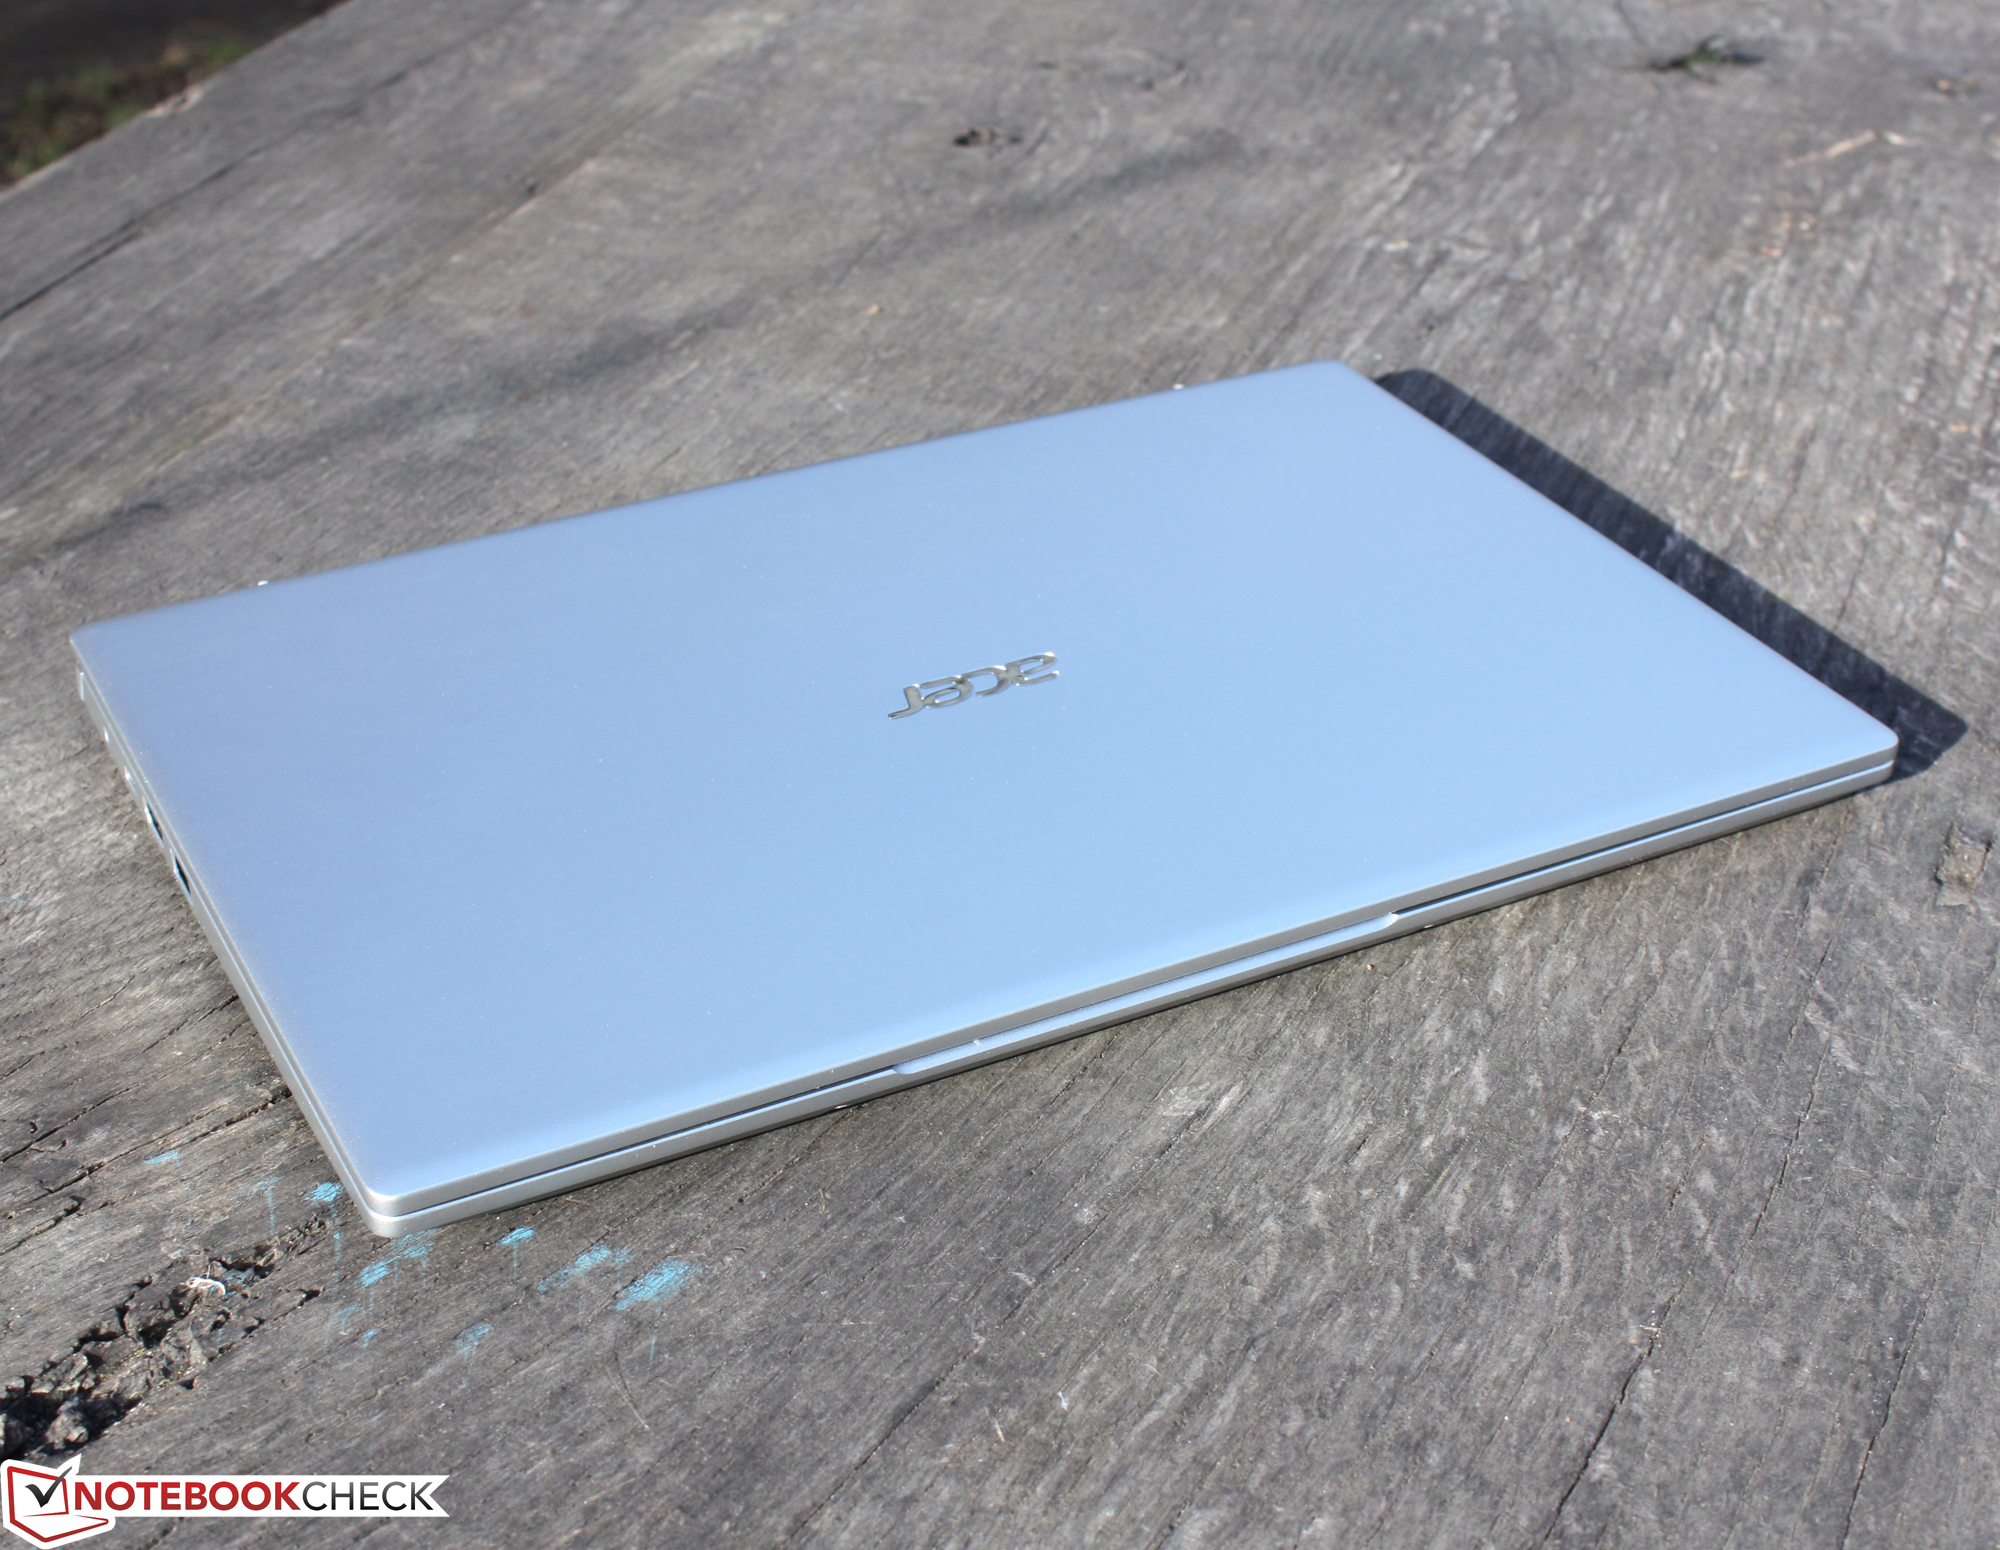
Acer offers a 14-inch notebook with a slim metal chassis in the Swift 3 SF314-43. The compact chassis weighs only 1.3 kg, is 16.5 mm thin, and offers excellent stability and haptics for the price range.
Acer delivers a mobile 14-incher with the Swift 3 SF314-43 that is only let down in terms of display and Wi-Fi.
The main criticism of the screen is the low brightness — an average of 230 cd/m² is too low even for a matte display. The color space coverage is also not very large, but this is hardly relevant for users who are not into image editing and CAD (and these users will certainly not buy a Swift 3).
The Ryzen 5 5500U APU, which is otherwise known for its good performance, throttles more than expected even during the Cinebench R15 loop. However, the Swift 3 SF314-43 still outperforms Intel laptops, or is at least on par with them.
The conservative temperature table makes for an almost silent 14-incher that stays cool at all times. Thus, the Swift 3 SF314-43 is a recommendable subnotebook for budget buyers who don't care about maximum performance, but want stability, ergonomics, and mobility.
If you want to stay within budget — but focus on maximum performance — you should take a look at Lenovo's ThinkPad E14 G3, which is able to extract more performance out of the Ryzen 5500U.
Price and availability
Our test configuration of the Acer Swift 3 SF314-43-R8BP is currently available for 679 Euros at notebooksbilliger.
Acer Swift 3 SF314-43-R8BP
- 03/09/2022 v7 (old)
Sebastian Jentsch
Price comparison

