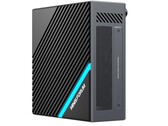
Kingston OM8PDP3512B-AI1
The Kingston OM8PDP3512B-AI1 is an entry level PCIe Gen.3 NVMe SSD for system designers and builders. It offers 512 GB 3D NAND flash and uses the M.2 2280 form factor. It should be similar to the Kingston OM8PDP3512B-A01 that is listed on the Kingston website.
| Type | SSD |
| Size | M.2 2280 |
| Capacity | 512 GB |
| Interface | NVMe |
| Announced | 12.09.2021 |
Benchmarks
Performance Rating - DiskSpd
16.2 pt (18%)
Seagate ST1000LM014 Solid State Hybrid Drive
...
AirDisk AFF 10-512G
Kingston OM8PCP3512F-AB
Kingston OM8PDP3512B-AI1
Kingston OM8PDP3256B
Samsung PM991 MZVLQ512HBLU
Samsung PM991 MZALQ256HAJD
...
Kingston Fury Renegade G5 8TB
0%
100%
AS SSD - Copy Game
min: 284.2 avg: 340.2 median: 322 (5%) max: 414.46 MB/s
AS SSD - Copy Program
min: 282.3 avg: 340.7 median: 361.4 (13%) max: 378.31 MB/s
AS SSD - Copy ISO
min: 278.1 avg: 977 median: 1018.2 (4%) max: 1635.71 MB/s
AS SSD - Score Total
min: 1033 avg: 1922 median: 1967 (12%) max: 2722 Points
AS SSD - Score Write
min: 387 avg: 754 median: 689 (10%) max: 1251 Points
AS SSD - Score Read
min: 478 avg: 804 median: 865.5 (14%) max: 1007 Points
AS SSD - Access Time Write *
min: 0.029 avg: 0.1 median: 0 (0%) max: 0.353 ms
AS SSD - Access Time Read *
min: 0 avg: 0.1 median: 0.1 (0%) max: 0.15 ms
AS SSD - 4K-64 Write
min: 242.8 avg: 580 median: 546.1 (9%) max: 984.11 MB/s
AS SSD - 4K-64 Read
min: 256.5 avg: 574 median: 633.9 (12%) max: 772.77 MB/s
AS SSD - 4K Write
min: 57.24 avg: 98.4 median: 92.1 (18%) max: 152.35 MB/s
AS SSD - 4K Read
min: 24.04 avg: 38.8 median: 36.7 (12%) max: 57.87 MB/s
AS SSD - Sequential Write
min: 308.3 avg: 759 median: 790.7 (7%) max: 1145 MB/s
AS SSD - Sequential Read
min: 1451 avg: 1910 median: 1942.8 (15%) max: 2303.9 MB/s
CrystalDiskMark 3.0 - 4K QD32 Write
min: 483.9 avg: 490 median: 490 (46%) max: 496 MB/s
CrystalDiskMark 3.0 - 4K QD32 Read
min: 546.8 avg: 587 median: 586.9 (45%) max: 627 MB/s
CrystalDiskMark 3.0 - 4K Write
min: 161.9 avg: 188.4 median: 188.4 (6%) max: 214.9 MB/s
CrystalDiskMark 3.0 - 4K Read
min: 45.02 avg: 47.1 median: 47.1 (1%) max: 49.18 MB/s
CrystalDiskMark 3.0 - 512K Write
min: 1143 avg: 1148 median: 1147.5 (12%) max: 1152 MB/s
CrystalDiskMark 3.0 - 512K Read
min: 1331 avg: 1346 median: 1346 (28%) max: 1361 MB/s
CrystalDiskMark 3.0 - Sequential Write
min: 1184 avg: 1187 median: 1186.5 (11%) max: 1189 MB/s
CrystalDiskMark 3.0 - Sequential Read
min: 1738 avg: 1780 median: 1779.5 (20%) max: 1821 MB/s
CrystalDiskMark 5.2 / 6 - CDM 5/6 Write 4K
min: 114.2 avg: 176.8 median: 149.9 (14%) max: 293.1 MB/s
CrystalDiskMark 5.2 / 6 - CDM 5/6 Read 4K
min: 31.31 avg: 47.9 median: 49.1 (1%) max: 62.1 MB/s
CrystalDiskMark 5.2 / 6 - CDM 5 Write Seq
min: 459.3 avg: 942 median: 1059.3 (6%) max: 1191 MB/s
CrystalDiskMark 5.2 / 6 - CDM 5 Read Seq
min: 838.3 avg: 1424 median: 1532.5 (17%) max: 1792 MB/s
CrystalDiskMark 5.2 / 6 - CDM 5/6 Write 4K Q32T1
min: 220.3 avg: 369.4 median: 379 (8%) max: 499.4 MB/s
CrystalDiskMark 5.2 / 6 - CDM 5/6 Read 4K Q32T1
min: 316.2 avg: 508 median: 498.3 (7%) max: 719 MB/s
CrystalDiskMark 5.2 / 6 - CDM 5/6 Write Seq Q32T1
min: 436 avg: 1022 median: 1213 (8%) max: 1227.2 MB/s
CrystalDiskMark 5.2 / 6 - CDM 5/6 Read Seq Q32T1
min: 2222 avg: 2460 median: 2532.3 (14%) max: 2554.3 MB/s
CrystalDiskMark 5.2 / 6 - CDM 6 Write 4K Q8T8
min: 1045.2 avg: 1069 median: 1068.6 (21%) max: 1092 MB/s
CrystalDiskMark 5.2 / 6 - CDM 6 Read 4K Q8T8
min: 841 avg: 849 median: 849.2 (13%) max: 857.4 MB/s
PCMark 8 - PCMark 8 Storage v2
4920 Points (96%)
DiskSpd - DiskSpd 4k_q1t1_write
min: 114 avg: 165.4 median: 160 (37%) max: 218 MB/s
DiskSpd - DiskSpd 4k_q1t1_read
min: 29.9 avg: 36 median: 35.6 (10%) max: 44.4 MB/s
DiskSpd - DiskSpd 4k_q32t16_write
min: 293 avg: 686 median: 688 (10%) max: 1032 MB/s
DiskSpd - DiskSpd 4k_q32t16_read
min: 395 avg: 628 median: 672 (8%) max: 803 MB/s
DiskSpd - DiskSpd seq_write
min: 551 avg: 1037 median: 1157 (11%) max: 1185 MB/s
DiskSpd - DiskSpd seq_read
min: 1116 avg: 1447 median: 1459.5 (17%) max: 1713 MB/s
DiskSpd - DiskSpd seq_q8t1_write
min: 553 avg: 1083 median: 1194 (8%) max: 1210 MB/s
DiskSpd - DiskSpd seq_q8t1_read
min: 1679 avg: 2160 median: 2180.5 (14%) max: 2531 MB/s
DiskSpd - DiskSpd Loop seq_q8t1_read
min: 1905 avg: 2145 median: 2160.5 (13%) max: 2353 MB/s
- Range of benchmark values
- Average benchmark values
* Smaller numbers mean a higher performance
v1.35
Notebook reviews with Kingston OM8PDP3512B-AI1

Minisforum is already well known to many as a manufacturer of Mini PCs. But up until now its portfolio hasn't included a really powerful gaming PC. The Minisforum EliteMini B550 is about to change that. Your choice of dedicated graphics card allows you to determine graphics performance.
AMD Ryzen 7 5700G, Vega 8, 1.1 kg
Geekom Mini IT8 SFF desktop hands-on
The Geekom Mini IT8 is a compact desktop. Despite its tiny footprint, it packs some decent power thanks to its quad-core CPU and Intel Iris Plus Graphics 655 iGPU. However, its older chipset limits its capabilities, particularly with regard to gaming.
Intel Core i5-8259U, Iris Plus Graphics 655, 586 g
Acer Swift 3 SF314 in review: No flight of fancy for the AMD laptop
AMD-equipped subnotebooks are often more powerful than corresponding Intel variants today. We take a look at the Acer Swift 3, the current entry-level model with a Ryzen 5 5500U and an integrated graphics card. The processor seems like a good choice but is it also convincing in practice?
AMD Ryzen 5 5500U, Vega 7, 14", 1.3 kg
Minisforum EliteMini TH50 Review: Compact desktop PC for everyday office use
Minisforum offers a rock-solid Intel-based work PC with the compact EliteMini TH50. Thanks to Thunderbolt, the range of applications has been expanded considerably. In this review, we will find out what this small computing powerhouse has to offer.
Intel Core i5-11320H, Iris Xe G7 96EUs, 763 g
MSI Katana GF66 11UG review: A gaming laptop with wasted potential
Despite being equipped with top hardware, this is what the MSI Katana GF66 delivers. After several benchmarks in our test, the question presents itself whether MSI cut corners in the wrong places. The Nvidia GeForce RTX 3070 and the Intel Core i7-11800H are unable to make use of their full performance potential.
Intel Core i7-11800H, NVIDIA GeForce RTX 3070 Laptop GPU, 15.6", 2.3 kgAcer Swift 3 SF314-43-R8BP: AMD Ryzen 5 5500U AMD Radeon RX Vega 7, 14.00", 1.3 kg
External Review » Acer Swift 3 SF314-43-R8BP
MSI Katana GF66 11UG-220: Intel Core i7-11800H NVIDIA GeForce RTX 3070 Laptop GPU, 15.60", 2.3 kg
External Review » MSI Katana GF66 11UG-220
» MSI Katana GF66: The gaming laptop wastes a lot of potential