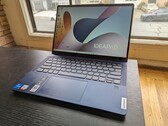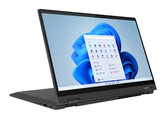

Lenovo ThinkPad L13 Yoga G4 Intel convertible review: Shorter battery life than AMD
The ThinkPad L13 Yoga G4 comes with both Intel and AMD options. Intel offers better single-thread performance and Thunderbolt support as expected, but expect louder fans and shorter runtimes than the AMD alternative.
Intel Core i7-1355U, Iris Xe G7 96EUs, 13.3", 1.4 kg