Notebookcheck Logo

Micron 2210 MTFDHBA1T0QFD

Micron 2210 MTFDHBA1T0QFD 2210 1TB

The Micron 2210 1TB M.2 MTFDHBA1T0QFD is a mid range PCIe SSD in M.2 2280 format. It uses 3D-NAND QLC from Micron (64 Layer Generation 2) and is specified at 2200 MB/s read and 1800 MB/s write. The power consumption is specified at 0.0025W sleep,  0.4W idle and 4W in use. The MTBF is 2 Mio. hours and 360 TB TBW.

TypeSSD
SizeM.2 2280
Capacity1024 GB
InterfaceNVMe
Announced26.01.2021

Benchmarks

Performance Rating - DiskSpd
23.1 pt (35%)
64 GB eMMC Flash
2.27 -90%
...
22.8 -1%
22.8 -1%
Samsung PM991a MZ9LQ1T0HBLB-00BKN
22.9 -1%
WDC PC SN540 SDDPNPF-512G
22.9 -1%
Kingston OM8PCP31024F
22.9 -1%
23 0%
23 0%
23 0%
Samsung SSD PM981 MZVLB256HAHQ
23 0%
Micron 2210 MTFDHBA1T0QFD
23.1
23.1 0%
23.1 0%
23.3 1%
23.4 1%
Kingston KC3000 2048G SKC3000D2048G
23.4 1%
23.4 1%
23.4 1%
SK Hynix HFS512 GDE9X081N
23.4 1%
23.5 2%
...
66.5 188%
0%
100%
AS SSD - Copy Game
min: 1000     avg: 1285     median: 1400 (23%)     max: 1454.54 MB/s
AS SSD - Copy Program
min: 351.6     avg: 552     median: 643 (24%)     max: 662.67 MB/s
AS SSD - Copy ISO
min: 1837     avg: 1920     median: 1895.3 (17%)     max: 2029 MB/s
AS SSD - Score Total
min: 2950     avg: 3136     median: 3143 (29%)     max: 3300 Points
AS SSD - Score Write
min: 1168     avg: 1368     median: 1367 (24%)     max: 1546 Points
AS SSD - Score Read
min: 1157     avg: 1164     median: 1166 (4%)     max: 1170 Points
AS SSD - Access Time Write *
min: 0.031     avg: 0     median: 0 (0%)     max: 0.032 ms
AS SSD - Access Time Read *
min: 0.071     avg: 0.1     median: 0.1 (0%)     max: 0.109 ms
AS SSD - 4K-64 Write
min: 793.58     avg: 1039     median: 1028 (20%)     max: 1235 MB/s
AS SSD - 4K-64 Read
min: 895     avg: 900     median: 901 (27%)     max: 904 MB/s
AS SSD - 4K Write
min: 127.7     avg: 146.4     median: 130.2 (25%)     max: 189.63 MB/s
AS SSD - 4K Read
min: 55.2     avg: 62.5     median: 61.9 (20%)     max: 70.6 MB/s
AS SSD - Sequential Write
min: 1781     avg: 1826     median: 1834 (16%)     max: 1850 MB/s
AS SSD - Sequential Read
min: 1994     avg: 2012     median: 2016 (16%)     max: 2023 MB/s
CrystalDiskMark 3.0 - 4K QD32 Write
407.5 MB/s (40%)
CrystalDiskMark 3.0 - 4K QD32 Read
680 MB/s (53%)
CrystalDiskMark 3.0 - 4K Write
219.6 MB/s (25%)
CrystalDiskMark 3.0 - 4K Read
79.6 MB/s (1%)
CrystalDiskMark 3.0 - 512K Write
1171 MB/s (27%)
CrystalDiskMark 3.0 - 512K Read
1282 MB/s (37%)
CrystalDiskMark 3.0 - Sequential Write
1881 MB/s (33%)
CrystalDiskMark 3.0 - Sequential Read
1735 MB/s (34%)
CrystalDiskMark 5.2 / 6 - CDM 5/6 Write 4K
min: 86.8     avg: 148.7     median: 136.2 (12%)     max: 229.5 MB/s
CrystalDiskMark 5.2 / 6 - CDM 5/6 Read 4K
min: 59     avg: 68.5     median: 66.4 (2%)     max: 79.69 MB/s
CrystalDiskMark 5.2 / 6 - CDM 5 Write Seq
min: 885     avg: 1675     median: 1851 (10%)     max: 1902 MB/s
CrystalDiskMark 5.2 / 6 - CDM 5 Read Seq
min: 1659     avg: 1710     median: 1714 (21%)     max: 1740 MB/s
CrystalDiskMark 5.2 / 6 - CDM 5/6 Write 4K Q32T1
min: 344.2     avg: 441.8     median: 456 (15%)     max: 542 MB/s
CrystalDiskMark 5.2 / 6 - CDM 5/6 Read 4K Q32T1
min: 549     avg: 614     median: 589 (9%)     max: 677.4 MB/s
CrystalDiskMark 5.2 / 6 - CDM 5/6 Write Seq Q32T1
min: 1874     avg: 1944     median: 1960 (13%)     max: 1977.5 MB/s
CrystalDiskMark 5.2 / 6 - CDM 5/6 Read Seq Q32T1
min: 1966     avg: 2120     median: 2118 (11%)     max: 2227 MB/s
CrystalDiskMark 5.2 / 6 - CDM 6 Write 4K Q8T8
min: 1109.8     avg: 1198     median: 1197.9 (24%)     max: 1286 MB/s
CrystalDiskMark 5.2 / 6 - CDM 6 Read 4K Q8T8
min: 956     avg: 958     median: 958.4 (14%)     max: 960.7 MB/s
PCMark 8 - PCMark 8 Storage v2
5074 Points (99%)
DiskSpd - DiskSpd 4k_q1t1_write
min: 84.3     avg: 168.5     median: 146 (34%)     max: 303 MB/s
DiskSpd - DiskSpd 4k_q1t1_read
min: 51.4     avg: 64.4     median: 61.6 (18%)     max: 82.4 MB/s
DiskSpd - DiskSpd 4k_q32t16_write
min: 594     avg: 1084     median: 1232 (25%)     max: 1289 MB/s
DiskSpd - DiskSpd 4k_q32t16_read
min: 419     avg: 848     median: 961 (16%)     max: 968 MB/s
DiskSpd - DiskSpd seq_write
min: 882     avg: 1693     median: 1891 (21%)     max: 1925 MB/s
DiskSpd - DiskSpd seq_read
min: 882     avg: 1377     median: 1519 (22%)     max: 1725 MB/s
DiskSpd - DiskSpd seq_q8t1_write
min: 923     avg: 1763     median: 1960 (13%)     max: 1995 MB/s
DiskSpd - DiskSpd seq_q8t1_read
min: 970     avg: 1767     median: 1825 (11%)     max: 2238 MB/s
DiskSpd - DiskSpd Loop seq_q8t1_read
min: 985     avg: 1478     median: 1469 (9%)     max: 2238 MB/s
010020030040050060070080090010001100120013001400150016001700Tooltip
- Range of benchmark values for this graphics card
- Average benchmark values for this graphics card
* Smaller numbers mean a higher performance

Add one or more devices and compare

In the following list you can select (and also search for) devices that should be added to the comparison. You can select more than one device.

restrict list:

show all (including archived), 2024, 2023
v1.26
log 17. 04:31:06

#0 no ids found in url (should be separated by "_") +0s ... 0s

#1 not redirecting to Ajax server +0s ... 0s

#2 did not recreate cache, as it is less than 5 days old! Created at Tue, 12 Mar 2024 16:12:25 +0100 +0.001s ... 0.001s

#3 composed specs +0.006s ... 0.007s

#4 did output specs +0s ... 0.007s

#5 getting avg benchmarks for device 3614 +0.02s ... 0.026s

#6 got single benchmarks 3614 +0.02s ... 0.046s

#7 got avg benchmarks for devices +0s ... 0.046s

#8 min, max, avg, median took s +1.429s ... 1.475s

#9 return log +0.013s ... 1.488s

Notebook reviews with Micron 2210 MTFDHBA1T0QFD

Acer Predator Orion 3000 PO3-640 (Source: Acer)

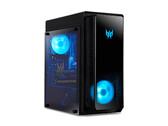
Acer Predator Orion 3000 desktop PC with Core i7-12700F and RTX 3070 in review

Acer carries its gaming devices under the pseudonym Predator, both in laptops and desktop systems. We took a closer look at the Predator Orion 3000 based on a C...
Intel Core i7-12700F | NVIDIA GeForce RTX 3070 | | 7.4 kg
MSI Alpha 15 with Ryzen 5 5800H and Radeon RX 6600M AMD Advantage review

MSI Alpha 15 Gaming Laptop Review: Ryzen 7 5800H and Radeon RX 6600M augur well for mainstream 1080p gaming

The MSI Alpha 15 is one among the handful of AMD Advantage gaming laptops available. Powered by the Ryzen 7 5800H and Radeon RX 6600M, the Alpha 15 comes with t...
AMD Ryzen 7 5800H | AMD Radeon RX 6600M | 15.60" | 2.4 kg
Acer Swift 3X laptop in review: Intel Iris Xe MAX combines high battery life and gaming performance

Acer Swift 3X laptop in review: Intel Iris Xe MAX combines high battery life and gaming performance

Acer's Swift 3 series offers decent multimedia laptops. The Swift 3X comes with a dedicated GPU in addition to the iGPU. This provides solid performance for the...
Intel Core i7-1165G7 | Intel Iris Xe MAX Graphics | 14.00" | 1.4 kg
MSI Delta 15 gaming laptop review: The Radeon RX 6700M makes its debut

MSI Delta 15 gaming laptop review: The Radeon RX 6700M makes its debut

While AMD has been right at the forefront of mobile processors for quite some time, things have looked rather gloomy in recent years when it comes to their mobi...
AMD Ryzen 9 5900HX | AMD Radeon RX 6700M | 15.60" | 2 kg
Acer Aspire 5 A515-56-511A

Acer Aspire 5 A515 in review: A look at a Tiger Lake laptop

The exterior of the Aspire 5 A515 has remained in line with its predecessors but now contains a Tiger Lake CPU. Find out how this processor fares in everyday us...
Intel Core i5-1135G7 | Intel Iris Xe Graphics G7 80EUs | 15.60" | 1.9 kg

MSI Alpha 15 B5EEK-008: AMD Ryzen 7 5800H AMD Radeon RX 6600M, 15.60", 2.4 kg
  External Review » MSI Alpha 15 B5EEK-008

MSI Delta 15 A5EFK: AMD Ryzen 9 5900HX AMD Radeon RX 6700M, 15.60", 2 kg
  External Review » MSI Delta 15 A5EFK

MSI Alpha 15 B5EEK-008: AMD Ryzen 7 5800H AMD Radeon RX 6600M, 15.60", 2.4 kg
  External Review » MSI Alpha 15 B5EEK-008

Acer Swift 3X SF314-510G-70DW: Intel Core i7-1165G7 Intel Iris Xe MAX Graphics, 14.00", 1.4 kg
  External Review » Acer Swift 3X SF314-510G-70DW

Acer Aspire 5 A515-56-511A: Intel Core i5-1135G7 Intel Iris Xe Graphics G7 80EUs, 15.60", 1.9 kg
  External Review » Acer Aspire 5 A515-56-511A

Acer Swift 3X SF314-510G-70DW: Intel Core i7-1165G7 Intel Iris Xe MAX Graphics, 14.00", 1.4 kg
   » The Acer Swift 3X impresses with 18 hours of battery life and solid gaming performance in our review

MSI Delta 15 A5EFK: AMD Ryzen 9 5900HX AMD Radeon RX 6700M, 15.60", 2 kg
   » MSI Delta 15: AMD takes the gloves off with the Radeon RX 6700M

Acer Aspire 5 A515-56-511A: Intel Core i5-1135G7 Intel Iris Xe Graphics G7 80EUs, 15.60", 1.9 kg
   » Acer Aspire 5 with Tiger Lake: A notebook like many others

Please share our article, every link counts!
> Expert Reviews and News on Laptops, Smartphones and Tech Innovations > Benchmarks / Tech > Laptop harddisks (HDD, SSD) benchmarks > Micron 2210 MTFDHBA1T0QFD SSD Benchmarks
Klaus Hinum (Update: 2021-01-26)