Notebook reviews with SK hynix PC801 HFS001TEJ9X101N
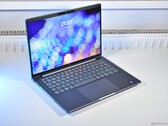
HP OmniBook 7 Aero 13 review: World's lightest 13-inch laptop with over 40 TOPS NPU
The OmniBook 7 Aero 13 is an almost ideal subnotebook for constant travelers who want to carry as light as possible without sacrificing too much in terms of performance or quality. The AMD Zen 5 CPU in particular is excellent considering the size and weight of the system.
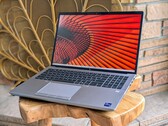
AMD Ryzen AI 7 350, Radeon 860M, 13.3", 1 kgCompact 14-inch workstation with professional RTX – HP ZBook 8 G1i 14 review
Compact but powerful, the HP ZBook 8 G1i pairs a professional Nvidia GPU with a hefty 64 GB of RAM. We tested how much performance this small workstation can really deliver.
Intel Core Ultra 7 265H, NVIDIA RTX 500 Ada Generation Laptop, 14", 1.7 kgThe Firefly successor that bets on Intel ARC: HP ZBook 8 G1i 14 laptop review
With the 2025 generation, HP retires its ZBook Firefly branding, instead selling the HP ZBook 8 G1i 14 as its affordable workstation laptop. The newest version uses Intel Arrow Lake H and our particular model does not have a Nvidia GPU - can the experiment with using just Intel graphics work?
Intel Core Ultra 7 255H, Arc 140T, 14", 1.7 kgFirst serious 14-inch workstation laptop thanks to Strix Halo: HP ZBook Ultra G1a review
HP's ZBook Ultra G1a 14 is among the most expensive current 14-inch laptops in the Windows market, but also one of the most interesting ones. With Strix Halo, it takes on the workstation market with a unique concept. In this review, we are taking a look at the WUXGA and Ryzen AI Max Pro 390 version.
AMD Ryzen AI Max PRO 390, Radeon 8050S, 14", 1.6 kgNvidia RTX 3500 Ada performance debut: HP ZBook Fury 16 G11 workstation review
The ZBook Fury 16 series has been updated with new Raptor Lake-HX processor options for faster performance. The difference, however, is smaller than we would like to be mostly unnoticeable for most scenarios.
Intel Core i9-14900HX, NVIDIA RTX 3500 Ada Generation Laptop, 16", 2.6 kgLG gram Pro 2-in-1 16T90SP: Intel Core Ultra 7 155H Intel Arc 8-Core iGPU, 16.00", 1.4 kg
Review » LG gram Pro 2-in-1 16T90SP review - Light and powerful
HP Spectre x360 16 RTX 4050: Intel Core Ultra 7 155H NVIDIA GeForce RTX 4050 Laptop GPU, 16.00", 2 kg
Review » HP Spectre x360 16 convertible review: Now with 55 W GeForce RTX 4050 graphics
HP EliteBook 865 G10: AMD Ryzen 9 PRO 7940HS AMD Radeon 780M, 16.00", 1.9 kg
Review » HP EliteBook 865 G10 laptop review - Capable business laptop ruined by Sure View
HP Omen 16 (2024): Intel Core i9-14900HX NVIDIA GeForce RTX 4080 Laptop GPU, 16.10", 2.4 kg
Review » HP Omen 16 (2024) review: QHD gaming notebook with Core i9 and RTX 4080 for €3,200
Lenovo ThinkPad P16v G1 AMD: AMD Ryzen 7 PRO 7840HS NVIDIA RTX A1000 Laptop GPU, 16.00", 2.3 kg
Review » Lenovo ThinkPad P16v G1 AMD review - Entry-level workstation with Zen4
HP Pavilion Plus 14-ew0153TU: Intel Core i7-1355U Intel Iris Xe Graphics G7 96EUs, 14.00", 1.4 kg
Review » HP Pavilion Plus 14 Core i7 Review: Intel Raptor Lake or AMD Zen 4? The choice is clear
HP ZBook Fury 16 G10: Intel Core i9-13950HX NVIDIA RTX 5000 Ada Generation Laptop, 16.00", 2.6 kg
Review » HP ZBook Fury 16 G10 mobile workstation review: 100 W Nvidia RTX 5000 Ada
LG Gram Style 14Z90RS-G.AD7AG: Intel Core i7-1360P Intel Iris Xe Graphics G7 96EUs, 14.00", 1 kg
Review » LG Gram Style 14 laptop review: Elegant, fast, and (too) hot
Asus ROG Strix Scar 17 G733PYV-LL053X: AMD Ryzen 9 7945HX3D NVIDIA GeForce RTX 4090 Laptop GPU, 17.30", 2.9 kg
Review » Asus ROG Strix SCAR 17 X3D review - The world's fastest gaming laptop
Review » AMD Ryzen 9 7945HX3D Zen4 analysis - The fastest mobile gaming processor thanks to 3D V-Cache
HP EliteBook 845 G10 818N0EA: AMD Ryzen 9 PRO 7940HS AMD Radeon 780M, 14.00", 1.5 kg
Review » HP EliteBook 845 G10 review: The almost perfect business laptop with AMD Zen4
LG Gram SuperSlim (2023): Intel Core i7-1360P Intel Iris Xe Graphics G7 96EUs, 15.60", 1 kg
Review » LG Gram SuperSlim (2023) review: 990 gram laptop with long battery life and OLED display
Alienware x16 R1: Intel Core i9-13900HK NVIDIA GeForce RTX 4080 Laptop GPU, 16.00", 2.6 kg
Review » Intel Core i9-13900HK performance debut: Alienware x16 R1 laptop review
Dell XPS 17 9730 RTX 4070: Intel Core i7-13700H NVIDIA GeForce RTX 4070 Laptop GPU, 17.00", 2.5 kg
Review » Dell XPS 17 9730 laptop review: GeForce RTX 4070 multimedia monster
Dell XPS 15 9530 RTX 4070: Intel Core i7-13700H NVIDIA GeForce RTX 4070 Laptop GPU, 15.60", 1.9 kg
Review » Dell XPS 15 9530 RTX 4070 laptop review: Both impressive and underwhelming
Asus ROG Strix Scar 17 G733PY-XS96: AMD Ryzen 9 7945HX NVIDIA GeForce RTX 4090 Laptop GPU, 17.30", 2.9 kg
Review » Asus ROG Strix Scar 17 G733PY laptop review: Intel is no longer king
Alienware m18 R1: Intel Core i9-13980HX NVIDIA GeForce RTX 4090 Laptop GPU, 18.00", 3.9 kg
Review » Alienware m18 R1 laptop review: Bigger and heavier than the MSI Titan GT77
HP Omen 17-ck2097ng: Intel Core i9-13900HX NVIDIA GeForce RTX 4080 Laptop GPU, 17.30", 2.8 kg
Review » HP Omen 17 (2023) review: Gaming laptop uses RTX 4080
HP ZBook 8 G1i 14, RTX 500: Intel Core Ultra 7 265H NVIDIA RTX 500 Ada Generation Laptop, 14.00", 1.7 kg
External Review » HP ZBook 8 G1i 14, RTX 500
HP OmniBook 7 Aero 13-bg1077nr: AMD Ryzen AI 7 350 AMD Radeon 860M, 13.30", 1 kg
External Review » HP OmniBook 7 Aero 13-bg1077nr
HP ZBook Fury 16 G11: Intel Core i9-14900HX NVIDIA RTX 3500 Ada Generation Laptop, 16.00", 2.6 kg
External Review » HP ZBook Fury 16 G11
HP Omen 16 (2024): Intel Core i9-14900HX NVIDIA GeForce RTX 4080 Laptop GPU, 16.10", 2.4 kg
External Review » HP Omen 16 (2024)
LG gram Pro 2-in-1 16T90SP: Intel Core Ultra 7 155H Intel Arc 8-Core iGPU, 16.00", 1.4 kg
External Review » LG gram Pro 2-in-1 16T90SP
HP EliteBook 865 G10: AMD Ryzen 9 PRO 7940HS AMD Radeon 780M, 16.00", 1.9 kg
External Review » HP EliteBook 865 G10
HP Spectre x360 16 RTX 4050: Intel Core Ultra 7 155H NVIDIA GeForce RTX 4050 Laptop GPU, 16.00", 2 kg
External Review » HP Spectre x360 16 RTX 4050
HP ZBook Fury 16 G10: Intel Core i9-13950HX NVIDIA RTX 5000 Ada Generation Laptop, 16.00", 2.6 kg
External Review » HP ZBook Fury 16 G10
HP Pavilion Plus 14-ew0153TU: Intel Core i7-1355U Intel Iris Xe Graphics G7 96EUs, 14.00", 1.4 kg
External Review » HP Pavilion Plus 14-ew0153TU
LG Gram Style 14Z90RS-G.AD7AG: Intel Core i7-1360P Intel Iris Xe Graphics G7 96EUs, 14.00", 1 kg
External Review » LG Gram Style 14Z90RS-G.AD7AG
LG Gram SuperSlim (2023): Intel Core i7-1360P Intel Iris Xe Graphics G7 96EUs, 15.60", 1 kg
External Review » LG Gram SuperSlim (2023)
Dell XPS 17 9730 RTX 4070: Intel Core i7-13700H NVIDIA GeForce RTX 4070 Laptop GPU, 17.00", 2.5 kg
External Review » Dell XPS 17 9730 RTX 4070
Alienware x16 R1: Intel Core i9-13900HK NVIDIA GeForce RTX 4080 Laptop GPU, 16.00", 2.6 kg
External Review » Alienware x16 R1
Dell XPS 15 9530 RTX 4070: Intel Core i7-13700H NVIDIA GeForce RTX 4070 Laptop GPU, 15.60", 1.9 kg
External Review » Dell XPS 15 9530 RTX 4070
Asus ROG Strix Scar 17 G733PY-XS96: AMD Ryzen 9 7945HX NVIDIA GeForce RTX 4090 Laptop GPU, 17.30", 2.9 kg
External Review » Asus ROG Strix Scar 17 G733PY-XS96
HP Omen 17-ck2097ng: Intel Core i9-13900HX NVIDIA GeForce RTX 4080 Laptop GPU, 17.30", 2.8 kg
External Review » HP Omen 17-ck2097ng
Alienware m18 R1: Intel Core i9-13980HX NVIDIA GeForce RTX 4090 Laptop GPU, 18.00", 3.9 kg
External Review » Alienware m18 R1
HP OmniBook 7 Aero 13-bg1077nr: AMD Ryzen AI 7 350 AMD Radeon 860M, 13.30", 1 kg
» HP OmniBook 7 Aero 13 is barely 4 months old and already almost 40 percent off
» The 1 kg HP OmniBook 7 Aero 13 is impressive, but there are some compromises
HP ZBook 8 G1i 14, RTX 500: Intel Core Ultra 7 265H NVIDIA RTX 500 Ada Generation Laptop, 14.00", 1.7 kg
» HP ZBook 8 G1i 14 – A 14-inch creator workstation with seven display options to choose from
HP ZBook 8 G1i 14: Intel Core Ultra 7 255H Intel Arc Graphics 140T, 14.00", 1.7 kg
» The return of an old standard: HP brings back the RJ45-Ethernet port to many business models
HP ZBook Ultra G1a A3ZQ0ET: AMD Ryzen AI Max PRO 390 AMD Radeon 8050S, 14.00", 1.6 kg
» 32 GB of memory is suddenly not enough: Why you should not choose less than 64 GB for AMD Strix Halo
Alienware m18 R1: Intel Core i9-13980HX NVIDIA GeForce RTX 4090 Laptop GPU, 18.00", 3.9 kg
» Certified-refurbished Acer Predator Helios 18 RTX 4080 gaming laptop with two-year warranty is now $725 off
Lenovo ThinkPad P16v G1 AMD: AMD Ryzen 7 PRO 7840HS NVIDIA RTX A1000 Laptop GPU, 16.00", 2.3 kg
» Lenovo ThinkPad P16v: Big 66% discount on 4K laptop with AMD Ryzen 7 Pro and Nvidia RTX graphics
Asus ROG Strix Scar 17 G733PY-XS96: AMD Ryzen 9 7945HX NVIDIA GeForce RTX 4090 Laptop GPU, 17.30", 2.9 kg
» ROG Strix Scar 17 with RTX 4080 Laptop GPU and Ryzen 9 7945HX CPU drops to lowest price ever on Amazon
LG Gram SuperSlim (2023): Intel Core i7-1360P Intel Iris Xe Graphics G7 96EUs, 15.60", 1 kg
» LG Gram SuperSlim with OLED display, 32 GB RAM, 2 TB storage marked down by $831
Lenovo ThinkPad P16v G1 AMD: AMD Ryzen 7 PRO 7840HS NVIDIA RTX A1000 Laptop GPU, 16.00", 2.3 kg
» Lenovo ThinkPad P16v laptop with 4K display, RTX dGPU and AMD Ryzen 7 Pro discounted by 58%
Alienware x16 R1: Intel Core i9-13900HK NVIDIA GeForce RTX 4080 Laptop GPU, 16.00", 2.6 kg
» Alienware x16 gaming laptop with Core i9, RTX 4080, 32GB RAM and 2TB SSD gets 43% discount
HP EliteBook 865 G10: AMD Ryzen 9 PRO 7940HS AMD Radeon 780M, 16.00", 1.9 kg
» HP EliteBook 865 G10 review: Why isn't the series being refreshed like HP Spectre 16?
HP Omen 16 (2024): Intel Core i9-14900HX NVIDIA GeForce RTX 4080 Laptop GPU, 16.10", 2.4 kg
» HP Omen 16 (2024): Core i9, RTX 4080, Thunderbolt 4
Dell XPS 17 9730 RTX 4070: Intel Core i7-13700H NVIDIA GeForce RTX 4070 Laptop GPU, 17.00", 2.5 kg
» Monstrous Dell XPS 17 laptop with RTX 4080, 4K display, 32GB RAM and Core i9 gets largest discount ever
Dell XPS 15 9530 RTX 4070: Intel Core i7-13700H NVIDIA GeForce RTX 4070 Laptop GPU, 15.60", 1.9 kg
» Dell XPS 15 laptop with Core i7 and Intel ARC A370M dGPU gets sweet $510 discount
HP Omen 17-ck2097ng: Intel Core i9-13900HX NVIDIA GeForce RTX 4080 Laptop GPU, 17.30", 2.8 kg
» Maxed-out HP Omen 17 with RTX 4090, Core i9, 32GB RAM and 2TB SSD gets $720 discount
Alienware x16 R1: Intel Core i9-13900HK NVIDIA GeForce RTX 4080 Laptop GPU, 16.00", 2.6 kg
» Brutally fast Alienware x16 gaming laptop with RTX 4080, 32GB RAM and Core i9 hits record-low price
HP Omen 17-ck2097ng: Intel Core i9-13900HX NVIDIA GeForce RTX 4080 Laptop GPU, 17.30", 2.8 kg
» HP OMEN 16 2023 price drops again to 120-day low at Best Buy for Ryzen 9 7940HS and RTX 4070 SKU
LG Gram Style 14Z90RS-G.AD7AG: Intel Core i7-1360P Intel Iris Xe Graphics G7 96EUs, 14.00", 1 kg
» Not matured yet: LG Gram Style 14 reviewed
Alienware m18 R1: Intel Core i9-13980HX NVIDIA GeForce RTX 4090 Laptop GPU, 18.00", 3.9 kg
» Beastly Alienware m18 with RTX 4080, i9-13900HX and 480Hz display now 25% off in Dell's gaming laptop sale
HP EliteBook 845 G10 818N0EA: AMD Ryzen 9 PRO 7940HS AMD Radeon 780M, 14.00", 1.5 kg
» AMD Zen4 for the office: HP EliteBook 845 G10 convinces with bright display and great keyboard
LG Gram SuperSlim (2023): Intel Core i7-1360P Intel Iris Xe Graphics G7 96EUs, 15.60", 1 kg
» LG Gram SuperSlim (2023): The slim laptop comes without USB-A or HDMI
Alienware x16 R1: Intel Core i9-13900HK NVIDIA GeForce RTX 4080 Laptop GPU, 16.00", 2.6 kg
» Alienware x16 offers 175 W TGP graphics while being thinner than even the Razer Blade 16, but there are some caveats
Dell XPS 15 9530 RTX 4070: Intel Core i7-13700H NVIDIA GeForce RTX 4070 Laptop GPU, 15.60", 1.9 kg
» Dell XPS 15 9530 comes with 40 W to 50 W TGP GeForce RTX 4070 graphics
HP Omen 17-ck2097ng: Intel Core i9-13900HX NVIDIA GeForce RTX 4080 Laptop GPU, 17.30", 2.8 kg
» 2023 HP Omen 17 gaming laptop with RTX 4080 and Core i7-13700HX gets notable discount in Easter sale
Alienware m18 R1: Intel Core i9-13980HX NVIDIA GeForce RTX 4090 Laptop GPU, 18.00", 3.9 kg
» Razer is ahead of the curve when it comes to small and compact 330 W AC adapters
HP Omen 17-ck2097ng: Intel Core i9-13900HX NVIDIA GeForce RTX 4080 Laptop GPU, 17.30", 2.8 kg
» HP Omen 17 (2023): QHD gaming laptop with RTX 4080 allows CPU undervolting