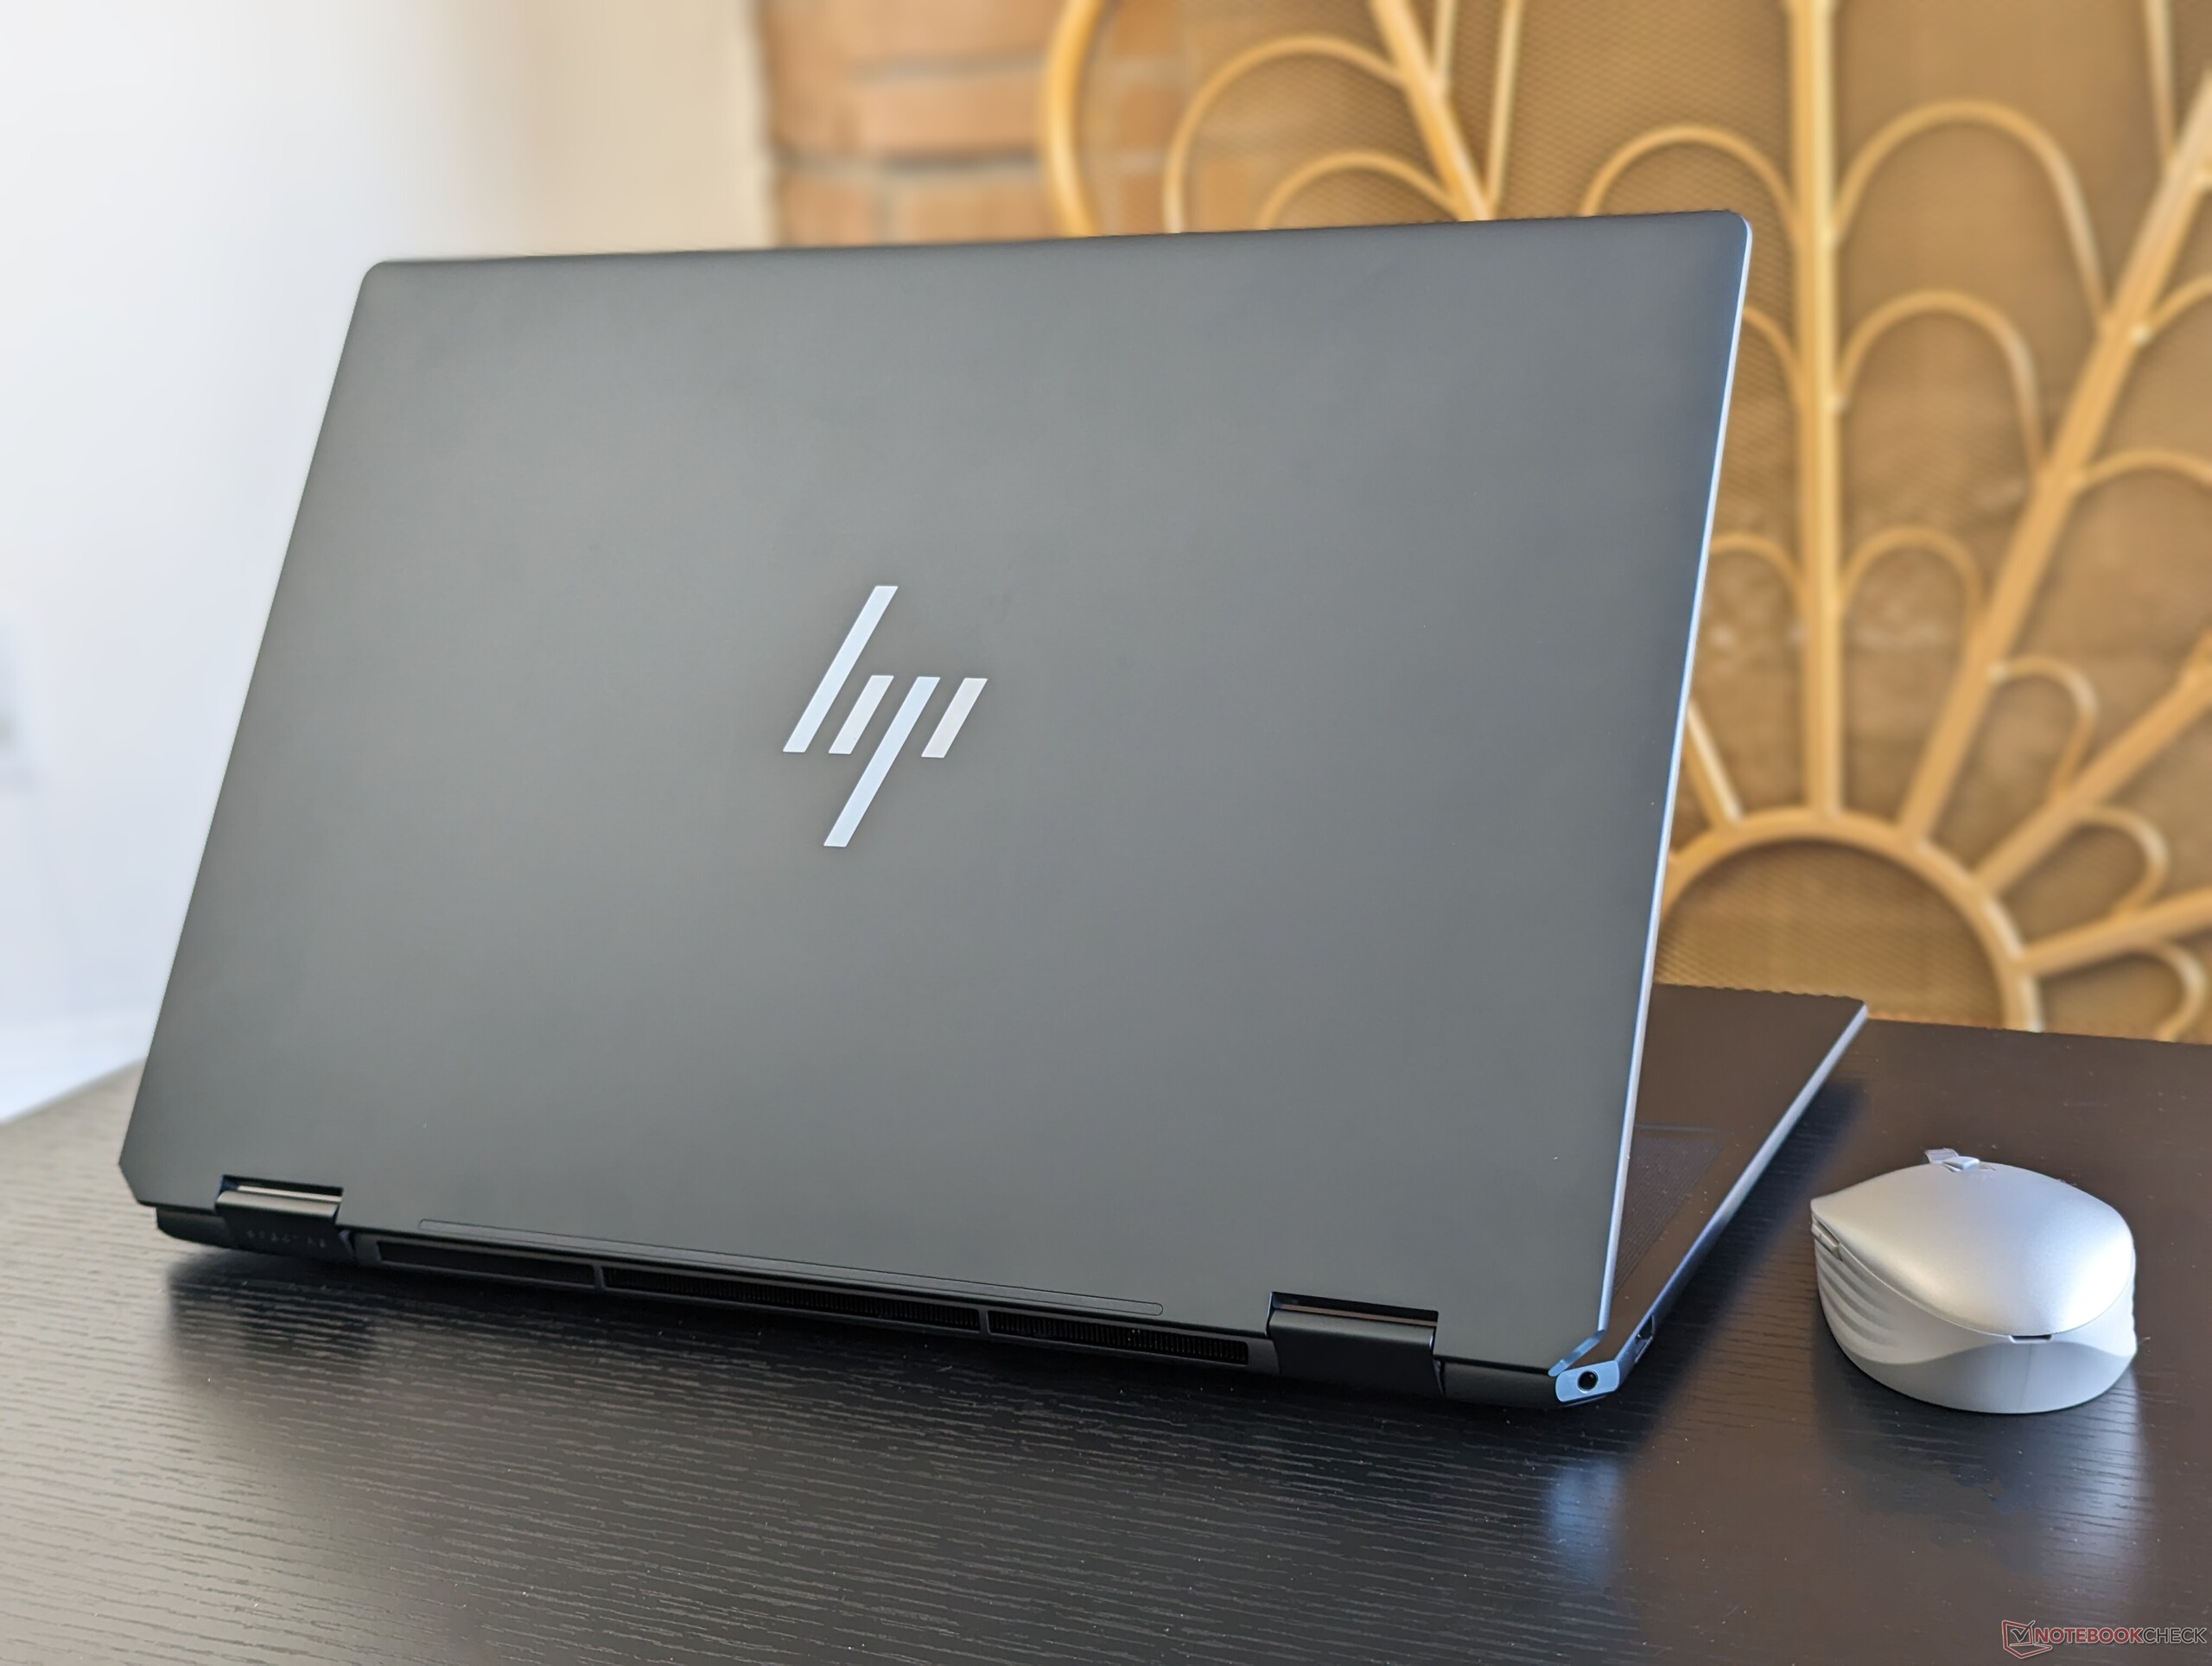
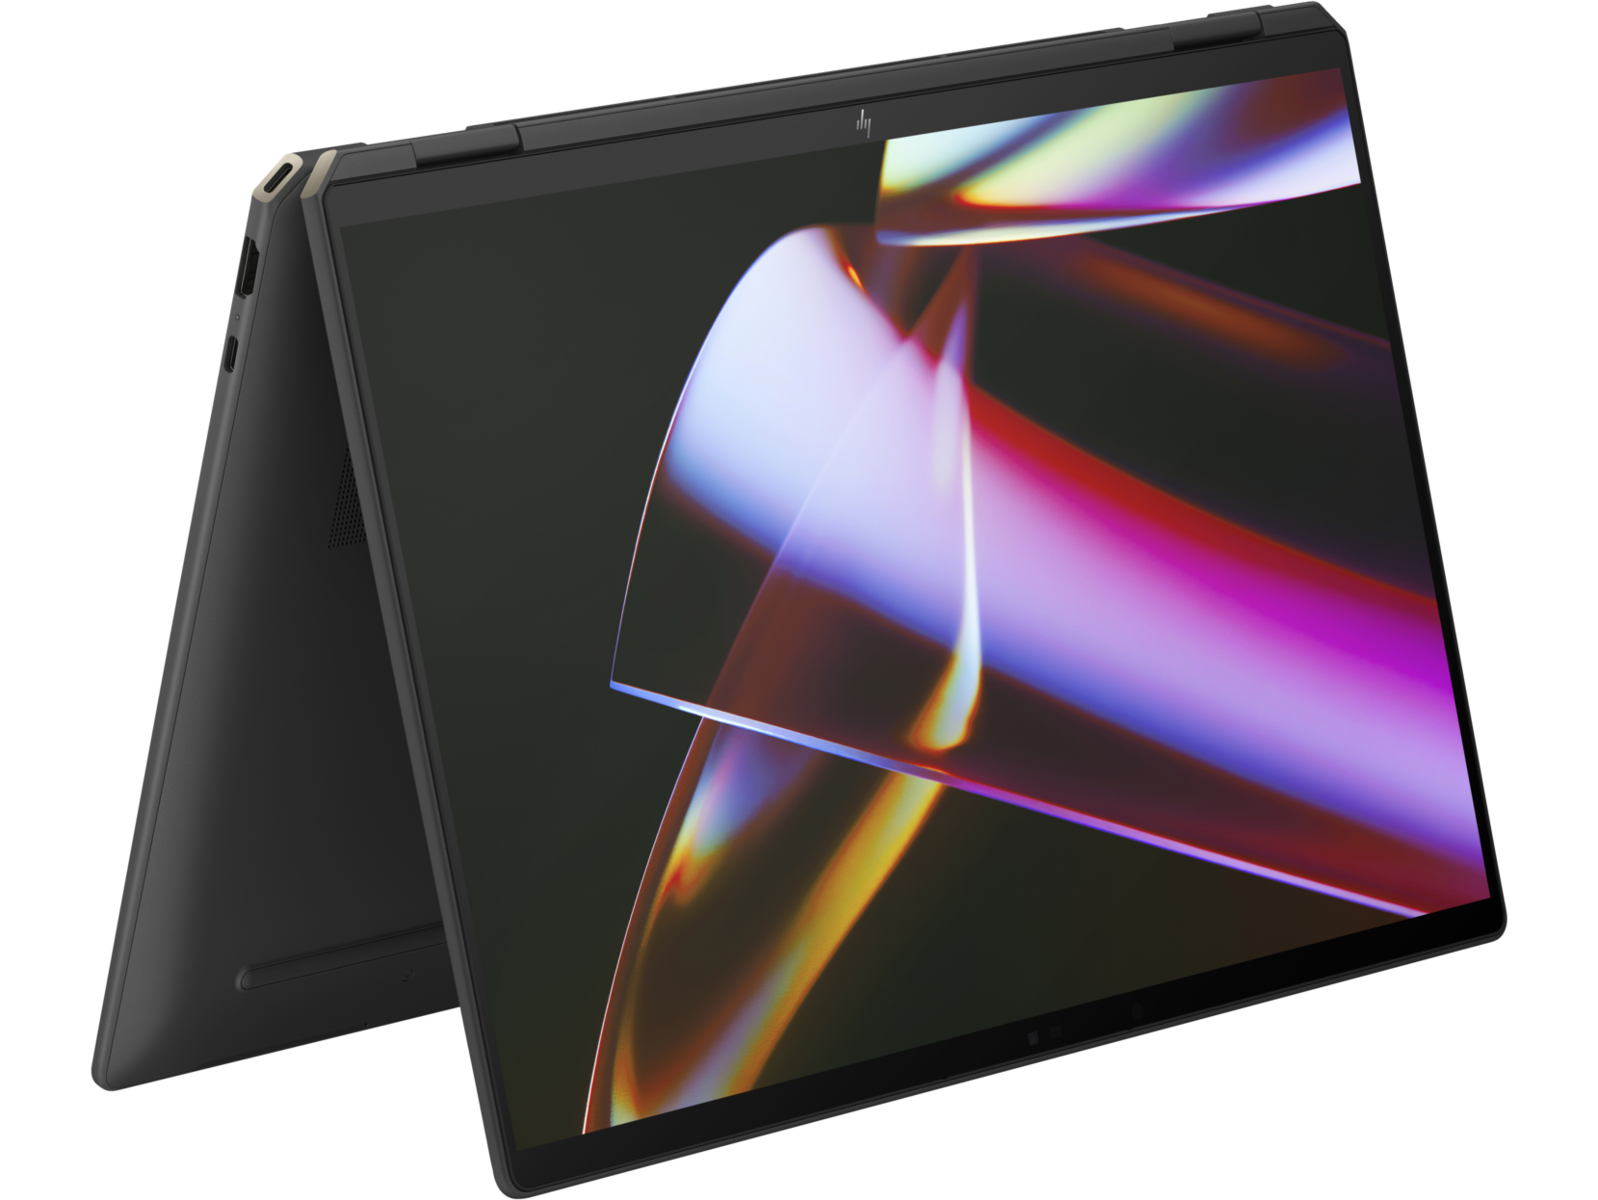
HP Spectre x360 16 convertible review: Now with 55 W GeForce RTX 4050 graphics

After recently reviewing the iGPU version of the new Spectre x360 16, we're now ready to check out the GeForce RTX configuration of the same model. Essentially everything else about the laptop remains identical between the two configurations and so we recommend checking out our existing review on the iGPU SKU to learn more about the physical features of the convertible laptop.
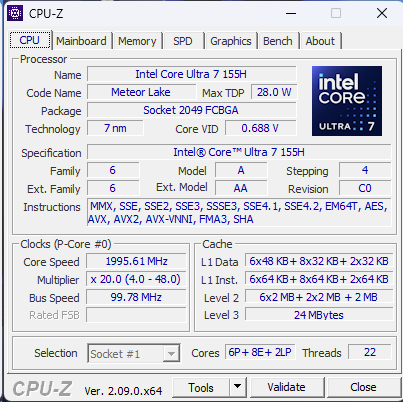
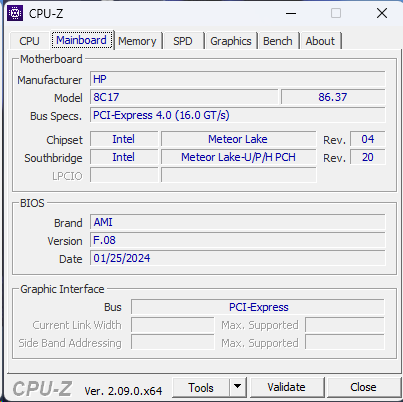
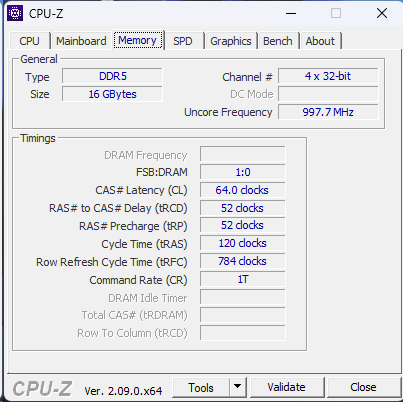
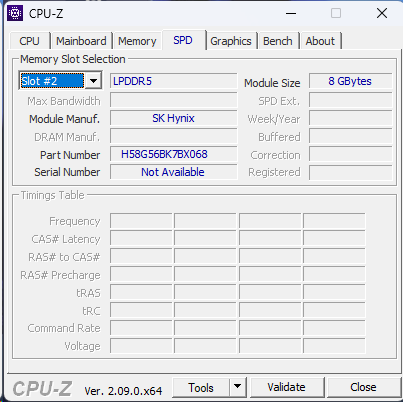
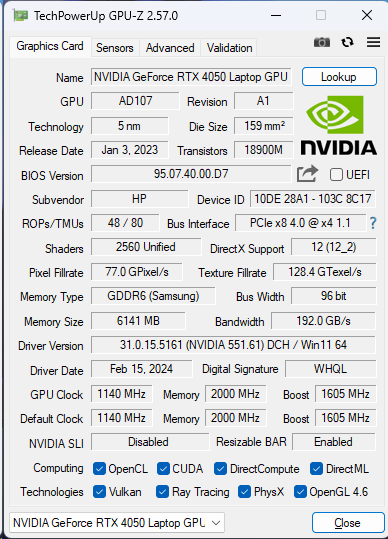
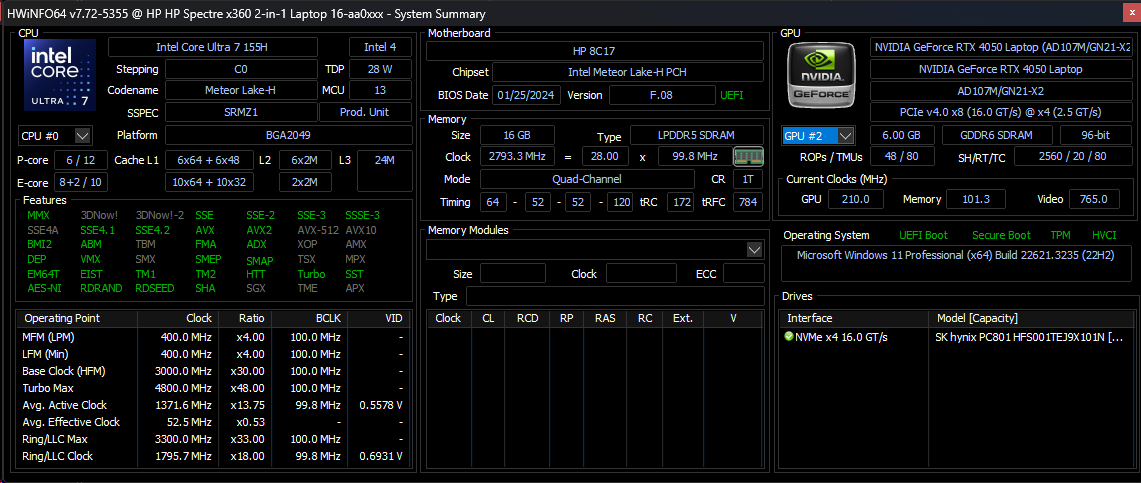
Our unit in review comes configured with the 1st gen Core Ultra 7 155H CPU, 55 W GeForce RTX 4050 GPU, 16 GB of soldered RAM, and 1800p OLED touchscreen for approximately $1600 retail. Other SKUs may include double the RAM or a 1600p 120 Hz IPS touchscreen instead, but all have the same Core Ultra 7 CPU and RTX 4050 GPU.
More HP reviews:
Potential Competitors in Comparison
Rating | Date | Model | Weight | Height | Size | Resolution | Price |
|---|---|---|---|---|---|---|---|
| 91.1 % v7 (old) | 03 / 2024 | HP Spectre x360 16 RTX 4050 Ultra 7 155H, GeForce RTX 4050 Laptop GPU | 2 kg | 19.8 mm | 16.00" | 2880x1800 | |
| 91.4 % v7 (old) | 02 / 2024 | HP Spectre x360 16-aa0074ng Ultra 7 155H, Arc 8-Core | 1.9 kg | 19.8 mm | 16.00" | 2880x1800 | |
| 87.3 % v7 (old) | 01 / 2023 | HP Spectre x360 2-in-1 16-f1075ng i7-12700H, Iris Xe G7 96EUs | 2 kg | 19.9 mm | 16.00" | 3072x1920 | |
| 90 % v7 (old) | 03 / 2024 | Honor MagicBook Pro 16 2024 Ultra 7 155H, GeForce RTX 4060 Laptop GPU | 1.9 kg | 17.9 mm | 16.00" | 3072x1920 | |
| 88.1 % v7 (old) | 12 / 2023 | MSI Prestige 16 B1MG-001US Ultra 7 155H, Arc 8-Core | 1.6 kg | 19.1 mm | 16.00" | 2560x1600 | |
| 85.8 % v7 (old) | 11 / 2023 | LG Gram 2in1 16 16T90R - G.AA78G i7-1360P, Iris Xe G7 96EUs | 1.5 kg | 17.2 mm | 16.00" | 2560x1600 |
Case
The dGPU configuration is slightly heavier than the iGPU option by about 100 g.
Communication
Webcam


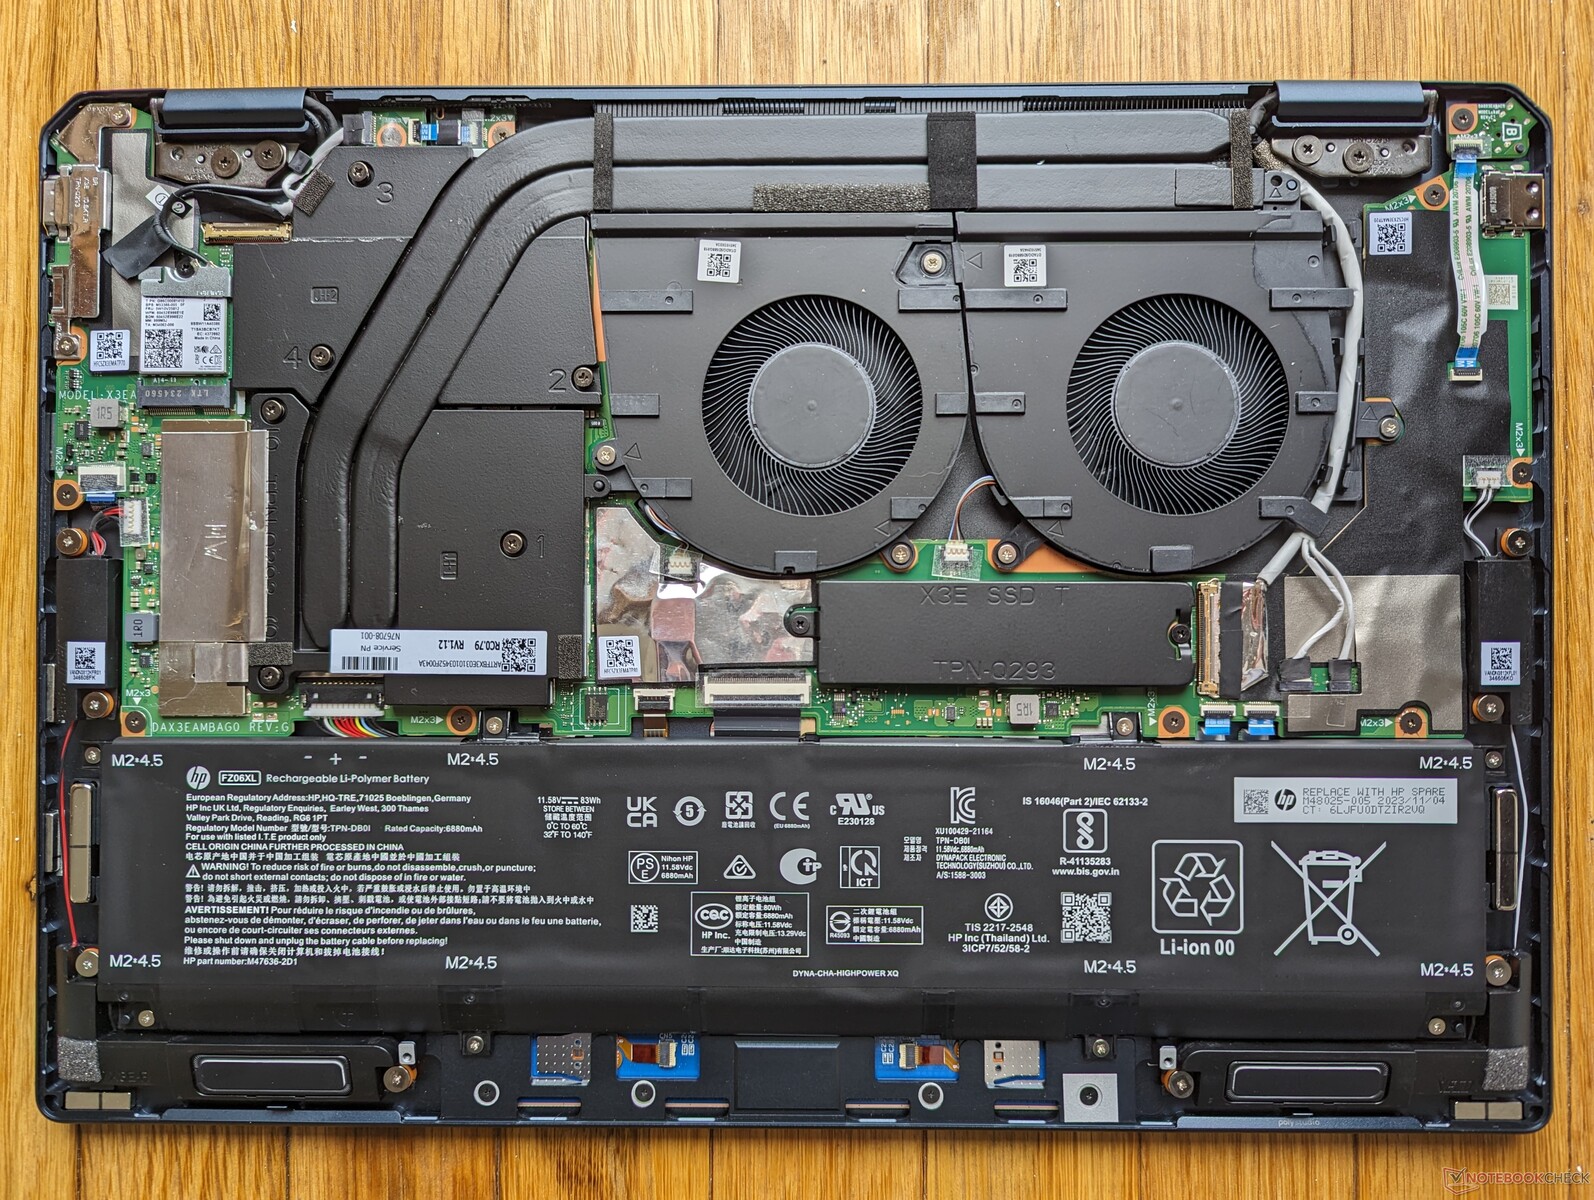
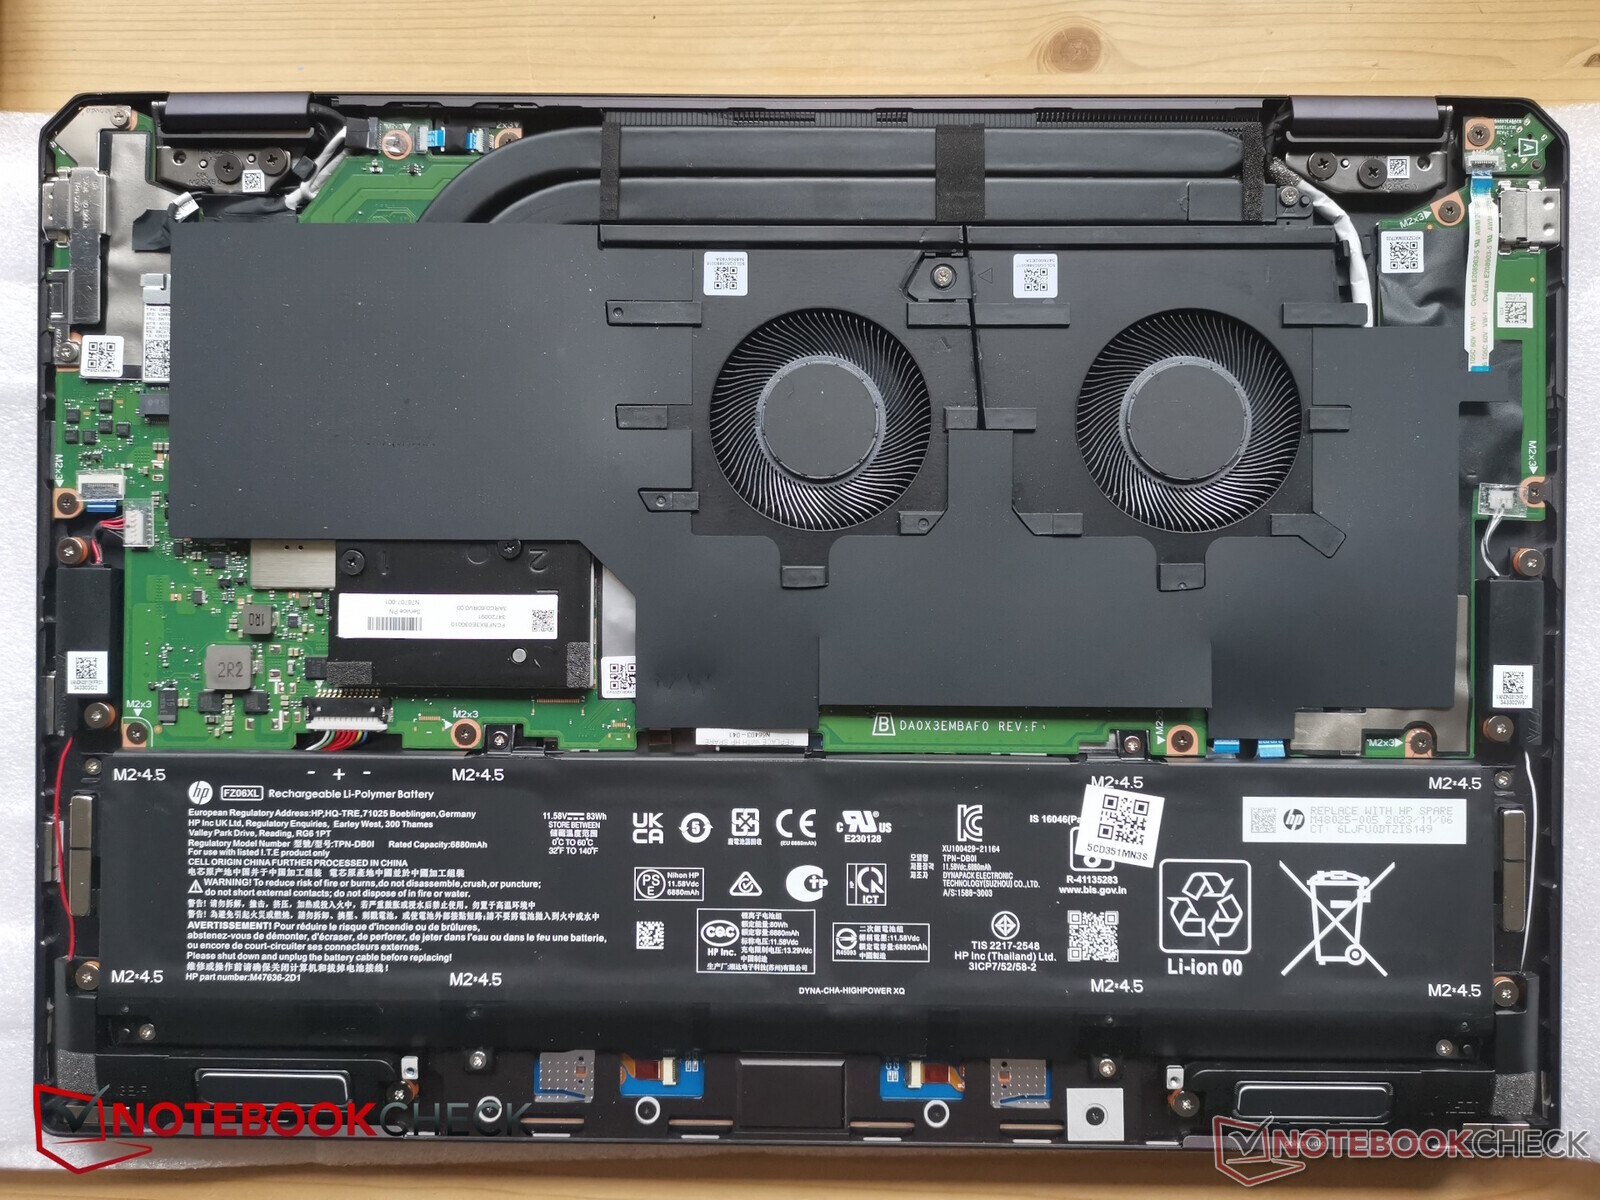
Maintenance
The dGPU configuration includes longer copper heat pipes than the iGPU version as shown below which contributes to the slightly heavier weight. The motherboard is otherwise nearly identical.
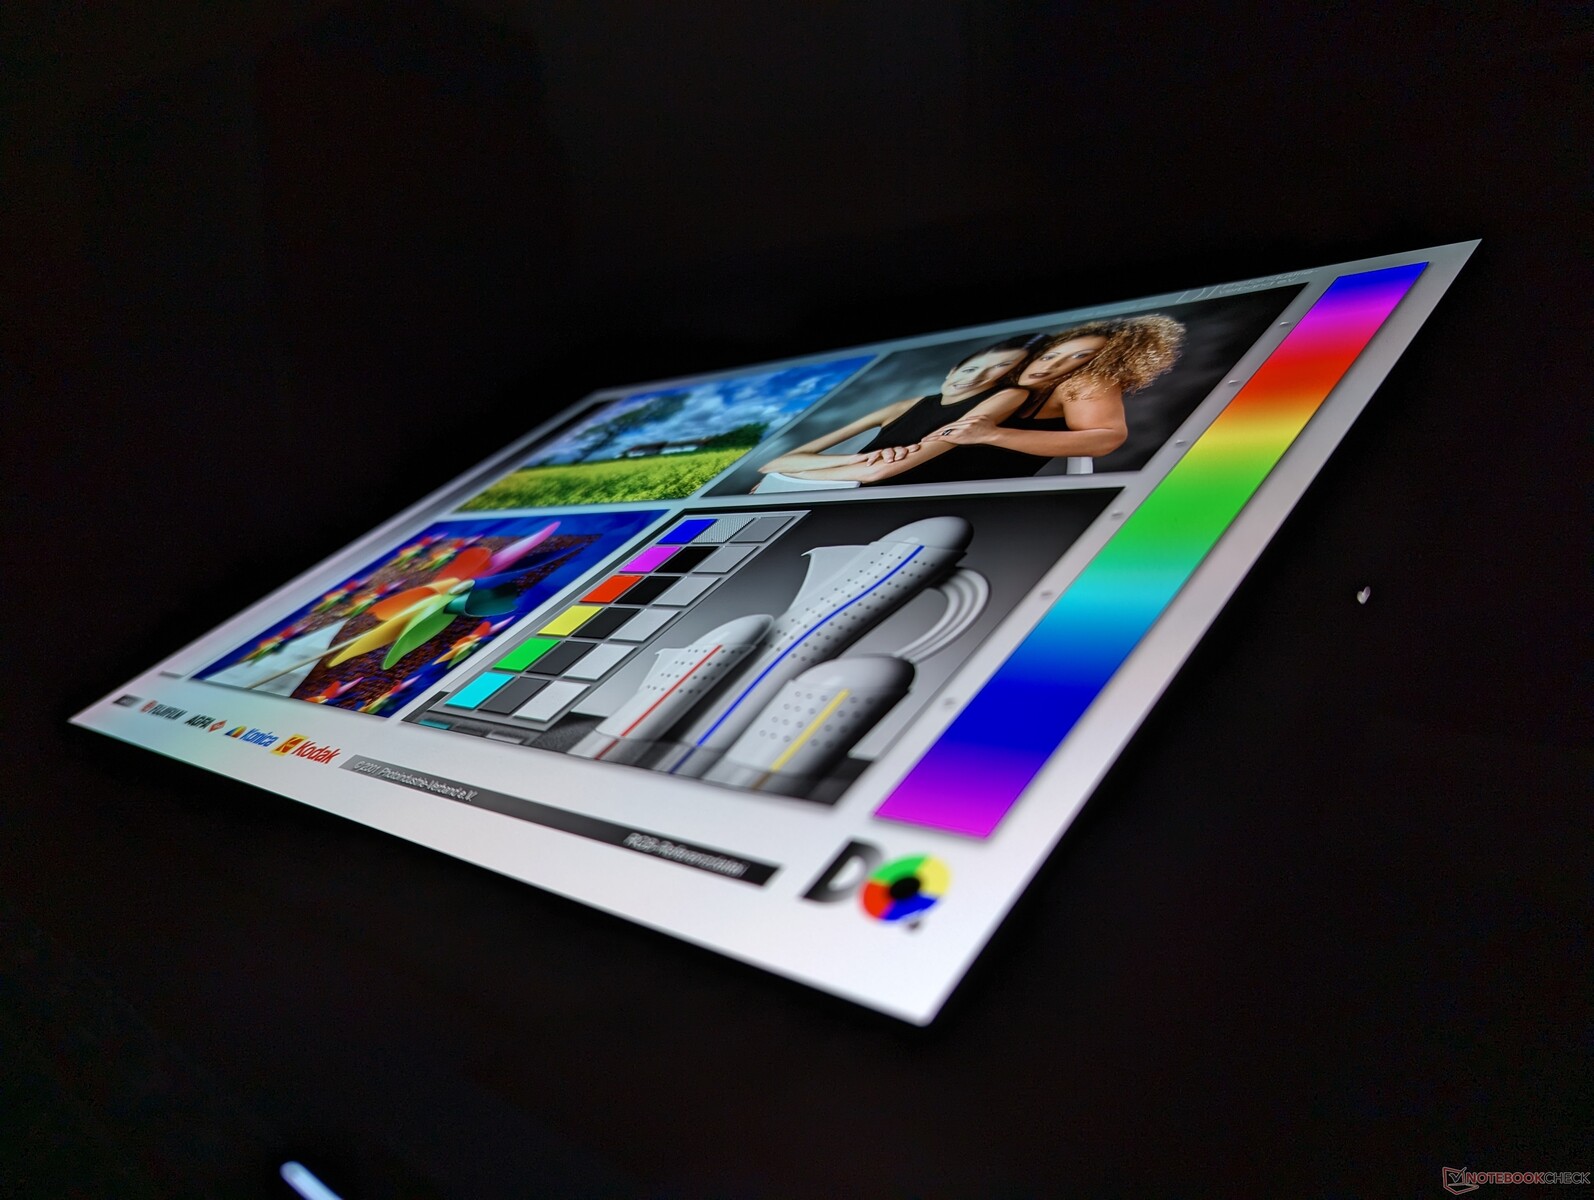
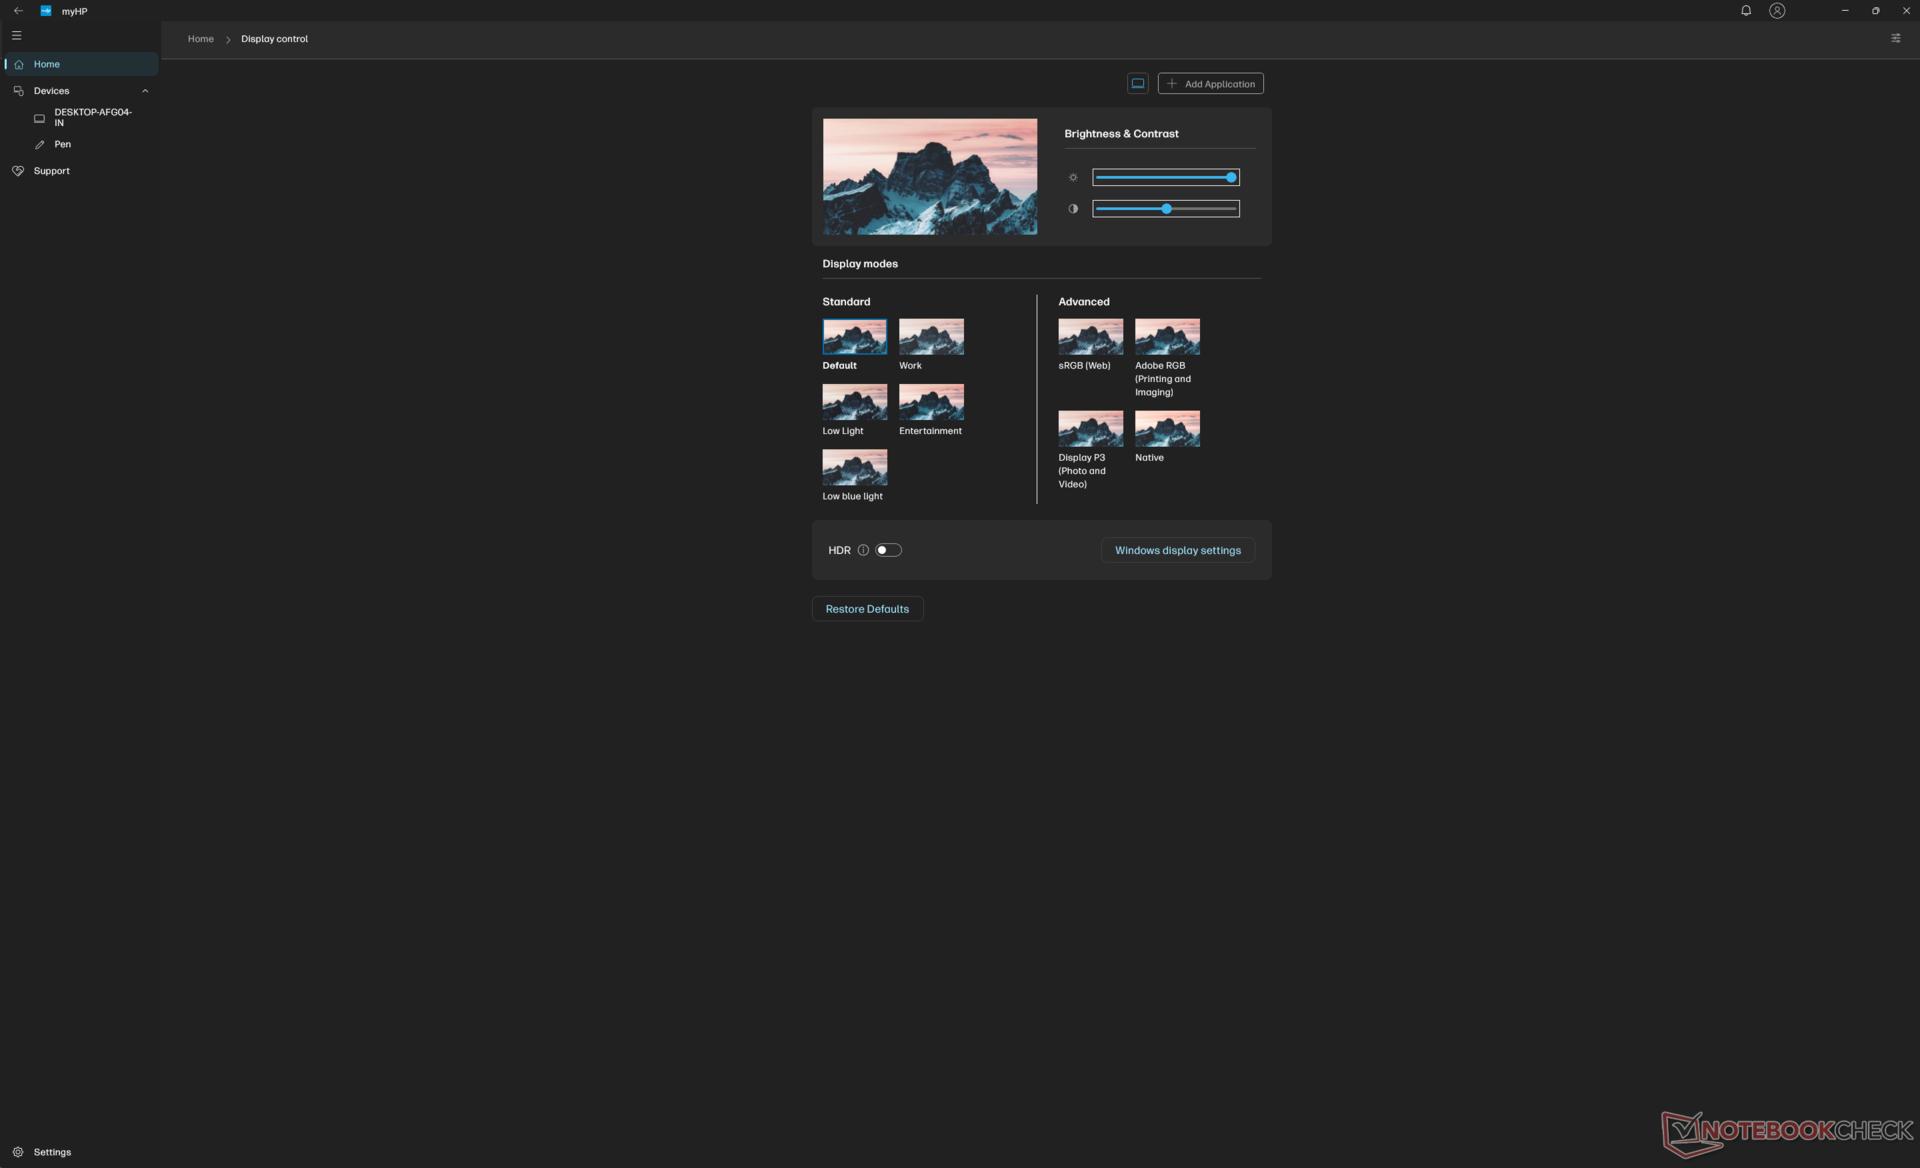
Display
| |||||||||||||||||||||||||
Brightness Distribution: 99 %
Center on Battery: 385.2 cd/m²
Contrast: ∞:1 (Black: 0 cd/m²)
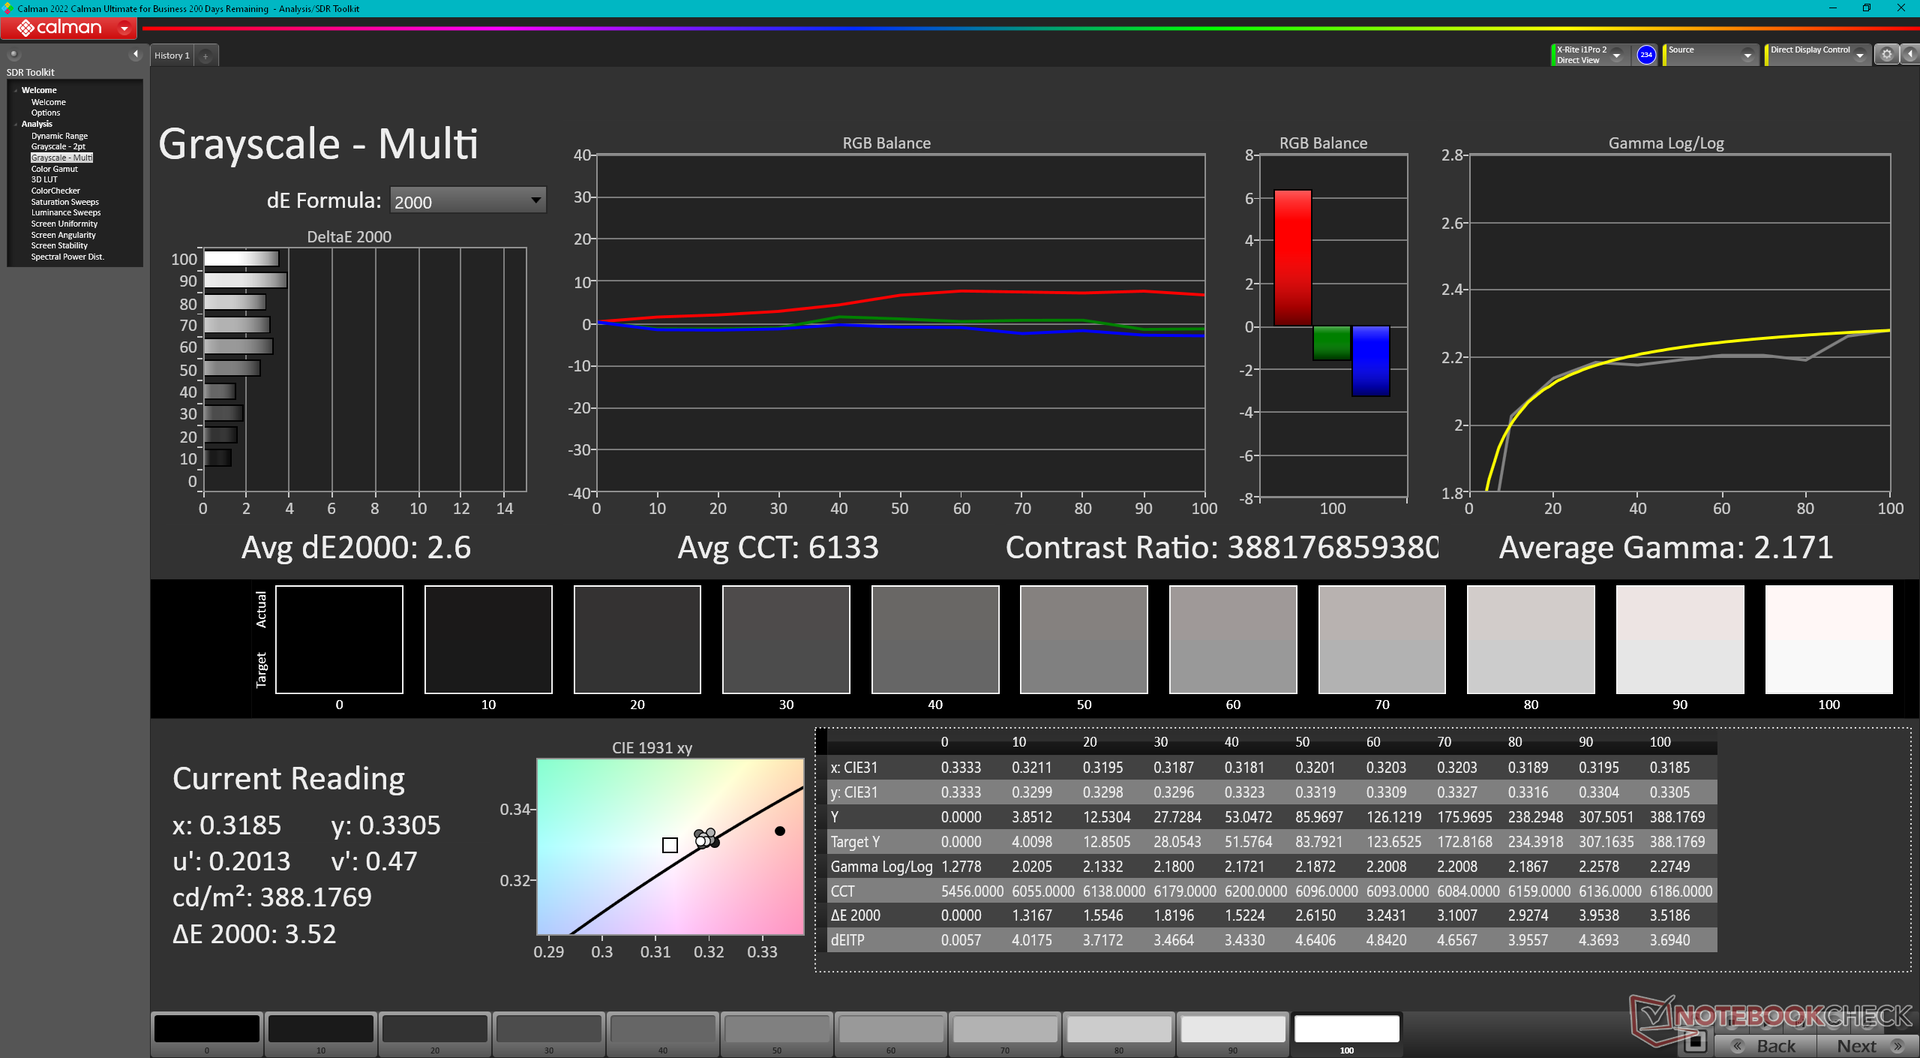
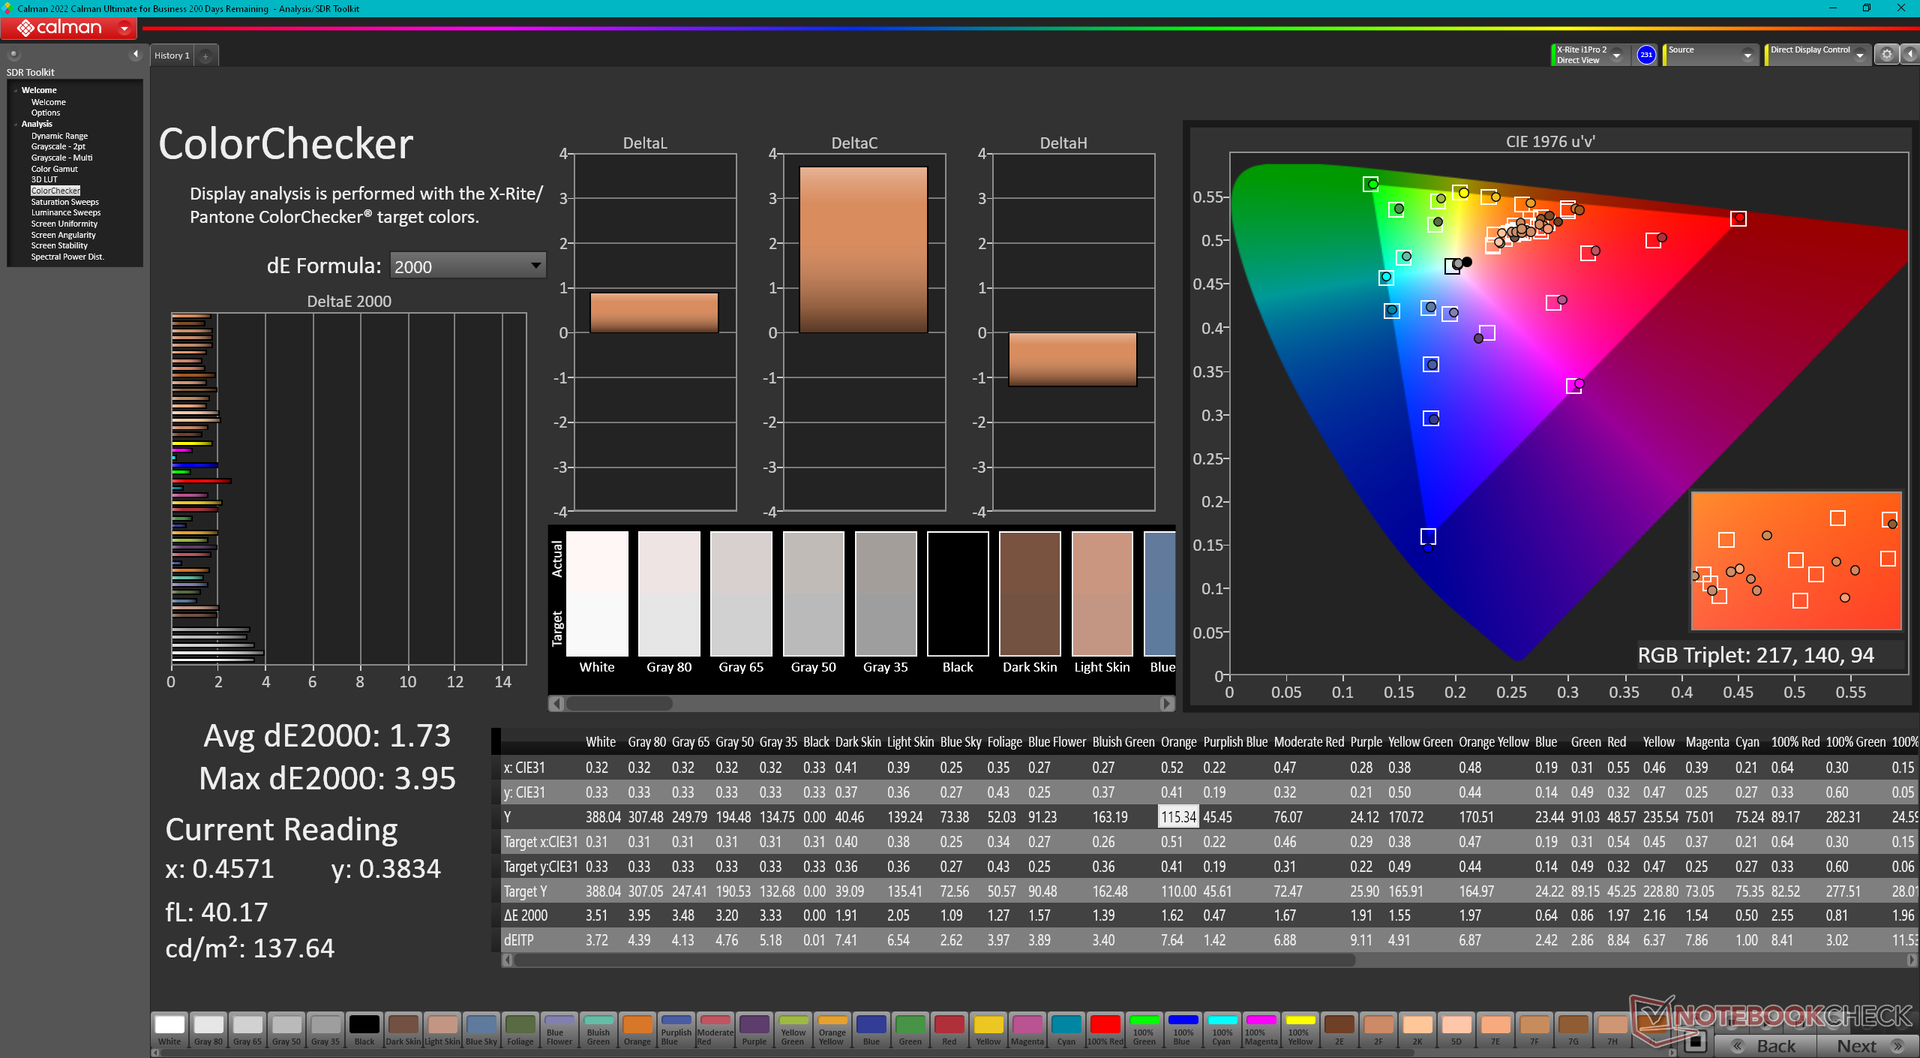
ΔE ColorChecker Calman: 1.73 | ∀{0.5-29.43 Ø4.73}
ΔE Greyscale Calman: 2.6 | ∀{0.09-98 Ø4.97}
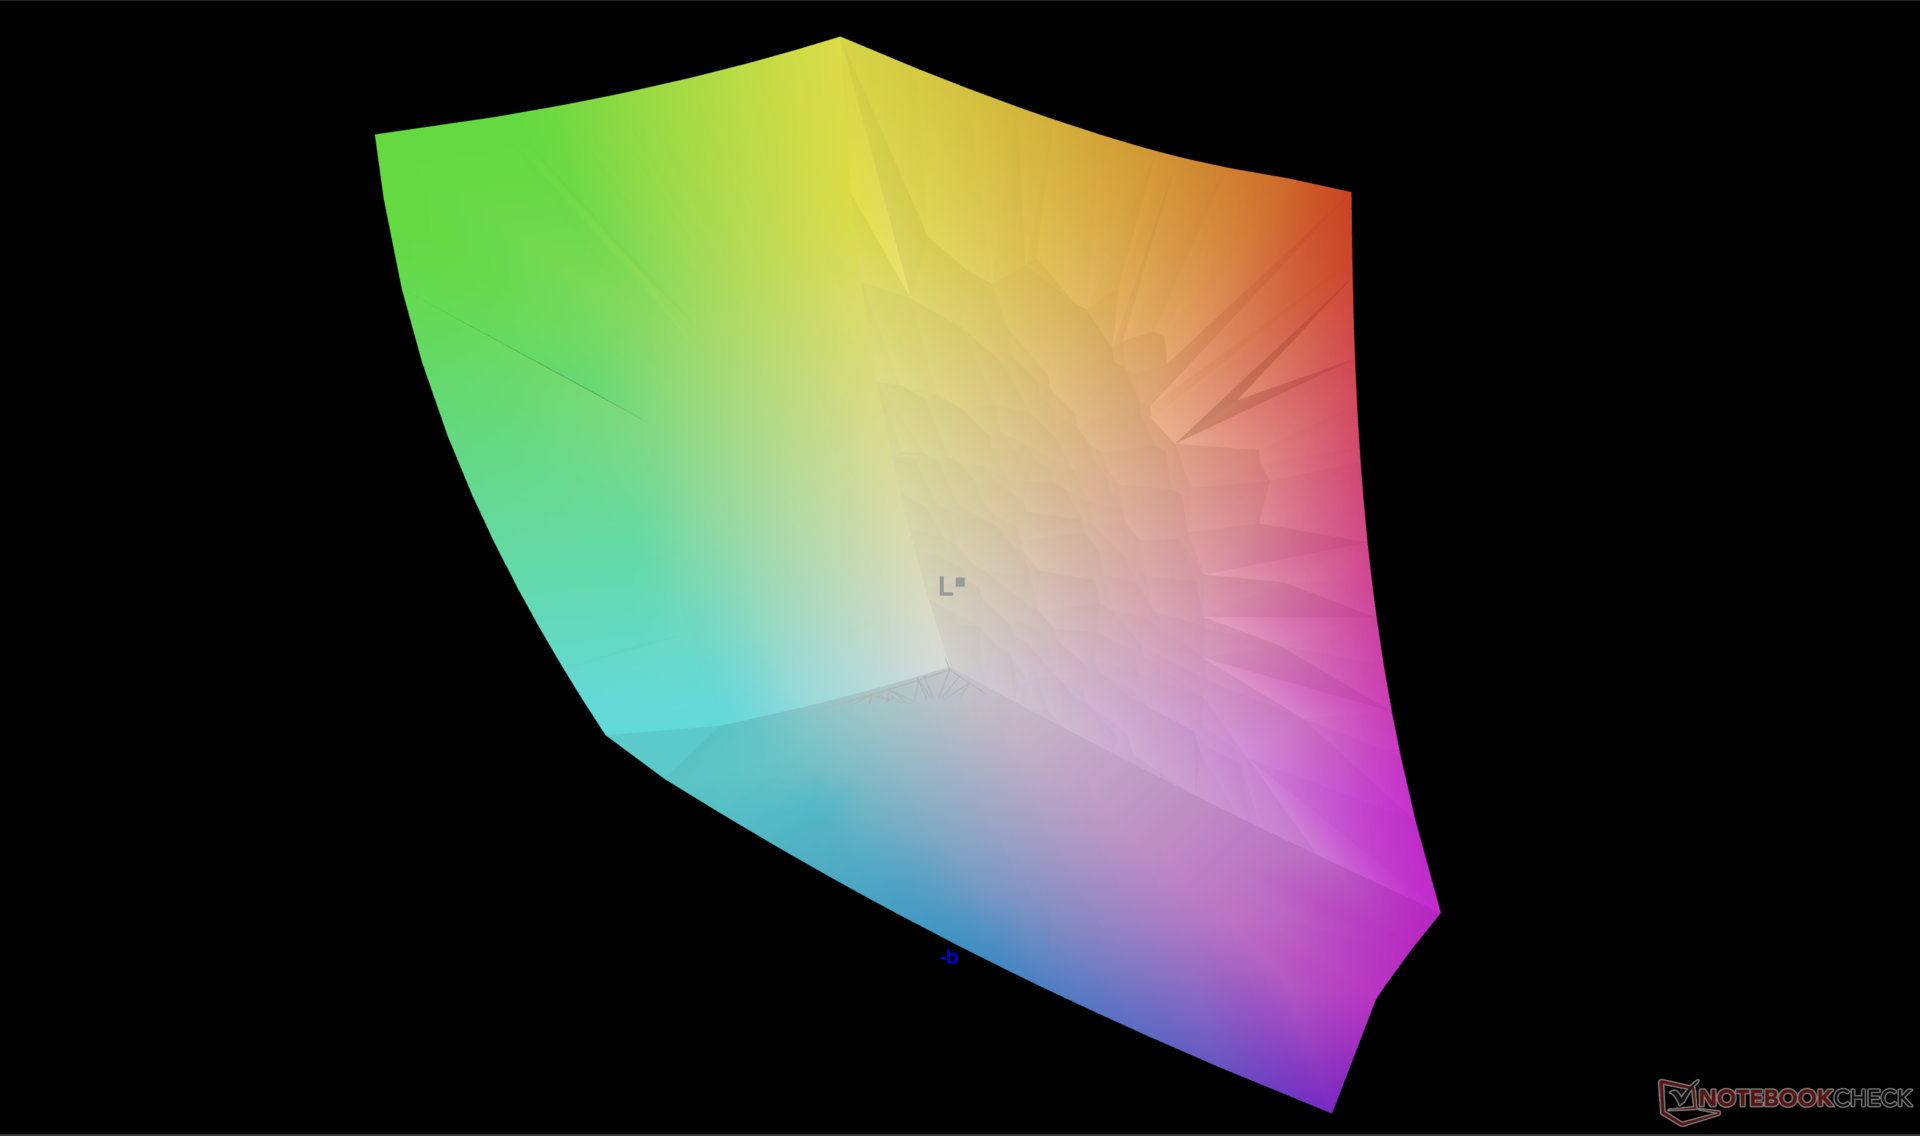
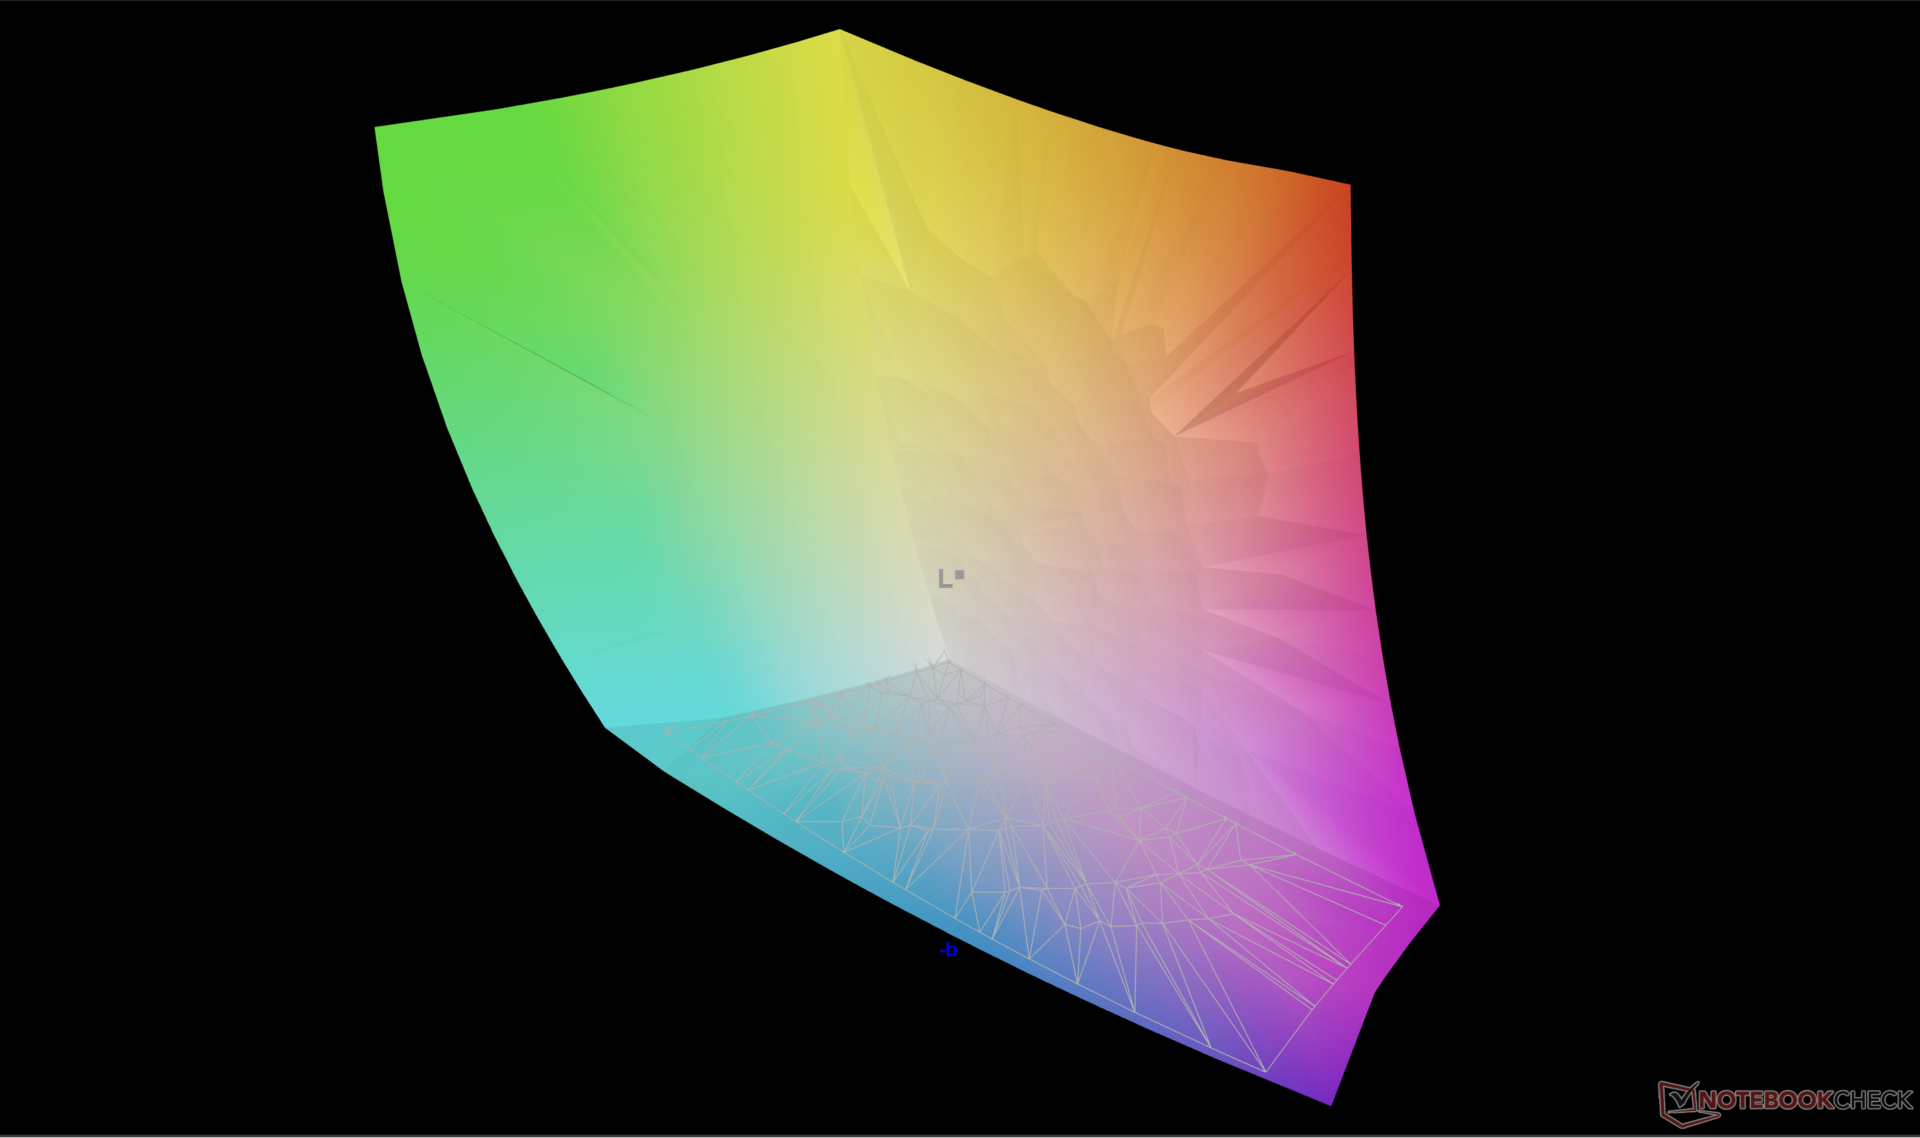
96.7% AdobeRGB 1998 (Argyll 3D)
100% sRGB (Argyll 3D)
99.6% Display P3 (Argyll 3D)
Gamma: 2.17
CCT: 6133 K
| HP Spectre x360 16 RTX 4050 Samsung SDC41A6, OLED, 2880x1800, 16" | HP Spectre x360 16-aa0074ng Samsung SDC41A6, OLED, 2880x1800, 16" | HP Spectre x360 2-in-1 16-f1075ng AU Optronics AUO50A3, IPS, 3072x1920, 16" | Honor MagicBook Pro 16 2024 TL160MDMP01, IPS, 3072x1920, 16" | MSI Prestige 16 B1MG-001US AU Optronics B160QAN03.R, IPS, 2560x1600, 16" | LG Gram 2in1 16 16T90R - G.AA78G LP160WQ1-SPB2, IPS, 2560x1600, 16" | |
|---|---|---|---|---|---|---|
| Display | -1% | -15% | -3% | -5% | -5% | |
| Display P3 Coverage (%) | 99.6 | 98.9 -1% | 75.6 -24% | 98.8 -1% | 96.7 -3% | 96.5 -3% |
| sRGB Coverage (%) | 100 | 99.9 0% | 100.2 0% | 100 0% | 99.8 0% | 99.9 0% |
| AdobeRGB 1998 Coverage (%) | 96.7 | 94.4 -2% | 77.2 -20% | 89.1 -8% | 84.6 -13% | 84.6 -13% |
| Response Times | -10% | -4862% | -630% | -5038% | -3606% | |
| Response Time Grey 50% / Grey 80% * (ms) | 0.78 ? | 0.8 ? -3% | 52 ? -6567% | 6.3 ? -708% | 49.4 ? -6233% | 38.4 ? -4823% |
| Response Time Black / White * (ms) | 0.86 ? | 1 ? -16% | 28 ? -3156% | 5.6 ? -551% | 33.9 ? -3842% | 21.4 ? -2388% |
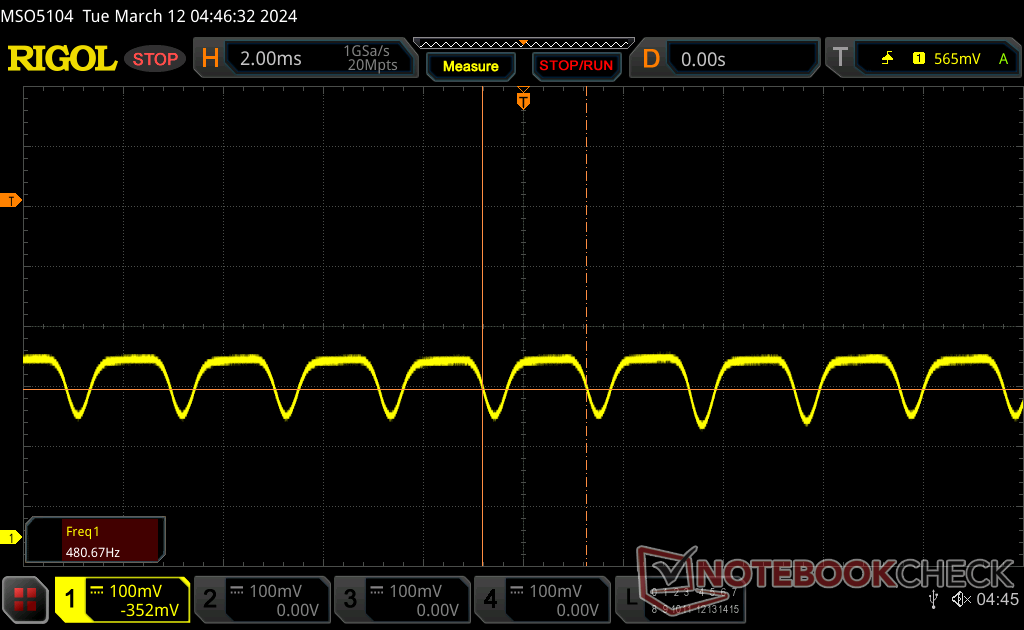
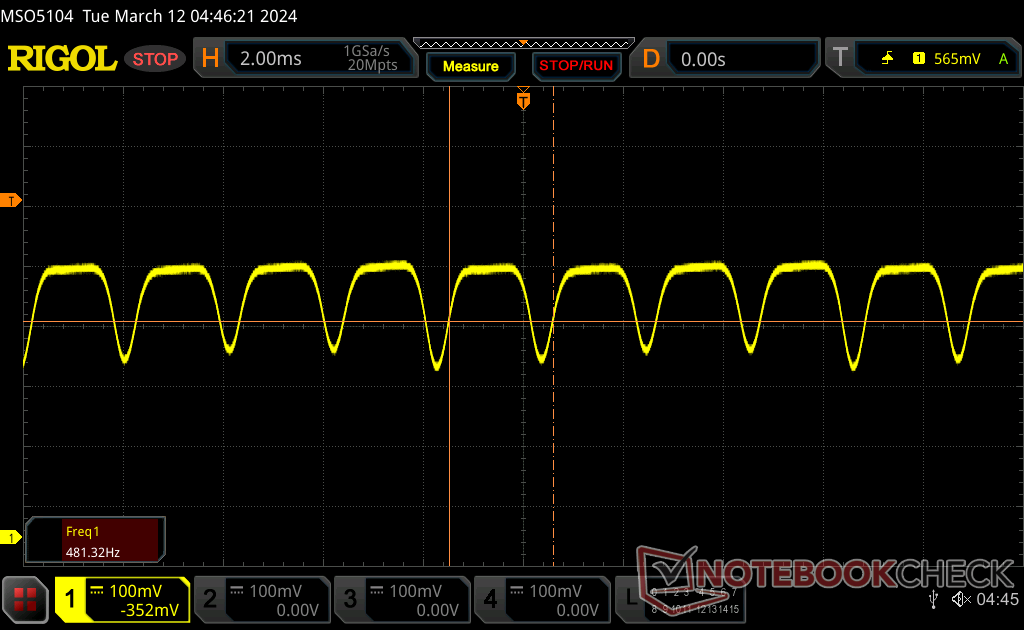
| PWM Frequency (Hz) | 480 ? | 480 | ||||
| Screen | -7% | -102% | 13% | -88% | -58% | |
| Brightness middle (cd/m²) | 385.2 | 424 10% | 425 10% | 551 43% | 473.6 23% | 329 -15% |
| Brightness (cd/m²) | 387 | 425 10% | 406 5% | 524 35% | 456 18% | 310 -20% |
| Brightness Distribution (%) | 99 | 99 0% | 78 -21% | 91 -8% | 87 -12% | 88 -11% |
| Black Level * (cd/m²) | 0.24 | 0.52 | 0.19 | 0.39 | ||
| Colorchecker dE 2000 * | 1.73 | 2.37 -37% | 5.8 -235% | 1.7 2% | 5.9 -241% | 3.52 -103% |
| Colorchecker dE 2000 max. * | 3.95 | 4.97 -26% | 11.03 -179% | 4.1 -4% | 9.37 -137% | 6.96 -76% |
| Greyscale dE 2000 * | 2.6 | 2.55 2% | 7.57 -191% | 2.4 8% | 7.3 -181% | 5.75 -121% |
| Gamma | 2.17 101% | 2.49 88% | 6600 0% | 2.2 100% | 1.9 116% | 2.137 103% |
| CCT | 6133 106% | 6548 99% | 6842 95% | 7260 90% | 7584 86% | |
| Colorchecker dE 2000 calibrated * | 2.26 | 4.16 | 1 | 0.89 | 1.15 | |
| Contrast (:1) | 1771 | 1060 | 2493 | 844 | ||
| Total Average (Program / Settings) | -6% /
-6% | -1660% /
-943% | -207% /
-108% | -1710% /
-966% | -1223% /
-688% |
* ... smaller is better
Display Response Times
| ↔ Response Time Black to White | ||
|---|---|---|
| 0.86 ms ... rise ↗ and fall ↘ combined | ↗ 0.4 ms rise | 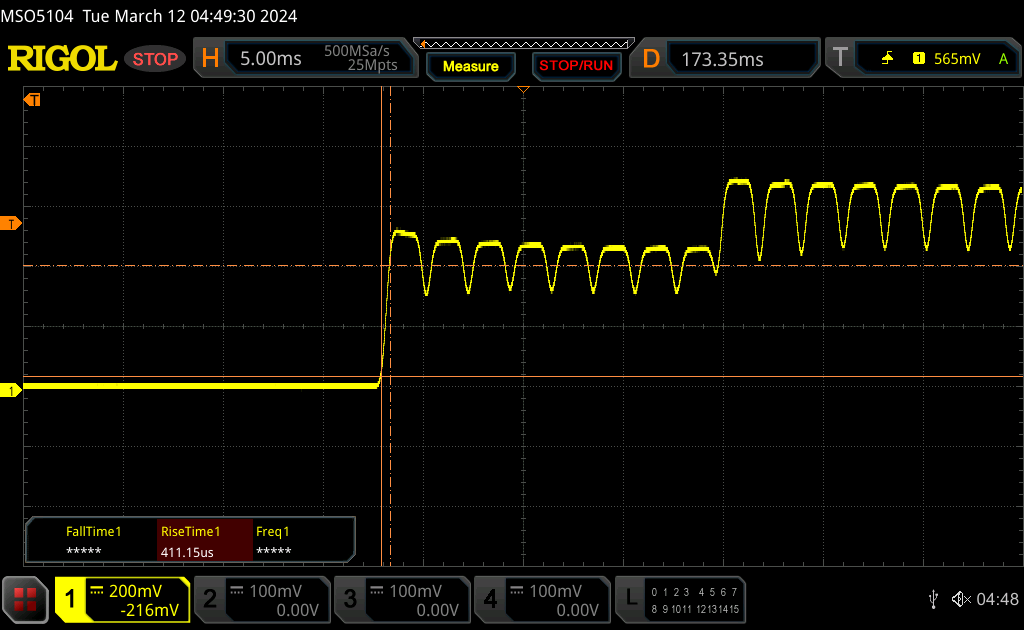 |
| ↘ 0.46 ms fall | ||
| The screen shows very fast response rates in our tests and should be very well suited for fast-paced gaming. In comparison, all tested devices range from 0.1 (minimum) to 240 (maximum) ms. » 3 % of all devices are better. This means that the measured response time is better than the average of all tested devices (19.9 ms). | ||
| ↔ Response Time 50% Grey to 80% Grey | ||
| 0.78 ms ... rise ↗ and fall ↘ combined | ↗ 0.44 ms rise |  |
| ↘ 0.34 ms fall | ||
| The screen shows very fast response rates in our tests and should be very well suited for fast-paced gaming. In comparison, all tested devices range from 0.165 (minimum) to 636 (maximum) ms. » 3 % of all devices are better. This means that the measured response time is better than the average of all tested devices (31.1 ms). | ||
Screen Flickering / PWM (Pulse-Width Modulation)
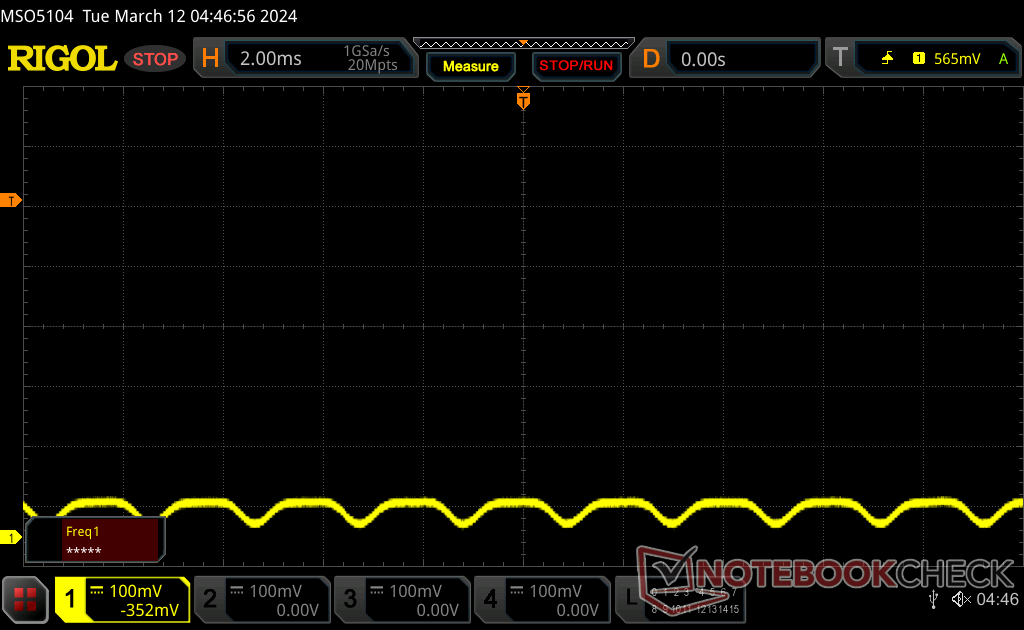
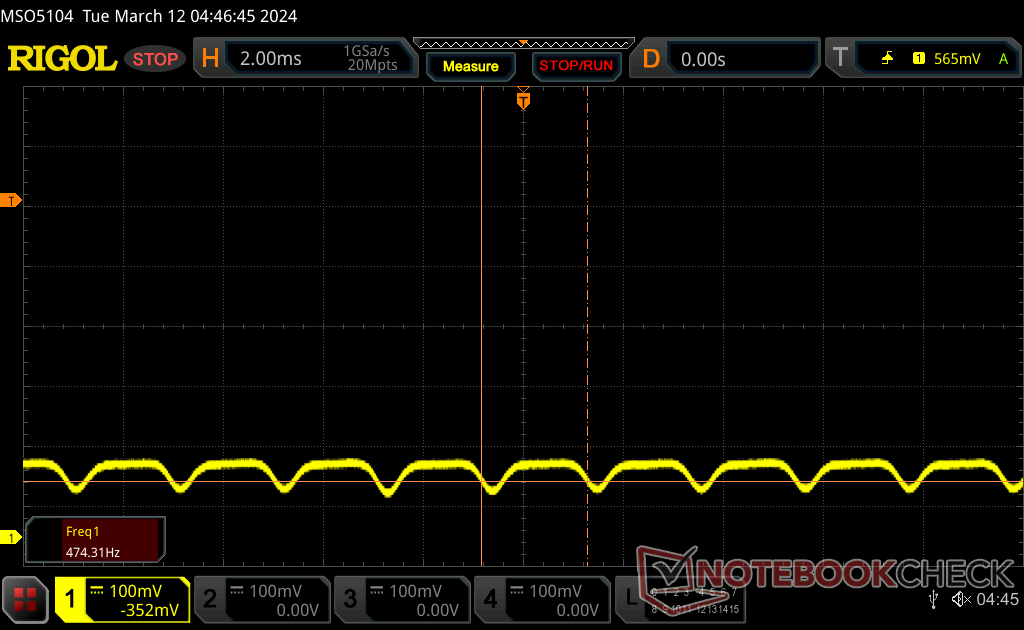
| Screen flickering / PWM detected | 480 Hz | ≤ 100 % brightness setting | 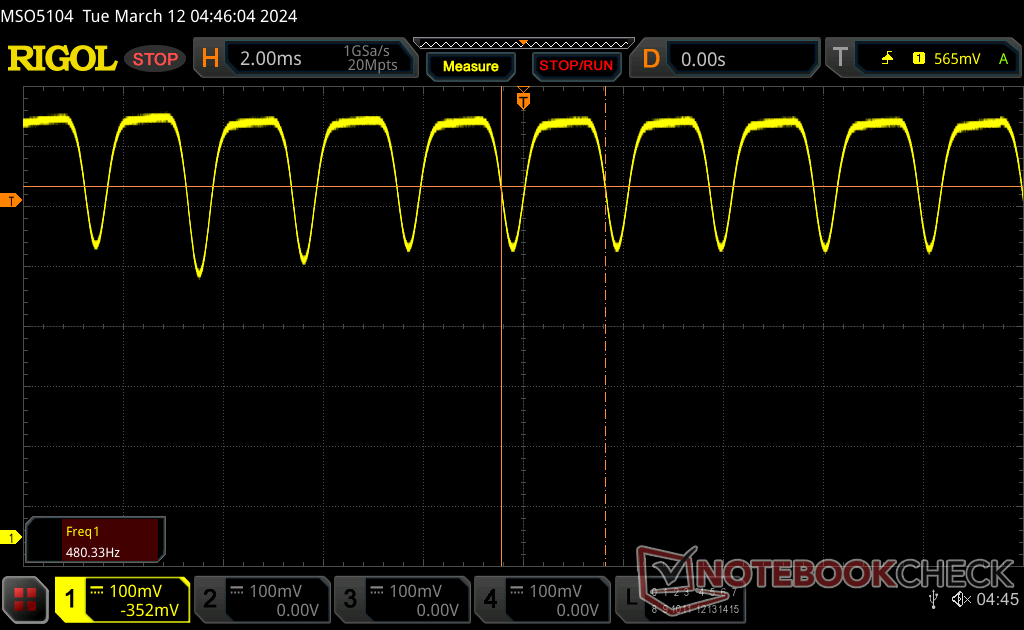 |
The display backlight flickers at 480 Hz (worst case, e.g., utilizing PWM) Flickering detected at a brightness setting of 100 % and below. There should be no flickering or PWM above this brightness setting. The frequency of 480 Hz is relatively high, so most users sensitive to PWM should not notice any flickering. However, there are reports that some users are still sensitive to PWM at 500 Hz and above, so be aware. In comparison: 52 % of all tested devices do not use PWM to dim the display. If PWM was detected, an average of 7798 (minimum: 5 - maximum: 343500) Hz was measured. | |||


Performance
Testing Conditions
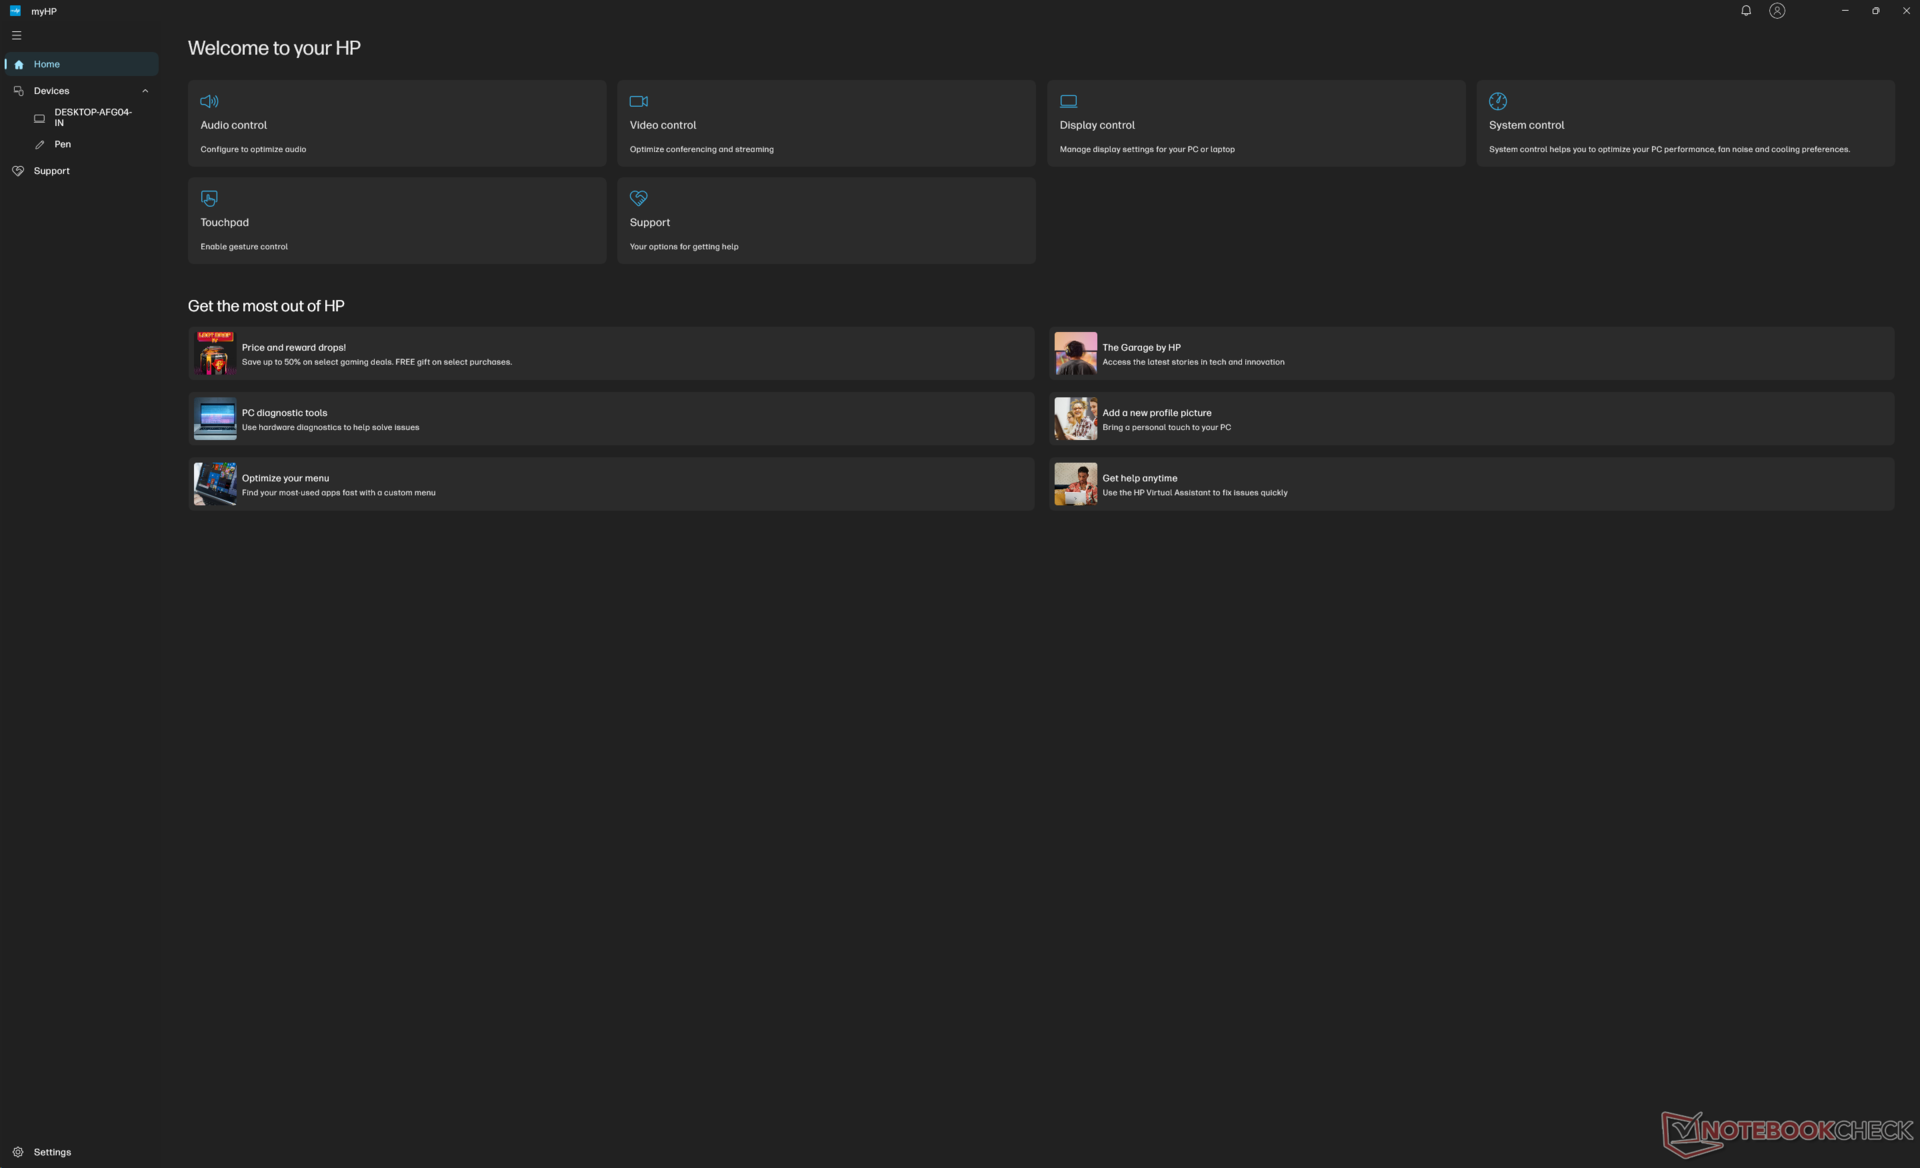
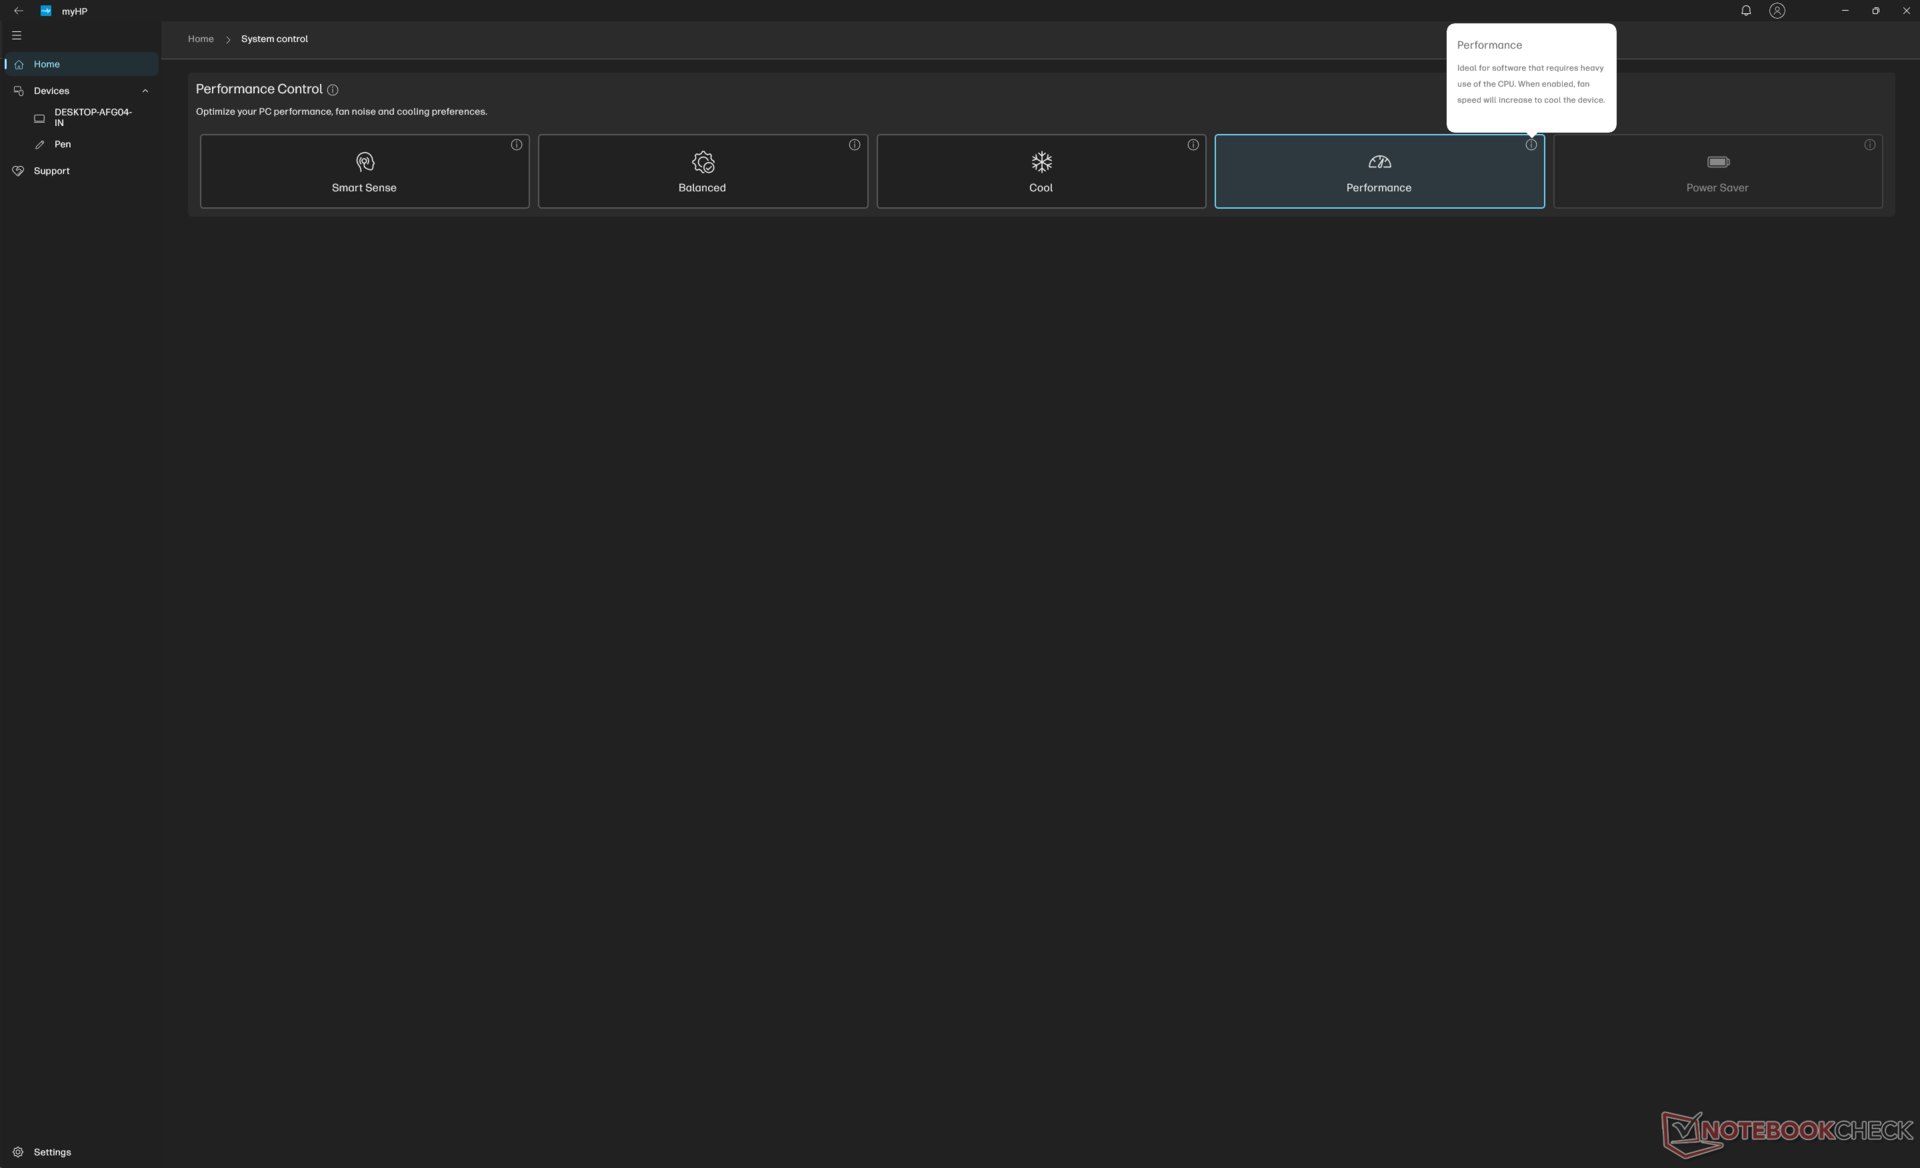
We set Windows and MyHP to their respective Performance modes prior to running the benchmarks below. Both MyHP and Omen Gaming Hub are installed on the system, but most of the important features related to usability and power profiles are tied to MyHP.
Processor
The Core Ultra 7 155H in our dGPU configuration would return lower scores than the same CPU in our iGPU configuration. The deficit can be as wide as 20 percent between the two systems and results would not improve even after several retests. Indeed, when looking closer at the CPU board power draw levels on each configuration, the CPU in our dGPU unit would reach as low as 28 W whereas the same CPU in our iGPU unit would stabilize at a higher power level of 40 W.
HP says it is aware of the CPU "incorrectly throttling during certain workloads" and that a software update is in the works to resolve it. We will add the new results here once the update is live.
Cinebench R15 Multi Loop
Cinebench R23: Multi Core | Single Core
Cinebench R20: CPU (Multi Core) | CPU (Single Core)
Cinebench R15: CPU Multi 64Bit | CPU Single 64Bit
Blender: v2.79 BMW27 CPU
7-Zip 18.03: 7z b 4 | 7z b 4 -mmt1
Geekbench 6.7: Multi-Core | Single-Core
Geekbench 5.5: Multi-Core | Single-Core
HWBOT x265 Benchmark v2.2: 4k Preset
LibreOffice : 20 Documents To PDF
R Benchmark 2.5: Overall mean
* ... smaller is better
AIDA64: FP32 Ray-Trace | FPU Julia | CPU SHA3 | CPU Queen | FPU SinJulia | FPU Mandel | CPU AES | CPU ZLib | FP64 Ray-Trace | CPU PhotoWorxx
| Performance rating | |
| Honor MagicBook Pro 16 2024 | |
| MSI Prestige 16 B1MG-001US | |
| HP Spectre x360 16 RTX 4050 | |
| Average Intel Core Ultra 7 155H | |
| HP Spectre x360 16-aa0074ng | |
| HP Spectre x360 2-in-1 16-f1075ng | |
| LG Gram 2in1 16 16T90R - G.AA78G | |
| AIDA64 / FP32 Ray-Trace | |
| Honor MagicBook Pro 16 2024 | |
| MSI Prestige 16 B1MG-001US | |
| HP Spectre x360 16 RTX 4050 | |
| Average Intel Core Ultra 7 155H (6670 - 18470, n=50) | |
| HP Spectre x360 16-aa0074ng | |
| HP Spectre x360 2-in-1 16-f1075ng | |
| LG Gram 2in1 16 16T90R - G.AA78G | |
| LG Gram 2in1 16 16T90R - G.AA78G | |
| AIDA64 / FPU Julia | |
| Honor MagicBook Pro 16 2024 | |
| MSI Prestige 16 B1MG-001US | |
| HP Spectre x360 16 RTX 4050 | |
| Average Intel Core Ultra 7 155H (40905 - 93181, n=50) | |
| HP Spectre x360 16-aa0074ng | |
| HP Spectre x360 2-in-1 16-f1075ng | |
| LG Gram 2in1 16 16T90R - G.AA78G | |
| AIDA64 / CPU SHA3 | |
| Honor MagicBook Pro 16 2024 | |
| MSI Prestige 16 B1MG-001US | |
| HP Spectre x360 16 RTX 4050 | |
| Average Intel Core Ultra 7 155H (1940 - 4436, n=50) | |
| HP Spectre x360 16-aa0074ng | |
| HP Spectre x360 2-in-1 16-f1075ng | |
| LG Gram 2in1 16 16T90R - G.AA78G | |
| AIDA64 / CPU Queen | |
| MSI Prestige 16 B1MG-001US | |
| HP Spectre x360 2-in-1 16-f1075ng | |
| HP Spectre x360 16-aa0074ng | |
| Honor MagicBook Pro 16 2024 | |
| Average Intel Core Ultra 7 155H (64698 - 94181, n=50) | |
| LG Gram 2in1 16 16T90R - G.AA78G | |
| HP Spectre x360 16 RTX 4050 | |
| AIDA64 / FPU SinJulia | |
| Honor MagicBook Pro 16 2024 | |
| MSI Prestige 16 B1MG-001US | |
| HP Spectre x360 16 RTX 4050 | |
| HP Spectre x360 16-aa0074ng | |
| Average Intel Core Ultra 7 155H (5639 - 10647, n=50) | |
| HP Spectre x360 2-in-1 16-f1075ng | |
| LG Gram 2in1 16 16T90R - G.AA78G | |
| AIDA64 / FPU Mandel | |
| Honor MagicBook Pro 16 2024 | |
| MSI Prestige 16 B1MG-001US | |
| HP Spectre x360 16 RTX 4050 | |
| Average Intel Core Ultra 7 155H (18236 - 47685, n=50) | |
| HP Spectre x360 16-aa0074ng | |
| HP Spectre x360 2-in-1 16-f1075ng | |
| LG Gram 2in1 16 16T90R - G.AA78G | |
| AIDA64 / CPU AES | |
| Honor MagicBook Pro 16 2024 | |
| HP Spectre x360 2-in-1 16-f1075ng | |
| LG Gram 2in1 16 16T90R - G.AA78G | |
| Average Intel Core Ultra 7 155H (45713 - 152179, n=50) | |
| MSI Prestige 16 B1MG-001US | |
| HP Spectre x360 16 RTX 4050 | |
| HP Spectre x360 16-aa0074ng | |
| AIDA64 / CPU ZLib | |
| Honor MagicBook Pro 16 2024 | |
| MSI Prestige 16 B1MG-001US | |
| HP Spectre x360 16 RTX 4050 | |
| Average Intel Core Ultra 7 155H (557 - 1250, n=50) | |
| HP Spectre x360 16-aa0074ng | |
| HP Spectre x360 2-in-1 16-f1075ng | |
| LG Gram 2in1 16 16T90R - G.AA78G | |
| AIDA64 / FP64 Ray-Trace | |
| Honor MagicBook Pro 16 2024 | |
| MSI Prestige 16 B1MG-001US | |
| HP Spectre x360 16 RTX 4050 | |
| Average Intel Core Ultra 7 155H (3569 - 9802, n=50) | |
| HP Spectre x360 16-aa0074ng | |
| HP Spectre x360 2-in-1 16-f1075ng | |
| LG Gram 2in1 16 16T90R - G.AA78G | |
| AIDA64 / CPU PhotoWorxx | |
| HP Spectre x360 16-aa0074ng | |
| HP Spectre x360 16 RTX 4050 | |
| Average Intel Core Ultra 7 155H (32719 - 54223, n=50) | |
| MSI Prestige 16 B1MG-001US | |
| Honor MagicBook Pro 16 2024 | |
| LG Gram 2in1 16 16T90R - G.AA78G | |
| HP Spectre x360 2-in-1 16-f1075ng | |
Stress Test
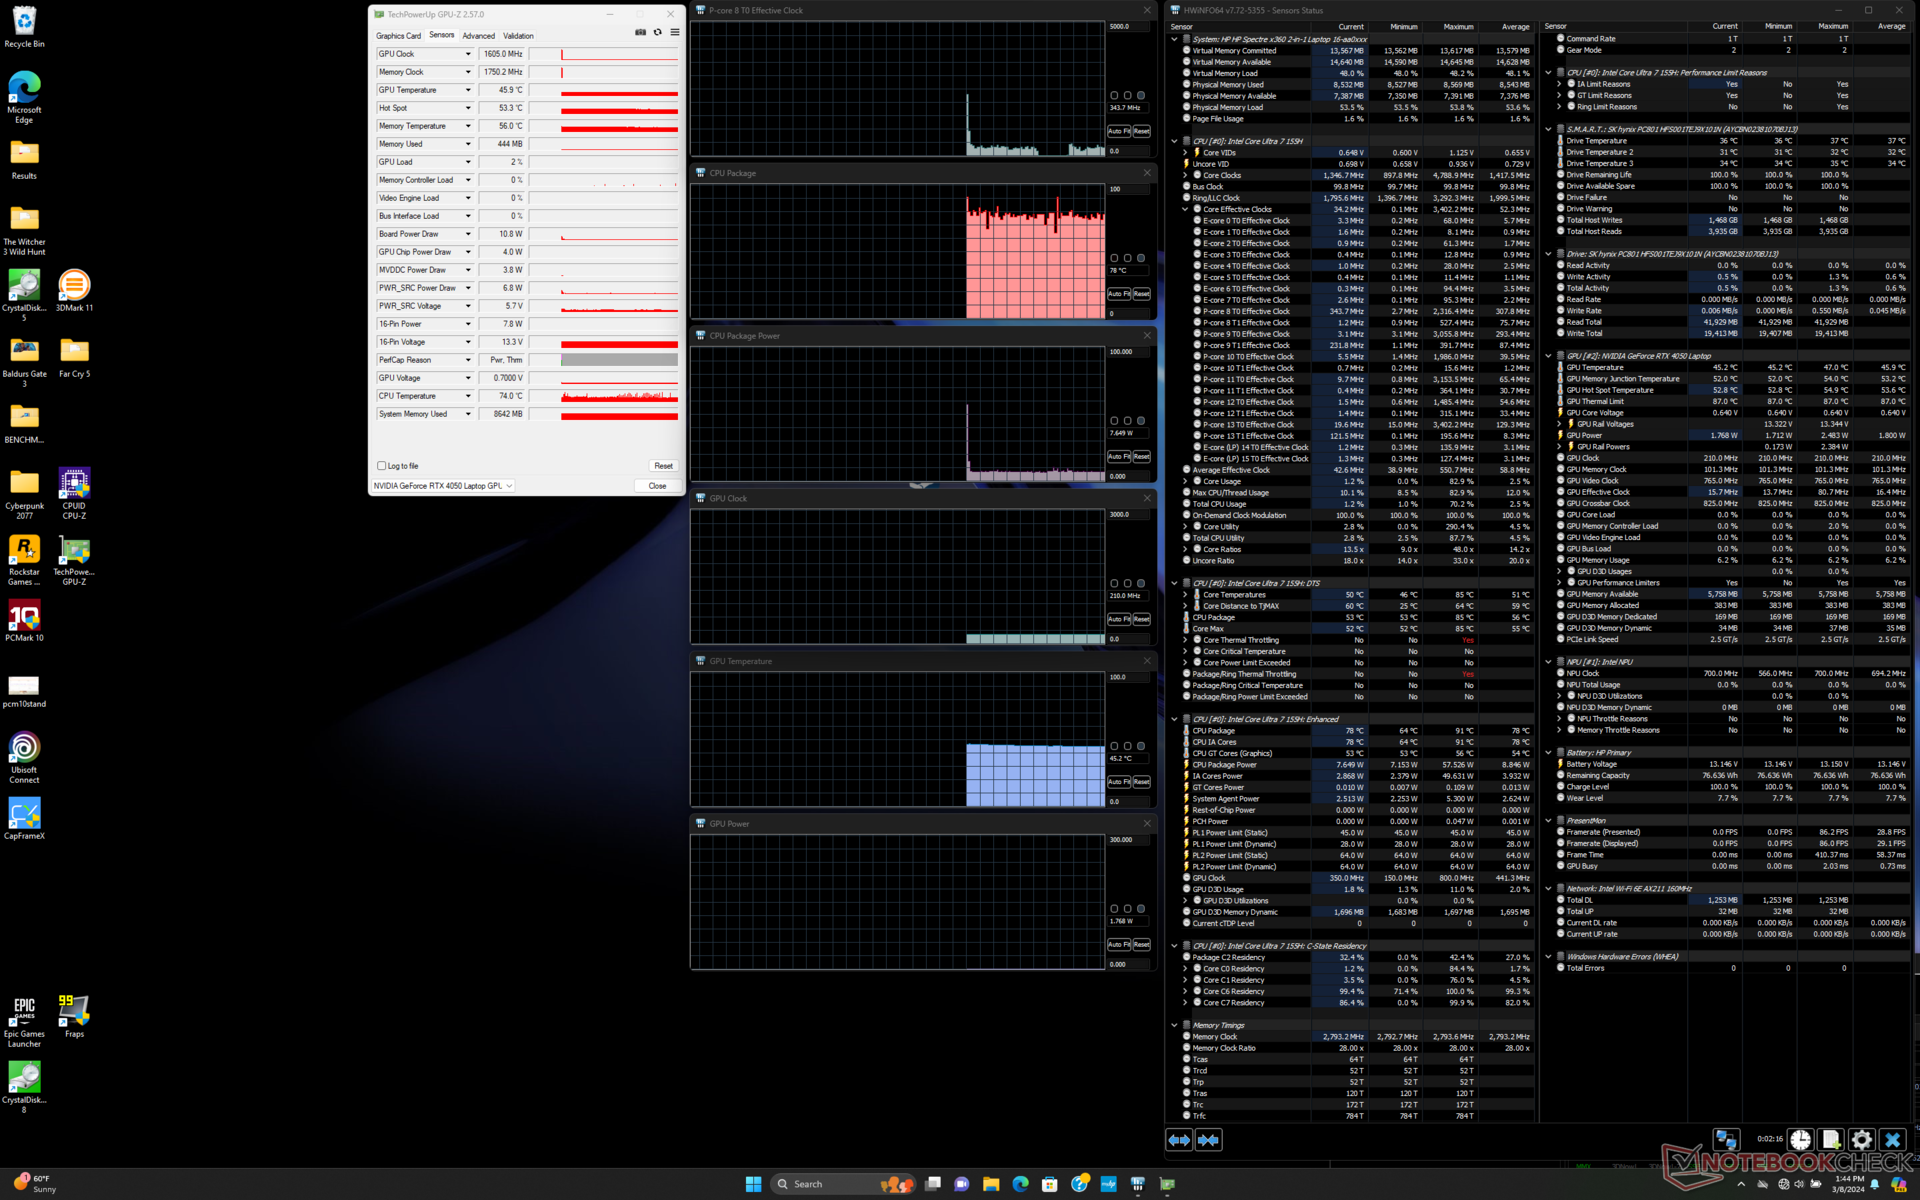
CPU clock rates and board power draw when initiating Prime95 stress would reach 3.2 GHz and 65 W, respectively, before dropping to just 1.4 GHz and 28 W a few seconds later to represent a relatively steep performance decline. Core temperature would be as warm as 95 C when Turbo Boost reaches 3.2 GHz and so the slower clock rates are necessary to keep temperatures in check.
Graphics performance is different between Balanced and Performance modes. For example, GPU clock rate and board power draw when running Witcher 3 on Balanced mode would stabilize at 1920 MHz and 39 W, respectively, compared to 2235 MHz and 53 W when on Performance mode. Core temperatures are also warmer when on Performance mode as shown by the table below.
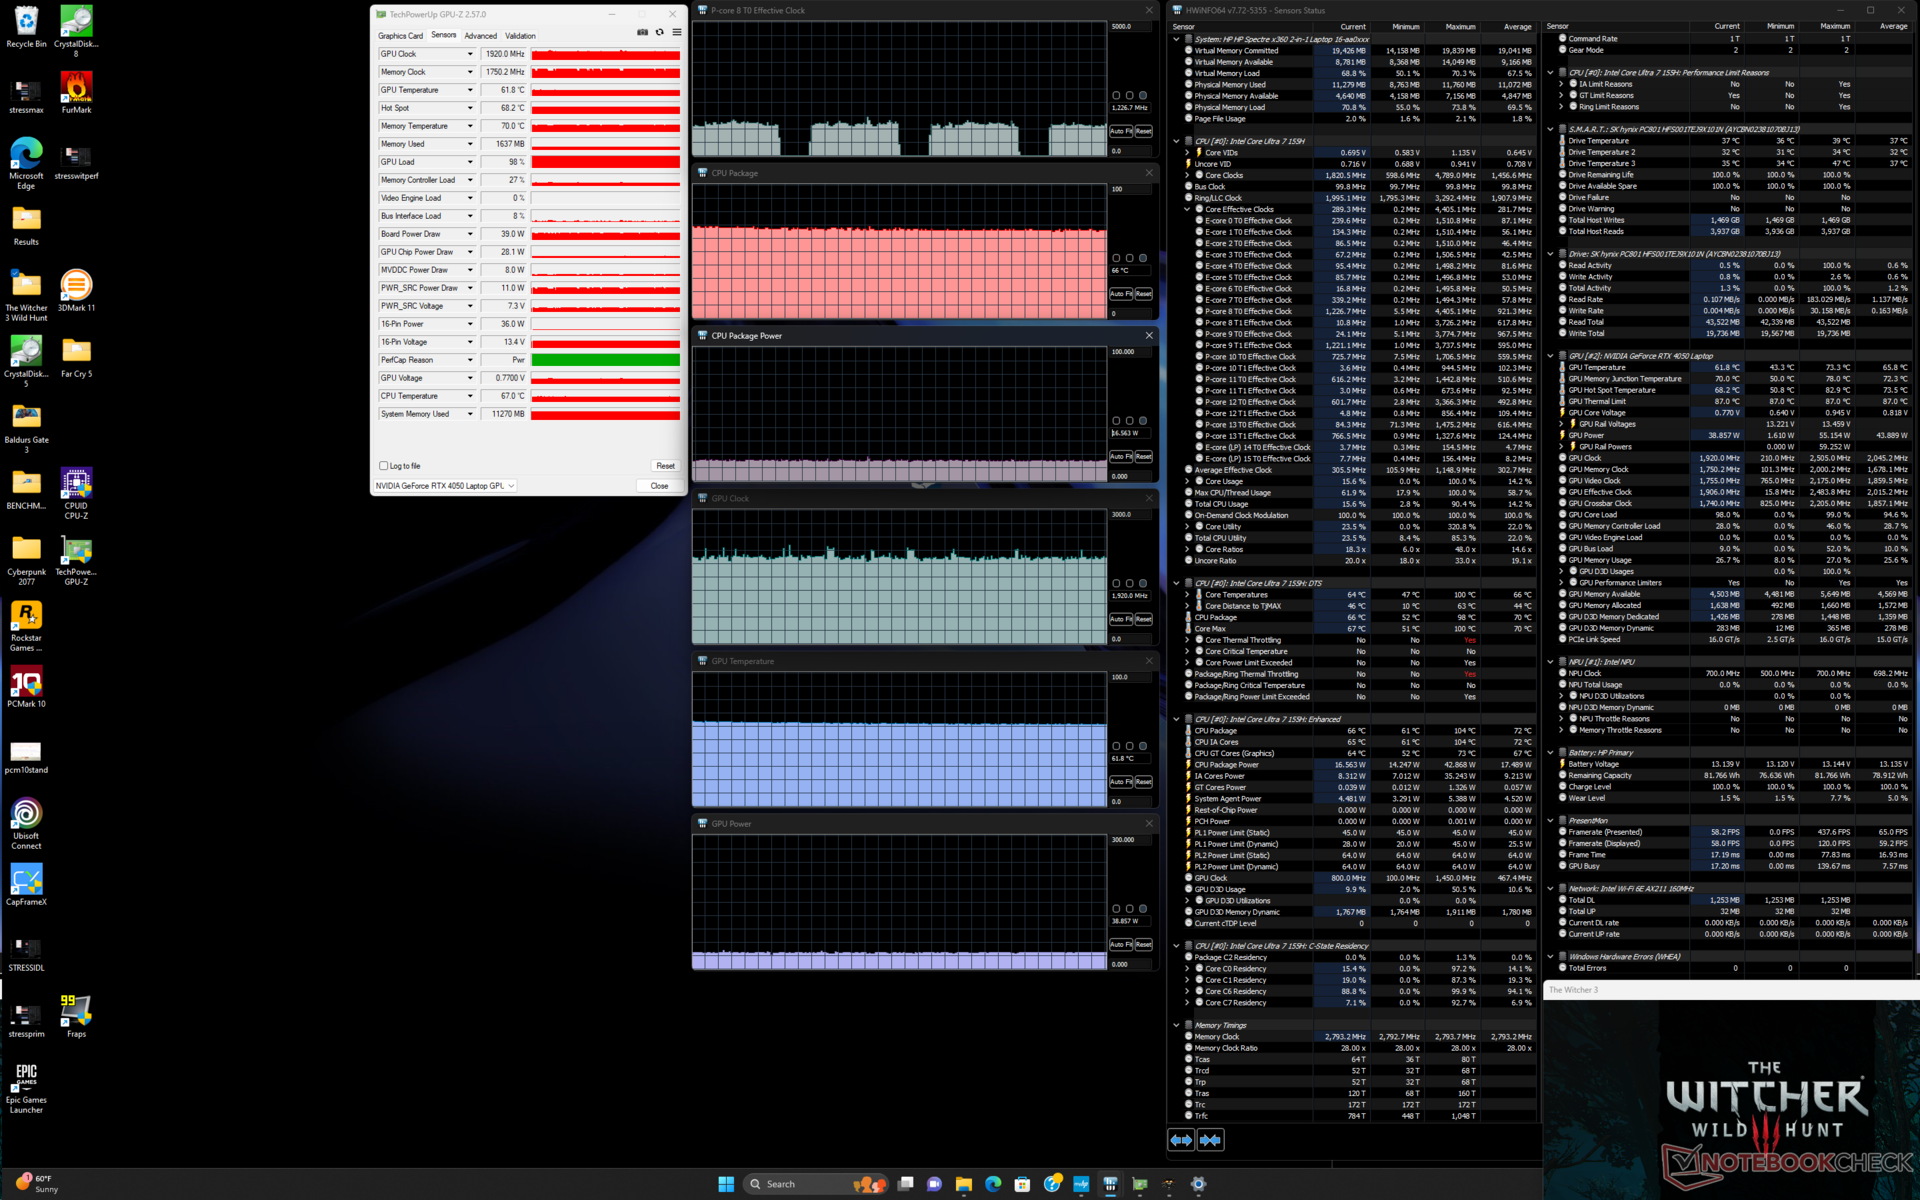

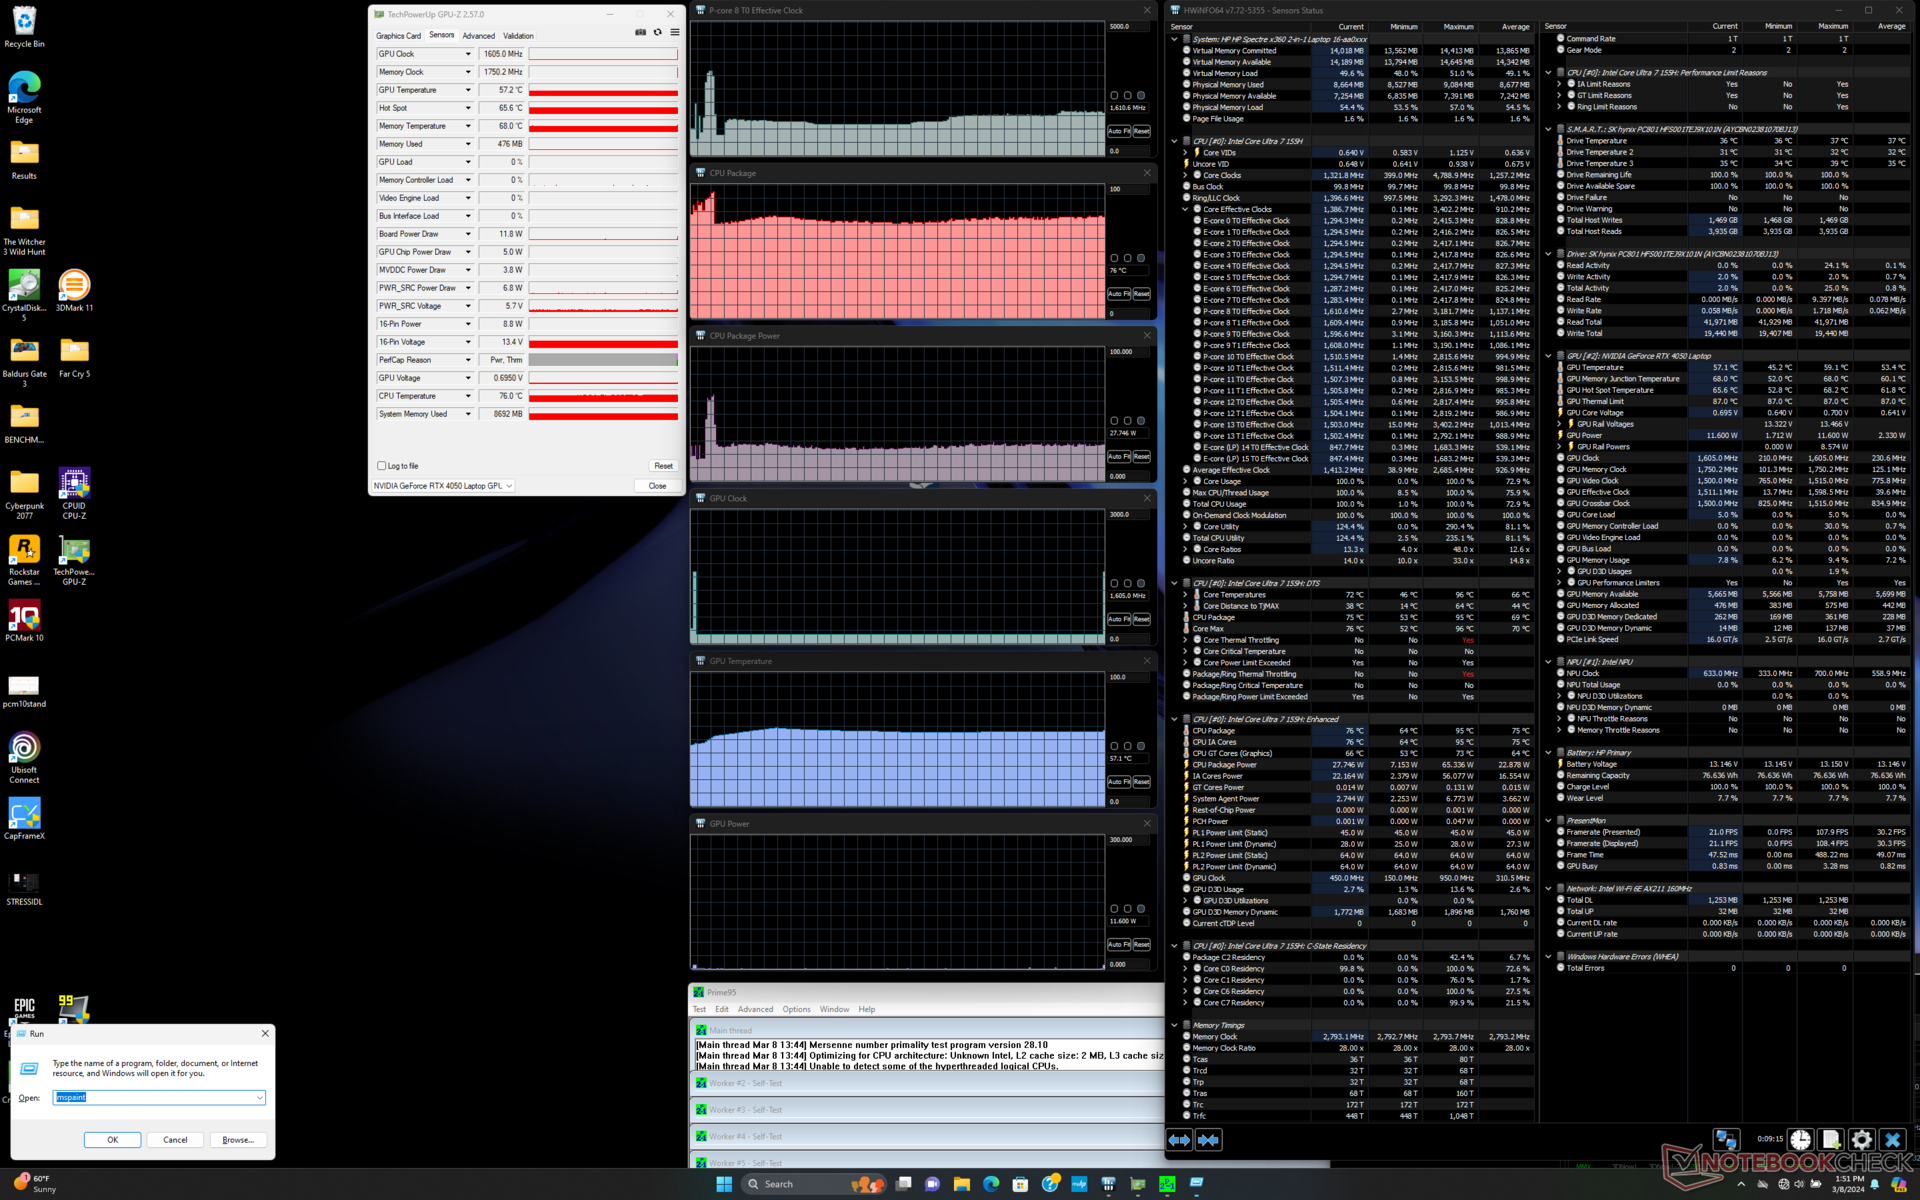
| CPU Clock (GHz) | GPU Clock (MHz) | Average CPU Temperature (°C) | Average GPU Temperature (°C) | |
| System Idle | -- | -- | 53 | 45 |
| Prime95 Stress | ~1.5 | -- | 75 | 57 |
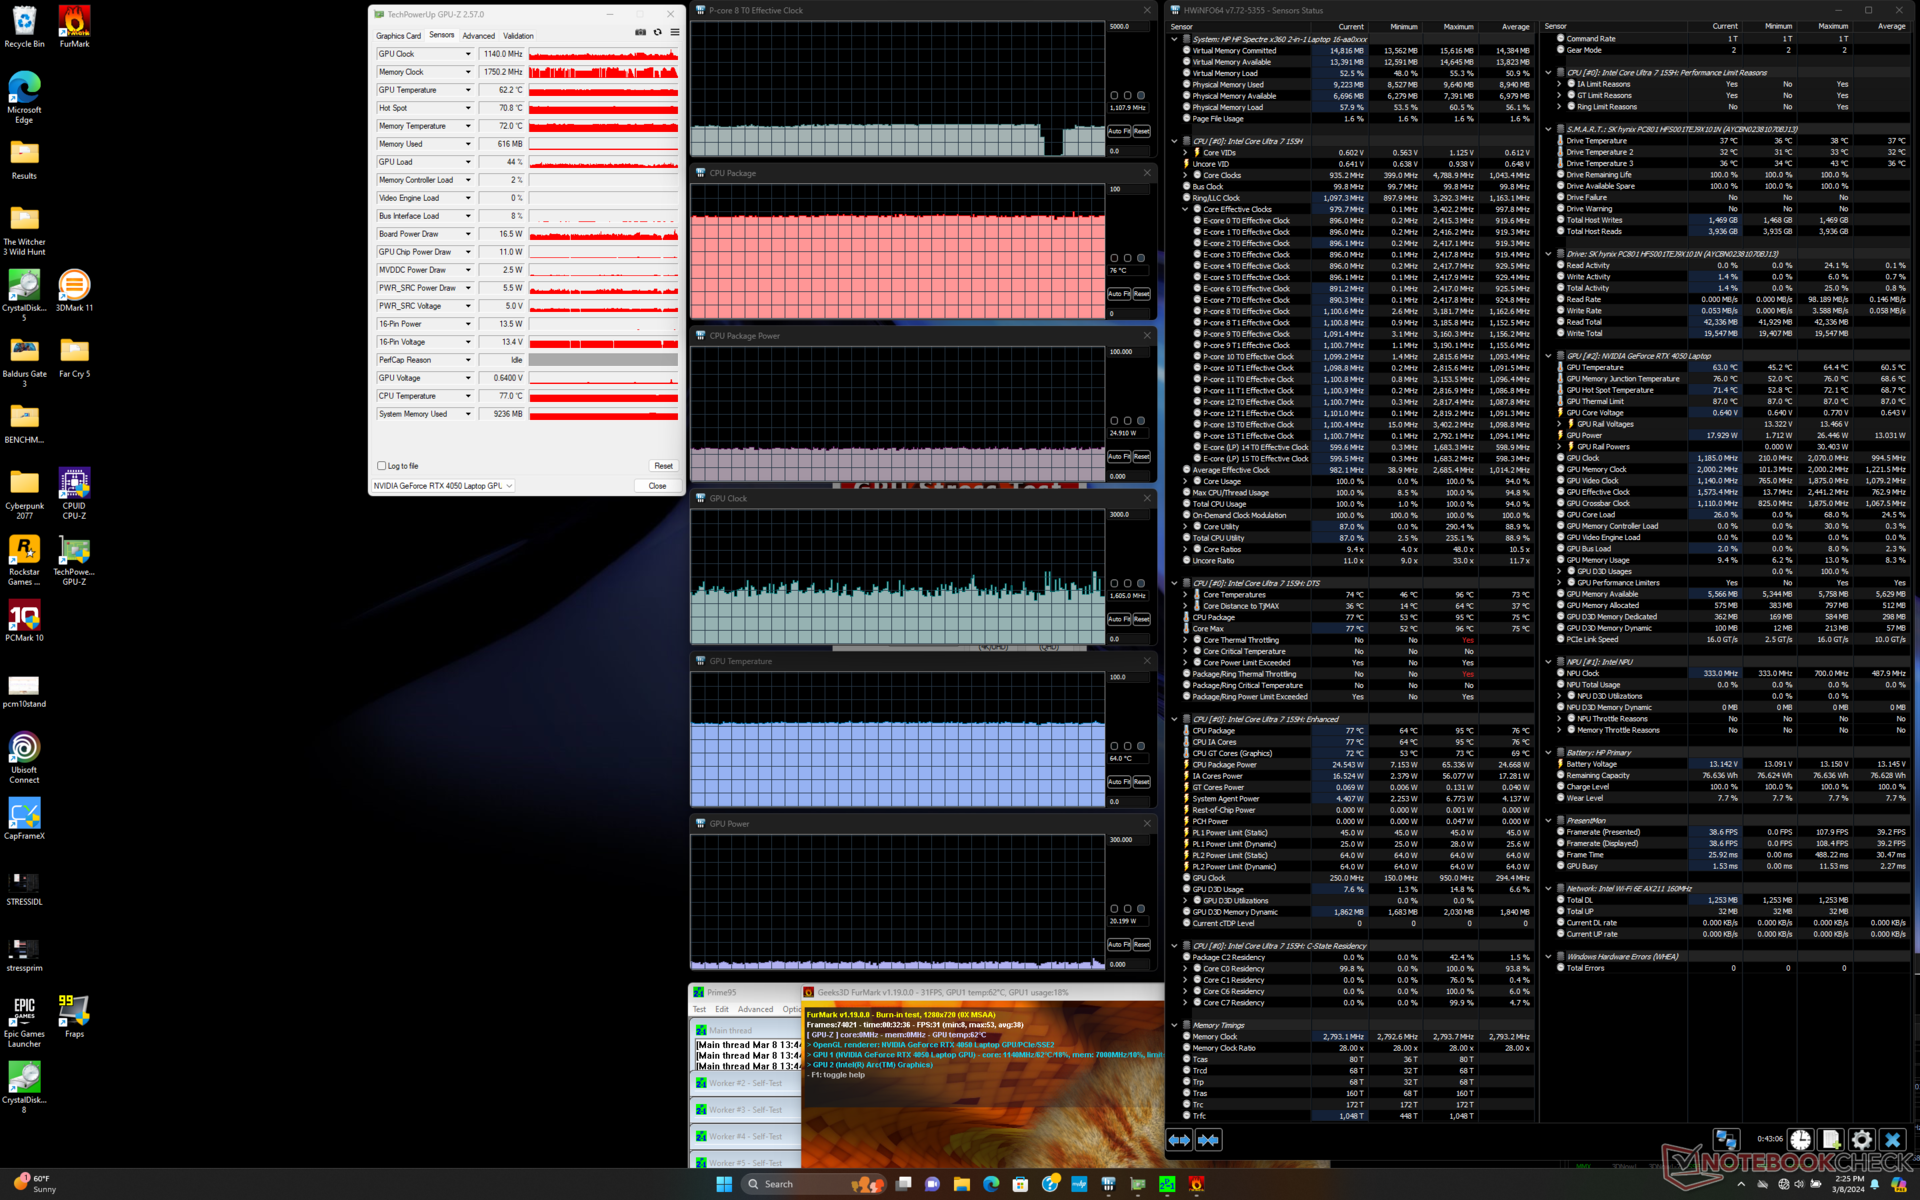
| Prime95 + FurMark Stress | ~1.1 | ~1140 | 77 | 64 |
| Witcher 3 Stress (Balanced mode) | ~1.1 | 1920 | 66 | 62 |
| Witcher 3 Stress (Performance mode) | ~1.1 | 2235 | 72 | 71 |
System Performance
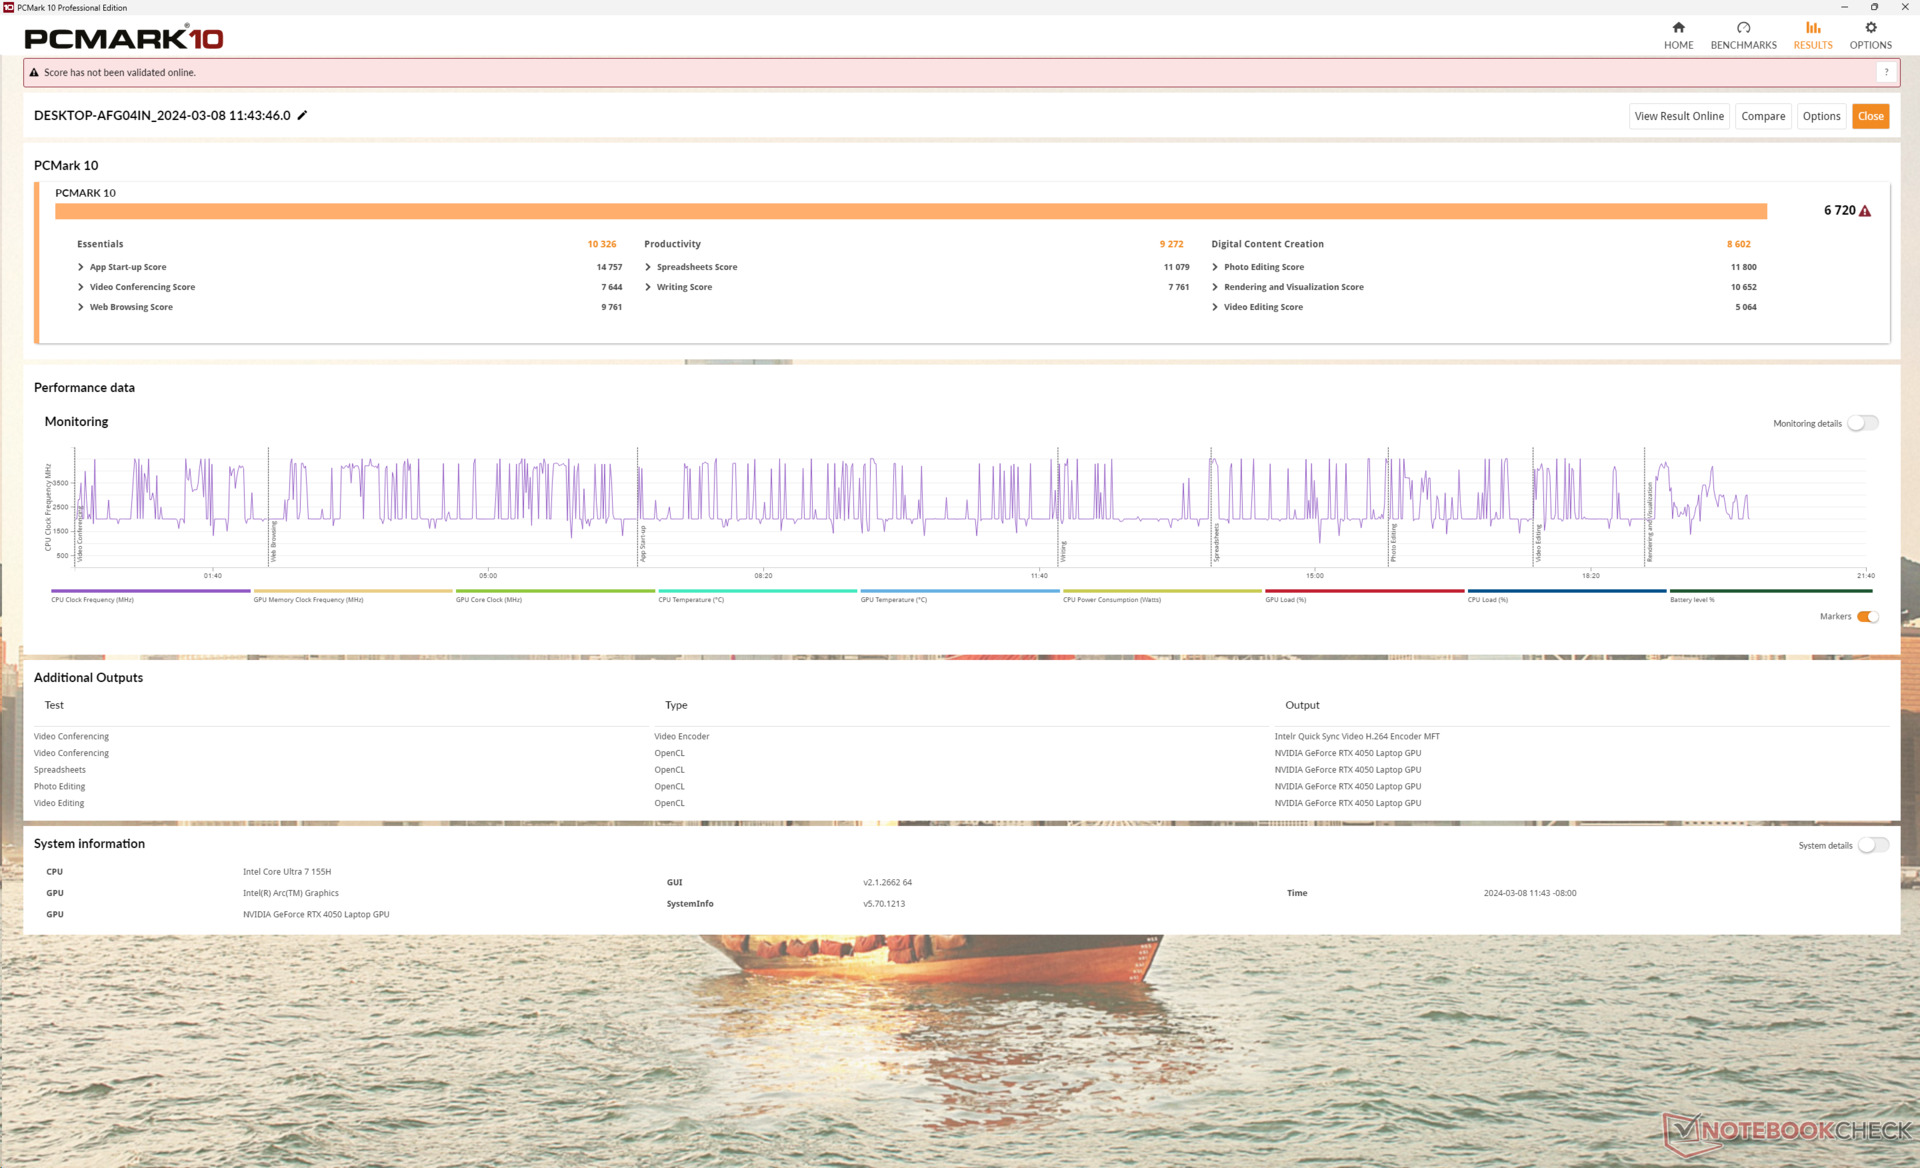
PCMark 10 scores are comparable to the iGPU configuration of the same model even though our dGPU version is significantly faster. However, PCMark has never been an accurate GPU benchmarking tool for systems with Optimus 1.0 graphics like our Spectre x360 16 series.
CrossMark: Overall | Productivity | Creativity | Responsiveness
WebXPRT 3: Overall
WebXPRT 4: Overall
Mozilla Kraken 1.1: Total
| PCMark 10 / Score | |
| MSI Prestige 16 B1MG-001US | |
| HP Spectre x360 16-aa0074ng | |
| Average Intel Core Ultra 7 155H, NVIDIA GeForce RTX 4050 Laptop GPU (6537 - 6973, n=5) | |
| Honor MagicBook Pro 16 2024 | |
| HP Spectre x360 16 RTX 4050 | |
| HP Spectre x360 2-in-1 16-f1075ng | |
| LG Gram 2in1 16 16T90R - G.AA78G | |
| PCMark 10 / Essentials | |
| LG Gram 2in1 16 16T90R - G.AA78G | |
| MSI Prestige 16 B1MG-001US | |
| HP Spectre x360 2-in-1 16-f1075ng | |
| HP Spectre x360 16-aa0074ng | |
| HP Spectre x360 16 RTX 4050 | |
| Average Intel Core Ultra 7 155H, NVIDIA GeForce RTX 4050 Laptop GPU (9463 - 10446, n=5) | |
| Honor MagicBook Pro 16 2024 | |
| PCMark 10 / Productivity | |
| HP Spectre x360 16 RTX 4050 | |
| Average Intel Core Ultra 7 155H, NVIDIA GeForce RTX 4050 Laptop GPU (8769 - 9272, n=5) | |
| HP Spectre x360 16-aa0074ng | |
| MSI Prestige 16 B1MG-001US | |
| Honor MagicBook Pro 16 2024 | |
| HP Spectre x360 2-in-1 16-f1075ng | |
| LG Gram 2in1 16 16T90R - G.AA78G | |
| PCMark 10 / Digital Content Creation | |
| Honor MagicBook Pro 16 2024 | |
| MSI Prestige 16 B1MG-001US | |
| Average Intel Core Ultra 7 155H, NVIDIA GeForce RTX 4050 Laptop GPU (8602 - 10622, n=5) | |
| HP Spectre x360 16-aa0074ng | |
| HP Spectre x360 16 RTX 4050 | |
| HP Spectre x360 2-in-1 16-f1075ng | |
| LG Gram 2in1 16 16T90R - G.AA78G | |
| CrossMark / Overall | |
| MSI Prestige 16 B1MG-001US | |
| Honor MagicBook Pro 16 2024 | |
| HP Spectre x360 16-aa0074ng | |
| HP Spectre x360 2-in-1 16-f1075ng | |
| Average Intel Core Ultra 7 155H, NVIDIA GeForce RTX 4050 Laptop GPU (1552 - 1740, n=5) | |
| HP Spectre x360 16 RTX 4050 | |
| LG Gram 2in1 16 16T90R - G.AA78G | |
| CrossMark / Productivity | |
| HP Spectre x360 2-in-1 16-f1075ng | |
| MSI Prestige 16 B1MG-001US | |
| Honor MagicBook Pro 16 2024 | |
| HP Spectre x360 16-aa0074ng | |
| Average Intel Core Ultra 7 155H, NVIDIA GeForce RTX 4050 Laptop GPU (1459 - 1659, n=5) | |
| LG Gram 2in1 16 16T90R - G.AA78G | |
| HP Spectre x360 16 RTX 4050 | |
| CrossMark / Creativity | |
| MSI Prestige 16 B1MG-001US | |
| HP Spectre x360 16-aa0074ng | |
| Average Intel Core Ultra 7 155H, NVIDIA GeForce RTX 4050 Laptop GPU (1811 - 1943, n=5) | |
| HP Spectre x360 16 RTX 4050 | |
| Honor MagicBook Pro 16 2024 | |
| HP Spectre x360 2-in-1 16-f1075ng | |
| LG Gram 2in1 16 16T90R - G.AA78G | |
| CrossMark / Responsiveness | |
| HP Spectre x360 2-in-1 16-f1075ng | |
| Honor MagicBook Pro 16 2024 | |
| MSI Prestige 16 B1MG-001US | |
| LG Gram 2in1 16 16T90R - G.AA78G | |
| HP Spectre x360 16-aa0074ng | |
| Average Intel Core Ultra 7 155H, NVIDIA GeForce RTX 4050 Laptop GPU (1167 - 1467, n=5) | |
| HP Spectre x360 16 RTX 4050 | |
| WebXPRT 3 / Overall | |
| MSI Prestige 16 B1MG-001US | |
| Honor MagicBook Pro 16 2024 | |
| HP Spectre x360 16 RTX 4050 | |
| Average Intel Core Ultra 7 155H, NVIDIA GeForce RTX 4050 Laptop GPU (262 - 285, n=5) | |
| HP Spectre x360 16-aa0074ng | |
| HP Spectre x360 2-in-1 16-f1075ng | |
| LG Gram 2in1 16 16T90R - G.AA78G | |
| WebXPRT 4 / Overall | |
| MSI Prestige 16 B1MG-001US | |
| HP Spectre x360 16-aa0074ng | |
| Honor MagicBook Pro 16 2024 | |
| HP Spectre x360 16 RTX 4050 | |
| Average Intel Core Ultra 7 155H, NVIDIA GeForce RTX 4050 Laptop GPU (247 - 260, n=5) | |
| HP Spectre x360 2-in-1 16-f1075ng | |
| Mozilla Kraken 1.1 / Total | |
| LG Gram 2in1 16 16T90R - G.AA78G | |
| HP Spectre x360 16 RTX 4050 | |
| MSI Prestige 16 B1MG-001US | |
| HP Spectre x360 2-in-1 16-f1075ng | |
| Honor MagicBook Pro 16 2024 | |
| HP Spectre x360 16-aa0074ng | |
| Average Intel Core Ultra 7 155H, NVIDIA GeForce RTX 4050 Laptop GPU (416 - 561, n=5) | |
* ... smaller is better
| PCMark 10 Score | 6720 points | |
Help | ||
| AIDA64 / Memory Copy | |
| HP Spectre x360 16-aa0074ng | |
| HP Spectre x360 16 RTX 4050 | |
| Honor MagicBook Pro 16 2024 | |
| Average Intel Core Ultra 7 155H (62397 - 96791, n=50) | |
| MSI Prestige 16 B1MG-001US | |
| LG Gram 2in1 16 16T90R - G.AA78G | |
| HP Spectre x360 2-in-1 16-f1075ng | |
| AIDA64 / Memory Read | |
| HP Spectre x360 16 RTX 4050 | |
| HP Spectre x360 16-aa0074ng | |
| Average Intel Core Ultra 7 155H (60544 - 90647, n=50) | |
| Honor MagicBook Pro 16 2024 | |
| MSI Prestige 16 B1MG-001US | |
| LG Gram 2in1 16 16T90R - G.AA78G | |
| HP Spectre x360 2-in-1 16-f1075ng | |
| AIDA64 / Memory Write | |
| HP Spectre x360 16 RTX 4050 | |
| LG Gram 2in1 16 16T90R - G.AA78G | |
| MSI Prestige 16 B1MG-001US | |
| Honor MagicBook Pro 16 2024 | |
| HP Spectre x360 16-aa0074ng | |
| Average Intel Core Ultra 7 155H (58692 - 93451, n=50) | |
| HP Spectre x360 2-in-1 16-f1075ng | |
| AIDA64 / Memory Latency | |
| Average Intel Core Ultra 7 155H (116.2 - 233, n=50) | |
| Honor MagicBook Pro 16 2024 | |
| HP Spectre x360 16-aa0074ng | |
| HP Spectre x360 16 RTX 4050 | |
| MSI Prestige 16 B1MG-001US | |
| LG Gram 2in1 16 16T90R - G.AA78G | |
| HP Spectre x360 2-in-1 16-f1075ng | |
* ... smaller is better
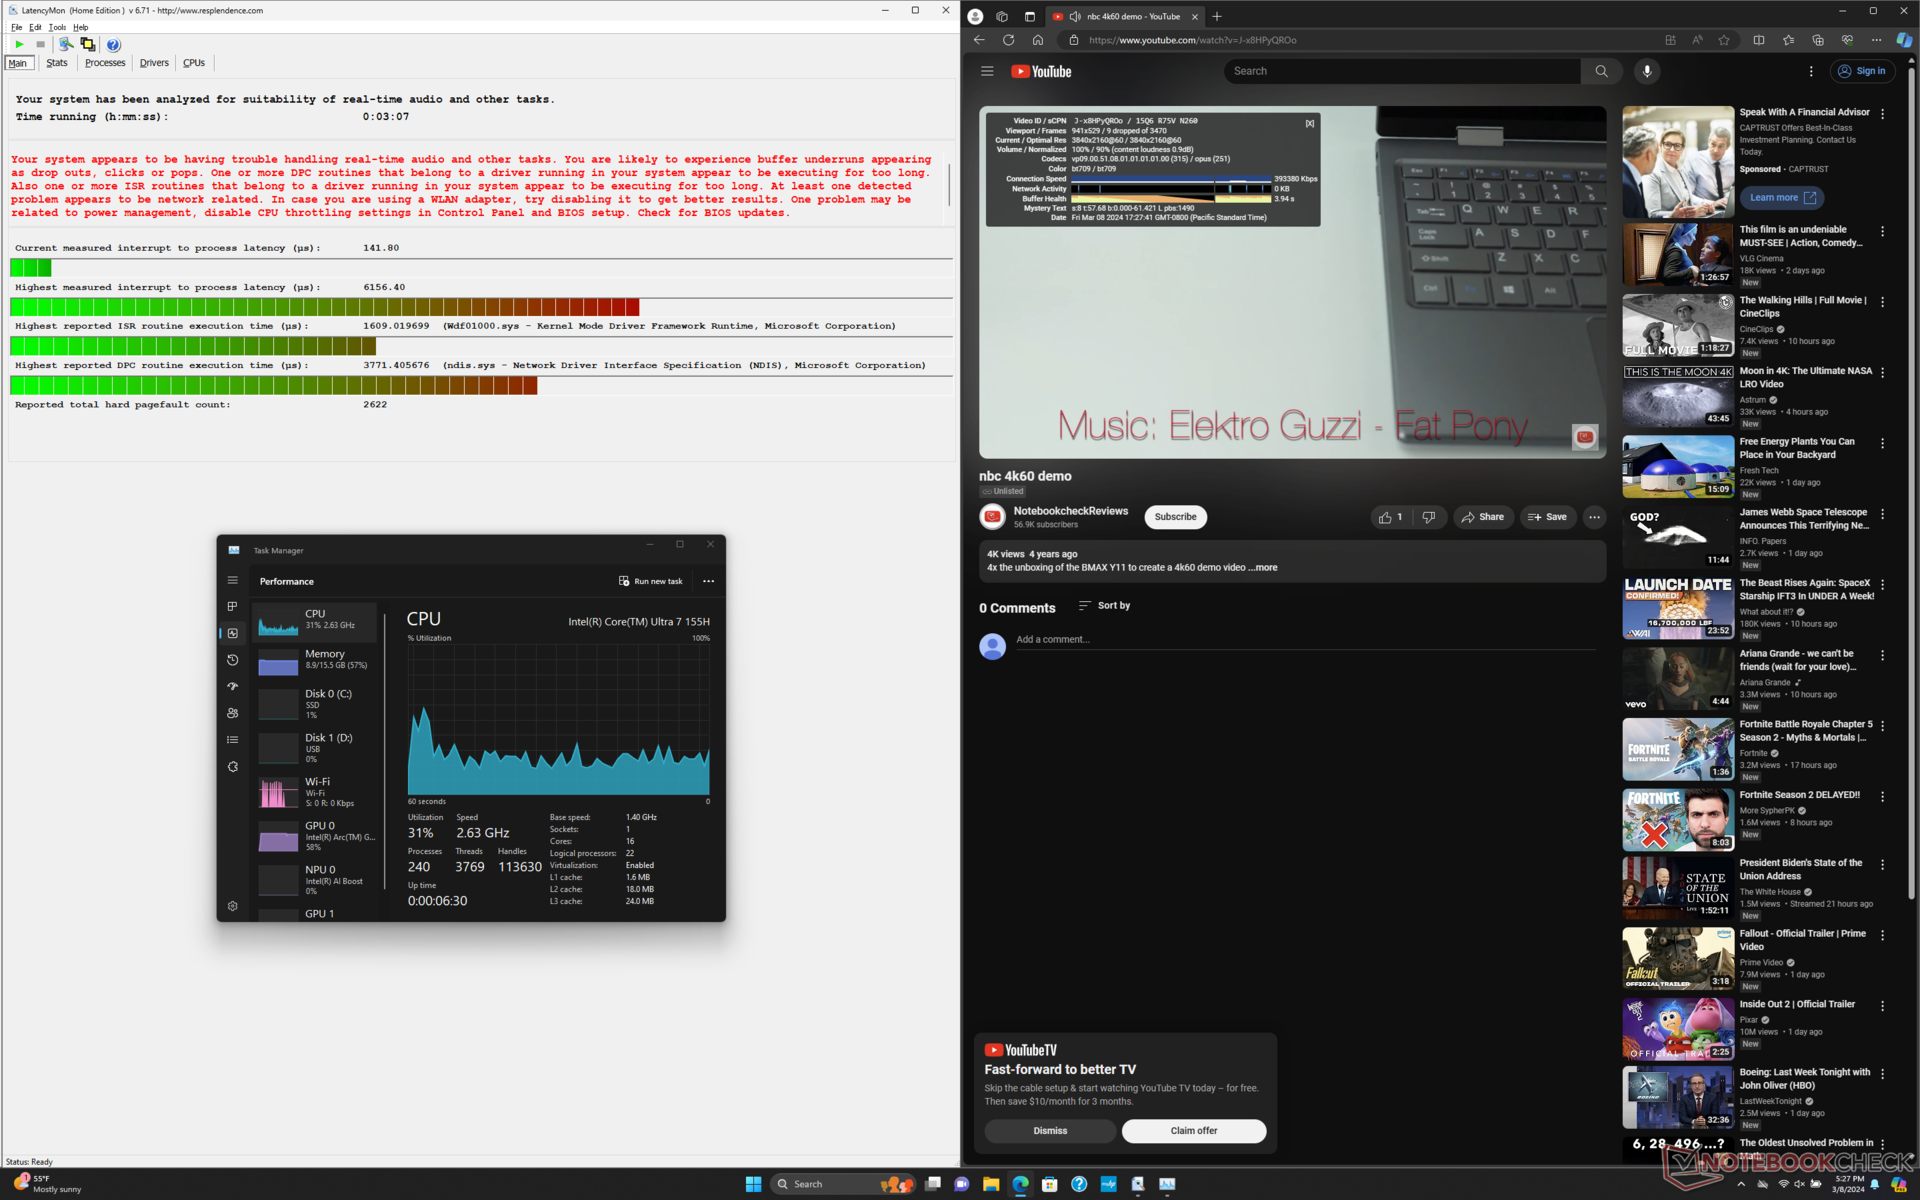
DPC Latency
LatencyMon reveals both DPC issues and dropped frames during our minute-long 4K60 video test. Our iGPU review unit would exhibit dropped frames as well during the same test to suggest a potential underlying issue across both configurations.

| DPC Latencies / LatencyMon - interrupt to process latency (max), Web, Youtube, Prime95 | |
| LG Gram 2in1 16 16T90R - G.AA78G | |
| HP Spectre x360 16 RTX 4050 | |
| Honor MagicBook Pro 16 2024 | |
| HP Spectre x360 2-in-1 16-f1075ng | |
| HP Spectre x360 16-aa0074ng | |
| MSI Prestige 16 B1MG-001US | |
* ... smaller is better
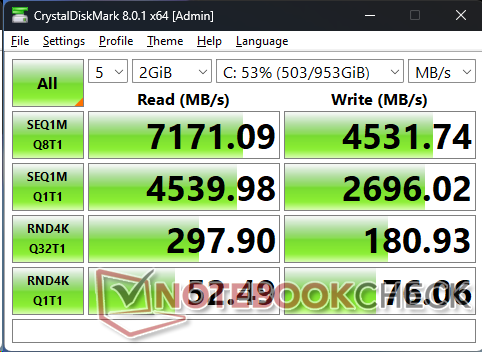
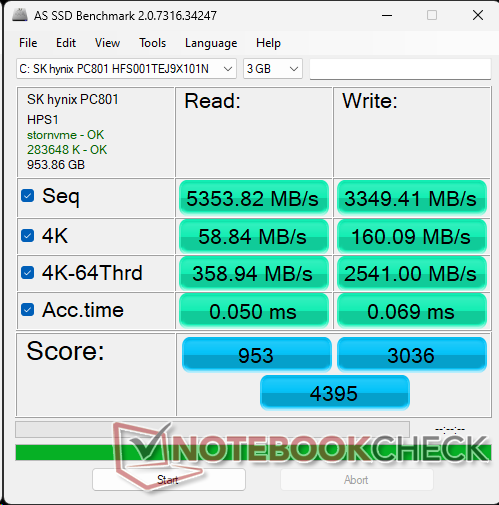
Storage Devices
Our specific test unit ships with the SK Hynix PC801 instead of the Kioxia XG8. Transfer rates are nonetheless excellent with no notable throttling issues when running DiskSpd in a loop.

* ... smaller is better
Disk Throttling: DiskSpd Read Loop, Queue Depth 8
GPU Performance
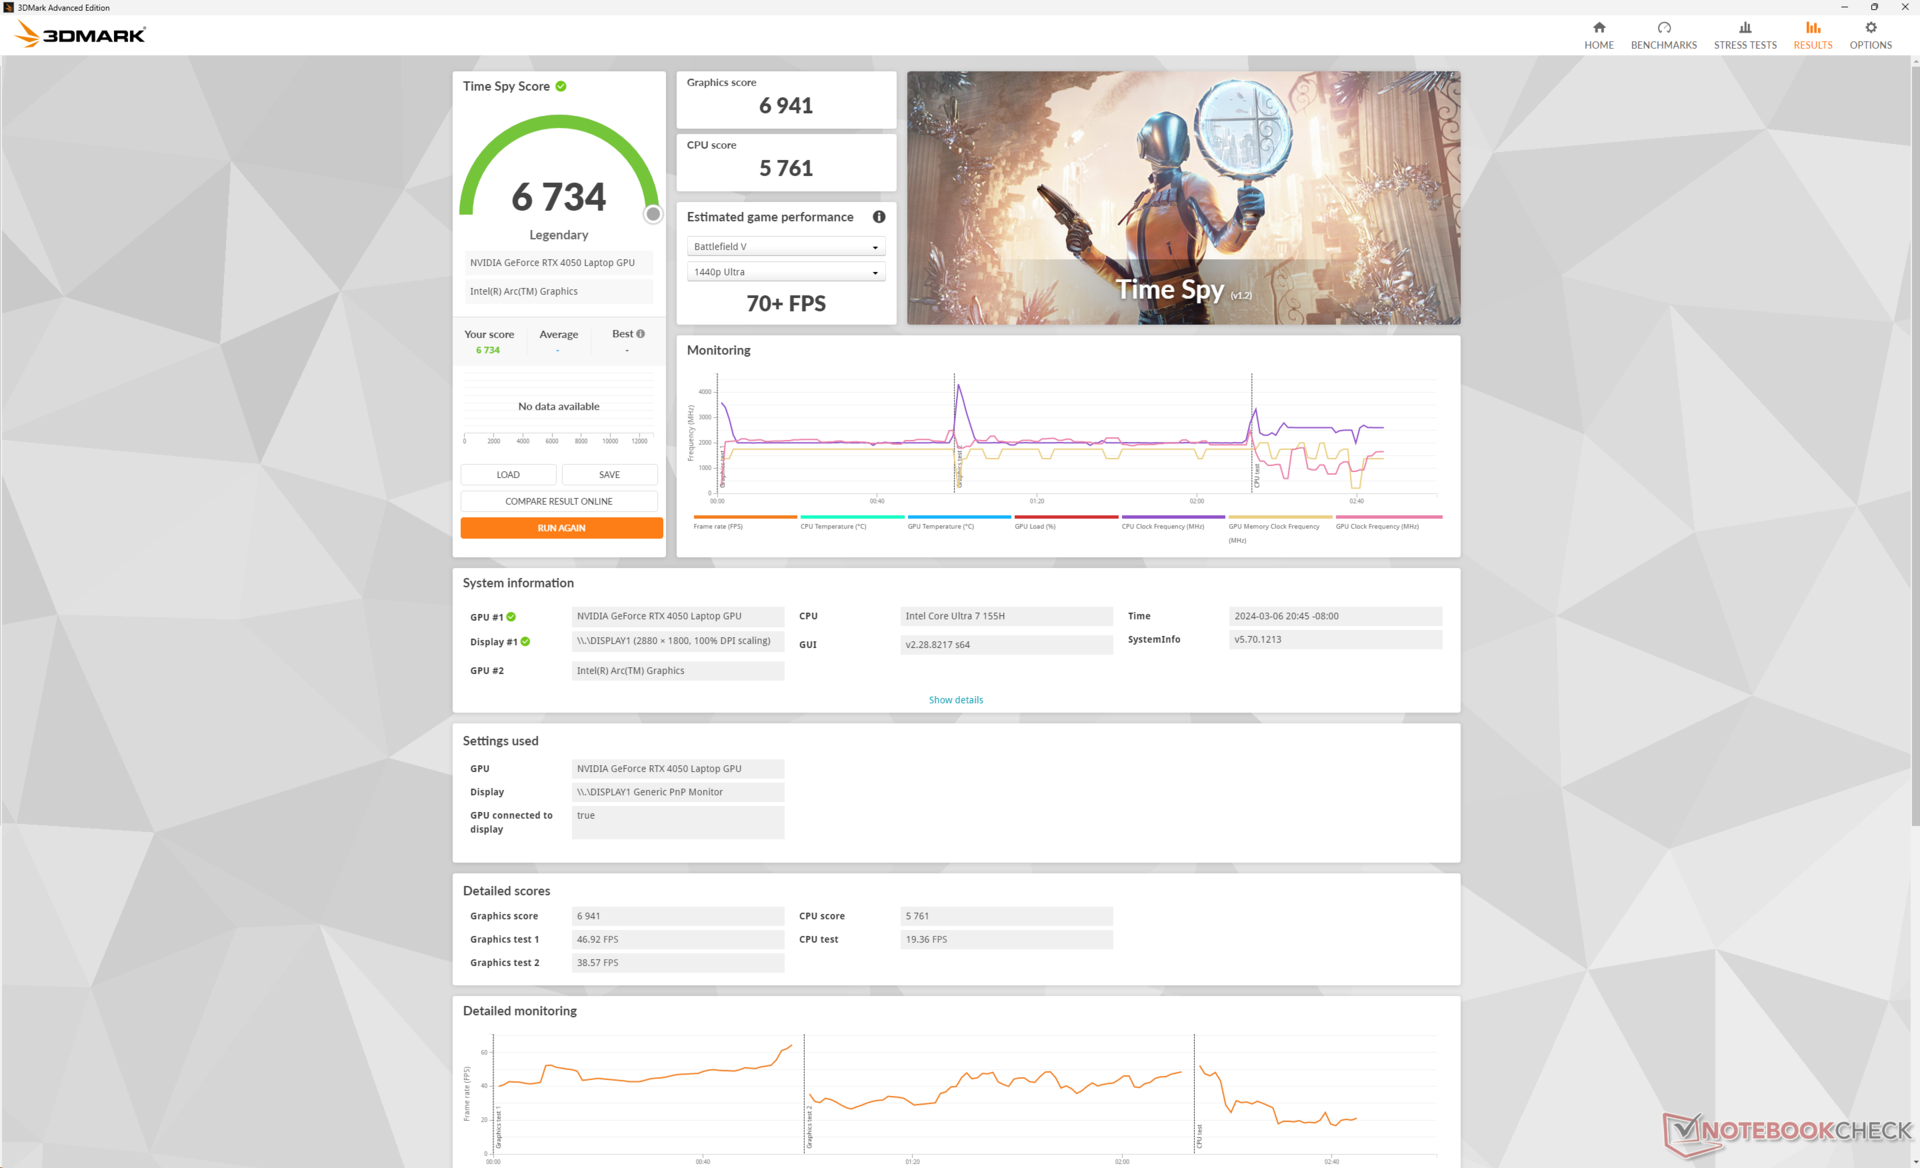
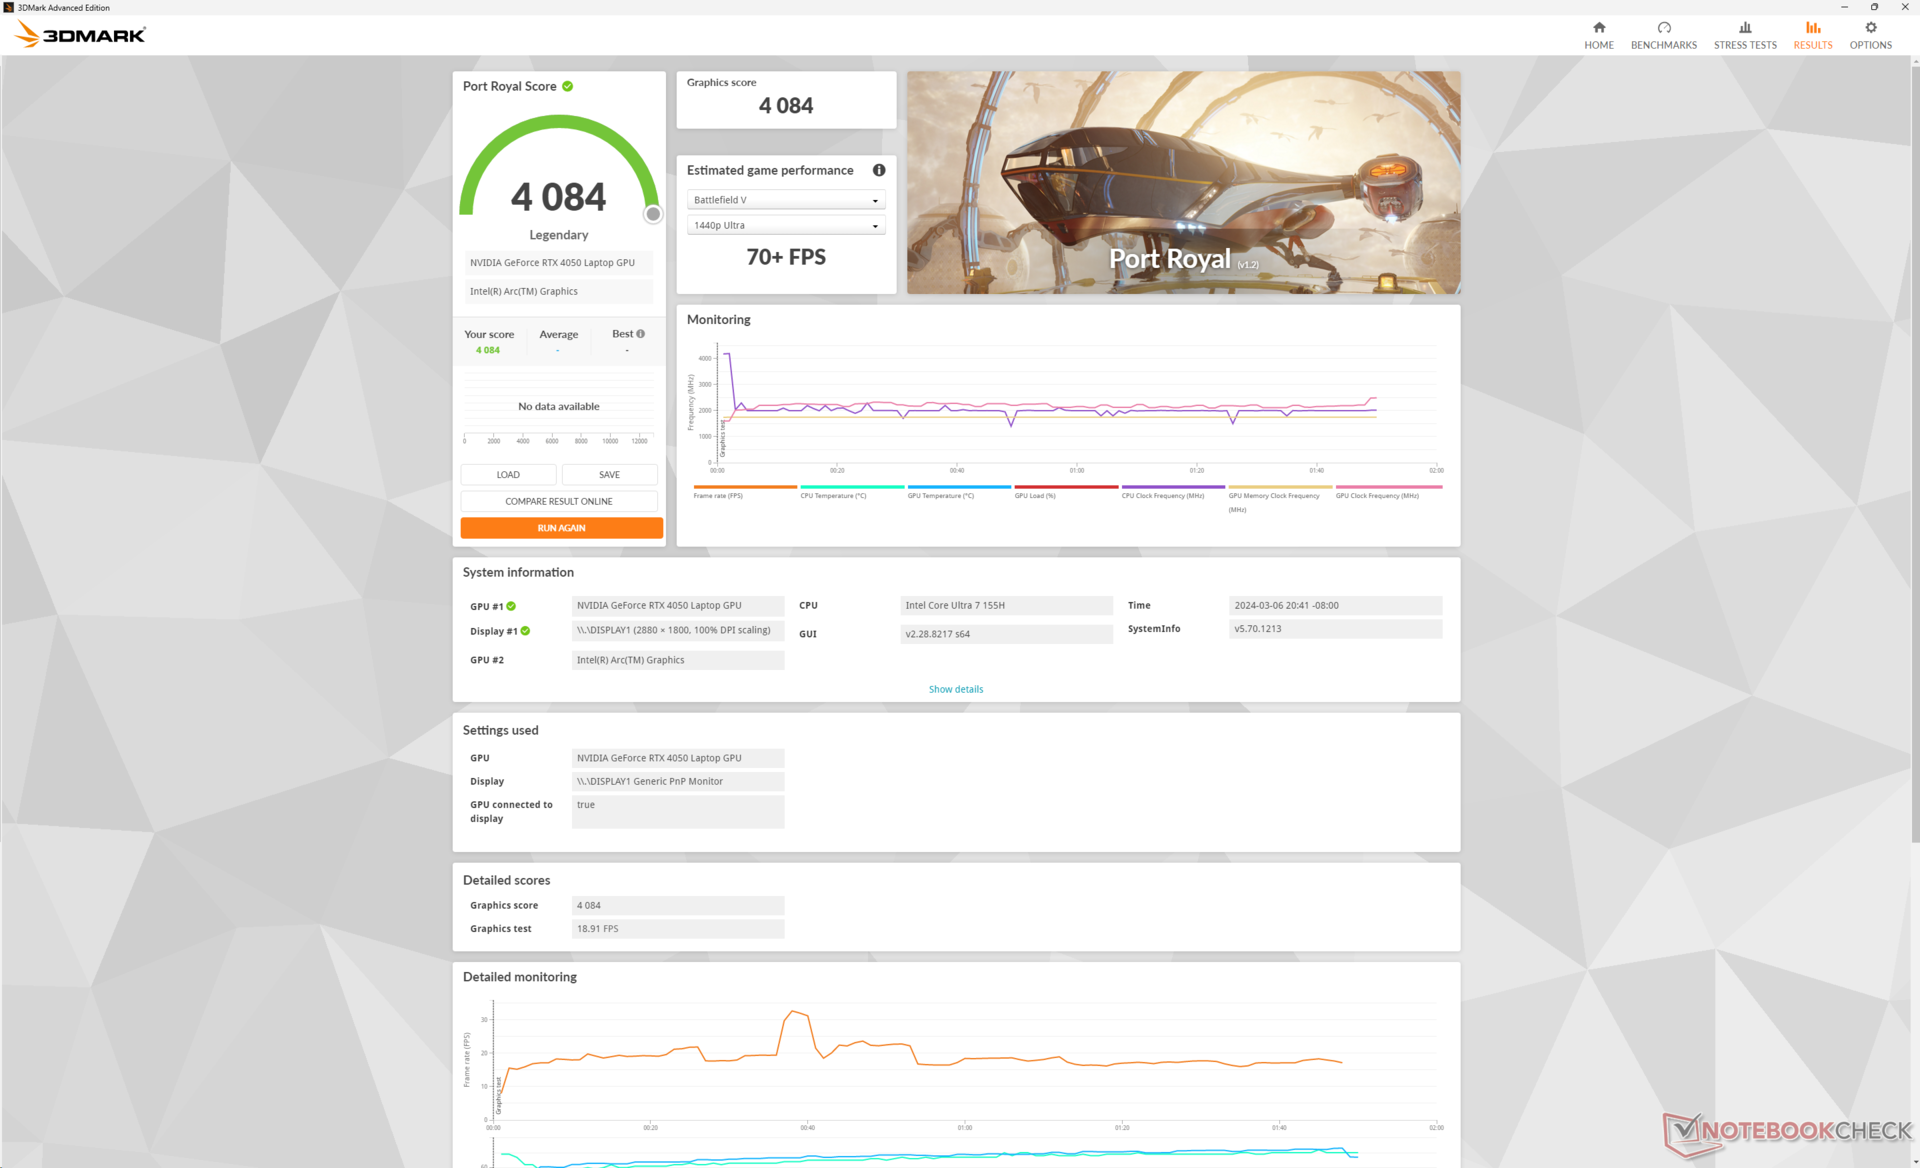
Needless to say, the GeForce RTX 4050 offers massive performance boosts over the integrated Arc 8 configuration. 3DMark scores are roughly 2x higher while CUDA acceleration allows for faster rendering in Blender by almost a factor of 10.
From the perspective of other laptops with the same RTX 4050 GPU, however, the Spectre x360 16 underperforms. The 55 W TGP target is lower than on competing laptops like the Acer Predator Helios Neo 16 or Victus 15 which target 130 W and 75 W, respectively. As a result, 3DMark scores are about 10 to 15 percent slower than the average laptop in our database with the same GeForce RTX 4050 GPU.
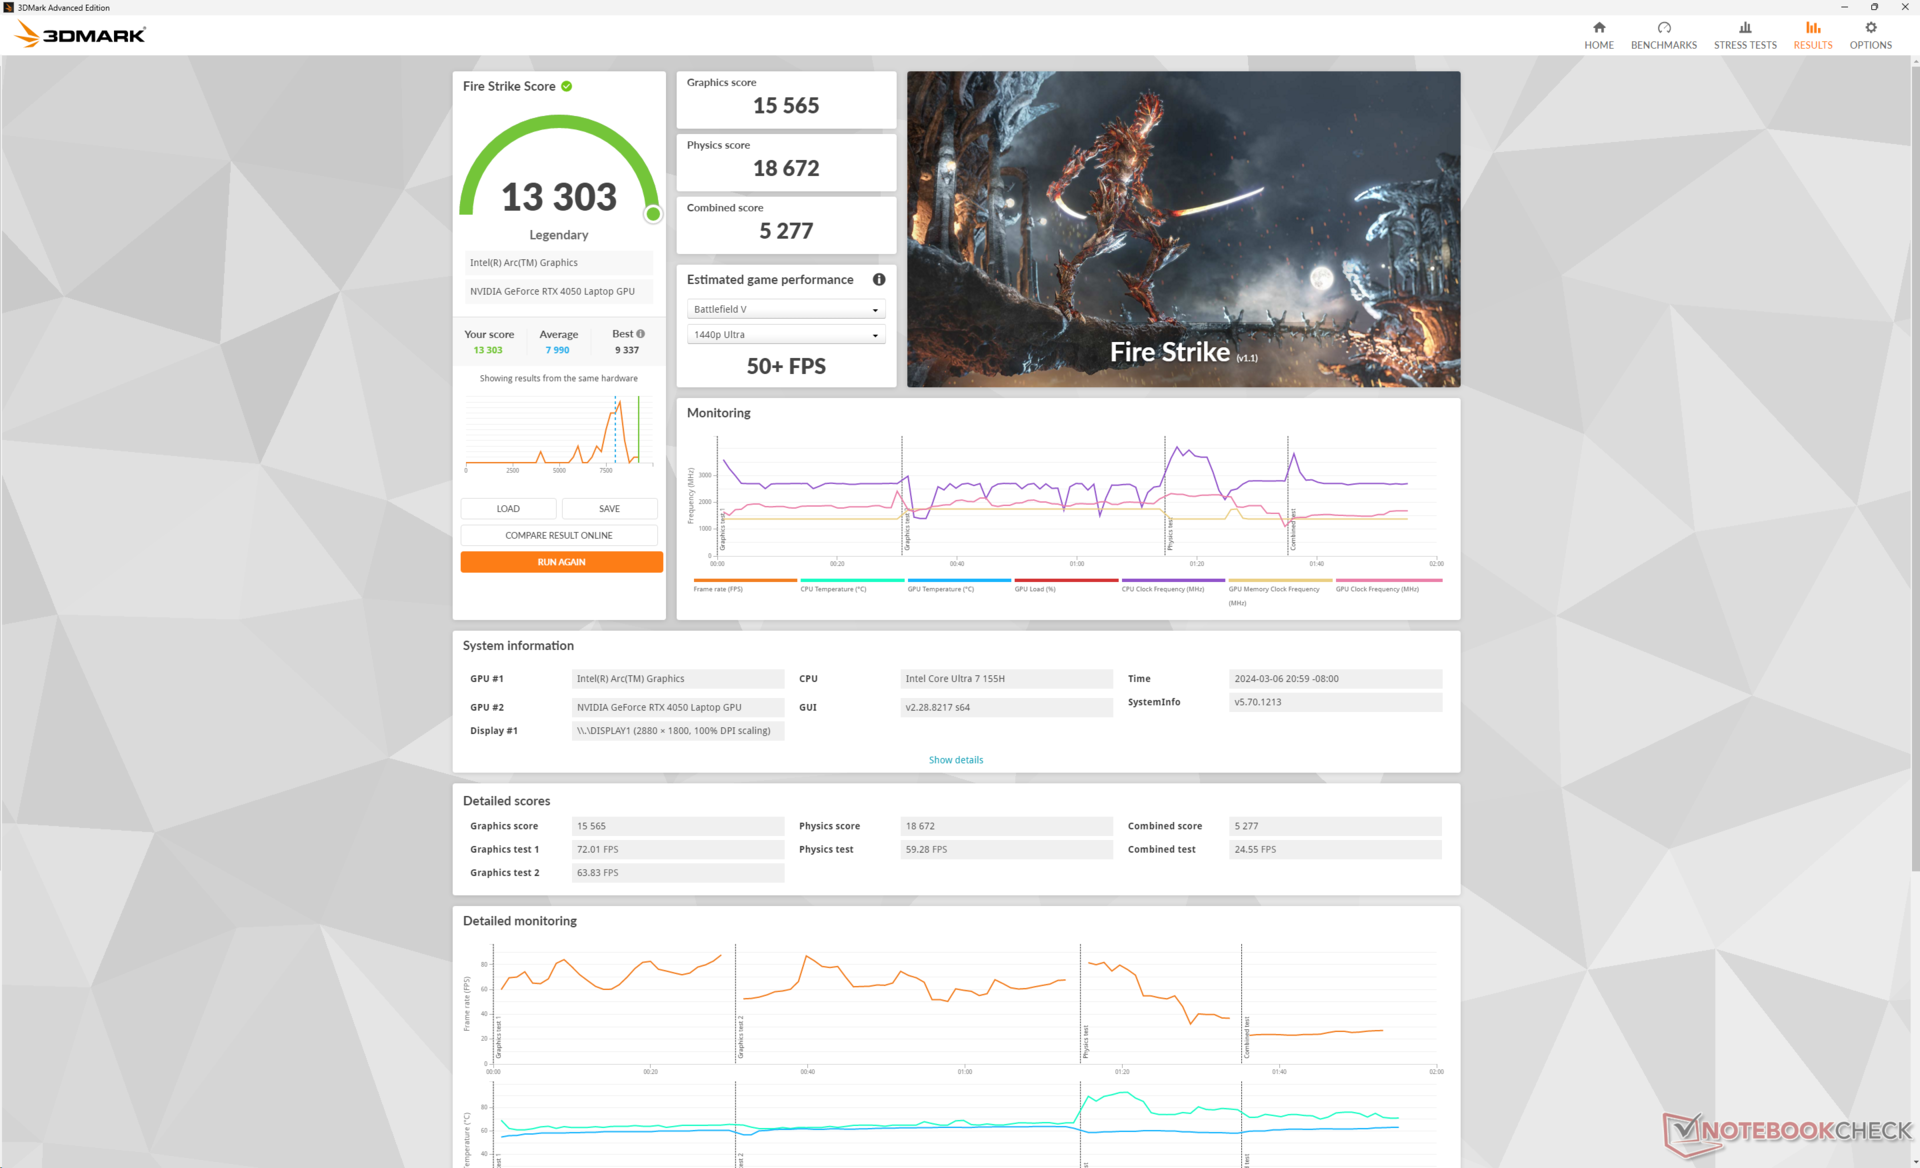
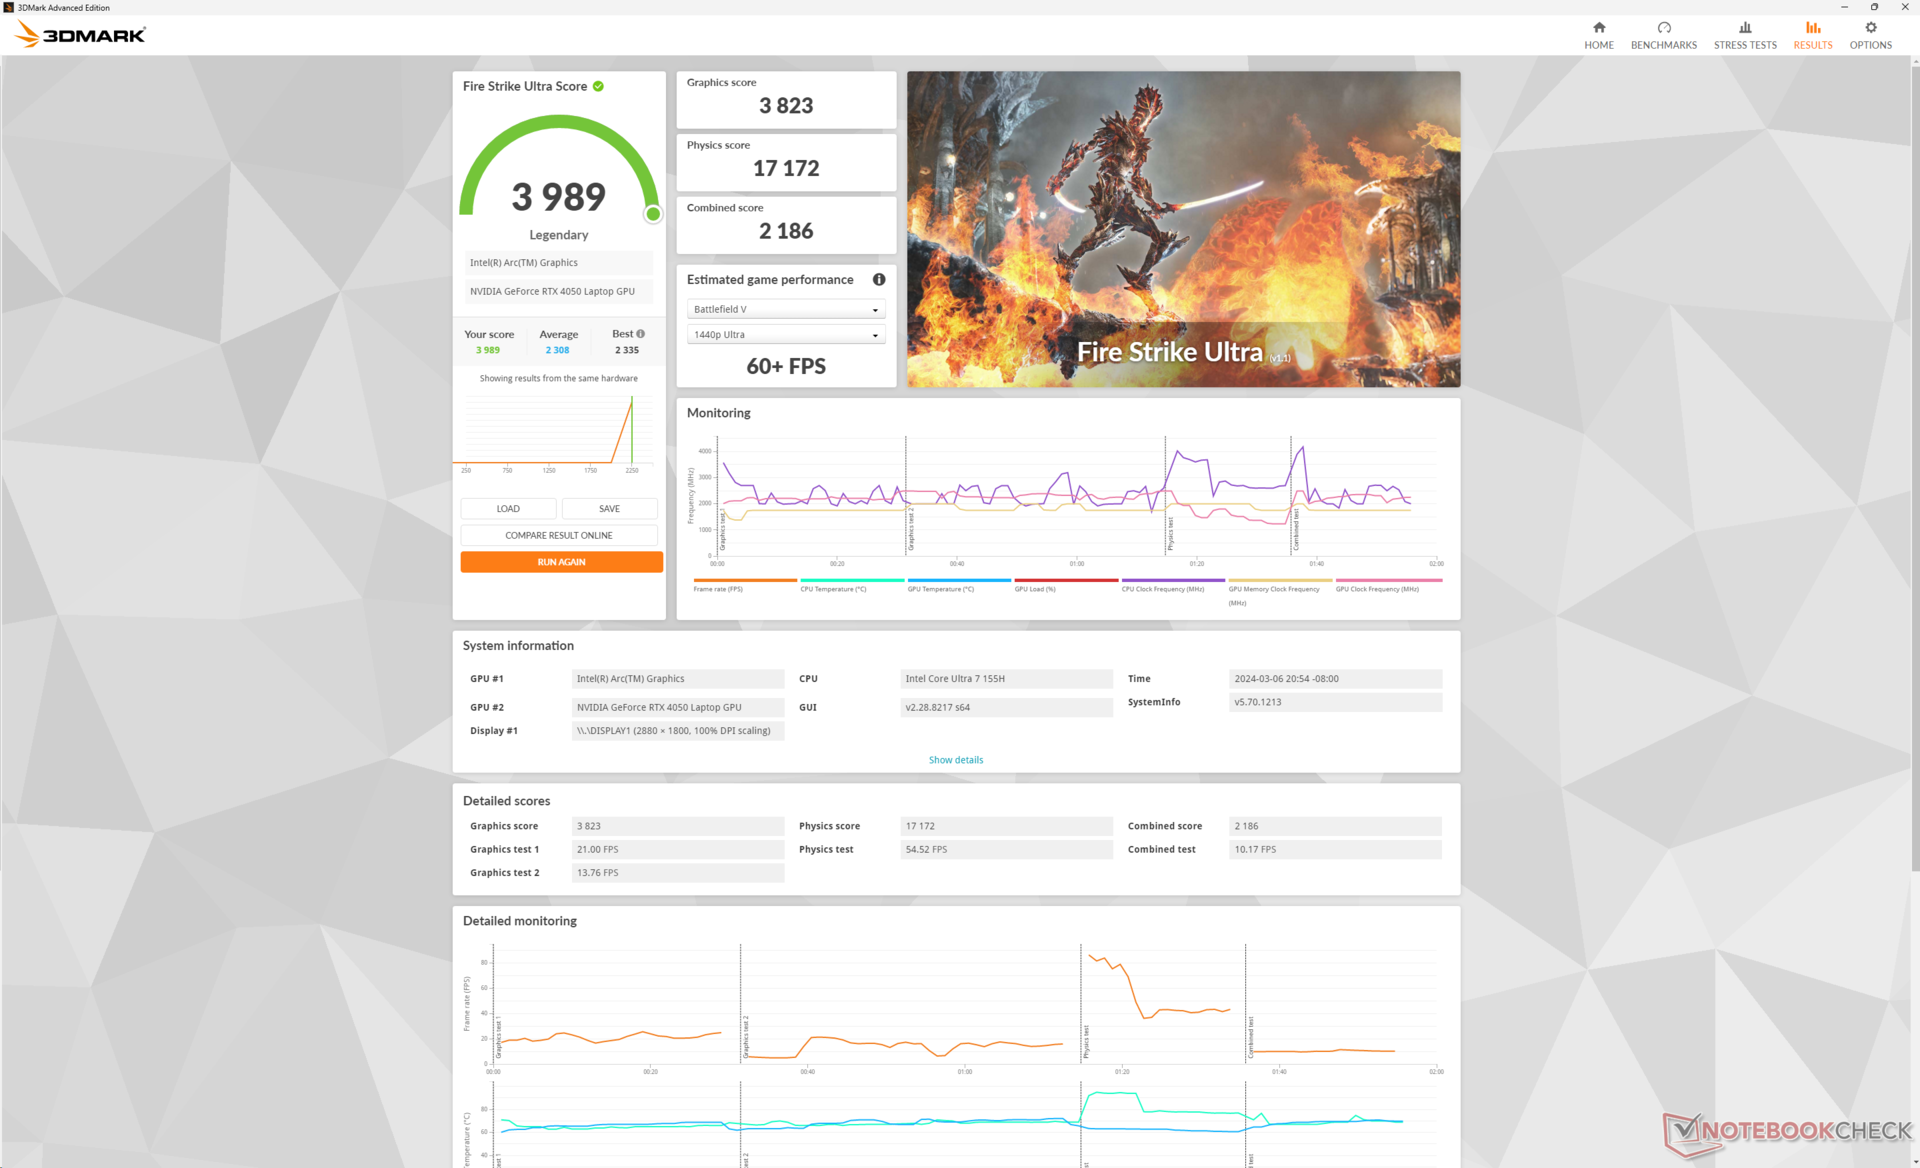
| Power Profile | Graphics Score | Physics Score | Combined Score |
| Performance Mode | 17908 | 17248 | 7364 |
| Balanced Mode | 15565 (-13%) | 18672 (+8%) | 5277 (-28%) |
| Battery Power | 14156 (-21%) | 21326 (+24%) | 5985 (-19%) |
Fire Strike results are inconsistent as shown by our table above. The CPU score would increase on Balanced and Battery modes while the opposite is true for the GPU score even after several retests on a cold state. Again, HP is aware of the issue and says a fix is in the works.
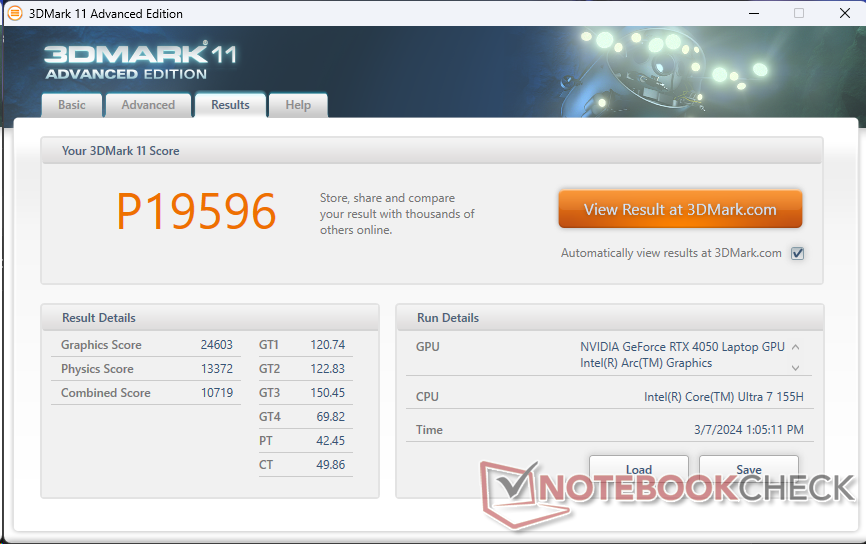

| 3DMark 11 Performance | 19596 points | |
| 3DMark Fire Strike Score | 15586 points | |
| 3DMark Time Spy Score | 6734 points | |
Help | ||
* ... smaller is better
Gaming Performance
The GeForce RTX 4050 is powerful for gaming despite its status as an entry-level RTX GPU. Demanding games like Cyberpunk 2077 run well at 1080p Ultra settings before any DLSS enhancements. However, things get choppy at higher resolutions in which case lower settings are recommended to keep frame rates afloat. Games look very sharp when playing on the native 1800p OLED display, but be prepared to tune down most graphical effects.
| The Witcher 3 - 1920x1080 Ultra Graphics & Postprocessing (HBAO+) | |
| Honor MagicBook Pro 16 2024 | |
| HP Spectre x360 16 RTX 4050 | |
| MSI Prestige 16 B1MG-001US | |
| HP Spectre x360 16-aa0074ng | |
| LG Gram 2in1 16 16T90R - G.AA78G | |
| HP Spectre x360 2-in-1 16-f1075ng | |
| GTA V - 1920x1080 Highest AA:4xMSAA + FX AF:16x | |
| Honor MagicBook Pro 16 2024 | |
| HP Spectre x360 16 RTX 4050 | |
| HP Spectre x360 16-aa0074ng | |
| LG Gram 2in1 16 16T90R - G.AA78G | |
| HP Spectre x360 2-in-1 16-f1075ng | |
| Final Fantasy XV Benchmark - 1920x1080 High Quality | |
| Honor MagicBook Pro 16 2024 | |
| HP Spectre x360 16 RTX 4050 | |
| MSI Prestige 16 B1MG-001US | |
| HP Spectre x360 16-aa0074ng | |
| LG Gram 2in1 16 16T90R - G.AA78G | |
| HP Spectre x360 2-in-1 16-f1075ng | |
| Strange Brigade - 1920x1080 ultra AA:ultra AF:16 | |
| Honor MagicBook Pro 16 2024 | |
| HP Spectre x360 16 RTX 4050 | |
| HP Spectre x360 16-aa0074ng | |
| MSI Prestige 16 B1MG-001US | |
| LG Gram 2in1 16 16T90R - G.AA78G | |
| HP Spectre x360 2-in-1 16-f1075ng | |
| Dota 2 Reborn - 1920x1080 ultra (3/3) best looking | |
| Honor MagicBook Pro 16 2024 | |
| HP Spectre x360 16 RTX 4050 | |
| MSI Prestige 16 B1MG-001US | |
| HP Spectre x360 16-aa0074ng | |
| LG Gram 2in1 16 16T90R - G.AA78G | |
| HP Spectre x360 2-in-1 16-f1075ng | |
| X-Plane 11.11 - 1920x1080 high (fps_test=3) | |
| Honor MagicBook Pro 16 2024 | |
| HP Spectre x360 16 RTX 4050 | |
| HP Spectre x360 2-in-1 16-f1075ng | |
| LG Gram 2in1 16 16T90R - G.AA78G | |
| MSI Prestige 16 B1MG-001US | |
| HP Spectre x360 16-aa0074ng | |
| Tiny Tina's Wonderlands | |
| 1920x1080 Medium Preset (DX12) | |
| Average NVIDIA GeForce RTX 4050 Laptop GPU (93.4 - 149.2, n=7) | |
| HP Spectre x360 16 RTX 4050 | |
| Lenovo ThinkPad E16 G1 Core i5-1335U | |
| 1920x1080 High Preset (DX12) | |
| Average NVIDIA GeForce RTX 4050 Laptop GPU (63.3 - 99.5, n=7) | |
| HP Spectre x360 16 RTX 4050 | |
| Lenovo ThinkPad E16 G1 Core i5-1335U | |
| 1920x1080 Badass Preset (DX12) | |
| Average NVIDIA GeForce RTX 4050 Laptop GPU (49.8 - 77.3, n=7) | |
| HP Spectre x360 16 RTX 4050 | |
| Lenovo ThinkPad E16 G1 Core i5-1335U | |
| 2560x1440 Badass Preset (DX12) | |
| Average NVIDIA GeForce RTX 4050 Laptop GPU (33.6 - 49.5, n=4) | |
| HP Spectre x360 16 RTX 4050 | |
| Baldur's Gate 3 | |
| 1920x1080 Medium Preset AA:T | |
| Average NVIDIA GeForce RTX 4050 Laptop GPU (56 - 91.9, n=10) | |
| HP Spectre x360 16 RTX 4050 | |
| 1920x1080 High Preset AA:T | |
| Average NVIDIA GeForce RTX 4050 Laptop GPU (49.8 - 83.5, n=10) | |
| HP Spectre x360 16 RTX 4050 | |
| 1920x1080 Ultra Preset AA:T | |
| HP Spectre x360 16 RTX 4050 | |
| Average NVIDIA GeForce RTX 4050 Laptop GPU (48.3 - 81.3, n=11) | |
| 2560x1440 Ultra Preset AA:T | |
| HP Spectre x360 16 RTX 4050 | |
| Average NVIDIA GeForce RTX 4050 Laptop GPU (32.4 - 55, n=7) | |
Witcher 3 FPS Chart
| low | med. | high | ultra | QHD | |
|---|---|---|---|---|---|
| GTA V (2015) | 171.3 | 162.2 | 135.3 | 76.7 | 57.3 |
| The Witcher 3 (2015) | 299 | 209.6 | 120.1 | 62.7 | |
| Dota 2 Reborn (2015) | 142 | 124.2 | 119.6 | 106.4 | |
| Final Fantasy XV Benchmark (2018) | 132.7 | 94.5 | 68.6 | 49.6 | |
| X-Plane 11.11 (2018) | 100.6 | 86.7 | 69.7 | ||
| Far Cry 5 (2018) | 97 | 93 | 95 | 87 | 64 |
| Strange Brigade (2018) | 299 | 171.1 | 137.4 | 121.3 | 81.2 |
| Tiny Tina's Wonderlands (2022) | 135.1 | 113.4 | 75.4 | 59.1 | 40.4 |
| F1 22 (2022) | 159.4 | 146.6 | 124.6 | 42 | 26.9 |
| Baldur's Gate 3 (2023) | 84.9 | 71.4 | 64 | 63.1 | 42.5 |
| Cyberpunk 2077 (2023) | 79.3 | 63.3 | 53.5 | 46 | 27.5 |
Emissions — One Of The Quietest 16-inch Convertibles
System Noise
Fan noise is only slightly louder than the iGPU configuration which was already very quiet to begin with. We're only able to record a maximum of 32 dB(A) when gaming on Performance mode compared to 29 dB(A) on the iGPU version or 39 dB(A) on last year's Spectre x360 16 design.
Noise level
| Idle |
| 23.6 / 23.6 / 23.6 dB(A) |
| Load |
| 29.2 / 32.1 dB(A) |
 | ||
30 dB silent 40 dB(A) audible 50 dB(A) loud |
||
min: | ||
| HP Spectre x360 16 RTX 4050 GeForce RTX 4050 Laptop GPU, Ultra 7 155H, SK hynix PC801 HFS001TEJ9X101N | HP Spectre x360 16-aa0074ng Arc 8-Core, Ultra 7 155H, Kioxia XG8 KXG80ZNV1T02 | HP Spectre x360 2-in-1 16-f1075ng Iris Xe G7 96EUs, i7-12700H, SK Hynix PC711 1TB HFS001TDE9X073N | Honor MagicBook Pro 16 2024 GeForce RTX 4060 Laptop GPU, Ultra 7 155H, WD PC SN740 SDDPNQD-1T00 | MSI Prestige 16 B1MG-001US Arc 8-Core, Ultra 7 155H, Samsung PM9A1 MZVL22T0HBLB | LG Gram 2in1 16 16T90R - G.AA78G Iris Xe G7 96EUs, i7-1360P, Samsung PM9A1 MZVL21T0HCLR | |
|---|---|---|---|---|---|---|
| Noise | 8% | -21% | -13% | -24% | -12% | |
| off / environment * (dB) | 23.3 | 23 1% | 26 -12% | 24 -3% | 24.5 -5% | 25.1 -8% |
| Idle Minimum * (dB) | 23.6 | 23 3% | 26 -10% | 24 -2% | 24.5 -4% | 25.1 -6% |
| Idle Average * (dB) | 23.6 | 23 3% | 26 -10% | 24 -2% | 26.3 -11% | 25.1 -6% |
| Idle Maximum * (dB) | 23.6 | 23 3% | 26 -10% | 27.2 -15% | 26.3 -11% | 26.1 -11% |
| Load Average * (dB) | 29.2 | 23 21% | 42.9 -47% | 29 1% | 36.5 -25% | 31.4 -8% |
| Witcher 3 ultra * (dB) | 32.1 | 27 16% | 42.9 -34% | 42.1 -31% | 46.3 -44% | 41.1 -28% |
| Load Maximum * (dB) | 32.1 | 28.62 11% | 39.1 -22% | 45 -40% | 52.9 -65% | 36.6 -14% |
* ... smaller is better
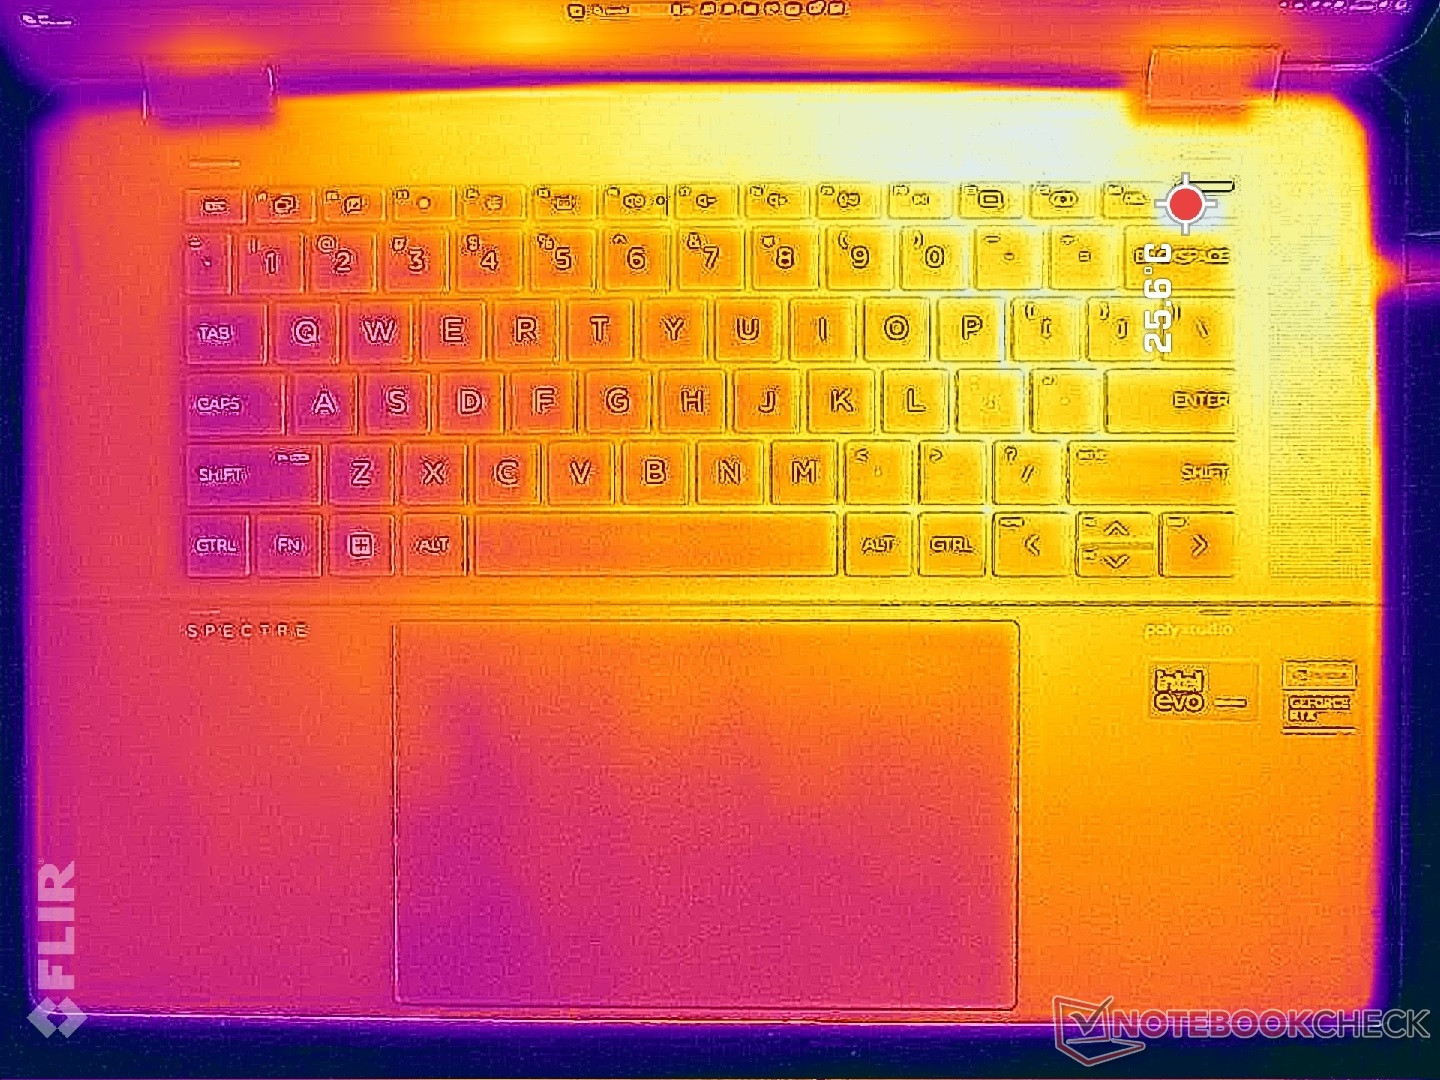
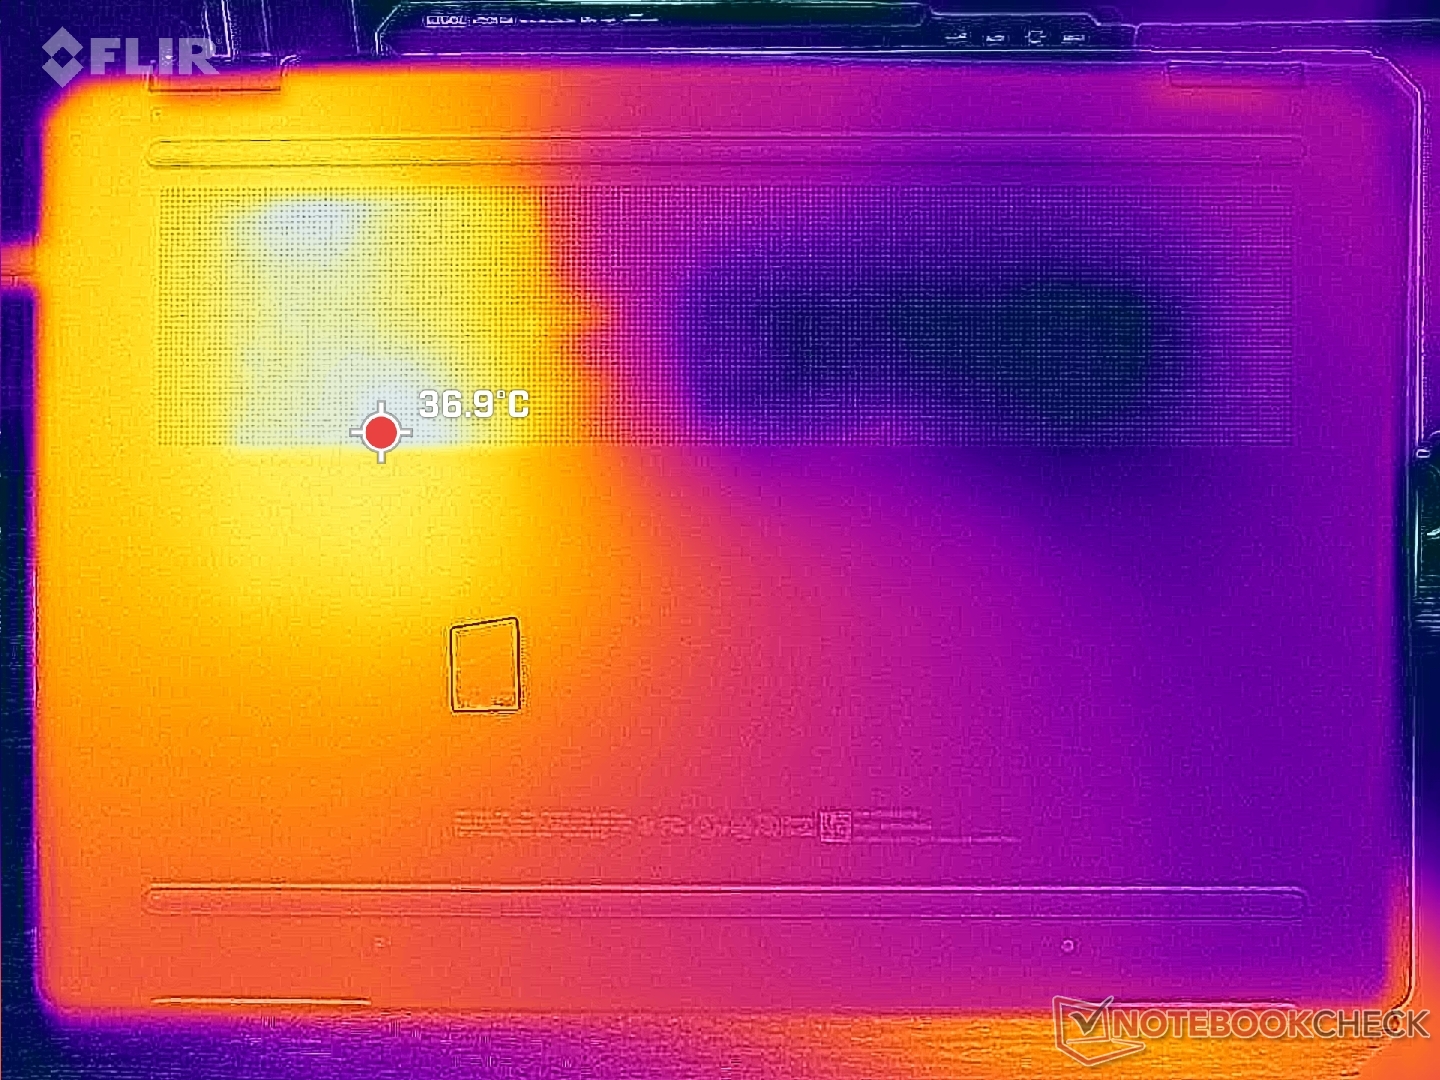
Temperature
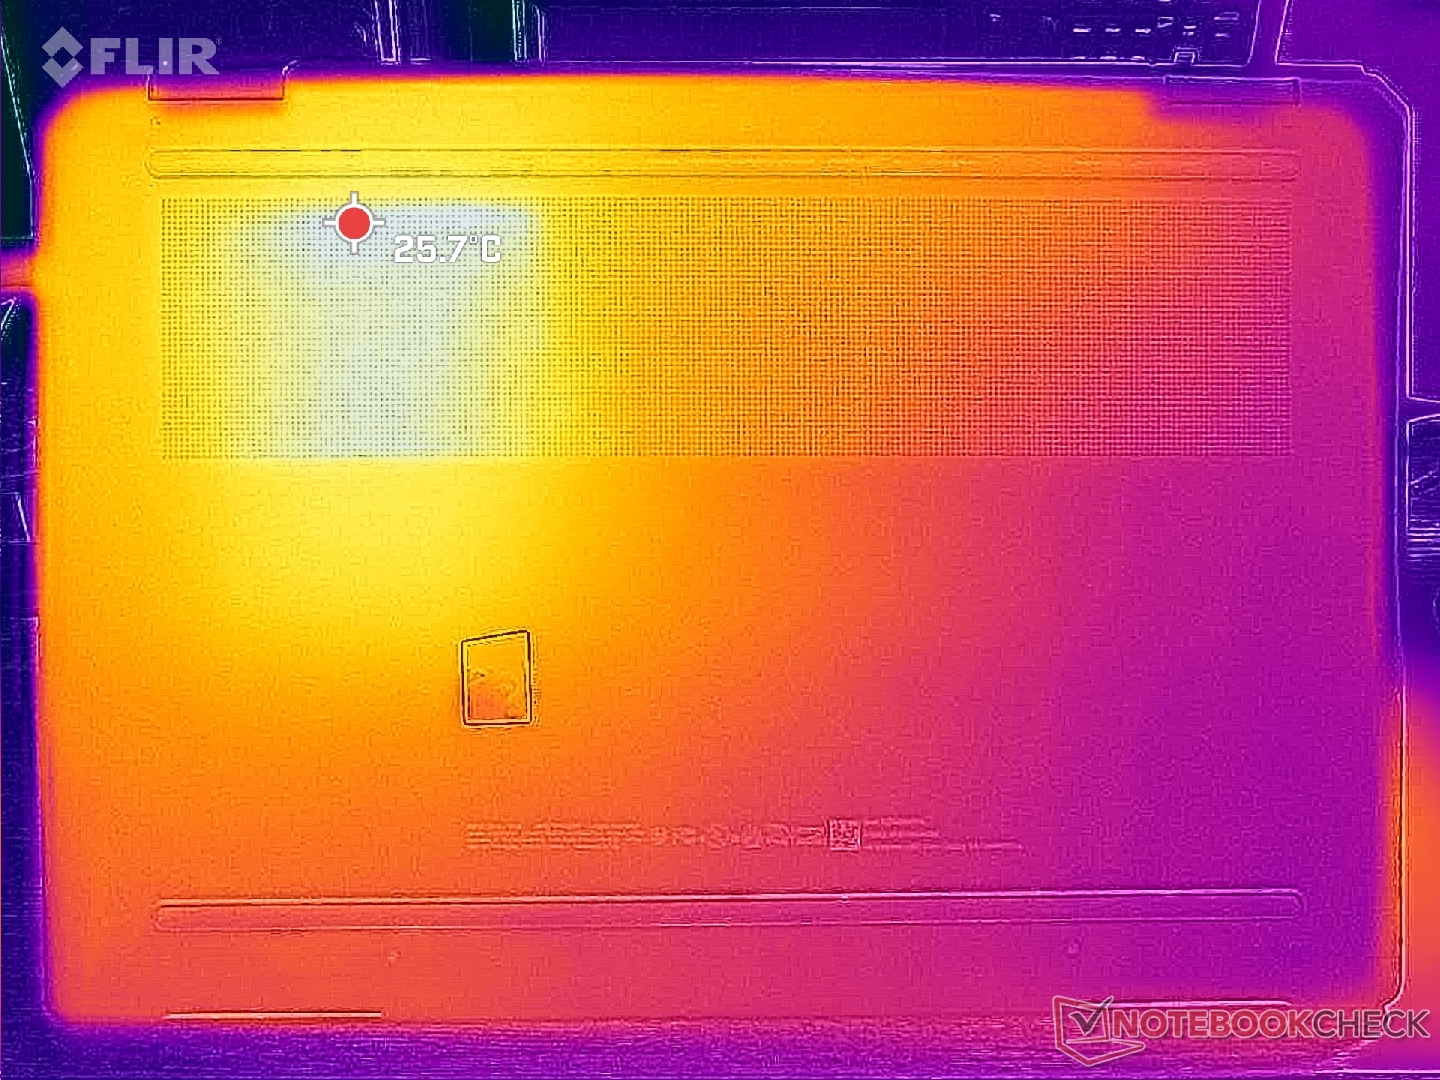
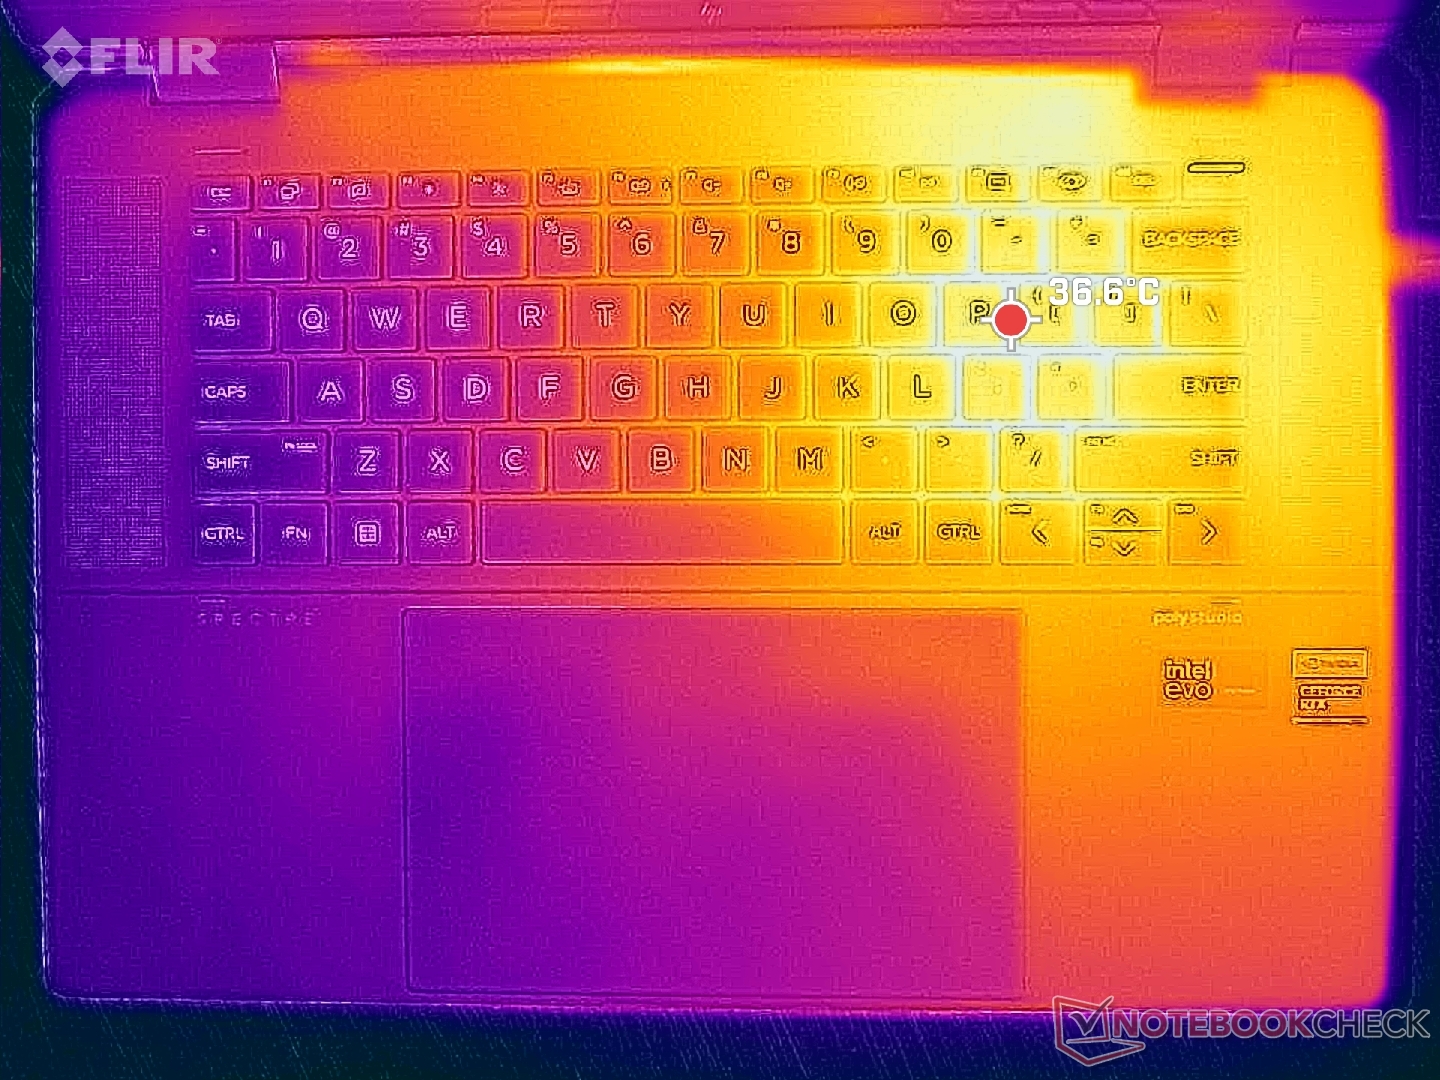
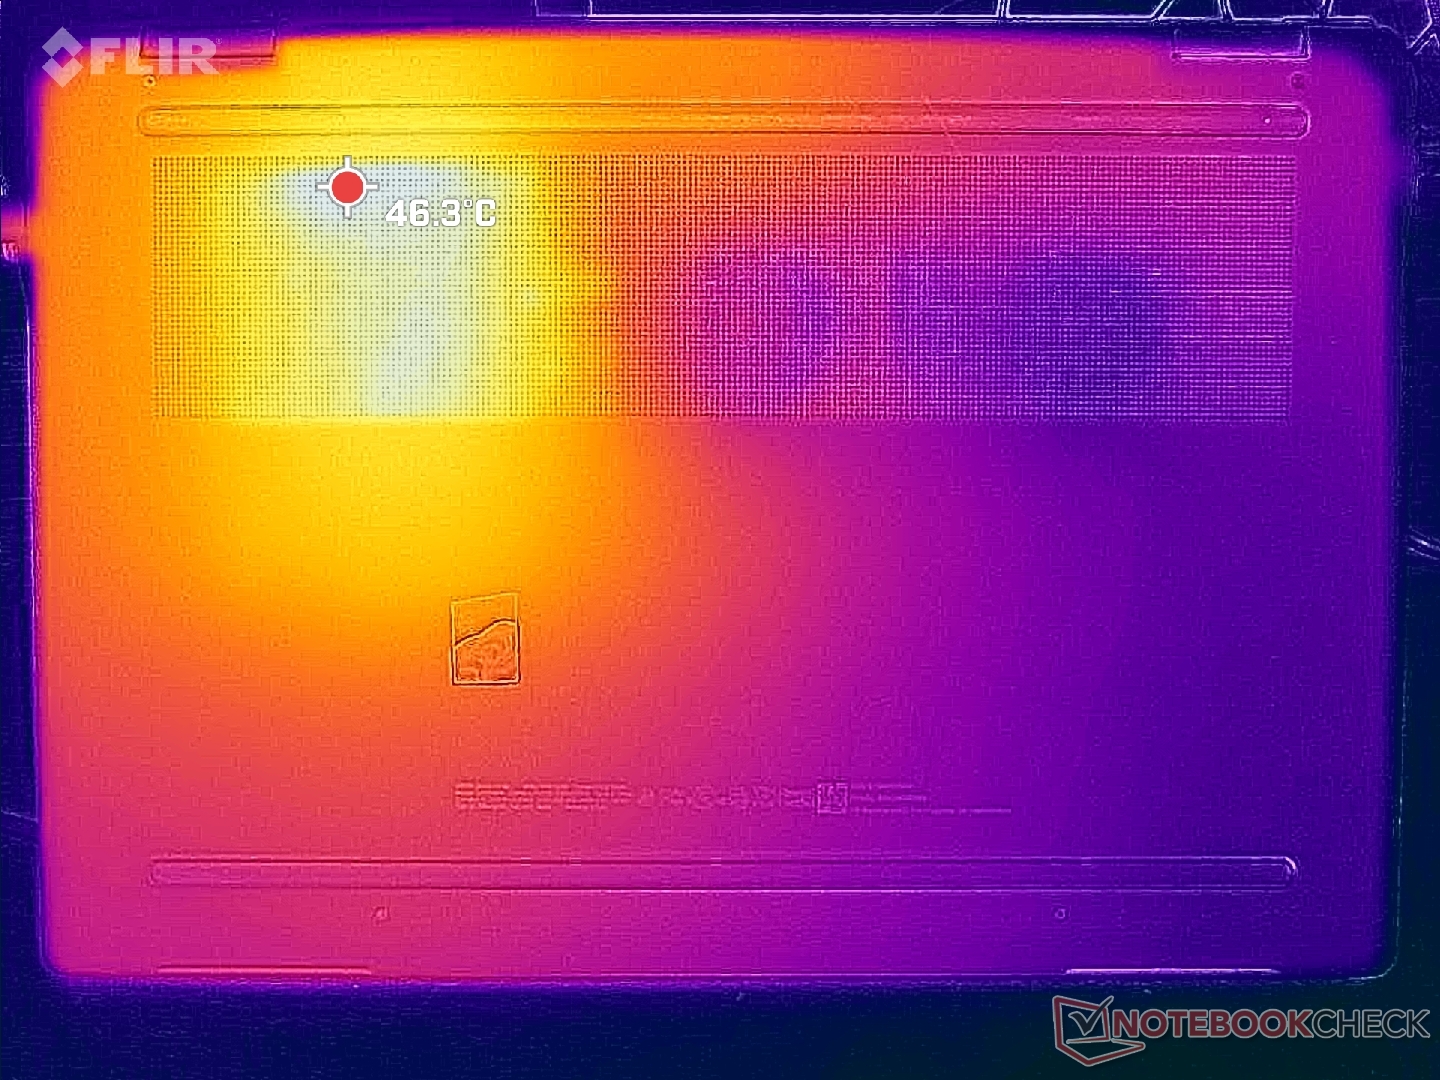
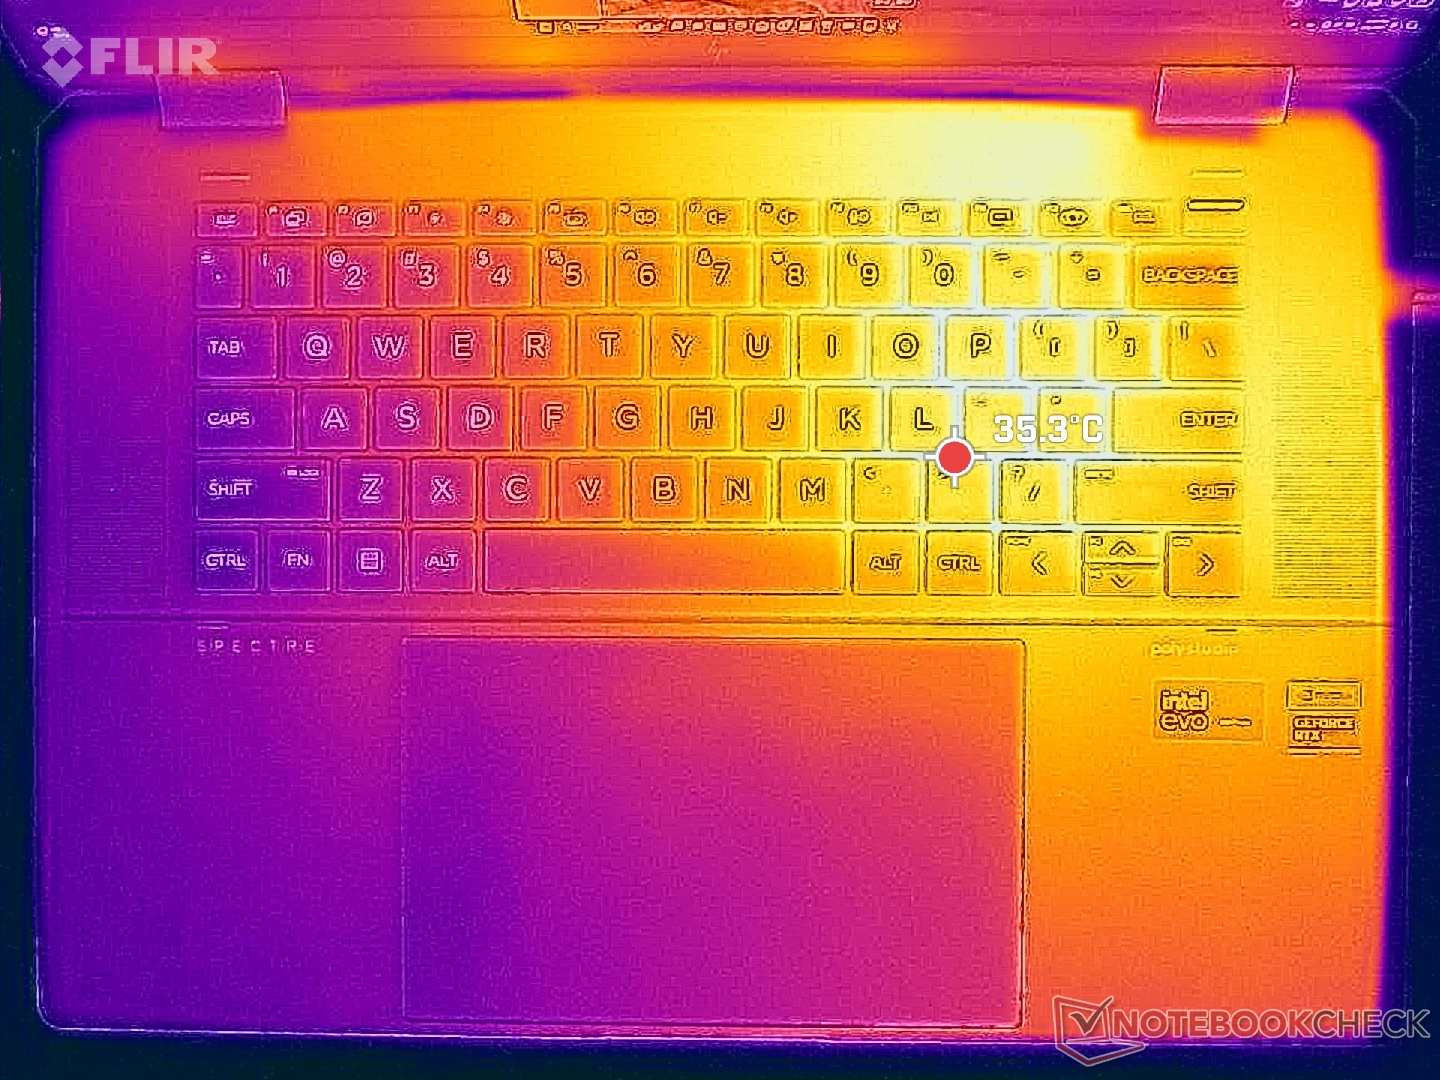
Surface temperatures are again much warmer on the right half of the laptop than the left half as shown by the temperature maps below due to how the cooling solution is designed. Hot spots are predictably warmer on our dGPU version than the iGPU version; the top and bottom when running Witcher 3 would reach up to 40 C and 46 C, respectively, compared to just 35 C and 40 C on the iGPU version.
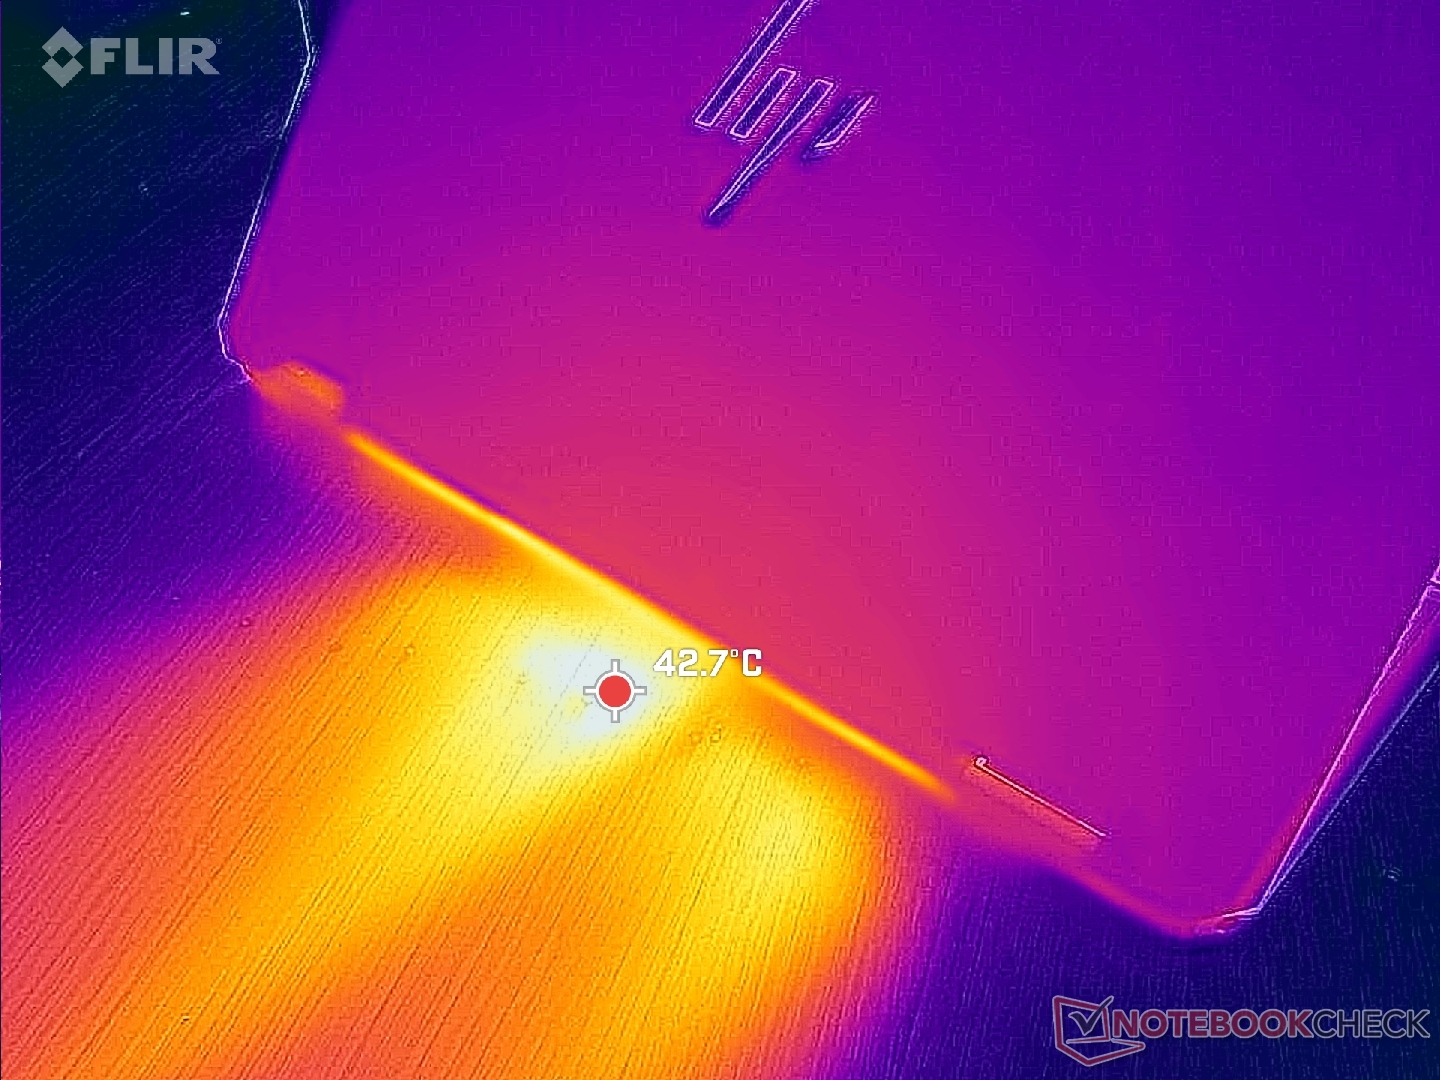
(+) The maximum temperature on the upper side is 39.6 °C / 103 F, compared to the average of 35.4 °C / 96 F, ranging from 19.6 to 60 °C for the class Convertible.
(+) The bottom heats up to a maximum of 39.2 °C / 103 F, compared to the average of 36.9 °C / 98 F
(+) In idle usage, the average temperature for the upper side is 26.1 °C / 79 F, compared to the device average of 30.3 °C / 87 F.
(+) Playing The Witcher 3, the average temperature for the upper side is 31.6 °C / 89 F, compared to the device average of 30.3 °C / 87 F.
(+) The palmrests and touchpad are reaching skin temperature as a maximum (32.2 °C / 90 F) and are therefore not hot.
(-) The average temperature of the palmrest area of similar devices was 28 °C / 82.4 F (-4.2 °C / -7.6 F).
| HP Spectre x360 16 RTX 4050 Intel Core Ultra 7 155H, NVIDIA GeForce RTX 4050 Laptop GPU | HP Spectre x360 16-aa0074ng Intel Core Ultra 7 155H, Intel Arc 8-Core iGPU | HP Spectre x360 2-in-1 16-f1075ng Intel Core i7-12700H, Intel Iris Xe Graphics G7 96EUs | Honor MagicBook Pro 16 2024 Intel Core Ultra 7 155H, NVIDIA GeForce RTX 4060 Laptop GPU | MSI Prestige 16 B1MG-001US Intel Core Ultra 7 155H, Intel Arc 8-Core iGPU | LG Gram 2in1 16 16T90R - G.AA78G Intel Core i7-1360P, Intel Iris Xe Graphics G7 96EUs | |
|---|---|---|---|---|---|---|
| Heat | -1% | 8% | 9% | -1% | -24% | |
| Maximum Upper Side * (°C) | 39.6 | 37 7% | 37.4 6% | 39.7 -0% | 48.8 -23% | 55 -39% |
| Maximum Bottom * (°C) | 39.2 | 44 -12% | 39.1 -0% | 42.9 -9% | 47.6 -21% | 55.4 -41% |
| Idle Upper Side * (°C) | 29 | 31 -7% | 27.1 7% | 23.7 18% | 24.2 17% | 34.9 -20% |
| Idle Bottom * (°C) | 31.6 | 29 8% | 26.3 17% | 23.5 26% | 23.6 25% | 30 5% |
* ... smaller is better
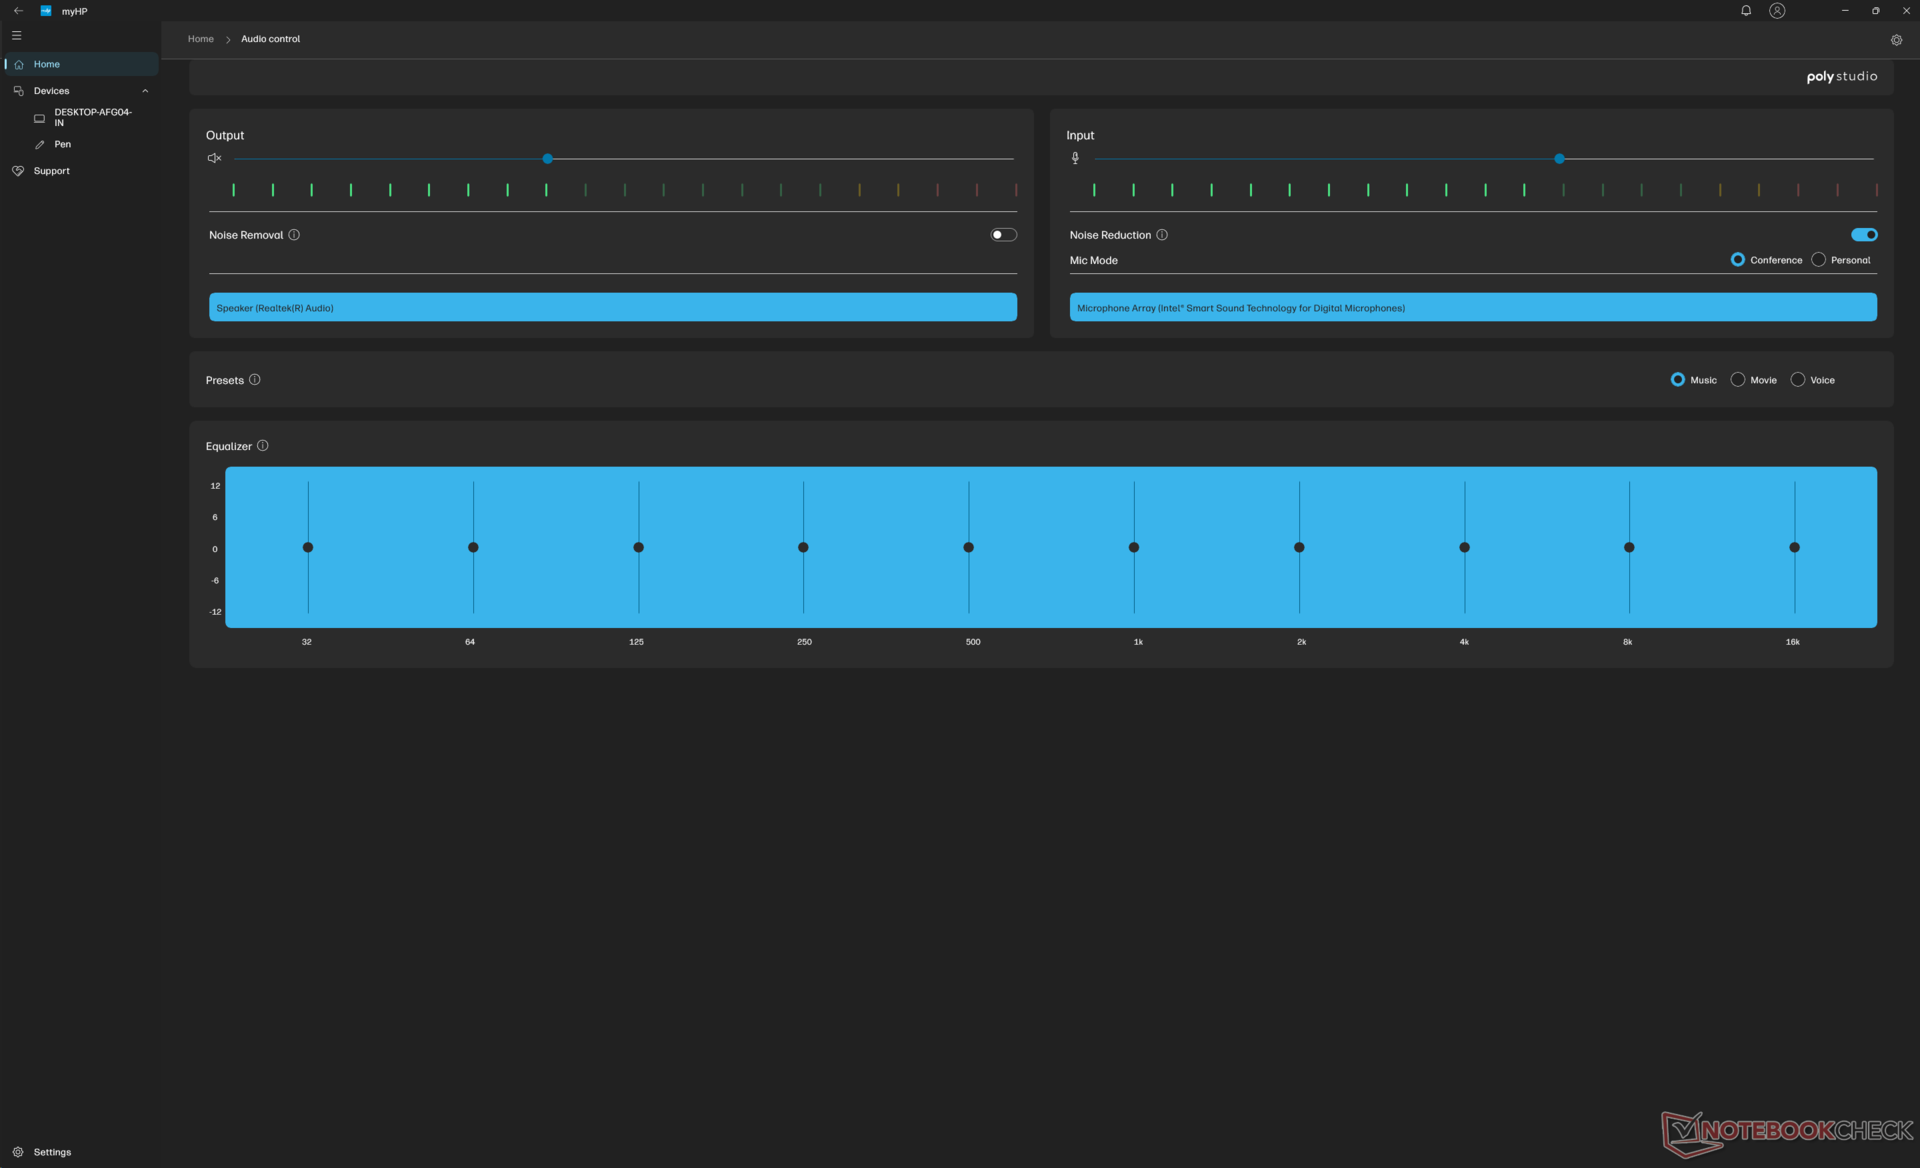
Speakers
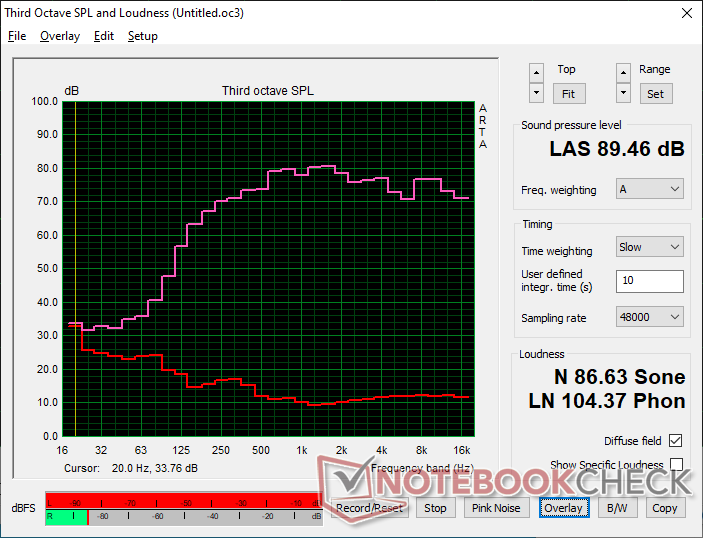
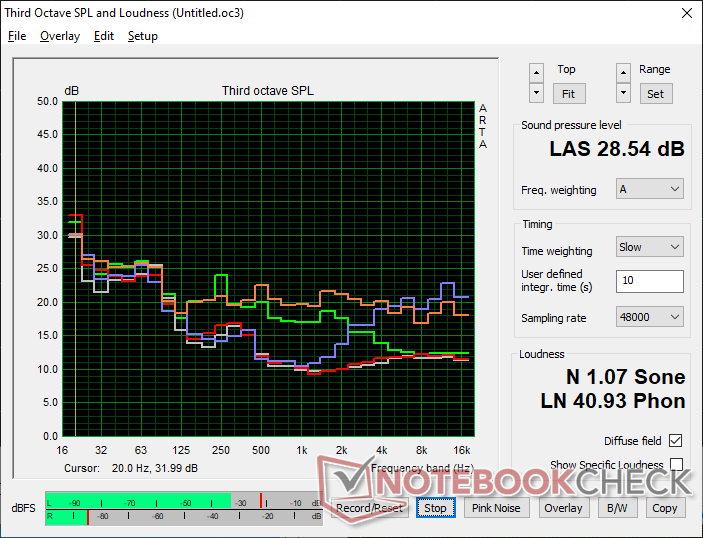
HP Spectre x360 16 RTX 4050 audio analysis
(+) | speakers can play relatively loud (89.5 dB)
Bass 100 - 315 Hz
(±) | reduced bass - on average 13.2% lower than median
(±) | linearity of bass is average (7.9% delta to prev. frequency)
Mids 400 - 2000 Hz
(+) | balanced mids - only 3.2% away from median
(+) | mids are linear (3% delta to prev. frequency)
Highs 2 - 16 kHz
(+) | balanced highs - only 1.6% away from median
(+) | highs are linear (3.5% delta to prev. frequency)
Overall 100 - 16.000 Hz
(+) | overall sound is linear (9.2% difference to median)
Compared to same class
» 4% of all tested devices in this class were better, 1% similar, 95% worse
» The best had a delta of 6%, average was 20%, worst was 57%
Compared to all devices tested
» 3% of all tested devices were better, 1% similar, 96% worse
» The best had a delta of 4%, average was 24%, worst was 134%
Apple MacBook Pro 16 2021 M1 Pro audio analysis
(+) | speakers can play relatively loud (84.7 dB)
Bass 100 - 315 Hz
(+) | good bass - only 3.8% away from median
(+) | bass is linear (5.2% delta to prev. frequency)
Mids 400 - 2000 Hz
(+) | balanced mids - only 1.3% away from median
(+) | mids are linear (2.1% delta to prev. frequency)
Highs 2 - 16 kHz
(+) | balanced highs - only 1.9% away from median
(+) | highs are linear (2.7% delta to prev. frequency)
Overall 100 - 16.000 Hz
(+) | overall sound is linear (4.6% difference to median)
Compared to same class
» 0% of all tested devices in this class were better, 0% similar, 100% worse
» The best had a delta of 5%, average was 17%, worst was 45%
Compared to all devices tested
» 0% of all tested devices were better, 0% similar, 100% worse
» The best had a delta of 4%, average was 24%, worst was 134%
Energy Management
Power Consumption
Running Witcher 3 on Performance mode demands around 93 W or almost 2x more than the iGPU configuration. Frame rates with the Nvidia GPU are 2x to 3x faster and so the higher power demands are still worth it from a performance-per-watt perspective.
Repeating the above test on Balanced mode instead of Performance mode would lower consumption to 75 W. The power savings correlate with our TGP observations in the Stress Test section above. If you want the most out of your system, then be sure to enable Performance mode through MyHP.
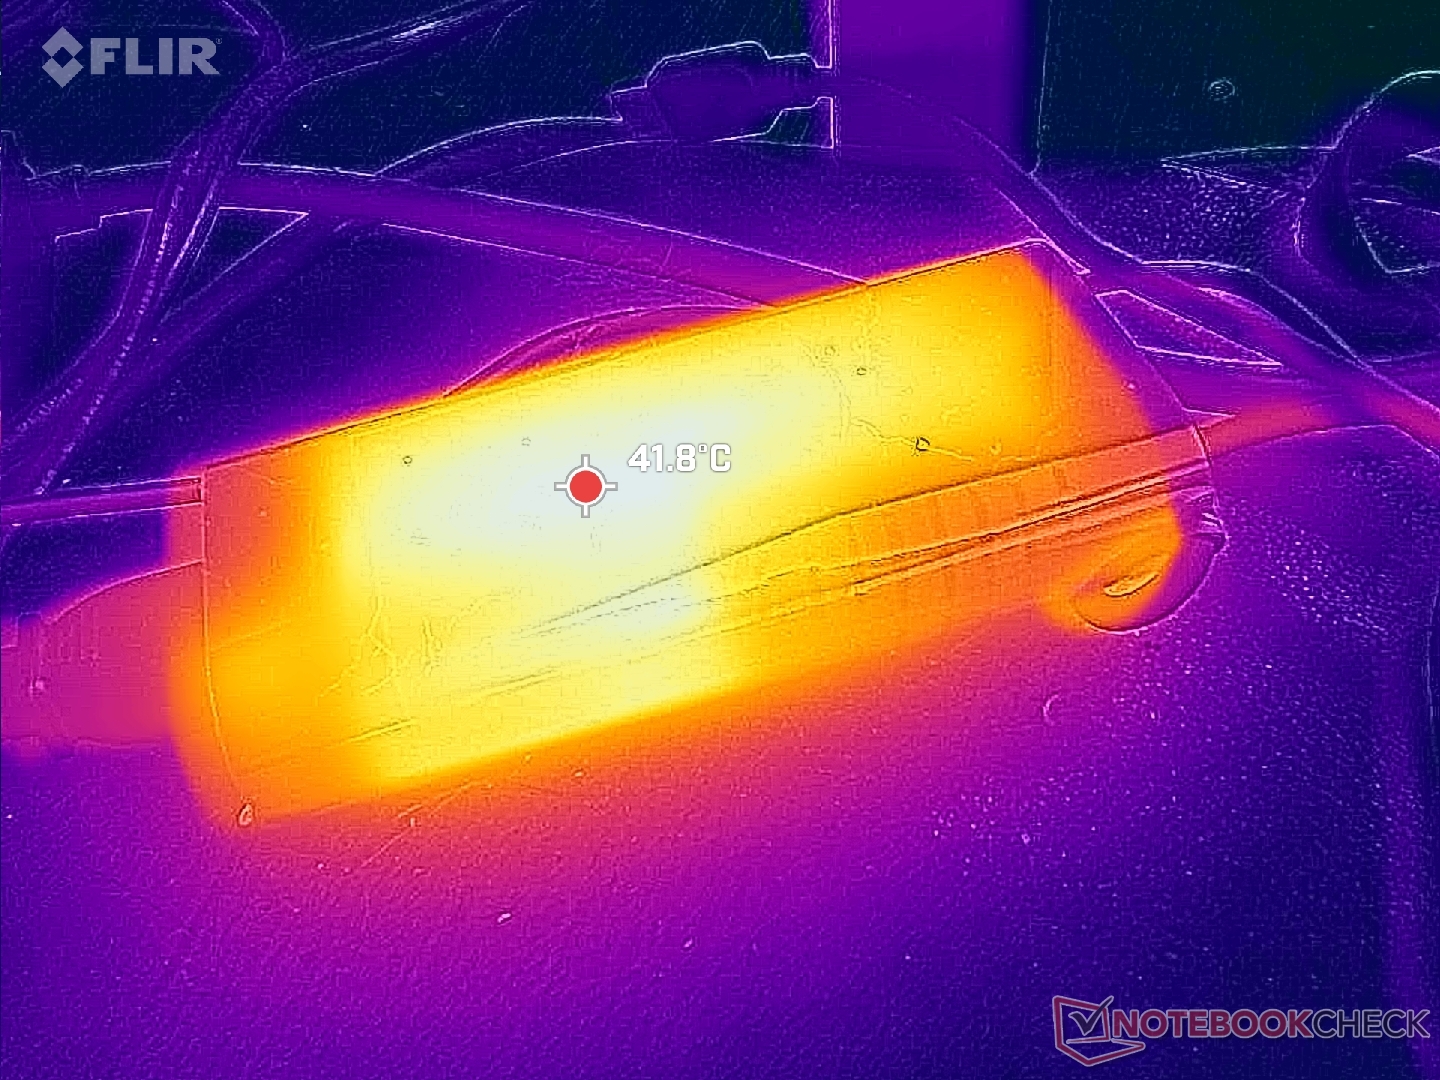
We're able to record a temporary maximum draw of 121 W from the small-medium (~13.8 x 6.5 x 2.9 cm) 140 W USB-C AC adapter when the CPU and GPU are each at 100 percent utilization. The charging rate isn't significantly affected as performance throttling kicks in very quickly as mentioned above to bring consumption down to the 60 W to 70 W range. Note that the iGPU configuration ships with a smaller 100 W USB-C adapter instead.
| Off / Standby | |
| Idle | |
| Load |
|
Key:
min: | |
| HP Spectre x360 16 RTX 4050 Ultra 7 155H, GeForce RTX 4050 Laptop GPU, SK hynix PC801 HFS001TEJ9X101N, OLED, 2880x1800, 16" | HP Spectre x360 16-aa0074ng Ultra 7 155H, Arc 8-Core, Kioxia XG8 KXG80ZNV1T02, OLED, 2880x1800, 16" | HP Spectre x360 2-in-1 16-f1075ng i7-12700H, Iris Xe G7 96EUs, SK Hynix PC711 1TB HFS001TDE9X073N, IPS, 3072x1920, 16" | Honor MagicBook Pro 16 2024 Ultra 7 155H, GeForce RTX 4060 Laptop GPU, WD PC SN740 SDDPNQD-1T00, IPS, 3072x1920, 16" | MSI Prestige 16 B1MG-001US Ultra 7 155H, Arc 8-Core, Samsung PM9A1 MZVL22T0HBLB, IPS, 2560x1600, 16" | LG Gram 2in1 16 16T90R - G.AA78G i7-1360P, Iris Xe G7 96EUs, Samsung PM9A1 MZVL21T0HCLR, IPS, 2560x1600, 16" | |
|---|---|---|---|---|---|---|
| Power Consumption | 48% | 26% | -10% | 33% | 39% | |
| Idle Minimum * (Watt) | 5.8 | 4.1 29% | 9 -55% | 5.2 10% | 3 48% | 5.5 5% |
| Idle Average * (Watt) | 12.3 | 4.5 63% | 11.1 10% | 14.4 -17% | 9.5 23% | 7.2 41% |
| Idle Maximum * (Watt) | 33.9 | 5.9 83% | 16.4 52% | 15.4 55% | 12 65% | 12.9 62% |
| Load Average * (Watt) | 83.3 | 51.2 39% | 38.3 54% | 105.4 -27% | 68.3 18% | 55 34% |
| Witcher 3 ultra * (Watt) | 89.1 | 47.6 47% | 34.4 61% | 107.6 -21% | 59.8 33% | 47 47% |
| Load Maximum * (Watt) | 120.8 | 90.4 25% | 82.5 32% | 195.2 -62% | 104.8 13% | 63.6 47% |
* ... smaller is better
Battery Life
Battery life is predictably shorter than on the iGPU configuration, but the difference is surprisingly minor. We're able to squeeze 11 hours of real-world browsing usage on the Balanced profile or just about an hour less than what we recorded on the iGPU unit. Opting for the IPS configuration will likely extend runtimes.
| HP Spectre x360 16 RTX 4050 Ultra 7 155H, GeForce RTX 4050 Laptop GPU, 83 Wh | HP Spectre x360 16-aa0074ng Ultra 7 155H, Arc 8-Core, 83 Wh | HP Spectre x360 2-in-1 16-f1075ng i7-12700H, Iris Xe G7 96EUs, 83 Wh | Honor MagicBook Pro 16 2024 Ultra 7 155H, GeForce RTX 4060 Laptop GPU, 75 Wh | MSI Prestige 16 B1MG-001US Ultra 7 155H, Arc 8-Core, 99.9 Wh | LG Gram 2in1 16 16T90R - G.AA78G i7-1360P, Iris Xe G7 96EUs, 80 Wh | |
|---|---|---|---|---|---|---|
| Battery runtime | 9% | -5% | 11% | 66% | 8% | |
| WiFi v1.3 (h) | 11 | 12 9% | 10.5 -5% | 12.2 11% | 18.3 66% | 11.9 8% |
| H.264 (h) | 14.4 | 11.2 | 13.1 | |||
| Load (h) | 2.3 | 1.6 | 1 | 2.8 | 2 | |
| Reader / Idle (h) | 20.6 | 25.1 |
Pros
Cons
Verdict — Versatile At The Cost Of Some Performance
The HP Spectre x360 16 is one of the quietest and most portable 16-inch convertible laptops in the market with discrete GeForce RTX 4050 graphics. This system was designed for on-the-go power users who can also exploit the 2-in-1 form factor and deep P3 colors of the OLED touchscreen. The model is a success from that perspective.
The thinness of the design necessitated performance compromises. In particular, the 55 W RTX 4050 GPU is notably slower than most other laptops with the same graphics option. The Spectre x360 16 is still fast for the size, of course, but its GeForce GPU is definitely on the lower-end of the spectrum due to its low TGP target. Users who want to maximize performance or don't find the 2-in-1 form factor useful may want to consider the MSI Prestige 16 or Honor MagicBook Pro 16 instead which can be configured with higher-end RTX graphics than the HP while retaining a similar thin-and-light design philosophy.
The Spectre x360 16 is a high-end and well-built 16-inch convertible. Performance is generally excellent, but there are certainly faster alternatives out there if you're willing to give up the 2-in-1 design.
We must also mention the slower-than-expected CPU performance of the dGPU configuration at the time of writing. HP says a hotfix is in the works and we will update the CPU section when the fix goes live. Otherwise, the GPU appears to be performing correctly.
Price and Availability
HP is now shipping the Spectre x360 16 2-in-1 with GeForce RTX 4050 graphics starting at $1440 with the IPS touchscreen or $1600 with the OLED touchscreen as reviewed.
HP Spectre x360 16 RTX 4050
- 03/13/2024 v7 (old)
Allen Ngo
Transparency
The selection of devices to be reviewed is made by our editorial team. The test sample was provided to the author as a loan by the manufacturer or retailer for the purpose of this review. The lender had no influence on this review, nor did the manufacturer receive a copy of this review before publication. There was no obligation to publish this review. As an independent media company, Notebookcheck is not subjected to the authority of manufacturers, retailers or publishers.
This is how Notebookcheck is testing
Every year, Notebookcheck independently reviews hundreds of laptops and smartphones using standardized procedures to ensure that all results are comparable. We have continuously developed our test methods for around 20 years and set industry standards in the process. In our test labs, high-quality measuring equipment is utilized by experienced technicians and editors. These tests involve a multi-stage validation process. Our complex rating system is based on hundreds of well-founded measurements and benchmarks, which maintains objectivity. Further information on our test methods can be found here.
Price comparison
