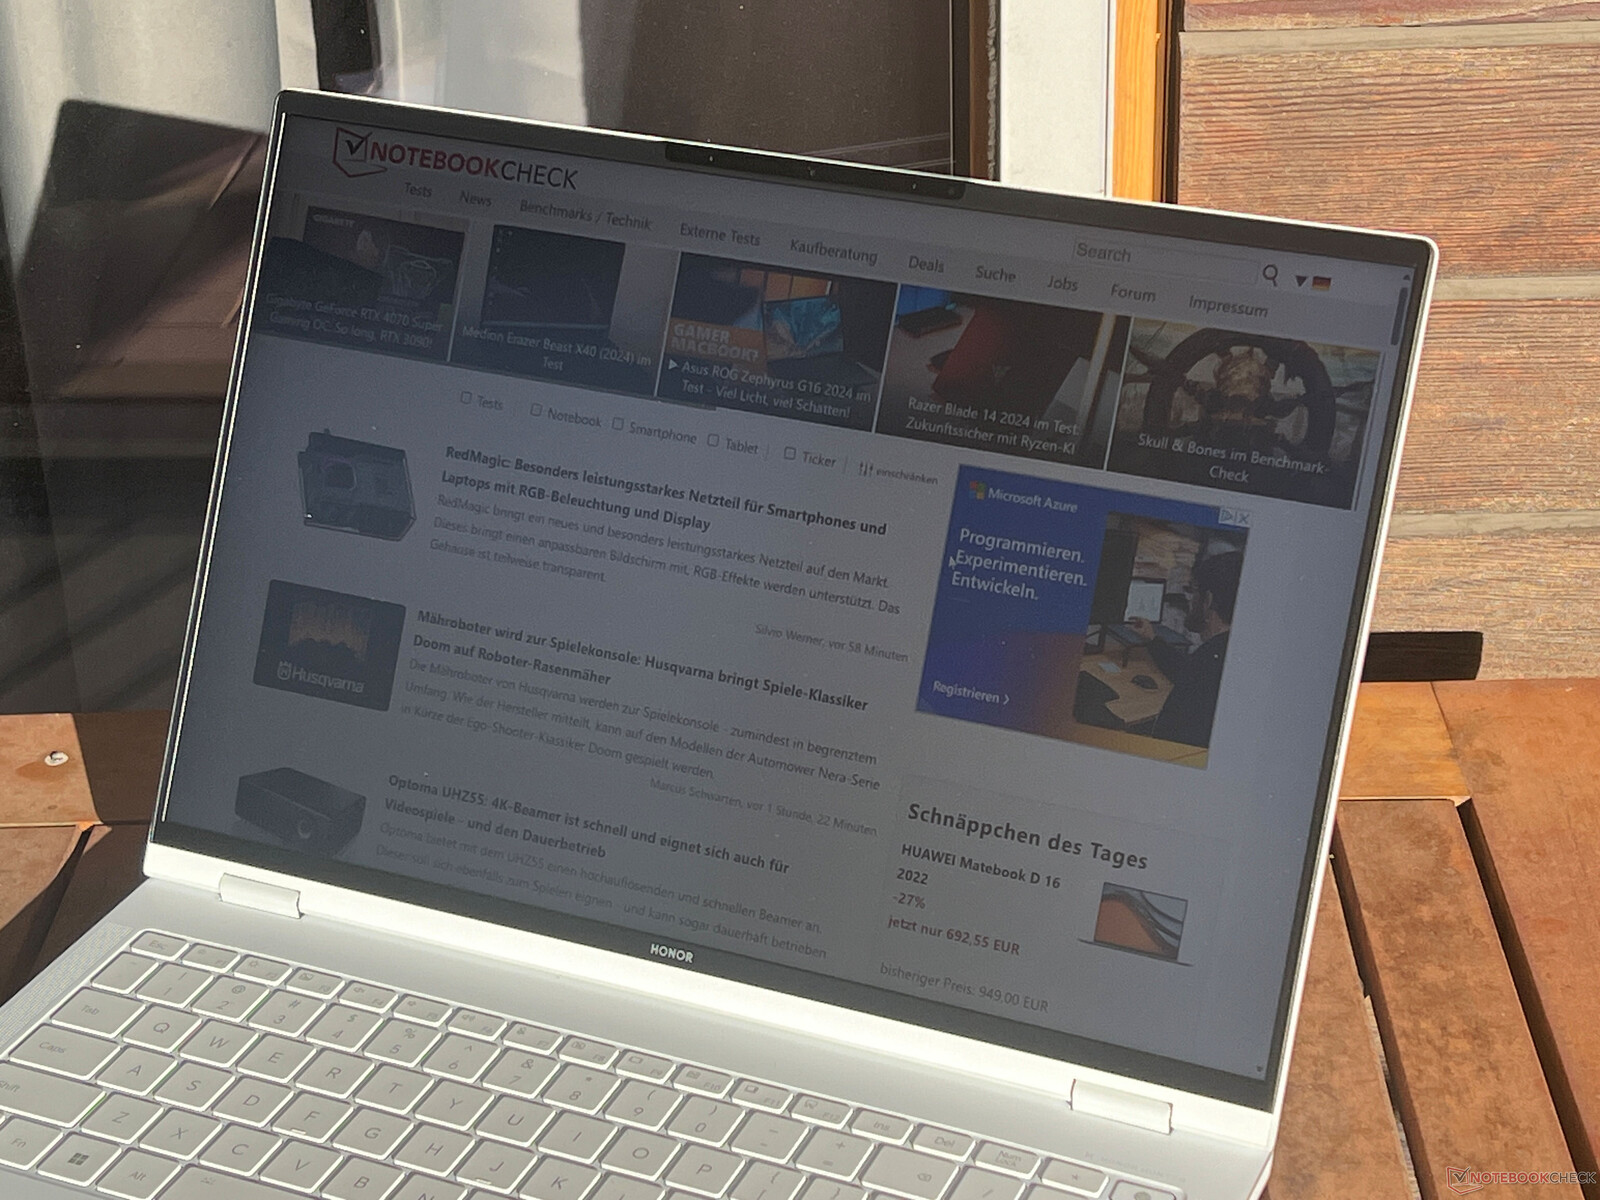
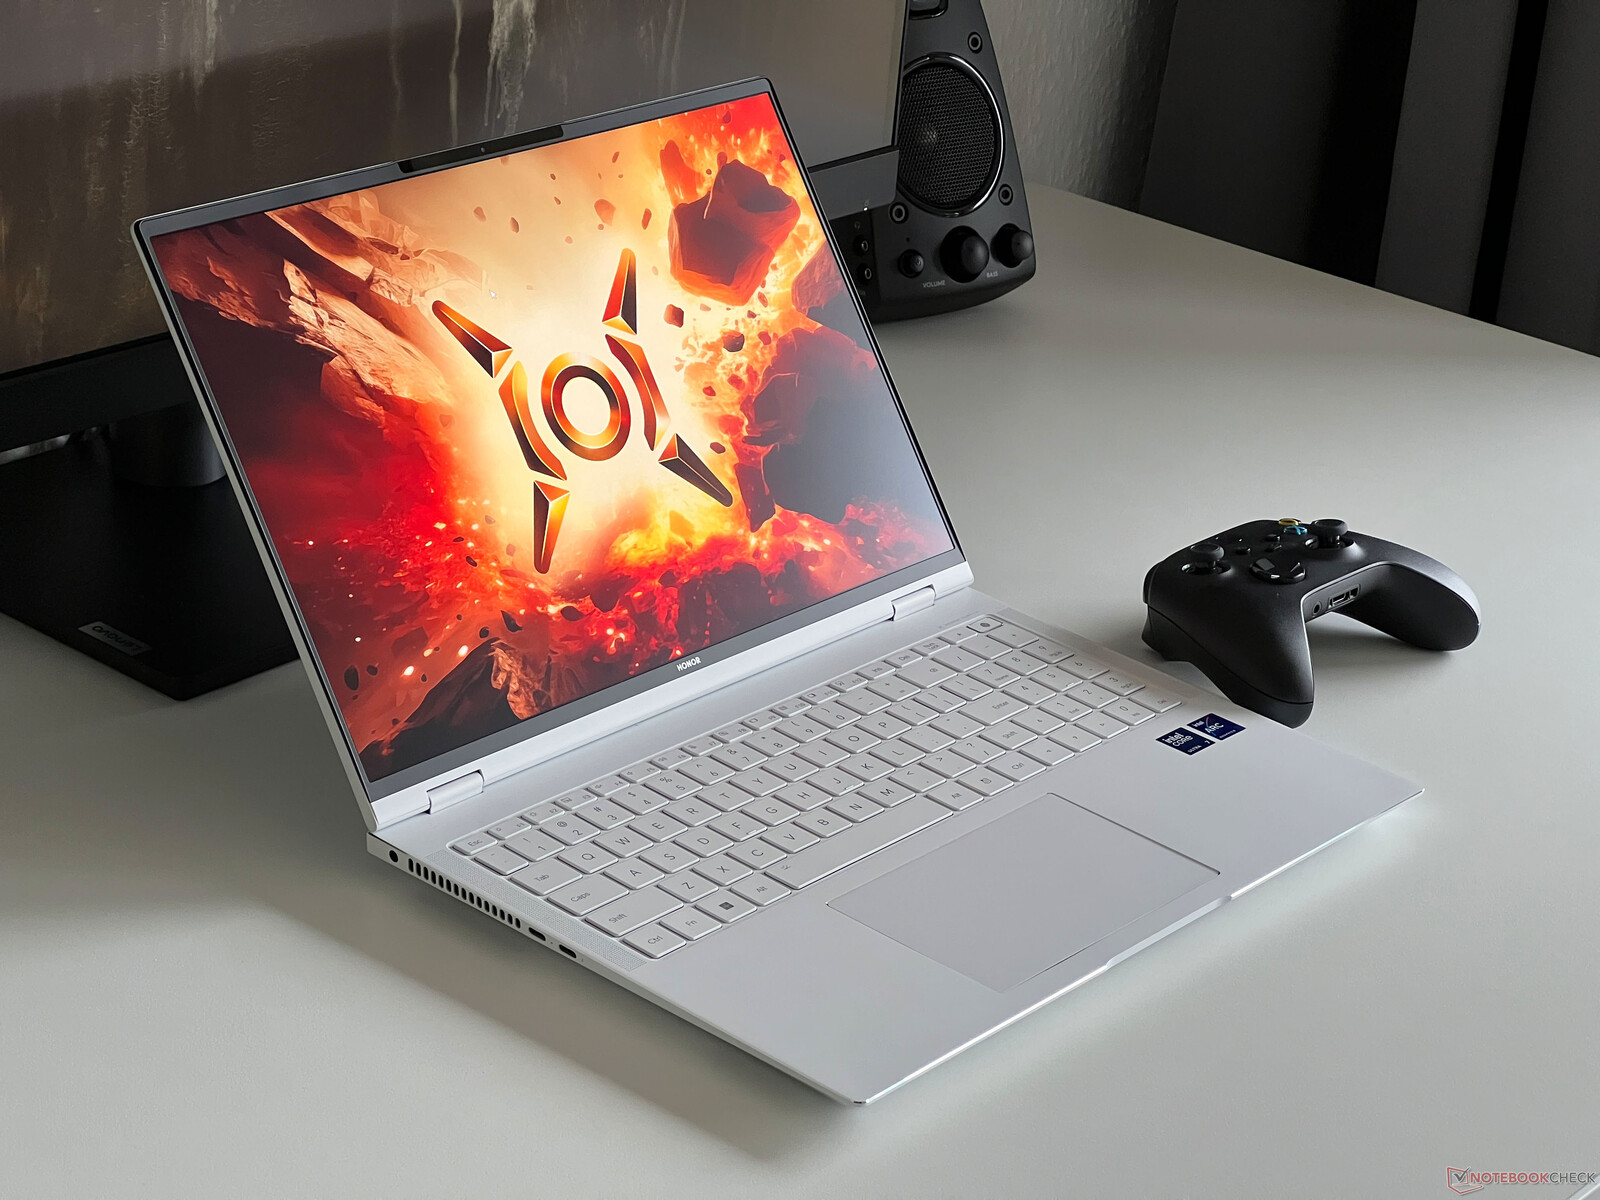
Honor MagicBook Pro 16 2024 - A multimedia laptop with a 165 Hz IPS panel and RTX 4060
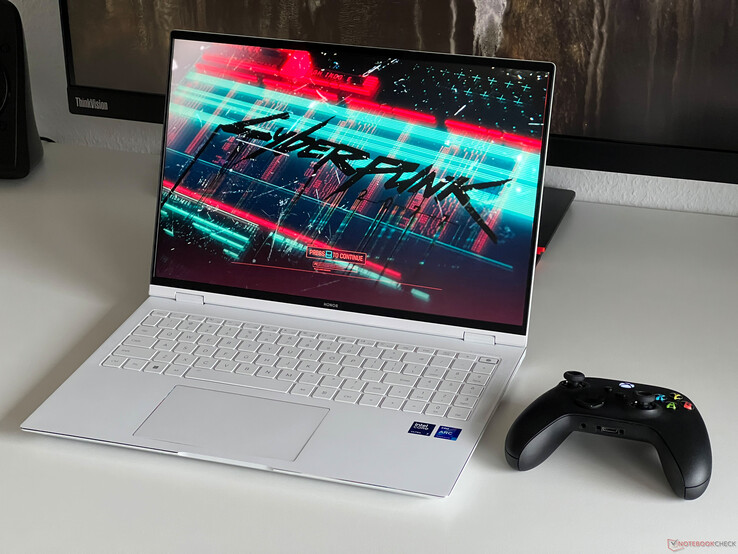
The name MagicBook Pro 16 immediately conjures up thoughts of a multimedia laptop that has a good price-performance ratio. However, with the 2024 model, Honor is taking a new approach by presenting us with a multimedia laptop that comes with an up-to-date Intel Meteor Lake processor as well as the laptop version of the Nvidia GeForce RTX 4060. We are lucky to have been allowed to thoroughly review the new MagicBook Pro 16 before it officially hit the streets. In addition to the Core Ultra 7 155H and the GeForce RTX 4060 laptop, we have 32 GB of RAM, a 1 TB SSD and a matte, 500 cd/m² IPS display, 165 Hz and P3 coverage. At the time of testing, we are unable to name a price for this configuration.
Possible competitors compared
Rating | Date | Model | Weight | Height | Size | Resolution | Price |
|---|---|---|---|---|---|---|---|
| 90 % v7 (old) | 03 / 2024 | Honor MagicBook Pro 16 2024 Ultra 7 155H, GeForce RTX 4060 Laptop GPU | 1.9 kg | 17.9 mm | 16.00" | 3072x1920 | |
| 89.6 % v7 (old) | 01 / 2024 | Framework Laptop 16 R9 7940HS, Radeon RX 7700S | 2.4 kg | 20.95 mm | 16.00" | 2560x1600 | |
| 88.6 % v7 (old) | 12 / 2023 | Lenovo ThinkPad Z16 Gen 2 R9 PRO 7940HS, Radeon RX 6550M | 1.8 kg | 15.8 mm | 16.00" | 3840x2400 | |
| 87.1 % v7 (old) | 08 / 2023 | Dell Inspiron 16 Plus 7630 i7-13700H, GeForce RTX 4060 Laptop GPU | 2.2 kg | 19.95 mm | 16.00" | 2560x1600 | |
| 88.4 % v7 (old) | 08 / 2023 | Lenovo Yoga Pro 9 16-IRP G8 i7-13705H, GeForce RTX 4060 Laptop GPU | 2.2 kg | 18.2 mm | 16.00" | 3200x2000 | |
| 88.6 % v7 (old) | 07 / 2023 | Schenker VISION 16 Pro (M23) i7-13700H, GeForce RTX 4070 Laptop GPU | 1.6 kg | 17.1 mm | 16.00" | 2560x1600 | |
| 86.2 % v7 (old) | 07 / 2023 | Asus Vivobook Pro 16X K6604JV-MX016W i9-13980HX, GeForce RTX 4060 Laptop GPU | 2.1 kg | 22.8 mm | 16.00" | 3200x2000 |
Case - The MagicBook Pro comes with a plastic case
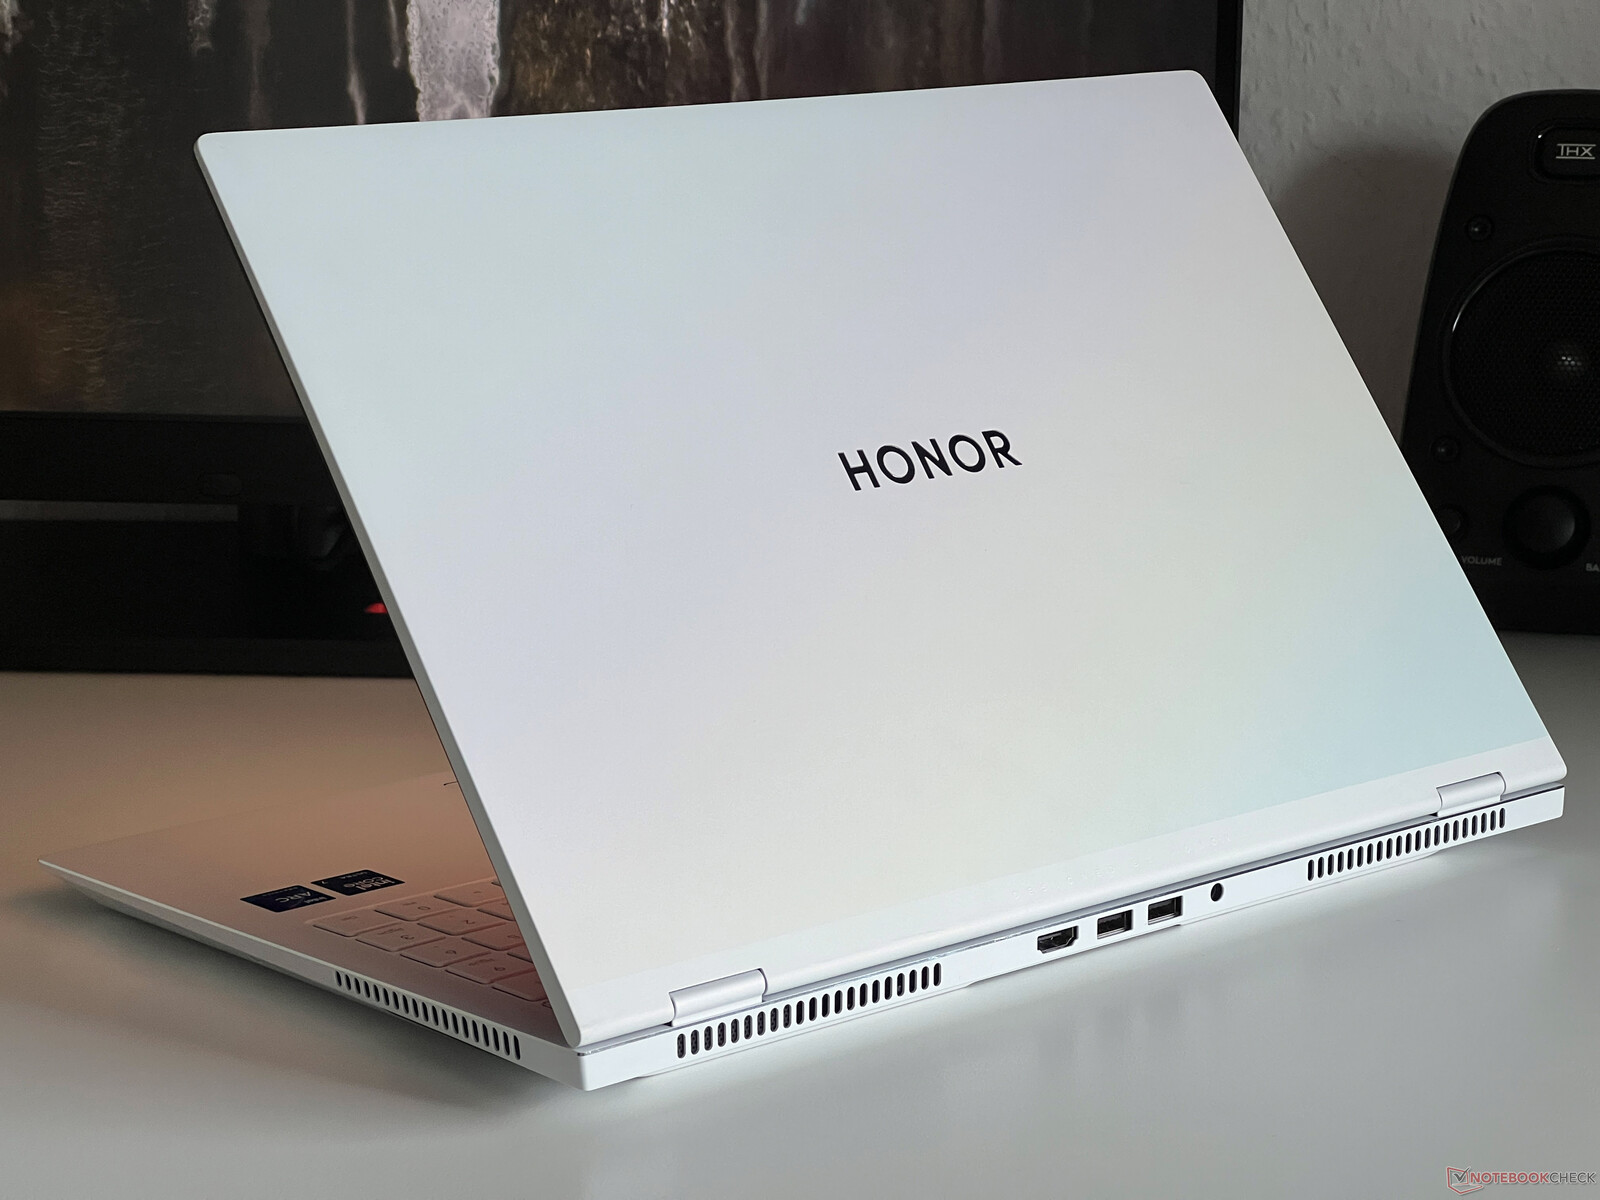
The MagicBook Pro 16 is available in either white or purple although a metallic-color has been applied to the screen lids. Apart from that, the device is very understated and, aside from the surrounding trim on the base unit, two black air inlets and the black screen frame, there are no design elements.
The case is completely made of plastic and, even though the finish is very good, our review device displayed evidence of slight creaking noises when handled. Stability appears to be very good with the center area of the keyboard remaining solid even when pressure is applied. That also applies to the thin screen lid as we were unable to provoke any image distortion. The hinges allow a maximum opening angle of 180 degrees and the lid can be opened with one hand, although, in doing so, the lid itself does tend to wobble slightly.
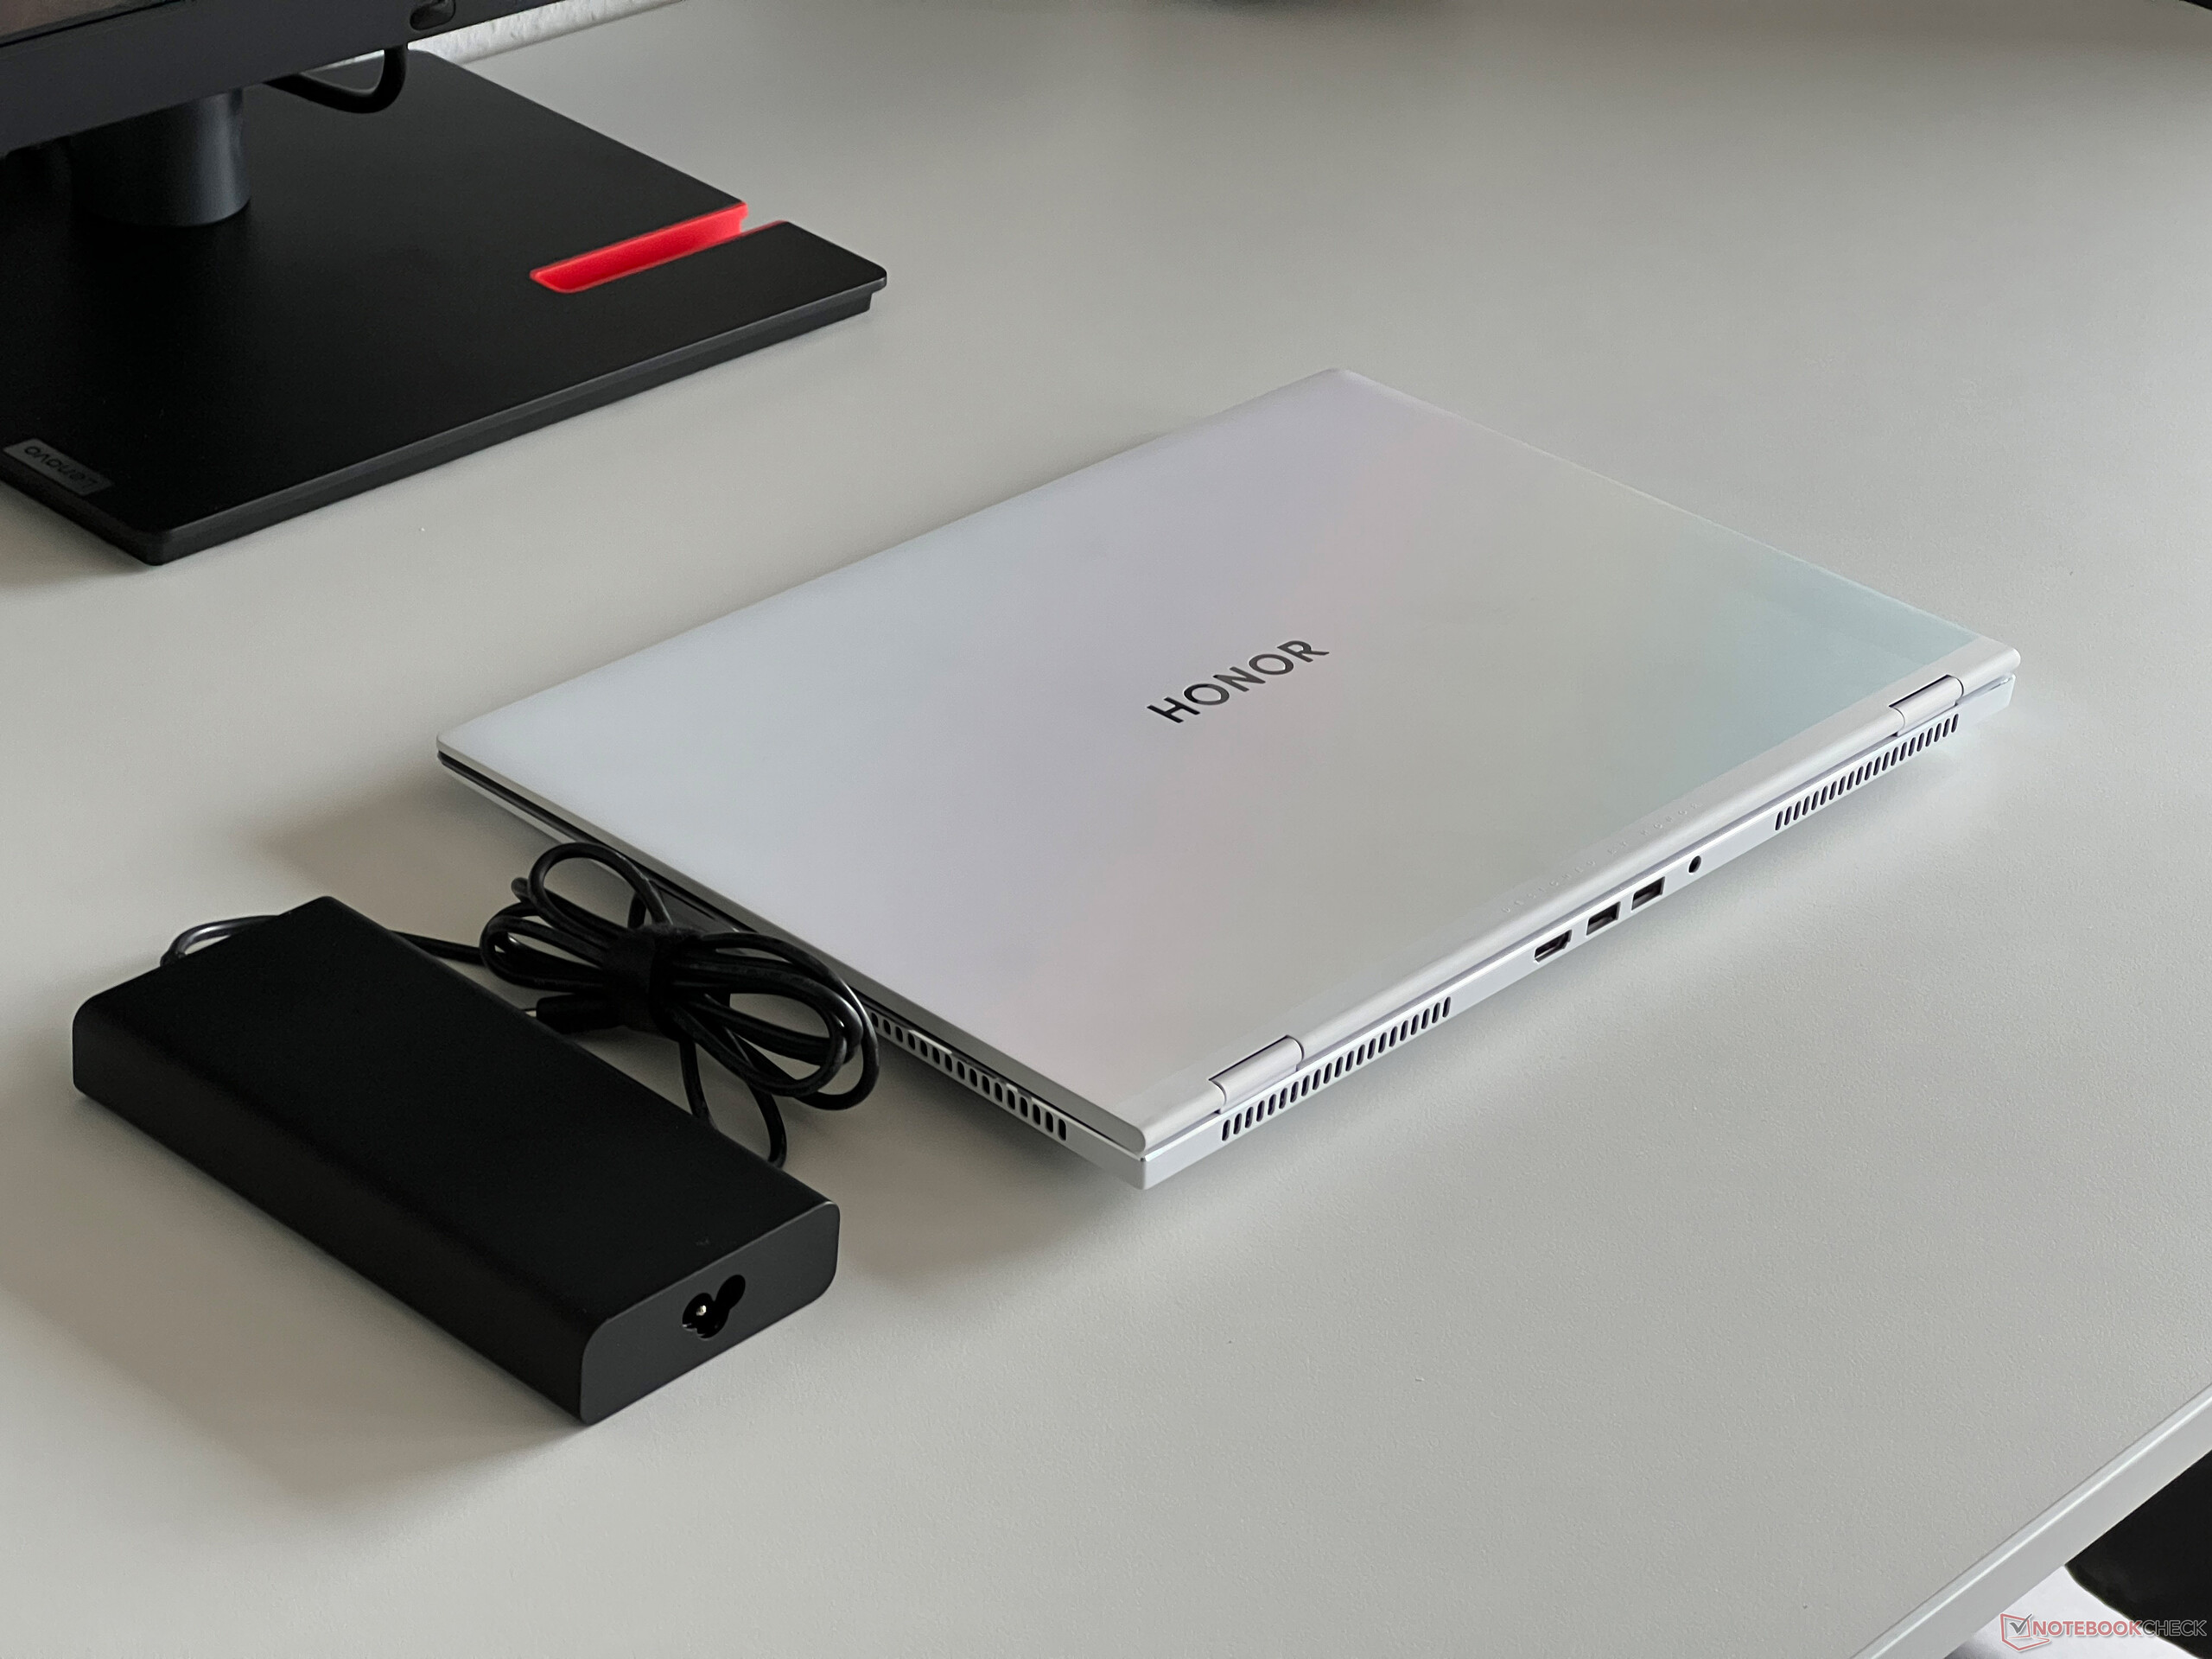
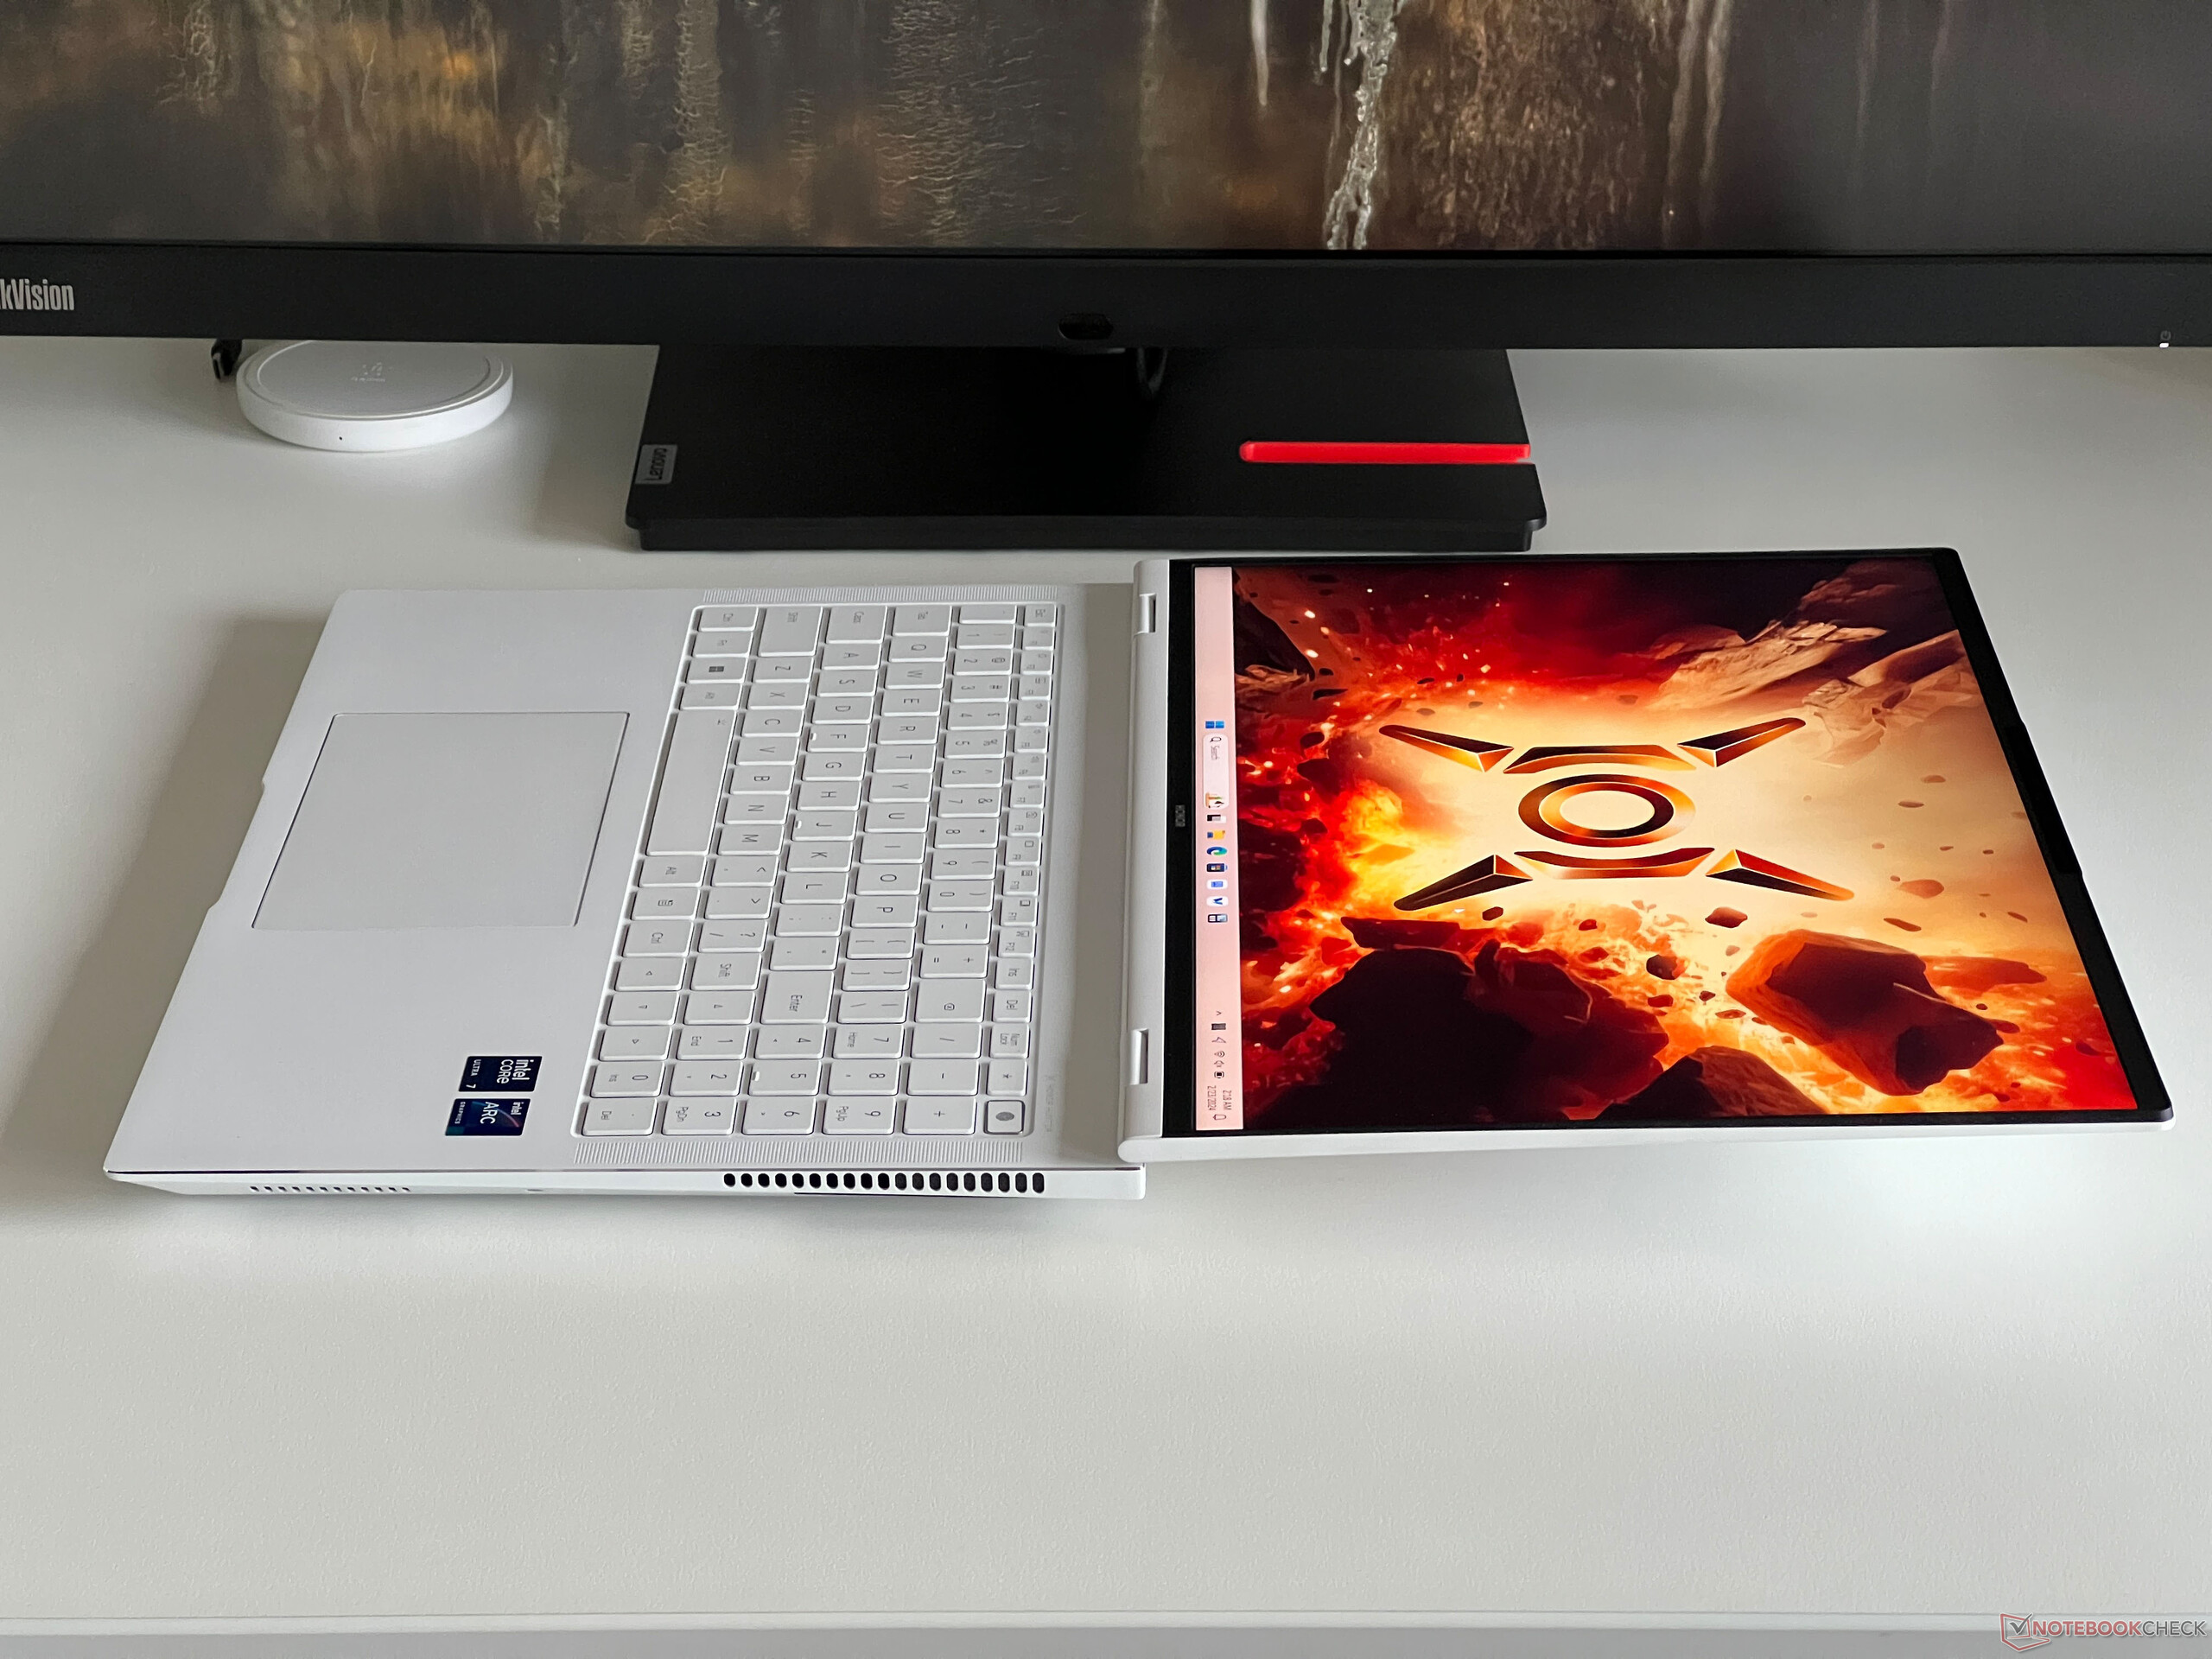
Within the field of comparison devices, the MagicBook Pro 16 belongs to the most compact machines and, at almost 1.8 cm, also the slimmest. The 1.9 kg laptop and the 200-watt PSU bring another 719 grams to the scales.
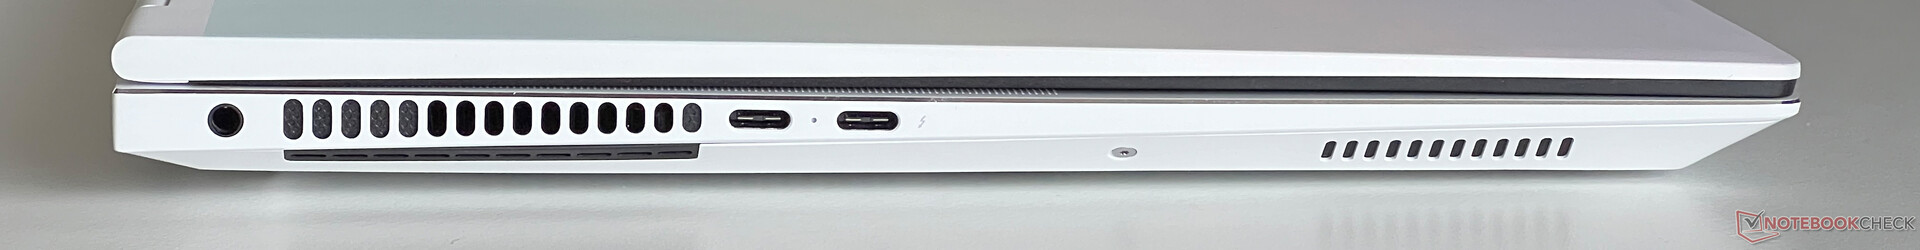
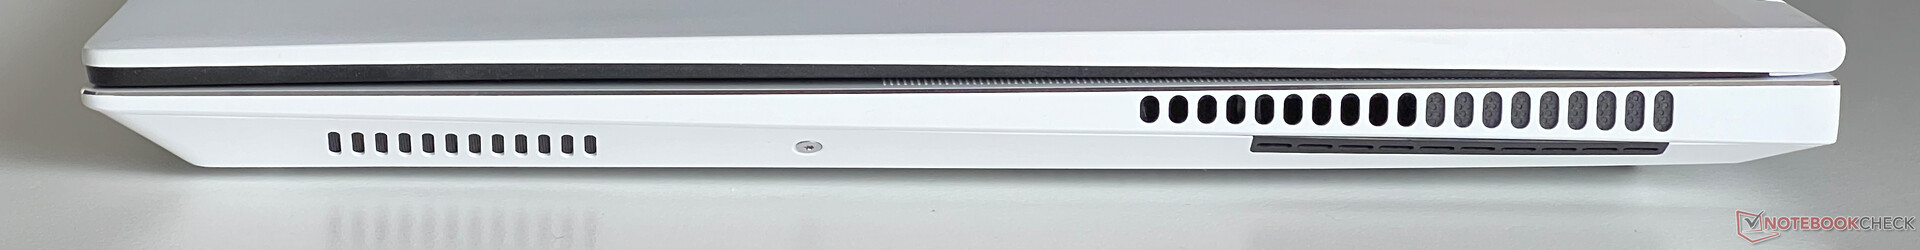
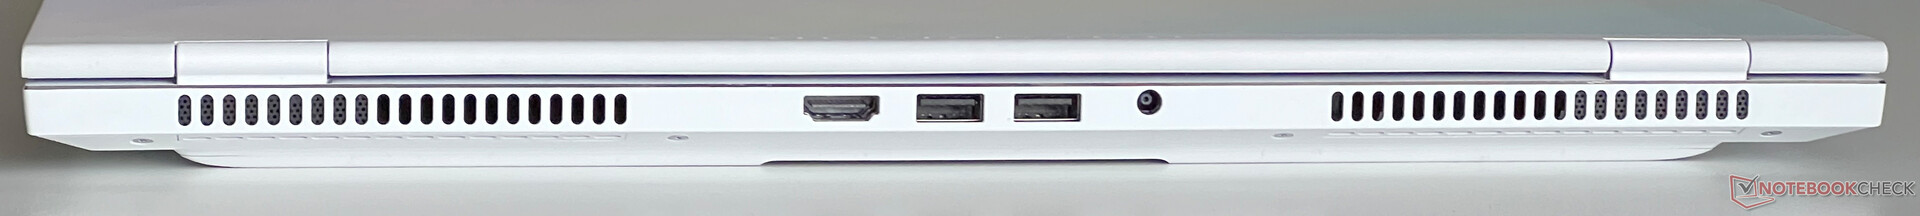
Features - Honor has installed Thunderbolt 4
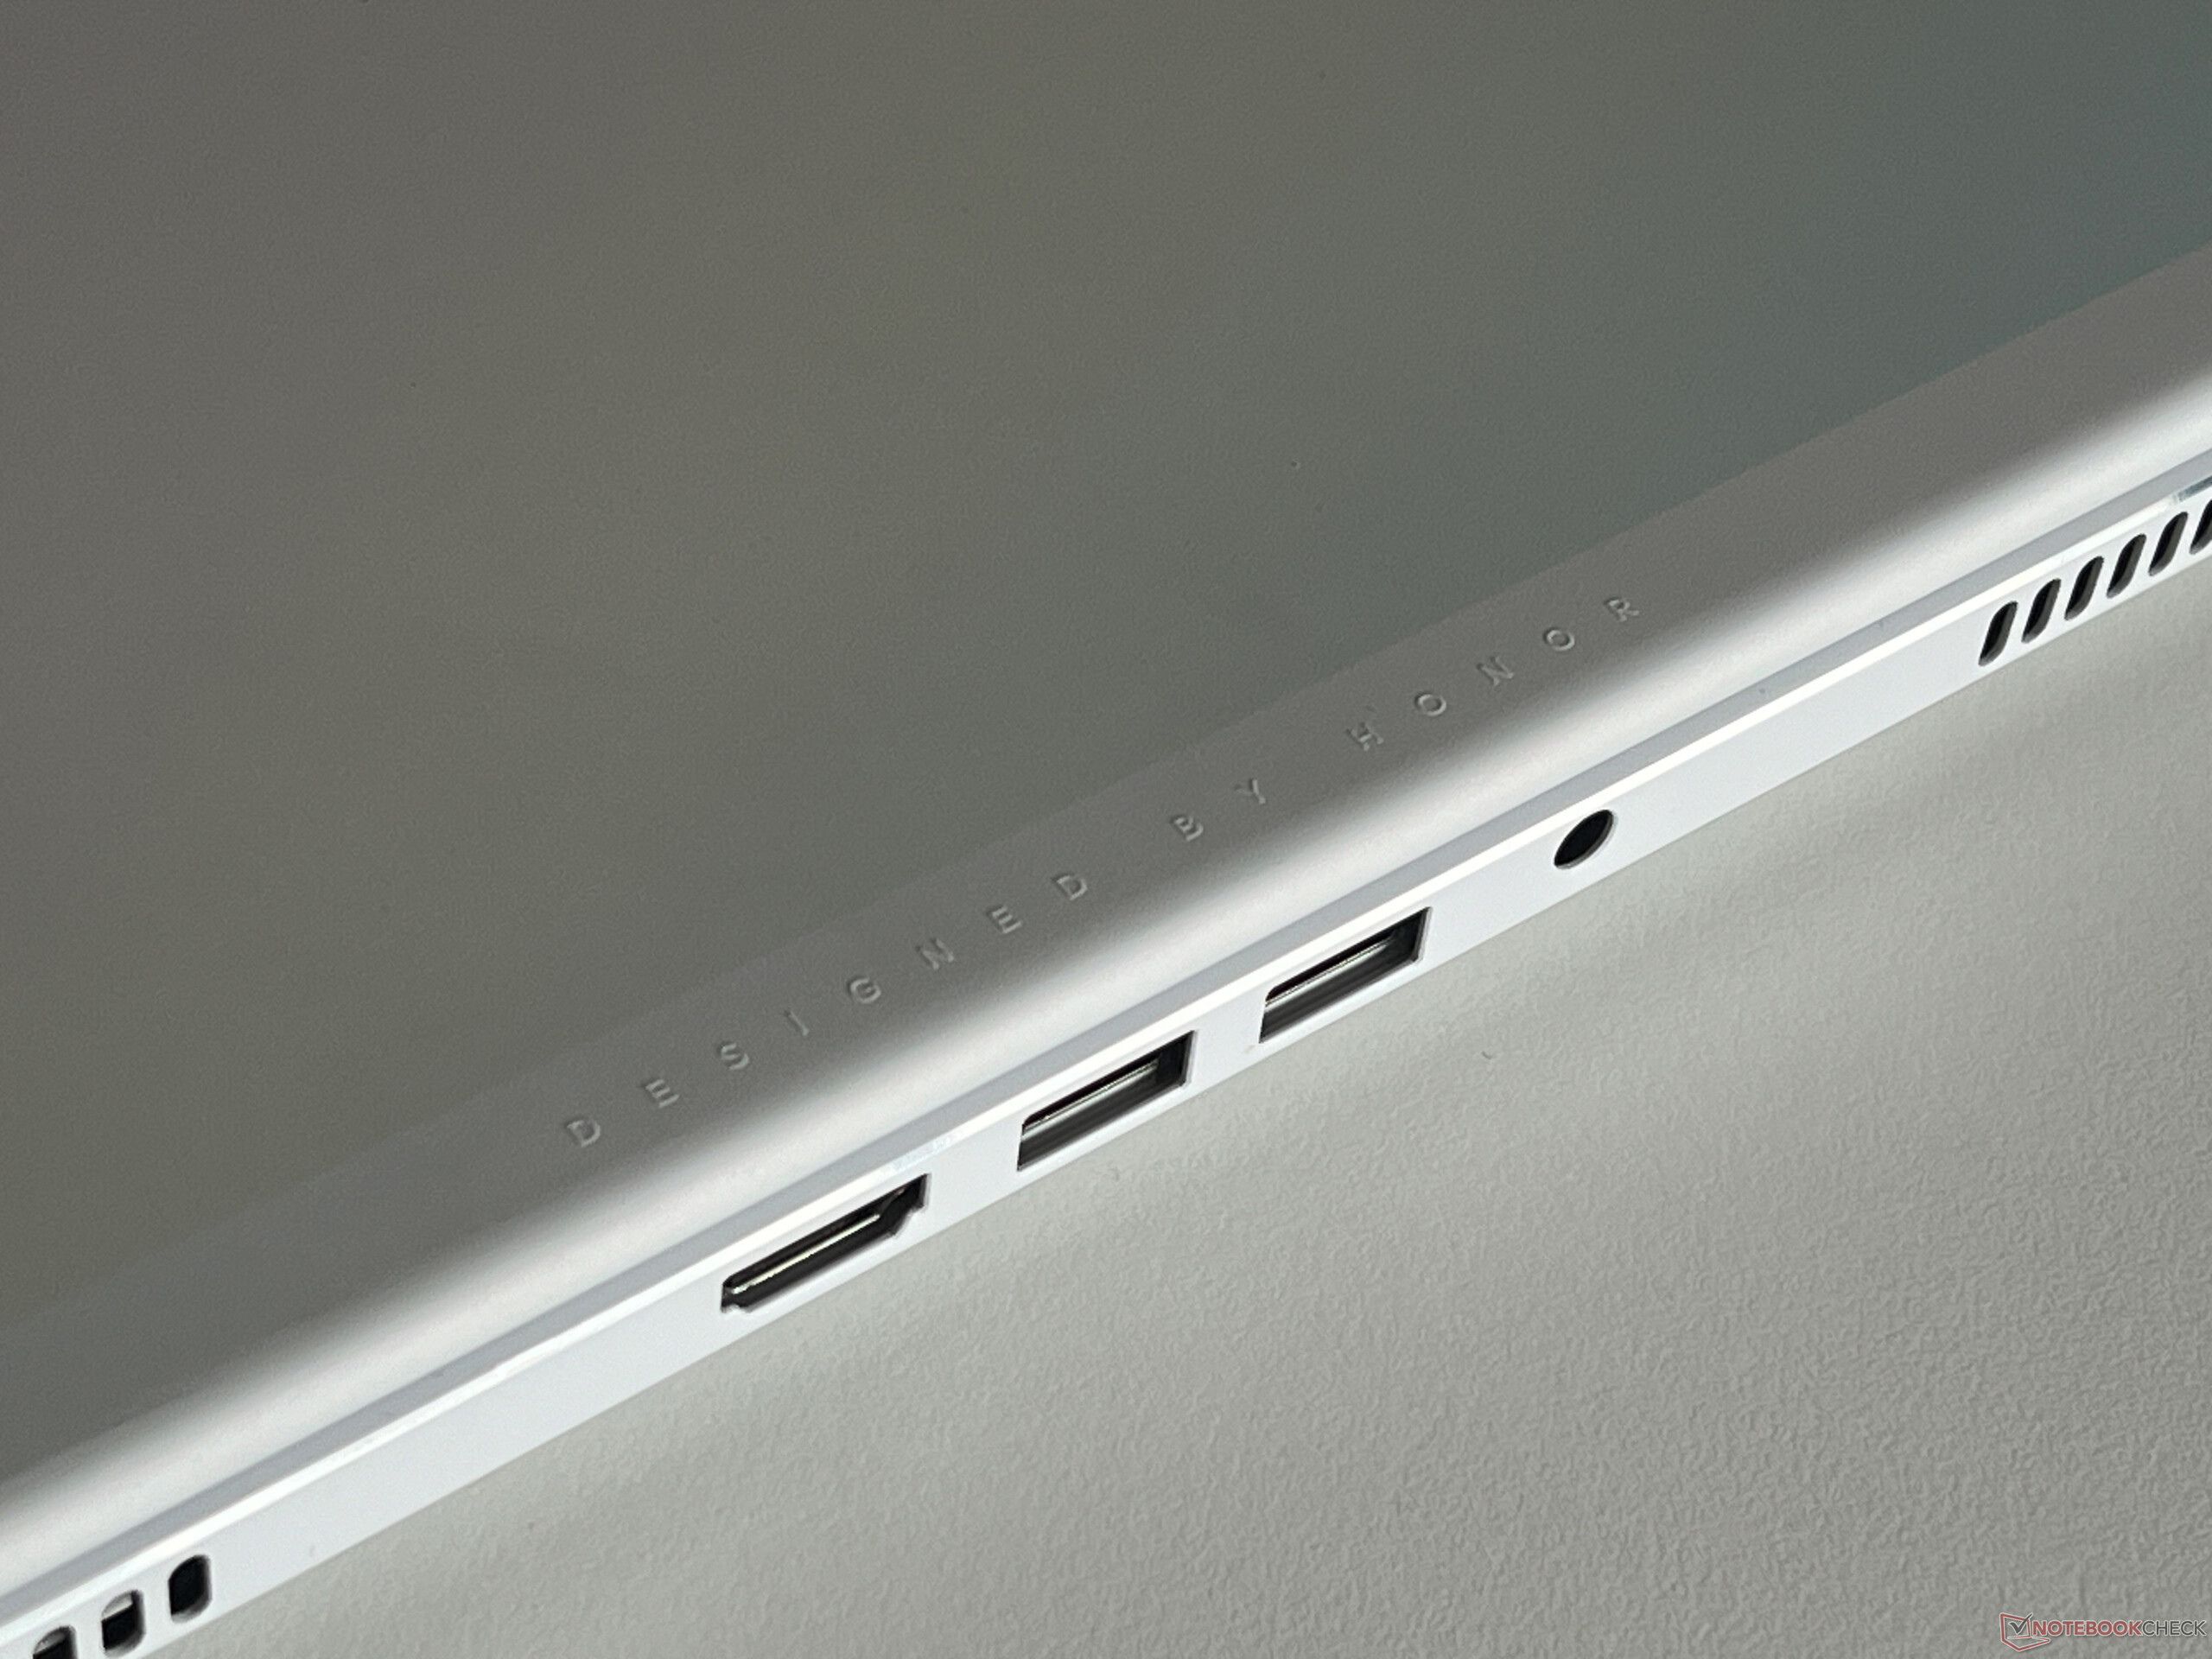
The position of the ports is unusual. As well as both USB-C ports (1x Thunderbolt 4) on the left-hand side, all of the other ports can be found in the middle of the rear of the device. We would have preferred to have both USB-A ports on the right-hand side of the device. The HDMI output and as well as both of the USB-C connectors are connected via the iGPU meaning when you use an external display the Nvidia GPU isn't necessarily running. The HDMI output supports 4K output at 60 Hz but no higher frequencies and also no G-Sync.
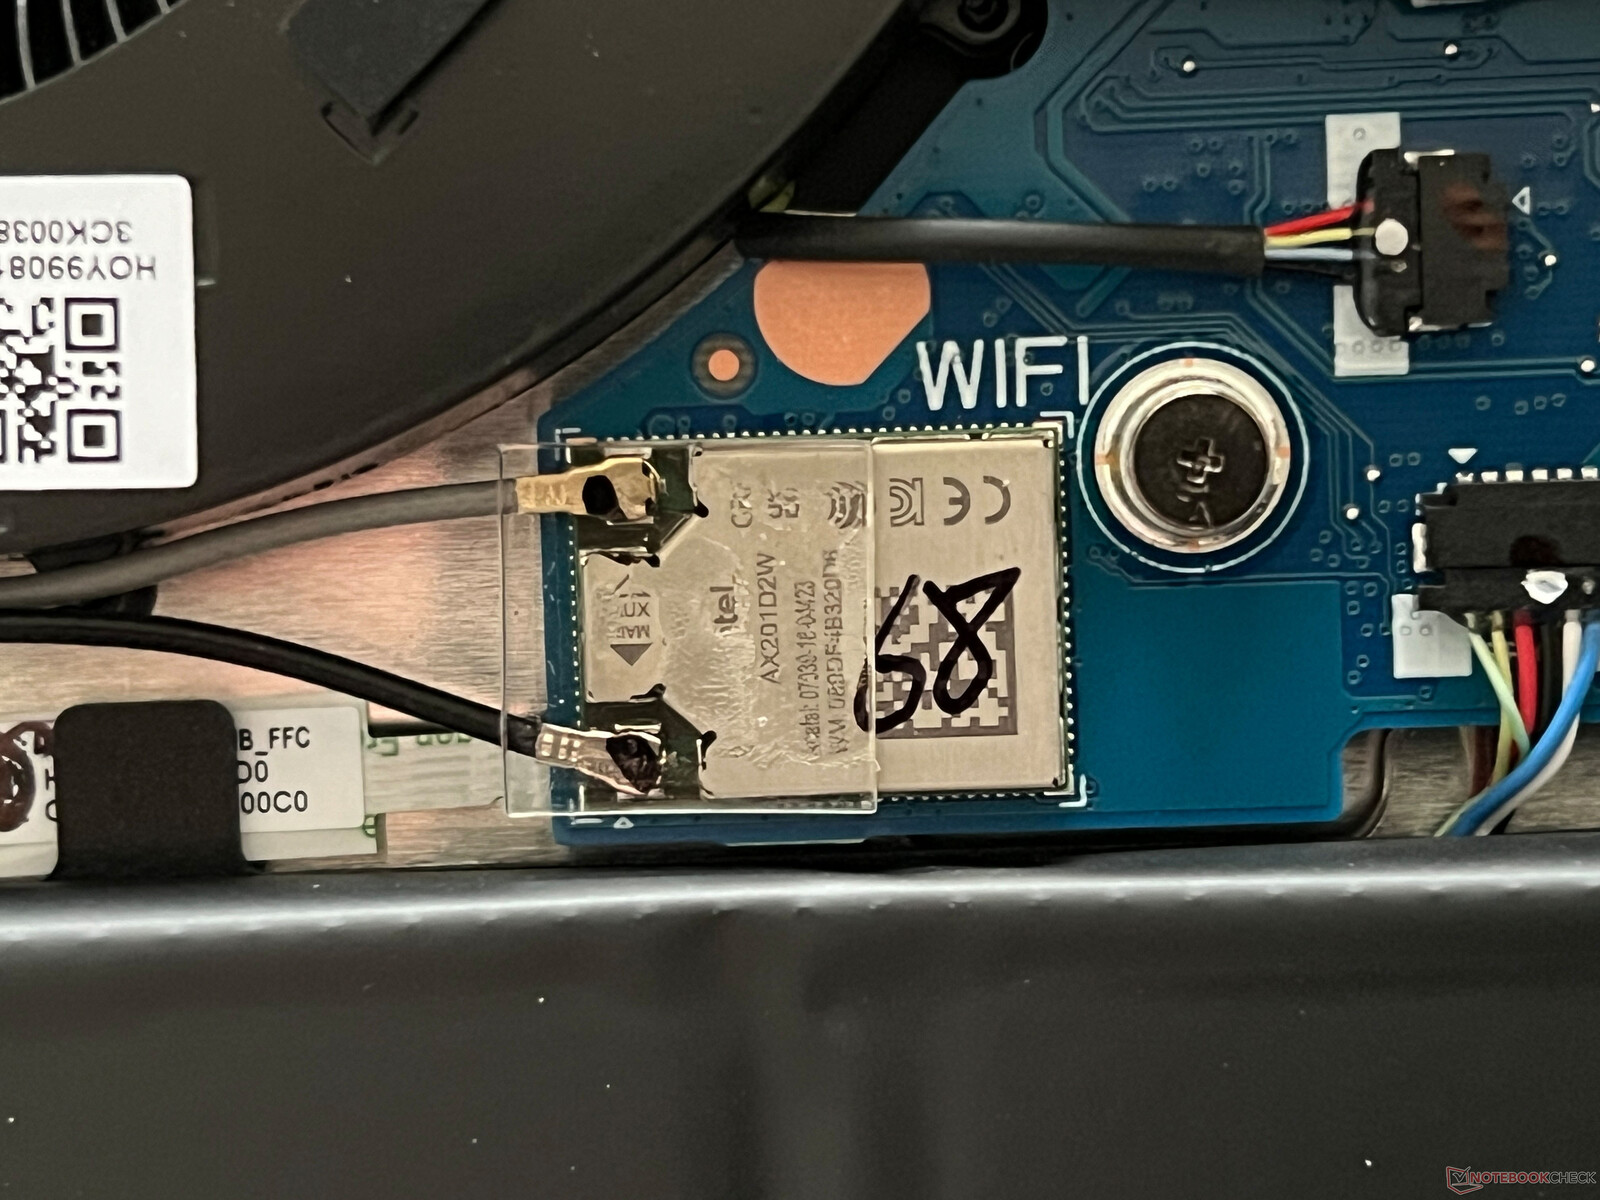
Communication
The Wi-Fi module is the familiar Intel AX201 one which means the MagicBook Pro supports neither Wi-Fi 6E nor Wi-Fi 7. However, there are currently no big limitations and the transfer speeds in our test with the Asus reference router are very high and stable. Anyone using additional Honor devices can also easily send files between the two devices or, for example, display smartphone content on the PC.
| Networking | |
| Honor MagicBook Pro 16 2024 | |
| iperf3 transmit AXE11000 | |
| iperf3 receive AXE11000 | |
| Framework Laptop 16 | |
| iperf3 transmit AXE11000 | |
| iperf3 receive AXE11000 | |
| iperf3 transmit AXE11000 6GHz | |
| iperf3 receive AXE11000 6GHz | |
| Lenovo ThinkPad Z16 Gen 2 | |
| iperf3 transmit AXE11000 | |
| iperf3 receive AXE11000 | |
| iperf3 transmit AXE11000 6GHz | |
| iperf3 receive AXE11000 6GHz | |
| Dell Inspiron 16 Plus 7630 | |
| iperf3 transmit AXE11000 | |
| iperf3 receive AXE11000 | |
| iperf3 transmit AXE11000 6GHz | |
| iperf3 receive AXE11000 6GHz | |
| Lenovo Yoga Pro 9 16-IRP G8 | |
| iperf3 transmit AXE11000 | |
| iperf3 receive AXE11000 | |
| Schenker VISION 16 Pro (M23) | |
| iperf3 transmit AXE11000 | |
| iperf3 receive AXE11000 | |
| Asus Vivobook Pro 16X K6604JV-MX016W | |
| iperf3 transmit AXE11000 | |
| iperf3 receive AXE11000 | |
| iperf3 transmit AXE11000 6GHz | |
| iperf3 receive AXE11000 6GHz | |
Webcam
The 1080p webcam supports Windows studio effects (soft focus, eye contact, head tracking) and the camera's quality can be described as average.


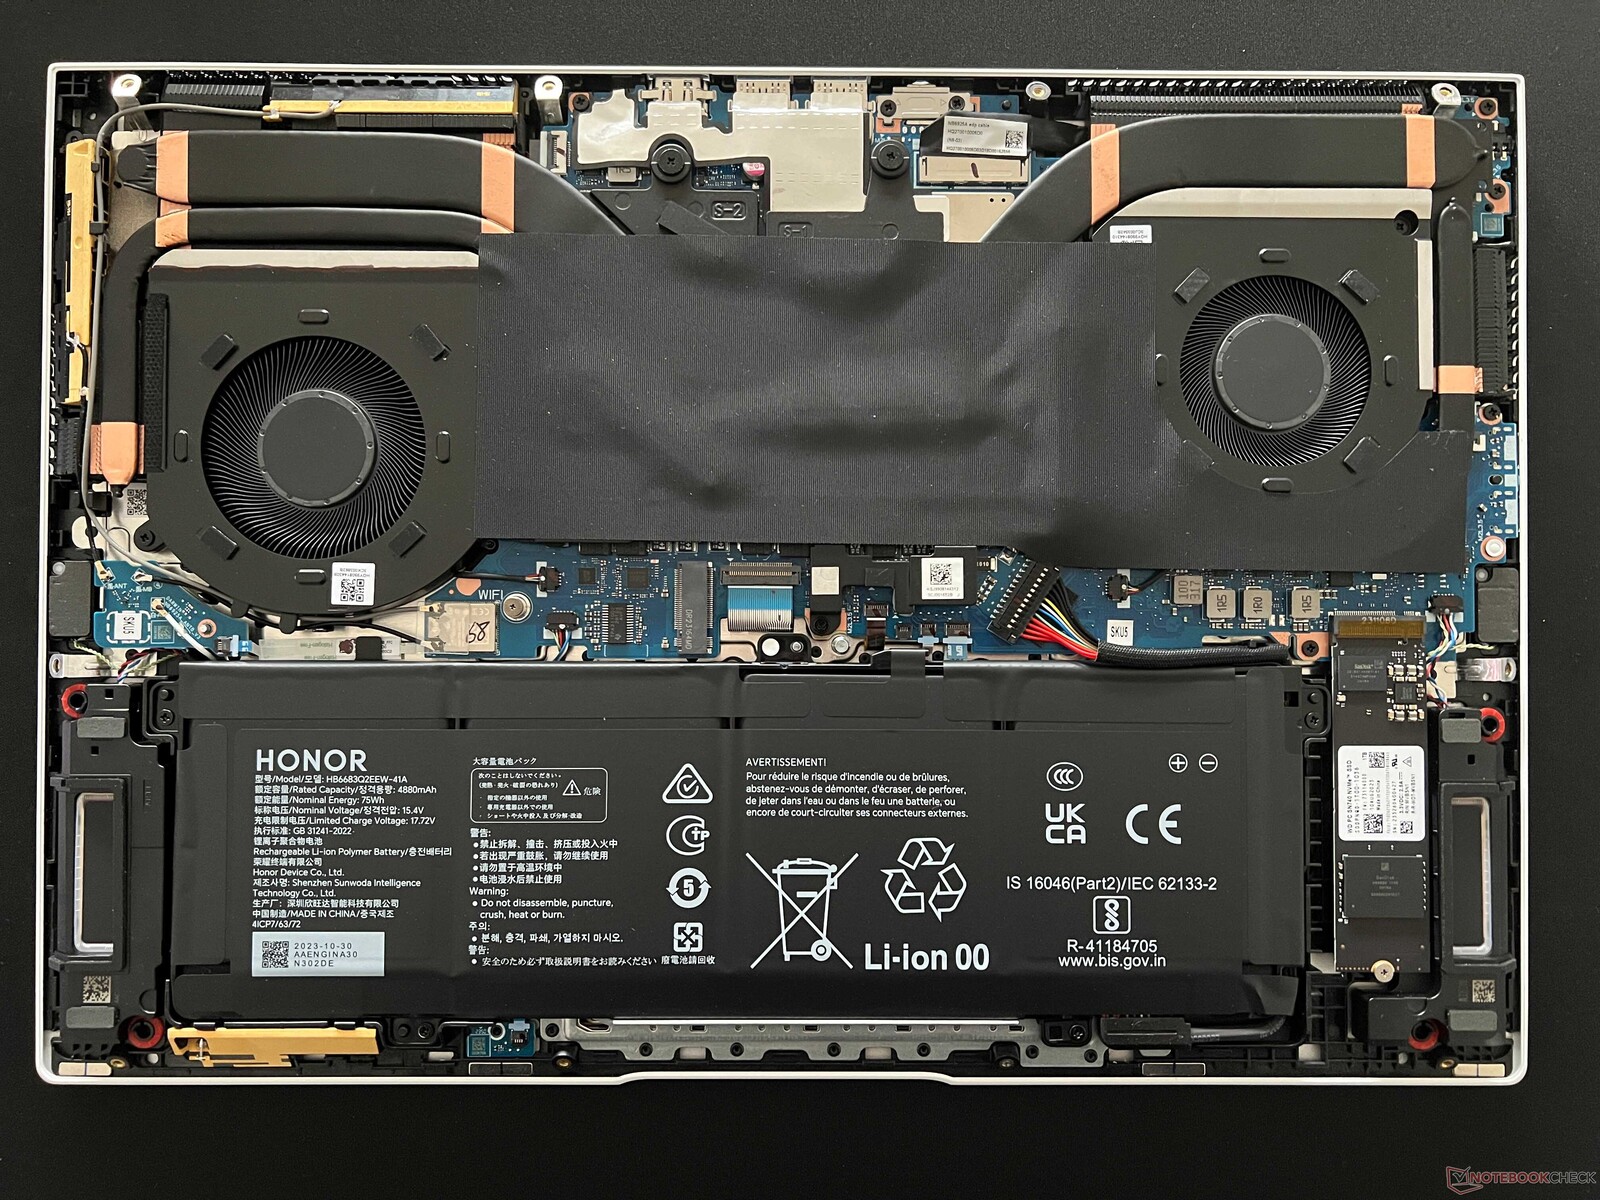
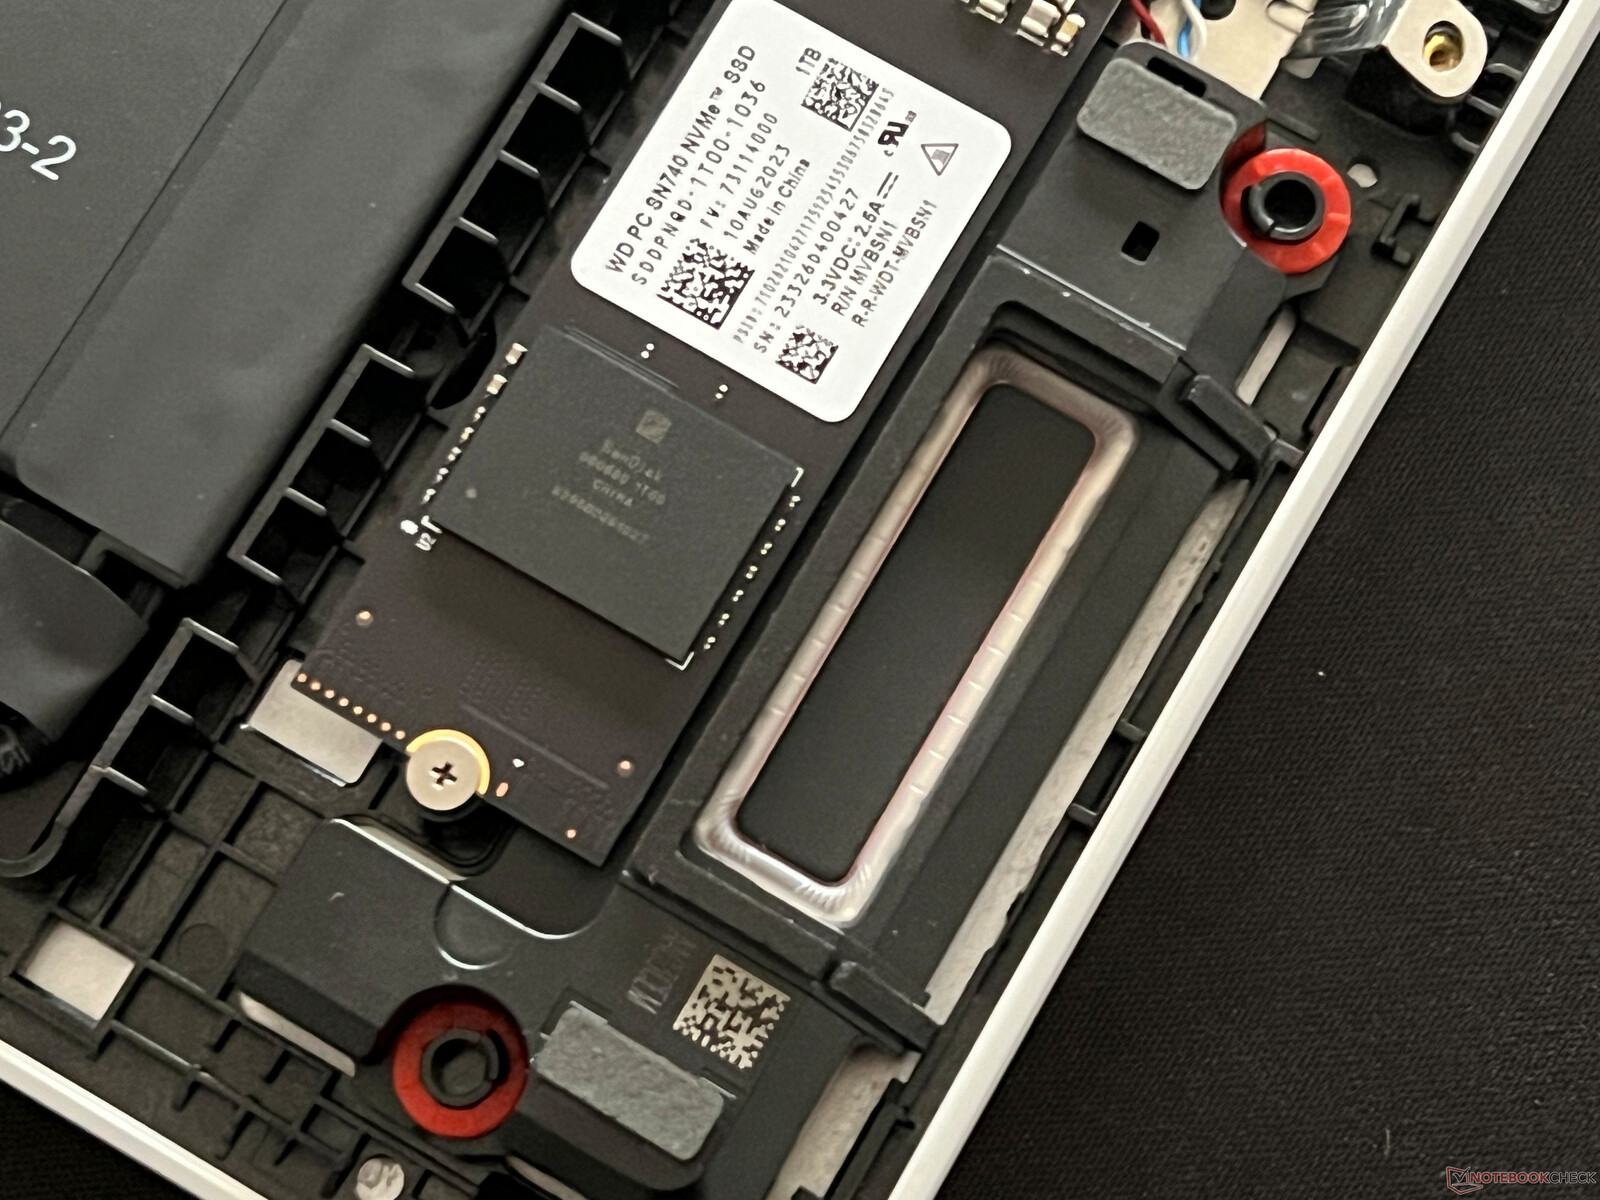
Maintenance
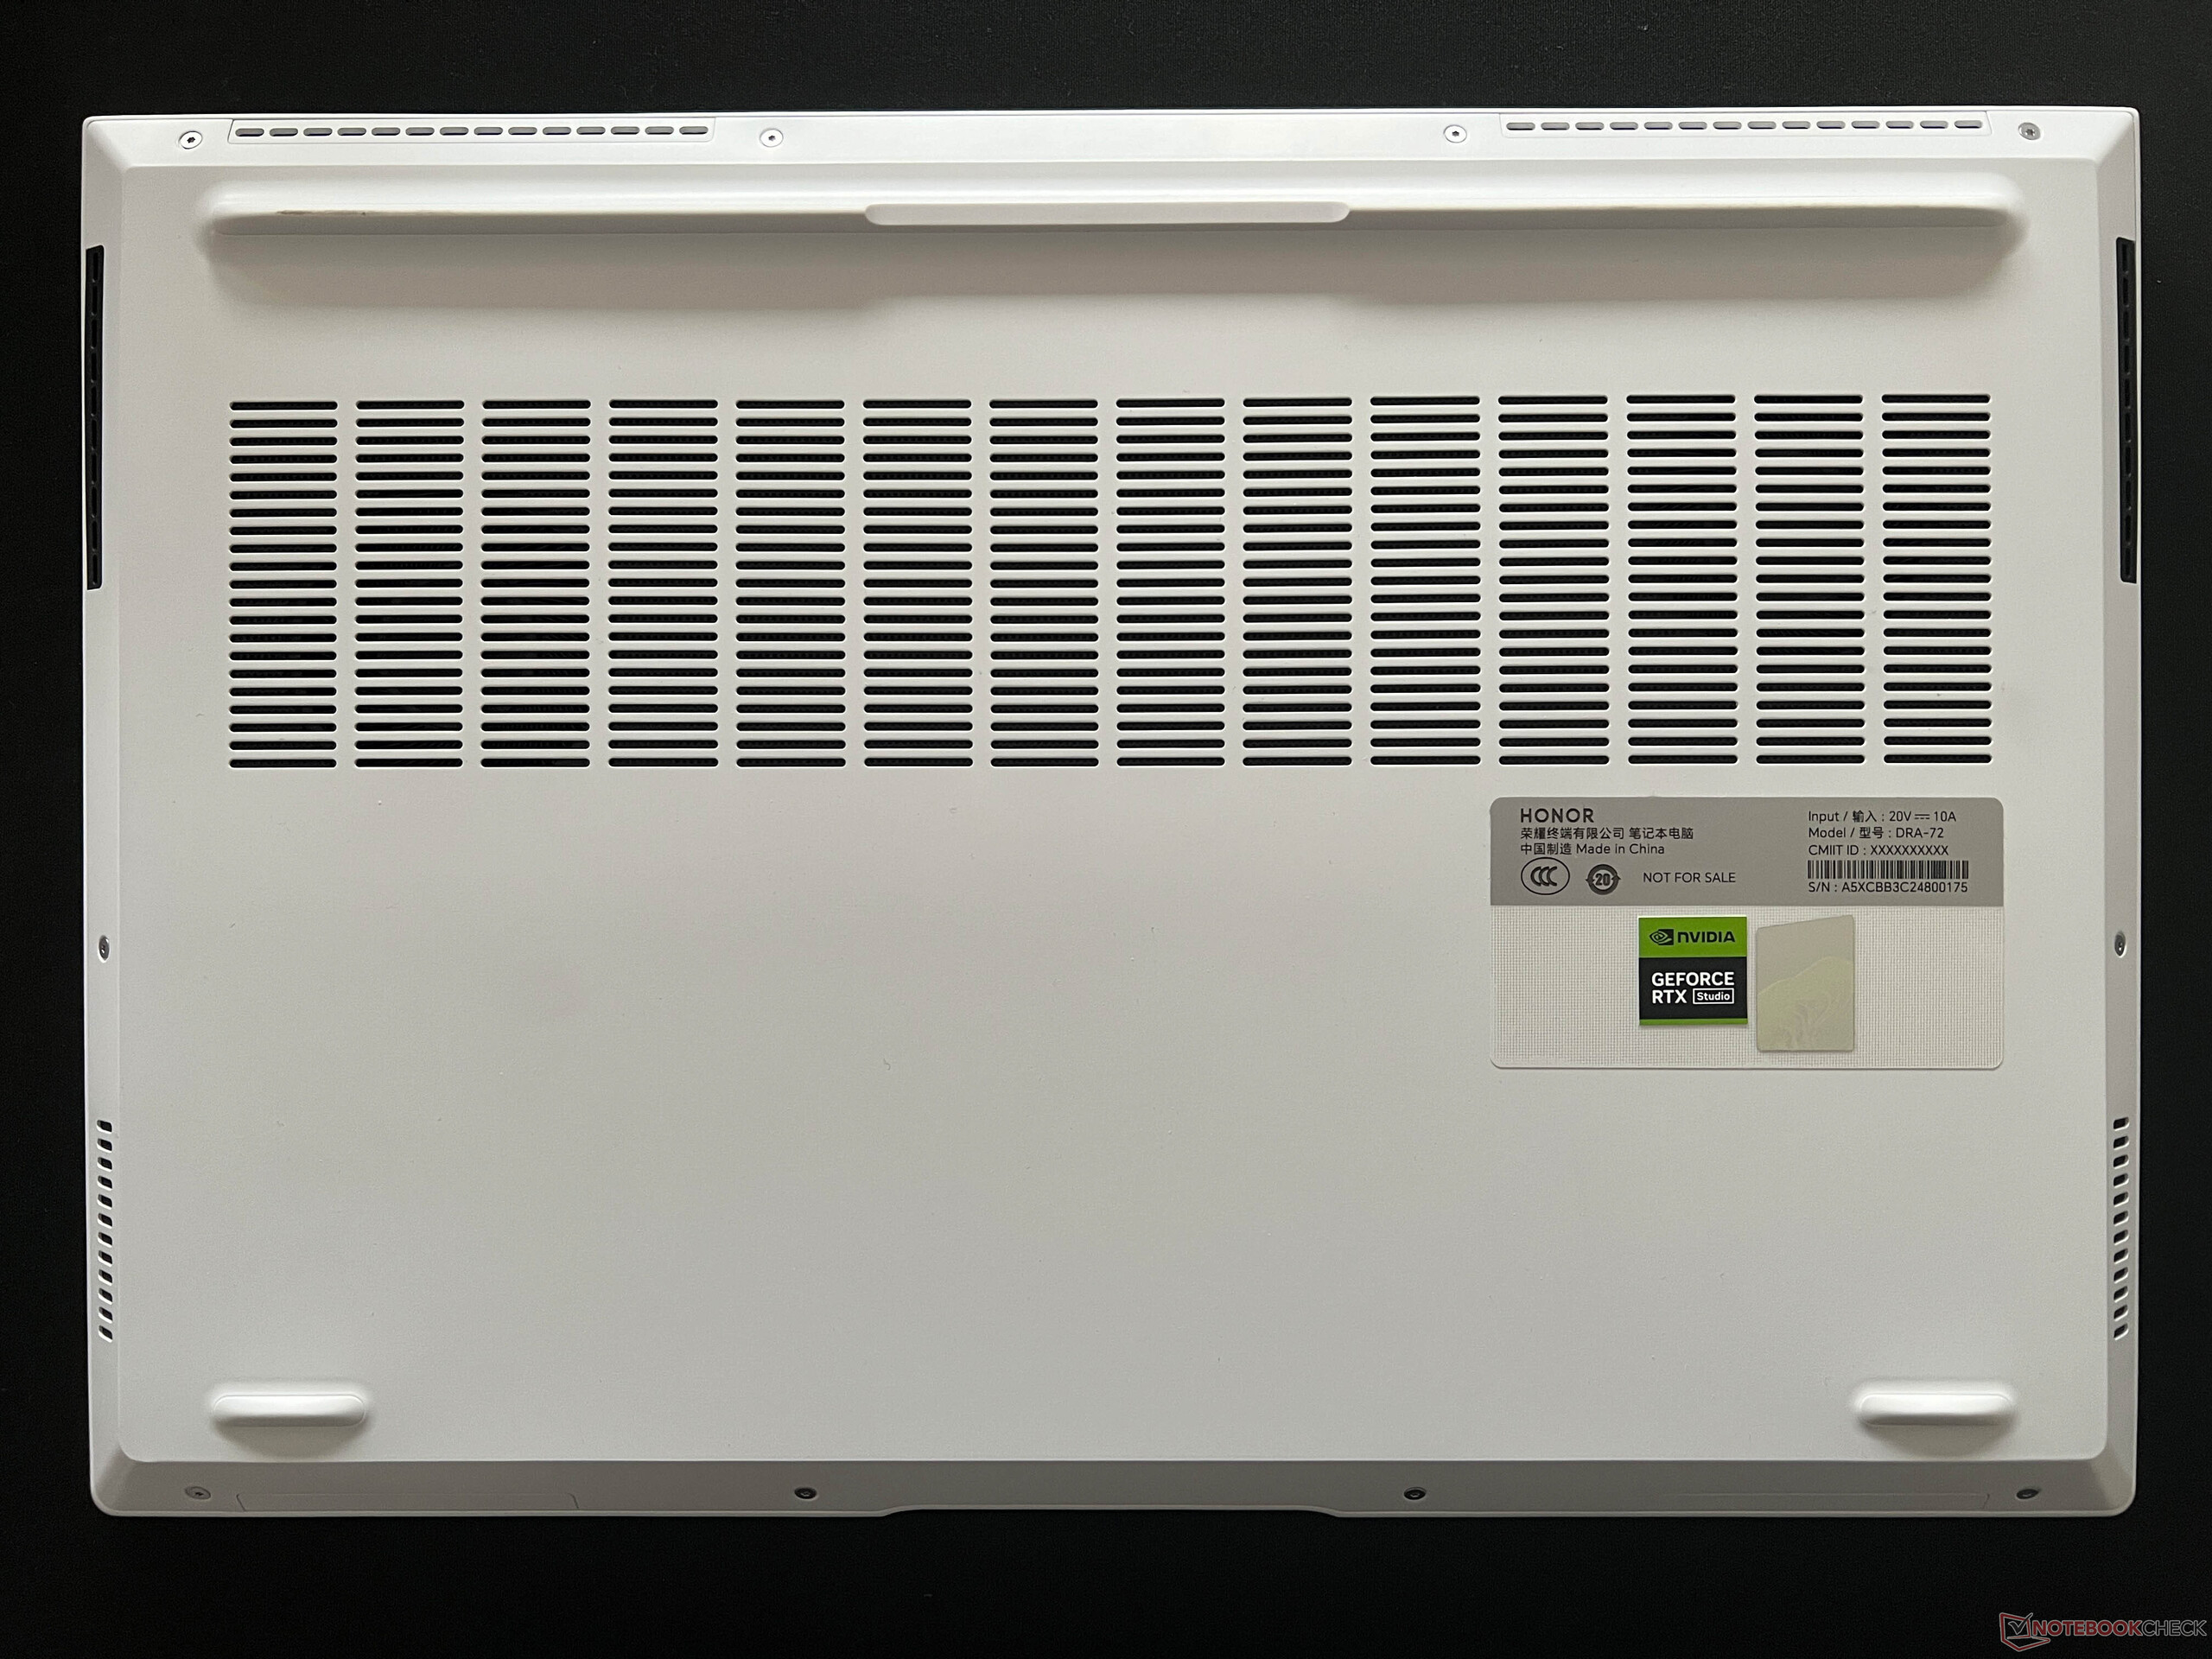
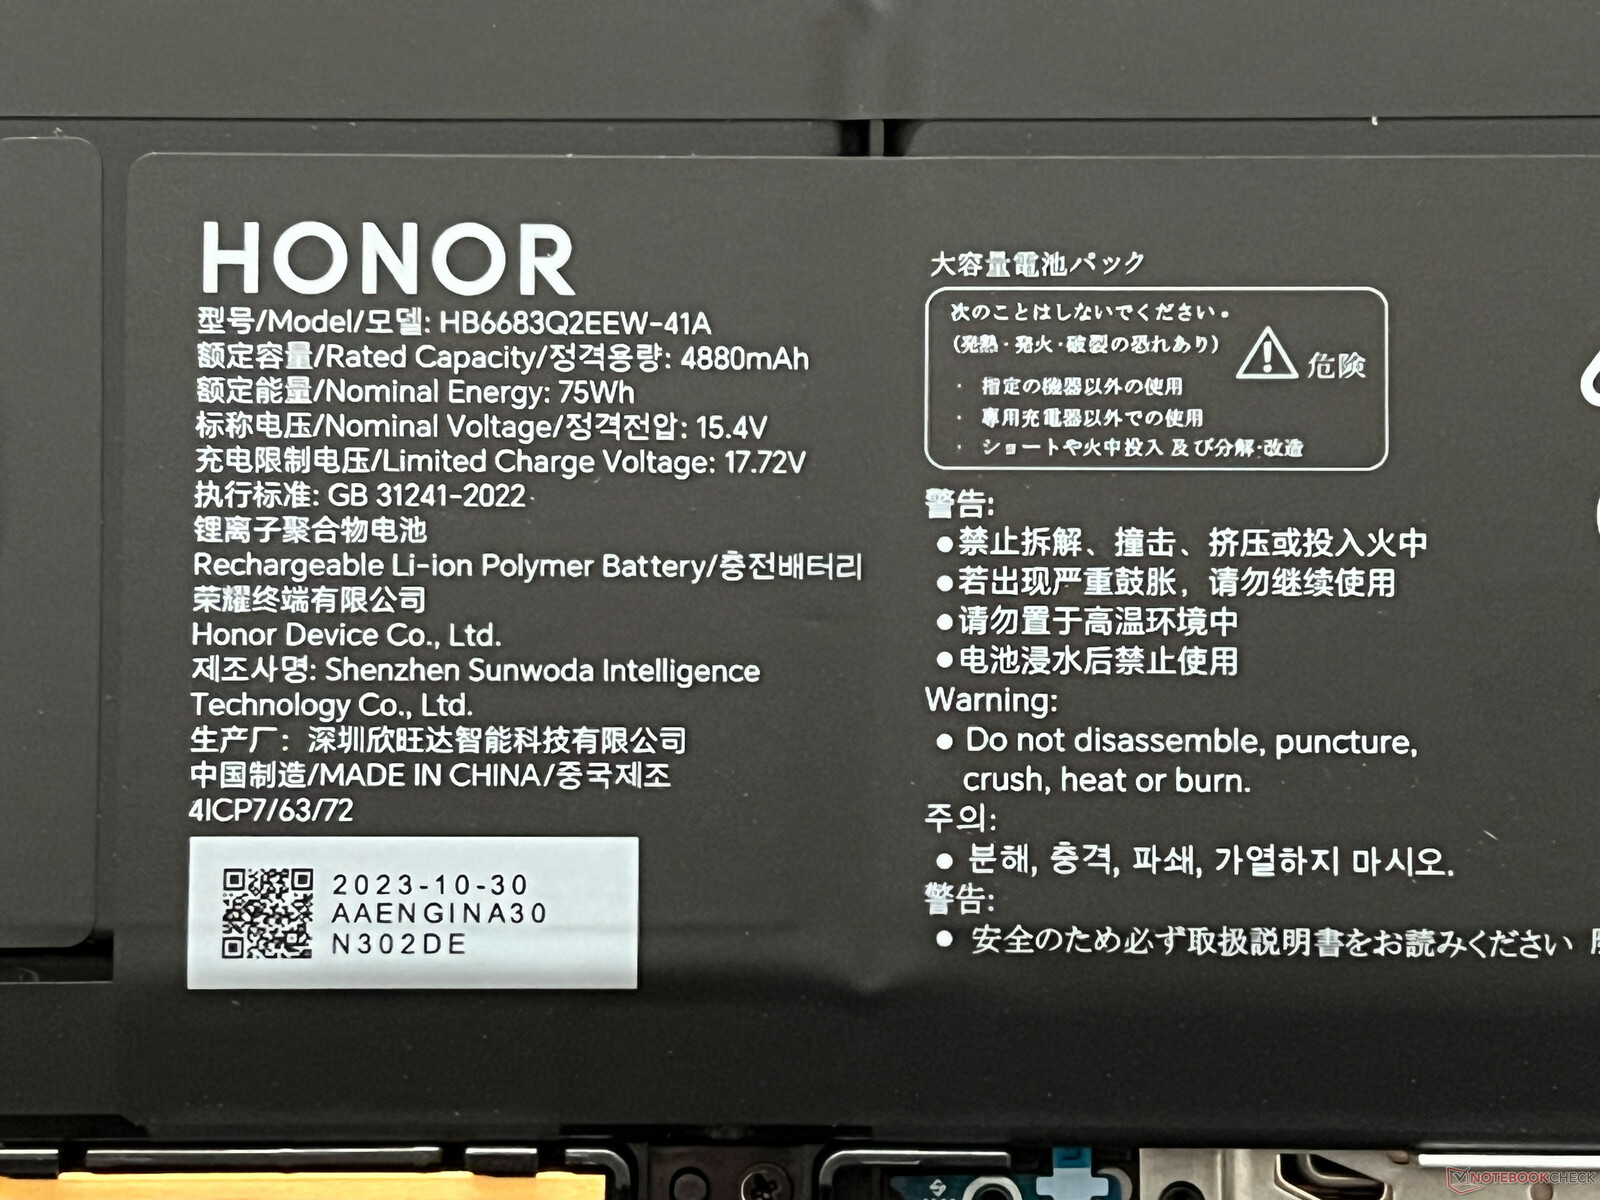
The bottom case cover is secured with some Torx screws (T6) and can be removed easily. Inside the device, both fans can be cleaned and both the battery and the SSD can be replaced. However, all of the other components including the RAM and Wi-Fi module are soldered.
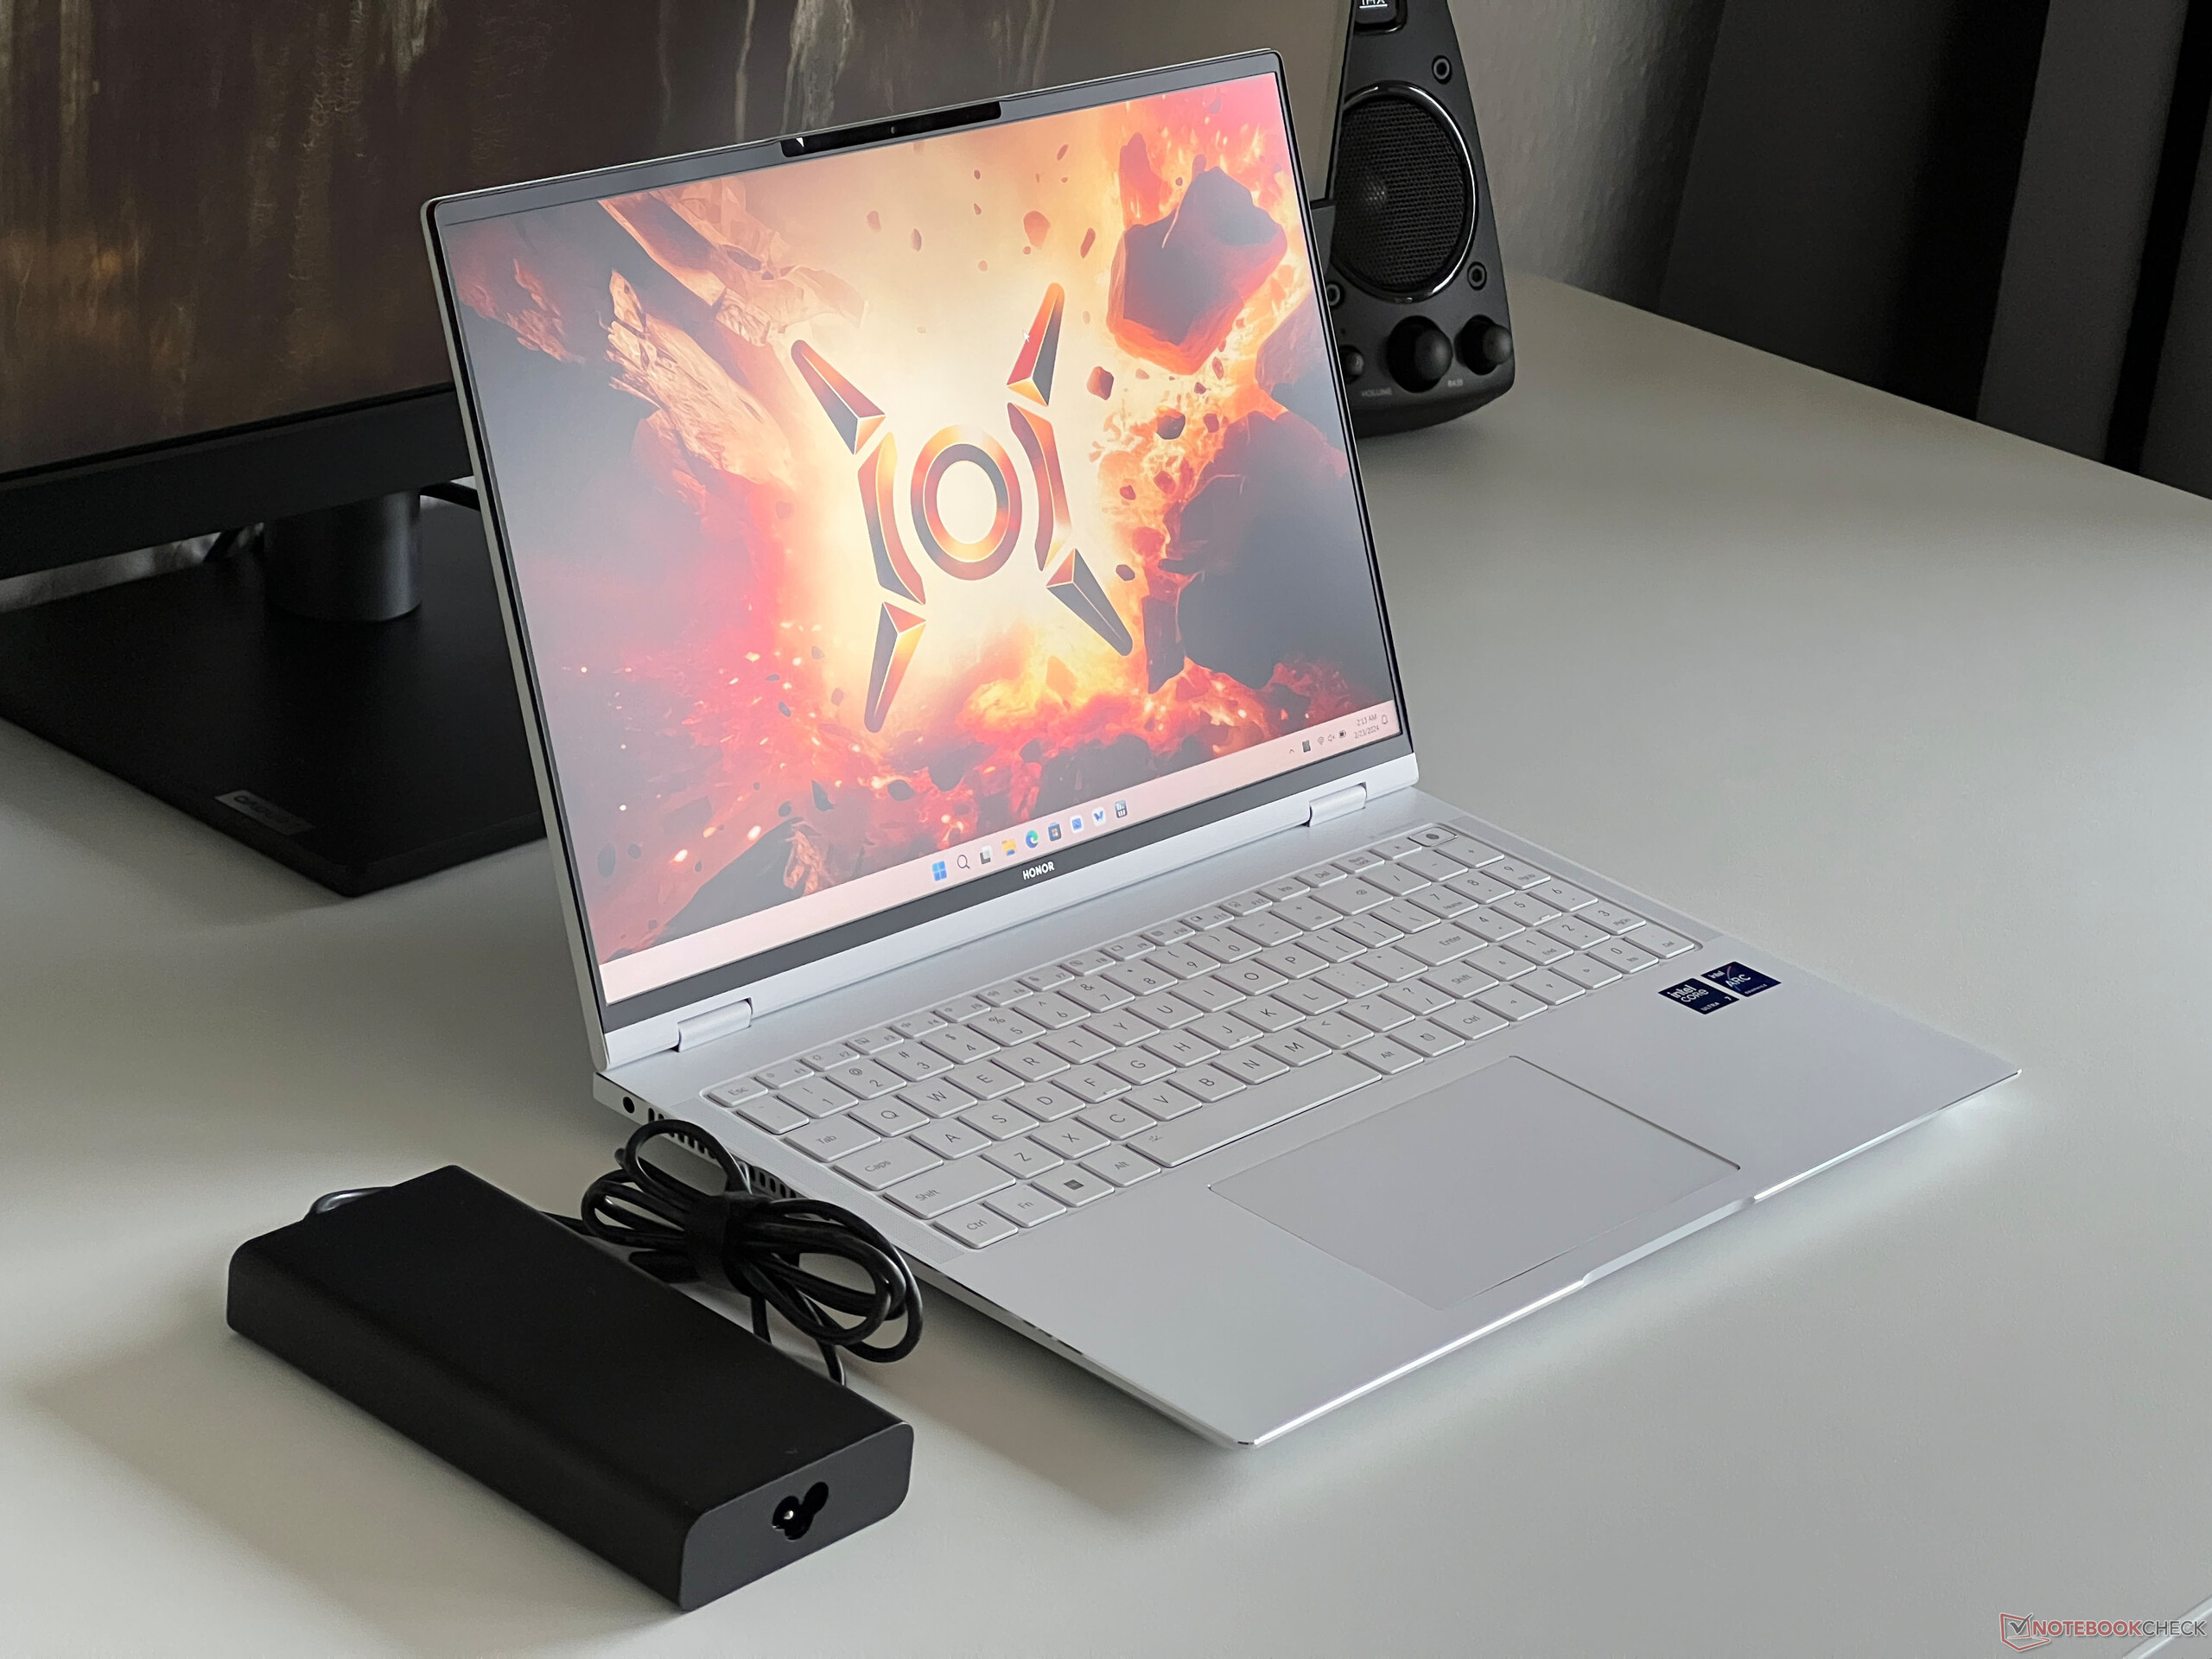
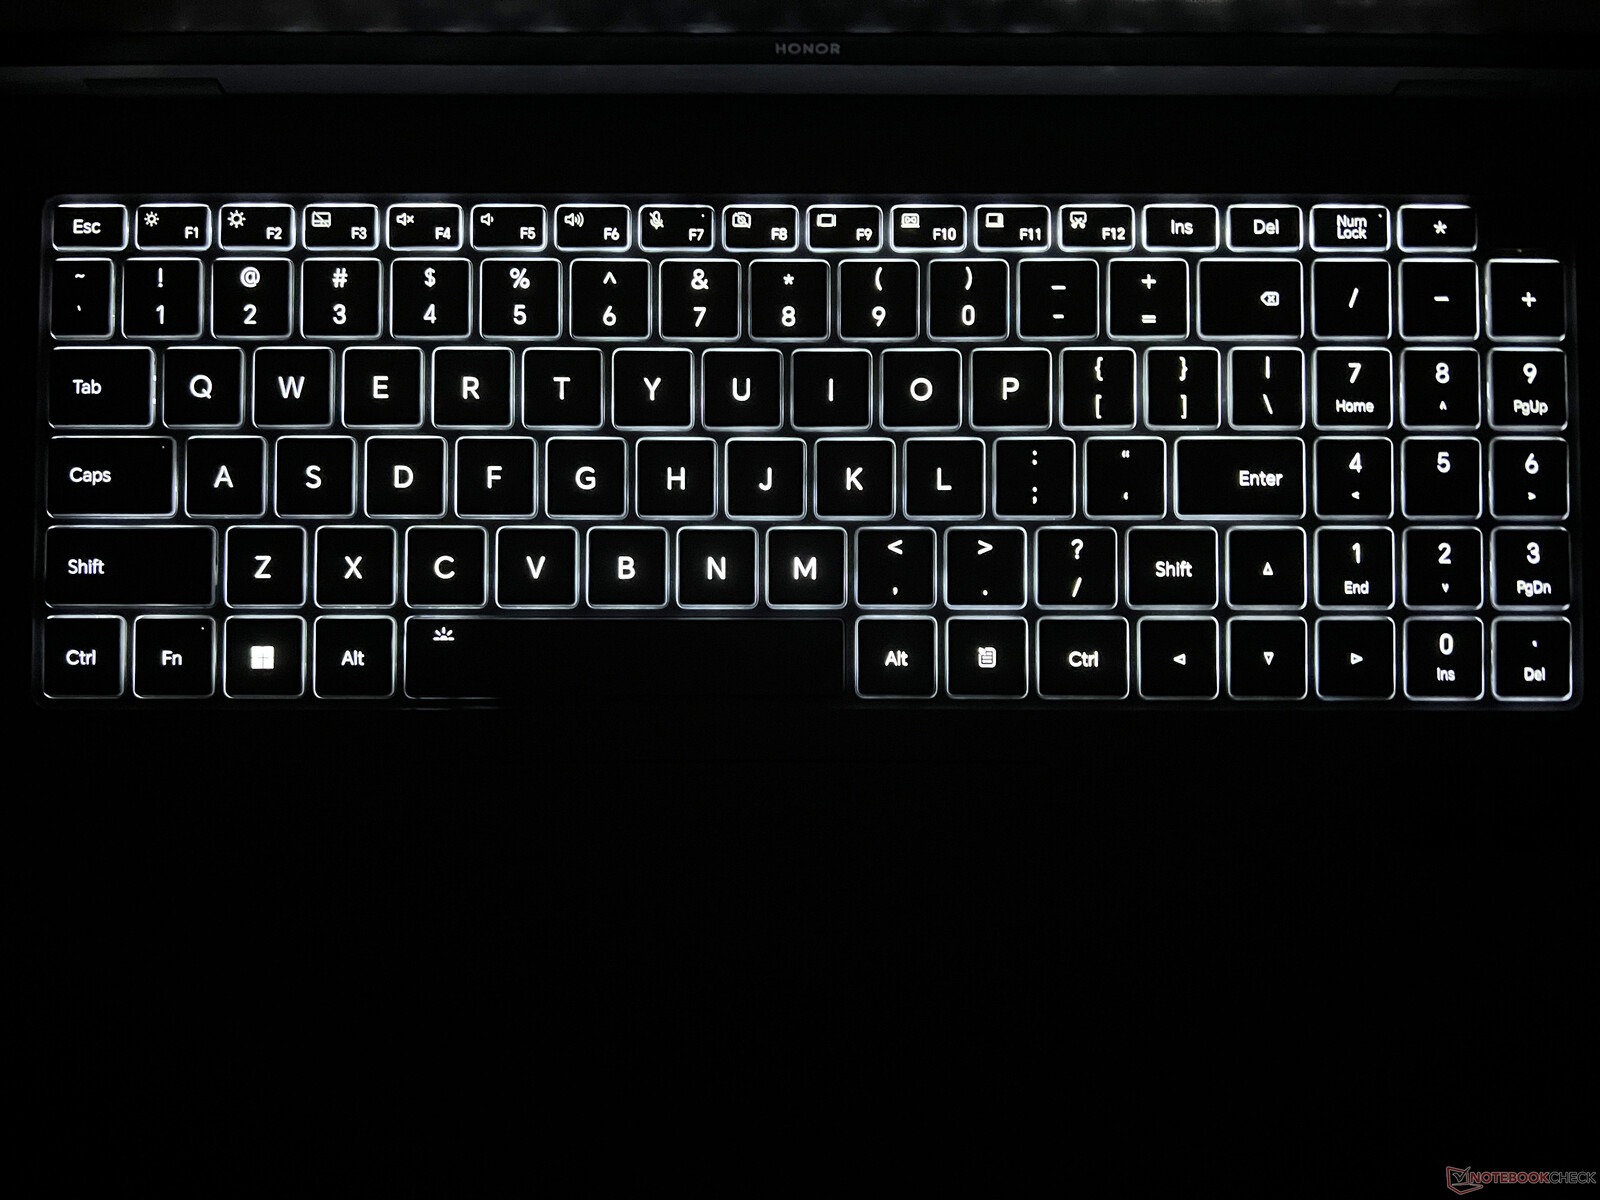
Input devices - A numerical pad and awkward clickpad
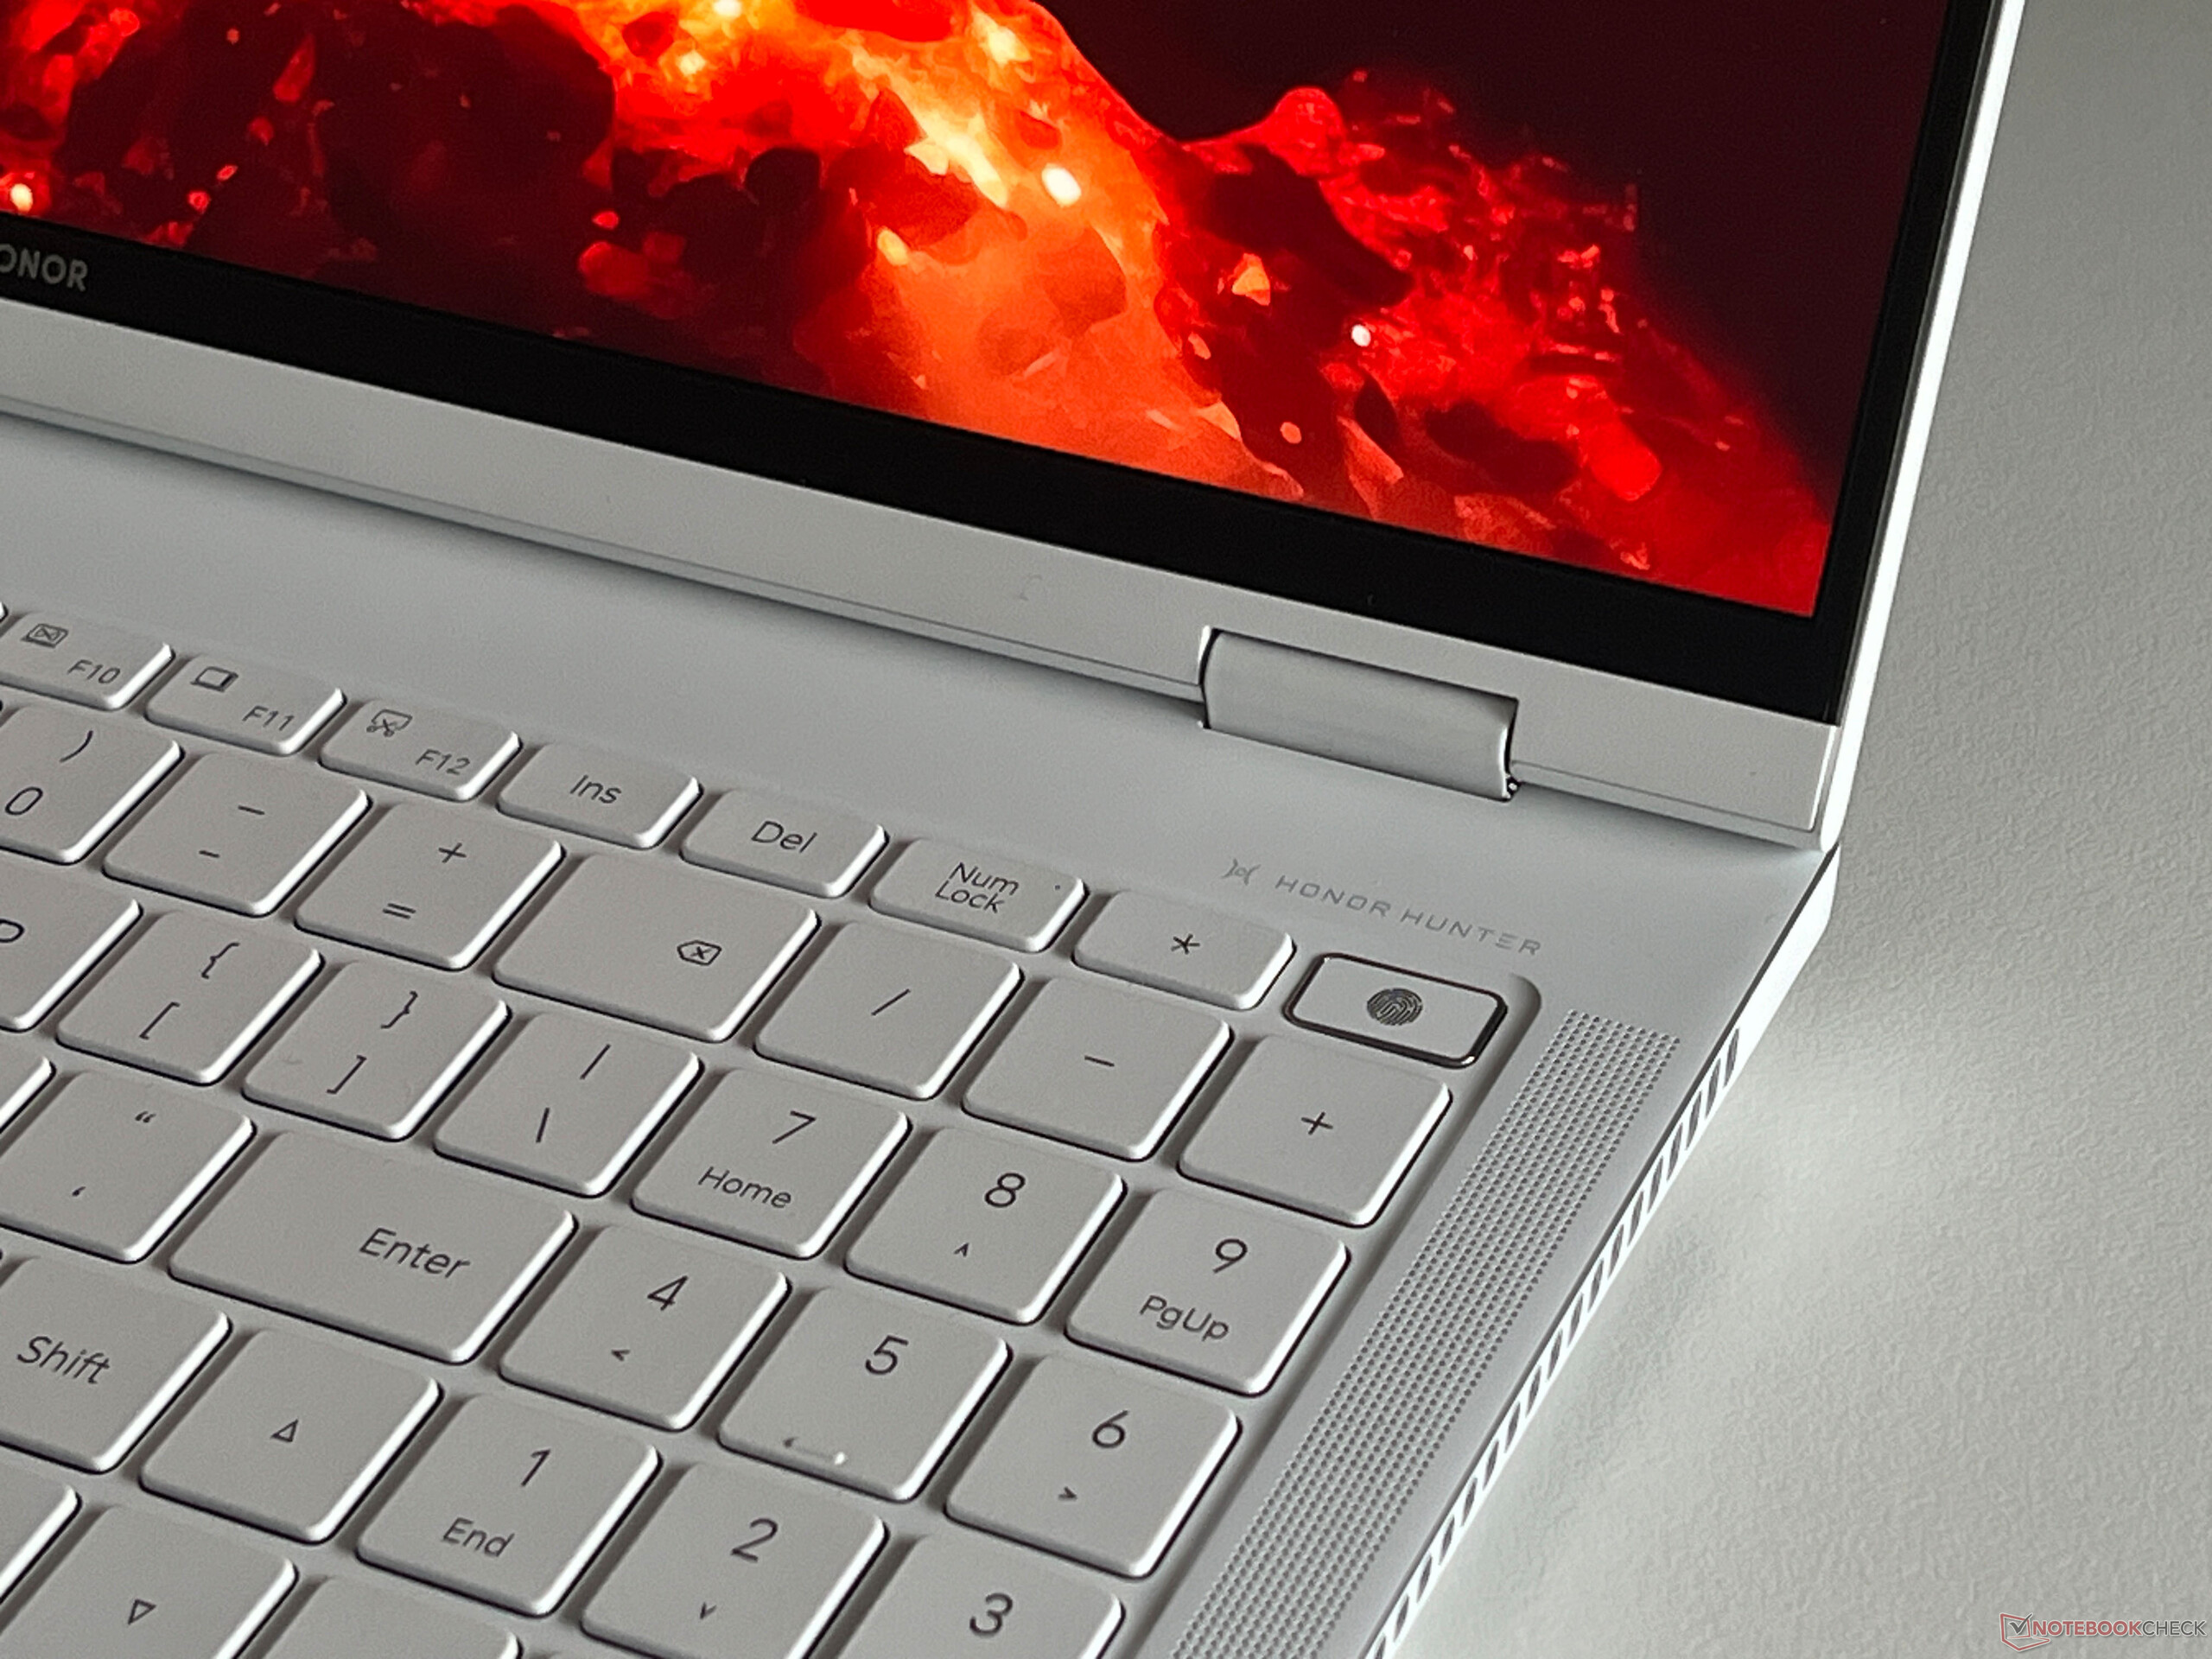
The MagicBook Pro 16 offers a large keyboard with a numerical keypad and white backlighting. This can be activated automatically but the contrast between the white keys and the lighting is very low which means their visibility under poor lighting conditions can be even worse. But that is a general problem to be found in light-colored keyboards. Apart from that, the typing experience is very comfortable and makes even longer texts a piece of cake. The power button is at the top right and, as well as being integrated into the keyboard, it houses the fingerprint scanner.
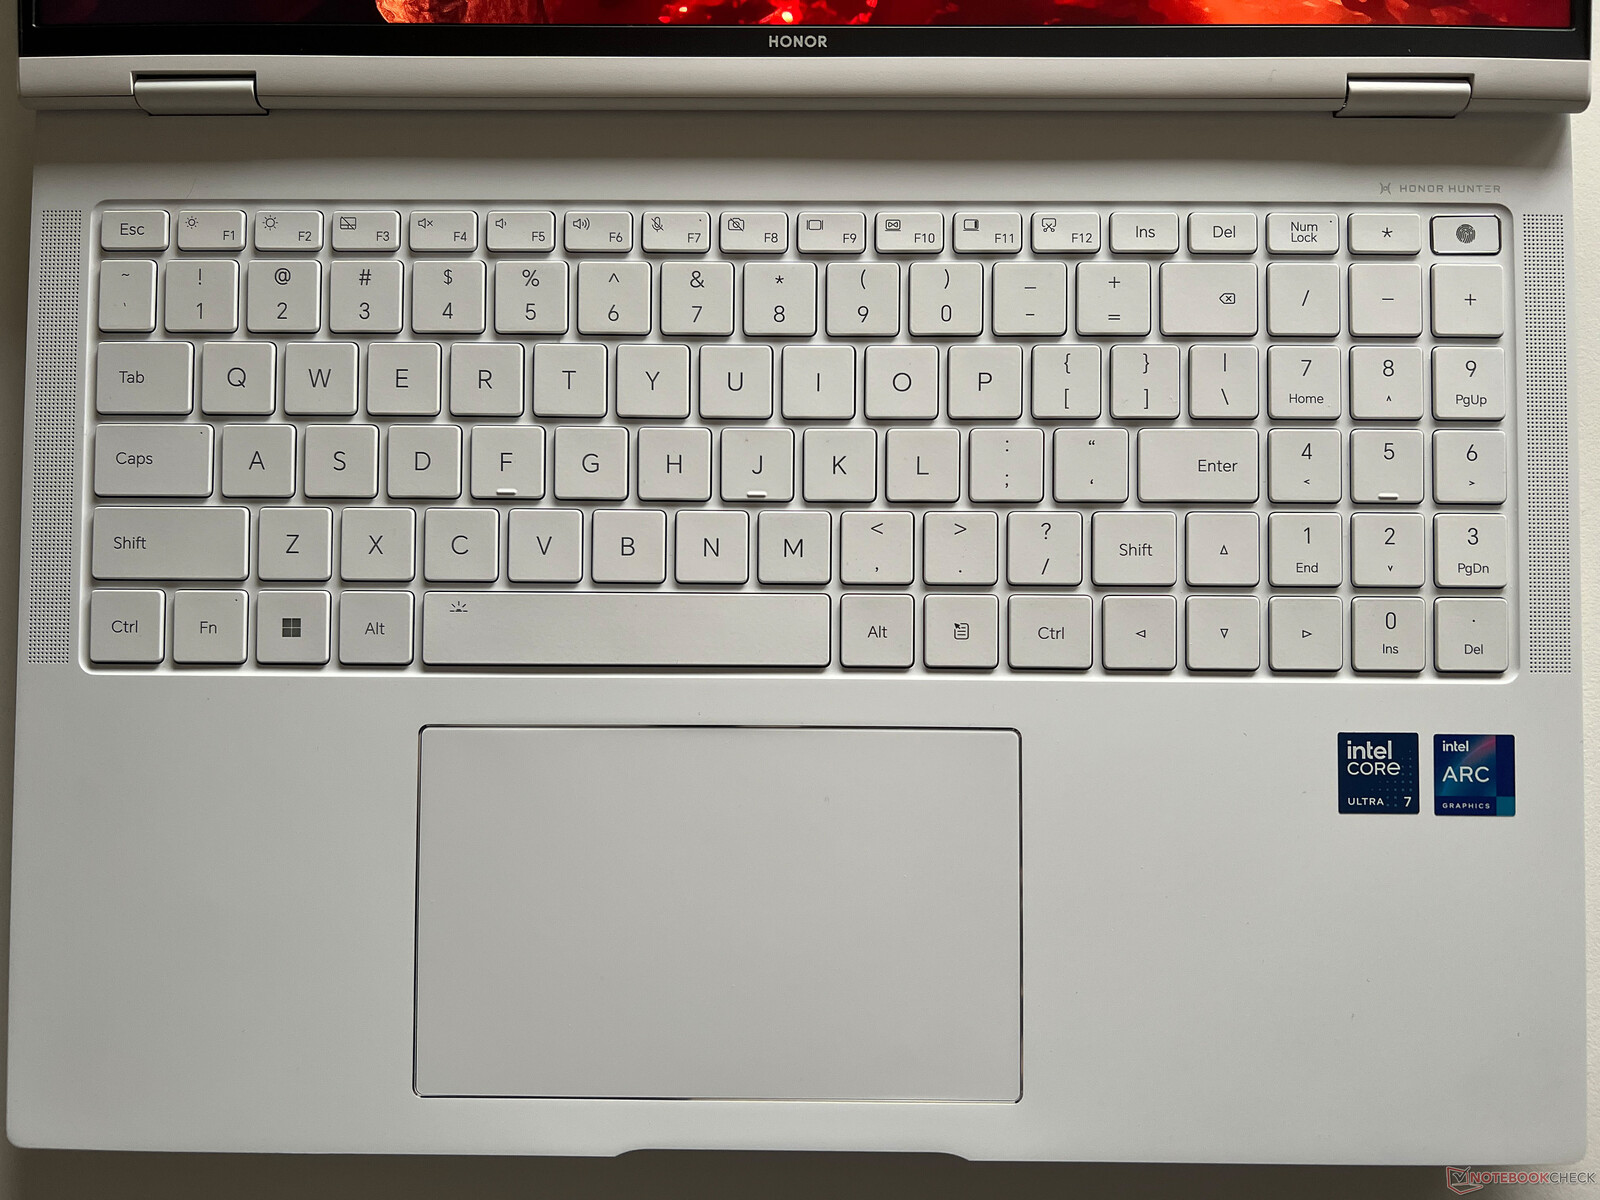
At 13.5 x 8.2 cm, the large clickpad offers sufficient space for mouse movement and gestures with up to four fingers but the swiping experience on the plastic surface is not perfect. During the tests, we also had occasional problems with the pad since the inputs were only registered after a small delay. That was very annoying but, with it only happening from time to time, we reckon it's only a driver problem. In the lower area, the pad can be physically pressed but this comes with loud clicking noises.
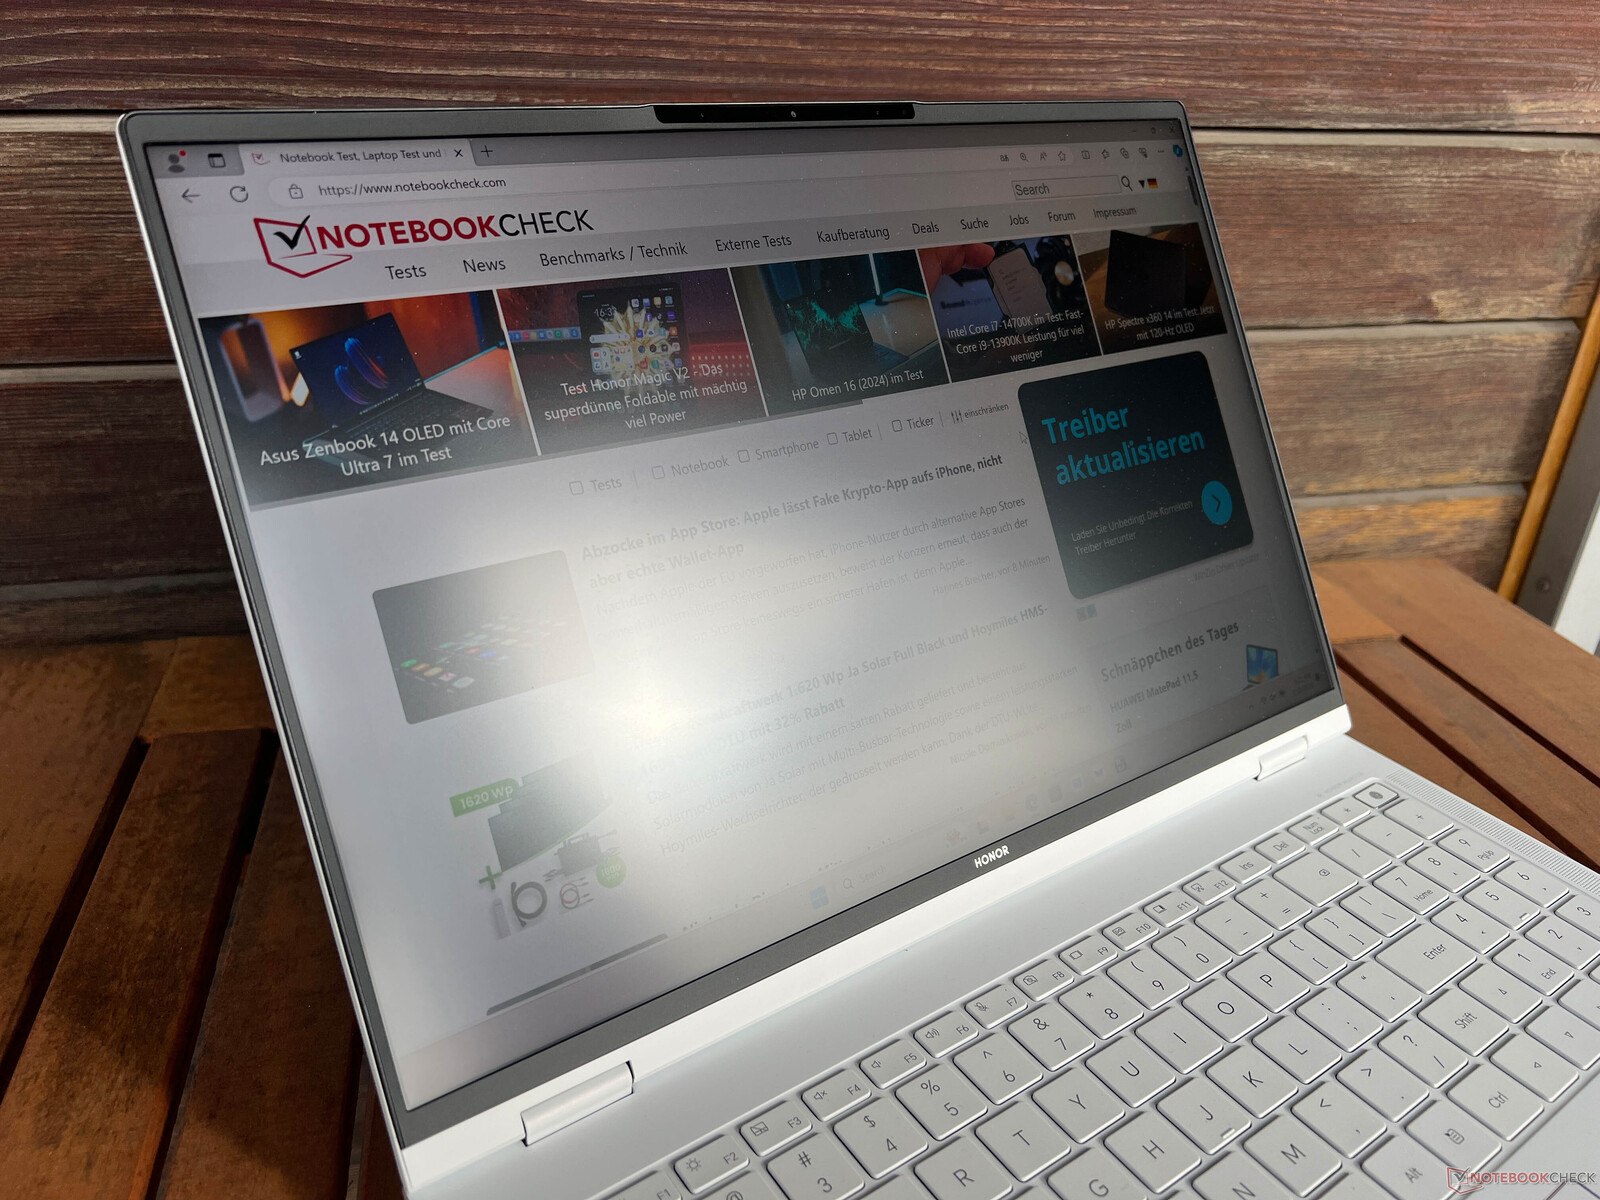
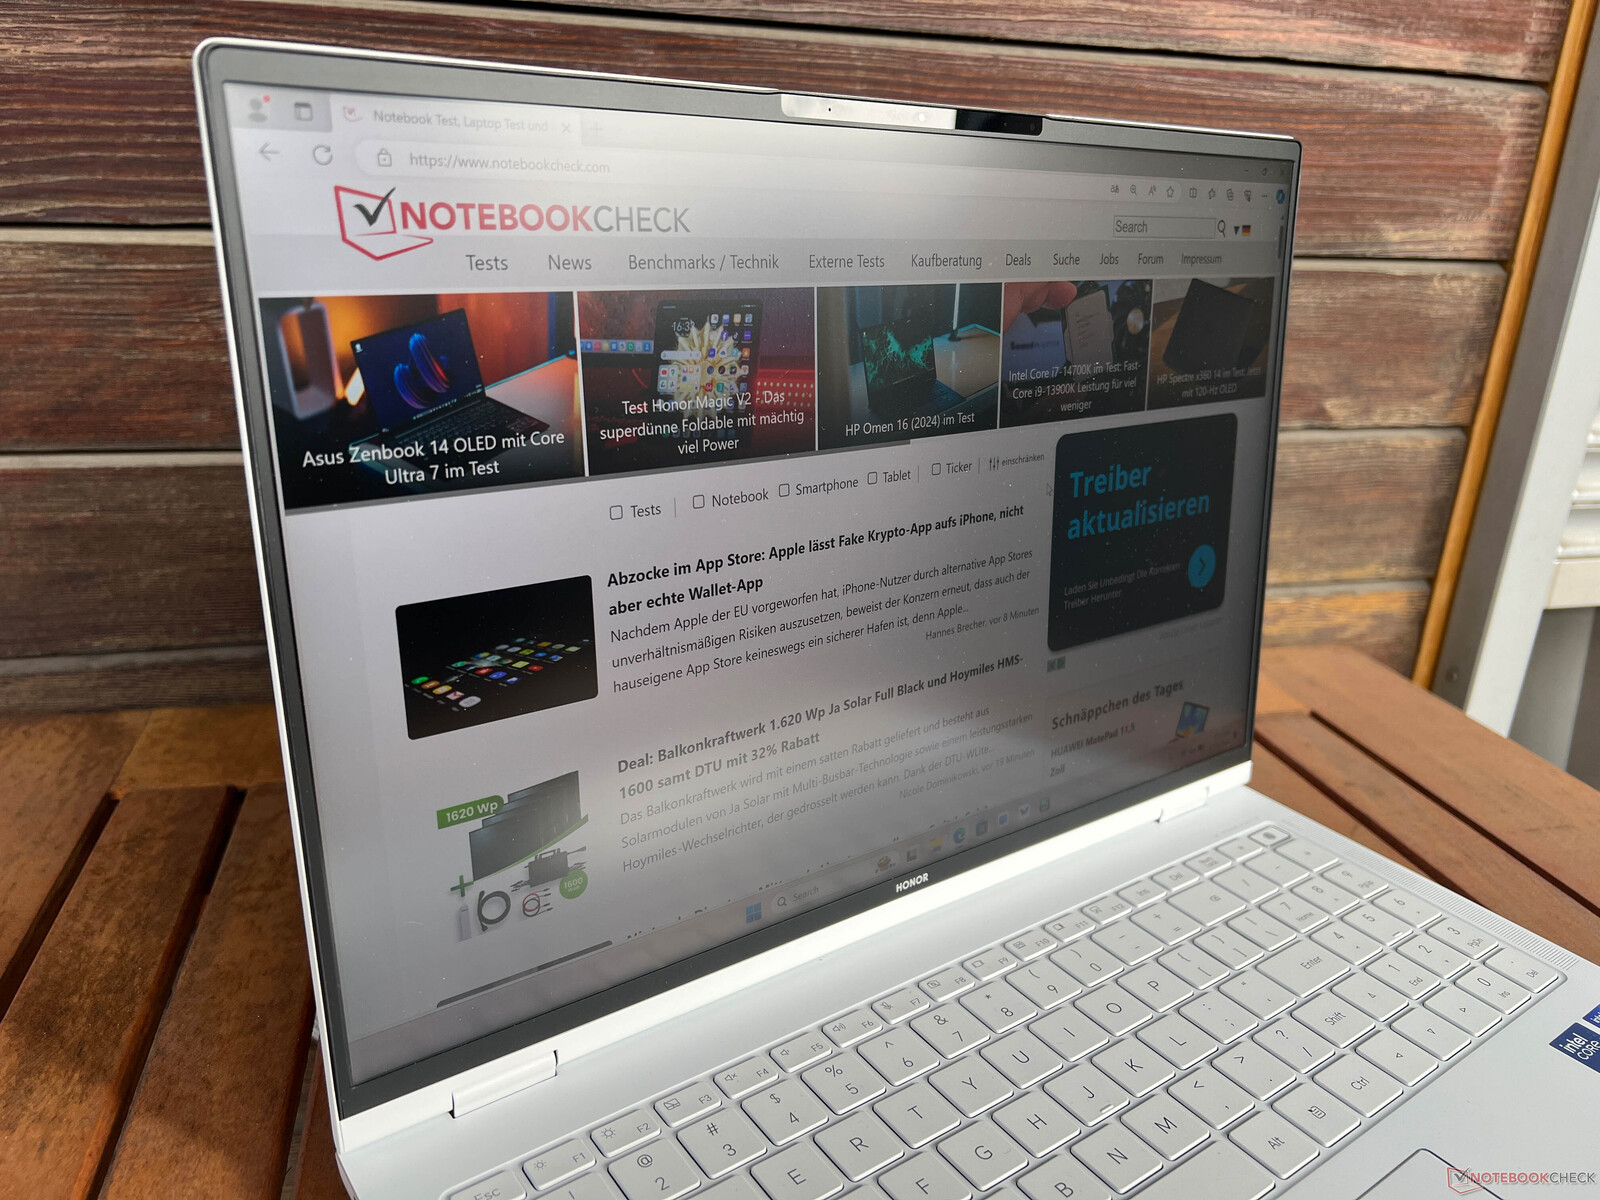
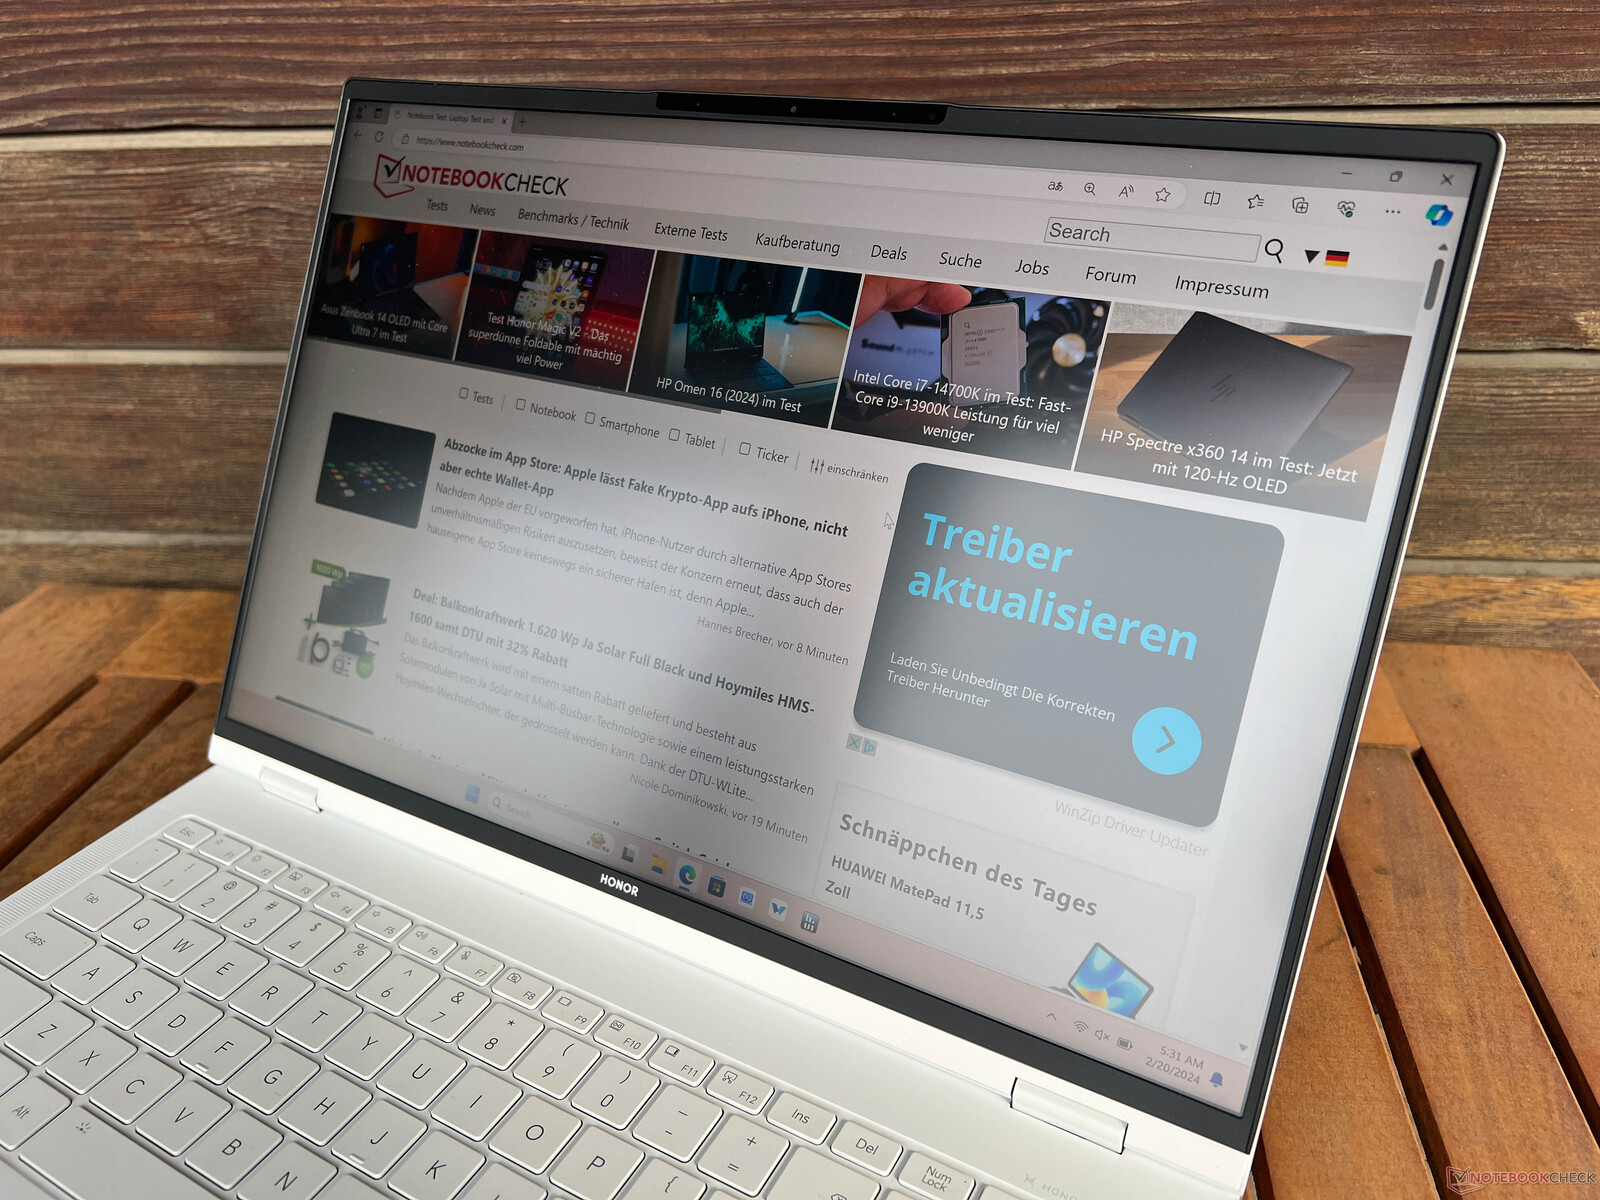
Display - IPS at 165 Hz
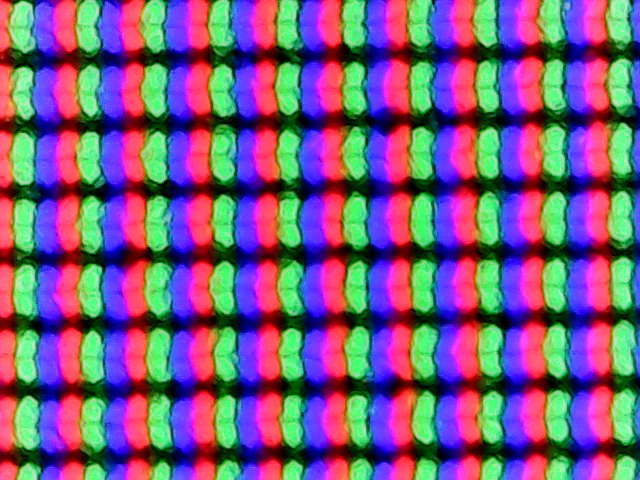
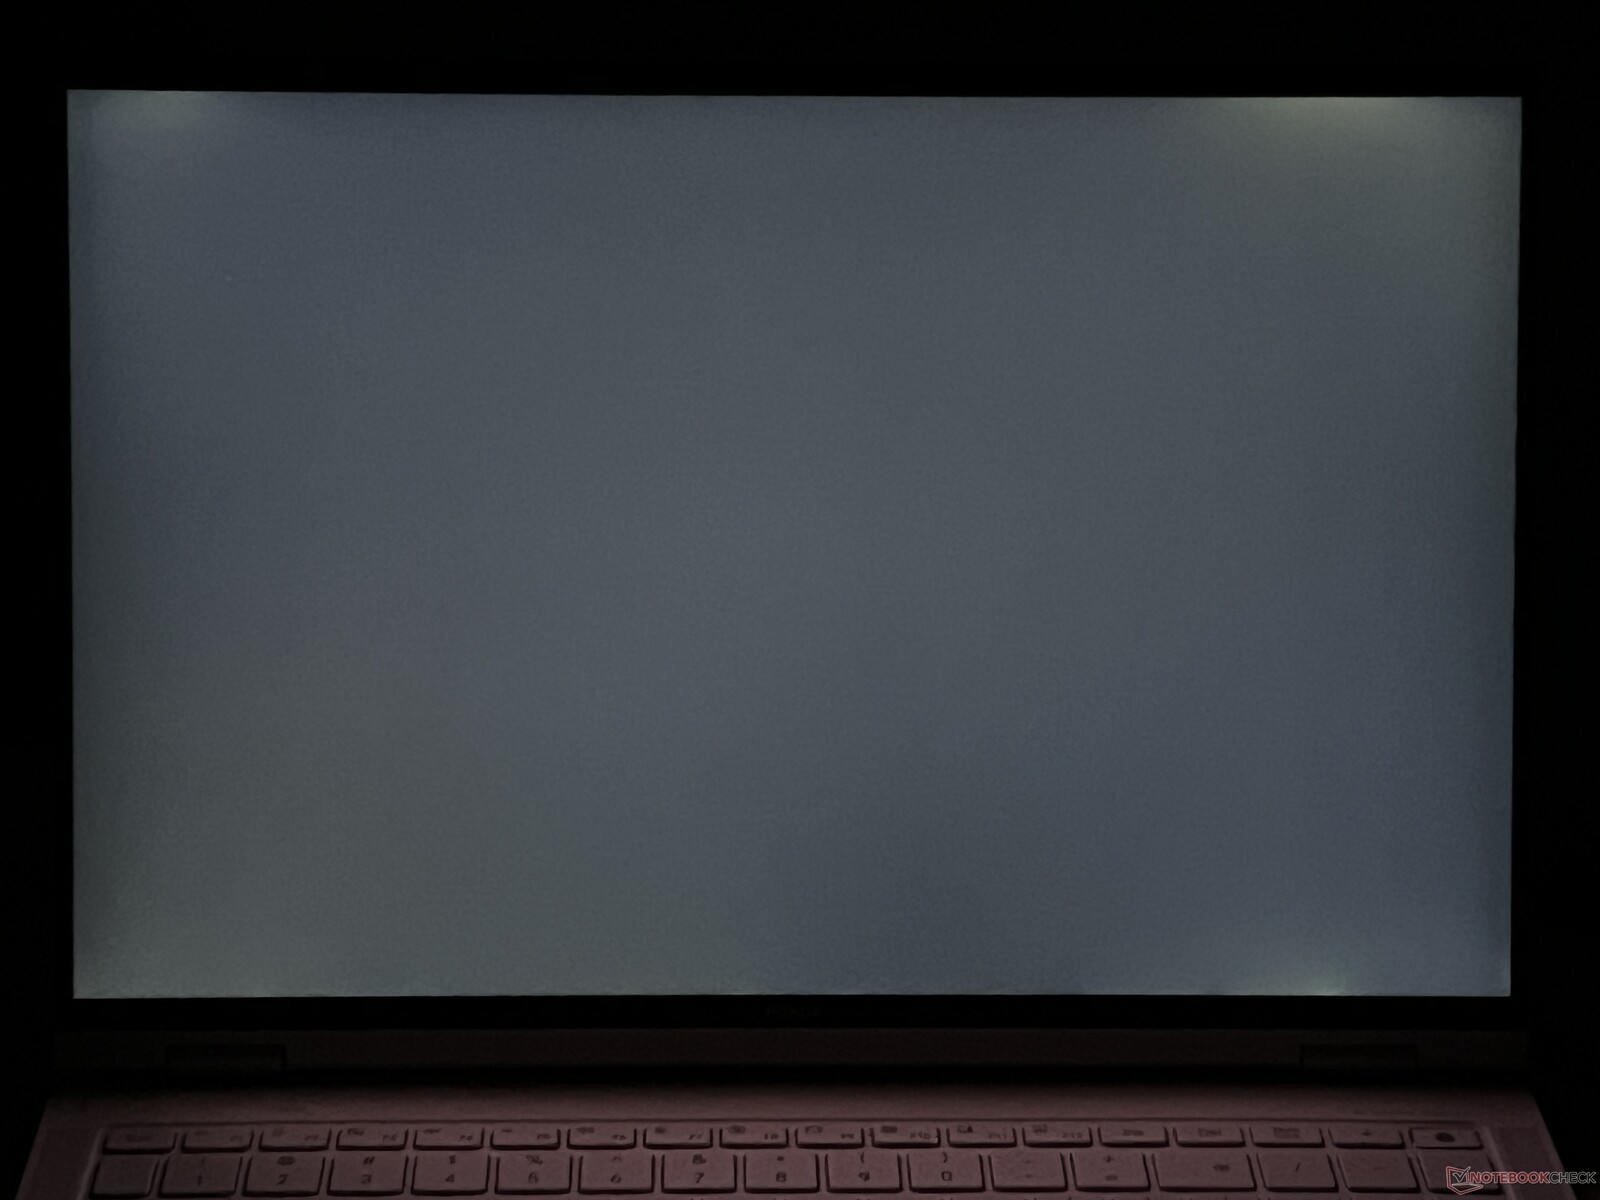
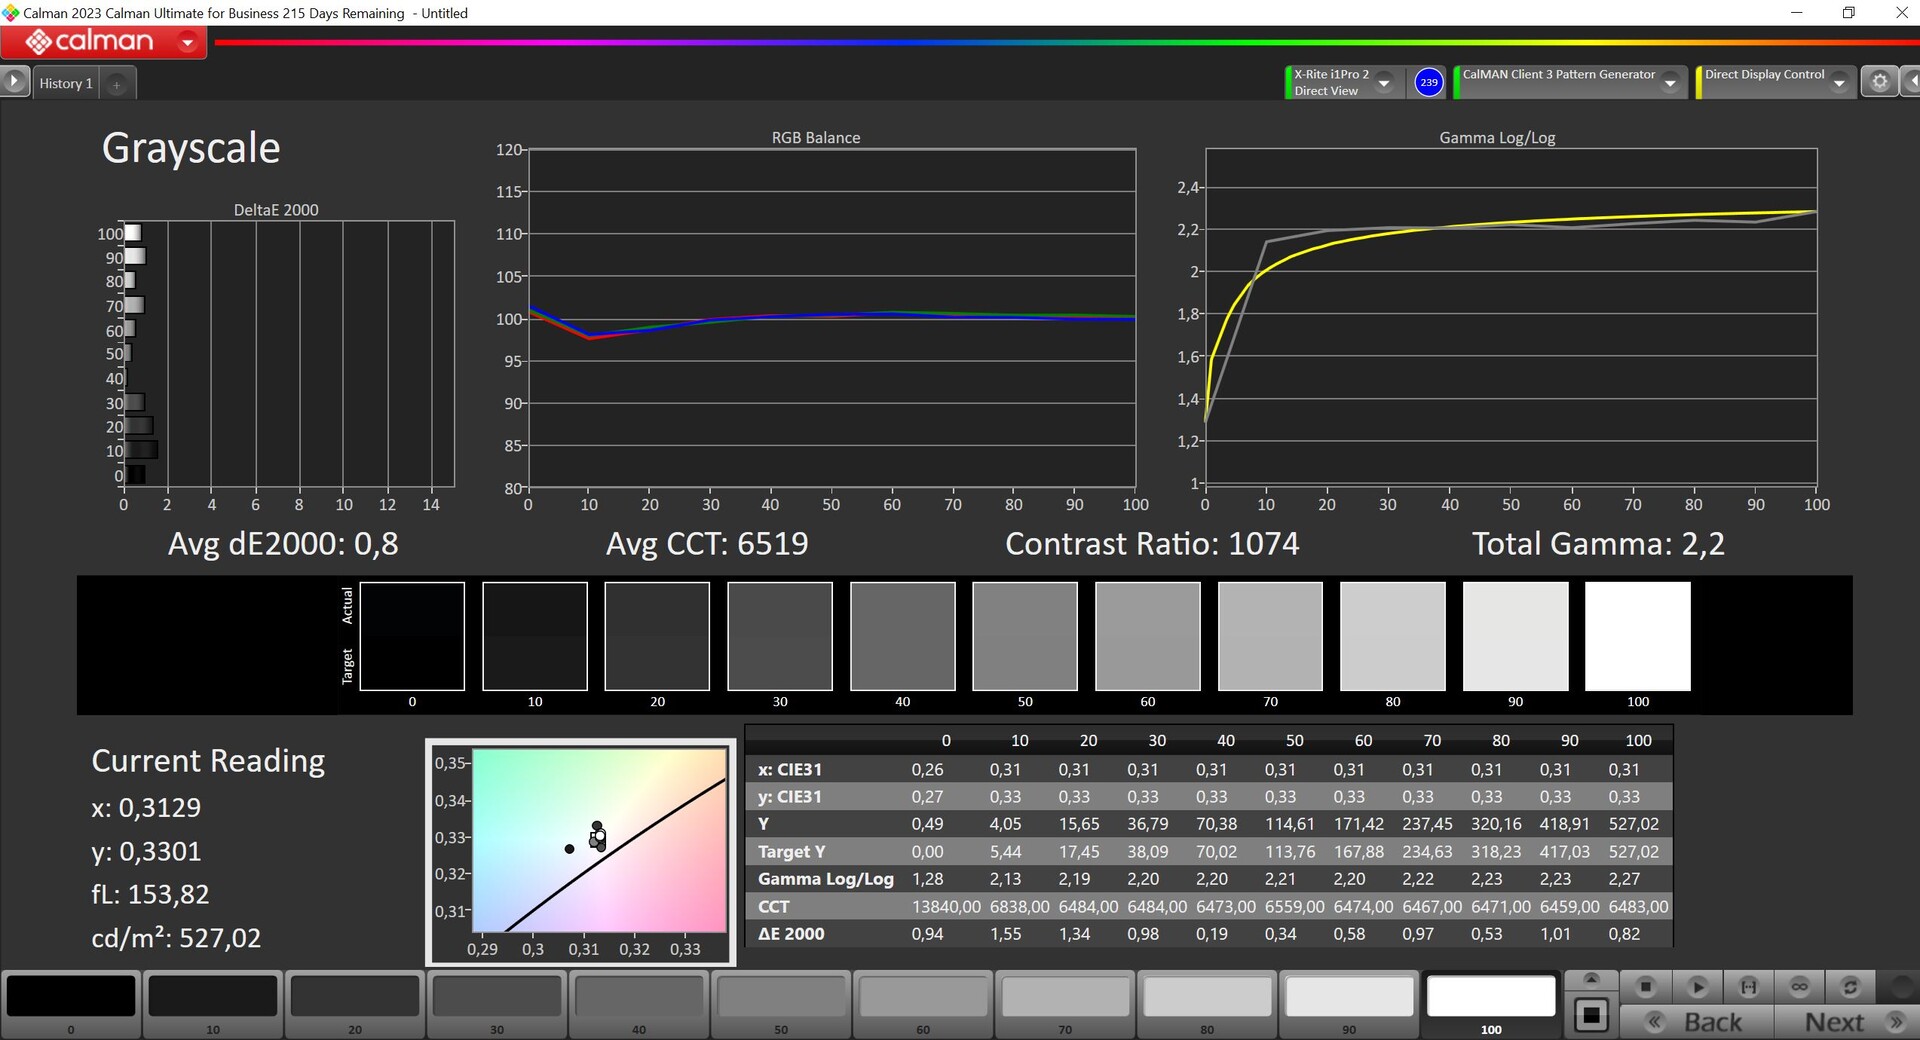
The display is a matte, 16:10 IPS panel with a resolution of 3,072 x 1,920 pixels. The subjective image quality is very good but the colors are not as vibrant as those to be found in OLED panels. Despite its matte surface, bright areas don't appear grainy and PWM is absent. In dark scenes, you can see slight light bleed at the edges but this isn't annoying in everyday use. The response times are pleasantly fast and there are no problems here when it comes to playing games.
We measured a maximum brightness of more than 550 cd/m² (an average of 524cd/m²) and the benefit when compared to current OLED panels (~360-400 cd/m² in SDR operation) is that you always have access to this brightness. Nevertheless, the big downside is the increased black level of 0.52 cd/m² and this means black content is more like dark gray than black. That also affects the maximum contrast that only sits at a little more than 1.000:1.
| |||||||||||||||||||||||||
Brightness Distribution: 91 %
Center on Battery: 550 cd/m²
Contrast: 1060:1 (Black: 0.52 cd/m²)
ΔE ColorChecker Calman: 1.7 | ∀{0.5-29.43 Ø4.72}
calibrated: 1
ΔE Greyscale Calman: 2.4 | ∀{0.09-98 Ø4.97}
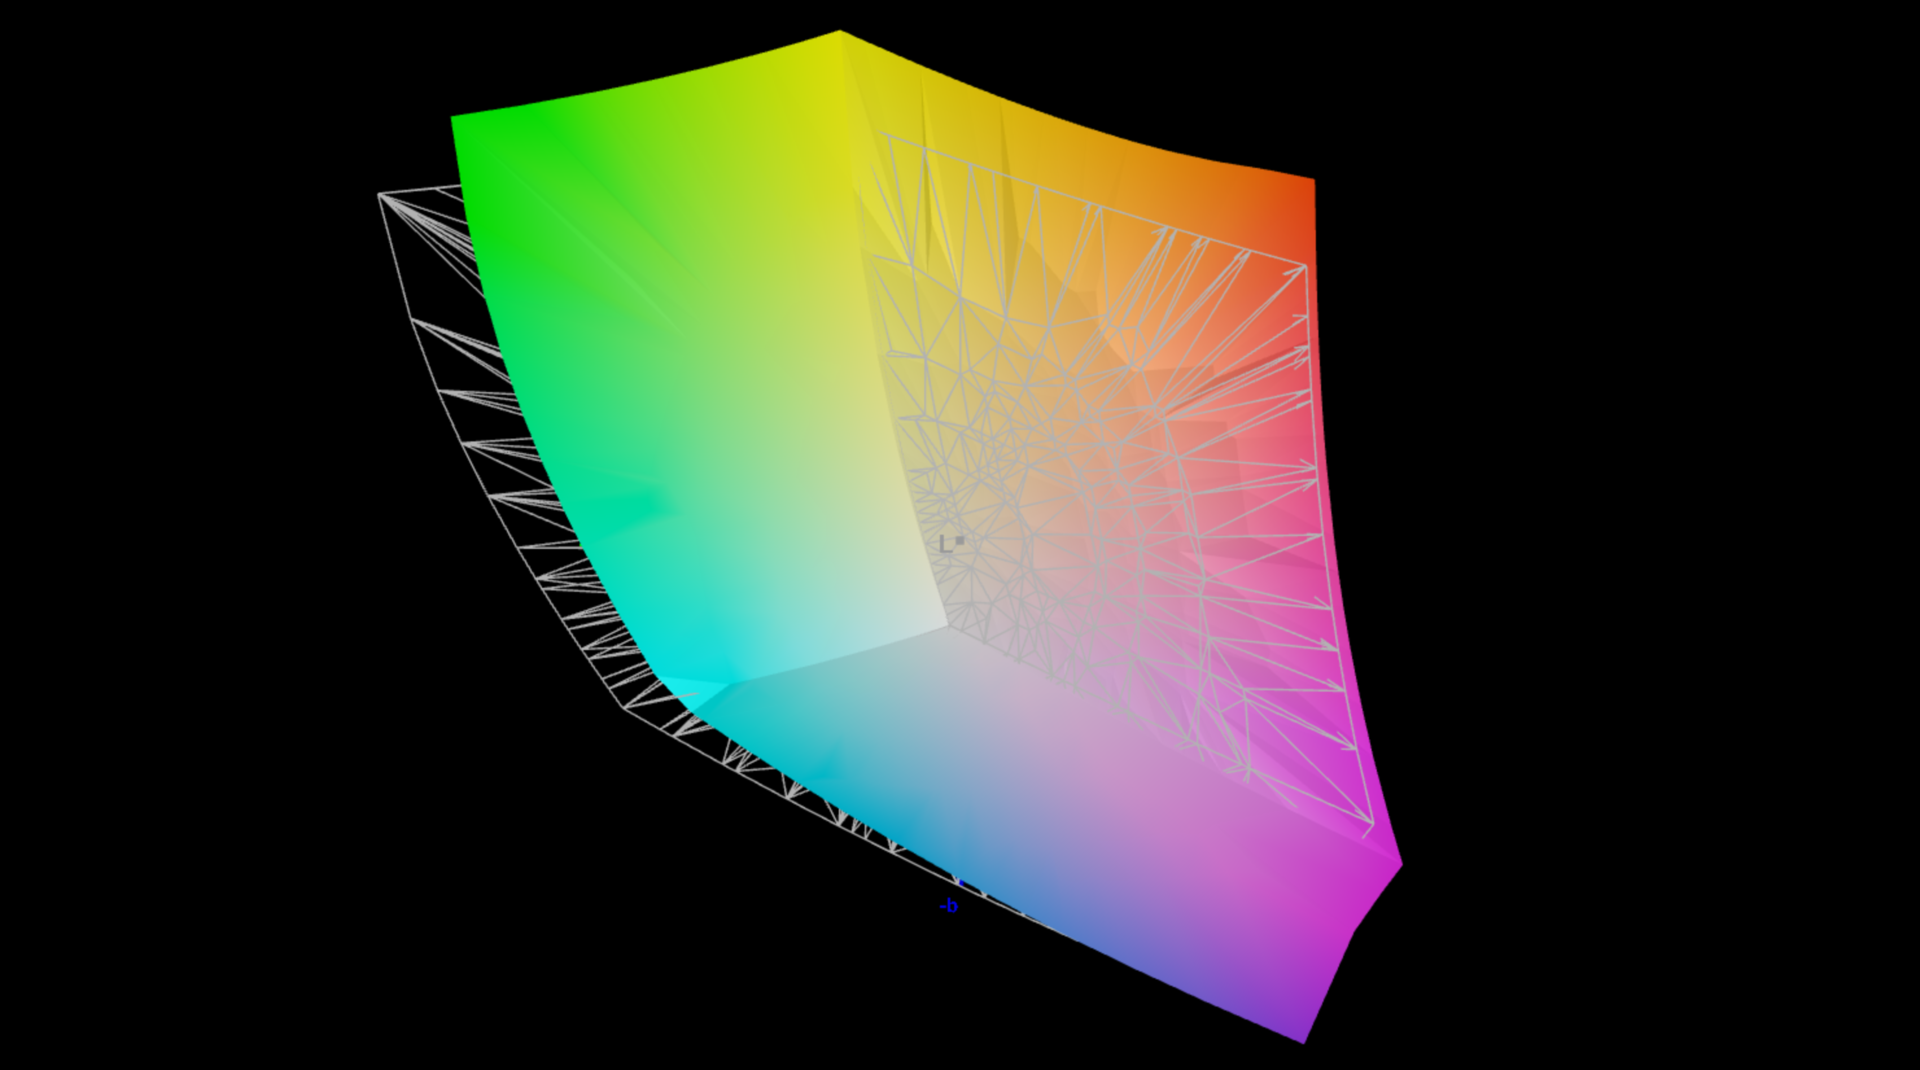
89.1% AdobeRGB 1998 (Argyll 3D)
100% sRGB (Argyll 3D)
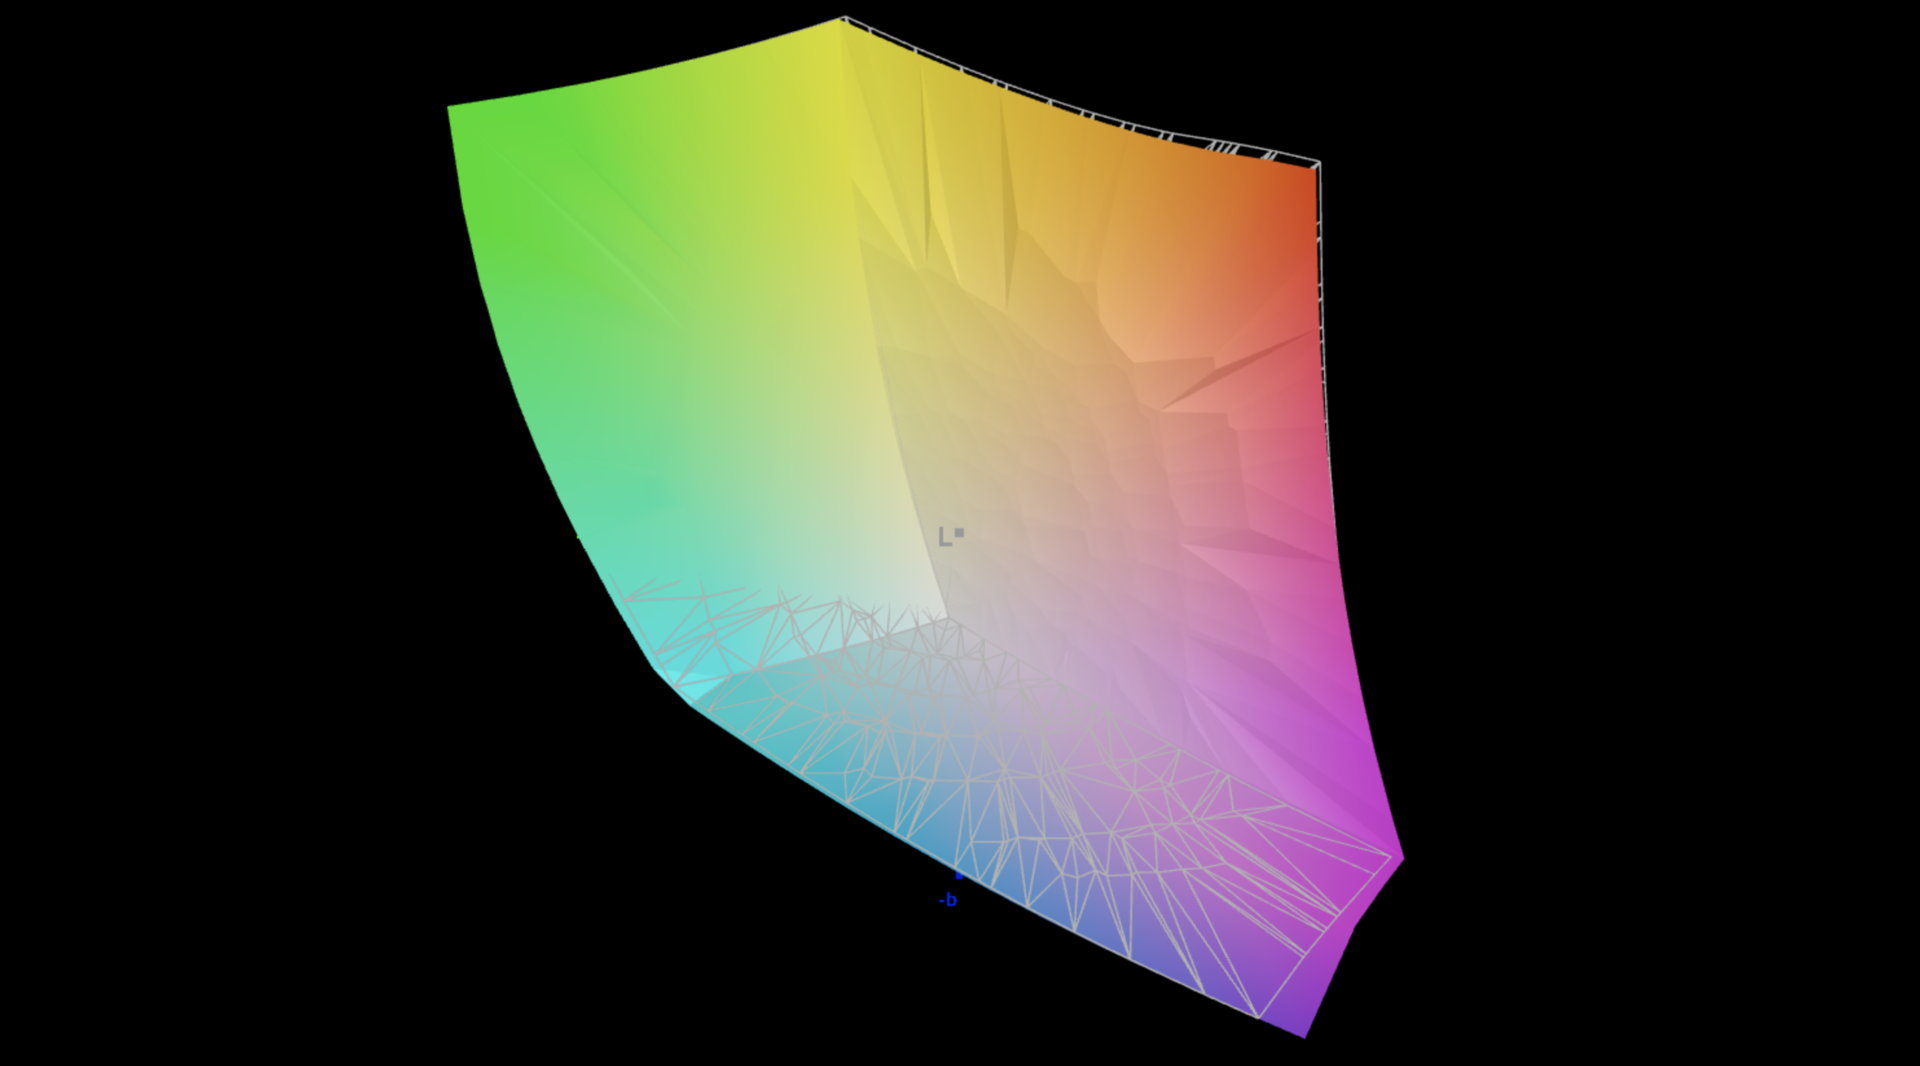
98.8% Display P3 (Argyll 3D)
Gamma: 2.2
CCT: 6842 K
| Honor MagicBook Pro 16 2024 TL160MDMP01, IPS, 3072x1920, 16" | Framework Laptop 16 2560x1600, 16" | Lenovo ThinkPad Z16 Gen 2 Samsung ATNA60YV04-0, OLED, 3840x2400, 16" | Dell Inspiron 16 Plus 7630 LG Philips 160WQ2, IPS, 2560x1600, 16" | Lenovo Yoga Pro 9 16-IRP G8 LEN160-3.2K, Mini-LED, 3200x2000, 16" | Schenker VISION 16 Pro (M23) NE160QDM-NZ1, IPS, 2560x1600, 16" | Asus Vivobook Pro 16X K6604JV-MX016W Samsung SDC4178 ATNA60BX01-1, OLED, 3200x2000, 16" | |
|---|---|---|---|---|---|---|---|
| Display | -1% | 3% | -16% | 2% | -17% | 3% | |
| Display P3 Coverage (%) | 98.8 | 97.7 -1% | 99.7 1% | 70.1 -29% | 97 -2% | 68.8 -30% | 98.4 0% |
| sRGB Coverage (%) | 100 | 99.7 0% | 100 0% | 99.6 0% | 99.8 0% | 98.8 -1% | 99.7 0% |
| AdobeRGB 1998 Coverage (%) | 89.1 | 87 -2% | 96.7 9% | 72.3 -19% | 95.1 7% | 70 -21% | 95.8 8% |
| Response Times | -117% | 68% | -394% | -93% | -81% | 75% | |
| Response Time Grey 50% / Grey 80% * (ms) | 6.3 ? | 14.6 ? -132% | 1.86 ? 70% | 35 ? -456% | 14 ? -122% | 13.7 ? -117% | 1.6 ? 75% |
| Response Time Black / White * (ms) | 5.6 ? | 11.3 ? -102% | 1.89 ? 66% | 24.2 ? -332% | 9.2 ? -64% | 8.1 ? -45% | 1.4 ? 75% |
| PWM Frequency (Hz) | 60 ? | 5800 ? | 120 ? | ||||
| Screen | 7% | 1% | -32% | 41% | -33% | 46% | |
| Brightness middle (cd/m²) | 551 | 504.8 -8% | 390.1 -29% | 299.4 -46% | 539 -2% | 384 -30% | 347 -37% |
| Brightness (cd/m²) | 524 | 490 -6% | 393 -25% | 290 -45% | 546 4% | 371 -29% | 346 -34% |
| Brightness Distribution (%) | 91 | 84 -8% | 97 7% | 92 1% | 96 5% | 88 -3% | 97 7% |
| Black Level * (cd/m²) | 0.52 | 0.41 21% | 0.21 60% | 0.18 65% | 0.3 42% | 0.06 88% | |
| Contrast (:1) | 1060 | 1231 16% | 1426 35% | 2994 182% | 1280 21% | 5783 446% | |
| Colorchecker dE 2000 * | 1.7 | 1.23 28% | 1.41 17% | 4.25 -150% | 1.4 18% | 3.4 -100% | 1.89 -11% |
| Colorchecker dE 2000 max. * | 4.1 | 3.74 9% | 3.43 16% | 6.71 -64% | 2.1 49% | 9.2 -124% | 3.26 20% |
| Colorchecker dE 2000 calibrated * | 1 | 1.1 -10% | 0.52 48% | 1.3 -30% | 1.97 -97% | ||
| Greyscale dE 2000 * | 2.4 | 2 17% | 2 17% | 5.5 -129% | 2.2 8% | 3.4 -42% | 1.55 35% |
| Gamma | 2.2 100% | 2.22 99% | 2.22 99% | 2.35 94% | 2.19 100% | 2.16 102% | 2.39 92% |
| CCT | 6842 95% | 6670 97% | 6324 103% | 6368 102% | 6479 100% | 7462 87% | 6458 101% |
| Total Average (Program / Settings) | -37% /
-13% | 24% /
14% | -147% /
-80% | -17% /
11% | -44% /
-36% | 41% /
41% |
* ... smaller is better
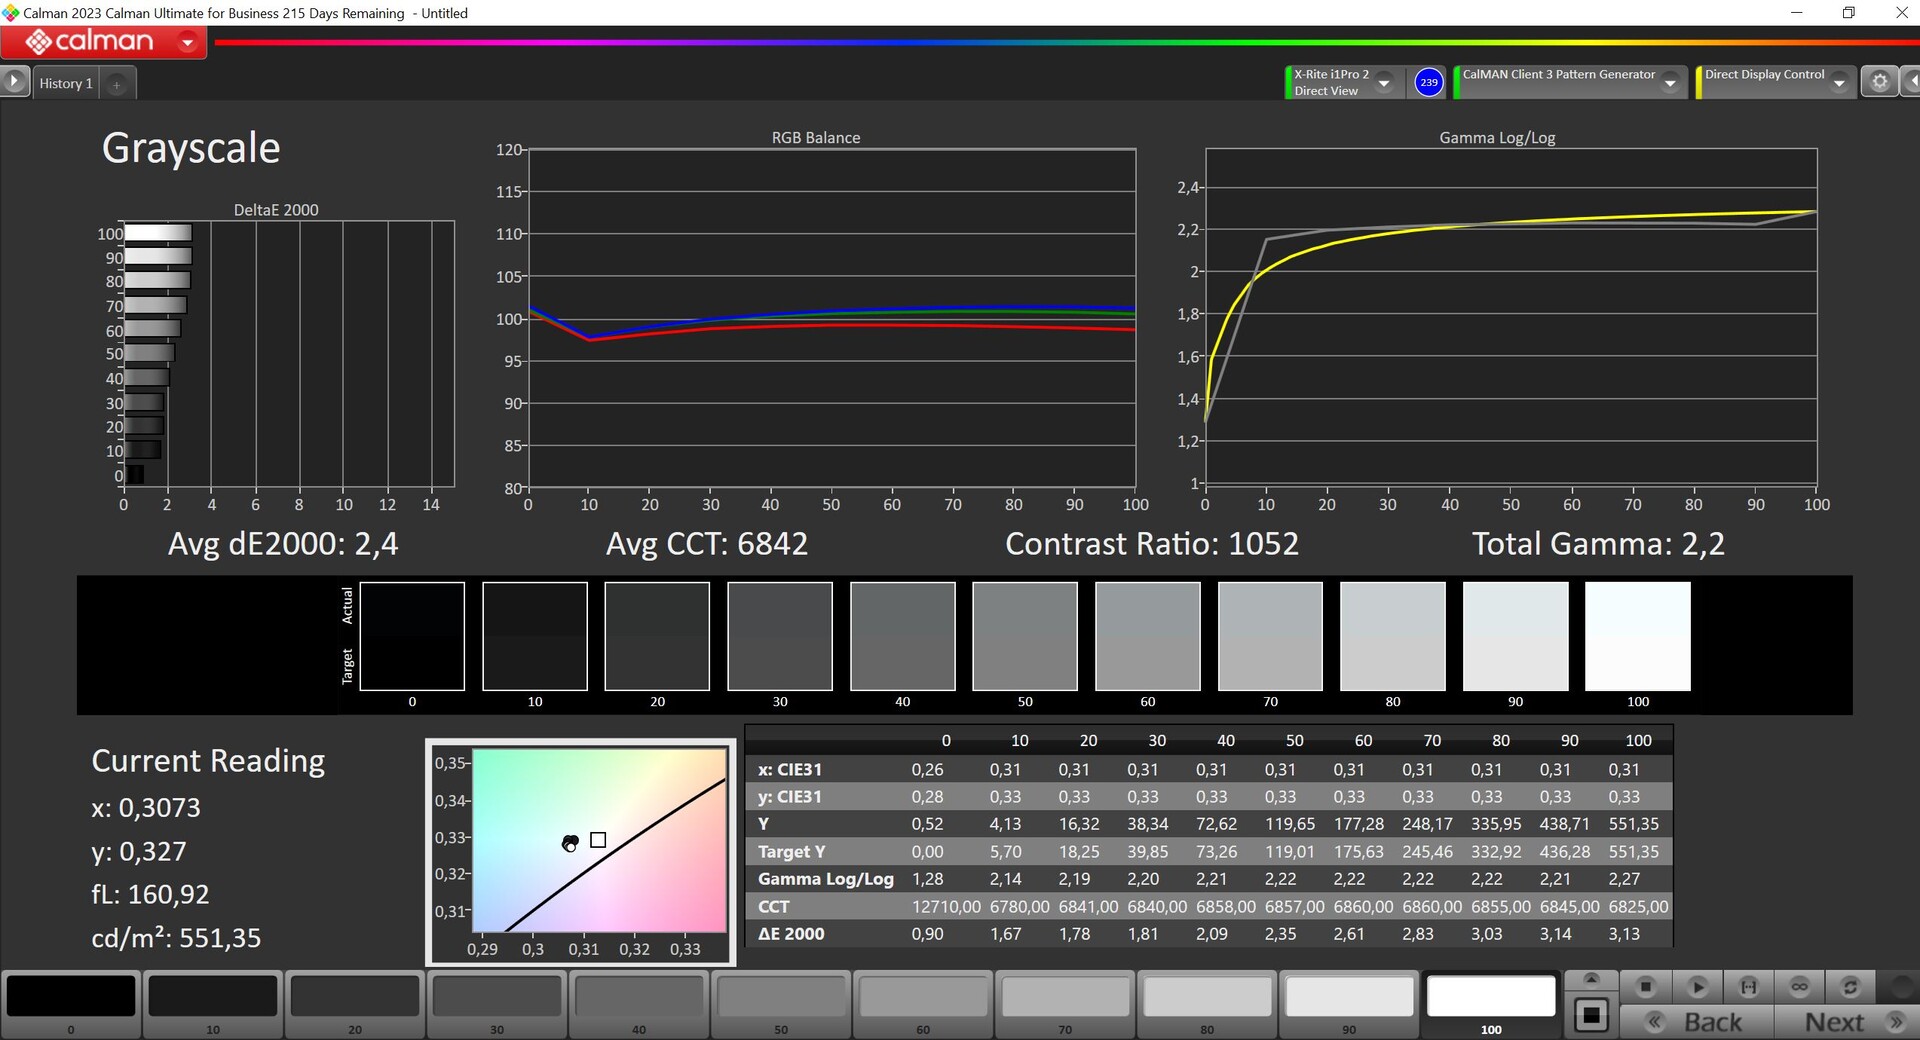
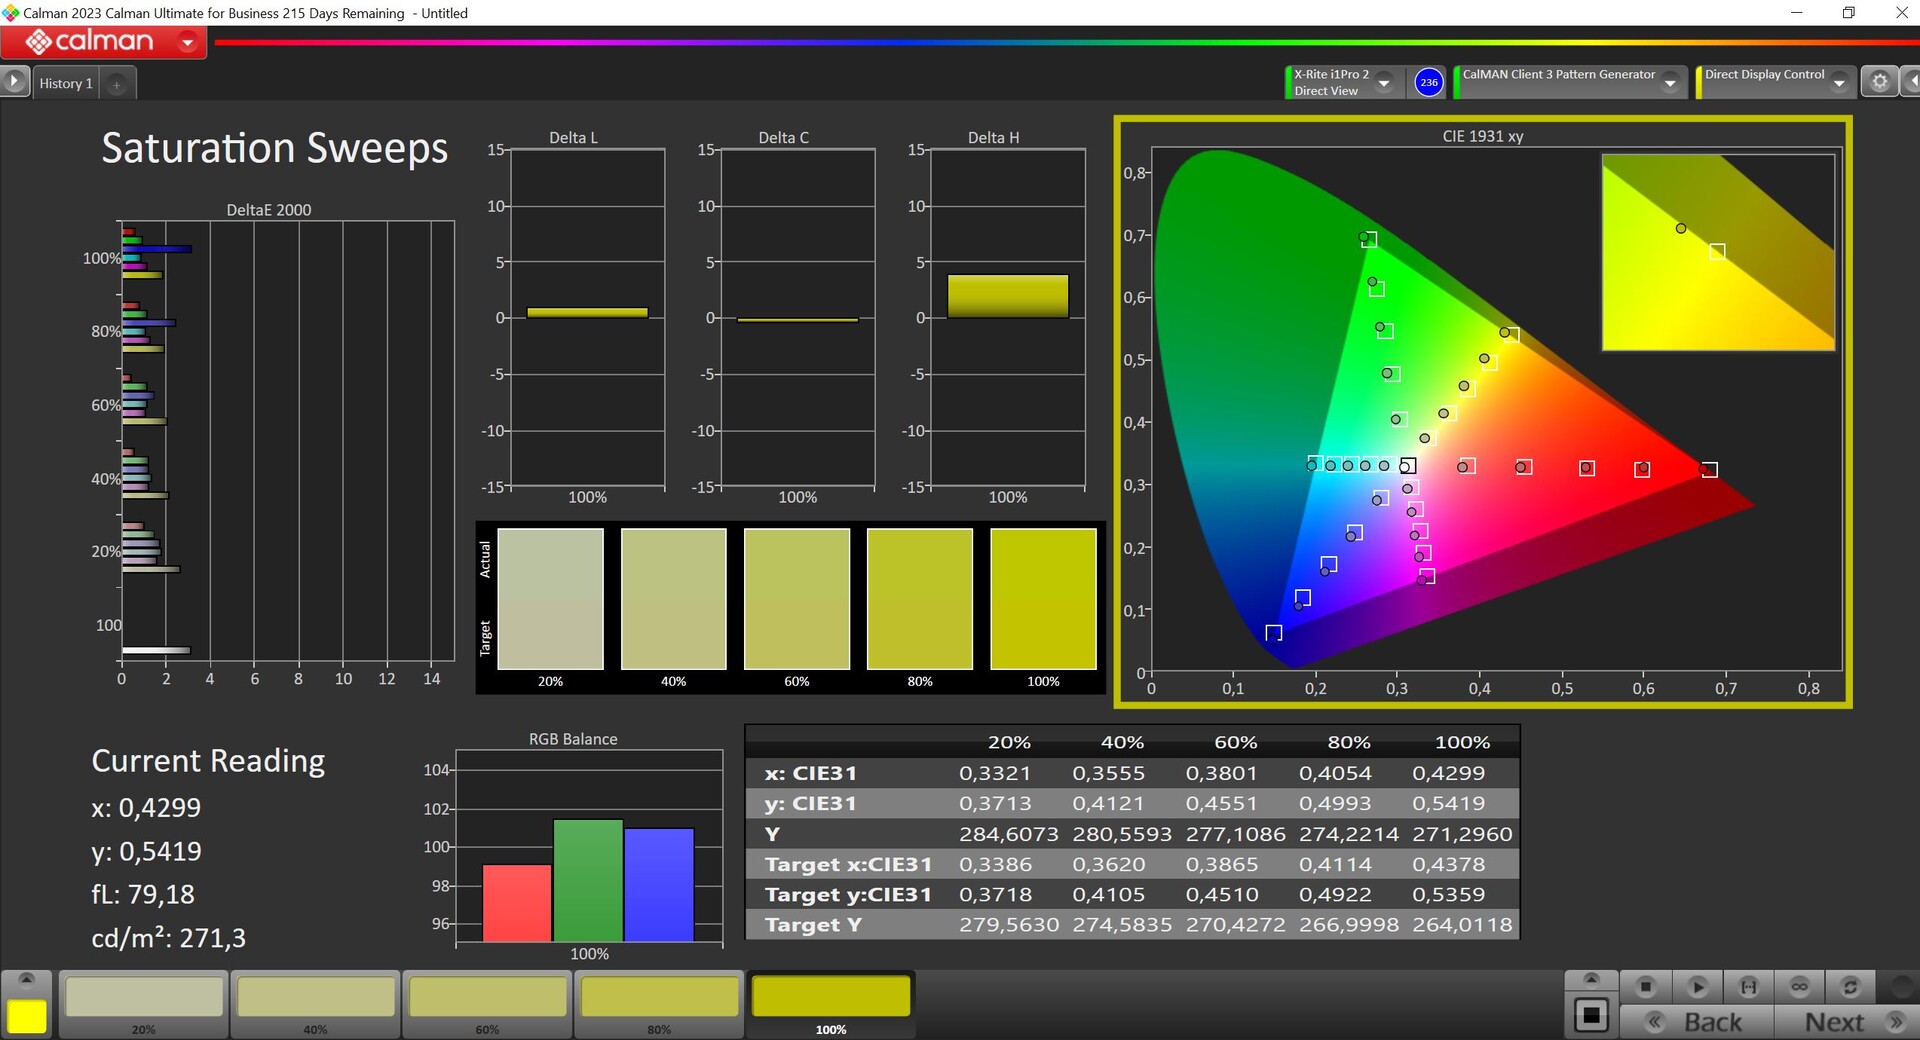
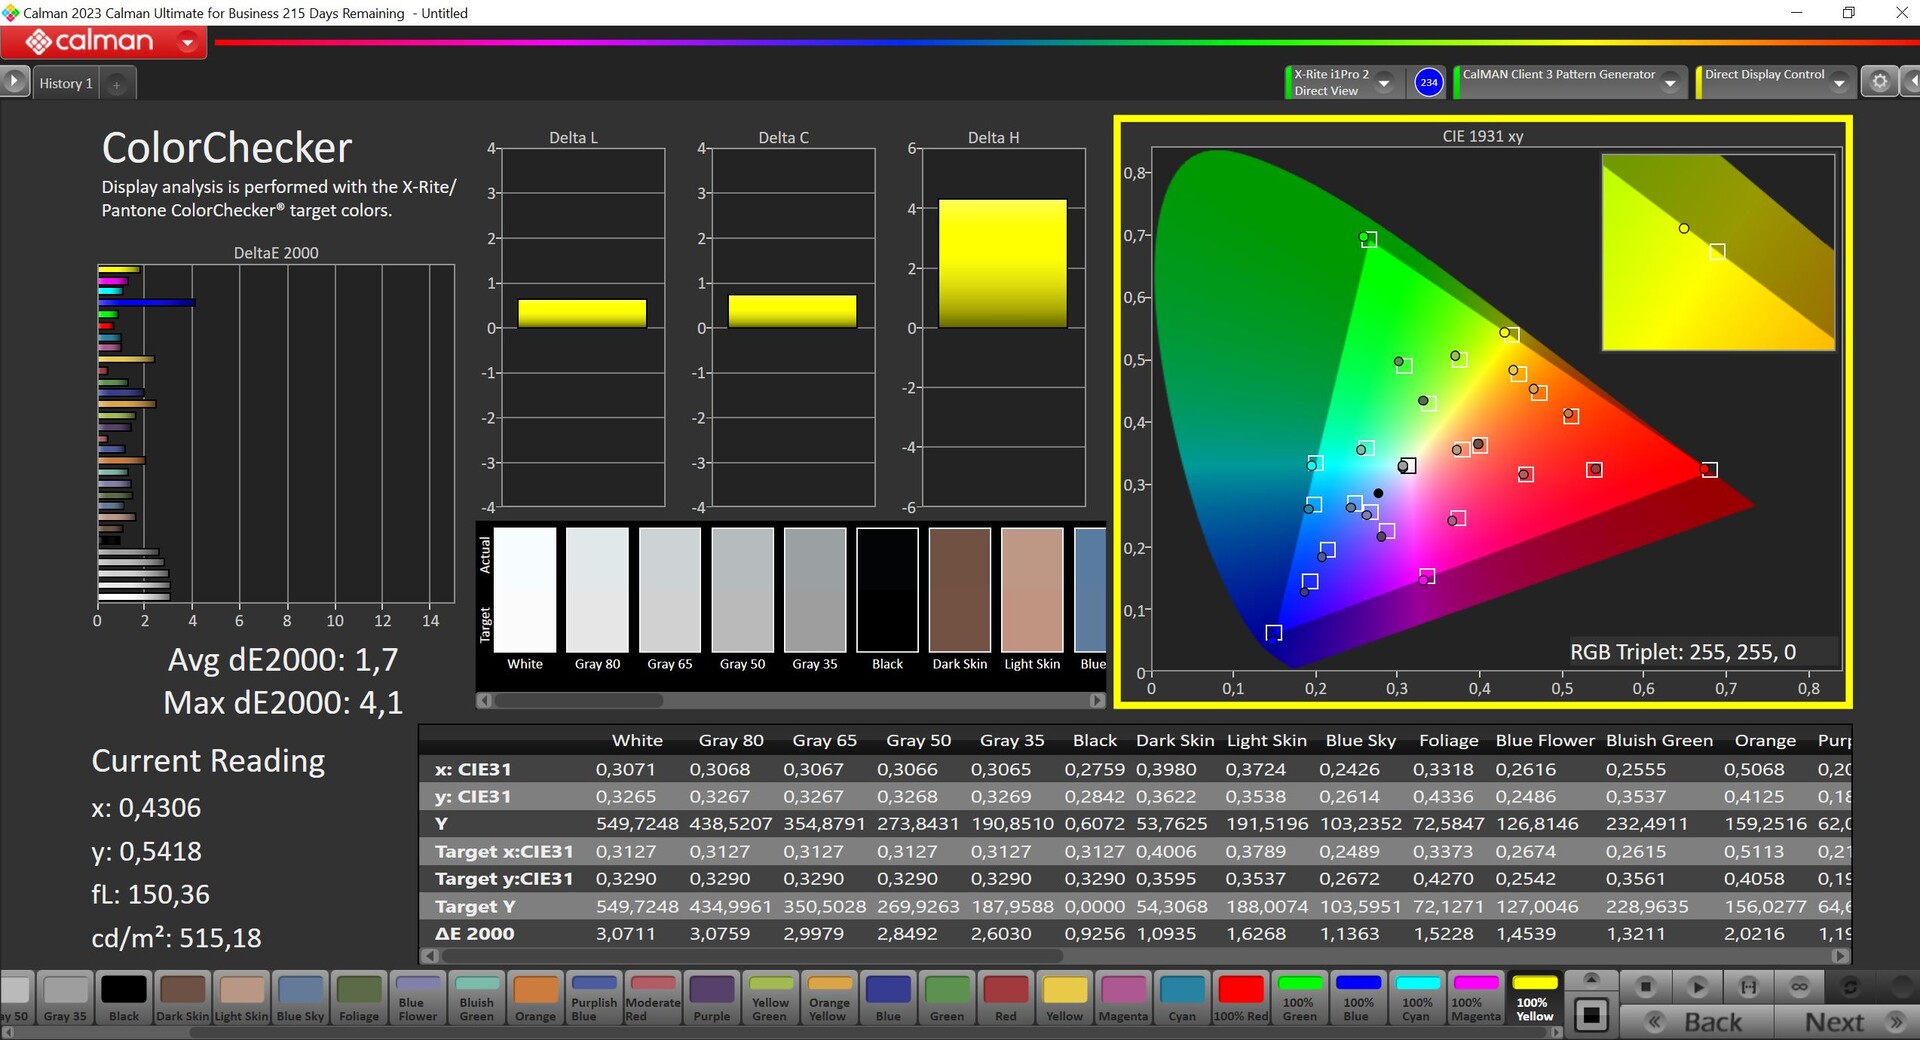
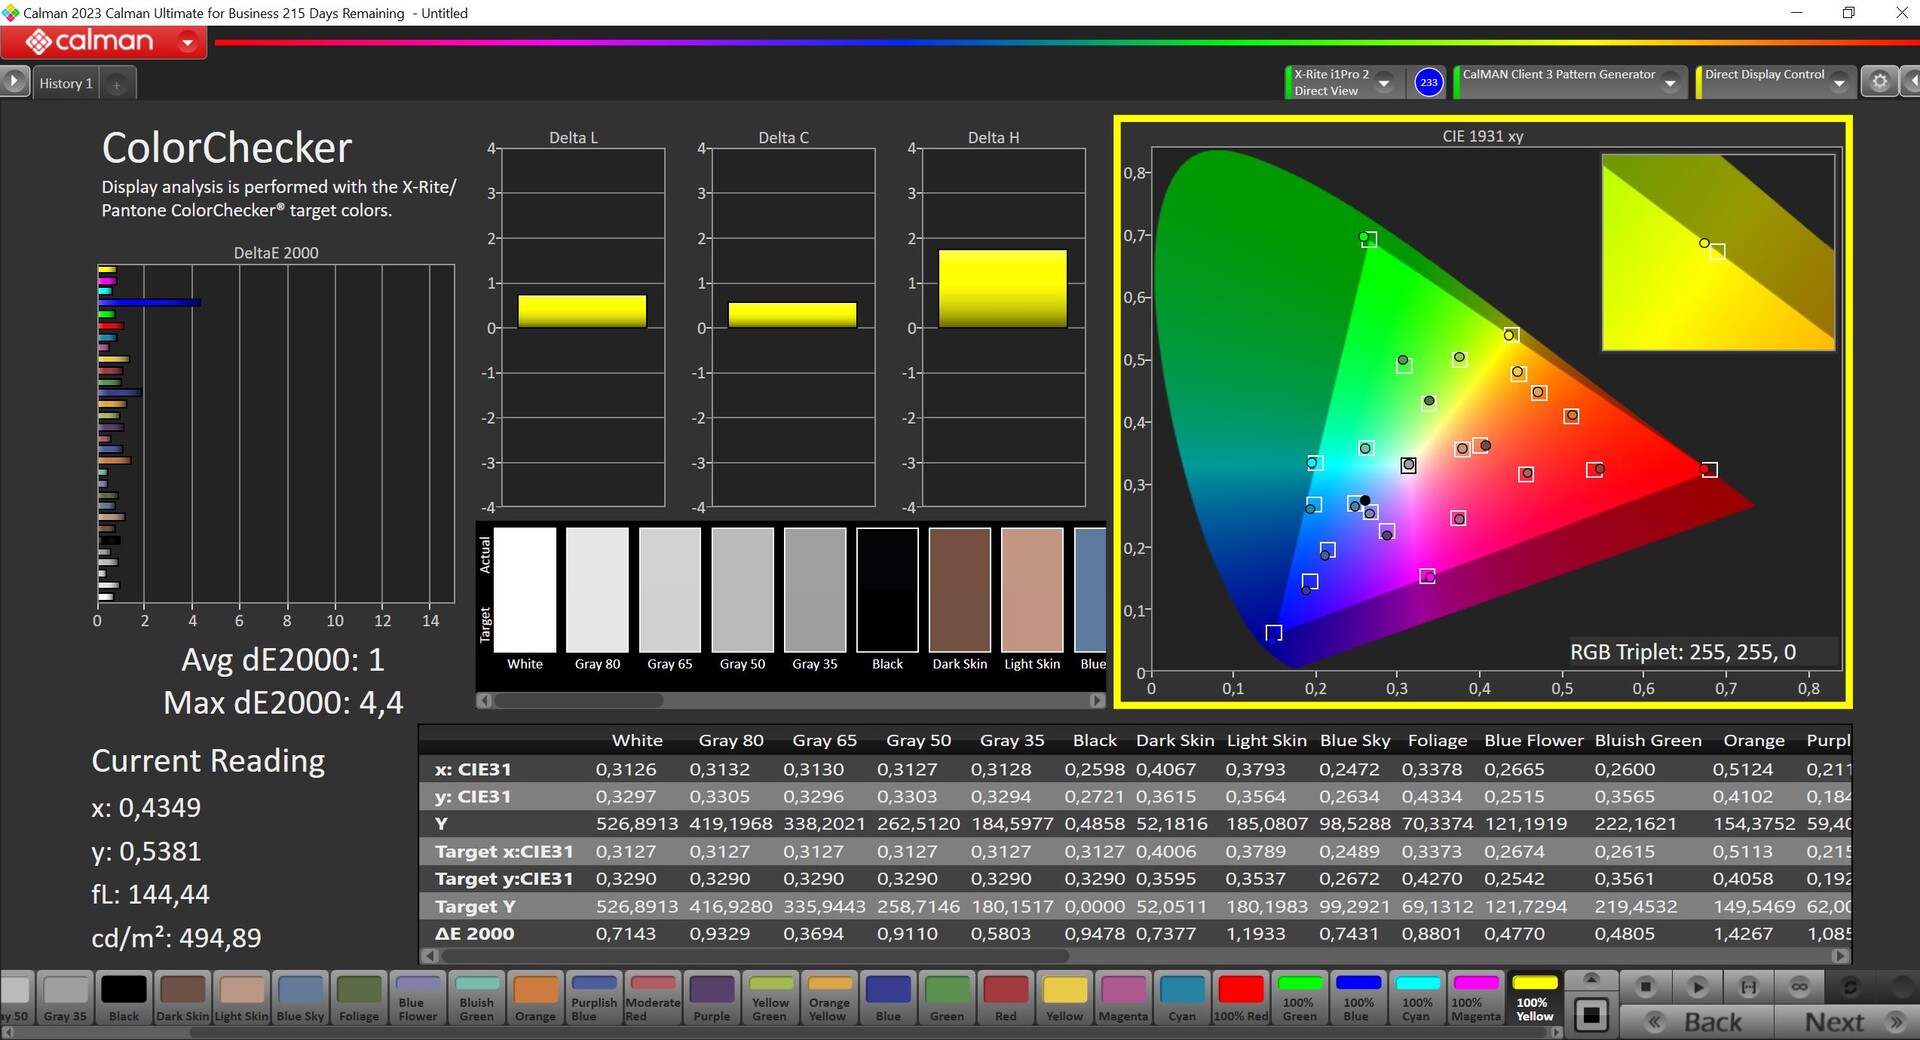
Honor doesn't offer any color profiles meaning there is also no option of being able to restrict the color space from P3 to sRGB. We analysed the panel using the professional CalMAN software and the gray scale deviations are very low. However, there is a slight blue hue paired with a color temperature which is a touch on the cool side but this isn't particularly problematic. In terms of the colors, only blue is a little above the target value of 3 and this can be considered solid performance. With our calibration, (the corresponding free, downloadable profile can be found above) we managed to get both the color hue and color temperature under control and the resulting average color deviations are smaller with the only hitch still being the color blue.


Display Response Times
| ↔ Response Time Black to White | ||
|---|---|---|
| 5.6 ms ... rise ↗ and fall ↘ combined | ↗ 1.6 ms rise | 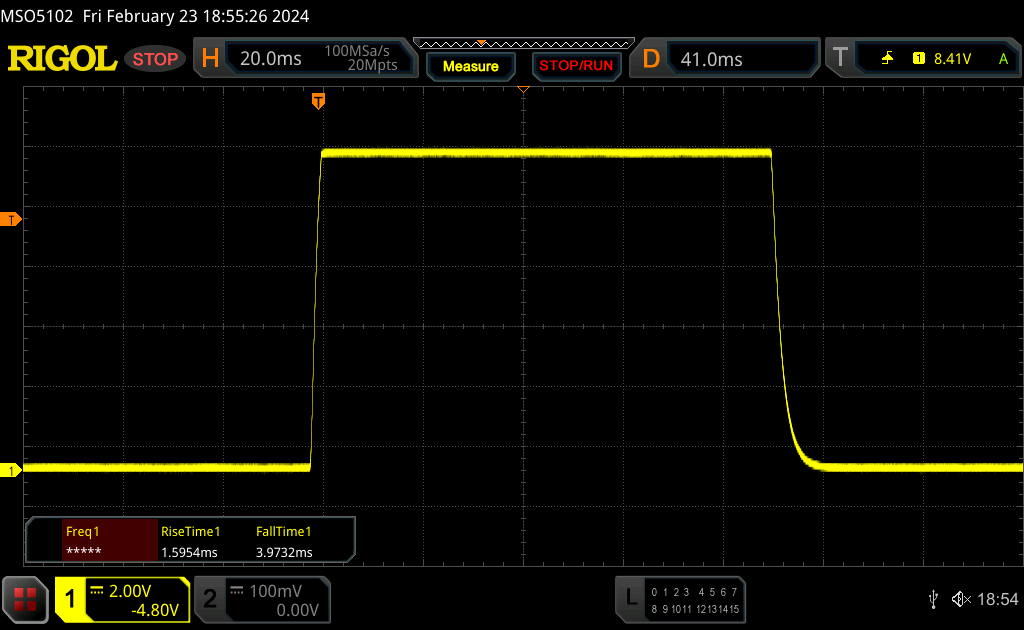 |
| ↘ 4 ms fall | ||
| The screen shows very fast response rates in our tests and should be very well suited for fast-paced gaming. In comparison, all tested devices range from 0.1 (minimum) to 240 (maximum) ms. » 18 % of all devices are better. This means that the measured response time is better than the average of all tested devices (19.8 ms). | ||
| ↔ Response Time 50% Grey to 80% Grey | ||
| 6.3 ms ... rise ↗ and fall ↘ combined | ↗ 2.5 ms rise | 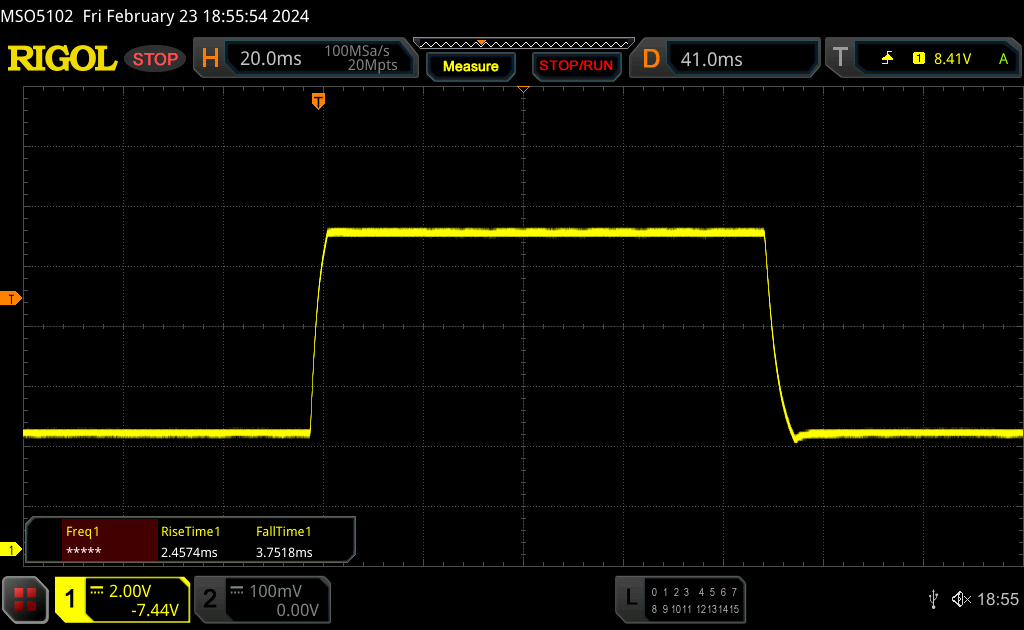 |
| ↘ 3.8 ms fall | ||
| The screen shows very fast response rates in our tests and should be very well suited for fast-paced gaming. In comparison, all tested devices range from 0.165 (minimum) to 636 (maximum) ms. » 19 % of all devices are better. This means that the measured response time is better than the average of all tested devices (31 ms). | ||
Screen Flickering / PWM (Pulse-Width Modulation)
| Screen flickering / PWM not detected | 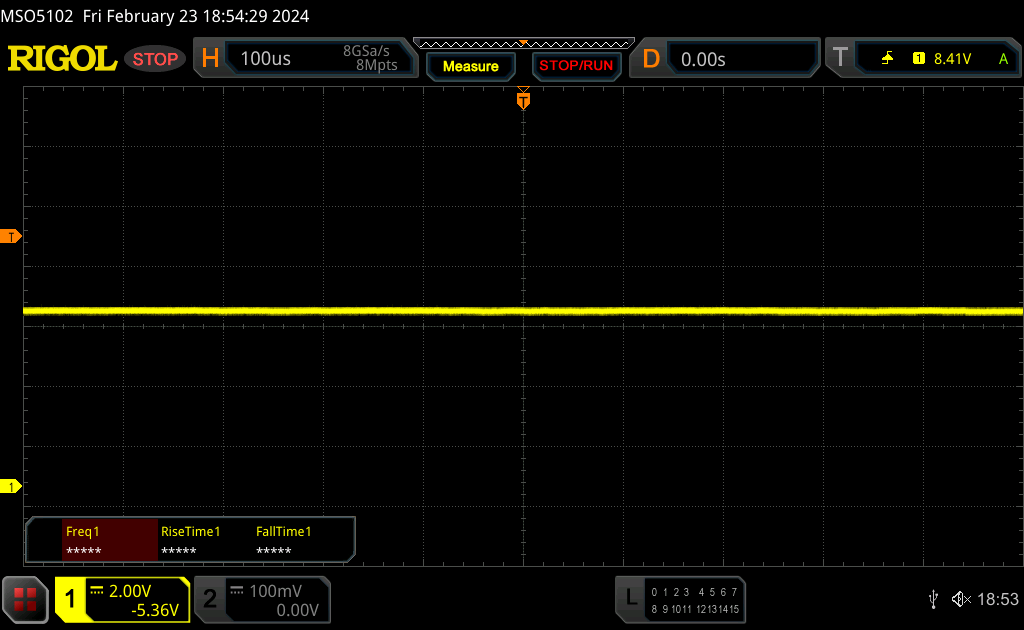 | ||
In comparison: 52 % of all tested devices do not use PWM to dim the display. If PWM was detected, an average of 7763 (minimum: 5 - maximum: 343500) Hz was measured. | |||
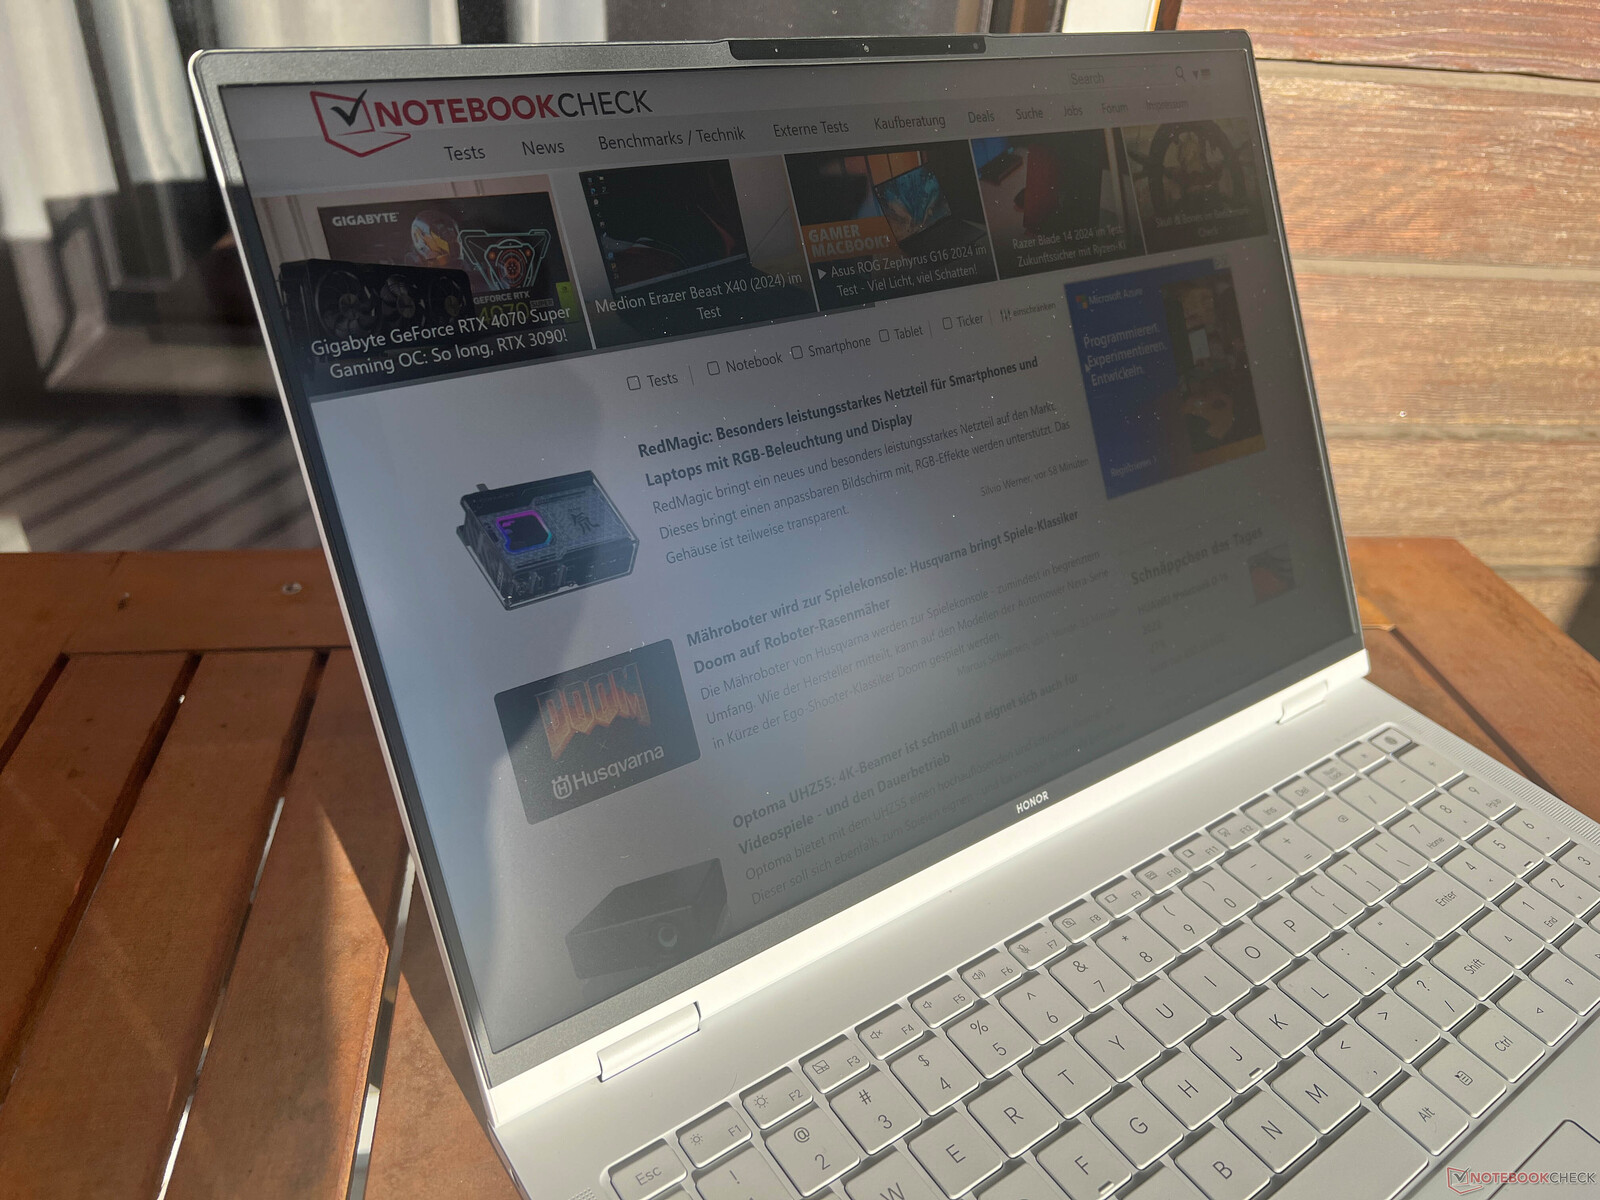
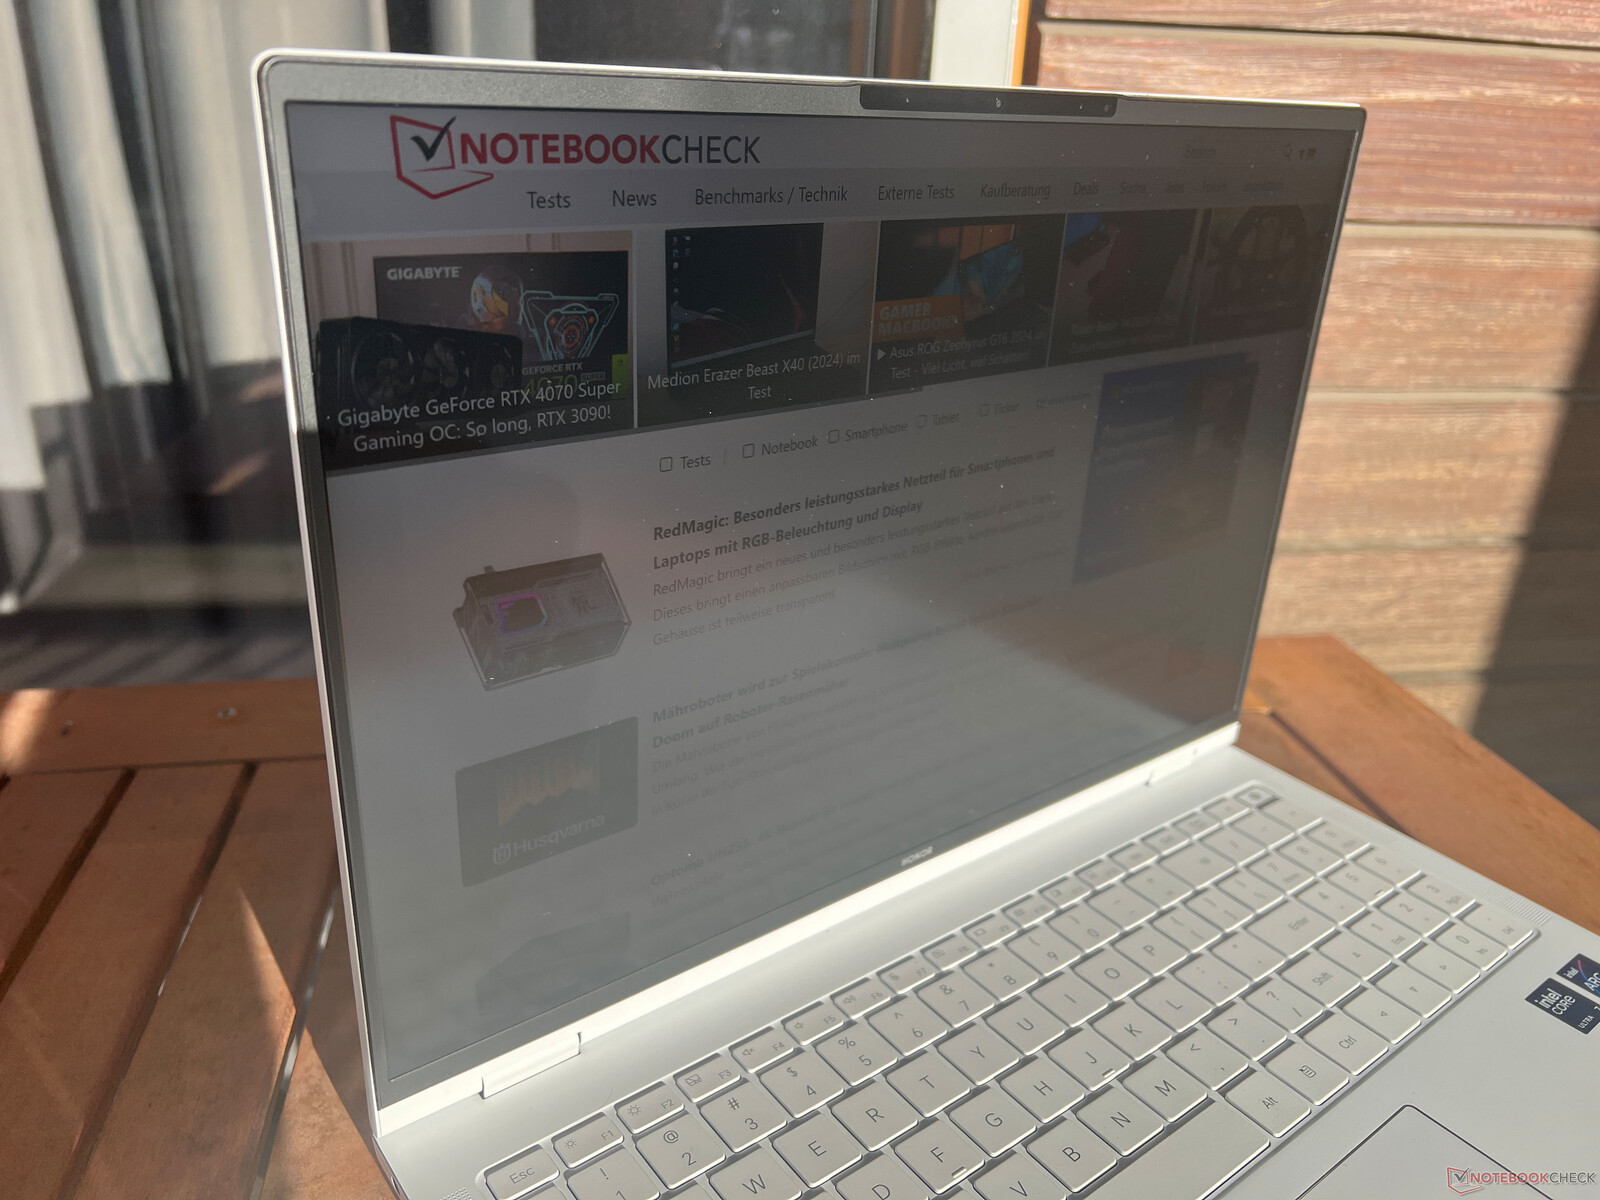
The pairing of a matte panel and its high brightness is, of course, an advantage outdoors. This even means outdoor use on sunny days is possible as long as you avoid direct sunlight. The viewing angle stability is good with only slight image brightening present when viewing the display from above at an angle.

Performance - Meteor Lake and RTX 4060 laptop
Test conditions
Honor offers two energy profiles: Smart and high-performance. As is the standard, smart mode is active and the high-performance mode is only available when plugged into the wall. In the following table, we have listed the respective TDP/TGP values. We carried out the following measurements using the smart mode.
| Energy profile | CPU loadt | CB R23 Multi | GPU load | Time Spy Graphics | Cyberpunk 2077 QHD Ultra | max. fan volume |
|---|---|---|---|---|---|---|
| Smart | 90->60 watts | 19,007 points | 65 watts | 9,026 points | 36.5fps | 45 dB(A) |
| High performance | 90->78 watts | 19,112 points | 115 watts | 11,153 points | 46.3fps | 53.2 dB(A) |
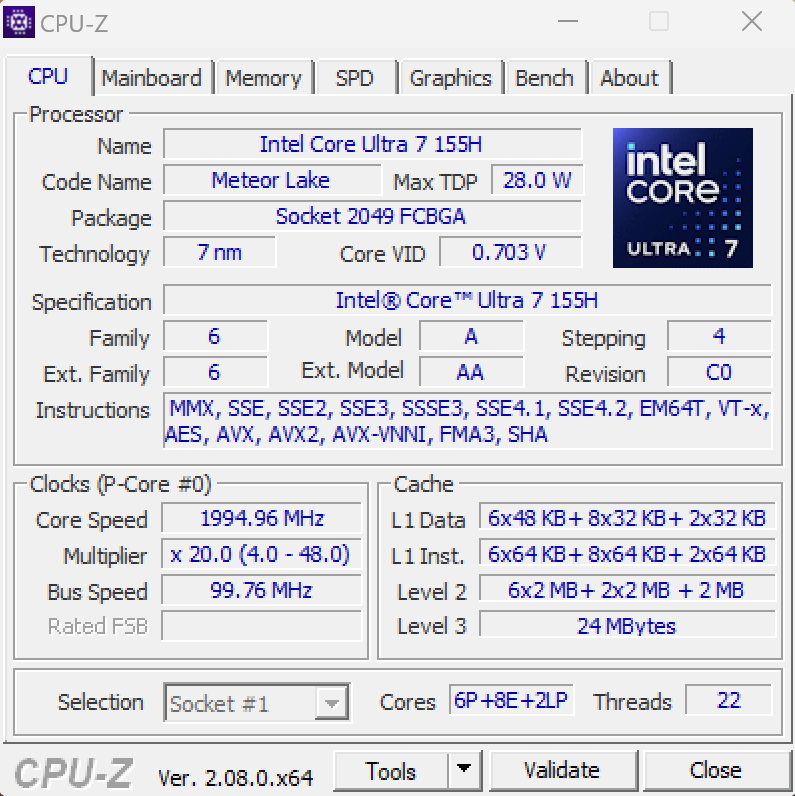
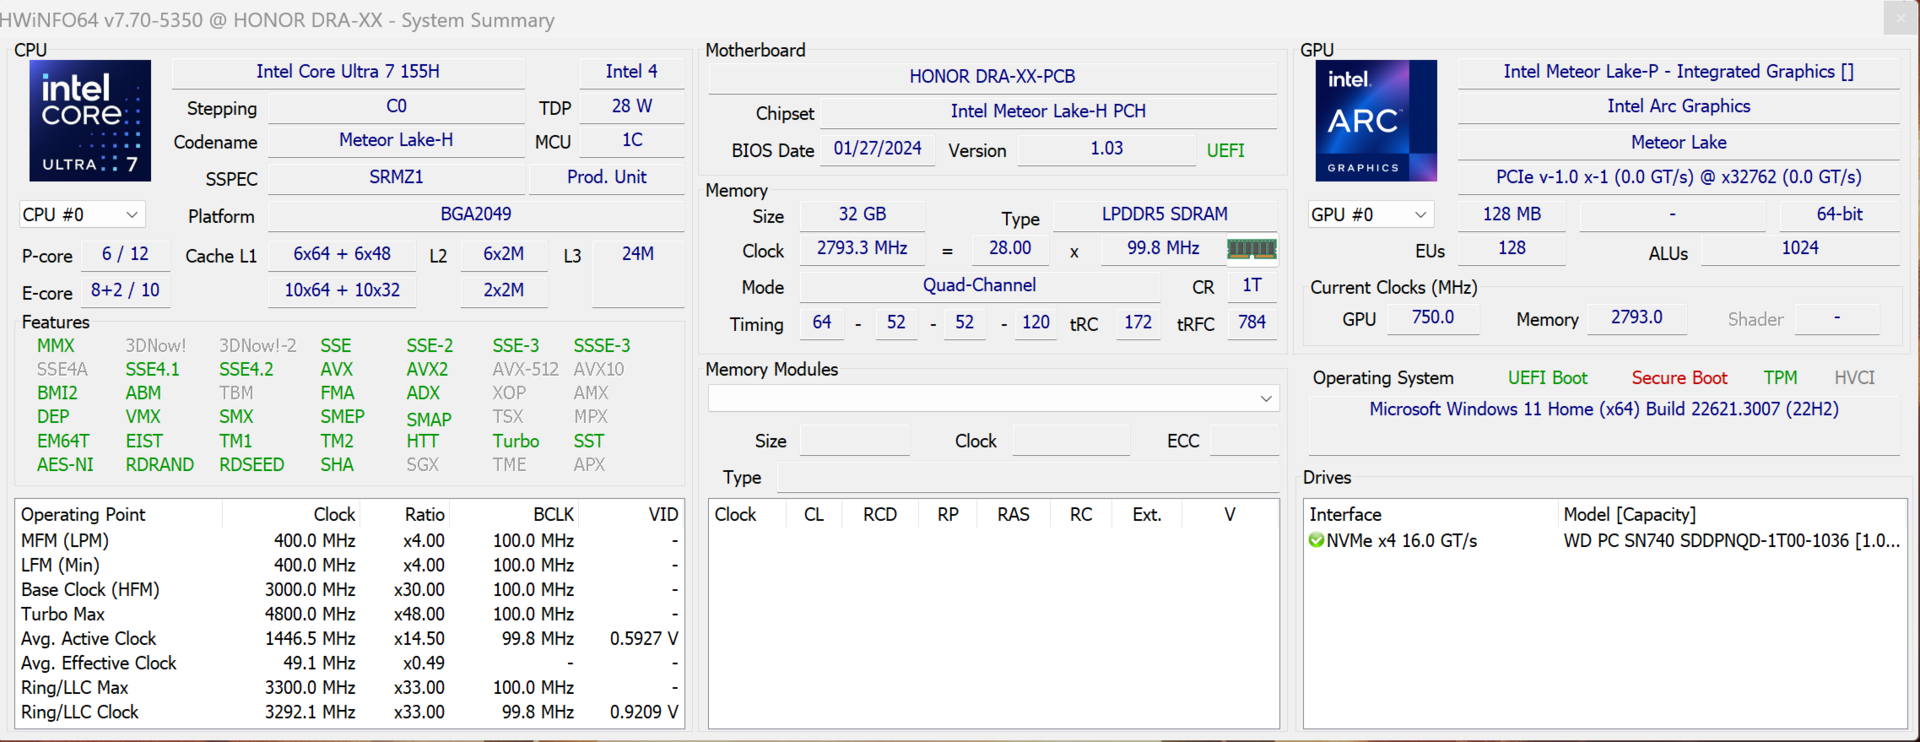
Processor - Core Ultra 7 155H
The new Core Ultra 7 155H offers 16 cores (22 threads) and is the successor to the Core i7-13700H. In the case of the MagicBook Pro, the processor can draw a maximum of 90 watts falling subsequently to 60 watts. This means the overall performance is on the same level as the old Core i7-13705H found in the Lenovo Yoga Pro 9 16 as well as the Ryzen 9 7940HS.
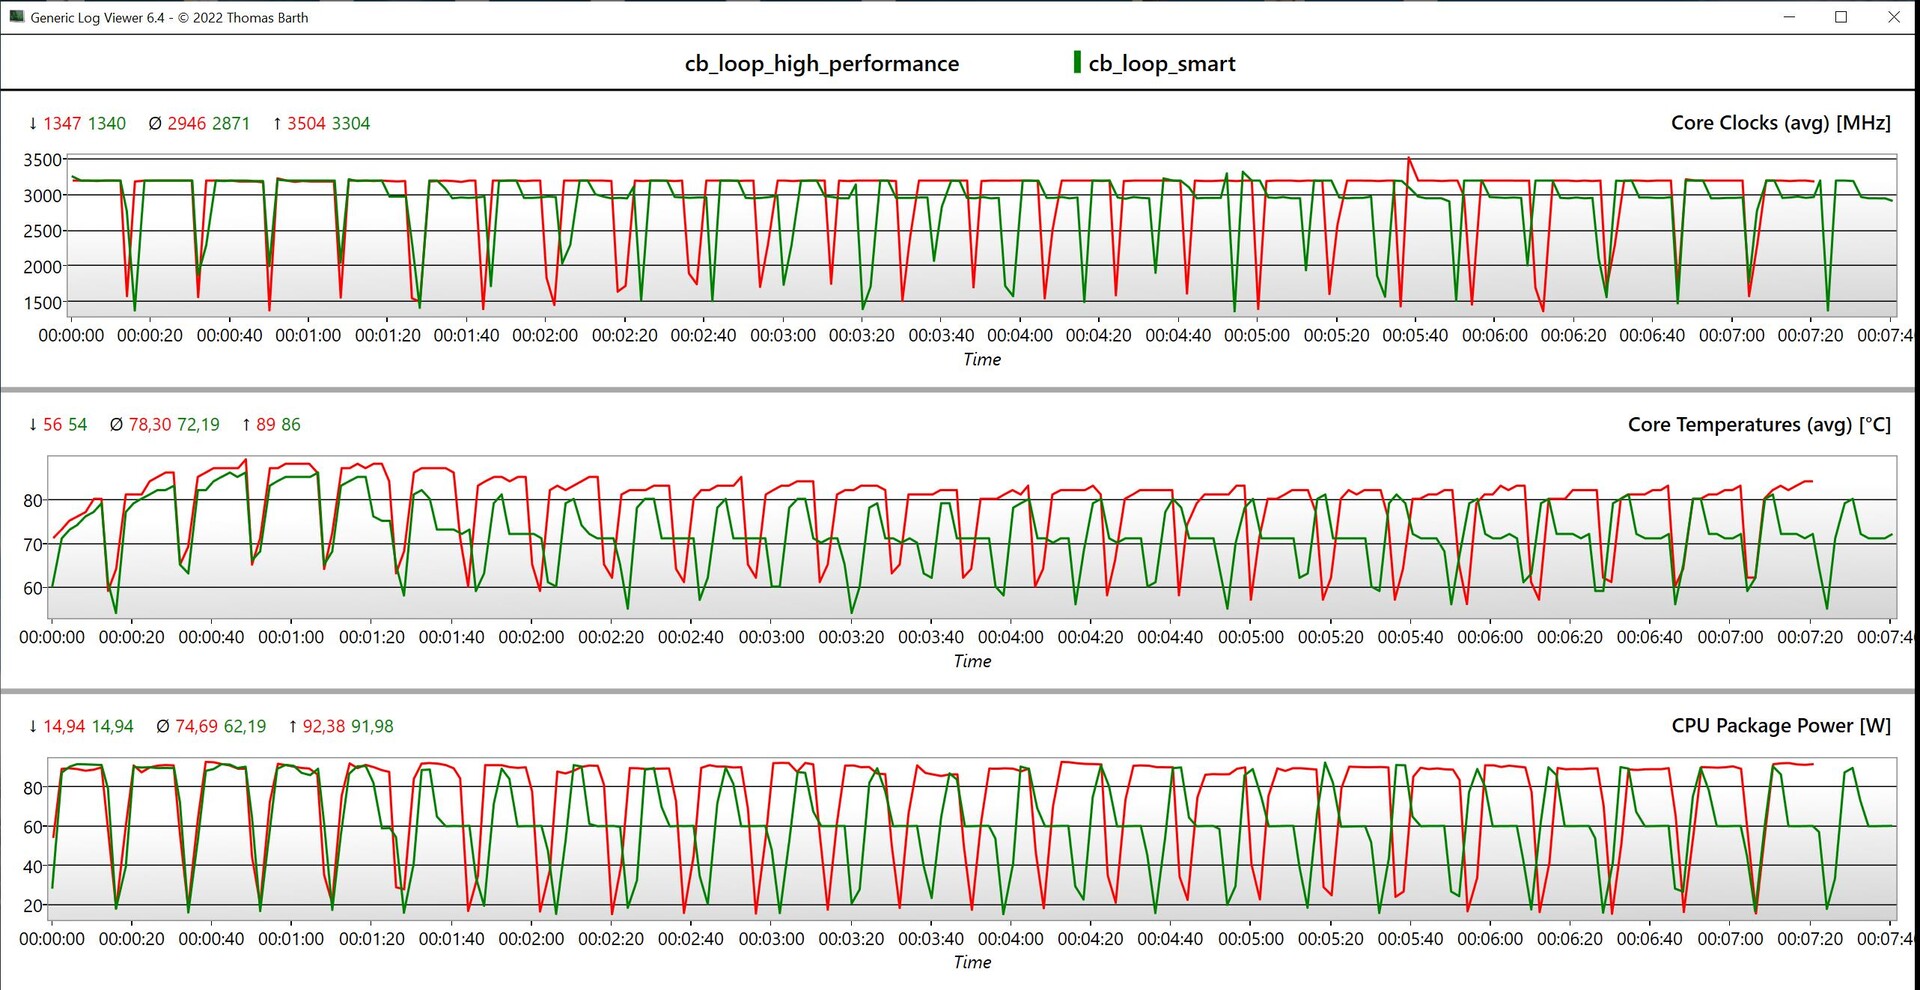
Cinebench R15 multi continuous test
Additionally, in our CB R15 multi-loop, the performance also showed itself to remain stable even when put under load for longer periods. With the high-performance mode, the maximum performance stays the same and, with longer periods of load, the results are a little higher. In battery mode, the maximum consumption sits briefly at 60 watts and then quickly drops to 45 watts. This is why the multi-core performance is around 20 % lower in this area. Additional CPU benchmarks are available in our technology section.
Cinebench R23: Multi Core | Single Core
Cinebench R20: CPU (Multi Core) | CPU (Single Core)
Cinebench R15: CPU Multi 64Bit | CPU Single 64Bit
Blender: v2.79 BMW27 CPU
7-Zip 18.03: 7z b 4 | 7z b 4 -mmt1
Geekbench 6.7: Multi-Core | Single-Core
Geekbench 5.5: Multi-Core | Single-Core
HWBOT x265 Benchmark v2.2: 4k Preset
LibreOffice : 20 Documents To PDF
R Benchmark 2.5: Overall mean
| CPU Performance rating | |
| Asus Vivobook Pro 16X K6604JV-MX016W -2! | |
| Lenovo Yoga Pro 9 16-IRP G8 | |
| Framework Laptop 16 | |
| Lenovo ThinkPad Z16 Gen 2 | |
| Honor MagicBook Pro 16 2024 | |
| Average of class Multimedia | |
| Dell Inspiron 16 Plus 7630 | |
| Schenker VISION 16 Pro (M23) -2! | |
| Average Intel Core Ultra 7 155H | |
| Cinebench R23 / Multi Core | |
| Asus Vivobook Pro 16X K6604JV-MX016W | |
| Lenovo Yoga Pro 9 16-IRP G8 | |
| Honor MagicBook Pro 16 2024 | |
| Lenovo ThinkPad Z16 Gen 2 | |
| Average of class Multimedia (4861 - 33362, n=80, last 2 years) | |
| Framework Laptop 16 | |
| Dell Inspiron 16 Plus 7630 | |
| Average Intel Core Ultra 7 155H (9769 - 19007, n=52) | |
| Schenker VISION 16 Pro (M23) | |
| Cinebench R23 / Single Core | |
| Average of class Multimedia (1128 - 2459, n=72, last 2 years) | |
| Schenker VISION 16 Pro (M23) | |
| Lenovo Yoga Pro 9 16-IRP G8 | |
| Dell Inspiron 16 Plus 7630 | |
| Asus Vivobook Pro 16X K6604JV-MX016W | |
| Lenovo ThinkPad Z16 Gen 2 | |
| Honor MagicBook Pro 16 2024 | |
| Framework Laptop 16 | |
| Average Intel Core Ultra 7 155H (1496 - 1815, n=52) | |
| Cinebench R20 / CPU (Multi Core) | |
| Asus Vivobook Pro 16X K6604JV-MX016W | |
| Lenovo Yoga Pro 9 16-IRP G8 | |
| Honor MagicBook Pro 16 2024 | |
| Lenovo ThinkPad Z16 Gen 2 | |
| Framework Laptop 16 | |
| Average of class Multimedia (1887 - 12912, n=63, last 2 years) | |
| Dell Inspiron 16 Plus 7630 | |
| Average Intel Core Ultra 7 155H (3798 - 7409, n=50) | |
| Schenker VISION 16 Pro (M23) | |
| Cinebench R20 / CPU (Single Core) | |
| Lenovo Yoga Pro 9 16-IRP G8 | |
| Schenker VISION 16 Pro (M23) | |
| Dell Inspiron 16 Plus 7630 | |
| Average of class Multimedia (425 - 853, n=63, last 2 years) | |
| Asus Vivobook Pro 16X K6604JV-MX016W | |
| Lenovo ThinkPad Z16 Gen 2 | |
| Honor MagicBook Pro 16 2024 | |
| Framework Laptop 16 | |
| Average Intel Core Ultra 7 155H (601 - 696, n=50) | |
| Cinebench R15 / CPU Multi 64Bit | |
| Asus Vivobook Pro 16X K6604JV-MX016W | |
| Lenovo Yoga Pro 9 16-IRP G8 | |
| Honor MagicBook Pro 16 2024 | |
| Lenovo ThinkPad Z16 Gen 2 | |
| Framework Laptop 16 | |
| Average of class Multimedia (856 - 5224, n=67, last 2 years) | |
| Average Intel Core Ultra 7 155H (1932 - 2880, n=56) | |
| Dell Inspiron 16 Plus 7630 | |
| Schenker VISION 16 Pro (M23) | |
| Cinebench R15 / CPU Single 64Bit | |
| Asus Vivobook Pro 16X K6604JV-MX016W | |
| Lenovo ThinkPad Z16 Gen 2 | |
| Average of class Multimedia (184.8 - 326, n=65, last 2 years) | |
| Framework Laptop 16 | |
| Schenker VISION 16 Pro (M23) | |
| Lenovo Yoga Pro 9 16-IRP G8 | |
| Honor MagicBook Pro 16 2024 | |
| Dell Inspiron 16 Plus 7630 | |
| Average Intel Core Ultra 7 155H (99.6 - 268, n=52) | |
| Blender / v2.79 BMW27 CPU | |
| Average of class Multimedia (100 - 557, n=64, last 2 years) | |
| Average Intel Core Ultra 7 155H (175 - 381, n=47) | |
| Schenker VISION 16 Pro (M23) | |
| Dell Inspiron 16 Plus 7630 | |
| Framework Laptop 16 | |
| Lenovo ThinkPad Z16 Gen 2 | |
| Honor MagicBook Pro 16 2024 | |
| Lenovo Yoga Pro 9 16-IRP G8 | |
| Asus Vivobook Pro 16X K6604JV-MX016W | |
| 7-Zip 18.03 / 7z b 4 | |
| Asus Vivobook Pro 16X K6604JV-MX016W | |
| Lenovo Yoga Pro 9 16-IRP G8 | |
| Framework Laptop 16 | |
| Honor MagicBook Pro 16 2024 | |
| Lenovo ThinkPad Z16 Gen 2 | |
| Schenker VISION 16 Pro (M23) | |
| Dell Inspiron 16 Plus 7630 | |
| Average Intel Core Ultra 7 155H (41739 - 70254, n=50) | |
| Average of class Multimedia (26062 - 130368, n=61, last 2 years) | |
| 7-Zip 18.03 / 7z b 4 -mmt1 | |
| Asus Vivobook Pro 16X K6604JV-MX016W | |
| Framework Laptop 16 | |
| Schenker VISION 16 Pro (M23) | |
| Lenovo ThinkPad Z16 Gen 2 | |
| Lenovo Yoga Pro 9 16-IRP G8 | |
| Average of class Multimedia (3666 - 7545, n=62, last 2 years) | |
| Dell Inspiron 16 Plus 7630 | |
| Honor MagicBook Pro 16 2024 | |
| Average Intel Core Ultra 7 155H (4594 - 5621, n=50) | |
| Geekbench 6.7 / Multi-Core | |
| Average of class Multimedia (4983 - 29415, n=75, last 2 years) | |
| Lenovo Yoga Pro 9 16-IRP G8 | |
| Dell Inspiron 16 Plus 7630 | |
| Framework Laptop 16 | |
| Honor MagicBook Pro 16 2024 | |
| Lenovo ThinkPad Z16 Gen 2 | |
| Average Intel Core Ultra 7 155H (7732 - 13656, n=55) | |
| Geekbench 6.7 / Single-Core | |
| Average of class Multimedia (1534 - 4335, n=74, last 2 years) | |
| Dell Inspiron 16 Plus 7630 | |
| Framework Laptop 16 | |
| Lenovo ThinkPad Z16 Gen 2 | |
| Lenovo Yoga Pro 9 16-IRP G8 | |
| Honor MagicBook Pro 16 2024 | |
| Average Intel Core Ultra 7 155H (1901 - 2473, n=52) | |
| Geekbench 5.5 / Multi-Core | |
| Asus Vivobook Pro 16X K6604JV-MX016W | |
| Lenovo Yoga Pro 9 16-IRP G8 | |
| Honor MagicBook Pro 16 2024 | |
| Average of class Multimedia (4652 - 20422, n=61, last 2 years) | |
| Dell Inspiron 16 Plus 7630 | |
| Framework Laptop 16 | |
| Lenovo ThinkPad Z16 Gen 2 | |
| Average Intel Core Ultra 7 155H (10017 - 13556, n=52) | |
| Schenker VISION 16 Pro (M23) | |
| Geekbench 5.5 / Single-Core | |
| Asus Vivobook Pro 16X K6604JV-MX016W | |
| Framework Laptop 16 | |
| Average of class Multimedia (805 - 2974, n=61, last 2 years) | |
| Lenovo ThinkPad Z16 Gen 2 | |
| Dell Inspiron 16 Plus 7630 | |
| Schenker VISION 16 Pro (M23) | |
| Honor MagicBook Pro 16 2024 | |
| Lenovo Yoga Pro 9 16-IRP G8 | |
| Average Intel Core Ultra 7 155H (1462 - 1824, n=52) | |
| HWBOT x265 Benchmark v2.2 / 4k Preset | |
| Asus Vivobook Pro 16X K6604JV-MX016W | |
| Lenovo Yoga Pro 9 16-IRP G8 | |
| Framework Laptop 16 | |
| Honor MagicBook Pro 16 2024 | |
| Lenovo ThinkPad Z16 Gen 2 | |
| Average of class Multimedia (5.26 - 36.1, n=62, last 2 years) | |
| Schenker VISION 16 Pro (M23) | |
| Average Intel Core Ultra 7 155H (9.93 - 21.2, n=50) | |
| Dell Inspiron 16 Plus 7630 | |
| LibreOffice / 20 Documents To PDF | |
| Asus Vivobook Pro 16X K6604JV-MX016W | |
| Average of class Multimedia (23.9 - 146.7, n=63, last 2 years) | |
| Average Intel Core Ultra 7 155H (37.5 - 79.2, n=49) | |
| Lenovo Yoga Pro 9 16-IRP G8 | |
| Schenker VISION 16 Pro (M23) | |
| Honor MagicBook Pro 16 2024 | |
| Lenovo ThinkPad Z16 Gen 2 | |
| Dell Inspiron 16 Plus 7630 | |
| Framework Laptop 16 | |
| R Benchmark 2.5 / Overall mean | |
| Average Intel Core Ultra 7 155H (0.4457 - 0.53, n=49) | |
| Average of class Multimedia (0.3604 - 0.947, n=62, last 2 years) | |
| Honor MagicBook Pro 16 2024 | |
| Lenovo Yoga Pro 9 16-IRP G8 | |
| Lenovo ThinkPad Z16 Gen 2 | |
| Framework Laptop 16 | |
| Schenker VISION 16 Pro (M23) | |
| Dell Inspiron 16 Plus 7630 | |
| Asus Vivobook Pro 16X K6604JV-MX016W | |
* ... smaller is better
AIDA64: FP32 Ray-Trace | FPU Julia | CPU SHA3 | CPU Queen | FPU SinJulia | FPU Mandel | CPU AES | CPU ZLib | FP64 Ray-Trace | CPU PhotoWorxx
| Performance rating | |
| Framework Laptop 16 | |
| Lenovo ThinkPad Z16 Gen 2 | |
| Asus Vivobook Pro 16X K6604JV-MX016W | |
| Honor MagicBook Pro 16 2024 | |
| Lenovo Yoga Pro 9 16-IRP G8 | |
| Average of class Multimedia | |
| Schenker VISION 16 Pro (M23) | |
| Average Intel Core Ultra 7 155H | |
| Dell Inspiron 16 Plus 7630 | |
| AIDA64 / FP32 Ray-Trace | |
| Lenovo ThinkPad Z16 Gen 2 | |
| Framework Laptop 16 | |
| Asus Vivobook Pro 16X K6604JV-MX016W | |
| Lenovo Yoga Pro 9 16-IRP G8 | |
| Average of class Multimedia (2214 - 50388, n=59, last 2 years) | |
| Honor MagicBook Pro 16 2024 | |
| Dell Inspiron 16 Plus 7630 | |
| Schenker VISION 16 Pro (M23) | |
| Average Intel Core Ultra 7 155H (6670 - 18470, n=50) | |
| AIDA64 / FPU Julia | |
| Lenovo ThinkPad Z16 Gen 2 | |
| Framework Laptop 16 | |
| Asus Vivobook Pro 16X K6604JV-MX016W | |
| Honor MagicBook Pro 16 2024 | |
| Lenovo Yoga Pro 9 16-IRP G8 | |
| Average of class Multimedia (12867 - 201874, n=60, last 2 years) | |
| Schenker VISION 16 Pro (M23) | |
| Average Intel Core Ultra 7 155H (40905 - 93181, n=50) | |
| Dell Inspiron 16 Plus 7630 | |
| AIDA64 / CPU SHA3 | |
| Asus Vivobook Pro 16X K6604JV-MX016W | |
| Lenovo ThinkPad Z16 Gen 2 | |
| Framework Laptop 16 | |
| Honor MagicBook Pro 16 2024 | |
| Lenovo Yoga Pro 9 16-IRP G8 | |
| Average of class Multimedia (626 - 8623, n=60, last 2 years) | |
| Average Intel Core Ultra 7 155H (1940 - 4436, n=50) | |
| Schenker VISION 16 Pro (M23) | |
| Dell Inspiron 16 Plus 7630 | |
| AIDA64 / CPU Queen | |
| Asus Vivobook Pro 16X K6604JV-MX016W | |
| Lenovo ThinkPad Z16 Gen 2 | |
| Framework Laptop 16 | |
| Lenovo Yoga Pro 9 16-IRP G8 | |
| Dell Inspiron 16 Plus 7630 | |
| Schenker VISION 16 Pro (M23) | |
| Honor MagicBook Pro 16 2024 | |
| Average Intel Core Ultra 7 155H (64698 - 94181, n=50) | |
| Average of class Multimedia (13483 - 181505, n=47, last 2 years) | |
| AIDA64 / FPU SinJulia | |
| Lenovo ThinkPad Z16 Gen 2 | |
| Framework Laptop 16 | |
| Asus Vivobook Pro 16X K6604JV-MX016W | |
| Lenovo Yoga Pro 9 16-IRP G8 | |
| Honor MagicBook Pro 16 2024 | |
| Average Intel Core Ultra 7 155H (5639 - 10647, n=50) | |
| Schenker VISION 16 Pro (M23) | |
| Dell Inspiron 16 Plus 7630 | |
| Average of class Multimedia (886 - 28794, n=60, last 2 years) | |
| AIDA64 / FPU Mandel | |
| Lenovo ThinkPad Z16 Gen 2 | |
| Framework Laptop 16 | |
| Asus Vivobook Pro 16X K6604JV-MX016W | |
| Honor MagicBook Pro 16 2024 | |
| Lenovo Yoga Pro 9 16-IRP G8 | |
| Average of class Multimedia (6395 - 105740, n=59, last 2 years) | |
| Average Intel Core Ultra 7 155H (18236 - 47685, n=50) | |
| Dell Inspiron 16 Plus 7630 | |
| Schenker VISION 16 Pro (M23) | |
| AIDA64 / CPU AES | |
| Framework Laptop 16 | |
| Honor MagicBook Pro 16 2024 | |
| Asus Vivobook Pro 16X K6604JV-MX016W | |
| Lenovo ThinkPad Z16 Gen 2 | |
| Lenovo Yoga Pro 9 16-IRP G8 | |
| Average Intel Core Ultra 7 155H (45713 - 152179, n=50) | |
| Schenker VISION 16 Pro (M23) | |
| Average of class Multimedia (8171 - 126790, n=60, last 2 years) | |
| Dell Inspiron 16 Plus 7630 | |
| AIDA64 / CPU ZLib | |
| Asus Vivobook Pro 16X K6604JV-MX016W | |
| Honor MagicBook Pro 16 2024 | |
| Lenovo Yoga Pro 9 16-IRP G8 | |
| Lenovo ThinkPad Z16 Gen 2 | |
| Average of class Multimedia (143.8 - 2022, n=60, last 2 years) | |
| Average Intel Core Ultra 7 155H (557 - 1250, n=50) | |
| Schenker VISION 16 Pro (M23) | |
| Framework Laptop 16 | |
| Dell Inspiron 16 Plus 7630 | |
| AIDA64 / FP64 Ray-Trace | |
| Lenovo ThinkPad Z16 Gen 2 | |
| Framework Laptop 16 | |
| Asus Vivobook Pro 16X K6604JV-MX016W | |
| Average of class Multimedia (1014 - 26875, n=60, last 2 years) | |
| Lenovo Yoga Pro 9 16-IRP G8 | |
| Honor MagicBook Pro 16 2024 | |
| Dell Inspiron 16 Plus 7630 | |
| Schenker VISION 16 Pro (M23) | |
| Average Intel Core Ultra 7 155H (3569 - 9802, n=50) | |
| AIDA64 / CPU PhotoWorxx | |
| Lenovo Yoga Pro 9 16-IRP G8 | |
| Average of class Multimedia (8187 - 88154, n=60, last 2 years) | |
| Average Intel Core Ultra 7 155H (32719 - 54223, n=50) | |
| Honor MagicBook Pro 16 2024 | |
| Schenker VISION 16 Pro (M23) | |
| Asus Vivobook Pro 16X K6604JV-MX016W | |
| Framework Laptop 16 | |
| Dell Inspiron 16 Plus 7630 | |
| Lenovo ThinkPad Z16 Gen 2 | |
System performance
Although the synthetic benchmark results are average, in everyday use, the MagicBook Pro 16 is a very responsive laptop that can implement inputs without any noticeable delays. We only experienced a brief delay when switching to the Nvidia GPU (e.g. when booting a game) and this is normal when switching to Advanced Optimus. Anyone bothered by this can activate the normal Optimus switch in the Nvidia drivers.
CrossMark: Overall | Productivity | Creativity | Responsiveness
WebXPRT 3: Overall
WebXPRT 4: Overall
Mozilla Kraken 1.1: Total
| PCMark 10 / Score | |
| Framework Laptop 16 | |
| Lenovo ThinkPad Z16 Gen 2 | |
| Average of class Multimedia (4325 - 10386, n=57, last 2 years) | |
| Dell Inspiron 16 Plus 7630 | |
| Schenker VISION 16 Pro (M23) | |
| Lenovo Yoga Pro 9 16-IRP G8 | |
| Average Intel Core Ultra 7 155H, NVIDIA GeForce RTX 4060 Laptop GPU (6751 - 7370, n=5) | |
| Asus Vivobook Pro 16X K6604JV-MX016W | |
| Honor MagicBook Pro 16 2024 | |
| PCMark 10 / Essentials | |
| Framework Laptop 16 | |
| Lenovo ThinkPad Z16 Gen 2 | |
| Dell Inspiron 16 Plus 7630 | |
| Lenovo Yoga Pro 9 16-IRP G8 | |
| Schenker VISION 16 Pro (M23) | |
| Asus Vivobook Pro 16X K6604JV-MX016W | |
| Average of class Multimedia (8025 - 11664, n=56, last 2 years) | |
| Average Intel Core Ultra 7 155H, NVIDIA GeForce RTX 4060 Laptop GPU (9476 - 10446, n=5) | |
| Honor MagicBook Pro 16 2024 | |
| PCMark 10 / Productivity | |
| Average of class Multimedia (7323 - 18233, n=56, last 2 years) | |
| Framework Laptop 16 | |
| Lenovo ThinkPad Z16 Gen 2 | |
| Schenker VISION 16 Pro (M23) | |
| Dell Inspiron 16 Plus 7630 | |
| Asus Vivobook Pro 16X K6604JV-MX016W | |
| Lenovo Yoga Pro 9 16-IRP G8 | |
| Average Intel Core Ultra 7 155H, NVIDIA GeForce RTX 4060 Laptop GPU (8079 - 9477, n=5) | |
| Honor MagicBook Pro 16 2024 | |
| PCMark 10 / Digital Content Creation | |
| Framework Laptop 16 | |
| Dell Inspiron 16 Plus 7630 | |
| Lenovo ThinkPad Z16 Gen 2 | |
| Lenovo Yoga Pro 9 16-IRP G8 | |
| Schenker VISION 16 Pro (M23) | |
| Average Intel Core Ultra 7 155H, NVIDIA GeForce RTX 4060 Laptop GPU (9811 - 11620, n=5) | |
| Honor MagicBook Pro 16 2024 | |
| Average of class Multimedia (3651 - 16240, n=56, last 2 years) | |
| Asus Vivobook Pro 16X K6604JV-MX016W | |
| CrossMark / Overall | |
| Asus Vivobook Pro 16X K6604JV-MX016W | |
| Schenker VISION 16 Pro (M23) | |
| Average of class Multimedia (866 - 2728, n=66, last 2 years) | |
| Dell Inspiron 16 Plus 7630 | |
| Lenovo Yoga Pro 9 16-IRP G8 | |
| Honor MagicBook Pro 16 2024 | |
| Average Intel Core Ultra 7 155H, NVIDIA GeForce RTX 4060 Laptop GPU (1540 - 1746, n=5) | |
| Framework Laptop 16 | |
| Lenovo ThinkPad Z16 Gen 2 | |
| CrossMark / Productivity | |
| Asus Vivobook Pro 16X K6604JV-MX016W | |
| Schenker VISION 16 Pro (M23) | |
| Dell Inspiron 16 Plus 7630 | |
| Average of class Multimedia (931 - 2489, n=66, last 2 years) | |
| Lenovo Yoga Pro 9 16-IRP G8 | |
| Honor MagicBook Pro 16 2024 | |
| Average Intel Core Ultra 7 155H, NVIDIA GeForce RTX 4060 Laptop GPU (1436 - 1684, n=5) | |
| Framework Laptop 16 | |
| Lenovo ThinkPad Z16 Gen 2 | |
| CrossMark / Creativity | |
| Asus Vivobook Pro 16X K6604JV-MX016W | |
| Average of class Multimedia (907 - 3465, n=66, last 2 years) | |
| Lenovo Yoga Pro 9 16-IRP G8 | |
| Dell Inspiron 16 Plus 7630 | |
| Schenker VISION 16 Pro (M23) | |
| Framework Laptop 16 | |
| Average Intel Core Ultra 7 155H, NVIDIA GeForce RTX 4060 Laptop GPU (1811 - 1929, n=5) | |
| Honor MagicBook Pro 16 2024 | |
| Lenovo ThinkPad Z16 Gen 2 | |
| CrossMark / Responsiveness | |
| Schenker VISION 16 Pro (M23) | |
| Asus Vivobook Pro 16X K6604JV-MX016W | |
| Honor MagicBook Pro 16 2024 | |
| Dell Inspiron 16 Plus 7630 | |
| Lenovo Yoga Pro 9 16-IRP G8 | |
| Average of class Multimedia (605 - 2024, n=66, last 2 years) | |
| Average Intel Core Ultra 7 155H, NVIDIA GeForce RTX 4060 Laptop GPU (1165 - 1631, n=5) | |
| Framework Laptop 16 | |
| Lenovo ThinkPad Z16 Gen 2 | |
| WebXPRT 3 / Overall | |
| Framework Laptop 16 | |
| Average of class Multimedia (136.4 - 596, n=69, last 2 years) | |
| Lenovo ThinkPad Z16 Gen 2 | |
| Dell Inspiron 16 Plus 7630 | |
| Schenker VISION 16 Pro (M23) | |
| Lenovo Yoga Pro 9 16-IRP G8 | |
| Honor MagicBook Pro 16 2024 | |
| Average Intel Core Ultra 7 155H, NVIDIA GeForce RTX 4060 Laptop GPU (274 - 290, n=5) | |
| Asus Vivobook Pro 16X K6604JV-MX016W | |
| WebXPRT 4 / Overall | |
| Average of class Multimedia (167.3 - 402, n=70, last 2 years) | |
| Schenker VISION 16 Pro (M23) | |
| Dell Inspiron 16 Plus 7630 | |
| Framework Laptop 16 | |
| Lenovo Yoga Pro 9 16-IRP G8 | |
| Honor MagicBook Pro 16 2024 | |
| Lenovo ThinkPad Z16 Gen 2 | |
| Asus Vivobook Pro 16X K6604JV-MX016W | |
| Average Intel Core Ultra 7 155H, NVIDIA GeForce RTX 4060 Laptop GPU (236 - 262, n=5) | |
| Mozilla Kraken 1.1 / Total | |
| Average Intel Core Ultra 7 155H, NVIDIA GeForce RTX 4060 Laptop GPU (519 - 585, n=5) | |
| Lenovo ThinkPad Z16 Gen 2 | |
| Honor MagicBook Pro 16 2024 | |
| Asus Vivobook Pro 16X K6604JV-MX016W | |
| Lenovo Yoga Pro 9 16-IRP G8 | |
| Dell Inspiron 16 Plus 7630 | |
| Schenker VISION 16 Pro (M23) | |
| Framework Laptop 16 | |
| Average of class Multimedia (228 - 835, n=72, last 2 years) | |
* ... smaller is better
| PCMark 10 Score | 6800 points | |
Help | ||
| AIDA64 / Memory Copy | |
| Honor MagicBook Pro 16 2024 | |
| Average Intel Core Ultra 7 155H (62397 - 96791, n=50) | |
| Average of class Multimedia (11299 - 132135, n=60, last 2 years) | |
| Framework Laptop 16 | |
| Lenovo Yoga Pro 9 16-IRP G8 | |
| Asus Vivobook Pro 16X K6604JV-MX016W | |
| Lenovo ThinkPad Z16 Gen 2 | |
| Schenker VISION 16 Pro (M23) | |
| Dell Inspiron 16 Plus 7630 | |
| AIDA64 / Memory Read | |
| Average of class Multimedia (11624 - 174586, n=60, last 2 years) | |
| Average Intel Core Ultra 7 155H (60544 - 90647, n=50) | |
| Lenovo Yoga Pro 9 16-IRP G8 | |
| Honor MagicBook Pro 16 2024 | |
| Asus Vivobook Pro 16X K6604JV-MX016W | |
| Schenker VISION 16 Pro (M23) | |
| Dell Inspiron 16 Plus 7630 | |
| Framework Laptop 16 | |
| Lenovo ThinkPad Z16 Gen 2 | |
| AIDA64 / Memory Write | |
| Lenovo Yoga Pro 9 16-IRP G8 | |
| Lenovo ThinkPad Z16 Gen 2 | |
| Framework Laptop 16 | |
| Average of class Multimedia (11755 - 134998, n=60, last 2 years) | |
| Honor MagicBook Pro 16 2024 | |
| Average Intel Core Ultra 7 155H (58692 - 93451, n=50) | |
| Asus Vivobook Pro 16X K6604JV-MX016W | |
| Schenker VISION 16 Pro (M23) | |
| Dell Inspiron 16 Plus 7630 | |
| AIDA64 / Memory Latency | |
| Average Intel Core Ultra 7 155H (116.2 - 233, n=50) | |
| Honor MagicBook Pro 16 2024 | |
| Average of class Multimedia (7 - 535, n=59, last 2 years) | |
| Lenovo ThinkPad Z16 Gen 2 | |
| Lenovo Yoga Pro 9 16-IRP G8 | |
| Dell Inspiron 16 Plus 7630 | |
| Framework Laptop 16 | |
| Asus Vivobook Pro 16X K6604JV-MX016W | |
| Schenker VISION 16 Pro (M23) | |
* ... smaller is better
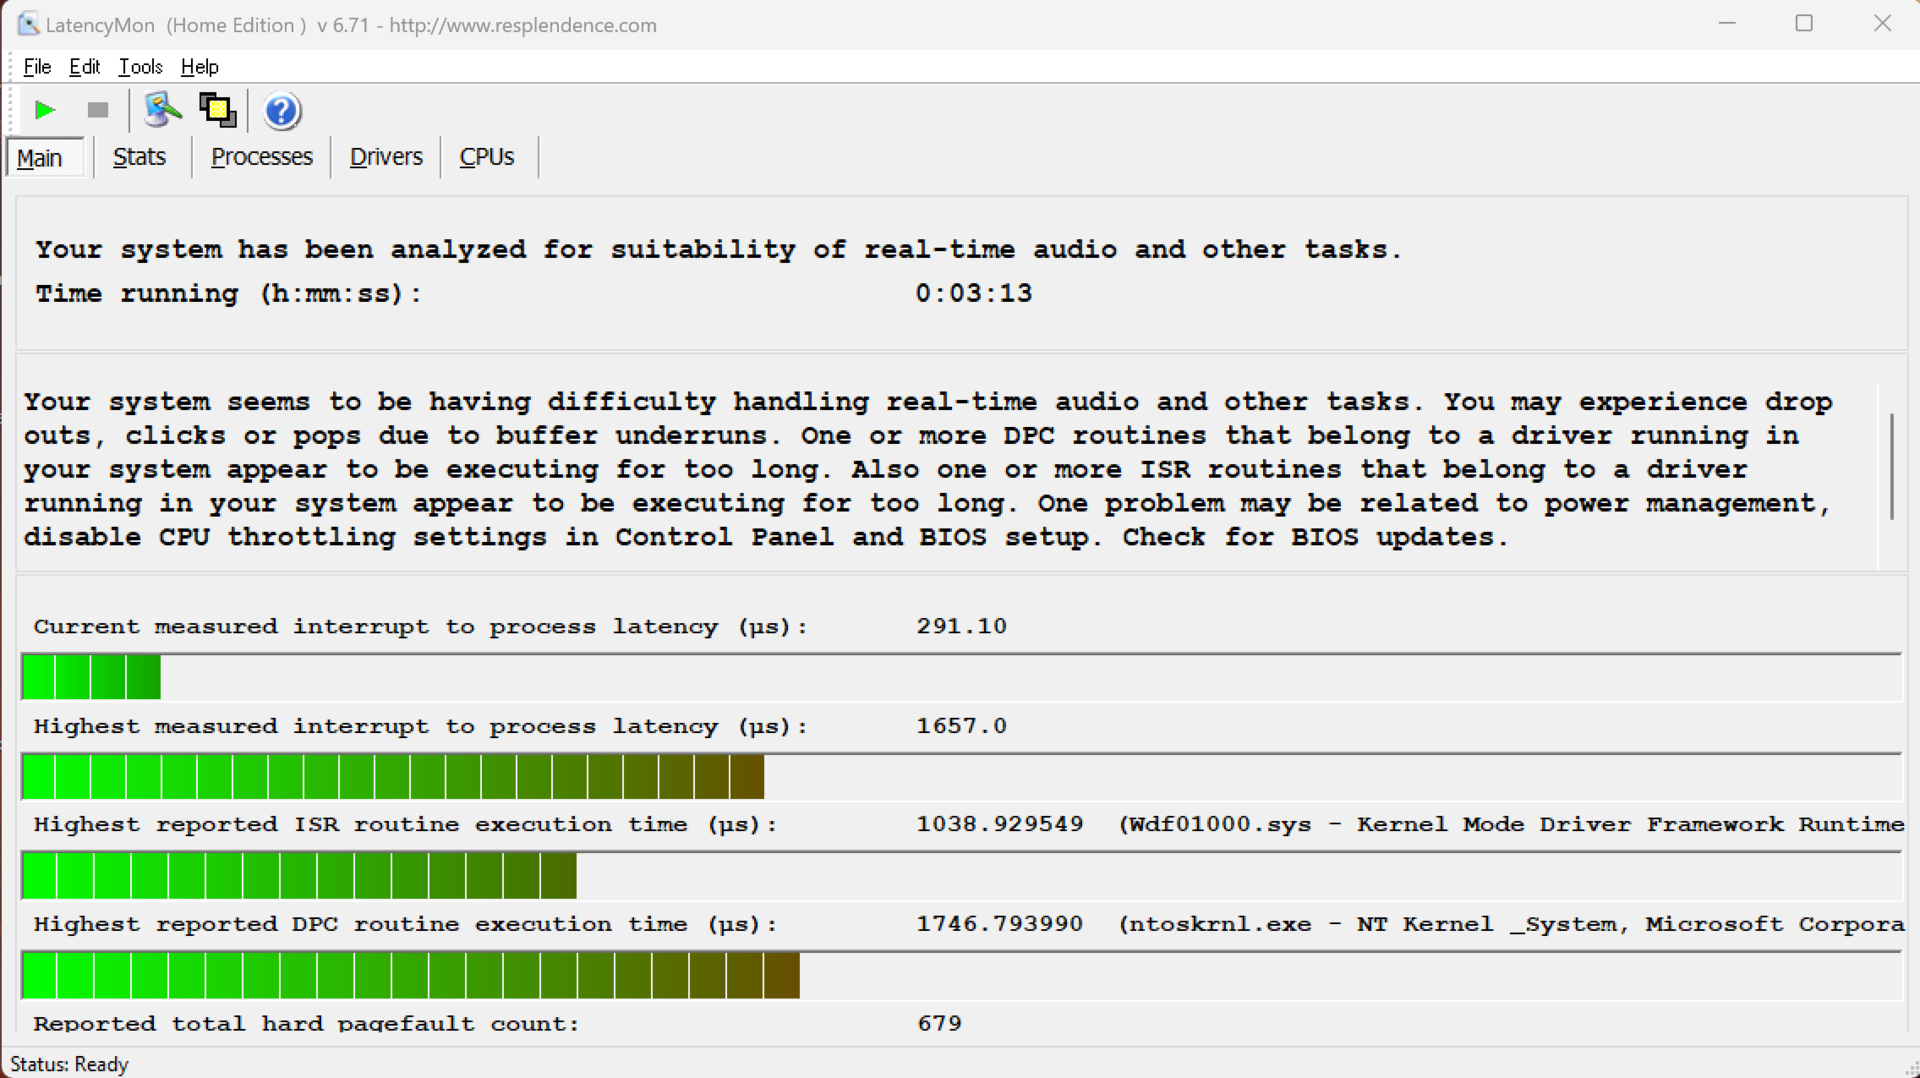
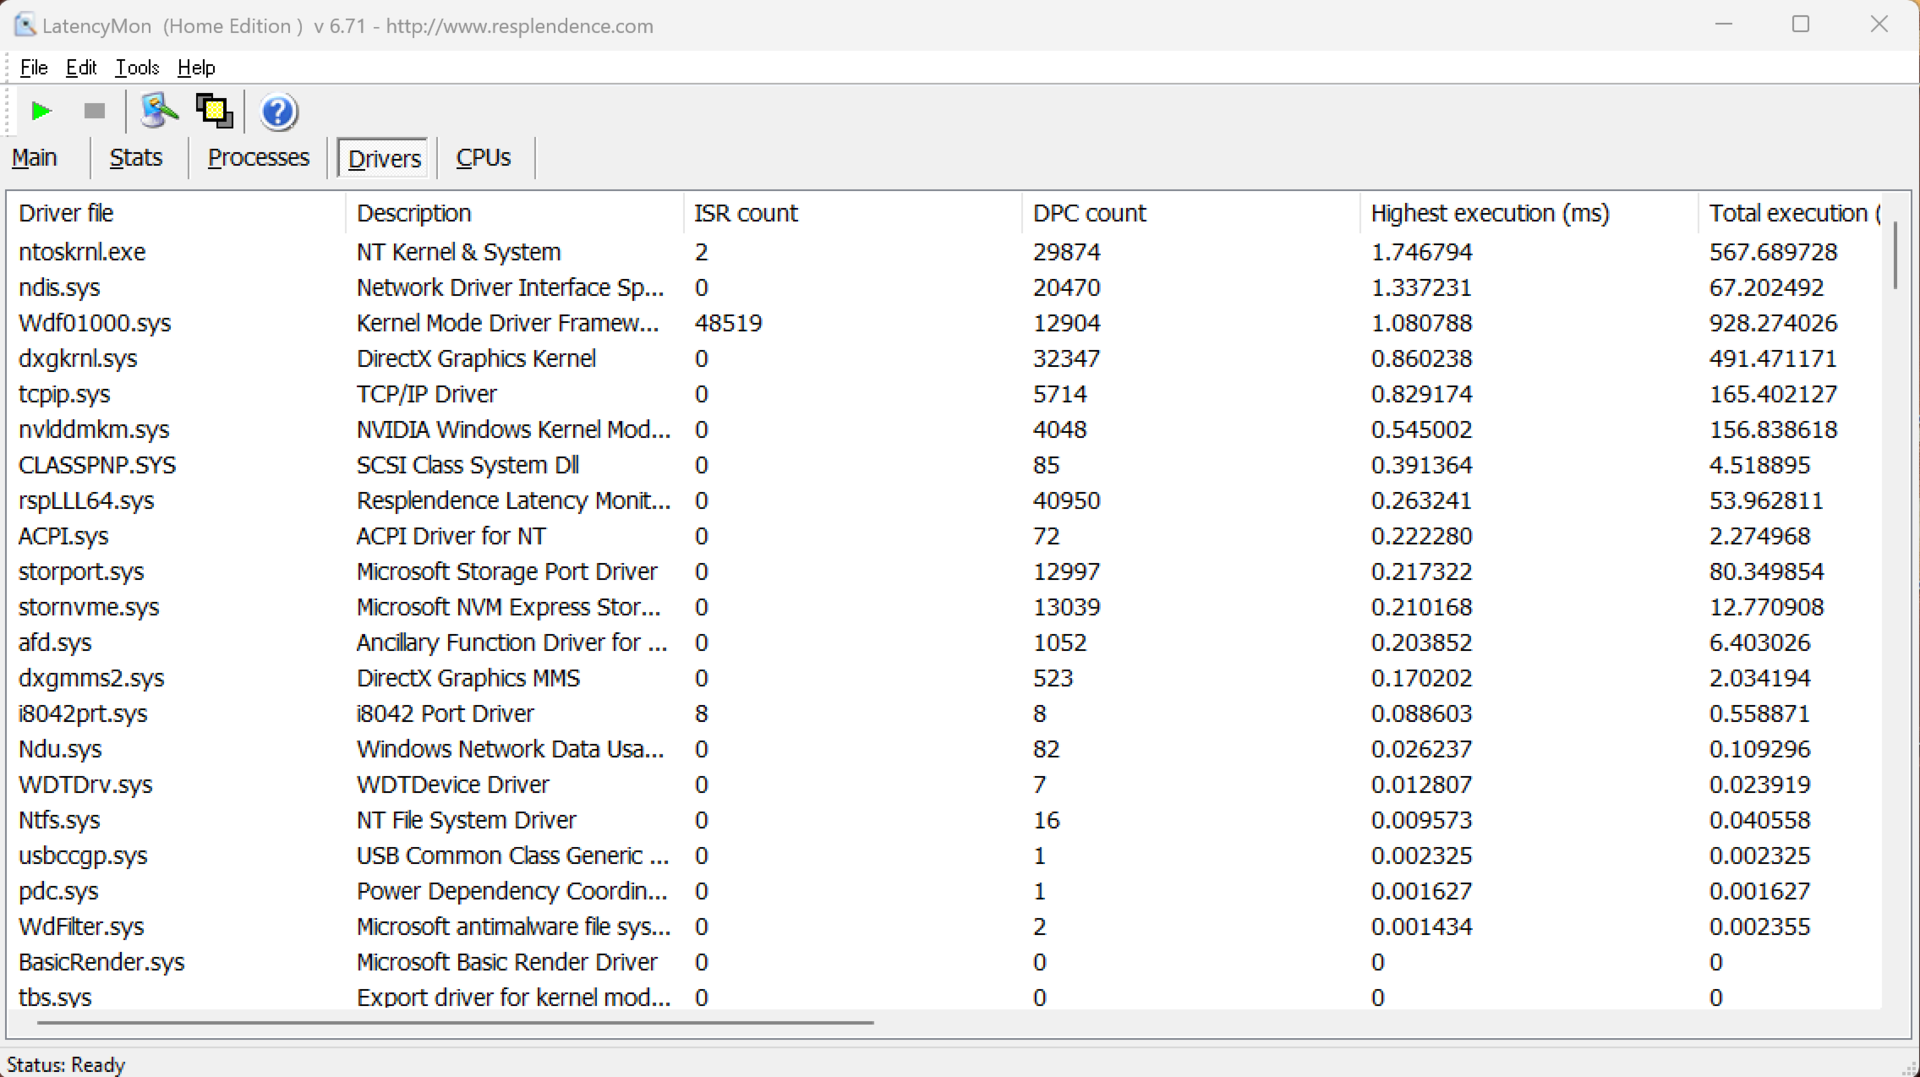
DPC latencies
In our standardized latency test (surfing the internet, 4K YouTube playback, CPU load), the review device showed slight limitations when it came to using real-time audio applications with the current BIOS version.
| DPC Latencies / LatencyMon - interrupt to process latency (max), Web, Youtube, Prime95 | |
| Lenovo Yoga Pro 9 16-IRP G8 | |
| Asus Vivobook Pro 16X K6604JV-MX016W | |
| Honor MagicBook Pro 16 2024 | |
| Lenovo ThinkPad Z16 Gen 2 | |
| Framework Laptop 16 | |
| Dell Inspiron 16 Plus 7630 | |
| Schenker VISION 16 Pro (M23) | |
* ... smaller is better
Mass storage
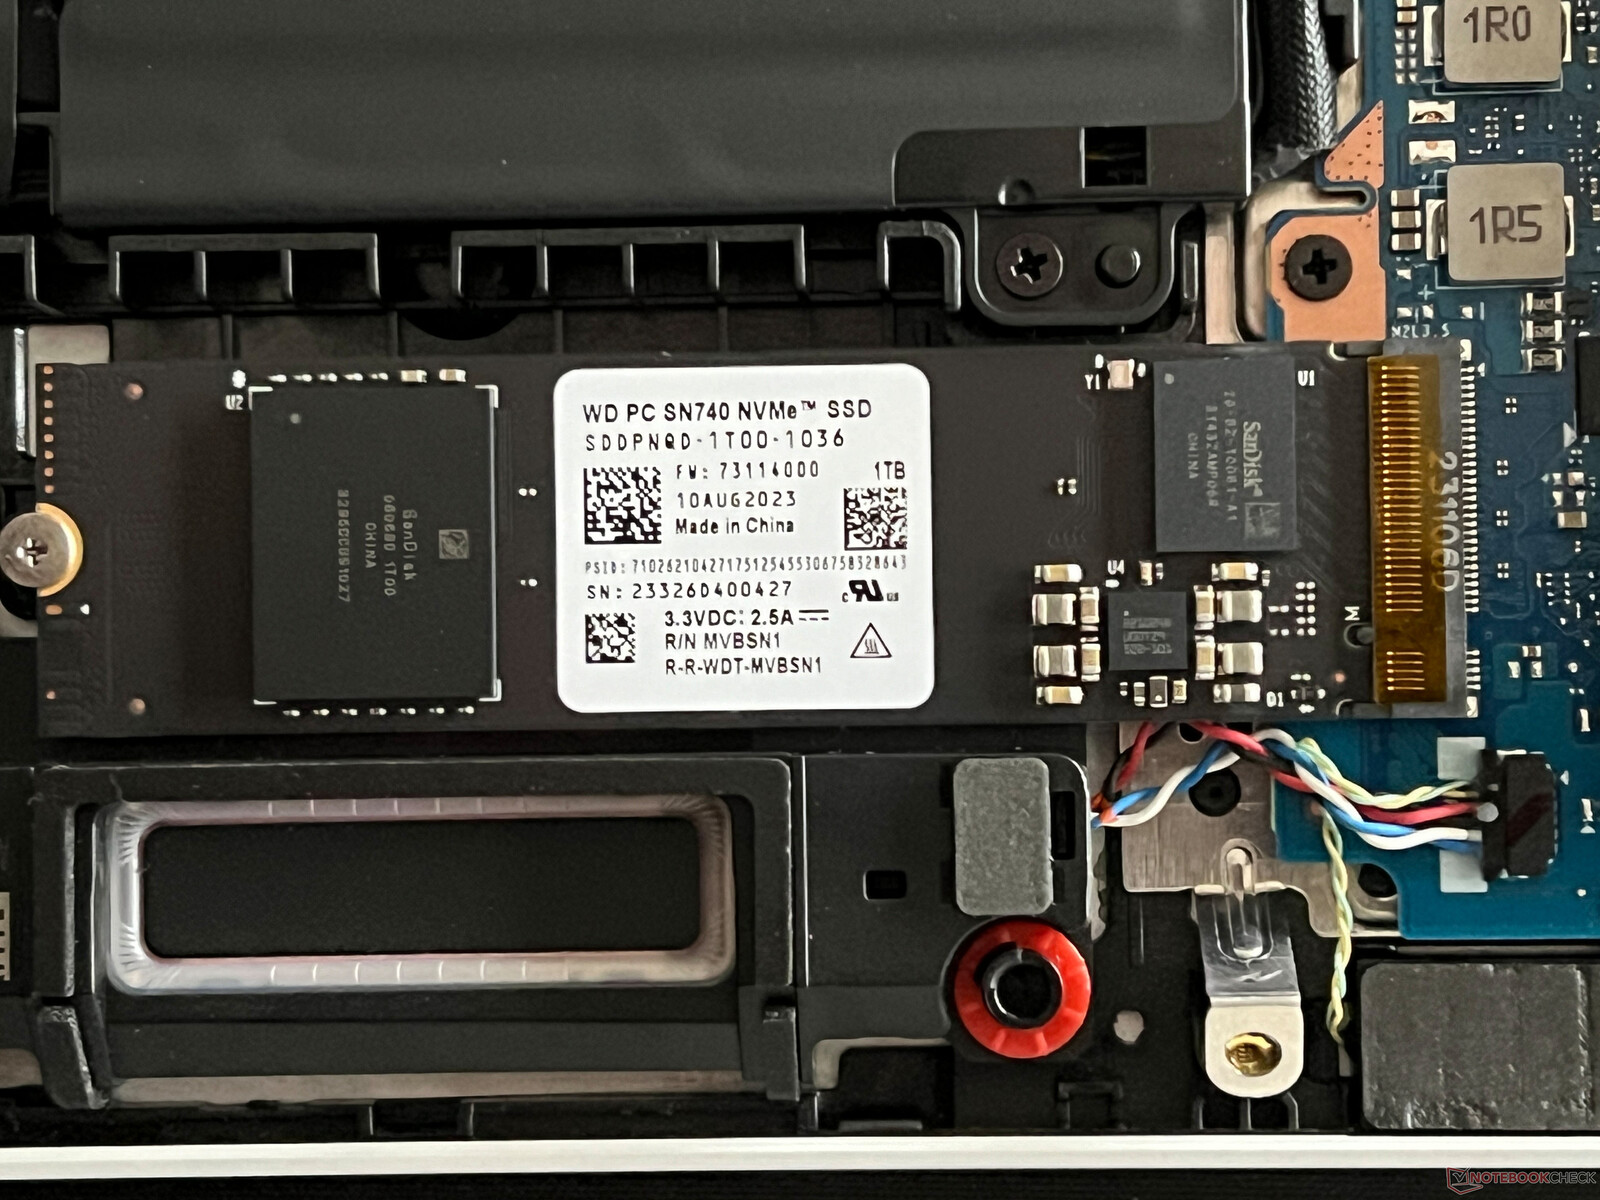
The PCIe 4.0 SSD found in our review device originates from Western Digital (SN740) and offers 1 GB of storage capacity, although the user only has access to 847 GB on the first boot up. However, as with previous Honor devices, the SSD is partitioned and 221 GB are available on the system drive with the remaining 626 GB available on the D drive. That is unnecessary and can quickly lead to problems when installing games if you are not careful with the target directory. The SSD's performance is very good but not completely stable under continuous load. Additional SSD benchmarks are listed here.

* ... smaller is better
Continuous Performance: DiskSpd Read Loop, Queue Depth 8
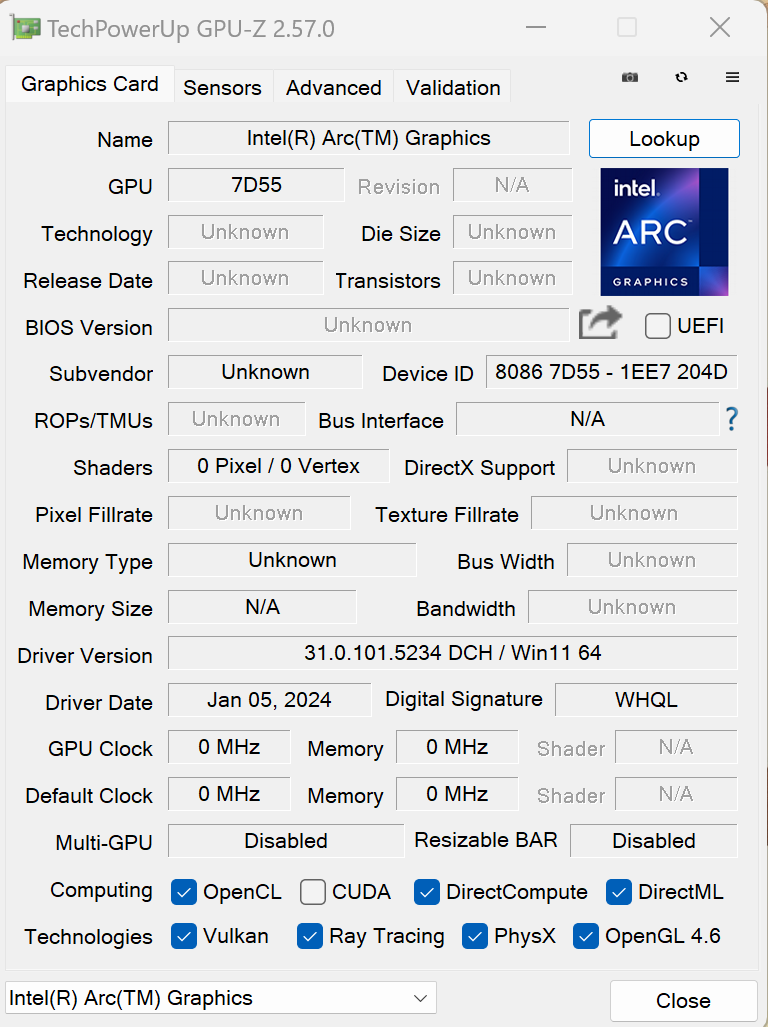
Graphics card
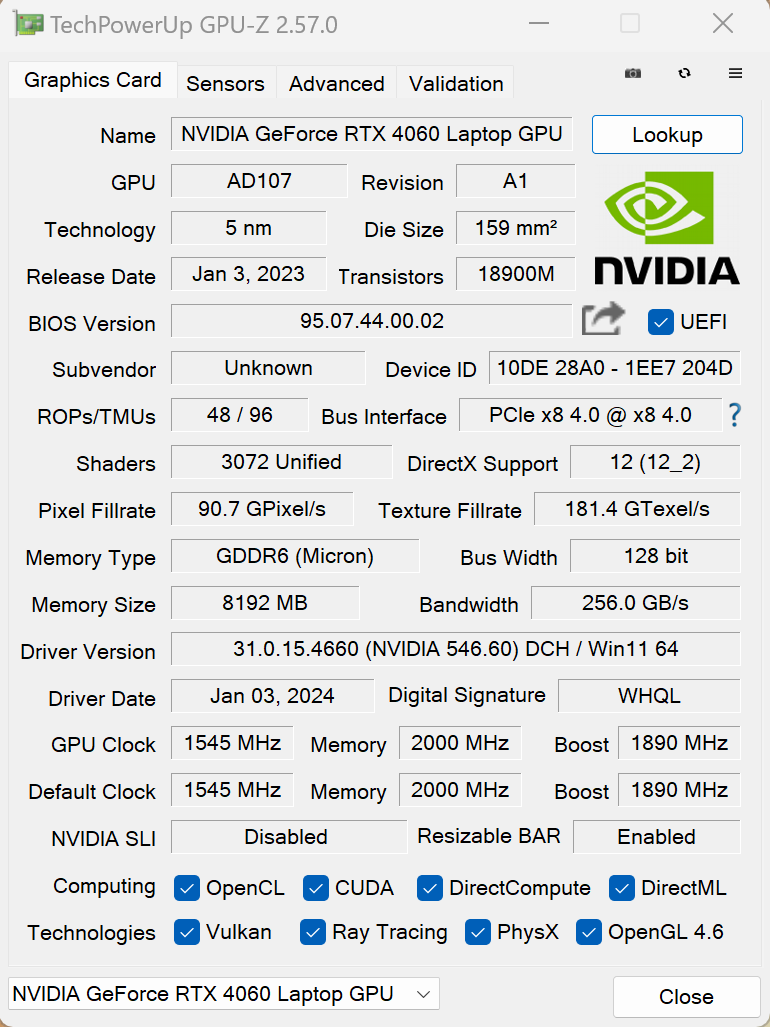
The integrated Arc iGPU takes care of everyday applications including the playback of high-resolution videos, and in addition to this, the device automatically switches to its GeForce RTX 4060 laptop when running demanding applications (Advanced Optimus). Basically, we are dealing with a very fast variant of the RTX 4060 laptop at 115 watts, albeit only in high-performance mode. It's 65 watts in smart mode and, likewise, this is sufficient for good performance values. In high-performance mode, the device elbows its way to the front of the pack of competing devices and this can be seen in the Time Spy result. In this area, the MagicBook can keep up with the competition which is equipped with the weaker variant of the RTX 4070 laptop.
The GPU's performance remains completely stable, even under longer periods of load (with both energy profiles) and easily passes the Time Spy stress test (99,1 %). In battery mode, the GPU can draw a maximum of 50 watts which is why the GPU performance is 15 % lower in this area (compared to the smart mode). Additional GPU benchmarks are available here.
| 3DMark 11 Performance | 28416 points | |
| 3DMark Fire Strike Score | 21094 points | |
| 3DMark Time Spy Score | 9230 points | |
Help | ||
| Blender / v3.3 Classroom OPTIX/RTX | |
| Average of class Multimedia (12 - 105, n=24, last 2 years) | |
| Dell Inspiron 16 Plus 7630 | |
| Asus Vivobook Pro 16X K6604JV-MX016W | |
| Lenovo Yoga Pro 9 16-IRP G8 | |
| Schenker VISION 16 Pro (M23) | |
| Honor MagicBook Pro 16 2024 | |
| Average NVIDIA GeForce RTX 4060 Laptop GPU (19 - 28, n=53) | |
| Blender / v3.3 Classroom CUDA | |
| Average of class Multimedia (20 - 186, n=24, last 2 years) | |
| Dell Inspiron 16 Plus 7630 | |
| Asus Vivobook Pro 16X K6604JV-MX016W | |
| Lenovo Yoga Pro 9 16-IRP G8 | |
| Average NVIDIA GeForce RTX 4060 Laptop GPU (39 - 53, n=53) | |
| Honor MagicBook Pro 16 2024 | |
| Schenker VISION 16 Pro (M23) | |
| Blender / v3.3 Classroom CPU | |
| Average of class Multimedia (134.5 - 1042, n=66, last 2 years) | |
| Dell Inspiron 16 Plus 7630 | |
| Schenker VISION 16 Pro (M23) | |
| Honor MagicBook Pro 16 2024 | |
| Framework Laptop 16 | |
| Average NVIDIA GeForce RTX 4060 Laptop GPU (189 - 452, n=53) | |
| Lenovo Yoga Pro 9 16-IRP G8 | |
| Lenovo ThinkPad Z16 Gen 2 | |
| Asus Vivobook Pro 16X K6604JV-MX016W | |
* ... smaller is better
Gaming performance
All in all, the gaming performance is very good and it's possible to play demanding games smoothly at 1080p and maximum detail settings. At even higher resolutions or with ray tracing, it's not possible to ignore upscaling technologies such as Nvidia's DLSS. In addition, the following table shows the differences between both energy profiles. Using the smart mode, it's also possible, within reason, to play without having to reach for headphones.
| Energy profile | Far Cry 5 | Witcher 3 | Cyberpunk 2077 | Modern Warfare 3 | Star Wars Jedi Survivor |
|---|---|---|---|---|---|
| Smart | 80fps | 68fps | 36.5fps | 51fps | 30.6fps |
| High performance | 103fps | 79fps | 46.3fps | 59fps | 33.7fps |
| The Witcher 3 - 1920x1080 Ultra Graphics & Postprocessing (HBAO+) | |
| Schenker VISION 16 Pro (M23) | |
| Asus Vivobook Pro 16X K6604JV-MX016W | |
| Dell Inspiron 16 Plus 7630 | |
| Lenovo Yoga Pro 9 16-IRP G8 | |
| Framework Laptop 16 | |
| Honor MagicBook Pro 16 2024 | |
| Average of class Multimedia (11 - 121, n=11, last 2 years) | |
| Lenovo ThinkPad Z16 Gen 2 | |
| GTA V - 1920x1080 Highest AA:4xMSAA + FX AF:16x | |
| Lenovo Yoga Pro 9 16-IRP G8 | |
| Asus Vivobook Pro 16X K6604JV-MX016W | |
| Honor MagicBook Pro 16 2024 | |
| Schenker VISION 16 Pro (M23) | |
| Framework Laptop 16 | |
| Average of class Multimedia (7.92 - 141.6, n=61, last 2 years) | |
| F1 2021 - 1920x1080 Ultra High Preset + Raytracing AA:T AF:16x | |
| Schenker VISION 16 Pro (M23) | |
| Average NVIDIA GeForce RTX 4060 Laptop GPU (109.4 - 146.7, n=5) | |
| Lenovo Yoga Pro 9 16-IRP G8 | |
| Honor MagicBook Pro 16 2024 | |
| F1 23 - 1920x1080 Ultra High Preset AA:T AF:16x | |
| Average NVIDIA GeForce RTX 4060 Laptop GPU (43.8 - 119.9, n=13) | |
| Lenovo Yoga Pro 9 16-IRP G8 | |
| Asus Vivobook Pro 16X K6604JV-MX016W | |
| Honor MagicBook Pro 16 2024 | |
| Average of class Multimedia (11 - 70.3, n=4, last 2 years) | |
| Call of Duty Modern Warfare 3 2023 - 1920x1080 Ultra Preset | |
| Average NVIDIA GeForce RTX 4060 Laptop GPU (81 - 99, n=5) | |
| Average of class Multimedia (34 - 127, n=3, last 2 years) | |
| Honor MagicBook Pro 16 2024 | |
| Star Wars Jedi Survivor - 1920x1080 Epic Preset | |
| Schenker VISION 16 Pro (M23) | |
| Lenovo Yoga Pro 9 16-IRP G8 | |
| Average NVIDIA GeForce RTX 4060 Laptop GPU (45.5 - 66.7, n=10) | |
| Asus Vivobook Pro 16X K6604JV-MX016W | |
| Honor MagicBook Pro 16 2024 | |
Witcher 3 FPS diagram
| low | med. | high | ultra | QHD | |
|---|---|---|---|---|---|
| GTA V (2015) | 179.2 | 172.9 | 100.4 | 76.4 | |
| The Witcher 3 (2015) | 177 | 81.5 | 68 | ||
| Dota 2 Reborn (2015) | 174 | 155.5 | 149.7 | 139.5 | |
| Final Fantasy XV Benchmark (2018) | 117.3 | 84.3 | 63.9 | ||
| X-Plane 11.11 (2018) | 135.6 | 120.2 | 91.4 | ||
| Far Cry 5 (2018) | 159 | 127 | 119 | 112 | 80 |
| Strange Brigade (2018) | 191 | 165 | 112 | ||
| F1 2021 (2021) | 212 | 109.4 | 78.6 | ||
| F1 22 (2022) | 152.8 | 54.8 | 34.7 | ||
| Star Wars Jedi Survivor (2023) | 60.6 | 53.3 | 50.1 | 47.8 | 30.6 |
| F1 23 (2023) | 149.2 | 45 | 29 | ||
| Cyberpunk 2077 (2023) | 96.7 | 79.6 | 68.6 | 60.1 | 36.7 |
| Call of Duty Modern Warfare 3 2023 (2023) | 116 | 106 | 81 | 75 | 51 |
| Avatar Frontiers of Pandora (2023) | 46 | 36 | 32 | 25 | 17 |
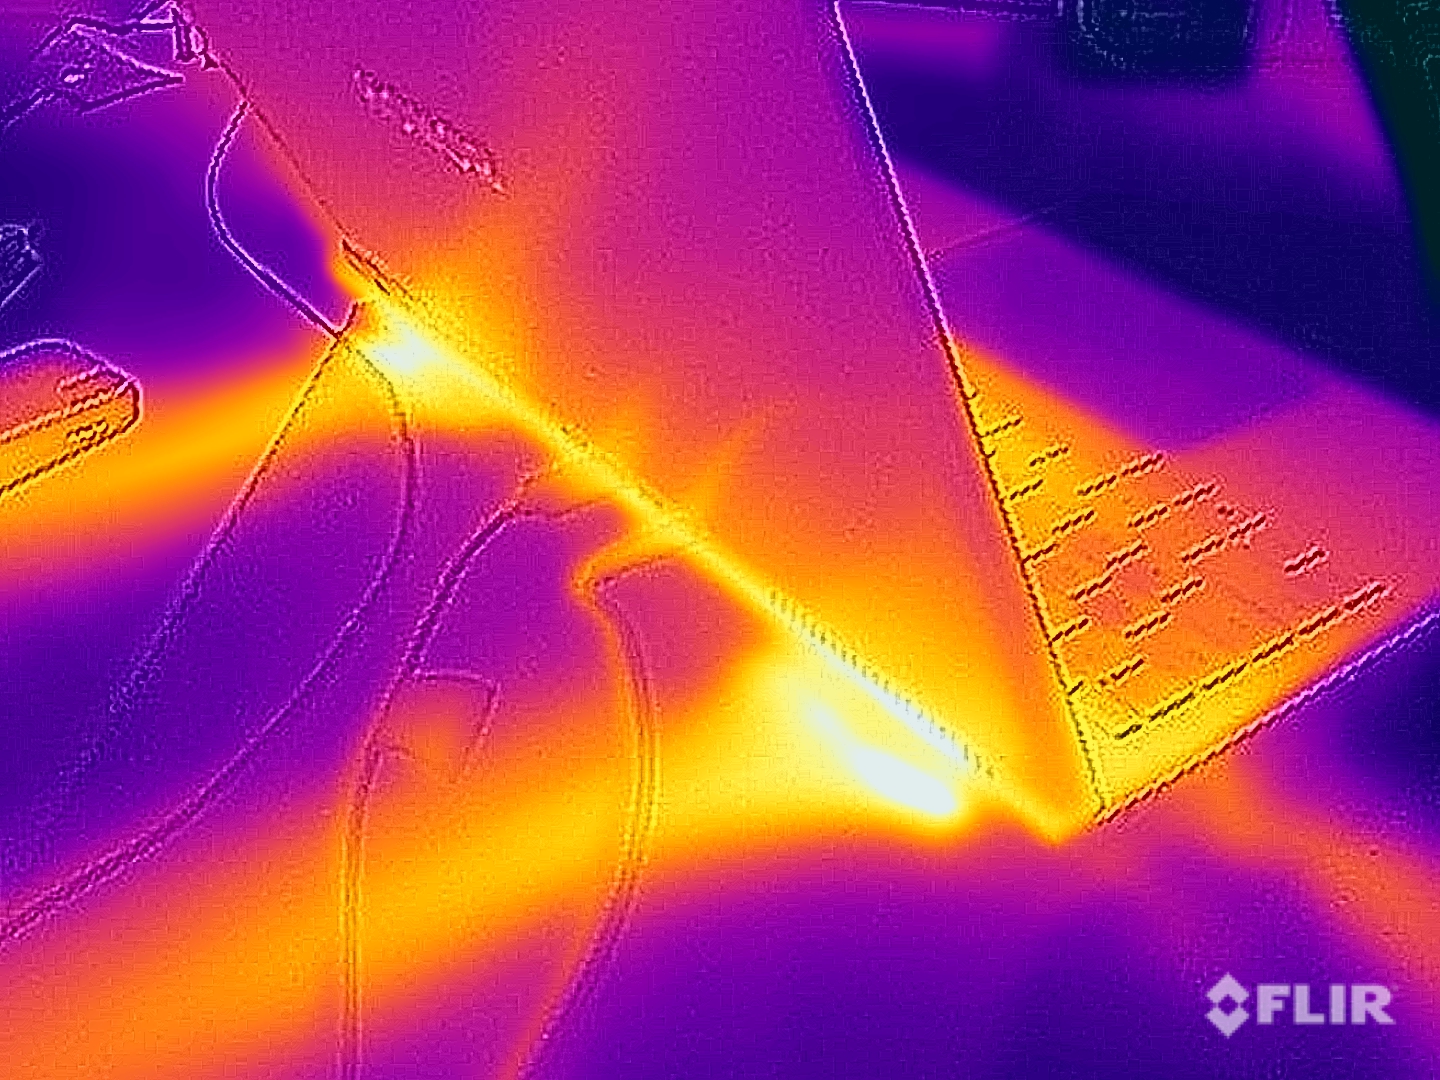
Emissions - Honor has installed powerful cooling
Noise emissions

For its cooling components, Honor uses multiple heat pipes and two large fans. In idle use and running simple tasks, the device is mostly silent or there is only a slight noise level of around 27 dB(A). Brief load peaks can also usually be handled without the fans revving up. When playing games and during the stress test, at 42-45 dB(A), the fans then make themselves heard but the whirring noise isn't annoying and, just as importantly, they remain constant. Thanks to the good speakers, you can also play this way without headphones. At 50-53.7 dB(A) in high-performance mode, it gets significantly louder. There were no other electronic noises present in the review device.
| Energy profile | 3DMark 06 | Witcher 3 | Cyberpunk 2077 Phantom Liberty | stress test |
|---|---|---|---|---|
| Smart | 29 dB(A) | 42.1 dB(A) | 45 dB(A) | 45 dB(A) |
| High performance | 34.4 dB(A) | 47.2 dB(A) | 50.4 dB(A) | 53.7 dB(A) |
Noise level
| Idle |
| 24 / 24 / 27.2 dB(A) |
| Load |
| 29 / 45 dB(A) |
 | ||
30 dB silent 40 dB(A) audible 50 dB(A) loud |
||
min: | ||
| Honor MagicBook Pro 16 2024 GeForce RTX 4060 Laptop GPU, Ultra 7 155H, WD PC SN740 SDDPNQD-1T00 | Framework Laptop 16 Radeon RX 7700S, R9 7940HS, WDC PC SN810 1TB | Lenovo ThinkPad Z16 Gen 2 Radeon RX 6550M, R9 PRO 7940HS, Kioxia XG8 KXG8AZNV1T02 | Dell Inspiron 16 Plus 7630 GeForce RTX 4060 Laptop GPU, i7-13700H, WD PC SN740 SDDPTQD-1T00 | Lenovo Yoga Pro 9 16-IRP G8 GeForce RTX 4060 Laptop GPU, i7-13705H, Samsung PM9A1 MZVL21T0HCLR | Schenker VISION 16 Pro (M23) GeForce RTX 4070 Laptop GPU, i7-13700H, Samsung 990 Pro 1 TB | Asus Vivobook Pro 16X K6604JV-MX016W GeForce RTX 4060 Laptop GPU, i9-13980HX, Solidigm P41 Plus SSDPFKNU010TZ | |
|---|---|---|---|---|---|---|---|
| Noise | -4% | -9% | -6% | -13% | -21% | -24% | |
| off / environment * (dB) | 24 | 23.8 1% | 22.6 6% | 23.2 3% | 24.7 -3% | 25.9 -8% | 25.2 -5% |
| Idle Minimum * (dB) | 24 | 23.9 -0% | 22.9 5% | 23.2 3% | 24.7 -3% | 25.9 -8% | 26.6 -11% |
| Idle Average * (dB) | 24 | 23.9 -0% | 29.4 -22% | 23.2 3% | 26.2 -9% | 25.9 -8% | 26.6 -11% |
| Idle Maximum * (dB) | 27.2 | 23.9 12% | 29.4 -8% | 23.2 15% | 26.2 4% | 32 -18% | 29.2 -7% |
| Load Average * (dB) | 29 | 28.5 2% | 29.5 -2% | 35.1 -21% | 39.7 -37% | 47.2 -63% | 53.4 -84% |
| Witcher 3 ultra * (dB) | 42.1 | 51.9 -23% | 52 -24% | 52.5 -25% | 53.2 -26% | 53.1 -26% | |
| Load Maximum * (dB) | 45 | 53.7 -19% | 52 -16% | 52.5 -17% | 53.2 -18% | 53.1 -18% | 56.9 -26% |
* ... smaller is better
Temperature
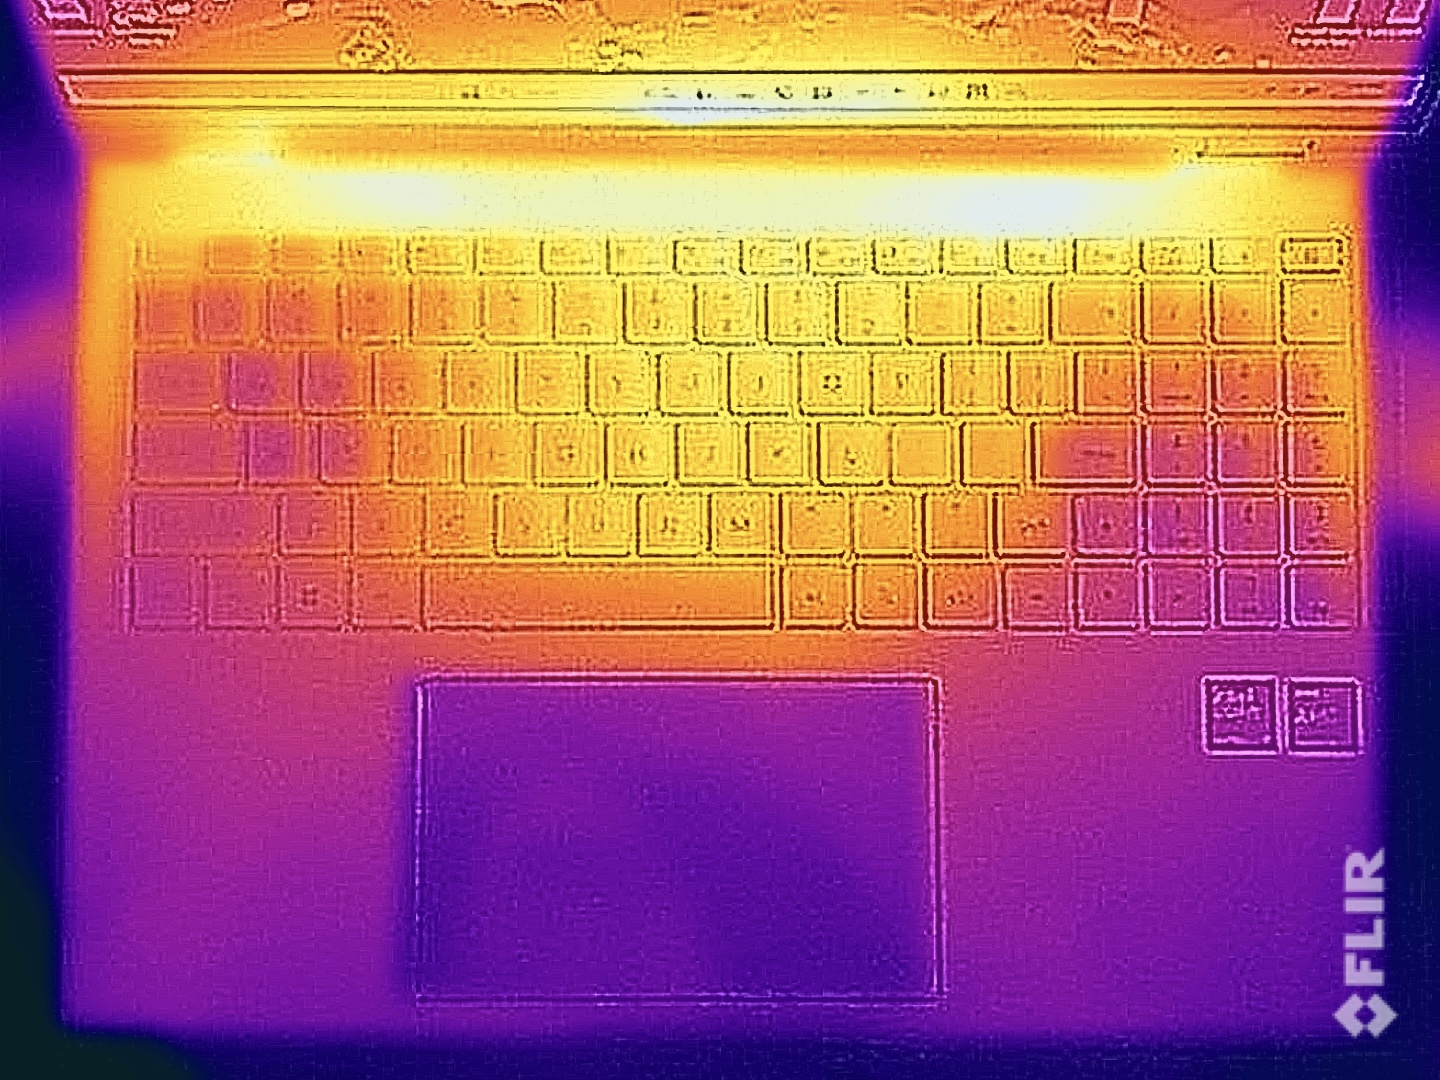
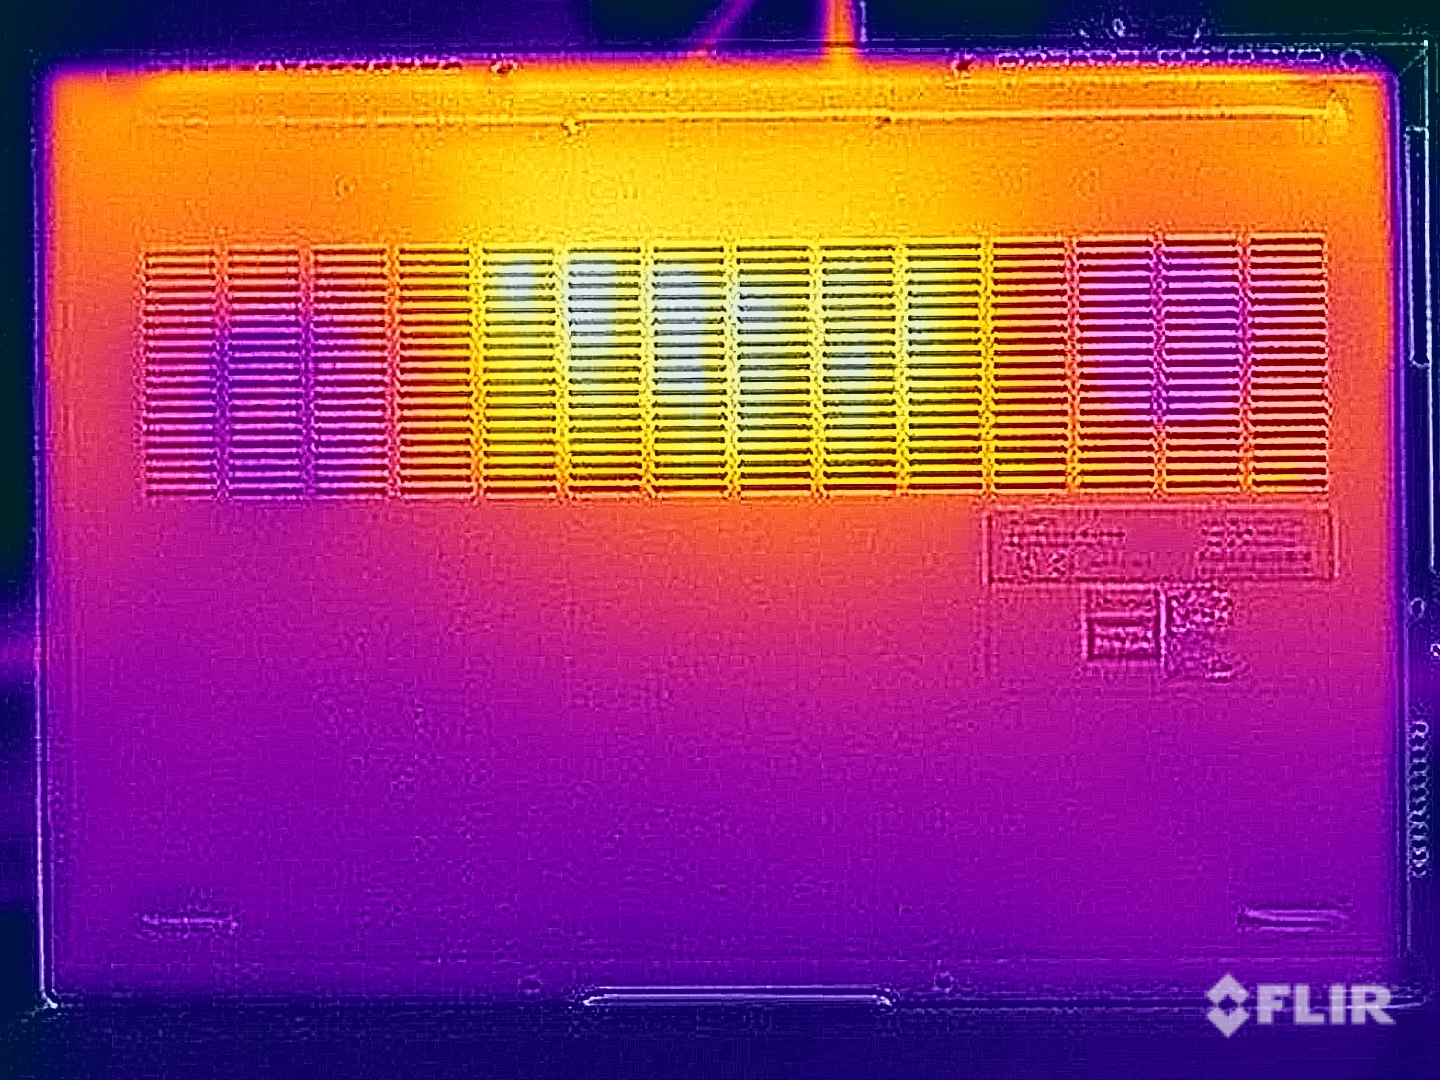
The MagicBook Pro 16's surface temperatures give no cause for concern. In idle use, the case remains very cool and, even under load, the temperatures don't exceed 40 °C on the bottom of the device and are considerably lower than 40 °C in the keyboard area - again no cause for concern. We also measured the temperatures using the optional high-performance mode. Although they are a few degrees higher, these can also be considered good values, in face of the good performance (see the next section).
(+) The maximum temperature on the upper side is 39.7 °C / 103 F, compared to the average of 36.8 °C / 98 F, ranging from 21 to 71 °C for the class Multimedia.
(±) The bottom heats up to a maximum of 42.9 °C / 109 F, compared to the average of 39.1 °C / 102 F
(+) In idle usage, the average temperature for the upper side is 22.9 °C / 73 F, compared to the device average of 31.3 °C / 88 F.
(±) Playing The Witcher 3, the average temperature for the upper side is 32.6 °C / 91 F, compared to the device average of 31.3 °C / 88 F.
(+) The palmrests and touchpad are cooler than skin temperature with a maximum of 26.3 °C / 79.3 F and are therefore cool to the touch.
(+) The average temperature of the palmrest area of similar devices was 28.7 °C / 83.7 F (+2.4 °C / 4.4 F).
Temperatures in high-performance mode
(±) The maximum temperature on the upper side is 40 °C / 104 F, compared to the average of 36.8 °C / 98 F, ranging from 21 to 71 °C for the class Multimedia.
(-) The bottom heats up to a maximum of 45.3 °C / 114 F, compared to the average of 39.1 °C / 102 F
(+) The palmrests and touchpad are cooler than skin temperature with a maximum of 26.8 °C / 80.2 F and are therefore cool to the touch.
(±) The average temperature of the palmrest area of similar devices was 28.7 °C / 83.7 F (+1.9 °C / 3.5 F).
| Honor MagicBook Pro 16 2024 Intel Core Ultra 7 155H, NVIDIA GeForce RTX 4060 Laptop GPU | Framework Laptop 16 AMD Ryzen 9 7940HS, AMD Radeon RX 7700S | Lenovo ThinkPad Z16 Gen 2 AMD Ryzen 9 PRO 7940HS, AMD Radeon RX 6550M | Dell Inspiron 16 Plus 7630 Intel Core i7-13700H, NVIDIA GeForce RTX 4060 Laptop GPU | Lenovo Yoga Pro 9 16-IRP G8 Intel Core i7-13705H, NVIDIA GeForce RTX 4060 Laptop GPU | Schenker VISION 16 Pro (M23) Intel Core i7-13700H, NVIDIA GeForce RTX 4070 Laptop GPU | Asus Vivobook Pro 16X K6604JV-MX016W Intel Core i9-13980HX, NVIDIA GeForce RTX 4060 Laptop GPU | |
|---|---|---|---|---|---|---|---|
| Heat | -13% | 4% | -29% | -14% | -18% | -30% | |
| Maximum Upper Side * (°C) | 39.7 | 42.4 -7% | 43 -8% | 47.8 -20% | 41.6 -5% | 46.7 -18% | 39.7 -0% |
| Maximum Bottom * (°C) | 42.9 | 40.8 5% | 41.6 3% | 42.2 2% | 50 -17% | 54.1 -26% | 60 -40% |
| Idle Upper Side * (°C) | 23.7 | 31.4 -32% | 21.2 11% | 35.2 -49% | 26.8 -13% | 26.5 -12% | 30.9 -30% |
| Idle Bottom * (°C) | 23.5 | 27.8 -18% | 21.4 9% | 35 -49% | 27.9 -19% | 26.8 -14% | 34.7 -48% |
* ... smaller is better
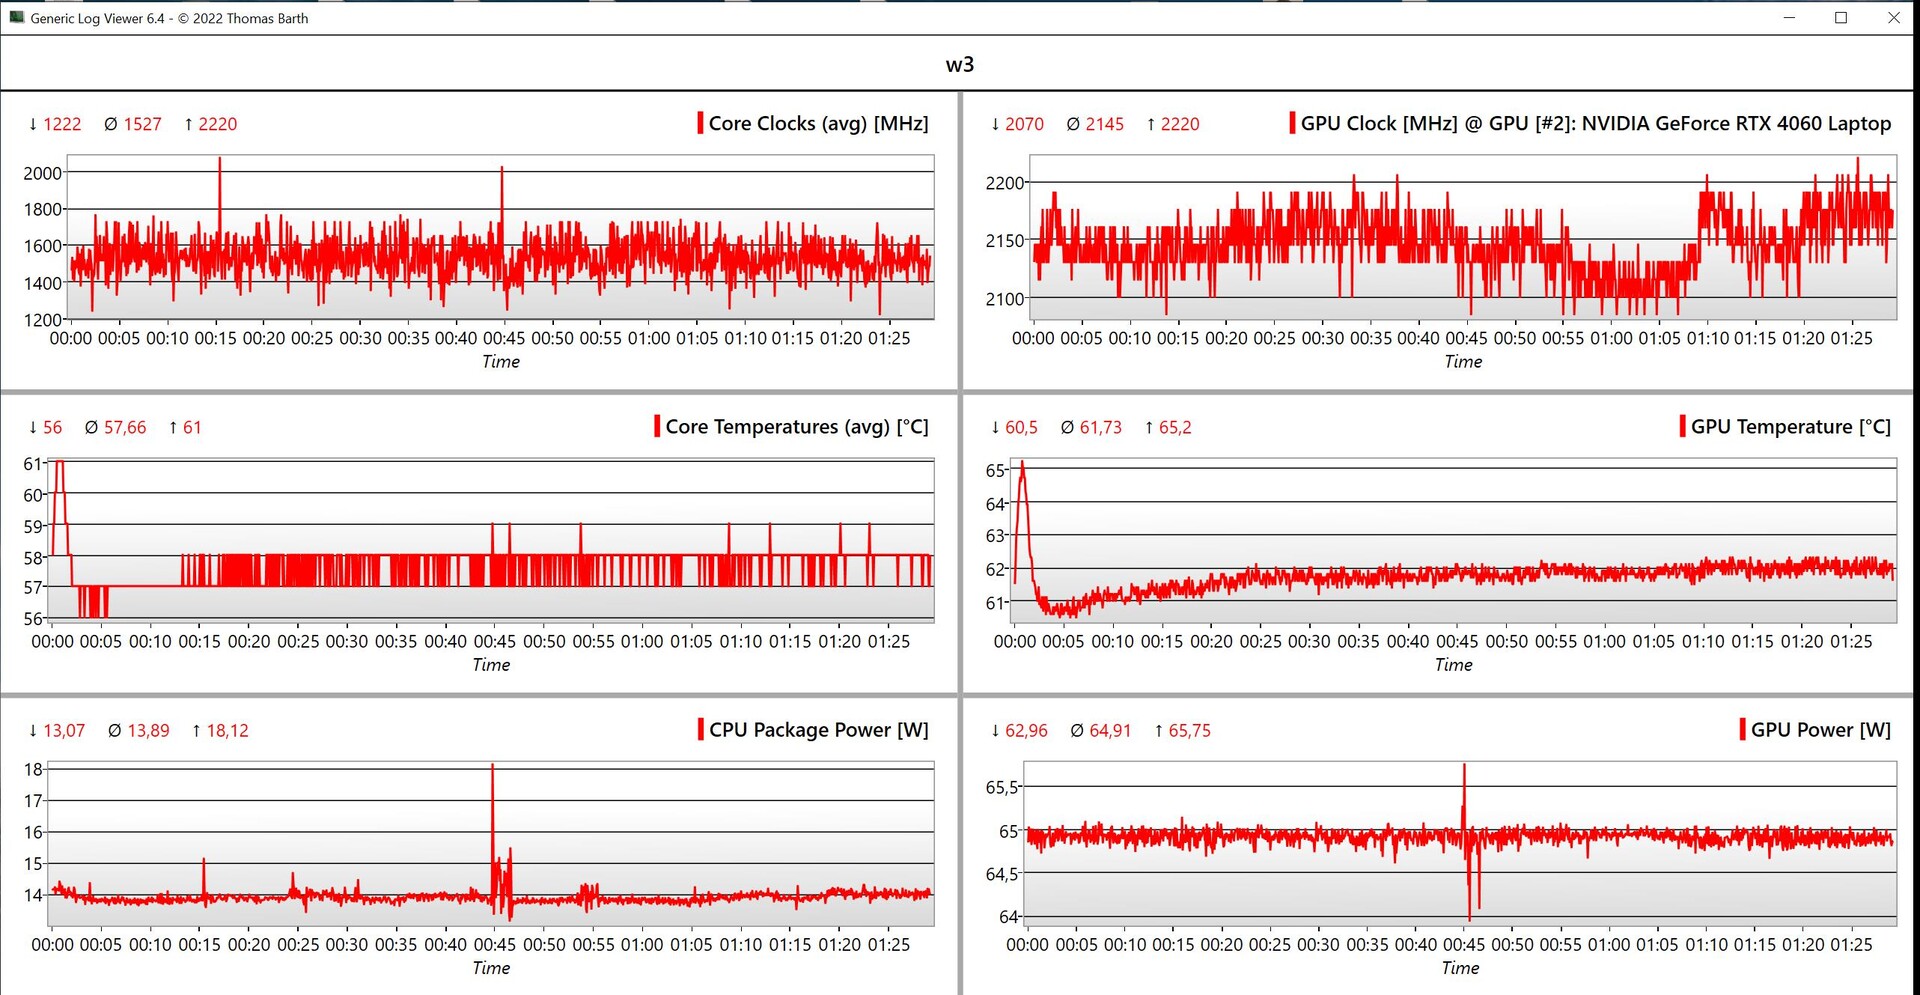
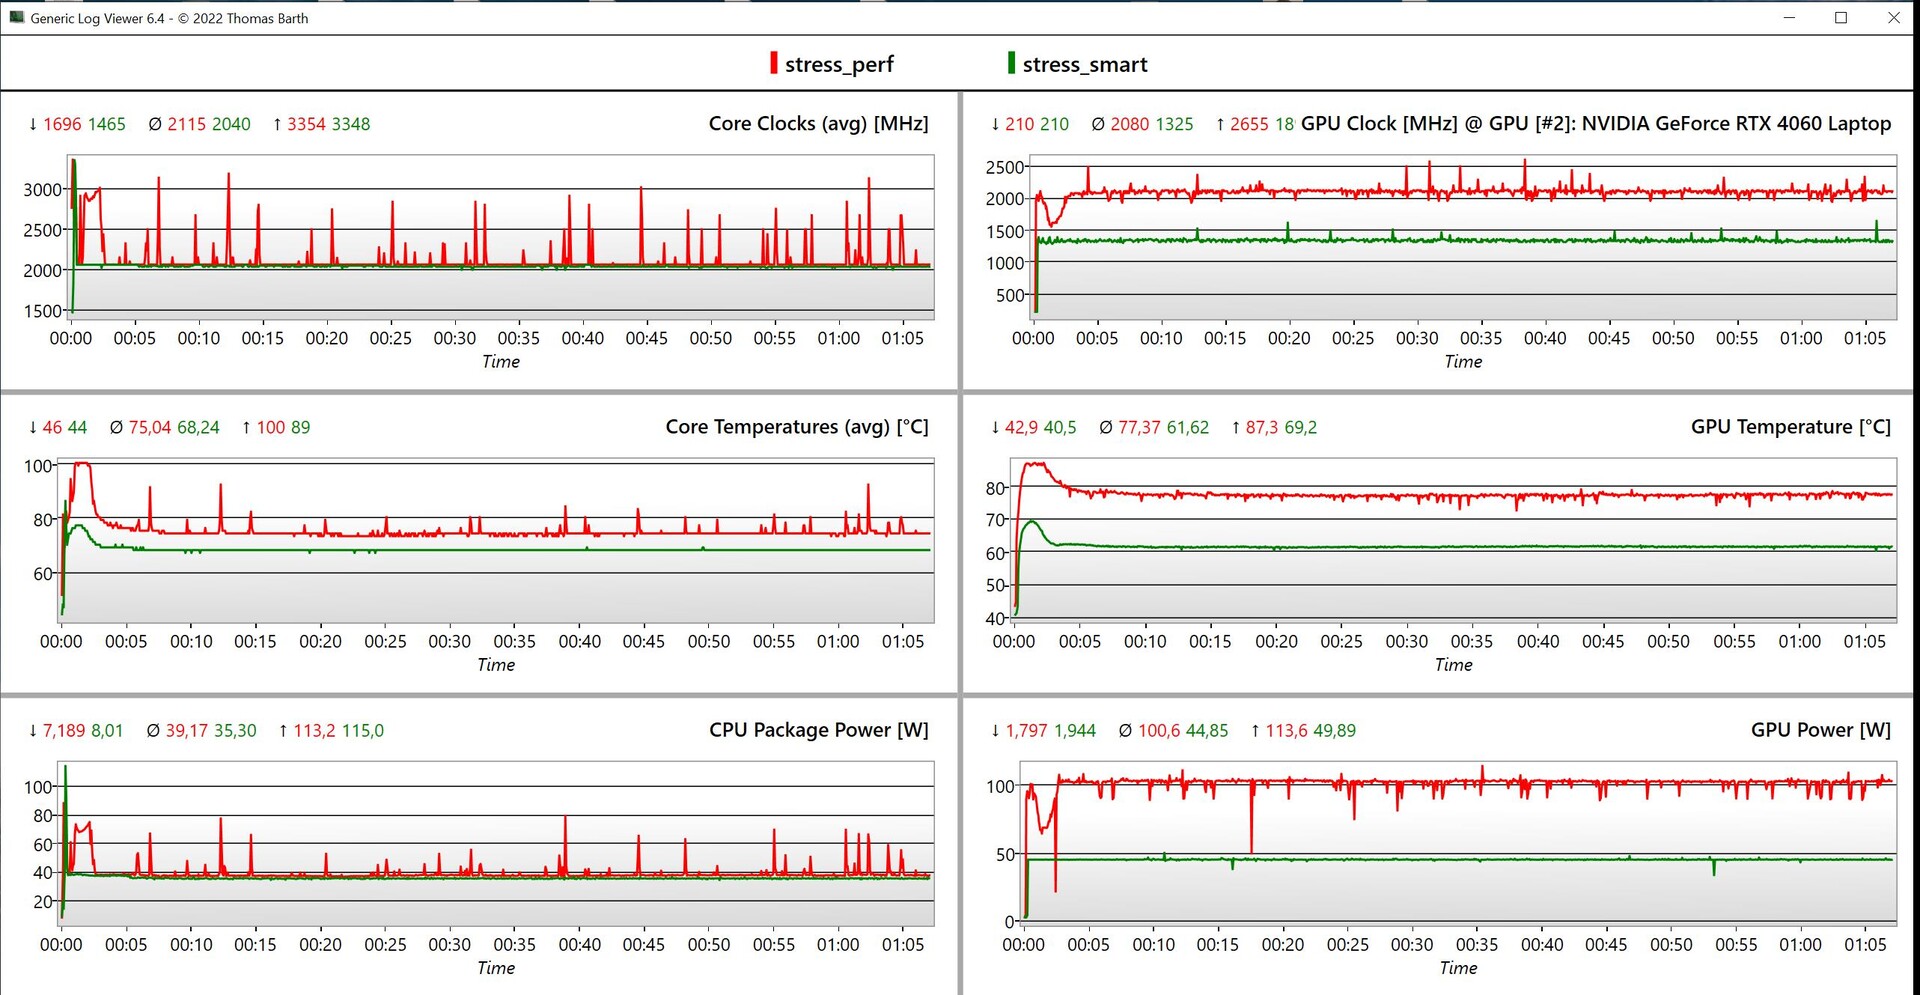
Stress test
In the stress test, the MagicBook Pro 16 performed very well. Using smart mode, the CPU and GPU settled to 35 and 45 watts, respectively and almost 40 watts (CPU) and 100 watts (GPU) in the high-performance mode. Of course, in this case, the fans get louder but the temperatures remain totally acceptable. In battery mode, the stress test consumption dropped to 25 watts for the CPU and 50 watts for the GPU.
Speakers
The sound system consists of 6 speakers which generally provide good sound and they are about the same level as other multimedia devices such as the Lenovo Yoga Pro 9 16. More is possible, especially when it comes to bass but that is high-level moaning
Honor MagicBook Pro 16 2024 audio analysis
(±) | speaker loudness is average but good (81.3 dB)
Bass 100 - 315 Hz
(±) | reduced bass - on average 6.8% lower than median
(±) | linearity of bass is average (9% delta to prev. frequency)
Mids 400 - 2000 Hz
(+) | balanced mids - only 2.1% away from median
(+) | mids are linear (5.2% delta to prev. frequency)
Highs 2 - 16 kHz
(+) | balanced highs - only 2.1% away from median
(+) | highs are linear (6.5% delta to prev. frequency)
Overall 100 - 16.000 Hz
(+) | overall sound is linear (8.7% difference to median)
Compared to same class
» 11% of all tested devices in this class were better, 2% similar, 87% worse
» The best had a delta of 5%, average was 17%, worst was 45%
Compared to all devices tested
» 3% of all tested devices were better, 1% similar, 97% worse
» The best had a delta of 4%, average was 23%, worst was 134%
Lenovo Yoga Pro 9 16-IRP G8 audio analysis
(±) | speaker loudness is average but good (80.5 dB)
Bass 100 - 315 Hz
(+) | good bass - only 4.9% away from median
(±) | linearity of bass is average (9.1% delta to prev. frequency)
Mids 400 - 2000 Hz
(+) | balanced mids - only 3.2% away from median
(+) | mids are linear (6.5% delta to prev. frequency)
Highs 2 - 16 kHz
(+) | balanced highs - only 2.9% away from median
(+) | highs are linear (3% delta to prev. frequency)
Overall 100 - 16.000 Hz
(+) | overall sound is linear (8.4% difference to median)
Compared to same class
» 9% of all tested devices in this class were better, 2% similar, 89% worse
» The best had a delta of 5%, average was 17%, worst was 45%
Compared to all devices tested
» 2% of all tested devices were better, 1% similar, 97% worse
» The best had a delta of 4%, average was 23%, worst was 134%
Energy management - Good stamina
Power consumption
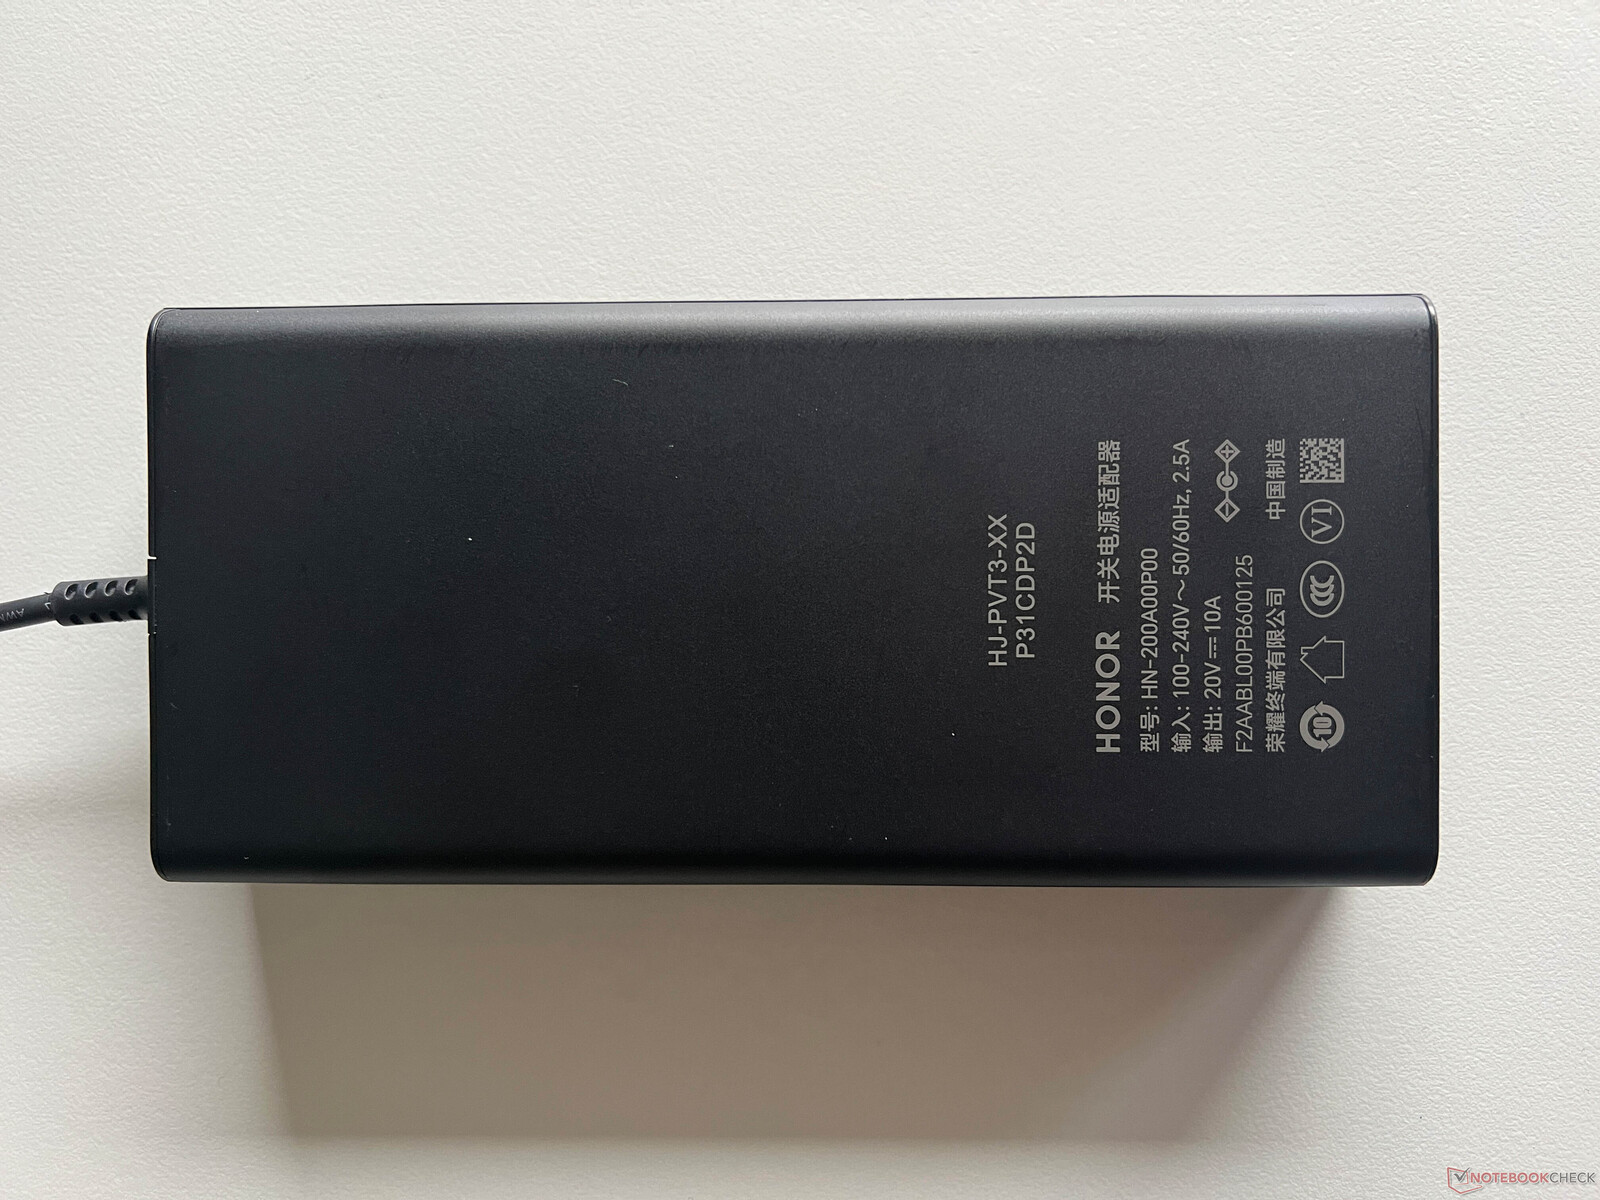
Running idle at full brightness, the IPS display requires up to 15 watts which is very acceptable considering the high brightness and resolution. In the stress test, we briefly measured a maximum of 196 watts although these values quickly settled to 115 watts. In the high-performance mode, we also recorded a maximum of 196 watts but this value stayed longer at this level and then settled to roughly 170 watts. In both cases, the supplied 200-watt PSU is more than sufficient.
| Off / Standby | |
| Idle | |
| Load |
|
Key:
min: | |
| Honor MagicBook Pro 16 2024 Ultra 7 155H, GeForce RTX 4060 Laptop GPU, WD PC SN740 SDDPNQD-1T00, IPS, 3072x1920, 16" | Framework Laptop 16 R9 7940HS, Radeon RX 7700S, WDC PC SN810 1TB, , 2560x1600, 16" | Lenovo ThinkPad Z16 Gen 2 R9 PRO 7940HS, Radeon RX 6550M, Kioxia XG8 KXG8AZNV1T02, OLED, 3840x2400, 16" | Dell Inspiron 16 Plus 7630 i7-13700H, GeForce RTX 4060 Laptop GPU, WD PC SN740 SDDPTQD-1T00, IPS, 2560x1600, 16" | Lenovo Yoga Pro 9 16-IRP G8 i7-13705H, GeForce RTX 4060 Laptop GPU, Samsung PM9A1 MZVL21T0HCLR, Mini-LED, 3200x2000, 16" | Schenker VISION 16 Pro (M23) i7-13700H, GeForce RTX 4070 Laptop GPU, Samsung 990 Pro 1 TB, IPS, 2560x1600, 16" | Asus Vivobook Pro 16X K6604JV-MX016W i9-13980HX, GeForce RTX 4060 Laptop GPU, Solidigm P41 Plus SSDPFKNU010TZ, OLED, 3200x2000, 16" | Average NVIDIA GeForce RTX 4060 Laptop GPU | Average of class Multimedia | |
|---|---|---|---|---|---|---|---|---|---|
| Power Consumption | -26% | 7% | -37% | -40% | -5% | -50% | -32% | 24% | |
| Idle Minimum * (Watt) | 5.2 | 9.5 -83% | 7.5 -44% | 15.6 -200% | 10.9 -110% | 8.6 -65% | 13.8 -165% | 11.5 ? -121% | 5.65 ? -9% |
| Idle Average * (Watt) | 14.4 | 17 -18% | 9.6 33% | 17.7 -23% | 22.6 -57% | 12 17% | 16 -11% | 16 ? -11% | 10 ? 31% |
| Idle Maximum * (Watt) | 15.4 | 17.2 -12% | 18.5 -20% | 20.6 -34% | 23.5 -53% | 12.4 19% | 19 -23% | 20.3 ? -32% | 12.3 ? 20% |
| Load Average * (Watt) | 105.4 | 96.2 9% | 57.1 46% | 87.4 17% | 84.6 20% | 80 24% | 147 -39% | 92.9 ? 12% | 65.1 ? 38% |
| Witcher 3 ultra * (Watt) | 107.6 | 171.9 -60% | 115.8 -8% | 121.7 -13% | 159.5 -48% | 147.7 -37% | 147.8 -37% | ||
| Load Maximum * (Watt) | 195.2 | 175.7 10% | 131.7 33% | 138 29% | 177.3 9% | 173.1 11% | 244 -25% | 210 ? -8% | 112.5 ? 42% |
* ... smaller is better
Power consumption Witcher 3 / stress test
Power consumption with an external monitor
Battery life
The 75 Wh battery allows for very good run times with adaptive brightness set to 150 cd/m² (representing 55% of the review device's maximum brightness). At 60 Hz, our Wi-Fi test ran for more than 12 hours and, at 165 Hz, it ran for 9 hours and 20 minutes. If you use the full display brightness, you can get around 6 hours and this is where the higher frequency no longer has a major influence (359 minutes at 165 Hz). Our video test (set to 150 cd/m²) ran for more than 13 hours but, under maximum load and at full brightness, it's possible to completely drain the battery within 58 minutes. A full charging cycle, with the device turned on, only takes 62 minutes and you have access to 80 % after only 34 minutes.
| Honor MagicBook Pro 16 2024 Ultra 7 155H, GeForce RTX 4060 Laptop GPU, 75 Wh | Framework Laptop 16 R9 7940HS, Radeon RX 7700S, 85 Wh | Lenovo ThinkPad Z16 Gen 2 R9 PRO 7940HS, Radeon RX 6550M, 72 Wh | Dell Inspiron 16 Plus 7630 i7-13700H, GeForce RTX 4060 Laptop GPU, 86 Wh | Lenovo Yoga Pro 9 16-IRP G8 i7-13705H, GeForce RTX 4060 Laptop GPU, 75 Wh | Schenker VISION 16 Pro (M23) i7-13700H, GeForce RTX 4070 Laptop GPU, 80 Wh | Asus Vivobook Pro 16X K6604JV-MX016W i9-13980HX, GeForce RTX 4060 Laptop GPU, 90 Wh | Average of class Multimedia | |
|---|---|---|---|---|---|---|---|---|
| Battery runtime | 13% | 10% | 9% | -40% | -15% | -19% | 30% | |
| H.264 (h) | 13.1 | 7.5 -43% | 7.8 -40% | 5.3 -60% | 16.2 ? 24% | |||
| WiFi v1.3 (h) | 12.2 | 9.1 -25% | 6 -51% | 9.4 -23% | 6.4 -48% | 7.8 -36% | 6.5 -47% | 12 ? -2% |
| Load (h) | 1 | 1.5 50% | 1.7 70% | 1.4 40% | 0.7 -30% | 1.3 30% | 1.5 50% | 1.669 ? 67% |
Pros
Cons
Verdict - The MagicBook Pro 16 is a surprisingly good multimedia laptop
With the new MagicBook Pro 16, Honor is breaking new ground and bringing a powerful multimedia laptop to the market that is interesting for both content creators and gamers. In particular, when it comes to cooling, the device is impressive even in the first run-through. Using smart mode, a good balance has been found between performance and fan volume meaning you can play games without headphones. In the high-performance mode, the combined CPU/GPU performance load is very pronounced and comes at the cost of fan volume. In both cases, the surface temperatures give no cause for concern. Demanding titles benefit from the combination of the new Core Ultra 7 155H and the GeForce RTX 4060 laptop together with Advanced Optimus and fit well to a multimedia laptop.
In terms of the display, Honor has not gone for mini LED or OLED but has opted for a classic IPS panel with a high resolution of 3,072 x 1,920 pixels. The surface is matte which is why colors are not very vibrant, meaning you will have to live with some limitations, especially in the areas of black levels and contrast ratio. However, the advantage is that PWM is absent and the panel's full brightness of more than 500 nits is accessible in normal SDR operation. Likewise, the response times are pleasantly fast. Anyone who likes to edit photos and videos will be annoyed that there is no sRGB profile.
The new Honor MagicBook Pro 16 is a very balanced multimedia laptop with powerful components and effective cooling. The bright, matte IPS panel doesn't suffer from PWM and offers a high frequency of 165 Hz as well as speedy response times.
Additional advantages are the comfortable keyboard and its numerical pad, the 6-speaker sound system as well as the Wi-Fi performance, even though you have to do without the current standards (Wi-Fi 6E, Wi-Fi 7). In terms of ports, more would have been possible (for example, HDMI 2.1 with G-Sync), but, at least with Thunderbolt 4 and HDMI 2.0, the most important standards are covered. The location of the USB-A ports on the rear of the device is not perfect and these would have fit better on the right-hand side of the device.
We were also not completely bowled over by the plastic case as this is responsible for some creaking noises, even though the stability itself is very good. Additionally, although it is not possible to expand the RAM, our 32 GB review configuration ought to be sufficient for most users. In tests, on a few occasions, the clickpad didn't work properly but with this only happening sporadically we presume it has something to do with driver problems. Hopefully, this can get sorted out before the device hits the market.
And that's where we come to our next problem. Unfortunately, we currently don't have any information regarding the availability (presumably as of the second quarter) or price, which is why it's difficult to make comparisons with competing devices such as the Lenovo Yoga Pro 9i 16, at the moment. We will add the information as soon as possible.
Price and availability
The new Honor MagicBook Pro 16 2024 is expected to be available globally as of the second quarter. At the current time, we are not yet able to name the RRP.
Honor MagicBook Pro 16 2024
- 02/28/2024 v7 (old)
Andreas Osthoff
Transparency
The selection of devices to be reviewed is made by our editorial team. The test sample was provided to the author as a loan by the manufacturer or retailer for the purpose of this review. The lender had no influence on this review, nor did the manufacturer receive a copy of this review before publication. There was no obligation to publish this review. As an independent media company, Notebookcheck is not subjected to the authority of manufacturers, retailers or publishers.
This is how Notebookcheck is testing
Every year, Notebookcheck independently reviews hundreds of laptops and smartphones using standardized procedures to ensure that all results are comparable. We have continuously developed our test methods for around 20 years and set industry standards in the process. In our test labs, high-quality measuring equipment is utilized by experienced technicians and editors. These tests involve a multi-stage validation process. Our complex rating system is based on hundreds of well-founded measurements and benchmarks, which maintains objectivity. Further information on our test methods can be found here.
Price comparison

