Reviews for the AMD Ryzen 9 7940HS processor
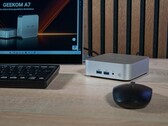
Geekom A7 Max Mini-PC review: Elegant all-rounder with Ryzen 9 7940HS and wasted performance
With the Geekom A7 Max, the manufacturer is sending a powerful mini PC with AMD Ryzen 9 7940HS and Radeon 780M into the race. DDR5 RAM, a fast PCIe SSD, and numerous connections sound promising. But can the compact system deliver this performance over the long term - and how does it perform in terms of cooling, noise, and efficiency in everyday use?
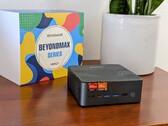
AMD Ryzen 9 7940HS, Radeon 780M, 681 gBOSGAME M2 mini PC review: Fixes a major complaint about the original M1
The M2 addresses the audio issues we reported about on the M1 while upping the base processor option from Ryzen 7 to Ryzen 9. However, we think the manufacturer should have gone the extra mile to better differentiate between the two models.
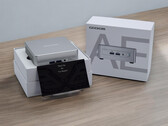
AMD Ryzen 9 7940HS, Radeon 780M, 819 gGeekom AE7 review: NUC mini-PC with AMD Ryzen 9 7940HS, DDR5 RAM, modern interfaces and one problem
The Geekom AE7 mini-PC corresponds to the well-known Intel NUC models, which are now marketed by Asus. An AMD Ryzen 9 7940HS is used as the CPU, which promises a lot thanks to its powerful iGPU. The most important thing, however, is the power available for the CPU, which has a significant impact on performance. In this review, we have put the Geekom AE7 through all the benchmarks and the performance of the mini-PC.
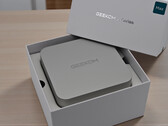
AMD Ryzen 9 7940HS, Radeon 780M, 578 gGeekom A7 with 0.5l case in review: Premium mini-PC with AMD Ryzen 9 7940HS, 32 GB DDR5 RAM and 2 TB SSD
Visually, the Geekom A7 impresses with its stylish design. A look at the datasheet also promises a lot because you can expect a lot from an AMD Ryzen 9 7940HS. As a result, and also thanks to the pricing, the Geekom A7 is aimed at the premium segment. We analyze whether the mini PC lives up to this claim in the test with numerous measurements and benchmarks.
AMD Ryzen 9 7940HS, Radeon 780M, 417 gRadeon RX 7700S performance debut: Framework Laptop 16 review
The name may be generic, but the design is anything but. The environmentally-friendly Laptop 16 takes everything great about the Laptop 13.5 and bumps it up a notch with even more upgradeable and customizable components including a removable Radeon RDNA 3 GPU.
AMD Ryzen 9 7940HS, Radeon RX 7700S, 16", 2.4 kgAsus TUF Gaming A17 FA707XI-NS94: NVIDIA GeForce RTX 4070 Laptop GPU, 17.30", 2.5 kg
Review » Asus TUF Gaming A17 FA707XI laptop review: 140 W GeForce RTX 4070 for $1400
Asus ROG Flow X13 GV302XV: NVIDIA GeForce RTX 4060 Laptop GPU, 13.40", 1.3 kg
Review » Asus ROG Flow X13 GV302XV (2023) Review: Svelte gaming convertible that packs a punch with AMD Zen 4 Ryzen 9 7940HS and 60 W Nvidia RTX 4060
Minisforum Venus Series UM790 Pro: AMD Radeon 780M, 0.7 kg
Review » Minisforum Venus Series UM790 Pro review: Better than its competitors thanks to an AMD Ryzen 9 7940HS and a Radeon 780M
Razer Blade 14 RTX 4070: NVIDIA GeForce RTX 4070 Laptop GPU, 14.00", 1.8 kg
Review » Razer Blade 14 Zen 4 laptop review: Lots of changes that matter
Asus TUF Gaming A16 FA617XS: AMD Radeon RX 7600S, 16.00", 2.2 kg
Review » Asus TUF Gaming A16 Advantage Edition FA617XS review: The AMD laptop with up to 20-hour runtimes
Asus ROG Zephyrus G14 GA402XY: AMD Radeon 780M, 14.00"
Review » AMD Radeon 780M iGPU analysis - AMD's new RDNA-3 GPU takes on its competitors
Review » AMD Ryzen 9 7940HS analysis - Zen4 Phoenix is ideally as efficient as Apple
Review » Asus ROG Zephyrus G14 Review - Compact Gaming Laptop with AMD Zen4 Phoenix & RTX 4090
Acer Nitro 17 AN17-41-R3S4: NVIDIA GeForce RTX 4070 Laptop GPU, 17.30", 3.1 kg
External Review » Acer Nitro 17 AN17-41-R3S4
Acer Nitro 16 AN16-41, R9 7940HS: NVIDIA GeForce RTX 4070 Laptop GPU, 16.00", 2.7 kg
External Review » Acer Nitro 16 AN16-41, R9 7940HS
Asus VivoBook Pro 15 M6500XV: NVIDIA GeForce RTX 4060 Laptop GPU, 15.60", 1.8 kg
External Review » Asus VivoBook Pro 15 M6500XV
Framework Laptop 16: AMD Radeon RX 7700S, 16.00", 2.4 kg
External Review » Framework Laptop 16
HP Omen 16-xf0000ng: NVIDIA GeForce RTX 4070 Laptop GPU, 16.10", 2.4 kg
External Review » HP Omen 16-xf0000ng
Asus ROG Zephyrus G14 GA402XI: NVIDIA GeForce RTX 4070 Laptop GPU, 14.00", 1.7 kg
External Review » Asus ROG Zephyrus G14 GA402XI
Asus TUF Gaming A15 FA507XI: NVIDIA GeForce RTX 4070 Laptop GPU, 15.60", 2.2 kg
External Review » Asus TUF Gaming A15 FA507XI
Acer Swift X SFX16-61G: NVIDIA GeForce RTX 4050 Laptop GPU, 16.00", 2 kg
External Review » Acer Swift X SFX16-61G
Asus ROG Zephyrus G14 GA402XZ: NVIDIA GeForce RTX 4080 Laptop GPU, 14.00", 1.7 kg
External Review » Asus ROG Zephyrus G14 GA402XZ
Asus TUF Gaming A17 FA707XI: NVIDIA GeForce RTX 4070 Laptop GPU, 17.30", 2.6 kg
External Review » Asus TUF Gaming A17 FA707XI
Asus ROG Flow X13 GV302XI: NVIDIA GeForce RTX 4070 Laptop GPU, 13.40", 1.3 kg
External Review » Asus ROG Flow X13 GV302XI
Razer Blade 14 RTX 4060: NVIDIA GeForce RTX 4060 Laptop GPU, 14.00", 1.8 kg
External Review » Razer Blade 14 RTX 4060
Asus ROG Zephyrus G14 GA402XV: NVIDIA GeForce RTX 4060 Laptop GPU, 14.00", 1.7 kg
External Review » Asus ROG Zephyrus G14 GA402XV
Asus TUF Gaming A15 FA507XV: NVIDIA GeForce RTX 4060 Laptop GPU, 15.60", 2.2 kg
External Review » Asus TUF Gaming A15 FA507XV
Razer Blade 14 RTX 4070: NVIDIA GeForce RTX 4070 Laptop GPU, 14.00", 1.8 kg
External Review » Razer Blade 14 RTX 4070
Asus ROG Flow X13 GV302XV: NVIDIA GeForce RTX 4060 Laptop GPU, 13.40", 1.3 kg
External Review » Asus ROG Flow X13 GV302XV
Asus TUF Gaming A16 FA617XS: AMD Radeon RX 7600S, 16.00", 2.2 kg
External Review » Asus TUF Gaming A16 FA617XS
Asus ROG Zephyrus G14 GA402XY: NVIDIA GeForce RTX 4090 Laptop GPU, 14.00", 1.7 kg
External Review » Asus ROG Zephyrus G14 GA402XY
Framework Laptop 16: AMD Radeon RX 7700S, 16.00", 2.4 kg
» $500 for 4 GB VRAM: Nvidia GeForce RTX 5070 12 GB is extremely expensive
Geekom A7 Max, R9 7940HS: AMD Radeon 780M, 0.7 kg
» Mini PC with AMD Ryzen 9: Is the Geekom A7 Max Edition 2026 worth it?
Geekom AE7: AMD Radeon 780M, 0.6 kg
» Geekom AE7 mini PC with AMD Ryzen 9 and 32GB RAM gets massive 34% discount
Framework Laptop 16: AMD Radeon RX 7700S, 16.00", 2.4 kg
» Framework 12 announced as repairable 'entry-level' 2-in-1 laptop with rugged design
» Framework Laptop 16 now supports four M.2 SSDs for up to 16 TB of storage
Asus TUF Gaming Advantage A16: AMD Radeon RX 7600S, 0.00"
» RTX 4060-equivalent Asus TUF A16 gaming laptop gets $400 discount: 40 percent off Ryzen 7, Radeon RX 7700S 1080p powerhouse in Best Buy Black Friday deal
Framework Laptop 16: AMD Radeon RX 7700S, 16.00", 2.4 kg
» Framework Laptop Brick System expands notebook with Lego feet, wheels, cable holders and more
Asus ROG Zephyrus G14 GA402XI: NVIDIA GeForce RTX 4070 Laptop GPU, 14.00", 1.7 kg
» Asus ROG Zephyrus G14 gaming laptop with RTX 4070 back on sale for record-low price
HP Omen 16-xf0000ng: NVIDIA GeForce RTX 4070 Laptop GPU, 16.10", 2.4 kg
» HP Omen 16 gaming laptop with RTX 4070 and Ryzen 9 now discounted by $750
Asus ROG Zephyrus G14 GA402XY: NVIDIA GeForce RTX 4090 Laptop GPU, 14.00", 1.7 kg
» Maxed-out Asus ROG Zephyrus G14 gaming laptop with RTX 4090 and 32GB RAM gets $500 price cut
Asus ROG Zephyrus G14 GA402XV: NVIDIA GeForce RTX 4060 Laptop GPU, 14.00", 1.7 kg
» RTX 4060-powered Asus ROG Zephyrus G14 QHD gaming laptop with AMD Ryzen 9 7940HS now 31% off
Asus TUF Gaming A15 FA507XV: NVIDIA GeForce RTX 4060 Laptop GPU, 15.60", 2.2 kg
» 2023 Lenovo Legion Slim 5 price sees whopping 38% cut for open-box SKU with Ryzen 5 7640HS CPU and RTX 4060 GPU