BOSGAME M2 mini PC review: Fixes a major complaint about the original M1
Verdict — Essentially The Same Performance As The M1
The Bosgame M2 addresses the audio latency that noted in the original M1 with its integrated speakers. The newer model may therefore appeal to users who value the speakers as such a feature is uncommon on most mini PCs. Otherwise, it is essentially the same machine with the same performance despite the "upgraded" processor.
For potential future revisions, we would like to see the system move away from the proprietary AC adapter to universal USB-C Power Delivery instead. It's also a shame that the M2 continues to use AMD Zen 4 when Zen 5 is already available with integrated AI acceleration. In this sense, the M2 feels more like a separate SKU of the M1 rather than a true successor. Perhaps a more appropriate name would have been the "M1 Pro" or "M1 Ryzen 9 Edition".
Pros
Cons
Price and Availability
Amazon is now shipping the Bosgame M2 for $600 complete with 32 GB of RAM and 1 TB SSD. Alternatively, users can purchase directly from the manufacturer for $700.
Potential Competitors in Comparison
Image | Model / Review | Price | Weight | Height | Display |
|---|---|---|---|---|---|
1. 79%  | BOSGAME M2 AMD Ryzen 9 7940HS ⎘ AMD Radeon 780M ⎘ 32 GB Memory, 1024 GB SSD | Amazon: 1. $689.99 BOSGAME eGPU Graphic Card Do... 2. $509.99 BOSGAME P4 Plus Mini PC Desk... 3. $289.99 BOSGAME E2 Mini PC, AMD Ryze... List Price: 600 USD | 819 g | 51 mm | x |
2. 84.5% v7 (old)  | BOSGAME M1 AMD Ryzen 7 7840HS ⎘ AMD Radeon 780M ⎘ 32 GB Memory, 1024 GB SSD | Amazon: 1. $699.99 BOSGAME P3 Mini Gaming PC AM... 2. $654.54 BOSGAME M4 Neo Oculink Mini ... 3. $649.99 BOSGAME M4 Neo Ryzen 7 7840H... List Price: 690 USD | 766 g | 51 mm | x |
3. 66.1% 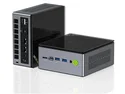 | GMK NucBox M7 Pro AMD Ryzen 9 PRO 6950H ⎘ AMD Radeon 680M ⎘ 32 GB Memory | Amazon: List Price: 440 USD | 621 g | 58.4 mm | x |
4. 77.1% 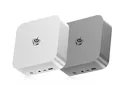 | Beelink SER9 AMD Ryzen AI 9 HX 370 ⎘ AMD Radeon 890M ⎘ 32 GB Memory, 1024 GB SSD | Amazon: List Price: 1000 USD | 814 g | 44.7 mm | x |
5. 74.7% 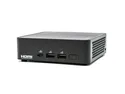 | Asus NUC 14 Pro Intel Core Ultra 5 125H ⎘ Intel Arc 7-Core iGPU ⎘ , 2048 GB SSD | Amazon: 1. $1,049.00 ASUS NUC 14 Pro, Intel NUC 1... 2. $1,299.00 ASUS NUC 14 Pro AI Mini PC, ... 3. $394.99 ASUS NUC 14 Pro Tall Barebon... List Price: 500 EUR | 525 g | 37 mm | x |
6. 83.1% v7 (old) 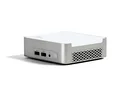 | Intel NUC 13 Pro Desk Edition Kit Intel Core i7-1360P ⎘ Intel Iris Xe Graphics G7 96EUs ⎘ 32 GB Memory, 512 GB SSD | Amazon: 1. $949.99 Intel NUC 13 Pro Kit NUC13AN... 2. $699.99 Intel NUC 13 Pro Kit NUC13AN... 3. $839.99 Intel NUC 13 Pro Kit NUC13AN... List Price: 800€ | 558 g | 37 mm | x |
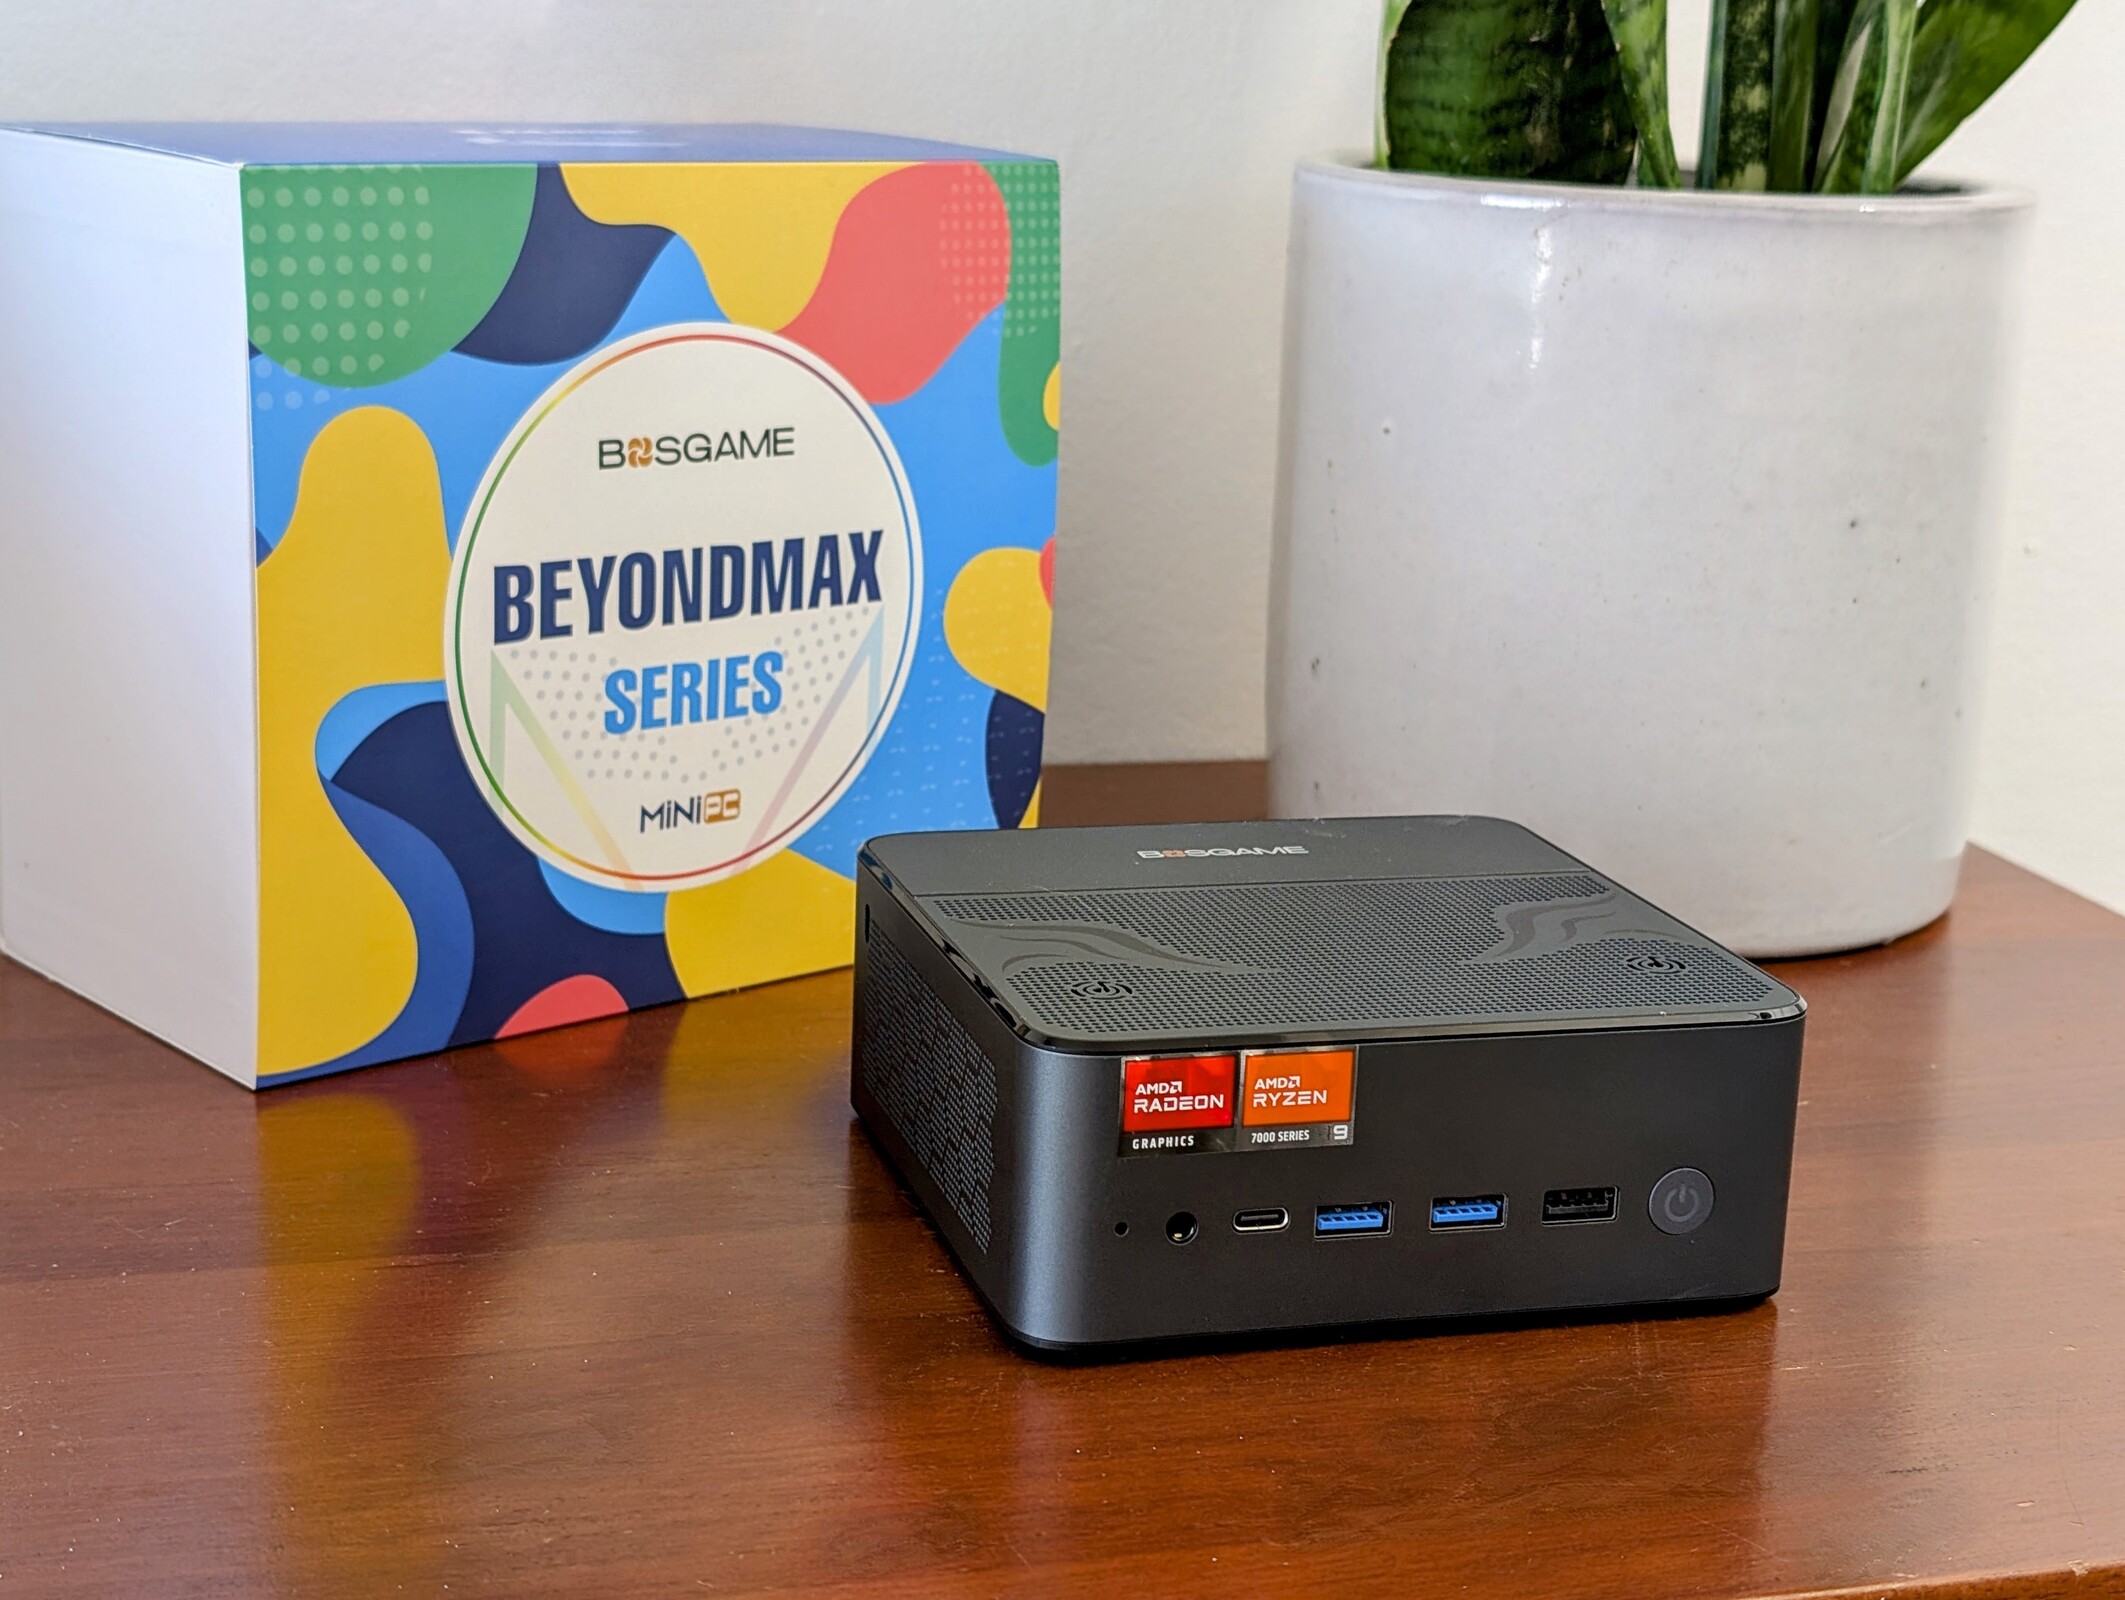
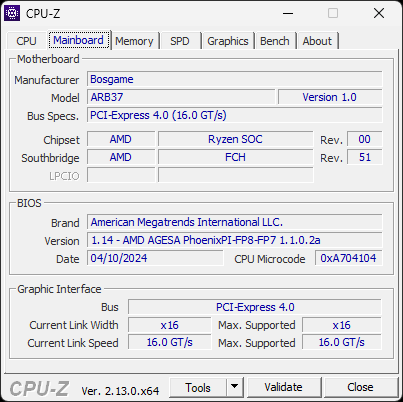
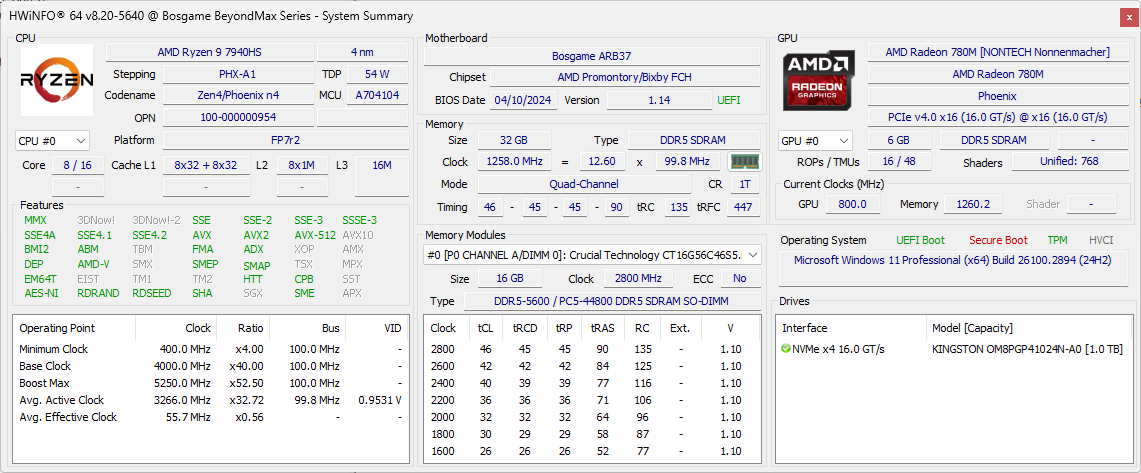
The Bosgame M2 succeeds the Bosgame M1 by upgrading the Ryzen 7 7840HS to the Ryzen 9 7940HS. It is otherwise essentially the same mini PC from top to bottom.
Our test unit ships with the aforementioned Ryzen 9 CPU alongside 32 GB of RAM and a 1 TB NVMe SSD for approximately $600 USD. Other SKUs are not widely available at the time of writing.
Alternatives to the Bosgame M2 include other high-performance mini PCs like the Beelink SER9, Asus NUC 14 Pro, or GMK NucBox M7 Pro.
More Bosgame reviews:
Specifications
Case
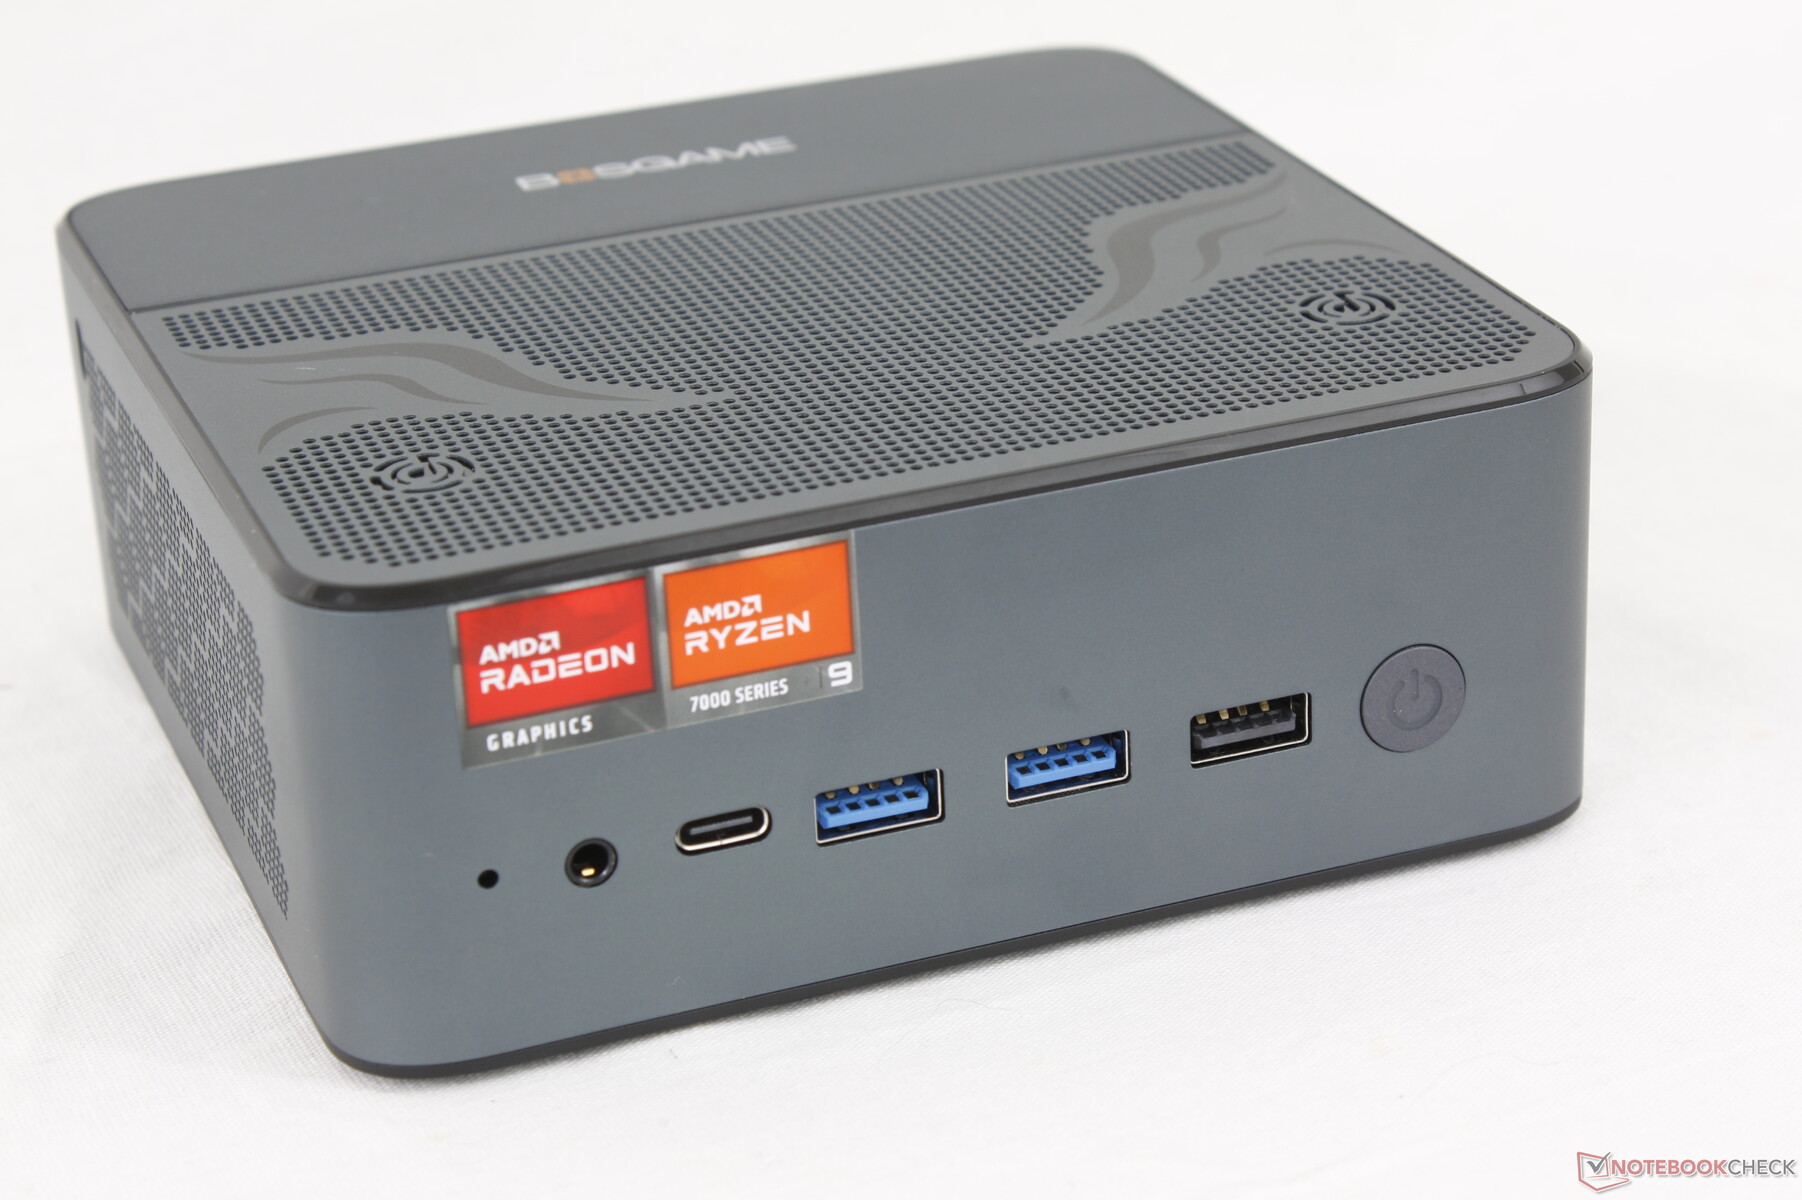
The metal chassis remains the same as on last year's M1. Users must look for the M2 labeling on the bottom surface of the unit to visually distinguish the model from its M1 predecessor.
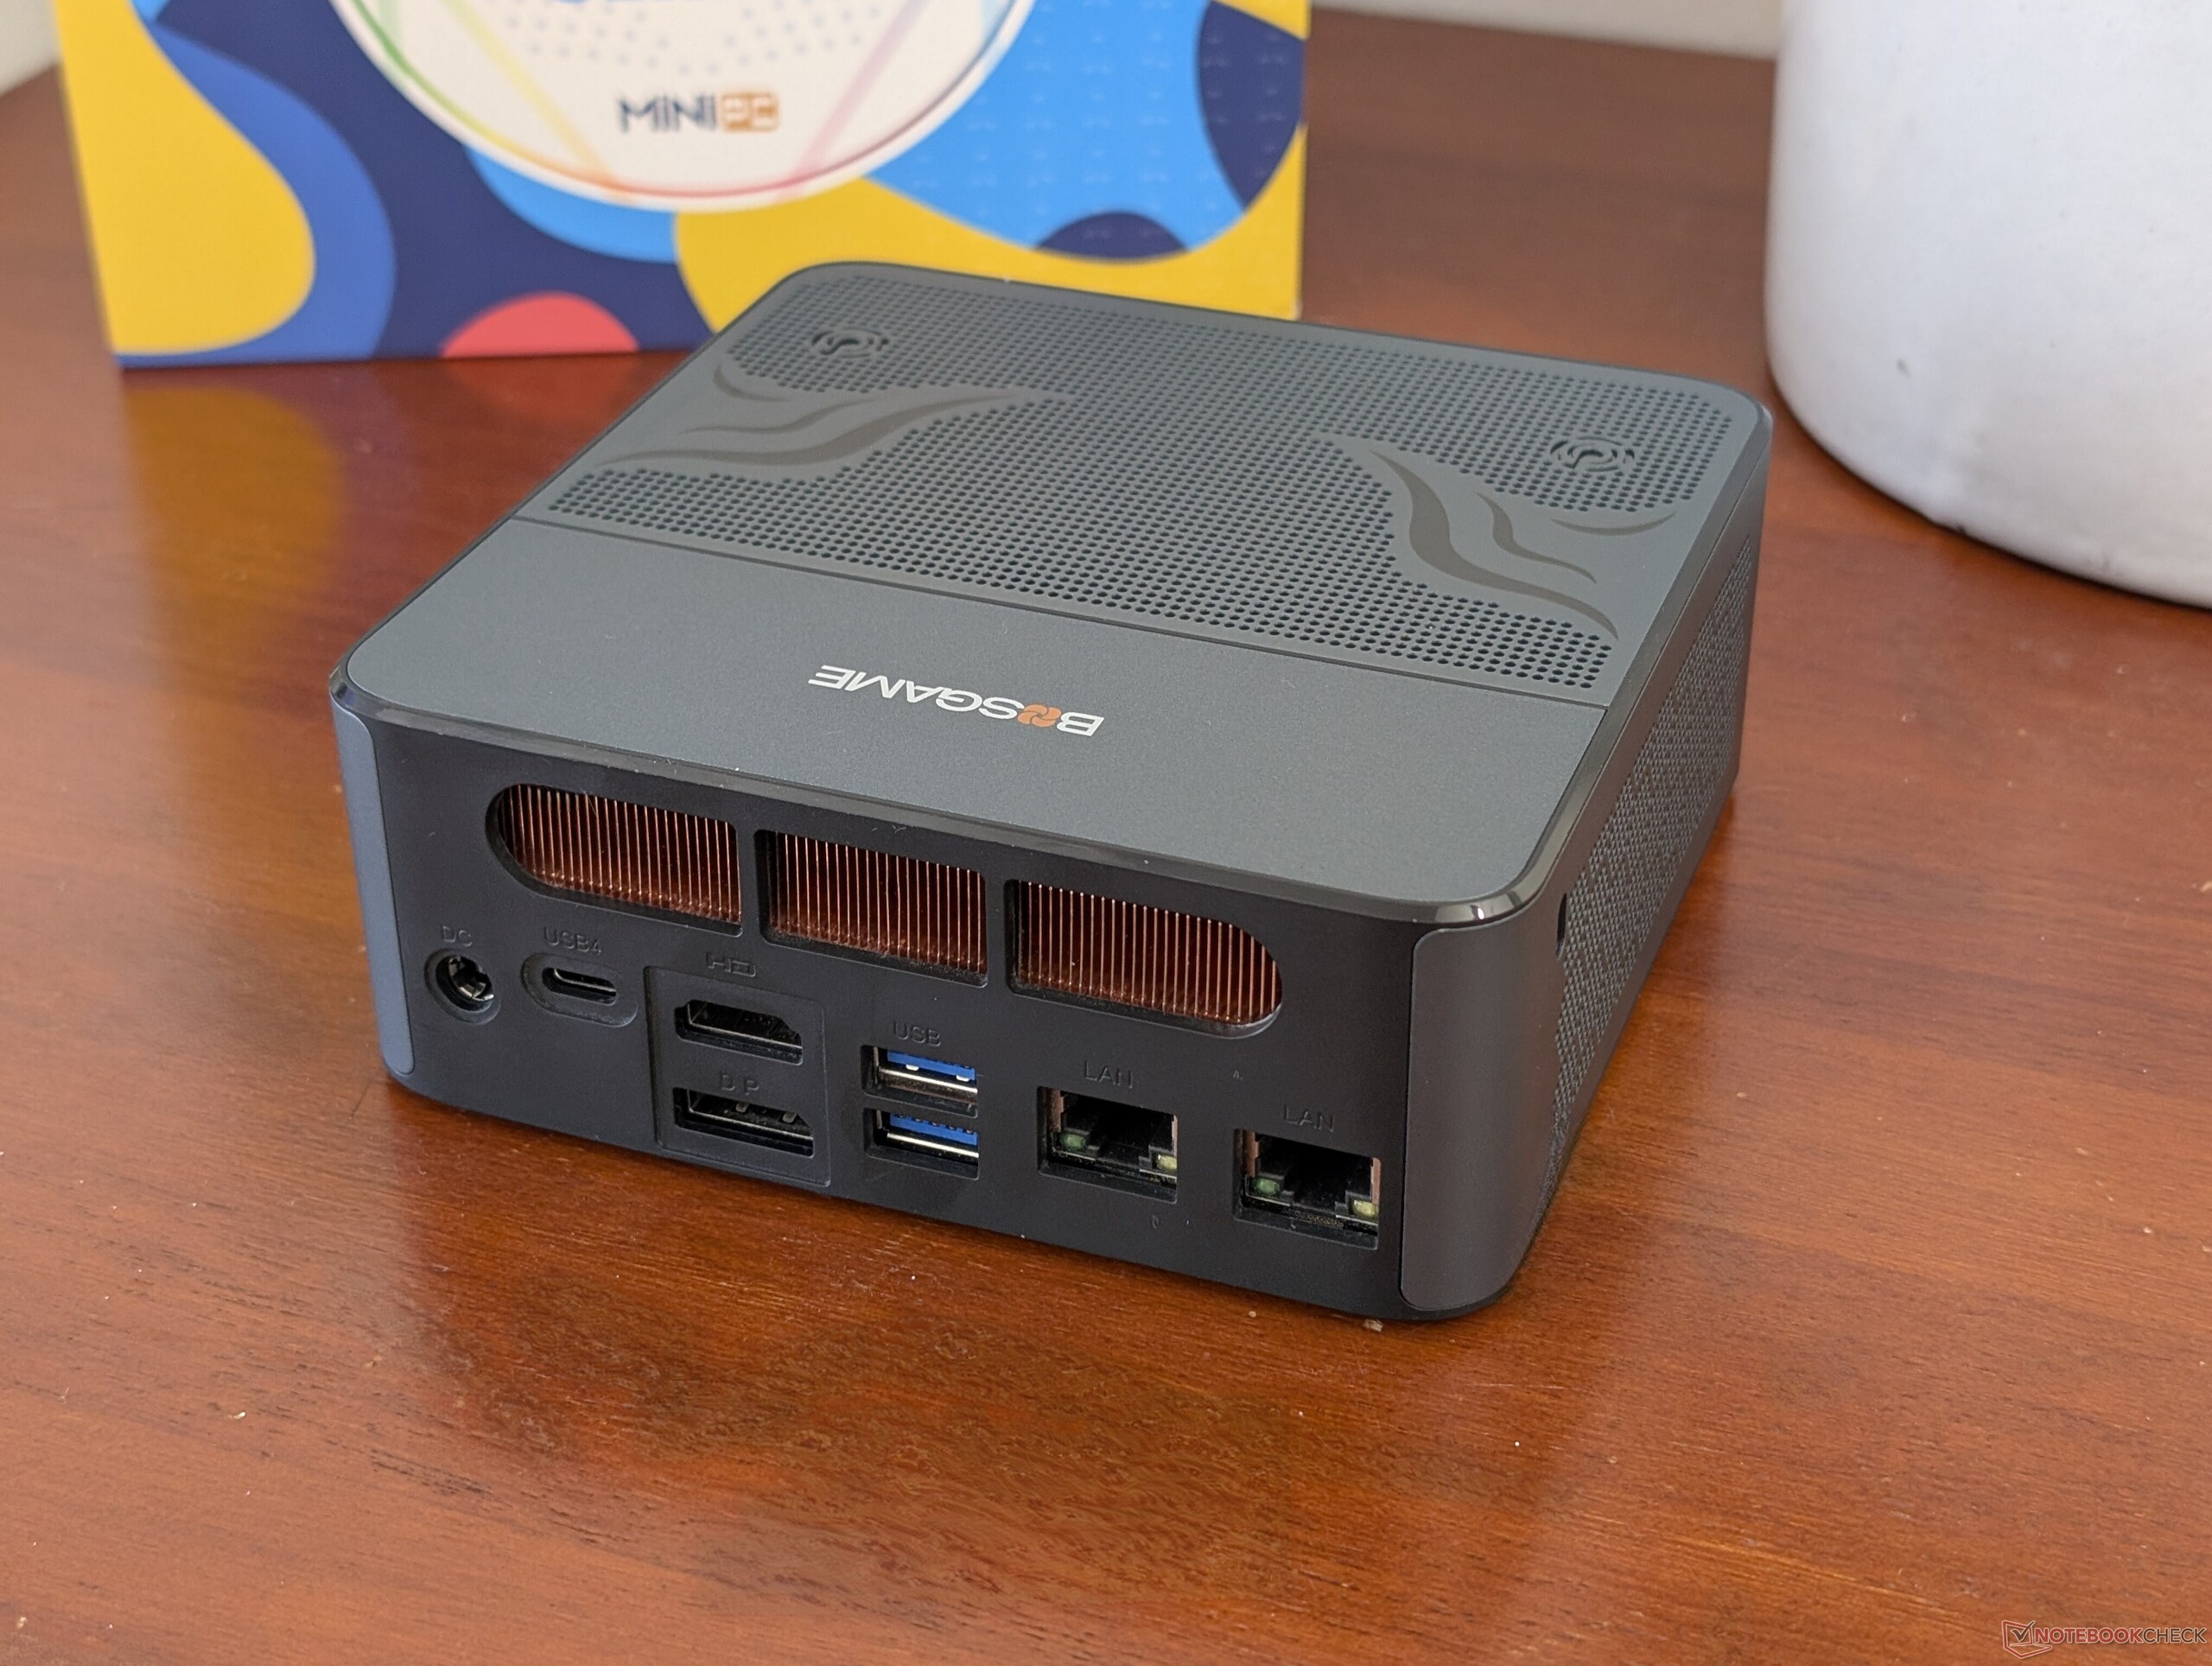
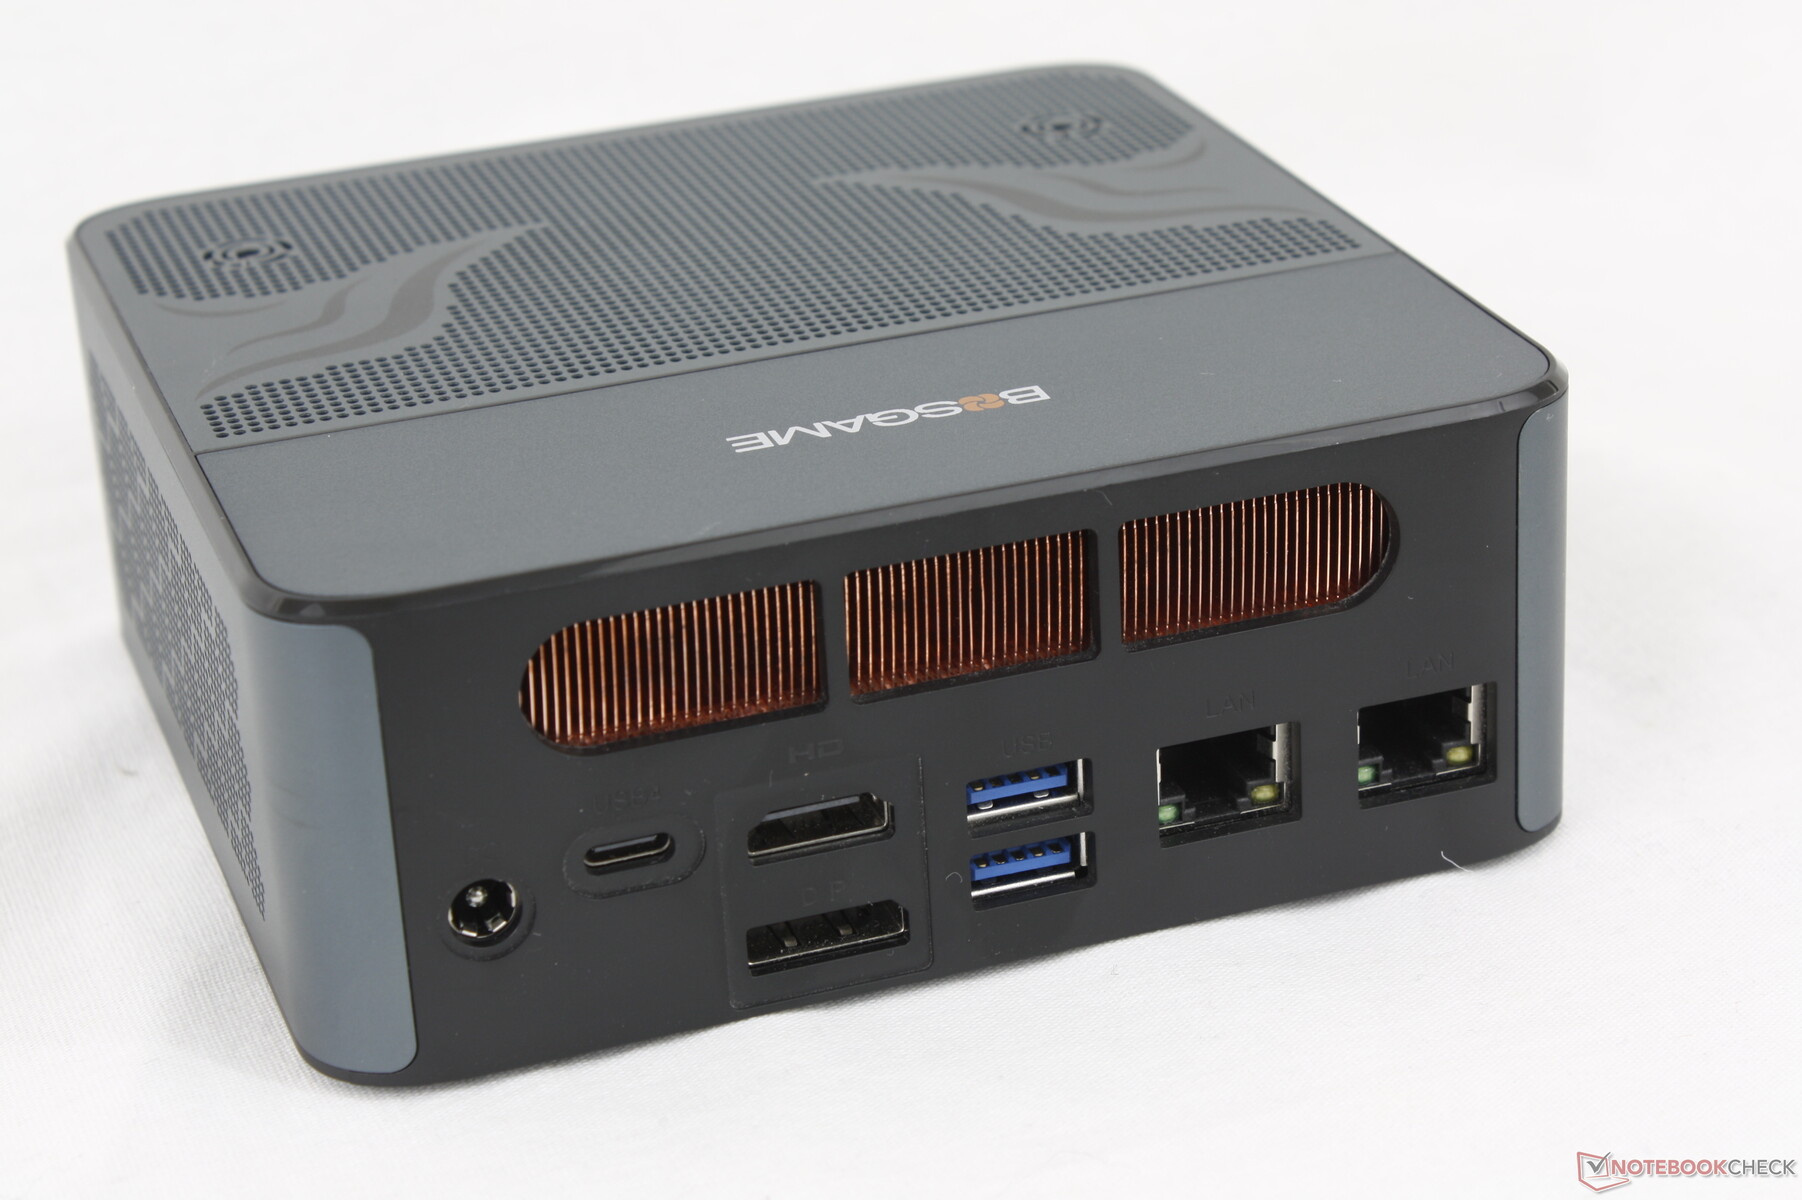
Connectivity
Port options have not changed including the use of a proprietary AC barrel adapter port instead of relying wholly on universal USB-C Power Delivery.
Communication
The Intel AX210 comes standard for both Wi-Fi 6E and Bluetooth 5.3 support. The BE200 would have been preferable for Wi-Fi 7 connectivity to better differentiate the M2 from the original M1 model.
| Networking | |
| iperf3 transmit AXE11000 | |
| BOSGAME M1 | |
| Asus NUC 14 Pro | |
| Intel NUC 13 Pro Desk Edition Kit | |
| GMK NucBox M7 Pro | |
| BOSGAME M2 | |
| Beelink SER9 | |
| iperf3 receive AXE11000 | |
| BOSGAME M1 | |
| Asus NUC 14 Pro | |
| GMK NucBox M7 Pro | |
| Intel NUC 13 Pro Desk Edition Kit | |
| BOSGAME M2 | |
| Beelink SER9 | |
| iperf3 transmit AXE11000 6GHz | |
| Intel NUC 13 Pro Desk Edition Kit | |
| Asus NUC 14 Pro | |
| BOSGAME M1 | |
| BOSGAME M2 | |
| iperf3 receive AXE11000 6GHz | |
| Asus NUC 14 Pro | |
| Intel NUC 13 Pro Desk Edition Kit | |
| BOSGAME M1 | |
| BOSGAME M2 | |
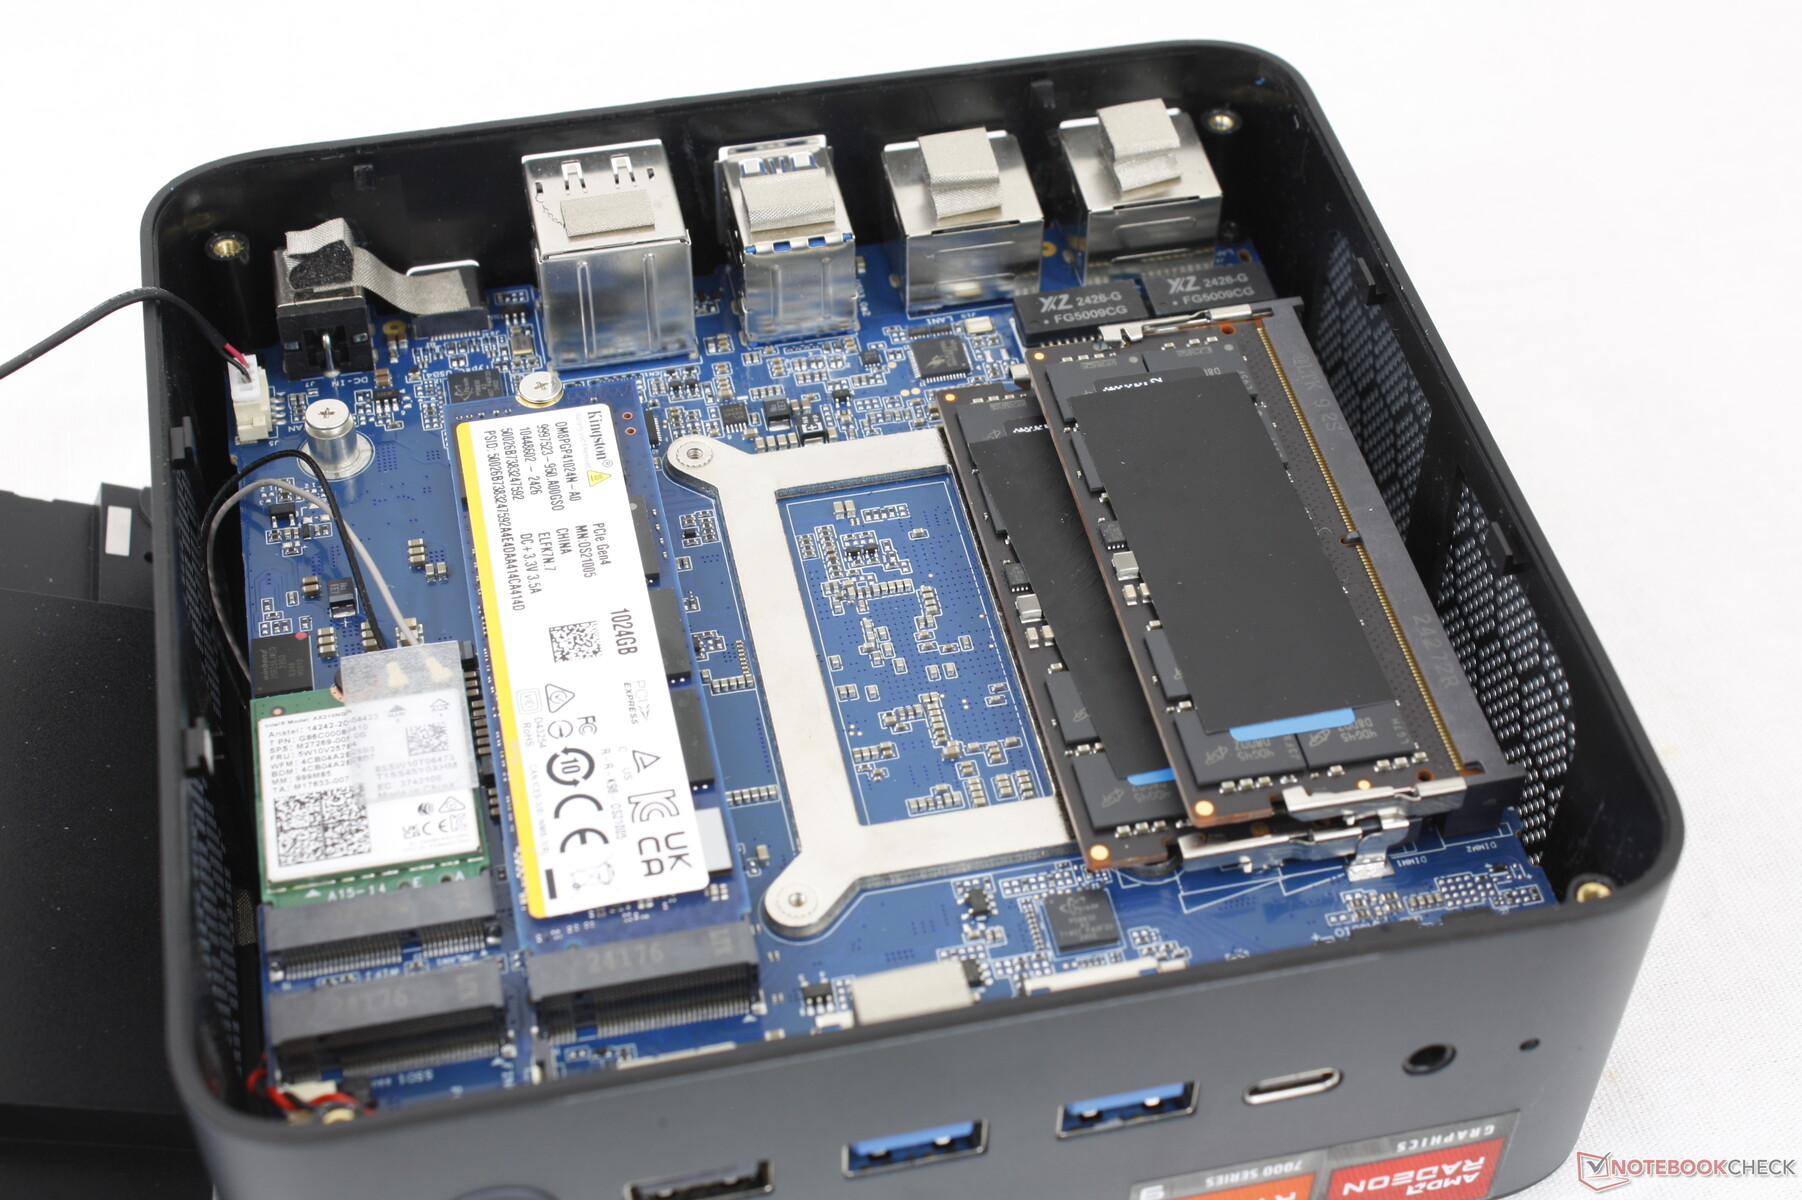
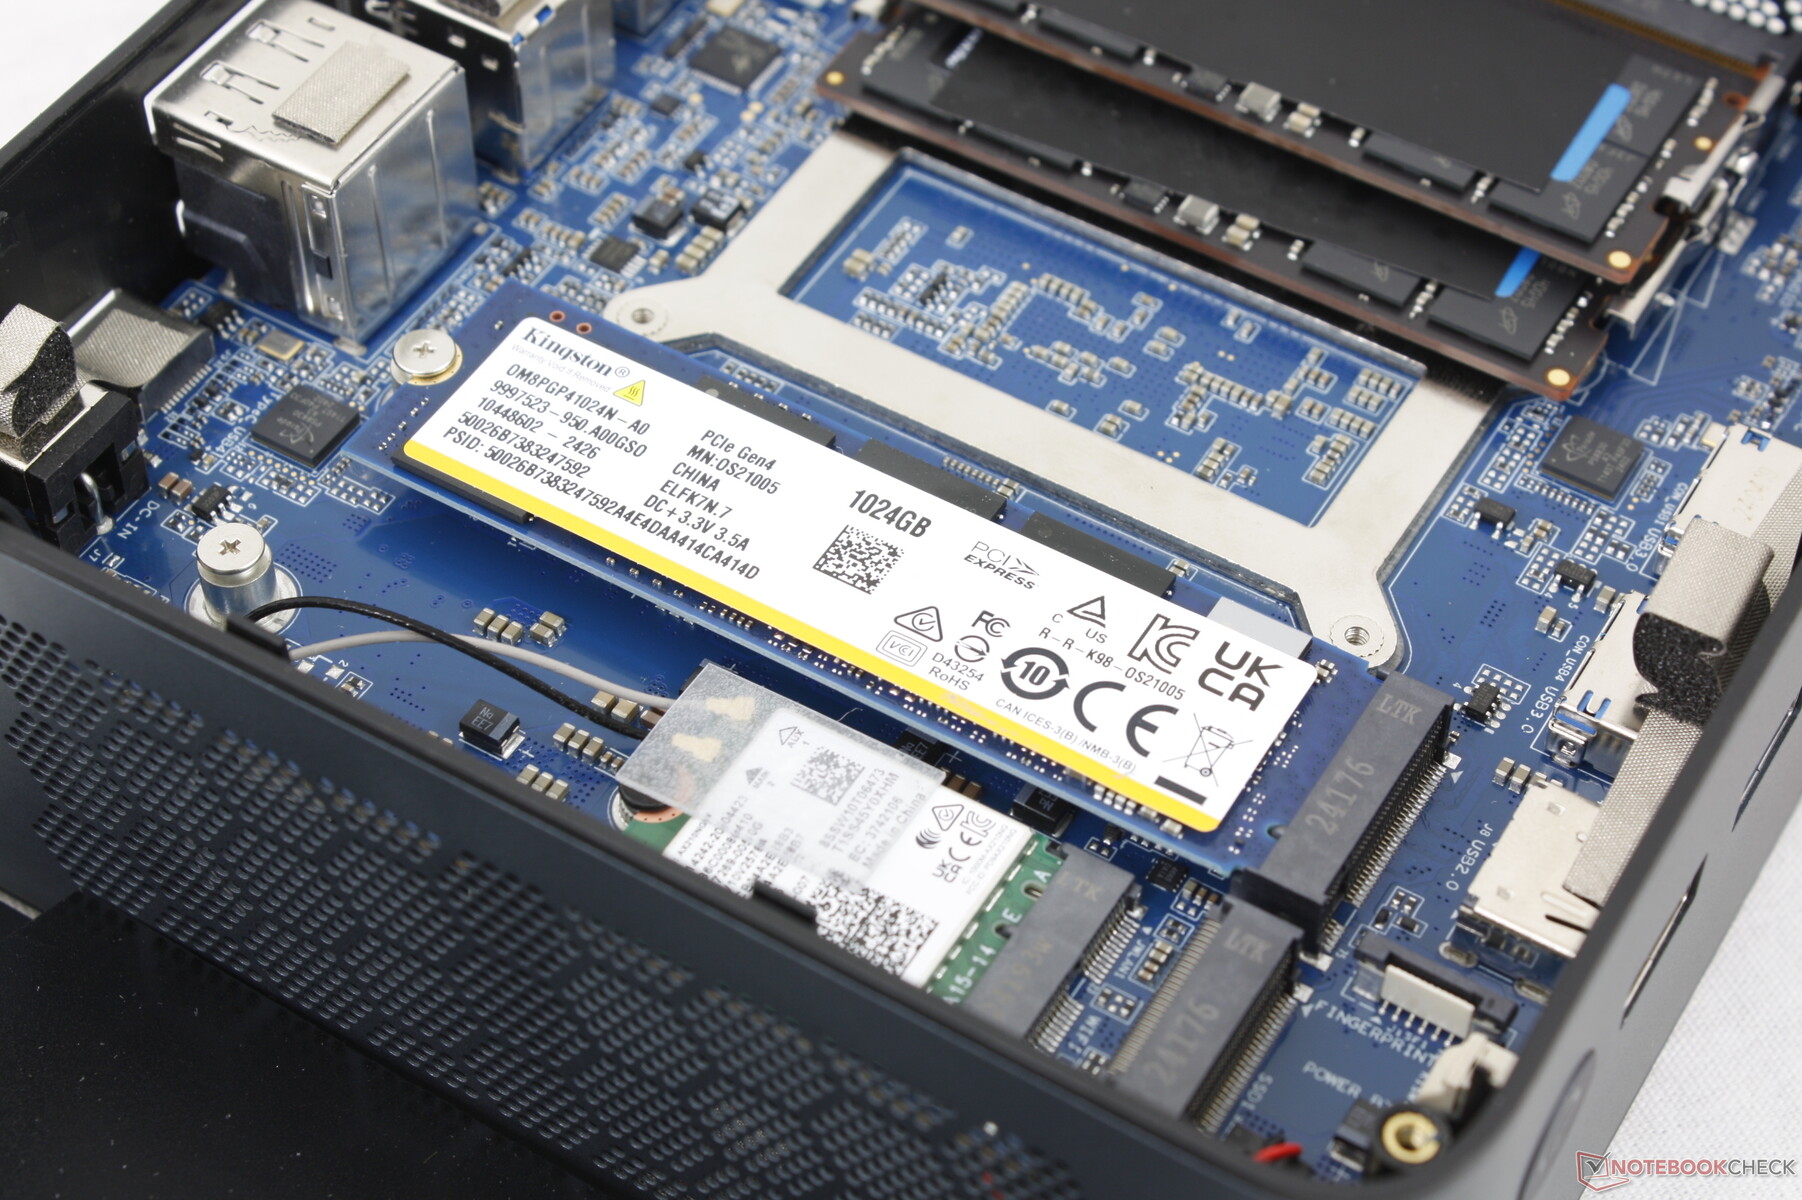
Maintenance
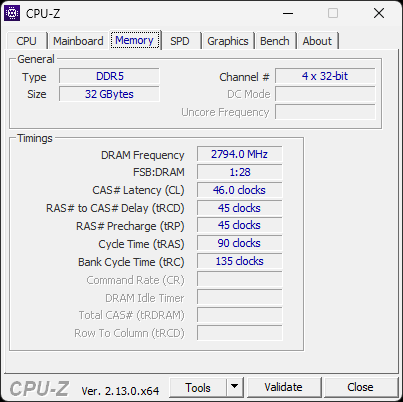
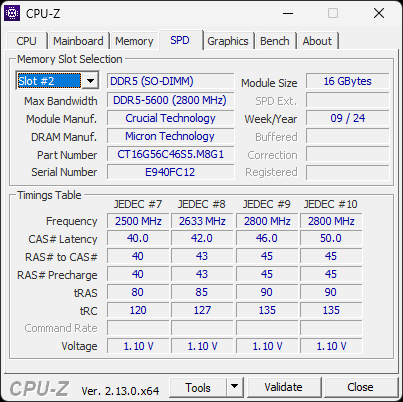
The bottom panel is easily removable with just a Phillips screwdriver. Upgradeable components include two DDR5 SODIMM slots, two M.2 PCIe4 x4 NVMe 2280 slots and the removable WLAN module.
Sustainability
The manufacturer makes no mention of any sustainability measures taken during manufacturing. The packaging itself is mostly cardboard with some plastic wrapping.
Accessories And Warranty
The retail box includes an AC adapter, removable VESA mounting bracket, HDMI cable, and a user manual.
A one-year limited manufacturer warranty applies if purchased in the US.
Performance
Testing Conditions
We set Windows to Performance mode prior to running the benchmarks below. There are no special pre-installed "Control Center" applications.
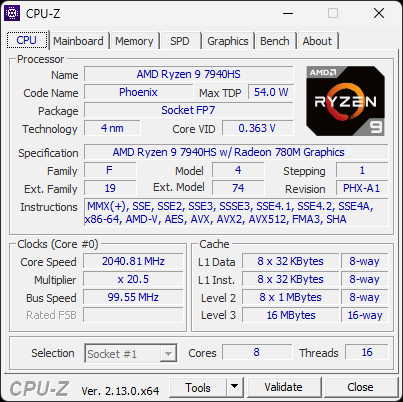
Processor
The Ryzen 9 7940HS performs almost identically to the Ryzen 7 7840HS. Their paper specifications differ by just a few hundred MHz between them and so the results should be unsurprising to enthusiasts who are familiar with the Ryzen lineup.
Cinebench R15 Multi Loop
Cinebench R23: Multi Core | Single Core
Cinebench R20: CPU (Multi Core) | CPU (Single Core)
Cinebench R15: CPU Multi 64Bit | CPU Single 64Bit
Blender: v2.79 BMW27 CPU
7-Zip 18.03: 7z b 4 | 7z b 4 -mmt1
Geekbench 6.6: Multi-Core | Single-Core
Geekbench 5.5: Multi-Core | Single-Core
HWBOT x265 Benchmark v2.2: 4k Preset
LibreOffice : 20 Documents To PDF
R Benchmark 2.5: Overall mean
| CPU Performance rating | |
| Beelink SER9 | |
| Beelink SER8 | |
| Average AMD Ryzen 9 7940HS | |
| BOSGAME M2 | |
| BOSGAME M1 | |
| Intel NUC 13 Pro Desk Edition Kit | |
| Geekom XT13 Pro | |
| GMK NucBox M7 Pro | |
| Asus NUC 14 Pro | |
| Beelink SER6 Pro -2! | |
| GMK NucBox M6 | |
| MSI Cubi NUC 1M | |
| Beelink SER5 | |
| Cinebench R23 / Multi Core | |
| Beelink SER9 | |
| Average AMD Ryzen 9 7940HS (15556 - 18131, n=12) | |
| Beelink SER8 | |
| BOSGAME M2 | |
| BOSGAME M1 | |
| Asus NUC 14 Pro | |
| GMK NucBox M7 Pro | |
| Intel NUC 13 Pro Desk Edition Kit | |
| Geekom XT13 Pro | |
| Beelink SER6 Pro | |
| GMK NucBox M6 | |
| Beelink SER5 | |
| MSI Cubi NUC 1M | |
| Cinebench R23 / Single Core | |
| Beelink SER9 | |
| Intel NUC 13 Pro Desk Edition Kit | |
| MSI Cubi NUC 1M | |
| Average AMD Ryzen 9 7940HS (1733 - 1832, n=12) | |
| Beelink SER8 | |
| BOSGAME M2 | |
| Asus NUC 14 Pro | |
| Geekom XT13 Pro | |
| BOSGAME M1 | |
| GMK NucBox M7 Pro | |
| Beelink SER6 Pro | |
| GMK NucBox M6 | |
| Beelink SER5 | |
| Cinebench R20 / CPU (Multi Core) | |
| Beelink SER9 | |
| Average AMD Ryzen 9 7940HS (6277 - 7111, n=12) | |
| Beelink SER8 | |
| BOSGAME M1 | |
| BOSGAME M2 | |
| Asus NUC 14 Pro | |
| GMK NucBox M7 Pro | |
| Geekom XT13 Pro | |
| Intel NUC 13 Pro Desk Edition Kit | |
| Beelink SER6 Pro | |
| GMK NucBox M6 | |
| Beelink SER5 | |
| MSI Cubi NUC 1M | |
| Cinebench R20 / CPU (Single Core) | |
| Beelink SER9 | |
| Intel NUC 13 Pro Desk Edition Kit | |
| MSI Cubi NUC 1M | |
| Beelink SER8 | |
| Average AMD Ryzen 9 7940HS (679 - 714, n=12) | |
| BOSGAME M1 | |
| BOSGAME M2 | |
| Geekom XT13 Pro | |
| GMK NucBox M7 Pro | |
| Asus NUC 14 Pro | |
| Beelink SER6 Pro | |
| GMK NucBox M6 | |
| Beelink SER5 | |
| Cinebench R15 / CPU Multi 64Bit | |
| Beelink SER9 | |
| Average AMD Ryzen 9 7940HS (2470 - 2848, n=12) | |
| Beelink SER8 | |
| BOSGAME M1 | |
| BOSGAME M2 | |
| Geekom XT13 Pro | |
| GMK NucBox M7 Pro | |
| Asus NUC 14 Pro | |
| Intel NUC 13 Pro Desk Edition Kit | |
| Beelink SER6 Pro | |
| GMK NucBox M6 | |
| Beelink SER5 | |
| MSI Cubi NUC 1M | |
| Cinebench R15 / CPU Single 64Bit | |
| Beelink SER9 | |
| Beelink SER8 | |
| Average AMD Ryzen 9 7940HS (258 - 288, n=12) | |
| BOSGAME M1 | |
| Intel NUC 13 Pro Desk Edition Kit | |
| GMK NucBox M7 Pro | |
| MSI Cubi NUC 1M | |
| BOSGAME M2 | |
| Asus NUC 14 Pro | |
| Geekom XT13 Pro | |
| GMK NucBox M6 | |
| Beelink SER6 Pro | |
| Beelink SER5 | |
| Blender / v2.79 BMW27 CPU | |
| MSI Cubi NUC 1M | |
| Beelink SER5 | |
| GMK NucBox M6 | |
| Beelink SER6 Pro | |
| Intel NUC 13 Pro Desk Edition Kit | |
| Geekom XT13 Pro | |
| GMK NucBox M7 Pro | |
| Asus NUC 14 Pro | |
| BOSGAME M2 | |
| BOSGAME M1 | |
| Average AMD Ryzen 9 7940HS (182 - 202, n=11) | |
| Beelink SER8 | |
| Beelink SER9 | |
| 7-Zip 18.03 / 7z b 4 | |
| Beelink SER9 | |
| Beelink SER8 | |
| BOSGAME M1 | |
| Average AMD Ryzen 9 7940HS (63459 - 73434, n=12) | |
| BOSGAME M2 | |
| GMK NucBox M7 Pro | |
| Geekom XT13 Pro | |
| Beelink SER6 Pro | |
| Intel NUC 13 Pro Desk Edition Kit | |
| GMK NucBox M6 | |
| Beelink SER5 | |
| MSI Cubi NUC 1M | |
| Asus NUC 14 Pro | |
| 7-Zip 18.03 / 7z b 4 -mmt1 | |
| Beelink SER8 | |
| Average AMD Ryzen 9 7940HS (6310 - 6776, n=12) | |
| BOSGAME M1 | |
| BOSGAME M2 | |
| Beelink SER9 | |
| GMK NucBox M7 Pro | |
| MSI Cubi NUC 1M | |
| Intel NUC 13 Pro Desk Edition Kit | |
| Geekom XT13 Pro | |
| Beelink SER6 Pro | |
| GMK NucBox M6 | |
| Asus NUC 14 Pro | |
| Beelink SER5 | |
| Geekbench 6.6 / Multi-Core | |
| Beelink SER9 | |
| Beelink SER8 | |
| BOSGAME M2 | |
| BOSGAME M1 | |
| Average AMD Ryzen 9 7940HS (9798 - 13470, n=11) | |
| Asus NUC 14 Pro | |
| Geekom XT13 Pro | |
| Intel NUC 13 Pro Desk Edition Kit | |
| GMK NucBox M7 Pro | |
| GMK NucBox M6 | |
| MSI Cubi NUC 1M | |
| Beelink SER5 | |
| Geekbench 6.6 / Single-Core | |
| Beelink SER9 | |
| BOSGAME M2 | |
| Beelink SER8 | |
| MSI Cubi NUC 1M | |
| BOSGAME M1 | |
| Average AMD Ryzen 9 7940HS (2408 - 2746, n=11) | |
| Intel NUC 13 Pro Desk Edition Kit | |
| Geekom XT13 Pro | |
| Asus NUC 14 Pro | |
| GMK NucBox M7 Pro | |
| GMK NucBox M6 | |
| Beelink SER5 | |
| Geekbench 5.5 / Multi-Core | |
| Beelink SER9 | |
| BOSGAME M2 | |
| Beelink SER8 | |
| BOSGAME M1 | |
| Average AMD Ryzen 9 7940HS (10089 - 12500, n=13) | |
| Geekom XT13 Pro | |
| Asus NUC 14 Pro | |
| Intel NUC 13 Pro Desk Edition Kit | |
| GMK NucBox M7 Pro | |
| Beelink SER6 Pro | |
| GMK NucBox M6 | |
| MSI Cubi NUC 1M | |
| Beelink SER5 | |
| Geekbench 5.5 / Single-Core | |
| Beelink SER8 | |
| BOSGAME M2 | |
| Average AMD Ryzen 9 7940HS (1823 - 2032, n=13) | |
| Beelink SER9 | |
| BOSGAME M1 | |
| MSI Cubi NUC 1M | |
| Intel NUC 13 Pro Desk Edition Kit | |
| Geekom XT13 Pro | |
| Asus NUC 14 Pro | |
| GMK NucBox M7 Pro | |
| Beelink SER6 Pro | |
| GMK NucBox M6 | |
| Beelink SER5 | |
| HWBOT x265 Benchmark v2.2 / 4k Preset | |
| Beelink SER9 | |
| BOSGAME M2 | |
| Beelink SER8 | |
| Average AMD Ryzen 9 7940HS (18.5 - 22.6, n=11) | |
| BOSGAME M1 | |
| GMK NucBox M7 Pro | |
| Asus NUC 14 Pro | |
| Beelink SER6 Pro | |
| Geekom XT13 Pro | |
| Intel NUC 13 Pro Desk Edition Kit | |
| GMK NucBox M6 | |
| Beelink SER5 | |
| MSI Cubi NUC 1M | |
| LibreOffice / 20 Documents To PDF | |
| Beelink SER5 | |
| Asus NUC 14 Pro | |
| GMK NucBox M6 | |
| Beelink SER9 | |
| Beelink SER6 Pro | |
| GMK NucBox M7 Pro | |
| BOSGAME M1 | |
| Intel NUC 13 Pro Desk Edition Kit | |
| Geekom XT13 Pro | |
| Beelink SER8 | |
| Average AMD Ryzen 9 7940HS (36.9 - 54.8, n=12) | |
| BOSGAME M2 | |
| MSI Cubi NUC 1M | |
| R Benchmark 2.5 / Overall mean | |
| Beelink SER5 | |
| GMK NucBox M6 | |
| Beelink SER6 Pro | |
| Asus NUC 14 Pro | |
| GMK NucBox M7 Pro | |
| Geekom XT13 Pro | |
| Intel NUC 13 Pro Desk Edition Kit | |
| MSI Cubi NUC 1M | |
| BOSGAME M1 | |
| Beelink SER8 | |
| Average AMD Ryzen 9 7940HS (0.4159 - 0.4467, n=12) | |
| BOSGAME M2 | |
| Beelink SER9 | |
Cinebench R23: Multi Core | Single Core
Cinebench R20: CPU (Multi Core) | CPU (Single Core)
Cinebench R15: CPU Multi 64Bit | CPU Single 64Bit
Blender: v2.79 BMW27 CPU
7-Zip 18.03: 7z b 4 | 7z b 4 -mmt1
Geekbench 6.6: Multi-Core | Single-Core
Geekbench 5.5: Multi-Core | Single-Core
HWBOT x265 Benchmark v2.2: 4k Preset
LibreOffice : 20 Documents To PDF
R Benchmark 2.5: Overall mean
* ... smaller is better
AIDA64: FP32 Ray-Trace | FPU Julia | CPU SHA3 | CPU Queen | FPU SinJulia | FPU Mandel | CPU AES | CPU ZLib | FP64 Ray-Trace | CPU PhotoWorxx
| Performance rating | |
| Beelink SER9 | |
| BOSGAME M2 | |
| BOSGAME M1 | |
| Average AMD Ryzen 9 7940HS | |
| GMK NucBox M7 Pro | |
| Asus NUC 14 Pro | |
| Intel NUC 13 Pro Desk Edition Kit | |
| AIDA64 / FP32 Ray-Trace | |
| Beelink SER9 | |
| Average AMD Ryzen 9 7940HS (25226 - 29109, n=10) | |
| BOSGAME M2 | |
| BOSGAME M1 | |
| GMK NucBox M7 Pro | |
| Asus NUC 14 Pro | |
| Intel NUC 13 Pro Desk Edition Kit | |
| AIDA64 / FPU Julia | |
| Beelink SER9 | |
| Average AMD Ryzen 9 7940HS (106512 - 123214, n=10) | |
| BOSGAME M2 | |
| BOSGAME M1 | |
| GMK NucBox M7 Pro | |
| Asus NUC 14 Pro | |
| Intel NUC 13 Pro Desk Edition Kit | |
| AIDA64 / CPU SHA3 | |
| Beelink SER9 | |
| BOSGAME M2 | |
| Average AMD Ryzen 9 7940HS (4566 - 5119, n=10) | |
| BOSGAME M1 | |
| Asus NUC 14 Pro | |
| GMK NucBox M7 Pro | |
| Intel NUC 13 Pro Desk Edition Kit | |
| AIDA64 / CPU Queen | |
| Average AMD Ryzen 9 7940HS (118174 - 124783, n=10) | |
| BOSGAME M2 | |
| BOSGAME M1 | |
| Beelink SER9 | |
| GMK NucBox M7 Pro | |
| Intel NUC 13 Pro Desk Edition Kit | |
| Asus NUC 14 Pro | |
| AIDA64 / FPU SinJulia | |
| Beelink SER9 | |
| BOSGAME M2 | |
| Average AMD Ryzen 9 7940HS (14663 - 15551, n=10) | |
| BOSGAME M1 | |
| GMK NucBox M7 Pro | |
| Asus NUC 14 Pro | |
| Intel NUC 13 Pro Desk Edition Kit | |
| AIDA64 / FPU Mandel | |
| Beelink SER9 | |
| Average AMD Ryzen 9 7940HS (56839 - 66238, n=10) | |
| BOSGAME M2 | |
| BOSGAME M1 | |
| GMK NucBox M7 Pro | |
| Asus NUC 14 Pro | |
| Intel NUC 13 Pro Desk Edition Kit | |
| AIDA64 / CPU AES | |
| BOSGAME M2 | |
| BOSGAME M1 | |
| GMK NucBox M7 Pro | |
| Average AMD Ryzen 9 7940HS (86309 - 171350, n=10) | |
| Beelink SER9 | |
| Asus NUC 14 Pro | |
| Intel NUC 13 Pro Desk Edition Kit | |
| AIDA64 / CPU ZLib | |
| Beelink SER9 | |
| Average AMD Ryzen 9 7940HS (866 - 1152, n=10) | |
| BOSGAME M2 | |
| BOSGAME M1 | |
| Asus NUC 14 Pro | |
| GMK NucBox M7 Pro | |
| Intel NUC 13 Pro Desk Edition Kit | |
| AIDA64 / FP64 Ray-Trace | |
| Beelink SER9 | |
| Average AMD Ryzen 9 7940HS (13175 - 15675, n=10) | |
| BOSGAME M2 | |
| BOSGAME M1 | |
| GMK NucBox M7 Pro | |
| Asus NUC 14 Pro | |
| Intel NUC 13 Pro Desk Edition Kit | |
| AIDA64 / CPU PhotoWorxx | |
| Beelink SER9 | |
| Asus NUC 14 Pro | |
| BOSGAME M2 | |
| BOSGAME M1 | |
| Average AMD Ryzen 9 7940HS (22477 - 41567, n=10) | |
| GMK NucBox M7 Pro | |
| Intel NUC 13 Pro Desk Edition Kit | |
System Performance
CrossMark: Overall | Productivity | Creativity | Responsiveness
WebXPRT 3: Overall
WebXPRT 4: Overall
Mozilla Kraken 1.1: Total
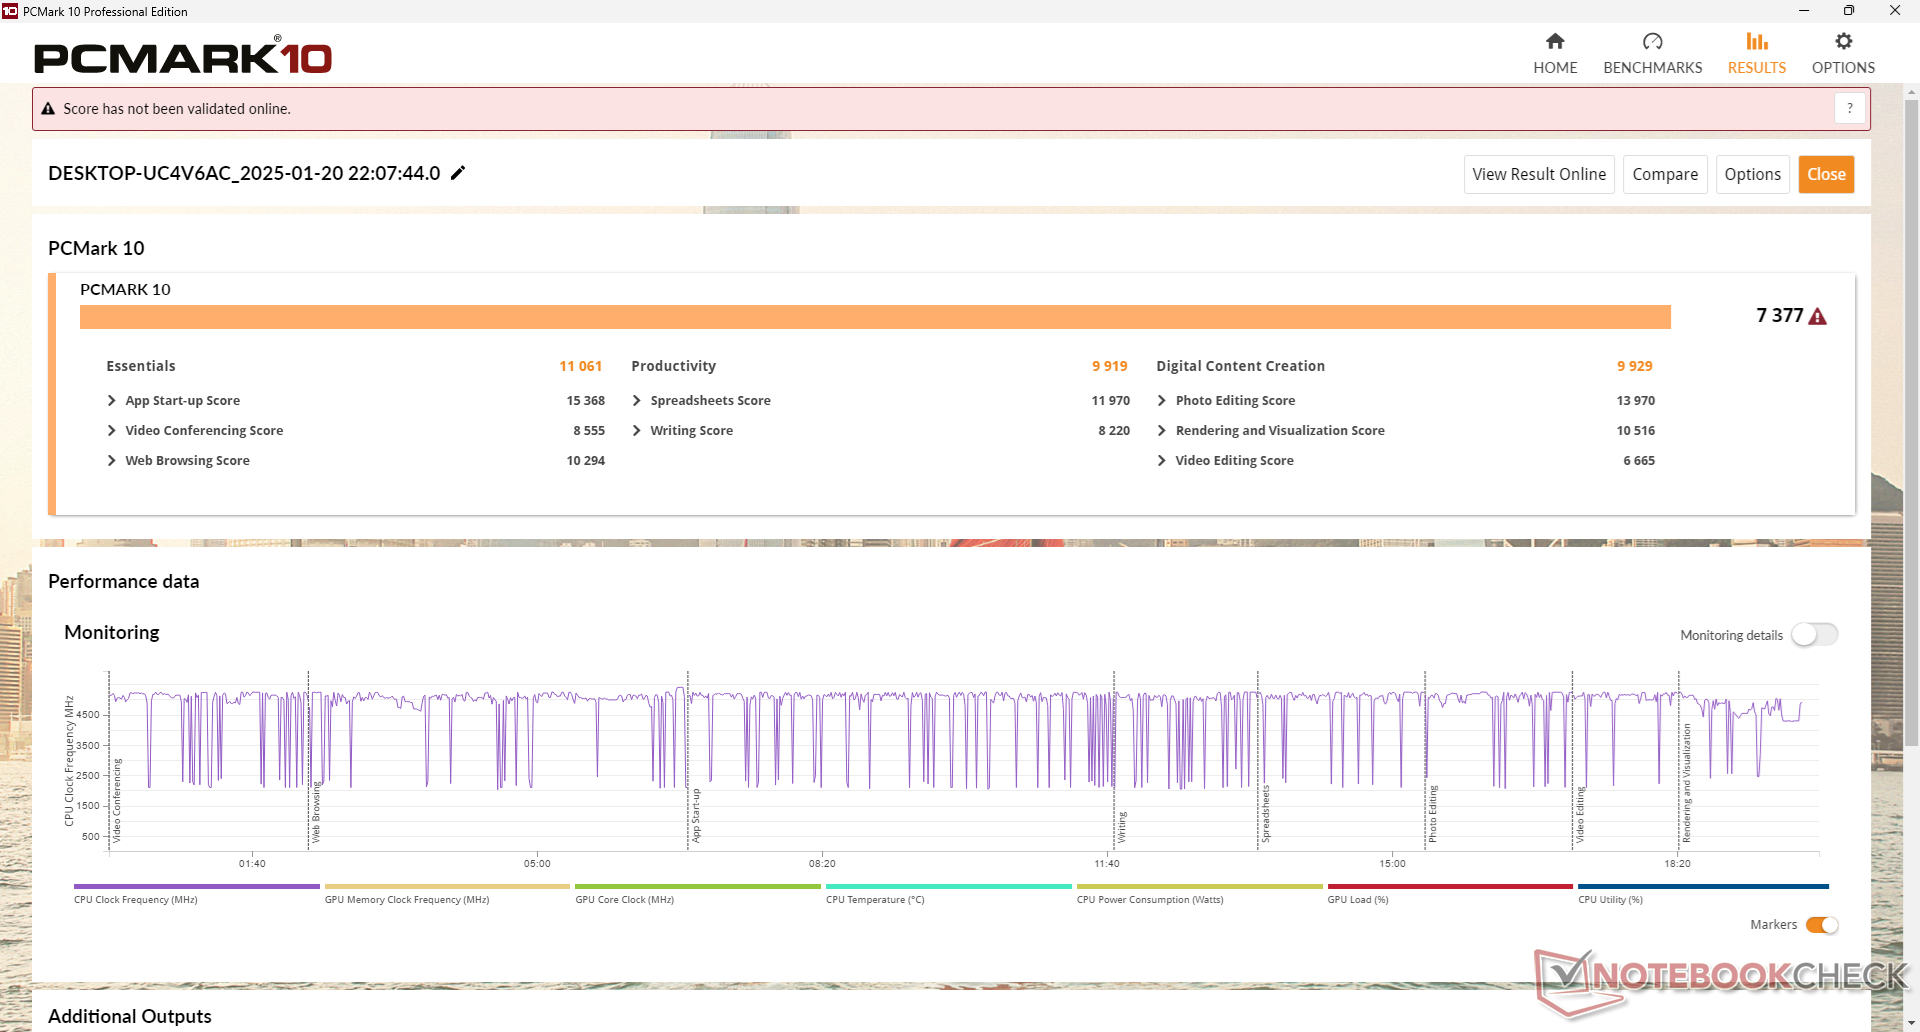
| PCMark 10 / Score | |
| Beelink SER9 | |
| BOSGAME M2 | |
| Average AMD Ryzen 9 7940HS, AMD Radeon 780M (6724 - 7520, n=5) | |
| BOSGAME M1 | |
| GMK NucBox M7 Pro | |
| Asus NUC 14 Pro | |
| Intel NUC 13 Pro Desk Edition Kit | |
| PCMark 10 / Essentials | |
| BOSGAME M1 | |
| BOSGAME M2 | |
| Intel NUC 13 Pro Desk Edition Kit | |
| Average AMD Ryzen 9 7940HS, AMD Radeon 780M (10091 - 11114, n=5) | |
| Beelink SER9 | |
| GMK NucBox M7 Pro | |
| Asus NUC 14 Pro | |
| PCMark 10 / Productivity | |
| Average AMD Ryzen 9 7940HS, AMD Radeon 780M (9569 - 10717, n=5) | |
| BOSGAME M2 | |
| Beelink SER9 | |
| BOSGAME M1 | |
| GMK NucBox M7 Pro | |
| Asus NUC 14 Pro | |
| Intel NUC 13 Pro Desk Edition Kit | |
| PCMark 10 / Digital Content Creation | |
| Beelink SER9 | |
| BOSGAME M1 | |
| BOSGAME M2 | |
| Asus NUC 14 Pro | |
| Average AMD Ryzen 9 7940HS, AMD Radeon 780M (8543 - 9929, n=5) | |
| GMK NucBox M7 Pro | |
| Intel NUC 13 Pro Desk Edition Kit | |
| CrossMark / Overall | |
| BOSGAME M1 | |
| Average AMD Ryzen 9 7940HS, AMD Radeon 780M (1663 - 1861, n=5) | |
| BOSGAME M2 | |
| Beelink SER9 | |
| Intel NUC 13 Pro Desk Edition Kit | |
| Asus NUC 14 Pro | |
| GMK NucBox M7 Pro | |
| CrossMark / Productivity | |
| BOSGAME M1 | |
| Average AMD Ryzen 9 7940HS, AMD Radeon 780M (1659 - 1781, n=5) | |
| BOSGAME M2 | |
| Beelink SER9 | |
| Intel NUC 13 Pro Desk Edition Kit | |
| Asus NUC 14 Pro | |
| GMK NucBox M7 Pro | |
| CrossMark / Creativity | |
| BOSGAME M1 | |
| BOSGAME M2 | |
| Average AMD Ryzen 9 7940HS, AMD Radeon 780M (1720 - 2072, n=5) | |
| Beelink SER9 | |
| Intel NUC 13 Pro Desk Edition Kit | |
| Asus NUC 14 Pro | |
| GMK NucBox M7 Pro | |
| CrossMark / Responsiveness | |
| BOSGAME M1 | |
| BOSGAME M2 | |
| Beelink SER9 | |
| Average AMD Ryzen 9 7940HS, AMD Radeon 780M (1382 - 1562, n=5) | |
| Intel NUC 13 Pro Desk Edition Kit | |
| Asus NUC 14 Pro | |
| GMK NucBox M7 Pro | |
| WebXPRT 3 / Overall | |
| BOSGAME M2 | |
| BOSGAME M1 | |
| Average AMD Ryzen 9 7940HS, AMD Radeon 780M (291 - 342, n=6) | |
| GMK NucBox M7 Pro | |
| Intel NUC 13 Pro Desk Edition Kit | |
| Beelink SER9 | |
| Asus NUC 14 Pro | |
| WebXPRT 4 / Overall | |
| BOSGAME M2 | |
| Intel NUC 13 Pro Desk Edition Kit | |
| BOSGAME M1 | |
| Average AMD Ryzen 9 7940HS, AMD Radeon 780M (234 - 274, n=5) | |
| GMK NucBox M7 Pro | |
| Asus NUC 14 Pro | |
| Beelink SER9 | |
| Mozilla Kraken 1.1 / Total | |
| GMK NucBox M7 Pro | |
| Asus NUC 14 Pro | |
| BOSGAME M1 | |
| Average AMD Ryzen 9 7940HS, AMD Radeon 780M (487 - 536, n=6) | |
| BOSGAME M2 | |
| Intel NUC 13 Pro Desk Edition Kit | |
| Beelink SER9 | |
* ... smaller is better
| PCMark 10 Score | 7377 points | |
Help | ||
| AIDA64 / Memory Copy | |
| Beelink SER9 | |
| BOSGAME M2 | |
| BOSGAME M1 | |
| Asus NUC 14 Pro | |
| Average AMD Ryzen 9 7940HS (35327 - 78739, n=10) | |
| GMK NucBox M7 Pro | |
| Intel NUC 13 Pro Desk Edition Kit | |
| AIDA64 / Memory Read | |
| Beelink SER9 | |
| Asus NUC 14 Pro | |
| BOSGAME M1 | |
| BOSGAME M2 | |
| Average AMD Ryzen 9 7940HS (30769 - 61836, n=10) | |
| GMK NucBox M7 Pro | |
| Intel NUC 13 Pro Desk Edition Kit | |
| AIDA64 / Memory Write | |
| Beelink SER9 | |
| BOSGAME M2 | |
| BOSGAME M1 | |
| Average AMD Ryzen 9 7940HS (42217 - 91567, n=10) | |
| Asus NUC 14 Pro | |
| GMK NucBox M7 Pro | |
| Intel NUC 13 Pro Desk Edition Kit | |
| AIDA64 / Memory Latency | |
| Asus NUC 14 Pro | |
| Beelink SER9 | |
| BOSGAME M2 | |
| Intel NUC 13 Pro Desk Edition Kit | |
| Average AMD Ryzen 9 7940HS (87.6 - 111.1, n=10) | |
| BOSGAME M1 | |
| GMK NucBox M7 Pro | |
* ... smaller is better
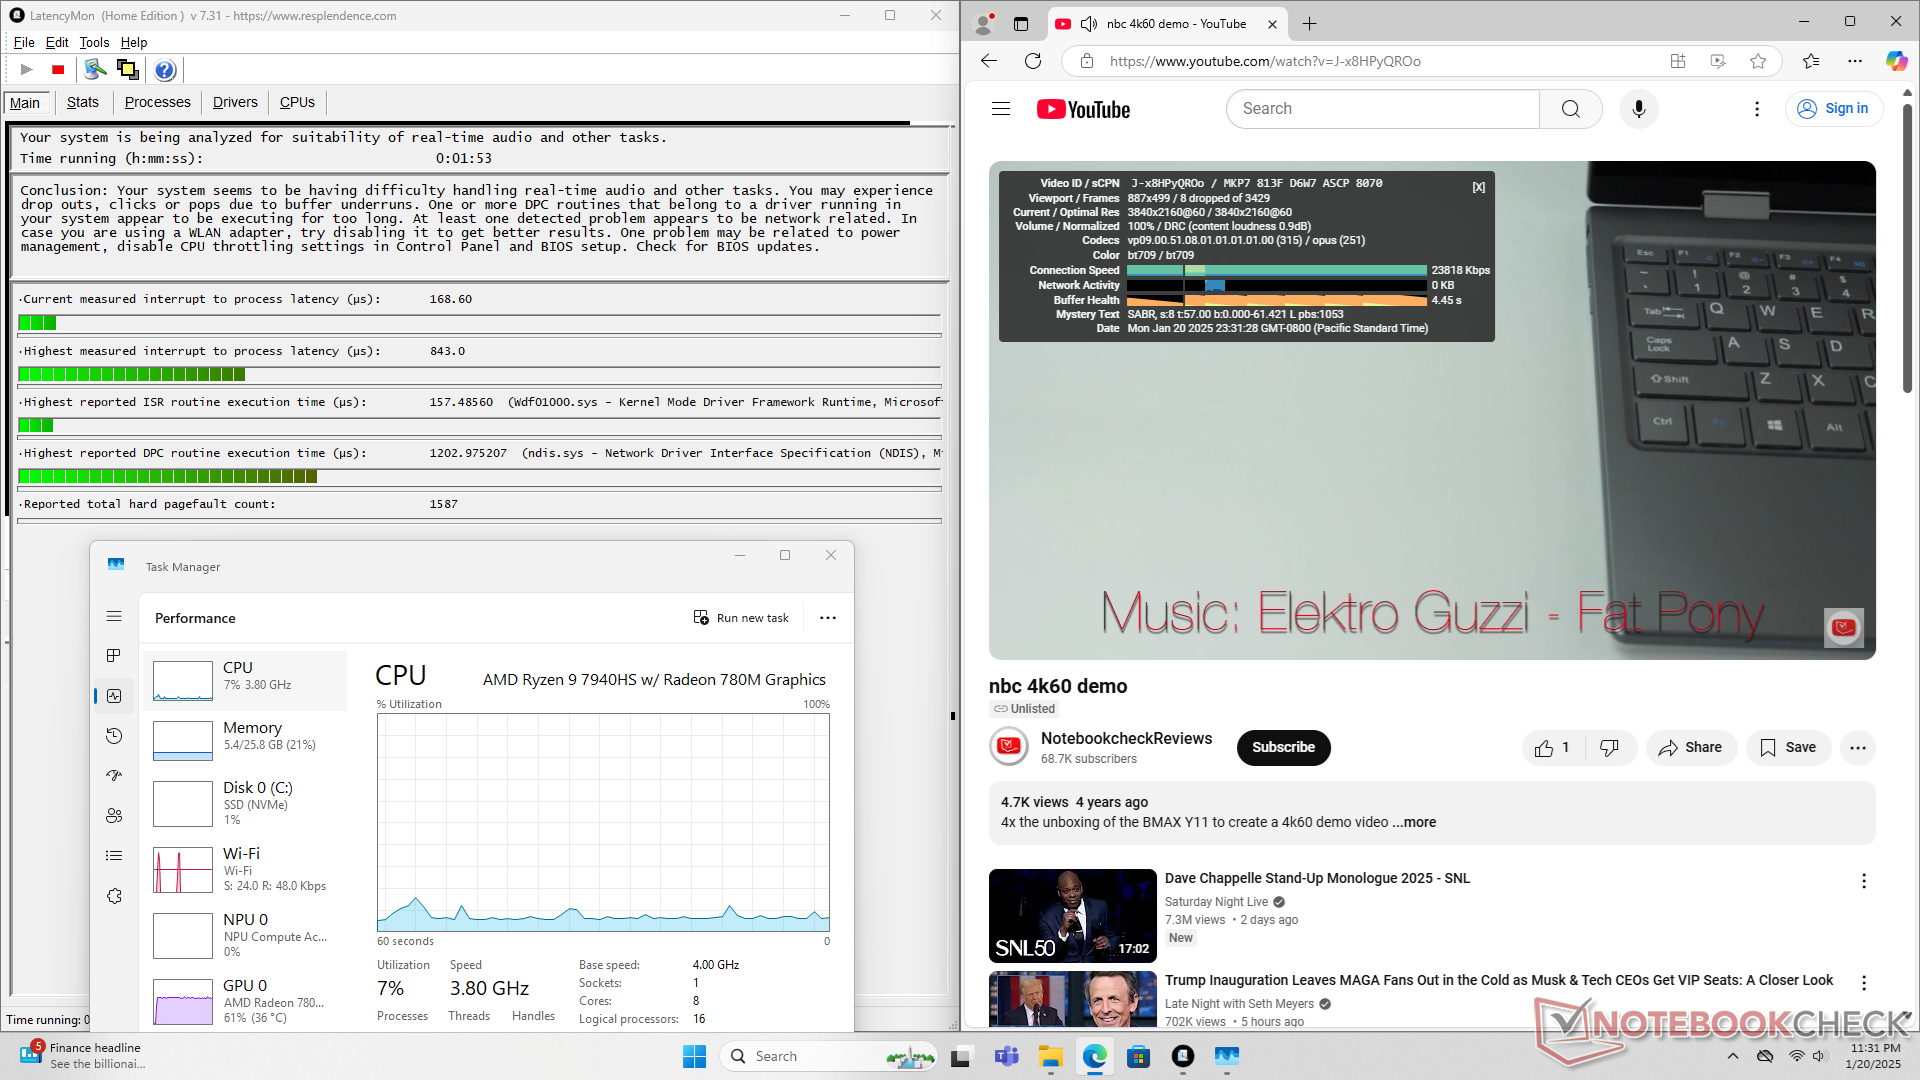
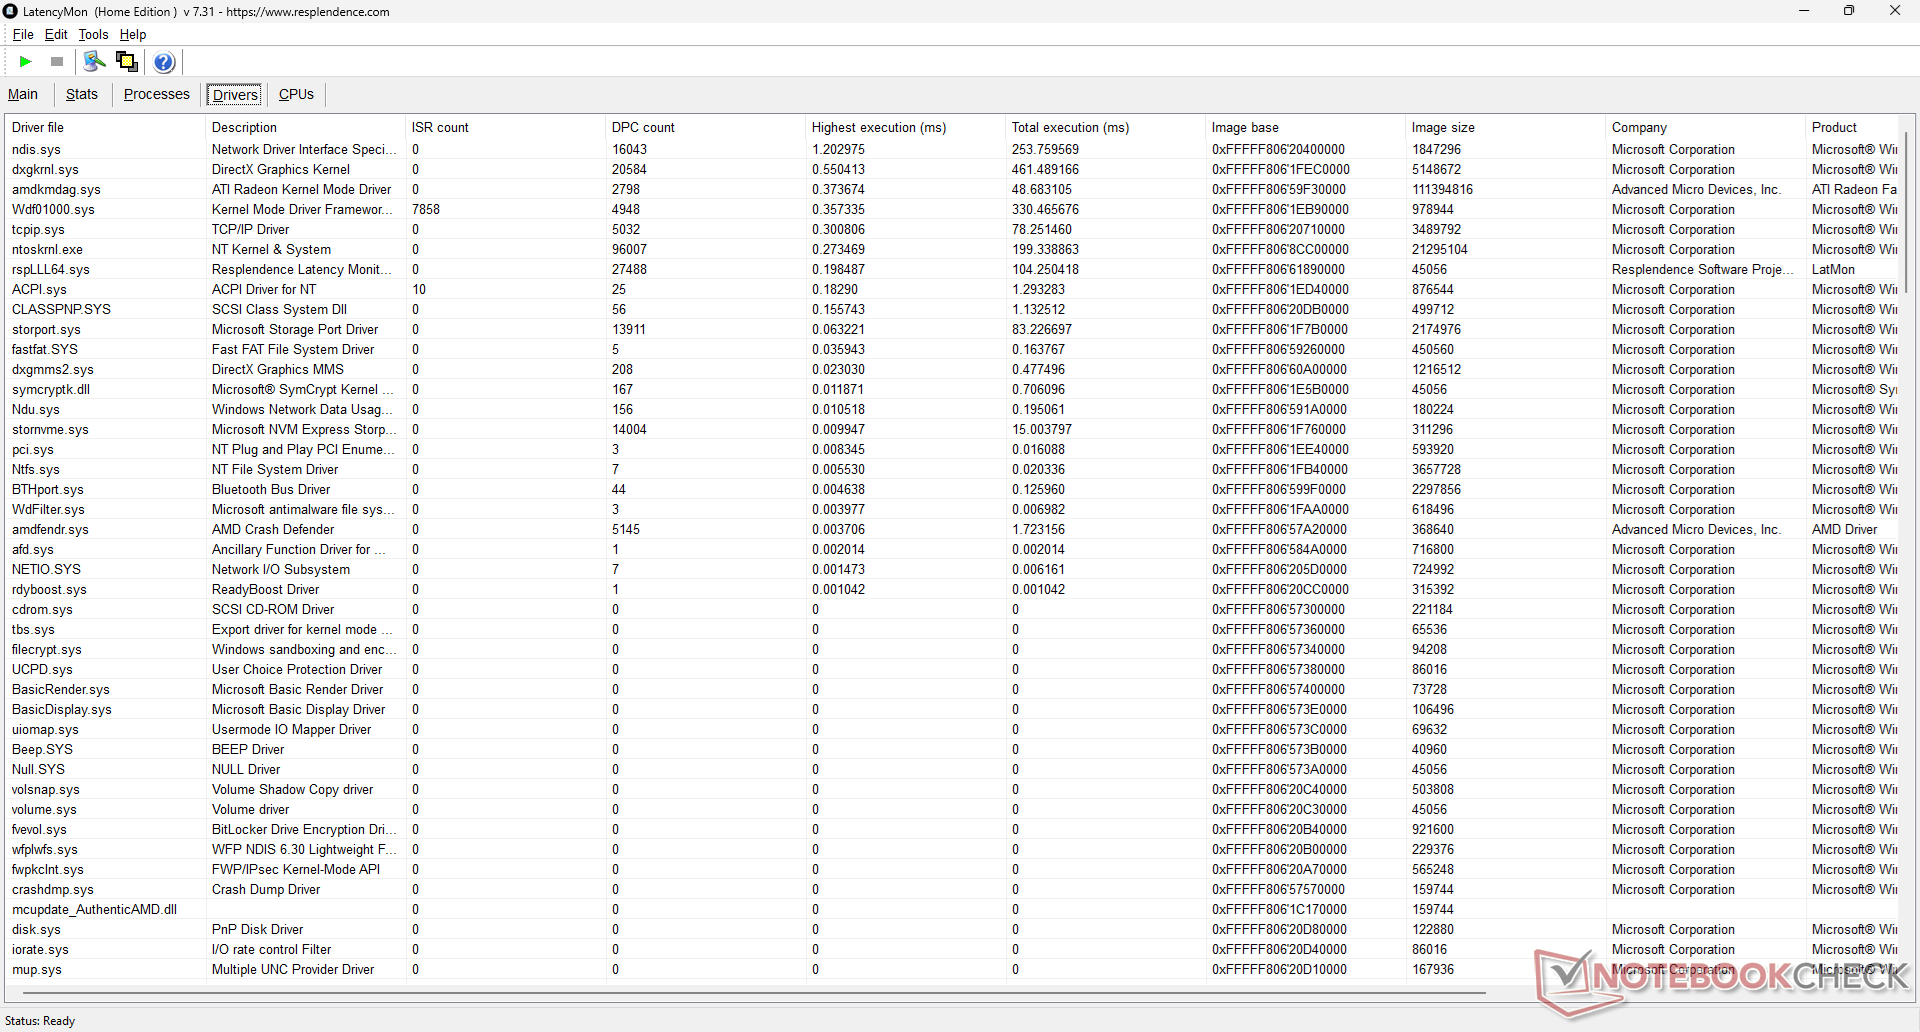
DPC Latency
LatencyMon reveals only minor DPC issues when opening multiple browser tabs of our homepage. 4K60 video playback is unfortunately imperfect with 8 dropped frames during a 60-second time span. The frame skips are low enough to be essentially unnoticeable during regular use, but they should ideally be zero nonetheless.
| DPC Latencies / LatencyMon - interrupt to process latency (max), Web, Youtube, Prime95 | |
| GMK NucBox M7 Pro | |
| Asus NUC 14 Pro | |
| BOSGAME M1 | |
| Intel NUC 13 Pro Desk Edition Kit | |
| BOSGAME M2 | |
* ... smaller is better
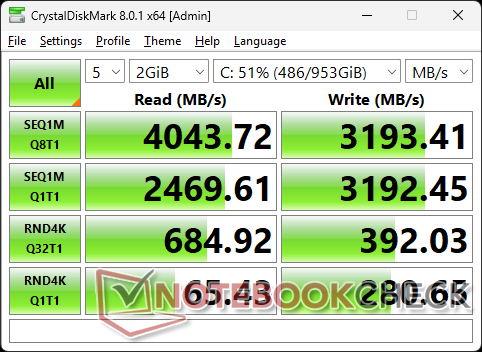
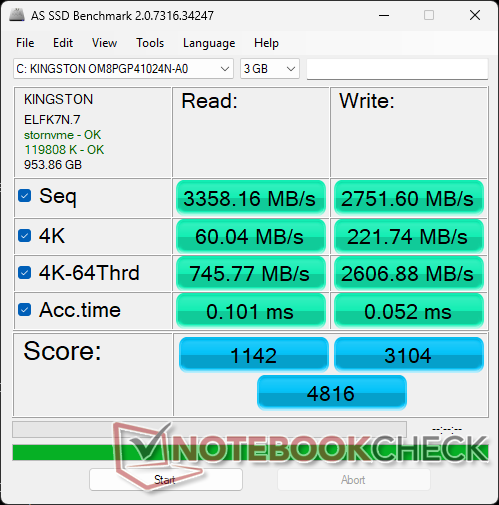
Storage Devices
Our test unit ships with the same Kingston OM8PGP41024N-A0 NVMe SSD as found on the M1. Transfer rates top out at around 4000 MB/s with no notable performance throttling issues.

| Drive Performance rating - Percent | |
| Intel NUC 13 Pro Desk Edition Kit | |
| Asus NUC 14 Pro | |
| BOSGAME M2 | |
| Beelink SER9 | |
| BOSGAME M1 | |
| GMK NucBox M7 Pro | |
* ... smaller is better
Disk Throttling: DiskSpd Read Loop, Queue Depth 8
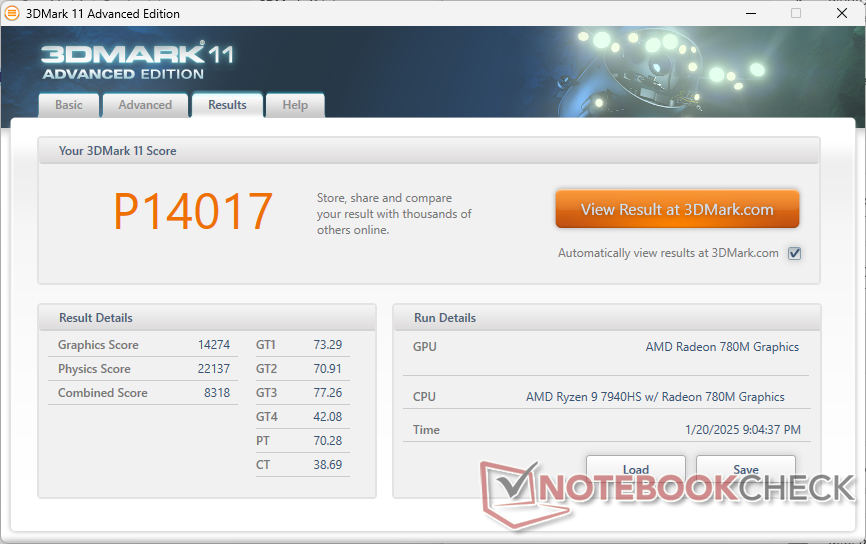
GPU Performance
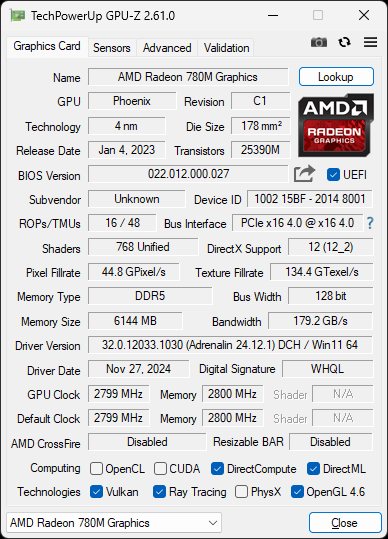
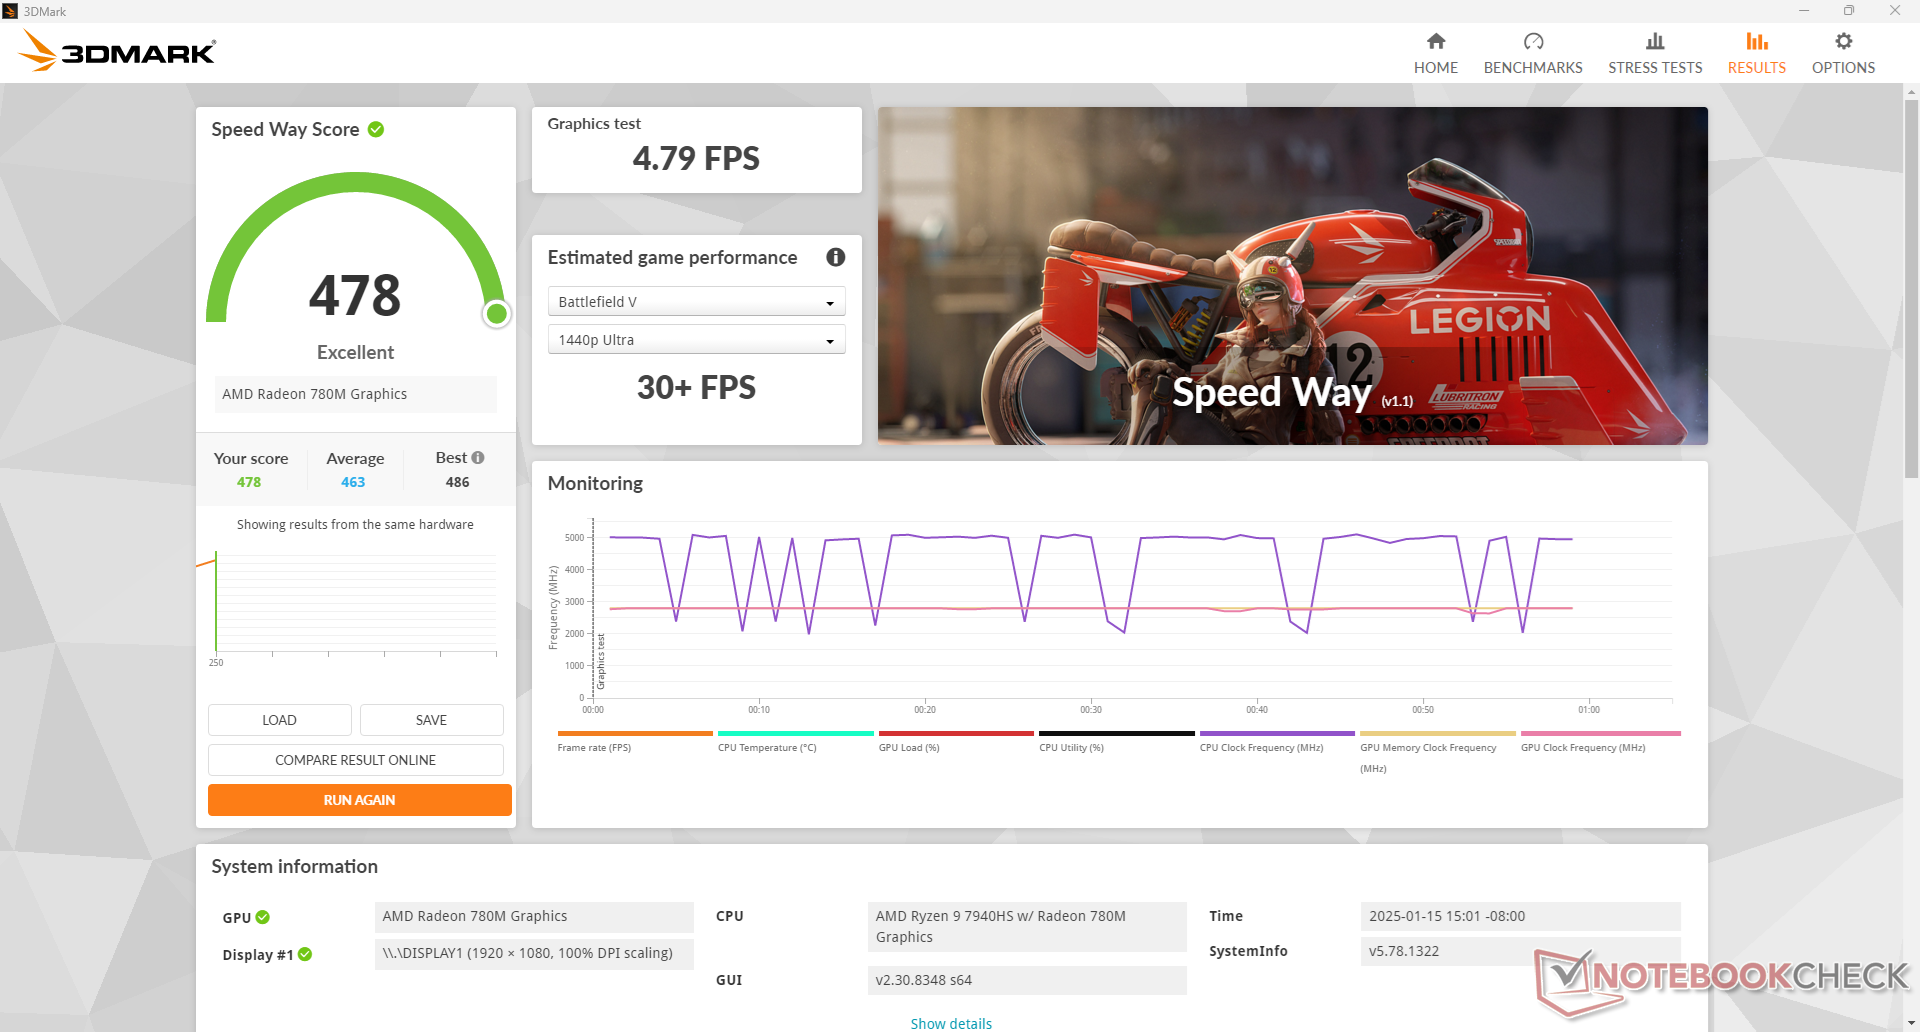
The Ryzen 7 7840HS and Ryzen 9 7940HS each come with the same integrated Radeon 780M GPU for no major graphical performance differences between them.
| 3DMark Performance rating - Percent | |
| Beelink SER9 | |
| BOSGAME M1 | |
| BOSGAME M2 | |
| Beelink SER8 | |
| Asus NUC 14 Pro | |
| Average AMD Radeon 780M | |
| GMK NucBox M7 Pro -1! | |
| Beelink SER6 Pro | |
| Geekom XT13 Pro -1! | |
| Intel NUC 13 Pro Desk Edition Kit -1! | |
| GMK NucBox M6 -1! | |
| MSI Cubi NUC 1M -1! | |
| Beelink SER5 -1! | |
| 3DMark 11 Performance | 14017 points | |
| 3DMark Cloud Gate Standard Score | 38111 points | |
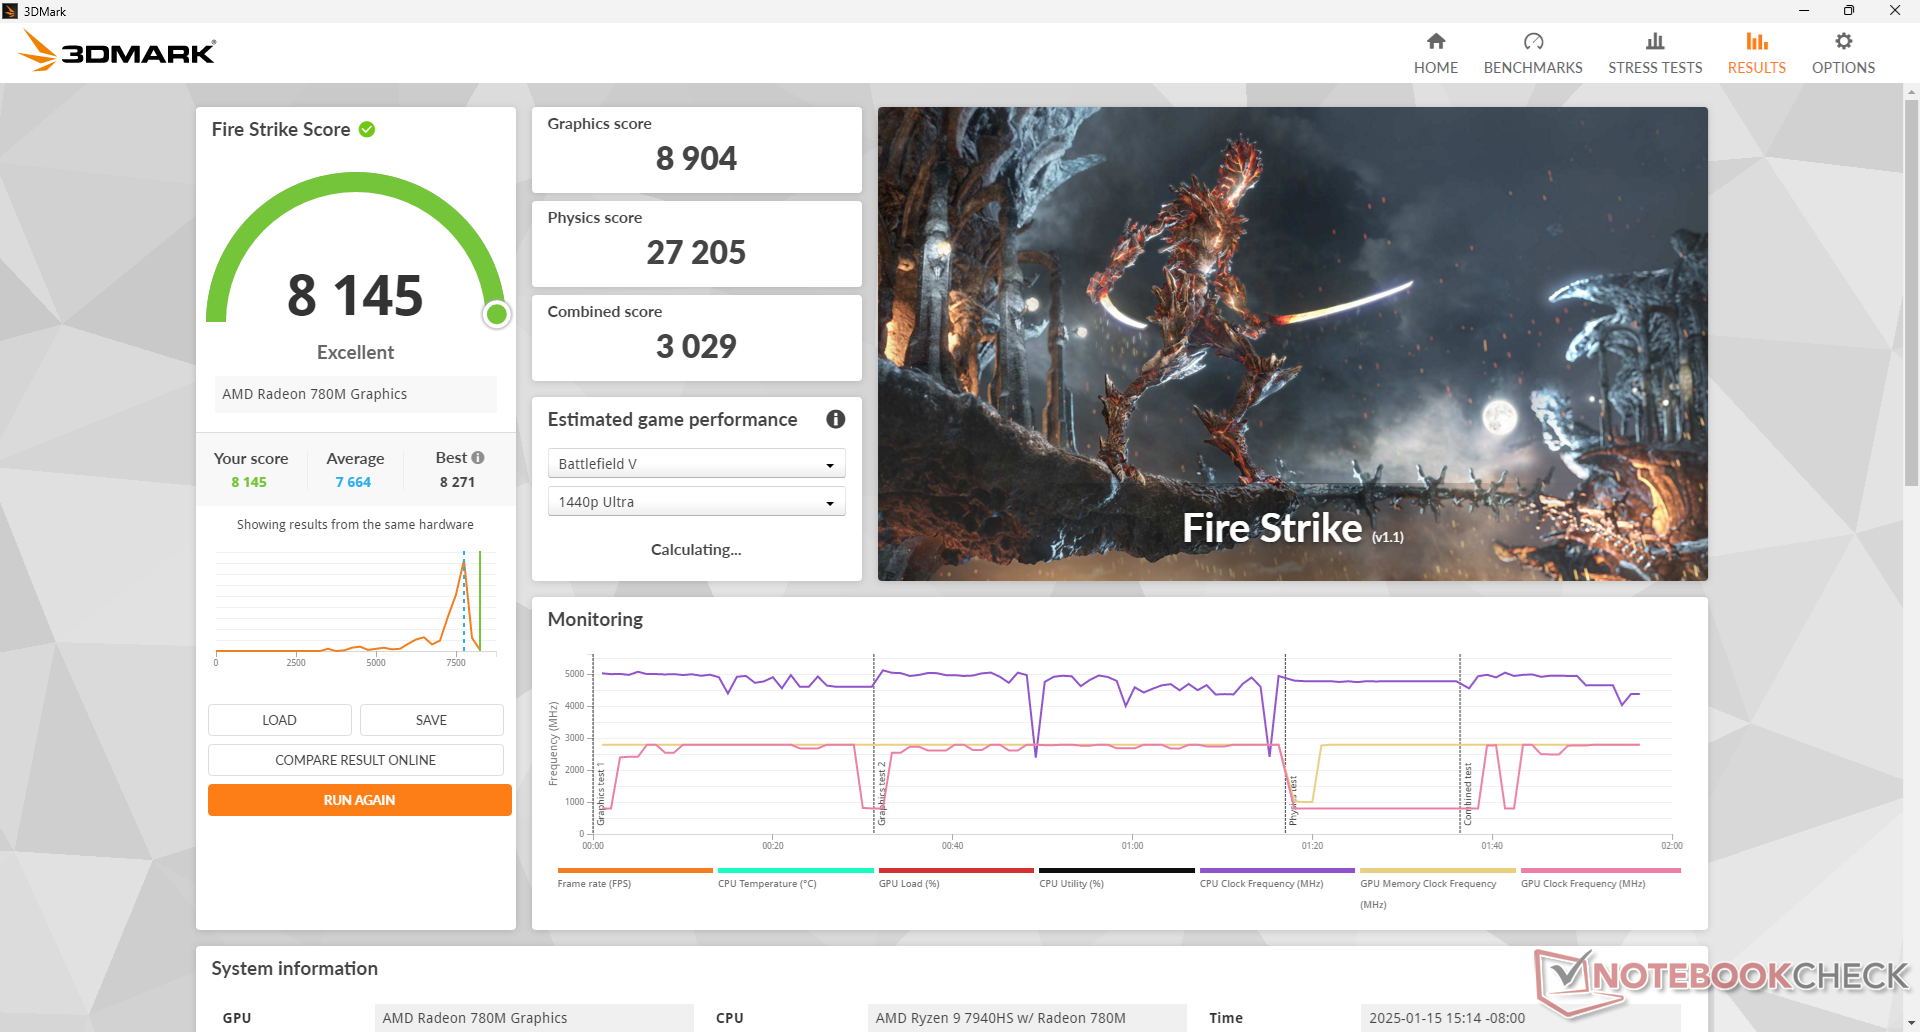
| 3DMark Fire Strike Score | 8145 points | |
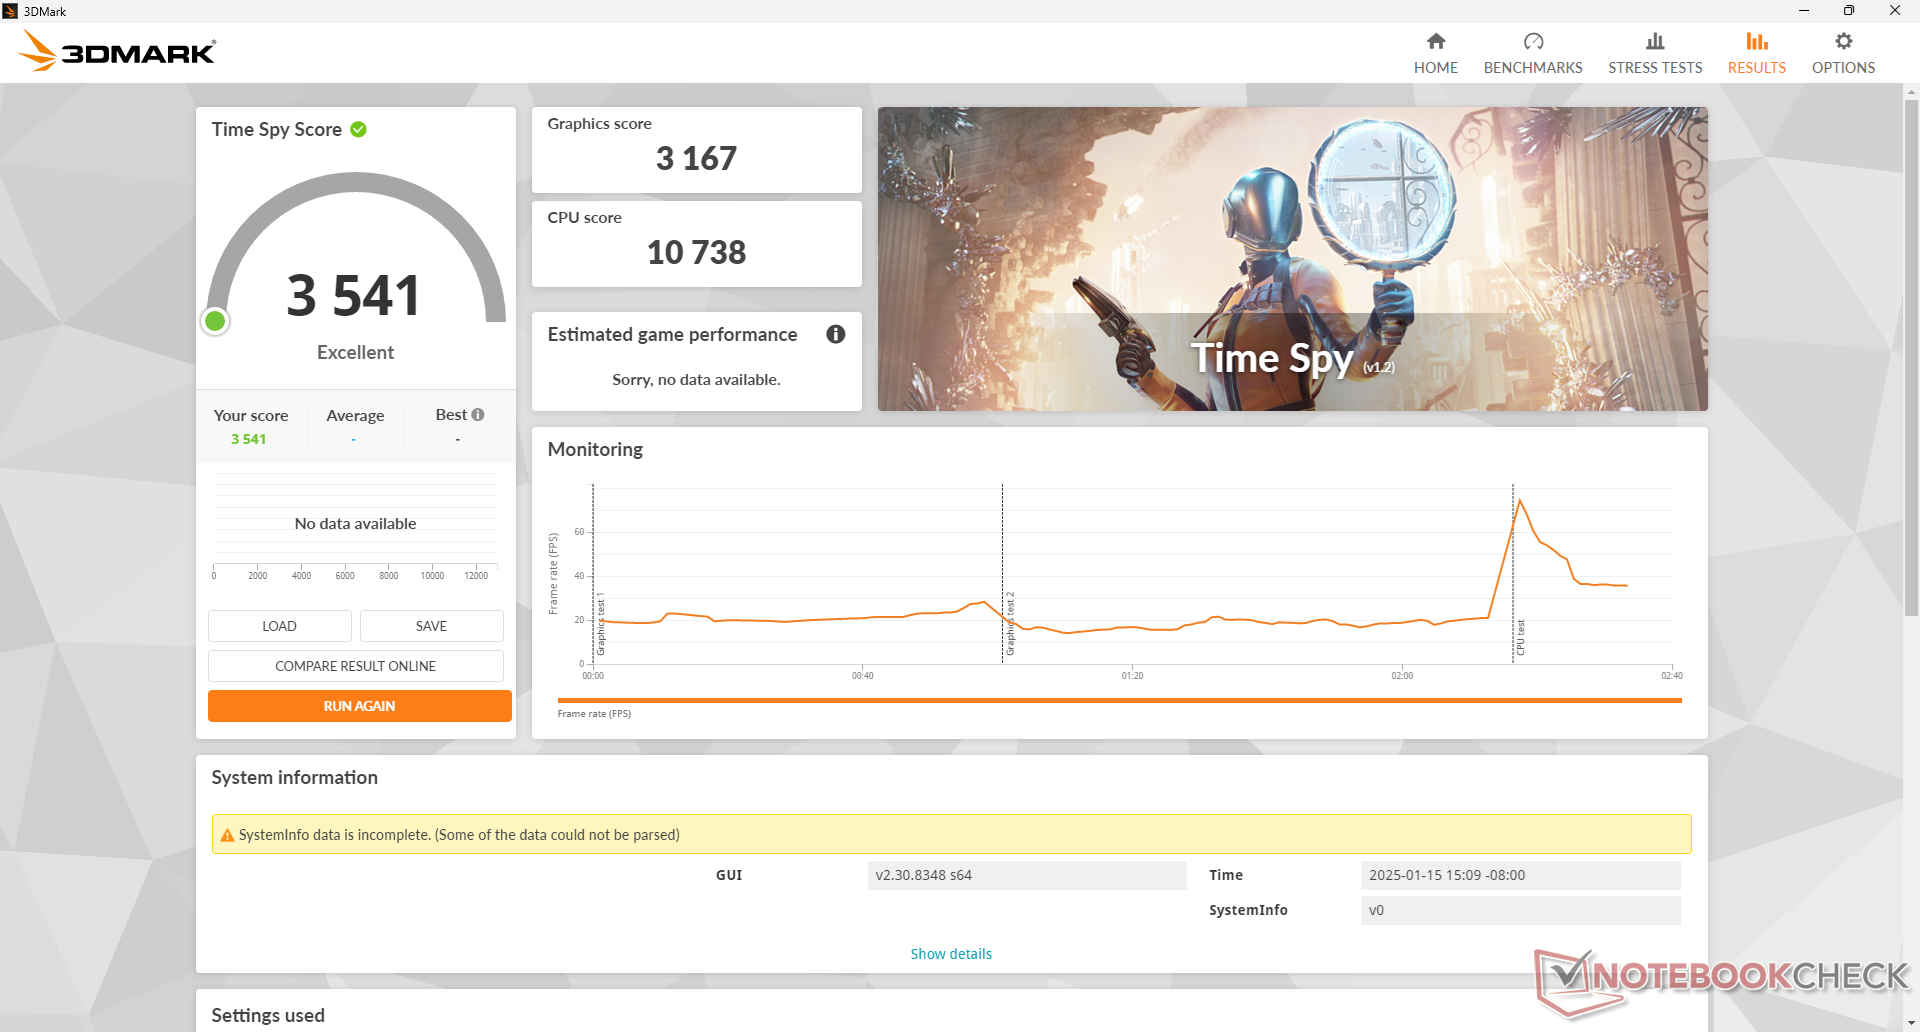
| 3DMark Time Spy Score | 3541 points | |
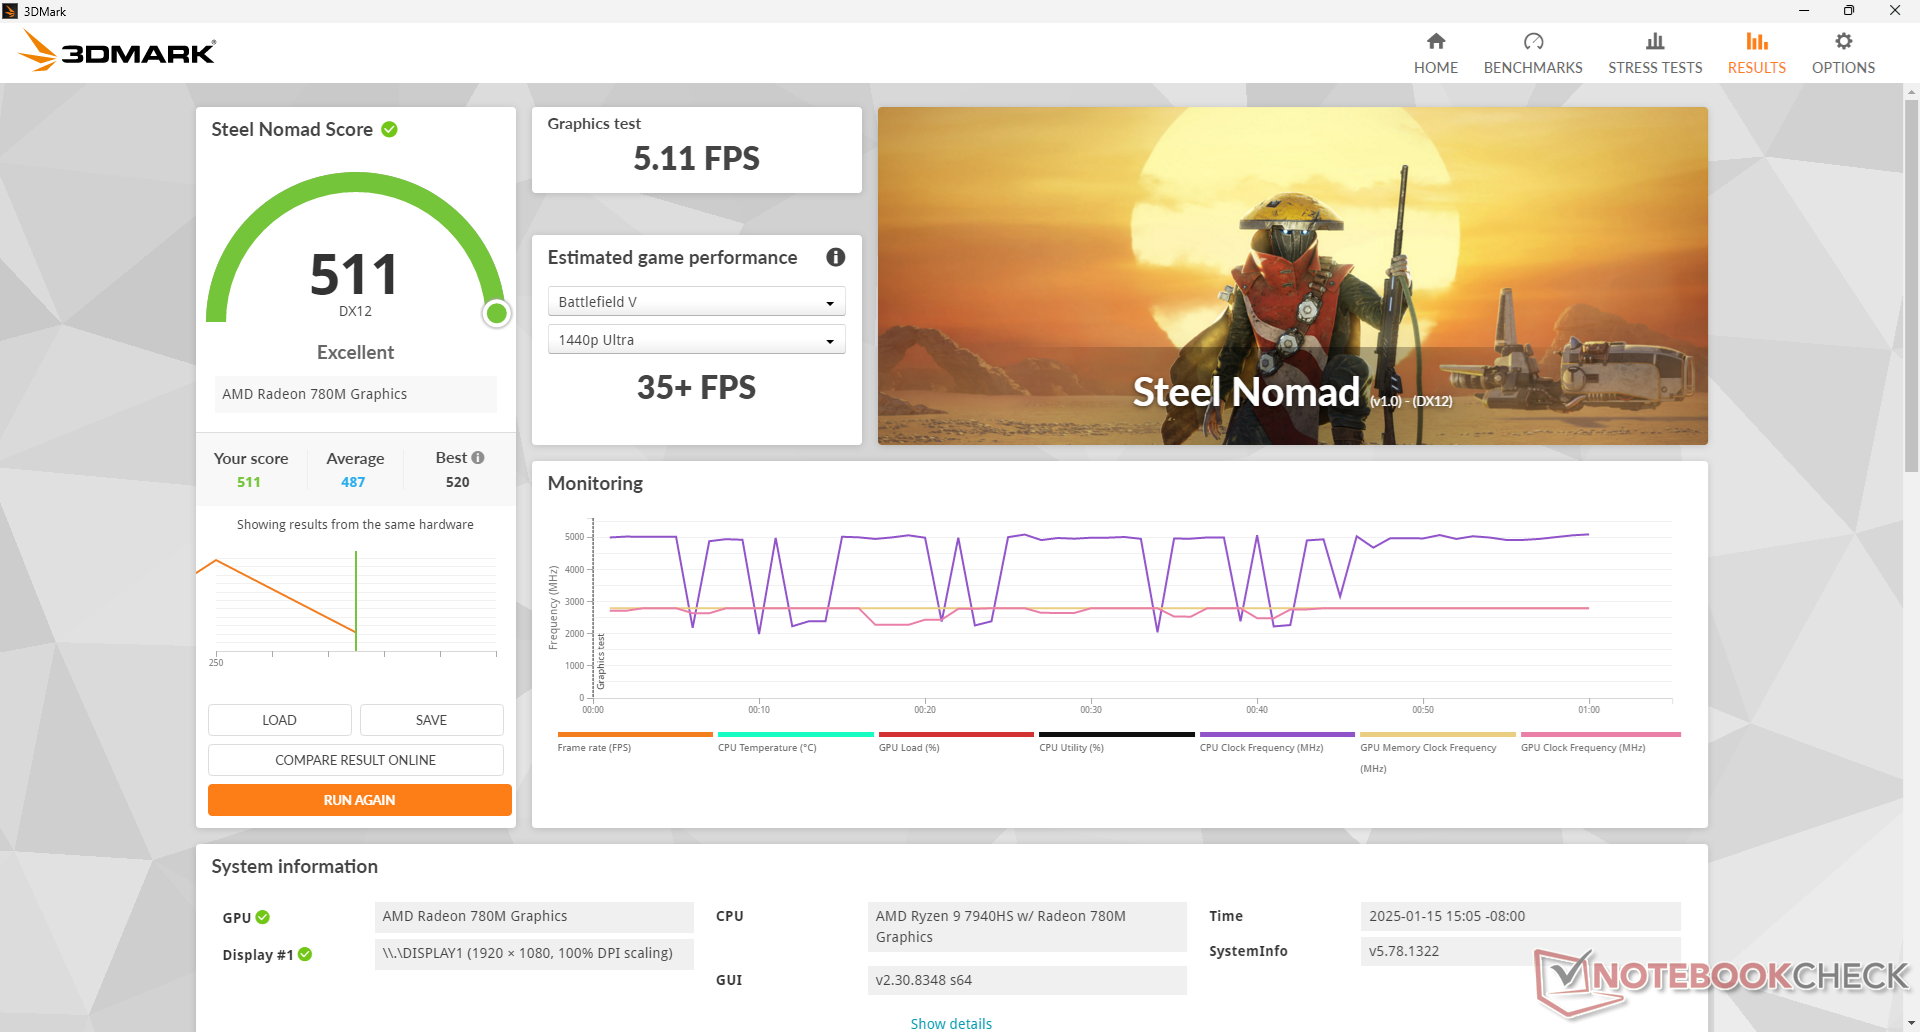
| 3DMark Steel Nomad Score | 511 points | |
Help | ||
* ... smaller is better
Cyberpunk 2077 ultra FPS Chart
| low | med. | high | ultra | |
|---|---|---|---|---|
| GTA V (2015) | 166.6 | 155.8 | 69.4 | 28.5 |
| Dota 2 Reborn (2015) | 155.8 | 122.7 | 98.4 | 88.1 |
| Final Fantasy XV Benchmark (2018) | 83.8 | 41.5 | 30.1 | |
| X-Plane 11.11 (2018) | 66.1 | 49.1 | 41.4 | |
| Far Cry 5 (2018) | 88 | 53 | 49 | 46 |
| Strange Brigade (2018) | 175.1 | 70.4 | 59.7 | 51.2 |
| Tiny Tina's Wonderlands (2022) | 76.9 | 55.9 | 37.8 | 30.3 |
| F1 22 (2022) | 107.3 | 93.3 | 69.1 | 19.3 |
| Baldur's Gate 3 (2023) | 44.1 | 36.5 | 30.6 | 29.6 |
| Cyberpunk 2077 (2023) | 46.3 | 36.3 | 29.2 | 25.8 |
Emissions
System Noise
Fan noise and characteristics are essentially identical to the M1 based on our measurements. When gaming, the system reaches just over 40 dB(A) to be much louder than the pricier Beelink SER9 but also quieter than the weaker Asus NUC 14 Pro.
Noise level
| Idle |
| 31.5 / 32.3 / 34.9 dB(A) |
| Load |
| 39 / 42.5 dB(A) |
 | ||
30 dB silent 40 dB(A) audible 50 dB(A) loud |
||
min: | ||
| BOSGAME M2 Radeon 780M, R9 7940HS, Kingston OM8PGP41024N-A0 | BOSGAME M1 Radeon 780M, R7 7840HS, Kingston OM8PGP41024N-A0 | GMK NucBox M7 Pro Radeon 680M, R9 PRO 6950H | Beelink SER9 Radeon 890M, Ryzen AI 9 HX 370, Crucial P3 Plus CT1000P3PSSD8 | Asus NUC 14 Pro Arc 7-Core, Ultra 5 125H, Kingston KC3000 2048G SKC3000D2048G | Intel NUC 13 Pro Desk Edition Kit Iris Xe G7 96EUs, i7-1360P, Samsung PM9A1 MZVL2512HCJQ | |
|---|---|---|---|---|---|---|
| Noise | 1% | -3% | 15% | 3% | 4% | |
| off / environment * (dB) | 23 | 23.2 -1% | 23 -0% | 23.2 -1% | 24 -4% | 25.2 -10% |
| Idle Minimum * (dB) | 31.5 | 32 -2% | 35.9 -14% | 26.6 16% | 26 17% | 28.1 11% |
| Idle Average * (dB) | 32.3 | 32 1% | 36.7 -14% | 26.8 17% | 26.2 19% | 28.2 13% |
| Idle Maximum * (dB) | 34.9 | 32 8% | 36.7 -5% | 26.8 23% | 26.2 25% | 28.3 19% |
| Load Average * (dB) | 39 | 38.7 1% | 38.4 2% | 33.4 14% | 42.4 -9% | 42 -8% |
| Cyberpunk 2077 ultra * (dB) | 40.3 | 38.7 4% | 34.6 14% | 47.7 -18% | ||
| Load Maximum * (dB) | 42.5 | 42 1% | 39.8 6% | 33.8 20% | 47.8 -12% | 42.1 1% |
| Witcher 3 ultra * (dB) | 41.7 |
* ... smaller is better
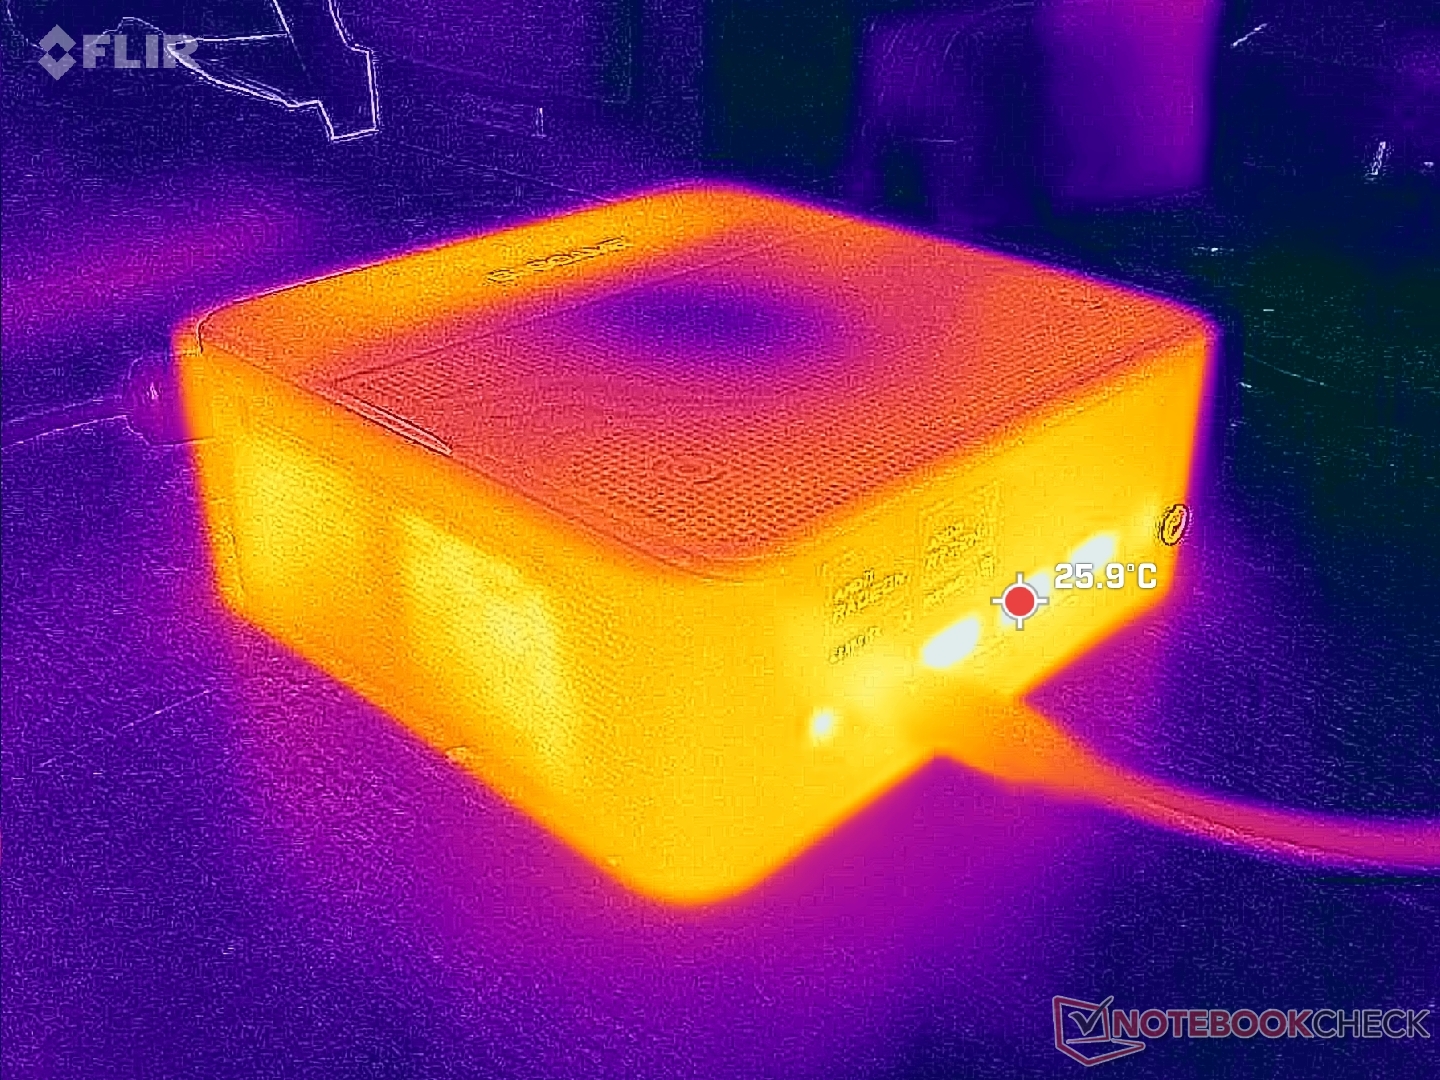
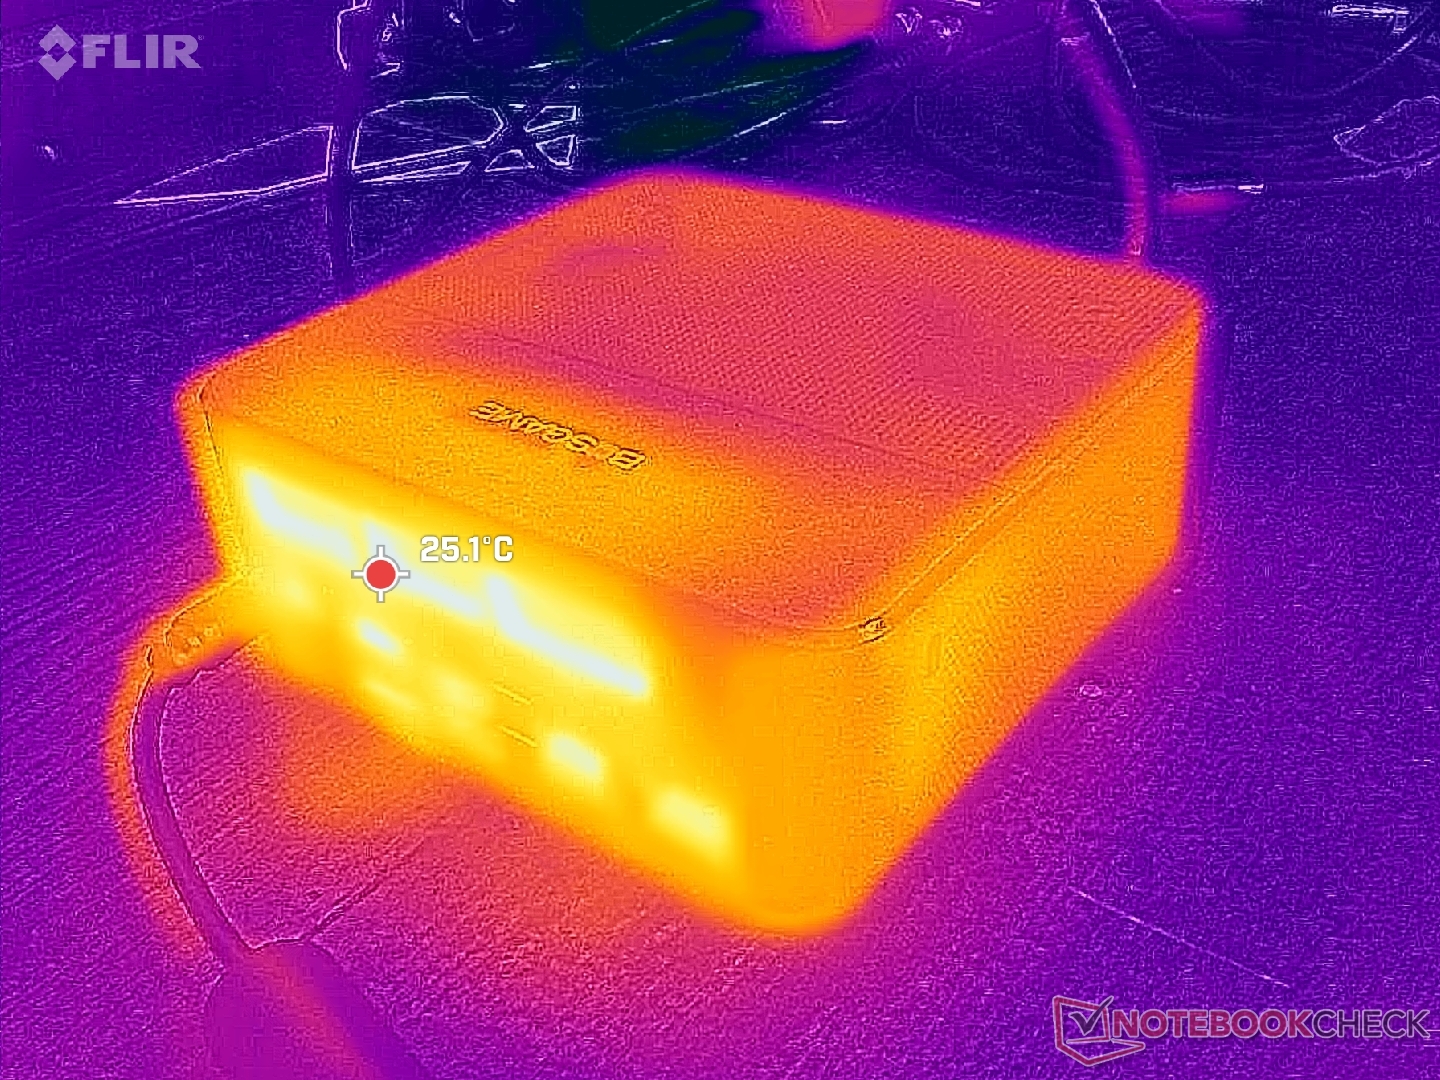
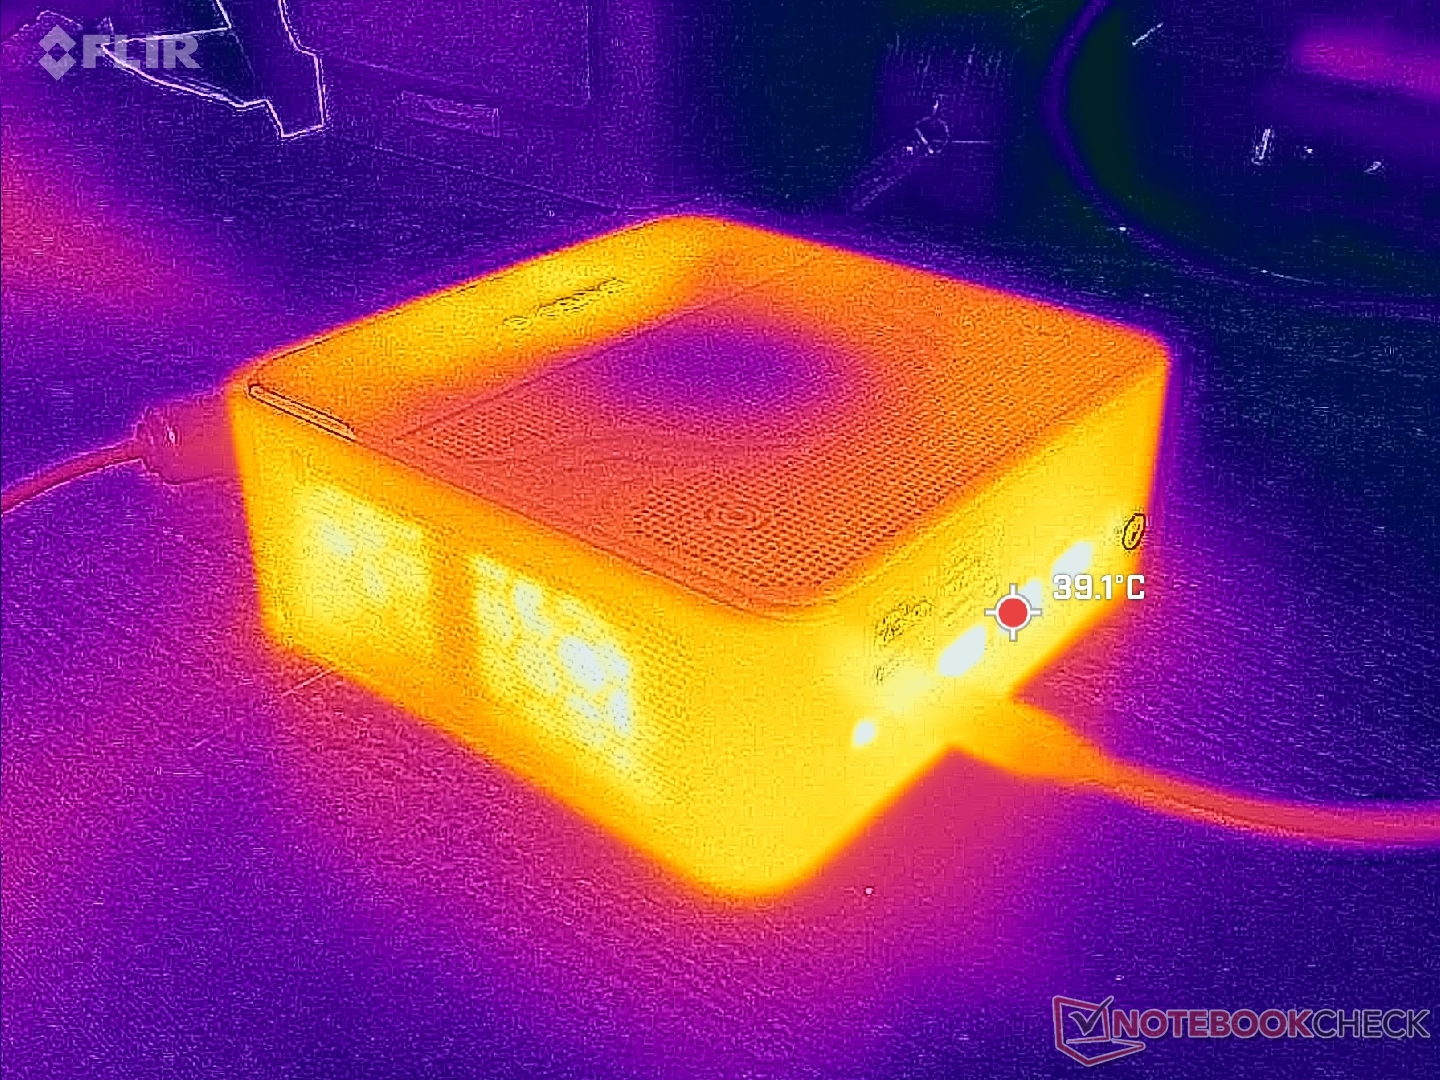
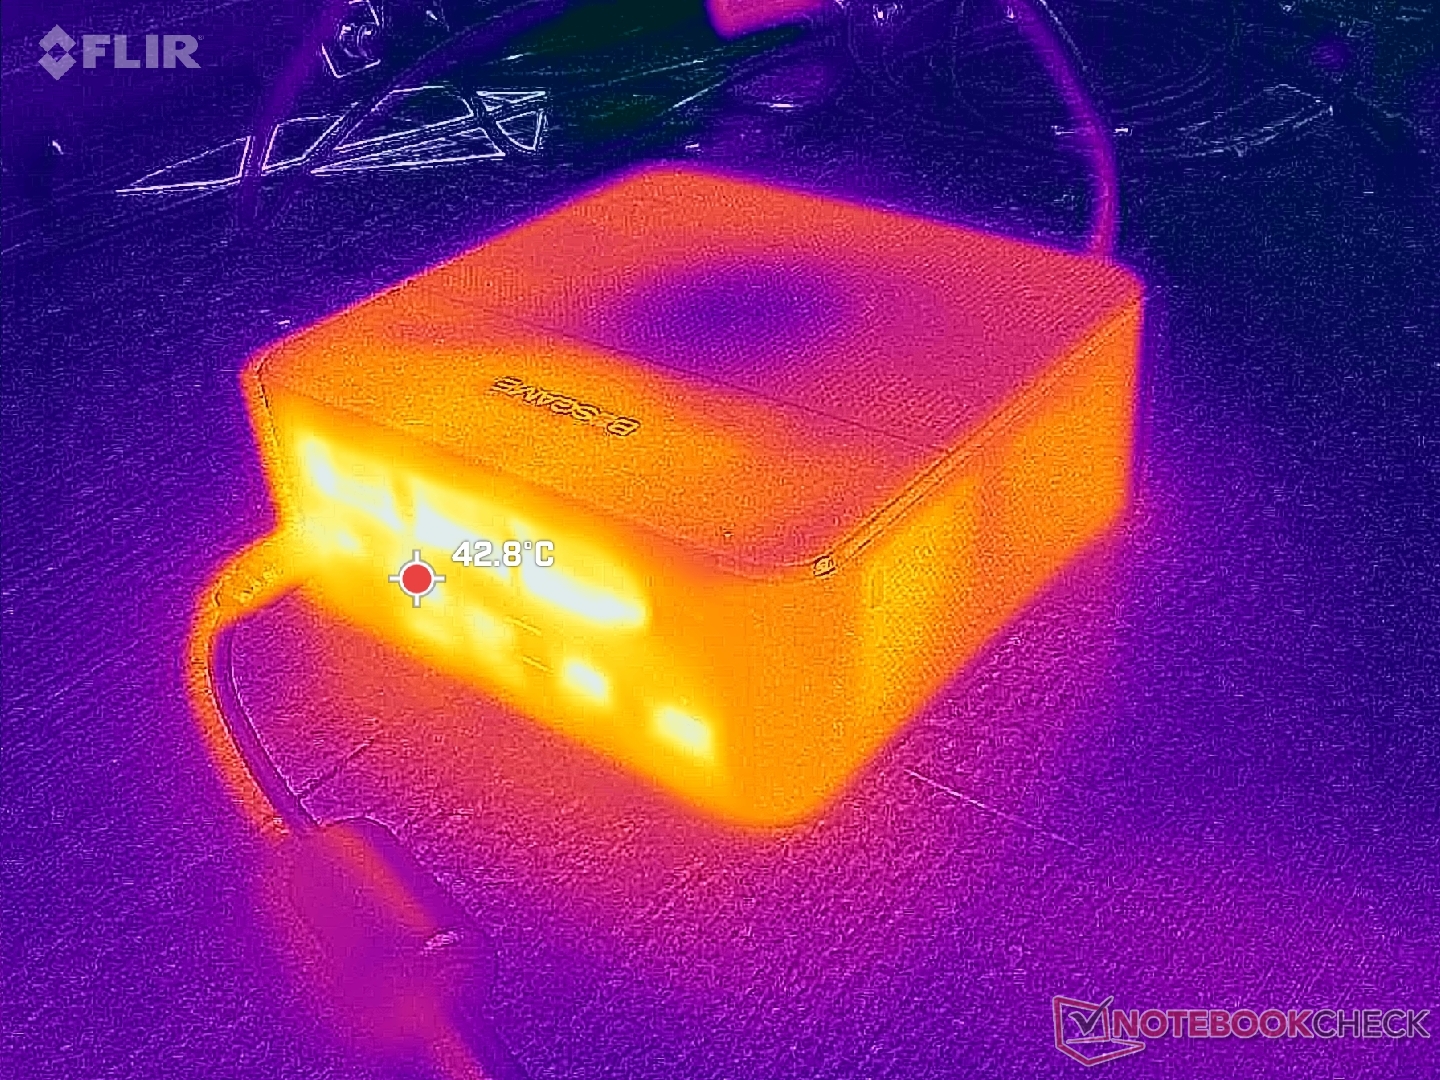
Temperature
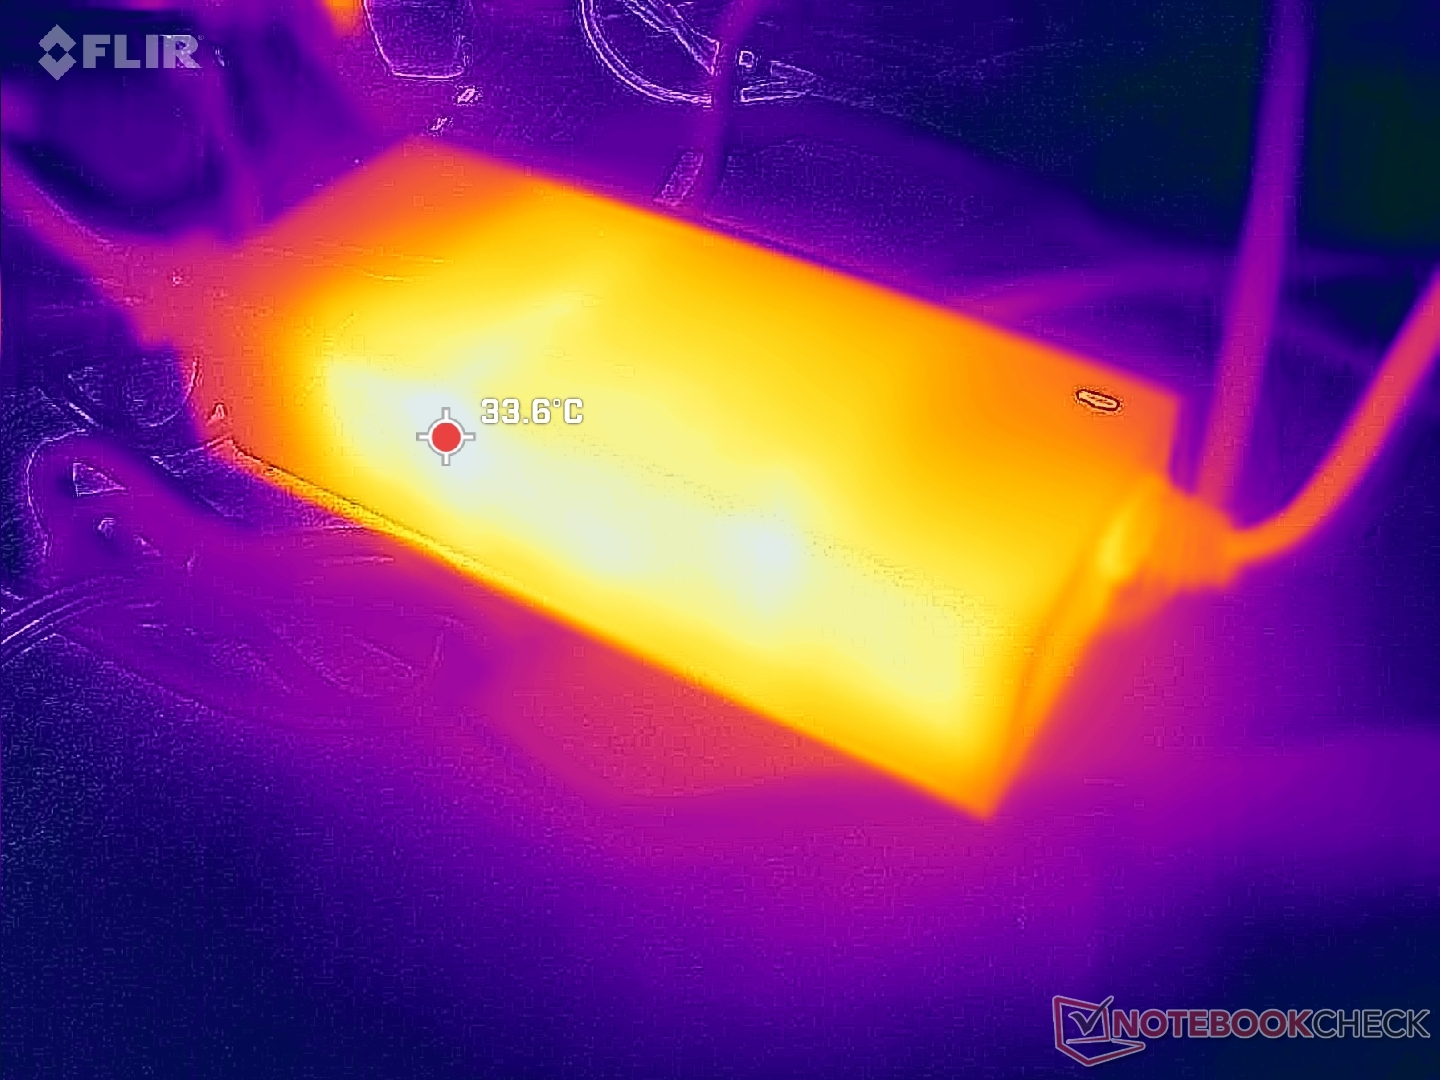
Five of the six faces of the chassis are ventilated and so surface temperatures are relatively low. Hot spots are along the front and rear where they can reach around 40 C.
Stress Test
When running Prime95 stress, the CPU would boost to 4.4 GHz and 65 W until hitting a core temperature of 81 C a few seconds later. Clock rate and package power would then fall to and stabilize at 4.0 GHz and 54 W, respectively, while maintaining a toasty core temperature of 87 C. In comparison, the faster AMD CPU in the Beelink SER9 would stabilize at a notably cooler core temperature of 71 C under similar conditions.
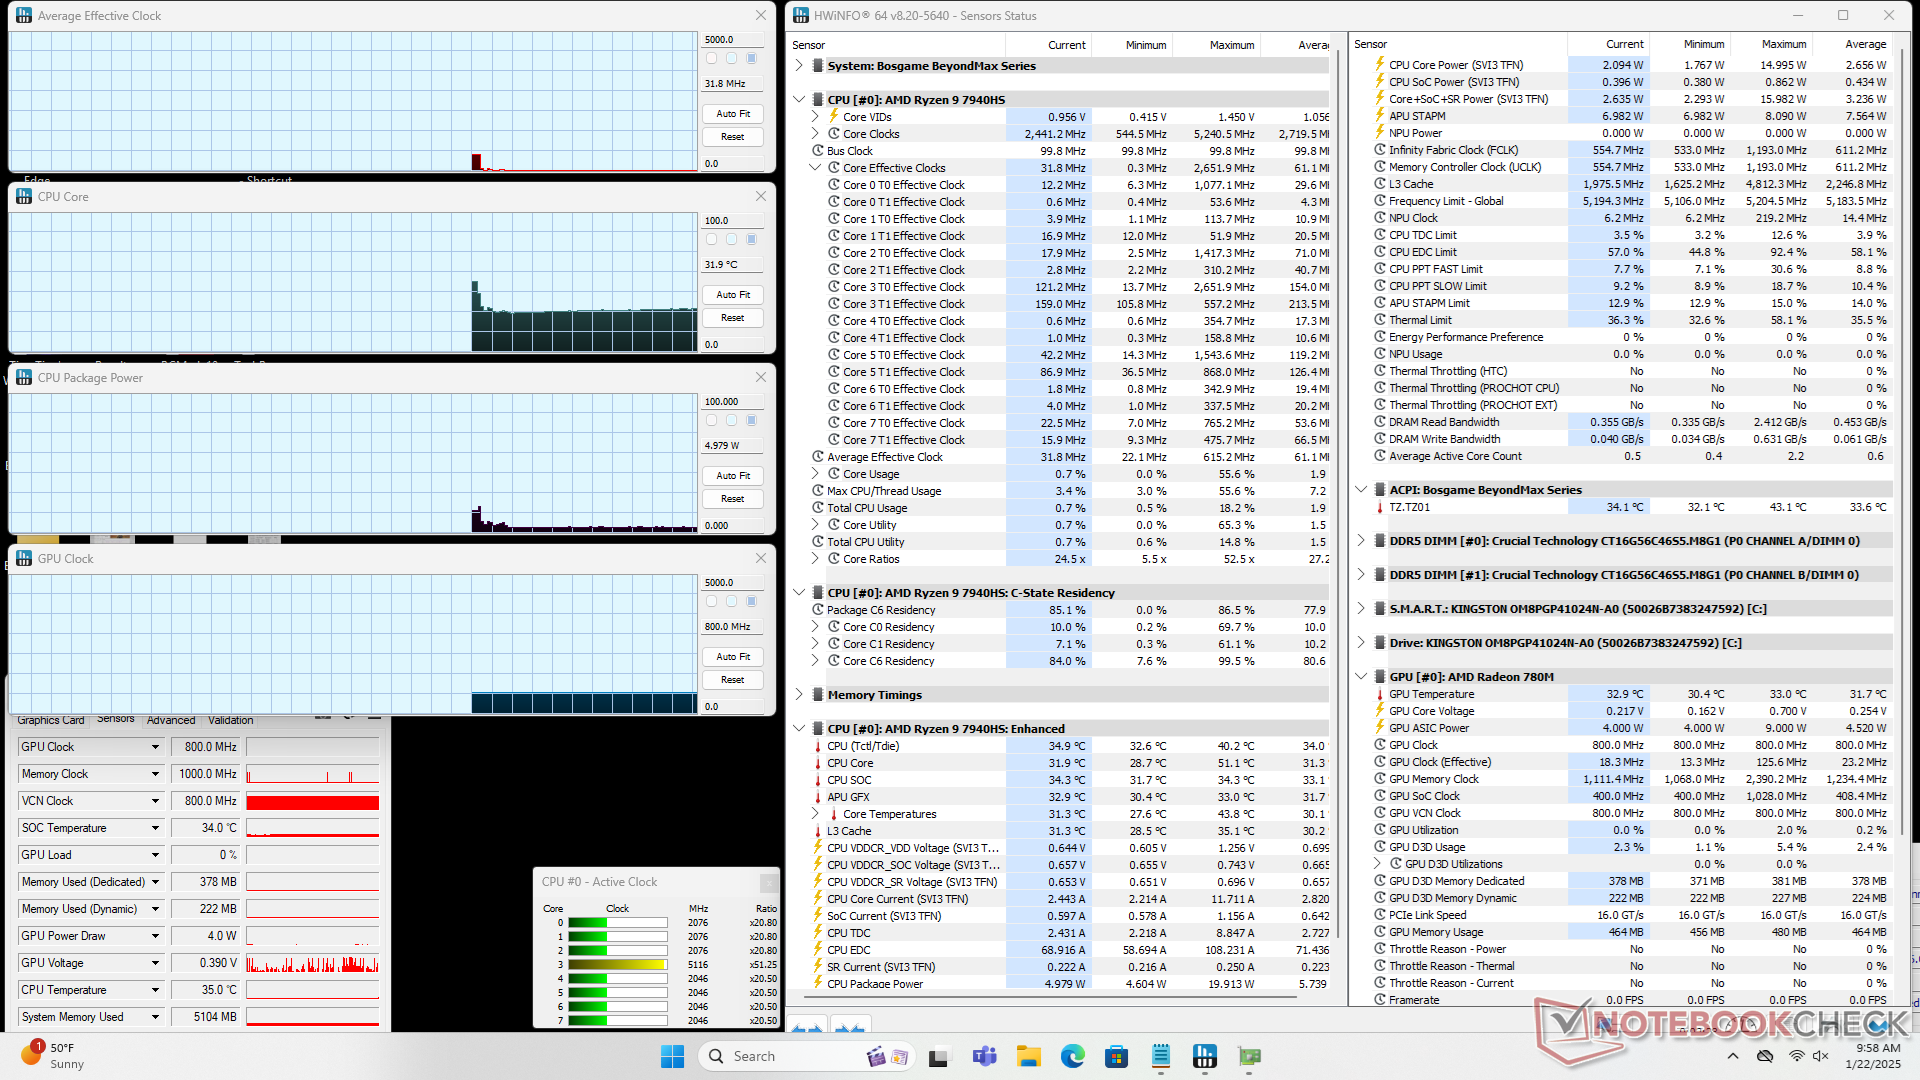
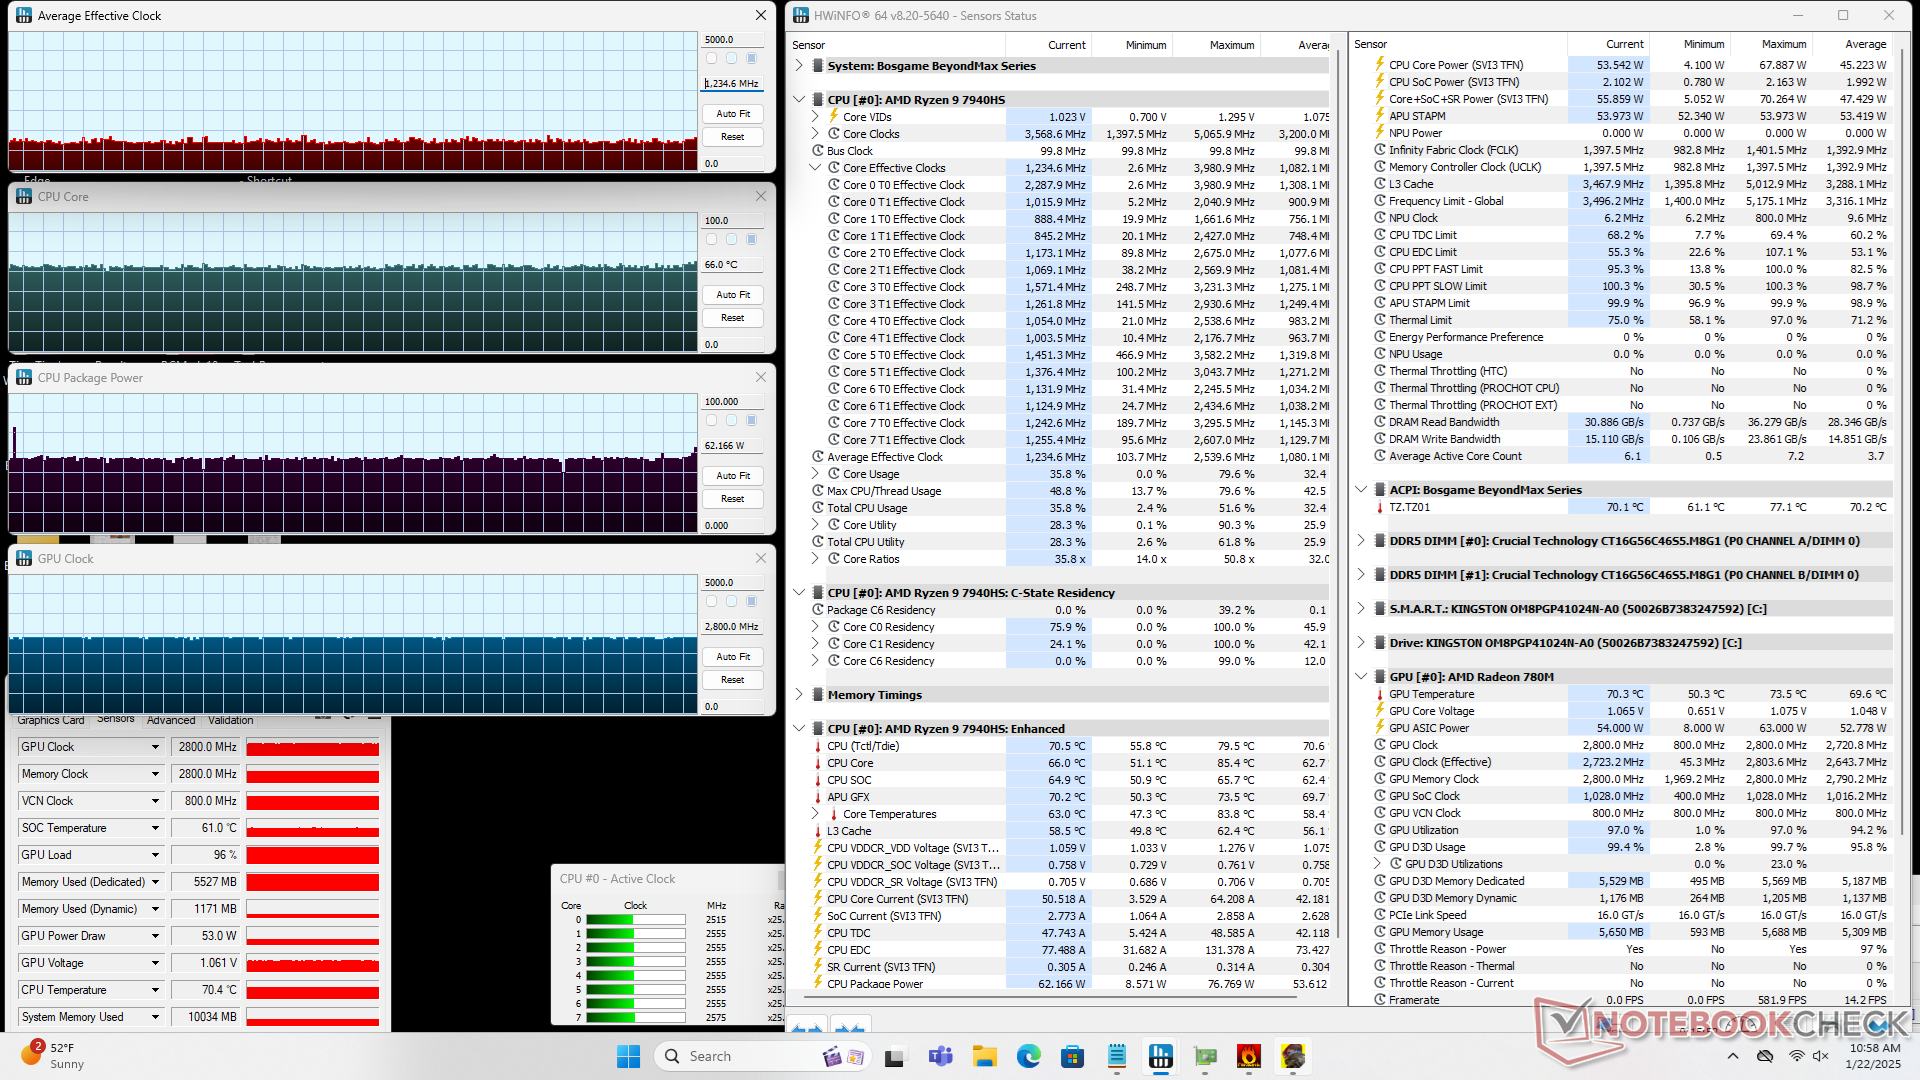
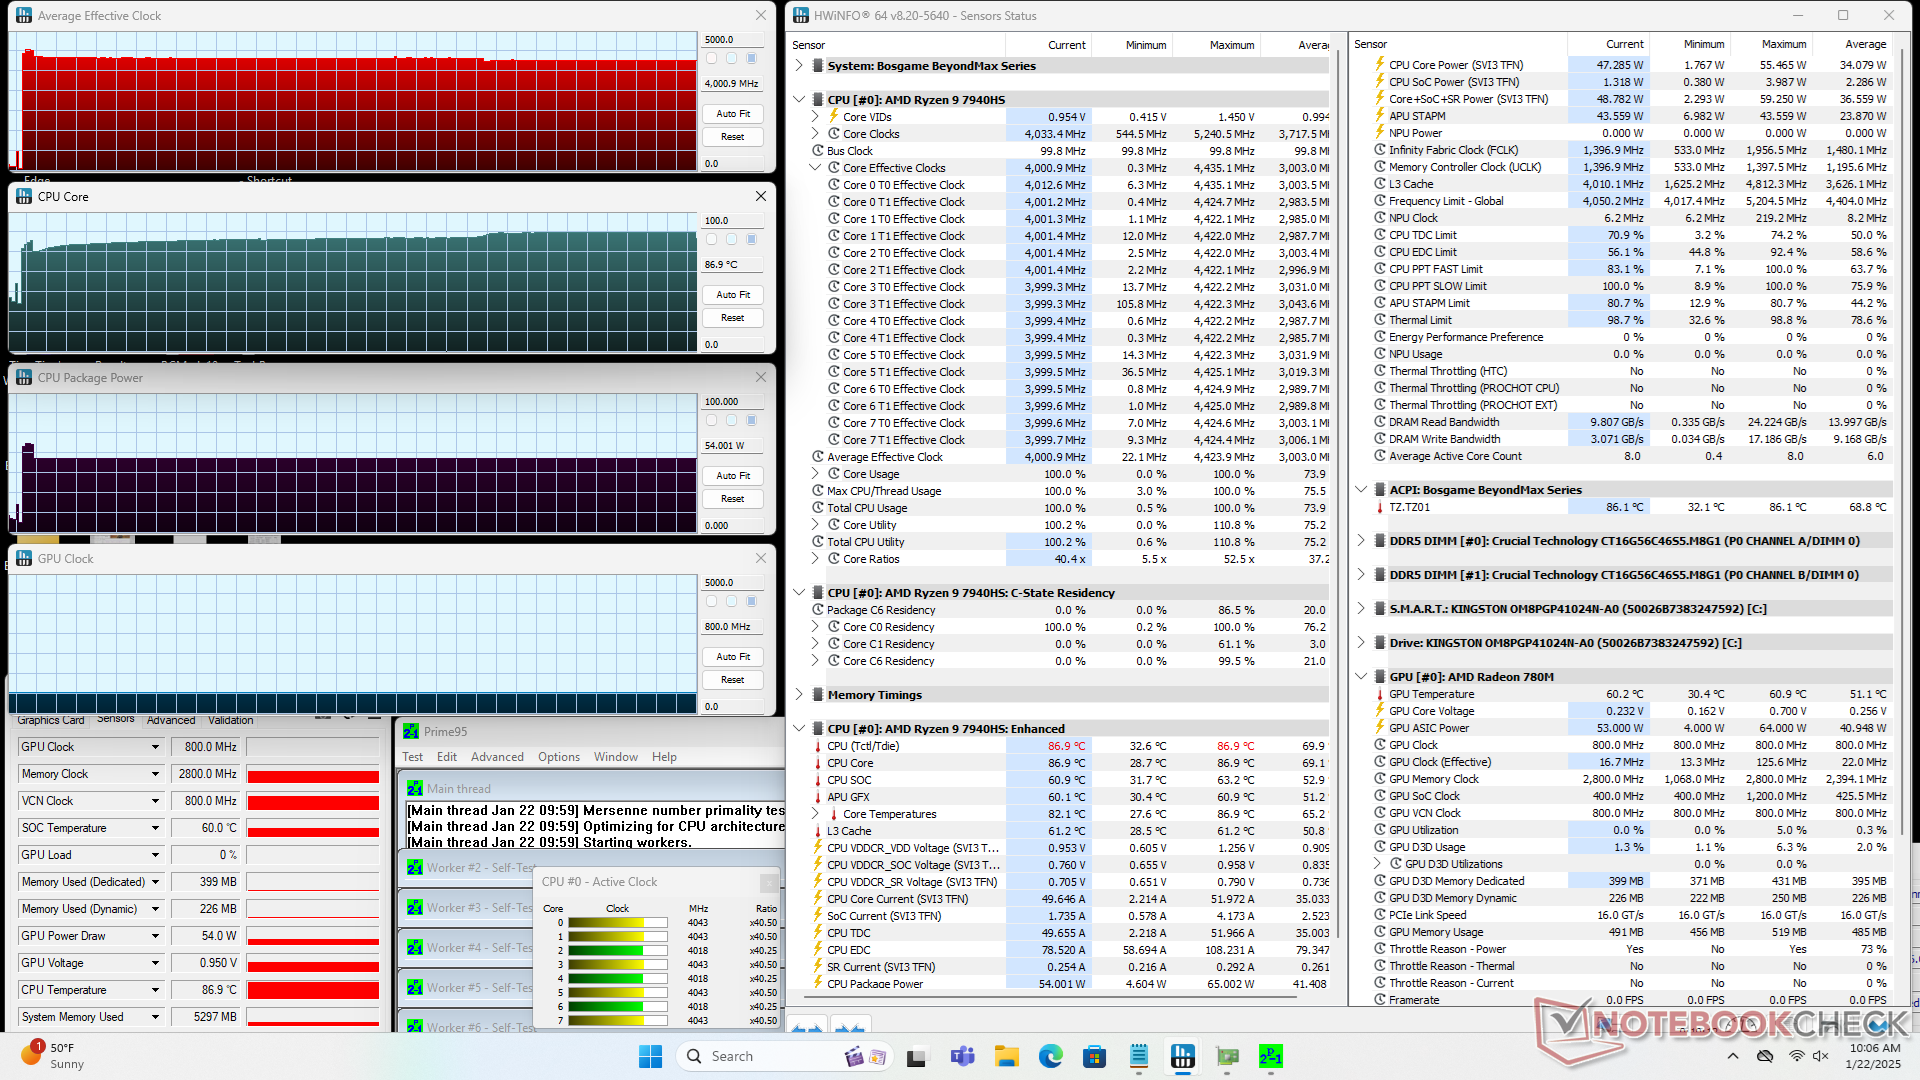
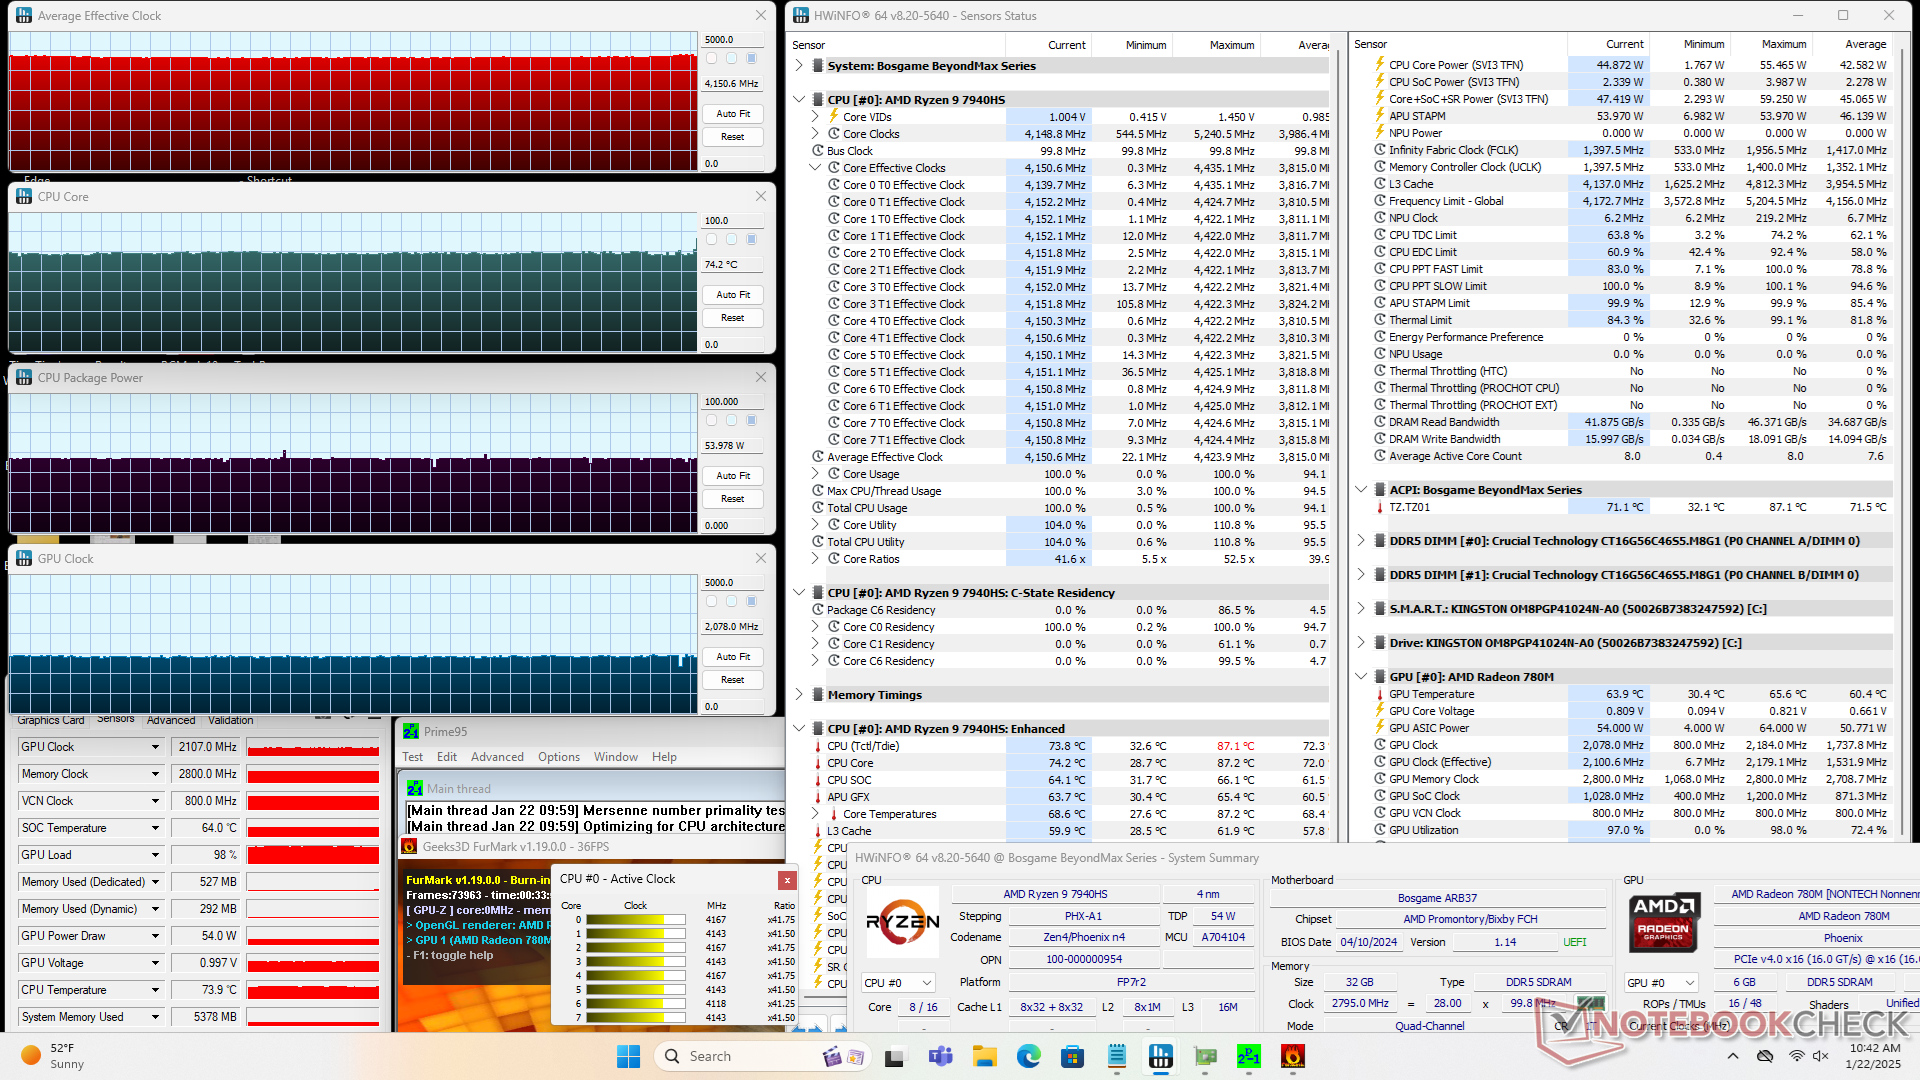
| Average CPU Clock (GHz) | GPU Clock (MHz) | Average CPU Temperature (°C) | |
| System Idle | -- | -- | 32 |
| Prime95 Stress | 4.0 | 800 | 87 |
| Prime95 + FurMark Stress | 4.2 | 2078 | 74 |
| Cyberpunk 2077 Stress | 1.2 | 2800 | 66 |
Speakers
While audio quality and maximum volume haven't changed, the slight audio delay we noticed on the M1 has now been fixed. This makes the integrated speakers more appropriate for gaming or video playback. If you intend to use the integrated speakers mainly for music, then the original M1 may be the better buy as the latency issue becomes less of a concern.
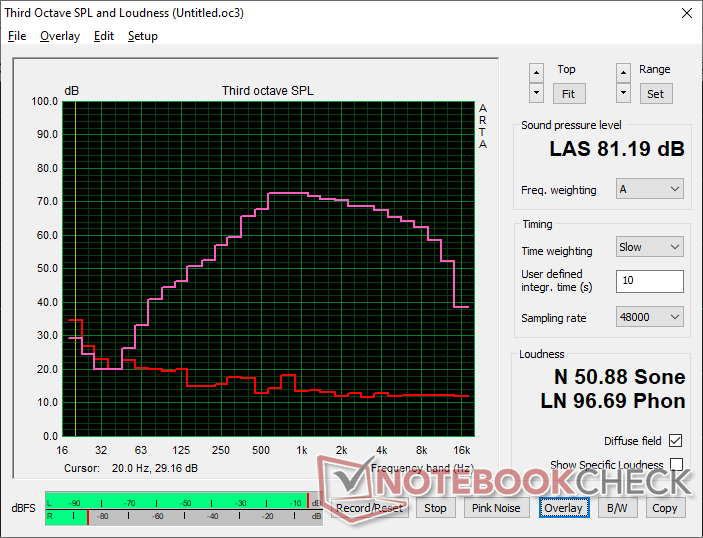
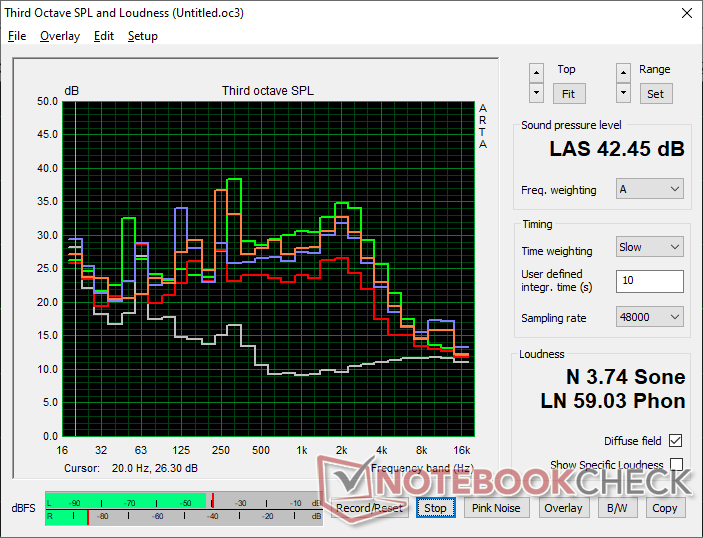
BOSGAME M2 audio analysis
(±) | speaker loudness is average but good (81.2 dB)
Bass 100 - 315 Hz
(±) | reduced bass - on average 13.6% lower than median
(+) | bass is linear (5.9% delta to prev. frequency)
Mids 400 - 2000 Hz
(±) | higher mids - on average 5.2% higher than median
(+) | mids are linear (3.7% delta to prev. frequency)
Highs 2 - 16 kHz
(+) | balanced highs - only 2.8% away from median
(+) | highs are linear (3.3% delta to prev. frequency)
Overall 100 - 16.000 Hz
(±) | linearity of overall sound is average (16.3% difference to median)
Compared to same class
» 7% of all tested devices in this class were better, 11% similar, 82% worse
» The best had a delta of 13%, average was 24%, worst was 64%
Compared to all devices tested
» 27% of all tested devices were better, 6% similar, 68% worse
» The best had a delta of 4%, average was 24%, worst was 134%
Apple MacBook Pro 16 2021 M1 Pro audio analysis
(+) | speakers can play relatively loud (84.7 dB)
Bass 100 - 315 Hz
(+) | good bass - only 3.8% away from median
(+) | bass is linear (5.2% delta to prev. frequency)
Mids 400 - 2000 Hz
(+) | balanced mids - only 1.3% away from median
(+) | mids are linear (2.1% delta to prev. frequency)
Highs 2 - 16 kHz
(+) | balanced highs - only 1.9% away from median
(+) | highs are linear (2.7% delta to prev. frequency)
Overall 100 - 16.000 Hz
(+) | overall sound is linear (4.6% difference to median)
Compared to same class
» 0% of all tested devices in this class were better, 0% similar, 100% worse
» The best had a delta of 5%, average was 17%, worst was 45%
Compared to all devices tested
» 0% of all tested devices were better, 0% similar, 100% worse
» The best had a delta of 4%, average was 24%, worst was 134%
Energy Management
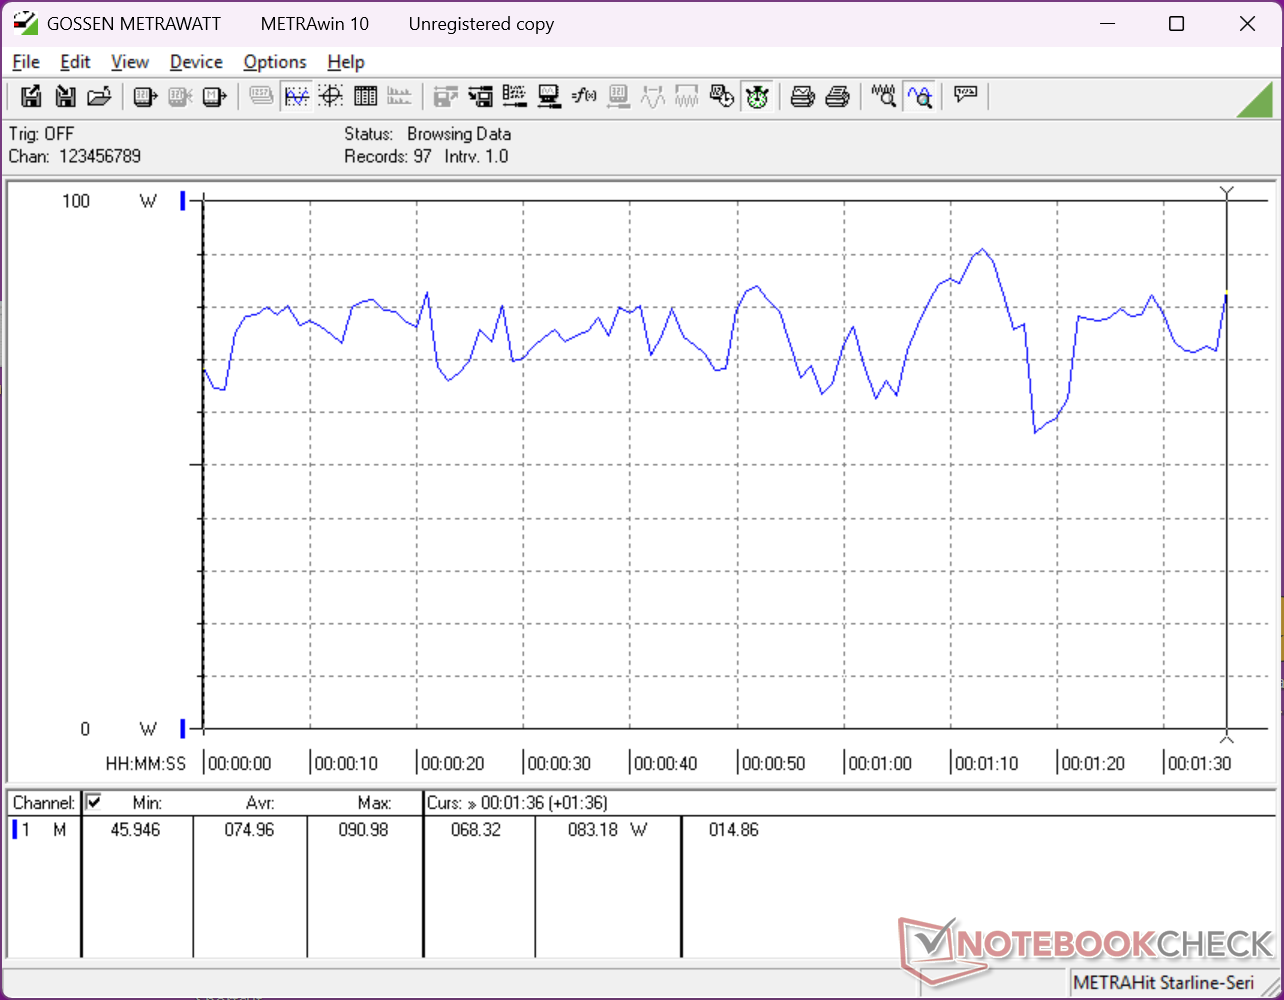
Power Consumption
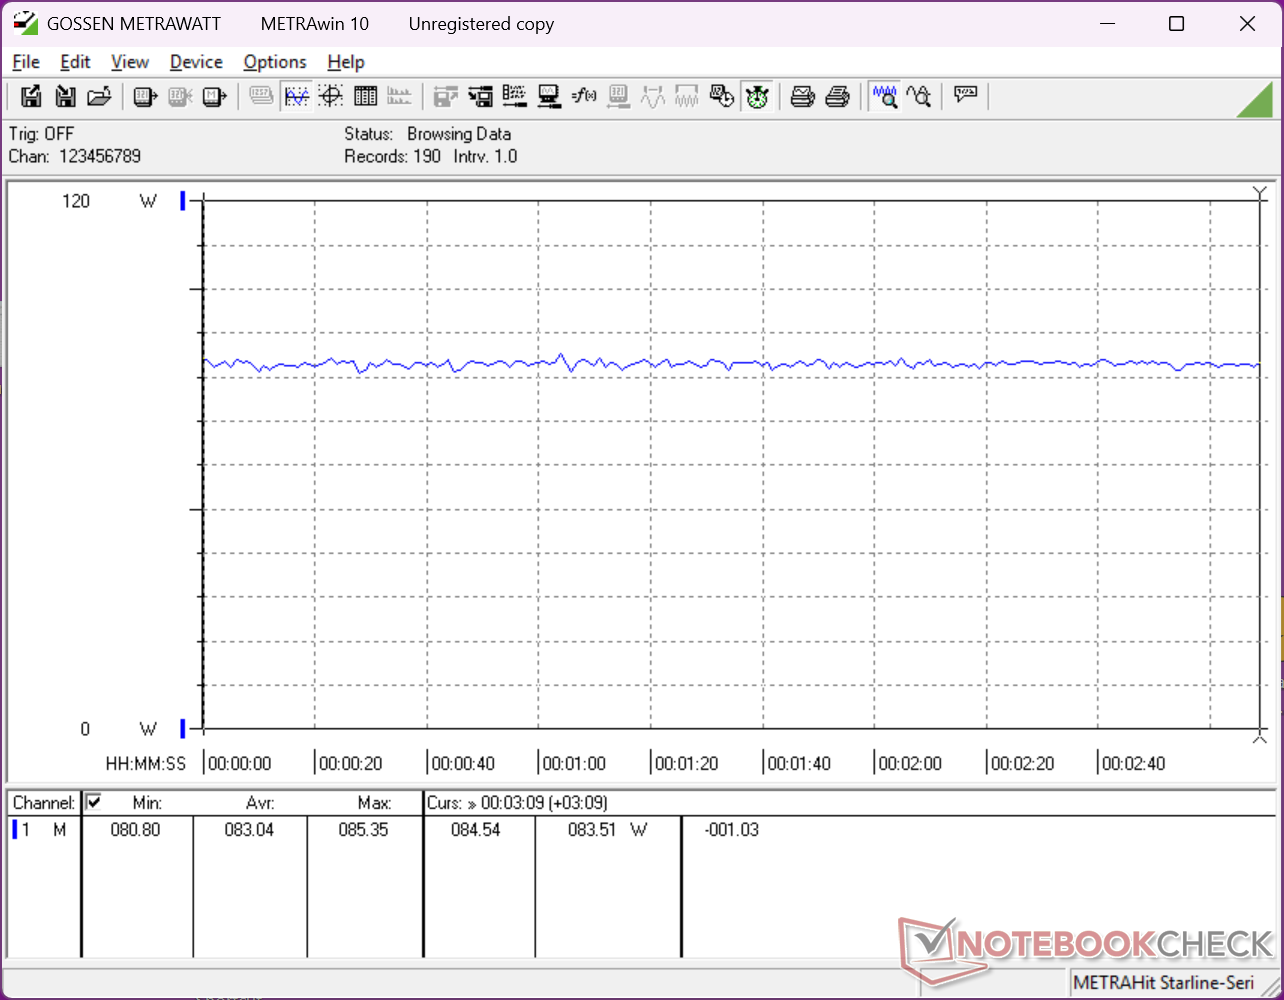
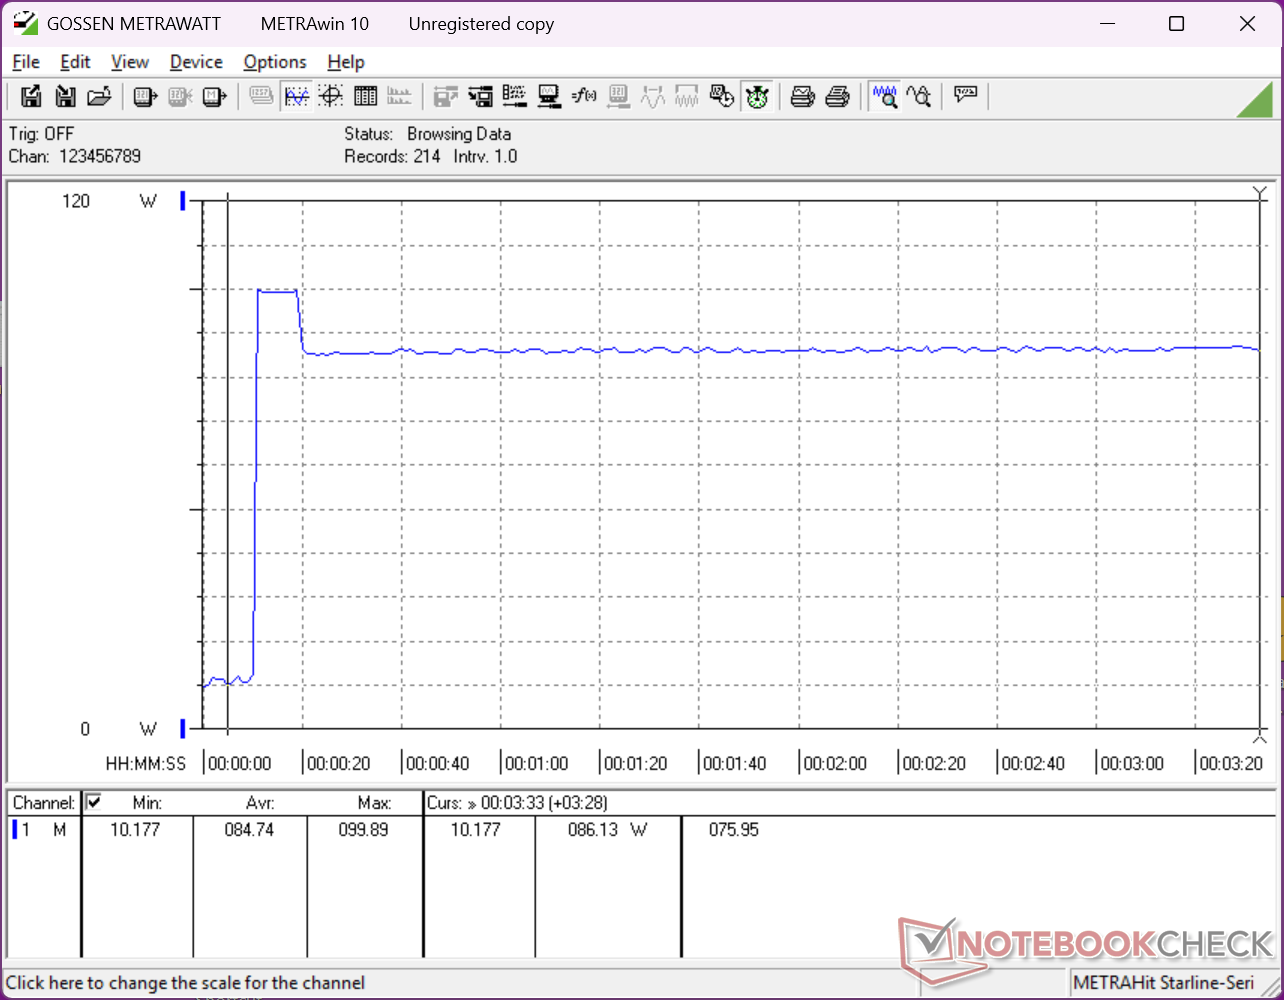
Consumption rates are almost exactly the same as what we recorded on the M1 as shown by the graphs below to show that the Ryzen 9 7940HS is neither faster nor more efficient than the Ryzen 7 7840HS by any significant margin.

| Off / Standby | |
| Idle | |
| Load |
|
Key:
min: | |
| BOSGAME M2 R9 7940HS, Radeon 780M, Kingston OM8PGP41024N-A0, , x, | BOSGAME M1 R7 7840HS, Radeon 780M, Kingston OM8PGP41024N-A0, , x, | GMK NucBox M7 Pro R9 PRO 6950H, Radeon 680M, , , x, | Beelink SER9 Ryzen AI 9 HX 370, Radeon 890M, Crucial P3 Plus CT1000P3PSSD8, , x, | Asus NUC 14 Pro Ultra 5 125H, Arc 7-Core, Kingston KC3000 2048G SKC3000D2048G, , x, | Intel NUC 13 Pro Desk Edition Kit i7-1360P, Iris Xe G7 96EUs, Samsung PM9A1 MZVL2512HCJQ, , x, | |
|---|---|---|---|---|---|---|
| Power Consumption | -4% | -58% | 14% | -2% | -10% | |
| Idle Minimum * (Watt) | 6.4 | 7.3 -14% | 14.6 -128% | 5.7 11% | 5.1 20% | 7 -9% |
| Idle Average * (Watt) | 7.3 | 7.3 -0% | 15 -105% | 5.9 19% | 6.4 12% | 9.2 -26% |
| Idle Maximum * (Watt) | 7.5 | 8.4 -12% | 16 -113% | 6 20% | 14.7 -96% | 11.8 -57% |
| Load Average * (Watt) | 75 | 72.7 3% | 80.4 -7% | 68.7 8% | 55.5 26% | 45 40% |
| Cyberpunk 2077 ultra external monitor * (Watt) | 83 | 86.2 -4% | 78.2 6% | 59.1 29% | ||
| Load Maximum * (Watt) | 99.9 | 99.1 1% | 89.5 10% | 82 18% | 103.3 -3% | 97.2 3% |
| Witcher 3 ultra * (Watt) | 80.5 |
* ... smaller is better
Power Consumption Cyberpunk / Stress Test
Power Consumption external Monitor
Notebookcheck Rating
BOSGAME M2
- 01/27/2025 v8
Allen Ngo
 Total Sustainability Score:
 Transparency
The selection of devices to be reviewed is made by our editorial team. The test sample was provided to the author as a loan by the manufacturer or retailer for the purpose of this review. The lender had no influence on this review, nor did the manufacturer receive a copy of this review before publication. There was no obligation to publish this review. As an independent media company, Notebookcheck is not subjected to the authority of manufacturers, retailers or publishers.
This is how Notebookcheck is testing
Every year, Notebookcheck independently reviews hundreds of laptops and smartphones using standardized procedures to ensure that all results are comparable. We have continuously developed our test methods for around 20 years and set industry standards in the process. In our test labs, high-quality measuring equipment is utilized by experienced technicians and editors. These tests involve a multi-stage validation process. Our complex rating system is based on hundreds of well-founded measurements and benchmarks, which maintains objectivity. Further information on our test methods can be found here.
