BOSGAME M1 mini PC review: Ryzen 7 7840HS is still a beast

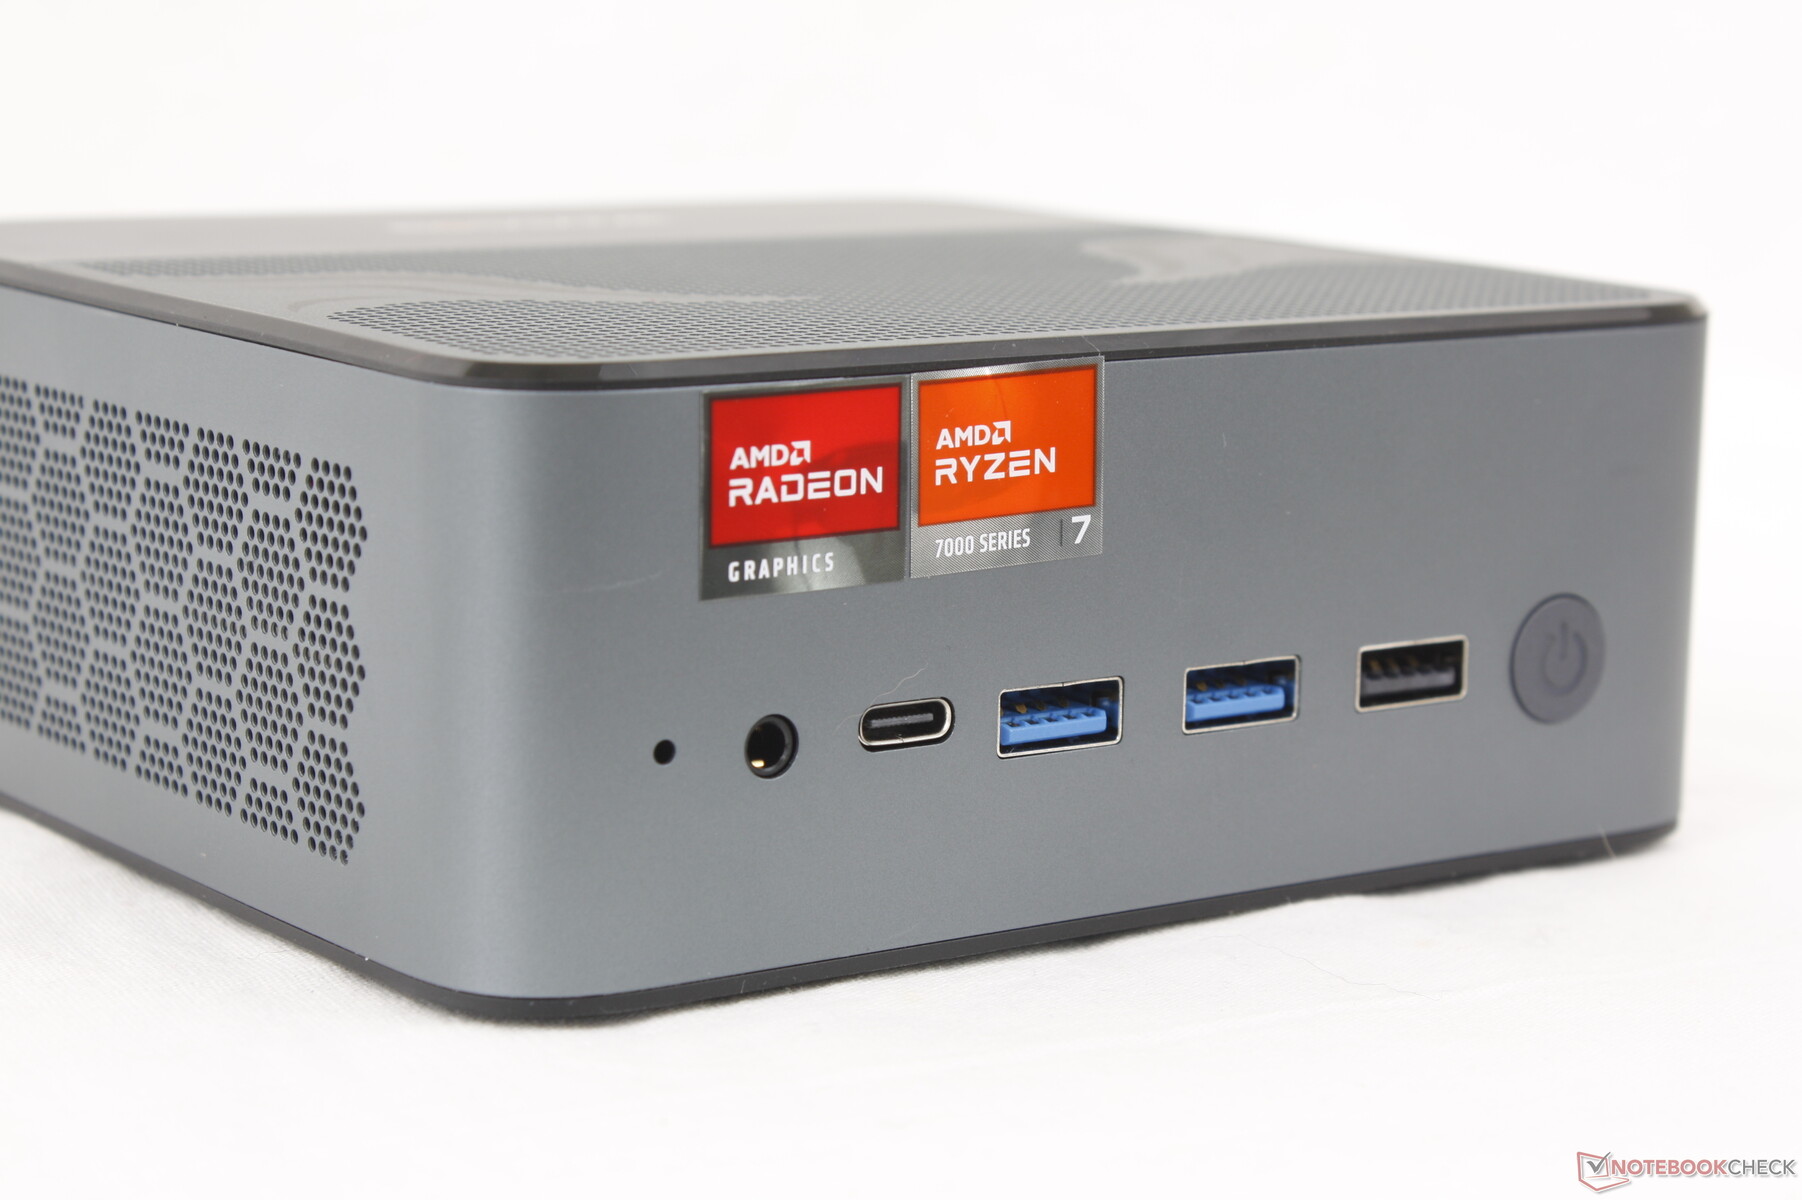
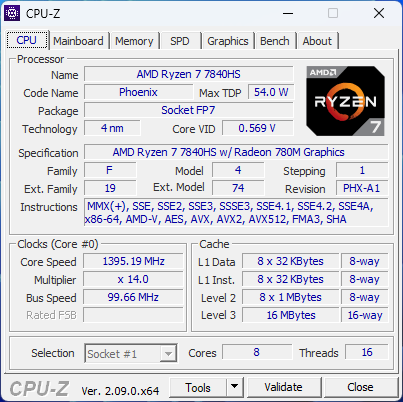
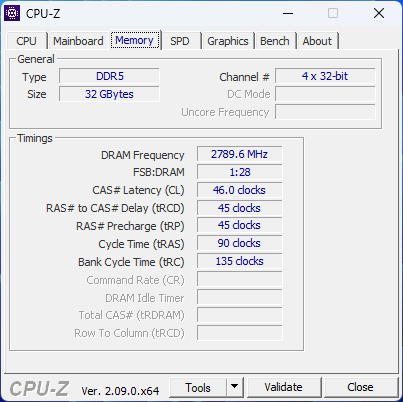
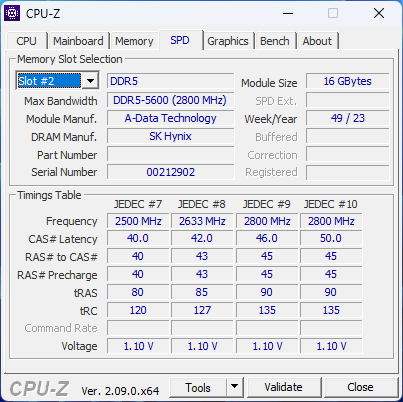
Whereas the Bosgame N95 targets budget HTPC users, the M1 targets office and power users who need more performance out of their mini PCs. The model sports a gaming-class Ryzen 7 7840HS CPU with integrated Radeon 780M graphics, 1 TB NVMe SSD, and 32 GB of removable RAM for approximately $690 USD. The M1 is notable for its integrated stereo speakers whereas the vast majority of mini PCs rely on external speakers instead.
Alternatives to the Bosgame M1 include other NUC-sized mini PCs like the GMK NucBox K6, Intel NUC 13 Pro, or Beelink SER7.
More Bosgame reviews:
Potential Competitors in Comparison
Rating | Date | Model | Weight | Height | Size | Resolution | Price |
|---|---|---|---|---|---|---|---|
| 84.5 % v7 (old) | 05 / 2024 | BOSGAME M1 R7 7840HS, Radeon 780M | 766 g | 51 mm | x | ||
| 78.9 % v7 (old) | 04 / 2024 | GMK NucBox M5 R7 5700U, Vega 8 | 505 g | 48 mm | x | ||
| 83.6 % v7 (old) | 04 / 2024 | GMK NucBox K6 R7 7840HS, Radeon 780M | 514 g | 47 mm | x | ||
| 80.8 % v7 (old) | 04 / 2023 | Intel NUC 13 Pro Kit NUC13ANK i7-1360P, Iris Xe G7 96EUs | 538 g | 37 mm | x | ||
| 86.6 % v7 (old) | 09 / 2023 | Beelink SER7 R7 7840HS, Radeon 780M | 640 g | 49 mm | x | ||
v (old) | 11 / 2022 | Beelink GTR6 R9 6900HX, Radeon 680M | 815 g | 43 mm | x |
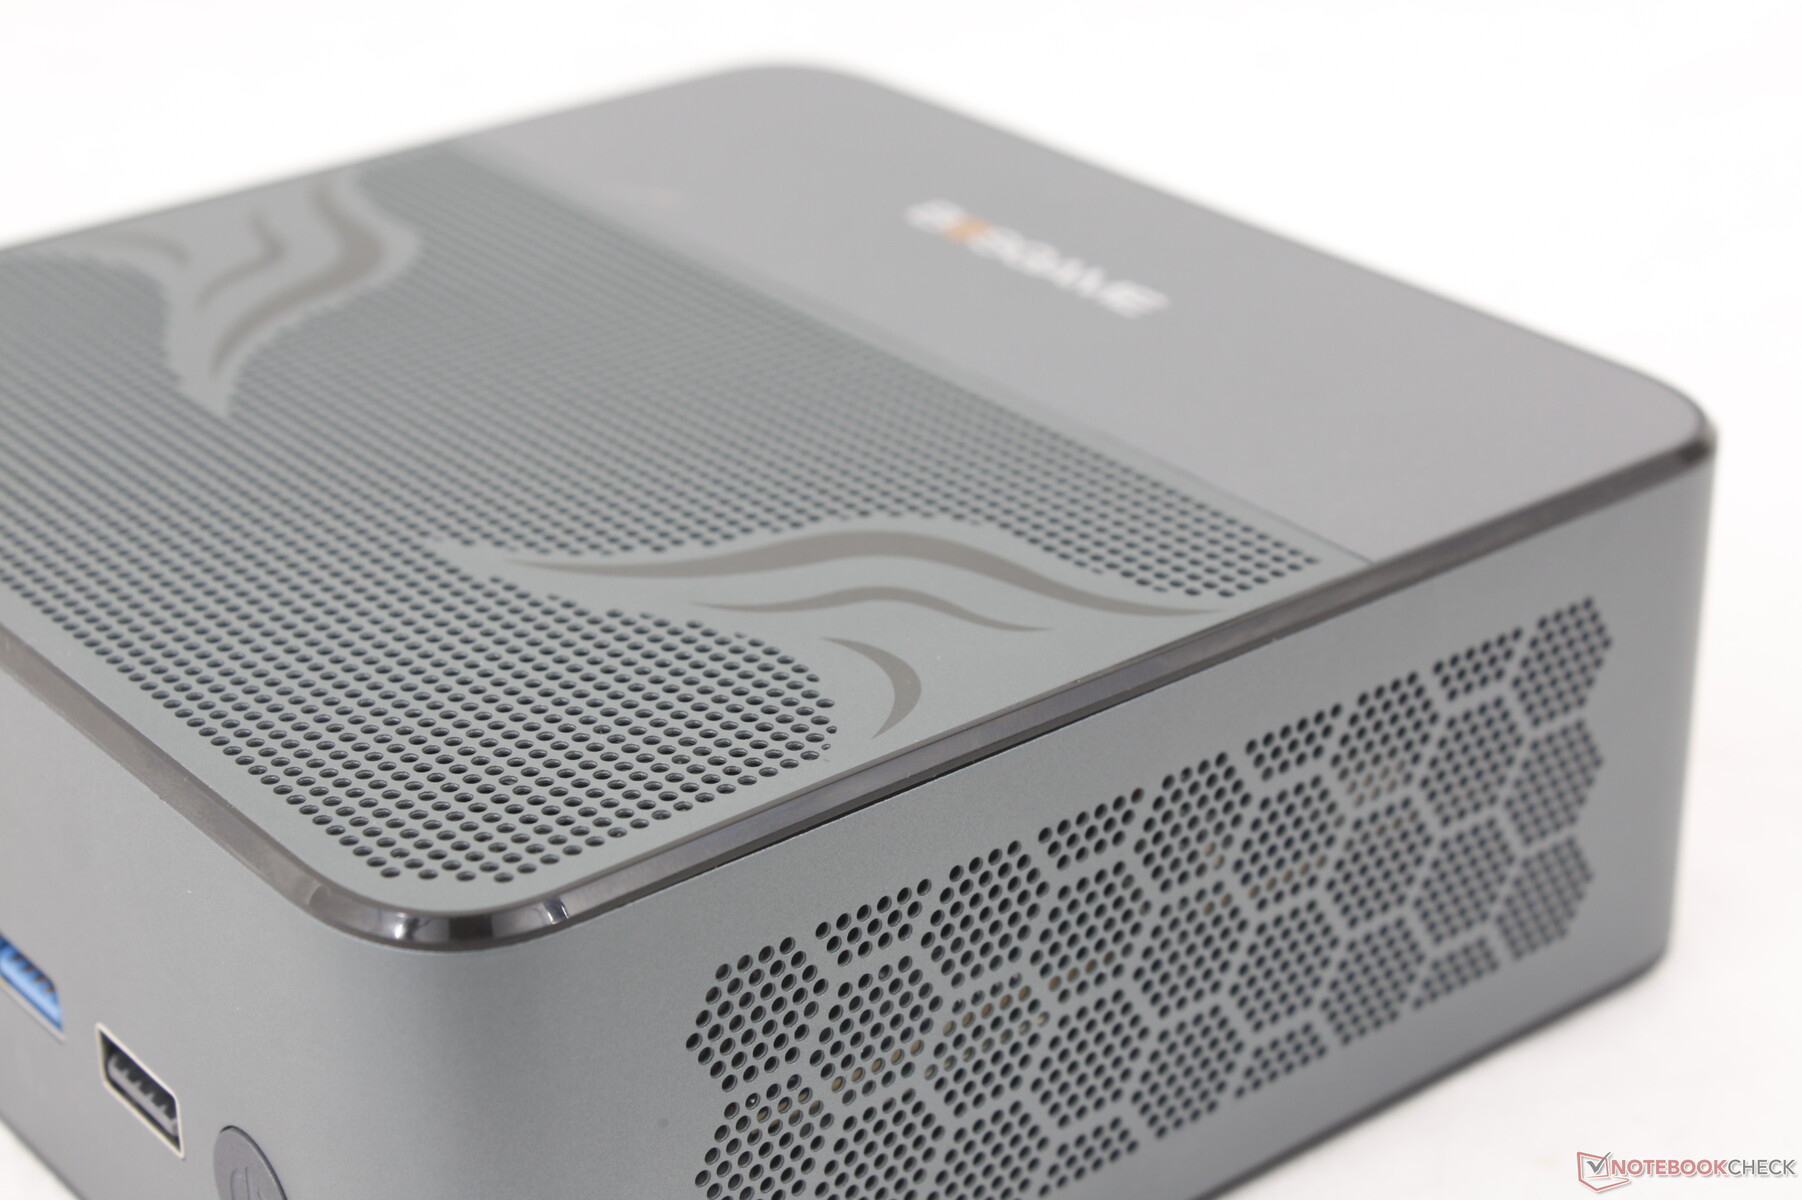
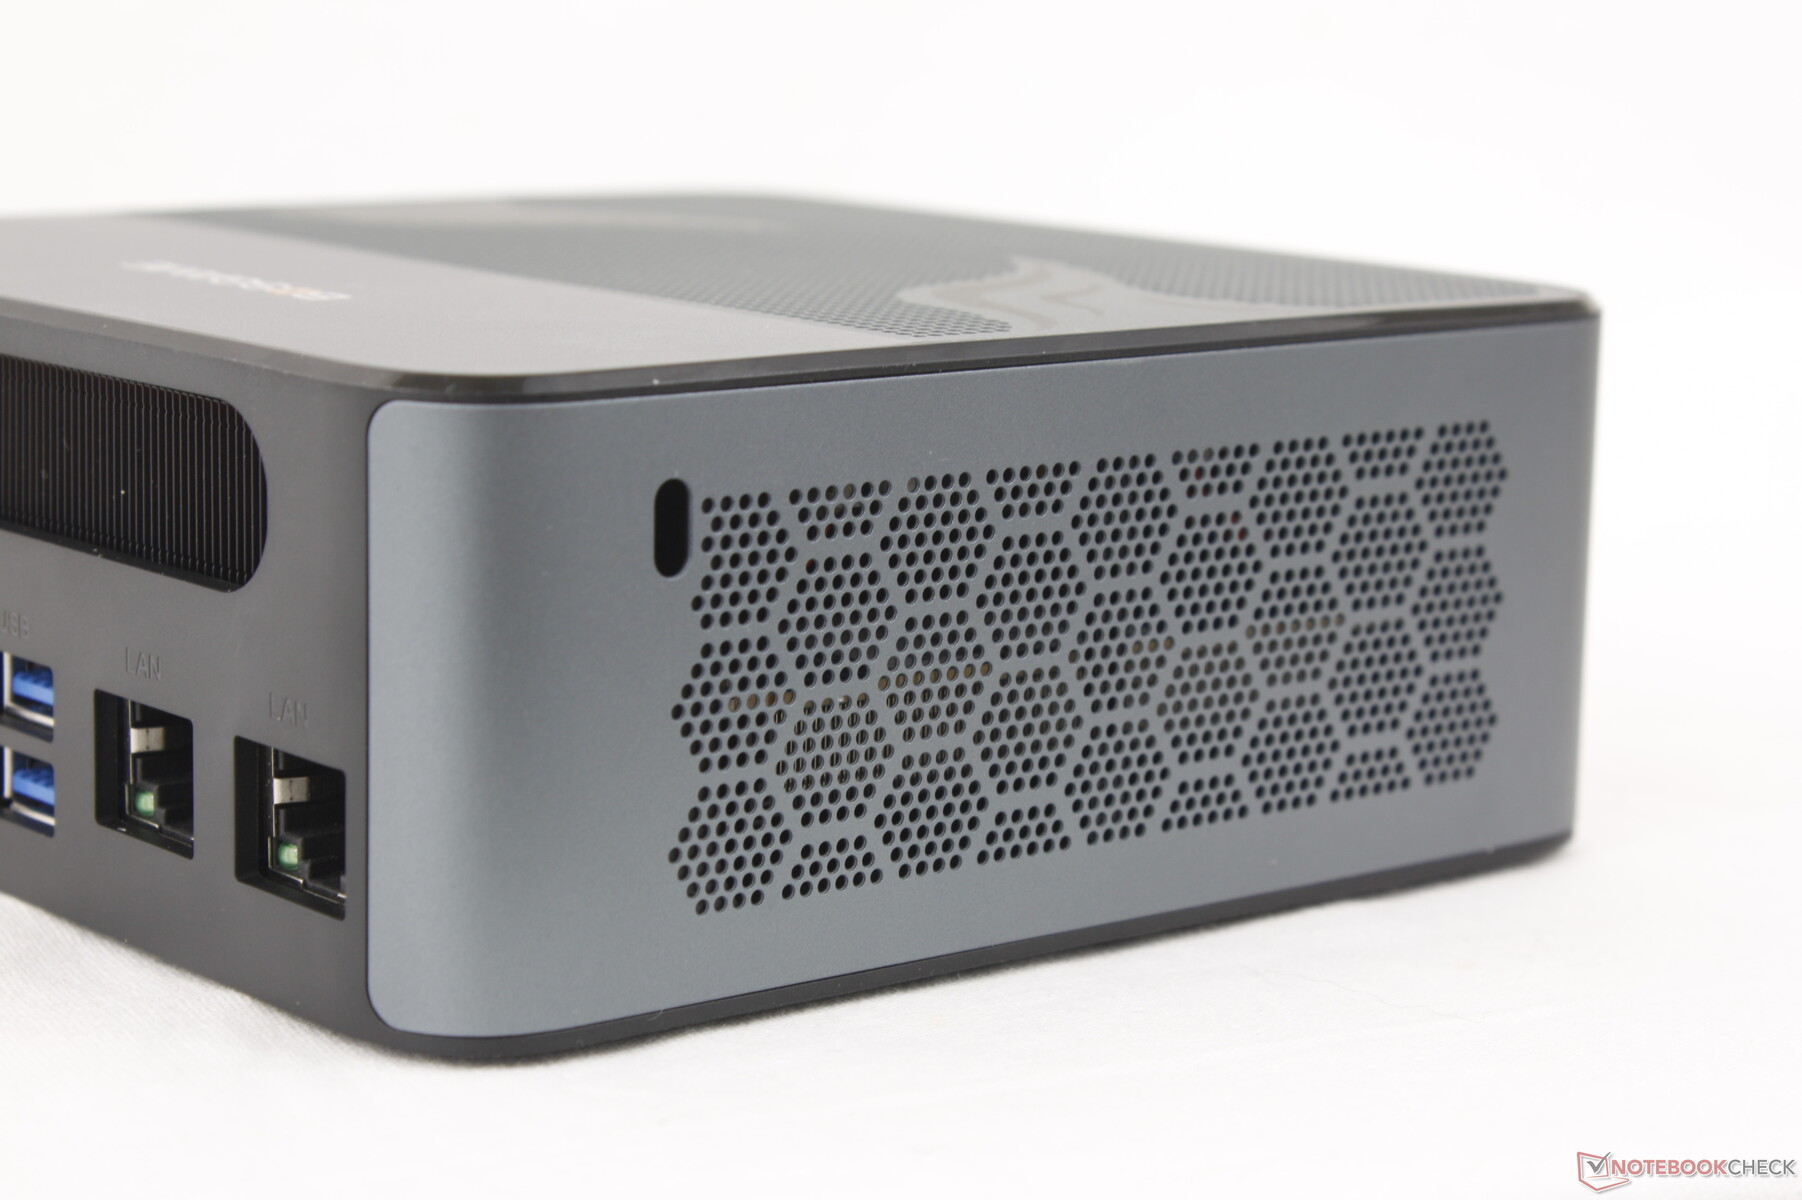
Case — Sturdy And Weighty
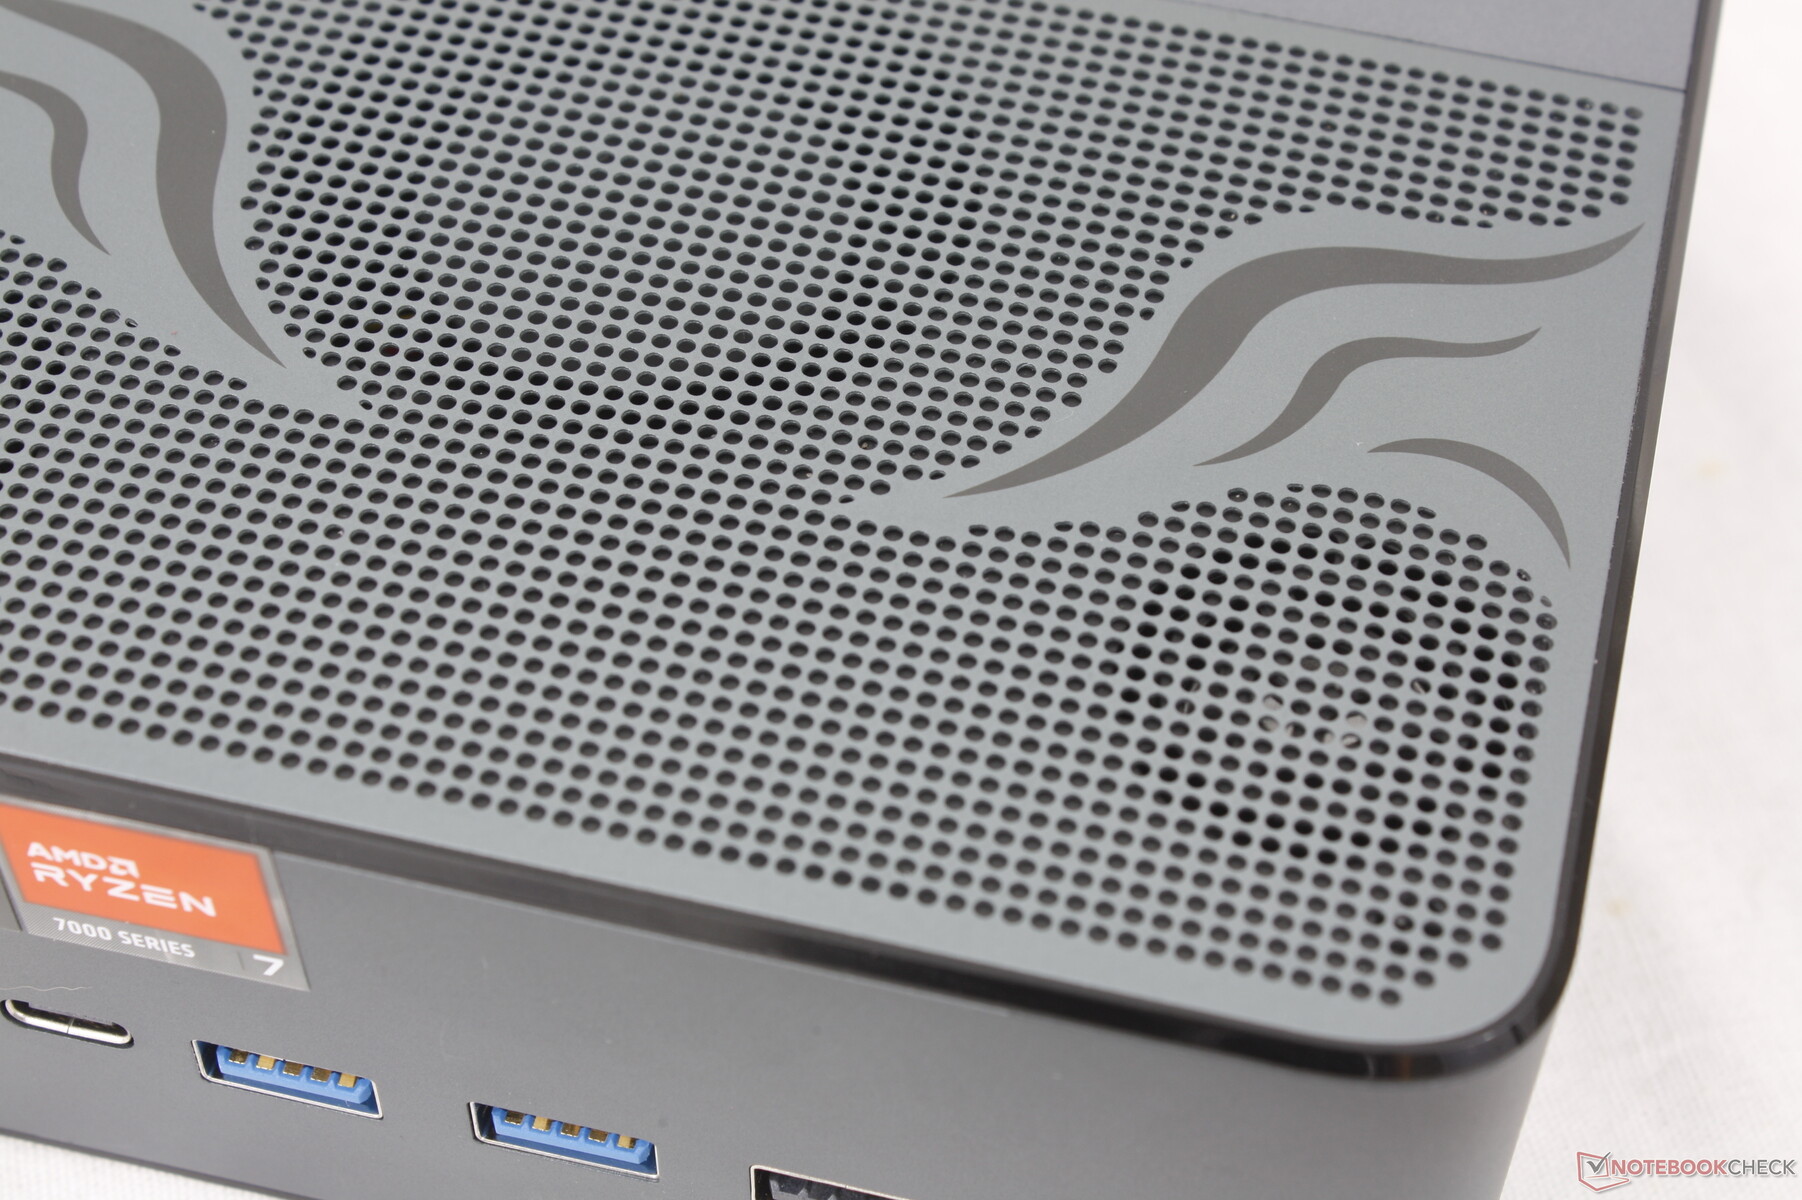
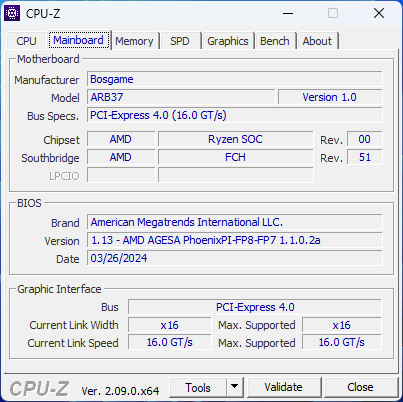
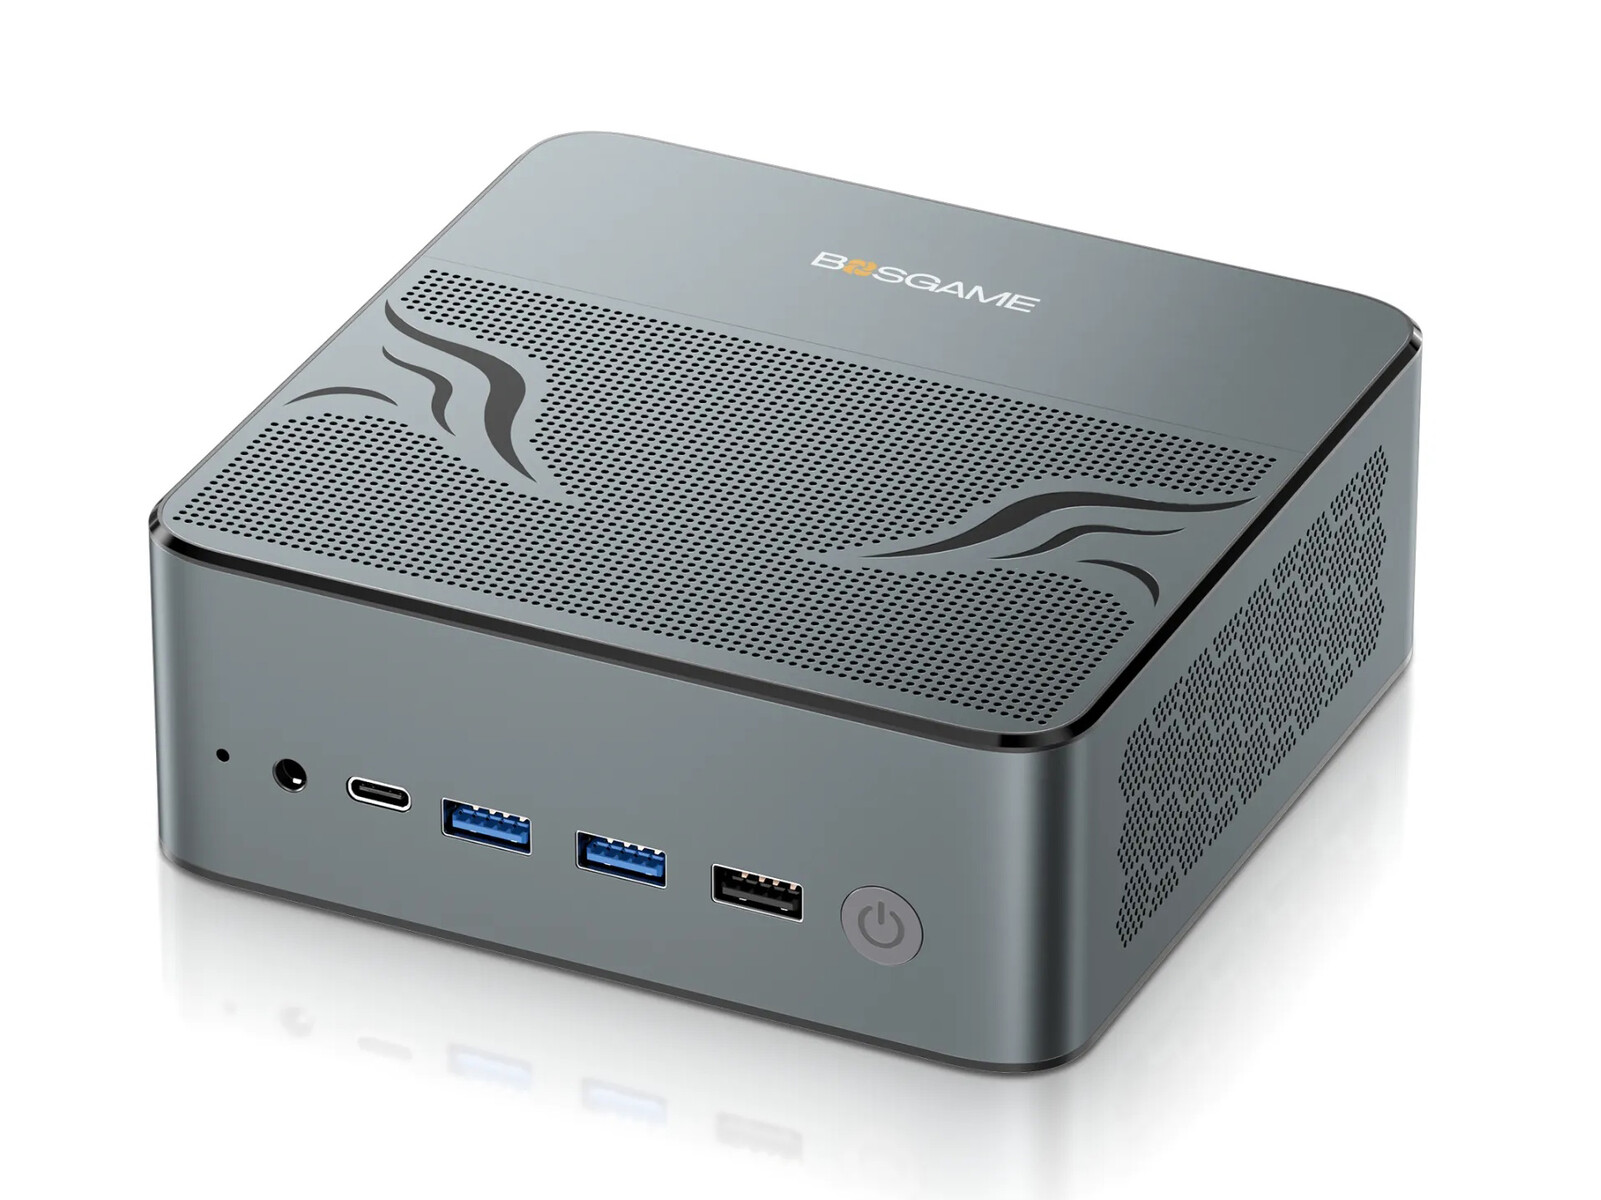
Aside from the removable metal plate on the bottom, the rest of the chassis is one piece of metal for a solid construction and feel rivaling the NUC series. This is in contrast to some Beelink designs which have plastic or mesh tops for a somewhat cheaper look. The main drawback is the lack of color and customization options, but we don't find that to be a deal breaker.
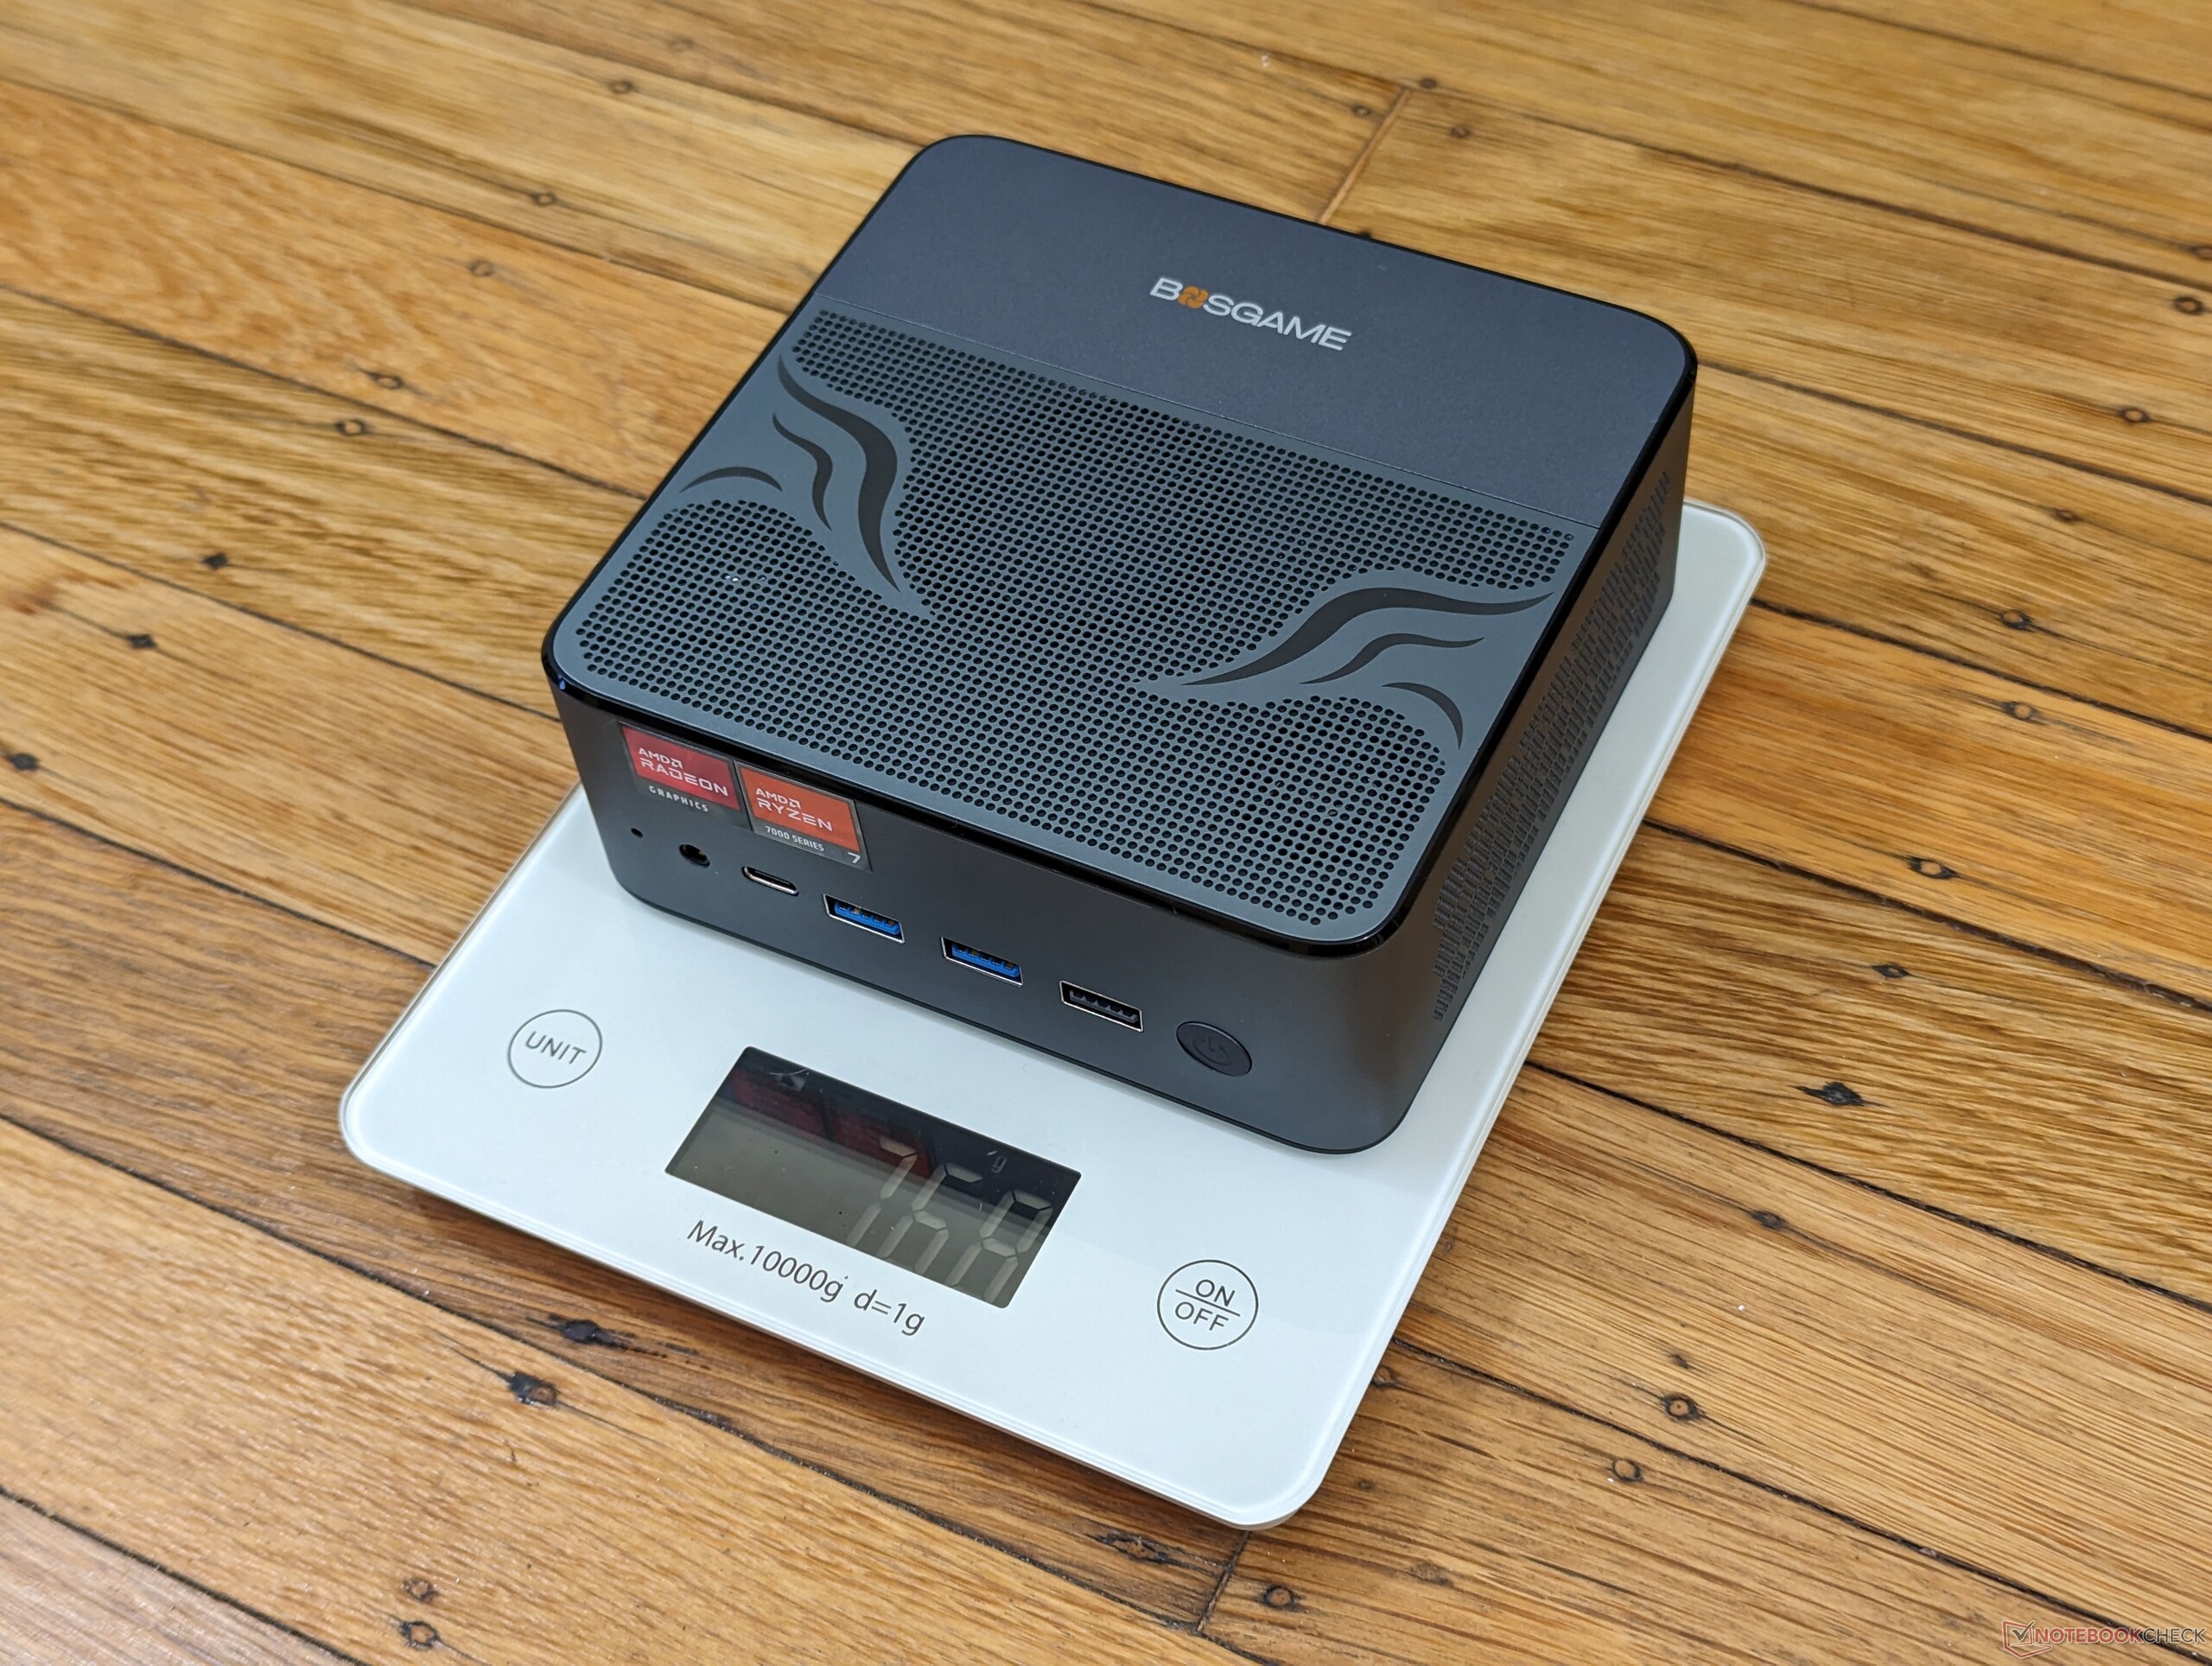
While its overall design is best described as "NUC-like", the M1 is actually larger and heavier than many other NUC-class mini PCs in the market including the NUC 13 Pro and GMK NucBox K6. This can be partly attributed to the integrated speakers which most other mini PCs lack. The girthier design has its benefits, however, as our performance sections below will show.
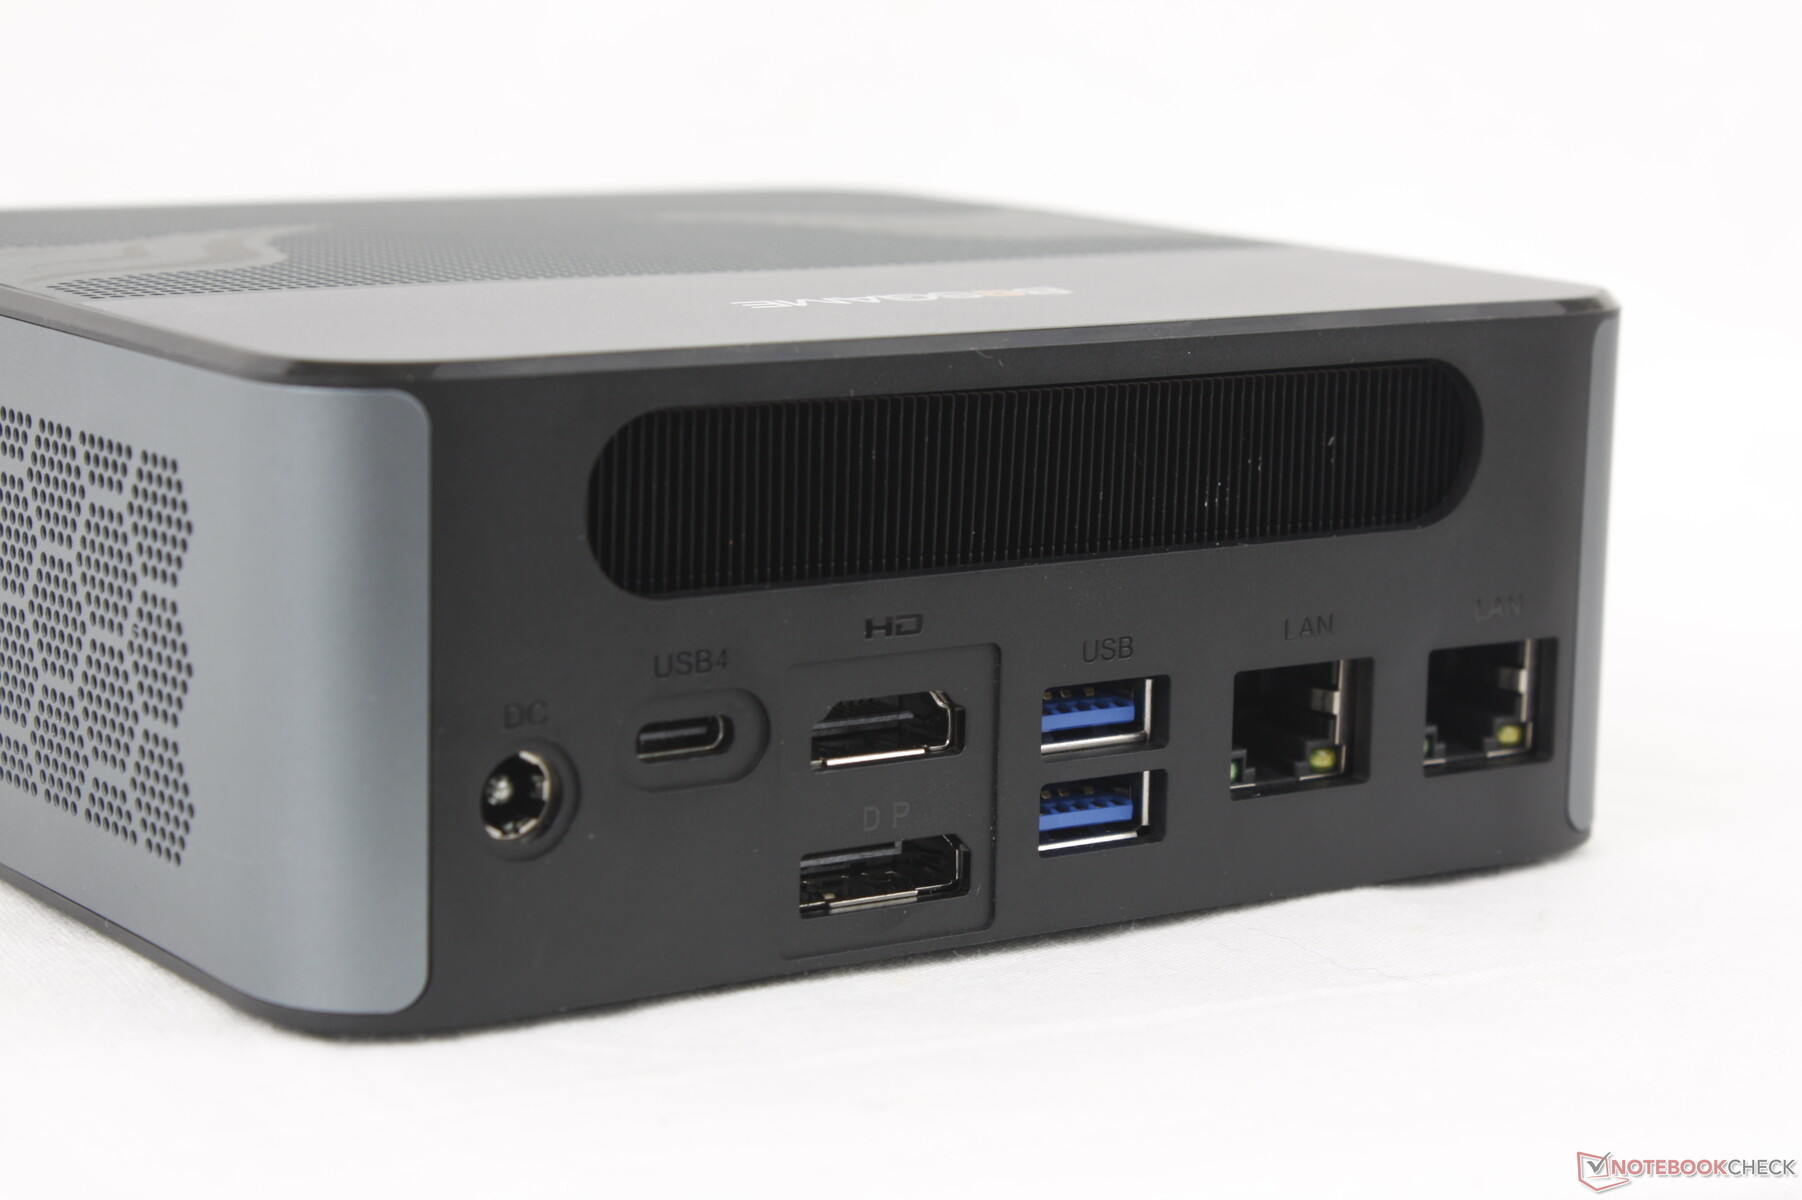
Connectivity
Port options are wide and varied as to be expected from a mini PC. The standout ports on the M1 include full-size DisplayPort and dual USB-C 4.0 ports for a dock-friendly system. Note that the USB-C ports are also compatible with Power Delivery of up to 100 W; if you ever lose the proprietary AC adapter that ships with the system, then universal third-party USB-C AC adapters can be used to power the model instead. Our 135 W USB-C Lenovo adapter, for example, is compatible with the Bosgame M1. Hopefully the manufacturer will simply drop the special AC barrel adapter altogether in favor of universal USB-C adapters on future models.
Communication
The MediaTek MT7922 comes standard for Wi-Fi 6E and Bluetooth 5.2 connectivity. Transfer rates are both steady and excellent when paired to our Wi-Fi 6 or 6E network.
| Networking | |
| iperf3 transmit AXE11000 | |
| BOSGAME M1 | |
| GMK NucBox M5 | |
| Beelink SER7 | |
| Beelink GTR6 | |
| Intel NUC 13 Pro Kit NUC13ANK | |
| GMK NucBox K6 | |
| iperf3 receive AXE11000 | |
| BOSGAME M1 | |
| GMK NucBox M5 | |
| GMK NucBox K6 | |
| Beelink SER7 | |
| Intel NUC 13 Pro Kit NUC13ANK | |
| Beelink GTR6 | |
| iperf3 transmit AXE11000 6GHz | |
| Intel NUC 13 Pro Kit NUC13ANK | |
| GMK NucBox M5 | |
| BOSGAME M1 | |
| Beelink GTR6 | |
| GMK NucBox K6 | |
| iperf3 receive AXE11000 6GHz | |
| Intel NUC 13 Pro Kit NUC13ANK | |
| GMK NucBox M5 | |
| BOSGAME M1 | |
| GMK NucBox K6 | |
| Beelink GTR6 | |
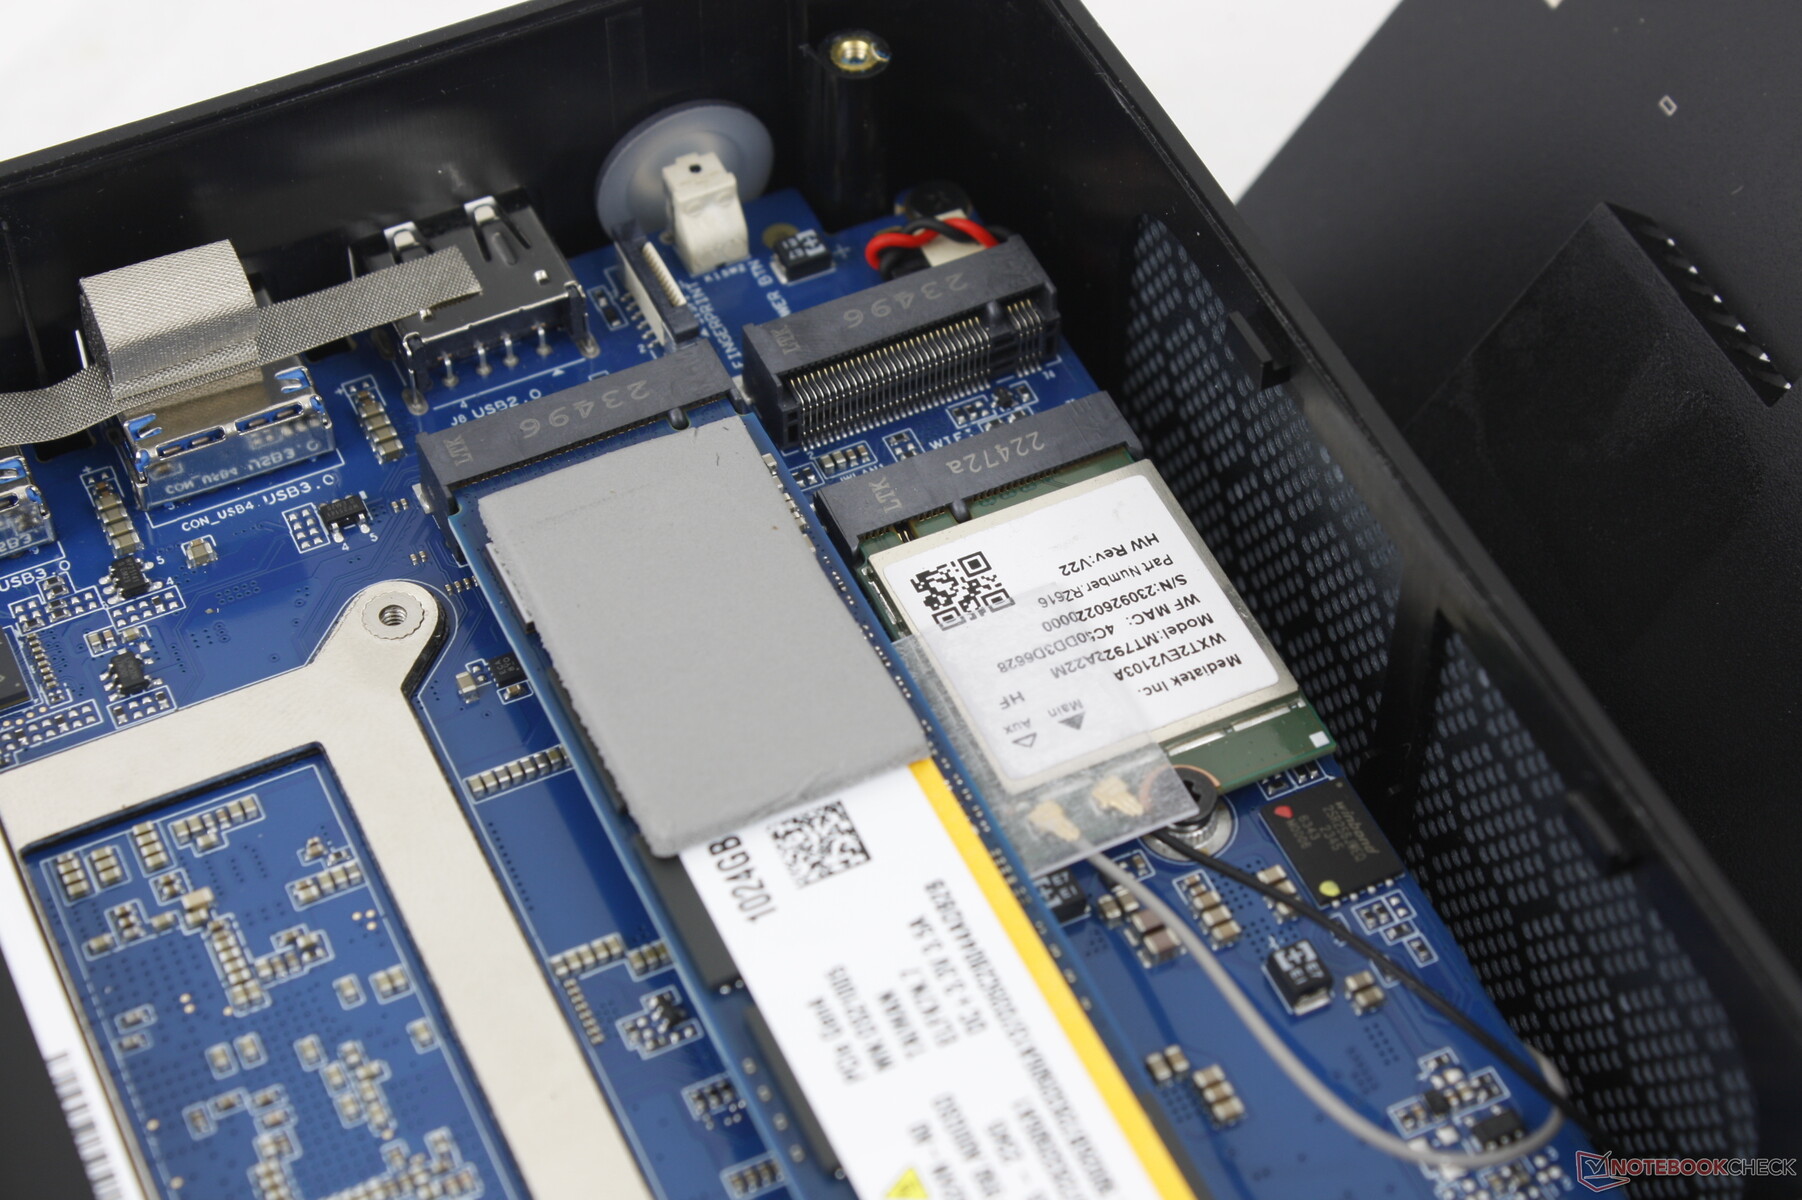
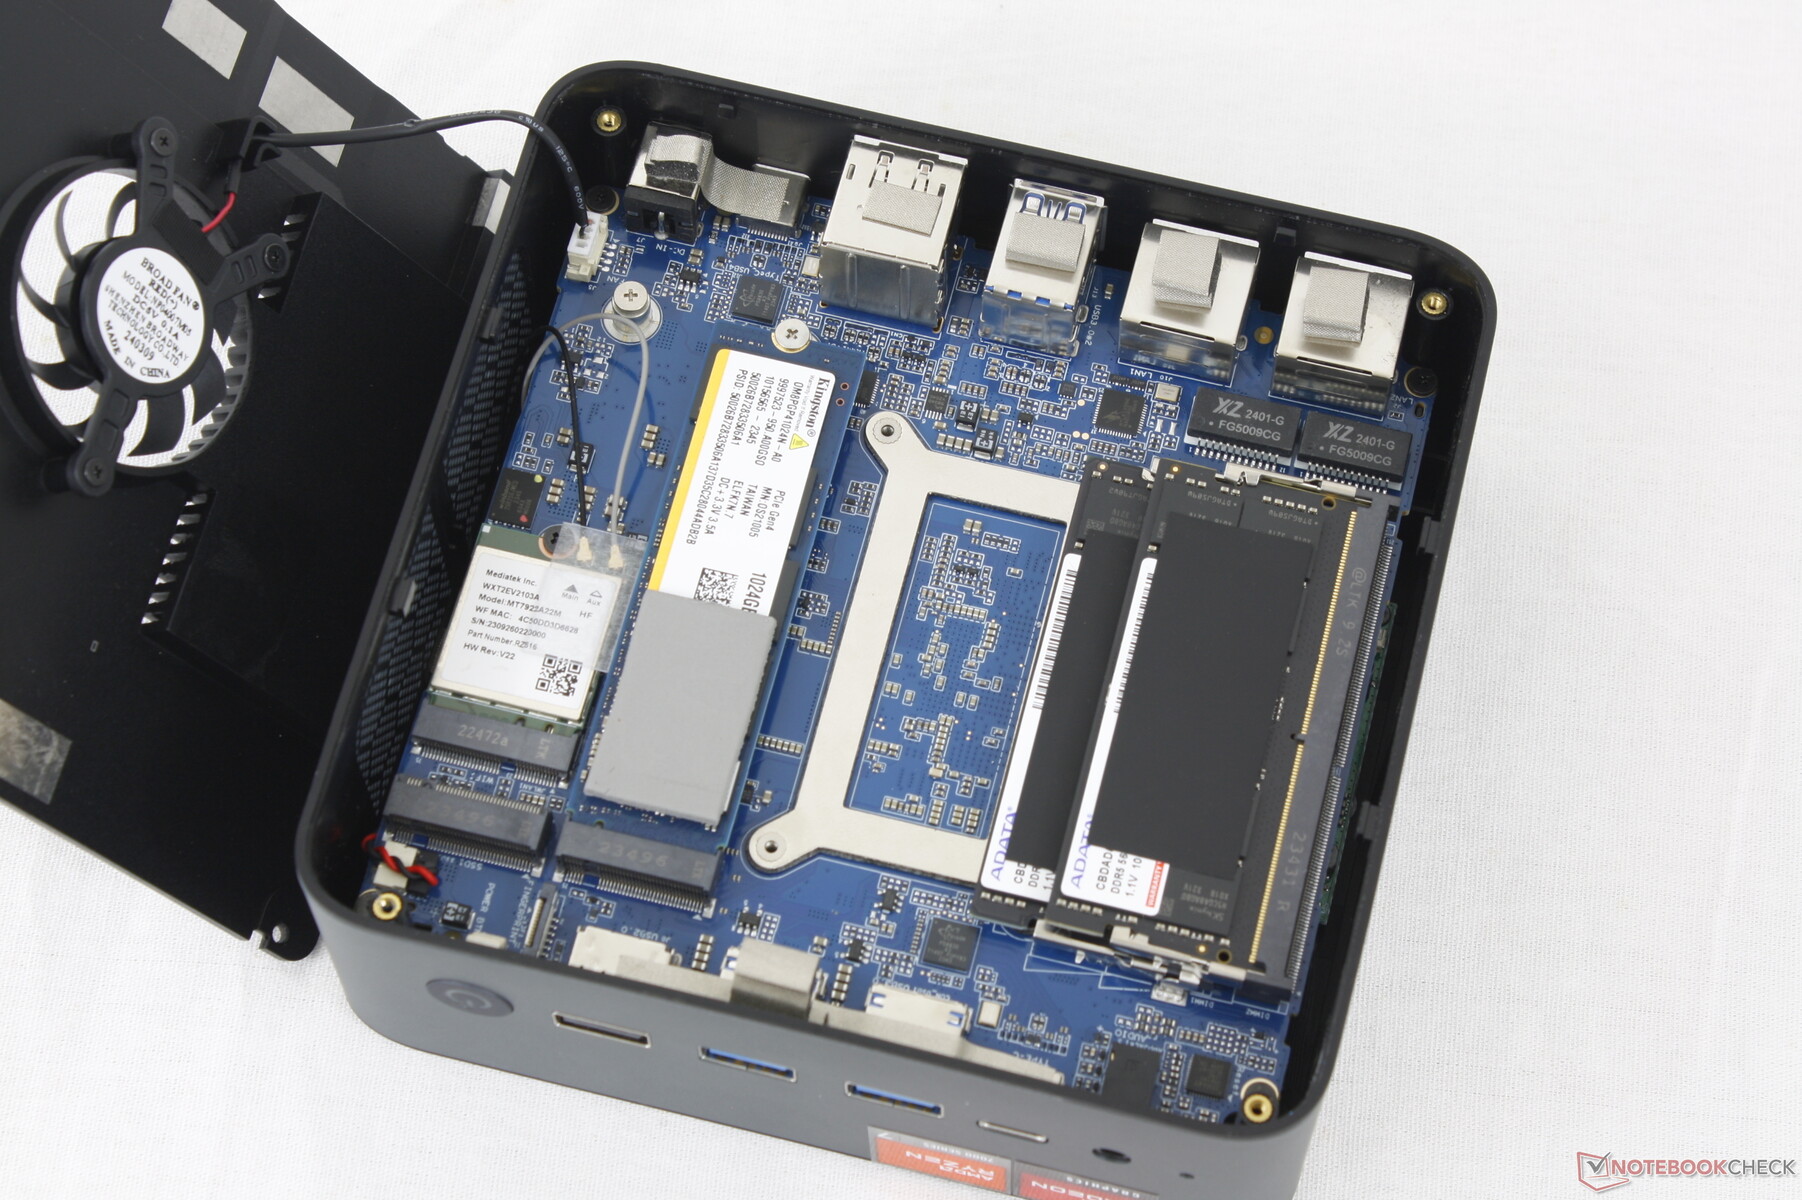
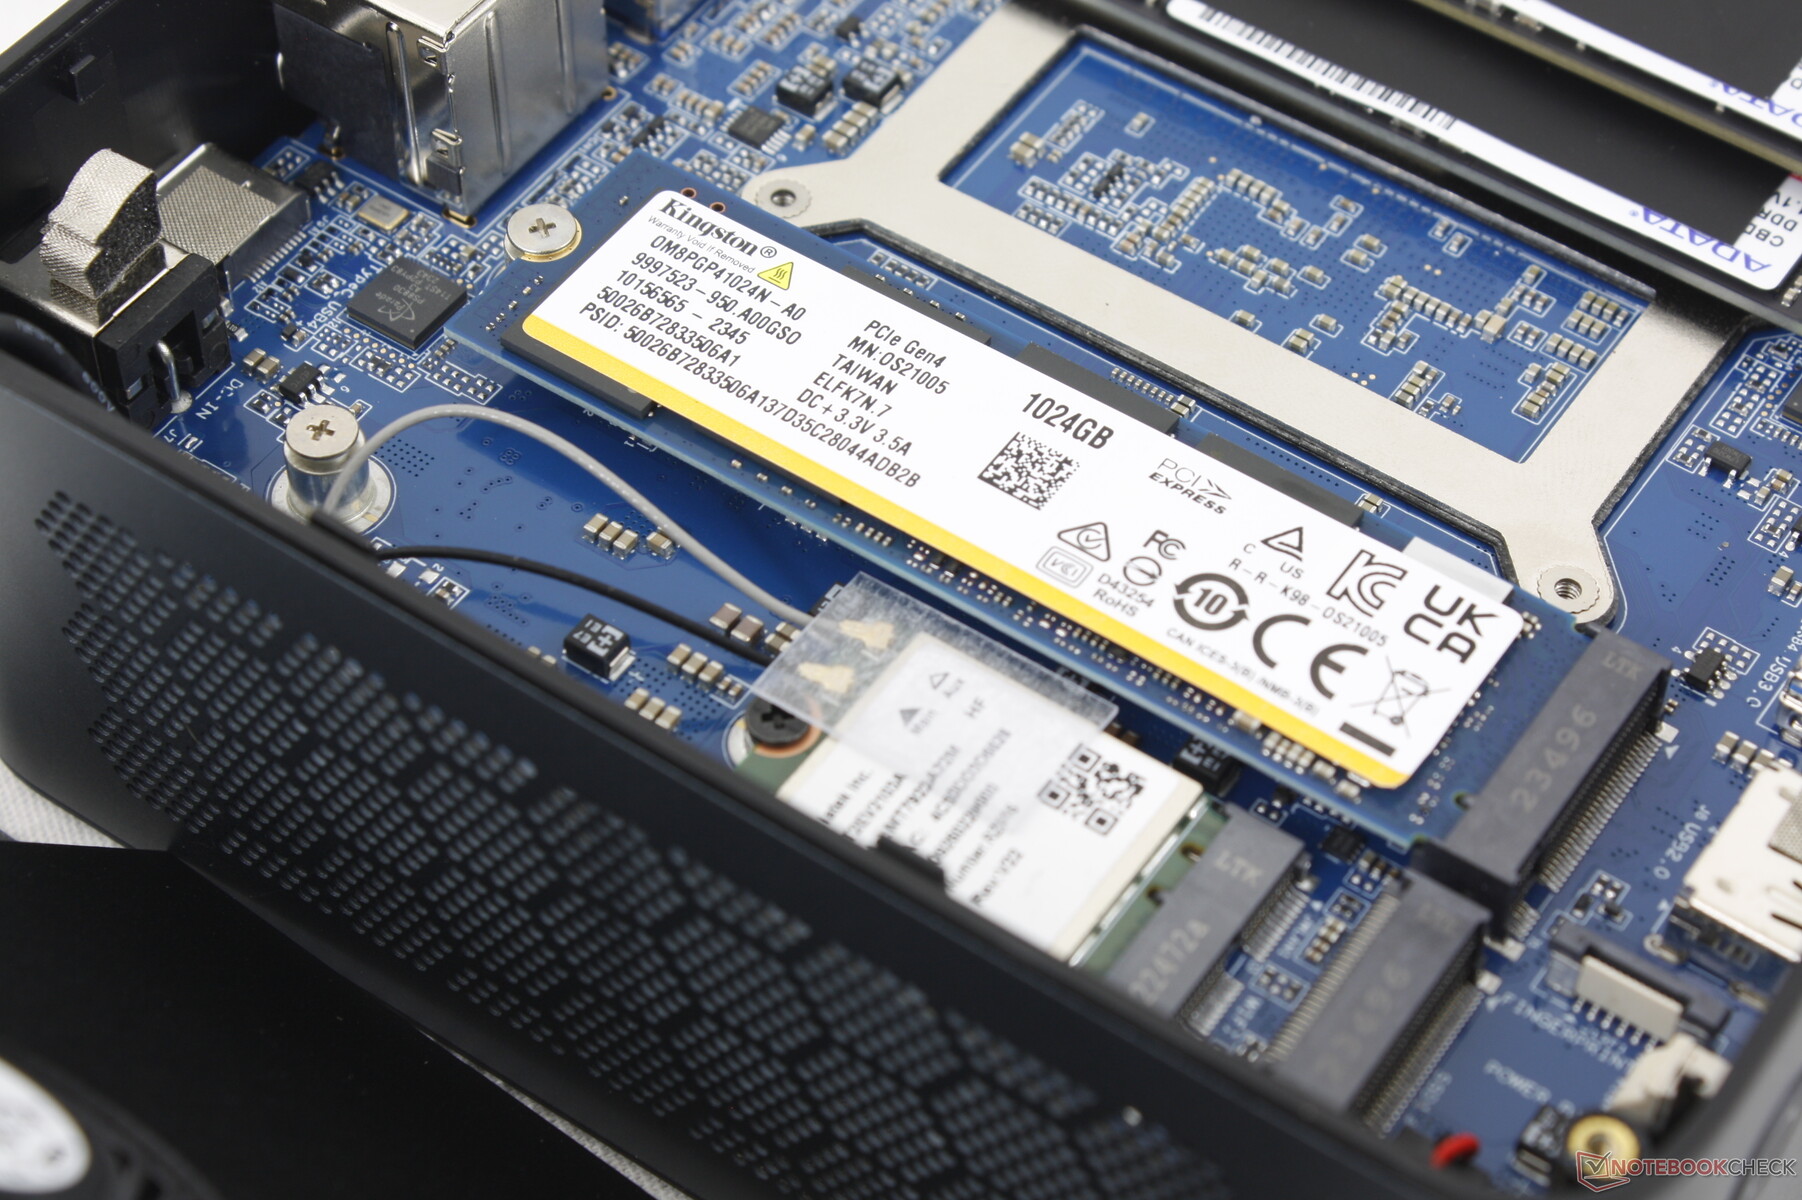
Maintenance
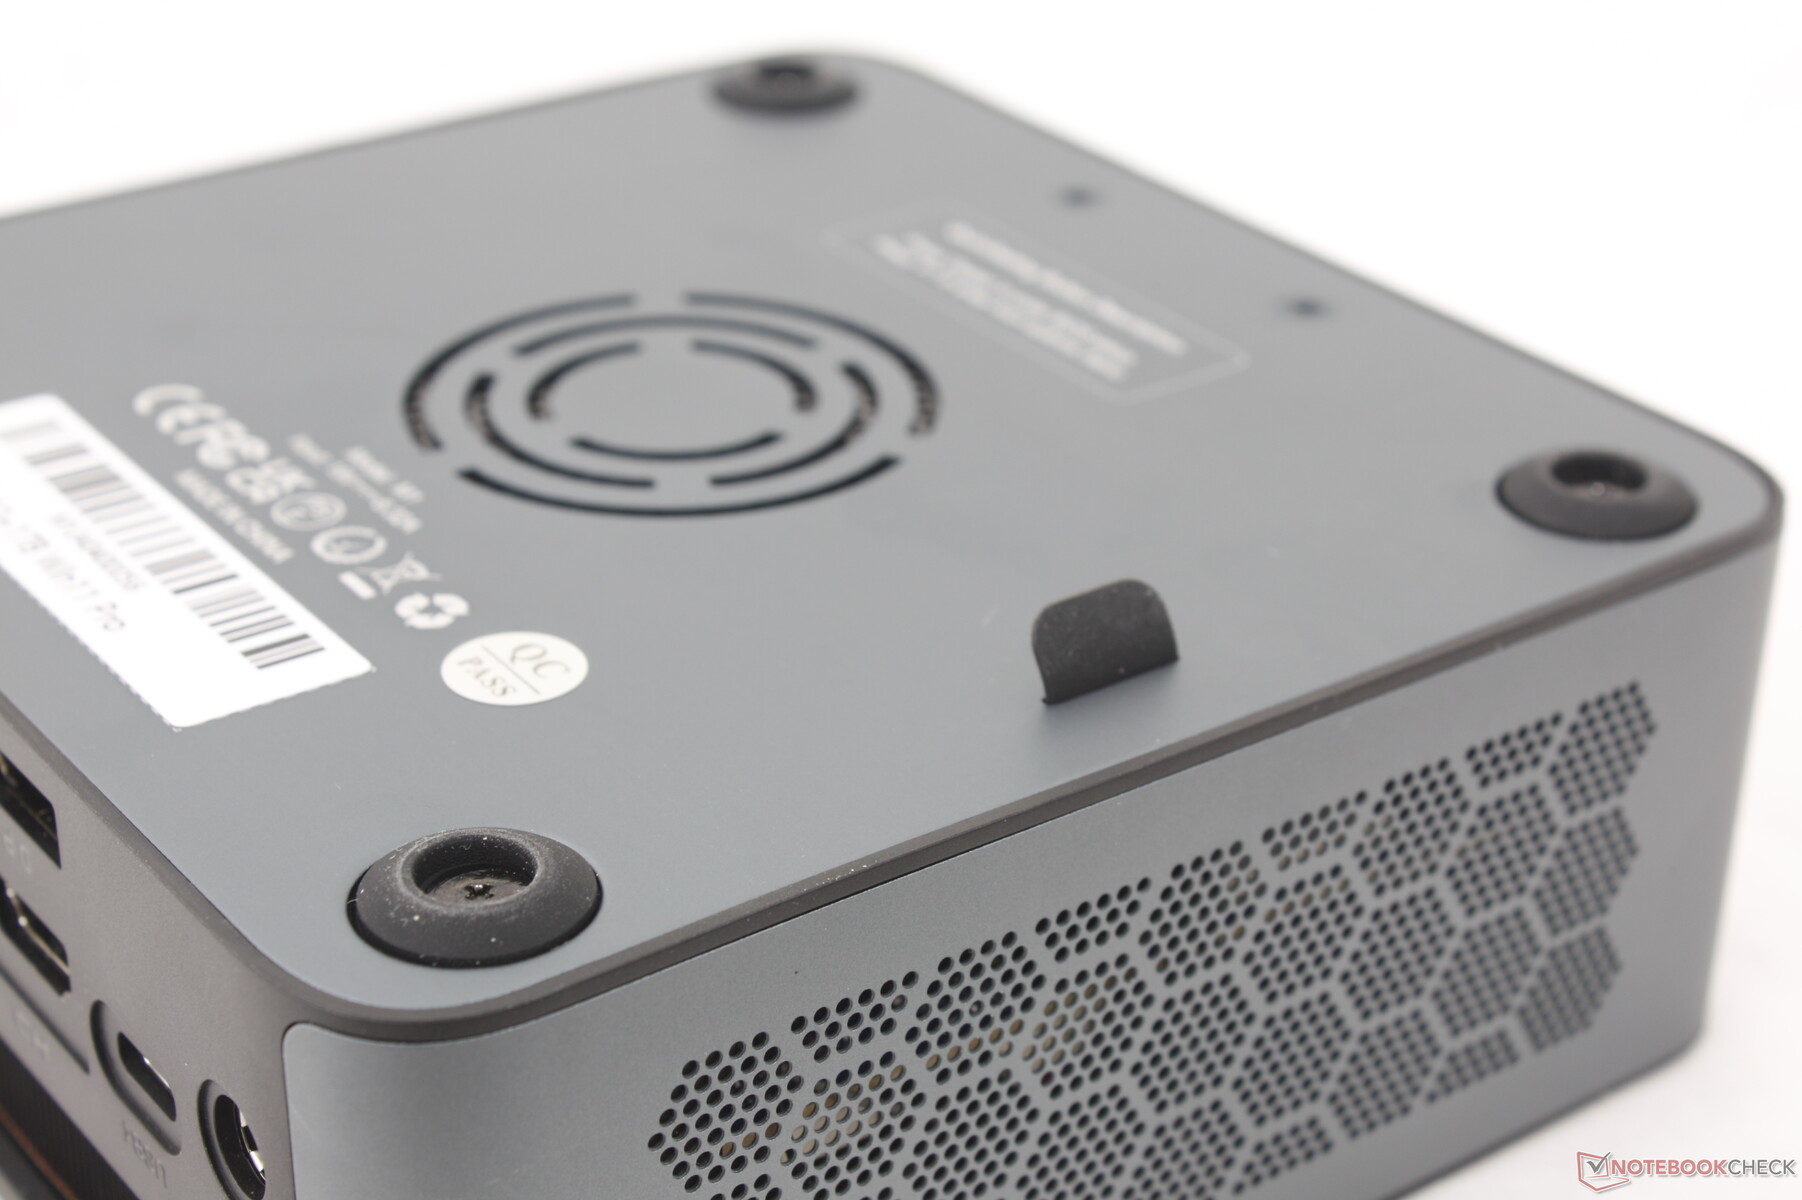
Servicing is a two-step process as the motherboard is underneath both the cooling apparatus and the removable bottom plate. Luckily, only a Phillips screwdriver is required for removing these two pieces. Owners have access to 2x SODIMM slots, 2x M.2 2280 PCIe4 x4 slots, and the removable WLAN module as shown below.
Accessing the other side of the motherboard requires removing the motherboard from the chassis entirely. Cleaning the second fan on top of the motherboard is therefore much more involved than the first fan below the motherboard.
Accessories And Warranty
The retail box includes a removable VESA bracket with screws, HDMI cable, and the usual AC adapter and paperwork. A one-year limited manufacturer warranty applies if purchased in the US.
Performance — Radeon 7 7840HS Works Wonders For Mini PCs
Testing Conditions
We set Windows to Performance mode prior to running the benchmarks below. There are no specialized pre-installed applications for a clean Windows experience.
Processor
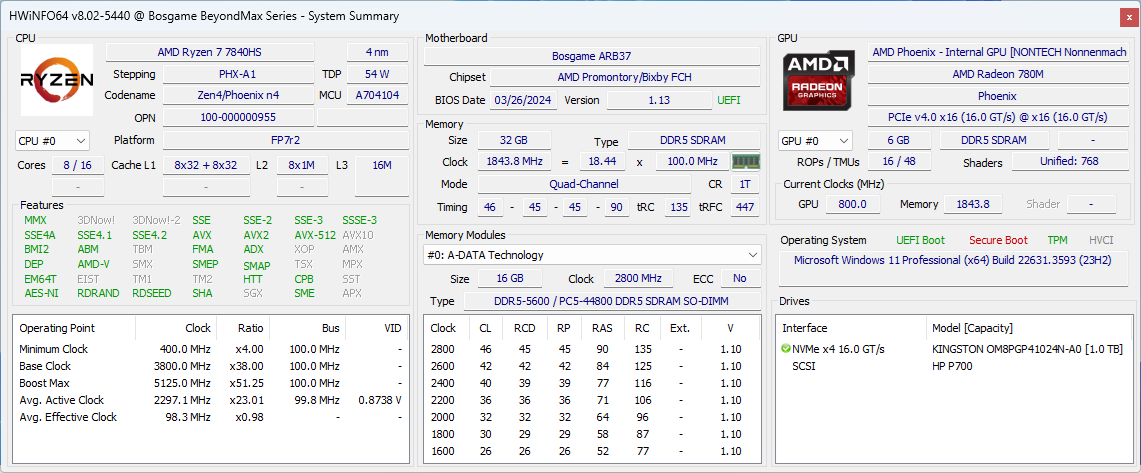
The year-old Ryzen 7 7840HS is still powerful and comparable to newer Meteor Lake-H and Hawk Point-HS CPUs from Intel and AMD, respectively. The Core Ultra 9 185H in the much more expensive Minisforum AtomMan X7 Ti, for example, is only 10 to 15 percent faster for poorer performance-per-dollar than our Bosgame.
Sticking with the older Ryzen 7 7840HS will mean missing out on the integrated NPU of the Ryzen 7 8840HS or Intel Meteor Lake series. However, users who have no interest in local AI acceleration may find the Ryzen 7 7840HS favorable as it can often outperform the Ryzen 7 8840HS when it comes to non-AI applications.
Cinebench R15 Multi Loop
Cinebench R23: Multi Core | Single Core
Cinebench R20: CPU (Multi Core) | CPU (Single Core)
Cinebench R15: CPU Multi 64Bit | CPU Single 64Bit
Blender: v2.79 BMW27 CPU
7-Zip 18.03: 7z b 4 | 7z b 4 -mmt1
Geekbench 6.7: Multi-Core | Single-Core
Geekbench 5.5: Multi-Core | Single-Core
HWBOT x265 Benchmark v2.2: 4k Preset
LibreOffice : 20 Documents To PDF
R Benchmark 2.5: Overall mean
* ... smaller is better
AIDA64: FP32 Ray-Trace | FPU Julia | CPU SHA3 | CPU Queen | FPU SinJulia | FPU Mandel | CPU AES | CPU ZLib | FP64 Ray-Trace | CPU PhotoWorxx
| Performance rating | |
| BOSGAME M1 | |
| GMK NucBox K6 | |
| Beelink SER7 | |
| Average AMD Ryzen 7 7840HS | |
| Beelink GTR6 | |
| Intel NUC 13 Pro Kit NUC13ANK | |
| GMK NucBox M5 | |
| AIDA64 / FP32 Ray-Trace | |
| Average AMD Ryzen 7 7840HS (22845 - 28921, n=21) | |
| BOSGAME M1 | |
| Beelink SER7 | |
| GMK NucBox K6 | |
| Beelink GTR6 | |
| Intel NUC 13 Pro Kit NUC13ANK | |
| GMK NucBox M5 | |
| AIDA64 / FPU Julia | |
| Average AMD Ryzen 7 7840HS (97164 - 123167, n=21) | |
| BOSGAME M1 | |
| Beelink SER7 | |
| GMK NucBox K6 | |
| Beelink GTR6 | |
| Intel NUC 13 Pro Kit NUC13ANK | |
| GMK NucBox M5 | |
| AIDA64 / CPU SHA3 | |
| BOSGAME M1 | |
| Beelink SER7 | |
| Average AMD Ryzen 7 7840HS (4293 - 5155, n=21) | |
| GMK NucBox K6 | |
| Beelink GTR6 | |
| Intel NUC 13 Pro Kit NUC13ANK | |
| GMK NucBox M5 | |
| AIDA64 / CPU Queen | |
| BOSGAME M1 | |
| Average AMD Ryzen 7 7840HS (102271 - 125820, n=21) | |
| Beelink SER7 | |
| GMK NucBox K6 | |
| Beelink GTR6 | |
| Intel NUC 13 Pro Kit NUC13ANK | |
| GMK NucBox M5 | |
| AIDA64 / FPU SinJulia | |
| BOSGAME M1 | |
| Average AMD Ryzen 7 7840HS (13767 - 15525, n=21) | |
| GMK NucBox K6 | |
| Beelink SER7 | |
| Beelink GTR6 | |
| GMK NucBox M5 | |
| Intel NUC 13 Pro Kit NUC13ANK | |
| AIDA64 / FPU Mandel | |
| Average AMD Ryzen 7 7840HS (52084 - 65812, n=21) | |
| BOSGAME M1 | |
| Beelink SER7 | |
| GMK NucBox K6 | |
| Beelink GTR6 | |
| Intel NUC 13 Pro Kit NUC13ANK | |
| GMK NucBox M5 | |
| AIDA64 / CPU AES | |
| BOSGAME M1 | |
| GMK NucBox K6 | |
| Beelink SER7 | |
| Average AMD Ryzen 7 7840HS (67389 - 177158, n=21) | |
| Beelink GTR6 | |
| Intel NUC 13 Pro Kit NUC13ANK | |
| GMK NucBox M5 | |
| AIDA64 / CPU ZLib | |
| Average AMD Ryzen 7 7840HS (944 - 1123, n=21) | |
| BOSGAME M1 | |
| GMK NucBox K6 | |
| Beelink SER7 | |
| Intel NUC 13 Pro Kit NUC13ANK | |
| Beelink GTR6 | |
| GMK NucBox M5 | |
| AIDA64 / FP64 Ray-Trace | |
| Average AMD Ryzen 7 7840HS (12248 - 15599, n=21) | |
| Beelink SER7 | |
| BOSGAME M1 | |
| GMK NucBox K6 | |
| Beelink GTR6 | |
| Intel NUC 13 Pro Kit NUC13ANK | |
| GMK NucBox M5 | |
| AIDA64 / CPU PhotoWorxx | |
| BOSGAME M1 | |
| Beelink SER7 | |
| GMK NucBox K6 | |
| Average AMD Ryzen 7 7840HS (17615 - 41516, n=21) | |
| Beelink GTR6 | |
| Intel NUC 13 Pro Kit NUC13ANK | |
| GMK NucBox M5 | |
Stress Test
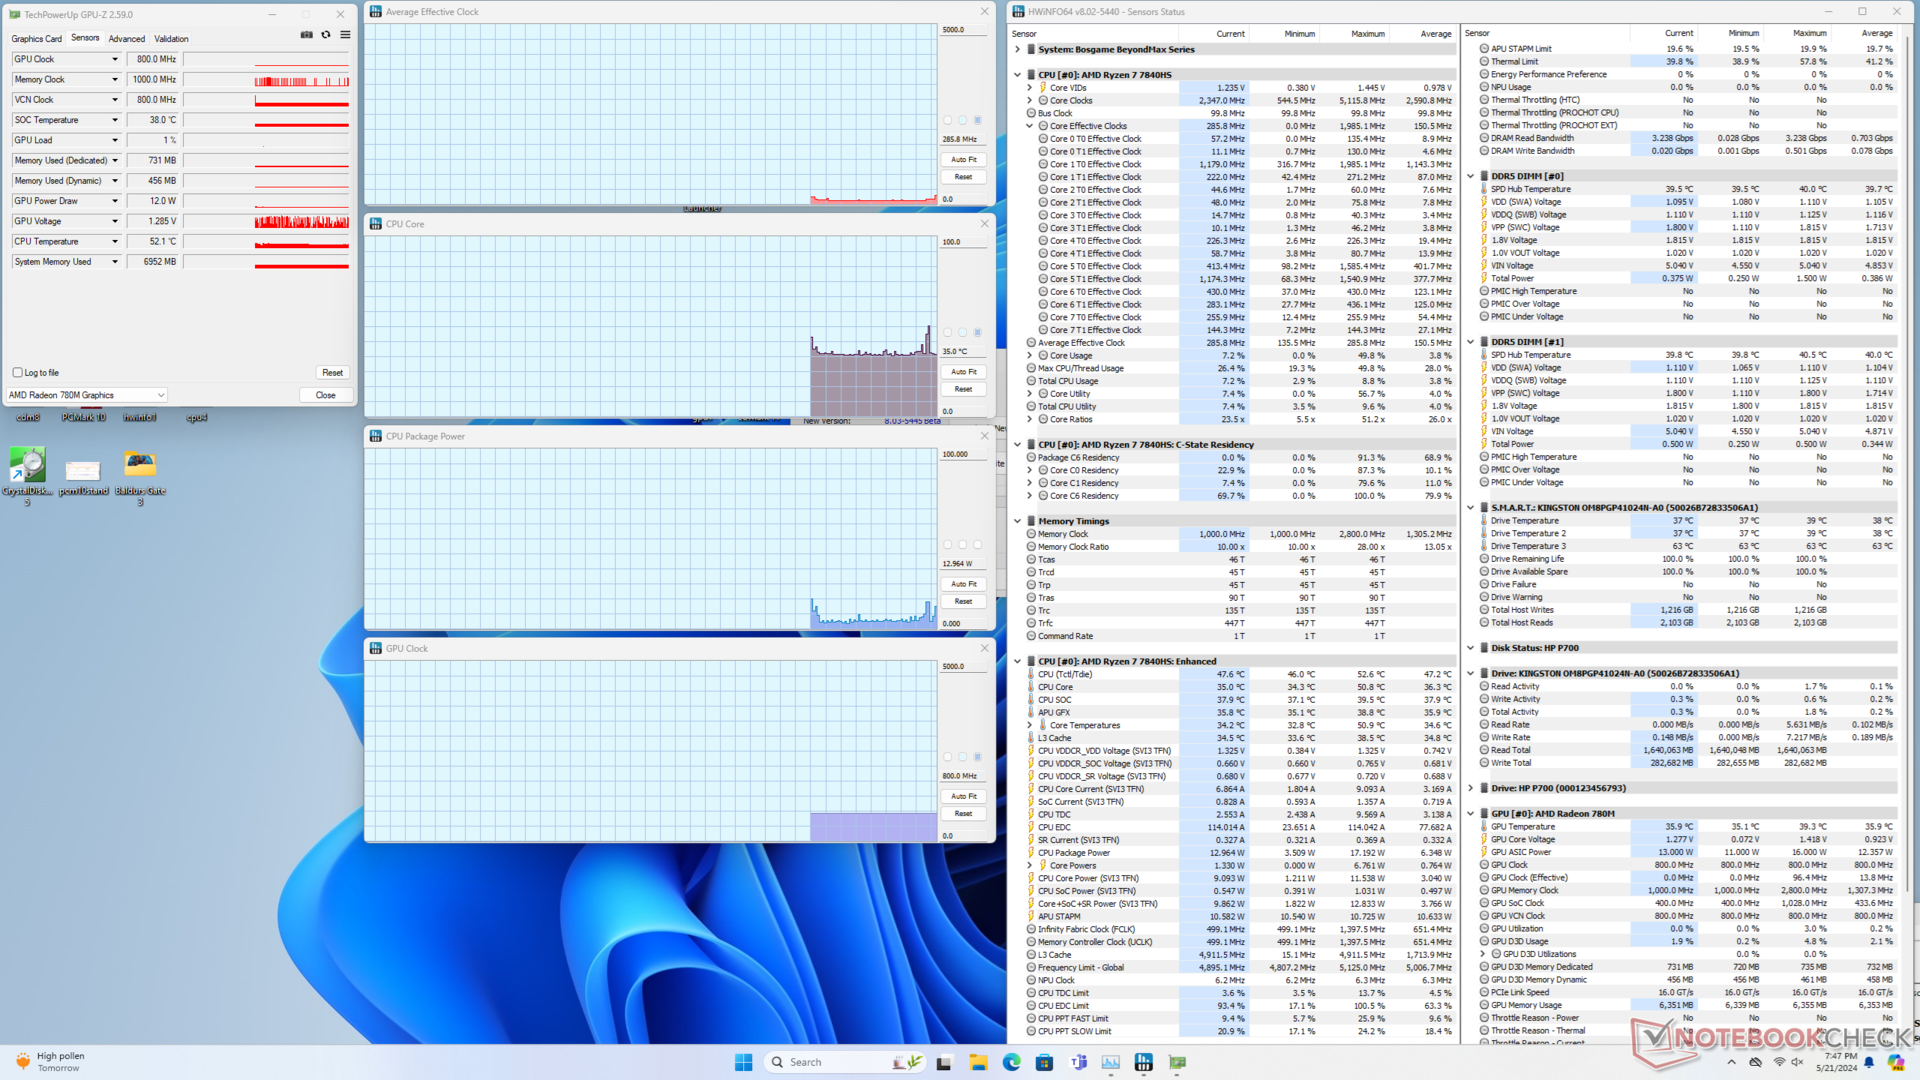
Running Prime95 stress causes the CPU to boost to 4.3 GHz and 65 W for the first few seconds before settling at 4 GHz, 54 W, and 80 C. Repeating this test on the Beelink SER7 with the exact same Ryzen 7 CPU would return very similar results even though our M1 is noticeably larger and heavier than the Beelink.
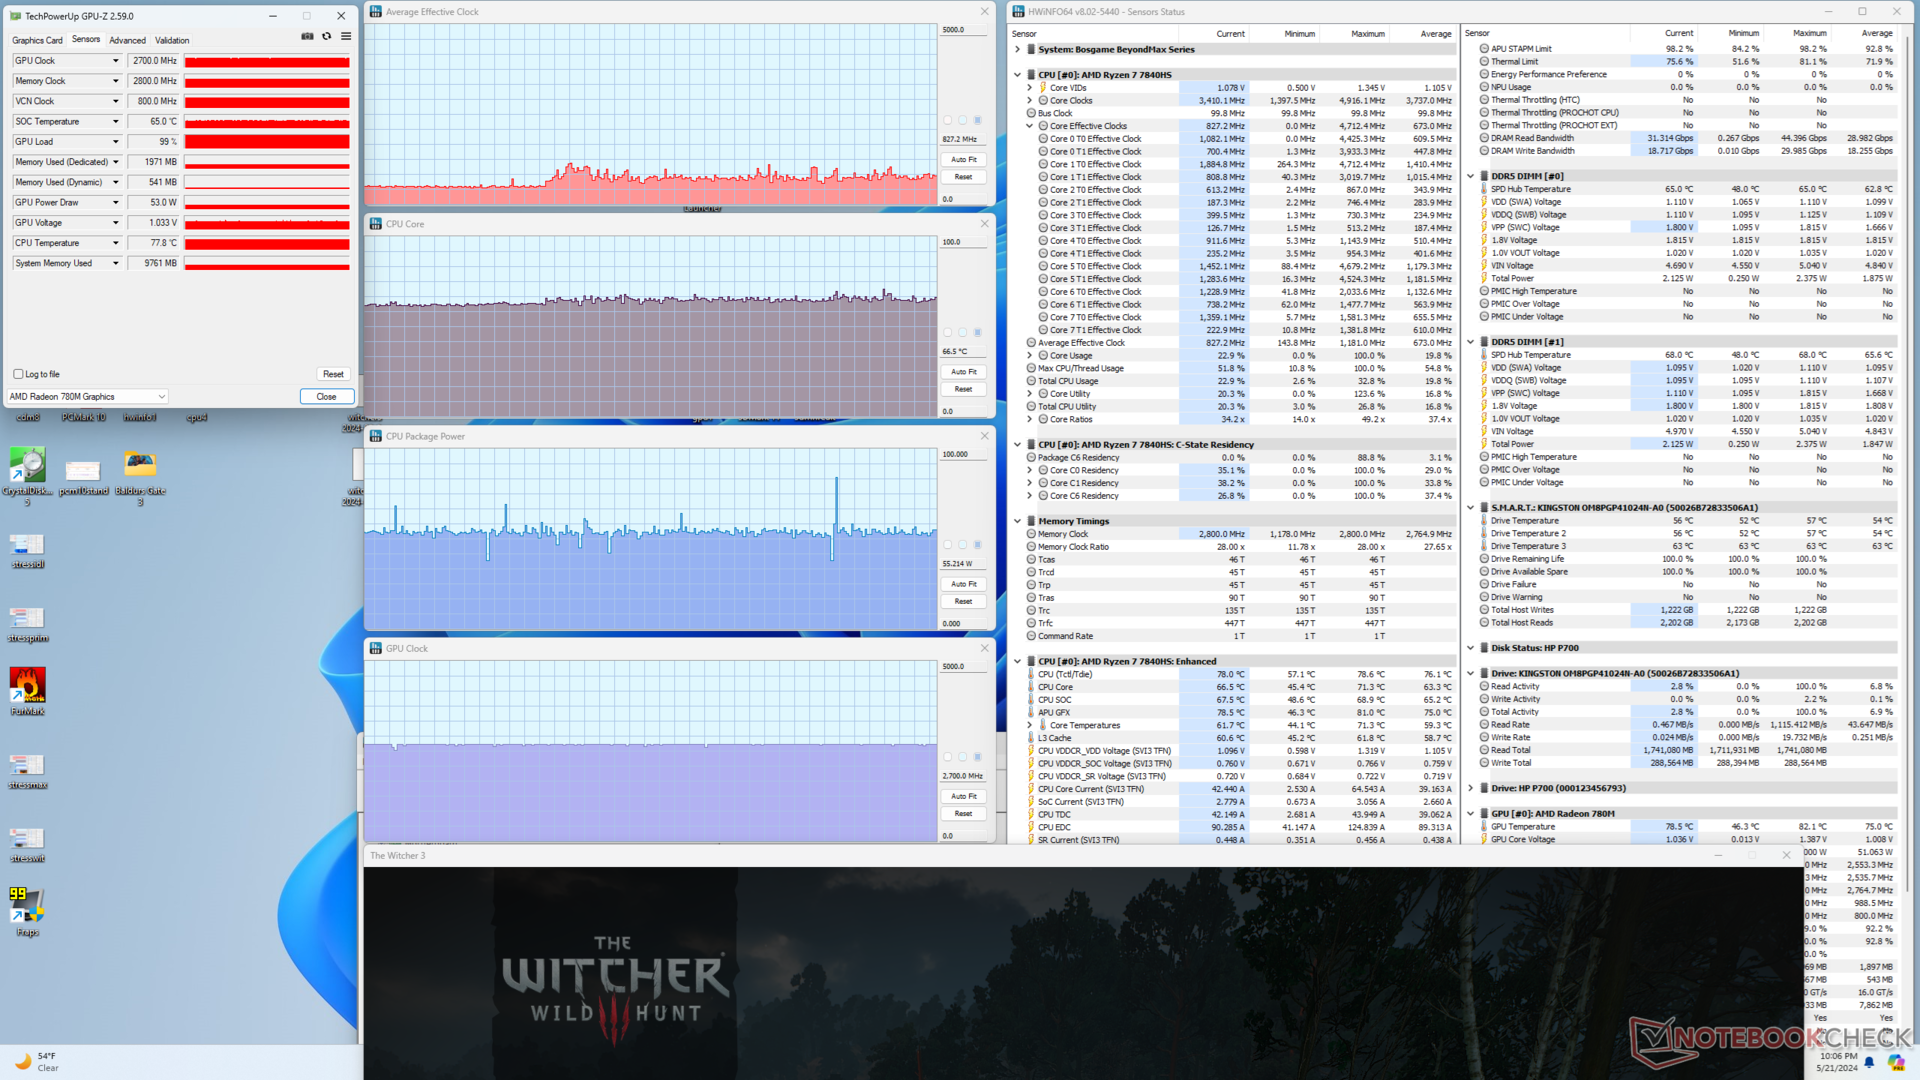
GPU clock rate and temperature when running Witcher 3 to represent gaming stress would stabilize at 2700 MHz and 67 C, respectively, compared to ~2500 MHz on the Beelink SER7 or GMK NucBox K6 all equipped with the same AMD processor. The slightly higher GPU clock rate in our Bosgame correlates with the slightly higher graphics performance in the GPU Performance section below.
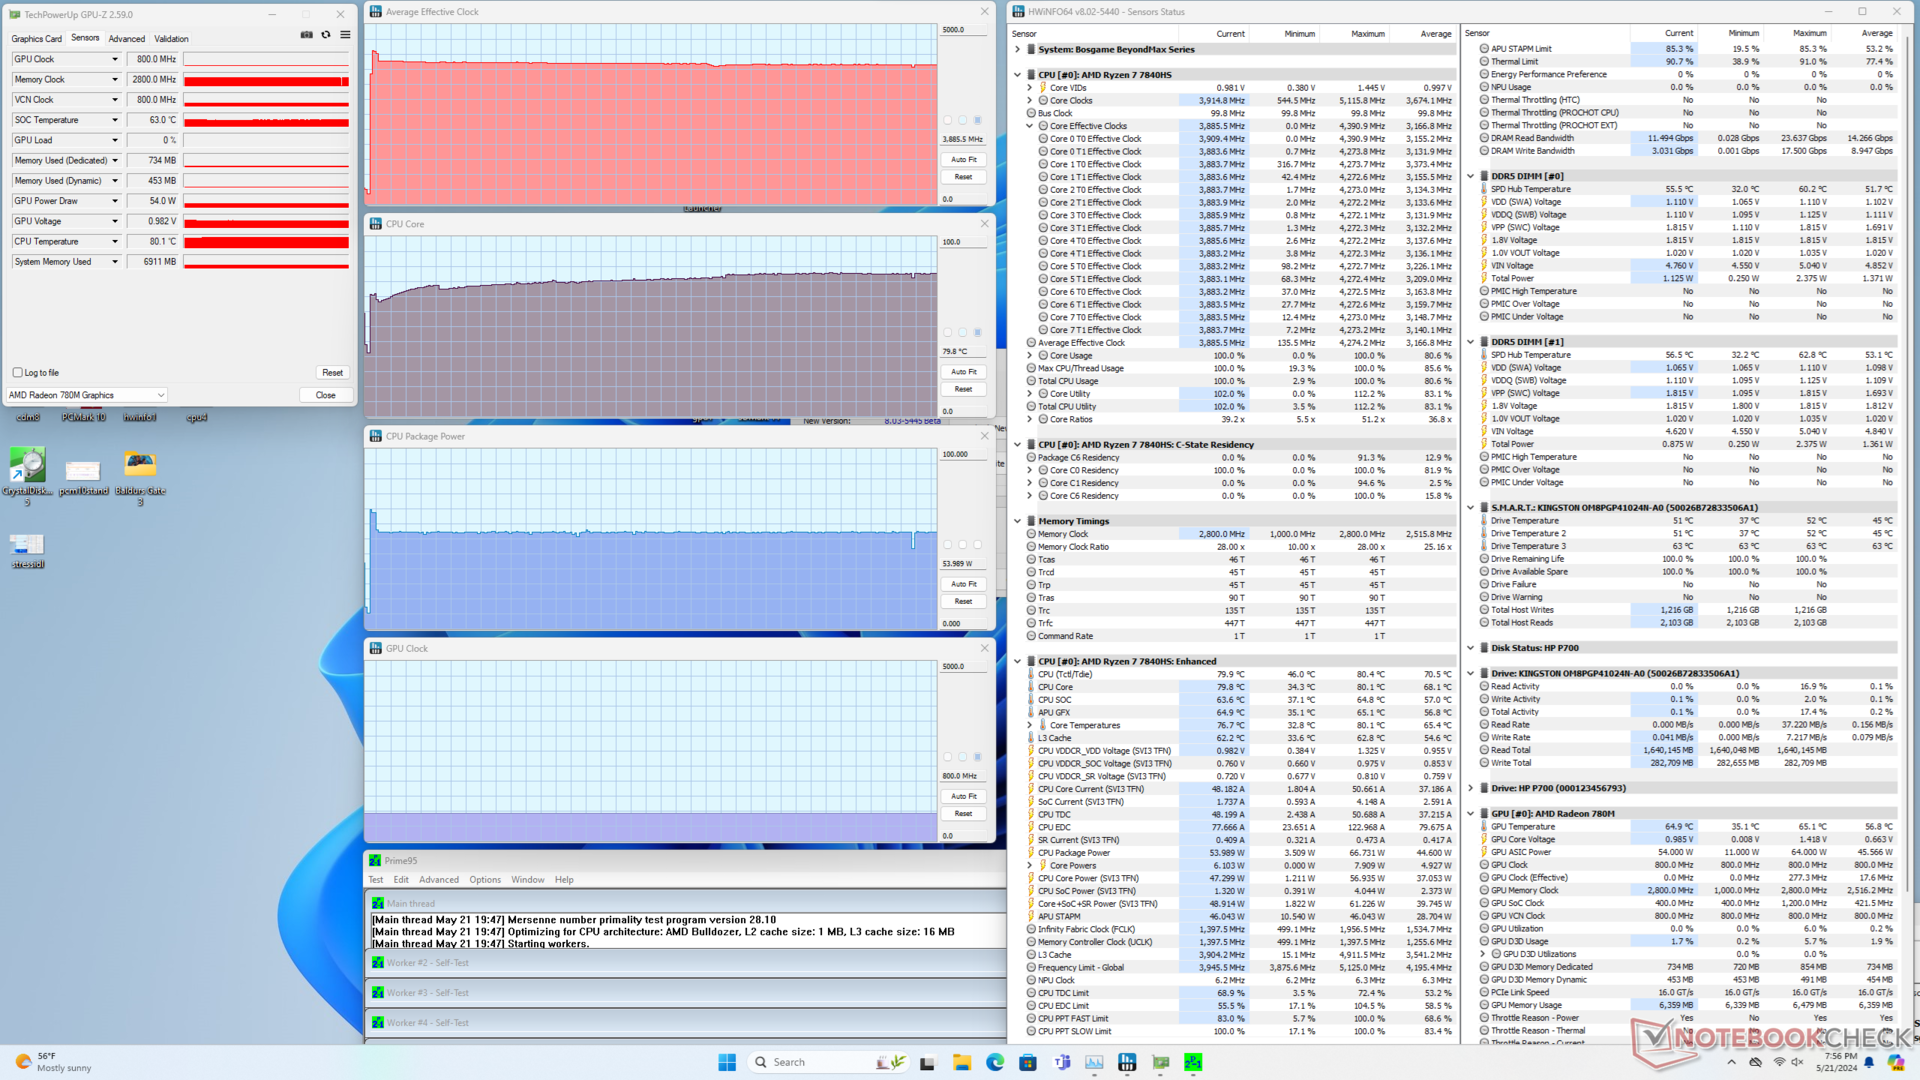
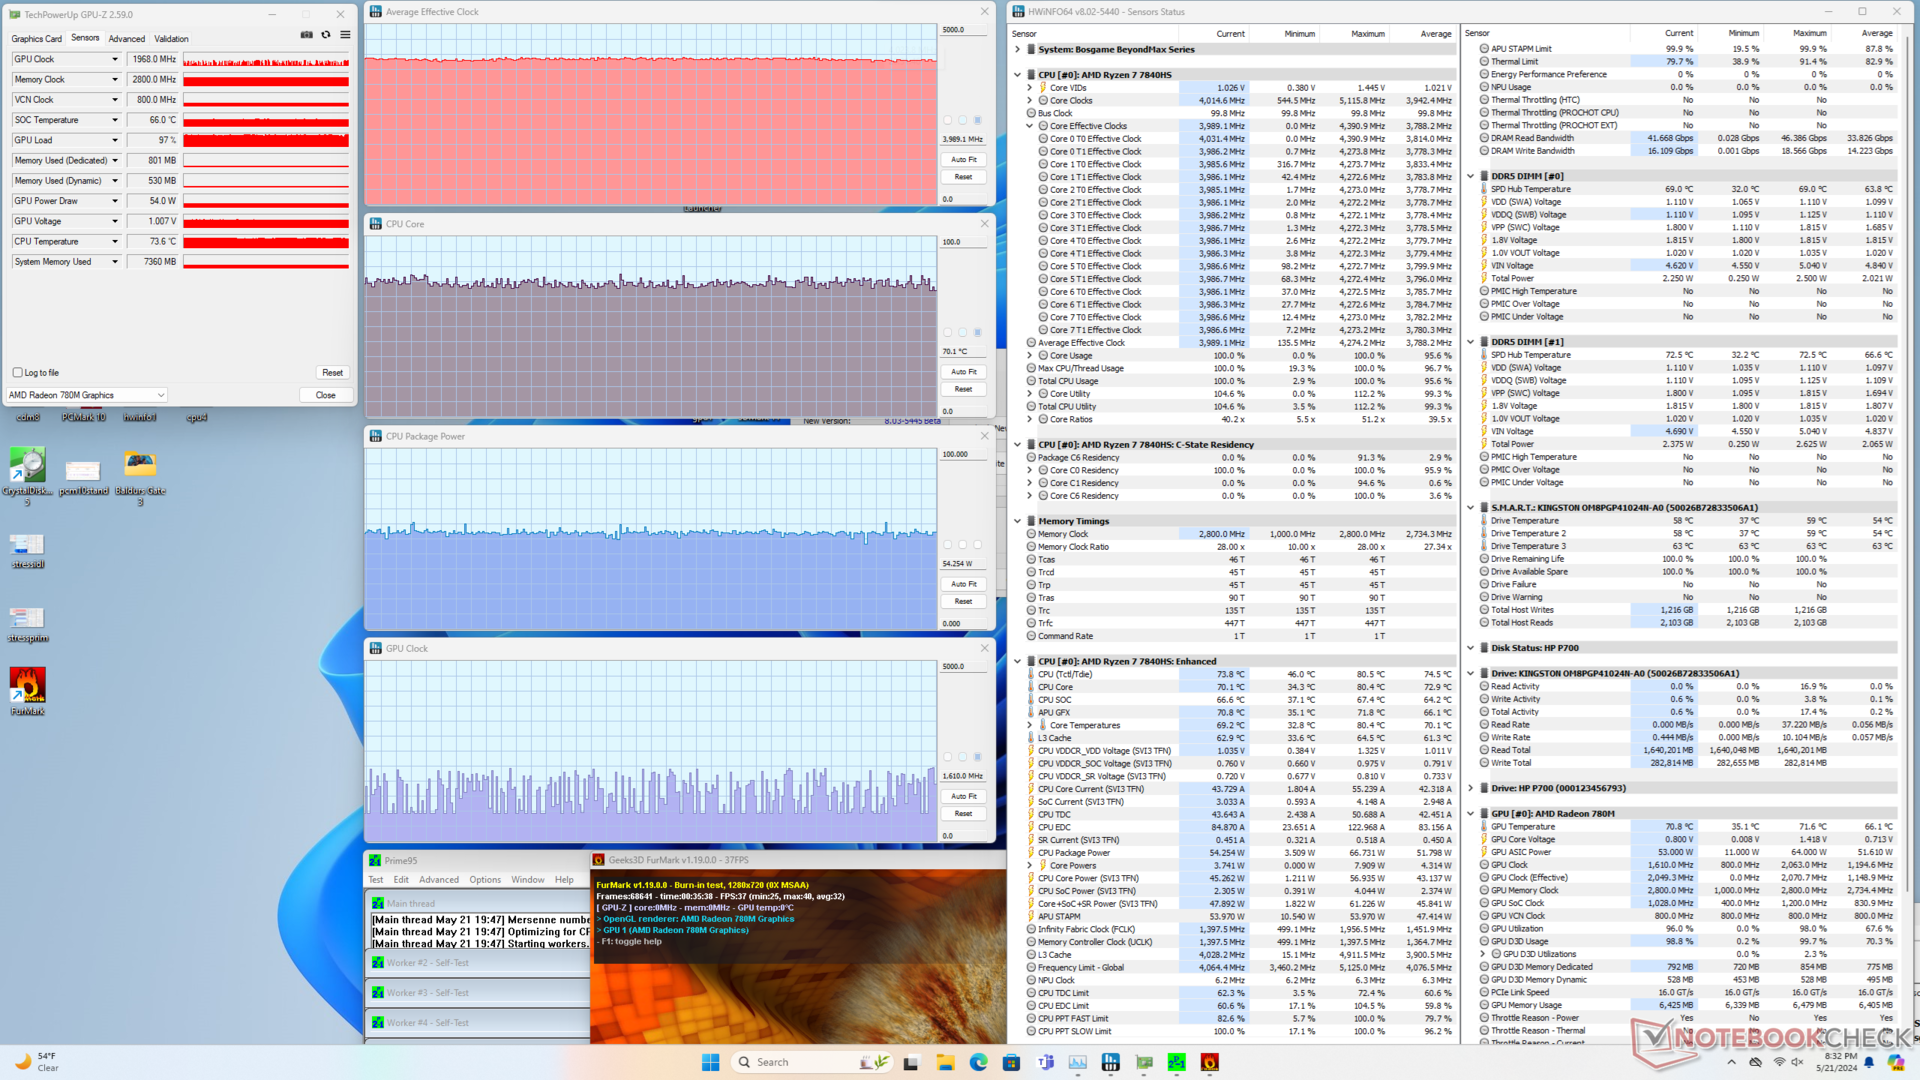
| Average CPU Clock (GHz) | GPU Clock (MHz) | Average CPU Temperature (°C) | |
| System Idle | -- | -- | 35 |
| Prime95 Stress | 3.9 | -- | 80 |
| Prime95 + FurMark Stress | 4.0 | 833 - 2100 | 70 |
| Witcher 3 Stress | ~0.8 | 2700 | 67 |
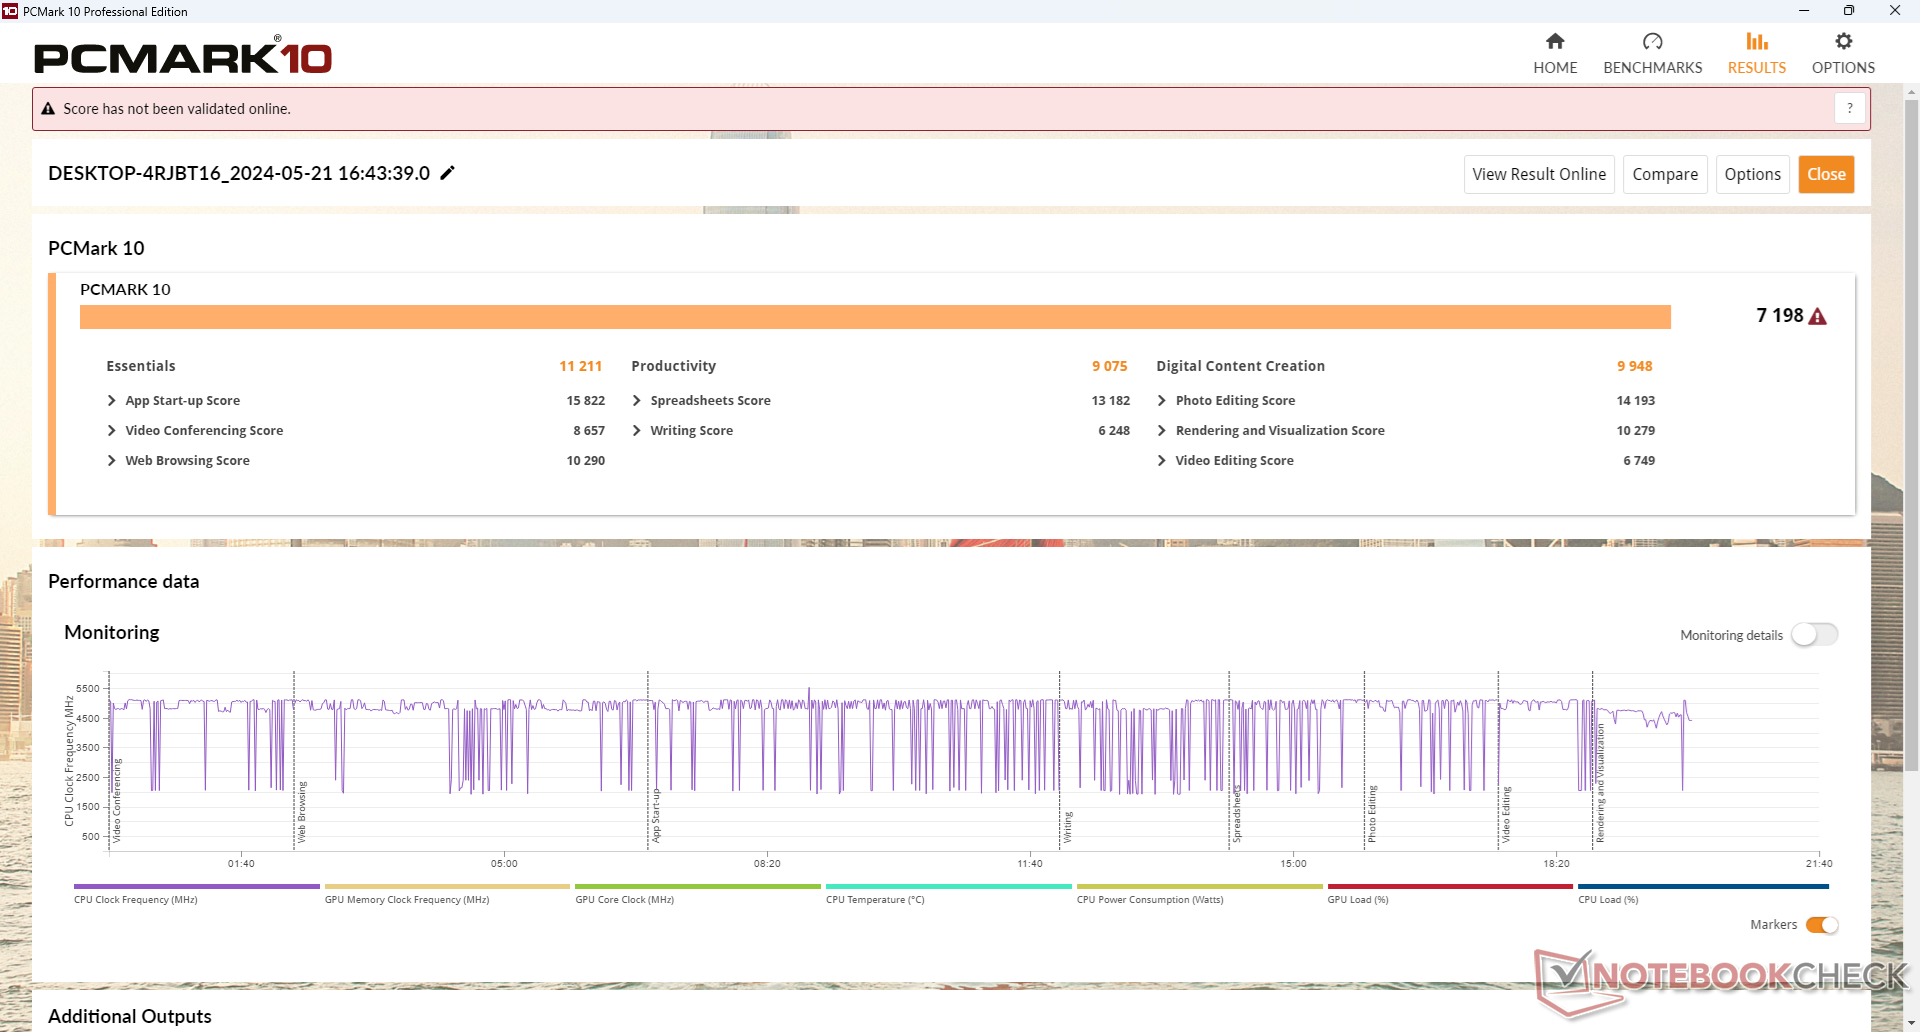
System Performance
PCMark results are comparable to other higher-end mini PCs such as the GMK NucBox K6 or Beelink SER7. Its Digital Content Creation subscore in particular is much higher than any other mini PC running on older Iris Xe or RX Vega hardware.
While we experienced no major issues on our test unit, the system would annoyingly beep every minute or so upon booting up when its Bluetooth speakers are actively searching. Disconnecting the speakers through the Bluetooth menu will stop the beeping.
CrossMark: Overall | Productivity | Creativity | Responsiveness
WebXPRT 3: Overall
WebXPRT 4: Overall
Mozilla Kraken 1.1: Total
| PCMark 10 / Score | |
| GMK NucBox K6 | |
| Average AMD Ryzen 7 7840HS, AMD Radeon 780M (6914 - 7651, n=10) | |
| Beelink SER7 | |
| BOSGAME M1 | |
| Beelink GTR6 | |
| Intel NUC 13 Pro Kit NUC13ANK | |
| GMK NucBox M5 | |
| PCMark 10 / Essentials | |
| Intel NUC 13 Pro Kit NUC13ANK | |
| Beelink GTR6 | |
| GMK NucBox K6 | |
| BOSGAME M1 | |
| Average AMD Ryzen 7 7840HS, AMD Radeon 780M (10519 - 11214, n=10) | |
| Beelink SER7 | |
| GMK NucBox M5 | |
| PCMark 10 / Productivity | |
| GMK NucBox K6 | |
| Beelink SER7 | |
| Beelink GTR6 | |
| Average AMD Ryzen 7 7840HS, AMD Radeon 780M (9075 - 10970, n=10) | |
| BOSGAME M1 | |
| GMK NucBox M5 | |
| Intel NUC 13 Pro Kit NUC13ANK | |
| PCMark 10 / Digital Content Creation | |
| BOSGAME M1 | |
| GMK NucBox K6 | |
| Average AMD Ryzen 7 7840HS, AMD Radeon 780M (9052 - 9987, n=10) | |
| Beelink SER7 | |
| Beelink GTR6 | |
| Intel NUC 13 Pro Kit NUC13ANK | |
| GMK NucBox M5 | |
| CrossMark / Overall | |
| BOSGAME M1 | |
| GMK NucBox K6 | |
| Intel NUC 13 Pro Kit NUC13ANK | |
| Average AMD Ryzen 7 7840HS, AMD Radeon 780M (1566 - 1891, n=10) | |
| Beelink SER7 | |
| Beelink GTR6 | |
| GMK NucBox M5 | |
| CrossMark / Productivity | |
| BOSGAME M1 | |
| GMK NucBox K6 | |
| Intel NUC 13 Pro Kit NUC13ANK | |
| Beelink GTR6 | |
| Average AMD Ryzen 7 7840HS, AMD Radeon 780M (1535 - 1823, n=10) | |
| Beelink SER7 | |
| GMK NucBox M5 | |
| CrossMark / Creativity | |
| BOSGAME M1 | |
| GMK NucBox K6 | |
| Intel NUC 13 Pro Kit NUC13ANK | |
| Beelink SER7 | |
| Average AMD Ryzen 7 7840HS, AMD Radeon 780M (1556 - 2040, n=10) | |
| Beelink GTR6 | |
| GMK NucBox M5 | |
| CrossMark / Responsiveness | |
| BOSGAME M1 | |
| GMK NucBox K6 | |
| Beelink GTR6 | |
| Intel NUC 13 Pro Kit NUC13ANK | |
| Average AMD Ryzen 7 7840HS, AMD Radeon 780M (1293 - 1749, n=10) | |
| Beelink SER7 | |
| GMK NucBox M5 | |
| WebXPRT 3 / Overall | |
| Beelink SER7 | |
| GMK NucBox K6 | |
| Average AMD Ryzen 7 7840HS, AMD Radeon 780M (297 - 339, n=10) | |
| BOSGAME M1 | |
| Intel NUC 13 Pro Kit NUC13ANK | |
| Beelink GTR6 | |
| GMK NucBox M5 | |
| WebXPRT 4 / Overall | |
| Intel NUC 13 Pro Kit NUC13ANK | |
| GMK NucBox K6 | |
| Average AMD Ryzen 7 7840HS, AMD Radeon 780M (245 - 319, n=9) | |
| Beelink SER7 | |
| BOSGAME M1 | |
| Beelink GTR6 | |
| GMK NucBox M5 | |
| Mozilla Kraken 1.1 / Total | |
| GMK NucBox M5 | |
| Beelink GTR6 | |
| GMK NucBox K6 | |
| BOSGAME M1 | |
| Beelink SER7 | |
| Average AMD Ryzen 7 7840HS, AMD Radeon 780M (485 - 544, n=10) | |
| Intel NUC 13 Pro Kit NUC13ANK | |
* ... smaller is better
| PCMark 10 Score | 7198 points | |
Help | ||
| AIDA64 / Memory Copy | |
| BOSGAME M1 | |
| Beelink SER7 | |
| GMK NucBox K6 | |
| Average AMD Ryzen 7 7840HS (30937 - 72158, n=21) | |
| Beelink GTR6 | |
| Intel NUC 13 Pro Kit NUC13ANK | |
| GMK NucBox M5 | |
| AIDA64 / Memory Read | |
| Beelink SER7 | |
| BOSGAME M1 | |
| GMK NucBox K6 | |
| Average AMD Ryzen 7 7840HS (30497 - 62147, n=21) | |
| Beelink GTR6 | |
| GMK NucBox M5 | |
| Intel NUC 13 Pro Kit NUC13ANK | |
| AIDA64 / Memory Write | |
| Beelink SER7 | |
| BOSGAME M1 | |
| GMK NucBox K6 | |
| Average AMD Ryzen 7 7840HS (34590 - 93323, n=21) | |
| Beelink GTR6 | |
| GMK NucBox M5 | |
| Intel NUC 13 Pro Kit NUC13ANK | |
| AIDA64 / Memory Latency | |
| GMK NucBox M5 | |
| Intel NUC 13 Pro Kit NUC13ANK | |
| Average AMD Ryzen 7 7840HS (85.1 - 112, n=21) | |
| BOSGAME M1 | |
| GMK NucBox K6 | |
| Beelink SER7 | |
| Beelink GTR6 | |
* ... smaller is better
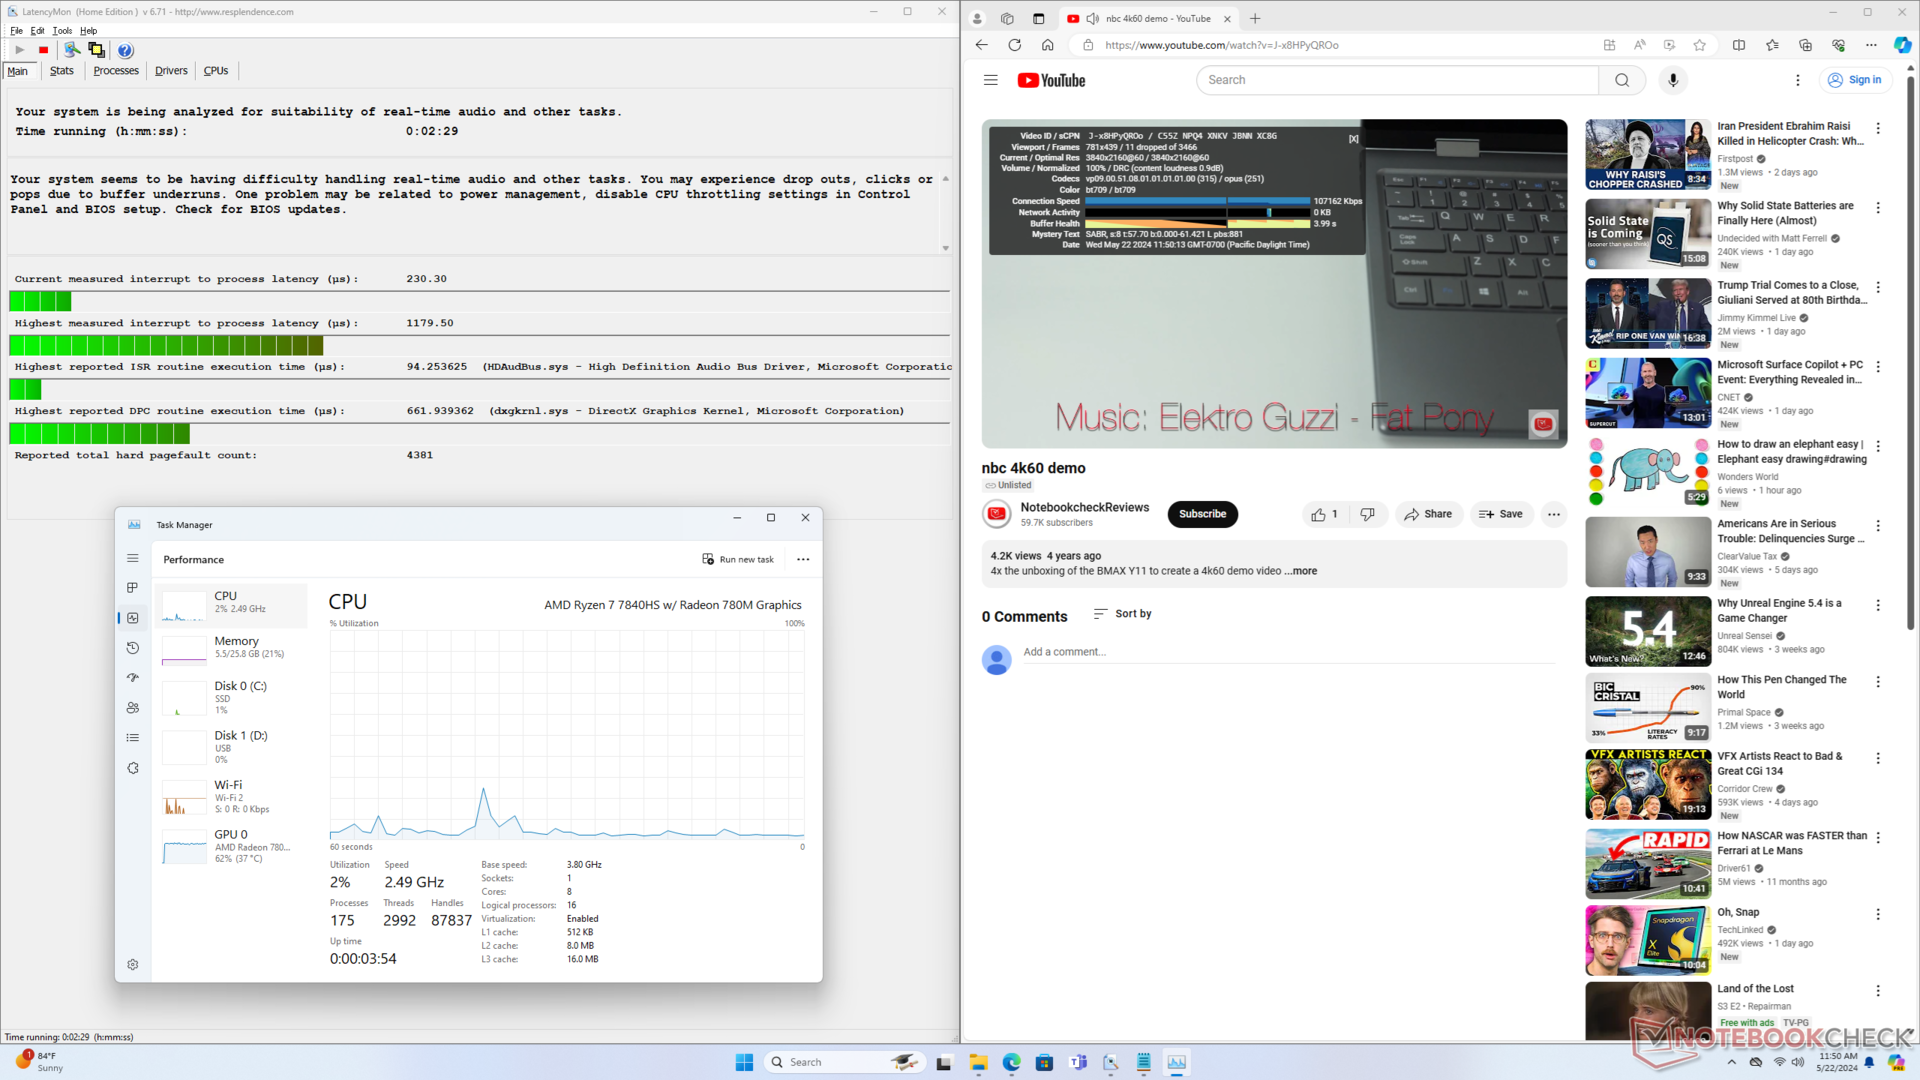
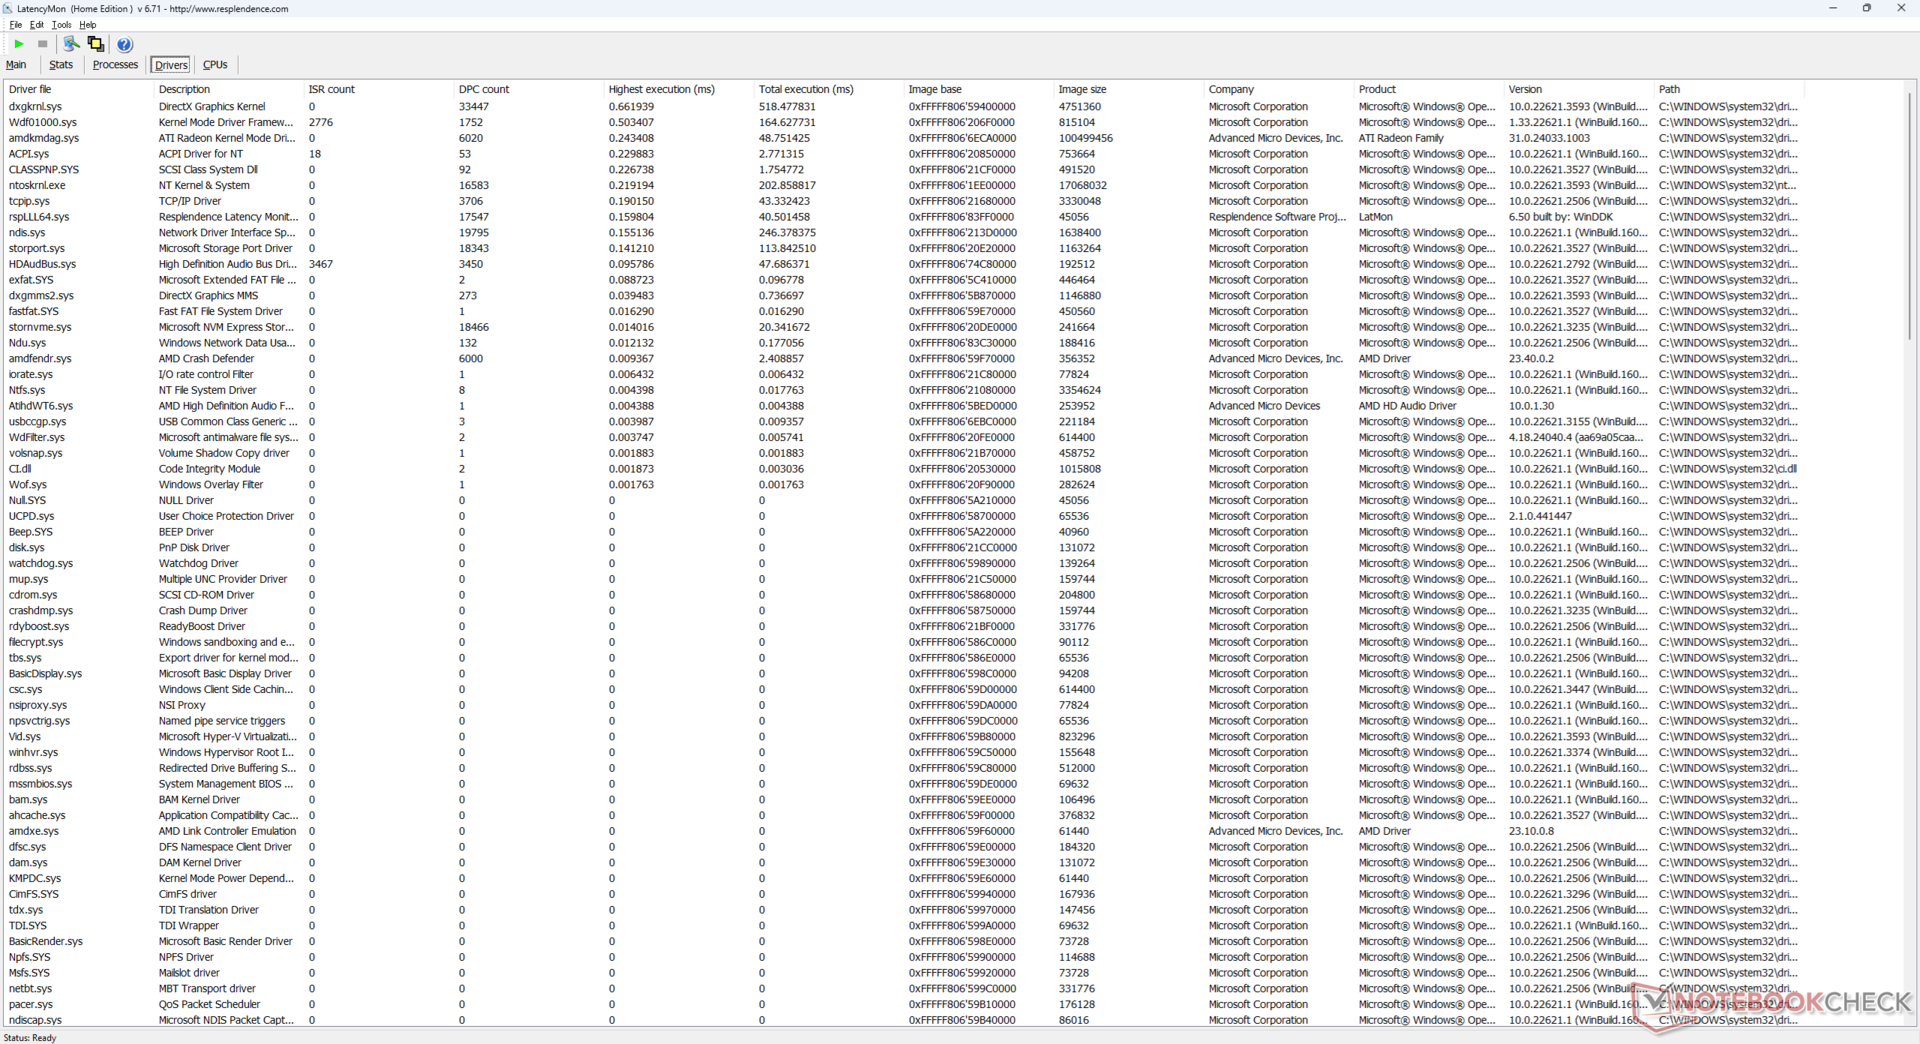
DPC Latency
LatencyMon reveals just minor DPC issues when opening multiple browser tabs of our homepage. However, 4K video playback at 60 FPS is unfortunately imperfect with 11 dropped frames recorded during a 60-second timespan. There should ideally be no dropped frames at all given how powerful the Zen 4 CPU is. This is where Intel-based PCs have proven consistently better in regards to video playback.
| DPC Latencies / LatencyMon - interrupt to process latency (max), Web, Youtube, Prime95 | |
| GMK NucBox K6 | |
| GMK NucBox M5 | |
| BOSGAME M1 | |
| Intel NUC 13 Pro Kit NUC13ANK | |
| Beelink SER7 | |
| Beelink GTR6 | |
* ... smaller is better
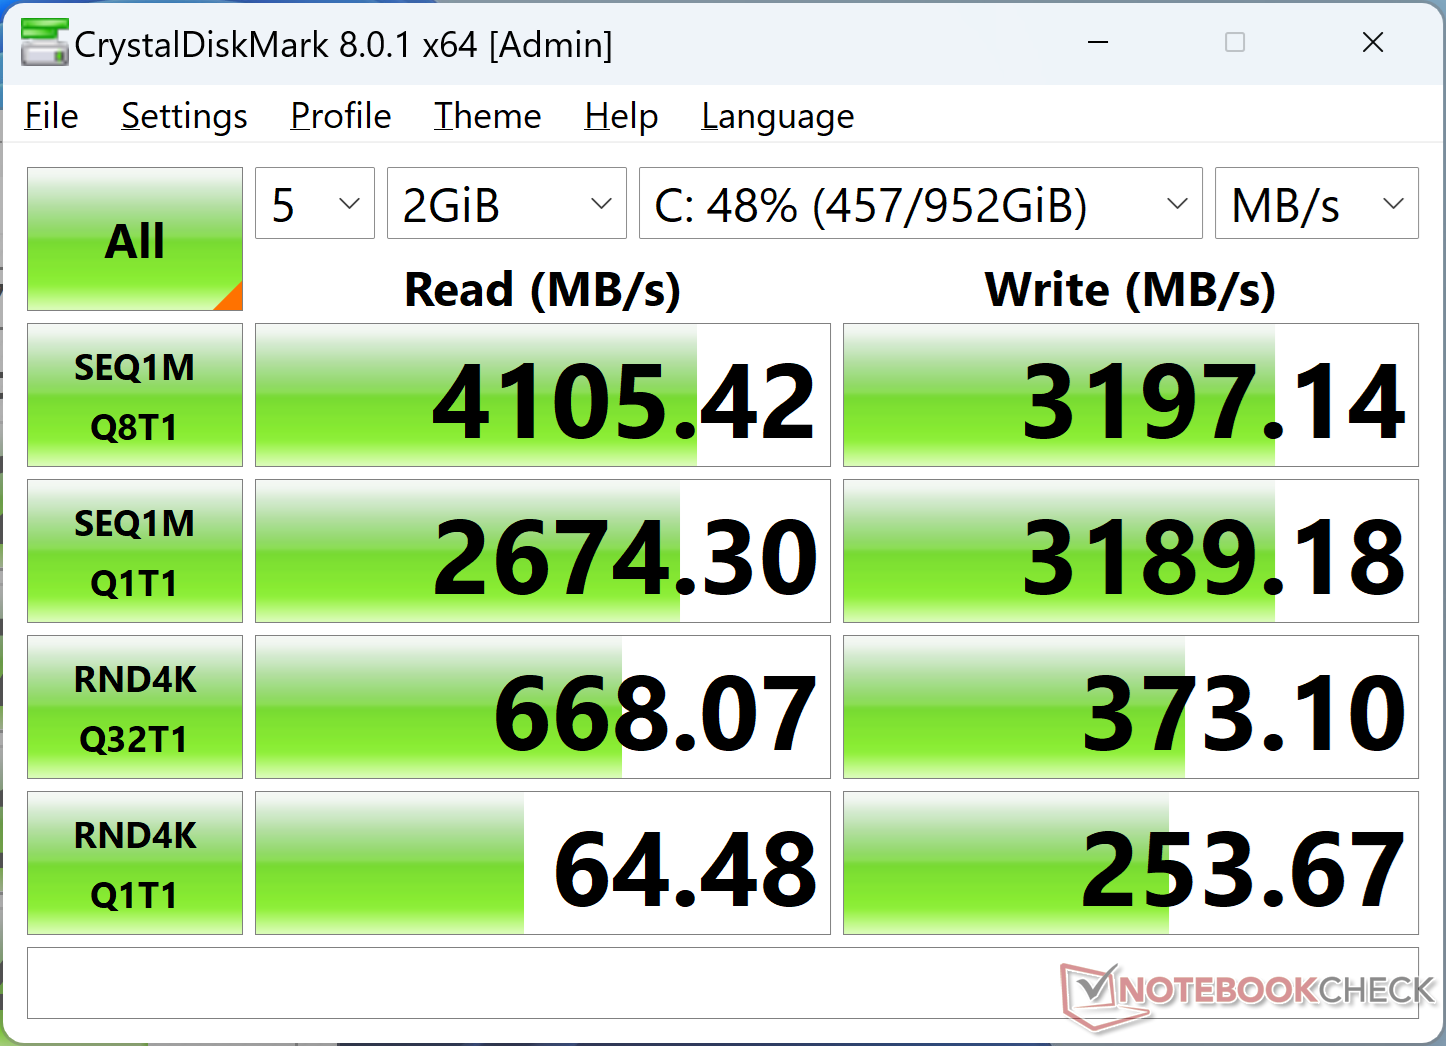
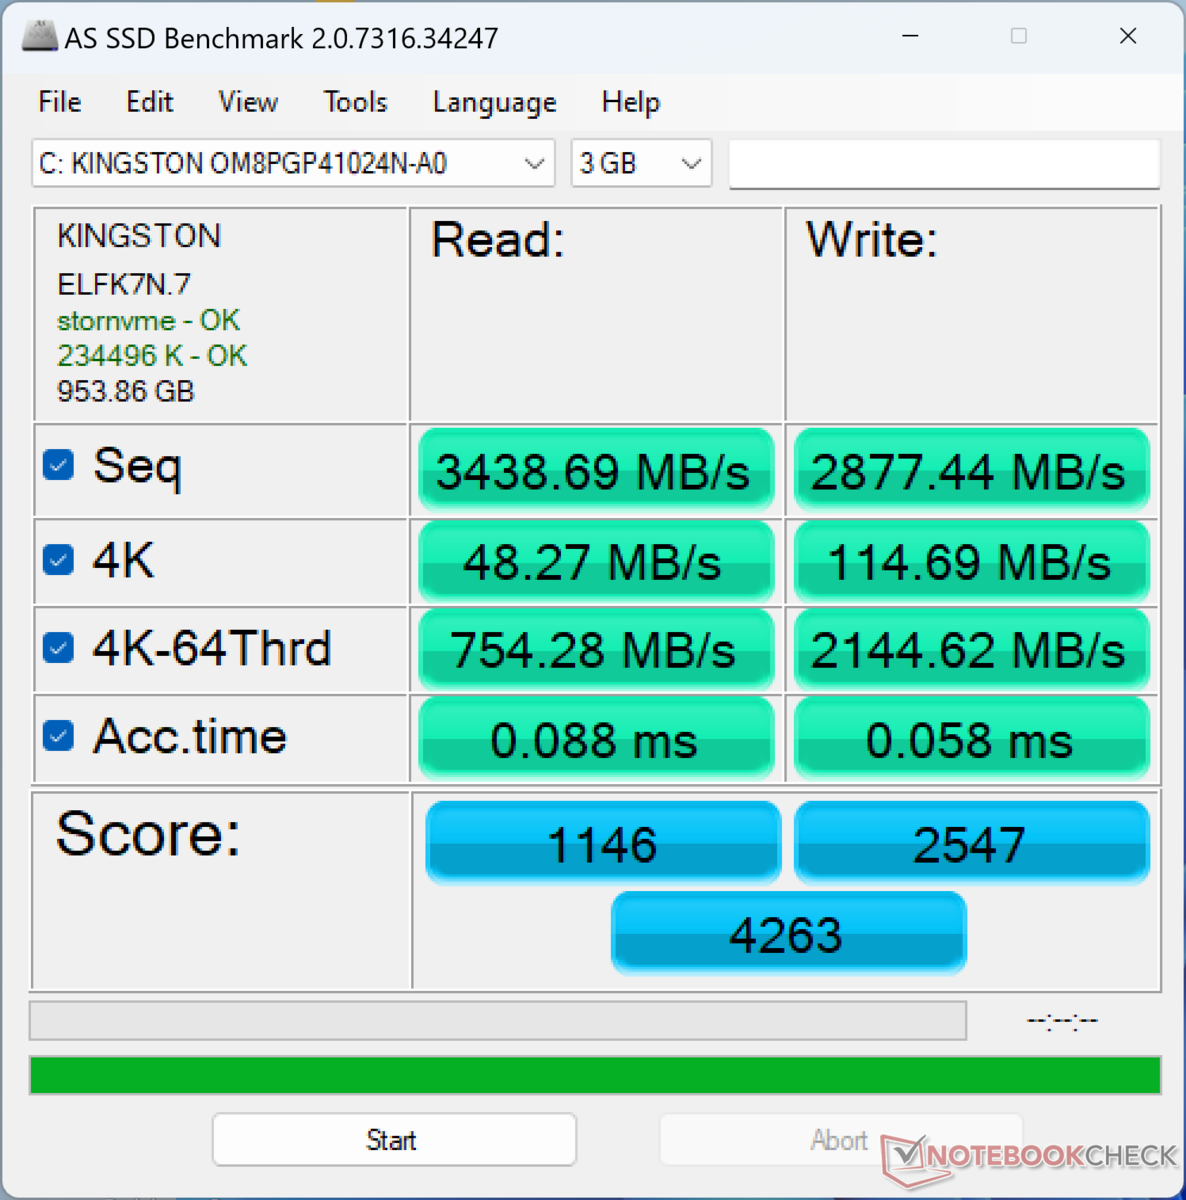
Storage Devices
Our unit ships with the midrange Kingston OM8PGP41024N-A0 PCIe4 x4 NVMe SSD offering transfer rates of around 4000 MB/s compared to >6500 MB/s on higher-end PCIe4 drives. While we'll never turn down a faster drive, the Kingston drive pairs well with this particular processor class and target price range.
A cooling pad is included for the drive to dissipate heat onto the metal fan apparatus underneath the bottom cover. However, you'll have supply your own cooling pad if installing a second SSD.

| Drive Performance rating - Percent | |
| GMK NucBox K6 | |
| Beelink GTR6 | |
| Intel NUC 13 Pro Kit NUC13ANK | |
| BOSGAME M1 | |
| GMK NucBox M5 | |
| Beelink SER7 | |
* ... smaller is better
Disk Throttling: DiskSpd Read Loop, Queue Depth 8
GPU Performance
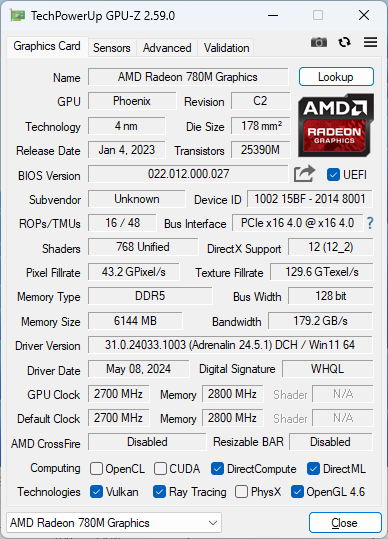
The Radeon 780M is one of the fastest integrated GPUs available and it's even faster on a mini PC platform when compared to most laptop form factors. In this case, the iGPU in our Bosgame is 15 to 20 percent faster than the average laptop running on the same Radeon 780M. This delta is enough to match or even slightly outperform the latest mini PCs running on Intel Arc 8 such as on the more expensive Acemagic F2A.
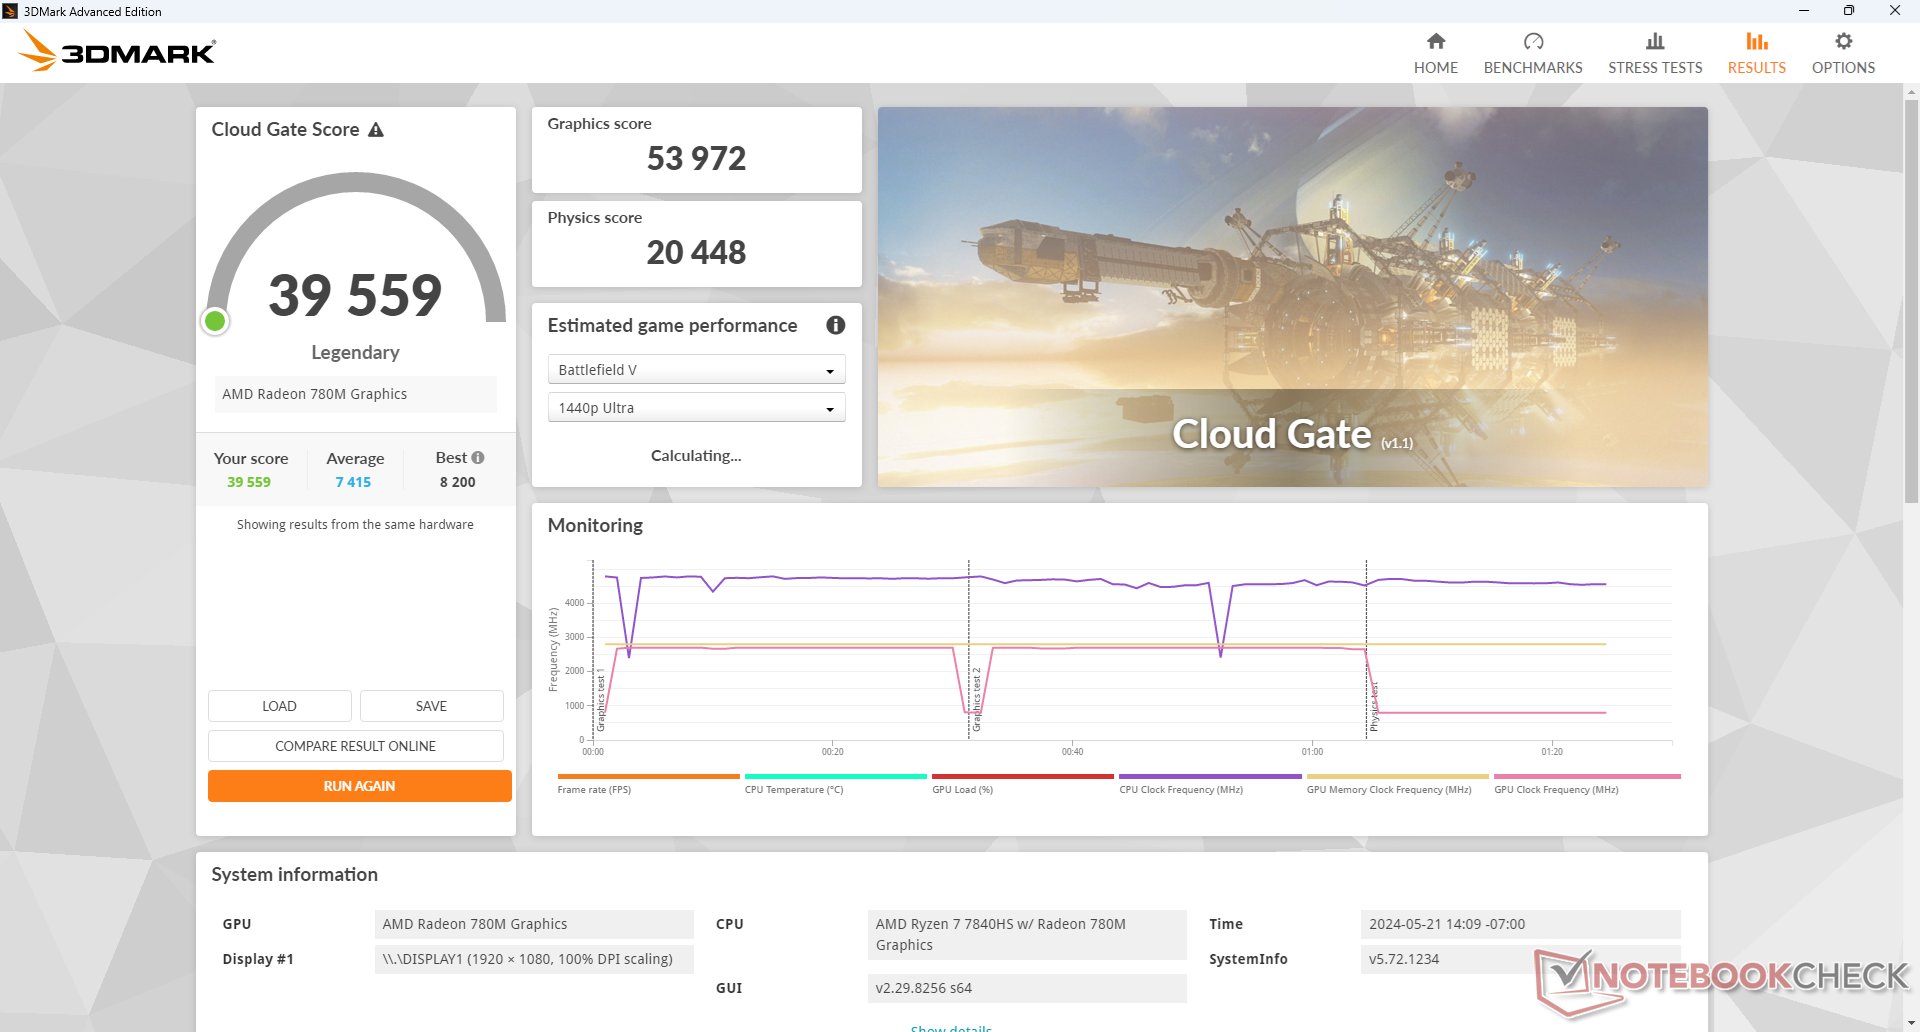
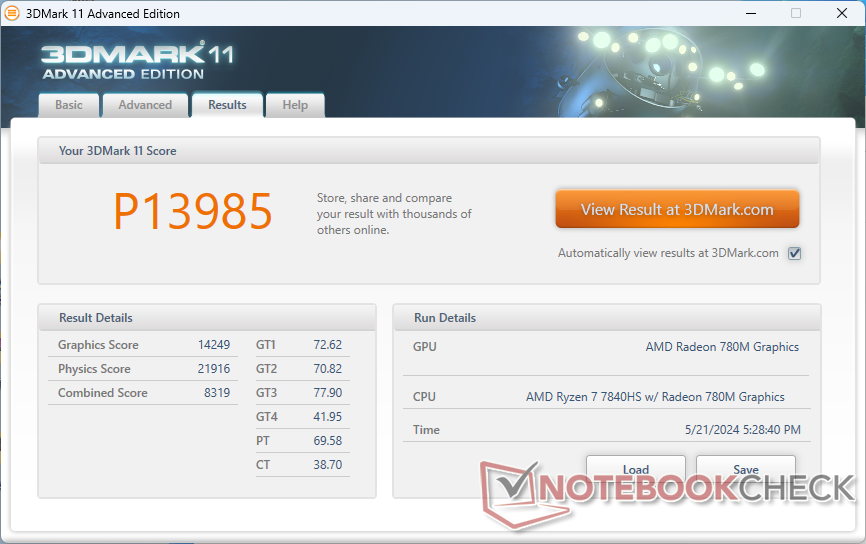
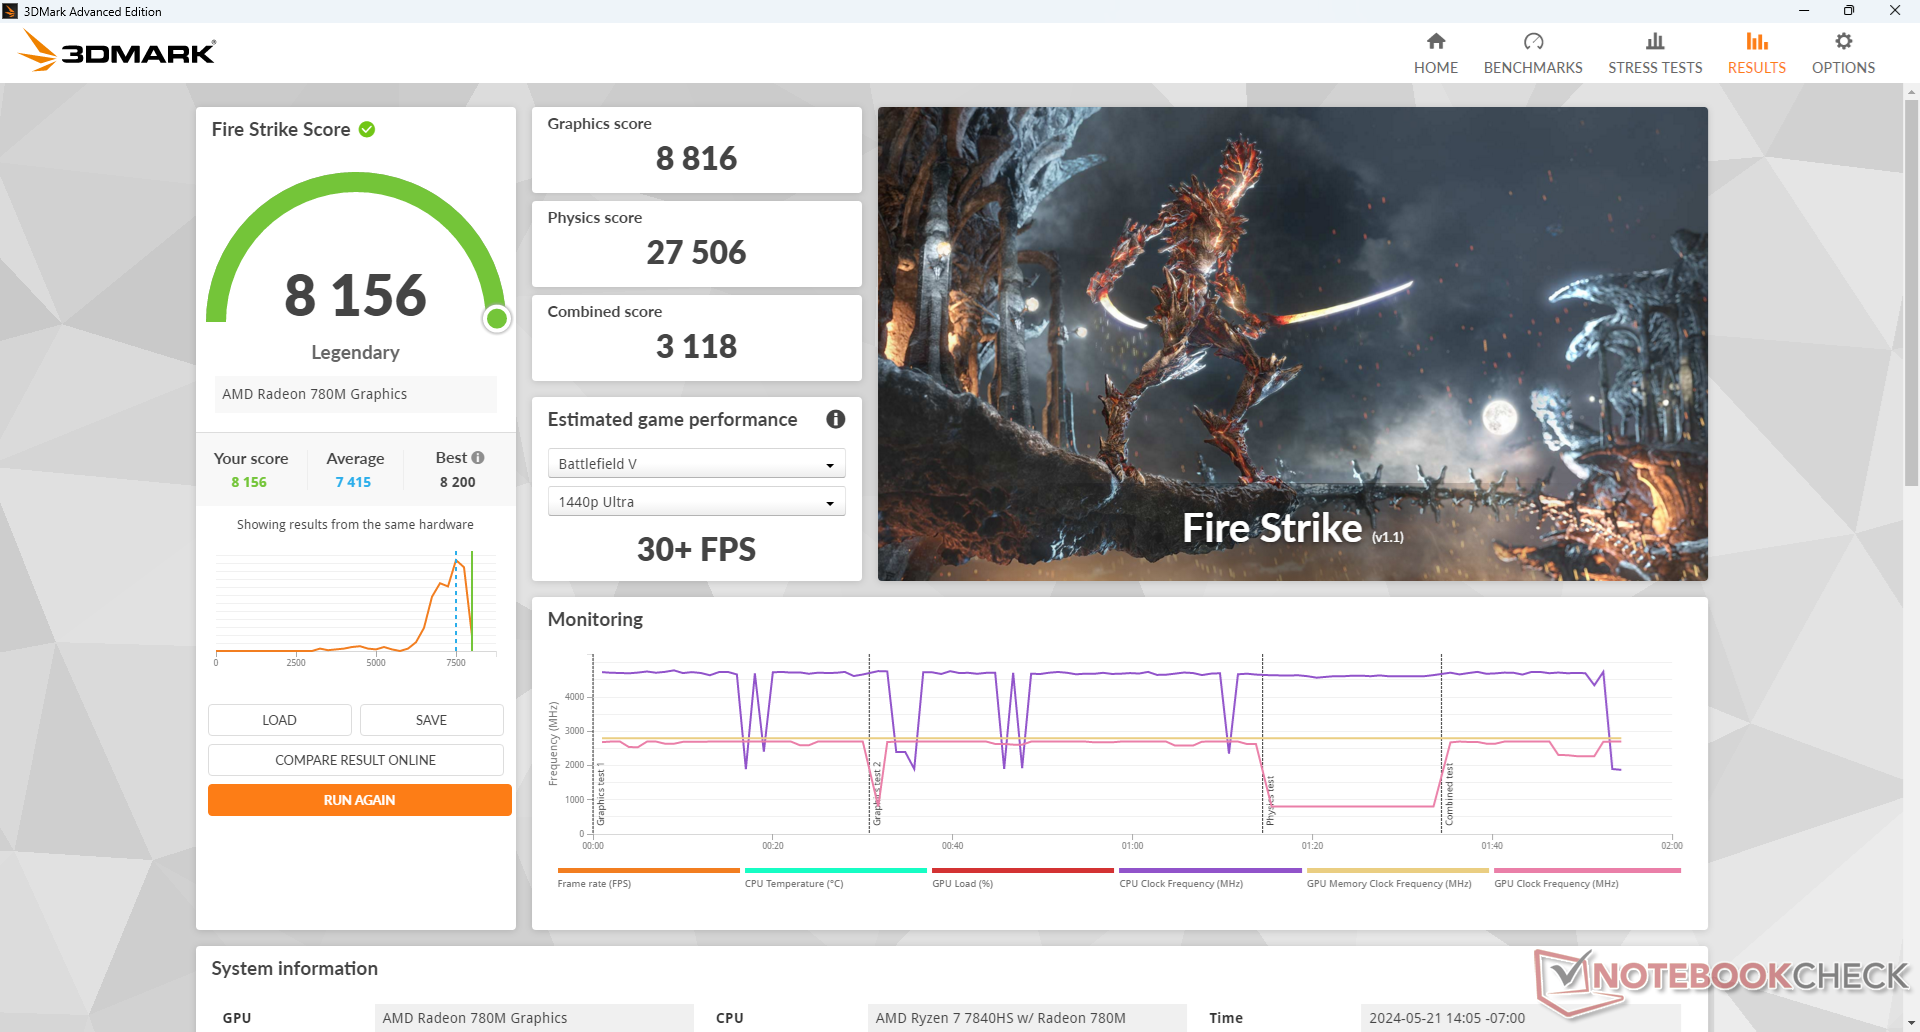
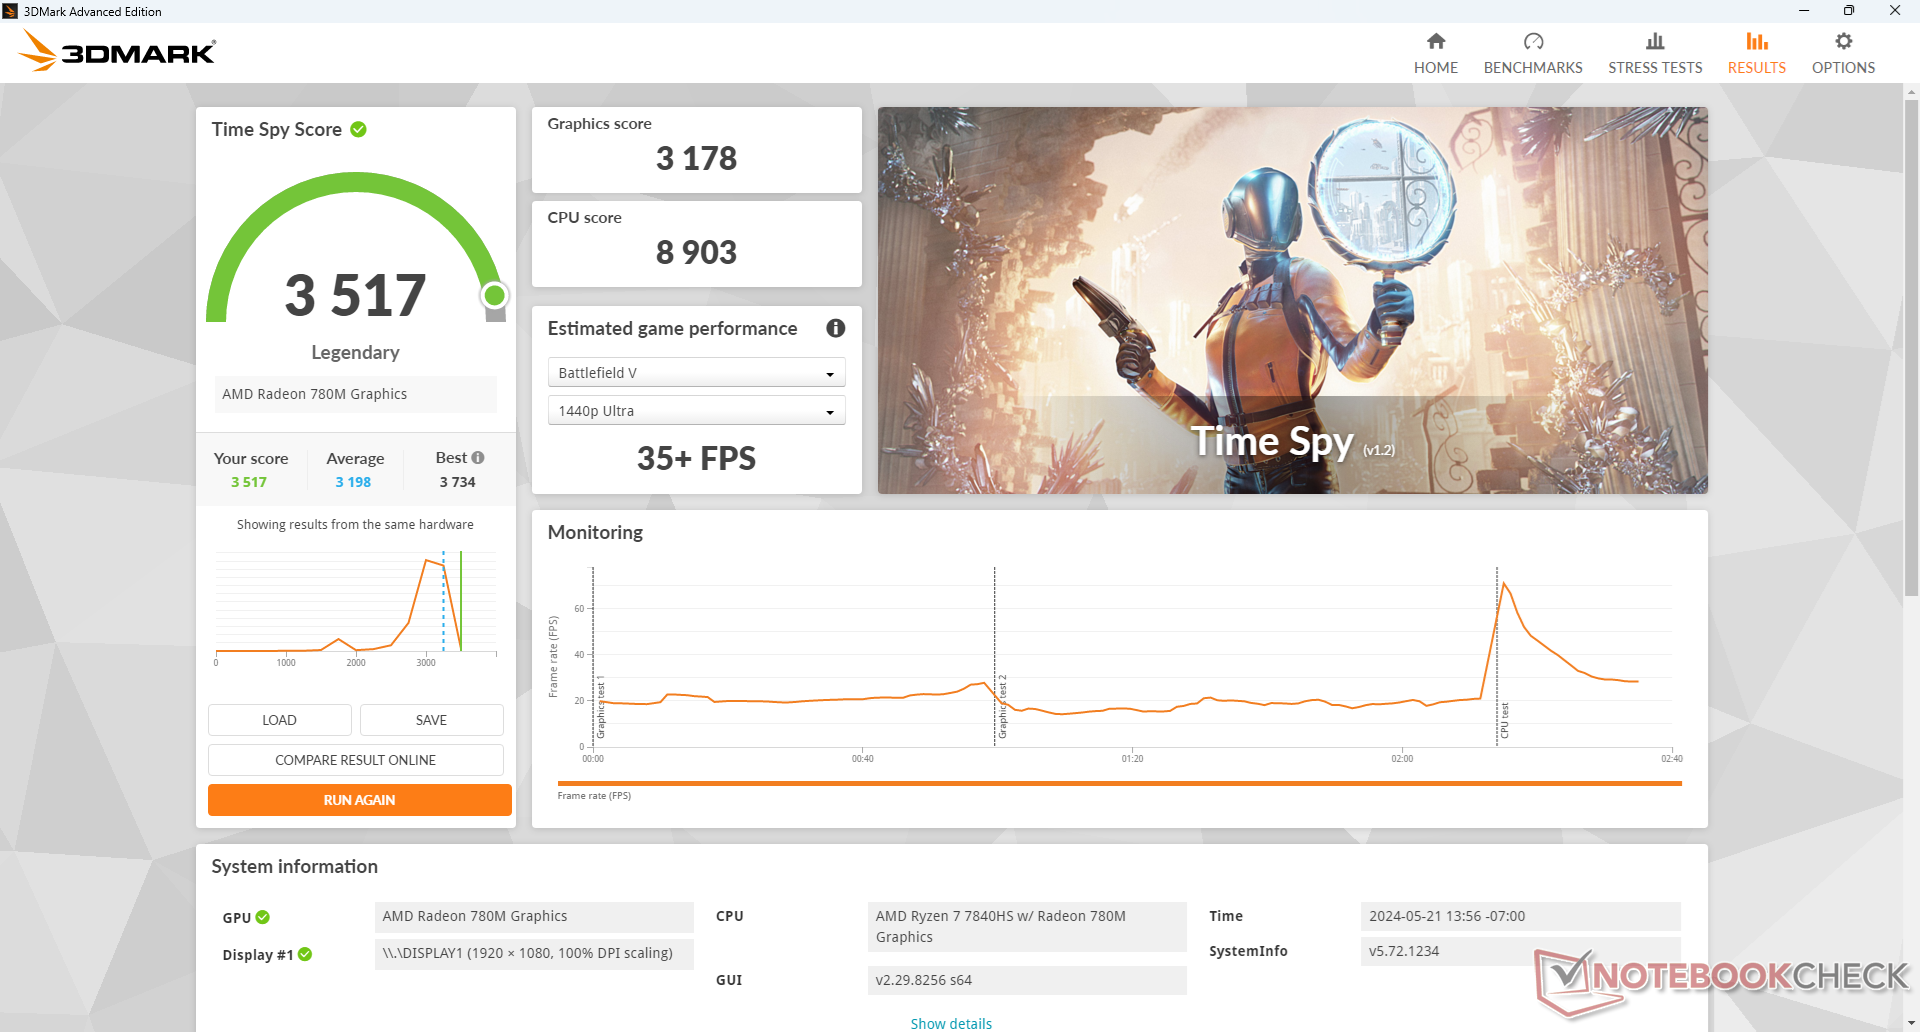
| 3DMark 11 Performance | 13985 points | |
| 3DMark Cloud Gate Standard Score | 39559 points | |
| 3DMark Fire Strike Score | 8156 points | |
| 3DMark Time Spy Score | 3517 points | |
Help | ||
* ... smaller is better
Gaming Performance — Playstation 4-Level Graphics
The excellent 3DMark scores above translate well to actual games as the Bosgame M1 would return higher-than-average frame rates on all tested games. The mini PC is powerful enough to run Cyberpunk 2077 Phantom Liberty on 1080p Medium settings at a stable 30 FPS or F1 22 on 1080p High settings at a stable 60 FPS. An adaptive sync display would consequently pair very well with the Bosgame for gaming purposes.
Users upgrading from an older Iris Xe 96 EUs PC can expect over 2x the gaming performance.
| Performance rating - Percent | |
| BOSGAME M1 | |
| GMK NucBox K6 | |
| Beelink SER7 | |
| Beelink GTR6 -1! | |
| Intel NUC 13 Pro Kit NUC13ANK -2! | |
| GMK NucBox M5 | |
| The Witcher 3 - 1920x1080 Ultra Graphics & Postprocessing (HBAO+) | |
| BOSGAME M1 | |
| GMK NucBox K6 | |
| Beelink SER7 | |
| Beelink GTR6 | |
| Intel NUC 13 Pro Kit NUC13ANK | |
| GMK NucBox M5 | |
| Final Fantasy XV Benchmark - 1920x1080 High Quality | |
| BOSGAME M1 | |
| GMK NucBox K6 | |
| Beelink SER7 | |
| Beelink GTR6 | |
| GMK NucBox M5 | |
| Strange Brigade - 1920x1080 ultra AA:ultra AF:16 | |
| BOSGAME M1 | |
| GMK NucBox K6 | |
| Beelink SER7 | |
| Beelink GTR6 | |
| Intel NUC 13 Pro Kit NUC13ANK | |
| GMK NucBox M5 | |
| Dota 2 Reborn - 1920x1080 ultra (3/3) best looking | |
| BOSGAME M1 | |
| GMK NucBox K6 | |
| Beelink SER7 | |
| Beelink GTR6 | |
| Intel NUC 13 Pro Kit NUC13ANK | |
| GMK NucBox M5 | |
| X-Plane 11.11 - 1920x1080 high (fps_test=3) | |
| Beelink GTR6 | |
| GMK NucBox K6 | |
| BOSGAME M1 | |
| Beelink SER7 | |
| GMK NucBox M5 | |
| Far Cry 5 - 1920x1080 Ultra Preset AA:T | |
| BOSGAME M1 | |
| Beelink SER7 | |
| GMK NucBox K6 | |
| Intel NUC 13 Pro Kit NUC13ANK | |
| GMK NucBox M5 | |
| Baldur's Gate 3 | |
| 1280x720 Low Preset AA:SM | |
| Geekom A8, R9 8945HS | |
| BOSGAME M1 | |
| Average AMD Radeon 780M (30.7 - 67.6, n=34) | |
| Minisforum AtomMan X7 Ti | |
| GMK NucBox M5 | |
| 1920x1080 Low Preset AA:SM | |
| BOSGAME M1 | |
| Geekom A8, R9 8945HS | |
| Average AMD Radeon 780M (20.2 - 44.1, n=47) | |
| Minisforum AtomMan X7 Ti | |
| GMK NucBox M5 | |
| 1920x1080 Medium Preset AA:T | |
| BOSGAME M1 | |
| Average AMD Radeon 780M (15.7 - 36.8, n=50) | |
| Geekom A8, R9 8945HS | |
| Minisforum AtomMan X7 Ti | |
| 1920x1080 High Preset AA:T | |
| BOSGAME M1 | |
| Average AMD Radeon 780M (13.3 - 30.6, n=50) | |
| Minisforum AtomMan X7 Ti | |
| Geekom A8, R9 8945HS | |
| 1920x1080 Ultra Preset AA:T | |
| BOSGAME M1 | |
| Average AMD Radeon 780M (12.8 - 29.6, n=49) | |
| Minisforum AtomMan X7 Ti | |
| Geekom A8, R9 8945HS | |
Witcher 3 FPS Chart
| low | med. | high | ultra | |
|---|---|---|---|---|
| The Witcher 3 (2015) | 160.7 | 103.8 | 52.2 | 33.3 |
| Dota 2 Reborn (2015) | 159.5 | 126.5 | 98.8 | 88.5 |
| Final Fantasy XV Benchmark (2018) | 84.5 | 40.9 | 30.8 | |
| X-Plane 11.11 (2018) | 64.2 | 46.3 | 38.7 | |
| Far Cry 5 (2018) | 88 | 54 | 49 | 47 |
| Strange Brigade (2018) | 175.9 | 70.9 | 60.6 | 52.1 |
| Tiny Tina's Wonderlands (2022) | 77.7 | 55.9 | 37.9 | 30.3 |
| F1 22 (2022) | 109.9 | 95 | 70.6 | 19.2 |
| Baldur's Gate 3 (2023) | 43.9 | 36.8 | 29.9 | 29.2 |
| Cyberpunk 2077 (2023) | 47.9 | 37.5 | 29.6 | 25.8 |
Emissions
System Noise — Audible, But Not Overly Loud
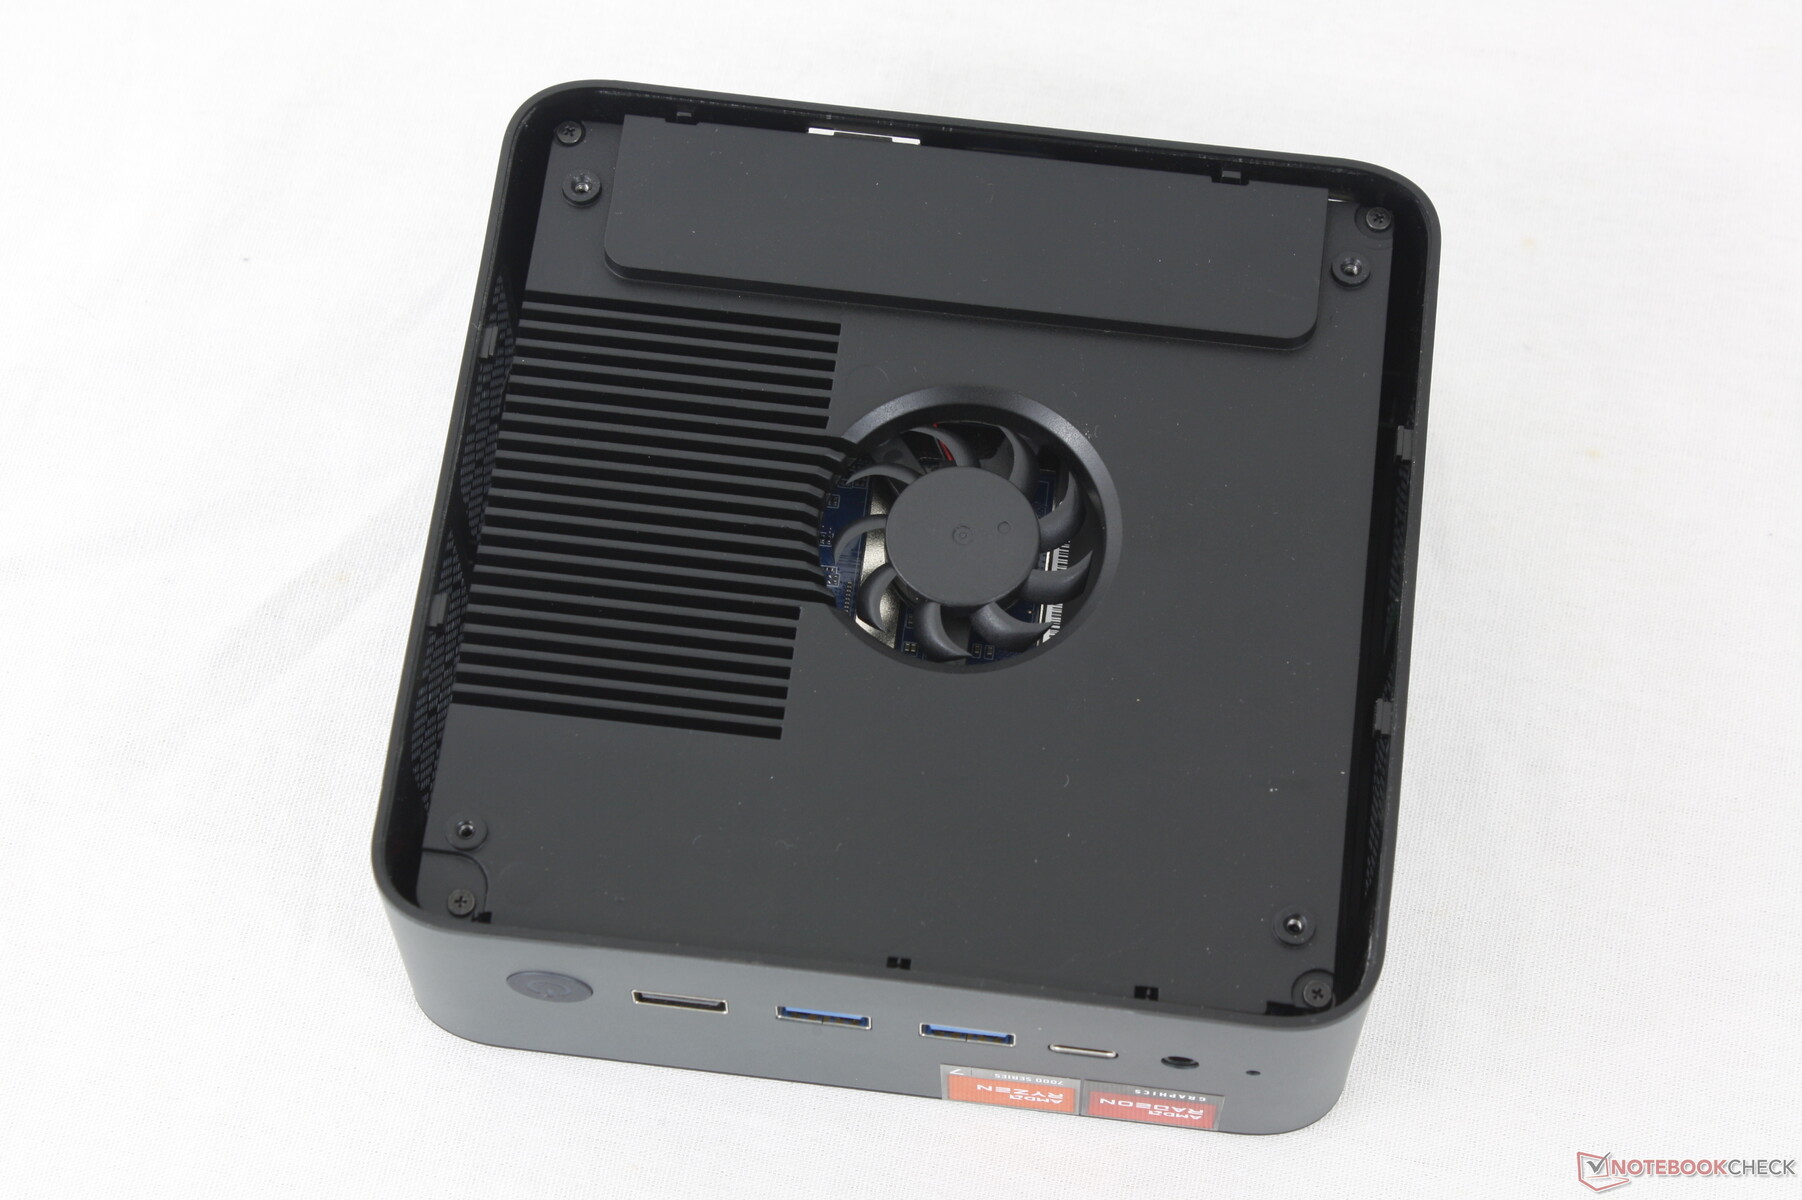
The model integrates two fans with one on top of the motherboard and one on the bottom. The fans are always active no matter the onscreen load for a low 32 dB(A) buzz when running undemanding loads like browsing or video streaming. This is typical of most mini PCs and we're glad to see that the fans in the M1 are generally lethargic with no annoying pulsing behavior.
Fan noise when running higher loads like games will induce a steady fan noise of 42 dB(A). This is quieter than on both the GMK NucBox K6 and Beelink SER7 all with the same Ryzen 7 7840HS CPU. We don't find the fan noise loud enough to be bothersome especially since users are more likely to sit further away from their mini PCs than their laptops.
Noise level
| Idle |
| 32 / 32 / 32 dB(A) |
| Load |
| 38.7 / 42 dB(A) |
 | ||
30 dB silent 40 dB(A) audible 50 dB(A) loud |
||
min: | ||
| BOSGAME M1 Radeon 780M, R7 7840HS, Kingston OM8PGP41024N-A0 | GMK NucBox M5 Vega 8, R7 5700U, Lexar 1024GB LNM6A1X001T-HNNNG | GMK NucBox K6 Radeon 780M, R7 7840HS, MasonSemi 1TB MC7000 | Intel NUC 13 Pro Kit NUC13ANK Iris Xe G7 96EUs, i7-1360P, Samsung PM9A1 MZVL2512HCJQ | Beelink SER7 Radeon 780M, R7 7840HS, Crucial P3 Plus CT1000P3PSSD8 | Beelink GTR6 Radeon 680M, R9 6900HX, Kingston KC3000 512G SKC3000S512G | |
|---|---|---|---|---|---|---|
| Noise | 2% | -6% | -3% | 11% | 5% | |
| off / environment * (dB) | 23.2 | 23.4 -1% | 23.2 -0% | 29.8 -28% | 24.5 -6% | 23.2 -0% |
| Idle Minimum * (dB) | 32 | 33.8 -6% | 31.3 2% | 30.2 6% | 25.1 22% | 23.6 26% |
| Idle Average * (dB) | 32 | 33.8 -6% | 31.3 2% | 31.1 3% | 25.1 22% | 23.8 26% |
| Idle Maximum * (dB) | 32 | 33.8 -6% | 33.4 -4% | 31.9 -0% | 25.1 22% | 36.2 -13% |
| Load Average * (dB) | 38.7 | 36.5 6% | 47.5 -23% | 40 -3% | 35.9 7% | 39.7 -3% |
| Witcher 3 ultra * (dB) | 41.7 | 36.8 12% | 43.6 -5% | 35.6 15% | 41 2% | |
| Load Maximum * (dB) | 42 | 36.9 12% | 47.7 -14% | 40.5 4% | 45.4 -8% | 43 -2% |
* ... smaller is better
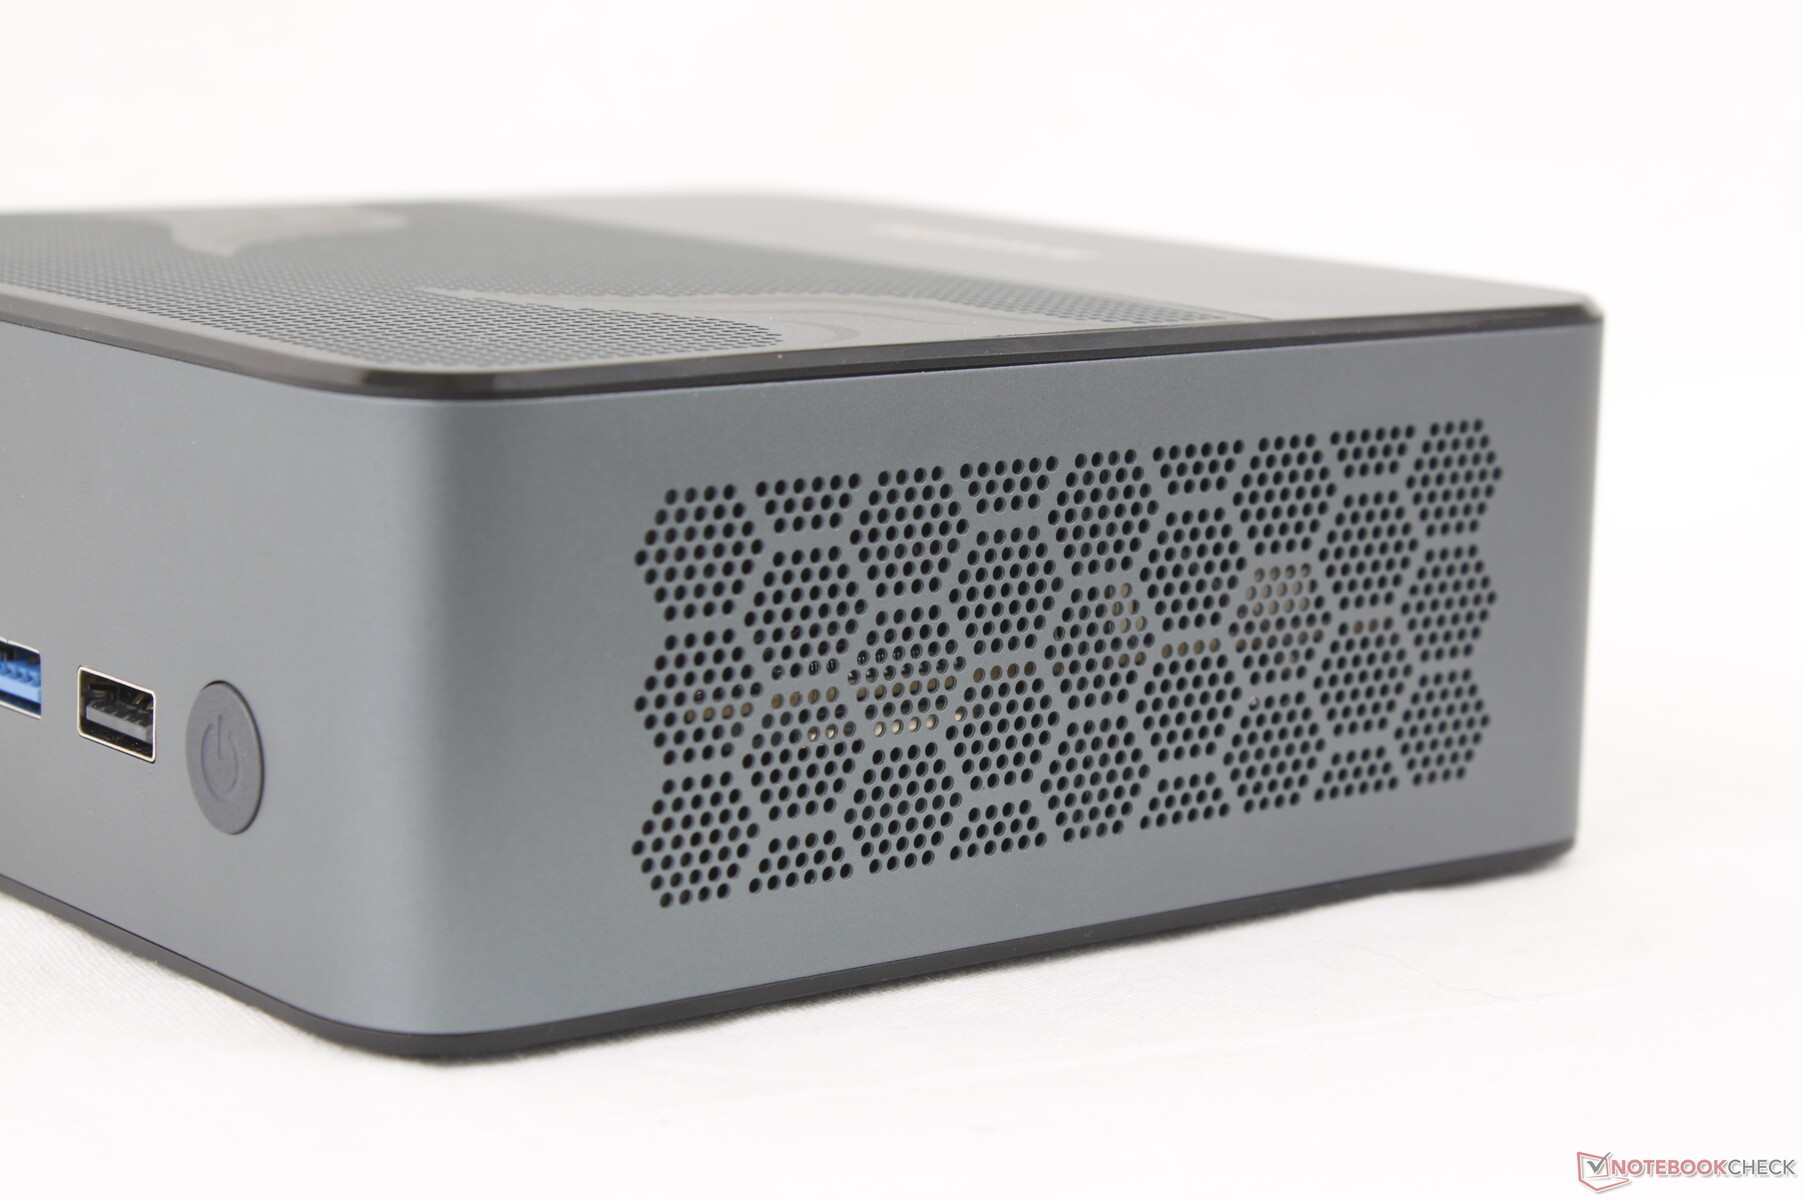
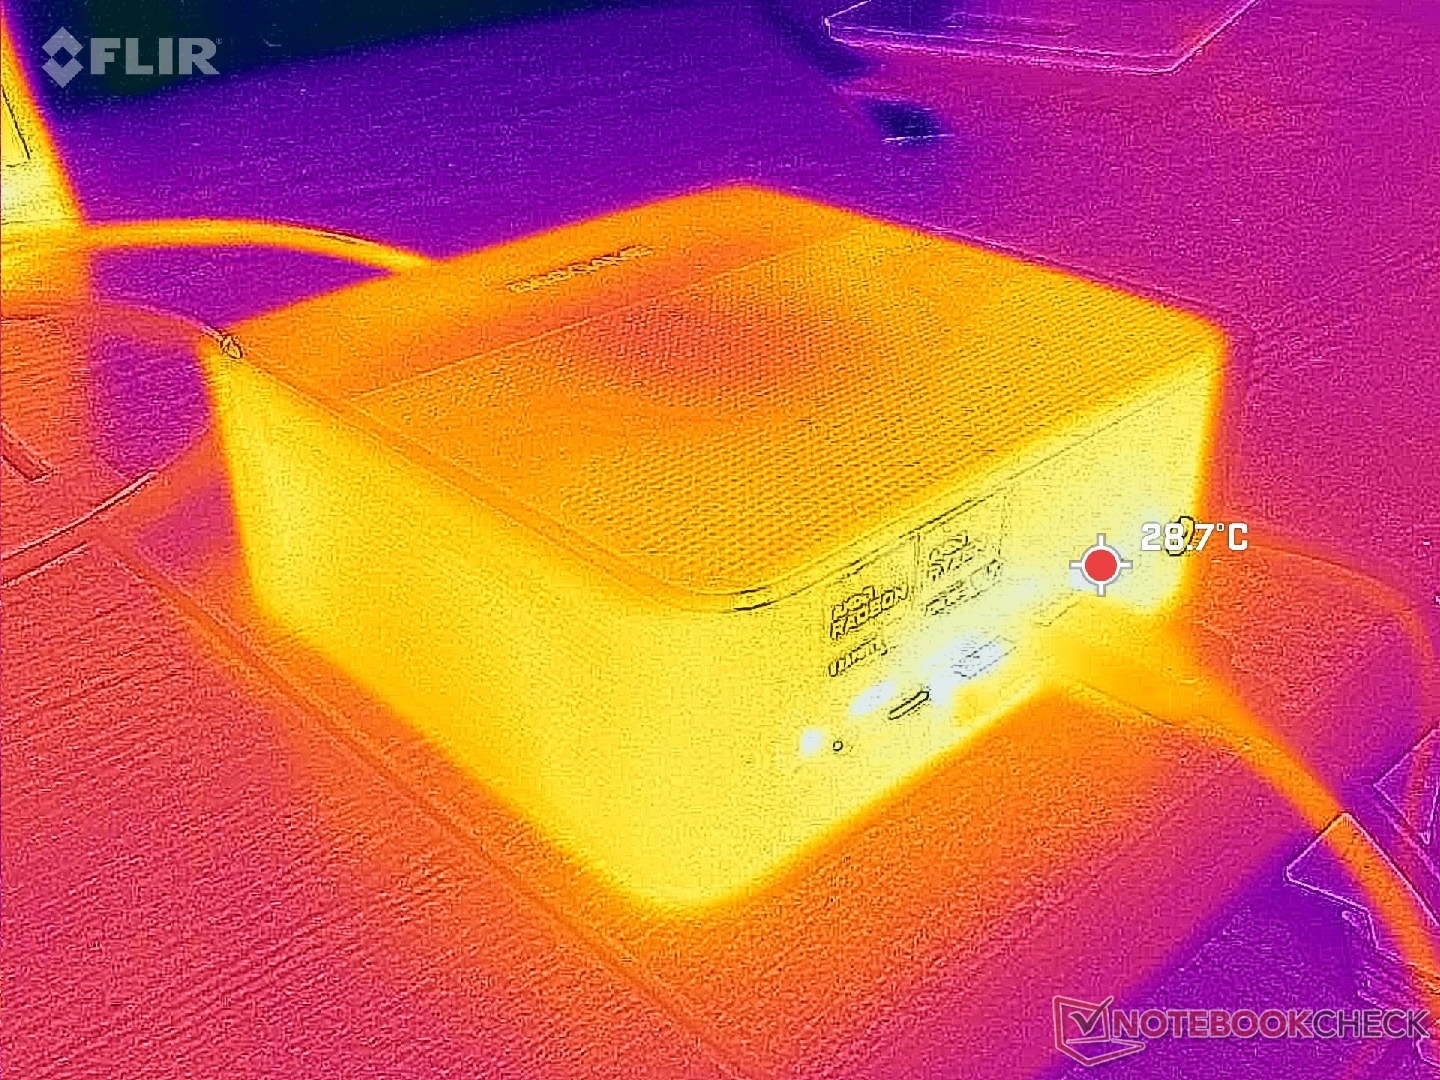
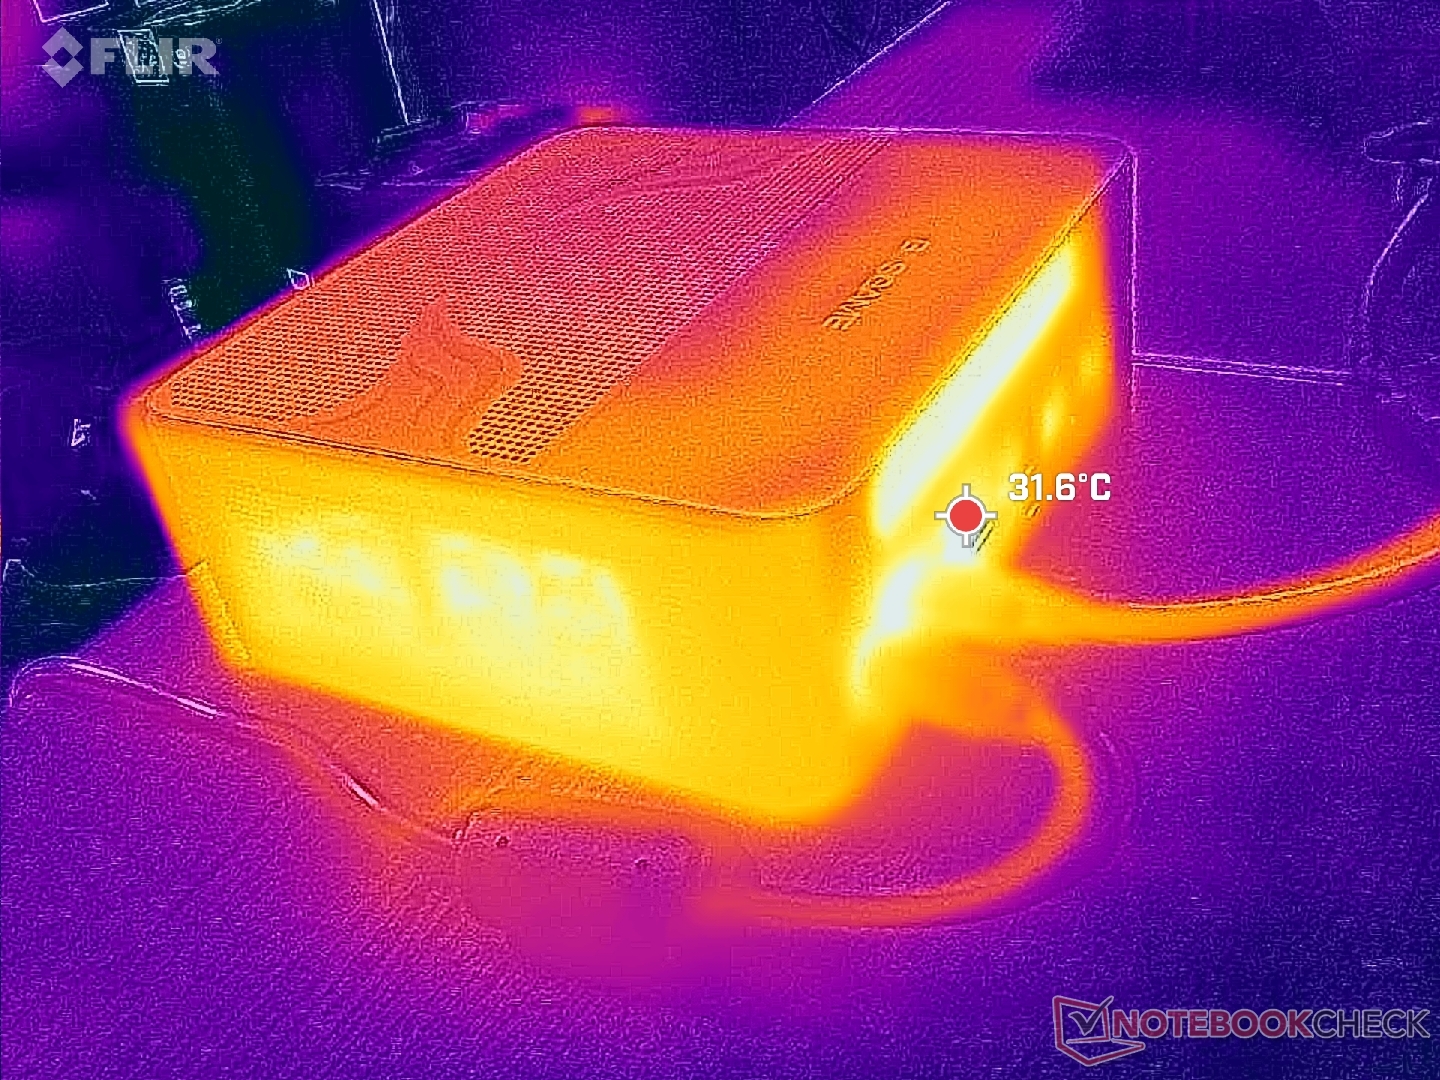
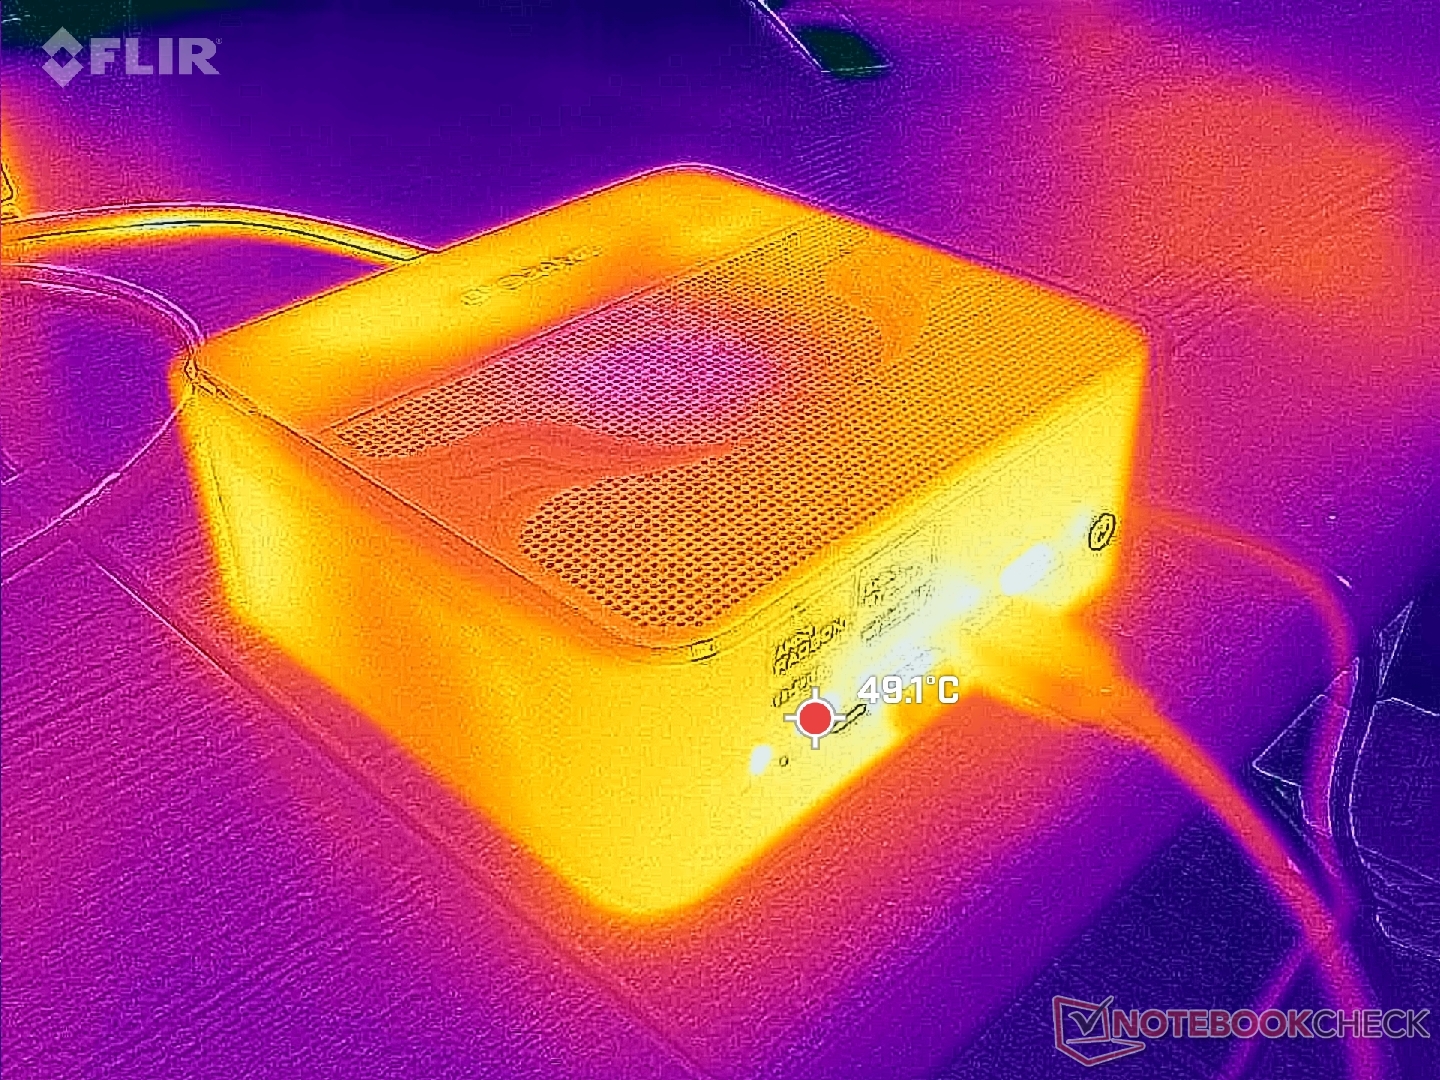
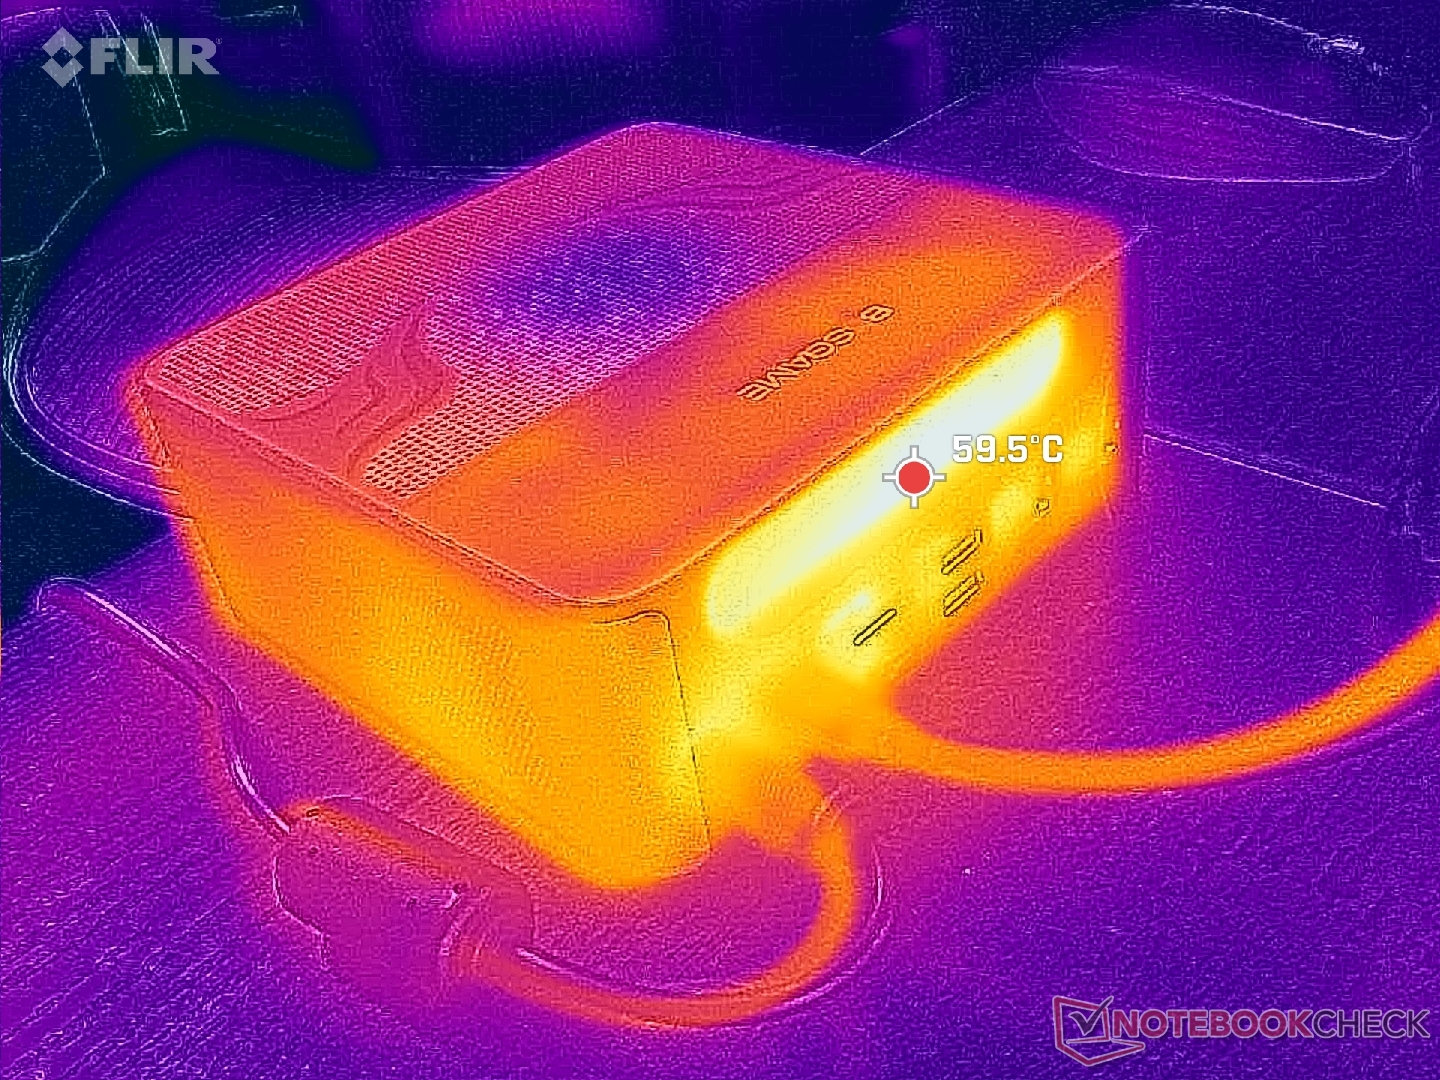
Temperature
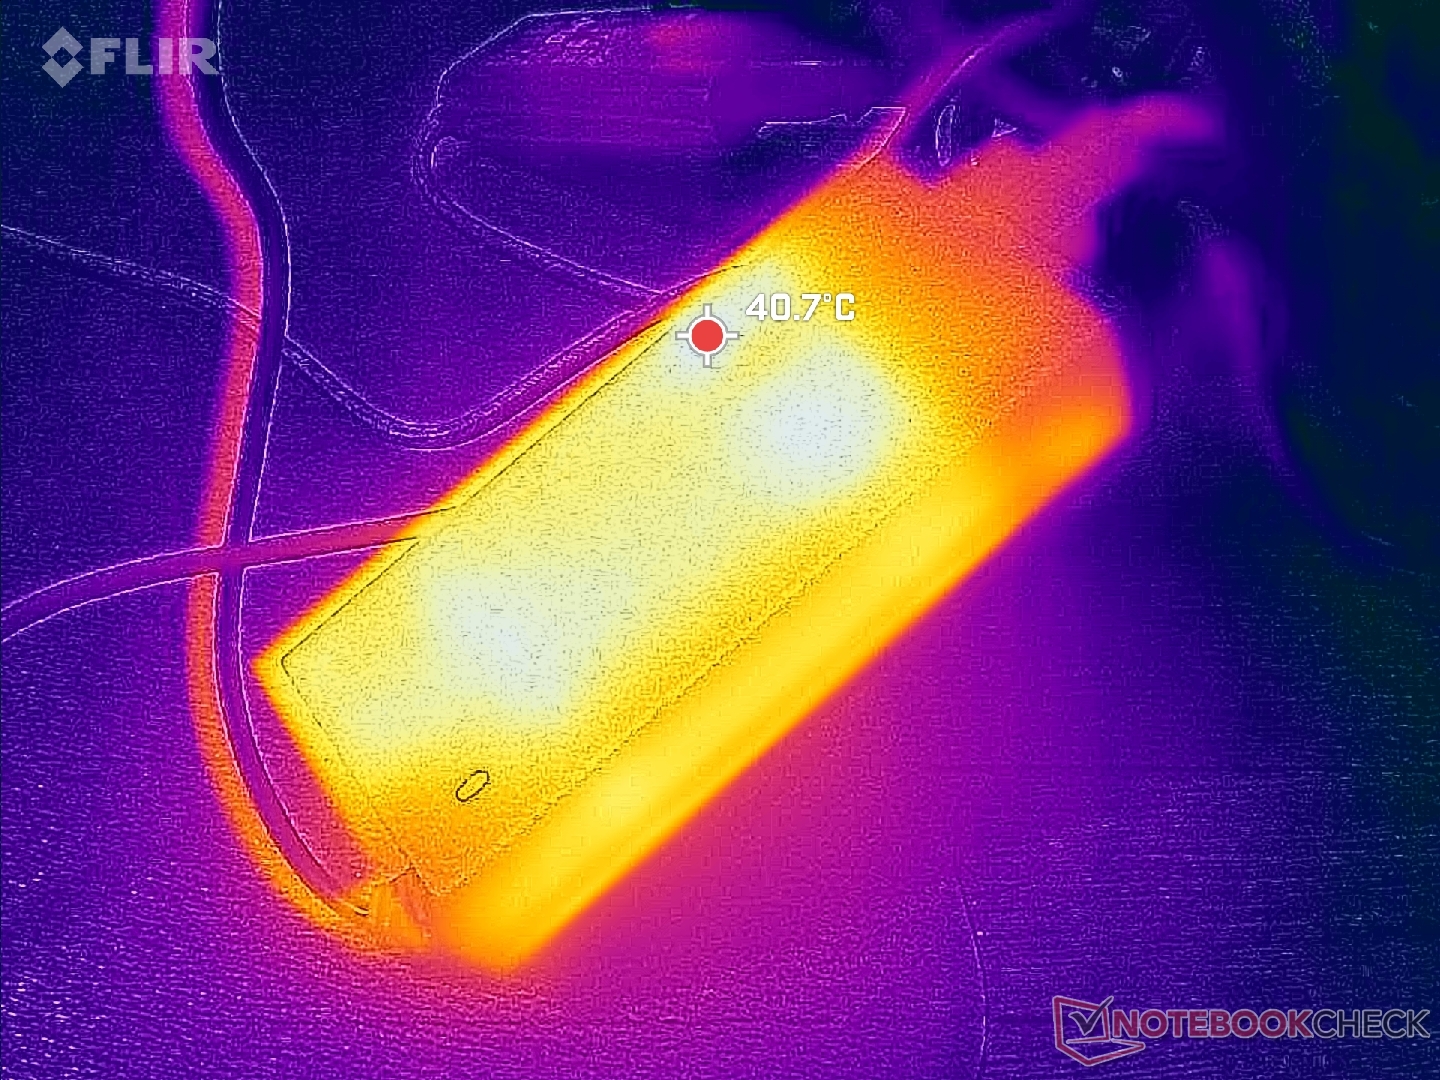
Surface temperatures are warmest along the front face and rear of the unit as shown by the temperature maps below. Fresh air is pulled from the top while waste heat exists through the rear. Placing items on top of the unit is therefore not recommended as airflow will be impeded.
The GMK NucBox K6 design is arguably more user-friendly when it comes to temperature control. Instead of pulling air from the top surface, the GMK system pulls air through slits all along the sides instead. This method allows for more freedom of positioning when compared to the Bosgame M1 design.
Speakers
The integrated 26 mm stereo speakers help to distinguish the M1 from most other mini PCs. If your space is limited or minimalist, for example, then you can simply use the integrated speakers instead of relying on external solutions.
Unfortunately, the integrated speakers are more of a "plan B" solution due to their average audio quality, average volume, and slight audio delay. They must be paired to Windows via Bluetooth and we can notice a half-second delay when compared to external 3.5 mm speakers. This delay can be overlooked for music and most casual video playback, but we can certainly notice it when running games or watching videos where voices don't perfectly sync.
Meanwhile, audio quality and volume are nothing special. Some laptops, such as the HP Spectre x360 16, have louder and crisper integrated speakers than the Bosgame M1. The M1 speakers are decent enough for offices or conference rooms, but they lack the oomph for living room HTPC environments.
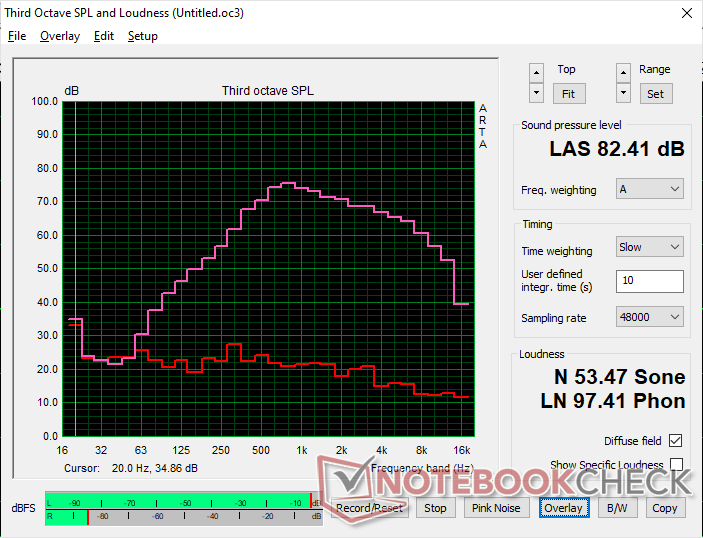
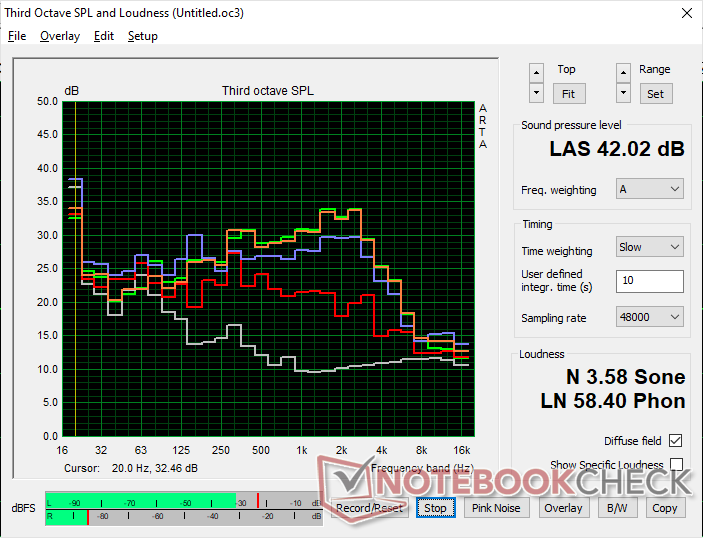
BOSGAME M1 audio analysis
(+) | speakers can play relatively loud (82.4 dB)
Bass 100 - 315 Hz
(±) | reduced bass - on average 13.6% lower than median
(±) | linearity of bass is average (9.2% delta to prev. frequency)
Mids 400 - 2000 Hz
(±) | higher mids - on average 6.8% higher than median
(+) | mids are linear (5.2% delta to prev. frequency)
Highs 2 - 16 kHz
(+) | balanced highs - only 3.2% away from median
(+) | highs are linear (4.6% delta to prev. frequency)
Overall 100 - 16.000 Hz
(±) | linearity of overall sound is average (20.4% difference to median)
Compared to same class
» 29% of all tested devices in this class were better, 25% similar, 46% worse
» The best had a delta of 13%, average was 24%, worst was 64%
Compared to all devices tested
» 54% of all tested devices were better, 8% similar, 38% worse
» The best had a delta of 4%, average was 23%, worst was 134%
Apple MacBook Pro 16 2021 M1 Pro audio analysis
(+) | speakers can play relatively loud (84.7 dB)
Bass 100 - 315 Hz
(+) | good bass - only 3.8% away from median
(+) | bass is linear (5.2% delta to prev. frequency)
Mids 400 - 2000 Hz
(+) | balanced mids - only 1.3% away from median
(+) | mids are linear (2.1% delta to prev. frequency)
Highs 2 - 16 kHz
(+) | balanced highs - only 1.9% away from median
(+) | highs are linear (2.7% delta to prev. frequency)
Overall 100 - 16.000 Hz
(+) | overall sound is linear (4.6% difference to median)
Compared to same class
» 0% of all tested devices in this class were better, 0% similar, 100% worse
» The best had a delta of 5%, average was 17%, worst was 45%
Compared to all devices tested
» 0% of all tested devices were better, 0% similar, 100% worse
» The best had a delta of 4%, average was 23%, worst was 134%
Energy Management
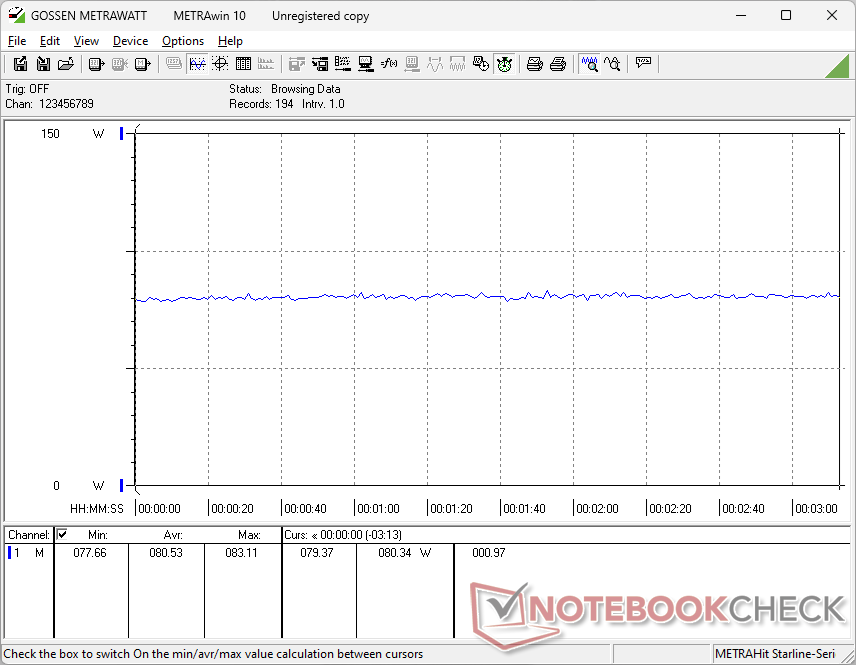
Power Consumption
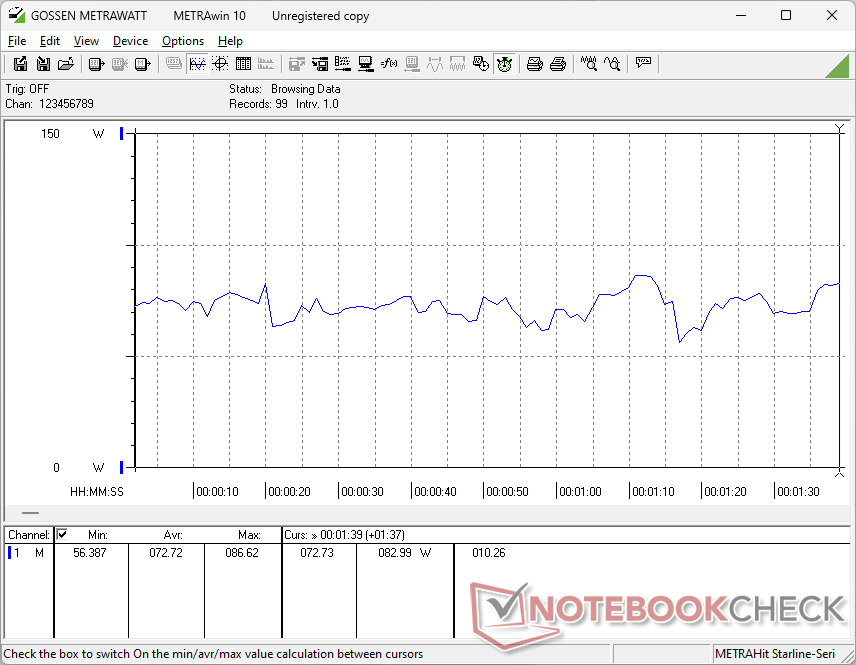
Idling on desktop consumes less than 9 W on average to be slightly more efficient than Beelink SER7 and GMK NucBox K6 by just a couple of watts. When running games, however, the Bosgame will demand a few watts more on average likely due to its aforementioned higher-clocked Radeon 780M.
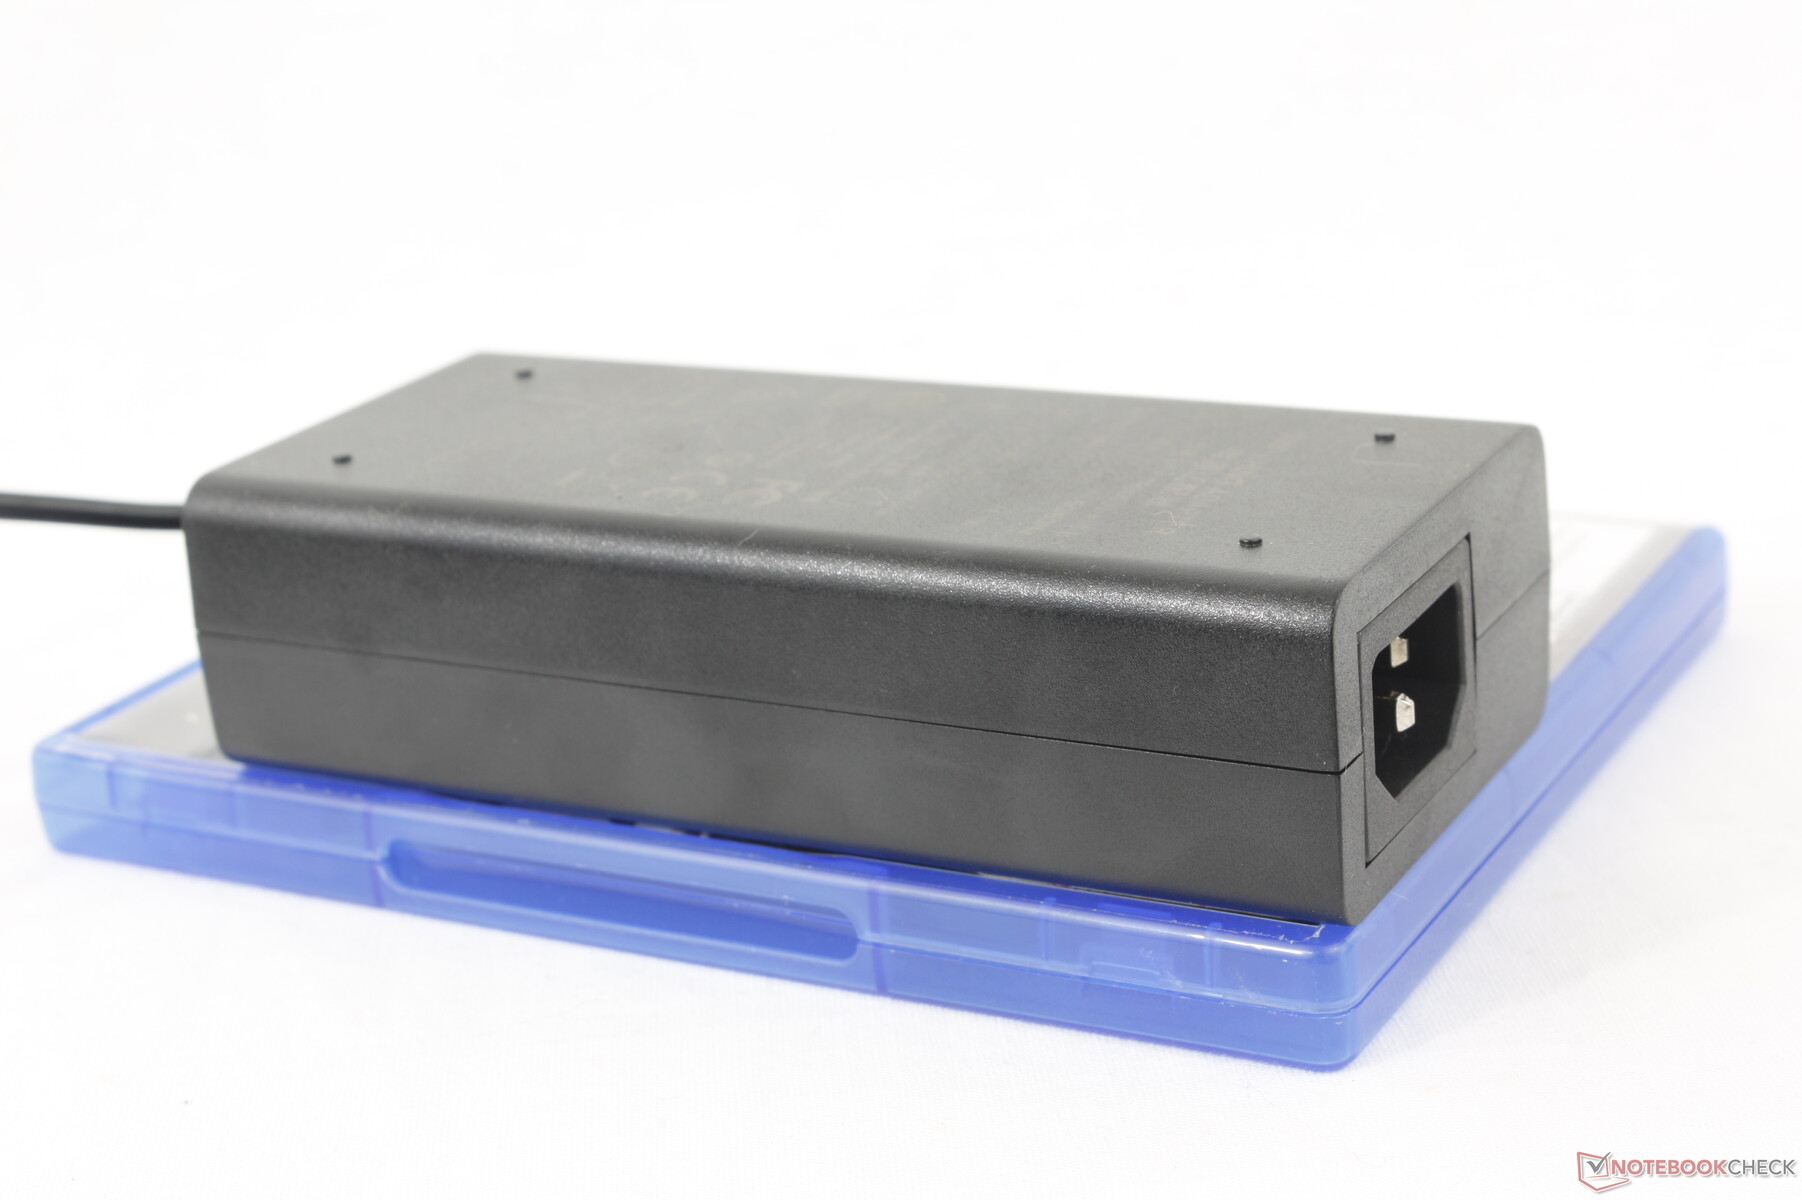
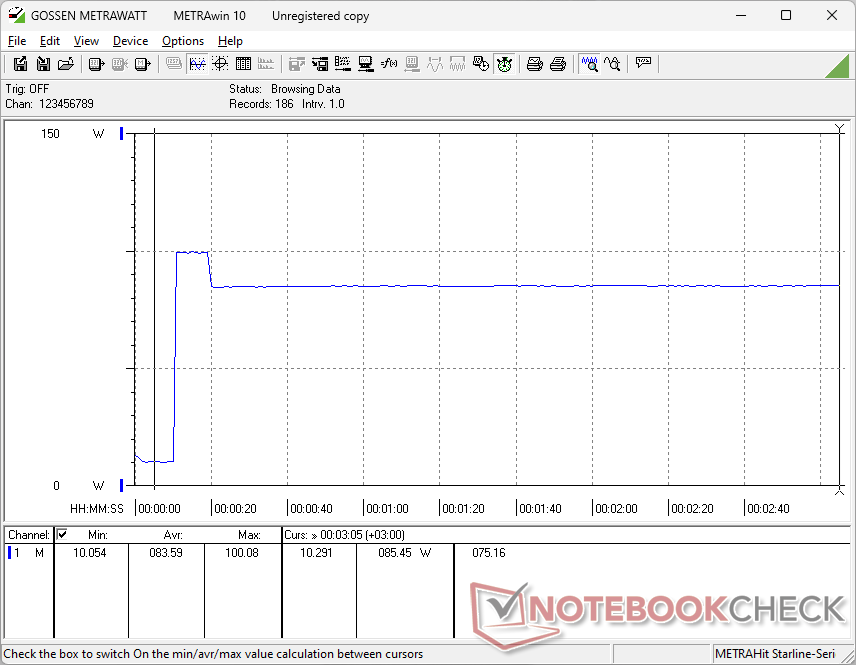
We're able to record a maximum draw of 99 W from the medium-sized (~13.9 x 6.3 x 3.5 cm) 120 W AC adapter when the CPU is at 100 percent utilization. The overhead can come in handy when connecting external USB devices or drives.

| Off / Standby | |
| Idle | |
| Load |
|
Key:
min: | |
| BOSGAME M1 R7 7840HS, Radeon 780M, Kingston OM8PGP41024N-A0, , x, | GMK NucBox M5 R7 5700U, Vega 8, Lexar 1024GB LNM6A1X001T-HNNNG, , x, | GMK NucBox K6 R7 7840HS, Radeon 780M, MasonSemi 1TB MC7000, , x, | Intel NUC 13 Pro Kit NUC13ANK i7-1360P, Iris Xe G7 96EUs, Samsung PM9A1 MZVL2512HCJQ, , x, | Beelink SER7 R7 7840HS, Radeon 780M, Crucial P3 Plus CT1000P3PSSD8, , x, | Beelink GTR6 R9 6900HX, Radeon 680M, Kingston KC3000 512G SKC3000S512G, , x, | |
|---|---|---|---|---|---|---|
| Power Consumption | 43% | 7% | 5% | -1% | -4% | |
| Idle Minimum * (Watt) | 7.3 | 5.9 19% | 6.7 8% | 5.1 30% | 6.7 8% | 7.6 -4% |
| Idle Average * (Watt) | 7.3 | 6.2 15% | 7 4% | 5.8 21% | 7.3 -0% | 9.9 -36% |
| Idle Maximum * (Watt) | 8.4 | 6.4 24% | 7.6 10% | 10.2 -21% | 11.6 -38% | 10.6 -26% |
| Load Average * (Watt) | 72.7 | 28.2 61% | 74.3 -2% | 68.1 6% | 64.1 12% | 64 12% |
| Witcher 3 ultra * (Watt) | 80.5 | 27.5 66% | 75 7% | 75.8 6% | 69 14% | |
| Load Maximum * (Watt) | 99.1 | 29.5 70% | 85.7 14% | 108.3 -9% | 94.8 4% | 80.4 19% |
* ... smaller is better
Power Consumption Witcher 3 / Stresstest
Power Consumption external Monitor
Pros
Cons
Verdict — Great Option Even Without The Integrated Speakers
The integrated stereo speakers are a unique selling point for the Bosgame M1. While they can certainly be handy when no external options are available, their audio quality leaves a lot to be desired for purposes beyond the office or conference room. You're still better off using external speakers for multimedia playback or if in a larger room.
Luckily, the M1 knocks it out of the park in regards to everything else. The all-metal chassis is of high quality, connectivity is excellent with multiple USB-C 4.0 ports, servicing is relatively easy, and performance is faster than expected. Casual gamers will love that it can run most games at 1080p while hardcore gamers can appreciate its eGPU support. The <$700 USD price point is also quite reasonable considering that it comes fully loaded with 32 GB of RAM, 1 TB of storage, and a Windows 11 Pro license. A barebones option would have made the M1 even cheaper and competitive against many Beelink alternatives.
The Bosgame M1 is a strong NUC alternative with performance levels rivaling higher-end Intel-based options. It's a tad bigger and heavier than most, but the performance and quality more than make up for the larger size.
The main drawbacks other than the somewhat underwhelming speakers are the slightly larger chassis size, bulky 120 W AC adapter, and a few dropped frames during 4K60 video playback. They're all relatively minor nonetheless and they don't detract from the overall value or build quality of the model.
Price and Availability
The Bosgame M1 is now available on Amazon for $690 with 32 GB RAM, 1 TB SSD, and Windows 11 Pro as reviewed. Alternatively, users can purchase directly from the manufacturer for the same price.
BOSGAME M1
- 05/25/2024 v7 (old)
Allen Ngo
Transparency
The selection of devices to be reviewed is made by our editorial team. The test sample was provided to the author as a loan by the manufacturer or retailer for the purpose of this review. The lender had no influence on this review, nor did the manufacturer receive a copy of this review before publication. There was no obligation to publish this review. As an independent media company, Notebookcheck is not subjected to the authority of manufacturers, retailers or publishers.
This is how Notebookcheck is testing
Every year, Notebookcheck independently reviews hundreds of laptops and smartphones using standardized procedures to ensure that all results are comparable. We have continuously developed our test methods for around 20 years and set industry standards in the process. In our test labs, high-quality measuring equipment is utilized by experienced technicians and editors. These tests involve a multi-stage validation process. Our complex rating system is based on hundreds of well-founded measurements and benchmarks, which maintains objectivity. Further information on our test methods can be found here.
Price comparison
