Geekom Mini IT12 with Intel Core i5-12450H in review - Mini PC with good performance and two USB 4 ports

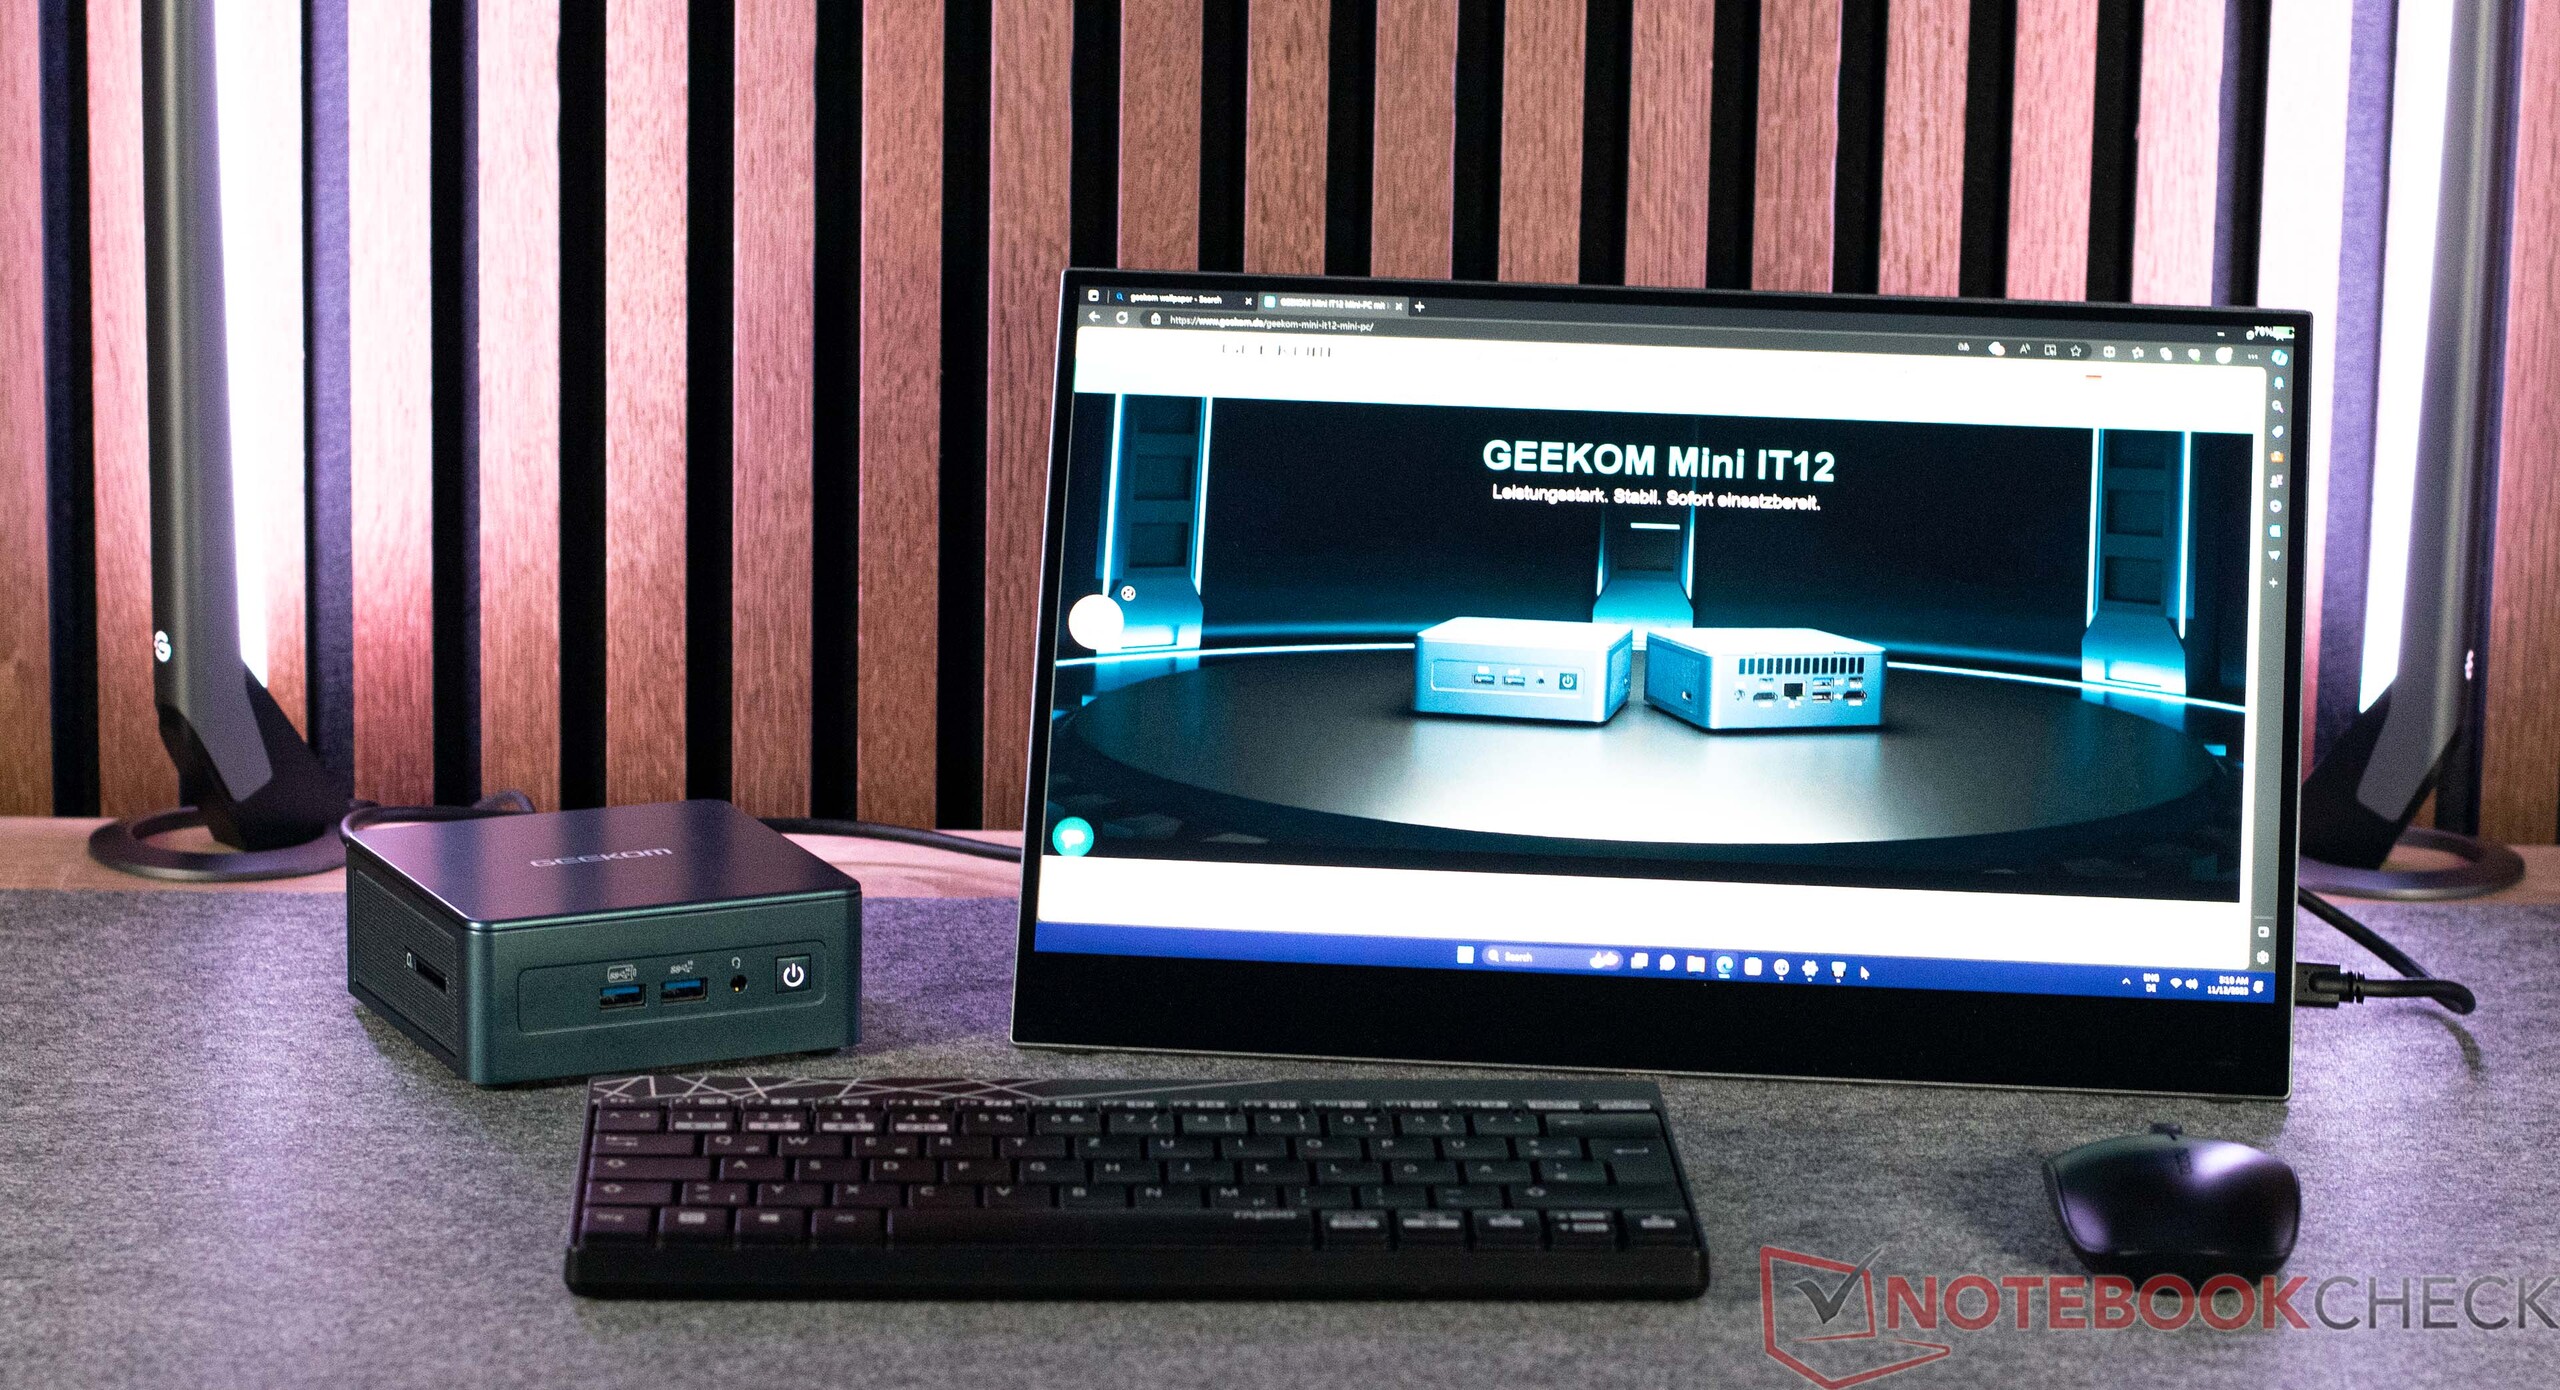
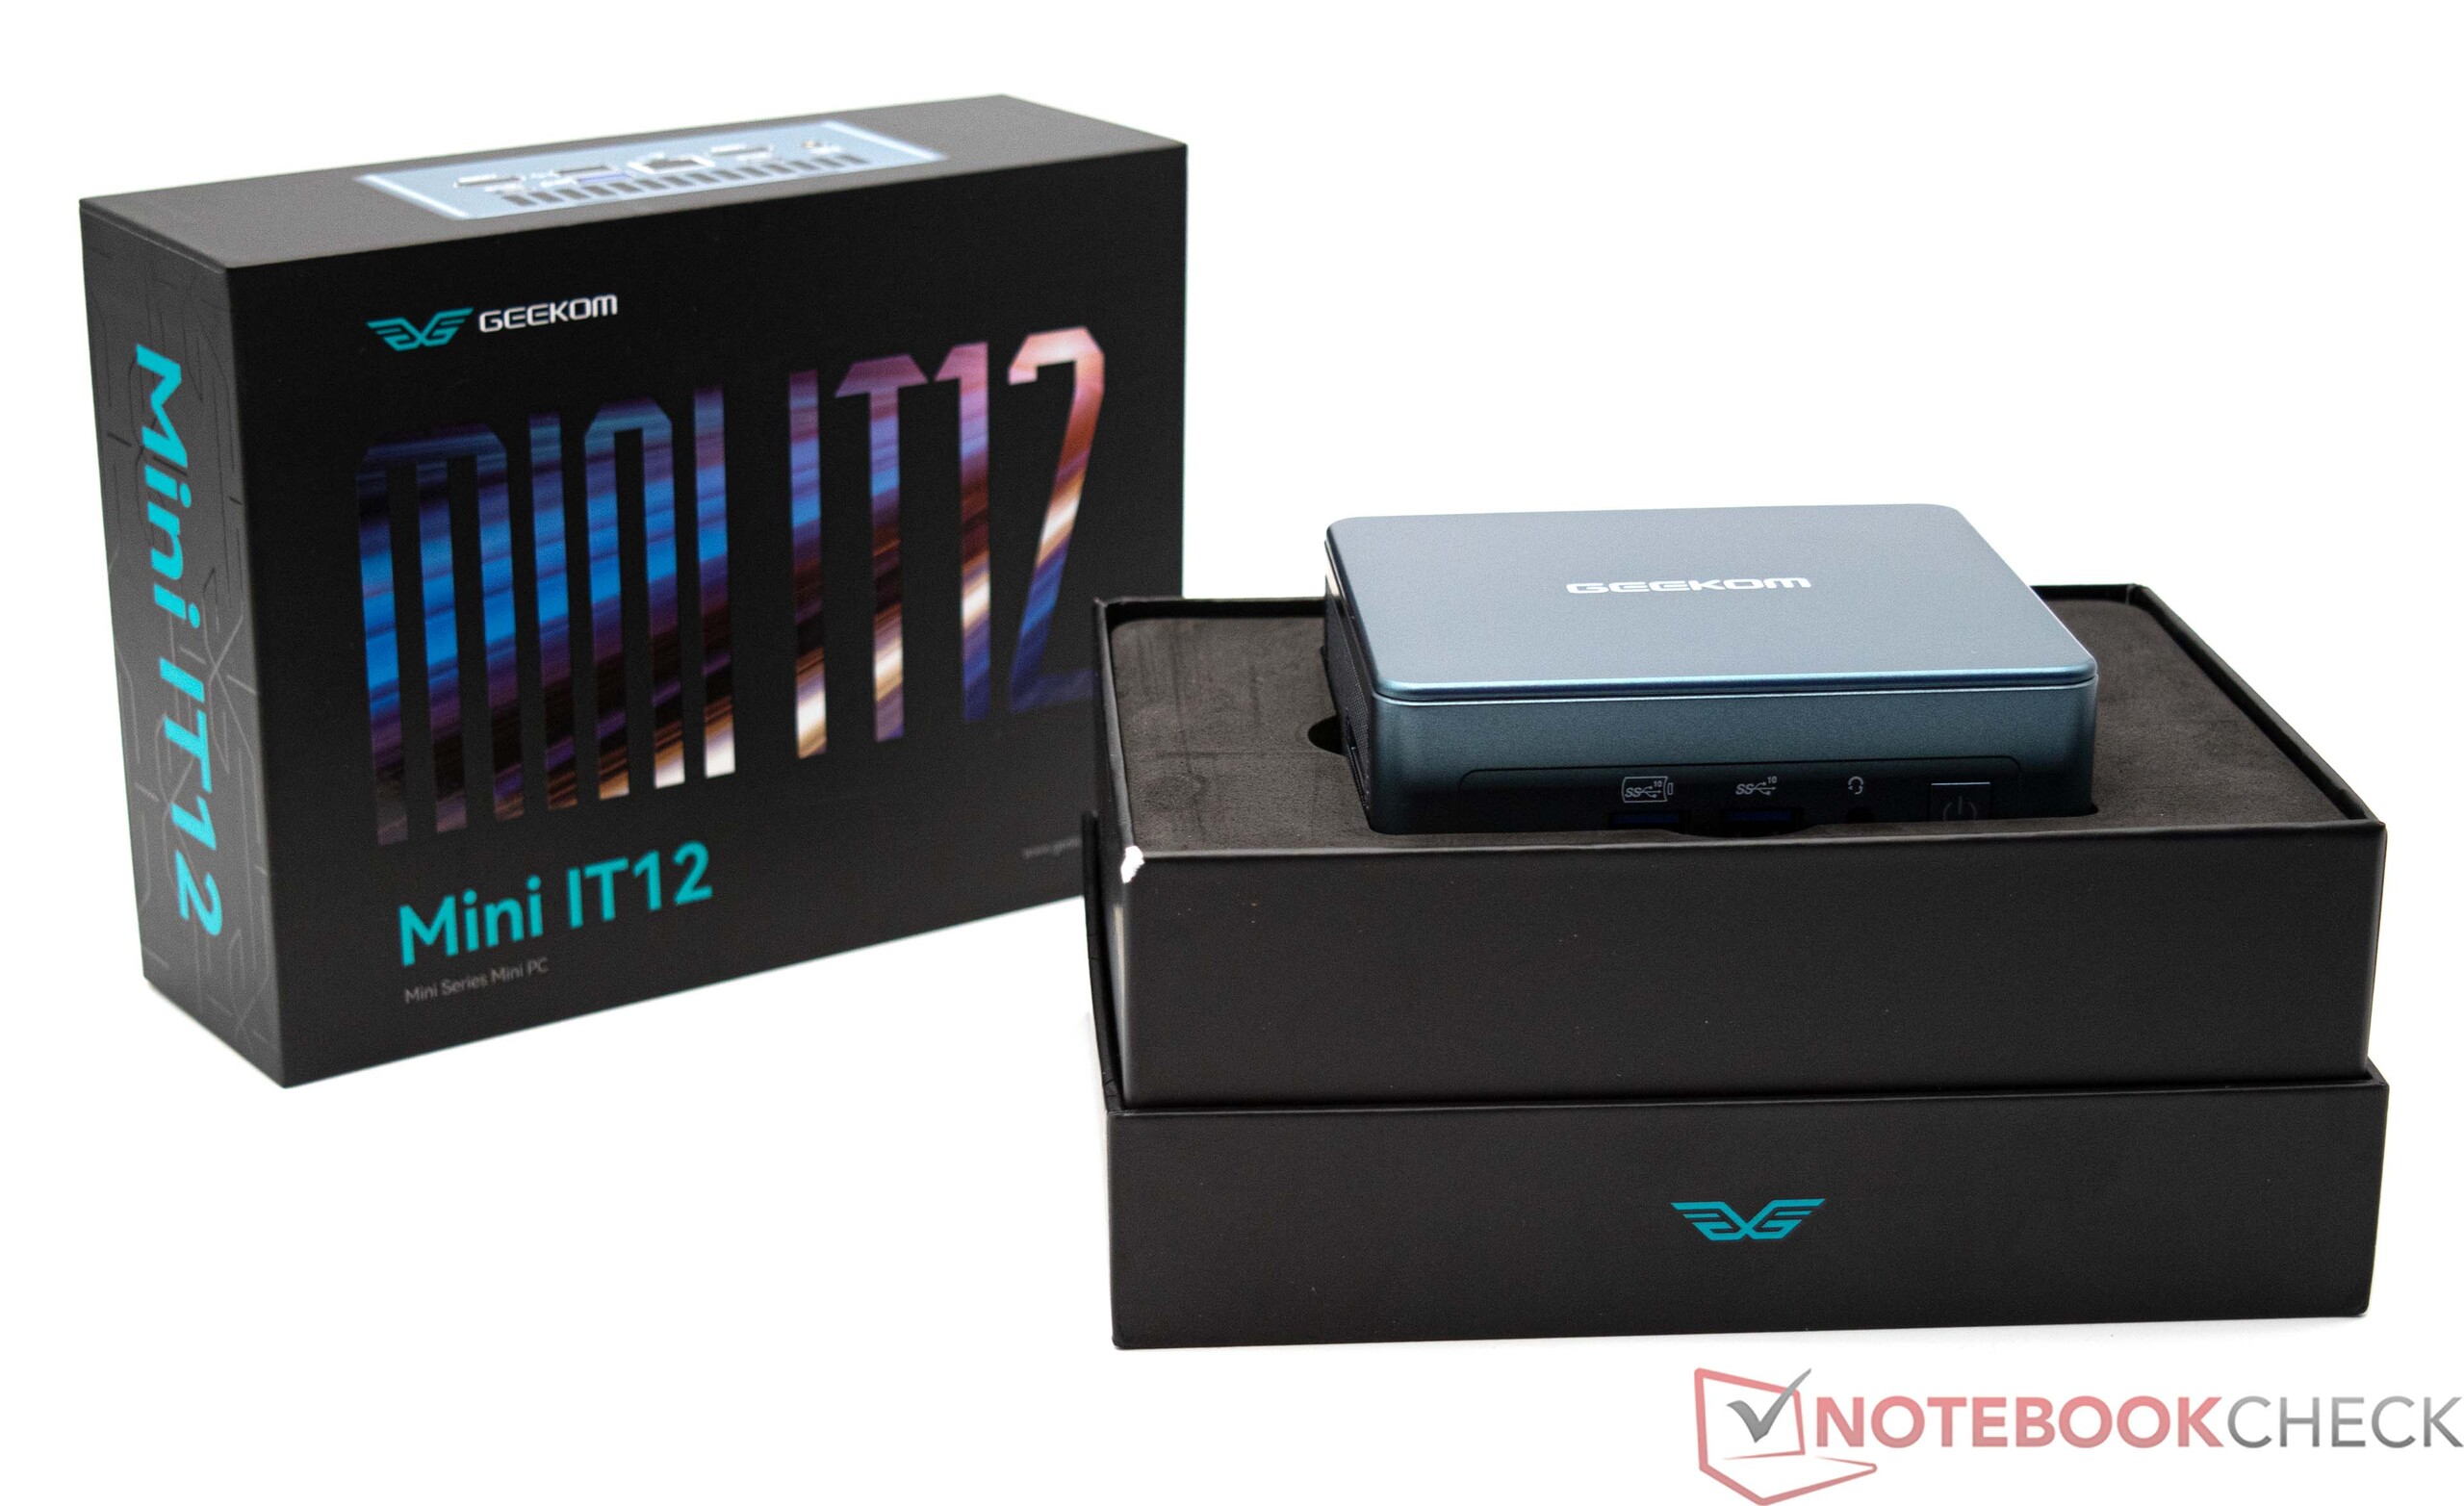
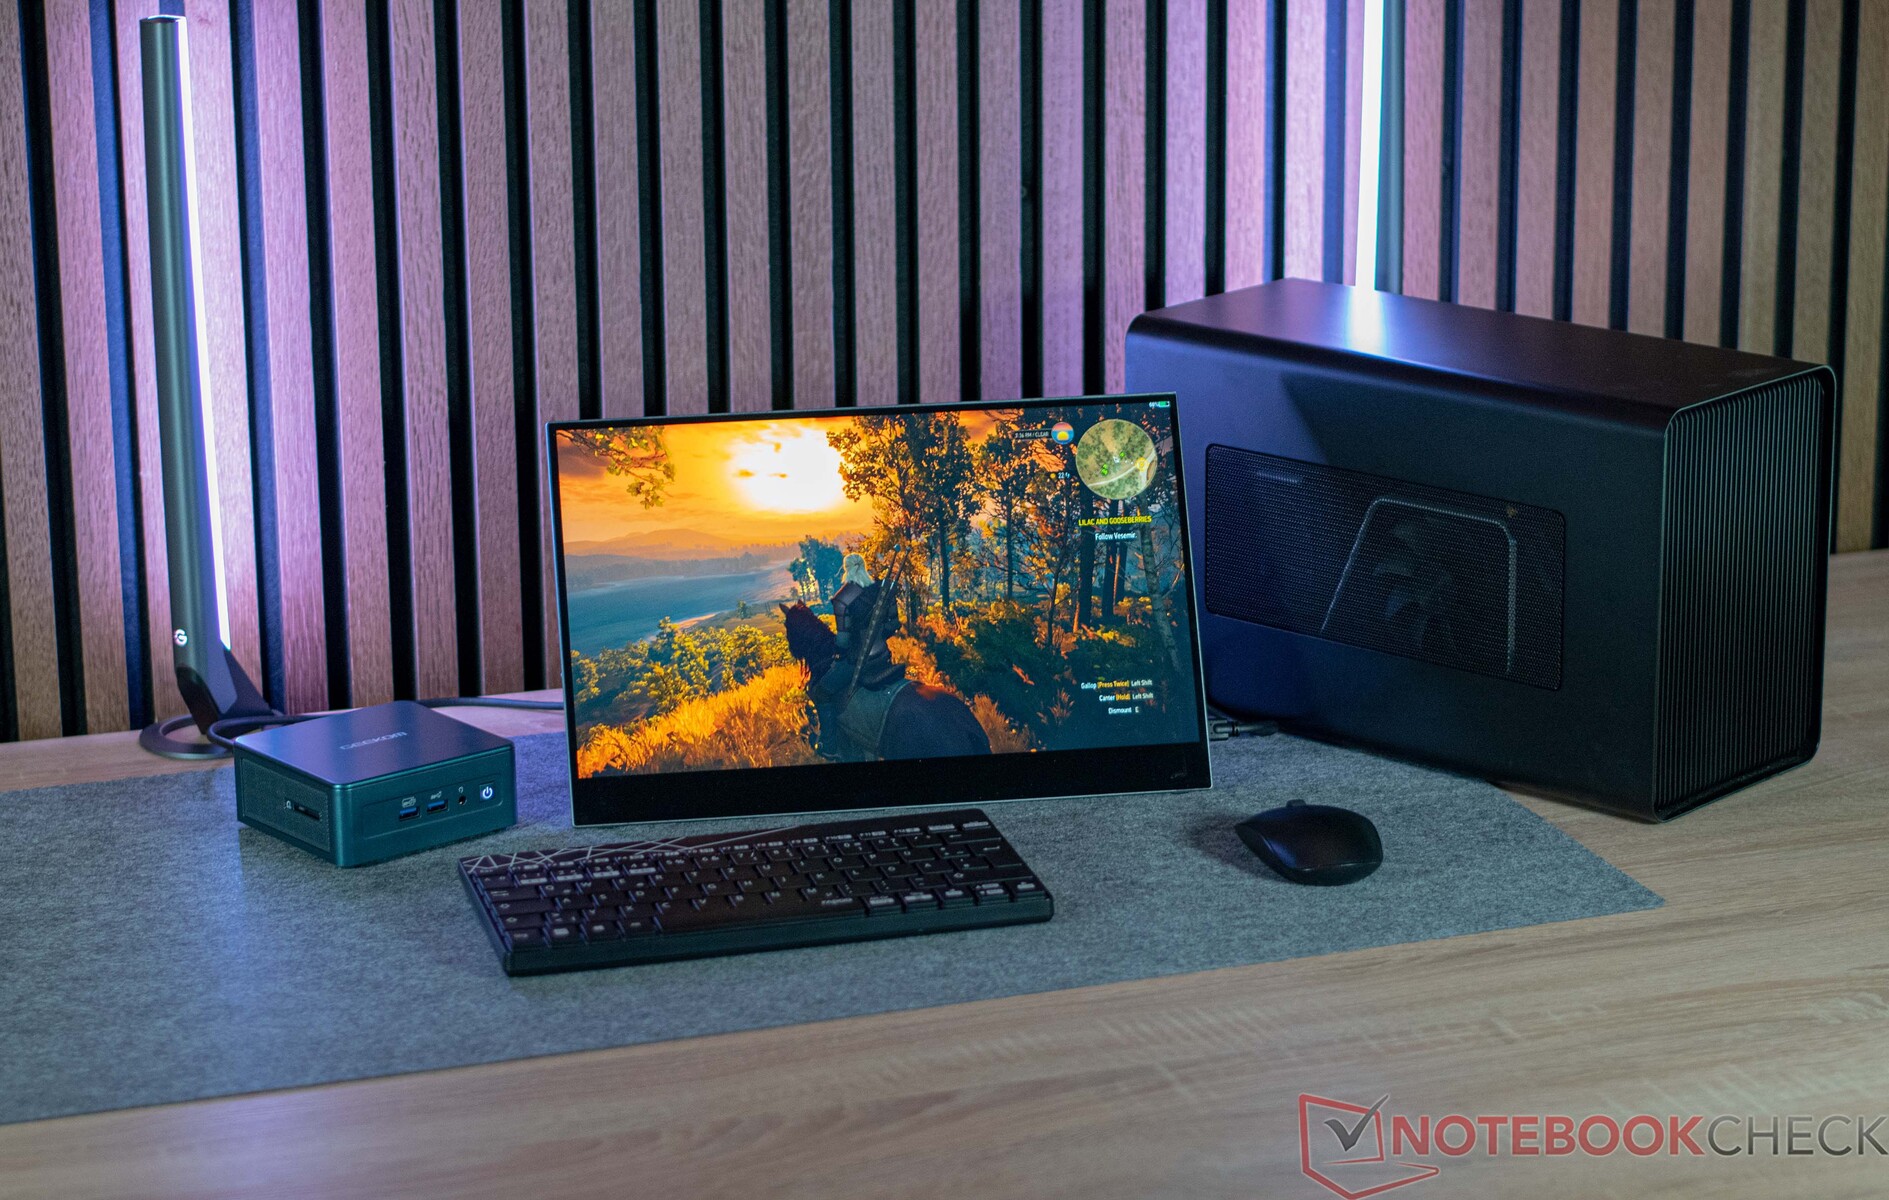
The Geekom Mini IT12 stands out as a compact and powerful mini PC, featuring an Intel Core i5-12450H, 16 GB RAM, and a 512 GB SSD in our test configuration. Priced at US$449, Geekom positions itself competitively within the market for similarly equipped devices. Notably, the Geekom Mini IT12 boasts slightly better connectivity, potentially influencing purchasing decisions.
Geared toward the Intel NUC series, now offered by Asus, the Geekom Mini IT12 faces competition from Minisforum and NiPoGi, both presenting comparable products. In the following overview, we've compiled a list of comparison devices for this review.
Potential Competitors in Comparison
Rating | Date | Model | Weight | Height | Price |
|---|---|---|---|---|---|
| 79.5 % v7 (old) | 11 / 2023 | Geekom Mini IT12 i5-12450H, UHD Graphics 64EUs | 572 g | 45.6 mm | |
| 82.3 % v7 (old) | 05 / 2023 | Geekom Mini IT12 i7-1260P, Iris Xe G7 96EUs | 572 g | 45.6 mm | |
| 80.8 % v7 (old) | 04 / 2023 | Intel NUC 13 Pro Kit NUC13ANK i7-1360P, Iris Xe G7 96EUs | 538 g | 37 mm | |
| 79.5 % v7 (old) | 02 / 2023 | Minisforum Mars Series MC560 R5 5600U, Vega 7 | 562 g | 66 mm | |
| 78.9 % v7 (old) | 11 / 2022 | Intel NUC 12 Pro Kit NUC12WSKi7 i7-1260P, Iris Xe G7 96EUs | 511 g | 37 mm | |
| 78 % v7 (old) | 10 / 2023 | Minisforum Venus Series UN1245 i5-12450H, UHD Graphics 64EUs | 545 g | 54.3 mm | |
| 77.2 % v7 (old) | 10 / 2023 | NiPoGi CK10 i5-12450H, UHD Graphics 64EUs | 481 g | 50 mm |
Geekom Mini IT12 i5-12450H in detail
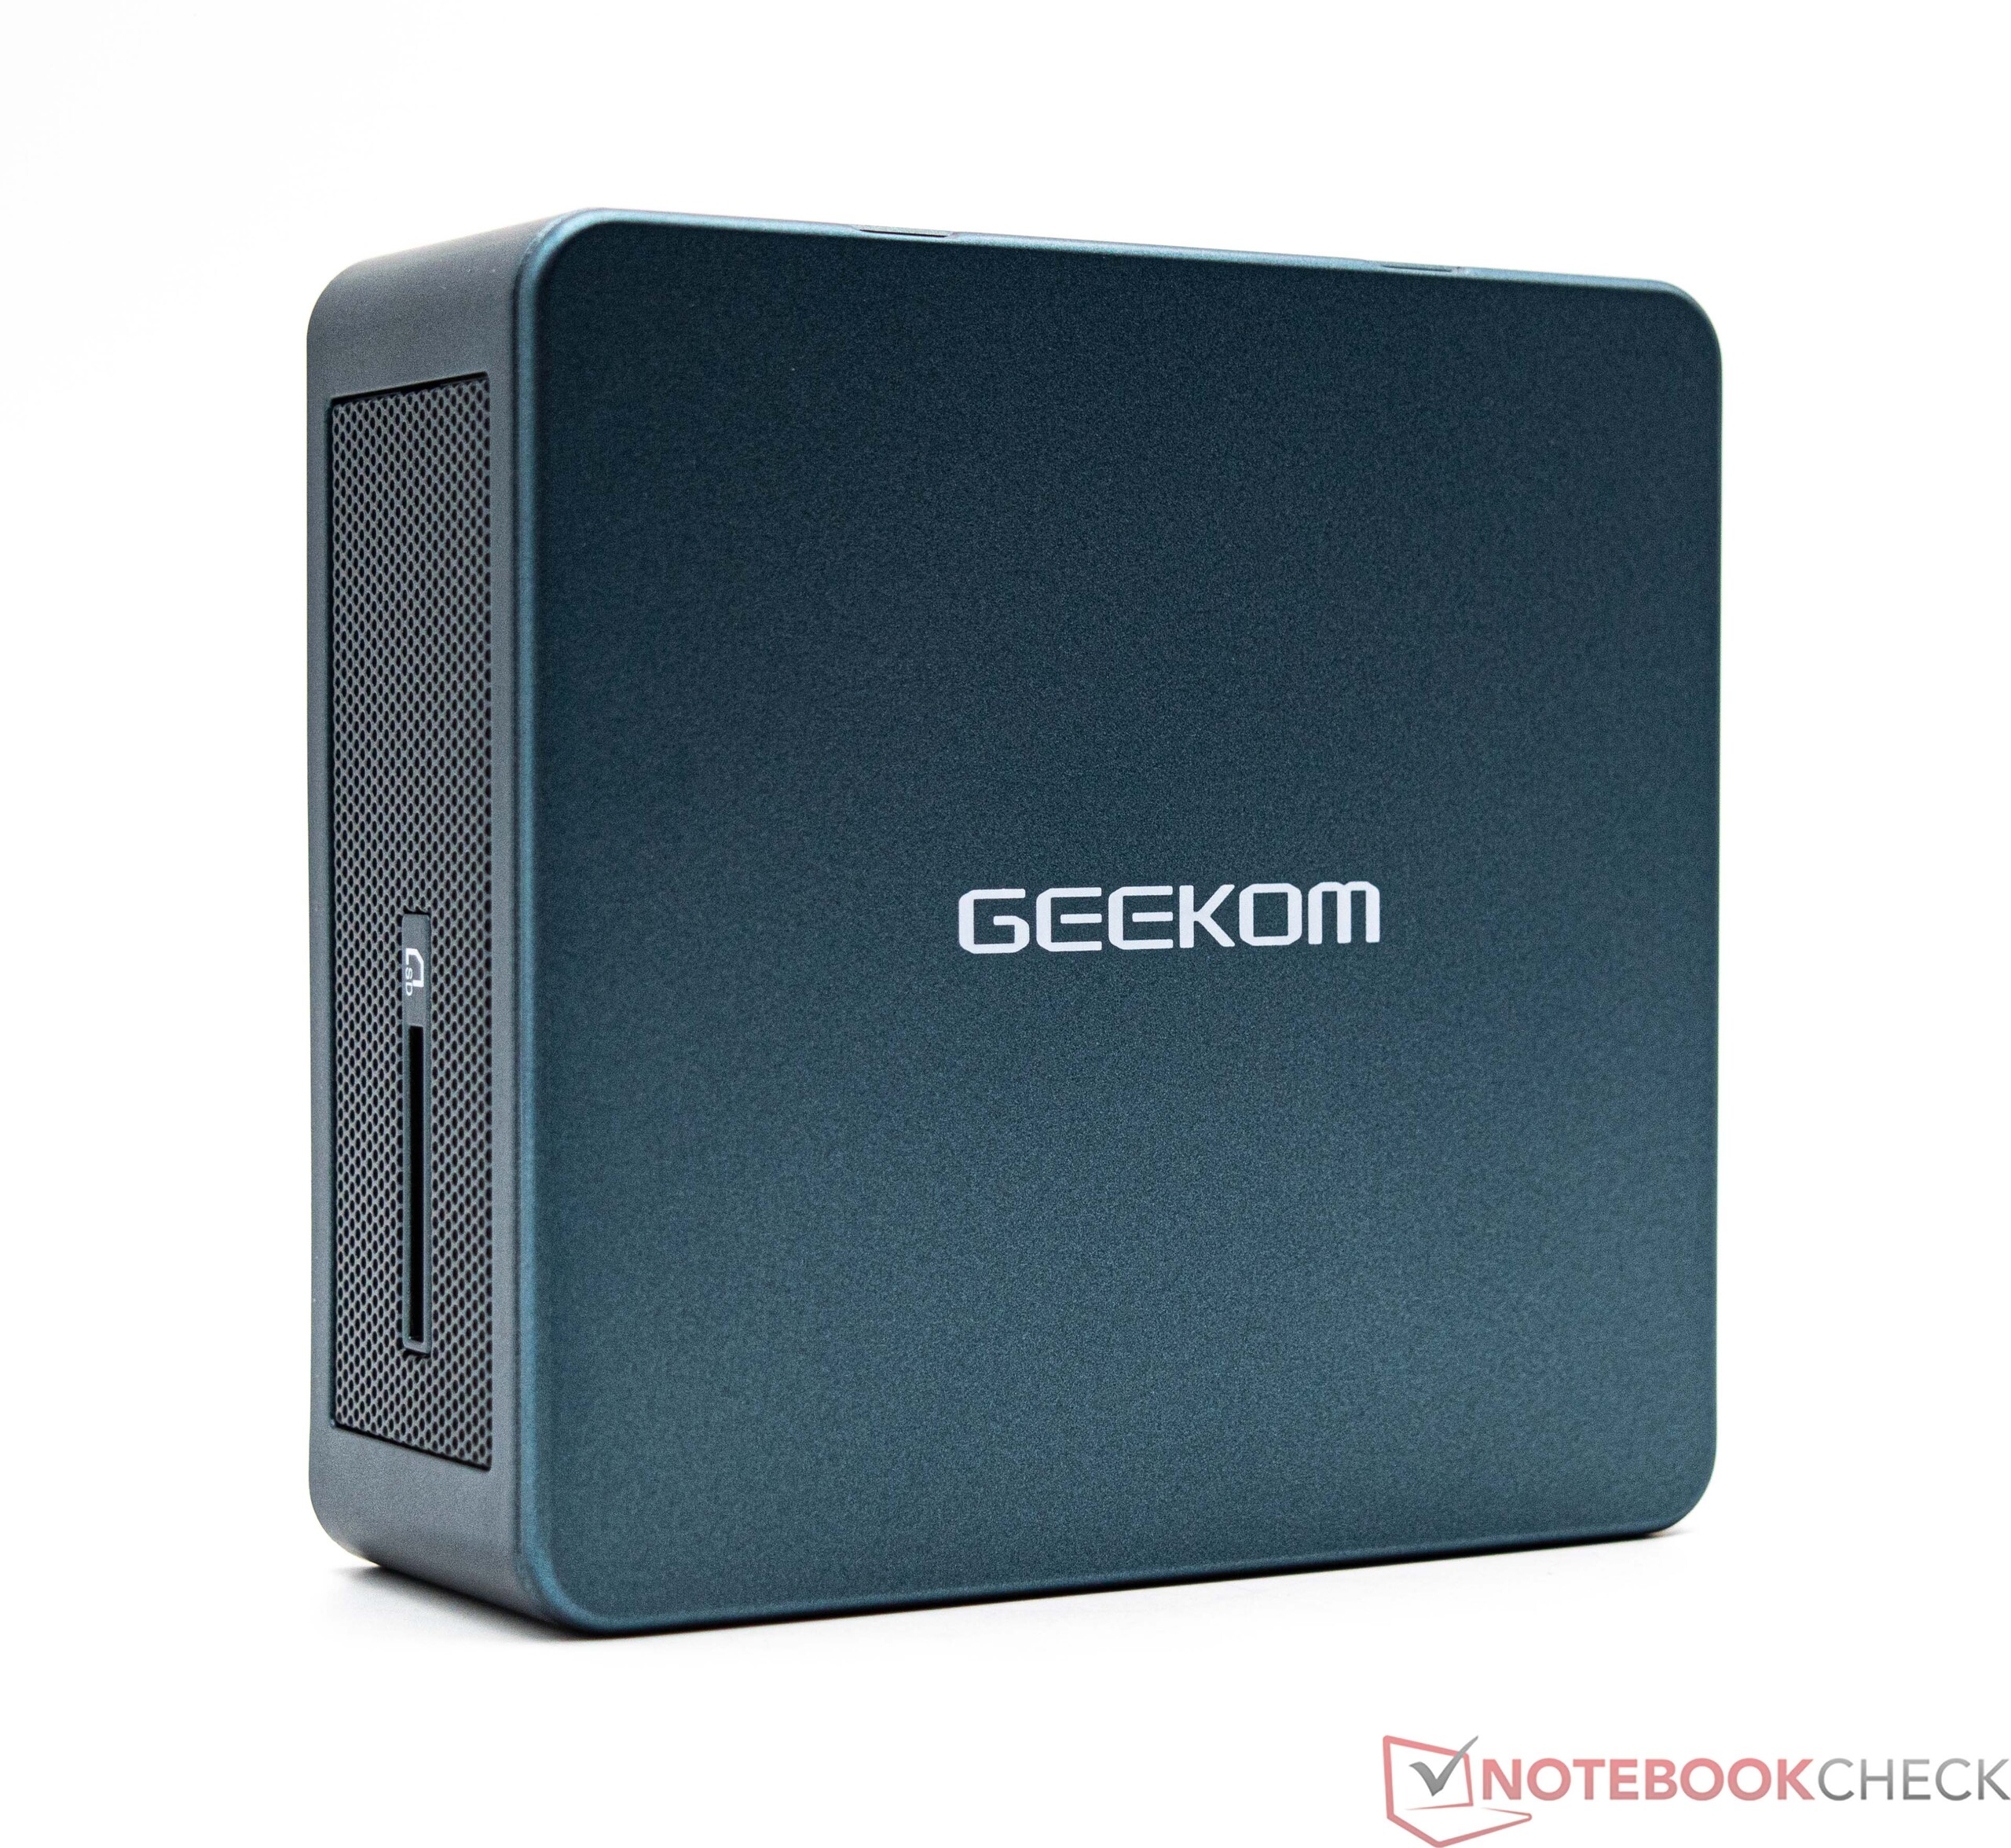
Case - Familiar Intel NUC-style exterior
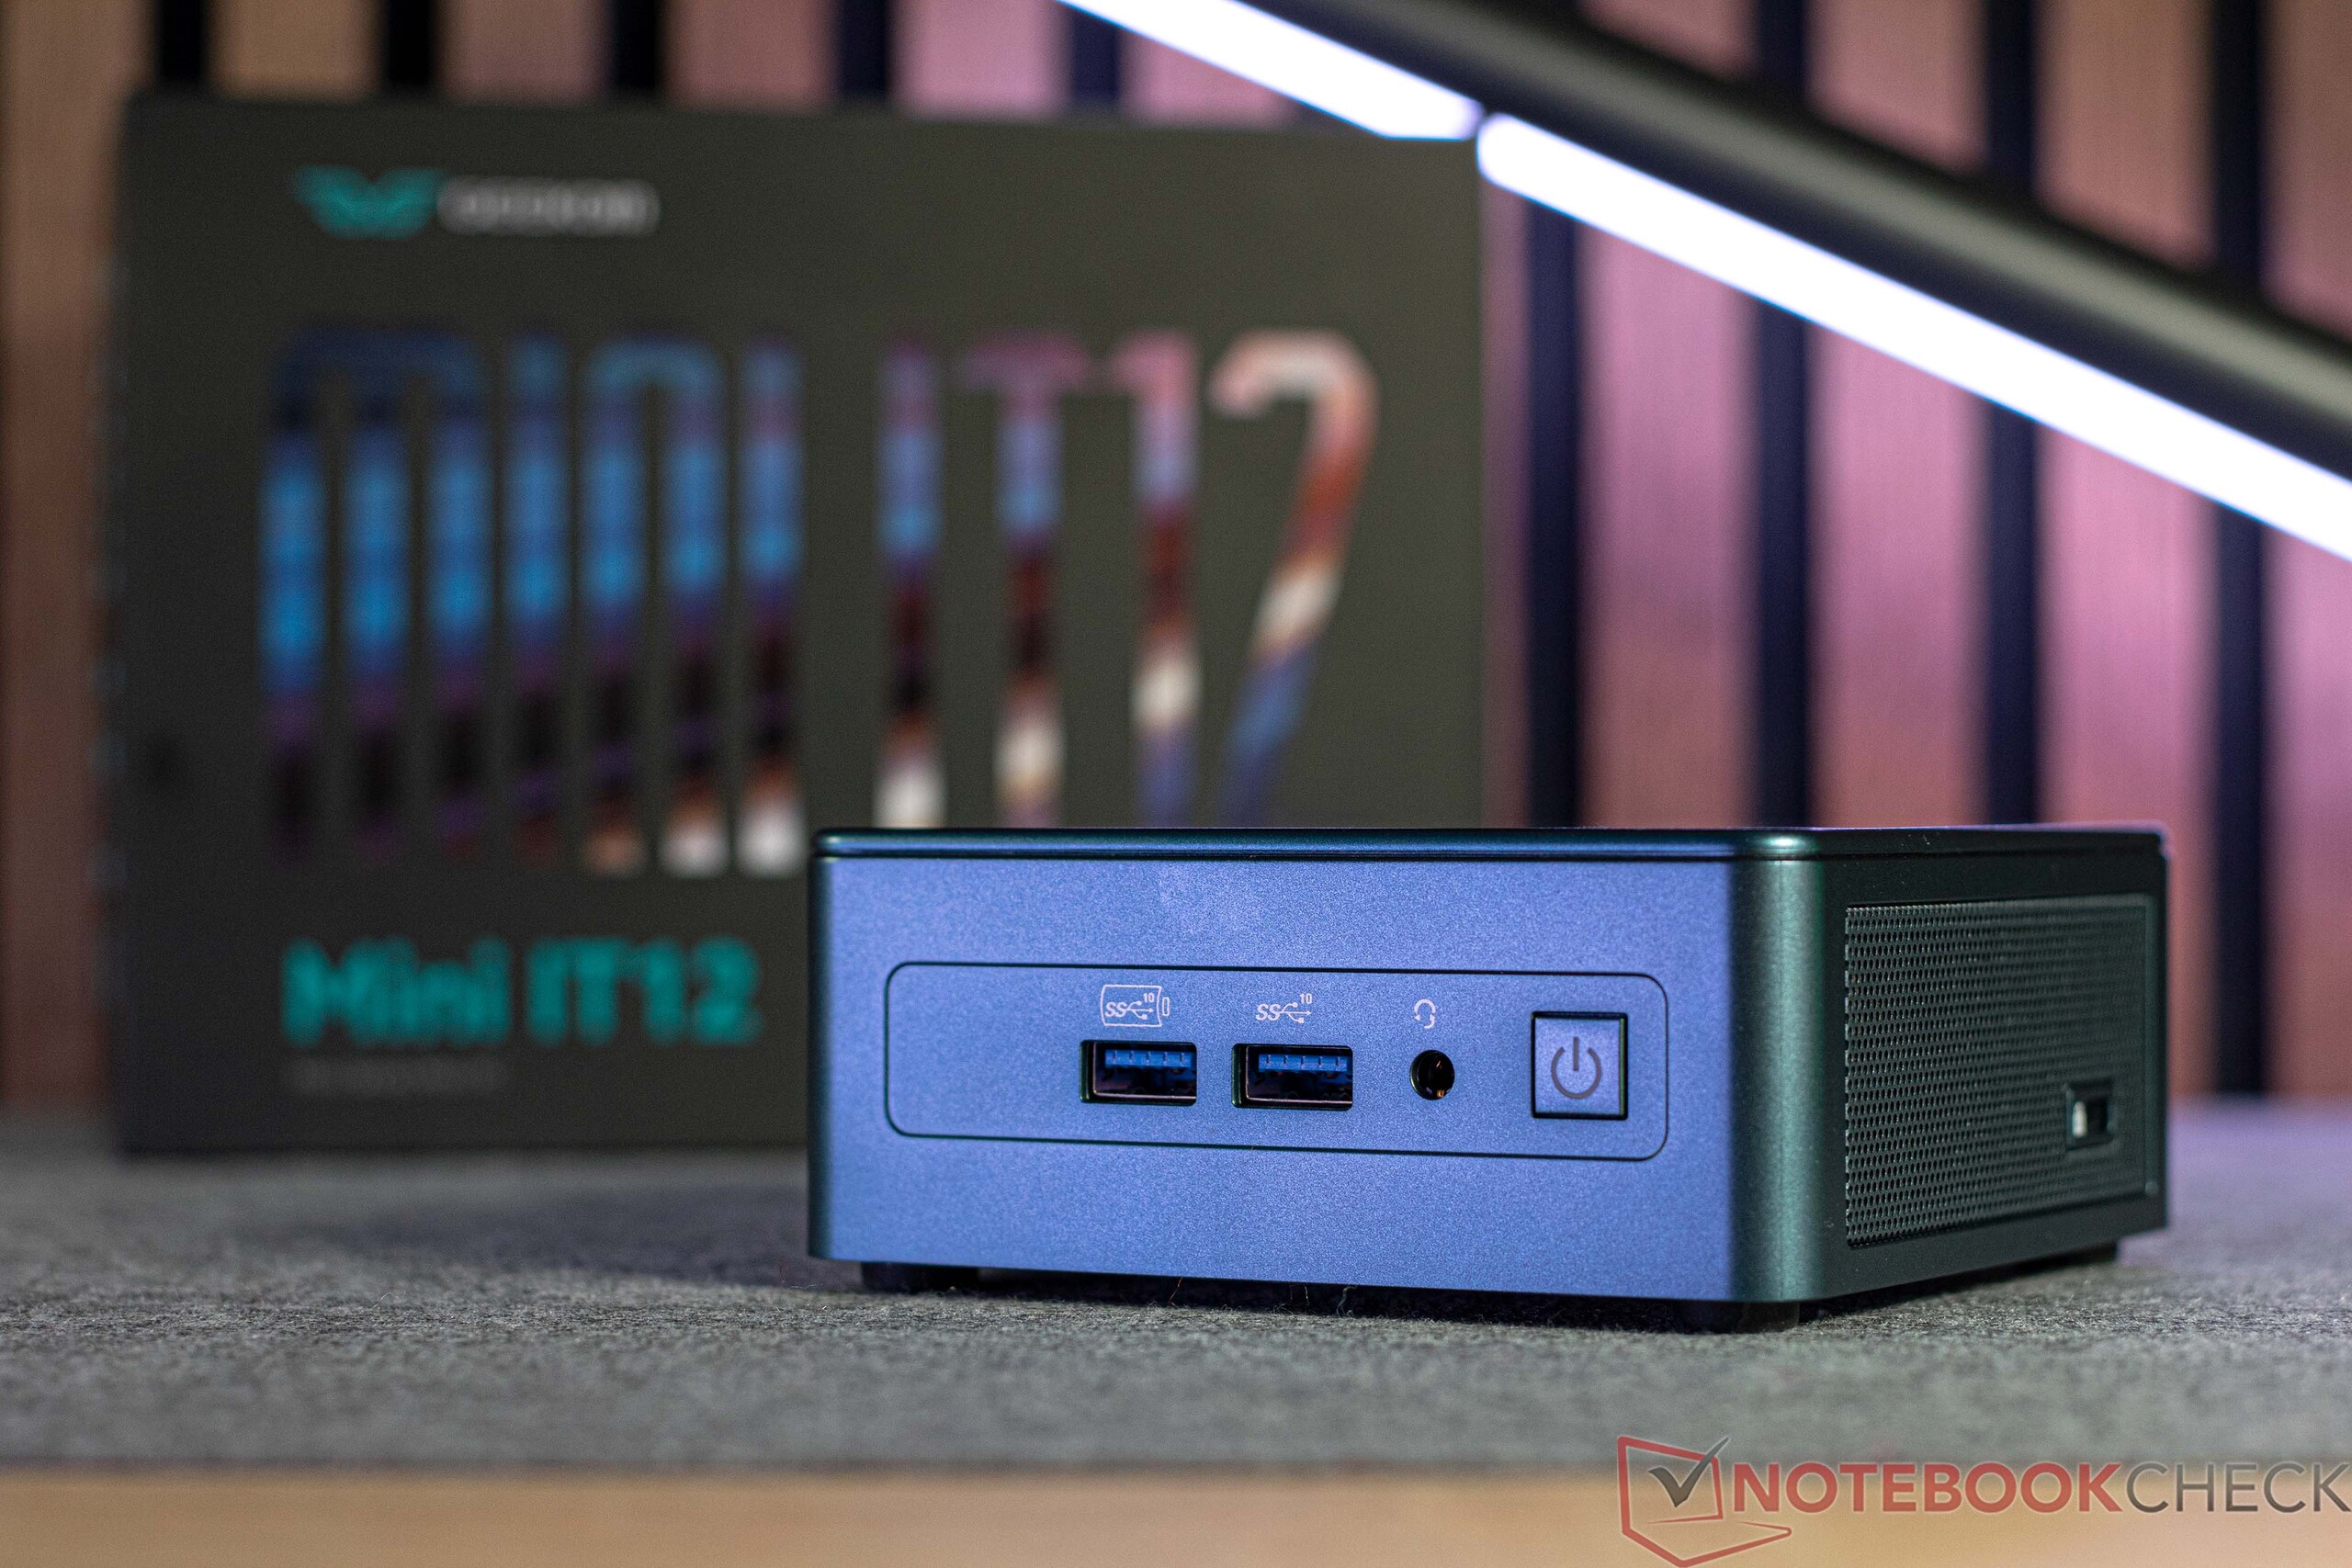
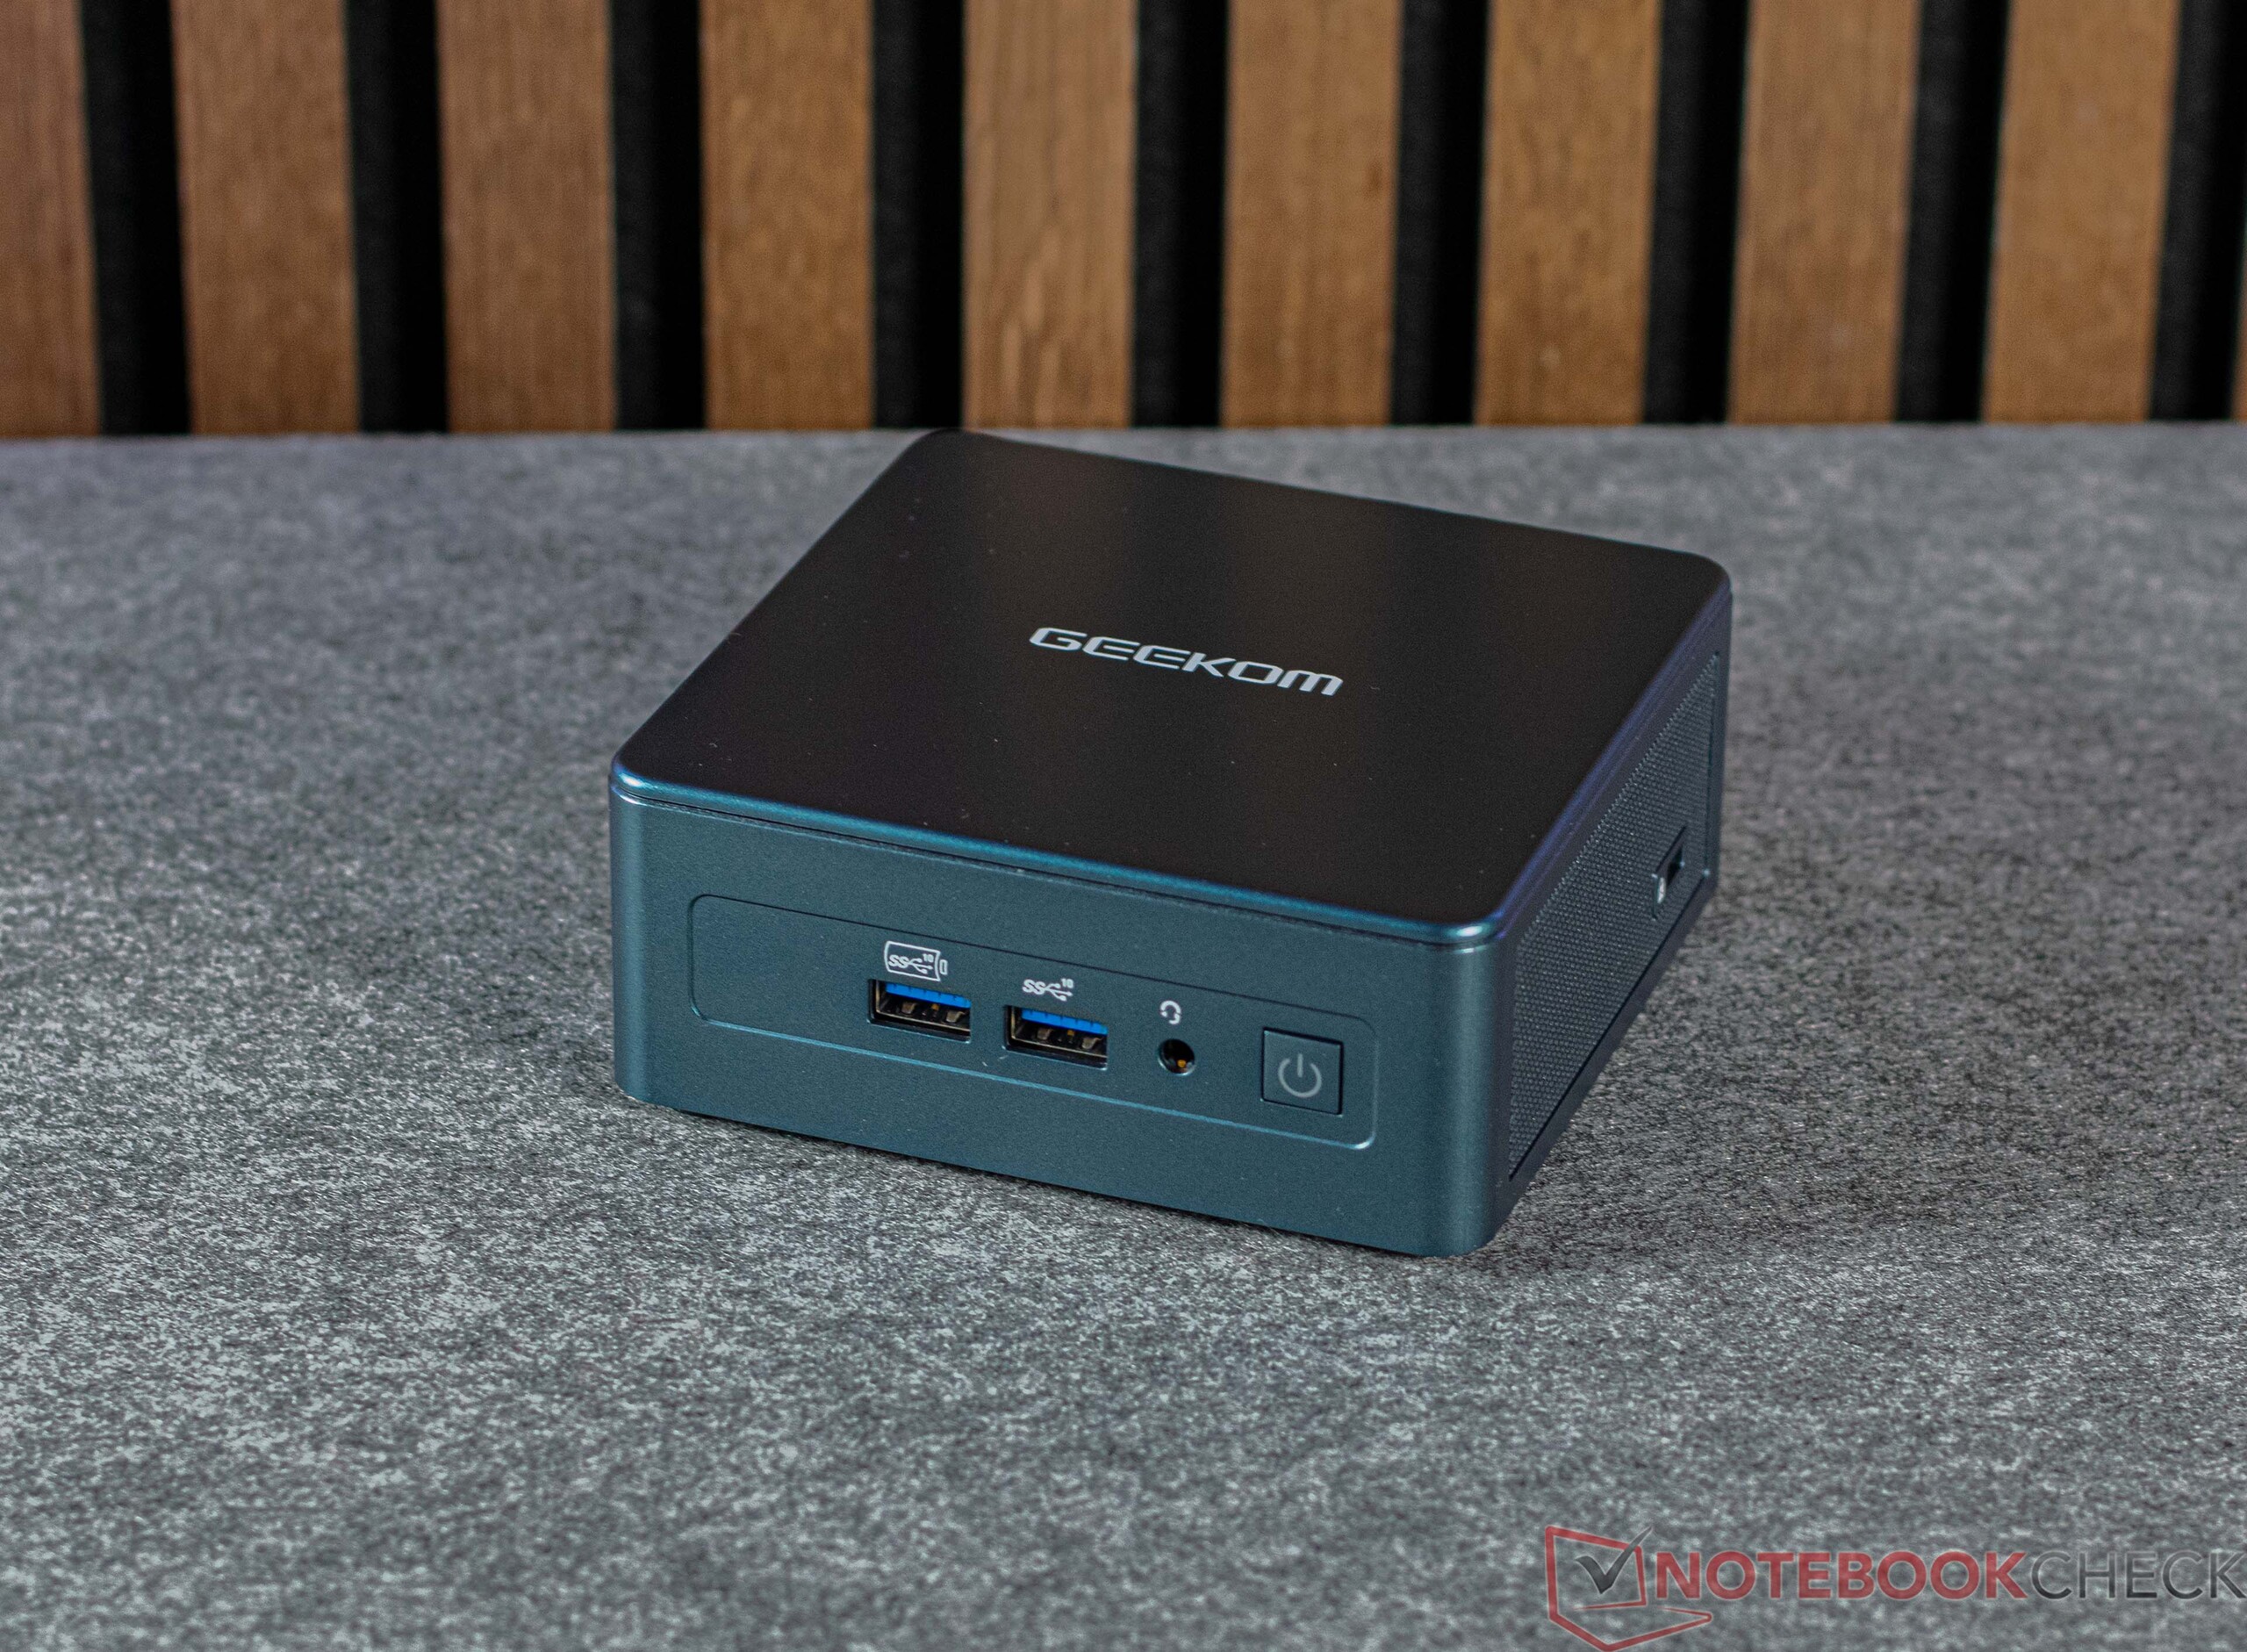
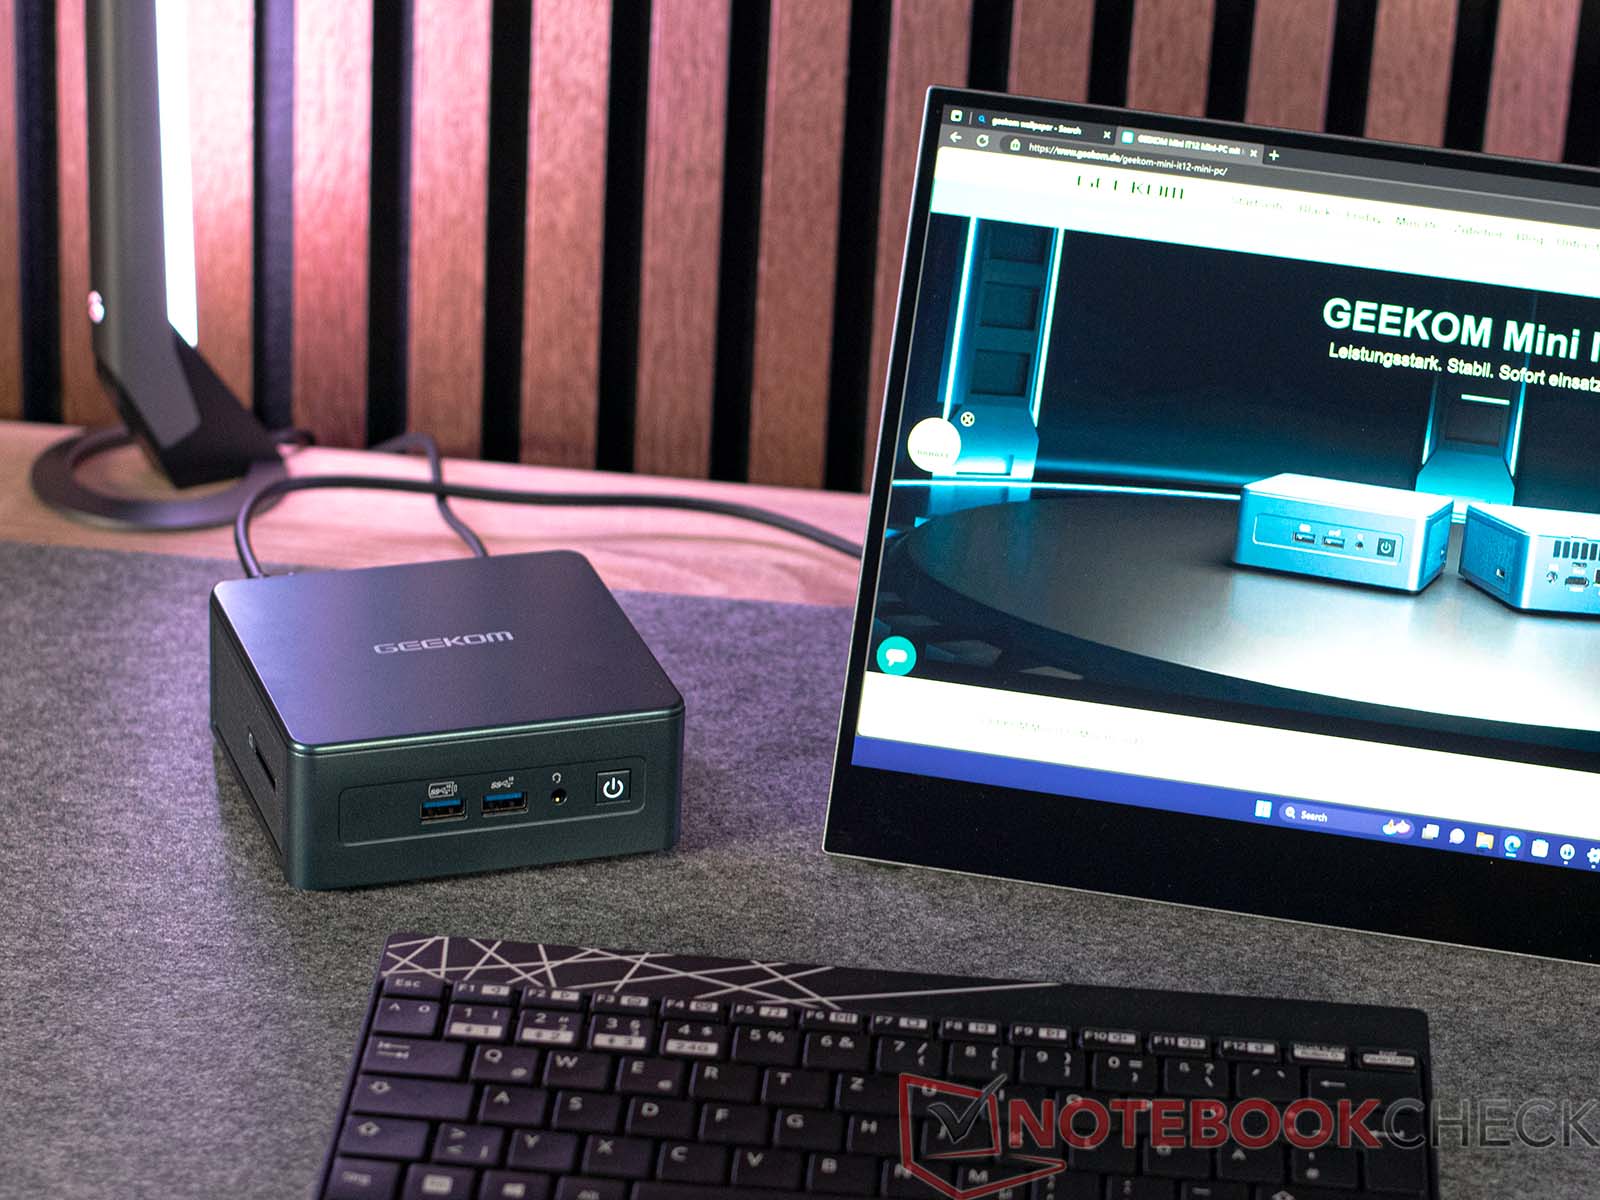
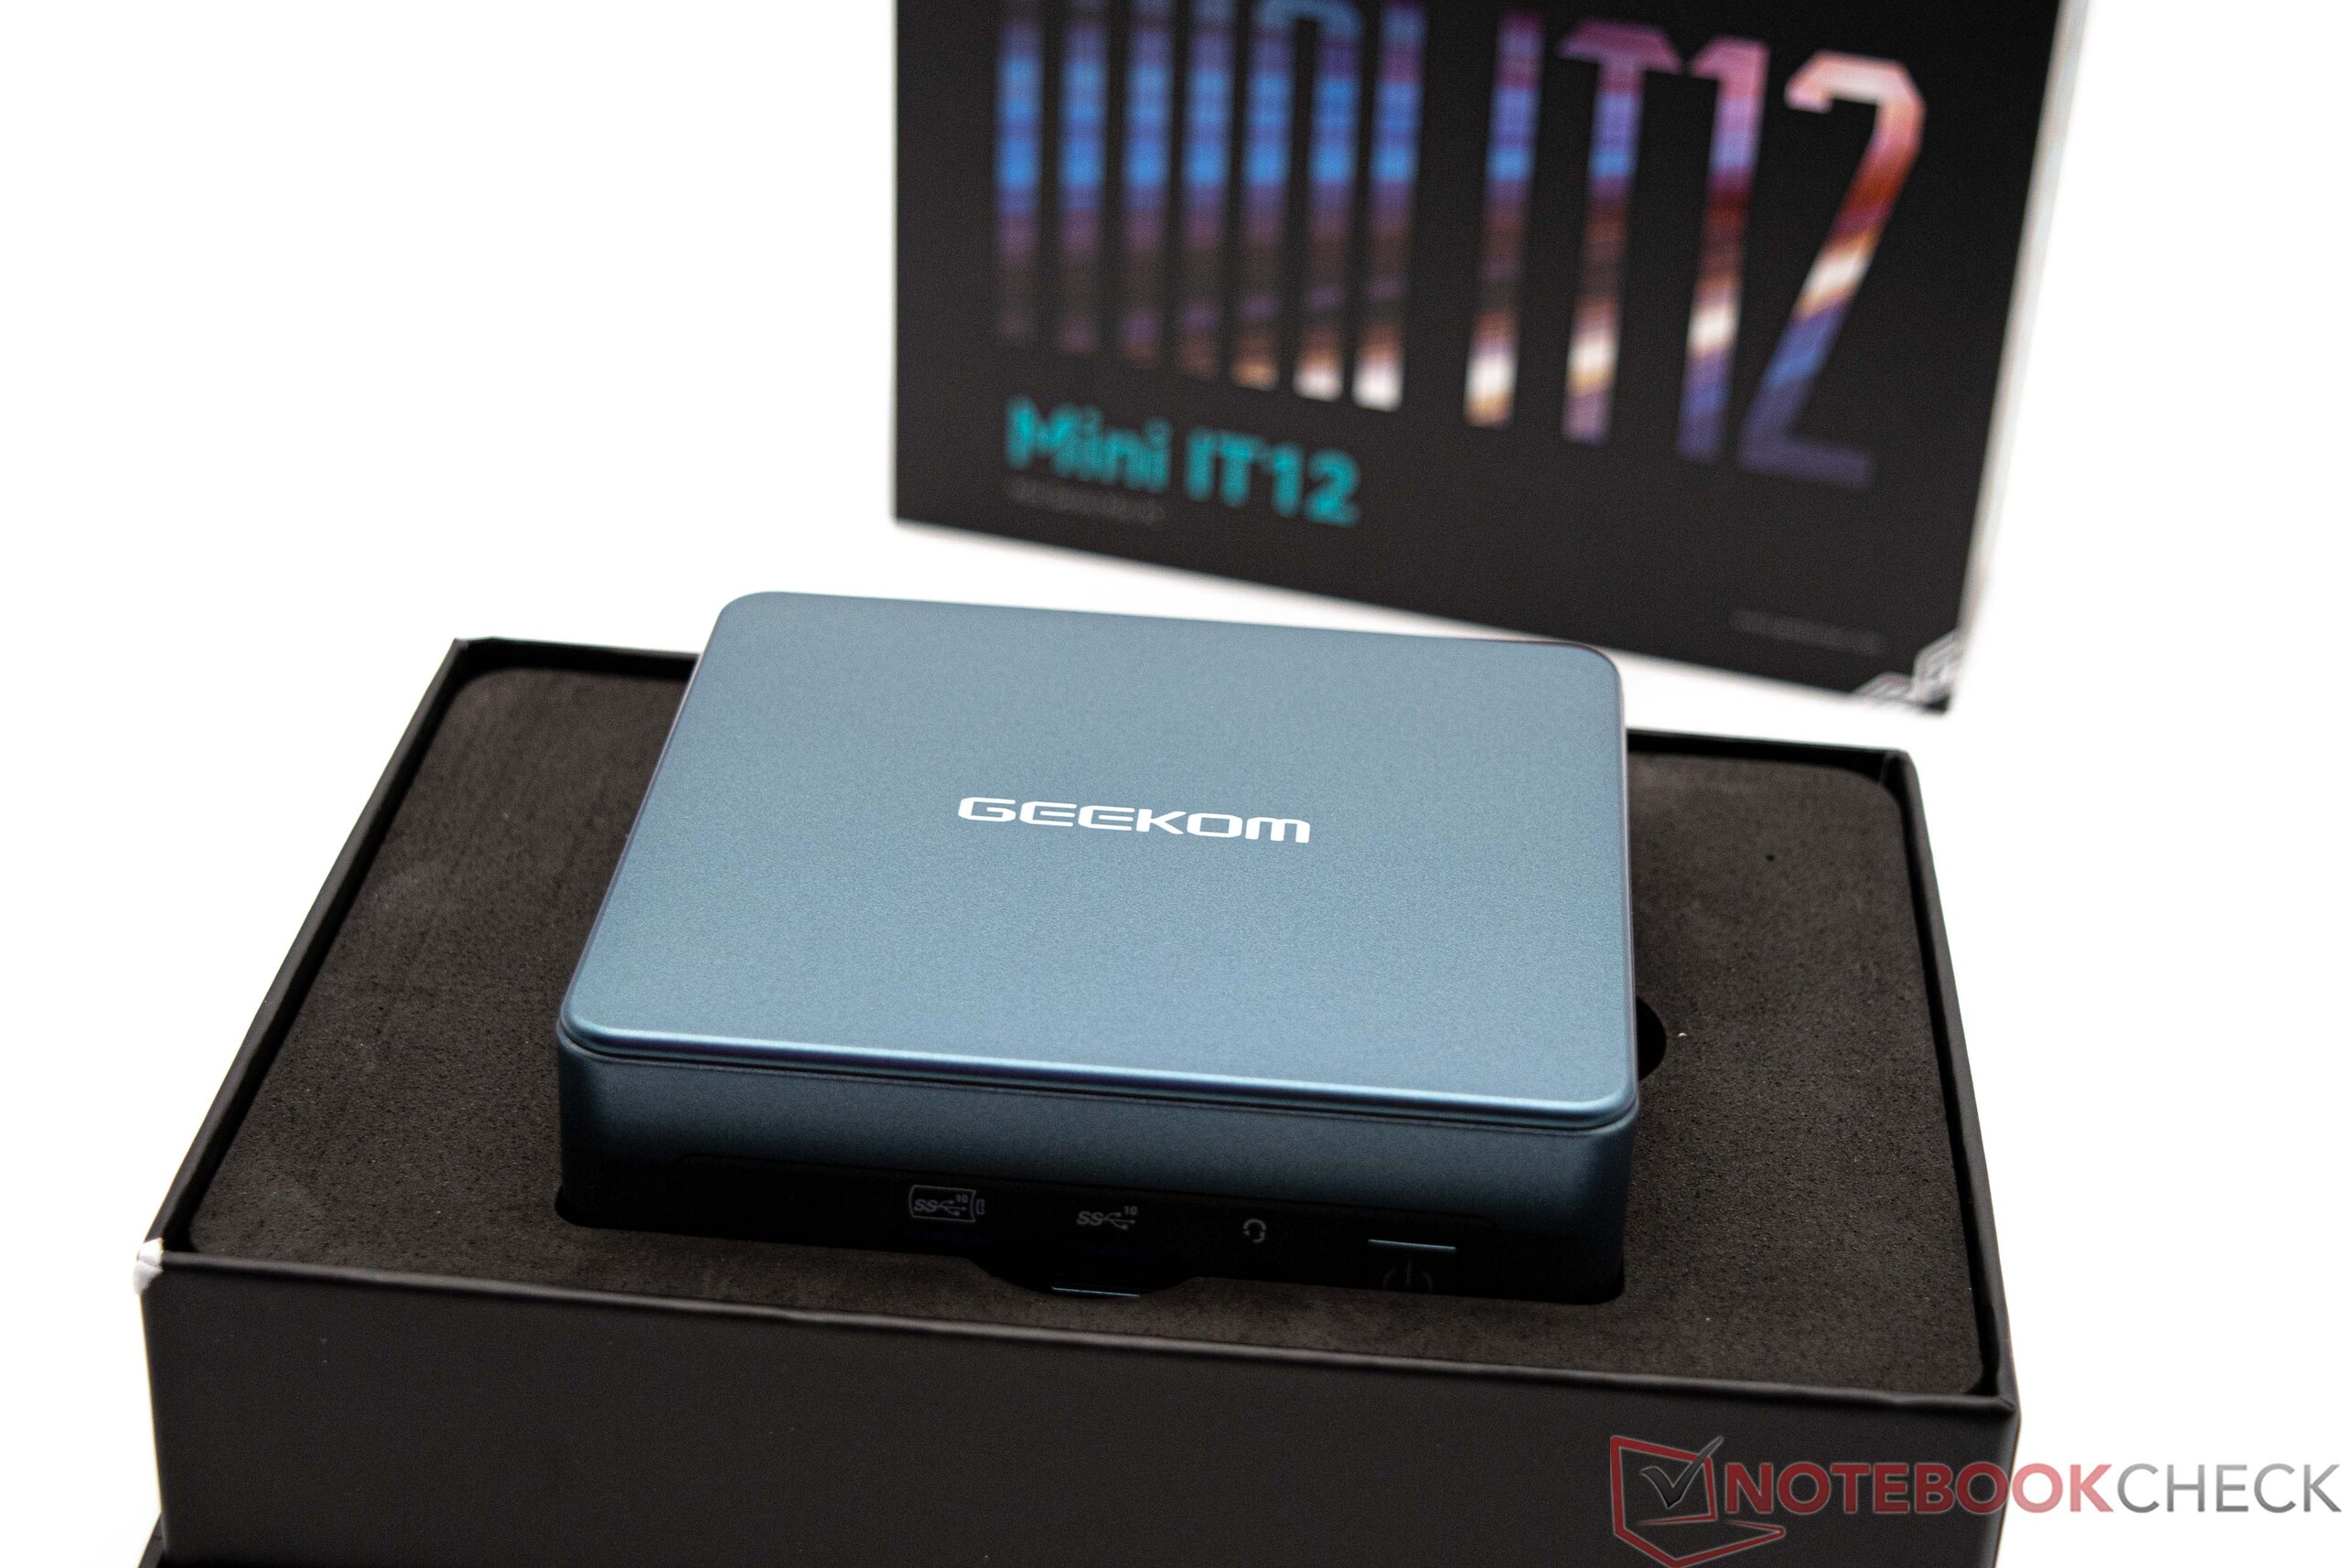
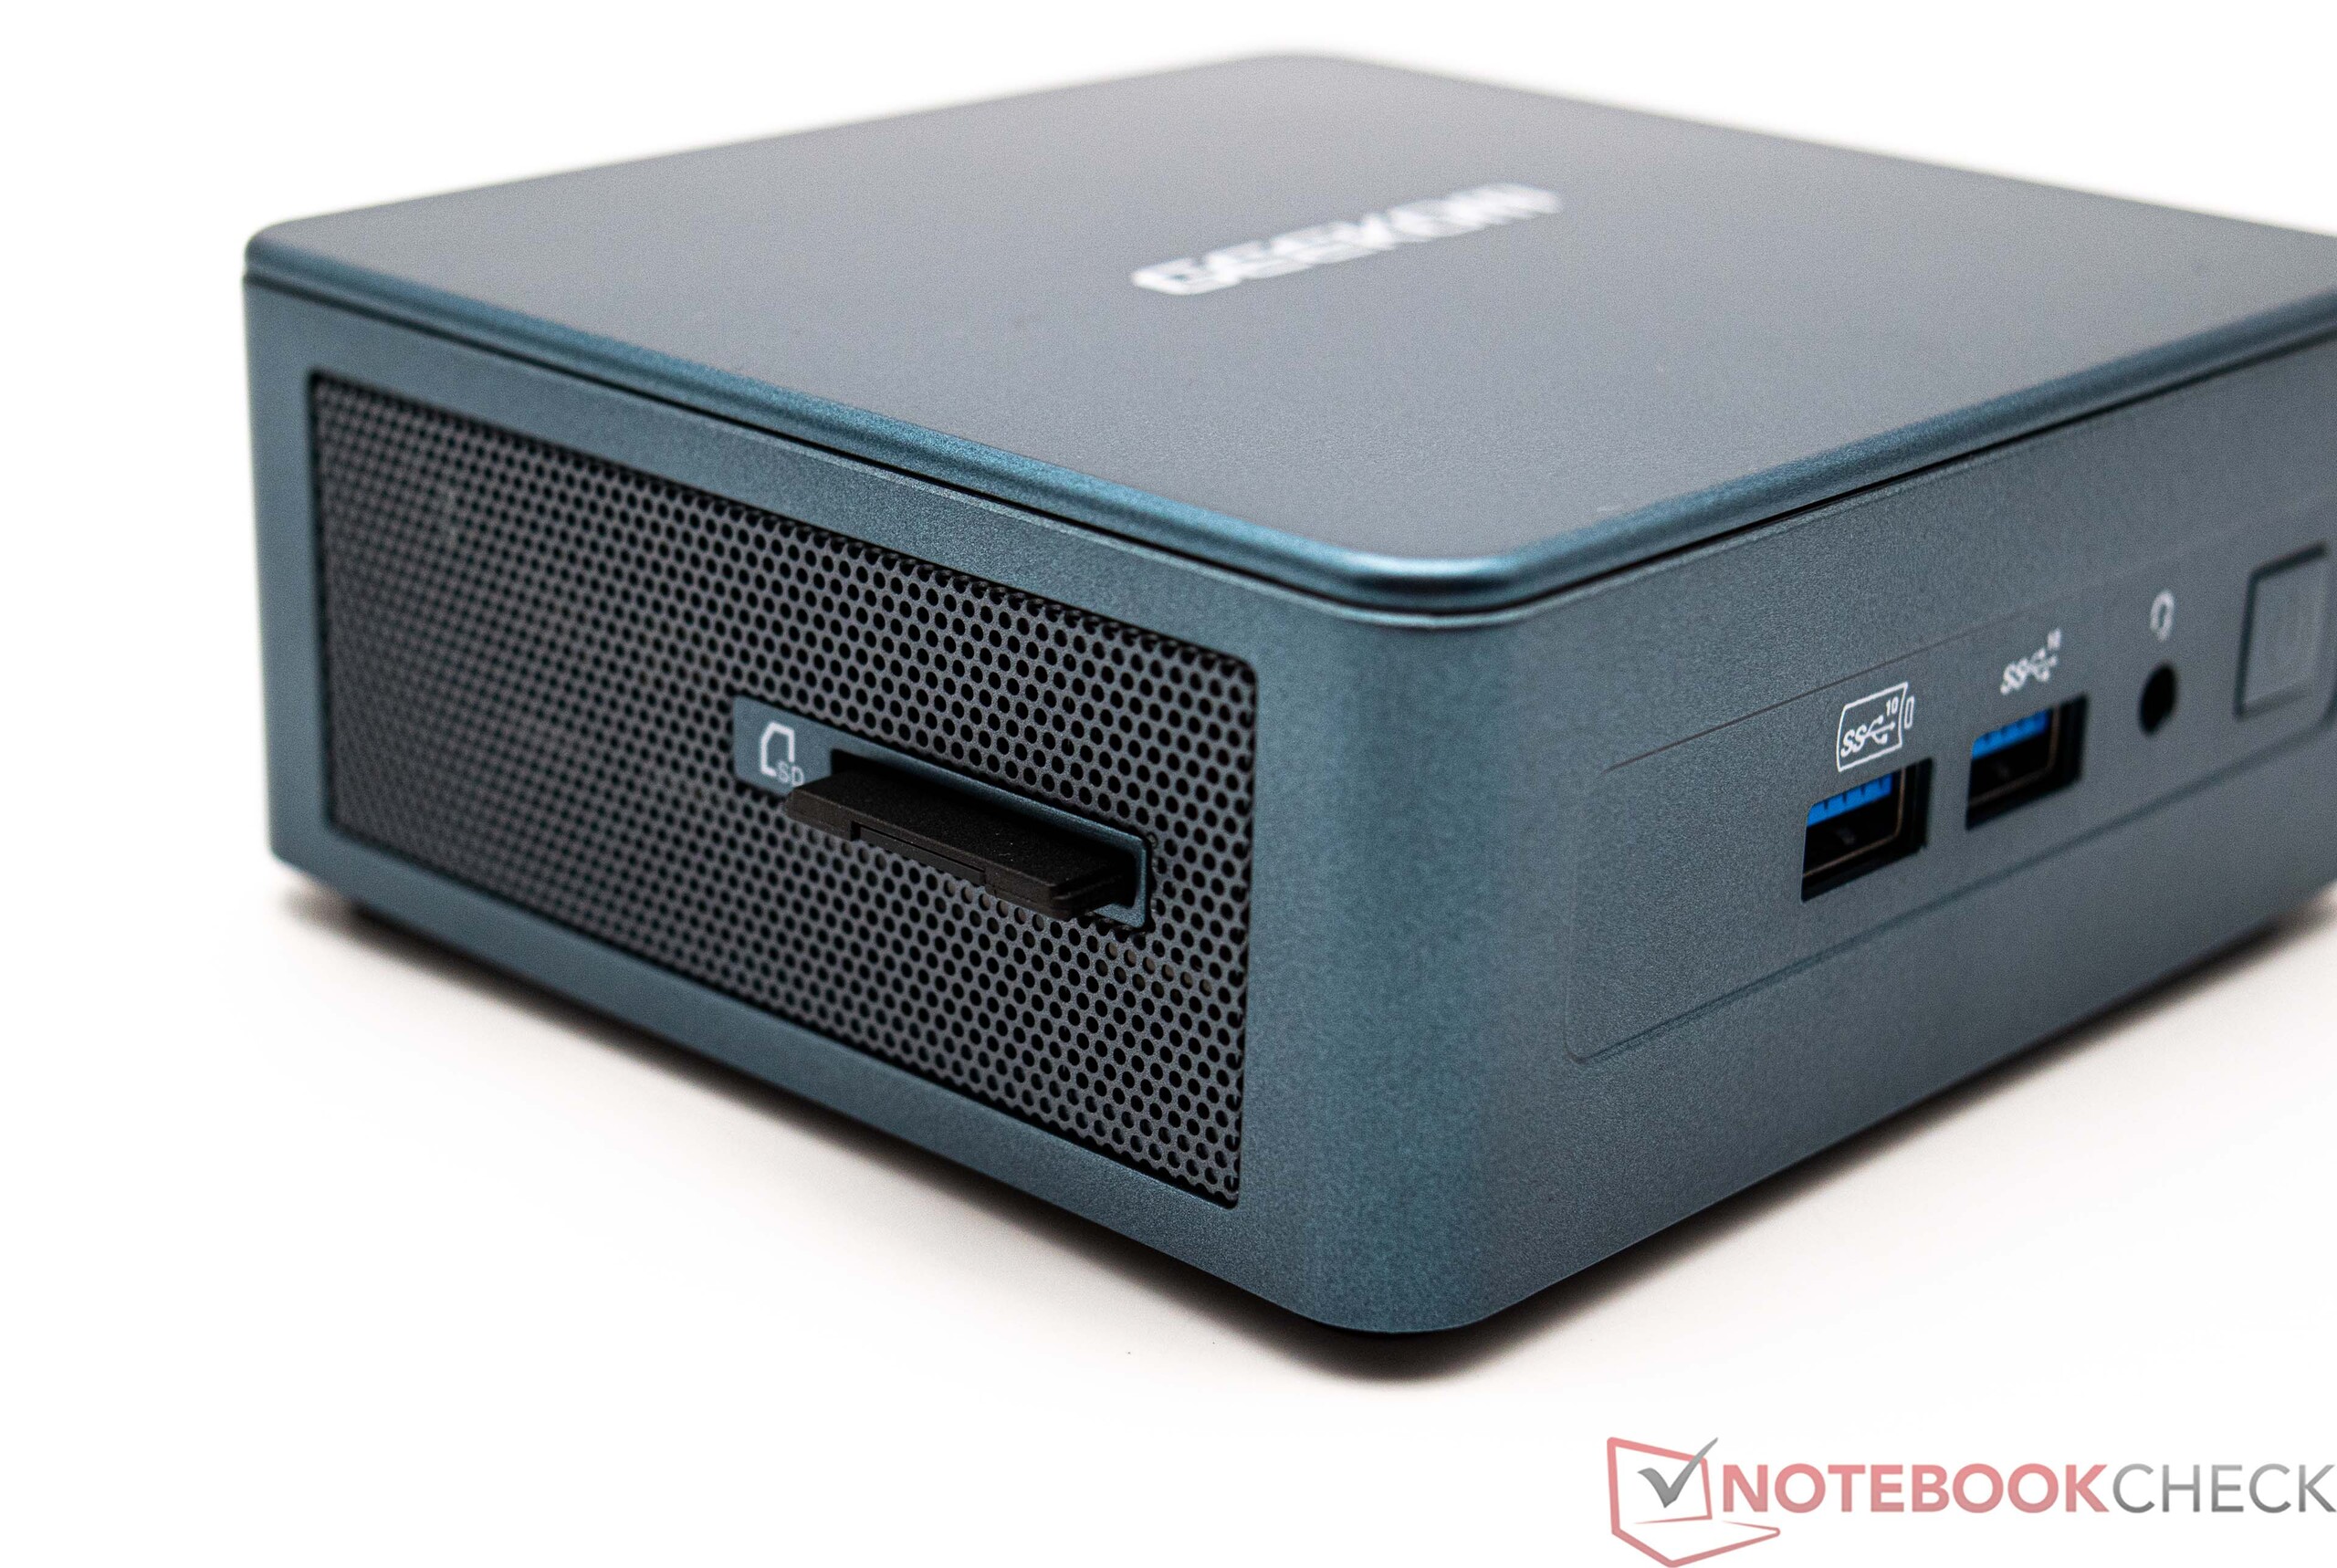
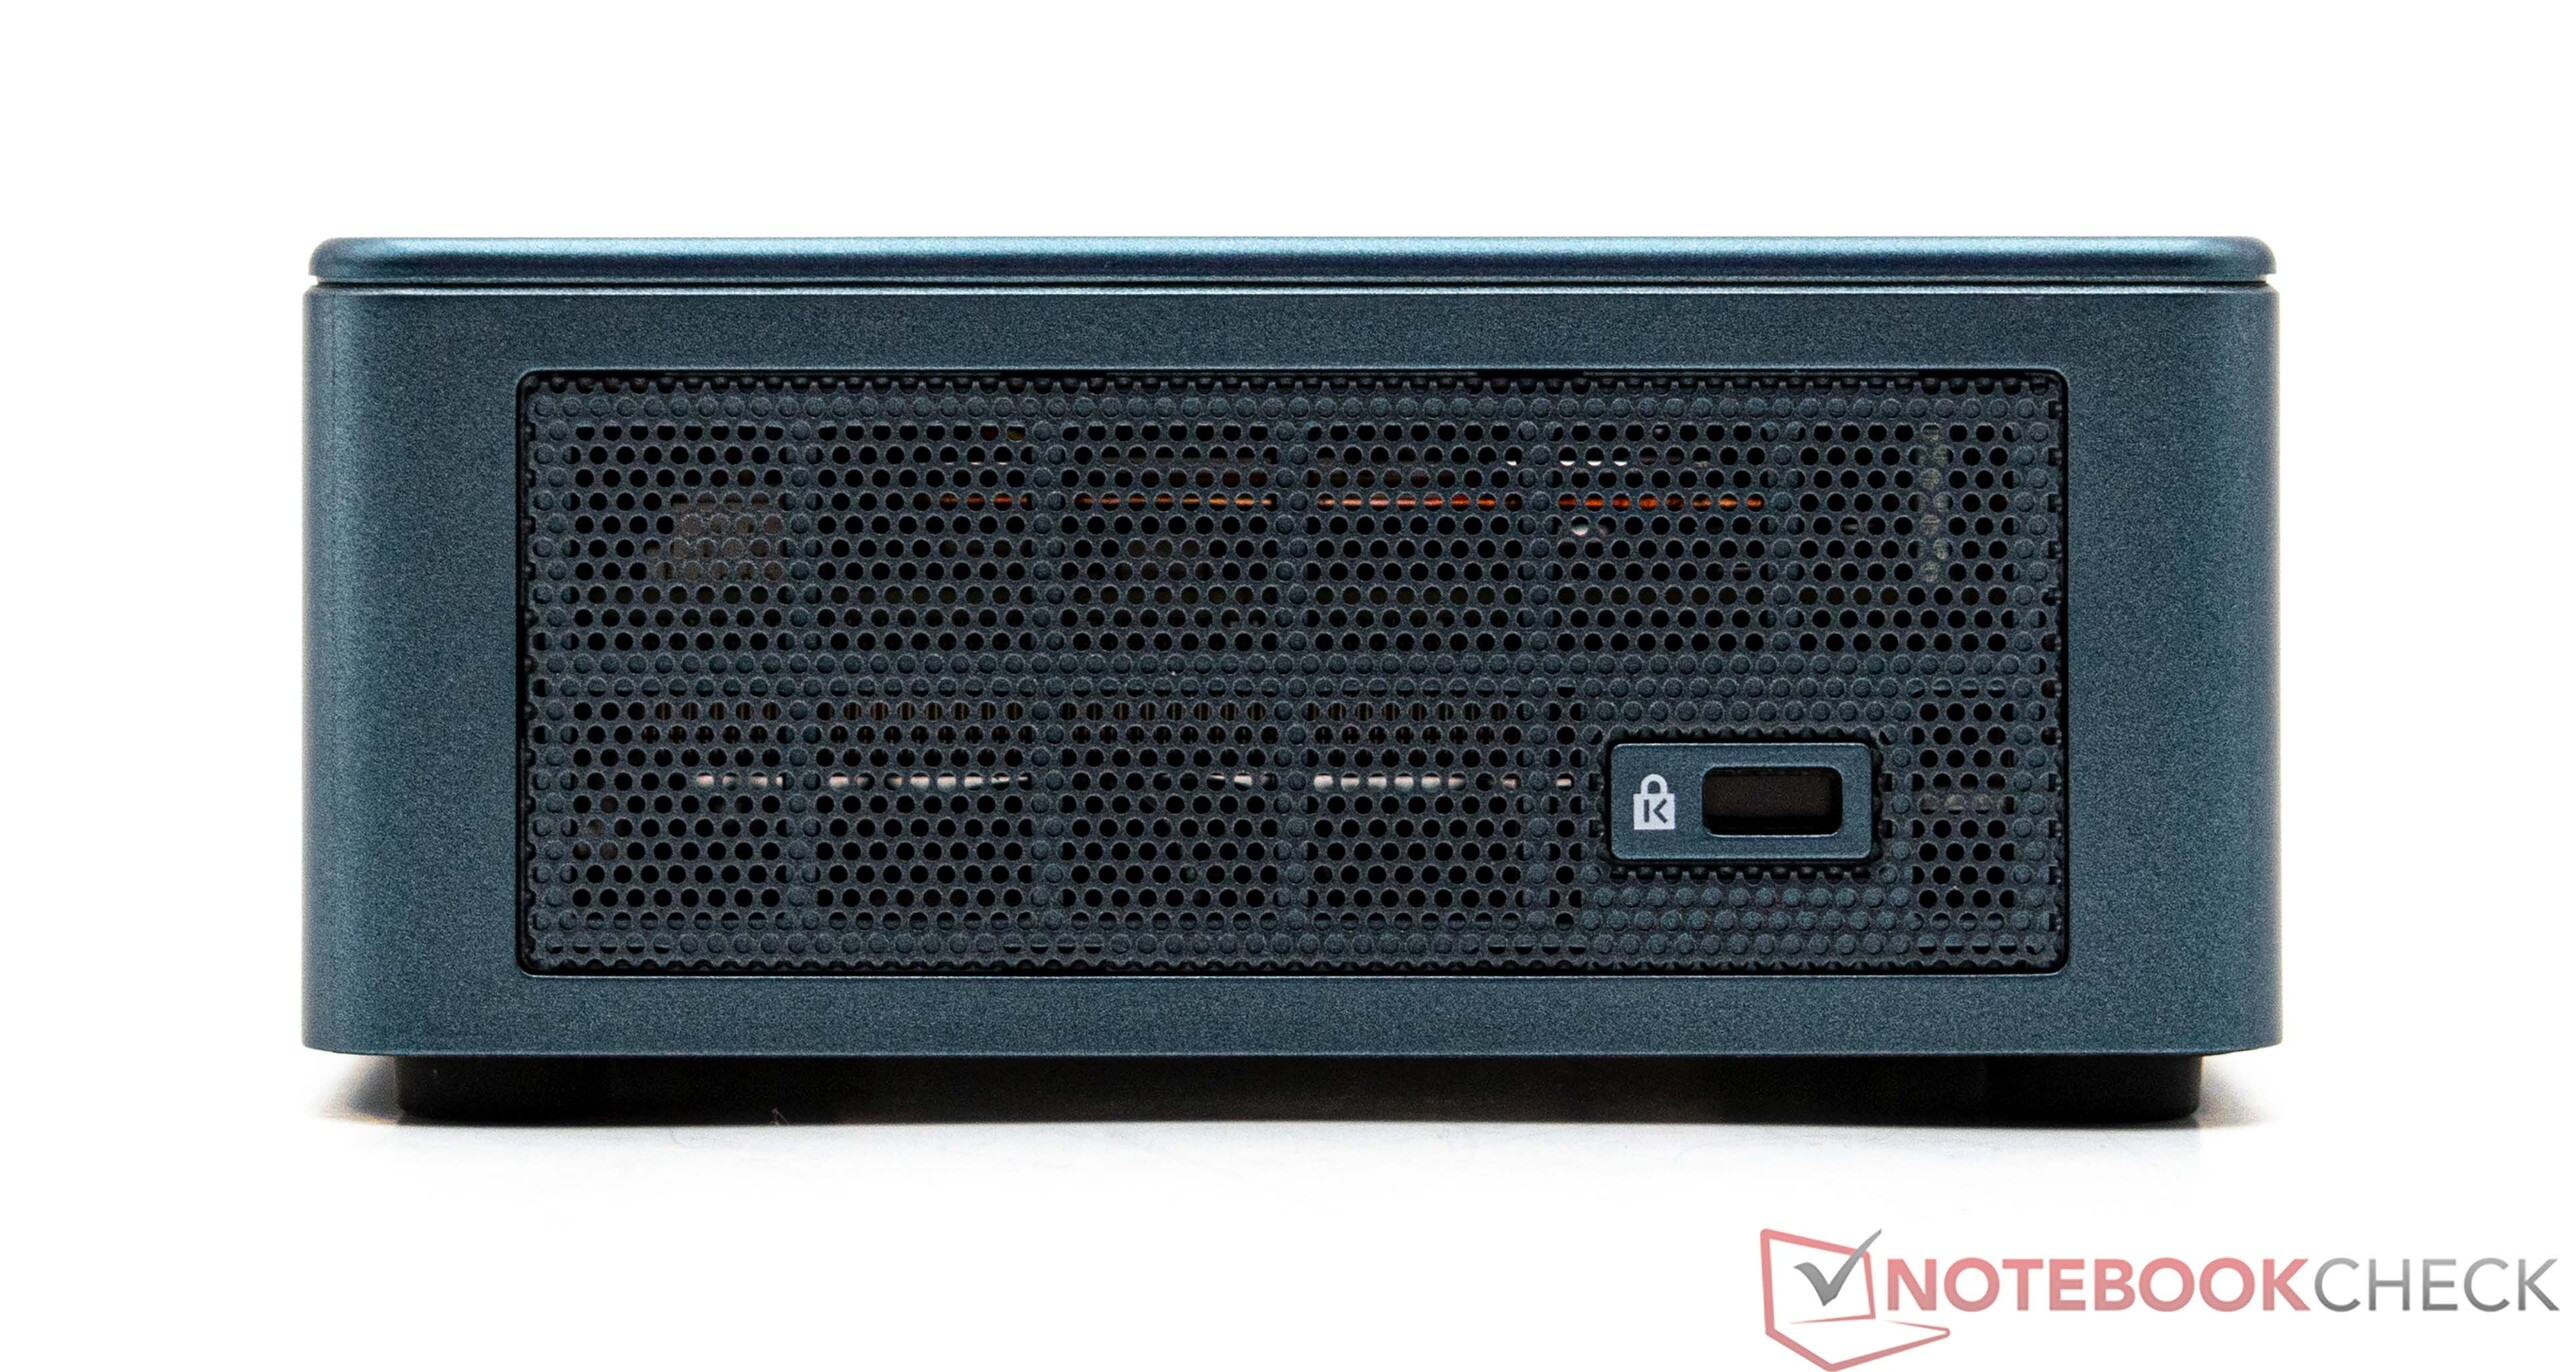
The Geekom Mini IT12 closely resembles Intel NUC devices, opting for a taller design that accommodates the installation of a 2.5-inch data carrier. Unlike Intel's previous "small" and "tall" variants, the Mini IT12 measures a compact 4.6 × 4.4 inches, minimizing desk space. The turquoise-colored housing exudes a high-quality appearance without the vulnerability of scratch-sensitive piano lacquer surfaces. While Geekom maintains the use of plastic for its materials, which is standard compared to the chosen competitors, some manufacturers have embraced complete aluminum housings for a more premium feel. Notably, like many other mini PCs, the Geekom Mini IT12 includes a VESA mount for convenient attachment to a monitor.
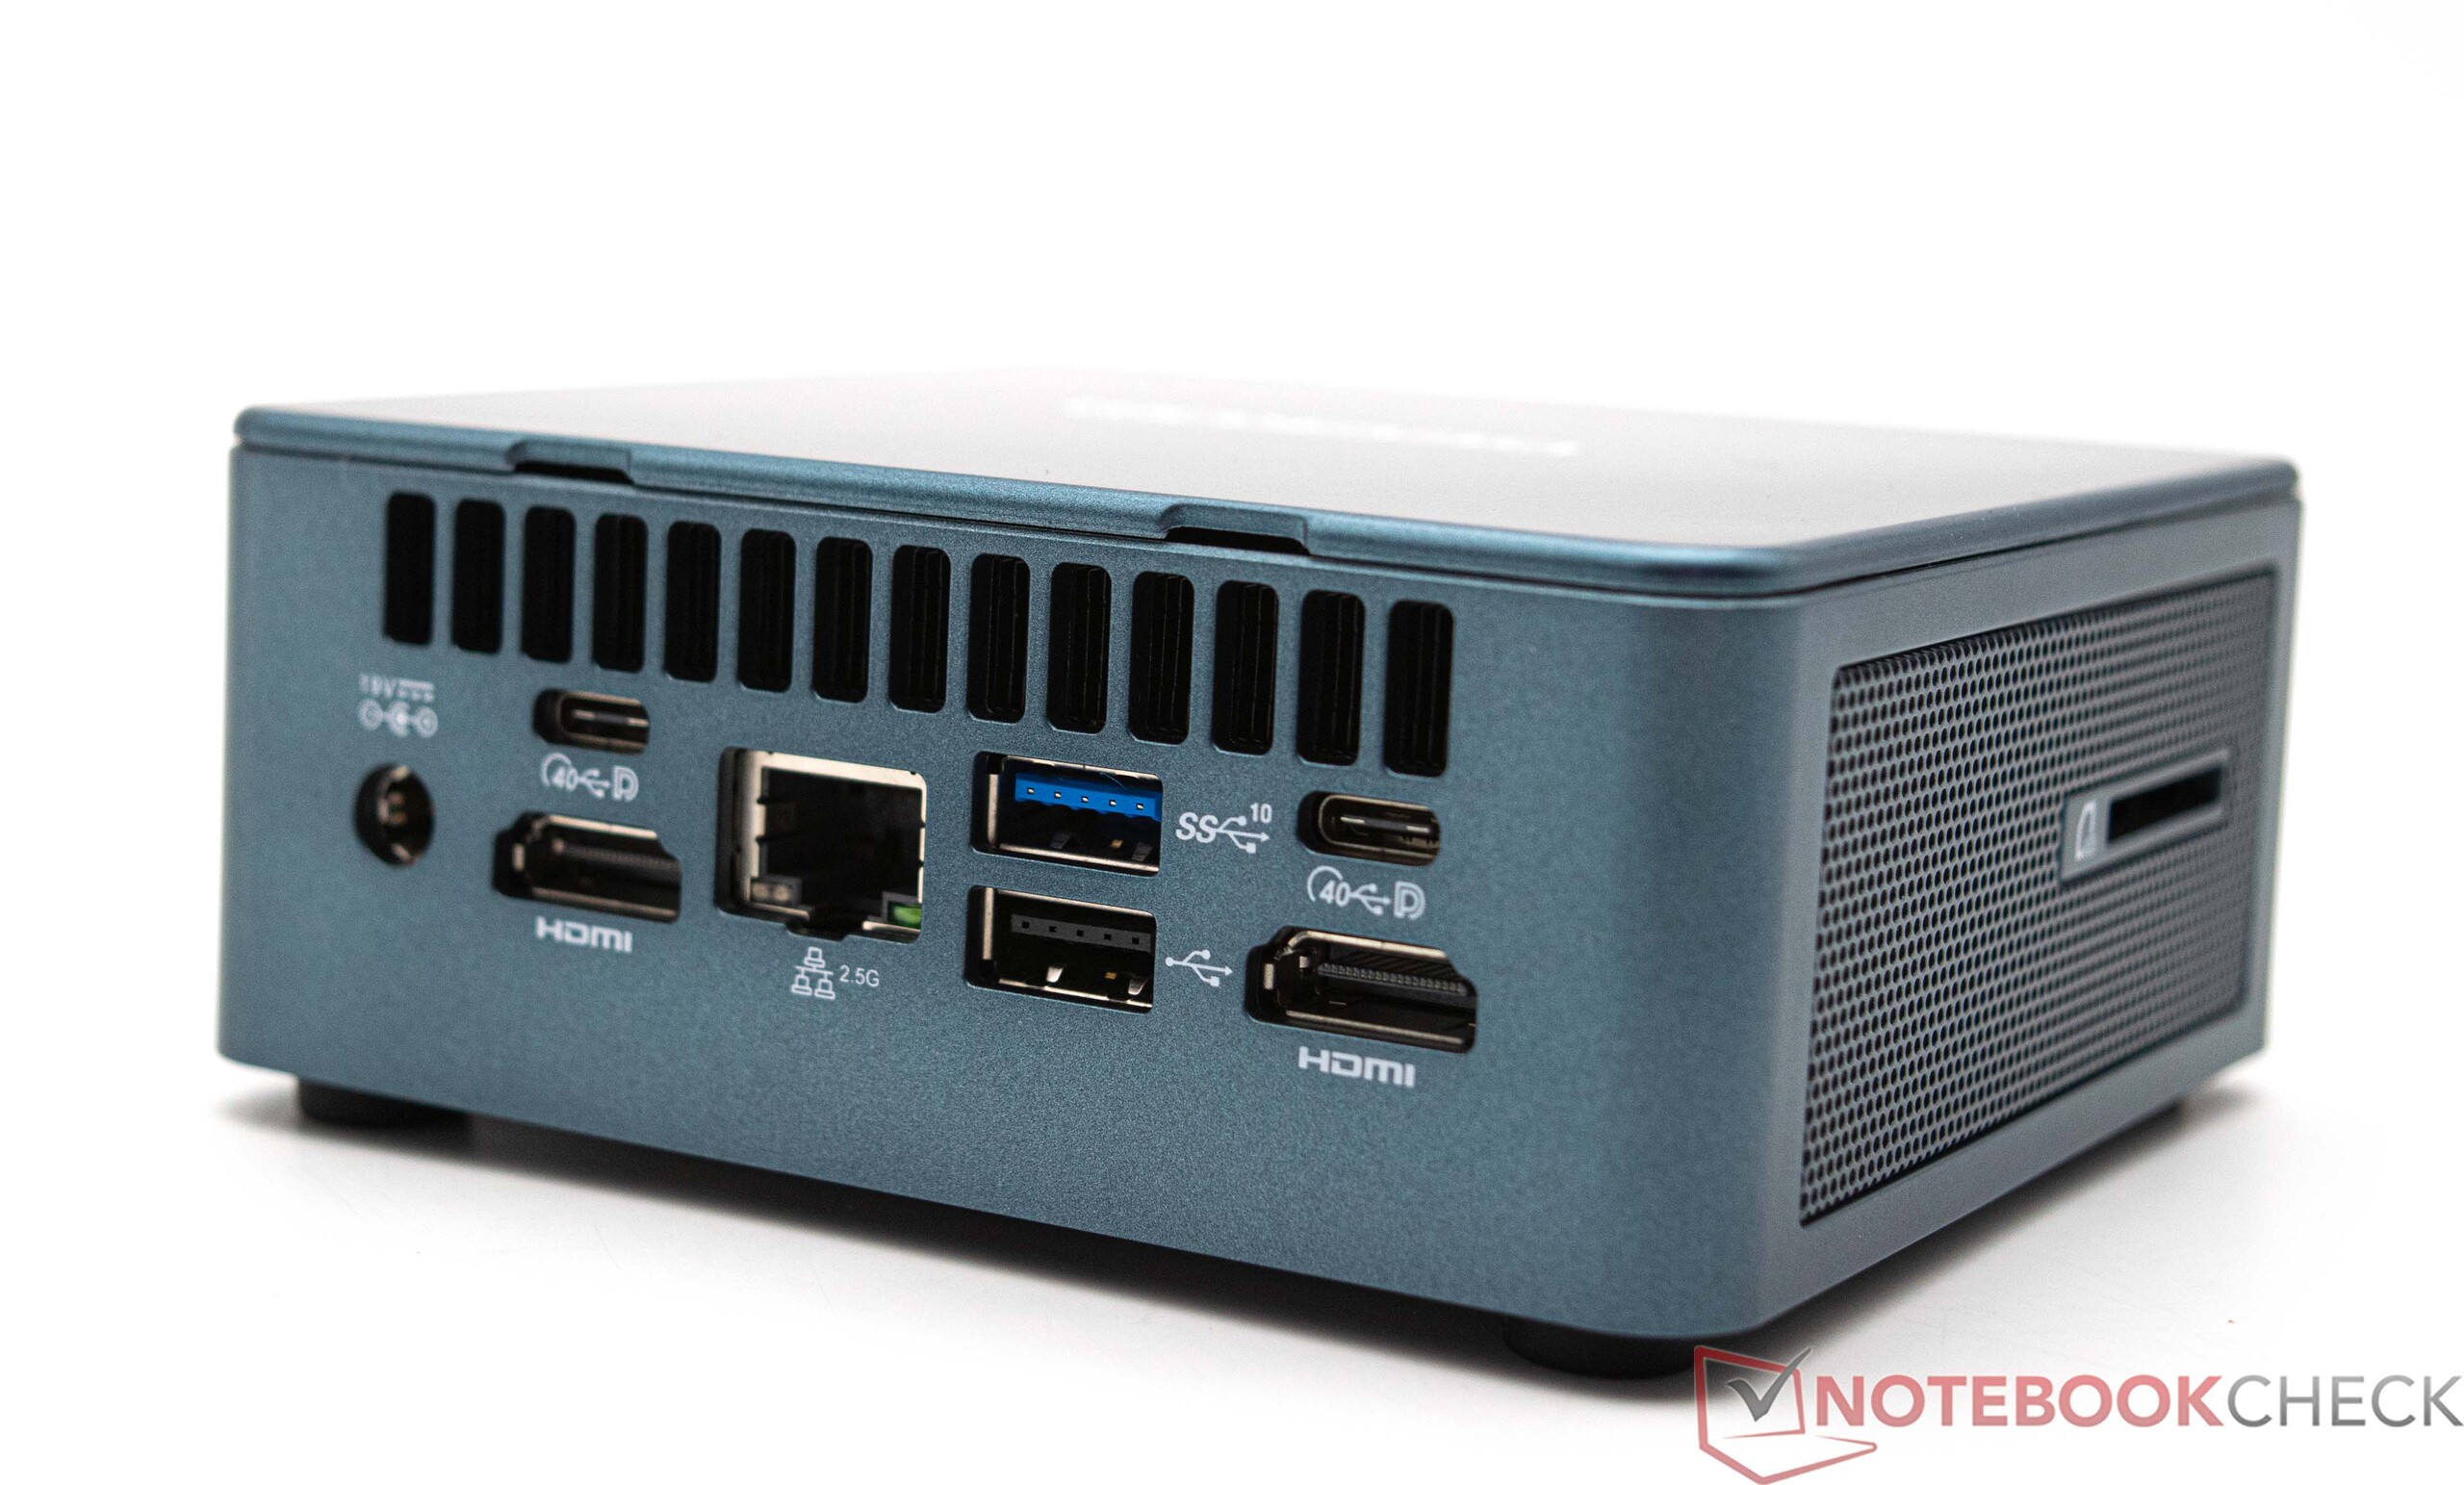
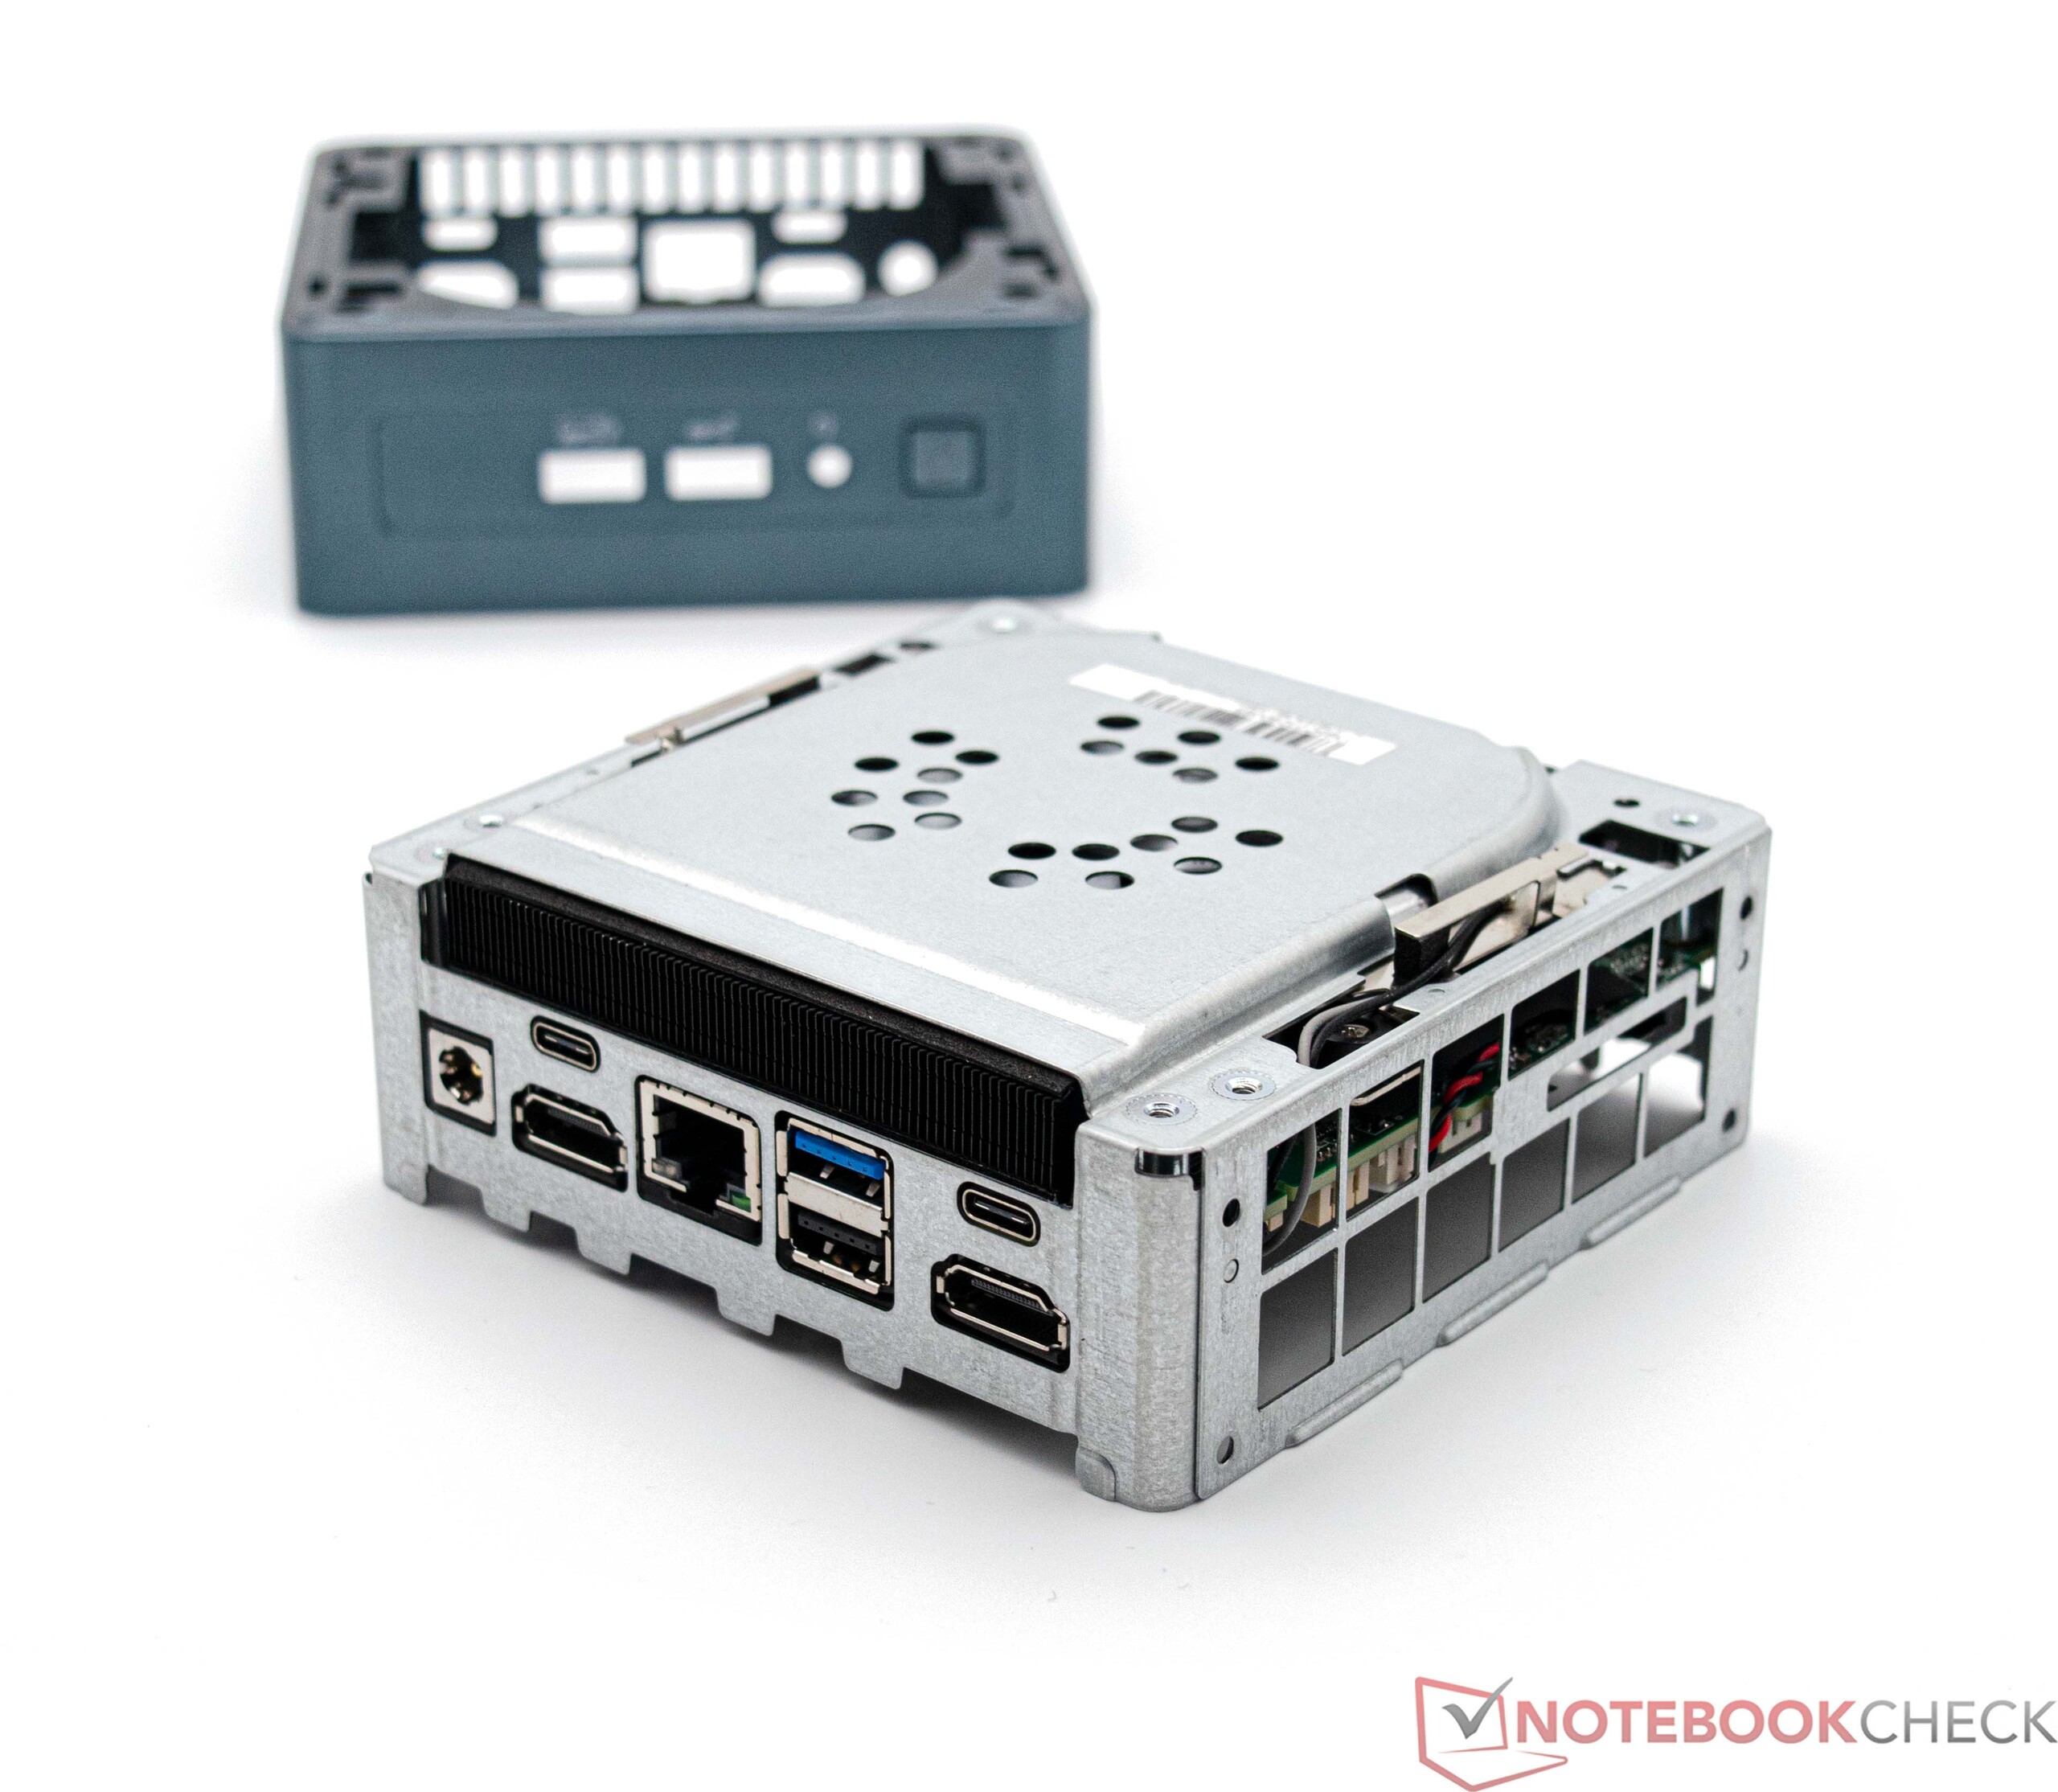
Connectivity
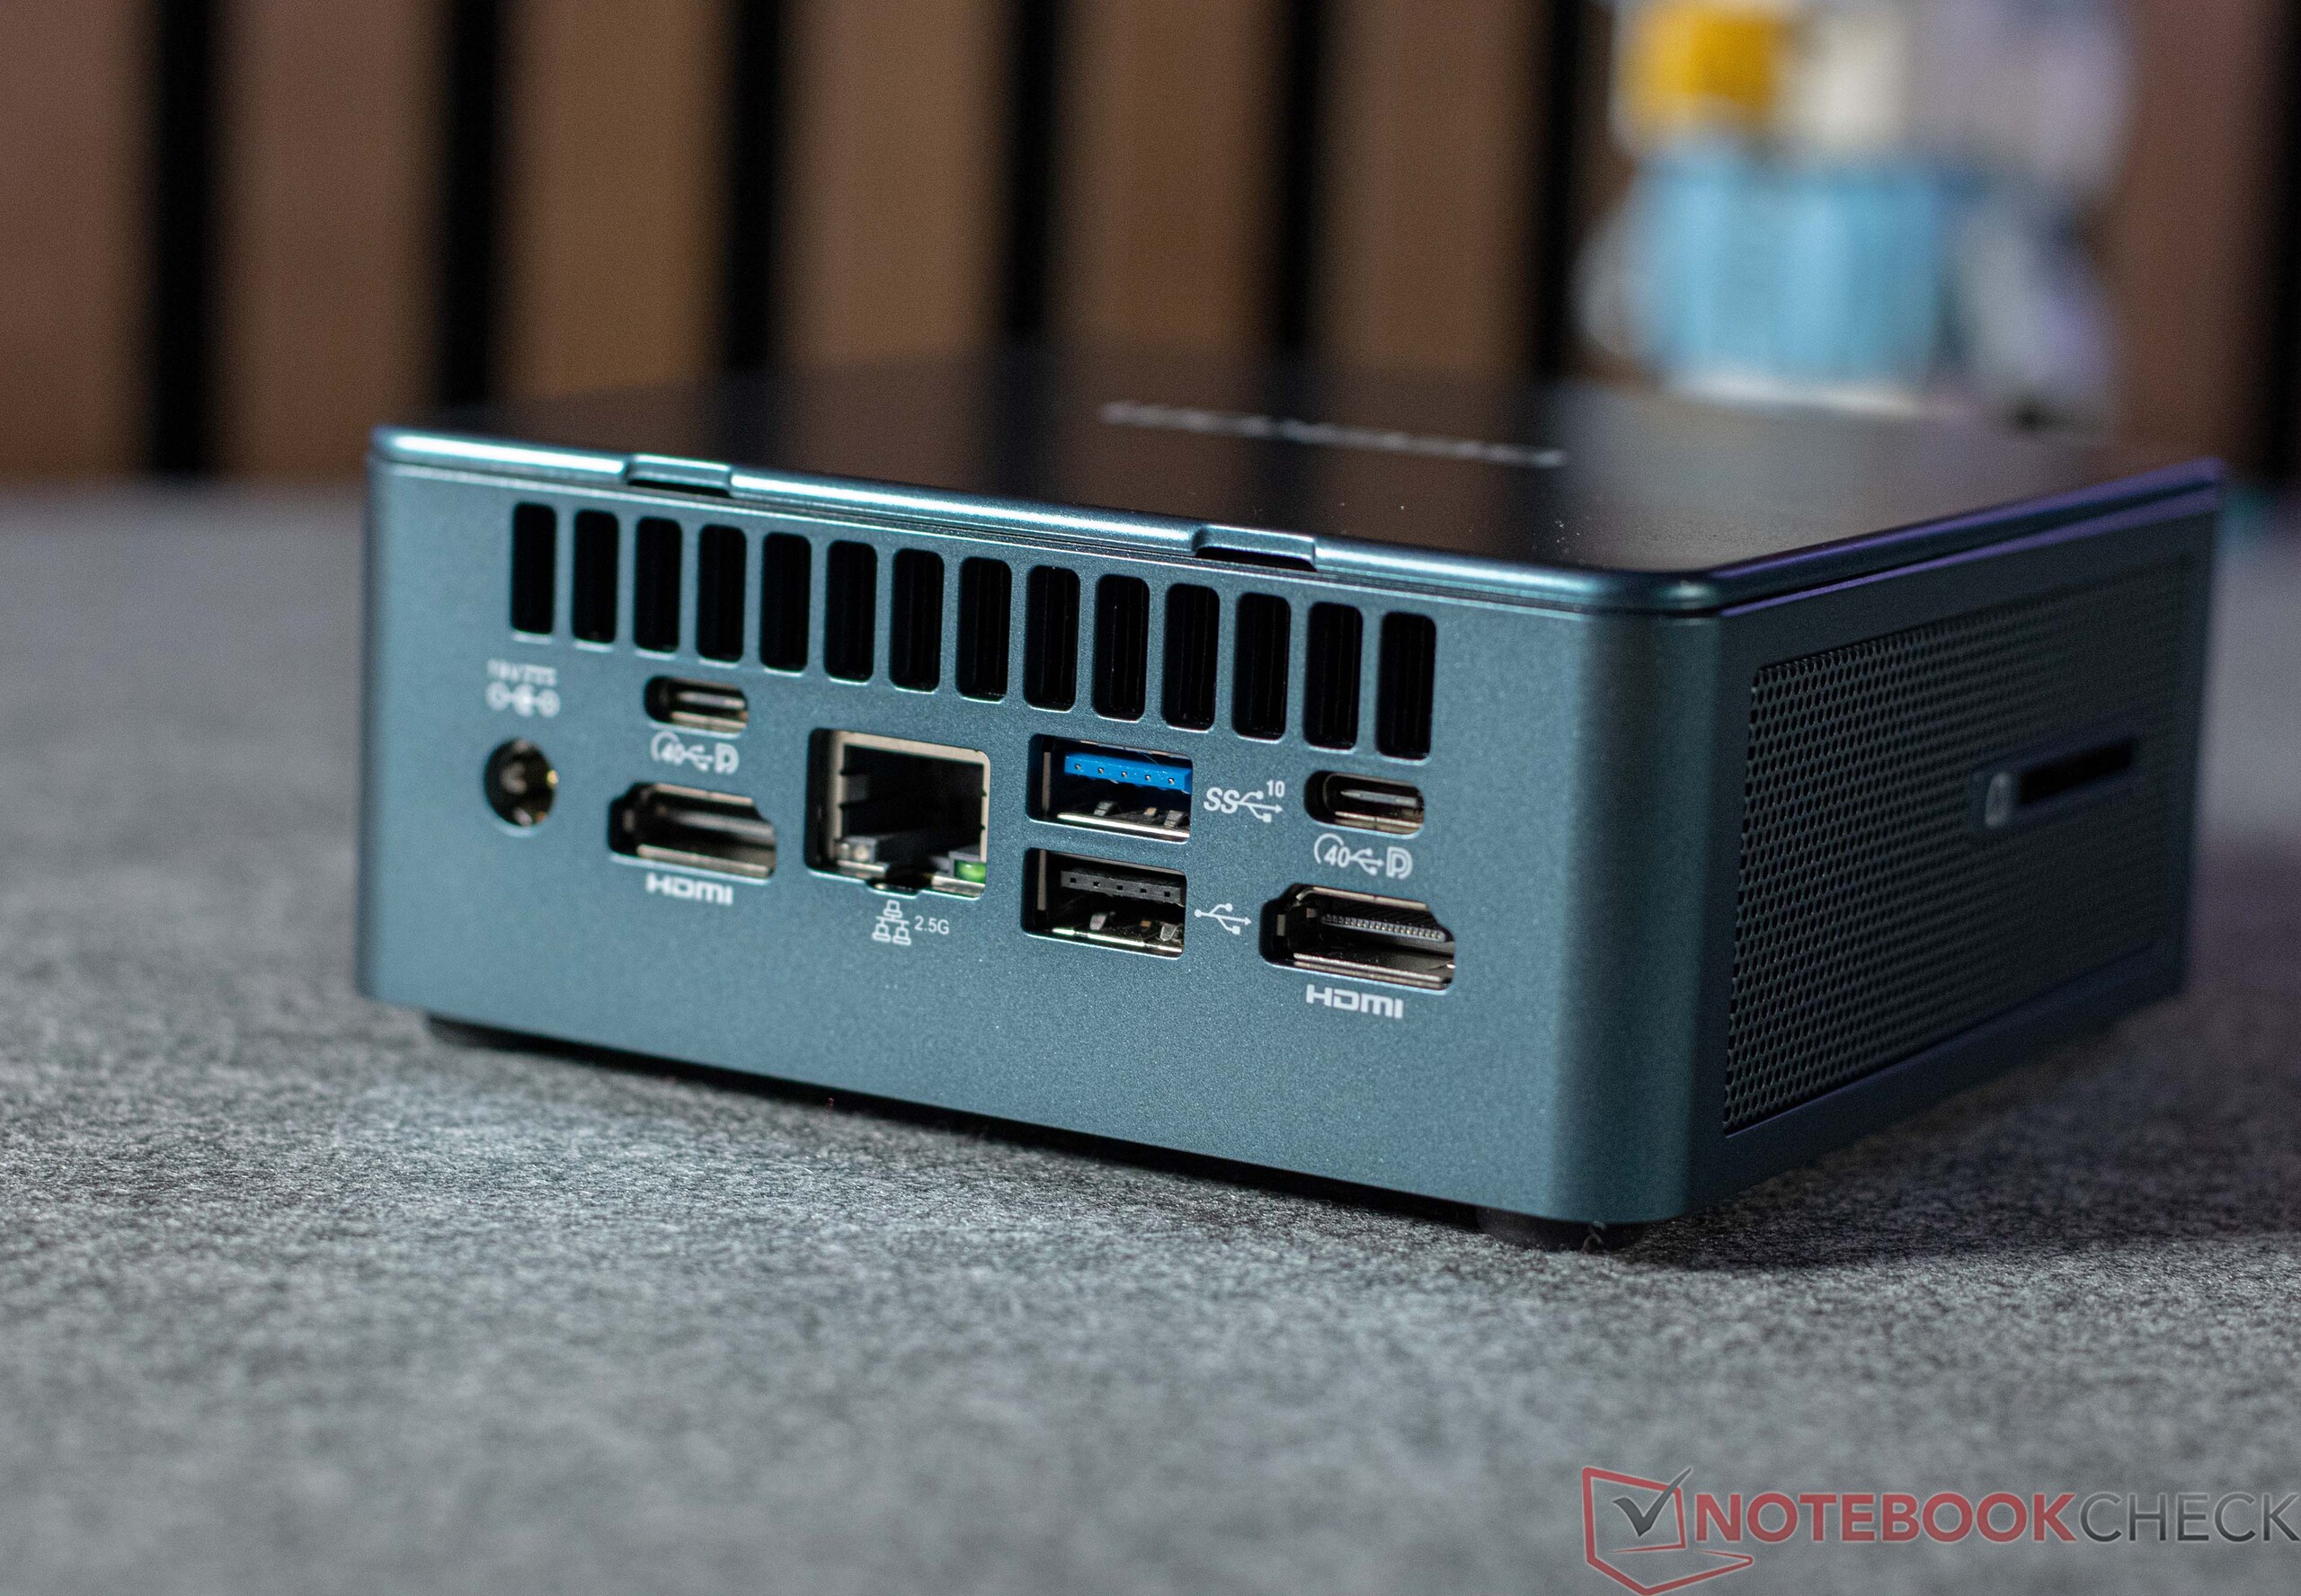
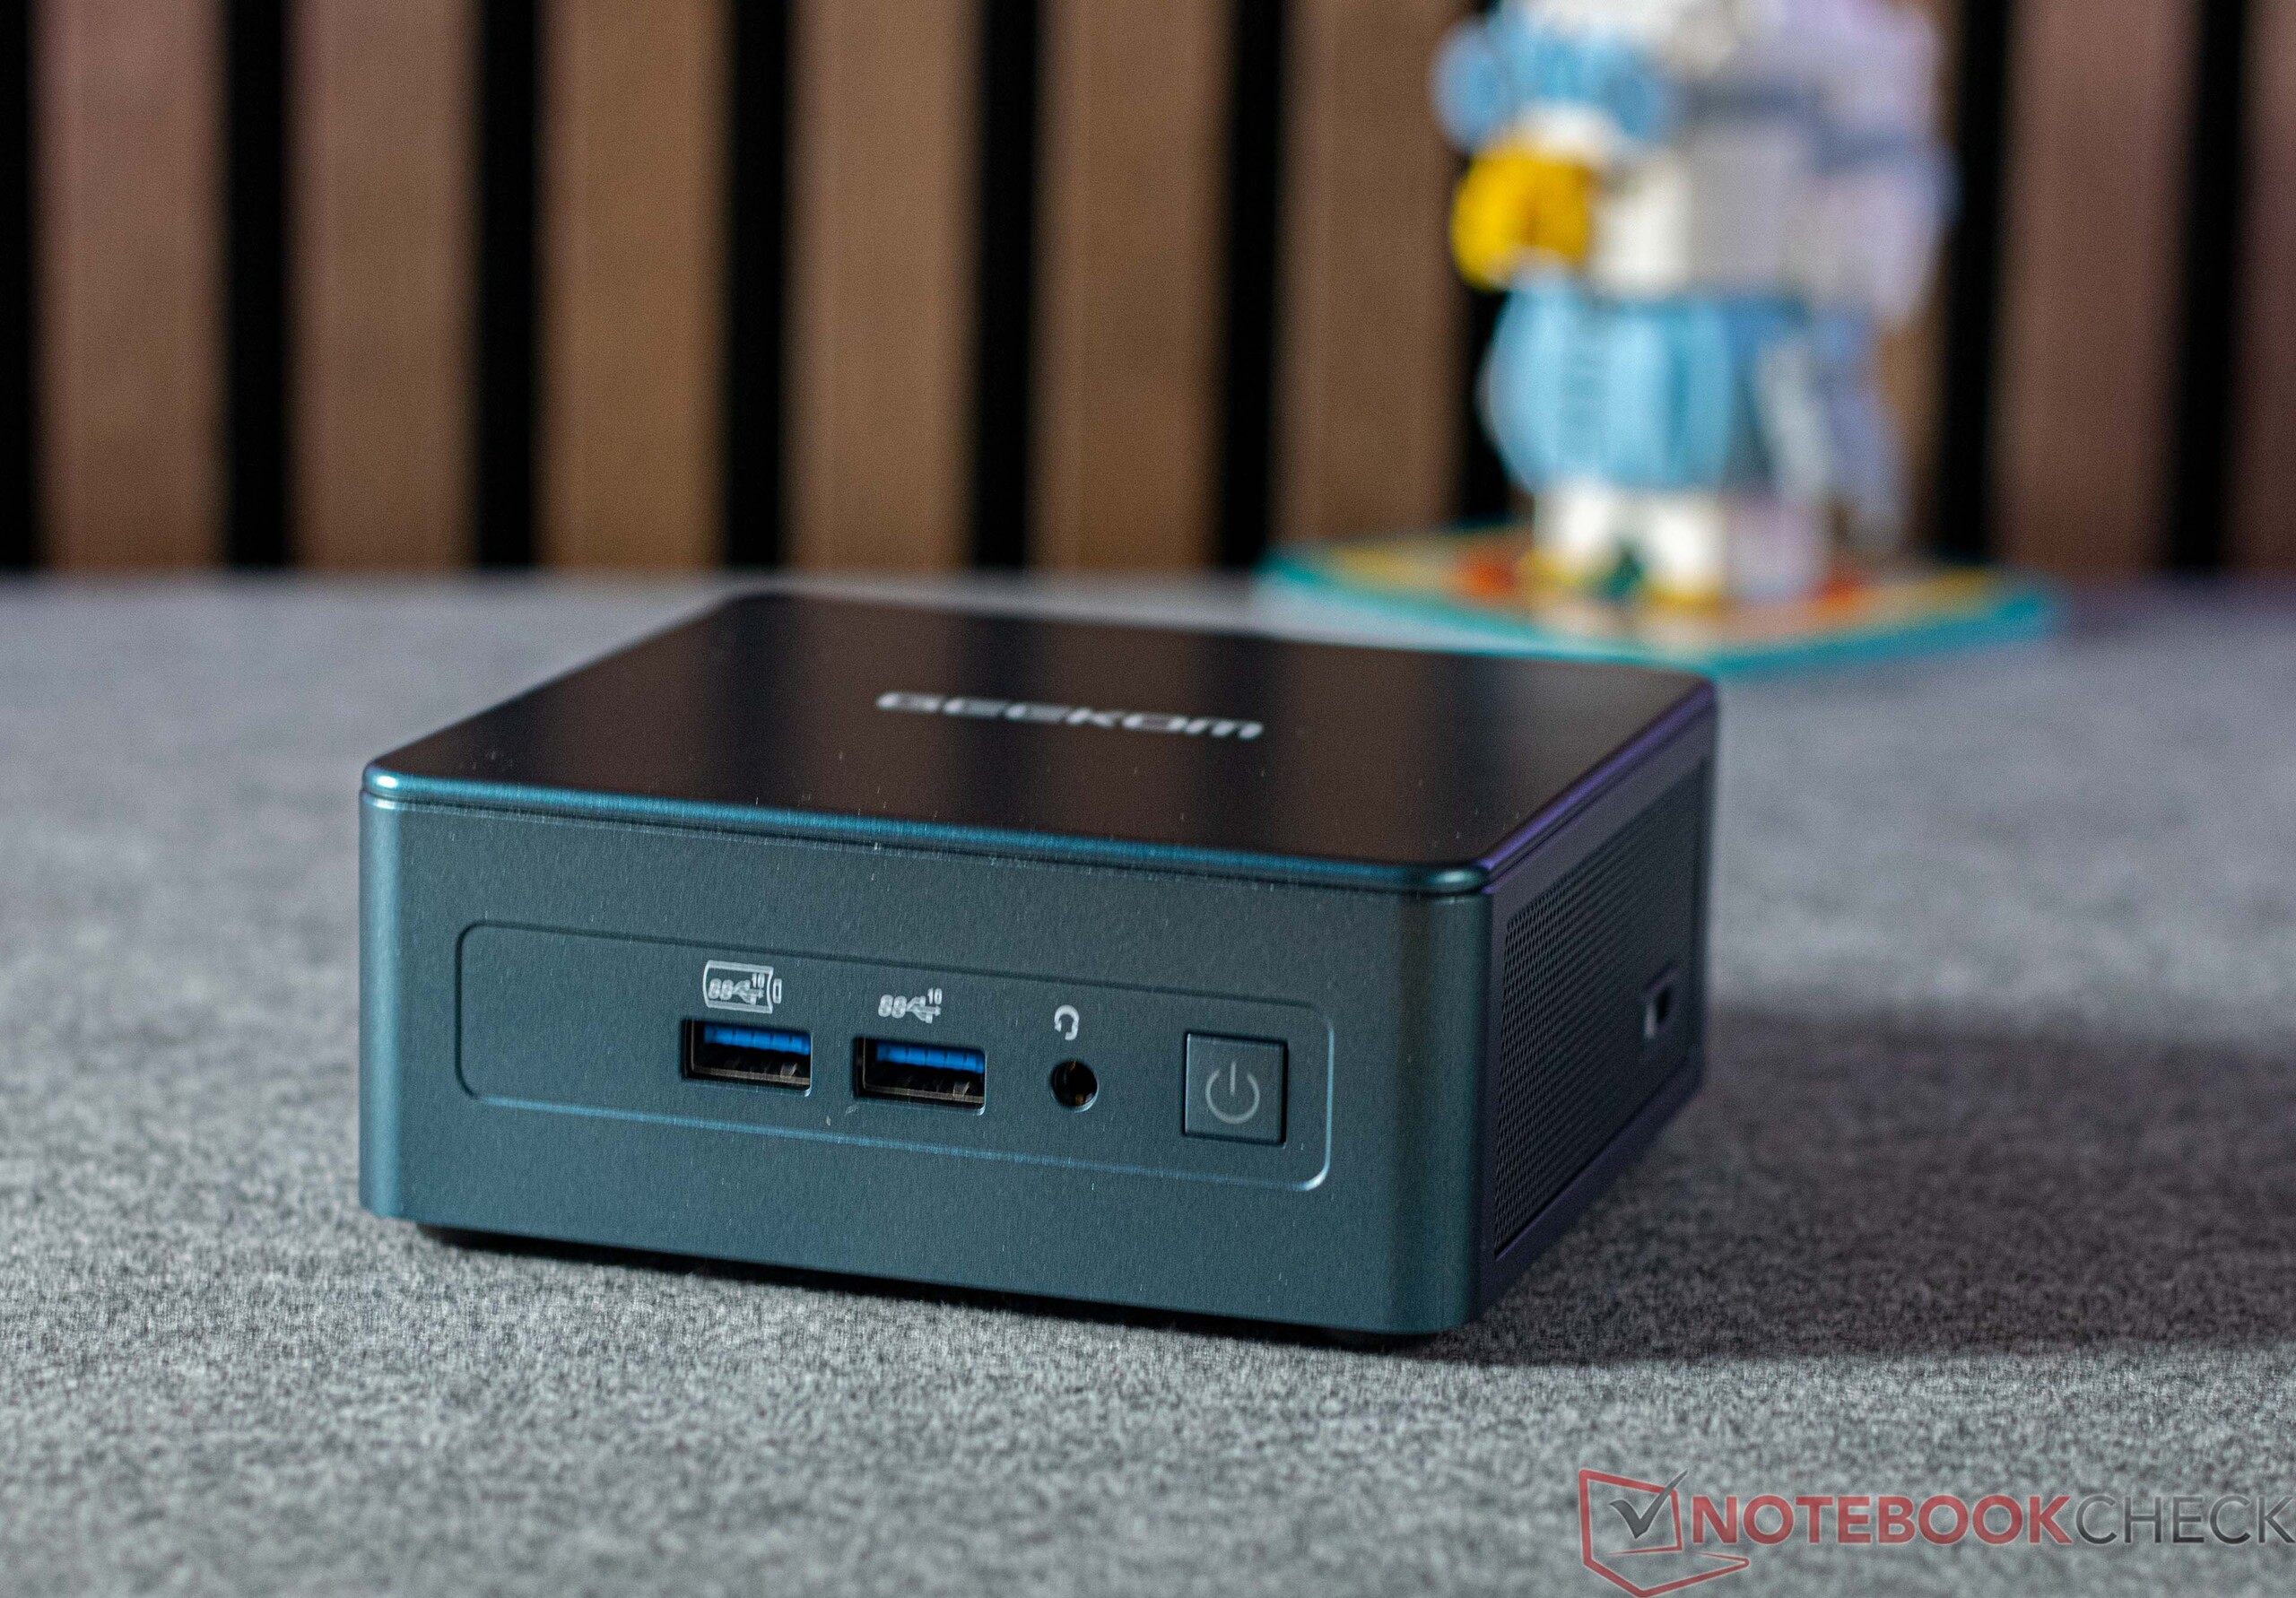
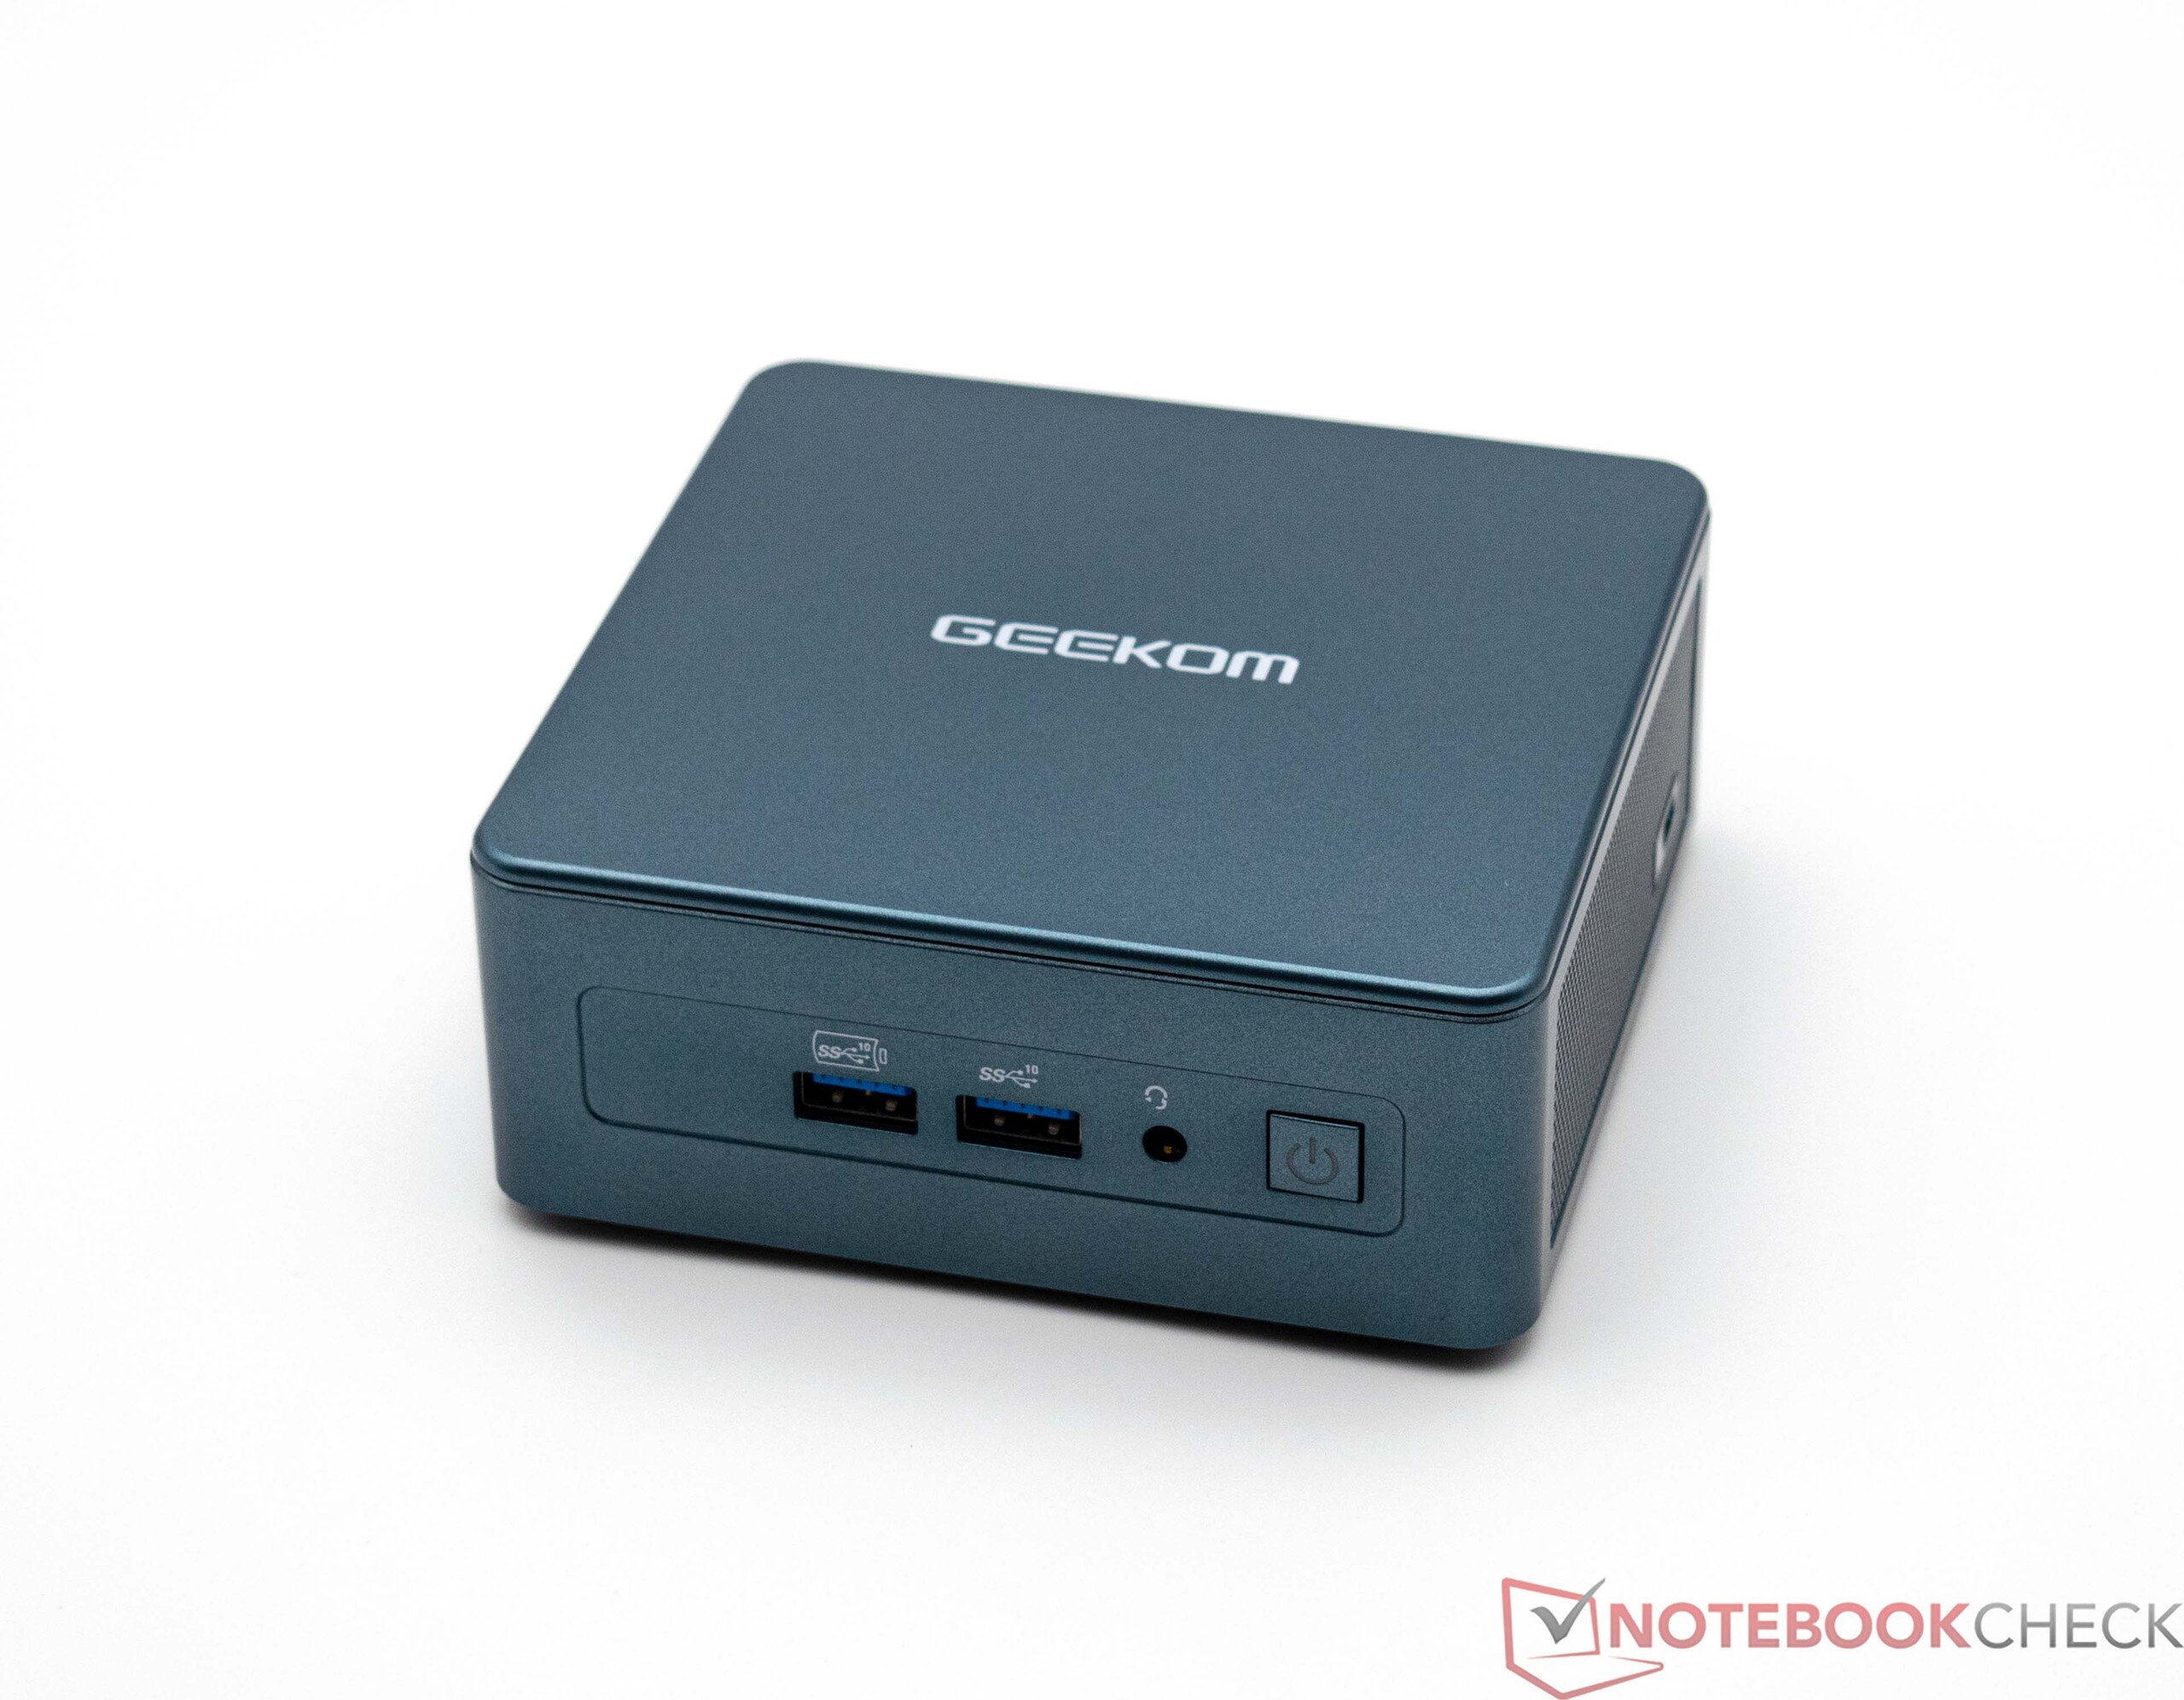
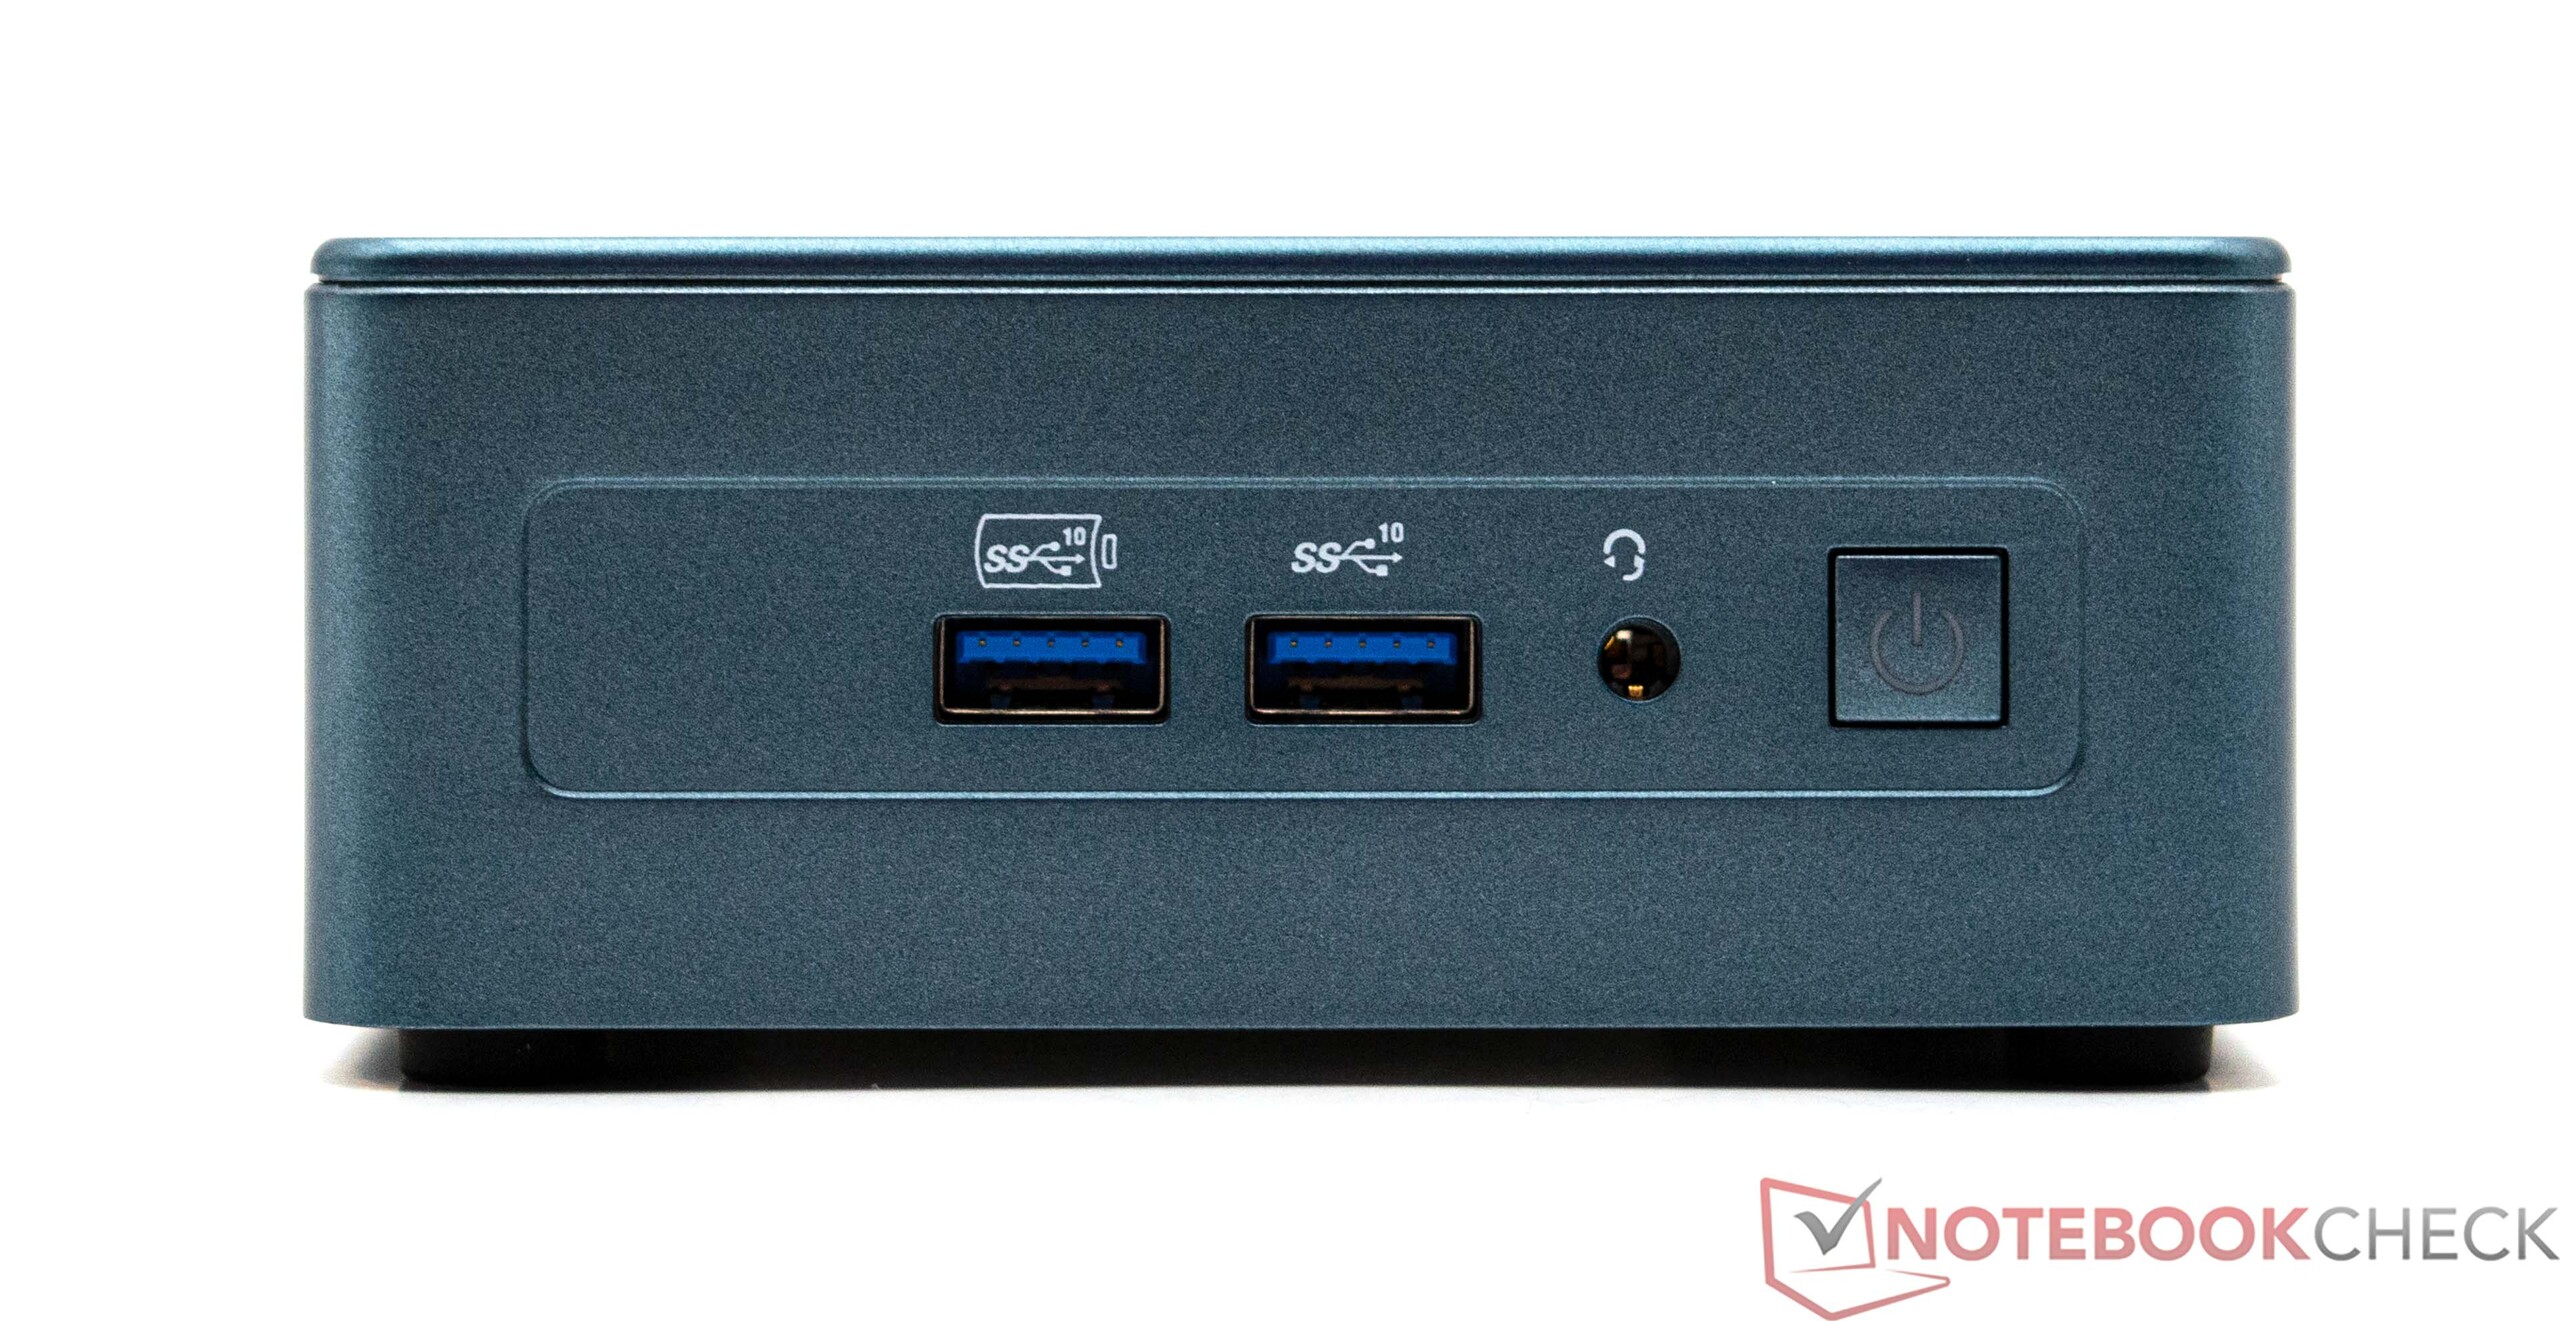
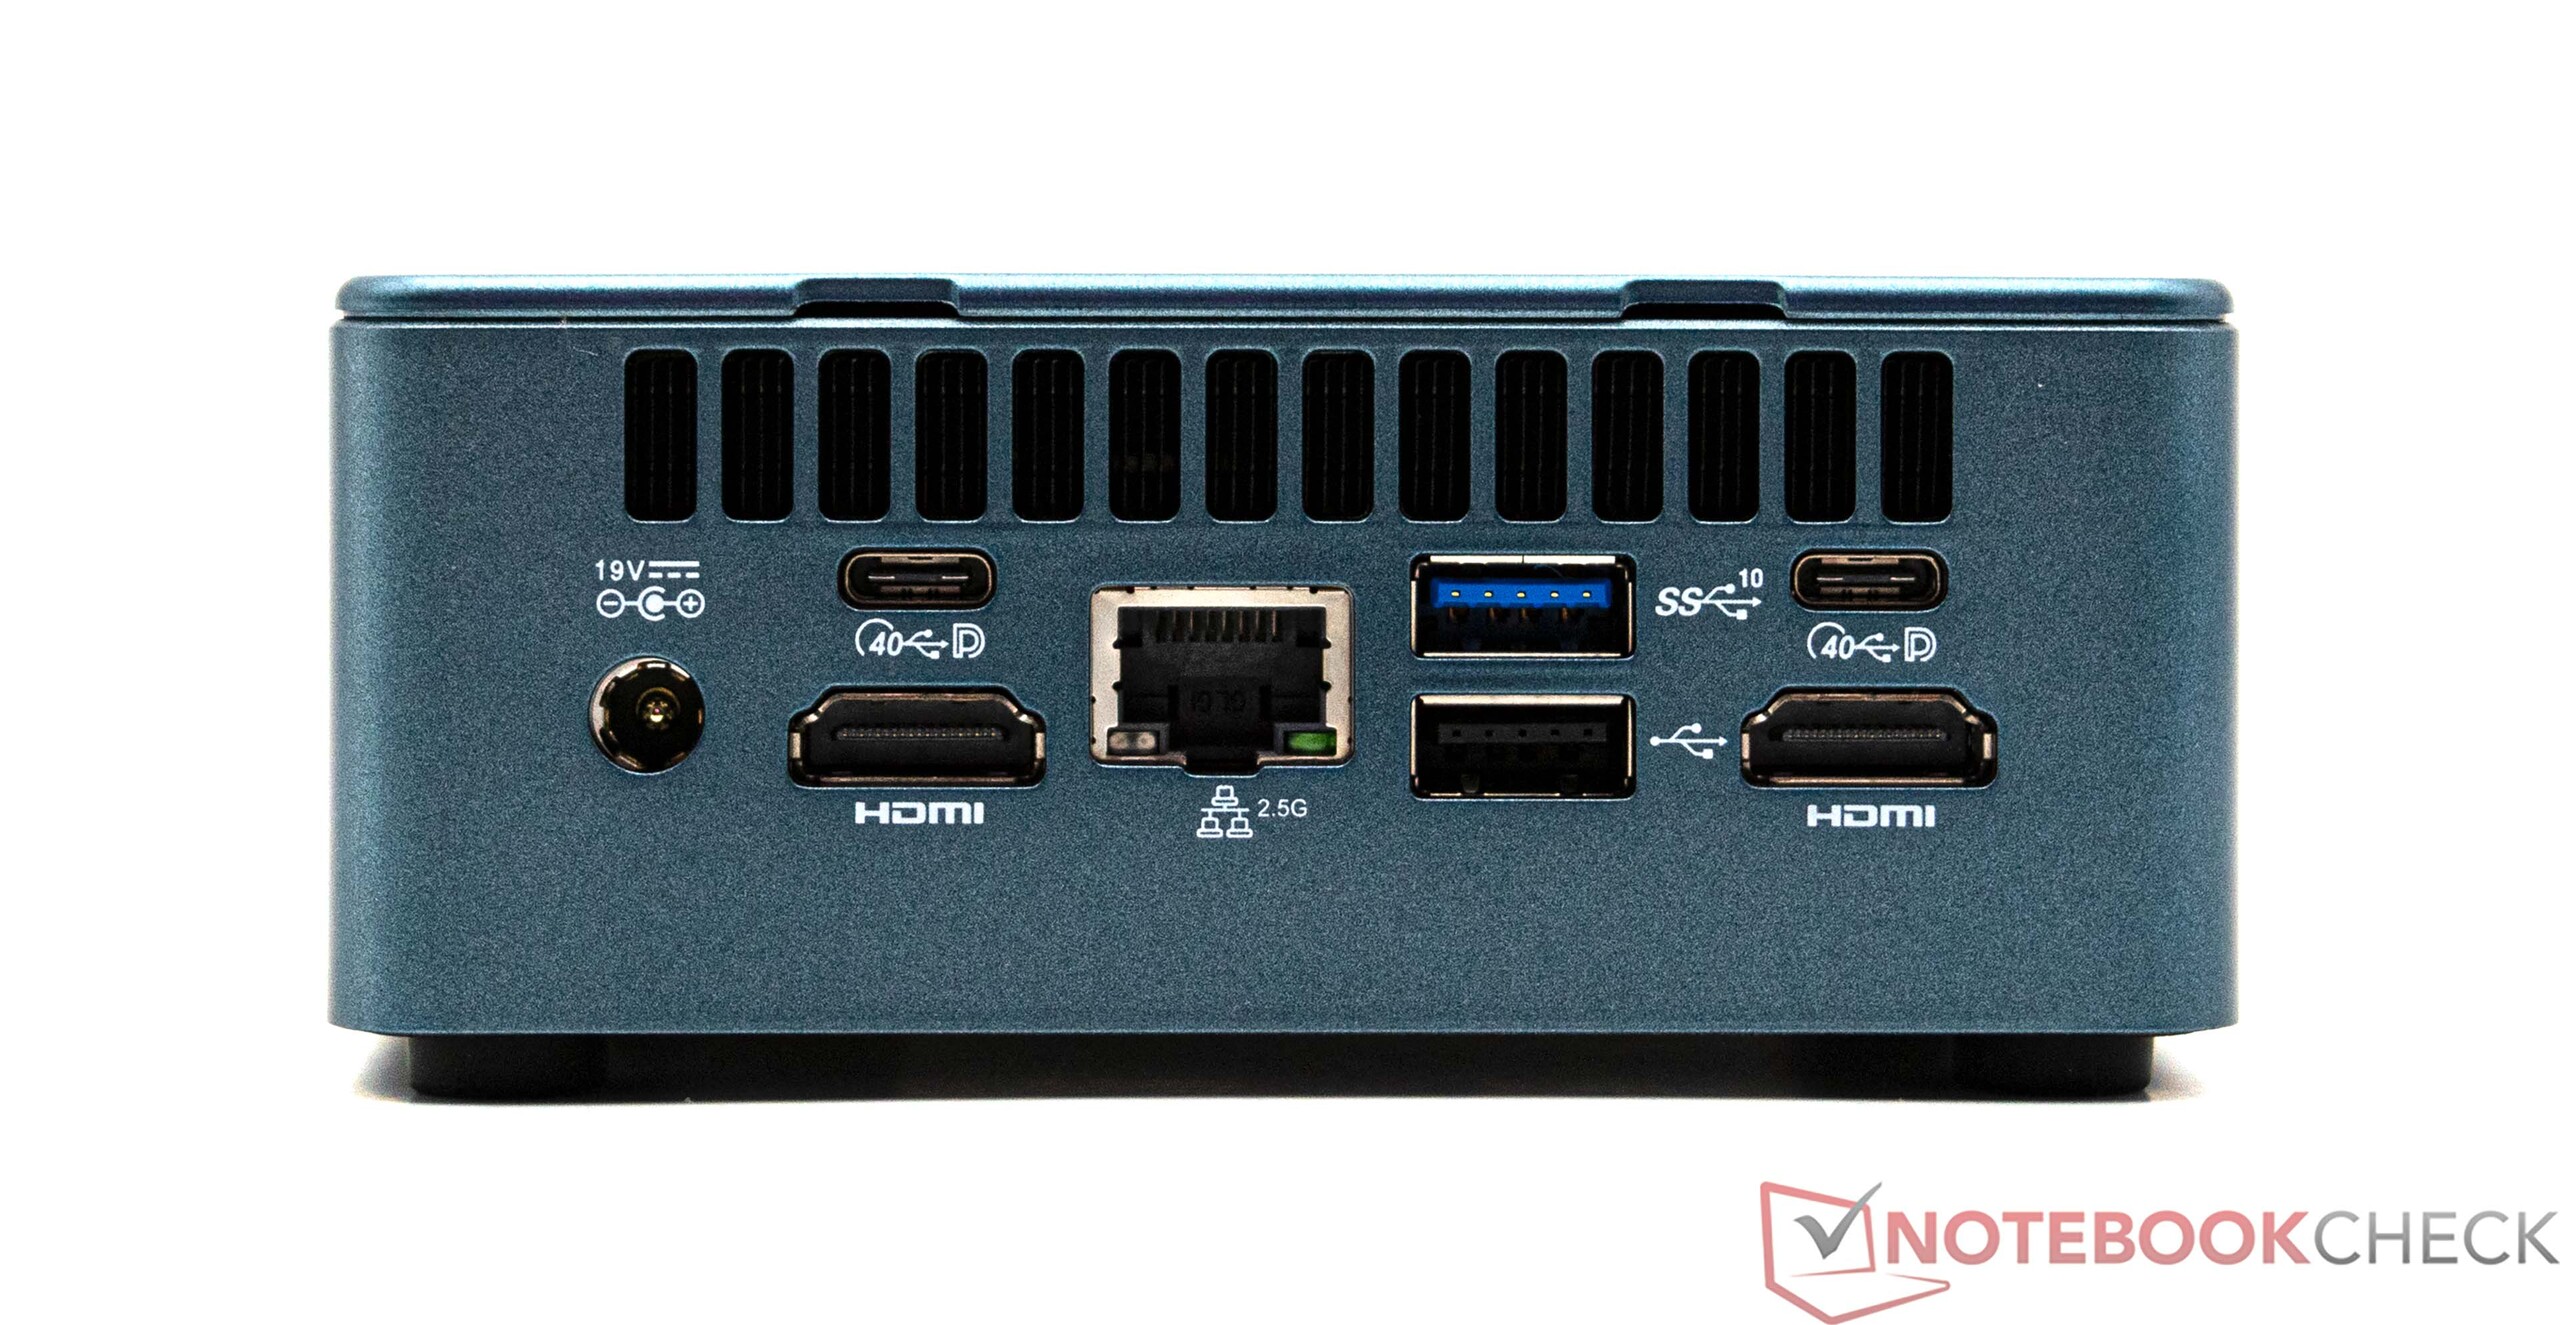
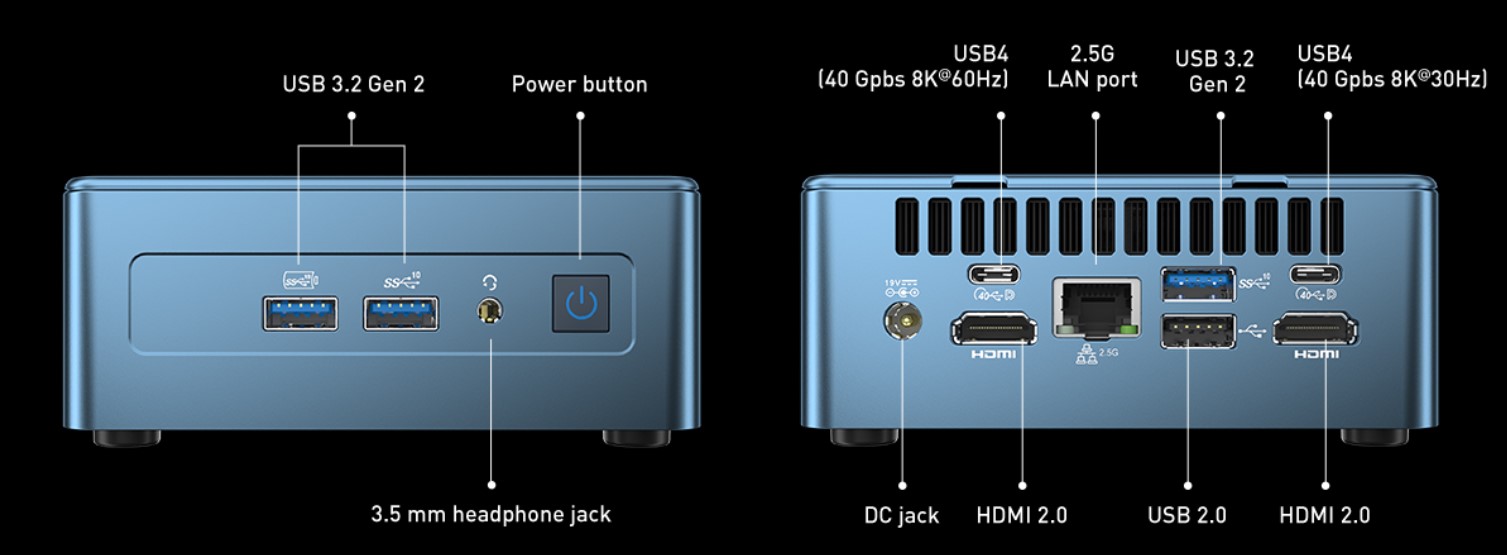
It provides a multitude of connectivity options for external devices. Notably, it supports the operation of up to four screens simultaneously, a feature uncommon in many Mini PCs. The distribution of four type-A USB ports, located both on the front and rear, offers convenient access. Furthermore, the inclusion of two USB 4 ports at the rear allows for the connection of dedicated graphics cards, expanding the Mini IT12's application possibilities. The presence of USB 4 opens up compatibility with various accessories from third-party manufacturers.
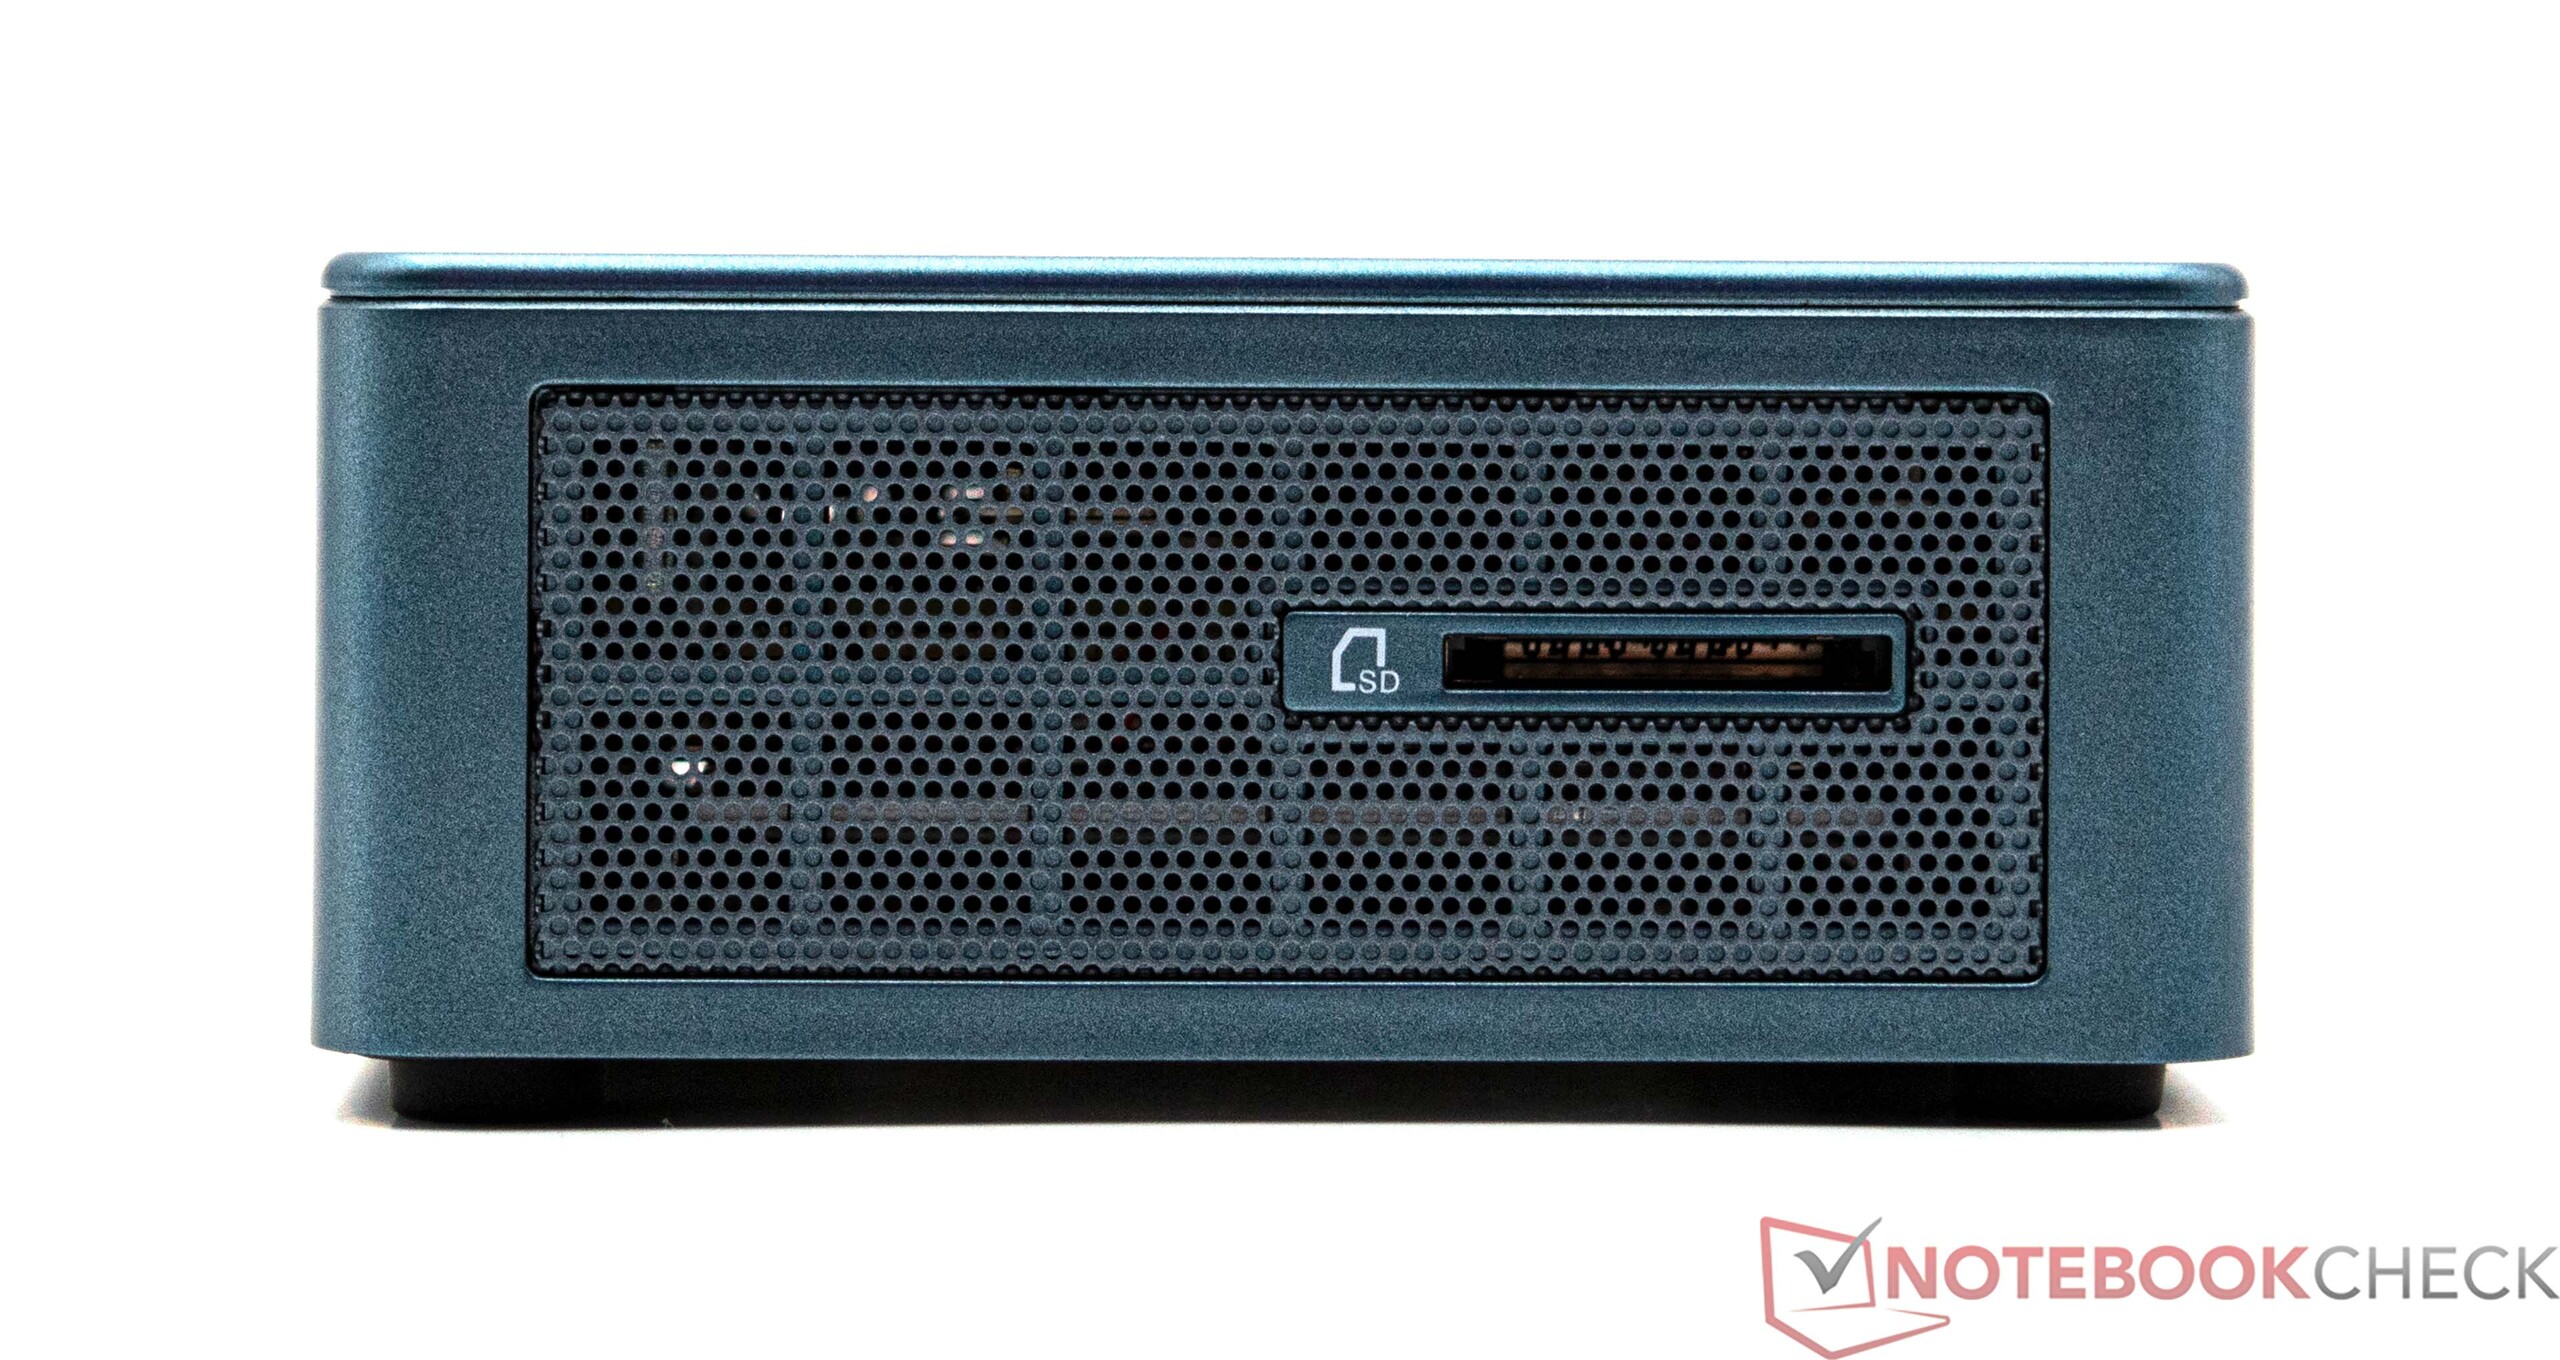
SD Card Reader
The Geekom Mini IT12 features an SD card reader capable of delivering impressive performance. When paired with our reference memory card (Angelbird SD Card AV PRO UHS-II 128GB V60), transfer rates well exceeding 100 MB/s are achieved. It's worth noting that a memory card with UHS-II support is required to fully harness this performance.
| SD Card Reader | |
| average JPG Copy Test (av. of 3 runs) | |
| Intel Beast Canyon NUC (AV Pro SD microSD 128 GB V60) | |
| Intel Dragon Canyon NUC | |
| Geekom Mini IT12 (AV Pro SD microSD 128 GB V60) | |
| Geekom Mini IT12 (AV Pro SD microSD 128 GB V60) | |
| Average of class Mini PC (17.3 - 214, n=23, last 2 years) | |
| Zotac ZBOX Magnus EN173070C (AV Pro SD microSD 128 GB V60) | |
| Geekom MiniAir 11 Special Edition (AV Pro SD microSD 128 GB V60) | |
| maximum AS SSD Seq Read Test (1GB) | |
| Intel Beast Canyon NUC (AV Pro SD microSD 128 GB V60) | |
| Intel Dragon Canyon NUC | |
| Geekom Mini IT12 (AV Pro SD microSD 128 GB V60) | |
| Geekom Mini IT12 (AV Pro SD microSD 128 GB V60) | |
| Average of class Mini PC (17.9 - 250, n=23, last 2 years) | |
| Zotac ZBOX Magnus EN173070C (AV Pro SD microSD 128 GB V60) | |
| Geekom MiniAir 11 Special Edition (AV Pro SD microSD 128 GB V60) | |
Communication
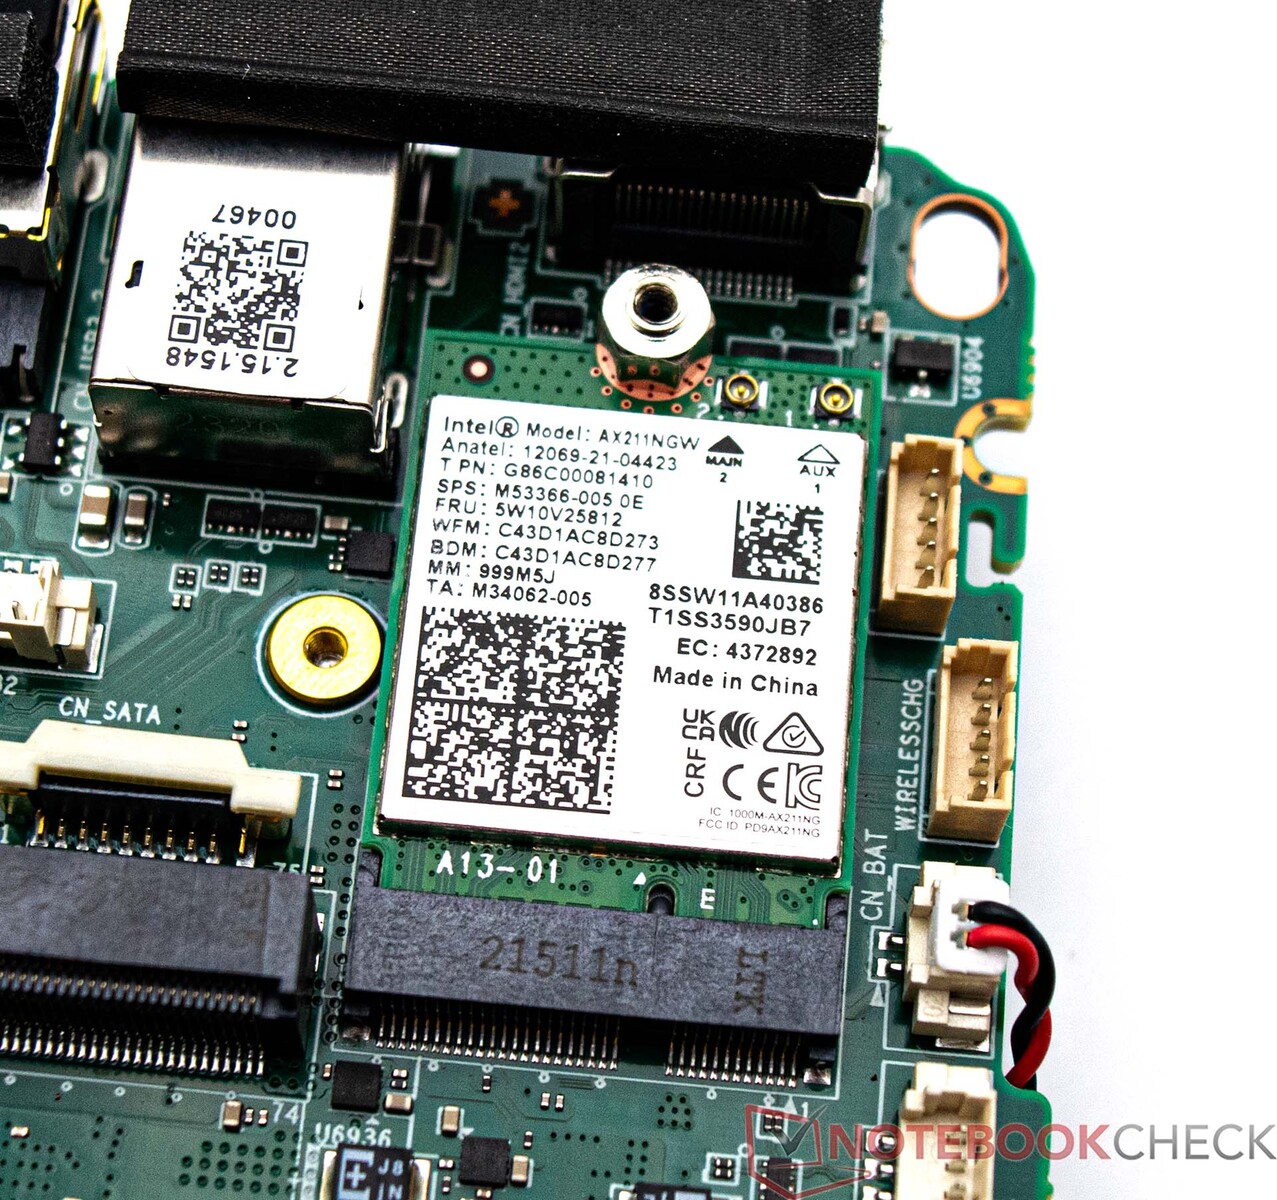
Geekom has incorporated a modern Wi-Fi 6E-AX211 module from Intel into the Mini IT12. The test results indicate that the performance does not meet the expected standards. In both the 5 GHz and 6 GHz bands, the measured data transmission and reception rates are lower than those achieved by competitors with the same WLAN module. It's important to note that our testing utilized the Asus ROG Rapture GT-AXE11000 router.
Accessories
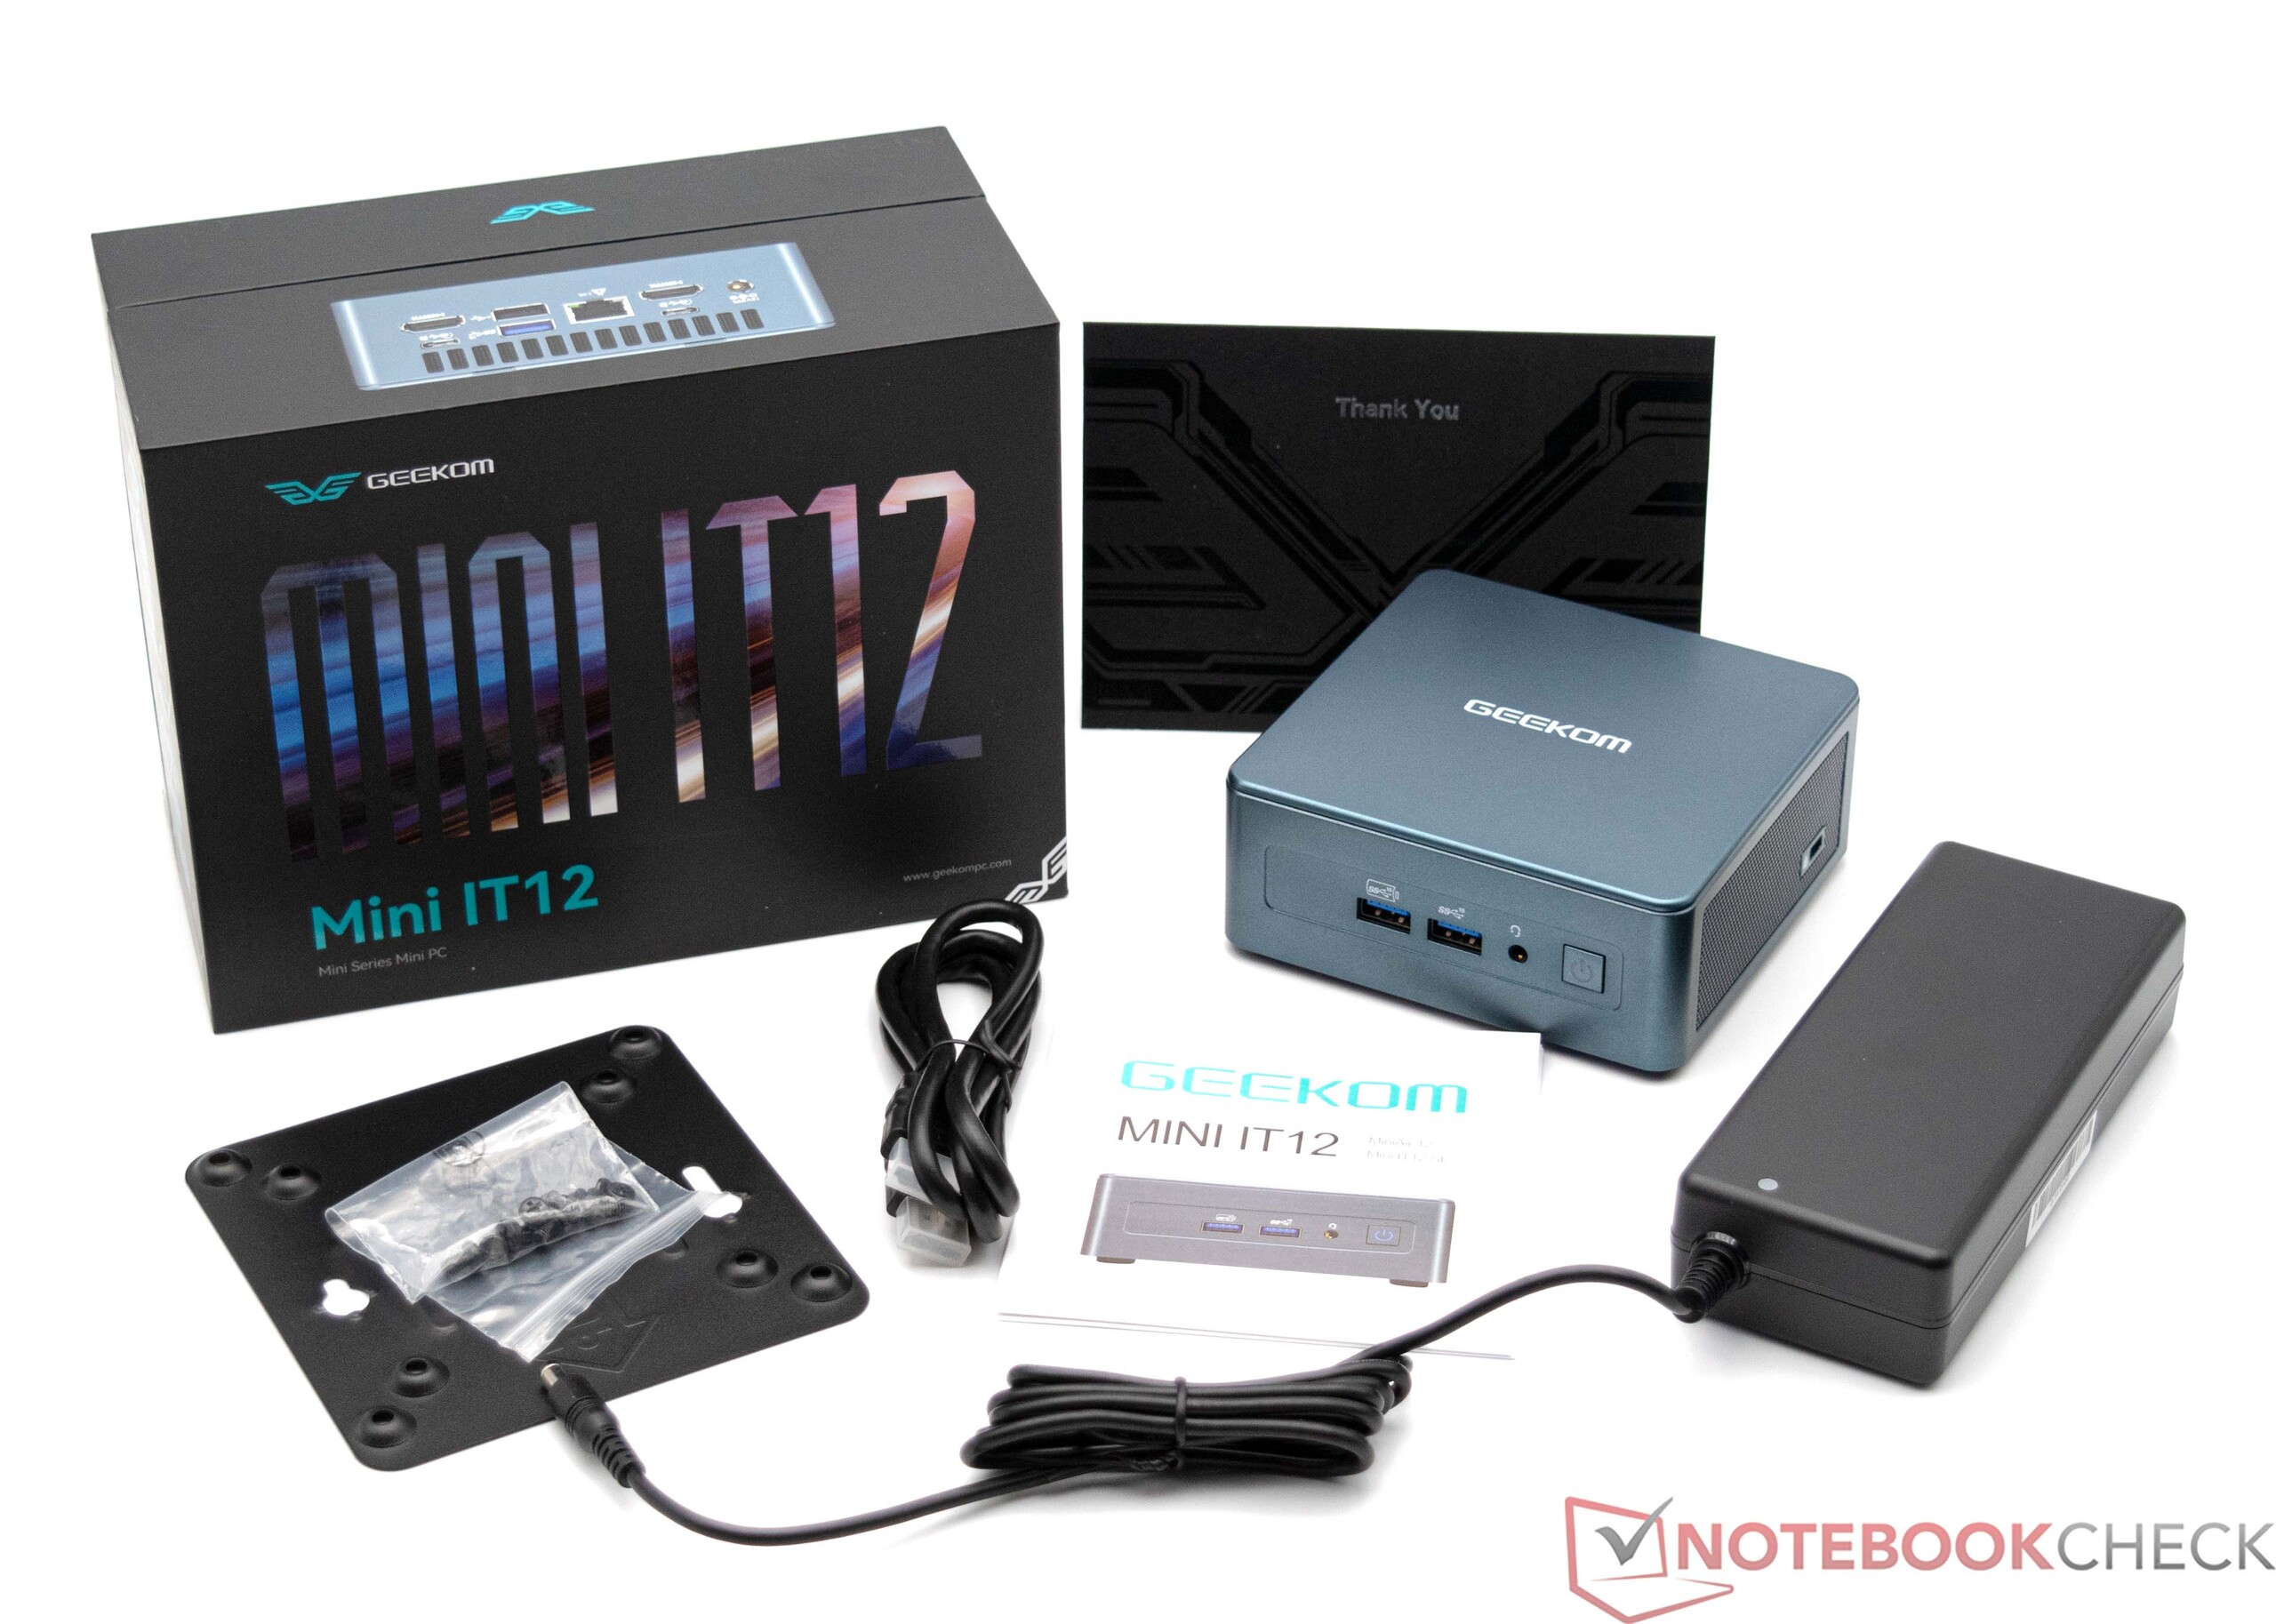
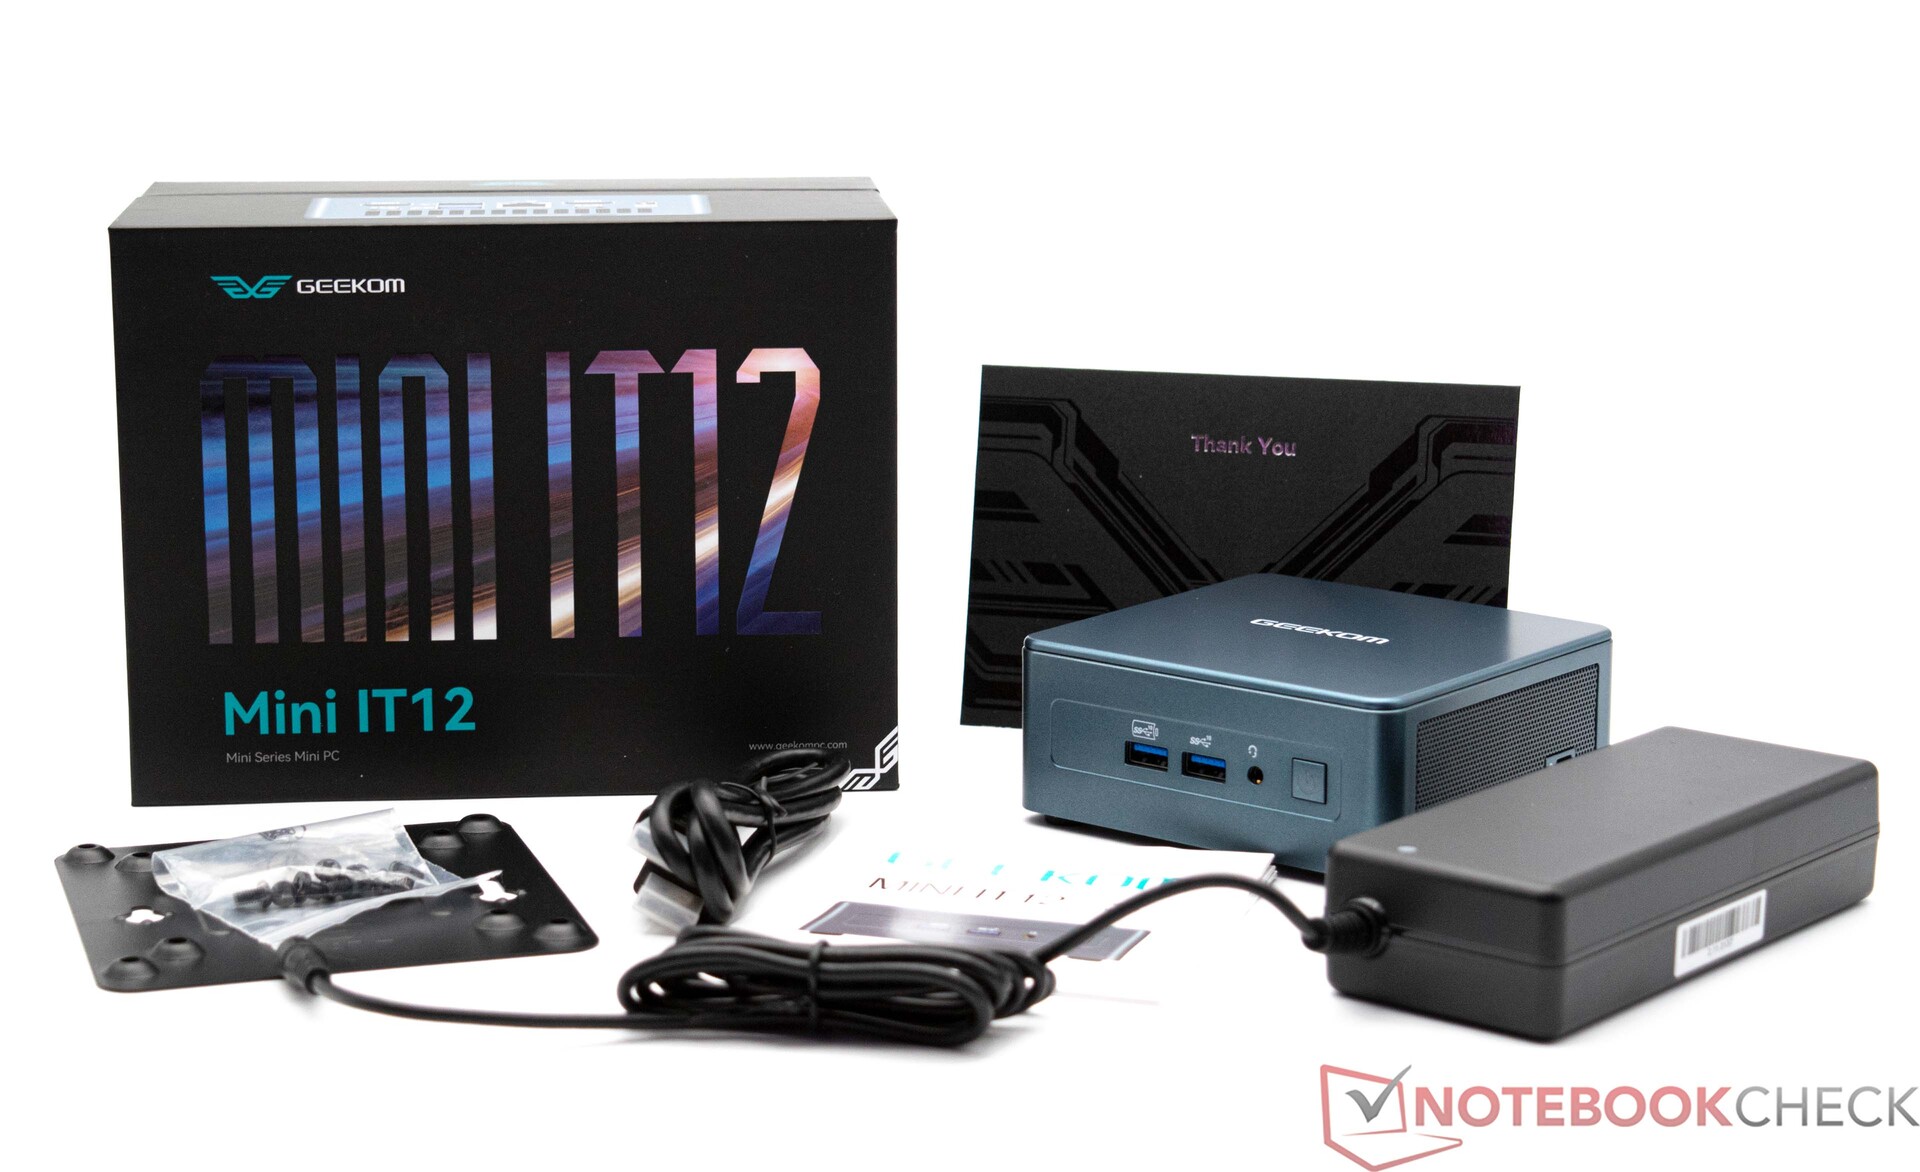
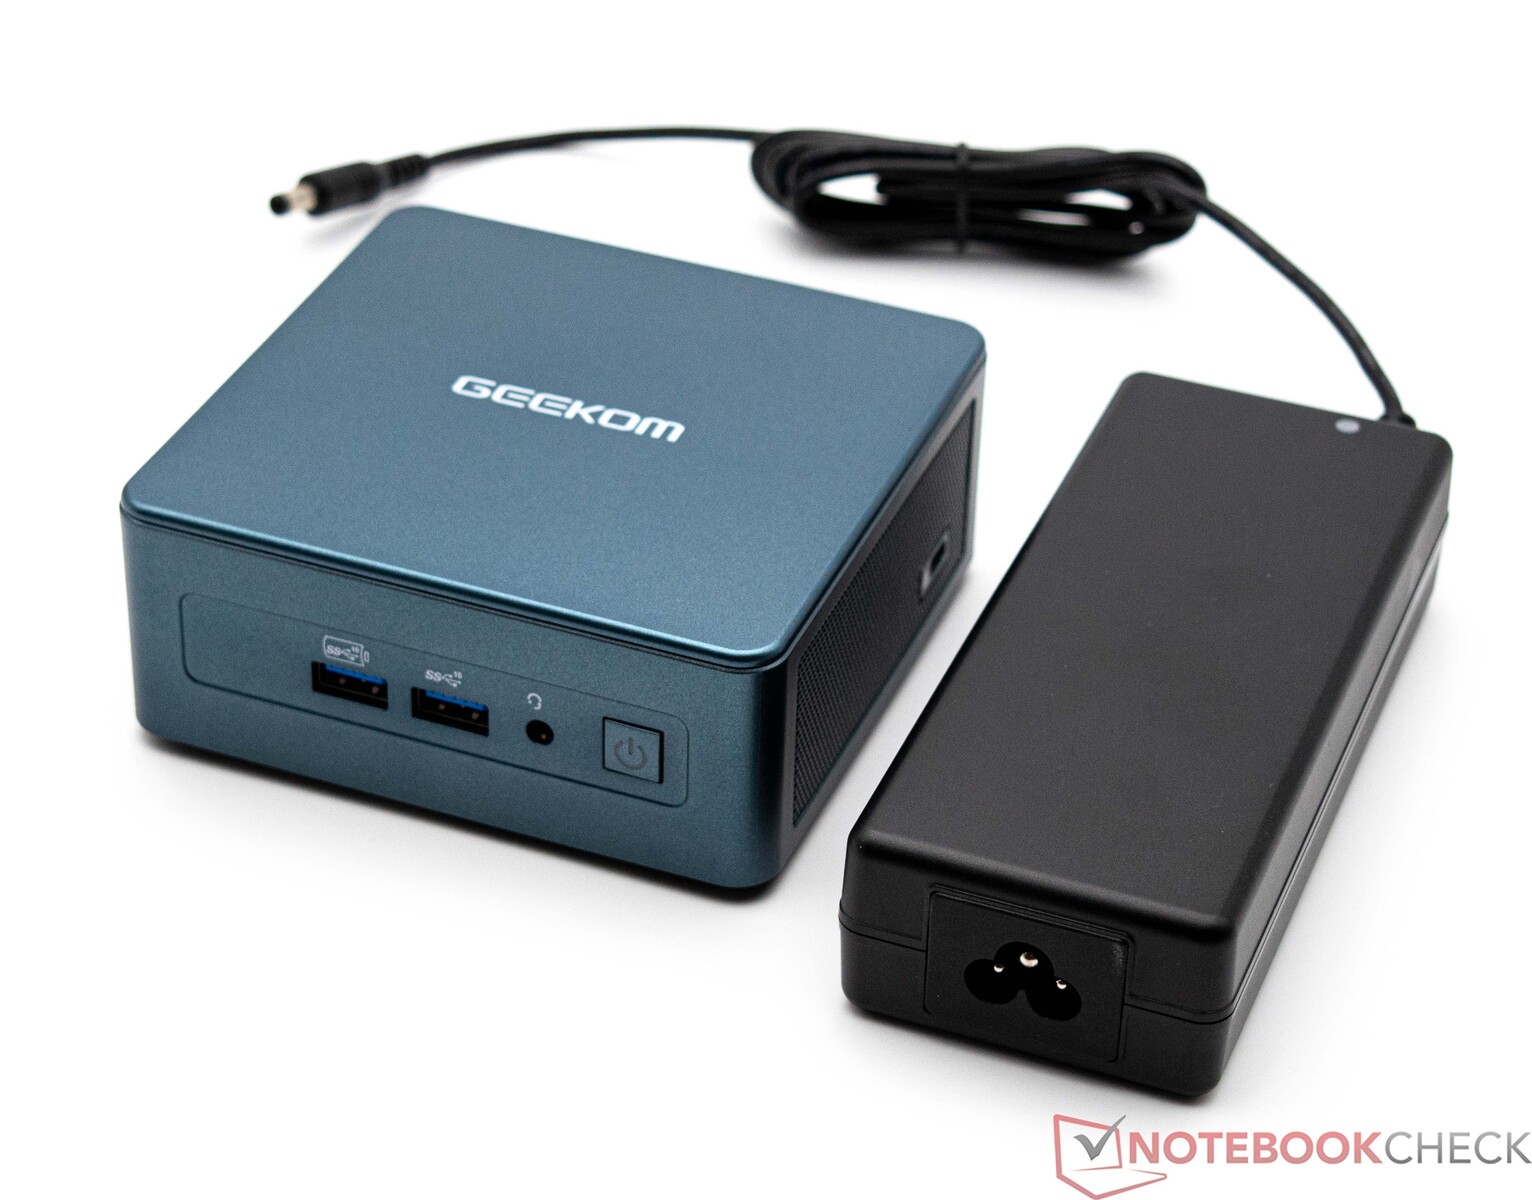
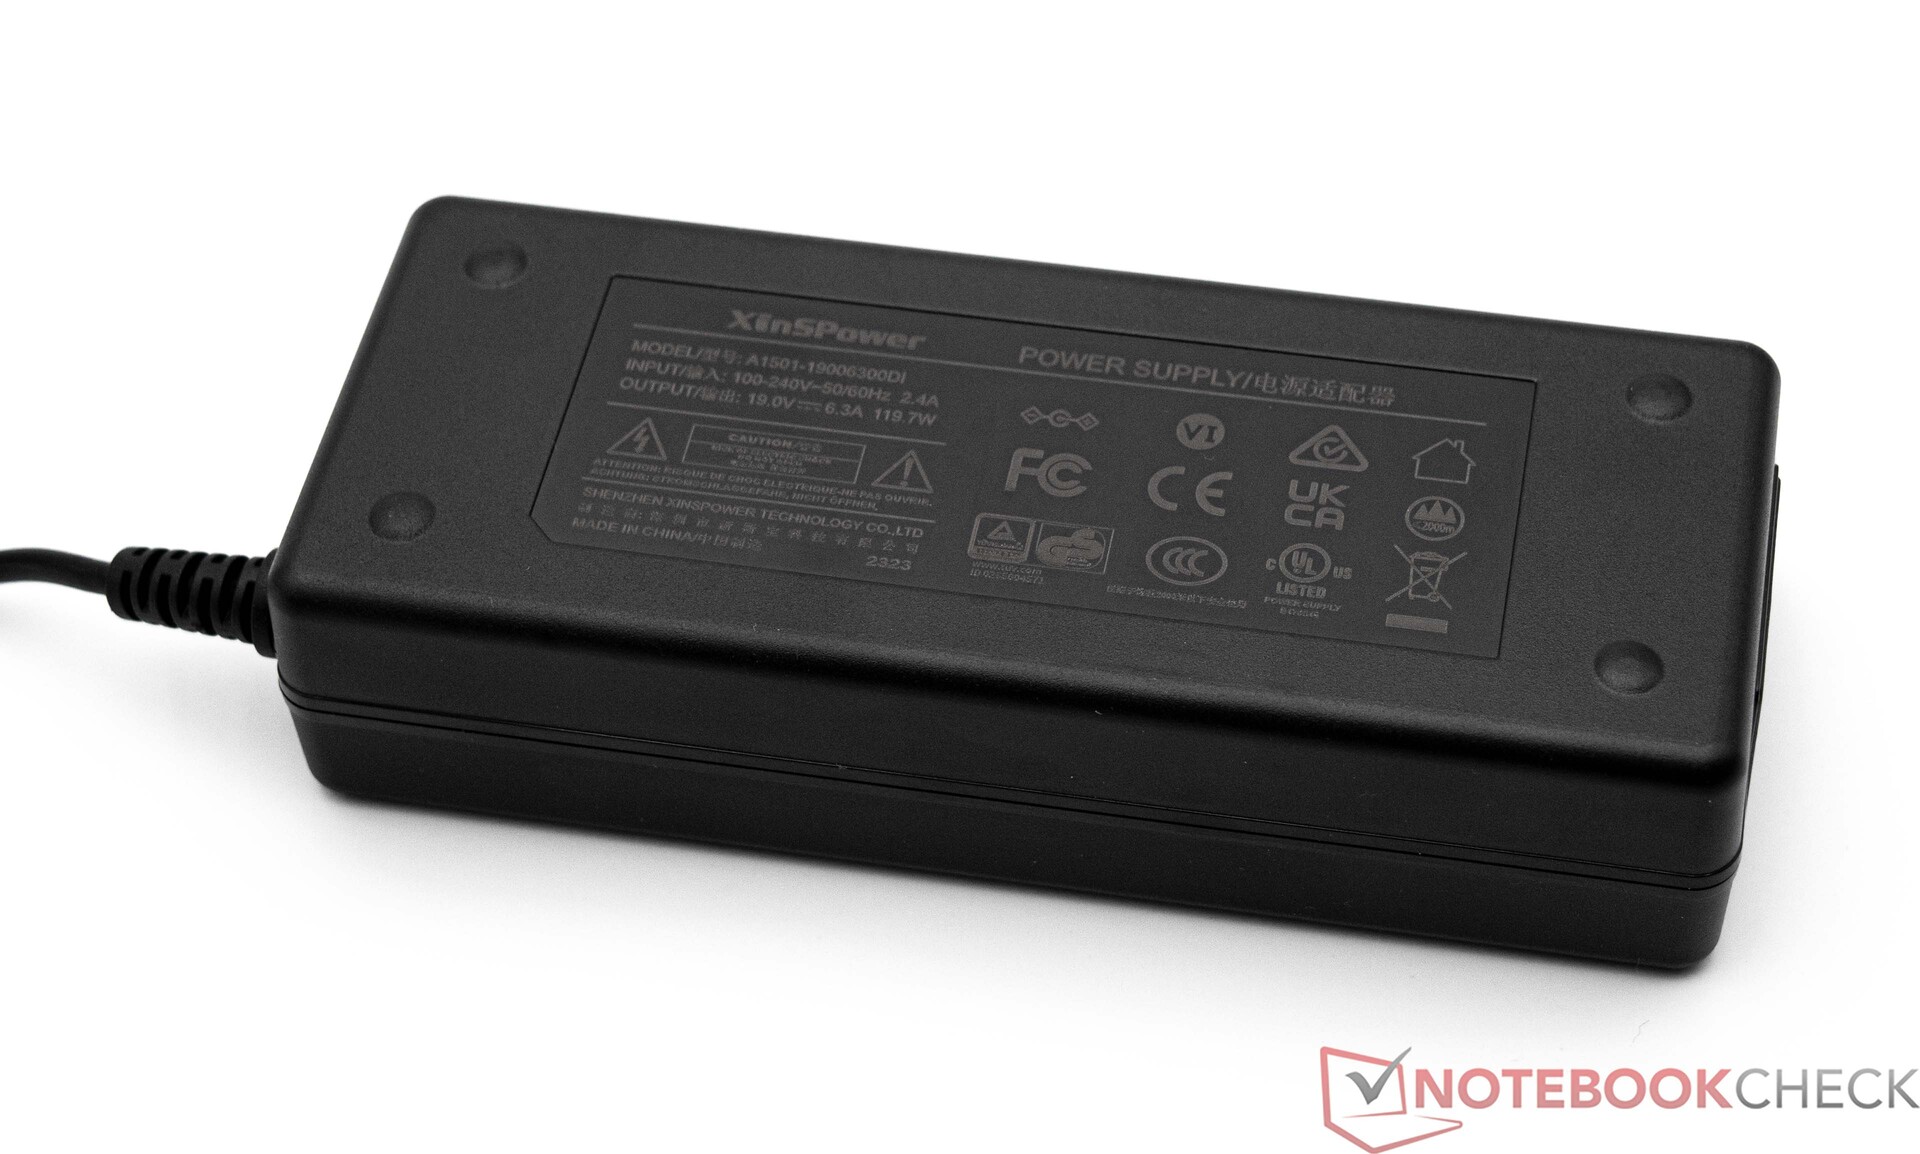
In addition to the device, the package includes a 90-watt power supply, a VESA mounting plate for attaching the device to a monitor, an HDMI cable, a quick start guide, and a thank-you card.
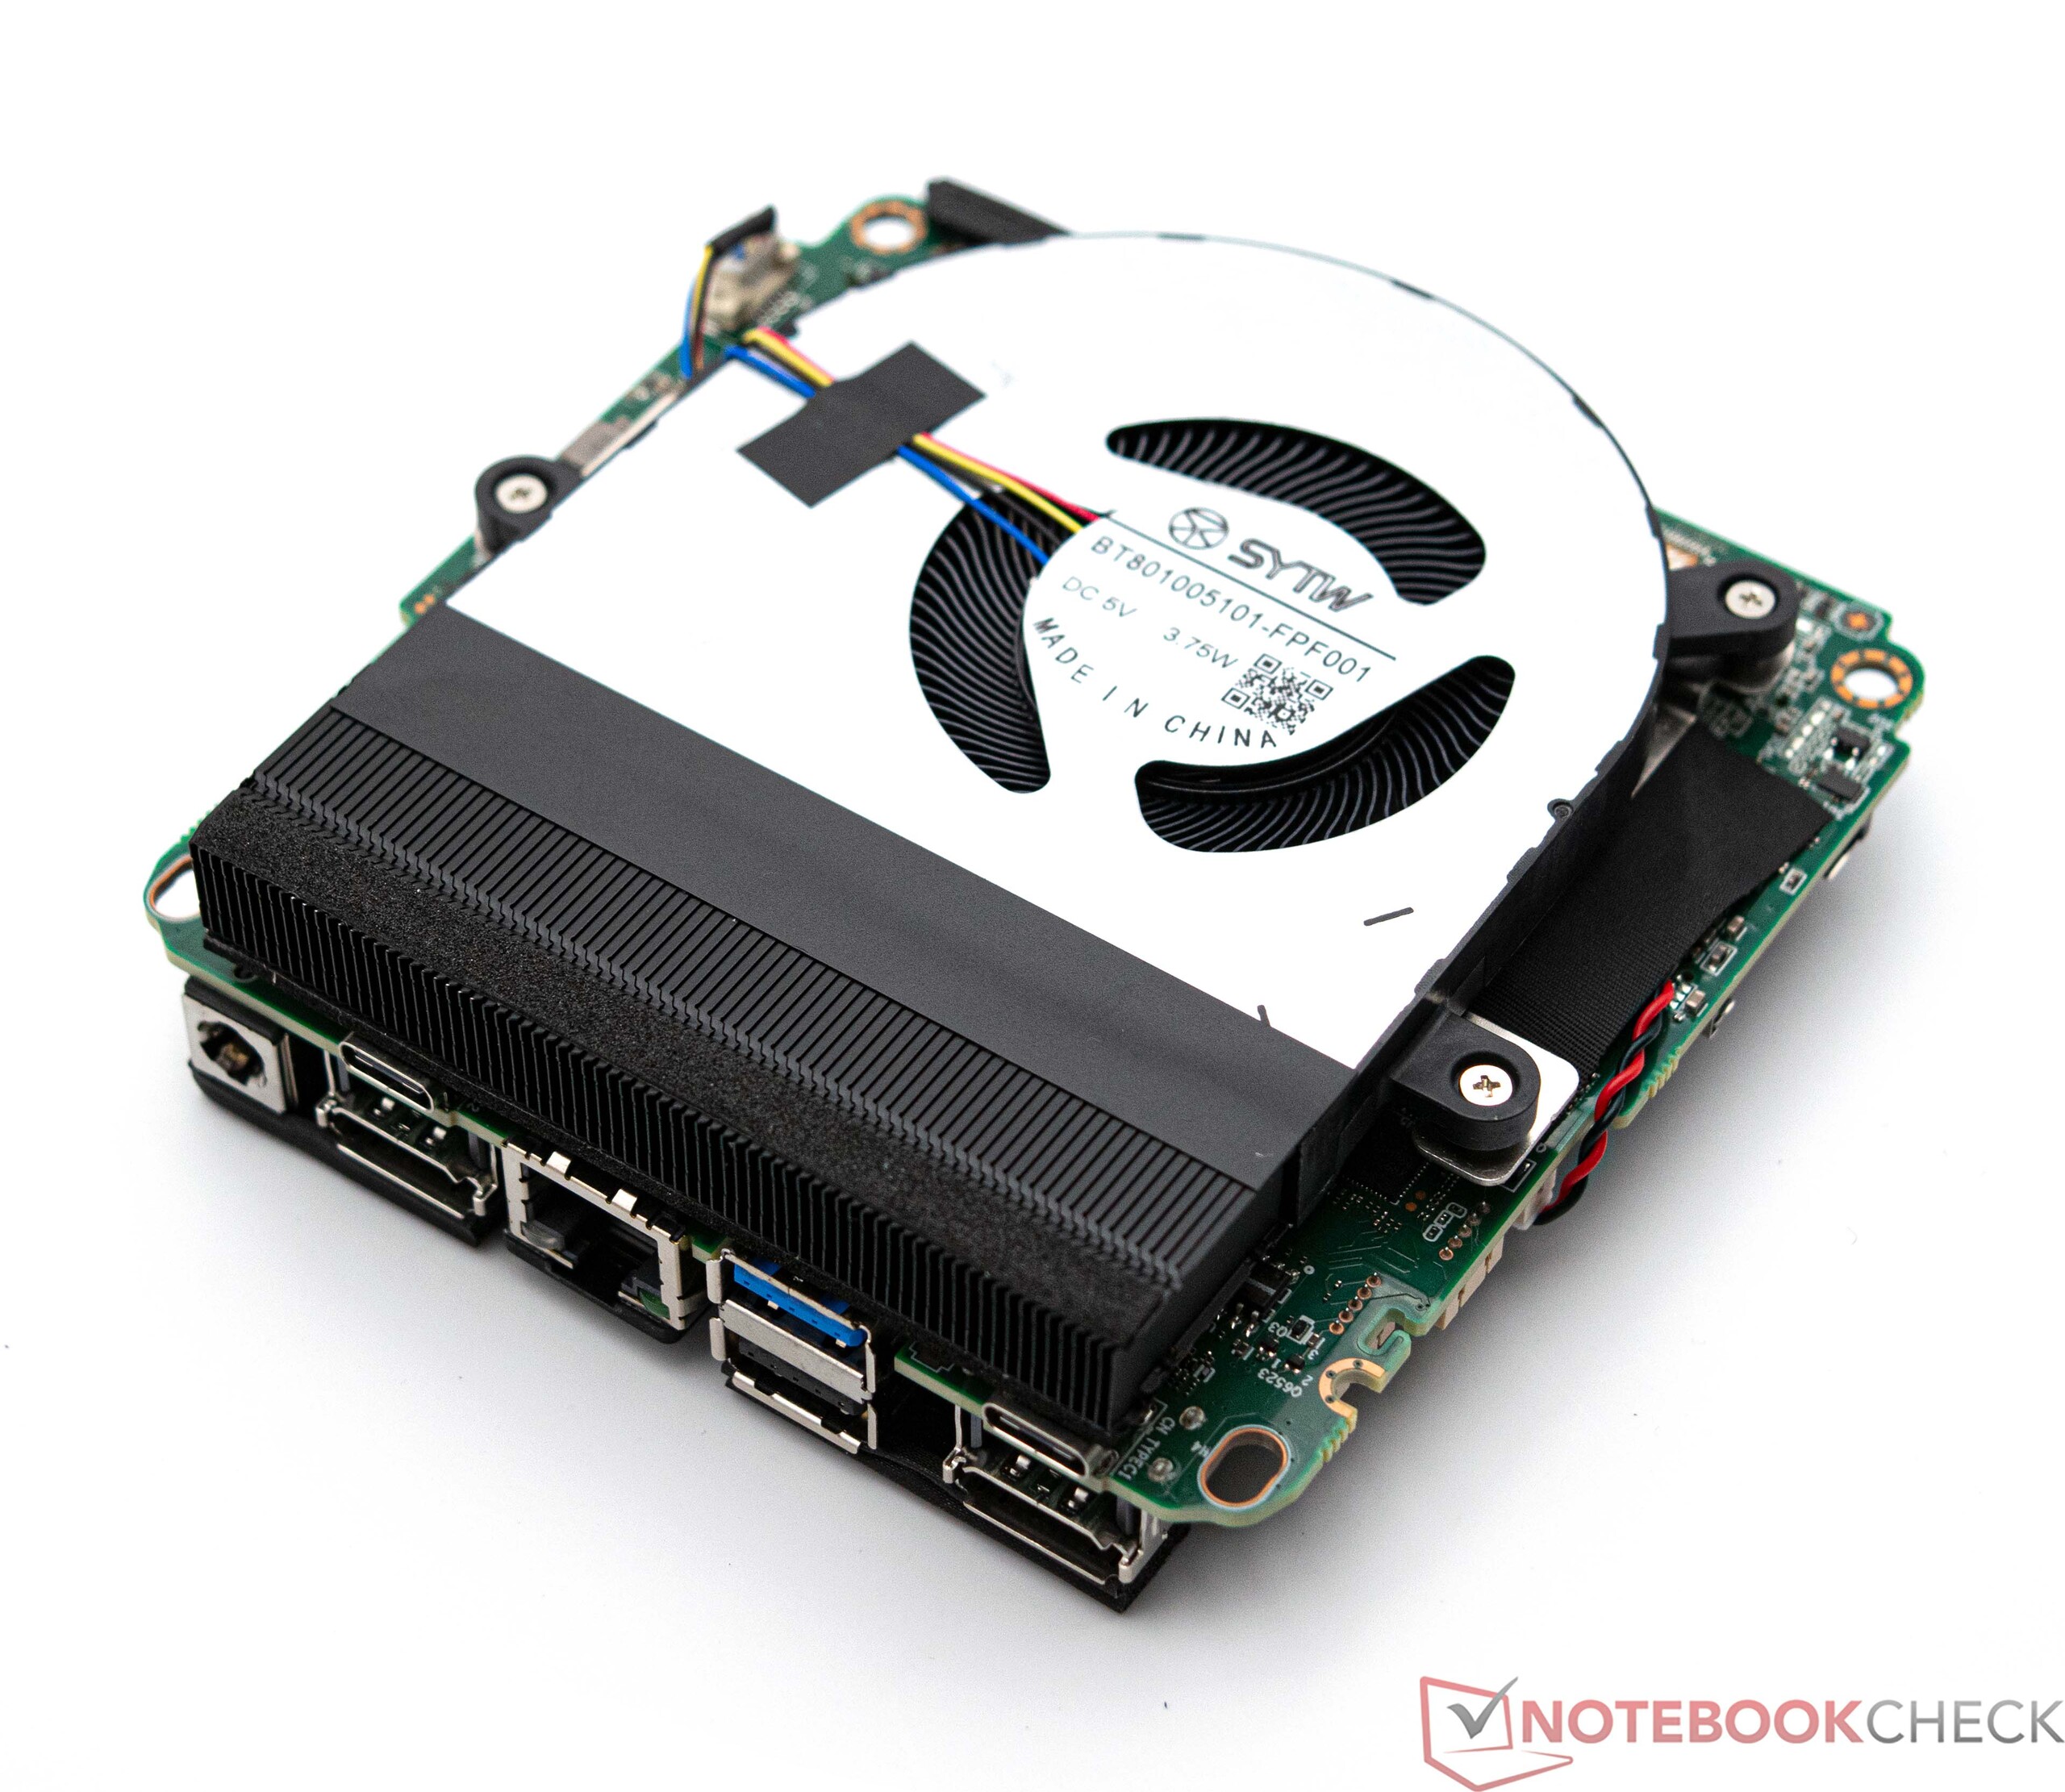
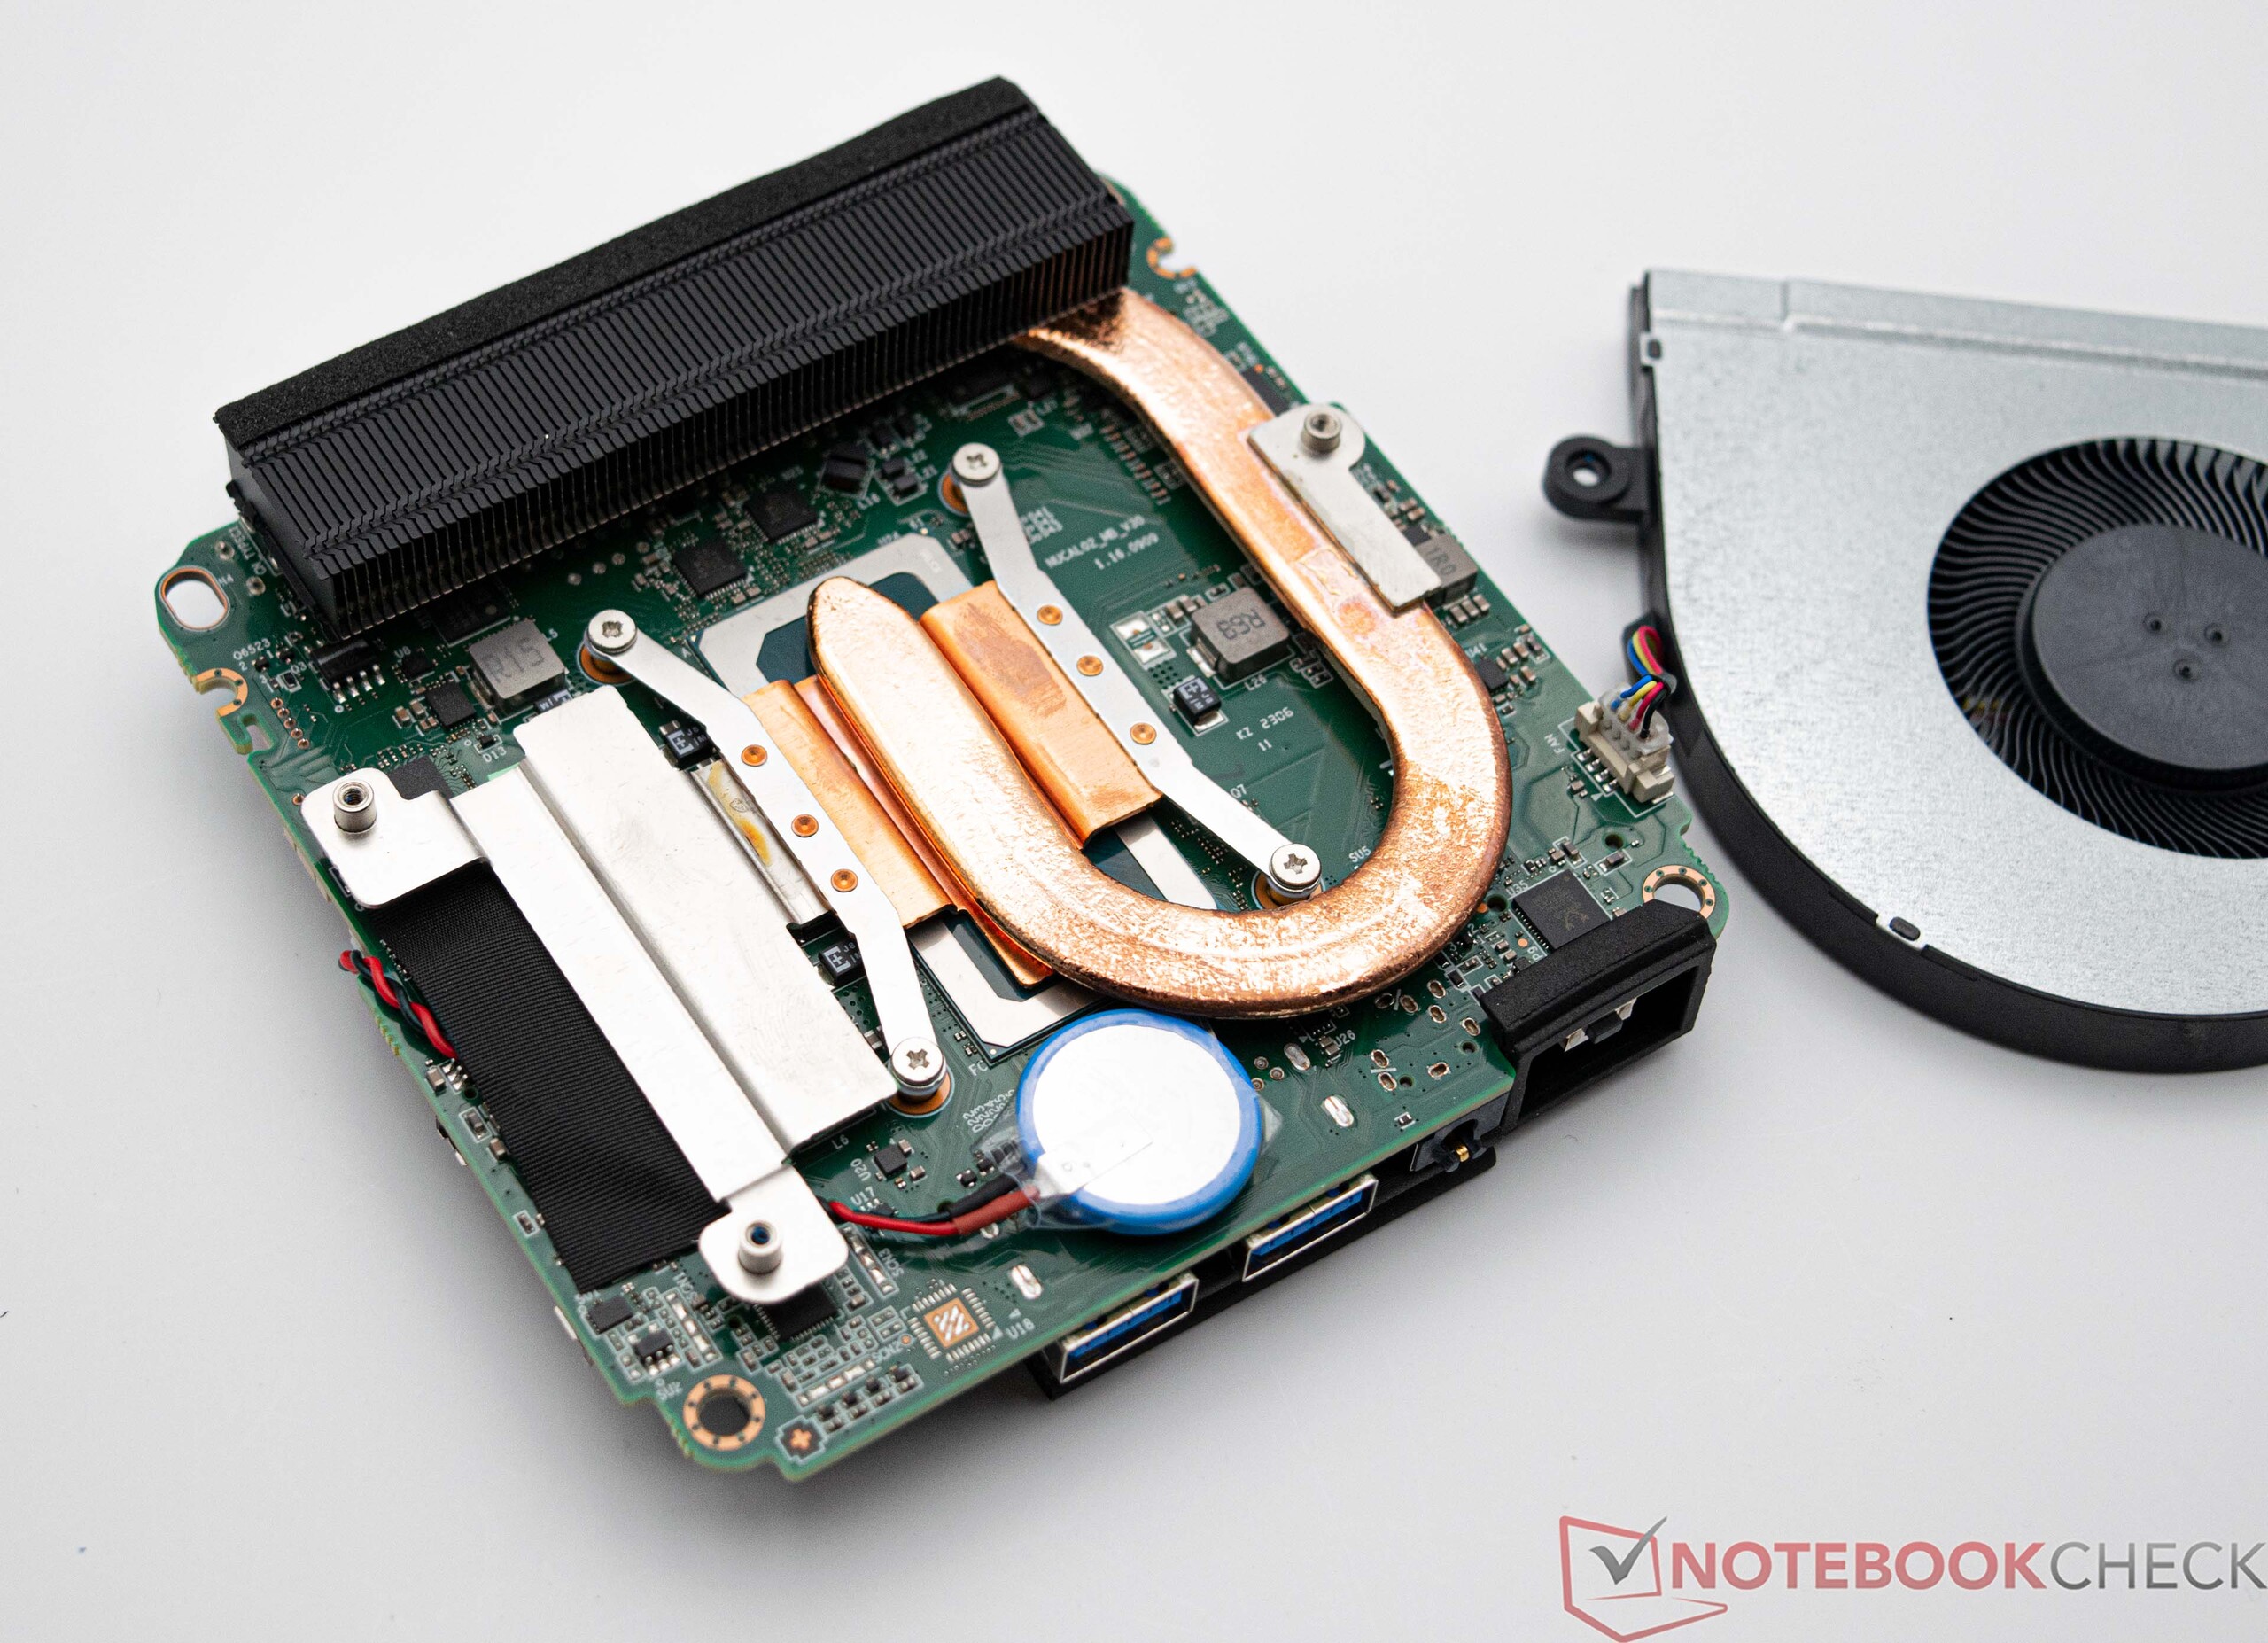
Maintenance
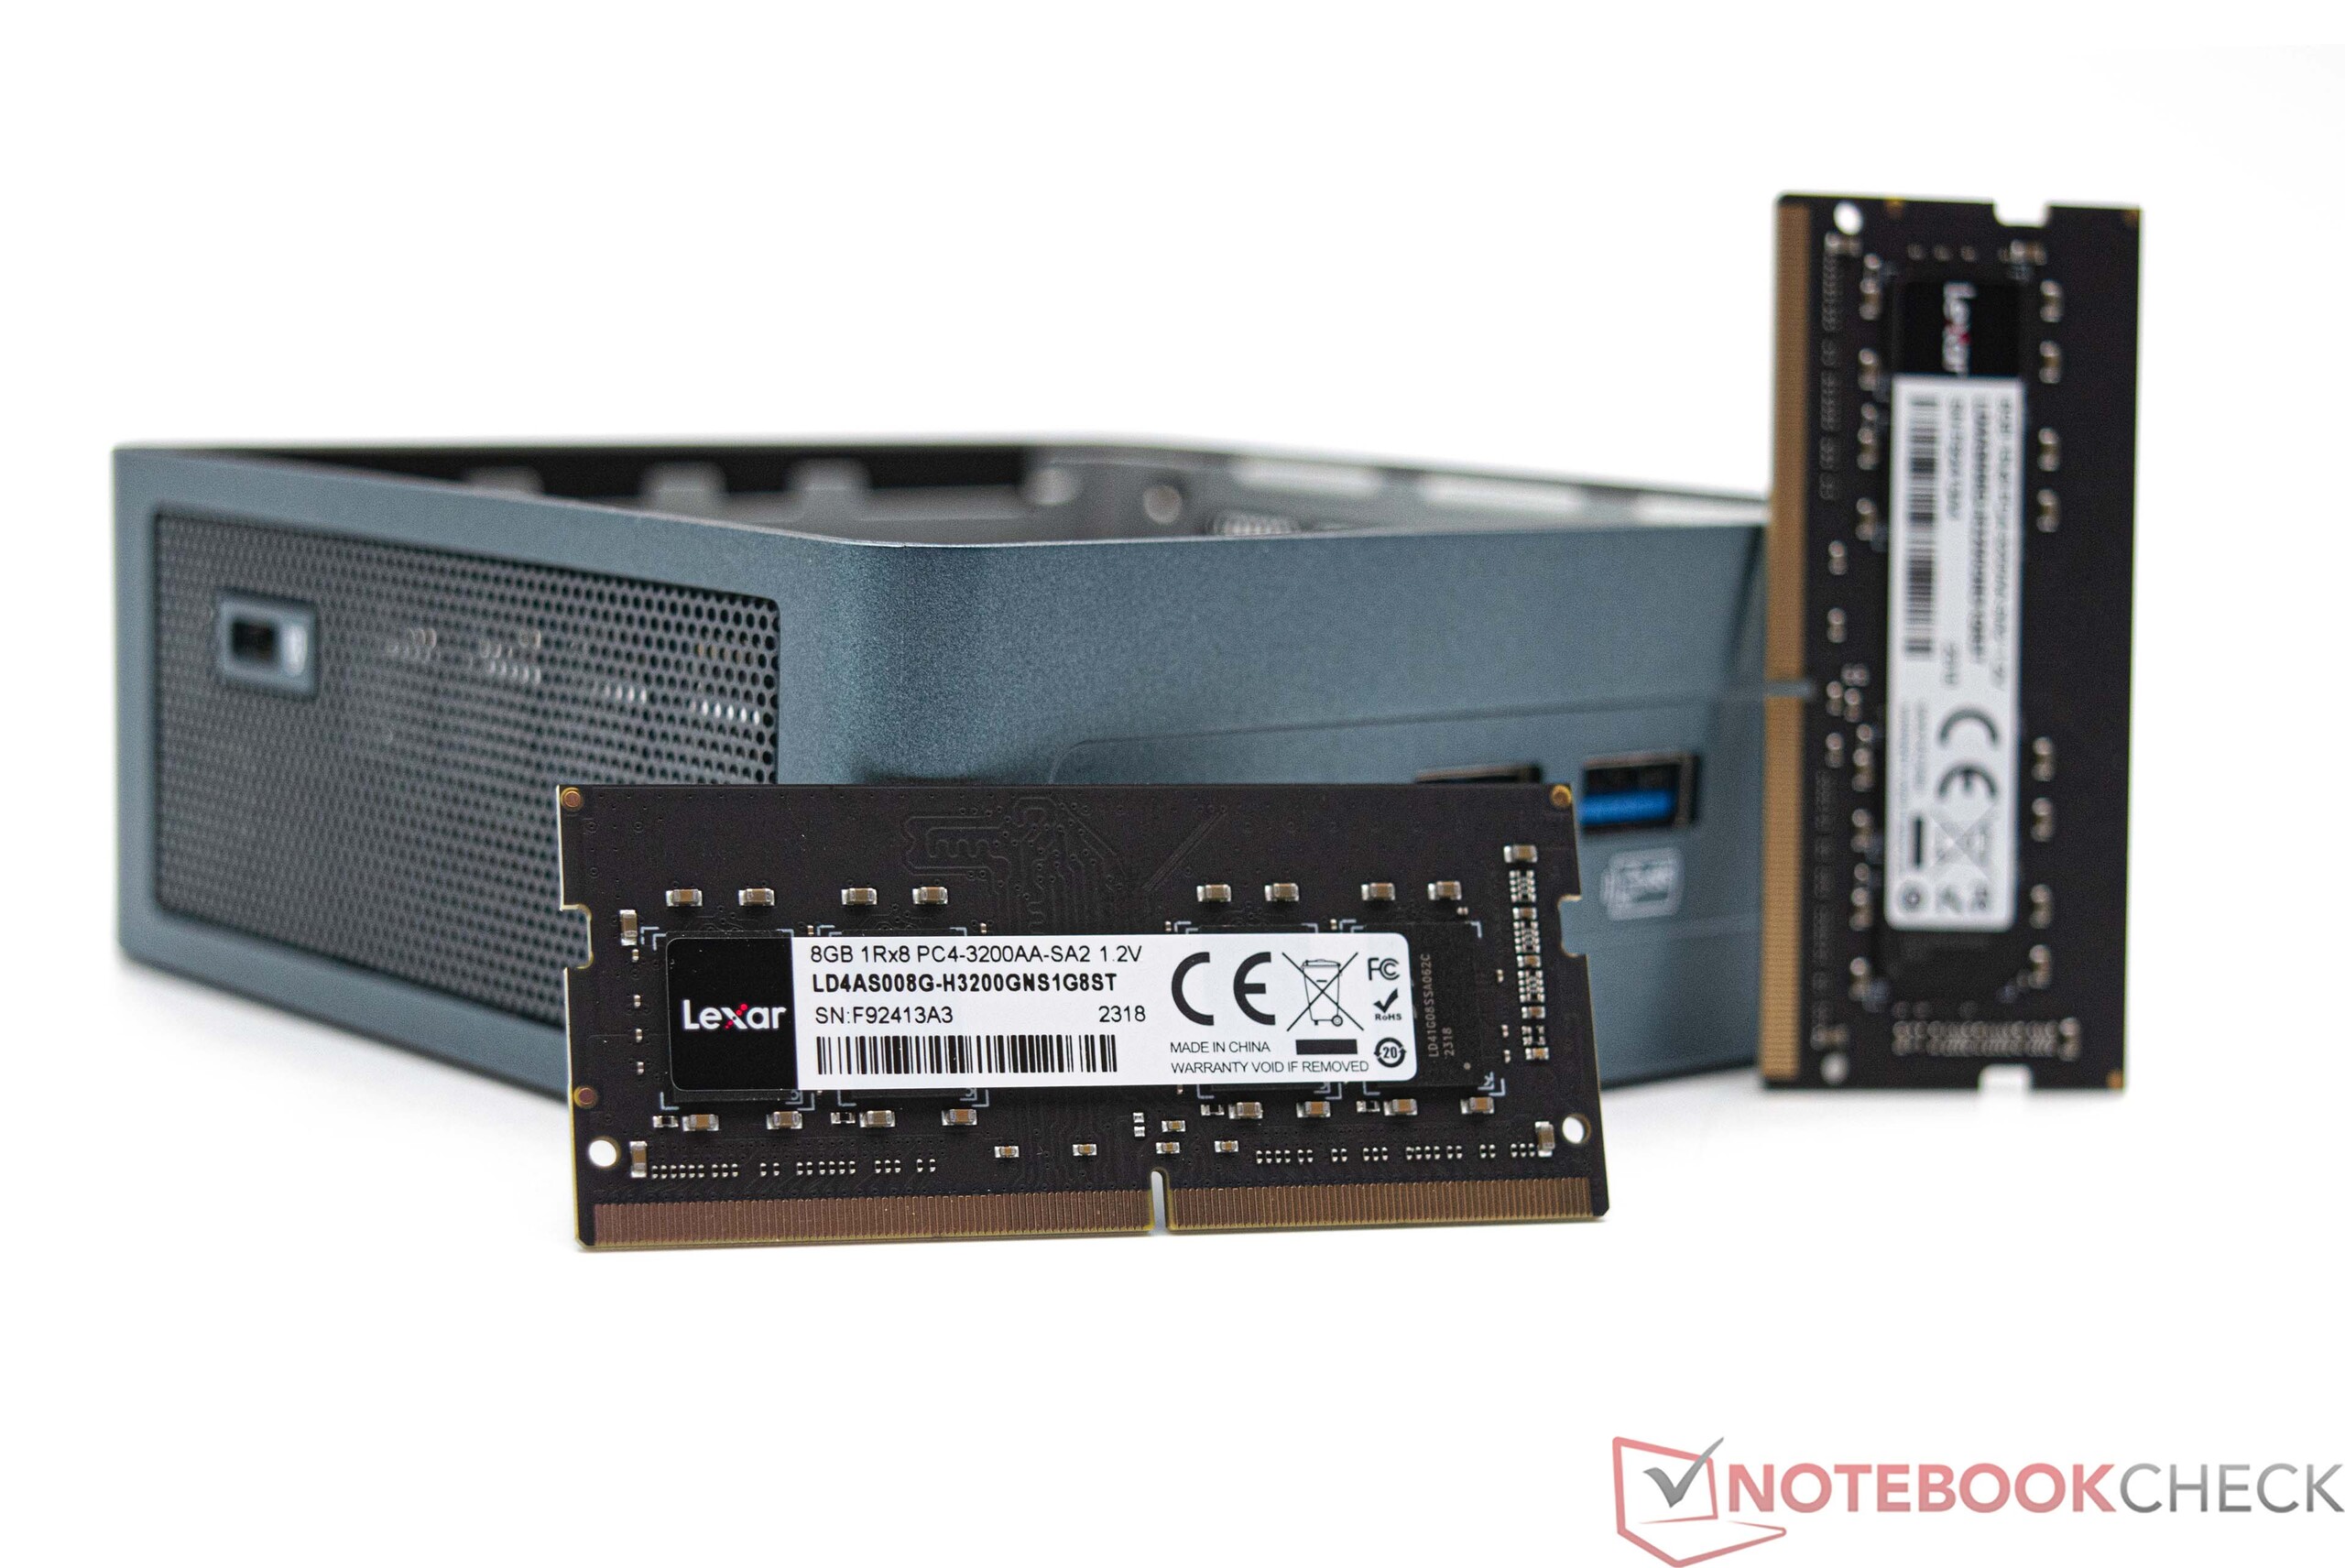
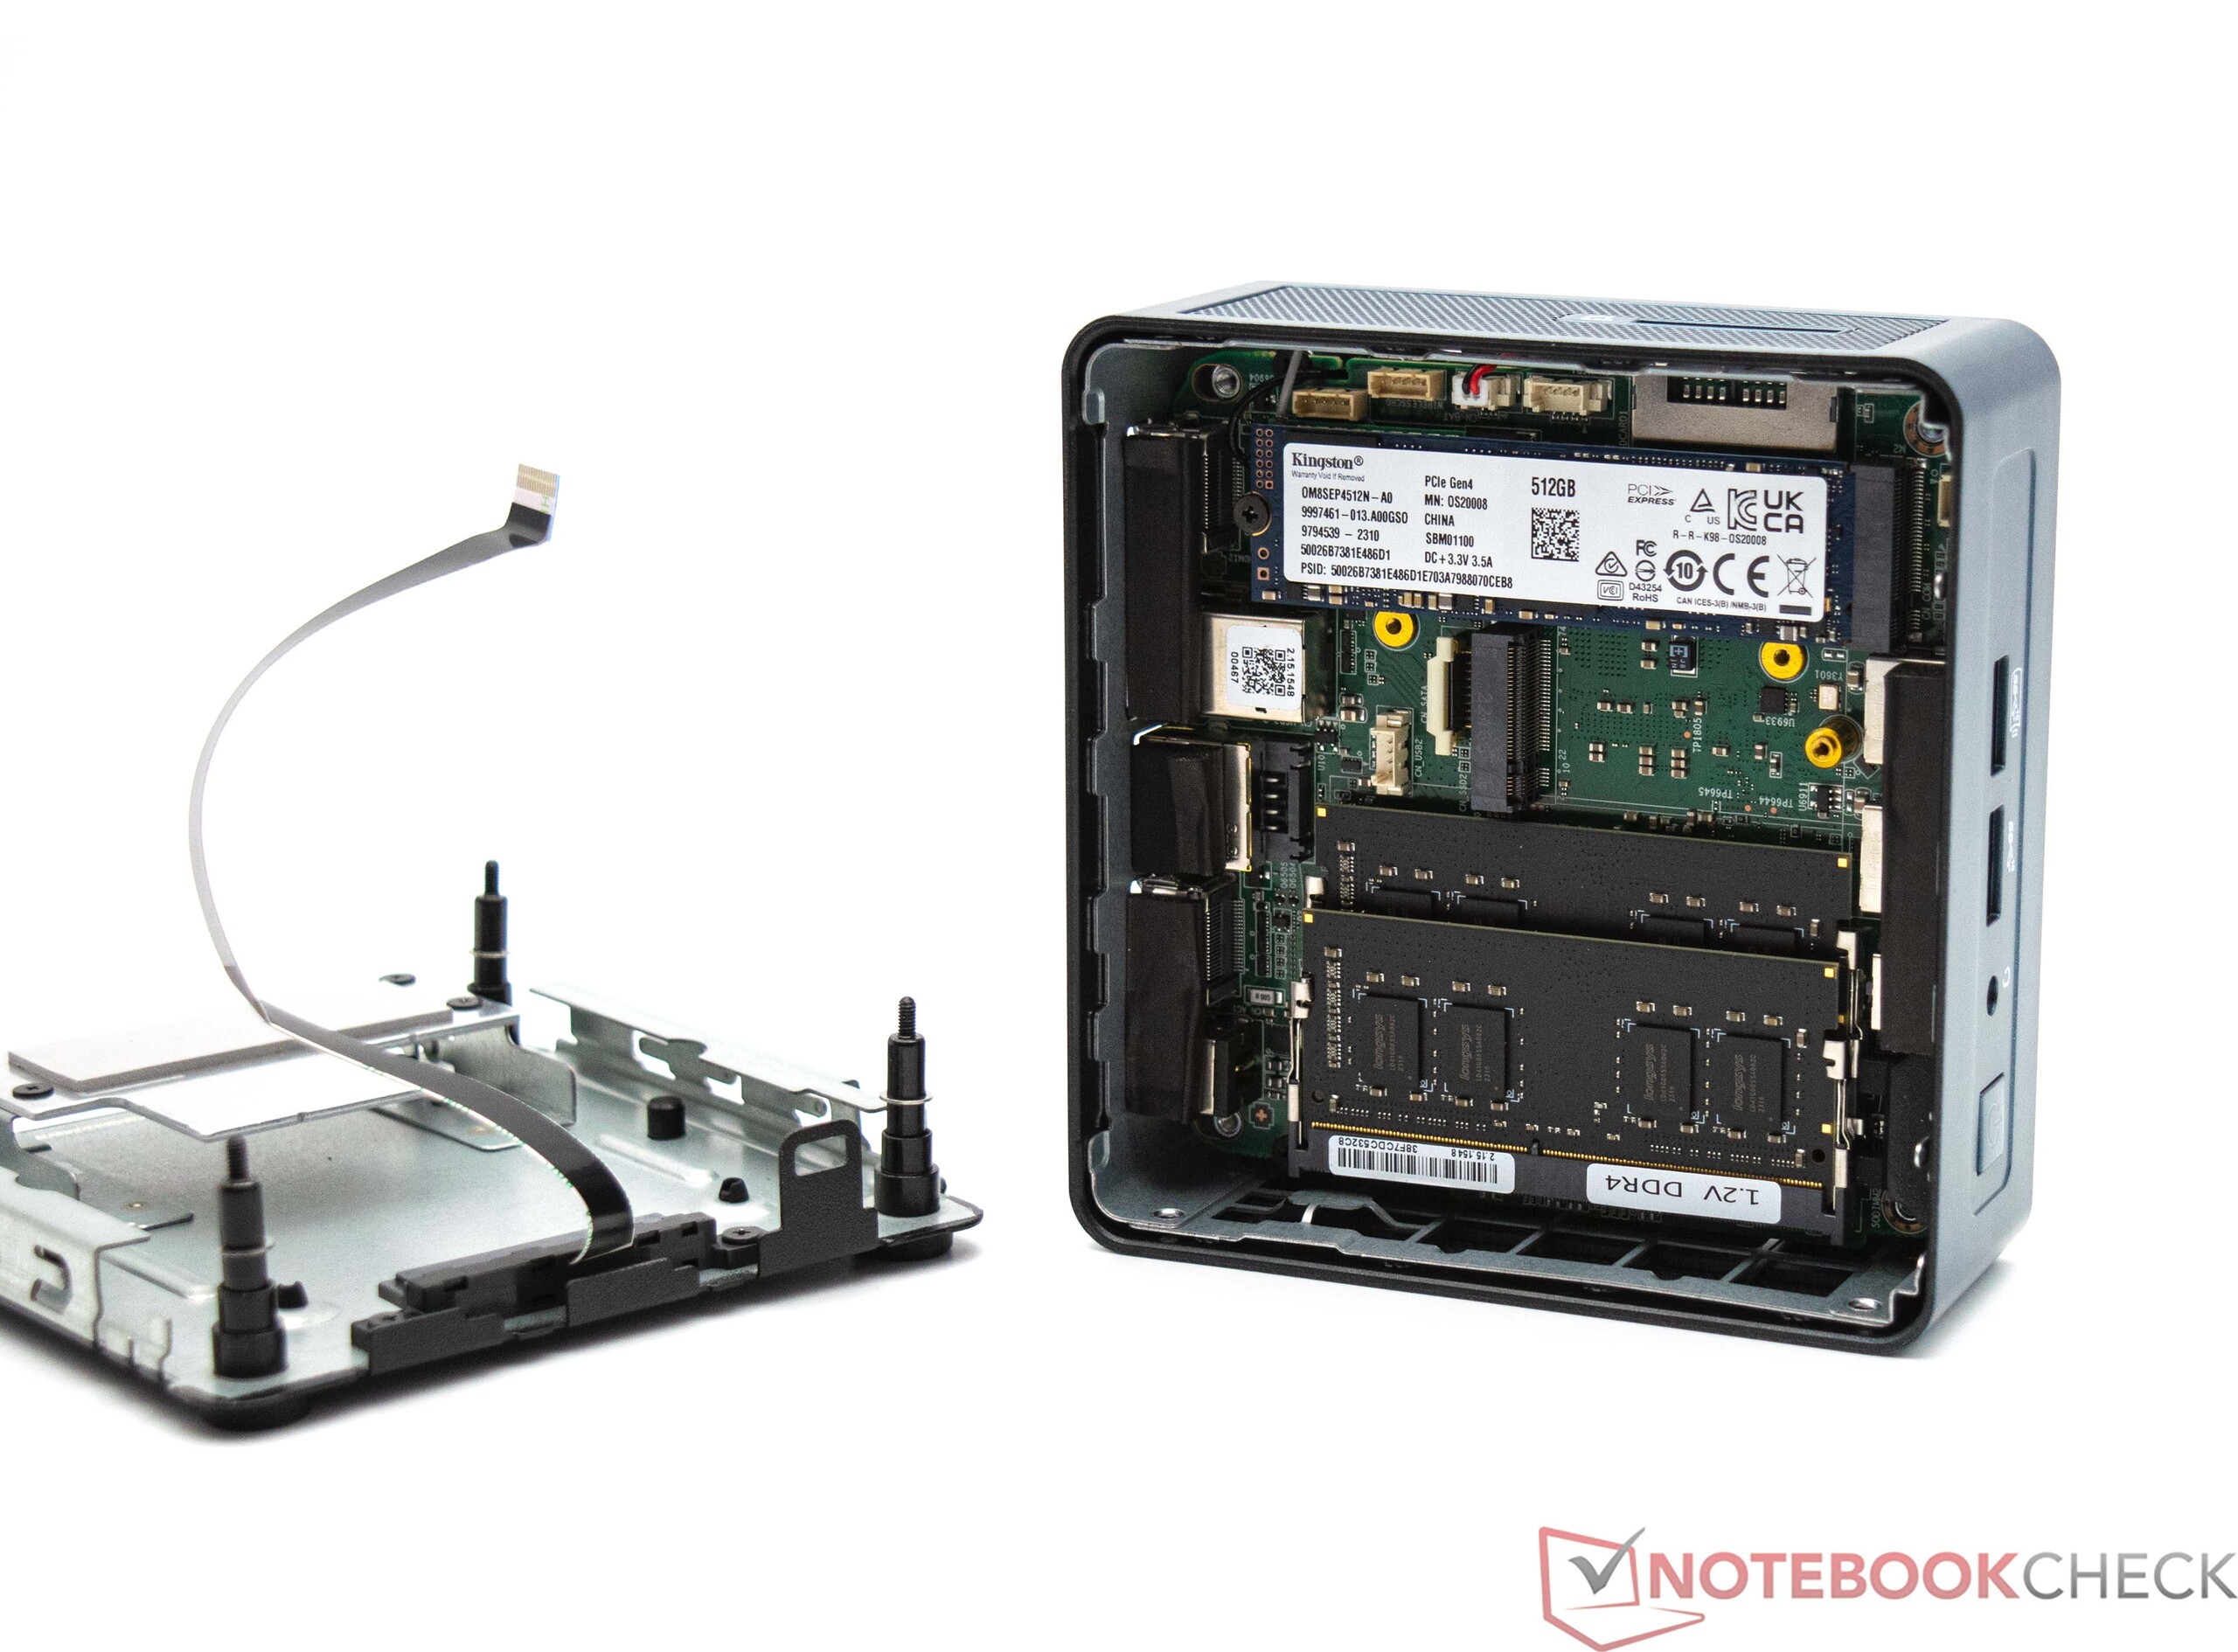
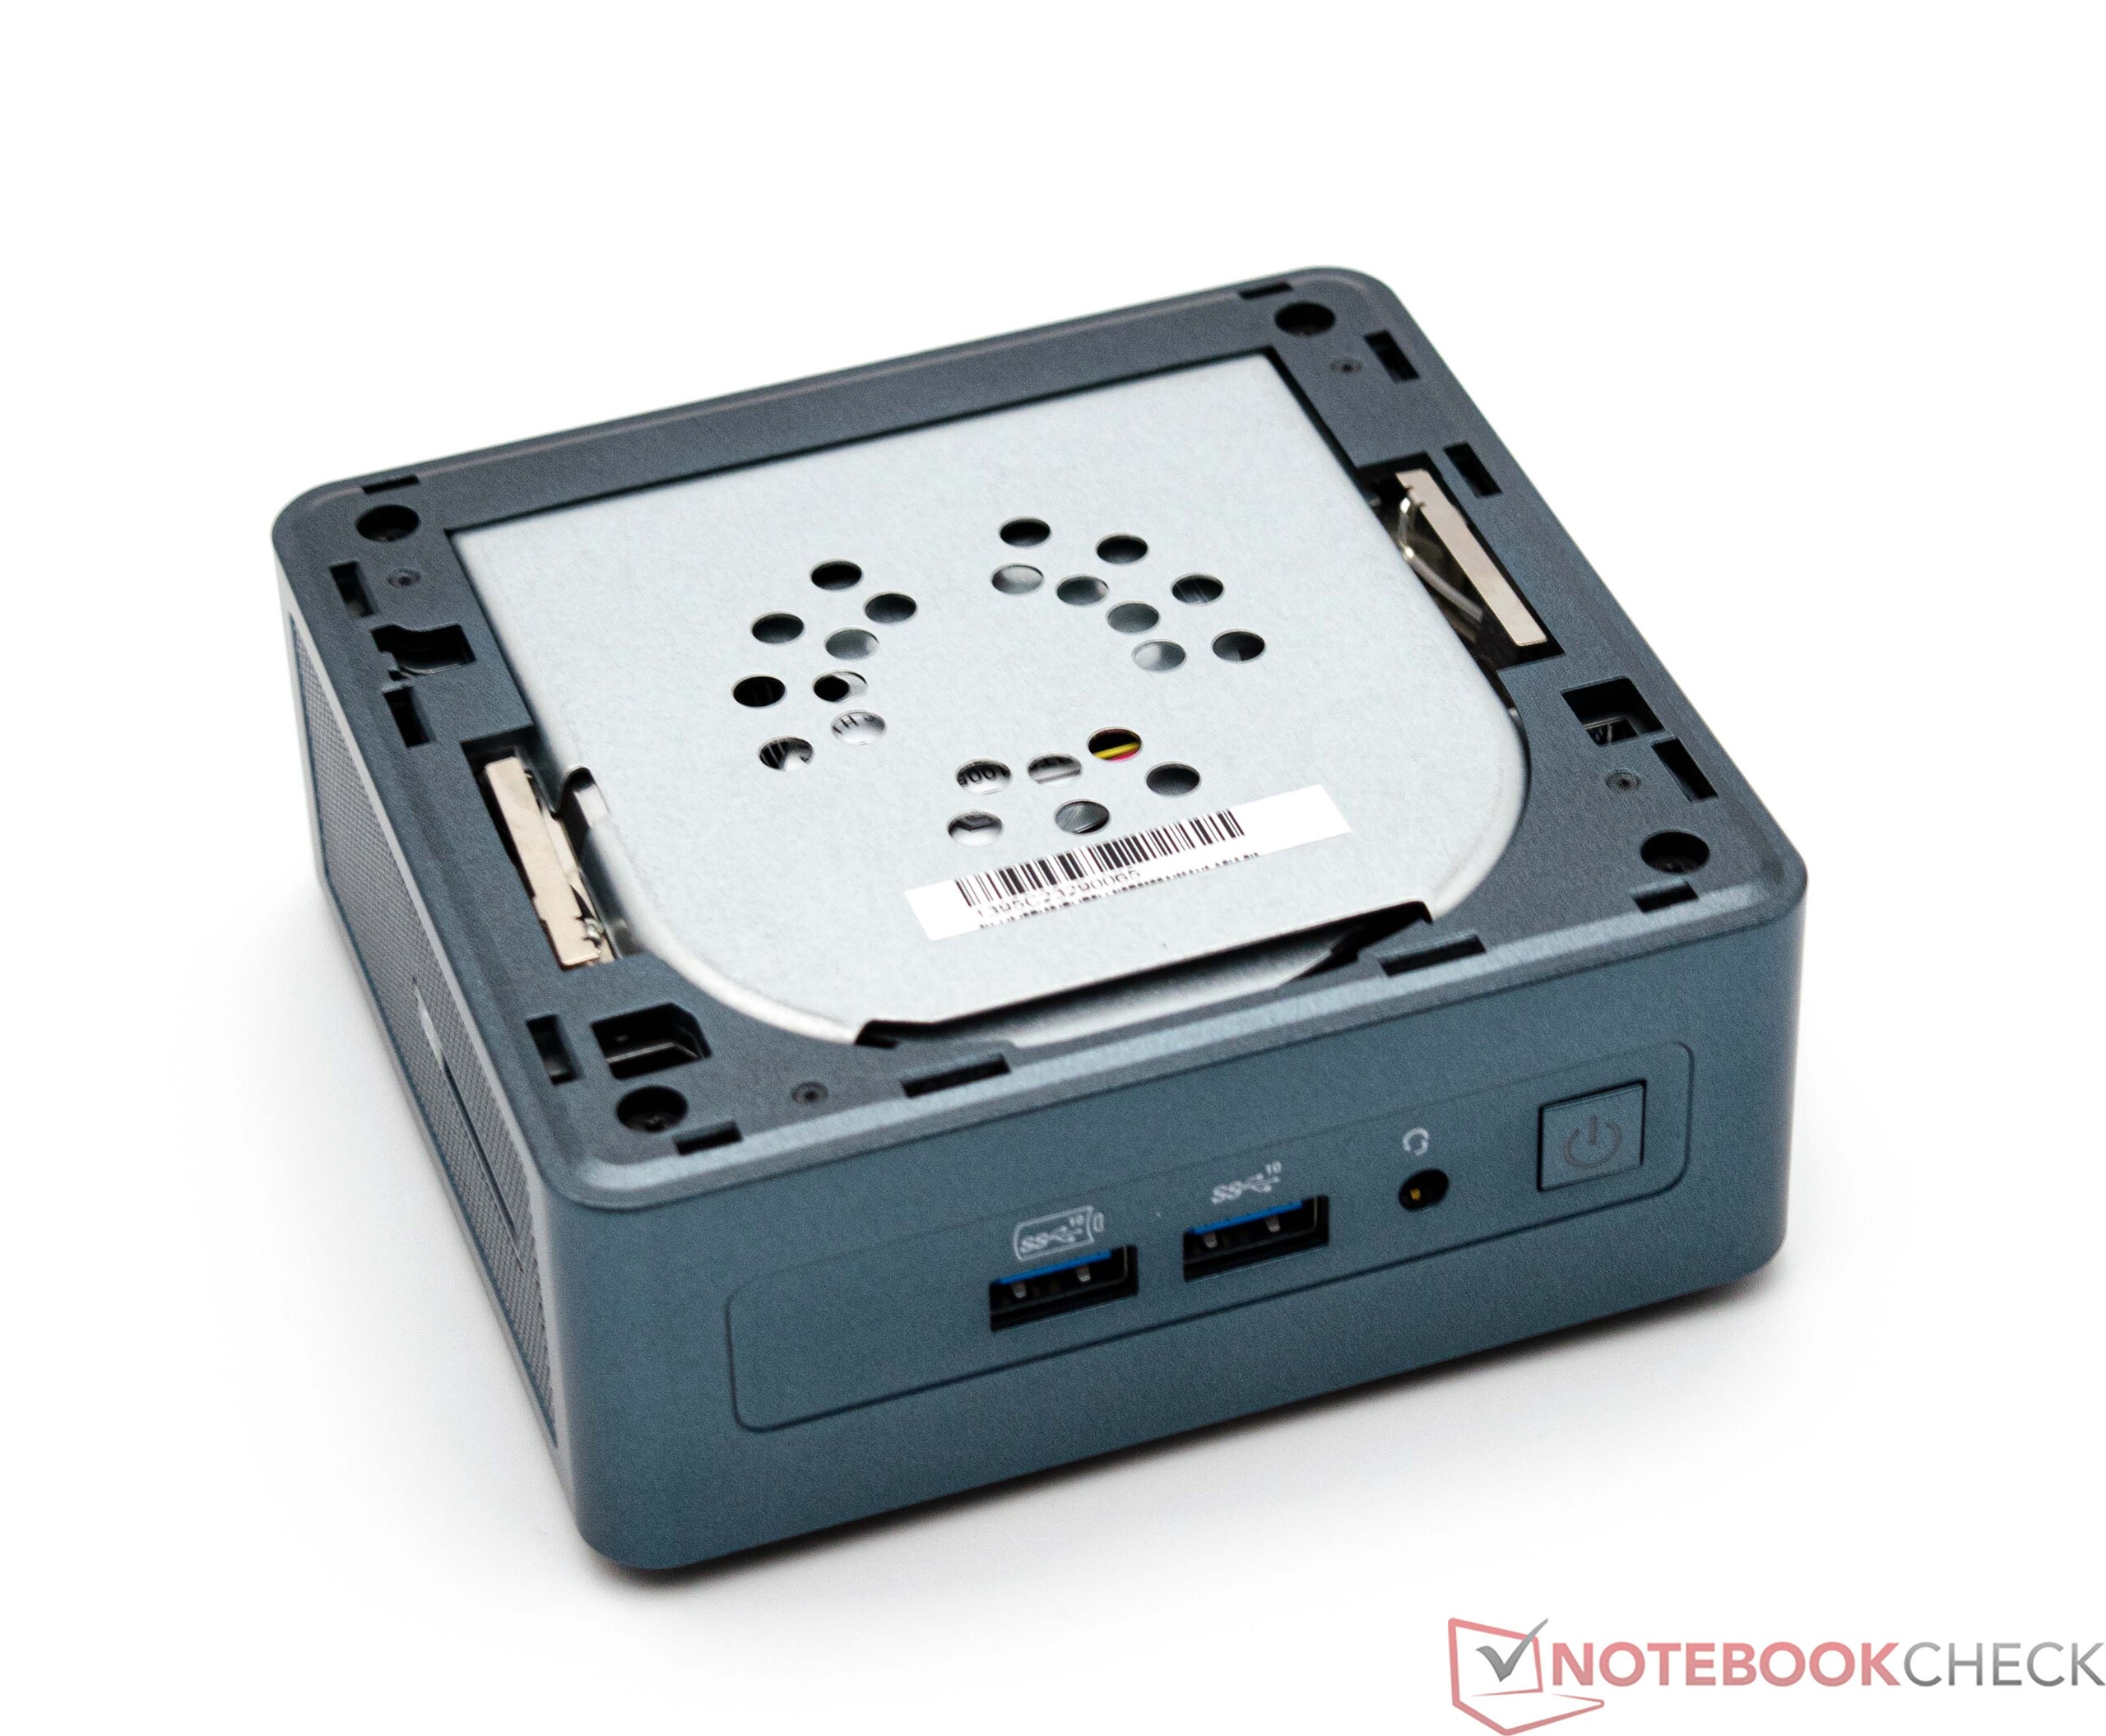
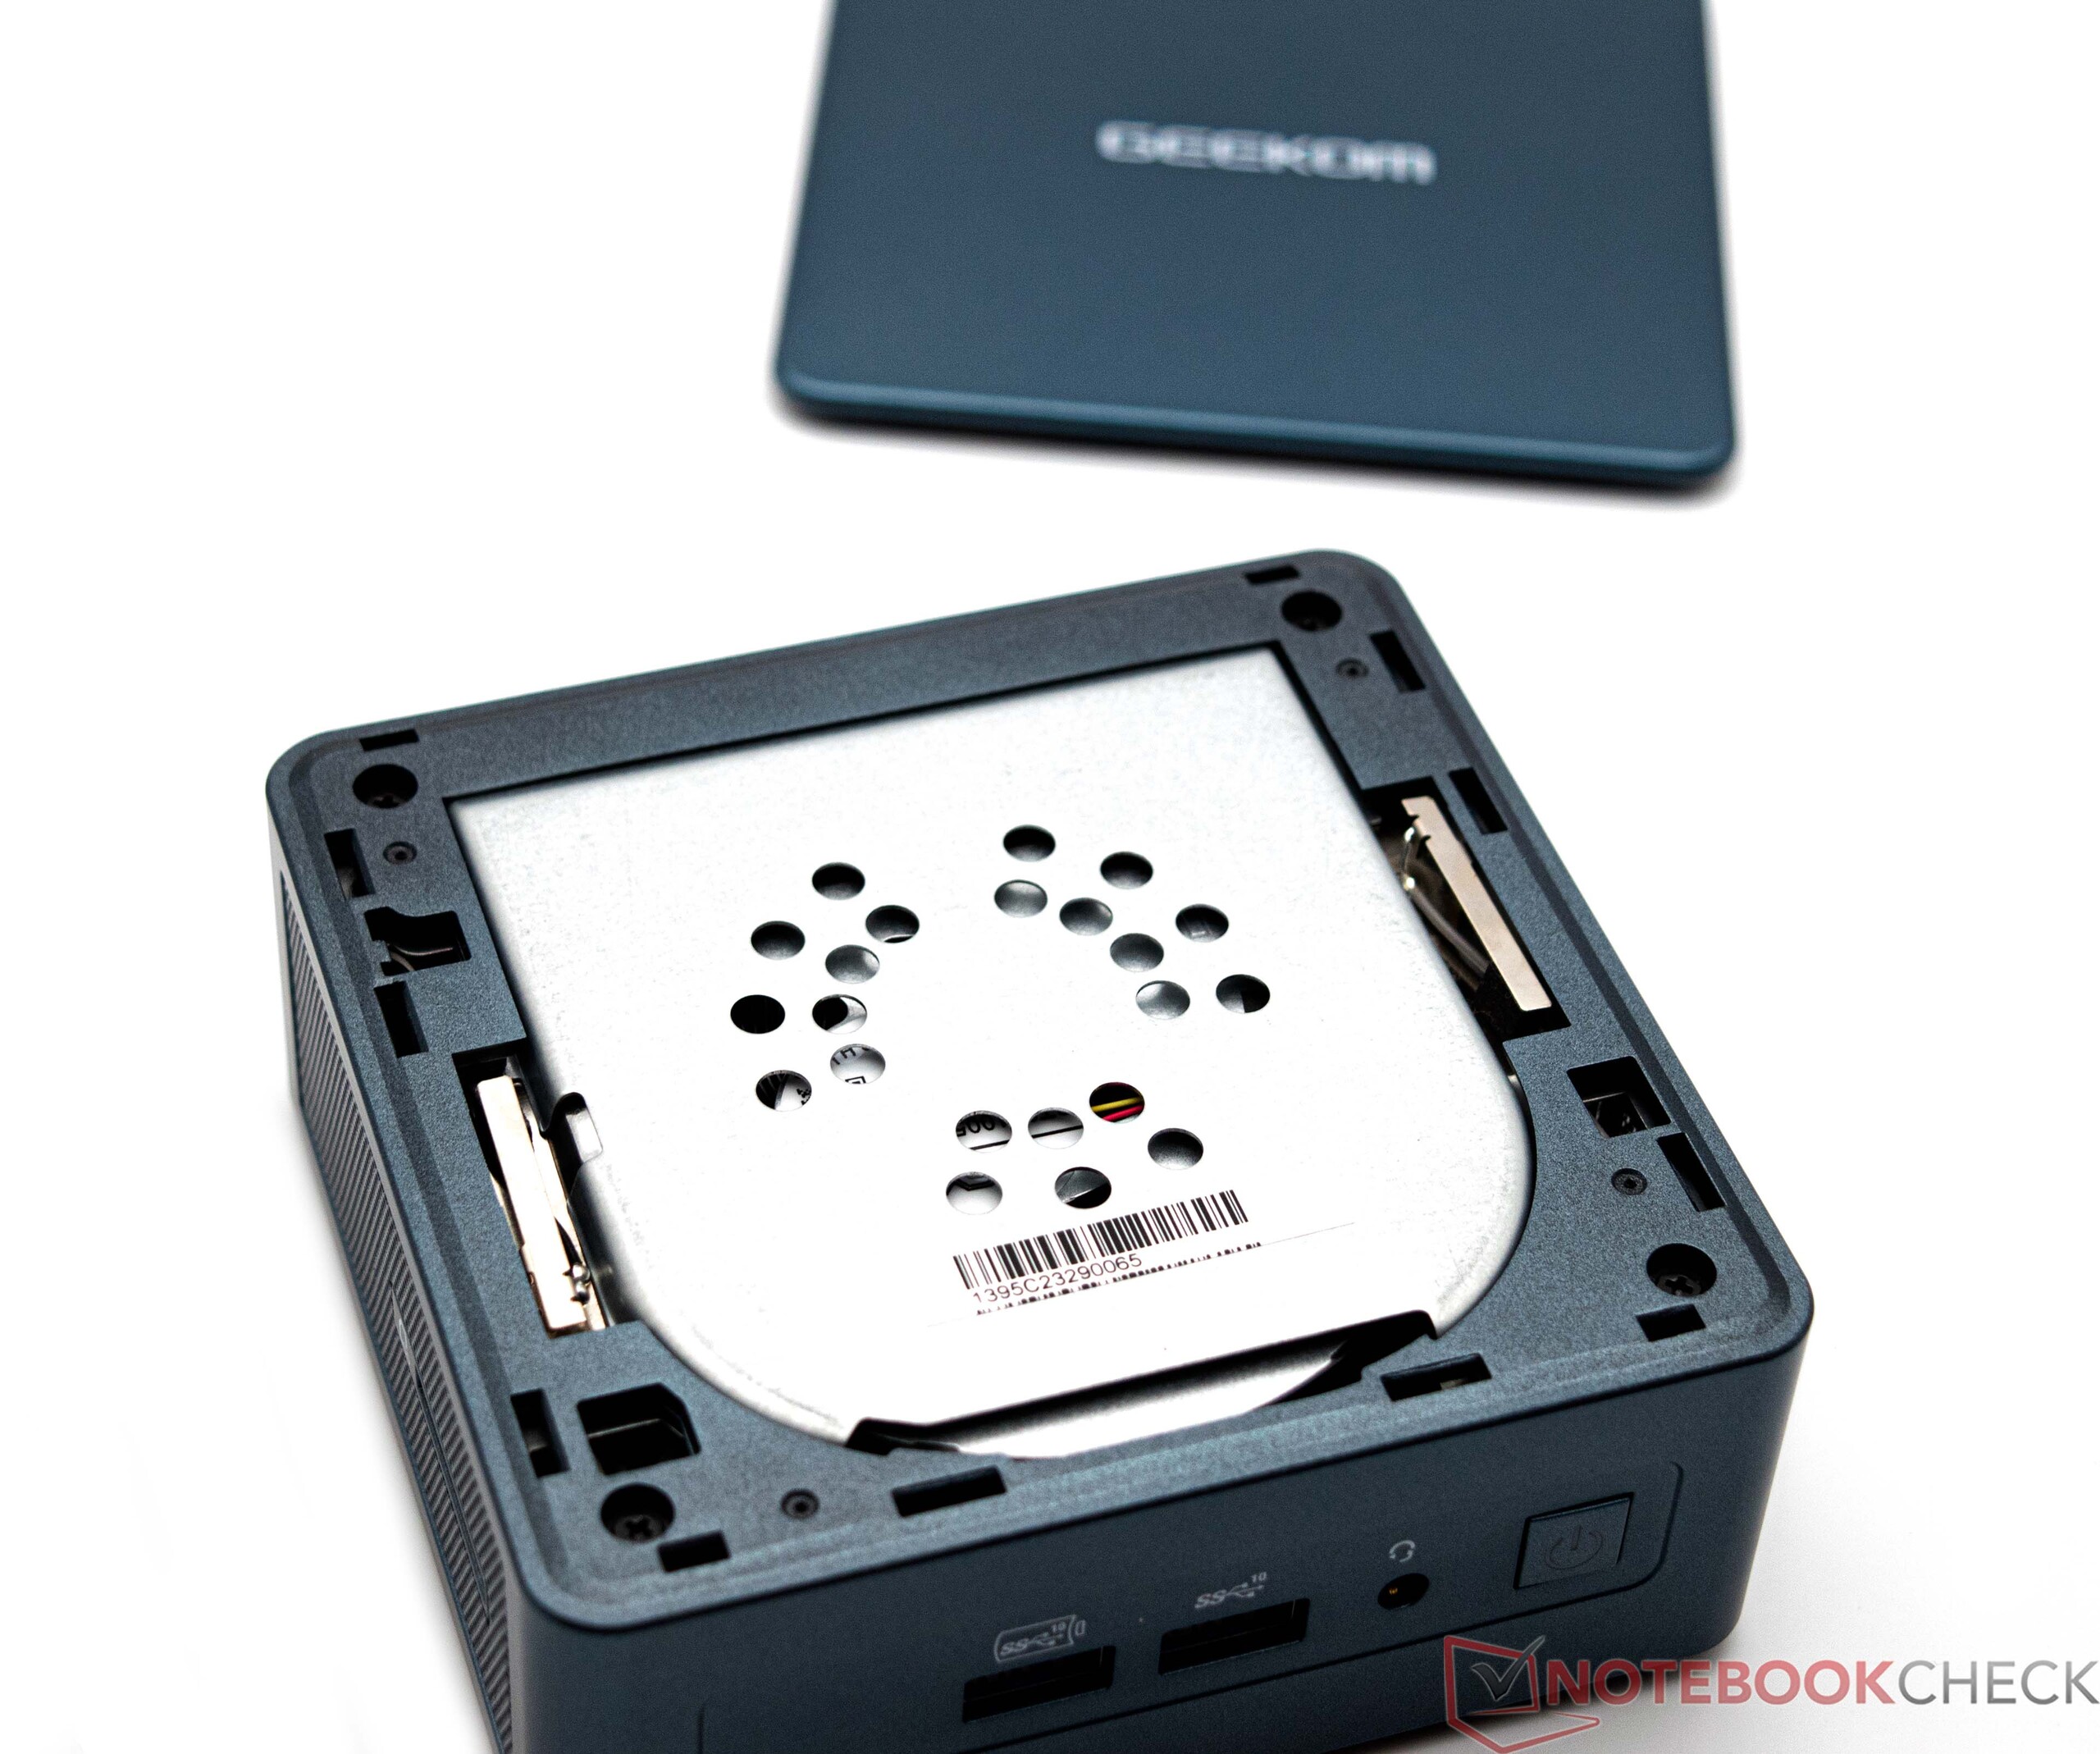
If you wish to access the internal components of the device, you need to remove the base plate first. This is a straightforward process: the screws holding the cover to the housing are located beneath the four rubber feet. Once removed, you can easily access the installed components such as RAM, SSD, or the WLAN module. The Geekom Mini IT12 also features an additional M.2 slot for installing an extra mass storage device. Additionally, it has space to accommodate a 2.5-inch mass storage device. The device can be further disassembled as needed, allowing for fan cleaning or the application of fresh thermal paste.
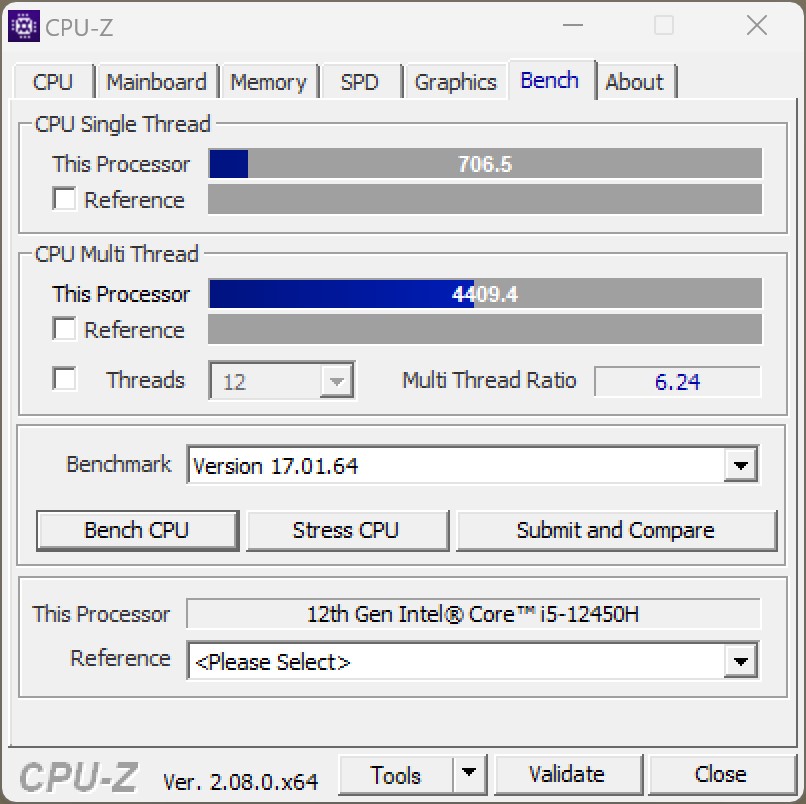
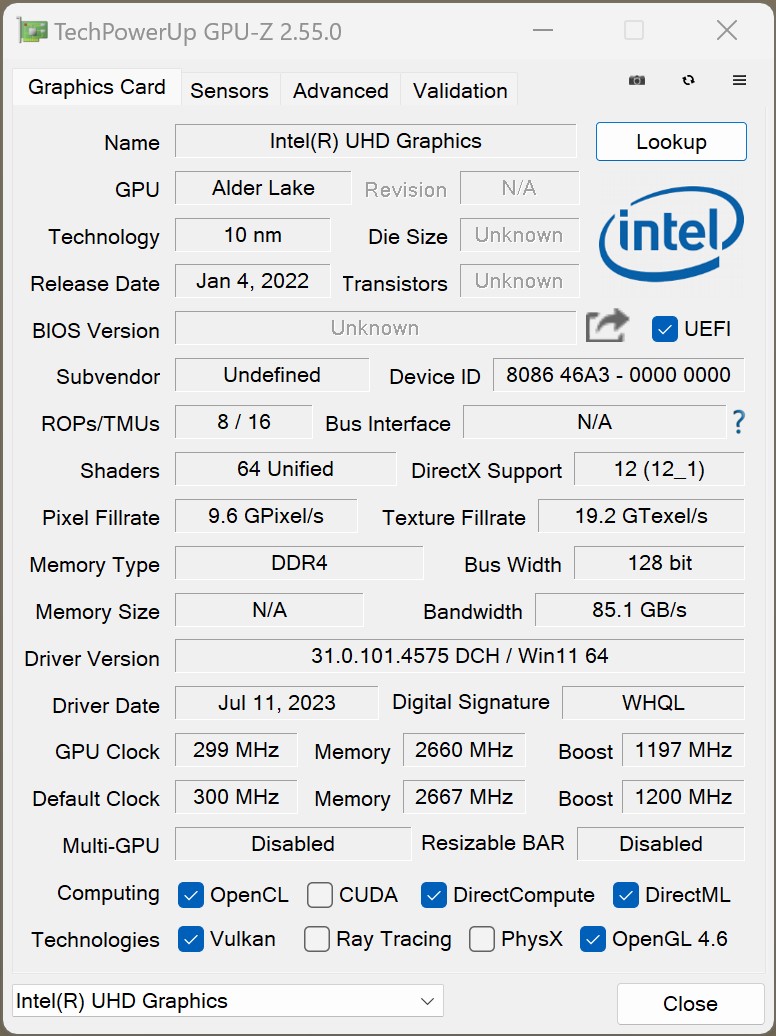
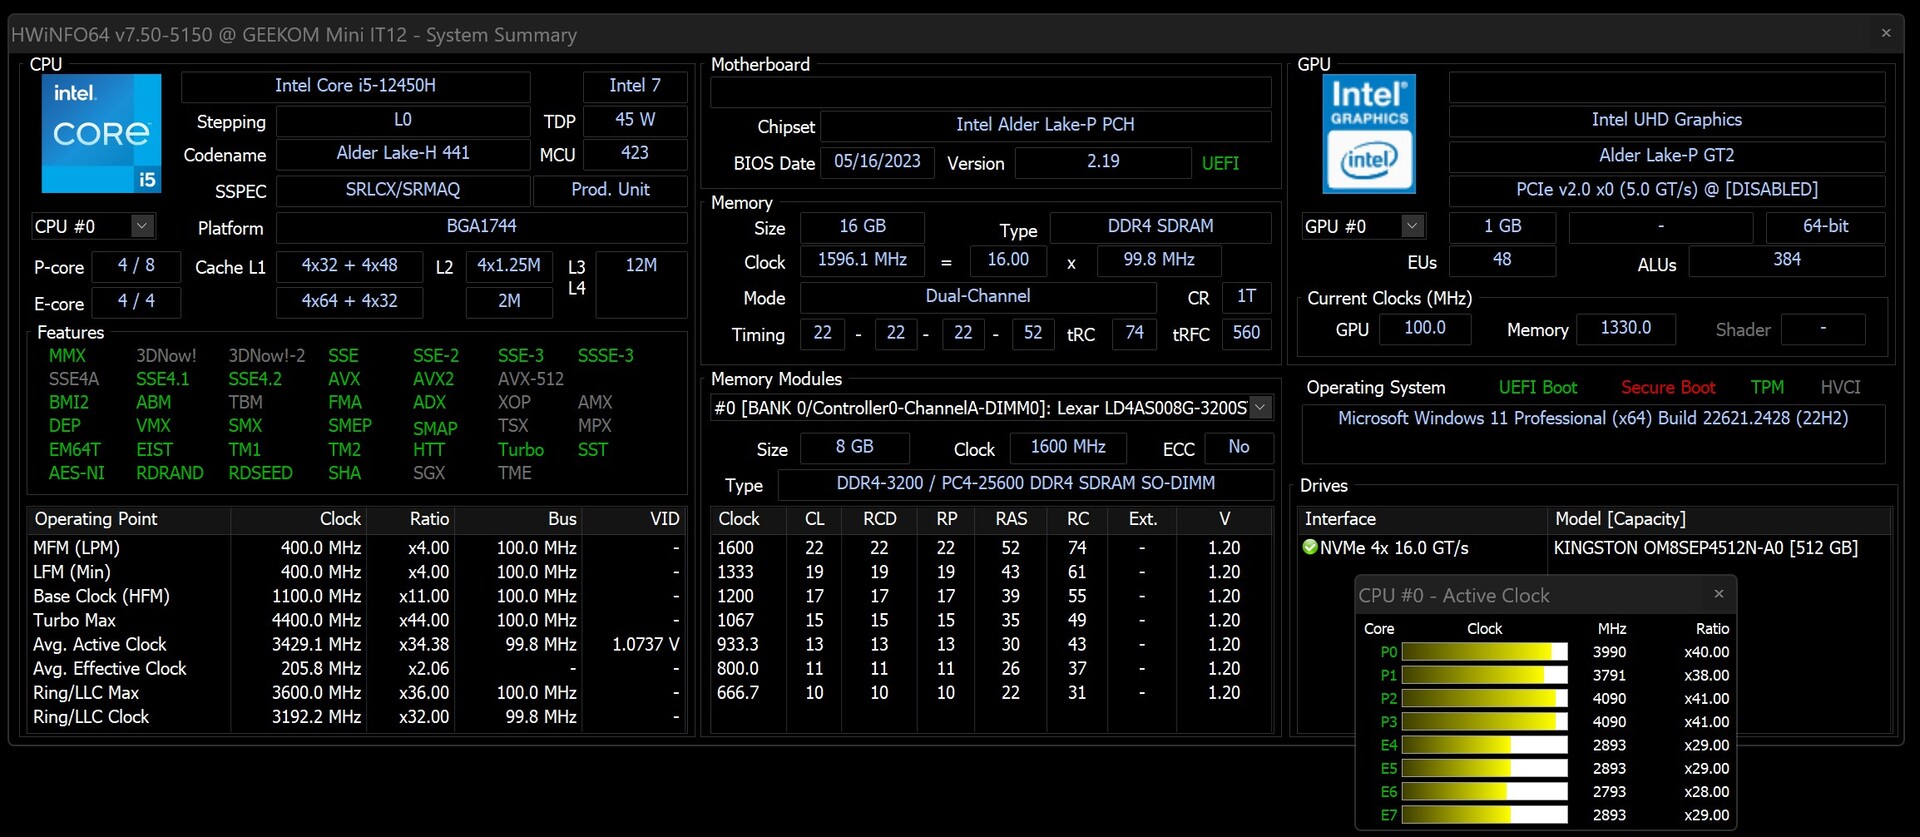
Performance - Alder Lake-H with P and E cores
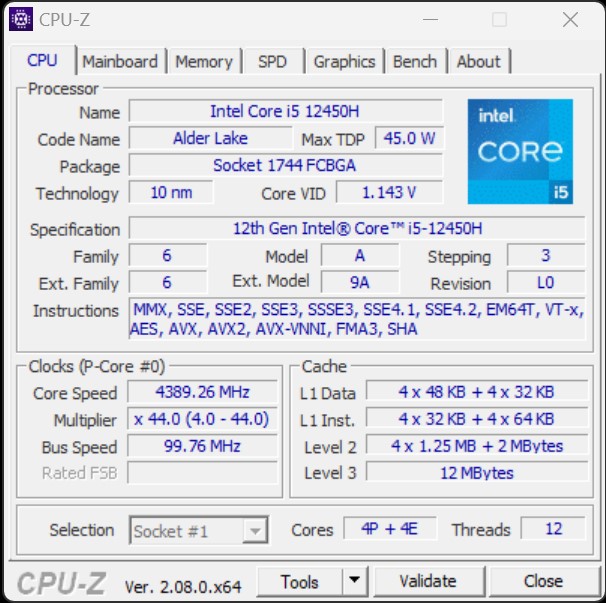
Even if it is not one of the most recent versions, the Geekom Mini IT12 delivers a dependable SoC with the Intel Core i5-12450H. Nonetheless, the CPU, which has 8 cores and 12 threads, should tackle demanding workloads with ease. It's worth mentioning that the Geekom Mini IT12 is also available with an Intel Core i7-12650H processor.
Testing Conditions
We conducted all performance tests using the balanced power profile. We didn't alter the SoC performance and maintained it in the default state according to the BIOS settings.
Processor
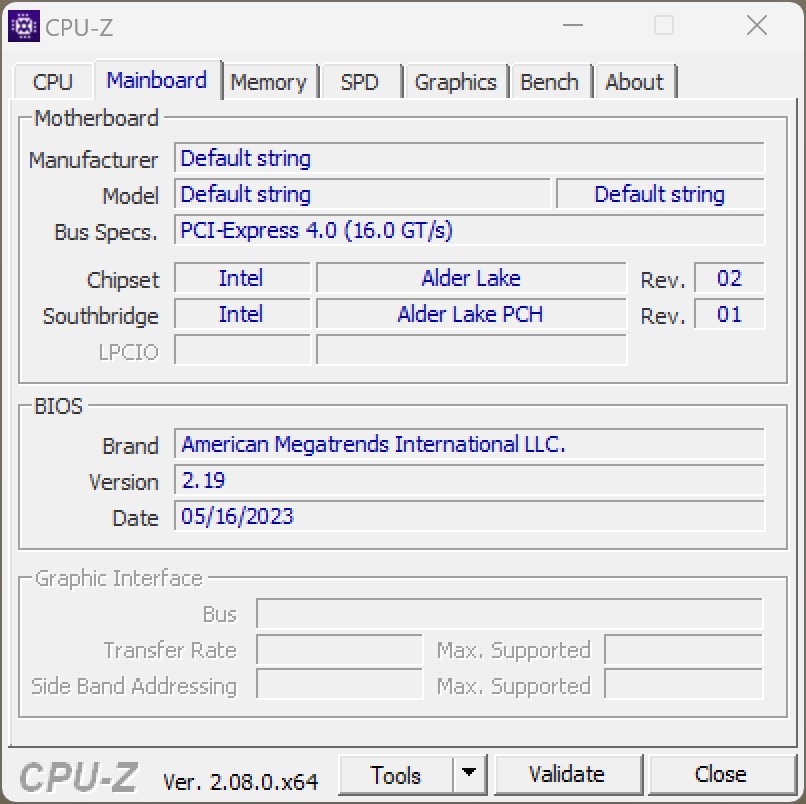
Geekom has fitted the Mini IT12 with an Intel Core i5-12450H processor. This Alder Lake H series CPU is also used in the Minisforum Venus Series UN1245 and the NiPoGi CK10. In a direct comparison, Geekom performs better overall, narrowly losing the internal duel with the Geekom Mini IT12 based on the Intel Core i7-1260P. Our test sample was outperformed by the two Intel NUC competitors.
For additional comparisons and benchmarks, please refer to our CPU comparison table.
| Performance rating - Percent | |
| Intel NUC 13 Pro Kit NUC13ANK | |
| Intel NUC 12 Pro Kit NUC12WSKi7 | |
| Geekom Mini IT12 | |
| Geekom Mini IT12 | |
| Minisforum Venus Series UN1245 | |
| NiPoGi CK10 | |
| Minisforum Mars Series MC560 | |
| Blender - v2.79 BMW27 CPU | |
| Minisforum Mars Series MC560 | |
| NiPoGi CK10 | |
| Geekom Mini IT12 | |
| Minisforum Venus Series UN1245 | |
| Intel NUC 12 Pro Kit NUC12WSKi7 | |
| Geekom Mini IT12 | |
| Intel NUC 13 Pro Kit NUC13ANK | |
| WinRAR - Result | |
| Intel NUC 12 Pro Kit NUC12WSKi7 | |
| Minisforum Mars Series MC560 | |
| Geekom Mini IT12 | |
| Minisforum Venus Series UN1245 | |
| Geekom Mini IT12 | |
| Intel NUC 13 Pro Kit NUC13ANK | |
| NiPoGi CK10 | |
| 3DMark 11 - 1280x720 Performance Physics | |
| Intel NUC 12 Pro Kit NUC12WSKi7 | |
| Intel NUC 13 Pro Kit NUC13ANK | |
| Geekom Mini IT12 | |
| Minisforum Venus Series UN1245 | |
| NiPoGi CK10 | |
| Minisforum Mars Series MC560 | |
| Geekom Mini IT12 | |
| HWBOT x265 Benchmark v2.2 - 4k Preset | |
| Intel NUC 13 Pro Kit NUC13ANK | |
| Intel NUC 12 Pro Kit NUC12WSKi7 | |
| Minisforum Venus Series UN1245 | |
| Geekom Mini IT12 | |
| Minisforum Mars Series MC560 | |
| Geekom Mini IT12 | |
| NiPoGi CK10 | |
| R Benchmark 2.5 - Overall mean | |
| Minisforum Mars Series MC560 | |
| NiPoGi CK10 | |
| Minisforum Venus Series UN1245 | |
| Geekom Mini IT12 | |
| Intel NUC 12 Pro Kit NUC12WSKi7 | |
| Geekom Mini IT12 | |
| Intel NUC 13 Pro Kit NUC13ANK | |
| LibreOffice - 20 Documents To PDF | |
| Minisforum Mars Series MC560 | |
| Geekom Mini IT12 | |
| Geekom Mini IT12 | |
| Minisforum Venus Series UN1245 | |
| Intel NUC 12 Pro Kit NUC12WSKi7 | |
| Intel NUC 13 Pro Kit NUC13ANK | |
| NiPoGi CK10 | |
| WebXPRT 3 - Overall | |
| Intel NUC 13 Pro Kit NUC13ANK | |
| Geekom Mini IT12 | |
| Intel NUC 12 Pro Kit NUC12WSKi7 | |
| Minisforum Venus Series UN1245 | |
| Geekom Mini IT12 | |
| NiPoGi CK10 | |
| Minisforum Mars Series MC560 | |
| Mozilla Kraken 1.1 - Total | |
| Minisforum Mars Series MC560 | |
| Minisforum Venus Series UN1245 | |
| NiPoGi CK10 | |
| Geekom Mini IT12 | |
| Geekom Mini IT12 | |
| Intel NUC 12 Pro Kit NUC12WSKi7 | |
| Intel NUC 13 Pro Kit NUC13ANK | |
* ... smaller is better
AIDA64: FP32 Ray-Trace | FPU Julia | CPU SHA3 | CPU Queen | FPU SinJulia | FPU Mandel | CPU AES | CPU ZLib | FP64 Ray-Trace | CPU PhotoWorxx
| Performance rating | |
| Average of class Mini PC | |
| Intel NUC 13 Pro Kit NUC13ANK | |
| Intel NUC 12 Pro Kit NUC12WSKi7 | |
| Minisforum Mars Series MC560 | |
| Minisforum Venus Series UN1245 | |
| Geekom Mini IT12 | |
| Geekom Mini IT12 | |
| NiPoGi CK10 | |
| AIDA64 / FP32 Ray-Trace | |
| Average of class Mini PC (974 - 82725, n=104, last 2 years) | |
| Intel NUC 13 Pro Kit NUC13ANK | |
| Intel NUC 12 Pro Kit NUC12WSKi7 | |
| Minisforum Mars Series MC560 | |
| Minisforum Venus Series UN1245 | |
| Geekom Mini IT12 | |
| Geekom Mini IT12 | |
| NiPoGi CK10 | |
| AIDA64 / FPU SinJulia | |
| Average of class Mini PC (1019 - 31931, n=104, last 2 years) | |
| Minisforum Mars Series MC560 | |
| Intel NUC 13 Pro Kit NUC13ANK | |
| Intel NUC 12 Pro Kit NUC12WSKi7 | |
| Minisforum Venus Series UN1245 | |
| Geekom Mini IT12 | |
| Geekom Mini IT12 | |
| NiPoGi CK10 | |
| AIDA64 / FP64 Ray-Trace | |
| Average of class Mini PC (537 - 43587, n=104, last 2 years) | |
| Intel NUC 13 Pro Kit NUC13ANK | |
| Intel NUC 12 Pro Kit NUC12WSKi7 | |
| Minisforum Mars Series MC560 | |
| Minisforum Venus Series UN1245 | |
| Geekom Mini IT12 | |
| Geekom Mini IT12 | |
| NiPoGi CK10 | |
| AIDA64 / CPU PhotoWorxx | |
| Average of class Mini PC (8069 - 96843, n=104, last 2 years) | |
| Intel NUC 13 Pro Kit NUC13ANK | |
| Minisforum Venus Series UN1245 | |
| Intel NUC 12 Pro Kit NUC12WSKi7 | |
| Geekom Mini IT12 | |
| NiPoGi CK10 | |
| Geekom Mini IT12 | |
| Minisforum Mars Series MC560 | |
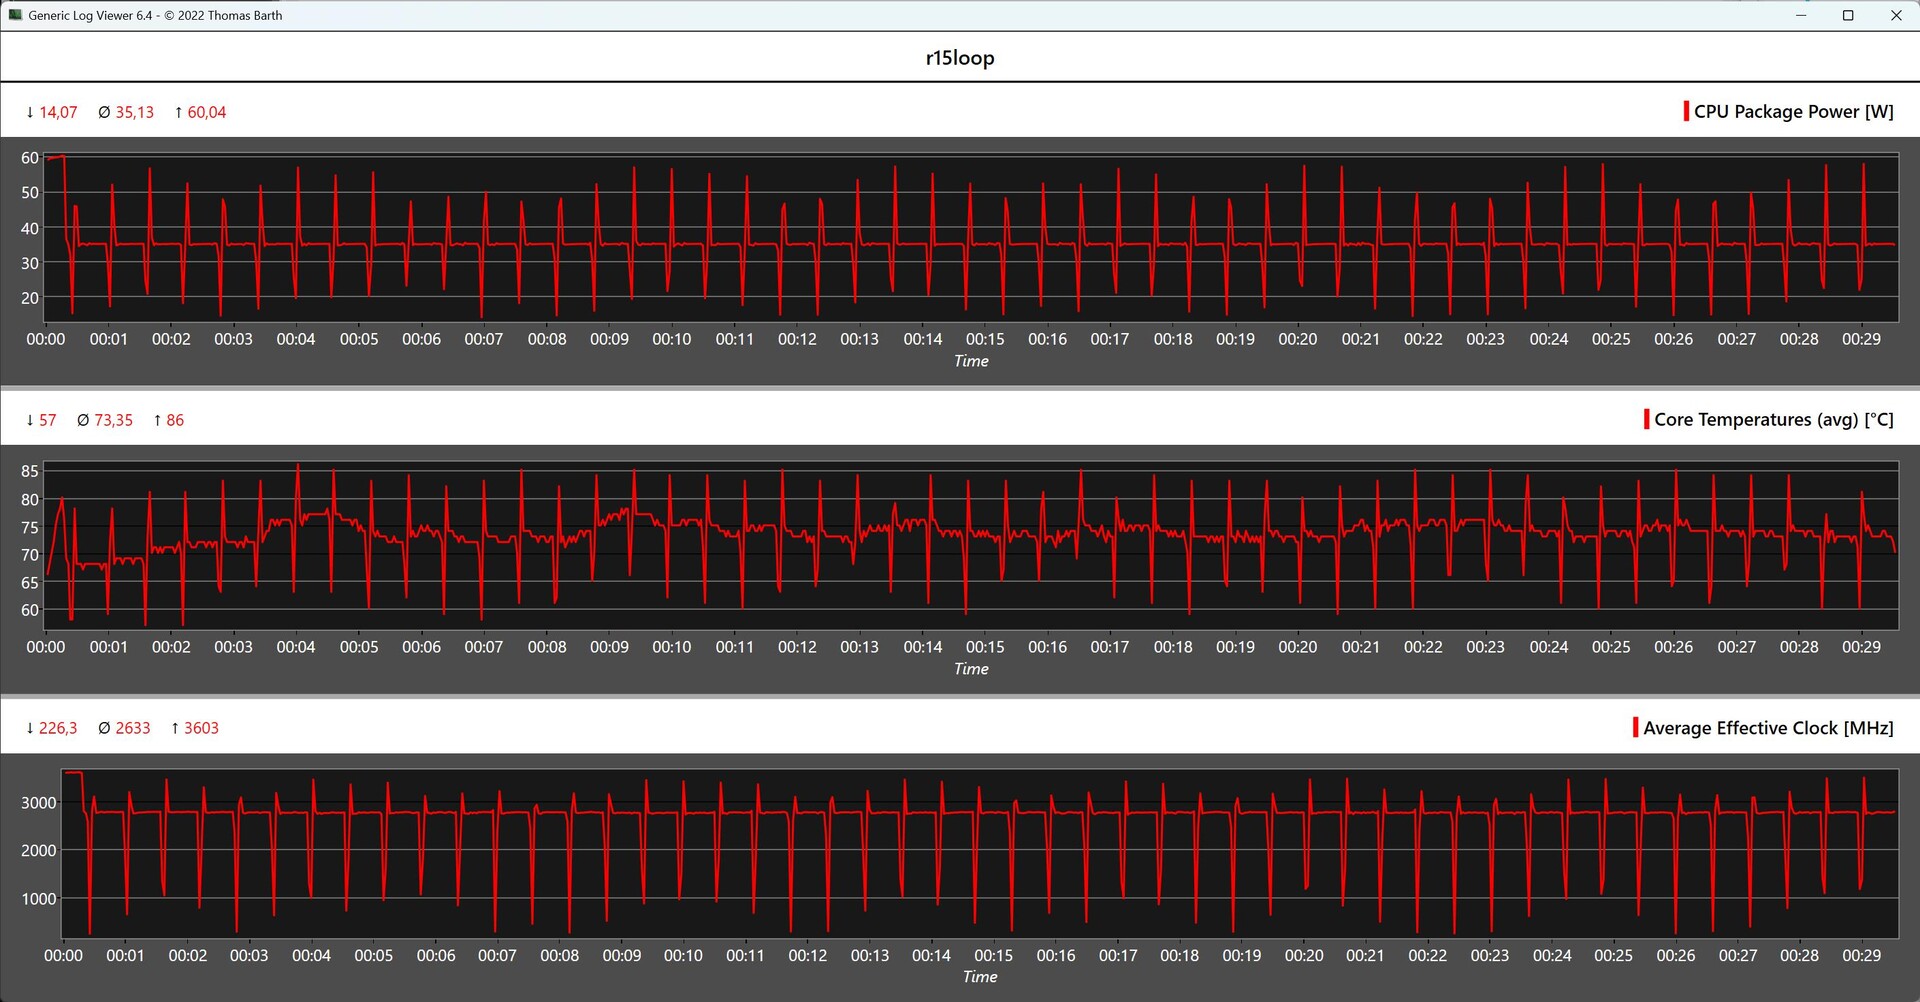
The Geekom Mini IT12 vs. Cinebench-R15 Multi Loop
We investigated the performance of the built-in cooling in conjunction with the power target of the Intel Core i5-12450H using the Cinebench R15 Multi Loop. The result suggests that the processor's maximal performance is only available at the start. After the second run, performance declines dramatically but then stabilizes for the remainder of the test. Our test gadget scores sixth in this benchmark, with an average score of 1,211 points.
System Performance
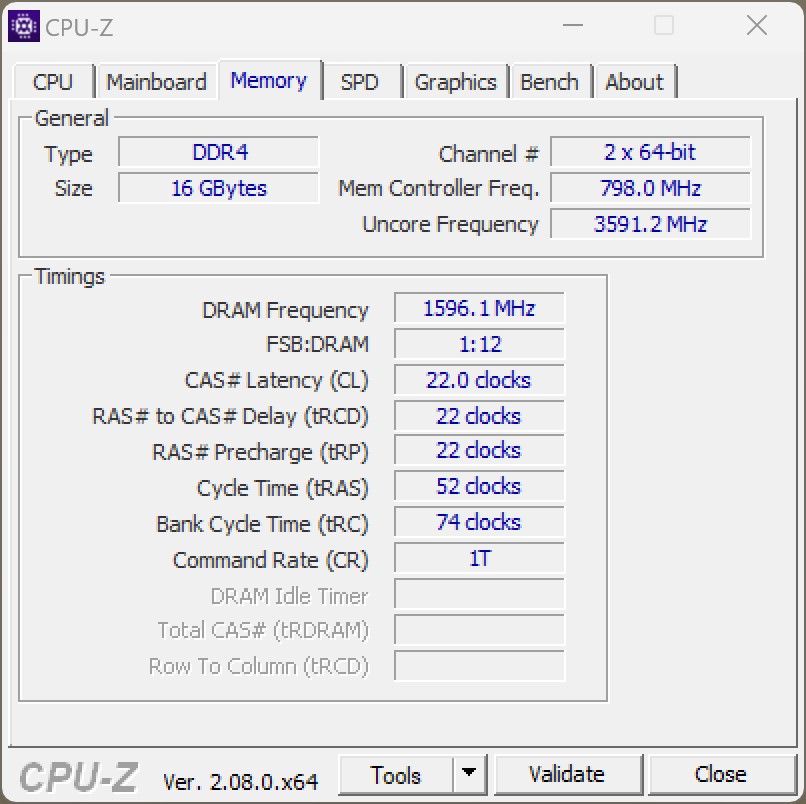
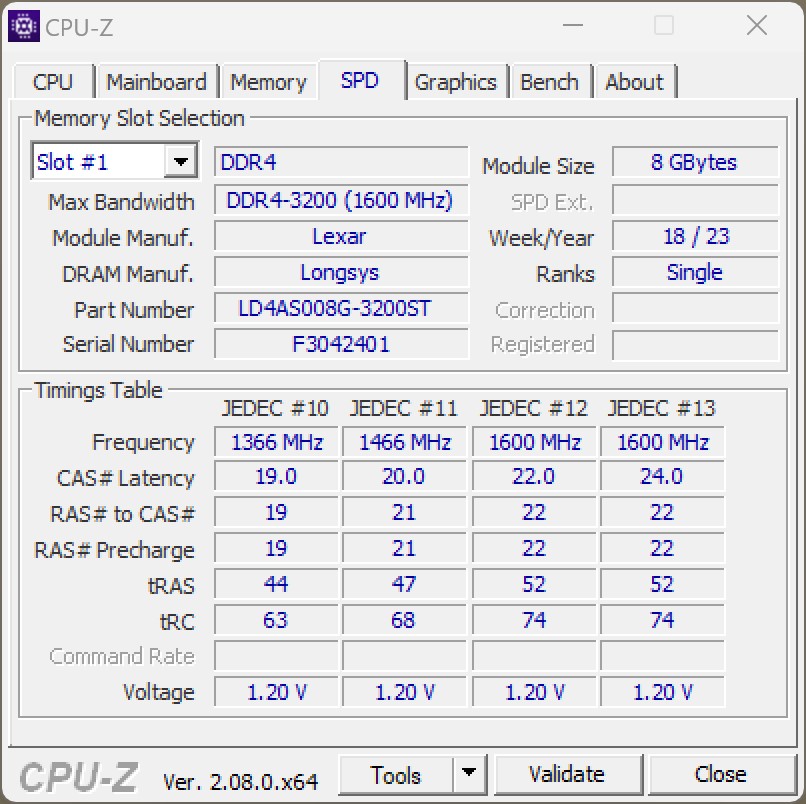
The system performance benchmarks paint a similar picture to the earlier CPU performance tests. Once again, the Geekom Mini IT12 outperforms the two competitors, Minisforum Venus Series UN1245 and NiPoGi CK10. During the RAM tests, all devices exhibit a similar performance, as none of the manufacturers have ventured to install faster DDR5 RAM. It's worth noting that the Intel Core i5-12450H supports DDR5 RAM with speeds of up to 5,200 MT/s.
| AIDA64 / Memory Write | |
| Average of class Mini PC (10630 - 216693, n=104, last 2 years) | |
| Geekom Mini IT12 | |
| NiPoGi CK10 | |
| Geekom Mini IT12 | |
| Minisforum Venus Series UN1245 | |
| Intel NUC 12 Pro Kit NUC12WSKi7 | |
| Intel NUC 13 Pro Kit NUC13ANK | |
| Minisforum Mars Series MC560 | |
| AIDA64 / Memory Latency | |
| Average of class Mini PC (88.1 - 184.8, n=105, last 2 years) | |
| Minisforum Mars Series MC560 | |
| Intel NUC 13 Pro Kit NUC13ANK | |
| Intel NUC 12 Pro Kit NUC12WSKi7 | |
| Geekom Mini IT12 | |
| Minisforum Venus Series UN1245 | |
| NiPoGi CK10 | |
| Geekom Mini IT12 | |
* ... smaller is better
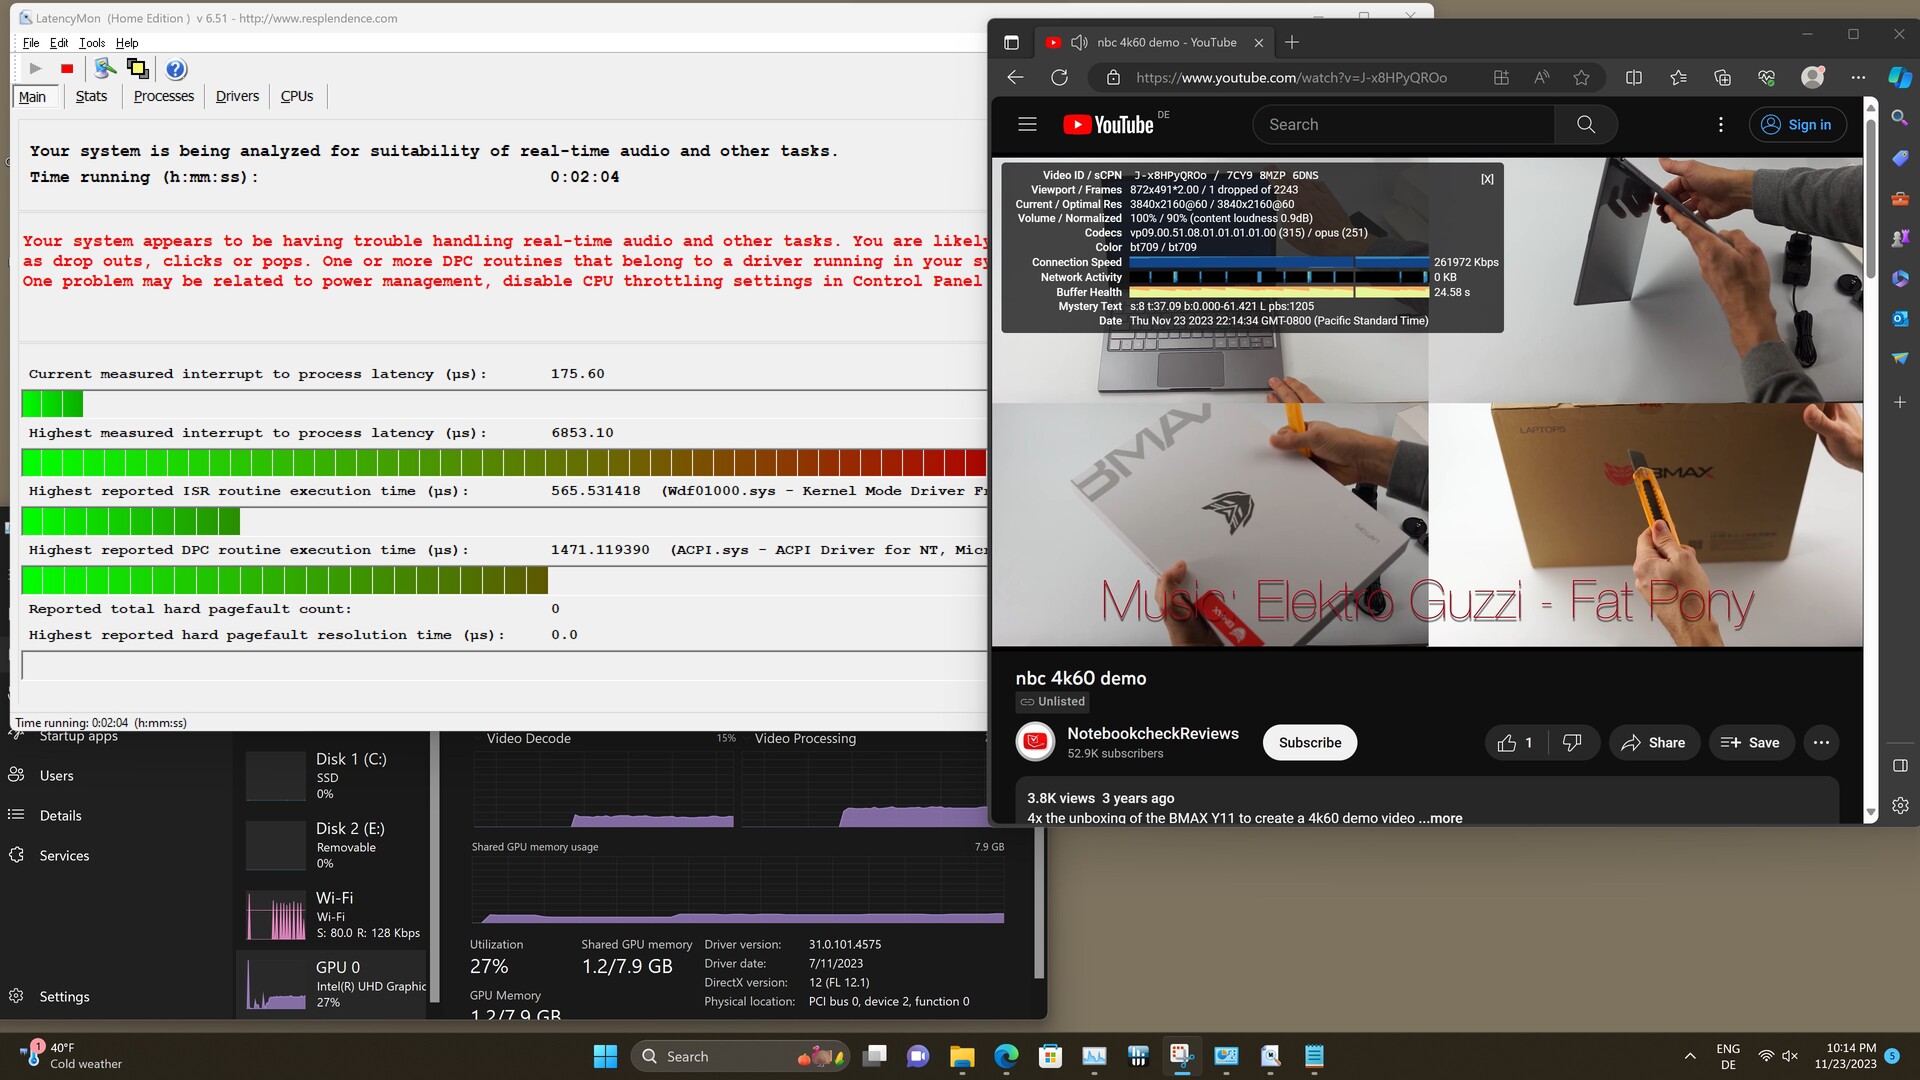
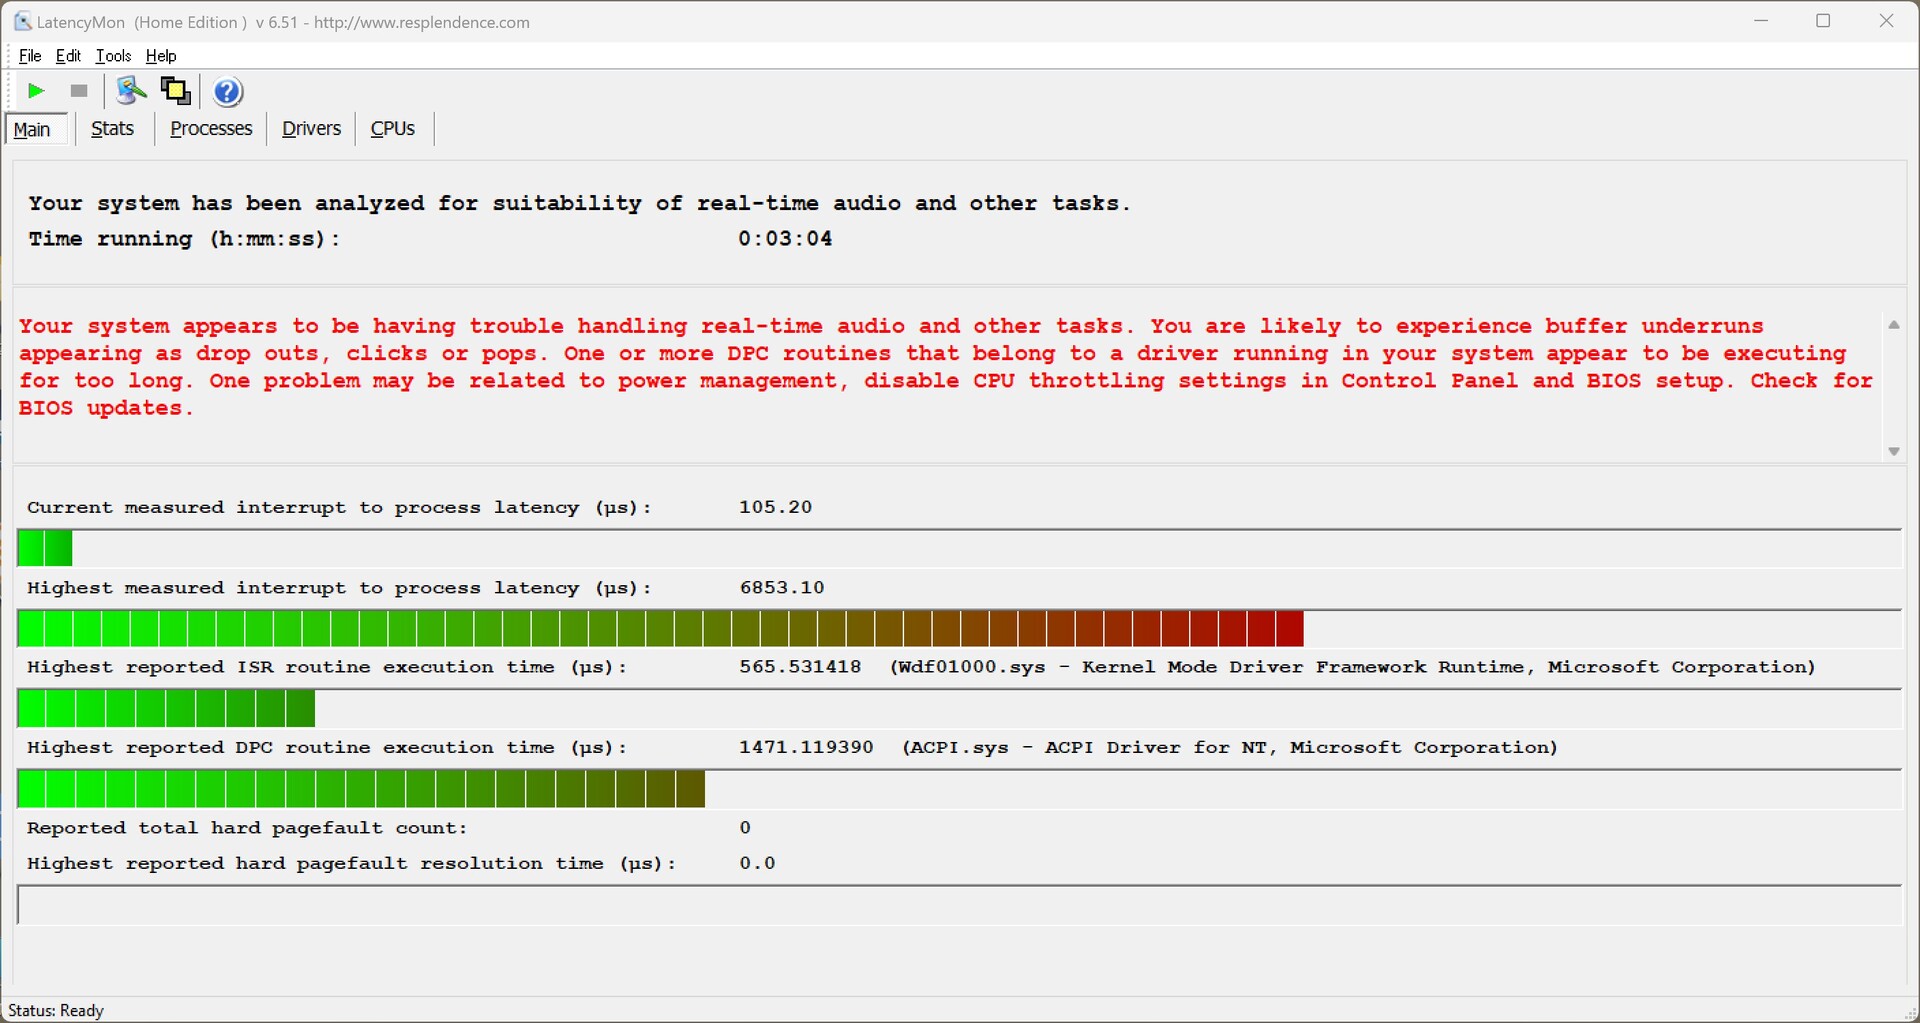
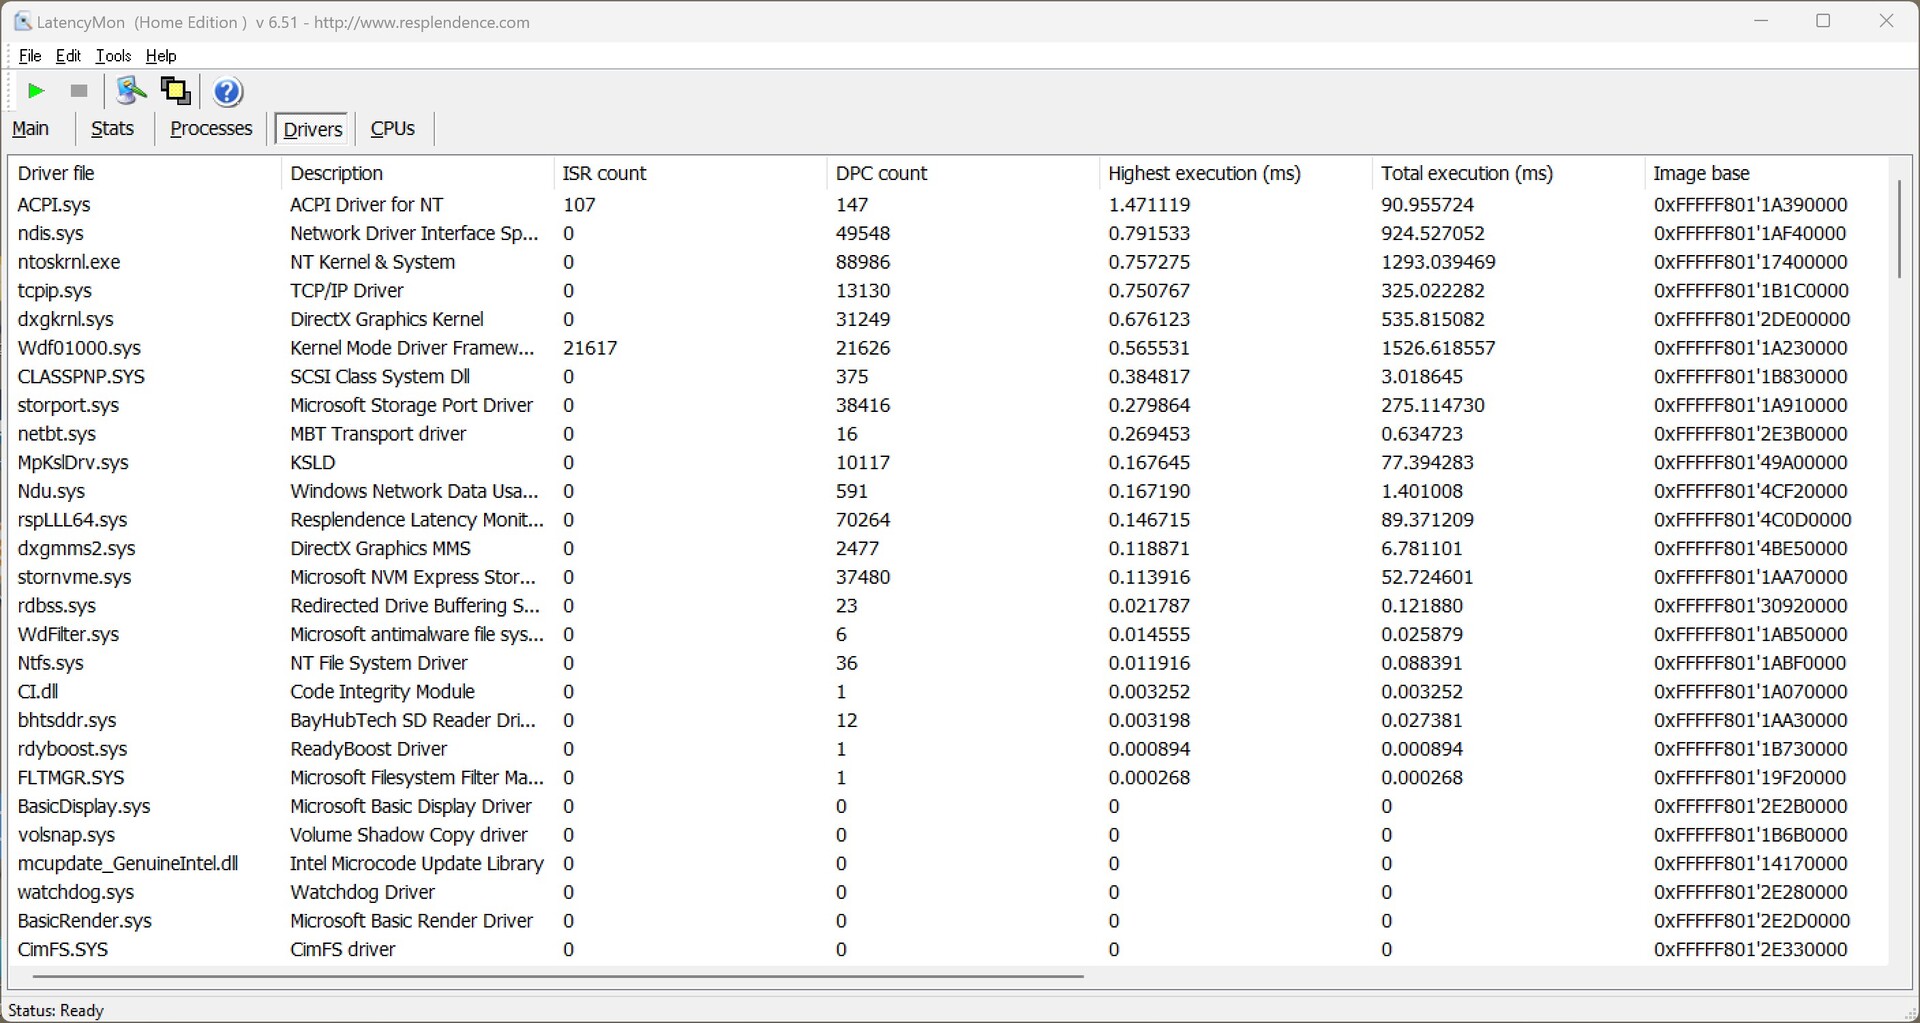
DPC Latency
The Geekom Mini IT12, based on the Intel Core i5-12450H, doesn't perform well in terms of DPC latencies. LatencyMon shows very high latencies even when opening several tabs in the Edge browser. Fortunately, there is no noticeable degradation in the playback of the 4K test video. With a low number of dropped frames, the Geekom Mini IT12 can still be used as a streaming client in the living room, for example.
| DPC Latencies / LatencyMon - interrupt to process latency (max), Web, Youtube, Prime95 | |
| Geekom Mini IT12 | |
| Minisforum Mars Series MC560 | |
| Intel NUC 13 Pro Kit NUC13ANK | |
| Geekom Mini IT12 | |
| NiPoGi CK10 | |
| Intel NUC 12 Pro Kit NUC12WSKi7 | |
| Minisforum Venus Series UN1245 | |
* ... smaller is better
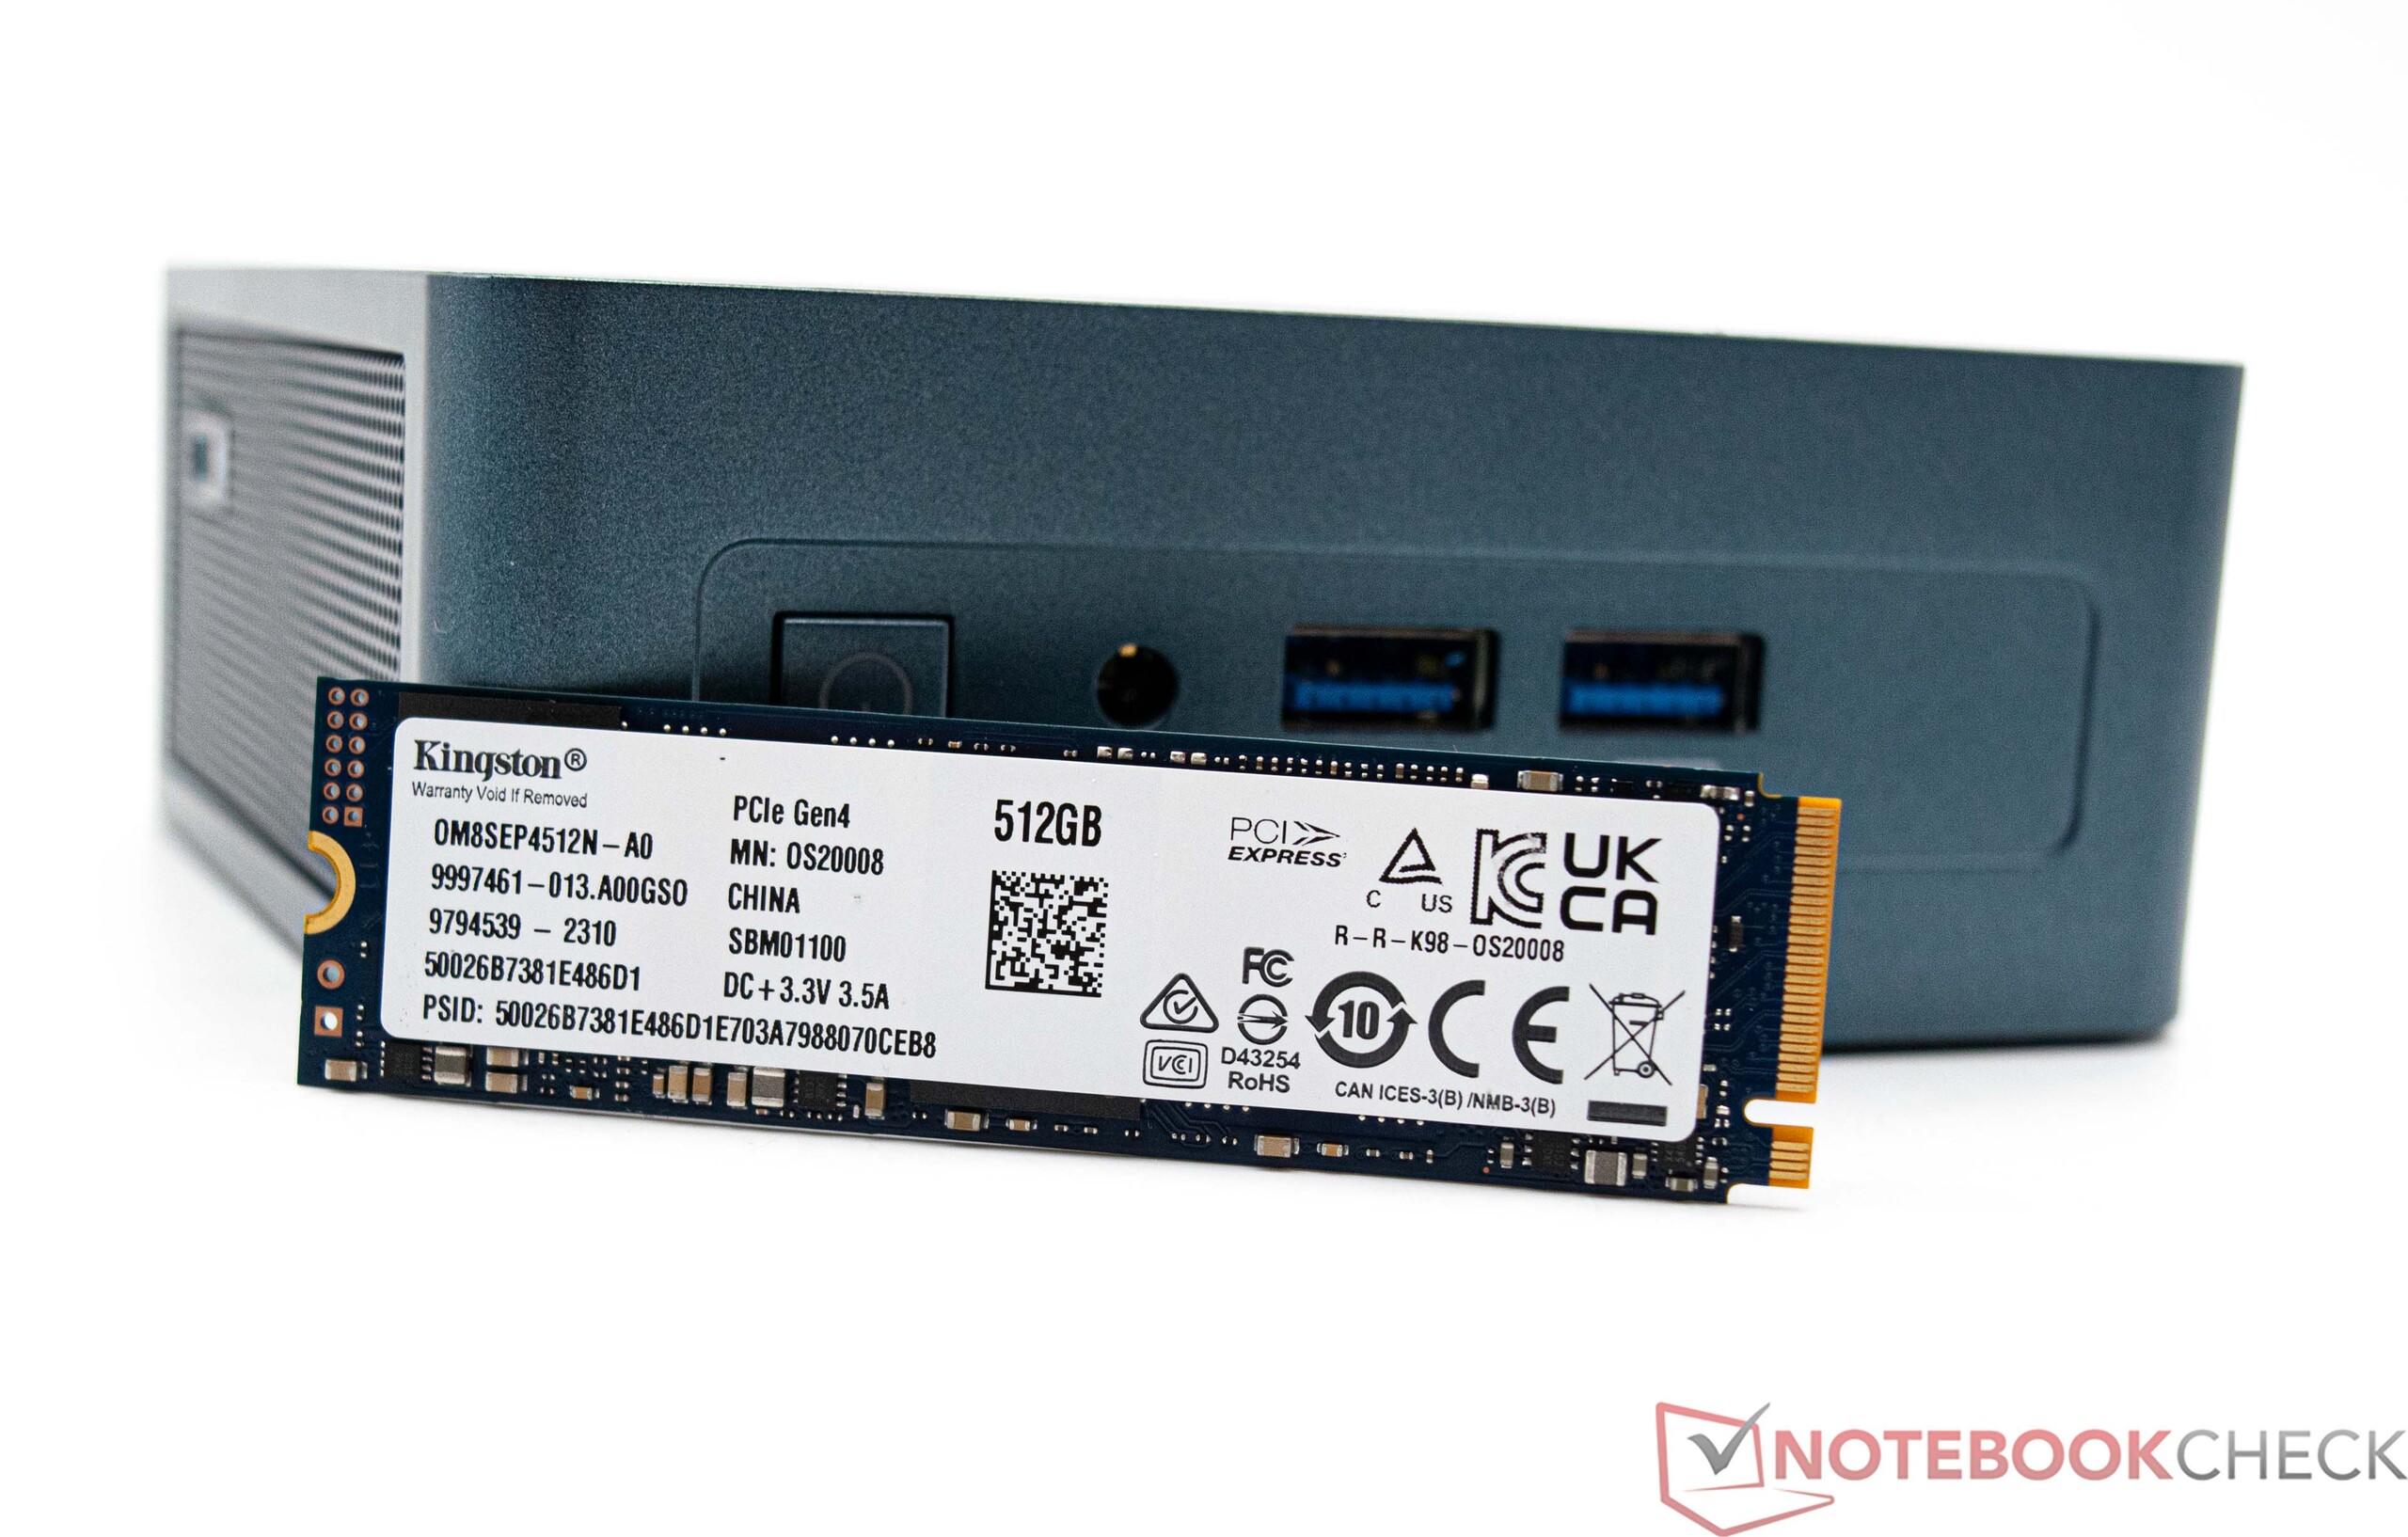
Storage Devices
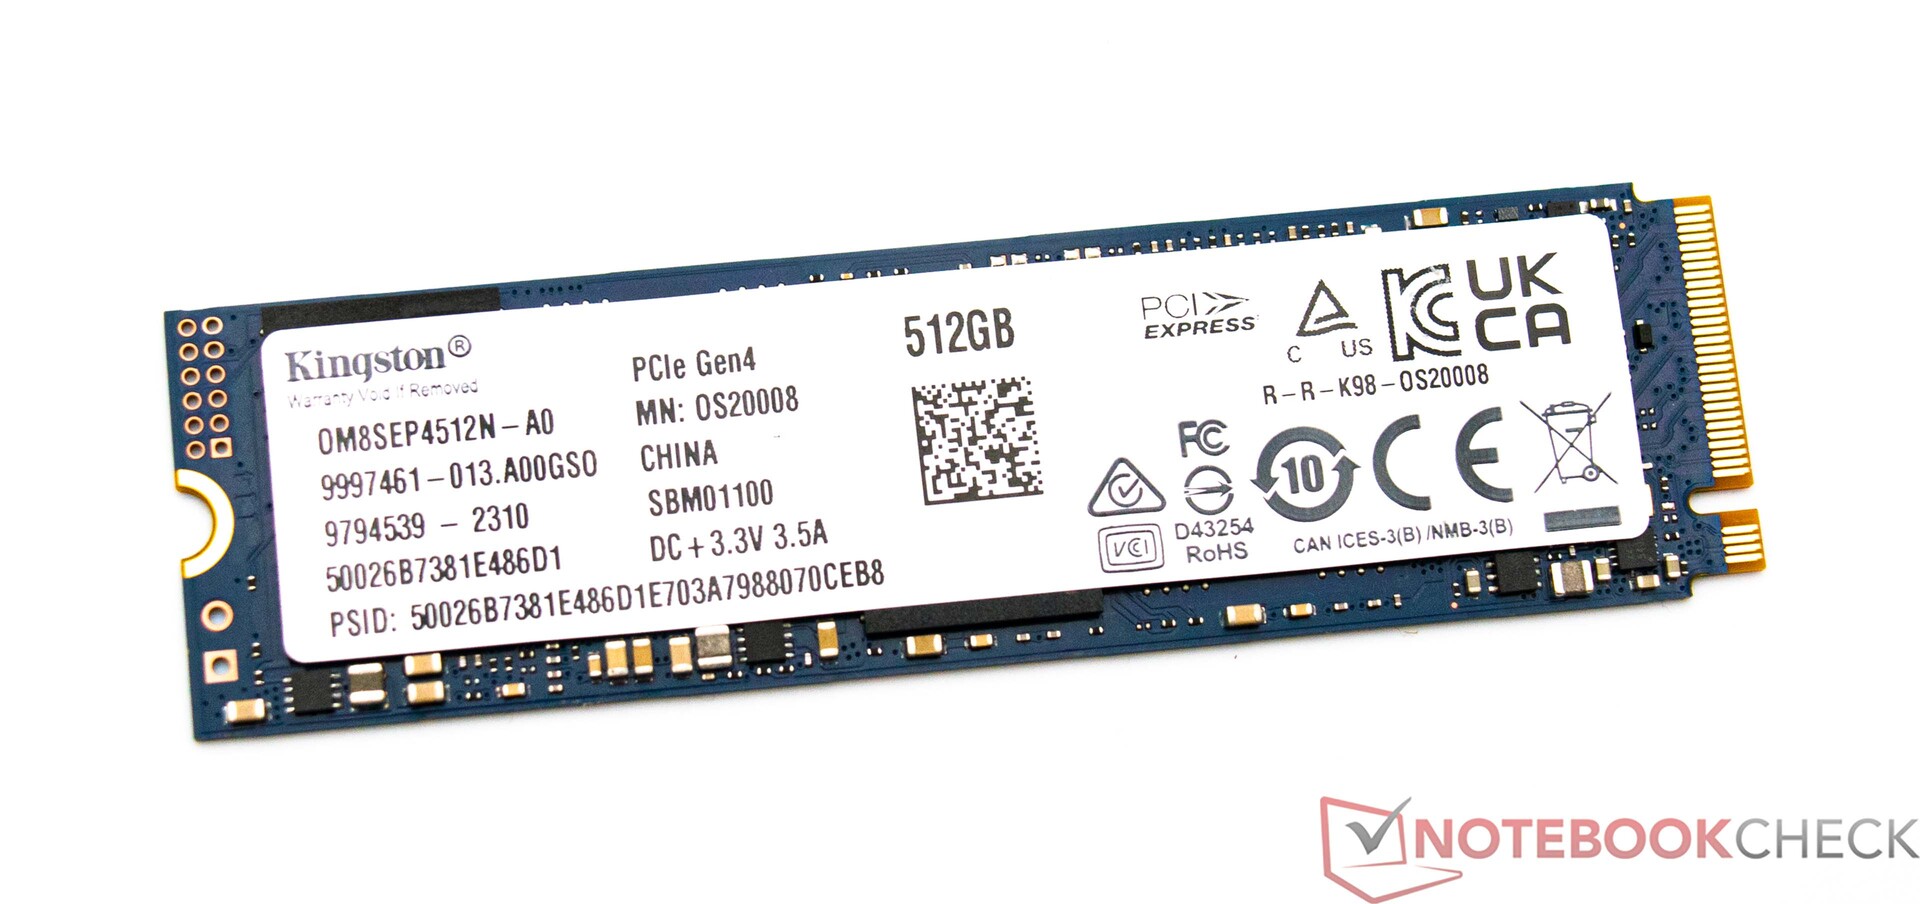
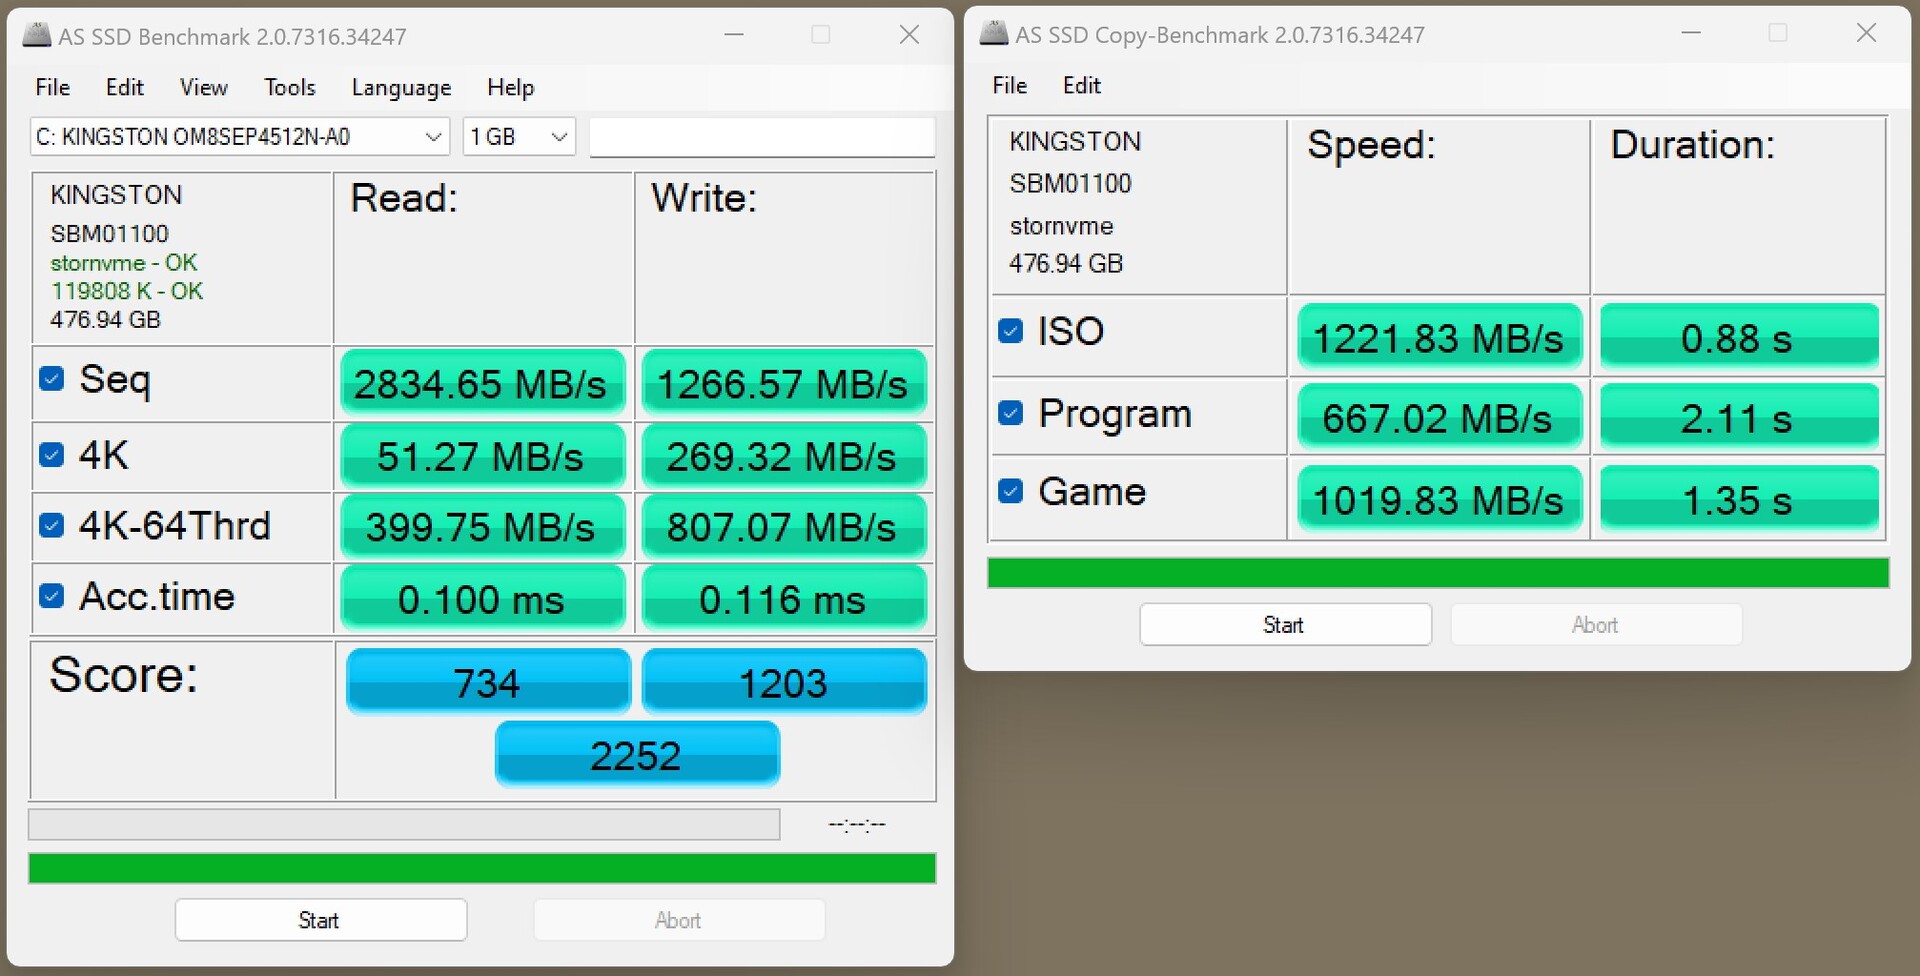
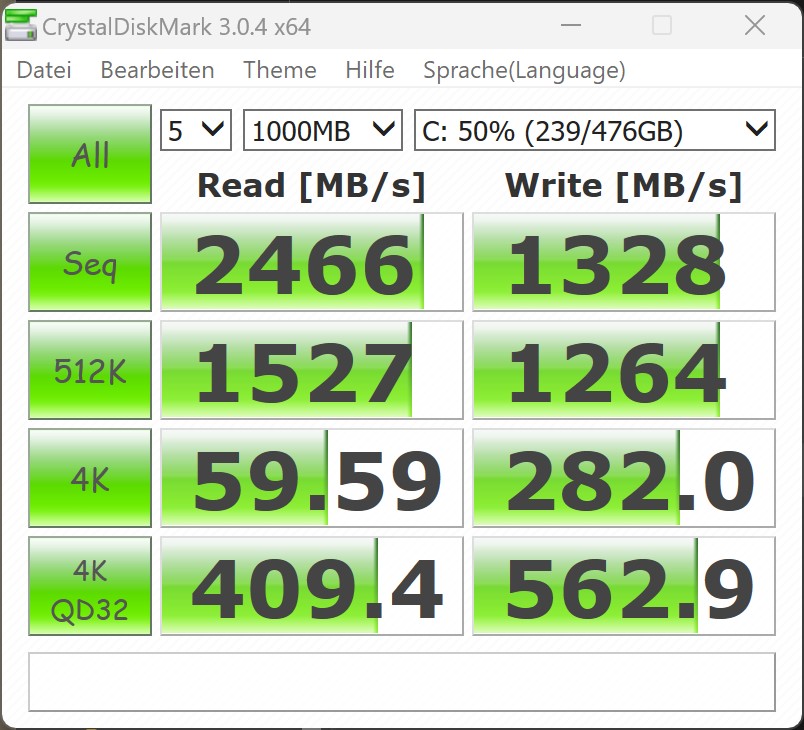
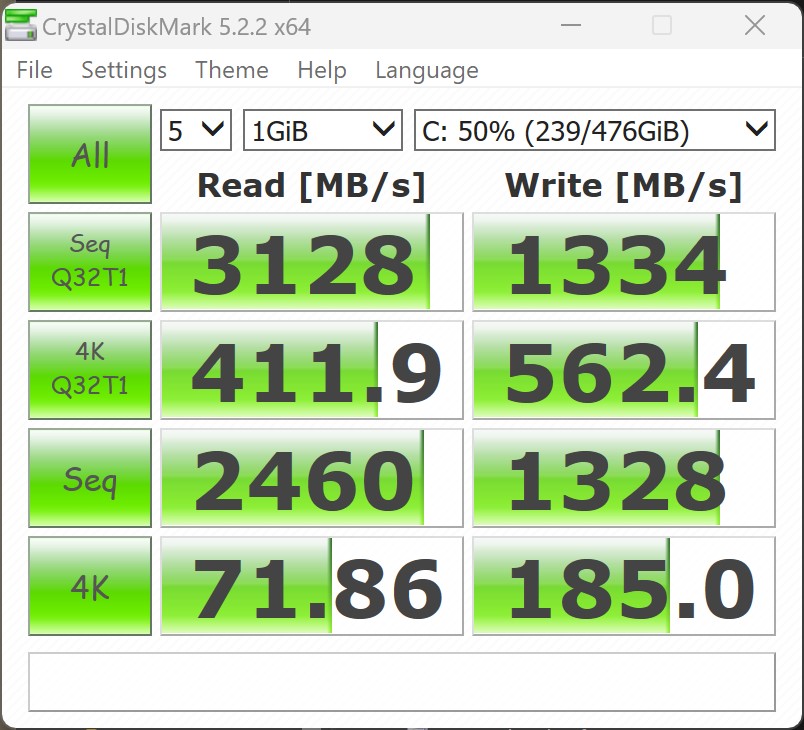
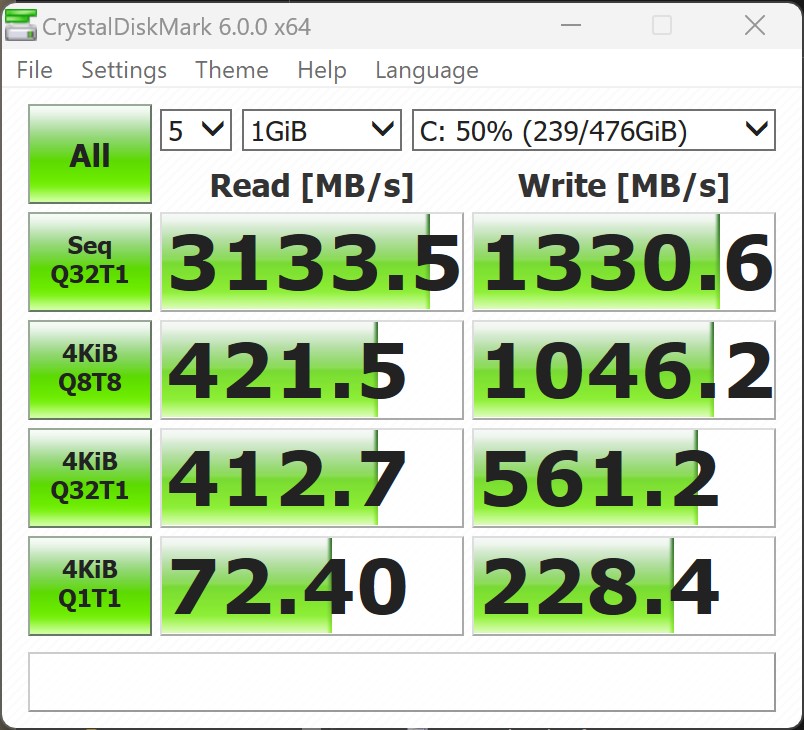
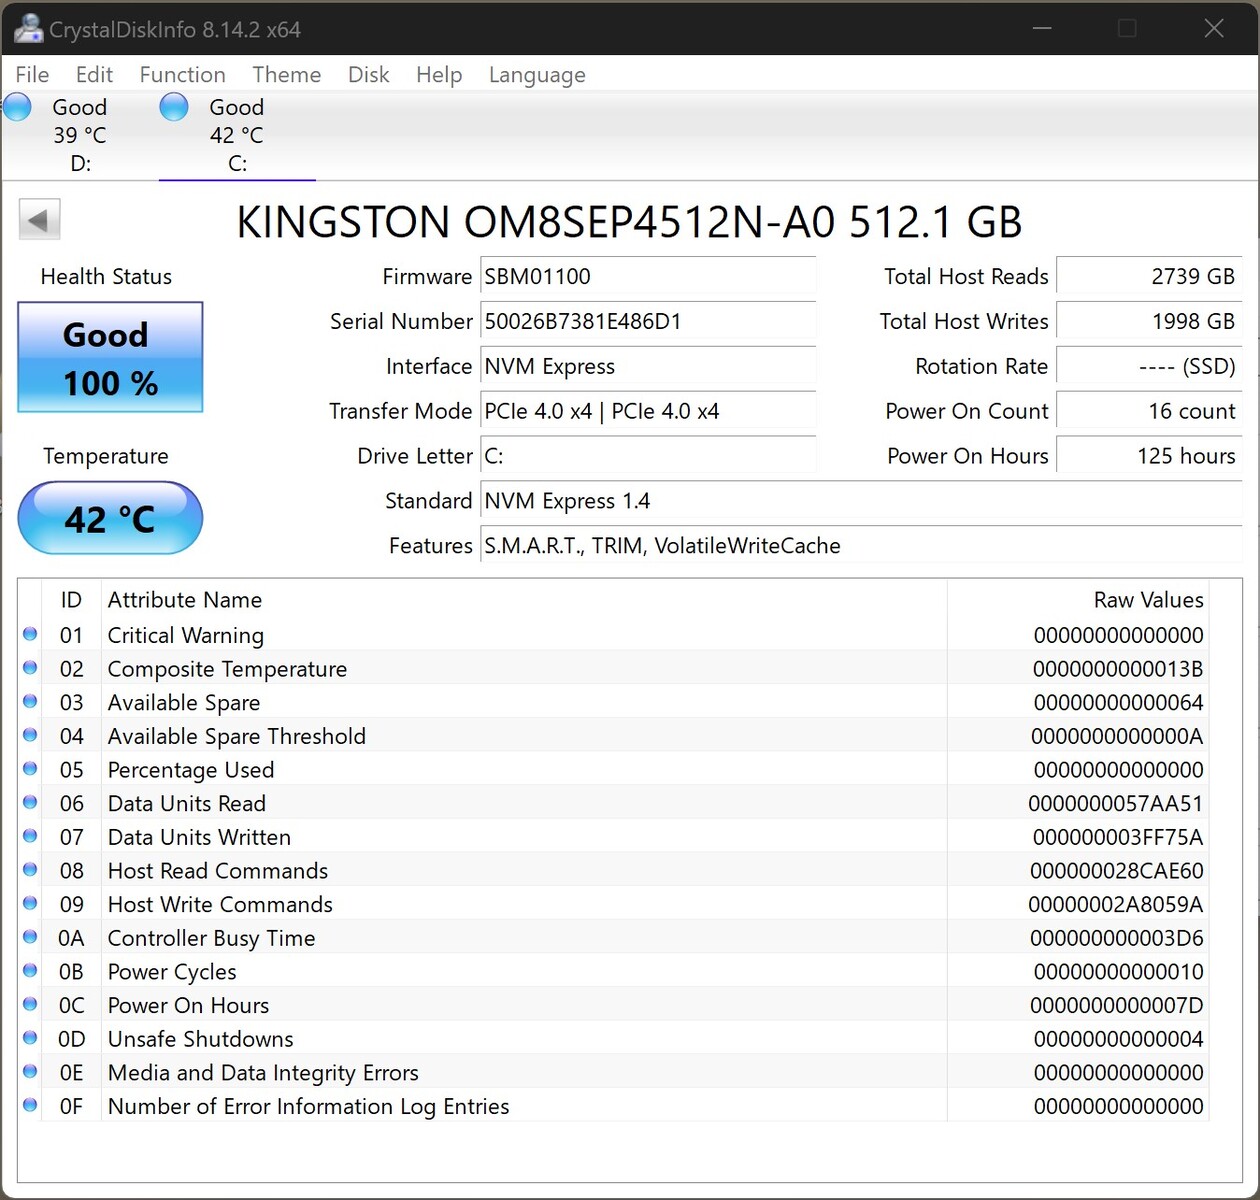
Geekom has equipped the Mini IT12 with a familiar 512 GB NVMe SSD from Kingston, a model we have seen in action in other systems. This SSD uses the NVMe interface, is equipped with QLC memory, and is connected with PCIe 4.0x4. However, in the test, the SSD falls behind its competitors, as some of them are fitted with significantly faster SSDs. Nevertheless, in everyday use, there should be no noticeable reduction in performance. The write and read rates are fast enough, and installing test programs was completed quickly. Thanks to passive cooling via the base plate, the SSD copes well with continuous load, and we did not notice any drop in performance under load. The Geekom Mini IT12 can accommodate up to three mass storage devices, including another SSD in M.2-2242 format and a 2.5-inch mass storage device, observing a maximum height of 7 millimeters.
For further comparisons and benchmarks, please refer to our comparison table.

* ... smaller is better
Dauerleistung Lesen: DiskSpd Read Loop, Queue Depth 8
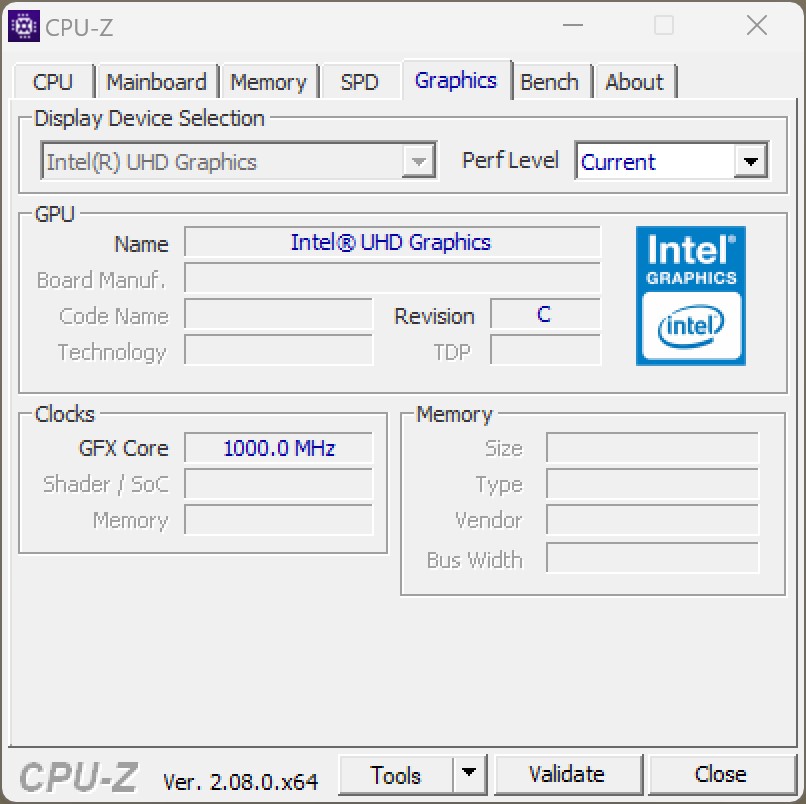
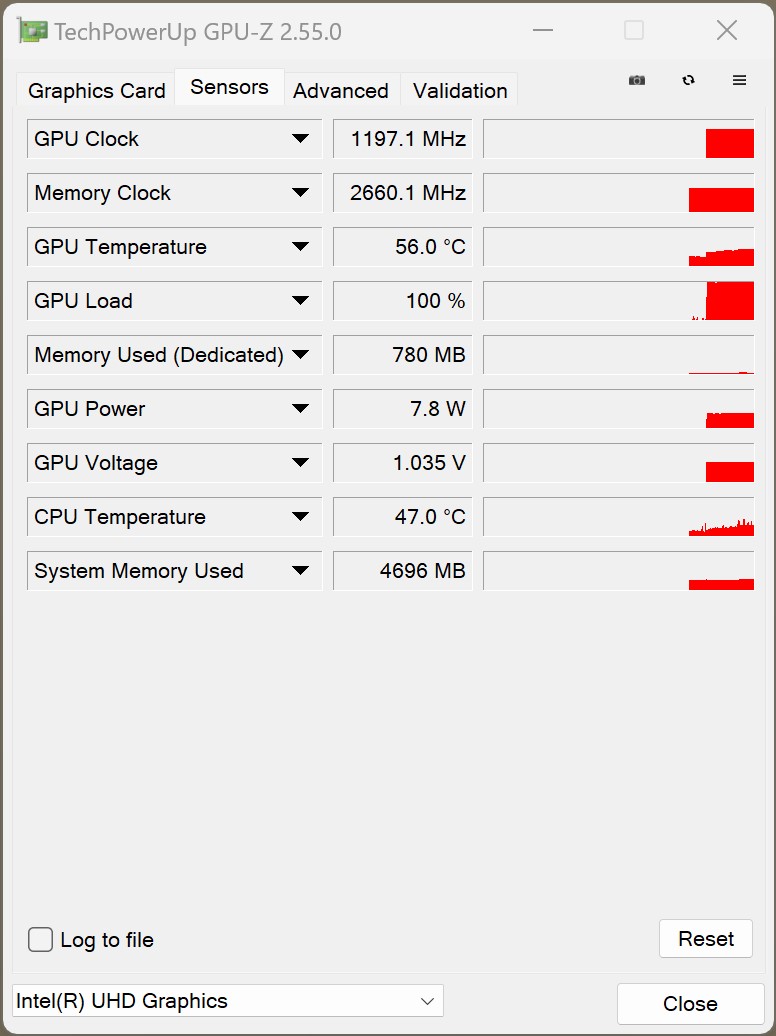
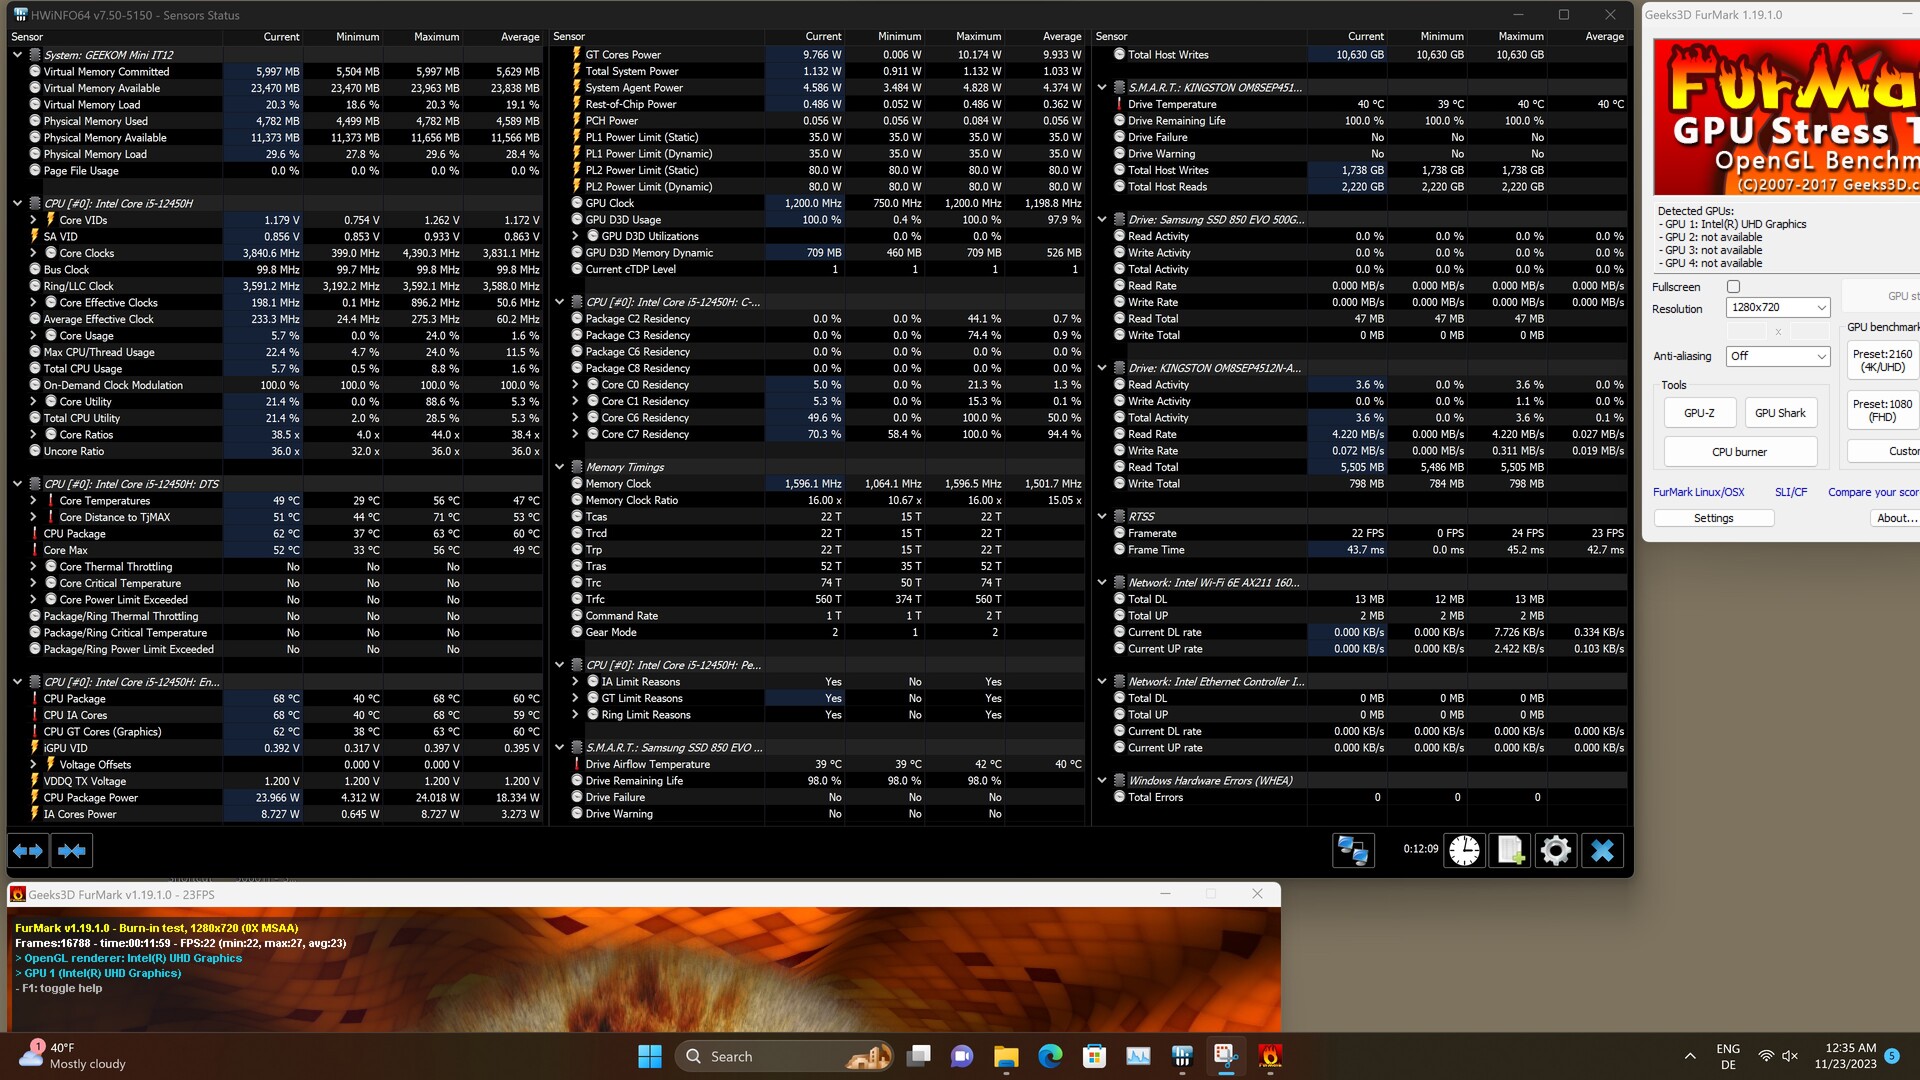
Graphics card
The Geekom Mini IT12 features a basic iGPU with 64 EUs and Intel UHD Graphics. The integrated graphics unit in our test sample outperforms the Minisforum Venus Series UN1245 and the NiPoGi CK10. However, there is a significant difference between this model and the Geekom Mini IT12 with Intel Core i7-1260P, as Intel includes an iGPU with 96 EUs in the somewhat faster CPUs. Consider AMD's Radeon 680M or Radeon 780M for significantly better performance.
Further comparisons and benchmarks can be found in our GPU comparison table.
| Affinity Photo 2 - Combined (Single / Multi GPU) | |
| Intel NUC 13 Pro Kit NUC13ANK | |
| Geekom Mini IT12 | |
| Minisforum Venus Series UN1245 | |
| Geekom Mini IT12 | |
| NiPoGi CK10 | |
| Average AMD Radeon 780M (1072 - 1889, n=21) | |
| Minisforum Mars Series MC560 | |
| Average AMD Radeon 680M (555 - 2339, n=12) | |
| 3DMark 05 Standard | 37574 points | |
| 3DMark 06 Standard Score | 23680 points | |
| 3DMark Vantage P Result | 15554 points | |
| 3DMark 11 Performance | 4450 points | |
| 3DMark Ice Storm Standard Score | 111432 points | |
| 3DMark Cloud Gate Standard Score | 18265 points | |
| 3DMark Fire Strike Score | 2879 points | |
| 3DMark Fire Strike Extreme Score | 1348 points | |
| 3DMark Time Spy Score | 982 points | |
Help | ||
Gaming Performance - iGPU
The poor 3D performance of the Intel UHD Graphics does not make playing complicated 3D games on the Geekom Mini IT12 fun. This small PC's main interest is not gaming. There are restrictions to playing casual games to pass the time. If gaming performance is a priority, the Minisforum UM790 Pro with AMD Radeon 780M or the Geekom AS 6 with AMD Ryzen 9 6900HX and AMD Radeon 680M may be better choices. Additionally, for those looking for a tiny PC with a dedicated graphics card, the Minisforum HX77G and Minisforum NUCXi7 are worth considering.
| The Witcher 3 | |
| 1024x768 Low Graphics & Postprocessing | |
| Average AMD Radeon 780M (74 - 163.3, n=49) | |
| Average AMD Radeon 680M (67.4 - 150, n=31) | |
| Intel NUC 13 Pro Kit NUC13ANK | |
| Intel NUC 12 Pro Kit NUC12WSKi7 | |
| Geekom Mini IT12 | |
| Minisforum Mars Series MC560 | |
| Minisforum Venus Series UN1245 | |
| Geekom Mini IT12 | |
| NiPoGi CK10 | |
| 1920x1080 High Graphics & Postprocessing (Nvidia HairWorks Off) | |
| Average AMD Radeon 780M (21.3 - 52.2, n=57) | |
| Average AMD Radeon 680M (22.3 - 48, n=33) | |
| Intel NUC 13 Pro Kit NUC13ANK | |
| Geekom Mini IT12 | |
| Minisforum Mars Series MC560 | |
| Minisforum Venus Series UN1245 | |
| Geekom Mini IT12 | |
| NiPoGi CK10 | |
| Intel NUC 12 Pro Kit NUC12WSKi7 | |
| low | med. | high | ultra | |
|---|---|---|---|---|
| GTA V (2015) | 108.9 | 90.1 | 14.4 | 6.18 |
| The Witcher 3 (2015) | 60.8 | 37.5 | 20 | 10.2 |
| Dota 2 Reborn (2015) | 115.2 | 84.1 | 44.4 | 41 |
| X-Plane 11.11 (2018) | 36.8 | 24.4 | 21.9 | |
| Far Cry 5 (2018) | 36 | 17 | 16 | 15 |
| Strange Brigade (2018) | 63.4 | 25.1 | 19.9 | 16.8 |
| Shadow of the Tomb Raider (2018) | 34.2 | 15.3 | 14.1 | |
| Far Cry New Dawn (2019) | 35 | 17 | 16 | 15 |
| Metro Exodus (2019) | 27.5 | 12.9 | 9.61 | 7.86 |
| Borderlands 3 (2019) | 32.2 | 14.2 | 8.51 | 6.17 |
| F1 2021 (2021) | 69.2 | 31.1 | 24.8 | 16.1 |
| F1 22 (2022) | 27.3 | 24.5 | 17.5 | 13.5 |
| F1 23 (2023) | 24.6 | 22.1 | 15.2 |
3D performance via eGPU-Dock with Nvidia GeForce RTX 3060 Ti
Because the Geekom Mini IT12 has two USB 4 ports, we compare its performance with the Razer Core X and an Nvidia GeForce RTX 3060 Ti. With this combo, 3D performance may be considerably enhanced. Due to the bandwidth constraint (PCIe x4 3.0), the performance of the dedicated graphics card is not equivalent to that of a traditional desktop machine. In the test, we found that the performance was comparable to that of other Mini PCs evaluated with the same accessories. Essentially, this combo works wonderfully. With this addon, many games may be played smoothly, with acceptable frame rates and maximum details.
| Performance rating - Percent | |
| Intel NUC 13 Pro Kit NUC13ANK (Nvidia GeForce RTX 3060 Ti FE TB3) | |
| Geekom Mini IT12 (Nvidia GeForce RTX 3060 Ti FE TB3) | |
| Geekbench Mini IT12 (Nvidia GeForce RTX 3060 Ti FE) | |
| Morefine M600 (Nvidia GeForce RTX 3060 Ti FE TB3) | |
| Minisforum Venus Series UM690 (Nvidia GeForce RTX 3060 Ti FE TB3) | |
| Minisforum Venus Series UM790 Pro (Nvidia GeForce RTX 3060 Ti FE TB3) | |
| Ace Magician AM08Pro (Nvidia GeForce RTX 3060 Ti FE TB3) | |
| 3DMark 11 - 1280x720 Performance GPU | |
| Geekbench Mini IT12 (Nvidia GeForce RTX 3060 Ti FE) | |
| Intel NUC 13 Pro Kit NUC13ANK (Nvidia GeForce RTX 3060 Ti FE TB3) | |
| Geekom Mini IT12 (Nvidia GeForce RTX 3060 Ti FE TB3) | |
| Minisforum Venus Series UM790 Pro (Nvidia GeForce RTX 3060 Ti FE TB3) | |
| Morefine M600 (Nvidia GeForce RTX 3060 Ti FE TB3) | |
| Ace Magician AM08Pro (Nvidia GeForce RTX 3060 Ti FE TB3) | |
| Minisforum Venus Series UM690 (Nvidia GeForce RTX 3060 Ti FE TB3) | |
| 3DMark | |
| 2560x1440 Time Spy Graphics | |
| Geekbench Mini IT12 (Nvidia GeForce RTX 3060 Ti FE) | |
| Intel NUC 13 Pro Kit NUC13ANK (Nvidia GeForce RTX 3060 Ti FE TB3) | |
| Geekom Mini IT12 (Nvidia GeForce RTX 3060 Ti FE TB3) | |
| Morefine M600 (Nvidia GeForce RTX 3060 Ti FE TB3) | |
| Minisforum Venus Series UM790 Pro (Nvidia GeForce RTX 3060 Ti FE TB3) | |
| Ace Magician AM08Pro (Nvidia GeForce RTX 3060 Ti FE TB3) | |
| Minisforum Venus Series UM690 (Nvidia GeForce RTX 3060 Ti FE TB3) | |
| 1920x1080 Fire Strike Graphics | |
| Intel NUC 13 Pro Kit NUC13ANK (Nvidia GeForce RTX 3060 Ti FE TB3) | |
| Geekbench Mini IT12 (Nvidia GeForce RTX 3060 Ti FE) | |
| Geekom Mini IT12 (Nvidia GeForce RTX 3060 Ti FE TB3) | |
| Morefine M600 (Nvidia GeForce RTX 3060 Ti FE TB3) | |
| Ace Magician AM08Pro (Nvidia GeForce RTX 3060 Ti FE TB3) | |
| Minisforum Venus Series UM790 Pro (Nvidia GeForce RTX 3060 Ti FE TB3) | |
| Minisforum Venus Series UM690 (Nvidia GeForce RTX 3060 Ti FE TB3) | |
| 3840x2160 Fire Strike Ultra Graphics | |
| Geekbench Mini IT12 (Nvidia GeForce RTX 3060 Ti FE) | |
| Geekom Mini IT12 (Nvidia GeForce RTX 3060 Ti FE TB3) | |
| Morefine M600 (Nvidia GeForce RTX 3060 Ti FE TB3) | |
| Intel NUC 13 Pro Kit NUC13ANK (Nvidia GeForce RTX 3060 Ti FE TB3) | |
| Minisforum Venus Series UM790 Pro (Nvidia GeForce RTX 3060 Ti FE TB3) | |
| Ace Magician AM08Pro (Nvidia GeForce RTX 3060 Ti FE TB3) | |
| Minisforum Venus Series UM690 (Nvidia GeForce RTX 3060 Ti FE TB3) | |
| Unigine Superposition | |
| 1280x720 720p Low | |
| Minisforum Venus Series UM790 Pro (Nvidia GeForce RTX 3060 Ti FE TB3) | |
| Intel NUC 13 Pro Kit NUC13ANK (Nvidia GeForce RTX 3060 Ti FE TB3) | |
| Geekom Mini IT12 (Nvidia GeForce RTX 3060 Ti FE TB3) | |
| Minisforum Venus Series UM690 (Nvidia GeForce RTX 3060 Ti FE TB3) | |
| Ace Magician AM08Pro (Nvidia GeForce RTX 3060 Ti FE TB3) | |
| Morefine M600 (Nvidia GeForce RTX 3060 Ti FE TB3) | |
| Geekbench Mini IT12 (Nvidia GeForce RTX 3060 Ti FE) | |
| 1920x1080 1080p High | |
| Intel NUC 13 Pro Kit NUC13ANK (Nvidia GeForce RTX 3060 Ti FE TB3) | |
| Geekbench Mini IT12 (Nvidia GeForce RTX 3060 Ti FE) | |
| Geekom Mini IT12 (Nvidia GeForce RTX 3060 Ti FE TB3) | |
| Morefine M600 (Nvidia GeForce RTX 3060 Ti FE TB3) | |
| Minisforum Venus Series UM690 (Nvidia GeForce RTX 3060 Ti FE TB3) | |
| Ace Magician AM08Pro (Nvidia GeForce RTX 3060 Ti FE TB3) | |
| Minisforum Venus Series UM790 Pro (Nvidia GeForce RTX 3060 Ti FE TB3) | |
| 1920x1080 1080p Extreme | |
| Geekom Mini IT12 (Nvidia GeForce RTX 3060 Ti FE TB3) | |
| Intel NUC 13 Pro Kit NUC13ANK (Nvidia GeForce RTX 3060 Ti FE TB3) | |
| Geekbench Mini IT12 (Nvidia GeForce RTX 3060 Ti FE) | |
| Morefine M600 (Nvidia GeForce RTX 3060 Ti FE TB3) | |
| Minisforum Venus Series UM690 (Nvidia GeForce RTX 3060 Ti FE TB3) | |
| Ace Magician AM08Pro (Nvidia GeForce RTX 3060 Ti FE TB3) | |
| Minisforum Venus Series UM790 Pro (Nvidia GeForce RTX 3060 Ti FE TB3) | |
| 3840x2160 4k Optimized | |
| Geekom Mini IT12 (Nvidia GeForce RTX 3060 Ti FE TB3) | |
| Intel NUC 13 Pro Kit NUC13ANK (Nvidia GeForce RTX 3060 Ti FE TB3) | |
| Geekbench Mini IT12 (Nvidia GeForce RTX 3060 Ti FE) | |
| Morefine M600 (Nvidia GeForce RTX 3060 Ti FE TB3) | |
| Minisforum Venus Series UM690 (Nvidia GeForce RTX 3060 Ti FE TB3) | |
| Ace Magician AM08Pro (Nvidia GeForce RTX 3060 Ti FE TB3) | |
| Minisforum Venus Series UM790 Pro (Nvidia GeForce RTX 3060 Ti FE TB3) | |
| 7680x4320 8k Optimized | |
| Geekom Mini IT12 (Nvidia GeForce RTX 3060 Ti FE TB3) | |
| Morefine M600 (Nvidia GeForce RTX 3060 Ti FE TB3) | |
| Geekbench Mini IT12 (Nvidia GeForce RTX 3060 Ti FE) | |
| Intel NUC 13 Pro Kit NUC13ANK (Nvidia GeForce RTX 3060 Ti FE TB3) | |
| Minisforum Venus Series UM690 (Nvidia GeForce RTX 3060 Ti FE TB3) | |
| Ace Magician AM08Pro (Nvidia GeForce RTX 3060 Ti FE TB3) | |
| Minisforum Venus Series UM790 Pro (Nvidia GeForce RTX 3060 Ti FE TB3) | |
| Unigine Valley 1.0 | |
| 1920x1080 Extreme HD DirectX AA:x8 | |
| Intel NUC 13 Pro Kit NUC13ANK (Nvidia GeForce RTX 3060 Ti FE TB3) | |
| Geekom Mini IT12 (Nvidia GeForce RTX 3060 Ti FE TB3) | |
| Geekbench Mini IT12 (Nvidia GeForce RTX 3060 Ti FE) | |
| Minisforum Venus Series UM690 (Nvidia GeForce RTX 3060 Ti FE TB3) | |
| Minisforum Venus Series UM790 Pro (Nvidia GeForce RTX 3060 Ti FE TB3) | |
| Morefine M600 (Nvidia GeForce RTX 3060 Ti FE TB3) | |
| Ace Magician AM08Pro (Nvidia GeForce RTX 3060 Ti FE TB3) | |
| 1920x1080 Extreme HD Preset OpenGL AA:x8 | |
| Geekbench Mini IT12 (Nvidia GeForce RTX 3060 Ti FE) | |
| Intel NUC 13 Pro Kit NUC13ANK (Nvidia GeForce RTX 3060 Ti FE TB3) | |
| Geekom Mini IT12 (Nvidia GeForce RTX 3060 Ti FE TB3) | |
| Minisforum Venus Series UM690 (Nvidia GeForce RTX 3060 Ti FE TB3) | |
| Morefine M600 (Nvidia GeForce RTX 3060 Ti FE TB3) | |
| Ace Magician AM08Pro (Nvidia GeForce RTX 3060 Ti FE TB3) | |
| Minisforum Venus Series UM790 Pro (Nvidia GeForce RTX 3060 Ti FE TB3) | |
| Unigine Heaven 4.0 | |
| Extreme Preset OpenGL | |
| Intel NUC 13 Pro Kit NUC13ANK (Nvidia GeForce RTX 3060 Ti FE TB3) | |
| Geekom Mini IT12 (Nvidia GeForce RTX 3060 Ti FE TB3) | |
| Geekbench Mini IT12 (Nvidia GeForce RTX 3060 Ti FE) | |
| Minisforum Venus Series UM690 (Nvidia GeForce RTX 3060 Ti FE TB3) | |
| Morefine M600 (Nvidia GeForce RTX 3060 Ti FE TB3) | |
| Ace Magician AM08Pro (Nvidia GeForce RTX 3060 Ti FE TB3) | |
| Minisforum Venus Series UM790 Pro (Nvidia GeForce RTX 3060 Ti FE TB3) | |
| Extreme Preset DX11 | |
| Intel NUC 13 Pro Kit NUC13ANK (Nvidia GeForce RTX 3060 Ti FE TB3) | |
| Geekom Mini IT12 (Nvidia GeForce RTX 3060 Ti FE TB3) | |
| Geekbench Mini IT12 (Nvidia GeForce RTX 3060 Ti FE) | |
| Minisforum Venus Series UM690 (Nvidia GeForce RTX 3060 Ti FE TB3) | |
| Morefine M600 (Nvidia GeForce RTX 3060 Ti FE TB3) | |
| Ace Magician AM08Pro (Nvidia GeForce RTX 3060 Ti FE TB3) | |
| Minisforum Venus Series UM790 Pro (Nvidia GeForce RTX 3060 Ti FE TB3) | |
| ComputeMark v2.1 | |
| 1024x600 Normal, Score | |
| Geekom Mini IT12 (Nvidia GeForce RTX 3060 Ti FE TB3) | |
| Morefine M600 (Nvidia GeForce RTX 3060 Ti FE TB3) | |
| Minisforum Venus Series UM790 Pro (Nvidia GeForce RTX 3060 Ti FE TB3) | |
| Intel NUC 13 Pro Kit NUC13ANK (Nvidia GeForce RTX 3060 Ti FE TB3) | |
| Minisforum Venus Series UM690 (Nvidia GeForce RTX 3060 Ti FE TB3) | |
| Geekbench Mini IT12 (Nvidia GeForce RTX 3060 Ti FE) | |
| Ace Magician AM08Pro (Nvidia GeForce RTX 3060 Ti FE TB3) | |
| 1024x600 Normal, Fluid 3DTex | |
| Morefine M600 (Nvidia GeForce RTX 3060 Ti FE TB3) | |
| Intel NUC 13 Pro Kit NUC13ANK (Nvidia GeForce RTX 3060 Ti FE TB3) | |
| Geekom Mini IT12 (Nvidia GeForce RTX 3060 Ti FE TB3) | |
| Geekbench Mini IT12 (Nvidia GeForce RTX 3060 Ti FE) | |
| Minisforum Venus Series UM790 Pro (Nvidia GeForce RTX 3060 Ti FE TB3) | |
| Minisforum Venus Series UM690 (Nvidia GeForce RTX 3060 Ti FE TB3) | |
| Ace Magician AM08Pro (Nvidia GeForce RTX 3060 Ti FE TB3) | |
| 1024x600 Normal, Fluid 2DTexArr | |
| Morefine M600 (Nvidia GeForce RTX 3060 Ti FE TB3) | |
| Geekom Mini IT12 (Nvidia GeForce RTX 3060 Ti FE TB3) | |
| Minisforum Venus Series UM690 (Nvidia GeForce RTX 3060 Ti FE TB3) | |
| Intel NUC 13 Pro Kit NUC13ANK (Nvidia GeForce RTX 3060 Ti FE TB3) | |
| Minisforum Venus Series UM790 Pro (Nvidia GeForce RTX 3060 Ti FE TB3) | |
| Geekbench Mini IT12 (Nvidia GeForce RTX 3060 Ti FE) | |
| Ace Magician AM08Pro (Nvidia GeForce RTX 3060 Ti FE TB3) | |
| 1024x600 Normal, Mandel Vector | |
| Geekom Mini IT12 (Nvidia GeForce RTX 3060 Ti FE TB3) | |
| Minisforum Venus Series UM790 Pro (Nvidia GeForce RTX 3060 Ti FE TB3) | |
| Intel NUC 13 Pro Kit NUC13ANK (Nvidia GeForce RTX 3060 Ti FE TB3) | |
| Morefine M600 (Nvidia GeForce RTX 3060 Ti FE TB3) | |
| Minisforum Venus Series UM690 (Nvidia GeForce RTX 3060 Ti FE TB3) | |
| Geekbench Mini IT12 (Nvidia GeForce RTX 3060 Ti FE) | |
| Ace Magician AM08Pro (Nvidia GeForce RTX 3060 Ti FE TB3) | |
| 1024x600 Normal, Mandel Scalar | |
| Geekom Mini IT12 (Nvidia GeForce RTX 3060 Ti FE TB3) | |
| Morefine M600 (Nvidia GeForce RTX 3060 Ti FE TB3) | |
| Minisforum Venus Series UM790 Pro (Nvidia GeForce RTX 3060 Ti FE TB3) | |
| Intel NUC 13 Pro Kit NUC13ANK (Nvidia GeForce RTX 3060 Ti FE TB3) | |
| Minisforum Venus Series UM690 (Nvidia GeForce RTX 3060 Ti FE TB3) | |
| Geekbench Mini IT12 (Nvidia GeForce RTX 3060 Ti FE) | |
| Ace Magician AM08Pro (Nvidia GeForce RTX 3060 Ti FE TB3) | |
| 1024x600 Normal, QJuliaRayTrace | |
| Geekom Mini IT12 (Nvidia GeForce RTX 3060 Ti FE TB3) | |
| Intel NUC 13 Pro Kit NUC13ANK (Nvidia GeForce RTX 3060 Ti FE TB3) | |
| Minisforum Venus Series UM790 Pro (Nvidia GeForce RTX 3060 Ti FE TB3) | |
| Morefine M600 (Nvidia GeForce RTX 3060 Ti FE TB3) | |
| Minisforum Venus Series UM690 (Nvidia GeForce RTX 3060 Ti FE TB3) | |
| Geekbench Mini IT12 (Nvidia GeForce RTX 3060 Ti FE) | |
| Ace Magician AM08Pro (Nvidia GeForce RTX 3060 Ti FE TB3) | |
| Performance rating - Percent | |
| Intel NUC 13 Pro Kit NUC13ANK (Nvidia GeForce RTX 3060 Ti FE TB3) | |
| Geekom Mini IT12 (Nvidia GeForce RTX 3060 Ti FE TB3) | |
| Geekom AS 6 (Nvidia GeForce RTX 3060 Ti FE TB3) | |
| Minisforum Venus Series UM790 Pro (Nvidia GeForce RTX 3060 Ti FE TB3) | |
| Ace Magician AM08Pro (Nvidia GeForce RTX 3060 Ti FE TB3) | |
| Geekbench Mini IT12 (Nvidia GeForce RTX 3060 Ti FE) | |
| GTA V - 1920x1080 Highest AA:4xMSAA + FX AF:16x | |
| Intel NUC 13 Pro Kit NUC13ANK (Nvidia GeForce RTX 3060 Ti FE TB3) | |
| Geekom Mini IT12 (Nvidia GeForce RTX 3060 Ti FE TB3) | |
| Geekom AS 6 (Nvidia GeForce RTX 3060 Ti FE TB3) | |
| Ace Magician AM08Pro (Nvidia GeForce RTX 3060 Ti FE TB3) | |
| Geekbench Mini IT12 (Nvidia GeForce RTX 3060 Ti FE) | |
| Minisforum Venus Series UM790 Pro (Nvidia GeForce RTX 3060 Ti FE TB3) | |
| The Witcher 3 - 1920x1080 Ultra Graphics & Postprocessing (HBAO+) | |
| Intel NUC 13 Pro Kit NUC13ANK (Nvidia GeForce RTX 3060 Ti FE TB3) | |
| Geekom Mini IT12 (Nvidia GeForce RTX 3060 Ti FE TB3) | |
| Geekbench Mini IT12 (Nvidia GeForce RTX 3060 Ti FE) | |
| Geekom AS 6 (Nvidia GeForce RTX 3060 Ti FE TB3) | |
| Minisforum Venus Series UM790 Pro (Nvidia GeForce RTX 3060 Ti FE TB3) | |
| Ace Magician AM08Pro (Nvidia GeForce RTX 3060 Ti FE TB3) | |
| Dota 2 Reborn - 1920x1080 ultra (3/3) best looking | |
| Minisforum Venus Series UM790 Pro (Nvidia GeForce RTX 3060 Ti FE TB3) | |
| Intel NUC 13 Pro Kit NUC13ANK (Nvidia GeForce RTX 3060 Ti FE TB3) | |
| Geekom Mini IT12 (Nvidia GeForce RTX 3060 Ti FE TB3) | |
| Geekom AS 6 (Nvidia GeForce RTX 3060 Ti FE TB3) | |
| Geekbench Mini IT12 (Nvidia GeForce RTX 3060 Ti FE) | |
| Ace Magician AM08Pro (Nvidia GeForce RTX 3060 Ti FE TB3) | |
| Final Fantasy XV Benchmark - 1920x1080 High Quality | |
| Geekom AS 6 (Nvidia GeForce RTX 3060 Ti FE TB3) | |
| Intel NUC 13 Pro Kit NUC13ANK (Nvidia GeForce RTX 3060 Ti FE TB3) | |
| Geekom Mini IT12 (Nvidia GeForce RTX 3060 Ti FE TB3) | |
| Minisforum Venus Series UM790 Pro (Nvidia GeForce RTX 3060 Ti FE TB3) | |
| Ace Magician AM08Pro (Nvidia GeForce RTX 3060 Ti FE TB3) | |
| Geekbench Mini IT12 (Nvidia GeForce RTX 3060 Ti FE) | |
| Strange Brigade - 1920x1080 ultra AA:ultra AF:16 | |
| Geekom AS 6 (Nvidia GeForce RTX 3060 Ti FE TB3) | |
| Intel NUC 13 Pro Kit NUC13ANK (Nvidia GeForce RTX 3060 Ti FE TB3) | |
| Geekom Mini IT12 (Nvidia GeForce RTX 3060 Ti FE TB3) | |
| Minisforum Venus Series UM790 Pro (Nvidia GeForce RTX 3060 Ti FE TB3) | |
| Ace Magician AM08Pro (Nvidia GeForce RTX 3060 Ti FE TB3) | |
| Geekbench Mini IT12 (Nvidia GeForce RTX 3060 Ti FE) | |
| Far Cry 5 - 1920x1080 Ultra Preset AA:T | |
| Intel NUC 13 Pro Kit NUC13ANK (Nvidia GeForce RTX 3060 Ti FE TB3) | |
| Minisforum Venus Series UM790 Pro (Nvidia GeForce RTX 3060 Ti FE TB3) | |
| Geekom Mini IT12 (Nvidia GeForce RTX 3060 Ti FE TB3) | |
| Ace Magician AM08Pro (Nvidia GeForce RTX 3060 Ti FE TB3) | |
| Geekom AS 6 (Nvidia GeForce RTX 3060 Ti FE TB3) | |
| Geekbench Mini IT12 (Nvidia GeForce RTX 3060 Ti FE) | |
| Far Cry New Dawn - 1920x1080 Ultra Preset | |
| Geekbench Mini IT12 (Nvidia GeForce RTX 3060 Ti FE) | |
| Intel NUC 13 Pro Kit NUC13ANK (Nvidia GeForce RTX 3060 Ti FE TB3) | |
| Minisforum Venus Series UM790 Pro (Nvidia GeForce RTX 3060 Ti FE TB3) | |
| Geekom Mini IT12 (Nvidia GeForce RTX 3060 Ti FE TB3) | |
| Ace Magician AM08Pro (Nvidia GeForce RTX 3060 Ti FE TB3) | |
| Geekom AS 6 (Nvidia GeForce RTX 3060 Ti FE TB3) | |
| Borderlands 3 - 1920x1080 Badass Overall Quality (DX11) | |
| Geekom Mini IT12 (Nvidia GeForce RTX 3060 Ti FE TB3) | |
| Intel NUC 13 Pro Kit NUC13ANK (Nvidia GeForce RTX 3060 Ti FE TB3) | |
| Geekom AS 6 (Nvidia GeForce RTX 3060 Ti FE TB3) | |
| Minisforum Venus Series UM790 Pro (Nvidia GeForce RTX 3060 Ti FE TB3) | |
| Ace Magician AM08Pro (Nvidia GeForce RTX 3060 Ti FE TB3) | |
| Geekbench Mini IT12 (Nvidia GeForce RTX 3060 Ti FE) | |
| F1 22 - 1920x1080 Ultra High Preset AA:T AF:16x | |
| Geekom AS 6 (Nvidia GeForce RTX 3060 Ti FE TB3) | |
| Intel NUC 13 Pro Kit NUC13ANK (Nvidia GeForce RTX 3060 Ti FE TB3) | |
| Geekbench Mini IT12 (Nvidia GeForce RTX 3060 Ti FE) | |
| Geekom Mini IT12 (Nvidia GeForce RTX 3060 Ti FE TB3) | |
| Minisforum Venus Series UM790 Pro (Nvidia GeForce RTX 3060 Ti FE TB3) | |
| Ace Magician AM08Pro (Nvidia GeForce RTX 3060 Ti FE TB3) | |
| Tiny Tina's Wonderlands - 1920x1080 Badass Preset (DX12) | |
| Geekom AS 6 (Nvidia GeForce RTX 3060 Ti FE TB3) | |
| Geekom Mini IT12 (Nvidia GeForce RTX 3060 Ti FE TB3) | |
| Intel NUC 13 Pro Kit NUC13ANK (Nvidia GeForce RTX 3060 Ti FE TB3) | |
| Minisforum Venus Series UM790 Pro (Nvidia GeForce RTX 3060 Ti FE TB3) | |
| Ace Magician AM08Pro (Nvidia GeForce RTX 3060 Ti FE TB3) | |
| Geekbench Mini IT12 (Nvidia GeForce RTX 3060 Ti FE) | |
| Shadow of the Tomb Raider - 1920x1080 Highest Preset AA:T | |
| Geekom AS 6 (Nvidia GeForce RTX 3060 Ti FE TB3) | |
| Geekom Mini IT12 (Nvidia GeForce RTX 3060 Ti FE TB3) | |
| Geekbench Mini IT12 (Nvidia GeForce RTX 3060 Ti FE) | |
| Intel NUC 13 Pro Kit NUC13ANK (Nvidia GeForce RTX 3060 Ti FE TB3) | |
| Minisforum Venus Series UM790 Pro (Nvidia GeForce RTX 3060 Ti FE TB3) | |
| Ace Magician AM08Pro (Nvidia GeForce RTX 3060 Ti FE TB3) | |
| Metro Exodus - 1920x1080 Ultra Quality AF:16x | |
| Intel NUC 13 Pro Kit NUC13ANK (Nvidia GeForce RTX 3060 Ti FE TB3) | |
| Geekom Mini IT12 (Nvidia GeForce RTX 3060 Ti FE TB3) | |
| Geekom AS 6 (Nvidia GeForce RTX 3060 Ti FE TB3) | |
| Minisforum Venus Series UM790 Pro (Nvidia GeForce RTX 3060 Ti FE TB3) | |
| Ace Magician AM08Pro (Nvidia GeForce RTX 3060 Ti FE TB3) | |
| Geekbench Mini IT12 (Nvidia GeForce RTX 3060 Ti FE) | |
| God of War - 1920x1080 Ultra Preset | |
| Geekom Mini IT12 (Nvidia GeForce RTX 3060 Ti FE TB3) | |
| Geekom AS 6 (Nvidia GeForce RTX 3060 Ti FE TB3) | |
| Intel NUC 13 Pro Kit NUC13ANK (Nvidia GeForce RTX 3060 Ti FE TB3) | |
| Minisforum Venus Series UM790 Pro (Nvidia GeForce RTX 3060 Ti FE TB3) | |
| Geekbench Mini IT12 (Nvidia GeForce RTX 3060 Ti FE) | |
| Ace Magician AM08Pro (Nvidia GeForce RTX 3060 Ti FE TB3) | |
| low | med. | high | ultra | QHD | 4K | |
|---|---|---|---|---|---|---|
| GTA V (2015) | 175 | 169.3 | 152.3 | 91.6 | 86.9 | 102.8 |
| The Witcher 3 (2015) | 286 | 212 | 153.9 | 73.5 | 63.6 | 72.9 |
| Dota 2 Reborn (2015) | 155.9 | 138.1 | 127.2 | 120.9 | 102.6 | |
| Final Fantasy XV Benchmark (2018) | 144.7 | 87.9 | 64.1 | 43.5 | 23.7 | |
| Far Cry 5 (2018) | 127 | 89 | 84 | 80 | 50 | 24 |
| Strange Brigade (2018) | 176.3 | 121.6 | 112.2 | 107.6 | 74.1 | 32.8 |
| Shadow of the Tomb Raider (2018) | 145.3 | 102.6 | 100.1 | 92.8 | 76.1 | 50.1 |
| Far Cry New Dawn (2019) | 130 | 115 | 110 | 100 | 94 | 60 |
| Metro Exodus (2019) | 111.3 | 53.6 | 49.2 | 40.3 | 31.5 | 19.9 |
| Borderlands 3 (2019) | 121.8 | 82.5 | 65.6 | 55.9 | 38.8 | 21.5 |
| F1 2020 (2020) | 194.1 | 115.2 | 119.8 | 101.7 | 90.7 | 60 |
| F1 2021 (2021) | 138.2 | 107.2 | 69.4 | 52.5 | 48.7 | 41.3 |
| Far Cry 6 (2021) | 67.7 | 53.3 | 45.5 | 40.2 | 32.8 | |
| God of War (2022) | 108.1 | 97.6 | 81.6 | 60.2 | 53.6 | 39.9 |
| GRID Legends (2022) | 81 | 64.4 | 55.5 | 50.7 | 39 | 23.6 |
| Tiny Tina's Wonderlands (2022) | 103.7 | 84.3 | 64.2 | 55.2 | 39.2 | 21.8 |
| F1 22 (2022) | 60.2 | 55 | 42.6 | 27.9 | 26.1 | 19.7 |
| F1 23 (2023) | 66.8 | 65.4 | 54.1 | 33.5 | 31.2 | 17.7 |
| Intel UHD Graphics 64EUs (Alder Lake 12th Gen) i5-12450H | i5-12450H | Intel Arc A770 R9 7950X | NVIDIA GeForce RTX 2060 Super (Desktop) R9 7950X | NVIDIA GeForce RTX 2070 Super (Desktop) R9 7950X | NVIDIA GeForce RTX 3060 Ti R9 7950X | NVIDIA GeForce RTX 4060 R9 7950X | NVIDIA GeForce RTX 4060 Ti 16G R9 7950X | NVIDIA GeForce RTX 4070 R9 7950X | NVIDIA GeForce RTX 4070 Ti R9 7950X | AMD Radeon RX 7600 R9 7950X | AMD Radeon RX 7700 XT R9 7950X | AMD Radeon RX 7800 XT R9 7950X | AMD Radeon RX 7900 GRE R9 7950X | AMD Radeon RX 6600 R9 7950X | AMD Radeon RX 6650 XT R9 7950X | AMD Radeon RX 6700 XT R9 7950X | AMD Radeon RX 6750 XT R9 7950X | Average of class Mini PC | |
|---|---|---|---|---|---|---|---|---|---|---|---|---|---|---|---|---|---|---|---|
| SPECviewperf 12 | 1223% | 581% | 1056% | 1178% | 1354% | 1401% | 1888% | 2558% | 3571% | 2212% | 2928% | 3380% | 3586% | 2436% | 2953% | 3231% | 2707% | 1666% | |
| 1900x1060 3ds Max (3dsmax-05) (fps) | 29.8 | 147 393% | 179 501% | 220 638% | 247 729% | 297 897% | 251 742% | 290 873% | 382 1182% | 436 1363% | 279 836% | 373 1152% | 427 1333% | 444 1390% | 258 766% | 310 940% | 363 1118% | 377 1165% | 152.2 ? 411% |
| 1900x1060 Catia (catia-04) (fps) | 22.9 | 115 402% | 174 660% | 84.5 269% | 114 398% | 114 398% | 113 393% | 128 459% | 161 603% | 192 738% | 273 1092% | 351 1433% | 386 1586% | 448 1856% | 256 1018% | 314 1271% | 339 1380% | 360 1472% | 144.2 ? 530% |
| 1900x1060 Creo (creo-01) (fps) | 17.7 | 59.7 237% | 45.3 156% | 58.8 232% | 65.7 271% | 65.2 268% | 60.6 242% | 73.4 315% | 89.1 403% | 99.4 462% | 115 550% | 123 595% | 148 736% | 155 776% | 133 651% | 142 702% | 152 759% | 154 770% | 71.6 ? 305% |
| 1900x1060 Energy (energy-01) (fps) | 0.24 | 13.4 5483% | 2.44 917% | 11.6 4733% | 12.4 5067% | 14.4 5900% | 15.9 6525% | 22.6 9317% | 31.7 13108% | 48 19900% | 25.5 10525% | 33.4 13817% | 38.4 15900% | 40.3 16692% | 31.3 12942% | 37.6 15567% | 40.6 16817% | 30.1 12442% | 22.7 ? 9358% |
| 1900x1060 Maya (maya-04) (fps) | 22.8 | 203 790% | 183 703% | 200 777% | 225 887% | 251 1001% | 233 922% | 257 1027% | 284 1146% | 287 1159% | 236 935% | 283 1141% | 304 1233% | 323 1317% | 218 856% | 246 979% | 268 1075% | 277 1115% | 130.7 ? 473% |
| 1900x1060 Medical (medical-01) (fps) | 5.07 | 73.5 1350% | 46.7 821% | 49.5 876% | 55.9 1003% | 65.6 1194% | 82.4 1525% | 110 2070% | 132 2504% | 157 2997% | 128 2425% | 177 3391% | 200 3845% | 226 4358% | 102 1912% | 137 2602% | 150 2859% | 144 2740% | 80.8 ? 1494% |
| 1900x1060 Showcase (showcase-01) (fps) | 13.2 | 149 1029% | 119 802% | 121 817% | 135 923% | 150 1036% | 109 726% | 132 900% | 190 1339% | 244 1748% | 127 862% | 179 1256% | 235 1680% | 222 1582% | 125 847% | 151 1044% | 176 1233% | 186 1309% | 84.9 ? 543% |
| 1900x1060 Solidworks (sw-03) (fps) | 38.9 | 78.3 101% | 73.4 89% | 79.7 105% | 95.1 144% | 93.5 140% | 91.2 134% | 95.1 144% | 109 180% | 118 203% | 221 468% | 288 640% | 322 728% | 319 720% | 232 496% | 242 522% | 275 607% | 290 646% | 122.8 ? 216% |
| SPECviewperf 13 | 968% | 900% | 836% | 972% | 1081% | 1120% | 1395% | 1784% | 2251% | 2347% | 3236% | 3803% | 4102% | 1434% | 1814% | 2240% | 2534% | 1282% | |
| 3ds Max (3dsmax-06) (fps) | 29.6 | 147 397% | 179 505% | 218 636% | 247 734% | 297 903% | 252 751% | 289 876% | 381 1187% | 433 1363% | 280 846% | 371 1153% | 434 1366% | 439 1383% | 258 772% | 310 947% | 360 1116% | 379 1180% | 148.3 ? 401% |
| Catia (catia-05) (fps) | 32.7 | 163 398% | 260 695% | 119 264% | 163 398% | 167 411% | 163 398% | 189 478% | 241 637% | 290 787% | 410 1154% | 529 1518% | 588 1698% | 661 1921% | 387 1083% | 482 1374% | 528 1515% | 565 1628% | 199.1 ? 509% |
| Creo (creo-02) (fps) | 26.5 | 230 768% | 90 240% | 203 666% | 240 806% | 243 817% | 230 768% | 301 1036% | 375 1315% | 455 1617% | 294 1009% | 387 1360% | 442 1568% | 470 1674% | 279 953% | 317 1096% | 353 1232% | 389 1368% | 167.5 ? 532% |
| Energy (energy-02) (fps) | 0.94 | 25.8 2645% | 22.5 2294% | 21.9 2230% | 23.8 2432% | 26.1 2677% | 34.6 3581% | 45.3 4719% | 54.2 5666% | 72.8 7645% | 82.9 8719% | 115 12134% | 139 14687% | 150 15857% | 44 4581% | 59.8 6262% | 74.3 7804% | 80.6 8474% | 41 ? 4262% |
| Maya (maya-05) (fps) | 32.2 | 355 1002% | 319 891% | 291 804% | 344 968% | 372 1055% | 343 965% | 403 1152% | 510 1484% | 591 1735% | 333 934% | 487 1412% | 548 1602% | 580 1701% | 348 981% | 403 1152% | 462 1335% | 482 1397% | 207 ? 543% |
| Medical (medical-02) (fps) | 4.49 | 65.3 1354% | 80.8 1700% | 54.2 1107% | 63.7 1319% | 74.3 1555% | 76.5 1604% | 85.1 1795% | 112 2394% | 132 2840% | 226 4933% | 300 6582% | 332 7294% | 372 8185% | 88.8 1878% | 105 2239% | 148 3196% | 202 4399% | 154.2 ? 3334% |
| Showcase (showcase-02) (fps) | 13.1 | 150 1045% | 119 808% | 122 831% | 135 931% | 150 1045% | 108 724% | 133 915% | 191 1358% | 244 1763% | 127 869% | 179 1266% | 234 1686% | 221 1587% | 125 854% | 151 1053% | 176 1244% | 186 1320% | 80.5 ? 515% |
| Solidworks (sw-04) (fps) | 47.2 | 109 131% | 77.5 64% | 119 152% | 136 188% | 135 186% | 127 169% | 135 186% | 157 233% | 168 256% | 195 313% | 265 461% | 294 523% | 287 508% | 220 366% | 231 389% | 272 476% | 286 506% | 124.1 ? 163% |
| SPECviewperf 2020 | 1005% | 1724% | 1419% | 1368% | 1914% | 1896% | 2460% | 3213% | 4074% | 3597% | 5203% | 6877% | 7116% | 1932% | 2647% | 3171% | 3596% | 1981% | |
| 3840x2160 Medical (medical-03) (fps) | 0.78 | 9.9 1169% | 22.3 2759% | 10.3 1221% | 12 1438% | 11.9 1426% | 13.7 1656% | 16.5 2015% | 22.2 2746% | 26.9 3349% | 36.1 4528% | 56.2 7105% | 63.7 8067% | 76.1 9656% | 20.9 2579% | 27.3 3400% | 30.1 3759% | 39.9 5015% | 23.1 ? 2862% |
| 3840x2160 Maya (maya-06) (fps) | 15.3 | 148 867% | 195 1175% | 162 959% | 185 1109% | 235 1436% | 196 1181% | 237 1449% | 305 1893% | 372 2331% | 178 1063% | 261 1606% | 346 2161% | 161 952% | 192 1155% | 258 1586% | 279 1724% | 142.5 ? 831% | |
| 3840x2160 Energy (energy-03) (fps) | 0.52 | 13.4 2477% | 25 4708% | 22.9 4304% | 17.8 3323% | 31.2 5900% | 33.2 6285% | 44.9 8535% | 57.6 10977% | 75.7 14458% | 67 12785% | 95 18169% | 111 21246% | 133 25477% | 29.5 5573% | 44.2 8400% | 52.2 9938% | 56.3 10727% | 34.2 ? 6477% |
| 3840x2160 Creo (creo-03) (fps) | 9.17 | 59 543% | 52.9 477% | 77.2 742% | 85.8 836% | 91.2 895% | 85.9 837% | 95.9 946% | 112 1121% | 121 1220% | 106 1056% | 130 1318% | 151 1547% | 159 1634% | 93.4 919% | 105 1045% | 123 1241% | 130 1318% | 50.2 ? 447% |
| 3840x2160 CATIA (catia-06) (fps) | 5.24 | 31.2 495% | 38.9 642% | 30.5 482% | 36.7 600% | 40.5 673% | 34 549% | 38.5 635% | 51.6 885% | 61.2 1068% | 68 1198% | 88.8 1595% | 101 1827% | 107 1942% | 60.8 1060% | 70.1 1238% | 77.2 1373% | 83.8 1499% | 35.1 ? 570% |
| 3840x2160 3ds Max (3dsmax-07) (fps) | 6.95 | 40.1 477% | 47.4 582% | 63.1 808% | 69.7 903% | 87 1152% | 67.4 870% | 88.8 1178% | 122 1655% | 147 2015% | 72.9 949% | 106 1425% | 125 1699% | 134 1828% | 42.4 510% | 51.5 641% | 85.4 1129% | 96.8 1293% | 55.4 ? 697% |
| Total Average (Program / Settings) | 1065% /
1071% | 1068% /
1009% | 1104% /
1075% | 1173% /
1155% | 1450% /
1408% | 1472% /
1434% | 1914% /
1865% | 2518% /
2455% | 3299% /
3228% | 2719% /
2639% | 3789% /
3660% | 4687% /
4374% | 4935% /
4737% | 1934% /
1934% | 2471% /
2455% | 2881% /
2854% | 2946% /
2887% | 1643% /
1612% |
Emissions - Efficient with questionable fan control
System Noise
Our test sample of the Geekom Mini IT12 doesn't perform well in volume measurements. Even at idle, we recorded 36.5 dB(A), which is notably louder compared to others. Additionally, the fan noise is high-pitched, further increasing the subjective perception of the noise level. Under average load, the sound pressure level increases only minimally, reaching a peak of 47.5 dB(A). In the BIOS, users can choose between the Silent, Auto, and Performance profiles, but this also changes the processor's power limits. The lack of an option to define power limits separately from the fan speed is puzzling. It's recommended that Geekom address this issue to significantly reduce the noise level. The Geekom Mini IT12 with the Intel Core i7-1260P showed improvement in this aspect.
Noise level
| Idle |
| 36.5 / 36.5 / 36.5 dB(A) |
| Load |
| 36.6 / 47.5 dB(A) |
 | ||
30 dB silent 40 dB(A) audible 50 dB(A) loud |
||
min: | ||
| Geekom Mini IT12 i5-12450H, UHD Graphics 64EUs | Geekom Mini IT12 i7-1260P, Iris Xe G7 96EUs | Intel NUC 13 Pro Kit NUC13ANK i7-1360P, Iris Xe G7 96EUs | Minisforum Mars Series MC560 R5 5600U, Vega 7 | Intel NUC 12 Pro Kit NUC12WSKi7 i7-1260P, Iris Xe G7 96EUs | Minisforum Venus Series UN1245 i5-12450H, UHD Graphics 64EUs | NiPoGi CK10 i5-12450H, UHD Graphics 64EUs | |
|---|---|---|---|---|---|---|---|
| Noise | 13% | 5% | 12% | 1% | 6% | 11% | |
| off / environment * (dB) | 24.8 | 29.8 -20% | 29.8 -20% | 30.2 -22% | 30.4 -23% | 25.2 -2% | 25 -1% |
| Idle Minimum * (dB) | 36.5 | 29.9 18% | 30.2 17% | 30.4 17% | 33.1 9% | 32 12% | 30.6 16% |
| Idle Average * (dB) | 36.5 | 30.1 18% | 31.1 15% | 30.4 17% | 33.1 9% | 32.1 12% | 31.1 15% |
| Idle Maximum * (dB) | 36.5 | 30.2 17% | 31.9 13% | 30.4 17% | 33.1 9% | 32.2 12% | 31.7 13% |
| Load Average * (dB) | 36.6 | 32.1 12% | 40 -9% | 31.8 13% | 38.1 -4% | 39.8 -9% | 32.9 10% |
| Witcher 3 ultra * (dB) | 36.6 | 36.2 1% | |||||
| Load Maximum * (dB) | 47.5 | 32.5 32% | 40.5 15% | 33.4 30% | 43.6 8% | 43.3 9% | 36.1 24% |
* ... smaller is better
Temperature
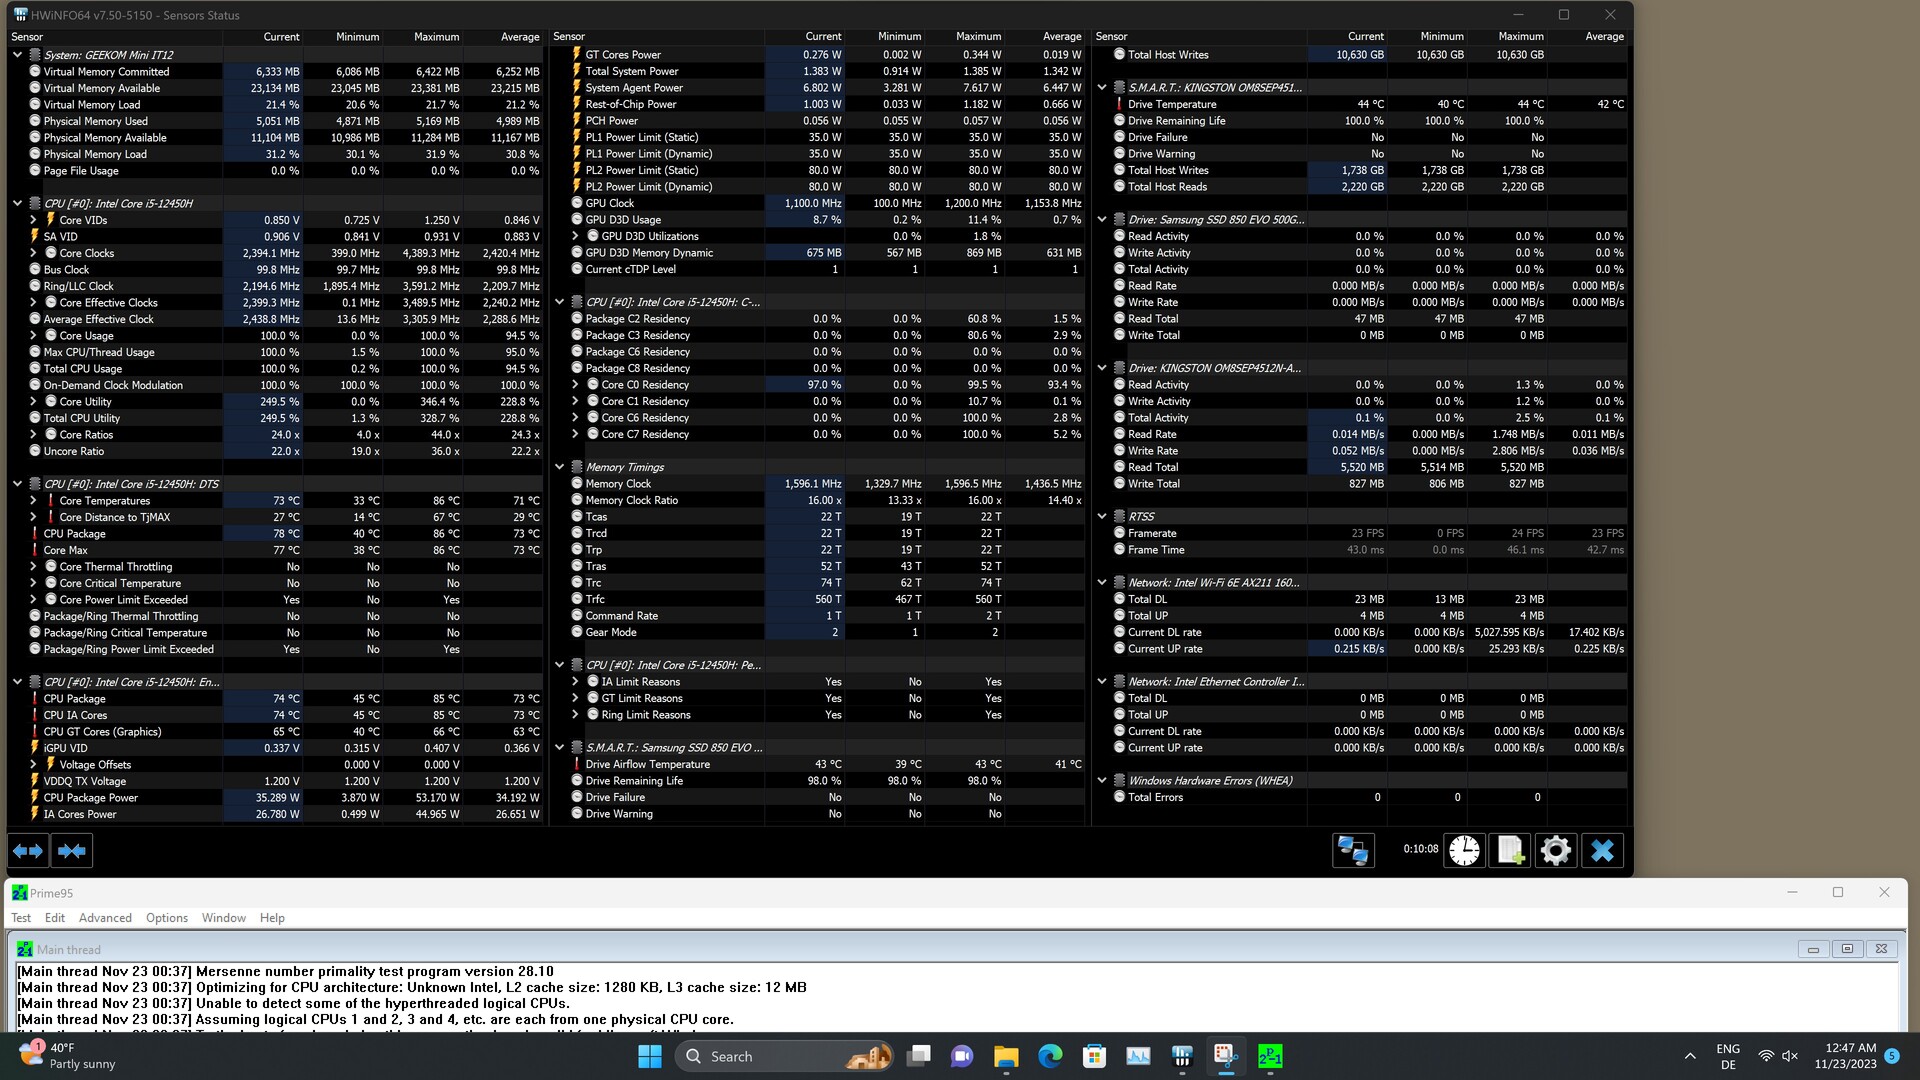
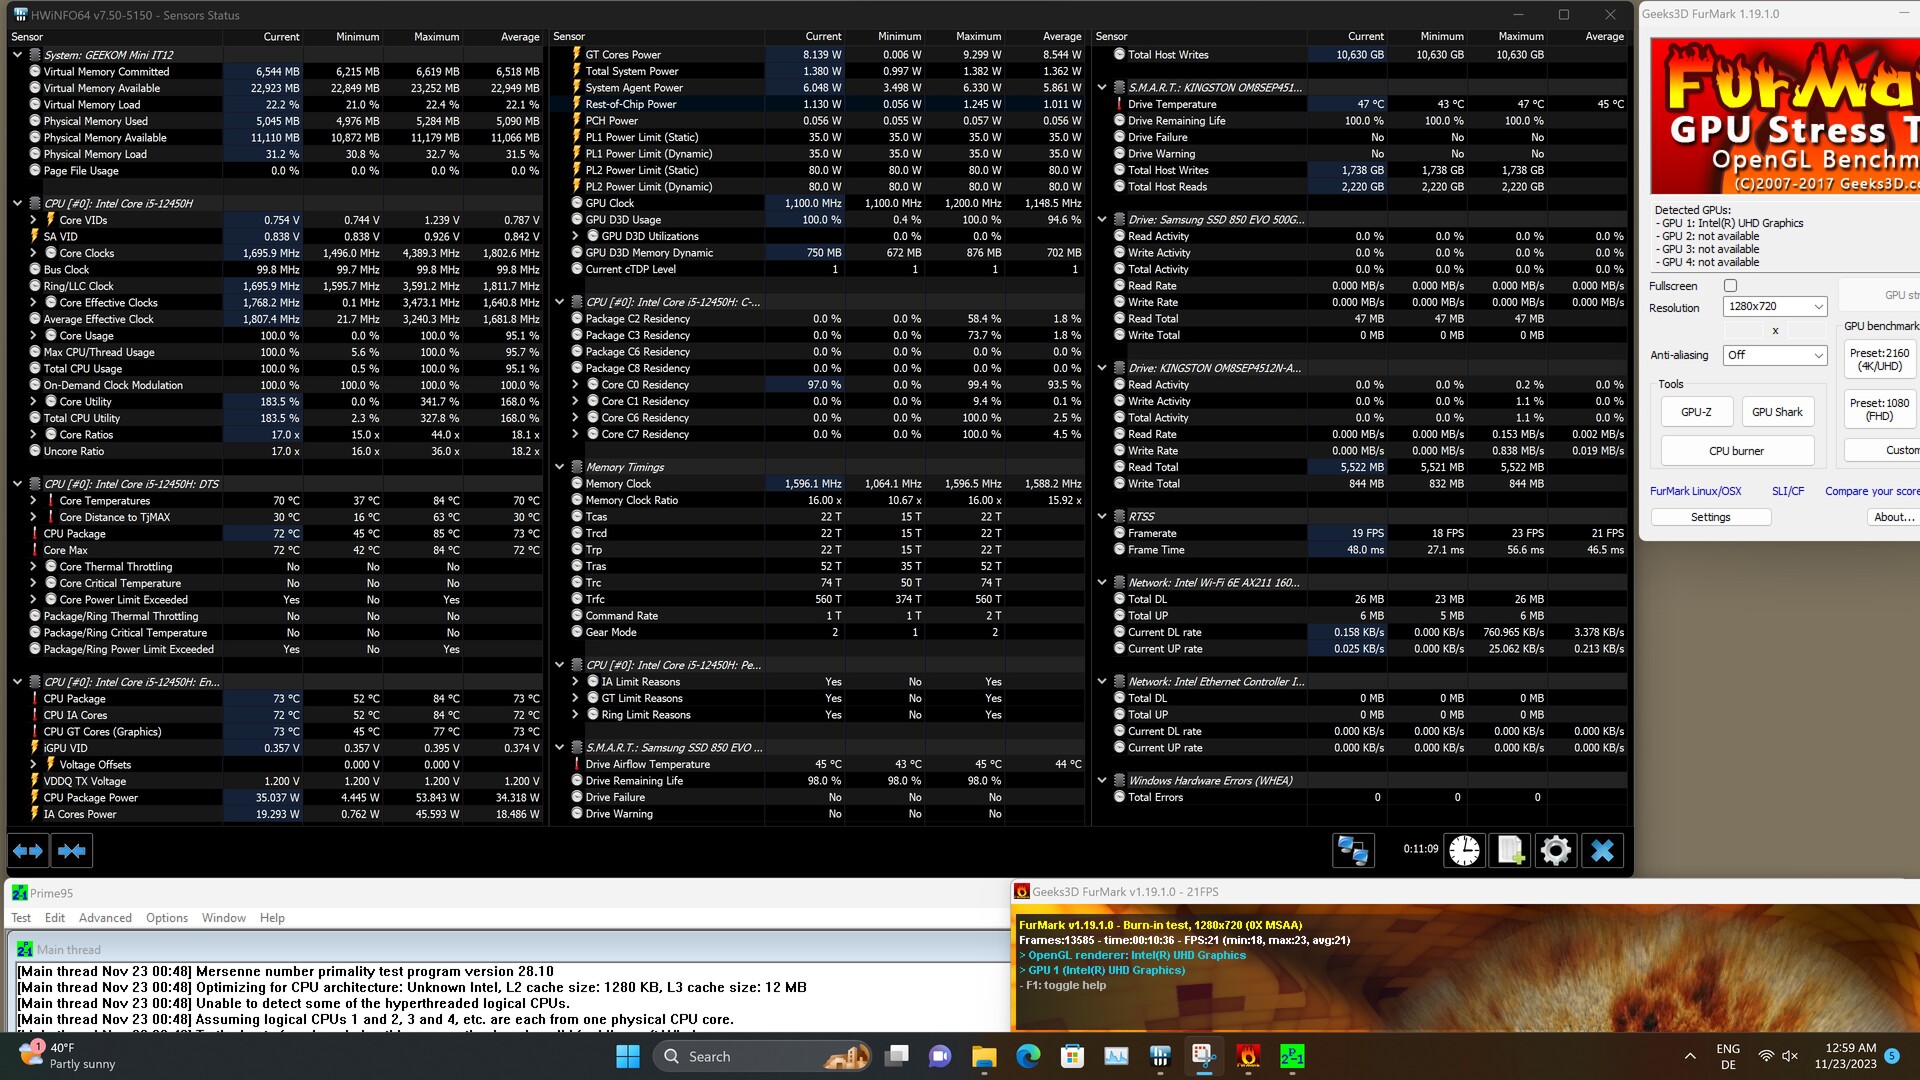
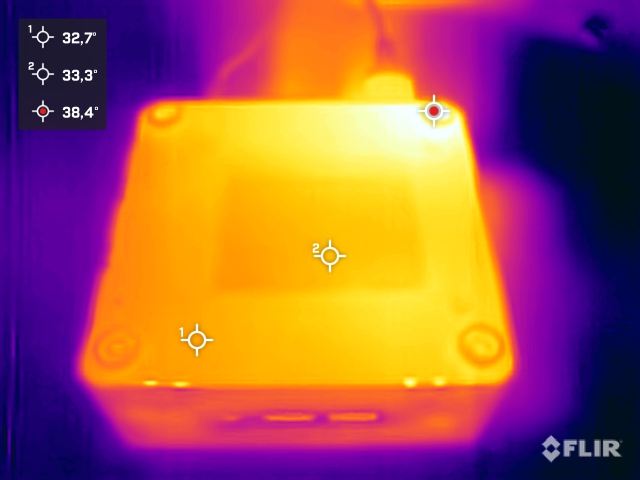
The casing of the Geekom Mini IT12 only warms up slightly during idle, with warmer areas becoming noticeable under load. The maximum temperature during the stress test is a harmless 106.52 °F. The Intel Core i5-12450H draws 35 watts under continuous load, a value consistently maintained throughout the stress test. Although the SoC briefly reaches 53 watts at the beginning, resulting in a maximum temperature of 185 °F, it appears the manufacturer has set a limit, as the CPU temperature settles at a stable 163.4 °F, below the maximum power limit of 80 watts in any benchmark.
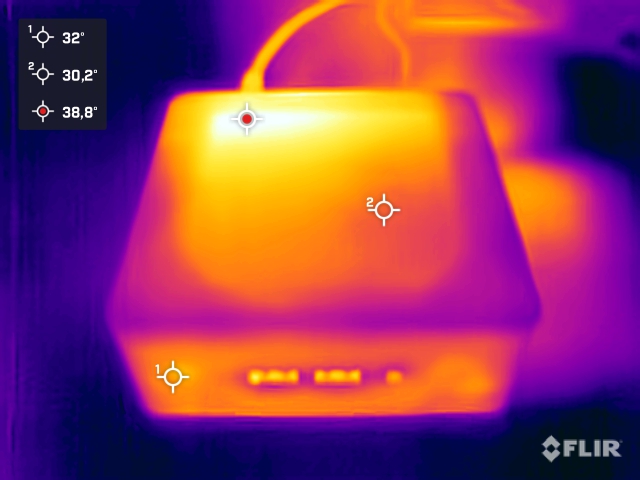
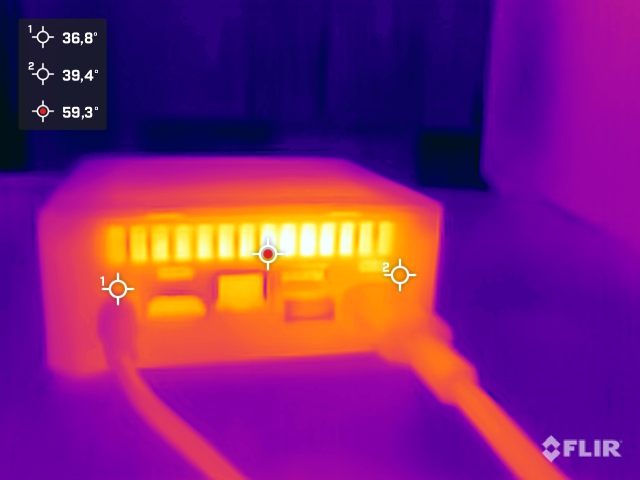
(±) The maximum temperature on the upper side is 41.4 °C / 107 F, compared to the average of 35.4 °C / 96 F, ranging from 20.6 to 69.5 °C for the class Mini PC.
(+) The bottom heats up to a maximum of 39.1 °C / 102 F, compared to the average of 36.1 °C / 97 F
(+) In idle usage, the average temperature for the upper side is 27.5 °C / 82 F, compared to the device average of 32.1 °C / 90 F.
Power Consumption
Geekom has intentionally limited the processor's power with certain constraints, resulting in the Mini IT12 being highly energy-efficient in both idle and load conditions. Power consumption in idle mode ranges from 5.5 to 11.3 watts. While the 90-watt power supply may briefly need to deliver just under 87 watts, this doesn't pose an issue. On average, the Geekom Mini IT12 consumes slightly over 40 watts, showcasing excellent energy efficiency compared to its competitors.
| Off / Standby | |
| Idle | |
| Load |
|
Key:
min: | |
| Geekom Mini IT12 i5-12450H, UHD Graphics 64EUs | Geekom Mini IT12 i7-1260P, Iris Xe G7 96EUs | Intel NUC 13 Pro Kit NUC13ANK i7-1360P, Iris Xe G7 96EUs | Minisforum Mars Series MC560 R5 5600U, Vega 7 | Intel NUC 12 Pro Kit NUC12WSKi7 i7-1260P, Iris Xe G7 96EUs | Minisforum Venus Series UN1245 i5-12450H, UHD Graphics 64EUs | NiPoGi CK10 i5-12450H, UHD Graphics 64EUs | Average Intel UHD Graphics 64EUs (Alder Lake 12th Gen) | Average of class Mini PC | |
|---|---|---|---|---|---|---|---|---|---|
| Power Consumption | 4% | -7% | 18% | -48% | -9% | -22% | -21% | -37% | |
| Idle Minimum * (Watt) | 5.5 | 5 9% | 5.1 7% | 6.2 -13% | 12.1 -120% | 8.2 -49% | 9.1 -65% | 8.78 ? -60% | 8.66 ? -57% |
| Idle Average * (Watt) | 8.5 | 7 18% | 5.8 32% | 6.3 26% | 12.2 -44% | 8.6 -1% | 11.3 -33% | 10.4 ? -22% | 10.8 ? -27% |
| Idle Maximum * (Watt) | 11.3 | 10.7 5% | 10.2 10% | 7.5 34% | 12.3 -9% | 9.6 15% | 13.7 -21% | 14.7 ? -30% | 13.6 ? -20% |
| Load Average * (Watt) | 42.3 | 50.3 -19% | 68.1 -61% | 41.3 2% | 64 -51% | 52.1 -23% | 49.5 -17% | 49 ? -16% | 64.3 ? -52% |
| Load Maximum * (Watt) | 86.5 | 82 5% | 108.3 -25% | 49 43% | 98.8 -14% | 73.6 15% | 62.3 28% | 67.6 ? 22% | 111.4 ? -29% |
* ... smaller is better
Energieaufnahme mit externem Monitor
Pros
Cons
Verdict - Economical office PC with good features

The Geekom Mini IT12 proves to be a reliable mini PC suitable for home use. Featuring the Intel Core i5-12450H, it handles most everyday tasks seamlessly. Its extensive connectivity options make it versatile for various applications, and it smoothly accommodates external graphics cards. In a comparison with the Intel Core i7-1260P variant of the same model, the tested device falls short. While, on paper, the similarly equipped Minisforum Venus Series UN1245 and NiPoGi CK10 don't quite match the Geekom Mini IT12, real-world performance differences are minimal and often imperceptible. Geekom gains a significant edge in connectivity, featuring the modern USB 4 port—a feature lacking in its competitors.
The Geekom Mini IT12 is a compact workhorse with broad applicability, enhanced by its excellent connectivity, even supporting external graphics cards.
Geekom maintains its consistent quality in craftsmanship and design. However, a fresh look could add distinction to their devices. The notable criticism of our test unit is the audible fan noise, a concern not present in our testing of the Mini IT12 with Intel Core i7-1260P. It remains to be seen whether the manufacturer will address this through a BIOS update. If fan noise is a concern, opting for the Intel Core i7-1260P model, if available, might be a preferable choice. Any improvements from the producer will be duly reflected in our future tests.
Price & Availability
Geekom Mini IT12
- 11/27/2023 v7 (old)
Sebastian Bade
Transparency
The selection of devices to be reviewed is made by our editorial team. The test sample was given to the author by the manufacturer free of charge for the purposes of review. There was no third-party influence on this review, nor did the manufacturer receive a copy of this review before publication. There was no obligation to publish this review. As an independent media company, Notebookcheck is not subjected to the authority of manufacturers, retailers or publishers.
This is how Notebookcheck is testing
Every year, Notebookcheck independently reviews hundreds of laptops and smartphones using standardized procedures to ensure that all results are comparable. We have continuously developed our test methods for around 20 years and set industry standards in the process. In our test labs, high-quality measuring equipment is utilized by experienced technicians and editors. These tests involve a multi-stage validation process. Our complex rating system is based on hundreds of well-founded measurements and benchmarks, which maintains objectivity. Further information on our test methods can be found here.

