Minisforum NUCXi7 desktop PC review: Ultra slim gaming PC with GeForce RTX 3070 and Core i7-11800H

Minisforum is known as a system manufacturer for mini PCs in this country (Germany). However, with the NUCX series, the manufacturer aims toward a slightly different target user group, offering a full-featured gaming PC with this model. This is not your usual desktop computer, but an ultra slim PC with a decent amount of power. It is based on an Intel NUC-XI5 laptop mainboard, which is also used in laptops.
The NUCX is currently available in two basic configurations that differ in both their CPUs and GPUs. On one hand, there is the Minisforum NUCXi5, which is based on the Intel Core i5-11400H in combination with an Nvidia GeForce RTX 3060 Laptop GPU, and on the other hand, the MinisForum NUCXi7 with the Intel Core i7-11800H in combination with an Nvidia GeForce RTX 3070 Laptop GPU. In terms of their price, the models start as barebones systems from 1,199 Euros (~$1,195) and 1,449 Euros (~$1,444) respectively. Our test unit, a NUCXi7 with 16 GB of RAM and a 512-GB SSD, costs 1,629 Euros (~$1,623) with the Pro version of Windows 11 already preinstalled.
In this review, other compact desktop PCs serve as comparison devices. In order to reflect the direct performance comparison of the GPU performance, we also included a similarly equipped gaming laptop in the field of our test competitors.
Possible Competitors in Comparison
Rating | Date | Model | Weight | Height | Price |
|---|---|---|---|---|---|
v7 (old) | 09 / 2022 | Minisforum NUCX i7 i7-11800H, GeForce RTX 3070 Laptop GPU | 2.4 kg | 393 mm | |
v (old) | 12 / 2021 | Intel Beast Canyon NUC i9-11900KB, GeForce RTX 3060 | 189 mm | ||
v (old) | 06 / 2021 | Zotac Magnus One (ECM73070C) i7-10700, GeForce RTX 3070 | |||
v (old) | 05 / 2022 | Zotac ZBOX Magnus EN173070C i7-11800H, GeForce RTX 3070 Laptop GPU | 1.8 kg | 62.2 mm | |
v (old) | 04 / 2022 | Intel Dragon Canyon NUC - RTX 3060 i9-12900, GeForce RTX 3060 | 189 mm | ||
v (old) | 06 / 2020 | Zotac MEK Mini (RTX 2070 Super) i7-9700, GeForce RTX 2070 Super (Desktop) | |||
| 83.2 % v7 (old) | 10 / 2021 | Gigabyte A7 X1 R9 5900HX, GeForce RTX 3070 Laptop GPU | 2.5 kg | 34 mm |
Minisforum NUCXi7 in Detail
Case
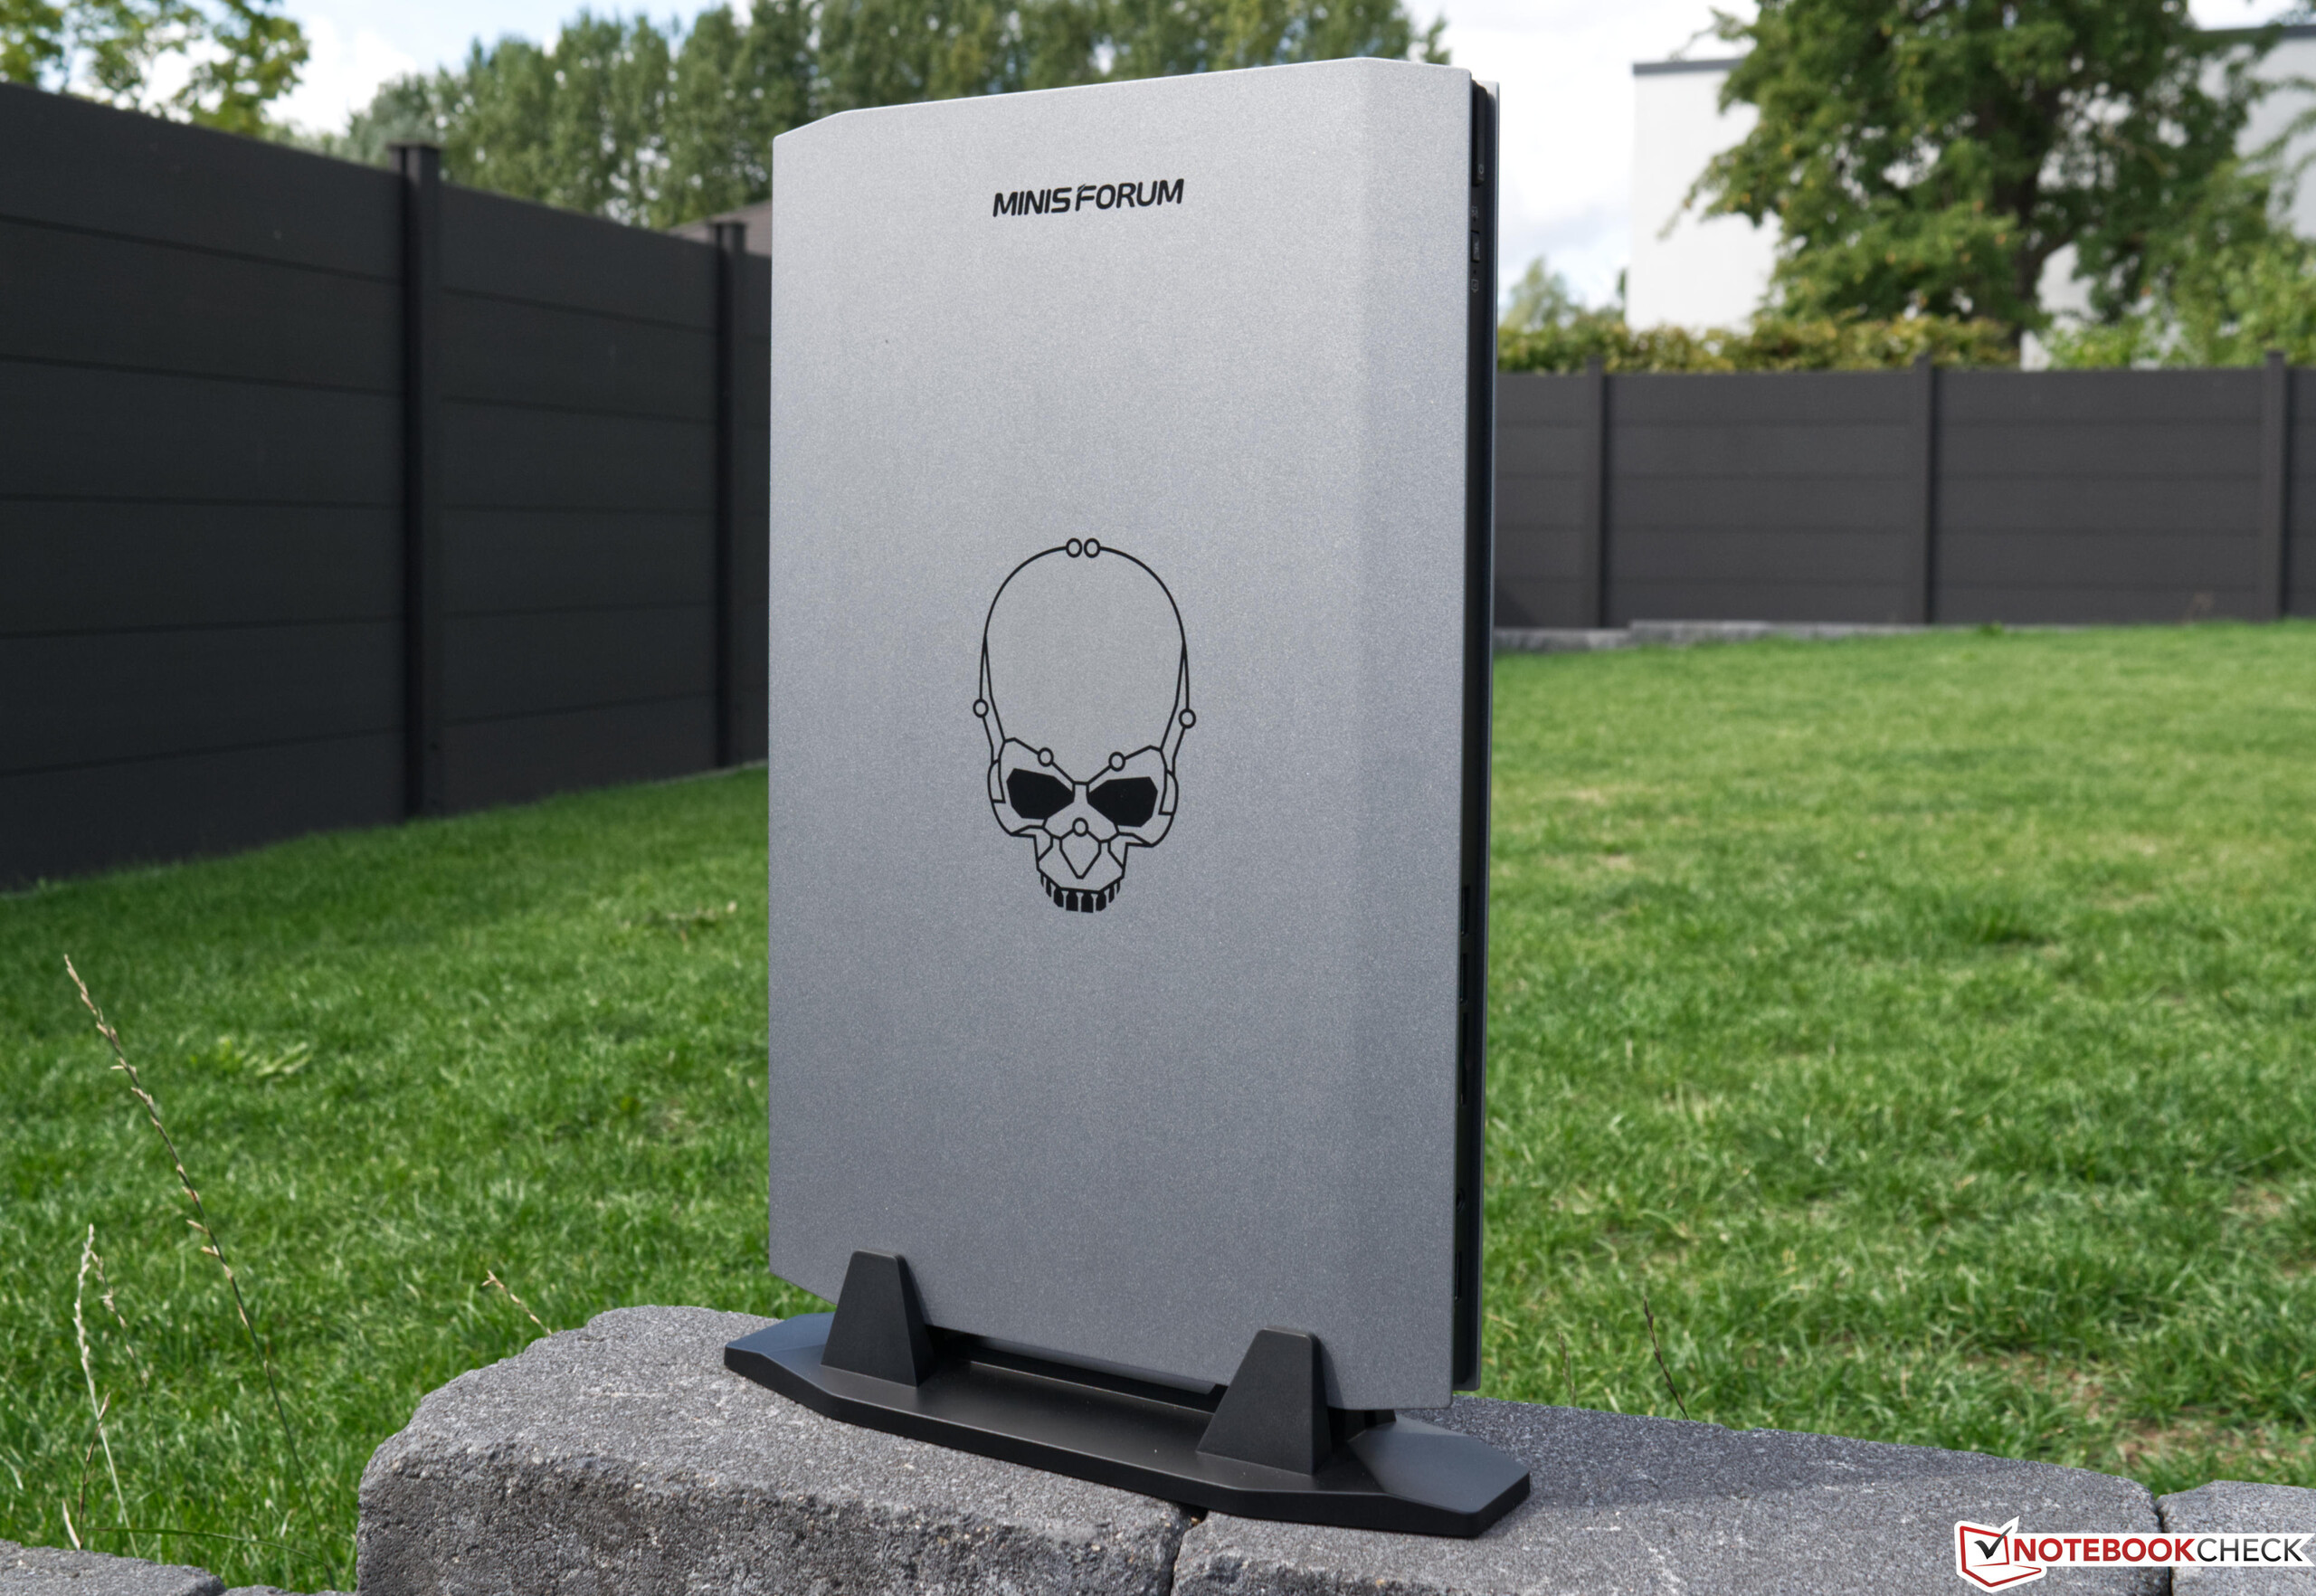
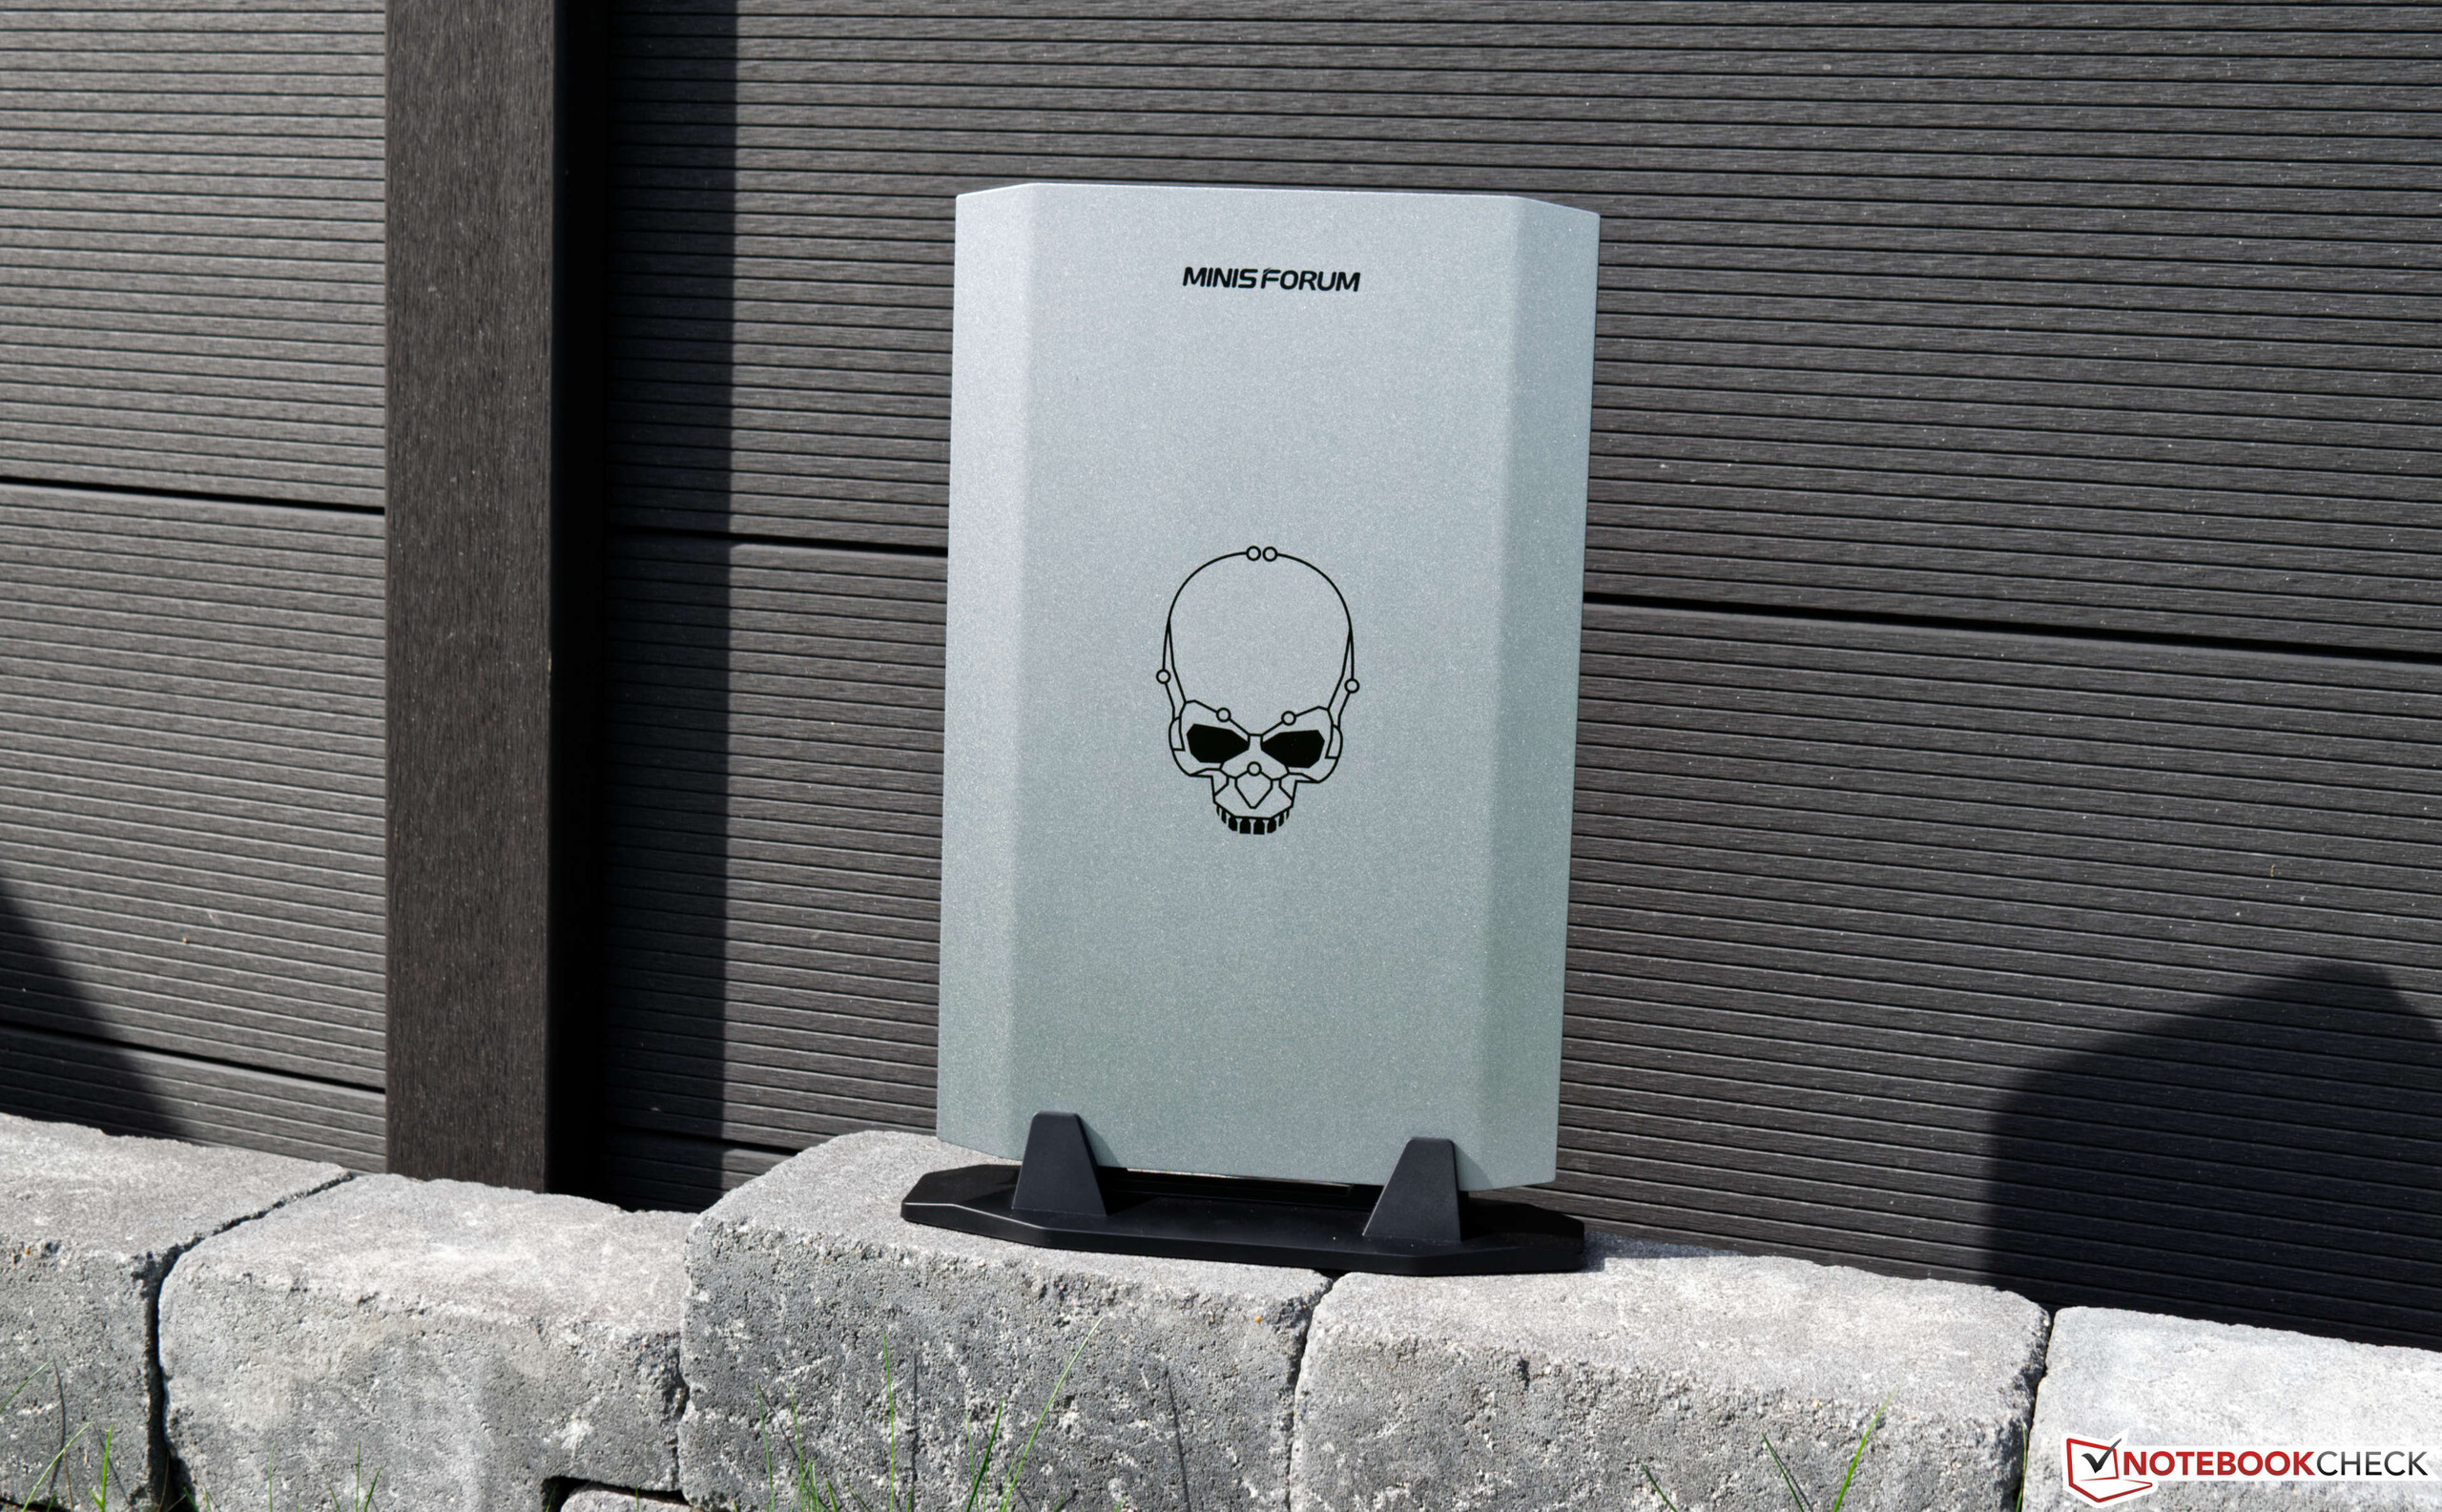
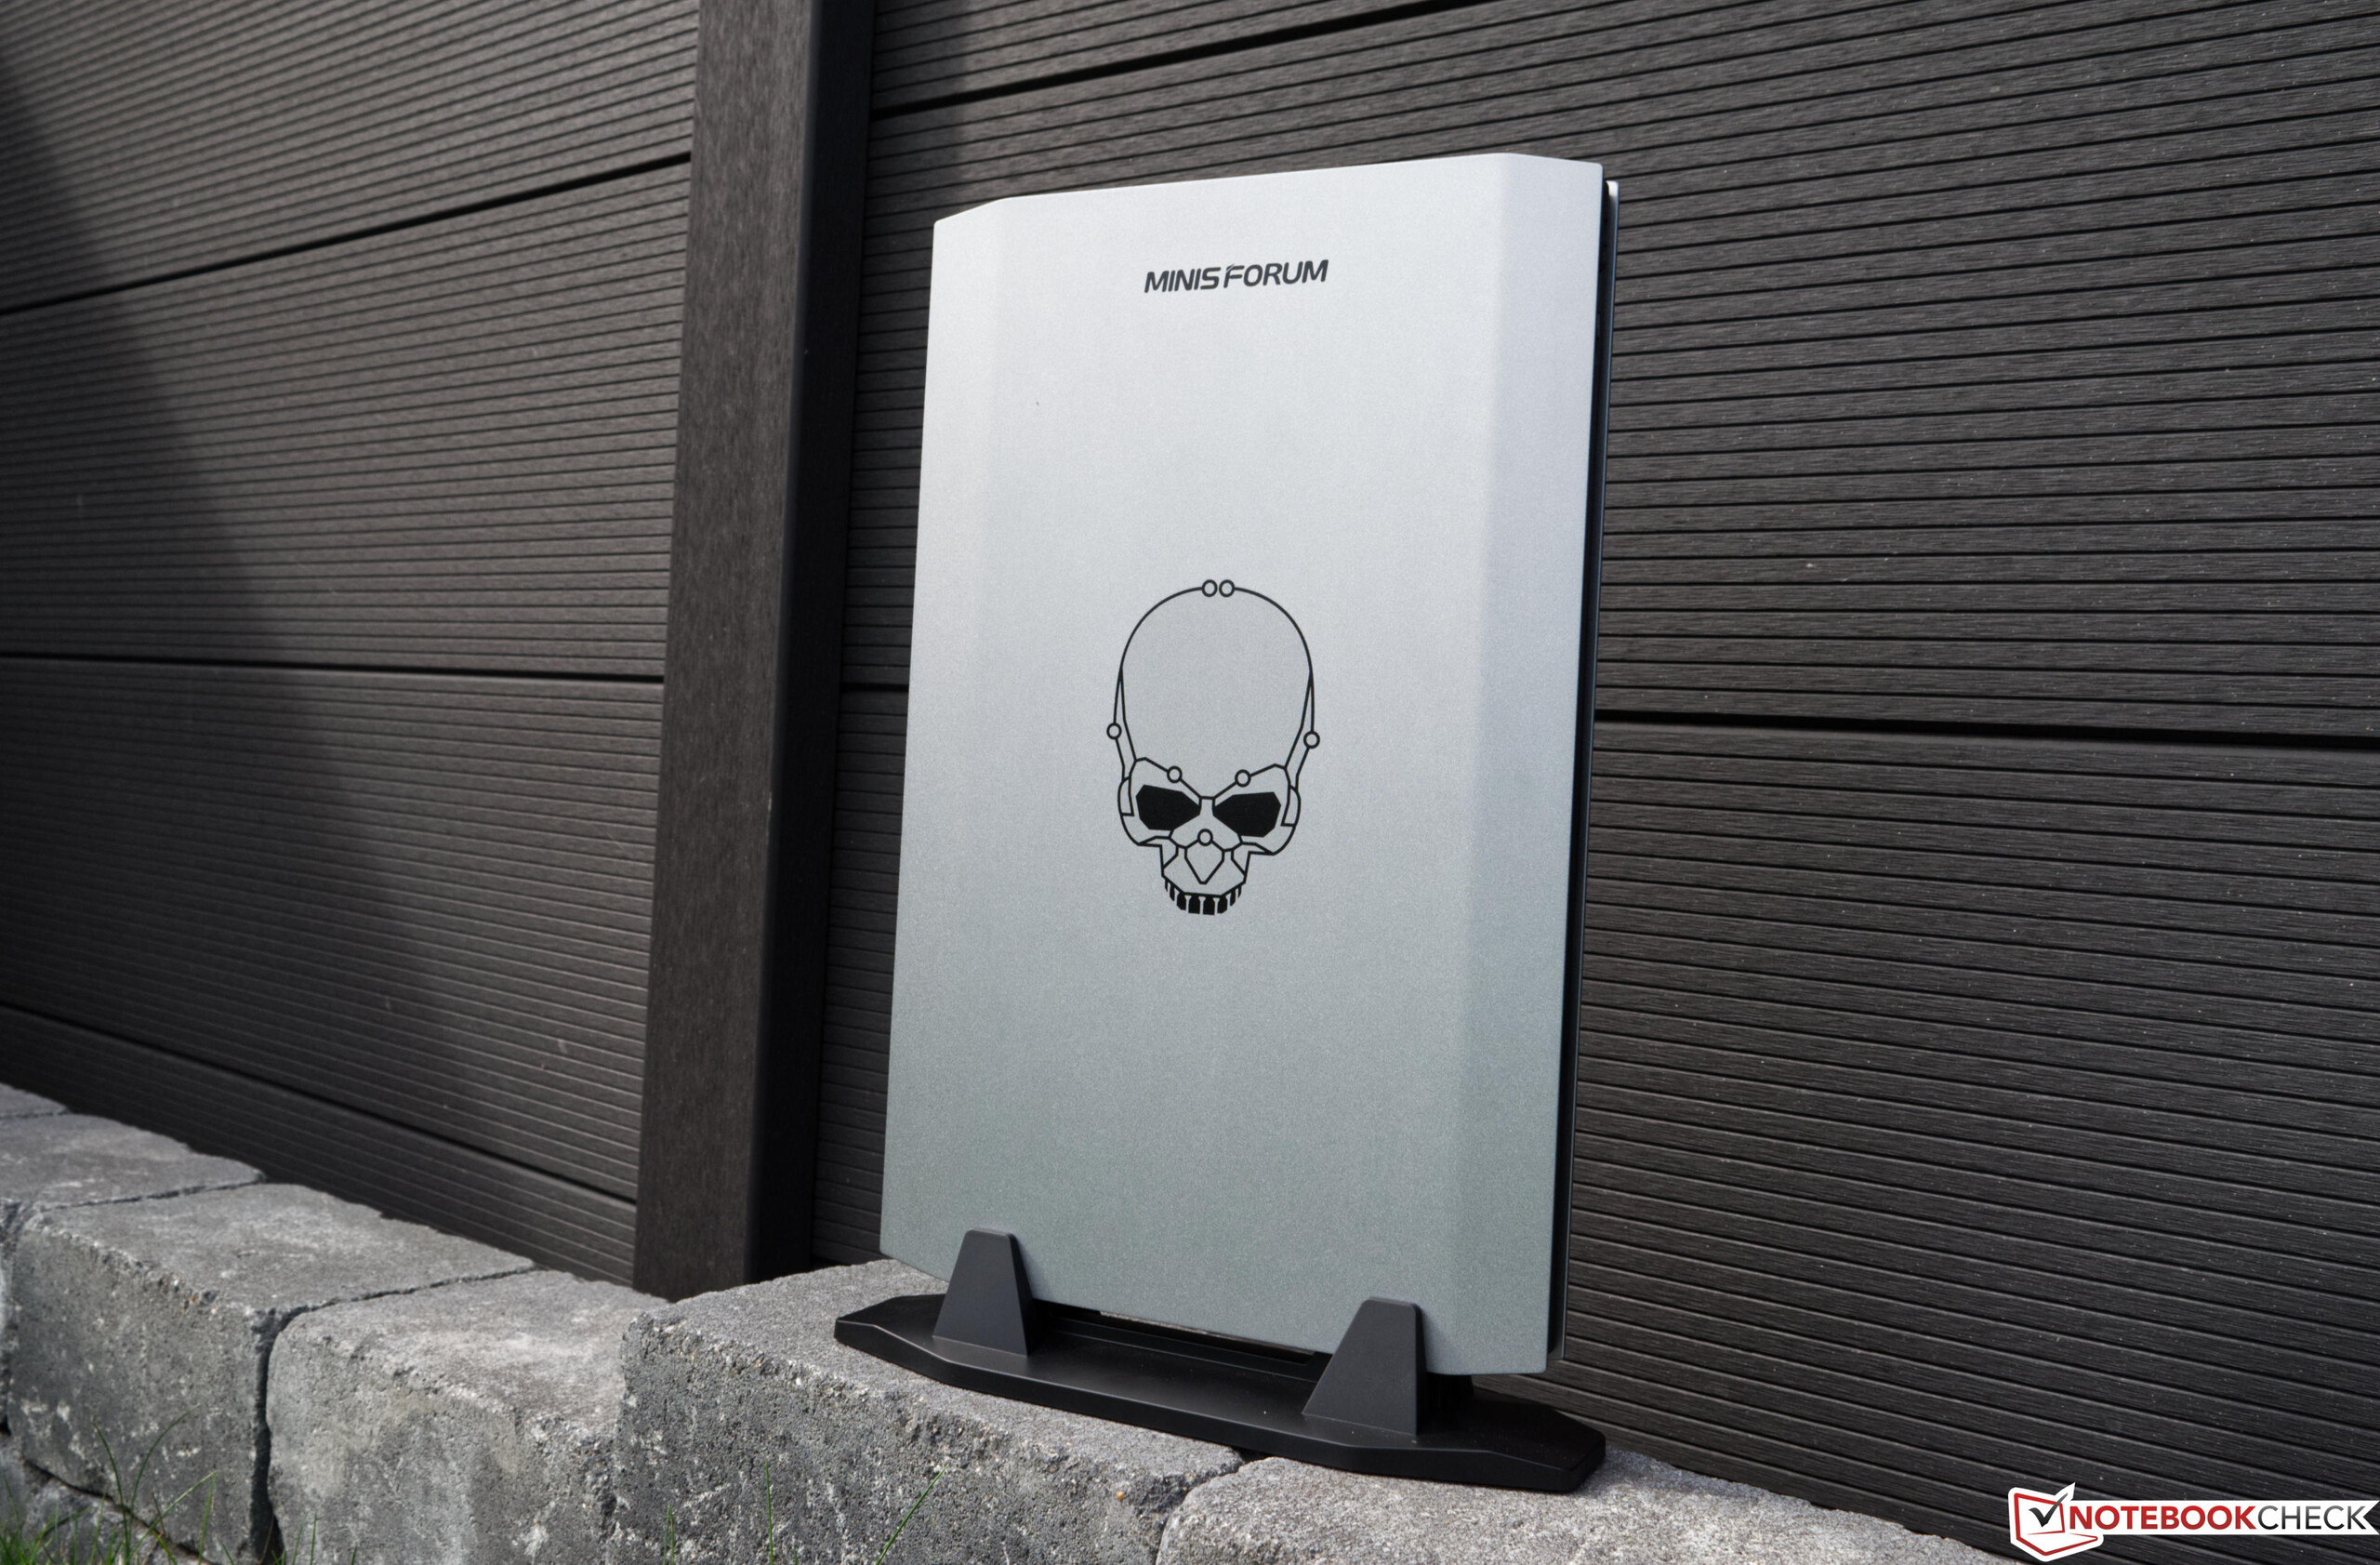
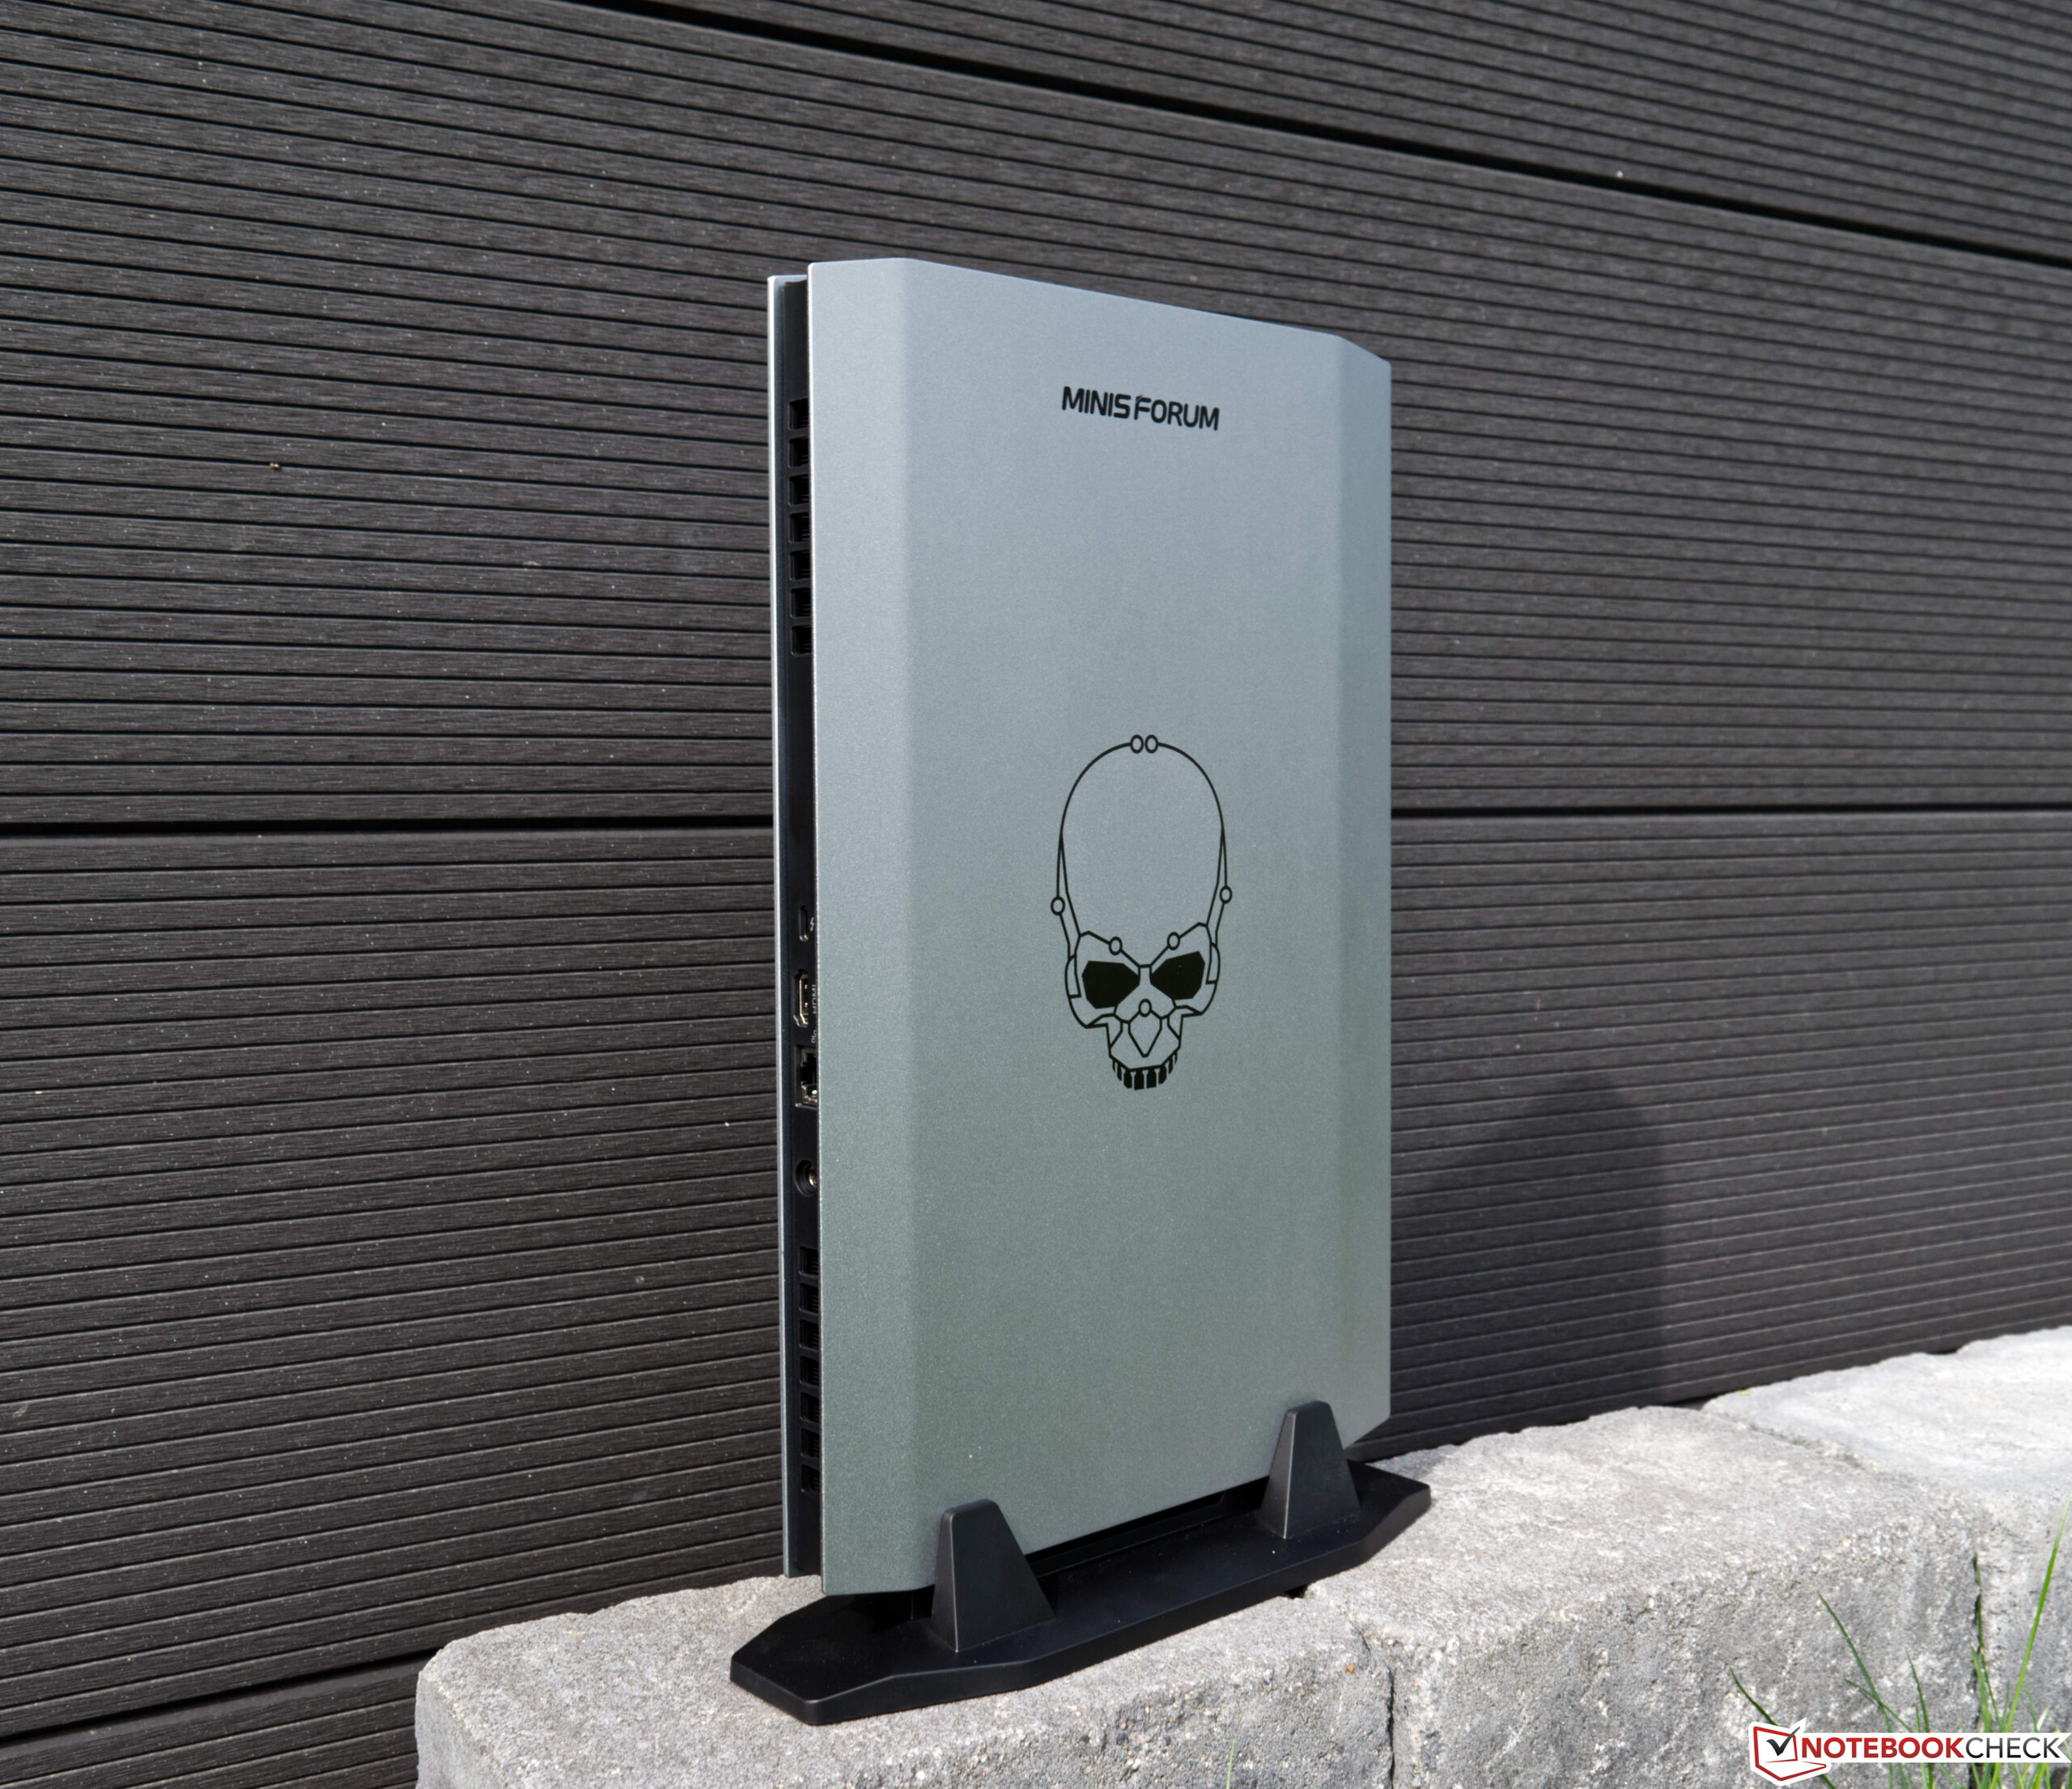
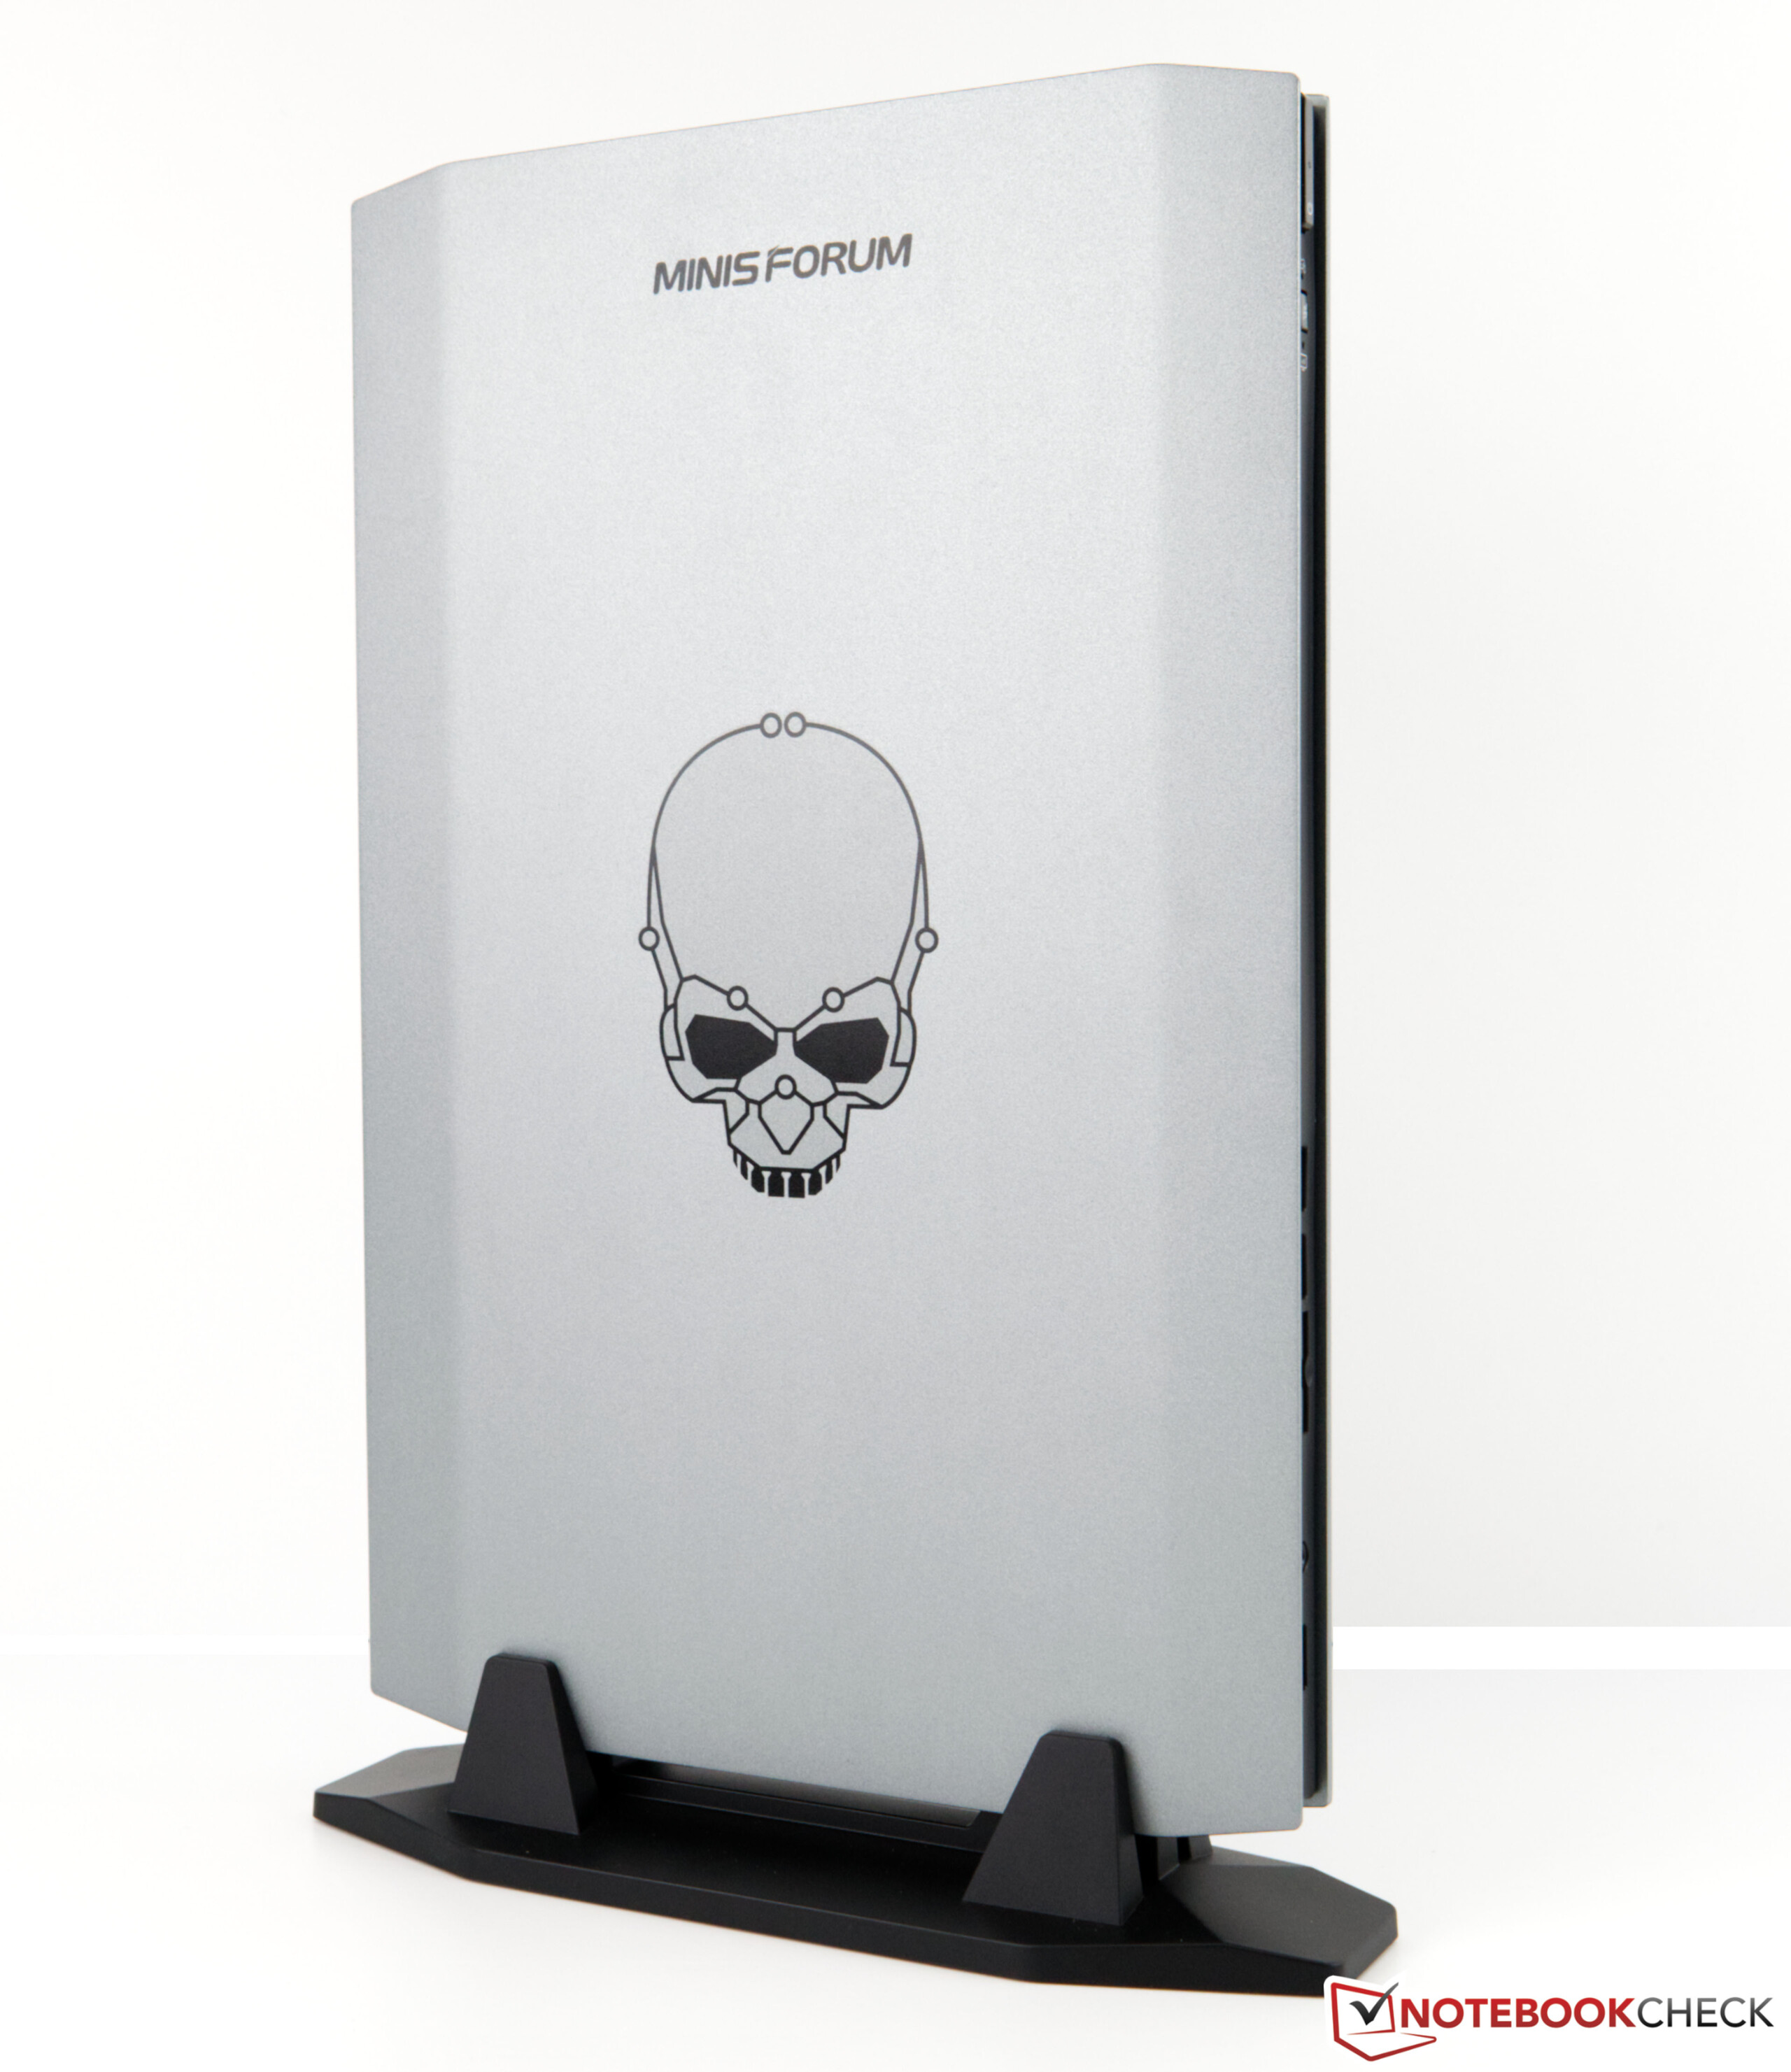
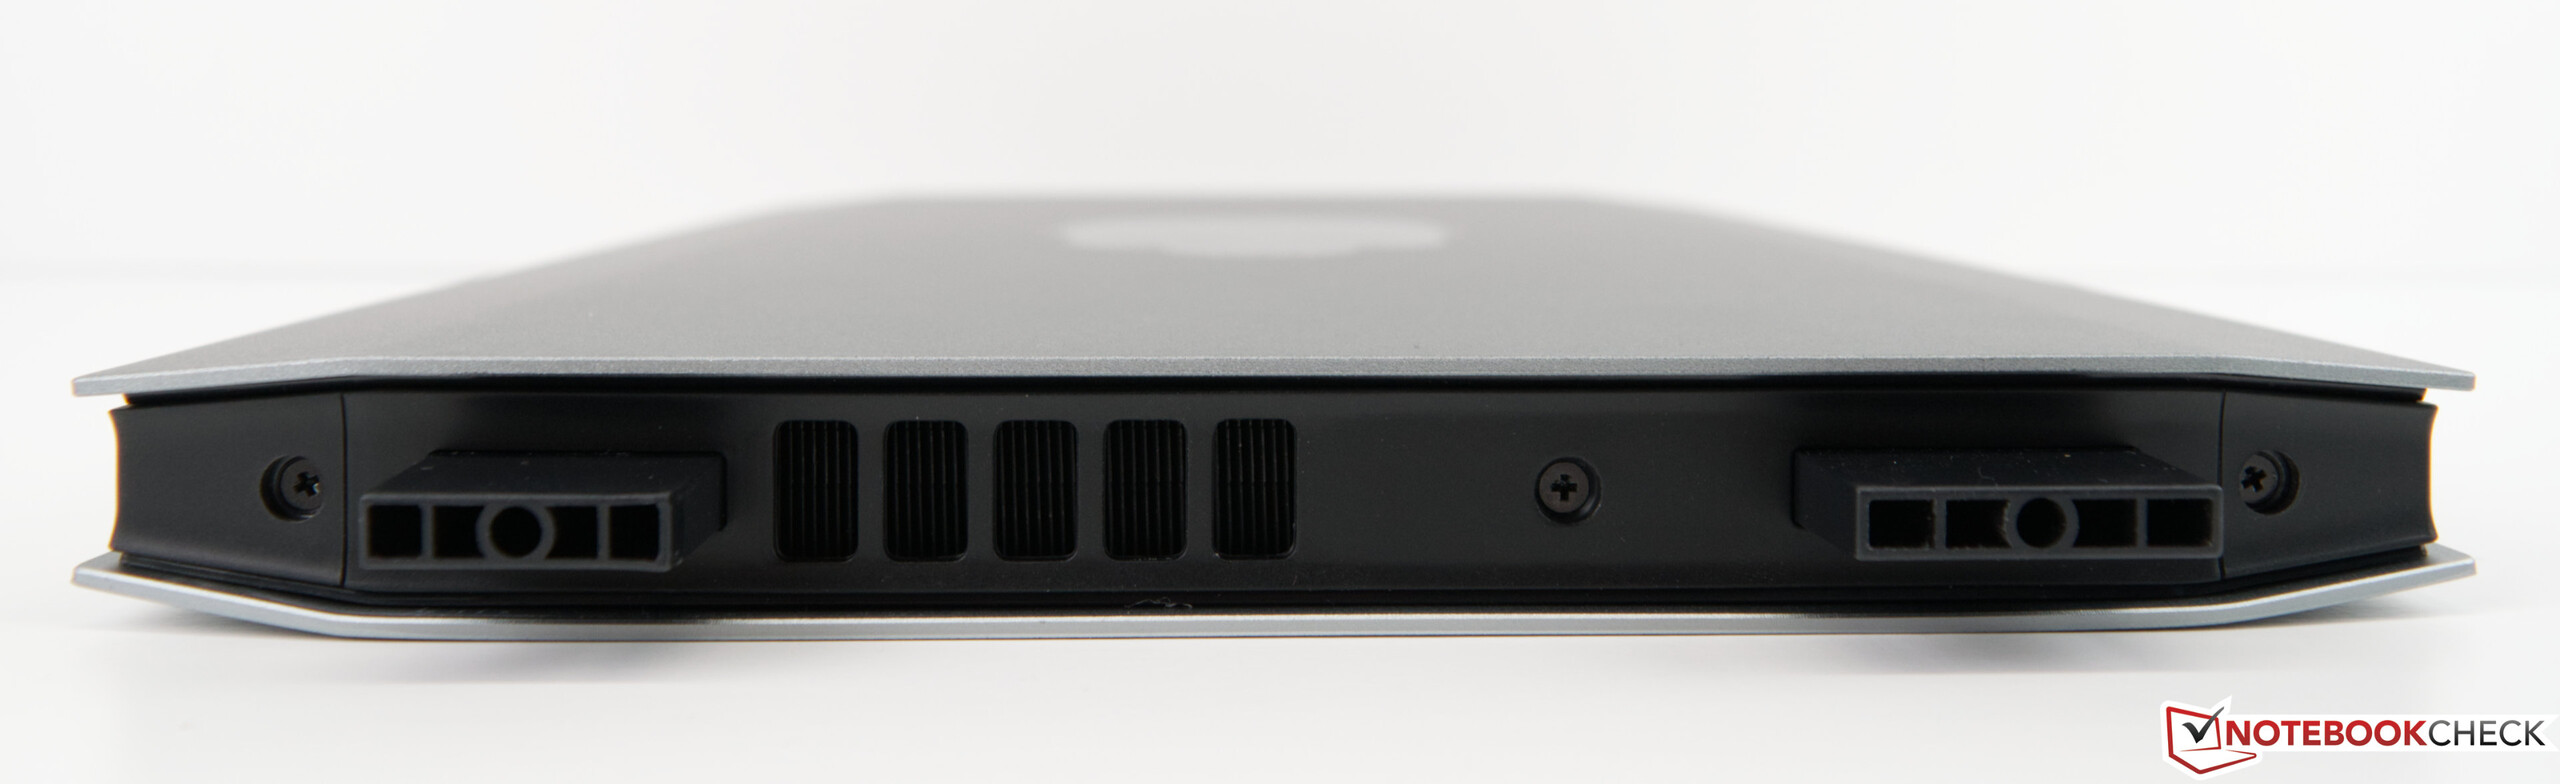
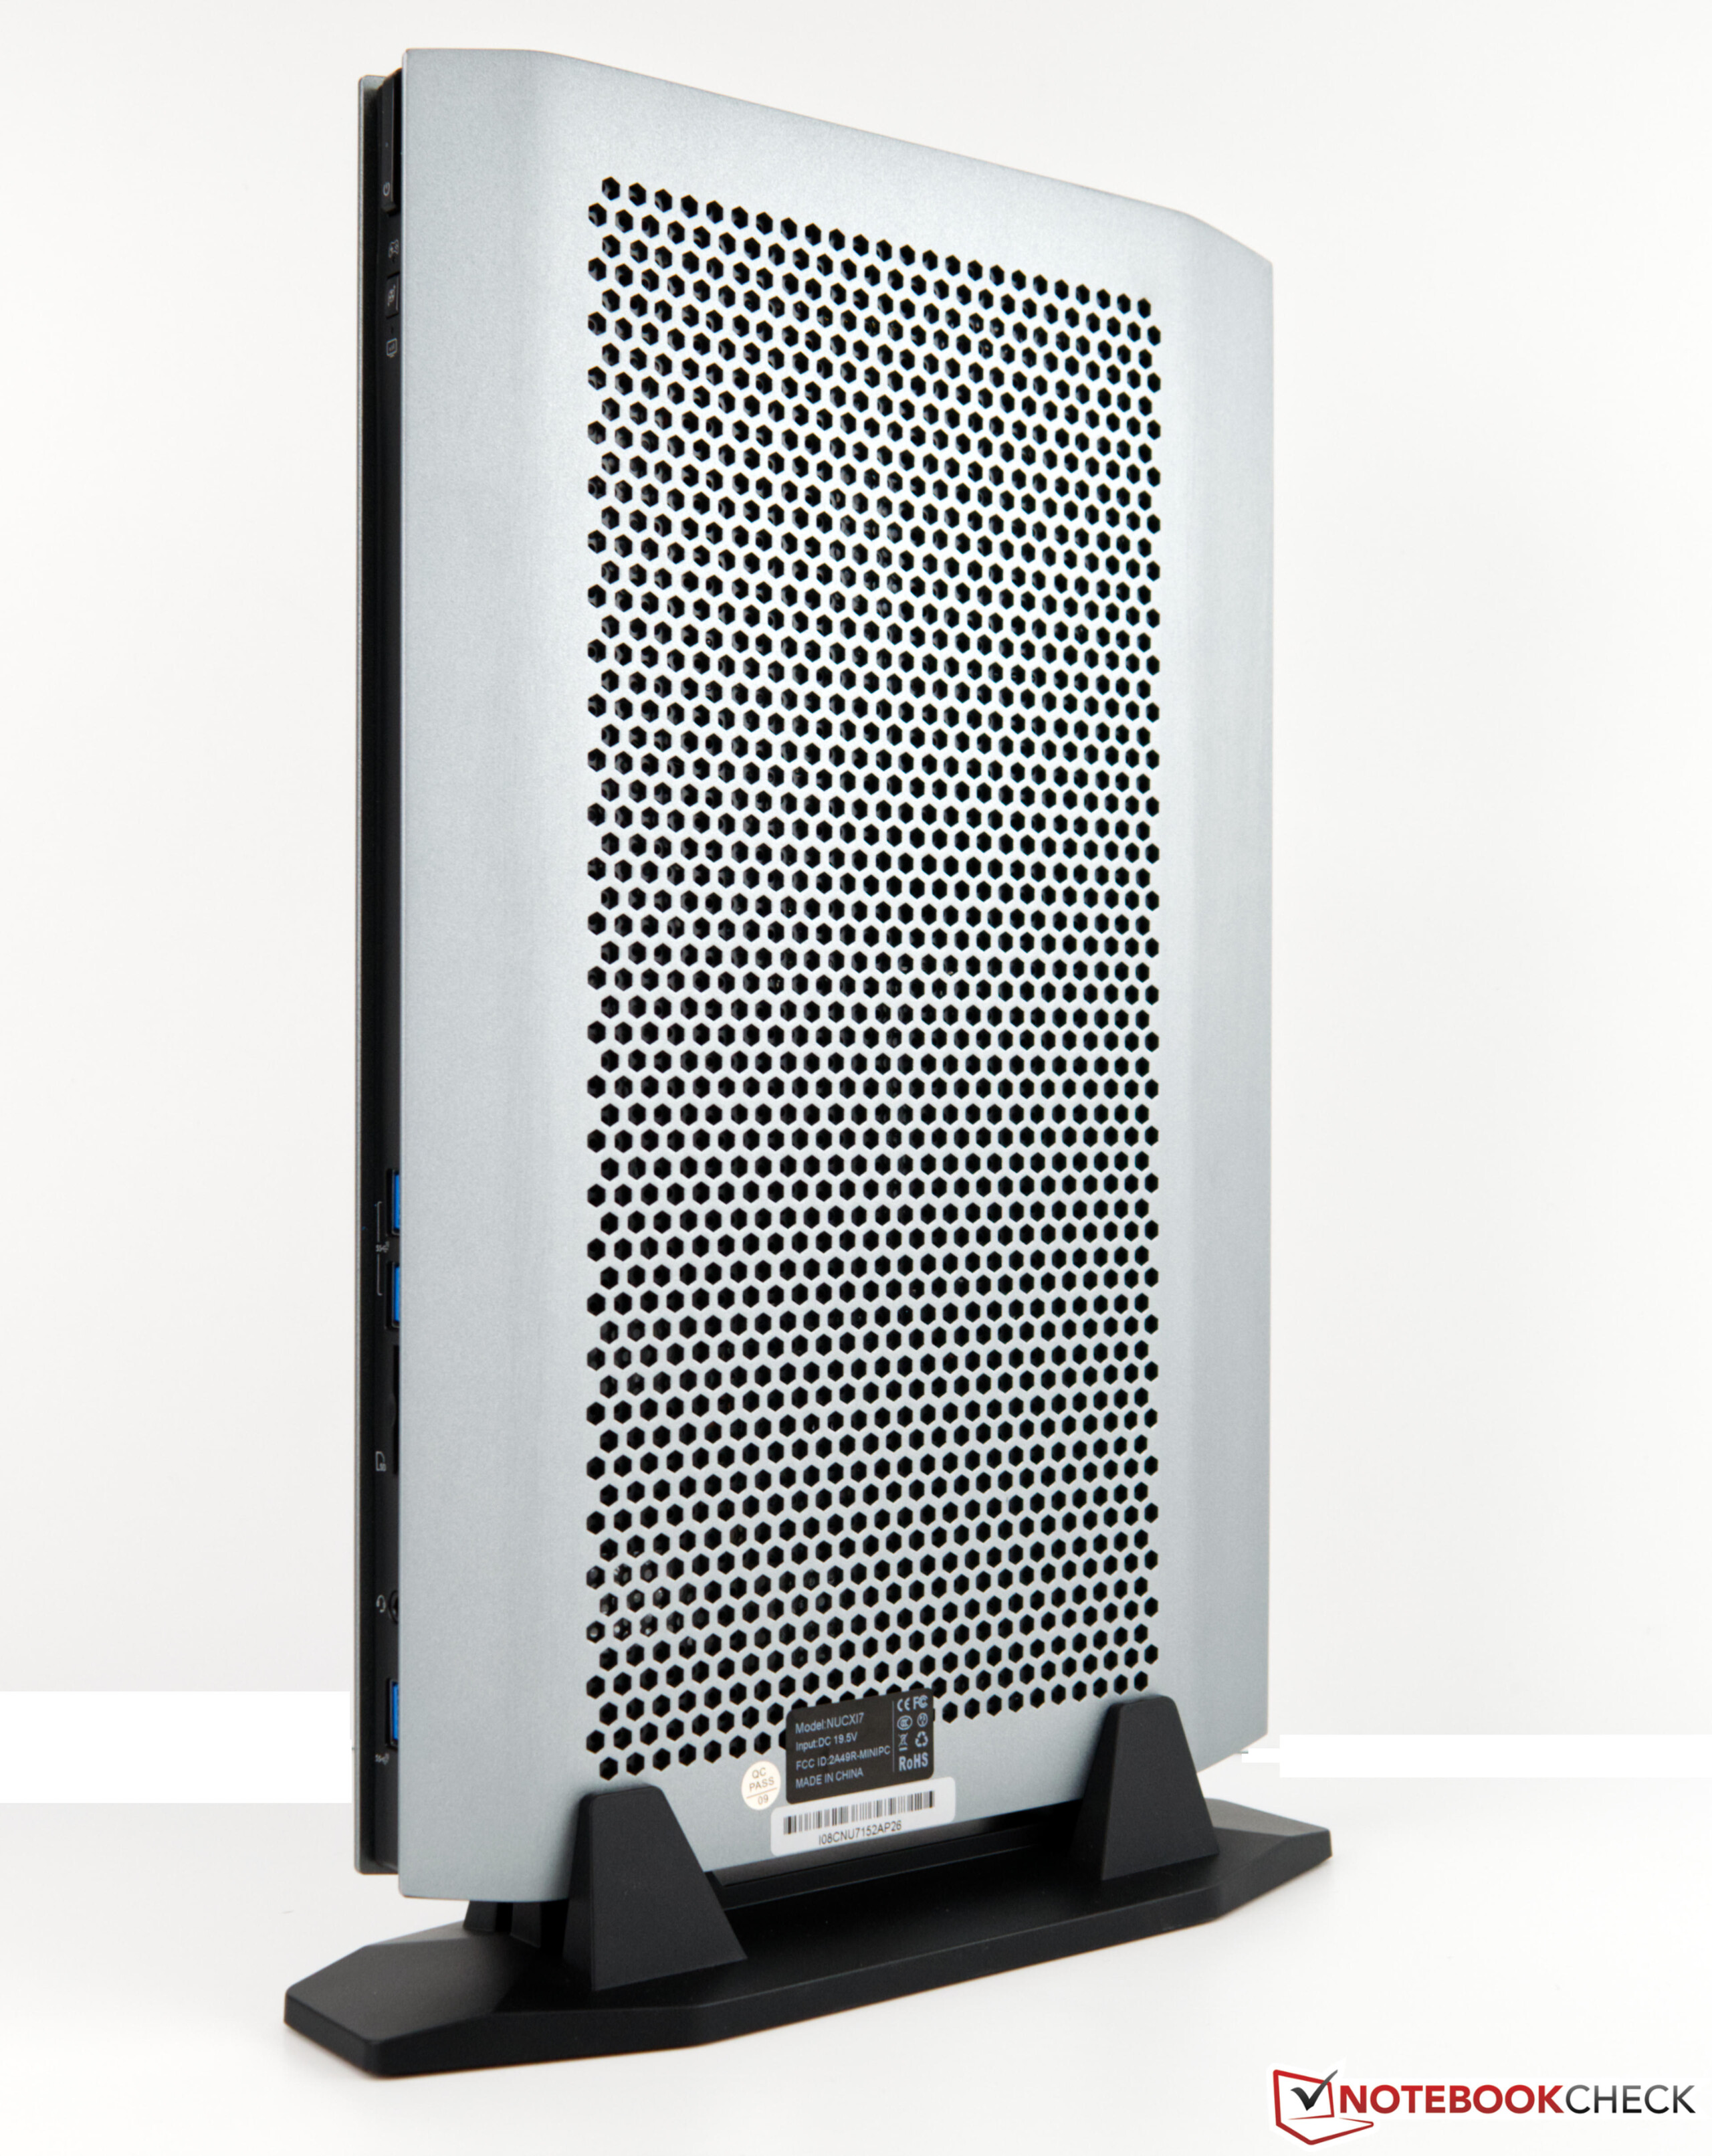
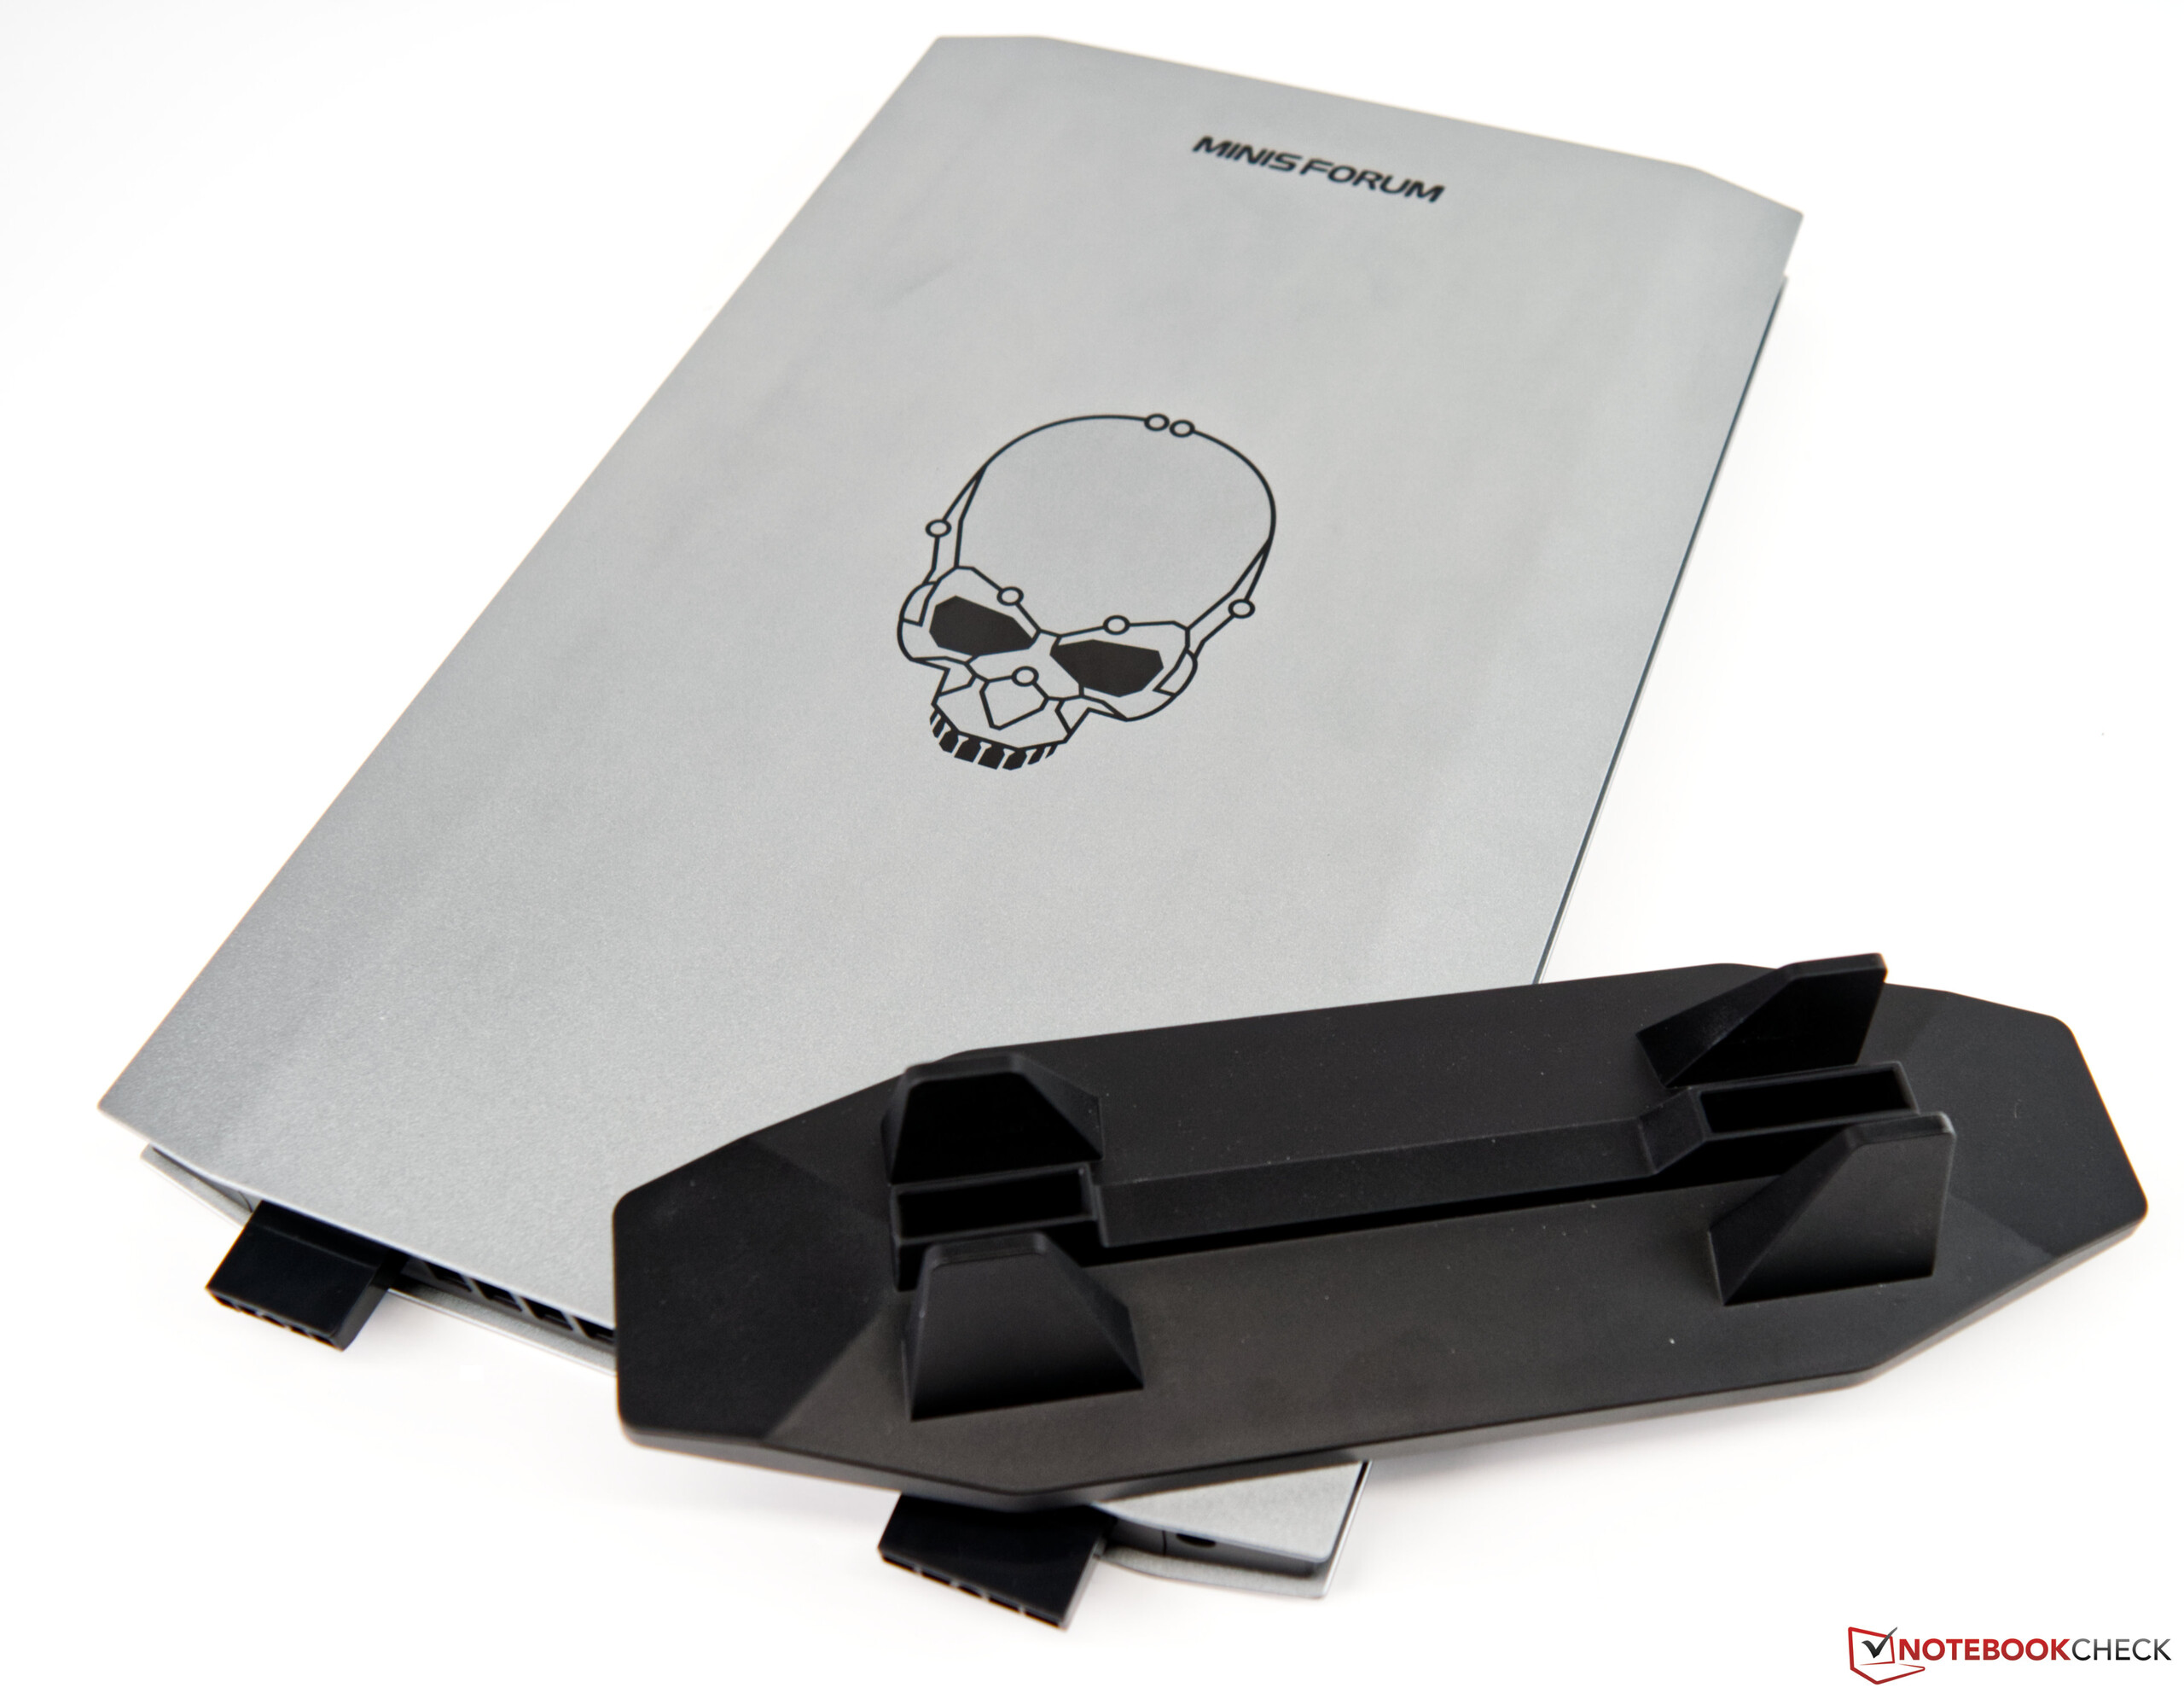
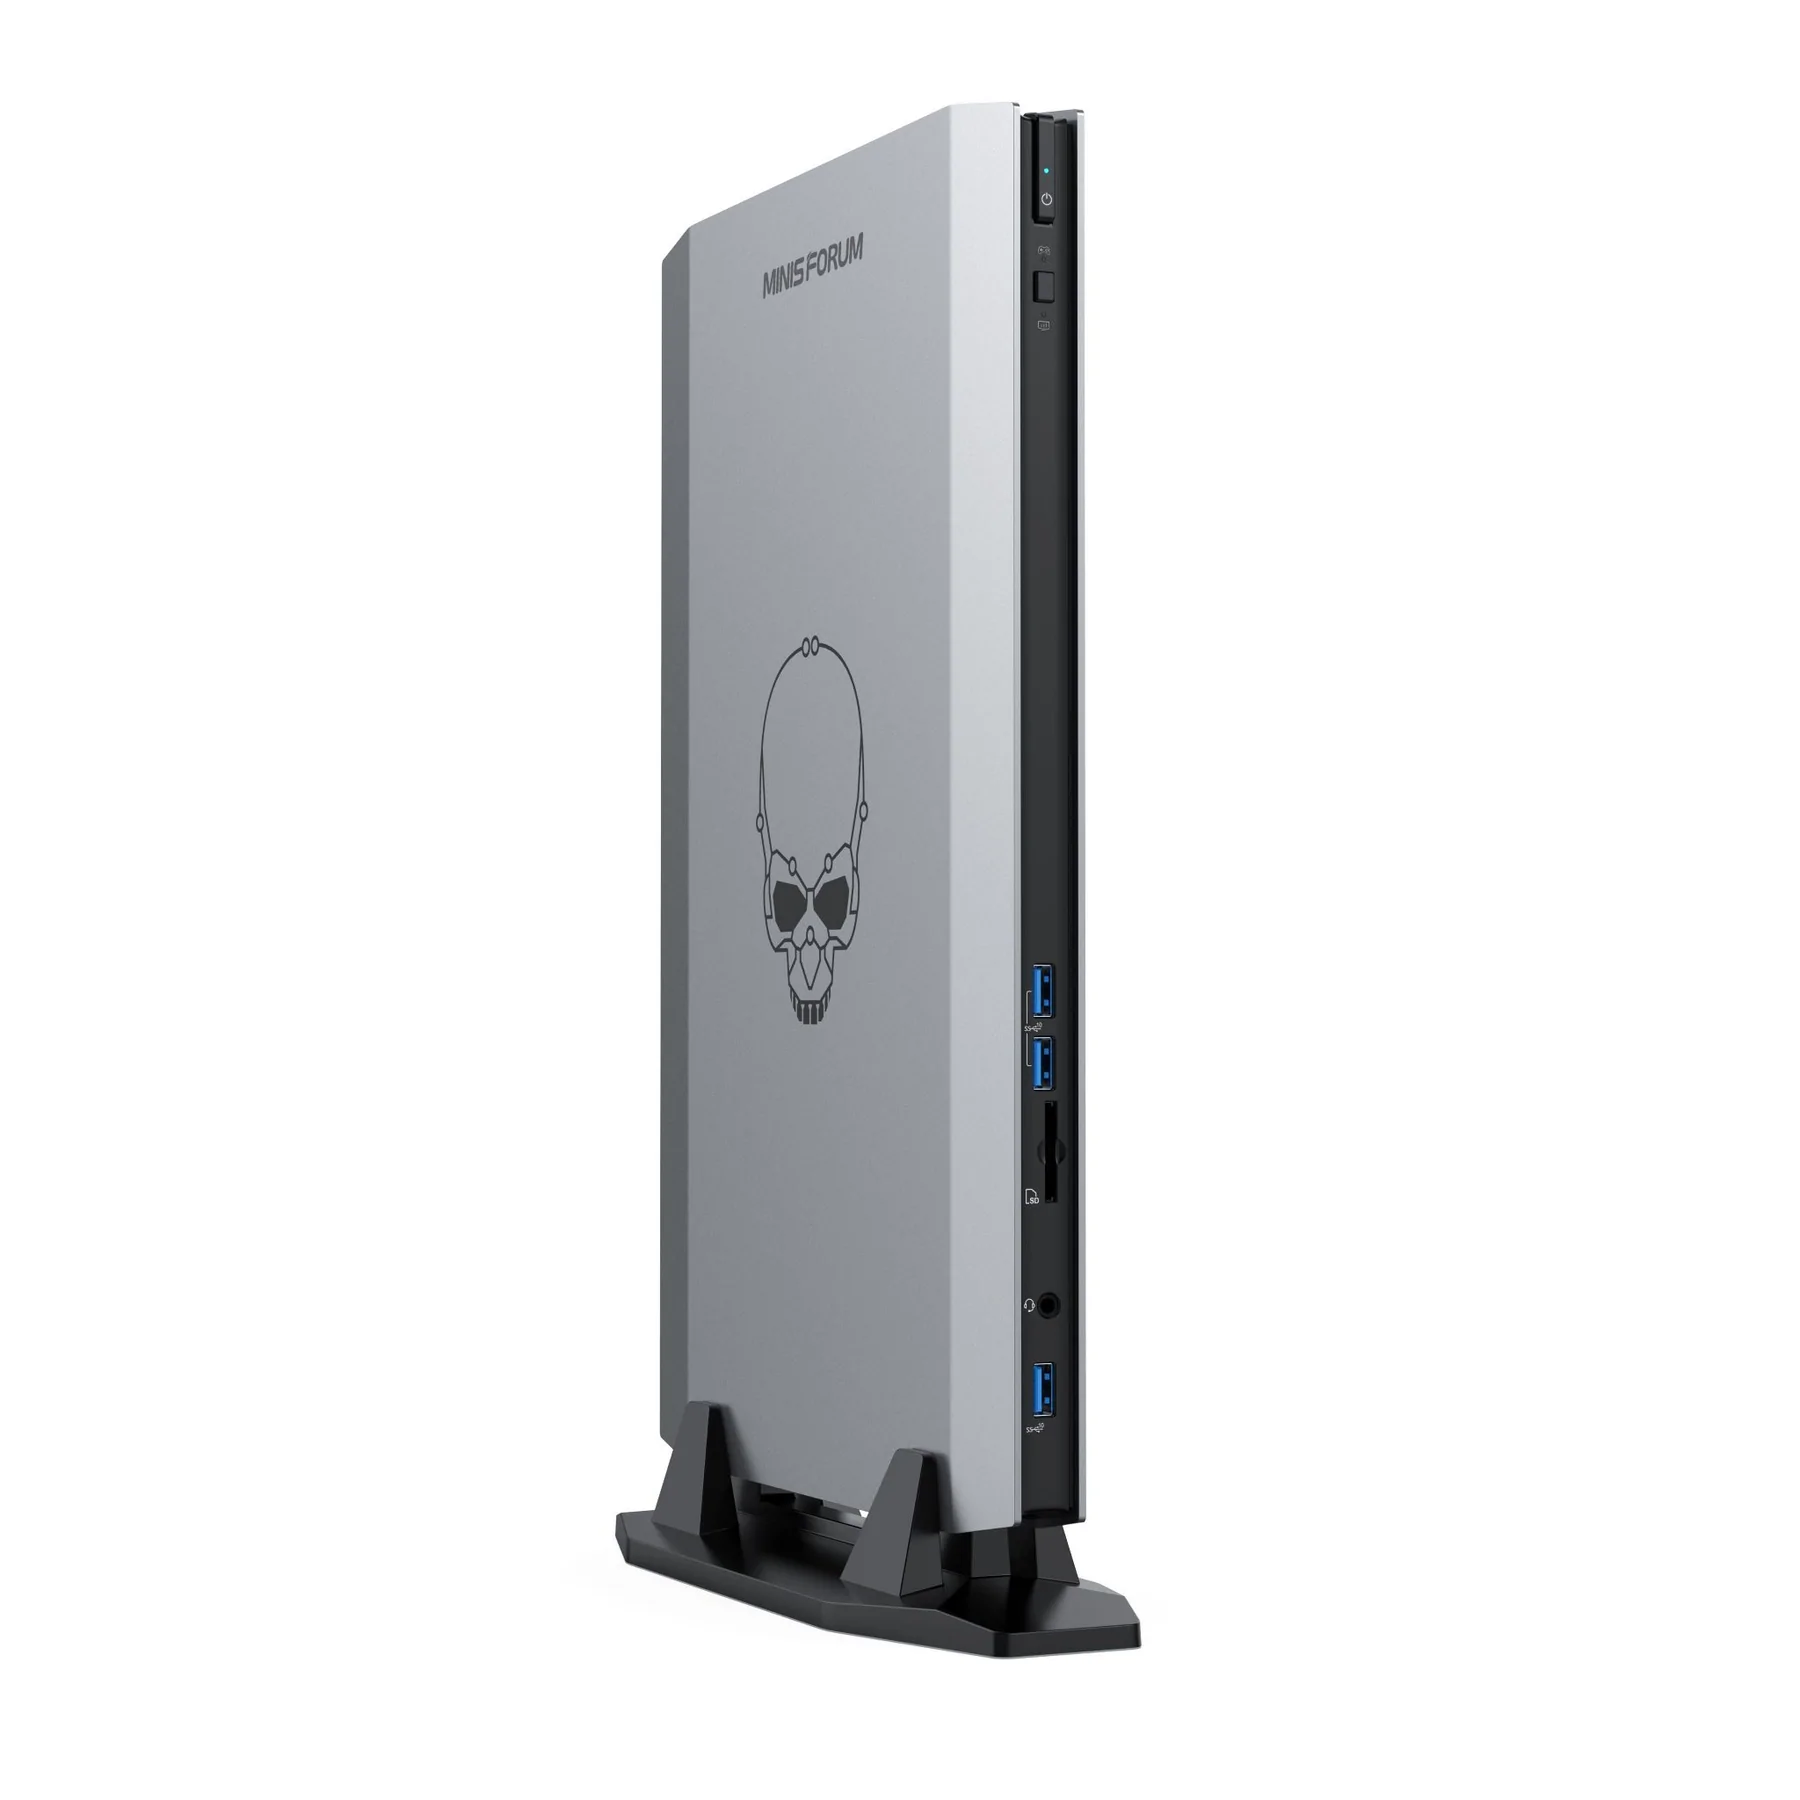
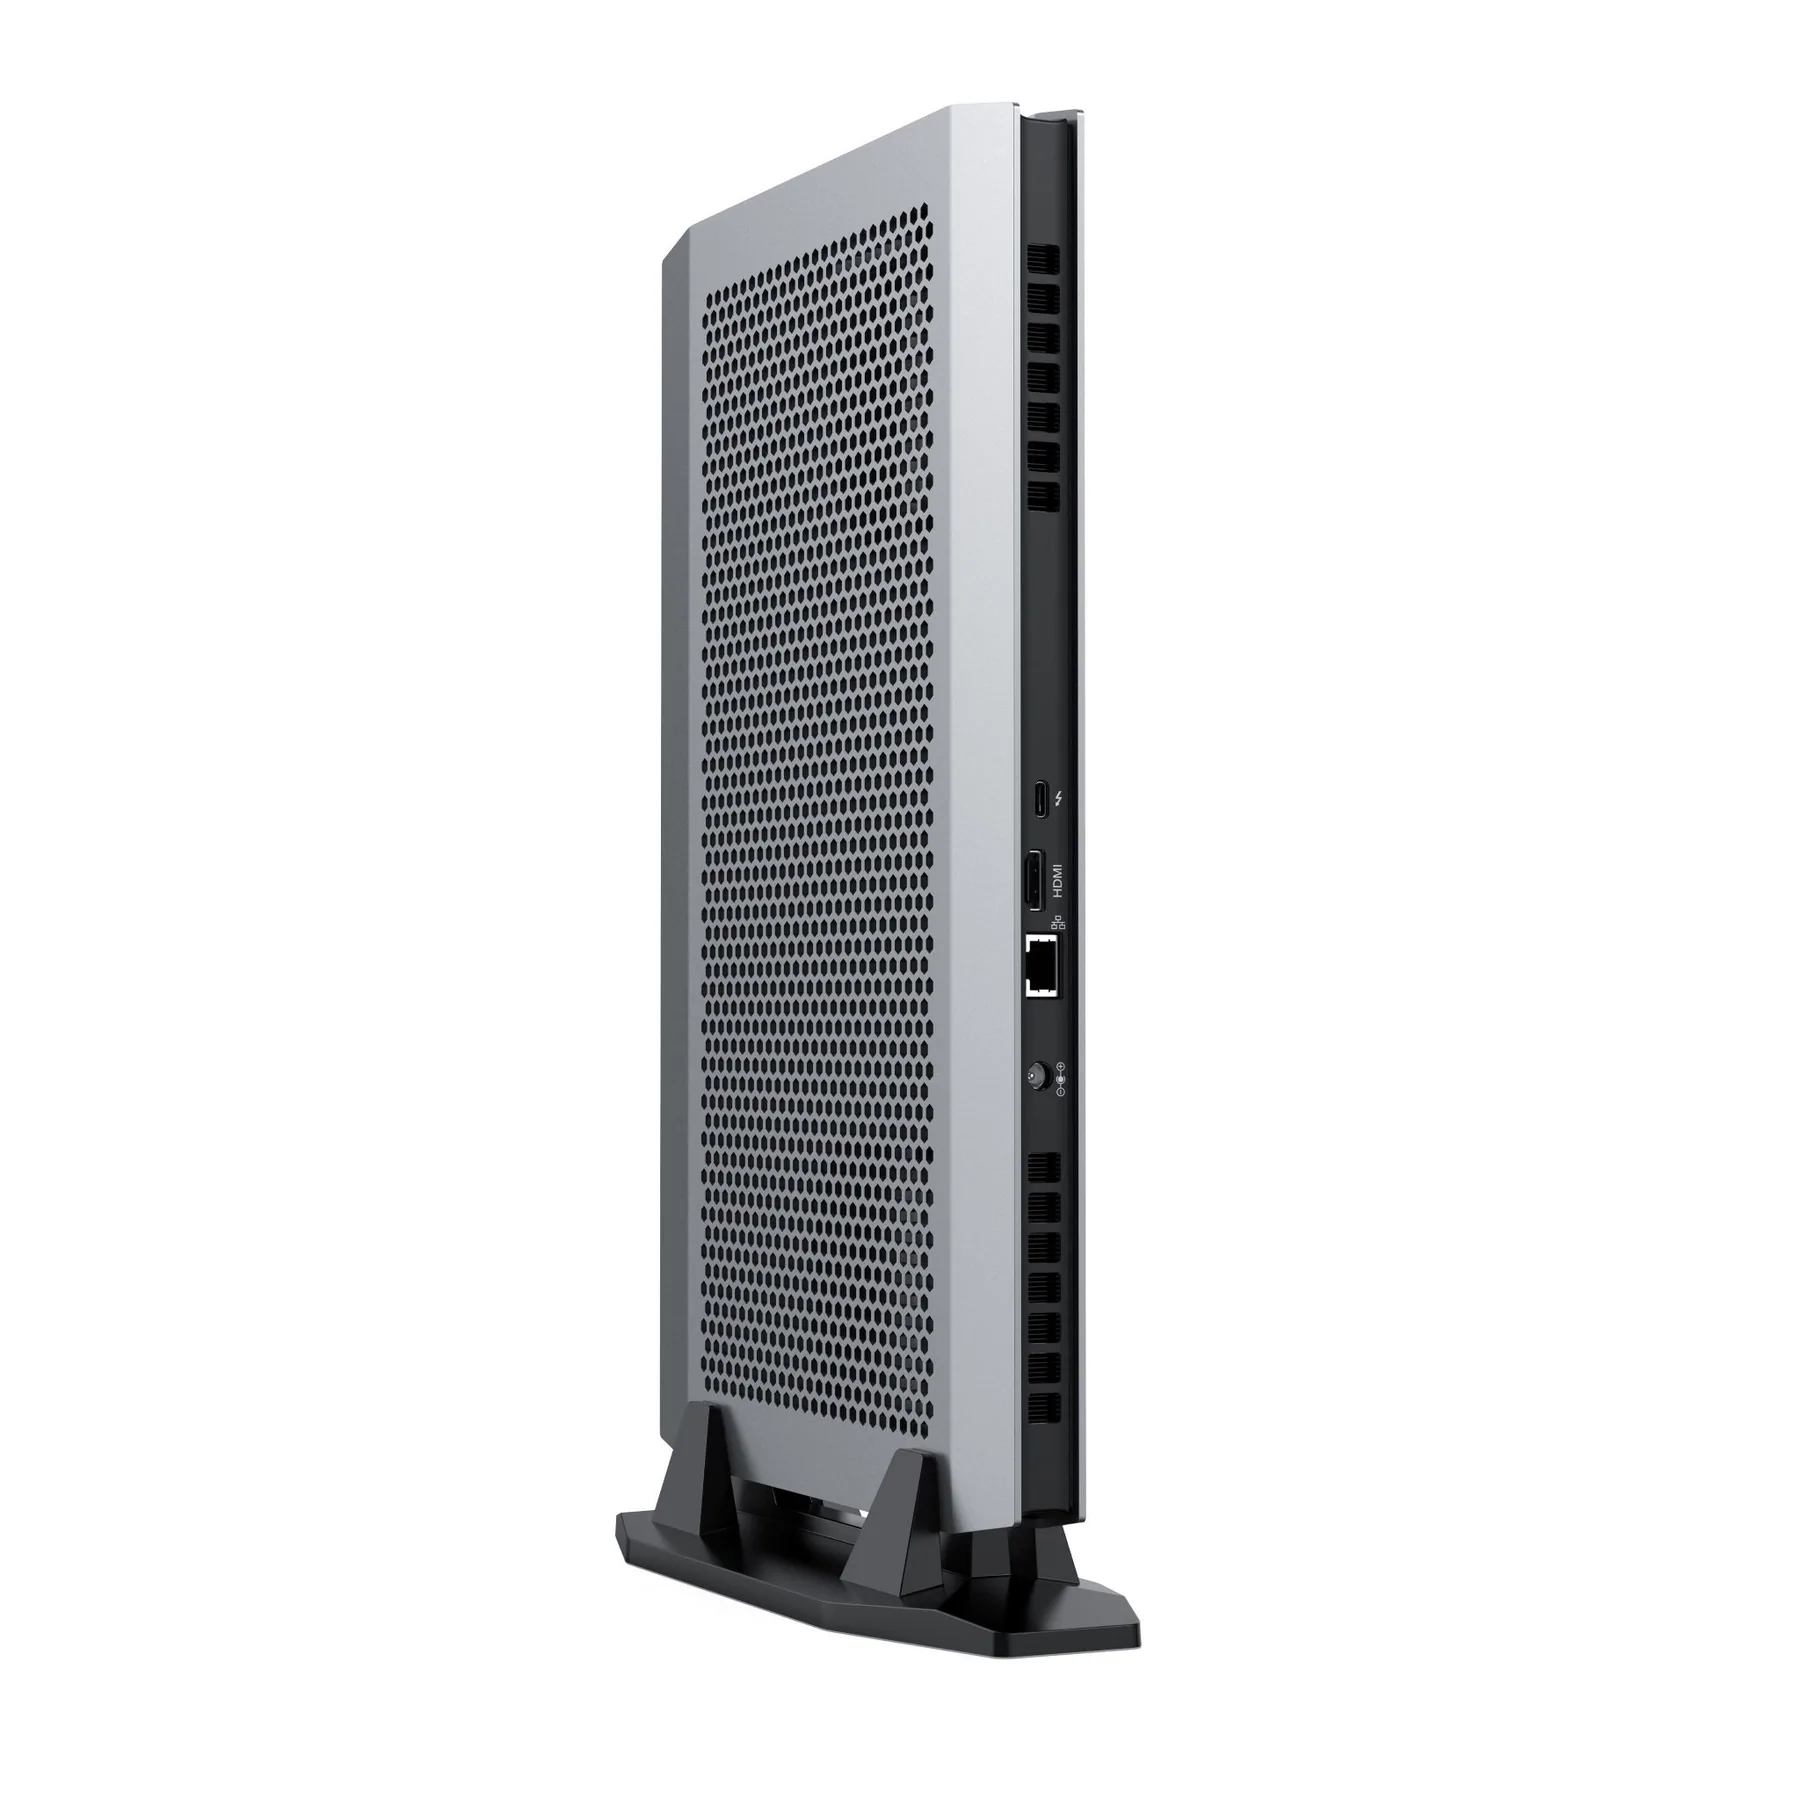
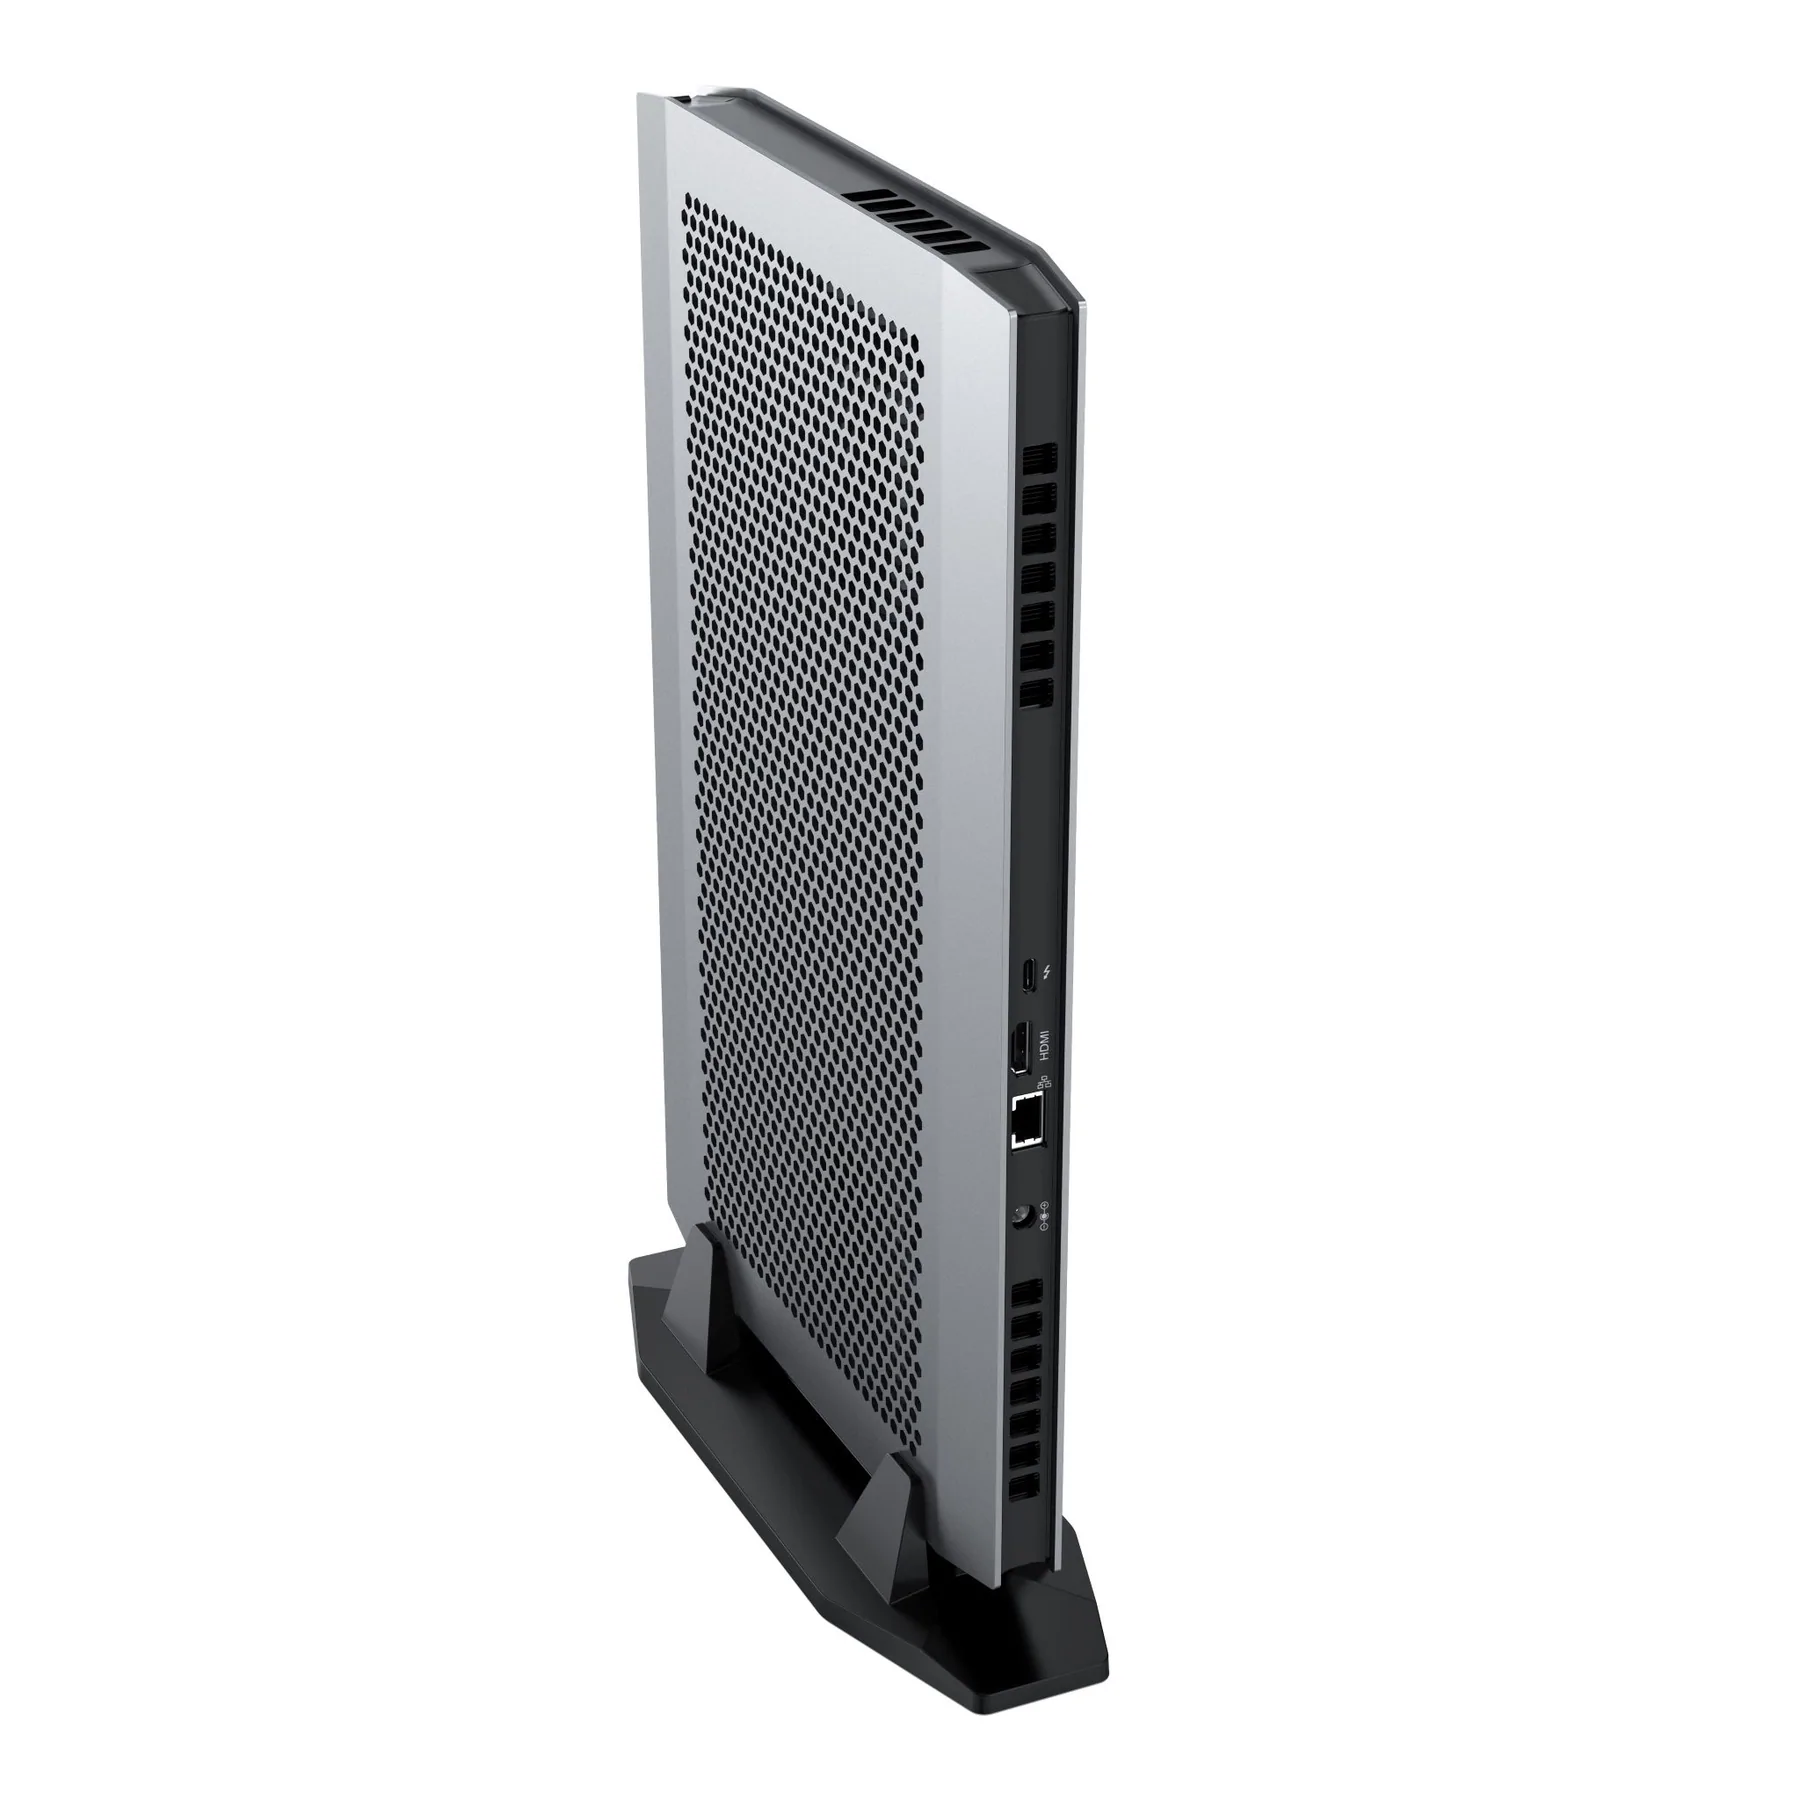
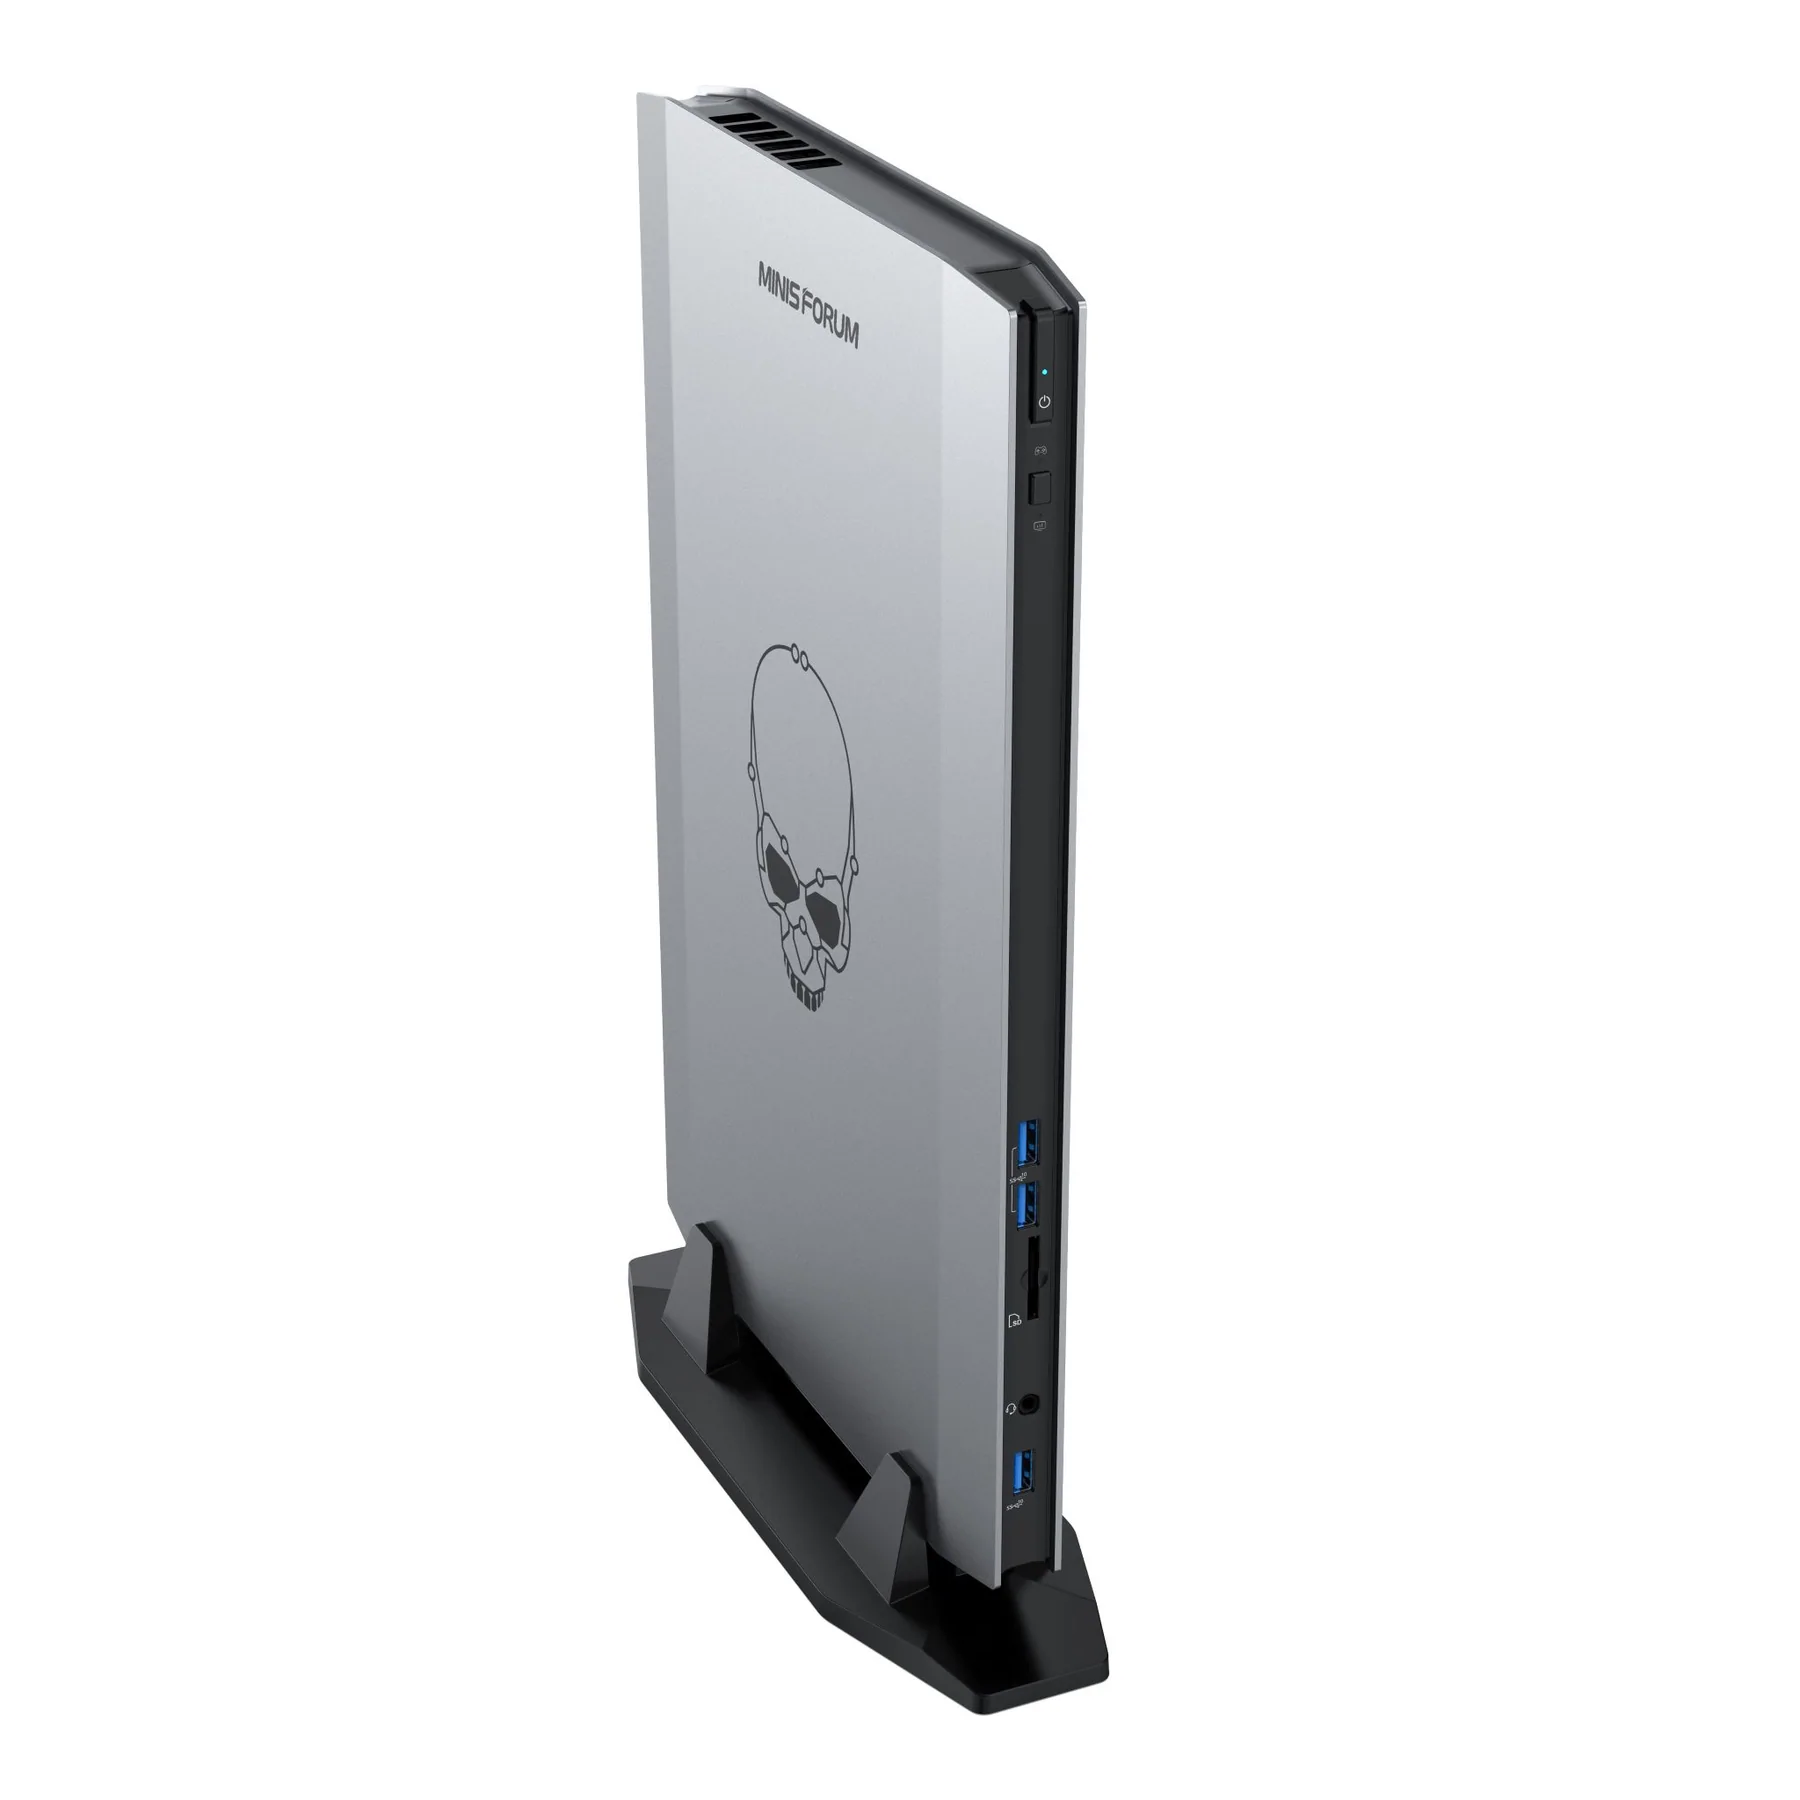
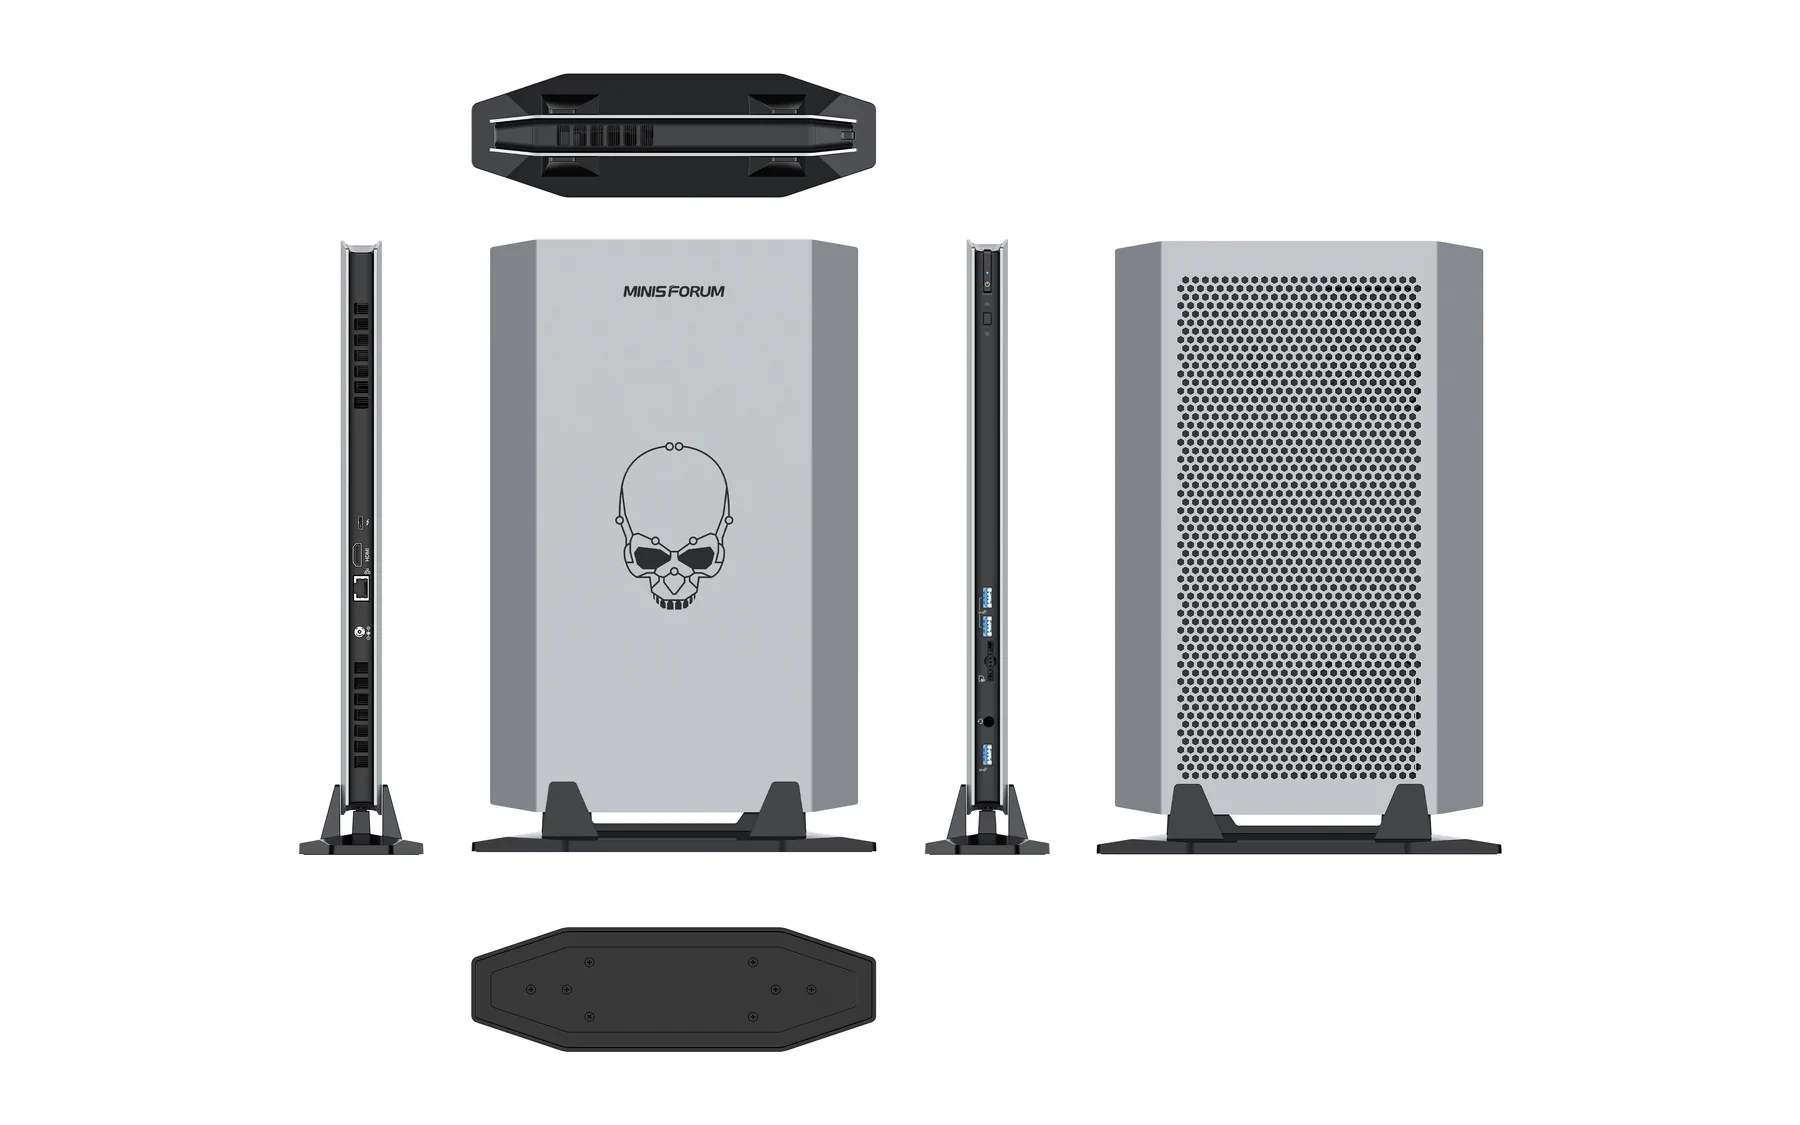
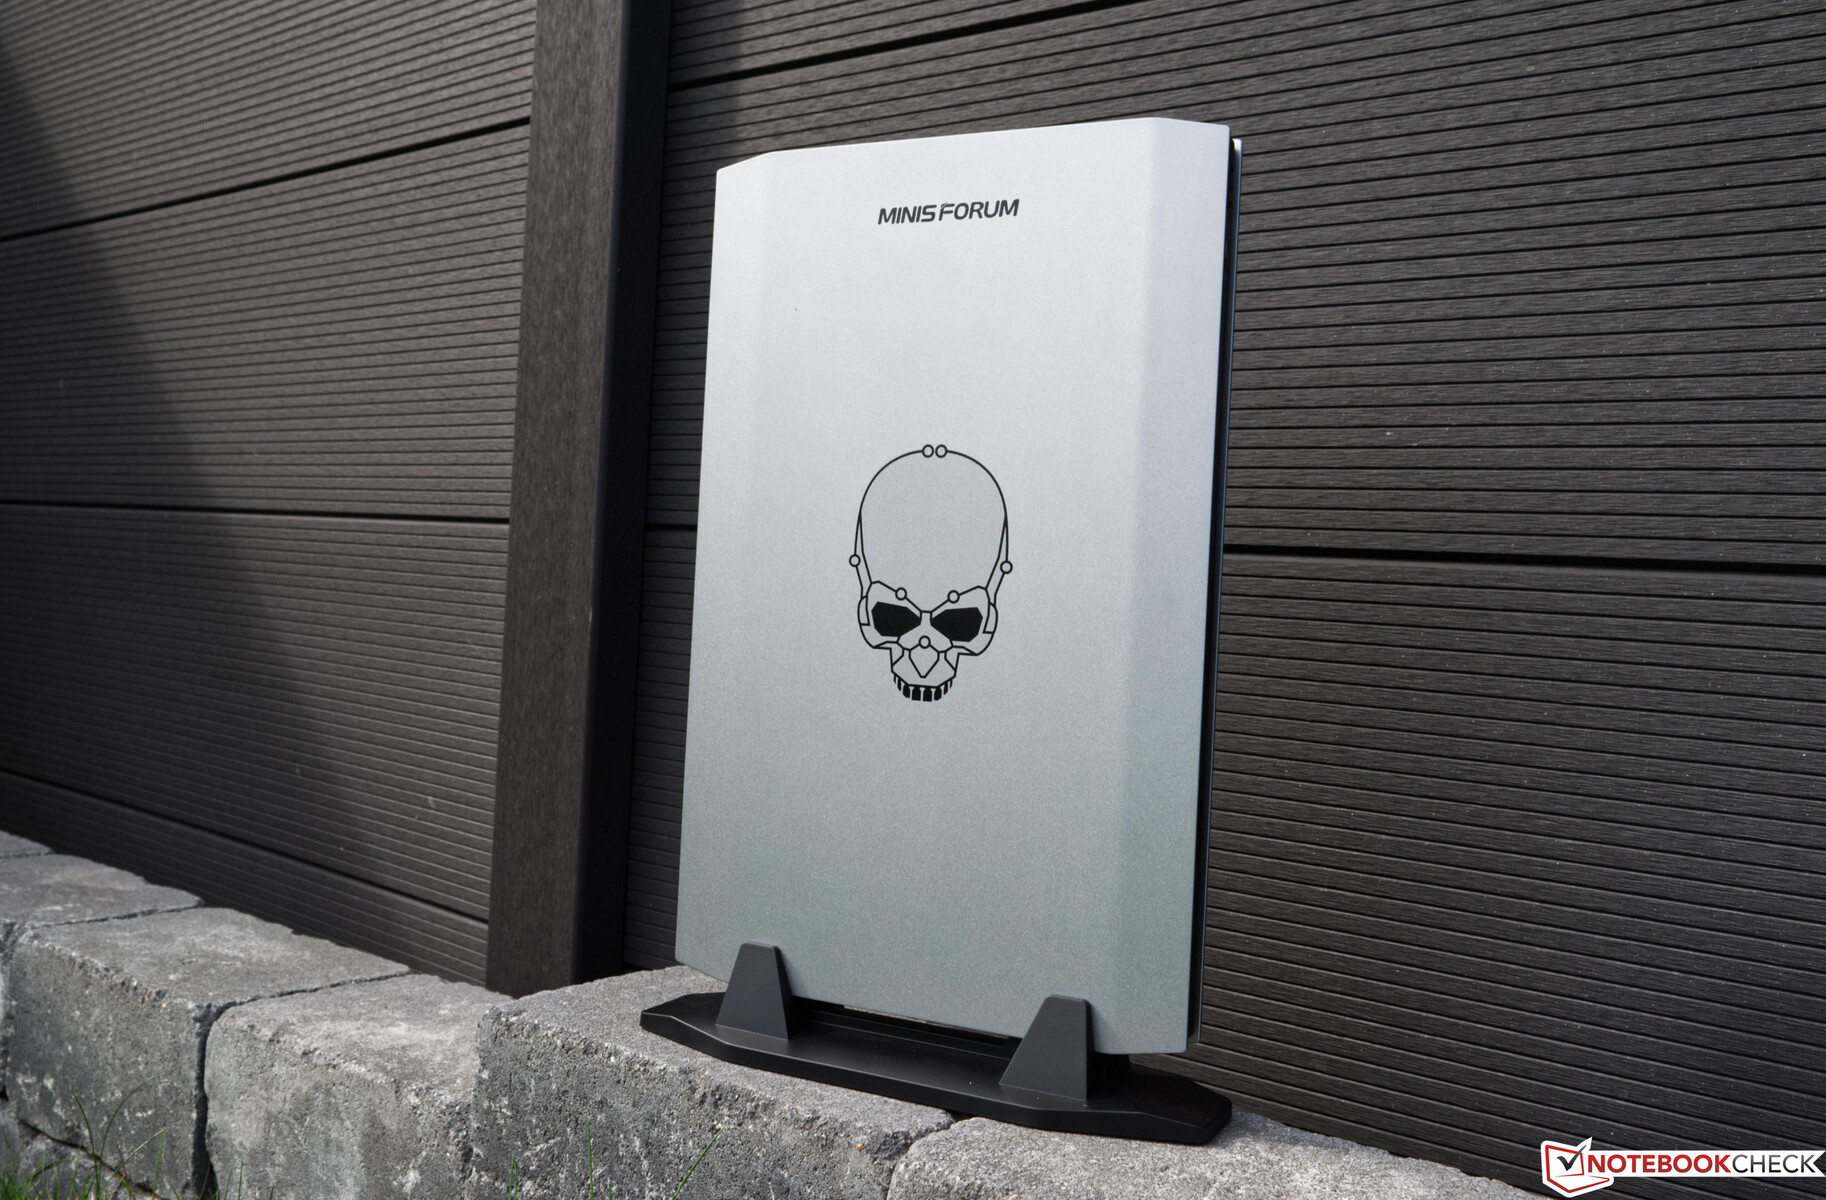
The Minisforum NUCXi7 isn't small and in our opinion not a classic mini PC. However, the device is still very slim, reminding of a laptop without display and input devices. Most of the case is made of plastic, while still giving a high-quality haptic impression. While an aluminum base would probably be heavier, the device would gain significantly in terms of the quality impression. Visually, the left side is ornamented by a skull, which livens up the otherwise plain silver side. The back is covered by a large honeycomb design to ensure good cooling. The device is screwed onto a stable stand and can only be run in the vertical position. The Minisforum NUCXi7 isn't designed for horizontal operation, since this would probably also be to the clear detriment of the cooling characteristics.
Including the stand, the Minisforum NUCXi7 brings only 2.4 kg (~5.3 lb) to the scale, which is very light. On the other hand, the weight of the stand prevents it from falling over easily. For the external power supply, you also have to add approximately another 0.5 kg (~1.1 lb) to the weight.
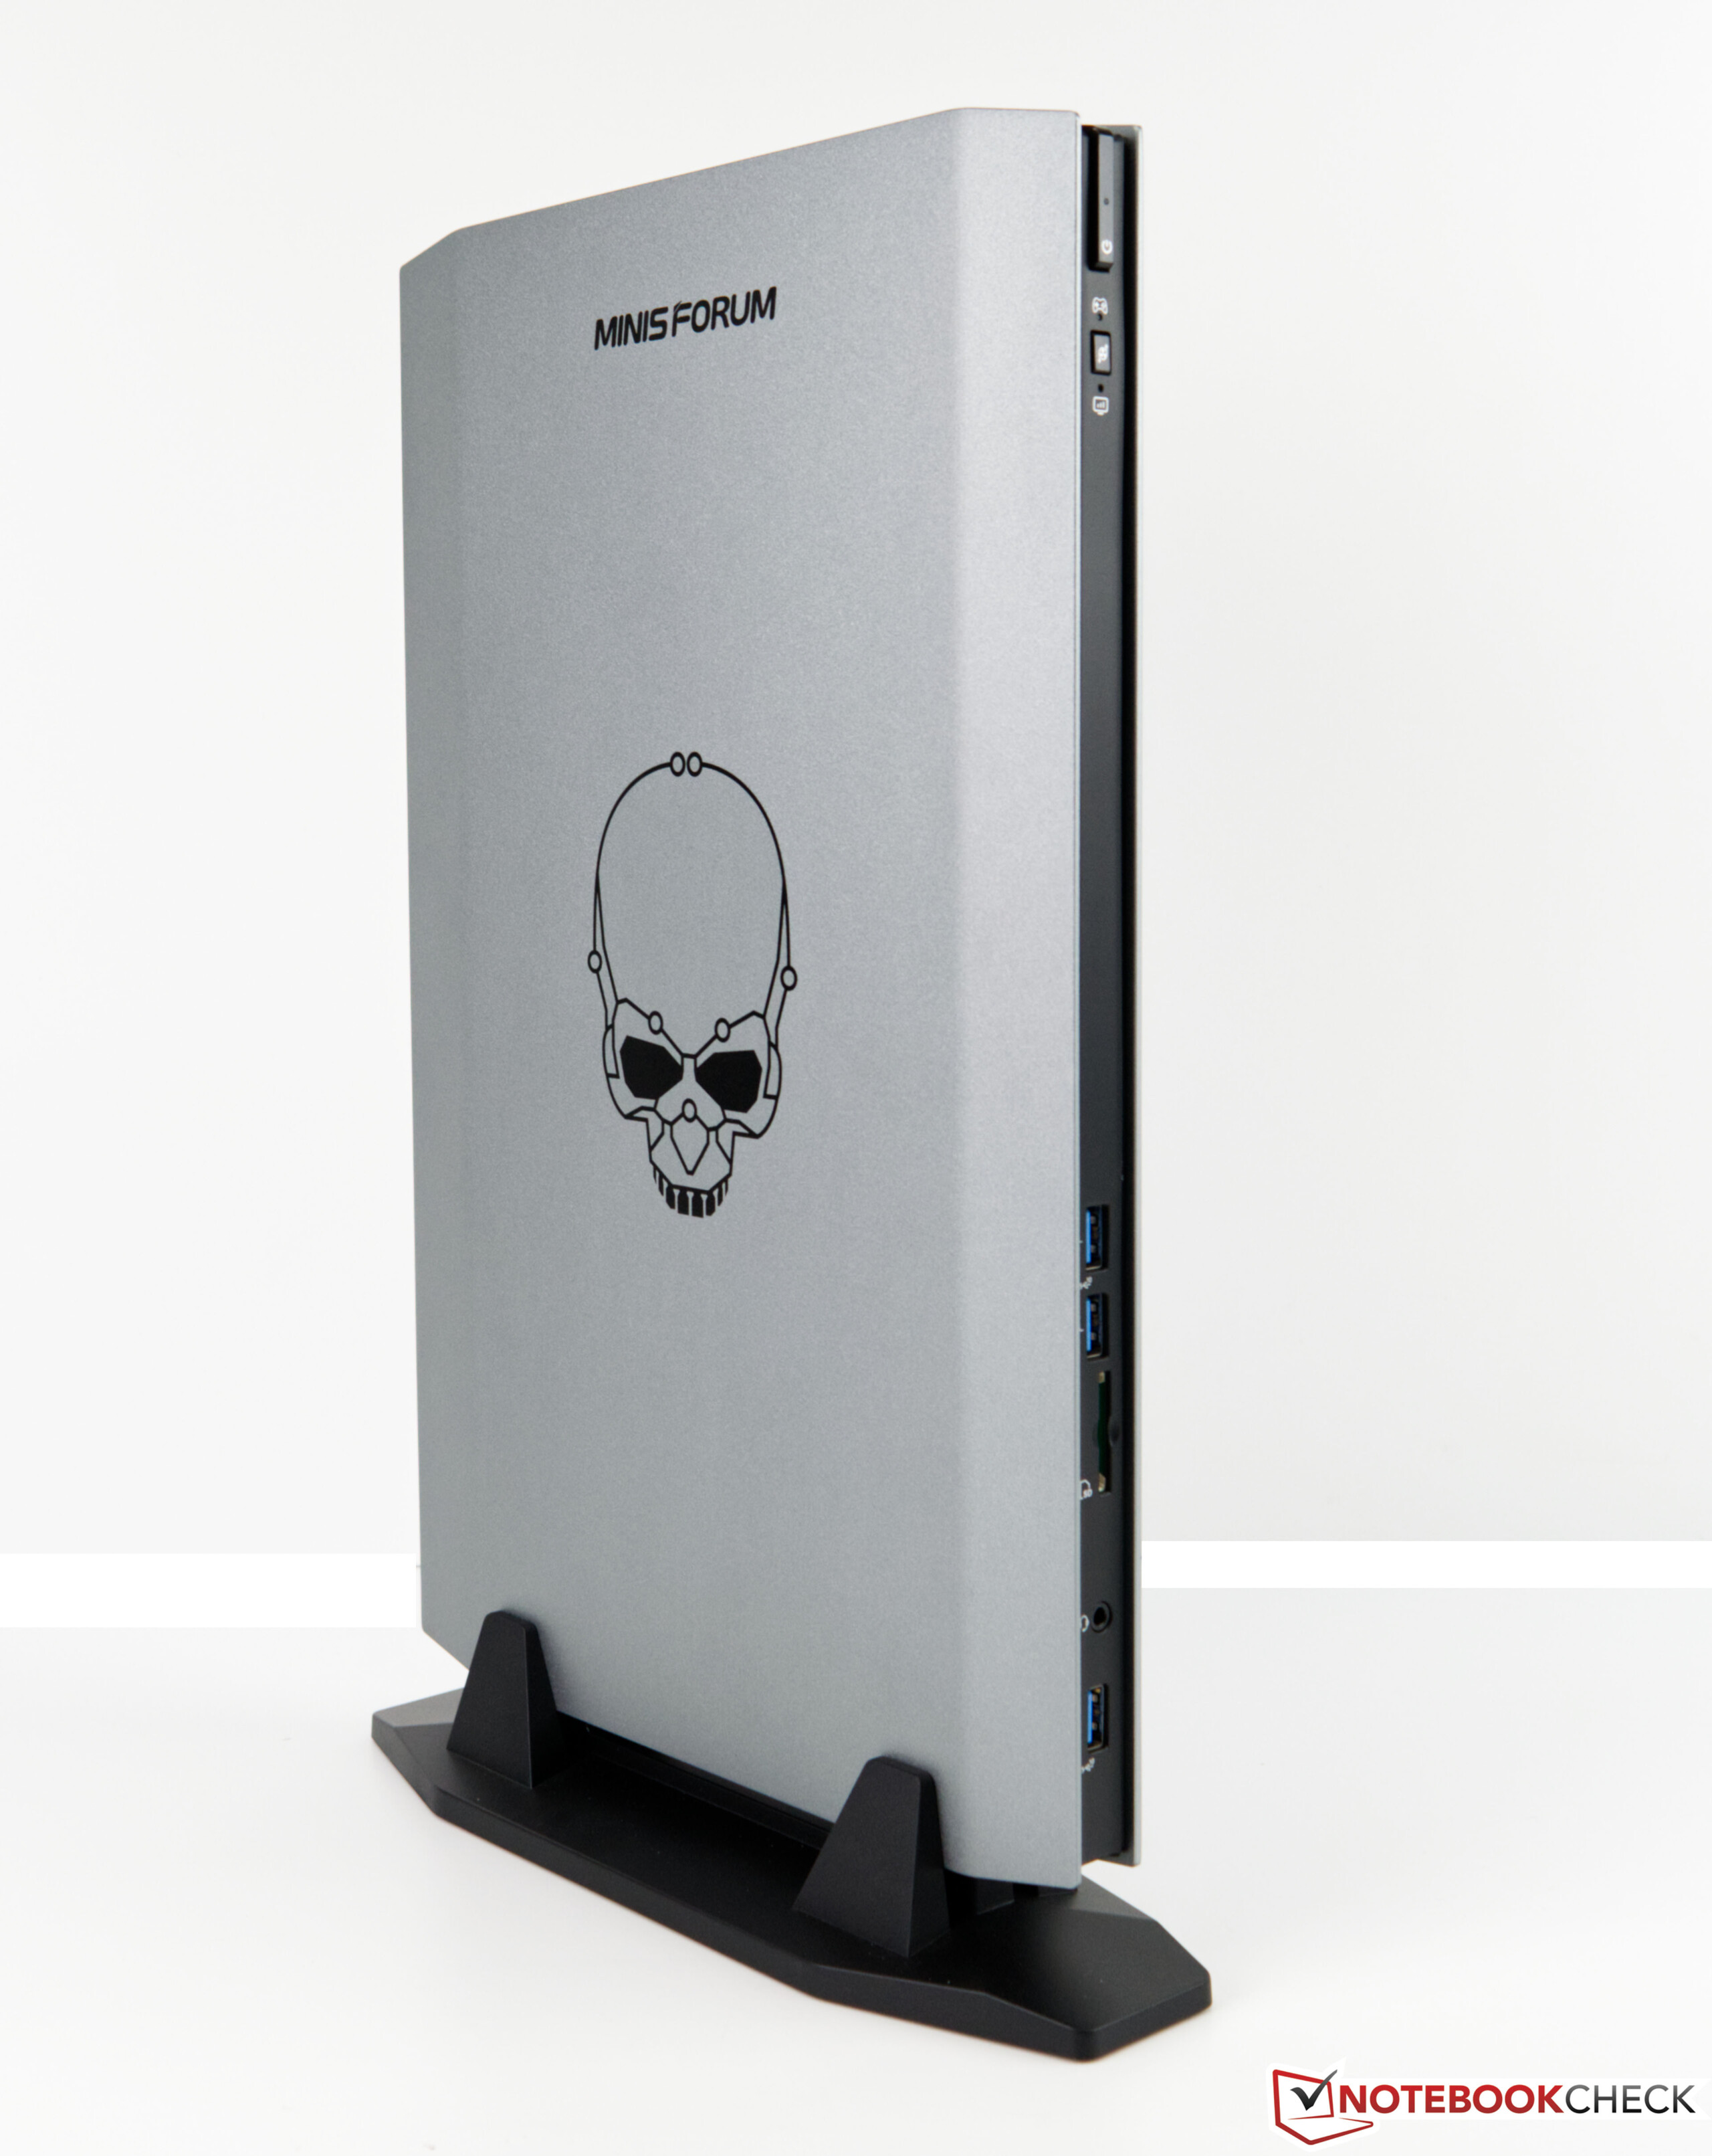
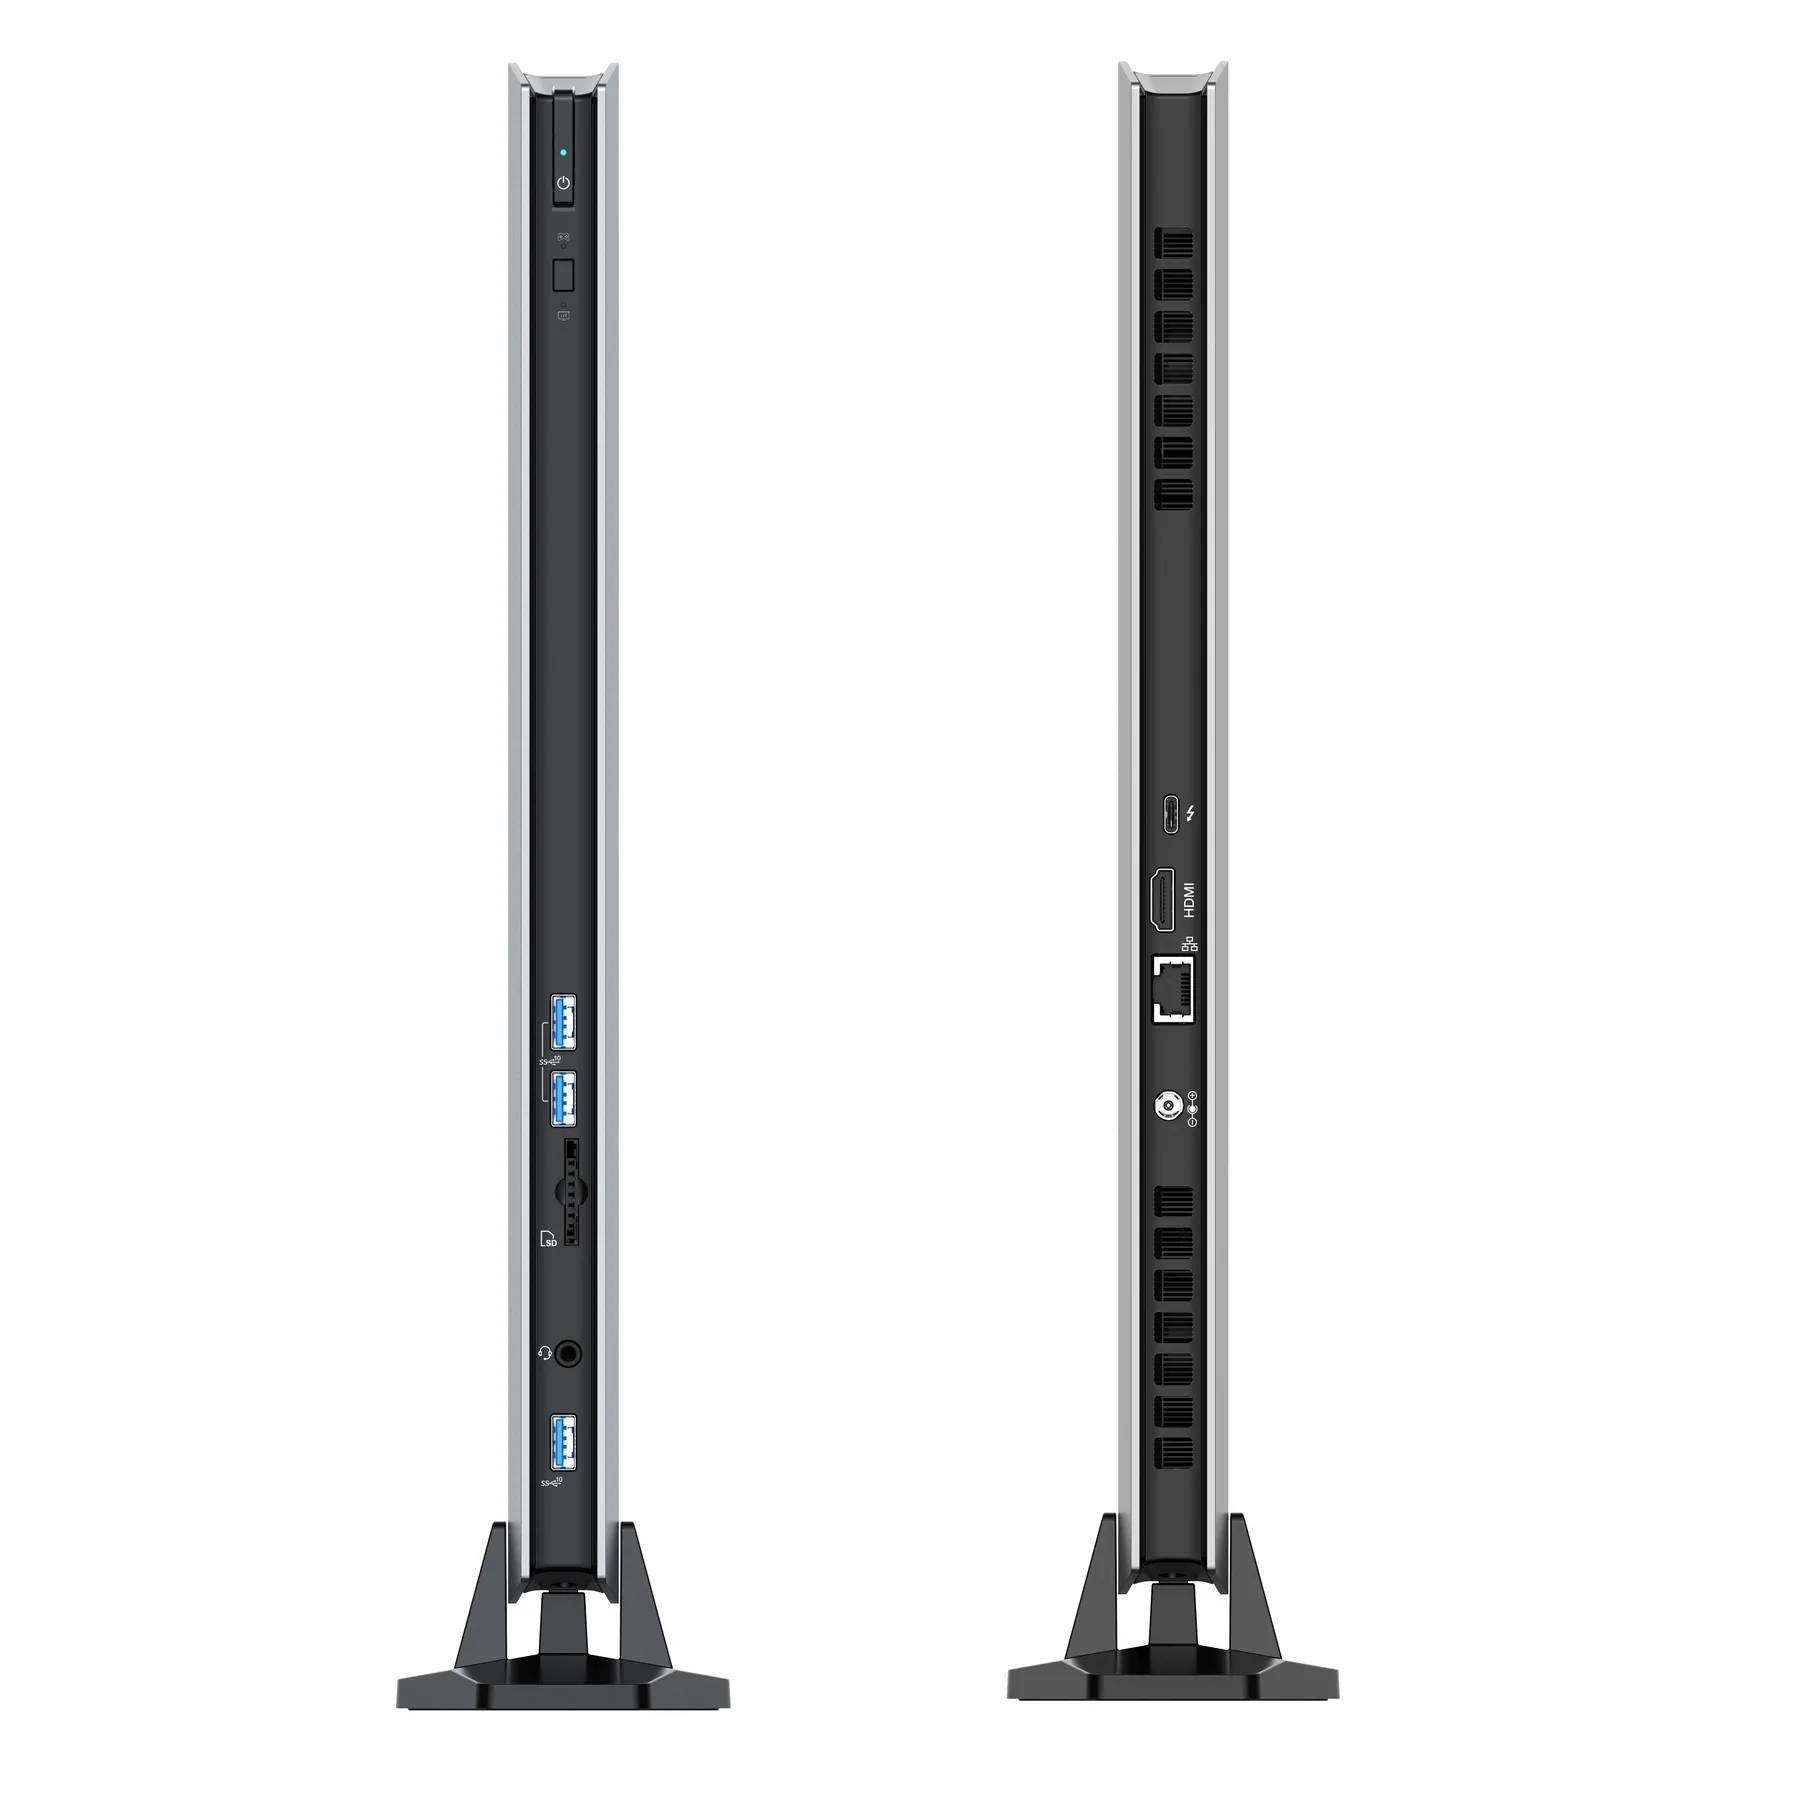
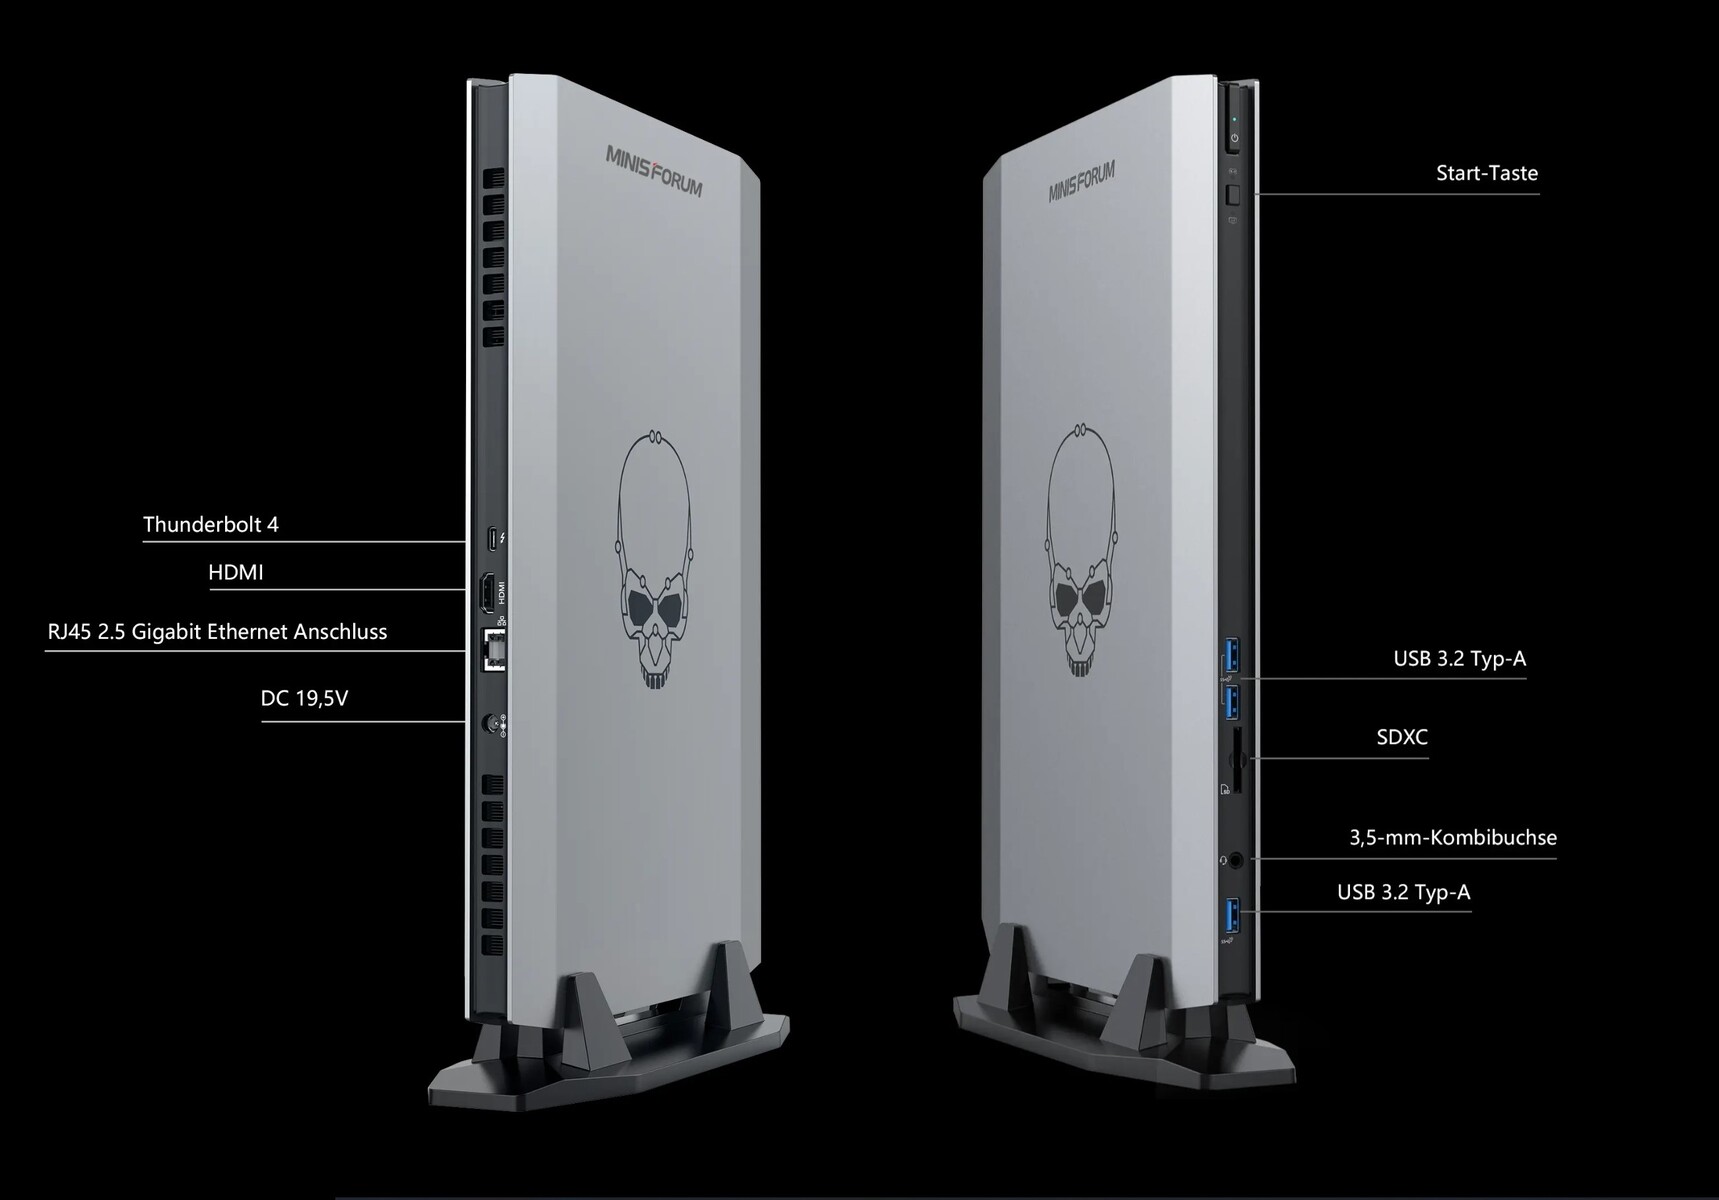
Equipment
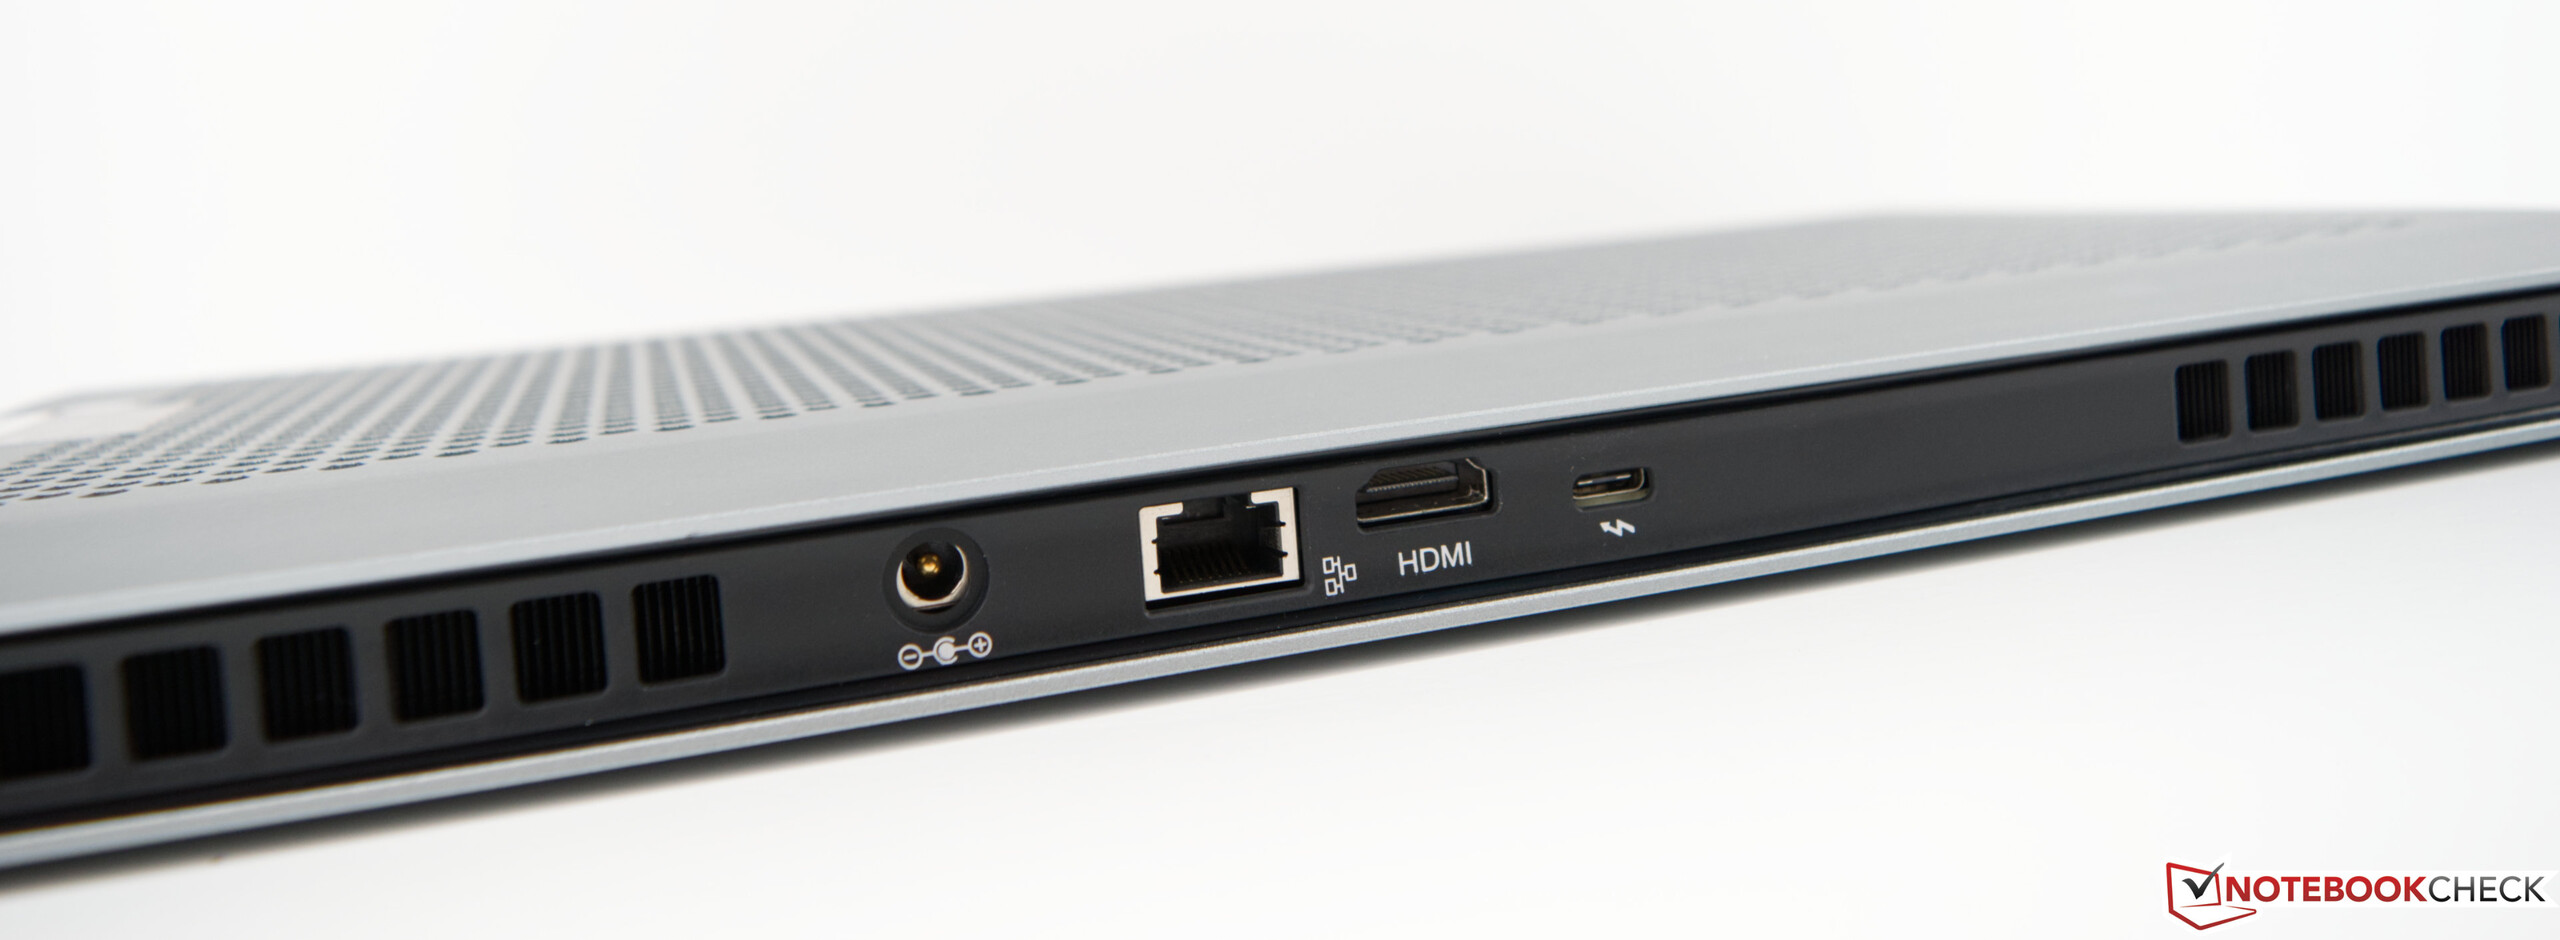
At first glance, all the important connections are available. There is even a modern Thunderbolt port. At the same time, you could have different opinions on the number of available USB 3.2 Type-A ports. The device offers only three of them, and they are all positioned in front. We could have liked at least one more USB port in the back. But unfortunately, the manufacturer is tied to the mainboard layout, which would make this more difficult. You can connect displays via HDMI or Thunderbolt, with both of these options working without any problems in our test. You also don't have to live without an SD card reader here.
SD Card Reader
The Minisforum NUCXi7 is equipped with an SD card reader that operates at USB 3 speeds. The 76 MB/s we measured in our test using our reference card (Angelbird AV Pro V60) with UHS-II connection also confirms the USB 3 speed. However, this performance is still worse than the average of the class.
| SD Card Reader - average JPG Copy Test (av. of 3 runs) | |
| Asus ROG Zephyrus Duo 16 GX650RX (AV PRO microSD 128 GB V60) | |
| Razer Blade 17 Early 2022 (AV PRO microSD 128 GB V60) | |
| Minisforum NUCX i7 (AV Pro SD microSD 128 GB V60) | |
| MSI Titan GT77 12UHS (AV PRO microSD 128 GB V60) | |
| Acer Predator Triton 500 SE PT516-52s-70KX (AV PRO microSD 128 GB V60) | |
| MSI Raider GE77 HX 12UHS (AV PRO microSD 128 GB V60) | |
Communication
Minisforum uses an Intel Wi-Fi 6E-AX210 module in the NUCXi7. In our test with our ASUS ROG Rapture GT-AXE11000 router, we were unable to reach the good performance of the comparison devices. The Minisforum NUCXi7 places at the end the comparison field, clearly left behind here. The integrated LAN port offers a good alternative to the wireless connection, supporting up to 2.5 Gbit/s.
Accessories
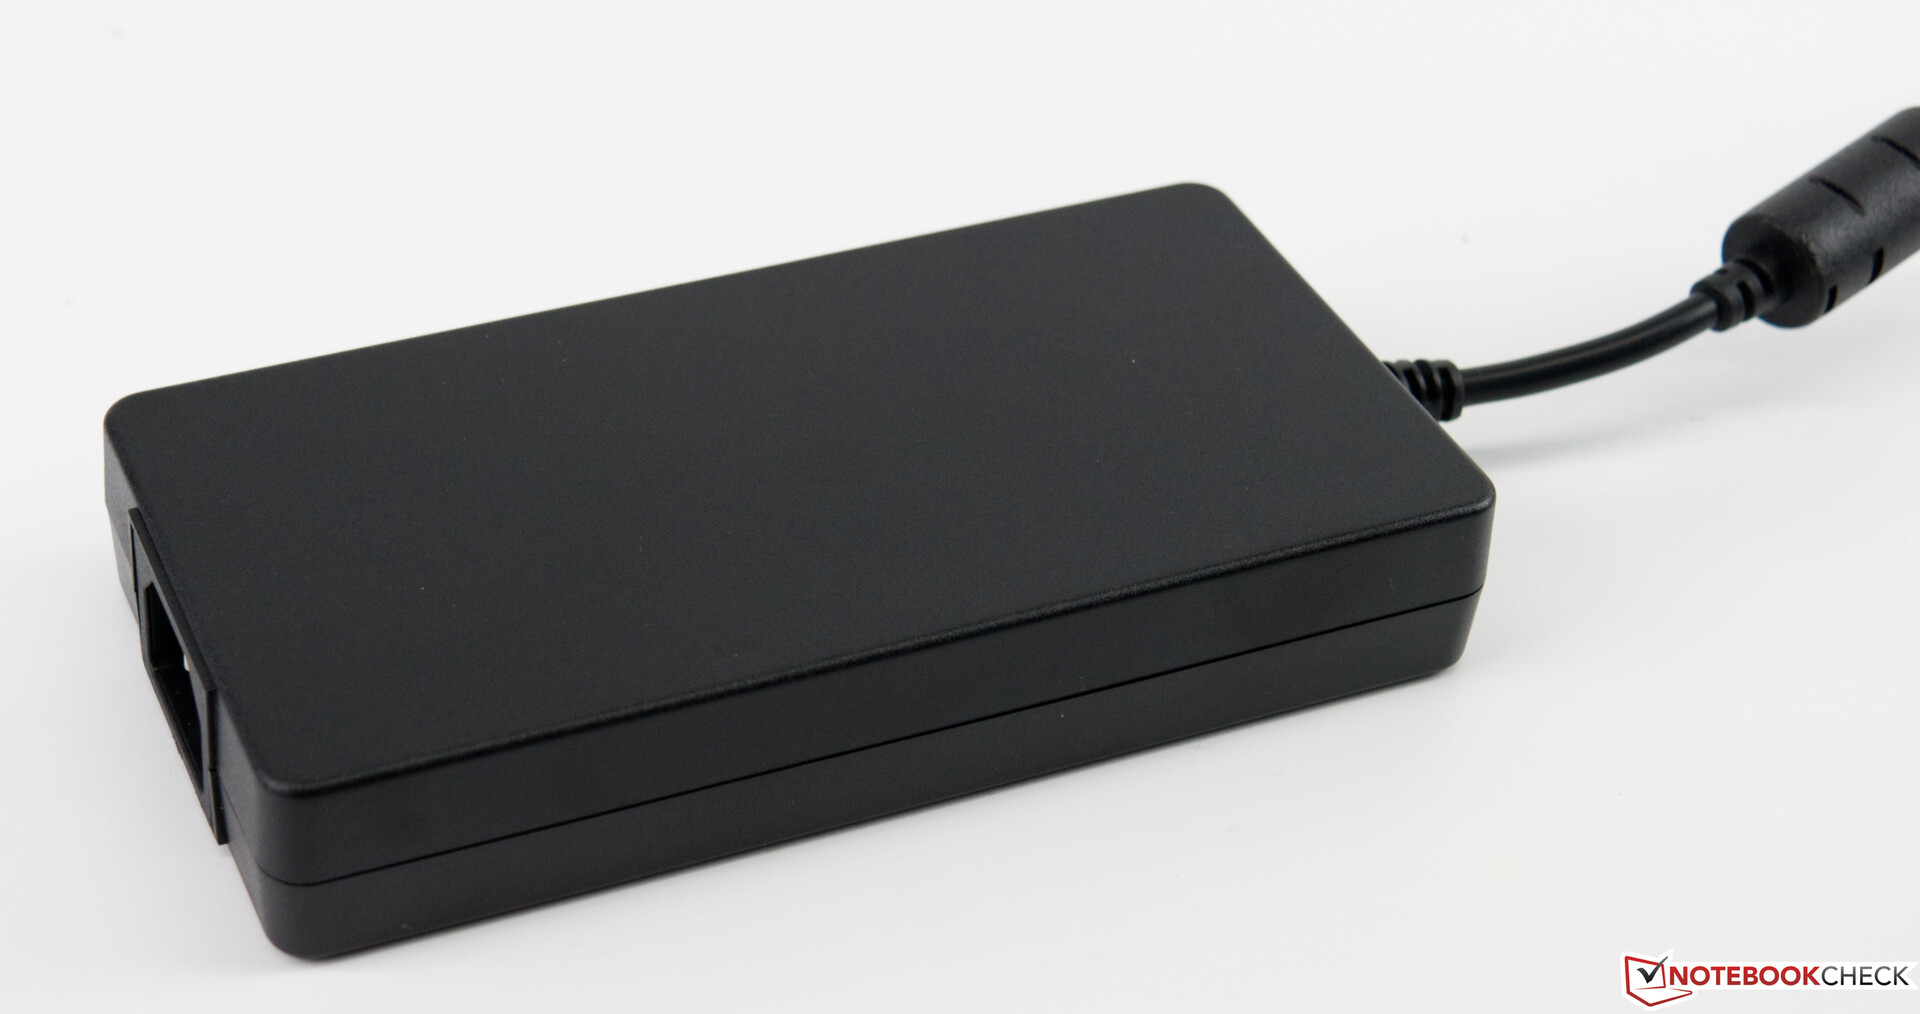
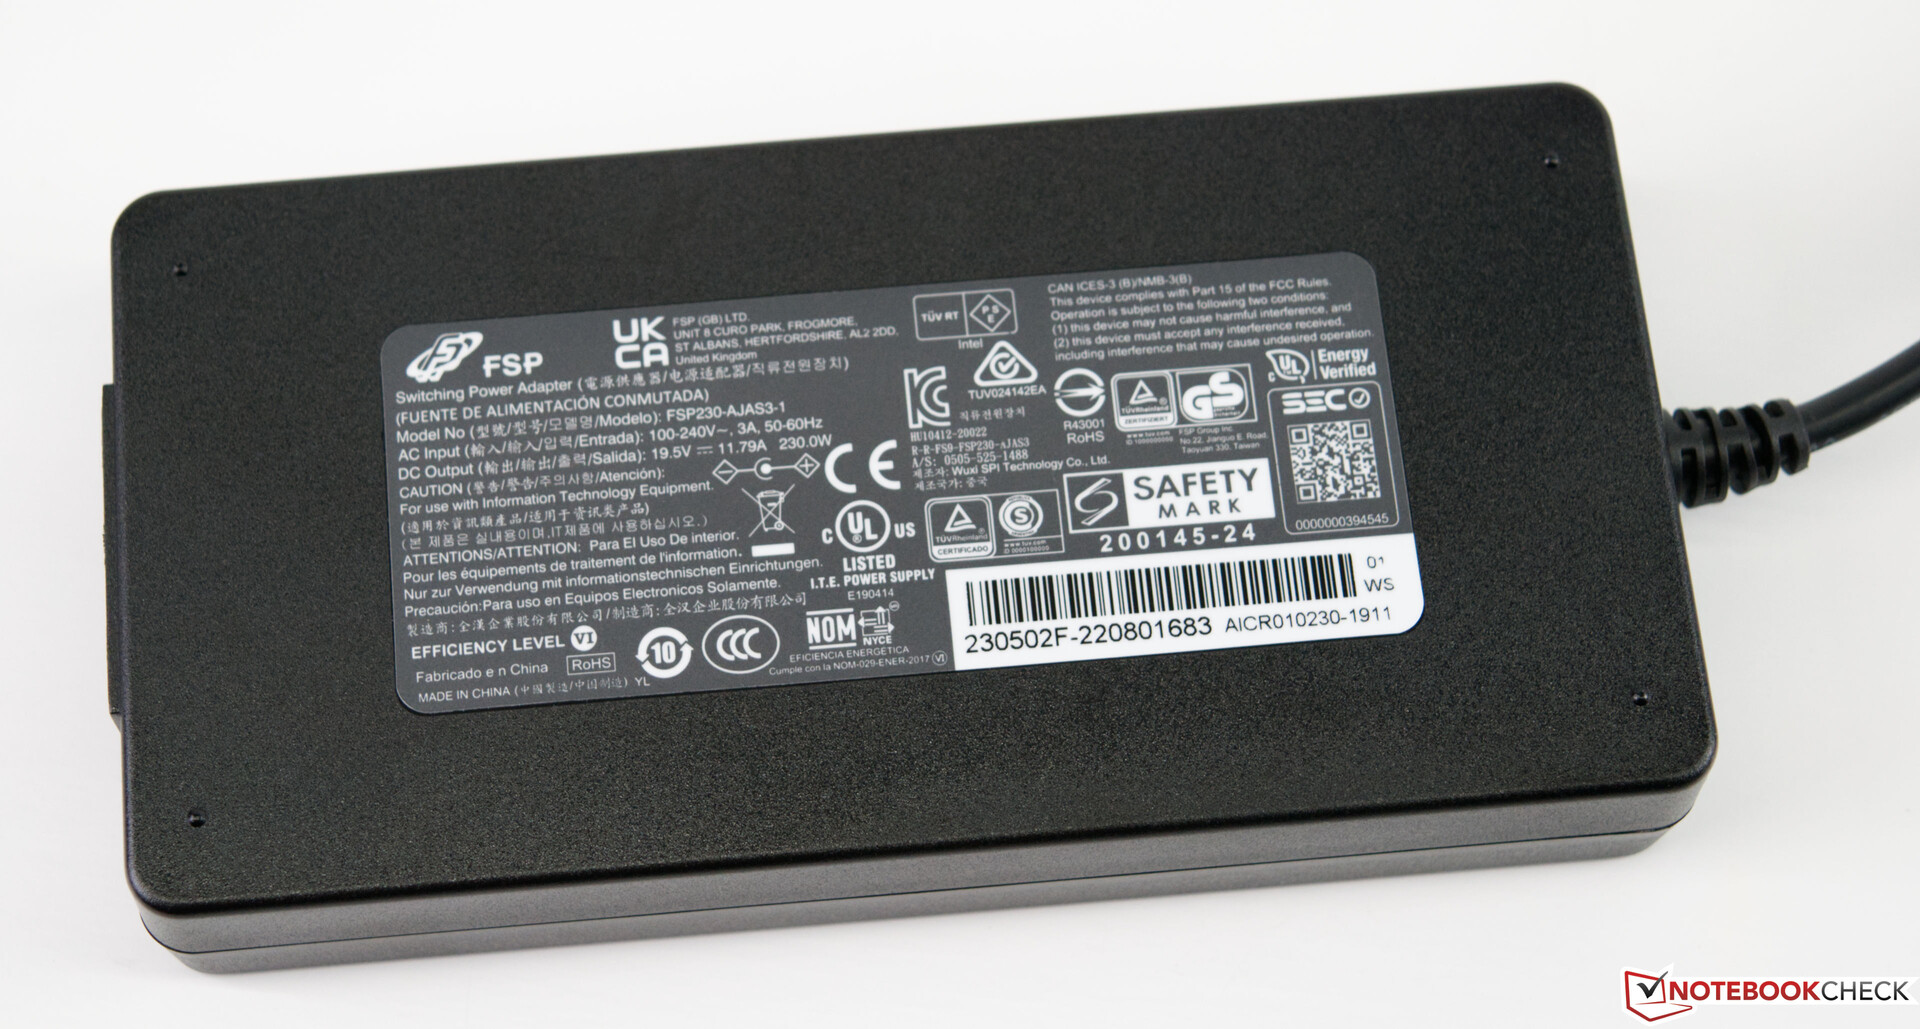
In addition to the computer itself, the box also includes the 230-Watt power supply and the stand, allowing you to place the device horizontally.
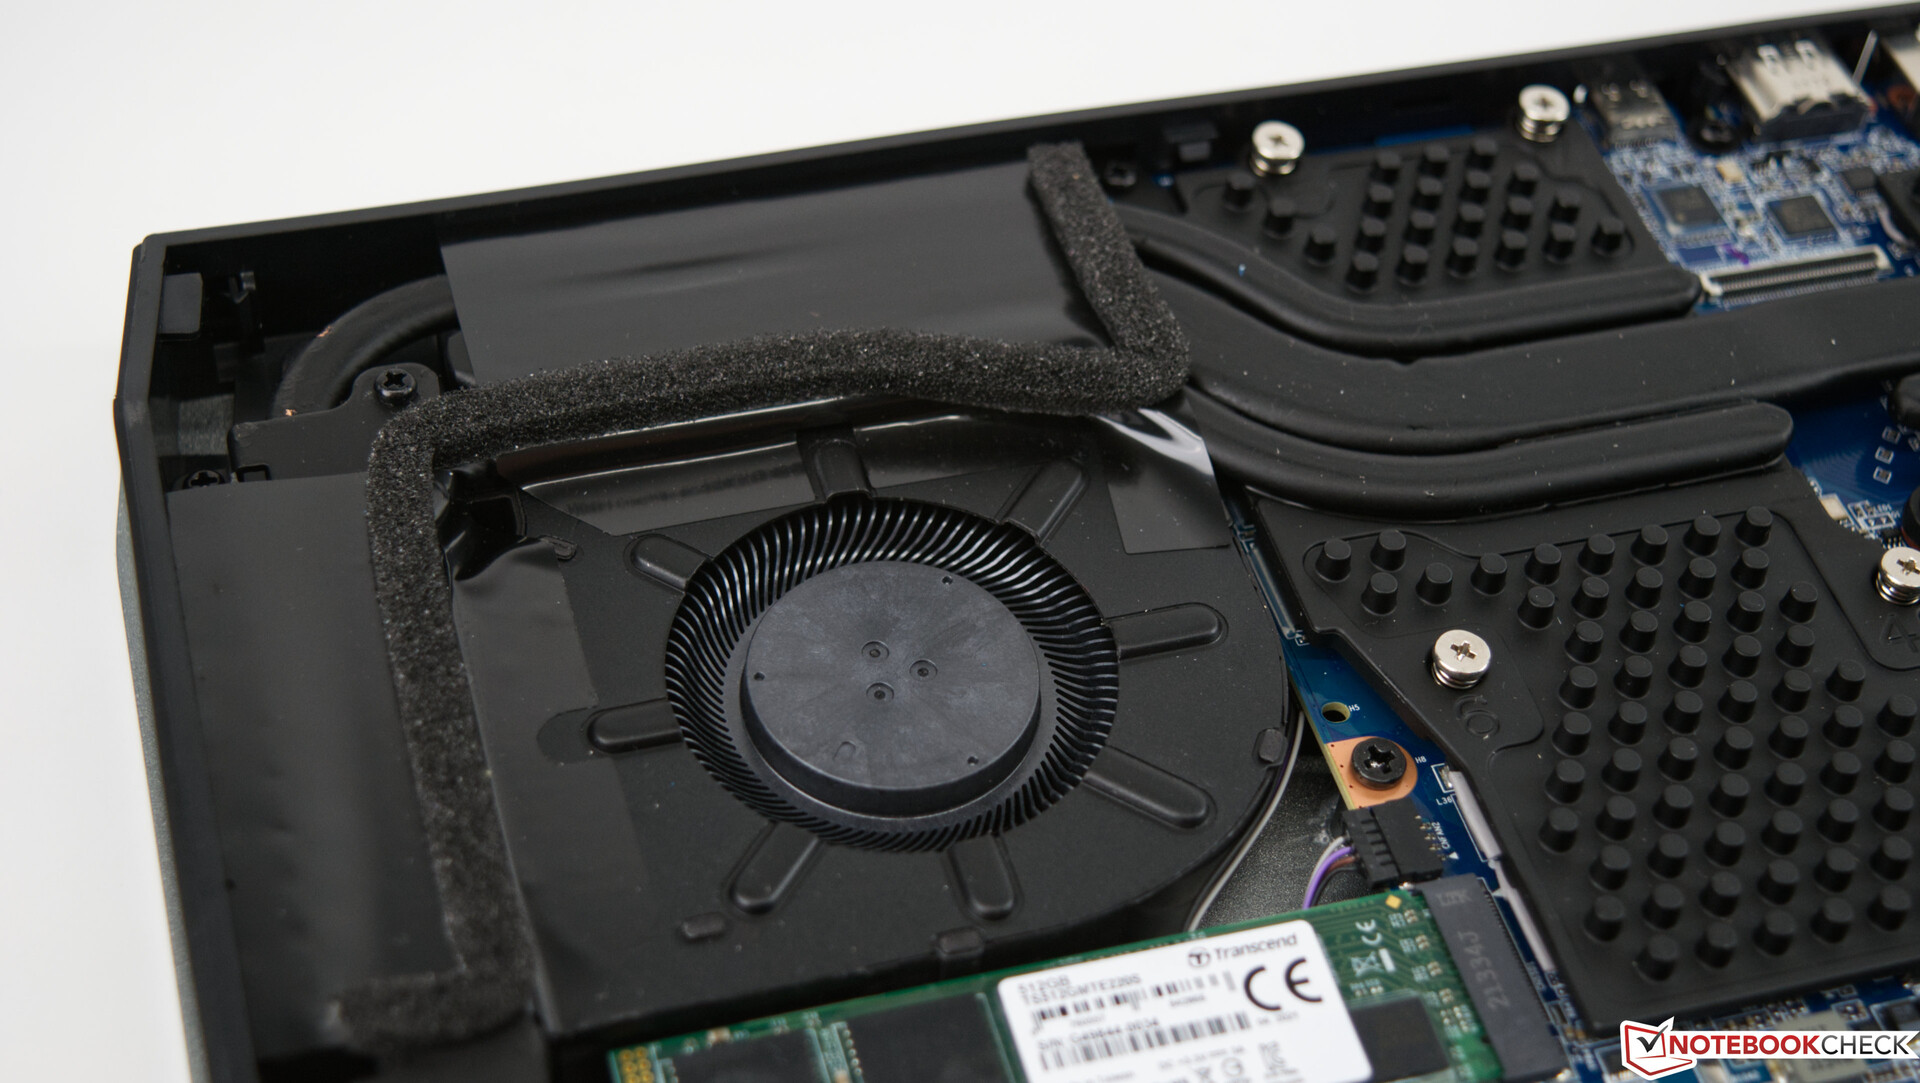
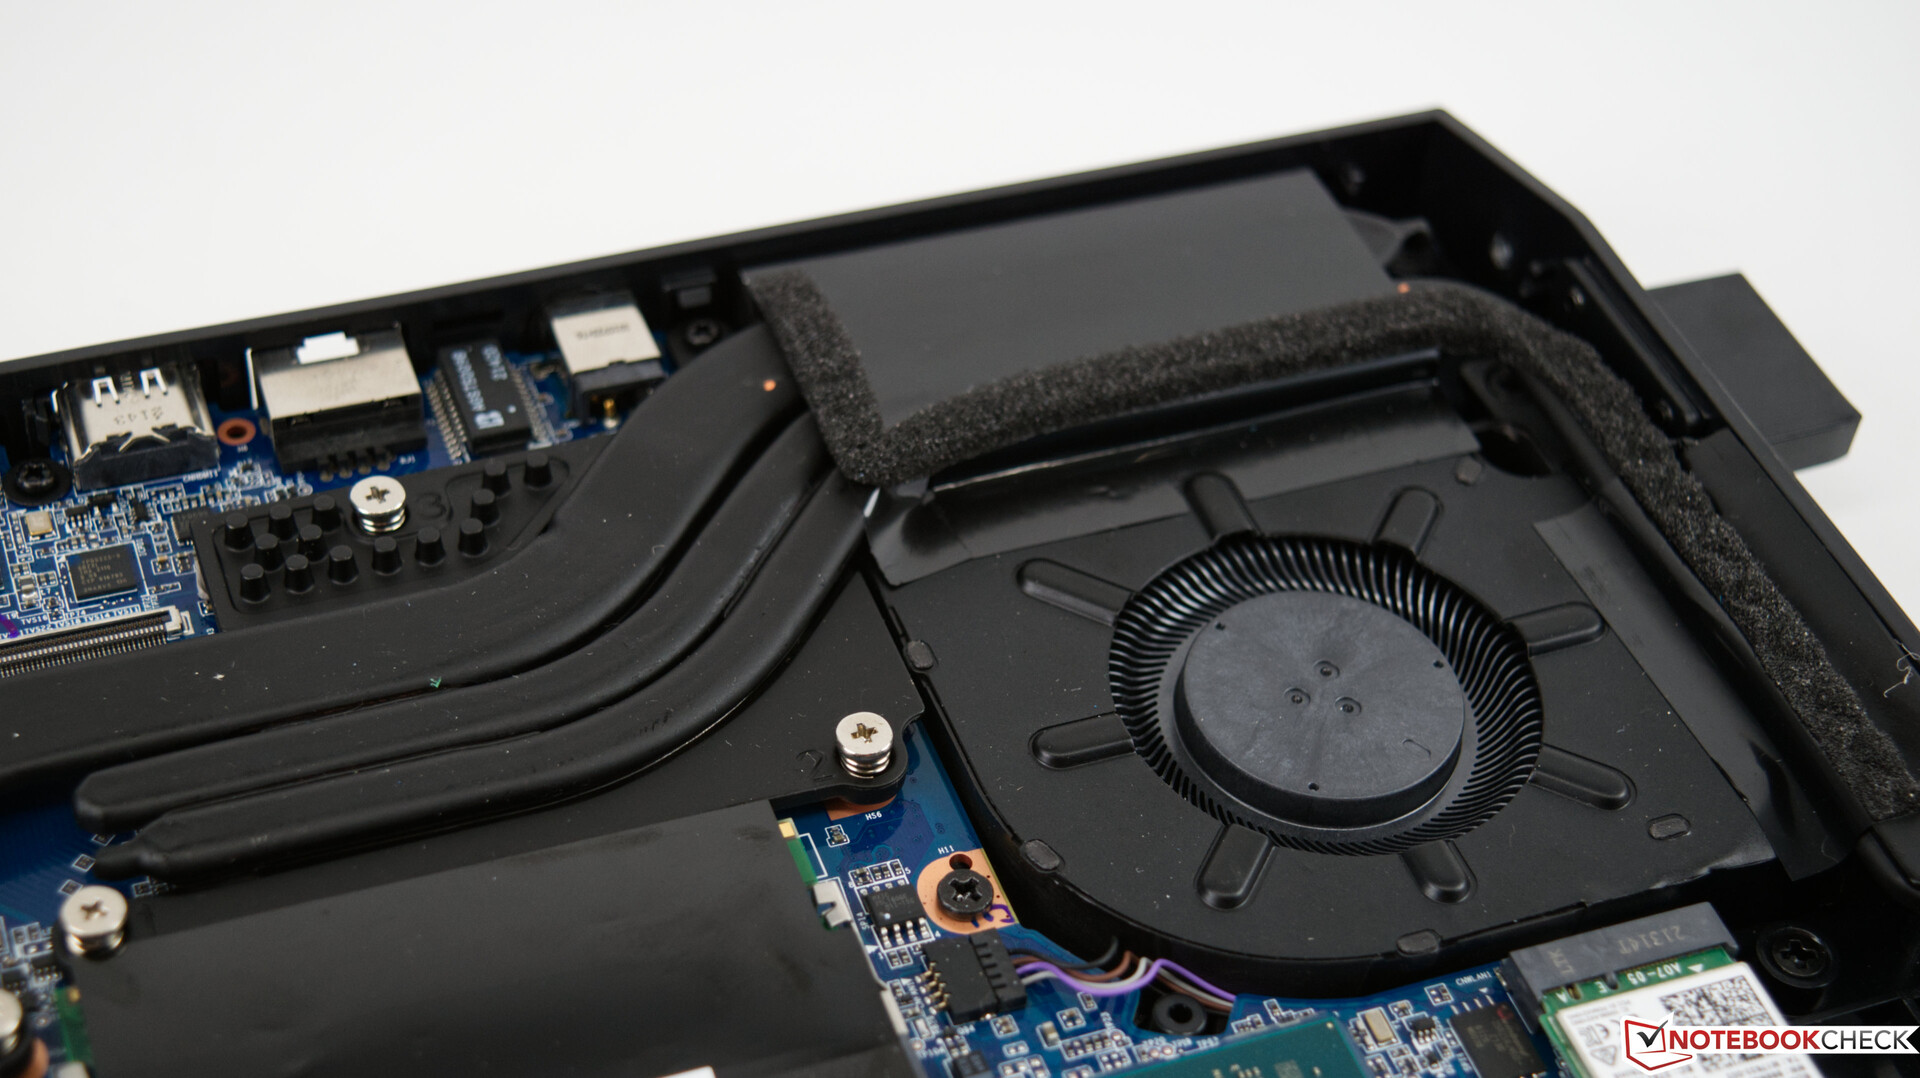
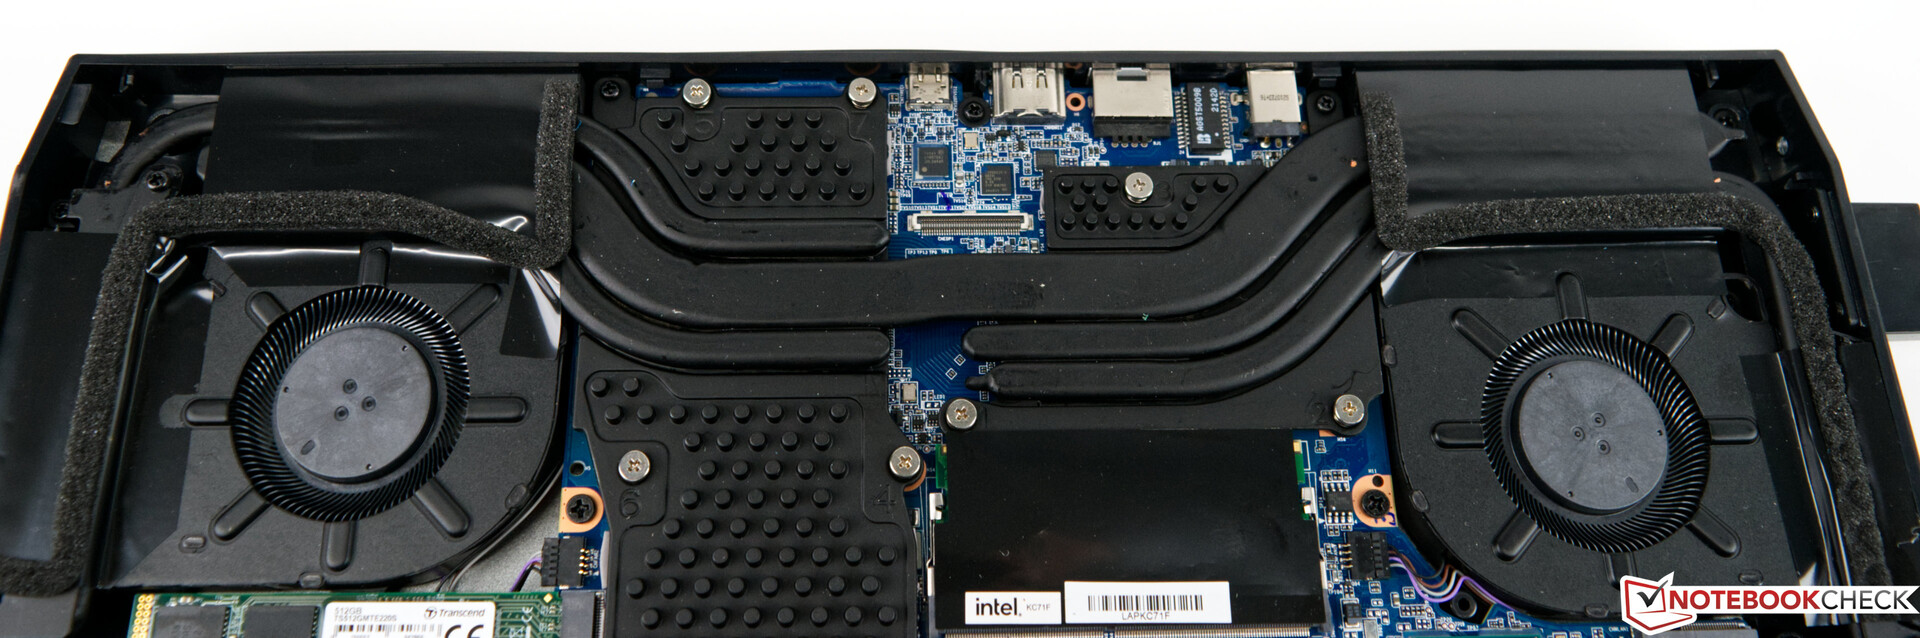
Maintenance
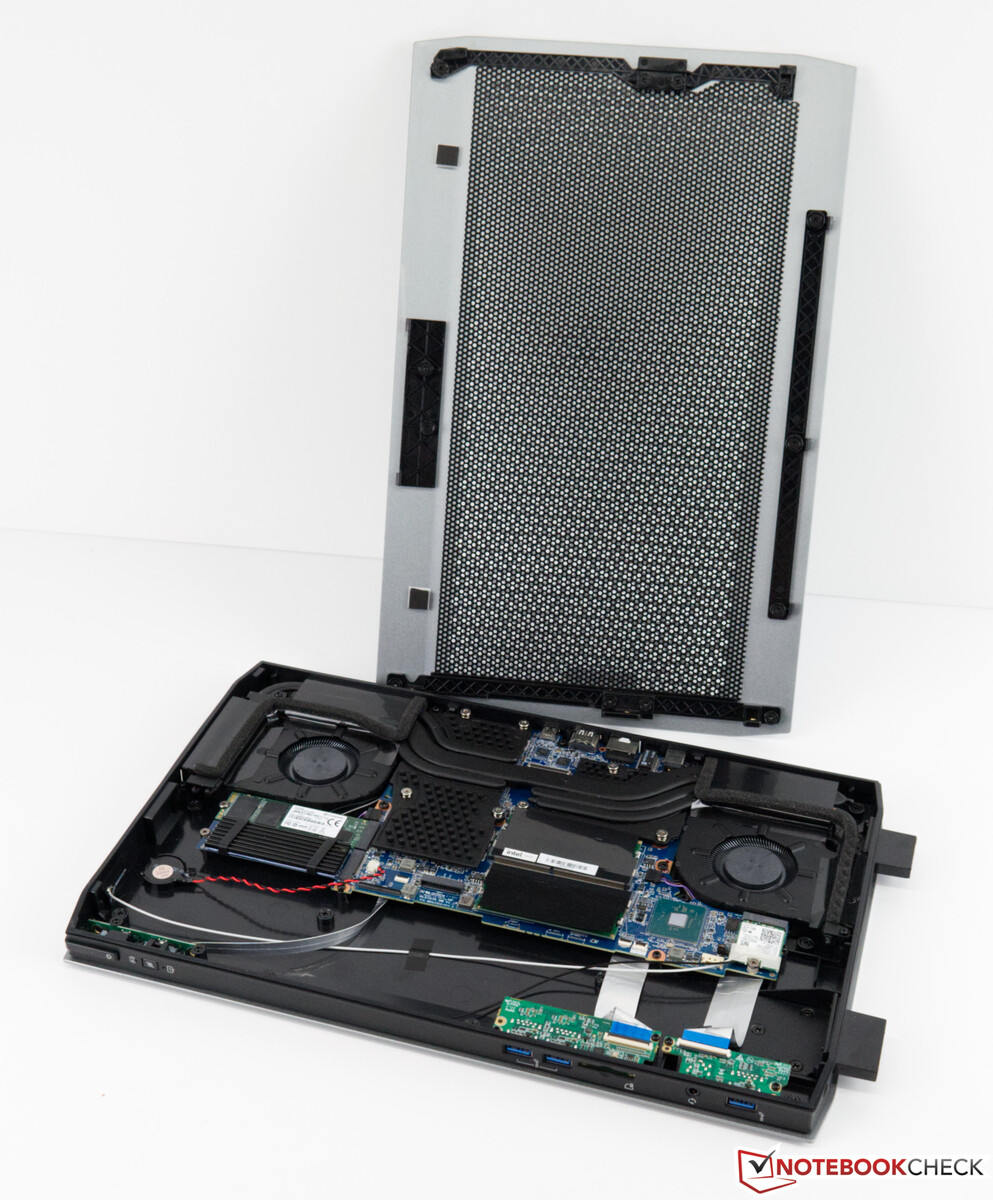
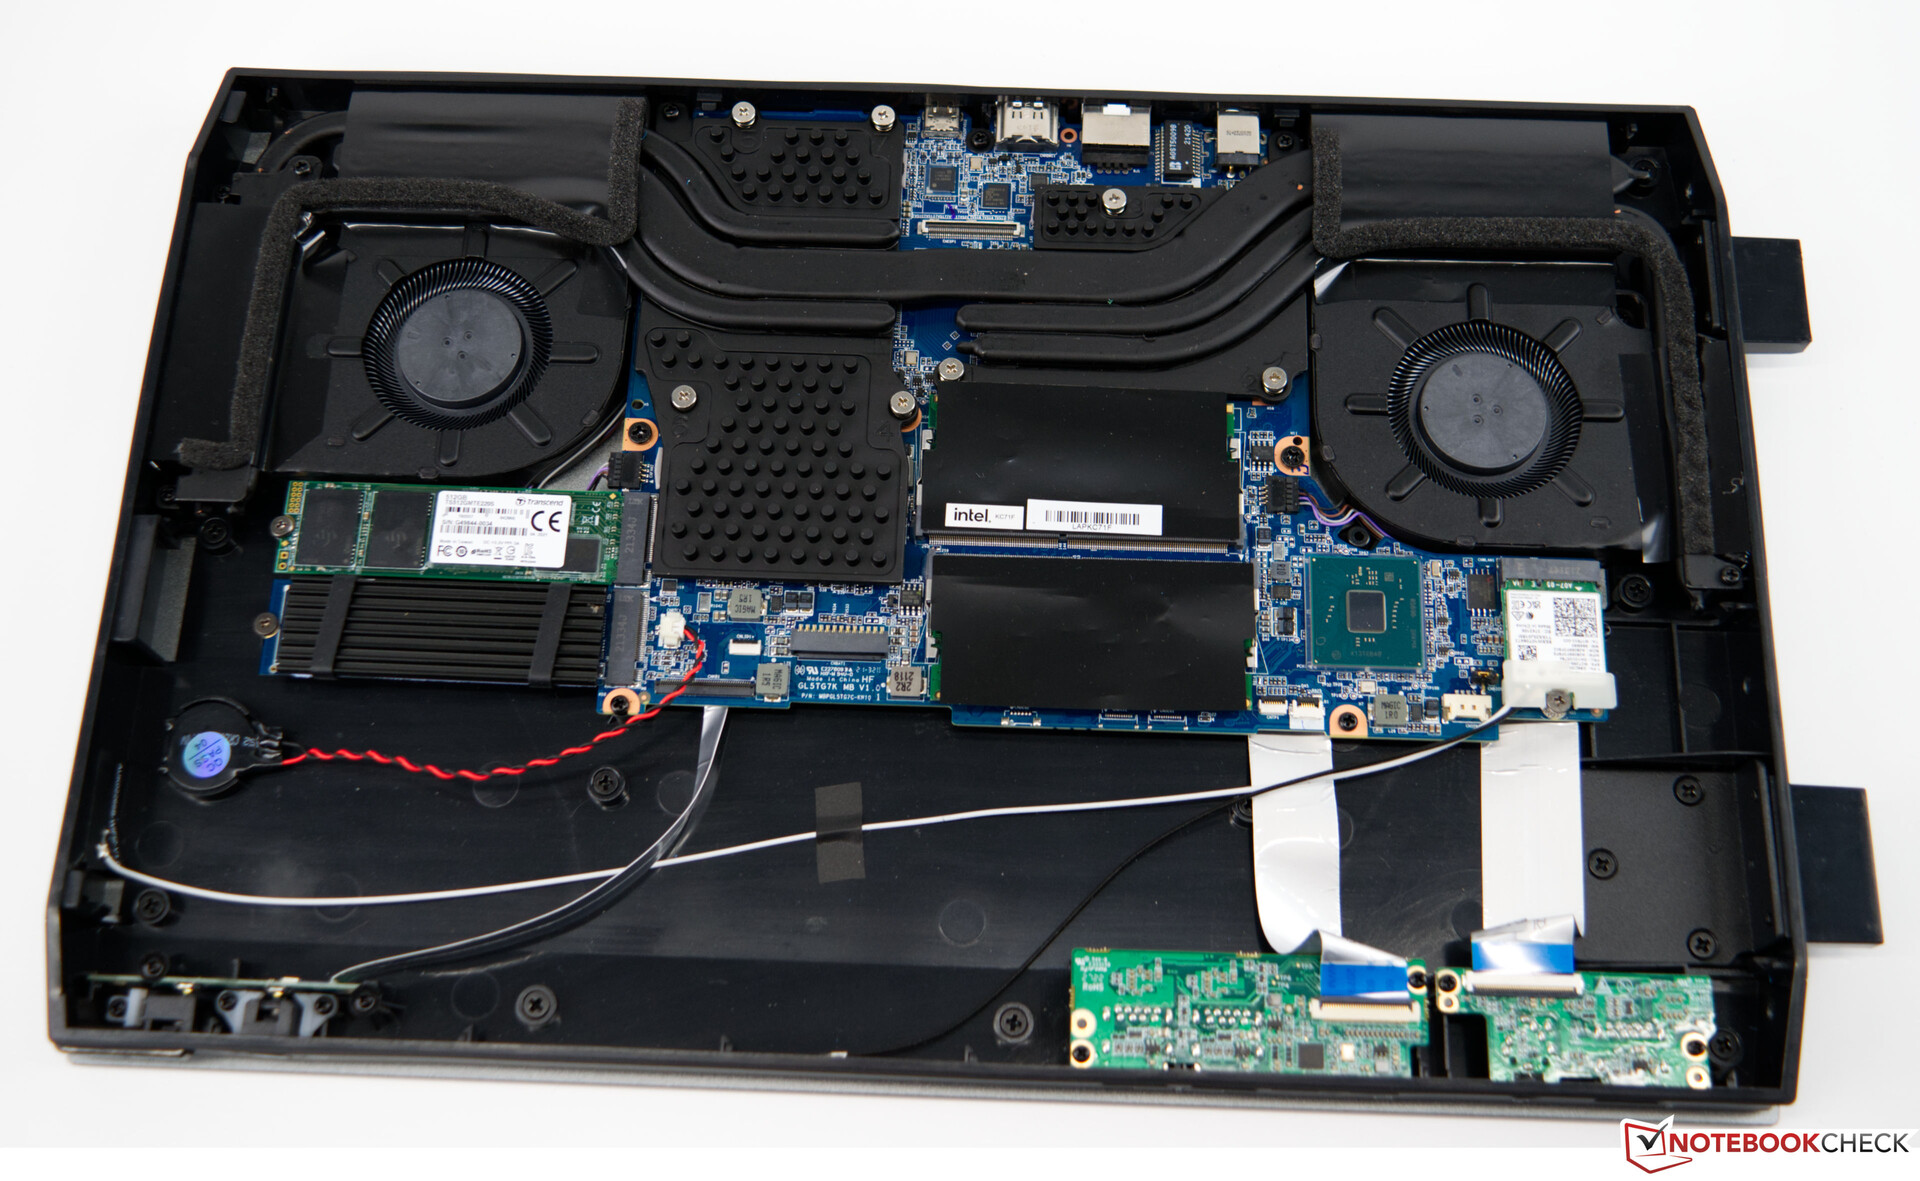
For expansion or maintenance tasks, you can remove the side cover of the device. This is fixed at the bottom with three screws, and after they have been removed, you can take off the cover without much trouble. An included brochure also explains how to do this. After removing the cover, you might be misled to think that you are looking at a laptop. But there is still a lot of unused space, which would usually be reserved for a battery. You can also see why you couldn't just easily add some USB ports in the back. The only space for some additional connections would be in front.
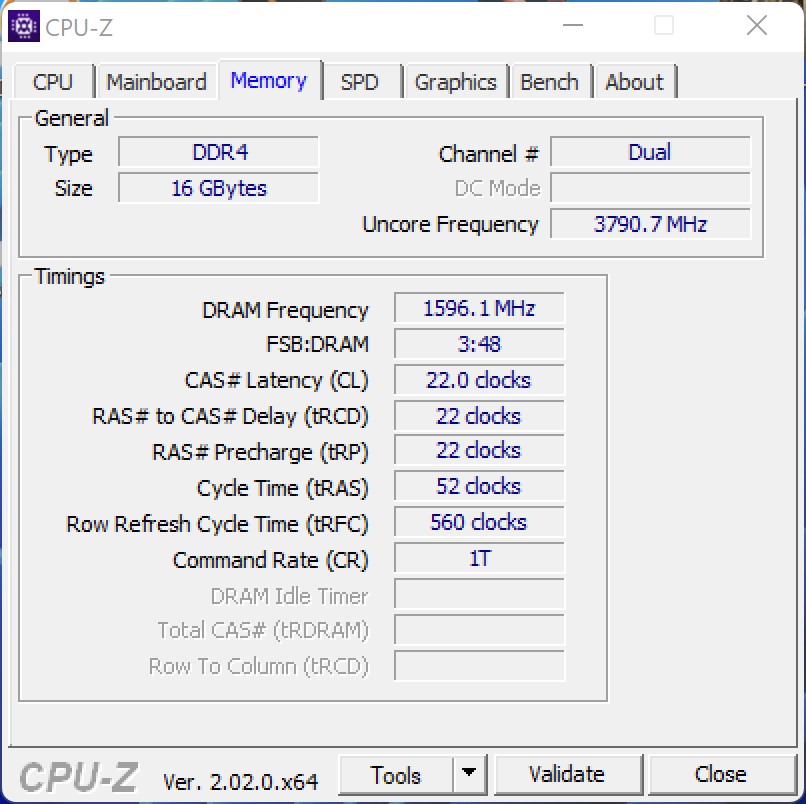
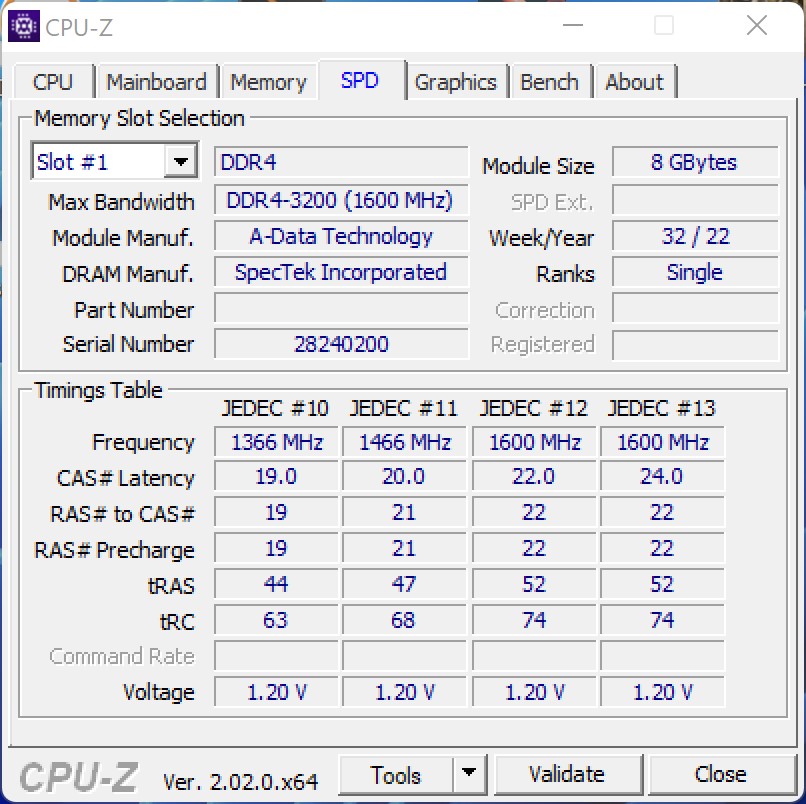
You can fit a total of two M.2 SSDs into the device, which we also did for this test. To expand the working memory, you only have the option to replace the modules, since both of the SO-Dimm slots are already occupied with 8-GB modules.
Performance - A fast Core i7-11800H
With the Intel Core i7-11800H, our test unit offers a good basis for handling demanding applications. In combination with the Nvidia GeForce RTX 3070 Laptop GPU, the Minisforum NUCXi7 looks like a well-equipped gaming laptop. The 16 GB of RAM are usually sufficient for all the current games, even though space can become a little tight with the 512 GB of the SSD. With this equipment, you can also enjoy current games at 1,440p. Those who only want to play games at 1,080p should take a closer look at the Minisforum NUCXi5.
Test Conditions
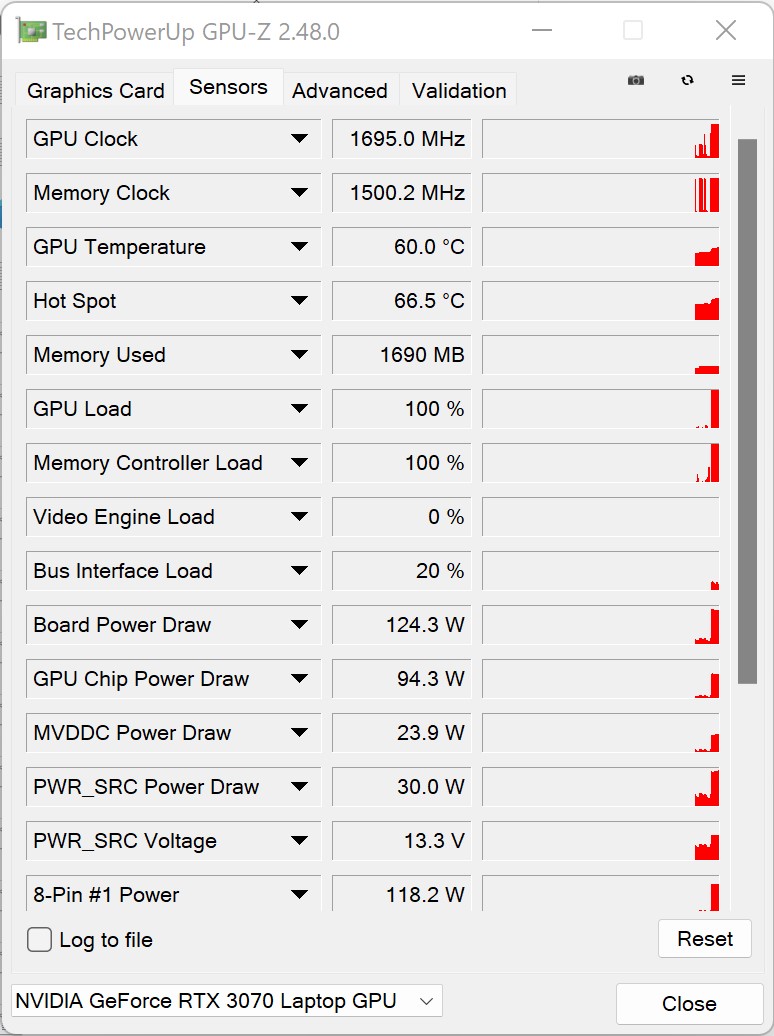
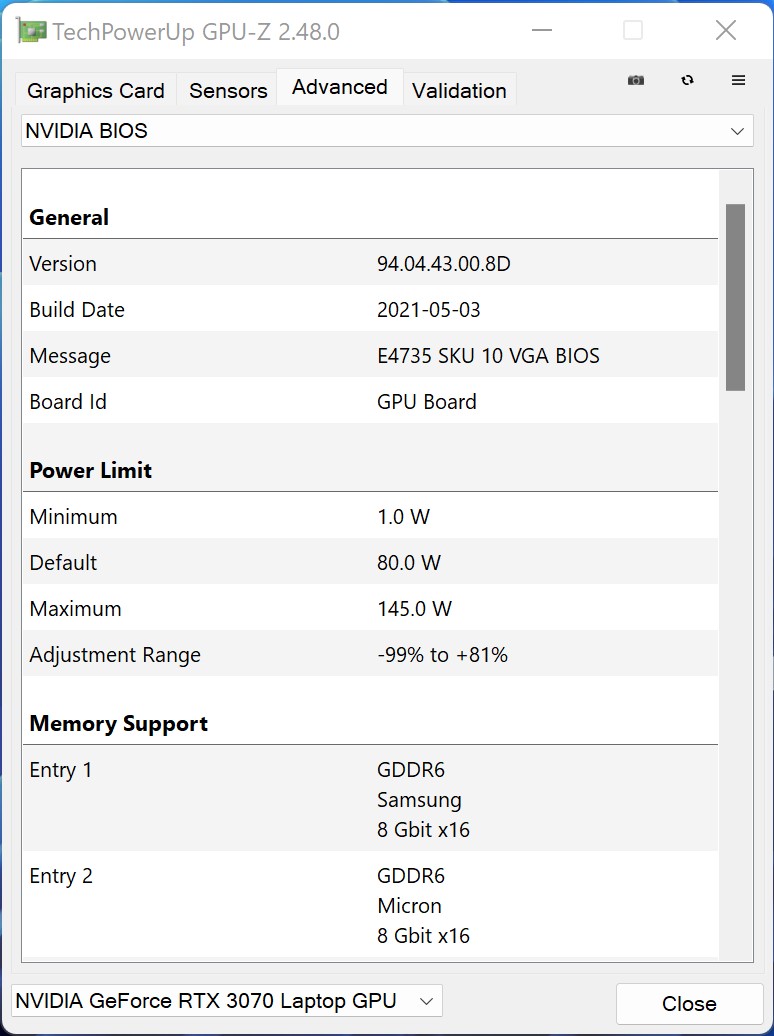
We ran all the performance tests in Gaming mode. This can be activated by pressing a button in the front, granting the GPU a higher power consumption under load. To be exact, this corresponds to an increase of the GPU power consumption to 125 watts.
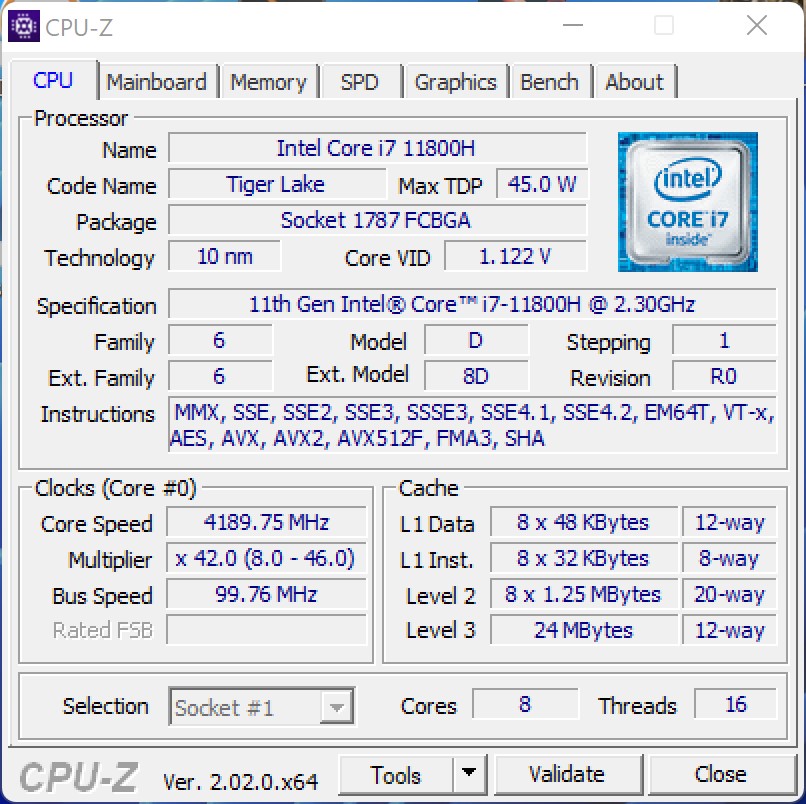
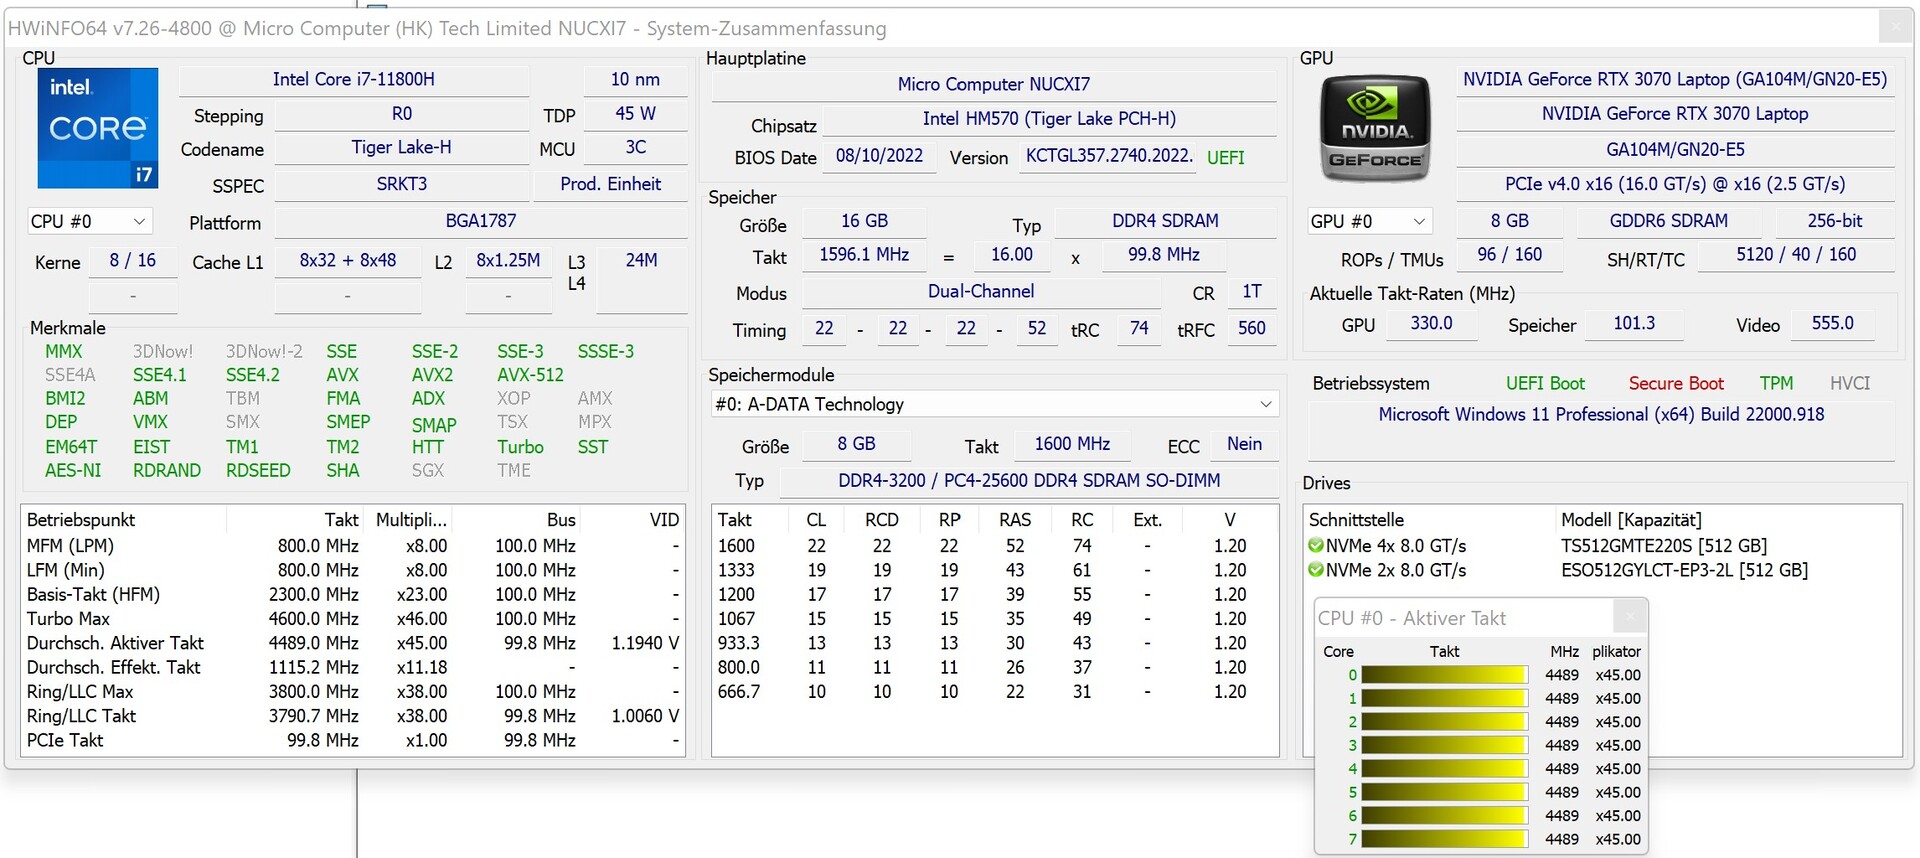
Processor
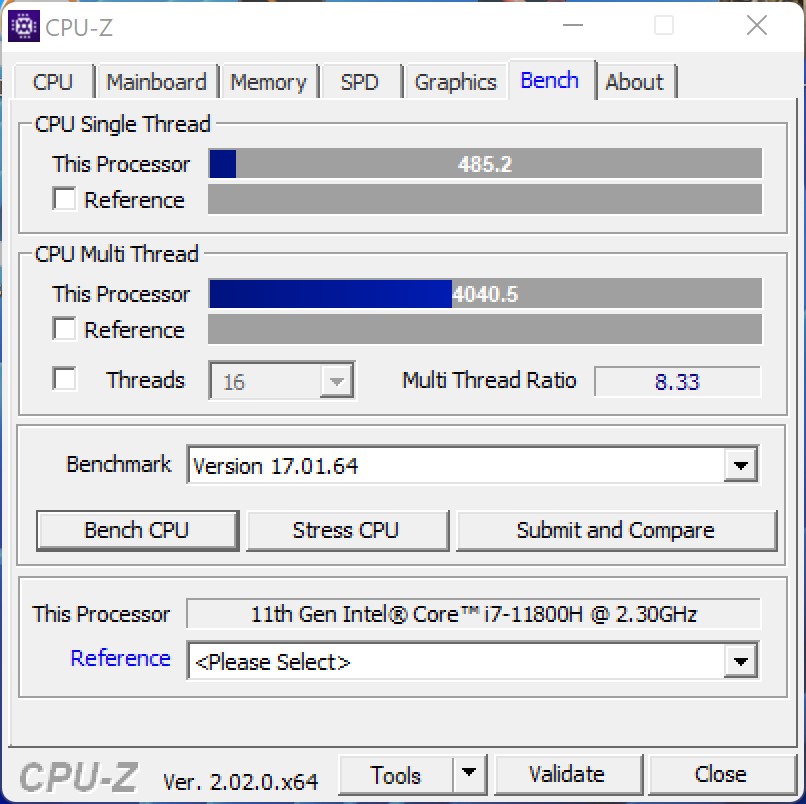
The Intel Core i7-11800H offers eight native computing cores and is based on Intel's Tiger Lake architecture. In terms of the power consumption, Minisforum gives some headspace of up to 110 watts (PL2), although at 68 watts, the PL1 is still a very good value to achieve a high performance. And this is indeed the case, since our test unit is able to secure a good place in the middle of the field with its performance achieved in our test. The disadvantage behind the faster comparison devices is small and subjectively not noticeable.
You can find additional benchmarks of the processors here.
* ... smaller is better
AIDA64: FP32 Ray-Trace | FPU Julia | CPU SHA3 | CPU Queen | FPU SinJulia | FPU Mandel | CPU AES | CPU ZLib | FP64 Ray-Trace | CPU PhotoWorxx
| Performance rating | |
| Average of class Desktop | |
| Gigabyte A7 X1 | |
| Intel Beast Canyon NUC | |
| Intel Dragon Canyon NUC - RTX 3060 | |
| Minisforum NUCX i7 | |
| Zotac ZBOX Magnus EN173070C | |
| Zotac MEK Mini (RTX 2070 Super) | |
| AIDA64 / FP32 Ray-Trace | |
| Average of class Desktop (12248 - 84577, n=21, last 2 years) | |
| Gigabyte A7 X1 | |
| Intel Beast Canyon NUC | |
| Intel Dragon Canyon NUC - RTX 3060 | |
| Zotac ZBOX Magnus EN173070C | |
| Minisforum NUCX i7 | |
| Zotac MEK Mini (RTX 2070 Super) | |
| AIDA64 / FPU Julia | |
| Average of class Desktop (65152 - 246125, n=21, last 2 years) | |
| Gigabyte A7 X1 | |
| Intel Beast Canyon NUC | |
| Intel Dragon Canyon NUC - RTX 3060 | |
| Zotac ZBOX Magnus EN173070C | |
| Minisforum NUCX i7 | |
| Zotac MEK Mini (RTX 2070 Super) | |
| AIDA64 / CPU SHA3 | |
| Average of class Desktop (2982 - 10804, n=21, last 2 years) | |
| Intel Beast Canyon NUC | |
| Intel Dragon Canyon NUC - RTX 3060 | |
| Zotac ZBOX Magnus EN173070C | |
| Minisforum NUCX i7 | |
| Gigabyte A7 X1 | |
| Zotac MEK Mini (RTX 2070 Super) | |
| AIDA64 / CPU Queen | |
| Average of class Desktop (76512 - 187912, n=18, last 2 years) | |
| Gigabyte A7 X1 | |
| Intel Beast Canyon NUC | |
| Intel Dragon Canyon NUC - RTX 3060 | |
| Minisforum NUCX i7 | |
| Zotac ZBOX Magnus EN173070C | |
| Zotac MEK Mini (RTX 2070 Super) | |
| AIDA64 / FPU SinJulia | |
| Average of class Desktop (6443 - 35251, n=21, last 2 years) | |
| Gigabyte A7 X1 | |
| Intel Beast Canyon NUC | |
| Intel Dragon Canyon NUC - RTX 3060 | |
| Minisforum NUCX i7 | |
| Zotac ZBOX Magnus EN173070C | |
| Zotac MEK Mini (RTX 2070 Super) | |
| AIDA64 / FPU Mandel | |
| Average of class Desktop (31697 - 129745, n=21, last 2 years) | |
| Gigabyte A7 X1 | |
| Intel Beast Canyon NUC | |
| Intel Dragon Canyon NUC - RTX 3060 | |
| Zotac ZBOX Magnus EN173070C | |
| Minisforum NUCX i7 | |
| Zotac MEK Mini (RTX 2070 Super) | |
| AIDA64 / CPU ZLib | |
| Average of class Desktop (887 - 2674, n=21, last 2 years) | |
| Gigabyte A7 X1 | |
| Minisforum NUCX i7 | |
| Intel Beast Canyon NUC | |
| Intel Dragon Canyon NUC - RTX 3060 | |
| Zotac ZBOX Magnus EN173070C | |
| Zotac MEK Mini (RTX 2070 Super) | |
| AIDA64 / FP64 Ray-Trace | |
| Average of class Desktop (6471 - 44013, n=21, last 2 years) | |
| Gigabyte A7 X1 | |
| Intel Beast Canyon NUC | |
| Intel Dragon Canyon NUC - RTX 3060 | |
| Zotac ZBOX Magnus EN173070C | |
| Minisforum NUCX i7 | |
| Zotac MEK Mini (RTX 2070 Super) | |
| AIDA64 / CPU PhotoWorxx | |
| Average of class Desktop (38071 - 63949, n=21, last 2 years) | |
| Zotac ZBOX Magnus EN173070C | |
| Minisforum NUCX i7 | |
| Intel Beast Canyon NUC | |
| Intel Dragon Canyon NUC - RTX 3060 | |
| Zotac MEK Mini (RTX 2070 Super) | |
| Gigabyte A7 X1 | |
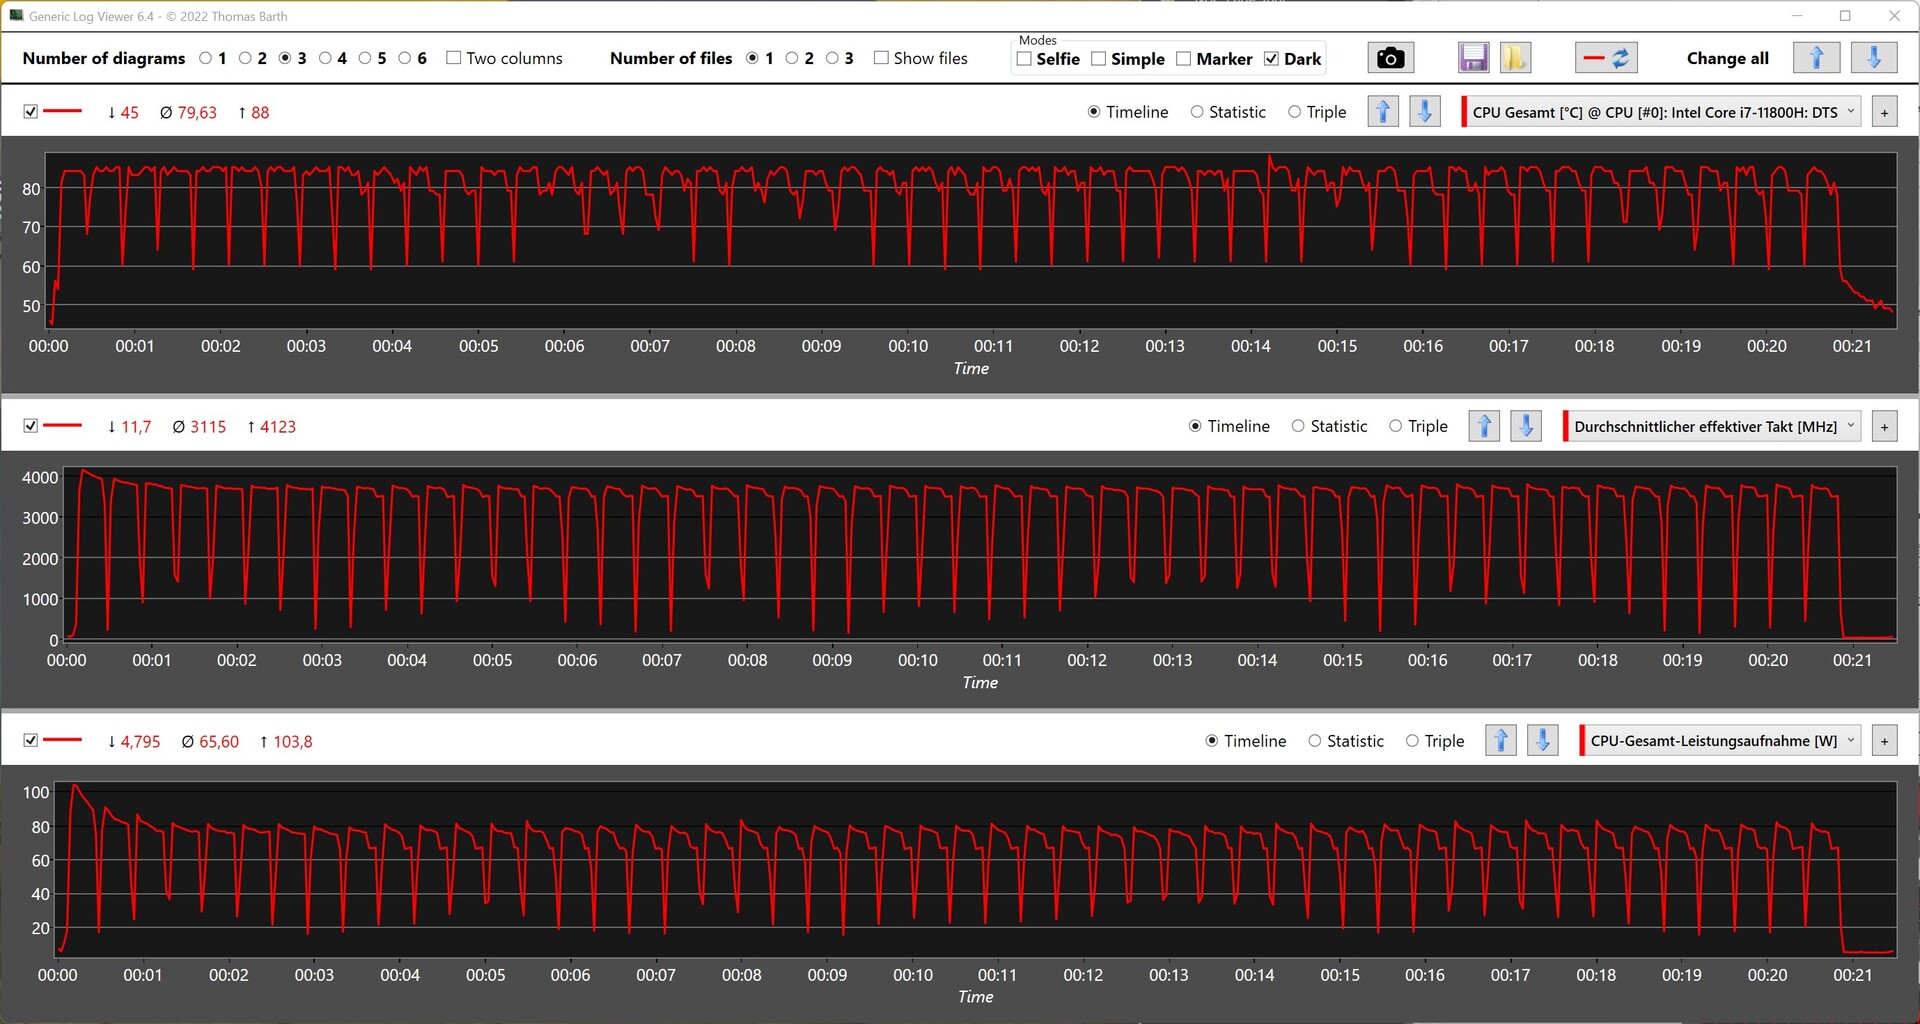
Minisforum NUCXi7 in the Cinebench R15 Multi Loop
The loop of the Cinebench R15 constant load test gives a good impression of the efficiency of the built-in cooling system. After the first runs, the performance only drops minimally, before continuing to level out at an average of 1,828 points.
System Performance
The Minisforum NUCXi7 leaves a good impression in the system benchmarks. The disadvantage behind the Intel Dragon Canyon NUC with an Intel Core i9-12900 is 17%. At the same time, the Intel Core i7-11800H, which at this point is already more than a year old, also shows that it won't belong to the scrap heap for quite a while. Nonetheless, Minisforum could also get some significant improvements with an upgrade to Intel's Alder Lake SoCs. But in the current equipment configuration, the Minisforum NUCXi7 delivers a solid performance that is also convincing in everyday operation.
| AIDA64 / Memory Copy | |
| Average of class Desktop (54743 - 98416, n=21, last 2 years) | |
| Intel Beast Canyon NUC | |
| Intel Dragon Canyon NUC - RTX 3060 | |
| Minisforum NUCX i7 | |
| Zotac ZBOX Magnus EN173070C | |
| Average Intel Core i7-11800H (24508 - 48144, n=21) | |
| Gigabyte A7 X1 | |
| Zotac MEK Mini (RTX 2070 Super) | |
| AIDA64 / Memory Read | |
| Average of class Desktop (58375 - 110448, n=21, last 2 years) | |
| Zotac ZBOX Magnus EN173070C | |
| Intel Beast Canyon NUC | |
| Intel Dragon Canyon NUC - RTX 3060 | |
| Minisforum NUCX i7 | |
| Average Intel Core i7-11800H (25882 - 50365, n=20) | |
| Gigabyte A7 X1 | |
| Zotac MEK Mini (RTX 2070 Super) | |
| AIDA64 / Memory Write | |
| Average of class Desktop (60635 - 93889, n=21, last 2 years) | |
| Zotac ZBOX Magnus EN173070C | |
| Minisforum NUCX i7 | |
| Intel Beast Canyon NUC | |
| Intel Dragon Canyon NUC - RTX 3060 | |
| Average Intel Core i7-11800H (22240 - 46214, n=20) | |
| Zotac MEK Mini (RTX 2070 Super) | |
| Gigabyte A7 X1 | |
| AIDA64 / Memory Latency | |
| Minisforum NUCX i7 | |
| Average of class Desktop (68.5 - 168, n=21, last 2 years) | |
| Intel Beast Canyon NUC | |
| Intel Dragon Canyon NUC - RTX 3060 | |
| Zotac ZBOX Magnus EN173070C | |
| Gigabyte A7 X1 | |
| Zotac MEK Mini (RTX 2070 Super) | |
| Average Intel Core i7-11800H (71.9 - 104.1, n=44) | |
* ... smaller is better
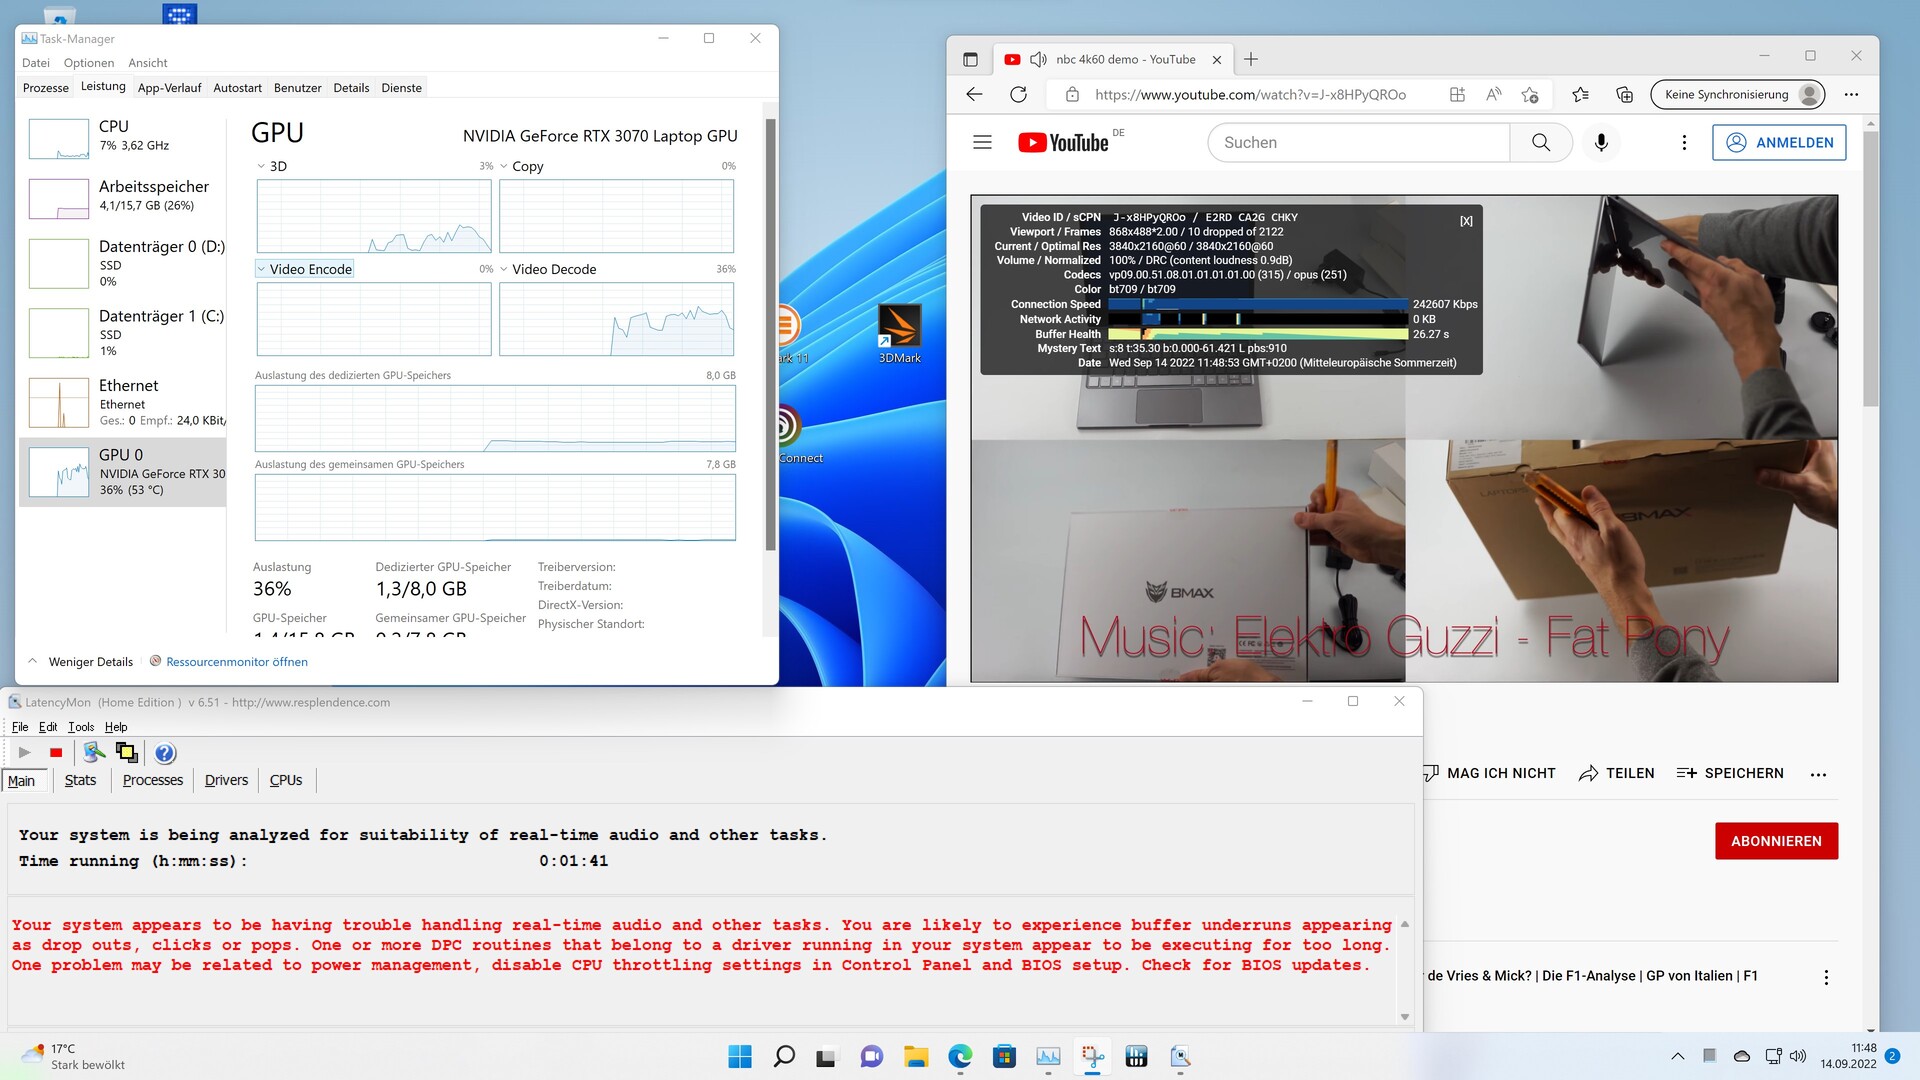
DPC Latencies
The Minisforum NUCXi7 struggles with increased latencies already when opening several tabs in the Edge browser. When playing our 4K test video, the Nvidia GeForce RTX 3070 Laptop GPU is loaded to about 36%.
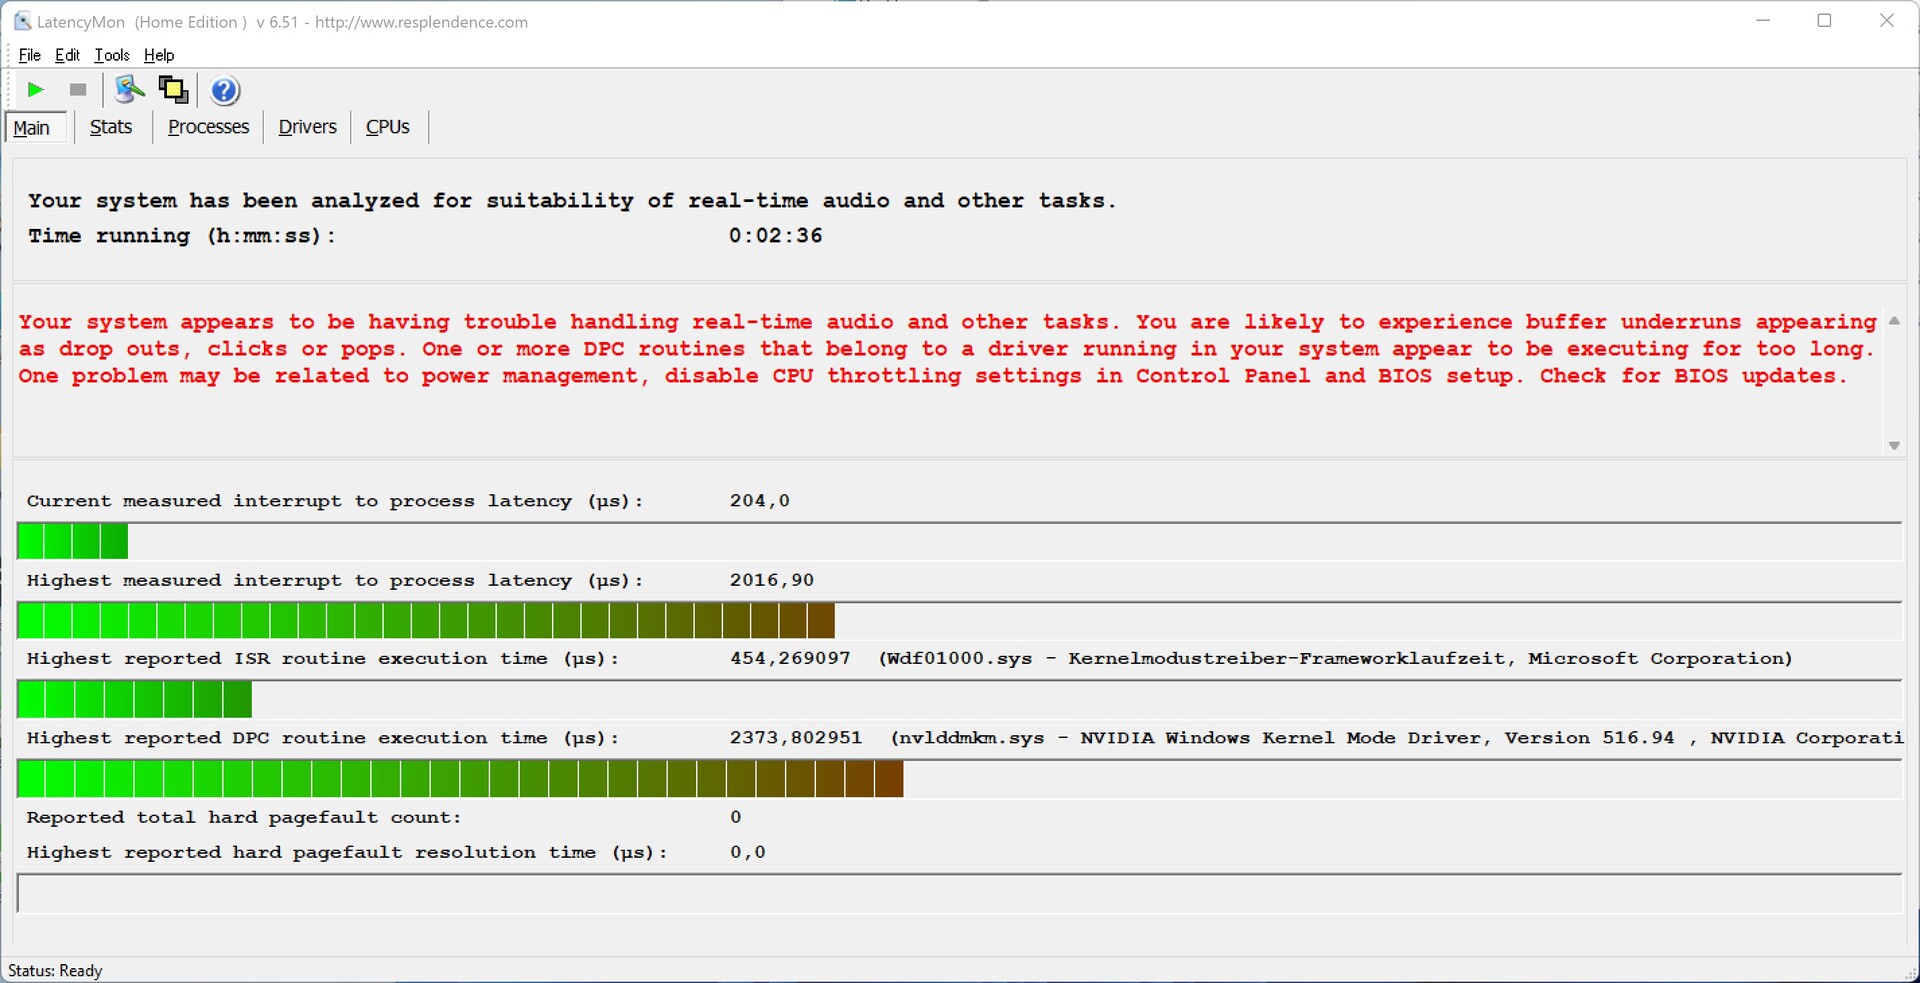
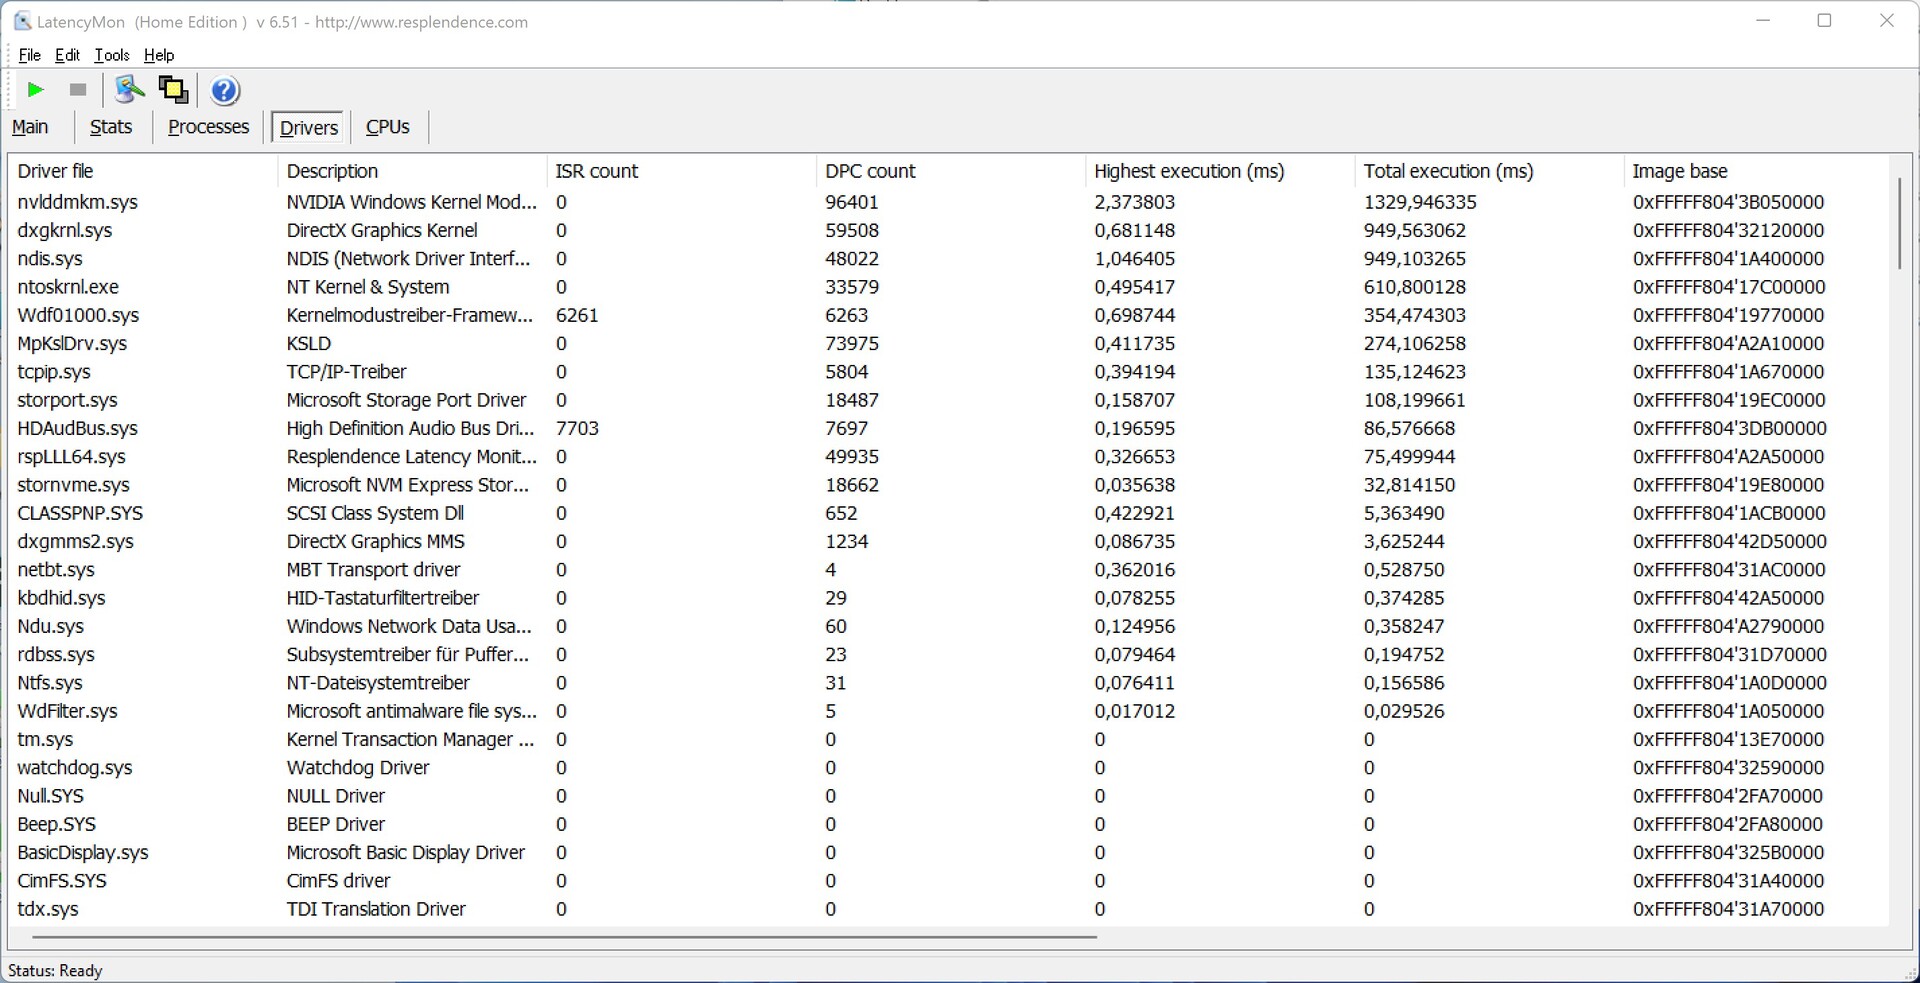
| DPC Latencies / LatencyMon - interrupt to process latency (max), Web, Youtube, Prime95 | |
| Minisforum NUCX i7, Intel Core i7-11800H | |
| Zotac ZBOX Magnus EN173070C, Intel Core i7-11800H | |
| Gigabyte A7 X1, AMD Ryzen 9 5900HX | |
* ... smaller is better
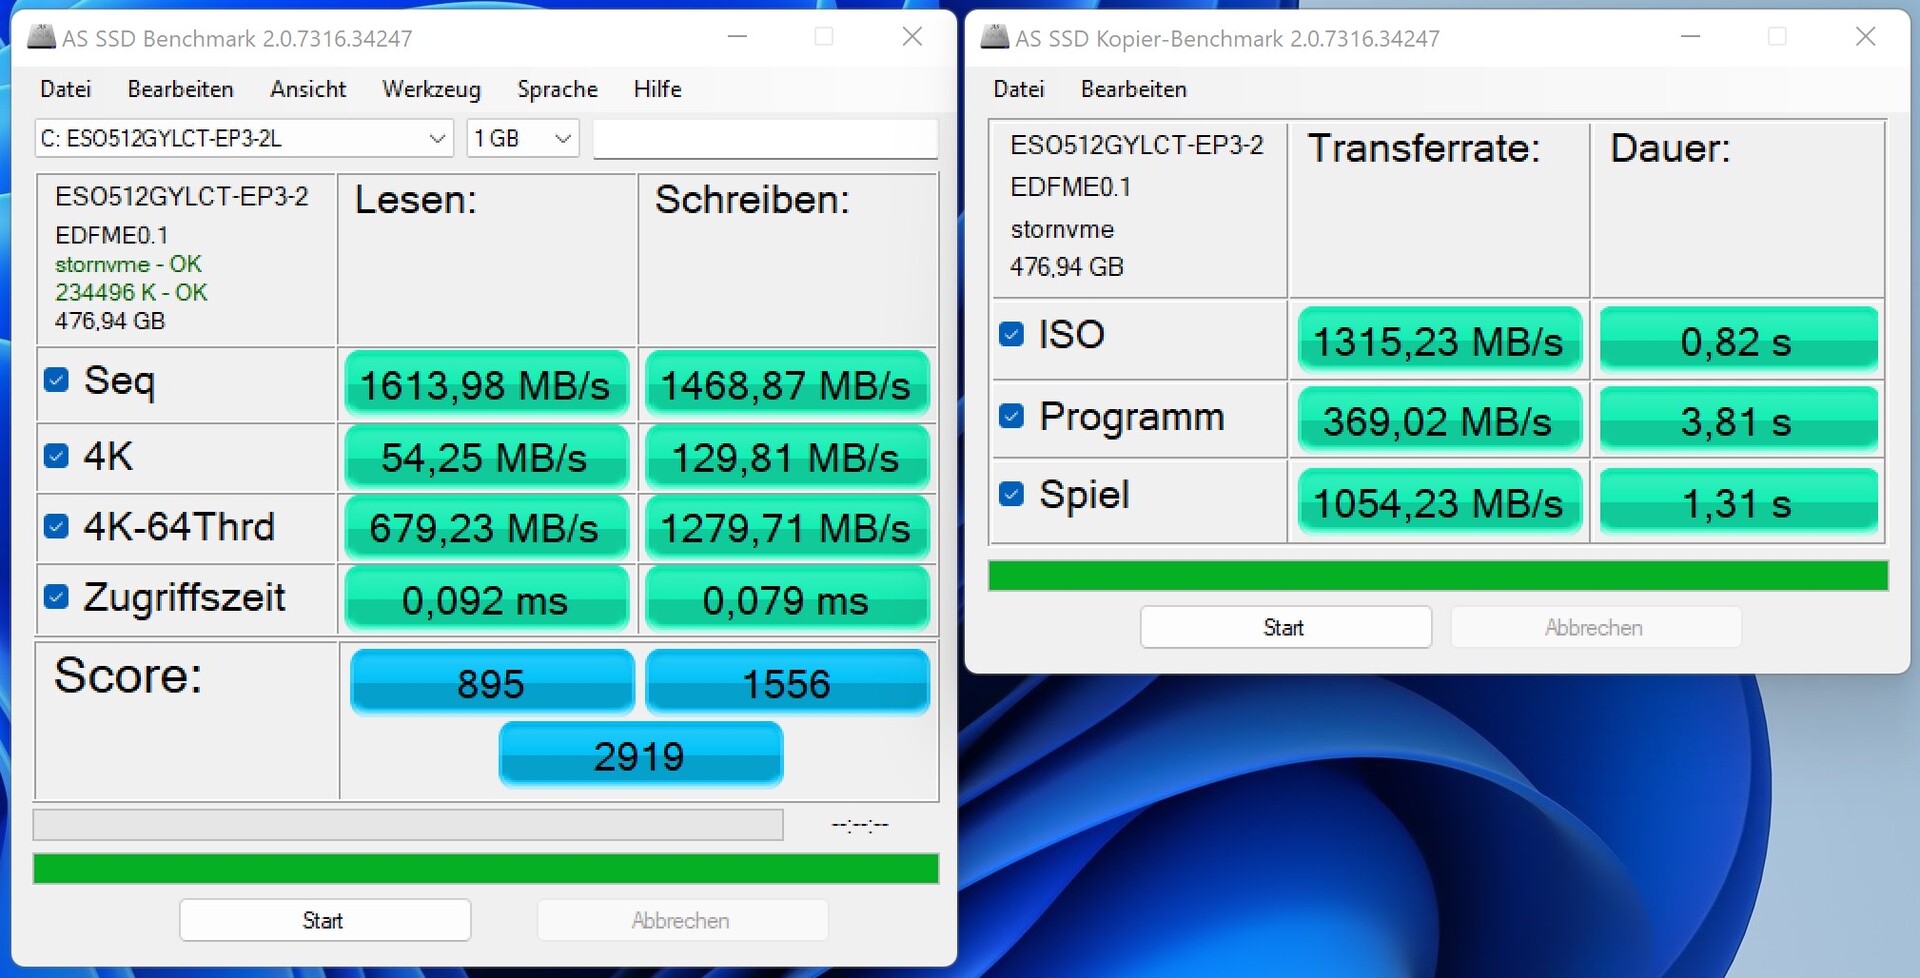
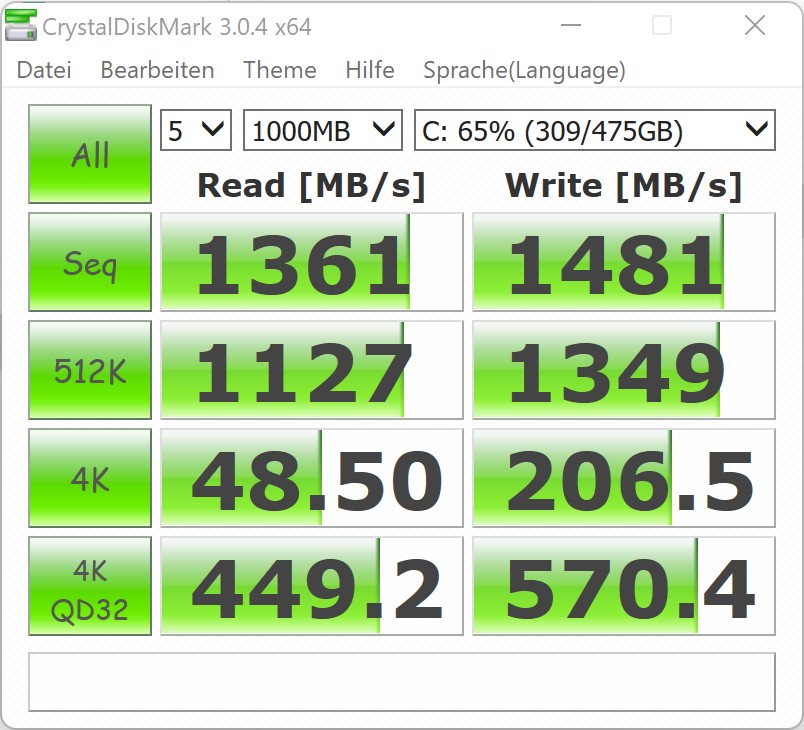
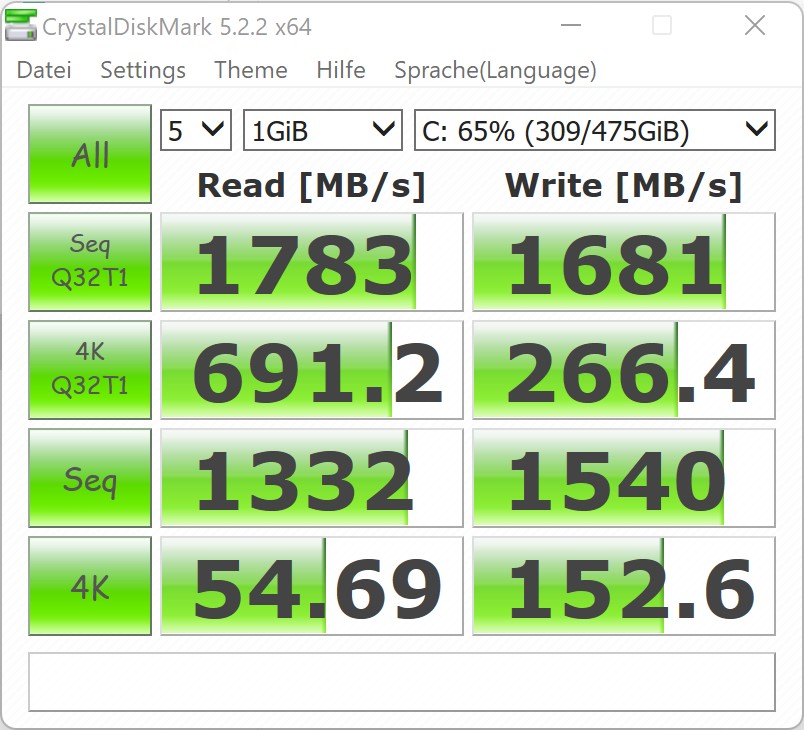
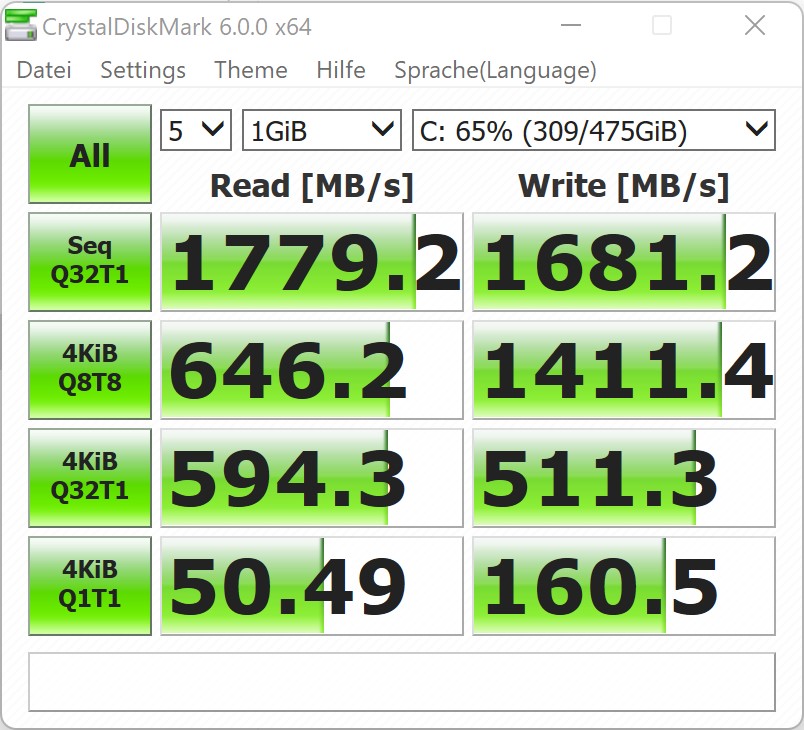
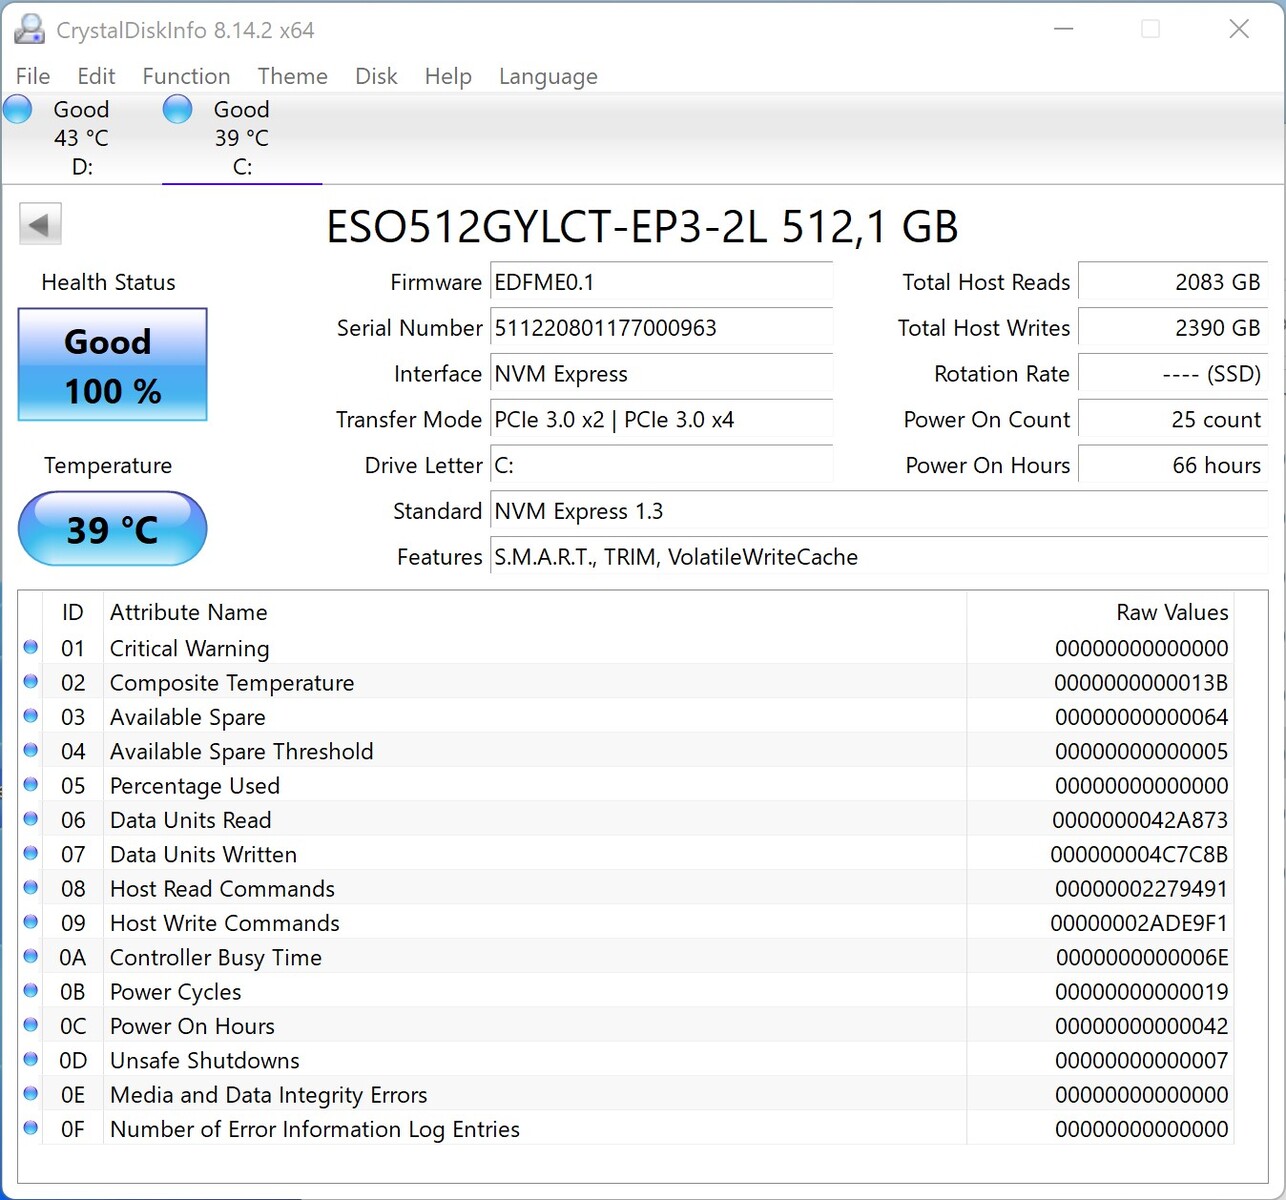
Storage Solution
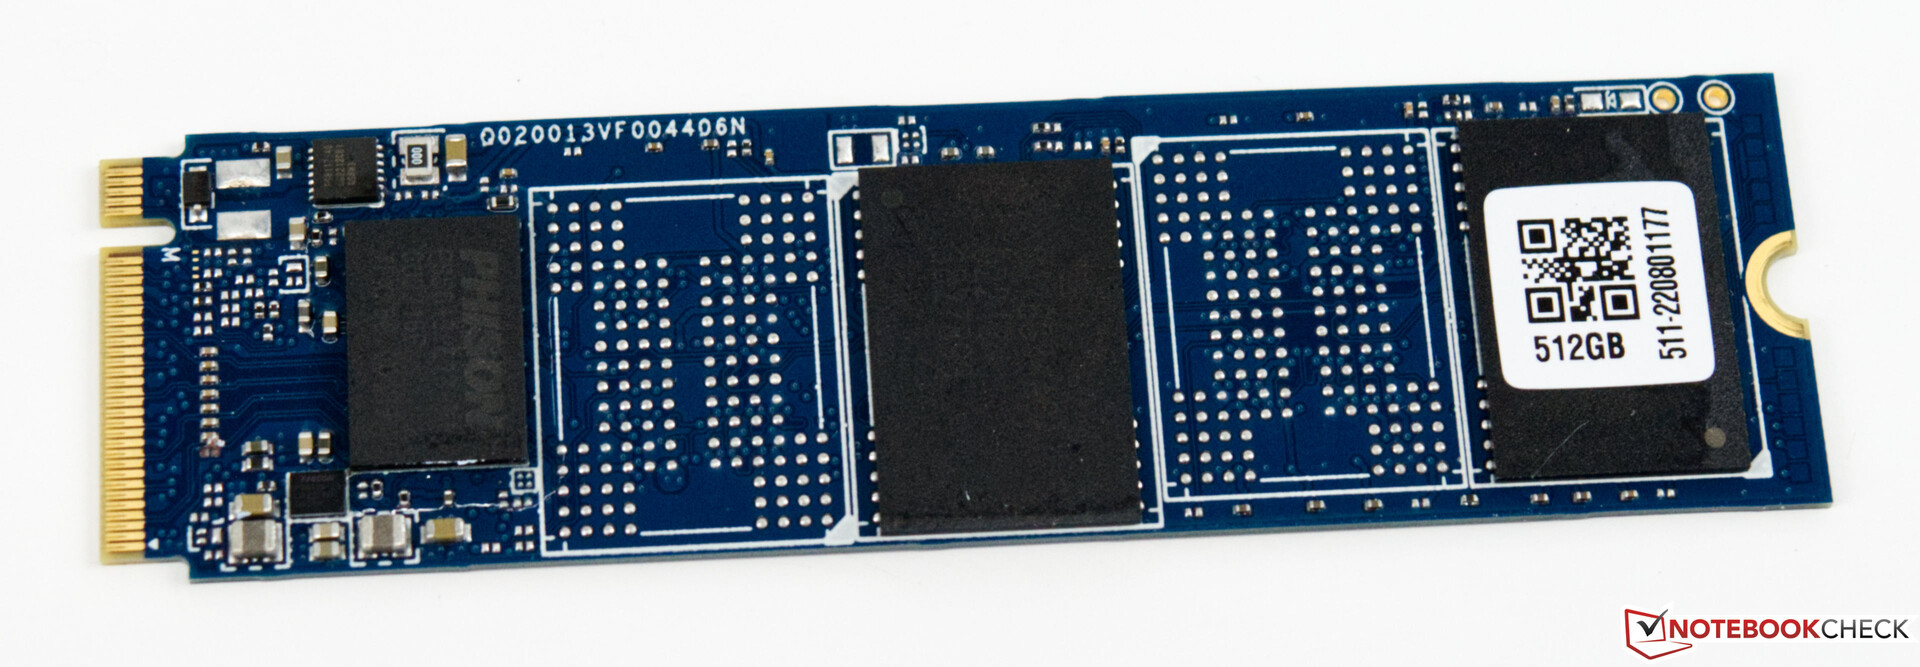
In our configuration, the storage solution is an NVMe SSD with 512 GB of storage space. While the model used is fast, it isn't quite able to keep up with the performance of our comparison devices. However, the performance is still sufficient for all the usual applications. In addition, we were unable to see any unnecessary latencies due to the SSD performance. On the other hand, considering the target user group, the storage space turns out very low at only 512 GB. For a gaming device, we expect at least 1 TB of storage. At the same time, you can also expand the storage at a later time using the second M.2 slot.
You can find additional comparisons and benchmarks in our comparison chart.

* ... smaller is better
Constant Performance Reading: DiskSpd Read Loop, Queue Depth 8
Graphics Card
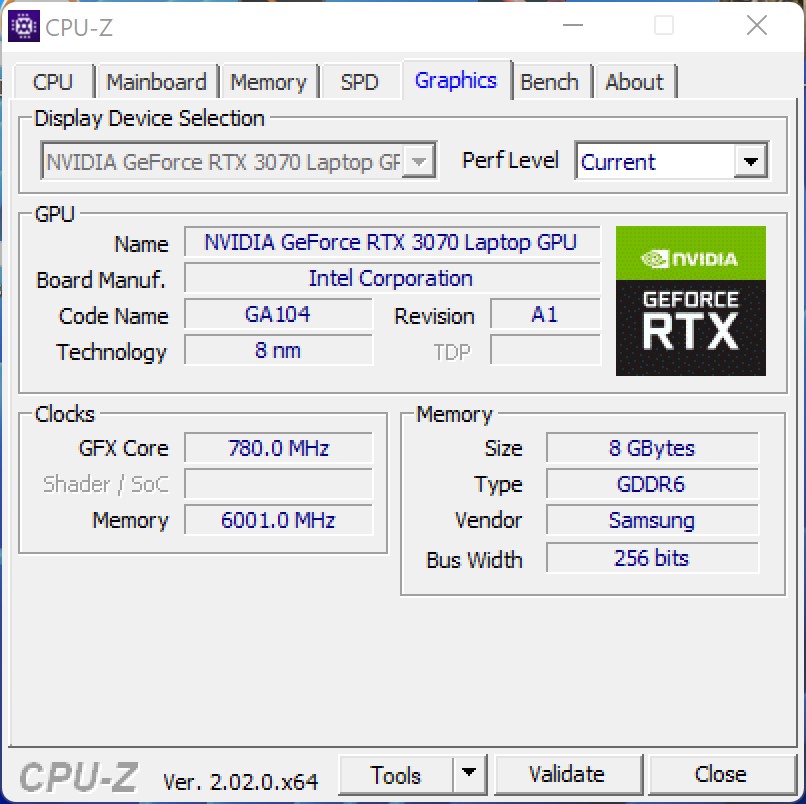
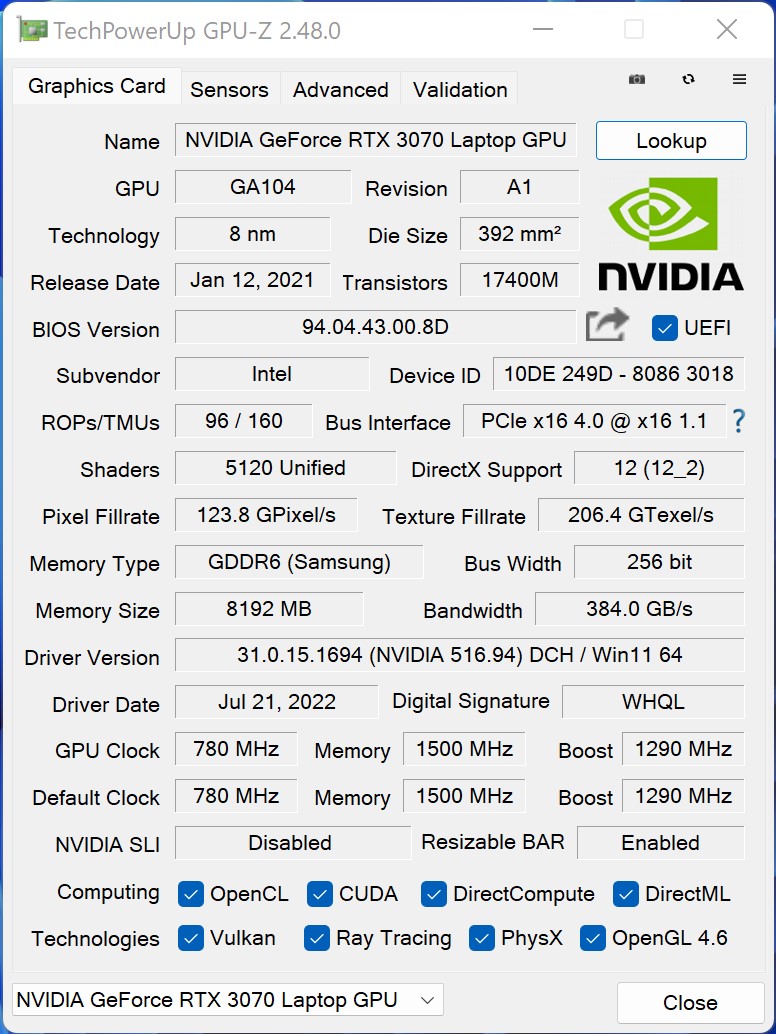
The Nvidia GeForce RTX 3070 Laptop GPU running in the Minisforum NUCXi7 is able to use its full performance of 125 watts in Gaming mode. However, you still have to be aware that this is the mobile version of the GeForce RTX 3070 whose performance doesn't come close to that of the desktop version. The Nvidia GeForce RTX 3070 Laptop GPU is about 25 to 30% slower than the Nvidia GeForce RTX 3070 Desktop GPU. However, our test unit keeps the competitors that are based on a Nvidia GeForce RTX 3060 Desktop GPU easily in check. In order to gauge the approximate performance of the Minisforum NUCXi5, we also include the average performance values of the Nvidia GeForce RTX 3060 Laptop GPU in our chart.
You can find additional benchmarks on the Nvidia GeForce RTX 3070 here.
| 3DMark 05 Standard | 46264 points | |
| 3DMark 06 Standard Score | 47138 points | |
| 3DMark Vantage P Result | 76594 points | |
| 3DMark 11 Performance | 27592 points | |
| 3DMark Ice Storm Standard Score | 218821 points | |
| 3DMark Cloud Gate Standard Score | 53894 points | |
| 3DMark Fire Strike Score | 21258 points | |
| 3DMark Fire Strike Extreme Score | 11291 points | |
| 3DMark Time Spy Score | 9337 points | |
| 3DMark Steel Nomad Score | 2368 points | |
| 3DMark Steel Nomad Light Score | 10548 points | |
Help | ||
Gaming Performance
The Minisforum NUCXi7 is surprisingly well suited as a gaming PC. The system performance is sufficient for 1,440p gaming in most cases. From time to time, you can also get 2,160p from the Nvidia GeForce RTX 3070 Laptop GPU, as long as the game doesn't pose too high demands on the hardware. However, the documented gaming performance here is astonishing in comparison. Often, our test unit is able to keep up with the comparison devices based on the faster desktop GPUs, or even surpass them.
You can find an overview of the performance of all our tested games compared to other models in our GPU games list.
| GTA V | |
| 1920x1080 Highest AA:4xMSAA + FX AF:16x | |
| Minisforum NUCX i7 | |
| Zotac ZBOX Magnus EN173070C | |
| Intel Beast Canyon NUC | |
| Intel Dragon Canyon NUC - RTX 3060 | |
| Zotac Magnus One (ECM73070C) | |
| Average NVIDIA GeForce RTX 3070 Laptop GPU (21.7 - 125.8, n=50) | |
| Gigabyte A7 X1 | |
| 1920x1080 High/On (Advanced Graphics Off) AA:2xMSAA + FX AF:8x | |
| Intel Beast Canyon NUC | |
| Intel Dragon Canyon NUC - RTX 3060 | |
| Minisforum NUCX i7 | |
| Zotac ZBOX Magnus EN173070C | |
| Zotac Magnus One (ECM73070C) | |
| Average NVIDIA GeForce RTX 3070 Laptop GPU (58.2 - 181.4, n=38) | |
| Gigabyte A7 X1 | |
| The Witcher 3 | |
| 1920x1080 High Graphics & Postprocessing (Nvidia HairWorks Off) | |
| Zotac Magnus One (ECM73070C) | |
| Minisforum NUCX i7 | |
| Zotac ZBOX Magnus EN173070C | |
| Intel Dragon Canyon NUC - RTX 3060 | |
| Zotac MEK Mini (RTX 2070 Super) | |
| Average NVIDIA GeForce RTX 3070 Laptop GPU (122.1 - 207, n=34) | |
| 1920x1080 Ultra Graphics & Postprocessing (HBAO+) | |
| Zotac Magnus One (ECM73070C) | |
| Zotac ZBOX Magnus EN173070C | |
| Minisforum NUCX i7 | |
| Gigabyte A7 X1 | |
| Zotac MEK Mini (RTX 2070 Super) | |
| Average NVIDIA GeForce RTX 3070 Laptop GPU (34.9 - 109, n=52) | |
| Intel Dragon Canyon NUC - RTX 3060 | |
| F1 2020 | |
| 2560x1440 Ultra High Preset AA:T AF:16x | |
| Minisforum NUCX i7 | |
| Zotac ZBOX Magnus EN173070C | |
| Intel Beast Canyon NUC | |
| Intel Dragon Canyon NUC - RTX 3060 | |
| Average NVIDIA GeForce RTX 3070 Laptop GPU (74 - 123.7, n=4) | |
| 1920x1080 Ultra High Preset AA:T AF:16x | |
| Minisforum NUCX i7 | |
| Zotac ZBOX Magnus EN173070C | |
| Intel Beast Canyon NUC | |
| Intel Dragon Canyon NUC - RTX 3060 | |
| Average NVIDIA GeForce RTX 3070 Laptop GPU (97 - 173, n=7) | |
| low | med. | high | ultra | QHD DLSS | QHD | 4K DLSS | 4K FSR | 4K | |
|---|---|---|---|---|---|---|---|---|---|
| GTA V (2015) | 184.7 | 179.4 | 171.5 | 106 | 90.6 | 85.6 | |||
| The Witcher 3 (2015) | 417 | 315 | 204 | 104.1 | 71.6 | ||||
| Dota 2 Reborn (2015) | 169.9 | 151.2 | 145.8 | 135.6 | 124.3 | ||||
| Rise of the Tomb Raider (2016) | 293 | 206 | 138.7 | 122 | 56.9 | ||||
| Final Fantasy XV Benchmark (2018) | 187.3 | 135.9 | 103.3 | 76.7 | 45.6 | ||||
| X-Plane 11.11 (2018) | 143.2 | 125.9 | 94.8 | 81.5 | |||||
| Far Cry 5 (2018) | 157 | 134 | 127 | 119 | 99 | 55 | |||
| Strange Brigade (2018) | 501 | 265 | 213 | 184.7 | 137.3 | 78.6 | |||
| Shadow of the Tomb Raider (2018) | 167.7 | 143.5 | 134.3 | 123.1 | 88.6 | 48 | |||
| Forza Horizon 4 (2018) | 211 | 189 | 188 | 167 | 140 | 93 | |||
| Far Cry New Dawn (2019) | 133 | 115 | 112 | 100 | 91 | 58 | |||
| Metro Exodus (2019) | 185 | 120.8 | 93.1 | 74.6 | 59.9 | 37.6 | |||
| Anno 1800 (2019) | 143.6 | 132.6 | 109.8 | 56.7 | 48.2 | 32.1 | |||
| Control (2019) | 240 | 131.7 | 96.1 | 61 | 30.3 | ||||
| Borderlands 3 (2019) | 141.9 | 124.9 | 101 | 84.7 | 62.6 | 34.8 | |||
| F1 2020 (2020) | 333 | 273 | 230 | 166.2 | 123.7 | 69.7 | |||
| Watch Dogs Legion (2020) | 114 | 106 | 96 | 73 | 64 | 27 | |||
| Dirt 5 (2020) | 210 | 147 | 114 | 91 | 73 | 49 | |||
| F1 2021 (2021) | 381 | 303 | 244 | 123.1 | 90.2 | 51.1 | |||
| New World (2021) | 115.7 | 95.2 | 89.1 | 84.2 | 67.5 | 35.7 | |||
| Far Cry 6 (2021) | 139.1 | 120 | 106.5 | 102.3 | 78.6 | ||||
| Forza Horizon 5 (2021) | 206 | 145 | 132 | 81 | 70 | 50 | |||
| God of War (2022) | 128.1 | 111 | 91.5 | 67.7 | 57.4 | 37 | |||
| GRID Legends (2022) | 147 | 163 | 153 | 122 | 81 | 56 | |||
| Cyberpunk 2077 1.6 (2022) | 145.6 | 129.2 | 113.9 | 72.3 | 47.3 | 22.3 | |||
| Tiny Tina's Wonderlands (2022) | 194.1 | 158.8 | 111.6 | 88.3 | 62.1 | 33.6 | |||
| F1 22 (2022) | 239 | 208 | 172.1 | 61.9 | 39.7 | 19.1 | |||
| A Plague Tale Requiem (2022) | 107.9 | 84.8 | 66.2 | 50.1 | 36.3 | 20.4 | |||
| Uncharted Legacy of Thieves Collection (2022) | 83.4 | 80.6 | 76.8 | 73.7 | 56.4 | 21.9 | |||
| Call of Duty Modern Warfare 2 2022 (2022) | 129 | 117 | 90 | 87 | 62 | 58 | 37 | ||
| Spider-Man Miles Morales (2022) | 124.8 | 114.7 | 111.3 | 100.4 | 66.6 | 44.6 | |||
| The Callisto Protocol (2022) | 124.9 | 105.2 | 100.2 | 72.5 | 53.2 | 30.8 | |||
| Need for Speed Unbound (2022) | 116.8 | 108.2 | 92.7 | 89.7 | 78.1 | 44.8 | |||
| High On Life (2023) | 216 | 157 | 124.3 | 103 | 65.5 | 27.6 | |||
| The Witcher 3 v4 (2023) | 161.1 | 151.2 | 128.4 | 112.6 | 81.9 | 46.5 | |||
| Dead Space Remake (2023) | 87.7 | 83.9 | 73.3 | 73.6 | 53.8 | 27.5 | |||
| Hogwarts Legacy (2023) | 97.1 | 88.4 | 72.4 | 59.1 | 47 | 26.7 | |||
| Returnal (2023) | 104 | 101 | 93 | 79 | 59 | 34 | |||
| Atomic Heart (2023) | 186.7 | 143.9 | 88.5 | 69.8 | 53.8 | 32.5 | |||
| Company of Heroes 3 (2023) | 193.5 | 167.4 | 134.3 | 133.9 | 100.8 | 58.4 | |||
| Sons of the Forest (2023) | 80.4 | 75.8 | 72.8 | 72.5 | 57.7 | 37.8 | |||
| Resident Evil 4 Remake (2023) | 140 | 103.1 | 96.7 | 67.6 | 52.6 | 30.5 | |||
| The Last of Us (2023) | 96.6 | 82.2 | 71.6 | 56.9 | 36.6 | 31 | 16.5 | ||
| Dead Island 2 (2023) | 209 | 205 | 164.3 | 126.1 | 89.9 | 45.1 | |||
| Star Wars Jedi Survivor (2023) | 81.1 | 72.3 | 67.4 | 64.2 | 40.5 | 19.8 | |||
| Diablo 4 (2023) | 250 | 197.9 | 164.1 | 155.6 | 111.2 | 57.3 | |||
| Ratchet & Clank Rift Apart (2023) | 87.6 | 75.7 | 66.8 | 63.5 | 61.7 | 51.3 | |||
| Atlas Fallen (2023) | 144.5 | 135 | 127 | 106.8 | 42.6 | 75.9 | |||
| Immortals of Aveum (2023) | 62.4 | 51.2 | 41.7 | 28.2 | 15.9 | ||||
| Armored Core 6 (2023) | 104.3 | 102.4 | 101.1 | 96.3 | 76.6 | 44.6 | |||
| Starfield (2023) | 73.5 | 64 | 51.6 | 47.1 | 32.5 | 23.1 | |||
| Lies of P (2023) | 160.7 | 152 | 130.2 | 117.1 | 80.2 | 65 | 41.6 | ||
| Baldur's Gate 3 (2023) | 163.1 | 121.6 | 102 | 86.7 | 84.7 | 30.3 | |||
| Cyberpunk 2077 (2023) | 122.9 | 99.3 | 84.8 | 75 | 46.9 | 20.9 | |||
| Counter-Strike 2 (2023) | 241 | 230 | 193.8 | 149.5 | 105.9 | 63.3 | |||
| EA Sports FC 24 (2023) | 249 | 199.3 | 161.7 | 151.4 | 129 | 79.5 | |||
| Assassin's Creed Mirage (2023) | 114 | 106 | 101 | 79 | 64 | 52 | 41 | ||
| Total War Pharaoh (2023) | 329.3 | 205.4 | 127.1 | 99.1 | 78.3 | 42.5 | |||
| Lords of the Fallen (2023) | 68 | 68.1 | 65.2 | 53.9 | 54.6 | 26.1 | 34 | ||
| Alan Wake 2 (2023) | 67 | 61.2 | 53.2 | 33.6 | 14.1 | ||||
| EA Sports WRC (2023) | 130.8 | 98.1 | 90.7 | 83.4 | 63.2 | 52.5 | 35.5 | ||
| Call of Duty Modern Warfare 3 2023 (2023) | 146 | 129 | 101 | 83 | 67 | 46 | 43 | ||
| Avatar Frontiers of Pandora (2023) | 76 | 72 | 61 | 46 | 31 | 28 | 16 | ||
| The Finals (2023) | 222 | 181.7 | 160.6 | 127.2 | 80.2 | 37.6 | |||
| Ready or Not (2023) | 210 | 189.1 | 174.8 | 131.3 | 82 | 75.1 | 37.2 | ||
| Prince of Persia The Lost Crown (2024) | 356 | 356 | 356 | 340 | 178 | ||||
| Palworld (2024) | 116.7 | 106.1 | 103 | 102.1 | 72.9 | 54.9 | 38.7 | ||
| Enshrouded (2024) | 80.3 | 68.8 | 58.8 | 49.2 | 38 | 34 | 32.8 | 22.8 | |
| Helldivers 2 (2024) | 130 | 101 | 91.3 | 89.5 | 65.6 | 35.3 | |||
| Skull & Bones (2024) | 112 | 103 | 84 | 63 | 50 | 46 | 43 | 31 | |
| Last Epoch (2024) | 192.2 | 184.2 | 167.2 | 127.3 | 83.6 | 40.7 | |||
| Alone in the Dark (2024) | 172.9 | 156.8 | 149.9 | 102.4 | 51.5 | 36.7 | 53.1 | 16.1 | |
| Dragon's Dogma 2 (2024) | 54.2 | 52.7 | 49.3 | 38.7 | 37.5 | 33.9 | |||
| Horizon Forbidden West (2024) | 104.2 | 96.2 | 62.7 | 60.5 | 47 | 42.2 | 38.8 | 29.3 | |
| Ghost of Tsushima (2024) | 88.6 | 80.7 | 74.5 | 60.3 | 63 | 48.3 | 8.5 | 4.8 | |
| Senua's Saga Hellblade 2 (2024) | 60.9 | 52.5 | 38.4 | 39.2 | 26.1 | 24.8 | 9.4 | ||
| F1 24 (2024) | 248 | 234 | 181.7 | 60 | 61.7 | 38.1 | 33 | 18.3 | |
| The First Descendant (2024) | 151.7 | 96.9 | 78.4 | 66.1 | 43.6 | 23.3 | 23.8 | ||
| Once Human (2024) | 184.4 | 126.1 | 108.6 | 99 | 68.2 | 35.6 | |||
| Black Myth: Wukong (2024) | 80 | 60 | 46 | 24 | 27 | 18 | 19 | 10 | |
| Star Wars Outlaws (2024) | 50.2 | 44.9 | 38.1 | 30.9 | 30.8 | 22.2 | |||
| Space Marine 2 (2024) | 77.3 | 71 | 68 | 62 | 61.8 | 46.4 | 38.8 | 24.2 | |
| Final Fantasy XVI (2024) | 69.4 | 66.7 | 56.5 | 49.6 | 40.8 | 36.2 | 17.9 | ||
| God of War Ragnarök (2024) | 127.7 | 107 | 91.4 | 83.1 | 90.6 | 63.2 | 35.6 | ||
| Until Dawn (2024) | 65.3 | 51.5 | 39.1 | 28.1 | 16.1 | ||||
| Call of Duty Black Ops 6 (2024) | 111 | 99 | 72 | 69 | 50 | 31 | |||
| Stalker 2 (2024) | 77.7 | 66.7 | 53.3 | 43.9 | 36.1 | ||||
| Indiana Jones and the Great Circle (2024) | 93.5 | 63 | |||||||
| Kingdom Come Deliverance 2 (2025) | 109 | 84.3 | 69.2 | 50.2 | 49.1 | 35.9 | 23 | 20.1 | |
| Monster Hunter Wilds (2025) | 60.2 | 51.1 | 30.5 | 31.1 | 24.6 | ||||
| Civilization 7 (2025) | 292 | 174.7 | 122.3 | 79.9 | 34.9 | ||||
| Assassin's Creed Shadows (2025) | 54 | 45 | 39 | 24 | 23 | ||||
| The Elder Scrolls IV Oblivion Remastered (2025) | 80.4 | 70.4 | 47.9 | 23.7 | 25.8 | 14.2 | |||
| Doom: The Dark Ages (2025) | 68 | 60.2 | 54.7 | 52.6 | 49.9 | 33.1 | |||
| F1 25 (2025) | 185.3 | 167.5 | 138.1 | 14.9 | 15.2 | 8.48 | 6.36 | 3.44 | |
| The Outer Worlds 2 (2025) | 86.3 | 80.4 | 64.6 | 36.5 | 31 | 23 | |||
| ARC Raiders (2025) | 181.7 | 114.9 | 92.4 | 57.5 | 58.1 | 40.2 | 36.4 | 22.7 | |
| Anno 117: Pax Romana (2025) | 95.6 | 73.5 | 55.9 | 30 | 30.6 | 21.5 | |||
| Death Stranding 2 (2026) | 71.4 | 61.8 | 56.8 | 44.4 | 47.9 | 33.3 | 29.6 | 20.6 | |
| Crimson Desert (2026) | 90.9 | 57.4 | 53.9 | 46.2 | 37.6 | 35.9 | 22.2 | 20.5 | |
| Pragmata (2026) | 114.4 | 86.2 | 69.2 | 67.4 | 50.6 | 42.7 | 27.7 | ||
| Forza Horizon 6 (2026) | 142 | 90 | 48 | 21 | 18 | 17 | |||
| 007 First Light (2026) | 63.7 | 52.9 | 57.8 | 49.3 | 6.93 |
Emissions - Good cooling and quiet under load
Noise Emissions
The cooling system of the Minisforum NUCXi7 consists of five heat pipes and two fans, which are hardly audible or even completely silent during idle operation. But even under load, the device never gets really loud, and we measure a maximum noise level of 40.8 dB(A).
Noise level
| Idle |
| 29.5 / 29.5 / 29.5 dB(A) |
| Load |
| 32.8 / 40.8 dB(A) |
 | ||
30 dB silent 40 dB(A) audible 50 dB(A) loud |
||
min: | ||
| Minisforum NUCX i7 i7-11800H, GeForce RTX 3070 Laptop GPU | Zotac Magnus One (ECM73070C) i7-10700, GeForce RTX 3070 | Zotac ZBOX Magnus EN173070C i7-11800H, GeForce RTX 3070 Laptop GPU | Intel Dragon Canyon NUC - RTX 3060 i9-12900, GeForce RTX 3060 | |
|---|---|---|---|---|
| Noise | -18% | -13% | -4% | |
| off / environment * (dB) | 29.5 | 30 -2% | 30.7 -4% | 30.2 -2% |
| Idle Minimum * (dB) | 29.5 | 33.58 -14% | 32.7 -11% | 30.2 -2% |
| Idle Average * (dB) | 29.5 | 32.8 -11% | 30.4 -3% | |
| Idle Maximum * (dB) | 29.5 | 32.8 -11% | 30.8 -4% | |
| Load Average * (dB) | 32.8 | 44.25 -35% | 41.7 -27% | |
| Load Maximum * (dB) | 40.8 | 48.72 -19% | 45.4 -11% | 45.1 -11% |
* ... smaller is better
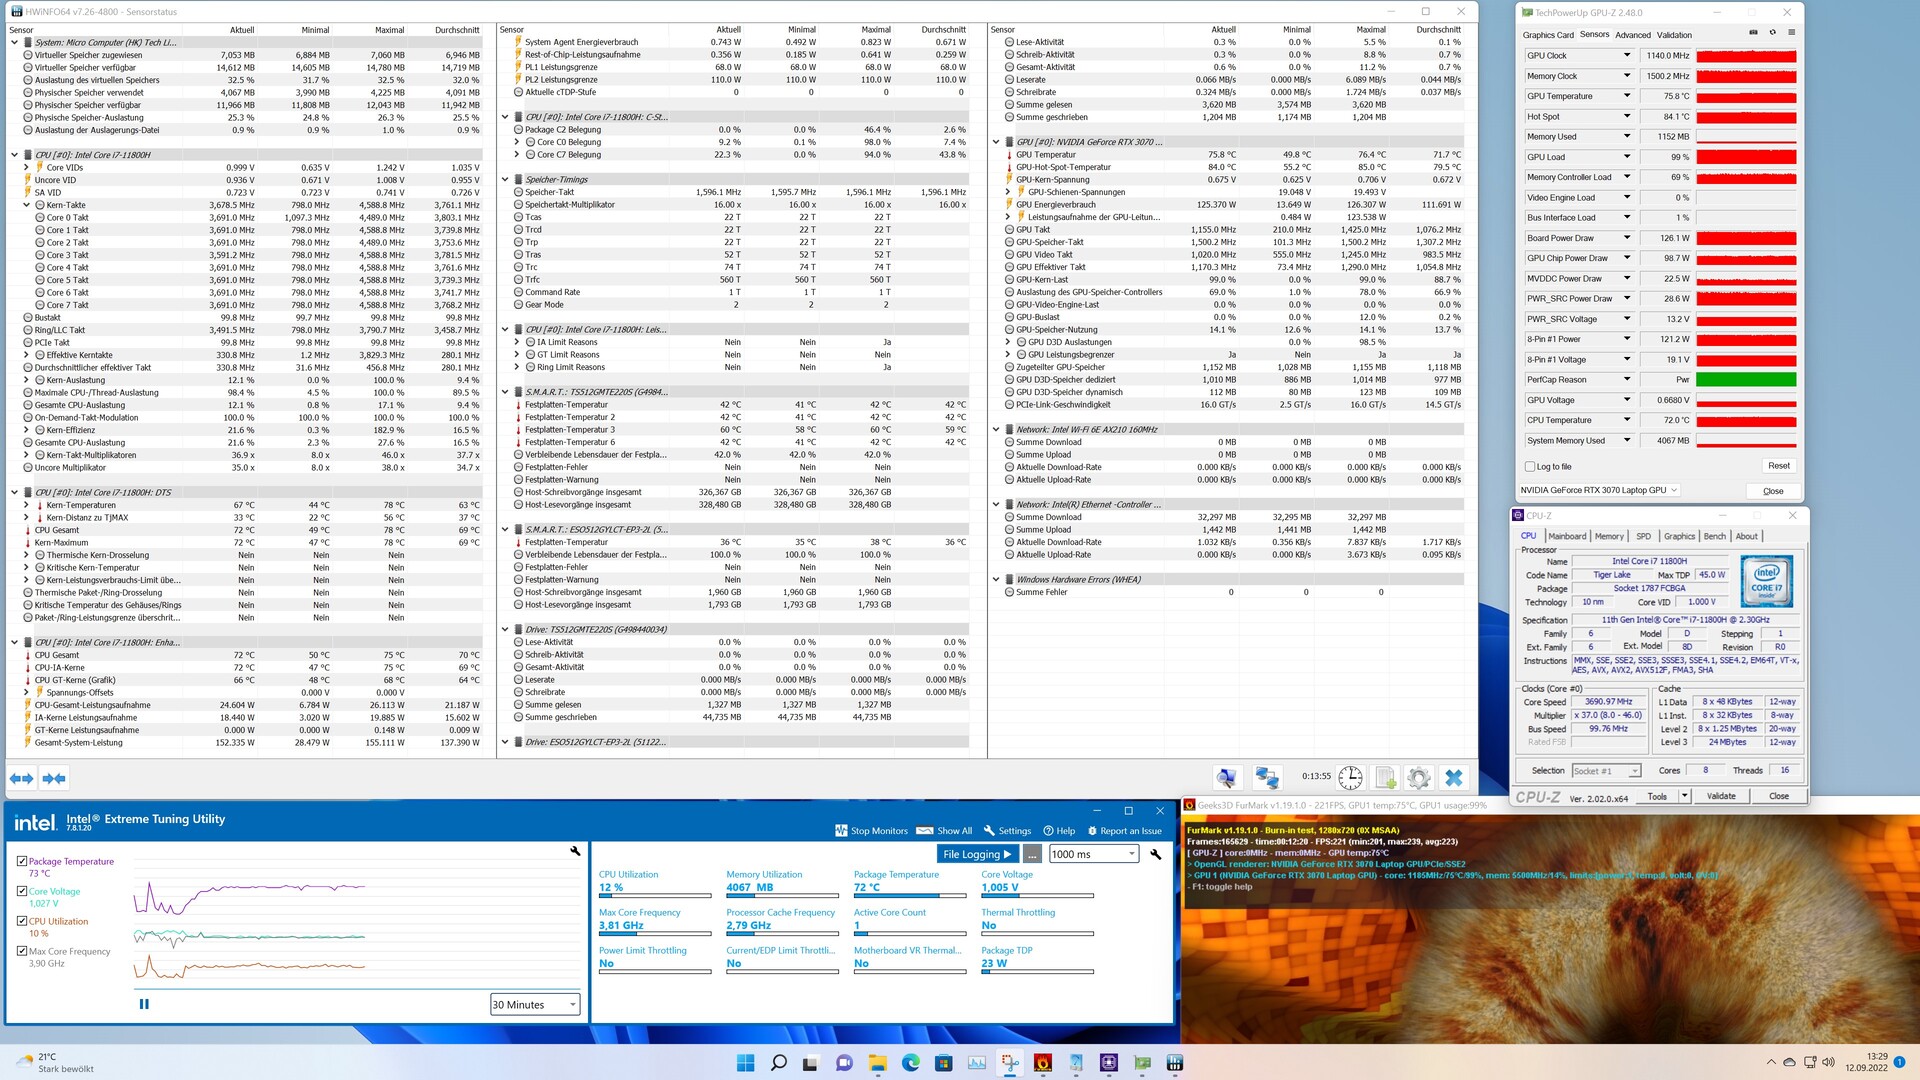
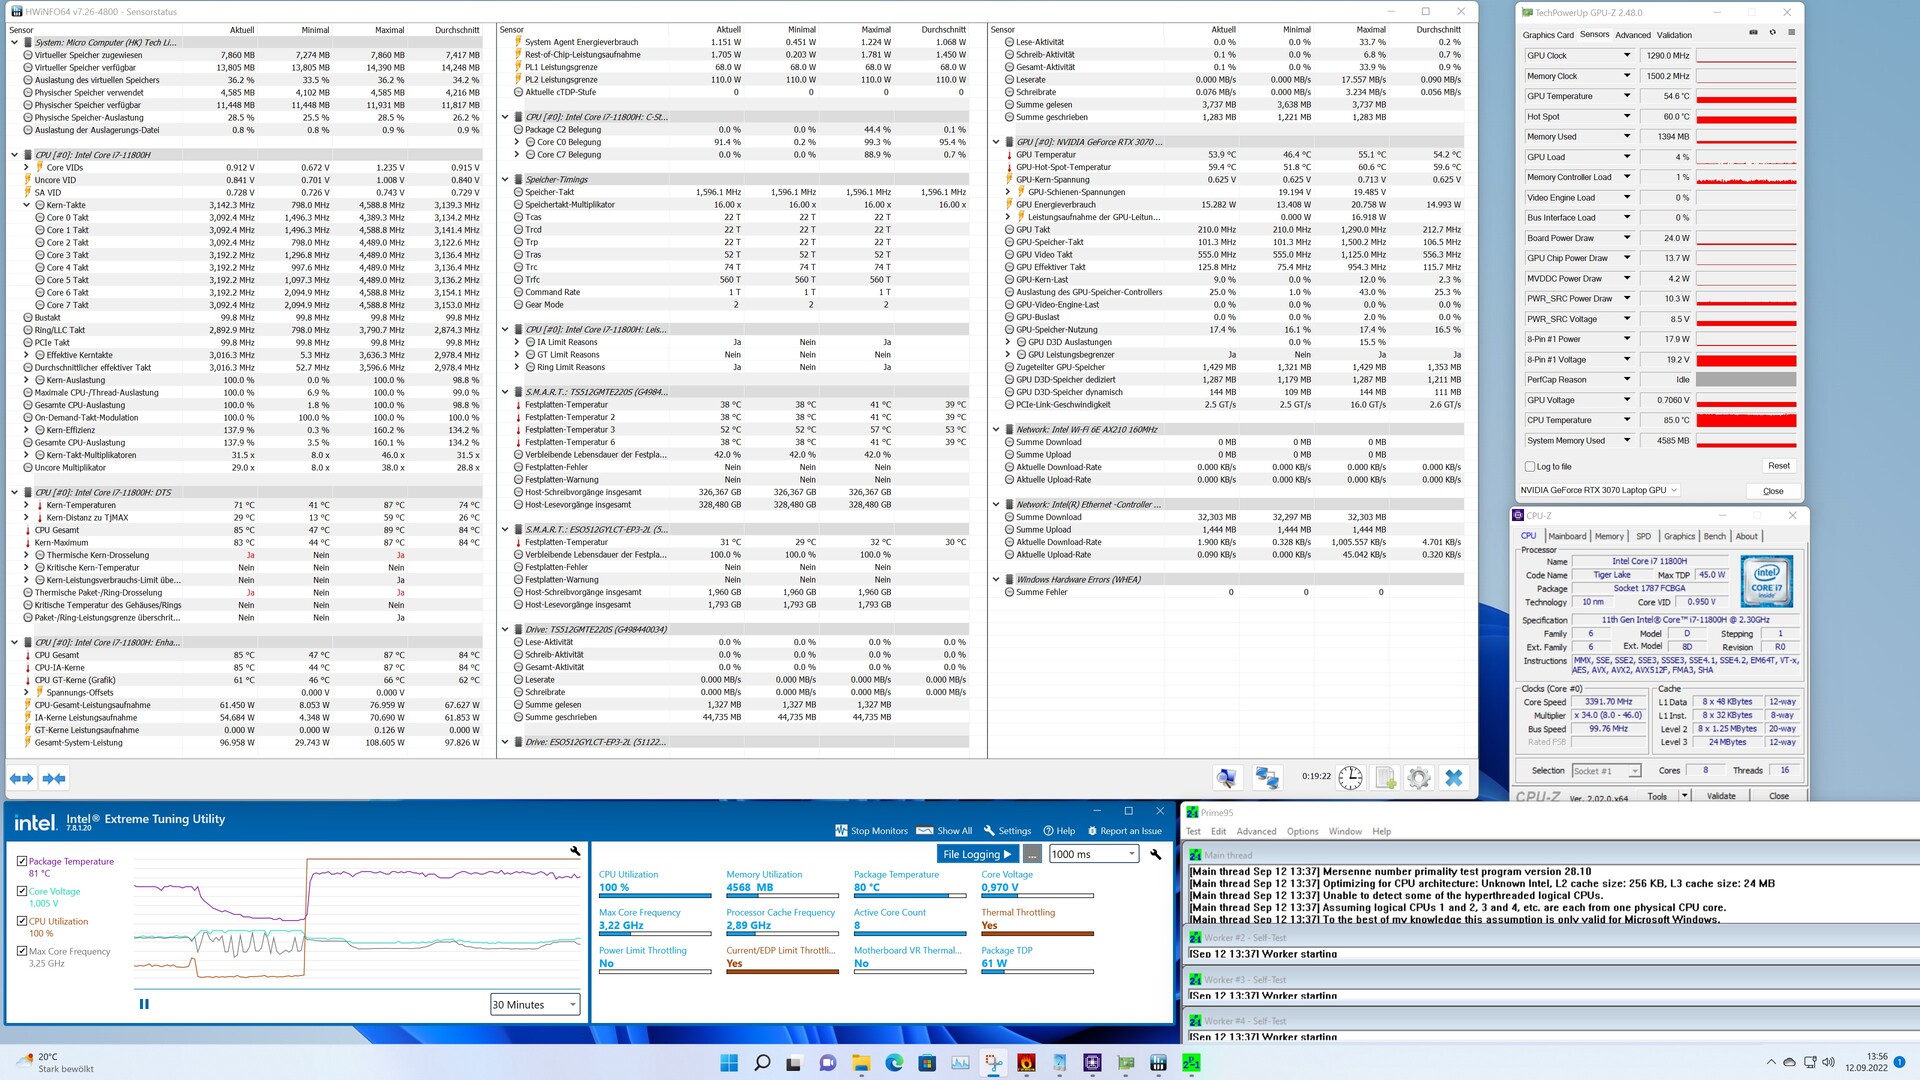
Temperatures
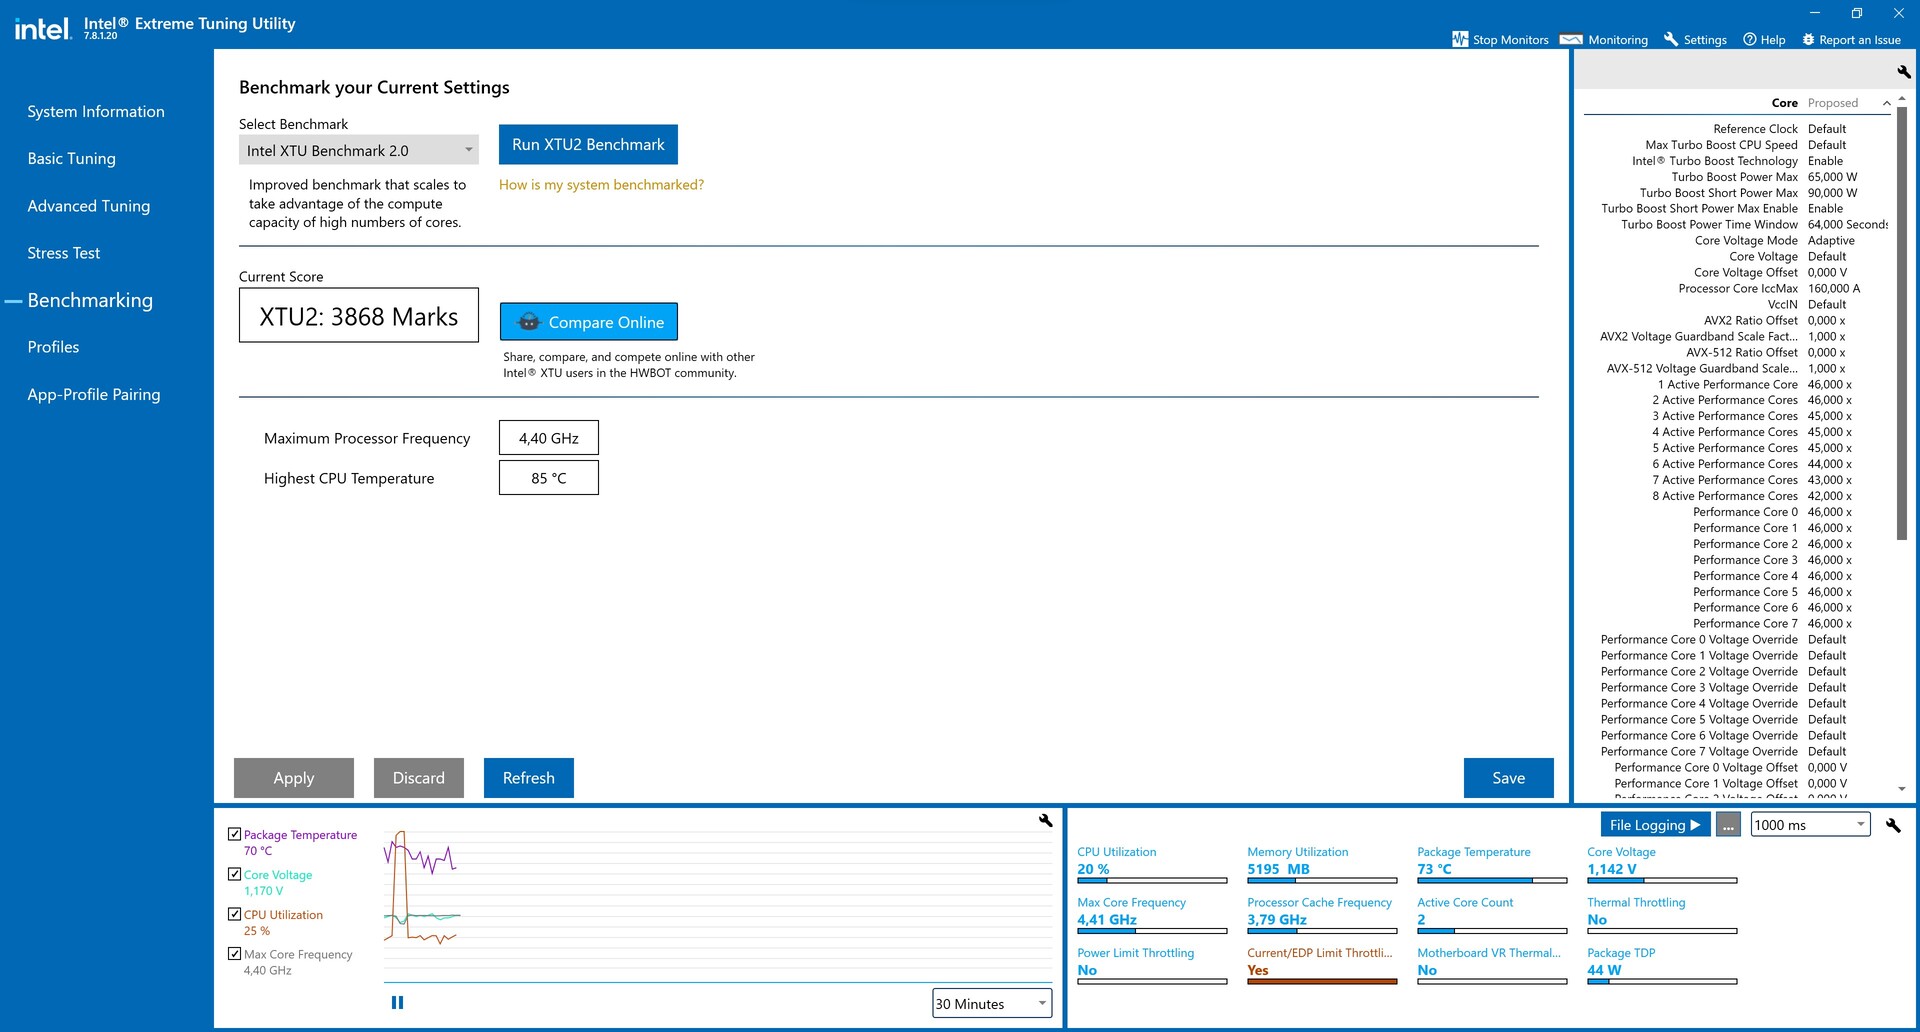
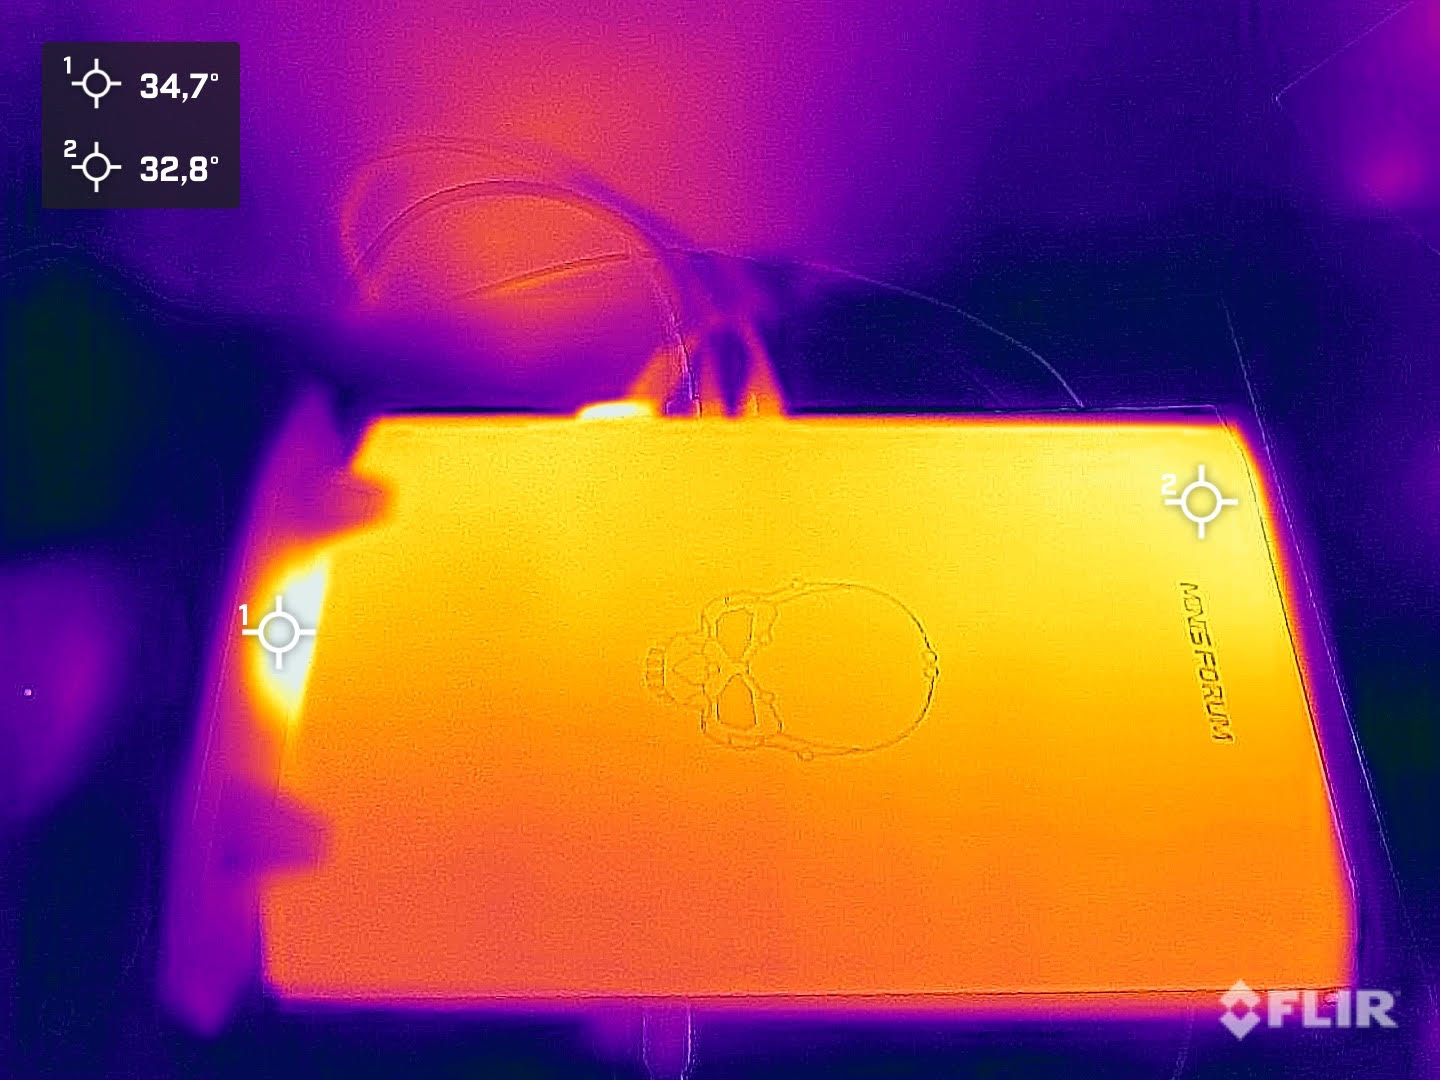
Due to the construction, the case temperatures are very similar to those of a gaming laptop. During the stress test, we measure 45.9 °C (114.6 °F) at the warmest spot on the visible side that also shows the logo and label. The case temperatures we measured during gaming are slightly lower.
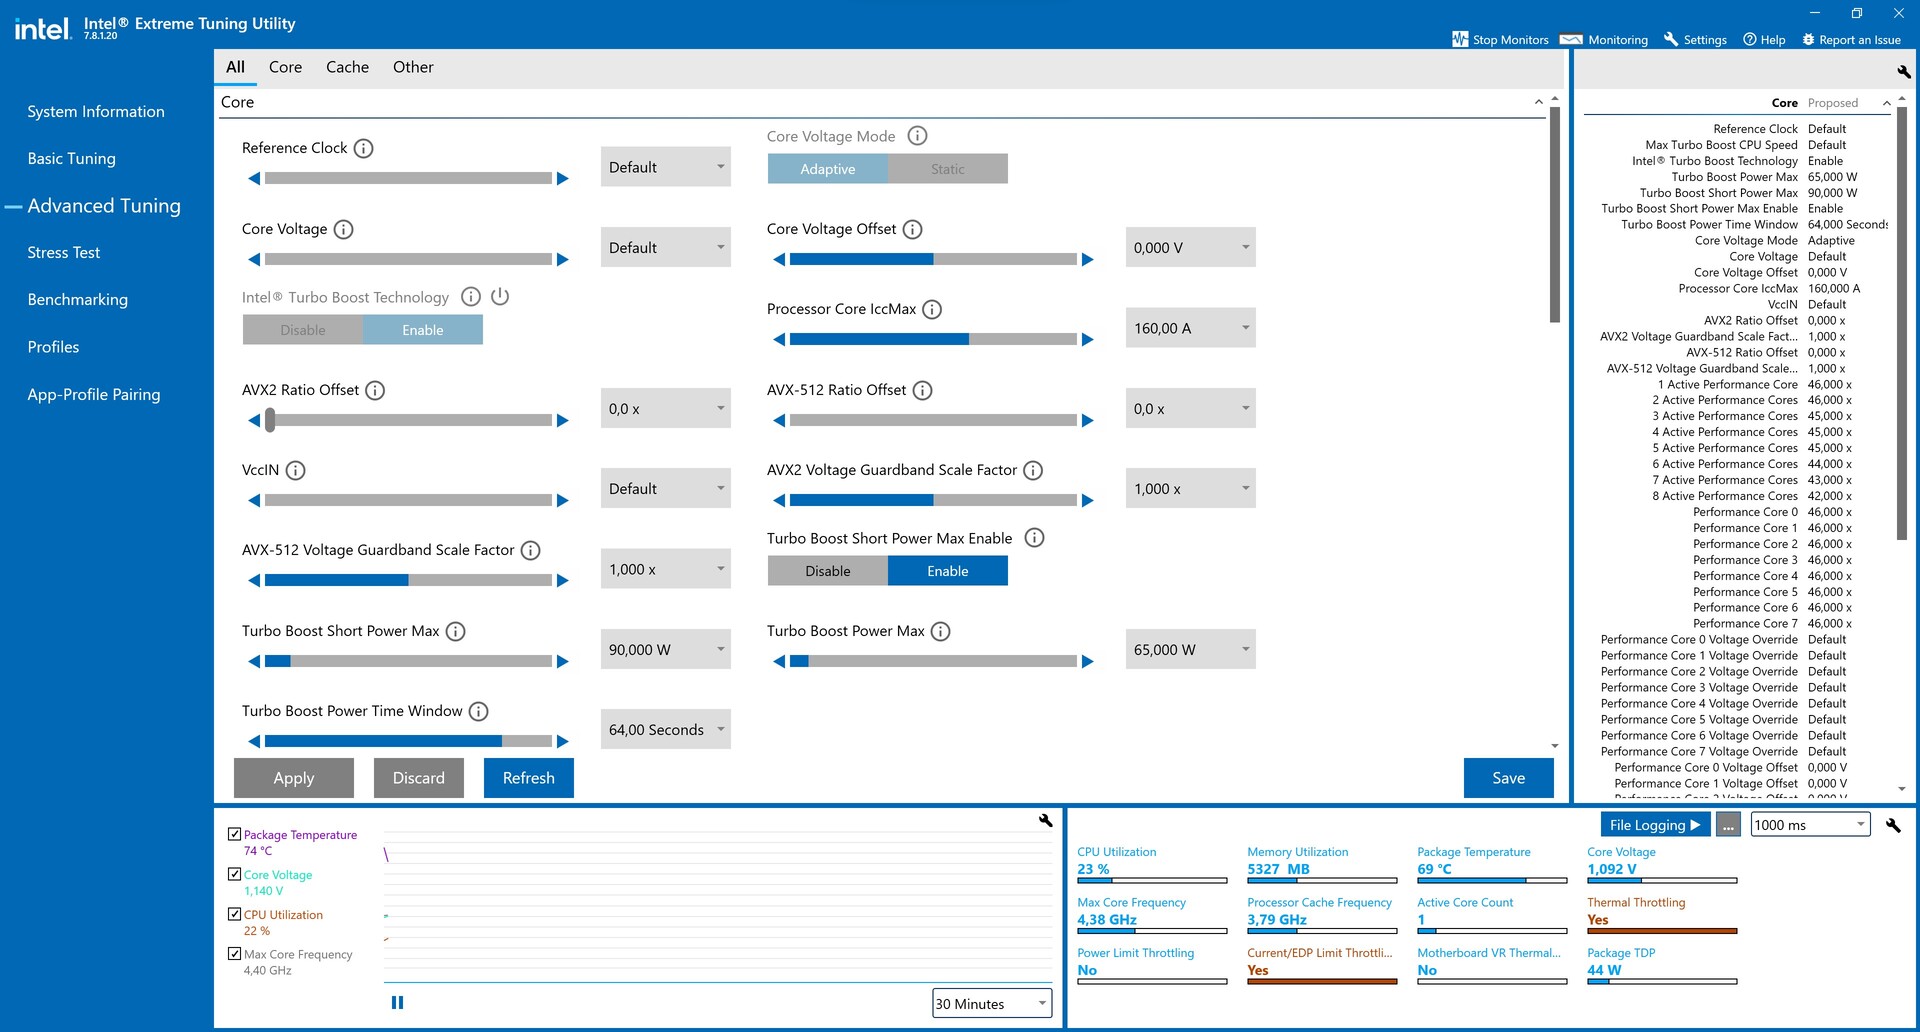
Things look similarly good with the components: The Intel Core i7-11800H reaches 86 °C (187 °F) under load, although the Nvidia GeForce RTX 3070 Laptop GPU remains slightly cooler during the stress test at 77 °C (°F). Intel XTU as well as HWiNFO report thermal throttling under load, which confirms that the manufacturer defined a thermal limit of 85 °C (185 °F) for the processor. You can increase this limit of the processor to 94 °C (201 °F) in the BIOS. On the other hand, the limit of 87 °C (189 °F) always remains fixed for the graphics card.
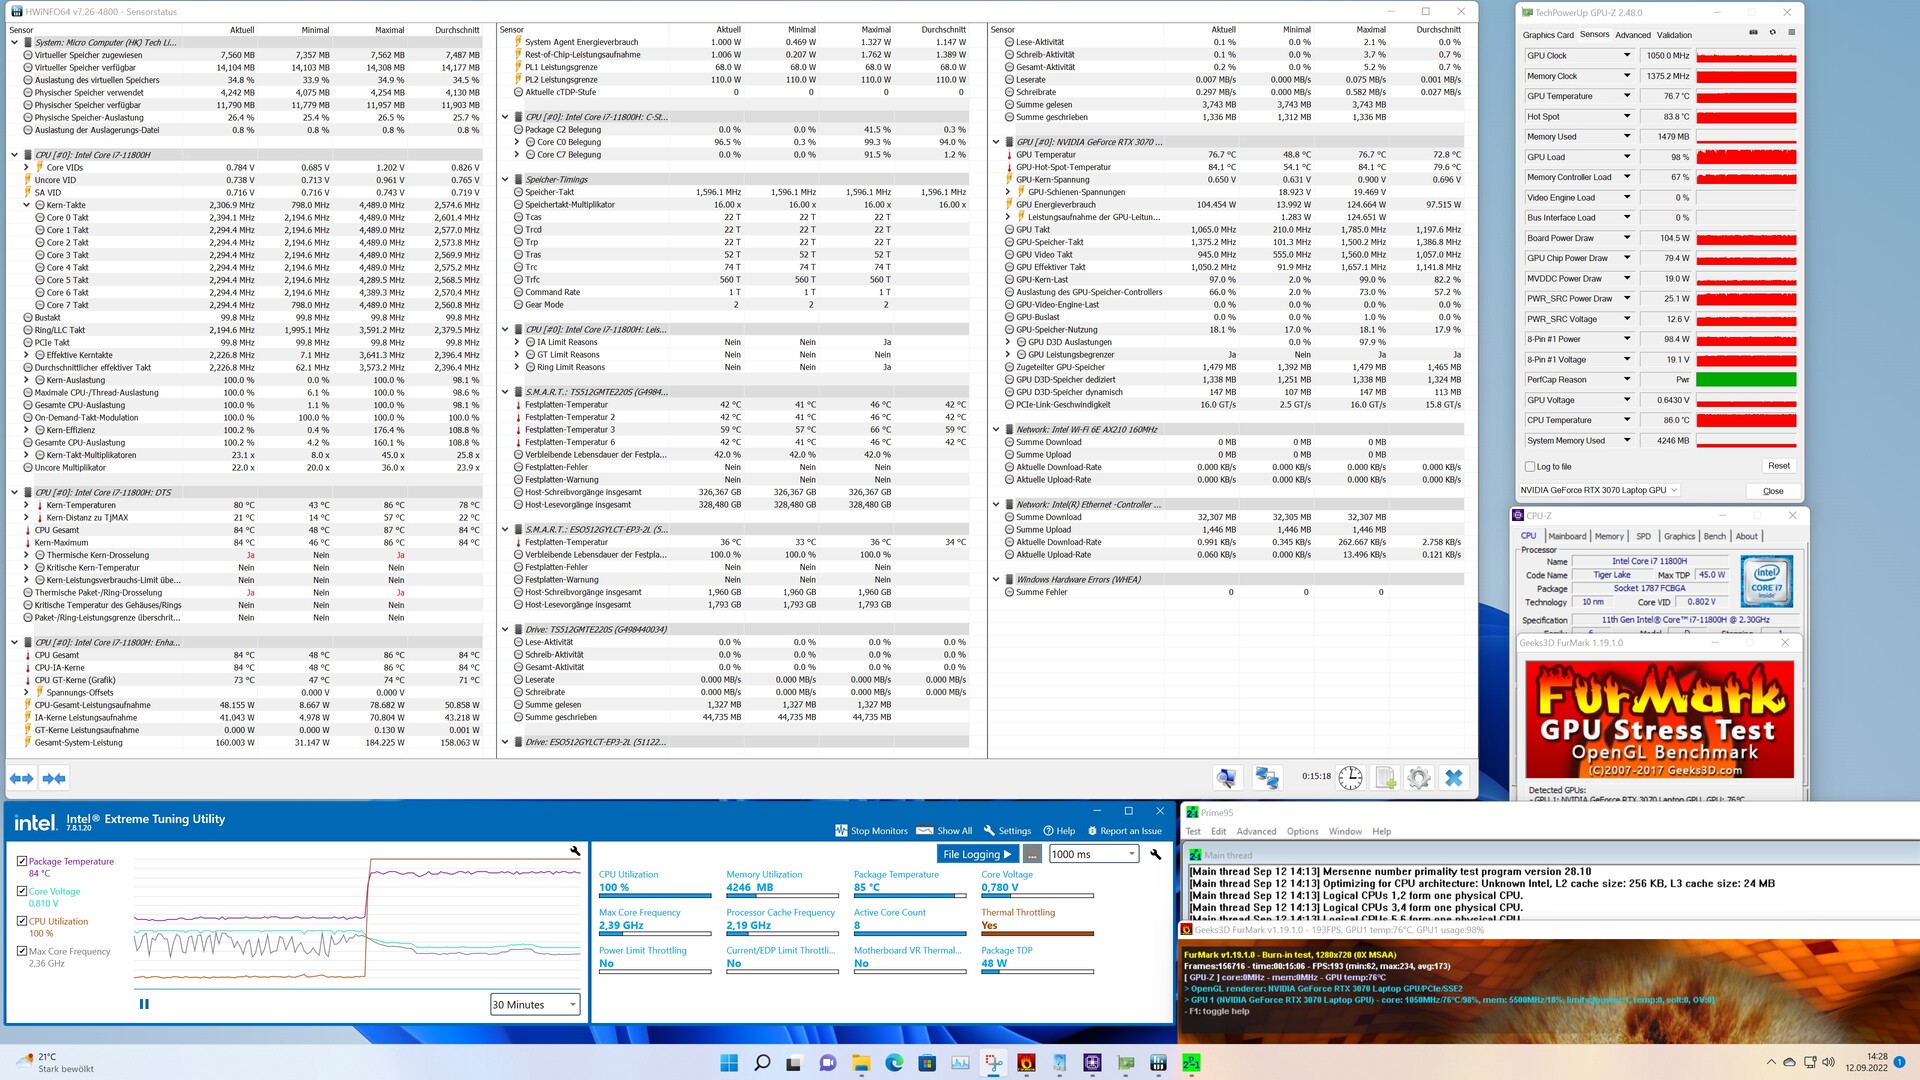
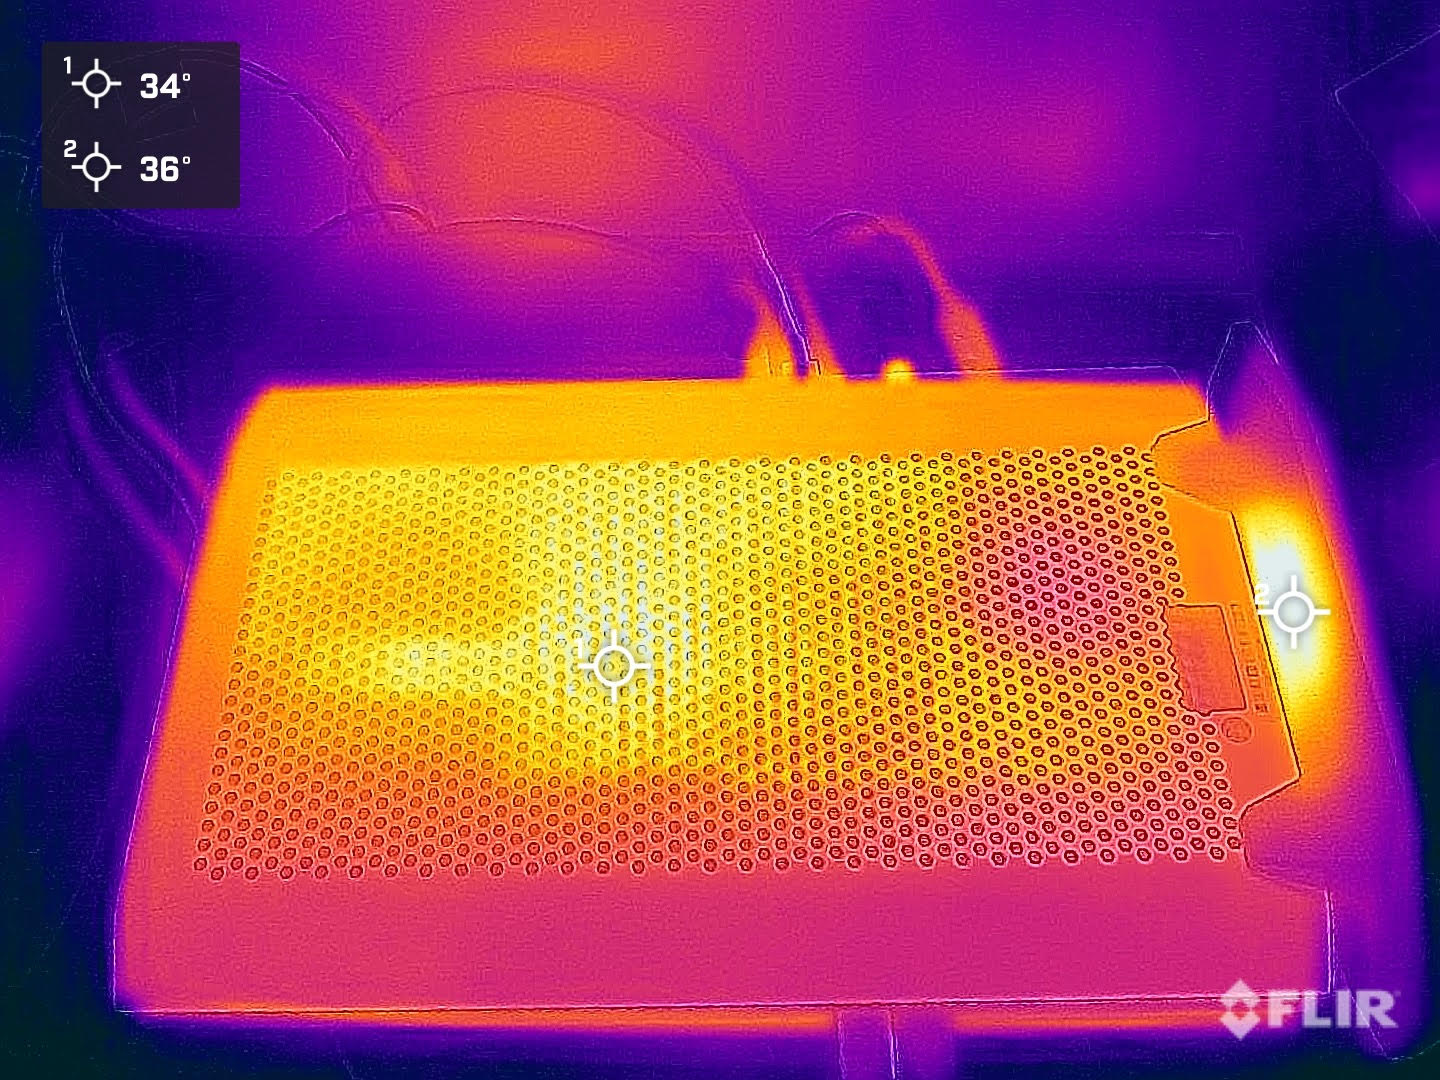
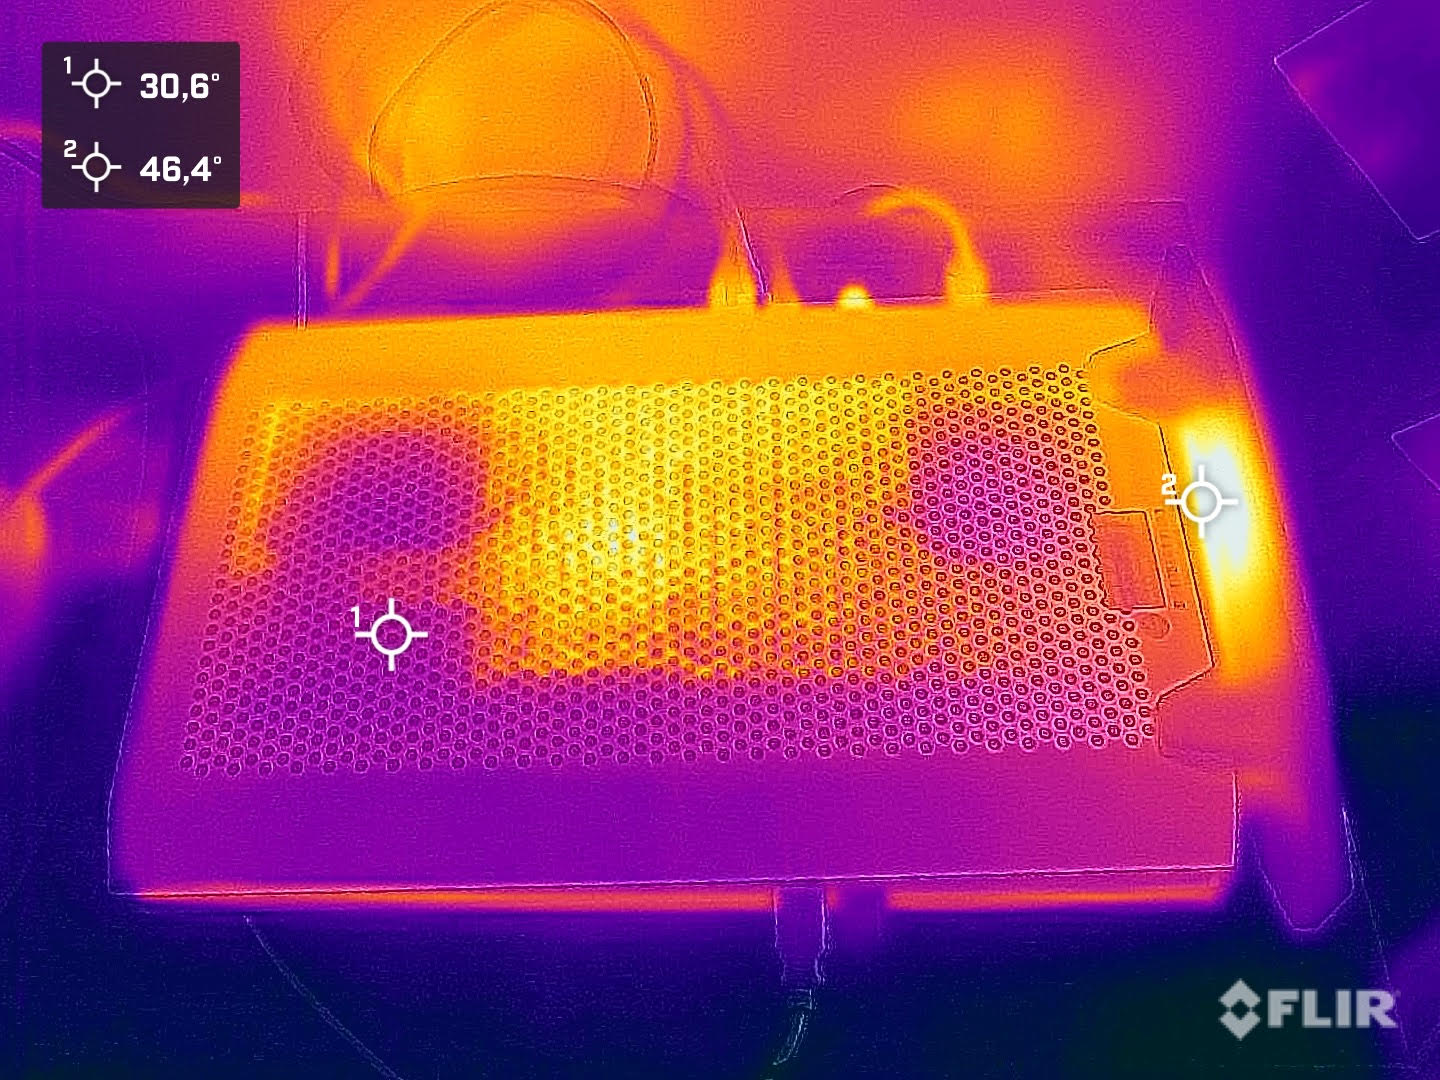
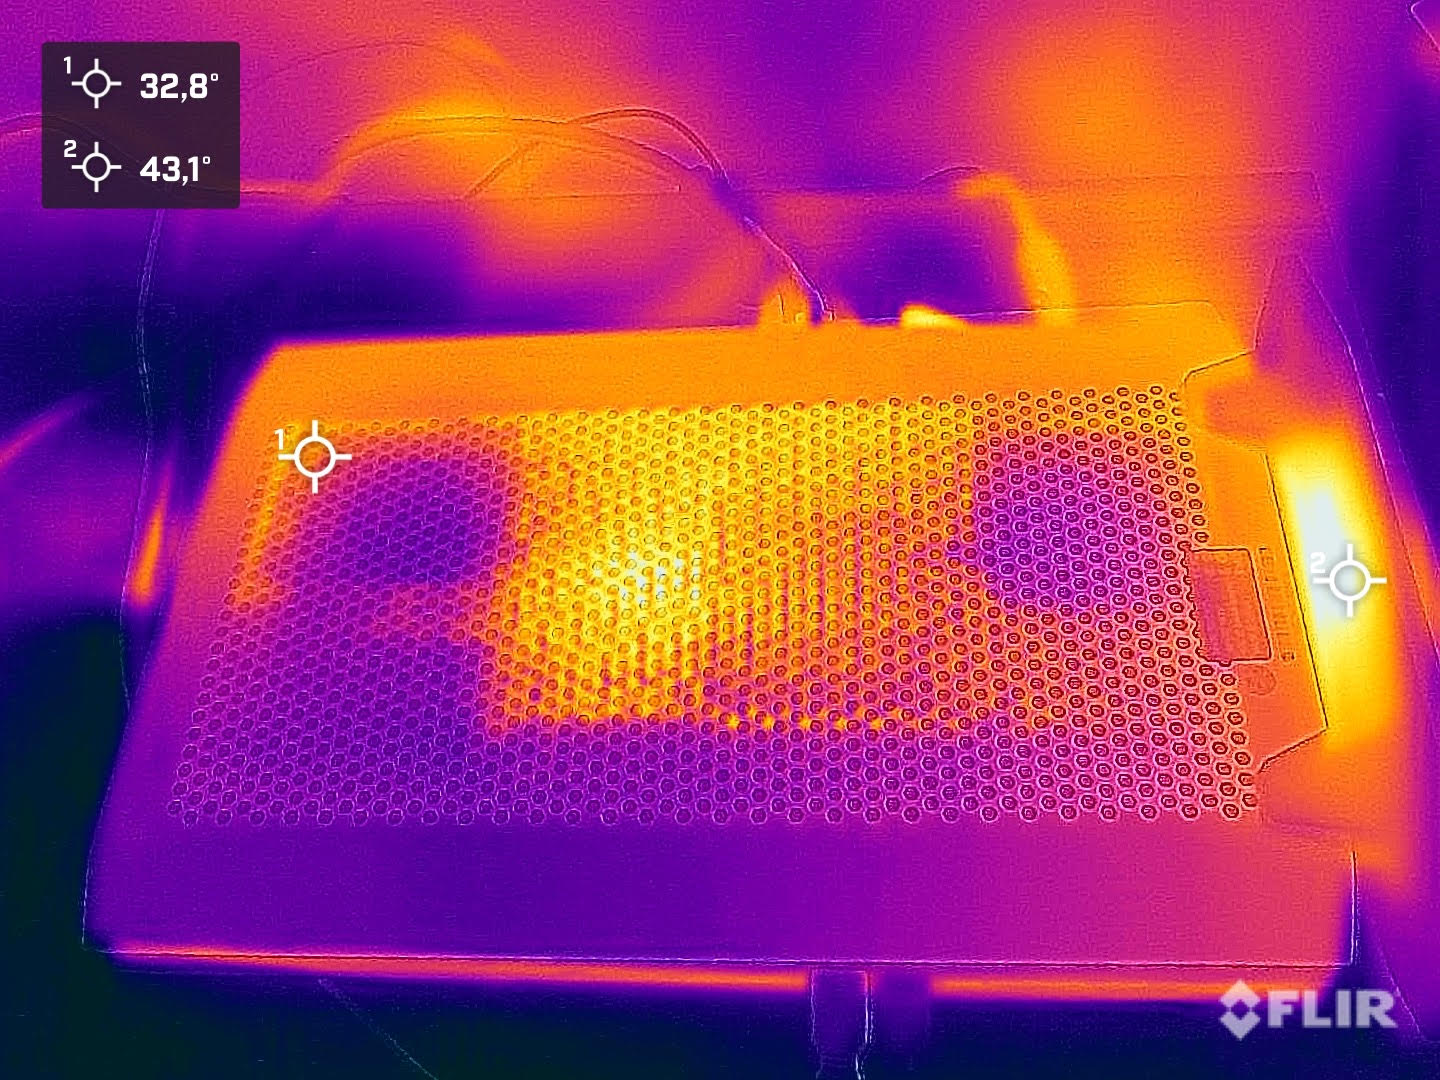
(-) The maximum temperature on the upper side is 45.9 °C / 115 F, compared to the average of 33.9 °C / 93 F, ranging from 25 to 47 °C for the class Desktop.
(+) The bottom heats up to a maximum of 39.3 °C / 103 F, compared to the average of 33.6 °C / 92 F
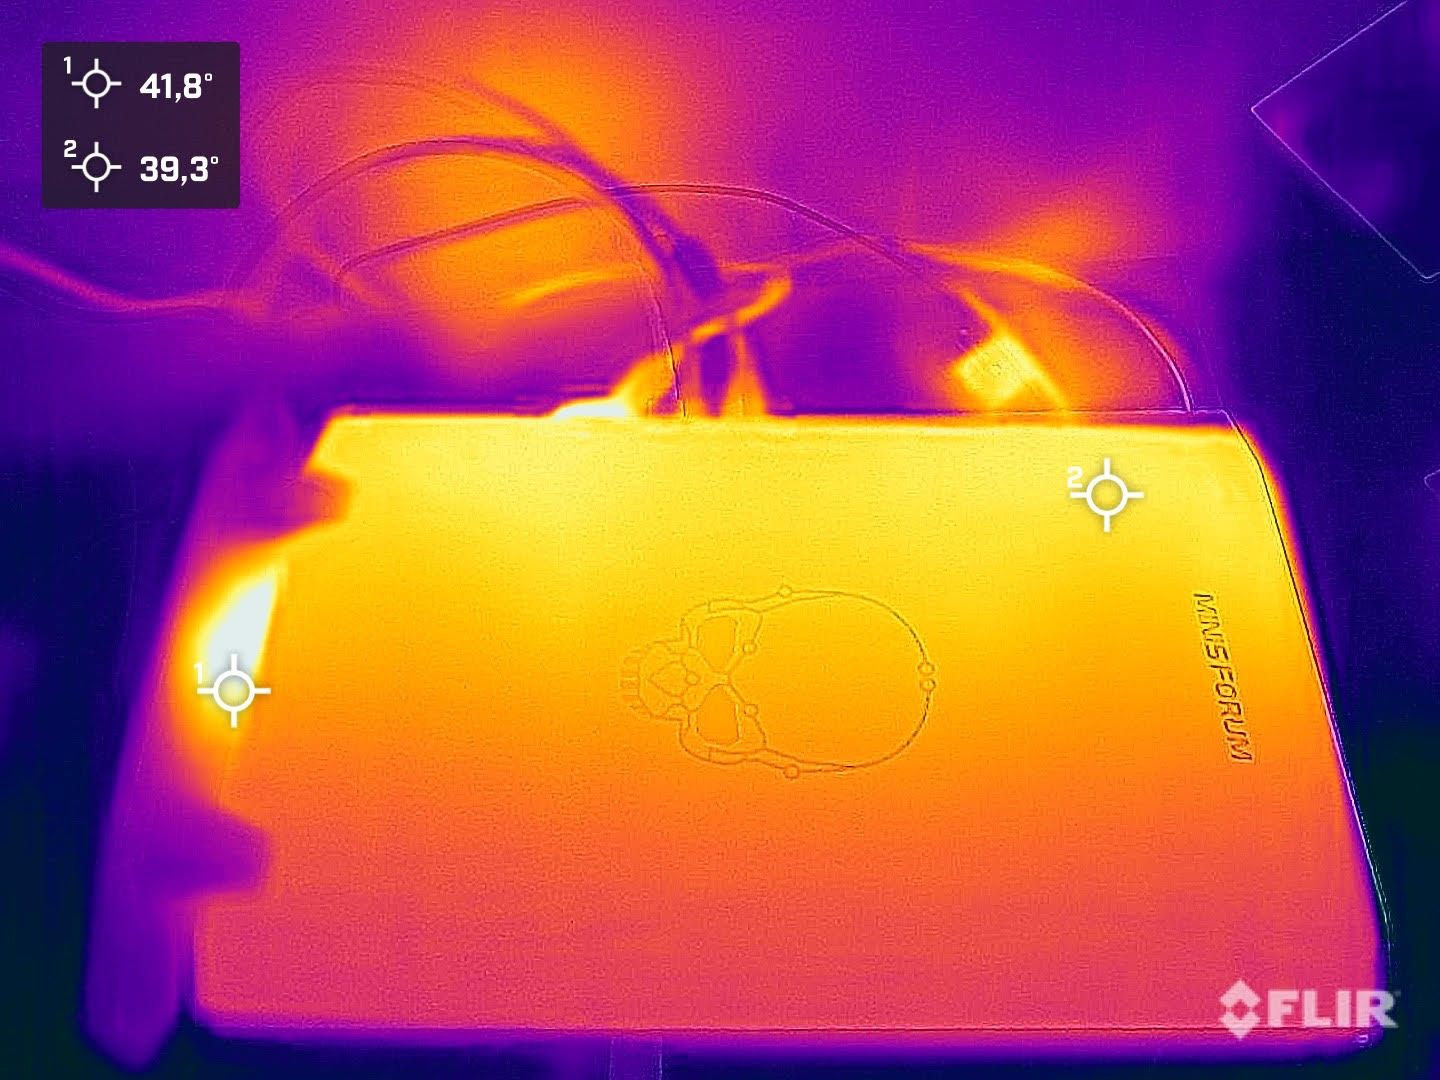
(±) In idle usage, the average temperature for the upper side is 35.7 °C / 96 F, compared to the device average of 29.5 °C / 85 F.
(-) Playing The Witcher 3, the average temperature for the upper side is 40.2 °C / 104 F, compared to the device average of 29.5 °C / 85 F.
Power Consumption
Compared to a regular desktop PC, the Minisforum NUCXi7 has a clear advantage due to its efficient components. Even compared to the Zotac ZBOX Magnus EN1730C, our test unit is clearly ahead, being significantly more efficient despite the almost identical hardware, while not losing any of the performance. At 28 to 36 watts, the power consumption is low without load but still significantly higher compared to the Gigabyte A7 X1. Under load, the Minisforum NUCXi7 then consumes an average of 83 watts, although we measure 167 watts while gaming. We also note brief peaks of up to 215 watts, which won't reach the limits of the 230-Watt power supply.
| Off / Standby | |
| Idle | |
| Load |
|
Key:
min: | |
| Minisforum NUCX i7 i7-11800H, GeForce RTX 3070 Laptop GPU | Zotac ZBOX Magnus EN173070C i7-11800H, GeForce RTX 3070 Laptop GPU | Gigabyte A7 X1 R9 5900HX, GeForce RTX 3070 Laptop GPU | Average NVIDIA GeForce RTX 3070 Laptop GPU | Average of class Desktop | |
|---|---|---|---|---|---|
| Power Consumption | -37% | 15% | 13% | 3% | |
| Idle Minimum * (Watt) | 28.2 | 31.3 -11% | 12 57% | 15.6 ? 45% | 17.9 ? 37% |
| Idle Average * (Watt) | 29.9 | 35.1 -17% | 14 53% | 20.1 ? 33% | 37.2 ? -24% |
| Idle Maximum * (Watt) | 36.2 | 41.6 -15% | 19 48% | 29.4 ? 19% | 41.3 ? -14% |
| Load Average * (Watt) | 83.2 | 214 -157% | 118 -42% | 110.8 ? -33% | 96.7 ? -16% |
| Witcher 3 ultra * (Watt) | 167 | 193.5 -16% | 205 -23% | ||
| Cyberpunk 2077 ultra external monitor * (Watt) | 177 | ||||
| Load Maximum * (Watt) | 215.7 | 231 -7% | 229 -6% | 214 ? 1% | 141.6 ? 34% |
* ... smaller is better
Power Consumption With External Monitor
Pros
Cons
Verdict - An ultra slim gaming PC
With the Minisforum NUCXi7, the manufacturer offers a very exciting gaming PC, using proven laptop technology. The combination of the Intel Core i7-11800H and Nvidia GeForce RTX 3070 Laptop GPU works very well and ensures a quickly running system. The very slim case looks to be of a high quality and modern at the same time. Due to the cooling, the Minisforum NUCXi7 should only be run in the vertical position. This is something you have to accept when you decide for the device. You also have to live with some small compromises in terms of the variety of connections, since the USB-A ports that are usually used for the mouse and keyboard are placed in the front of the device. With the 512-GB SSD, you are fairly well equipped for the beginning. However, considering the targeted users, gamers might quickly hit its limits, and we recommend at least 1 TB as the standard.
The Minisforum NUCXi7 is a quiet gaming PC in an ultra slim case that is designed for 1,440p gaming.
We really liked the low emission values of the Minisforum NUCXi7: Not only is the device quiet, but it is also efficient, always keeping the temperatures under control. At the same time, you don't have to live with a reduced performance of the CPU and GPU. In addition, our test sample did not commit any bad blunders at any time. The system performance is good while working or when gaming. In some parts, the Minisforum NUCXi7 is even able to keep up with regular desktop PCs.
As a possible alternative to the Minisforum NUCXi7, you could also look at a gaming laptop. There is definitely an additional value, even though there is also a small additional premium with similar equipment: The Gigabyte A7 X1 costs about $1800.
Price and Availability
The Minisforum NUCXi7 is listed in the Minisforum shop with orders to be shipped in mid-October. There are currently still some attractive "pre-sale" discounts. For example, our test unit currently costs $1,169. The regular price would be $1,339 without the rebate. The more affordable NUCXi5 currently costs $979 with the same RAM and SSD equipment (regularly $1129).
Minisforum NUCX i7
- 09/14/2022 v7 (old)
Sebastian Bade

