Zotac Magnus One desktop PC with Core i7 and GeForce RTX 3070 in review
With the new Magnus One series, Zotac introduces another compact gaming computer to their portfolio. However, it should be mentioned right away that the Zotac Magnus One is a barebone system. This means that the RAM, mass storage, and also the operating system have to be purchased separately. A similar approach is taken by Zotac with its ZBOX Magnus, which is even more compact, though.
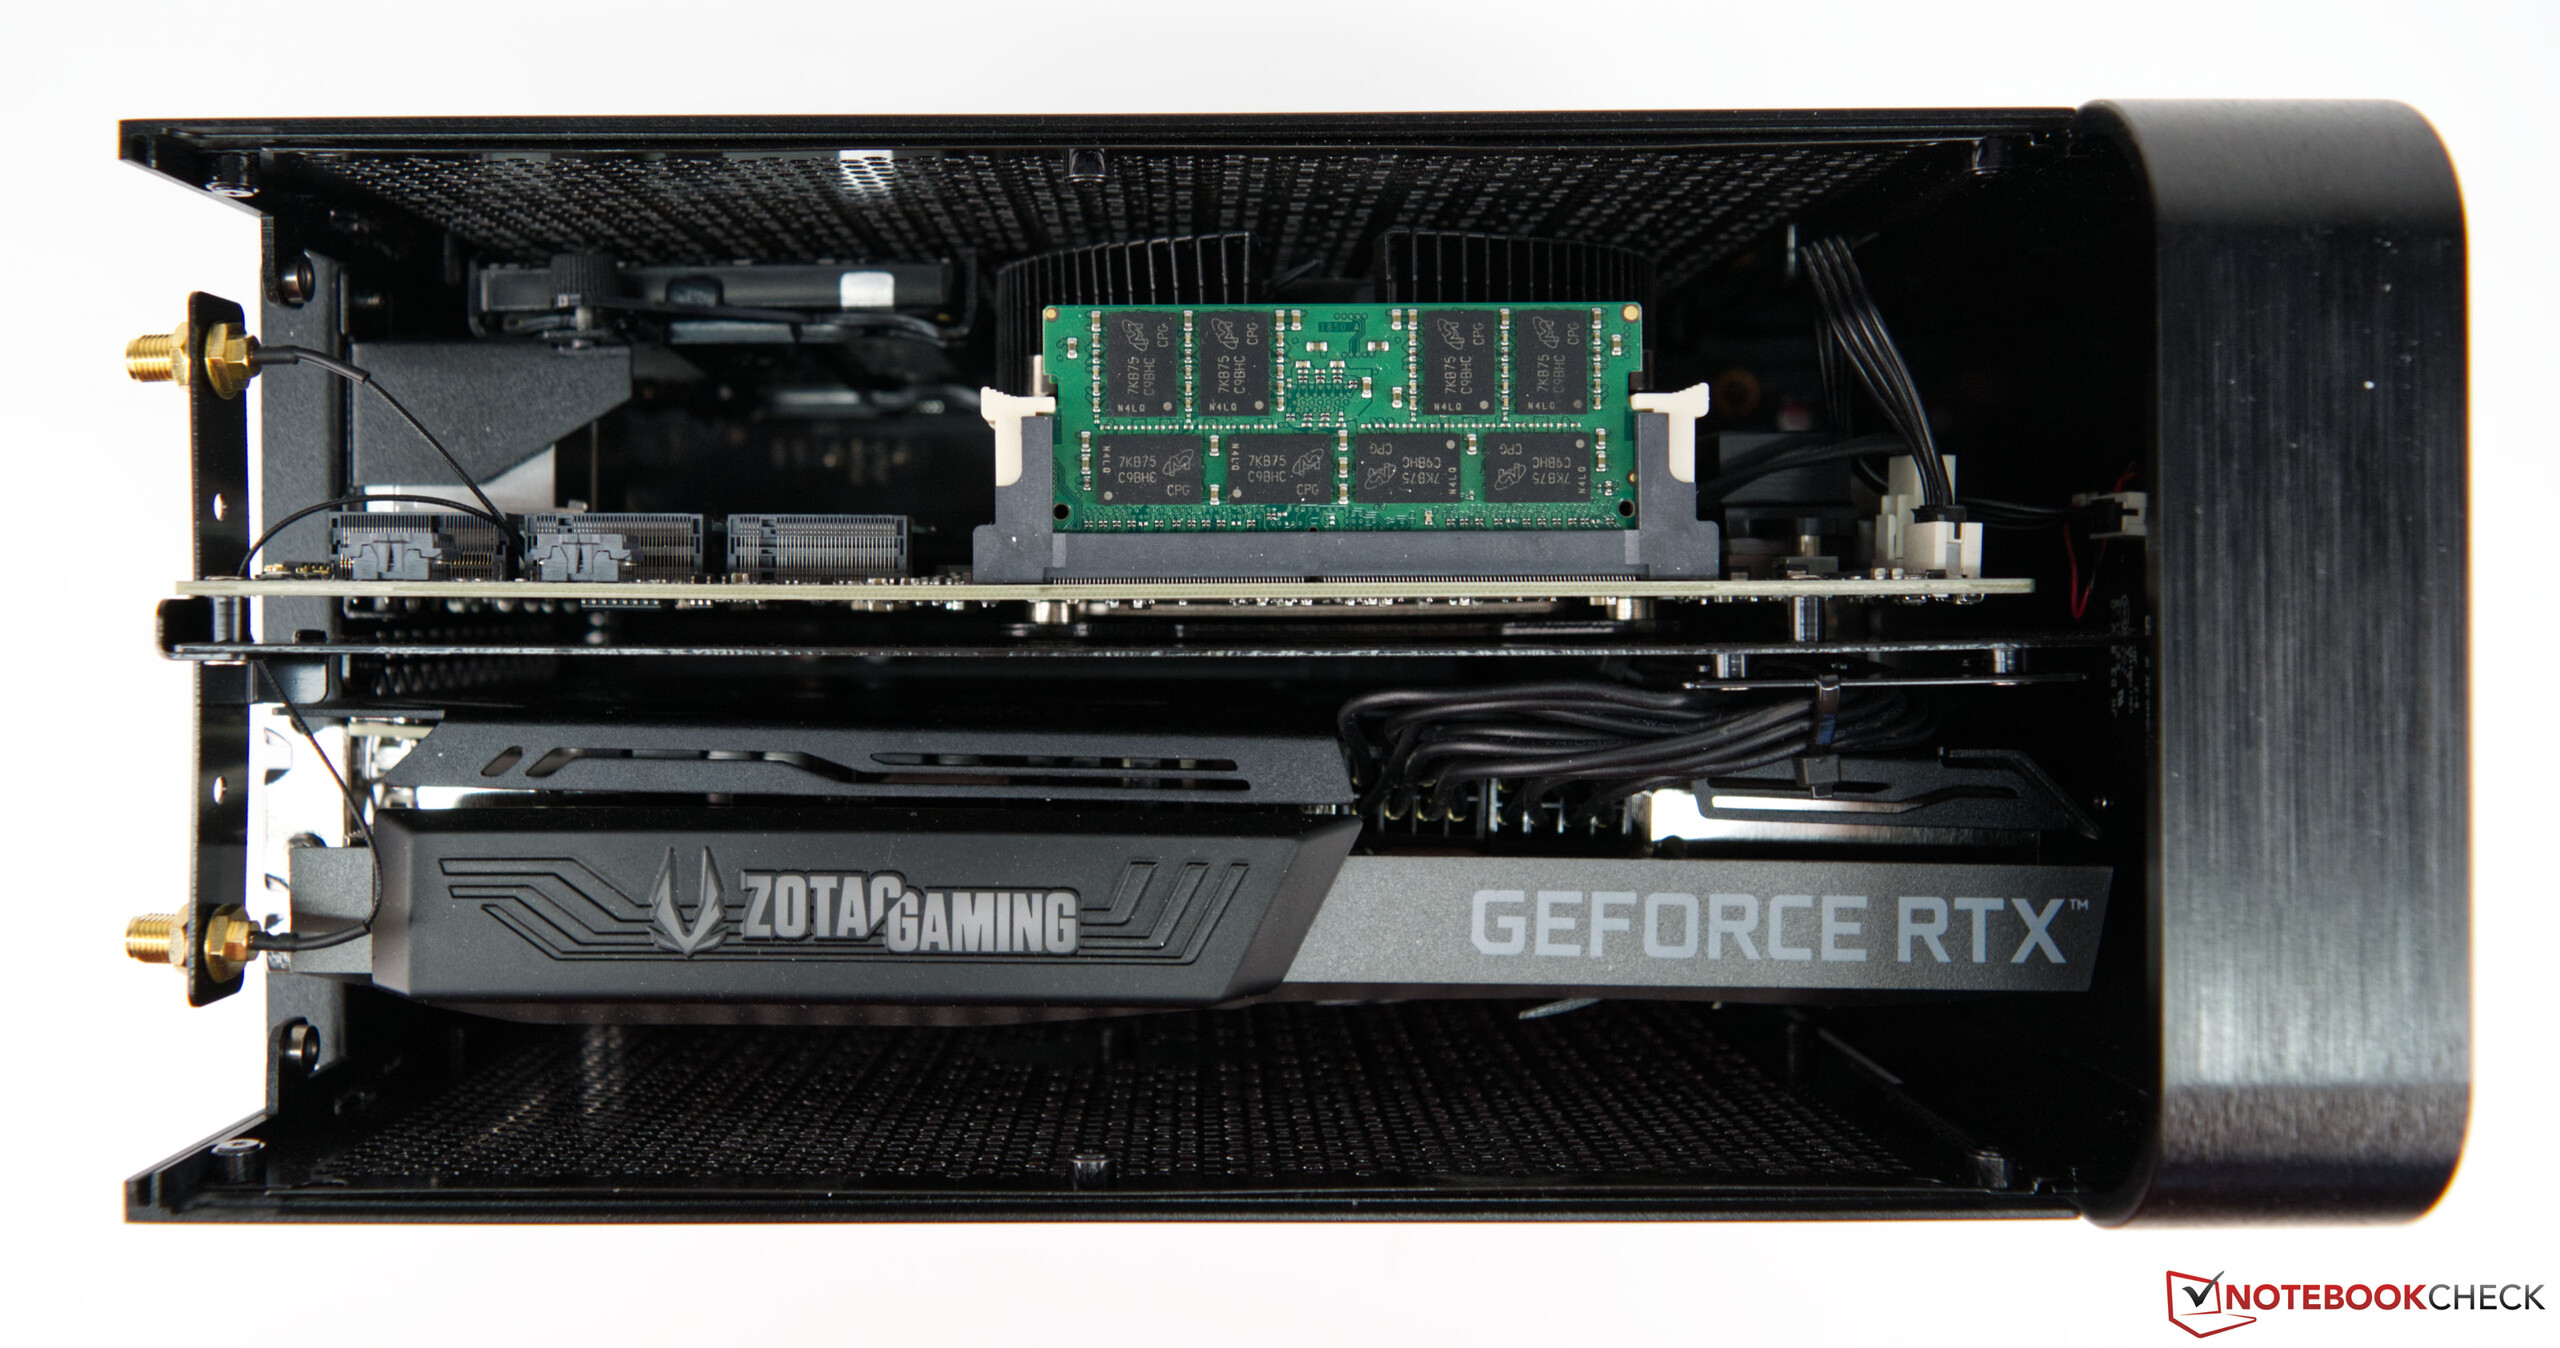
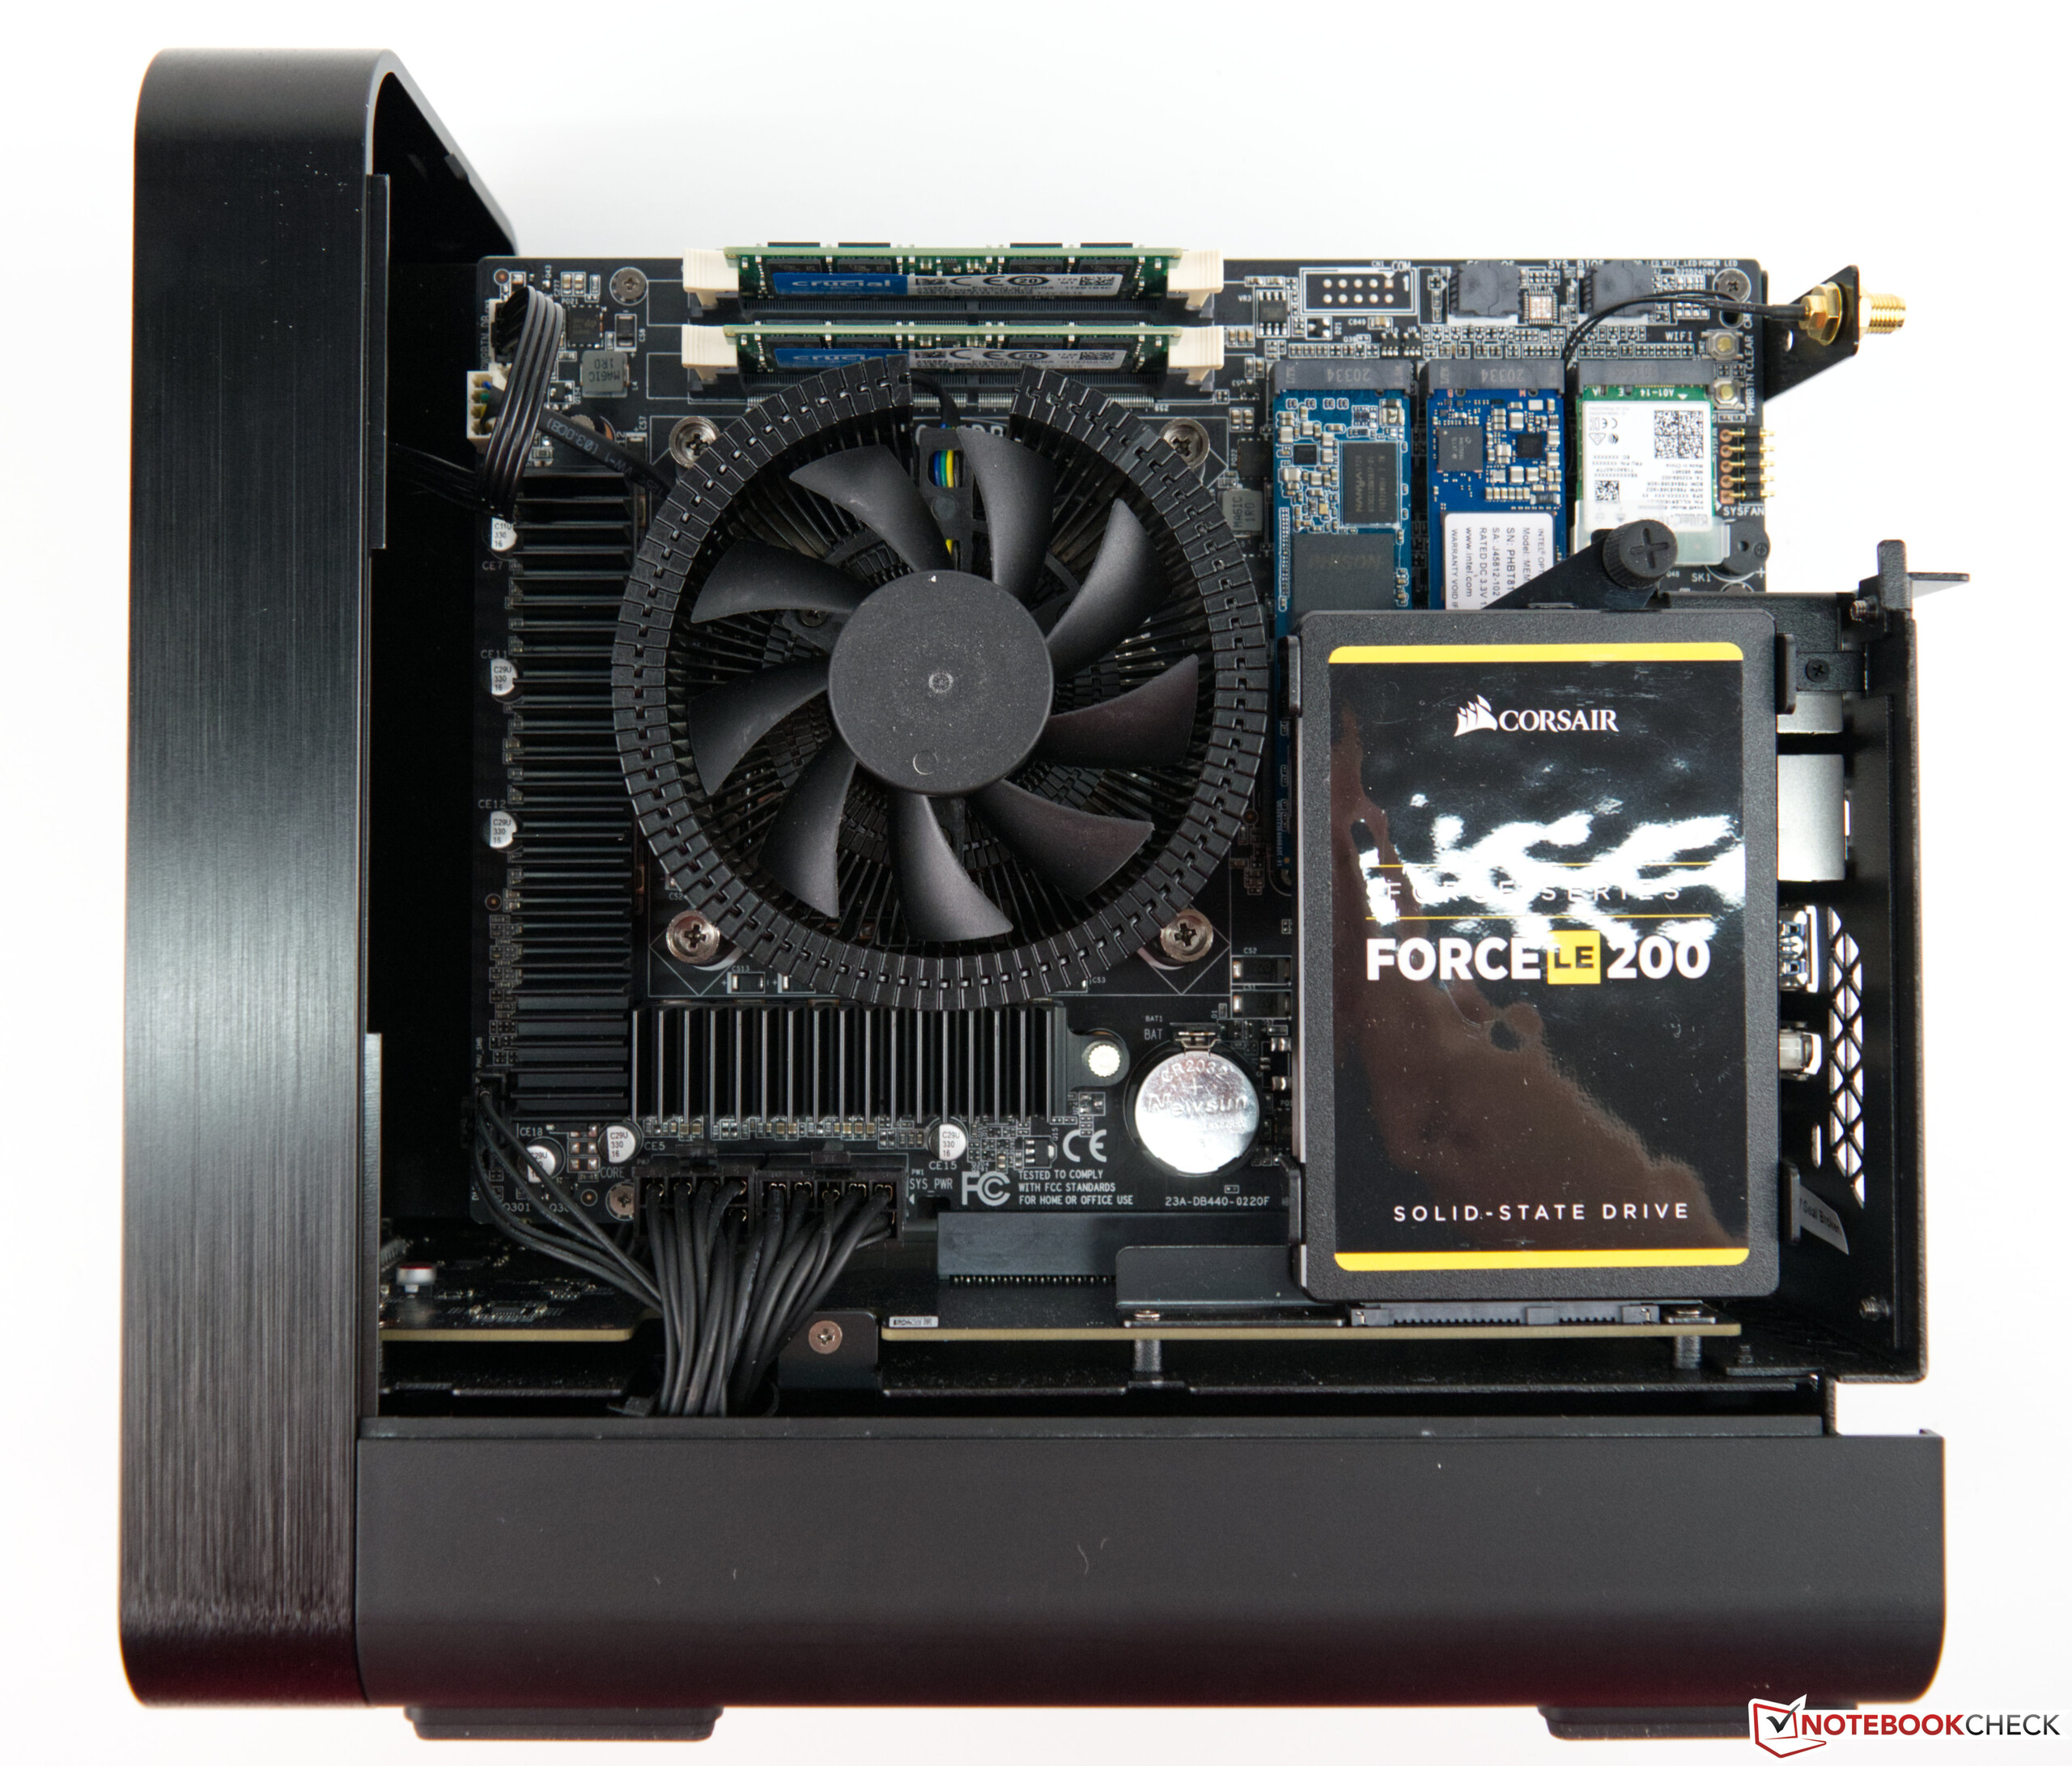
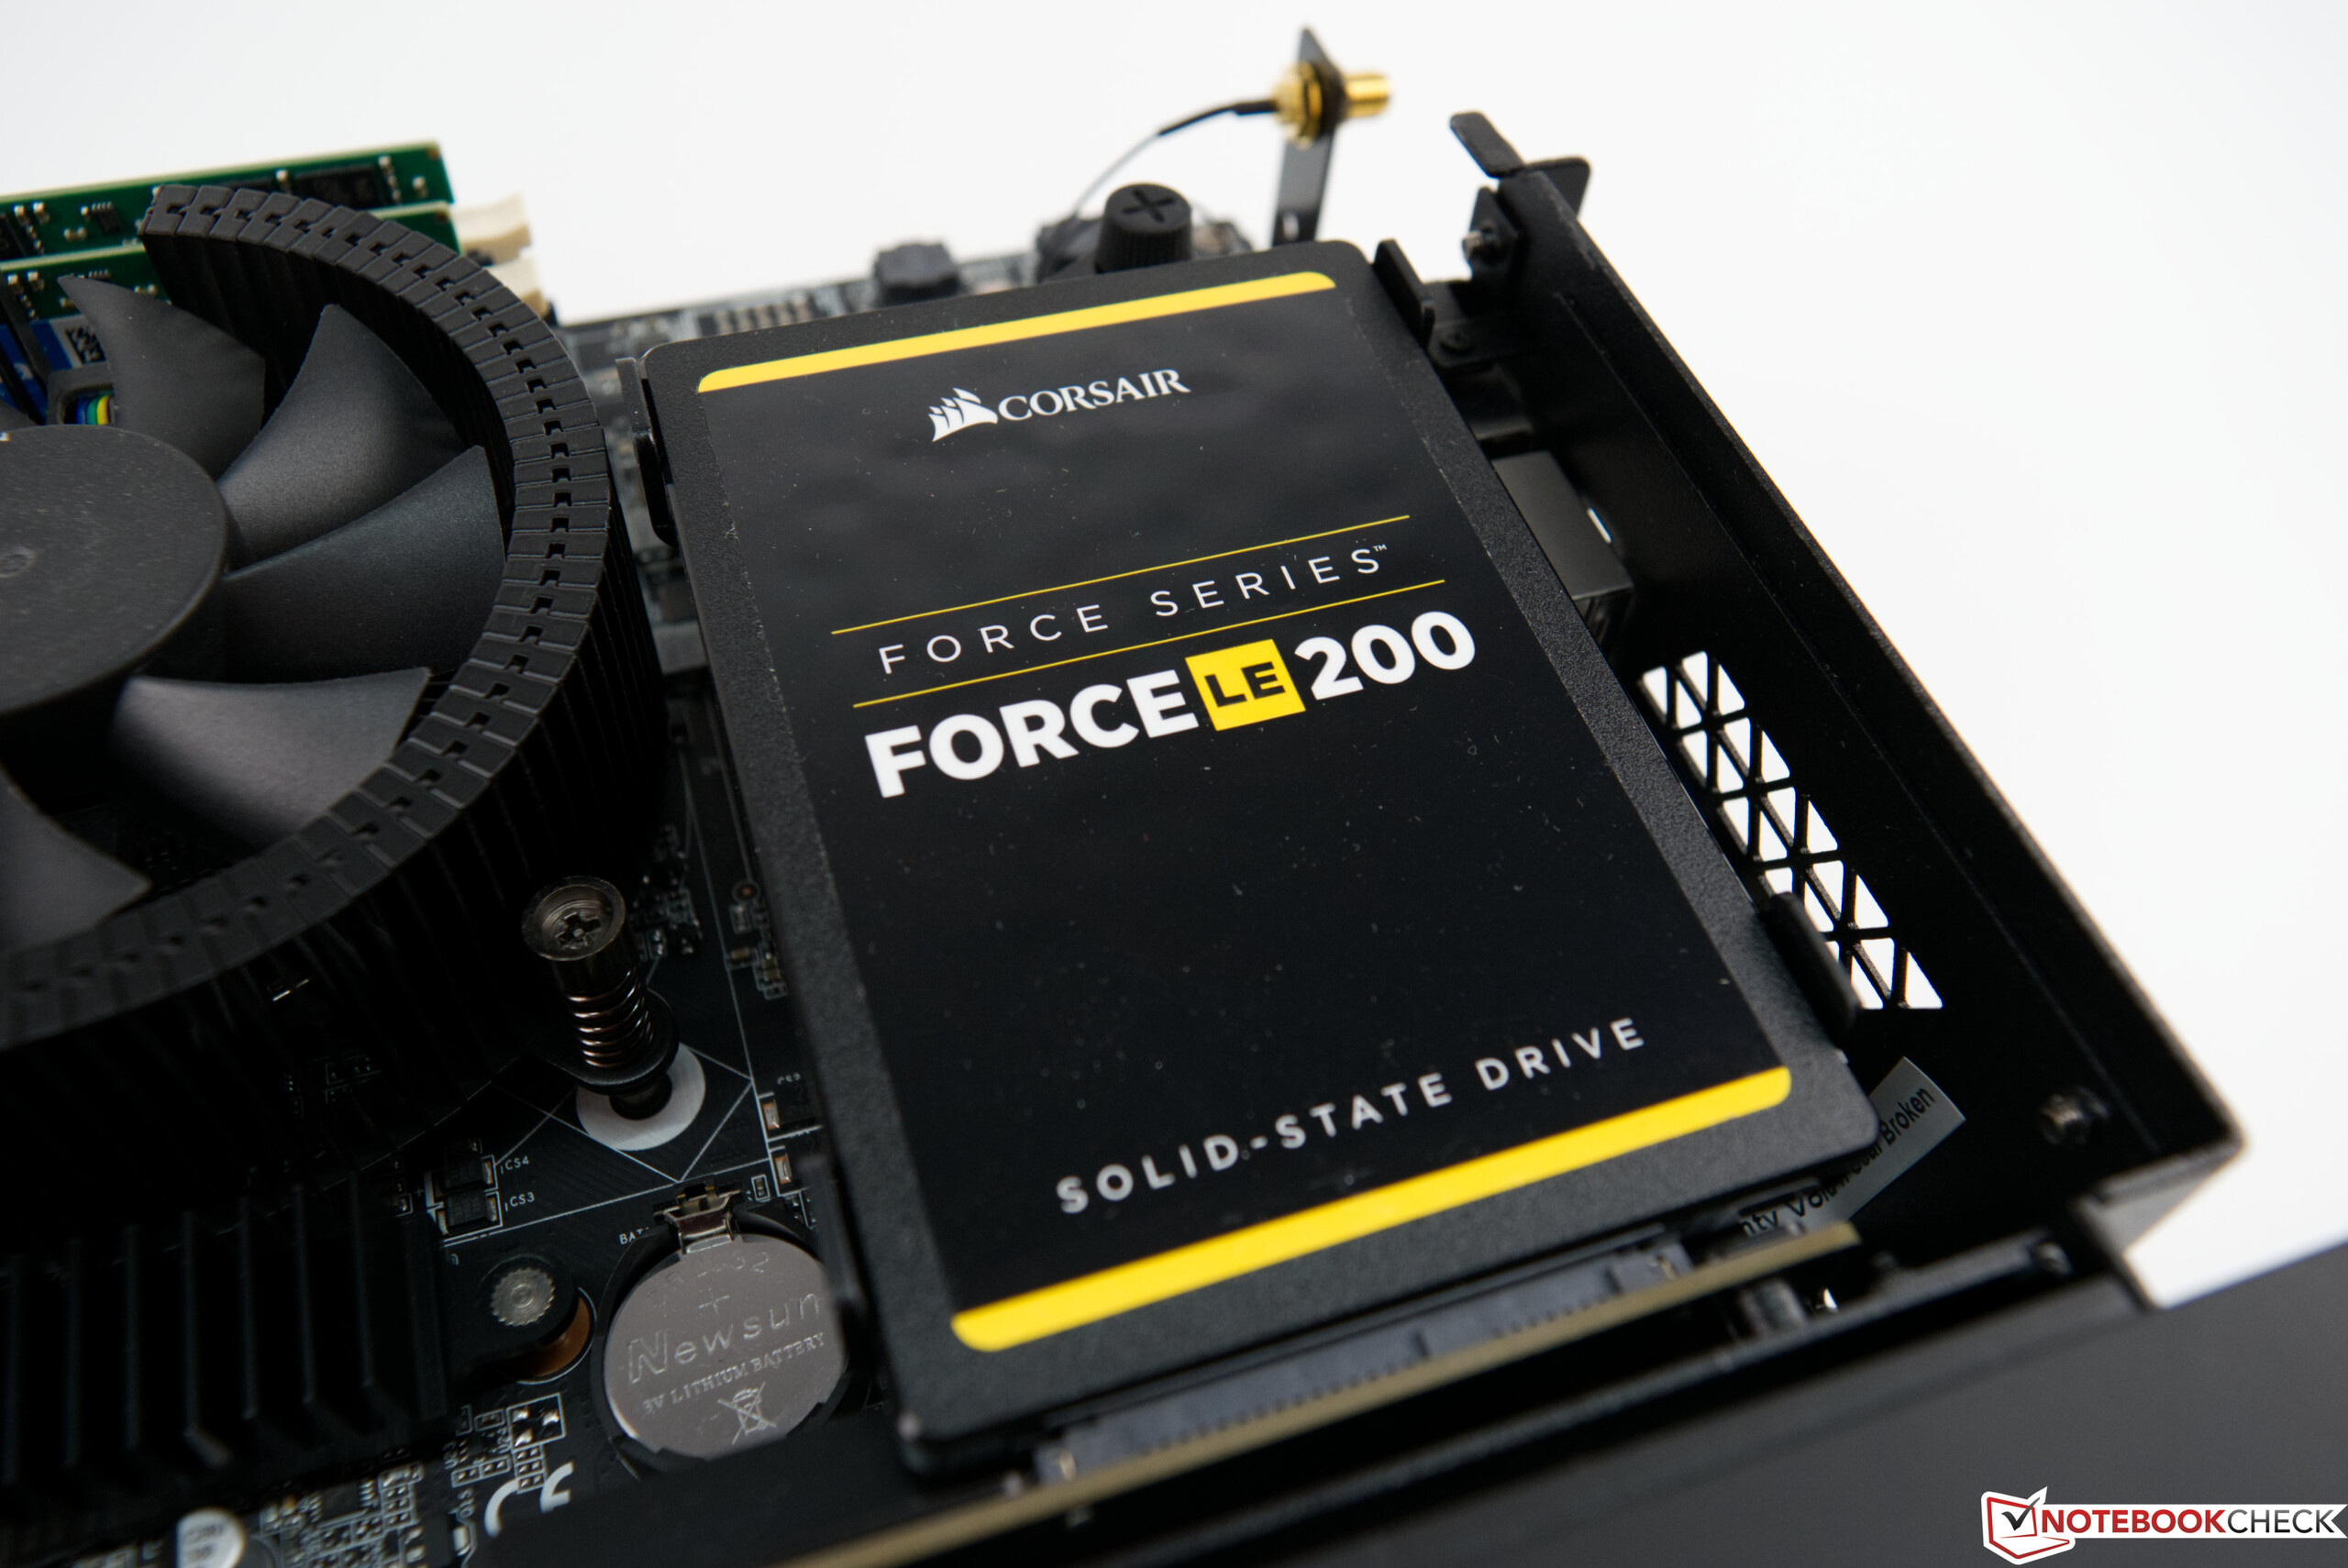
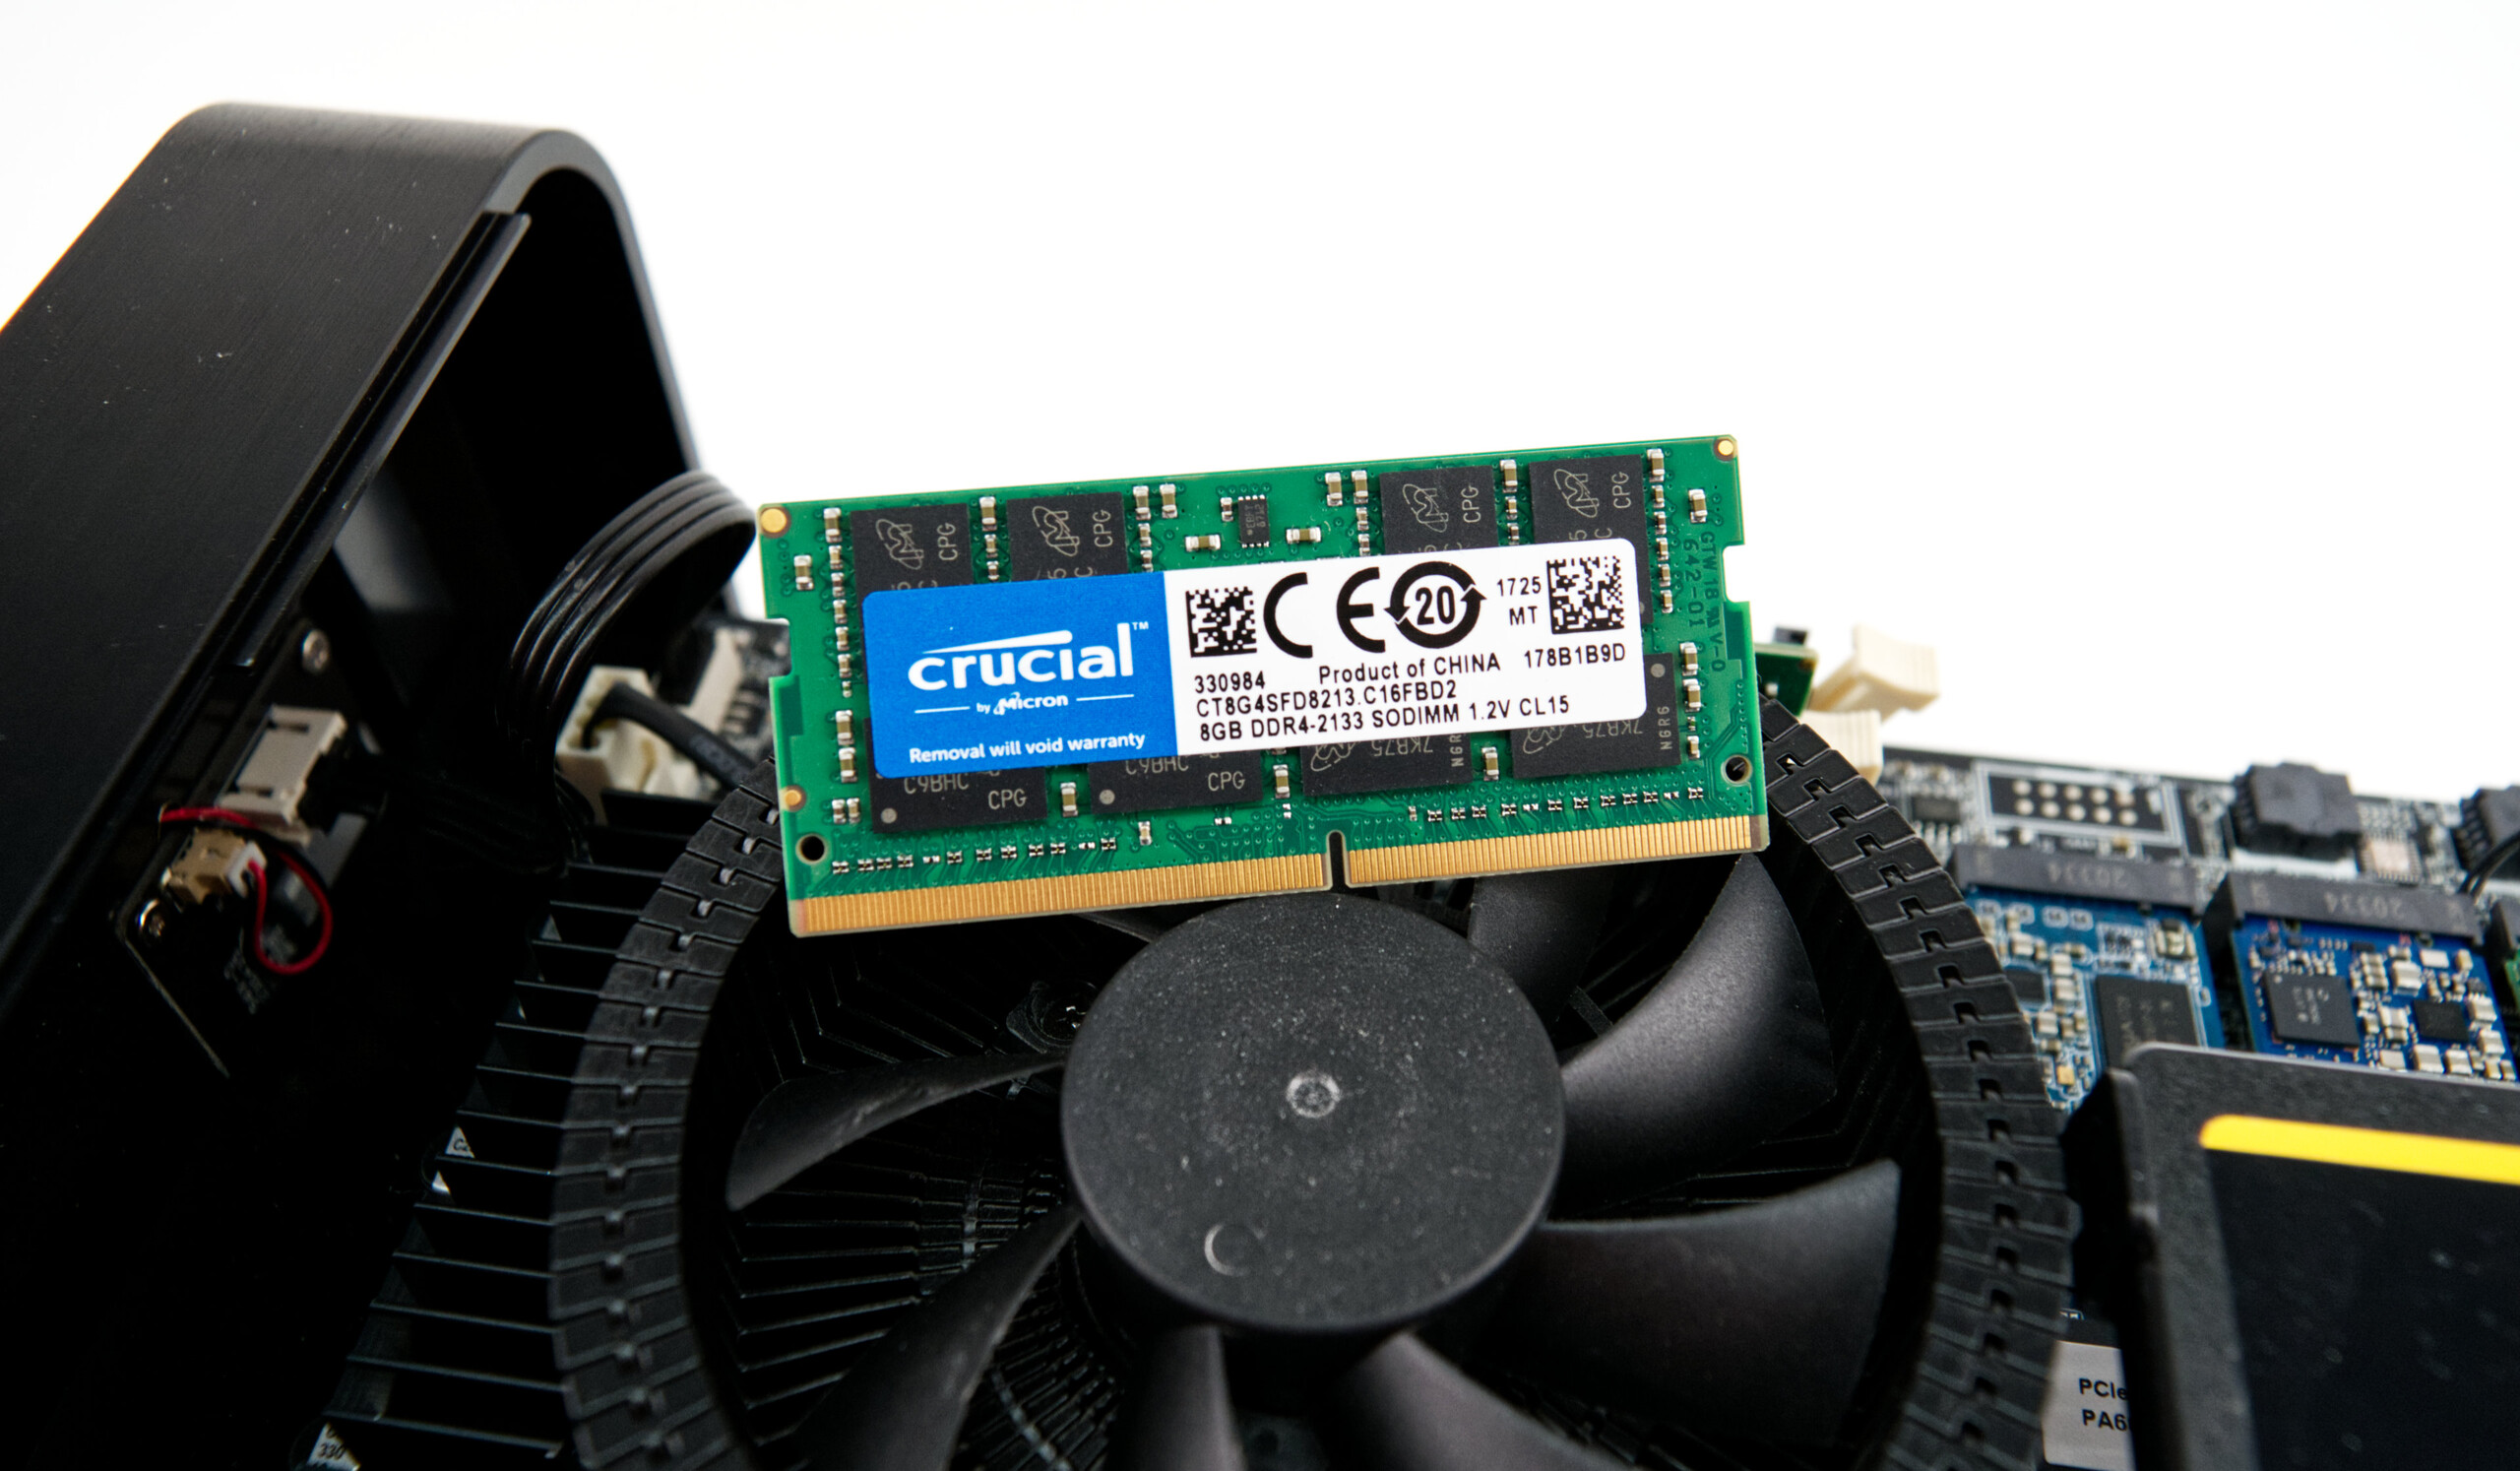
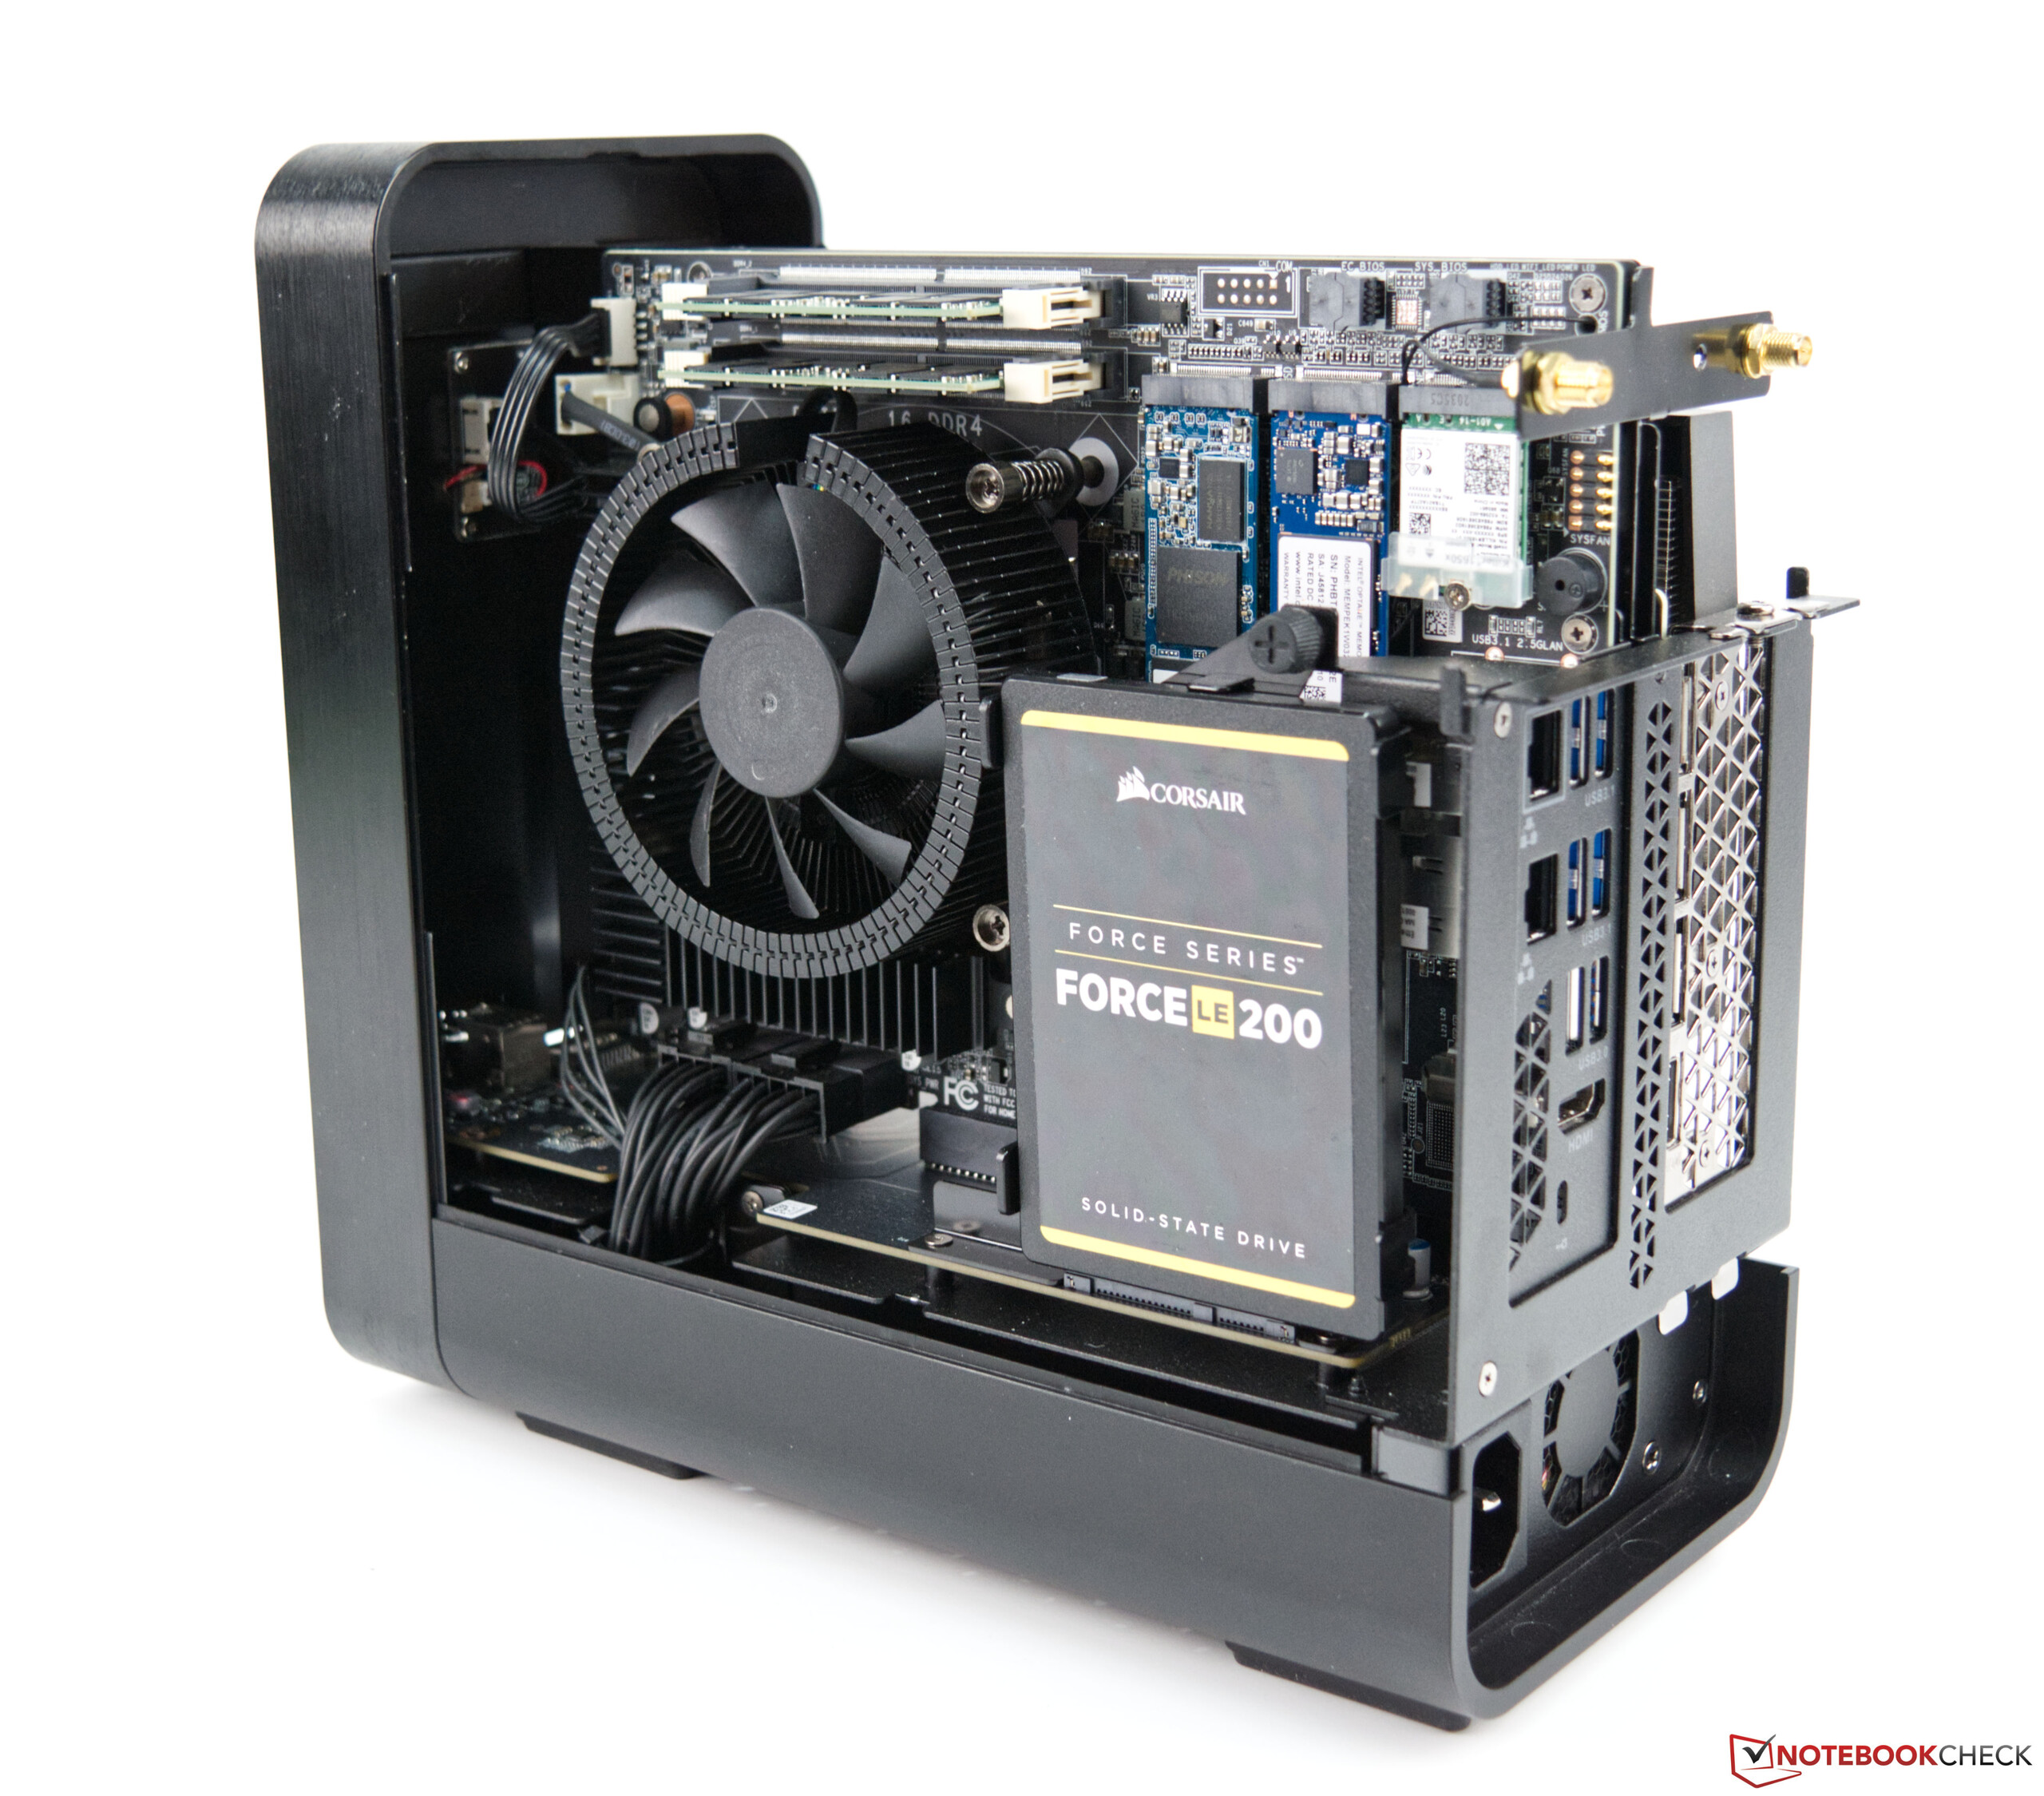
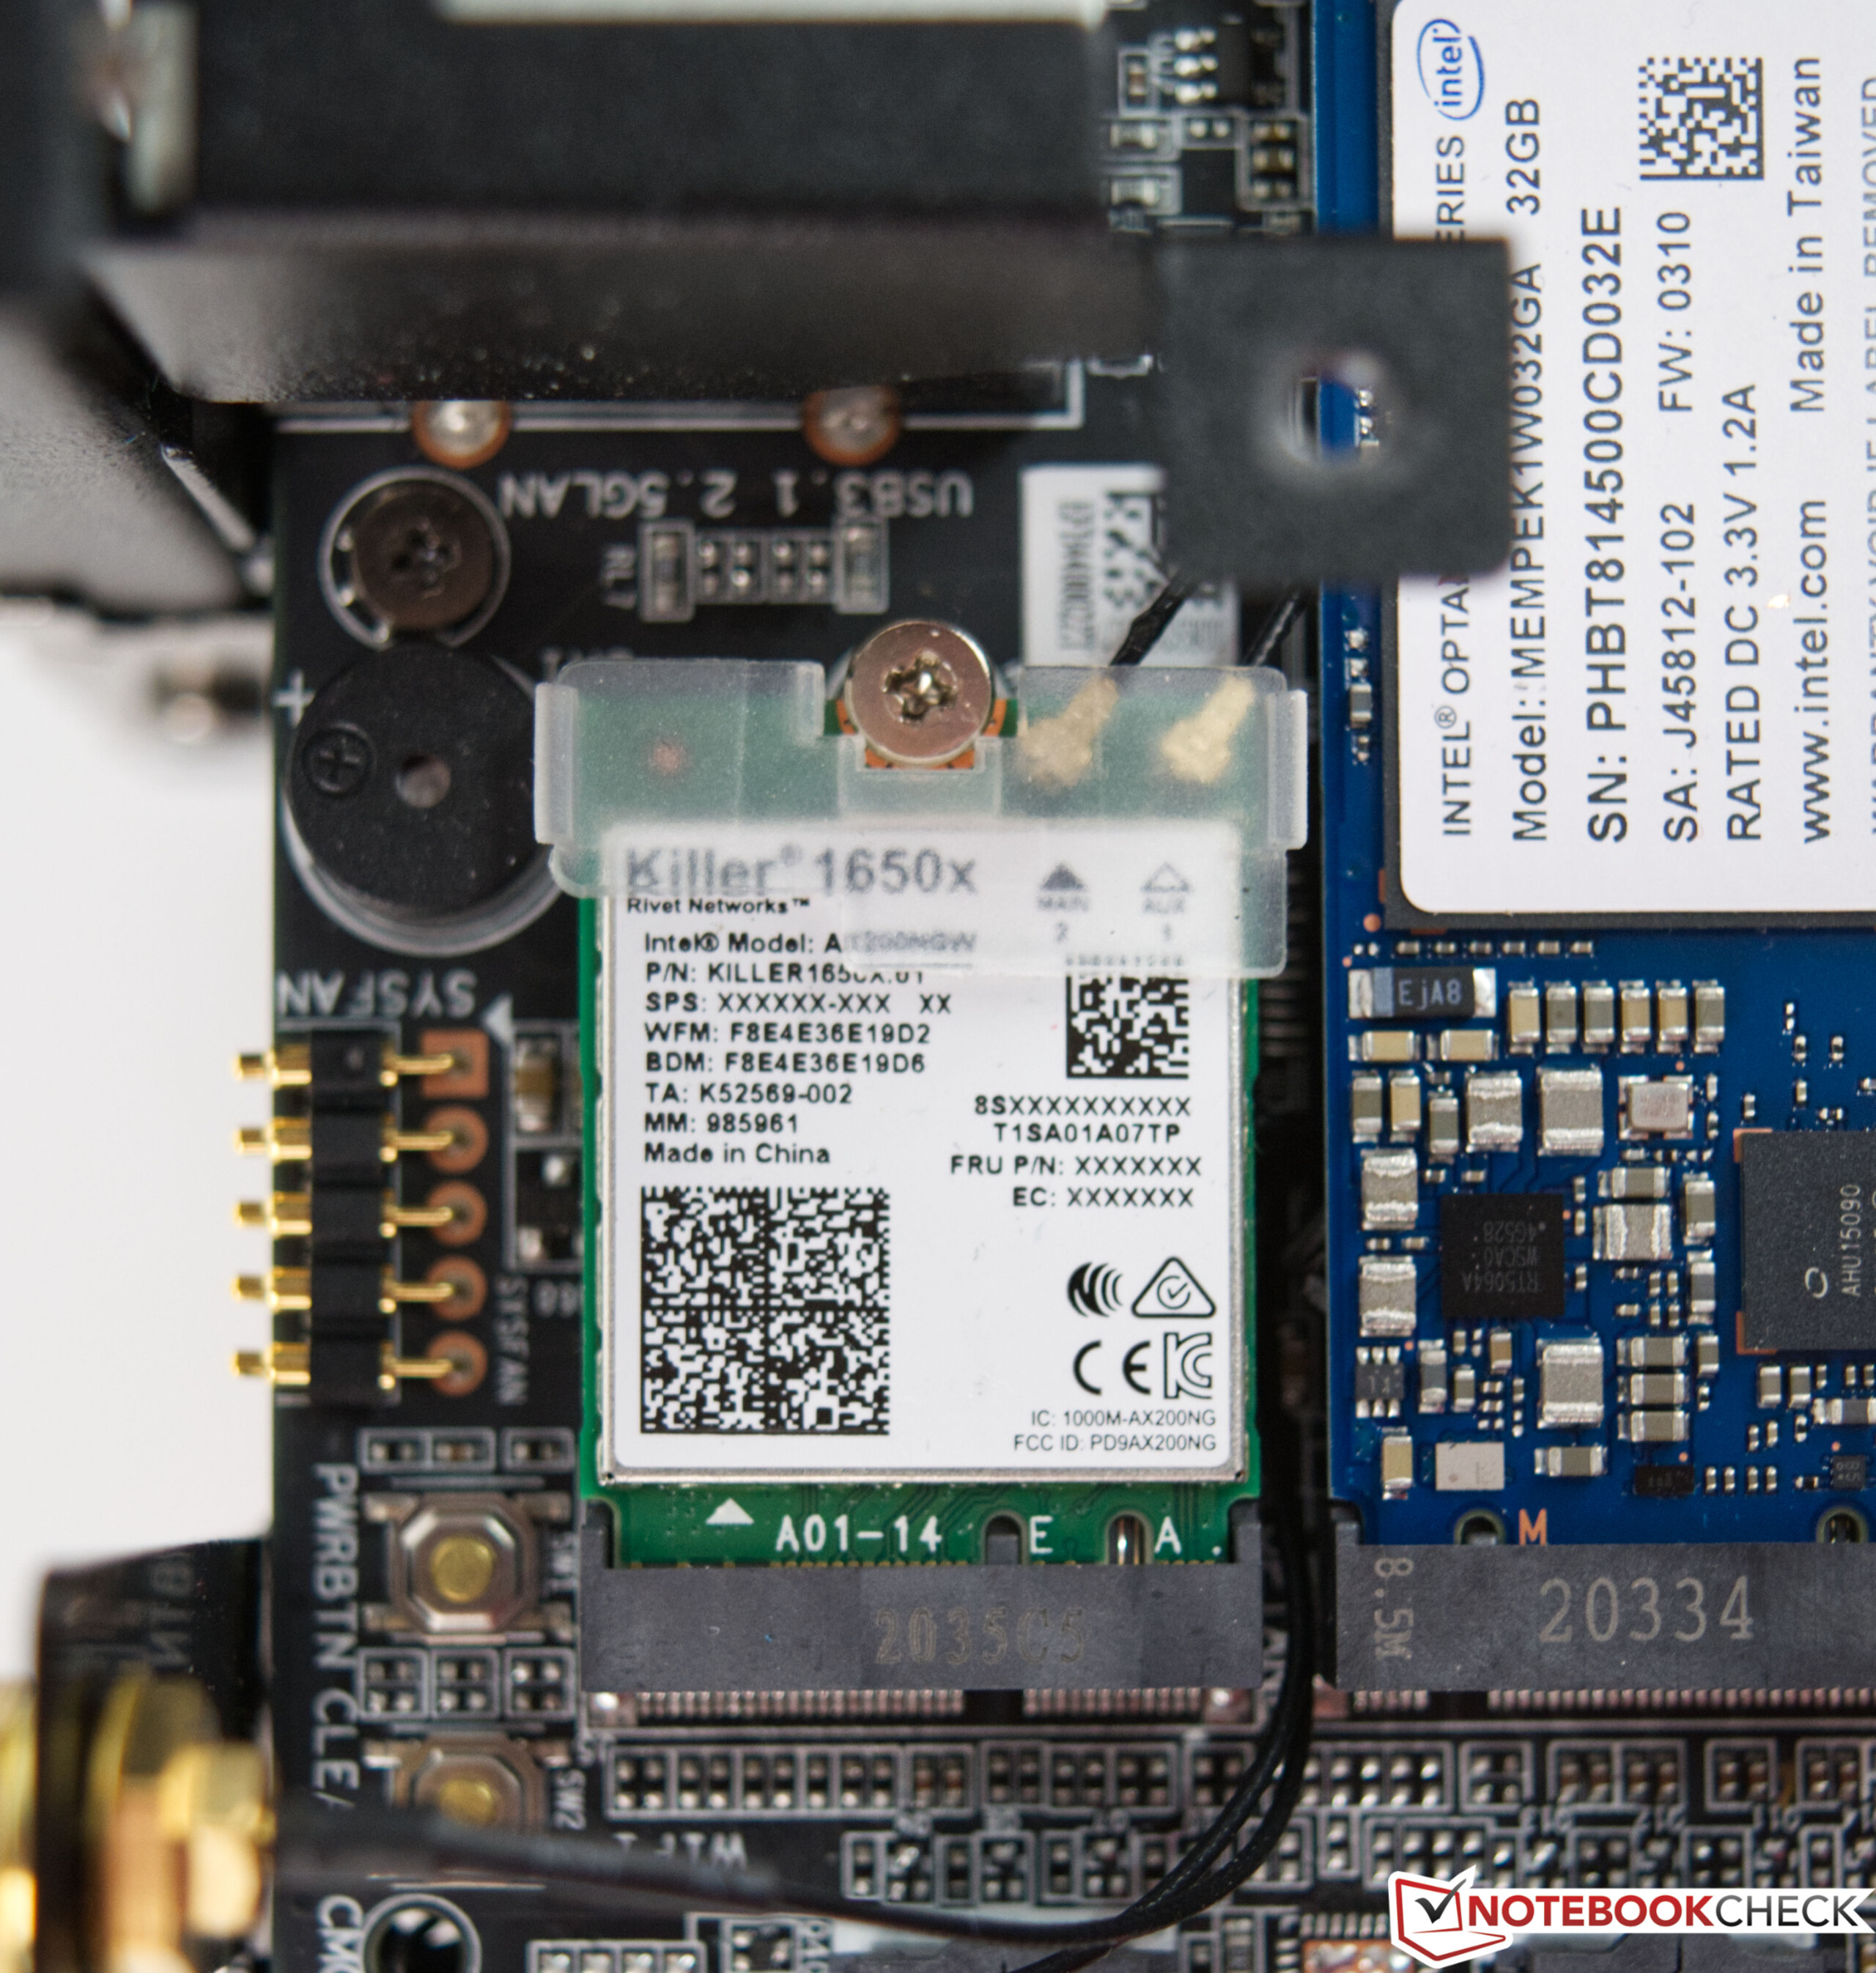
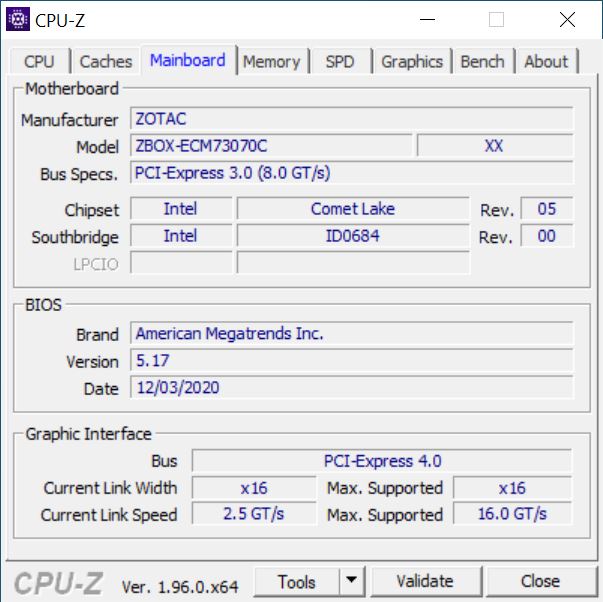
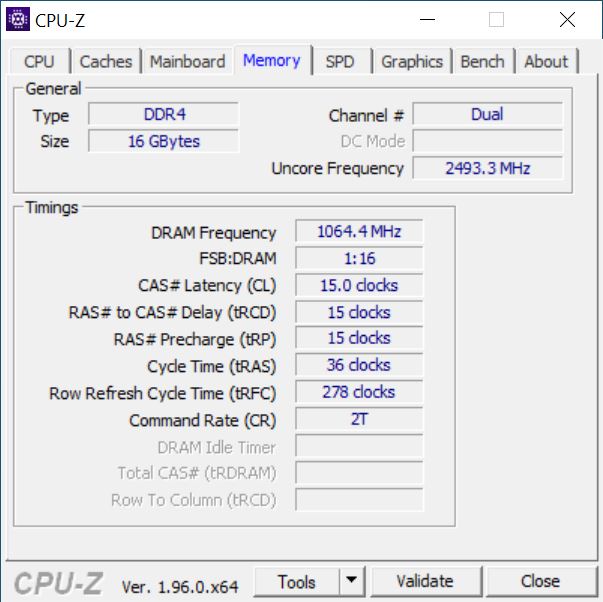
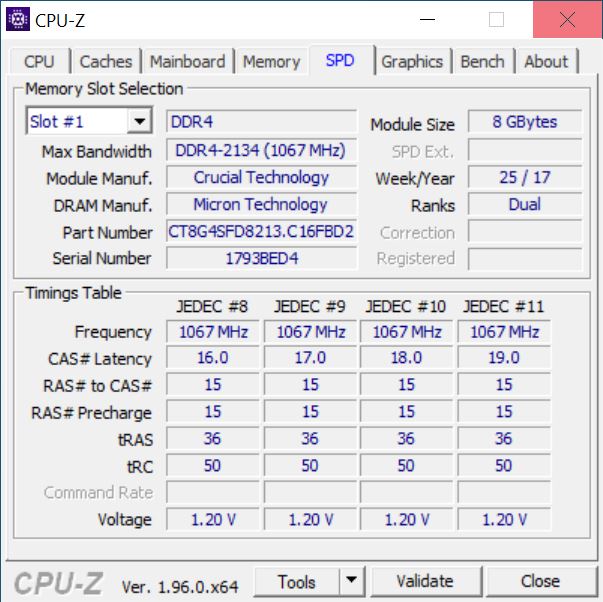
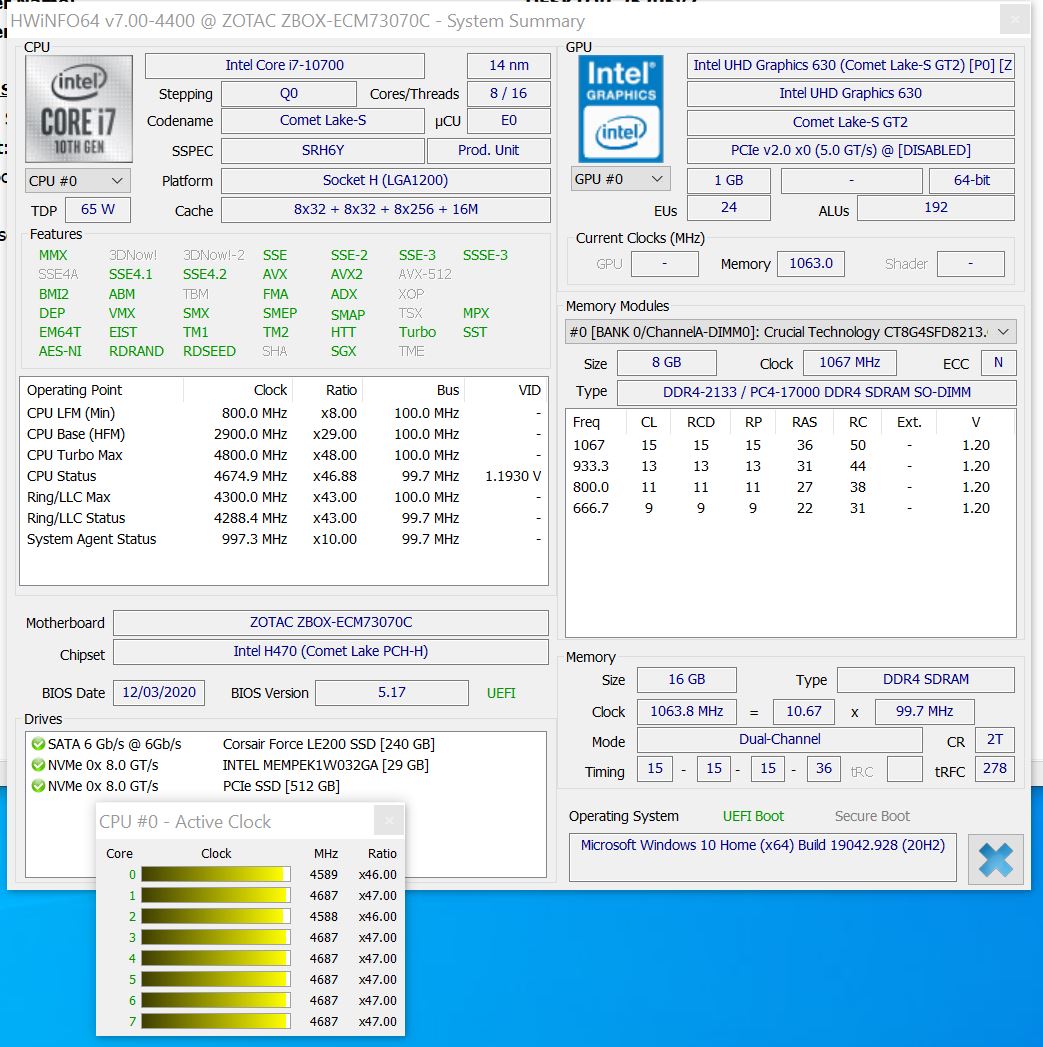
The very compact case includes everything you need for a full-fledged gaming PC. Even the power supply is inside the case, and it doesn't need to be connected separately like in the MEK Mini. A specially developed platform based on Intel's 1200 socket serves as foundation. With the Intel Core i7-10700, you get a reasonably modern processor that does its job well, since even demanding tasks can be mastered very well with its 8 cores and 16 threads. The 65-watt model is a good choice, because heat development shouldn't be overlooked. Furthermore, the system is equipped with a Zotac GeForce RTX 3070. Due to the limited space, Zotac has decided to use an SO-DIMM module for the RAM, which is mostly found in laptops. You can choose between a conventional 2.5-inch variant or an M.2 variant for mass storage. However, combining both is also possible. The slots don't interfere with each other.
Zotac provided us a Magnus One with 16 GB of DDR4 RAM and SSDs offering a total of 750 GB of storage space. The barebone system with the GeForce RTX 3070 is officially offered by Zotac at an MSRP of 1,499 Euros (~$1,825). Nevertheless, available models are listed significantly above the MSRP (starting at 1,650 Euros (~$2,009)) at the time of testing, which is related to the low stock levels of graphics cards.
Processor benchmarks
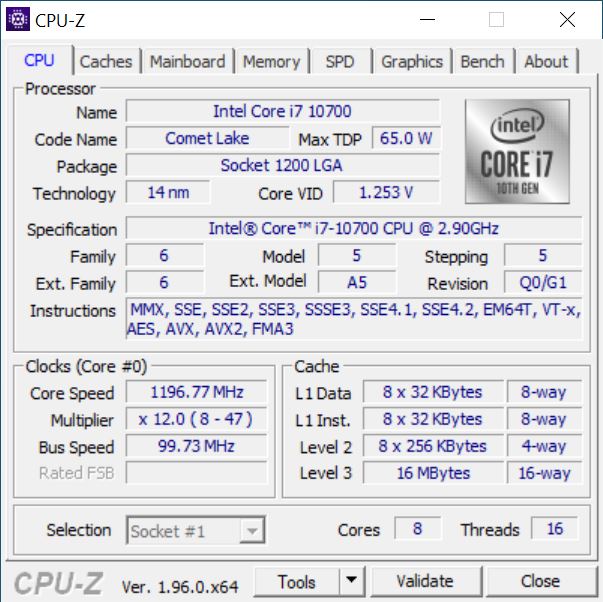
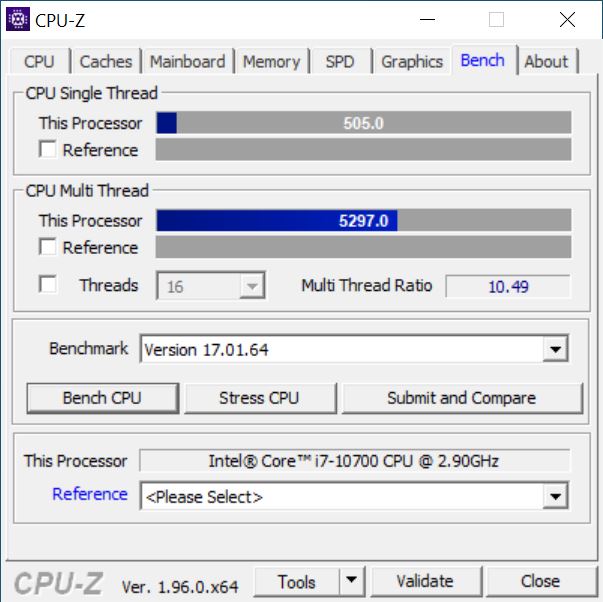
The Intel Core i7-10700 is an octa-core processor with a TDP of 65 watts. The base clock speed is 2.9 GHz and the maximum boost speed is specified at 4.8 GHz. The Core i7-10700 achieves a solid result in the Zotac Magnus One, leaving no room for more due to the latter's compactness. Nevertheless, the system performs well and can largely leave the Intel Core i7-9700K behind in the multithread tests. In the single-core tests, the Intel Core i7-10700 in our test system is somewhat on par with the Intel Core i5-10600K.
For further comparisons and benchmarks, we refer to our CPU comparison table here.
| Cinebench R20 | |
| CPU (Single Core) | |
| AMD Ryzen 7 5800X, AMD Ryzen 7 5800X | |
| AMD Ryzen 5 5600X, AMD Ryzen 5 5600X | |
| Intel Core i9-10900K, Intel Core i9-10900K | |
| Corsair One i160, Intel Core i9-9900K | |
| Intel Core i7-9700K, AMD Radeon RX Vega 64, Intel Core i7-9700K | |
| Intel Core i5-10600K, Intel Core i5-10600K | |
| Intel Core i5-10400F, Intel Core i5-10400F | |
| CPU (Multi Core) | |
| Intel Core i9-10900K, Intel Core i9-10900K | |
| AMD Ryzen 7 5800X, AMD Ryzen 7 5800X | |
| Corsair One i160, Intel Core i9-9900K | |
| AMD Ryzen 5 5600X, AMD Ryzen 5 5600X | |
| Intel Core i5-10600K, Intel Core i5-10600K | |
| Intel Core i7-9700K, AMD Radeon RX Vega 64, Intel Core i7-9700K | |
| Intel Core i5-10400F, Intel Core i5-10400F | |
| Cinebench R10 | |
| Rendering Single CPUs 64Bit | |
| AMD Ryzen 7 5800X, AMD Ryzen 7 5800X | |
| AMD Ryzen 5 5600X, AMD Ryzen 5 5600X | |
| Intel Core i9-10900K, Intel Core i9-10900K | |
| Corsair One i160, Intel Core i9-9900K | |
| Zotac Magnus One (ECM73070C), Intel Core i7-10700 | |
| Intel Core i7-9700K, AMD Radeon RX Vega 64, Intel Core i7-9700K | |
| Intel Core i5-10600K, Intel Core i5-10600K | |
| Intel Core i5-10400F, Intel Core i5-10400F | |
| Rendering Multiple CPUs 64Bit | |
| AMD Ryzen 7 5800X, AMD Ryzen 7 5800X | |
| Intel Core i9-10900K, Intel Core i9-10900K | |
| AMD Ryzen 5 5600X, AMD Ryzen 5 5600X | |
| Corsair One i160, Intel Core i9-9900K | |
| Intel Core i7-9700K, AMD Radeon RX Vega 64, Intel Core i7-9700K | |
| Zotac Magnus One (ECM73070C), Intel Core i7-10700 | |
| Intel Core i5-10600K, Intel Core i5-10600K | |
| Intel Core i5-10400F, Intel Core i5-10400F | |
| Geekbench 5.5 | |
| Multi-Core | |
| Intel Core i9-10900K, Intel Core i9-10900K | |
| AMD Ryzen 7 5800X, AMD Ryzen 7 5800X | |
| AMD Ryzen 5 5600X, AMD Ryzen 5 5600X | |
| Zotac Magnus One (ECM73070C), Intel Core i7-10700 | |
| Intel Core i7-9700K, AMD Radeon RX Vega 64, Intel Core i7-9700K | |
| Intel Core i5-10600K, Intel Core i5-10600K | |
| Intel Core i5-10400F, Intel Core i5-10400F | |
| Intel Core i5-10400F, Intel Core i5-10400F | |
| Intel Core i3-10100, Intel Core i3-10100 | |
| Single-Core | |
| AMD Ryzen 7 5800X, AMD Ryzen 7 5800X | |
| AMD Ryzen 5 5600X, AMD Ryzen 5 5600X | |
| Intel Core i9-10900K, Intel Core i9-10900K | |
| Intel Core i7-9700K, AMD Radeon RX Vega 64, Intel Core i7-9700K | |
| Zotac Magnus One (ECM73070C), Intel Core i7-10700 | |
| Intel Core i5-10600K, Intel Core i5-10600K | |
| Intel Core i5-10400F, Intel Core i5-10400F | |
| Intel Core i5-10400F, Intel Core i5-10400F | |
| Intel Core i3-10100, Intel Core i3-10100 | |
| Geekbench 5.0 | |
| 5.0 Multi-Core | |
| Intel Core i9-10900K, Intel Core i9-10900K | |
| AMD Ryzen 7 5800X, AMD Ryzen 7 5800X | |
| AMD Ryzen 5 5600X, AMD Ryzen 5 5600X | |
| Zotac Magnus One (ECM73070C), Intel Core i7-10700 | |
| Intel Core i5-10600K, Intel Core i5-10600K | |
| Intel Core i5-10400F, Intel Core i5-10400F | |
| Intel Core i3-10100, Intel Core i3-10100 | |
| 5.0 Single-Core | |
| AMD Ryzen 7 5800X, AMD Ryzen 7 5800X | |
| AMD Ryzen 5 5600X, AMD Ryzen 5 5600X | |
| Intel Core i9-10900K, Intel Core i9-10900K | |
| Zotac Magnus One (ECM73070C), Intel Core i7-10700 | |
| Intel Core i5-10600K, Intel Core i5-10600K | |
| Intel Core i5-10400F, Intel Core i5-10400F | |
| Intel Core i3-10100, Intel Core i3-10100 | |
| 3DMark 11 - 1280x720 Performance Physics | |
| AMD Ryzen 7 5800X, AMD Ryzen 7 5800X | |
| Intel Core i9-10900K, Intel Core i9-10900K | |
| AMD Ryzen 5 5600X, AMD Ryzen 5 5600X | |
| Corsair One i160, Intel Core i9-9900K | |
| Intel Core i7-9700K, AMD Radeon RX Vega 64, Intel Core i7-9700K | |
| Intel Core i5-10600K, Intel Core i5-10600K | |
| Zotac Magnus One (ECM73070C), Intel Core i7-10700 | |
| Intel Core i5-10400F, Intel Core i5-10400F | |
| R Benchmark 2.5 - Overall mean | |
| Intel Core i3-10100, Intel Core i3-10100 | |
| Intel Core i5-10400F, Intel Core i5-10400F | |
| Intel Core i5-10600K, Intel Core i5-10600K | |
| Zotac Magnus One (ECM73070C), Intel Core i7-10700 | |
| Intel Core i9-10900K, Intel Core i9-10900K | |
| AMD Ryzen 5 5600X, AMD Ryzen 5 5600X | |
| AMD Ryzen 7 5800X, AMD Ryzen 7 5800X | |
| LibreOffice - 20 Documents To PDF | |
| Intel Core i9-10900K, Intel Core i9-10900K | |
| Zotac Magnus One (ECM73070C), Intel Core i7-10700 | |
| Intel Core i3-10100, Intel Core i3-10100 | |
| Intel Core i5-10400F, Intel Core i5-10400F | |
| Intel Core i5-10600K, Intel Core i5-10600K | |
| AMD Ryzen 5 5600X, AMD Ryzen 5 5600X | |
| AMD Ryzen 7 5800X, AMD Ryzen 7 5800X | |
| WebXPRT 3 - Overall | |
| AMD Ryzen 7 5800X, AMD Ryzen 7 5800X | |
| AMD Ryzen 5 5600X, AMD Ryzen 5 5600X | |
| Intel Core i9-10900K, Intel Core i9-10900K | |
| Zotac Magnus One (ECM73070C), Intel Core i7-10700 | |
| Intel Core i5-10600K, Intel Core i5-10600K | |
| Intel Core i5-10400F, Intel Core i5-10400F | |
| Intel Core i3-10100, Intel Core i3-10100 | |
| Mozilla Kraken 1.1 - Total | |
| Intel Core i5-10400F, Intel Core i5-10400F | |
| Intel Core i3-10100, Intel Core i3-10100 | |
| Intel Core i5-10600K, Intel Core i5-10600K | |
| Zotac Magnus One (ECM73070C), Intel Core i7-10700 | |
| Intel Core i9-10900K, Intel Core i9-10900K | |
| AMD Ryzen 5 5600X, AMD Ryzen 5 5600X | |
| AMD Ryzen 7 5800X, AMD Ryzen 7 5800X | |
* ... smaller is better
Zotac Magnus One in the Cinebench R15 multi-loop
The Intel Core i7-10700 experiences a slight performance drop after the first run, but it becomes increasingly stable in the further course of the test. Nevertheless, performance is at a high level with an average of 1,338 points.
Application performance
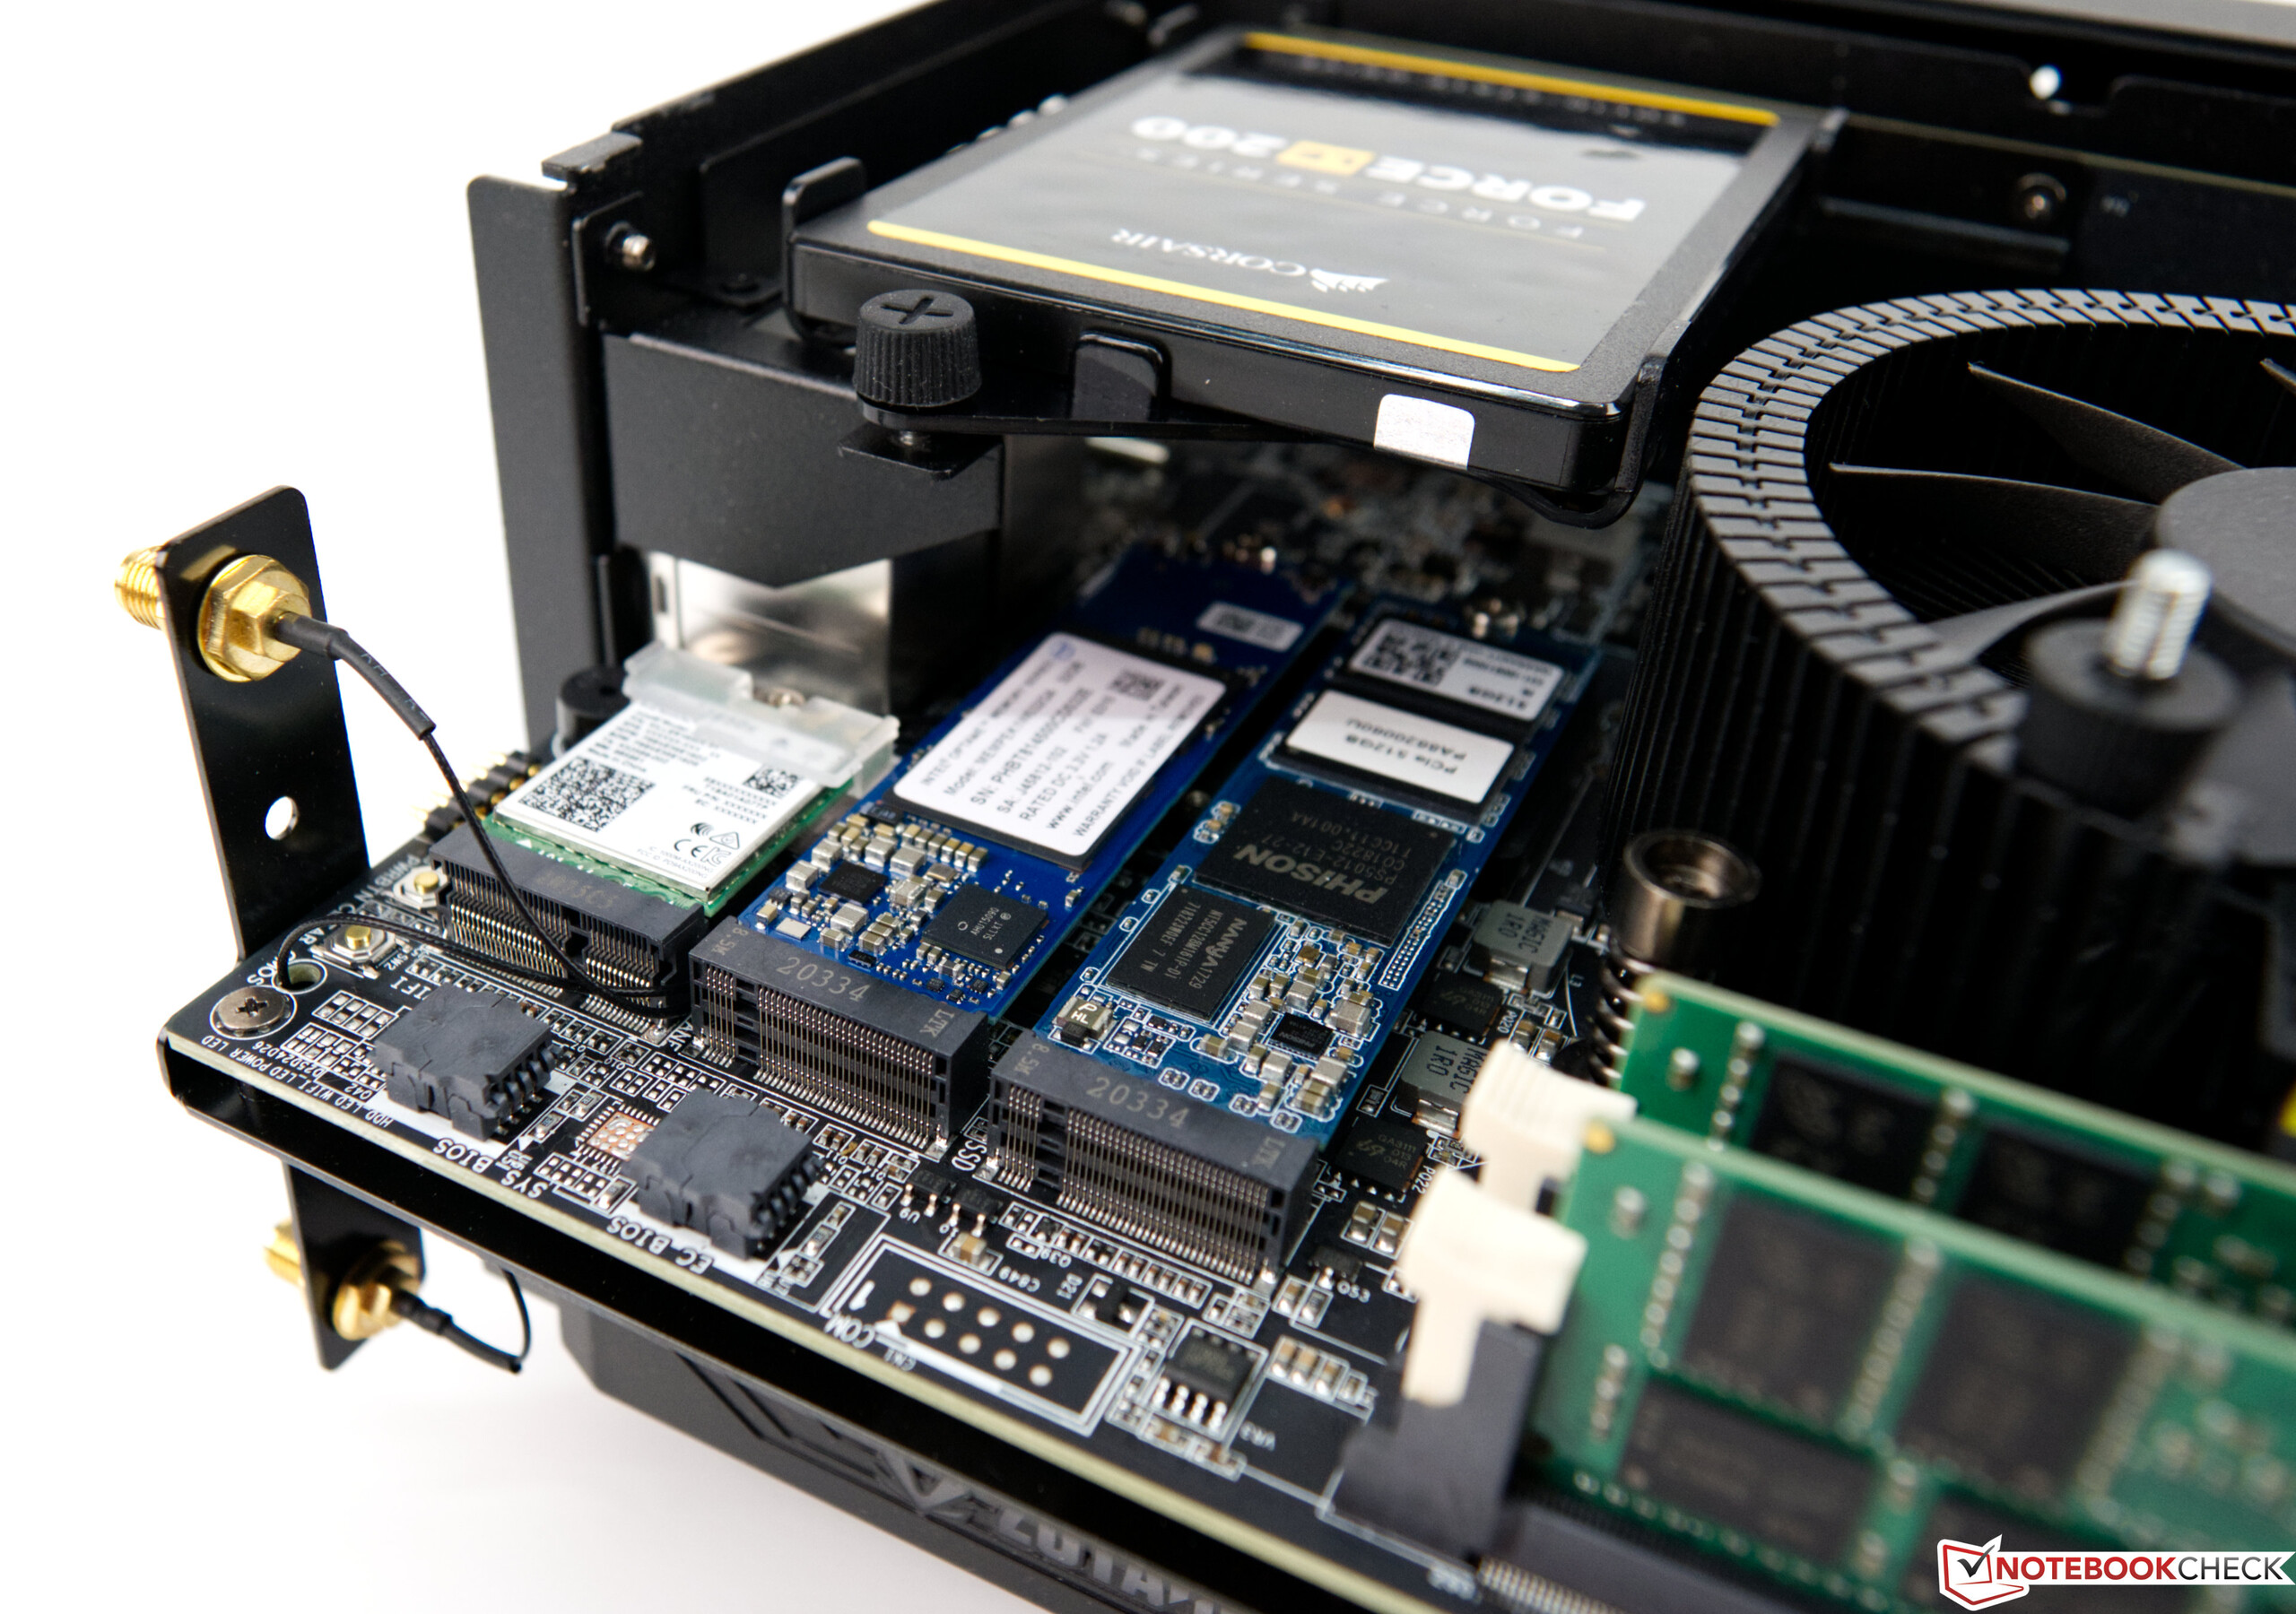
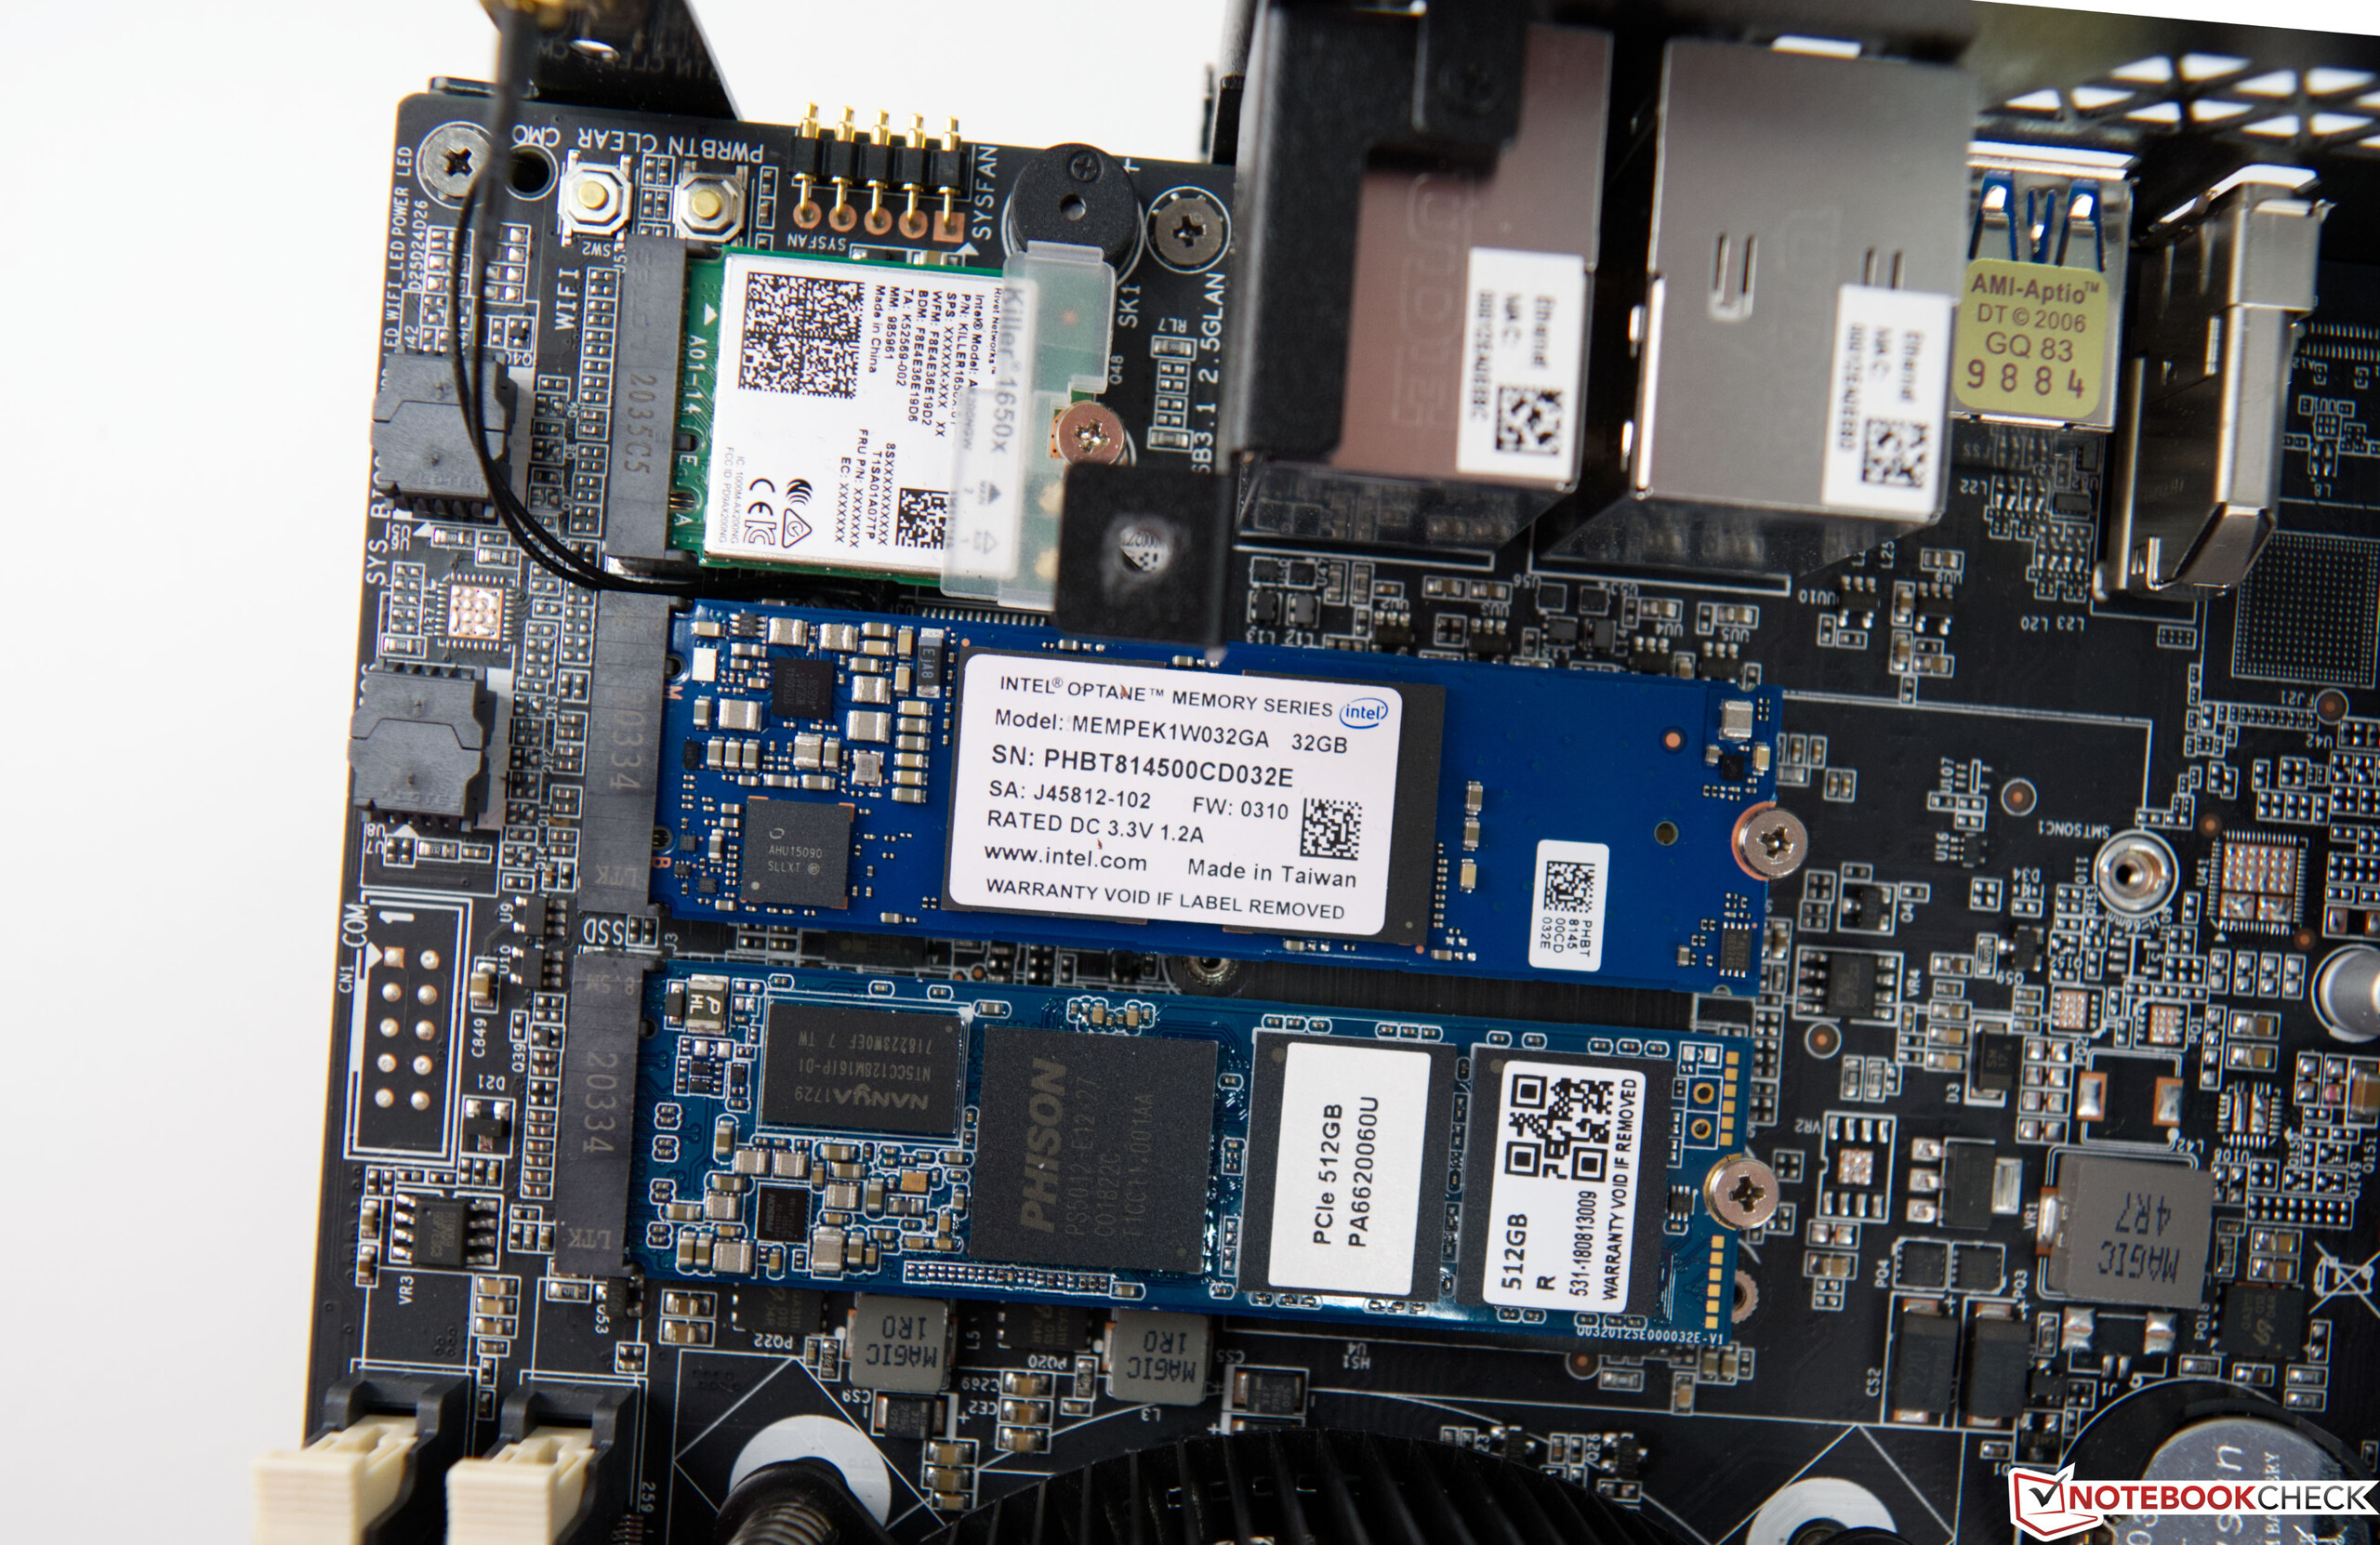
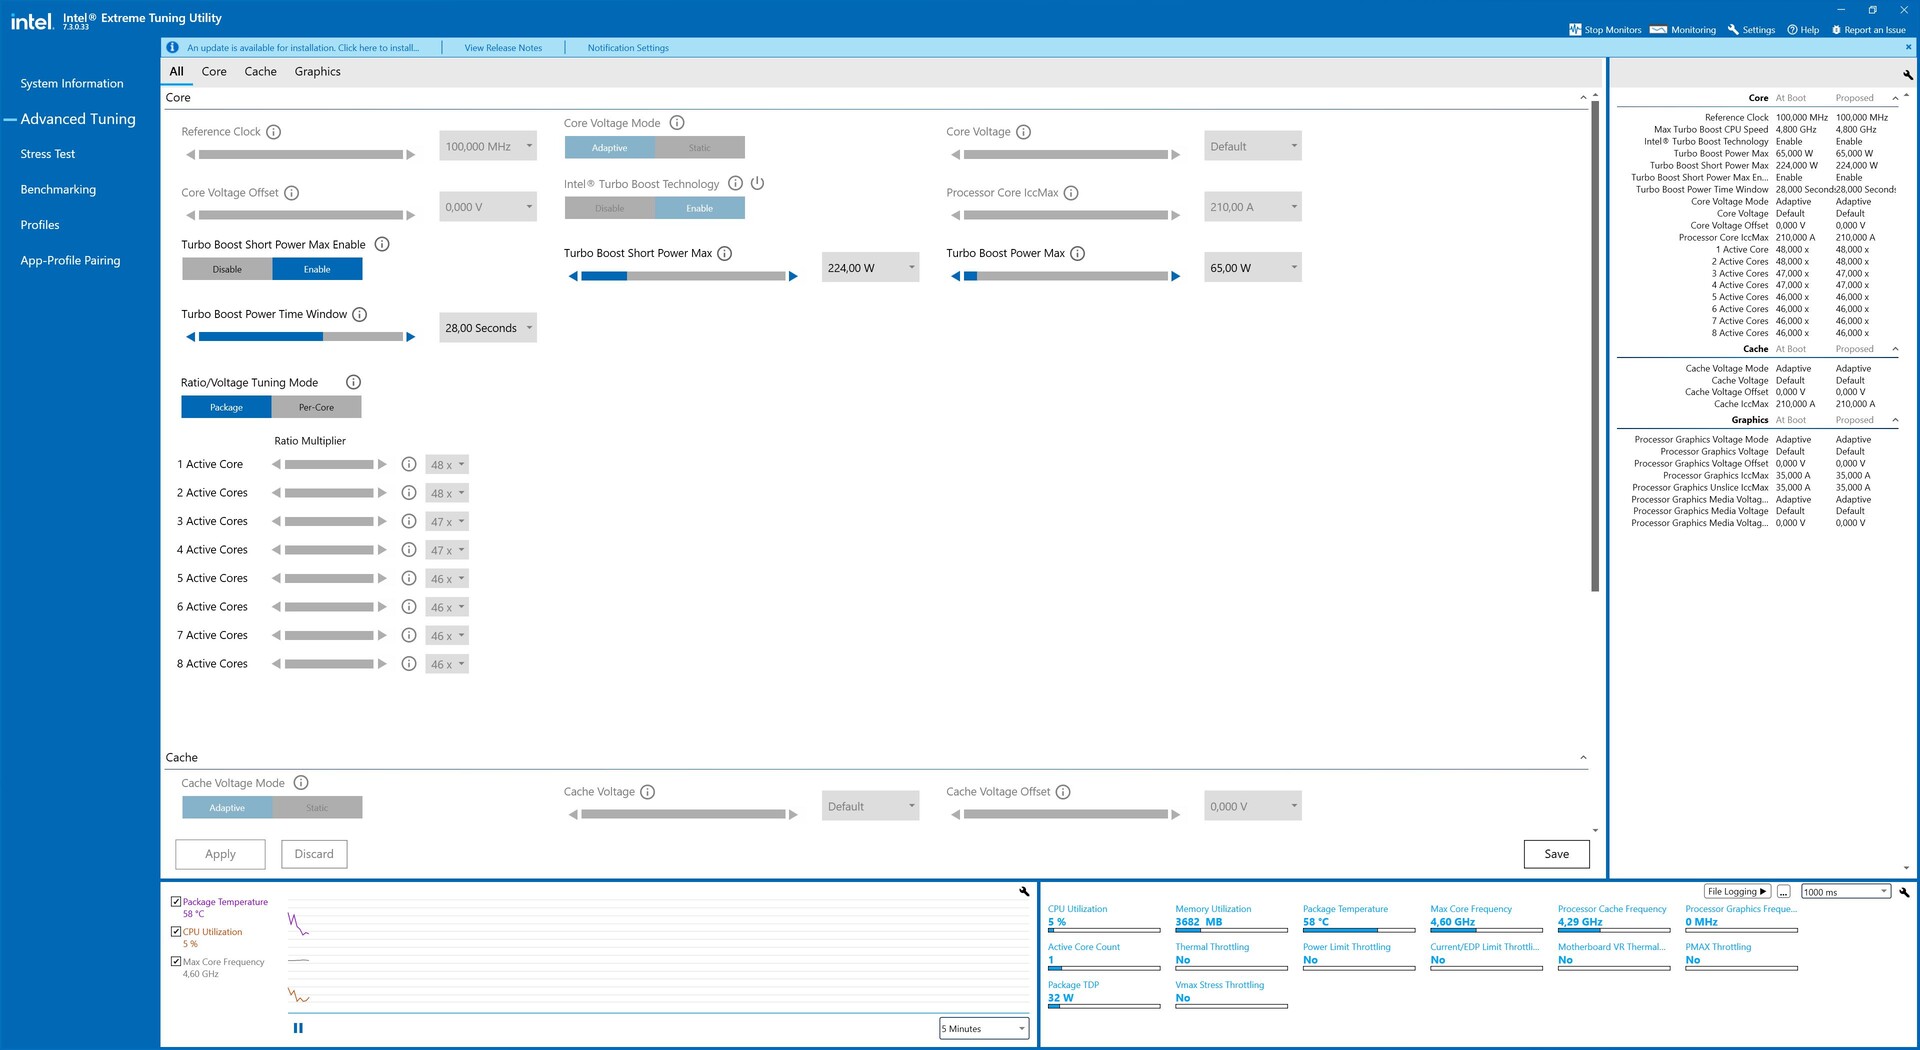
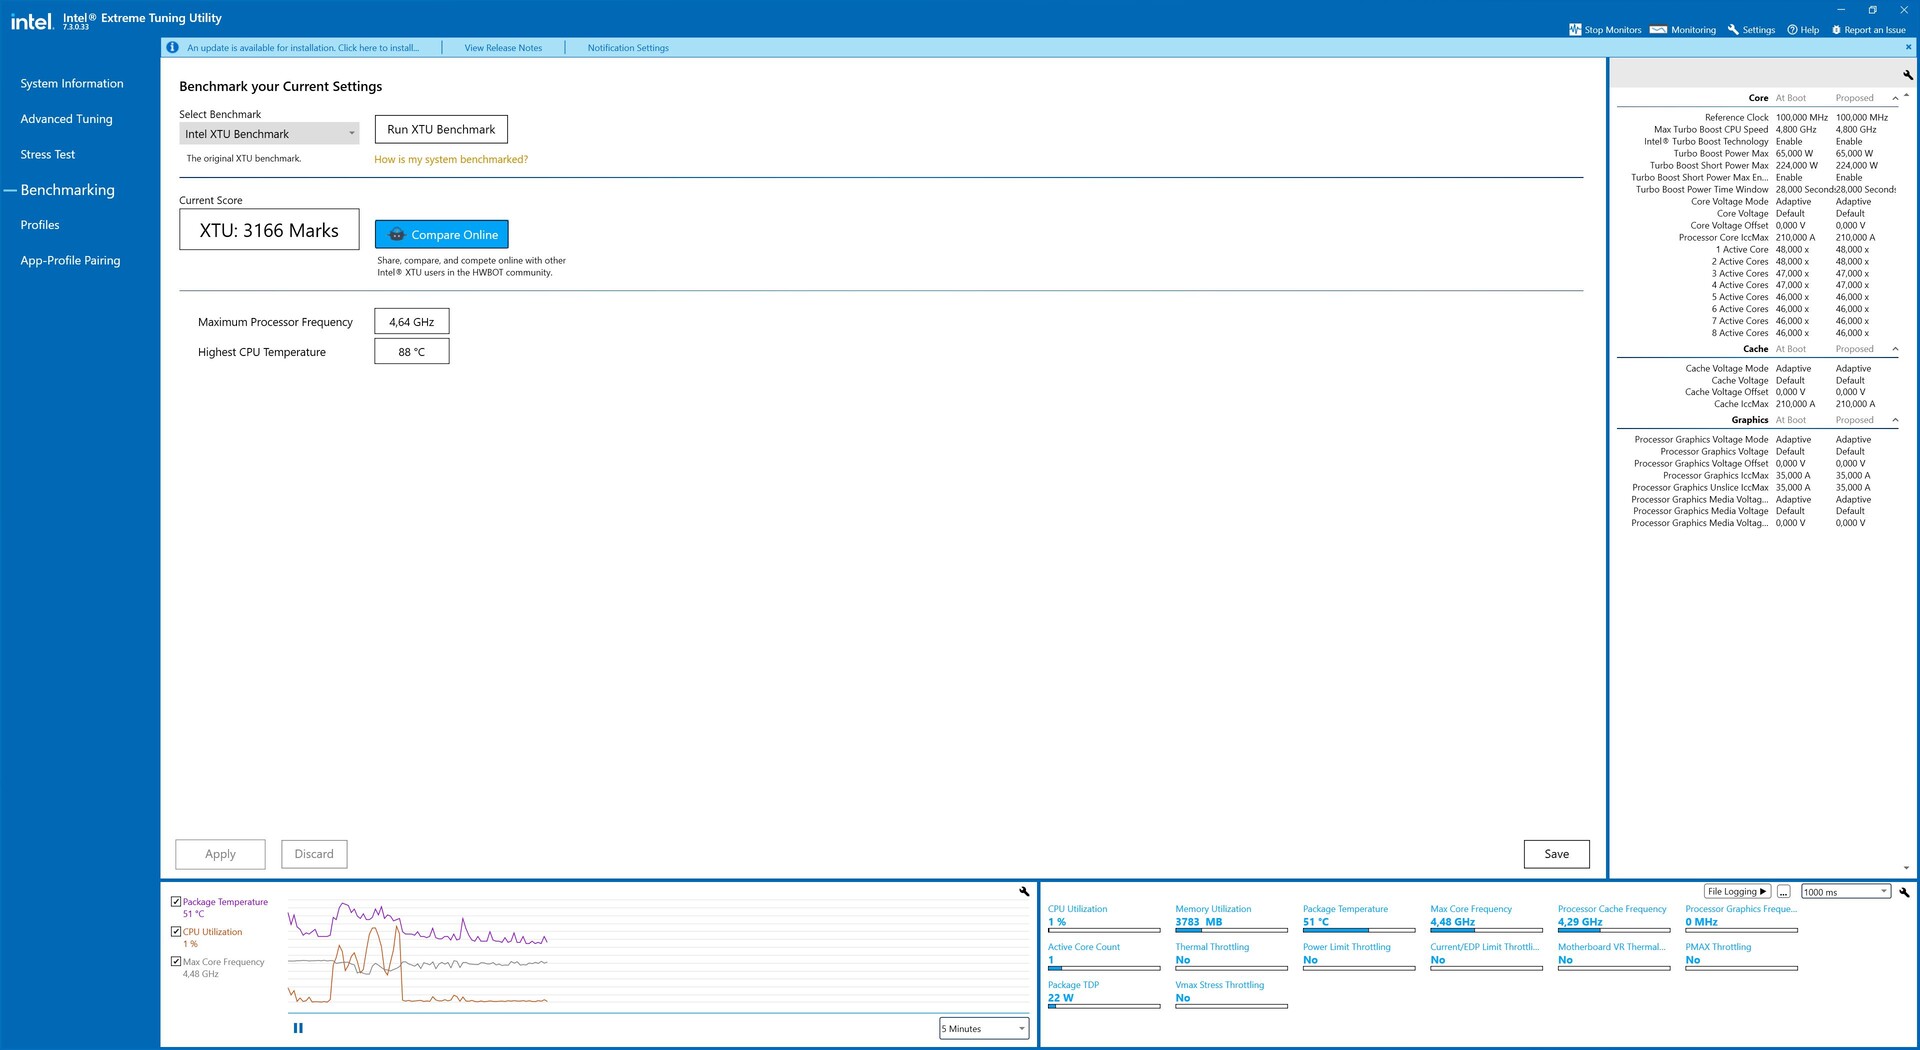
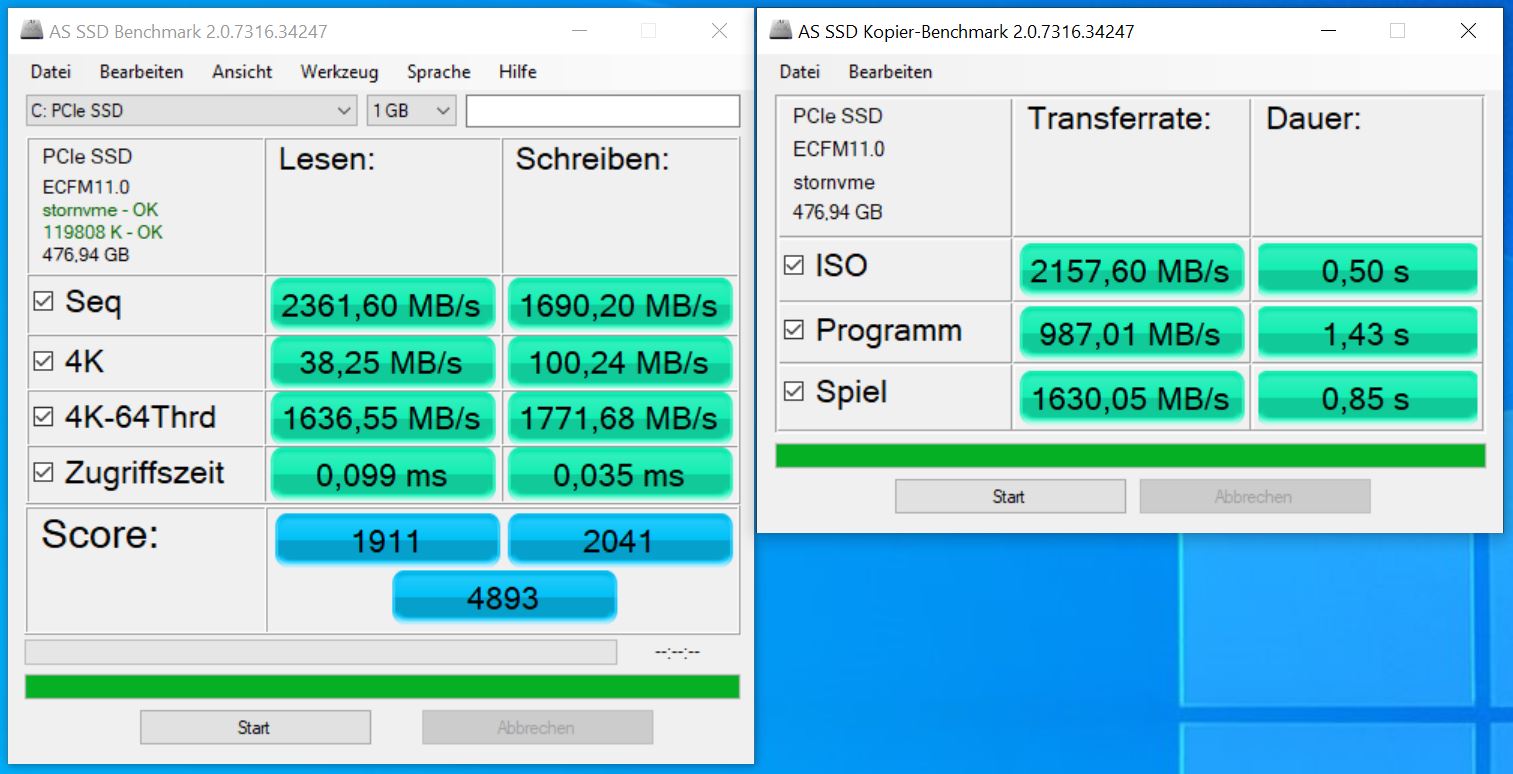
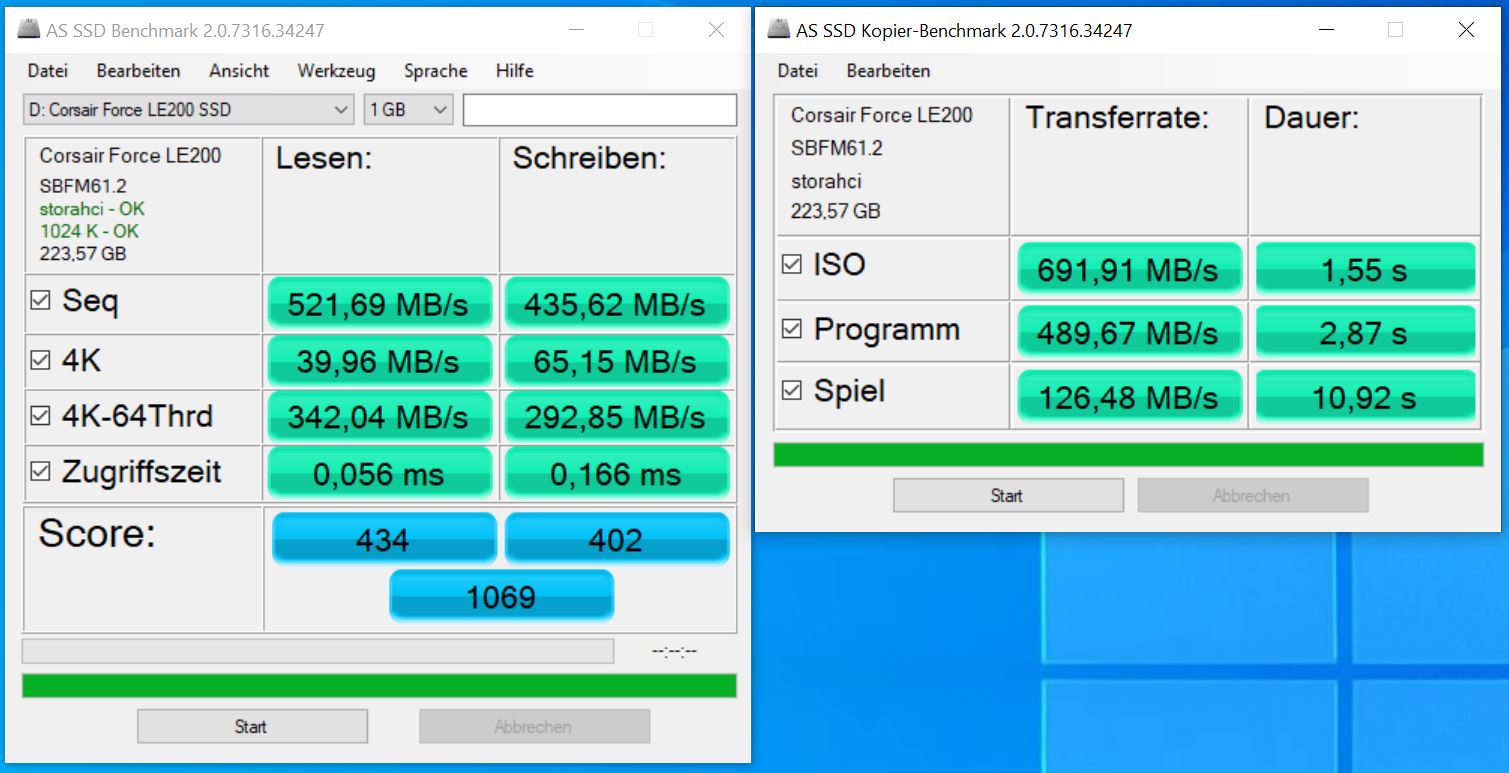
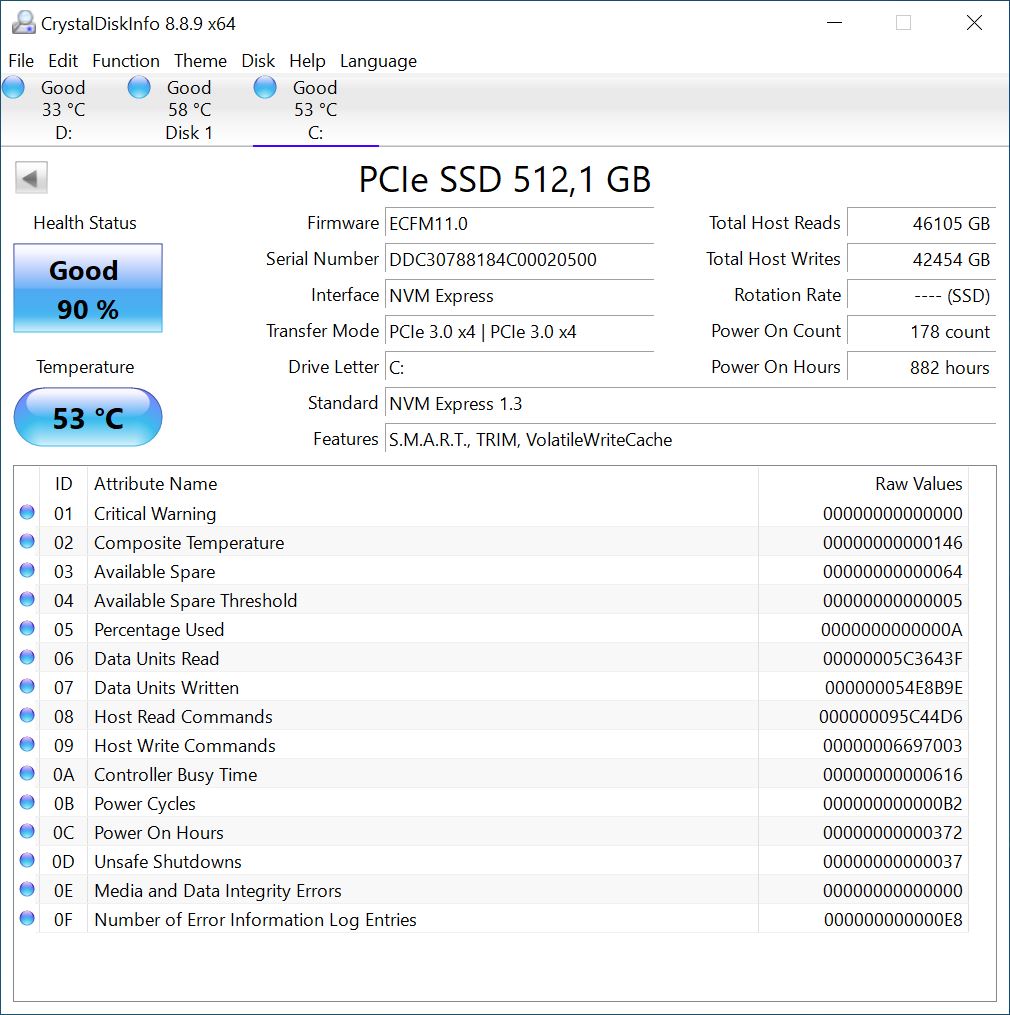
Our test configuration of the Magnus One achieves relatively good rates in our application benchmarks. Nonetheless, we expected better performance due to the built-in components. Compared to our other test systems, the Magnus One is often left behind. We do like the fact that it doesn't have a conventional hard drive. However, users have the freedom to choose the type of mass storage device that they want to use. The attached screenshots give a rough idea of the performance that can be expected. A total of three mass storage devices can be accommodated in the case.

3D and gaming performance
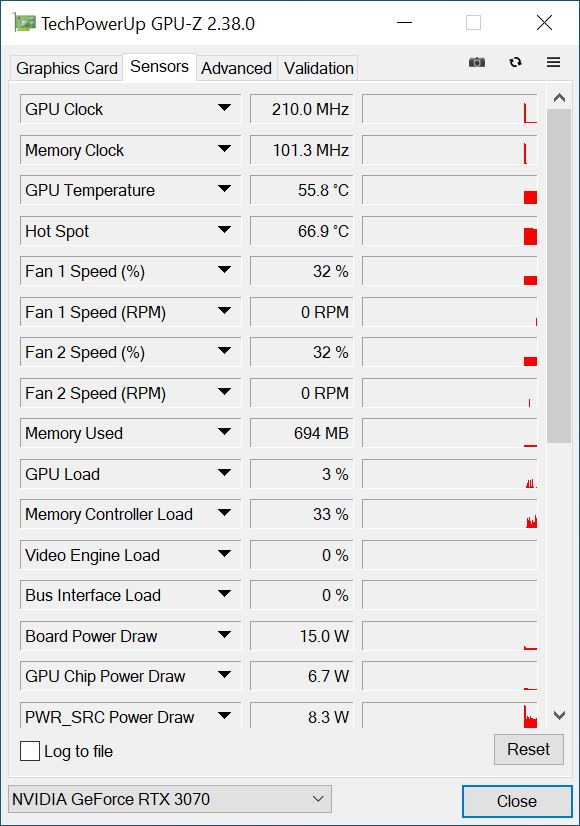
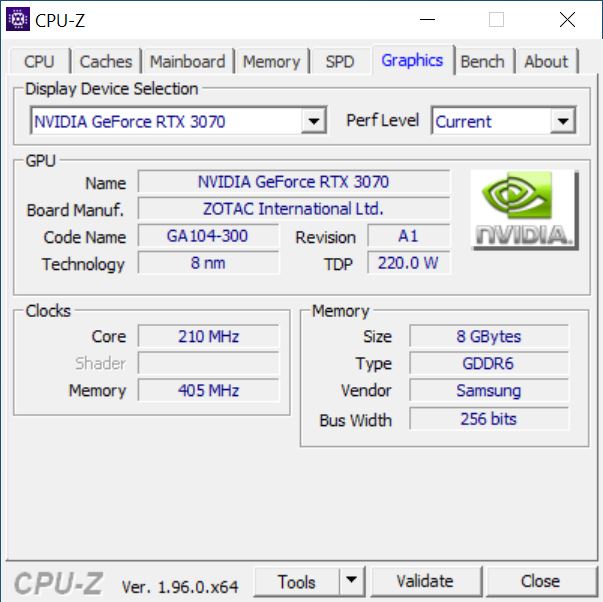
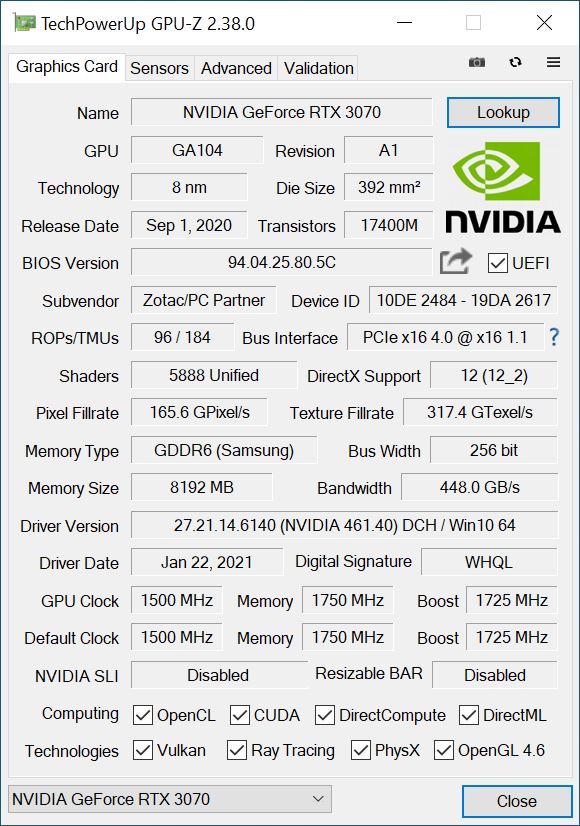
An Nvidia GeForce RTX 3070 that comes directly from Zotac's in-house portfolio is responsible for the good 3D performance. The system delivered a solid performance in the test and scored a bit better overall than in the previous tests that only examined the CPU. In terms of sheer performance, the Magnus One with the GeForce RTX 3070 ranks right behind our test system based on the slightly faster AMD Ryzen 9 5900X and the MSI GeForce RTX 3070 Ventus 3X. However, the somewhat lower performance can't be described as being noticeable. Nonetheless, the RTX 3070 has it easy when it comes to the previous generation equipped with the RTX 2070 Super. An improvement of up to 30% in performance is possible, and it's definitely perceptible when gaming as well. The equipment of the Magnus One certainly allows many games to be enjoyed in 2160p, although 1440p gaming should be the main target.
For more comparisons and benchmarks concerning the RTX 3070's performance, please check our GPU comparison table.
| Borderlands 3 - 1920x1080 Badass Overall Quality (DX11) | |
| Zotac Magnus One (ECM73070C) | |
| MSI GeForce RTX 3070 Ventus 3X | |
| Average NVIDIA GeForce RTX 2070 Super (Desktop) (74.3 - 86, n=5) | |
| Nvidia GeForce RTX 2070 Super | |
| KFA2 GeForce RTX 2070 Super Work The Frames | |
| Average NVIDIA GeForce RTX 2070 (Desktop) (70.9 - 74.4, n=2) | |
| Average NVIDIA GeForce RTX 2060 Super (Desktop) (68.6 - 74.1, n=4) | |
| low | med. | high | ultra | QHD | 4K | |
|---|---|---|---|---|---|---|
| GTA V (2015) | 180 | 173 | 161 | 95.6 | 91.6 | 110 |
| The Witcher 3 (2015) | 367 | 316 | 235 | 121 | 84 | |
| Dota 2 Reborn (2015) | 164.2 | 143.8 | 138.2 | 129.7 | 127.4 | |
| Final Fantasy XV Benchmark (2018) | 167 | 146 | 112 | 89.2 | 54.8 | |
| X-Plane 11.11 (2018) | 124 | 110 | 91 | 78.8 | ||
| Far Cry 5 (2018) | 150 | 133 | 126 | 117 | 112 | 70 |
| Strange Brigade (2018) | 430 | 311 | 253 | 222 | 165 | 97.1 |
| Far Cry New Dawn (2019) | 126 | 110 | 106 | 95 | 92 | 70 |
| Metro Exodus (2019) | 166 | 136 | 116 | 93.1 | 76.1 | 49 |
| Borderlands 3 (2019) | 149 | 132 | 118 | 98.8 | 75.5 | 42.7 |
Emissions
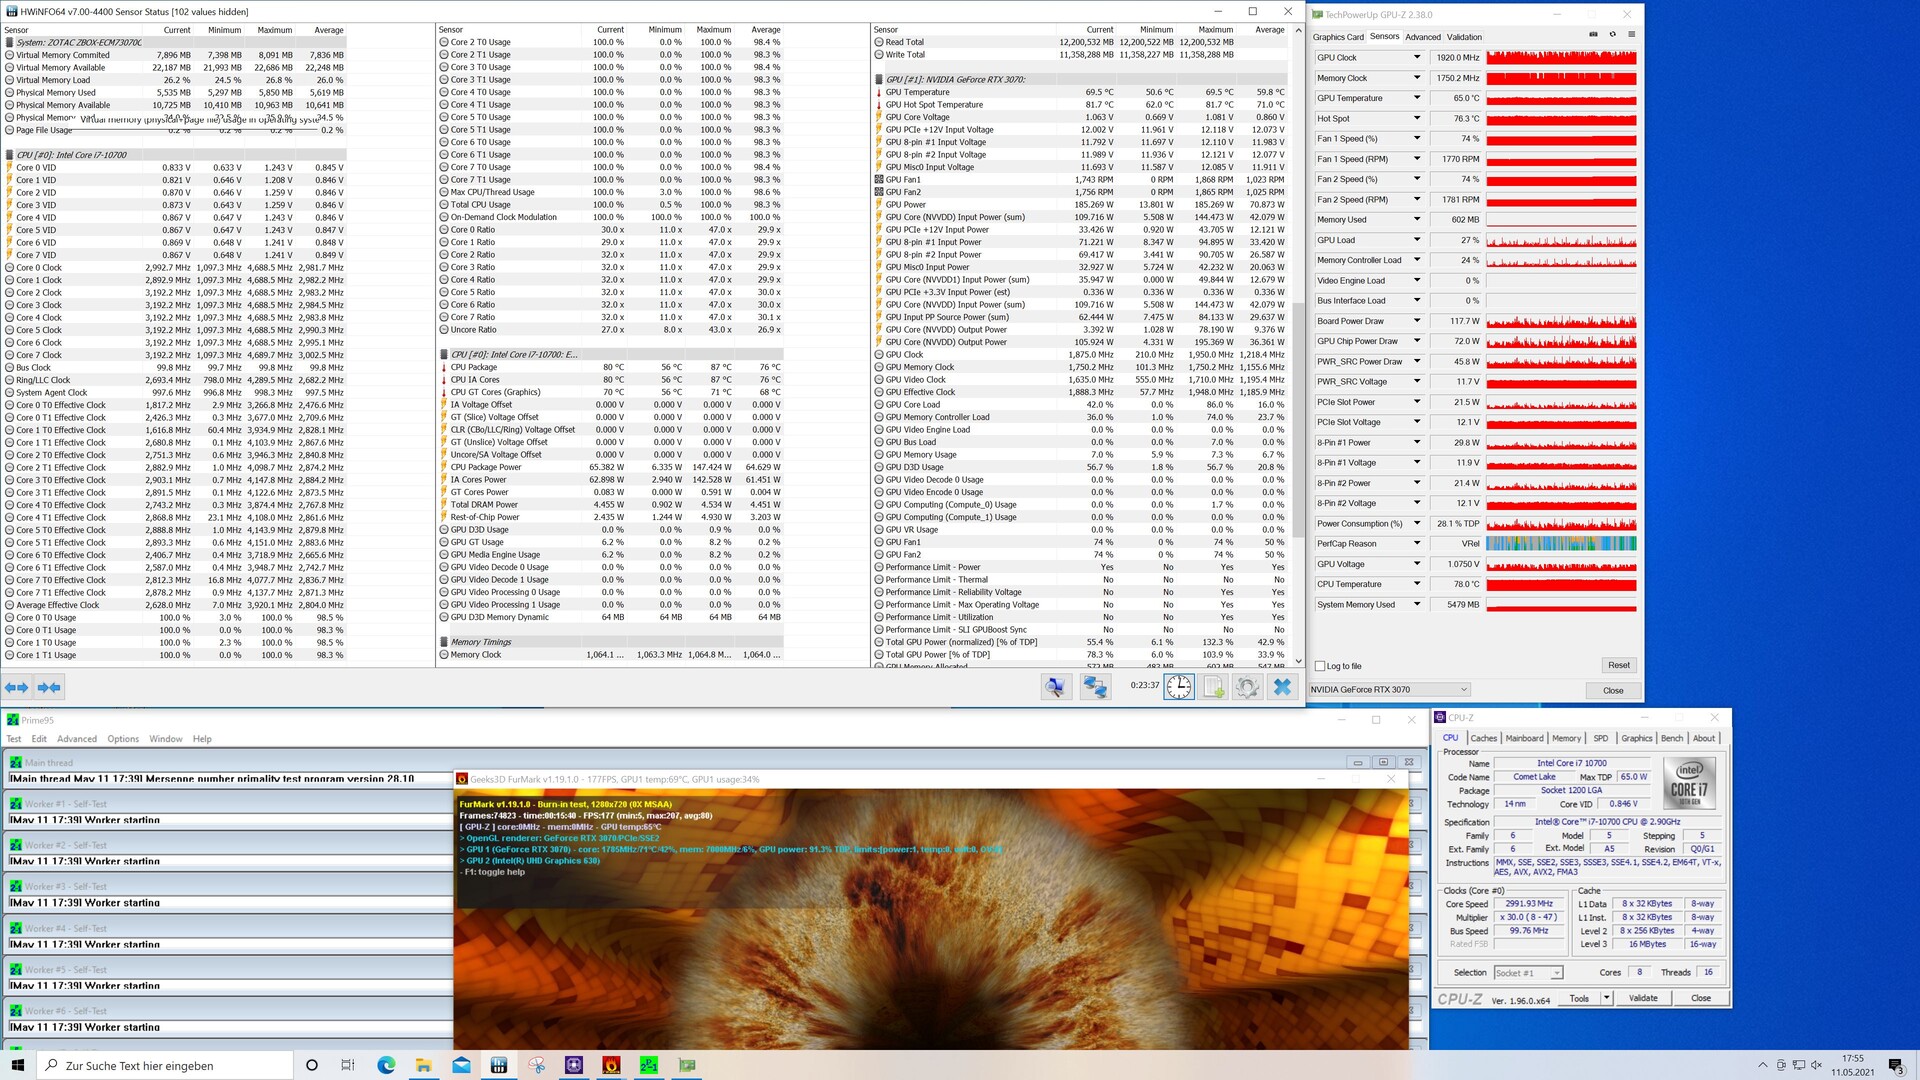
The Zotac Magnus One in the stress test
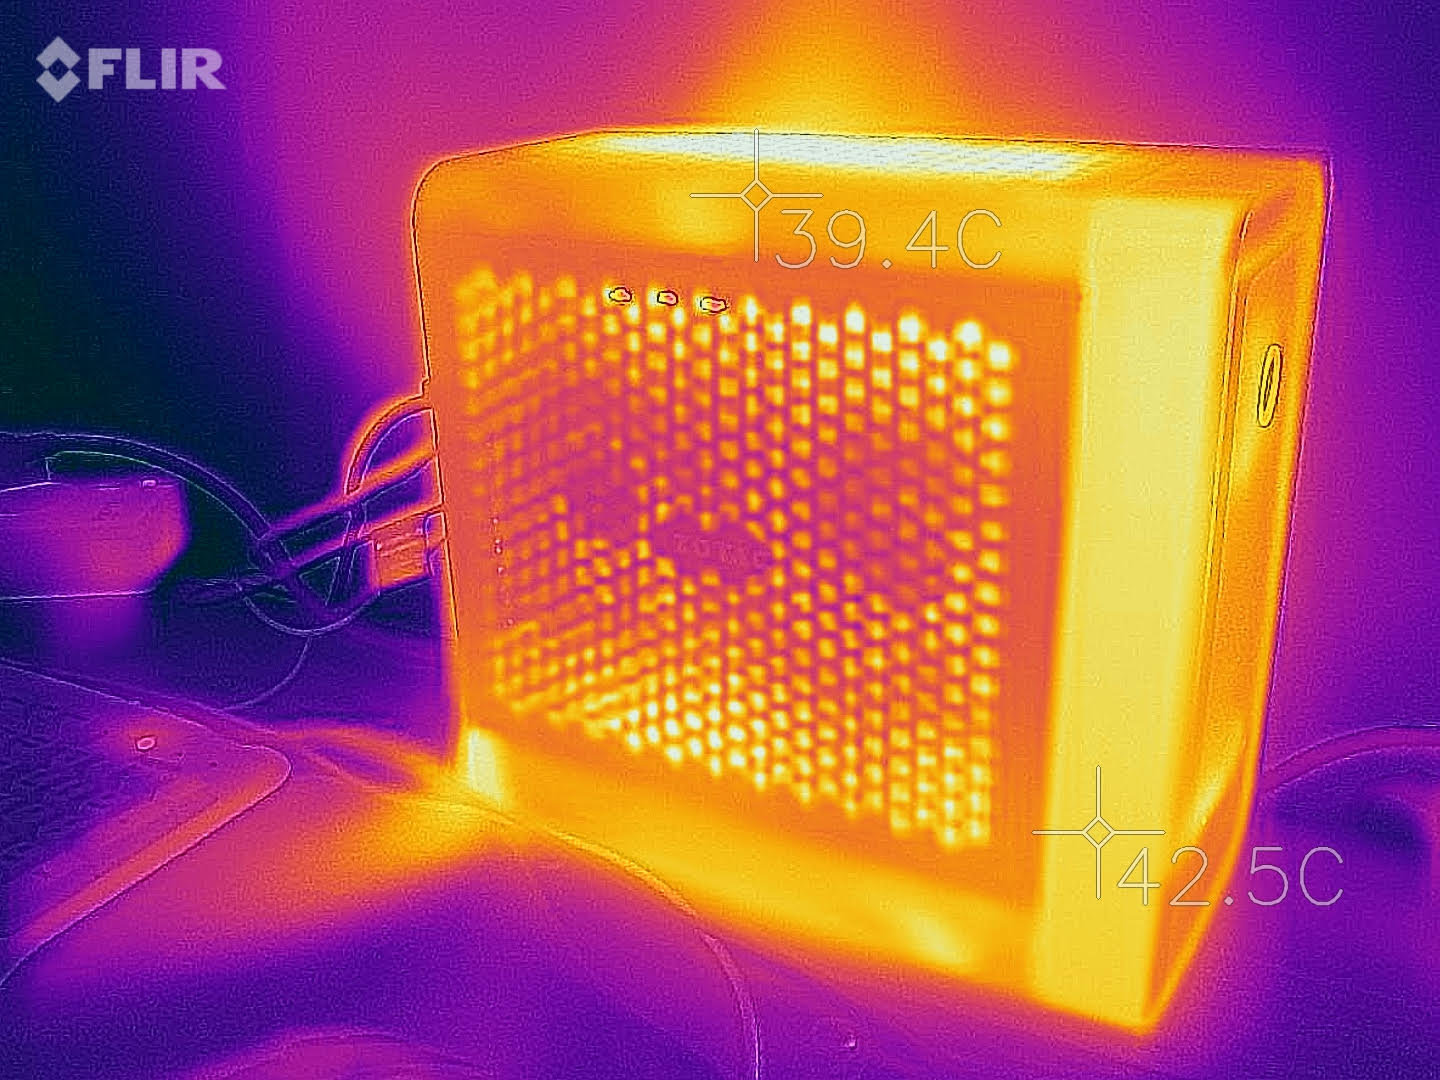
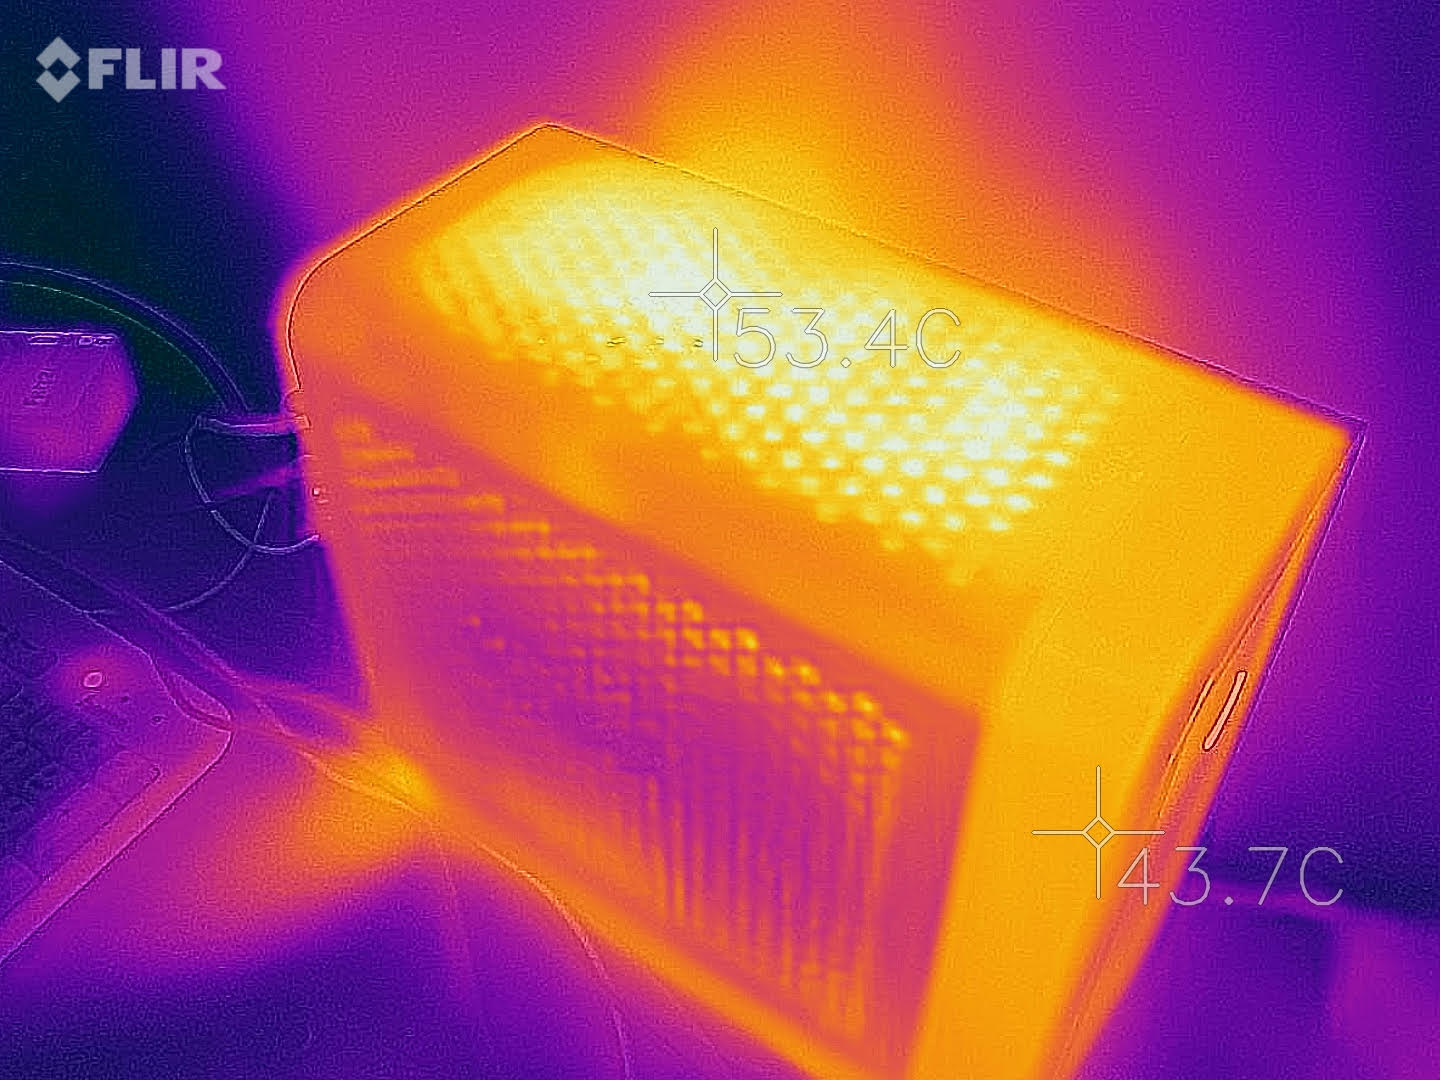
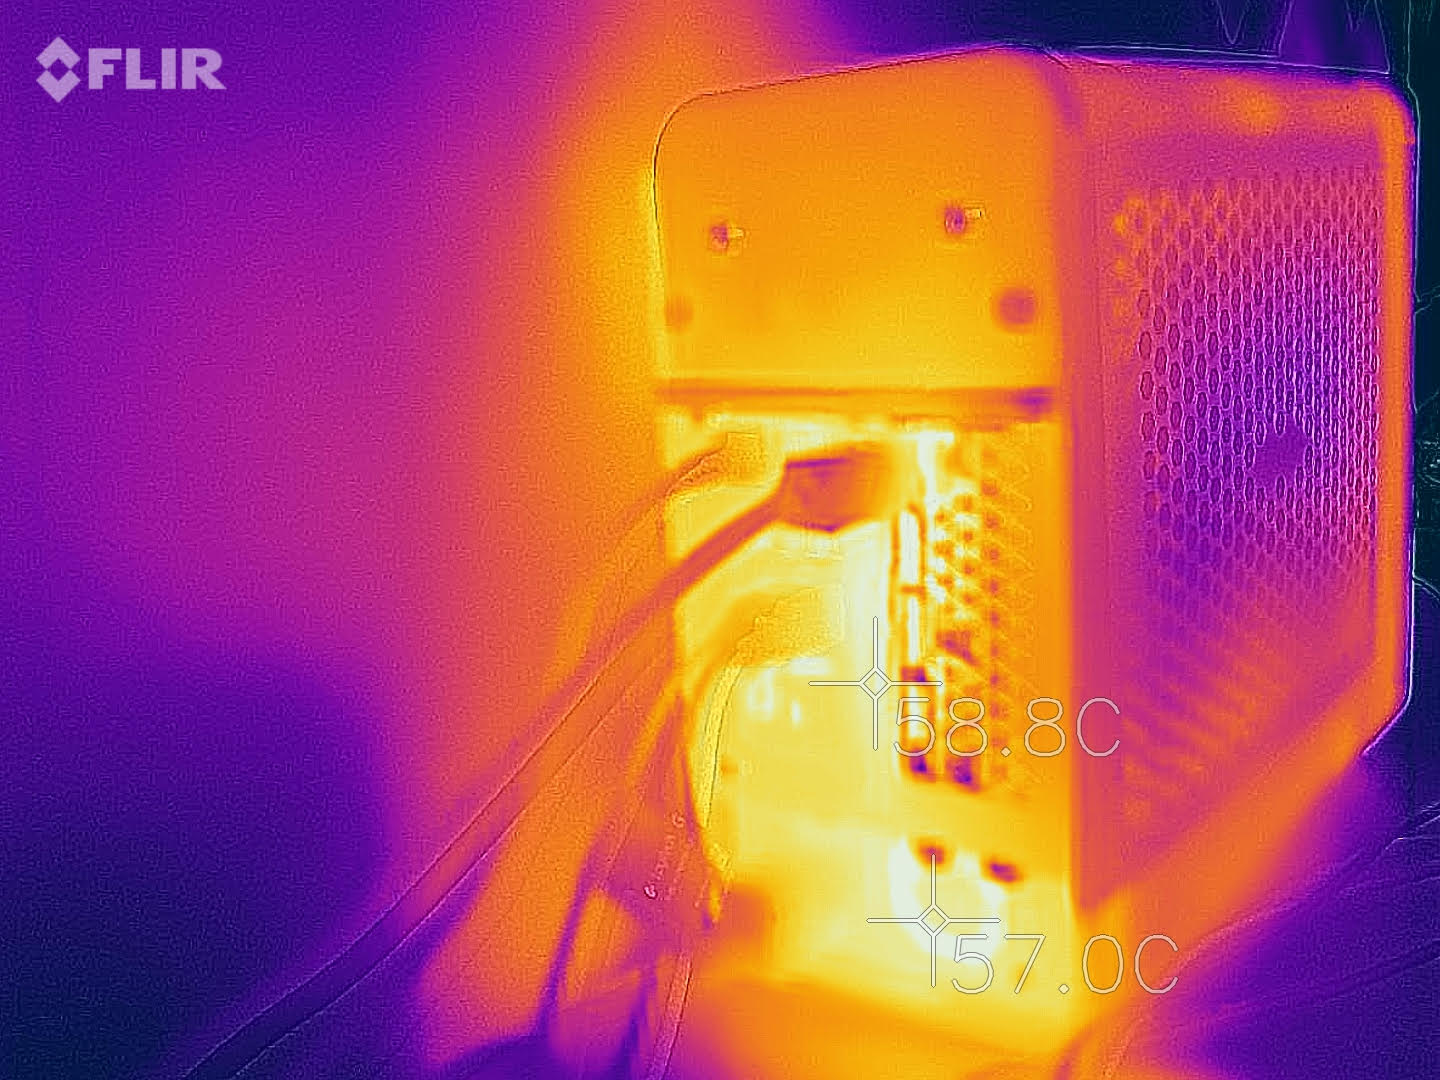
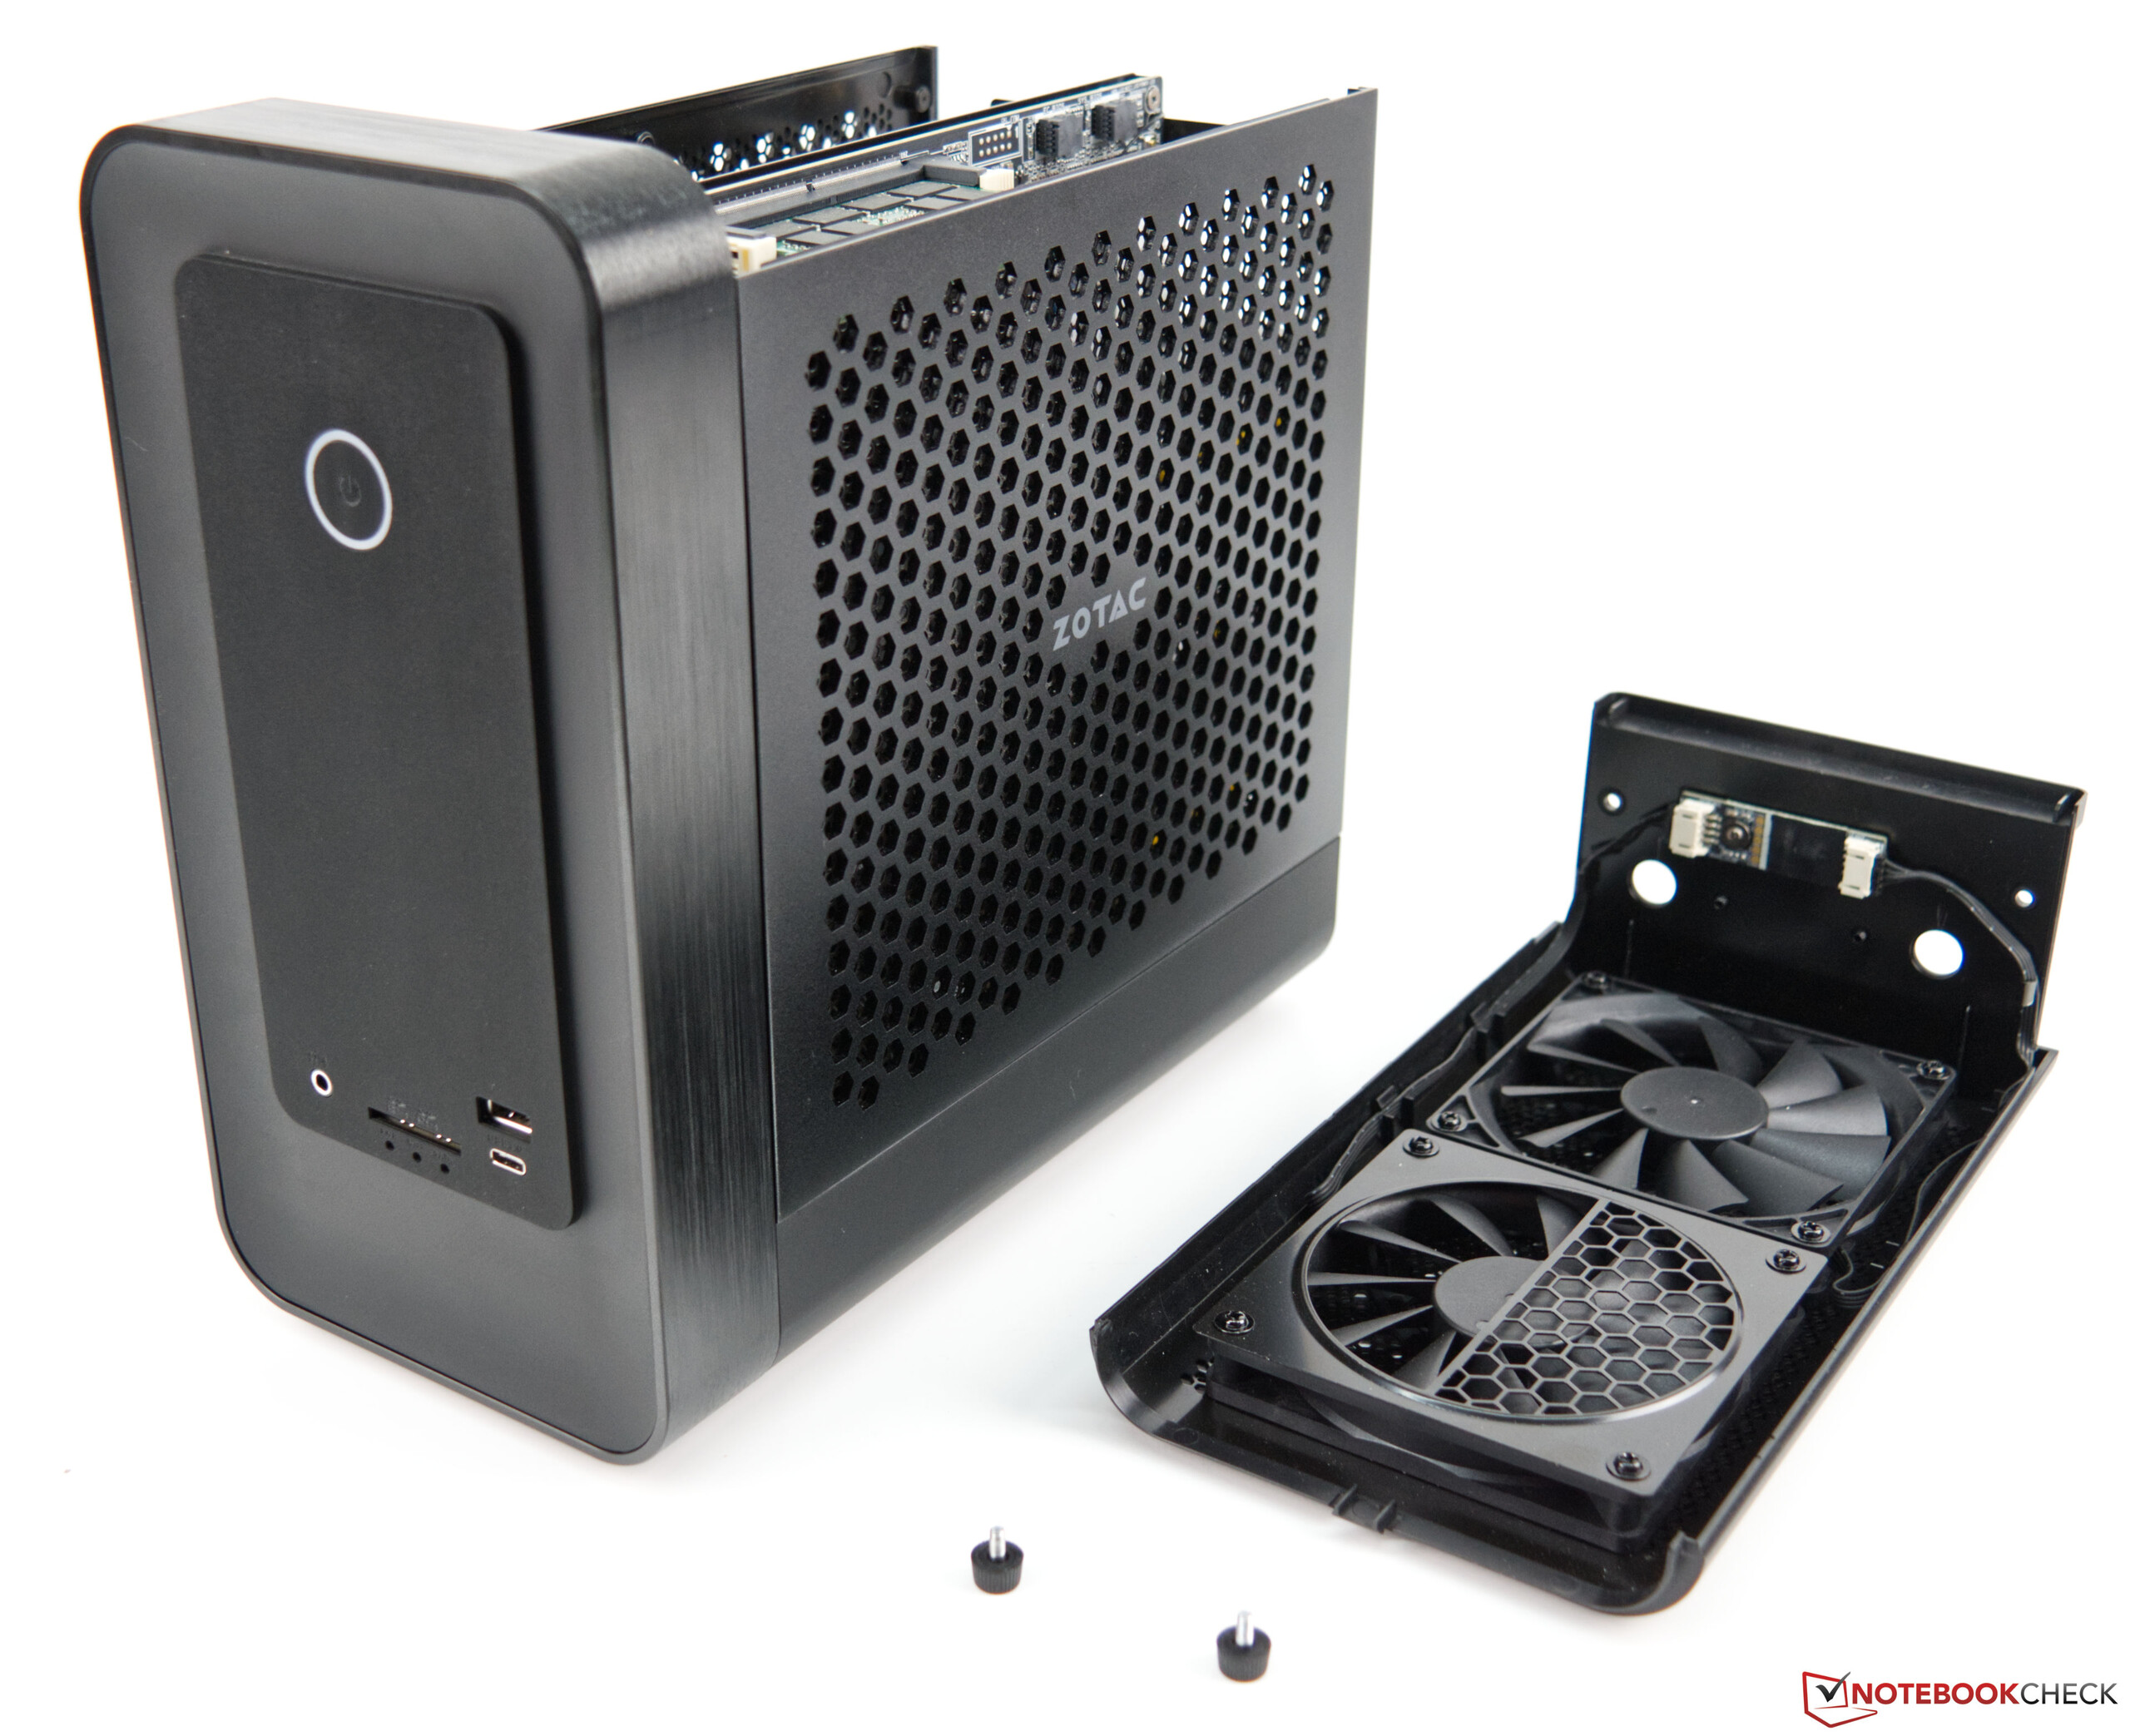
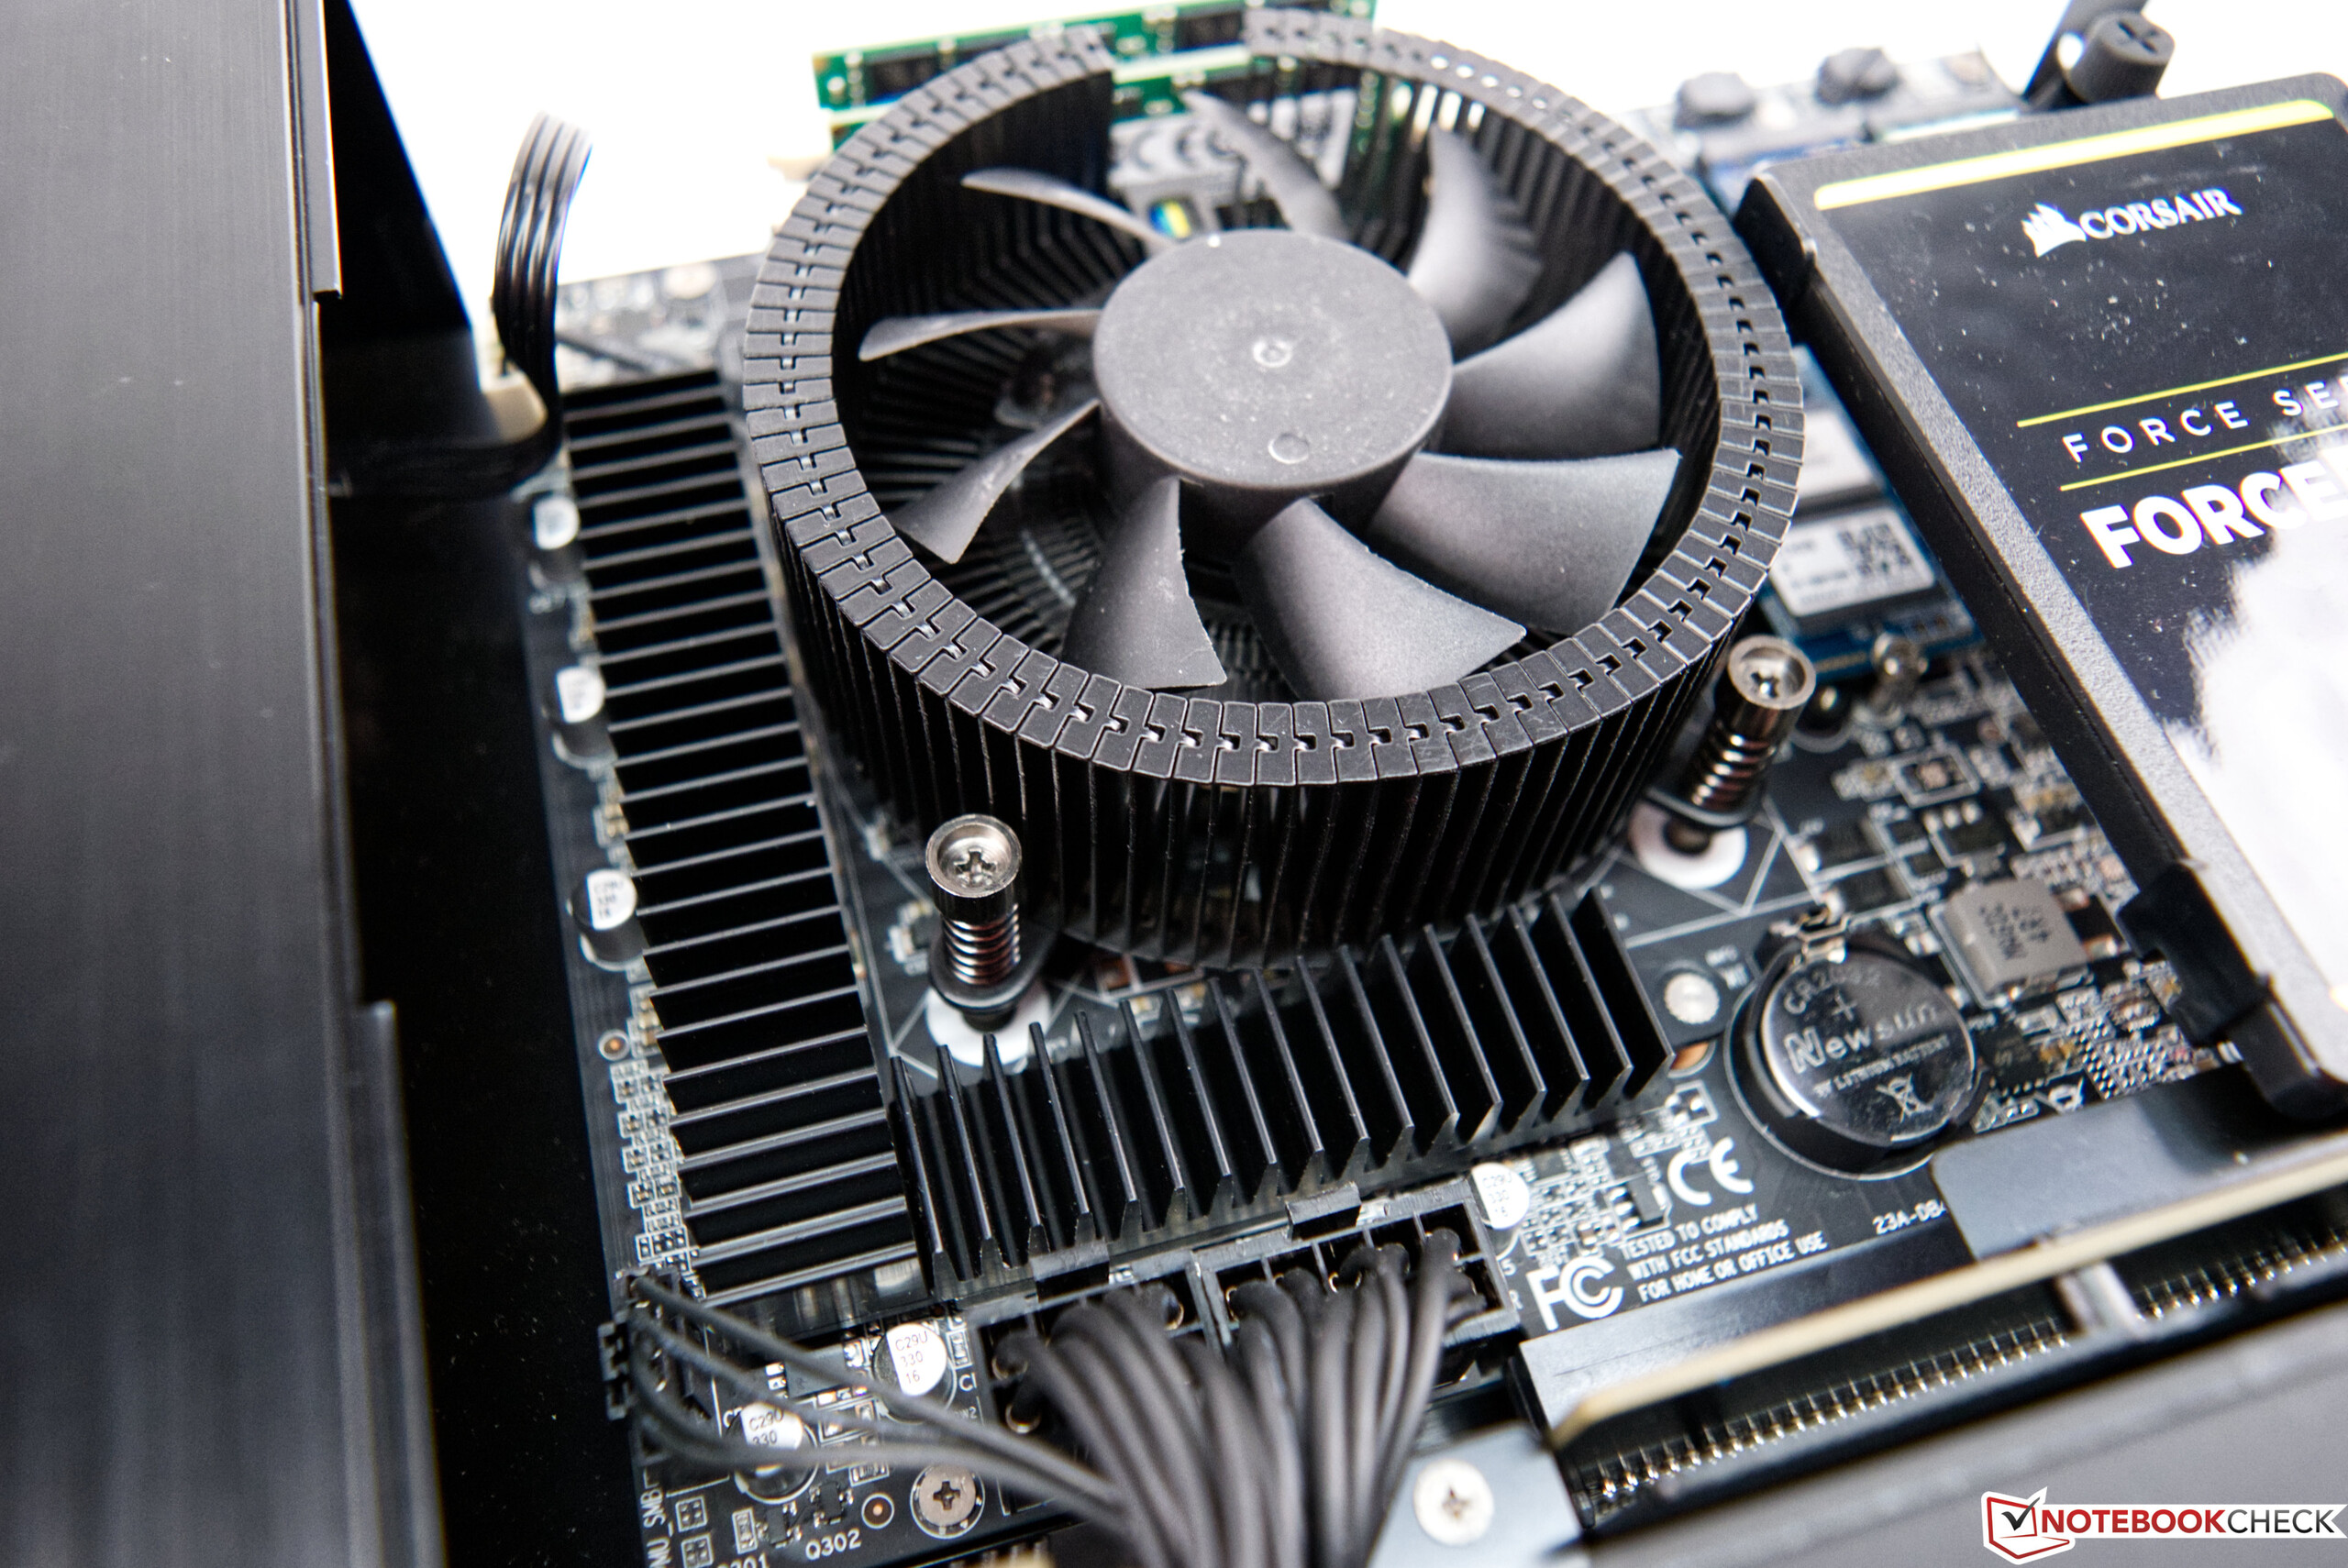
The compact design requires a clever cooling system. Zotac uses the so-called "chimney effect" here and installs two fans at the top that transport the resulting waste heat out of the case well. Nevertheless, the Intel Core i7-10700 heats up to a maximum of 87 °C (~187 °F) during the stress test. Moreover, the temperature of the GeForce RTX 3070 climbed up to almost 81 °C (~178 °F) during the stress test. This is all still within acceptable limits, and there's no reason for concern. Even during lengthy gaming sessions, there were no noticeable performance drops that would indicate that temperatures were too high.
For a desktop system, however, the Magnus One is clearly audible under load due to its cooling situation. We only measured 33.5 dB(A) in idle usage, although it got considerably louder at 48.7 dB(A) when gaming. The noise level was a bit lower in the stress test at 44.2 dB(A). At this point, we'd like to make a positive note of the fact that we didn't notice any high-frequency fan noise or coil whine.
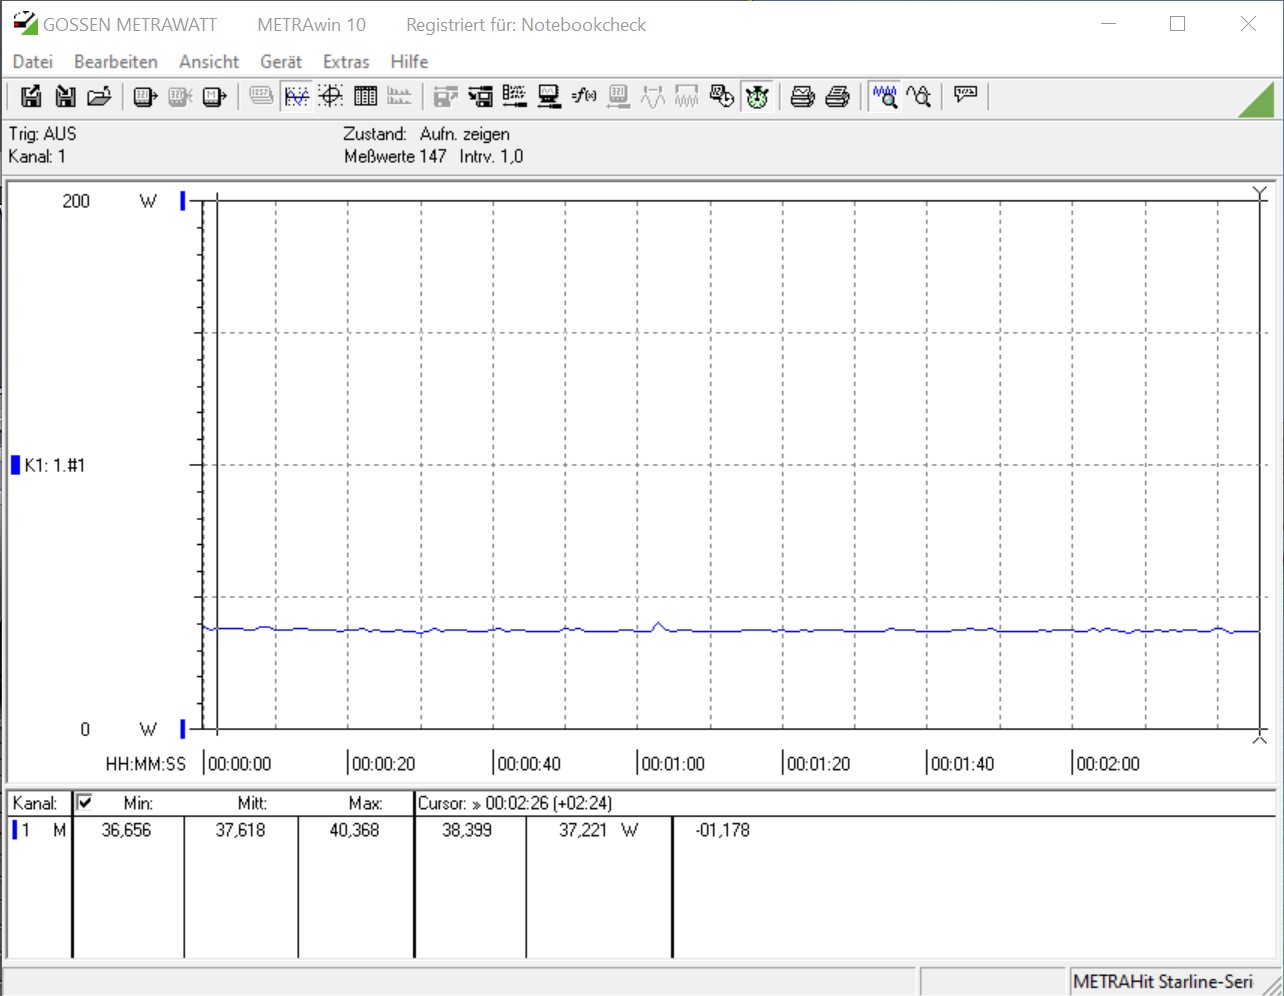
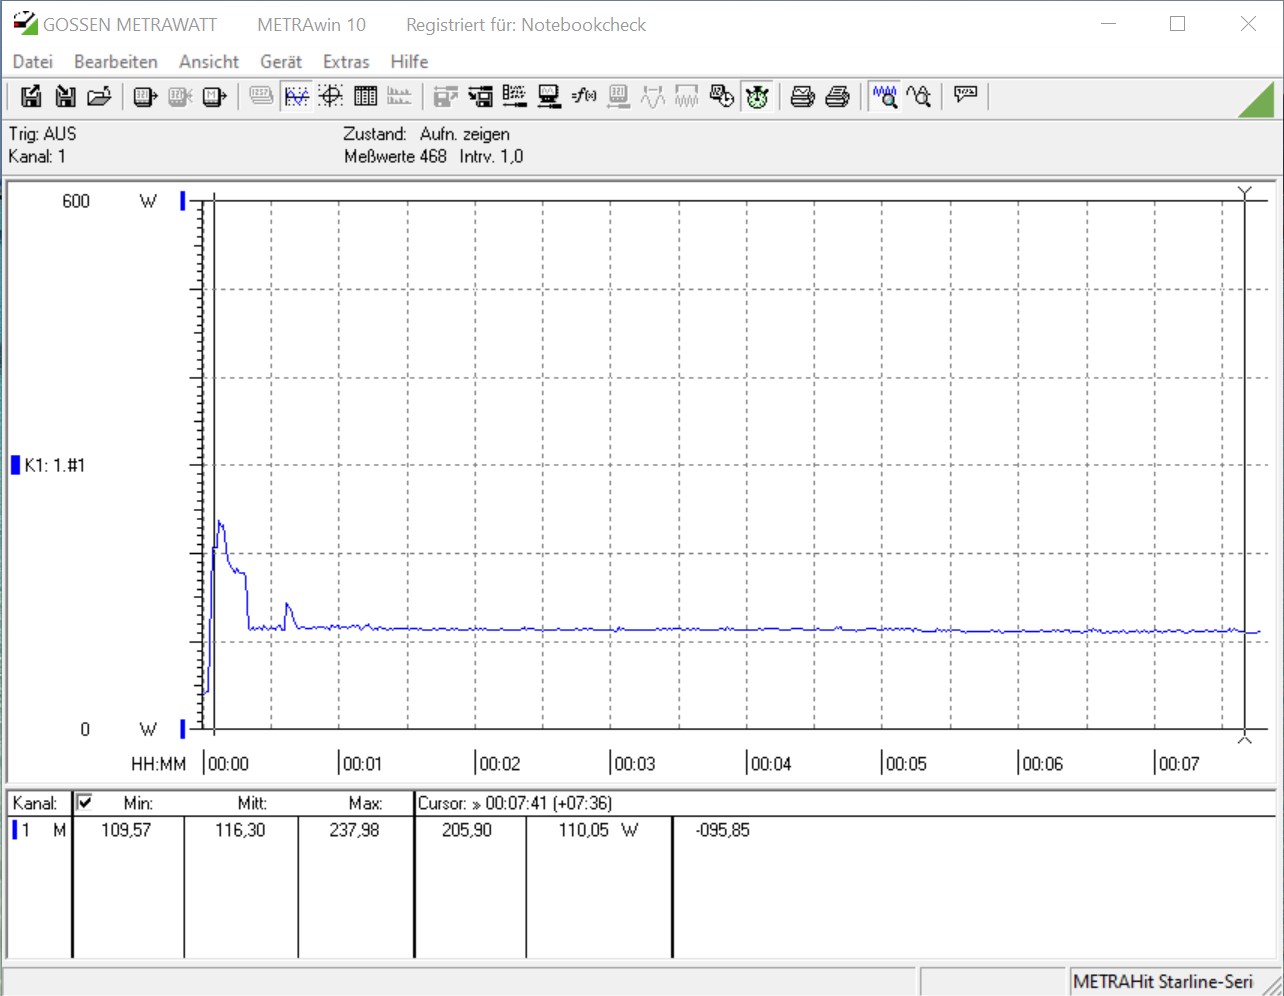
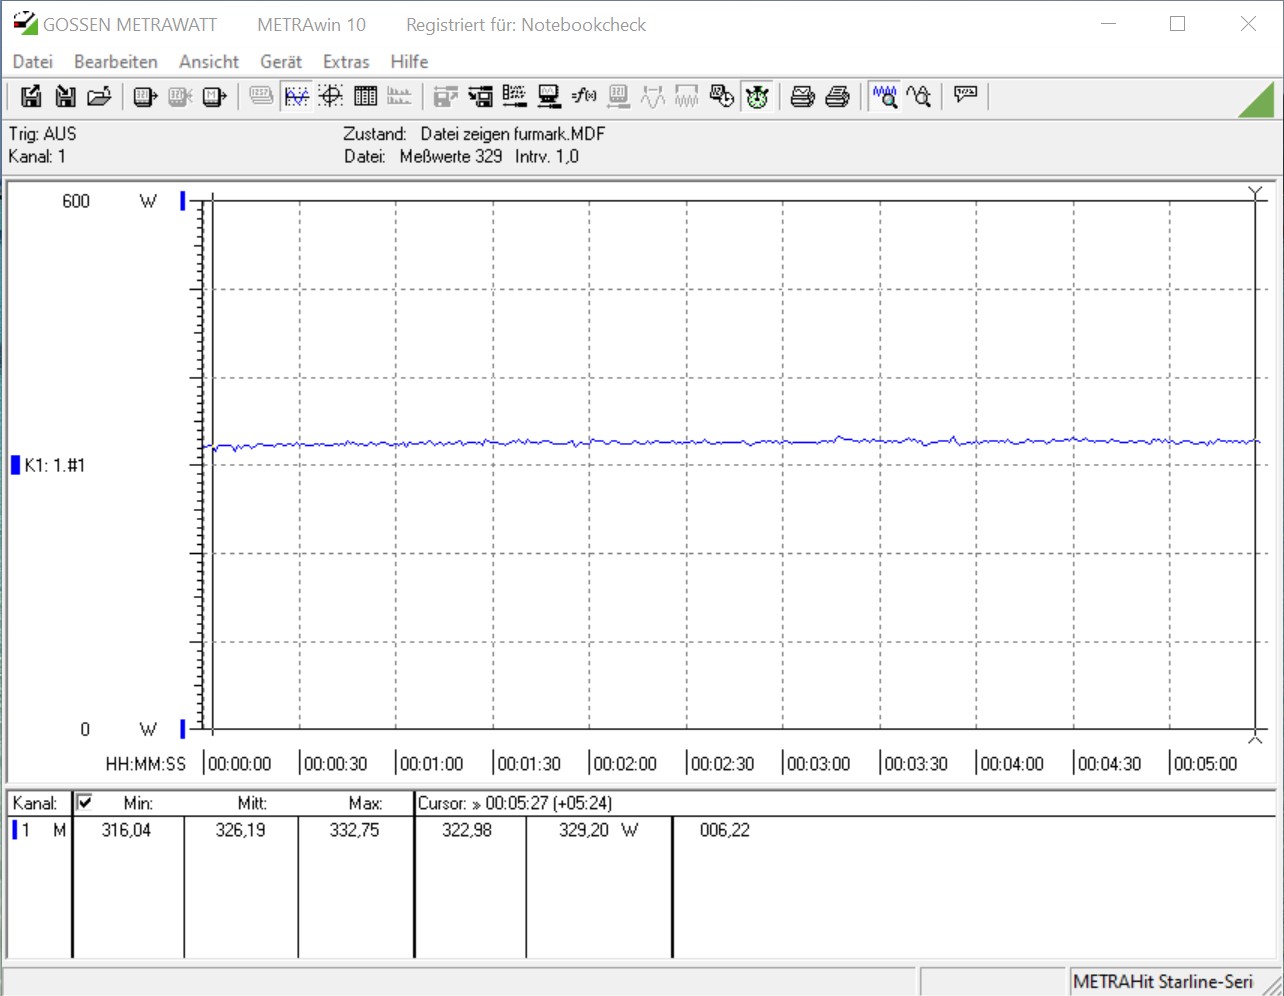
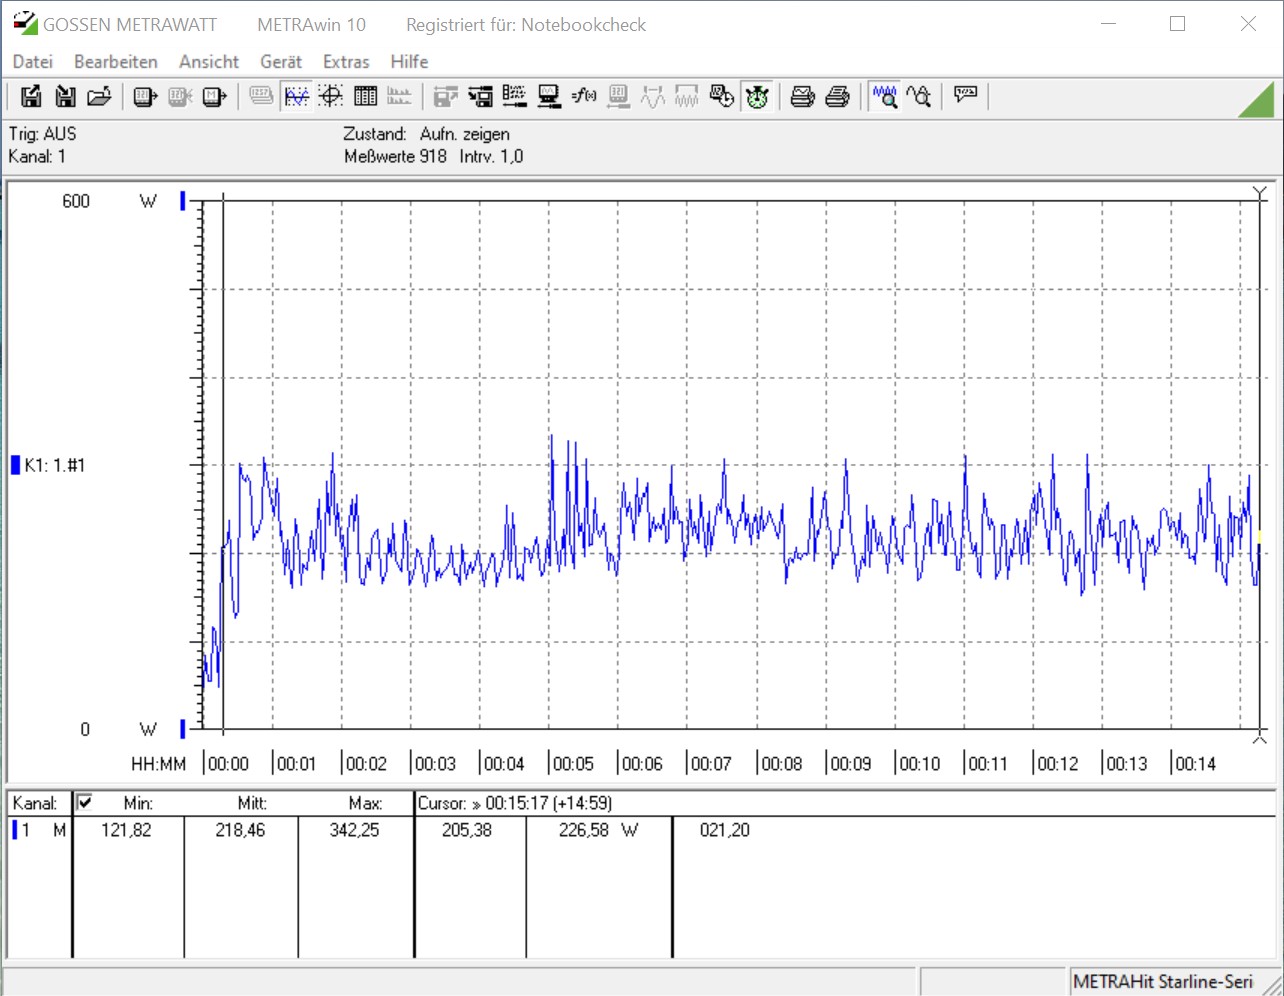
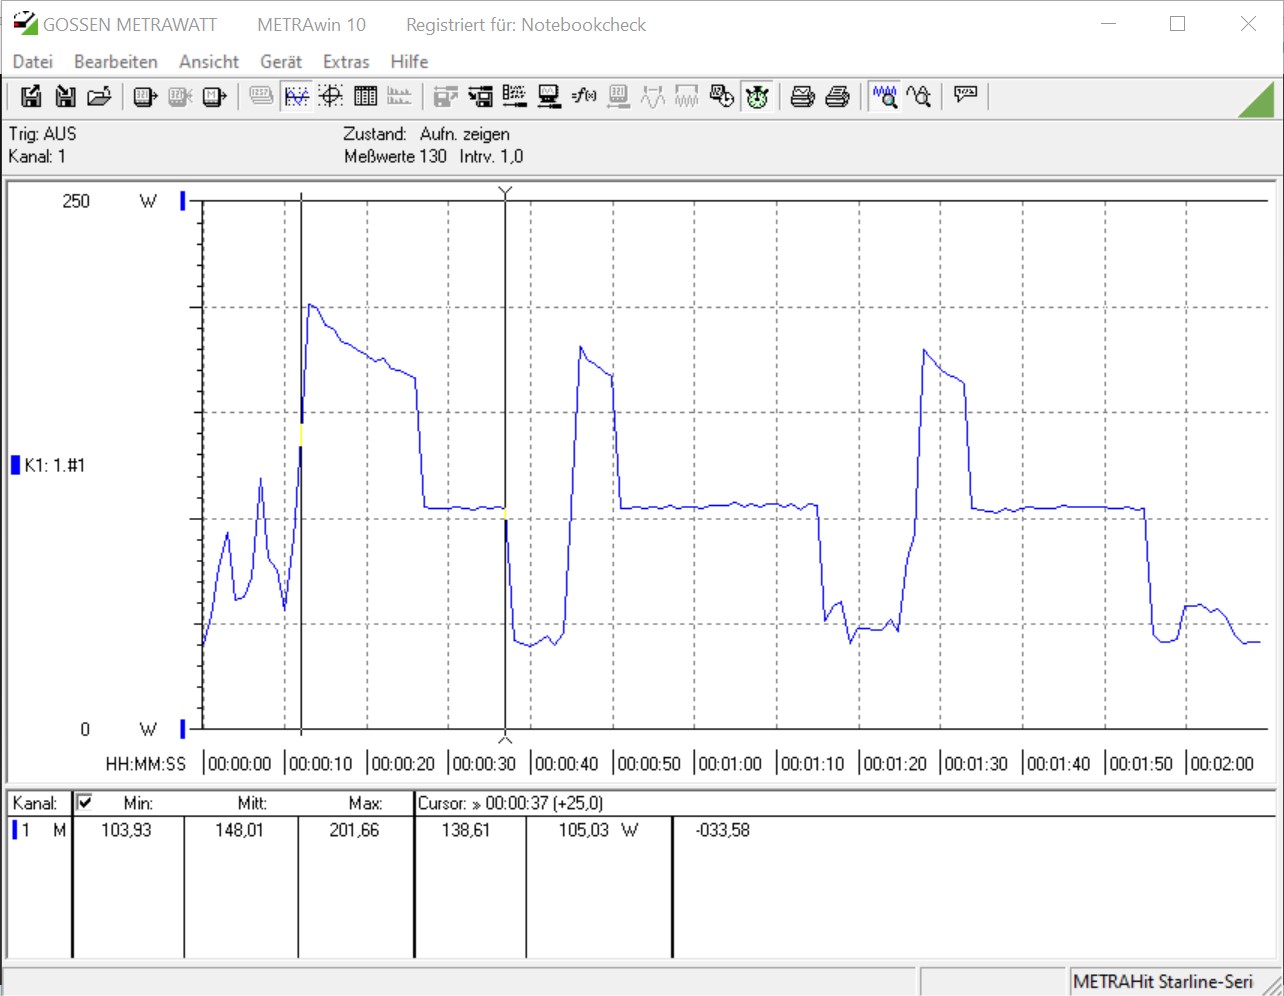
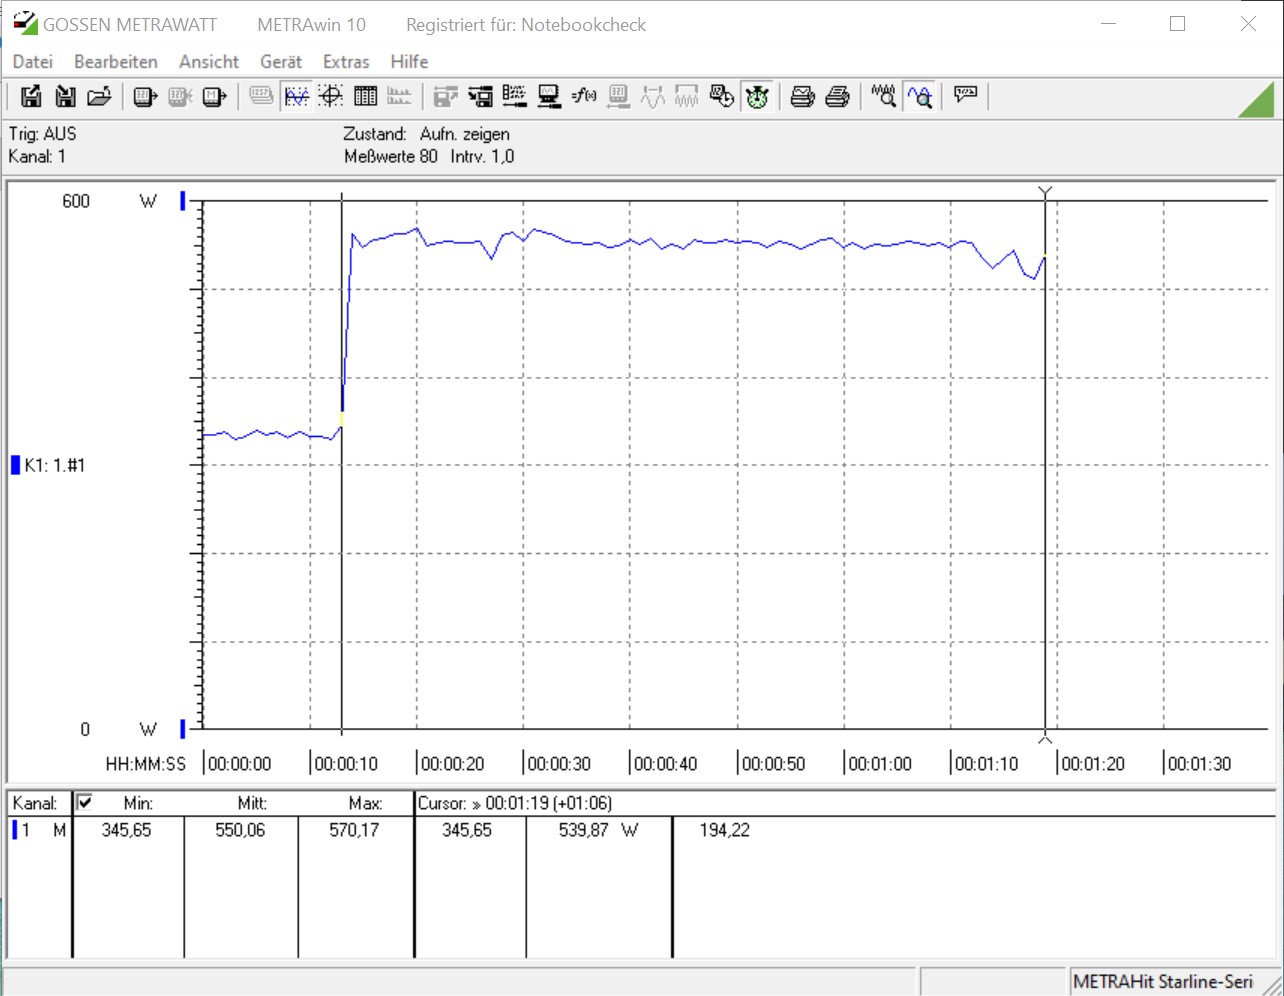
On one hand, the Magnus One is relatively economical in terms of power consumption, but on the other hand, it's also very power-hungry when it comes to gaming. Our measuring device showed an average of 550 watts in the gaming test. The installed power supply is specified at 500 watts. Nevertheless, there were no crashes during the test that would point to an overload.
| Power Consumption | |
| 1920x1080 The Witcher 3 ultra (external Monitor) | |
| Zotac Magnus One (ECM73070C) (Idle: 37.6 W) | |
| AMD Ryzen 7 5800X (Idle: 77.5 W) | |
| AMD Ryzen 5 5600X (Idle: 79.23 W) | |
| Intel Core i5-10600K (Idle: 52.2 W) | |
| Intel Core i7-9700K, AMD Radeon RX Vega 64 | |
| MSI GeForce RTX 3070 Ventus 3X (Idle: 91.46 W) | |
| Prime95 V2810 Stress (external Monitor) | |
| AMD Ryzen 7 5800X (Idle: 77.5 W) | |
| Intel Core i7-9700K, AMD Radeon RX Vega 64 | |
| Intel Core i5-10600K (Idle: 52.2 W) | |
| AMD Ryzen 5 5600X (Idle: 79.23 W) | |
| Zotac Magnus One (ECM73070C) (Idle: 37.6 W) | |
| Cinebench R15 Multi (external Monitor) | |
| AMD Ryzen 7 5800X (Idle: 77.5 W) | |
| Intel Core i7-9700K, AMD Radeon RX Vega 64 | |
| Intel Core i5-10600K (Idle: 52.2 W) | |
| AMD Ryzen 5 5600X (Idle: 79.23 W) | |
| Zotac Magnus One (ECM73070C) (Idle: 37.6 W) | |
| Temperatures - CPU Temperature Prime95 | |
| AMD Ryzen 7 5800X | |
| Intel Core i5-10600K | |
* ... smaller is better
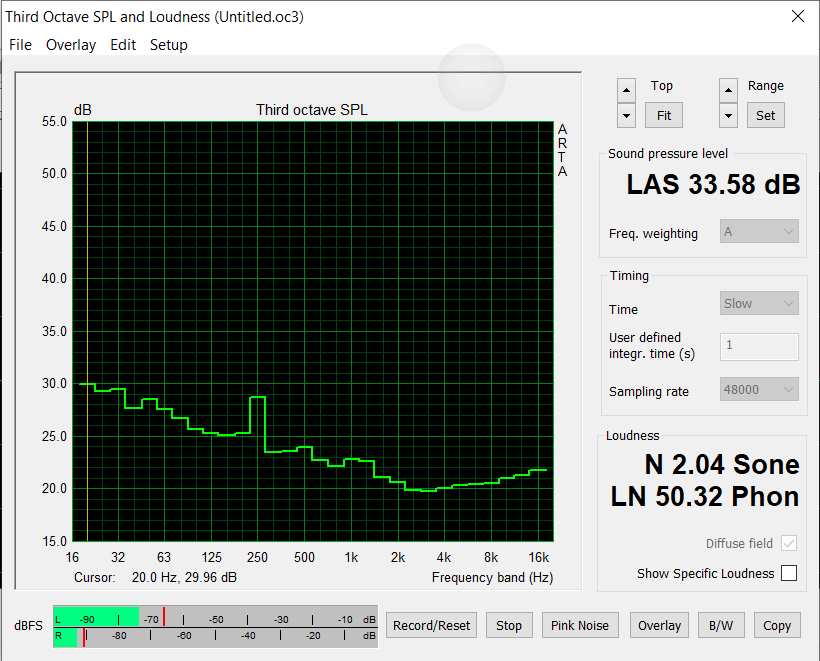
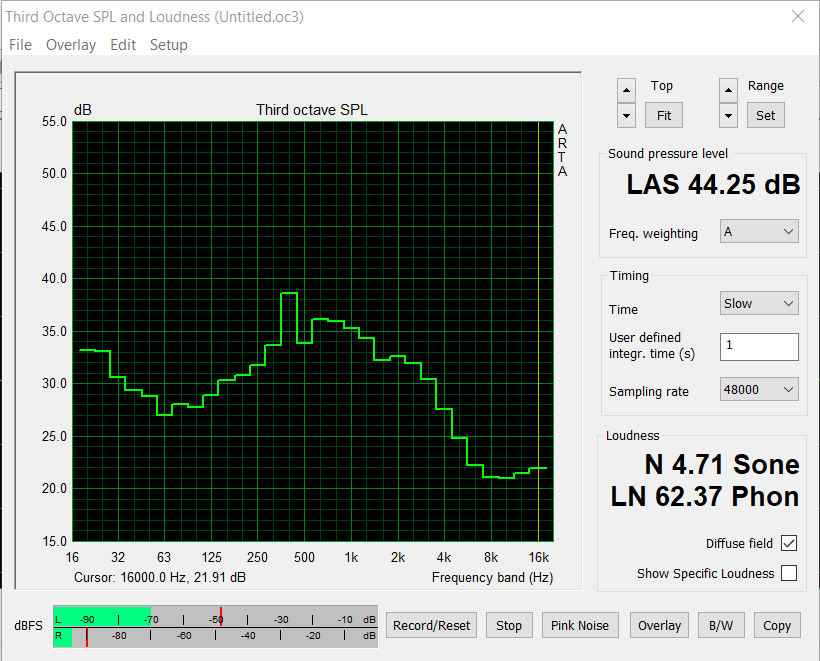
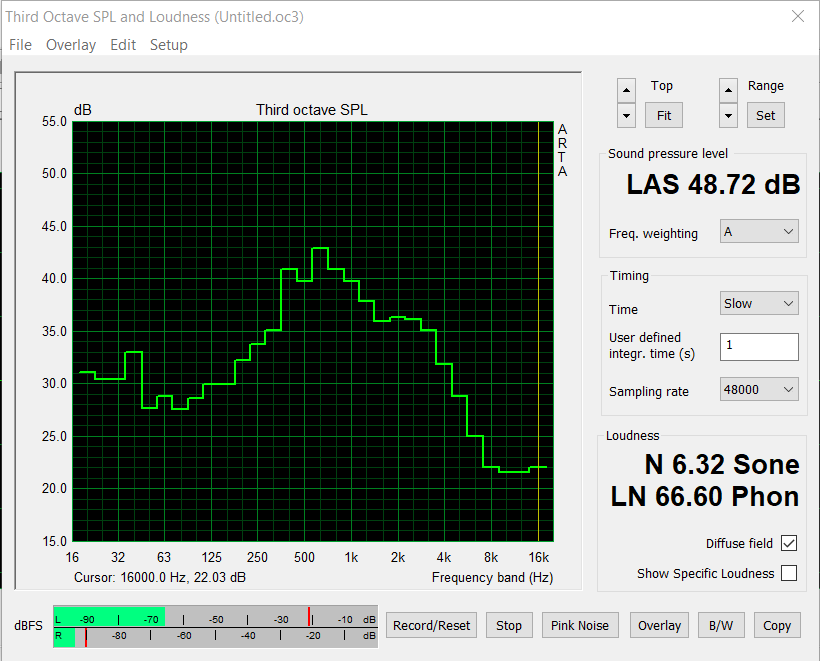
Noise level
| Idle |
| 33.58 / / dB(A) |
| Load |
| 44.25 / 48.72 dB(A) |
 | ||
30 dB silent 40 dB(A) audible 50 dB(A) loud |
||
min: | ||
Pros
Cons
Verdict - Good performance and good connectivity
Zotac's Magnus One is a compact device that offers very good performance in the smallest of spaces. Note that this is a barebone system where the RAM, the mass storage, and the operating system as well are not part of the MSRP of 1,499 Euros (~$1,825). However, at the time of testing, realistic street prices start at 1,650 Euros (~$2,009) and upwards. Users who can get hold of the Magnus One at a good price might even get a bargain, since the GeForce RTX 3070 alone already costs considerably more than 1,000 Euros (~$1,218). The Intel Core i7-10700 is not the latest version of the Core processors, but this isn't a problem in everyday use. All in all, the small Core i7-10700, which hasn't been limited in terms of TDP, fits well into the overall system. However, the Magnus One scores better in our 3D and gaming benchmarks than in the dedicated CPU tests. AMD is somewhat better positioned here with the Ryzen 5000 series. Maybe Zotac will consider developing a system based on AMD as well.
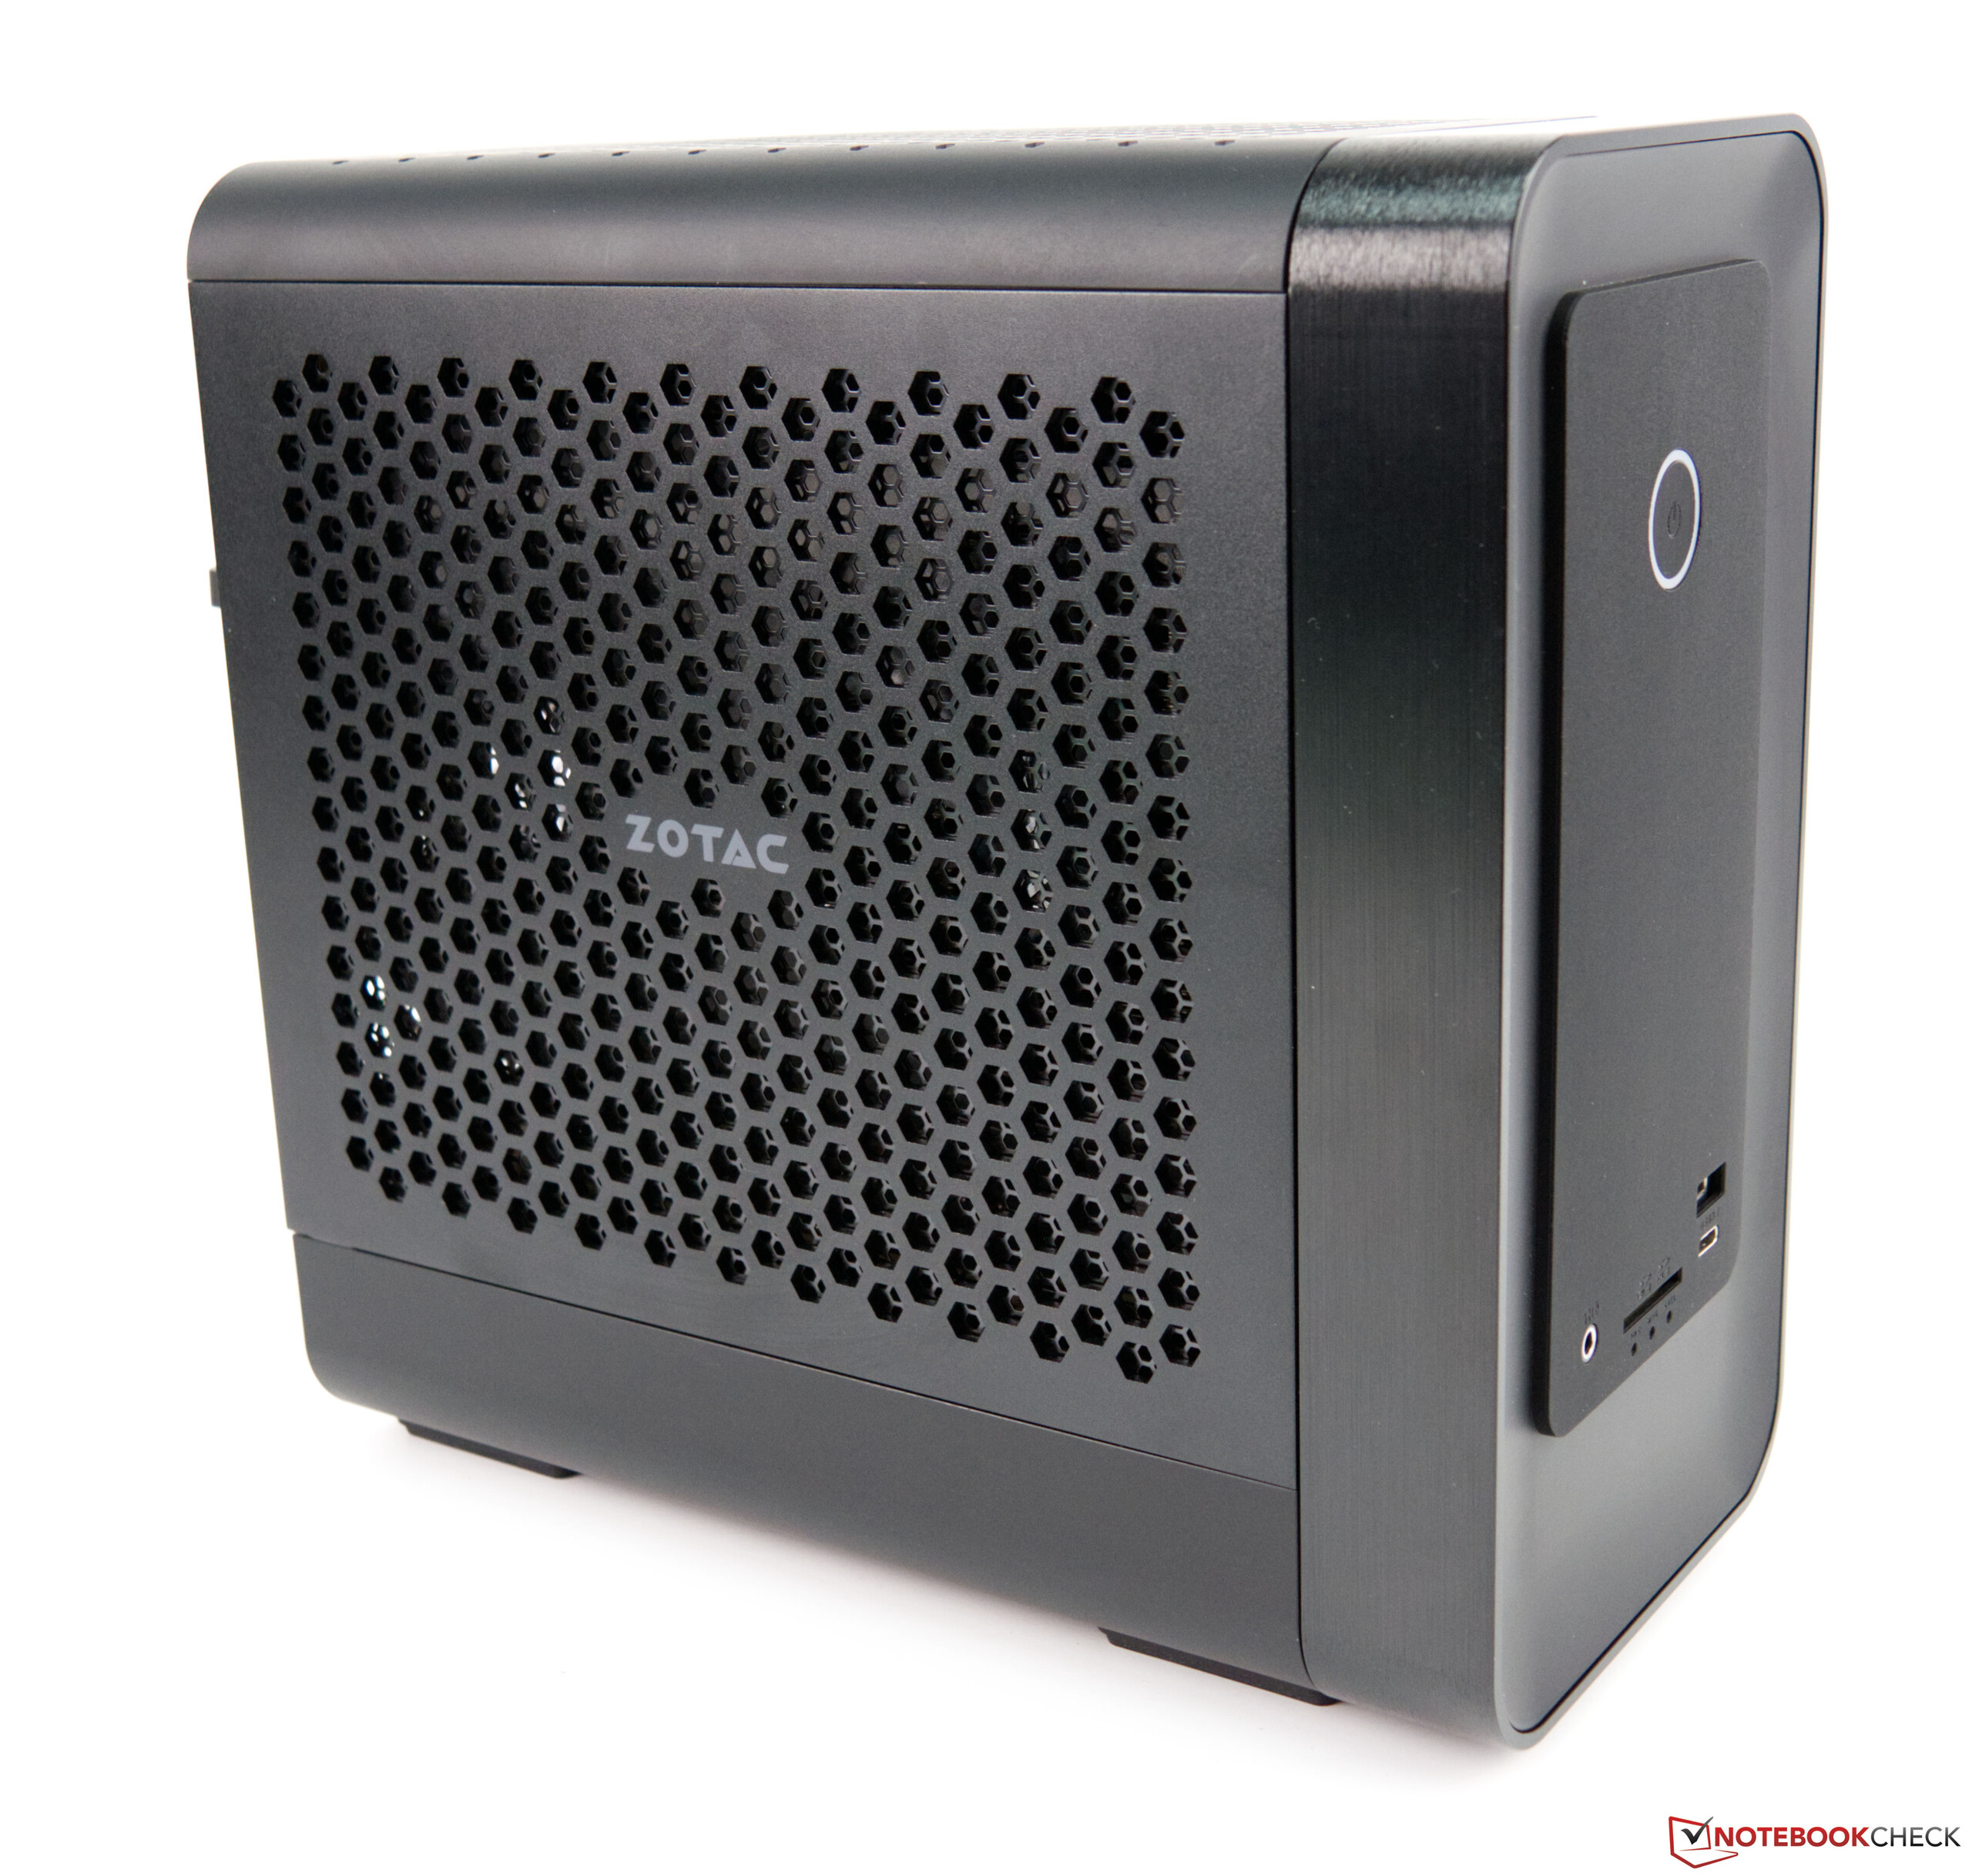
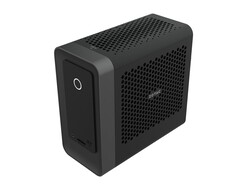
The Magnus One is a powerful and compact system that is an eye-catcher even without RGB.
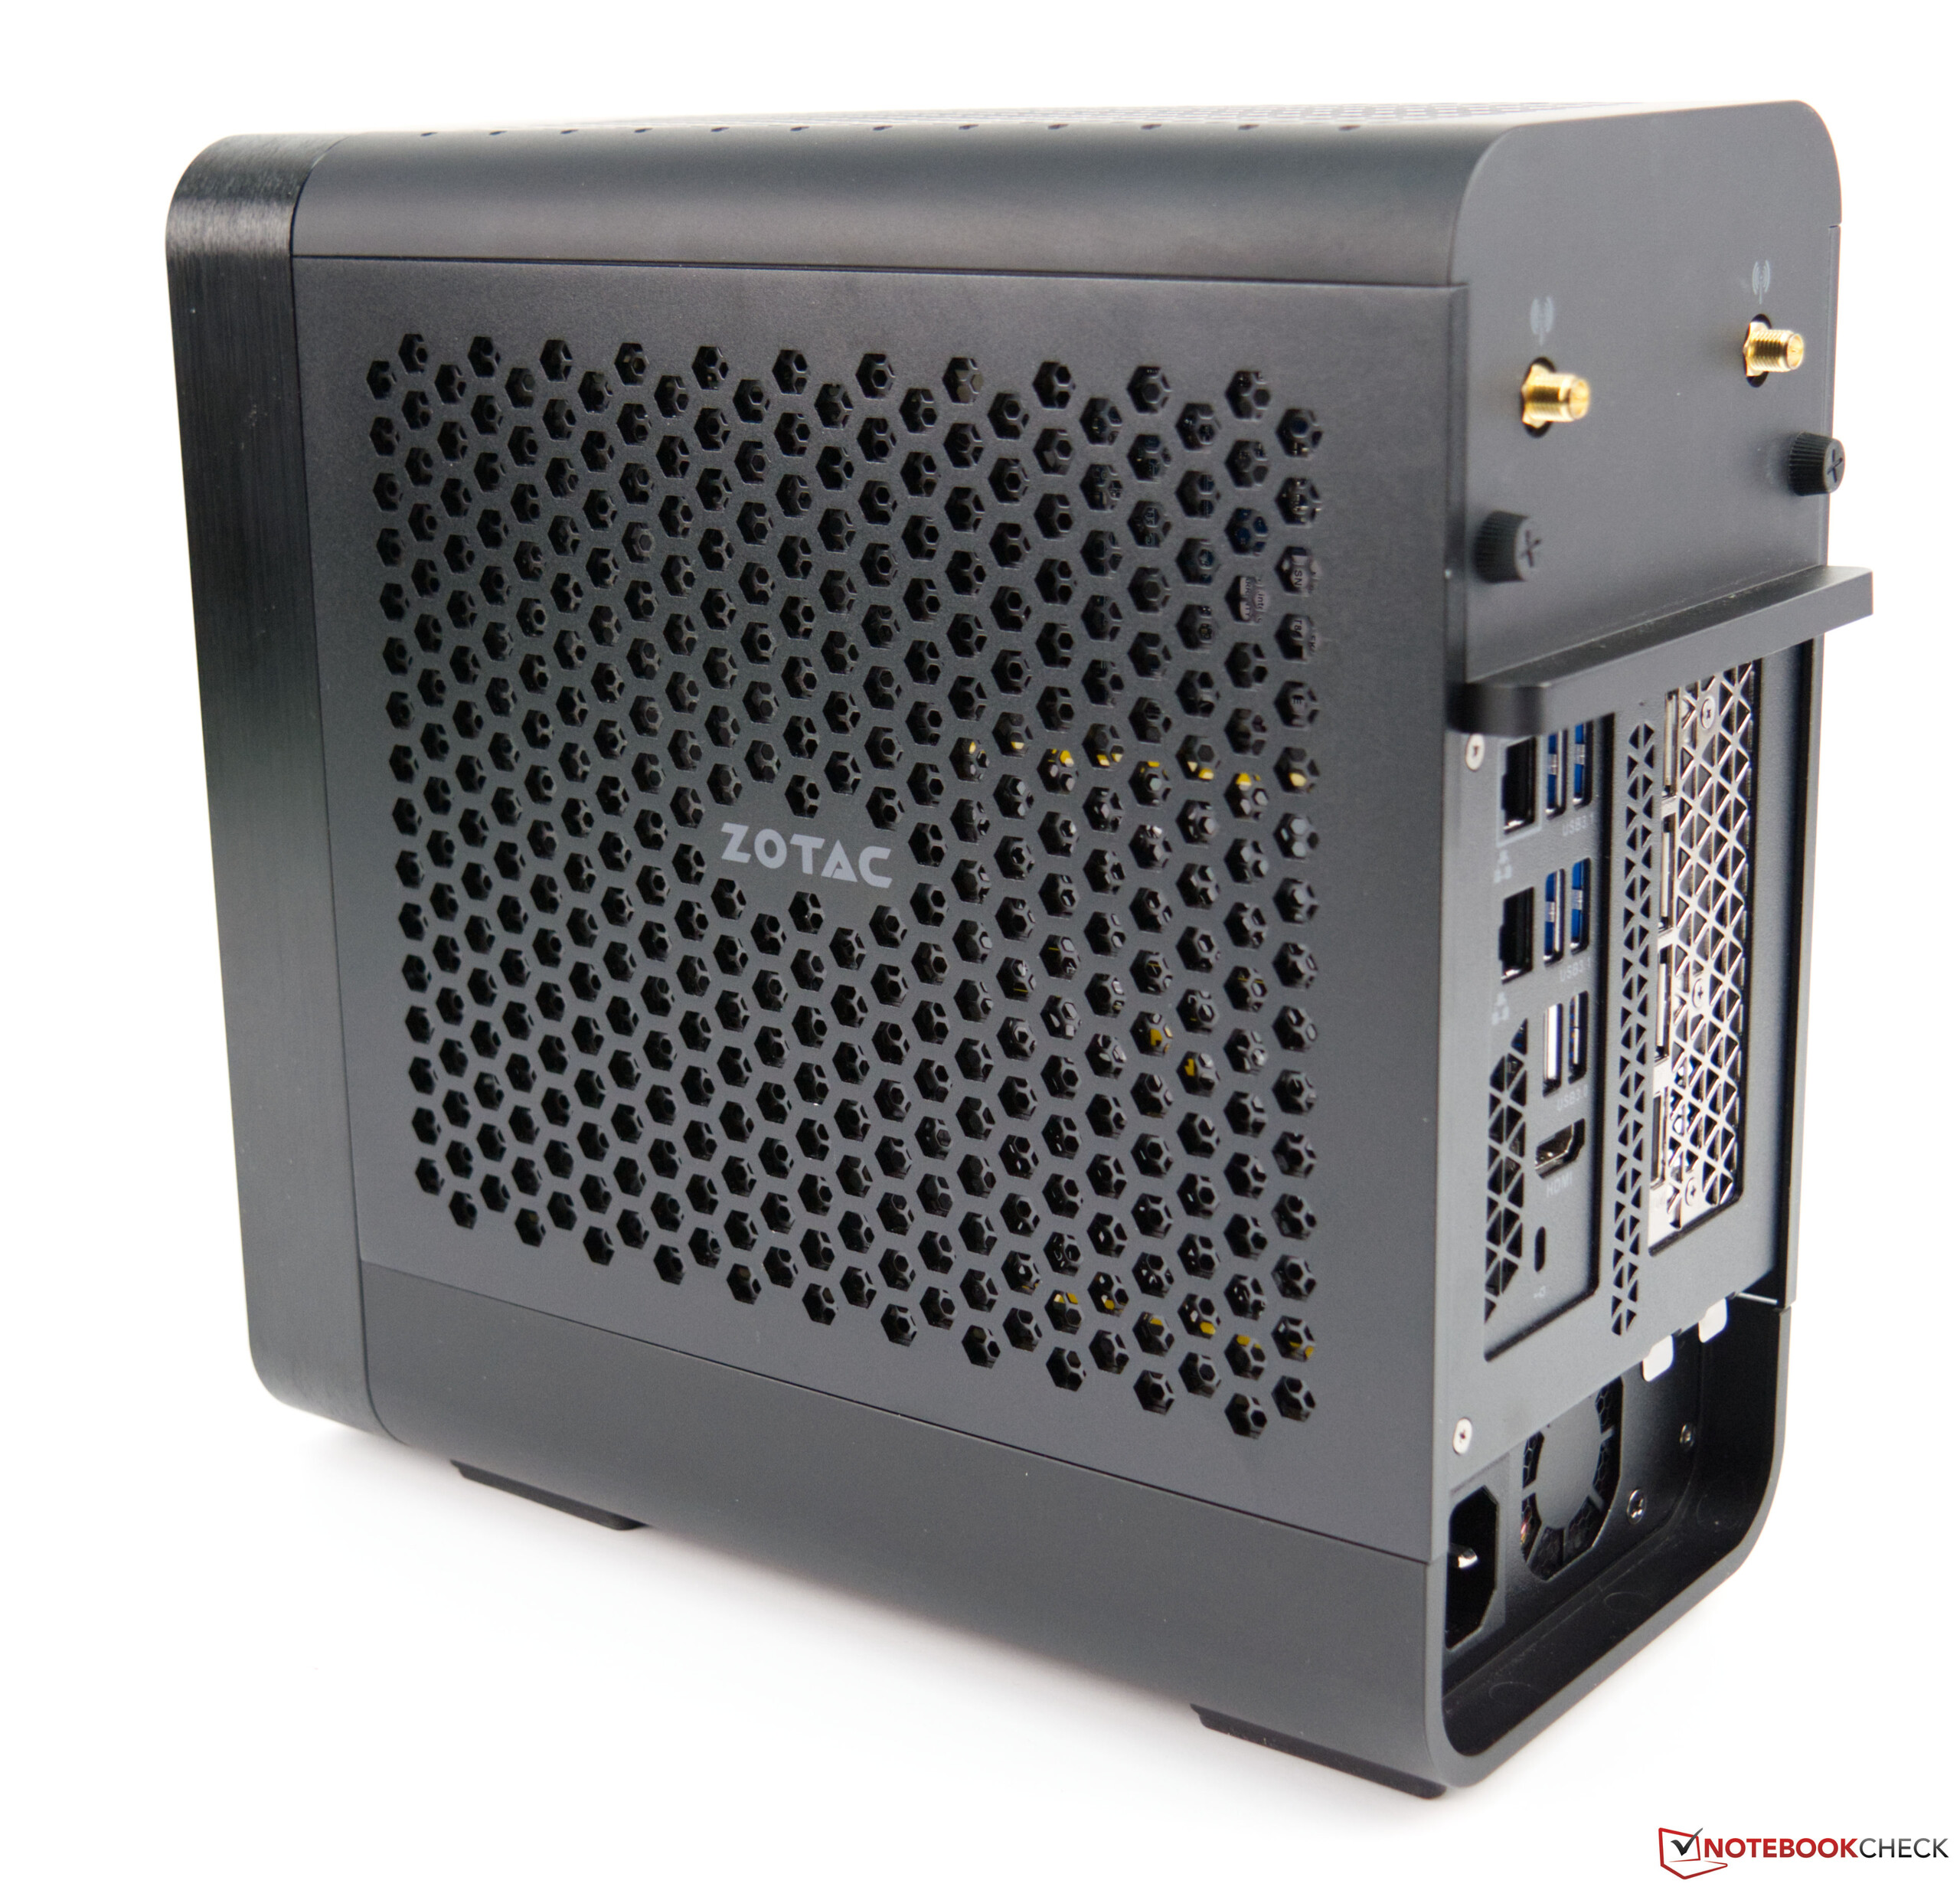
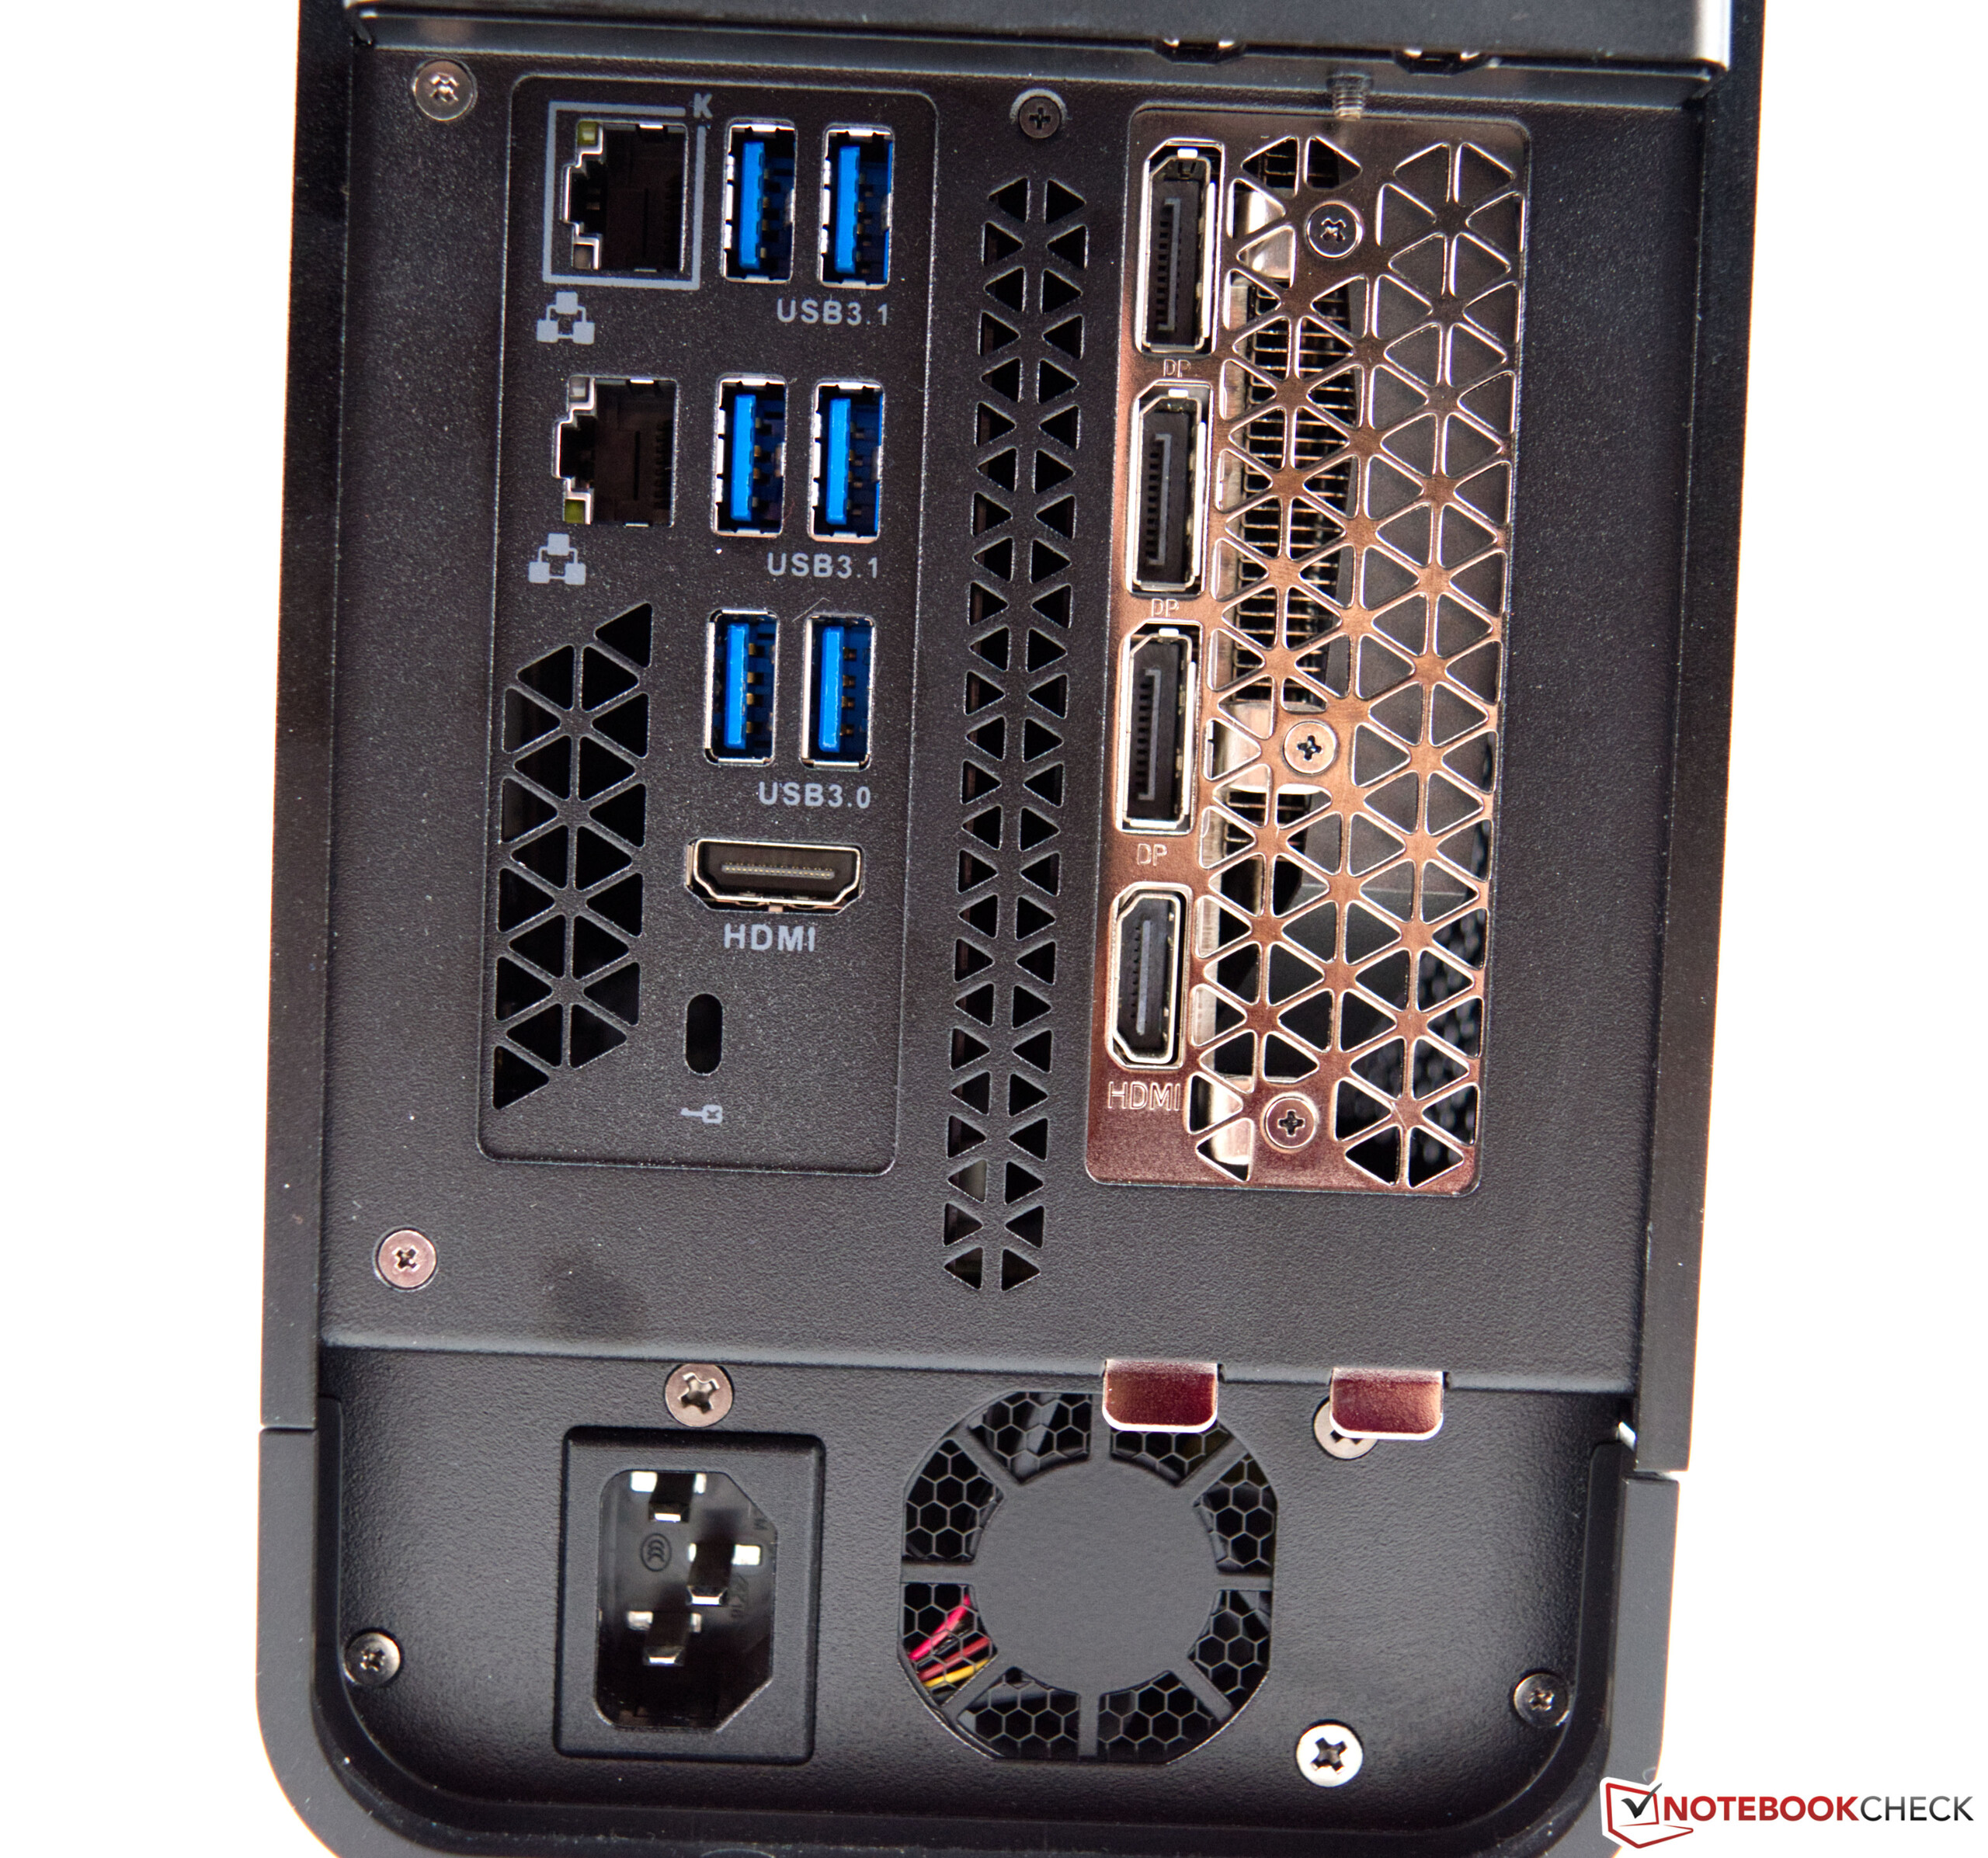
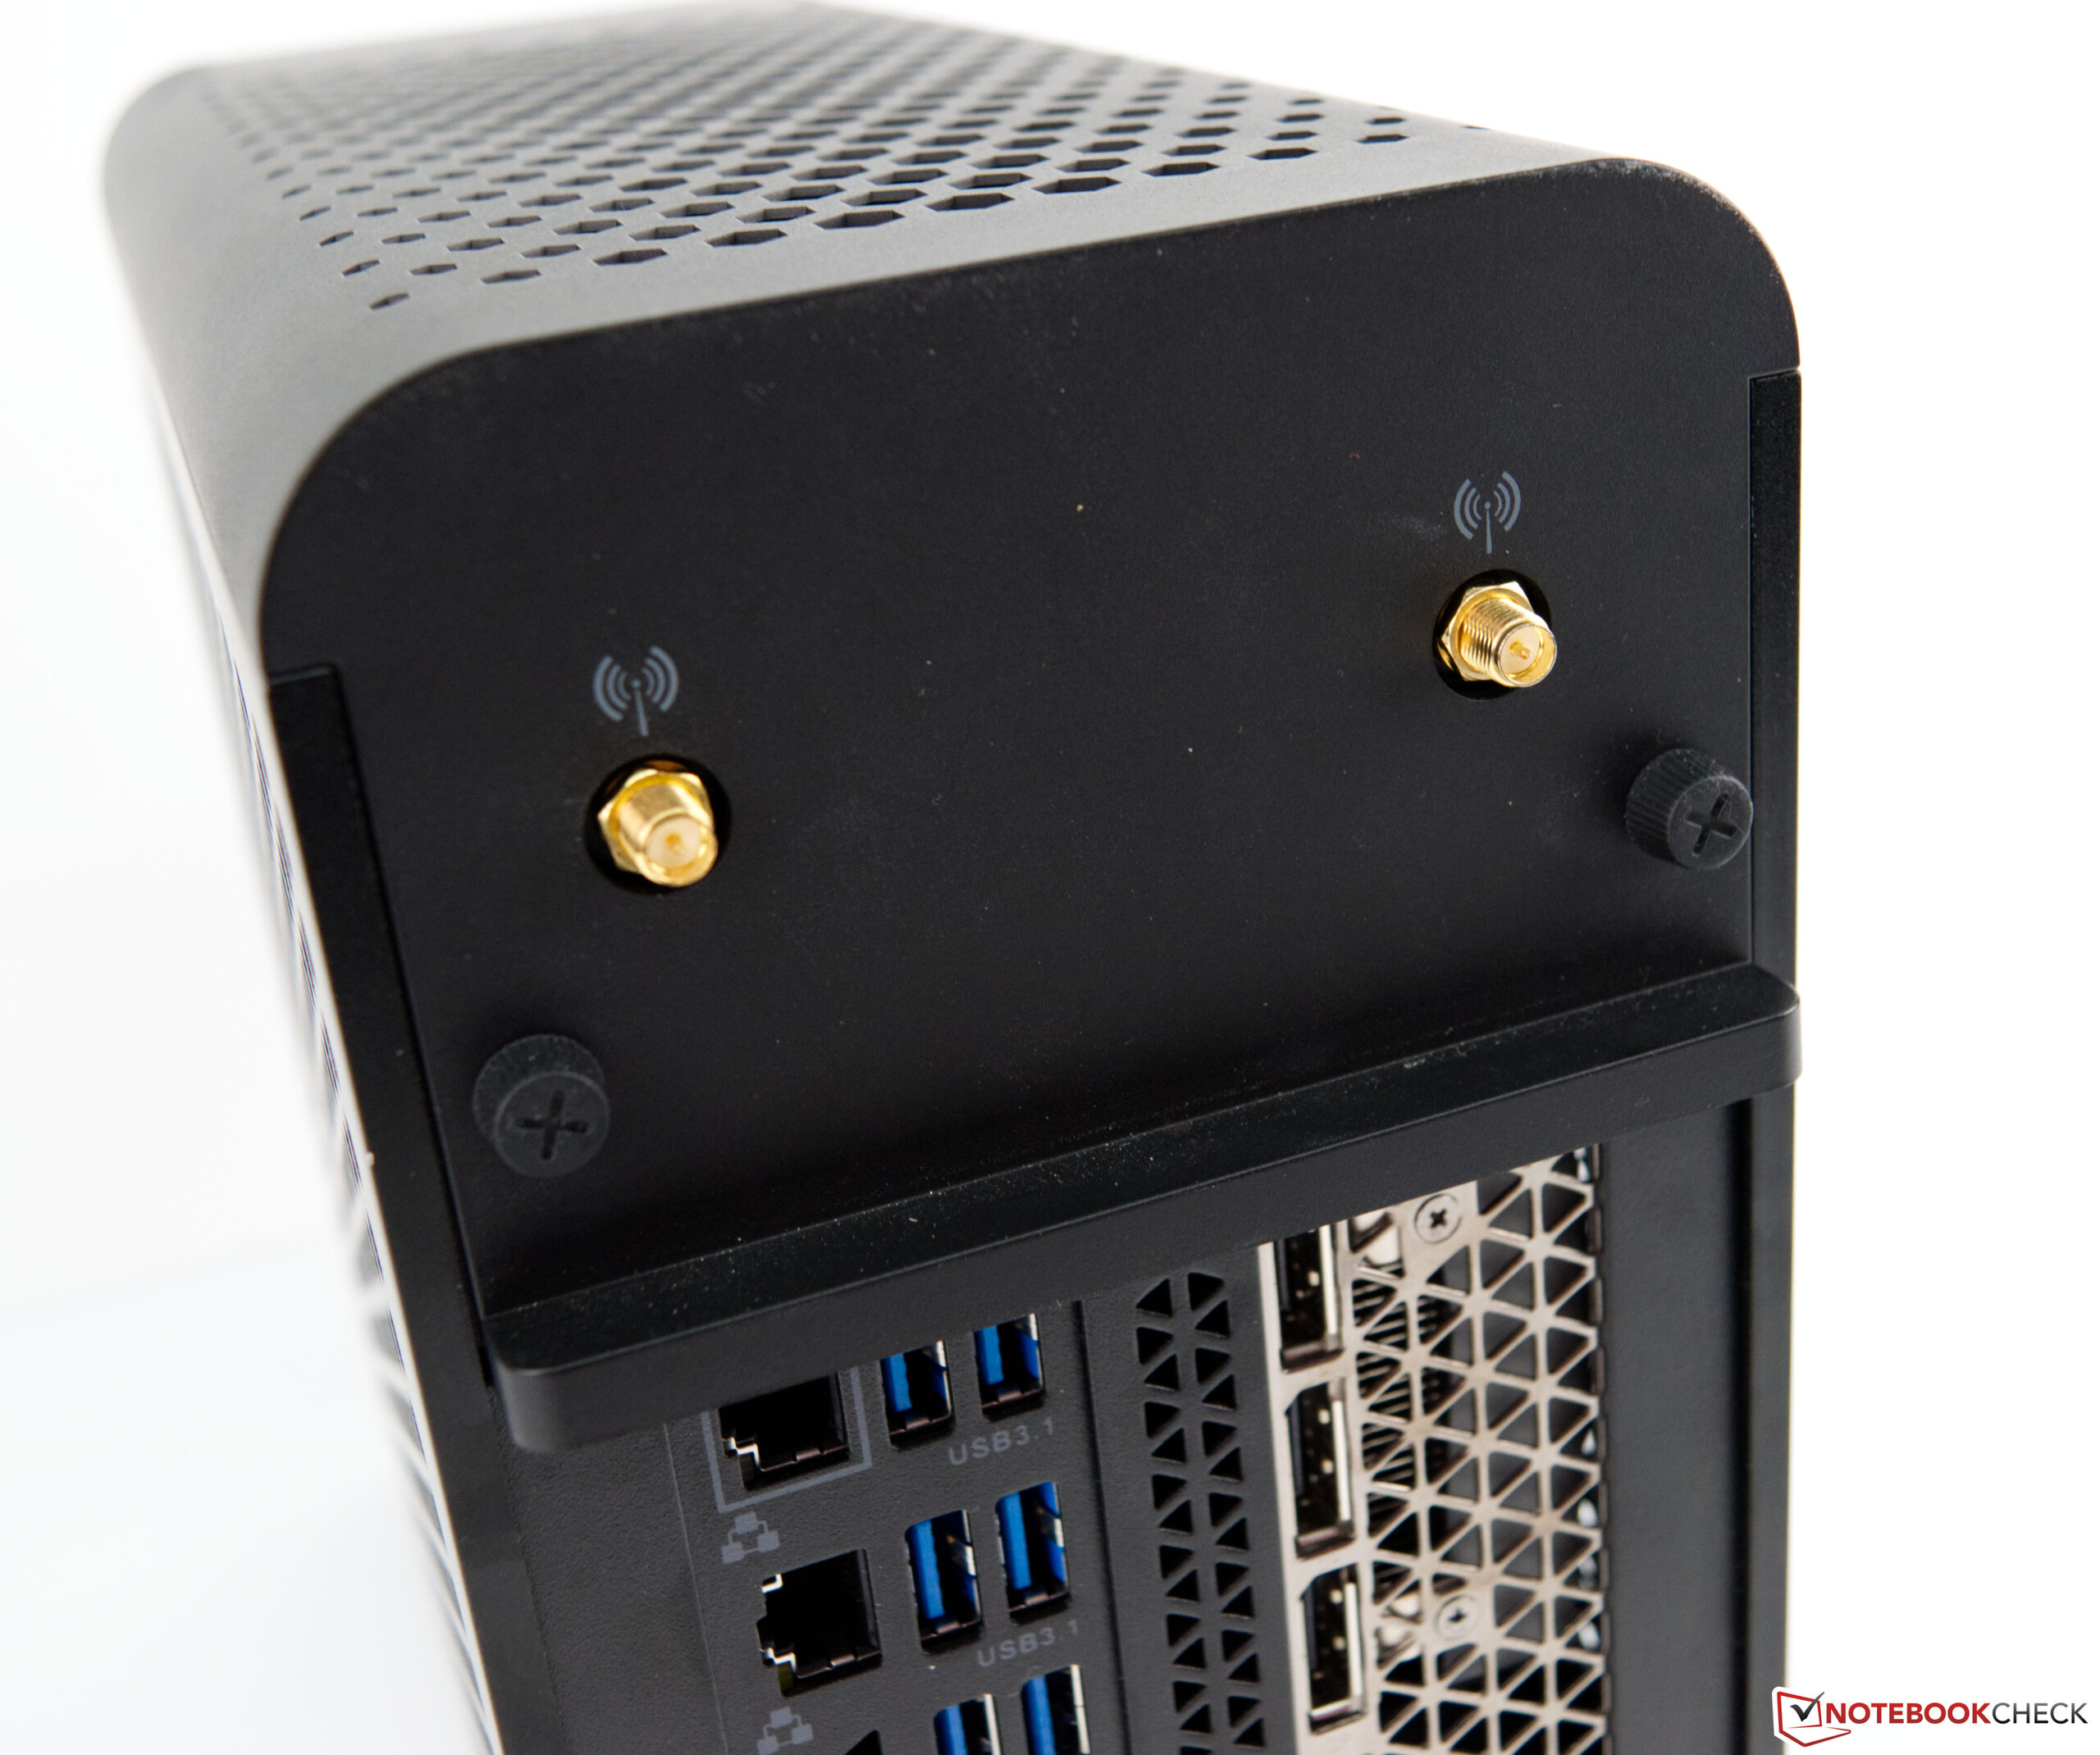
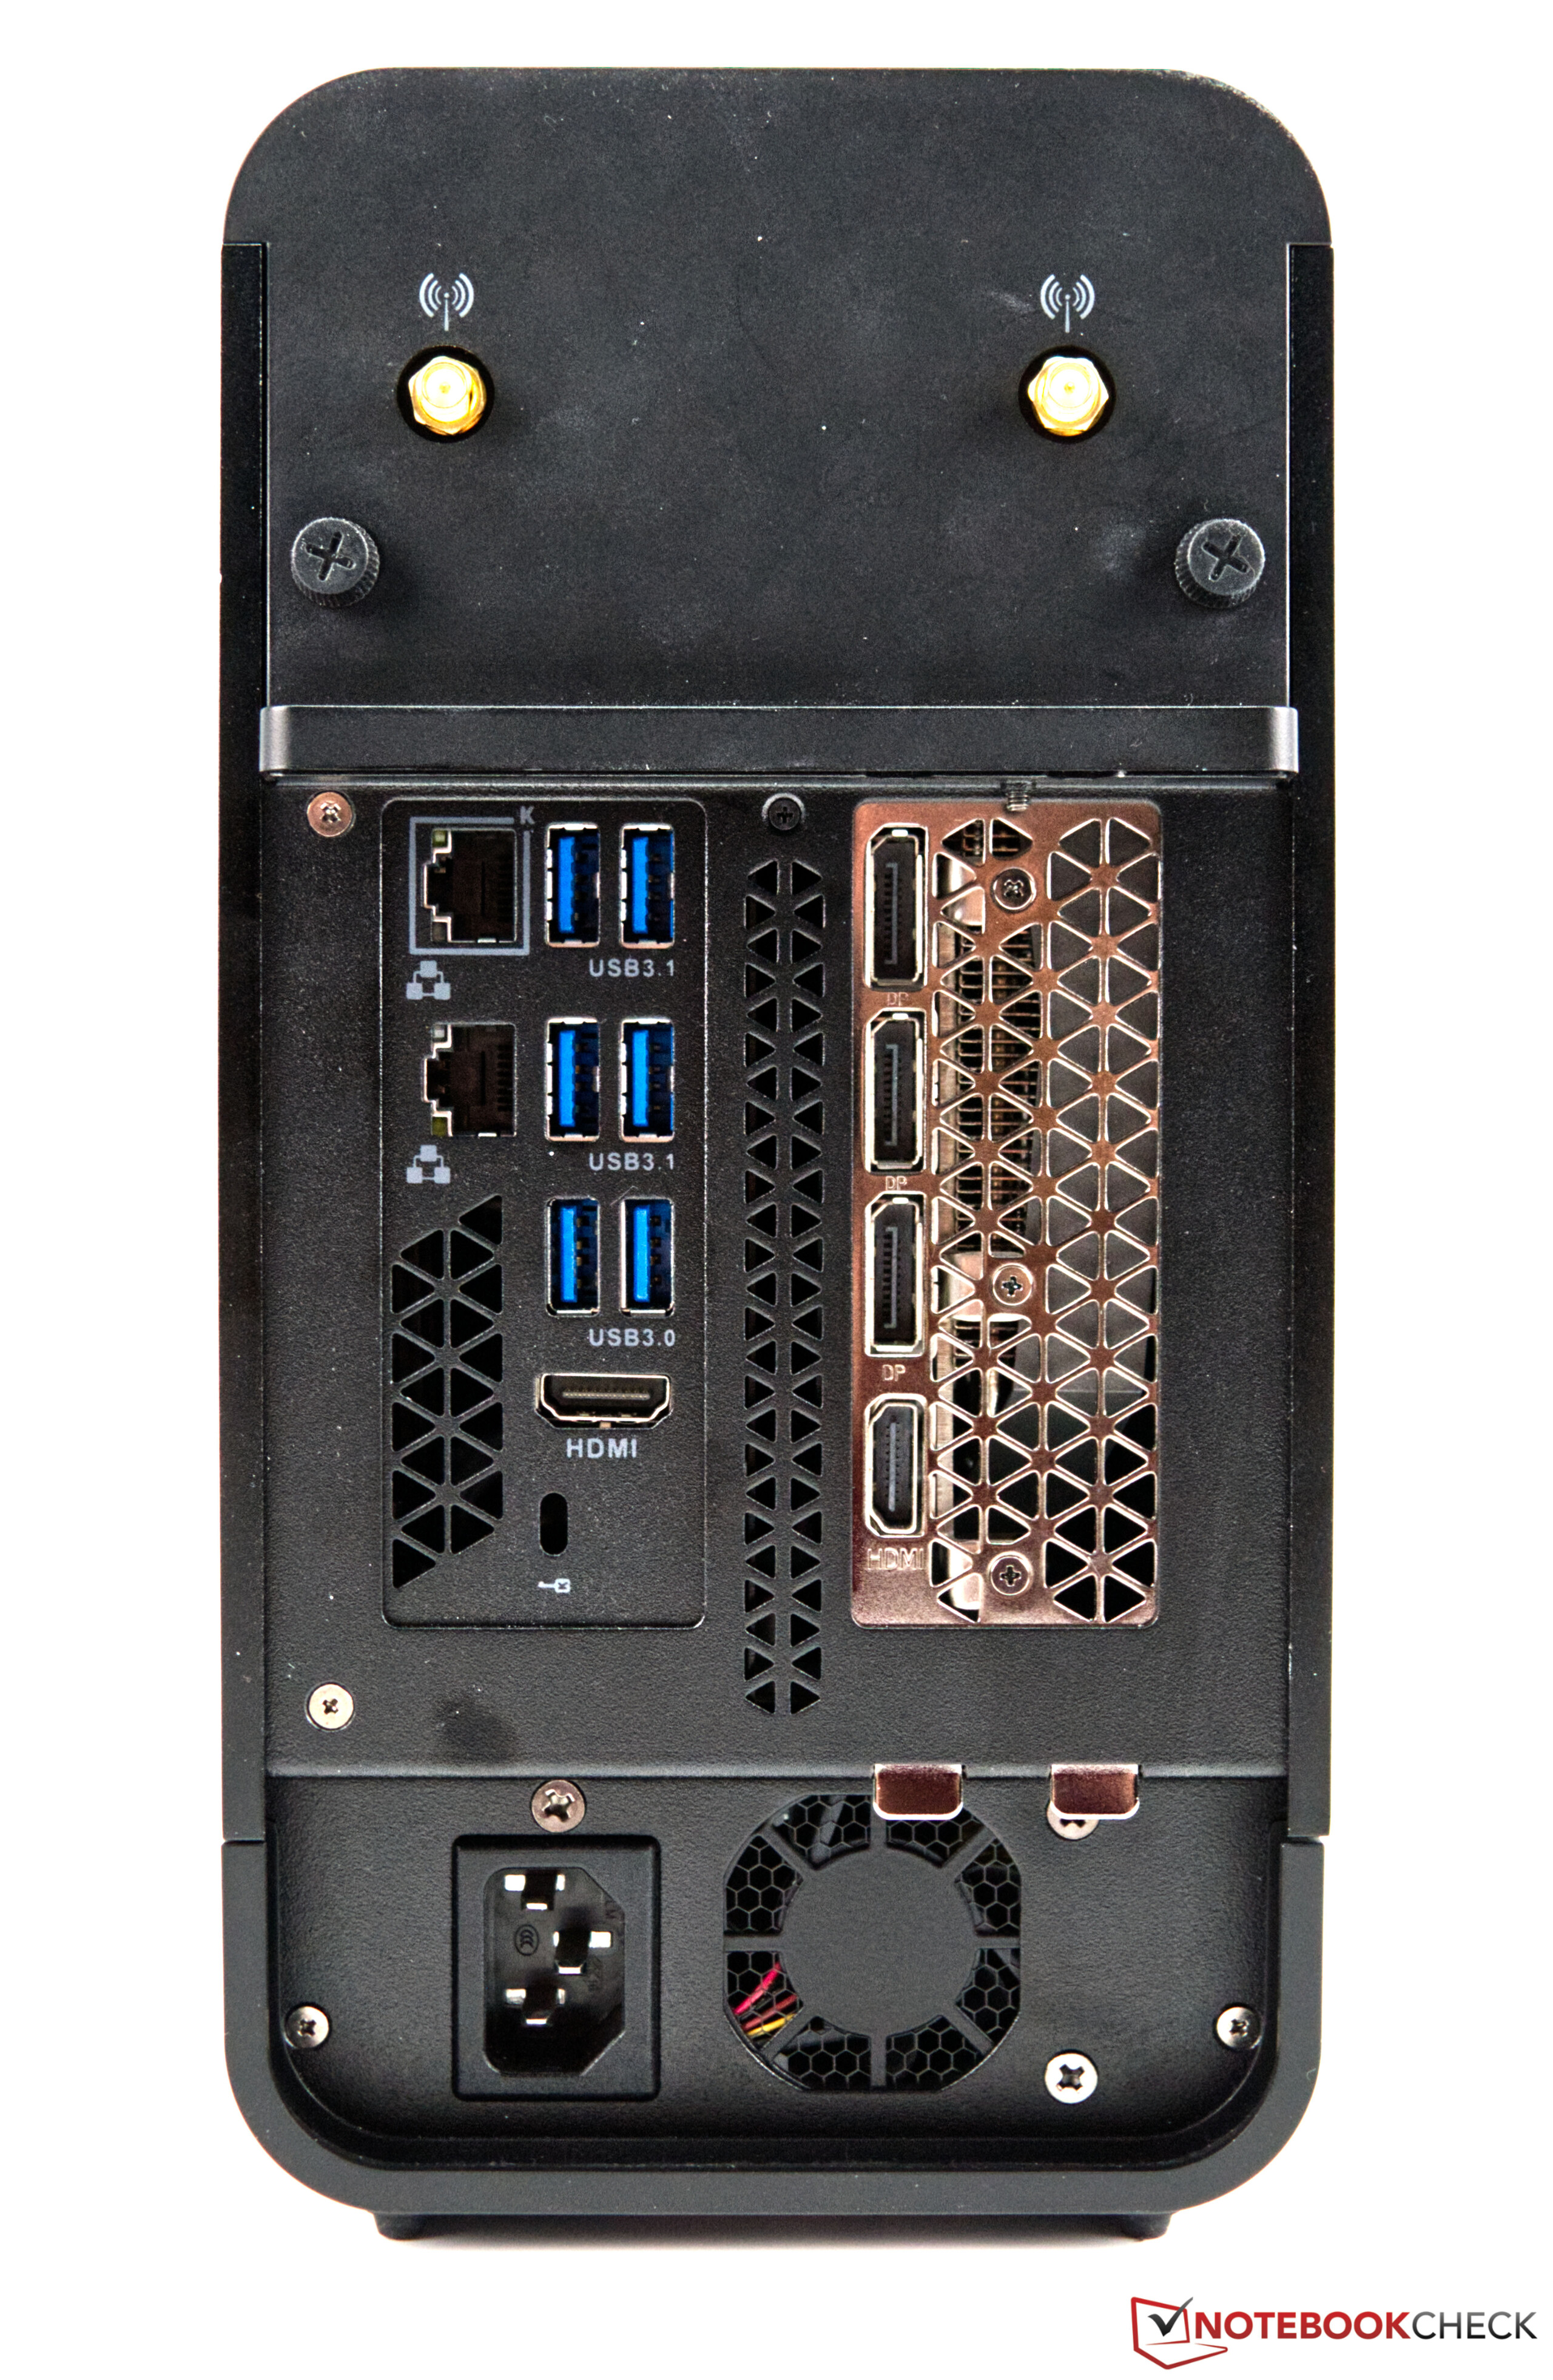
The PC's case looks good without lots of bells and whistles, and RGB spectacles have been completely foregone as well. This isn't necessarily a bad thing, because many users are looking for a sober case, and Zotac has succeeded in creating this with the Magnus One. In addition, the choice of materials is very good, since the case is mostly made of metal. The port selection is versatile too, and it hardly leaves anything to be desired. Nevertheless, we have to criticize the somewhat obtrusive cooling under load.
There aren't many alternatives to the Zotac Magnus One, though, since popular manufacturers usually focus on complete systems. For comparison, however, you can take a look at the MSI MEG Trident X series. It offers a similar configuration in an attractive and compact case.

