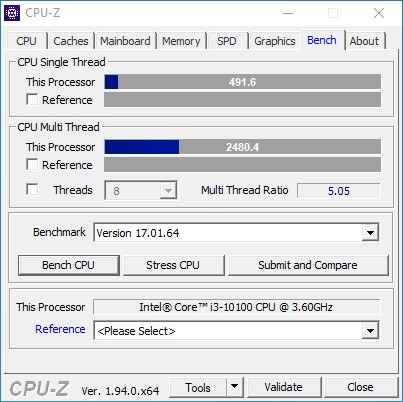
Intel Core i3-10100 Desktop Processor - Benchmarks and Specs
Intel Core i3-10100
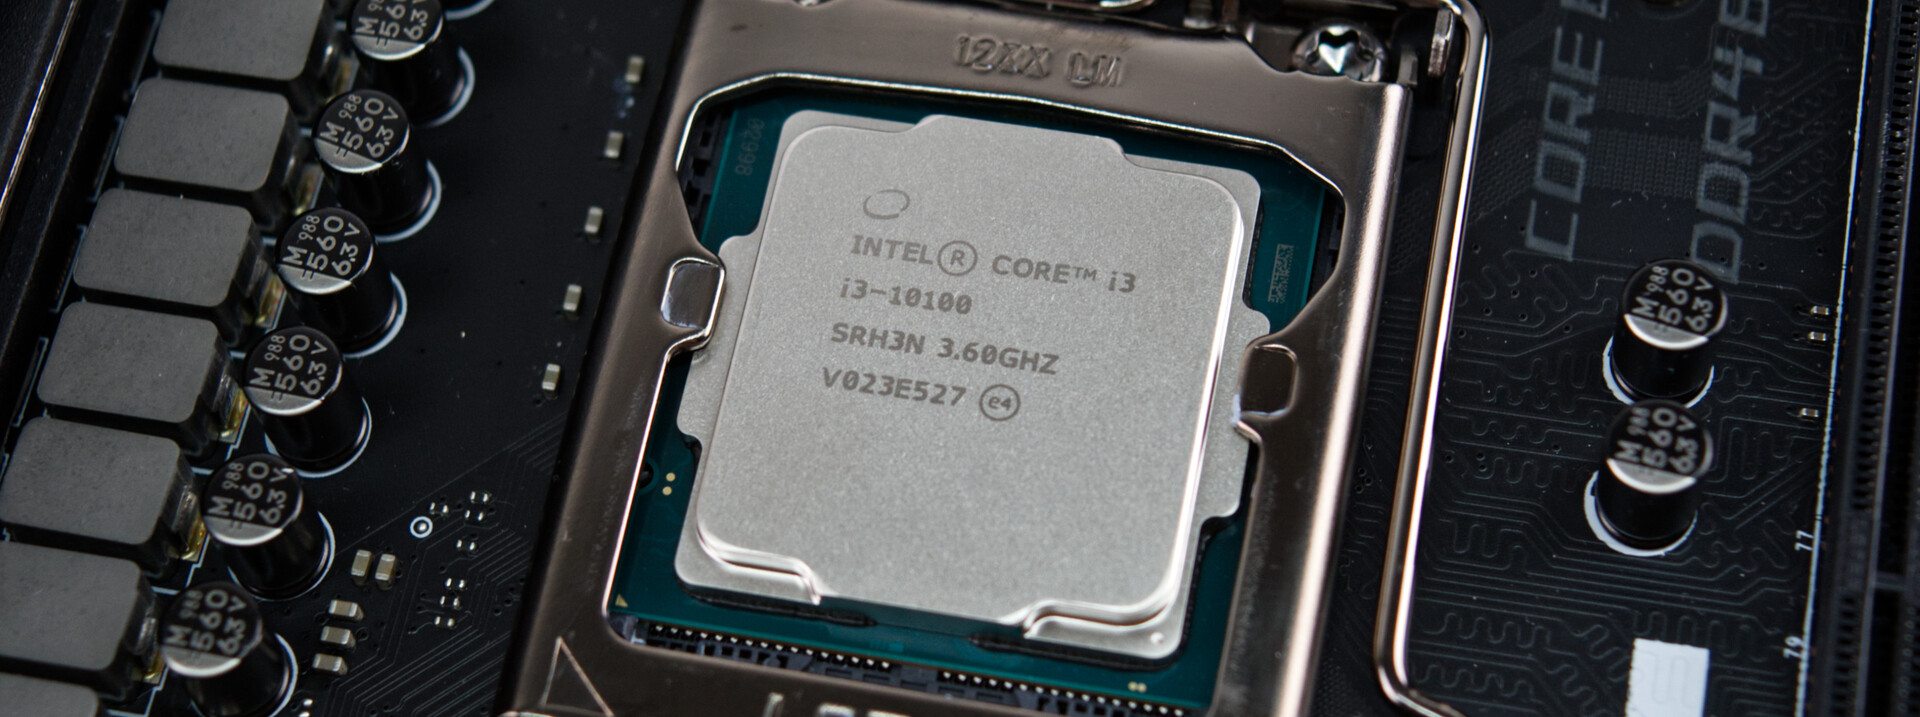
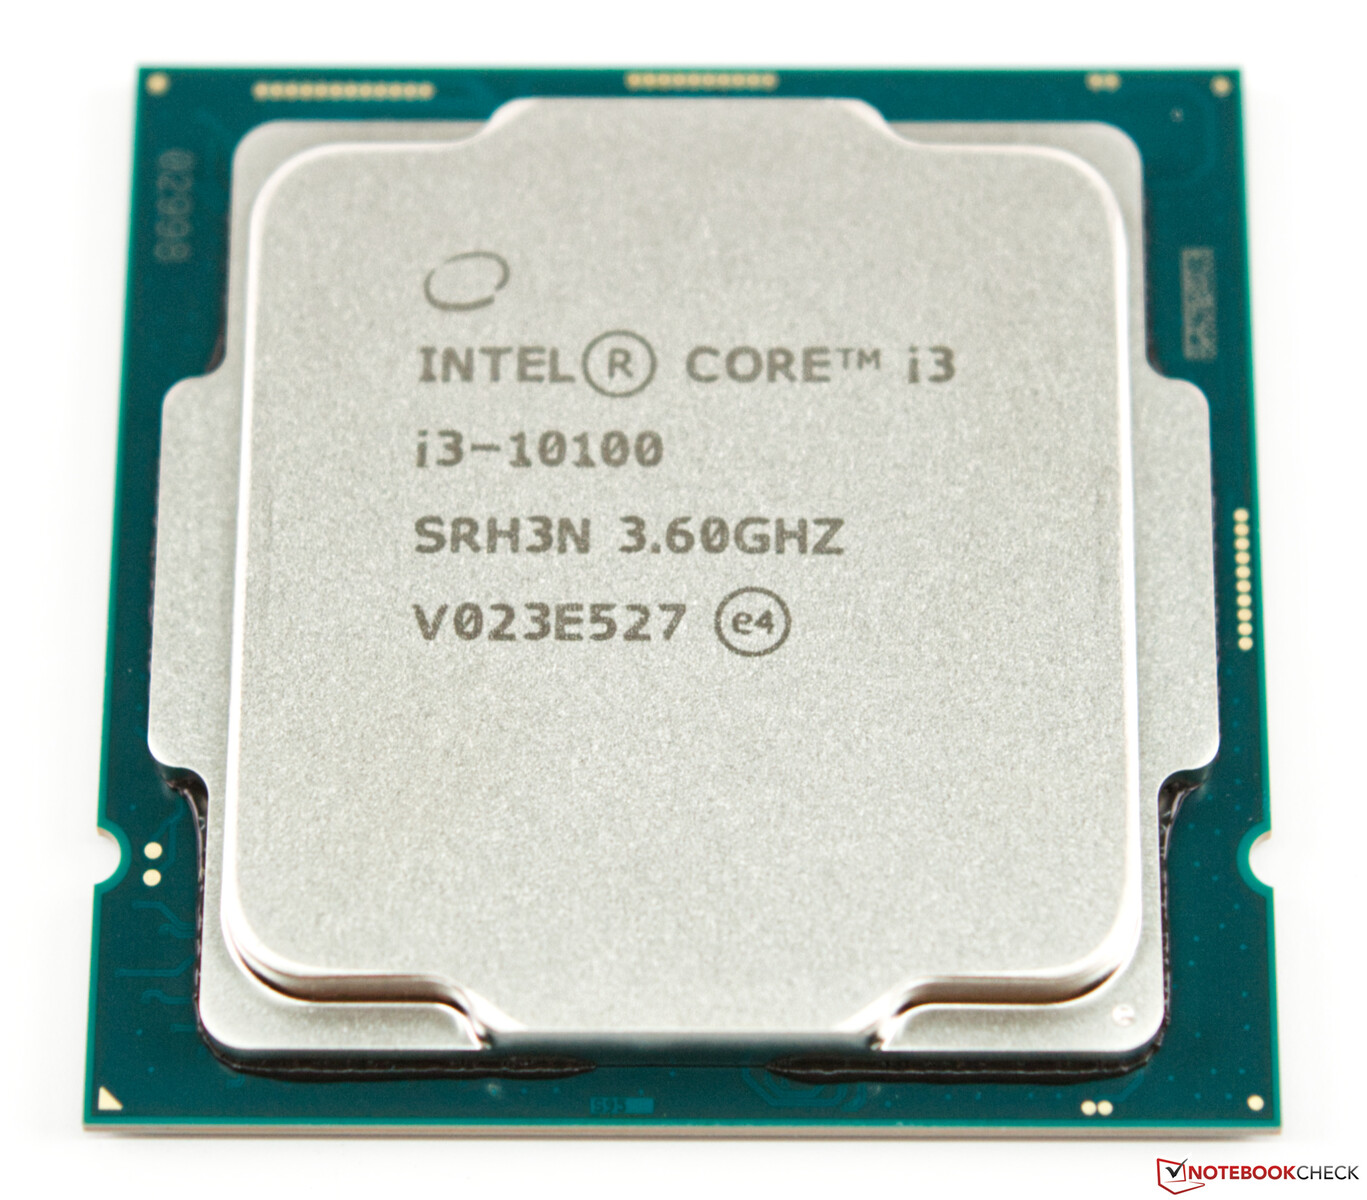
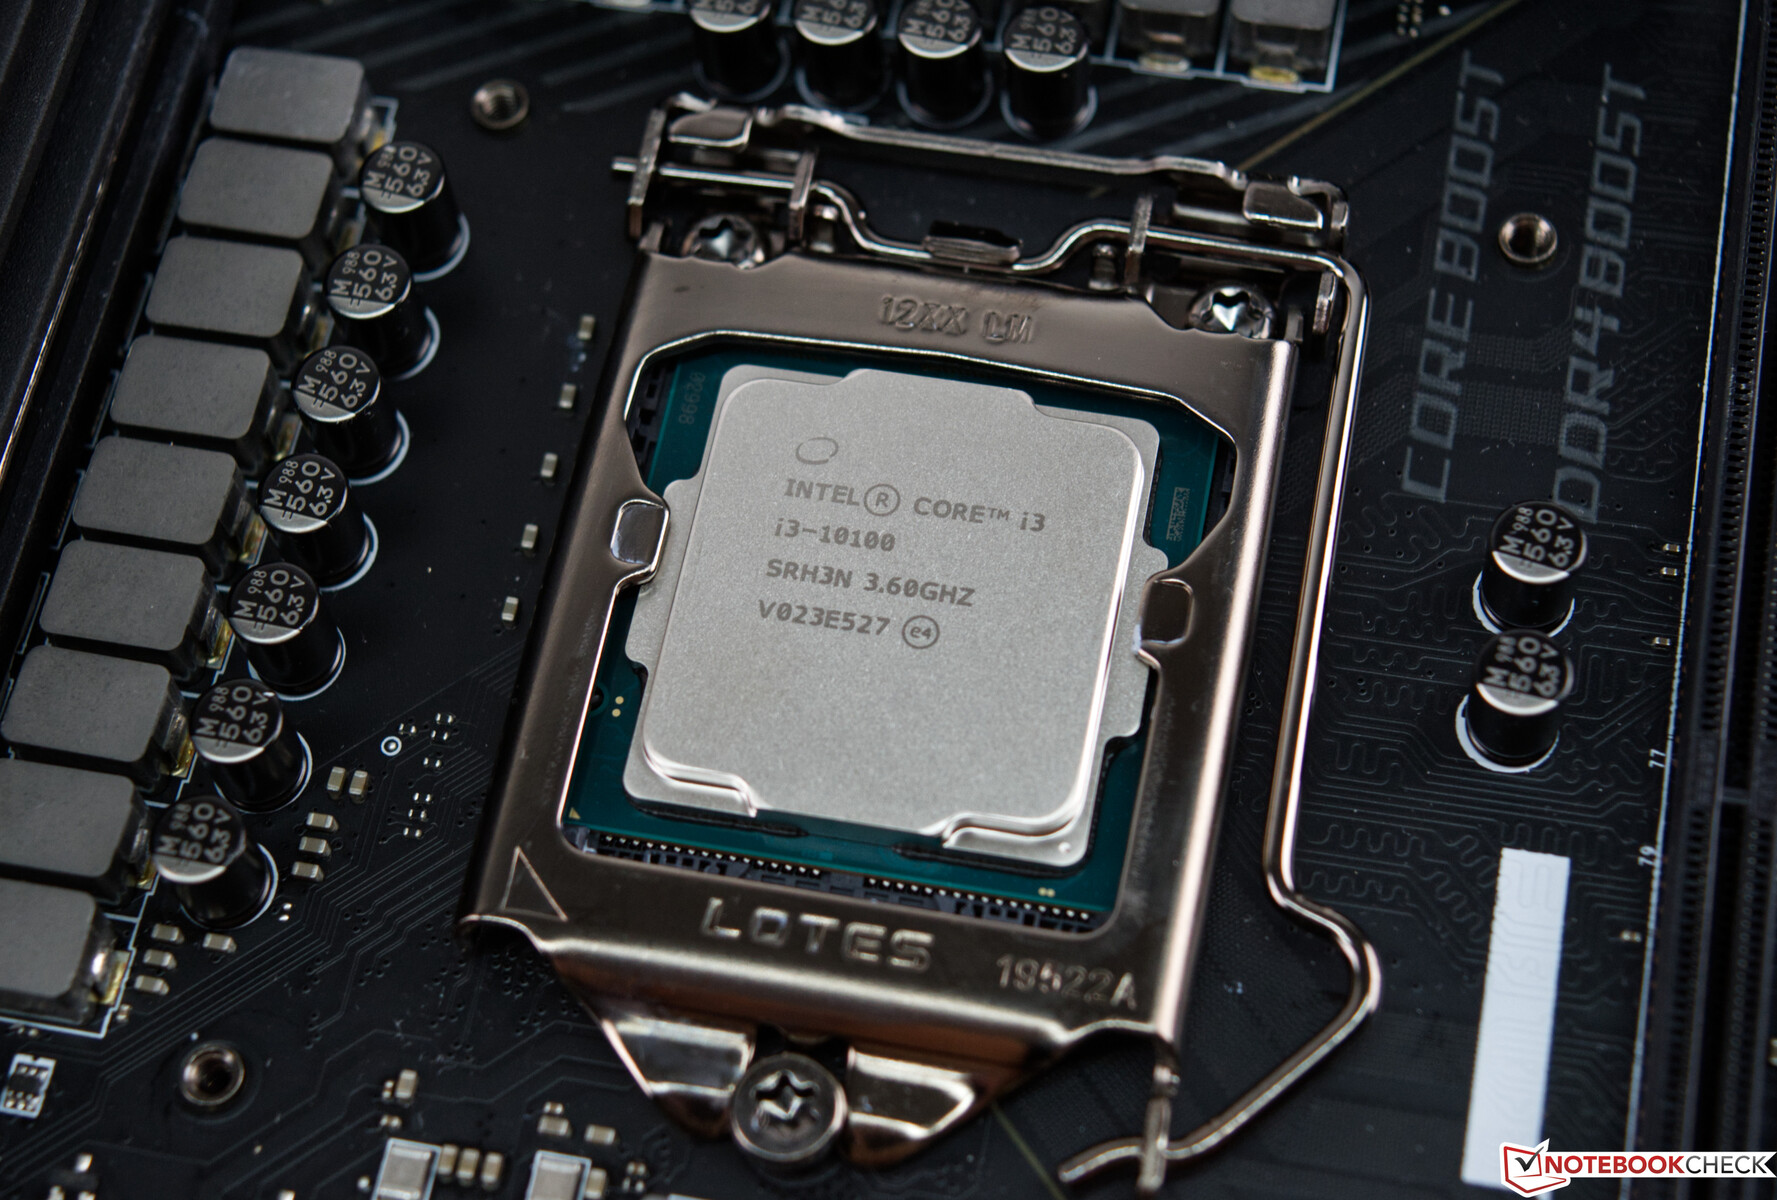
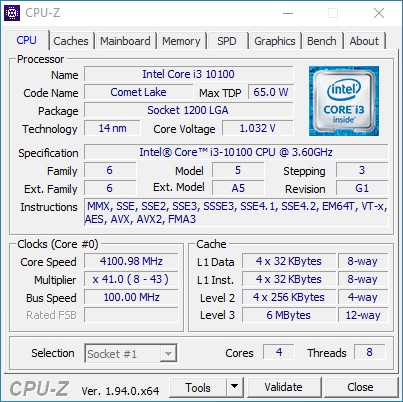
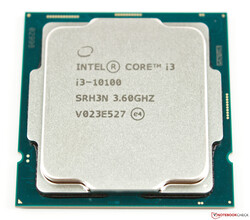
The Intel Core i3-10100 is a four-core desktop processor based on the Comet Lake S architecture. The processor clocks at 3.6 - 4.3 GHz and can process up to 8 threads simultaneously. The Intel Core i3-10100 is manufactured in the improved 14nm process (14nm++). Compared to the older i3-9100 (Comet Lake-S), the 10100 offers a 100 MHz higher turbo clock, multithreading and support for faster DDR4-2666 memory.
Performance
The performance should be only slightly above the Core i3-9100 in the entry level for desktop CPUs. Thus the performance is sufficient for office and undemanding gaming.
Graphics Card
The Intel Core i3-10100 is a processor with a rather slow entry level integrated graphics unit (Intel UHD Graphics 630).
Power consumption
Intel puts the Thermal Design Power (TDP) at 65 watts. This means there is no need for large cooling systems, which also allows installation in very compact housings.
| Codename | Comet Lake-S | ||||||||||||||||
| Series | Intel Comet Lake | ||||||||||||||||
Series: Comet Lake Comet Lake-S
| |||||||||||||||||
| Clock Rate | 3600 - 4300 MHz | ||||||||||||||||
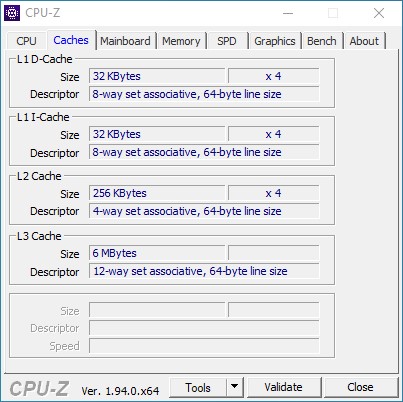
| Level 1 Cache | 256 KB | ||||||||||||||||
| Level 2 Cache | 1 MB | ||||||||||||||||
| Level 3 Cache | 6 MB | ||||||||||||||||
| Number of Cores / Threads | 4 / 8 | ||||||||||||||||
| Power Consumption (TDP = Thermal Design Power) | 65 Watt | ||||||||||||||||
| Manufacturing Technology | 14 nm | ||||||||||||||||
| Die Size | 126 mm2 | ||||||||||||||||
| Max. Temperature | 100 °C | ||||||||||||||||
| Socket | FCLGA1200 | ||||||||||||||||
| Features | Dual-Channel DDR4-2666 Memory Controller, AVX, AVX2, AES-NI, TSX, Quick Sync, Virtualization | ||||||||||||||||
| 64 Bit | 64 Bit support | ||||||||||||||||
| Architecture | x86 | ||||||||||||||||
| Starting Price | $130 U.S. | ||||||||||||||||
| Announcement Date | 04/30/2020 | ||||||||||||||||

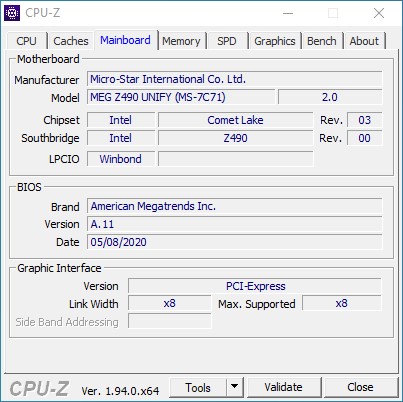
Details about our test system
For the following benchmarks and tests we use the following system:
- Raijintek Pean Benchtable
- Intel Core i3-10100
- MSI Z490 Unify
- Alphacool Eisbear 280 AiO
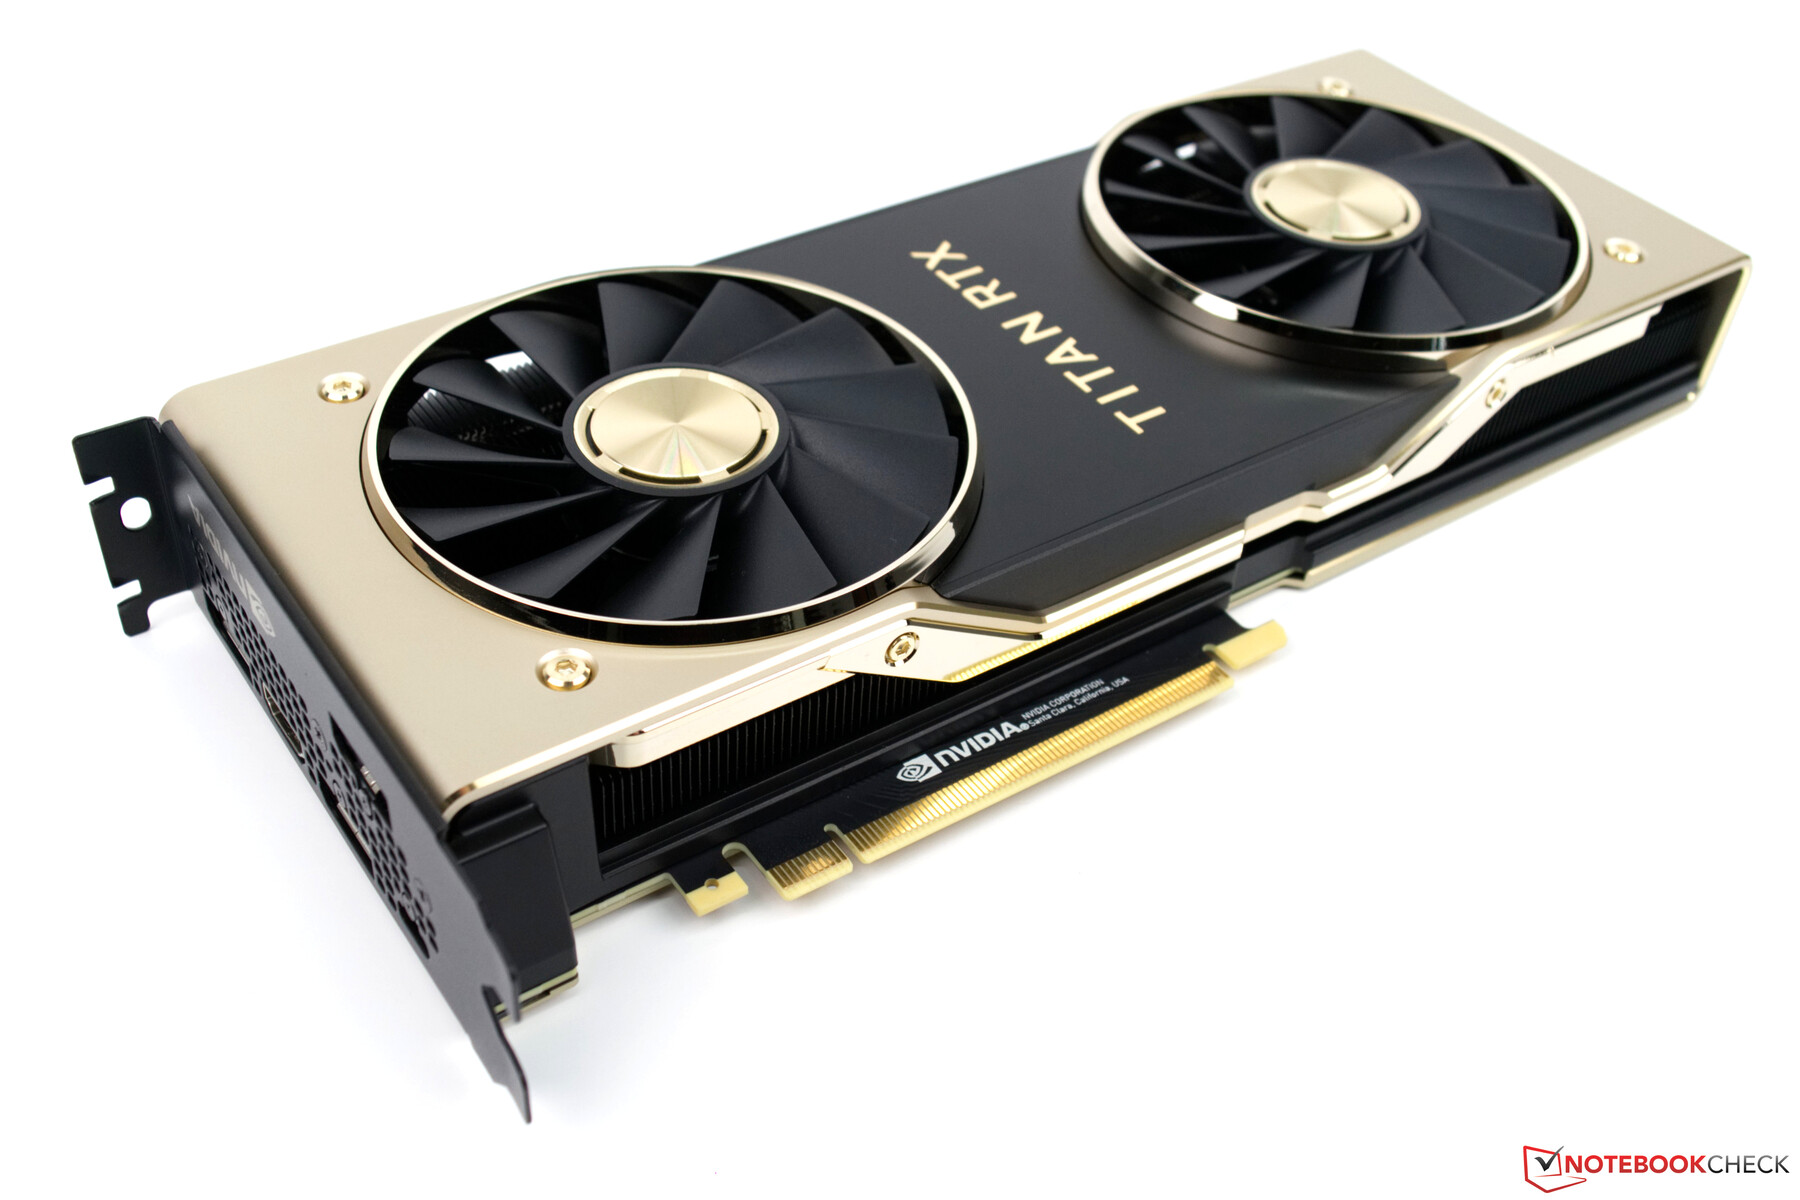
- Nvidia Titan RTX (Nvidia 456.71)
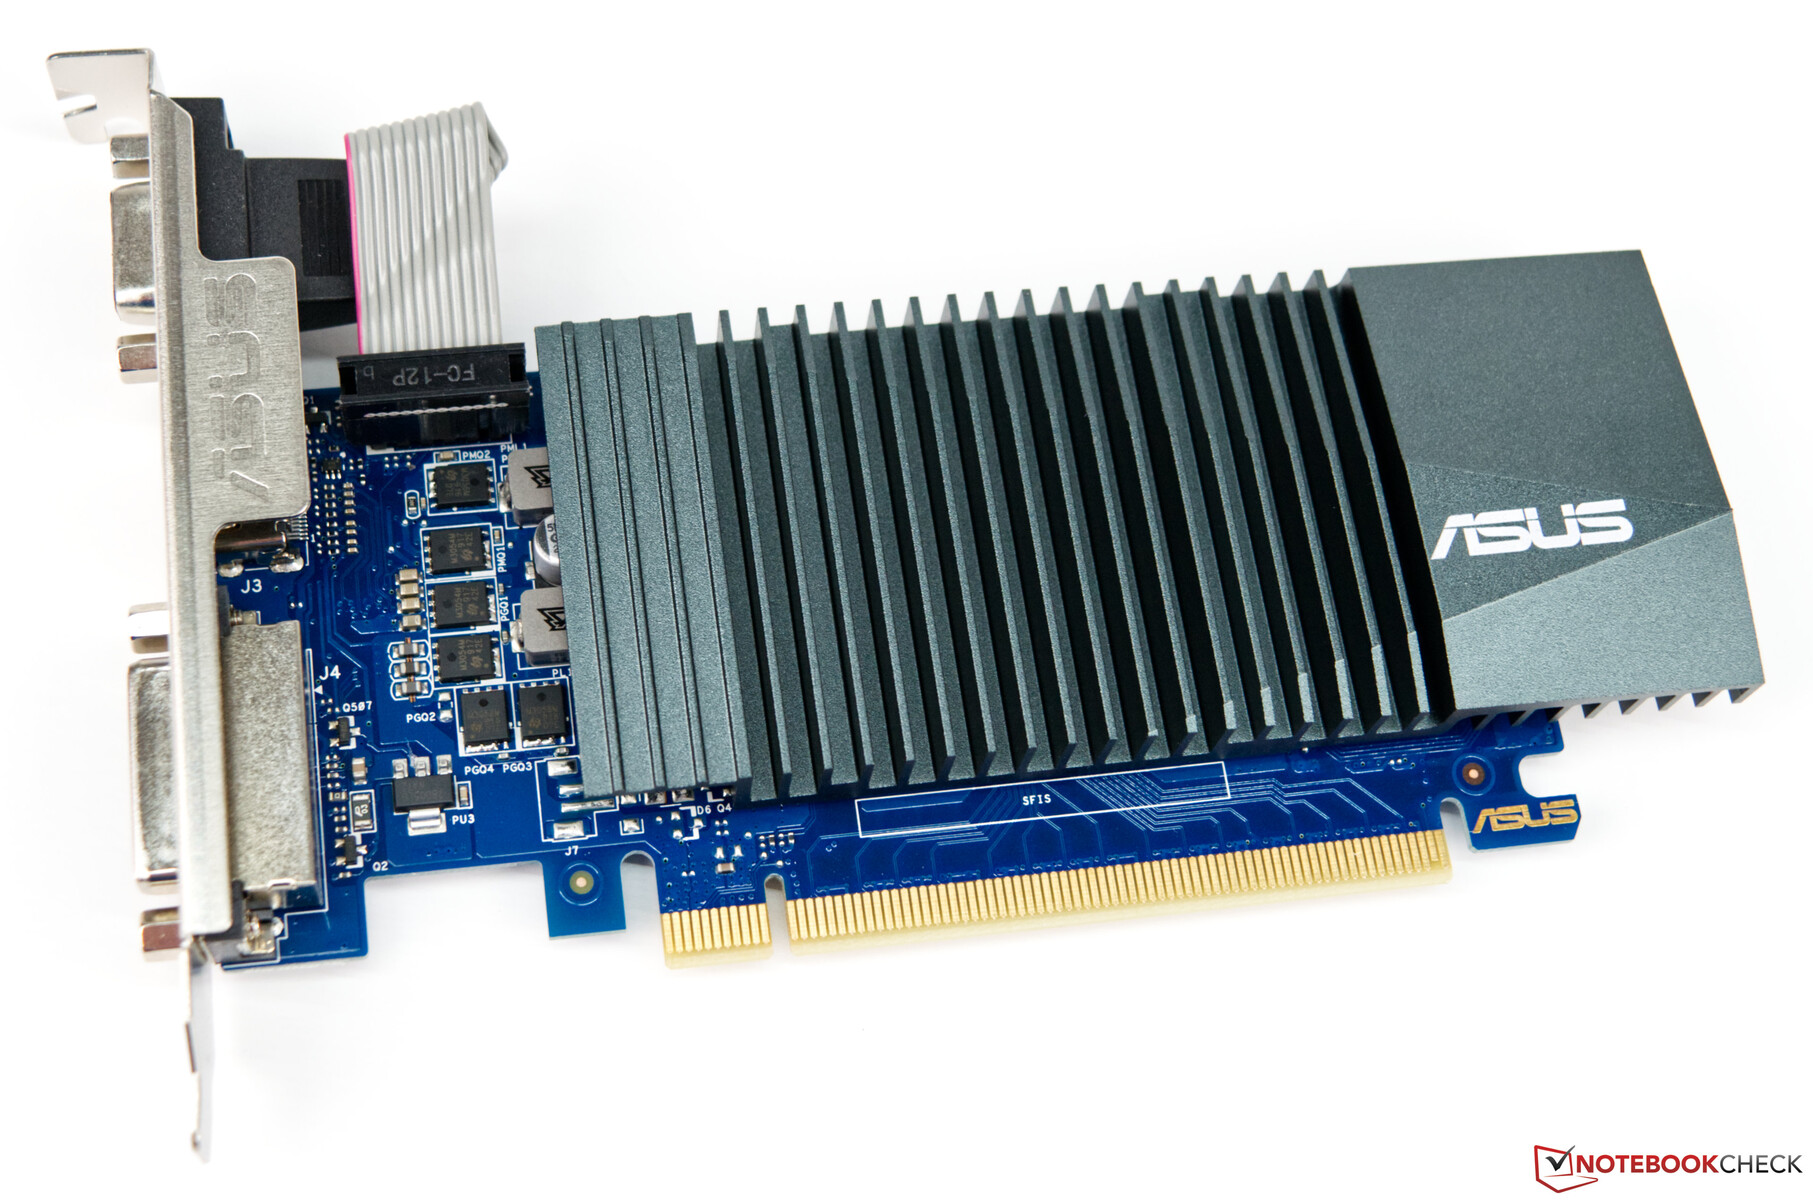
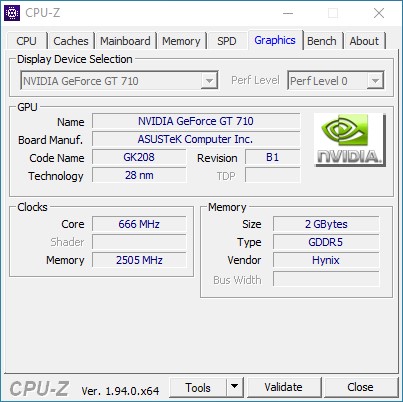
- Asus GeForce GT 710 (Nvidia 456.71)
- Corsair HX 1200i power supply
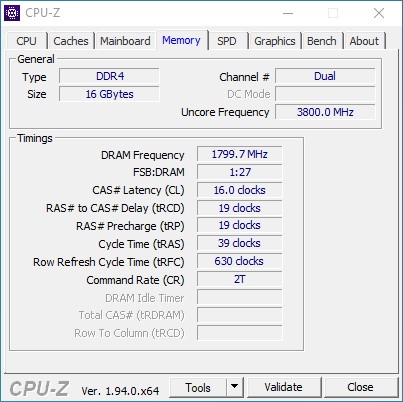
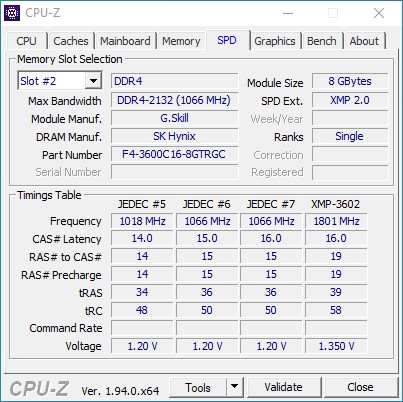
- G-Skill Trident Z Royal Gold DDR4-3600 memory kit 2 x 8 GB, set to DDR4-3800 CL16-19-19-39
- Intel Optane 905P 480GB PCIe SSD
- Microsoft Windows 10 Professional 64-Bit (Version 20H2)
From Intel comes the Core i3-10100, MSI supported us with the mainboard and from Caseking comes the RaijintekPean Showcase. As cooling we use the Alphacool Eisbear 280 AiO.
Processor Benchmarks
The Core i3-10100 clearly wins the direct comparison with the Intel Core i3-9100F. Nevertheless, our test sample can't get out a big lead in single-core performance, even though the multi-core performance is now much better due to hyper-threading. Some processors of the 9th generation unfortunately had to do without this feature. In our CPU benchmarks, the Core i3-10100 can often even beat the Intel Core i5-9400F, although the latter has six physical processing units. Intel, however, has a hard time keeping up with the small AMD Ryzen-3 models. The AMD Ryzen 3 3100 is almost always ahead of our test sample in the multi-core tests. However, we would not describe the difference in performance between the two processors as noticeable.
More CPU benchmarks can be found here in our CPU benchmark comparison.
| Blender - v2.79 BMW27 CPU | |
| Intel Core i3-9100F, NVIDIA Titan RTX | |
| AMD Ryzen 5 2400G, AMD Radeon RX Vega 11 | |
| Intel Core i3-10100, NVIDIA Titan RTX | |
| Intel Core i3-10100, NVIDIA GeForce GT 710 | |
| AMD Ryzen 3 3100, NVIDIA Titan RTX | |
| Intel Core i5-9400F, NVIDIA Titan RTX | |
| AMD Ryzen 3 3300X, NVIDIA Titan RTX | |
| Intel Core i5-10600K, NVIDIA Titan RTX | |
| Geekbench 5.5 | |
| Multi-Core | |
| Intel Core i5-10600K, NVIDIA Titan RTX | |
| AMD Ryzen 5 2400G, AMD Radeon RX Vega 11 | |
| AMD Ryzen 5 2400G, AMD Radeon RX Vega 11 | |
| Intel Core i5-9400F, NVIDIA Titan RTX | |
| AMD Ryzen 3 3300X, NVIDIA Titan RTX | |
| AMD Ryzen 3 3100, NVIDIA Titan RTX | |
| Intel Core i3-10100, NVIDIA GeForce GT 710 | |
| Intel Core i3-10100, NVIDIA Titan RTX | |
| Intel Core i3-9100F, NVIDIA Titan RTX | |
| Single-Core | |
| AMD Ryzen 3 3300X, NVIDIA Titan RTX | |
| Intel Core i5-10600K, NVIDIA Titan RTX | |
| AMD Ryzen 5 2400G, AMD Radeon RX Vega 11 | |
| AMD Ryzen 5 2400G, AMD Radeon RX Vega 11 | |
| Intel Core i3-10100, NVIDIA GeForce GT 710 | |
| Intel Core i3-10100, NVIDIA Titan RTX | |
| Intel Core i3-9100F, NVIDIA Titan RTX | |
| Intel Core i5-9400F, NVIDIA Titan RTX | |
| AMD Ryzen 3 3100, NVIDIA Titan RTX | |
| Geekbench 4.4 | |
| 64 Bit Single-Core Score | |
| Intel Core i5-10600K, NVIDIA Titan RTX | |
| AMD Ryzen 3 3300X, NVIDIA Titan RTX | |
| Intel Core i3-10100, NVIDIA GeForce GT 710 | |
| Intel Core i3-10100, NVIDIA Titan RTX | |
| Intel Core i5-9400F, NVIDIA Titan RTX | |
| Intel Core i3-9100F, NVIDIA Titan RTX | |
| AMD Ryzen 3 3100, NVIDIA Titan RTX | |
| AMD Ryzen 5 2400G, AMD Radeon RX Vega 11 | |
| 64 Bit Multi-Core Score | |
| Intel Core i5-10600K, NVIDIA Titan RTX | |
| Intel Core i5-9400F, NVIDIA Titan RTX | |
| AMD Ryzen 3 3300X, NVIDIA Titan RTX | |
| Intel Core i3-10100, NVIDIA GeForce GT 710 | |
| AMD Ryzen 3 3100, NVIDIA Titan RTX | |
| Intel Core i3-10100, NVIDIA Titan RTX | |
| Intel Core i3-9100F, NVIDIA Titan RTX | |
| AMD Ryzen 5 2400G, AMD Radeon RX Vega 11 | |
| HWBOT x265 Benchmark v2.2 - 4k Preset | |
| Intel Core i5-10600K, NVIDIA Titan RTX | |
| Intel Core i5-9400F, NVIDIA Titan RTX | |
| AMD Ryzen 3 3300X, NVIDIA Titan RTX | |
| Intel Core i3-10100, NVIDIA GeForce GT 710 | |
| Intel Core i3-10100, NVIDIA Titan RTX | |
| AMD Ryzen 3 3100, NVIDIA Titan RTX | |
| Intel Core i3-9100F, NVIDIA Titan RTX | |
| AMD Ryzen 5 2400G, AMD Radeon RX Vega 11 | |
| R Benchmark 2.5 - Overall mean | |
| AMD Ryzen 5 2400G, AMD Radeon RX Vega 11 | |
| Intel Core i5-9400F, NVIDIA Titan RTX | |
| Intel Core i3-9100F, NVIDIA Titan RTX | |
| Intel Core i3-10100, NVIDIA Titan RTX | |
| Intel Core i3-10100, NVIDIA GeForce GT 710 | |
| AMD Ryzen 3 3100, NVIDIA Titan RTX | |
| Intel Core i5-10600K, NVIDIA Titan RTX | |
| AMD Ryzen 3 3300X, NVIDIA Titan RTX | |
| LibreOffice - 20 Documents To PDF | |
| AMD Ryzen 5 2400G, AMD Radeon RX Vega 11 | |
| Intel Core i3-9100F, NVIDIA Titan RTX | |
| AMD Ryzen 3 3100, NVIDIA Titan RTX | |
| Intel Core i5-9400F, NVIDIA Titan RTX | |
| Intel Core i3-10100, NVIDIA Titan RTX | |
| Intel Core i3-10100, NVIDIA GeForce GT 710 | |
| AMD Ryzen 3 3300X, NVIDIA Titan RTX | |
| Intel Core i5-10600K, NVIDIA Titan RTX | |
| Mozilla Kraken 1.1 - Total | |
| AMD Ryzen 5 2400G, AMD Radeon RX Vega 11 | |
| Intel Core i5-9400F, NVIDIA Titan RTX | |
| Intel Core i3-9100F, NVIDIA Titan RTX | |
| Intel Core i3-10100, NVIDIA Titan RTX | |
| Intel Core i3-10100, NVIDIA GeForce GT 710 | |
| AMD Ryzen 3 3100, NVIDIA Titan RTX | |
| Intel Core i5-10600K, NVIDIA Titan RTX | |
| AMD Ryzen 3 3300X, NVIDIA Titan RTX | |
* ... smaller is better
Cinebench-R15-Multi-Schleife
Application performance and gaming performance
In the application benchmarks, the Core i3-10100 can achieve very good results together with the very fast Nvidia Titan RTX. If the same system is used with a very weak graphics card (GeForce GT 710), the benchmark results also drop drastically. An AMD Ryzen 5 2400G, which costs about the same as the Intel/Nvidia combination, consistently delivers a bit more performance in PCMark 10 and 3DMark.
| PCMark 10 - Score | |
| Intel Core i3-10100 | |
| AMD Ryzen 3 3300X | |
| Intel Core i5-9400F | |
| AMD Ryzen 3 3100 | |
| Intel Core i3-9100F | |
| AMD Ryzen 5 2400G | |
| Intel Core i3-10100 | |
| 3DMark | |
| 1920x1080 Fire Strike Score | |
| Intel Core i3-10100 | |
| AMD Ryzen 3 3300X | |
| Intel Core i5-9400F | |
| AMD Ryzen 3 3100 | |
| Intel Core i3-9100F | |
| AMD Ryzen 5 2400G | |
| Intel Core i3-10100 | |
| 1920x1080 Fire Strike Graphics | |
| Intel Core i3-10100 | |
| Intel Core i3-9100F | |
| Intel Core i5-9400F | |
| AMD Ryzen 3 3100 | |
| AMD Ryzen 3 3300X | |
| Intel Core i3-10100 | |
| 2560x1440 Time Spy Score | |
| Intel Core i5-9400F | |
| Intel Core i3-10100 | |
| AMD Ryzen 3 3300X | |
| AMD Ryzen 3 3100 | |
| Intel Core i3-9100F | |
| AMD Ryzen 5 2400G | |
| Intel Core i3-10100 | |
| 2560x1440 Time Spy Graphics | |
| Intel Core i3-10100 | |
| Intel Core i5-9400F | |
| AMD Ryzen 3 3300X | |
| Intel Core i3-9100F | |
| AMD Ryzen 3 3100 | |
| AMD Ryzen 5 2400G | |
| Intel Core i3-10100 | |
| 1280x720 Cloud Gate Standard Physics | |
| Intel Core i3-10100 | |
| AMD Ryzen 3 3300X | |
| Intel Core i3-10100 | |
| AMD Ryzen 3 3100 | |
| Intel Core i5-9400F | |
| AMD Ryzen 5 2400G | |
| Intel Core i3-9100F | |
| 1280x720 Cloud Gate Standard Graphics | |
| Intel Core i3-10100 | |
| Intel Core i5-9400F | |
| AMD Ryzen 3 3300X | |
| Intel Core i3-9100F | |
| AMD Ryzen 3 3100 | |
| AMD Ryzen 5 2400G | |
| Intel Core i3-10100 | |
| GTA V | |
| 1024x768 Lowest Settings possible | |
| Intel Core i3-10100 | |
| AMD Ryzen 5 2400G | |
| Intel Core i3-10100 | |
| 1366x768 Normal/Off AF:4x | |
| Intel Core i3-10100 | |
| AMD Ryzen 5 2400G | |
| Intel Core i3-10100 | |
| 1920x1080 High/On (Advanced Graphics Off) AA:2xMSAA + FX AF:8x | |
| Intel Core i3-10100 | |
| AMD Ryzen 5 2400G | |
| Intel Core i3-10100 | |
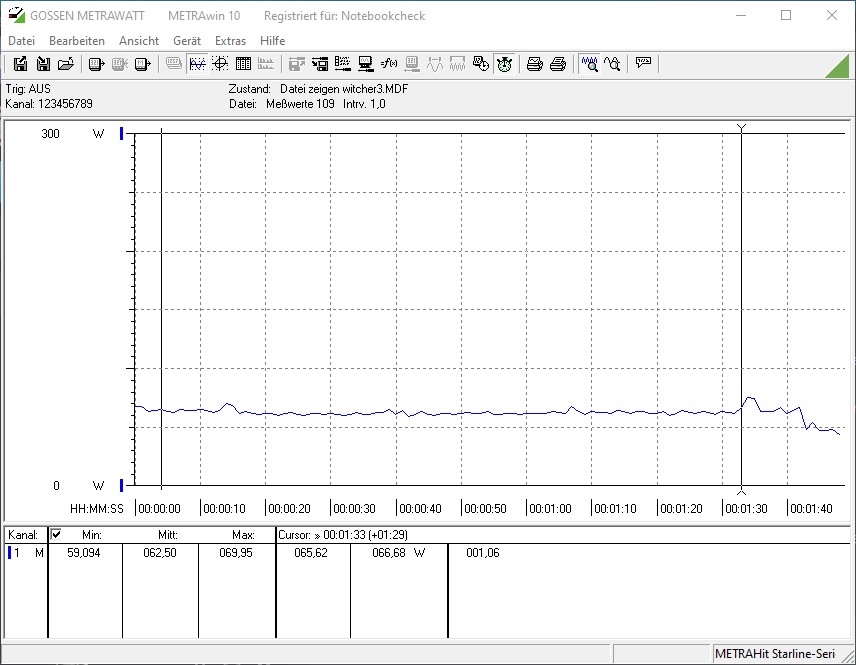
| The Witcher 3 | |
| 1024x768 Low Graphics & Postprocessing | |
| Intel Core i3-10100 | |
| AMD Ryzen 5 2400G | |
| Intel Core i3-10100 | |
| 1366x768 Medium Graphics & Postprocessing | |
| Intel Core i3-10100 | |
| Intel Core i3-10100 | |
| 1920x1080 High Graphics & Postprocessing (Nvidia HairWorks Off) | |
| Intel Core i3-10100 | |
| AMD Ryzen 5 2400G | |
| Intel Core i3-10100 | |
| Dota 2 Reborn | |
| 1280x720 min (0/3) fastest | |
| Intel Core i3-10100 | |
| Intel Core i3-10100 | |
| AMD Ryzen 5 2400G | |
| 1366x768 med (1/3) | |
| Intel Core i3-10100 | |
| AMD Ryzen 5 2400G | |
| Intel Core i3-10100 | |
| 1920x1080 high (2/3) | |
| Intel Core i3-10100 | |
| AMD Ryzen 5 2400G | |
| Intel Core i3-10100 | |
| Final Fantasy XV Benchmark | |
| 1280x720 Lite Quality | |
| Intel Core i3-10100 (1.3) | |
| AMD Ryzen 5 2400G (1.3) | |
| Intel Core i3-10100 (1.3) | |
| 1920x1080 Standard Quality | |
| Intel Core i3-10100 (1.3) | |
| AMD Ryzen 5 2400G (1.3) | |
| Intel Core i3-10100 (1.3) | |
| 1920x1080 High Quality | |
| Intel Core i3-10100 (1.3) | |
| AMD Ryzen 5 2400G (1.3) | |
| Intel Core i3-10100 (1.3) | |
| X-Plane 11.11 | |
| 1280x720 low (fps_test=1) | |
| Intel Core i3-10100 | |
| AMD Ryzen 5 2400G | |
| Intel Core i3-10100 | |
| 1920x1080 med (fps_test=2) | |
| Intel Core i3-10100 | |
| AMD Ryzen 5 2400G | |
| Intel Core i3-10100 | |
| 1920x1080 high (fps_test=3) | |
| Intel Core i3-10100 | |
| AMD Ryzen 5 2400G | |
| Intel Core i3-10100 | |
| Far Cry 5 | |
| 1280x720 Low Preset AA:T | |
| Intel Core i3-10100 | |
| AMD Ryzen 5 2400G | |
| Intel Core i3-10100 | |
| 1920x1080 Medium Preset AA:T | |
| Intel Core i3-10100 | |
| AMD Ryzen 5 2400G | |
| Intel Core i3-10100 | |
| 1920x1080 High Preset AA:T | |
| Intel Core i3-10100 | |
| AMD Ryzen 5 2400G | |
| Intel Core i3-10100 | |
| Far Cry New Dawn | |
| 1280x720 Low Preset | |
| Intel Core i3-10100 | |
| AMD Ryzen 5 2400G | |
| Intel Core i3-10100 | |
| 1920x1080 Medium Preset | |
| Intel Core i3-10100 | |
| AMD Ryzen 5 2400G | |
| Intel Core i3-10100 | |
| 1920x1080 High Preset | |
| Intel Core i3-10100 | |
| AMD Ryzen 5 2400G | |
| Intel Core i3-10100 | |
| Strange Brigade | |
| 1280x720 lowest AF:1 | |
| Intel Core i3-10100 (1.47.22.14 D3D12) | |
| AMD Ryzen 5 2400G (1.47.22.14 D3D12) | |
| Intel Core i3-10100 (1.47.22.14 D3D12) | |
| 1920x1080 medium AA:medium AF:4 | |
| Intel Core i3-10100 (1.47.22.14 D3D12) | |
| AMD Ryzen 5 2400G (1.47.22.14 D3D12) | |
| Intel Core i3-10100 (1.47.22.14 D3D12) | |
| 1920x1080 high AA:high AF:8 | |
| Intel Core i3-10100 (1.47.22.14 D3D12) | |
| AMD Ryzen 5 2400G (1.47.22.14 D3D12) | |
| Intel Core i3-10100 (1.47.22.14 D3D12) | |
| Metro Exodus | |
| 1280x720 Low Quality AF:4x | |
| Intel Core i3-10100 | |
| AMD Ryzen 5 2400G | |
| Intel Core i3-10100 | |
| 1920x1080 Medium Quality AF:4x | |
| Intel Core i3-10100 | |
| AMD Ryzen 5 2400G | |
| Intel Core i3-10100 | |
| 1920x1080 High Quality AF:16x | |
| Intel Core i3-10100 | |
| AMD Ryzen 5 2400G | |
| Intel Core i3-10100 | |
| Borderlands 3 | |
| 1280x720 Very Low Overall Quality (DX11) | |
| Intel Core i3-10100 | |
| AMD Ryzen 5 2400G | |
| Intel Core i3-10100 | |
| 1920x1080 Medium Overall Quality (DX11) | |
| Intel Core i3-10100 | |
| AMD Ryzen 5 2400G | |
| Intel Core i3-10100 | |
| 1920x1080 High Overall Quality (DX11) | |
| Intel Core i3-10100 | |
| AMD Ryzen 5 2400G | |
| Intel Core i3-10100 | |
Intel Core i3-10100 + Nvidia Titan RTX
| low | med. | high | ultra | QHD | 4K | |
|---|---|---|---|---|---|---|
| GTA V (2015) | 179 | 173 | 157 | 92.4 | 87.5 | 125 |
| The Witcher 3 (2015) | 338 | 297 | 250 | 142 | 105 | |
| Dota 2 Reborn (2015) | 148.5 | 132.8 | 128.9 | 124.9 | 122.1 | |
| Final Fantasy XV Benchmark (2018) | 158 | 148 | 120 | 105 | 63.3 | |
| X-Plane 11.11 (2018) | 94.8 | 87.8 | 76.3 | 67.7 | ||
| Far Cry 5 (2018) | 151 | 135 | 128 | 120 | 116 | 80 |
| Strange Brigade (2018) | 376 | 316 | 284 | 242 | 181 | 106 |
| Far Cry New Dawn (2019) | 130 | 115 | 111 | 101 | 99 | 81 |
| Metro Exodus (2019) | 159 | 138 | 120 | 101 | 55.3 | |
| Borderlands 3 (2019) | 143 | 127 | 116 | 103 | 82.1 | 46 |
Intel Core i3-10100 + Nvidia GeForce GT 710
| low | med. | high | ultra | QHD | 4K | |
|---|---|---|---|---|---|---|
| GTA V (2015) | 58.5 | 48.6 | 11.5 | 5.9 | ||
| The Witcher 3 (2015) | 15.8 | 9.63 | 5.39 | 2.82 | ||
| Dota 2 Reborn (2015) | 113.8 | 49.5 | 19.5 | 18.1 | 7.3 | |
| Final Fantasy XV Benchmark (2018) | 8.41 | 3.68 | 2.93 | 1.89 | 1.89 | |
| X-Plane 11.11 (2018) | 27.9 | 16.3 | 14.8 | 14.7 | ||
| Far Cry 5 (2018) | 11 | 5 | 4 | 4 | ||
| Strange Brigade (2018) | 19.6 | 7.7 | 5.4 | 5.1 | 5 | 5 |
| Far Cry New Dawn (2019) | 11 | 5 | 5 | |||
| Metro Exodus (2019) | 7.67 | 3.81 | 2.97 | 2.42 | ||
| Borderlands 3 (2019) | 13.7 | 5.28 | 3.33 | 2.37 |
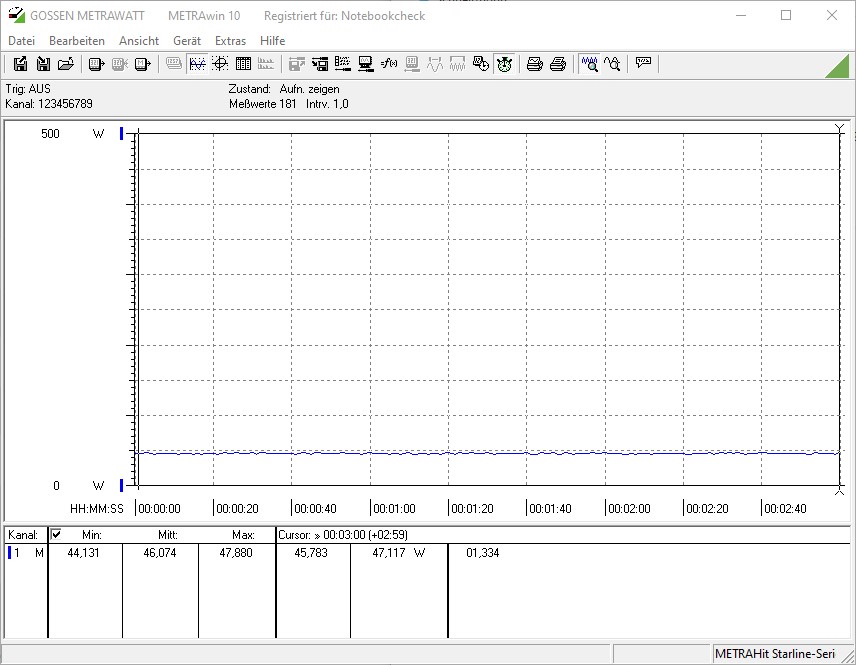
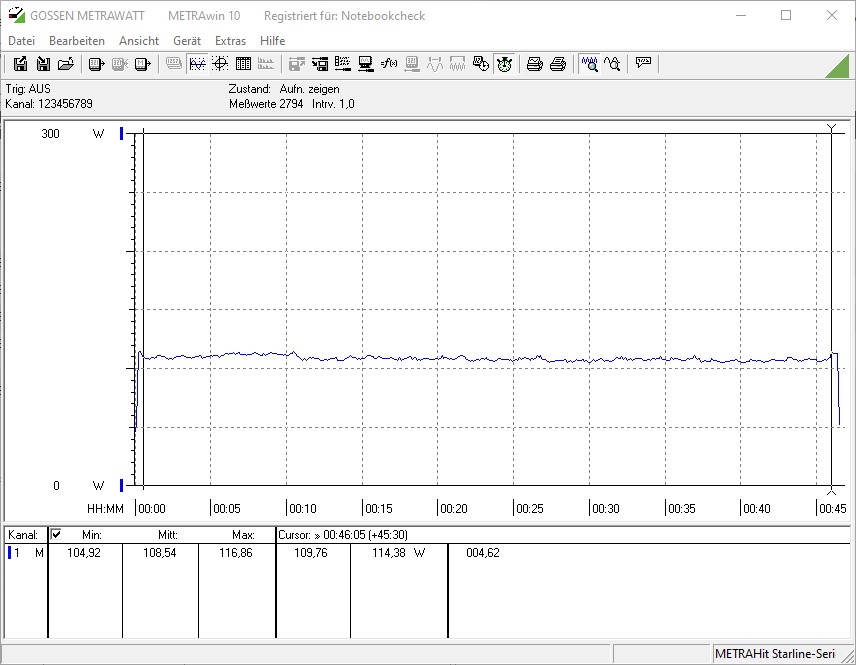
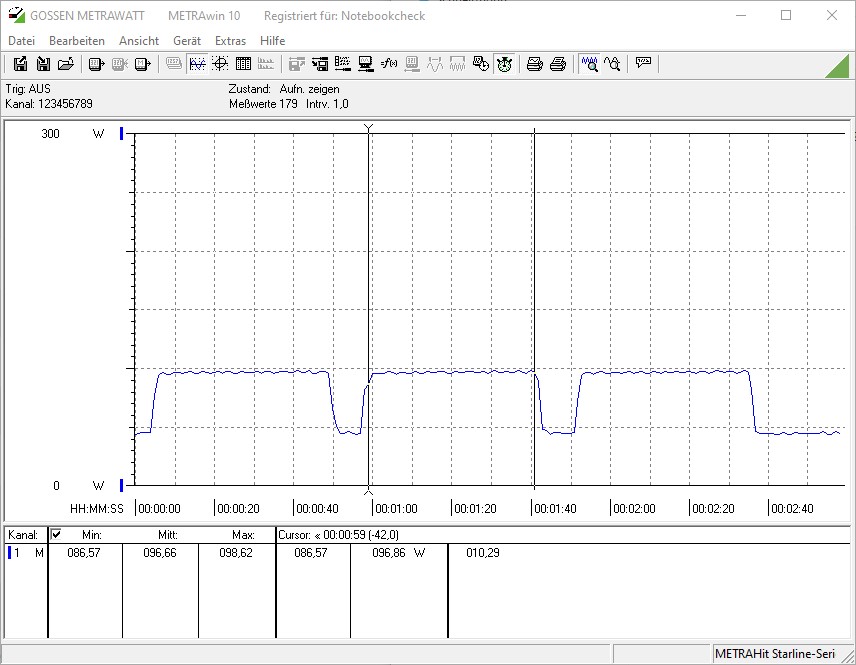
Energy consumption
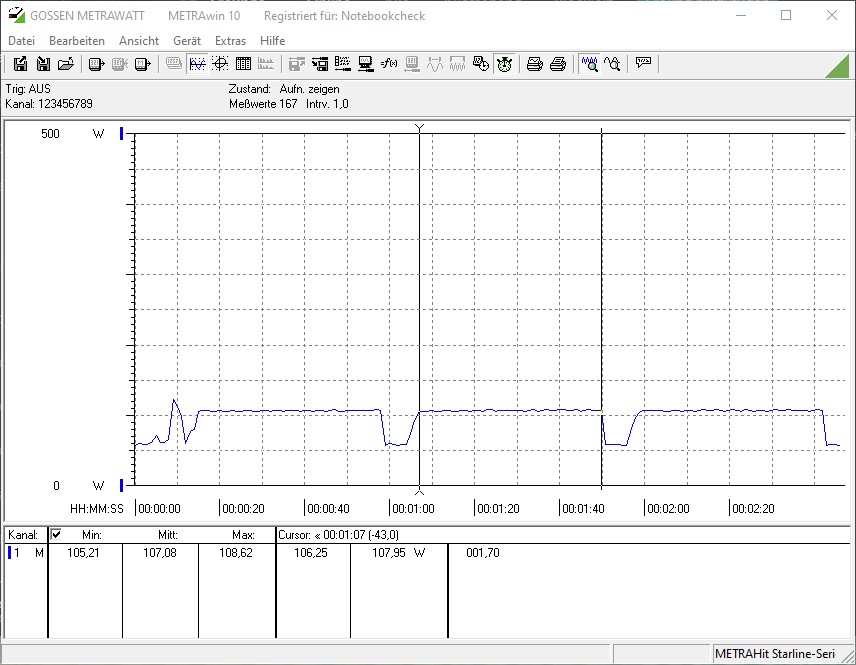
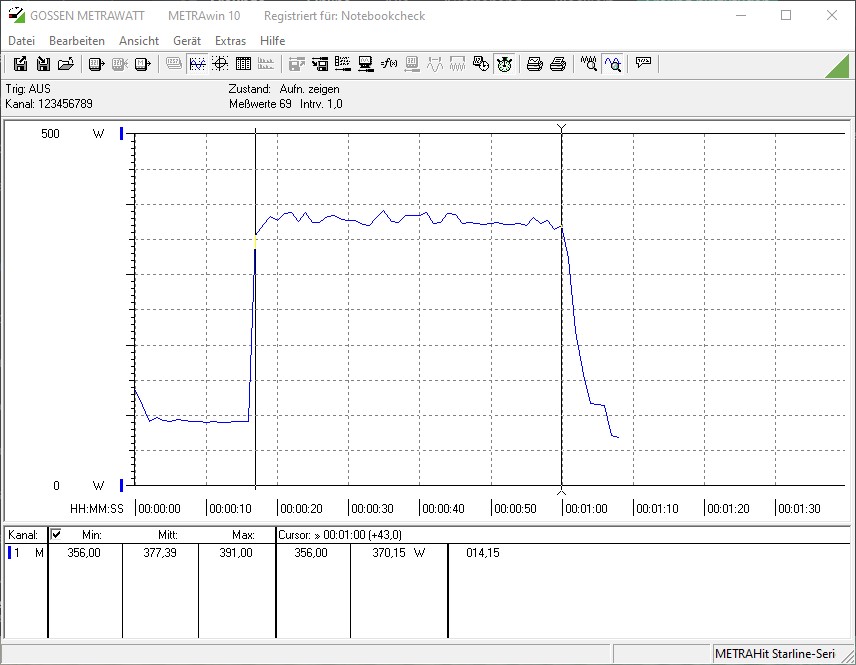
If you want to assemble an economical PC, an Intel Core i3-10100 is a good choice. In idle the system is content with about 46 Watts when using the GeForce GT 710, and only 12 Watts more with the Nvidia Titan RTX. The system based on the Ryzen 5 2400G is even more economical with 19 W in idle. Under load, in the Cinebench R15 multi-test, this changes in favor of the Intel Core i3-10100. The AMD system is again somewhat more economical in the stress test and the gaming test. Nevertheless, the differences are very small. Compared to the Core i3-9100F, the Core i3-10100 wins and has become more economical despite a significant performance increase.
Intel Core i3-10100 + Nvidia GeForce GT 710
Intel Core i3-10100 + Nvidia Titan RTX

| Power Consumption / Cinebench R15 Multi (external Monitor) | |
| AMD Ryzen 3 3300X (Idle: 88.8 W) | |
| AMD Ryzen 3 3100 (Idle: 86 W) | |
| Intel Core i5 9400F (Idle: 57 W) | |
| Intel Core i3-10100 (Idle: 58.7 W) | |
| AMD Ryzen 5 2400G (Idle: 19.1 W) | |
| Intel Core i3 9100F (Idle: 56 W) | |
| Intel Core i3-10100 (Idle: 46.1 W) | |
| Power Consumption / Prime95 V2810 Stress (external Monitor) | |
| AMD Ryzen 3 3300X (Idle: 88.8 W) | |
| Intel Core i3 9100F (Idle: 56 W) | |
| AMD Ryzen 3 3100 (Idle: 86 W) | |
| Intel Core i5 9400F (Idle: 57 W) | |
| Intel Core i3-10100 (Idle: 58.7 W) | |
| Intel Core i3-10100 (Idle: 46.1 W) | |
| AMD Ryzen 5 2400G (Idle: 19.1 W) | |
| Power Consumption / The Witcher 3 ultra (external Monitor) | |
| AMD Ryzen 3 3300X (Idle: 88.8 W) | |
| AMD Ryzen 3 3100 (Idle: 86 W) | |
| Intel Core i5 9400F (Idle: 57 W) | |
| Intel Core i3-10100 (Idle: 58.7 W) | |
| Intel Core i3 9100F (Idle: 56 W) | |
| Intel Core i3-10100 (Idle: 46.1 W) | |
| AMD Ryzen 5 2400G (Idle: 19.1 W) | |
* ... smaller is better
Conclusion - Good price-performance ratio
With the latest Comet Lake-S processors, Intel has introduced many new processors to the market this year. With the Intel Core i3-10100 we now had the opportunity to put the smallest model of the series through its paces. Currently the Intel Core i3-10100 costs about 105 Euros. For this, the processor offers hyperthreading and an integrated graphics unit, making this model very interesting for small office systems. AMD has similar products in its portfolio with the APUs Ryzen 5 2400G or Ryzen 5 3400G. However, their iGPU is much more powerful, as we saw in the test. Even the GeForce GT 710, together with the Core i3-10100, is slower than the comparison system based on an AMD Ryzen 5 2400G.
With the Intel Core i3-10100, Intel offers a fast and economical desktop processor for office systems.
If you still pack the Intel Core i3-10100 into a gaming system, you still can get good frame rates with a decent GPU. Only CPU-intensive games fall behind in comparison with faster processors. However, the Core i3-10100's core competence is everyday office work, which is also done with low energy consumption.
Price comparison
Benchmarks

* Smaller numbers mean a higher performance
Reviews for the Intel Core i3-10100 processor
Intel Core i3-10100: NVIDIA Titan RTX, 32.00"
» Intel Core i3-10100 Desktop Processor - Benchmarks and Specs
» Intel Core i3-10100 Desktop Processor - Benchmarks and Specs
"Comparison of mobile processors
All CPU series for notebooks with short description
"Mobile Processors - Benchmarklist
Sortable and filterable benchmark list