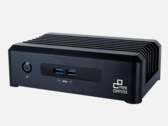
Notebookcheck Logo

Intel Core i7-8665U

The Intel Core i7-8665U is a power efficient quad-core SoC for notebooks and Ultrabooks based on the Whiskey Lake generation that was announced in April 2019 as part of two vPro enabled WHL-U processors. Compared to the similar named Kaby Lake-R processors (e.g. Core i7-8550U), the Whiskey Lake CPUs are now produced in a further improved 14nm process (14nm++) and offer higher clock speeds. The architecture and features are the same. The i7-8665U offers e.g. high Turbo clock speeds of 4,8 GHz (versus 4 GHz of the i7-8550U) for a single core. The integrated GPU is still named Intel UHD Graphics 620 and the dual-channel memory controller still supports the same RAM speeds as Kaby-Lake-R (DDR4-2400 / LPDDR3-2133). Compared to the slower Core i5-8265U and i3-8145U, the i7 should support Thermal Velocity Boost (like the Core i7-8565U, the predecessor).

The Whiskey Lake SoCs are used with a new PCH produced in 14nm that supports USB 3.1 Gen 2 (10 Gbps) and CNVi WiFi/BT parts.

Architecture

Intel basically uses the same micro architecture compared to Skylake and Kaby Lake, so the per-MHz performance does not differ. That means Whiskey Lake is a Kaby Lake chip manufactured in the improved 14nm++ process.

Performance

The performance of the i7-8665U depends on the cooling solution of the laptop and the defined TDP limits for short and long term performance. We already saw big differences for Kaby Lake-R (e.g., i7-8550U benchmarks), especially for long term (sustained) performance. Therefore, it will be interesting to see how the additionalTurbo  clock speed can be made use of. Due to the 200 MHz higher Turbo Boost, the 8665U should outperform the i7-8565U (see for benchmarks).

Graphics

The integrated Intel UHD Graphics 620 (Intel Gen 9.5) is untouched from the 8th Gen Kaby Lake chips. With fast dual-channel memory it can reach the performance of a dedicated GeForce 920M.

Contrary to Skylake, Kaby Lake and Whiskey Lake now also supports H.265/HEVC Main 10 with a 10-bit color depth as well as Google's VP9 codec. The dual-core Kaby Lake processors announced in January should also support HDCP 2.2.

Power Consumption

The chip is manufactured in a further improved 14nm process with FinFET transistors (14nm++), the same as the 8th Gen Coffee Lake processors. Intel still specifies the TDP with 15 Watts, which is typical for ULV chips. Depending on the usage scenario, the TDP can vary between 7.5 (cTDP Down) and 25 Watts.

SeriesIntel Core i7
CodenameWhiskey Lake-U

Series: Core i7 Whiskey Lake-U

Intel Core i7-8665U « 1.9 - 4.8 GHz4 / 8 cores8 MB L3
Intel Core i7-8565U compare1.8 - 4.6 GHz4 / 8 cores8 MB L3
Clock Rate1900 - 4800 MHz
Level 1 Cache256 KB
Level 2 Cache1 MB
Level 3 Cache8 MB
Number of Cores / Threads4 / 8
Power Consumption (TDP = Thermal Design Power)15 Watt
Manufacturing Technology14 nm
Max. Temperature100 °C
SocketBGA1528
FeaturesDual-Channel DDR4 Memory Controller, HyperThreading, AVX, AVX2, Quick Sync, Virtualization, AES-NI
GPUIntel UHD Graphics 620 (300 - 1150 MHz)
64 Bit64 Bit support
Architecturex86
Announcement Date04/16/2019
Product Link (external)Intel Core i7 i7-8665U

Benchmarks

Performance Rating - CB R15 + R20 + 7-Zip + X265 + Blender + 3DM11 CPU
34.3 pt (38%)
Cinebench R15 - Cinebench R15 CPU Multi 64 Bit
min: 458     avg: 612     median: 670 (7%)     max: 701 Points
04080120160200240280320360400440480520560600640680720Tooltip
Cinebench R10 - Cinebench R10 Rend. Multi (32bit)
min: 16602     avg: 18427     median: 18426.5 (13%)     max: 20251 points
HWBOT x265 Benchmark v2.2 - HWBOT x265 4k Preset
min: 3.82     avg: 4.5     median: 4.5 (10%)     max: 5.2 fps
012345678910111213Tooltip
3DMark 06 - CPU - 3DMark 06 - CPU
min: 6202     avg: 6365     median: 6365 (14%)     max: 6528 Points
3DMark - 3DMark Ice Storm Unlimited Physics
min: 54189     avg: 59812     median: 60829 (51%)     max: 63399 Points
Mozilla Kraken 1.1 - Kraken 1.1 Total Score *
min: 1016     avg: 1072     median: 1067.5 (1%)     max: 1136 ms
Octane V2 - Octane V2 Total Score
min: 30142     avg: 33976     median: 34548 (33%)     max: 36667 Points
- Range of benchmark values for this graphics card
- Average benchmark values for this graphics card
* Smaller numbers mean a higher performance

Add one or more devices and compare

In the following list you can select (and also search for) devices that should be added to the comparison. You can select more than one device.

restrict list: