Dell Latitude 5500 Review: A business laptop with many options

In our previous tests, the laptops of Dell's Latitude series often produced mixed results. For example, while the Dell Latitude 3590 was targeted towards small and growing companies as an affordable business notebook, it was marred by an insufficient display and annoying fan noises. The Latitude 5591 gave a similar impression. However, what both of these laptops had in common was that they offered very good workmanship and convincing input devices and security equipment.
At first glance, the latter qualities can also be seen in our current test unit, the Dell Latitude 5500. With an Intel Core i7-8665U and integrated UHD Graphics 620 graphics unit, a look at the datasheet also shows a good business performance. In addition, there is the maximum amount of working memory with 32 GB and a 1 TB SSD.
For a price of about 2200 Euros (~$2413; simpler configurations start from $978 in the US) - with the storage equipment of 32 GB of RAM and the 1 TB SSD increasing the price of our test unit significantly - buyers can also find good business notebooks from the competitors. In this test, we therefore compare the Latitude 5500 with HP's EliteBook 755 G5, the Lenovo ThinkPad T580, and Acer's Swift 5. For the benchmarks, we also include the Lenovo ThinkPad X1 Carbon, because it uses the same CPU as our test model. At the bottom of each chart, you can also include additional notebooks from our database for comparison.
Case and Equipment - A business notebook with many options
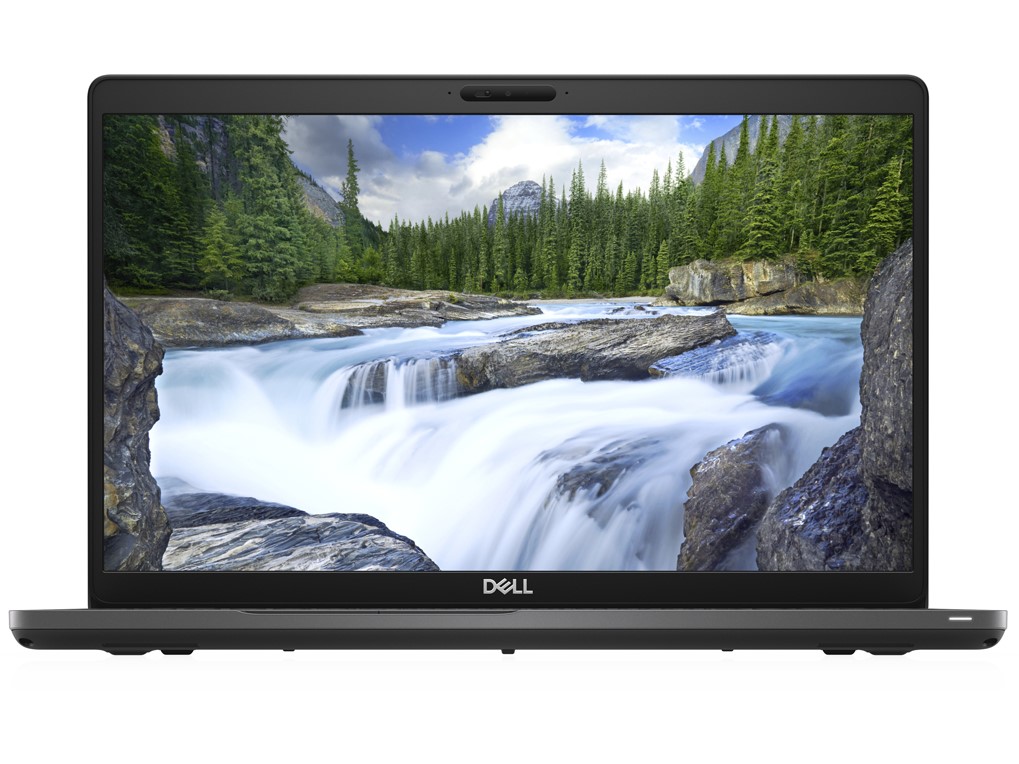
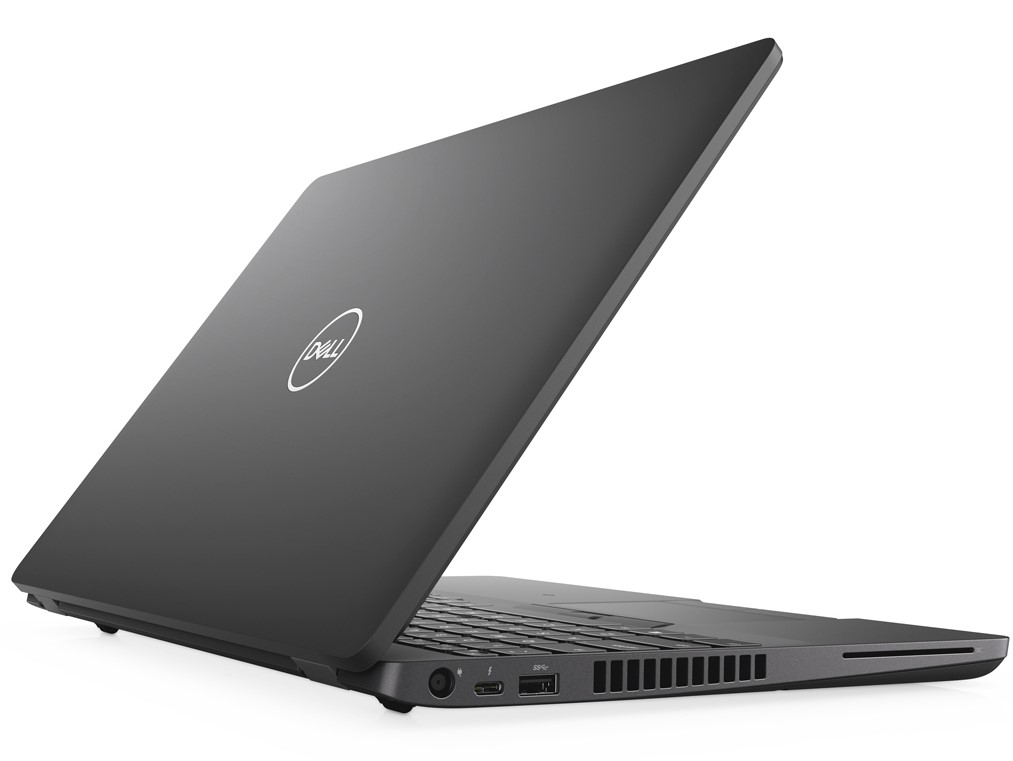
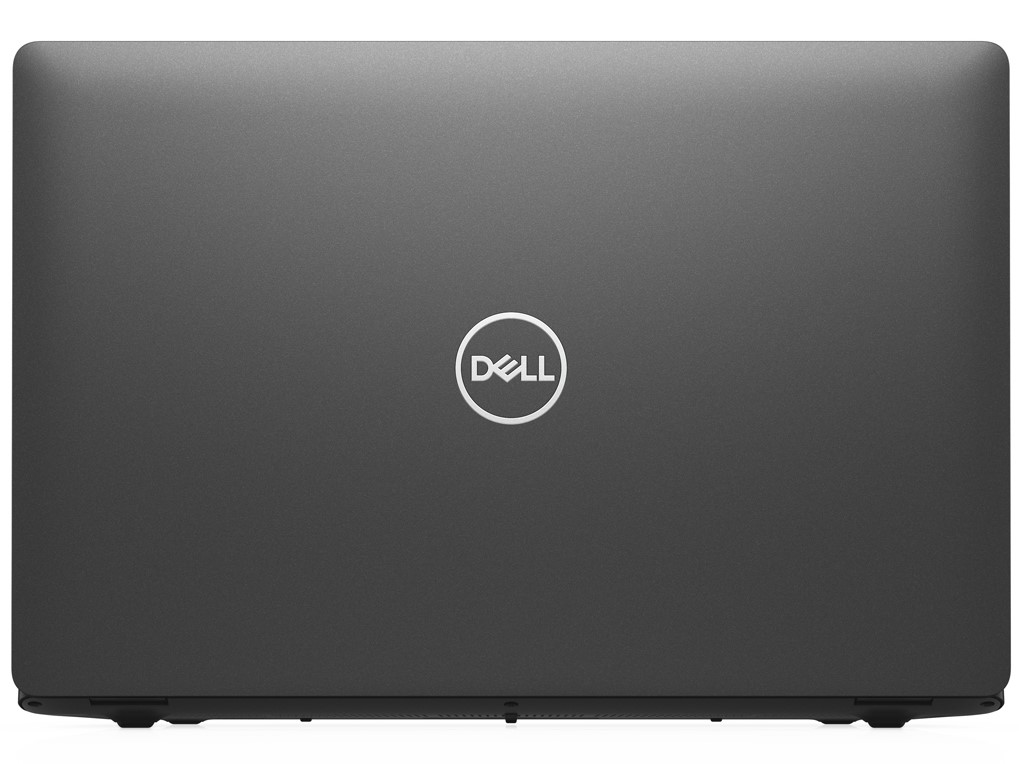
The plastic case of the Dell Latitude 5500 shows high-quality workmanship and offers comfortable haptics. The smooth surface does not show fingerprints, and all the gaps are even. However, due to the low weight of the base unit, the display lid can only be opened when holding down the base with your other hand. The opening angle is 180 degrees, and the display lid is stable enough that it can be moved with one hand without getting warped.
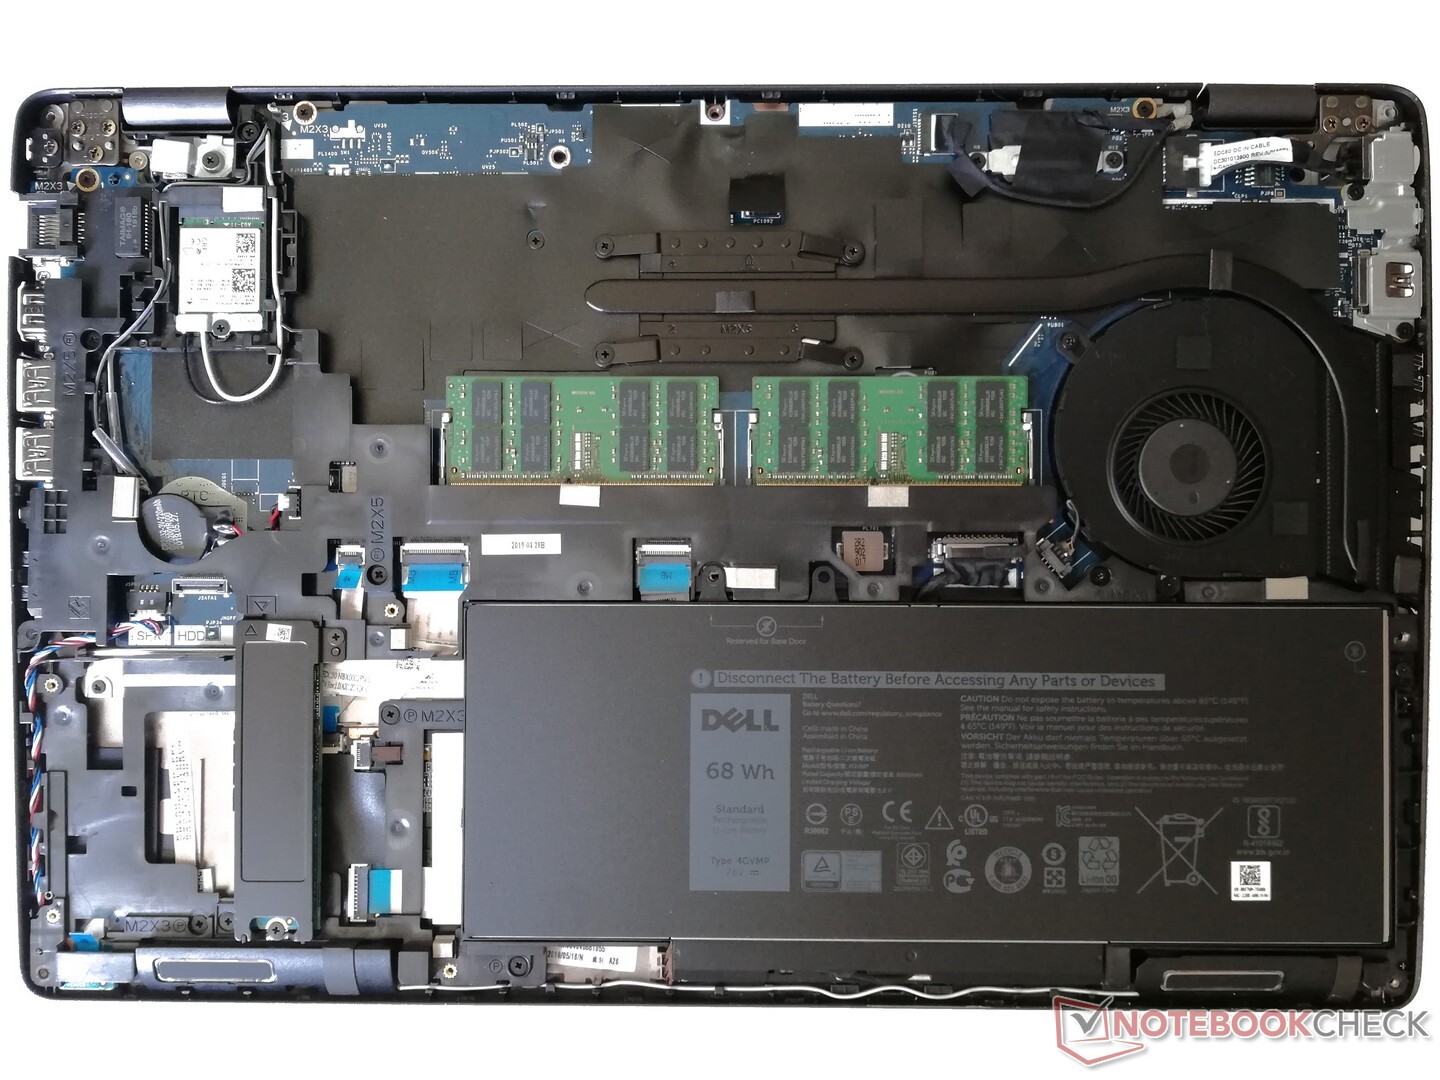
The bottom of the case of the Latitude 5500 can be removed fairly easily, after all the corresponding screws on the bottom have been removed. You then get access to the insides, allowing you to expand the working memory or replace the SSD, for example. The latter is built into our test model in the M.2 format and can also be replaced by a 2.5-inch SATA hard drive. However, you cannot use both, since the M.2 SSD has to be placed across the free SATA slot.
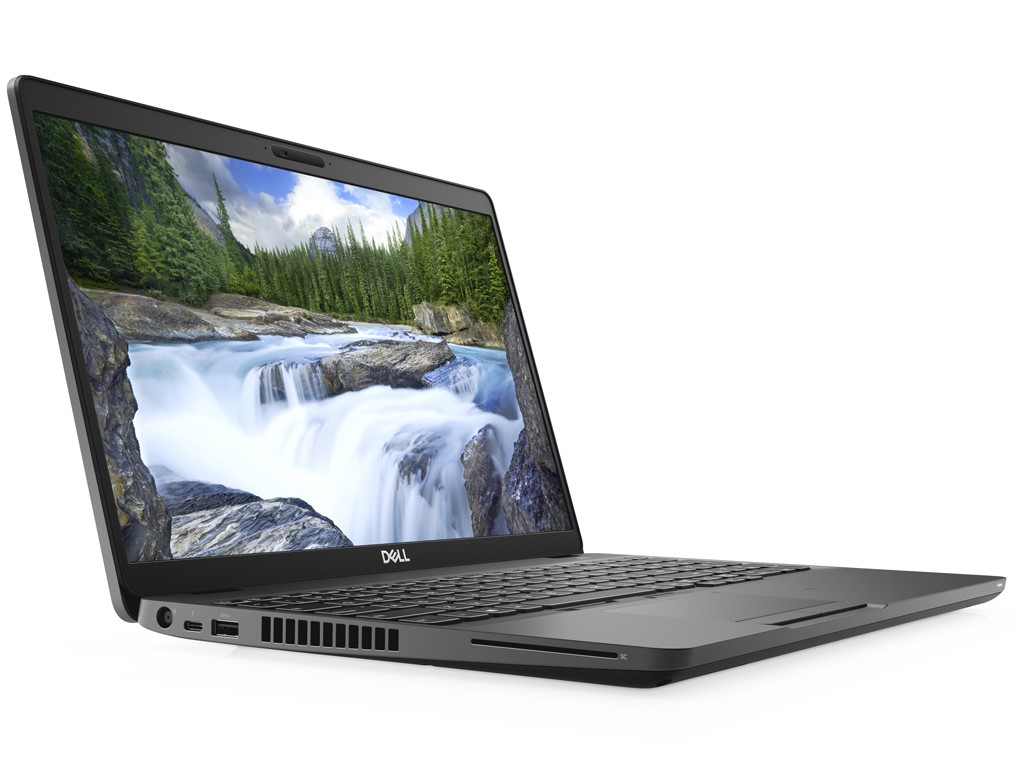
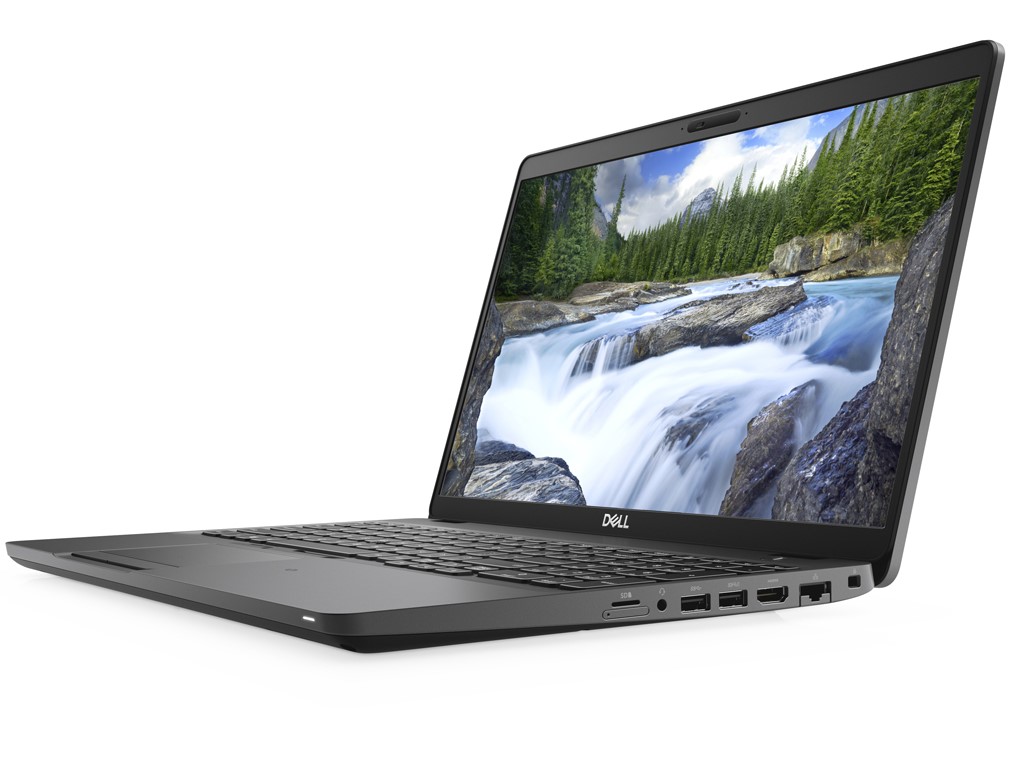
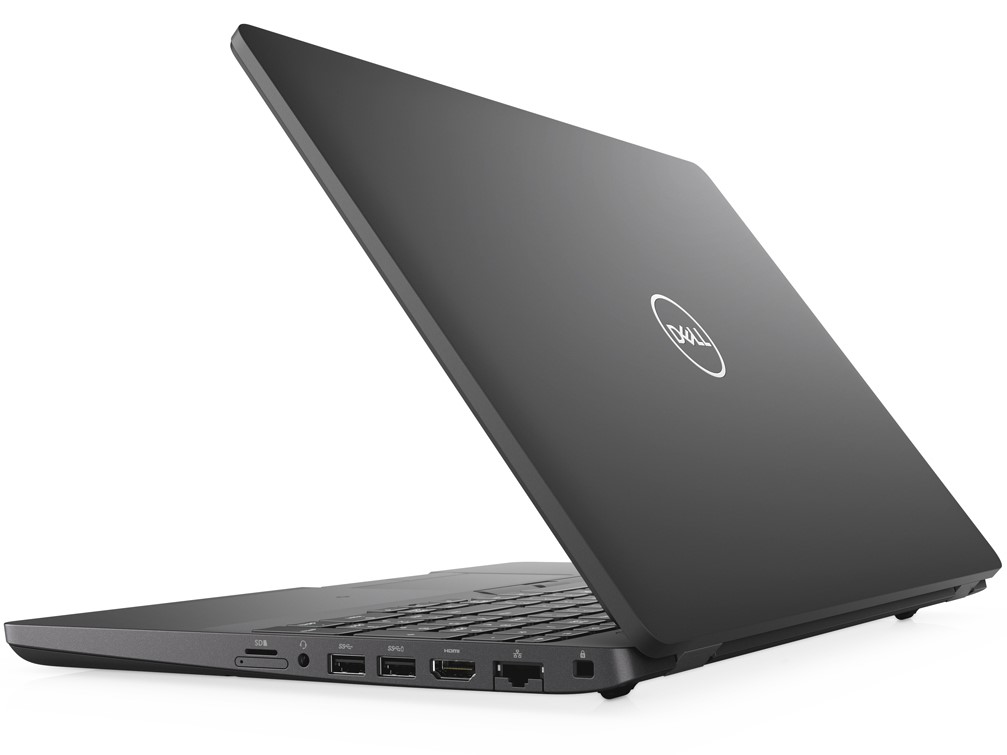
You can find the most necessary connections on the sides of the Dell notebook, with the Thunderbolt-3 port in particular warranting some mention. However, you need to preconfigure this, since Dell also offers a USB-3.1 Gen2 connection in Type-C format as well. For business users, the optional smartcard reader might also be interesting. Not only is the card reader itself present with its slot for insertion of the corresponding card, but if necessary, the Latitude 5500 can also be equipped with a wireless contact area and an NFC sensor below that. In addition, the webcam has a mechanical cover to protect you from unwanted eyes.
Since the Latitude 5500 is also available with an optional LTE module, underneath the storage card reader is a place for the SIM card slot. The card reader itself can only accept microSD cards and offers very good speeds with 181 MB/s while reading and 195.2 MB/s while writing data. The WLAN module built into our test unit supports wireless networks in the 802.11ac standard and offers 2x2-MIMO antenna technology. This allows the business notebook to also achieve very good speeds in our tests, with 624 Mb/s while receiving and 634 Mb/s while transferring data. Optionally, the Dell Latitude 5500 is also available with a WLAN module that supports the coming 802.11ax standard with Wi-Fi 6.
Connection Equipment


| SD Card Reader | |
| average JPG Copy Test (av. of 3 runs) | |
| Dell Latitude 5500 (Toshiba Exceria Pro M501 64 GB UHS-II) | |
| Lenovo ThinkPad T580-20L9001AUS (Toshiba Exceria Pro SDXC 64 GB UHS-II) | |
| Average of class Office (19.8 - 198.5, n=22, last 2 years) | |
| maximum AS SSD Seq Read Test (1GB) | |
| Dell Latitude 5500 (Toshiba Exceria Pro M501 64 GB UHS-II) | |
| Lenovo ThinkPad T580-20L9001AUS (Toshiba Exceria Pro SDXC 64 GB UHS-II) | |
| Average of class Office (27.4 - 249, n=21, last 2 years) | |
Input Devices - The Dell laptop offers a touchpad and TrackPoint
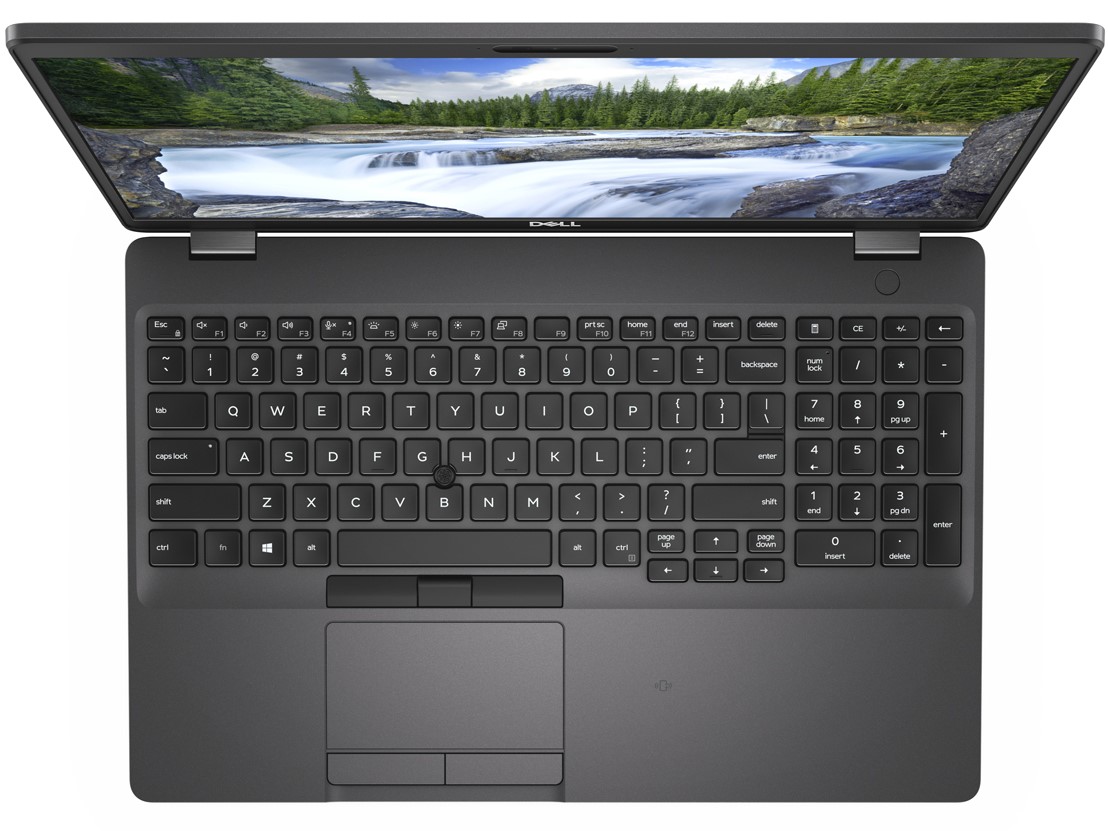
The keyboard of the Dell Latitude 5500 offers a full-sized number block and sufficiently large keys. All the keys can be reached easily, and only the Enter key turns out slightly small. The typing experience is slightly soft, but the pressure point is still clear. After a short period to get accustomed, longer typing tasks can also be performed easily. In addition, our test model can be equipped with an optional two-step keyboard illumination. Its brightness is distributed very evenly and ensures that the keyboard lettering can be easily recognized even in the dark.
As mouse replacement, there are a touchpad with separate mouse keys, and a TrackPoint, which also offers two separate mouse keys below the Space key. While the keys of the touchpad offer a low pressure point and soft feedback, the two keys of the TrackPoint are significantly harder to press. The TrackPoint is rubberized, which prevents slipping of the fingertip. The touchpad, on the other hand, is very smooth and offers a comfortable resistance to the fingers, allowing very precise navigation with the mouse pointer.
Display - An anti-glare touchscreen in the Latitude 5500
The display in our test unit is a 15.6-inch IPS panel that supports touch and has a matte surface and resolution of 1920x1080 pixels. The brightness of this display is 228 cd/m² on average and thus the lowest in our test field. On the other hand, at 93% the brightness distribution is the highest among our selected comparison devices. During our measurements, we also determined that PWM is not used for brightness control.
Interested buyers can choose among various display options. Besides the touchscreen we mentioned above, you can also choose a non-touch version that supposedly offers a brightness of 300 cd/m² and a resolution of 1920x1080 pixels, according to the manufacturer. There is also a panel with a resolution of 1366x768 pixels that has a maximum brightness of about 220 cd/m².
| |||||||||||||||||||||||||
Brightness Distribution: 93 %
Center on Battery: 233 cd/m²
Contrast: 1017:1 (Black: 0.23 cd/m²)
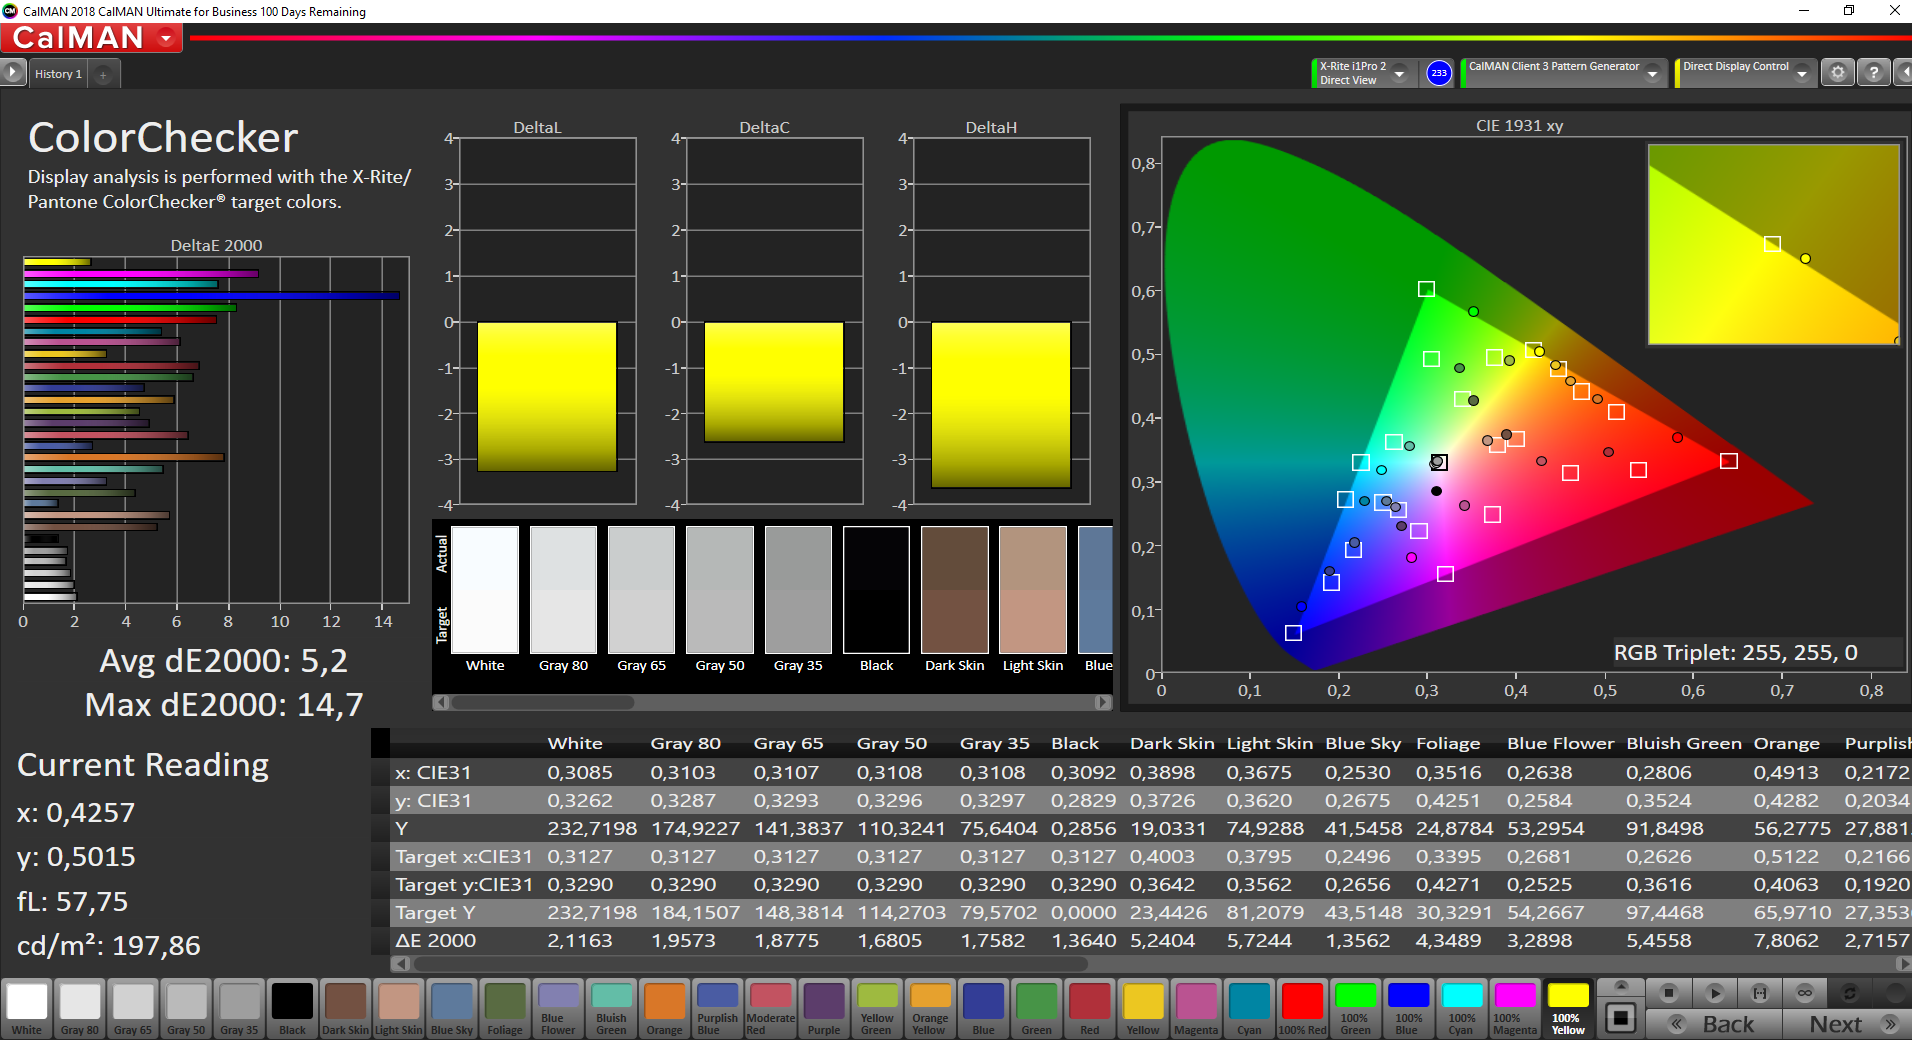
ΔE ColorChecker Calman: 5.2 | ∀{0.5-29.43 Ø4.72}
calibrated: 4.6
ΔE Greyscale Calman: 2.5 | ∀{0.09-98 Ø4.97}
57% sRGB (Argyll 1.6.3 3D)
36.2% AdobeRGB 1998 (Argyll 1.6.3 3D)
39.33% AdobeRGB 1998 (Argyll 3D)
57.3% sRGB (Argyll 3D)
38.07% Display P3 (Argyll 3D)
Gamma: 2.44
CCT: 6649 K
| Dell Latitude 5500 LGD05FF 156WFD, , 1920x1080, 15.6" | Lenovo ThinkPad T580-20L9001AUS B156HAK02.0, , 1920x1080, 15.6" | Acer Swift 5 SF515-51T-76B6 LG Philips LP156WFA-SPG2, , 1920x1080, 15.6" | HP EliteBook 755 G5 3UN79EA BOE074E, , 1920x1080, 15.6" | |
|---|---|---|---|---|
| Display | -3% | 73% | 67% | |
| Display P3 Coverage (%) | 38.07 | 36.94 -3% | 66.8 75% | 66.9 76% |
| sRGB Coverage (%) | 57.3 | 55.3 -3% | 98 71% | 90.2 57% |
| AdobeRGB 1998 Coverage (%) | 39.33 | 38.16 -3% | 67.8 72% | 66.1 68% |
| Response Times | 8% | 6% | -9% | |
| Response Time Grey 50% / Grey 80% * (ms) | 37.6 ? | 33.2 ? 12% | 38 ? -1% | 39 ? -4% |
| Response Time Black / White * (ms) | 28.4 ? | 27.6 ? 3% | 25 ? 12% | 32 ? -13% |
| PWM Frequency (Hz) | 21000 ? | |||
| Screen | -5% | 38% | -20% | |
| Brightness middle (cd/m²) | 234 | 254.5 9% | 341 46% | 456 95% |
| Brightness (cd/m²) | 229 | 238 4% | 319 39% | 410 79% |
| Brightness Distribution (%) | 93 | 87 -6% | 87 -6% | 84 -10% |
| Black Level * (cd/m²) | 0.23 | 0.27 -17% | 0.31 -35% | 0.62 -170% |
| Contrast (:1) | 1017 | 943 -7% | 1100 8% | 735 -28% |
| Colorchecker dE 2000 * | 5.2 | 4.58 12% | 2.01 61% | 7.09 -36% |
| Colorchecker dE 2000 max. * | 14.7 | 17.99 -22% | 4.74 68% | 12.64 14% |
| Colorchecker dE 2000 calibrated * | 4.6 | 4.34 6% | 1.11 76% | |
| Greyscale dE 2000 * | 2.5 | 3.3 -32% | 2.01 20% | 9.15 -266% |
| Gamma | 2.44 90% | 2.403 92% | 2.52 87% | 2.31 95% |
| CCT | 6649 98% | 6355 102% | 6704 97% | 7195 90% |
| Color Space (Percent of AdobeRGB 1998) (%) | 36.2 | 35 -3% | 63 74% | 59 63% |
| Color Space (Percent of sRGB) (%) | 57 | 55 -4% | 98 72% | 90 58% |
| Total Average (Program / Settings) | 0% /
-3% | 39% /
41% | 13% /
-1% |
* ... smaller is better
Display Response Times
| ↔ Response Time Black to White | ||
|---|---|---|
| 28.4 ms ... rise ↗ and fall ↘ combined | ↗ 17.2 ms rise | 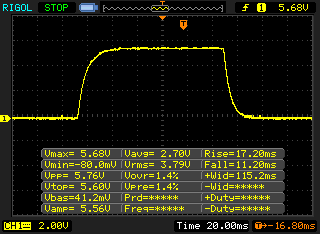 |
| ↘ 11.2 ms fall | ||
| The screen shows relatively slow response rates in our tests and may be too slow for gamers. In comparison, all tested devices range from 0.1 (minimum) to 240 (maximum) ms. » 75 % of all devices are better. This means that the measured response time is worse than the average of all tested devices (19.8 ms). | ||
| ↔ Response Time 50% Grey to 80% Grey | ||
| 37.6 ms ... rise ↗ and fall ↘ combined | ↗ 19.6 ms rise | 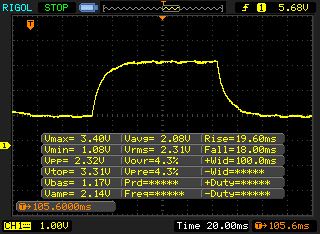 |
| ↘ 18 ms fall | ||
| The screen shows slow response rates in our tests and will be unsatisfactory for gamers. In comparison, all tested devices range from 0.165 (minimum) to 636 (maximum) ms. » 55 % of all devices are better. This means that the measured response time is worse than the average of all tested devices (31 ms). | ||
Screen Flickering / PWM (Pulse-Width Modulation)
| Screen flickering / PWM not detected | 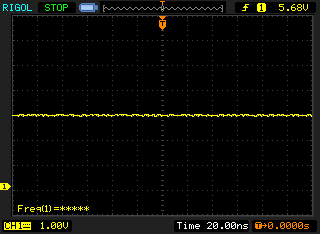 | ||
In comparison: 52 % of all tested devices do not use PWM to dim the display. If PWM was detected, an average of 7747 (minimum: 5 - maximum: 343500) Hz was measured. | |||
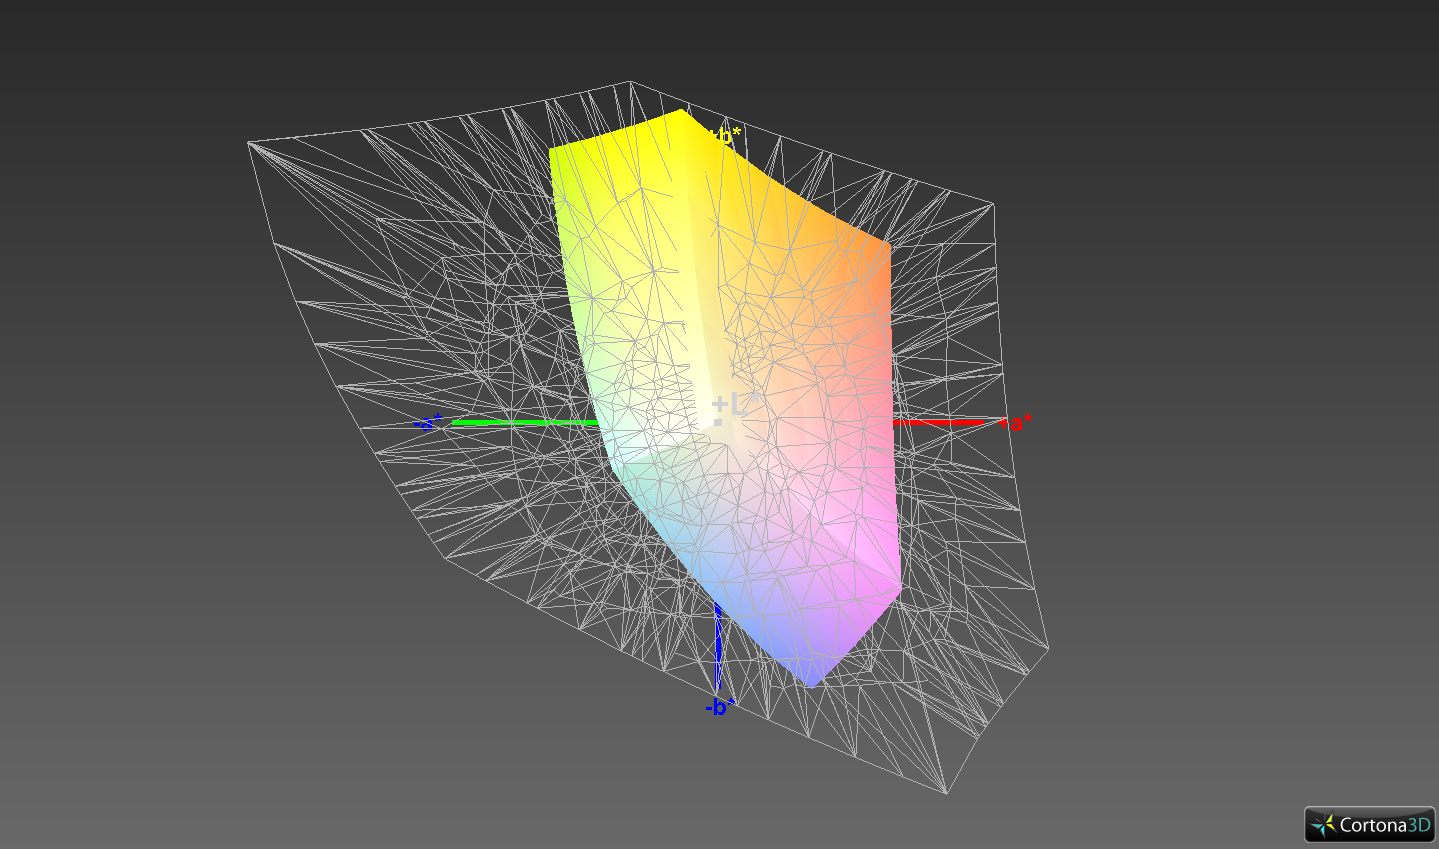
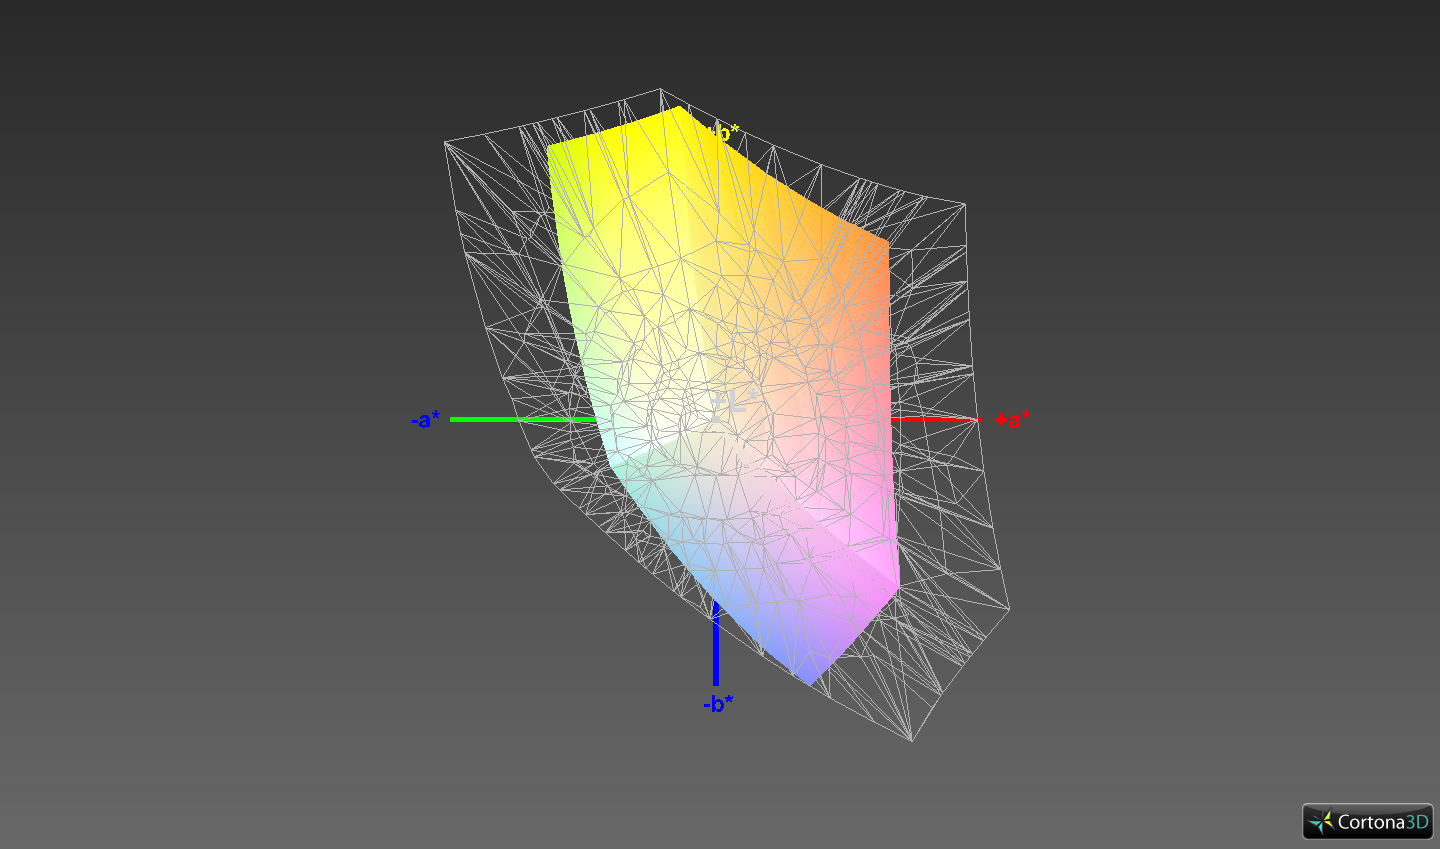


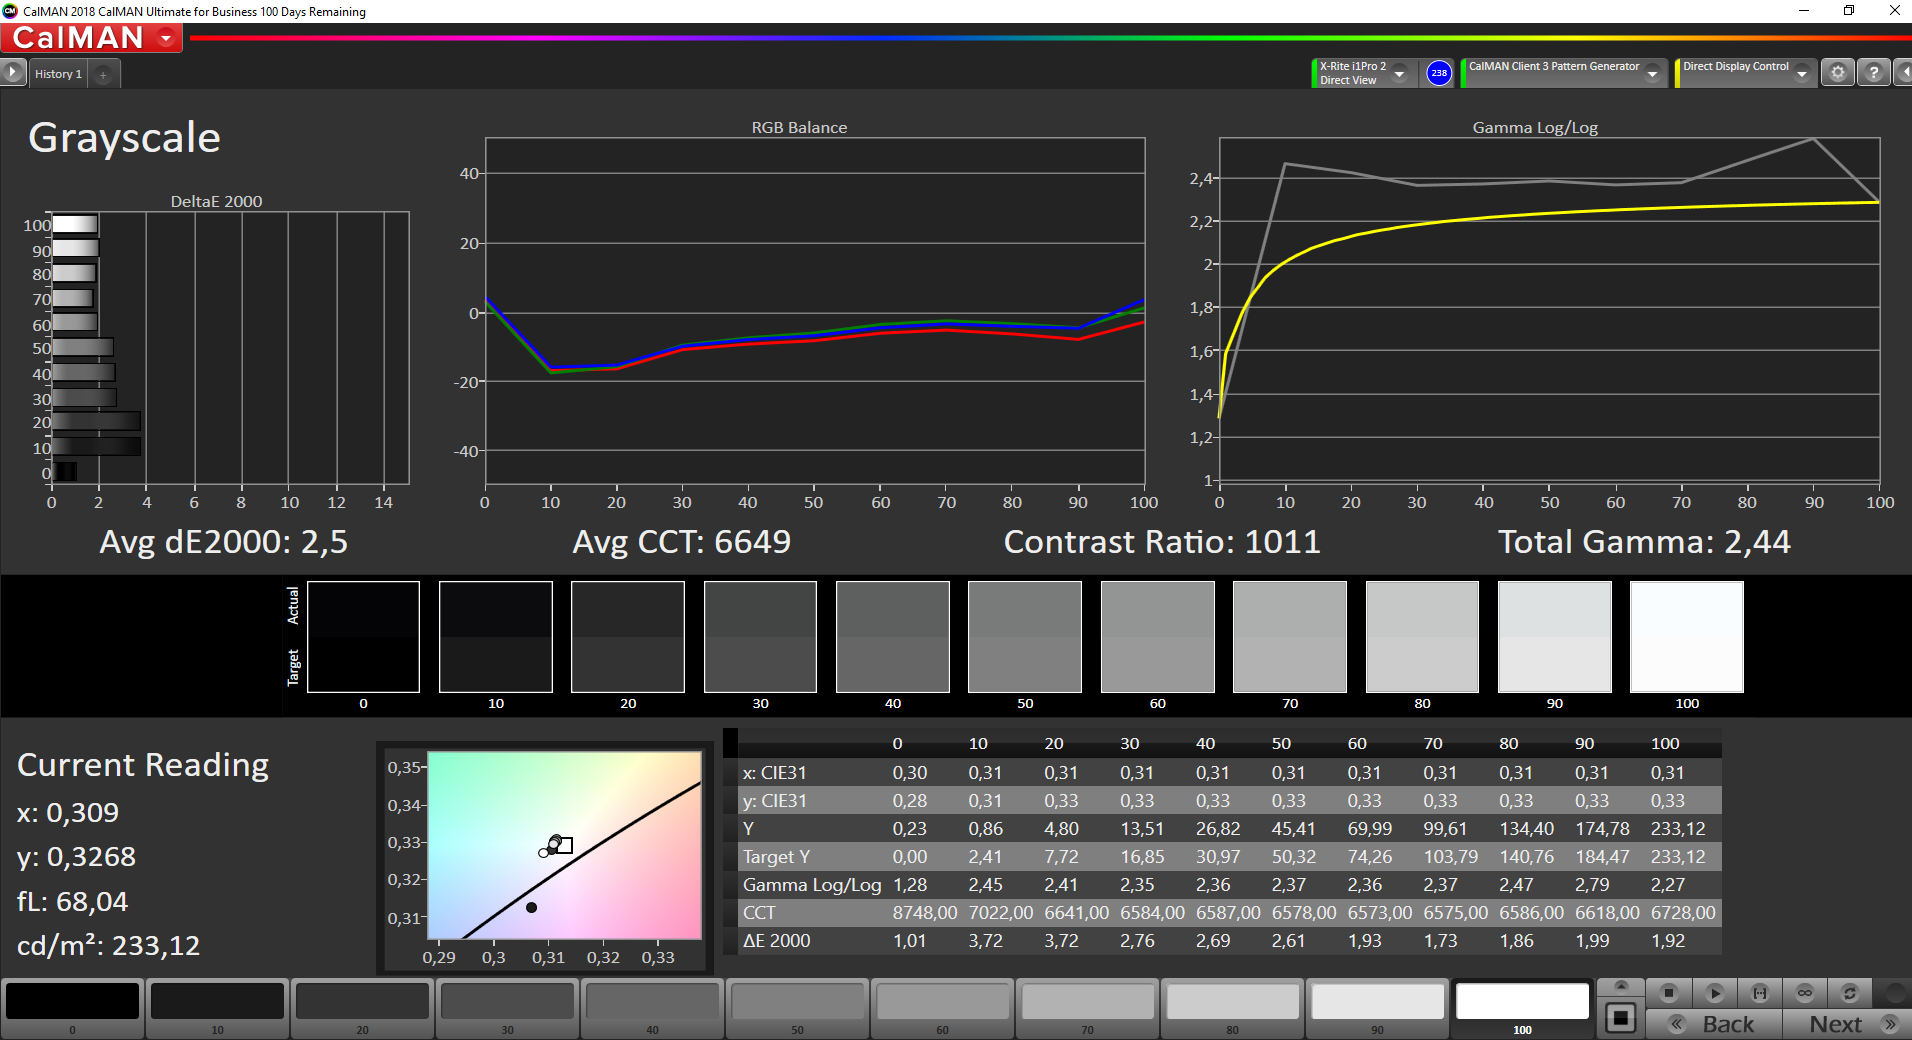
Our measurements attest the Dell Latitude 5500 with a good contrast ratio of 1017:1 and an also good black value of 0.28 cd/m². This causes the colors to appear well delineated and black tones are displayed relatively saturated. On the other hand, at 57% of the sRGB and 36% of the AdobeRGB color spaces, the coverage is only mediocre.
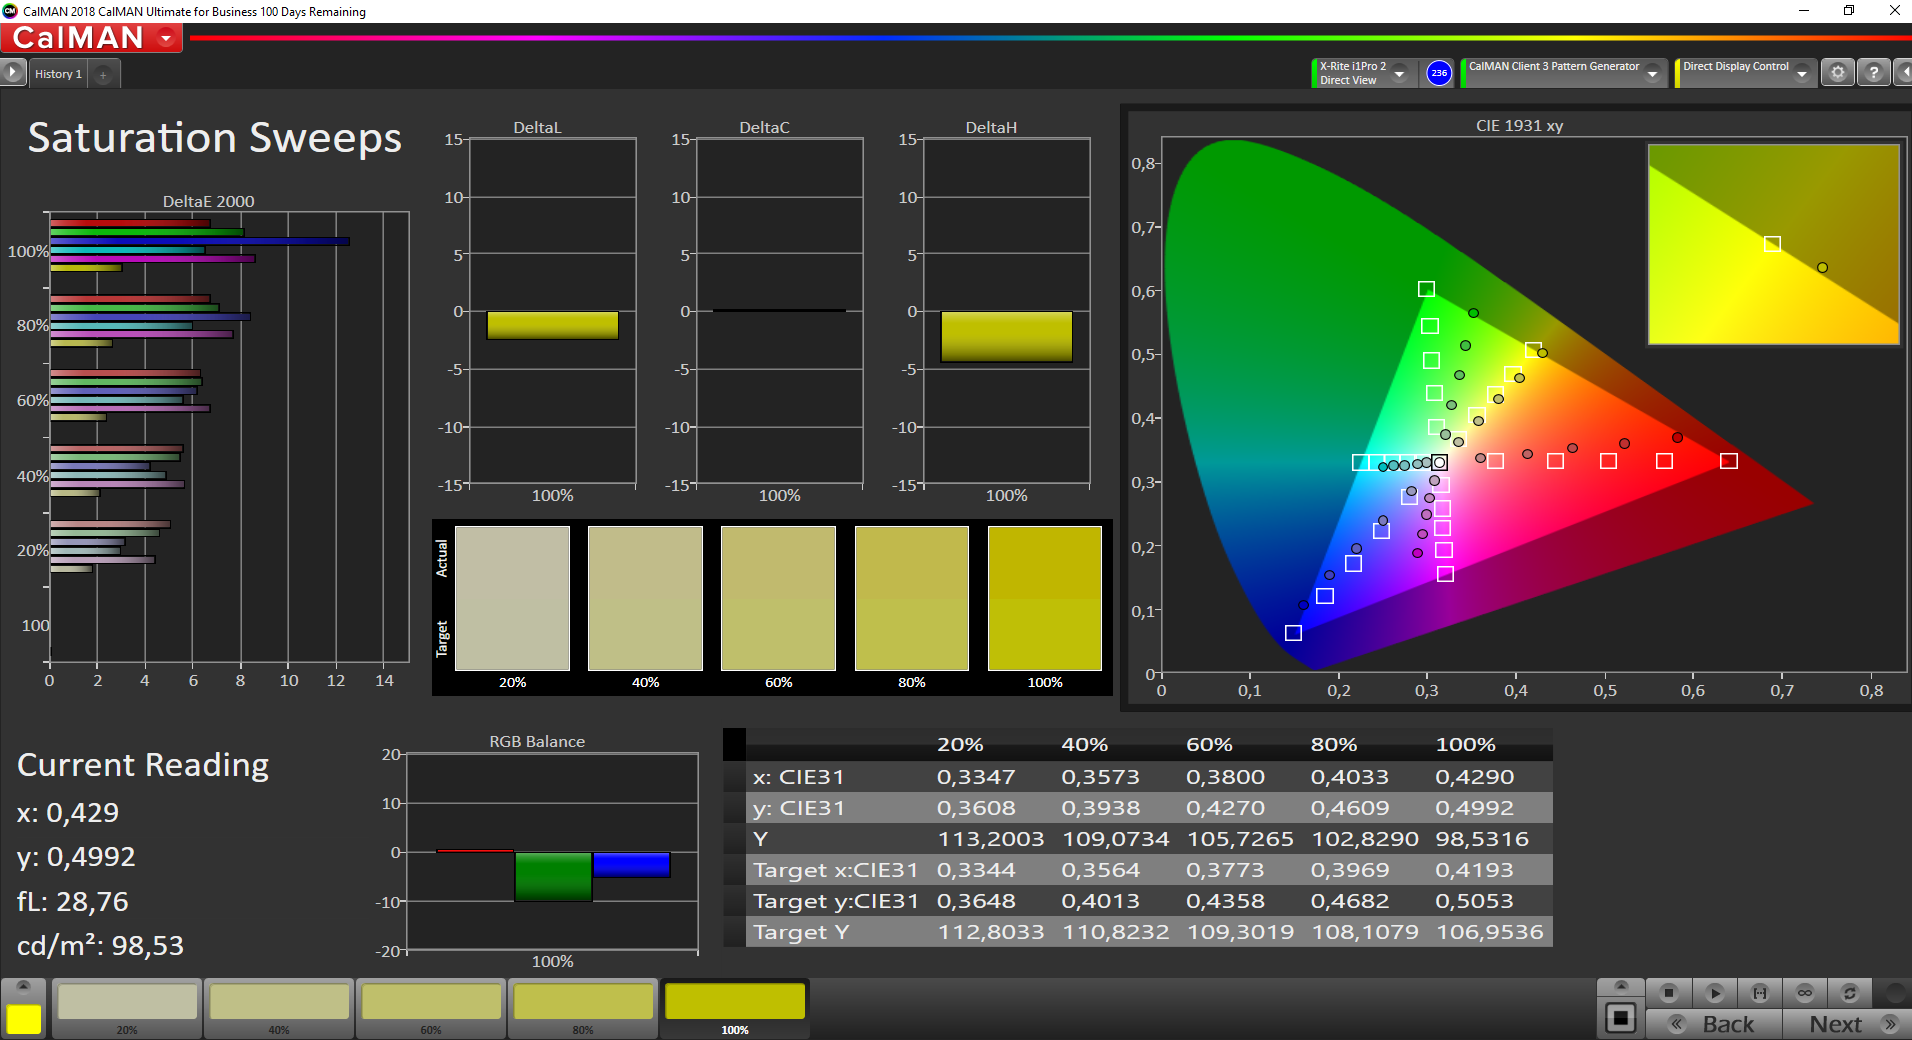
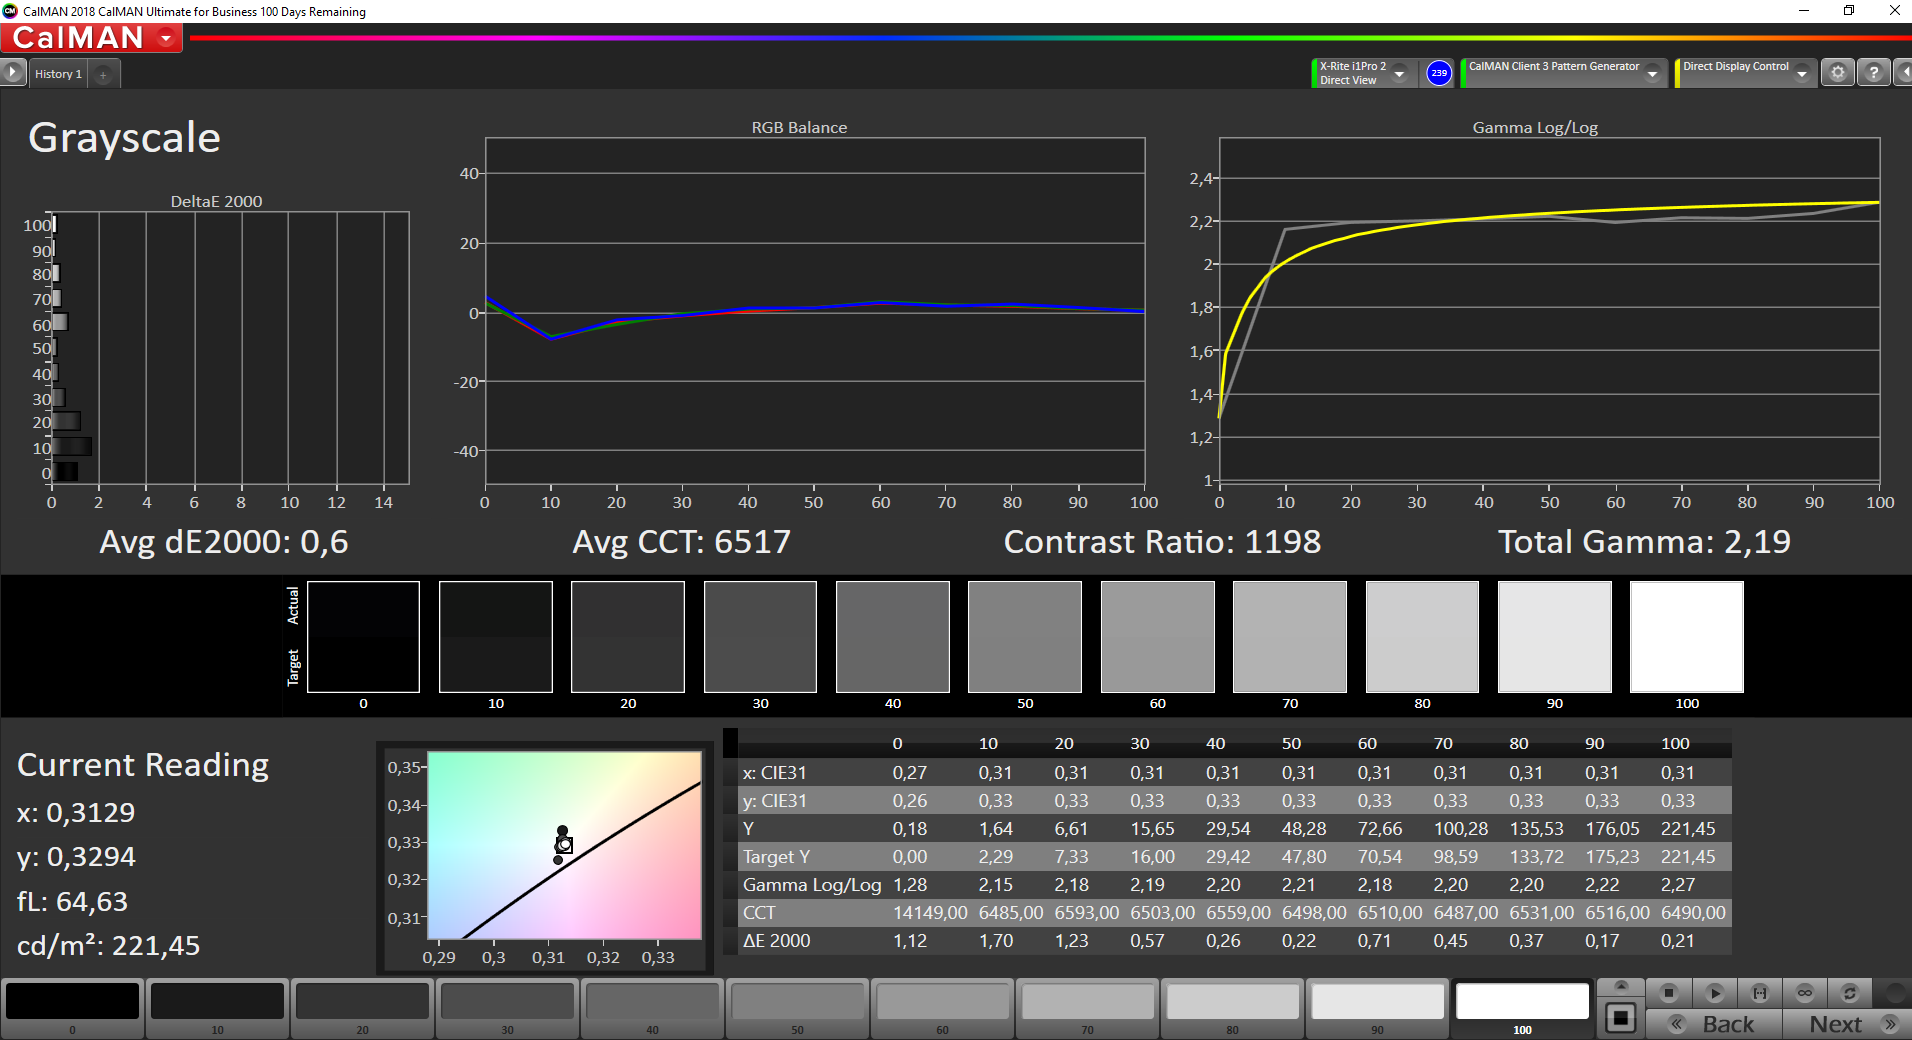
The CalMAN analysis also shows that the display reproduces the colors fairly balanced already in the state of delivery. With calibration, this low deviation can even be reduced further. You can find the link to the corresponding ICC file in the box above on the right, next to the graphic with the brightness distribution.
Performance - Good system performance for the Dell Latitude 5500
The Dell Latitude 5500 is targeted towards business users who need a good system performance but do not have many demands on the graphics performance. As CPU options, you can choose among Intel's Core i3, i5, and i7 processors of the 8th generation, which are all equipped with an integrated Intel UHD Graphics 620 graphics unit. If you do need a dedicated GPU, there is also an option for the AMD Radeon 540X.
Processor
Our test unit of the Latitude 5500 is equipped with an Intel Core i7-8665U. At the time of our test, this represents the most powerful CPU option and is based on Intel's Whiskey Lake architecture. Compared to Intel's Core i7-8550U, the i7-8665U offers a higher Turbo speed that, due to Intel's Thermal Velocity Boost, can even be maintained for longer, as long as the core temperatures remain within a low range. The basic clock speed of the quad-core processor is 1.9 GHz and the Turbo speed is 4.8 GHz. How long the latter can be maintained depends mainly on the cooling system that is used.
In our Cinebench R15 constant load test, the performance of the Dell Latitude 5500 soon drops after a short time by about 18%. This lower value can then be maintained fairly evenly until the end of the test, without fluctuating as much as, for example, is the case with the i7-8665U in the Lenovo ThinkPad X1 Carbon.
In the Cinebench R15 single tests, the Latitude 5500 achieves very good values. In the single-core test, the business notebook from Dell is able to leave our selected competitors behind. The result in the multi-core test is still sufficient for second place in our test field. However, in battery operation, the available performance drops significantly, and only 324 points is scored in the multi-core test.
System Performance
In the PCMark tests on the system performance, the Dell Latitude 5500 also achieves very good values. While the business notebook is able to lead our test field in any of the disciplines of the PCMark 10 benchmark, it has to be content with second place in PCMark 8. During our testing period, the Dell laptop showed a smooth system operation and fast data access. We did not notice any micro stutters or anything similar.
On the other hand, at the beginning of our tests, the system froze up one time each during the PCMark 8 and the PCMark 10 benchmarks and could only be used again after a hard reboot. However, we were unable to reproduce this error and there were no further limitations in our remaining testing period.
You can find out about the performance of other notebooks compared to the Dell Latitude 5500 in our tests on our CPU benchmark page.
| PCMark 8 Home Score Accelerated v2 | 3959 points | |
| PCMark 10 Score | 4515 points | |
Help | ||
Storage Solution
Dell has equipped our Latitude 5500 test unit with a 1 TB SSD from Toshiba. As typical for SSDs, this offers very fast read and write rates, leaving common HDDs significantly behind. In the comparison with the selected competing devices, the SSD in the Latitude 5500 is able to surpass most of the other storage solutions.
You can find out about the values achieved by other storage solutions in our tests on our HDD/SSD benchmark page.
| Dell Latitude 5500 Toshiba XG6 KXG60ZNV1T02 | Lenovo ThinkPad T580-20L9001AUS Samsung SSD PM981 MZVLB512HAJQ | Acer Swift 5 SF515-51T-76B6 SK Hynix BC501 HFM512GDJTNG | HP EliteBook 755 G5 3UN79EA Toshiba XG5 KXG50ZNV512G | Lenovo ThinkPad X1 Carbon 2019-20QE000VGE WDC PC SN720 SDAQNTW-512G | Average Toshiba XG6 KXG60ZNV1T02 | Average of class Office | |
|---|---|---|---|---|---|---|---|
| CrystalDiskMark 5.2 / 6 | -21% | -25% | -14% | 37% | 23% | 79% | |
| Write 4K (MB/s) | 149 | 122.1 -18% | 109.6 -26% | 119.9 -20% | 196.9 32% | 136.3 ? -9% | 153.5 ? 3% |
| Read 4K (MB/s) | 48.26 | 44.61 -8% | 41.15 -15% | 30.39 -37% | 51.3 6% | 50.7 ? 5% | 73.3 ? 52% |
| Write Seq (MB/s) | 1772 | 826 -53% | 747 -58% | 558 -69% | 1715 -3% | 1869 ? 5% | 2454 ? 38% |
| Read Seq (MB/s) | 1200 | 811 -32% | 1134 -5% | 1689 41% | 2464 105% | 1984 ? 65% | 3229 ? 169% |
| Write 4K Q32T1 (MB/s) | 414.5 | 293.9 -29% | 321.5 -22% | 265.9 -36% | 429.1 4% | 435 ? 5% | 428 ? 3% |
| Read 4K Q32T1 (MB/s) | 393 | 374.8 -5% | 354 -10% | 329.5 -16% | 542 38% | 439 ? 12% | 513 ? 31% |
| Write Seq Q32T1 (MB/s) | 2941 | 1714 -42% | 872 -70% | 710 -76% | 2521 -14% | 3019 ? 3% | 4083 ? 39% |
| Read Seq Q32T1 (MB/s) | 1510 | 1772 17% | 1639 9% | 2984 98% | 3481 131% | 3016 ? 100% | 6007 ? 298% |
| AS SSD | -6% | -26% | -328% | 26% | 4% | 18% | |
| Seq Read (MB/s) | 1287 | 1454 13% | 1446 12% | 1810 41% | 2978 131% | 2385 ? 85% | 4305 ? 234% |
| Seq Write (MB/s) | 1280 | 1324 3% | 708 -45% | 261.4 -80% | 2287 79% | 1491 ? 16% | 2766 ? 116% |
| 4K Read (MB/s) | 49.57 | 50.8 2% | 44.27 -11% | 24.38 -51% | 47.39 -4% | 47.9 ? -3% | 57.8 ? 17% |
| 4K Write (MB/s) | 158 | 106.2 -33% | 124.8 -21% | 5.77 -96% | 175.6 11% | 129.5 ? -18% | 162.9 ? 3% |
| 4K-64 Read (MB/s) | 1043 | 1140 9% | 788 -24% | 528 -49% | 1209 16% | 1099 ? 5% | 965 ? -7% |
| 4K-64 Write (MB/s) | 1415 | 1325 -6% | 737 -48% | 90.7 -94% | 1148 -19% | 1440 ? 2% | 1632 ? 15% |
| Access Time Read * (ms) | 0.039 | 0.047 -21% | 0.2 -413% | 0.05787 ? -48% | 0.08504 ? -118% | ||
| Access Time Write * (ms) | 0.027 | 0.035 -30% | 0.033 -22% | 0.748 -2670% | 0.023 15% | 0.03213 ? -19% | 0.05931 ? -120% |
| Score Read (Points) | 1221 | 1336 9% | 977 -20% | 733 -40% | 1554 27% | 1386 ? 14% | 1453 ? 19% |
| Score Write (Points) | 1701 | 1564 -8% | 932 -45% | 123 -93% | 1553 -9% | 1718 ? 1% | 2071 ? 22% |
| Score Total (Points) | 3558 | 3587 1% | 2384 -33% | 1157 -67% | 3874 9% | 3776 ? 6% | 4202 ? 18% |
| Copy ISO MB/s (MB/s) | 955 | 1986 ? | 2533 ? | ||||
| Copy Program MB/s (MB/s) | 327.1 | 564 ? | 788 ? | ||||
| Copy Game MB/s (MB/s) | 700 | 1110 ? | 1643 ? | ||||
| Total Average (Program / Settings) | -14% /
-12% | -26% /
-25% | -171% /
-196% | 32% /
31% | 14% /
12% | 49% /
44% |
* ... smaller is better

Graphics Card
The Intel UHD Graphics 620 that is integrated into the Latitude 5500 benefits strongly from the built-in working memory. At 32 GB, not only is this abundant in Dell's business notebook, but it also operates in dual-channel mode. This leads to slightly better results in the 3DMark 11 benchmarks than for other notebooks that use this GPU. In our test field, only the HP EliteBook 755 G5 with AMD's integrated Radeon RX Vega 10 is able to do better.
You can find out about the performance users can expect from other GPUs on our GPU benchmark list.
| 3DMark 11 Performance | 2277 points | |
Help | ||
Gaming Performance
The increased performance of the UHD Graphics 620 due to the large amount of working memory also becomes noticeable in the gaming tests. While Full HD gaming is still not possible even with older games, you can get quite smooth frame rates at a resolution of 1366x768 pixels. However, you should not even think about trying demanding or current games here, as only casual or older games can be played.
You can find out in our GPU games list what gaming performances to expect with Intel's UHD Graphics 620.
| low | med. | high | ultra | |
|---|---|---|---|---|
| BioShock Infinite (2013) | 90.2 | 42.62 | 35.9 | 11.69 |
| Dota 2 Reborn (2015) | 83 | 54.8 | 23.2 | 20.2 |
| X-Plane 11.11 (2018) | 17.8 | 12.4 | 10.7 |
Emissions and Power Management - A Dell notebook with a long battery life
Noise Emissions
During idle operation, the fans of the Dell Latitude 5500 remain turned off. Only under moderate load do they start revving up with a very quiet whir. The sound is very even and can be ignored easily while you work. This makes the business notebook also suitable for very quiet surroundings. We did not notice any other noises in our test unit such as coil whine.
Noise level
| Idle |
| 28.8 / 28.8 / 28.8 dB(A) |
| Load |
| 30.3 / 32.6 dB(A) |
 | ||
30 dB silent 40 dB(A) audible 50 dB(A) loud |
||
min: | ||
Temperature
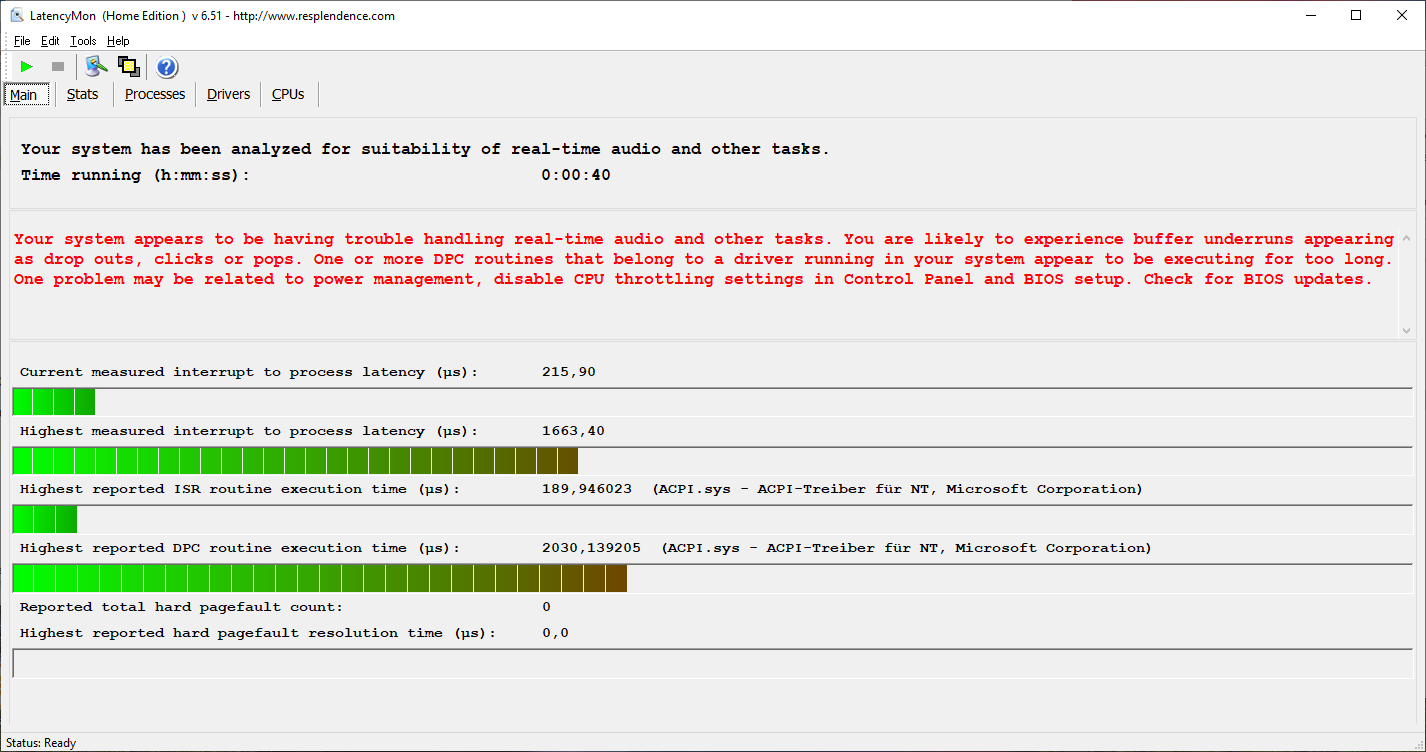
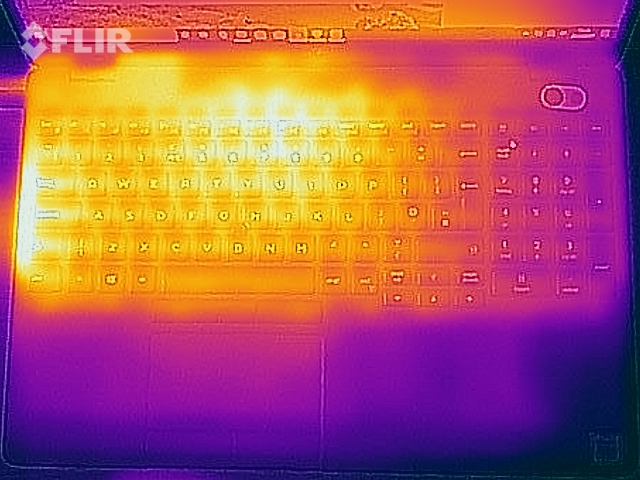
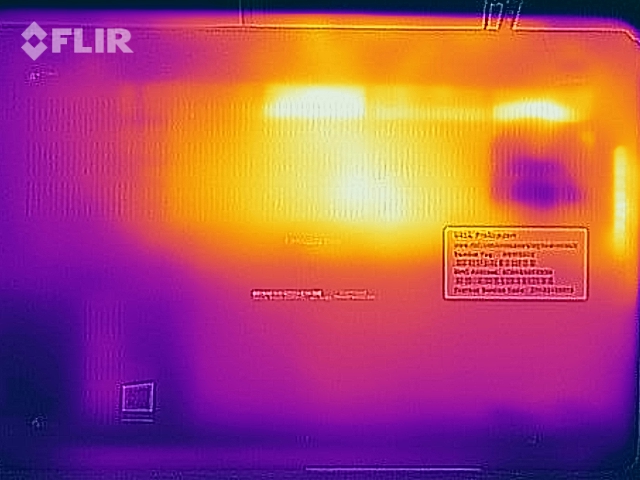
Our measurements attest the Latitude 5500 with surface temperatures of up to 24.6 °C (76 °F) during idle operation and a maximum of 46.4 °C (115.5 °F) under load. The warmest spot is in the center back at the bottom. Our stress test also shows that the core temperatures increase to more than 95 °C (203 °F) just before the fans turn on. This might also be the reason for the crashes in our benchmark tests, since the system froze during the first attempt to start the test. Apparently the fans turn on slightly too late, causing the CPU to be cooled insufficiently and not in time.
After the restart, the Dell notebook was only able to last for 25 minutes of the hour-long test, before it simply turned itself off. According to our last look at HWInfo, the core temperatures were about 70 °C (158 °F) on average. In the beginning, the clock speeds dropped significantly below the basic clock speed of 1.9 GHz and then leveled out at about 1.8 GHz. Users should therefore expect some limitations when using the Dell Latitude 5500 due to the temperatures being too high, since not only did the problems occur during our stress test scenario, which is almost impossible to duplicate in real life, but also during the PCMark benchmarks.
(±) The maximum temperature on the upper side is 41 °C / 106 F, compared to the average of 34.3 °C / 94 F, ranging from 21.2 to 62.5 °C for the class Office.
(-) The bottom heats up to a maximum of 46.4 °C / 116 F, compared to the average of 36.8 °C / 98 F
(+) In idle usage, the average temperature for the upper side is 23.2 °C / 74 F, compared to the device average of 29.5 °C / 85 F.
(+) The palmrests and touchpad are cooler than skin temperature with a maximum of 29.2 °C / 84.6 F and are therefore cool to the touch.
(±) The average temperature of the palmrest area of similar devices was 27.5 °C / 81.5 F (-1.7 °C / -3.1 F).
Speakers
The speakers of the Dell Latitude 5500 produce a mediocre volume and a sound spectrum that emphasizes the highs and mids. Lower tones drop strongly, causing a slightly weak sound impression. While the speakers are suitable for the occasional reproduction of media content, for more frequent usage, external speakers or headphones are recommended. They can be connected to the business laptop via the 3.5-mm audio combo port, which accepts the corresponding plugs tightly and has no negative impact on the sound quality.
Dell Latitude 5500 audio analysis
(±) | speaker loudness is average but good (80.3 dB)
Bass 100 - 315 Hz
(-) | nearly no bass - on average 25.8% lower than median
(±) | linearity of bass is average (7.6% delta to prev. frequency)
Mids 400 - 2000 Hz
(+) | balanced mids - only 3.7% away from median
(±) | linearity of mids is average (7.2% delta to prev. frequency)
Highs 2 - 16 kHz
(+) | balanced highs - only 3.5% away from median
(+) | highs are linear (2.5% delta to prev. frequency)
Overall 100 - 16.000 Hz
(±) | linearity of overall sound is average (20.5% difference to median)
Compared to same class
» 46% of all tested devices in this class were better, 10% similar, 45% worse
» The best had a delta of 7%, average was 21%, worst was 53%
Compared to all devices tested
» 54% of all tested devices were better, 8% similar, 38% worse
» The best had a delta of 4%, average was 23%, worst was 134%
Apple MacBook 12 (Early 2016) 1.1 GHz audio analysis
(+) | speakers can play relatively loud (83.6 dB)
Bass 100 - 315 Hz
(±) | reduced bass - on average 11.3% lower than median
(±) | linearity of bass is average (14.2% delta to prev. frequency)
Mids 400 - 2000 Hz
(+) | balanced mids - only 2.4% away from median
(+) | mids are linear (5.5% delta to prev. frequency)
Highs 2 - 16 kHz
(+) | balanced highs - only 2% away from median
(+) | highs are linear (4.5% delta to prev. frequency)
Overall 100 - 16.000 Hz
(+) | overall sound is linear (10.2% difference to median)
Compared to same class
» 7% of all tested devices in this class were better, 2% similar, 90% worse
» The best had a delta of 5%, average was 18%, worst was 53%
Compared to all devices tested
» 5% of all tested devices were better, 1% similar, 94% worse
» The best had a delta of 4%, average was 23%, worst was 134%
Power Consumption
Our measurements attest the Latitude 5500 with a power consumption of at least 4.4 watts during idle operation and up to 69.1 watts under load. However, this value is only reached for a short time. During the course of the stress test, the consumption levels out at about 39 watts.
The included power supply offers a nominal performance of 65 watts and is thus sufficiently sized to provide the Latitude 5500 with power.
| Off / Standby | |
| Idle | |
| Load |
|
Key:
min: | |
Battery Life
The Latitude 5500 is able to last in our realistic WLAN test for slightly longer than 12 hours before it has to be reconnected to the charger. While this result clearly surpasses those of our selected competitors, the Dell notebook also has the battery with the largest capacity.
Using the included charger, the 68 Wh battery can be completely recharged within about two-and-a-half hours.
Pros
Cons
Verdict - The Latitude 5500 has heat problems
In our tests, the Dell Latitude 5500 presents itself as a solid business notebook with many features and good connectivity. From a fingerprint reader up to a smartcard reader and NFC, many options that ensure a lot of security even beyond TPM 2.0 are available. Those who want to be prepared for Wi-Fi 6 or use mobile Internet on the road will also find suitable equipment with the corresponding WLAN card and LTE. The hardware is up-to-date and can also be expanded easily. In addition, the battery life is also very good.
Business users will have a multitude of options with the Dell Latitude 5500, but they also have to live with a cooling system that is unable to cope with a very heavy load.
However, all the advantages are negated by a critical problem. The fan control is unable to handle sudden heavy system loads. It might happen sometimes that a notebook capitulates during our stress test, but it should not freeze up during the PCMark benchmarks. We cannot say at this time whether Dell will still fix this, but perhaps the fast processor with its high Turbo speed is simply too much for the cooling system. When in doubt, a "smaller" Core i5 might be the better choice.
Dell Latitude 5500
- 09/02/2019 v7 (old)
Mike Wobker

