The Dell Latitude 5590 is a modern business device that should be able to persuade potential buyers with its many configuration options. Consequently, the Latitude 5590 can be optimally configured for specific business requirements without having to break the bank. The Latitude 5590 is powered by a choice of Intel 7th and 8th generation processors. Our test device is equipped with an Intel Core i5-8250U processor, 8 GB of RAM and a 256 GB SSD, the combination of which offers plenty of power and speedy performance. The configuration is complemented by a matte IPS display, all of which is currently available online at €1,100 (~$1,355). There are more powerful and equally more expensive configurations available, such as the €2,000 (~$2,460) model that is equipped with an Intel Core i7-8650U processor and 16 GB of DDR4 RAM. In this review, we will be using the Fujitsu LifeBook U757, the HP EliteBook 850 G4, and the Lenovo ThinkPad T570 as comparison models. To evaluate generational improvements, we will be comparing the Latitude 5590 against its predecessor, the Latitude 5580. ↺
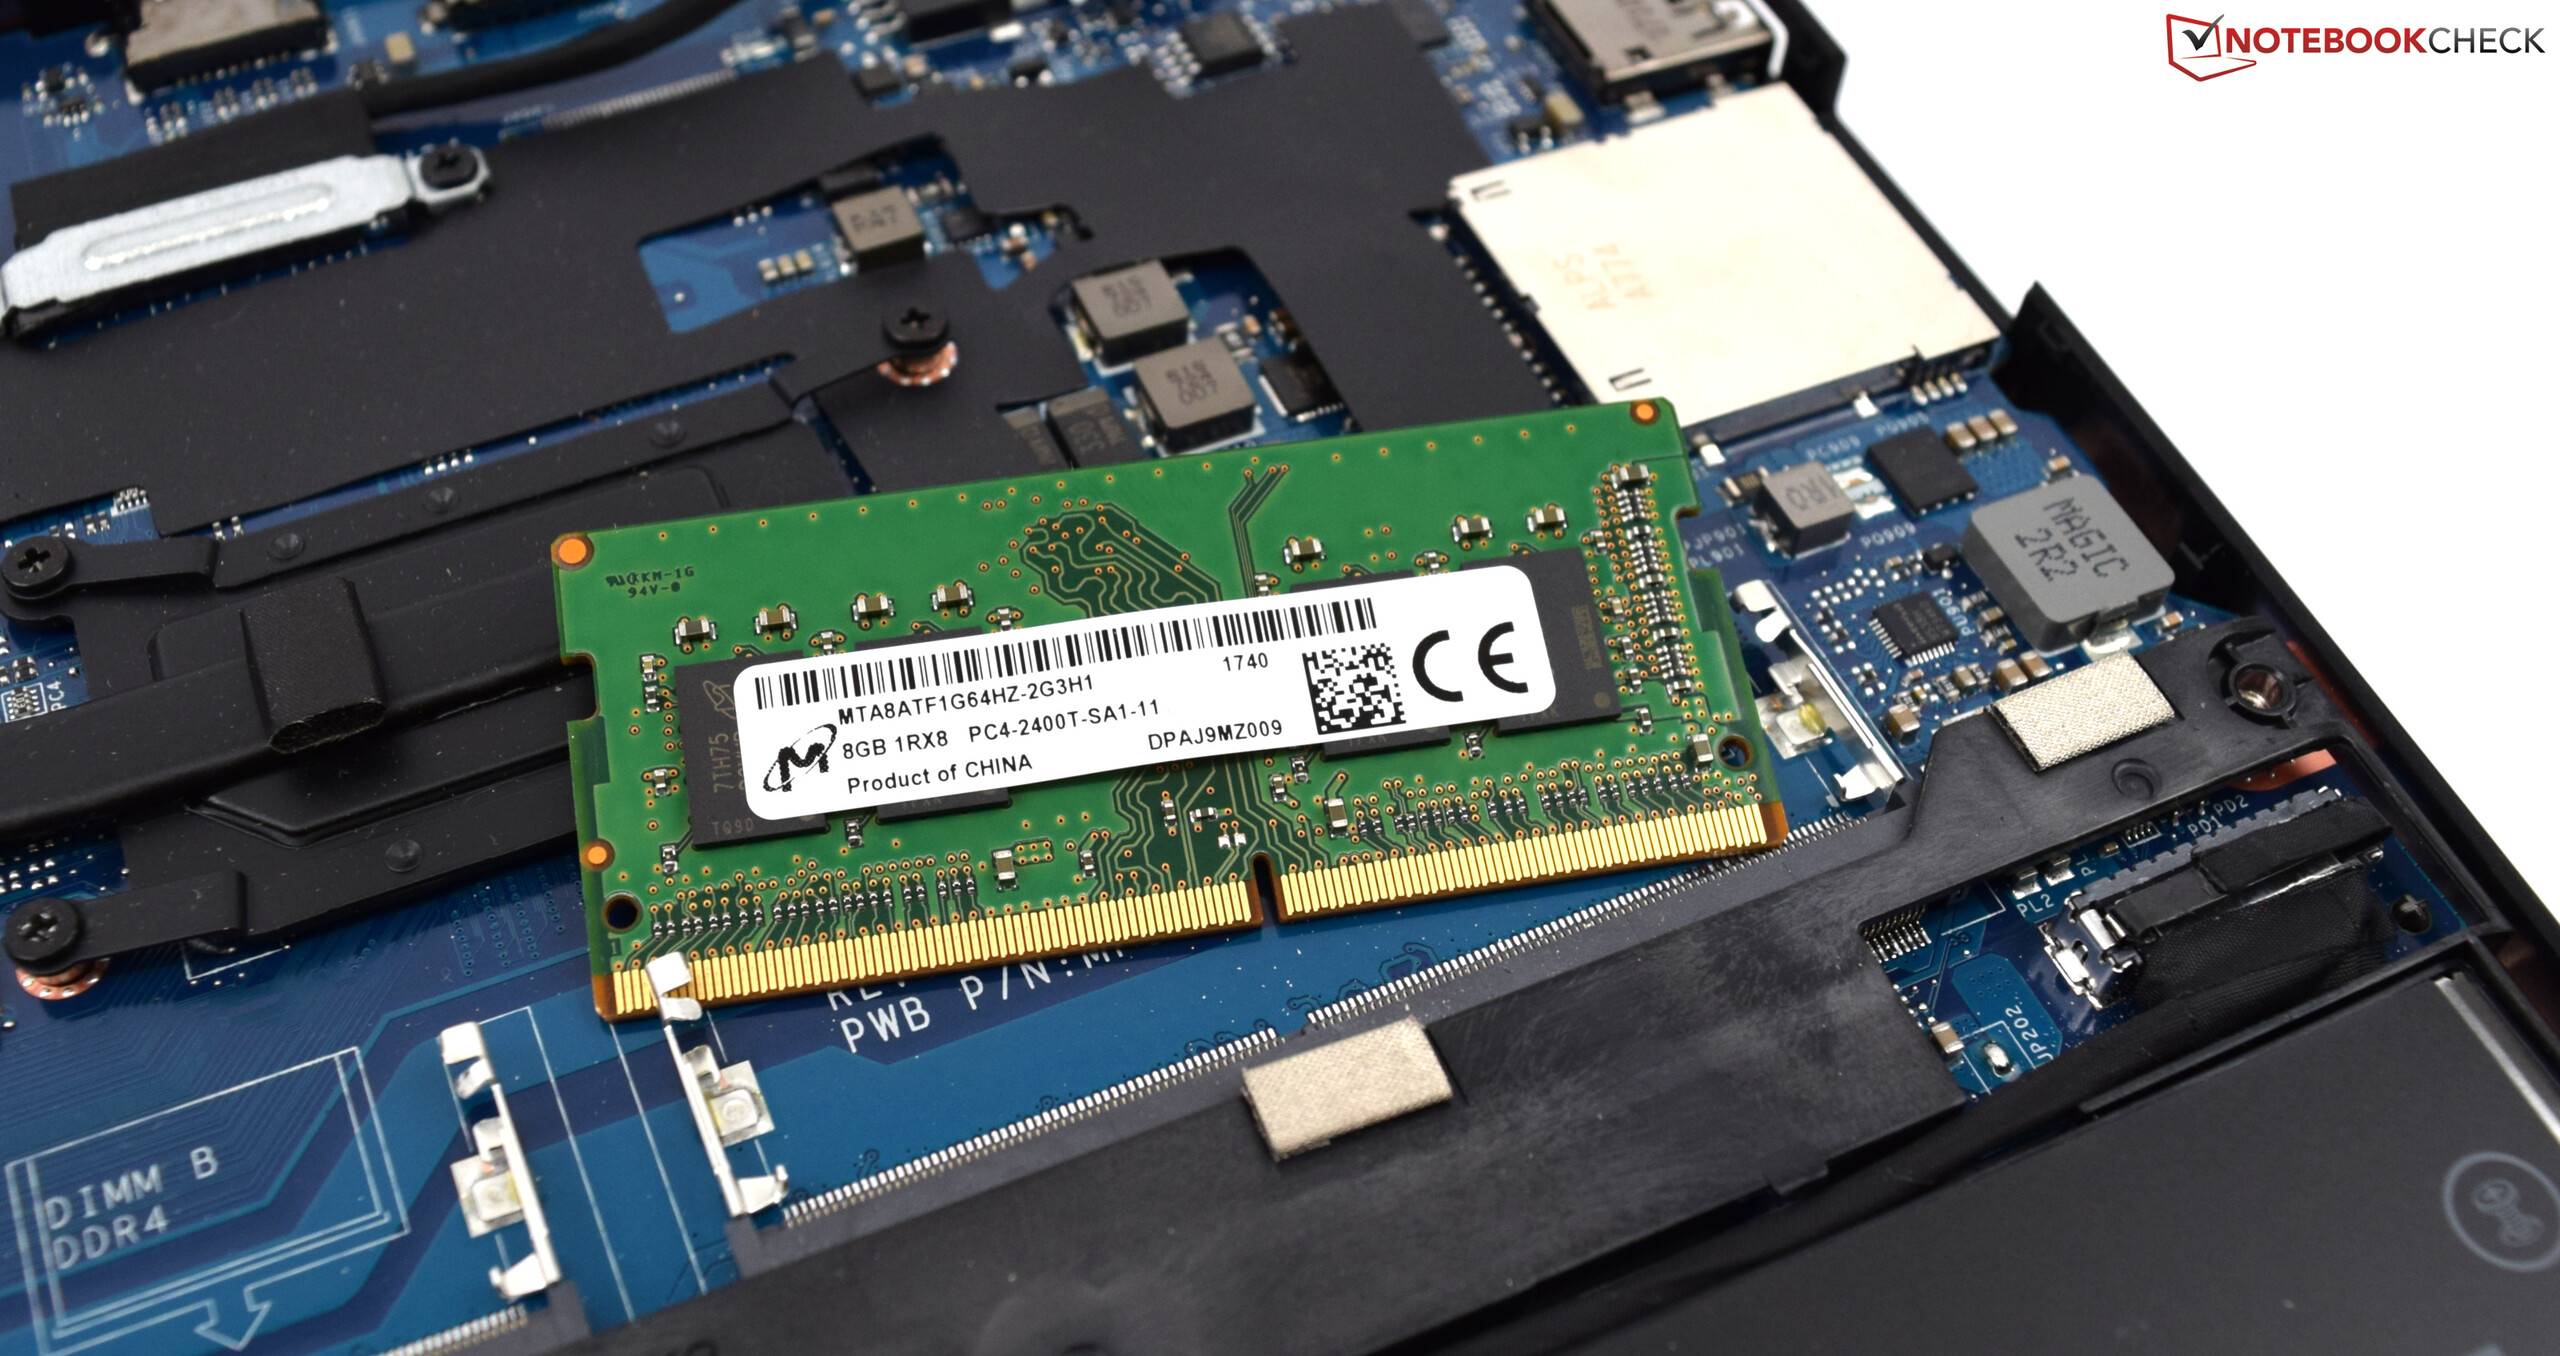
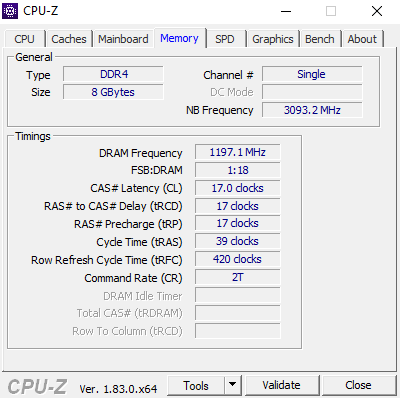
The Latitude 5590 is powered by a choice of Intel 7th and 8th generation processors. Our test device is equipped with an Intel Core i5-8250U processor, 8 GB of RAM and a 256 GB SSD, the combination of which offers plenty of power and speedy performance. The configuration is complemented by a matte IPS display, all of which is currently available online at €1,100 (~$1,355). There are more powerful and equally more expensive configurations available, such as the €2,000 (~$2,460) model that is equipped with an Intel Core i7-8650U processor and 16 GB of DDR4 RAM.
In this review, we will be using the Fujitsu LifeBook U757, the HP EliteBook 850 G4, and the Lenovo ThinkPad T570 as comparison models. To evaluate generational improvements, we will be comparing the Latitude 5590 against its predecessor, the Latitude 5580.
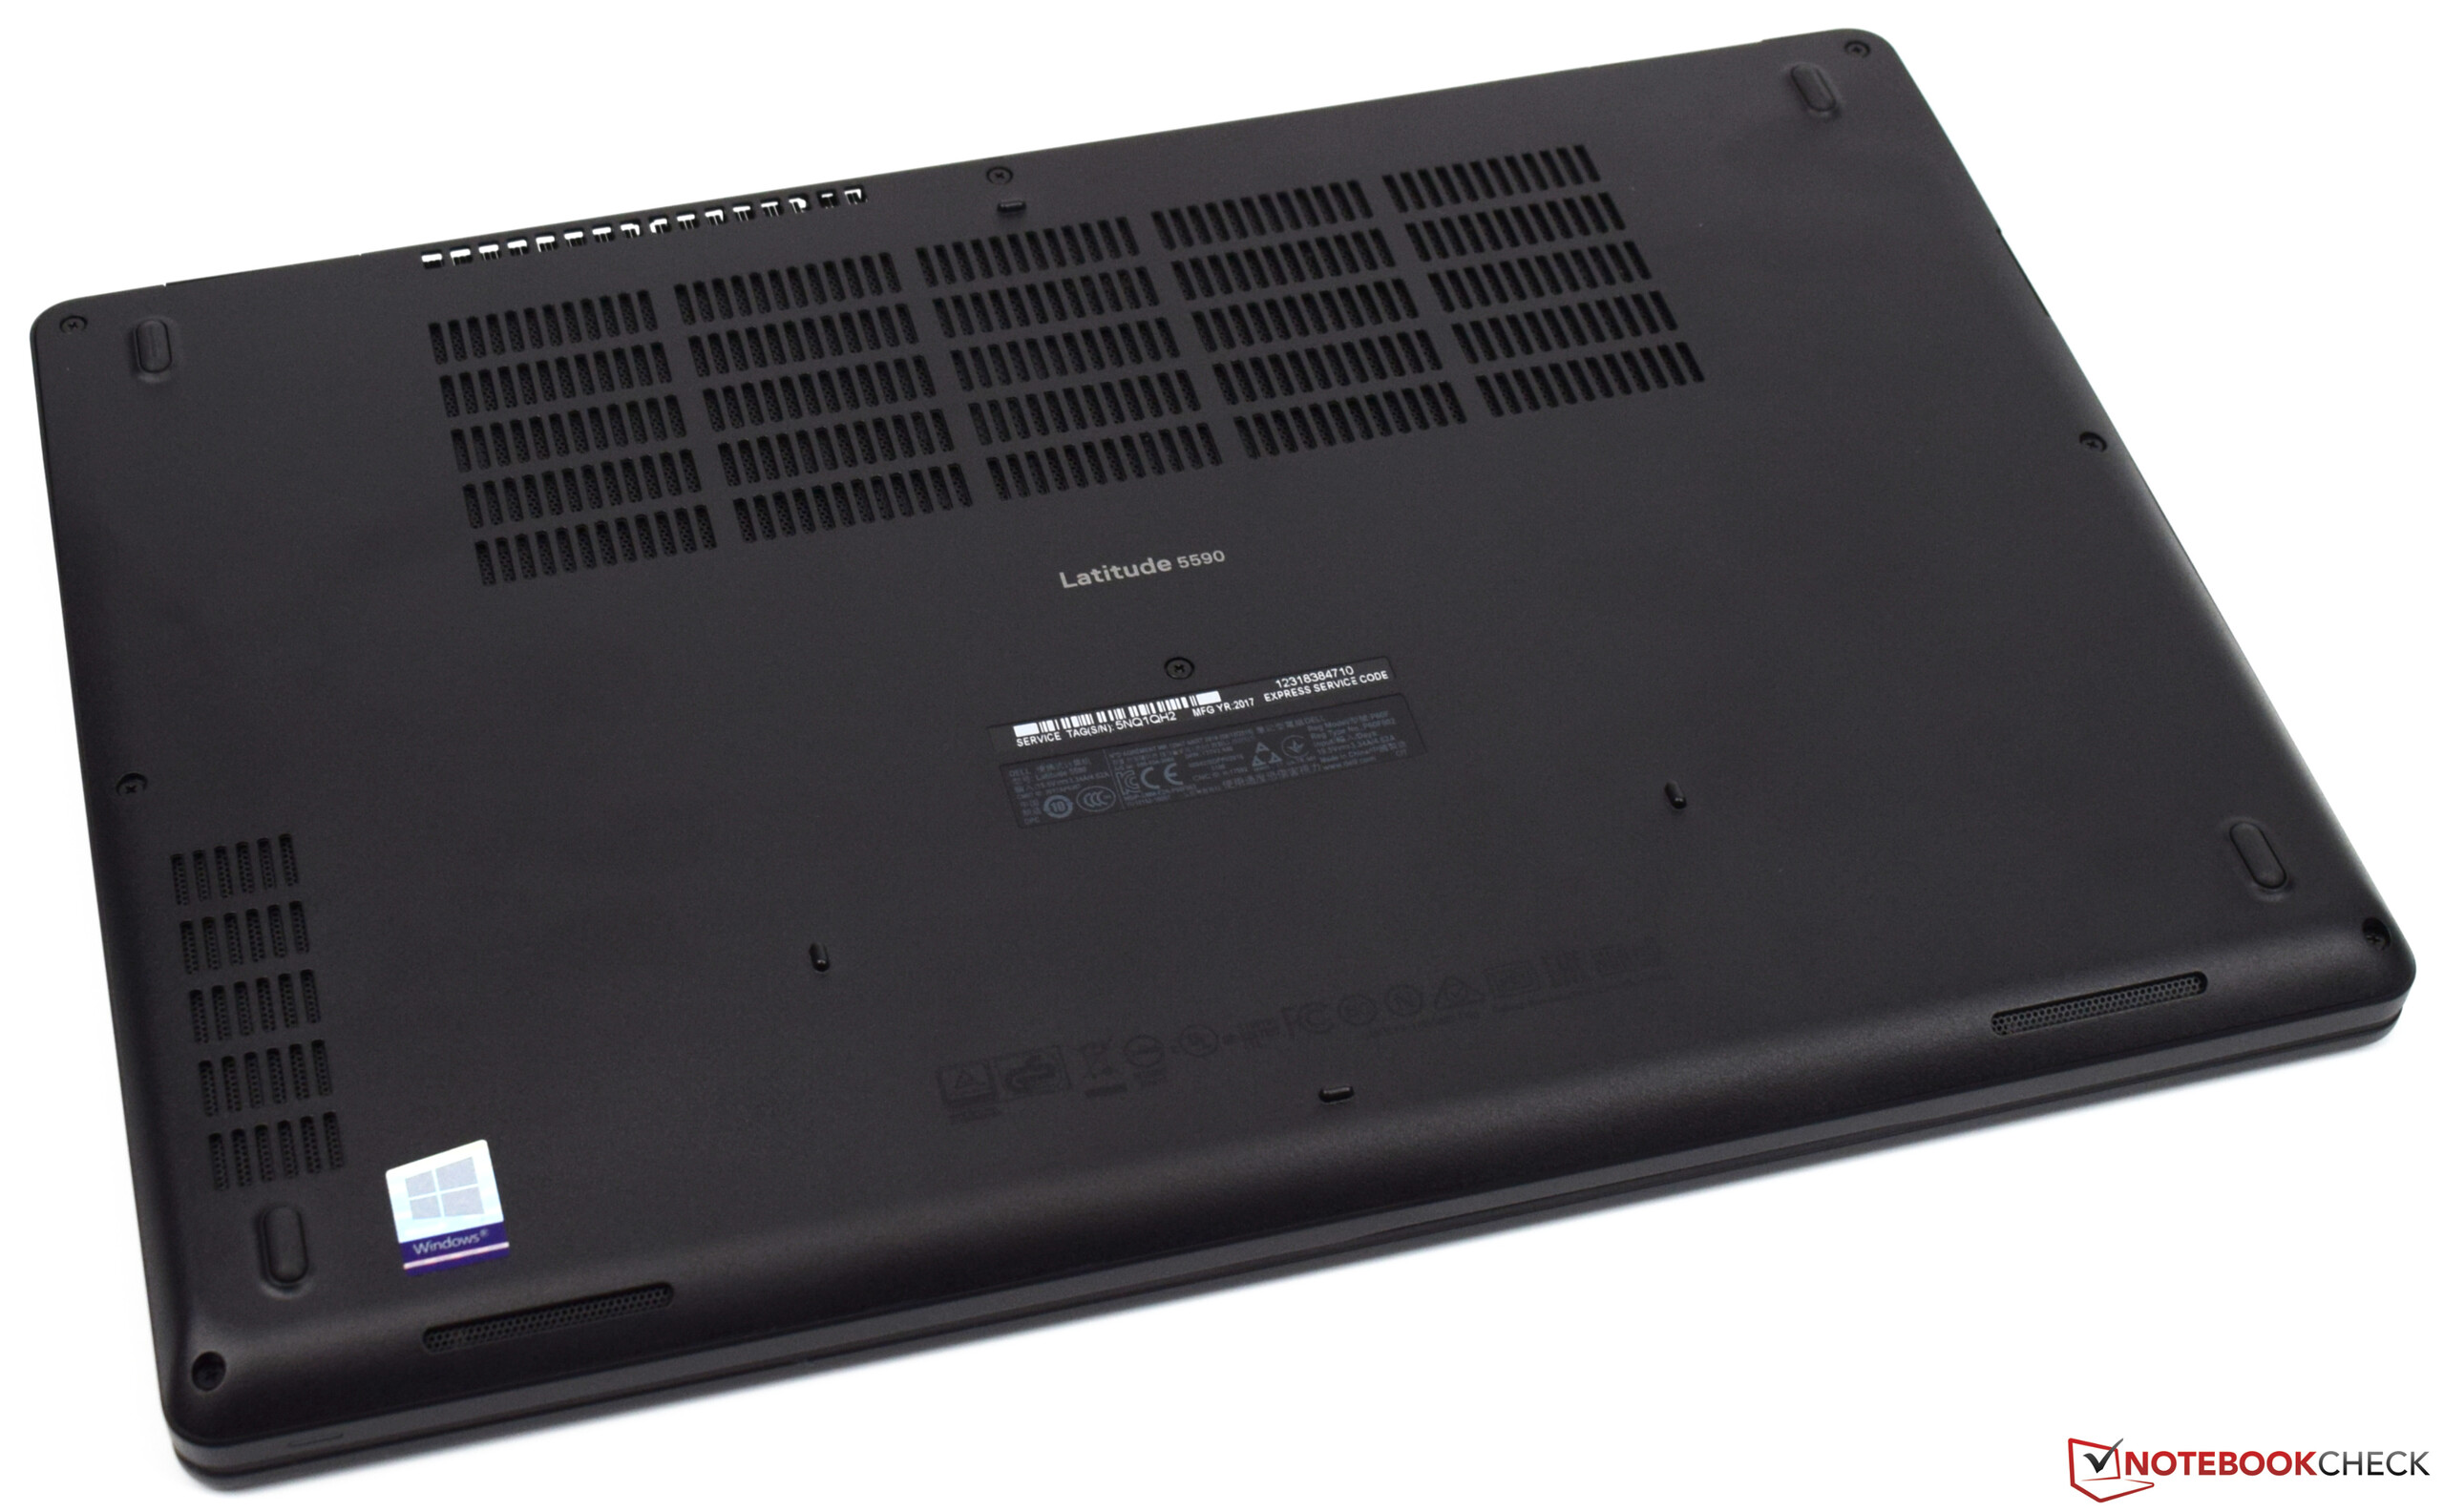
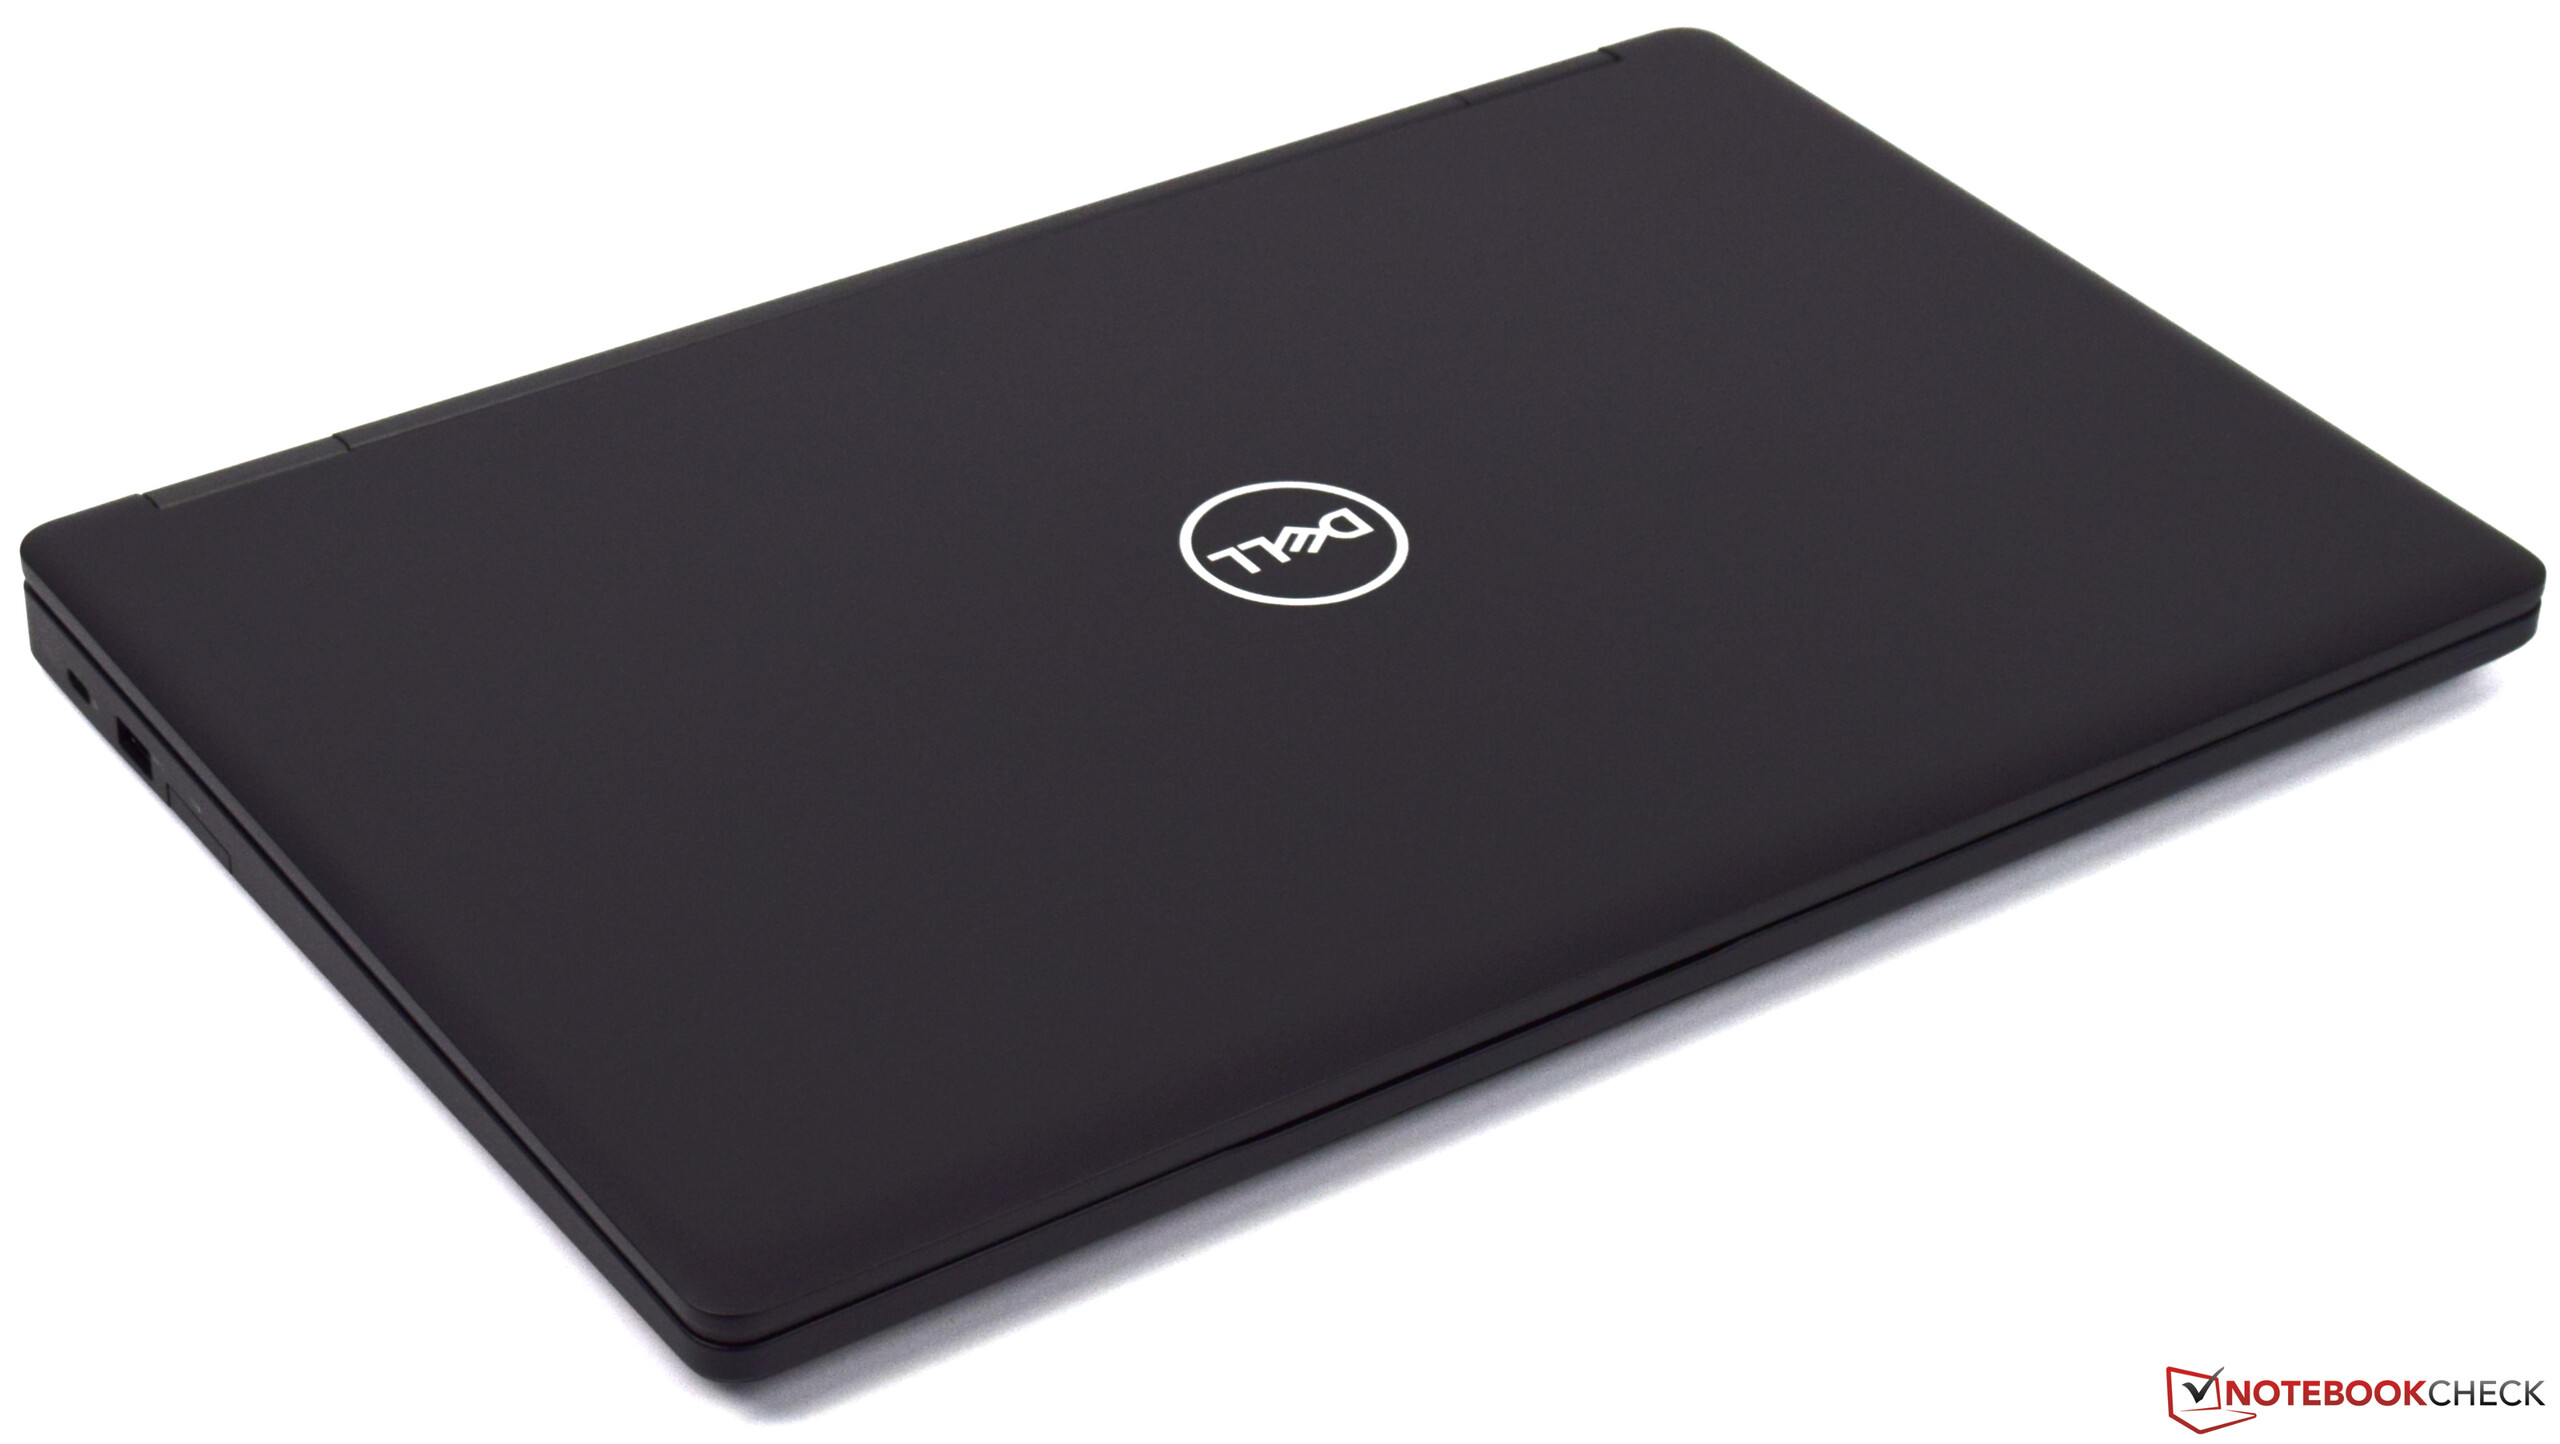
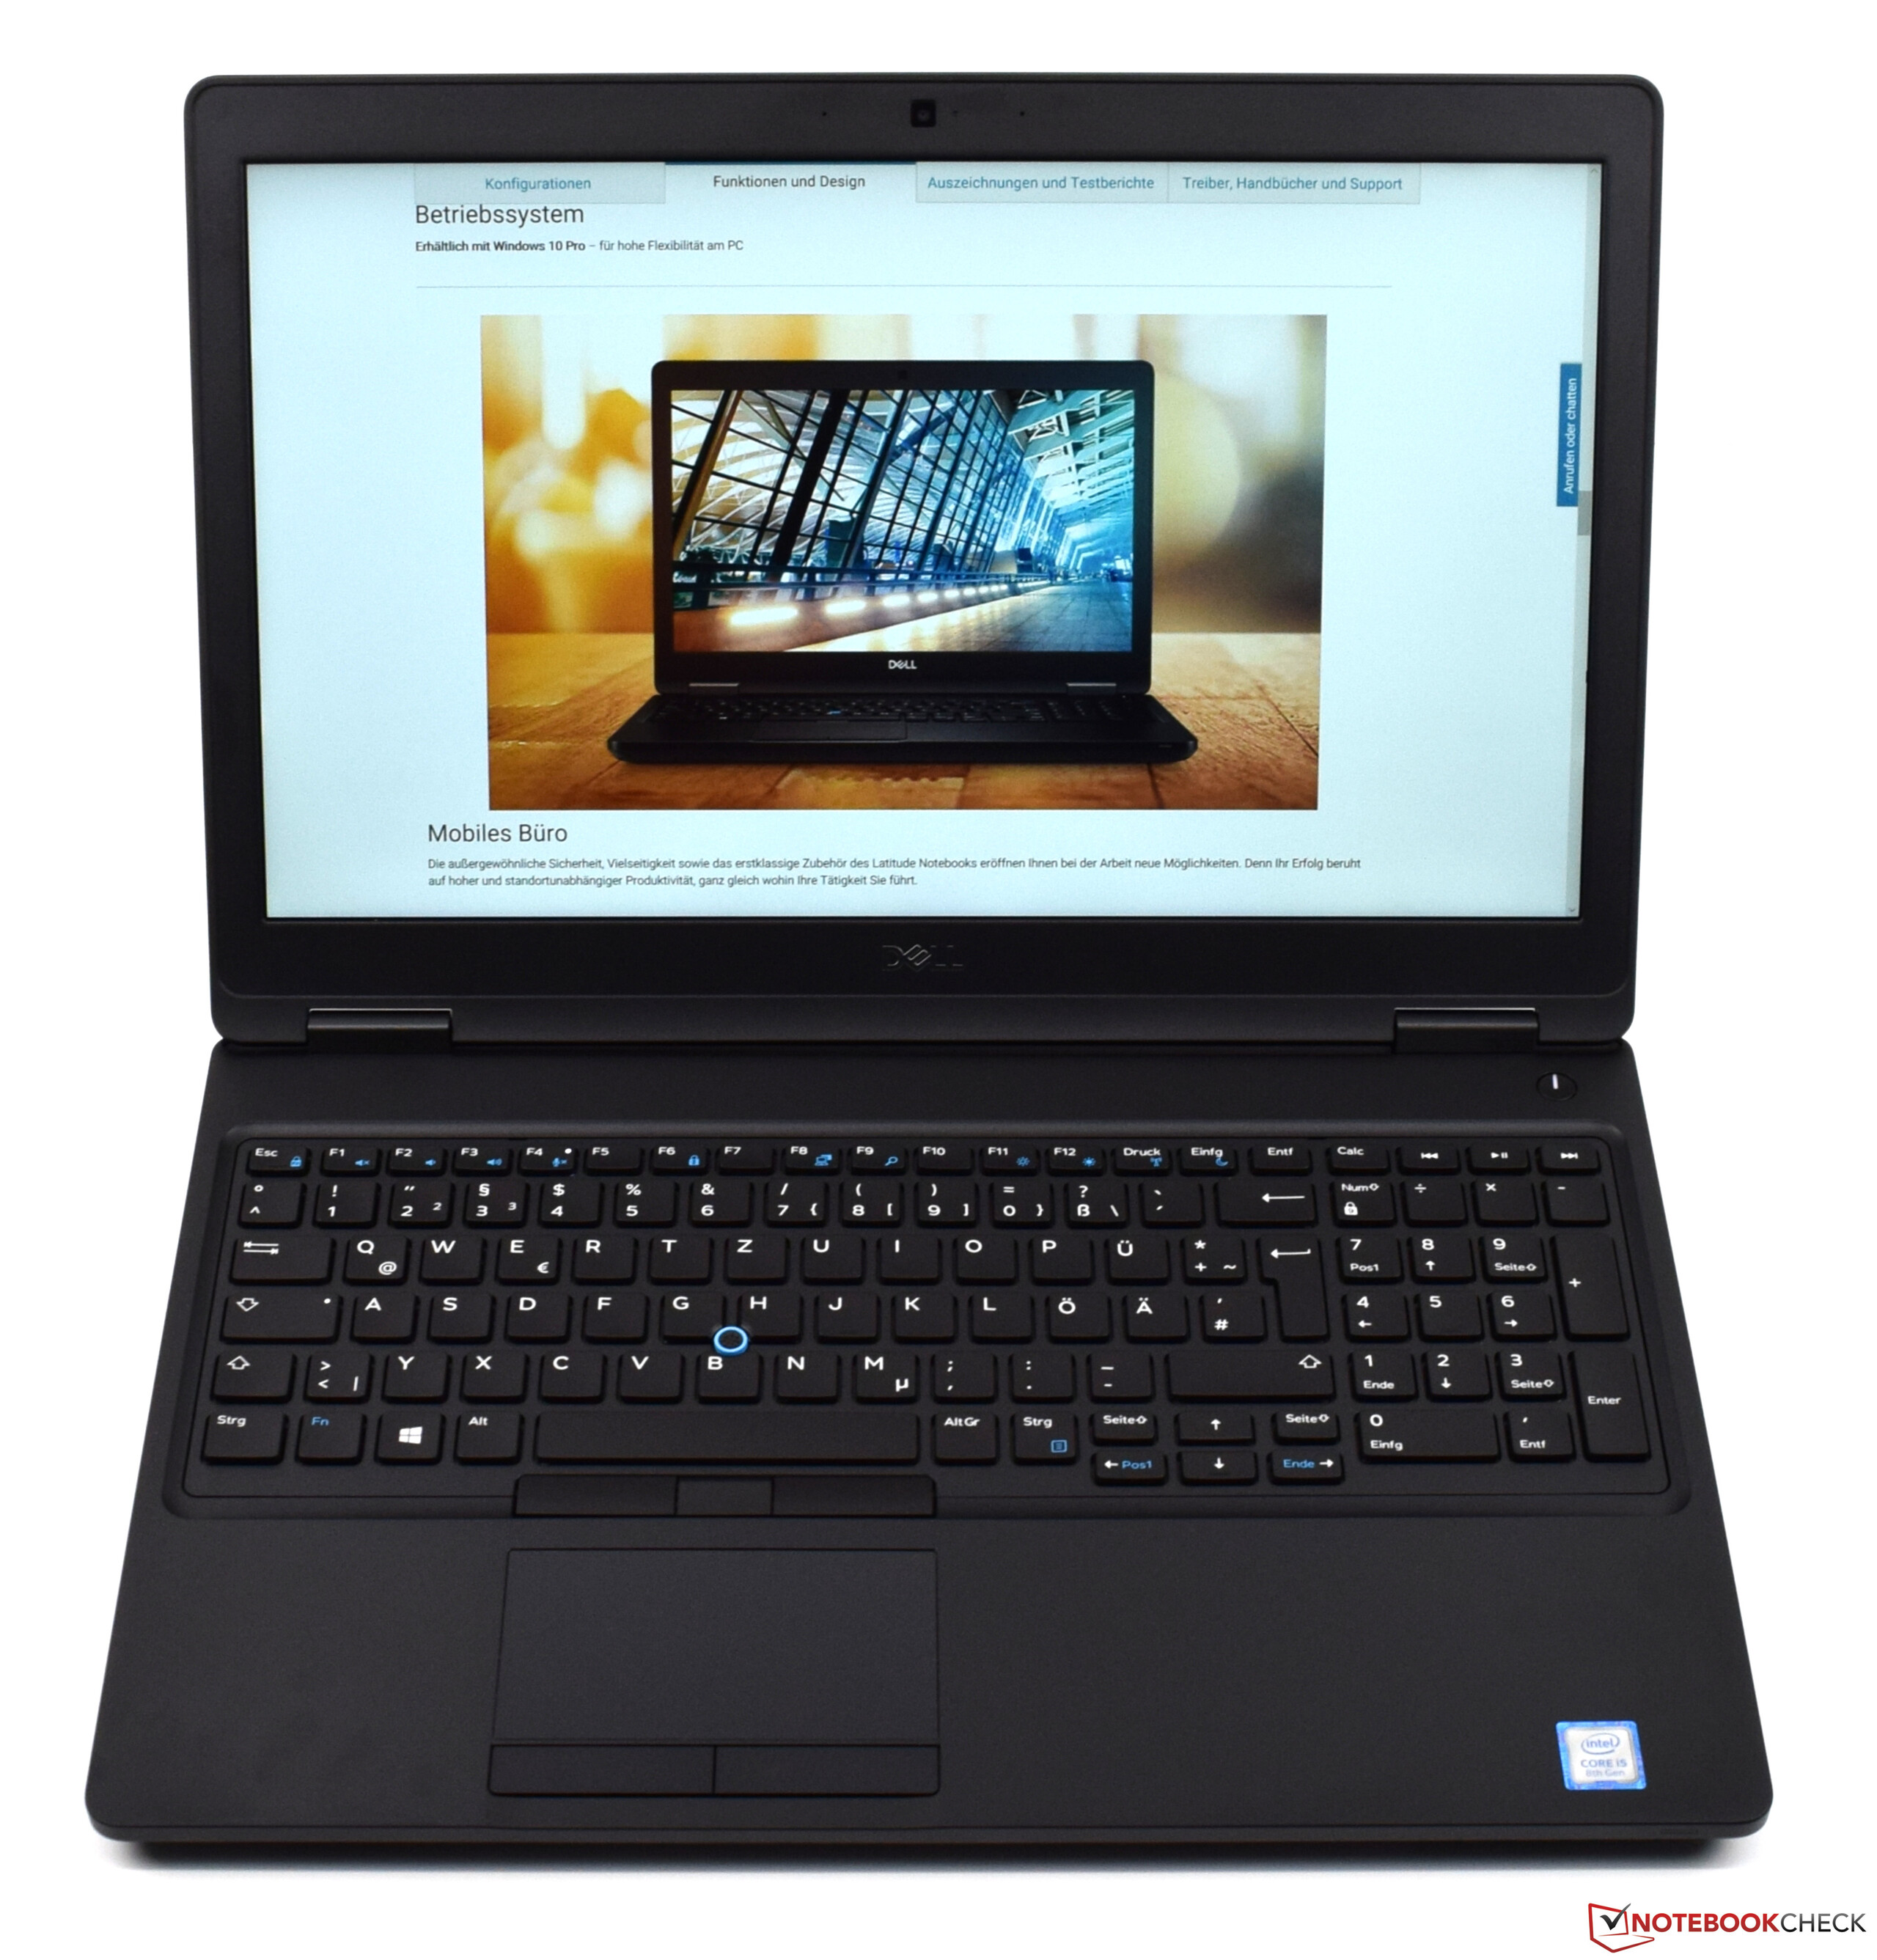
Case and Equipment
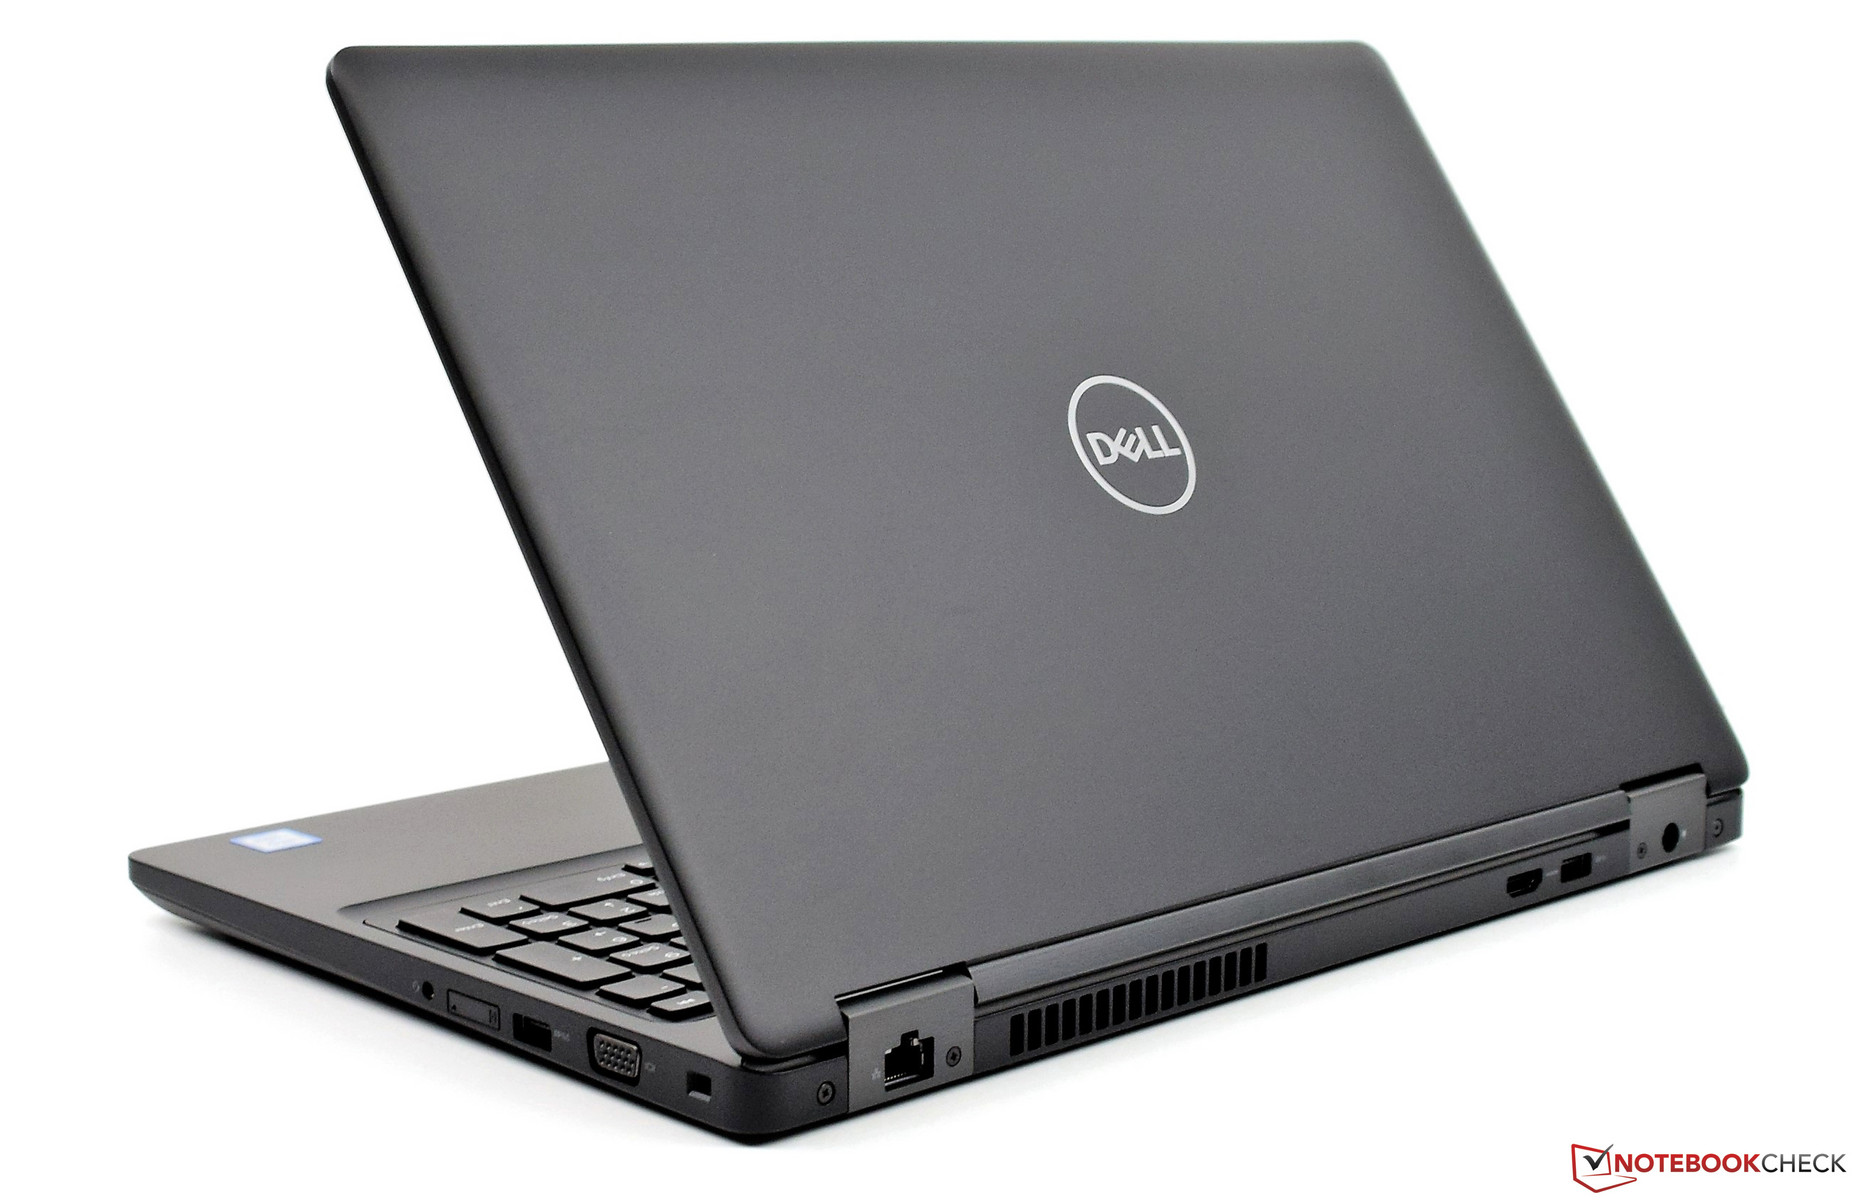
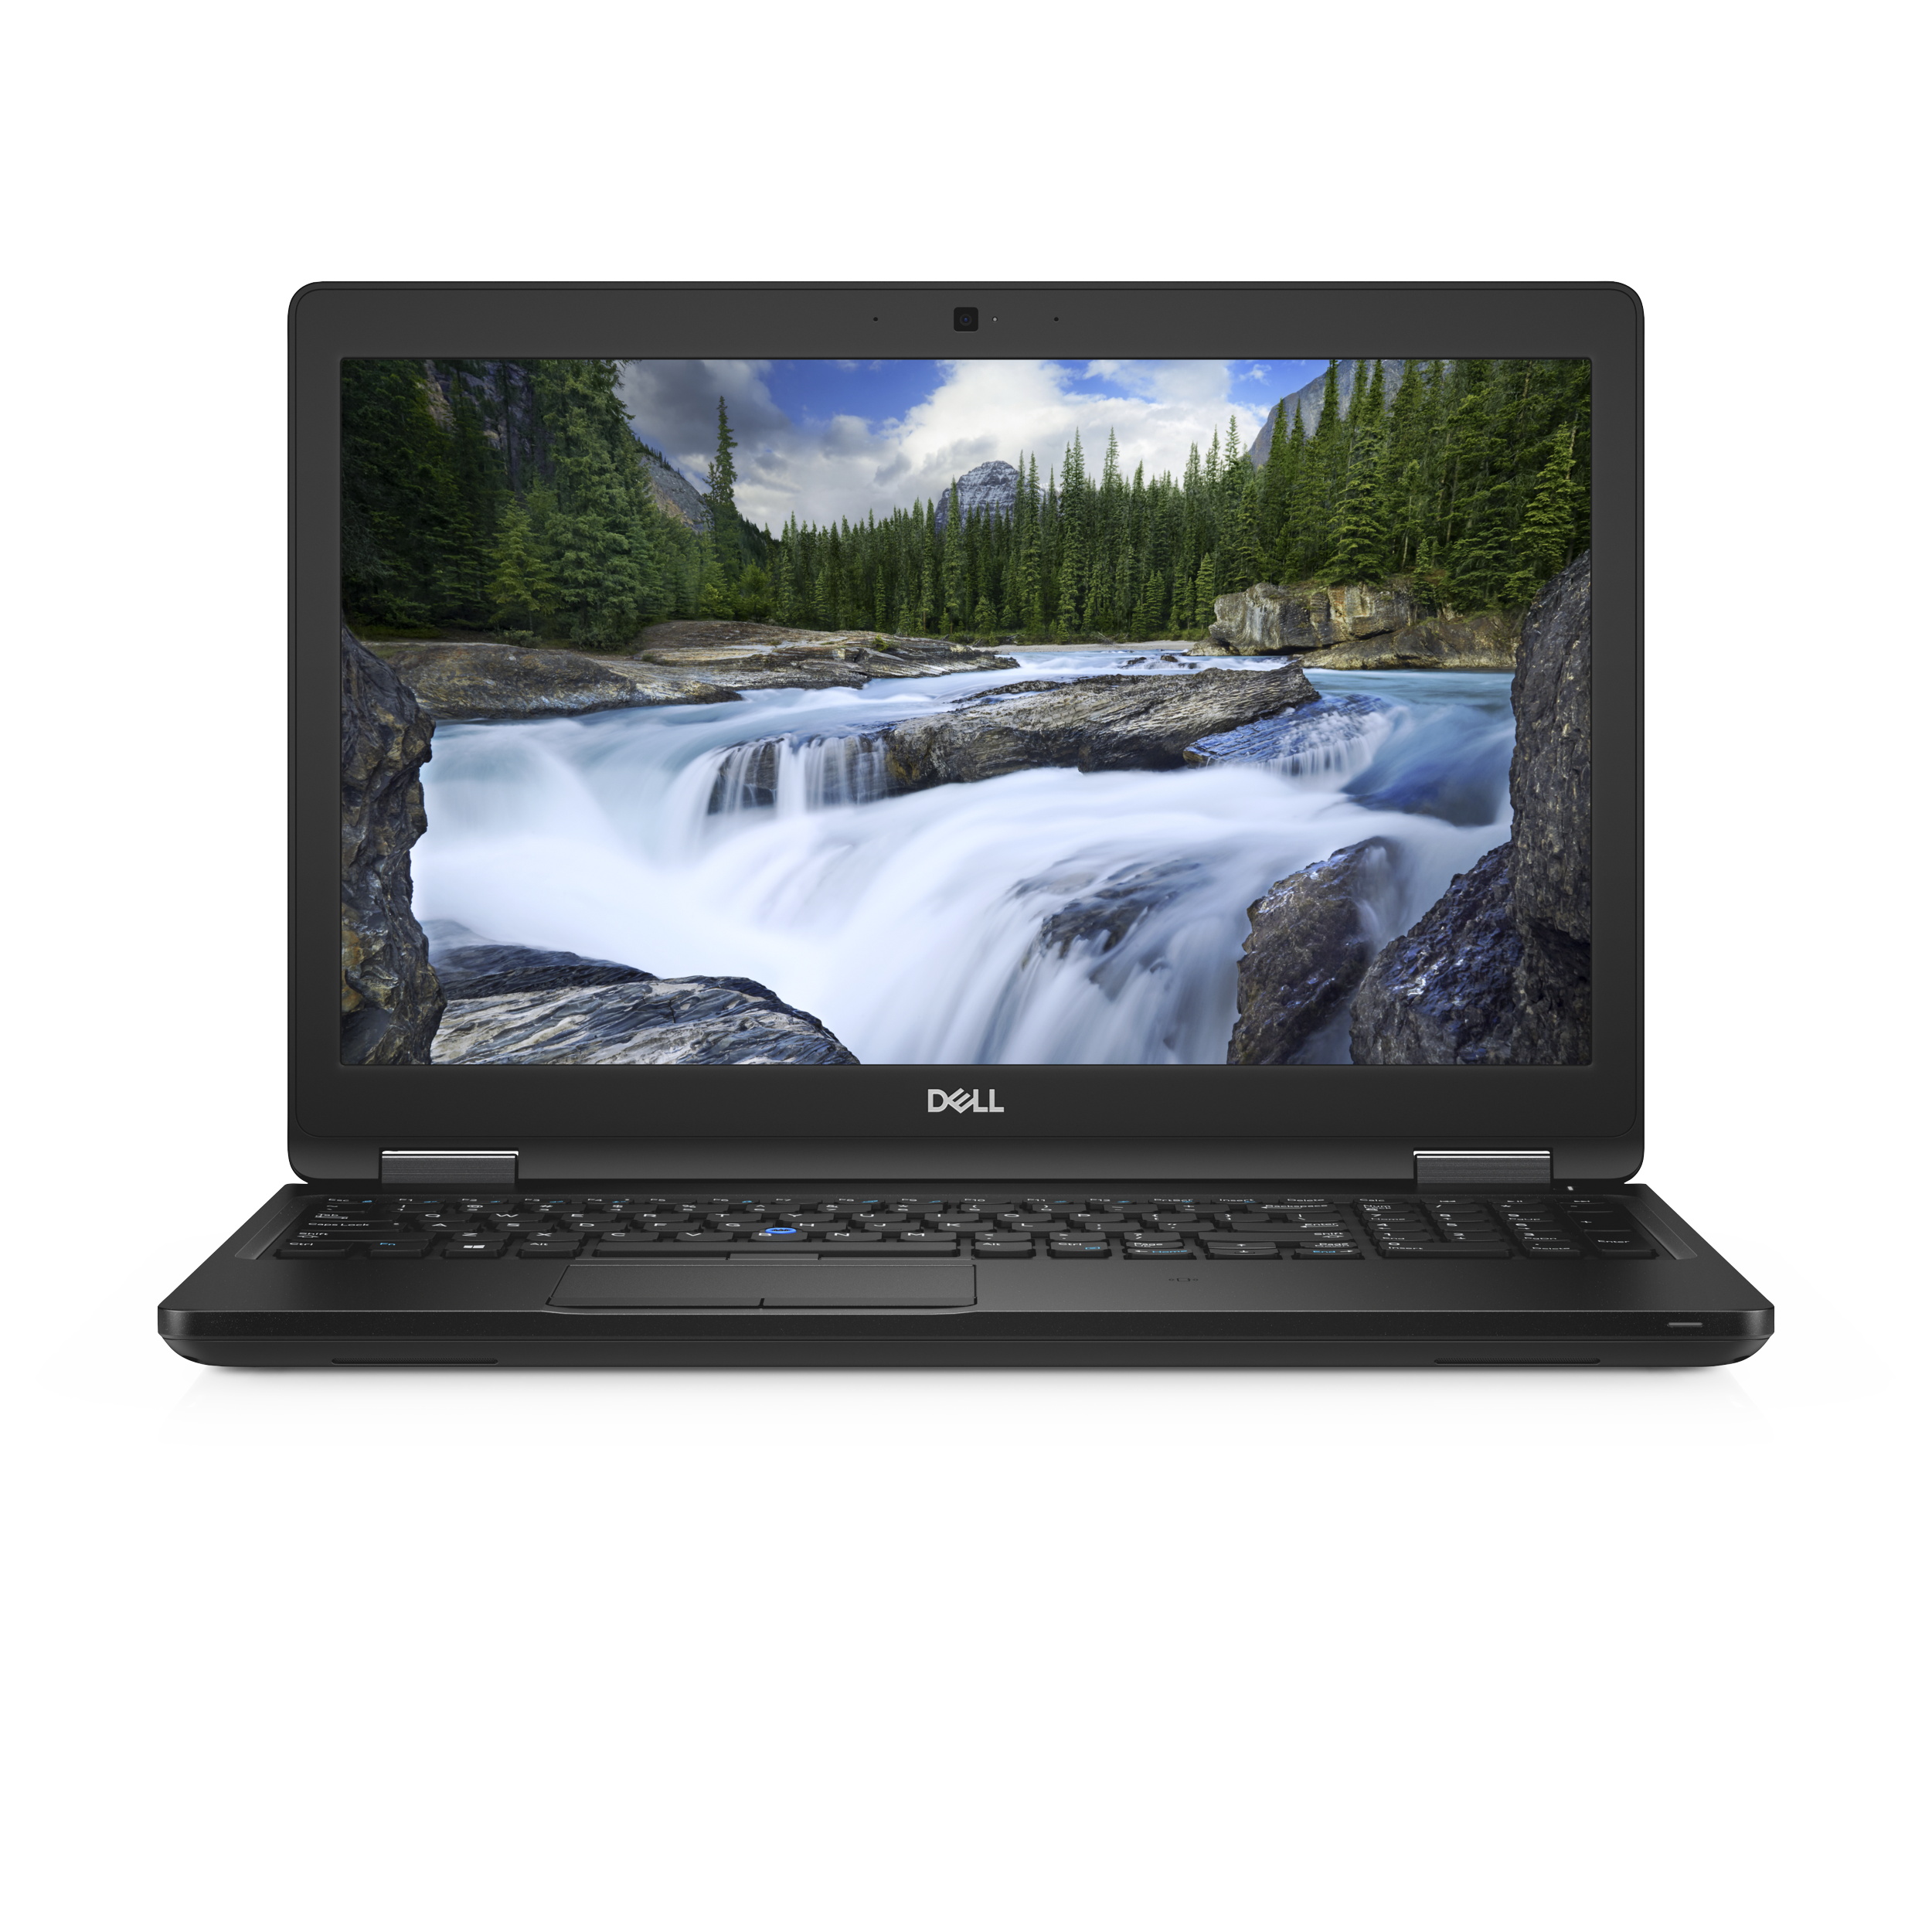
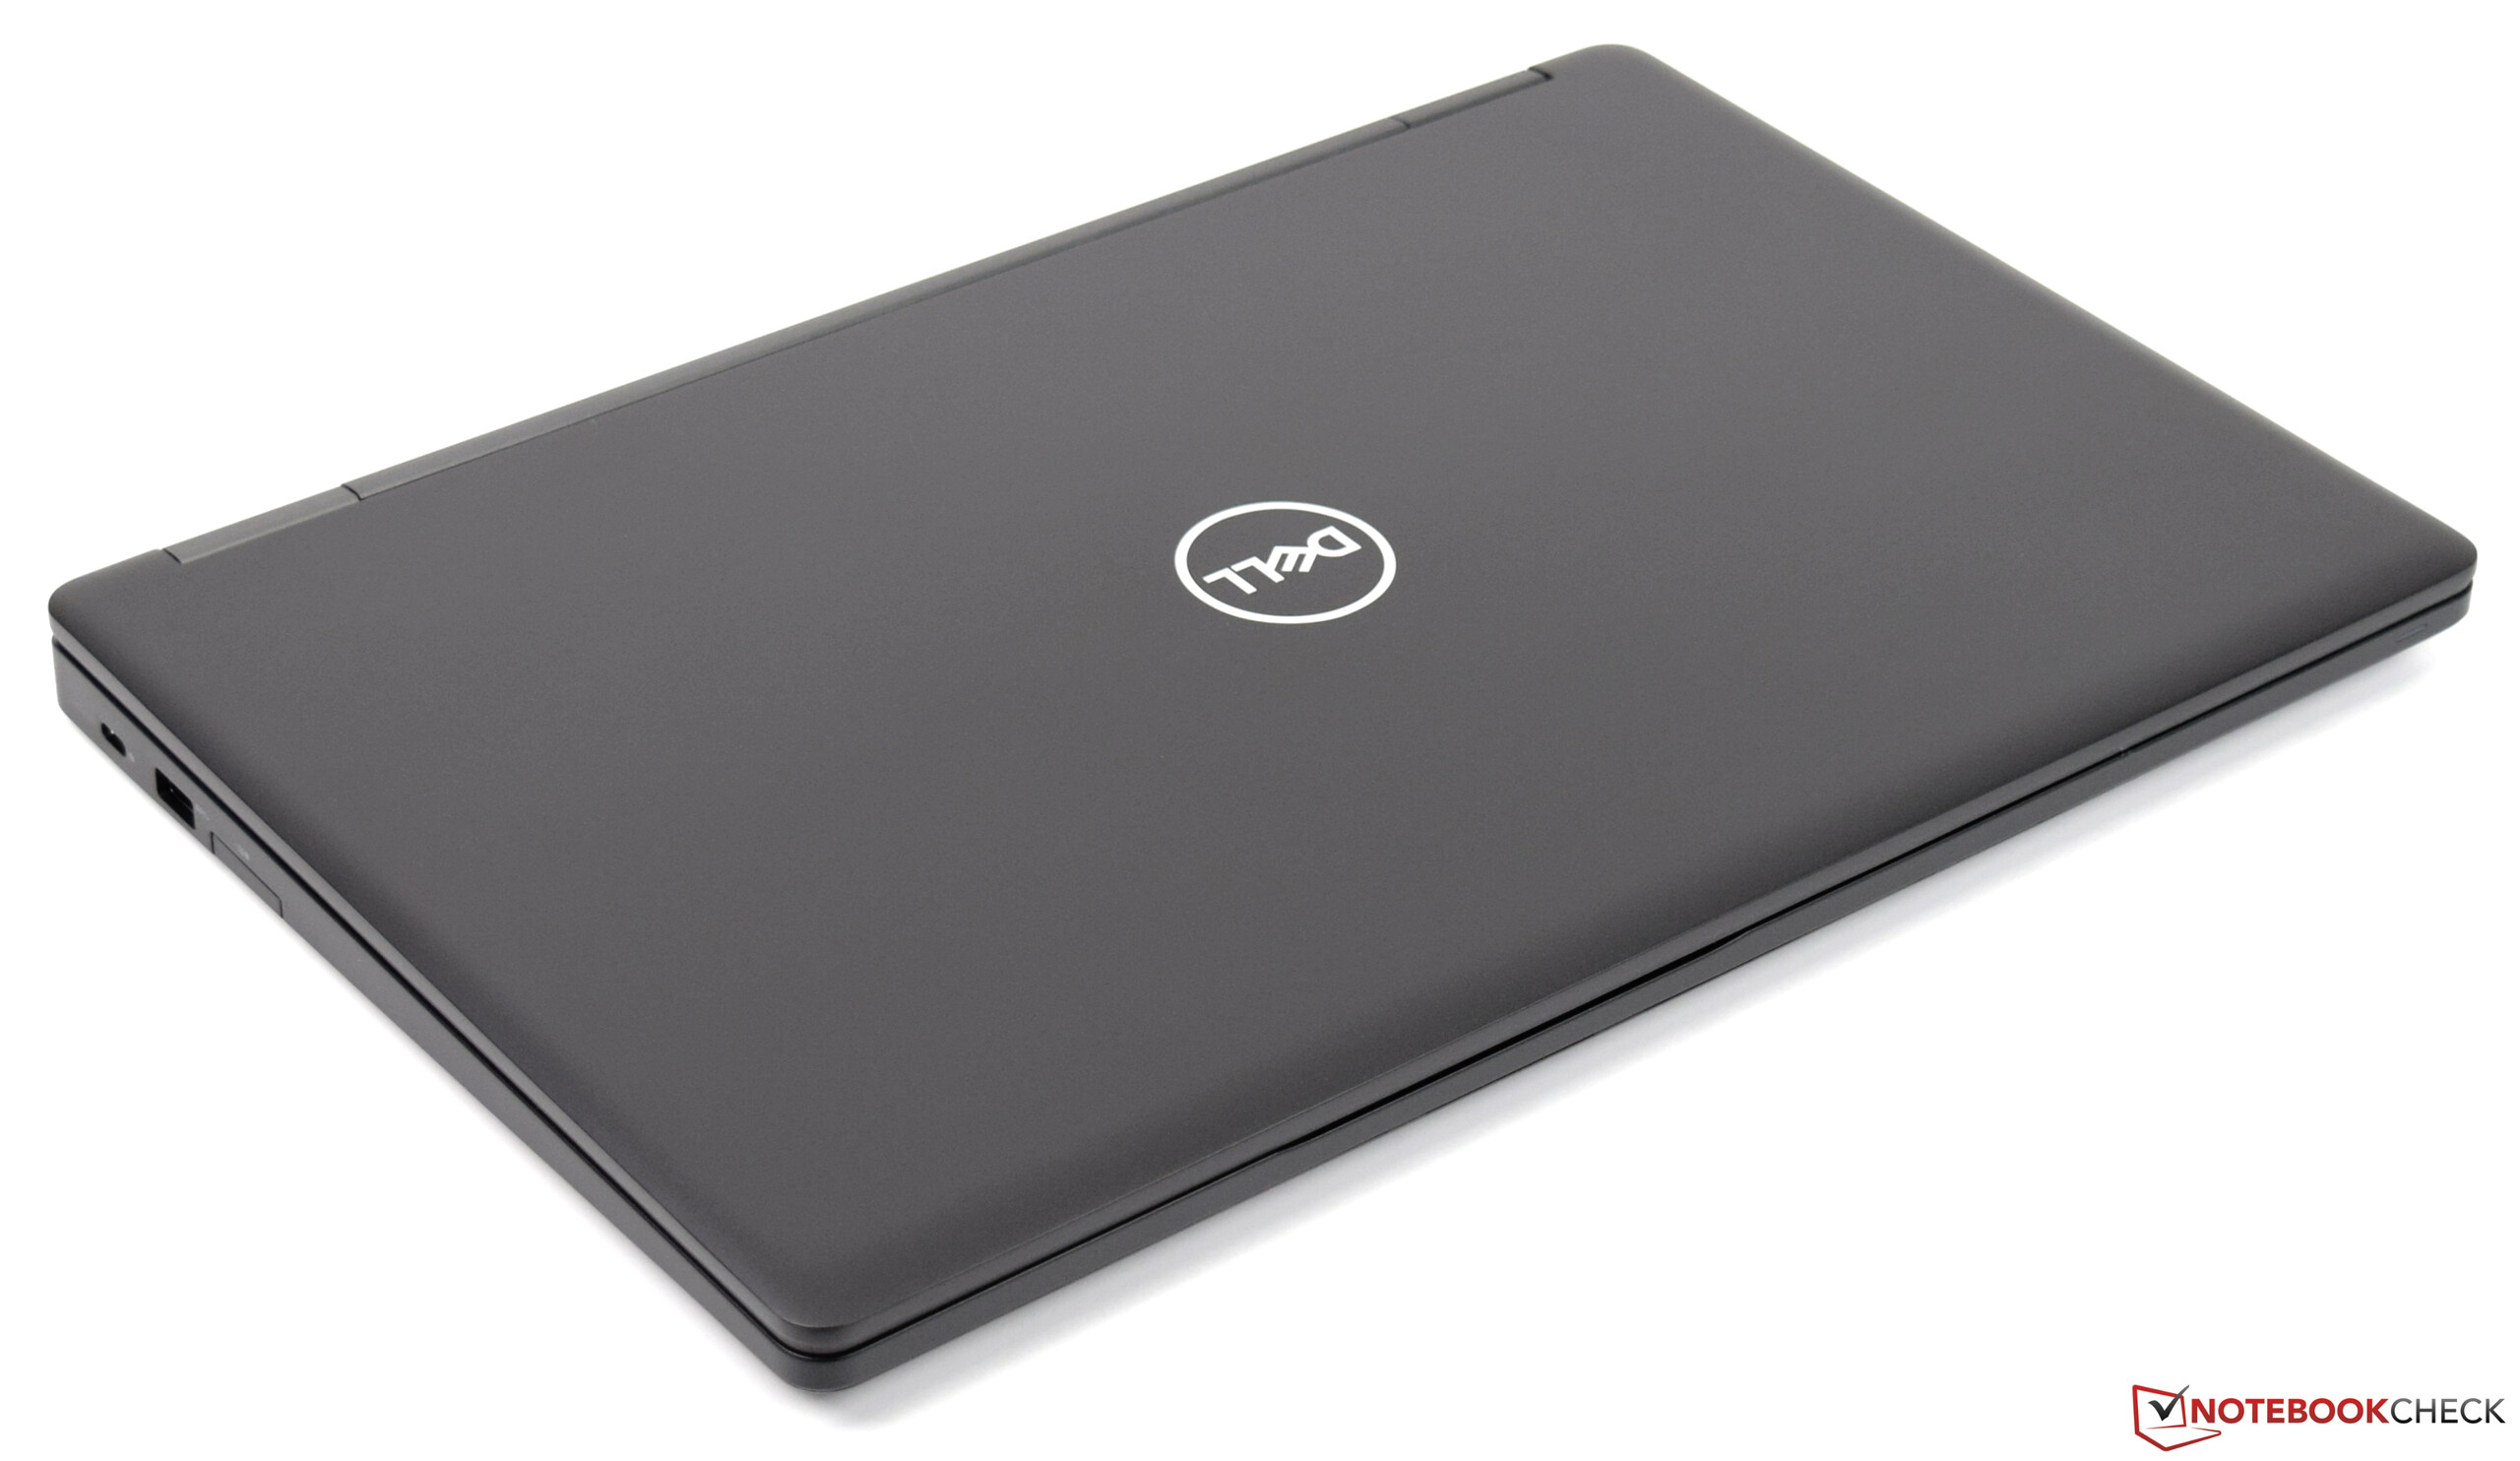
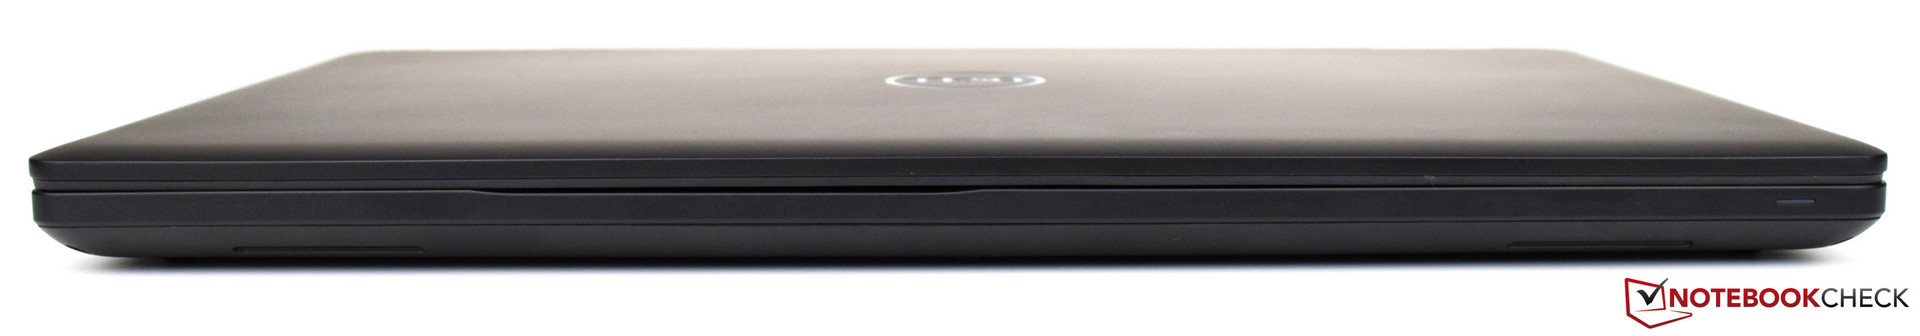
The all-black case looks premium, even though we would have preferred a stronger base plate. We can visibly twist it with little effort and it yields in the middle when we apply pressure with our fingers. Thankfully the casing around the display is more robust, although the display is visibly affected when we applied pressure to the display case. Despite this lack of rigidity, the case is certified to the US military standard MIL-STD 810G, which means that the Latitude 5590 should easily withstand daily work routine. The two display hinges work well and open to 180 degrees. The display cannot be opened one-handed because of the low counterweight of the base.
The Latitude 5590 is not exactly lightweight at 2.0 kg (~4.4 lb), but it is about as heavy as its competitors. The HP EliteBook 850 is our only 15-inch comparison device and it weighs just 100 g (~3.5 oz) less than the Latitude 5590. The two devices have roughly the same footprint. The Latitude 5590’s power supply weighs 314 g (~11.1 oz), which may be a consideration if you plan to carry the device around with you.
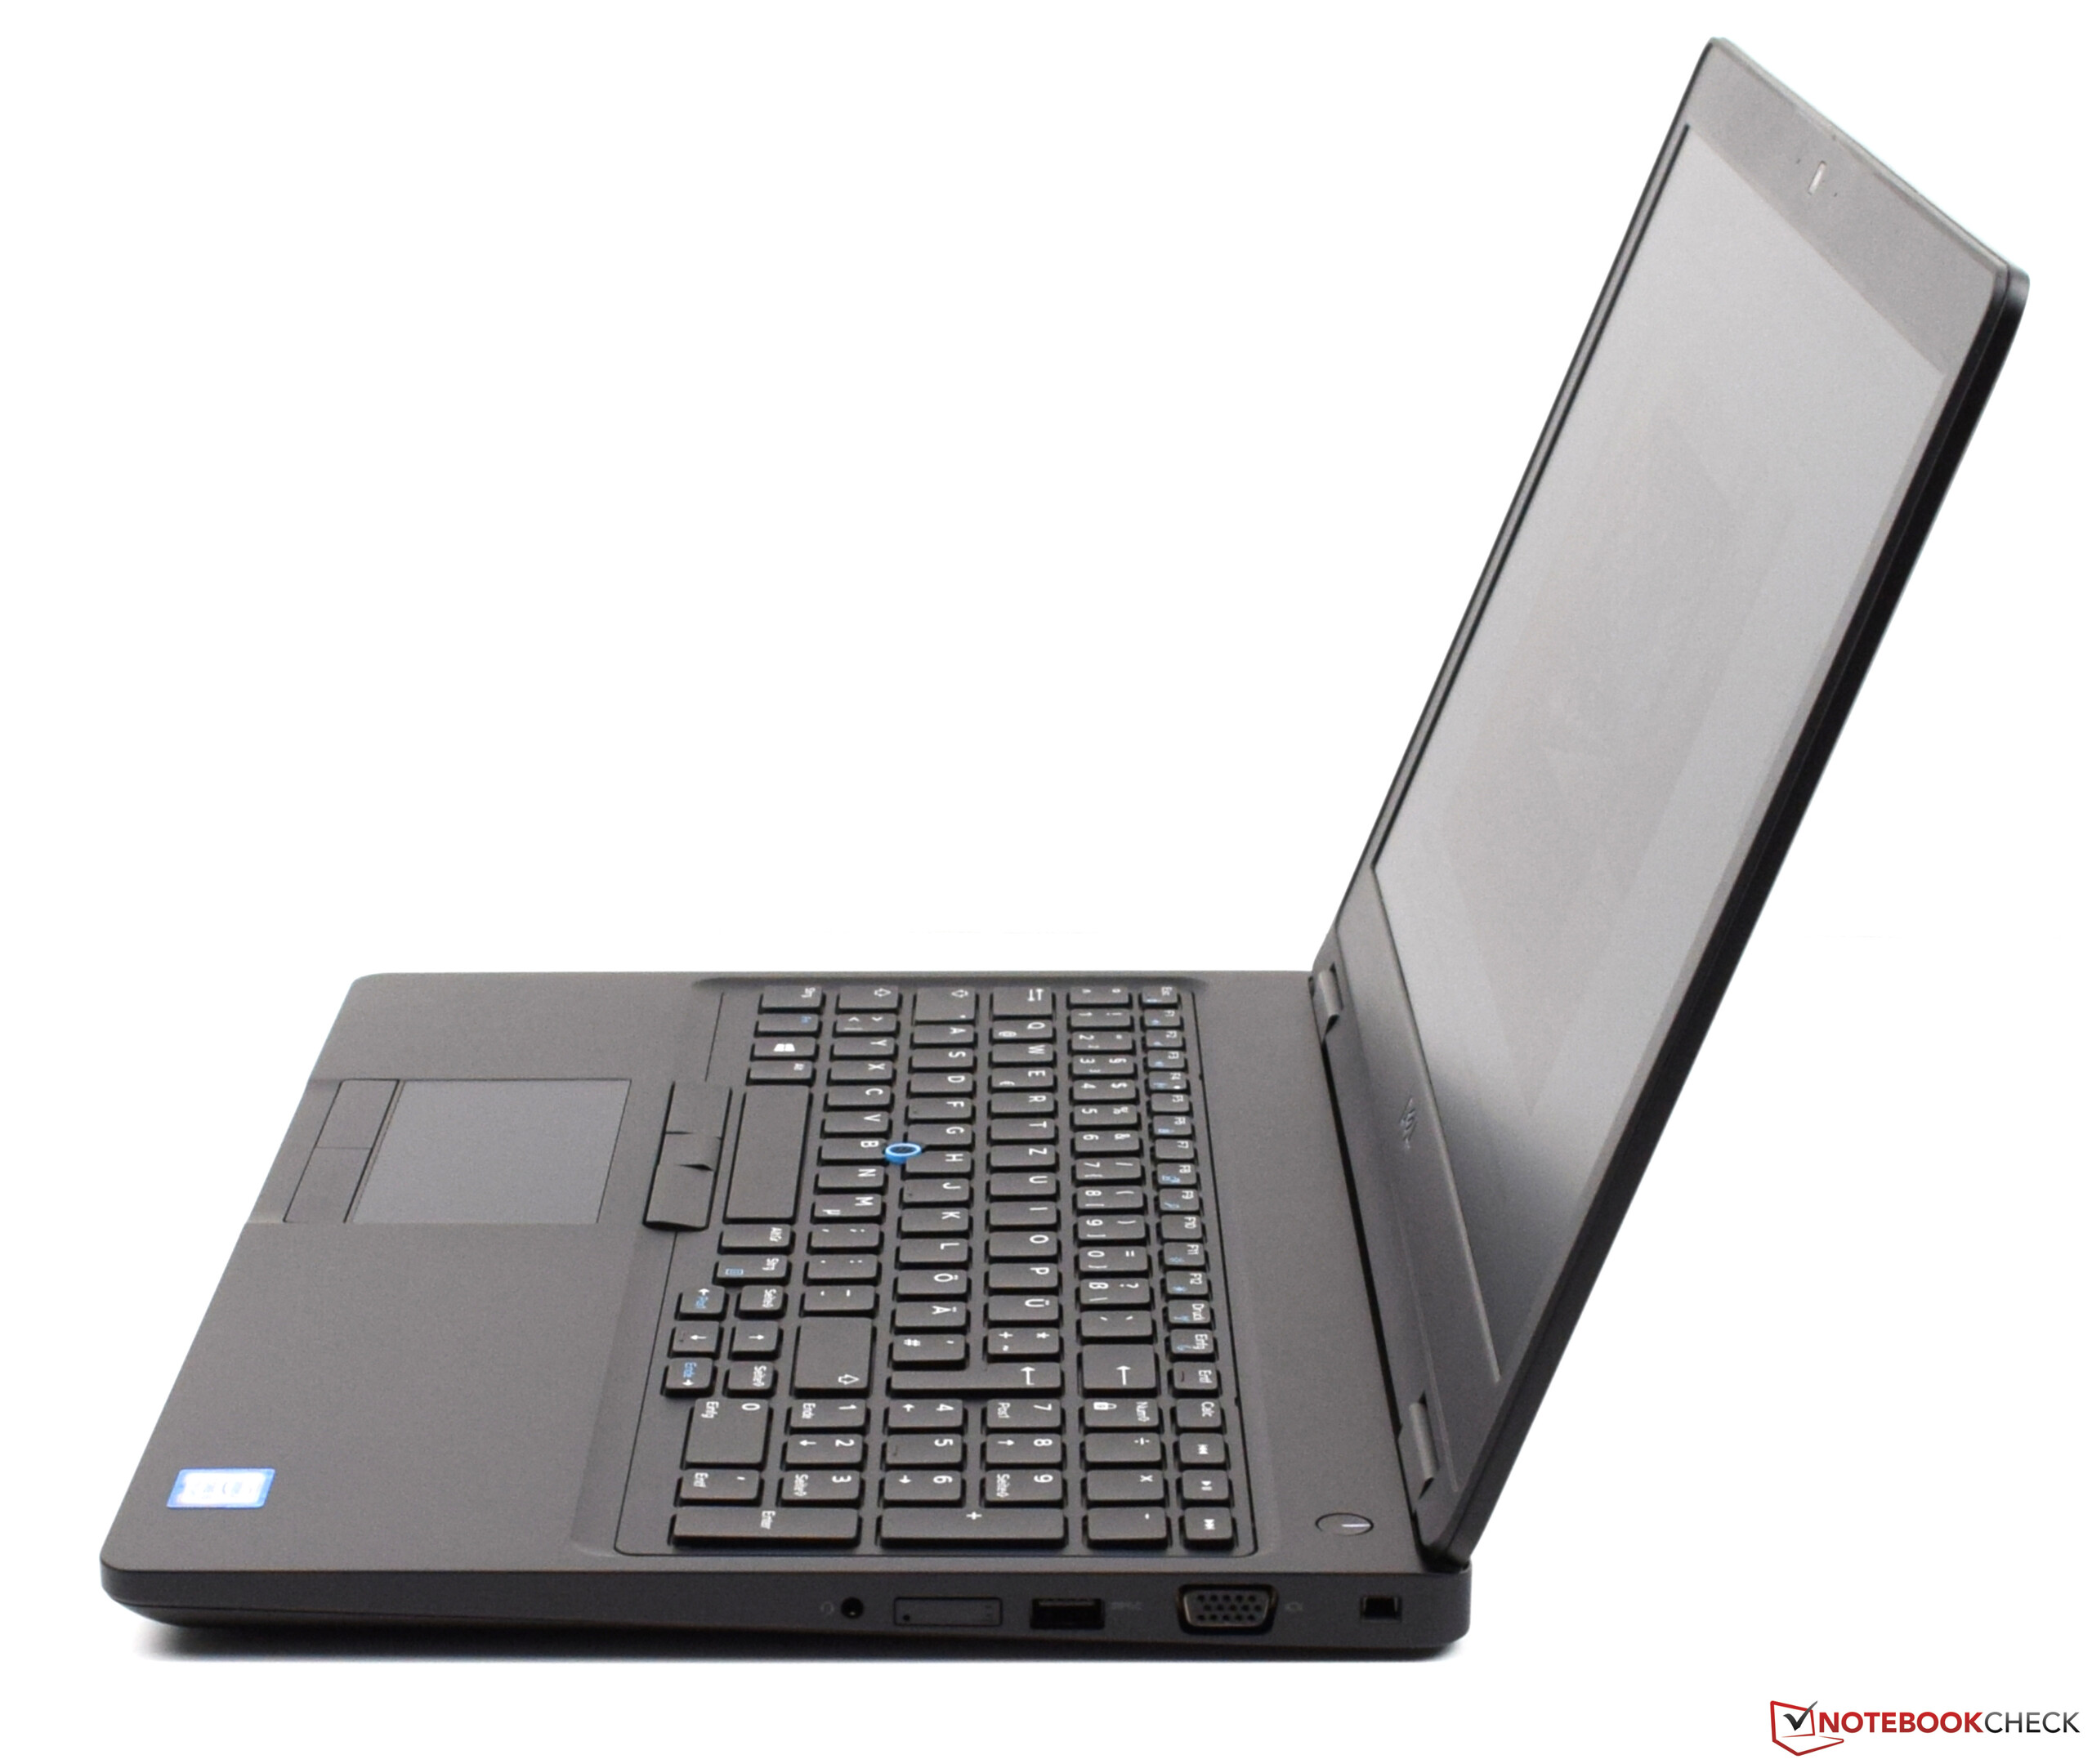
Connectivity
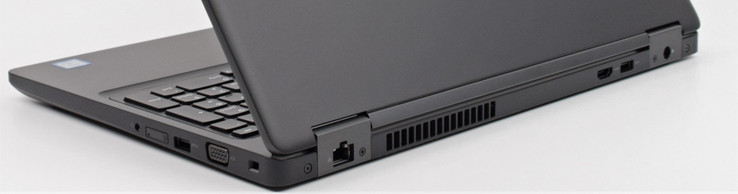
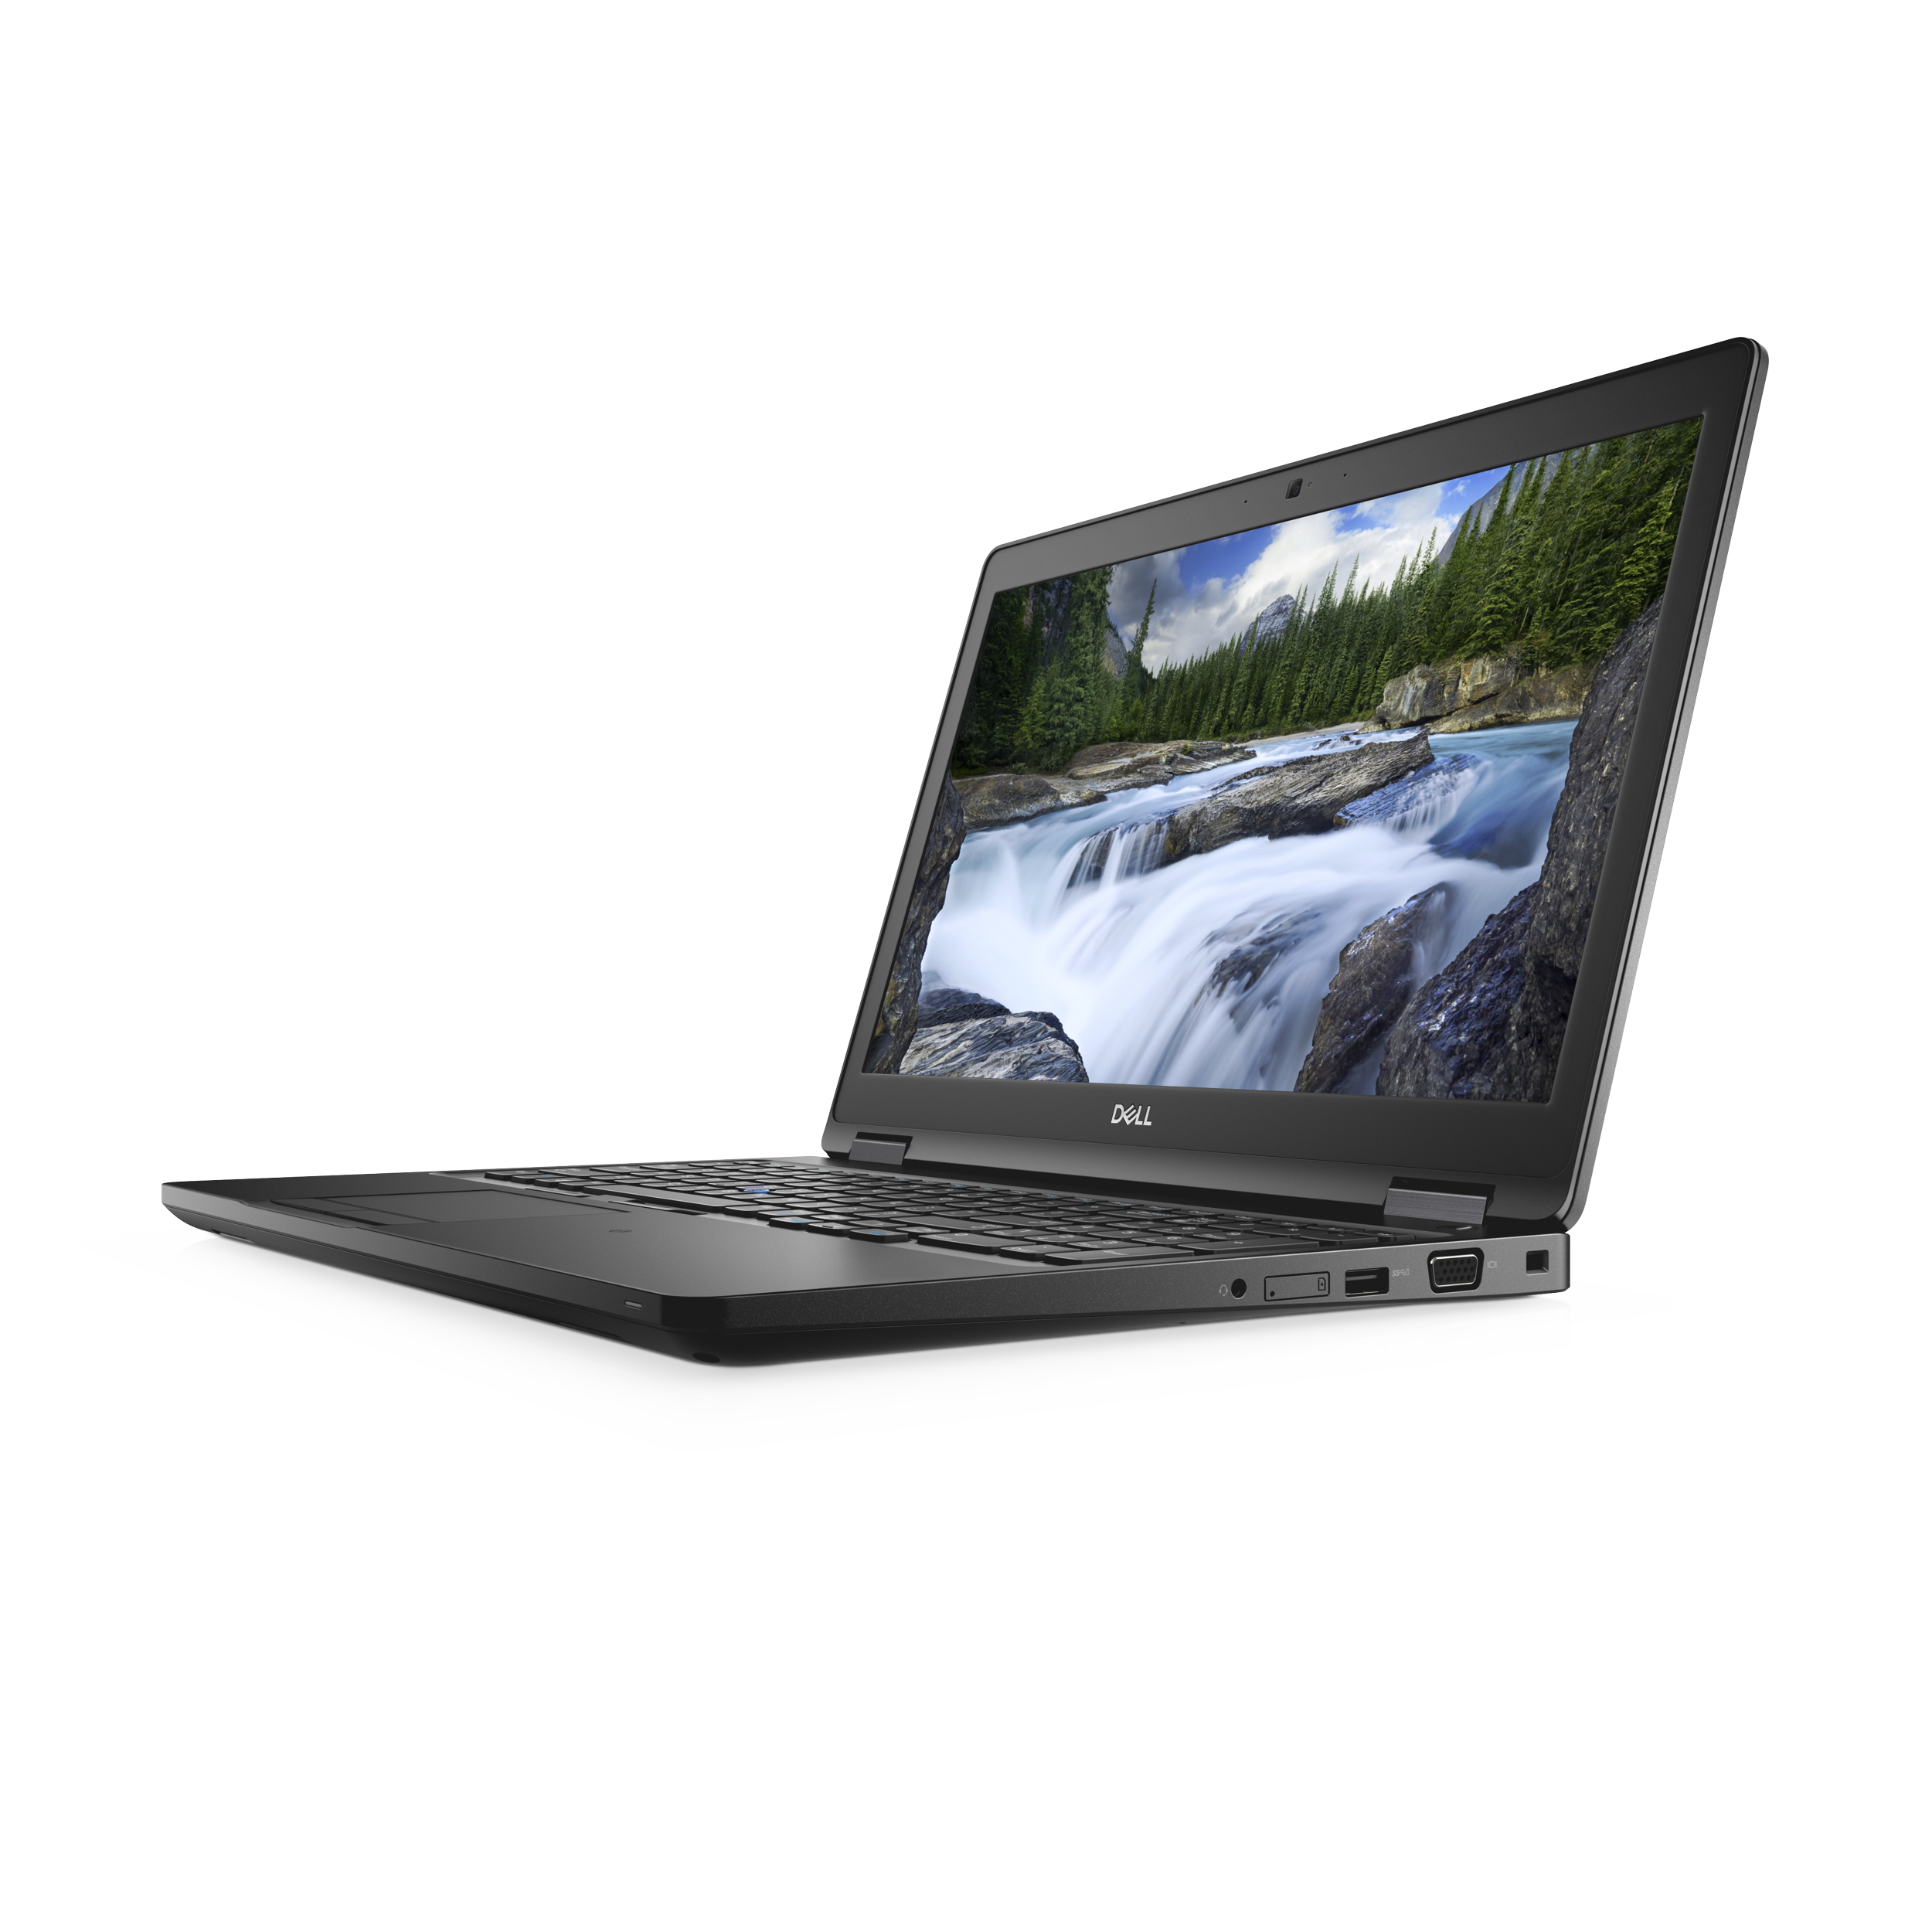
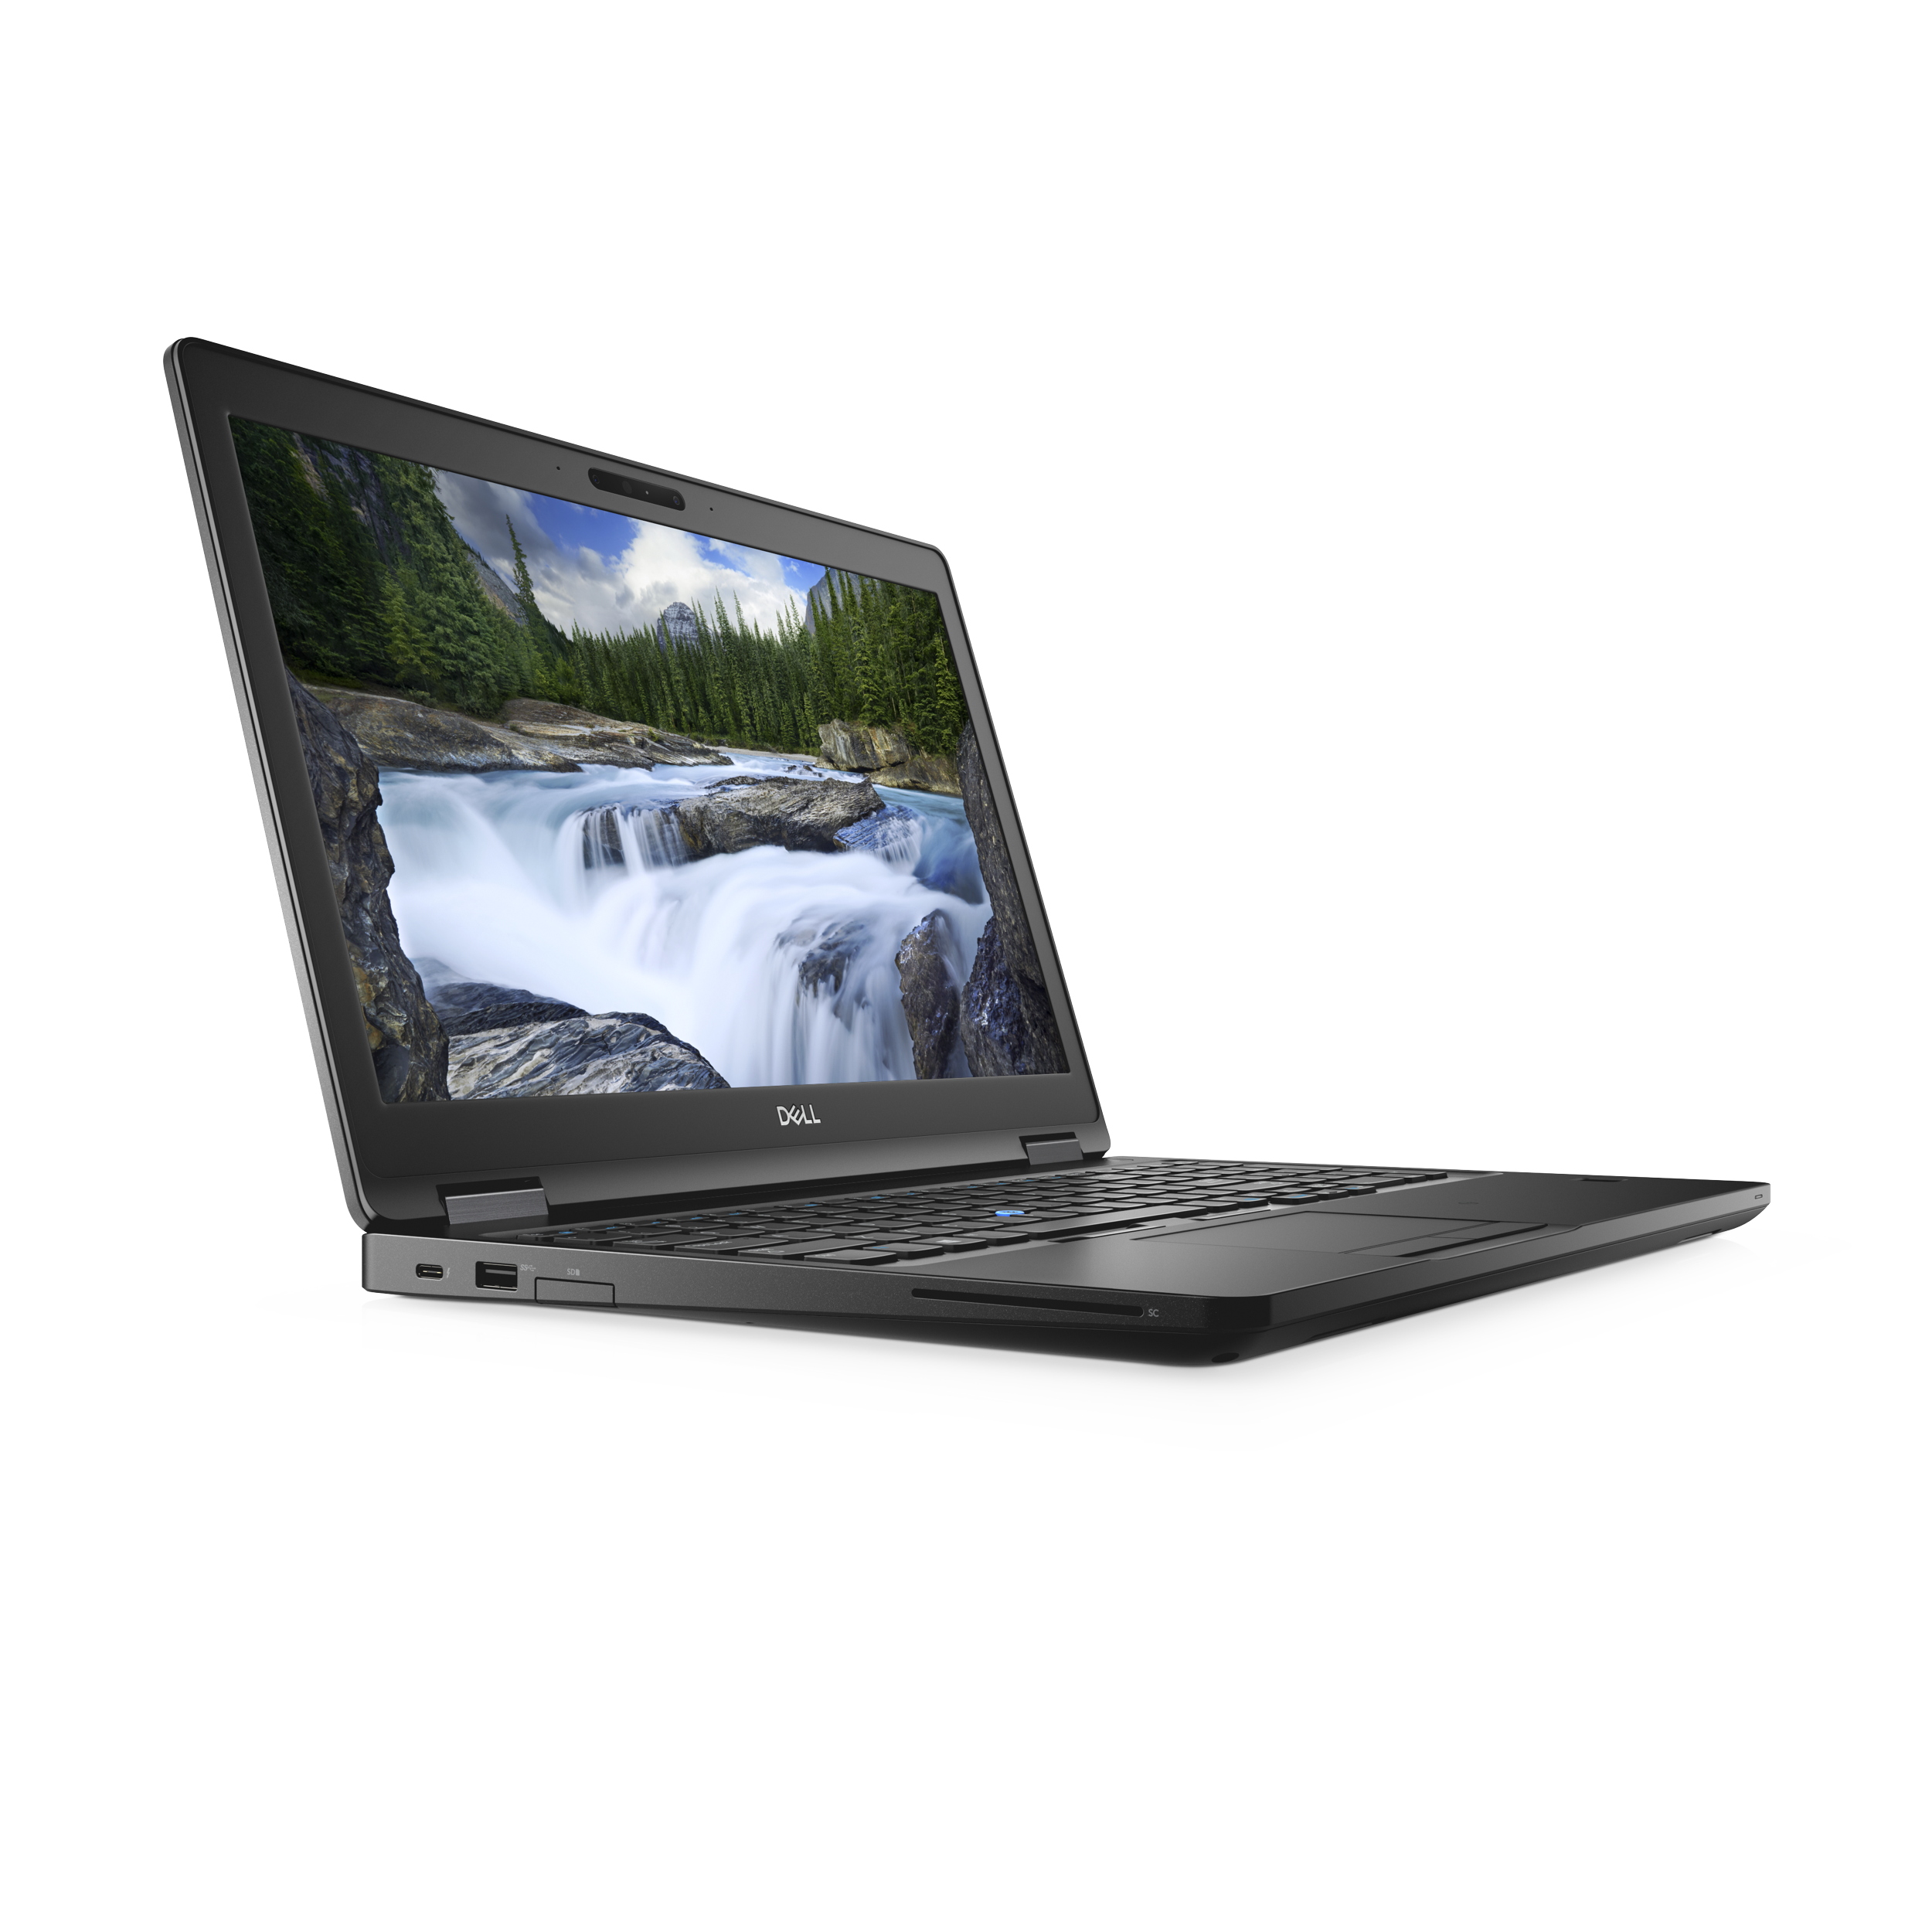
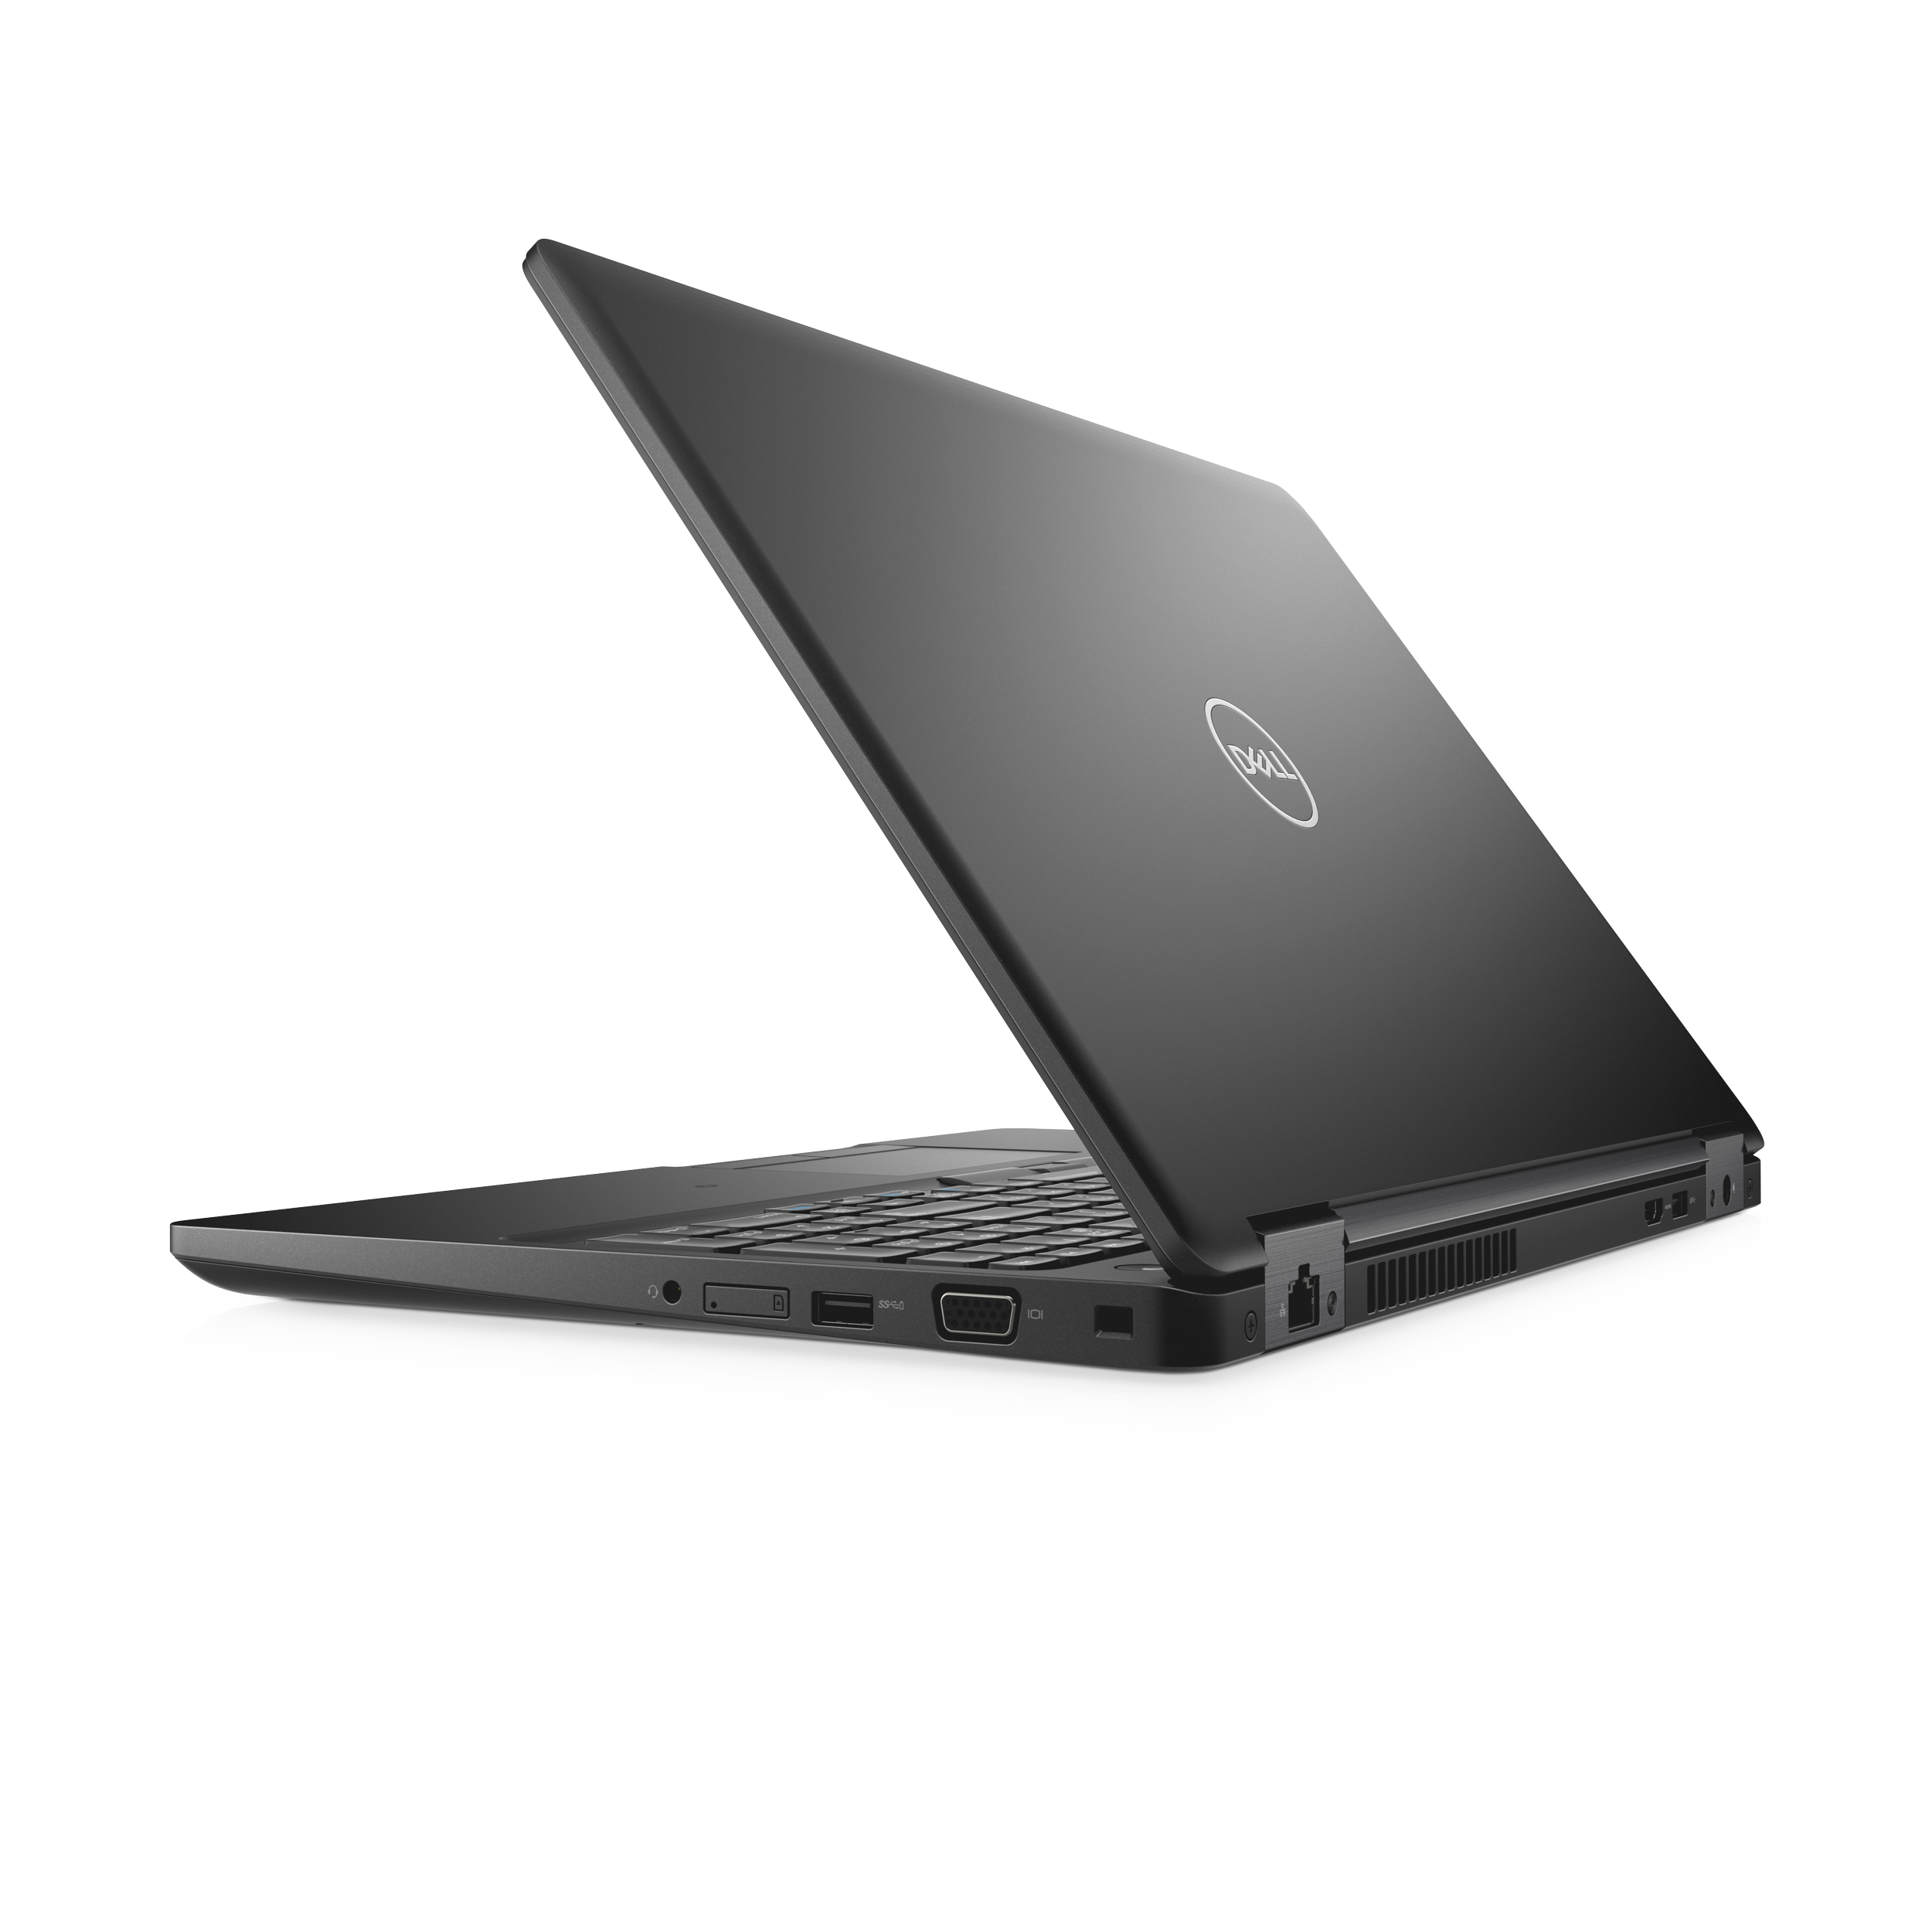
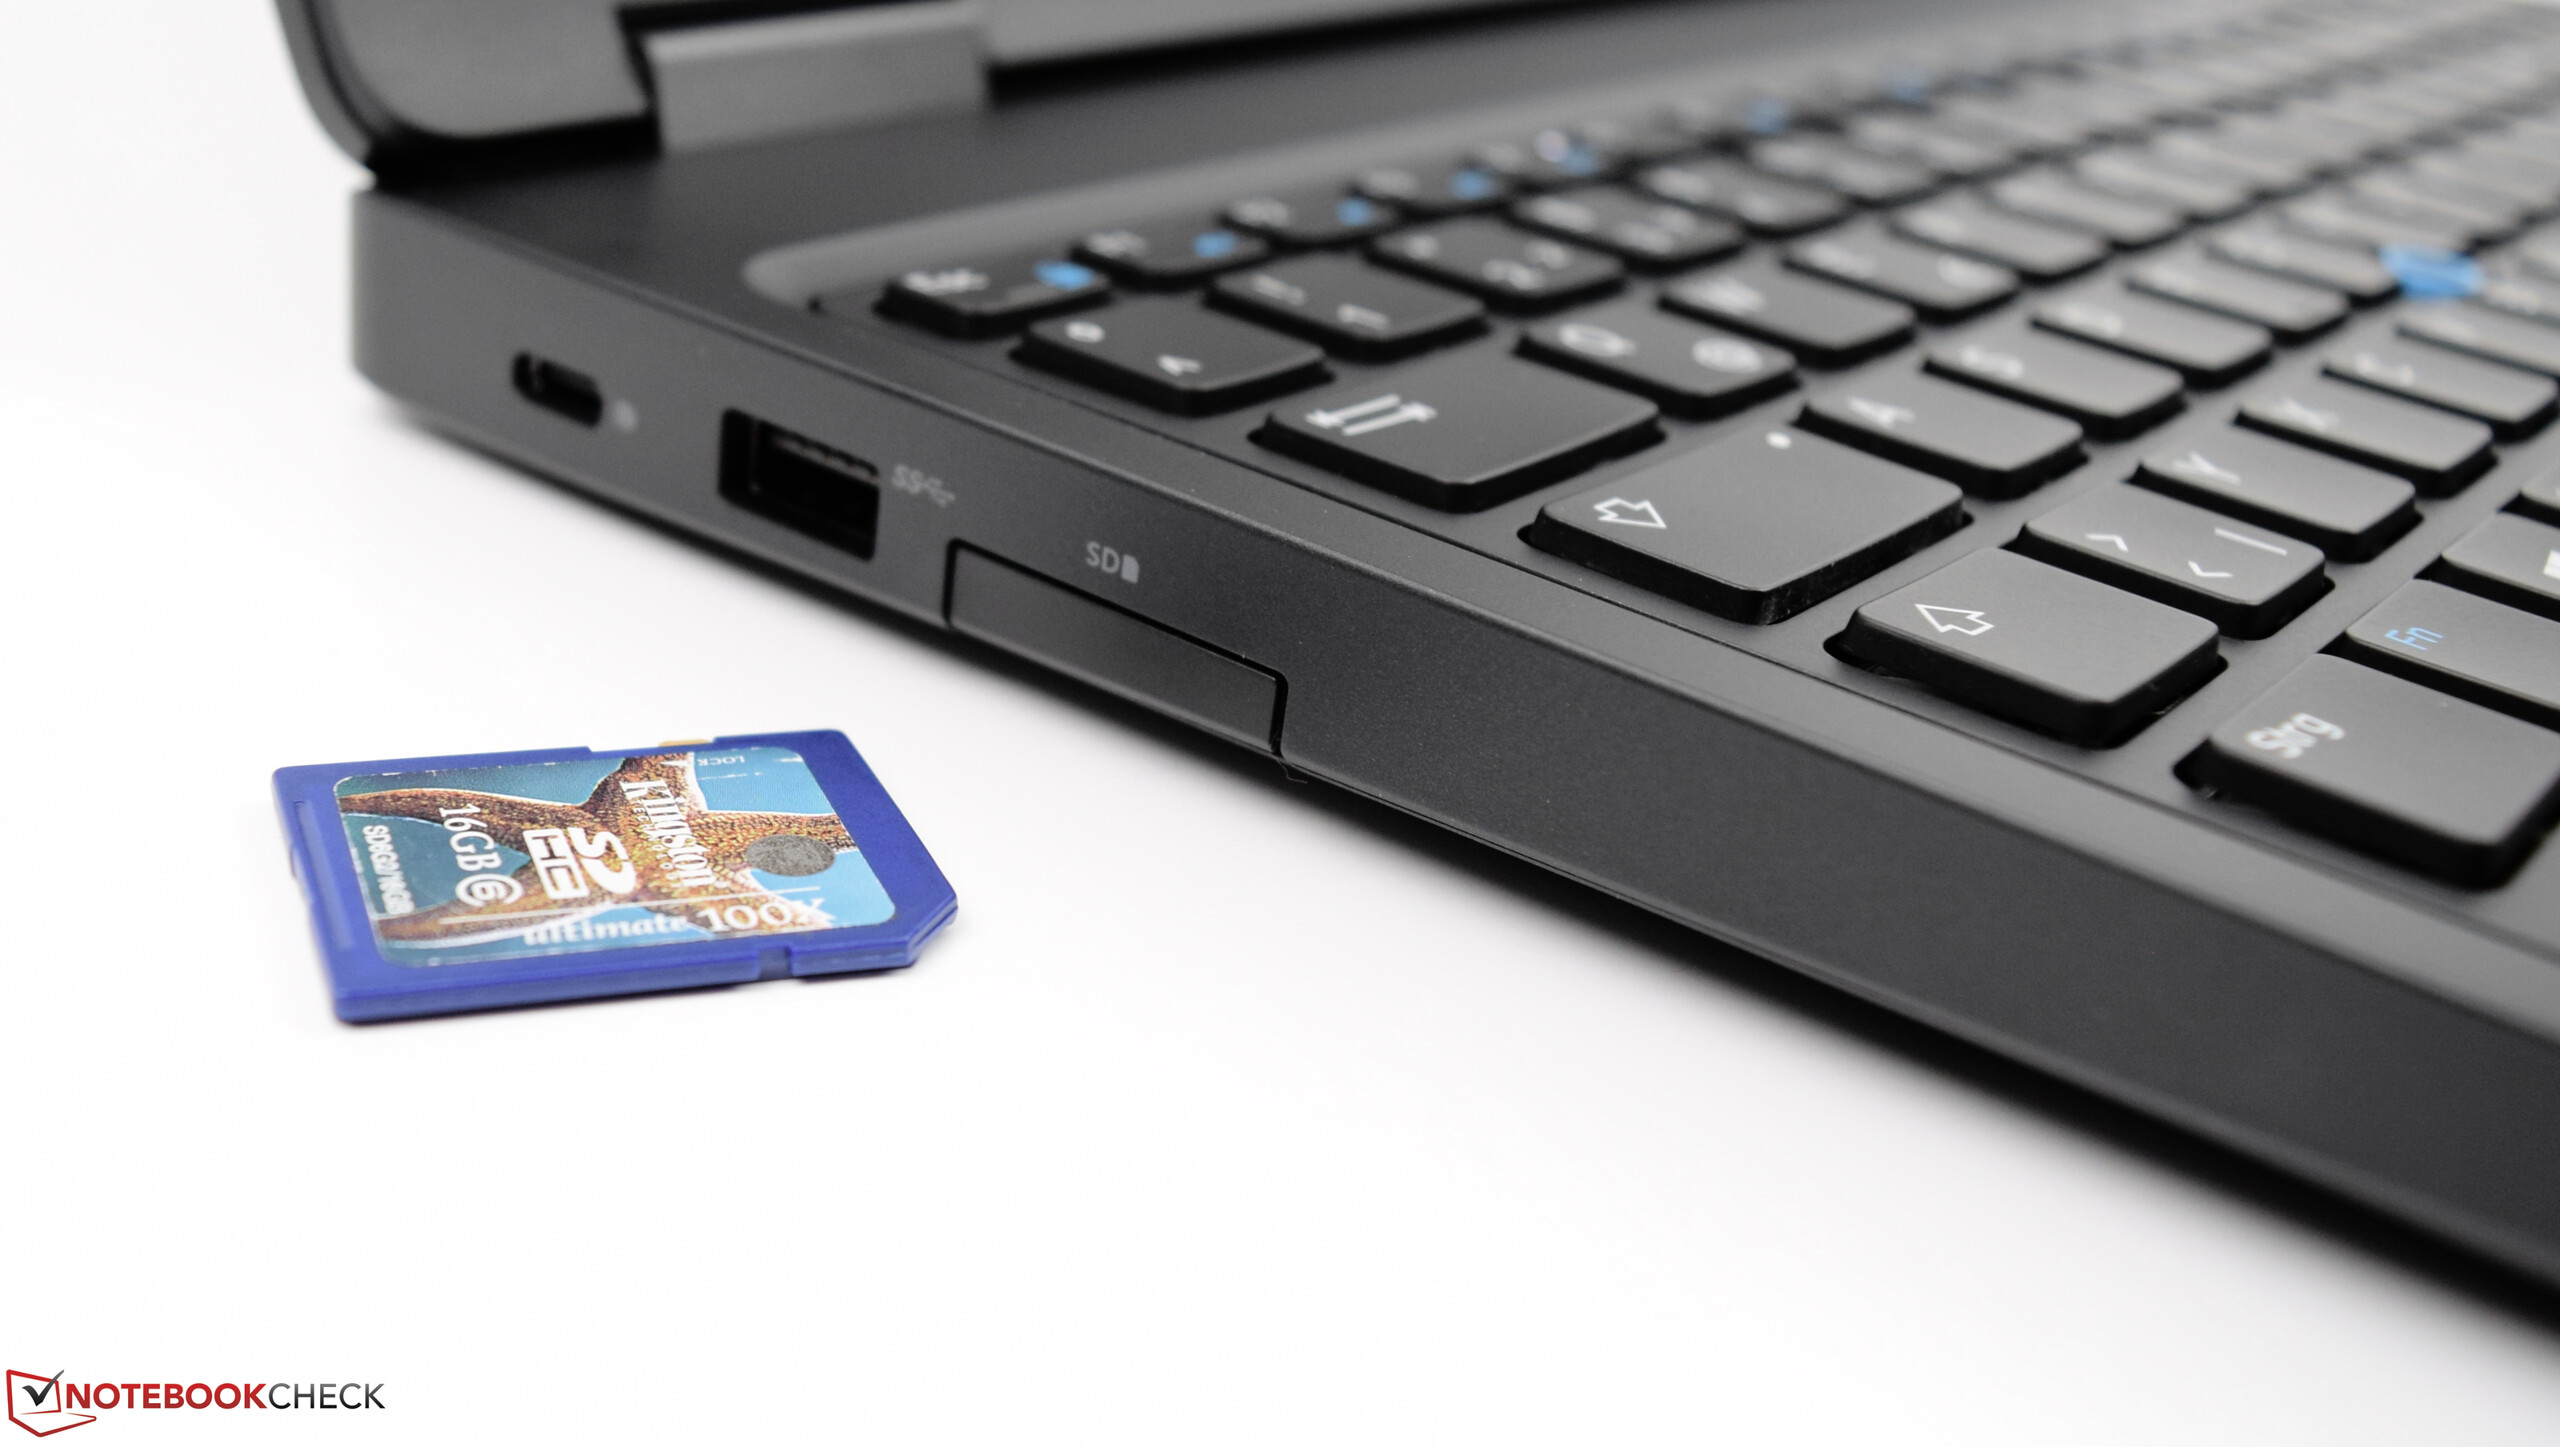
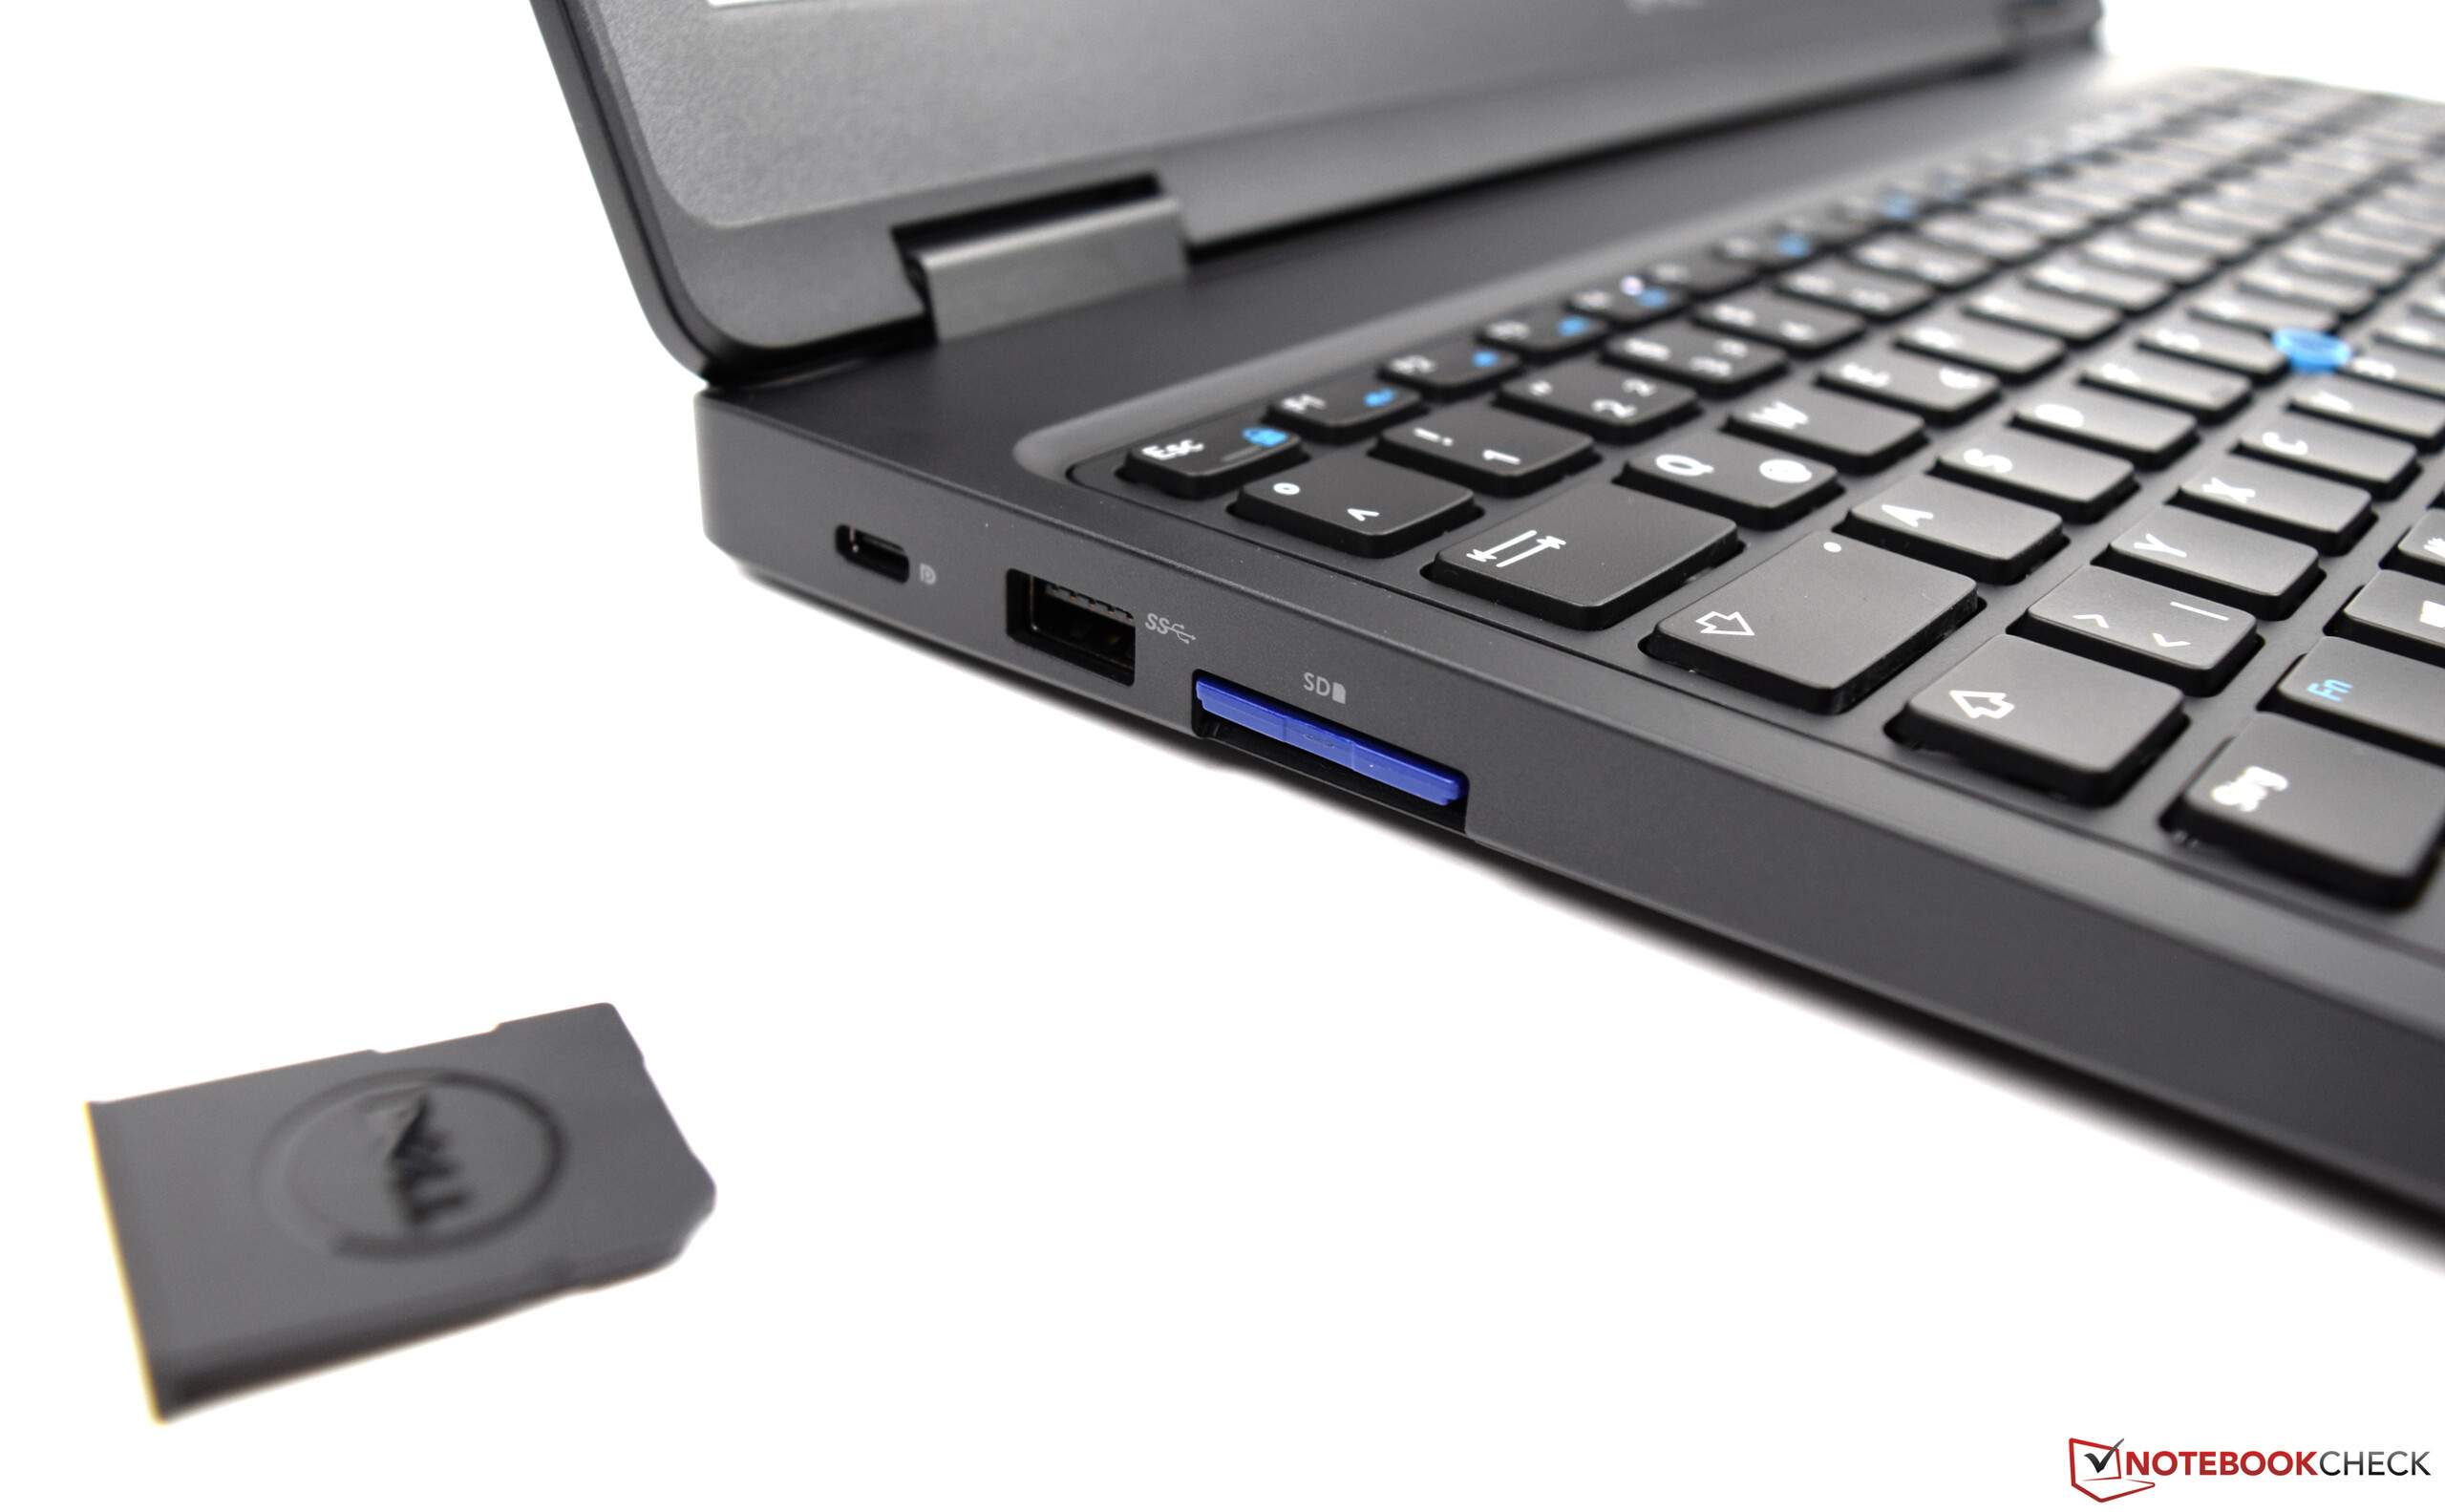
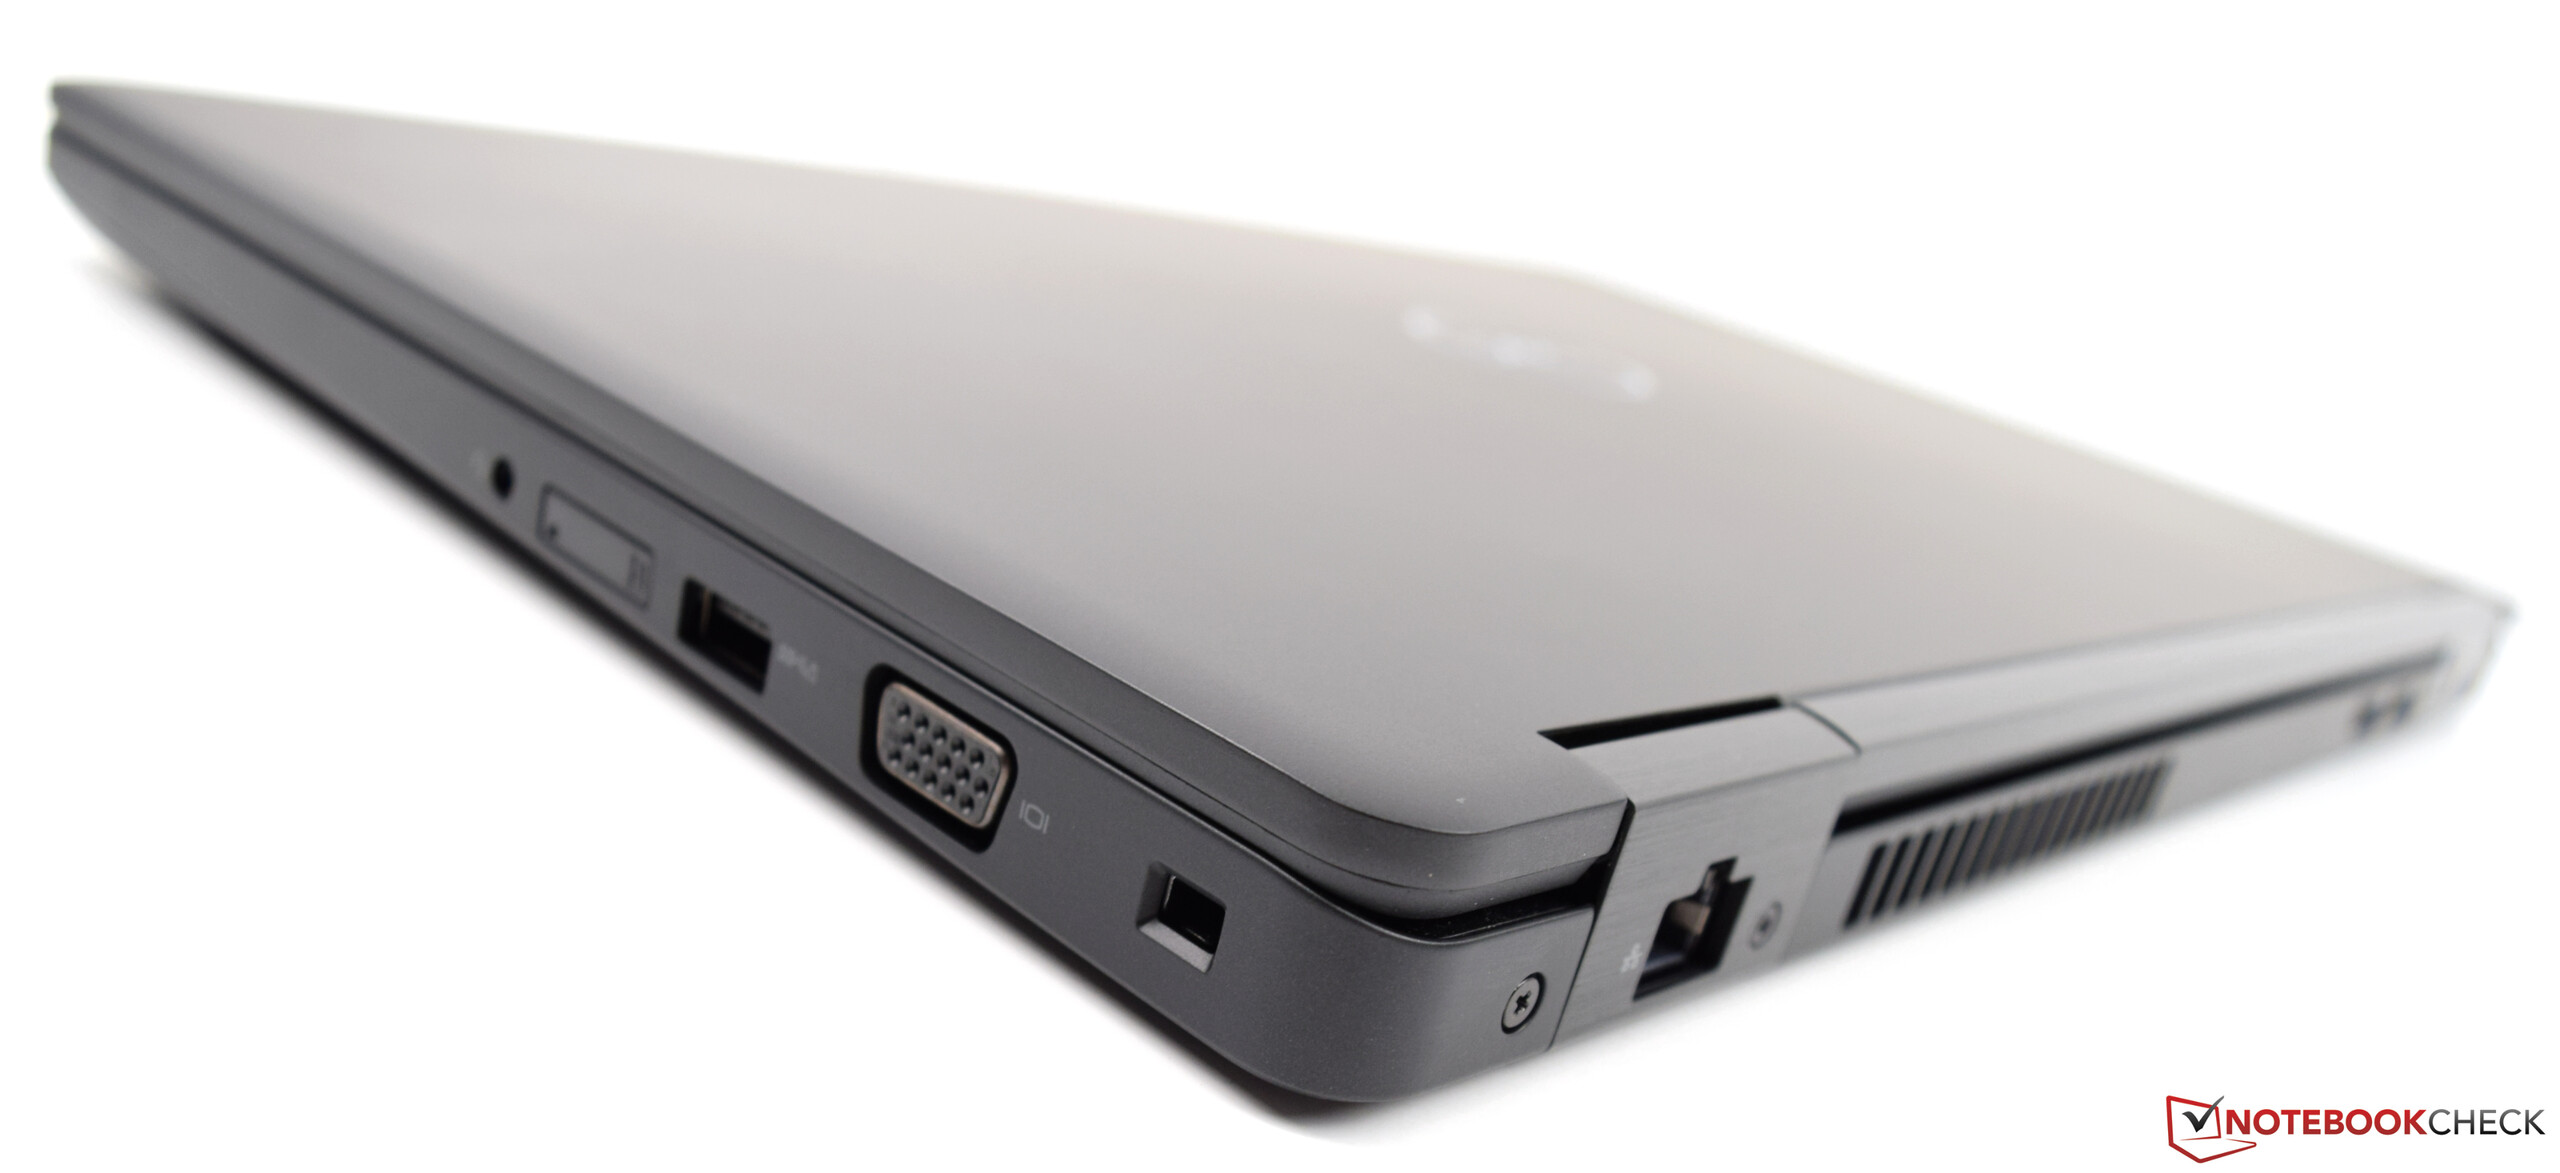
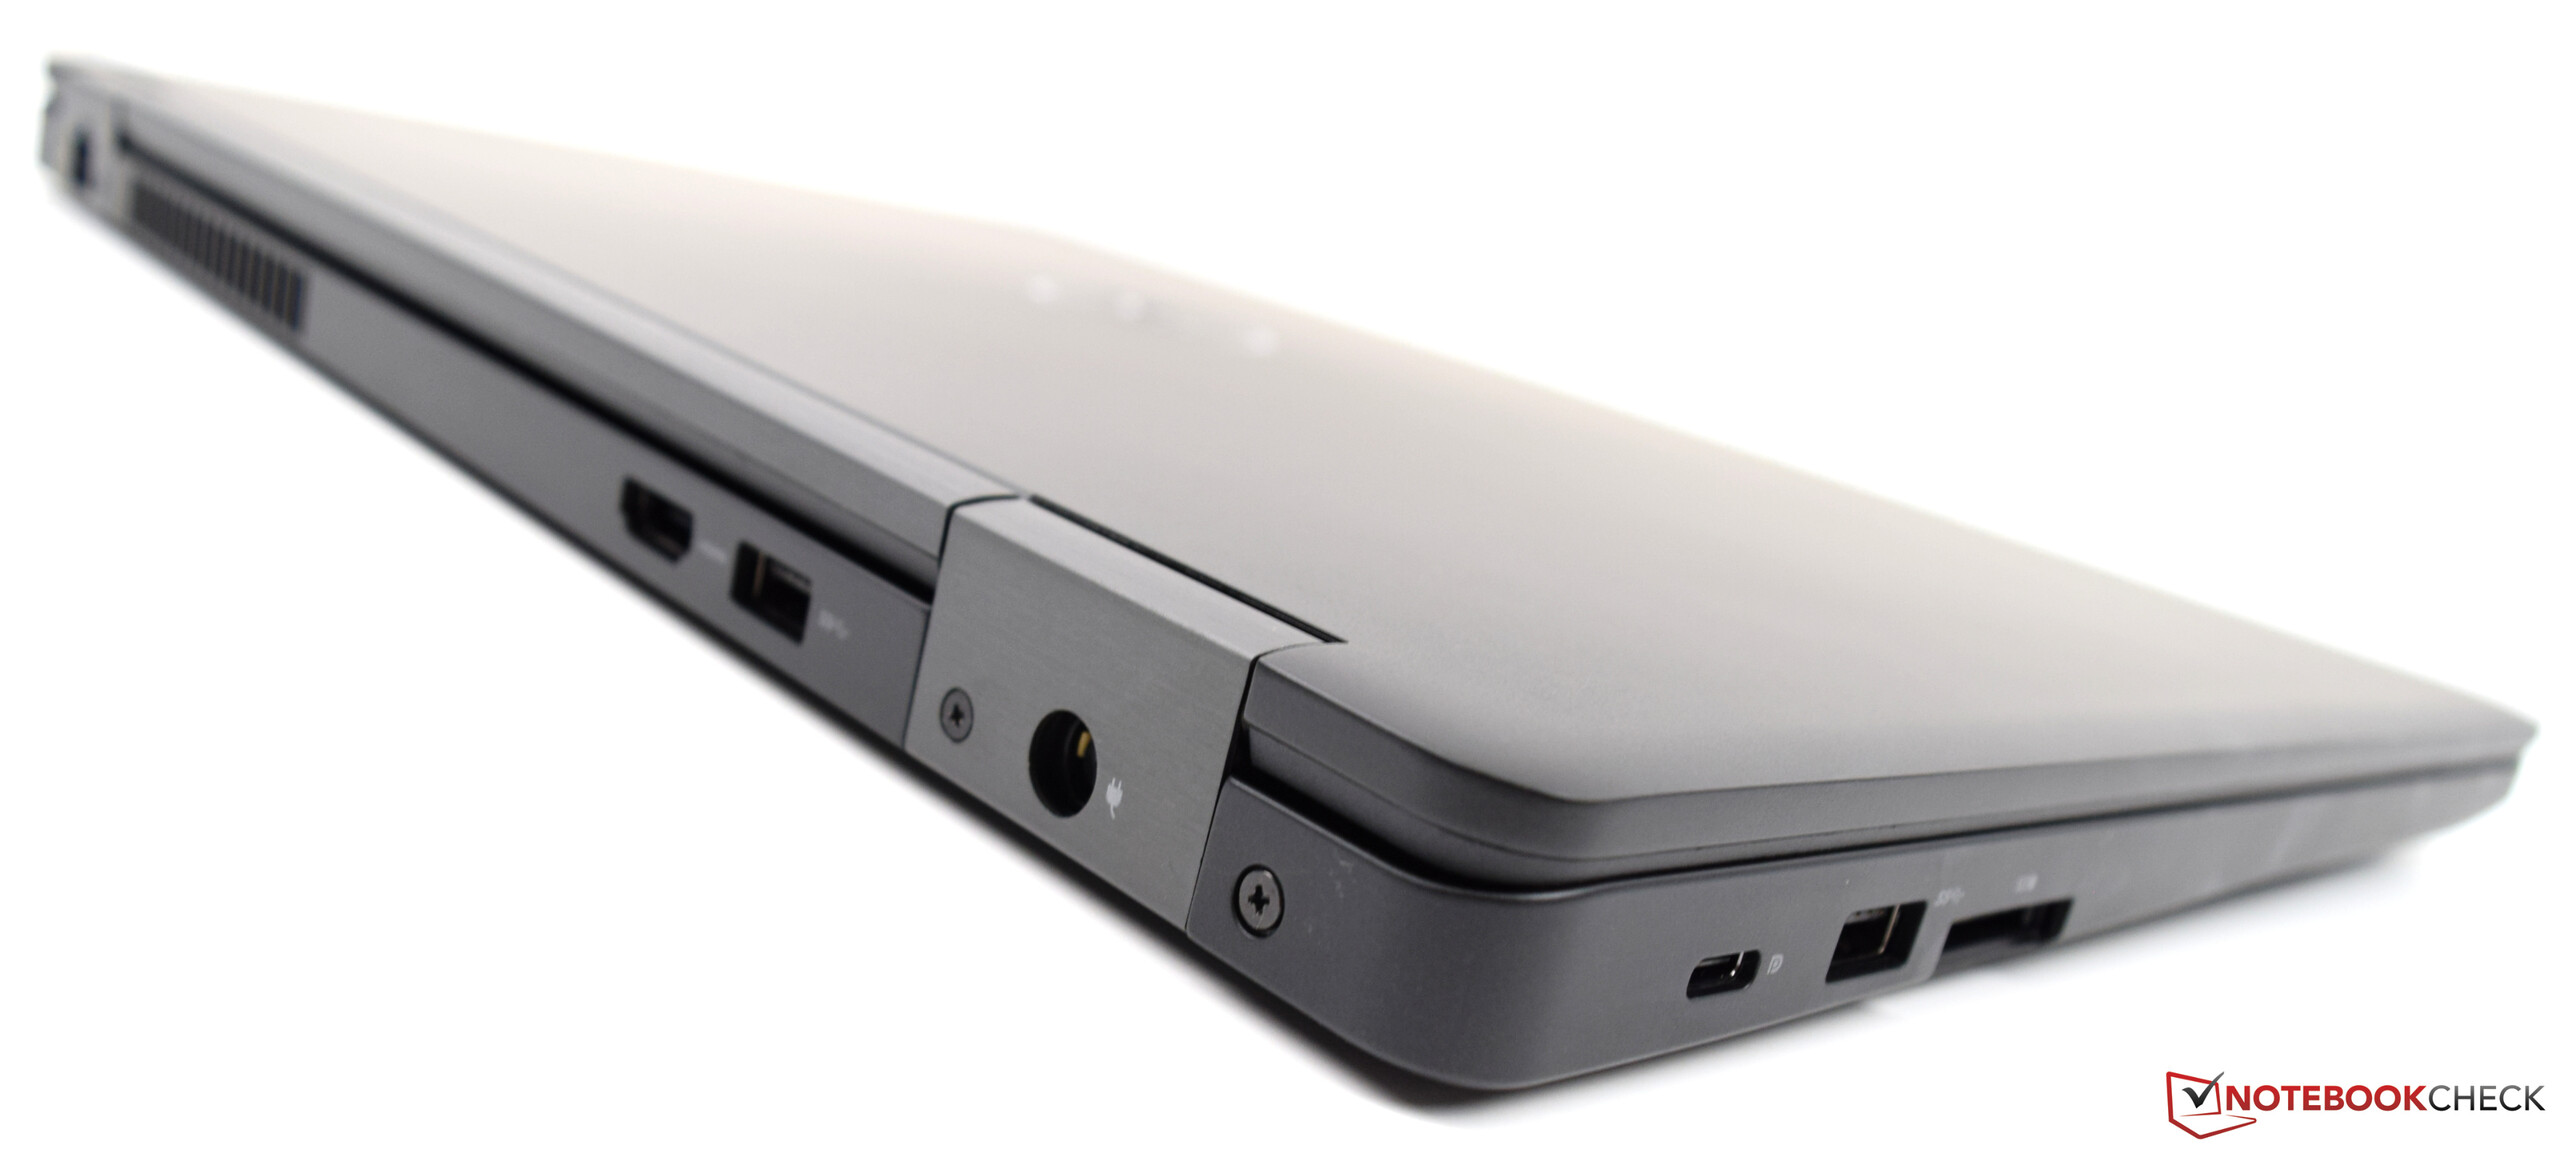
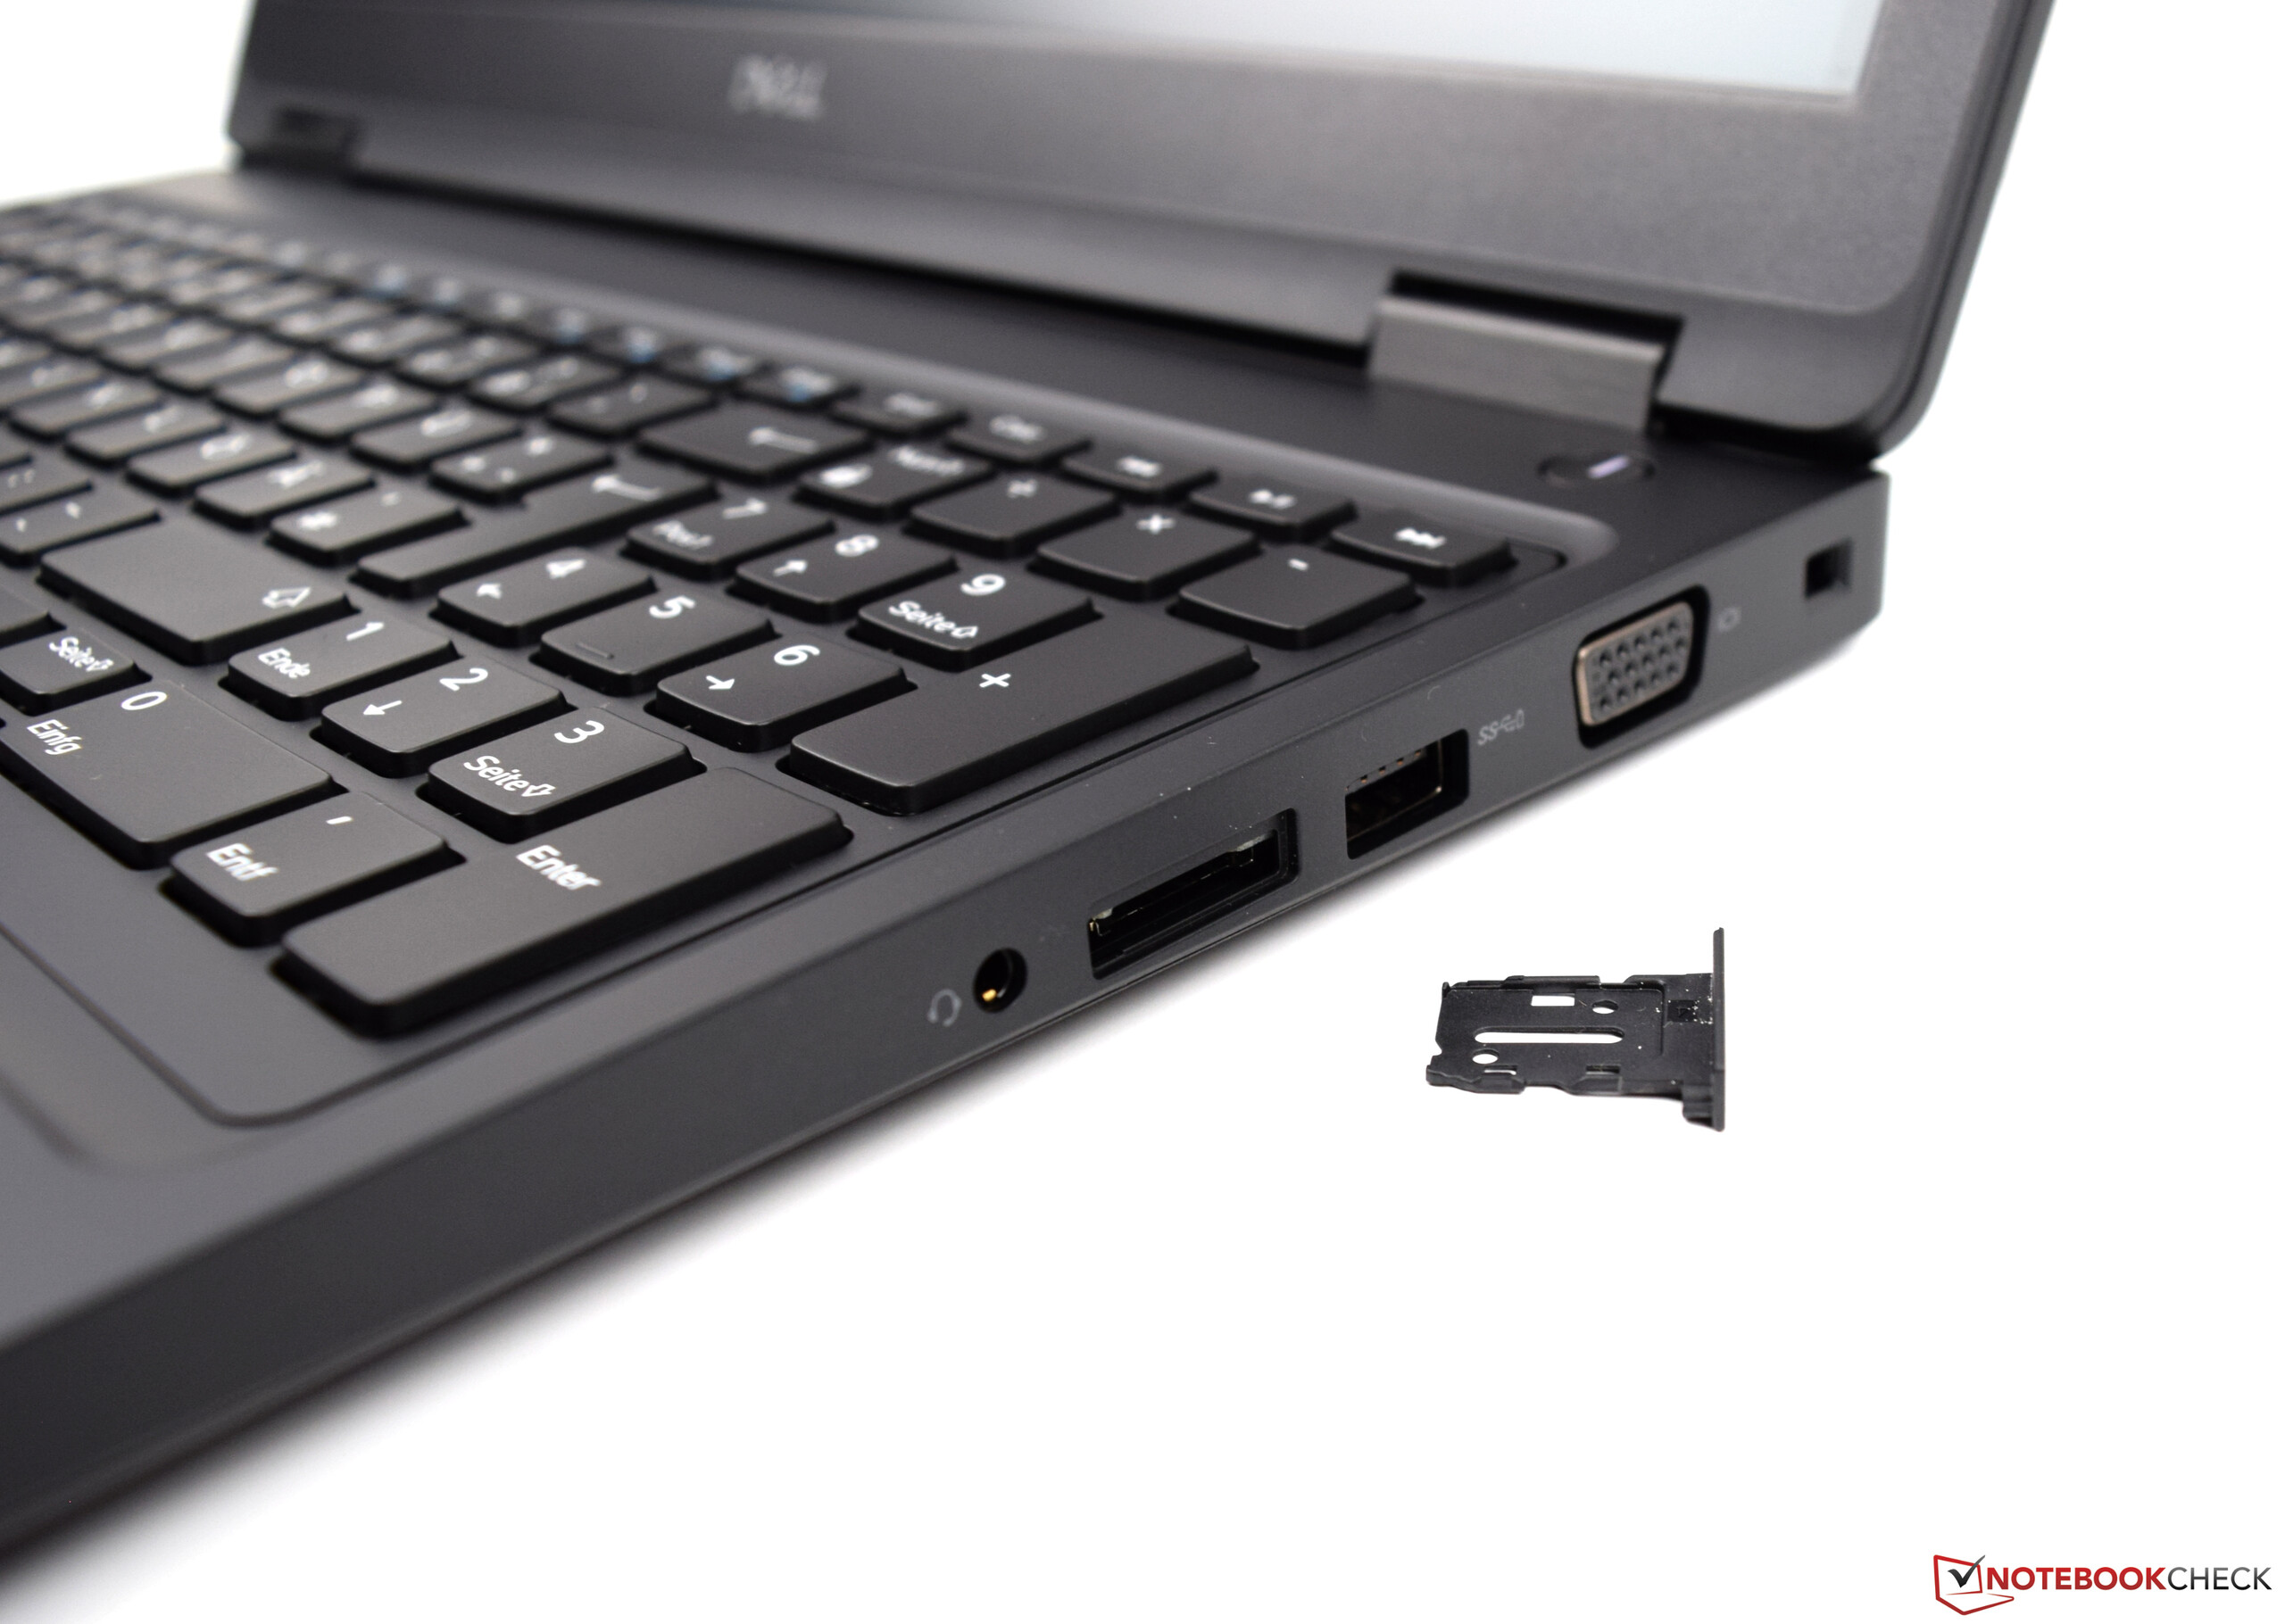
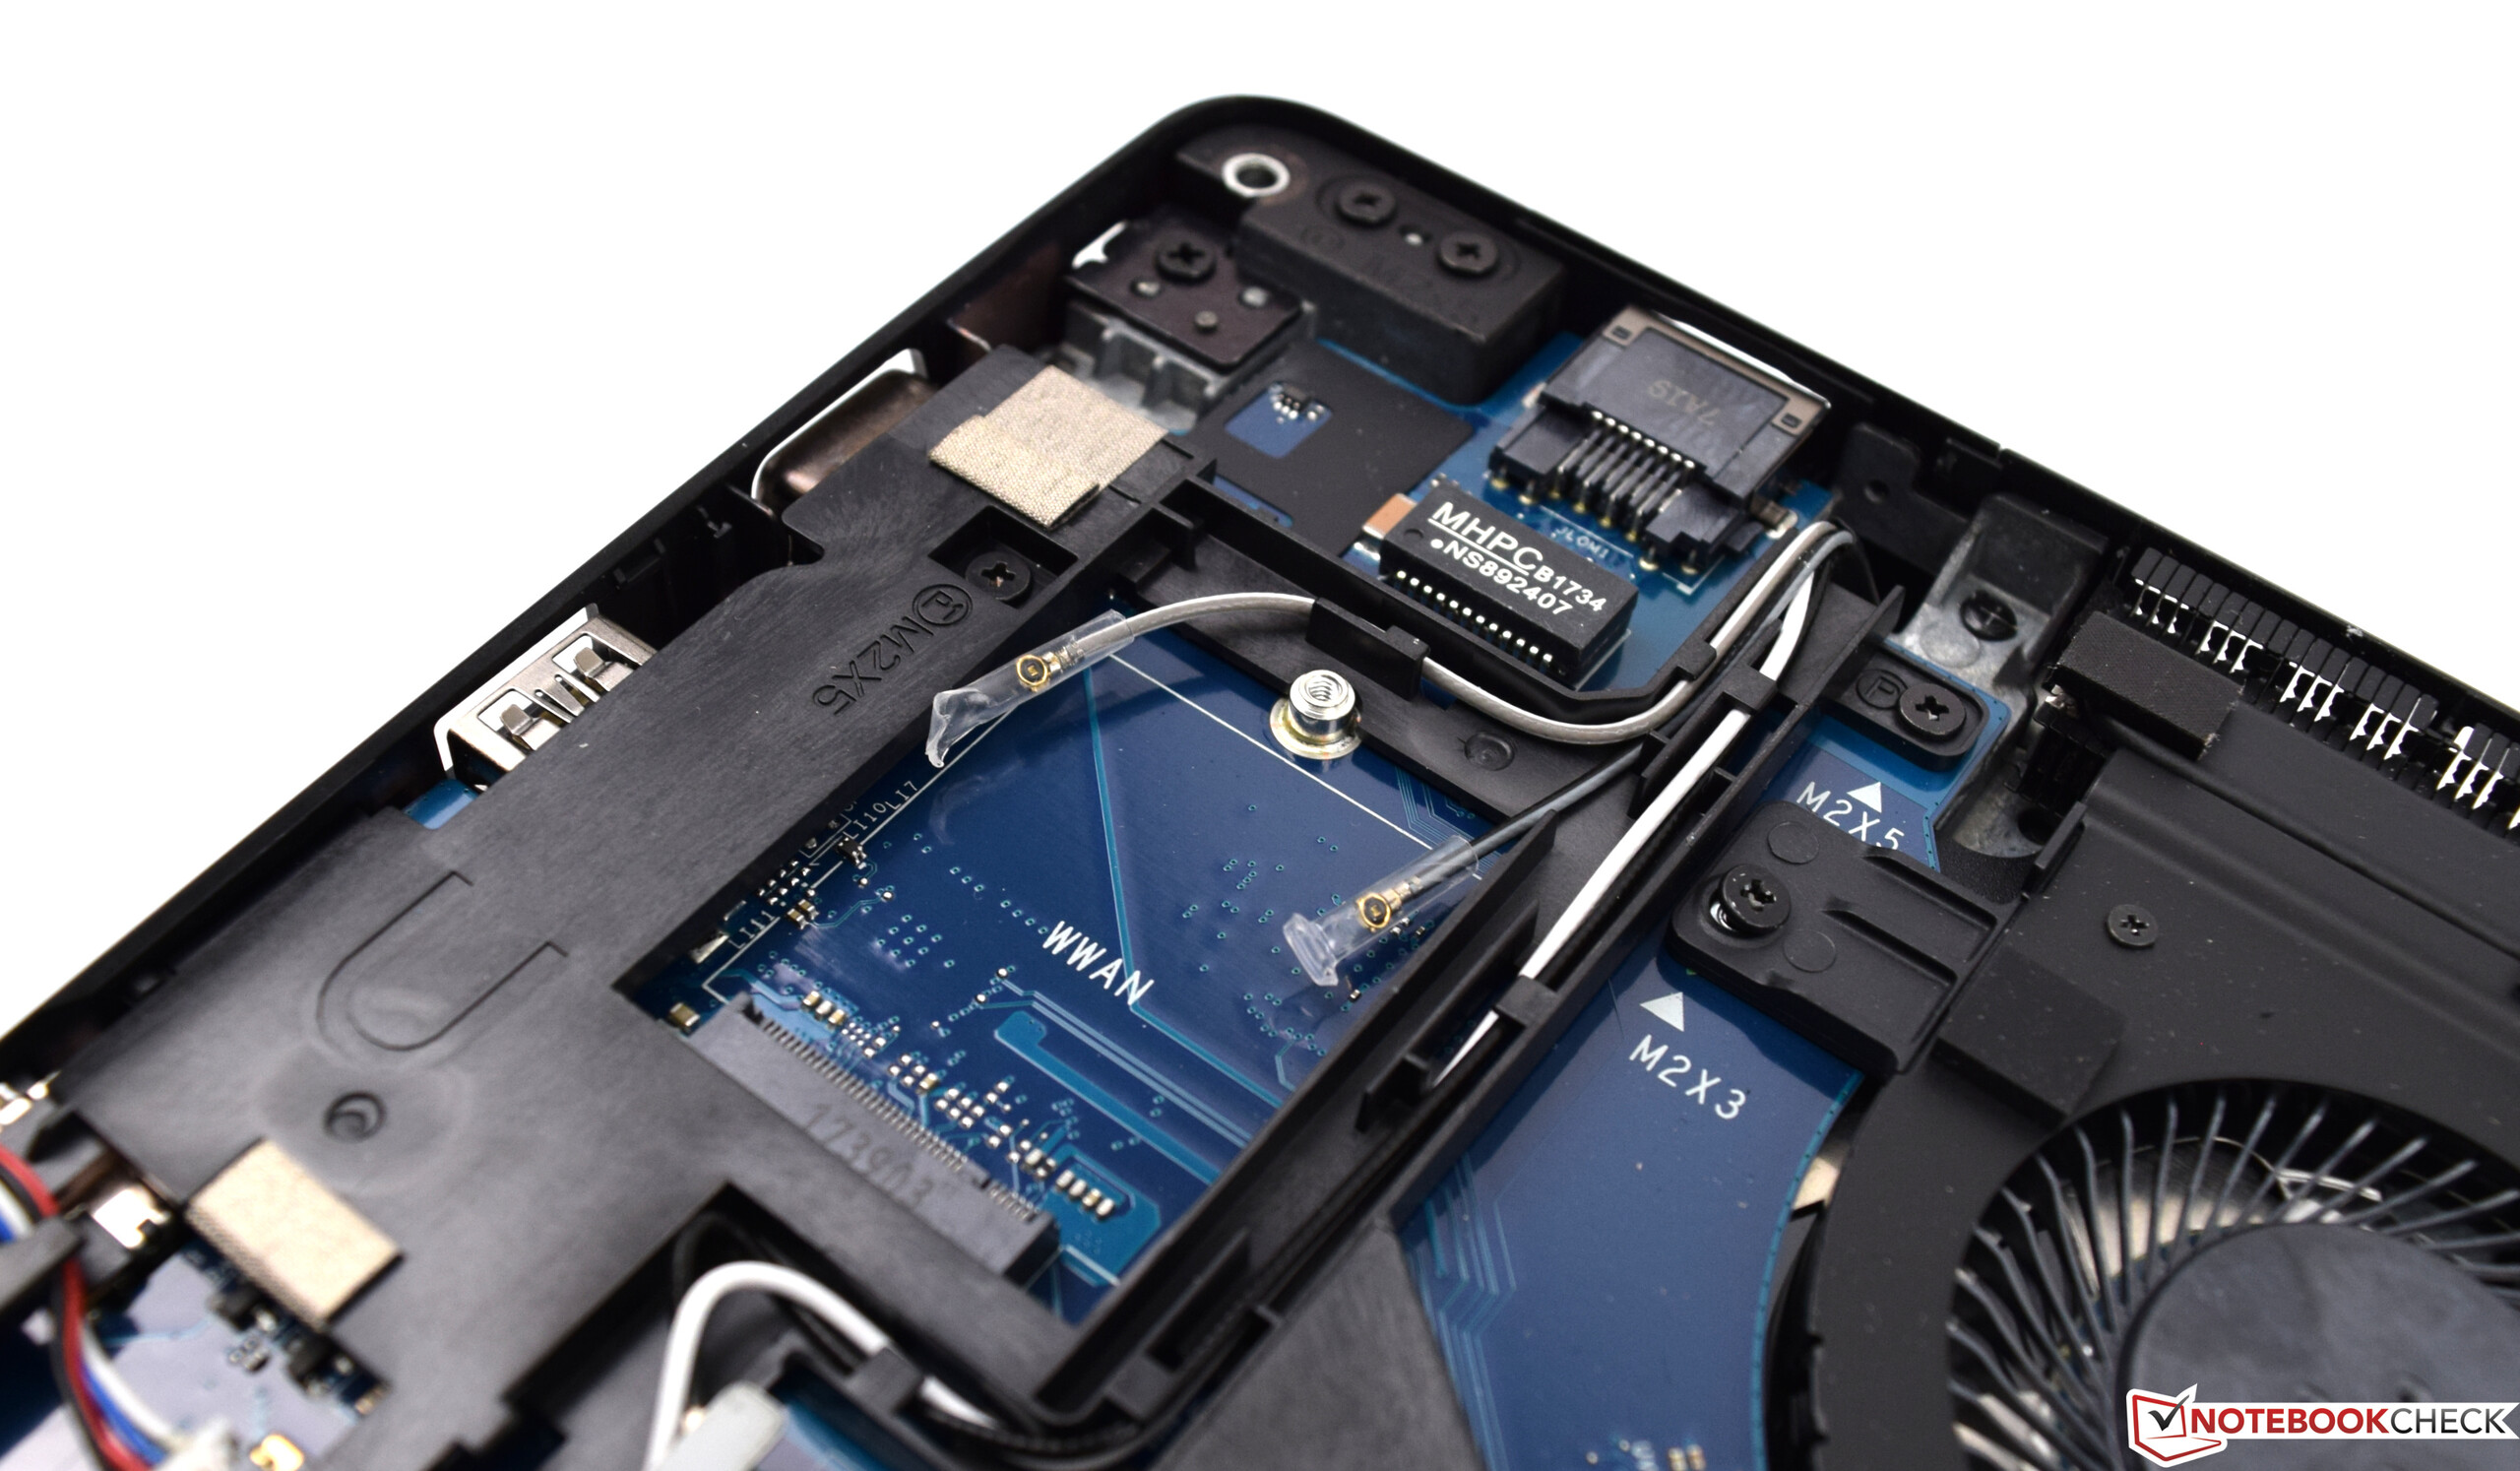
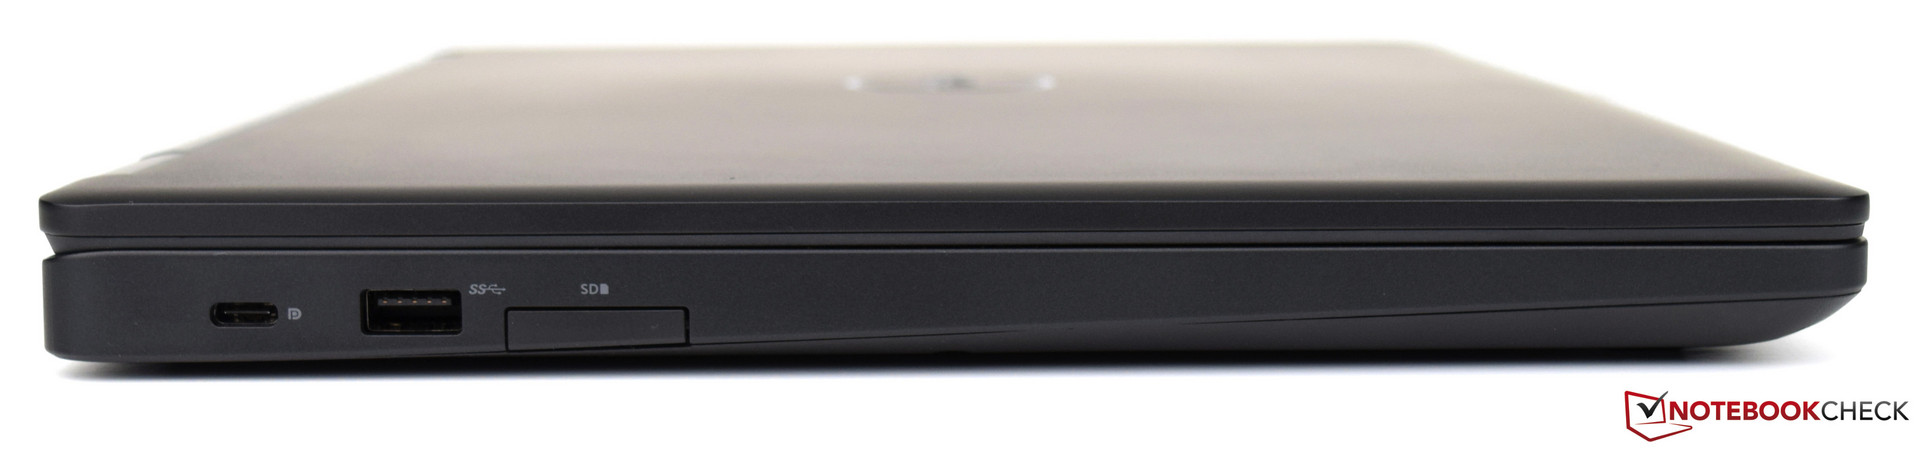
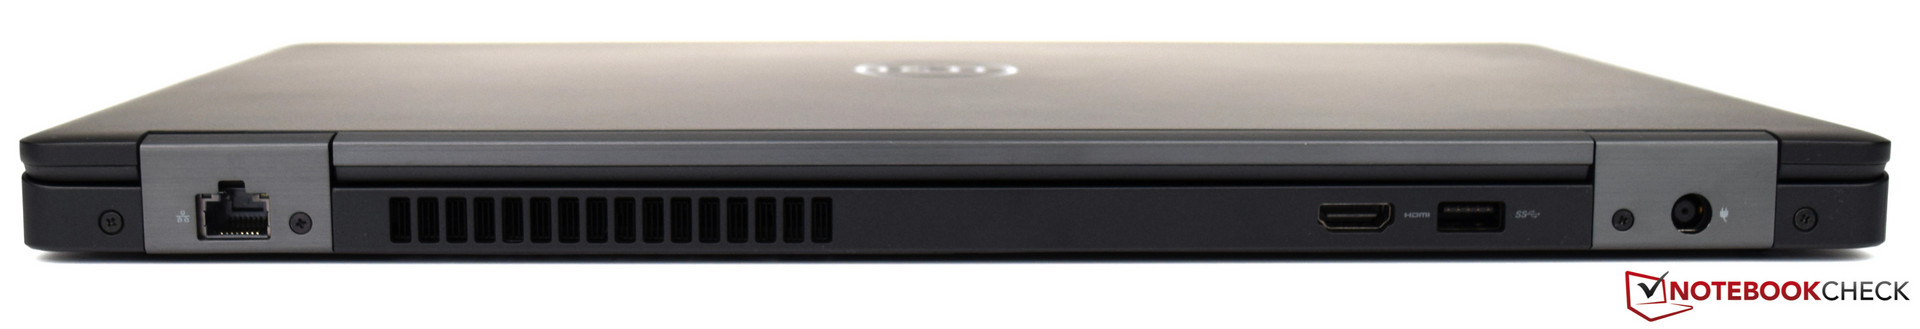
The Latitude 5590 is well equipped in terms of I/O. There are three USB 3.1 Type-A ports, a USB Type-C that supports DisplayPort output, an SD card reader, a 3.5 mm jack, and an RJ-45 Ethernet port. We appreciate Dell’s inclusion of HDMI and VGA ports, the latter of which we hope Dell will continue to include in its business laptops. Many projectors still only have a VGA connection and its inclusion on the Latitude 5590 means that we do not have to carry around an adaptor.
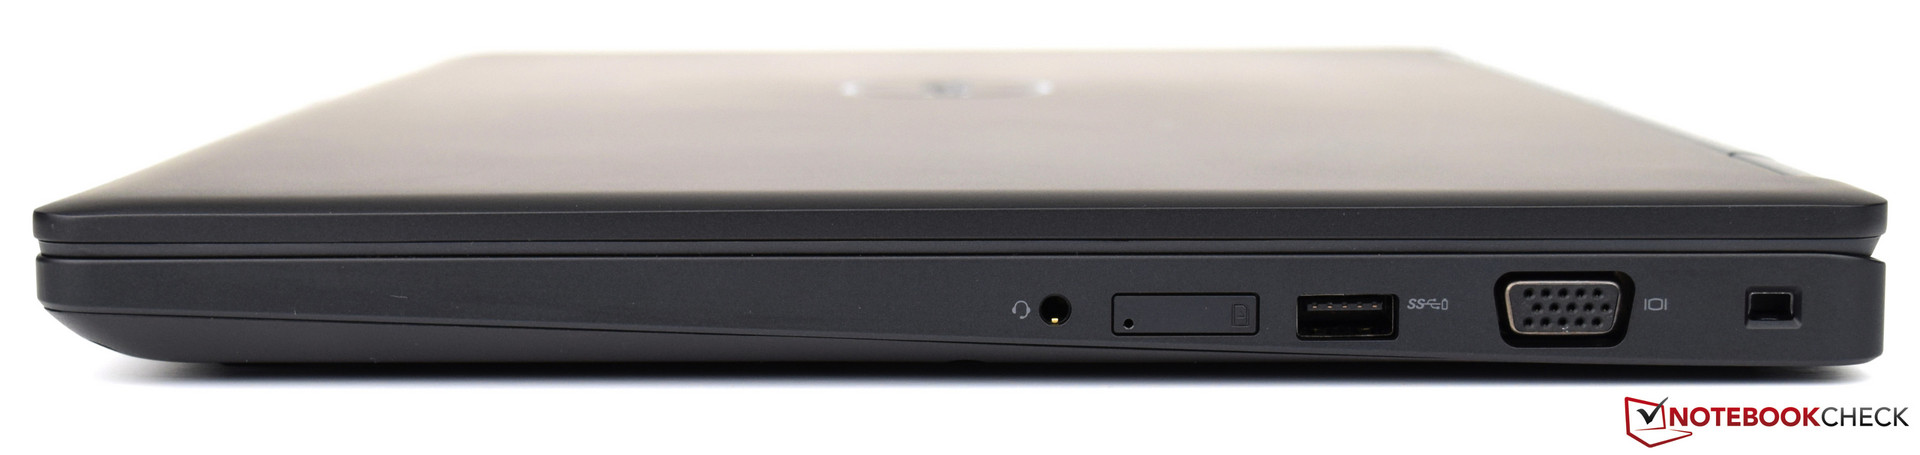
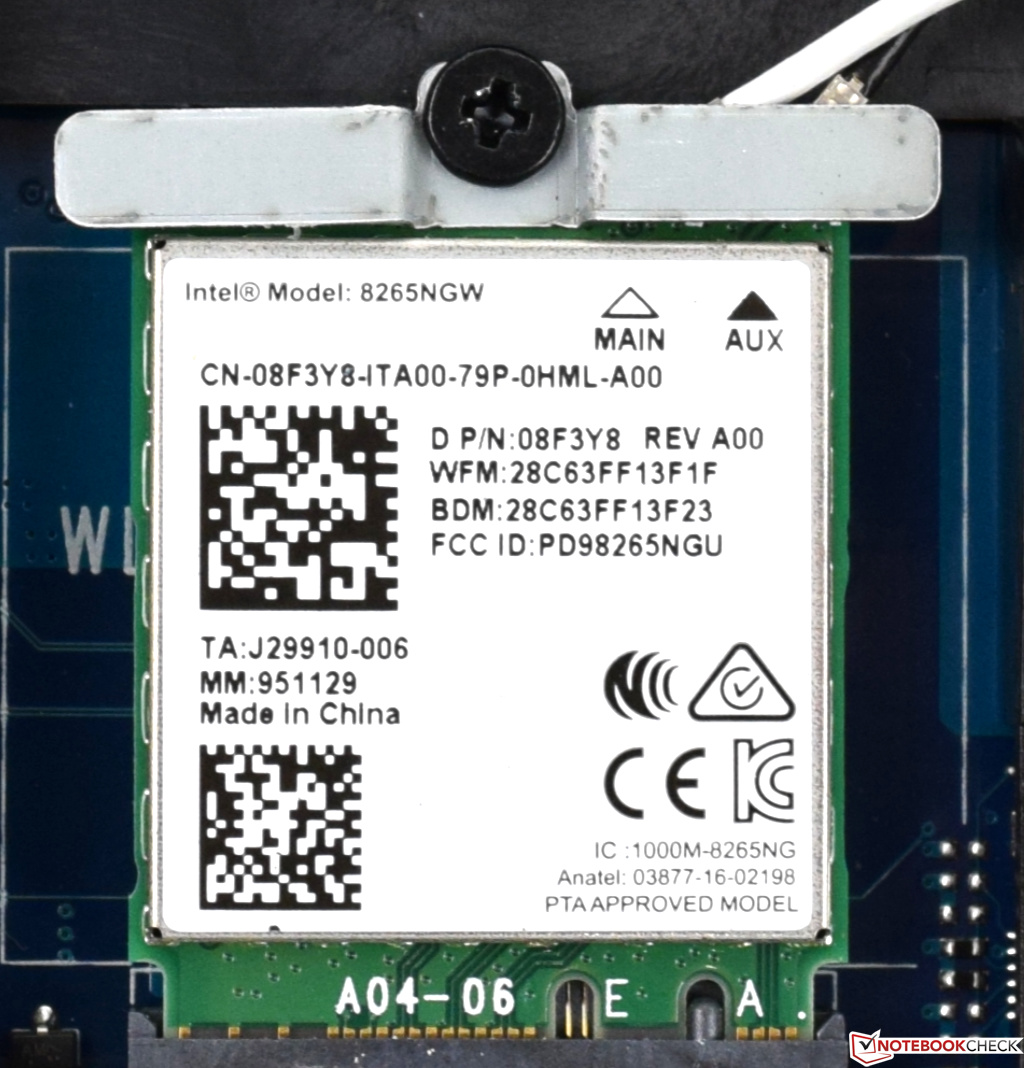
Hats off to Dell for including an SD card reader that accepts the entire SD card, with no protrusion. The transfer speeds are equally impressive, with the UHS-II speeds being well above the class average. Unfortunately, the same cannot be said of the Wi-Fi performance with the Latitude 5590 being resoundingly beaten by the Fujitsu LifeBook U757.
| SD Card Reader | |
| average JPG Copy Test (av. of 3 runs) | |
| Dell Latitude 5590 (Toshiba Exceria Pro SDXC 64 GB UHS-II) | |
| Dell Latitude 5580 (Toshiba Exceria Pro SDXC 64 GB UHS-II) | |
| Fujitsu LifeBook U757 (Toshiba Exceria Pro SDXC 64 GB UHS-II) | |
| Lenovo ThinkPad T570-20H90002GE (Toshiba Exceria Pro SDXC 64 GB UHS-II) | |
| HP EliteBook 850 G4-Z2W86ET (Toshiba Exceria Pro SDXC 64 GB UHS-II) | |
| Average of class Office (22.4 - 198.5, n=21, last 2 years) | |
| maximum AS SSD Seq Read Test (1GB) | |
| Dell Latitude 5580 (Toshiba Exceria Pro SDXC 64 GB UHS-II) | |
| Dell Latitude 5590 (Toshiba Exceria Pro SDXC 64 GB UHS-II) | |
| Lenovo ThinkPad T570-20H90002GE (Toshiba Exceria Pro SDXC 64 GB UHS-II) | |
| HP EliteBook 850 G4-Z2W86ET (Toshiba Exceria Pro SDXC 64 GB UHS-II) | |
| Fujitsu LifeBook U757 (Toshiba Exceria Pro SDXC 64 GB UHS-II) | |
| Average of class Office (27.4 - 249, n=20, last 2 years) | |
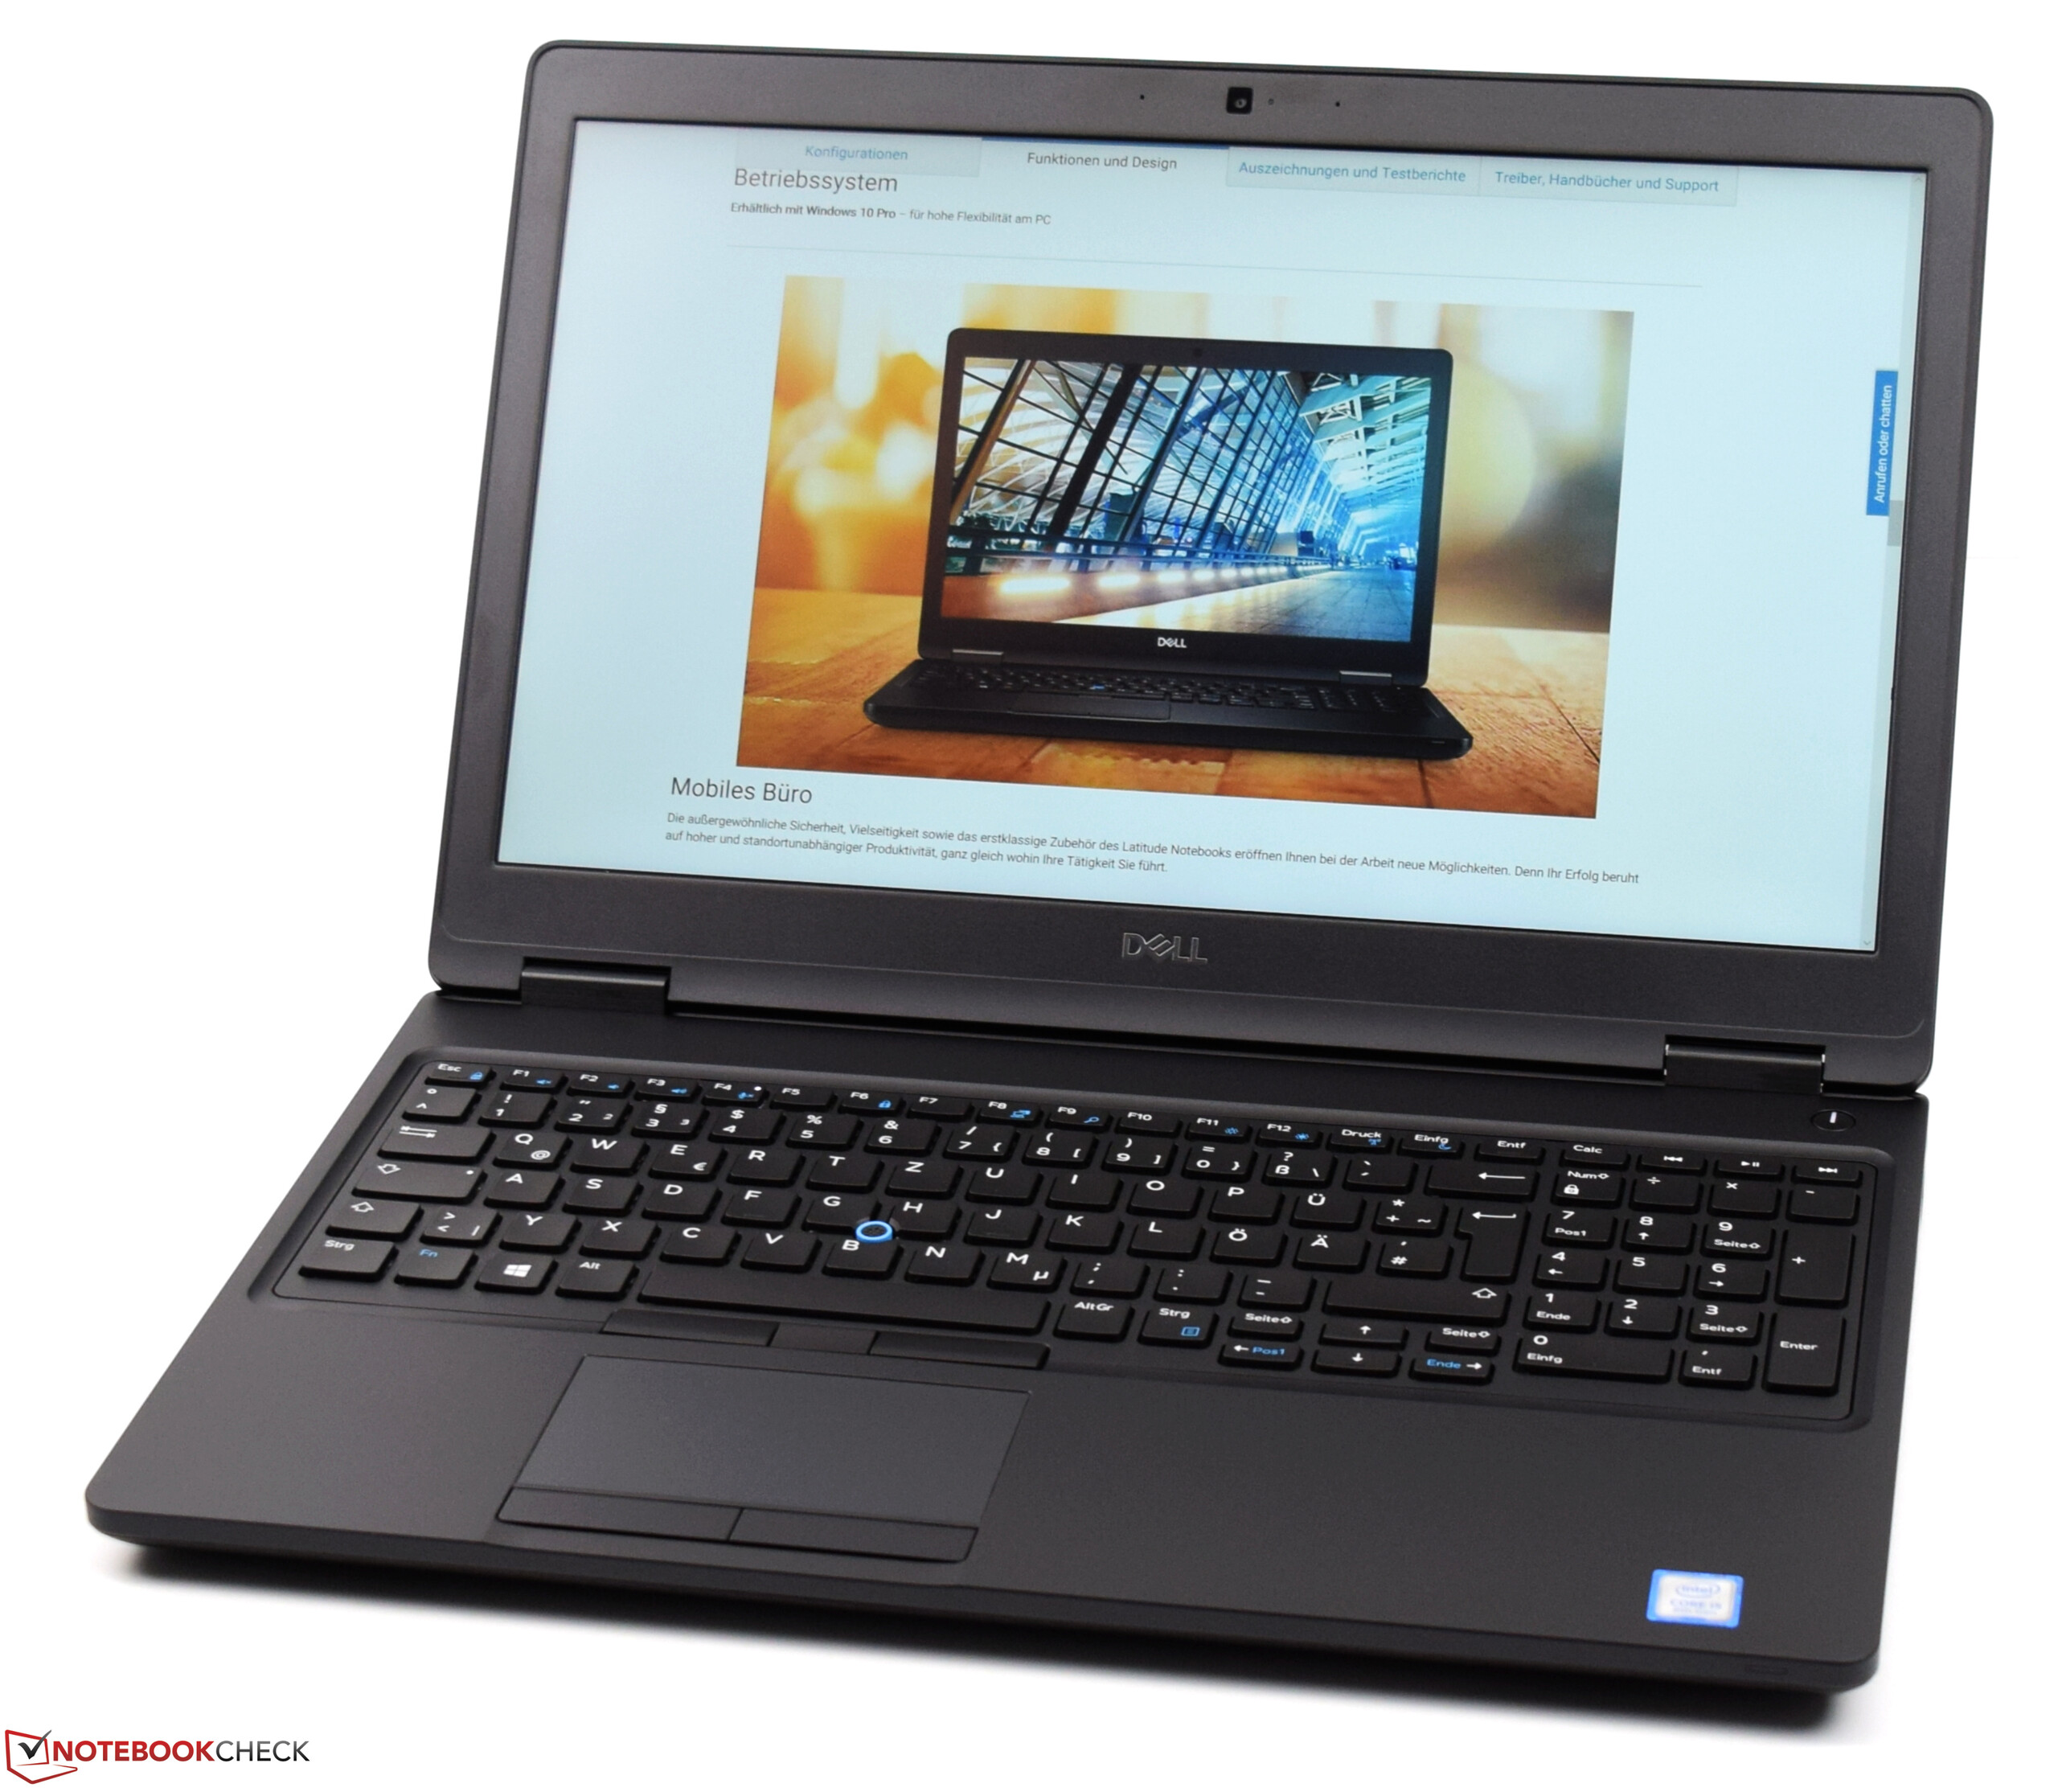
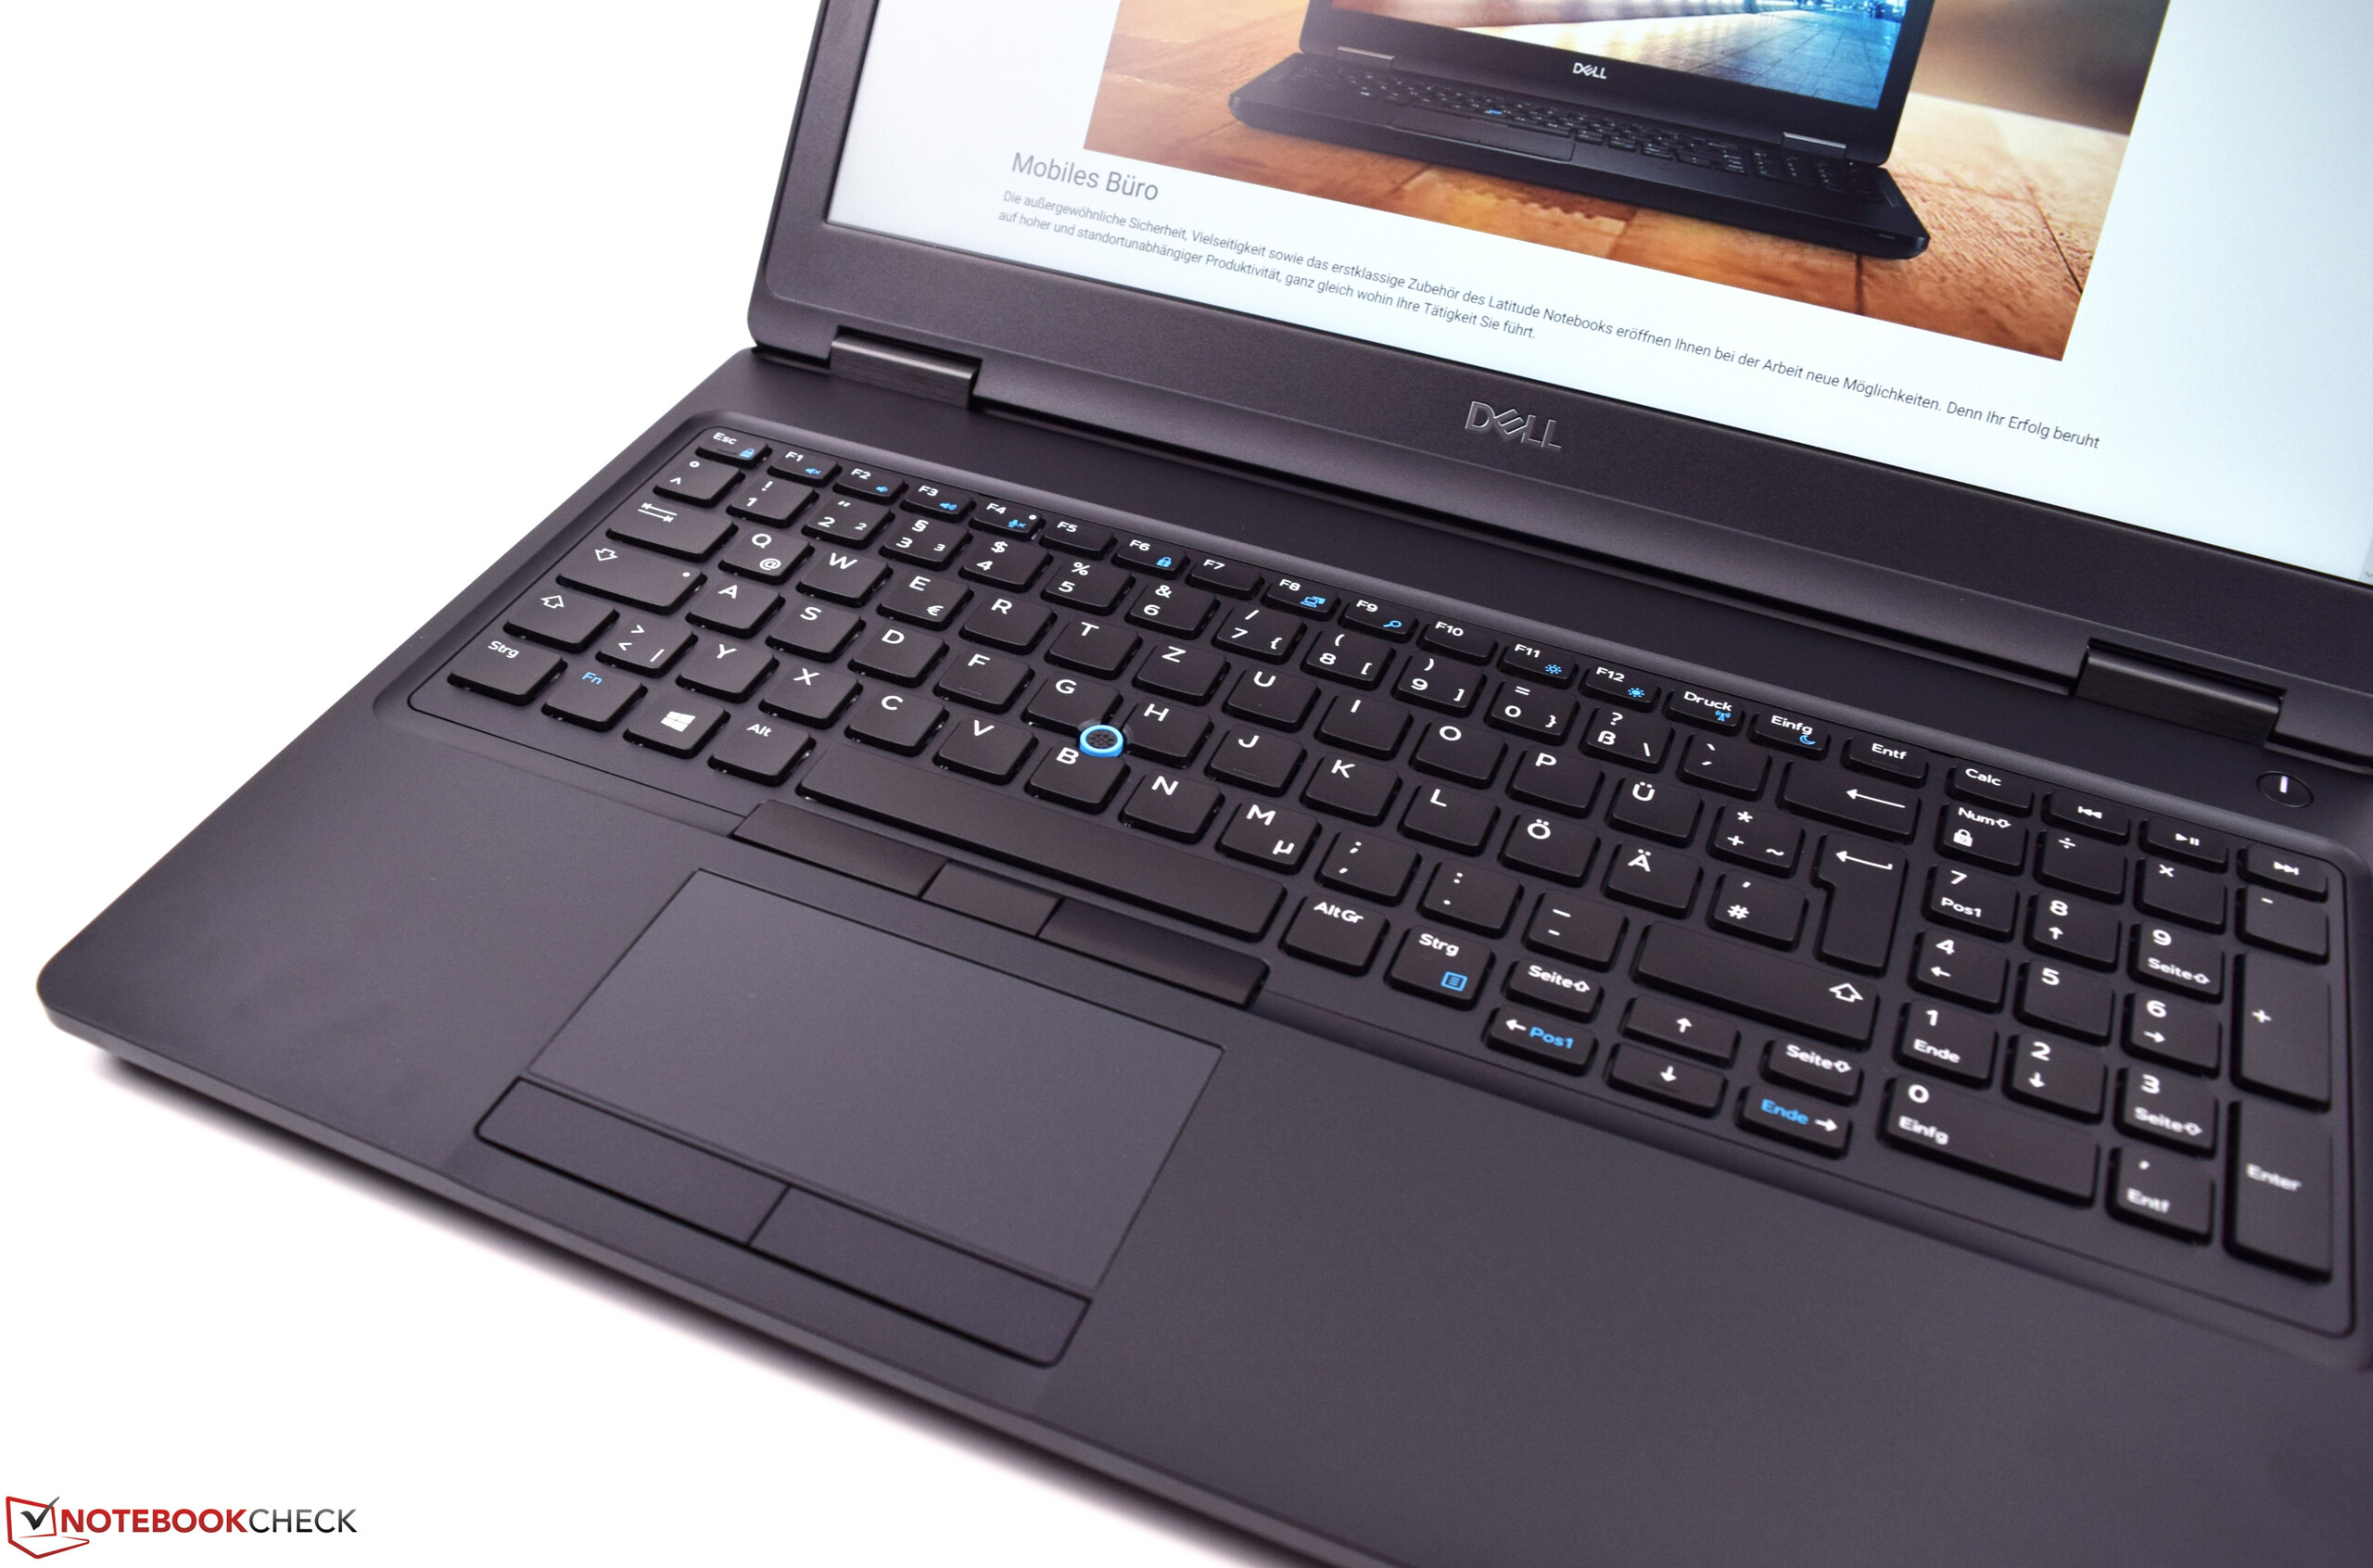
Input Devices
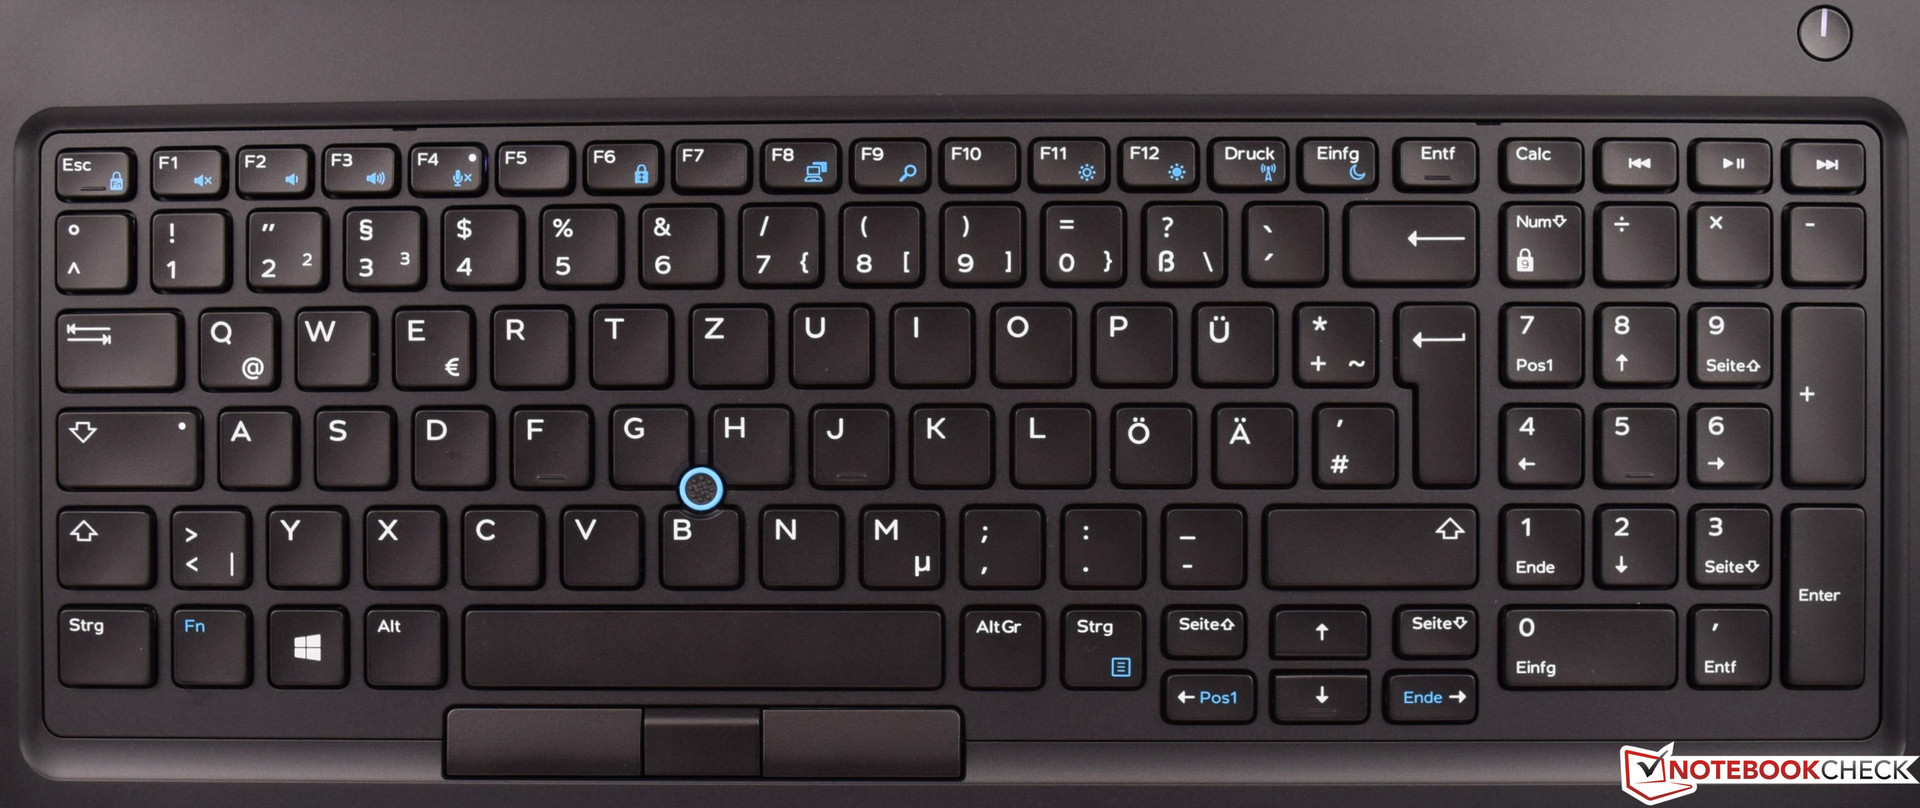
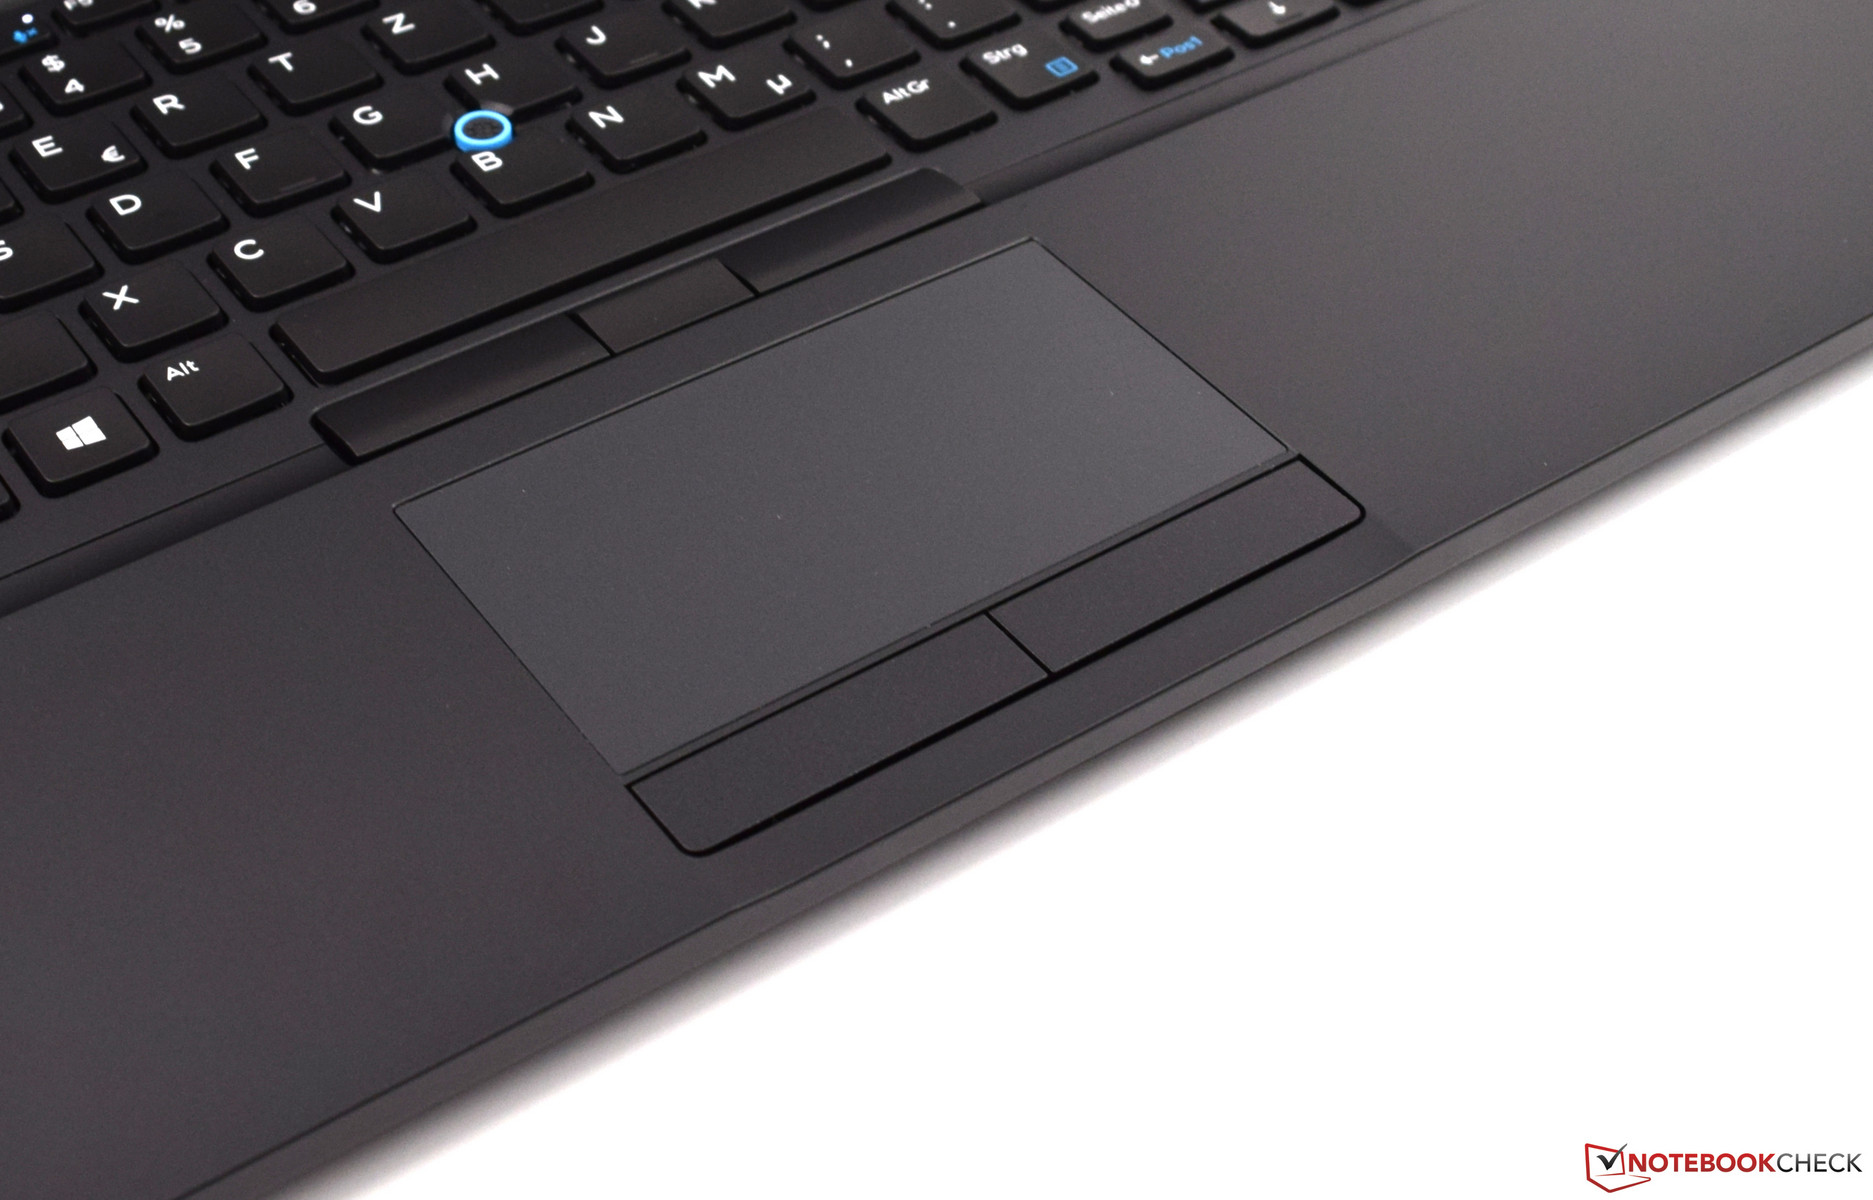
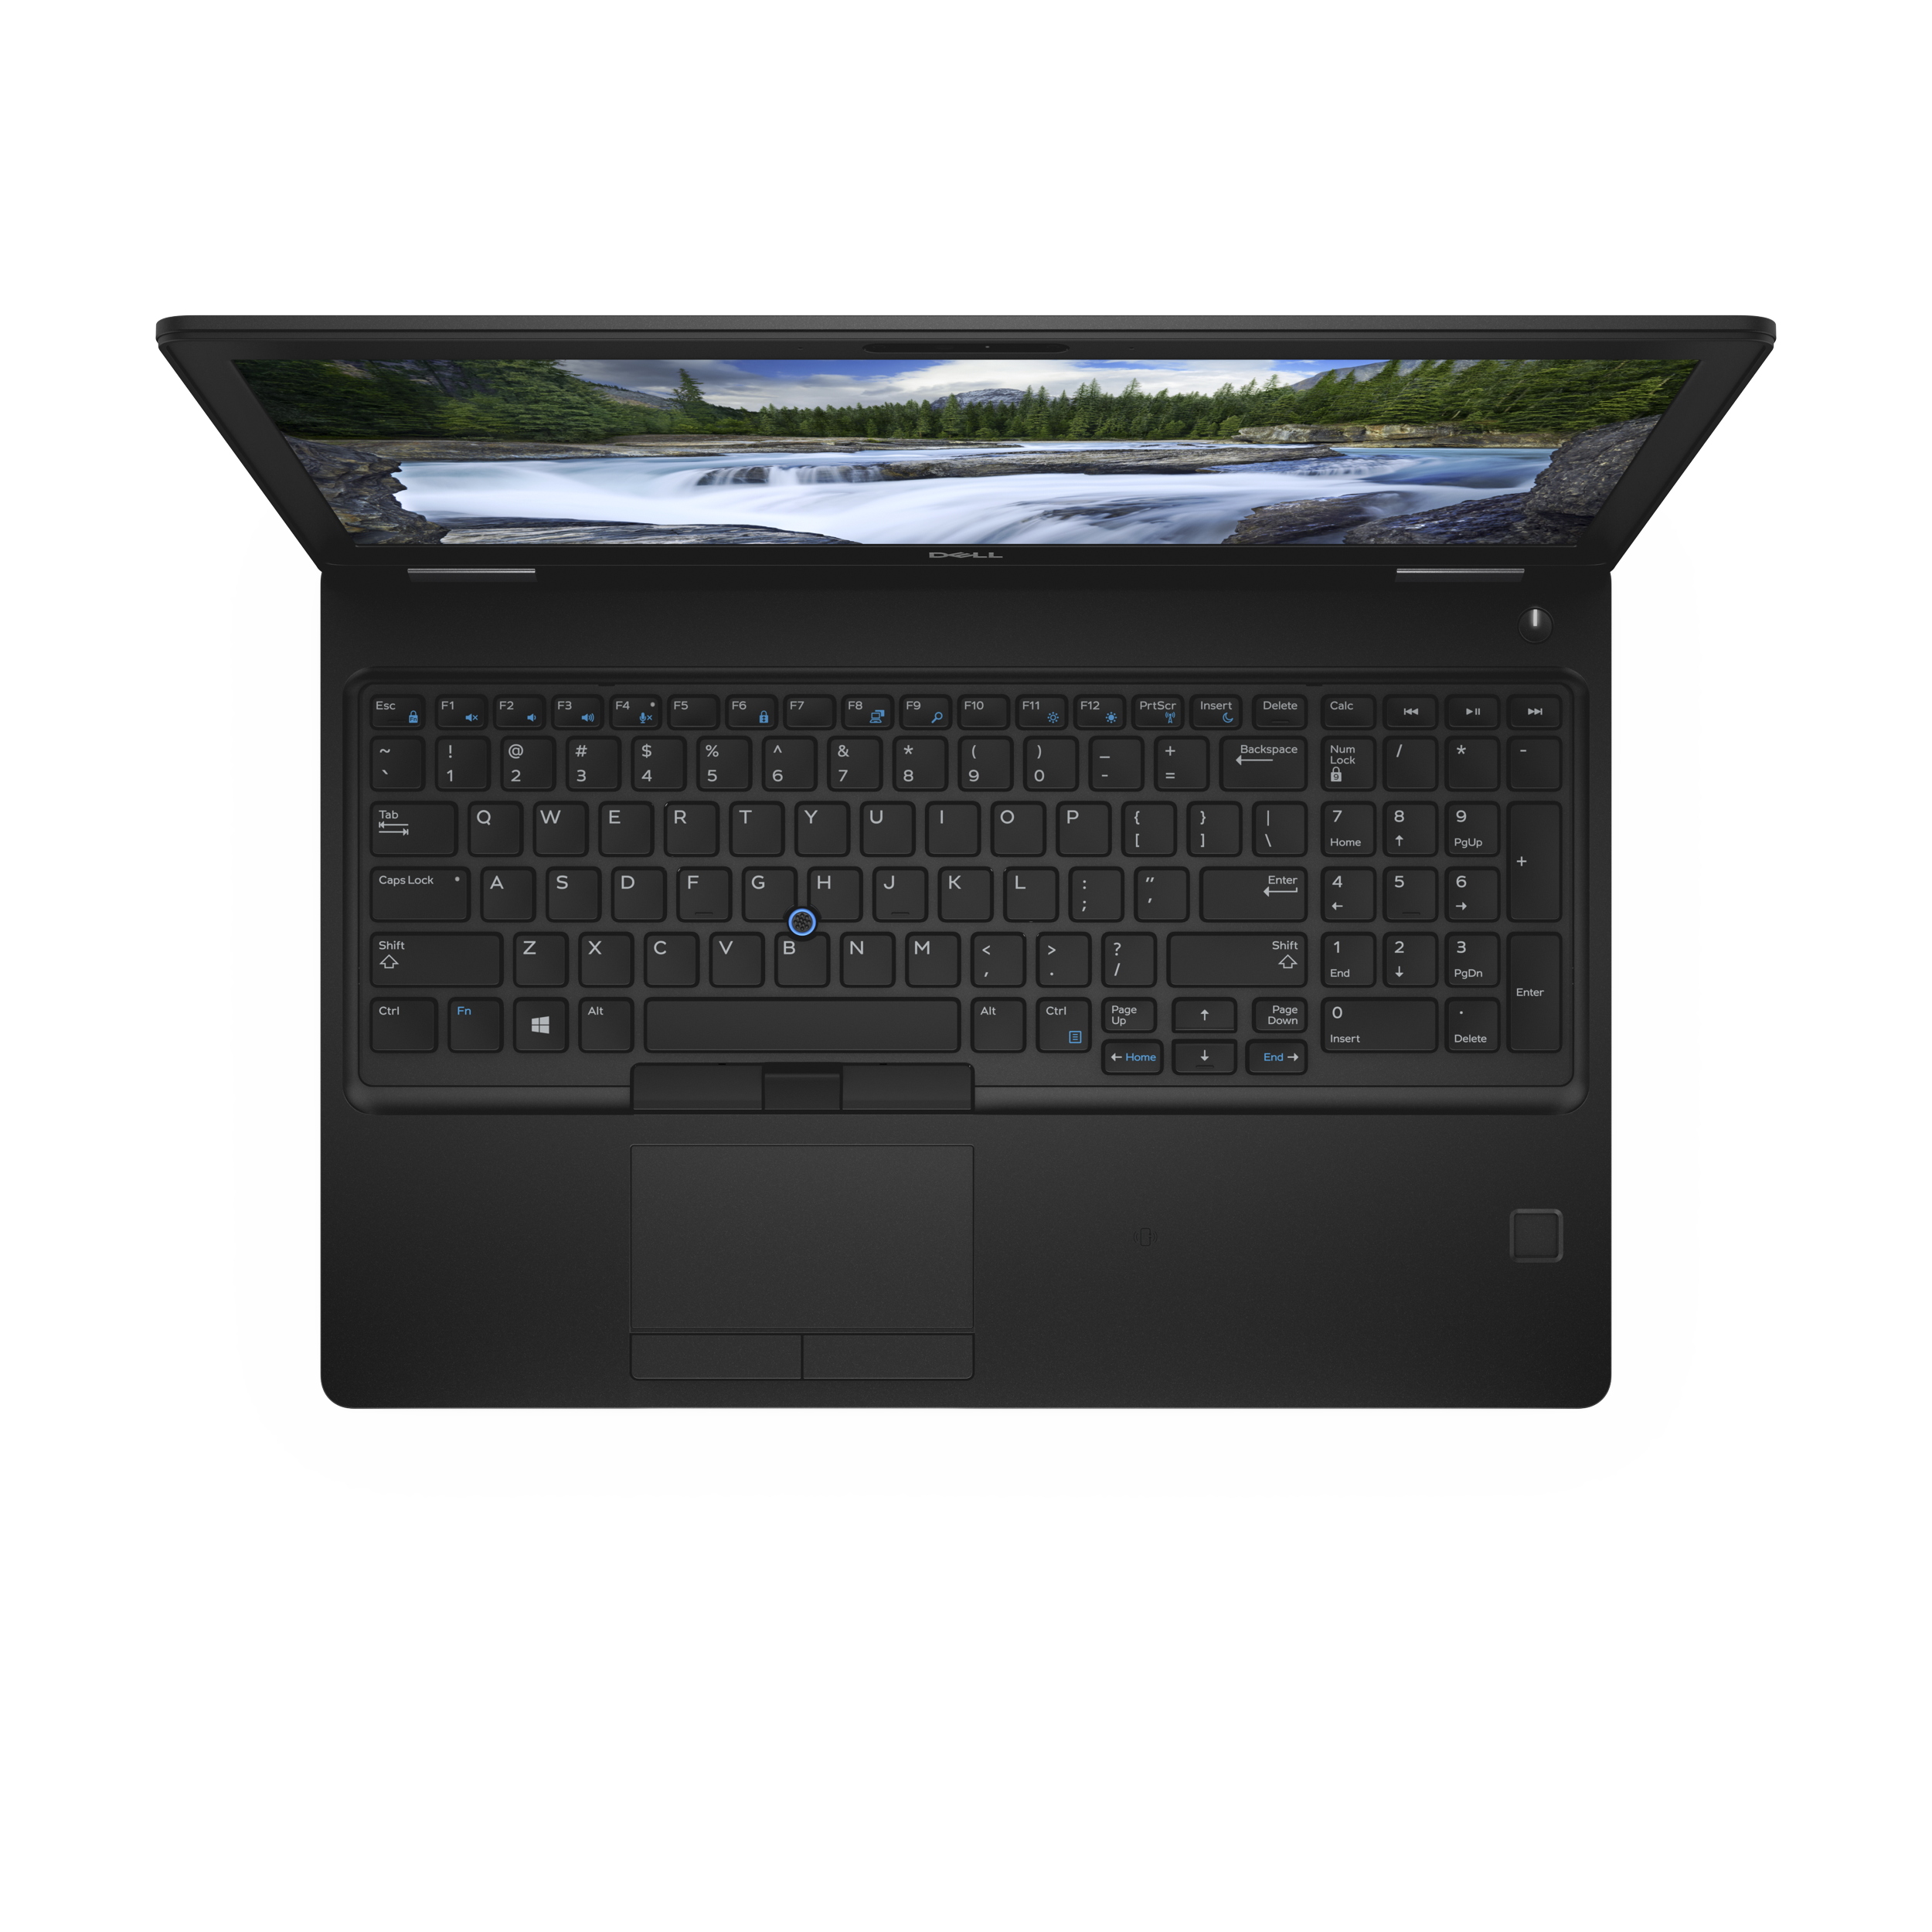
The keyboard looks clear and tidy with 14 x 14 mm (~0.55 x 0.55 in) keys that are only slightly smaller than those found on comparable devices. Overall, the chiclet keyboard is pleasant to use, but there are a few minor gripes. The keys have a noticeable pressure point, although we would have liked this to be a bit firmer. There is audible key noise when typing, but this is somewhat muffled and something that we did not find to be annoying. The layout may take some getting used to as the arrow keys are half-sized, while the TrackPoint that sits in the middle of the G, H, and B keys could have been more pleasant to use if it were a few millimeters higher. The TrackPoint worked well, but will take some getting used to as we frequently pressed the surrounding keys accidentally when using it for navigation. The TrackPoint input keys can be found just below the space bar and have a soft acoustic feedback when pressed.
The Touchpad is rather small at 10 x 5.4 cm (~3.9 x 2.1 in), and perhaps it would have been a better use of space if Dell had incorporated the dedicated input buttons into the Touchpad for a larger tracking area. The Touchpad is slightly inaccurate and has a slightly roughened texture to it. The two input buttons below the Touchpad work well, as do the ones below the spacebar.
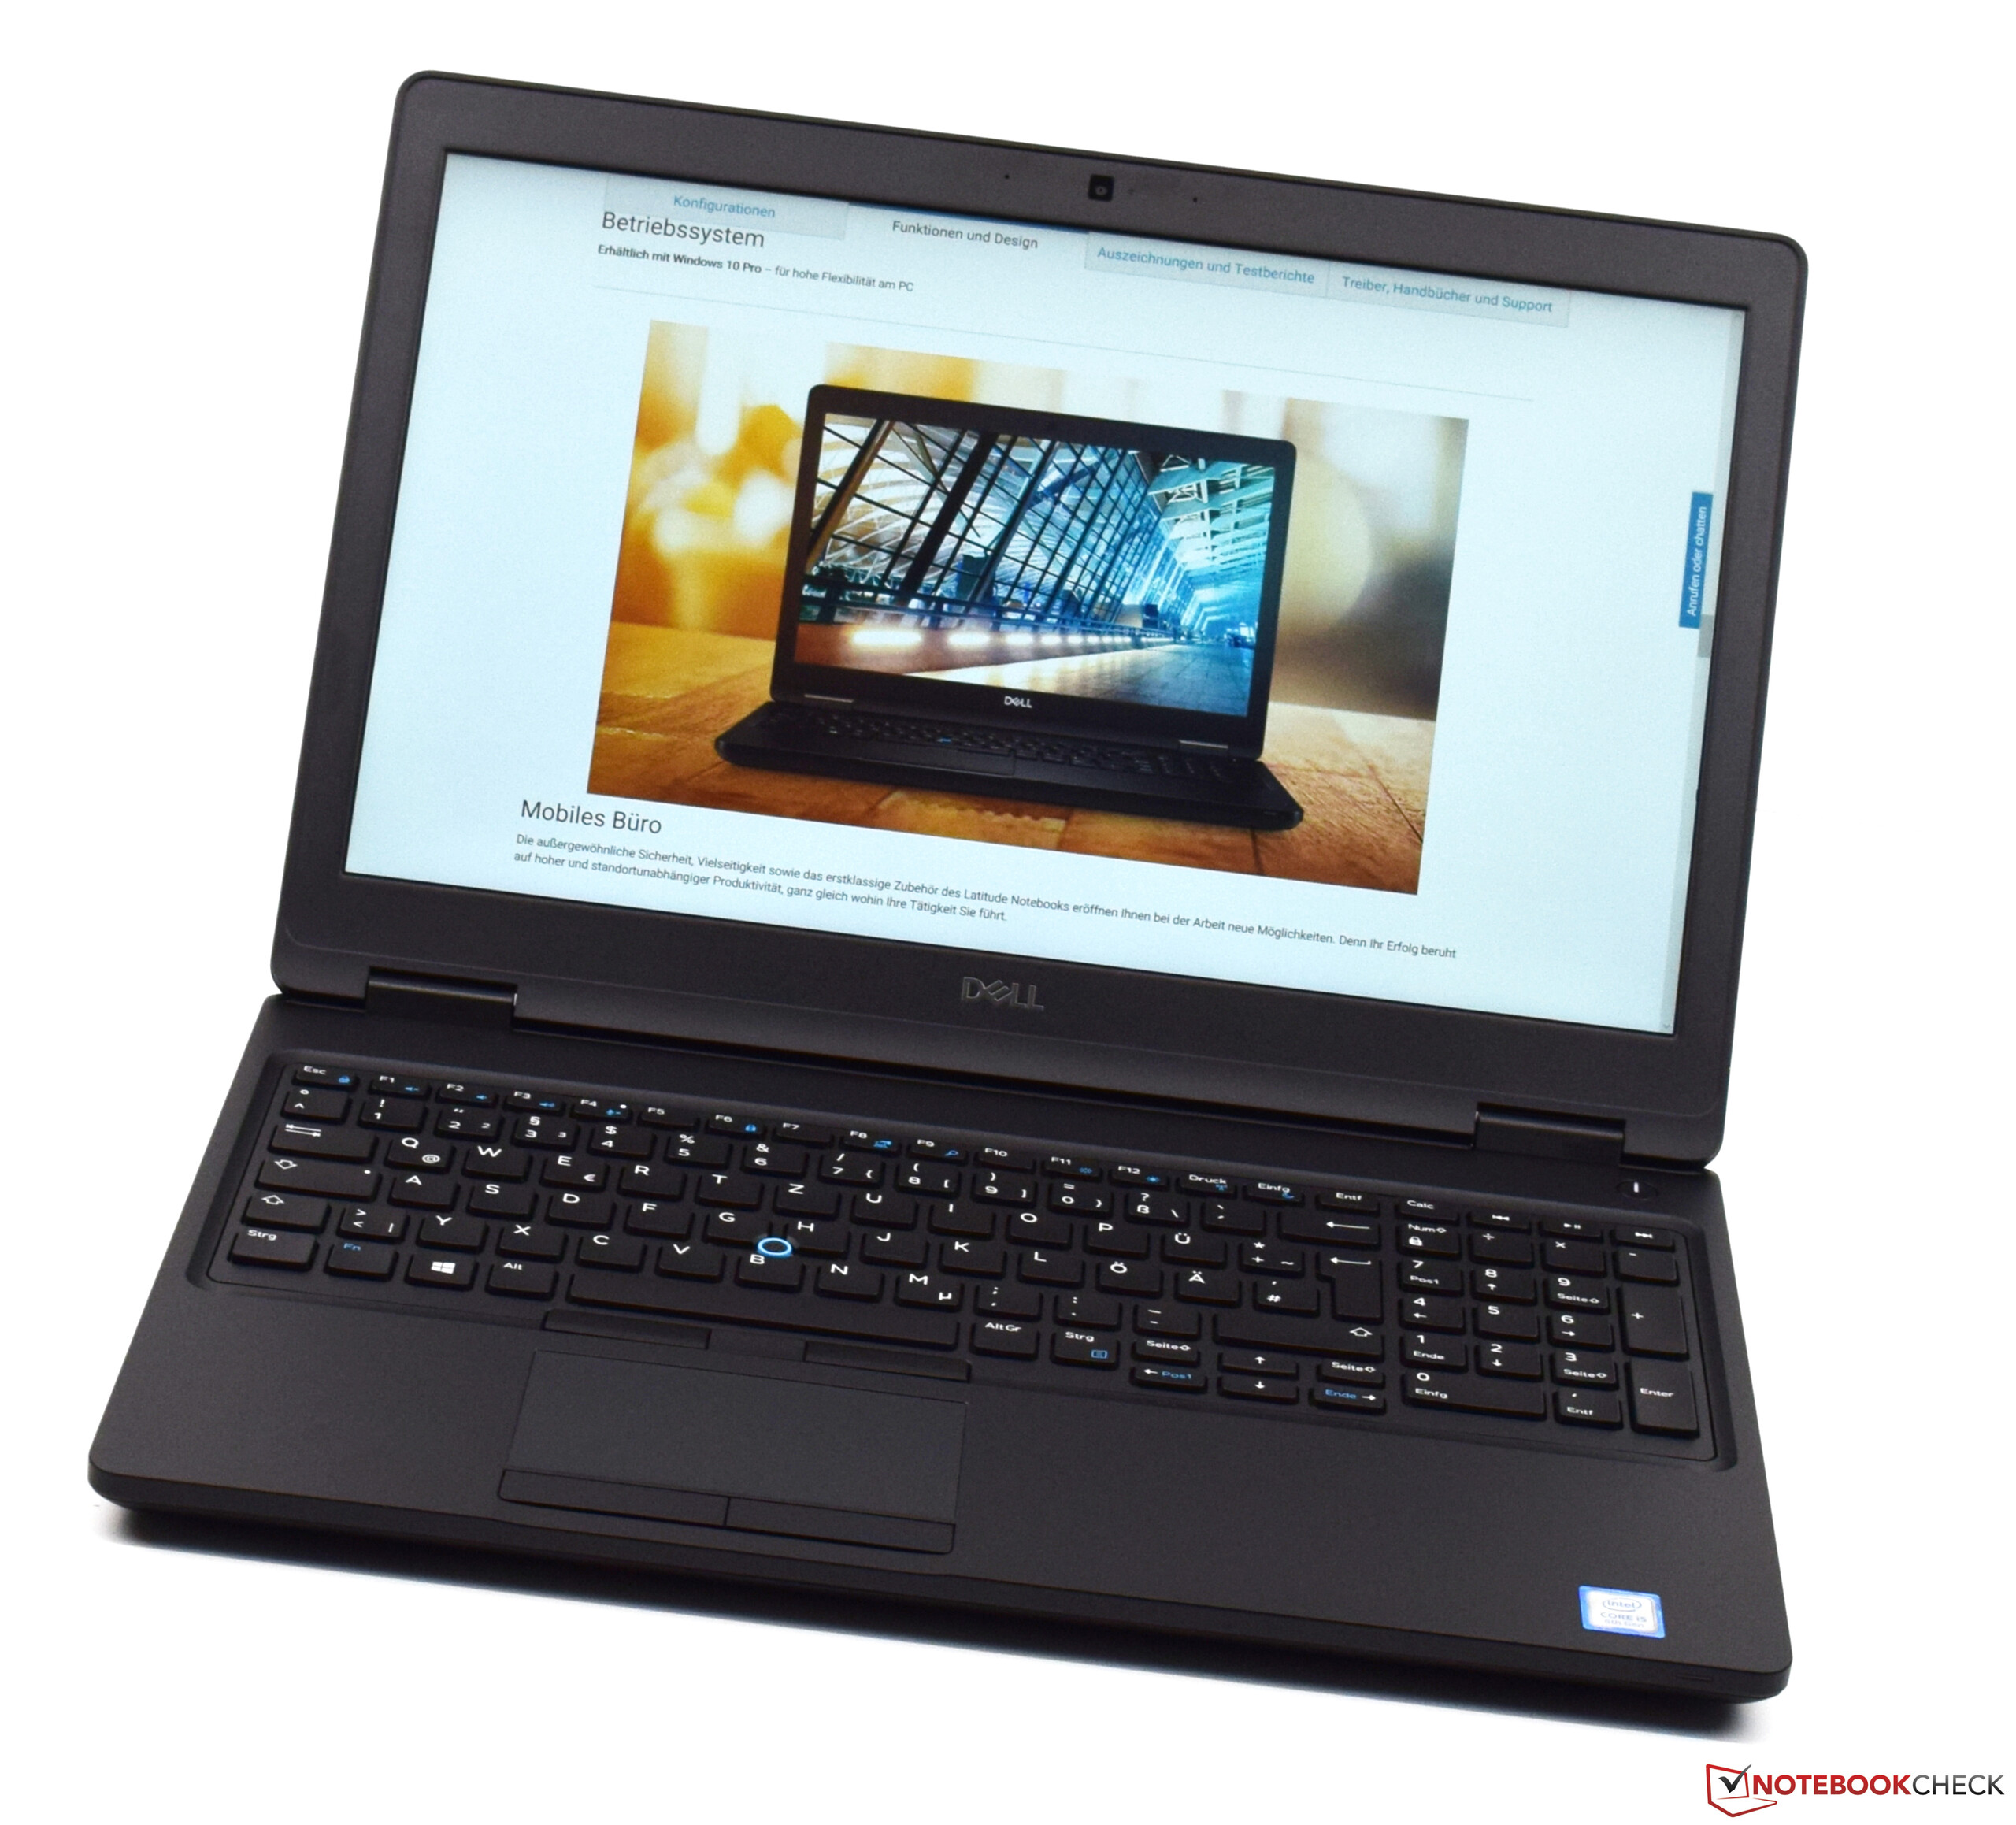
Display
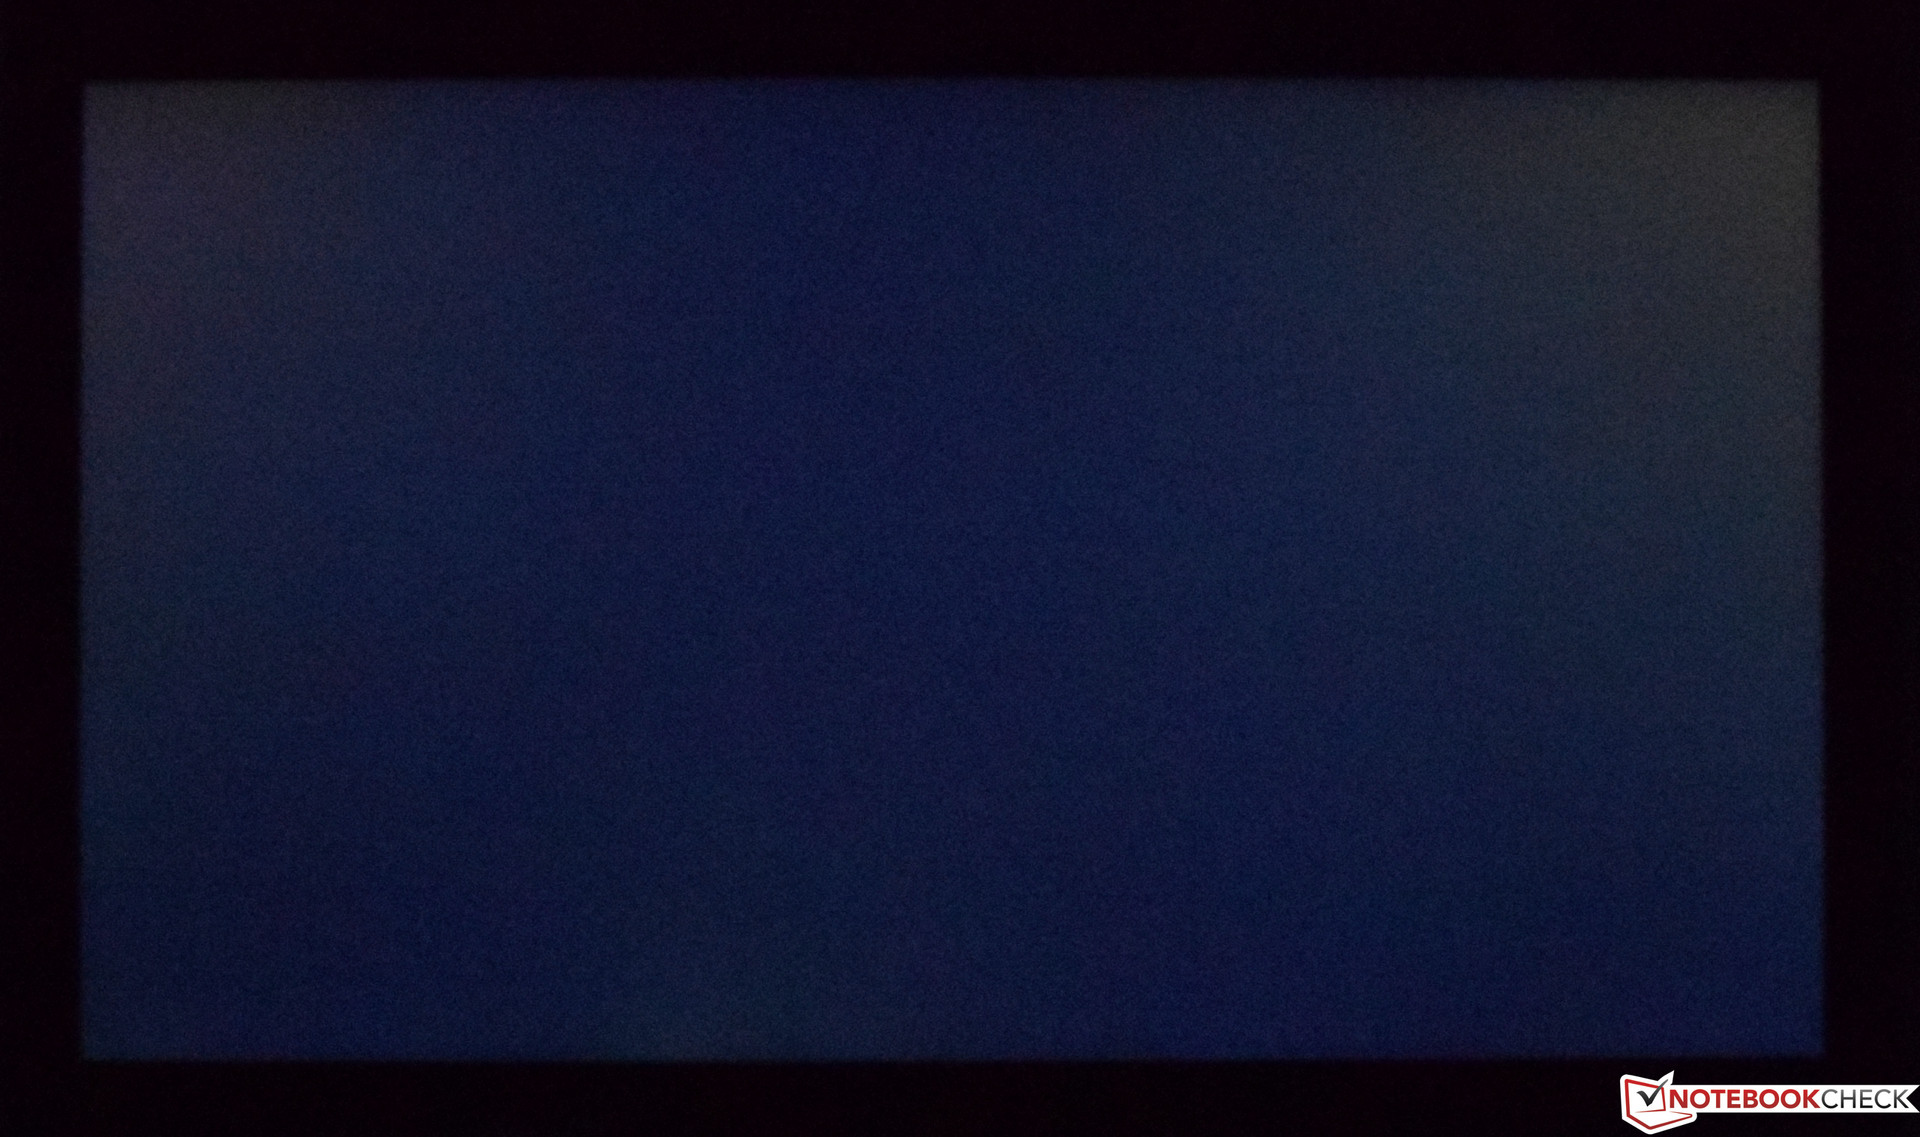
The display is a 15.6-inch matte IPS panel with a 1,920x1,080 native resolution. The display is somewhat dark, achieving an average brightness of 243 cd/m². This means that the Latitude 5590 trails its competitors, all of which have brighter displays. Similarly, brightness distribution is below average at 83%. The low black value of 0.19 is good, which yields an impressive 1,279:1 contrast ratio. While we noticed some backlight bleeding in the upper corners of the display, it should not prove to be an issue in daily use as it is only visible with a completely black image. The Latitude 5590 regulates its brightness with PWM, at a frequency of 1,000 Hz.
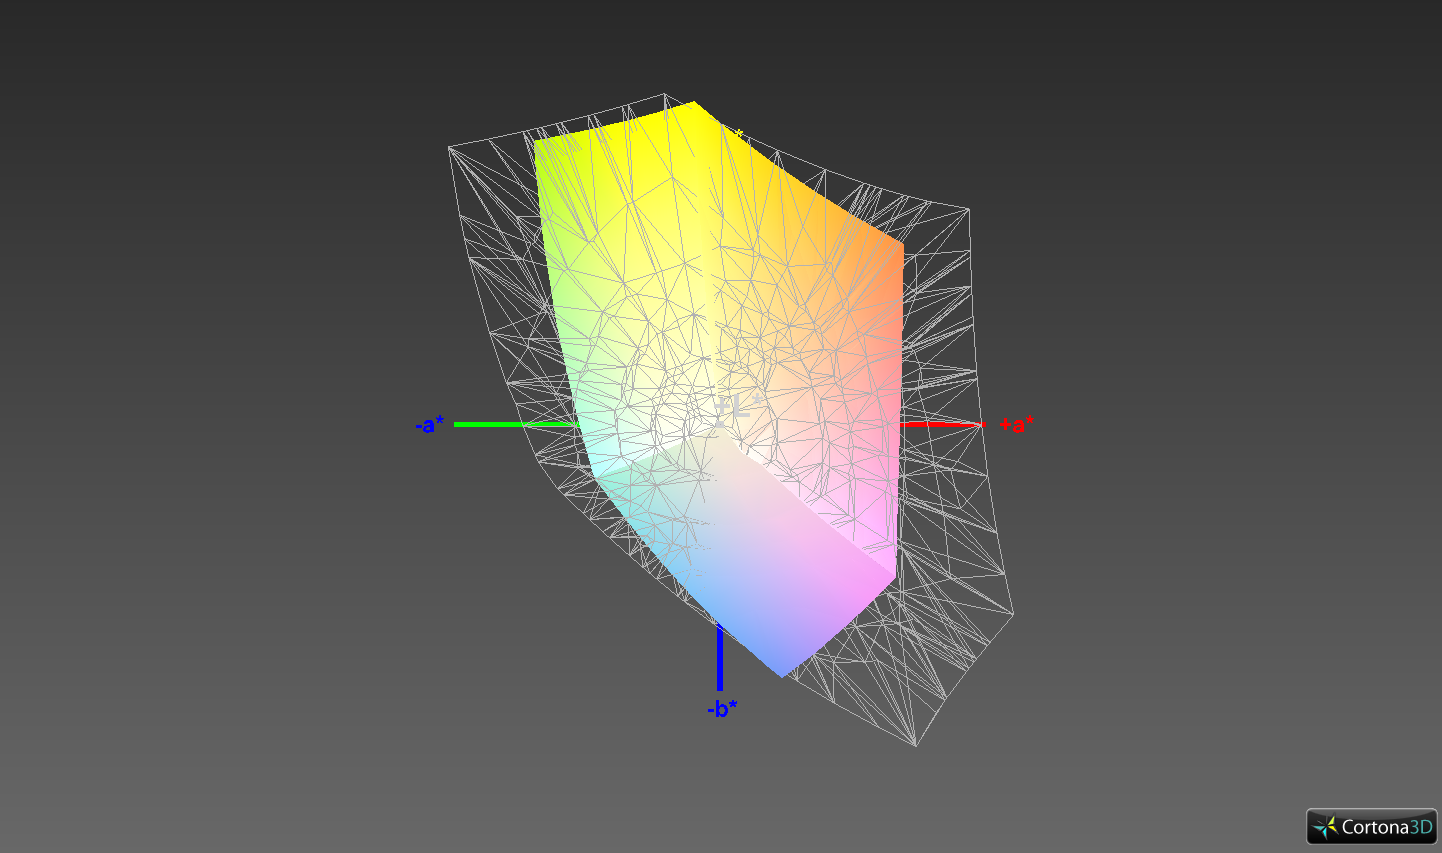
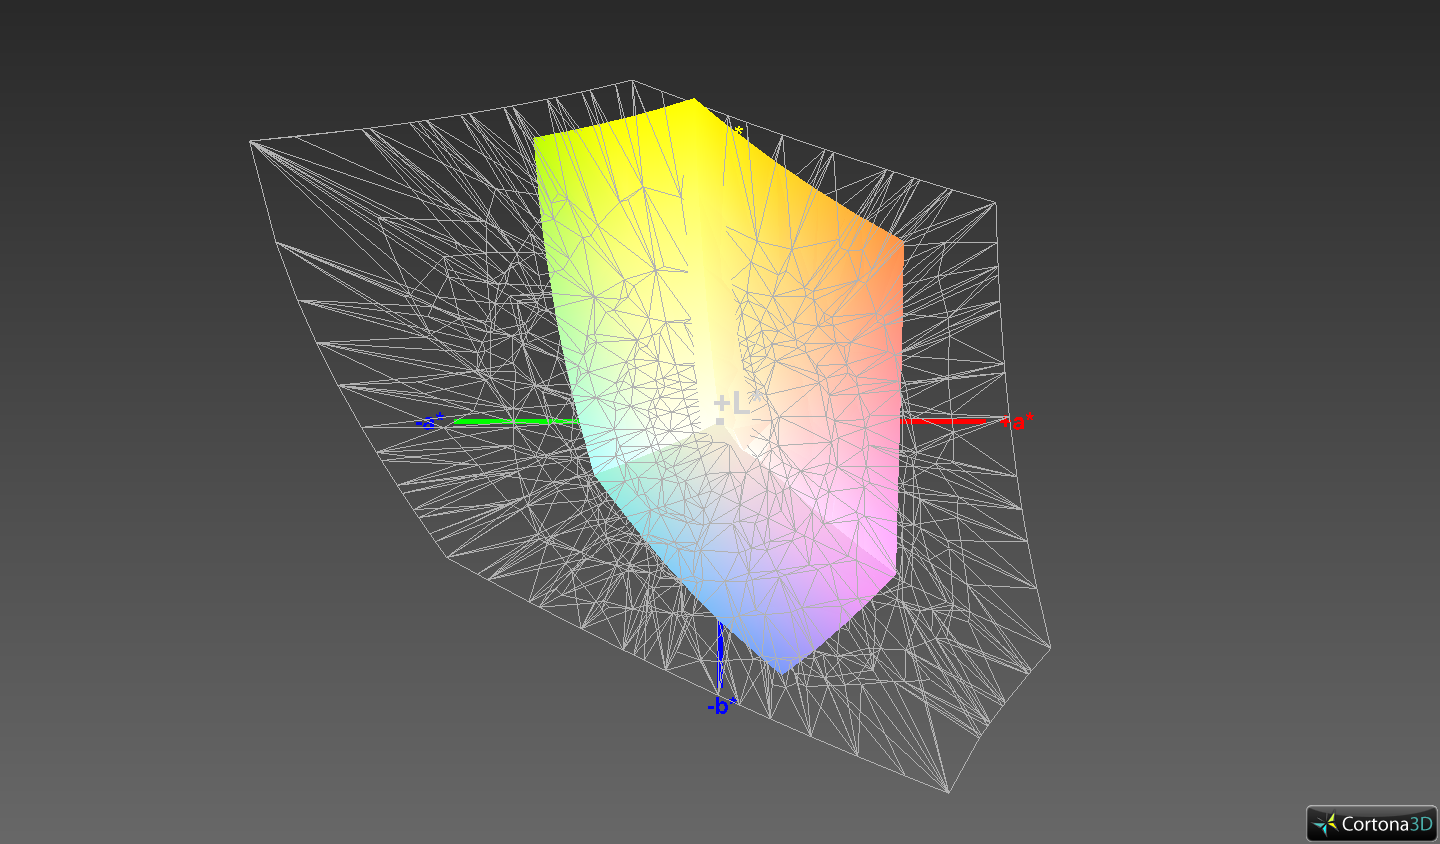
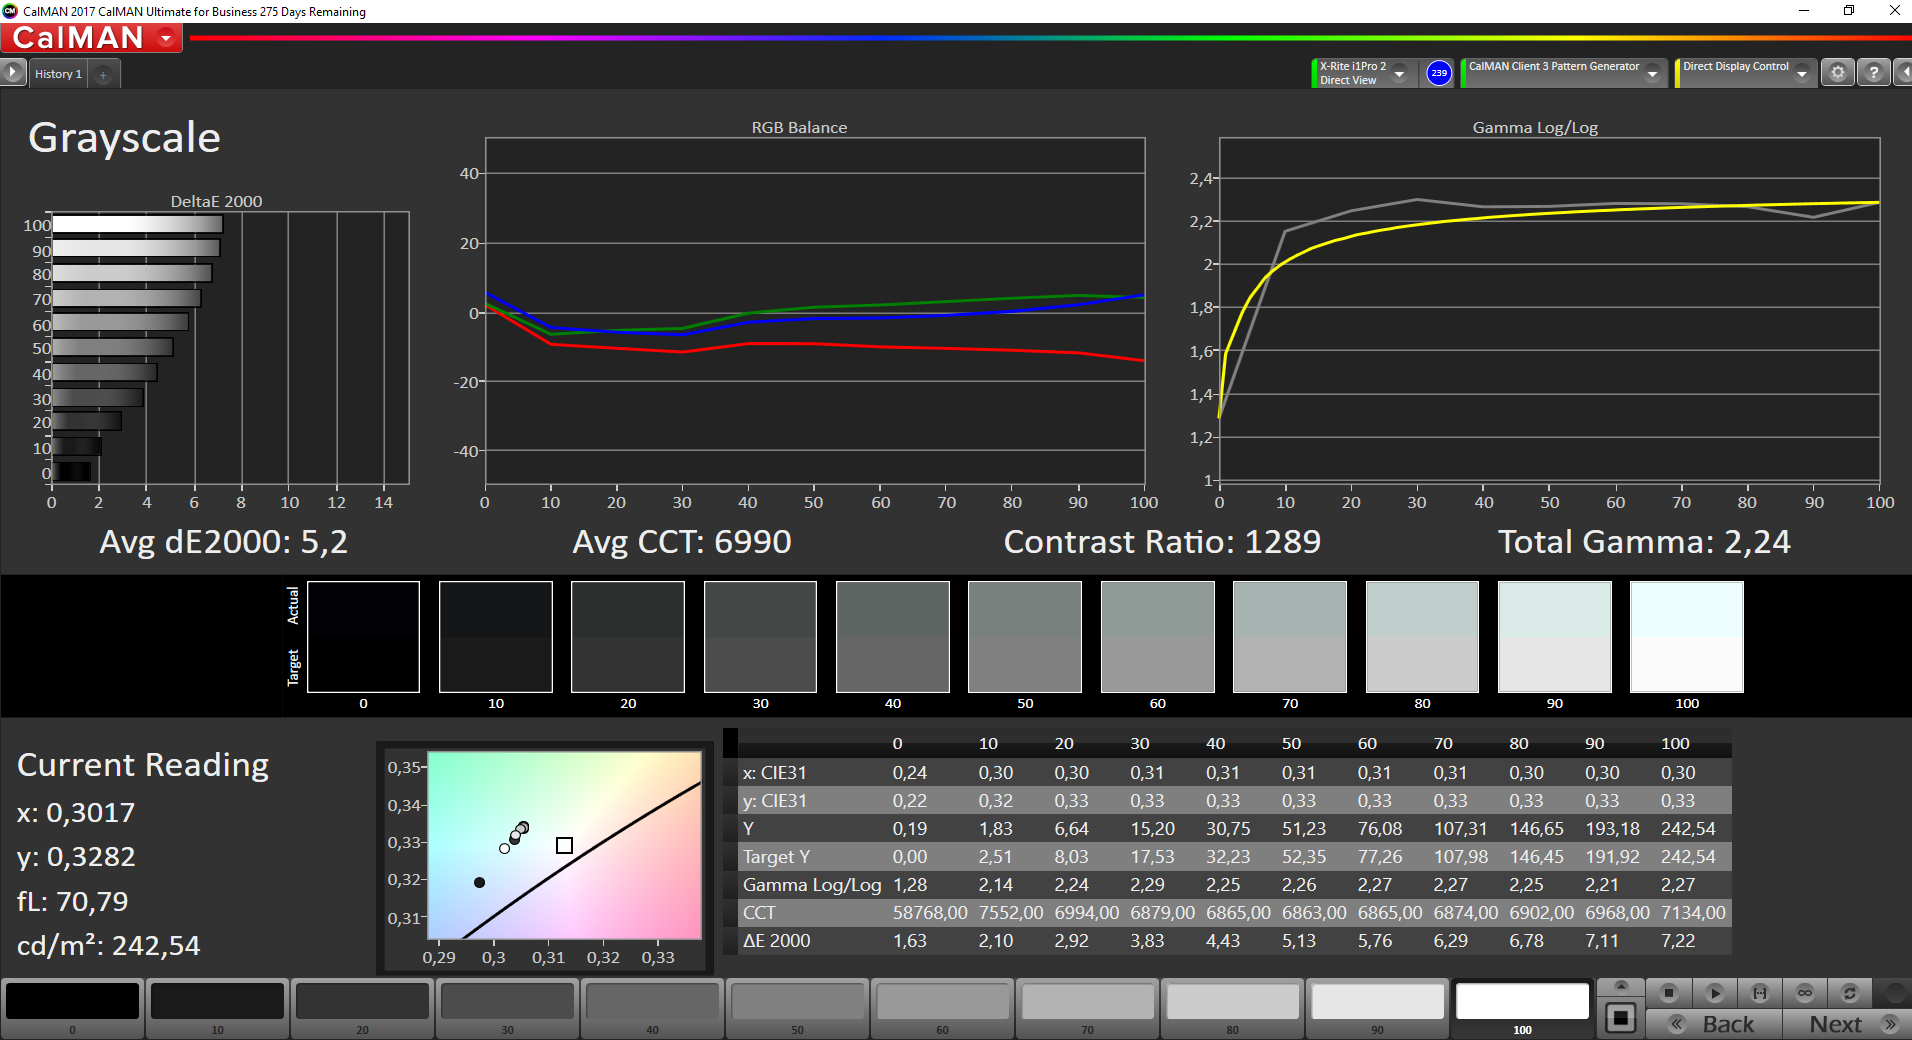
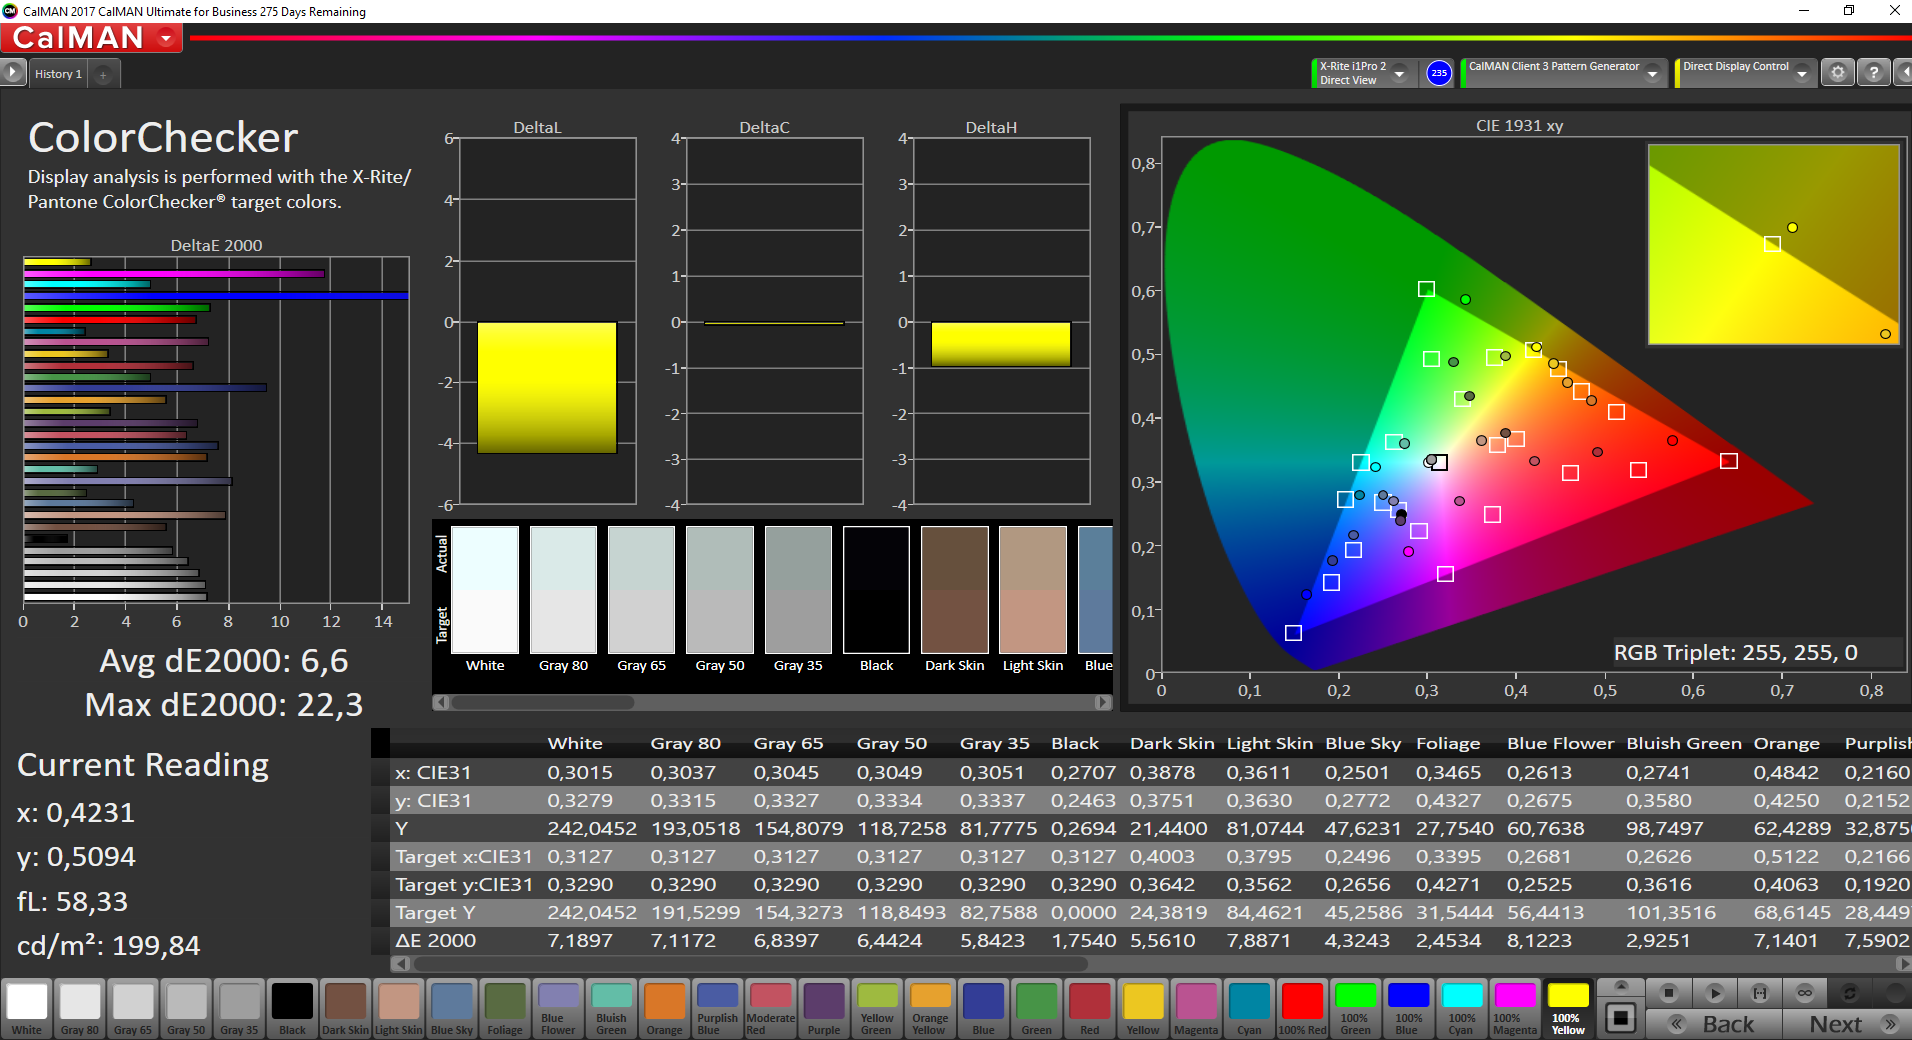
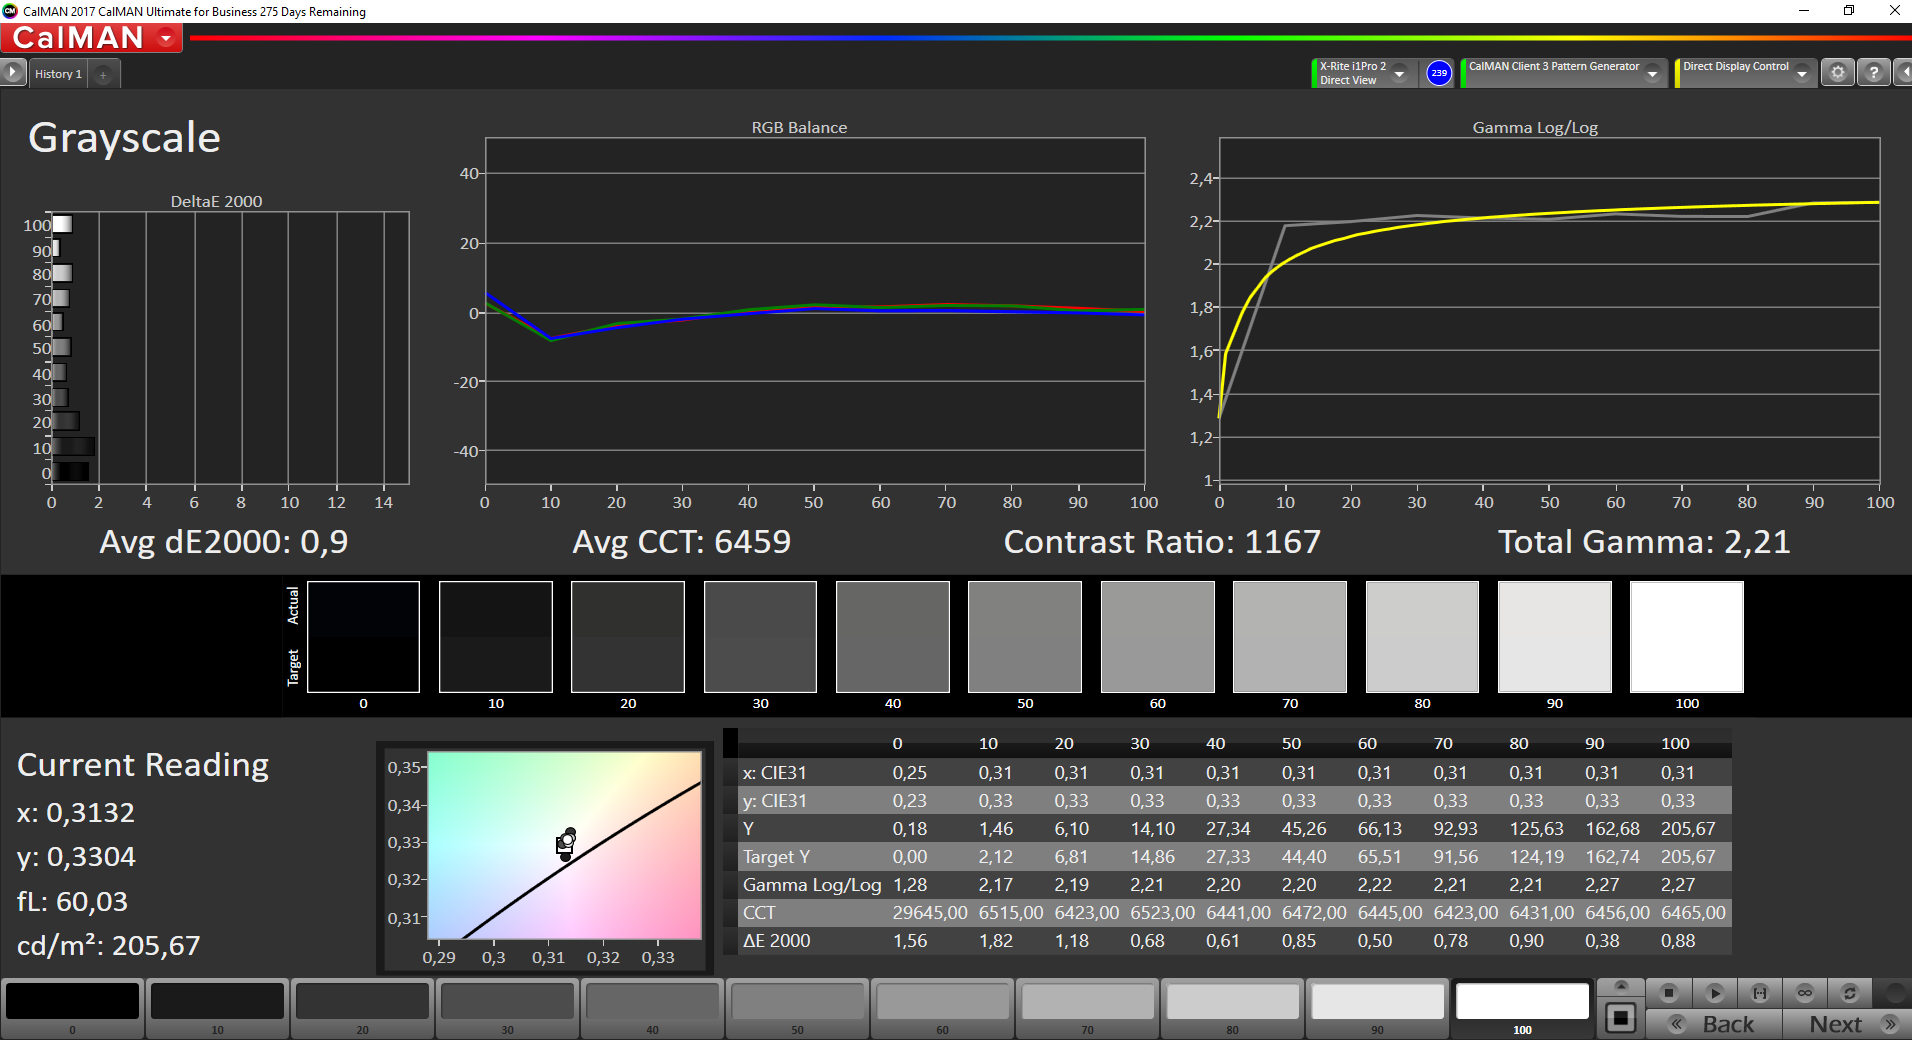
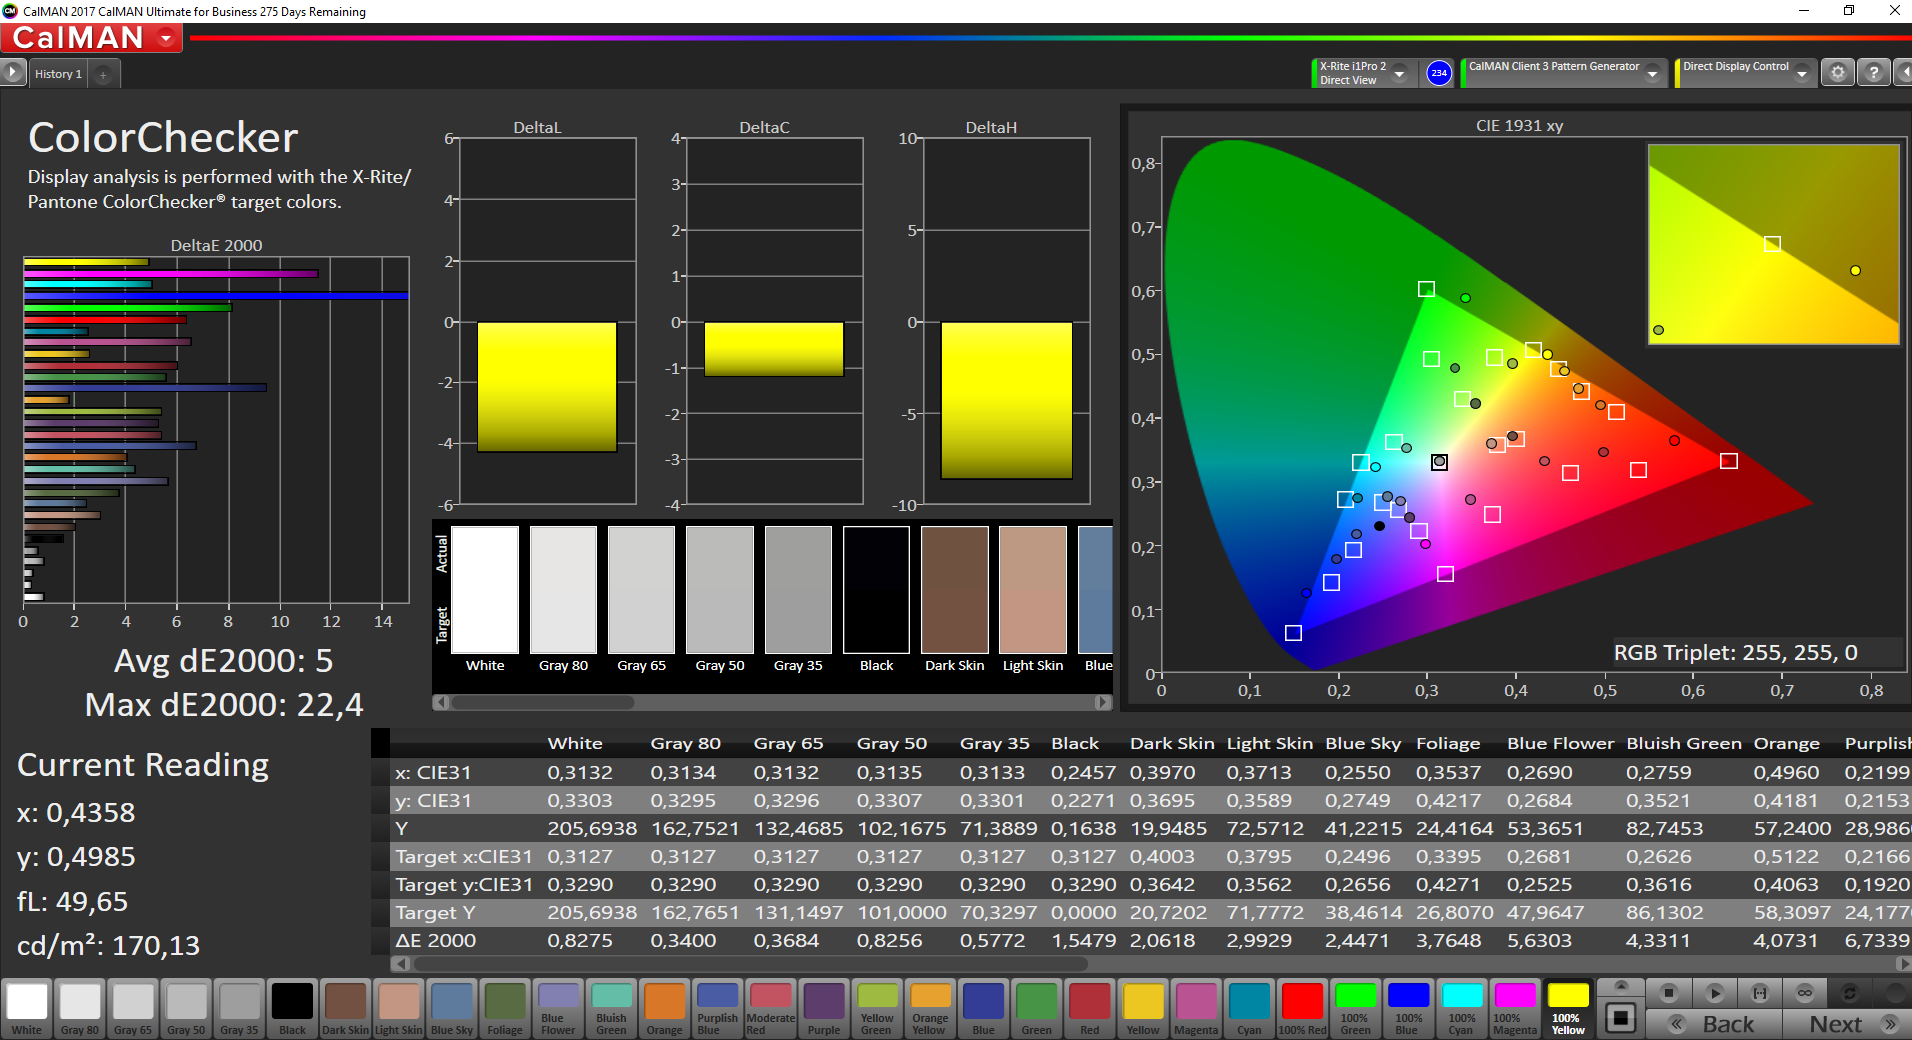
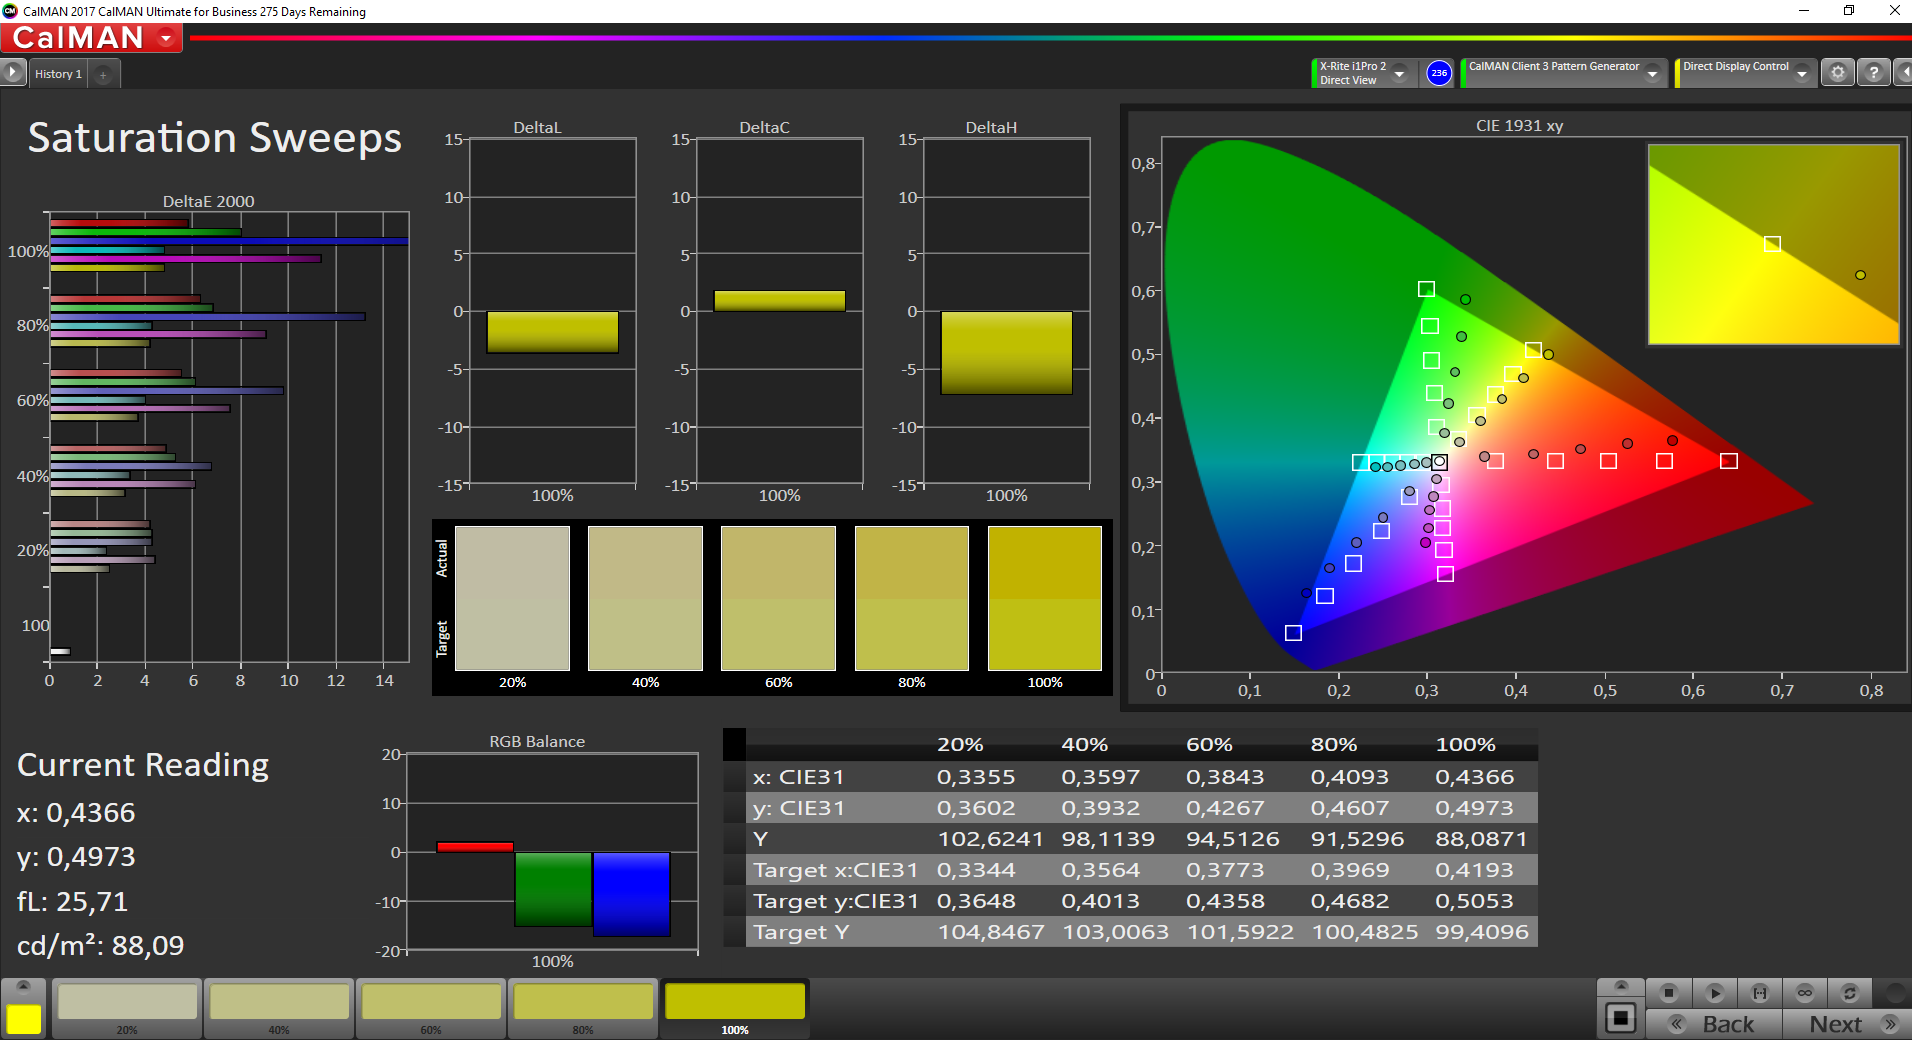
The image quality is good. Using DeltaE 2000 we determined average values of 6.6 for ColorChecker and 5.2 for grayscale. These can be significantly improved by calibrating the display, for which there is a link for the ICC profile in the above comparison table. Unfortunately, the Latitude 5590 scores poorly with sRGB and AdobeRGB, achieving 60.8% and 39.2% respectively. These scores are just good enough for hobby-like image processing.
| |||||||||||||||||||||||||
Brightness Distribution: 83 %
Center on Battery: 244 cd/m²
Contrast: 1279:1 (Black: 0.19 cd/m²)
ΔE ColorChecker Calman: 6.6 | ∀{0.5-29.43 Ø4.73}
calibrated: 5
ΔE Greyscale Calman: 5.2 | ∀{0.09-98 Ø4.97}
60.8% sRGB (Argyll 1.6.3 3D)
39.2% AdobeRGB 1998 (Argyll 1.6.3 3D)
42.93% AdobeRGB 1998 (Argyll 3D)
61.3% sRGB (Argyll 3D)
41.56% Display P3 (Argyll 3D)
Gamma: 2.24
CCT: 6990 K
| Dell Latitude 5590 NV15N42, 1920x1080, 15.6" | HP EliteBook 850 G4-Z2W86ET AUO35ED, 1920x1080, 15.6" | Fujitsu LifeBook U757 LP156WF6-SPP1, 1920x1080, 15.6" | Dell Latitude 5580 1366x768, 15.6" | Lenovo ThinkPad T570-20H90002GE N156HCA-EAA, 1920x1080, 15.6" | |
|---|---|---|---|---|---|
| Display | 37% | 47% | -3% | 6% | |
| Display P3 Coverage (%) | 41.56 | 56.8 37% | 65.8 58% | 40.13 -3% | 44.08 6% |
| sRGB Coverage (%) | 61.3 | 83.7 37% | 84.8 38% | 60 -2% | 65.6 7% |
| AdobeRGB 1998 Coverage (%) | 42.93 | 58.7 37% | 62 44% | 41.5 -3% | 45.66 6% |
| Response Times | 37% | 33% | 35% | 35% | |
| Response Time Grey 50% / Grey 80% * (ms) | 53.2 ? | 47.2 ? 11% | 36 ? 32% | 30 ? 44% | 41.6 ? 22% |
| Response Time Black / White * (ms) | 39.6 ? | 15.2 ? 62% | 26.4 ? 33% | 29.6 ? 25% | 20.8 ? 47% |
| PWM Frequency (Hz) | 1000 ? | 199.2 ? | 201.6 ? | 26040 ? | |
| Screen | -43% | 19% | -49% | 11% | |
| Brightness middle (cd/m²) | 243 | 338 39% | 313 29% | 238 -2% | 262 8% |
| Brightness (cd/m²) | 234 | 341 46% | 294 26% | 216 -8% | 245 5% |
| Brightness Distribution (%) | 83 | 90 8% | 84 1% | 83 0% | 89 7% |
| Black Level * (cd/m²) | 0.19 | 0.81 -326% | 0.27 -42% | 0.53 -179% | 0.24 -26% |
| Contrast (:1) | 1279 | 417 -67% | 1159 -9% | 449 -65% | 1092 -15% |
| Colorchecker dE 2000 * | 6.6 | 10.9 -65% | 4.5 32% | 10.8 -64% | 4.5 32% |
| Colorchecker dE 2000 max. * | 22.3 | 18.7 16% | 10.5 53% | 29.3 -31% | 10.5 53% |
| Colorchecker dE 2000 calibrated * | 5 | ||||
| Greyscale dE 2000 * | 5.2 | 13.3 -156% | 4 23% | 12.1 -133% | 3.5 33% |
| Gamma | 2.24 98% | 2.11 104% | 2.24 98% | 2.25 98% | 2.32 95% |
| CCT | 6990 93% | 16030 41% | 6387 102% | 14344 45% | 6524 100% |
| Color Space (Percent of AdobeRGB 1998) (%) | 39.2 | 53.8 37% | 55.3 41% | 38.3 -2% | 42.04 7% |
| Color Space (Percent of sRGB) (%) | 60.8 | 83.4 37% | 84.74 39% | 59.9 -1% | 65.4 8% |
| Total Average (Program / Settings) | 10% /
-16% | 33% /
27% | -6% /
-28% | 17% /
13% |
* ... smaller is better
Display Response Times
| ↔ Response Time Black to White | ||
|---|---|---|
| 39.6 ms ... rise ↗ and fall ↘ combined | ↗ 23.2 ms rise | 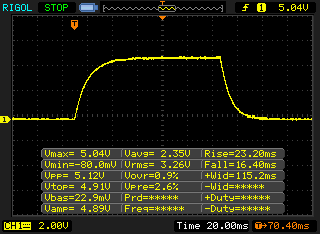 |
| ↘ 16.4 ms fall | ||
| The screen shows slow response rates in our tests and will be unsatisfactory for gamers. In comparison, all tested devices range from 0.1 (minimum) to 240 (maximum) ms. » 97 % of all devices are better. This means that the measured response time is worse than the average of all tested devices (19.9 ms). | ||
| ↔ Response Time 50% Grey to 80% Grey | ||
| 53.2 ms ... rise ↗ and fall ↘ combined | ↗ 26.8 ms rise | 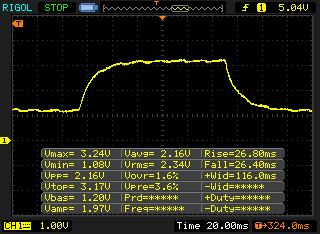 |
| ↘ 26.4 ms fall | ||
| The screen shows slow response rates in our tests and will be unsatisfactory for gamers. In comparison, all tested devices range from 0.165 (minimum) to 636 (maximum) ms. » 90 % of all devices are better. This means that the measured response time is worse than the average of all tested devices (31.1 ms). | ||
Screen Flickering / PWM (Pulse-Width Modulation)
| Screen flickering / PWM detected | 1000 Hz | ≤ 98 % brightness setting | 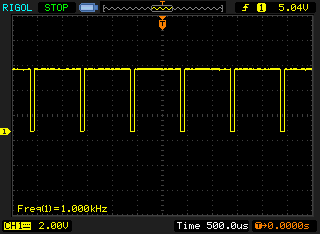 |
The display backlight flickers at 1000 Hz (worst case, e.g., utilizing PWM) Flickering detected at a brightness setting of 98 % and below. There should be no flickering or PWM above this brightness setting. The frequency of 1000 Hz is quite high, so most users sensitive to PWM should not notice any flickering. In comparison: 52 % of all tested devices do not use PWM to dim the display. If PWM was detected, an average of 7794 (minimum: 5 - maximum: 343500) Hz was measured. | |||

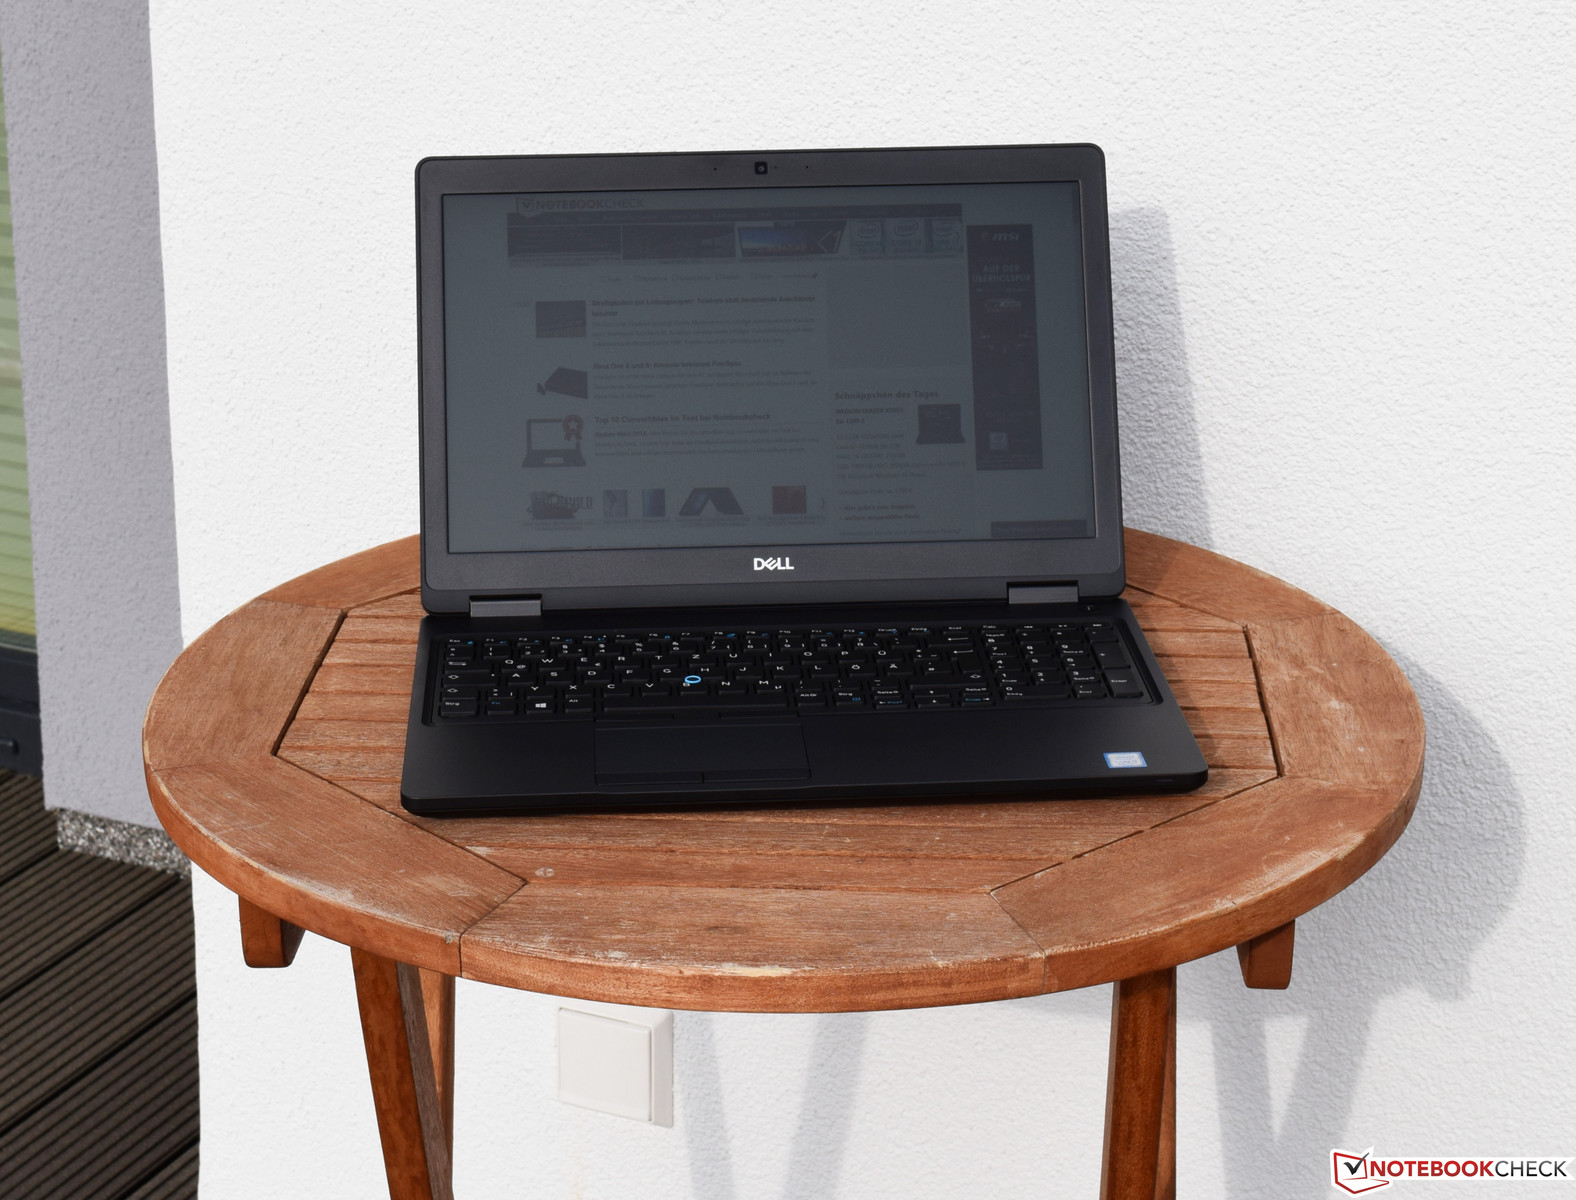
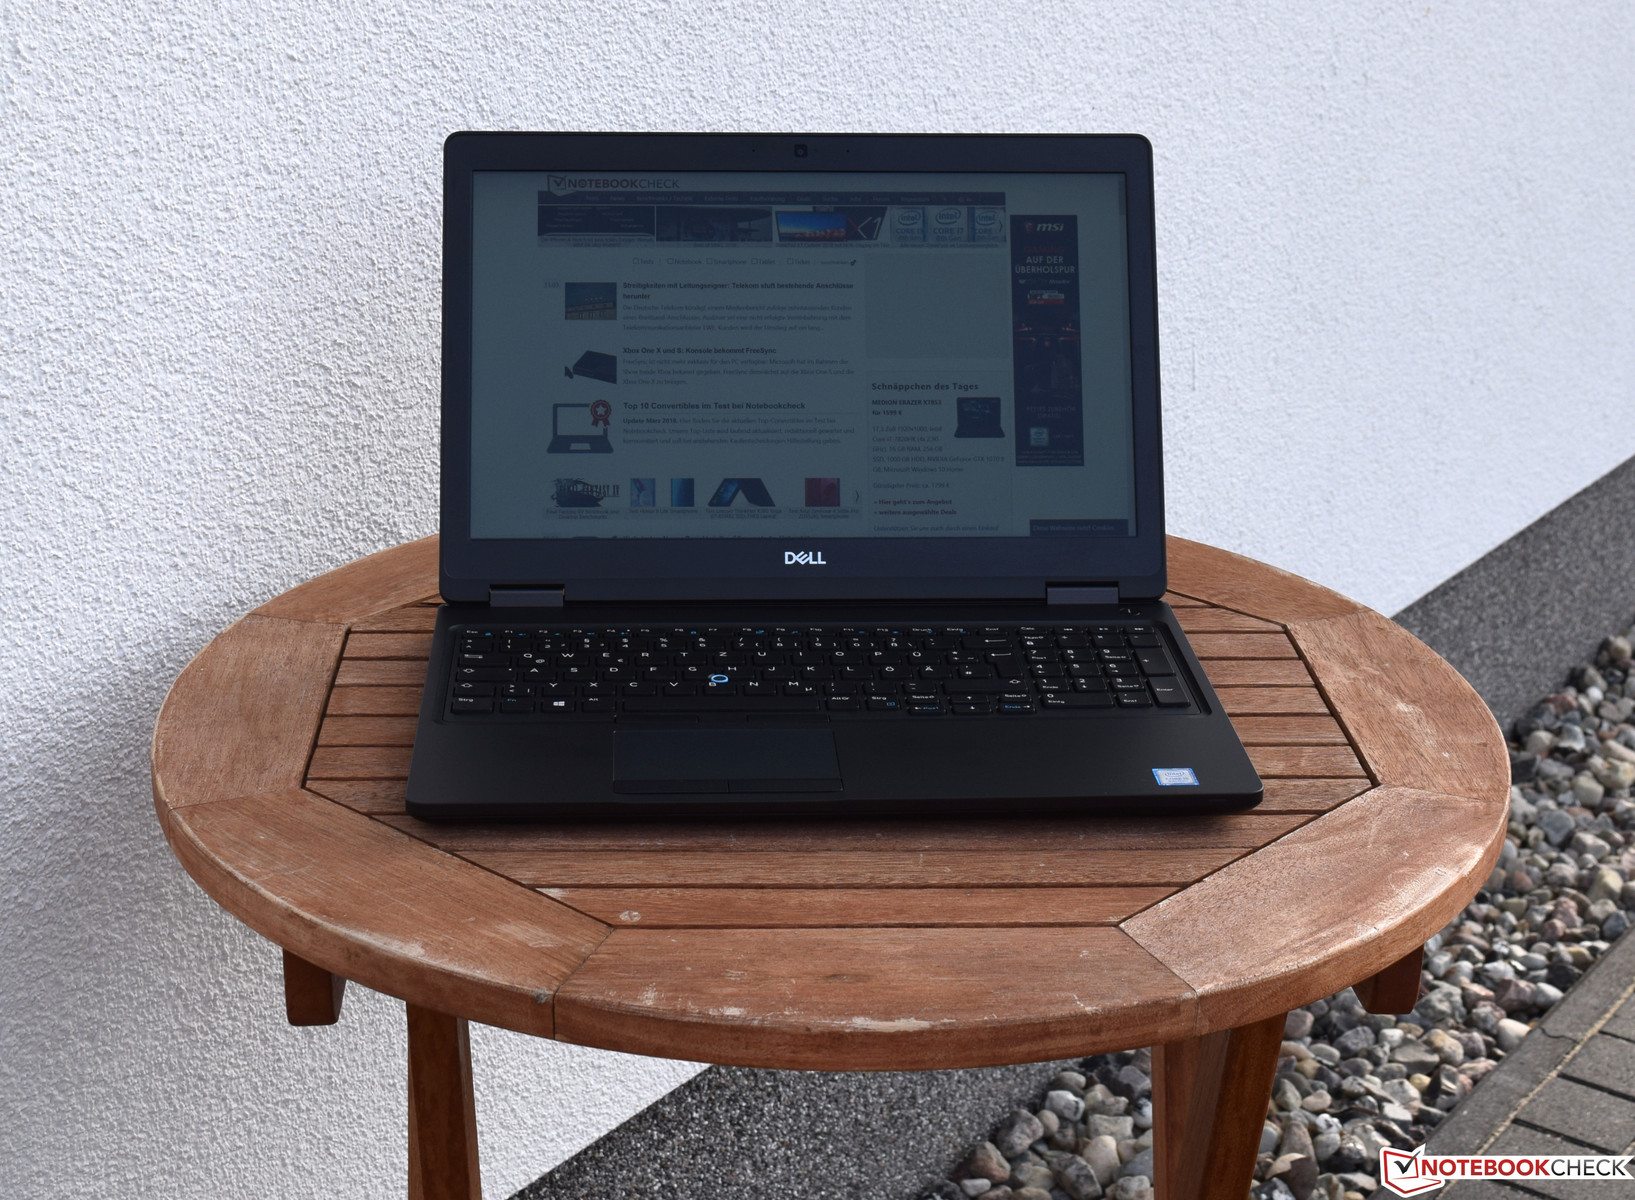
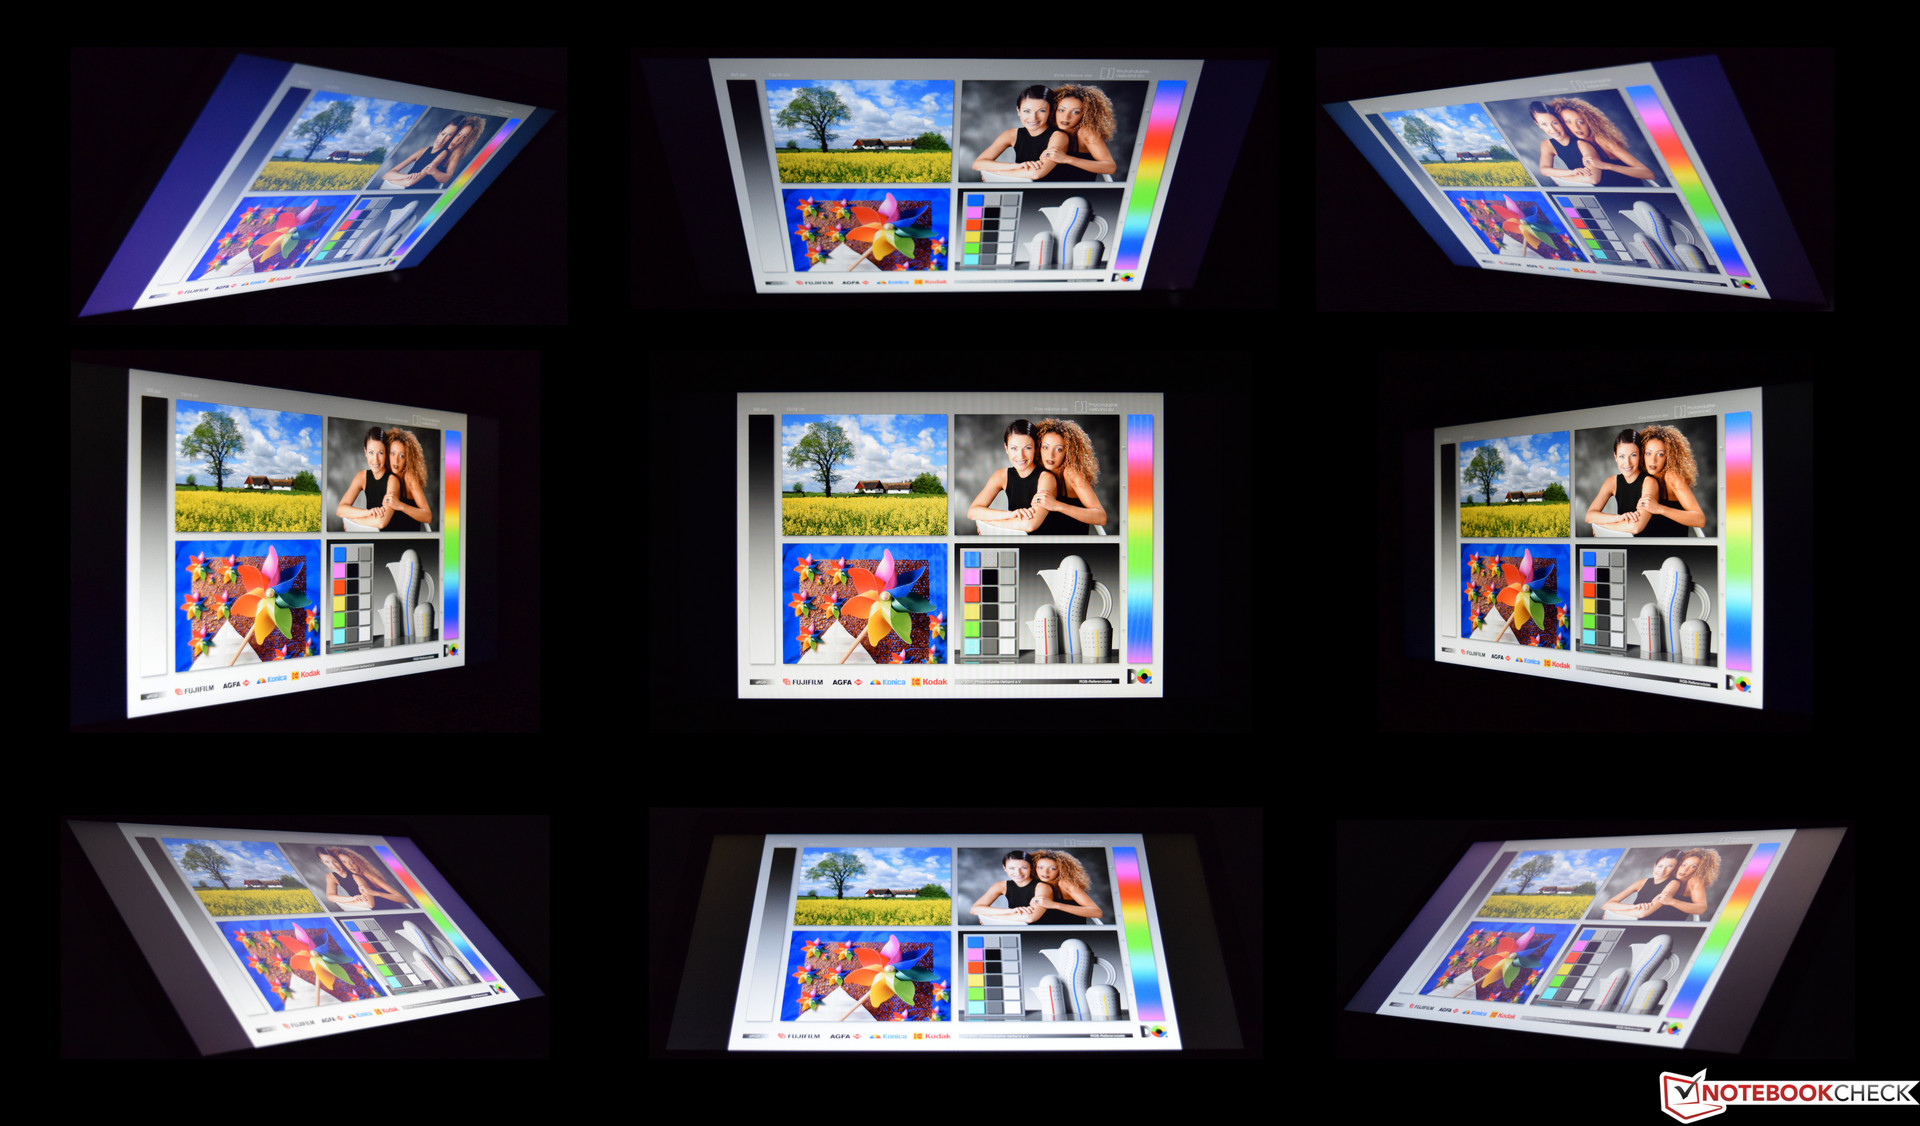
Using the Latitude 5590 outdoors is difficult because of its low brightness. The matte display helps as it prevents reflections, but we would still recommend using the device in a shady spot if you need to use it outdoors. Viewing angles are good thanks to the IPS panel, with color and brightness shifts only visible at acute angles. Images are still displayed accurately at these angles though.
Performance
The Latitude 5590 is a 15-inch business laptop, which is great for work thanks to its combination of a powerful processor and fast SSD. Our test device is powered by an Intel Core i5-8250U which provides enough power for everyday office use. Dell offers more powerful processor options, but potentially the extra cost of upgrading to a Core i7-8650U would be better spent on an extra RAM or a larger SSD instead.
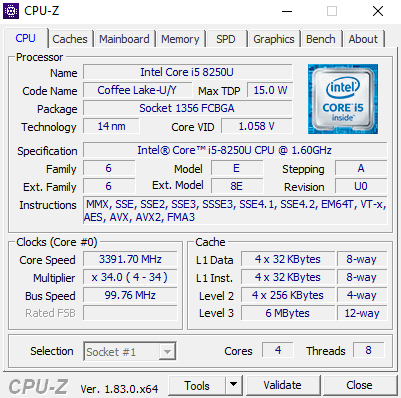

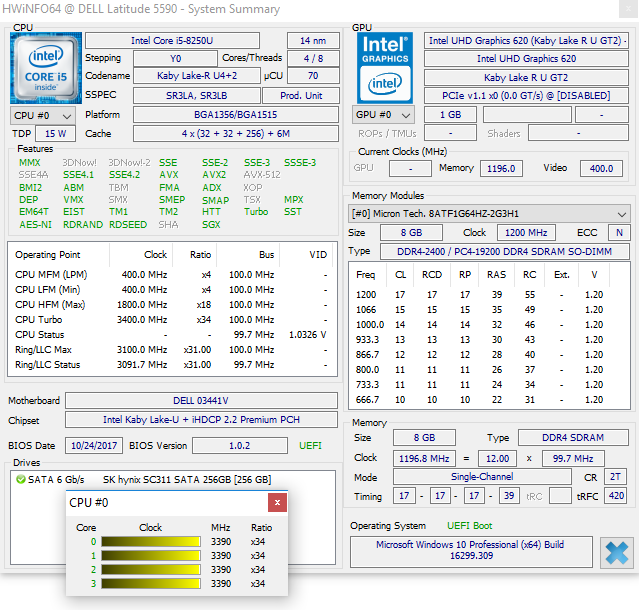
Processor
The Intel Core i5-8250U is a modern quad-core processor with a 1.6 GHz base clock speed, and eight threads thanks to Hyper-threading support. The CPU performs well in multi-threaded applications, with the Latitude 5590 taking first place in our comparison tests.
Further benchmarks for the Intel Core i5-8250U can be found here.
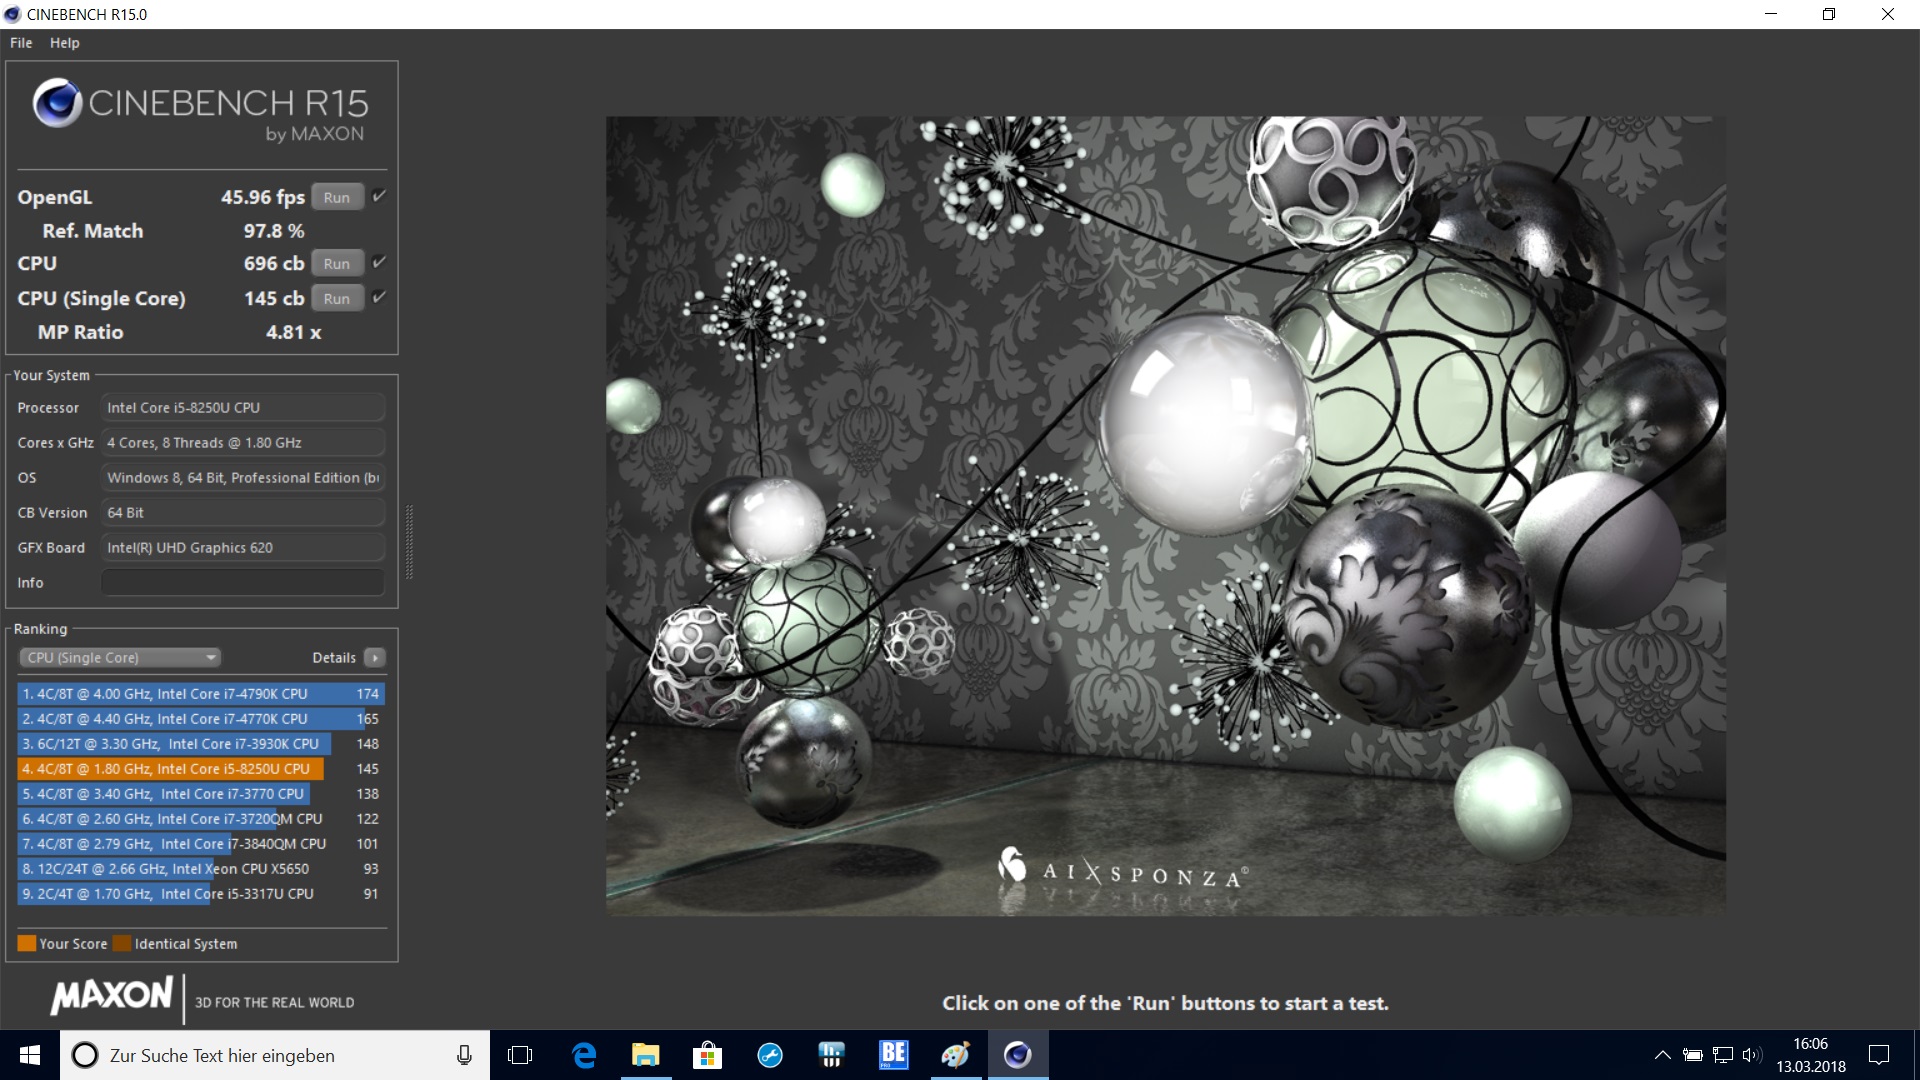
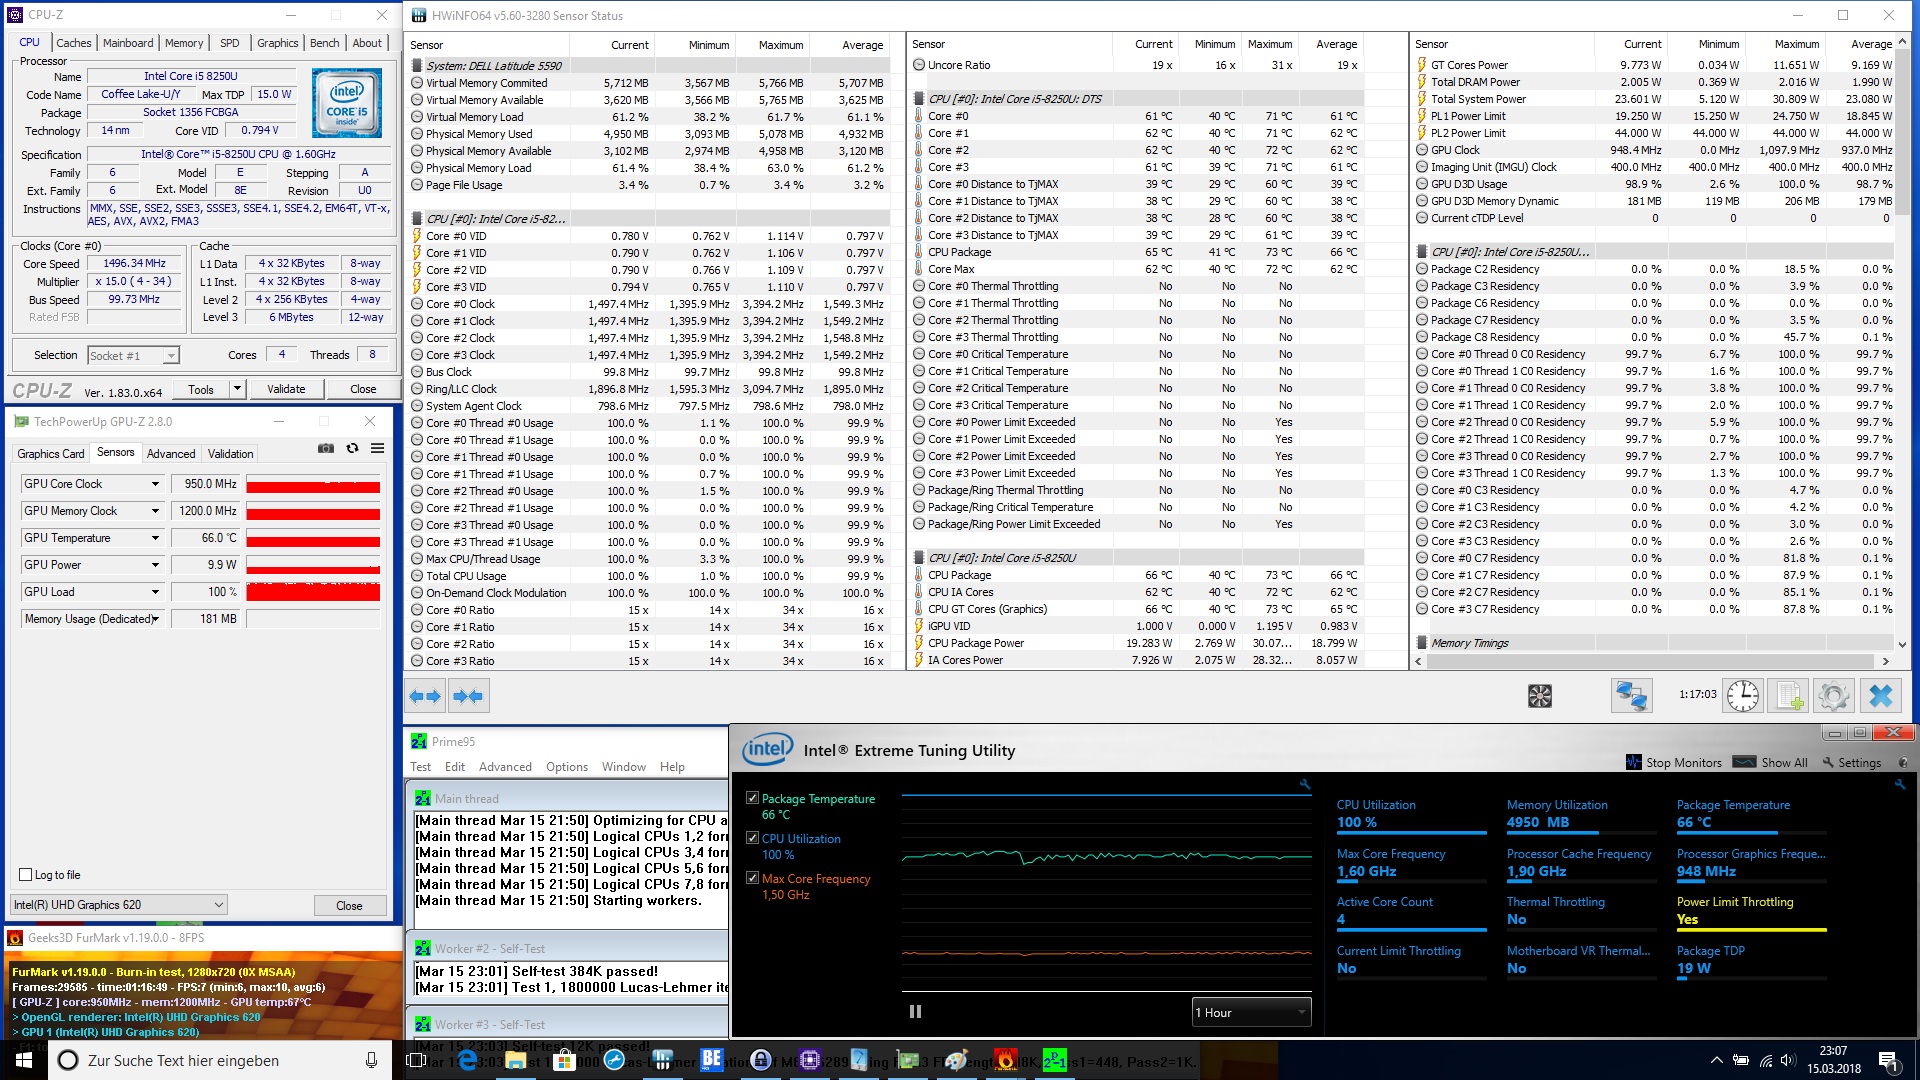
Our Cinebench R15 multi-loop benchmark demonstrates that the CPU cannot sustain maximum performance under full load. Initially, the Latitude 5590 scored 696 points, dropping to 620 points on the second pass. Scores dropped further on subsequent passes to an average of between 550 and 560 points. This can be equated to approximately a 20% performance drop under continuous load.
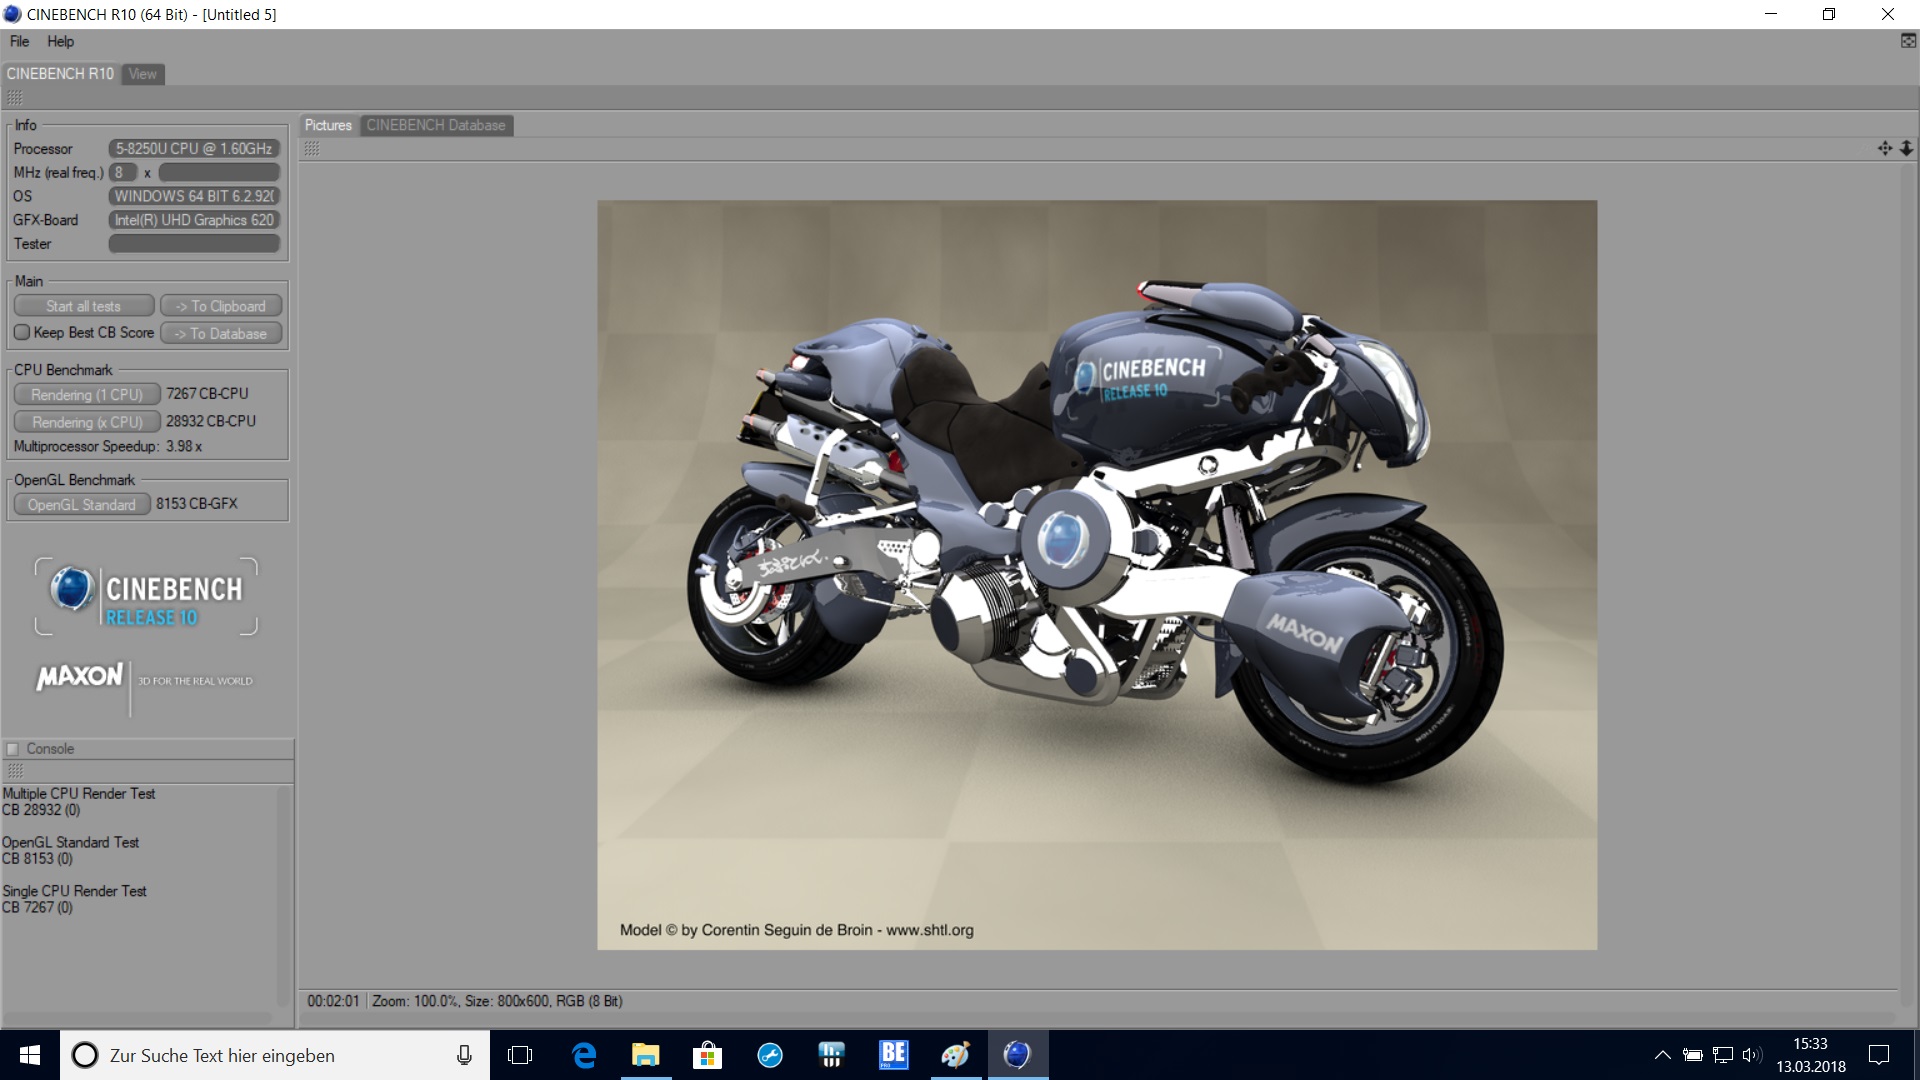
| Cinebench R10 - Rendering Single CPUs 64Bit | |
| Average of class Office (11106 - 15443, n=6, last 2 years) | |
| Dell Latitude 5590 | |
| Average Intel Core i5-8250U (5163 - 8153, n=13) | |
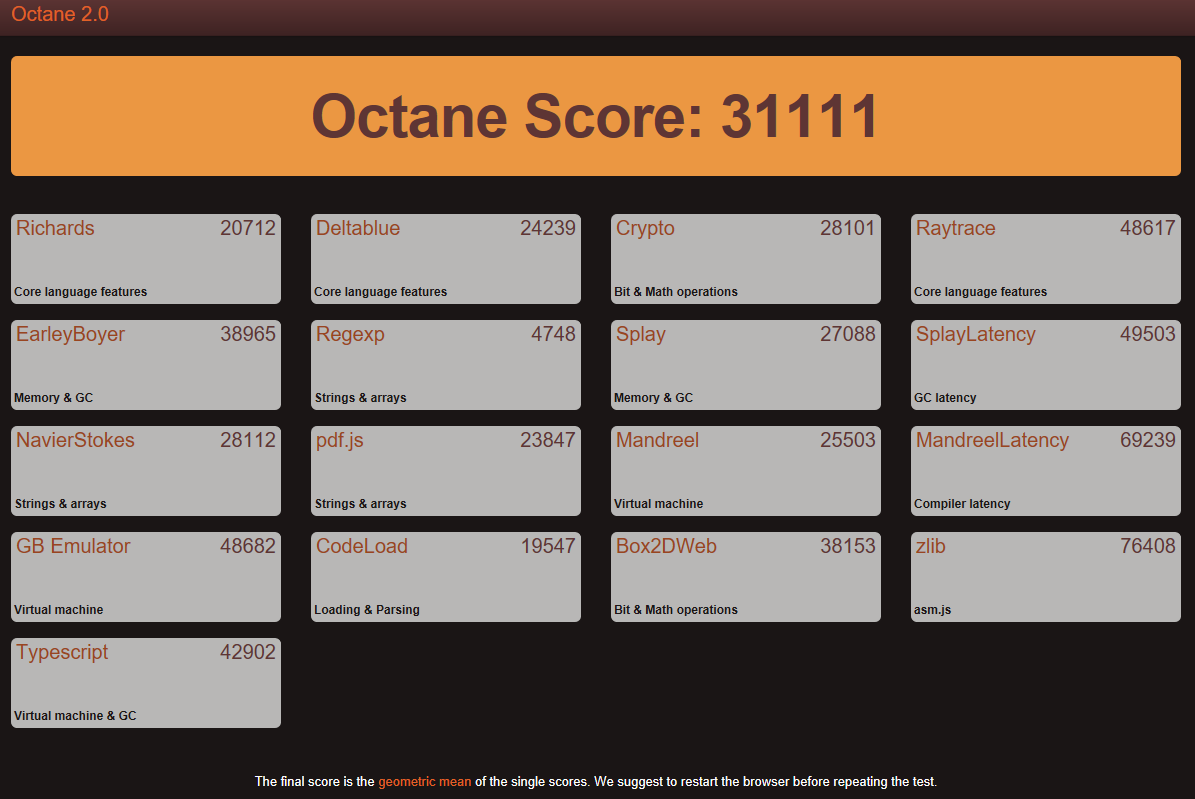
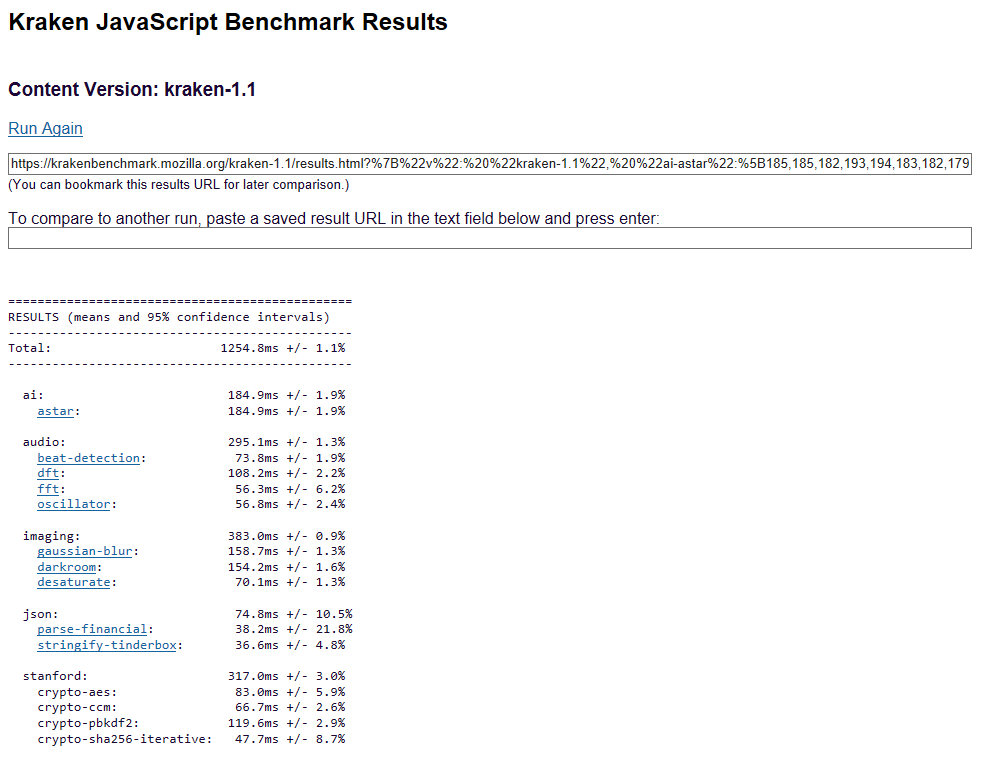
| JetStream 1.1 - 1.1 Total | |
| Dell Latitude 5590 | |
| Average Intel Core i5-8250U (151.5 - 256, n=78) | |
| HP EliteBook 850 G4-Z2W86ET | |
| Lenovo ThinkPad T570-20H90002GE | |
| Dell Latitude 5580 | |
| Fujitsu LifeBook U757 | |
* ... smaller is better

System Performance
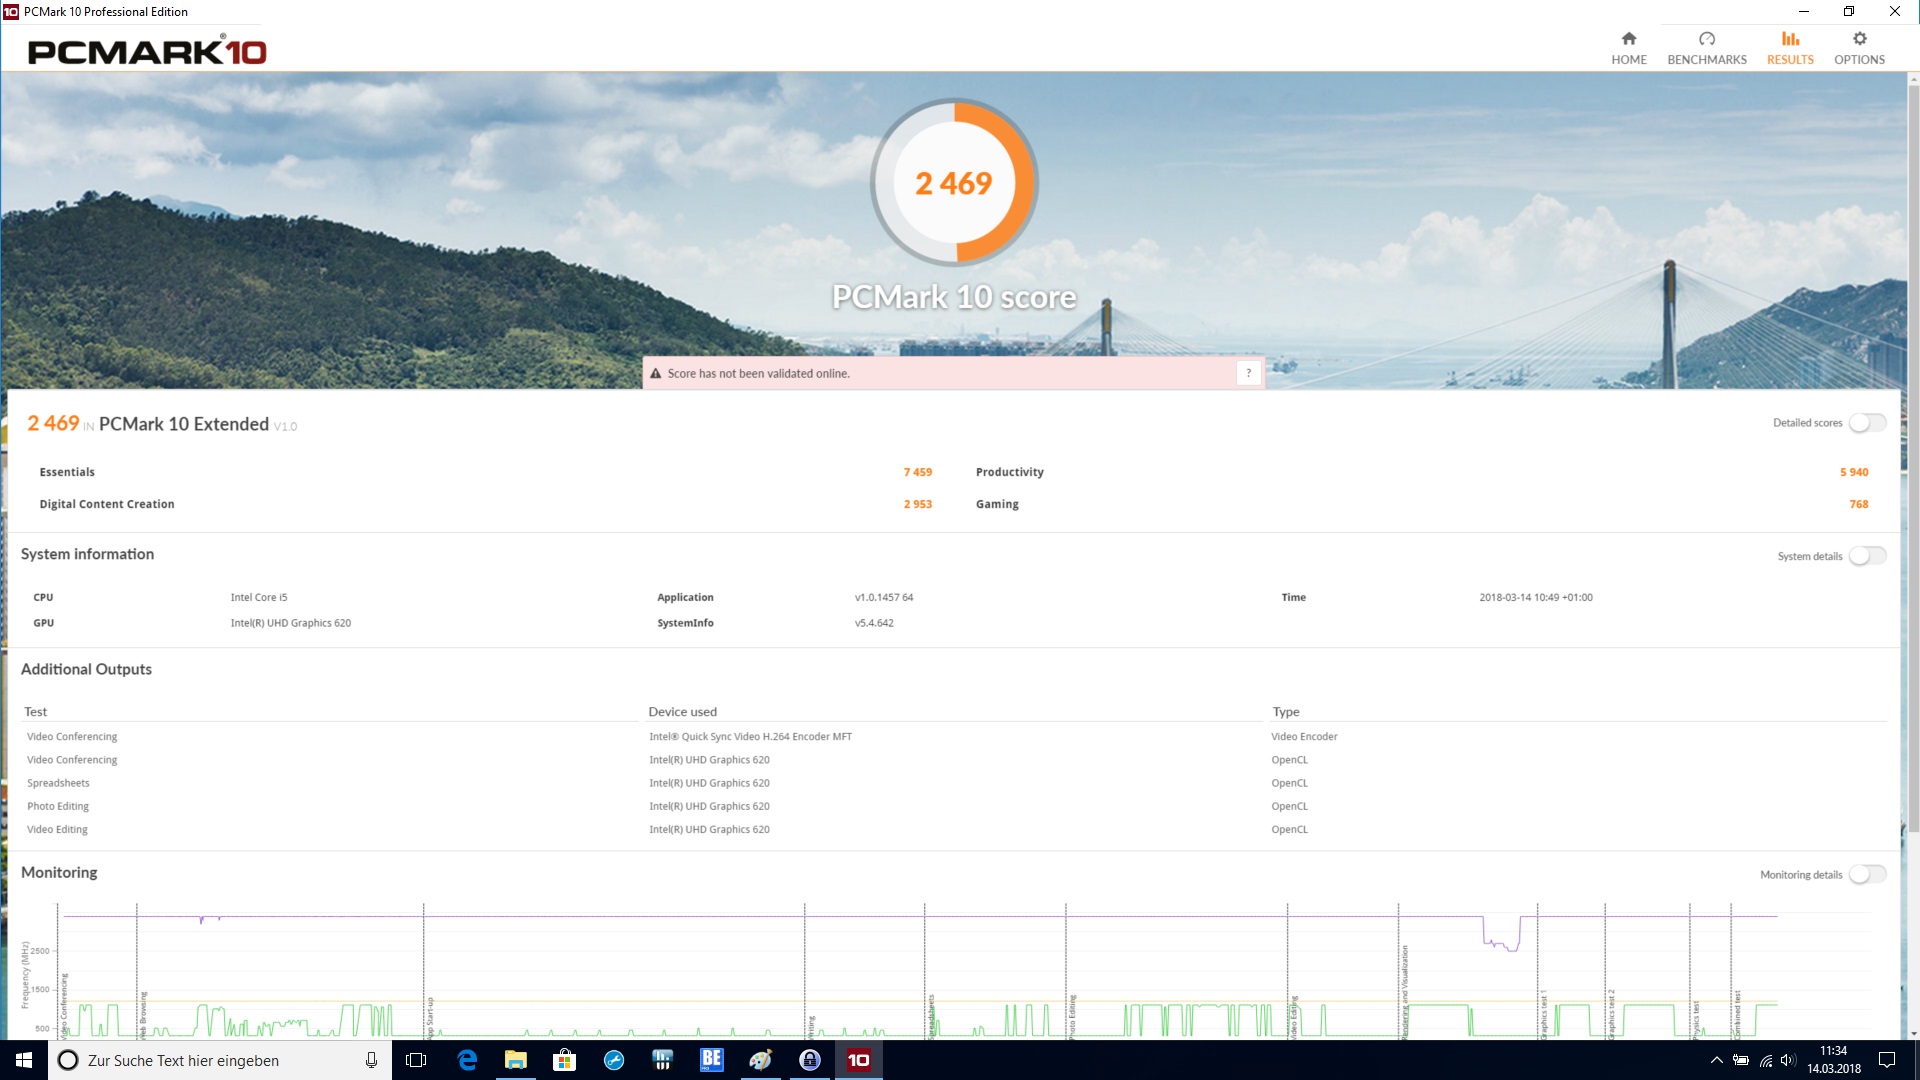
The Latitude 5590 performs well above the class average, even during our stress tests. Our test device booted quickly, and we did not experience long waiting times during our tests.
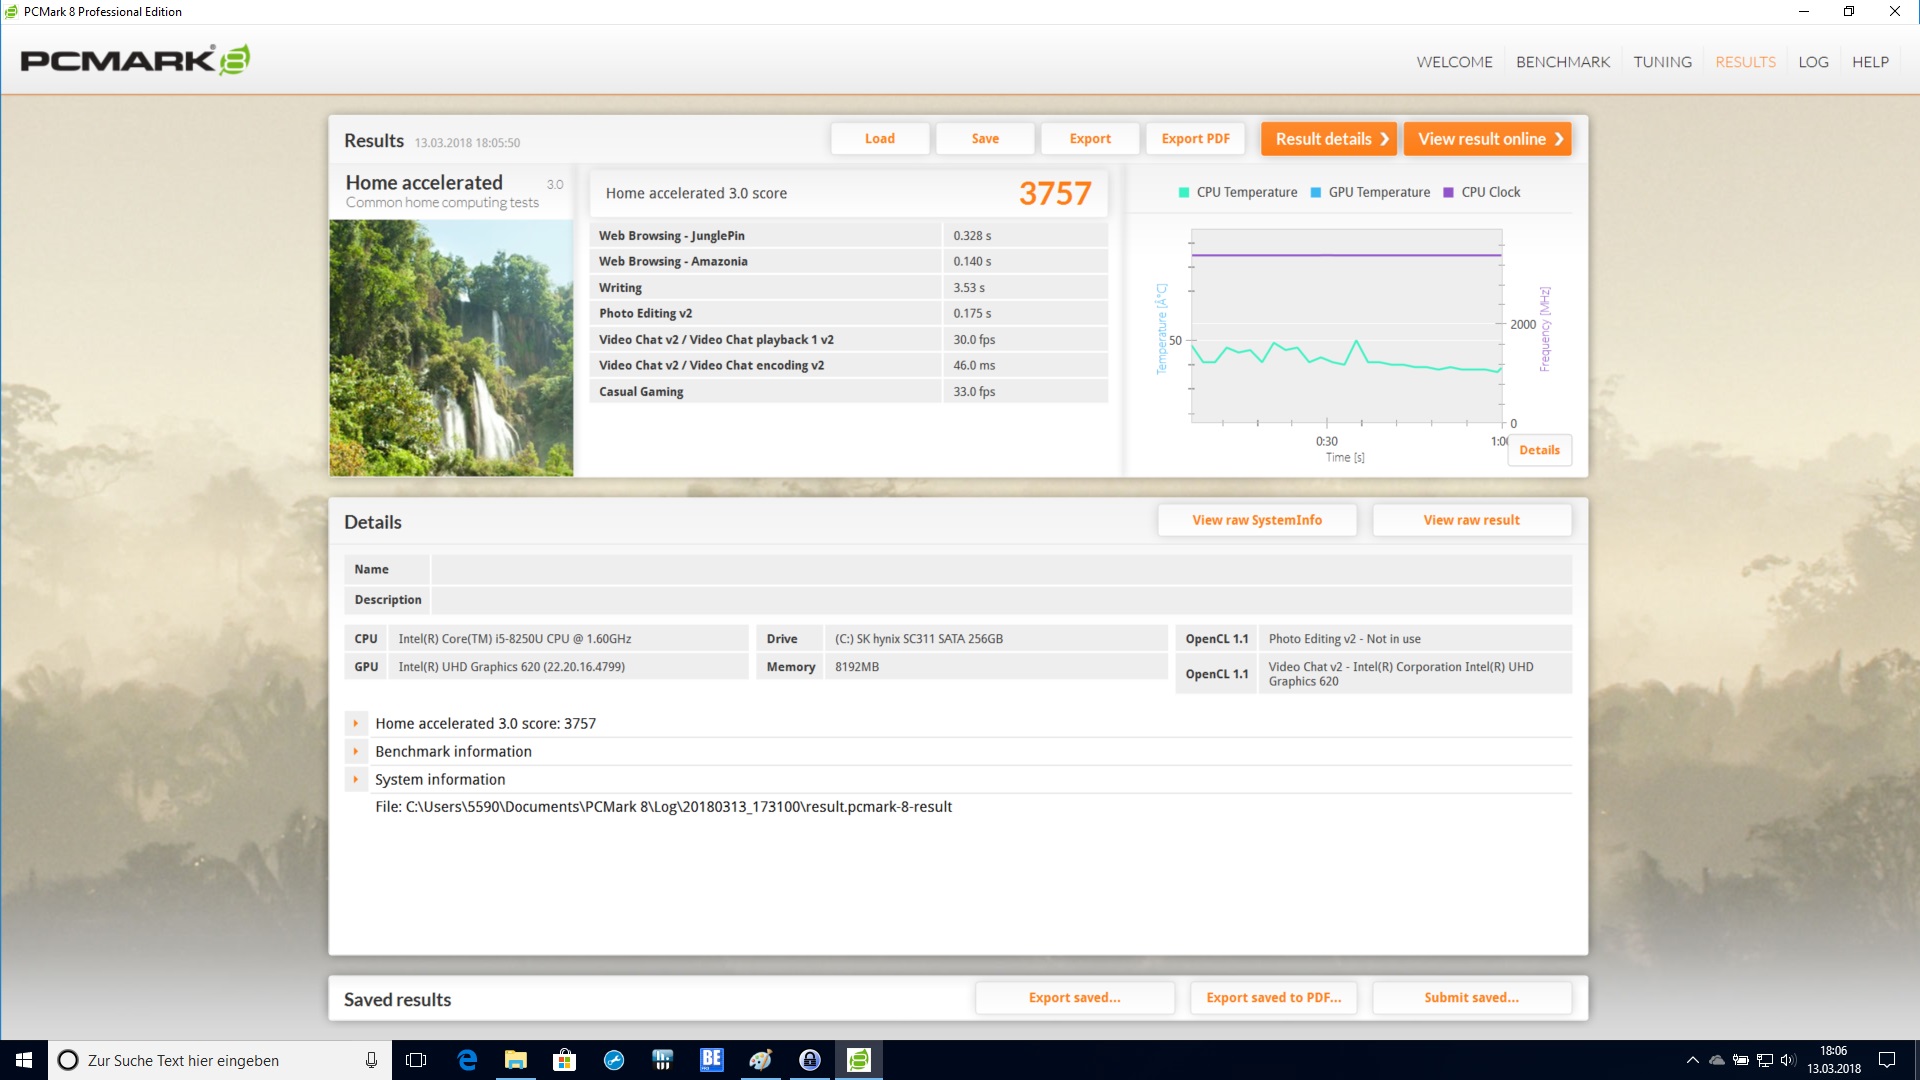
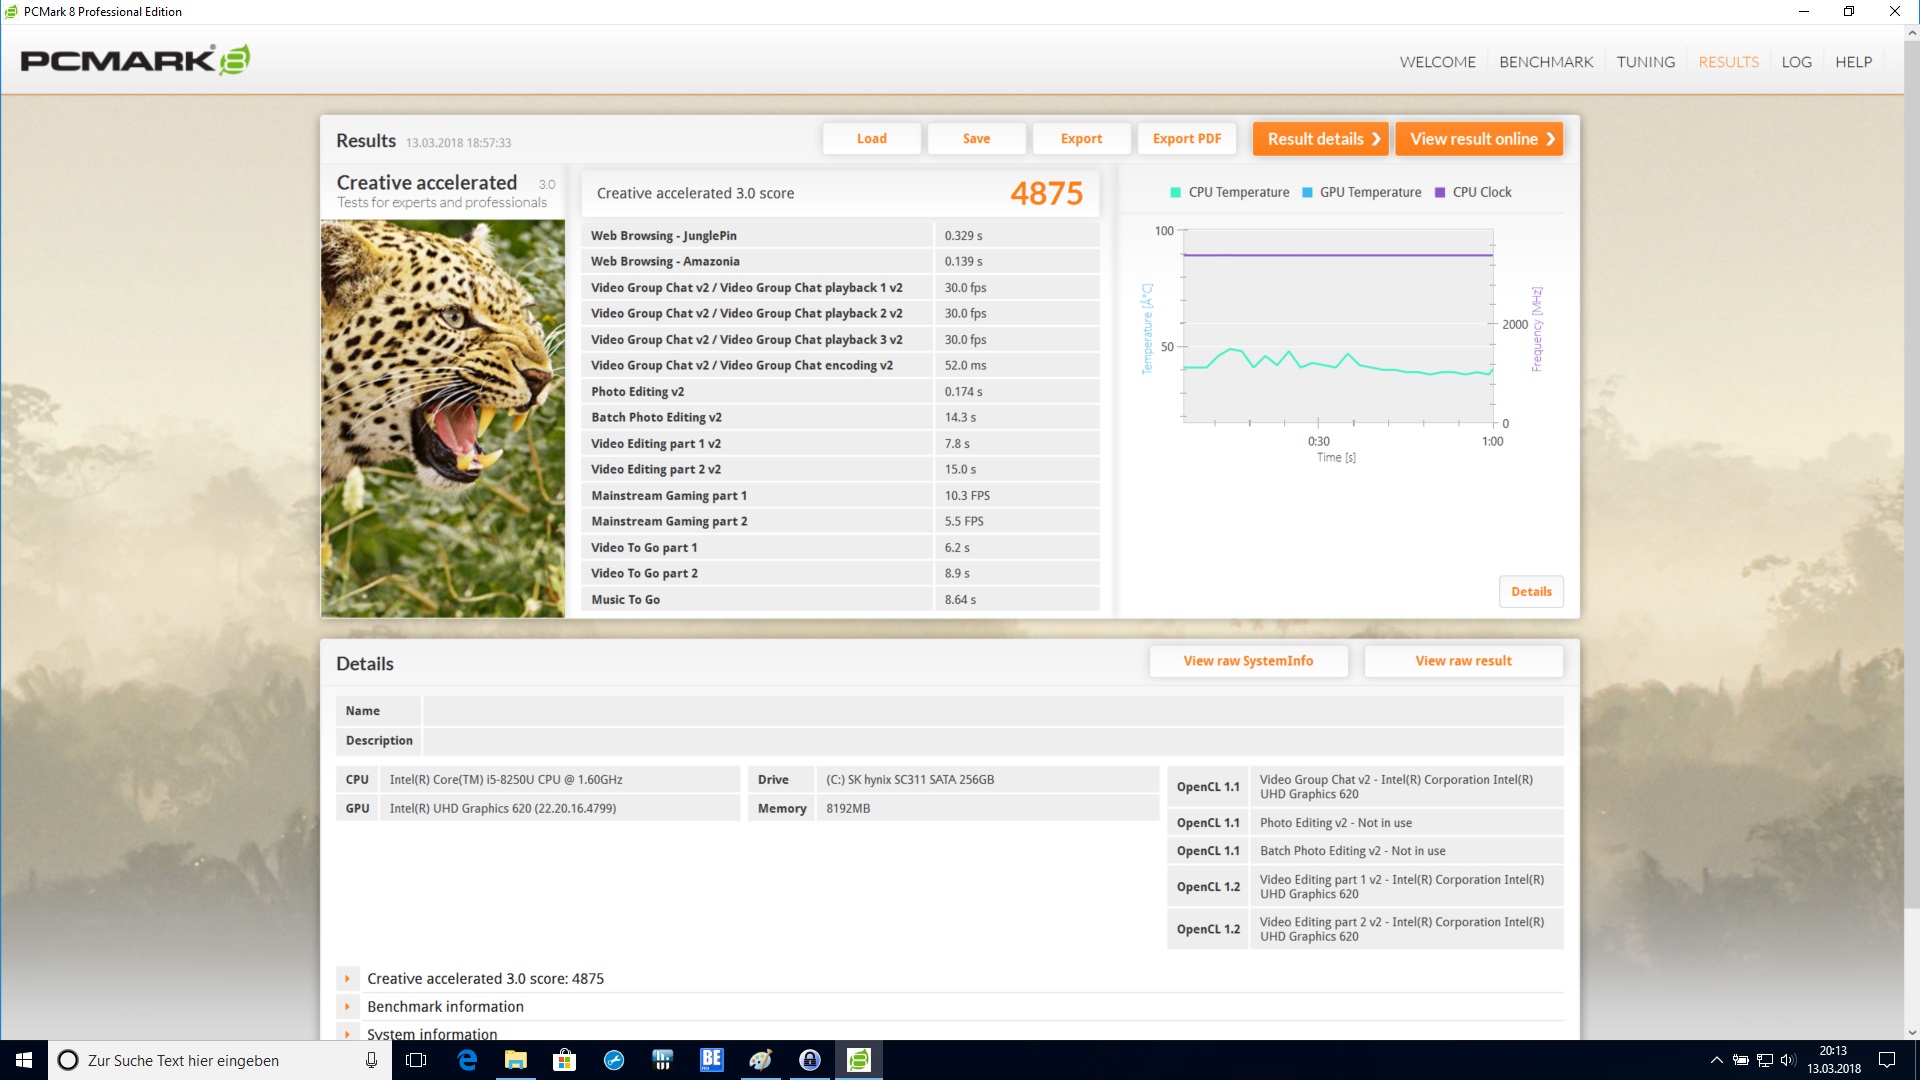
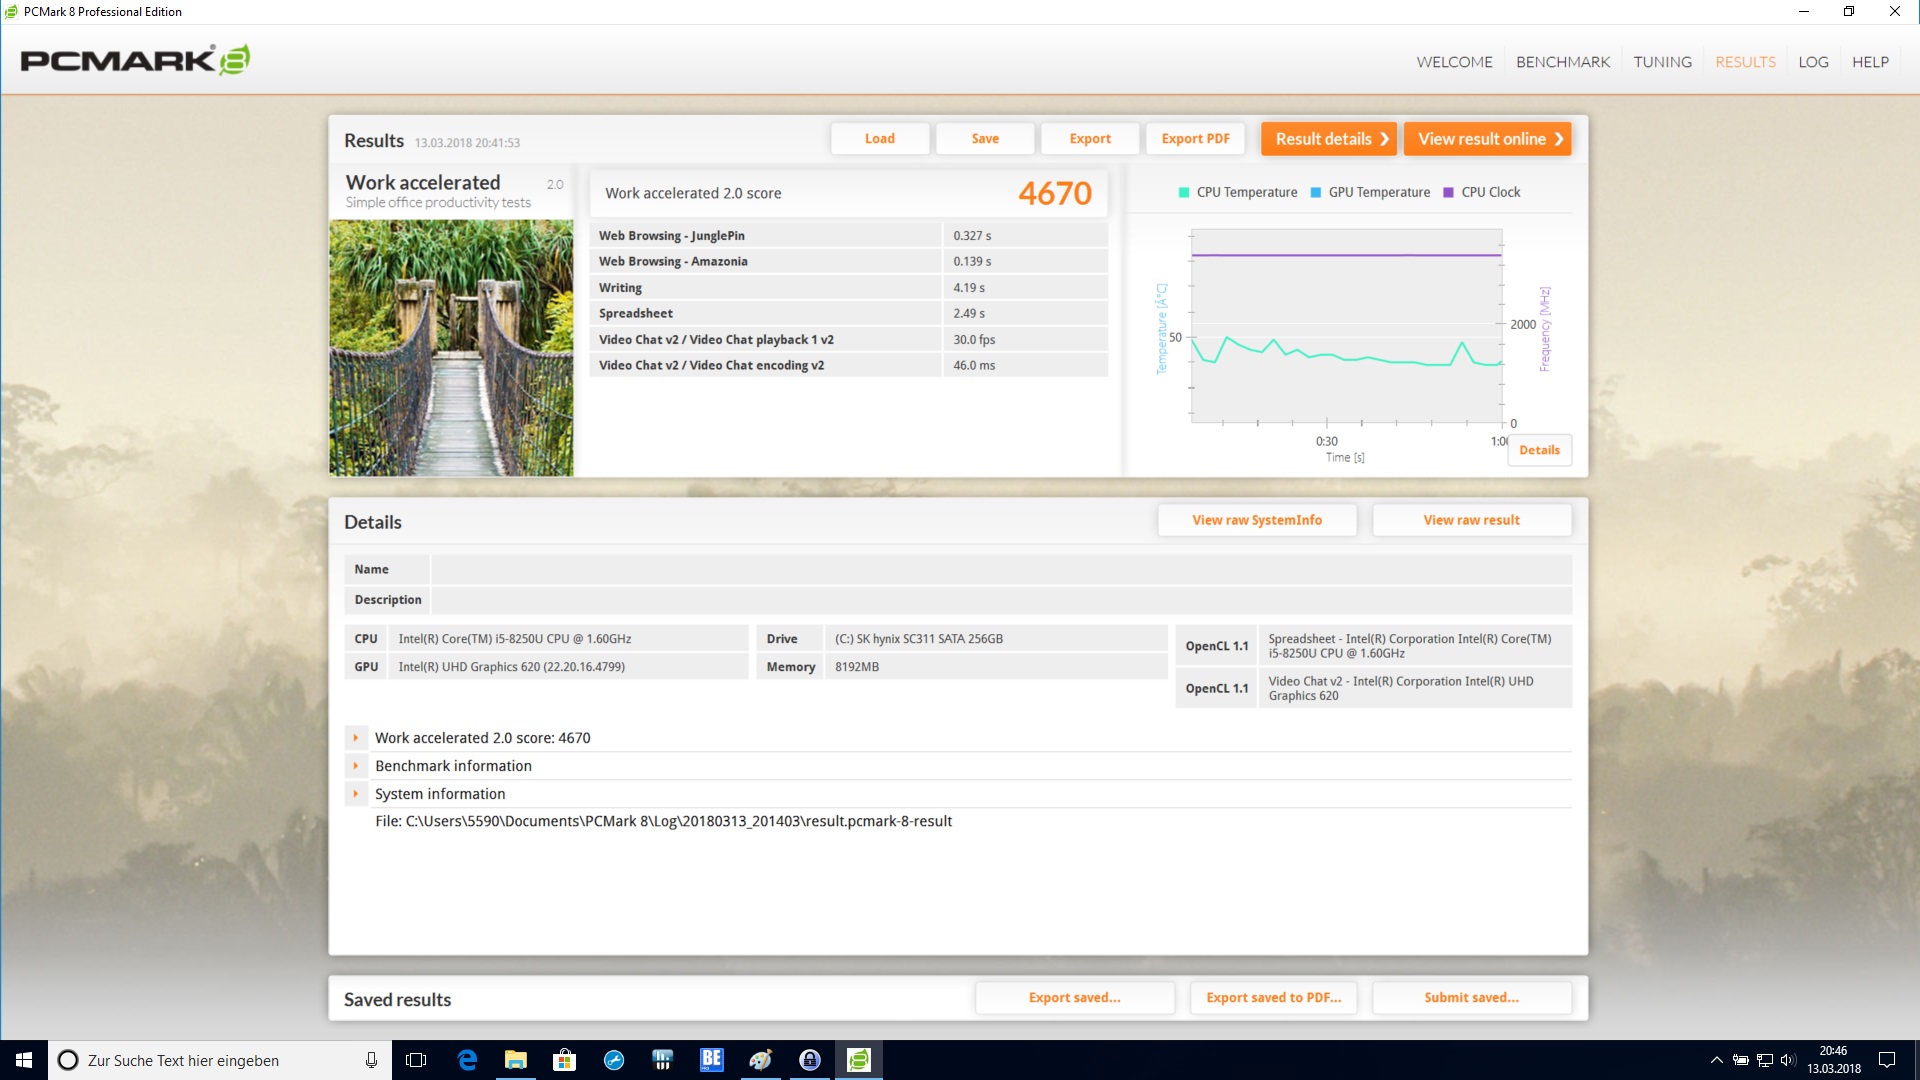
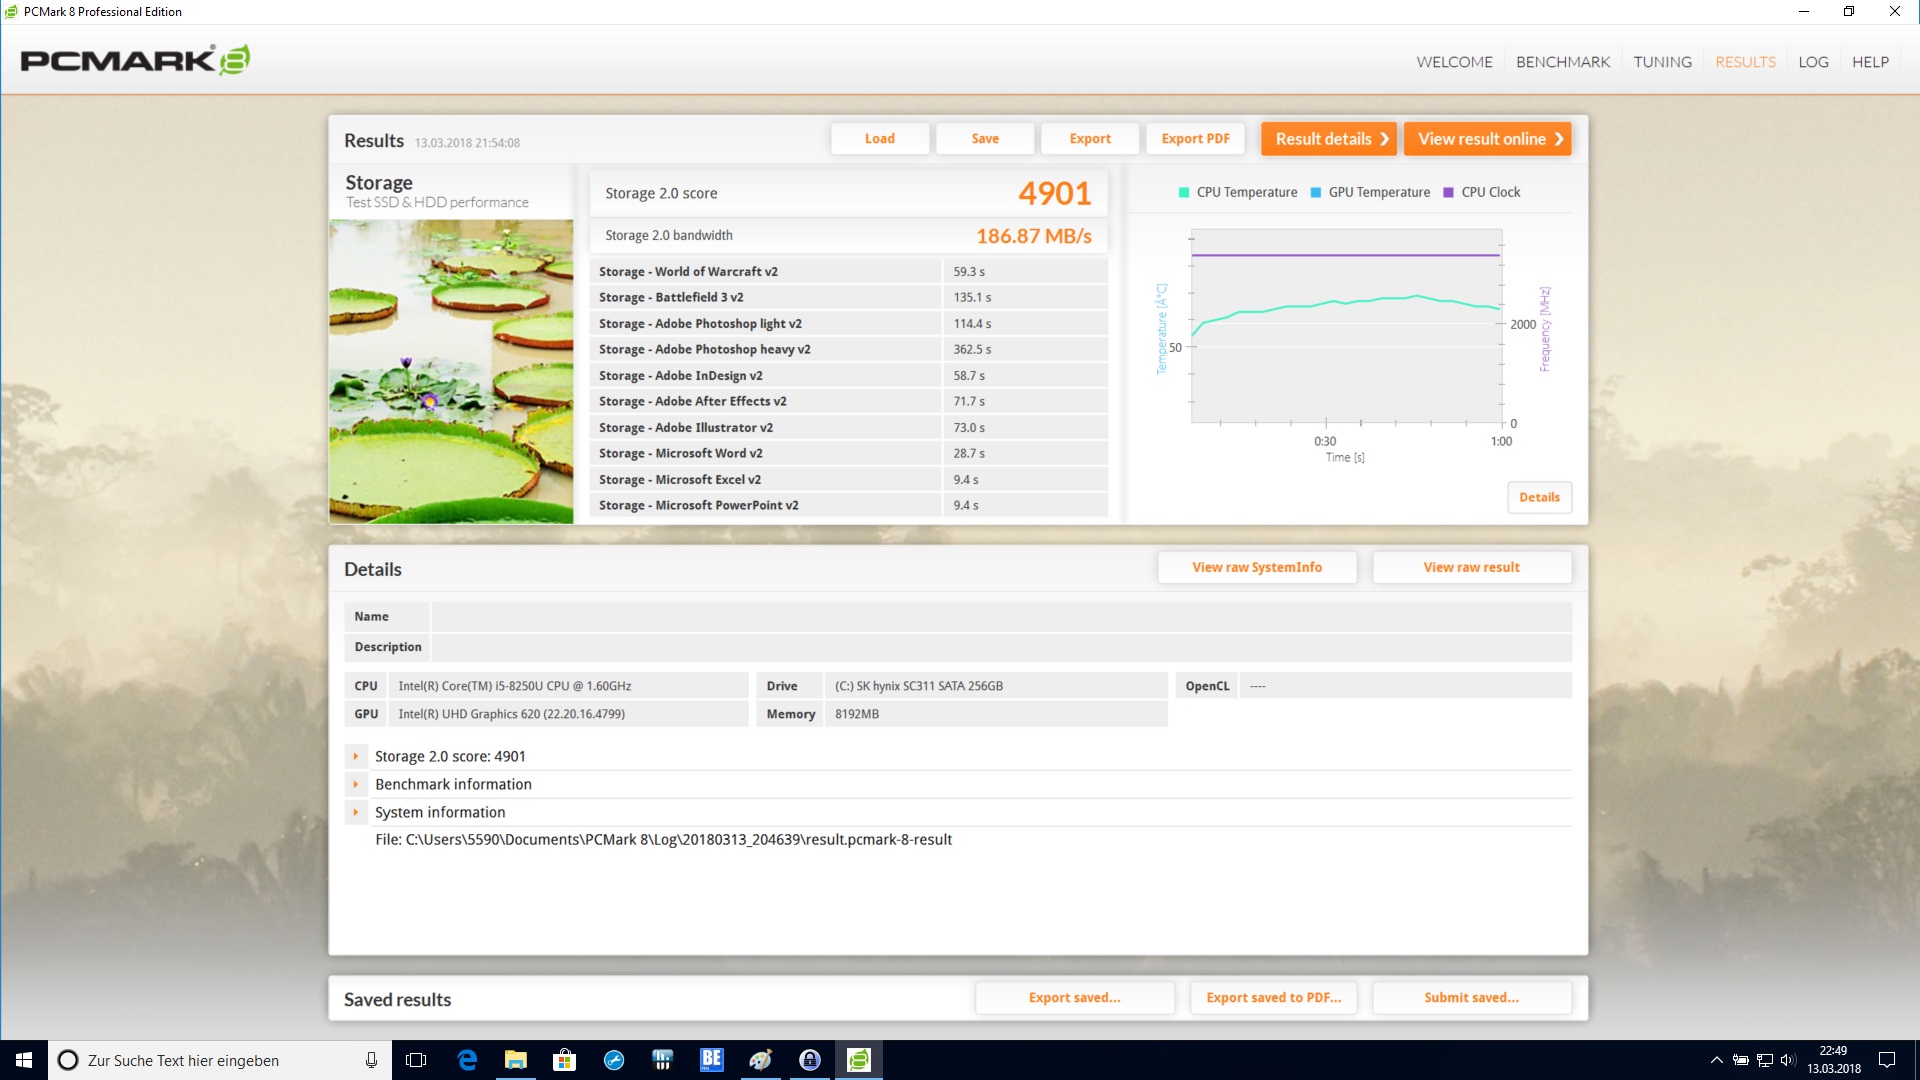
| PCMark 8 Home Score Accelerated v2 | 3757 points | |
| PCMark 8 Creative Score Accelerated v2 | 4875 points | |
| PCMark 8 Work Score Accelerated v2 | 4670 points | |
| PCMark 10 Score | 2469 points | |
Help | ||
Storage Devices
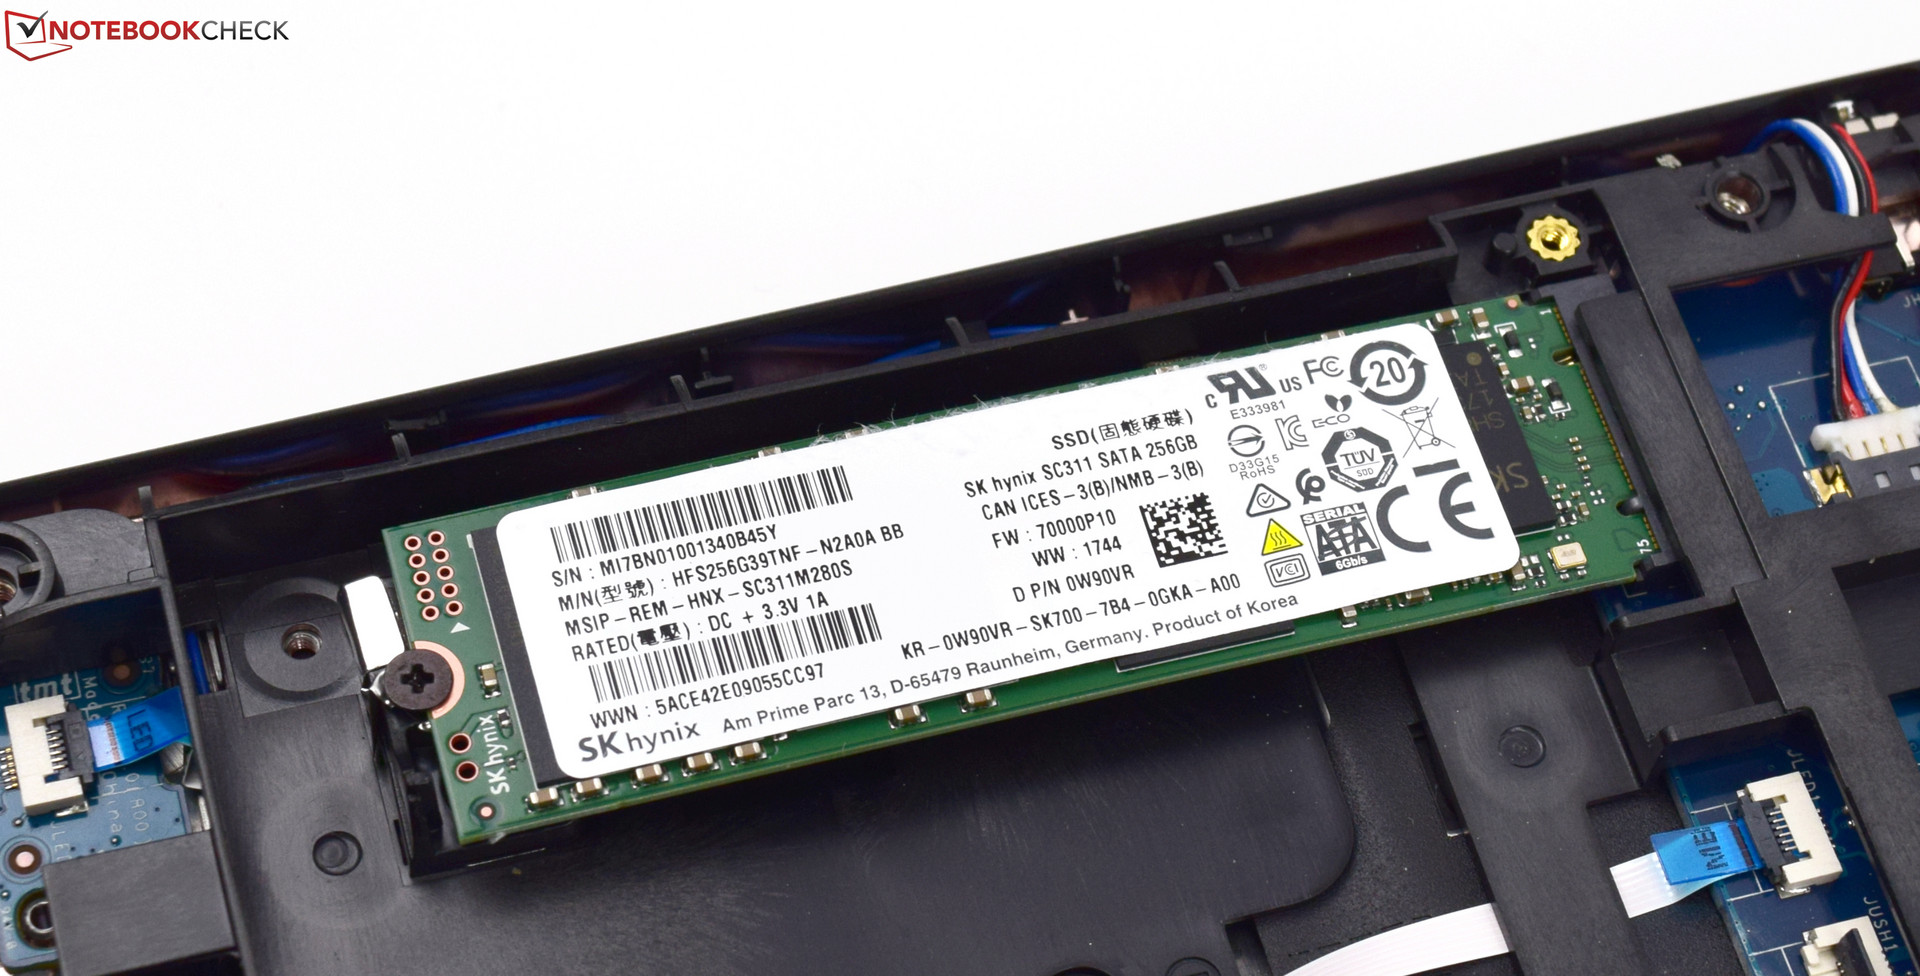
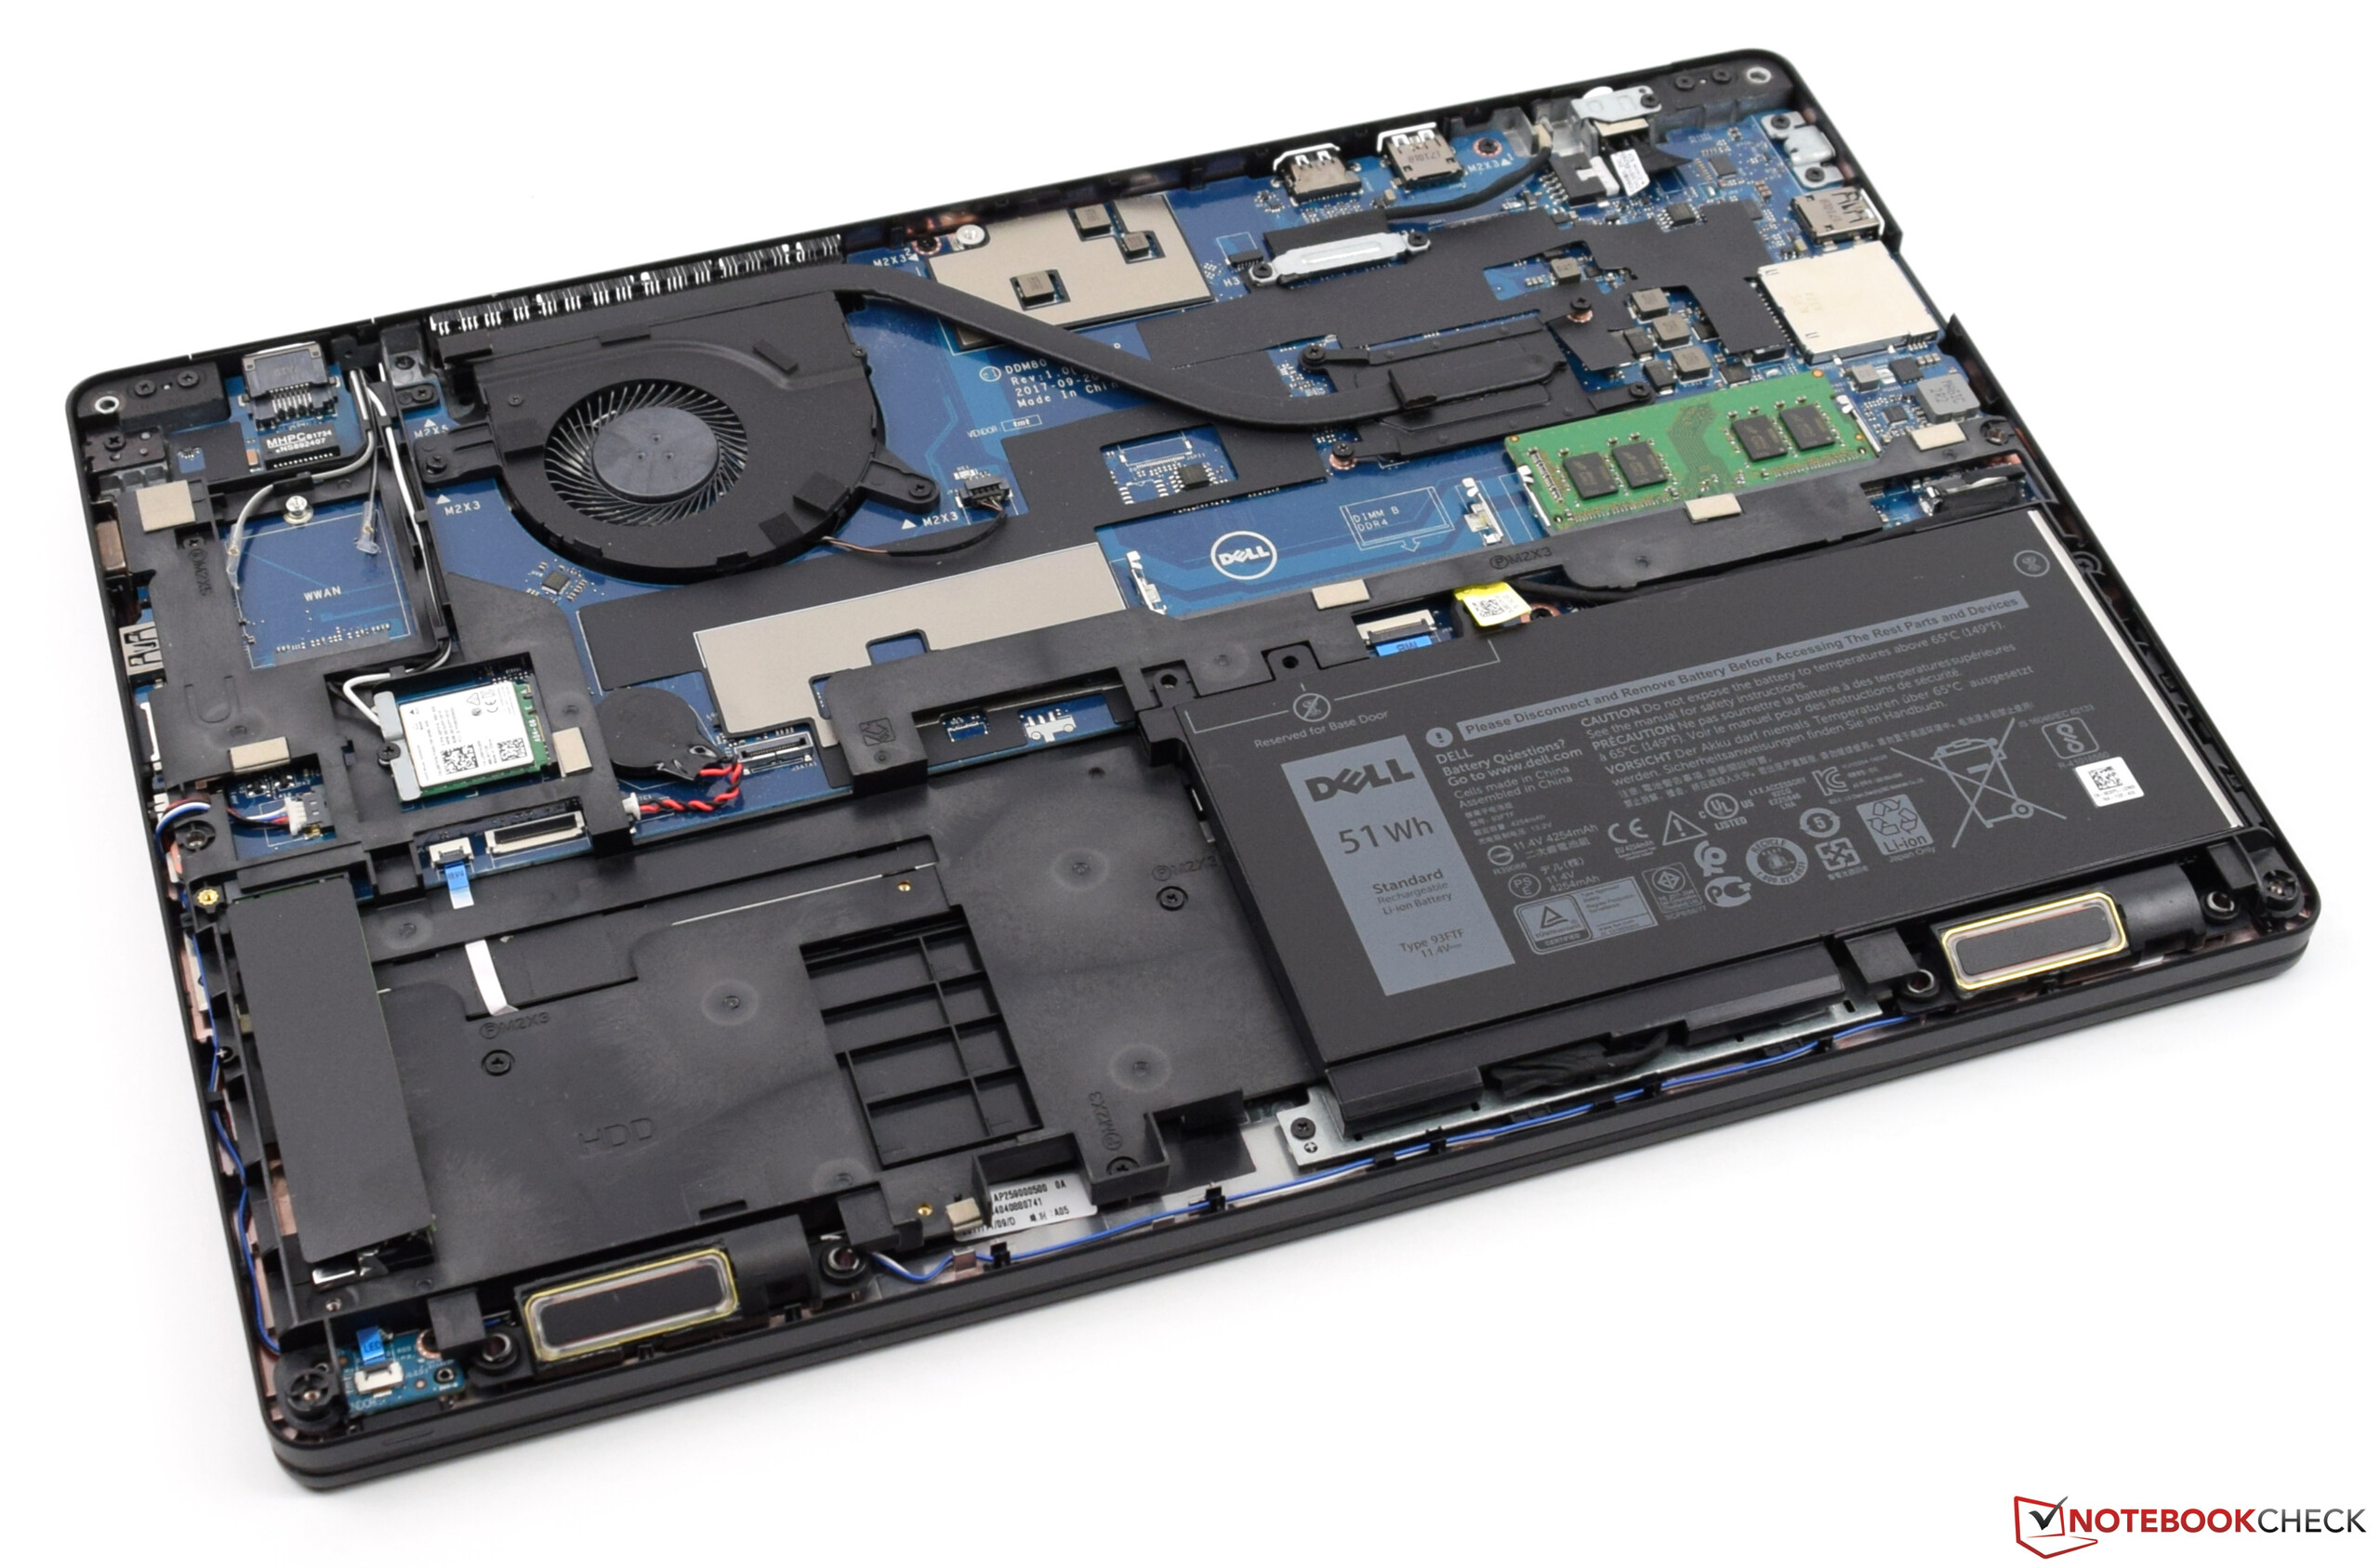
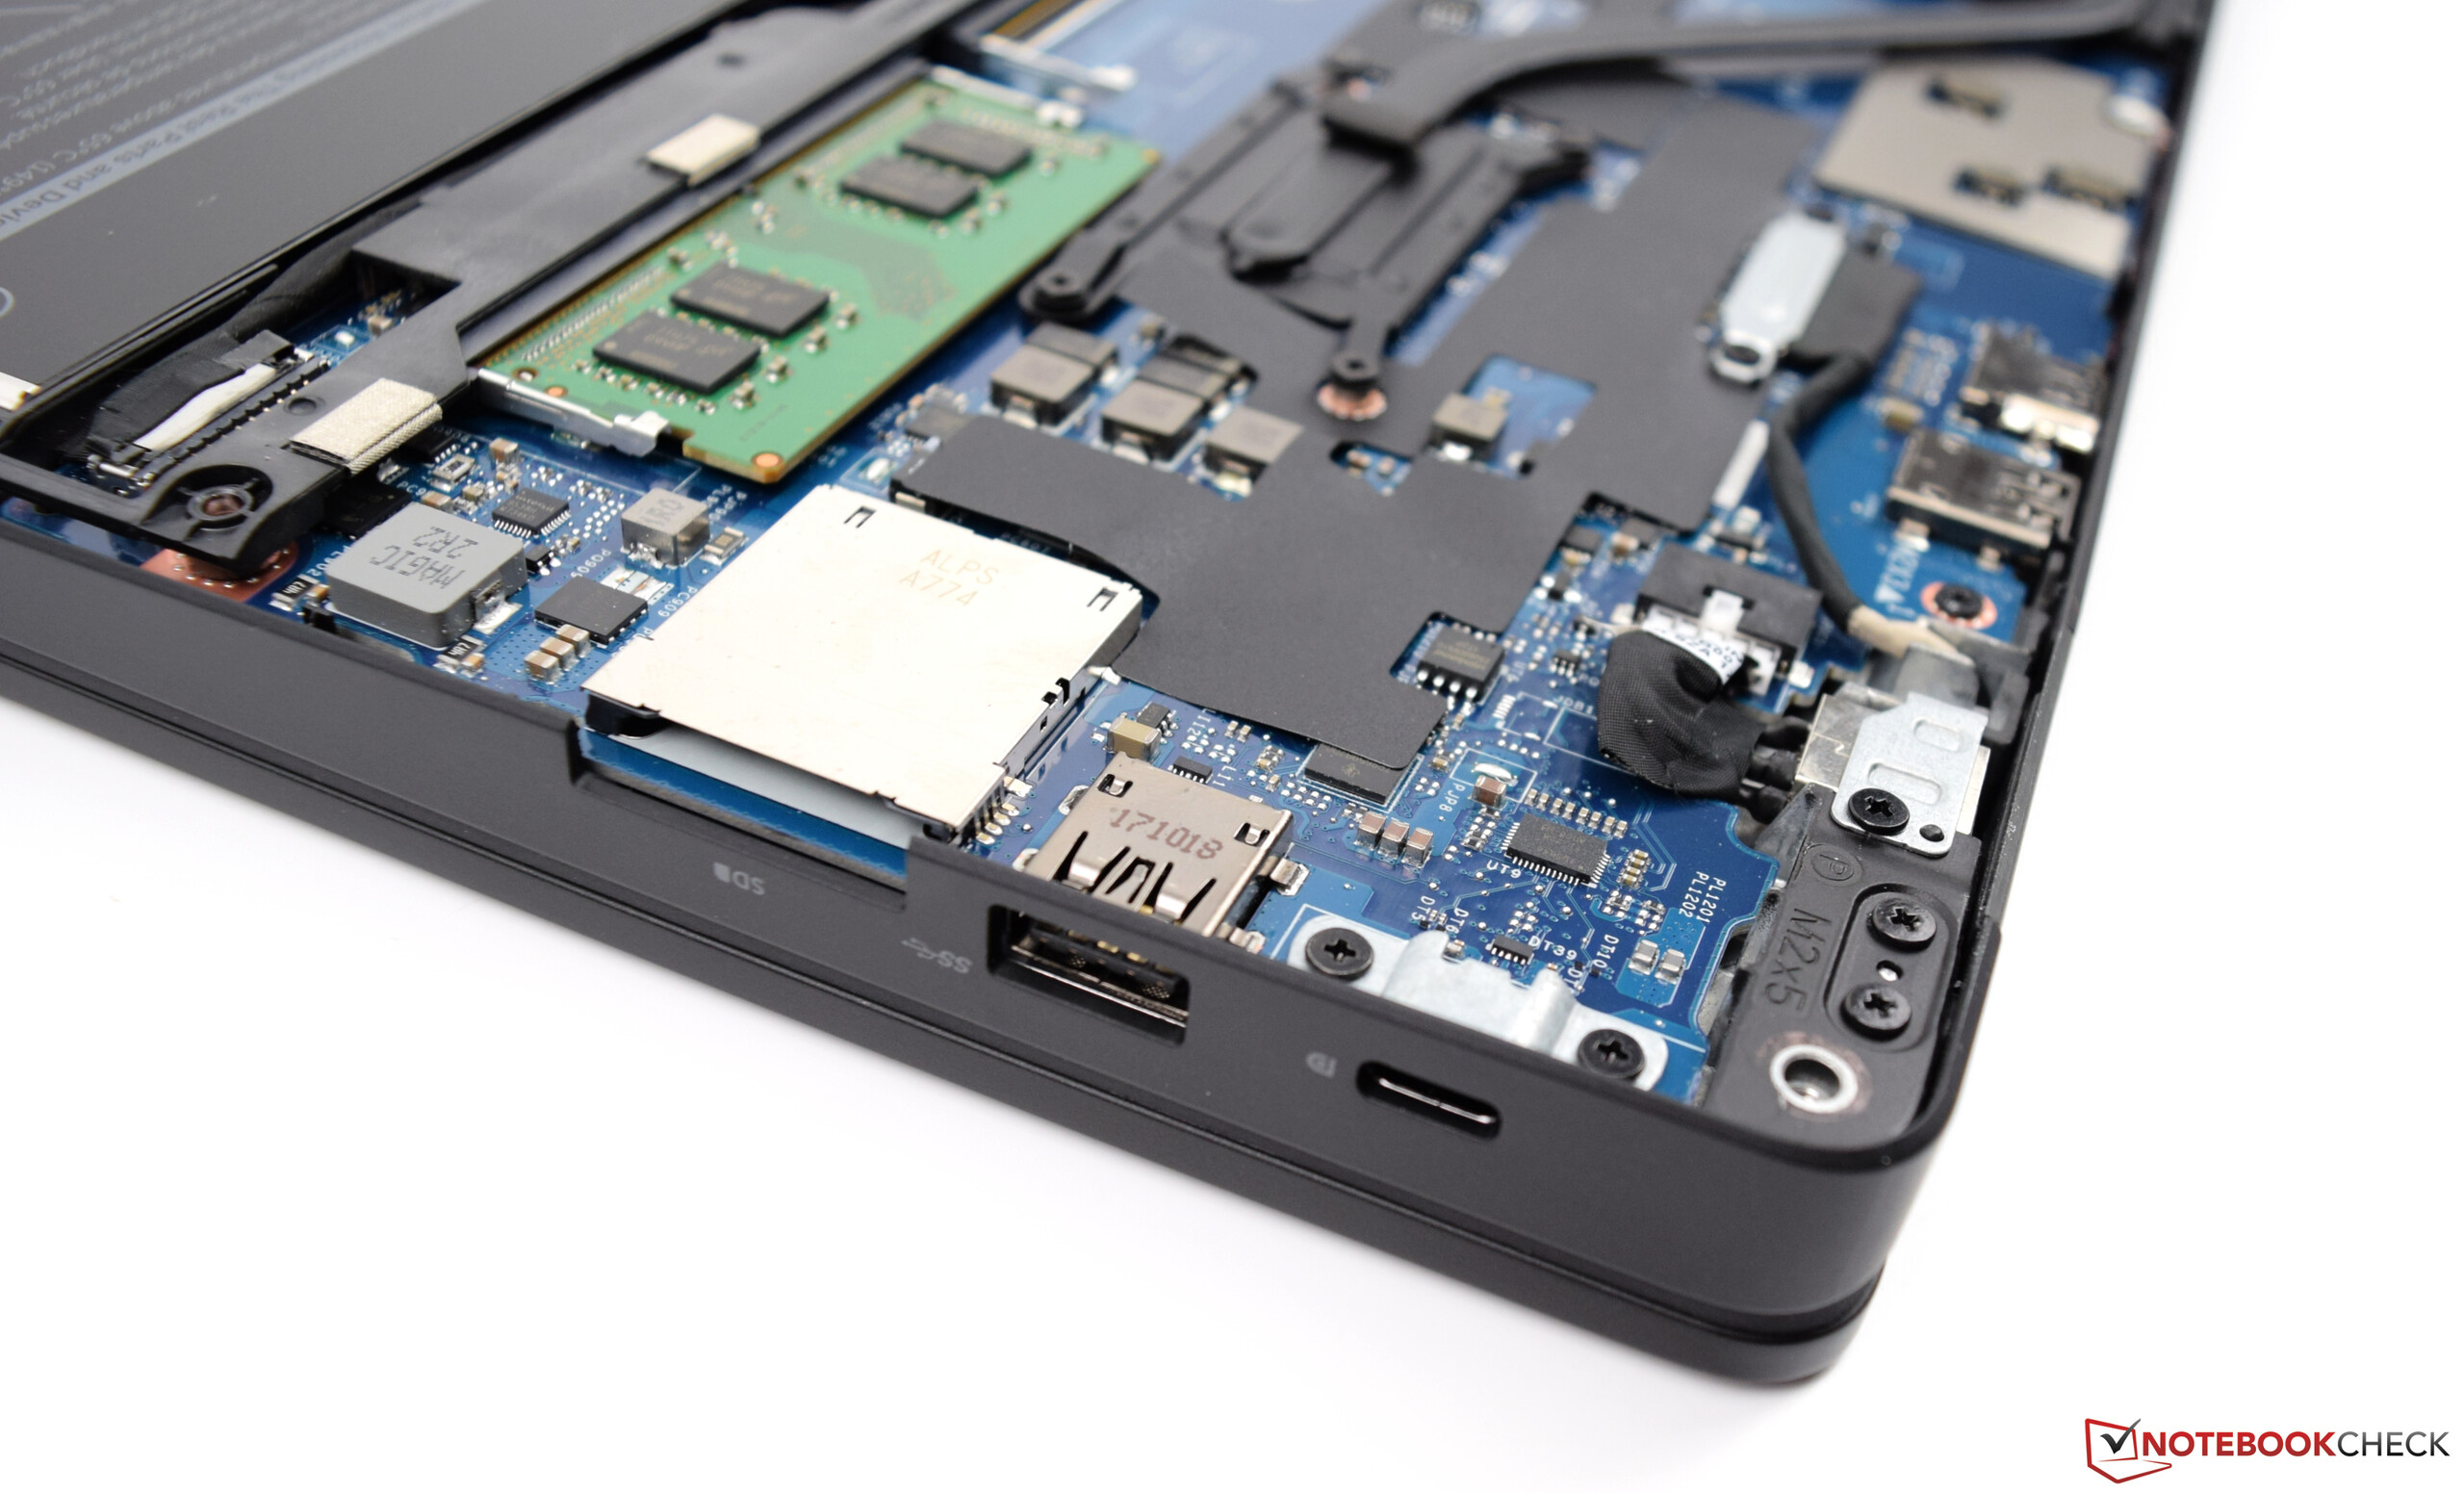
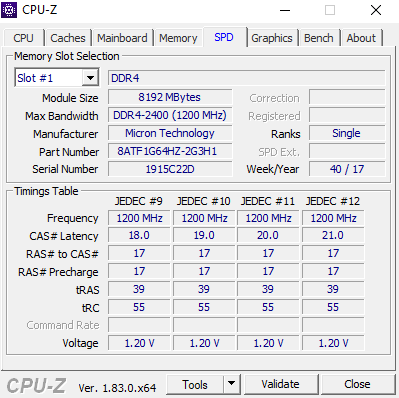
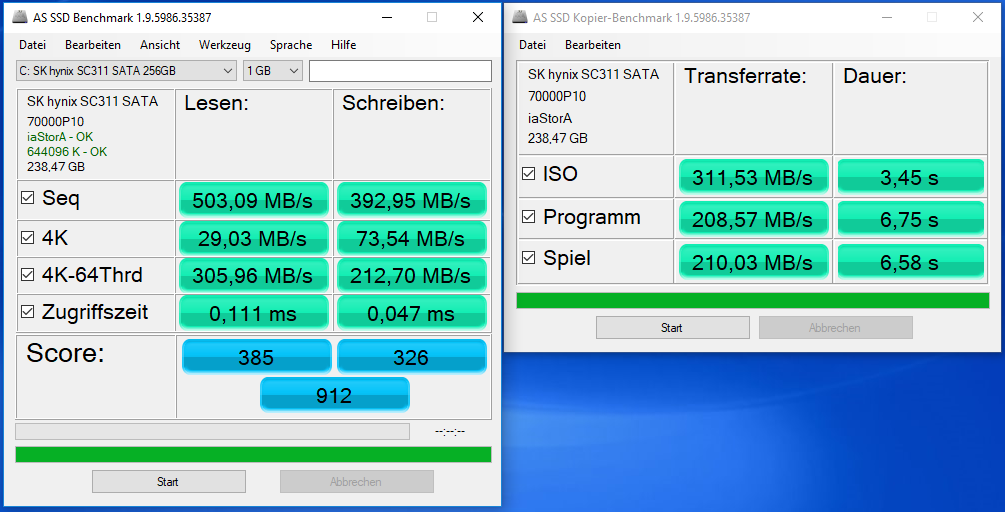
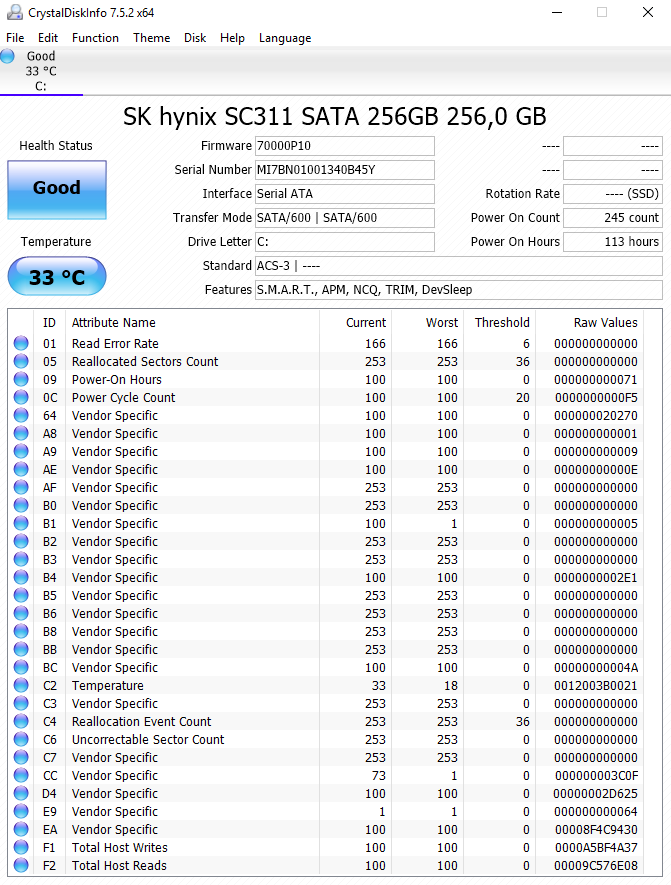
Our test device is equipped with a 256 GB M.2-2280 SSD made by SK Hynix, which has enough storage space for typical office applications. The SK Hynix drive supports SATA speeds, which should be sufficient for most users. Dell’s technical documentation states that the Latitude 5590 supports NVMe drives, which would offer faster read and write speeds resulting in improved system performance. Additionally, the Latitude 5590 has a 2.5-inch drive bay, the connecting cable for which Dell has not included in the box.
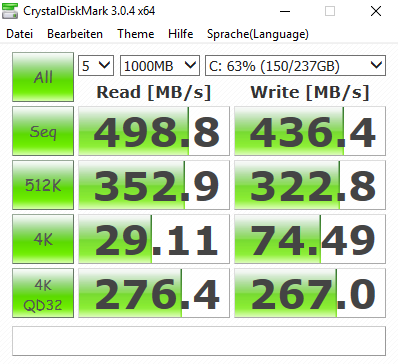
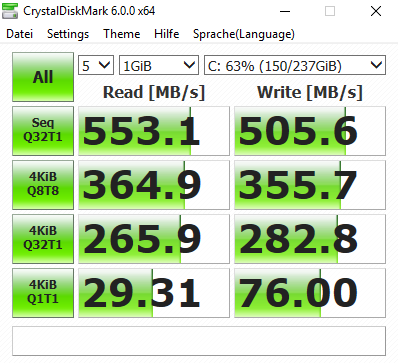
| Dell Latitude 5590 SK hynix SC311 M.2 | HP EliteBook 850 G4-Z2W86ET Samsung PM951 NVMe MZVLV256 | Fujitsu LifeBook U757 Samsung CM871a MZNTY256HDHP | Dell Latitude 5580 Seagate ST500LM021-1KJ15 | Lenovo ThinkPad T570-20H90002GE Samsung PM961 MZVLW256HEHP | |
|---|---|---|---|---|---|
| CrystalDiskMark 3.0 | 53% | 15% | -89% | 122% | |
| Read Seq (MB/s) | 498.8 | 1245 150% | 509 2% | 132.3 -73% | 1318 164% |
| Write Seq (MB/s) | 436.4 | 298.6 -32% | 488.4 12% | 131.1 -70% | 1166 167% |
| Read 512 (MB/s) | 352.9 | 673 91% | 414.3 17% | 27.04 -92% | 933 164% |
| Write 512 (MB/s) | 322.8 | 298.8 -7% | 321.7 0% | 56.6 -82% | 860 166% |
| Read 4k (MB/s) | 29.11 | 41.79 44% | 36.43 25% | 0.459 -98% | 56.6 94% |
| Write 4k (MB/s) | 74.5 | 138.4 86% | 88.4 19% | 0.812 -99% | 130.6 75% |
| Read 4k QD32 (MB/s) | 276.4 | 495 79% | 402.8 46% | 1.1 -100% | 510 85% |
| Write 4k QD32 (MB/s) | 267 | 297.5 11% | 256.7 -4% | 0.828 -100% | 426.4 60% |

Graphics Card
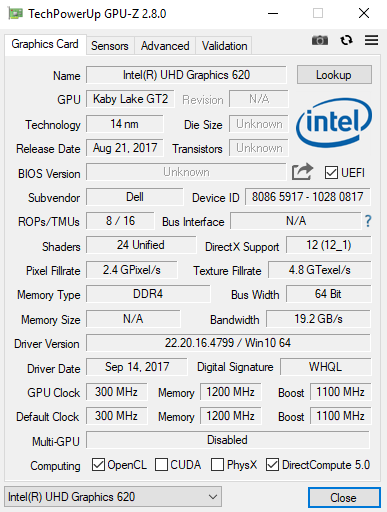
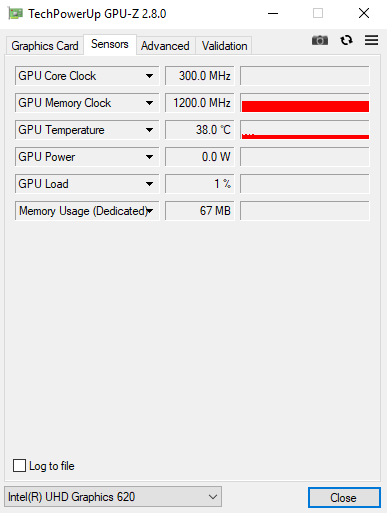
Intel UHD Graphics 620 handles the graphics, which offers improved performance over its predecessor, the Intel HD Graphics 620. Performance could be further improved by adding a second RAM module, which would enable dual-channel mode. This still does not make for a good gaming experience though. Instead, the GPU is better suited for decoding high-resolution videos, such as H.265 / HEVC with 10-bit color depth and Google’s VP9 codec.
Further information and benchmarks for the Intel UHD Graphics 620 can be found here.
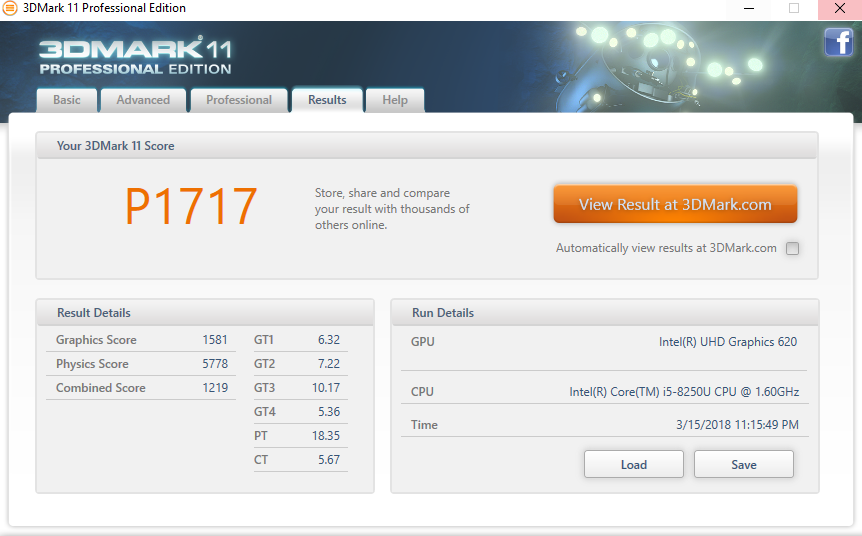
| 3DMark 11 - 1280x720 Performance GPU (sort by value) | |
| Dell Latitude 5590 | |
| HP EliteBook 850 G4-Z2W86ET | |
| Fujitsu LifeBook U757 | |
| Dell Latitude 5580 | |
| Lenovo ThinkPad T570-20H90002GE | |
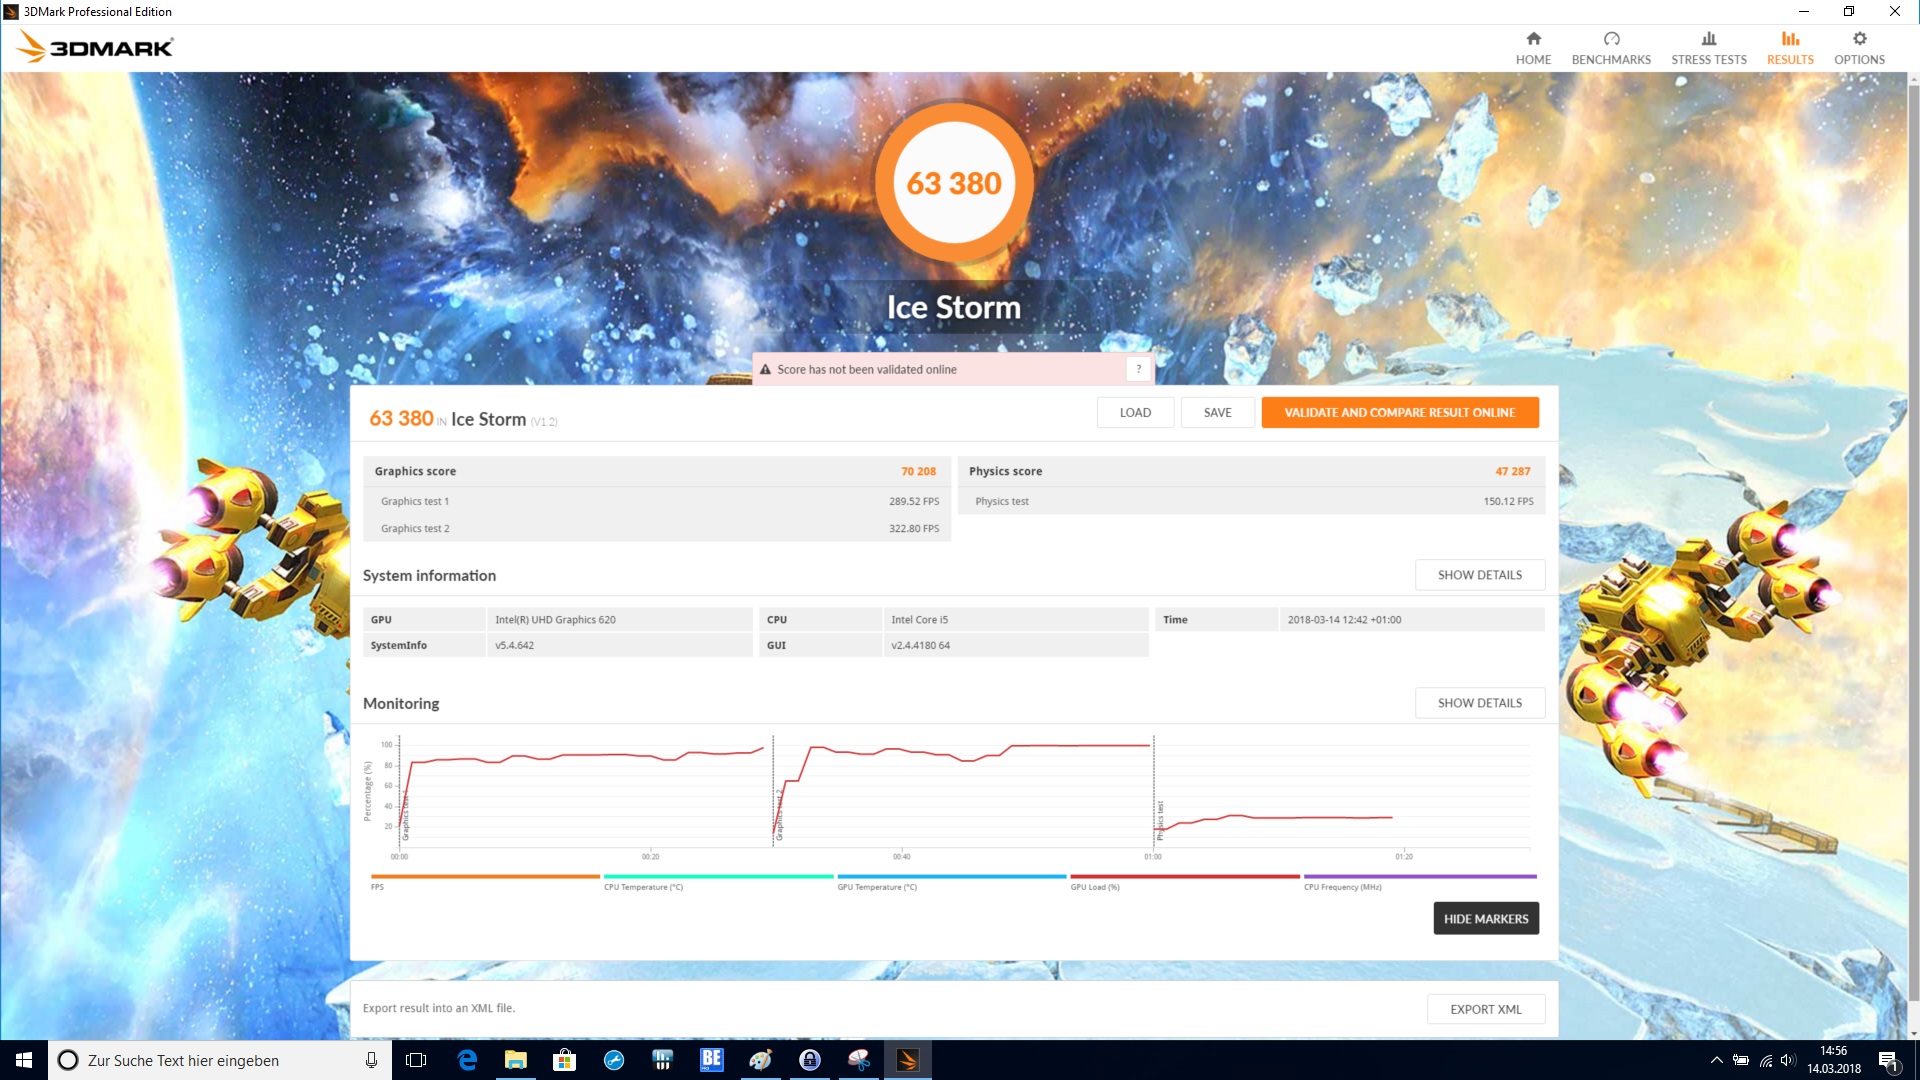
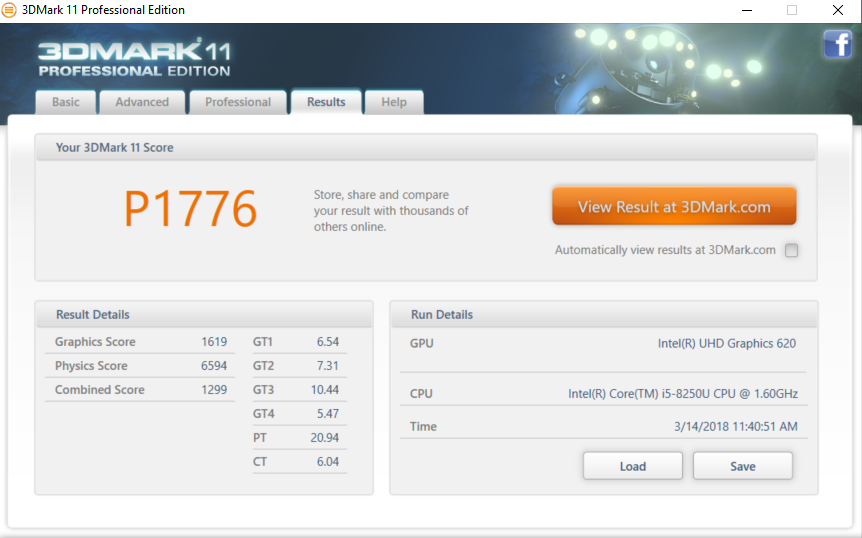
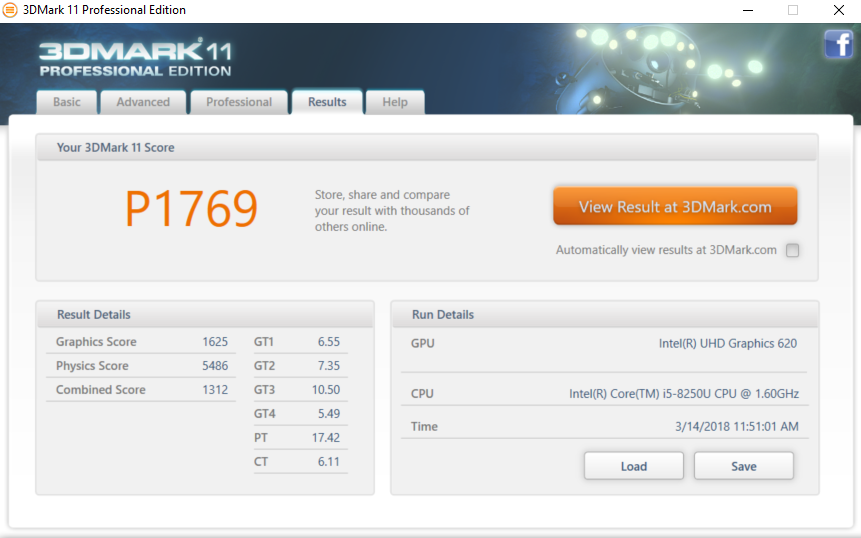
| 3DMark 11 Performance | 1776 points | |
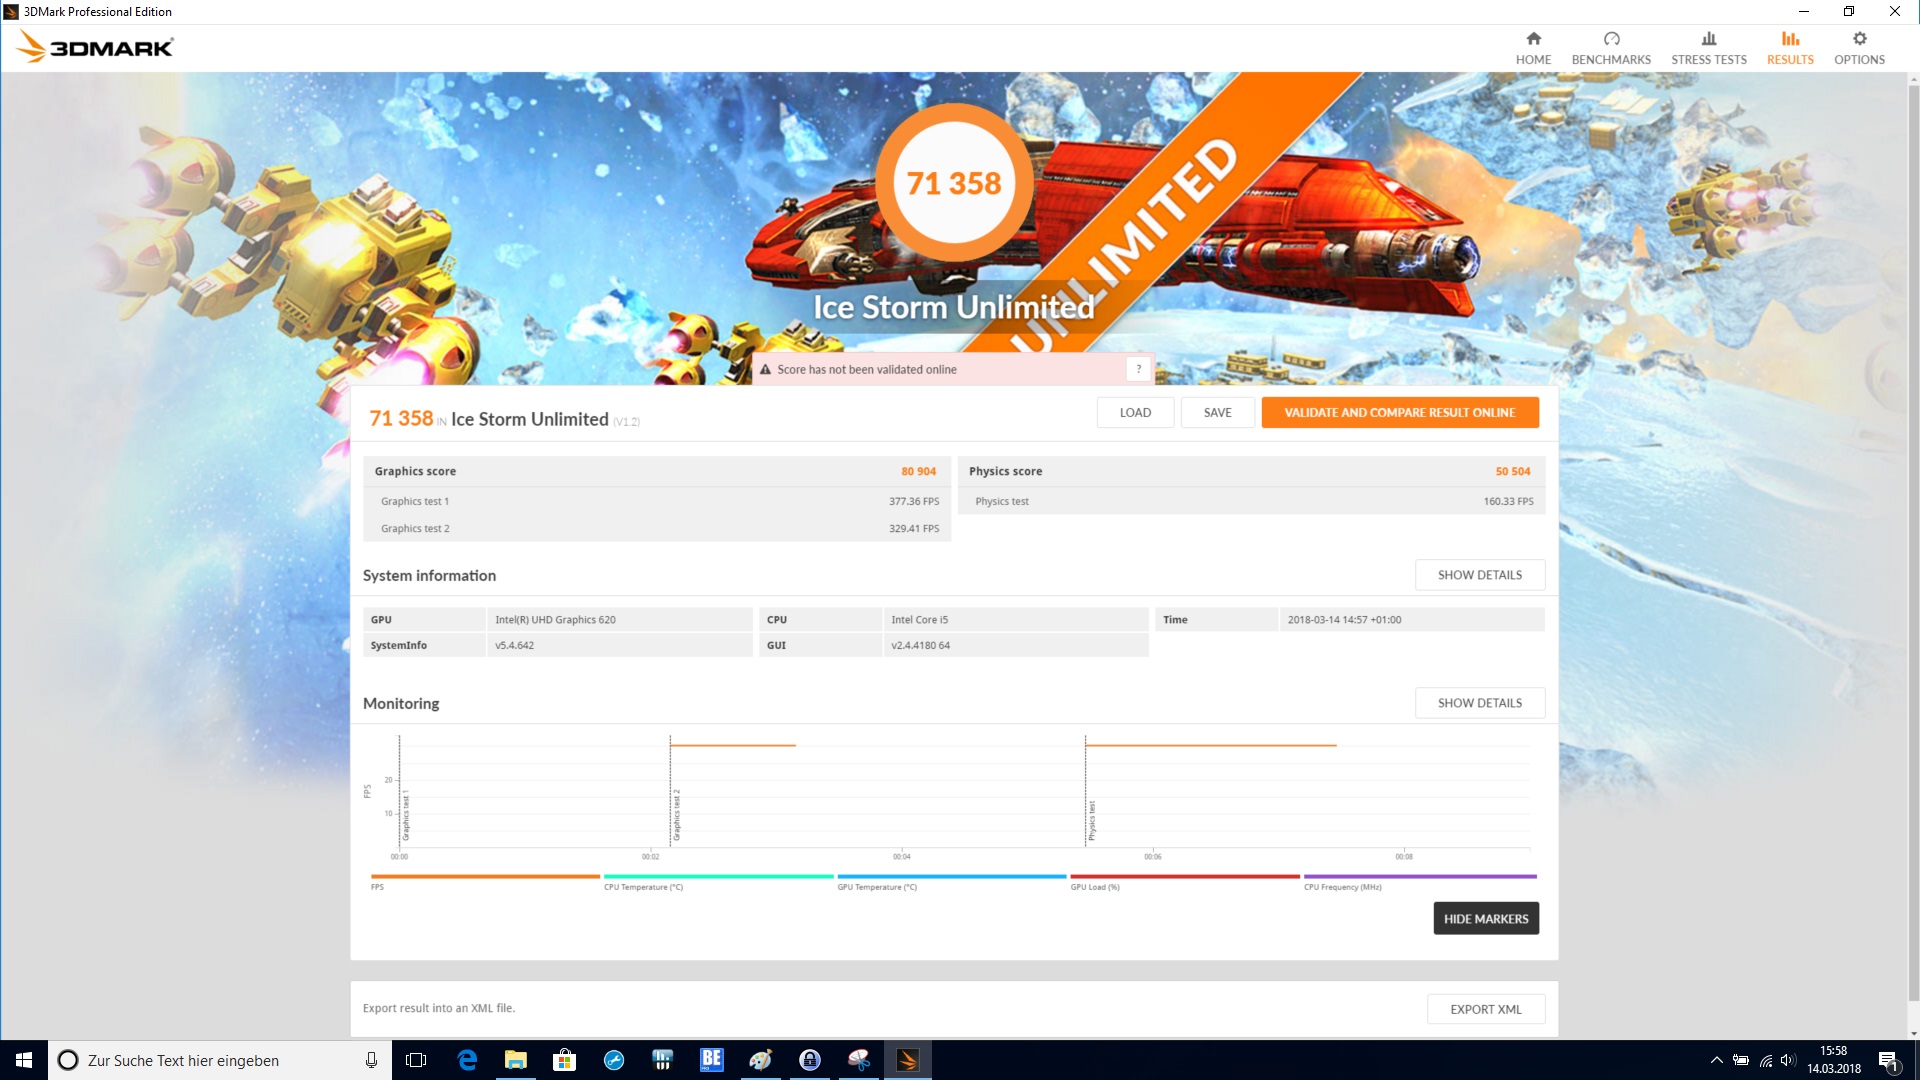
| 3DMark Ice Storm Standard Score | 63380 points | |
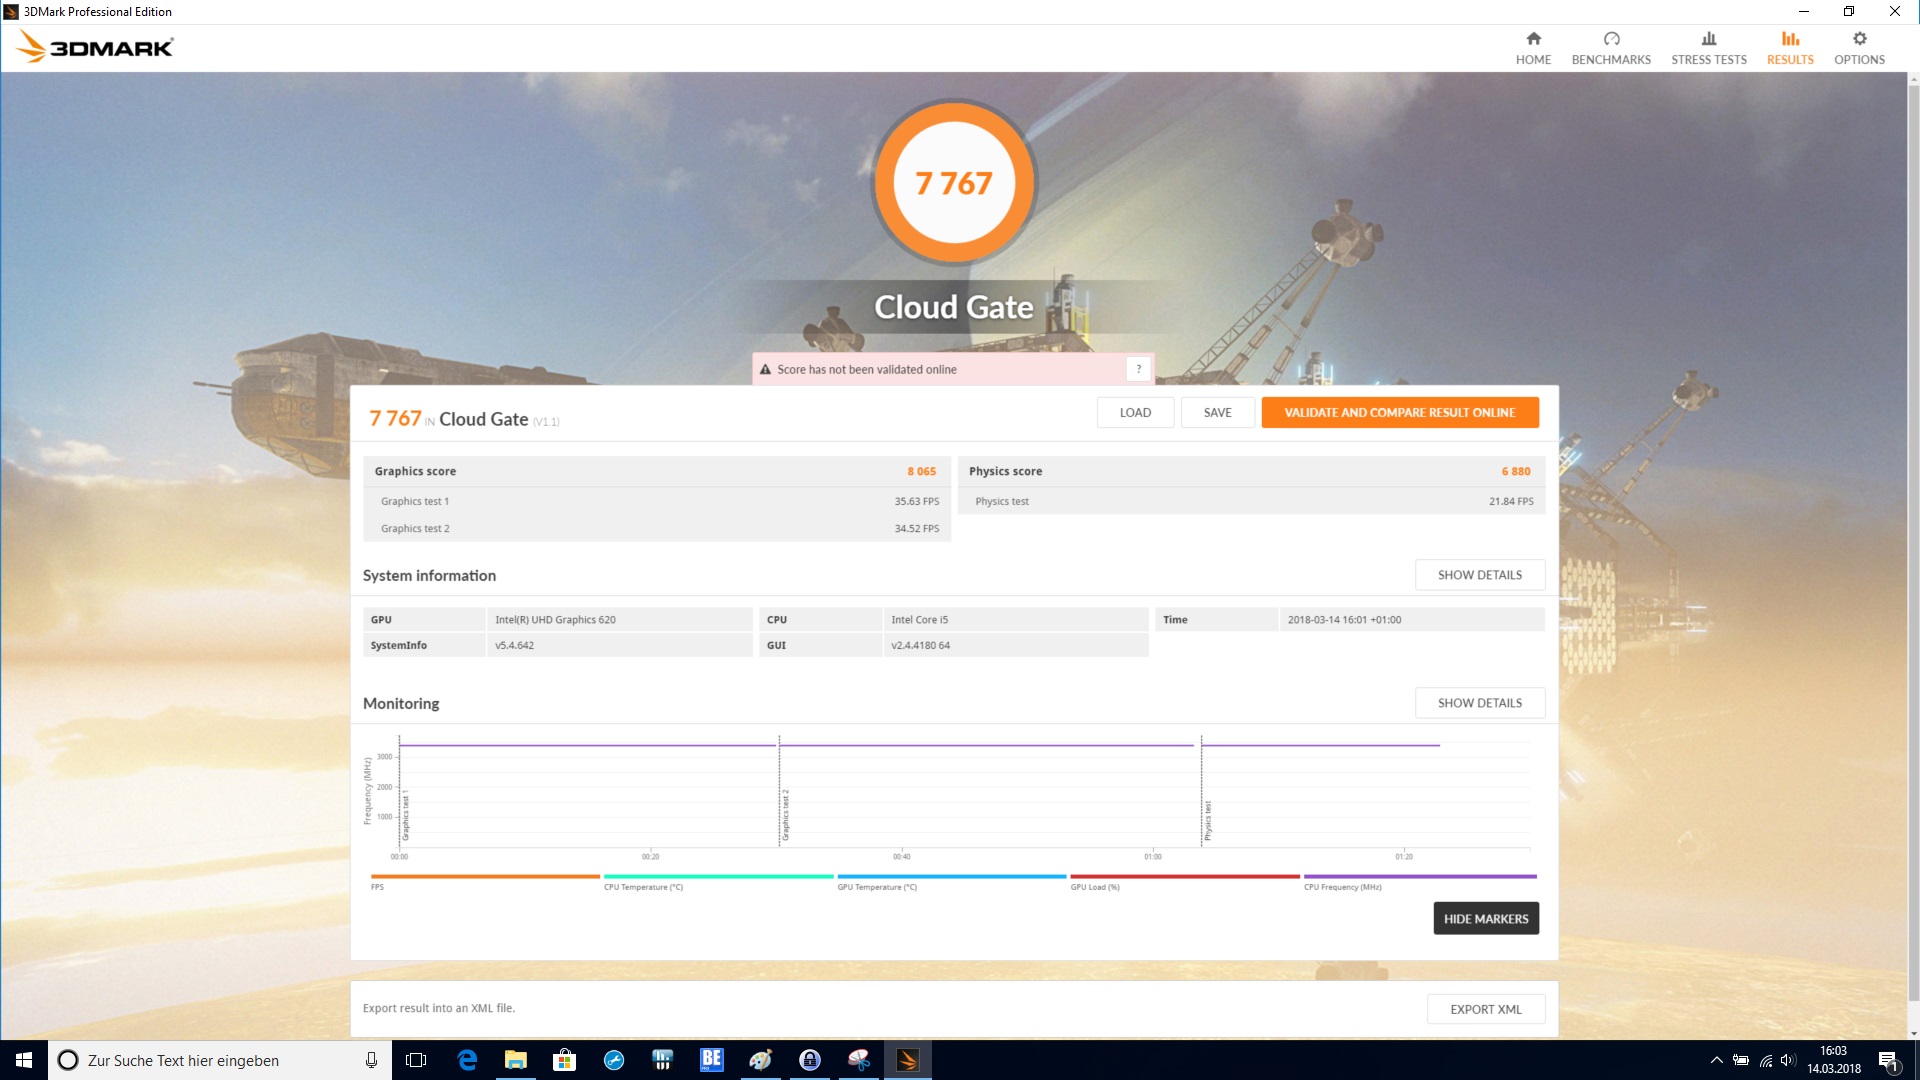
| 3DMark Cloud Gate Standard Score | 7767 points | |
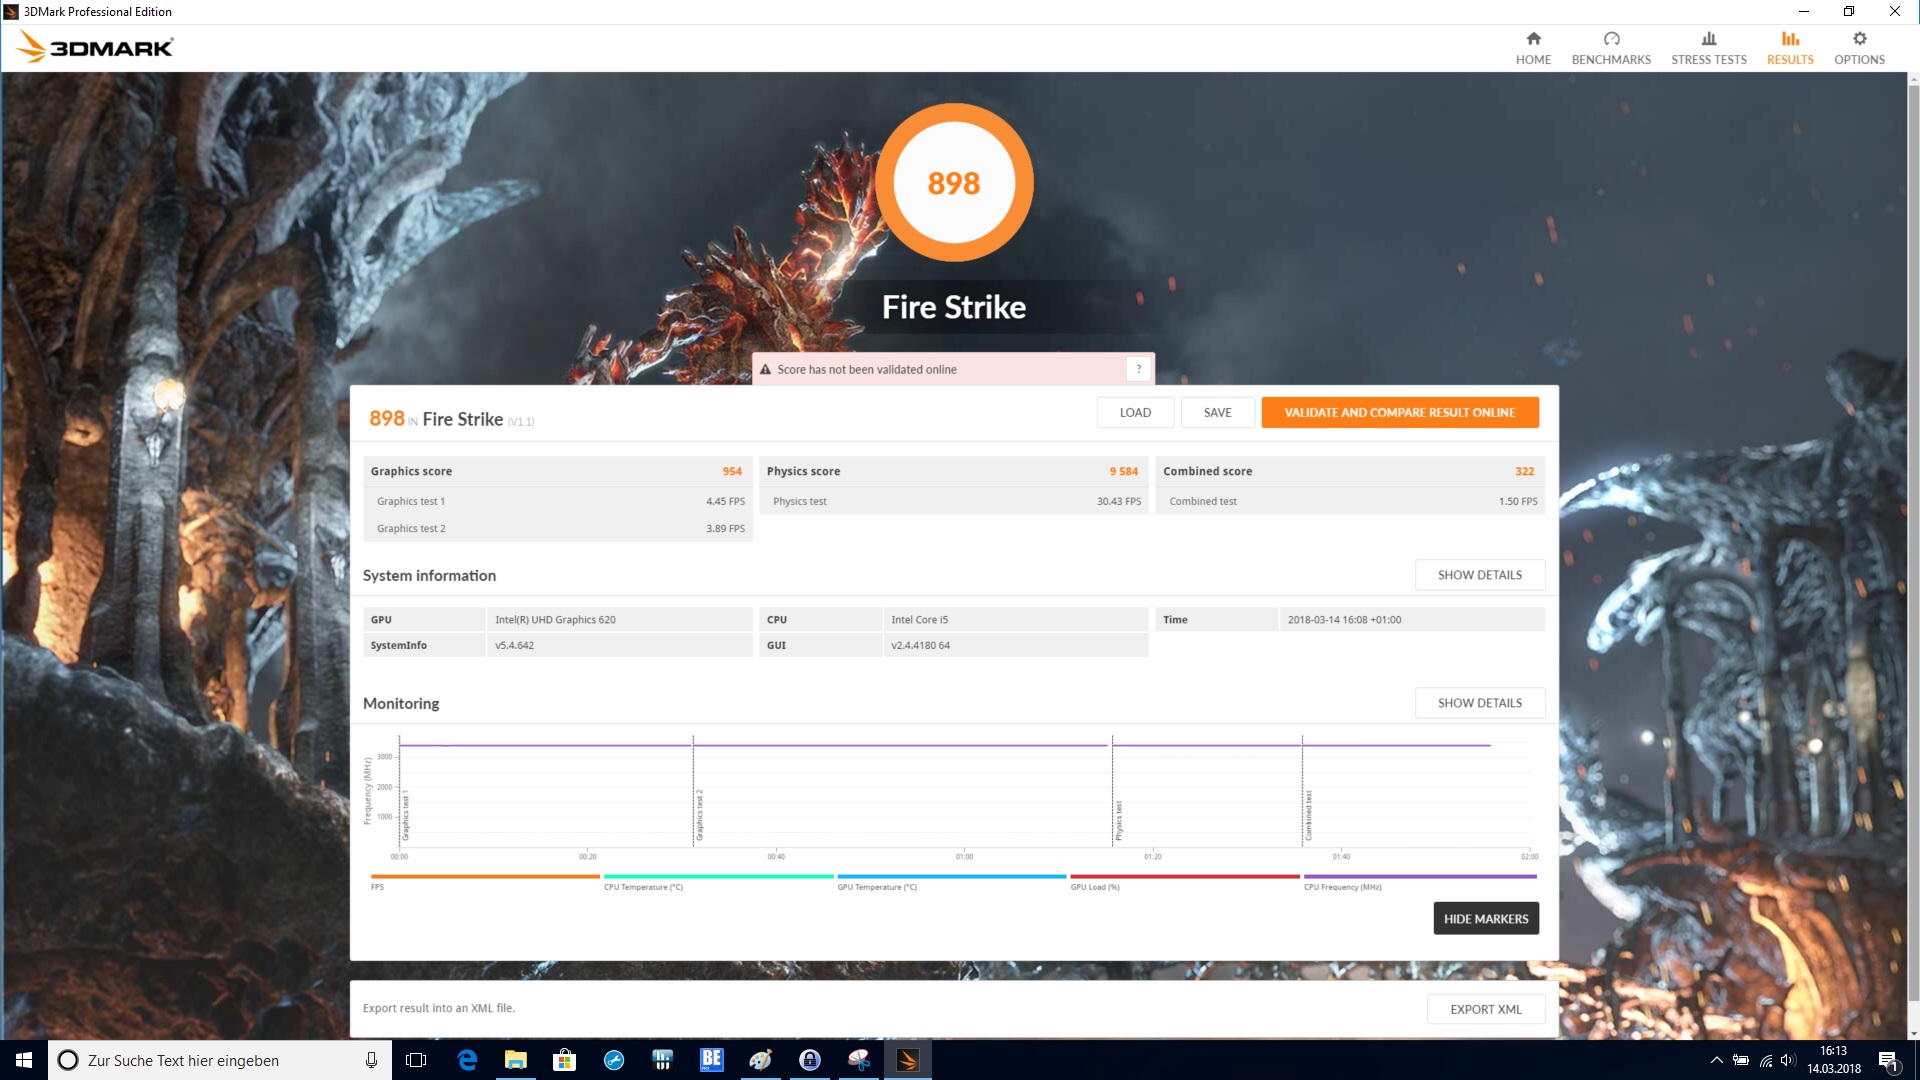
| 3DMark Fire Strike Score | 898 points | |
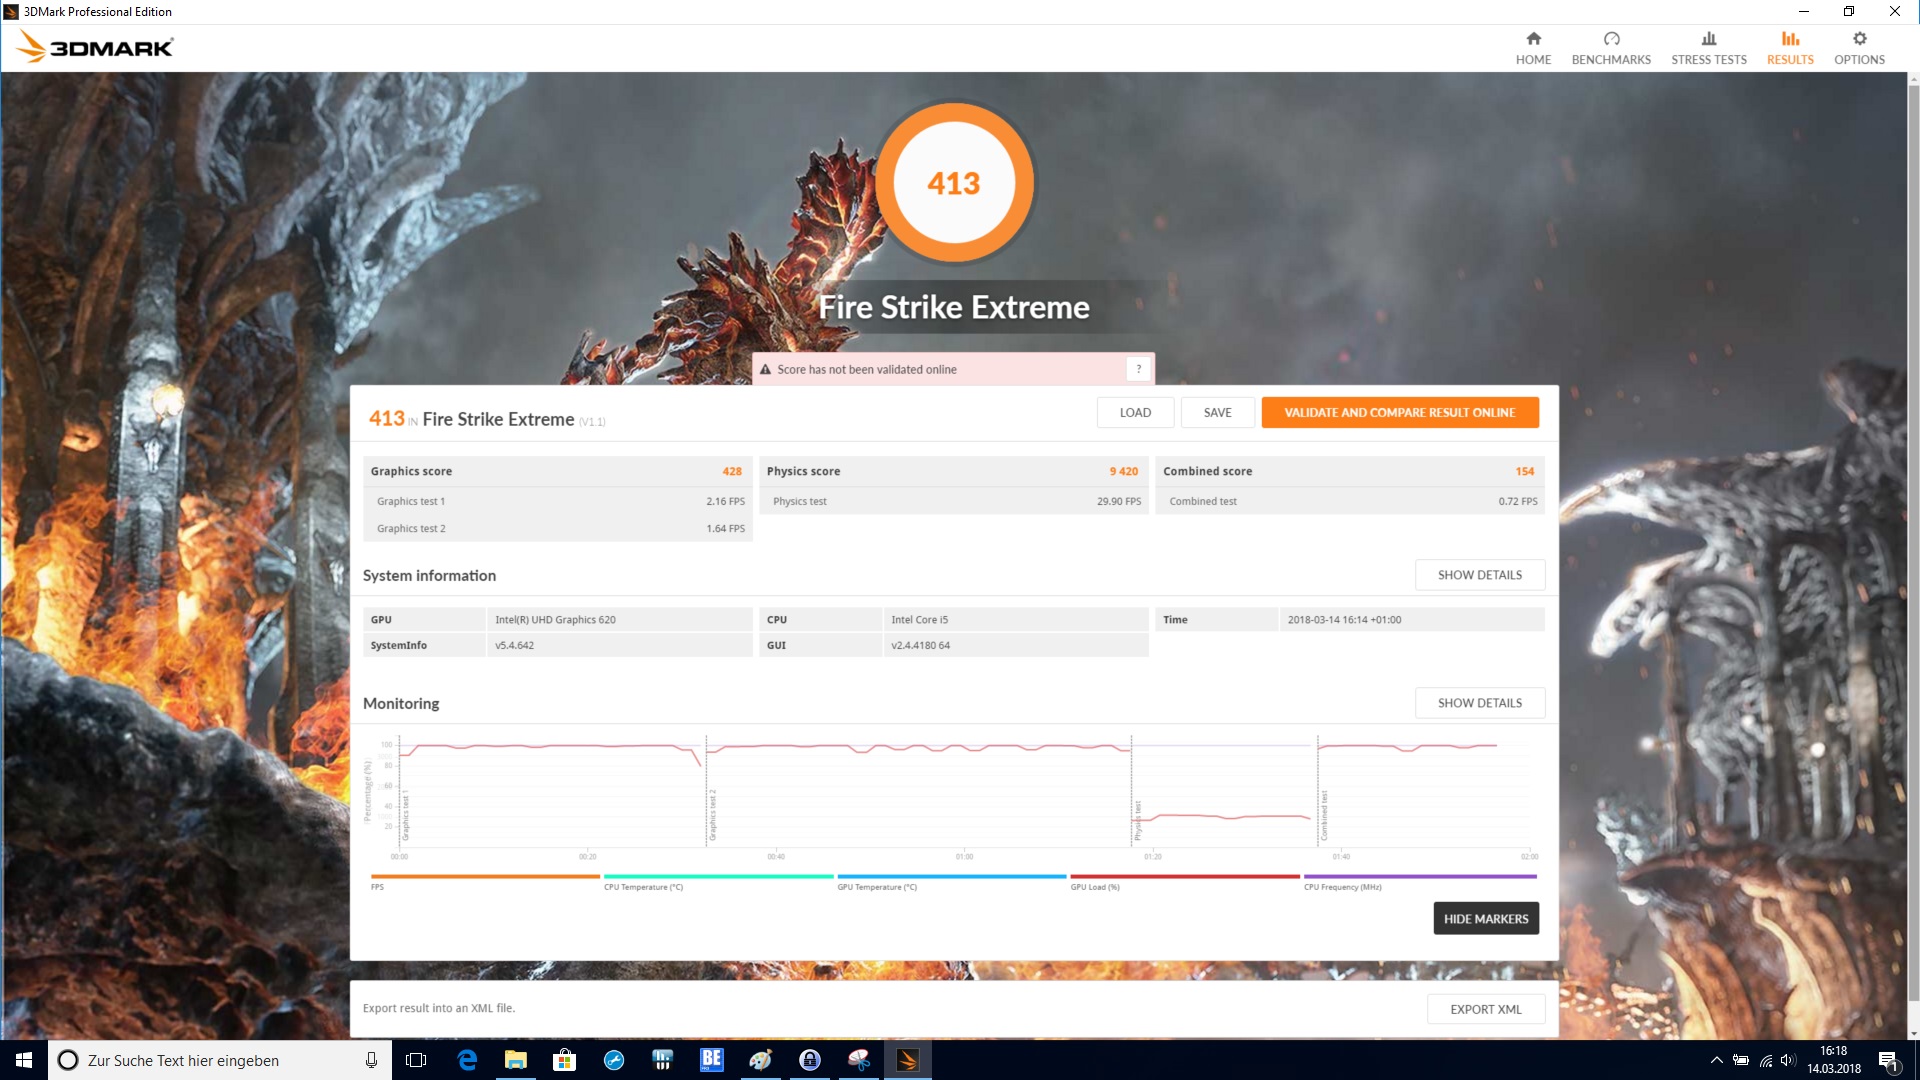
| 3DMark Fire Strike Extreme Score | 413 points | |
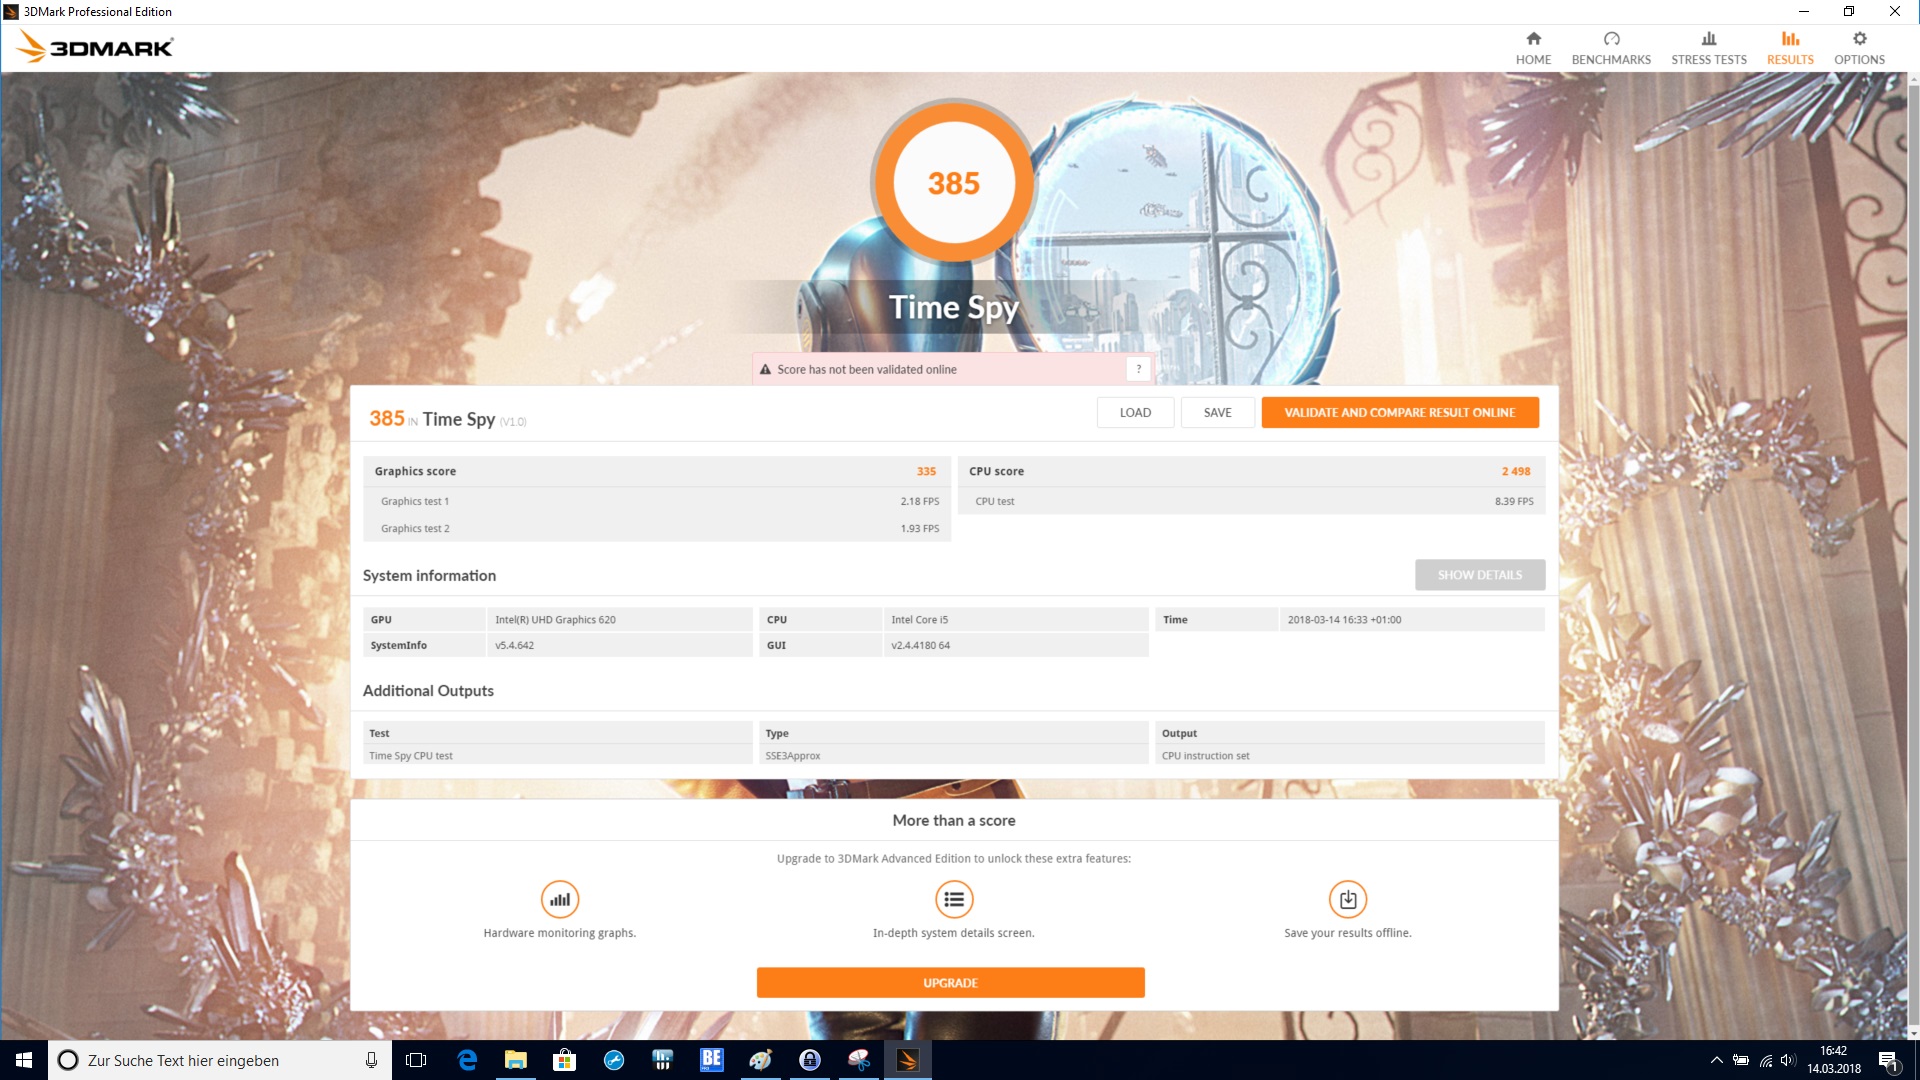
| 3DMark Time Spy Score | 385 points | |
Help | ||
Gaming Performance
As an office device, the Latitude 5590 does not need to provide high framerates. It can also not do this, as the Intel UHD Graphics 620 does not provide enough power to play complex 3D games smoothly. The Latitude 5590 can play simpler games though, which could provide variety to breaks during or after work.
| low | med. | high | ultra | |
|---|---|---|---|---|
| BioShock Infinite (2013) | 48 | 29.5 | 24.1 | 7.7 |
Emissions
Noise Emissions
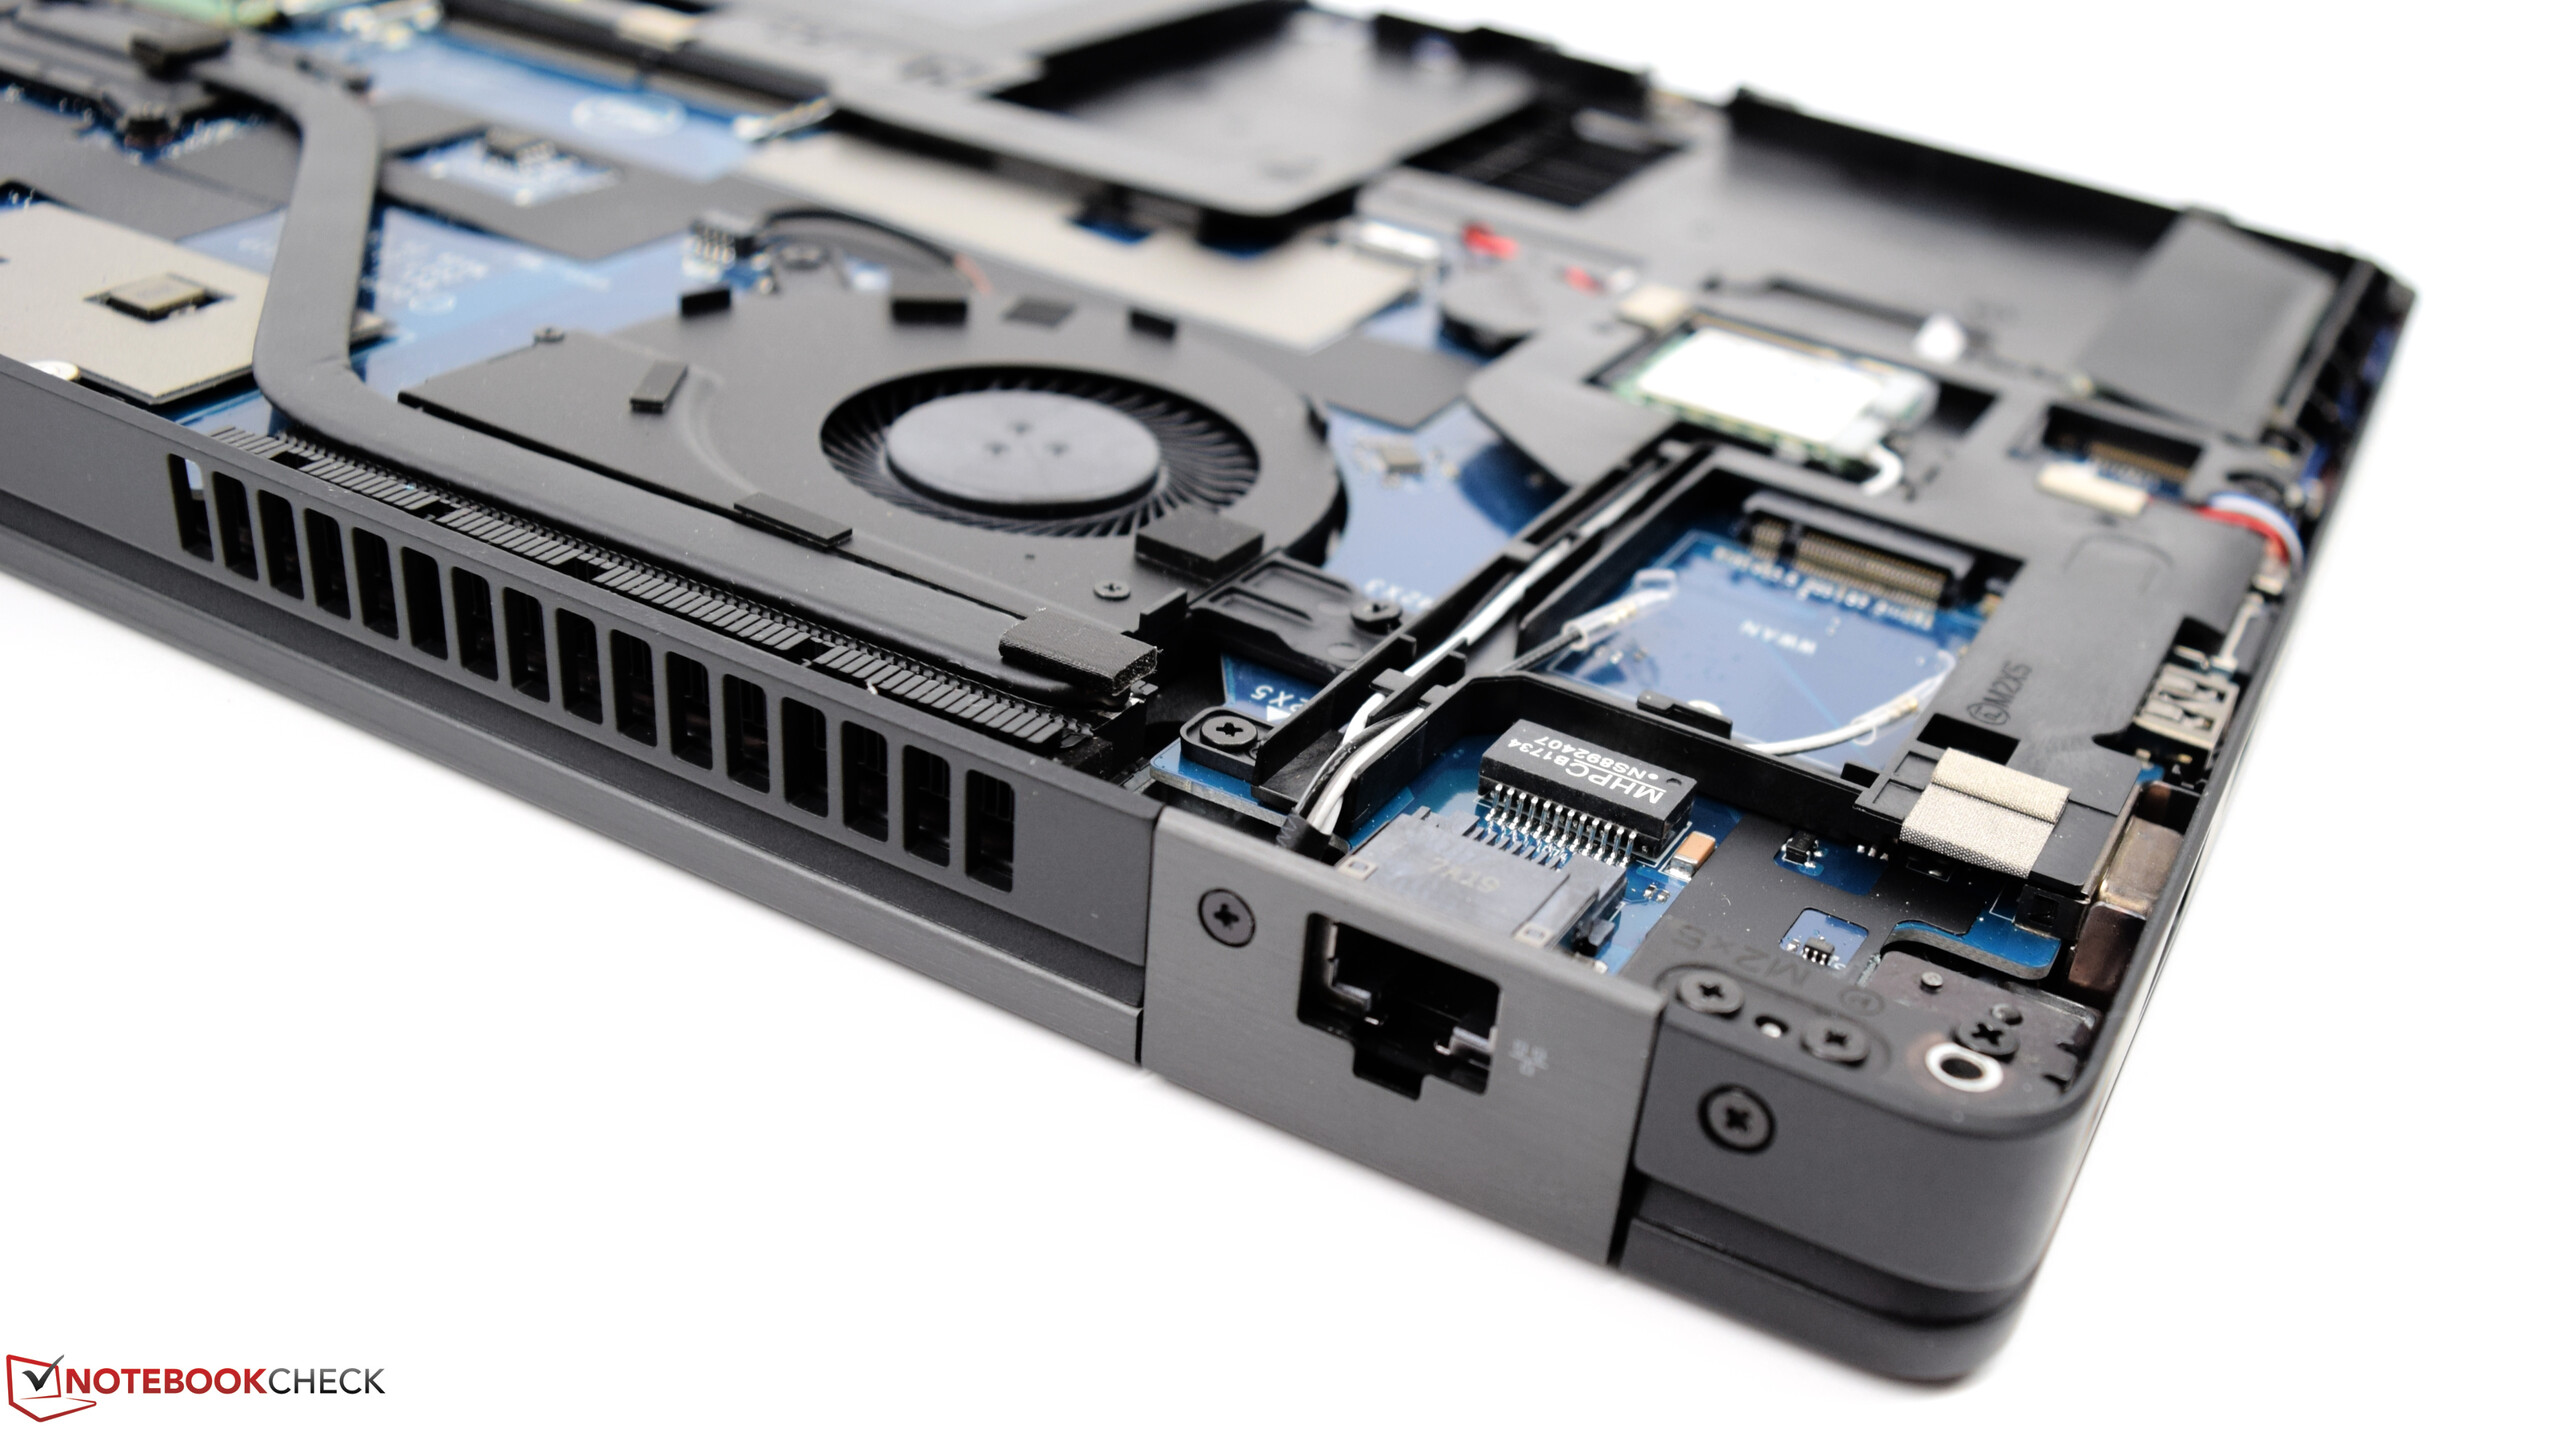
The Latitude 5590 has louder fan noise than its competitors. The small fan is rarely quiet, reaching up to 36.6 dB(A) under average load. This increases up to 40.9 dB(A) at maximum load. While this is clearly audible, we did not find it distracting when using the device. The fan control works well and slowly varies the fan speed. During our tests, we could not hear any pulsating fan sounds.
Noise level
| Idle |
| 29 / 29 / 31.3 dB(A) |
| Load |
| 36.6 / 40.9 dB(A) |
 | ||
30 dB silent 40 dB(A) audible 50 dB(A) loud |
||
min: | ||
| Dell Latitude 5590 UHD Graphics 620, i5-8250U, SK hynix SC311 M.2 | HP EliteBook 850 G4-Z2W86ET HD Graphics 620, i5-7200U, Samsung PM951 NVMe MZVLV256 | Fujitsu LifeBook U757 HD Graphics 620, i5-7200U, Samsung CM871a MZNTY256HDHP | Dell Latitude 5580 HD Graphics 620, i5-7200U, Seagate ST500LM021-1KJ15 | Lenovo ThinkPad T570-20H90002GE HD Graphics 620, i5-7200U, Samsung PM961 MZVLW256HEHP | |
|---|---|---|---|---|---|
| Noise | 7% | 8% | -1% | 1% | |
| off / environment * (dB) | 29 | 29 -0% | 28.2 3% | 28.2 3% | 29.3 -1% |
| Idle Minimum * (dB) | 29 | 29 -0% | 28.2 3% | 32.6 -12% | 29.3 -1% |
| Idle Average * (dB) | 29 | 29 -0% | 28.2 3% | 32.6 -12% | 29.3 -1% |
| Idle Maximum * (dB) | 31.3 | 29 7% | 28.2 10% | 32.8 -5% | 31.2 -0% |
| Load Average * (dB) | 36.6 | 31 15% | 33.3 9% | 33.5 8% | 35.1 4% |
| Load Maximum * (dB) | 40.9 | 33.4 18% | 34 17% | 34.7 15% | 38.7 5% |
* ... smaller is better
Temperature
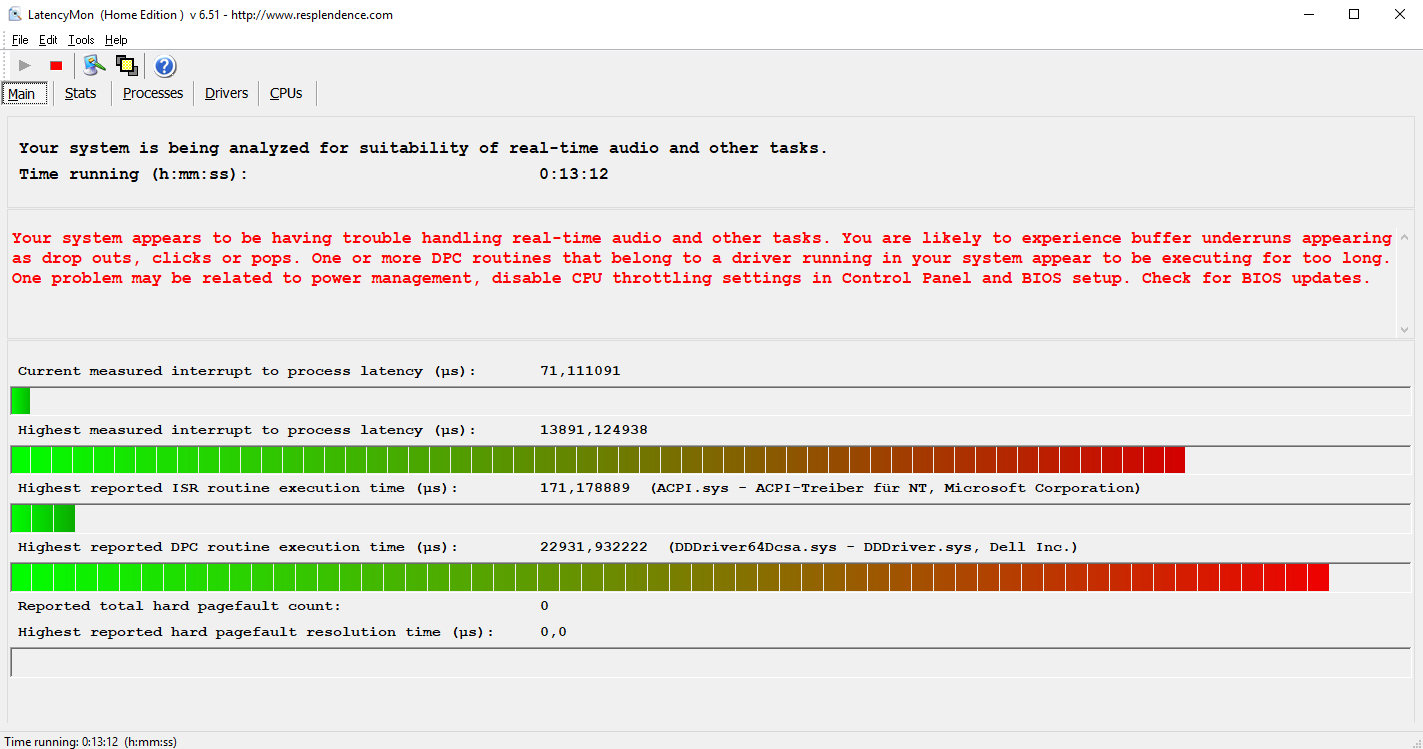
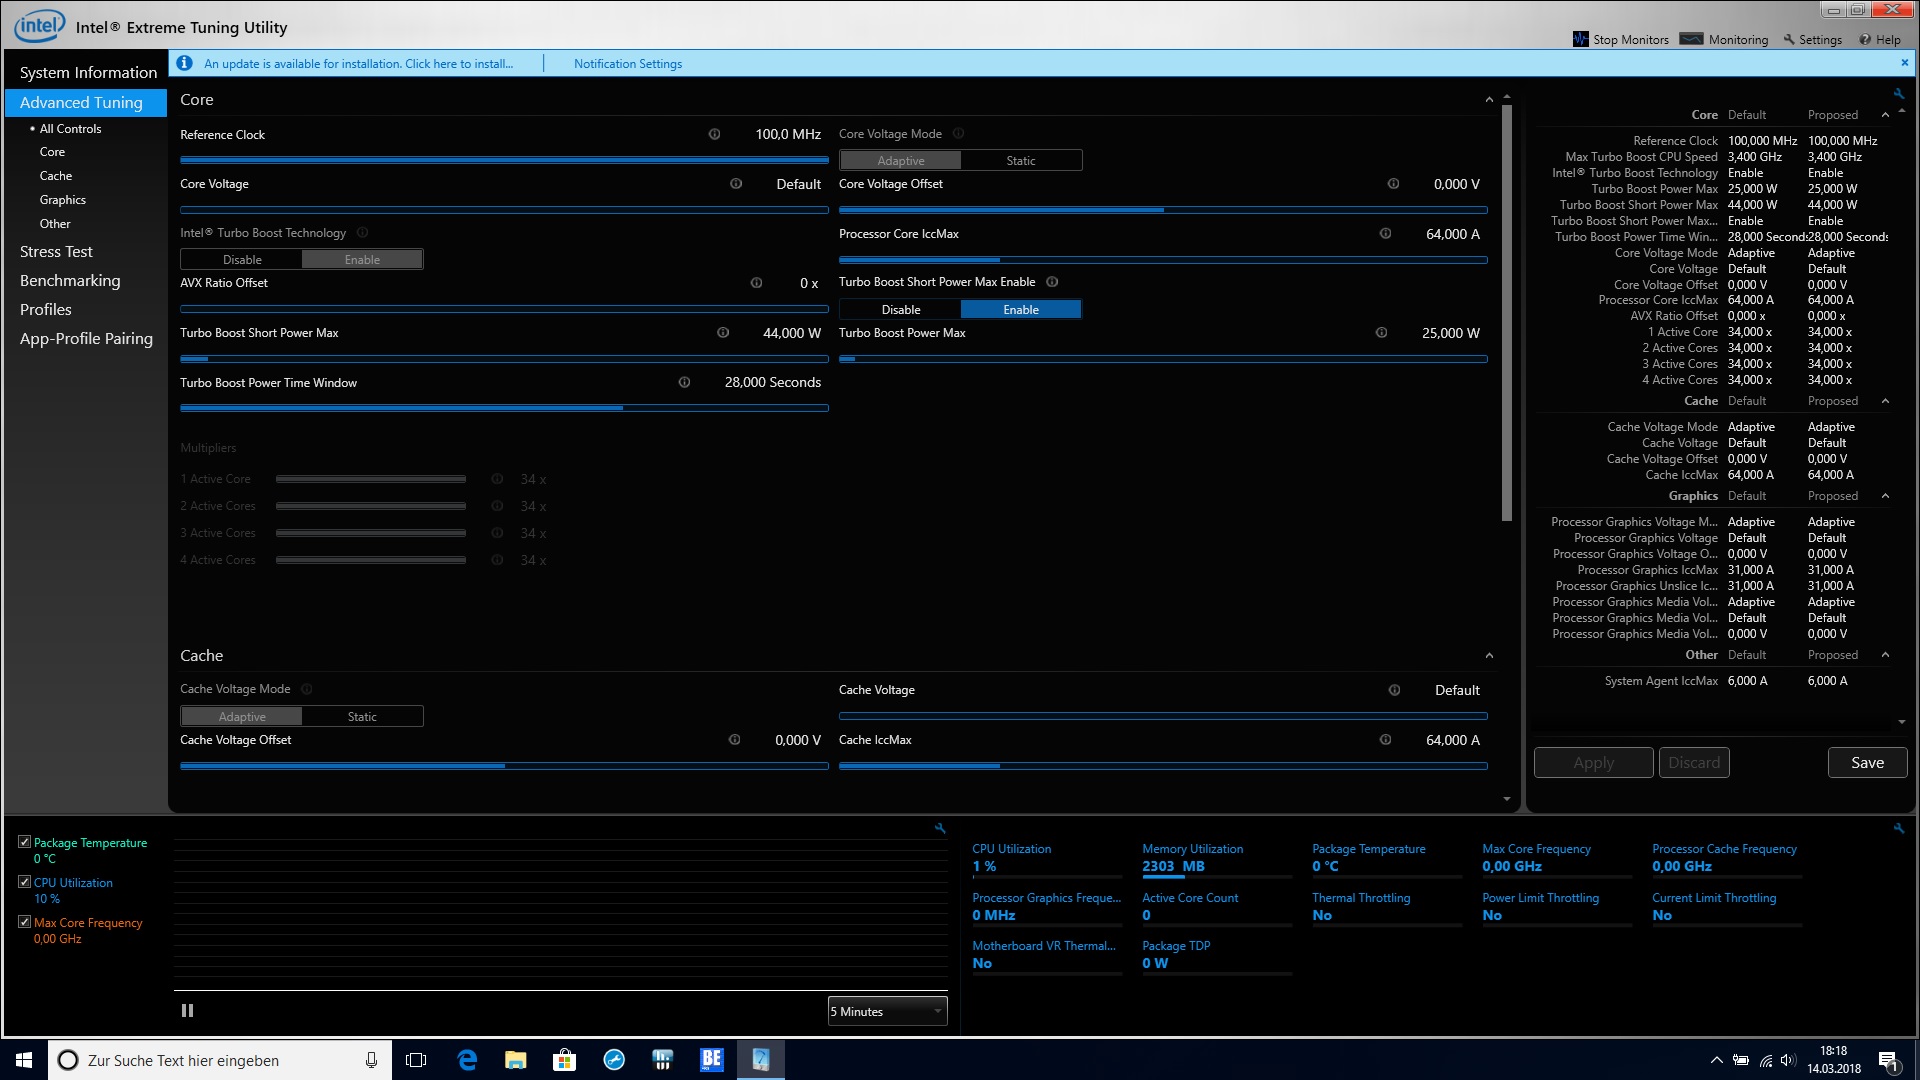
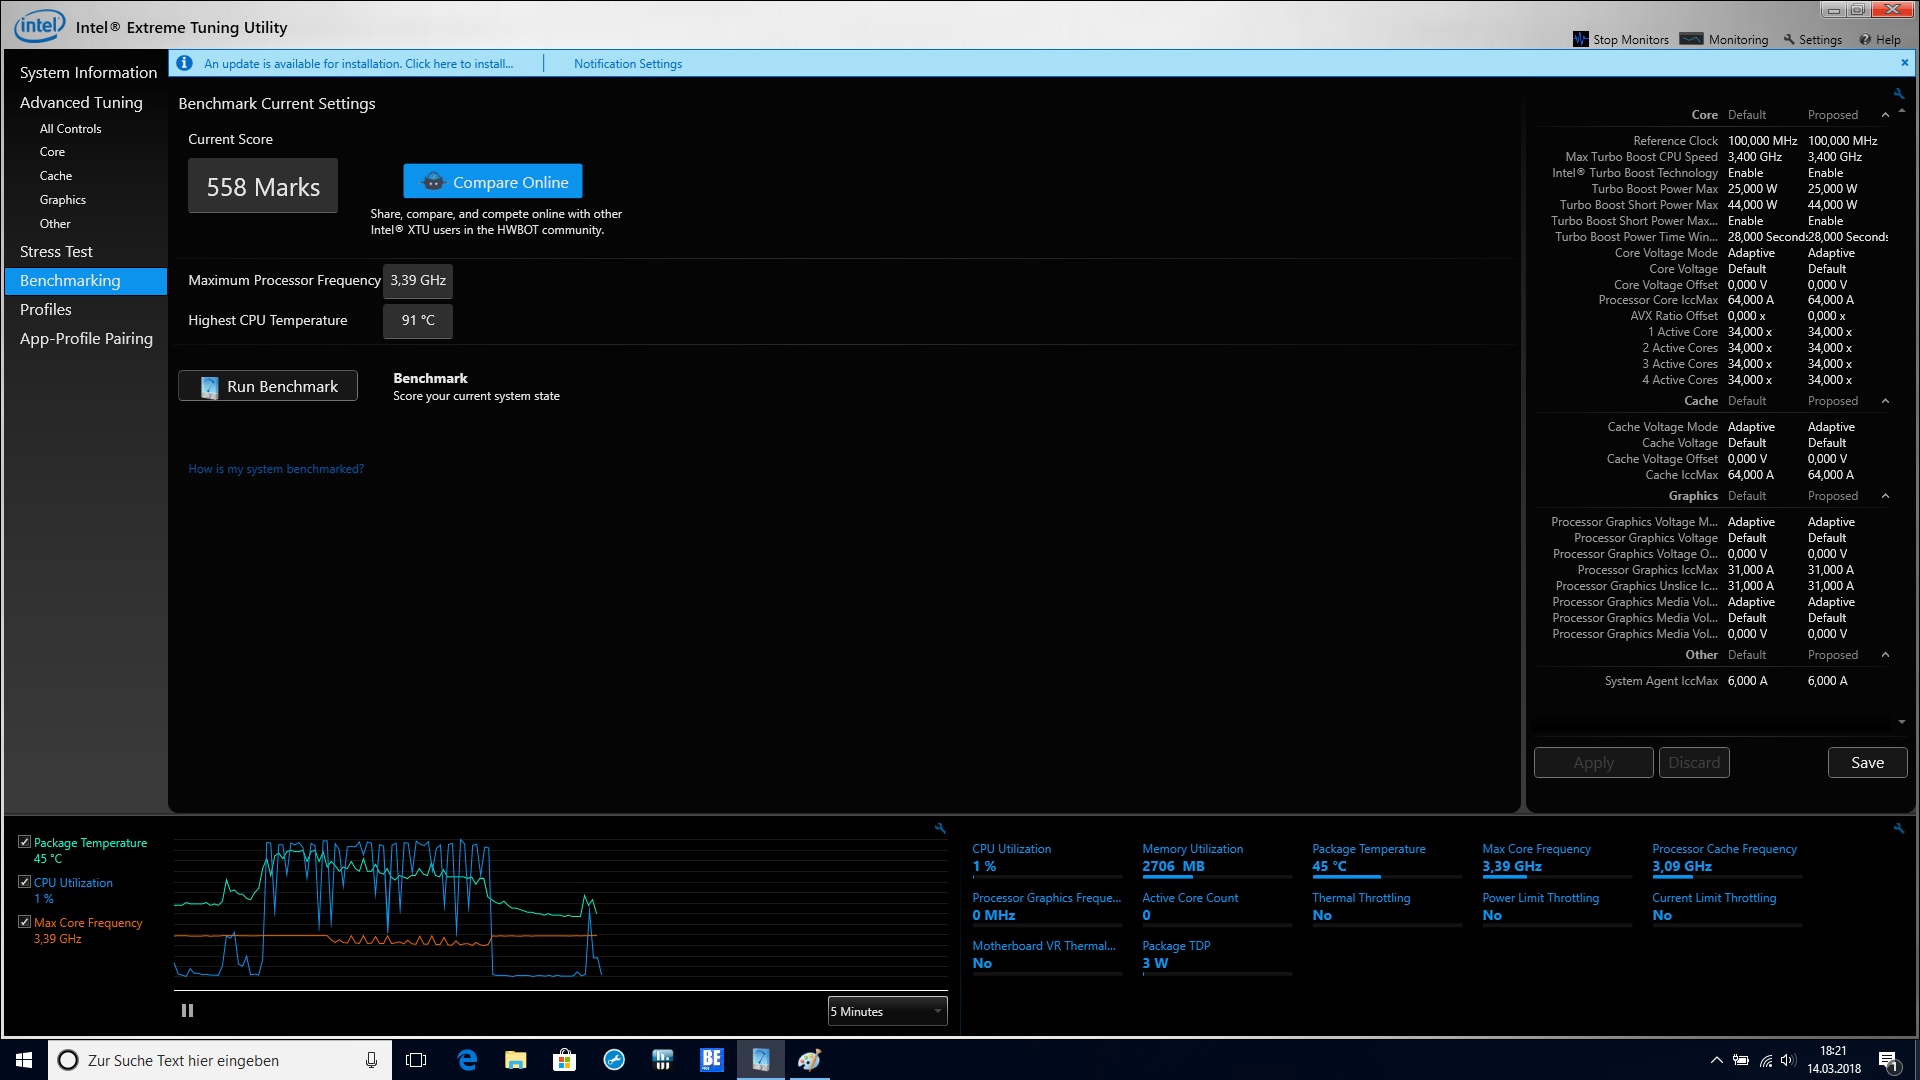
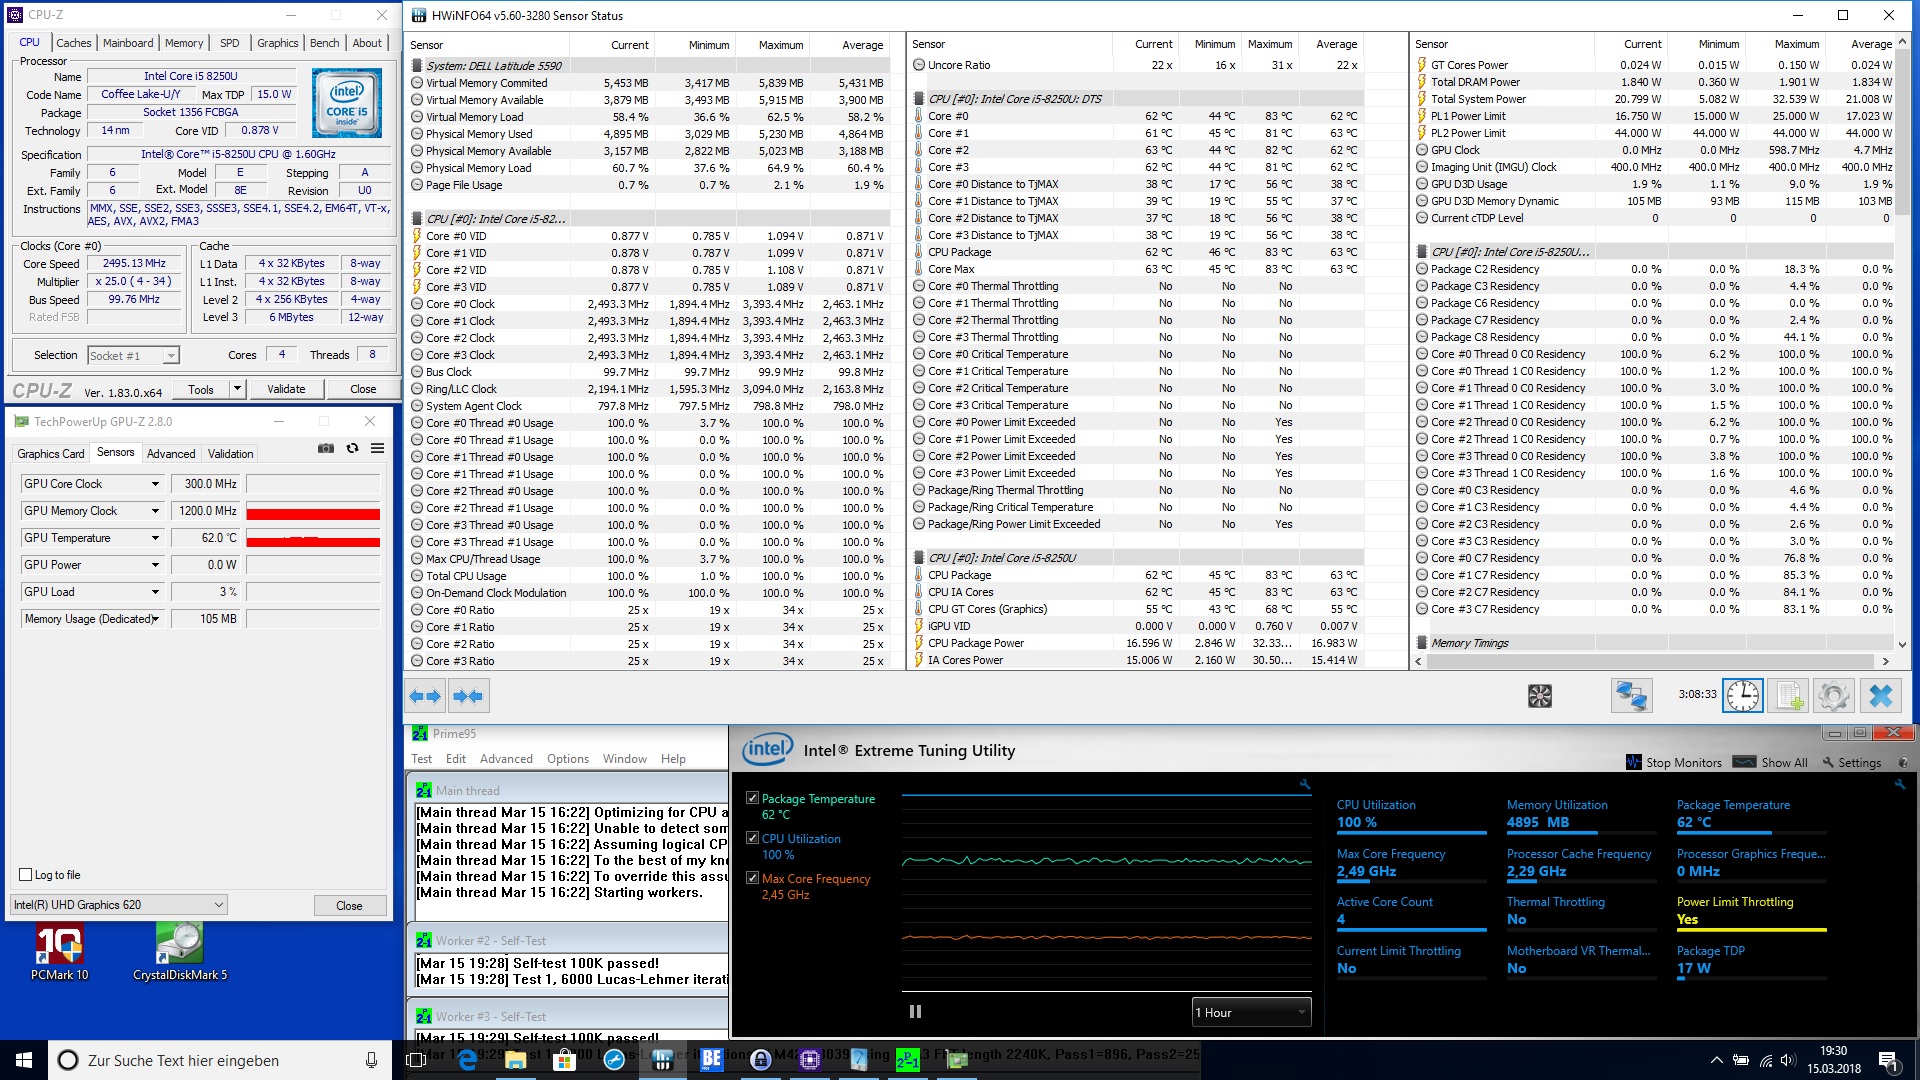
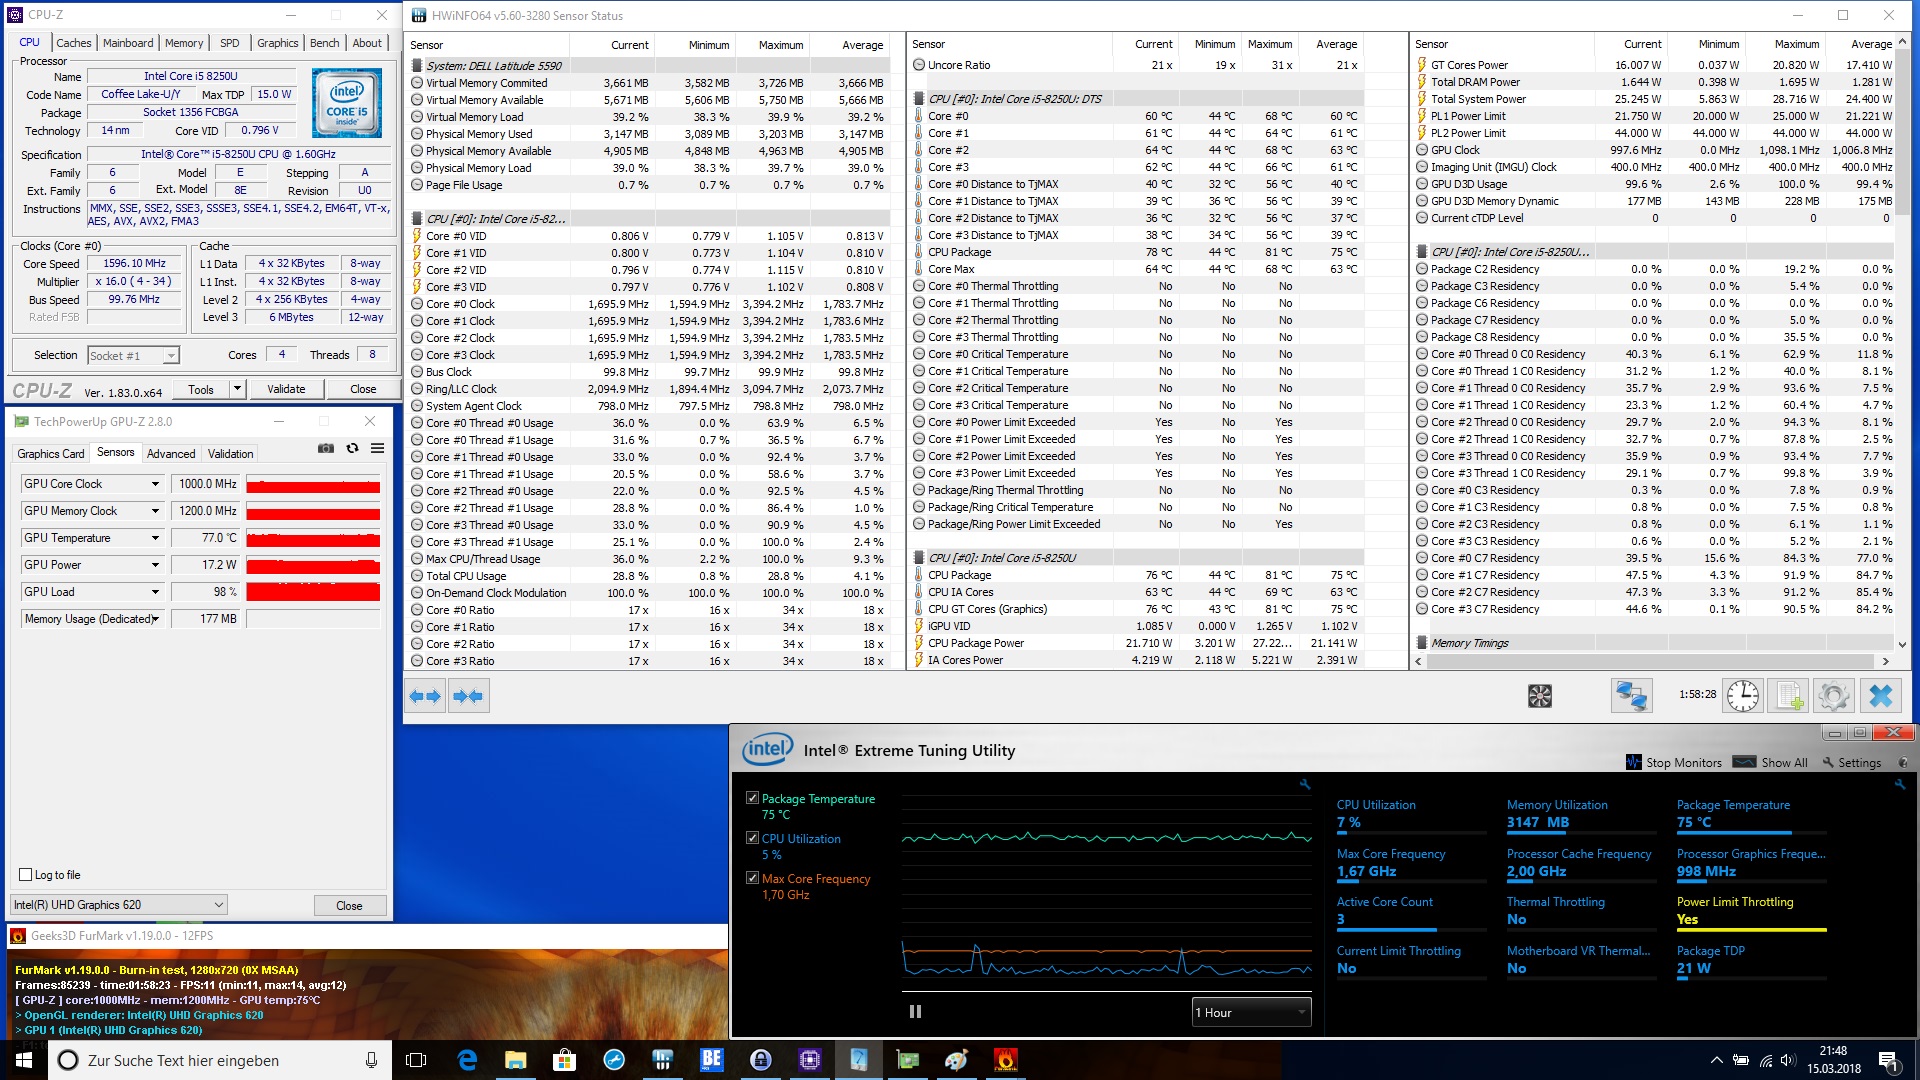
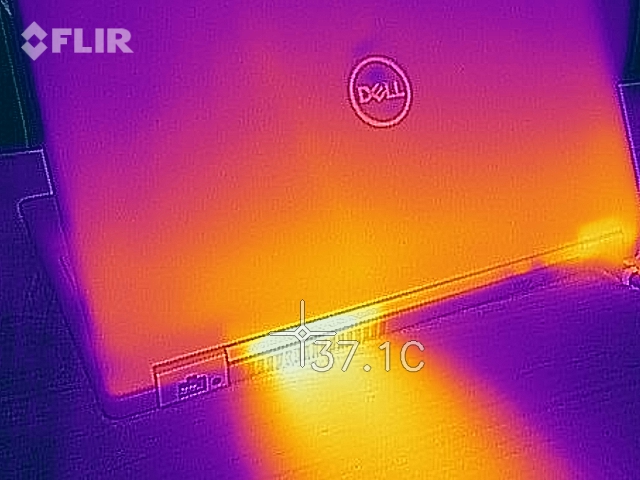
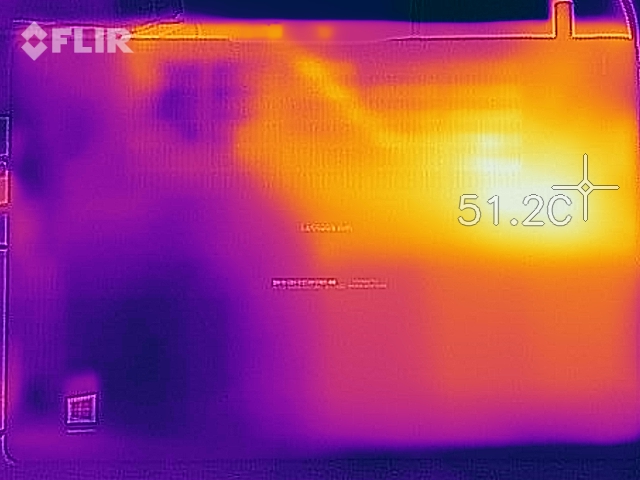
The Latitude 5590 is hottest on the base plate, reaching up to a maximum of 47.5 °C (~118 °F). This is marginally warmer than the Latitude 5580, whose maximum temperature we measured at 45.6 °C (~114 °F). During our stress tests, we measured the CPU reaching 83 °C (~181 °F). Core temperatures ramped up quickly thanks to the i5-8250U’s 44 W TDP short term Turbo Boost. Following the rise in core temperatures, the CPU downclocks to 2.4 GHz clock speed, which helps core temperatures cool to 62 °C (~144 °F). The clock speed and temperatures remained at these levels for the rest of our stress tests. It is worth noting that stress tests did not affect 3D performance.
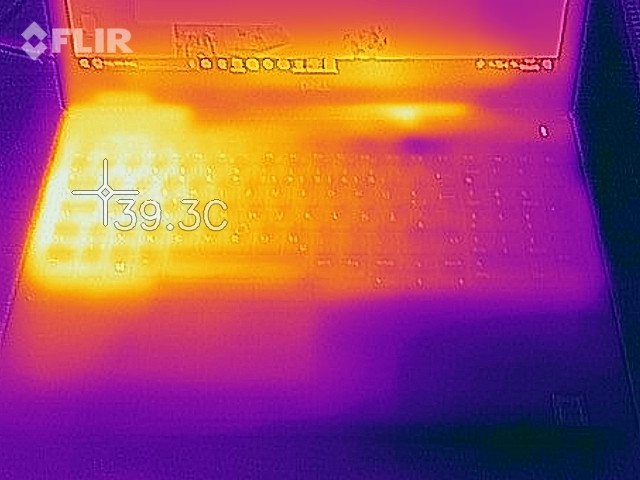
(+) The maximum temperature on the upper side is 36.6 °C / 98 F, compared to the average of 34.3 °C / 94 F, ranging from 21.2 to 62.5 °C for the class Office.
(-) The bottom heats up to a maximum of 47.5 °C / 118 F, compared to the average of 36.8 °C / 98 F
(+) In idle usage, the average temperature for the upper side is 22.5 °C / 73 F, compared to the device average of 29.5 °C / 85 F.
(+) The palmrests and touchpad are cooler than skin temperature with a maximum of 26.2 °C / 79.2 F and are therefore cool to the touch.
(±) The average temperature of the palmrest area of similar devices was 27.5 °C / 81.5 F (+1.3 °C / 2.3 F).
| Dell Latitude 5590 UHD Graphics 620, i5-8250U, SK hynix SC311 M.2 | HP EliteBook 850 G4-Z2W86ET HD Graphics 620, i5-7200U, Samsung PM951 NVMe MZVLV256 | Fujitsu LifeBook U757 HD Graphics 620, i5-7200U, Samsung CM871a MZNTY256HDHP | Dell Latitude 5580 HD Graphics 620, i5-7200U, Seagate ST500LM021-1KJ15 | Lenovo ThinkPad T570-20H90002GE HD Graphics 620, i5-7200U, Samsung PM961 MZVLW256HEHP | |
|---|---|---|---|---|---|
| Heat | 4% | -8% | -9% | -5% | |
| Maximum Upper Side * (°C) | 36.6 | 37 -1% | 42 -15% | 36.2 1% | 39.5 -8% |
| Maximum Bottom * (°C) | 47.5 | 41.1 13% | 38.8 18% | 45.6 4% | 48.3 -2% |
| Idle Upper Side * (°C) | 23.2 | 23.2 -0% | 29.2 -26% | 27.2 -17% | 24.5 -6% |
| Idle Bottom * (°C) | 24.2 | 23.2 4% | 26.3 -9% | 29.8 -23% | 25.3 -5% |
* ... smaller is better
Speakers
The speakers are the same as those found in the Latitude 5580. There are two downward firing speakers located at the front of the case. In terms of sound reproduction, the treble is balanced while the bass is difficult to hear. Dell includes Waves’ MaxxAudio software which offers good equalization and allows quick changes to bass and treble. Overall, the sound quality is fine for a business notebook. Maximum volume is also sufficiently loud for a small room.
Dell Latitude 5590 audio analysis
(+) | speakers can play relatively loud (84.7 dB)
Bass 100 - 315 Hz
(-) | nearly no bass - on average 17.3% lower than median
(±) | linearity of bass is average (9.3% delta to prev. frequency)
Mids 400 - 2000 Hz
(±) | higher mids - on average 5.4% higher than median
(+) | mids are linear (4.6% delta to prev. frequency)
Highs 2 - 16 kHz
(+) | balanced highs - only 3.4% away from median
(+) | highs are linear (4.5% delta to prev. frequency)
Overall 100 - 16.000 Hz
(±) | linearity of overall sound is average (16.3% difference to median)
Compared to same class
» 19% of all tested devices in this class were better, 7% similar, 75% worse
» The best had a delta of 7%, average was 21%, worst was 53%
Compared to all devices tested
» 27% of all tested devices were better, 6% similar, 68% worse
» The best had a delta of 4%, average was 24%, worst was 134%
Fujitsu LifeBook U757 audio analysis
(-) | not very loud speakers (68 dB)
Bass 100 - 315 Hz
(-) | nearly no bass - on average 16.4% lower than median
(±) | linearity of bass is average (7.5% delta to prev. frequency)
Mids 400 - 2000 Hz
(±) | higher mids - on average 5.5% higher than median
(±) | linearity of mids is average (9.7% delta to prev. frequency)
Highs 2 - 16 kHz
(+) | balanced highs - only 4.4% away from median
(±) | linearity of highs is average (8.7% delta to prev. frequency)
Overall 100 - 16.000 Hz
(±) | linearity of overall sound is average (26.6% difference to median)
Compared to same class
» 82% of all tested devices in this class were better, 6% similar, 12% worse
» The best had a delta of 7%, average was 21%, worst was 53%
Compared to all devices tested
» 82% of all tested devices were better, 3% similar, 15% worse
» The best had a delta of 4%, average was 24%, worst was 134%
Frequency diagram in comparison (checkboxes are de/selectable)
Power Consumption
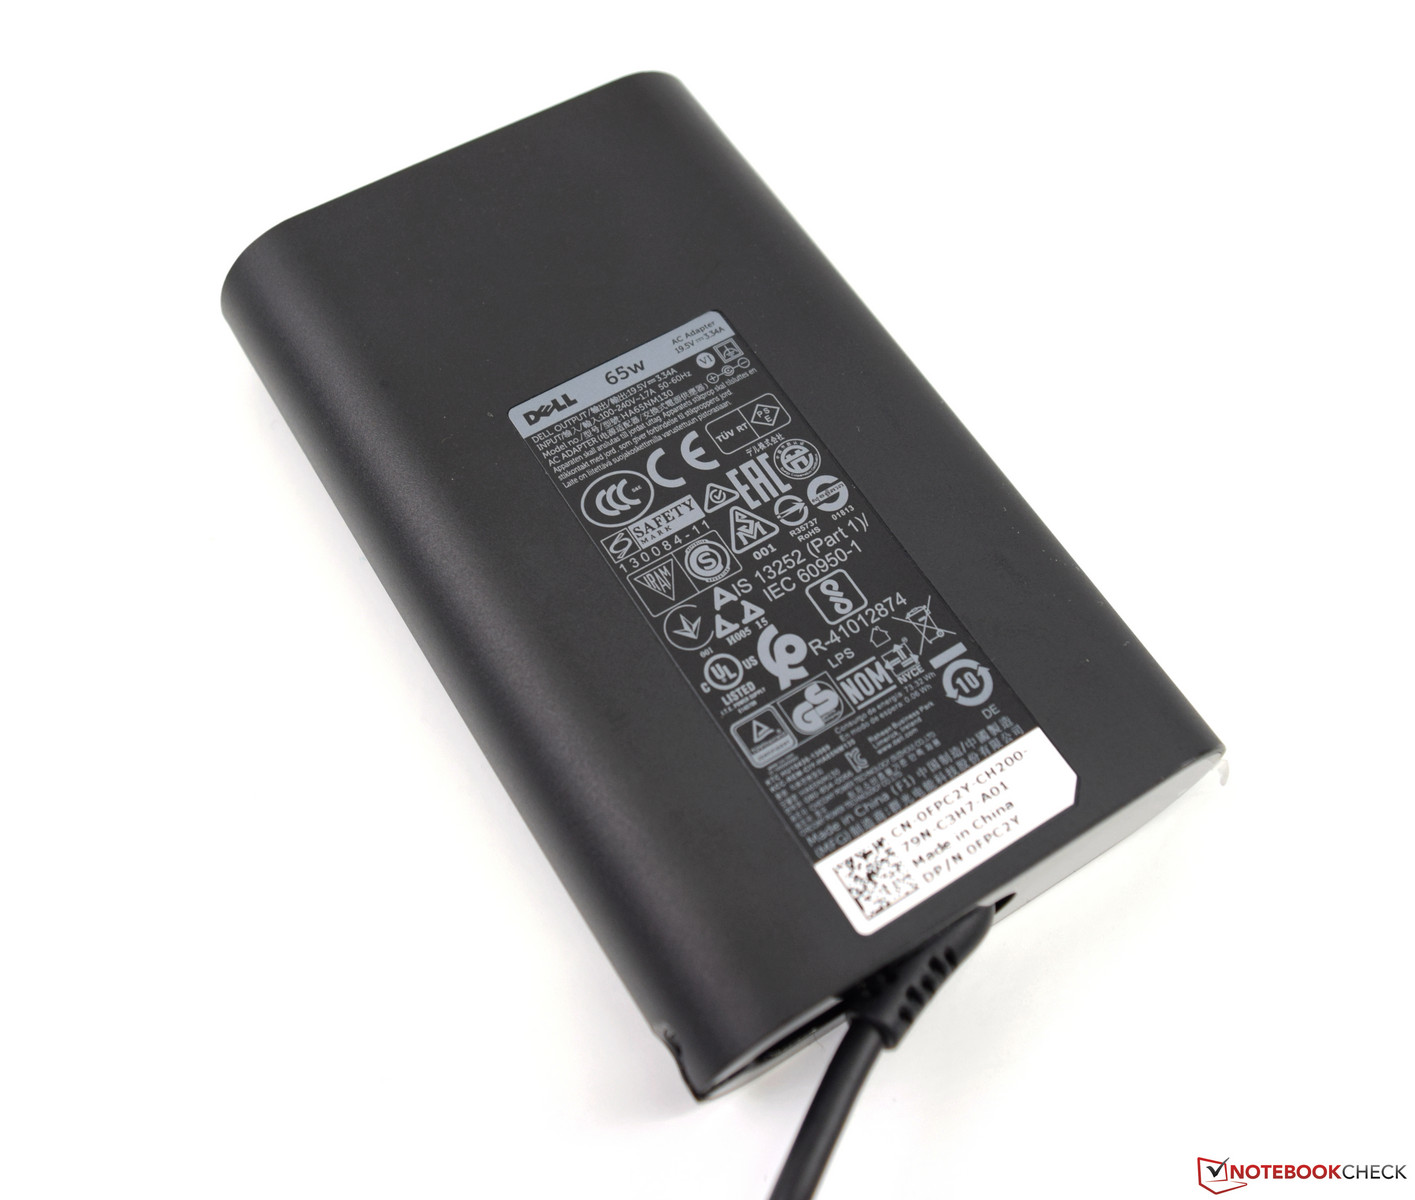
Unfortunately, the Latitude 5590 cannot be described as energy efficient. While the Latitude 5590 idles at a similar wattage to its predecessor, we measured a significant increase in power consumption under load. The Latitude 5590 consumed an average of 46.2 W under load, with a maximum consumption of 68.8 W. Maximum power consumption has more than doubled from the Latitude 5590’s predecessor, while the Latitude 5580 is on average a third more power efficient under load than its successor. The power supply is rated at 65 W, which means that it operated above its specification with our 68.8 W result. As the average consumption under load is nearly 20 W less than the power supply officially supports, we did not notice any reduction in charge levels during our stress tests with our test device plugged into mains power.
| Off / Standby | |
| Idle | |
| Load |
|
Key:
min: | |
| Dell Latitude 5590 UHD Graphics 620, i5-8250U, SK hynix SC311 M.2 | HP EliteBook 850 G4-Z2W86ET HD Graphics 620, i5-7200U, Samsung PM951 NVMe MZVLV256 | Fujitsu LifeBook U757 HD Graphics 620, i5-7200U, Samsung CM871a MZNTY256HDHP | Dell Latitude 5580 HD Graphics 620, i5-7200U, Seagate ST500LM021-1KJ15 | Lenovo ThinkPad T570-20H90002GE HD Graphics 620, i5-7200U, Samsung PM961 MZVLW256HEHP | |
|---|---|---|---|---|---|
| Power Consumption | 18% | 8% | 20% | 7% | |
| Idle Minimum * (Watt) | 3.6 | 3.58 1% | 3.96 -10% | 3.5 3% | 3.6 -0% |
| Idle Average * (Watt) | 6.5 | 5.97 8% | 7.74 -19% | 6 8% | 7.7 -18% |
| Idle Maximum * (Watt) | 7.2 | 6.81 5% | 8.64 -20% | 7.3 -1% | 8.2 -14% |
| Load Average * (Watt) | 46.2 | 29.4 36% | 28.8 38% | 30.8 33% | 30.8 33% |
| Load Maximum * (Watt) | 68.8 | 39.7 42% | 32 53% | 31 55% | 46.1 33% |
* ... smaller is better
Battery Life
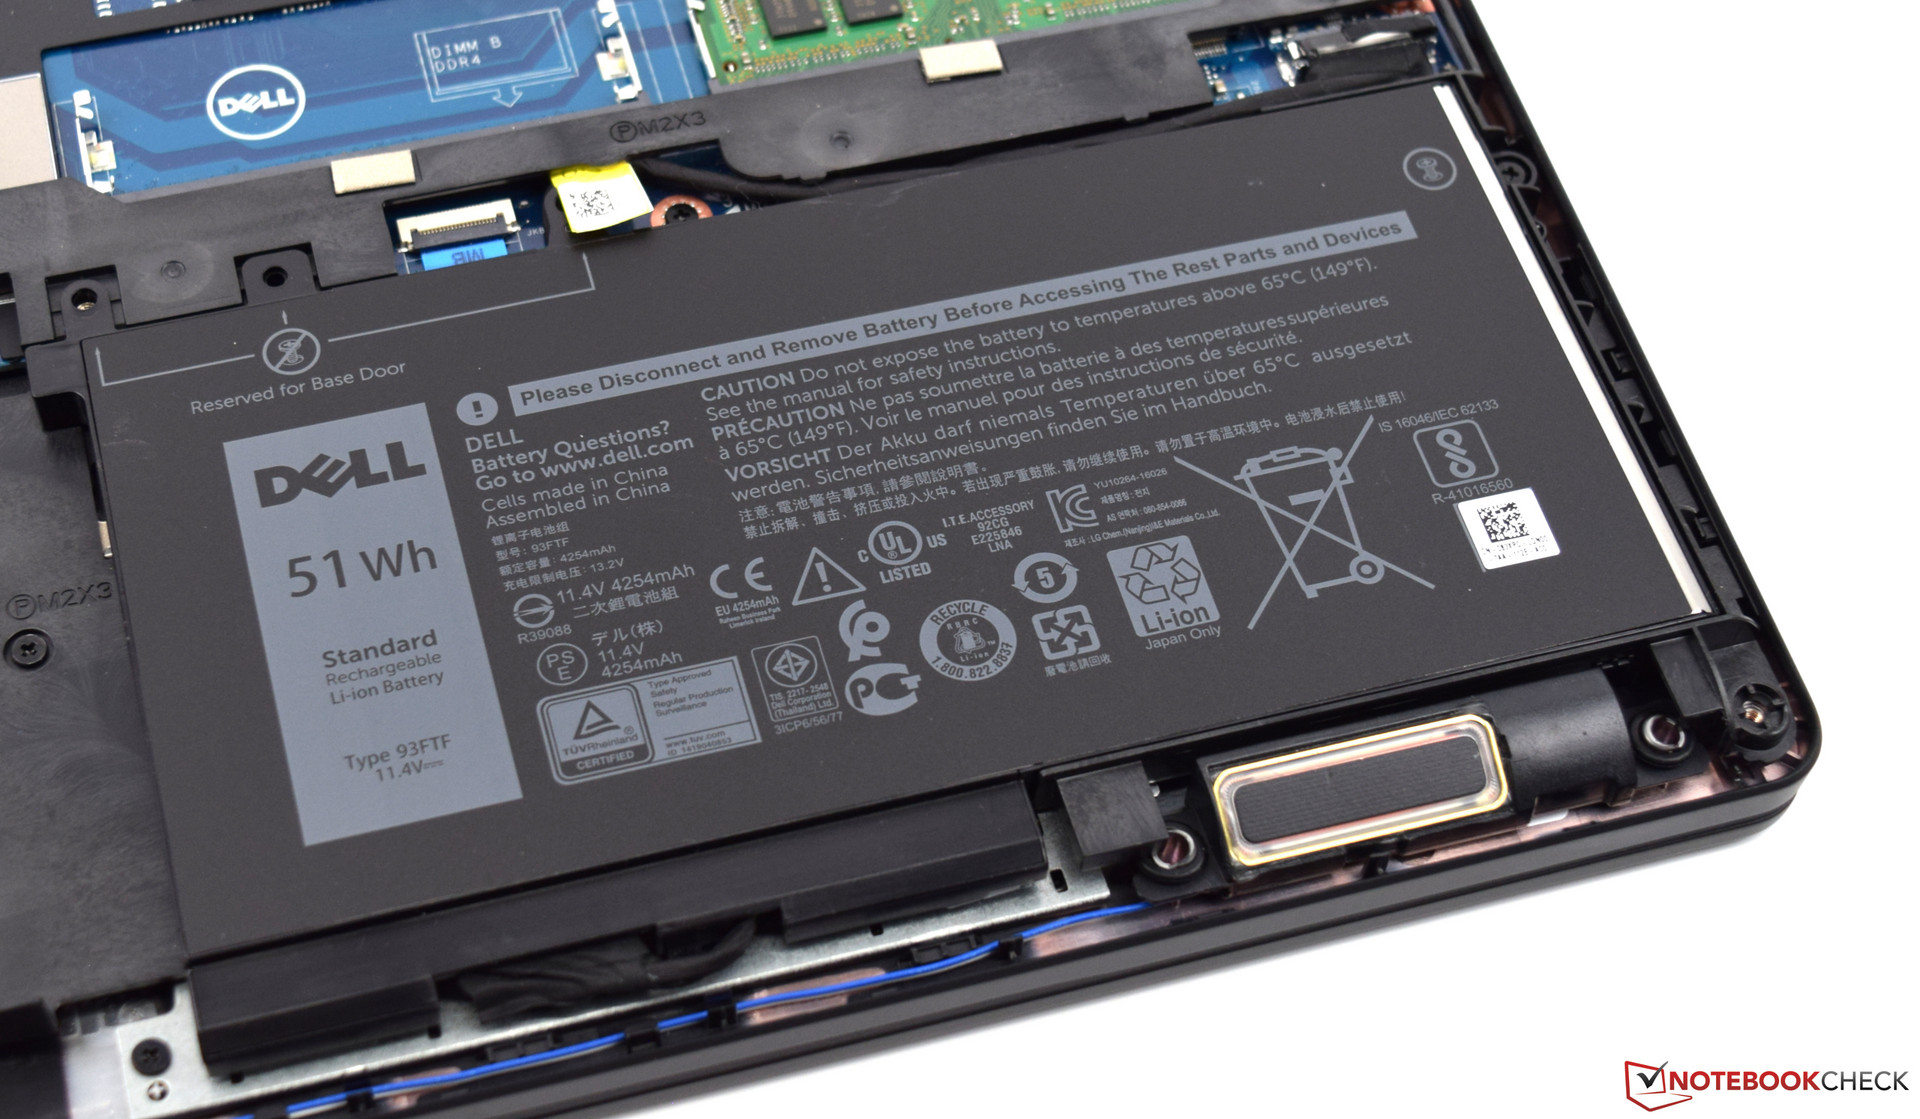
The 51 Wh battery is built-in and provides a maximum idle runtime of seventeen hours and twenty-four minutes. Battery life has decreased compared with the Latitude 5580 thanks to the Latitude 5590’s increased power consumption. The Latitude 5590 lasted for seven hours and twenty-four minutes in our practical Wi-Fi test. During this test, we set the display brightness at 83%, which equates to 150 cd/m². A full re-charge takes almost two hours.
According to Dell, there is an optional 68 W battery. We can only assume that the 2.5-inch drive bay would be sacrificed for this increased battery capacity because of space constraints.
| Dell Latitude 5590 i5-8250U, UHD Graphics 620, 51 Wh | HP EliteBook 850 G4-Z2W86ET i5-7200U, HD Graphics 620, 51 Wh | Fujitsu LifeBook U757 i5-7200U, HD Graphics 620, 50 Wh | Dell Latitude 5580 i5-7200U, HD Graphics 620, 68 Wh | Lenovo ThinkPad T570-20H90002GE i5-7200U, HD Graphics 620, 56 Wh | |
|---|---|---|---|---|---|
| Battery runtime | |||||
| Reader / Idle (h) | 17.4 | 18 3% | 18.4 6% | 19.5 12% | |
| H.264 (h) | 6.7 | 10.6 58% | 9.8 46% | ||
| WiFi v1.3 (h) | 7.4 | 8.8 19% | 7.3 -1% | 11.6 57% | 7.6 3% |
| Load (h) | 1.4 | 2.7 93% | 2.2 57% | 3.4 143% |

Pros
Cons
Verdict

The Dell Latitude 5590 is a good 15.6-inch business notebook. The ease of serviceability and many configuration options are big positives. The keyboard is comfortable and is especially good for prolific writers. Equally, the Intel Core i5-8250U processor has enough power to handle even demanding applications, which is complemented by the fast 8 GB of DDR4 RAM and 256 GB SSD. The matte IPS display completes the package and has solid viewing angles. Expect to pay €1,100 (~$1,355) for this variant, which we believe is significantly better value for money than far more costly i7 equipped models.
The Dell Latitude 5590 will be of interest to companies, thanks to its many configuration options, which should allow it to be optimized for most business needs.
The only piece of criticism we have of the Latitude 5590 is its IPS display, which is simply not good enough for a business device at this price point. Unfortunately, brightness and color space coverage are below par compared with the class average. If you plan to mainly attach the Latitude 5590 to a docking station, then you will enjoy strong and more than sufficient system performance. However, our test device has too much of a thirst for power for our liking.
Dell Latitude 5590
- 03/20/2018 v6 (old)
Sebastian Bade
Price comparison

