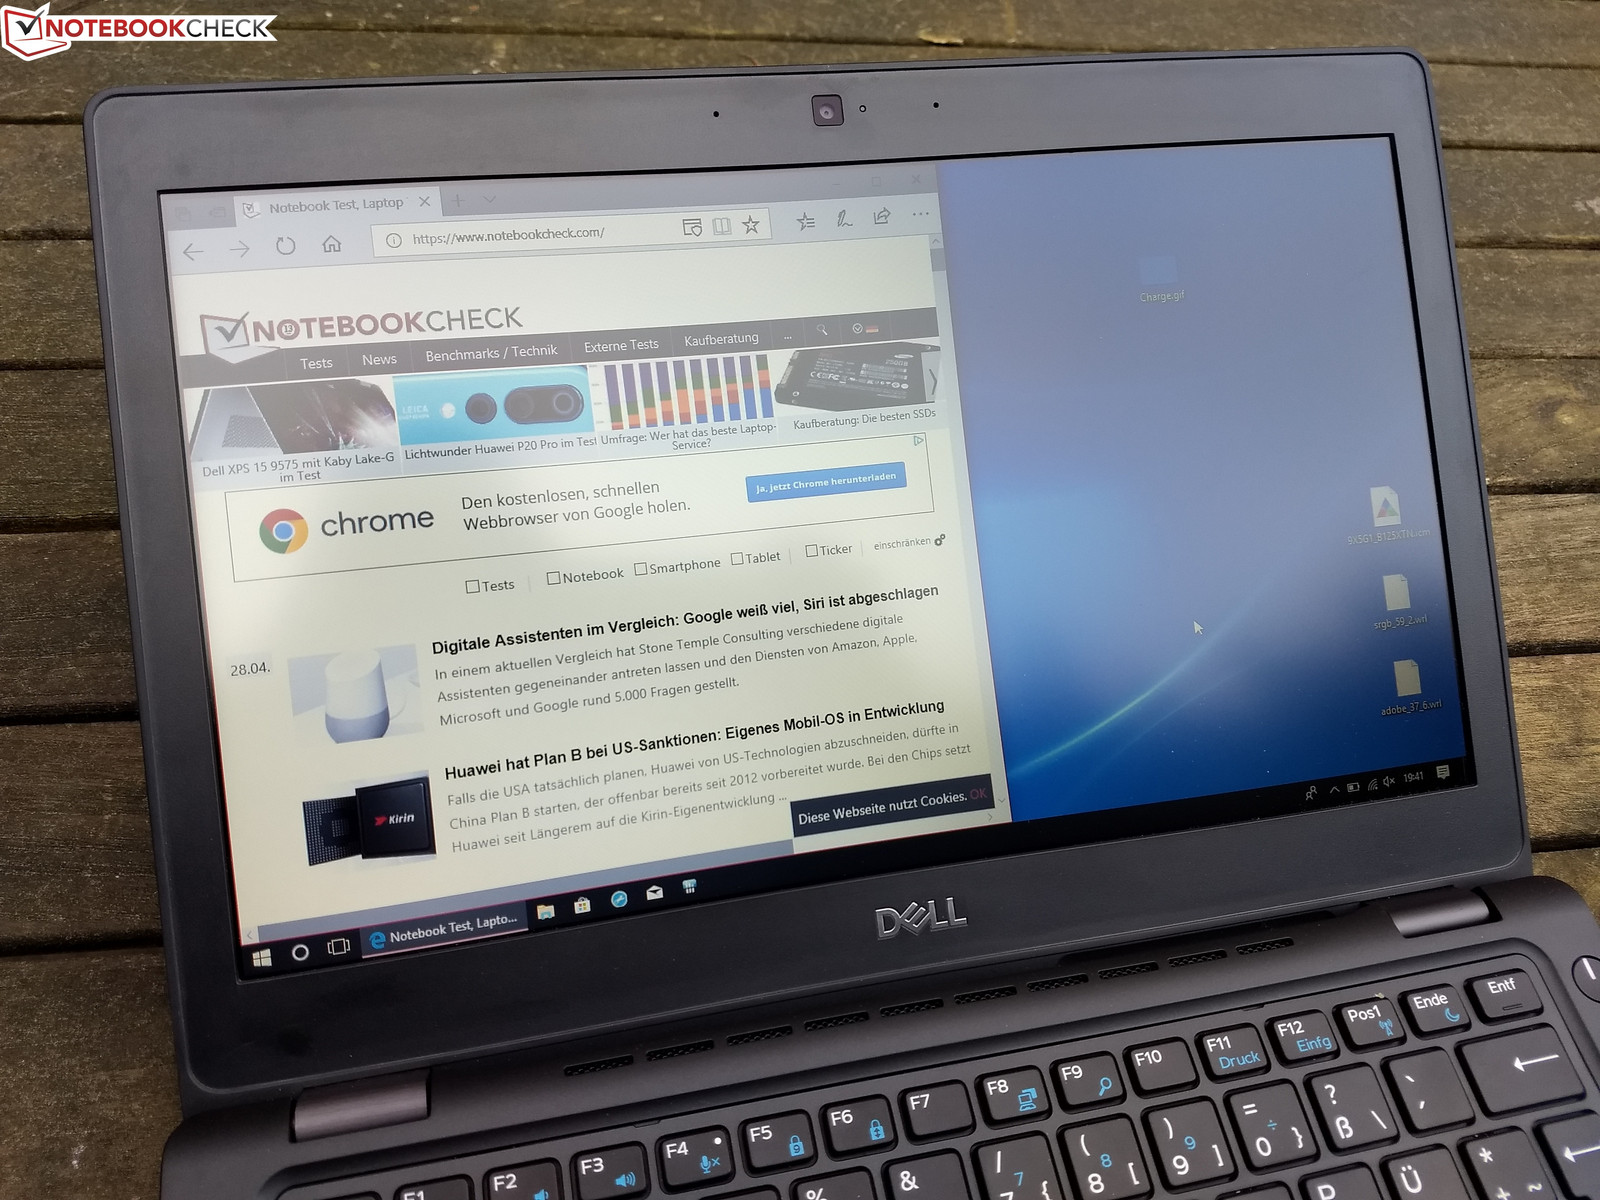
Dell Latitude 5290 (i5-8250U, HD) Laptop Review
In general, compact 12-inch notebooks are not entrenched in the lower ranges of the market in the business segment. An exception is the Latitude-5000 series from Dell, since Dell also offers the more affordable Latitudes in the smaller form factor. Our current test unit, the Dell Latitude 5290, is the latest sprout of these mid-range Latitudes. We are particularly interested in the question of what comprises the manufacturer had to make compared to the more expensive subnotebooks. We therefore compare the Latitude with the Lenovo ThinkPad X280, the HP EliteBook 830 G5, and the Dell Latitude 7280. Of course the Latitude 5280 predecessor is also included in our comparison.
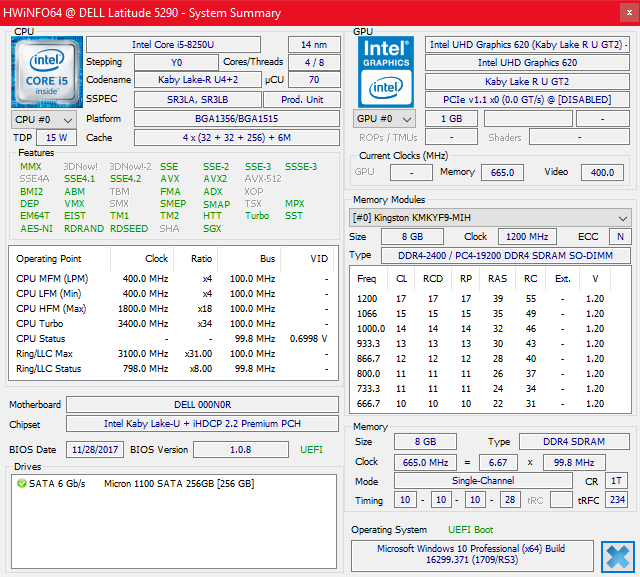
Even though it belongs to the 5000 series, the Latitude is not a real bargain. For a sales price of almost 1300 Euros (~$1560, starting at $800 in the US for a simpler configuration), you can get the basic configuration of the Latitude 5290, which is also what we have. Its most important specifications include the Core i5-8250U, a 256-GB SSD, 8 GB of RAM, and an HD display.
Case and Features
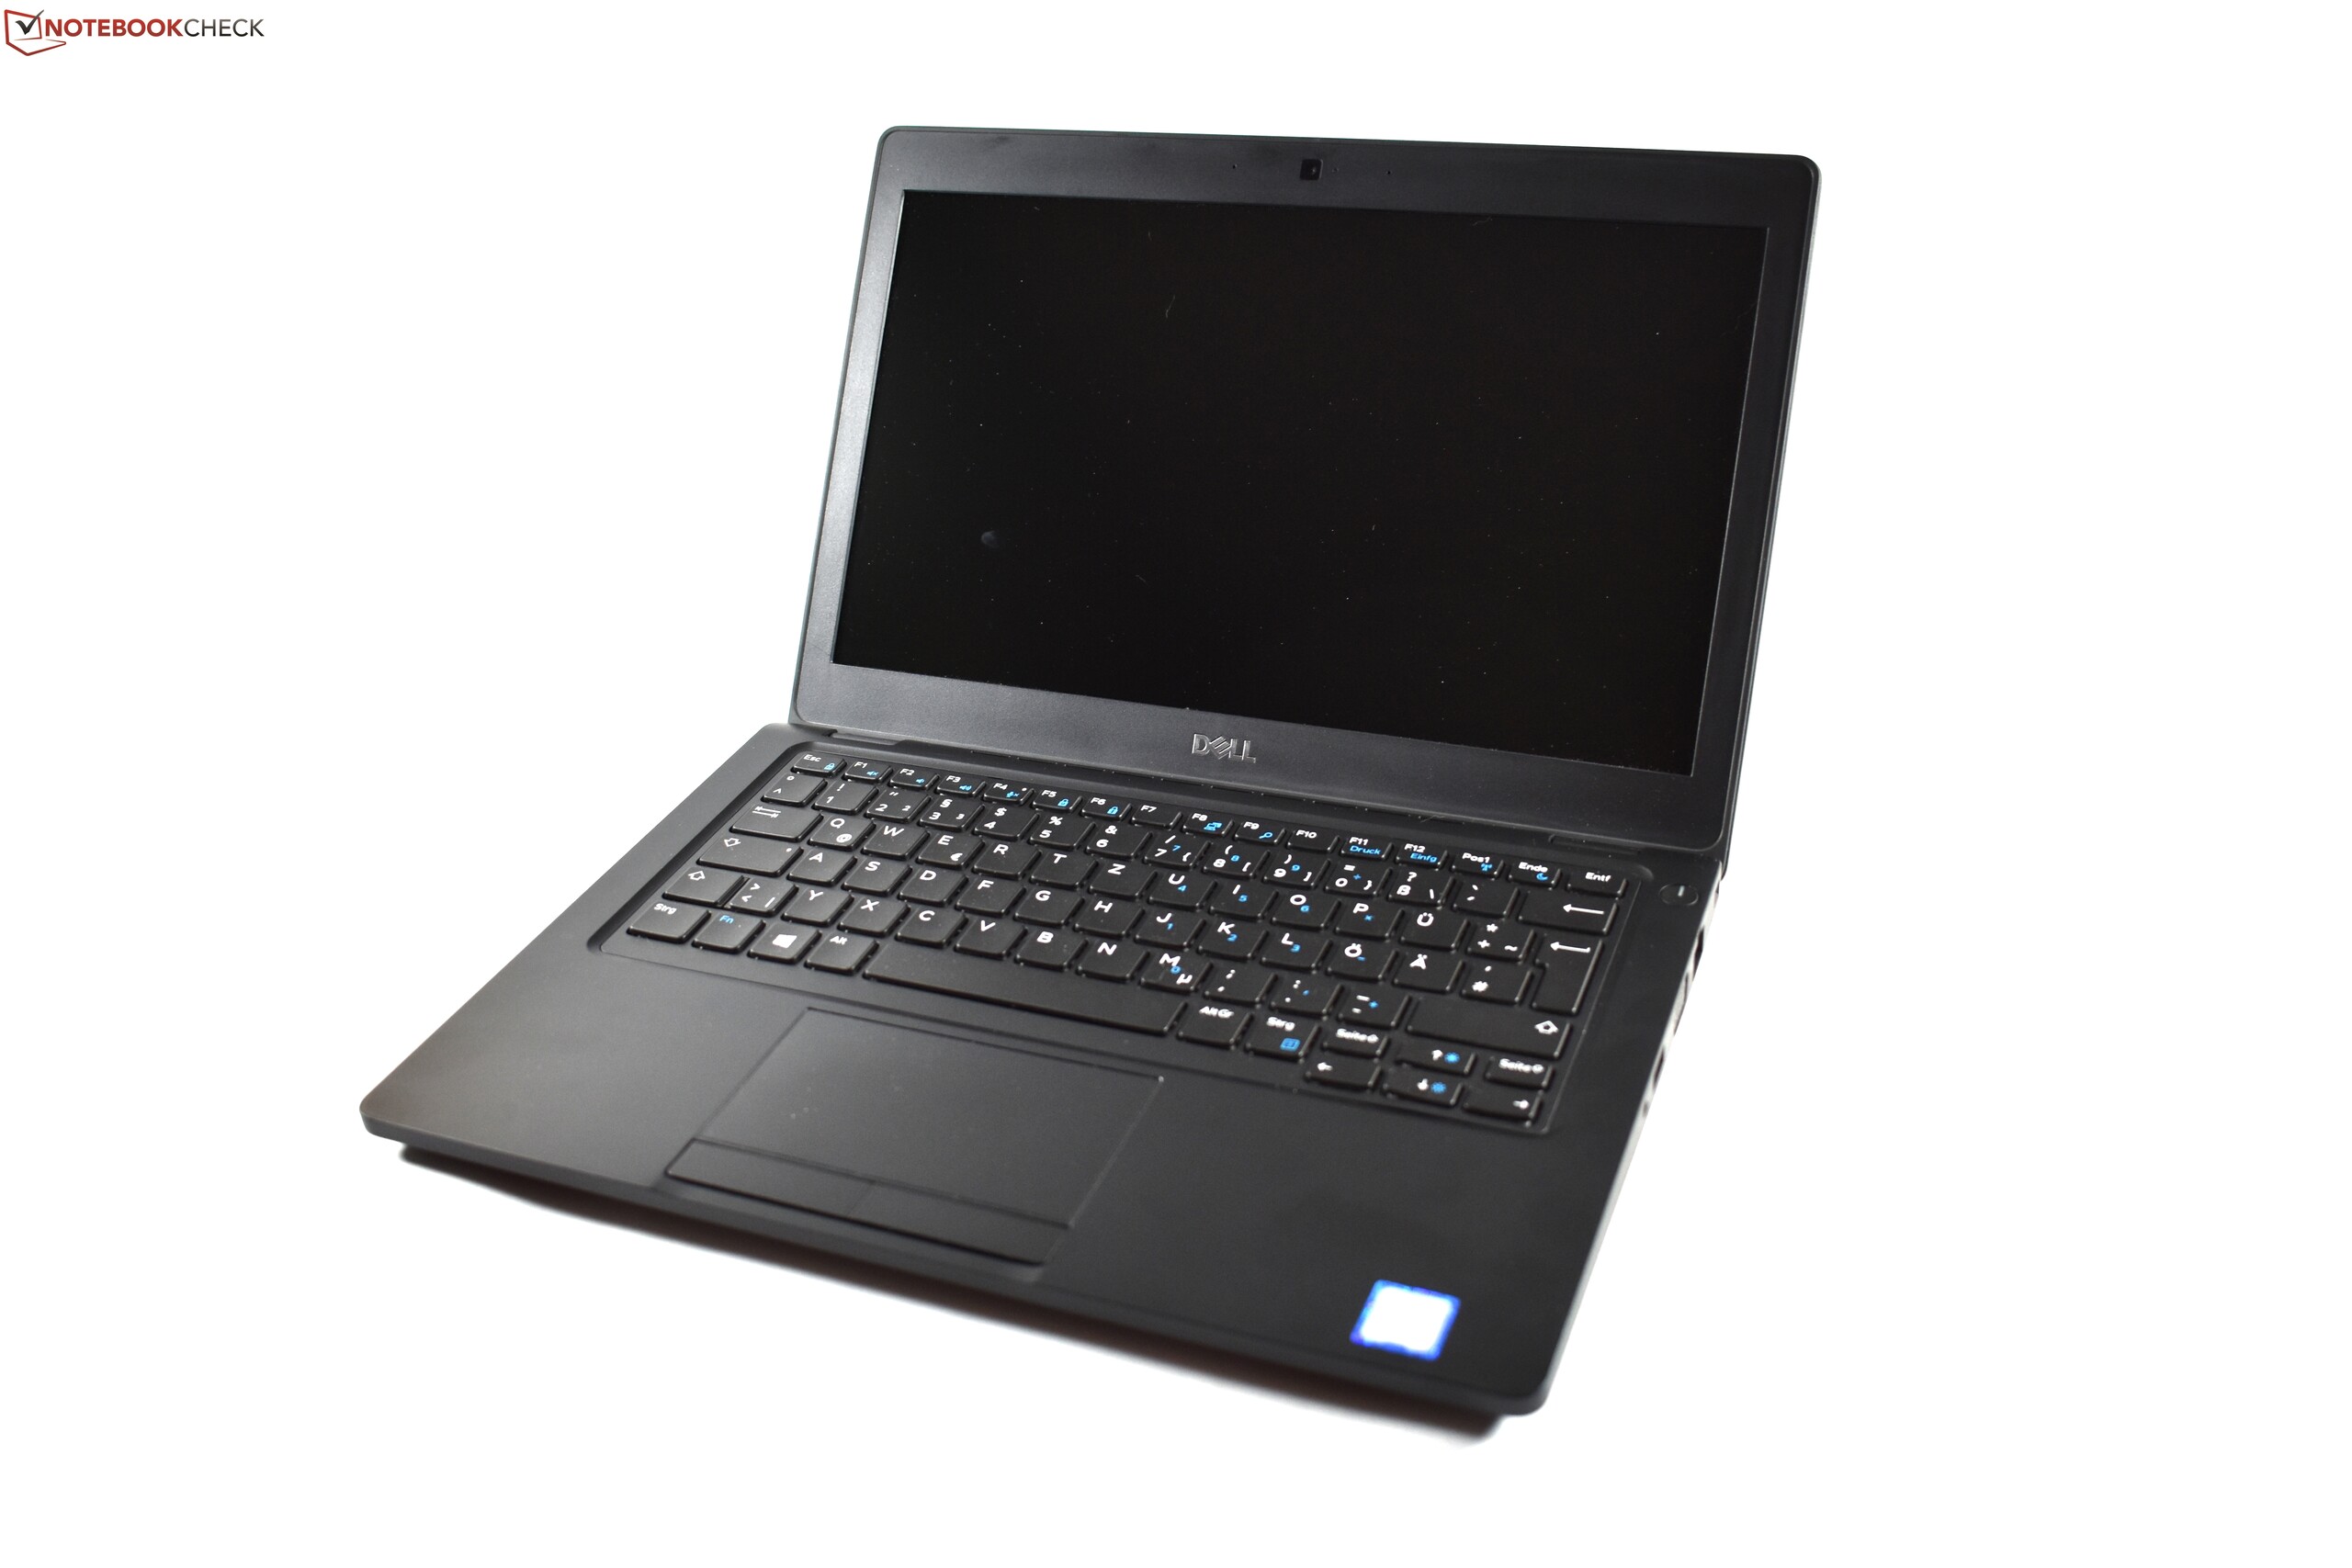
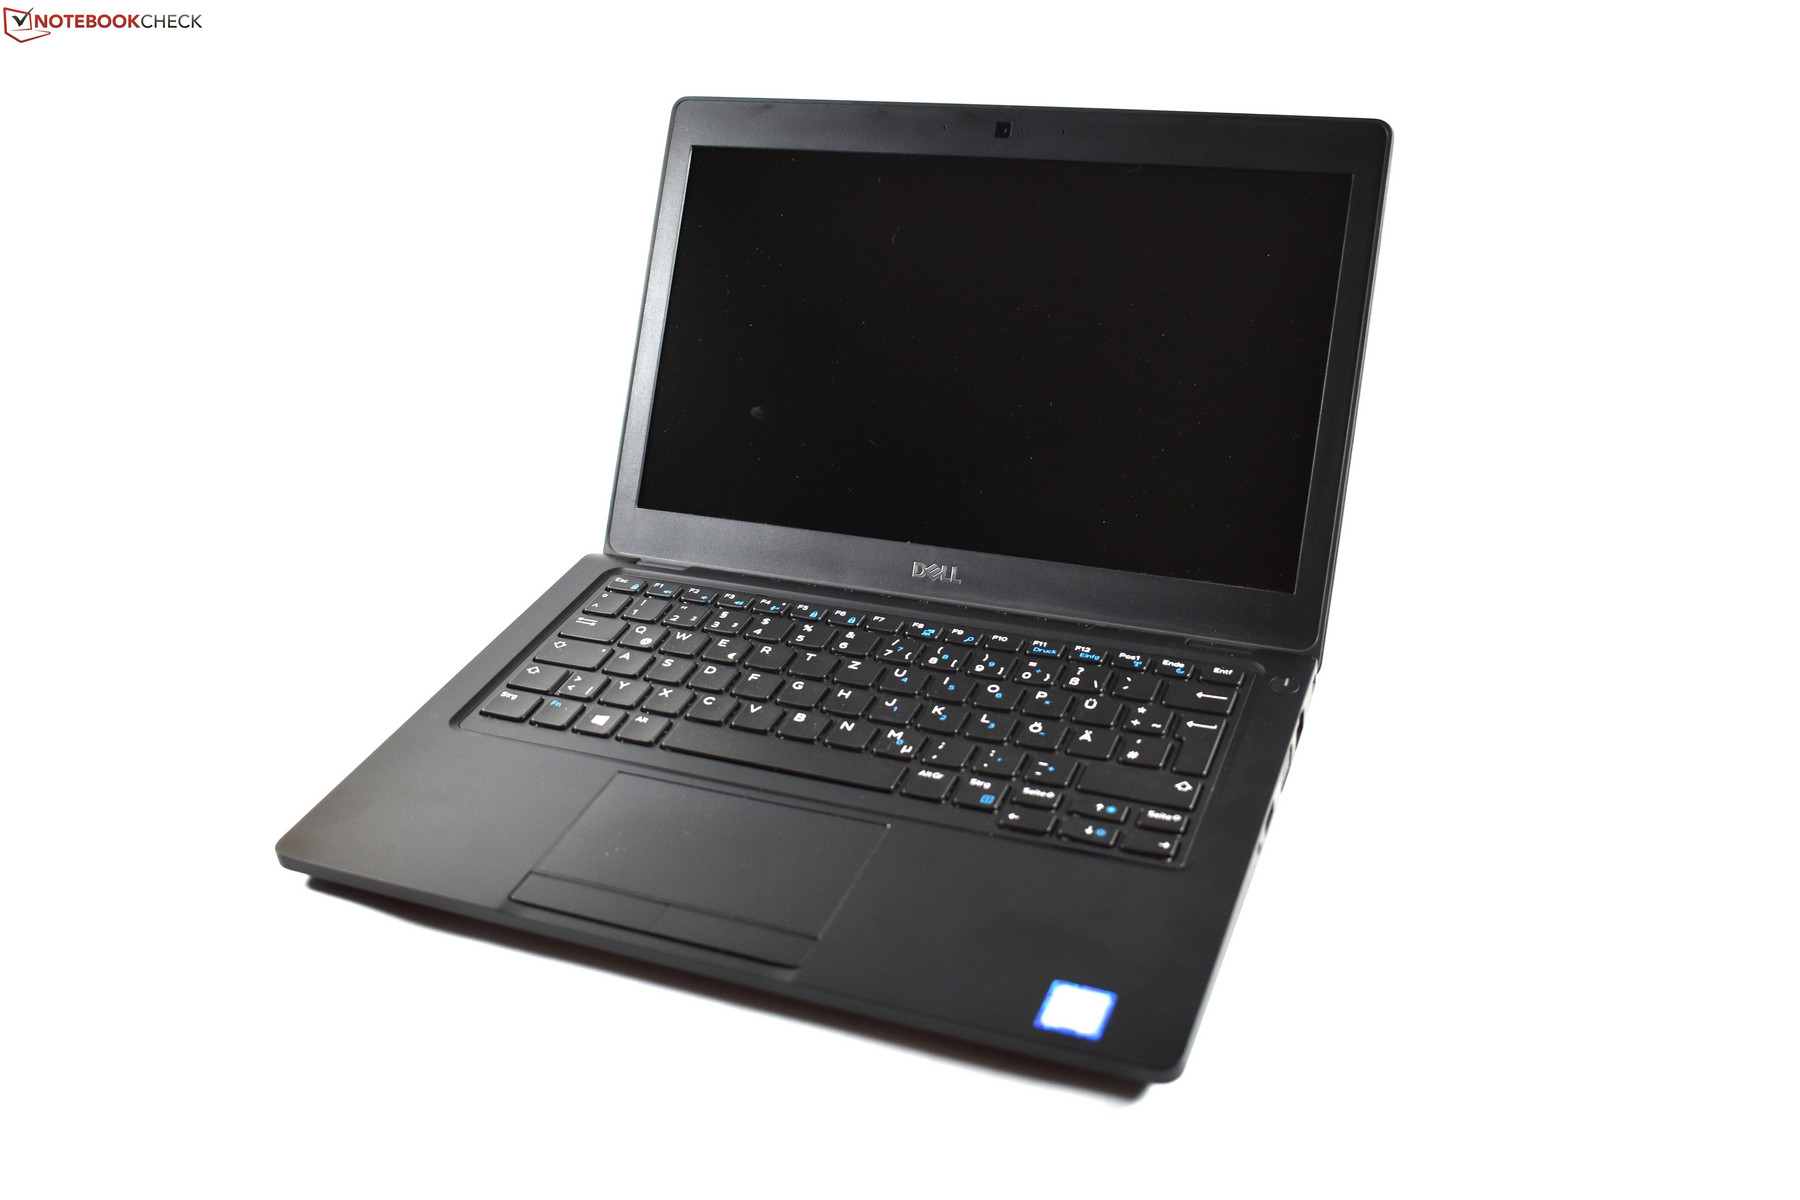
The Latitude 5290 is a laptop with a modest black case that fits into its business surroundings just like a black suit.You can recognize it externally as an affordable Latitude by the thickness of its case, and the Latitude 7280 is noticeably and visibly slimmer. The materials are also more affordable, and plastic has been used more generously. At the palm rest and the back of the display lid, the surfaces are lacquered velvety soft, while the display frame and the case bottom are made from unlacquered, rougher plastic. In terms of its stability, the case is not bad at all, and the keyboard can only be pressed down minimally in the center. However, the display lid is slightly weaker. Pressure on the back of the lid is transferred relatively quickly onto the LCD panel. The drop down hinges which hold the display in place do not allow single-handed opening of the display lid. On the other hand, they at least allow opening the display lid up to 180°.
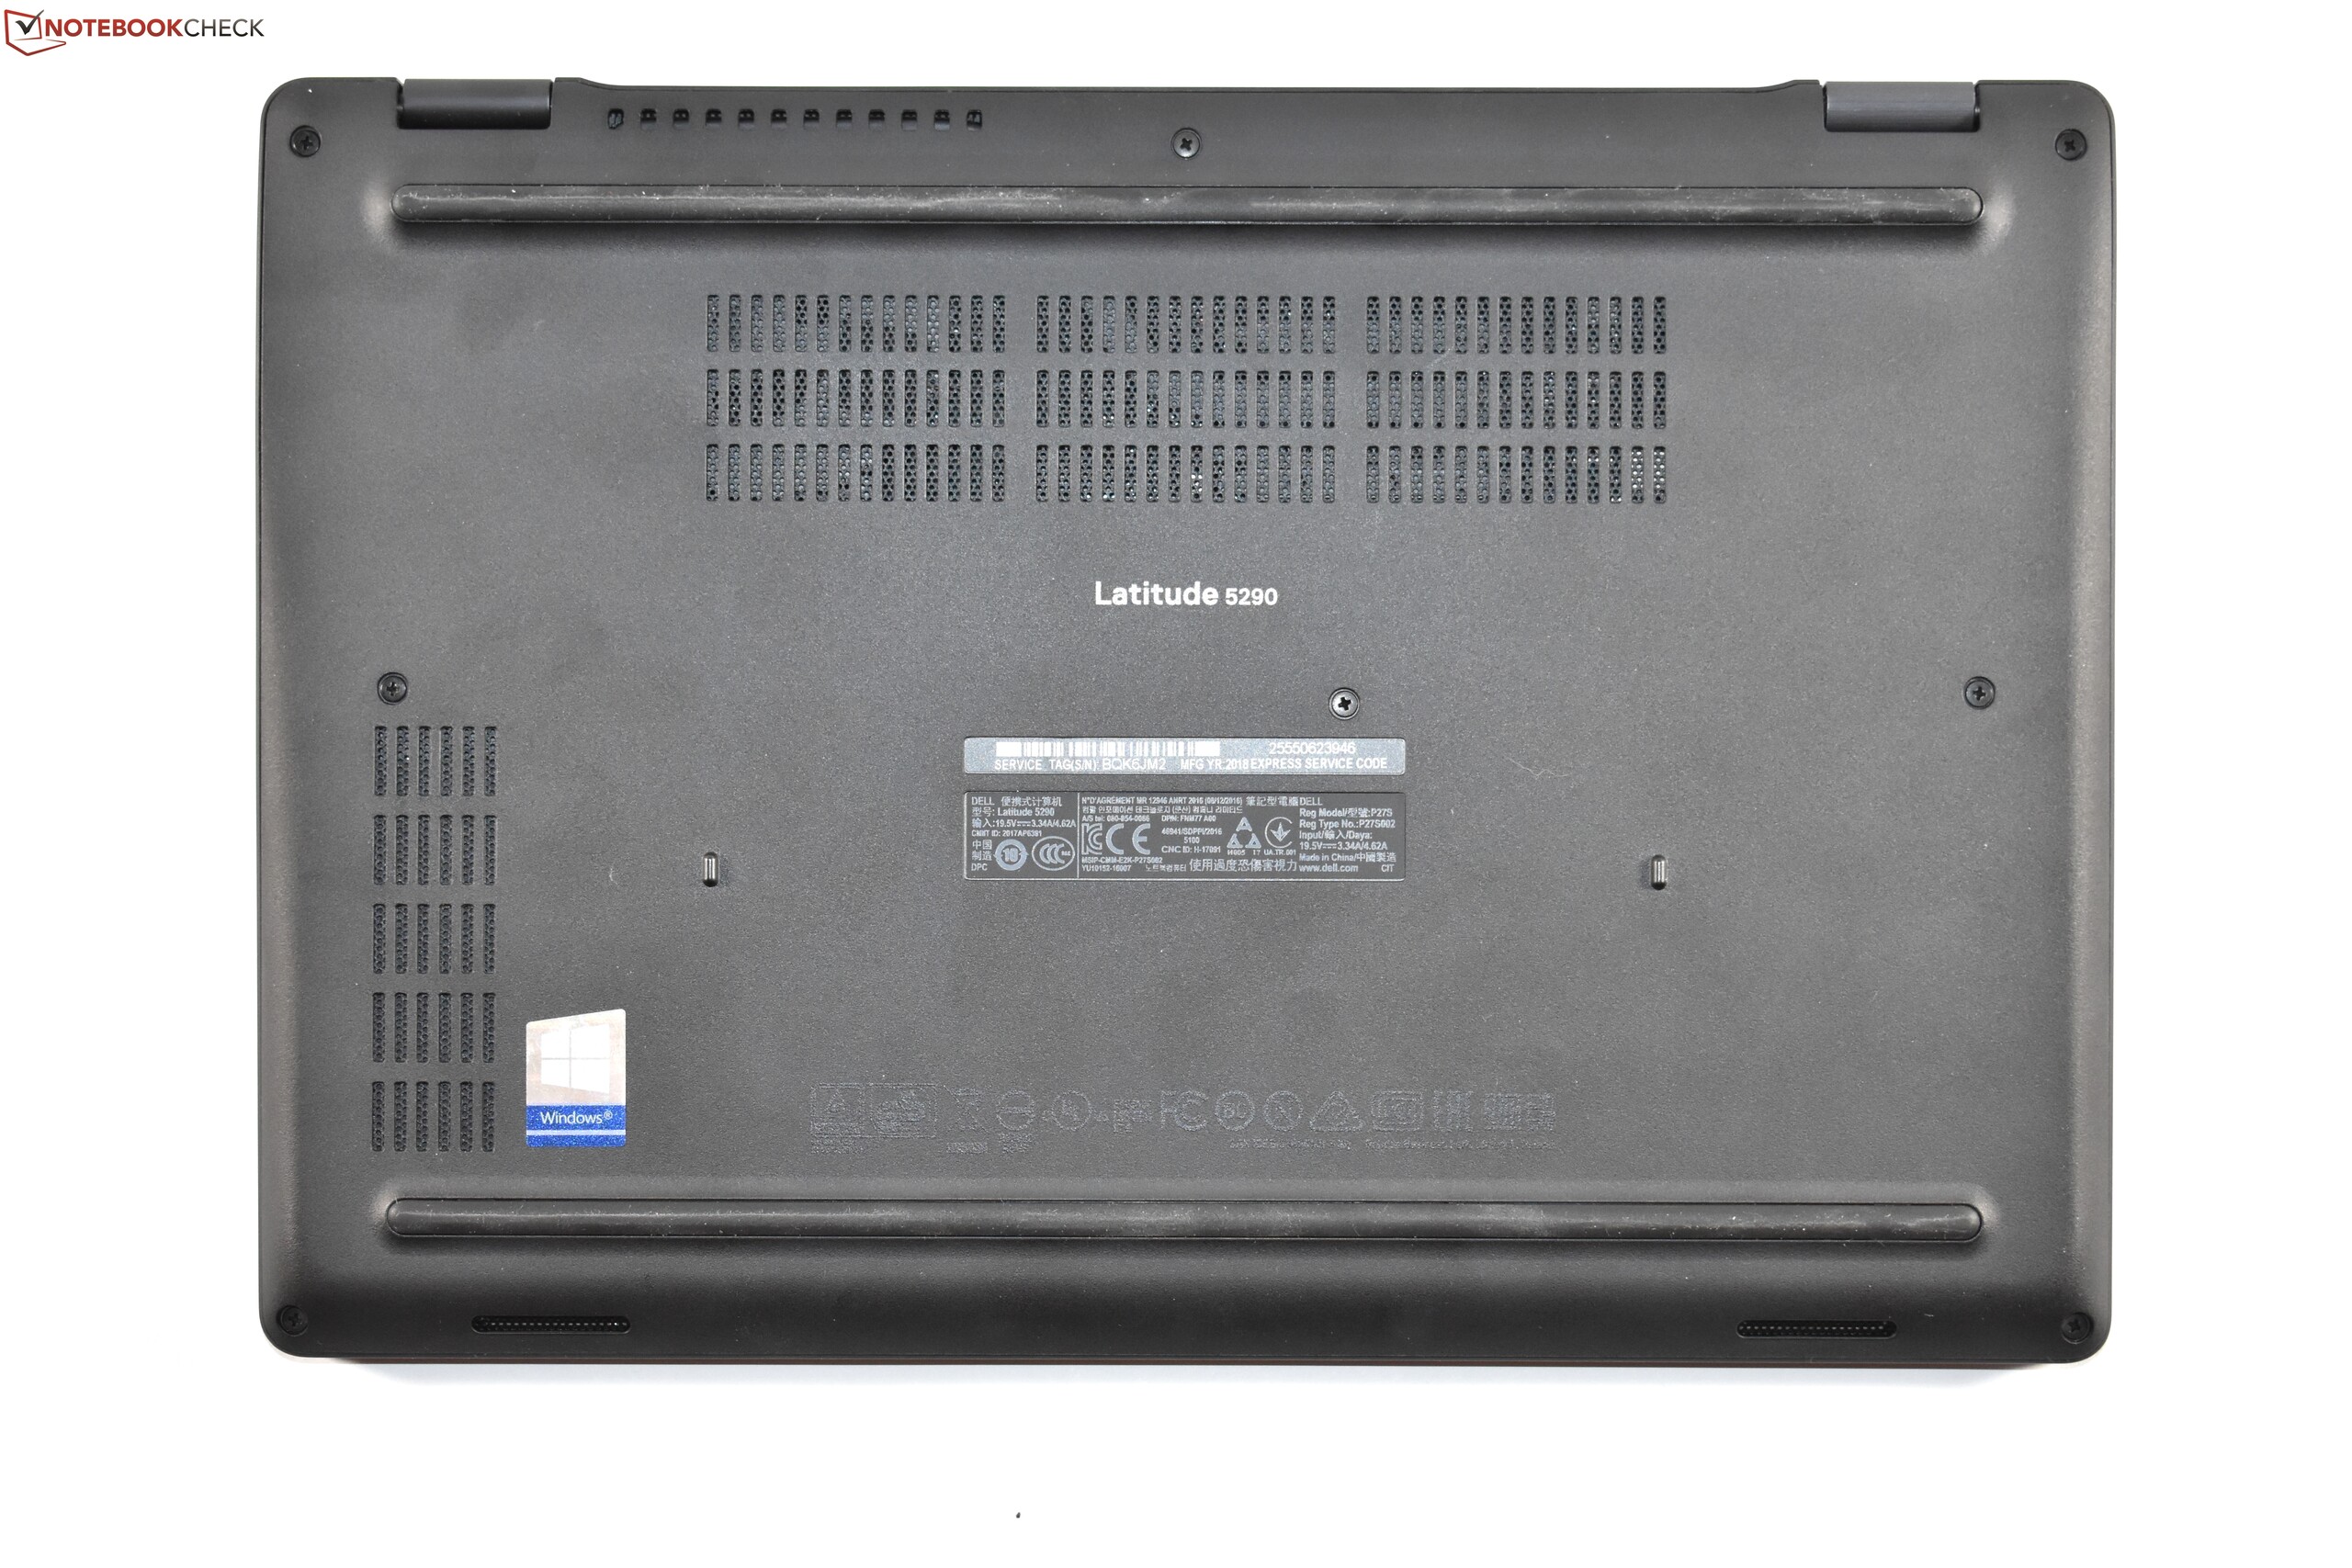
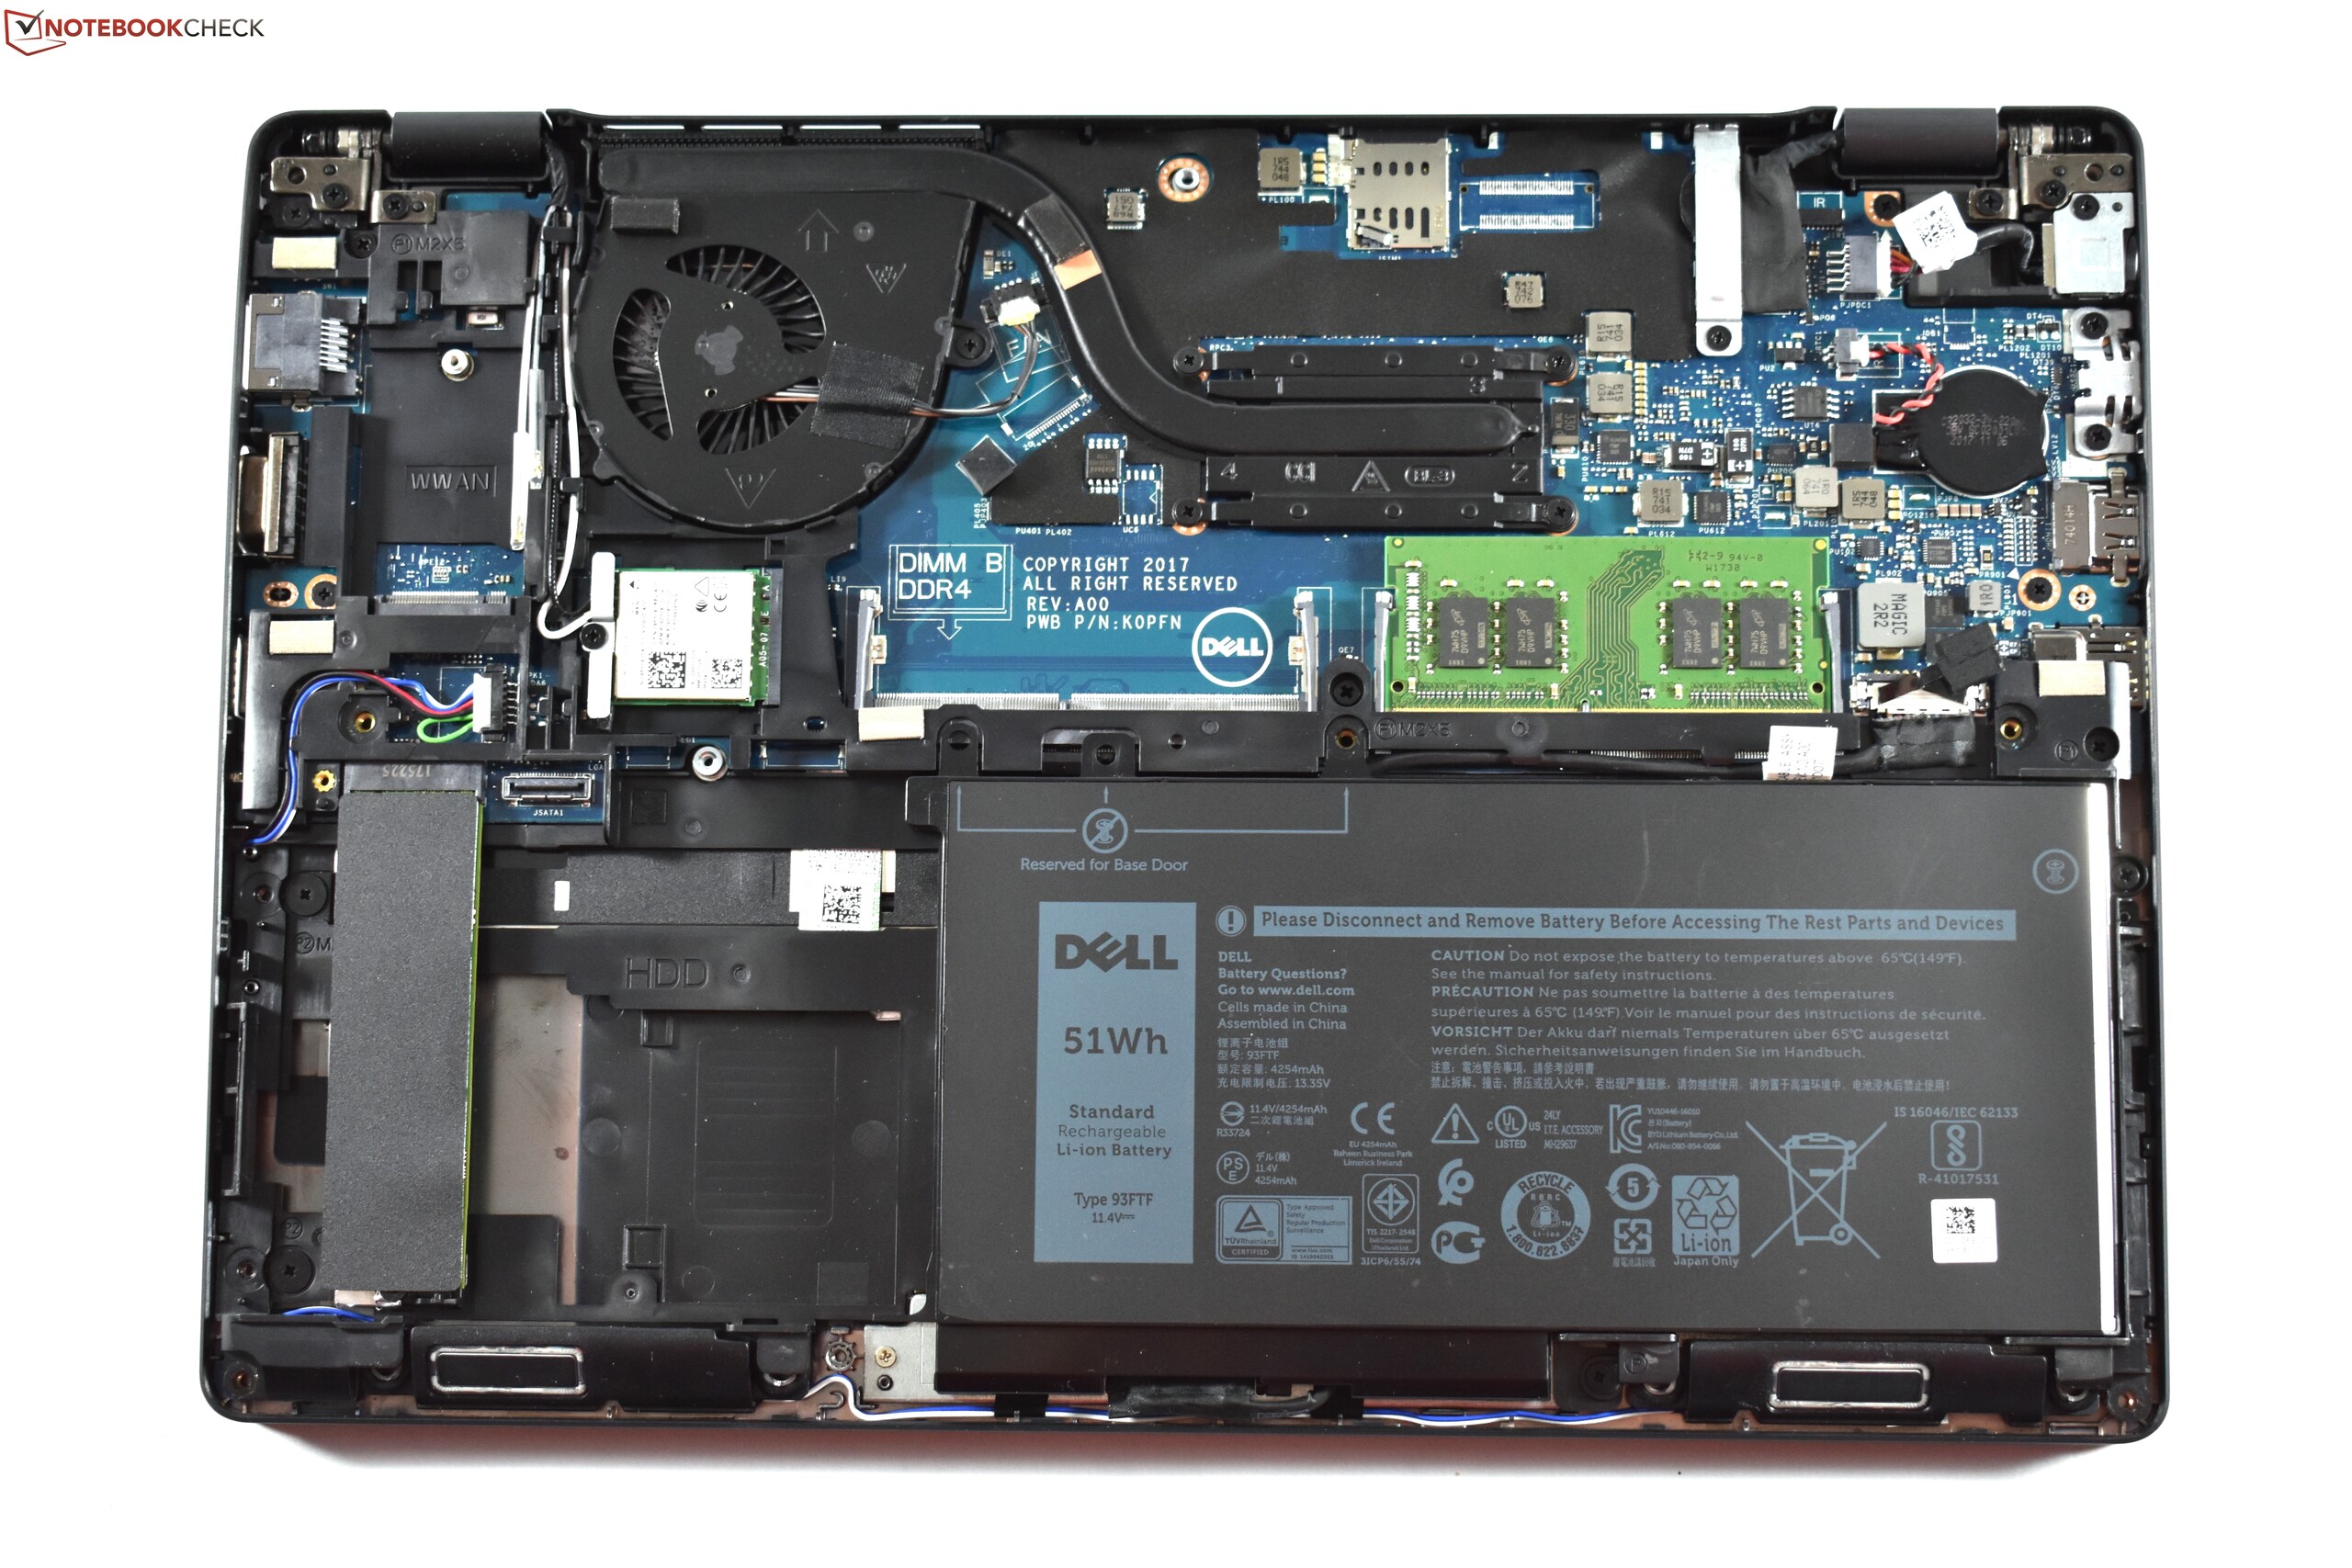
In order to access the components of the Latitude, you need to remove the bottom plate, and to do this, you have to remove the screws and clips. Once you have managed that, you can get access to all the important components. The empty 2.5-inch slot is immediately noticeable. However, you cannot use it easily, since you would need a cable and a frame which are not included in the scope of delivery.
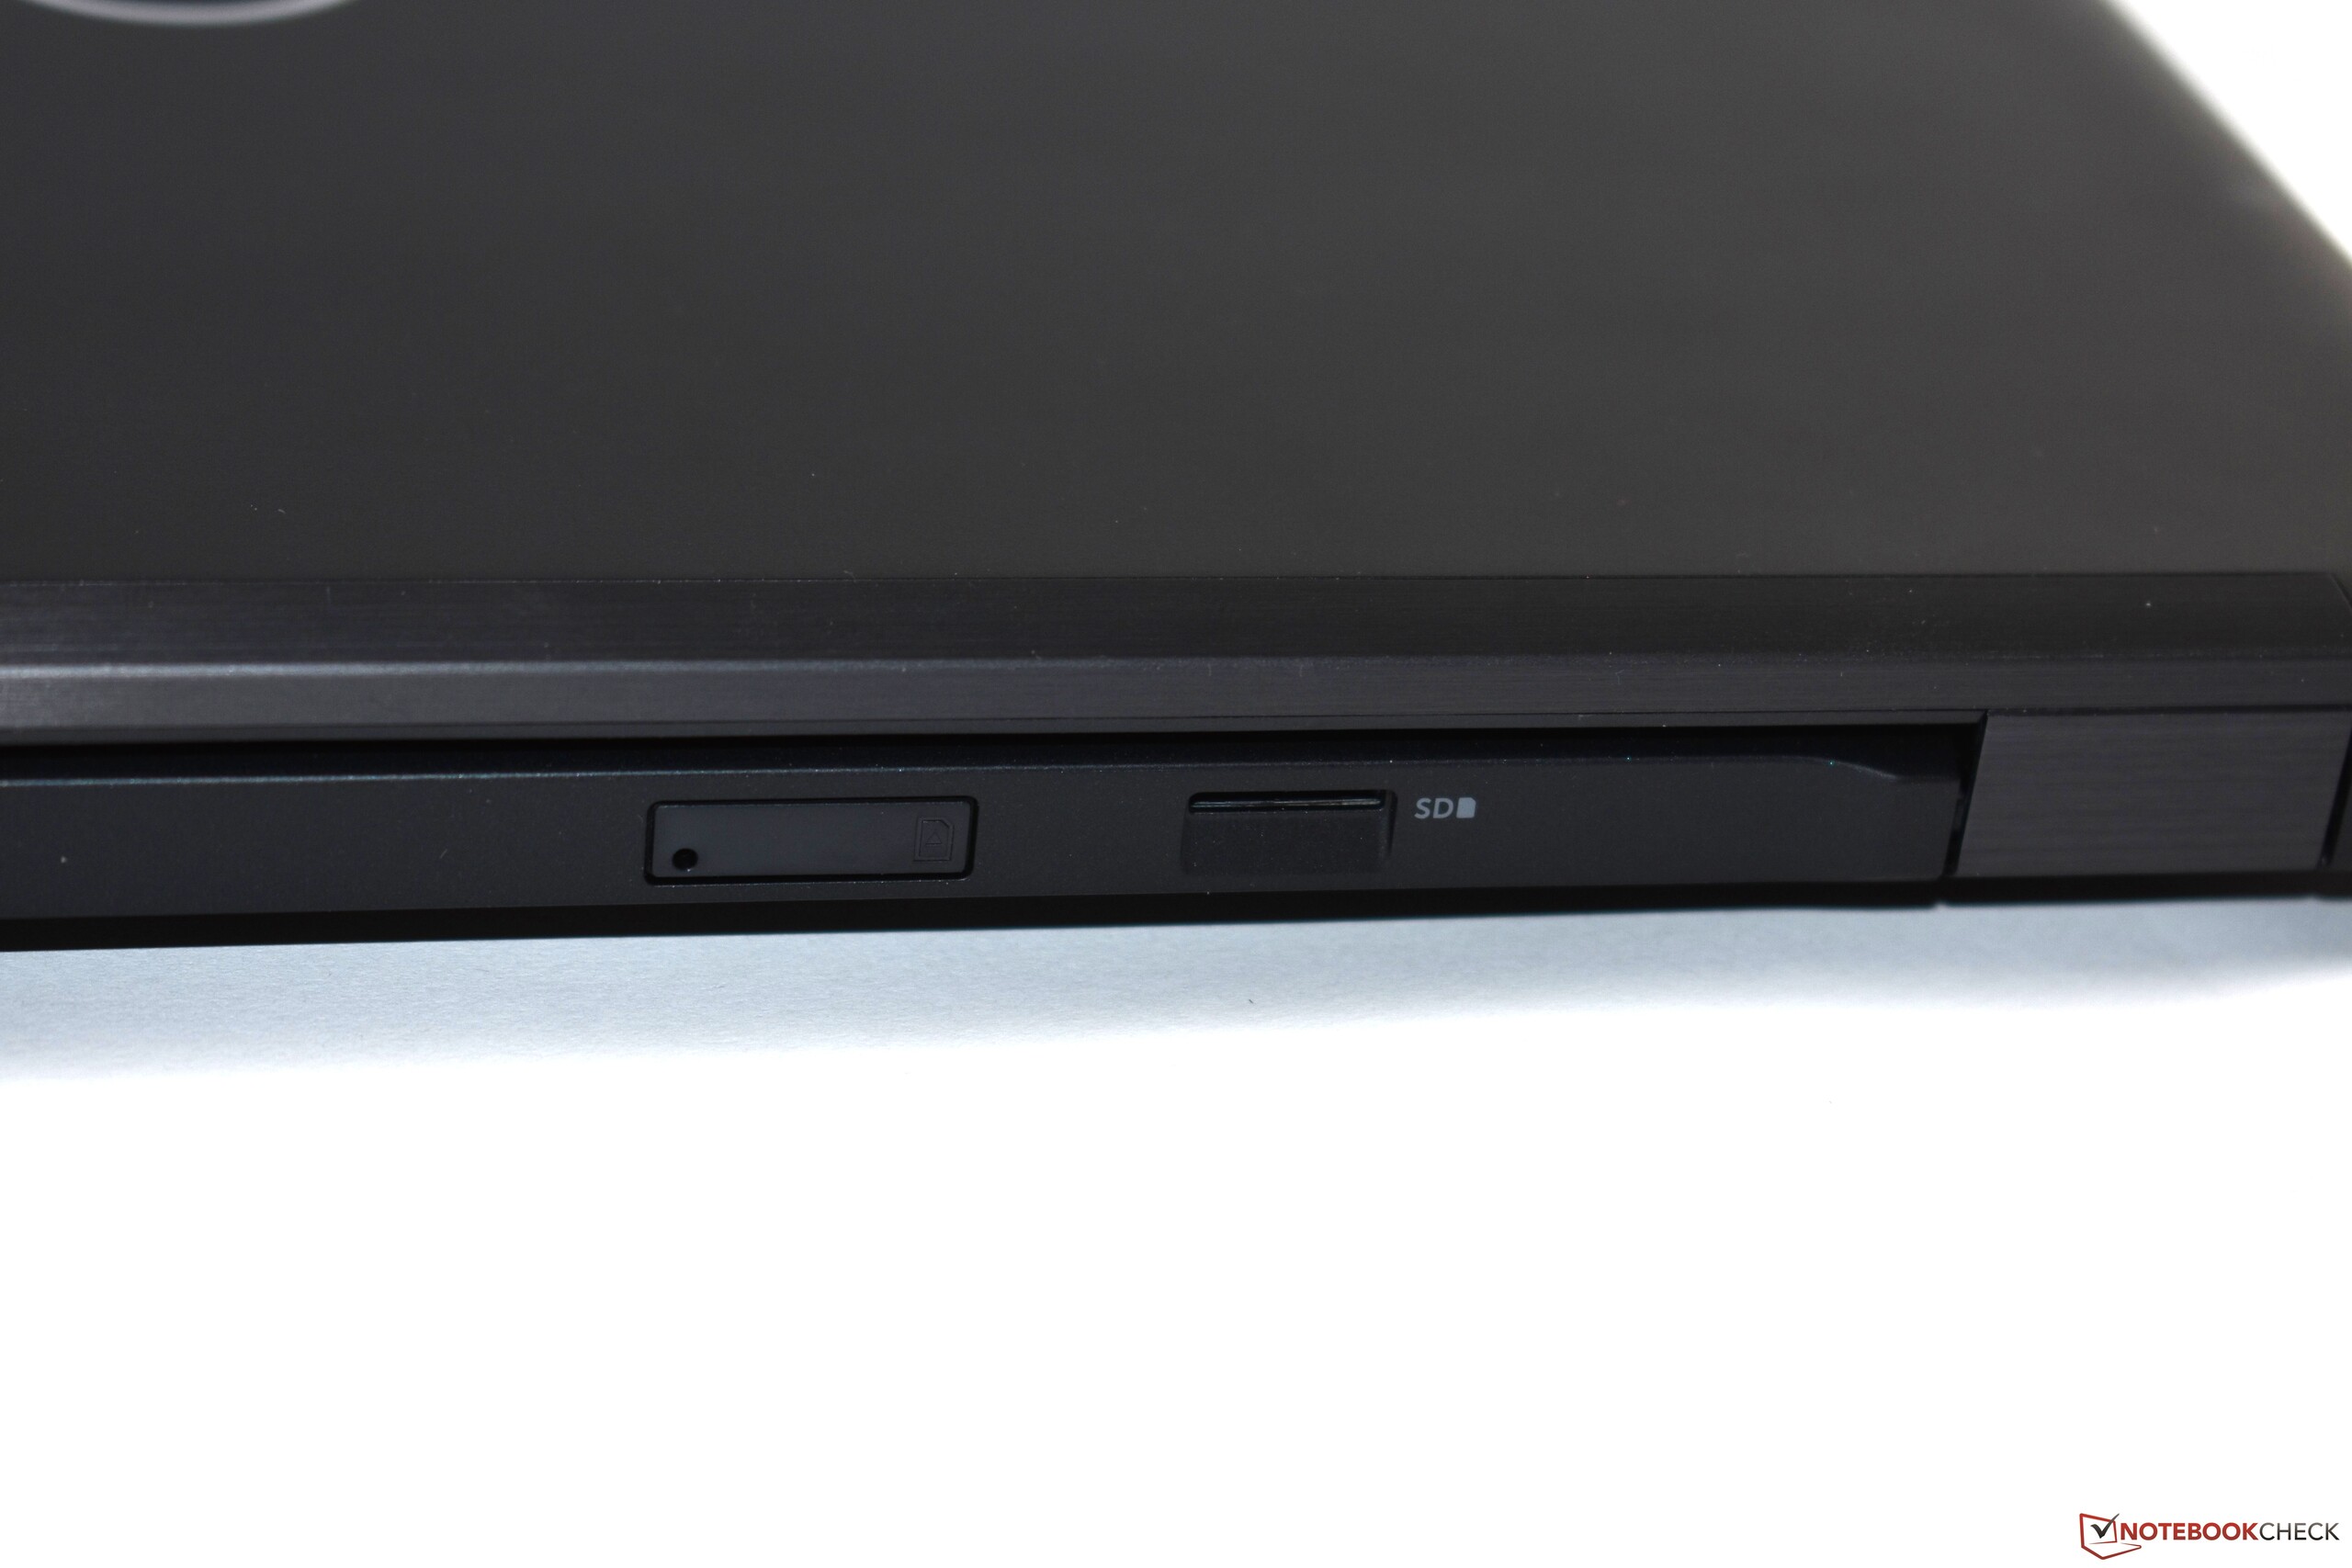
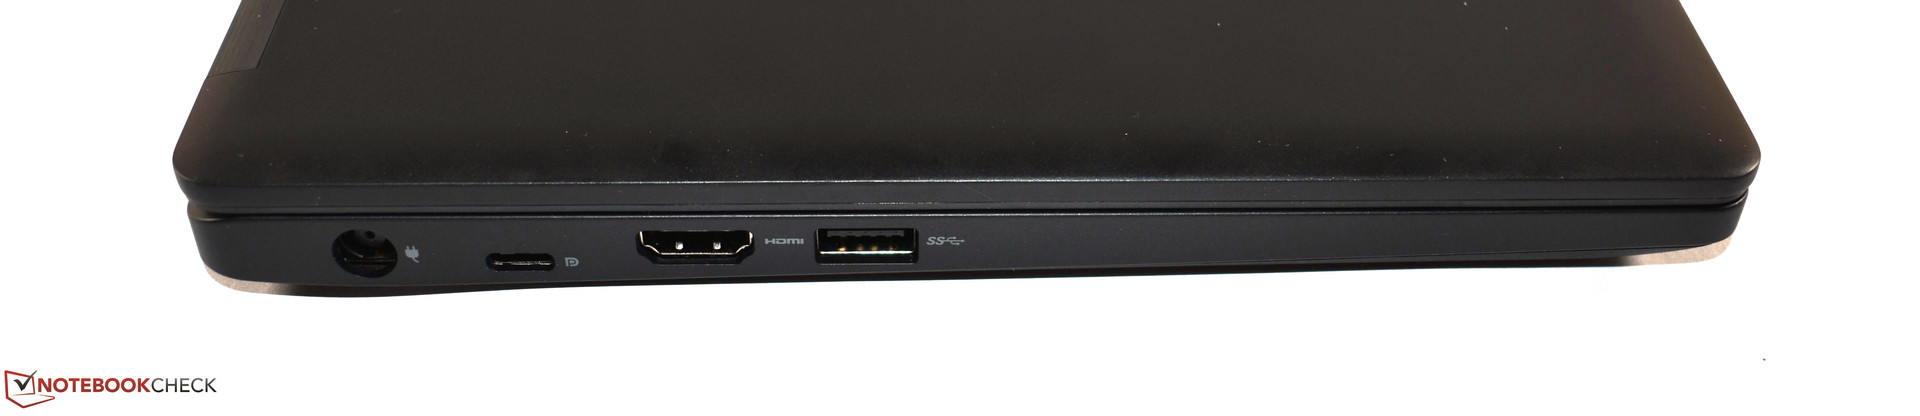
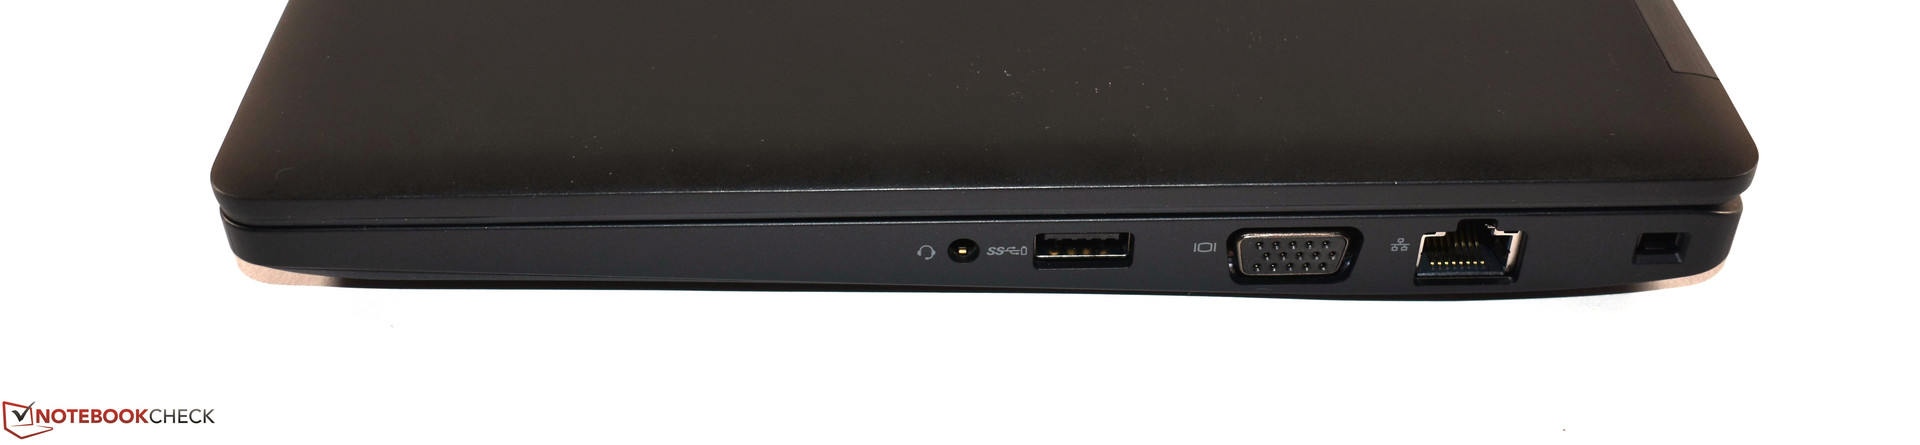
The Latitude still offers a VGA connection - a rarity in the year 2018. But this does not mean that you have to do without the modern standards, since USB Type-C is also there. Even though this connection cannot handle Thunderbolt, at least you can charge the notebook with it and also connect a monitor via the DisplayPort. The Dell Latitude Ultrabook also has a microSD card reader, which is customary for subnotebooks at this point. While this card reader performs at an above-average speed, its position at the back is bad.
Connection Equipment
| SD Card Reader | |
| average JPG Copy Test (av. of 3 runs) | |
| Dell Latitude 5290 (Toshiba Exceria Pro M501) | |
| Dell Latitude 7280 (Toshiba THN-M401S0640E2) | |
| Lenovo ThinkPad X280-20KES01S00 (Toshiba Excerie Pro M501) | |
| Average of class Subnotebook (23.7 - 188, n=9, last 2 years) | |
| Dell Latitude 5280 (Toshiba THN-M401S0640E2) | |
| maximum AS SSD Seq Read Test (1GB) | |
| Dell Latitude 5290 (Toshiba Exceria Pro M501) | |
| Average of class Subnotebook (24.9 - 195, n=8, last 2 years) | |
| Dell Latitude 5280 (Toshiba THN-M401S0640E2) | |
| Dell Latitude 7280 (Toshiba THN-M401S0640E2) | |
| Lenovo ThinkPad X280-20KES01S00 (Toshiba Excerie Pro M501) | |
Input Devices
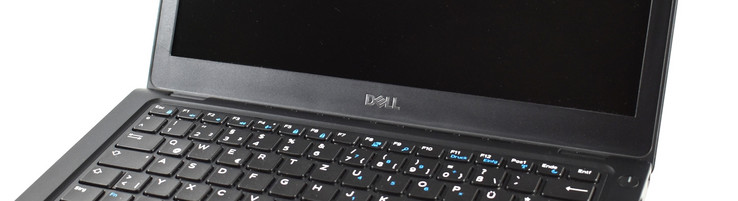
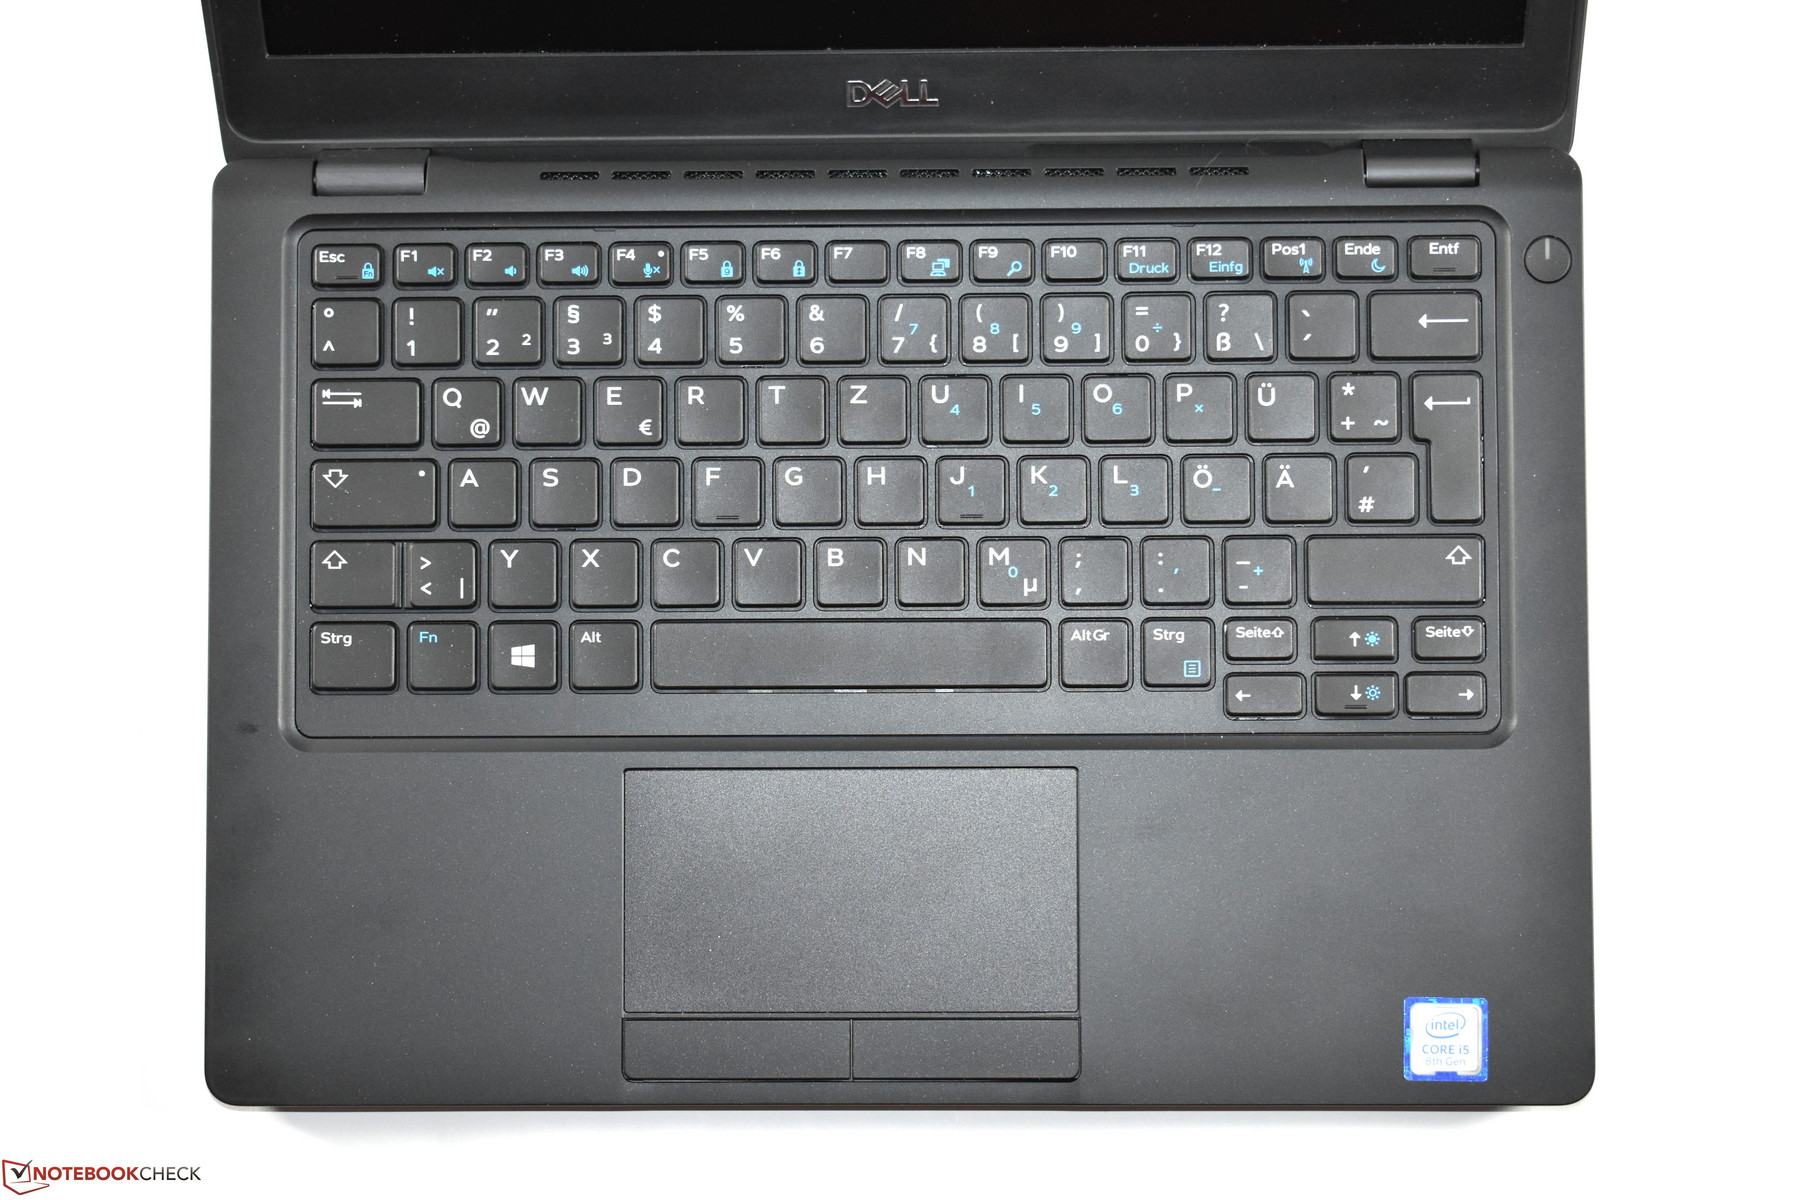
The only colored accents in the design of the Latitude are the blue FN markings on the chiclet keyboard. The keyboard has six rows, and a variant without a backlight is built into our Dell Latitude 12 5290 test unit. Even though there would still be some more space on the left and right of the keyboard, Dell still uses a keyboard with slightly smaller keys. For example, you can see this looking at the Enter key which is less wide. The typing experience on the slightly roughened keys is pleasant. The stroke is generous for current standards, and the pressure point is neither too soft, nor too tight. You might need some time to get used to the smaller layout, but Dell has created a smaller layout that is very usable overall.
Dell is using a traditional touchpad with dedicated mouse keys below a fixed touch area. While this reminds us of the last decade, using it is not uncomfortable at all. Even though the plastic surface does not have a high-quality feel and the sliding characteristics are not ideal, the touchpad is not really bad either. At least, it is also a Microsoft-Precision TrackPad. A TrackPoint equivalent is not available in the 12-inch Latitudes.
Display
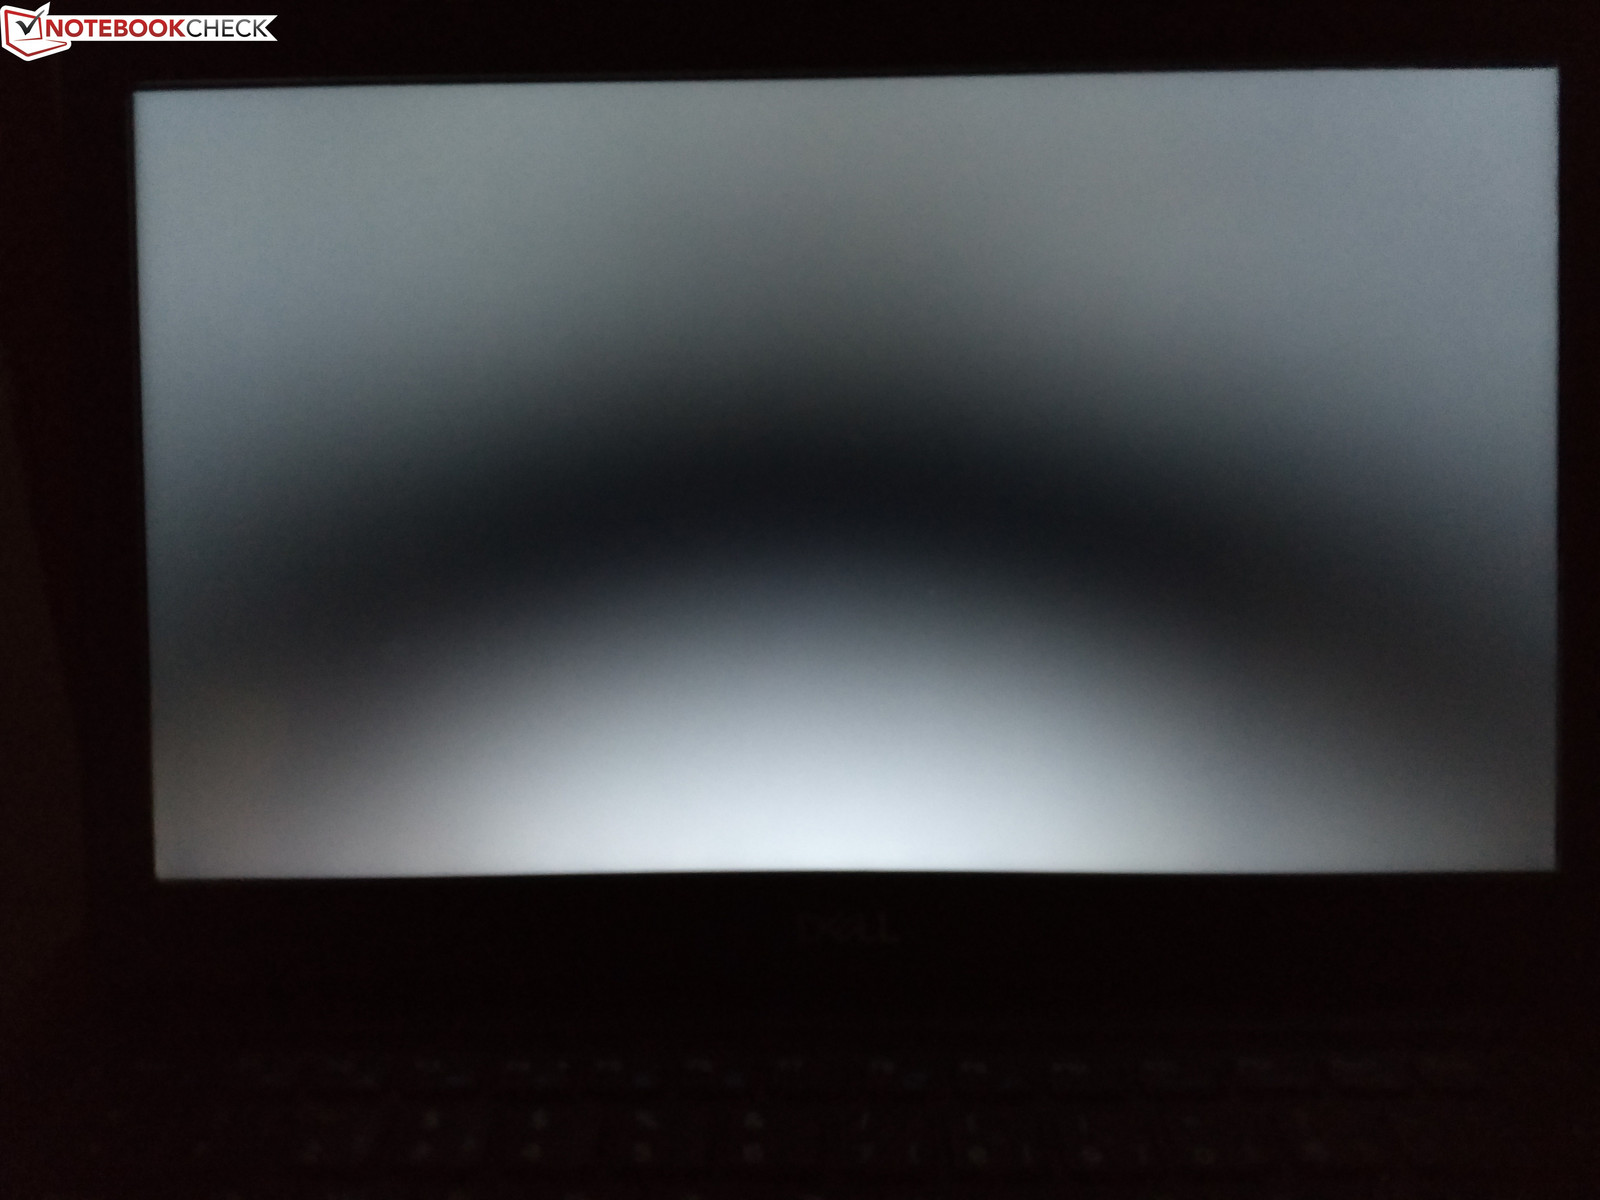
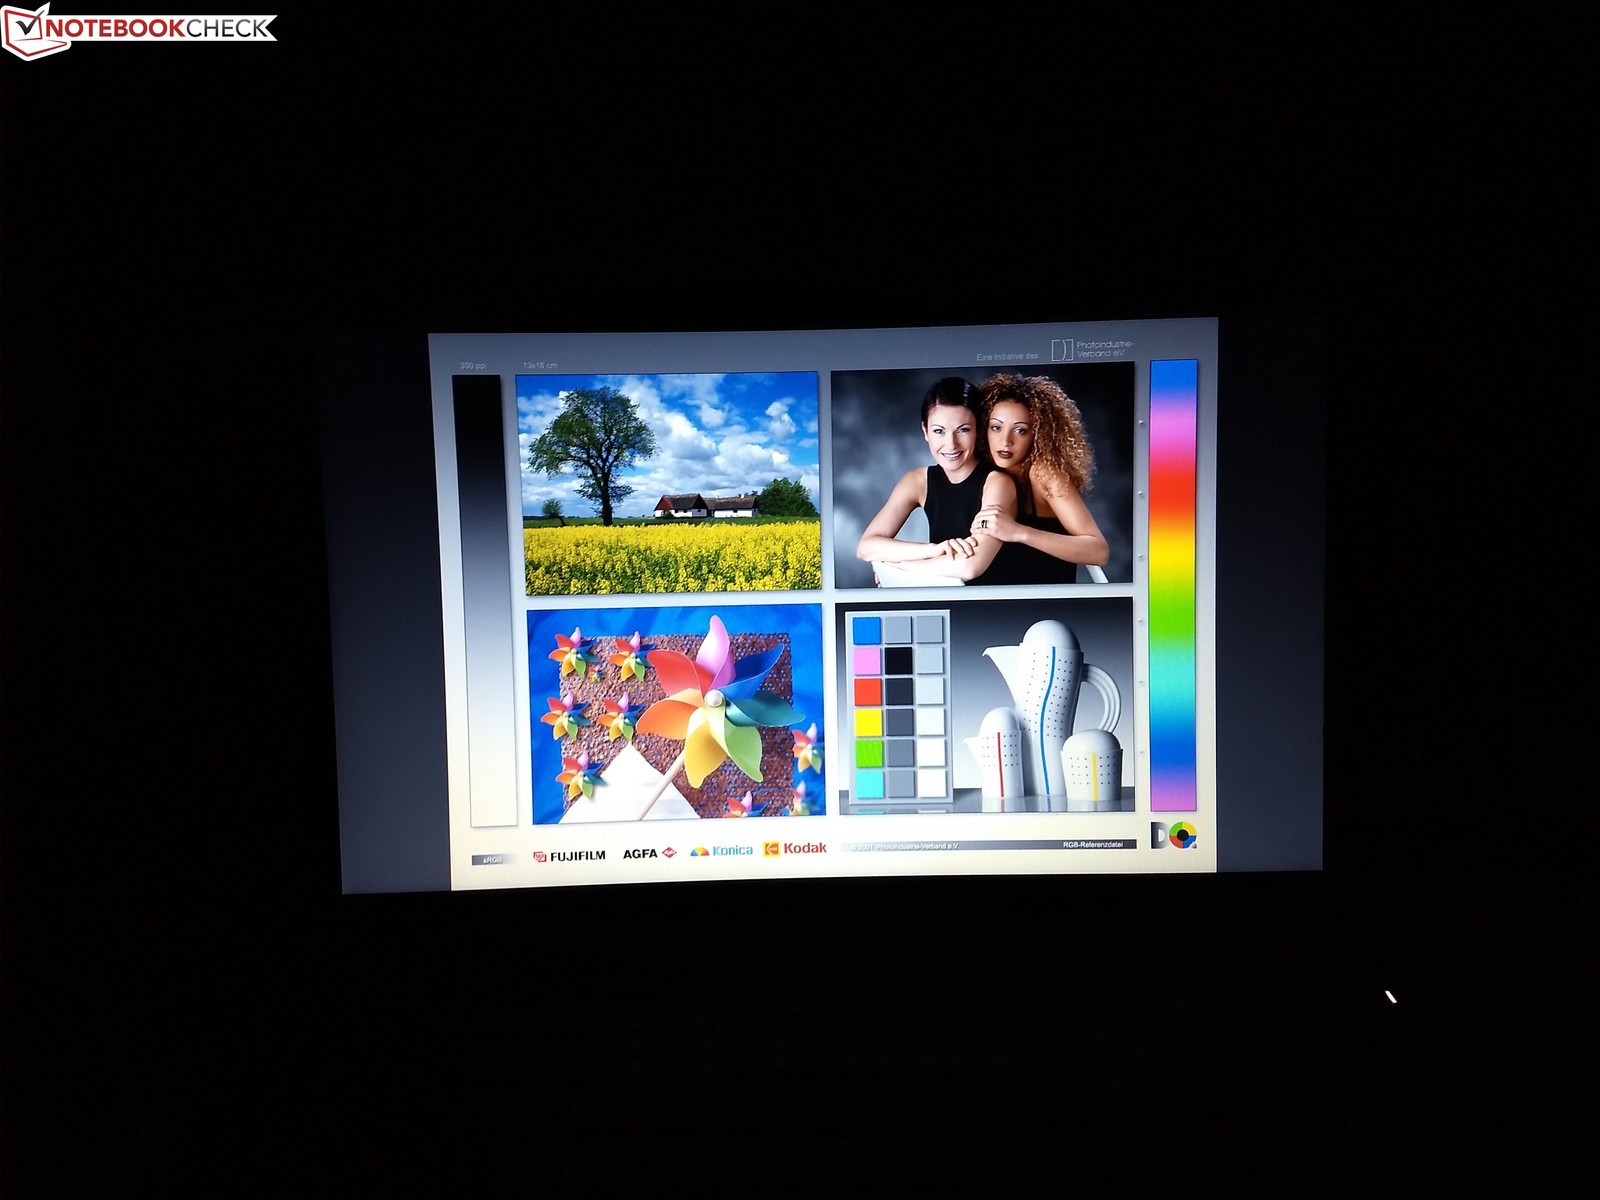
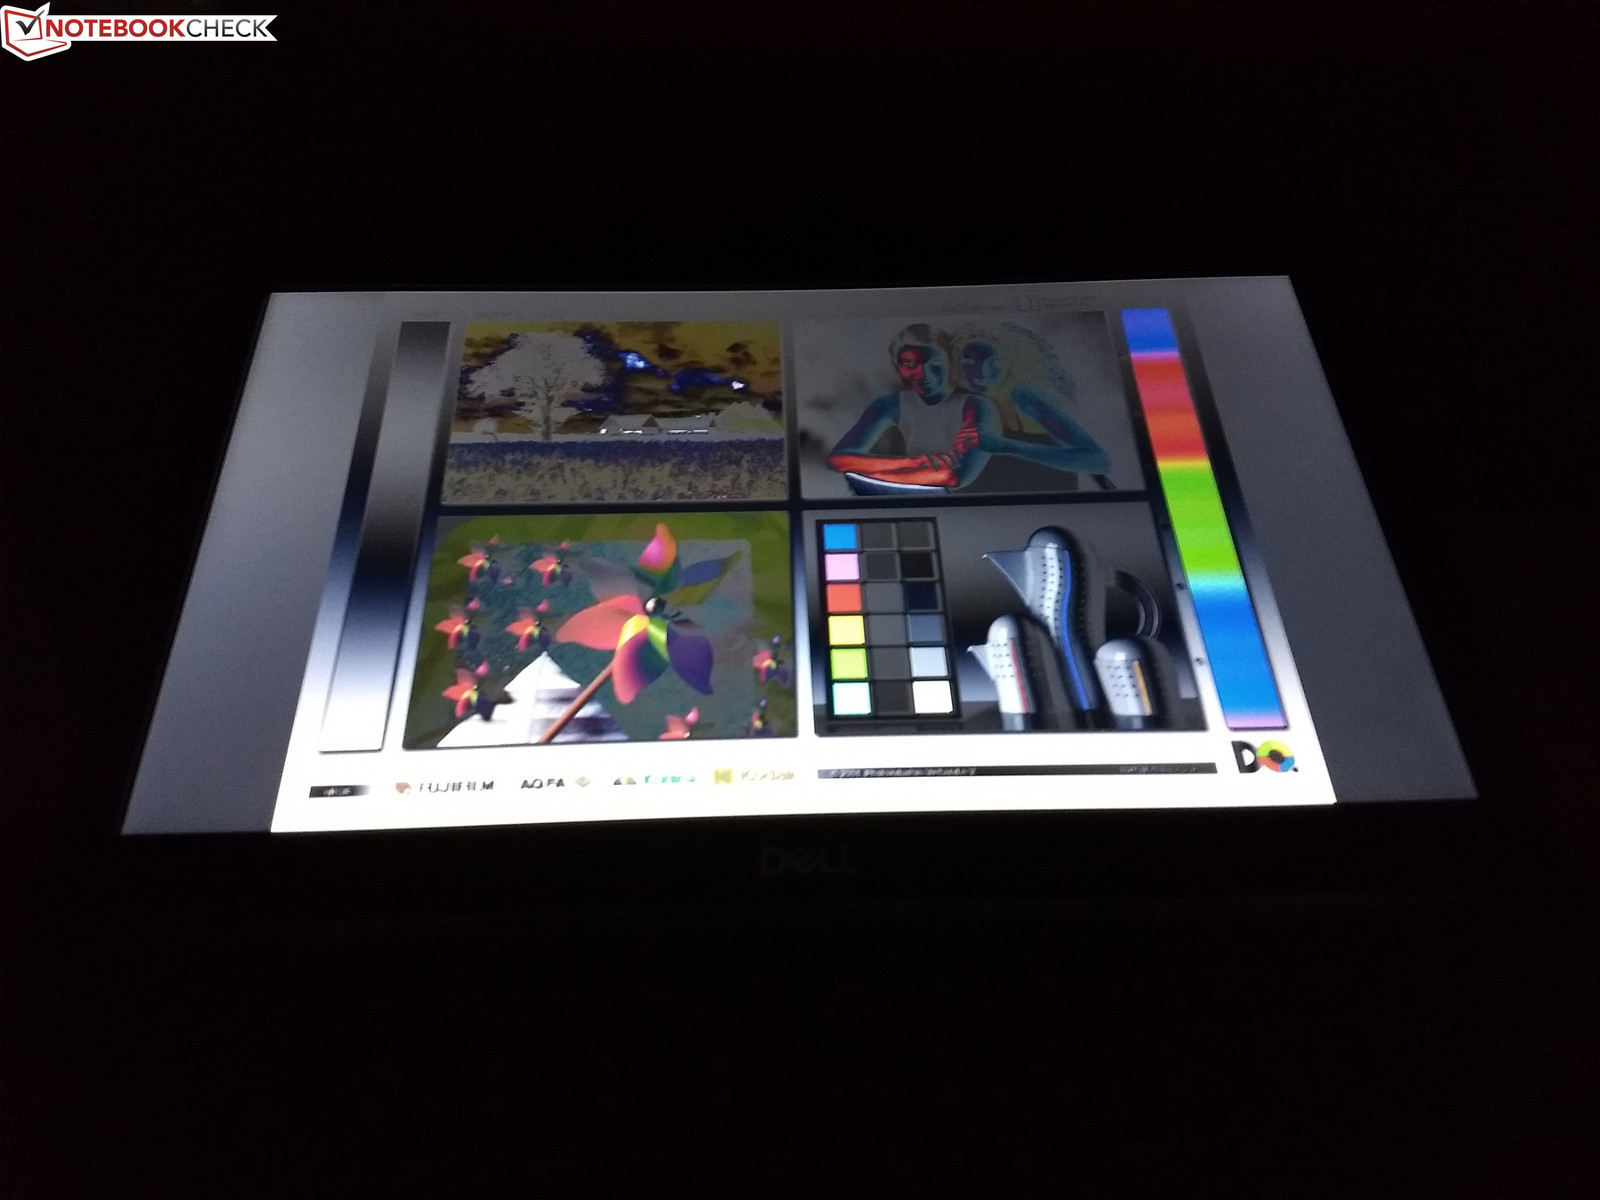
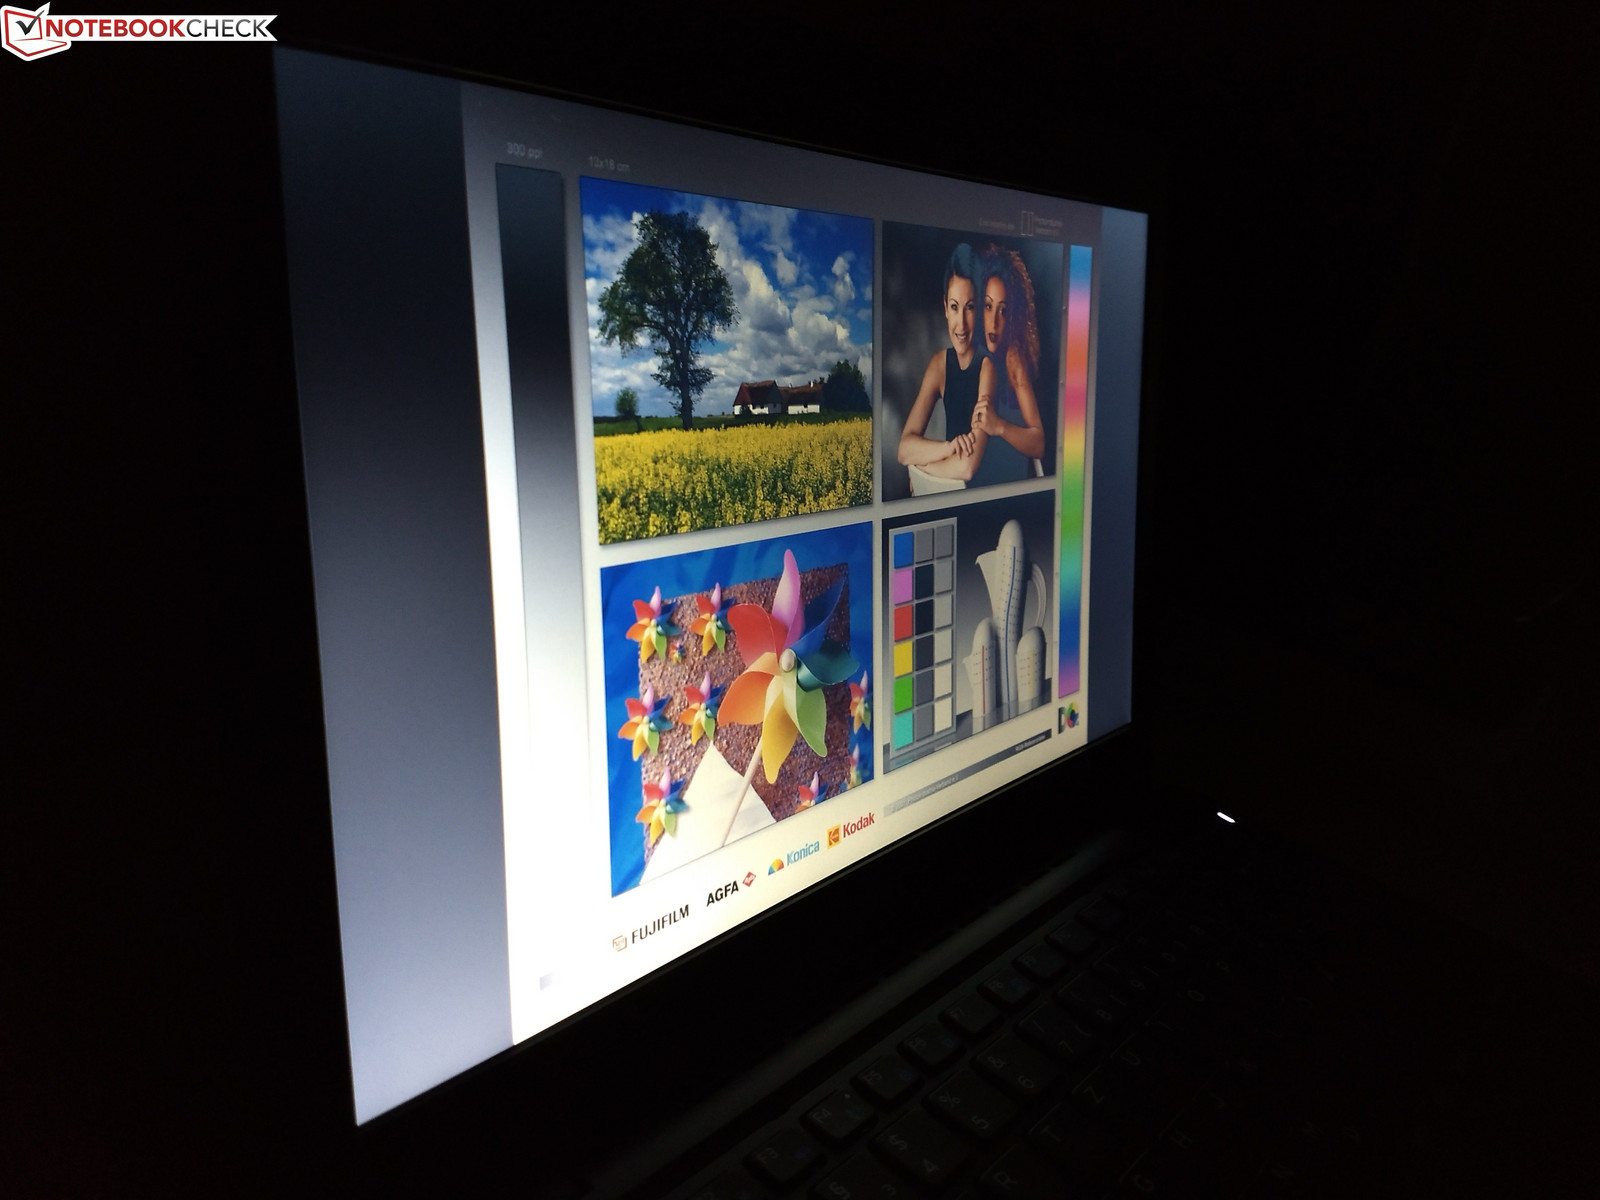
The earlier Latitude 5280 already had a bad HD TN display (1366x768) and the AUO panel that Dell uses in the Latitude 5290 is even worse. It is even darker, among other things. On average, the display achieves only 218 cd/m². We would normally recommend purchasing the test unit with another display option. But the problem is that there is no other display option, neither currently on the German market, nor according to the data sheet.
So naturally, the Latitude 5290 is defeated by the competitors in every respect, since they are all equipped with Full HD IPS displays (1920x1080). Not only do these screens have a higher contrast, but also a higher brightness of more than 300 cd/m². The inadequate stability of the viewing angles which is typical for TN LCDs naturally adds to the problem. On the other hand, the display has no backlight bleeding, but considering the terrible black value and the bad contrast, this does not matter anymore.
| |||||||||||||||||||||||||
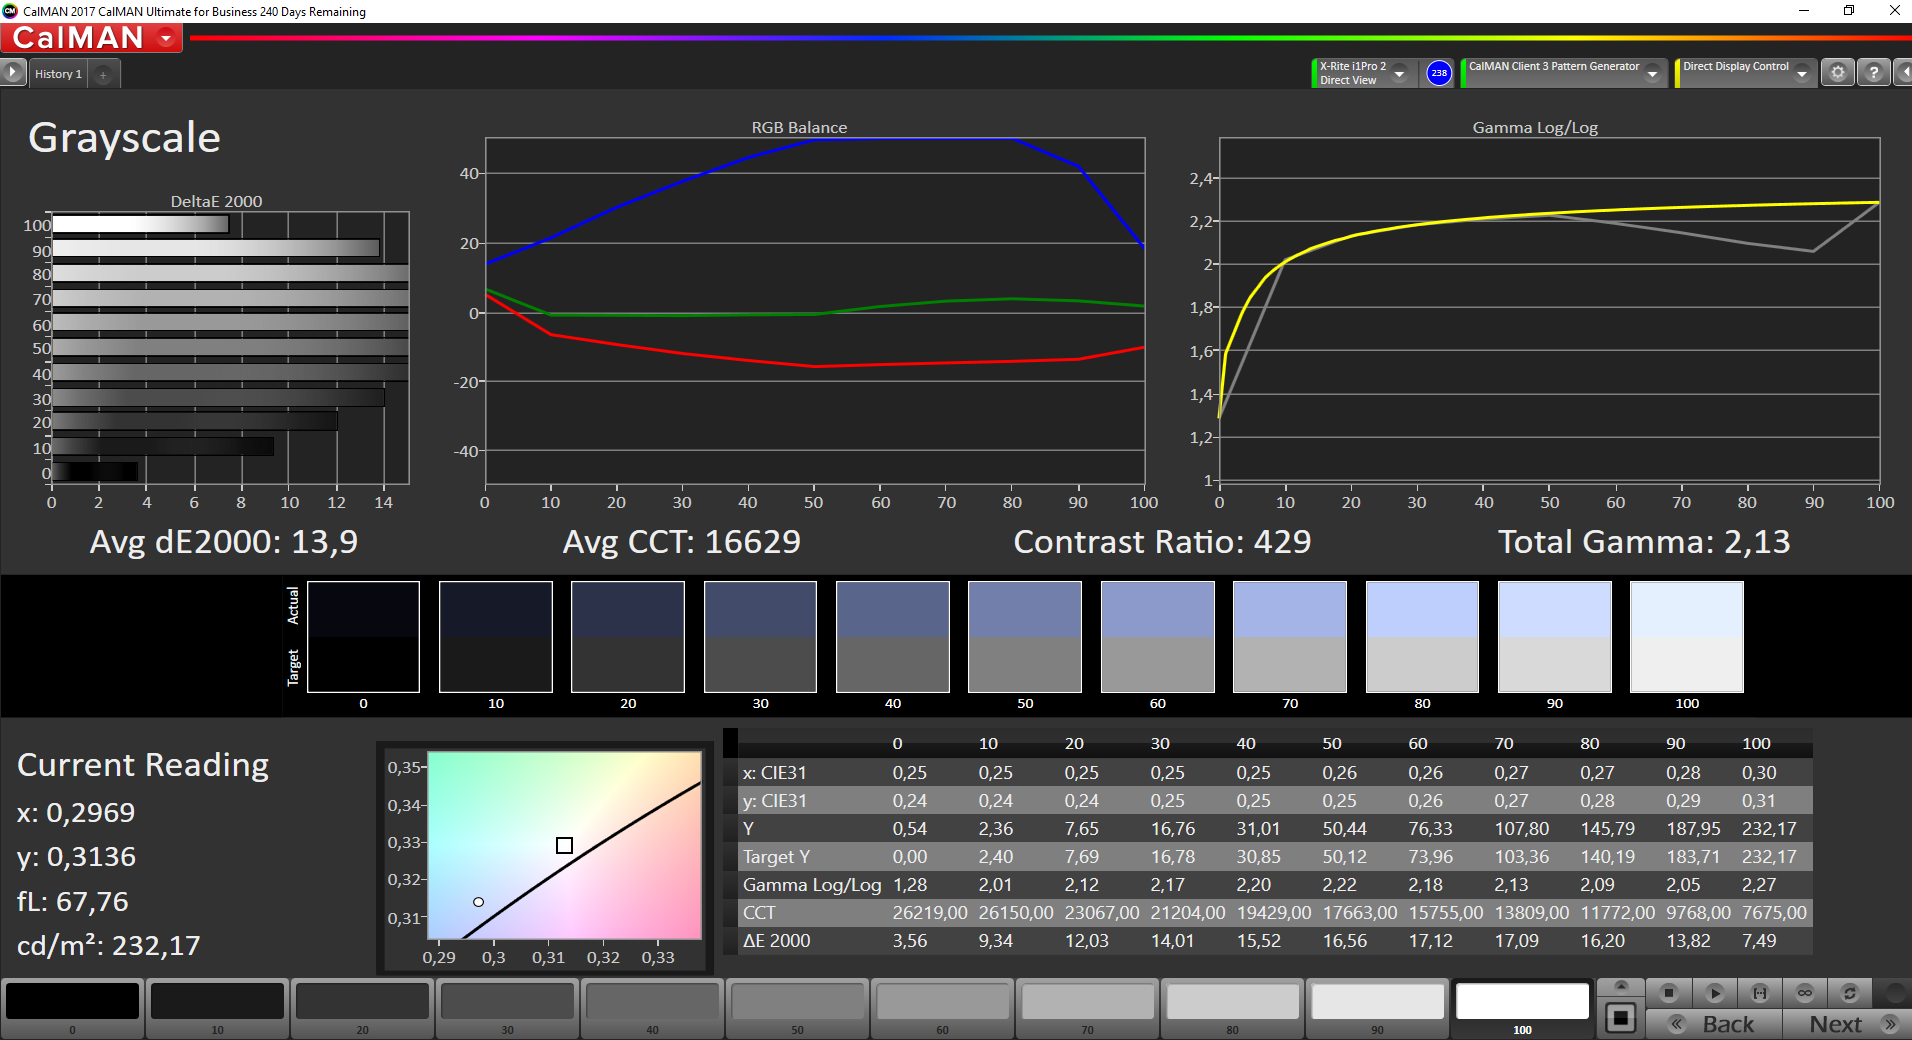
Brightness Distribution: 86 %
Center on Battery: 232 cd/m²
Contrast: 430:1 (Black: 0.54 cd/m²)
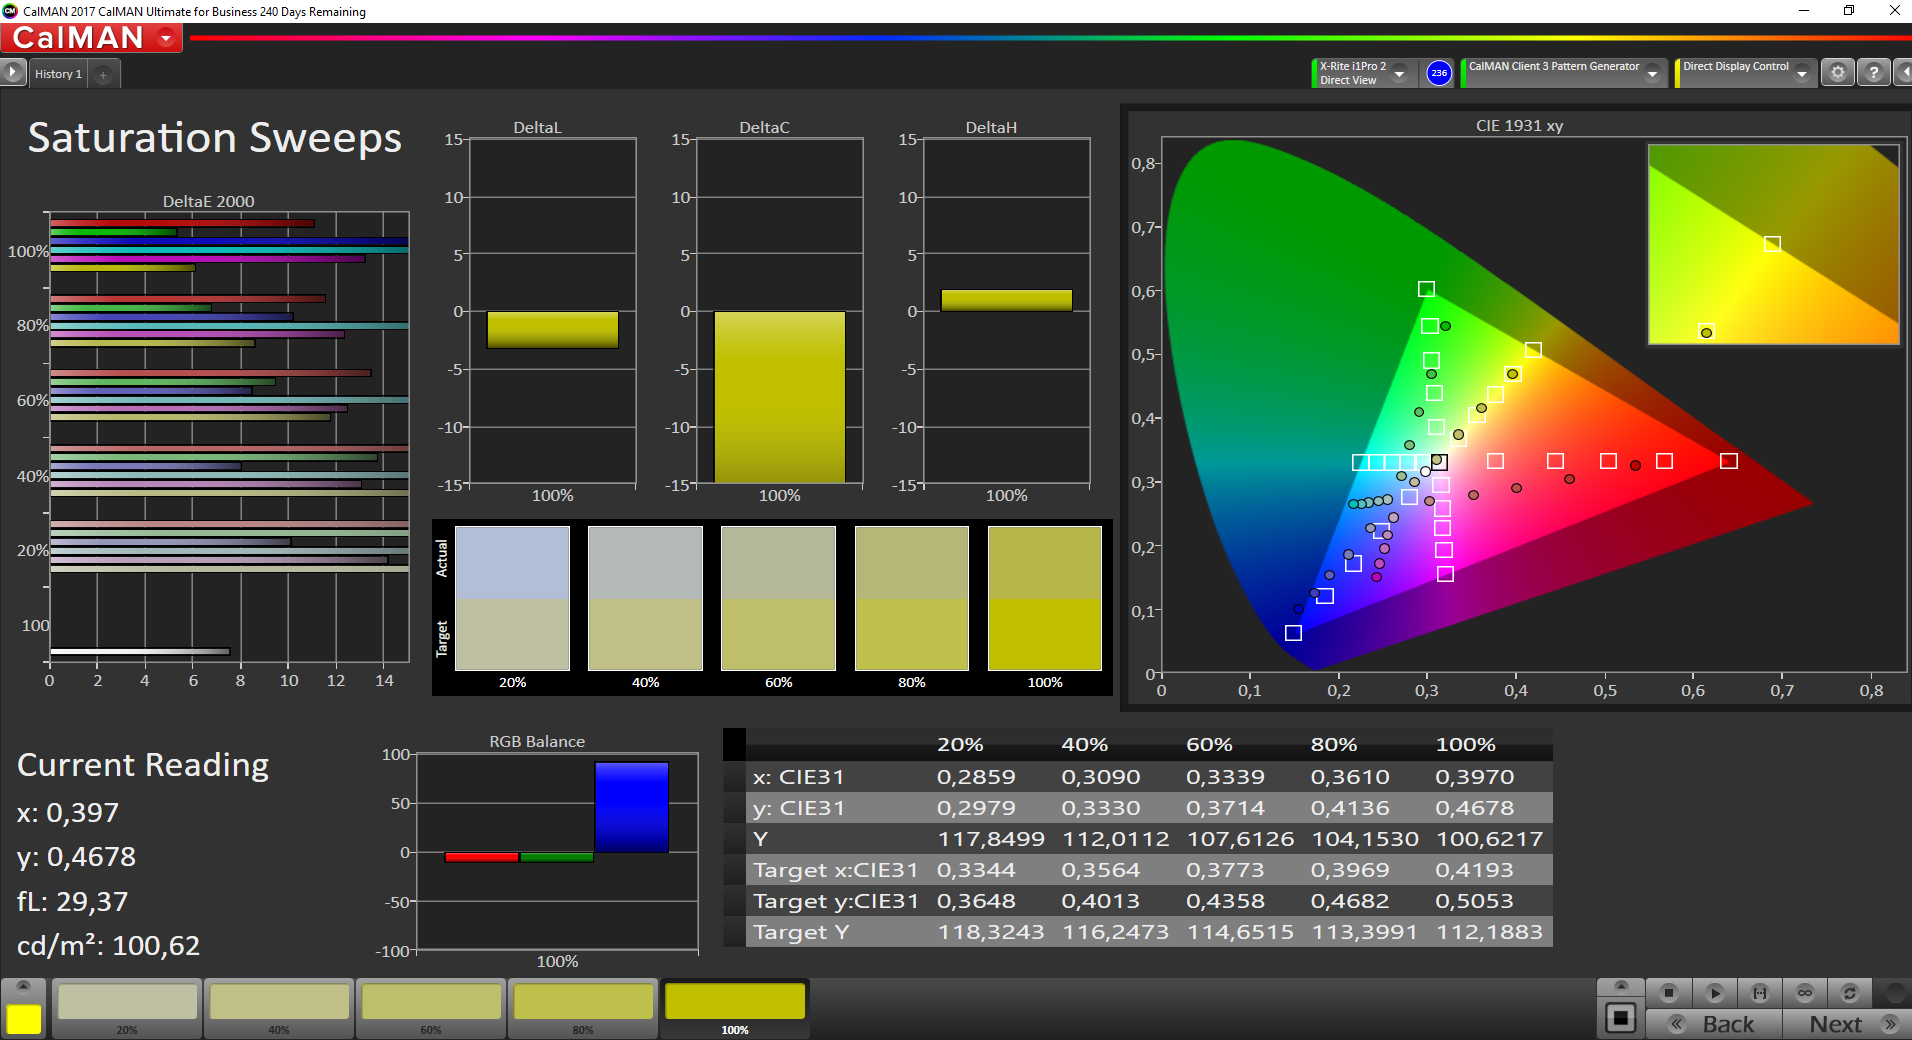
ΔE ColorChecker Calman: 11.8 | ∀{0.5-29.43 Ø4.73}
calibrated: 3.9
ΔE Greyscale Calman: 13.9 | ∀{0.09-98 Ø4.97}
59.2% sRGB (Argyll 1.6.3 3D)
37.6% AdobeRGB 1998 (Argyll 1.6.3 3D)
40.56% AdobeRGB 1998 (Argyll 3D)
59% sRGB (Argyll 3D)
39.22% Display P3 (Argyll 3D)
Gamma: 2.13
CCT: 16629 K
| Dell Latitude 5290 AUO B125XW01-V0, , 1366x768, 12.5" | Lenovo ThinkPad X280-20KES01S00 B125HAN02.2, , 1920x1080, 12.5" | HP EliteBook 830 G5-3JX74EA IVO M133NVF3-R0, , 1920x1080, 13.3" | Dell Latitude 7280 AUO236D , , 1920x1080, 12.5" | Dell Latitude 5280 1366x768, 12.5" | |
|---|---|---|---|---|---|
| Display | 11% | 59% | 12% | 0% | |
| Display P3 Coverage (%) | 39.22 | 44 12% | 64.2 64% | 44.41 13% | 39.34 0% |
| sRGB Coverage (%) | 59 | 64.5 9% | 89.2 51% | 65.4 11% | 59.2 0% |
| AdobeRGB 1998 Coverage (%) | 40.56 | 45.45 12% | 65.2 61% | 45.9 13% | 40.67 0% |
| Response Times | -58% | -36% | -57% | -36% | |
| Response Time Grey 50% / Grey 80% * (ms) | 46.8 ? | 40 ? 15% | 36 ? 23% | 32.4 ? 31% | 42 ? 10% |
| Response Time Black / White * (ms) | 12.8 ? | 29.6 ? -131% | 24.8 ? -94% | 31.2 ? -144% | 23.2 ? -81% |
| PWM Frequency (Hz) | 1020 ? | ||||
| Screen | 54% | 67% | 39% | -3% | |
| Brightness middle (cd/m²) | 232 | 344 48% | 316 36% | 310.4 34% | 251.8 9% |
| Brightness (cd/m²) | 218 | 313 44% | 326 50% | 301 38% | 246 13% |
| Brightness Distribution (%) | 86 | 82 -5% | 85 -1% | 88 2% | 90 5% |
| Black Level * (cd/m²) | 0.54 | 0.25 54% | 0.19 65% | 0.32 41% | 0.75 -39% |
| Contrast (:1) | 430 | 1376 220% | 1663 287% | 970 126% | 336 -22% |
| Colorchecker dE 2000 * | 11.8 | 4.7 60% | 4.5 62% | 5.9 50% | 11.3 4% |
| Colorchecker dE 2000 max. * | 23.2 | 19.4 16% | 12.1 48% | 21 9% | 23.1 -0% |
| Colorchecker dE 2000 calibrated * | 3.9 | 2.9 26% | |||
| Greyscale dE 2000 * | 13.9 | 2.2 84% | 5 64% | 5.1 63% | 13.2 5% |
| Gamma | 2.13 103% | 2.16 102% | 2.22 99% | 2.33 94% | 2.05 107% |
| CCT | 16629 39% | 6252 104% | 6018 108% | 6816 95% | 14912 44% |
| Color Space (Percent of AdobeRGB 1998) (%) | 37.6 | 41.2 10% | 57.9 54% | 42 12% | 37.6 0% |
| Color Space (Percent of sRGB) (%) | 59.2 | 64.1 8% | 87.3 47% | 65 10% | 59.2 0% |
| Total Average (Program / Settings) | 2% /
30% | 30% /
53% | -2% /
21% | -13% /
-6% |
* ... smaller is better
Display Response Times
| ↔ Response Time Black to White | ||
|---|---|---|
| 12.8 ms ... rise ↗ and fall ↘ combined | ↗ 7.6 ms rise | 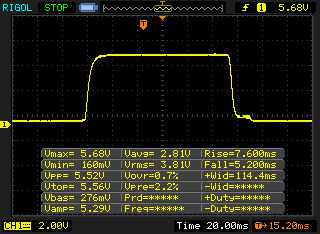 |
| ↘ 5.2 ms fall | ||
| The screen shows good response rates in our tests, but may be too slow for competitive gamers. In comparison, all tested devices range from 0.1 (minimum) to 240 (maximum) ms. » 33 % of all devices are better. This means that the measured response time is better than the average of all tested devices (19.9 ms). | ||
| ↔ Response Time 50% Grey to 80% Grey | ||
| 46.8 ms ... rise ↗ and fall ↘ combined | ↗ 26.8 ms rise | 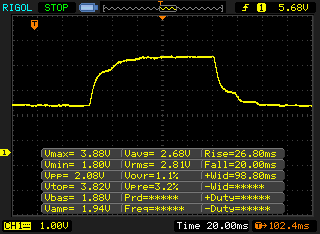 |
| ↘ 20 ms fall | ||
| The screen shows slow response rates in our tests and will be unsatisfactory for gamers. In comparison, all tested devices range from 0.165 (minimum) to 636 (maximum) ms. » 80 % of all devices are better. This means that the measured response time is worse than the average of all tested devices (31.1 ms). | ||
Screen Flickering / PWM (Pulse-Width Modulation)
| Screen flickering / PWM not detected |  | ||
In comparison: 52 % of all tested devices do not use PWM to dim the display. If PWM was detected, an average of 7794 (minimum: 5 - maximum: 343500) Hz was measured. | |||
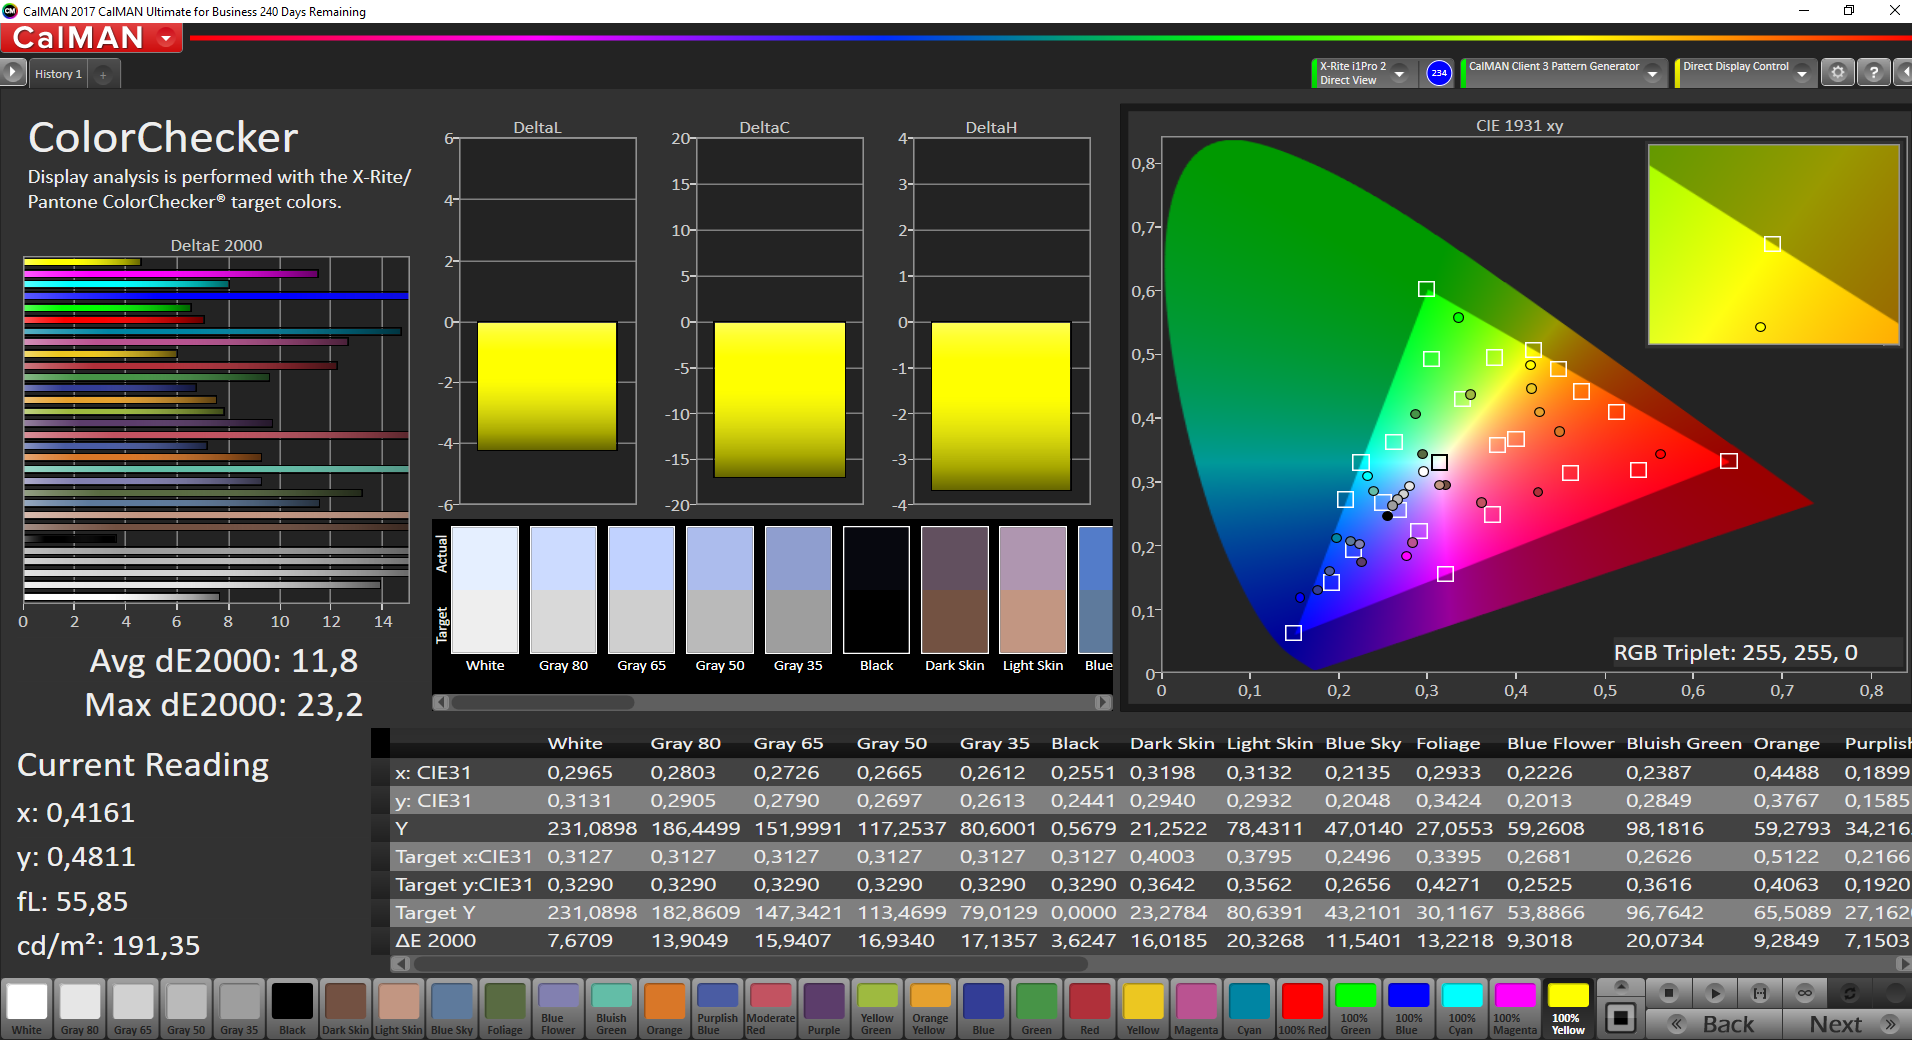

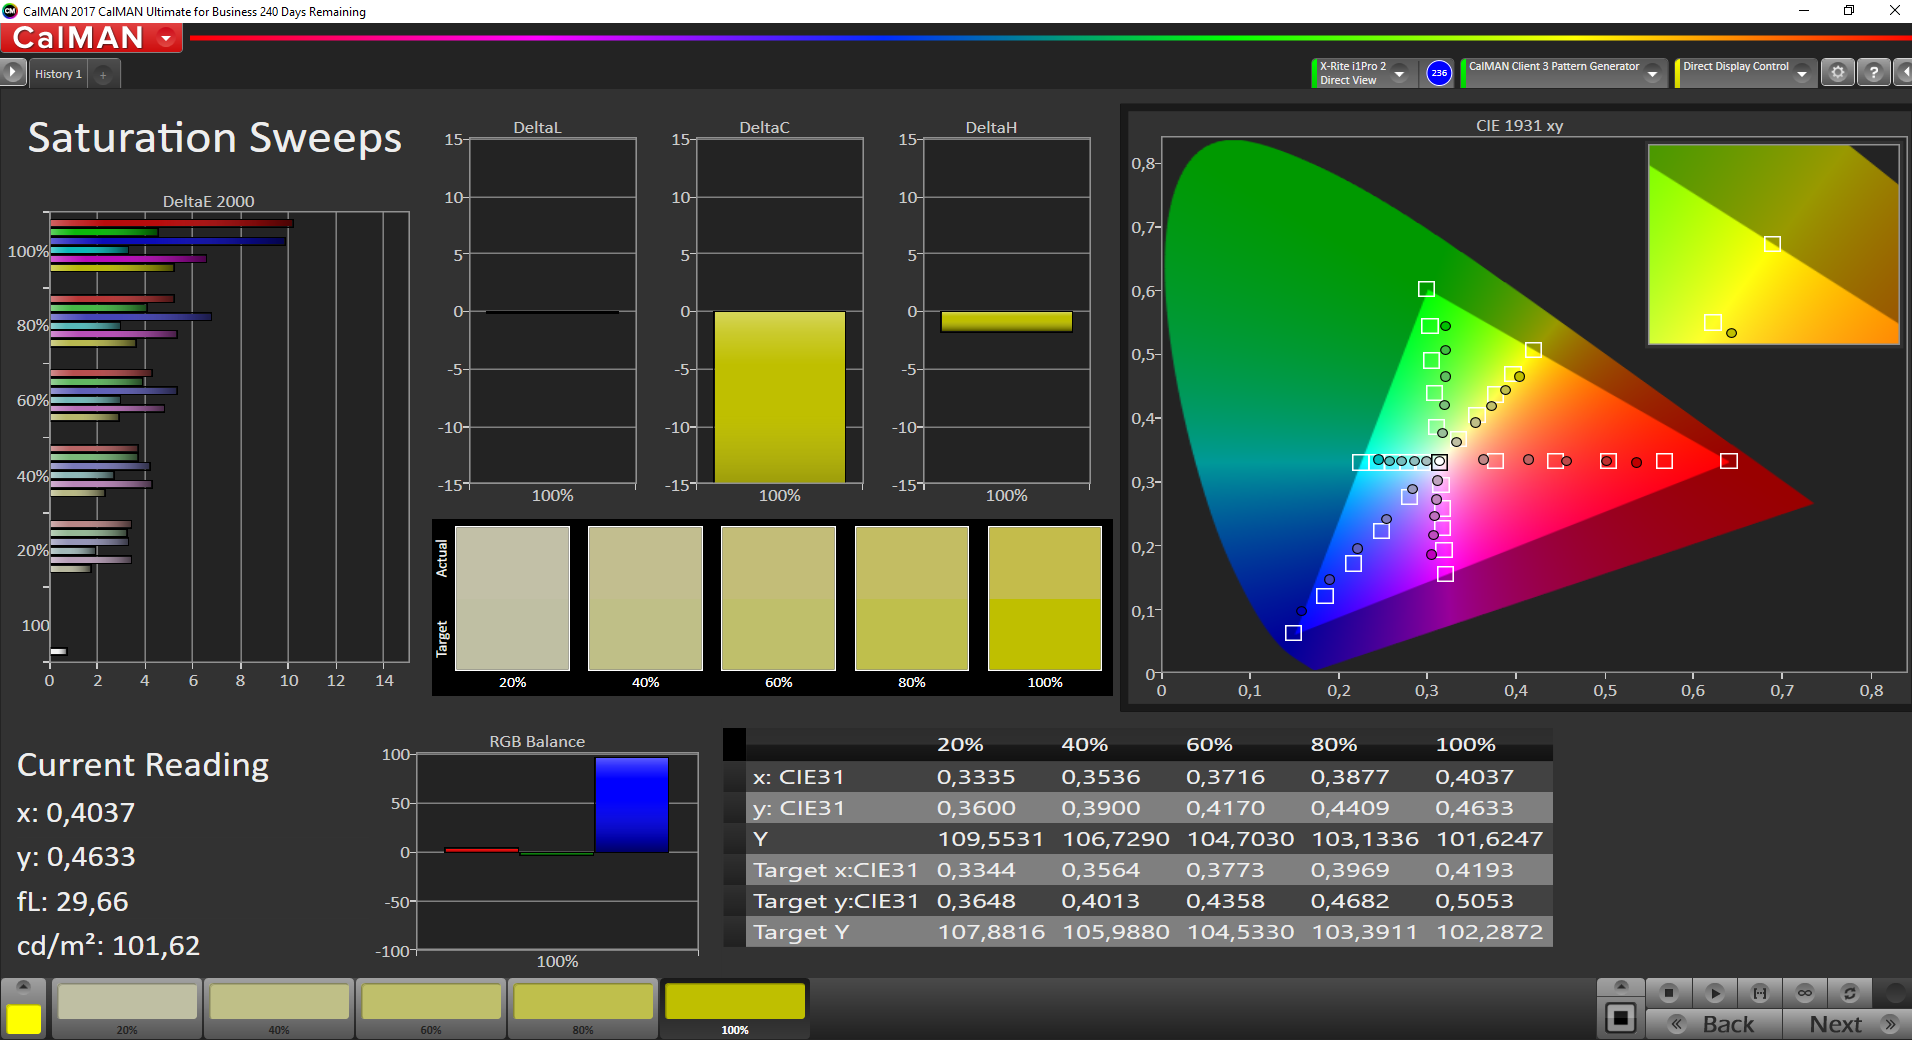
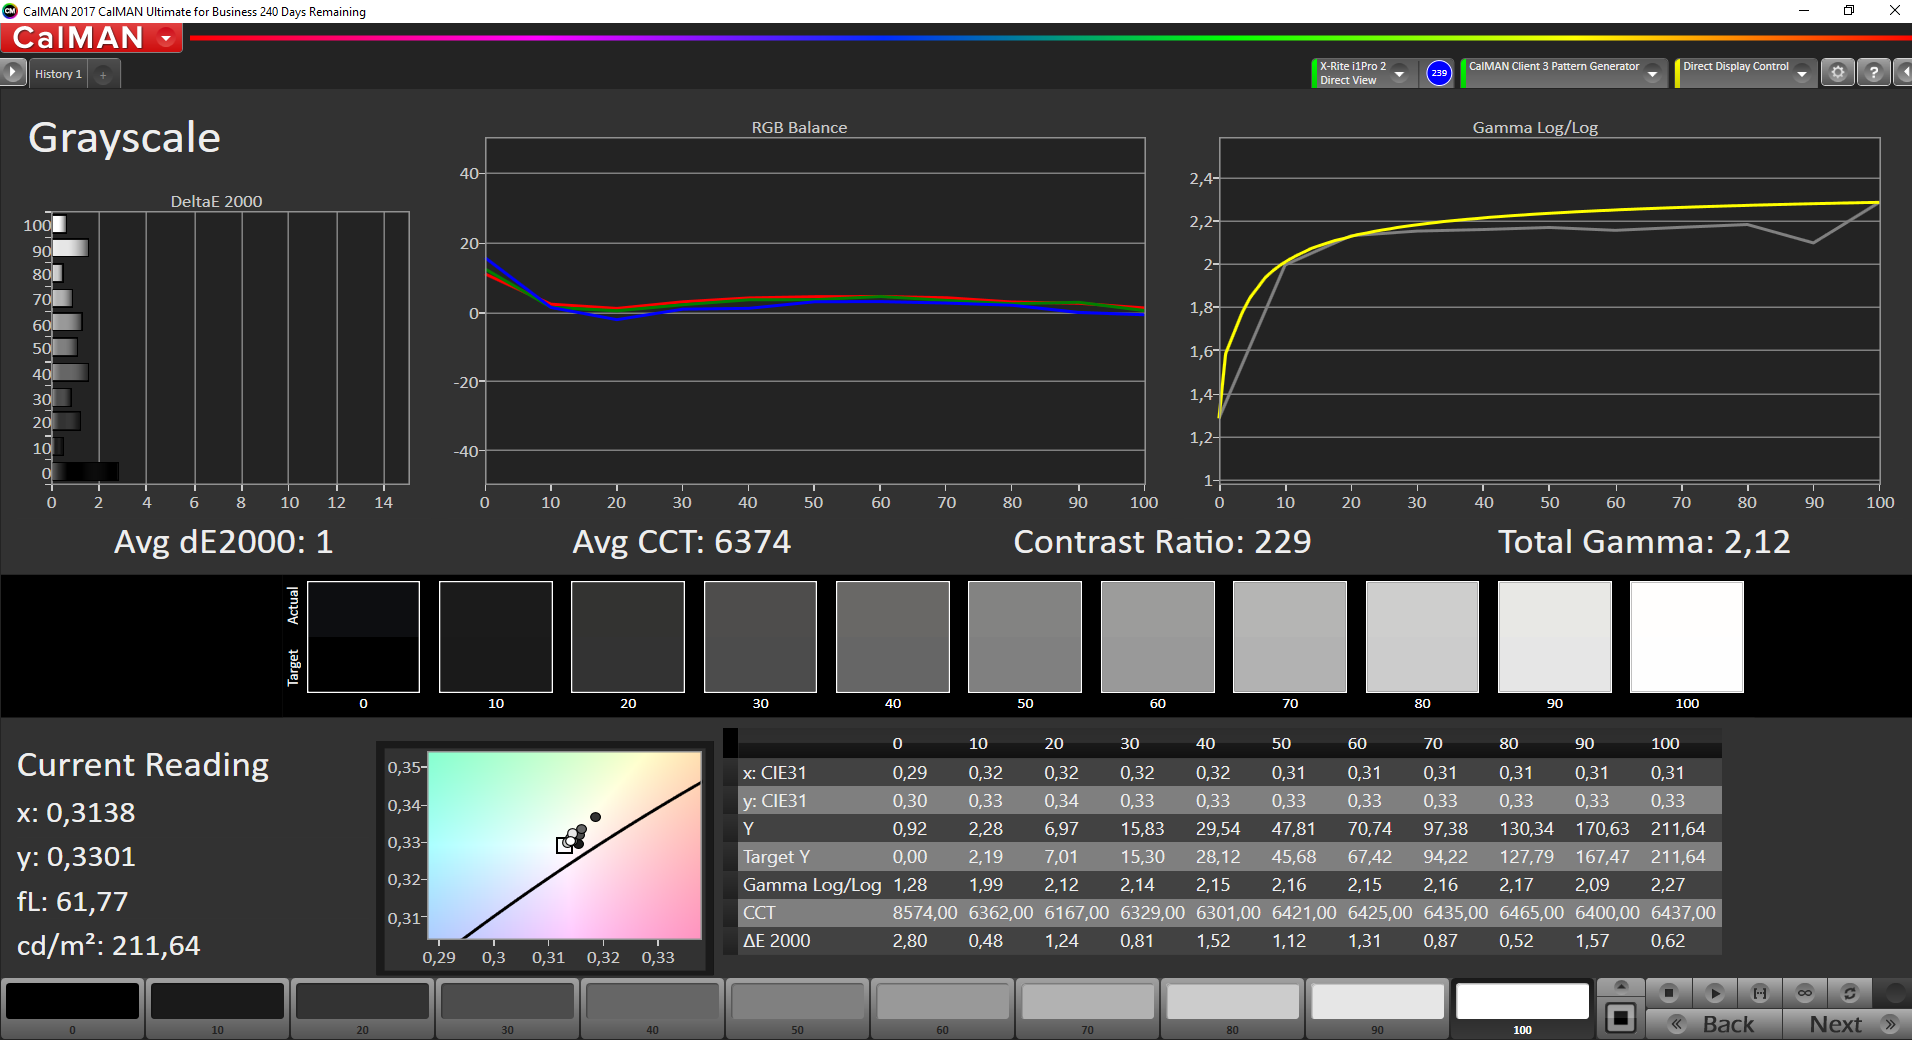
We do not need to waste many words on the color space coverage, since at 59.2% of the sRGB color space, it is inadequate. Considering the cheap HD TN display, a different result would have really surprised us. The display is not suited for any kind of work on colors.
Despite the rather low display brightness, you can still use it outdoors, thanks to the matte display surface. However, you always have to stay in the shade, since barely 220 cd/m² does not begin to be enough to fight against the sun. Even indirect sunlight is a problem with this display.
Performance
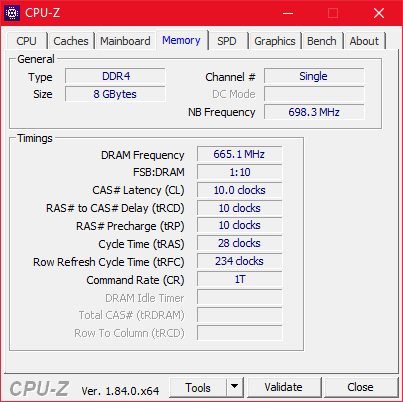
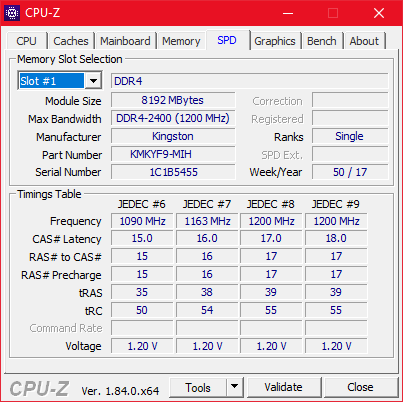
The number of configuration options is not really ample in the Dell 5290. Currently, you can get two different models from various traders in Germany. The only difference between these models is the built-in processor: one model uses the Intel Core i5-8250U, while the other uses the Core i7-8650U vPro processor. Both models use a 256-GB SSD and 8 GB of DDR4-2400 RAM (expandable to a maximum of 32 GB). If you order directly from the Dell shop, you will have only a few options more in the laptop configurator: The most affordable model has the Core i5-8350U, and in addition you can configure the Latitude with a WWAN card and a backlit keyboard.
Processor
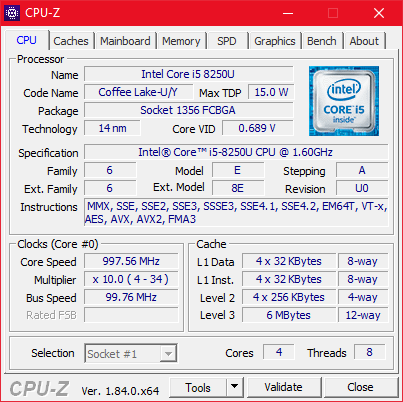
The Intel Core i5-8250U is the most affordable quad-core processor of the U series from Intel. The U series is an "ultra-low Voltage" series, whose processors also have a TDP of 15 watts in general. The basic clock speed of the Core i5-8250U is 1.6 GHz and the Turbo speed of 3.4 GHz. Our CPU benchmark list offers further benchmarks on this processor.
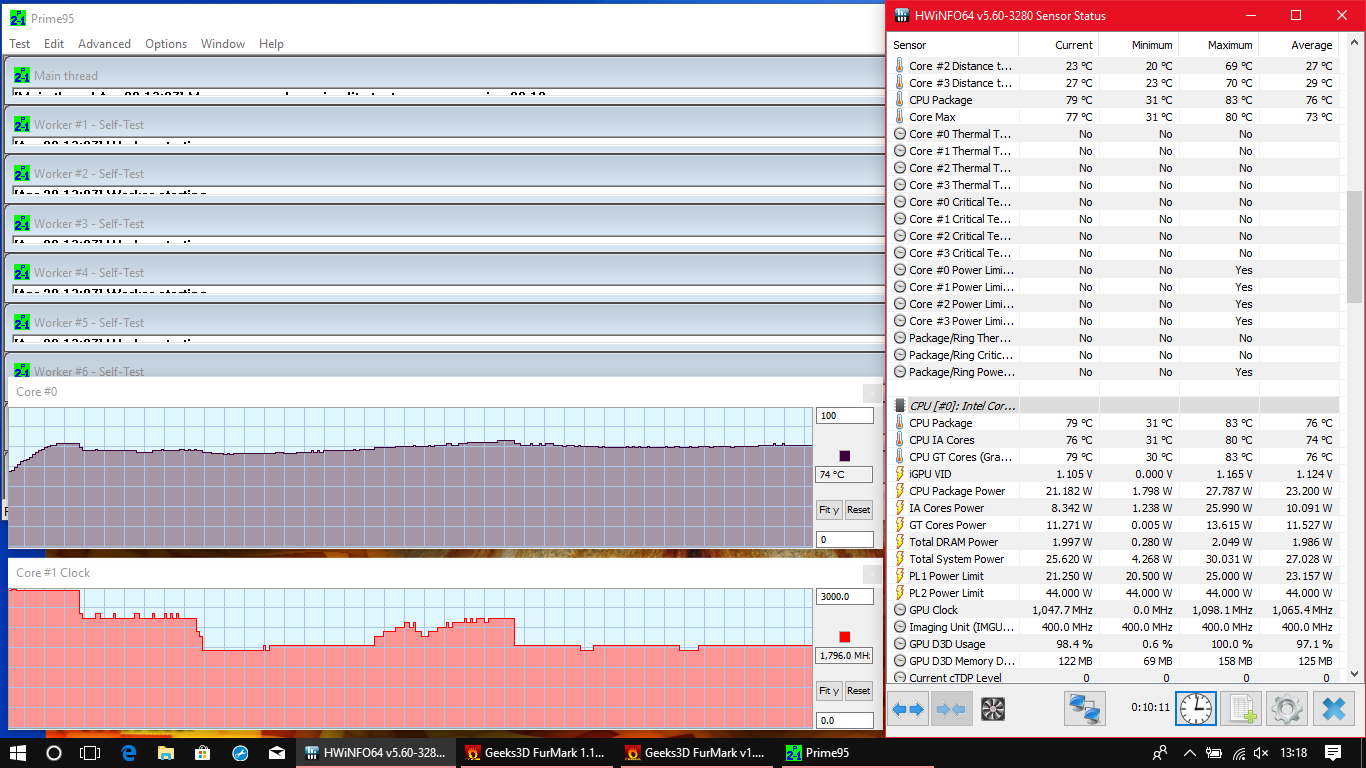
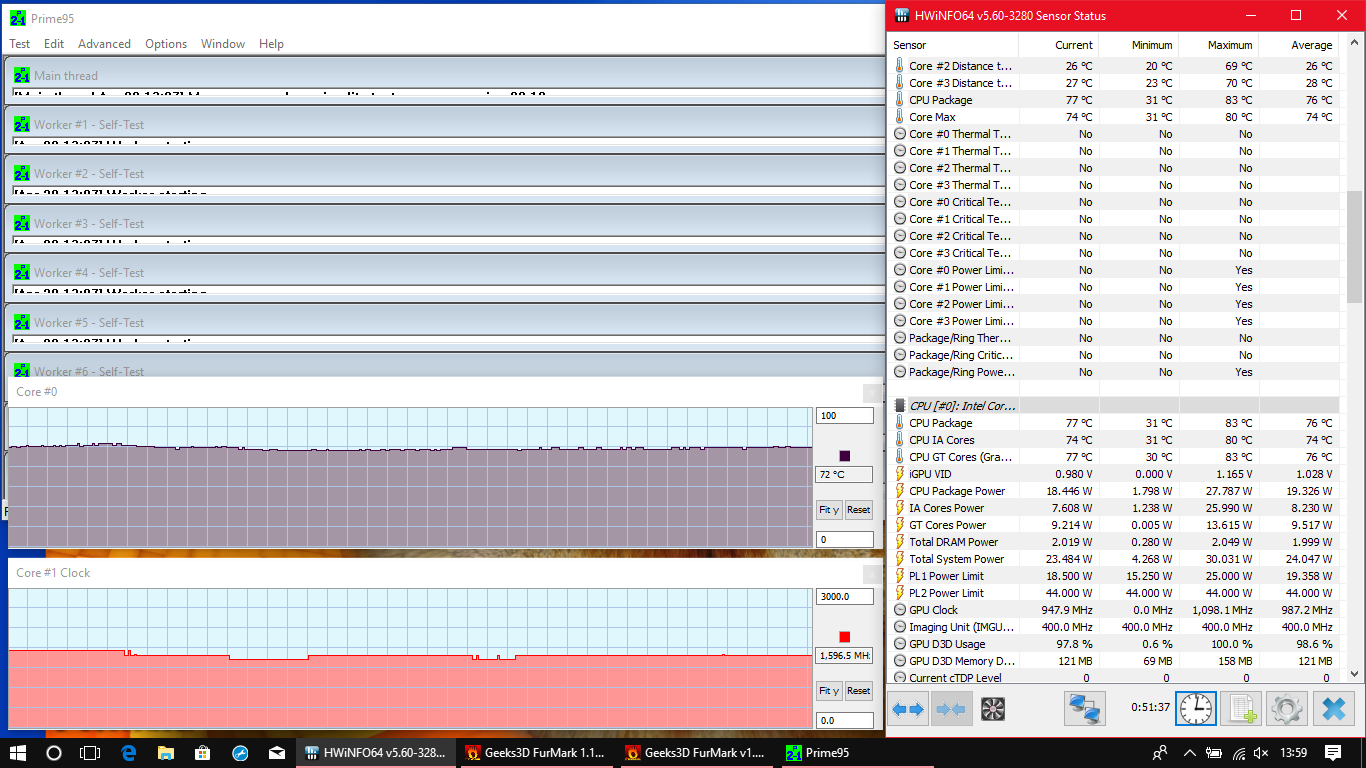
Dell has provided the processor with a wide range, with the TDP of 25 watts instead of 15 watts. The processor is even enabled to use up to 44 watts for up to 28 seconds. Thus, it reaches a very good result of more than 700 points in the first iteration of the Cinebench loop, which is close to the maximum for this processor. However, in the second run the maximum boost performance is not available anymore, so that the performance drops from 3.4 to 3 GHz accordingly. Continuing the test, the performance then drops slightly further, fluctuating while doing this. The reason for this lies in a temperature limit, which Dell has set to about 90 °C (194 °F). If this limit is reached, the clock speed drops down to 2.7 GHz temporarily, until the temperatures have gone down a bit.
The multicore boost performance of the Core i5-8250U in the Latitude is excellent, almost at the same level as the Lenovo ThinkPad T480s, which has achieved the best performance with this processor up until now. The performance during continuous load is not quite as excellent, but still significantly above average.
The CPU performance is not throttled in battery operation.
System Performance
In the PCMark8 benchmark, the Latitude is at the top of the field, which is not surprising considering the good CPU performance and the low display resolution. During everyday use, the Latitude similarly runs very fast.
| PCMark 8 Home Score Accelerated v2 | 4019 points | |
| PCMark 10 Score | 3741 points | |
Help | ||
Storage Solution
A 256-GB M.2 SSD from Micron with the model number MTFDDAV256TBN serves as the single storage unit of the Dell Latitude 5290 business notebook. This is a SATA-III SSD as you can find it nowadays only in budget PCs. The SSD achieves a performance suitable for everyday work, but if you need to copy larger amounts of data, you could notice the difference to a faster PCIe-NVMe SSD. All the comparison devices are better, and only the Dell Latitude 5280 predecessor was even worse, since it used an HDD.
| Dell Latitude 5290 Micron 1100 MTFDDAV256TBN | Lenovo ThinkPad X280-20KES01S00 Samsung SSD PM981 MZVLB512HAJQ | HP EliteBook 830 G5-3JX74EA Samsung SSD PM961 1TB M.2 PCIe 3.0 x4 NVMe (MZVLW1T0) | Dell Latitude 7280 SanDisk X400 M.2 2280 256GB | Dell Latitude 5280 Toshiba MQ01ACF050 | Average Micron 1100 MTFDDAV256TBN | Average of class Subnotebook | |
|---|---|---|---|---|---|---|---|
| CrystalDiskMark 3.0 | 409% | 278% | 55% | -85% | 40% | ||
| Read Seq (MB/s) | 472.8 | 2535 436% | 2331 393% | 470.8 0% | 107.5 -77% | 465 ? -2% | |
| Write Seq (MB/s) | 164.5 | 1236 651% | 1114 577% | 477.4 190% | 95.3 -42% | 379 ? 130% | |
| Read 512 (MB/s) | 310.1 | 1751 465% | 1219 293% | 370.1 19% | 31.13 -90% | 315 ? 2% | |
| Write 512 (MB/s) | 163.4 | 1864 1041% | 1058 547% | 323.2 98% | 45.49 -72% | 315 ? 93% | |
| Read 4k (MB/s) | 19.71 | 59.3 201% | 49.4 151% | 30.23 53% | 0.357 -98% | 24.6 ? 25% | |
| Write 4k (MB/s) | 83.5 | 129.4 55% | 113.9 36% | 59.5 -29% | 0.827 -99% | 80.8 ? -3% | |
| Read 4k QD32 (MB/s) | 173.4 | 387.9 124% | 305 76% | 344.4 99% | 0.737 -100% | 227 ? 31% | |
| Write 4k QD32 (MB/s) | 163.5 | 646 295% | 412.8 152% | 183 12% | 0.795 -100% | 233 ? 43% |

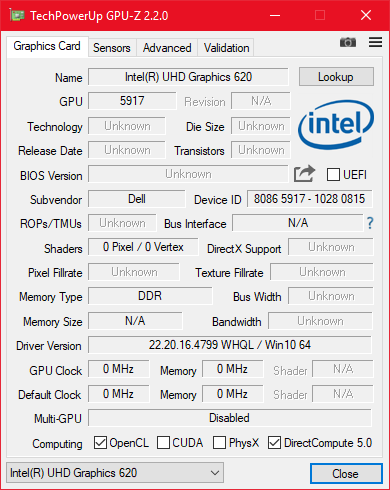
Graphics Card
The Intel UHD Graphics 620, which is included in all the Kaby Lake Refresh CPUs, is an integrated graphics card with 24 execution units. Since it does not have its own storage, it has to use the main storage. Correspondingly, the GPU performance is dependent on whether the storage runs in single or dual-channel mode. Since it operates in single-channel mode in our test unit, the potential of the graphics chip is not fully used. You can change this easily by adding a second storage module.
There is no limitation of the GPU performance in battery operation.
| 3DMark 11 Performance | 1770 points | |
| 3DMark Cloud Gate Standard Score | 7862 points | |
| 3DMark Fire Strike Score | 904 points | |
Help | ||
Gaming Performance
The Dell Latitude 5290 is not a gaming system, and the built-in iGPU is too weak for almost all the newer games. If you want to play games, you should look for a different PC.
| low | med. | high | ultra | |
|---|---|---|---|---|
| BioShock Infinite (2013) | 51.8 | 29.6 | 24.2 |
Emissions and Power Management
Noise Emissions
During idle operation and low loads, the fan of the Latitude 12 5290 hardly ever starts, so Dell has optimized the fan control well. Under load, on the other hand, the running fan can easily be heard, but this might be necessary to provide decent cooling to the powerful processor. We do not notice any coil whining which afflicted other Dell systems such as the older XPS 13.
Noise level
| Idle |
| 29.3 / 29.3 / 29.3 dB(A) |
| Load |
| 34.3 / 39.1 dB(A) |
 | ||
30 dB silent 40 dB(A) audible 50 dB(A) loud |
||
min: | ||
Temperatures
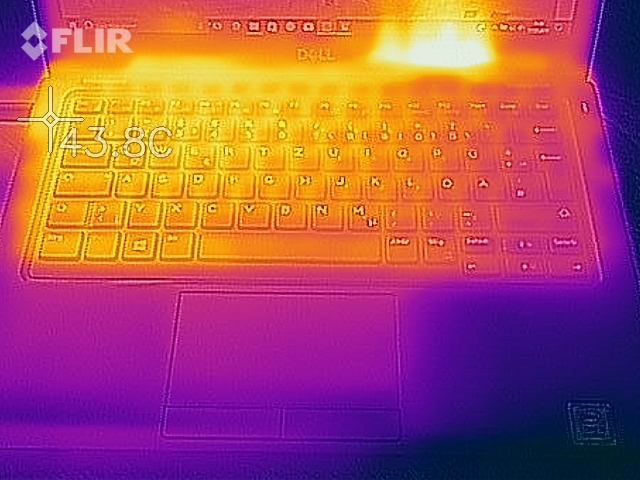
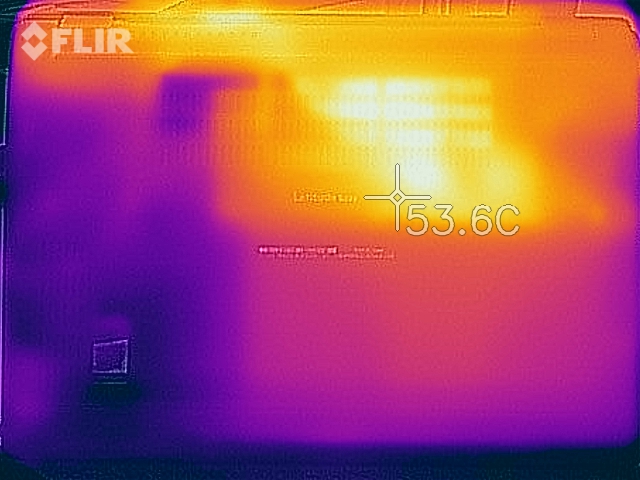
Under load, the case heats up noticeably, particularly at the bottom. In the center, a maximum of 51 °C (124 °F) is possible, which does give some reason for concern, since during long work sessions, using it on your lap can become uncomfortable.
In the stress test with Prime95 and FurMark, the processor starts operating at 3 GHz, and after 28 seconds the speed drops to about 2.6 GHz. This is because the CPU cores have to share the TDP of 25 watts with the iGPU. After about 10 minutes, the CPU speed stabilizes at 1.8 GHz, which is due to a temperature limit that the manufacturer has set at about 80 °C (176 °F) for simultaneous CPU and GPU load. During the course of the test, the speed continues to drop slightly more, down to the basic clock speed of 1.6 GHz. Since the speed never drops below the basic clock speed, thermal throttling does not occur.
A 3DMark11 that we ran right after the stress test showed normal results.
(±) The maximum temperature on the upper side is 41.2 °C / 106 F, compared to the average of 35.9 °C / 97 F, ranging from 21.4 to 59 °C for the class Subnotebook.
(-) The bottom heats up to a maximum of 51 °C / 124 F, compared to the average of 39.2 °C / 103 F
(+) In idle usage, the average temperature for the upper side is 24.3 °C / 76 F, compared to the device average of 30.8 °C / 87 F.
(+) The palmrests and touchpad are cooler than skin temperature with a maximum of 30.3 °C / 86.5 F and are therefore cool to the touch.
(-) The average temperature of the palmrest area of similar devices was 28.2 °C / 82.8 F (-2.1 °C / -3.7 F).
Speakers
For a subnotebook of the business realm, the speakers of the Dell Latitude 5290 are quite good. In comparison, the speakers of the Lenovo ThinkPad X280 are considerably quieter and less balanced. The Latitude speakers only lack bass completely, but this is almost always the case for notebooks. You get an even better sound experience, if you use external speakers or headphones, which can be connected to the audio port.
Dell Latitude 5290 audio analysis
(+) | speakers can play relatively loud (86.7 dB)
Bass 100 - 315 Hz
(-) | nearly no bass - on average 23.1% lower than median
(+) | bass is linear (4.8% delta to prev. frequency)
Mids 400 - 2000 Hz
(+) | balanced mids - only 4.2% away from median
(±) | linearity of mids is average (8.6% delta to prev. frequency)
Highs 2 - 16 kHz
(+) | balanced highs - only 4% away from median
(+) | highs are linear (5.1% delta to prev. frequency)
Overall 100 - 16.000 Hz
(±) | linearity of overall sound is average (16.9% difference to median)
Compared to same class
» 43% of all tested devices in this class were better, 7% similar, 49% worse
» The best had a delta of 5%, average was 18%, worst was 53%
Compared to all devices tested
» 30% of all tested devices were better, 8% similar, 62% worse
» The best had a delta of 4%, average was 24%, worst was 134%
Lenovo ThinkPad X280-20KES01S00 audio analysis
(±) | speaker loudness is average but good (76.8 dB)
Bass 100 - 315 Hz
(-) | nearly no bass - on average 17% lower than median
(±) | linearity of bass is average (11.8% delta to prev. frequency)
Mids 400 - 2000 Hz
(+) | balanced mids - only 4.1% away from median
(±) | linearity of mids is average (9.9% delta to prev. frequency)
Highs 2 - 16 kHz
(+) | balanced highs - only 1.9% away from median
(+) | highs are linear (4.7% delta to prev. frequency)
Overall 100 - 16.000 Hz
(±) | linearity of overall sound is average (17.7% difference to median)
Compared to same class
» 49% of all tested devices in this class were better, 7% similar, 44% worse
» The best had a delta of 5%, average was 18%, worst was 53%
Compared to all devices tested
» 35% of all tested devices were better, 8% similar, 57% worse
» The best had a delta of 4%, average was 24%, worst was 134%
Power Consumption
Under low load, laptops with ULV processors often run very efficiently, and this is also the case for the Latitude 5290. The maximum idle usage of 5.2 watts is a very good result.
The included power supply provides 65 watts to the Dell Laptop. Although the Latitude 5290 uses slightly more under load, since the consumption is lowered during the stress test anyway, the power supply does provide sufficient power.
| Off / Standby | |
| Idle | |
| Load |
|
Key:
min: | |
Battery Life
The specifications of the Latitude 5290 lists a total of three different battery options: a 42-Wh battery, a 51-Wh battery, and a battery with 68-Wh. All the configurations available in Germany have the medium 51-Wh battery, which is built into the case. With this battery, Dell achieves a very decent Wi-Fi battery life of 10 hours and 6 minutes. For example, the Latitude 5280 predecessor only lasted less than 8 hours. The Lenovo ThinkPad X280 also did not fare quite as well in the WLAN test, with the lesser power consumption due to the display having a lower resolution likely providing an advantage for the Latitude in this respect.
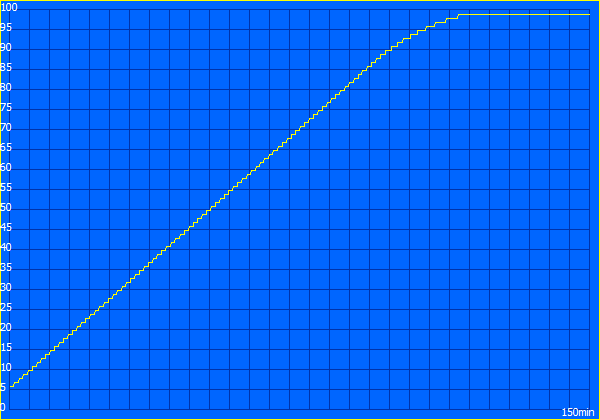
It takes 150 minutes to charge the battery.
Pros
Cons
Verdict
The Latitude 5290 is a compact laptop that Dell has optimized through and through for use in business - with all the advantages and disadvantages that are accompanying such an orientation towards specific target groups.
The advantages include for example, the good keyboard and the robust case. The Latitude also has VGA, a connection that is probably still appreciated by some users in the business sector, since there are probably still many VGA projectors around. Furthermore, the Latitude always runs very quietly during idle, while still offering an above-average CPU performance. The battery life is good, and the speakers are also not bad for a small business device. With two RAM slots and up to 32 GB of working memory, the Latitude is also expandable.
The greatest problem of the Latitude 5290 which casts a cloud over everything else is the LCD panel. Dell uses an absolutely inferior HD TN display, as you can still find it today in many business laptops. That is why most of them are still belonging to the below-1000-Euro price range (~$1200). But in terms of its price, the Latitude 5290 plays in a higher league. So this display is just completely out of place. Compared to this, the other problems of the Latitude such as the lack of a TrackPoint or a keyboard illumination, the bad positioning of the microSD card slot, the short warranty, or the SATA-III SSD are rather minor blemishes.
Even though the Dell Latitude 5290 can score in many respects, it does not earn our recommendation. Businesses should not mistreat the eyes of their employees with such a bad display.
Naturally, the Dell Latitude 5290 does not receive a recommendation, since the display is simply too abysmal for a device of this price range. If Dell would only offer a better display, it could have been an interesting device. Business customers who care about the eyes of their employees should look for others models such as the Lenovo ThinkPad X280 or the HP EliteBook 830 G5 (to be tested soon). The Dell Latitude 7290 we have not tested yet might also be a better option.
Dell Latitude 5290
- 04/30/2018 v6 (old)
Benjamin Herzig
Price comparison
